Evaluation of the carbon adsorption method with parallel ...
74
Scholars' Mine Scholars' Mine Masters Theses Student Theses and Dissertations 1970 Evaluation of the carbon adsorption method with parallel solvent Evaluation of the carbon adsorption method with parallel solvent extraction studies extraction studies Stanley Kent Wagher Follow this and additional works at: https://scholarsmine.mst.edu/masters_theses Part of the Civil Engineering Commons Department: Department: Recommended Citation Recommended Citation Wagher, Stanley Kent, "Evaluation of the carbon adsorption method with parallel solvent extraction studies" (1970). Masters Theses. 7213. https://scholarsmine.mst.edu/masters_theses/7213 This thesis is brought to you by Scholars' Mine, a service of the Missouri S&T Library and Learning Resources. This work is protected by U. S. Copyright Law. Unauthorized use including reproduction for redistribution requires the permission of the copyright holder. For more information, please contact [email protected].
-
Upload
khangminh22 -
Category
Documents
-
view
0 -
download
0
Transcript of Evaluation of the carbon adsorption method with parallel ...

Scholars' Mine Scholars' Mine
Masters Theses Student Theses and Dissertations
1970
Evaluation of the carbon adsorption method with parallel solvent Evaluation of the carbon adsorption method with parallel solvent
extraction studies extraction studies
Stanley Kent Wagher
Follow this and additional works at: https://scholarsmine.mst.edu/masters_theses
Part of the Civil Engineering Commons
Department: Department:
Recommended Citation Recommended Citation Wagher, Stanley Kent, "Evaluation of the carbon adsorption method with parallel solvent extraction studies" (1970). Masters Theses. 7213. https://scholarsmine.mst.edu/masters_theses/7213
This thesis is brought to you by Scholars' Mine, a service of the Missouri S&T Library and Learning Resources. This work is protected by U. S. Copyright Law. Unauthorized use including reproduction for redistribution requires the permission of the copyright holder. For more information, please contact [email protected].

EVALUATION OF THE CARBON ADSORPI'ION METHOD WITH PARALLEL SOLVENT EXTRACTION STUDIES
BY
STANLEY KENT WAGHER, 1944-
A
THESIS
submitted to the faculty of
THE UNIVERSITY OF MISSOURI-ROLLA
in partial fulfillment of the requirements for the
Degree of
MASTER OF SCIENCE IN CIVIL ENGINEERING
Rolla, Missouri
1970
T2505
73 pages c.l
Approved by~-. _\_.~=~;..:..-_'""-· ,----'G,._._~-~-tr· _·--.""-3~'-::-_-\._,---.:, __ (Advisor) .....,_rA· '-#-:::;..!1~:....:......:-L.....:....~~...:......!~.L..-
l
t( . .&. "?~

11
ABSTRACT
In spite of the importance of the carbon adsorption method (CAM)
in determining drinking water quality and its wide use in research and
plant control studies, little work has been undertaken to quanti
tatively and qualitatively evaluate the method, especially under field
conditions. This investigation was, therefore, undertaken in order to
develop a test system consisting of equipment and procedures which would
make possible the field evaluation of the carbon adsorption method by
parallel solvent extraction studies, and to employ this system in pre
liminary field investigations to establish guidelines for the experi
mental conditions required for its effective application.
The test system developed in this study consisted of a sand filter
and four carbon filters connected in series; a raw water pump; an acid
storage tank and acid pump; sample outlets and storage reservoirs lo
cated before and after each filter unit; and associated flow meter,
pressure gage, valves and piping. Organic micropollutants were re
covered from a subsurface water source (Maramec Spring) by carbon ad
sorption at the natural ( 7.1) and an adjusted pH ( 2. 5) and were eluted
from the carbon with chloroform and benzene. Raw water and filter ef
fluent samples, composited over appropriate periods, were solvent ex
tracted with chloroform and benzene at appropriate pH levels (7.1, 2.5,
and lo.o).
The test system proved to be satisfactory for the field evaluation
of the CAM and enabled the monitoring of the trace organics in the in
fluent to and effluent from the carbon filters. Preliminary evaluation
studies indicated that the CAM had a low total efficiency for recovering
trace organics, however, further research is needed in order to fully
evaluate the method and establish its liaitations.

ACKNOWLEDGEMENT
The author wishes to recognize the Department of Civil Engine
ering of the University of Missouri-Rolla for providing facilities
iii
for this investigation and the James Foundation, St. James, Missouri,
for providing the sampling location. Appreciation is also expressed
to Mr. Hershel Hollingsworth, Laboratory Mechanic, Department of Civil
Engineering, for his help and guidance in the construction of the test
equipment used in this project.
Special thanks is also extended to Dr. T. R. Beveridge, Chairman
Department of Geology and Geophysics, University of Missouri-Rolla, for
the use of the departmental truck when transporting the test equipment
to the field.
Special acknowledgement is given to the author's wife, Judith,
whose support and typing skill were of great importance.
This investigation was supported by Training Grant No. 5T1-WP-86-
02-04 from the Federal Water Quality Administration, and in part by
Research Grant No. ES-00082 #6 from the u.s. Public Health Service
and a special equipment grant from the University of Missouri. The
author is indebted to his advisor, Dr. S. G. Grigoropoulos, Professor
of Civil Engineering, for awarding him the traineeship and other
support.

iv
TABU~ OF CONTENTS
Pap;e
LIST OF FIGURES. e • e a • e • e • II • II a e I • I I 8 • t e e P II II e •• t1 II e e II • II • II e • e • II e II e e e II II v
LIST OF TABLES . ••••••••••••••••••••••••••••••.•••••••••••••••••• , • vi
I.
II.
III.
IV.
v.
VI.
VII.
INTRODUCTION •••••••••••••••••••••••••••••••• ................ REVIEW OF LITERATURE ••••••••••••••••••••••••••••••••••••••••
A. B. c.
Carbon Adsorption Method•••••••••••••••••••••••••••••••• Evaluation of the Carbon Adsorption Method •••••••••••••• Solvent Extraction Method•••••••••••••••••••••••••••••••
FIELD TEST SYSTEM•••••••••••••••••••••••••••••••••••••••••••
A. B.
Design Features••••••••••••••••••••••••••••••••••••••••• Field Test System•••••••••••••••••••••••••••••••••••••••
EXPERIMENTAL STUDIES AND RESULTS••••••••••••••••••••••••••••
A. B.
c.
Location • •••••••••••••..••••••••••••••••••.•••••.•••••.. Procedures •••••••••••••••••••••••••••••••••••••••••••••• 1. Field Sampling Procedures••••••••••••••••••••••••••• 2. Laboratory Recovery Procedures••••••••••••••••••••••
a. Solvent Extraction•••••••••••••••••••••••••••••• b. Carbon Elution••••••••••••••••••••••••••••••••••
3. Summary of Experimental Conditions •••••••••••••••••• Results • •••••••••••••••••••••••..••••••••••.•.•••••••••• 1. Merarnec Spring Run No. 1•••••••••••••••••••••••••••• 2. Meramec Spring Run No. 2••••••••••••••••••••••••••••
DISCUSSION ••••••••••••••••••••••••••••••••••••••••••••••••••
CONCLUSIONS •••••••••••••••••••••••••••••••••••••••••••••••••
RECOMMENDATIONS FOR FUTURE ~ORK•••••••••••••••••••••••••••••
1
5
5 6
13
16
16 18
26
26 27 27 30 30 32 37 37 37 43
50
59
61
BIBLIOGRAPHY................................................ 62
APPENDIX A •••••••••••••••••••••••••••••••••• • • •••••••••• • • • • 65
Acid Solution Pump Setting•••••••••••••••••••••••••••••• 65
VITA........................................................ 67

v
LIST OF FIGURES
Figure Page
1. Field Test System••••••••••••••••••••••••••••••••••••••••••• 19
2. Sand or Activated Carbon Filter Unit•••••••••••••••••••••••• 20
3. Pump and Filter Arrangement••••••••••••••••••••••••••••••••• 23
4. Pump and Filter Arrangement on Location at Meramec Spring... 24
5. Solvent Extraction Scheme••••••••••••••••••••••••••••••••••• 31
6. Equipment Used in Solvent Extraction Studies................ 33
7. Modified Soxhlet Extraction Apparatus••••••••••••••••••••••• 35
8. Evaluation of the Carbon Adsorption Method Solvent and Carbon Extraction Data--Meramec Spring Run No. 2 48
9. Evaluation of the Carbon Adsorption Method Meramec Spring Run No. 2•••••••••••••••••••••••••••••••••••• 55
A-1. Titration Curve for Meramec Spring Water•••••••••••••••••••• 66

vi
LIST OF TABLES
Table Page
I. Modifications of the Carbon Adsorption Method Summary of Sampling Data••••••••••••••••••••••••••••••••••• 7
II. Modifications of the Carbon Adsorption Method Summary of Recovery Data••••••••••••••••••••••••••••••••••• 8
III. Evaluation of the Carbon Adsorption Method••••••••••••••••• 38
IV. Evaluation of the Carbon Adsorption Method Solvent Extraction Data--Meramec Spring Run No. 1 •••••••••• 41
v. Evaluation of the Carbon Adsorption Method Carbon Extraction Data--Maramec Spring Run No. 1 ••••••••••• 42
VI. Evaluation of the Carbon Adsorption Method Solvent Extraction Data--Meramec Spring Run No. 2 •••••••••• 46
VII. Evaluation of the Carbon Adsorption Method Carbon Extraction Data--Maramec Spring Run No. 2 ••••••••••• 47
VIII. Evaluation of the Carbon Adsorption Method Average Recoveries--Maramec Spring Run No. 2 ••••••••••••••• 53

I. INTRODUCTION
The presence of organic micropollutants, including pesticides,
in surface and subsurface water is creating considerable concern.
These organic materials are contributed from several sources, such
as domestic and industrial wastes, agricultural runoff, accidental
spillage, and the decomposition of natural products (1,2). Although
present in water at minute concentrations, trace organics are often
responsible for taste and odor, color, and toxicity.
The possibility that trace organics may deteriorate the aesthetic
quality of the water, their resistance to biodegradation and con
ventional water treatment which enables them to concentrate during
the recycling needed to meet increased water demands, and our in
ability to fully define the chemical and toxicological nature of
these materials have necessitated the establishment of limiting con
centrations for organic pollutants in drinking water supplies.
1
These limits include a maximum permissible concentration of 200 pg/1
for carbon chloroform extract set by the Public Health Service (PHS)
Drinking Water Standards (3) 1 and goals of 40 and 100 pg/1 for carbon
chloroform extract (CCE) and carbon alcohol extract (CAE), respectively,
adopted by the American Water Works Association (AWWA) (4).
Both the PHS standard and the AWWA goals depend upon the carbon
adsorption method (CAM) for recovering the trace organic pollutants
from the water. This method was developed by the Public Health Ser
vice in the early 1950's (5) and has been included as a tentative
method in Standard Methods (6, p.215). It consists of passing a
known volume of water (usually 5 1 000 gallons) through an 18 inch
by 3 inch diameter cylinder filled with activated carbon at a flow

rate of 0.5 gpm and eluting the organics from the carbon by serial
extraction with chloroform. Chloroform was chosen as the solvent
because it had been shown (5) that the chloroform-soluble materials
contained the most odorous taste organics.
Several modifications have been applied to the CAM in an effort
to increase the recovery of trace organics. These modifications
have included sequential extraction with other solvents to enable
the recoveryoforganic materials not eluted with chloroform, larger
size carbon filters to allow the sampling of greater volumes of
water in a shorter period of time, and pH adjustment of the water
prior to filtration to aid the adsorption process. In addition,
two or more carbon filters have been employed in series in order
to facilitate the recovery of organics not adsorbed on the first
filter, or provide for further adsorption following pH adjustment.
In spite of the importance of the CAM in determining drinking
water quality and its wide use in research and plant control studies,
little work has been undertaken to quantitatively and qualitatively
evaluate the method, especially under field conditions. However,
concern has been expressed in the literature over the ability of
the carbon to adsorb all of the organics present in the water being
sampled or the ability of the solvent to elute all the adsorbed or
ganics, as well as the possibility of alteration of the organic
materials while on the carbon. According to Hoak (7), Middleton and
associates have studied the recovery of phenol under laboratory con
ditions and found that the adsorption efficiency ranged from 30 to
99 percent and the recovery efficiency from 61 to 77 percent, giving
an overall recovery in the range of 19 to 77 percent. Hoak (7) has
2

also found that phenol adsorption on activated carbon was at least
98 percent with desorption as low as 47 percent.
Although the studies utilizing phenol have provided a partial
insight into the efficiency of the CAM, it must be recognized that
the organic pollutants which are present in natural waters are very
complex materials and would not necessarily behave similarly to
phenol. Consequently, there is a need to evaluate the CAM under
actual field conditions. The basic difficulty encountered with such
studies is the lack of instrumentation capable of directly measuring
the total trace organics at the levels that are usually found in
3
water without requiring prior concentration. However, another approach
might be possible using a recovery method, such as solvent extraction,
which does not depend on carbon adsorption to monitor the concen
tration of trace organics in the influent to and the effluent from
the carbon filters.
Solvent extraction is receiving increased attention as a means
of recovering trace organics, and has been adopted by the American
Society for Testing and Materials (ASTM) as a tentative method (8).
It consists of stirring the water with a solvent to transfer the
organic materials from the water to the solvent phase, separating
the solvent phase, and evaporating off the solvent to obtain the
organic extract.
The purpose of this investigation was to develop a test system
consisting of equipment and procedures which would make possible
the field evaluation of the carbon adsorption method by parallel
solvent extraction studies, and to employ this system in preliminary
field investigations to establish guidelines for the experimental
conditions required for its effective application.

The test equipment developed in this study consisted of five
filter units (each containing 0.196 cubic feet of filter media)
connected in series; one of these units was to be used as a sand
filter when the water was turbid and required pretreatment, or as
a stand-by carbon filter when a different pretreatment method was
used or pretreatment was not necessary. Provisions were made for
the continuous acidification of the water and the collection of
samples for solvent extraction studies. Field investigations were
conducted at Meramec Spring, Missouri. Carbon adsorption studies
were made at the natural pH of the water and at a pH value of 2. 5,
and solvent extraction studies were performed at the natural pH as
well as pH values of 2.5 and 10.0. Chloroform and benzene were the
solvents employed to elute the concentrated organics from the carbon
and to extract the trace organics directly from the water.
4

II. REVIEW OF LITERATURE
The purpose of this literature review is to present information
pertinent to the evaluation of the carbon adsorption method for re
covering and concentrating organic micropollutants in water. The
review also contains information concerning both the standard
carbon adsorption method (CAM) and its modifications and the batch
type solvent extraction method (SEM) which served as a basis for the
development of the test equipment and procedures incorporated in this
study.
A. CARBON ADSORPI'ION METHOD
This method, which is widely used in the United States, was
developed at the Robert A. Taft Sanitary Engineering Center (5,9) and
has been adopted as a standard method for the recovery of organic
contaminants in water (6, p.214). It consists of passing 3,000 to
5,000 gallons of water upward through a vertically oriented filter,
18 inches high and 3 inches in diameter, containing 9 inches of
fine (+30 mesh) activated carbon between two layers of coarse
(4 x 10 mesh) activated carbon each 4.5 inches in thickness. The
flow rate through the filter is from 0.25 to 0.5 gpm providing a
contact time of 4.4 to 2.2 minutes, respectively. After the desired
volume of water has been filtered, the carbon is removed, dried,
and then serially eluted with chloroform to desorb the organic
materials.
Several modifications of the standard CAM have been used by
various investigators primarily to enable greater recoveries of a
wider spectrum of organic substances in water in a shorter period
of time. These modifications have included sequential elution of
5

the carbon with additional solvents to recover organics other than
chloroform-soluble materials, two or more filters in series to ex
tract organics not recovered on the first filter and allow for pH
adjustment of the water, larger size filters to permit the sampling
of greater volumes of water at higher filtration rates, and acidi
fication of the water to enhance the adsorptive ability of the carbon.
In addition, several pretreatment methods have been used with turbid
waters to prevent clogging of the carbon filters.
A number of studies which have employed a modified CAM are sum
marized in Tables I and II. Table I presents information on the
extraction system used as well as the source and volume of the
water sampled, and Table II gives the quantity of organics recovered
from each filter by sequentially eluting the carbon with different
solvents. Increased amounts of organic contaminants were recovered
under the conditions described; however, the data obtained in these
investigations cannot be used to directly evaluate the CAM because
the quantity and character of the organic materials in the influent
to and the effluent from the filters were not determined.
B. EVALUATION OF THE CARBON ADSORPTION METHOD
Hoak (7) has summarized studies undertaken to evaluate the CAM
using simple phenolic materials over a wide range of concentrations.
He reported that Middleton and associates at the Robert A. Taft
Sanitary Engineering Center used a procedure consisting of mixing
3.0 grams of Nuchar C-190 with a series of 200 ml solutions contain
ing from 0.1 to 3.0 grams of phenol; after 30 minutes of stirring
the mixtures were allowed to stand overnight; the carbon was then
filtered off, air dried, and extracted with chloroform. They found
6

Source of Water
Investigators Sampled
Middleton, Cincinnati et al. Tap Water
Middleton, Ohio et al. River
Dornbush & Ryckman
Myrick Missouri & Ryckman River
Spicher & Skrinde
Grigoropoulos Meramec & Smith Spring
Table I
Modifications of the Carbon Adsorption Method Summary of Sampling Data
Sampling System Activated Carbon*
Pretreat- No. of Volume % Flow ment Filters cu. ft. Fine Coarse gpm
None 2*** 0.073 100 0.25
Sand Filter 2 1.24 50 50 7.0
Sedimen-tat ion 5.0
and 2*** 1.30 60 40 to Diatomite 7.5 Filtra-tion
None 3 1.5 50 50 5.2
Sampling Data Detention Volume of Time** Water min. gal.
3.5 7,300#
1.3 121,900
96,400 1.3 to 2.0 91,300
103,000
## 2.2 131,000
*Each filter; Fine: +30 mesh Nuchar c-190, Coarse: 4 x 10 mesh Cliffchar; two equal layers of coarse carbon, one on the top and one on the bottom of the fine carbon layer.
**Computed for each filter unit. ***Water was acidified before entering the second filter.
#Average of four runs ranging from 5,160 to 11,640 gal. ##Average of two runs of 129,000 and 133,000 gal.
I I
Ref. I
I I 10 I
11
12 I
13
14
1, 15
--.J

Table II
Modifications of the Carbon Adsorption Method Summary of Recovery Data
Filter No. 1 Filter No. 2 CAcE CBE CAcE CBE
Investigators pH CCE CAE CBE# CAcE* pH CCE CAE CBE CAcE
Trace Organics Recovered, grams
Middleton, et al. 8.5 2.7 --- --- --- ).4 4.2 ---Middleton, et al. ** 41.0+ 1oo.o+ --- --- ** 41.o+ 1oo.o+
Dombush & Ryckman 8.1 2?.? 85.6 --- --- 2.9 28,4 115.5
Myrick & Ryckman 8.1 28.8 112.5 --- --- 3.5 23.9 195.8
Spicher & Skrinde 7.7 27.9 65.1 --- --- 3.2 23.0 151.0
Grigoropoulos 7.0 2.9 & Smith ** 20.4 )0.8 0.2 ).1 ** 8.1 28.0
#Extraction sequence: Chloroform, ethanol, acetone, benzene. *Extraction sequence: Chloroform, ethanol, benzene, acetone.
**At natural pH, +Total recovery by the two filters which were eluted simultaneously.
--- ------ ---
--- ---
--- ---
--- ---9.1 4.8 o.3 6.8
Filter No. 3
CAcE CBE pH CCE CAE CBE CAcE Ref.
--- --- --- --- --- 1o I I
--- --- --- --- --- 11 !
--- --- --- --- --- 12
--- --- --- --- --- 13
--- --- --- --- --- 14
8.6 2.8 1, ** 5.3 16.? 1.4 5.0 15
())

that adsorption ranged from 99 to 30 percent and decreased as the
phenol concentration increased, and that desorption ranged from 77
to 61 percent; and reported that phenol did not seem to change while
adsorbed on the carbon. Golding and associates, also at the Taft
Center, reported adsorption of 1.0 gram of phenol on 15 grams of
activated carbon and 72.7 percent recovery of the phenol by elution
with chloroform. Hoak (7) repeated the experiments of Middleton
and associates using 0.5 grams of phenol and 3.0 grams of carbon
and found that the adsorption efficiency ranged from 98.0 to 99.6
percent, while the desorption efficiency varied from 72.8 to 76.2
percent. However, when the carbon suspension was allowed to stand
for a longer period of time (28 days rather than overnight) the
desorption efficiency was decreased to 47.0 percent. This indi-
cated that recovery decreased with time of contact of the phenol
and carbon and was attributed by Hoak to possible phenol oxidation
on the active carbon surface and bacterial degradation.
Several serial extractions are required to elute a significant
percentage of the adsorbed materials. Studies conducted by Middleton,
et al. (10) have shown that the rate of recovery of the organics
from the carbon depended primarily on the type of the adsorbed
materials and the extent of saturation of the carbon. When acti-
vated carbon which had been used to recover organic materials from
a raw water was extracted with chloroform, the following results
were obtained.
Period of Extraction Extract Recovered hours grams ..1f
8 15.546 91 24 1.065 6 46 0.519 3
9

As can be seen from these data, 97 percent of all the material
eluted in 46 hours was recovered in 24 hours.
Several investigators have commented on the efficiency of the
CAM on the basis of their evaluation of CAM data. Hoadley ( 16),
after reviewing data from the FWQA (formerly PHS) Water Pollution
Surveillance System, concluded that the adsorptive capacity of the
carbon may have been exhausted and recommended that the amount of
carbon be increased or the flow rate decreased. The Water Pollution
Surveillance System (17) was established in 1957 to collect and
disseminate basic data on chemical, physical, and biological water
quality, and by 1966 had expanded to 131 sampling stations through-
out the United States. As part of this system, trace organic pol-
lutants are recovered at these stations by means of a standard
(0.073 cubic foot) activated carbon filter and elution with chloro-
form and ethanol.
Atkins and Tomlinson (18) conducted studies to measure the
variation of the concentration of organic pollutants in the Missouri
River using a modified and a standard carbon filter. The operational
data were as follows:
Carbon Length of Flow Volume Volume Filter Run Rate of Water
Filter cu. ft. Pretreatment dals g£!!L_ gal.
Modified -1.3 Sedimentation 0.5 <7 2,800-5,000 Standard 0.073 Sand Filtration 14 0.25 5,000
The carbon was sequentially eluted with chloroform and ethanol.
Sixteen one-day sampling runs were made using the modified filter and
two runs were made using the standard filter during a period of
approximately one month. It was found that the average values of
10

the daily CCE and CAE were two and three times as high as the CCE
and CAE obtained from the standard filter over a period of 14 days.
This variation was attributed to the large carbon volume used in
the modified filter, which was 20 times as large as the standard
filter, and the fact that the modified filter was recharged daily,
thereby lessening the possibility of exhausting the adsorptive
capacity of the carbon.
Greenburg, et al. (19) performed studies to evaluate the CAM
11
and determine its reproducibility and efficiency. Five standard
carbon filters containing 100 percent fine (+30 mesh) carbon were
operated in series or in parallel. Water from a 900 million gallon
reservoir filled with Sacramento River water was passed through the
filters at a rate of 0.5 gpm. Volumes of 1,500, 3,000, and 6,900
gallons were passed through the five filters in series during three
separate runs, and volumes ranging from 450 to 6,600 gallons were
passed through the filters in parallel during another run. The
carbon from the various units was sequentially eluted with chloroform
and ethanol. Assuming that the total organic material obtained from
the five filters in series represented 100 percent of the organics
in the sample, these investigators estimated that the CCE and CAE
recovery efficiencies of the first filter decreased from maximum
values of 67 and 49 percent when 1,500 gallons were sampled to minimum
values of 42 and 29 percent when 6,900 gallons were filtered. Three
or four filters in series were required for 90 percent recovery. The
quantities of CCE and CAE materials recovered from the filters which
were operated in parallel differed by less than 5 percent, indicating
that the CAM was a reliable sampling procedure. On the basis of their

findings, Greenburg, et al. (19) recommended that two standard CAM
units be operated in series when flow rates of 0.25 to 0.5 gpm are
used, and that the maximum sample volume be reduced to 2,500 gallons.
Grigoropoulos and Smith (1) in their studies of trace organics
in Missouri waters employed three large carbon filters in series
(see Table I, p.7) to sample a spring and two deep wells. They
concluded that the number of filters required to effectively recover
organics from water depended on the source of the water and the
nature and concentration of the organics. One filter was found
adequate for the well waters; however, considerable additional
material was obtained with the second and third filter when the
spring water was sampled. The concentrations of the CCE and CAE
recovered with each filter in two runs at the spring were as fol-
lows:
Filter No.
1 2 3
CCE & CAE Recovered, ~g/1 Run No. 1 Run No. 2
78.0 50.4 24.3
128.1 95.1 64.4
These investigators noted that Filters No. 2 and 3 of Runs No. 1
and 2 recovered approximately 27 and 33 ~g/1, respectively, less
than their preceding unit, and estimated that while the three units
effectively removed all the trace organics from the water in the
first run, a significant quantity of materials was not recovered
in the second run and a fourth unit would have been necessary for
complete recovery.
These evaluations have been based upon the amount of materials
obtained by a number of filter units in series and the assumption
12

that all the organics in the water sample had been recovered. How
ever, without knowing the actual organic concentrations going into
and leaving the £ilters, the e££iciency o£ the CAM cannot be £ully
evaluated. It is necessary to use a procedure which can determine
the concentration o£ the organic contaminants in the water be£ore
and a£ter each £ilter. The solvent extraction method may serve such
a £unction.
C • SOL VENT EXTRACTION METHOD
The batch-type solvent (liquid-liquid) extraction method (SEM)
has been recently adopted as a tentative method by the American
Society £or Testing and Materials (8). This method consists o£
mixing the water £or two minutes with an appropriate solvent to
transfer the organic materials £rom the water to the solvent phase,
separating the solvent phase, and evaporating o££ the solvent to
obtain the organic extract. The type of solvent to be used is not
specified other than it must be immiscible with water; however, a
total sol vent to sample ratio o£ 1 to 12, added in three equal
increments, is specified. Extractions are sequentially performed
at neutral, acid (pH )), and alkaline (pH 11) conditions to enable
a general classification o£ the organic constituents and a more
complete separation o£ the total organic content o£ the water
sample.
Skrinde and Tomlinson (2 0) have discussed the recovery o£ trace
organics using the SEM. Benzene was used to extract samples o£
Missouri River water which were fortified with 0.4 mg/1 o£ the
pesticide lindane. Recoveries o£ 79 and 68 percent were obtained
when benzene to water ratios o£ 1 to 10 and 1 to 20 were employed.
1)

A total solvent to water ratio of 1 to 10 and three serial ex-
tractions were successfully employed in extracting trace organic
materials from Missouri River water using chloroform, and the fol-
lowing recoveries were obtained at different pH levels.
Trace Organics Recovered, pg/1 Sample
1 2 3
£!!...£ 900 900 850
P!L.Z 570 770 570
pH 11 420 450 6oo
They reported that the formation of an emulsion between the solvent
and water phases was a major operational difficulty; this problem
was intensified in the presence of turbidity in the water but was
greatly reduced at the lower pH value.
In order to reduce the solubility of the organics in the
water, Caruso, et al. (21) added sodium chloride to 6 liter water
samples which were sequentially extracted with reagent grade ethyl
ether after pH adjustment to 4 and 10. A solvent to water ratio of
1 to 3 was used. Following extraction, the volume of the sample
was reduced and the extracts were subjected to gas chromatographic
analysis to provide a "fingerprint" of the organic compounds in the
water. Baker and Malo (22) also employed the SEM to concentrate
trace organics in water prior to gas chromatographic analysis. The
samples were sequentially extracted with ethyl ether (ratio of 1
to 3) at pH values of 3, 7, and 10 in order to make possible the
separation of the acid, neutral, and basic compounds.
Hoak (7) used the solvent extraction method with a variety
of solvents, including chloroform, methyl isobutyl ketone, carbon
tetrachloride, benzene, petroleum ether, pentane, isopropyl ether,
14

and heptane. Ten and 20 ml portions of the various solvents were
mixed with a 500 ml solution of 100 ~g/1 phenol in distilled water
and shaken for 1 and 5 minute periods in a separatory funnel. The
methyl isobutyl ketone proved to be the best, however, it was
difficult to separate from the organics.
Ryckman, et al. {23) in their review of new techniques for the
evaluation of organic micropollutants have pointed out that the SEM
gives greater organic yields than the standard CAM. The SEM can
be completed in 2 to 4 hours, whereas the standard CAM requires
3 weeks. They also reported certain drawbacks to the method, includ
ing the difficulty with sample turbidity which causes emulsions, the
need for a solvent that is immiscible in water, and the limited
volume of water which can be sampled.
15

III. FIELD TEST SYSTEM
A primary objective of this investigation was the development
of a test system which would make possible the field evaluation of
the carbon adsorption method (CAM). The solvent extraction method
(SEM) was selected as the means for monitoring the influent and
effluent concentration of trace organics to and from the carbon
filters, thereby enabling the direct evaluation of the efficiency
of the CAM. To accomplish this objective a field test system which
allowed parallel, concurrent carbon adsorption and solvent ex
traction studies was designed and constructed.
A. DESIGN FEATURES
After reviewing the literature available in this area of
study and considering the overall objective of this investigation,
the desirable design features of the test system were established.
The standard CAM employs small filters (0.073 cubic foot) requiring
a long sampling period (14 days for a 5,000 gallon sample) at a
0.25 gpm flow rate (4.4 minute contact time); several investigators
have used large filters (1.2 to 1.5 cubic foot) that were difficult
to handle, but gave large organic samples in a shorter period of
time. These large filters can sample the same volume of water as
the standard filter in less than one day using flow rates of 5.0
to 7.5 gpm (1.3 to 2.2 minute contact time). It was decided that
16
the filters used in this study should incorporate the basic con
cepts of both the large and small filters, and yet be inexpensive,
mobil, versatile, and adaptable to the many different water supplies
that would be sampled when evaluating the method. Sampling conditions
may require that the filters be subjected to the high pressures

encountered at water supply pumping stations, as well as to trans
portation in trailers or other such vehicles. For this reason, the
units should be ruggedly constructed and durable. Location of the
test equipment at bridge sites, which offer accessibility and pro
tection, may necessitate suspending the equipment under the bridge
and, therefore, require that it forms an integral and compact
structure.
The number of filters in series is another important consider
ation. There is ample evidence in the literature that more than
one filter in series are often needed in order to recover a major
portion of the organic materials in the water. A number of filters
in series also offers the opportunity for reducing the pH of the
water filtered through some of the units, thus gaining additional
recoveries not possible at natural pH levels. Acidification of
the water involves special precautions for storing and injecting
the acid solution and for protecting the equipment from corrosion.
The sample turbidity will vary with each sampling location,
and pretreatment must be incorporated to insure continuous oper
ation. The pretreatment facility must comply with the overall com
pactness, flexibility, ease of assembly, and durability required
of the other test units.
The system should be equipped with a pump which has a range
of pressures sufficient to meet the friction losses and elevation
requirements dictated by the topography of the sampling location.
This pump should also be capable of providing the flow rates dic
tated by the desirable sample volume and available sampling time.
17

18
Sampling outlets must be provided at key points within the
system for the collection of samples to be used in the monitoring
studies by the SEM. Storage reservoirs should be provided for each
of these outlets to facilitate the collection of a composite sample
over an appropriate period of time. These reservoirs should be
large enough to collect a sufficient size sample for the solvent
extraction studies. The following guidelines for sample size
selection have been presented by ASTM (8).
Sarn;2le Size 1 liters Organic Matter in Sarn;2le • mgLl 25 0.1 5 0.1 to 0.5 2 0.5 to 5.0 1 5.0 to 50
B. FIELD TEST SYSTEM
The test equipment developed in this study is shown in Figure 1.
It consisted of a sand filter (not shown) and four carbon filters
connected in series; a raw water pump; an acid storage tank and
acid pump; sampling outlets and storage reservoirs located before
and after each filter unit; and associated flow meter, pressure
gage, valves, and piping.
The sand and carbon filter units were constructed from salvaged
steel fire extinguisher bottles which were altered to give the
desired arrangement. The dimensions and construction details of
each unit are shown in Figure 2. These bottles were selected be-
cause of the pressures they could withstand, while being of a con-
venient size and weight for portability in field studies. The
interior of the bottles was sand blasted in order to clean the
metal, and then coated with two coats of epoxy primer (Phelan

a. Test Equipment Arrangement
b. Test Equipment on Location at Meramec Spring
Figure 1
Field Test System
19

8- 5/16" Diameter Bolts Spaced at 3"
Plan View
-
20
A
__ __j
I" Pipe Ell------
111 Pipe Nipple----- Brazed Connection
114' Cork Gasket~ 1 ~
2" Stainless ~'-'"·1------4-i ~1/4" Steel S1eel Legs ~ , I 114"
Rim
Brazed Connection
Stainless Steel Screens
:~ -1
Rim
Perforated Stainless Steel Plates
I" Stainless -----~Eiii3i%9rl""Eb:cr:J Steel Legs ----I" Pipe Nipple
----1" Pipe Ell --- ""
Section A-A
Figure 2
Sand or Activated Carbon Filter Unit

Faust No. 4051*) followed after 24 hours of drying by three coats
of white epoxy enamel (Phelan Faust No. 3850*). This epoxy finish
was selected as a coating because it was thought to provide an inert
surface which would be resistant to corrosion due to the wet carbon
and acidic conditions. Later on in the study, however, it was
found that this finish was affected by the acid solution and main-
tained, even after prolonged periods, the characteristic odor of
the solvent phase, indicating that the curing process might not have
been completed. At the suggestion of a Phelan Faust representative
(24) the units were placed in a drying oven at 2100F for 12 hours in
an attempt to speed up the curing process; this treatment was not
21
successful and another epoxy finish was sought. At the recommendation
of the Phelan Faust representative, the Carboline Company was con
tacted and their representative (25) recommended and provided
materials for a new finish which, in addition to being inert, did
not contain high boiling point solvents not readily removed. The
previous finish was removed by sand blasting and a new finish was
applied. This finish consisted of a one coat application of epoxy
primer (Phenoline No. )68**) followed after 24 hours of drying by
a two coat application of epoxy finish (Phenoline X2301-114**). The
units were then heat cured at 210°F for 24 hours. Two 40 x 40 mesh
stainless steel screens supported by perforated plates were placed
on the top and bottom of the carbon column to keep it in a packed
state. Magnesium plates coated with the Phelan Faust epoxy finish
*A product of the Phelan Faust Paint Mfg. Co., St. Louis, Missouri. **A product of the Carboline Company, St. Louis, Missouri.

22
were used initially, but were later replaced with stainless steel
plates. The location of the screens and plates formed a 0.196 cubic
foot carbon column which was 6 inches in diameter and 12 inches high.
The pump and filter arrangement is shown in Figures 3 and 4.
The sand filter (shown in Figure 3) would only be necessary when a
turbid water sample is to be filtered. This filter could be back-
washed simply by opening and closing appropriate valves before and
after it. Because the sand filter was identical in construction
details to the carbon filters, it could also be employed as a fifth
or a substitute carbon filter when pretreatment was not necessary
or was accomplished by other means (such as coagulation-sedimentation
or diatomite filtration). The connections between the various units
were all interchangeable so that the acid solution used for pH
adjustment could be administered between any two of the filters
in the series. The flow rate and pressure in the system could be
regulated with a series of valves.
The water was supplied to the filters by a 3/4 horsepower
centrifugal pump (Sears model 390.208*) on a 220 volt hook-up.
The pump capacity was greater than would normally be required and
provisions were made for by-passing the excess flow. The inlet
facility consisted of a one inch galvanized pipe equipped with a
screened foot valve. A Trident Triseal meter (Neptune style No. 3,
5/8 connections**) was used to measure the total volume of water
passed through the system, and was placed between the first and
second filter in order to protect it from the turbidity in the
*A product of Sears, Roebuck and Company, Kansas City, Missouri. **Purchased from the Folla Municipal Utilities, Rolla, Missouri.

1 1o·~ .. 1. 2011 1 2011 r 20 11 ~ 20'~
E- Ell
E U<D E E U E E U E
Sand Filter
Q:Jrboo RJter
I
Q:Jrbon I
Filter 2
Flow Meter
E U E E U E
1-1 'Carbon
Fil~er I lj
E
Acid Pump
Carton Riter
4
EPiastlc /,
t Return to be mixed with b
P- Pressure Gage S- Sampling Point U- Union v- Gate Valve -- Flow
NOTE: All Pipes are 111 Galvanized Iron.
Figure 3
Pump and Filter Arrangement
3011
N w

Figure 4
Pump and Filter Arrangement on Location at Meramec Spring N ~

water or the low pH present after acidification. The meter could be
closed off from the system by valving without affecting the flow
through the system. This protected the meter from clogging by fine
carbon while the filters were being flushed at the beginning of a
run. A 16 foot section of one inch PVC pipe was provided to return
the filter assembly effluent to the outlet of the by-pass pipe, and
the combined effluent and by-pass flow were discharged downstream
from the intake point.
A diaphragm pump (Wallace & Tiernan No. 94-110*) with a variable
output was used to inject the acid solution into the system. It
25
was used in conjunction with a Wallace & Tiernan )0 gallon polyethylene
solution tank* with fiber glass cover and 1/20 horsepower solution
stainless steel mixer.* The acidification assembly is shown in
Figure 4.
Raw water and filter effluent samples were collected from ap
propriate sampling outlets and stored in 20 gallon reservoirs (gal
vanized garbage cans). Cans which received filter effluents after
the water had been acidified were coated with the same epoxy finish
used to coat the filter units in order to protect them from attack by
the acid. The arrangement of the sampling outlets and reservoirs is
shown in Figure 1a, p.19. In order to prevent freezing of the filter
units, and especially of the sampling outlets and reservoirs, a small
thermostatically controlled electric heater was employed to maintain
the temperature of the test system above the freeze point.
*Purchased from Lesco Division of Sidener Supply Co., Granite City, Illinois.

IV. EXPERIMENTAL STUDIES AND RESULTS
Organic micropollutants were concentrated and recovered from
a subsurface water source (Meramec Spring) at the natural (7.1)
and an adjusted pH (2.5) using the field test system previously
described. Two sampling runs were made during this study; the first
run was from July 10 to August 3, 1969, and the second run was from
November 3 to November 29, 1969. Raw water and filter effluent
samples composited over five day periods during the run were taken
to the laboratory and solvent extracted sequentially with chloro
form and benzene at appropriate pH levels (7.1, 2.5, and 10.0).
26
At the end of a sampling run, the carbon was removed from the filters,
dried, and sequentially eluted with chloroform and benzene. The
solvents containing the concentrated organic materials were evaporated
off and the extracts obtained.
A. LOCATION
Meramec Spring (Figure 1b, p.19) was chosen as the source of
spring water to be sampled during this study. The spring is located
9 miles east of St. James, Missouri, on Route 8 and is reported
to be the seventh largest spring in Missouri (26). The rock for
mation through which this spring flows is Van Buren Dolomite and
there are many supply routes connected to surface feeders in the
area south, west, and southwest of the spring. The average flow of
the spring during the first run was 105 cfs, ranging from 100 to 110
cfs; during the second run the average flow was 81 cfs, ranging from
71 to 87 cfs (27).
Maramec Spring was selected as the sampling location because
of its relatively close proximity to Rolla and the fact that it is

subject to surface contamination. In addition, trace organic pol-
lutants have also been recovered from this spring by other investi-
gators at the University of Missouri-Rolla (1,15,28) and their data
were available for guidance in the development of this study and
evaluation of its findings.
Locating the test equipment at Meramec Spring required some
special preparations. A 4 foot wide and 8 foot long platform
(Figure 1) was constructed of 5/8 inch exterior plywood reinforced
with 2 x 4 members on the underside. It was supported over the
water by two adjustable pipe jacks and was fastened to the shore with
two steel stakes driven flush with the platform top. Wire twist
braces were incorporated to stabilize and strengthen the platform.
The field equipment was located on this platform and was covered
by a canvas top; with this arrangement the equipment was protected
from and did not interfere with the visitors to the spring. A
temporary 220 and 110 volt hook-up was installed to provide the
electricity needed for the operation of the pumps, mixer, and heater.
A one inch galvanized pipe, which extended into the mouth of the
spring and was equipped with a screened foot valve, served as the
intake.
B. PROCEDURES
1. Field Sampling Procedures.
The carbon filters and all pipes, valves, and connections were
cleaned with a mild Bon Ami solution and rinsed thoroughly with tap
water. The filters were packed with 575 grams coarse* and )60 grams
*4 x 10 mesh Cliffchar, a product of Cliffs Dow Chemical Co., Marquette, Michigan.
27

fine* activated carbon (50 percent each by volume) at the Civil
Engineering Building, assembled into a series compound, and then
transported as a unit to the sampling location. The total volume of
carbon in each filter was 0.196 cubic feet and consisted of two
layers of coarse carbon (3 inches each), one layer on either side
of a layer of fine carbon (6 inches); this gave a 12 inch column
of carbon through which the sample had to pass. Teflon tape was
used as a pipe thread sealant to provide an inert seal.
At the sampling location the pump, inlet and outlet pipes,
flow meter, acidification assembly, and sample reservoirs were added
to the filter compound to form the complete test system. Before
the beginning of a run each filter was washed with spring water for
approximately 5 minutes in order to remove any carbon fines, and
the washings were discharged to the spring via the saapling outlets
between the filters. The water flow rate was set at 0.79 gpm
(3 liters/min) by adjusting the valve preceding Filter No. 1 and
that following Filter No. 4; this provided a 1.9 minute detention
time at each filter. The acid pump was activated and adjusted to
inject approximately 38 ml/min-of o.4N sulfuric acid solution into
the influent to Filter No. 3 (Figure 4, p.24). As described in
Appendix A, this flow was found to reduce the pH of the water to
the desired 2.5 level. In order to prevent injury to fish and
other aquatic life in the pond formed by the spring, the final
effluent was returned to the by-pass stream so that it could be
neutralized by the by-passed water before it was discharged. The
*+30 mesh Nuchar, a product of West Virginia Pulp & Paper Co., New York, New York.
28

by-pass flow was 36 times greater than the filter effluent. The
valves at the five sampling outlets (Figure 1a) were adjusted to
discharge one drop of water per second into the 20 gallon storage
reservoirs. At this rate, an 18 ± 1 gallon composite sample could
be collected over a five day period.
The water flow rate and inlet pressure to the system were
observed continuously for the first 6 hours of operation; thereafter
they were checked daily and adjusted whenever necessary. The total
volume of water filtered and the pH of the raw water and effluent
from each filter were recorded each day. The 30 gallon acid solution
storage tank was filled every other day with o.4N sulfuric acid.
The general condition of the spring and the weather were observed
and recorded during each day's check.
At 5 day intervals, the contents of the sample reservoirs
were thoroughly mixed and 20 liter volumes were transferred to
5 gallon Pyrex bottles. Two samples were obtained from the raw
water reservoir and one from each of the filtered water reservoirs.
29
The water remaining in the reservoirs was discarded and the reservoirs
were rinsed and returned to the system. The six bottles were trans-
ported to the laboratory where they were stored in a walk-in incu
bator* at 10°0 until they could be solvent extracted.
After approximately 20,000 and 25,000 gallons of water had passed
through the filters in the first and second run, respectively, the
pumps were shut off and the filters were allowed to drain. The com
plete filter assembly was transported to the laboratory where the
*Model 704A Constant Temperature Room, Lab-Line Instruments, Inc., Melrose Park, Illinois.

30
carbon was removed. The equipment remaining at the sampling location
was disassembled and taken to the laboratory for inspection, cleaning,
and storage.
2. Laborato:ey Recovery Procedures.
a. Solvent Extraction.
Trace organic pollutants were recovered from the raw water and
filter effluent samples at the natural and adjusted pH levels using
chloroform and benzene and a solvent to sample ratio of 1 to to.
The general extraction scheme is outlined in Figure 5. Required
pH adjustments in the laboratory were made with l.ON solutions of
hydrochloric acid and sodium hydroxide. Two 10 liter samples were
sequentially withdrawn from the 5 gallon bottles stored in the walk
in incubator, starting with the raw water sample, and were placed
in two 3.5 gallon Pyrex bottles. The turbidity of the water was
noted and the pH was measured and recorded; if necessary, the pH
was adjusted to the desired level. The solvent (1 liter) was then
added to the sample (10 liters) in three equal portions (333 ml each),
and following each addition, the mixture was shaken for a 3 minute
interval. The solvent and water phases were allowed to separate;
chloroform (1.489 specific gravity) settled to the bottom, while
benzene (0.879 specific gravity) floated to the top. The solvent
phase containing the concentrated trace organics was siphoned into
a 500 ml separatory funnel and after further separation was placed
in a 3 liter boiling flask; the water phase was returned to the
remaining sample. Another portion (333 ml) of the solvent was added
to the 10 liter sample and the procedure was repeated until all the

Raw Water Raw Water (Sample No. 1) (Sample No. 2)
l ~ 20 liters 20 liters
l ! pH 7.1 pH 2.5
l (Adjusted)
! Chlorofonn Chlorofonn
! j Benzene Benzene
~ ~ Waste pH 10,0
(Adjusted)
l Chlorofonn
l . Benzene
l Waste
Filter No. 1 Filter No. 2 (Effluent)
~ (Effluent)
! 20 liters 20 liters
~ ! pH ?.4 pH ?.4
j l Chlorofonn Chlorofonn
~ ~ Benzene Benzene
! + Waste pH 2.5
(Adjusted)
l Chlorofonn
~ Benzene
! Waste
Figure 5
Solvent Extraction Scheme
Chlorofonn
~ Benzene
~ Waste
Filter No, 4 (Effluent)
! 20 liters
~ pH 2,5
J Chlorofonn
~ Benzene
• pH 10,0 (Adjusted)
J Chloroform
~ Benzene
~ Waste
I..IJ ~

solvent had been used. Chloroform was first employed and was fol-
lowed by benzene. The equipment used in the solvent extraction
studies is shown in Figure 6.
After all the chloroform or benzene portions had been placed
in the 3 liter boiling flask, the solvents were distilled off until
a residual volume of approximately 210 ml remained. The residual
solvent and concentrated organics were then filtered through a fine
sintered glass funnel, and the remaining solvent was evaporated off
on a steam bath (Precision No. 66738*) to a volume of approximately
25 ml. The solvent containing the recovered organics was trans-
ferred to a numbered (for identification) and tared 16 ml vial
which was returned to the steam bath until all solvent had been
32
driven off and constant weight had been obtained. The vial containing
the organic extracts was finally stored in the desiccator.
b. Carbon Elution.
At the end of a run, the carbon filters were disengaged from
the field test system and brought to the laboratory where the units
were opened and the activated carbon was removed and dried. The
carbon which was used in the first run was freeze dried.** The
material from each filter was distributed in four tared 3 liter
boiling flasks, which were then immersed in liquid nitrogen for
approximately 30 minutes until the wet carbon was frozen. The
flasks and contents were weighed and placed on the freeze drying
unit; they were periodically removed from the unit and reweighed
*A product of Precision Scientific Co., Chicago, Illinois. **A VirTis Freeze-Mobile, Model 10-145-MR-BA, was used; it was a pro
duct of the VirTis Company, Inc., Gardiner, New York. This equipment was available in the Graduate Center for Materials Research, University of Missouri-Rolla.

33 (/) Q
) ..-1 't1 ::s +
l [I)
r::: 0 ..-1 +
l
~ 1< \.0
M
+l
Q)
s::
~ ~
r-1 ..-1
0 li.
[I)
s:: ..-1
't1 Q
) (/)
::;:J
+> s:: Q)
IS p.,
..-1 ::s d
!%1

until a constant weight had been reached indicating that the carbon
was dried. This procedure required 6 days for drying the contents
of each filter (24 days for all four filters) and was, therefore,
abandoned in the second run in favor of the standard (6, p.216) air
34
drying method. The carbon from each filter was transferred to a wooden
tray (24 x 26 x 3 inches) lined with a 4 mil polyethylene sheet and
spread out forming a layer which was approximately one inch thick:
the trays were then placed in a walk-in incubator* where the carbon
was allowed to air dry at 400C for 5 days while being stirred twice
daily. The dried carbon was stored in polyethylene sacks until it
could be eluted.
Before the carbon was placed into the Soxhlet extractors for
elution with chloroform, the coarse and fine carbon was separated
with a No. 12 (1.68 mm opening) sieve. Both coarse and fine carbon
was then placed into the Soxhlet extractors with the coarse material
forming the bottom one-half layer. In earlier trials with the
extractor units, the author had found that the head loss through the
fine carbon during the siphoning operation was too high to allow
complete draining of the solvent and break of the siphoning cycle.
With the coarse layer at the bottom, the head loss was decreased
sufficiently to insure proper operation.
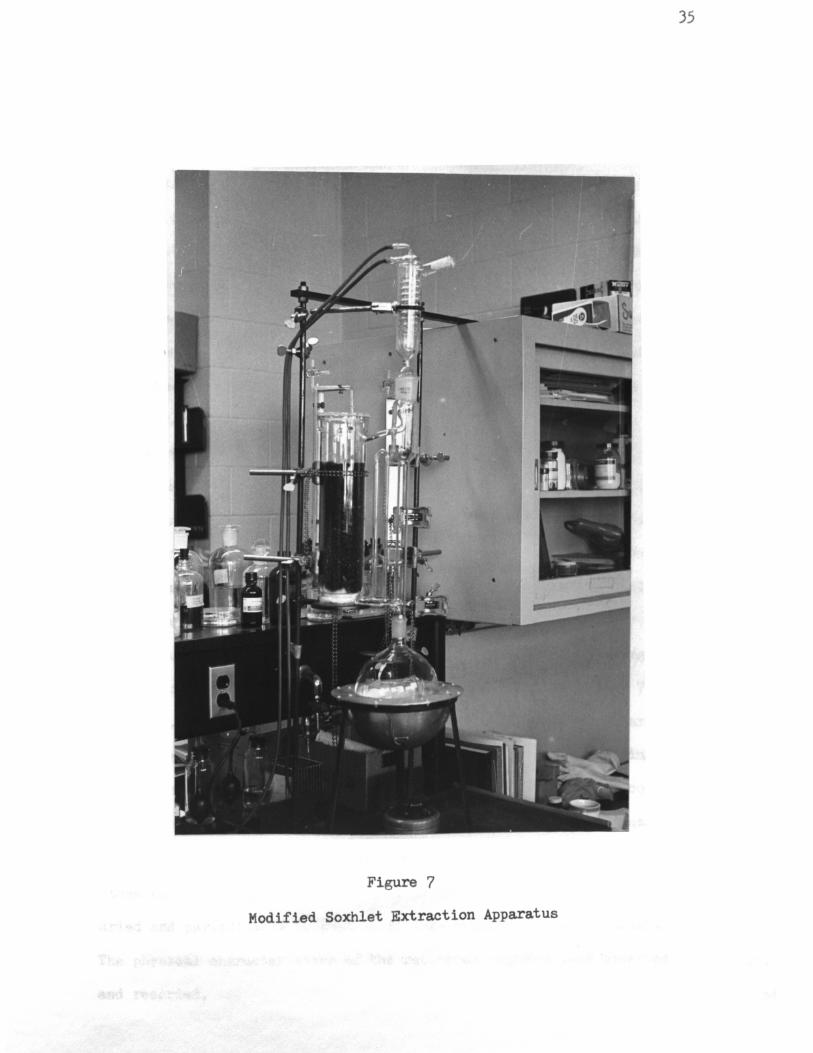
Three modified Soxhlet extractors (Pyrex No. )885**) were used
for the elution of the carbon. One of these units, assembled and
operatin~, is shown in Figure ?. The procedure outlined in Standard
*Model 704 Constant Temperature Room, Lab-Line Instruments, Inc., Melrose Park, Illinois.
**A product of Corning Glass Works, Corning, New York.
35
Figure 7
Modified Soxhlet Extraction Apparatus

)6
Methods (6, p.217) was followed, except that extraction was continued
for only 24 hours (48 cycles) rather than the specified 35 hours.
Middleton, et al. (10) have shown that 97 percent of all the material
eluted in 46 hours will be recovered in 24 hours (see Literature
Review, p.lo). After the extraction with chloroform had been com
pleted, the carbon was transferred from the extractor into a porcelain
coated tray and placed under a fume hood until no traces of chloro
form remained (approximately J4 hours). The chloroform-extracted
carbon was then eluted with benzene for a 24 hour period (48 cycles).
Redistilled analytical reagent grade chloroform and benzene were
employed.
At the end of an extraction period (24 hours), the eluted
organic materials were contained in approximately 2 liters of solvent.
The organics were concentrated by distilling off all but approximately
210 ml of solvent. The residual solvent and concentrated organic
materials were then filtered through a fine sintered glass funnel
to remove particles of carbon which had escaped from the carbon
column during the siphoning cycles. The filtered solvent and organics
were evaporated on a steam bath until a volume of approximately 75 ml
remained. The residual volume was step-wise transferred to a tared
16 ml vial during the first sampling run and a 75 ml bottle during
the second sampling run; the larger bottles were used in the second
run because they provided a greater surface area and a higher rate
of solvent removal. The remaining solvent was evaporated off on the
steam bath with final drying in a desiccator. The extracts were
dried and periodically weighed until they reached a constant weight.
The physical characteristics of the recovered organics were observed
and recorded.
Two carbon blanks (wet and dry) were also extracted as described
above. The wet blank was prepared by packing a carbon filter with
coarse and fine carbon in the predescribed manner; tap water was
passed through the filter until the fines had been removed (approxi
mately 5 minutes), the carbon (and water) was retained in the filter
for 8 hours, and was then removed, air dried, and eluted with the
two solvents. The dry carbon blank consisted of the same amounts
of virgin coarse and fine carbon as was used in packing the filters,
and was eluted without any prior treatment.
3. Summary of Experimental Conditions.
The experimental conditions employed in the field sampling and
laboratory recovery studies are summarized in Table III.
C. RESULTS
1. Meramec Spring Run No. 1.
37
The first run was started July 10 and continued through August ),
1969. A total volume of 19,840 gallons of Meramec Spring water was
passed through the filters during that period at a rate of approxi
mately 0.79 gpm (3 liters/min). Composite samples for solvent
extraction were withdrawn from the 20 gallon reservoirs on July 15,
23 and 29, and on August 3, each time after approximately 4,000 to
6,000 gallons of water had been filtered. At the end of the sampling
period, the carbon was removed from the filters and the adsorbed
organics were recovered.
The test equipment performed satisfactorily throughout the run
with only one minor difficulty which occurred during the first day
of operation. Approximately one hour after the test had been started
and 50 gallons of water had been filtered, Filter No. 3 failed because

Table III
Evaluation of the Carbon Adsorption Method
a. Summary of Field Sampling Conditions
Run Carbon Extraction Data Solvent Extraction Data Av. Filter Units Sampling Data Collected Samples Water
length Spring Detent, pH Volume Fre- Through No. days Period Flow No. Volume* Flow Time Filters of Water Type No, quency Filters
cfs cu. ft. gpm min, 1&2 J&4 gal. days gal.
Raw 1 20 7/10-8/3/69 105 19,840 water & 4
4 0,196 0.79 1.9 7.1 2.5 filter ---- 5 5,000** 2 25 11/3-29/69 81 25,680 efflu- 5
ents
b, Summary of Laboratory Recovery Conditions
Solvent Contact
Method Type Sol vent /Sample pH Sample Volume Sample Type Ratio Time
2.5 20 1, composite samples Two raw water & four
SEM 1/10 9 min,# 7.1 for each 5,000** gal, of effluents (one for Chloroform 10,0 water filtered each carbon filter) followed
by benzene 0.196 cu. ft. activat-CAM N/A 24 hr,## 7.1 19,840 gal.-Run No. 1 ed carbon from each of
2.5 25,680 gal.-Run No. 2 the four filters
*Each filter; 5o% fine, +30 mesh Nuchar C-190, 5~fo coarse, 4 x 10 mesh Cliffchar; two 3 in. layers of coarse carbon, one on top and one on bottom of a 6 in. layer of fine carbon,
**Approximate average volume. #Three 3 min. extractions, each with 1/3 of the solvent.
##Serial elution of dried carbon in a modified Soxhlet extractor.
I
w ())

39
of insuf1icient packing of the carbon in this unit. This resulted
in the displacement of the top stainless steel screen and the flushing
away of the carbon into the pipe assembly between Filters No. 3 and
No. 4, thus preventing any additional flow through the system. This
was not discovered until the following morning (some 16 hours later)
at which time these filters were carefully repacked to insure that
the screens remained against the support plates and the run was
continued.
The pH control in the third and fourth filters was easily main
tained throughout the run using an acid pump setting of 55 percent
(38 ml/min) and a o.4N sulfuric acid solution. Approximately six
9 pound bottles of reagent grade acid was used during the sampling
run to furnish the necessary total volume of o.4N solution, and the
solution tank required filling every other day. The average pH of
the spring water during the run was 7.1, the average effluent pH
of the first two filter units was 7.4, and the average effluent pH
of the last two filters was 2.5.
The time between sample withdrawals was sufficient to extract
the six composite samples following the procedure outlined in
Figure 5 (p.31). However, additional time was required to completely
evaporate off the solvent on the steam bath. Unfortunately, during
the second extraction period the steam bath broke down and replace
ment parts could not be obtained until two months later. The re
maining solvent extracts were, therefore, stored in (9 pound acid)
glass bottles, and the procedure was continued after the steam bath
had been repaired.

The solvent extraction data are presented in Table IV and the
carbon extraction data are given in Table V. The quantities of
organics recovered from the four activated carbon filters have been
corrected by the amounts of materials extracted from activated
carbon blanks (for procedure see p.37) which were as follows:
Type of Trace Organics Recovered Blank ~ suantitl! grams* Concentration 2 l!gLgram carbon
Wet CCE 0.0200 20.0 CBE 0.0080 8.0
Dry** CCE 0.0114 11.4 CBE o.oo62 6.6
*From 520 grams coarse plus 360 grams fine activated carbon. **Values used in determining actual organic recoveries.
The dry blank values were used because they compared favorably with
those obtained by Smith (15) who used the same batch of coarse and
fine activated carbon.
The results obtained in Run No. 1 (Tables IV and V) were found
to be erratic and considered to be unreliable. The considerable
variation in trace organic recoveries was thought to result partly
from the unsatisfactory protective finish initially applied to the
interior of the carbon filters, the acid solution tank, and the
sampling point reservoirs, and partly from the deterioration of
the solvent (primarily chloroform) while the extract-solvent mixtures
were stored for an extended length of time because of the steam
bath failure. When the filters were opened at the end of the run,
they still gave off the characteristic solvent odor which was
40
prominent during the curing period that followed the epoxy application.
However, the only surface change observed on the various units was

Saapling Data
Vol\llle of Water
Through Period Carbon 20
gallons
Table IV Evaluation of the Carbon Adsorption Method
Solvent Extration Data--Meramec Spring Run No, 1
Effluent• Raw Water
Filter No. 1 Filter No. 2 FH t.er No. 3
Sample Voluae Extracted, liters
20 20 20 20
pH
Filter No. 4
20
7.1 2.5 10.0 7.4 7.4 2.5 2.5 2.5 10.0
Type of Trace Organics Recovered Jul,10 During Aug, 3 Total Period SCE SBE SCE SBE SCE SBE SCE SBE SCE SBE SCE SBE SCE SBE SCE SBE SCE
Quantity of Trace Organics, grams
10-15 3.741 3,741 2.124 1.557 1.274 6.726 15,080 12.673 15.576 15,222 14.864 15.930 1.486 o.637 16.284 15.788 16.355 14,726 14,443
15-23 9,800 6,059 15,919 22,933 27.748 22,360 26,832 22.360 5.618 23.850 4.357 21,786 5.160 28.322 2,4o8 26,089 4.472 )0,845 ),210
23-29 15,130 5.330 2. 723 4,136 .... 3.429 2,017 4,943 ** 1,210 ** 28.647 0,605 0.504 4,942 0.302 1,109 0.807 0,504
29-3 19,84o 4,910 2.973 1,984 2.323 1. 765 1,951 6,690 ** 2.973 ** 2.044 2,1)6 1,487 ** 2,1)7 2.788 2.509 1.580
Total Recovery 26.7)9 30.610 ** )4,280 45,880 46,666 ** 43.255 ** 68,407 9.)87 30.950 ** 44,316 24.724 48.887 19.737
Concentration of Trace Organics, ~g/1
8-15 3,741 3,741 150 110 90 475 1,065 895 1,100 1,075 1,050 1,125 105 45 1,i50 1,115 1,155 1,04o 1,020
15-13 9,800 6,059 825 1,000 1,210 975 1,170 975 245 1,040 190 950 225 1,235 150 1,135 195 1,345 14o
23-29 15,130 5.330 135 205 ** 170 100 245 ** 60 ** 1,420 30 25 245 15 55 40 25
29-3 19,84o 4,910 160 100 125 95 io5 360 ** 160 ** 110 115 80 ** 115 150 135 85
Average Concentration 368 409 ** 458 L__§~ L_623 ** 577 ** 912 125 414 ** 591 329 651 286
*Effluents froa Filters No. 1 and 2 had a pH of 7,4, effluents from Filters No, 3 and 4 had a pH of 2,5.
**No values reported; extremely high recoveries were measured and were attributed to chloroform deterioration during the prolonged storage of the chloroform-organics solution.
SBE
17.629
14.791
0.908
2.044
35.372
1,245
645
45
110
472
~ ...

Sampling Data Volume
of Water Through
I Carbon Period gallons pH
"' 7.1-\0 7.4 "' ...-l . (""\
.t-) Ill 19,840 So ::s < 0
.t-)
0 ...-l 2.5 »
.-1 ::s ..
Table V
Evaluation of the Carbon Adsorption Method Carbon Extraction Data--Meramec Spring Run l•'o, 1
Trace Organics Recovered Physical Characteristics
Concen-Filter Quantity tration
No, Type grams pg/1 Color Fonn Odor
Chemical-CCE 0,7150 9.53 Dark Brown Solid musty
1 CBE 0,0083 0,11 Light Brown Solid Medicinal CCE~BE 0. 7233 9.64
Chemical-CCE 0.1986 2.65 Dark Brown Solid musty
2 CBE 0,0146 0,19 Light Brown Solid Medicinal CCE~BE 0,2132 2,84
Chemical-CCE 0,4379 5.84 Dark Brown Highly Viscous sweet
3 CBE 0,0236 0,)2 Yellow Highly Viscous Medicinal CCE~BE 0,4615 6,16
Chemical-CCE 0,2948 ).93 Dark Brown Highly Viscous sweet
4 CBE 0,0125 0.17 Yellow Highly Viscous Medicinal CCE~BE 0.3073 4,10
---
z

that of the acid solution storal'!e tank. The acid had changed V1e
surface texture and the finish had developed blisters over the
area in contact with the acid solution. It should be pointed out
that the solvents used in this Phelan Faust epoxy finish were of
the high boiling point type and the curing procedure prescribed by
the manufacturer did not result in the complete evaporation of the
solvents.
Although the recovery data were not satisfactory, this run
served as a guide in evaluating the field sampling procedures
developed for this study and provided the investigator with practical
experience in effectively performing the necessary operational
tasks. The most valuable findings during this first run were the
significant recoveries of trace organics obtained with the SEM from
the spring water and filter effluents, and the successful operation
of the test equipment.
2. Meramec Spring Run No. 2.
Because of the possible epoxy solvent contamination and
chloroform deterioration during the first run at l~eramec Spring,
it was felt necessary that a second run be performed which would be
essentially identical to the first. Run No. 2 was started after the
initial protective coating had been removed and a new epoxy finish
had been applied and cured (see p,21). The new coating was very
satisfactory and there was no trace of solvent odor after the curin~
procedure or after the sampling run; in addition, the protective
surface was not visually altered in any way during the run.
The second run was started on November 3 and continued through
November 29, 1969. A total volume of 25,680 gallons of spring water
43
44
was passed through the filters during that period at a rate of
approximately 0.79 gpm (3 liters/min). Composite samples for solvent
extraction were withdrawn on November 7, 13, 18, 24 and 29, each time
after approximately 4,000 to 6,000 gallons of water had been filtered.
At the end of the sampling period, the carbon was removed from the
filters and the adsorbed organics were recovered.
The atmospheric temperature during this sampling period ranged
from 73°F (November 4) to 15°F (November 14) and the electric heater
operated about 30 percent of the time. This heater maintained the
temperature on the equipment-support platform so that the filter
units and especially the solvent extraction sampling outlets and
reservoirs would not freeze.
Difficulty was encountered because of temporary clogging of
Filters No. 3 and 4. On November 18, during the second week of
operation, Filter No. 4 became slightly plugged; it was, therefore,
necessary to increase the pumping pressure through the filter units
from the normal operational level of 7 to 10 psi. The effluent
ran slightly cloudy for a brief period (3 minutes) after the pres
sure had been increased; this cloudy (milky-gray) appearance may
have been due to a sloughing off of material that had built up on
the carbon because of the low pH maintained in this unit during the
run. After three days of operation at the increased pressure, the
filter began to operate normally and the pressure was reduced to
the original level. This same problem developed again on November
26, however, this time it was Filter No. 3 which exhibited signs of
being plugged. The pressure was increased to 10 psi once more and
remained there throughout the last three days of the run without
any further difficulty.

During the week preceding the first increase in pumping
pressure (November 8 to 12), the spring showed a slight turbidity
(milky-cloudy appearance) as did the well waters in the St, James,
Missouri, area,* It had rained before and during these five days
and the turbidity increase of the spring water was a natural
phenomenon; nonetheless, the high turbidity present in the St. James
well waters was more unusual, and this dictated the need for record-
ing this event. The higher spring turbidity could have been the
reason for the effluents of the last two filters becoming murky,
however, the effluents of the first two filters showed no change
at any time during the run and the activated carbon retained its
natural black color when removed from all of the filters at the
end of the run,
The solvent and carbon extraction data are presented in Tables
VI and VII, respectively, and are graphically shown in Figure 8.
The quantities of trace organics recovered from the four activated
carbon filters have been again corrected by the amounts of materials
extracted from a dry carbon blank (see p.4o). The physical charac-
teristics of the CCE and CBE are also shown in Table VII. The
characteristics of the SCE and SBE of the filter effluents appeared
to be similar to the corresponding CCE and CBE, however, their
amounts were so infinitesimal that it was not practical to record
their physical characteristics with any degree of surety.
*This was reported by residents of St. James who were employed by the James Foundation at the Meramec Spring Park.
45

Suplift! Data
Voluae of Vater
Period Through Carbon 20 gallons
7.1
During Nov, Total Period SCE SBE
3-7 4,190 4,190 2.695 1,665
7-13 9,)60 5,170 2.9)0 1,955
13-18 14,180 4,820 2,050 1,7)2
18-24 20,165 ~.985 0,566 0,?94
24-29 25,680 ),515 3.3)0 1.980
Total Recovery 11, 5?1 8,126
3-7 4,190 4,190 170 150
?-13 9,)60 5,170 150 100
1)-18 14,180 4,820 110 95
18-24 20,165 5,985 25 35
24-29 25,680 5,515 160 95
Ave~e Concentration 119 84
Table VI
Evaluation of the Carbon Adsorption Method Solvent Extraction Data--Meramec Spring Run No. 2
Effluent• Raw Vater
Filter No. 1 Filter No, 2 Filter No. 3
Saaple Voluae Extracted, liters
20 20 20 20
pH
2.5 10,0 7.4 7.4 2.5 2.5
Type of Trace Organics Recovered
SCE SBZ SCE SBB SCE SBE SCE SBE SCE SBE SCE SBE
Quantity of Trace Organics, grams
1,823 1,586 1,189 1.905 2.380 1,)48 2,300 1,428 1.586 1.905 2.620 1,586
2,440 1,465 1.875 2.7)5 4,300 1.955 2.050 1,857 2,050 2.050 2.735 2,245
1.552 1,460 8,940 2,190 2,282 3.4?0 1.552 1.642 1,005 1,918 1.?33 1,642
1.1)2 1,815 0,90? 2,265 1,472 1,928 1,021 2.380 1,021 1,4?5 0.453 3.6)0
2,290 6.560 1.355 1.562 1.250 1.562 3.125 1,9?8 2,915 1.8?5 ?.?00 2,085
'1.237 12.886 14,248 10,65? 11,684 10.263 10,048 9.285 8.5?7 9.223 15.241 11,188
Concentration of Trace Organics, pg/1
115 100 75 120 150 85 145 90 100 120 165 100
125 75 95 140 220 100 105 95 105 105 140 115
85 80 490 120 125 190 85 90 55 105 95 90
so 80 40 100 65 85 45 105 45 65 20 160
110 )15 65 75 60 75 60 Q'j 140 90 370 100
96 1)) 146 __J._
109 120 105 103 95 88 95 157 115
-Effluents fraa Filters No, 1 and 2 h~ a pH of 7,4, effluents from Filters No. 3 and 4 had a pH of 2.5.
Filter No. 4
20
2.5 10,0
SCE SBE SCE SBE
' 2,065 1.508 0,874 1,)48
I
),615 1.955 1,857 1,857
1,642 0,?)0 0.54? 0,822
1,815 1,?01 1,247 0.113
1,980 4,580 1,562 6.zso 1
11,11? 10,474 6,08? 10.?8?
1)0 95 55 85
185 100 95 95
90 40 30 45
80 75 55 5
95 220 75 300
114 107 63 111
+'"" (]

Sampling Data Volume
of Water Through Carbon
Period gallons pH
?.1-()'\ ?.4 '-() ()\ T"l . ()\
N 25,680 I ("'\
!-! Q) .0 s ~ 0 2.5 z
Table VII
Evaluation of the Carbon Adsorption Hethod Carbon Extraction Data--l1eramec Spring Run No. 2
Trace Organics Recovered Physical Characteristics
Concen-Filter Quantity tration
No. Type grams tlg/1 Color Form Odor I
CCE 0. 7311 7.52 Dark Brown Solid Chemical- I
musty I
1 CBE 0.0200 0.21 Light Brown Solid l1edicinal CCE+CBE 0. 7511 8.73
Chemical-CCE 0.2314 2.48 Dark Brown Solid musty
2 CBE 0.0098 0.10 Light Brown Solid Medicinal CCE+CBE 0.2412 2.58
Chemical-CCE 0.44)6 4.56 Dark Brown Highly Viscous sweet
3 CBE 0,0099 0.10 Yellow Highly Viscous Medicinal CCE+CBE 0.4535 4.66
Chemical-CCE 0.3699 3.81 Dark Brown Highly Viscous sweet
4 CBE 0.01?6 0.18 Yellow Highly Viscous Hedicinal CCE+CBE 0.3875 3.99
+c-..,)

48
... ~ i ~ 8 -e. ~ ~ "0 Ill ... Ill ~
u: Ill ... ~ i -0
Ill E ::1
~
Carbon Effluent Corbon Effluent Carbon Effluent Carbon Effluent Raw Water
Filter No.I Filter No.2 Filter No. 3 Filter No. 4
~pH2.5 iiPH 10.0 I Figure 8
Evaluation of the Carbon Adsorption Method Solvent and Carbon Extraction Data--Meramec Spring Run 1110. 2

The data from both the solvent extraction and carbon elution
studies showed that the spring contained trace organic pollutants,
but the two values did not compare as expected. The raw water
(natural pH) SCE and SBE average concentrations for the entire run
were 119 and 84 vg/1, respectively, whereas the CCE and CBE from
the first carbon filter were only 7.5 and 0.2 ~g/1, respectively.
A similar relationship existed between the total quantity of organics
recovered from a filter effluent and the amount of material desorbed
from the carbon of the following filter in the series. Sequential
extraction of the raw spring water at pH 2.5 and 10.0 resulted in
a two-fold increase in the recovery of SCE and SBE materials, as
compared to the amounts obtained with a single extraction at the
natural pH of 7.1.
The CCE recovered from the dry activated carbon blank was
approximately 1.6, 4.9, 2.6, and 3.1 percent of the CCE recovered*
during the run with Filters No. 1, 2, 3, and 4, respectively. The
CBE eluted from the dry blank represented a greater percentage of
the total recovery from each unit than did the CCE; the blank CBE
was approximately 31, 63, 62, and 35 percent of the CBE recovered*
with Filters No. 1, 2, 3, and 4, respectively.
At the end of the run it was realized that the equipment had
performed satisfactorily as a compact, easy to assemble and main
tain unit. If there are no major preliminary site preparation re
quirements, the equipment can be assembled by one person and be
operating in less than eight hours.
*These values refer to actual recoveries before blank correction.
49

50
V. DISCUSSION
The equipment and procedures developed during this investigation
formed a test system which could be effectively employed in the evalu
ation of the carbon adsorption method (CAM) under field conditions
and depended upon the solvent extraction method (SEM) to monitor the
concentration of trace organic substances in the filter influent and
effluent. Preliminary studies using this system have indicated that
the CAM had a low total (adsorption-desorption) efficiency for recover
ing trace organics from natural water, however, more work is needed
in order to fully evaluate the method and establish its limitations.
The (0.196 cubic foot) activated carbon filter units, which were
an integral part of the field test system, incorporated the basic
concepts of both the large (1.5 cubic foot) and small (0.073 cubic
foot) filters used in previous investigations. The large number
(five) of filters available was capable of meeting many different
experimental conditions, including the need for pretreatment, oper
ation in series or in parallel, and pH adjustment; and the location
of the sampling outlets was selected to enable the monitoring of the
influent to and effluent from each filter. The total system formed
a rugged, compact, self-contained, mobile arrangement which would
effectively serve a wide variety of field applications.
During the preliminary field investigation, various operational
parameters were investigated in order to establish guidelines for
the effective application of the test system. The size of the sample
to be filtered (20,000 to 25,000 gallons) was selected to be well in
excess of the recommended sample volume for the standard filter
(5,000 gallons) properly adjusted for the larger size of the test

filters. Since the filters used in this investigation were approxi
mately three times as large as the standard filter, 15,000 gallons
would have been the recommended size; however, this volume was in
creased to 20,000 or 2.5,000 gallons in order to investigate the
possible breakthrough of organic matter through the carbon columns.
The total volume was divided into smaller increments (4,000 to 6,000
gallons) for the parallel solvent extraction studies in an attempt
.51
to determine the time at which each filter became overloaded and to
evaluate the relative efficiency of the filters during the run.
Because earlier studies {1, 28) at Meramec Spring had indicated a
relatively low concentration of trace organics in the spring water,
the volume of sample (20 liters) selected for the solvent extraction
studies had to be sufficient to insure measurable recoveries. How
ever, the sample size was also dictated by the need to extract and
process a large number of samples during the five day period between
sample collections. A total of 18 different extractions were per
formed on the six samples taken during each sampling period in order
to allow use of two different solvents (chloroform and benzene) and
extraction at three different pH levels (natural, 2 • .5, and 10.0). The
flow rate through the filters was daily set at 0.79 gpm (J liters/min)
giving a contact time of 1.9 minutes. However, on the basis of the
total volume of water filtered, the flow rate during the first run
averaged only o.61 gpm and during the second run 0.71 gpm. The cor
responding detention times were 2.4 and 2.1 minutes, respectively,
and compared favorably with the values employed by other investi
gators. The system was designed so that the flow rate could be
varied over a wide range, and consequently the contact time could
be adjusted to different levels to permit the evaluation of the
effect of this variable.
The average concentrations of trace organics recovered from
Meramec Spring water by solvent extraction and carbon adsorption in
Run No. 2 are summarized in Table VIII. The concentration of SCE and
S.BE in the spring water (119 and 84 pg/1, respectively) compared
favorably with the quantity of SCE and SBE recovered by Chang (28)
from the same water (96.3 and 194.4 pg/1, respectively) in the winter
of 1969. Chang also extracted Meraaec Spring water sequentially at
pH 4 and 10 and found that pH adjustment resulted in increased SCE
and SBE recoveries. However, he extracted the water at the two pH
values with either chloroform or benzene; consequently his data can
not be directly compared to the findings of this study where chloro
form extraction was always followed by benzene extraction (see Figure 5,
p.J1). The concentration of CCE and CBE in the spring water was, on
the other hand, much lower than the values reported by Grigoropoulos
and Smith (1). These investigators used three large carbon filters
in series and sampled Meramec Spring water at its natural pH in two
runs made during the winter of 1966; they eluted the carbon with both
chloroform and benzene, however, they followed chlorofo:z:m extraction
with ethanol and in soae cases acetone extraction before using
benzene. Because of the different experimental conditions employed,
it is possible to compare only the CCE recovered by their first two
filters to the values determined in the present study. On this basis,
the CCE concentrations obtained by Grigoropoulos and Smith in their
two runs ()0.4 and 51.7 pg/1 with the first filter and 10.8 and
21.8 pg/1 with the second filter) were four to seven or eight times

pH Filter of
No. Water
1 ?.1
2 ?.4
3 2.5
4* 2.5
Table VIII
Evaluation of the Carbon Adsorption Method Average Recoveries--Maramec Spring Run No, 2
Chloroform Extract Benzene Extract Organics, \lg/1 Recovery Organics, }lg/1
in Eluted % in Eluted Filter from % of Filter No, Filter from %
Influent Carbon Recovery 1 3 Influent Carbon Recovery
119 ?.5 6,) 100 N/A 84 0,2 0,24
120 2,5 2,1 33.3 N/A 105 0,1 0.09
88 4,6 5.2 61,4 100 95 0,1 0,11
157 ),8 2,4 50.6 82,6 115 0,2 0,1?
Recovery %
of Filter No, 1 3
100 N/A
3?.5 N/A
45.8 100
?0.8 200
*The effluent from this filter contained 114 \lg/1 SCE and 10? \lg/1 SBE (when solvent extracted at pH 2,5).
\J1 I...,)

greater than the values obtained in this study (7.5 and 2.5 pg/1 with
the two filters). The second filter employed by Grigoropoulos and
Smith recovered approXimately 35 to 42 percent of the amount of CCE
recovered with the first unit and this is also true in the present
study where the corresponding value was )) percent. Lowering of
the pH of the water before it entered Filter No. ) significantly
increased the amount of CCE and CBE recovered by this filter as well
as Filter No. 4 (Table VIII).
Comparison of the solvent extraction and carbon adsorption data
(Table VIII) would indicate that the CAM had an apparent recovery
efficiency which was considerably lower than the values determined
by Hoak and others (7) in batch laboratory studies using phenol
which ranged from 19 to 77 percent. In fact, if the average concen
tration of SCE and SBE over the total sampling period is considered,
it would appear that the effluent from Filters No. 1 and ) had a
greater trace organics content than the corresponding influent to
these filters. To further verify this observation, the total con
centration of solvent extracts (both chloroform and benzene) obtained
from the influent to and effluent from each filter during each
sampling period is presented graphically in Figure 9. In preparing
this figure, only the SCE and SEE materials recovered by extraction
at the pH of the water passed through the corresponding filter have
been considered. The arithmetic difference between the influent and
effluent concentration for any given filter and at any given time
has been indicated in Figure 9 as either adsorption (+) or de
sorption (-). During the first sampling period, Filter No. 1
appeared to be adsorbing organics, whereas during the second, third,
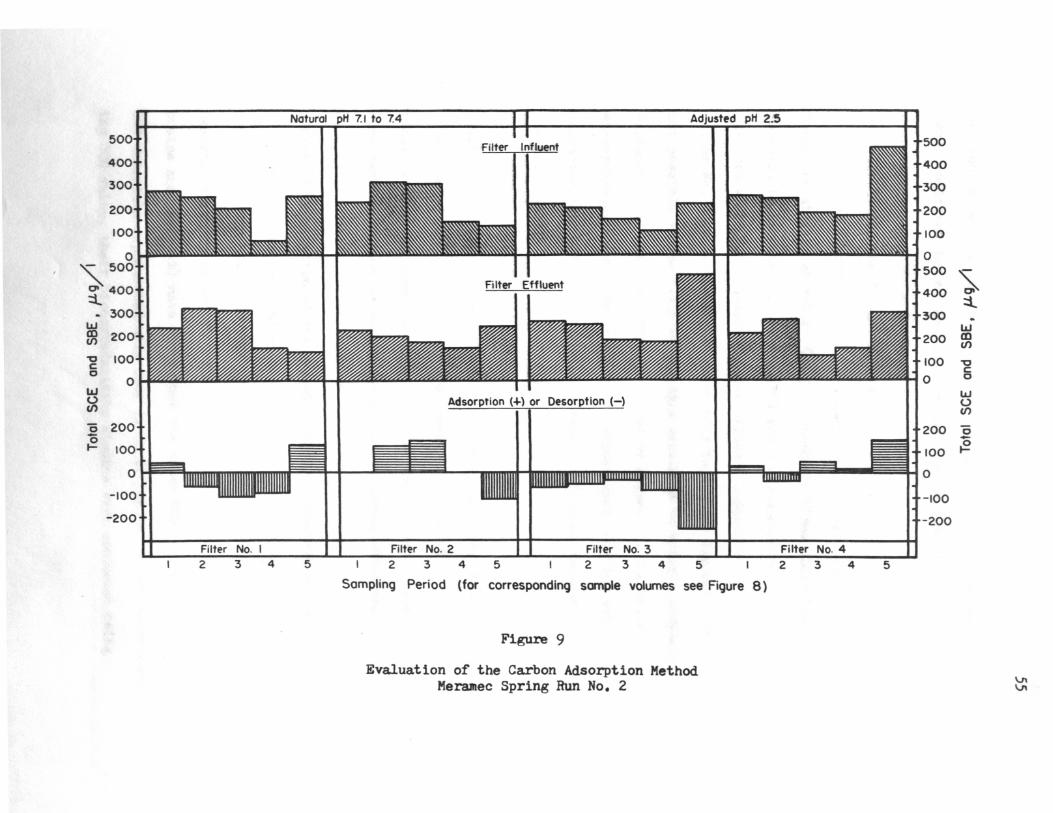
w m (/) 200
-a 100 c 0
0 w (.) (/)
0 200
~ 11"\1"\
4 5
Adsorption (~) or Desorption (-)
I F9 II
2
Sampling Period (for corresponding sample volumes see Rgure 8)
Figure 9
Evaluation of the Carbon Adsorption Method Meramec Spring Run No. 2
200
100
0
200
·--
'S. 0
::t. -w
m (/)
-a c 0
w (.) (/)
0 -{:!
\.J\ \.J\

and fourth periods it appeared to be losing organics; adsorption was
again indicated during the fifth period. On the contrary, Filter
No. 2 showed adsorption during the second and third periods and de
sorption during the fifth, while showing neither gain nor loss during
the first and fourth periods. Although pH adjustment seemed to en
hance the ability of Filter No. 3 to recover CCE and CBE, this filter
appeared to be releasing in its effluent a concentration of solvent
extracts which was greater than the influent concentration. Finally
Filter No. 4 gained material essentially throughout the run. It is
not possible on the basis of the data available to offer a complete
explanation of the conditions indicated by Figure 9. The organic
micropollutants are complex materials whose exact identity and
character have not been fully established. Although the qualitative
and quantitative recovery efficiency of the SEM has not actually
been determined, it is reasonable to assume that all the trace
organic materials present in the water sample were not recovered
under the solvent and pH conditions employed; in addition it is
possible that the organics might have undergone changes while they
were passing through or were adsorbed on the carbon which could
have altered their solvent extraction characteristics. Partial
microbial degradation of the organic materials adsorbed on the
carbon might have resulted in the release of intermediates, and
56
this could also have accounted for the low concentration of organics
desorbed from the carbon at the end of the run. Although Grigoro
poulos and Smith (1) have found that the 5 day BOD of Maramec Spring
CCE materials represented only from 11 to 19 percent of the correspond
ing COD value, their biodegradability studies were conducted using

57
extracts that had been actually recovered from the carbon and do not
necessarily reflect what had happened while the organics were sorbed
on the carbon. Better knowledge of the character of the trace
organic substances recovered by solvent extraction and carbon ad
sorption would be of great value in the further evaluation of the two
recovery techniques, and research is urgently needed in this important
aspect of the trace organics problem.
Obviously this study has left many questions unanswered. Yet it
represents the first study that has been performed to evaluate the
CAM using the actual organic materials which are found in natural
water; and has been conducted under actual field conditions. From
the operational viewpoint, additional work at various flow rates
through the carbon is needed in order to evaluate the effect of con
tact time on sorption efficiency. The size of the sample which is
solvent extracted should be increased to provide a more significant
quantity of organics which will not only improve the reliability of
determination but will also provide sufficient sample for characteri
zation studies. Batch-type solvent extraction, however, is a tedious
and ti.me consuming operation and the size of sample to be extracted
would be limited by practical considerations; the development of a
continuous flow solvent extractor would effectively overcome this
difficulty. The number of raw water and filter effluent samples
collected over the sampling period was also dictated by the time
required to extract some 18 different samples. More frequent sampling
during the early part of the run would have been desi.rable and could
have been accomplished with a continuous flow extractor. Finally,
other sources and types of water which might contain different types

of trace organic pollutants and at different concentration levels
should be employed in the evaluation of the CAM in order to develop
a range of operational parameters, including flow rate and contact
time, frequency of sampling, size of sample to be filtered and size
of sample to be solvent extracted, pH, and appropriate solvents.
58

VI. CONCLUSIONS
On the basis of the findings of this study, the following con
clusions may be drawn.
1. The test system developed during this investigation proved to
be satisfactory for the field evaluation of the carbon adsorption
method with parallel solvent extraction studies and enabled the
monitoring of the trace organic materials in the influent to
and effluent from the carbon filters.
2. The preliminary evaluation of the carbon adsorption method using
this test system indicated that the method had a low total ef
ficiency for recovering trace organic pollutants from Meramec
Spring water; however, further research is needed in order to
fully evaluate the method and establish its limitations.
3. The adjustment of the pH of the spring water and effluents
from the carbon filters to 2.5 and 10 significantly increased
the concentration of trace organics recovered with solvent ex
traction, and the lowering of the pH of the spring water to
2.5 significantly increased the concentration of trace organics
recovered by carbon adsorption.
4. The spring water SCE and SBE materials averaged 119 and 84 vg/1,
respectively, during a 27 day sampling period; an average of
10 ~g/1 CCE and 0.3 vg/1 CBE were recovered by two carbon filters
in series during this period and an additional 8.4 ~g/1 CCE and
0.3 ~g/1 CBE were obtained with two more filters in series after
the pH of the water had been adjusted to 2.5.
5. In order to fully evaluate the carbon adsorption method using
the test system and experimental procedures developed in this

study, additional sources and types of water should be employed
and the flow rate through the carbon and frequency of solvent
extraction should be varied. In addition, the character of the
solvent and carbon extracts should be established.
60

VII. RECOMMENDATIONS FOR FUTURE WORK
On the basis of the findings of this study, the following
areas of further research are recommended.
1. The recovery efficiency of the carbon adsorption method should
be evaluated during the early part of a run (less than 4,000
to 5,000 gallons of water filtered) in order to assure that
the carbon had not been overloaded.
2, A continuous flow solvent extraction system should be developed
in order to enable extraction of a large size sample and re
covery of a significant quantity of trace organics.
3. The trace organic substances recovered with both solvent ex
traction and carbon adsorption should be characterized using
advanced analytical instrumentation in order to allow the
qualitative evaluation and comparison of the two recovery
methods.
4. Additional studies using different flow rates through the
carbon, sampling sources, pH adjustment schemes, and filter
arrangements are necessary for the complete evaluation of the
carbon adsorption method using parallel solvent extraction.
61

62
BIBLIOGRAPHY
1. Grigoropoulos, s. G. and Smith, J. w., "Trace Organics in Missouri Subsurface Waters," Journal American Water Works Association, 60, 586 (1968).
2 • Borneff, J., Selenka, F. , Knute, H. , and Maximos, A. , "Experimental Studies on the Formation of Polycyclic Aromatic Hydrocarbons in Plants," Environmental Research, 2, 22 ( 1968).
3. "USPHS Drinking Water Standards, 1962," Public Health Service Publication No. 956, u. S. Government Printing Office, Washington, D • C • ( 1962) •
4. AWWA Year Book, "Quality Goals for Potable Water," Journal American Water Works Association, 61, 28 (1969).
5. Braus, H., Middleton, F. M., and Walton, G., "Organic Chemical Compounds in Raw and Filtered Surface Waters," Analytical Chemistry, ~. 1160 (1951).
6. "Standard Methods for the Examination of Water and Wastewater," 12th Edition, American Public Health Association, New York (1965).
7. Hoak, R. D., "Recovery and Identification of Organics in Water," International Journal Air and Water Pollution,£, 521 (1962).
8. "Report of Committee D-19 on Water," Presented at the SeventySecond Annual Meeting of the American Society for Testing and Materials, Atlantic City, N.J. (June 1969).
9. Middleton, F. M., Braus, H., and Ruchhoft, c. c., "Fundamental Studies of Taste and Odor in Water Supplies," Journal American Water Works Association, 44, 536 (1952).
10. Middleton, F. M., Braus, H., and Ruchhoft, c. c., "Application of the Carbon Filter and Countercurrent Extraction to the Analysis of Organic Industrial Wastes," Proceedings 7th Annual Purdue University Industrial Waste Conference, Series 79, 439 (1952).
11. Middleton, F. M., Pettit, H. H., and Rosen, A. A., "The Mega Sampler for Extensive Investigation of Organic Pollutants in Water," Proceedings 17th Annual Purdue University Industrial Waste Conference, Series 112, 454 (1962).
12. Dornbush, J. N. and Ryckman, D. w., "The Effects of Physiochemical Processes in Removing Organic Contaminants," Journal Water Pollution Control Federation, ]2, 1325 (1963).

13.
14,
16.
17.
18.
20.
21.
22.
23.
24.
25.
Myrick, H. N. and Ryckman, D. w., "Consideration in the Isolation and Measurement of' Organic Refractories in Water," Journal American Water Works Association, 22• 783 (1963).
Spicher, R. G, and Skrinde, R. T., "Potassium Permanganate Oxidation of' Organic Contaminants in Water Supplies," Journal American Water Works Association, 22• 1174 (1963).
Smith, J. w., "The Recovery and Characterization of' Organic Micropollutants from Missouri Subsurface Waters," M. s. Thesis, University of' Missouri-Rolla (1967).
Hoadley, A. W., "A Preliminary Review of' Carbon Adsorption Data Collected as a Part of' the National Water Quality Network Sampling Program," U. s. PHS Development No. 5 (1962).
63
Breidenbach, A. w., Lichtenberg, J. J,, Henke, c. F,, Smith, D. J., Eichelberger, J, w., Jr,, and Stierle, H., "The Identification and Measurement of' Chlorinated Hydrocarbon Pesticides in Surf'ace Waters," Federal Water Pollution Control Administration Publication WP-22 (1966).
Atkins, P. F., Jr. and Tomlinson, H. D., "Evaluation of Daily Variations of' Carbon Chloroform Extracts of' the Presently Used Two Week Carbon Adsorption Method," Water and Sewage Works, 110, 275 (1963).
Greenburg, A. E., Maehler, C. z., and Cornelius, J., "Evaluation of' the Carbon Adsorption Method," Journal American Water Works Association, jz, 791 (1965).
Skrinde, R. T. and Tomlinson, H. D., "Organic Micropollution Instrumentation and Measurement," Journal Water Pollution Control Federation, ]2, 1292 (1963).
Caruso, s. c., Bramer, H. c., and Hoak, R. D., "Tracing Organic Compounds in Surf' ace Streams," International Journal of' Air and Water Pollution, 1Q, 41 (1966).
Baker, R. A. and Malo, B. A., "Characterization of' Microorganic Constituents of Water by Instrumental Procedures," Water and Sewage, 114, R223 (1967).
Ryckman, D. w., Burbank, N. c., Jr., and Edgerley, E., Jr., "New Techniques for the Evaluation of Organic Pollutants," Journal American Water Works Association, 2£, 975 (1964).
Weckback, w., Director of Research, Phelan Faust Paint Mfg. Co,, St. Louis, Personal Communication (1969).
Byrd, J • D., Technical Service Manager, Carboline Company, St. Louis, Personal Communication (1969).

64
26. Beckman, H. c. and Hinchey, N. s., "The Large Springs of Missouri," Missouri Geological Survey and Water Resources, Rolla, Missouri, 97 (1944).
27. Roemer, E., Hydraulic Engineer, Water Resources Division, u. s. Geological Survey, Rolla, Personal Communication (1970).
28. Chang, W. C. W., "Recovery of' Trace Organic Pollutants by Solvent Extraction," University of' Missouri-Rolla, Unpublished Research.

APPENDIX A
Acid Solution Pump Setting
A special pump was used to inject an acid solution into the
test system between Filter No. 2 and Filter No. 3. A variable out-
put diaphragm pump* was selected for this purpose, and was used in
conjunction with a 30 gallon acid solution tank and mixer (Figure 4,
p.24). The maximum output of the pump was 70 ml/min and the manu-
facturer recommended that it be run at 40 to 70 percent of its
maximum capacity.
A titration curve (Figure A-1) was prepared for Meramec Spring
water using o.4N sulfuric acid. Approximately 11.5 ml of o.4N acid
were required per liter of water to reduce its pH to the 2.5 value.
Since the flow through the activated carbon filters was to be
3 liters/min, a 35 ml/min acid solution feed would be required.
A pump setting of 50 percent (5 on the pump dial) would give
an approximate flow rate of 35 ml/min. This setting was initially
used, however, after operating the actual test system for a few
hours, it was found that a pump rate of 55 percent (5.5 on the dial)
was necessary to provide the desired pH control.
*Wallace & Tiernan No. 94-110, purchased from Lesco Division of Sidener Supply Co., Granite City, Illinois.
65

pH
00 20
6 I iter Meramec Spring Water Sample
40 60 80 100 120
0.4N H2so4 , ml
Figure A-1
Titration Curve for Meramec Spring Water
140
(]'. (]'.

VITA
Stanley Kent Wagher was born on June 10, 1944, in Princeville,
Illinois. He received his primary education in Victoria, Illinois,
and his secondary education in Oneida, Illinois. He received a
Bachelor of Science degree in Civil Engineering from the University
of Missouri-Rolla, Rolla, Missouri, in May 1968.
He was enrolled in the Graduate School of the University of
Missouri-Rolla working toward a Master of Science degree in Civil
(Sanitary) Engineering from June 1968 to January 1970 and during
this period he was awarded a Federal Water Quality Administration
Traineeship. He is presently serving his two year ROTC Commission
obligation in the Nedical Service Corps, u.s. Army.
He was married to Judith Annette Jensen of Rolla, Missouri, on
June 8, 1968, and they have a son, Nathan Michael.
859 190
67