Evaluation of significant sources influencing the variation of physico-chemical parameters in Port...
6
Baseline Evaluation of significant sources influencing the variation of physico-chemical parameters in Port Blair Bay, South Andaman, India by using multivariate statistics Biraja Kumar Sahu ⇑ , Mehmuna Begum, M.K. Khadanga, Dilip Kr Jha, N.V. Vinithkumar, R. Kirubagaran National Institute of Ocean Technology (NIOT), Chennai 600 100, India article info Keywords: Nutrients Cluster analysis Factor analysis Port Blair Bay abstract Port Blair is the capital city of Andaman & Nicobar Islands, the union territory of India. More than 50% of the population of these islands lives around Port Blair Bay. Therefore the anthropogenic effects in the bay water were studied for monitoring purpose from seven stations. Physico-chemical parameters of seawa- ter were analyzed in samples collected once in every 3 months for 2 years from seven sampling stations located in Port Blair Bay, South Andaman Island to evaluate the spatial and tidal variation. Cluster anal- ysis and factor analysis were applied to the experimental data in an attempt to understand the sources of variation of physico-chemical parameters. In cluster analysis, the stations Junglighat Bay and Phoenix Bay having high anthropogenic influence formed a separate group. The factors obtained from factor analysis indicated that the parameters responsible for physico-chemical variations are mainly related to land run- off, sewage outfall and tidal flow. Crown Copyright Ó 2012 Published by Elsevier Ltd. All rights reserved. The coastal seas and bays are the most valuable and vulnerable habitats (Jickells, 1998). These ecosystems are subjected to anthro- pogenic activities, natural and oceanic variation. In recent decades, rapid economic growth and the increase in the population of the coastal areas have exercised a great impact on the ecological envi- ronment of the bays. Eutrophication and environmental pollution have obviously occurred in many coastal areas, especially in estu- aries and coastal bays with dense human populations in their watersheds. The coastal water of Andaman & Nicobar Islands is compara- tively pristine. However, increasing number of ships/ferries, which are the only means of transport of bulk cargo and mass transport to mainland and other islands, disposal of untreated anthropogenic wastes and sewage into enclosed bay areas are the factors that could pose potential threat to human health and health of sea water in some localities. The population of South Andaman Island is 2.4 lakhs (Census 2011) which is 62% of total population of A & N Islands. Recently there was an increase of tourists (25% rise in 2010–11) to these islands (Tourism Dept., A & N Administration). It is therefore essential and urgent to prevent and control marine water pollution and regularly implement monitoring programs which help to create an understanding of the spatial and temporal variations in coastal water quality. The large and complicated data sets of water quality parameters generated by monitoring programs are often difficult to analyze meaningfully and require data reduction methods to simplify the data structure so as to extract useful and interpretable information. In such cases, the multivariate statistical analysis, such as factor analysis (FA) and cluster analysis (CA) have been effectively em- ployed to evaluate the temporal and spatial characteristics of coastal water quality and river water (Vega et al., 1998; Simeonova et al., 2003; Simeonov et al., 2004; Singh et al., 2004; Panda et al., 2006; Shirodkar et al., 2009; Wu et al., 2010). Based on this, in the present study, statistical analysis methods (FA and CA) were em- ployed to elucidate the spatial and tidal variation of physico-chem- ical parameters in Port Blair Bay. Port Blair Bay, located in South Andaman Island extends as a narrow stretch in northeast to southwest direction and opens to Andaman Sea on the eastern side (Fig. 1). The bay is having patches of mangrove plants. Depth of the bay ranges from 3 to 25 m whereas in open sea area the depth is more than 50 m. This bay area is the center of major anthropogenic activities of Port Blair city, which congregate major share of the total Andaman & Nicobar Islands’ population. The sea level in Port Blair region has risen from the previous level due to the land subsidence during the 26th December 2004 earthquake followed by Tsunami (Meltzner et al., 2006). Large area of coastal land has been inundated during tsu- nami and a considerable area of coastal land has been submerged due to land subsidence and change in seawater level. Due to coast- al land submergence, the major portion of previous inter tidal re- gion of coastal area has been lost and a considerable area of mangrove forest has been degraded (Roy and Krishnan, 2005). The climate of these islands is typically tropical, with heavy gales, cyclones, and hot and humid conditions. The annual average 0025-326X/$ - see front matter Crown Copyright Ó 2012 Published by Elsevier Ltd. All rights reserved. http://dx.doi.org/10.1016/j.marpolbul.2012.09.021 ⇑ Corresponding author. Present Address: P.G. Dept. of Marine Sciences, Berhampur University, Berhampur 760 007, Odisha, India. E-mail address: [email protected] (B.K. Sahu). Marine Pollution Bulletin 66 (2013) 246–251 Contents lists available at SciVerse ScienceDirect Marine Pollution Bulletin journal homepage: www.elsevier.com/locate/marpolbul
-
Upload
pondiuni-anthropology -
Category
Documents
-
view
1 -
download
0
Transcript of Evaluation of significant sources influencing the variation of physico-chemical parameters in Port...

Marine Pollution Bulletin 66 (2013) 246–251
Contents lists available at SciVerse ScienceDirect
Marine Pollution Bulletin
journal homepage: www.elsevier .com/locate /marpolbul
Baseline
Evaluation of significant sources influencing the variation of physico-chemicalparameters in Port Blair Bay, South Andaman, India by using multivariate statistics
Biraja Kumar Sahu ⇑, Mehmuna Begum, M.K. Khadanga, Dilip Kr Jha, N.V. Vinithkumar, R. KirubagaranNational Institute of Ocean Technology (NIOT), Chennai 600 100, India
a r t i c l e i n f o
Keywords:NutrientsCluster analysisFactor analysisPort Blair Bay
0025-326X/$ - see front matter Crown Copyright � 2http://dx.doi.org/10.1016/j.marpolbul.2012.09.021
⇑ Corresponding author. Present Address: P.G.Berhampur University, Berhampur 760 007, Odisha, I
E-mail address: [email protected] (B.K. Sahu
a b s t r a c t
Port Blair is the capital city of Andaman & Nicobar Islands, the union territory of India. More than 50% ofthe population of these islands lives around Port Blair Bay. Therefore the anthropogenic effects in the baywater were studied for monitoring purpose from seven stations. Physico-chemical parameters of seawa-ter were analyzed in samples collected once in every 3 months for 2 years from seven sampling stationslocated in Port Blair Bay, South Andaman Island to evaluate the spatial and tidal variation. Cluster anal-ysis and factor analysis were applied to the experimental data in an attempt to understand the sources ofvariation of physico-chemical parameters. In cluster analysis, the stations Junglighat Bay and Phoenix Bayhaving high anthropogenic influence formed a separate group. The factors obtained from factor analysisindicated that the parameters responsible for physico-chemical variations are mainly related to land run-off, sewage outfall and tidal flow.
Crown Copyright � 2012 Published by Elsevier Ltd. All rights reserved.
The coastal seas and bays are the most valuable and vulnerablehabitats (Jickells, 1998). These ecosystems are subjected to anthro-pogenic activities, natural and oceanic variation. In recent decades,rapid economic growth and the increase in the population of thecoastal areas have exercised a great impact on the ecological envi-ronment of the bays. Eutrophication and environmental pollutionhave obviously occurred in many coastal areas, especially in estu-aries and coastal bays with dense human populations in theirwatersheds.
The coastal water of Andaman & Nicobar Islands is compara-tively pristine. However, increasing number of ships/ferries, whichare the only means of transport of bulk cargo and mass transport tomainland and other islands, disposal of untreated anthropogenicwastes and sewage into enclosed bay areas are the factors thatcould pose potential threat to human health and health of seawater in some localities. The population of South Andaman Islandis 2.4 lakhs (Census 2011) which is 62% of total population of A & NIslands. Recently there was an increase of tourists (25% rise in2010–11) to these islands (Tourism Dept., A & N Administration).It is therefore essential and urgent to prevent and control marinewater pollution and regularly implement monitoring programswhich help to create an understanding of the spatial and temporalvariations in coastal water quality.
The large and complicated data sets of water quality parametersgenerated by monitoring programs are often difficult to analyze
012 Published by Elsevier Ltd. All
Dept. of Marine Sciences,ndia.).
meaningfully and require data reduction methods to simplify thedata structure so as to extract useful and interpretable information.In such cases, the multivariate statistical analysis, such as factoranalysis (FA) and cluster analysis (CA) have been effectively em-ployed to evaluate the temporal and spatial characteristics ofcoastal water quality and river water (Vega et al., 1998; Simeonovaet al., 2003; Simeonov et al., 2004; Singh et al., 2004; Panda et al.,2006; Shirodkar et al., 2009; Wu et al., 2010). Based on this, in thepresent study, statistical analysis methods (FA and CA) were em-ployed to elucidate the spatial and tidal variation of physico-chem-ical parameters in Port Blair Bay.
Port Blair Bay, located in South Andaman Island extends as anarrow stretch in northeast to southwest direction and opens toAndaman Sea on the eastern side (Fig. 1). The bay is having patchesof mangrove plants. Depth of the bay ranges from 3 to 25 mwhereas in open sea area the depth is more than 50 m. This bayarea is the center of major anthropogenic activities of Port Blaircity, which congregate major share of the total Andaman & NicobarIslands’ population. The sea level in Port Blair region has risen fromthe previous level due to the land subsidence during the 26thDecember 2004 earthquake followed by Tsunami (Meltzner et al.,2006). Large area of coastal land has been inundated during tsu-nami and a considerable area of coastal land has been submergeddue to land subsidence and change in seawater level. Due to coast-al land submergence, the major portion of previous inter tidal re-gion of coastal area has been lost and a considerable area ofmangrove forest has been degraded (Roy and Krishnan, 2005).
The climate of these islands is typically tropical, with heavygales, cyclones, and hot and humid conditions. The annual average
rights reserved.
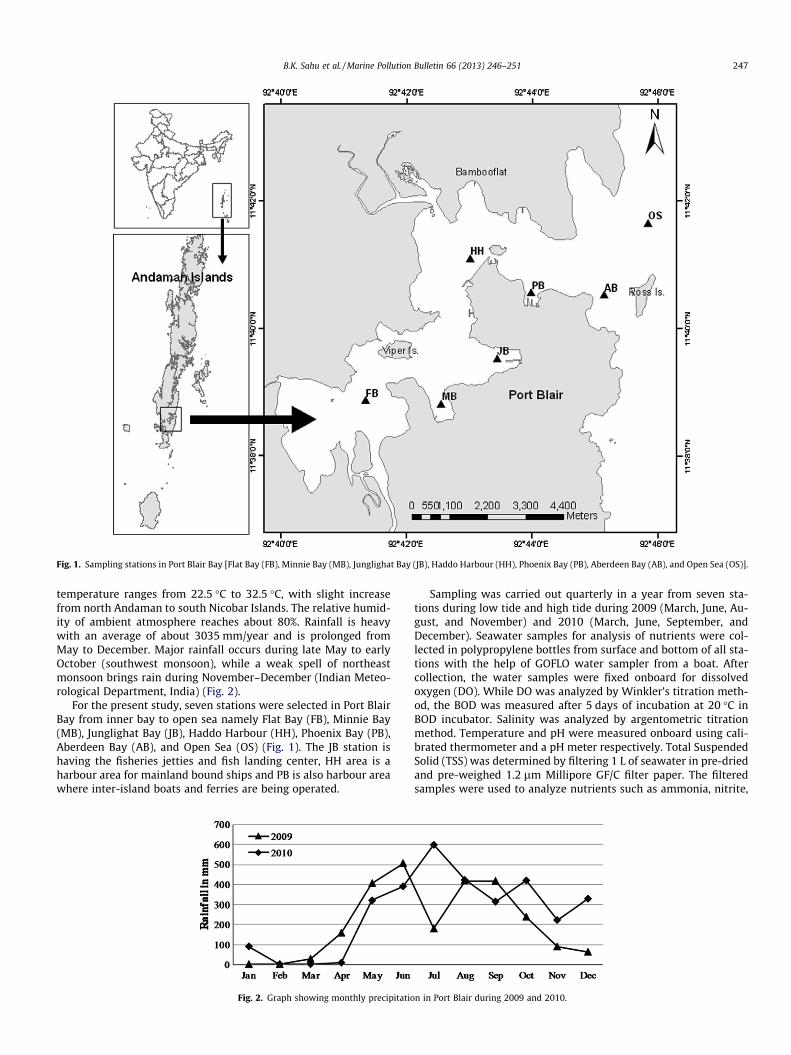
Fig. 1. Sampling stations in Port Blair Bay [Flat Bay (FB), Minnie Bay (MB), Junglighat Bay (JB), Haddo Harbour (HH), Phoenix Bay (PB), Aberdeen Bay (AB), and Open Sea (OS)].
B.K. Sahu et al. / Marine Pollution Bulletin 66 (2013) 246–251 247
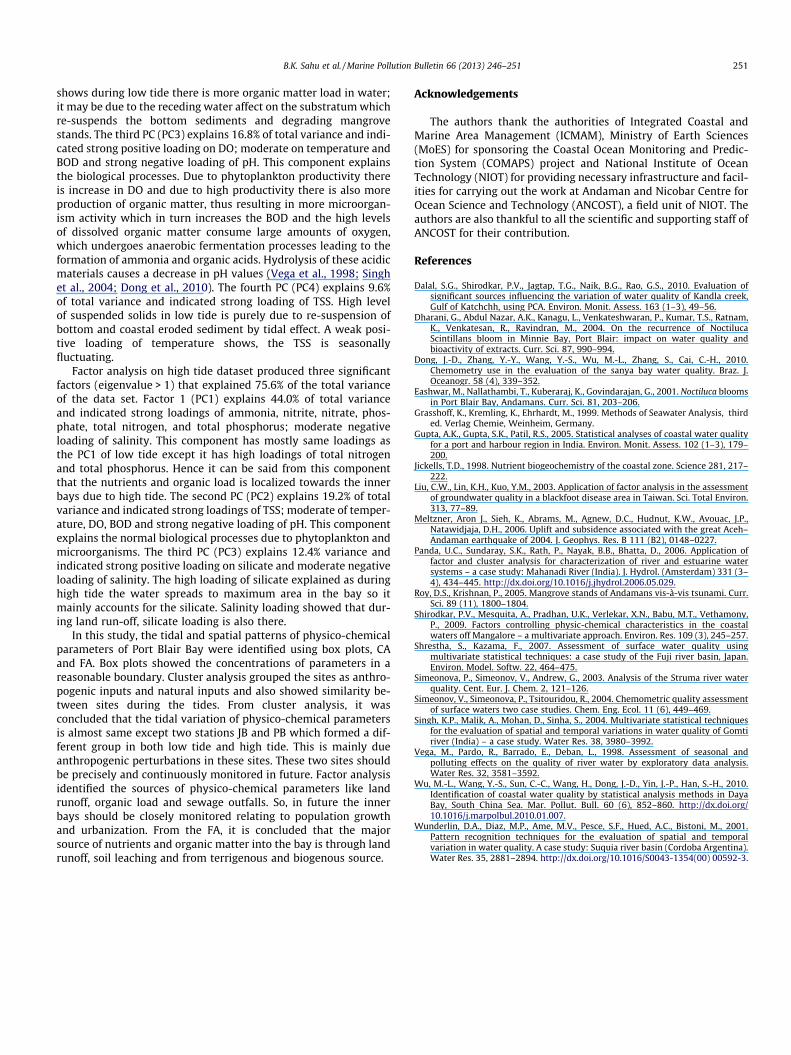
temperature ranges from 22.5 �C to 32.5 �C, with slight increasefrom north Andaman to south Nicobar Islands. The relative humid-ity of ambient atmosphere reaches about 80%. Rainfall is heavywith an average of about 3035 mm/year and is prolonged fromMay to December. Major rainfall occurs during late May to earlyOctober (southwest monsoon), while a weak spell of northeastmonsoon brings rain during November–December (Indian Meteo-rological Department, India) (Fig. 2).
For the present study, seven stations were selected in Port BlairBay from inner bay to open sea namely Flat Bay (FB), Minnie Bay(MB), Junglighat Bay (JB), Haddo Harbour (HH), Phoenix Bay (PB),Aberdeen Bay (AB), and Open Sea (OS) (Fig. 1). The JB station ishaving the fisheries jetties and fish landing center, HH area is aharbour area for mainland bound ships and PB is also harbour areawhere inter-island boats and ferries are being operated.
Fig. 2. Graph showing monthly precipitatio
Sampling was carried out quarterly in a year from seven sta-tions during low tide and high tide during 2009 (March, June, Au-gust, and November) and 2010 (March, June, September, andDecember). Seawater samples for analysis of nutrients were col-lected in polypropylene bottles from surface and bottom of all sta-tions with the help of GOFLO water sampler from a boat. Aftercollection, the water samples were fixed onboard for dissolvedoxygen (DO). While DO was analyzed by Winkler’s titration meth-od, the BOD was measured after 5 days of incubation at 20 �C inBOD incubator. Salinity was analyzed by argentometric titrationmethod. Temperature and pH were measured onboard using cali-brated thermometer and a pH meter respectively. Total SuspendedSolid (TSS) was determined by filtering 1 L of seawater in pre-driedand pre-weighed 1.2 lm Millipore GF/C filter paper. The filteredsamples were used to analyze nutrients such as ammonia, nitrite,
n in Port Blair during 2009 and 2010.

248 B.K. Sahu et al. / Marine Pollution Bulletin 66 (2013) 246–251
nitrate, inorganic reactive phosphate, and inorganic silicate. Unfil-tered samples were used for the analysis of Total Nitrogen (TN) andTotal Phosphorus (TP). The data quality was checked by carefulstandardization, procedural blank measurements and duplicatesamples. All the above nutrients were determined following stan-dard methods (Grasshoff et al., 1999).
The average values of all parameters of 2009–2010 were takenseparately for low-tides and high-tides in order to exclude extremeand missing values. All parameters were standardized by z-scaletransformation (mean = 0; variance = 1) to minimize the effectsof differences in measurement units and variance and to renderthe data dimensionless. The software SPSS 17.0 was used for thestatistical analyses.
Cluster analysis (CA) is an unsupervised pattern recognitiontechnique that uncovers intrinsic structure or underlying behaviorof a data set without making prior assumptions about the data, inorder to classify the objects of the system into categories or clus-ters based on their nearness or similarity (Vega et al., 1998). Hier-archical agglomerative CA was performed on the normalized dataset by means of the Ward’s method, using squared Euclidean dis-tances as a measure of similarity. The dendrograms generated incluster analysis provides a useful graphical tool determining thenumber of clusters which describe underlying process that leadto spatial variation (Simeonova et al., 2003; Shrestha and Kazama,2007).
Factor analysis (FA), which includes principal component anal-ysis (PCA), is one of the most powerful and common techniquesused for reducing the dimensionality of large sets of data withoutloss of information (Wunderlin et al., 2001). The factors group cor-related data together and they can be associated directly or indi-rectly with some specific source or process. FA takes datacontained in a correlation matrix and rearranges them in a mannerthat better explains the structure of the underlying system thatproduced the data. FA was done by the principal components(PCs) extraction method. Then the factor loadings matrix is rotatedto an orthogonal simple structure according to the Varimax rota-tion technique. In order to determine the sampling adequacy, theKaiser–Meyer–Olkin (KMO) criterion is followed. The factors,which best describe the variance of the analyzed data (eigen-value > 1) and can be reasonably interpreted, are accepted for fur-ther analysis. Bartlett’s sphericity test (v2 with degrees offreedom = 1/2[p(p � 1)]) was used to verify the applicability ofPCA to raw data (Gupta et al., 2005; Dalal et al., 2010). On thefactors also called varifactors (VFs), extracted by the PrincipalComponent Analysis method, the Varimax rotation was then per-formed to secure increased principal components of environmental
Table 1Mean and standard deviation of physico-chemical parameters of all the stations in Port B
Stations FB MB JB
Parameters Mean SD Mean SD Mean SD
Depth (m) 6.49 1.86 5.44 1.13 6.84 2.54Transparency (m) 2.06 1.04 2.54 0.82 2.29 1.28Temperature (�C) 30.04 1.32 30.01 1.29 29.79 1.47pH 8.19 0.23 8.25 0.26 8.21 0.20Salinity (PSU) 31.71 1.81 31.59 1.77 31.49 2.30DO (mg/L) 5.77 1.12 5.81 1.06 5.93 1.14BOD (mg/L) 1.37 0.84 1.23 0.77 1.79 0.99TSS (mg/L) 34.93 9.58 33.72 8.38 33.62 7.29NHþ4 �N (lmol/L) 0.83 0.99 0.61 0.75 2.61 6.88NO�2 � N (lmol/L) 0.22 0.28 0.19 0.25 0.37 0.75NO�3 � N (lmol/L) 1.04 1.23 0.84 0.90 2.61 6.33PO�4 � P (lmol/L) 0.28 0.27 0.20 0.16 0.72 1.44
SiO2�4 � Si (lmol/L) 4.25 3.67 3.03 2.58 3.41 2.55
TN (lmol/L) 13.21 11.26 12.65 8.45 17.06 18.90TP (lmol/L) 0.74 0.34 0.87 0.62 1.44 1.41
significance; a similar approach based on PCA has been used toidentify the main components in water quality (Vega et al., 1998;Wunderlin et al., 2001; Simeonova et al., 2003; Singh et al., 2004).
The mean value and standard deviation of the measured vari-ables in the water samples from seven stations are given in Table 1.The high standard deviation of most parameters indicates presenceof temporal and spatial variations caused likely by pollutingsources and/or climatic factors (Vega et al., 1998). pH, salinityand DO have shown increasing trend from inner bay (FB) to outerbay (OS) while TSS and BOD has shown the reverse order. Thenutrients such as ammonia, nitrite, nitrate, and phosphate concen-trations were found higher in Junglighat Bay and Phoenix Baywhile silicate concentration was higher in Flat Bay and PhoenixBay. TN and TP also have shown higher concentration in JB and PB.
Fig. 3 shows box plots (also called box-and-whisker plots) forsome physico-chemical parameters. Box plots provide a visualimpression of the location and shape of the underlying distribu-tions. For example, box plots with long whiskers at the top of thebox (such as that for ammonia in high tide) indicate the underlyingdistribution is skewed toward high concentration. Box plots withlarge spread indicate seasonal variations of the water composition(see nitrate and silicate box plot). It is possible to perceive differ-ences between the tides by inspecting these plots. For example,TSS and ammonia in high tide has a greater spread compared withthat in low tide. At the same time, the outliers and far outliers (cir-cles and asterisks in the box plot respectively) which are distrib-uted randomly, pointing to a change in the measured variables insome stations likely caused by some anthropogenic activities orclimatic factors. Sometimes these outliers are considered as mea-surement or data entry error, but if all the measurement and dataentry process is checked these values cannot be avoided from thesample.
The cluster analysis generated a dendrogram, grouping thesampling sites into four groups (Fig. 4a) during low tide. Cluster1 included HH, AB and OS which are located towards the outer re-gion of Port Blair Bay. Cluster 2 included FB and MB which are theinnermost stations of the bay. Cluster 3 included only a single sta-tion PB which has anthropogenic influence due to boats, ferries andsewage outfalls. Cluster 4 also included a single station JB whichhas also high anthropogenic influence mainly due to untreatedmunicipal sewage outfall and fish trawler activities.
PB and JB are areas of similar anthropogenic sources but theyformed two different clusters during low tide. This can be ex-plained as JB station is located in the inner part of Port Blair Baywhere the residence time of tidal influenced water is extendedand organic load input is higher due to sewage outfall and fishing
lair Bay during 2009–2010.
HH PB AB OS
Mean SD Mean SD Mean SD Mean SD
12.73 1.64 11.03 2.66 13.11 3.09 50.66 8.413.30 1.34 3.51 1.57 7.29 3.23 11.80 3.48
29.76 1.00 29.84 1.10 29.64 0.96 29.73 1.118.27 0.25 8.29 0.25 8.35 0.27 8.39 0.27
32.32 1.24 31.24 2.46 31.91 1.55 32.89 1.245.76 1.07 5.74 1.05 6.02 1.05 6.11 0.980.97 0.65 1.19 0.95 1.03 0.83 0.70 0.55
31.05 6.18 32.00 6.47 31.02 6.47 30.94 9.760.61 0.65 1.66 3.37 0.59 0.77 0.42 0.530.18 0.23 0.28 0.38 0.13 0.20 0.08 0.140.90 0.87 3.13 5.78 1.15 1.80 0.44 0.400.18 0.14 0.43 0.79 0.19 0.25 0.12 0.113.12 2.31 4.35 4.79 2.40 1.86 2.07 1.42
10.12 6.69 13.45 11.29 8.79 4.61 6.32 5.510.90 1.04 1.26 1.23 0.76 0.42 0.63 0.29

Fig. 3. Tidal variations-box plot for selected parameters for two tides (LT: Low tide, HT: High tide) (TSS: Total Suspended Solid, TN: Total Nitrogen, TP: Total Phosphorus). Ineach box plot, the central point represents the median, the box gives the interval between the 25% and 75% percentiles, and the whisker indicates the range.
B.K. Sahu et al. / Marine Pollution Bulletin 66 (2013) 246–251 249
trawler activities as compared to PB station which is located in theouter bay region where water movement is frequent.
Flat Bay and Minnie Bay which are the innermost bays gettingfreshwater inputs from many small channels. During rain, thesechannels bring terrestrial runoff from the adjacent area. Thereforethese two stations formed a different cluster (Cluster 2). Recentlyanthropogenic pressure has triggered to clear the vegetation inthe watershed areas and this will influence the physico-chemicalparameters in the bay.
During high tide, cluster analysis generated a dendrogramgrouping the sampling sites into three groups which are given inFig. 4b. The clusters showed more similarity between stations ex-cept JB and PB than the clusters in low tide. Here JB and PB formeda cluster (Cluster 3) which has more anthropogenic influence. Clus-ter 1 (HH, AB and OS) is closer to Cluster 2 (FB and MB) whichshows the tidal effect during high tide.
From the dendrogram it is clear that during high tide most ofthe stations having similar characteristics. JB and PB formed a clus-ter which is showing a different characteristic completely differentfrom other stations.
These clusters include sampling sites with similar characteris-tics features and natural background that are affected by sourcesof similar type/strength.
Factor analysis was applied separately to the data set pertainingto low tide and high tide. Results of factor analysis including factorloading matrix, eigenvalues, total & cumulative variance values andvariable loadings (communality) are presented at Table 2. Theeigenvalues and Scree plot was used to retain the significant factors.The factor loadings were sorted according to the criteria of Liu et al.(2003), i.e. strong, moderate and weak, corresponding to absoluteloading values of >0.75, 0.75–0.50 and 0.50–0.30 respectively. TheBartlett’s sphericity test showed p < 0.01, confirming that principal

Fig. 4. Dendrogram based on Ward’s clustering method for (a) Low tide and (b) High tide.
Table 2Varimax rotated factor loadings and communality of physico-chemical parameters during Low tide and High tide.
Variable Low tide High tide
PC1 PC2 PC3 PC4 Communality PC1 PC2 PC3 Communality
Temp. �.187 �.287 .655 .461 .758 �.452 .562 �.348 .641pH �.044 �.316 �.853 �.040 .831 .115 �.842 �.218 .770Salinity �.481 �.726 �.060 .054 .764 �.576 �.048 �.563 .651DO �.072 �.418 .774 �.169 .808 �.159 .665 �.229 .520BOD .383 .270 .615 .228 .649 .370 .522 .195 .447TSS .011 �.011 .080 .951 .912 �.044 .812 �.149 .684NHþ4 �N .962 .049 �.029 .072 .934 .963 .084 �.059 .938NO�2 � N .948 .166 �.053 �.048 .931 .913 �.173 .077 .869NO�3 � N .954 .217 �.042 �.082 .966 .859 �.135 .298 .845PO�4 � P .915 .100 .195 .099 .895 .975 �.023 .107 .963
SiO2�4 � Si .052 .934 �.015 .010 .876 .104 �.090 .888 .808
TN .633 .566 .015 �.097 .731 .897 �.136 .150 .845TP .561 .442 .051 �.106 .524 .861 �.140 .299 .850
Eigenvalues 4.710 2.432 2.189 1.247 5.720 2.503 1.609% Variance 36.23 18.70 16.84 9.59 44.00 19.25 12.37Cumulative (%) 36.23 54.93 71.77 81.37 44.00 63.25 75.62KMO adequacy = 0.742 KMO adequacy = 0.787
Extraction method: Principal Component Analysis. Rotation method: Varimax with Kaiser normalization.a Rotation converged in five iterations.
250 B.K. Sahu et al. / Marine Pollution Bulletin 66 (2013) 246–251
component extraction can achieve a significant reduction of thedimensionality of the original dataset.
Factor analysis on low tide dataset rendered four significant fac-tors (eigenvalue > 1) that explained 81.4% of the total variance ofthe data set. Factor 1 (PC1) explains 36.2% of total variance andindicated strong positive loadings of ammonia, nitrite, nitrate,and phosphate; moderate loading of total nitrogen and total phos-phorus and moderate negative loading of salinity. It showed a com-mon source for all nutrients and organic loads. As all thesenutrients showing negative loading with salinity, so it is clear thatthe main source of nutrients are land run-off and to some extentsewage falls. Due to sewage fall only localized affects could be seen
like in the case of JB and PB. It may not affect substantially to thebay due to high dilution factor. However in inner bay, the sewagefalls should be controlled. Nutrient enrichment by land runoff andplankton blooming was already observed previously from this bay(Eashwar et al., 2001; Dharani et al., 2004). The source of organicload may be from low efficiency in trophic transfer and degradingmangroves which were affected by 2004 tsunami. The second PC(PC2) explains 18.7% of total variance and indicated strong positiveloadings of silicate; moderate of total nitrogen and total phospho-rus and strong negative loading of salinity. Therefore the high load-ing of silicate with respect to salinity showed the major source ofsilicate is from the flow of land run-off and small streams. It also
B.K. Sahu et al. / Marine Pollution Bulletin 66 (2013) 246–251 251
shows during low tide there is more organic matter load in water;it may be due to the receding water affect on the substratum whichre-suspends the bottom sediments and degrading mangrovestands. The third PC (PC3) explains 16.8% of total variance and indi-cated strong positive loading on DO; moderate on temperature andBOD and strong negative loading of pH. This component explainsthe biological processes. Due to phytoplankton productivity thereis increase in DO and due to high productivity there is also moreproduction of organic matter, thus resulting in more microorgan-ism activity which in turn increases the BOD and the high levelsof dissolved organic matter consume large amounts of oxygen,which undergoes anaerobic fermentation processes leading to theformation of ammonia and organic acids. Hydrolysis of these acidicmaterials causes a decrease in pH values (Vega et al., 1998; Singhet al., 2004; Dong et al., 2010). The fourth PC (PC4) explains 9.6%of total variance and indicated strong loading of TSS. High levelof suspended solids in low tide is purely due to re-suspension ofbottom and coastal eroded sediment by tidal effect. A weak posi-tive loading of temperature shows, the TSS is seasonallyfluctuating.
Factor analysis on high tide dataset produced three significantfactors (eigenvalue > 1) that explained 75.6% of the total varianceof the data set. Factor 1 (PC1) explains 44.0% of total varianceand indicated strong loadings of ammonia, nitrite, nitrate, phos-phate, total nitrogen, and total phosphorus; moderate negativeloading of salinity. This component has mostly same loadings asthe PC1 of low tide except it has high loadings of total nitrogenand total phosphorus. Hence it can be said from this componentthat the nutrients and organic load is localized towards the innerbays due to high tide. The second PC (PC2) explains 19.2% of totalvariance and indicated strong loadings of TSS; moderate of temper-ature, DO, BOD and strong negative loading of pH. This componentexplains the normal biological processes due to phytoplankton andmicroorganisms. The third PC (PC3) explains 12.4% variance andindicated strong positive loading on silicate and moderate negativeloading of salinity. The high loading of silicate explained as duringhigh tide the water spreads to maximum area in the bay so itmainly accounts for the silicate. Salinity loading showed that dur-ing land run-off, silicate loading is also there.
In this study, the tidal and spatial patterns of physico-chemicalparameters of Port Blair Bay were identified using box plots, CAand FA. Box plots showed the concentrations of parameters in areasonable boundary. Cluster analysis grouped the sites as anthro-pogenic inputs and natural inputs and also showed similarity be-tween sites during the tides. From cluster analysis, it wasconcluded that the tidal variation of physico-chemical parametersis almost same except two stations JB and PB which formed a dif-ferent group in both low tide and high tide. This is mainly dueanthropogenic perturbations in these sites. These two sites shouldbe precisely and continuously monitored in future. Factor analysisidentified the sources of physico-chemical parameters like landrunoff, organic load and sewage outfalls. So, in future the innerbays should be closely monitored relating to population growthand urbanization. From the FA, it is concluded that the majorsource of nutrients and organic matter into the bay is through landrunoff, soil leaching and from terrigenous and biogenous source.
Acknowledgements
The authors thank the authorities of Integrated Coastal andMarine Area Management (ICMAM), Ministry of Earth Sciences(MoES) for sponsoring the Coastal Ocean Monitoring and Predic-tion System (COMAPS) project and National Institute of OceanTechnology (NIOT) for providing necessary infrastructure and facil-ities for carrying out the work at Andaman and Nicobar Centre forOcean Science and Technology (ANCOST), a field unit of NIOT. Theauthors are also thankful to all the scientific and supporting staff ofANCOST for their contribution.
References
Dalal, S.G., Shirodkar, P.V., Jagtap, T.G., Naik, B.G., Rao, G.S., 2010. Evaluation ofsignificant sources influencing the variation of water quality of Kandla creek,Gulf of Katchchh, using PCA. Environ. Monit. Assess. 163 (1–3), 49–56.
Dharani, G., Abdul Nazar, A.K., Kanagu, L., Venkateshwaran, P., Kumar, T.S., Ratnam,K., Venkatesan, R., Ravindran, M., 2004. On the recurrence of NoctilucaScintillans bloom in Minnie Bay, Port Blair: impact on water quality andbioactivity of extracts. Curr. Sci. 87, 990–994.
Dong, J.-D., Zhang, Y.-Y., Wang, Y.-S., Wu, M.-L., Zhang, S., Cai, C.-H., 2010.Chemometry use in the evaluation of the sanya bay water quality. Braz. J.Oceanogr. 58 (4), 339–352.
Eashwar, M., Nallathambi, T., Kuberaraj, K., Govindarajan, G., 2001. Noctiluca bloomsin Port Blair Bay, Andamans. Curr. Sci. 81, 203–206.
Grasshoff, K., Kremling, K., Ehrhardt, M., 1999. Methods of Seawater Analysis, thirded. Verlag Chemie, Weinheim, Germany.
Gupta, A.K., Gupta, S.K., Patil, R.S., 2005. Statistical analyses of coastal water qualityfor a port and harbour region in India. Environ. Monit. Assess. 102 (1–3), 179–200.
Jickells, T.D., 1998. Nutrient biogeochemistry of the coastal zone. Science 281, 217–222.
Liu, C.W., Lin, K.H., Kuo, Y.M., 2003. Application of factor analysis in the assessmentof groundwater quality in a blackfoot disease area in Taiwan. Sci. Total Environ.313, 77–89.
Meltzner, Aron J., Sieh, K., Abrams, M., Agnew, D.C., Hudnut, K.W., Avouac, J.P.,Natawidjaja, D.H., 2006. Uplift and subsidence associated with the great Aceh–Andaman earthquake of 2004. J. Geophys. Res. B 111 (B2), 0148–0227.
Panda, U.C., Sundaray, S.K., Rath, P., Nayak, B.B., Bhatta, D., 2006. Application offactor and cluster analysis for characterization of river and estuarine watersystems – a case study: Mahanadi River (India). J. Hydrol. (Amsterdam) 331 (3–4), 434–445. http://dx.doi.org/10.1016/j.jhydrol.2006.05.029.
Roy, D.S., Krishnan, P., 2005. Mangrove stands of Andamans vis-à-vis tsunami. Curr.Sci. 89 (11), 1800–1804.
Shirodkar, P.V., Mesquita, A., Pradhan, U.K., Verlekar, X.N., Babu, M.T., Vethamony,P., 2009. Factors controlling physic-chemical characteristics in the coastalwaters off Mangalore – a multivariate approach. Environ. Res. 109 (3), 245–257.
Shrestha, S., Kazama, F., 2007. Assessment of surface water quality usingmultivariate statistical techniques: a case study of the Fuji river basin, Japan.Environ. Model. Softw. 22, 464–475.
Simeonova, P., Simeonov, V., Andrew, G., 2003. Analysis of the Struma river waterquality. Cent. Eur. J. Chem. 2, 121–126.
Simeonov, V., Simeonova, P., Tsitouridou, R., 2004. Chemometric quality assessmentof surface waters two case studies. Chem. Eng. Ecol. 11 (6), 449–469.
Singh, K.P., Malik, A., Mohan, D., Sinha, S., 2004. Multivariate statistical techniquesfor the evaluation of spatial and temporal variations in water quality of Gomtiriver (India) – a case study. Water Res. 38, 3980–3992.
Vega, M., Pardo, R., Barrado, E., Deban, L., 1998. Assessment of seasonal andpolluting effects on the quality of river water by exploratory data analysis.Water Res. 32, 3581–3592.
Wu, M.-L., Wang, Y.-S., Sun, C.-C., Wang, H., Dong, J.-D., Yin, J.-P., Han, S.-H., 2010.Identification of coastal water quality by statistical analysis methods in DayaBay, South China Sea. Mar. Pollut. Bull. 60 (6), 852–860. http://dx.doi.org/10.1016/j.marpolbul.2010.01.007.
Wunderlin, D.A., Diaz, M.P., Ame, M.V., Pesce, S.F., Hued, A.C., Bistoni, M., 2001.Pattern recognition techniques for the evaluation of spatial and temporalvariation in water quality. A case study: Suquia river basin (Cordoba Argentina).Water Res. 35, 2881–2894. http://dx.doi.org/10.1016/S0043-1354(00) 00592-3.