STUDY ON THE PHYSICO-CHEMICAL CHARACTERISTICS OF GROUNDWATER IN MALURU TALUK (KARNATAKA)
15
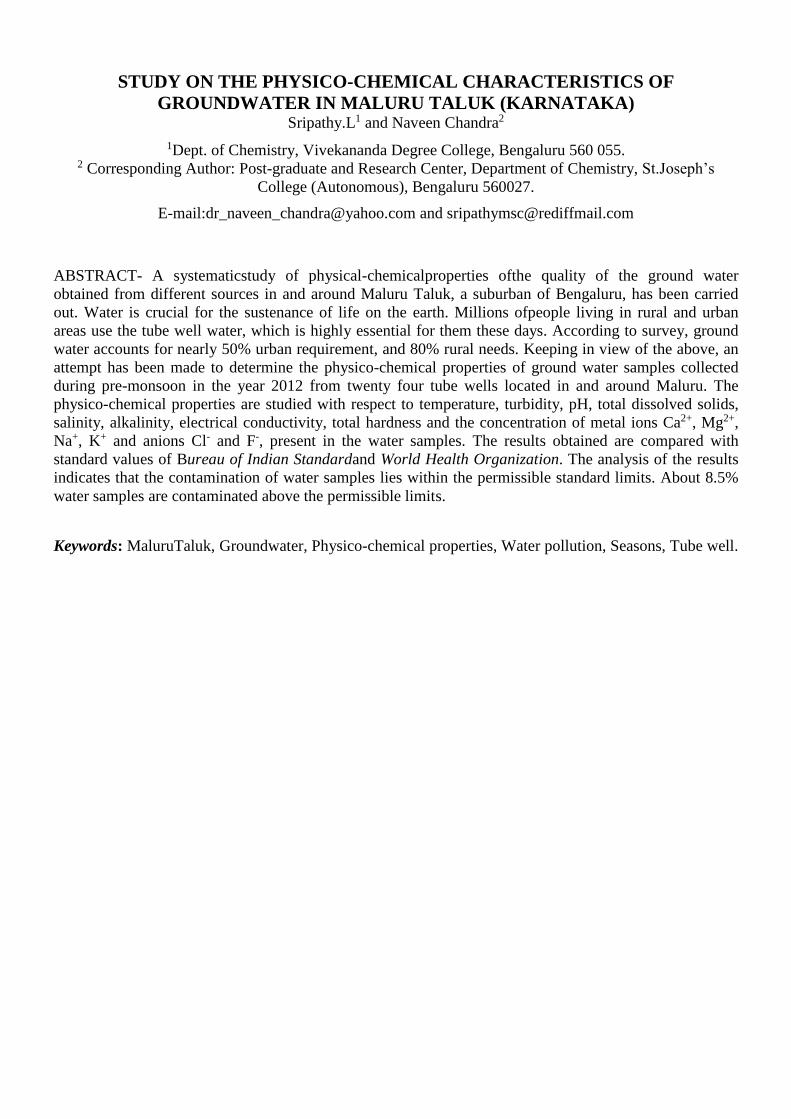
STUDY ON THE PHYSICO-CHEMICAL CHARACTERISTICS OF GROUNDWATER IN MALURU TALUK (KARNATAKA) Sripathy.L 1 and Naveen Chandra 2 1 Dept. of Chemistry, Vivekananda Degree College, Bengaluru 560 055. 2 Corresponding Author: Post-graduate and Research Center, Department of Chemistry, St.Joseph’s College (Autonomous), Bengaluru 560027. E-mail:[email protected] and [email protected] ABSTRACT- A systematicstudy of physical-chemicalproperties ofthe quality of the ground water obtained from different sources in and around Maluru Taluk, a suburban of Bengaluru, has been carried out. Water is crucial for the sustenance of life on the earth. Millions ofpeople living in rural and urban areas use the tube well water, which is highly essential for them these days. According to survey, ground water accounts for nearly 50% urban requirement, and 80% rural needs. Keeping in view of the above, an attempt has been made to determine the physico-chemical properties of ground water samples collected during pre-monsoon in the year 2012 from twenty four tube wells located in and around Maluru. The physico-chemical properties are studied with respect to temperature, turbidity, pH, total dissolved solids, salinity, alkalinity, electrical conductivity, total hardness and the concentration of metal ions Ca 2+ , Mg 2+ , Na + , K + and anions Cl - and F - , present in the water samples. The results obtained are compared with standard values of Bureau of Indian Standardand World Health Organization. The analysis of the results indicates that the contamination of water samples lies within the permissible standard limits. About 8.5% water samples are contaminated above the permissible limits. Keywords: MaluruTaluk, Groundwater, Physico-chemical properties, Water pollution, Seasons, Tube well.
-
Upload
independent -
Category
Documents
-
view
0 -
download
0
Transcript of STUDY ON THE PHYSICO-CHEMICAL CHARACTERISTICS OF GROUNDWATER IN MALURU TALUK (KARNATAKA)
STUDY ON THE PHYSICO-CHEMICAL CHARACTERISTICS OF
GROUNDWATER IN MALURU TALUK (KARNATAKA) Sripathy.L1 and Naveen Chandra2
1Dept. of Chemistry, Vivekananda Degree College, Bengaluru 560 055. 2 Corresponding Author: Post-graduate and Research Center, Department of Chemistry, St.Joseph’s
College (Autonomous), Bengaluru 560027.
E-mail:[email protected] and [email protected]
ABSTRACT- A systematicstudy of physical-chemicalproperties ofthe quality of the ground water
obtained from different sources in and around Maluru Taluk, a suburban of Bengaluru, has been carried
out. Water is crucial for the sustenance of life on the earth. Millions ofpeople living in rural and urban
areas use the tube well water, which is highly essential for them these days. According to survey, ground
water accounts for nearly 50% urban requirement, and 80% rural needs. Keeping in view of the above, an
attempt has been made to determine the physico-chemical properties of ground water samples collected
during pre-monsoon in the year 2012 from twenty four tube wells located in and around Maluru. The
physico-chemical properties are studied with respect to temperature, turbidity, pH, total dissolved solids,
salinity, alkalinity, electrical conductivity, total hardness and the concentration of metal ions Ca2+, Mg2+,
Na+, K+ and anions Cl- and F-, present in the water samples. The results obtained are compared with
standard values of Bureau of Indian Standardand World Health Organization. The analysis of the results
indicates that the contamination of water samples lies within the permissible standard limits. About 8.5%
water samples are contaminated above the permissible limits.
Keywords: MaluruTaluk, Groundwater, Physico-chemical properties, Water pollution, Seasons, Tube well.
Introduction
The precious gift of nature is undoubtedly the water after air, although three fourth of the earth is
occupied by water. As the adage says, “water, water is everywhere, not a single drop of water for
drinking”. As water is getting polluted day by day due to rapid urbanization and
industrialization1-4 the world is more concerned regarding purification of polluted water.
Chemicals, in spite of many uses, are toxic in nature and they contaminate land, water and air.
This is a serious global problem. Industrial effluents containing organic compounds from textile,
dyeing and printing industries cause skin cancer due to photosensitization and photodynamic
damage2. On the contrary, degradation products of these organic compounds are relatively less
toxic and in some cases these are almost harmless. Also, polluted water is of no use to man
unless these organic compounds are not removed. Such water cannot be utilized for irrigation,
washing and cleaning purposes5-8.The groundwater is increasingly gaining importance due to its
utility in view of scarcity of quality water ever needed for the growing demands of domestic,
agricultural and industrial uses. It has become crucial not only for targeting the groundwater
potential zones, but also monitoring and conserving this important ground water resource
(CGWB1985) 3,9-14. Approximately, 62.5 million people are suffering from the negative effects of
fluoride on teeth or bones through the process of fluorosis. The prime sources of water pollution
are domestic sewage water, industrial waste water, and chemicals such as pesticides and
insecticides and agriculture run off14-16. Maluru Taluku is a place located at 13°N and77.94°E. It
has an average elevation of 910 meters (2985 feet from the sea level, Chennai). Malur is at a
distance 46 km from Bengaluru City and is situated from other places within radius of 15- 30
kM. According to the 2011 India census,2 Malur, with a population of approximately 2,7791
people, is at distances 25.6 from Kolar and 38 kM y from Bengaluru, respectively. The total
population of Maluru ucomprising 345 villages is found to be 1,96,393 people. The villages are,
Abbenahalli, Adarsh Nagar, Araleri, Baliganahalli, Banahalli, Chickkakuntur, Chikkathirupathi,
Madivala, Malur, Maruthi Extension, Nehru Extension, Patalama Extension, Nosagere,
KavalaGiriyanaHalli,Rajenahalli,Shivarapatna,Doddashivara,Dadinaikanahallidoddi,Hulimanga-
l-ahosakote, Tekal, Masthi, Thornahalli, Rajenahalli, Santehalli and Karanje. There are nearly
419 tube wells which supply water to all these people of the villages. But, the tube wells have
been dried up in as many as 126 villages. However, the situation has become worst for the last
five years. The only hope that is left for the people of Maluru and its villages is to depend largely
on the ground water. In view of the above situation, a systematic study on the physico-chemical
properties, in order to assess the quality of the tube well water, has been carried out. It has been
found experimentally that only about 8.5 % of water is polluted.
Methods and Materials
Collection of samples
Water samples were collected from different tube-wells located in villages in and around Malur.
The water samples are utilized for the purpose of studying their phyisco-chemical properties.
Determination of Physico-Chemical parameters
Twenty four tube well samples were collected during the pre-monsoon period of 2012 from
different villages coming under the jurisdiction ofMalurTaluk. On spot experiments were carried
out to determine the parameters like temperature, pH, total dissolved solids, electric conductance,
salinity, and dissolved oxygen. These parameters were measured using Systronics Water
Analyser-371. The other properties such as total hardness and concentration of cations and
anionswere determined in the laboratory as per the standard methods4,5. The concentrations of
sodium and potassium were determined by Flame Photometer (Systronics FPM Digital µ-
Controller Based),whereas concentrations of Ca2+ and Mg2+were determined by EDTA titration
followed by Argentmetric, and Sodium-2-(parasulfophenylazo)-dihydroxy-3,6-
naphthalenedisulfonate (SPADNS) titrimetric methods for the determination of concentration of
Cl-, F
- and alkalinity of the water samples. The parameters were obtained after several times
repeat of measurements.
Results and Discussion:
All the parameters obtained from the measurements are entered in Table 1. The parameters are
explained as follows.
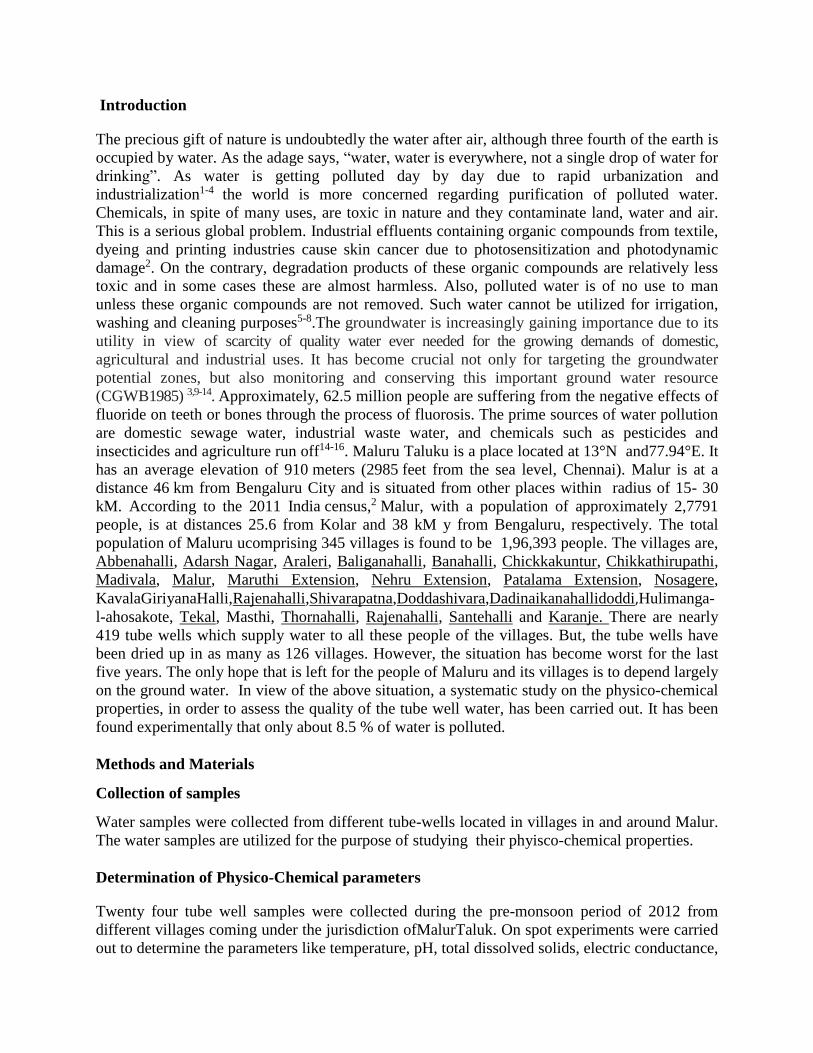
Physical Parameters: The graphical variations of the results of these are shown n Figs. 1 to 7.
Temperature: The temperature range recorded varies from 21physico-chemically 10C for all the
collected water samples.
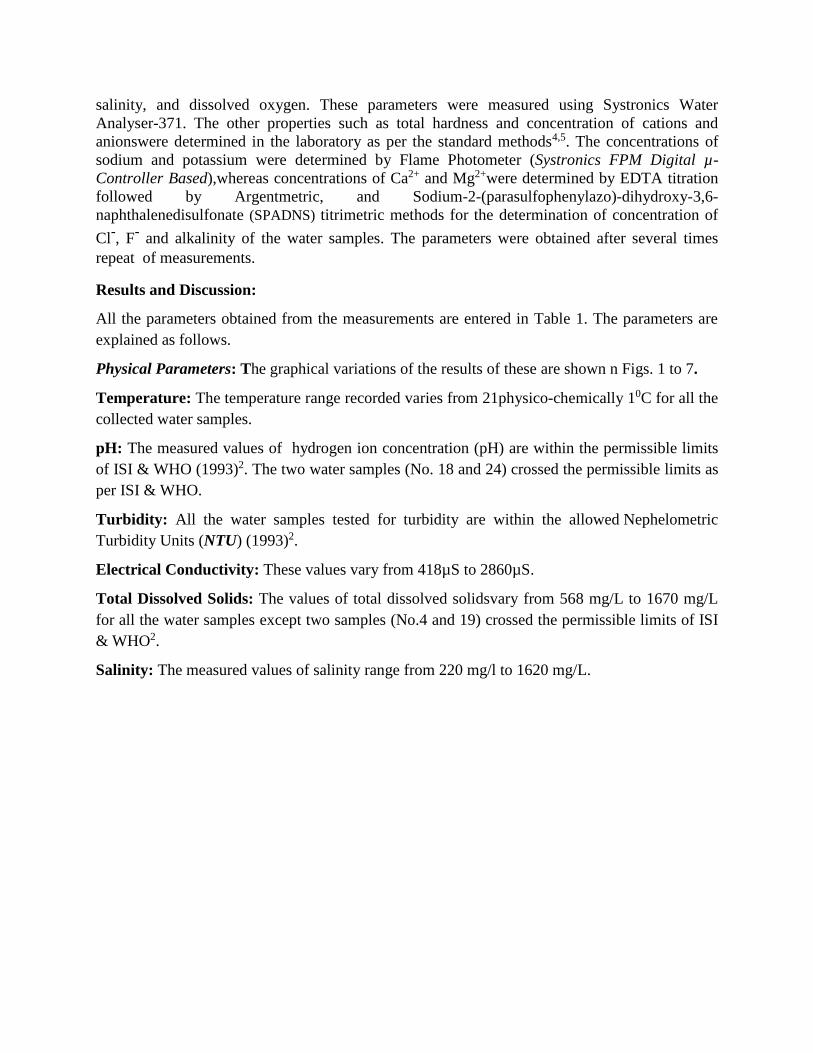
pH: The measured values of hydrogen ion concentration (pH) are within the permissible limits
of ISI & WHO (1993)2. The two water samples (No. 18 and 24) crossed the permissible limits as
per ISI & WHO.
Turbidity: All the water samples tested for turbidity are within the allowed Nephelometric
Turbidity Units (NTU) (1993)2.
Electrical Conductivity: These values vary from 418µS to 2860µS.
Total Dissolved Solids: The values of total dissolved solidsvary from 568 mg/L to 1670 mg/L
for all the water samples except two samples (No.4 and 19) crossed the permissible limits of ISI
& WHO2.
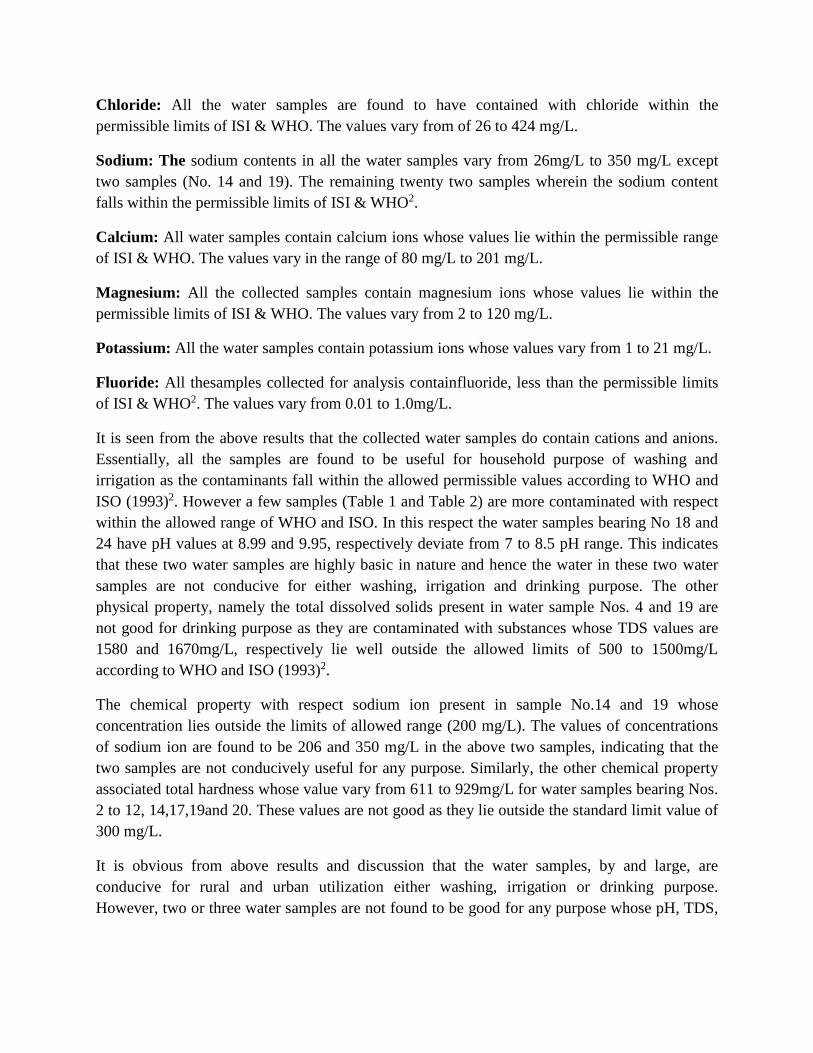
Salinity: The measured values of salinity range from 220 mg/l to 1620 mg/L.

Table 1 The Physical parameters of Ground Water
Sample Temperature
pH S/mol
turbidity EC TDS Salinity
No. in 0 C in NTU in µS mg/L in mg/L
1 25.9 6.34 2.09 1645 568 220
2 25.9 6.6 3.15 418 920 900
3 25.1 7.51 2.98 1650 900 880
4 26.1 7.96 1.48 2860 1580 1620
5 25.7 9.1 2.08 2050 1170 1140
6 25 7.45 3.03 1310 750 1400
7 24.8 7.22 1.07 2500 1430 1400
8 25.4 8.17 1.24 1220 700 680
9 23 8.19 2.32 1110 653 650
10 23.5 7.52 2.41 1190 690 670
11 21.2 7.95 22.54 1250 750 730
12 22.2 7.76 9.33 1620 930 910
13 22.4 7.64 8.61 1150 680 670
14 23.6 7.3 10.49 2040 1210 1180
15 26.1 7.91 5.52 1530 880 850
16 25.7 7.52 5.22 2140 1210 1200
17 24.7 7.97 6.5 1760 1030 1010
18 24.7 8.99 0.28 2060 1210 1610
19 25.1 6.99 1.1 2860 1670 1170
20 22.1 6.95 0.15 1900 951 930
21 24.3 7.85 0.23 2145 590 570
22 22.1 7.95 0.99 1100 586 527
23 23.5 7.92 0.25 1250 786 629
24 22.9 9.95 0.36 1364 659 593
WHO -- 7.0 – 8.5 5 to 25 - 500- 1500 -
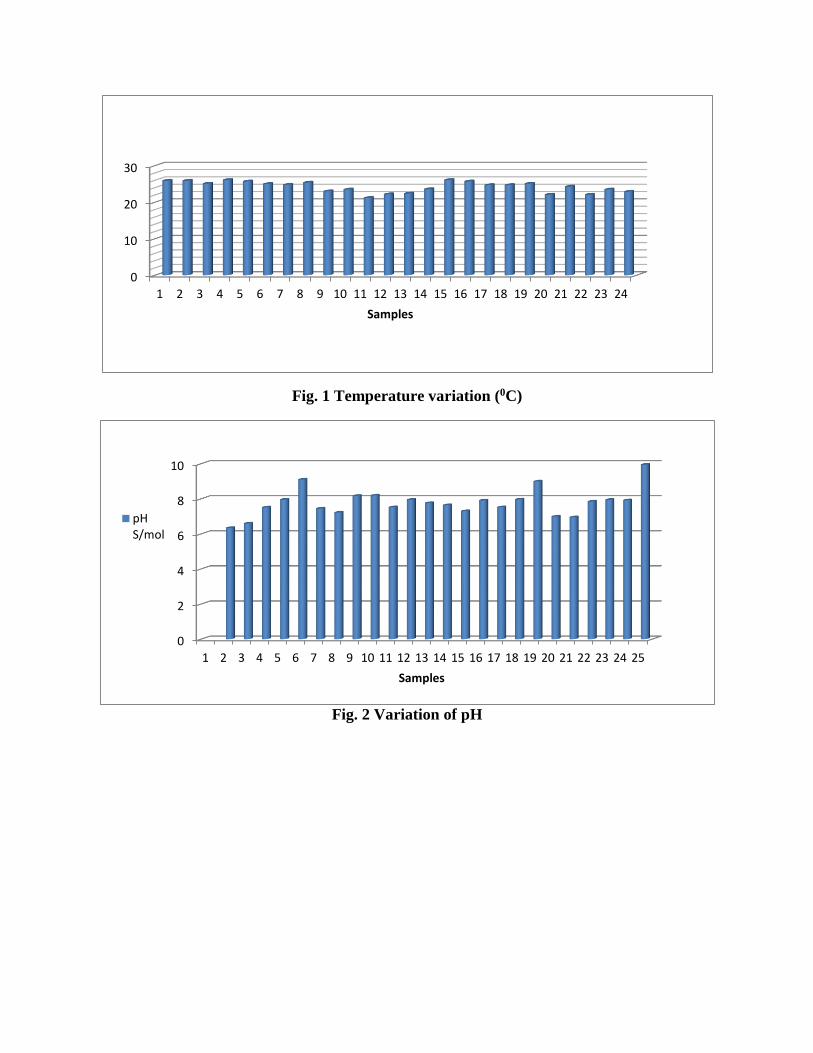
Fig. 1 Temperature variation (0C)
Fig. 2 Variation of pH
0
10
20
30
1 2 3 4 5 6 7 8 9 10 11 12 13 14 15 16 17 18 19 20 21 22 23 24
Samples
0
2
4
6
8
10
1 2 3 4 5 6 7 8 9 10 11 12 13 14 15 16 17 18 19 20 21 22 23 24 25
Samples
pHS/mol
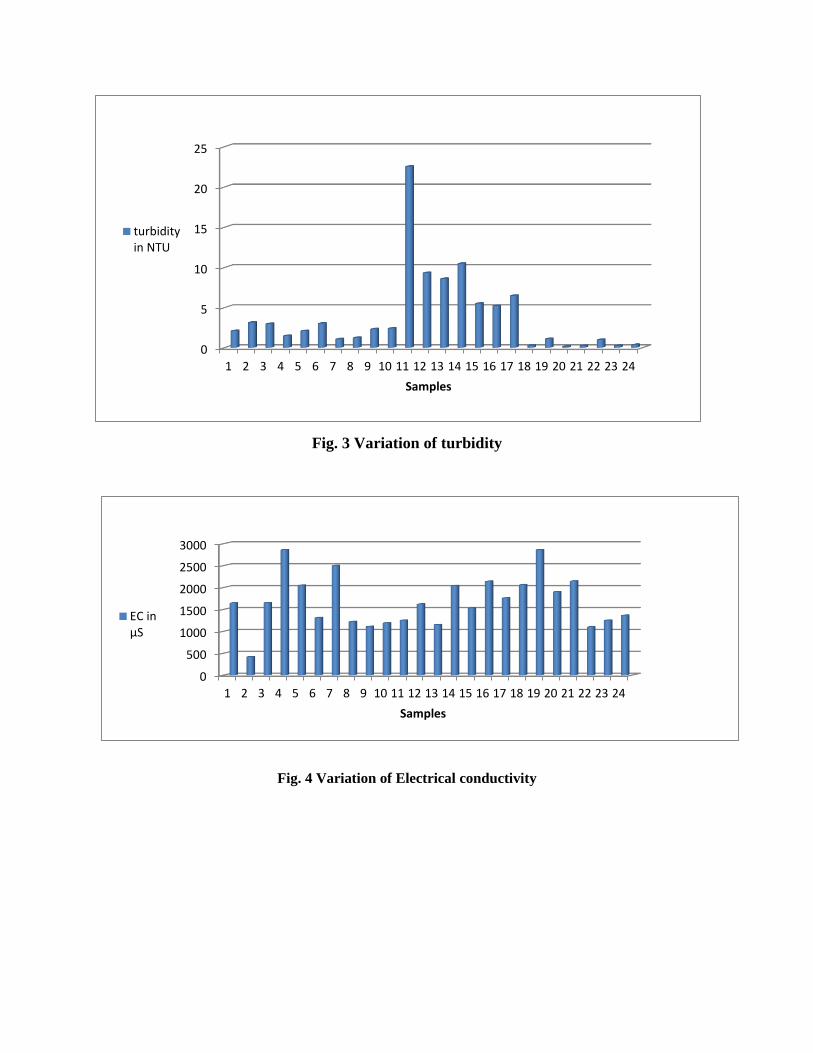
Fig. 3 Variation of turbidity
Fig. 4 Variation of Electrical conductivity
0
5
10
15
20
25
1 2 3 4 5 6 7 8 9 10 11 12 13 14 15 16 17 18 19 20 21 22 23 24
Samples
turbidityin NTU
0
500
1000
1500
2000
2500
3000
1 2 3 4 5 6 7 8 9 10 11 12 13 14 15 16 17 18 19 20 21 22 23 24
Samples
EC inµS
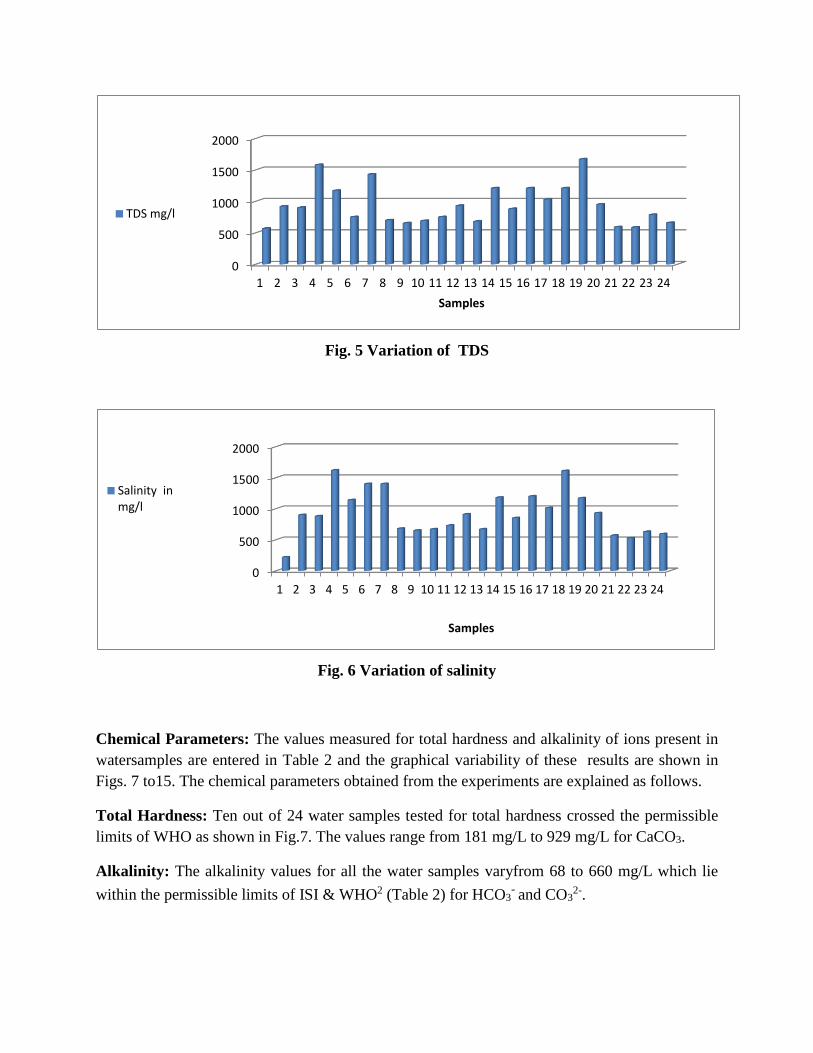
Fig. 5 Variation of TDS
Fig. 6 Variation of salinity
Chemical Parameters: The values measured for total hardness and alkalinity of ions present in
watersamples are entered in Table 2 and the graphical variability of these results are shown in
Figs. 7 to15. The chemical parameters obtained from the experiments are explained as follows.
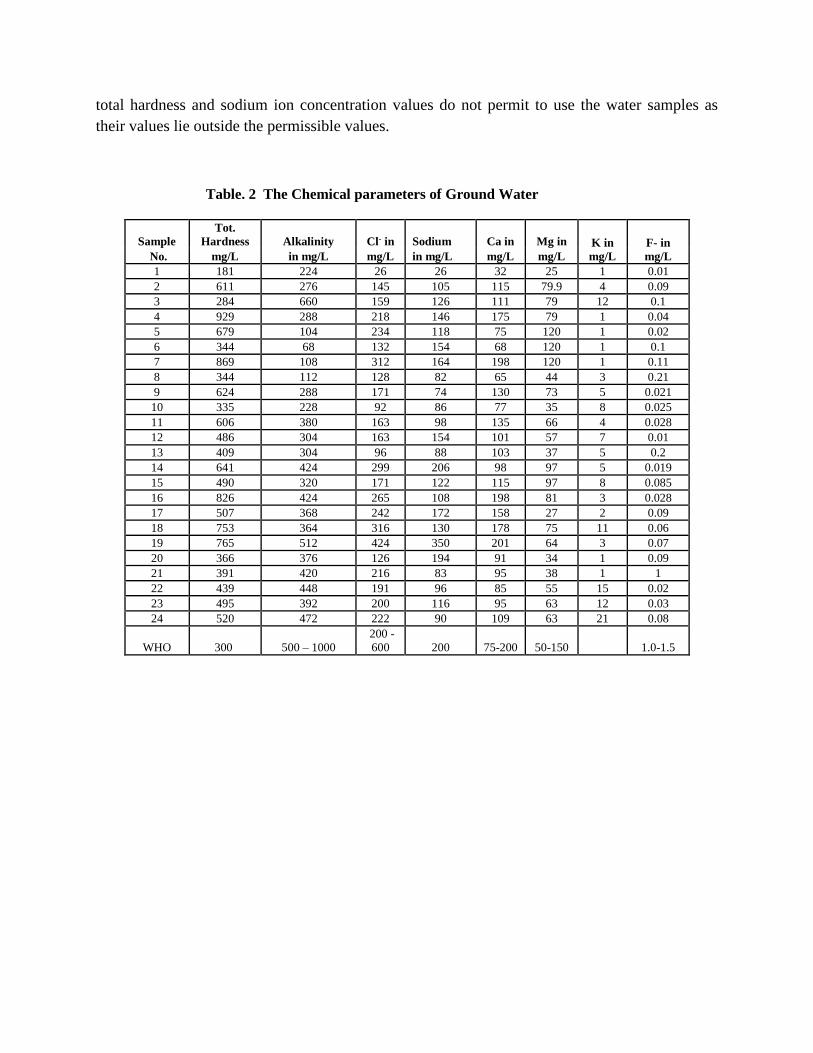
Total Hardness: Ten out of 24 water samples tested for total hardness crossed the permissible
limits of WHO as shown in Fig.7. The values range from 181 mg/L to 929 mg/L for CaCO3.
Alkalinity: The alkalinity values for all the water samples varyfrom 68 to 660 mg/L which lie
within the permissible limits of ISI & WHO2 (Table 2) for HCO3- and CO3
2-.
0
500
1000
1500
2000
1 2 3 4 5 6 7 8 9 10 11 12 13 14 15 16 17 18 19 20 21 22 23 24
Samples
TDS mg/l
0
500
1000
1500
2000
1 2 3 4 5 6 7 8 9 10 11 12 13 14 15 16 17 18 19 20 21 22 23 24
Samples
Salinity inmg/l
Chloride: All the water samples are found to have contained with chloride within the
permissible limits of ISI & WHO. The values vary from of 26 to 424 mg/L.
Sodium: The sodium contents in all the water samples vary from 26mg/L to 350 mg/L except
two samples (No. 14 and 19). The remaining twenty two samples wherein the sodium content
falls within the permissible limits of ISI & WHO2.
Calcium: All water samples contain calcium ions whose values lie within the permissible range
of ISI & WHO. The values vary in the range of 80 mg/L to 201 mg/L.
Magnesium: All the collected samples contain magnesium ions whose values lie within the
permissible limits of ISI & WHO. The values vary from 2 to 120 mg/L.
Potassium: All the water samples contain potassium ions whose values vary from 1 to 21 mg/L.
Fluoride: All thesamples collected for analysis containfluoride, less than the permissible limits
of ISI & WHO2. The values vary from 0.01 to 1.0mg/L.
It is seen from the above results that the collected water samples do contain cations and anions.
Essentially, all the samples are found to be useful for household purpose of washing and
irrigation as the contaminants fall within the allowed permissible values according to WHO and
ISO (1993)2. However a few samples (Table 1 and Table 2) are more contaminated with respect
within the allowed range of WHO and ISO. In this respect the water samples bearing No 18 and
24 have pH values at 8.99 and 9.95, respectively deviate from 7 to 8.5 pH range. This indicates
that these two water samples are highly basic in nature and hence the water in these two water
samples are not conducive for either washing, irrigation and drinking purpose. The other
physical property, namely the total dissolved solids present in water sample Nos. 4 and 19 are
not good for drinking purpose as they are contaminated with substances whose TDS values are
1580 and 1670mg/L, respectively lie well outside the allowed limits of 500 to 1500mg/L
according to WHO and ISO (1993)2.
The chemical property with respect sodium ion present in sample No.14 and 19 whose
concentration lies outside the limits of allowed range (200 mg/L). The values of concentrations
of sodium ion are found to be 206 and 350 mg/L in the above two samples, indicating that the
two samples are not conducively useful for any purpose. Similarly, the other chemical property
associated total hardness whose value vary from 611 to 929mg/L for water samples bearing Nos.
2 to 12, 14,17,19and 20. These values are not good as they lie outside the standard limit value of
300 mg/L.
It is obvious from above results and discussion that the water samples, by and large, are
conducive for rural and urban utilization either washing, irrigation or drinking purpose.
However, two or three water samples are not found to be good for any purpose whose pH, TDS,
total hardness and sodium ion concentration values do not permit to use the water samples as
their values lie outside the permissible values.
Table. 2 The Chemical parameters of Ground Water
Sample
Tot.
Hardness Alkalinity Cl- in Sodium Ca in Mg in K in
mg/L
F- in
mg/L No. mg/L in mg/L mg/L in mg/L mg/L mg/L
1 181 224 26 26 32 25 1 0.01
2 611 276 145 105 115 79.9 4 0.09
3 284 660 159 126 111 79 12 0.1
4 929 288 218 146 175 79 1 0.04
5 679 104 234 118 75 120 1 0.02
6 344 68 132 154 68 120 1 0.1
7 869 108 312 164 198 120 1 0.11
8 344 112 128 82 65 44 3 0.21
9 624 288 171 74 130 73 5 0.021
10 335 228 92 86 77 35 8 0.025
11 606 380 163 98 135 66 4 0.028
12 486 304 163 154 101 57 7 0.01
13 409 304 96 88 103 37 5 0.2
14 641 424 299 206 98 97 5 0.019
15 490 320 171 122 115 97 8 0.085
16 826 424 265 108 198 81 3 0.028
17 507 368 242 172 158 27 2 0.09
18 753 364 316 130 178 75 11 0.06
19 765 512 424 350 201 64 3 0.07
20 366 376 126 194 91 34 1 0.09
21 391 420 216 83 95 38 1 1
22 439 448 191 96 85 55 15 0.02
23 495 392 200 116 95 63 12 0.03
24 520 472 222 90 109 63 21 0.08
WHO 300 500 – 1000
200 -
600 200 75-200 50-150 1.0-1.5
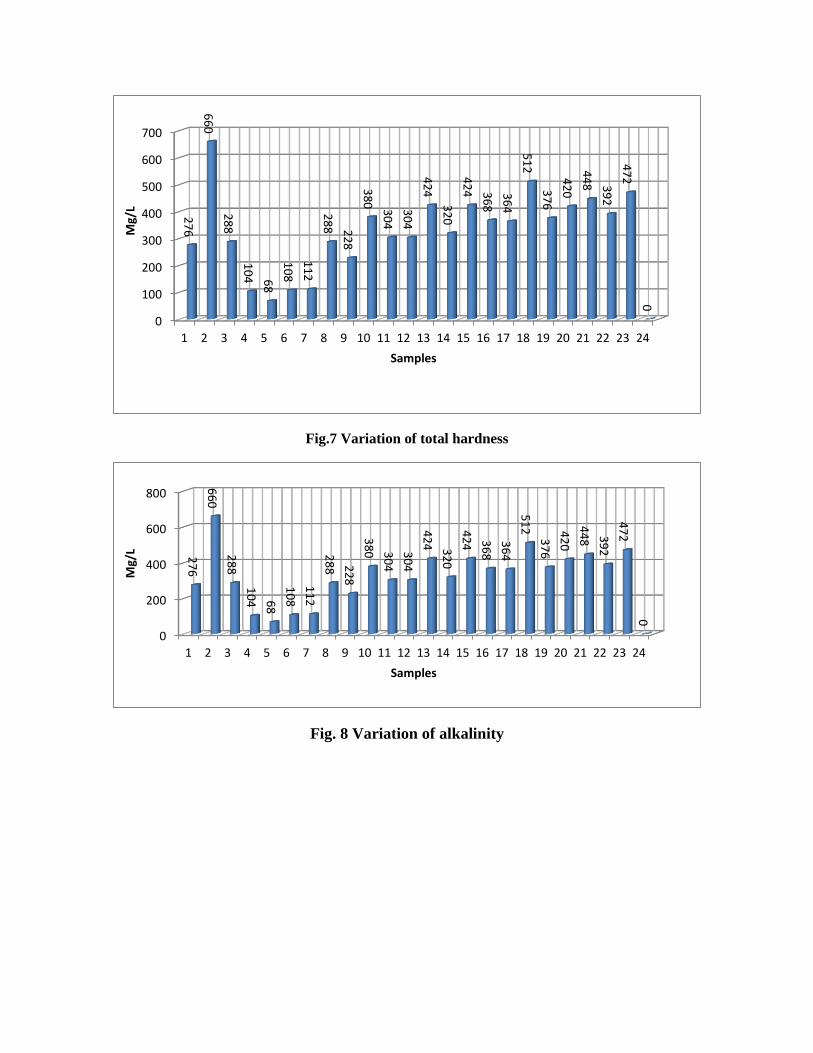
Fig.7 Variation of total hardness
Fig. 8 Variation of alkalinity
0
100
200
300
400
500
600
700
1 2 3 4 5 6 7 8 9 10 11 12 13 14 15 16 17 18 19 20 21 22 23 24
27
6
66
0
28
8
10
4 68
10
8
11
2
28
8 22
8
38
0
30
4
30
4
42
4
32
0
42
4 36
8
36
4
51
2
37
6
42
0
44
8 39
2
47
2
0
Mg/L
Samples
0
200
400
600
800
1 2 3 4 5 6 7 8 9 10 11 12 13 14 15 16 17 18 19 20 21 22 23 24
27
6
66
0
28
8
10
4 68
10
8
11
2
28
8 22
8
38
0 30
4
30
4
42
4 32
0
42
4 36
8
36
4
51
2
37
6
42
0
44
8 39
2
47
2
0
Mg/L
Samples
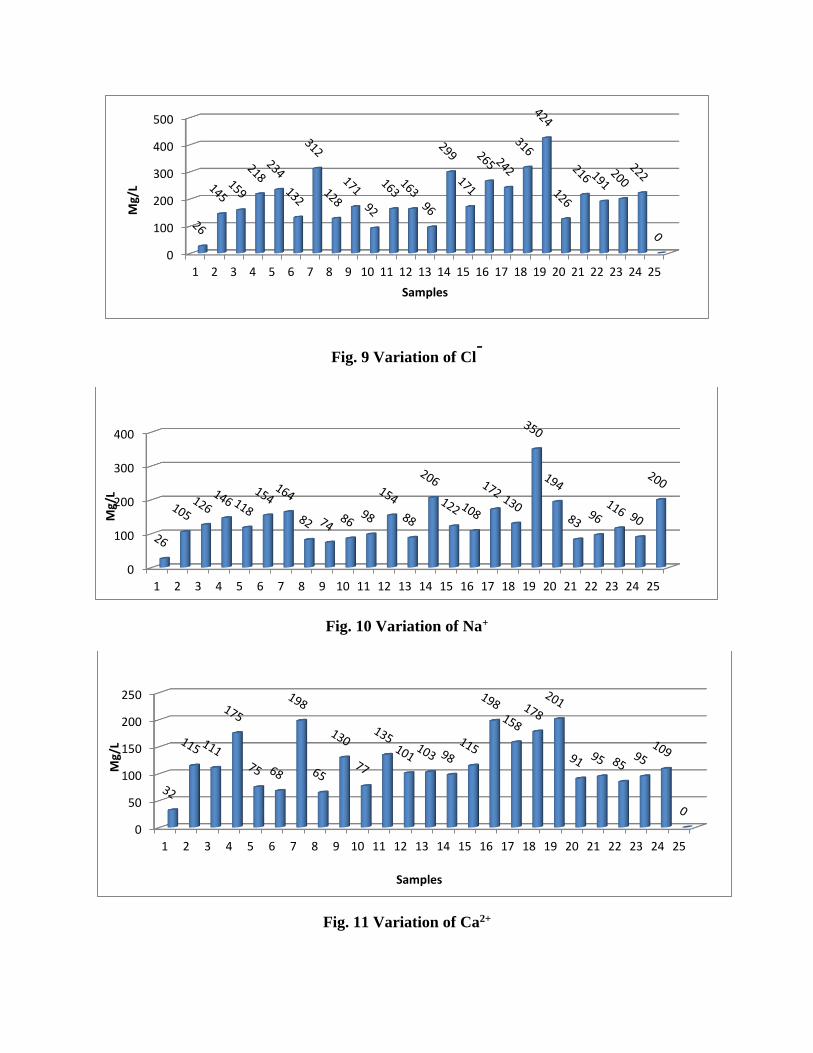
Fig. 9 Variation of Cl-
Fig. 10 Variation of Na+
Fig. 11 Variation of Ca2+
0
100
200
300
400
500
1 2 3 4 5 6 7 8 9 10 11 12 13 14 15 16 17 18 19 20 21 22 23 24 25
Mg/L
Samples
0
100
200
300
400
1 2 3 4 5 6 7 8 9 10 11 12 13 14 15 16 17 18 19 20 21 22 23 24 25
Mg/L
0
50
100
150
200
250
1 2 3 4 5 6 7 8 9 10 11 12 13 14 15 16 17 18 19 20 21 22 23 24 25
Mg/L
Samples

Fig. 12 Variation of Mg2+
Fig. 13 Variation of K+
0
20
40
60
80
100
120
1 2 3 4 5 6 7 8 9 10 11 12 13 14 15 16 17 18 19 20 21 22 23 24 25
25
79
.9 79
79
12
0
12
0
12
0
44
73
35
66 5
7
37
97
97
81
27
75 6
4
34
38
55
63
63
0
Mg/L
Samples
0
5
10
15
20
25
1 2 3 4 5 6 7 8 9 10 11 12 13 14 15 16 17 18 19 20 21 22 23 24
1
4
12
1 1 1 13
5
8
4
75 5
8
3 2
11
31 1
15
12
21
Mg/L
Samples
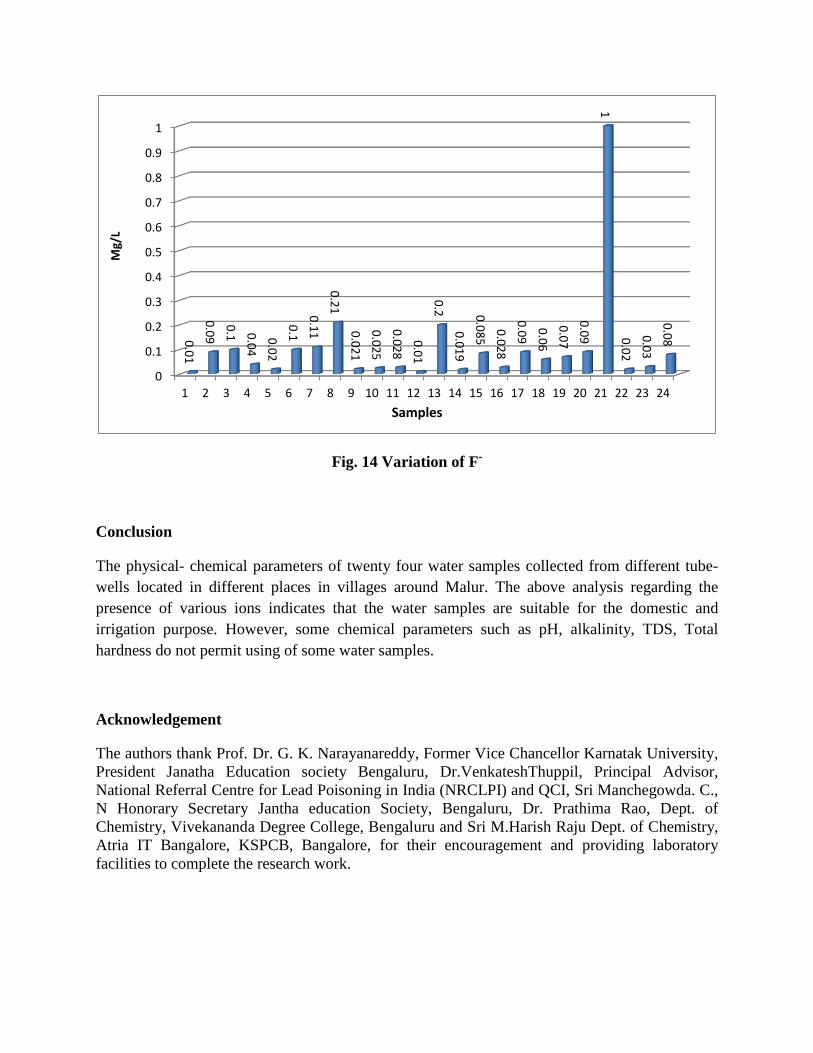
Fig. 14 Variation of F-
Conclusion
The physical- chemical parameters of twenty four water samples collected from different tube-
wells located in different places in villages around Malur. The above analysis regarding the
presence of various ions indicates that the water samples are suitable for the domestic and
irrigation purpose. However, some chemical parameters such as pH, alkalinity, TDS, Total
hardness do not permit using of some water samples.
Acknowledgement
The authors thank Prof. Dr. G. K. Narayanareddy, Former Vice Chancellor Karnatak University,
President Janatha Education society Bengaluru, Dr.VenkateshThuppil, Principal Advisor,
National Referral Centre for Lead Poisoning in India (NRCLPI) and QCI, Sri Manchegowda. C.,
N Honorary Secretary Jantha education Society, Bengaluru, Dr. Prathima Rao, Dept. of
Chemistry, Vivekananda Degree College, Bengaluru and Sri M.Harish Raju Dept. of Chemistry,
Atria IT Bangalore, KSPCB, Bangalore, for their encouragement and providing laboratory
facilities to complete the research work.
0
0.1
0.2
0.3
0.4
0.5
0.6
0.7
0.8
0.9
1
1 2 3 4 5 6 7 8 9 10 11 12 13 14 15 16 17 18 19 20 21 22 23 24
0.0
1
0.0
9
0.1 0
.04
0.0
2
0.1
0.1
1
0.2
1
0.0
21
0.0
25
0.0
28
0.0
1
0.2
0.0
19
0.0
85
0.0
28
0.0
9
0.0
6
0.0
7
0.0
9
1
0.0
2
0.0
3
0.0
8
Mg/L
Samples
References
[1]. American Public Health Association: Standard Methods for Examination of Water
and wastewater. Washington, DC (1999).
[2]. World Health Organization: Guidelines for Drinking Water Quality, WHO Geneva, Vol.
1-3 (1993).
[3]. Central Ground Water Board: Ground Water Balance and Mass Awareness Program in
Ernakulum District. Published by CGWB, Kerala Region, Thiruananthapuram, India
(2002)
[4] Kamble. P.N, Bhusal, S. S and Kuchekar, S. R. RASAYAN. J. Chemistry. 1-3 (2008).
[5]. Sonwane, D.V,. Lawanda, S.P, Gaikwad,V.B, Kamble, P.N and Kuchekar,S.R.
.RASAYAN J. Chemistry, 2, 421-423 (2009).
[6]. Manivaskam. Water Analyst Principle Health Laboratory, Coimbatore, India (2005).
[7]. Abida B. and Harikrishna. Study on the Quality of Water in Some Streams of
Cauvery River, E- Journal of Chemistry, 5, (2): 377-384 (2008).
[8]. Ahipathi M.V and Puttaiah, E.T. Ecological Characteristics of Vrishabhavathi
River in Bangalore (India), Environmental Geology, 49: 1217-1222 (2006).
[9]. Nagarajan. R, Rajmohan. N, Mahendran. U and Senthamilkumar. S,Evaluation of
Groundwater Quality and its Suitability for Drinking and Agricultural Use in Thanjavur
City, Tamil Nadu, India. Environ Monit Assess., Vol. 171, pp. 289-308(2010).
[10]. Iqbal, M. A and Gupta. S. G. Studies on Heavy Metal Ion Pollution of Ground Water
Sources As An Effect of Municipal Solid Waste Dumping, African Journal of Basic
&Applied Sciences, Vol. 1, No. 5-6, 2009, pp. 117- 122 (2009).
[11]. Kanagalakshmi, A.S. and Nagan S. Effect of Urbanization on Groundwater
Quality of TirumangalamTaluk, Madurai, Nature Environment and Pollution
Technology, Vol (12), No.2, PP:363-366 (2012).
[12]. Adekunle, I, Adetunji, M, Gbadebo, A. and Banjoko. O. Assessment of
Groundwater Quality in a Typical Rural Settlement in Southwest Nigeria,
International Journal of Environmental Research and Public Health, Vol. 4, No. 4,
pp. 307-318 (2007).
[13]. Kodata, K. J, Pophare, A.M, Gajbhiye, K and Meshram,Y, Hydrogeochemistry of
Groundwater From Bhadravati Tehsil, Chandrapur District, Maharastra:With Special
Reference to Fluoride Contamination. Ground Water Geological Magazine, vol.11, pp.113-
118 (2007).
[14]. Tiwari, A.N, Nawale, V.P, Tambe, J.A, and Satyakumar, Y.Correlation of Fuoride
with Bicarbonate in Groundwater of Exploratory Wells in Parts of Maharashtra. Journal of
Applied Geochemistry, vol.10, pp. 93-102 (2008).
[15]. Rajkumar, S, Velmurugan, P, Shanthi, K, Ayyasamy, P. M. and Lakshmanaperumalasamy, P.
Water Quality of Kodaikanal Lake, Tamilnadu in Relation to Physico-Chemical and
Bacteriological Characteristics, Capital Publishing Company, Lake, pp. 339-346(2004).
[16]. Singh,M.R; BeeteswariKh; Gupta,A. Water quality status of the Iril River,
Manipur, J.Curr.Sci.14 (1):173-180 (2009).