Evaluation of National Early Years Access Initiative & Síolta ...
185
Evaluation Team: Kieran McKeown Social & Economic Research Consultant www.kieranmckeown.ie Trutz Haase Social & Economic Consultant www.trutzhaase.eu Jonathan Pratschke University of Salerno, Italy Evaluation of National Early Years Access Initiative & Síolta Quality Assurance Programme: A Study of Child Outcomes in Pre-School Main Report May 2014
-
Upload
khangminh22 -
Category
Documents
-
view
2 -
download
0
Transcript of Evaluation of National Early Years Access Initiative & Síolta ...

Evaluation Team:Kieran McKeown
Social & Economic Research Consultantwww.kieranmckeown.ie
Trutz HaaseSocial & Economic Consultant
www.trutzhaase.eu
Jonathan PratschkeUniversity of Salerno, Italy
Evaluation of National Early YearsAccess Initiative & Síolta QualityAssurance Programme:
A Study of Child Outcomes in Pre-School
Main ReportMay 2014

Síolta Quality Assurance Programme (2009-2013)The Síolta QAP was developed to allow Early Childhood Careand Education (ECCE) settings to engage formally with the
Síolta Quality Framework.
The National Early Years Access Initiative 2O1O-2O14The National Early Years Access Initiative (NEYAI) is a
collaboration between a number of funding partners namely, theDepartment of Children and Youth Affairs(DCYA), the Departmentof Education and Skills (DES), the Mount Street Club Trust, The
Atlantic Philanthropies and the Board of Pobal.

Table of Contents
1 Background and Context ................................................................................................................. 1 1.1 Introduction.............................................................................................................................................. 1 1.2 National Policy on Early Childhood Care and Education .......................................................................... 2 1.3 Policy of Department of Children and Youth Affairs ................................................................................ 4 1.4 Policy of Department of Education and Skills .......................................................................................... 5 1.5 EU Policy on Early Childhood Care and Education ................................................................................... 9 1.6 Early Years Sector ................................................................................................................................... 10
1.6.1 Early Years Centres .................................................................................................................. 11 1.6.2 Expenditure on Early Years Services ........................................................................................ 12 1.6.3 Employment Status of Staff ..................................................................................................... 12 1.6.4 Length of Service of Staff ......................................................................................................... 13 1.6.5 Staff Qualifications ................................................................................................................... 13 1.6.6 Summary .................................................................................................................................. 14
1.7 Free Pre‐School Year .............................................................................................................................. 14 1.8 Síolta: National Quality Framework for Early Childhood Education ...................................................... 17 1.9 Aistear: National Early Childhood Education Curriculum Framework.................................................... 21 1.10 National Council for Curriculum and Assessment .................................................................................. 24 1.11 NEYAI: National Early Years Access Initiative ......................................................................................... 25 1.12 Overview of Report ................................................................................................................................ 28
2 Methodology ................................................................................................................................ 29 2.1 Introduction............................................................................................................................................ 29 2.2 Challenges in Creating the Research Design .......................................................................................... 29 2.3 Logic Model for Evaluation ..................................................................................................................... 33 2.4 Research Design ..................................................................................................................................... 35 2.5 Questionnaires ....................................................................................................................................... 36
2.5.1 Staff Questionnaire .................................................................................................................. 36 2.5.2 Child Assessment Questionnaire ............................................................................................. 38 2.5.3 Parent Questionnaire ............................................................................................................... 39
2.6 Sample Design ........................................................................................................................................ 41 2.7 Sample of Children and Parents ............................................................................................................. 42 2.8 Sample of Staff ....................................................................................................................................... 46 2.9 Data Analysis .......................................................................................................................................... 49 2.10 Ethical Considerations ............................................................................................................................ 50 2.11 Limitations of Study ................................................................................................................................ 50
3 Concept and Measurement of Child Outcomes .............................................................................. 54 3.1 Introduction............................................................................................................................................ 54 3.2 Domains of EDI ....................................................................................................................................... 55 3.3 Psychometric Properties of EDI .............................................................................................................. 56 3.4 Appropriateness of EDI for Pre‐School Children .................................................................................... 58 3.5 EDI Scores for NEYAI and Síolta QAP in Comparative Context ............................................................... 60 3.6 Summary ................................................................................................................................................ 63
4 Describing Child Outcomes ........................................................................................................... 64 4.1 Introduction............................................................................................................................................ 64
4.2 Representativeness and Relevance of Sample ....................................................................................... 65 4.3 Overall Child Outcomes .......................................................................................................................... 66 4.4 Gap in Outcomes Between Children ...................................................................................................... 67 4.5 Child Outcomes in NEYAI and Síolta QAP ............................................................................................... 69 4.6 Child Outcomes in Validated and Non‐Validated Síolta QAP Centres .................................................... 70 4.7 Project‐Level Variations in Child Outcomes ........................................................................................... 71 4.8 Summary ................................................................................................................................................ 71
5 Explaining Child Outcomes ............................................................................................................ 73 5.1 Introduction............................................................................................................................................ 73 5.2 Child Skills and Child Outcomes ............................................................................................................. 74 5.3 Explanatory Models of Skill Development in Pre‐School Children ......................................................... 75 5.4 Child Influences ...................................................................................................................................... 81
5.4.1 Gender ..................................................................................................................................... 82 5.4.2 Age ........................................................................................................................................... 82 5.4.3 NESB (Non‐English Speaking Background) ............................................................................... 83
5.5 Family and Social System Influences ...................................................................................................... 84 Social Class ............................................................................................................................................. 85 5.5.1 Parent‐Child Relationship and Mother’s Well‐Being ............................................................... 88
5.6 Pre‐School System Influences ................................................................................................................ 90 5.7 Summary ................................................................................................................................................ 93
6 Illustrating A Way of Improving Quality in Pre‐School ................................................................... 95 6.1 Introduction............................................................................................................................................ 95 6.2 The Language Enrichment Programme .................................................................................................. 97 6.3 Evaluation of Language Enrichment Programme ................................................................................... 98 6.4 Impact of Programme on Staff‐Child Interactions ............................................................................... 101 6.5 Impact of Programme on Setting Quality ............................................................................................. 102 6.6 Factors Facilitating Programme Implementation ................................................................................. 103 6.7 Summary .............................................................................................................................................. 104
7 Summary and Conclusions ...........................................................................................................106 7.1 Introduction.......................................................................................................................................... 106 7.2 Sample .................................................................................................................................................. 109 7.3 Measuring Outcomes ........................................................................................................................... 110 7.4 Changes in Outcomes ........................................................................................................................... 111 7.5 Overview of Influences on Outcomes .................................................................................................. 112 7.6 Influence of Child Characteristics ......................................................................................................... 113
7.6.1 Gender ................................................................................................................................... 113 7.6.2 Age ......................................................................................................................................... 113 7.6.3 NESB: Non‐English Speaking Background .............................................................................. 113
7.7 Influence of Family and Social System ................................................................................................. 114 7.7.1 Social Class ............................................................................................................................. 114 7.7.2 Parent‐Child Relationships ..................................................................................................... 114
7.8 Influence Pre‐School System ................................................................................................................ 115 7.9 Implications of Study ............................................................................................................................ 116
7.9.1 Considering a Second Free Pre‐School Year ........................................................................... 116 7.9.2 Improving Quality and Outcomes in Early Years System ....................................................... 122 7.9.3 Measuring Quality and Outcomes in Early Years System ...................................................... 125 7.9.4 Addressing the Pervasive Influence of Social Class ................................................................ 127 7.9.5 Supporting Parents ................................................................................................................ 130 7.9.6 Integrating New Communities ............................................................................................... 132
7.10 Concluding Comment ........................................................................................................................... 132
8 Bibliography ................................................................................................................................134

Figures and Tables Table 1.1: Actions in National Literacy & Numeracy Strategy Directed at Early Years Sector ............................... 6 Table 1.2 State Expenditure on Early Years Sector in Ireland, 2011 and 2012 ..................................................... 12 Figure 1.1 Proportion of Child’s Time Spend in Free Pre‐School Year .................................................................. 17 Table 1.3 Síolta QAP 12‐Step Quality Assurance Programme .............................................................................. 18 Table 1.4 Formal Engagement with Síolta Quality Assurance Programme, 2010‐2013 ....................................... 19 Table 1.5 Core Skills of Mentoring in Síolta Quality Assurance Programme, 2010‐2013 ..................................... 19 Table 1.6 Styles of Mentoring in Síolta Quality Assurance Programme, 2010‐2013 ............................................ 20 Table 1.7 Principles of Aistear .............................................................................................................................. 22 Table 1.8 Excerpts from NCCS’s Strategic Plan (2012‐2015) Relevant to Early Years Sector ............................... 24 Table 1.9 List of Projects in the National Early Years Access Initiative ................................................................. 27 Figure 2.1 Logic Model for Evaluation of NEYAI and Síolta QAP........................................................................... 34 Table 2.1 Staff Questionnaire ............................................................................................................................... 36 Table 2.2 Child Assessment Questionnaire .......................................................................................................... 38 Table 2.3 Parent Questionnaire ............................................................................................................................ 39 Table 2.4: NEYAI and Síolta QAP Sample Compared to Childcare Sector in Ireland ............................................. 43 Table 2.5: Sample of Children and Parents in NEYAI and Síolta QAP ................................................................... 44 Table 2.6: Age (at 1st September 2013) of Children in NEYAI and Síolta QAP ...................................................... 45 Table 2.7: Gender of Children in NEYAI and Síolta QAP ....................................................................................... 45 Table 2.8: Highest Level of Education of Parents of Children in NEYAI and Síolta QAP ....................................... 45 Table 2.9: Difficulty Making Ends Meet of Parents of Children in NEYAI and Síolta QAP ..................................... 46 Table 2.10: Home Learning Environment of Children in NEYAI & Síolta QAP Combined ..................................... 46 Table 2.11: Sample of Early Years Staff in NEYAI and Síolta QAP ......................................................................... 48 Table 2.12: Highest Level of Education of Staff in NEYAI and Síolta QAP (Wave 2) ............................................. 48 Table 2.13: Type of Employment (Wave 2) .......................................................................................................... 49 Figure 3.1: Domains, Sub‐Domains and Sample Items in Early Development Instrument ................................... 55 Figure 3.2: Classification of EDI Scores ................................................................................................................. 56 Table 3.1: EDI Scores by Age of Children in NEYAI and Síolta QAP at Wave 1 and Wave 2 .................................. 59 Table 3.2: EDI Scores by Gender of Children in NEYAI and Síolta QAP at Wave 1 and Wave 2 ............................ 60 Table 3.3: EDI Scores for NEYAI and Síolta QAP in Comparative Context ............................................................. 61 Figure 4.1: Change in Child Outcomes in Total Sample ........................................................................................ 67 Figure 4.2: Changes in Child Outcomes in NEYAI and Síolta QAP ......................................................................... 69 Figure 4.3: Size of Change in Child Outcomes in NEYAI and Síolta QAP ............................................................... 70 Figure 4.4: Size of Change in Outcomes in Síolta QAP Validated and Non‐Validated Centres ............................. 71 Table 4.1: Size of Change in Child Outcomes in NEYAI and Síolta QAP Projects .................................................. 72 Figure 5.1: Measurement Model for Social & Emotional Skills ............................................................................ 76 Figure 5.2: Structural Equation Model of Influences on Children’s Social & Emotional Skills .............................. 77 Figure 5.3: Structural Equation Model of Influences on Children’s Language & Cognitive Skills ......................... 78 Figure 5.4: Measurement Models for Latent Concepts Used in Analysis ............................................................. 79 Figure 5.5: Human Brain Development ................................................................................................................ 81 Table 5.1: Time Spent by Child in an Early Years Centre Prior to Free Pre‐School Year ....................................... 91 Table 5.2: Period between Assessments at Wave 1 and Wave 2 in Free Pre‐School Year ................................... 91 Table 6.1: Hanen Teacher Interaction and Language Rating Scale ....................................................................... 99 Table 6.2: Preschool Program Quality Assessment (PQA) Scale ........................................................................... 99 Table 6.3: Literacy and Numeracy Indicator Scale .............................................................................................. 100 Figure 7.1 Summary of Influences on Child Outcomes During Free Pre‐School Year ......................................... 112 Figure 7.2 Summary of Influences on Parent‐Child Relationship ....................................................................... 131
vi
Executive Summary
Background
This report is an evaluation of the National Early Years Access Initiative (NEYAI), a three‐year programme (2011‐2014) to improve quality and outcomes in the early years sector. NEYAI comprises 11 projects mainly located in disadvantaged areas of Dublin, Cork and Limerick and two rural locations in Longford/Westmeath and Donegal. It was officially launched by the Minister for Children & Youth Affairs in June 2011 who referred to NEYAI as being made up of local demonstration projects with ‘a focus on evidence‐based practice and ongoing project evaluation for the purpose of advising future policy and the mainstream provision’. A substantial body of evidence has been created through NEYAI1 including this Main Report, a Technical Report and a Summary Report; reports from local evaluations in each NEYAI project; and an evaluation of the NEYAI Learning Community.
NEYAI projects are multi‐dimensional in their activities, implementing multiple programmes (such as staff training and mentoring, parenting courses, family support services, interagency collaborations), across multiple sites, with all age‐ranges of children from birth to six, and including their parents. This diversity of activity, much of it unique to each project, created challenges for the national evaluation because it was necessary to find a common theme across all projects which would allow a coherent and systematic approach to the evaluation. In response to these challenges, the evaluation focused on one age‐group of children, namely those attending the 2012/13 Free Pre‐School Year, and compared child outcomes in NEYAI with those in the Síolta Quality Assurance Programme (Síolta QAP). Síolta QAP is a 12‐step quality improvement process for early years centres; it is supported by mentors with progress and validation based on a portfolio to demonstrate that Síolta standards are being met in each centre. The rationale for this research design is that NEYAI and Síolta QAP both share the same broad aim of improving quality in the early years sector while Síolta QAP occurred earlier and lasted longer than NEYAI (at least longer than the intervention period of the NEYAI evaluation) thereby providing a validated standard or benchmark of quality. The fact that this study is based entirely on children who participated in the 2012/13 Free Pre‐School Year also provides an opportunity to consider some aspects of this programme even if the study is not based on a representative sample of children in the Free Pre‐School Year and was not specifically designed as an evaluation of this programme. Nevertheless the sample provides some of the first evidence available on the Free Pre‐School Year particularly on the factors which influenced child outcomes during that year. From the perspective of the wider education system, the sample provides a basis for exploring the extent to which Ireland may have a successful pre‐school system which we define as a system to improve outcomes for all pre‐school children while simultaneously narrowing the gap in outcomes between children. This definition is informed by internationally‐recognised approaches to assessing school systems generally, especially in the OECD, and is also the stated goal for early years education by the Department of Education and Skills (DES): ‘Provide a quality inclusive school and early years education system with improved learning outcomes’ [emphasis added]. It is also the implicit understanding in the vision of the present Government (2011‐present) which expresses Irish society’s commitment to every child: ‘that growing up in Ireland means you have the best start in life available anywhere in the world.’ A variety of terms are used to refer to the care and education of children under the age of six, such as ‘early years’, ‘pre‐school’ or ‘childcare’, and it may be useful to begin with a clarification. In Ireland, the sector is officially known by the term ‘early childhood care and education’ (ECCE), a term also used by UNESCO. By contrast, the preferred term in OECD and EU publications is ‘early childhood education and care’ (ECEC). There is also a preference in Ireland for the term ‘pre‐school’ rather than the OECD term ‘pre‐primary’, although ‘infant classes’ (itself a uniquely odd term) in primary school are effectively ‘pre‐primary’ but not ‘pre‐school’. In keeping with these differences in terminology,
1 Copies of NEYAI reports are available at: www.pobal.ie; www.kieranmckeown.ie; www.trutzhaase.eu

vii
while also contributing to its perplexity, the Free Pre‐School Year is also known by its more formal title Early Childhood Care and Education (ECCE) Programme. Whether or not these different terms denote any difference in philosophical perspective or have any policy and practice implications is a matter of speculation, but some reform and standardisation of the language might be timely. Adopting a pragmatic perspective, we use the term ‘early years’ rather than ‘childcare’ but also use the term ‘pre‐school’ depending on the context. The study comes at a time when the early years sector in Ireland, defined as the care and education of children aged 0‐6, has experienced significant development in four main areas: (i) publication in 2006 of Síolta (National Framework for Early Childhood Education) and Aistear in 2009 (National Early Childhood Curriculum Framework); (ii) introduction in 2010 of the Free Pre‐School Year for every child between 3 years 2 months and 4 years 7 months; (iii) selective implementation of Síolta and Aistear as well as other initiatives to improve quality in early years through Prevention and Early Intervention Programme (PEIP) and its successor the Area‐Based Childhood (ABC) Programme, plus the National Early Years Access Initiative (NEYAI); (iv) introduction in 2014 of the National Quality Support Service (NQSS) and the National Policy Framework for Children & Young People (2014‐2020).
Sample
In Ireland, there are approximately 4,300 early years centres. This study covers nearly 2% of these: 70 in total, 49 in NEYAI and 21 in Síolta QAP. Similarly, the estimated number of staff employed in the early years sector in Ireland is 21,000. This study covers nearly 4% of these staff (759) with about three quarters in the NEYAI sample (553) and one quarter in the Síolta QAP sample (206). The number of children in the Free Pre‐School Year in Ireland in 2012 was around 66,000. This study covers less than 1% of these (448), just over half in NEYAI (258) and just under half in Síolta QAP (190). In order to understand the significance of the sample, we briefly summarise the sample design and some sample characteristics since these set parameters on making wider inferences from the study. As indicated, the sample design was built upon an initial decision to focus on one age‐range of children, namely those qualifying for the Free Pre‐School Year (3 years 2 months to 4 years 7 months), since this was judged to be the most appropriate way of evaluating a multi‐faceted programme like NEYAI. Centres in NEYAI and Síolta QAP were then selected by each project to participate in the study. The sample of children was randomly selected from a list of all children in each centre in the Free Pre‐School Year. Reflecting the focus of NEYAI, centres in the study are mainly located in more disadvantaged areas compared to early years centres in Ireland; however not all centres in the sample are situated in highly deprived areas. The sample includes a range of children from different social backgrounds but, on average, they are more disadvantaged by comparison with the national population of children. The majority of NEYAI (75%) and Síolta QAP (87%) centres are community‐based providers, unlike the generality of early years centres in Ireland which are private and only a quarter (26%) are community‐based. The sample of staff was based on all early years staff in the selected centres and a high proportion of these (76%) participated in the study. The results show that staff in NEYAI and Síolta QAP have somewhat higher levels of education (at Levels 6 and 7) compared to the early years sector as a whole. Employment patterns indicate that with less than half (48%) are employed full‐time, similar to the early years sector (46%) but radically different from the rest of the Irish economy where more than three quarters of all workers are employed full‐time (77%). In terms of their experience of work and the workplace, staff in NEYAI and Síolta QAP have consistently more positive attitudes compared to Irish workers generally. Specifically, they are more satisfied with their job, except for their earnings. They have greater commitment to their organisation although they also report more job pressure and less autonomy compared to the average Irish worker. Workplace consultation is higher in this sample compared to workplaces in Ireland and staff‐management relations are better; staff in the sample also have positive perceptions of their manager and feel valued and supported. NEYAI and Síolta QAP staff have a high level of commitment to their work, finding it energising, absorbing and are dedicated to it; this is a higher level of work commitment compared to other occupations in 10 different

viii
countries These aspects of the sample are important because they indicate that NEYAI and Síolta QAP centres are good places for staff to work and the data also provides an opportunity to analyse if the characteristics of staff and their workplace have any impact on child outcomes. In light of this sample design, which required retro‐fitting the evaluation framework to 11 pre‐selected multi‐dimensional projects, it is important to note that this is not a representative sample of centres, staff or children in NEYAI, Síolta QAP or the Free Pre‐School Year. This means that the results cannot be extrapolated directly to the wider population of children participating in these programmes. Other limitations with the research design should also be noted. First, the effective sample of 448 children, with matched data on parents and staff, is relatively small when considering the range of influences on which data was collected, thus limiting the power to identify statistically significant influences on child outcomes. Second, there is no ‘control group’ of children, staff or centres to evaluate the impact of NEYAI, Síolta QAP or the Free Pre‐School Year by comparison with ‘doing nothing’. The reason for this is simple: in order to establish a ‘control group’ a process of random allocation is necessary and this was precluded by the way these programmes were set up. Third, most of the data used in the evaluation is based on self‐report by parents and staff as well as staff assessments of children. This is an appropriate and tried‐and‐tested method of measurement, particularly where it involves instruments whose validity and reliability has been well‐established, as in this study. Nevertheless, these instruments cannot provide the type of insight and independent perspective that comes from direct observing quality in an early years setting, such as observing the interactions between staff and children, but this would have required a much larger research budget. Finally, data on parents was collected from mothers only based on the consideration that, since only one parent could be interviewed, for consistency this should be the mother, particularly since one‐parent households were more likely to be headed by a mother. This is a well‐established convention but the consequence of excluding fathers is recognised in terms of giving visibility to their role in lives of children and families bearing in mind that a growing body of research shows that fathers and mothers ‘influence their children in similar rather than dissimilar ways’.
Findings on Outcomes Outcomes are central to the study and these were measured using the Early Development Instrument (EDI), an instrument that is used in many countries, notably Canada and Australia, to assess the development of children around the ages of 4‐5. The measurement of outcomes involved assessing how well a child performs over 100 tasks in each domain of the EDI ‐ physical health & well‐being; social competence; emotional maturity; language & cognitive development; communication skills & general knowledge – and is a measure of the skill required to perform ordinary tasks of living and learning which are appropriate to a child of this age‐group. These skills are increasingly referred to as character skills and cognitive skills and a re‐analysis of the long‐term outcomes of pre‐school and similar programmes has concluded that character skills predict later‐life outcomes with ‘the same, or greater, strength’ as cognitive skills. All assessments were carried out by members of staff who worked directly with the child. Results are reported in terms of the five EDI domains and in more summary form in terms of two broad categories which we refer to as ‘social & emotional skills’ (which includes physical health & well‐being as part of this label) and ‘language & cognitive skills’.
Overall Outcomes
Children in the sample improved in all domains of the EDI. These improvements combine two processes of child development which cannot be separated, given the absence of a control group: (i) natural growth and (ii) impact of pre‐school. In other words, since the study does not have a control group of children who stayed at home, we do not know how much of this development is attributable to the Free Pre‐School Year. It is also worth adding that, since the Free Pre‐School Year is available to all eligible children and there is an uptake of over 95%, it would be difficult to generate a control group of matched children who are not in the programme. This is a feature of all universal services. It is also important to remember that the impact of pre‐school has largely been settled in international research, with the clear conclusion that high quality, multi‐year, pre‐school programmes are beneficial, especially for disadvantaged children, particularly where accompanied by additional support services for vulnerable families.

ix
Overview of Influences on Outcomes The study is based on the premise that child development is influenced by three sets of determinants: child characteristics; family and social system characteristics; pre‐school system characteristics. Our analysis of these influences, graphically summarised in Figure 1, is the centre‐piece of the study and the foundation of the main findings, conclusions and implications. Leaving details aside, there are three core findings of the study.
Figure 1 Summary of Influences on Child Outcomes During Free Pre‐School Year
First, the analysis shows that the distribution of skills within the sample of children is stable over time. This is particularly the case with social & emotional skills, but slightly less so with language & cognitive skills. In other words, children with more or better skills at the beginning of the study period tended to have more or better skills at the end of this period, whilst those with weaker skills at the beginning tended to remain in a weaker position at the end of the study. This indicates that the broad parameters on a child’s progress during the Free Pre‐School Year have already been set by the child’s development during the previous 3‐4 years. Similar to other studies in this field, our analysis explained about a quarter of the variation between children at the start of the Free Pre‐School Year which implies that most of what shapes a child’s development up to that time depends on individual factors (e.g. genetic factors) and other unmeasured characteristics of the child and his or her environment. Acknowledging the uniqueness of each child – because there are more things that make children different than similar ‐ is an inescapable fact of the research and foundational to understanding and supporting child development. Second, and again consistent with other studies, we found that child characteristics as well as family and social characteristics were the largest measurable influences on development. The pre‐school system also influenced child outcomes, but to a considerably lesser extent. On reflection, this finding is not surprising since child and family characteristics are present from the child’s birth whereas the Free Pre‐School Year, as we have measured it, represents about 3% of the child’s entire waking life up to that point. This does not imply early years services are not important, particularly since they have

x
added importance for children whose development may be vulnerable precisely because of family and social circumstances. However it does imply that in order to understand what happens during the Free Pre‐School Year, and how it might be improved, requires one to look at all significant influences on child outcomes and not just those in the pre‐school system. Third, the study found significant gaps between the skills of children at the outset, in both social & emotional skills and language & cognitive skills. For the most part, these gaps remained unchanged or widened during the following seven months on the programme. Given that a successful pre‐school system is one which improves outcomes for all pre‐school children, while simultaneously narrowing the gap in outcomes between children, this is an important issue. The economic rationale for investment in the early years rests on improving overall child outcomes, especially for disadvantaged children, but the additional benefits of ‘closing the gap’ between outcomes can also be substantial. This does not imply that the Free Pre‐School Year is not a good investment, or that it does not have a positive impact on disadvantaged children, but it suggests that, as currently organised, the Free Pre‐School Year does not contribute strongly to a reduction in the skills gap that separates different groups of children. The implications of these and related findings are discussed later. We now present more detail on what influenced these outcomes.
Influence of Child Characteristics The child’s gender, age and Non‐English‐Speaking Background (NESB) have a significant influence on skills, affecting both the starting point for children (wave 1) and their progress (wave 2) during the Free Pre‐School Year. In this study, a child is defined as NESB where the mother’s first language is not English (excluding mothers whose first language is Irish).
Gender There is a significant time‐lag in the development of boys compared to girls in both social & emotional skills and language & cognitive skills. This is not unexpected as it is in line with international evidence. The results indicate that, when other factors are taken into account, gender‐related gaps remain unchanged (in the case of social & emotional skills) or widen (in the case of language & cognitive skills). The international literature suggests that gender differences tend to converge by the age of 9‐11 years.
Age
Age is a significant influence on language & cognitive skills (but not on social & emotional skills) and influences the progress recorded between the first and second wave of data collection. Older children have an advantage in terms of language & cognitive skills, which tends to grow during their participation in the Free Pre‐School Year.
NESB: Non‐English Speaking Background
NESB children who have weaker social & emotional skills and weaker language & cognitive skills, a difference which was also found in the GUI profile of 3‐year old children; GUI refers to Growing Up in Ireland: National Longitudinal Study of Children). However, the gap in social & emotional skills between these and other children narrowed over time, pointing to an integrative effect of the pre‐school experience, although the gap in language & cognitive skills remained unchanged.
Given that age and gender differences in child development are normal among 3‐4 year olds, except where children are diagnosed as having ‘special needs’, the positive impact of the Free Pre‐School Year on the social & emotional skills of NESB children is a noteworthy finding. NESB children, as we shall see, are similar to other children in terms of socio‐economic status but somewhat different in terms of family characteristics.

xi
Influence of Family & Social System
The ‘family and social system’, as we use it in this study, refers to influences on the child which originate within the family but are linked to the family’s resources in society. This system is specified by three latent concepts: social class, mother’s well‐being and parent‐child relationship. The concept of social class denotes the family’s resources (material, social and cultural) and comprises mother’s education, occupation, and financial problems but also includes two other resources which are relevant to child development, notably the home learning environment and child’s diet. Mother’s well‐being is based on four observed aspects of the person: optimism, life satisfaction, positive affect and self‐esteem. Parent‐child relationship is based on how a parent relates to a child along three dimensions: conflict, dependency and stress. All concepts are measured with recognised scales, many of them also used in the GUI.
Social Class
Within the family and social system, social class is the main determinant of children’s social & emotional skills and language & cognitive skills. It is one of the biggest sources of differentiation between children in our sample. In the case of language & cognitive skills, social class creates the largest gap between children. The size of this gap can be expressed in ‘standard deviations’ by stating that a one unit change in a child’s social class is associated with a half unit change in a child’s language & cognitive skills. This gap remained unchanged during the Free Pre‐School Year. In the case of social & emotional skills, social class is also associated with a gap between children. The size of this gap can also be expressed by stating that a one standard deviation unit change in a child’s social class is associated with a quarter unit change in a child’s social & emotional skills. Once again, this gap between children remained unchanged during the year. The finding that children’s skills are differentiated by social class is not new or unexpected, particularly regarding children’s language & cognitive skills; it has been replicated in numerous international and Irish studies. Similarly, the finding that the gap in children’s language & cognitive skills remained unchanged over time, regardless of participation in the Free Pre‐School Year, is also consistent with other studies. This study, despite the relatively short period of seven months between wave 1 and wave 2, is testimony to just how strong this influence is when compared to other influences and, as discussed below, the scale of the challenge required to reduce preventable class‐related gaps between children.
Parent‐Child Relationships
Parent‐child relationships are a significant influence on children’s social & emotional skills and language & cognitive skills. The study found that a mother’s well‐being is the main influence on the parent‐child relationship which, in turn, is influenced by her social class, support networks and NESB. From the perspective of a child, this suggests that a child’s experience of the world is mediated through the parent‐child relationship and the mother’s experience of the world as reflected in the mirror of her personal well‐being and the resources available to her (material, social and cultural). The study also found evidence to suggest that different parenting styles have different impacts on children’s skills. Specifically, parents who have a more ‘relaxed parent‐child relationship’ (mainly associated with less conflict and stress) tend to facilitate children’s social & emotional skills while parents with a more ‘demanding parent‐child relationship’ (mainly associated with more conflict and stress) tend to facilitate children’s language & cognitive skills. This implies that parent‐child relationships involve a balance between relaxed and demanding styles of parenting since children’s skills are affected differently by each style.

xii
These findings on the family and social system underline how social class and parent‐child relationships constitute an interdependent set of active ingredients which influence the child’s progress during the Free Pre‐School Year, simultaneously weaving their influence in both the family and social system and the pre‐school system. This perspective underlines why development of children’s skills cannot be dissociated from the wider family and social system and, as discussed below, this wider set of cascading influences needs to be taken into account when considering how to improve child outcomes generally and not just during the Free Pre‐School Year.
Influence of Pre‐School System
Within the pre‐school system, we found that the amount of time a child spent in an early years centre prior to the Free Pre‐School Year – which in this sample averaged 15 months (compared to 7 months spent in the Free Pre‐School Year) – had a positive influence on the child’s progress during that year. This is an important result and, even allowing for limitations in the research design, is consistent with numerous landmark evaluations of early childhood programmes which have found a positive relationship between programme duration and child outcomes, but only for children who are aged two years and older. The finding clearly suggests that early years care and education has a positive influence on child outcomes. The analysis also found that duration in an early years centre prior to the Free Pre‐School Year was positively correlated with social class which suggests that children from more advantaged social class backgrounds have stronger skills, at least in part, because they start attending an early years centre at an earlier age. Conversely, it suggests that more disadvantaged children may face the ‘double disadvantage’ associated with lack of resources combined with less as well as later access to early years services. An important determinant of child outcomes during the Free Pre‐School Year may therefore be earlier entry and longer duration in an early years centre, at least for children aged two and older. This finding has wider significance since it is consistent with other studies ‐ based on larger samples of Irish children such as the 3‐year old cohort of GUI and the 15‐year old cohort of Irish children who participated in PISA 2012 – which also show that usage of early years services has a social gradient.
The analysis also indicates that whether the child attended a centre in NEYAI or Síolta QAP made no difference to outcomes, which implies that neither quality improvement programme had a marked advantage over the other when other influences were taken into account. The analysis also revealed that none of the self‐reported attributes of staff or their workplace – which included personal characteristics, professional qualifications, work experience, work commitment, quality of workplace, interactions with children and parents – had any statistically significant effect on these children’s progress during the Free Pre‐School Year. These findings may, once again, be related to the relatively small sample size used in this study and the short duration of the intervention; but they may also be due to our reliance on staff self‐report measures of quality rather than direct observation of years settings. However, it also needs to be seen in the wider context of educational research which shows that pre‐school systems, like school systems generally as measured through international studies such as PIRLS & TIMMS and PISA, tend to have less influence on child outcomes compared to child and family characteristics. It follows logically that if the pre‐school system has a relatively small effect on outcomes then individual aspects of the pre‐school system will have correspondingly smaller effects which are more difficult to detect in small samples such as this. The possibility that this finding may therefore be a ‘false negative’2 cannot be discounted, but a much larger sample combined with observational measures of quality would be needed to prove that.
Implications
It is clear from the study that the determinants of child outcomes are to be found predominantly outside, and to a lesser extent inside, the pre‐school system. That is why the implications of these findings extend well beyond the confines of the early years sector to include all influences on child
2 In research, it is conventional to refer to risks which can arise when making inferences about the impact of a
variable. One risk is a ‘false negative’ which can arise from claiming that a variable has no impact when it has. Another risk is a ‘false positive’ which can arise from claiming a variable has an impact when it has not.
xiii
outcomes. Our conclusions stop short of making recommendations since this requires a wider consultative process, particularly involving those with responsibility for formulating and implementing recommendations. We nevertheless set out six implications which invite reflection: considering a second Free Pre‐School Year; improving quality and outcomes in the pre‐school system; measuring quality and outcomes in the pre‐school system; addressing the pervasive influence of social class; supporting parents; integrating new communities.
Considering a Second Free Pre‐School Year
The introduction of a universal Free Pre‐School Year in 2010 is widely regarded as a success since the vast majority of parents (around 95%) have been enrolling their eligible children. One of the consequences of that decision is that it is no longer possible to assess the impact of the Free Pre‐School Year by comparison with doing nothing or doing something different, since it would be extremely difficult to generate a matched sample of children who do not attend the Free Pre‐School Year. The present study therefore cannot directly contribute to such assessment. It is true that the decision to introduce a Free Pre‐School Year is well‐supported by evidence, much of it cited in this report, which shows that pre‐school education produces beneficial and lasting effects on children, but only if it is high quality, multi‐year and preferably accompanied by additional support services for vulnerable families. This evidence alone, however, is not sufficient to prove that the existing Free Pre‐School Year is effective, bearing in mind that it is not a multi‐year programme, it does not meet the same standards of quality found in landmark studies of effective pre‐school programmes, and additional support services for vulnerable families are not a routine part of the programme. Consideration of a second Free Pre‐School Year is prompted by the fact that this is a ‘commitment’ in the National Policy Framework for Children & Young People (2014‐2020). Given that the Free Pre‐School Year is regarded as an ‘early’ intervention – at least early in the life of a child if not necessarily early in the development of a child ‐ the question of a second such year might usefully be framed in terms of whether it is ‘early enough’. Some findings in this study are relevant to a wider discussion of this issue because they identify sources of ‘naturally occurring variation’ in the skills of children, including socially‐generated gaps between children which seem difficult to change. It may be useful, therefore, to assemble and assess the evidence which could inform a decision about a second Free Pre‐School Year, acknowledging that other factors which are not considered here, such as resources, will also inform this decision. The study shows that children in NEYAI and Síolta QAP improved in all domains of the EDI during the Free Pre‐School Year but the absence of a control group of children means that we do not know whether this would have happened anyway even if the children stayed at home. Nevertheless, it is consistent with a wider body of international evidence on pre‐school programmes and suggests that it is at least likely that the overall objective of the Free Pre‐School Year ‐ ‘to benefit children in the key developmental period … before they start primary school’ – is being achieved to some degree. A robust finding of the study is that socially‐generated disparities between children observed at the beginning of the year tend to be maintained over the course of that year. In fact, what happens to a child before the Free Pre‐School Year has a much greater influence on the distribution of skills at the end of that year compared to what happens during that year. This has radical implications. First, the Free Pre‐School Year begins after substantial development has already taken place in the child’s life. These developments are measurable in terms of the child’s social & emotional skills and language & cognitive skills, which already display substantial gaps between children and which, because they are socially‐generated, may also be partially preventable. In that sense, the Free Pre‐School Year may be ‘early’ in the life of a child but it is not ‘early’ from the perspective of child development. Second, the pre‐school system is intimately connected to the child’s family and social system to the extent that a child’s experiences at home are more significant drivers of outcomes than what happens during pre‐school. This draws attention to the importance of even earlier intervention but also highlights that interventions need to take place in the family and social system and not just in the pre‐school system. By implication, it also highlights the need, as recommended by the Expert Advisory Group on the Early

xiv
Years Strategy, for ‘strong coordination mechanisms across Government departments’ as well as bringing together ‘in a single Government department all policy responsibility for early care and education services, including their funding, quality assurance, curriculum development, training and workforce development.’ The case for earlier intervention – whether through the early years system, the family system, or both – rests not just on the general principle that earlier is better and more effective than later but also on the evidence of this study that class‐related disparities in the skills of children are already well‐established before the Free Pre‐School Year begins and remain comparatively stable throughout this period. International research cited in the report shows that socially‐related gaps between children in vocabulary and language processing skills are measurable at 18 months (and detectable even earlier) and persist for many years. It is clear from this study that the Free Pre‐School Year, in its current form, does not have the capacity to significantly reduce or close these developmental gaps and that considerable staff skills will be required to do so, as well as additional complementary initiatives for children whose circumstances cause them to miss vital developmental opportunities. This is because child development is incremental, which implies that early advantages (and disadvantages) will tend to be reproduced, if not reinforced, by universal interventions alone. That is why some of the most effective early years interventions combine centre‐based programmes for children with family support services for more vulnerable parents. It is well‐known that the economic benefits of investment in the early years rests on improving overall child outcomes, especially for disadvantaged children, but additional benefits from closing the gap between outcomes can also be substantial. The strength of the economic argument rests on the return on investment that comes from the large benefits accruing to disadvantaged children, in terms of lifetime benefits to individuals and society; in other words, the opportunity cost (or ‘opportunity lost’) of poor outcomes is greater than the cost of reducing it. Given that the economic case for early years services is typically built on landmark studies which show a return on investment from high‐quality multi‐year programmes, the results of this study suggest that the Free Pre‐School Year will deliver the economic returns found elsewhere if, but only if, the investment is sufficient to deliver similar programmes. The study also shows that the amount of time spent by a child in an early years centre prior to the Free Pre‐School Year had a positive influence on progress during that year which, even allowing for limitations in the research design, suggests that both earlier entry and longer duration in an early years centre has a beneficial effect. This is consistent with numerous landmark evaluations which have found a positive relationship between duration of pre‐school and child outcomes, though only for children aged two years and older. In addition, the finding that the amount of time spent by a child in an early years centre is also positively correlated with social class is significant and in line with findings of much larger samples of Irish children. As already indicated, it suggests that more disadvantaged children may face the ‘double disadvantage’ associated with lack of resources combined with less and later access to early years care and education. Extending pre‐school provision to earlier years would address this inequity and could be especially beneficial for children from less advantaged backgrounds, although it is impossible to provide estimates of the potential benefit on the basis of the present study. The need to improve quality in the Irish pre‐school system is well‐recognised and this study strengthens the case for doing so by highlighting, among other things, the substantial skills that are required of staff to reduce preventable socially‐generated gaps between children, particularly in the area of language & cognitive skills. There is also an argument in favour of improving quality in the pre‐school system as a pre‐condition to further expanding pre‐school provision. But it could also be argued that extending pre‐school provision, even if equivalent in quality to current provision, would be beneficial in overall terms, given the finding that the amount of time spent by a child in an early years centre has a beneficial effect on outcomes. This finding does not imply that quality is adequate in all early years settings – and some centres may even be sub‐standard and potentially harmful to children and need to be removed from the system – but the positive influence of earlier and longer intervention highlights that the existing pre‐school system has beneficial effects. This suggests that improving pre‐school quality and extending pre‐school provision are both beneficial options whether

xv
considered separately or together. It might therefore be useful to consider the option of a second Free Pre‐School Year and the option of improving quality in the pre‐school system as separately beneficial rather than making one option conditional on the other. Whether both options combined would be sufficient to reduce the aforementioned gaps, without also strengthening family supports for vulnerable parents, remains unlikely. The question of how to balance universal and targeted measures within the pre‐school system is a matter of debate. For example, a second Free Pre‐School Year could be provided universally, like the first, or targeted at more vulnerable children, or involve a combination of both universal and targeted provision with additional resources directed at more disadvantaged children. Targeting is complementary to universal provision and an important component of the developmental welfare state, variously referred to as ‘tailored universalism’, ‘progressive universalism’ and ‘proportionate universalism’. One of the strengths of the Free Pre‐School Year is universal provision and, on balance, this is worth maintaining since universal provision is known to improve uptake by more disadvantaged families; it can also facilitate more interaction between children from different backgrounds; and there is the consideration that a substantial proportion of Irish families could not afford pre‐school unless it was free. However, extending universal pre‐school provision without targeting additional resources at those who are more disadvantaged is unlikely to disrupt the socially‐generated disparities between children’s skills that are documented by this study. This means that targeting additional resources will be required in some parts of the pre‐school system, either in addition to universal provision as recommended by the Expert Advisory Group on the Early Years Strategy, or instead of it if universal provision is not affordable. This model of combining universal and targeted provision is already well‐established in the education system through the DEIS programme in primary and secondary schools; and a second Free Pre‐School Year would fit well with the wider objectives of the national literacy and numeracy strategy which clearly recognises the foundational role of early childhood experiences for the success of this strategy. It is also worth emphasising that implementing targeted programmes in a way that is fair requires the inclusion of all disadvantaged children and not just those living in disadvantaged areas since there is a substantial body of evidence to show that the majority of ‘poor people’ do not live in ‘poor areas’. At the same time, given the extensive network of early years centres throughout the country, targeting disadvantaged children using small area deprivation scores could be an effective way of doing this. The newly‐formed Child and Family Agency, as its name suggests, has an important and potentially expanded role in supporting children during the early years, especially targeting services at vulnerable families where normal healthy child development may be at risk. The infrastructure of the pre‐school system in Ireland is built on a network of approximately 4,300 early years centres. Putting this in the wider context of education, the number of early years centres is greater than all first‐level schools (3,300) and second‐level schools (723) combined. There is evidence of surplus physical capacity within this system, at least in terms of available places, but questions about staff capacity and overall quality remain, as already indicated.
Improving Quality and Outcomes in Early Years System
It is Government policy to ‘improve the quality of the pre‐school year’. Consistent with this, the Minister for Children and Youth Affairs introduced the ‘Pre‐School Quality Agenda’ in October 2013 comprising a new National Quality Support Service (NQSS, costing €2.5m in 2014), training support for staff (costing €1.5m in 2014) and improvements in the Pre‐School Inspectorate (costing €1.1m in 2014). It has already been acknowledged that this study is limited from the perspective of measuring quality – due to the absence of direct observation of settings and the interactions between staff and children within those settings – with the result that just two findings are relevant to improving quality in the early years system. The first finding is that there is no significant difference in outcomes between centres in NEYAI and Síolta QAP when all other sources of variation are taken into account. This result is somewhat unexpected at least to the extent that Síolta QAP is a more substantial and sustained intervention to improve quality in early years settings by comparison with NEYAI. It involved a 12‐step Quality Assurance Programme (2010‐2013) delivered by Síolta Mentors with progress and validation based on

xvi
a portfolio to demonstrate that Síolta standards were being met within the centre; moreover the programme occurred earlier and lasted longer than NEYAI (at least longer than the intervention period of the NEYAI evaluation). By contrast, NEYAI is essentially a funding programme for quality improvement in 11 different ‘demonstration projects’ and the evaluation covered less than a year of this quality improvement process. In addition, not all NEYAI projects focused exclusively on quality improvement or indeed on early years settings. As explained, the research design was based on the assumption Síolta QAP provides a validated standard or benchmark of quality. It is beyond the scope of this study to undertake a thorough examination of the reasons why Síolta QAP, including its process of validation, is not associated with better child outcomes than NEYAI. We have already highlighted how the methodological limitations of the study may have influenced this result, and it is also possible that NEYAI was a particularly effective intervention, producing results which are comparable to those obtained by Síolta QAP. Keeping those limitations in mind, it is nevertheless useful to reflect on the possibility that Síolta QAP may not be having the impact on quality and outcomes that was intended and explore possible reasons for this. One possibility is that, since Síolta QAP is a mentoring programme, the focus of mentoring may not have addressed sufficiently the skills and practices of staff in their day‐to‐day interactions with children or parents, or indeed other active ingredients associated with child outcomes. Another possible reason is that the central role of reflective practice in this model of quality improvement – which requires staff to ‘have appropriate levels of skill and knowledge to help you assess the quality of both your practice and the environment’ – may have presumed that staff already had capacities which the programme was designed to promote. As a recent review of quality in Irish education observed, the value of reflective practice depends on having objective data on performance as a basis for reflection. Whatever the reasons, it is possible that Síolta QAP, and its validation process, may not have impacted sufficiently on the knowledge, skills and competencies of staff to make a significant difference to outcomes. This suggests that a challenge may need to be faced in terms of how best to implement Síolta, and possibly Aistear as well. The frameworks and standards embodied in Síolta and Aistear are likely to remain the bedrock of quality but the current model for implementing Síolta may need to be re‐examined since we have not been able to establish a demonstrable link between superior quality and outcomes in Síolta QAP, at least when compared with NEYAI. The second finding that is relevant to improving quality in early years services is based on an in‐depth case study which showed how a well‐designed and executed training intervention can measurably improve the capacity of staff to develop children’s speech, language and communication. This is an important case study for a number of reasons: language & cognitive skills are strong predictors of later academic achievement; these skills are highlighted in Síolta and Aistear; specific staff training is required to acquire the skills – variously referred to as ‘sustained shared thinking’ and ‘extended purposive conversations’ – in order to facilitate children’s language & cognitive development; this is a known area of weaknesses in the Irish pre‐school system and related services. Similar training interventions have been undertaken in other NEYAI and Síolta QAP projects but the availability of a robust local evaluation for this intervention – called the Language Enrichment Programme – makes it a ready‐made illustration of how quality can be improved within the Free Pre‐School Year, and within the early years sector generally. As with the national evaluation, this local evaluation is limited by the absence of a control group and longitudinal follow‐up after the intervention. Nevertheless, the local evaluation showed that the Language Enrichment Programme improved staff skills, based on direct observation of those skills before and after the training. Specifically, there were significant improvements in the three centres participating in this training and its evaluation, notably improvements in staff‐child interactions with the greatest improvement in the interaction strategy called, ‘OWL: Observe Wait Listen’, which is the hallmark of this programme: observe the children, wait for the children to make the first move, listen to what the children have to say. Further analysis from the perspective of the national evaluation revealed that this project is virtually indistinguishable from other NEYAI and Síolta QAP projects in terms of the characteristics of staff, children or parents. This suggests that no special staff attributes are required for this programme to have a similar impact in other centres. However it is also worth noting that child outcomes in this project were not significantly different from those observed in other centres when all other factors were taken into account; this is likely due to the small sample of children in this project (20) which is probably too small to detect a statistically significant difference when all other

xvii
variables are taken into account. Nevertheless the case study is an illustration of one way to improve quality and is consistent with ‘the best approaches’ to professional development of early years educators (and teachers) because it combines knowledge of effective adult‐child interaction strategies, use of video‐recording for self‐analysis, and expert individualised feedback on how staff interact with children. As such, it may offer a possible model of continuous professional development that could be used by the National Quality Support Service (NQSS).
Measuring Quality and Outcomes in Early Years System
One way of verifying the quality of Ireland’s early years system is by measuring child outcomes. This is necessary in order to show the link between implementing quality frameworks and standards on the one hand and better outcomes for children on the other. Making this link, rather than assuming it, is a significant challenge since the measurement of outcomes, even for the narrower age‐range of children in Free Pre‐School Year, is not without difficulty. This does not imply that pre‐school children should be continuously tested – a separate issue – but periodic assessment of quality and outcomes is an important aspect of checking the overall performance of the early years system. This study addressed the challenge of measuring outcomes in the Free Pre‐School Year by using the Early Development Instrument (EDI). The EDI is widely used internationally, particularly in Canada and Australia, but normally with children attending primary school – mainly 4‐5 year olds and not with children aged less than 3 years 8 months – and is normally completed by teachers rather than early years workers. This is the first study to use EDI in a pre‐school setting where it was completed by early years staff. The decision to use EDI, including permission to use the instrument which is protected by copyright, was made after consulting with its authors. The results of the study show that EDI scores were internally consistent, mirroring the child’s gender and chronological development but with greater sensitivity to changes in language & cognitive skills than to changes in social & emotional skills; the scores also showed considerable stability between waves 1 and 2 and were also broadly consistent with the pattern of scores from international studies. The significance of this finding, in conjunction with robust statistical analysis, shows that the EDI provides a realistic and reliable option for assessing outcomes associated with the Free Pre‐School Year. The EDI Handbook emphasises that this instrument is a ‘population measure’ which means that while measurements are collected at the level of each individual child, the EDI is not suitable for child‐level assessments. This is relevant to the national literacy and numeracy strategy which recognises that early years practitioners require ‘continuing professional development to enhance their ability to use a range of assessment for learning (AfL) and assessment of learning (AoL) approaches’. It is also recognised that assessment for learning is an area in need of development so that early childhood curriculum and assessment frameworks are aligned and support each other. Using the EDI to assess national outcomes of the Free Pre‐School Year provides one way of assessing quality in early years services. As already stated, existing frameworks and standards embodied in Síolta and Aistear remain the bedrock of quality, but the measurement of outcomes is the only way of verifying that their implementation is creating experiences for children that result in better outcomes such as improved social & emotional skills and language & cognitive skills. Taking a wider perspective on the evidence‐base that is required to support the Pre‐School Quality Agenda, it is clear that continuous national assessment of the Free Pre‐School Year is essential. This will require a much larger sample than this study, one which is representative of the entire population in question, and a longitudinal design over a much longer period. In addition to collecting new data, there is also need to do further analysis of existing datasets like GUI. Specifically, a full statistical analysis of the GUI infant cohort – based on a merged dataset of over 8,000 children at age 9 months (wave 1), 3 years (wave 2) and 5 years (wave 3) – would generate evidence and insight on all influences on child outcomes, including the role of early years services; this could be done with greater robustness and precision than has been possible with the small sample in this study.
xviii
Addressing the Pervasive Influence of Social Class
Social class, as conventionally defined in research, denotes the resources available to a child, adult or family. A conceptual innovation in this study involved extending the conventional concept of social class – which includes mother’s education, occupation and financial resources since these are known to have a pronounced social gradient on child outcomes – to include other resources which are also relevant to child development, notably the home learning environment and the child’s diet, and which are highly correlated with social class. These additional aspects are also part of the family’s resources, operating as risk and protective factors on child development in much the same way as more conventional aspects of social class. As indicated, social class is the main determinant of children’s social & emotional skills and especially their language & cognitive skills; by implication, social class is the main socially‐generated source of gaps in the skills of children at the start of the Free Pre‐School Year. The significance of this finding is far‐reaching because it identifies an active ingredient in early child development. For children who are most disadvantaged, these class‐related differentials, if unaddressed, have consequences though childhood and into adult life because they shape the capacity to learn skills, both character and cognitive skills, while also influencing each person’s self‐concept and related capacity to live well and be well. Other studies have treated the home learning environment as a separate influence on child development and found that it is ‘one of the most powerful influences’ on child development. Consistent with this, research shows that reading to a child has a positive influence on the cognitive development of 3‐year olds; reading stories also improves a child’s skills at entry to primary school; the quantity and quality of child‐directed speech in the home predicts a child’s vocabulary and language processing skills; the number of books in the home has been shown to influence academic performance of fourth class pupils (9‐11 year olds). Building on these findings, our study shows that the home learning environment is strongly influenced by structured differences in material, social and cultural resources, and is thus a statistically reliable indicator of the broader concept of social class that we have used in this study. The child’s diet ‐ measured by frequency of ‘healthy foods’ and ‘unhealthy foods’ in the previous 24 hours – is also treated as an indicator of social class, and is closely aligned with the mother’s education. Other studies have examined the separate influence of diet on child development. For example, findings from the infant cohort of the GUI show that about a quarter of 3‐year old Irish children are overweight (19%) or obese (6%). In many respects, diet and home learning environment seem to operate through similar processes because parents shape their children’s eating behaviour not only through the foods that are available in the home, but also through parental example and parenting practices. This underlines how parents create the child’s environment, with food being one aspect of it, creating experiences which give rise to differences in child outcomes that are observable in this study. One of the innovations in the study is to treat diet as an aspect of social class thereby illustrating how it is also part of a wider set of inter‐linked experiences for children and their parents. This underlines the importance of a holistic approach to child development which focuses on the major factors influencing development, in addition to the specific behaviours or characteristics that express their effects.
A strength of the concept of social class presented here – and an indicator of its pervasive influence – is its intergenerational character. The child’s environment is simultaneously the parent’s environment. That is why mother’s education, occupation and financial difficulties are integral parts of a shared family environment. This underlines how social class has an inter‐generational aspect and why children with weaker skills are more likely to have parents who also have weaker skills. This means that improving outcomes has a longer‐term intergenerational aspect which requires improving levels of education, employability and incomes amongst vulnerable parents. Viewed from this perspective, there is a clear linkage between the five benchmark targets for education and training in the Europe 2020 Strategy which Ireland has adopted: 1. at least 95% of children between 4 years old and the age for starting compulsory primary
education should participate in early childhood education;
2. the share of early leavers from education and training should be less than 10%;

xix
3. the share of low‐achieving 15‐years olds in reading, mathematics and science should be less than
15%;
4. the share of 30‐34 year olds with tertiary educational attainment should be at least 40%;
5. an average of at least 15 % of adults should participate in lifelong learning.
The understanding of social class presented here represents an extension of conventional measures of poverty and disadvantage to reflect more adequately the multifaceted nature of social class and how child poverty affects child development. Child poverty means lacking any of the resources necessary for child development which are social, cultural as well as material. It is obvious that the family’s financial resources are important (including the education and employment of parents) but so too is the child’s diet and home learning environment as well as the quality of interactions within the family. Poverty in this wider understanding gives rise to disparities in social & emotional skills and language & cognitive skills that were evident when children entered the study. Understanding the pervasive influence of social class on child outcomes is an essential step towards improving outcomes for children. It is also an essential step in developing services for children – including the coordination of early years services with other services for children and families – and needs to take full account of the impact which lack of resources (in the widest sense) has on child development.
Supporting Parents
Supporting parents is one of the ‘transformational goals’ in the National Policy Framework for Children & Young People (2014‐2020) and an integral part of the parenting support strategy of the Child & Family Agency. Parent‐child relationships are a significant influence on children’s social & emotional skills and language & cognitive skills. The study found that this relationship is part of a wider social context that needs to be taken into account, especially when considering how to support vulnerable parents. The analysis reveals that the main influence on parent‐child relationships is the mother’s well‐being; this in turn reflects her resources as indicated by social class, support networks and NESB. In other words, a significant part of a child’s experience of the world, and what the world offers, is mediated through the mother’s experience of the world as reflected in the mirror of her personal well‐being and her relationship with the child. This web of influences on the parent‐child relationship is illustrated in Figure 2.
Figure 2 Summary of Influences on the Parent‐Child Relationship
The study also found evidence to suggest that different ‘styles’ of the parent‐child relationship have different impacts on children’s skills. Specifically, parents who have a more ‘relaxed parent‐child

xx
relationship’ (mainly associated with less conflict and stress) tend to facilitate children’s social & emotional skills while parents with a more ‘demanding parent‐child relationship’ (mainly associated with more conflict and stress) tend to facilitate children’s language & cognitive skills. The interpretation of this finding recognises that a common root of all parenting styles is the attachment between parent and child since this bond is known to be foundational for every child; through this attachment bond, the child develops a sense of self and an internalised working model of interactions which normally lasts throughout adult life. In addition, parental responsiveness to the child, both emotional and cognitive, is also shaped by this attachment bond. Against this background, our findings suggest that a balance of relaxed and demand styles of parenting is conducive to the development of children’s skills. These findings have implications for how to support parents and, though that, improving child outcomes. It is true that how parents interact with their children remains central to child development – combining both ‘relaxed’ and ‘demanding’ styles as expressions of parental attachment and responsiveness to the child – but improving the parent‐child relationship may also require improving the mother’s well‐being. This study indicates that this can be done by ameliorating the negative impacts of disadvantage and lack of support since these also affect the parent‐child relationship and, through that relationship, the child’s development. Specifically, this perspective involves seeing the parent‐child relationship in the context of a wider set of influences on the child which include the mother’s self‐esteem, optimism, life satisfaction and positive affect (expressions of her well‐being); her education, occupation, financial difficulties, home learning environment and diet (expressions of her social class); as well as her sources of support when help is needed. In light of this, it is clear that supporting parents so that children achieve better outcomes involves improving the quality of their interactions but it also involves a wider set of supports for more vulnerable parents. This is consistent with the approach adopted in those early years programmes which have shown the largest and most enduring impacts on disadvantaged children because they are accompanied by family support services for parents. These insights could inform future developments of the Free Pre‐School Year – and early years services generally – while also being considered in the policy statement on ‘Parenting and Family Support’, one of the commitments in the National Policy Framework for Children & Young People (2014‐2020).
Integrating New Communities Ireland is an increasingly multi‐cultural society. In 2010 there were 75,000 children born in Ireland, over 20% of them to mothers not themselves born in Ireland. Reflecting this trend, a substantial minority of children in the study (15%) are described as NESB (Non‐English Speaking Background) because the mother’s first language is not English (excluding mothers whose first language is Irish). An important finding of the study is that the Free Pre‐School Year had a positive impact on children with NESB. Nevertheless, the gap in language & cognitive skills remained unchanged, indicating that further support is required including initiatives which develop the skills of staff to address the needs of these children. However, this study suggests that the Free Pre‐School Year has the potential to have a positive effect on promoting the integration of children from new communities, probably because of the benefits of interacting with staff and other children in a new environment. NESB is an attribute of the mother as well as the child and the analysis revealed that NESB mothers, though similar to other mothers in terms socio‐economic status, have consistently weaker well‐being. This means that they tend to have lower self‐esteem, optimism, life satisfaction and positive affect. The reasons for this are not apparent since no data was collected on the country of origin of NESB mothers, their reasons for coming to Ireland, how long they have been living here, or the circumstances in which they are living here. Nevertheless their weaker well‐being is a cause of concern in its own right but also because this has a negative impact on the parent‐child relationship and on their children’s development.
xxi
Concluding Comment
This study is part of a larger body of evidence generated by NEYAI on different aspects of early years services in Ireland. The study focused on child outcomes in pre‐school and, while this represents just one strand of work in NEYAI, it has particular national relevance in the context of the Free Pre‐School Year because it provides some of the first evidence available on the determinants of child outcomes during that year. The evidence presented showed that this sample of children improved their social & emotional skills and especially their language & cognitive skills during the Free Pre‐School Year but, without a matched control group of children not in the programme, it is impossible to know how much of this improvement is attributable to natural child development and how much to the impact of pre‐school. The study is on firmer ground in explaining why children varied in their progress during the Free Pre‐School Year and the three main findings merit repeating since they have radical implications for the future direction of the Free Pre‐School Year and early years services generally. First, child development is characterised by change and stability which, in the context of the Free Pre‐School Year, means that the parameters of a child’s progress are set by the child’s starting point: children who start with more skills make more progress while those who start with less skills make less progress. Second, the main influence on a child’s starting point, and therefore on progress during the Free Pre‐School Year, is the child’s family particularly the relationships and resources within the family which are essential for child development. Third, the gaps in skills between children which were evident at the start of the Free Pre‐School Year tended to remain unchanged or even widened and, without remediation, these gaps are likely to persist throughout primary and secondary school and possibly into adulthood. These findings, which are consistent with a much larger body of international and Irish evidence on pre‐school and school systems, have radical implications because they frame the Free Pre‐School Year in the wider context of a child’s life. It is easily forgotten that the Free Pre‐School Year represents just 3% of a child’s entire life up to that time and, although it comes relatively early in the life of a child, it is not early in terms of child development. This supports the case for earlier intervention, particularly where a child’s family circumstances are not conducive to normal healthy development. It also underlines why improving child outcomes and reducing socially‐generated gaps in child outcomes cannot be the sole responsibility of Ireland’s early years system, even if it has a substantial and potentially more important role to play. The findings of this study also underline why the economic case for early years services is typically built on the long‐term outcomes of programmes which are high quality, multi‐year and include family support and related services for vulnerable parents. These landmark programmes address all key influences on child outcomes which are identified in this study. It is clear that the Free Pre‐School Year does not meet the standard of these landmark programmes and, for that reason, will only deliver the expected economic return on investment if, but only if, that investment is sufficient to produce a programme of equivalent standard. In other words, all the evidence indicates that further progress is required to create a more successful early years system, including a more successful Free Pre‐School Year, in order to improve outcomes for all children while simultaneously narrowing the gap in outcomes between children.
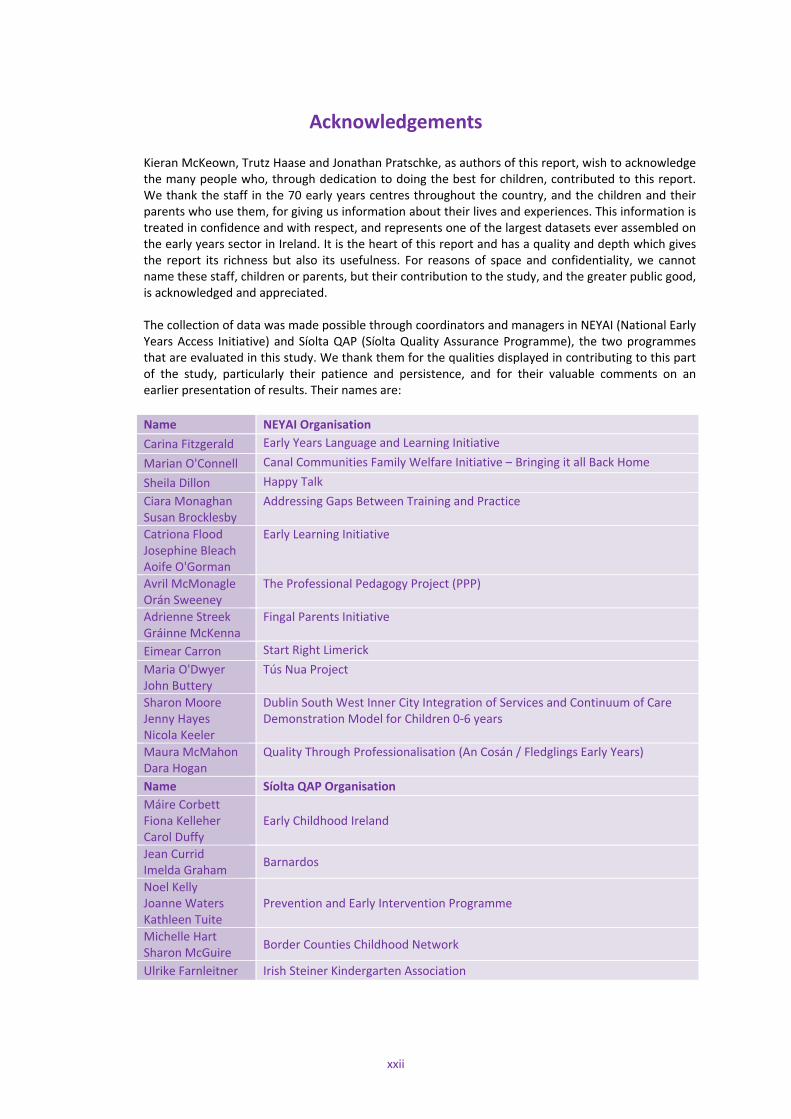
xxii
Acknowledgements Kieran McKeown, Trutz Haase and Jonathan Pratschke, as authors of this report, wish to acknowledge the many people who, through dedication to doing the best for children, contributed to this report. We thank the staff in the 70 early years centres throughout the country, and the children and their parents who use them, for giving us information about their lives and experiences. This information is treated in confidence and with respect, and represents one of the largest datasets ever assembled on the early years sector in Ireland. It is the heart of this report and has a quality and depth which gives the report its richness but also its usefulness. For reasons of space and confidentiality, we cannot name these staff, children or parents, but their contribution to the study, and the greater public good, is acknowledged and appreciated. The collection of data was made possible through coordinators and managers in NEYAI (National Early Years Access Initiative) and Síolta QAP (Síolta Quality Assurance Programme), the two programmes that are evaluated in this study. We thank them for the qualities displayed in contributing to this part of the study, particularly their patience and persistence, and for their valuable comments on an earlier presentation of results. Their names are: Name NEYAI Organisation Carina Fitzgerald Early Years Language and Learning InitiativeMarian O'Connell Canal Communities Family Welfare Initiative – Bringing it all Back Home Sheila Dillon Happy Talk Ciara Monaghan Susan Brocklesby
Addressing Gaps Between Training and Practice
Catriona Flood Josephine Bleach Aoife O'Gorman
Early Learning Initiative
Avril McMonagleOrán Sweeney
The Professional Pedagogy Project (PPP)
Adrienne Streek Gráinne McKenna
Fingal Parents Initiative
Eimear Carron Start Right LimerickMaria O'Dwyer John Buttery
Tús Nua Project
Sharon Moore Jenny Hayes Nicola Keeler
Dublin South West Inner City Integration of Services and Continuum of Care Demonstration Model for Children 0‐6 years
Maura McMahon Dara Hogan
Quality Through Professionalisation (An Cosán / Fledglings Early Years)
Name Síolta QAP Organisation Máire Corbett Fiona Kelleher Carol Duffy
Early Childhood Ireland
Jean Currid Imelda Graham Barnardos
Noel Kelly Joanne Waters Kathleen Tuite
Prevention and Early Intervention Programme
Michelle Hart Sharon McGuire Border Counties Childhood Network
Ulrike Farnleitner Irish Steiner Kindergarten Association

xxiii
The study was guided, supported and approved by an Evaluation & Learning Expert Advisory Group. This group is the type that researchers dream of: competent, challenging, good‐humoured, and committed to clarity of thought and purpose, mindful that research is a service for the common good. We express our appreciation to each member of this group:
Name Organisation
Tony Crooks (Chair) Adjunct Professor of Applied Social Studies, NUI Maynooth
Marjorie Smith Professor of the Psychology of the Family and Co‐Director of the Thomas Coram Research Unit, Institute of Education, University of London
Áine Hyland Emeritus Professor of Education, University College, Cork
Bernie McDonnell Programme Manager, NEYAI
Gail Birkbeck Strategic Learning & Evaluation Executive, Atlantic Philanthropies
Overall responsibility for NEYAI rests with a Steering Group. Our dealings with the Steering Group have been mainly through its Chair, Noel Kelly, who has been solid, generous and understanding in his support of our work. We have had separate contacts with Catherine Hynes and Maresa Duignan in the Department of Education & Skills regarding the Síolta sample and they did everything to facilitate this part of our work. We also had contacts with Albert O’Donoghue in the Department of Children & Youth Affairs and greatly appreciate the access we were granted to the Department’s database of early years centres. We thank these and all members of the Steering Group:
Name Organisation
Noel Kelly (Chair) Preparing for Life, Northside Partnership
Noelle Spring (Vice‐Chair) Katharine Howard Foundation
Marion Martin (replacing Albert O'Donoghue and prior Liz Canavan)
Department of Children and Youth Affairs
Catherine Hynes Early Years Policy Unit, Department of Education & Skills
Ruth Cullen (replacing Mary Cunningham, National Youth Council of Ireland )
Cork City Childcare Committee and Pobal Board
Charles Delap (replacing Brian Nolan)
Mount Street Club Trust
Jane Forman (replacing Tom Costello)
Atlantic Philanthropies
Tony Crooks Adjunct Prof of Applied Social Studies, NUI Maynooth
Gretta Murphy Kilkenny County Childcare Committee
Stella Owens (replacing Heino Schonfeld)
Centre for Effective Services
Aisling Gillen National Policy Development Manager Family Support, Child & Family Agency
Denis Leamy CEO, Pobal
Bernie McDonnell Programme Manager, NEYAI

xxiv
Throughout the study, we have been in regular contact with the staff team in Pobal who are responsible for NEYAI and its evaluation. This is a team of exemplary, dedicated and hard‐working public servants and they have done everything to facilitate our work. A special word of thanks is due to Bernie McDonnell, Programme Manager of NEYAI, for her skilfulness in managing the programme and its evaluation. It has been a pleasure to work with Bernie and her team, and we are grateful for their support right to the end:
Name Role
Bernie McDonnell Programme Manager, NEYAI
Nuala Kelly (replacing Siobhán O'Dowd) Co‐ordinator ‐ NEYAI
Emily Cunningham Administrator ‐ NEYAI
The collection of data for this report was a major undertaking. Some of the data, notably through the staff and child questionnaire, was collected on‐line through a website which we designed for the evaluation (www.neyai‐evaluation.ie). Insight Statistical Consulting (www.insightsc.ie) set up and managed the on‐line system of data collection and provided us with regular updates of progress. We particularly thank its CEO, David Harmon, for providing us with an excellent service at every stage of this process. Some of the data, notably from parents, was collected through face‐to‐face interviews. This was highly sensitive work but also required impressive logistical ability to set up and carry out hundreds of interviews throughout the country at relatively short notice, at a time and place that suited each parent. This work was carried out by Fieldwork Future (www.fieldworkfuture.com) who are experts in the field. It was managed by its Fieldwork Manager, Torsten Valbert, who also did some of the interviews, and we express our appreciation to him and his team for the admirable personal and professional qualities which they brought to this work. Over the course of the study, it has been a pleasure to have prolonged conversations with one of Ireland’s leading specialists in early childhood education, Geraldine French, whose clear and passionate thinking helped dissolve some confusion at earlier stages of the study. We are particularly grateful to her for providing a fine evaluation of the Language Enrichment Programme on which we draw heavily in Chapter Six of this report. We received some excellent feedback and commentary on an earlier draft of the report from Toby Wolfe and Ciairín de Buis, both of Start Strong. We particularly appreciate their insightful suggestions on how to improve the presentation of findings and implications. We acknowledge our gratitude to the funders of NEYAI for the generosity that made this initiative and its evaluation possible. These are: Atlantic Philanthropies, Mount Street Club Trust, Department of Children & Youth Affairs, Department of Education & Skills, and Pobal. In the now time‐honoured tradition, we assure everyone who has contributed to this report, particularly those named above, that they are not responsible for any errors of omission or commission which the report may contain. Kieran McKeown, Trutz Haase and Jonathan Pratschke take full responsibility for the report and its contents.

xxv
Finally, we recognise that this study is a small part of a larger work, inspired by the Government’s vision for children that: ‘growing up in Ireland means that you have the best start in life available anywhere in the world’. Everyone, named and unnamed, in these acknowledgements is a co‐author of that larger work. It is our service, as individuals and a society, to do all we can so that children ‘stand in the glow of ripeness’, to borrow a phrase about giving service from Polish poet and Nobel laureate, Czeslaw Milosz3: ‘Then he wants to use himself and things So that they stand in the glow of ripeness. It doesn't matter whether he knows what he serves: Who serves best doesn't always understand.’ Kieran McKeown, Trutz Haase & Jonathan Pratschke May 2014
3 Miłosz, C., (2001). Czeslaw Miłosz was awarded the Nobel Prize in Literature in 1980. He once wrote: ‘The
child who dwells inside us trusts that there are wise men somewhere who know the truth.’ Writing at the centenary of his birth in 2011, Seamus Heaney, Nobel Laureate in 1995, wrote that Milosz ‘has become one of those wise men’ (The Guardian, 7th April 2011).

1
1 Background and Context ‘The vision of Government: that growing up in Ireland means you have the best start in life available anywhere in the world.’4 Minister for Children and Youth Affairs, (2011‐present), Frances Fitzgerald. ‘If Ireland gets it ‘right from the start’, by adopting a comprehensive Early Years Strategy for our children, with a serious commitment to implementation, we will end up with a generation of children, and successive generations, who are happier, healthier, safer, learning more, developing better and coping better with the adversity that life throws up. … . If the people of Ireland really do want to change the future – to ensure that right from the start all our children have the best possible chance – that requires a major statement of political purpose and a radical re‐orientation of structures, organisations, resources and policy priorities.’5 Eilis Hennessy, Chair, on behalf of Expert Advisory Group on Early Years Strategy.
1.1 Introduction This study is about the education and care of children in the year before they start school. It assesses the influence of two programmes ‐ National Early Years Access Initiative (2011‐2014) (NEYAI) and the Síolta Quality Assurance Programme (2010‐2013) (Síolta QAP) ‐ on child outcomes in a sample of children who attended the 2012/13 Free Pre‐School Year. It is useful therefore to begin by stating why the education and care of children is important. Education is for life and for living life to the full. As such, it is intrinsically valuable and, because everyone is equally valuable, it is a universal right. Education is also useful for making a living and doing satisfying work and, for that reason, is extrinsically valuable for individuals and society. Combining these dimensions, the Kerry primary‐school teacher and writer, Bryan McMahon, observed that education ‘opens the windows of wonder’6 for each child and, in so doing, opens the window to being well and doing well. For these reasons, the value of education is universally accepted and the opportunity to experience its benefits is seen as something to which every person has a natural entitlement. A variety of terms are used to refer to the care and education of children under the age of six, such as ‘early years’, ‘pre‐school’ or ‘childcare’ and it may be useful to begin with a clarification. In Ireland, the sector is officially known by the term ‘early childhood care and education’ (ECCE), a term also used by UNESCO. By contrast, the preferred term in OECD and EU publications is ‘early childhood education and care’ (ECEC). There is also a preference in Ireland for the term ‘pre‐school’ rather than the OECD term ‘pre‐primary’, although ‘infant classes’ (itself a uniquely odd term) in primary school are effectively ‘pre‐primary’7 but not ‘pre‐school’. In keeping with these differences in terminology,
4 Minister for Children and Youth Affairs, 2012a:viii. 5 Expert Advisory Group on the Early Years Strategy,2013:1. 6 McMahon, 1992:80. 7 ‘Primary schools in Ireland are unusual in that they enrol large numbers of pupils who are younger than the
compulsory age of attendance at six years. In effect, this means that nearly half of four‐year‐olds and almost all five‐year‐olds are enrolled in the Infant classes of primary schools. There is often confusion about whether pupils in Infant classes in Ireland should be classified as pre‐primary (ISCED 0) or primary (ISCED 1)1. The Department of Education and Skills frequently uses the latter classification and most Irish people would consider pupils in Infants classes as attending primary school. However, in international contexts such as PIRLS and TIMSS, Infant classes are often classified as pre‐primary. The manual for ISCED (OECD, 1999) partly adds to the confusion, as the table for Ireland includes eight grades under primary/ISCED 1, but also notes that “Programme is divided into two ISCED levels in the UOE [UNESCO/OECD/EUROSTAT] data collection. For UOE reporting, ISCED level 0 comprises the first two years of this programme” (p. 92). The main basis for the distinction is the length of the school day, which is shorter for Infants classes.’ (Lewis and Archer, 2013:16). Note that ISCED, or the International Standard Classification of Education, is a multidimensional framework designed to facilitate international comparisons of educational statistics and to reflect educational pathways in the OECD indicators (OECD, 1999). Note also that UOE refers to the database on education statistics compiled by UNESCO, OECD and EUROSTAT on the basis of national administrative sources according to international standards, definitions and classifications.’ (Lewis and Archer, 2013:16).

2
while also contributing to perplexity, the Free Pre‐School Year is also known by its more formal title Early Childhood Care and Education (ECCE) Programme. Whether or not these different terms denote any difference in philosophical perspective or have any policy and practice implications is a matter of speculation, but some reform and standardisation of the language might be timely. Adopting a pragmatic perspective, we use the term ‘early years’ rather than ‘childcare’ but also use the term ‘pre‐school’ depending on the context. We also use the preferred Irish term ‘early childhood care and education’ (ECCE) rather ‘early childhood education and care’ (ECEC), unless the context suggests otherwise, such as when citing OECD or EU data. This chapter sets out the background and context by describing national, departmental and EU policy on early childhood care and education (sections 1.2‐1.5). A brief overview is provided of the early years sector in Ireland (section 1.6) and the Free Pre‐School Year (section 1.7) before describing the two quality frameworks for early years care and education ‐ Síolta: National Quality Framework for Early Childhood Education (Section 1.8) and Aistear: National Early Childhood Education Curriculum Framework (Section 1.9). The role of the National Council for Curriculum and Assessment in this sector is also outlined (Section 1.10). Finally, we describe the programme which gave rise to this evaluation – NEYAI: National Early Years Access Initiative (Section 1.11).
1.2 National Policy on Early Childhood Care and Education
National policy on children is informed by the Government’s vision, articulated by the Minister for Children and Youth Affairs, that: ‘growing up in Ireland means that you have the best start in life available anywhere in the world’8. Beginning with early childhood care and education, the programme of the current Government (2011‐present) states: ‘We will maintain the free pre‐school year in Early Childhood Care and Education to promote the best outcomes for children and families. We will improve the quality of the pre‐school year by implementing standards and reviewing training options. As resources allow, this Government will invest in a targeted early childhood education programme for disadvantaged children, building on existing targeted pre‐school supports for families most in need of assistance such as the youngballymun project.’9. Beyond the early years, it is also Government policy to improve the standard of education reached by all Irish students, particularly in literacy and numeracy, as measured by international tests: ‘A longer term aim of this Government will be to position Ireland in the top ten performing countries in the OECD Programme for International Student Assessment (PISA). … . This Government believes that no child should leave an Irish school unable to read and write. A national literacy strategy for children and young people will be developed as a matter of urgency, with school‐level targets that are related to national targets. Every school will be required to have a literacy action plan, with demonstrable outcomes. … . Together with a new focus on how literacy is taught, time spent on quality literacy tuition is important. DEIS primary schools will be required to teach literacy for 120 minutes per day; non‐DEIS schools to teach literacy for 90 minutes per day. This time includes incorporating structured literacy tuition into teaching of other subjects.’10 The Government’s focus on literacy is partly a response to PISA 2009 findings, an OECD test in literacy and numeracy for 15‐year olds, which showed that, in the area of print reading, Irish students were significantly below their performance in 2000 and fell from 5th to 17th place in the OECD rankings, the biggest decline among the OECD countries11. The reasons for the dramatic decline in performance of Ireland’s 15‐year olds between 2000 and 2009 are not entirely clear, including how much of this
8 Department of Children and Youth Affairs, 2012a:viii. 9 Department of Taoiseach, 2011:39. 10 Department of Taoiseach, 2011:40. 11 Perkins, Cosgrove, Moran and Shiel, 2012. The PISA 2009 findings in the area of print reading show that Irish
15‐year old students were not significantly different from the OECD average but their performance in in 2009 was were significantly below 2000 which led to their fall from 5th to 17th place in the OECD rankings. In the area of mathematics, Irish students were ranked 26th out of 34 OECD countries in PISA 2009 and well‐below the OECD average. Girls out‐performed boys in print reading but not in mathematics while socio‐economic status was a major influence on both individual‐level and school‐level performance.

3
reflects a real decline in performance12, but a benign consequence of this result is a renewed emphasis on the importance of literacy and numeracy, particularly since it is a strong predictor of progress at all levels of the education system13, and of economic prosperity generally14. The PISA 2009 results were also important in demonstrating how students across the OECD who attended one year of pre‐school performed significantly better than students who did not15. On reflection, this is not surprising given that achievement at any given moment is the cumulative and compound16 consequence of all previous achievements17. An important aspect of Government policy is the commitment to ‘tackling Ireland’s economic crisis in a way that is fair, balanced, and which recognises the need for social solidarity’18. Addressing poverty, and child poverty in particular, is an important aspect of this: ‘The elimination of poverty will be an objective of this Government. We are committed to achieving the targets in the National Action Plan for Social Inclusion to reduce the number of people experiencing poverty. A new approach is needed to break the cycle of child poverty where it is most deeply entrenched. We will adopt a new area based approach to child poverty, which draws on best international practice and existing services to tackle every aspect of child poverty. Initially, this model will be rolled out to up to ten of Ireland’s
12 ‘The results of this study confirm the interpretation that there has been a consistent decline in PISA
performance since PISA 2000, particularly in the reading domain. However, the analyses identified several limitations of the PISA methodology, and found that PISA 2009 results, and their presentation in particular, overstate the decline in performance in Ireland. Moreover, there is no clear evidence suggesting that this performance decline is wholly indicative of a decline in student proficiency.’ (Cartwright, 2011:41; see also Perkins, Cosgrove, Moran and Shiel, 2012).
13 The importance of literacy and numeracy continues into third‐level education where Leaving Certificate results in Maths and English are the two best predictors of successful progression at this level, and further corroborate the general principle that past educational attainment predicts future educational attainment. ‘Prior educational attainment is the strongest predictor of successful progression through higher education. This is reflected most clearly in Mathematics which is the strongest predictor of successful progression among higher education students. New entrants with higher points in Mathematics are most likely to progress. Attainment in English in the Leaving Certificate examination is also a strong indicator of progression, albeit not as direct as attainment in Mathematics’ (Mooney, Patterson, O’Connor and Chantler, 2010:6).
14 Commenting on the 2009 PISA findings for Ireland, an OECD expert drew attention to the economic implications: ‘The international achievement gap is imposing on the Irish economy an invisible yet recurring economic loss that is even greater than the output shortfall in the recent economic crisis. A study carried out by the OECD in collaboration with Stanford University suggests that a modest goal of having Ireland boost its average PISA scores by 25 points over the next 20 years – far less than the most rapidly improving education systems in the OECD achieved between 2000 and 2009 – could imply a gain of over 350 billion Euro for the Irish economy over the lifetime.’ (Schleicher, 2013:10).
15 ‘In all 34 OECD countries, students who attended pre‐primary education for more than one year outperformed students who did not. This finding remains unchanged after socio‐economic background is accounted for. On average across OECD countries, the advantage before accounting for socio‐economic factors stands at more than 54 score points, and after at 33 score points. In general, this reduction signals that attendance in pre‐primary education for more than one year and socio‐economic characteristics are somewhat related, yet there is still a strong independent relationship between attending primary school and performance at age 15. … . Part of the variation in the strength of the relationship between pre‐primary attendance and the socio‐economic background of students may be due to the fact that many other factors apart from pre‐primary attendance (e.g. education in and out of school that students received between the ages of six and 15) may influence the performance of 15‐year‐olds. Many studies have concluded that while pre‐primary attendance may raise students’ cognitive test scores and build a foundation for students to develop further in the course of their study, the gains attributed to attendance in pre‐primary education diminish over time, in part because students return to socio‐economically advantaged or disadvantaged environments and schools.’ (OECD, 2010:98). Note that ‘one school year corresponds to an average of 39 po0ints on the PISA reading scale’ (OECD, 2010:27).
16 Albert Einstein is said to have called ‘the power of compound interest the most powerful force in the universe’.
17 ‘An assessment such as PISA shows not only what young people have learned during their previous year at school, or even during their secondary school years, but also provides an indication of students’ cumulative learning. A country’s results in PISA, or in any assessment for that matter, depend on the quality of care and stimulation provided to children during infancy and their pre‐school years, as well as on the opportunities children have to learn, both in school and at home, during their elementary and secondary school years.’ (OECD, 2010:115).
18 Department of Taoiseach, 2011:52.

4
most disadvantaged communities, in cooperation with philanthropic partners to co‐fund and manage the project.’19 In October 2013, as part of budget announcements, the Minister for Children and Youth Affairs20 introduced the Pre‐School Quality Agenda with three elements: • Additional staff recruitment to the Pre‐School Inspectorate of the new Child and Family Agency
to address gaps which currently exist in the inspection system. (cost: €1.1m) • A new National Early Years Support Service NEYSS). The service will employ graduates in early
childhood care and education who will work directly with services to improve quality including assisting services to implement the Siolta framework and Aistear curriculum for 0 to 6 years. (cost: €2.5m in 2014)
• Training support provided to assist staff already working in the sector to meet the new qualification requirements being introduced from September 2015. (cost: €1.5m in 2014).
In November 2013, the Minister announced an extension of the Area Based Childhood (ABC) Programme till 2016, extending it from 3 to 13 projects with a budget of €30m co‐funded by the DCYA and Atlantic Philanthropies. Building on the earlier Prevention and Early Intervention Programme (PEIP) in three sites (Ballymun, Tallaght and Darndale), the ABC Programme aims to improve long‐term outcomes for children and families living in areas of disadvantage21.
1.3 Policy of Department of Children and Youth Affairs
The Department of Children and Youth Affairs (DCYA) was set up in June 2011 in order to bring greater cohesion to services for children and their families, and ‘lead the effort to improve the outcomes for children and young people in Ireland’22. DCYA’s Statement of Strategy lays particular emphasises on the importance of early years from a variety of perspectives including: promoting economic growth by ensuring affordable early years services; cultivating human capital through early years education particularly the Free Pre‐School Year; and reducing socio‐economic disadvantage through area‐based prevention and early intervention programmes23. The National Policy Framework for Children & Young People (2014‐2020)24 was launched in 2014 and sets out five national outcomes for children and young people. These aspire to ensure that every child and young person is: (1) active and healthy, with positive physical and mental wellbeing; (2) achieving full potential in all areas of learning and development; (3) safe and protected from harm; (4) has economic security and opportunity; (5) connected, respected and contributing to the world25. In order to achieve these outcomes, the framework sets out six ‘transformational goals’: (1) support parents; (2) earlier intervention and prevention; (3) a culture that listens to and involves children and young people; (4) quality services – outcomes‐driven, effective, efficient and trusted; (5) effective transitions; (6) cross‐Government and interagency collaboration and coordination26. DCYA is responsible for implementing the Free Pre‐School Year which, being a central theme of this report, is described in detail below (section 1.7). The Department also has responsibility for the Child and Family Agency (CFA) which became operational in January 2014. The Agency provides a range of services notably child protection, family support, educational welfare, children in detention schools, domestic and sexual violence27.
19 Department of Taoiseach, 2011:52. 20 Minister for Children and Youth Affairs, 2013a. 21 Minister for Children and Youth Affairs, 2013c. 22 Department of Children and Youth Affairs, 2012a. 23 Department of Children and Youth Affairs, 2012a. 24 Department of Children and Youth Affairs, 2014. 25 Department of Children and Youth Affairs, 2014:4‐6. 26 Department of Children and Youth Affairs, 2014:7‐9. 27 In July 2012 a Task Force to advise on setting up the agency recommended that it should directly provide or
commission the following core services: public health nursing, speech and language, child and adolescent mental health, psychology, educational welfare, children in detention schools, domestic and sexual violence

5
1.4 Policy of Department of Education and Skills
The Department of Education and Skills (DES) includes early years education as a first goal in its Statement of Strategy (2011‐2014): ‘Provide a quality inclusive school and early years education system with improved learning outcomes’28. Central to this goal is the national literacy and numeracy strategy whose aim is to improve the standard of literacy and numeracy among children and young people in the education system. This is described as ‘an urgent national priority for the Minister for Education and Skills and the Government’29. As part of this strategy, the outcome to be achieved by the early years settings is clearly stated: ‘Improve the oral‐language competence of young children in early childhood care and education (ECCE) settings and their readiness to develop early mathematical language and ideas.’30 The national literacy and numeracy strategy clearly sets out the reasons why literacy and numeracy are essential skills for each person and for society: ‘Missing out on the skills of literacy and numeracy or failing to develop these skills to the best of each person’s capability is not just a loss for the individual: it is also an enormous loss for all of us in Irish society. Mastering the skills of literacy and numeracy brings with it many social, economic and health benefits for the individual and society as a whole. Having young people who can apply mathematical understanding in a growing range of economic, technical, scientific, social and other contexts is essential if we are to ensure employment and economic prosperity in the future. We know too that children who do not learn to read, write and communicate effectively are more likely to leave school early and in later life to be unemployed or in low skilled jobs, to have poorer emotional and physical health, to have limited earning power, and are more likely to be imprisoned. This strategy is premised on the strong belief that developing good literacy and numeracy skills among all young people is fundamental to the life chances of each individual and essential to the quality and equity of Irish society.’31 The strategy also underlines the importance of early childhood experiences for subsequent learning: ‘Early childhood, the period from birth to six years of age, is a time of significant opportunity for learning. During these early years, children take their first steps along their journey of lifelong learning. They have an inherent capacity to learn from birth and the experiences they have in their homes and wider environment impact significantly on their development and future learning. Early experiences that support the development of children’s communication skills (such as their awareness of verbal and non‐verbal communication; their knowledge of sound, pattern, rhythm and repetition; their awareness of symbols such as print and pictures; the opportunities that they have to become familiar with and enjoy print in a meaningful way; and the opportunities that they have to use mark‐making materials) play a key role in the development of their literacy skills. Their awareness of materials, shape, space, pattern and difference, classifying, matching, comparing and ordering are important for the development of numeracy. The knowledge, skills, attitudes and dispositions developed in these early years impact significantly upon their later learning experiences.’32 The national literacy and numeracy strategy acknowledges that an effective education system enables all children, particularly those experiencing difficulties due to socio‐economic circumstances, to reach a satisfactory standard of literacy and numeracy: ‘Children from socially and economically disadvantaged backgrounds are significantly more likely to experience difficulties in literacy and numeracy achievement than other children. … . Some of these reasons are connected with poverty,
(Task Force on Child and Family Support Agency, 2012:31). The vision informing this recommendation was that ‘the scope of services provided directly by the agency, or linked with it in a defined and structured way, should range from support to families in the community to highly specialised interventions where children have been identified as requiring out of home care.’ (Task Force on Child and Family Support Agency, 2012:25). Some of the services recommended by the Task Force, notably public health nursing, speech and language, child and adolescent mental health, are not part of the Child and Family Agency as recommended by the Task Force.
28 Department of Education and Skills, 2011a:6. 29 Department of Education and Skills, 2011b:14. 30 Department of Education and Skills, 2011b:17; also 2011a:6. 31 Department of Education and Skills, 2011b:9. 32 Department of Education and Skills, 2011b:10.

6
poor housing and health, and parental unemployment. In some instances, parents themselves have not had good educational experiences … . schools and the education system can and do make a difference to the life chances of children from disadvantaged backgrounds. … schools in which there are high concentrations of students from socially and economically disadvantaged backgrounds may be affected by a “multiplier effect”. … . They are at greater risk of failing to acquire satisfactory literacy and numeracy skills and of leaving school early and without qualifications. … . Raising the educational attainment of these lowest performing students who are most at risk of failure, is vitally important because of the enormous impact improvement can have on the life‐chances of these young people and also because it fosters greater equity in the education system and society in general.’33 The national literacy and numeracy strategy contains a list of nearly 40 actions to improve capacity in the early years sector in order to improve literacy and numeracy outcomes. These are listed in Table 1.1.
Table 1.1: Actions in National Literacy & Numeracy Strategy Directed at Early Years Sector
Enabling Parents and Communities To Support Children’s Literacy and Numeracy Development (Chapter 3) Learn from ways that the existing early intervention pilot programmes supported by the Department of Children and Youth Affairs are successful in overcoming barriers to literacy and numeracy development in disadvantaged communities Building on evaluation and development work being undertaken by the Centre for Effective Services on behalf of the Department Children and Youth Affairs, work through Children’s Services Committees to secure better literacy and numeracy outcomes by integrating services and interventions effectively at local level Involve schools and ECCE settings in parental and wider community initiatives that promote and support the acquisition of literacy and numeracy skills (e.g., Shared reading, Maths for Fun, library services, etc.) Continue to support family literacy initiatives in socially and economically disadvantaged communities (such as those served by DEIS schools); in allocating support, priority will be given to projects (at early years and school level) that have been evaluated and proven to be effective through evaluations Over time, seek to coordinate expenditure by state agencies and bodies to prioritise initiatives that enable parents, families and communities to support children’s well‐being and learning and that strengthen links between home, ECCE settings and schools Ensure that relevant information on the child’s learning and development is transferred from the home to the preschool, to the primary school and to the post‐primary school to promote smooth transitions Engage with a wide range of child and family support agencies to disseminate information to parents and families on promoting the development of literacy and numeracy skills Develop, in co‐operation with the public library service, models of engagement between schools, ECCE settings and libraries, to include areas such as selection and provision of materials, library membership schemes and planned library visits Use existing networks to encourage sharing of best practice in literacy and numeracy development between groups of schools and ECCE settings in local areas Improving Teachers’ and ECCE Practitioners’ Professional Practice (Chapter 4) Ensure that the training and education courses completed by those entering the ECCE workforce include units on both content and pedagogical knowledge in literacy (including oral language and a focus on additional language learning) and numeracy by working with relevant accreditation bodies
33 Department of Education and Skills, 2011b:61‐62.

7
Continue to provide incentives for the continuing professional development of ECCE practitioners in state‐funded ECCE settings by continuing to link higher capitation rates for pre‐school services with higher qualification rates Work with relevant bodies to ensure that there is sufficient training provision to enable formal qualifications in early literacy and numeracy development be made a requirement for all ECCE leaders in state‐funded ECCE settings Increase the minimum qualification requirements for ECCE practitioners involved in the delivery of state funded ECCE programmes Building the Capacity of School Leadership (Chapter 5) No Actions Directed at Early Years Sector Improving the Curriculum and Learning Experience (Chapter 6) Identify the scope of curricular practice in the ECCE sector by surveying settings participating in the universal free preschool year programme Review the effectiveness of different curricular practices in the delivery of Aistear in the universal free pre‐school year programme Helping Students With Additional Learning Needs To Achieve Their Potential (Chapter 7) Continue to support the provision of early childhood care and education through the free ECCE programme Continue to support enhanced provision for literacy and numeracy in DEIS Band 1 and DEIS Band 2 schools, using a broad range of initiatives and supports In the light of recent evaluations in DEIS schools, concentrate DEIS supports in post‐primary schools in the junior cycle Ensure that all initial teacher education courses and ECCE training programmes include mandatory modules to enable teachers and ECCE practitioners to address the specific literacy and numeracy learning needs of students from disadvantaged backgrounds Ensure that serving teachers and principals have access to continuing professional development and guidance on meeting the learning needs of students from disadvantaged backgrounds Incentivise ECCE practitioners in state‐funded ECCE settings to engage in continuing professional development to enhance their ability to address the literacy and numeracy learning needs of students from disadvantaged backgrounds Continue to provide targeted continuing professional development opportunities in initiatives that improve the teaching, learning and assessment of literacy and numeracy in DEIS schools Improve the skills of teachers and ECCE practitioners in assessing, monitoring and recording literacy and numeracy outcomes for students from disadvantaged backgrounds Ensure that schools prioritise the tracking, assessment and analysis of the achievement of students from disadvantaged backgrounds as part of the school’s self‐evaluation and improvement process Encourage the management of ECCE settings and schools and their communities to put in place procedures to facilitate schools and ECCE settings to work collaboratively with parents to improve literacy and numeracy learning Ensure that all initial teacher education courses and ECCE training programmes include mandatory modules to: ‐ enable teachers and ECCE practitioners to address the specific literacy and numeracy learning
needs of students for whom English is an additional language ‐ raise awareness among teachers and ECCE practitioners that some migrant students will be
receiving informal support in their mother tongue in out‐of‐school educational settings Ensure that all initial teacher education courses and ECCE training programmes include mandatory modules to enable teachers and ECCE practitioners to address the specific literacy and numeracy learning needs of students with special educational needs

8
Incentivise state‐funded ECCE practitioners to engage in continuing professional development to enhance their ability to address the specific literacy and numeracy learning needs of students with special educational needs Promote the use of available guidelines and online resources for schools and ECCE settings on best practice in supporting the needs of students with special educational needs Improve the skills of teachers and ECCE practitioners in assessing, monitoring and recording literacy and numeracy outcomes for students with special educational needs Encourage the management of ECCE settings and schools and their communities to put in place procedures to facilitate schools and ECCE settings to work collaboratively with parents to improve literacy and numeracy learning Explore possibilities for synergies between initial and continuing professional development courses for teachers and ECCE practitioners, and those for speech and language therapists Ensure that an understanding of the role of speech and language therapy is included in the content of initial and continuing professional development courses for teachers and ECCE practitioners Improving Assessment and Evaluation to Support Better Learning In Literacy and Numeracy (Chapter 8) Ensure that all initial teacher education courses and ECCE training programmes include mandatory modules to enable teachers and ECCE practitioners to use a range of assessment approaches to: ‐ inform the planning of subsequent steps in students’ learning of literacy and numeracy, i.e. assessment for learning (AfL) approaches ‐ monitor effectively learners’ achievement in literacy and numeracy, i.e. assessment of learning
(AoL) approaches ‐ document students’ learning in literacy and numeracy and report to parents, other teachers and
other professionals as appropriate ‐ identify specific learning needs Incentivise state‐funded ECCE practitioners to engage in continuing professional development to enhance their ability to use a range of assessment for learning (AfL) and assessment of learning (AoL) approaches Support the development and publication of assessment tools to assist ECCE practitioners and teachers of infants to monitor and report on the progress that children in ECCE settings and infant classes are achieving Improve arrangements for the transfer of information about the progress and achievement of students between all schools and state‐funded ECCE settings by requiring all settings and schools to provide written reports in standard format to schools and settings to which students transfer (reports to be provided following admission of student to the new school/setting) Improve the quality assurance of state‐funded ECCE provision by:‐ Requiring self‐evaluation to be carried out in all state‐funded ECCE settings ‐ Providing materials and guidance to support self‐evaluation ‐ Developing and implementing pilot external evaluations of the quality of provision (including
the quality of early literacy and numeracy provision) in ECCE settings ‐ Review outcomes of pilot evaluations and use learning to improve quality assurance
mechanisms and models Source: Department of Education and Skills, 2011a:19‐84.

9
The workforce development plan is also a core part of the DES policy for the early years sector. This was prepared by the Early Years Policy Unit of DES which has been co‐located in DCYA since 2011. The main aim of the workforce development plan is to improve the qualifications of staff, both those in the sector as well as those wishing to enter it, based on the following vision: ‘The ECCE workforce should be supported to achieve qualifications (appropriate to their occupational role and profile) that equip them with the skills, knowledge, competencies, values and attitudes to: • Deliver high quality, enriching early childhood care and education experiences for all children
aged birth to six years. • Work effectively with parents and guardians in a mutually supportive partnership towards
achieving positive outcomes for children. • Engage in interdisciplinary professional work practices designed to support the delivery of
consistent quality in the early childhood service provision experiences of young children and their families.’34
In a recent review of the Irish school system35, the National Economic and Social Council observed that substantial progress had been made towards ‘a greater focus on evaluation, standards and accountability’ but also noted that ‘there still remains some way to go in building a system of quality and continuous improvement within teaching and schooling’. Specifically, it noted that: ‘there are some critical pieces missing, of which two are especially important: (1) the general absence of a culture and discipline of reflective practice within schools based upon relatively objective evidence rather than subjective impressions and (2) the absence of a provision of a national data and standards framework which provides a secure basis for judgment about quality and improvement. The first is absolutely dependent on the second whilst the second is redundant without the first. Processes of internal review within classrooms and schools need some external standards of quality and performance as a yardstick for benchmarking. And external standards of excellence are of limited use if they are not used to impel deeper, diagnostic enquiry into why certain problems of teaching and learning are manifesting themselves and how they might be ameliorated.’36 It could be argued that these critical pieces are also missing from the pre‐school and early years sector as well.
1.5 EU Policy on Early Childhood Care and Education The foundation of EU policy on early childhood education and care rests, in the first instance, on a decision of the EU Council in 2002 to establish a common framework for European cooperation in the field of education and training. In that year, the EU also agreed the following objectives for early years services: ‘Member States should remove disincentives to female labour force participation, taking into account the demand for childcare facilities and in line with national patterns of provision, to provide childcare by 2010 to at least 90% of children between 3 years old and the mandatory school age and at least 33% of children under 3 years of age.’37 Building on that foundation, a strategic framework on education and training (known as ET 2020, itself part of the Europe 2020 Strategy38) was adopted by the Council in May 2009. This strategy has five benchmark targets for ET2020: 1. at least 95% of children between 4 years old and the age for starting compulsory primary
education should participate in early childhood education; 2. the share of early leavers from education and training should be less than 10%; 3. the share of low‐achieving 15‐years olds in reading, mathematics and science should be less than
15%; 4. the share of 30‐34 year olds with tertiary educational attainment should be at least 40%; 5. an average of at least 15 % of adults should participate in lifelong learning. will carry on the work
between now and 2020.
34 Department of Education and Science, 2010b:4. 35 National Economic and Social Council, 2012. 36 Jordan and O’Donnell, 2013:25. 37 EU Commission, 2013b:4. 38 European Commission, 2011b.
10
Two of these benchmarks (2 and 4) have been made ‘headline targets’ for which Member States have set national targets. Ireland, which already exceeds these two targets, has set 8% as the target for early school leavers and 60% as the target for those with a third‐level qualification, to be achieved by 2020. A strategic objective of the ET 2020 framework is to promote equity, social cohesion and active citizenship, and one of the ways to achieve this is through early childhood education: ‘Education and training policy should enable all citizens, irrespective of their personal, social or economic circumstances, to acquire, update and develop over a lifetime both job‐specific skills and the key competences needed for their employability and to foster further learning, active citizenship and intercultural dialogue. Educational disadvantage should be addressed by providing high quality early childhood education and targeted support, and by promoting inclusive education. Education and training systems should aim to ensure that all learners – including those from disadvantaged backgrounds, those with special needs and migrants – complete their education, including, where appropriate, through second‐chance education and the provision of more personalised learning. Education should promote intercultural competences, democratic values and respect for fundamental rights and the environment, as well as combat all forms of discrimination, equipping all young people to interact positively with their peers from diverse backgrounds.’39 In 2011, the EU Commission published a communication on early childhood education emphasising its role in promoting ‘smart, sustainable and inclusive growth’ within Europe. The main focus of the communication was on the need for policy to focus on the quality as well as the quantity of early education, ‘the two‐fold challenge’ facing the sector across the EU: ‘to provide access to child care and education for all, but also to raise the quality of their provision through well integrated services that build on a joint vision of the role of ECEC [early childhood education and care], of the most effective curricular frameworks and of the staff competences and governance arrangements necessary to deliver it.’40 Of significance is the recognition that early years services alone, irrespective of quantity and quality, cannot address all of the challenges posed by social and family adversity: ‘It is important to bear in mind that ECEC services, however good, can only compensate partially for family poverty and socio‐economic disadvantage. To increase the long‐term benefits of high‐quality ECEC for the children from a disadvantaged background, ECEC must be linked to initiatives in other policy areas in a comprehensive strategy (employment, housing, health, etc.).’41 In 2013, the EU Commission reviewed the Barcelona objectives on access to early years services and reached the following conclusion: ‘More than 10 years after they were adopted, the Barcelona objectives have not been achieved by most Member States. Furthermore, the situation is deteriorating in several Member States. Significant improvements still need to be made to achieve a satisfactory level of availability, especially for children under 3. Also, the cost of services is still a significant obstacle for parents, as are opening hours, which are not always compatible with their occupational commitments. Investment in quality education and care services that are universal and accessible to all must be continued. This effort must be made largely at Member State level. The Commission is providing support on several fronts’42.
1.6 Early Years Sector
We have seen that services for children aged 0‐6 are known by a variety of terms such as ‘childcare’, ‘early years’, ‘early childhood care and education’ (the official term in Ireland), and ‘early childhood education and care’ (the official term in OECD and EU). In its widest sense, the sector covers all settings including home‐based, centre‐based and school‐based. In its narrower sense, and the sense used in this report, the term refers to centre‐based settings only. The distinction between the wide and narrow sense of the term is important in Ireland because, with the exception of the Free‐Pre‐School Year, the majority of early years services is still home‐based. A 2007‐survey of childcare
39 EU Council, 2009:C 119/4. 40 EU Commission, 2011a:3. 41 EU Commission, 2011a:5. 42 EU Commission, 2013b:17.

11
arrangements in Ireland used by parents of 0‐5 children on a weekly basis found that a minority of children (19%) were in centre‐based care43. In 2010/2011, a GUI survey found that more than a quarter (27%) of 3‐year old children were in centre‐based childcare44. In 2012, the Pobal Annual Survey of the Early Years Sector reported declining use of childcare with vacancies in a majority of centres (69%)45. A contributory factor may be the cost of childcare relative to earnings which is significantly higher than the EU average46, although the average hourly cost is €4.5047.
1.6.1 Early Years Centres
There are approximately 4,300 centre‐based early years providers in Ireland48. Putting this in the wider context of education, the number of early years centres is more than all first‐level schools (3,300) and second‐level schools (723) combined.49 All but 2% of early years centres provide the Free Pre‐School Year50. The majority of early years centres are private/for‐profit (about 68%) with the remainder (32%) described as community/not‐for‐profit51. The average number of places in the Free Pre‐School Year in each centre (16.3) is broadly the same in private (16.1) and community‐based (16.9) centres52. One of the purposes of community‐based early years centres is to provide a subsidised service to those who could not otherwise afford it. This is reflected in the fact that community‐based centres tend to be located in more disadvantaged areas (with a mean deprivation score of ‐5.6) compared to private centres (with a mean deprivation score of 2.0)53. This, however, is only a proxy indicator of targeting since the location of an early years centre may not be a reliable indicator of the children using the centre.
43 The survey found that the majority of 0‐5 children were cared for by their parents (58%) with only a minority
using centre‐based care (19%), the remainder being cared for by relatives or child‐minders (23%) (CSO Quarterly National Household Survey, 2007).
44 ‘Half of the children in Growing Up in Ireland at age three were in some form of non‐parental childcare. Over a quarter of three‐year‐olds were cared for in a crèche, Montessori, pre‐school or naoínra (an Irish‐language playgroup for pre‐school children), 11 per cent were cared for by a relative in a home‐based setting and the remaining 12 per cent were cared for by a non‐relative in a home‐based setting.’ (Williams, Murray, McCrory, McNally, 2013:92).
45 The Pobal Annual Survey of the Early Years Sector 2012 found that less than a third of centres (31%) were ‘full’ with nearly 24,000 vacant childcare places (Pobal, 2013:12).
46 ‘The average cost of a full‐time place in a pre‐school childcare facility (crèche) is about 20% of earnings compared to an EU average of 12%.’ (Pobal, 2013:34).
47 Williams, Murray, McCrory, McNally, 2013:94. 48 Based on Pobal Annual Survey of the Early Years Sector 2012 which surveyed 4,356 childcare centres in DCYA‐
funded programmes (Early Childhood Care & Education (ECCE), Community Childcare Subvention (CCS) and Childcare Education & Training Supports (CETS). (Pobal, 2013:3).
49 Department of Education and Skills, 2012. 50 Based on database of childcare centres in Department of Children and Youth Affairs. 51 Pobal, 2013:4. 52 Based on database of childcare centres in Department of Children and Youth Affairs. 53 The deprivation score is based on the Pobal Haase‐Pratschke Index which was created by Trutz Haase and
Jonathan Pratschke with funding from Pobal (Haase & Pratschke, 2005, 2008). The index is based on the understanding, verified by confirmatory factor analysis, that affluence and deprivation has three dimensions which they refer to as: demographic profile, social class composition, labour market situation. The index combines these dimensions into a single score which is calculated at Electoral District level (3,409 units) and Small Area level (14,937 units). It has a mean score of zero and a standard deviation of ten; consequently nearly all scores are situated within three standard deviations of the mean, ranging between ‐30 and +30. Based on this index, areas are classified as ‘disadvantaged’ (score of ‐10 to ‐20), ‘very disadvantaged’ (score of ‐20 to ‐30), or ‘extremely disadvantaged’ (score of < ‐30). Further details at www.pobal.ie and www.trutzhaase.eu..

12
1.6.2 Expenditure on Early Years Services
Table 1.2 summarises expenditure on early years services in Ireland in 2011 and 2012. This reveals that €266m was spent on early years services in 2012, down 12% from 2011. About two thirds of this (65%, €173.5m) was spent on direct pre‐school provision through the Free Pre‐School Year (€167.9m) and Early Start (€5.6m). If this is averaged across the 66,000 pre‐school children in Ireland54, the average State expenditure per pre‐school child amounts to €2,629.
Table 1.2 State Expenditure on Early Years Sector in Ireland, 2011 and 2012
Cost Category 2011 €m
2012€m
1 Free Pre‐School Year (Early Childhood Care & Education Programme) 166.0 167.92 Community Childcare Subvention (estimate based on 80% for 0‐6) 36.8 40.73 Childcare Education & Training Support (estimate based on 50% 0‐6) 11.5 8.84 City/County Childcare Committees 11.8 11.35 Voluntary Childcare Organisations 2.7 2.76 Early Start 5.6 5.67 Training & Community Employment 67.0 29.4Total 301.4 266.4
Notes: 1‐5 Data from the Department of Children & Youth Affairs; 6‐7 Data from Department Education & Skills.
1.6.3 Employment Status of Staff The estimated number of staff employed in the early years sector in Ireland is 21,00055. Putting this in the wider context of education, there are approximately 32,000 full‐time equivalent teaching staff in first‐level schools, a term covering both primary schools and special schools56. Employment in the early years sector in Ireland breaks down into those who are full‐time (49%), part‐time (42%) and on schemes (8%)57, excluding volunteers (1%) (Table 1.3). The early years sector is relatively unique in that it has twice the proportion of part‐time workers compared to the rest of the Irish economy which less than a quarter of all workers are employed part‐time (24%). Women are more likely to work part‐time compared to men (35% compared to 14%) but the proportion of part‐time workers in the early years sector, which is almost exclusively female, is even higher (54% if employment schemes are included).
Table 1.3: Type of Employment in Early Years Sector
Full‐time%
Part‐time%
Employment Scheme %
Total%
Early Years Sector* 49.1 41.8 8.0 100.0Irish economy** 76.5 23.5 100.0
*Source: Pobal Annual Survey of the Early Years Sector 2012 (Pobal, 2013:40).Excludes volunteers (1%). **Source: National Skills Bulletin 2012 (Expert Group on Future Skills Needs, 2013:87). The extent of part‐time working in the early years sector is partly the result of demand factors, since about three quarters of the demand – by parents and the State through the Free‐Pre‐School Year – is for part‐time rather than full‐time places. Supply‐side factors may also contribute to part‐time working since there may be a preference among staff who are also parents (67% in our survey) to work part‐time; the supply of employment‐scheme workers is, by definition, only available part‐time. The question of whether the full‐time/part‐time composition of the early years labour force is inhibiting its development as a profession, and an attractive career option, is worth debating, taking
54 Department of Children and Youth Affairs, 2012b:66‐67. 55 This is an estimate based on 4,356 centres with an average of 4.9 staff per centre (see Pobal, 2013:38‐39). 56 Department of Education and Science, 2012. 57 This is derived from the Pobal Annual Survey of the Early Years Sector 2011, which covers nearly eight out of
ten (78%) childcare centres (Pobal, 2012:4 and 32).

13
account of the economic factors involved58 but including analysis its wider role within economy and society, and the State’s multiple roles in shaping demand and supply.
1.6.4 Length of Service of Staff Length of service is an indicator of the amount of experience in the sector and this is summarised in Table 1.4. It shows that the median length of service of early years staff is 4 years; half have worked for less than that, half for more. By contrast, the median length of service of fourth class teachers in Ireland’s primary schools is twice that, at 8 years, itself low by international standards59. By these standards, length of service in the early years sector is low. This is influenced by staff turnover itself dependent on the large proportion of staff employed part‐time and on employment schemes60.
Table 1.4: Length of Service of Staff in Childcare Centres
Up to 1 Year %
1‐2 Years%
3‐4 Years%
4+ Years %
Total%
14.9 18.3 17.1 49.7 100.0Source: Pobal Annual Survey of the Early Years Sector 2012 (Pobal, 2013:41). Based on responses from 60% of centres.
1.6.5 Staff Qualifications
The most up‐to‐date estimate of qualifications in the early years sector is provided by the Pobal Annual Survey of the Early Years Sector 2012. Data derived from the survey are summarised in Table 1.5 and suggest that more than 9 out of 10 staff who work directly with children (92%) have a Level 5 qualification or above. In the National Framework of Qualifications61, Level 5 is equivalent to a Leaving Certificate. More than a third of staff (37%) has a Level 6 qualification which is equivalent to a third‐level qualification. Just over a tenth (13%) have a Level 7 qualification which is a third level degree, exactly half that of the general population (26%). All fourth class teachers in Ireland’s primary schools have a third level degree and nearly a fifth (18%) have a post‐graduate qualification62. The Expert Advisory Group on the Early Years Strategy recommended that ‘at least 60% of those working in pre‐school early care and education services are qualified to Degree‐level, including equally those working with under‐3s and those working with over‐3s.’63
58 ‘Economic forces have a significant influence on [childcare] availability, quality, and cost … . There are limits to
parents’ willingness or capacity to pay more for higher quality of care, economic analysis has shown. At the same time, the supply of people willing to work in early childhood care and education for relatively low wages is elastic, and the field has high rates of job turnover. Thus, despite the tremendous increase in the demand for child care that has occurred as mothers of young children have increased their labor force participation, the wages of ECCE workers have remained relatively flat. Government policies, such as regulations and standards, as well as funding allocations also influence this market.’ (Institute of Medicine and National Research Council. 2012:83).
59 ‘In Ireland, the median length of experience was eight years. … . Across all PIRLS countries, the median length of time teaching is slightly more than 16 years.’ (Clerkin, 2013:80). This is based on the report on PIRLS (Progress in International Reading Literacy Study) and TIMSS (Trends in International Maths and Science Study), an international assessment in 2011 of nearly 5,000 Irish fourth class pupils (9‐11 years) in reading, mathematics and science.
60 A national study of turnover rates in Ireland – sometimes referred to as job mobility ‐ found that ‘each year approximately 10 per cent of workers change jobs’, with lower turnover among workers who are older, more skilled, and employed in the public sector (Bergin, 2009:24).
61 www.qqi.ie In 2012, Quality and Qualifications Ireland was formed by merging FETAC and HETAC along with NQAI (National Qualifications Authority of Ireland) and IUQB (Irish Universities Quality Board).
62 Clerkin, 2013:81. 63 Expert Advisory Group on the Early Years Strategy, 2013:22.

14
Table 1.5: Qualifications of Staff Working Directly with Children
<Level 5%
Level 5%
Level 6 %
≥Level 7 %
Total%
Early Years Sector* 8 42 37 13 100Ireland – highest completed education ** 33 36 5 26 100
*Source: Pobal Annual Survey of the Early Years Sector 2012 (Pobal, 2013:43). This refers to early years qualifications only and excludes non‐accredited courses (2.8%) and courses accredited outside Ireland (1.1%). Based on responses from 60% of centres (n=12,838). Note that ’<Level 5’ includes those with no qualifications in early years.
**Source: Census of Population 2011.Based on those whose full‐time education has ceased and excludes those whose highest completed education is not stated.
Note: In the National Framework of Qualifications64, Level 4&5 is equivalent to a Leaving Certificate; Level 6 is a third‐level non‐degree qualification; Level 7&8 is a third‐level degree qualification; Level 9&10 is a third‐level post‐degree qualification.
1.6.6 Summary
The early years sector in Ireland comprises approximately 4,300 centres, broken‐down into two thirds private and one third community. Each centre has about 16 places in the Free Pre‐School Year. State expenditure in the sector amounted to €266m in 2012, about two thirds of it on pre‐school services. The early years sector employs about 21,000 staff who are almost exclusively female. Employment is almost equally divided between full‐time and part‐time which makes the early years sector relatively unique because it has twice the proportion of part‐time workers compared to the rest of the Irish economy. The median length of service of early years staff is 4 years, exactly half the median length of service of fourth class teachers in Ireland’s primary schools which is 8 years, itself low by international standards. The most up‐to‐date estimate of qualifications in the early years sector suggest that more than 9 out of 10 staff who work directly with children (92%) have a Level 5 qualification or above. Just over a tenth (13%) have a third level degree, exactly half that of the general population in Ireland (26%).
1.7 Free Pre‐School Year The Free Pre‐School Year was introduced in 2010. The purpose and objective is set out by the Department of Children & Youth Affairs (DCYA) as follows: ‘The objective of the ECCE programme is to make early learning in a formal setting available to eligible children in the year before they commence primary school. To achieve this, services participating in the pre‐school year are required to provide age‐appropriate activities and programmes to children. … . The object of the programme is to benefit children in the key developmental period by providing a free pre‐school year in the year before they start primary school. … . It is a fundamental principle of the scheme that the pre‐school year is available free to parents, and all participating services are obliged to meet the costs of the free pre‐school year out of the capitation fees. Services may, however, charge parents for additional services provided, including additional hours and additional activities, provided that certain rules are followed in relation to such charges.’65 In 2012/13, the Free Pre‐School Year was delivered by nearly 4,200 early years providers to nearly 70,000 children66. In order to deliver the programme, the pre‐school leader in each centre must have at least a FETAC‐Level 5 qualification in early childhood care and education, or equivalent. The cost of the programme in 2012/13 is around €168m. This is paid to early years providers through an annual capitation fee of approximately €2,400 per child, reduced slightly from September 2012. A higher capitation fee of approximately €2,800 per child is paid where the early years leader has a degree‐level qualification in childhood/early education and at least three years’ experience, and all early
64 www.qqi.ie In 2012, Quality and Qualifications Ireland was formed by merging FETAC and HETAC along with
NQAI (National Qualifications Authority of Ireland) and IUQB (Irish Universities Quality Board). 65 Website of Department of Children and Youth Affairs: www.dcya.ie. 66 Department of Children and Youth Affairs, 2012b:66‐67.

15
years staff have at least a FETAC‐Level 5 qualification in early childhood care and education. In 2011, 15% of centres qualified for the higher payment.67 The minimum staff ratio is one staff to 11 children. This is a more favourable ratio than the OECD average of one staff to 14 children68. Every child in Ireland is entitled to a year of free pre‐school education between 3 years 2 months and 4 years 7 months. The ‘school year’ is defined as three hours per day, five days per week, 38 weeks per year (183 days in total). The length of the Free Pre‐School year is the same as the ‘school year’ in primary schools but the number of hours in classroom is shorter69. The estimated uptake of the Free Pre‐School Year, based on the number of children in the DCYA database as a percent of the relevant age‐cohort in the 2011 Census of Population (3‐4 year olds), is 96%. This is an estimate only, since the age categories in the Census (3‐4 year olds) do not match exactly the age categories used to determine eligibility for the Free Pre‐School Year (3 years 2 months to 4 years 7 months). We analysed the DCYA database on centres providing the Free Pre‐School Year and this revealed slight variations in uptake of the Free Pre‐School Year across the country’s eight regions. Dublin – comprising its four local authorities (Dublin City, South County Dublin, Fingal, Dun Laoghaire / Rathdown) – has a lower participation rate (93%) compared to every other region and Ireland as a whole (96%). Analysis of uptake by county indicates that the highest uptake is found in the country’s larger cities of Cork City (120%), Galway City (112%), Limerick City (111%), Waterford City (106%); again, the exception is Dublin and its four local authorities: South County Dublin (86%), Fingal (92%), Dun Laoghaire / Rathdown (96%), Dublin City (98%). The higher uptake of the Free Pre‐School Year in larger cities (in excess of 100%) suggests a ‘travel‐to‐work‐area’ effect since there are more children attending the Free Pre‐School Year in those cities compared to the number of children living there. In effect this means that it is impossible, at least with this database, to calculate an exact estimate of regional or county variations in uptake of the Free Pre‐School Year due to this ‘travel‐to‐work‐area’ effect. Ireland spends more on all types of education – including pre‐school/ pre‐primary (‘infant classes’) education – compared to the OECD average and is ranked 10th out of 26 OECD countries (Table 1.3). Taking all expenditure on education (public and private combined) as a percent of GDP in 2010, Ireland (6.4%) was slightly above average OECD (6.3%) and above the EU‐21 average (5.9%)70.
67 Department of Children and Youth Affairs, 2012b:66. 68 OECD, 2012b:21. ‘The child‐to‐teacher ratio ranges from more than 20 in France, Israel, Mexico, Turkey and
the partner country China, to fewer than 10 in Chile, Estonia, Iceland, New Zealand, Slovenia and Sweden.’ (Ibid).
69 ‘Primary schools in Ireland are open for 183 days each year, and provide about 4.7 hours of daily instruction (i.e., excluding time for breaks and roll call). Irish Fourth class pupils receive, on average, 854 instructional hours per year – over 40 hours less than the international PIRLS and TIMSS averages (905 hours and 897 hours, respectively). However, there is not a clear relationship between total instruction time and performance on PIRLS and TIMSS.’ (Lewis and Archer, 2013:20) Note that PIRLS refers Progress in International Reading Literacy Study; TIMSS refers to Trends in International Maths and Science Study.
70 ‘A contraction in GDP in 2008 and 2009 explains some of this increase. This figure reflects Ireland’s continued maintenance of higher spending levels on education as the economy shrunk.’ (Department of Education and Skills, 2013a:11).
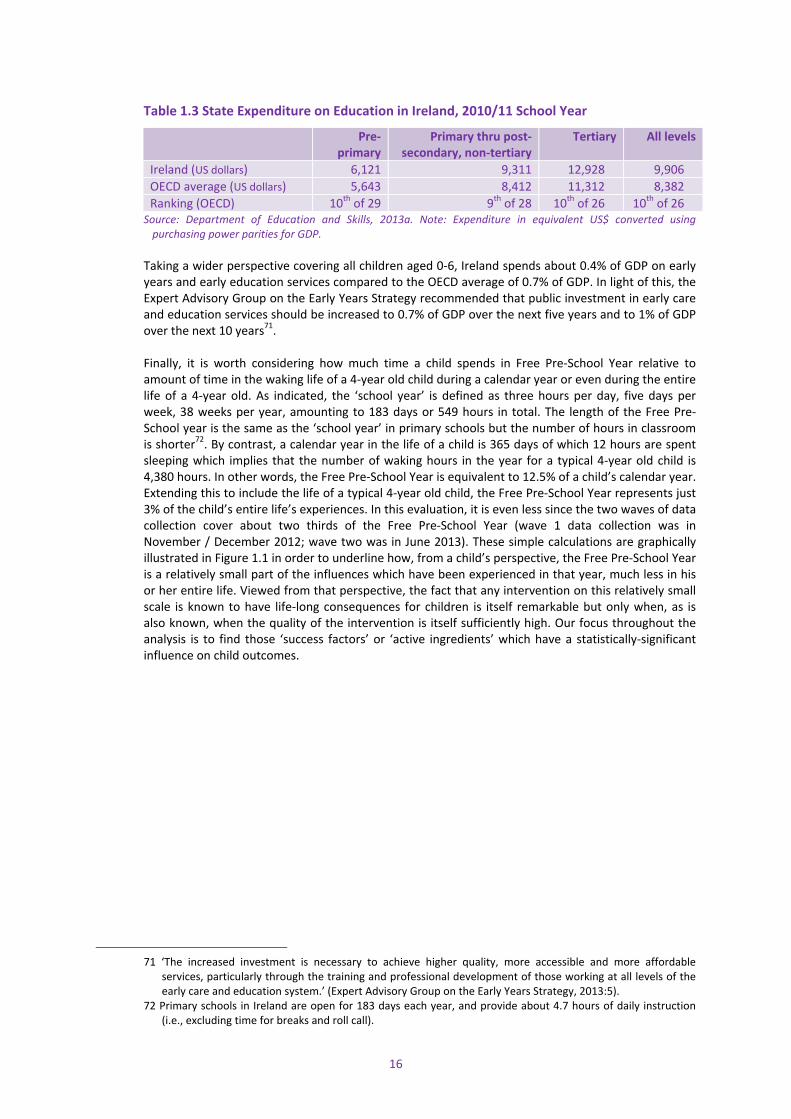
16
Table 1.3 State Expenditure on Education in Ireland, 2010/11 School Year
Pre‐primary
Primary thru post‐secondary, non‐tertiary
Tertiary All levels
Ireland (US dollars) 6,121 9,311 12,928 9,906OECD average (US dollars) 5,643 8,412 11,312 8,382Ranking (OECD) 10th of 29 9th of 28 10th of 26 10th of 26
Source: Department of Education and Skills, 2013a. Note: Expenditure in equivalent US$ converted using purchasing power parities for GDP.
Taking a wider perspective covering all children aged 0‐6, Ireland spends about 0.4% of GDP on early years and early education services compared to the OECD average of 0.7% of GDP. In light of this, the Expert Advisory Group on the Early Years Strategy recommended that public investment in early care and education services should be increased to 0.7% of GDP over the next five years and to 1% of GDP over the next 10 years71. Finally, it is worth considering how much time a child spends in Free Pre‐School Year relative to amount of time in the waking life of a 4‐year old child during a calendar year or even during the entire life of a 4‐year old. As indicated, the ‘school year’ is defined as three hours per day, five days per week, 38 weeks per year, amounting to 183 days or 549 hours in total. The length of the Free Pre‐School year is the same as the ‘school year’ in primary schools but the number of hours in classroom is shorter72. By contrast, a calendar year in the life of a child is 365 days of which 12 hours are spent sleeping which implies that the number of waking hours in the year for a typical 4‐year old child is 4,380 hours. In other words, the Free Pre‐School Year is equivalent to 12.5% of a child’s calendar year. Extending this to include the life of a typical 4‐year old child, the Free Pre‐School Year represents just 3% of the child’s entire life’s experiences. In this evaluation, it is even less since the two waves of data collection cover about two thirds of the Free Pre‐School Year (wave 1 data collection was in November / December 2012; wave two was in June 2013). These simple calculations are graphically illustrated in Figure 1.1 in order to underline how, from a child’s perspective, the Free Pre‐School Year is a relatively small part of the influences which have been experienced in that year, much less in his or her entire life. Viewed from that perspective, the fact that any intervention on this relatively small scale is known to have life‐long consequences for children is itself remarkable but only when, as is also known, when the quality of the intervention is itself sufficiently high. Our focus throughout the analysis is to find those ‘success factors’ or ‘active ingredients’ which have a statistically‐significant influence on child outcomes.
71 ‘The increased investment is necessary to achieve higher quality, more accessible and more affordable
services, particularly through the training and professional development of those working at all levels of the early care and education system.’ (Expert Advisory Group on the Early Years Strategy, 2013:5).
72 Primary schools in Ireland are open for 183 days each year, and provide about 4.7 hours of daily instruction (i.e., excluding time for breaks and roll call).

17
Figure 1.1 Proportion of Child’s Time Spend in Free Pre‐School Year
1.8 Síolta: National Quality Framework for Early Childhood Education
Síolta73 (National Quality Framework for Early Childhood Education) was developed by the Centre for Early Childhood Development and Education on behalf of the Department of Education & Skills. It was published in 200674, following a three‐year research and development process. Síolta comprises: (i) 12 principles, 16 standards and 75 components75; (ii) tools and supports for implementing them, notably a Síolta Mentor and a process of portfolio‐building; and (iii) a system of validation by a Síolta validator not previously known to the ECCE setting. Síolta applies to all early childhood care and education settings (ECCE), such as crèches, playgroups, child‐minding settings and infant classes in primary schools. Its implementation is the responsibility of the Early Years Education Policy Unit in the Department of Education & Skills. Síolta is not ‘mandatory’ or ‘statutory’ in the sense that ECCE settings can deliver their services without being approved or validated. However, it is a requirement that all ECCE settings in receipt of public funding, and specifically the Free Pre‐School Year, must adhere to the principles of Síolta76. In
73 Department of Education and Skills, 2010a. The origin of the word ‘Síolta’ is explained in the Síolta
Introductory Handbook as follows: ‘In order to underline and highlight the unique character of the Framework we call it 'Síolta'. Síolta is the Irish word for seeds. It expresses the potential of childhood and of this Framework to grow and succeed. It relates to the metaphor of the 'Kindergarten' as a place of care and education, and the role of the educator as a skilful gardener. Most of all, it relates this modern Framework to what has gone before and to the rich heritage of modern Ireland.’ (Available at (www.siolta.ie).
74 The publication of Síolta in 2006 followed logically and chronologically from the White Paper on Early Childhood Education, Ready to Learn (Department of Education & Skills, 1999), which stressed the importance of high quality services for pre‐school children. The Centre for Early Childhood Care and Education (CECDE) was established in October 2002 and a core part of its work was to develop a quality framework for early childhood education. Síolta was the result and CECDE was abolished in November 2008.
75 Síolta comprises 12 principles, which encapsulate the overall vision of the quality framework; 16 standards which cover the individual areas of ECCE practice such as play, interactions, transitions, environments and so forth; and 75 Components which set out detailed indicators of aspects of quality in respect of the 16 Standards.
76 ‘Participating service providers must agree to provide an appropriate educational programme for children in their pre‐school year which adheres to the principles of Síolta, the national framework for early years childhood education. Participating service providers will be supported in meeting this requirement through the assistance of Síolta Co‐ordinators and their local City or County Childcare Committee (CCC). Participating service providers must agree to accept assistance visits and advice from Síolta Co‐ordinators and staff of the local CCC.’ (General Terms and Conditions Governing Participating in the ECCE Programme; available at www.dcya.ie)

18
addition, they must be registered with the HSE and have ‘a satisfactory level of compliance with HSE regulations’77. ECCE settings can engage with Síolta on a formal or informal basis. Informal engagement involves ECCE practitioners receiving Síolta resource materials and applying them within their own setting at their own pace. Formal engagement with Síolta involves an ECCE setting implementing the Síolta Quality Assurance Programme (QAP), with the support of a Síolta Mentor, formerly known as a Síolta Coordinator. The Síolta QAP comprises a structured 3‐stage 12‐step process that culminates in the ECCE setting submitting a portfolio of work on its service with a view to being validated by an independent Síolta validator. This 12‐step process is summarised in Table 1.3 and is estimated to require 18 months to complete, with renewal of the validation every three years.
Table 1.3 Síolta QAP 12‐Step Quality Assurance Programme
Stage 1: Registration
1. Expression of Interest2. Registration 3. Síolta Implementation Toolkit 4. Introduction to Síolta Coordinator 5. Introduction to Síolta QAP (materials and processes)
Stage 2: Self‐assessment and Quality Improvement
6. Baseline Assessment7. Action Planning 8. Developing Quality & Portfolio Building 9. Portfolio Review and Submission
Stage 3: Validation
10. Validation11. Recognition 12. Renewing the Award
Source: Department of Education and Skills, 2010a. A total of 136 centres participated in a three‐year field‐test of the formal Síolta Quality Assurance Programme which began around January 2010 and ended in January 201378. The estimated cost of the programme was €1.8m or €13.5k per service monitored79. Table 1.4 indicates that a quarter of the participating centres (24%) have been validated, a smaller number (11%) have submitted portfolios for validation, and nearly a third (31%) may submit them in the future; a quarter of all centres are either no longer participating or not expected to submit for validation. By contrast, the Síolta QAP sample in this study comprises a much higher proportion of centres which have been validated (35%), have submitted portfolios for validation (22%), and may submit in the future (35%). In light of this, it could be said that the Síolta QAP sample for this study constitutes centres that, in terms of the nationally approved standard for early years care and education, are among the best in the country.
77 General Terms and Conditions Governing Participating in the ECCE Programme; available at www.dcya.ie. HSE
regulations are part of its statutory responsibility under the Child Care Act 1991 which charges it with ensuring the health, safety and welfare of pre‐school children attending services. The provisions of the 1991 Act relating to ECCE services were given effect by the Child Care (Pre‐school Services) Regulations 1996 and more recently the Child Care (Pre‐School Services) (No 2) Regulations 2006 and the Child Care (Pre‐School Services) (No 2) (Amendment) Regulations 2006. Note that the HSE’s pre‐school regulations apply only to services for pre‐school children. A ‘pre‐school child’ is a child who is under six years of age and who is not attending a national school or a school providing education similar to a national school. School‐age childcare services and child‐minders caring for three or fewer pre‐school children do not come under the HSE’s pre‐school regulations.
78 Department of Education and Skills, 2013b:22. 79 Department of Education and Skills, 2013b:22.
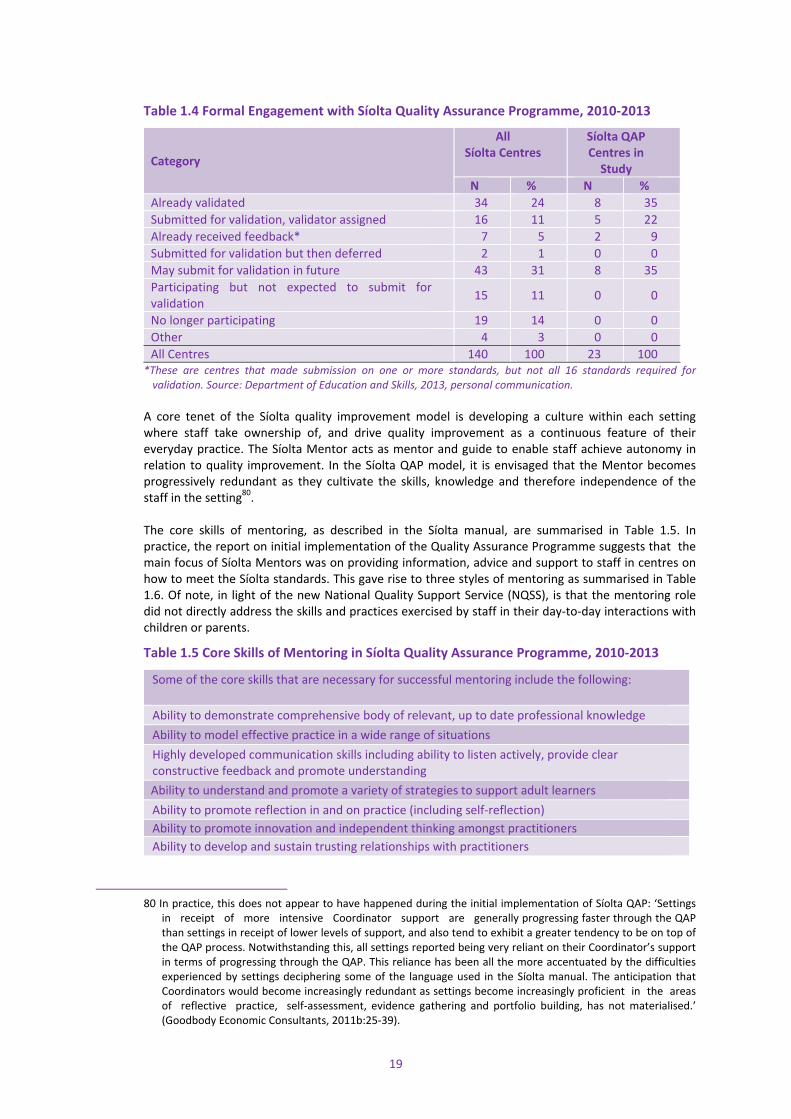
19
Table 1.4 Formal Engagement with Síolta Quality Assurance Programme, 2010‐2013
Category
AllSíolta Centres
Síolta QAP Centres in Study
N % N % Already validated 34 24 8 35Submitted for validation, validator assigned 16 11 5 22Already received feedback* 7 5 2 9Submitted for validation but then deferred 2 1 0 0May submit for validation in future 43 31 8 35Participating but not expected to submit for validation 15 11 0 0
No longer participating 19 14 0 0Other 4 3 0 0All Centres 140 100 23 100
*These are centres that made submission on one or more standards, but not all 16 standards required for validation. Source: Department of Education and Skills, 2013, personal communication.
A core tenet of the Síolta quality improvement model is developing a culture within each setting where staff take ownership of, and drive quality improvement as a continuous feature of their everyday practice. The Síolta Mentor acts as mentor and guide to enable staff achieve autonomy in relation to quality improvement. In the Síolta QAP model, it is envisaged that the Mentor becomes progressively redundant as they cultivate the skills, knowledge and therefore independence of the staff in the setting80. The core skills of mentoring, as described in the Síolta manual, are summarised in Table 1.5. In practice, the report on initial implementation of the Quality Assurance Programme suggests that the main focus of Síolta Mentors was on providing information, advice and support to staff in centres on how to meet the Síolta standards. This gave rise to three styles of mentoring as summarised in Table 1.6. Of note, in light of the new National Quality Support Service (NQSS), is that the mentoring role did not directly address the skills and practices exercised by staff in their day‐to‐day interactions with children or parents.
Table 1.5 Core Skills of Mentoring in Síolta Quality Assurance Programme, 2010‐2013
Some of the core skills that are necessary for successful mentoring include the following: Ability to demonstrate comprehensive body of relevant, up to date professional knowledge Ability to model effective practice in a wide range of situations Highly developed communication skills including ability to listen actively, provide clear constructive feedback and promote understanding Ability to understand and promote a variety of strategies to support adult learners Ability to promote reflection in and on practice (including self‐reflection) Ability to promote innovation and independent thinking amongst practitioners Ability to develop and sustain trusting relationships with practitioners
80 In practice, this does not appear to have happened during the initial implementation of Síolta QAP: ‘Settings
in receipt of more intensive Coordinator support are generally progressing faster through the QAP than settings in receipt of lower levels of support, and also tend to exhibit a greater tendency to be on top of the QAP process. Notwithstanding this, all settings reported being very reliant on their Coordinator’s support in terms of progressing through the QAP. This reliance has been all the more accentuated by the difficulties experienced by settings deciphering some of the language used in the Síolta manual. The anticipation that Coordinators would become increasingly redundant as settings become increasingly proficient in the areas of reflective practice, self‐assessment, evidence gathering and portfolio building, has not materialised.’ (Goodbody Economic Consultants, 2011b:25‐39).

20
Table 1.6 Styles of Mentoring in Síolta Quality Assurance Programme, 2010‐2013
Directional hand‐holding approach
Some Coordinators have implemented a directional ‘hand‐holding’ approach with settings. In this instance the Coordinator provides detailed instructions to the setting on the tasks they need to complete, for example a detailed list of the types of evidence they need to gather under each Síolta Standard, and at times works with the setting in completing the task. In this scenario, the setting is reliant on the Síolta Coordinator for detailed instructions when completing elements of the Síolta QAP steps. This approach is at variance with the approach specified in the QAP guidance in so far as settings are not being equipped with the skills necessary to work independently through the QAP
Semi‐Directional intensive support approach
Some Coordinators have implemented an approach where they provide intensive one‐to‐one support and guidance to their setting staff on the various steps in the QAP. As part of this approach, the Coordinator provides one‐to‐one consultations with staff on the contents of each Standard and Component. The Coordinator also provides one‐to‐one consultations with setting staff on how to complete each step of the QAP process, including how to engage in reflective practice, complete baseline assessments, action plans, gather evidence and so forth. The setting staff is left to prepare its baselines, action plans, gather evidence and is provided with detailed one‐to‐one feedback from their Coordinator each step of the way. In some instances, the Coordinator takes on the active role in assisting the setting, for example they may assist the setting type and/or collate the work prepared by the setting. In this scenario, the setting is initially very reliant on the Síolta Coordinator for instructions and detailed feedback on work completed, but as the setting progresses through the QAP they are likely to develop skills that will enable them to work increasingly independent of their Síolta Coordinator. This approach is more compliant with the approach specified in the QAP guidance documentation. However, the level of Coordinator support provided may exceed that originally envisaged in the guidance.
Semi‐Directional semi‐intensive support approach
A third model of support (the most common) relates to Coordinators that give guidance to settings on each aspect of the QAP. The guidance is delivered in (cluster) group sessions, where groups of settings are present, often on a monthly basis. The cluster groups may take the format of information dissemination on behalf of the Coordinator, or may be more interactive in nature where settings play an active role in learning from each other. As part of the group sessions, the Coordinator gives the settings tasks to complete, such as preparing descriptions of their settings in relation to a Standard (which will form part of their baseline assessments). The settings prepare the descriptions in their own time at their own pace. The Coordinator then visits the setting (usually at one monthly intervals) to provide feedback with respect to the work they have completed. This approach, which is also more compliant with the Síolta guidance, results in settings that are less reliant on their Síolta Coordinator, but the settings generally work through the QAP steps at a slower pace, owning to the lower levels of one‐to‐one Coordinator support available.
*Goodbody Economic Consultants, 2011b. Evaluation of Initial Implementation of Síolta – Final Report, December, Dublin: Department of Education & Skills.
Formal implementation of Síolta was done through a small number of voluntary childcare organisations (VCOs)81 who, in agreement with the Early Years Education Policy Unit of the Department of Education & Skills, deployed some of their resources and expertise to roll‐out the Síolta QAP. This involved employing 19 Síolta Coordinators/Mentors to work on the Síolta QAP
81 These VCOs were in receipt of the funding from National Childcare Investment Programme (NCIP). The VCOs,
with the number of Síolta Mentors in brackets are, Barnardos (5), National Children's Nurseries Association (4), Irish Preschool Play Association (4), Childminding Ireland (3), High/Scope Ireland (2), Irish Steiner Kindergarten Association (1).

21
support in the 134 ECCE settings82. Significantly, this was done by reallocating existing resources within the VCOs and without any new or additional resources from the Department of Education & Skills. It is doubtful if this process could be repeated on a wider scale without additional resources given that the Síolta QAP is a resource intensive process83. An evaluation of the first 18 months of this QAP (January 2010 to July 2011) found that settings were at different stages of implementation, varying from those who ‘have yet to develop their understanding of quality’, to those who ‘are thinking more about quality’, and finally those who have ‘implemented quality improvement developments within their settings’84. A range of factors which helped and hindered the QAP were identified85, and the evaluation recommended some consolidation of its 75 components and removal of standard 15 which covers compliance with national legislation and regulations86. Síolta QAP is one of the most substantial and sustained interventions ever undertaken to improve the quality of early childhood care and education in Ireland. For that reason, as explained in more detail in Chapter three, it was decided to adopt it as the comparison group for NEYAI.
1.9 Aistear: National Early Childhood Education Curriculum Framework Aistear87 is the early childhood curriculum framework for all children from 0‐6 years. It was developed by The National Council for Curriculum and Assessment (NCCA) in partnership with the early childhood sector, and published in 2009. The play‐based curriculum is designed for use in all early years settings, including sessional, full‐time and part‐time daycare, infant classes in primary schools,
82 This is described in Chapter Four of the evaluation report on the process of implementing Síolta QAP
(Goodbody Economic Consultants, 2011b:25‐39). 83 ‘The Síolta Coordinator mentoring model is a resource intensive model. This creates a major resource
issue in terms of a wider implementation of Síolta by settings in the sector on the basis that there are approximately 4,250 settings participating in the Free Pre‐School Year Scheme. An approach that combines a substantial increase in Coordinator numbers as well as a greater targeting of Coordinator resources will be necessary. In this regard, consideration will have to be given to the implementation of an initial assessment of setting’s level of quality service provision with a view to prioritising their participation in the QAP, or the targeting of smaller settings (with limited staff resources to allocate to the Síolta QAP process) or settings in disadvantaged areas. While the mentoring approach is the preferred option, an alternative approach which could be considered would be to adopt a more prescriptive (tick‐box like) approach within the National Quality Framework. A more prescriptive approach would mean settings could work independently through the quality improvement process, as no interpretations of quality on behalf of the setting would be required. This approach would involve settings receiving an inspection visit once they had completed the process. However, in order to encourage the engagement of settings in the process of quality development, and to ensure the long term sustainability of quality development within the sector, the less prescriptive mentoring approach is the preferred option.’ (Goodbody Economic Consultants, 2011b:81‐2).
84 Goodbody Economic Consultants, 2011b:97. 85 ‘In addition to intensive Coordinator support, the main enabling factors identified include: the capacity of staff
within the setting (which is influenced by previous experiences of other QAP processes); the levels of motivation and commitment to the process that exists among setting staff; the availability of supports (noncontact time/financial/time‐in‐lieu) for staff to support the time they dedicate to the process; the knowledge base of settings at the start of the process; and the availability of a manager/administrator with time to dedicate to driving the process. The main impeding factors identified include: the amount of staff time required to dedicate to the QAP (and in particular the lack of non‐contact time); difficulties interpreting the Síolta guidance; the open‐ended nature of Síolta; lack of buy‐in from some setting staff; the costs associated with participation (e.g. travel, photocopying); and a lack of writing and/or computer skills among some setting staff.’ (Goodbody Economic Consultants, 2011b:97‐98).
86 Goodbody Economic Consultants, 2011b:103‐104. 87 The origin of the word ‘Aistear’ is explained by The National Council for Curriculum and Assessment as follows:
‘Aistear: The Early Childhood Curriculum Framework celebrates early childhood as a time of being, and of enjoying and learning from experiences as they unfold. This early learning also lays important foundations for later learning. Because early childhood marks the beginning of children’s lifelong learning journeys, this framework is called Aistear, the Irish word for journey.’ (National Council for Curriculum and Assessment, 2009:6).

22
and child‐minding services; it can also be used by parents in children’s own homes. Aistear is based on 12 principles of early learning and development as summarised in Table 1.7.
Table 1.7 Principles of Aistear
1. The child’s uniqueness: Each child has his/her own set of experiences and a unique life‐story. He/she is an active learner growing up as a member of a family and community with particular traditions and ways of life. 2. Equality and diversity: Nurturing equality and diversity is important in early childhood. Promoting equality is about creating a fairer society in which everyone can participate equally with the opportunity to fulfil his/her potential. Diversity is about welcoming and valuing individual and group differences, and understanding and celebrating difference as part of life. 3. Children as citizens: Children are citizens with rights and responsibilities. They have opinions that are worth listening to, and have the right to be involved in making decisions about matters which affect them. In this way, they have a right to experience democracy. From this experience they learn that, as well as having rights, they also have a responsibility to respect and help others, and to care for their environment. 4. Relationships: Children have a fundamental need to be with other people. They learn and develop through loving and nurturing relationships with adults and other children, and the quality of these interactions impacts on their learning and development. 5. Parents, family and community: Parents are the most important people in children’s lives. The care and education that children receive from their parents and family, especially during their early months and years, greatly influence their overall development. Extended family and community also have important roles to play. 6. The adult’s role: Early learning takes place through a reciprocal relationship between the adult and the child – sometimes the adult leads the learning and sometimes the child leads. The adult enhances learning through a respectful understanding of the child’s uniqueness. He/she alters the type and amount of support as the child grows in confidence and competence, and achieves new things. 7. Holistic learning and development: Children learn many different things at the same time. What they learn is connected to where, how and with whom they learn. 8. Active learning: Active learning involves children learning by doing things. They use their senses to explore and work with the objects and materials around them and they interact enthusiastically with the adults and other children that they meet. Through these experiences, children develop the dispositions, skills, knowledge, and understanding, attitudes, and values that will help them to grow as confident and competent learners. 9. Play and hands‐on experiences: Much of children’s early learning and development takes place through play and hands‐on experiences. Through these, children explore social, physical and imaginary worlds. These experiences help them to manage their feelings, develop as thinkers and language users, develop socially, be creative and imaginative, and lay the foundations for becoming effective communicators and learners. 10. Relevant and meaningful experiences: Relevant and meaningful experiences make learning more enjoyable and positive for children. On‐going assessment of what children do, say and make, and reflection on these experiences helps practitioners to plan more developmentally appropriate and meaningful learning experiences for children. This also enables them to improve their practice. Assessment is about building a picture of children’s individual strengths, interests, abilities, and needs and using this to support and plan for their future learning and development. 11. Communication and language: The ability to communicate is at the very heart of early learning and development. Communication helps children learn to think about and make sense of their world. They communicate from birth using many different ways of giving and receiving information. Each of these ways is important in its own right. Learning to communicate in early childhood is shaped by two main factors: children’s own ability and their environment. 12. The learning environment: The learning environment (inside and outside) influences what and how children learn. An inviting environment encourages and helps children to explore and to take advantage of opportunities for fun, choice, freedom, adventure, and challenge.
Source: National Council for Curriculum and Assessment, 2009. Aistear: The Early Childhood Curriculum Framework – Principles and Themes. Available at www.ncca.ie.
23
Building on these principles, the Aistear framework for children’s learning and development takes the form of four themes: well‐being, identity and belonging, communicating, exploring and thinking. The purpose of the four themes is to ‘describe what children learn—the dispositions, attitudes and values, skills, knowledge, and understanding.’88 Under each theme, the Aistear manual offers ideas and suggestions for the types of learning experiences that adults might provide for children. These are supplemented by an online Aistear Toolkit (at www.ncca.ie) which include resources on quality interactions, learning through play, documenting and sharing evidence of learning, oral language and literacy, mathematics and planning. Commenting on significant developments in the early years sector over the past decade, one specialist has observed that ‘if one were to pick a development with the greatest potential to accomplish the objective of enhancing the quality of young children’s experiences and their early learning and development, it would be Aistear’89. The same author added that: ‘Unless there is direct engagement with Aistear in every setting with support from knowledgeable tutors/mentors and organisations, early childhood educators will not be able to reflect on their practice and embrace the valuable factual messages that Aistear contains’90. In Ireland, Aistear was developed for all children from 0‐6 years and this creates an overlap between pre‐school and primary school – effectively two strands comprising pre‐school and pre‐primary (‘infant classes’) – and the potential for integrating social pedagogy and school readiness approaches. This contrasts with other countries in the OECD where the emphasis is either on social pedagogy or school readiness91. As with Síolta, there is no national implementation plan for Aistear but a range of initiatives including NEYAI92 and others93. The Expert Advisory Group on the Early Years Strategy recommended that this implementation gap should be addressed: ‘develop a national plan for the phased, supported and simultaneous implementation of the Síolta and Aistear frameworks, to achieve their roll‐out at all levels of the early care and education system, including in all services and at the levels of inspectors and trainers themselves. Core elements of both frameworks should be extracted and prioritised for implementation. Development of the implementation plan should include a comprehensive review of all current quality assurance tools (including both Síolta and Aistear, as well as the Pre‐School Regulations and the new National Standards) to ensure that their implementation is coherent and integrated. The review should include an assessment of whether amendments are needed to any of these tools to ensure their mutual coherence and effective joint implementation.’94
88 National Council for Curriculum and Assessment, 2009:13. 89 French, 2013:3. 90 French, 2013:5. 91 ‘Broadly, there are two different approaches across countries. France and the English‐speaking countries tend
to see the partnership [between early childhood services and primary school] from the point of view of the school: early education should serve the objectives of public education and provide children with “readiness for school” skills. In contrast, countries inheriting the social pedagogy tradition (the Nordic and Central European countries) see this sector more to support families and the broad development needs of young children’ (OECD, 2012:22).
92 Most NEYAI projects have facilitated training in Aistear. 93 The National Council for Curriculum and Assessment and Early Childhood Ireland collaborated on an initiative
called Aistear in Action: ‘The initiative used an action research model which involved 24 practitioners in seven services reflecting on their practice in their own room and setting, and identifying actions for improvement.’ (National Council for Curriculum and Assessment and Early Childhood Ireland, 2013:7).
94 Expert Group on the Early Years Strategy, 2013:19.

24
1.10 National Council for Curriculum and Assessment The National Council for Curriculum and Assessment (NCCA) is a statutory body whose purpose, as outlined in the Education Act (1998), is to advise the Minister for Education and Skills on matters relating to: ‘…the curriculum for early childhood education, primary and post‐primary schools and the assessment procedures employed in schools and examinations on subjects which are part of the curriculum’. In light of that, NCCA is an important player in the early years sector and its 2012‐2015 Strategic Plan will support the evolution of the sector over this period. As part of this, it has developed the online Aistear Toolkit and supported in Aistear in Action Initiative95. In 2012, it commissioned and published three research papers on how Ireland’s pre‐school and school systems can promote language development in children aged 3‐8 years96. Table 1.8 reproduces some of the main elements of NCCA’s strategic plan of direct relevance to the early years sector.
Table 1.8 Excerpts from NCCS’s Strategic Plan (2012‐2015) Relevant to Early Years Sector
1.1 New approaches to assessment and changed reporting systems are being introduced in schools and other settings. To achieve this we will … • Work with partners and pre‐school settings to support the process of documenting
children’s development relevant to primary schools.
1.4 Aistear is increasingly used in the early childhood sector.
To achieve this we will … • Expand the online Aistear Toolkit and include resources on quality interactions, learning
through play, documenting and sharing evidence of learning, oral language and literacy, mathematics and planning.
1.6 Elements of the primary curriculum are revised to reflect developments in knowledge and research and greater consistency with Aistear and with junior cycle developments. To achieve this we will … • Develop an overview of the primary curriculum developments. • Begin the development of learning outcomes for the mathematics curriculum, for children
in junior infants to second class. • Begin the development of resources to support curriculum integration and higher‐order‐
thinking in maths and science. 2.1 NCCA school networks are generating ideas and material to support their own capacity and that of other schools in curriculum and assessment development and in supporting change. To achieve this we will … • Support a number of school and early childhood setting networks to gather examples of
how Aistear can be used to support children’s learning and development. 2.2 NCCA is supporting the work of partner networks engaged in curriculum and assessment development and supporting teaching and learning. To achieve this we will … • Continue our work with the Aistear Tutors and the education centres to engage infant
teachers in reflection on and introduction of the principles and methodologies of Aistear in primary classrooms.
• Continue our work with Early Childhood Ireland and initiate work with other organisations to support practitioners in working with Aistear.
3.1 Curriculum and assessment developments are informed by evidence and research.
95 National Council for Curriculum and Assessment and Early Childhood Ireland, 2013. 96 Shiel, Cregan, McGough and Archer, 2012; Kennedy, Dunphy, Dwyer, Hayes, McPhillips, Marsh, O’Connor,
Shiel, 2012; Ó Duibhir, P., Cummins, J., 2012.

25
To achieve this we will … • Undertake a review of research on mathematics in early childhood and primary education
(3–8 years). • Use data from TIMSS to generate an overview of international mathematics policy and
curricula for children 3–12 years. • Undertake a review of research on mathematics in early childhood and primary education
(3–8 years). • Undertake a review of international policy and practice in supporting the pre‐
school/primary transfer. • Undertake an audit of Irish practice in sharing information between pre‐schools and
primary about children’s learning and development. • Complete a review of the stages in children’s education (3–12 years), outlining the defining
features of each stage and identifying how learning and development differ in the first and subsequent stages.
• Ensure that overarching boards and development groups have access to evidence from research and from school and setting networks.
4.1 Collaborative relationships with a number of organisations are improving the understanding and quality of curriculum and assessment developments and implementation. To achieve this we will … • Work with the Early Years Education Policy Unit to support the early childhood sector in
using Aistear to improve practice and outcomes for children. 4.2 Staff and students in early childhood courses and initial teacher education are well‐informed about our work, and in turn, have opportunities to contribute to that work. To achieve this we will … • Engage with staff in initial teacher education and continuing teacher professional
development, and those involved in providing courses in early childhood education, on curriculum and assessment developments and invite feedback on key developments.
• Contribute to the development of a further education curriculum module in collaboration with relevant organisations, to support practitioners’ work with Aistear.
Source: National Council for Curriculum and Assessment, 2012. Strategic Plan 2012‐2015. Available at www.ncca.ie.
1.11 NEYAI: National Early Years Access Initiative
Finally, we describe the National Early Years Access Initiative (NEYAI) which gave rise to this study. NEYAI aims to improve the quality and outcomes of services in the early years sector. It is a three‐year initiative (2011‐2014) and was officially launched by the Minister for Children & Youth Affairs in June 2011. In a speech to Seanad Éireann in that year, the Minister referred to NEYAI as being made up of ‘a select number of local demonstration projects’ with ‘a focus on evidence‐based practice and ongoing project evaluation for the purpose of advising future policy and the mainstream provision’97. NEYAI was created through collaboration between Atlantic Philanthropies, Mount Street Club Trustees, Department of Children & Youth Affairs, Department of Education & Skills, and Pobal which manages the initiative. A fund of €5.25m was generated through this collaboration with a dual focus reflecting its national and local orientation: ‘At national or programmatic level, the Initiative is concerned with establishing a strong evidence‐base to contribute to improvements in practice and coordinated service delivery and to influence policy change (wherever relevant and appropriate) with regard to improved learning/educational, wellbeing outcomes for children and their families. At local level, it is concerned with building the delivery capacity of local projects specifically with regard to data collection, monitoring, reflective practice and creating an operating ethos/culture conducive to learning and continuous review. This approach will in turn help to strengthen the quality and impact of the local project while simultaneously contributing to the quality of the learning of the Initiative as a whole. The mechanism for uniting and inter‐linking these two dimensions will be the creation of a Learning Community whereby a creative space/opportunity can be made available (and appropriately
97 Minister for Children and Youth Affairs, 2012b.
26
resourced) as an aid to: stimulate thinking/learning; the cross fertilization of ideas; the sharing of resources; and the exploration of good practice etc. on an ongoing basis’98. The general aims of NEYAI are: • Improvement in the quality and coordination of local services to young children and families in a
small number of demonstration sites; and • Provision of an evidence‐base to inform mainstream practice and policy with regard to the
design and delivery of integrated services for young children and families and to leave in place a sustainable legacy for the future.
The more specific aims of NEYAI are: • Demonstrate innovative inter‐agency responses to the provision of early years care, education
and development; • Improve access to, and increase participation in early childhood care and education services; • Influence early years mainstream practice and provision; • Contribute to the ongoing development of early years policy; • Inform a community‐based model to underpin the local delivery of joined up services to children
and families; • Engage in a process of learning and review and share the learning arising from practice and
experience; and • Involve children and families as active participants in the programme. The five areas of project activity which are funded by the NEYAI are: 1. Promotion and dissemination of quality improvements through use of the National Framework
for Early Childhood Education (Síolta99) and the Early Childhood Curriculum Framework (Aistear100);
2. Up‐skilling the early childhood care and education workforce; 3. Fostering improved health/learning and school readiness outcomes among young children; 4. Developing parents’ skills and improved parenting support; 5. Demonstrating a continuum of services for the ‘whole child’ linking and integrating the child,
family, local services and the community. Table 1.9 lists the 11 demonstration projects that are funded by NEYAI over a three‐year period (2011‐2014). Each project is made up of a consortium comprising a lead organisation and at least two other organisations. Seven of the projects are in the Dublin area (identified by ID: BC, CC, CN, DD, FL, RO, TT) with the remaining four in Cork (CK), Limerick (LK), Longford (LD) and Donegal (DL), the latter two being the only rural‐based projects. Table 1.9 also lists the core activity of each project. Each NEYAI project received an average of about €300K (range €250K‐€400K) over the three years, equivalent to about €100K per annum. NEYAI comprises 136 early years centres plus 20 infant classes in primary schools.
98 Terms of Reference for Evaluation of National Early Years Access Initiative, 2011. 99 Department of Education and Skills, 2010a. 100 National Council for Curriculum and Assessment, 2009.

27
Table 1.9 List of Projects in the National Early Years Access Initiative
ID Location Name Lead Agency Intervention for Evaluation
BC Ballyfermot/ Chapelizod
Early Years Language and Learning Initiative
The Ballyfermot/Chapelizod Partnership Company Ltd
Train and mentor early years staff in Hanen Programme to: (i) Improve the child’s language development (ii) Support parents to encourage the child’s language development
CC Canal Comm‐unities
Canal Communities Family Welfare Initiative – Bringing it all Back Home
Daughters of Charity Child and Family Service
Train and mentor early years staff in Marte Meo Programme and Incredible Years Programme to: (i) Improve the child and parent outcomes (ii) Intensive outreach with children and their parents
CK Cork Happy Talk Cork City Partnership Ltd
Improve the language skills of children aged 0‐6 years in The Glen and Mayfield areas of Cork City through parent training programmes and working with teachers and early years providers
CN Clondalkin Addressing Gaps Between Training and Practice
South Dublin County Partnership Ltd
Mentor early years staff to improve outcomes for children and their parents
DD Dublin Docklands
Early Learning Initiative
National College of Ireland
Train and mentor early years staff in numeracy skills to: (i) Improve the child’s numeracy skills (ii) Support parents to encourage the child’s numeracy development
DL Donegal The Professional Pedagogy Project (PPP)
Donegal County Childcare Committee
Train and mentor early years staff to improve outcomes for children
FL Fingal Fingal Parents Initiative
The Fingal County Childcare Committee Ltd
Train early years staff to deliver: (i) Parents Together (6‐Week Parenting Course) (ii) Parents Plus Early Years (12‐Week Parenting Course)
LD Longford Tús Nua Project Longford County Childcare Committee
(i) Facilitate transitions from home to early years services (ii) Train and mentor early years staff to improve outcomes for children
LK Limerick Start Right Limerick
PAUL Partnership Ltd
Train and support early years staff to: (i) meet Síolta standards (ii) do intensive outreach with children and their parents
RO Rialto Dublin South West Inner City Integration of Services and Continuum of Care Demonstration Model for Children 0‐6 years
Barnardos Rialto Family Centre
Train and mentor early years staff in Hanen Programme to: (i) Improve the child’s language development (ii) Support parents to encourage the child’s language development

28
TT Tallaght Quality Through Professionalisation (An Cosán / Fledglings Early Years.)
The Shanty Educational Project Ltd
Deliver training based on the Fledglings Early Years Manual which integrates the two national early years frameworks – Síolta (Quality) and Aistear (Learning) ‐ through the pedagogical approach and curriculum of HighScope.
1.12 Overview of Report
The report comprises seven chapters. Chapter One gives background and context to the study while Chapter Two explains the methodology used to carry it out. Chapter Three describes the concept and measurement of child outcomes used in the study while Chapter Four described the main outcomes of the Free Pre‐School Year. Chapter Five explains the factors which contributed to these outcomes while Chapter Six uses a case study to illustrate how a training intervention improved staff skills. Chapter Seven presents a summary of findings and draws out their implications. Detailed statistics on which the report is based are contained in a separate Technical Report101.
101 McKeown, Haase and Pratschke, 2014b.

29
2 Methodology ‘Especially in its early phases, but also throughout the life course, human development takes place through processes of progressively more complex reciprocal interaction between an active, evolving biopsychological human organism and the persons, objects and symbols in its immediate environment. To be effective, the interaction must occur on a fairly regular basis over extended periods of time. Such enduring forms of interaction in the immediate environment are referred to as proximal processes. Examples of enduring patterns of proximal process are found in feeding or comforting a baby, playing with a young child, child‐child activities, group or solitary play, reading, learning new skills, athletic activities, problem solving, caring for others in distress, making plans, performing complex tasks, and acquiring new knowledge and know‐how. … . Proximal processes are posited as the primary engines of development.’102 Urie Bronfrenbrenner, (1917‐2005), noted US psychologist associated with the bioecological theory of human development and influential in setting up the Head Start programme in the US in 1965.
2.1 Introduction This study is an evaluation of NEYAI using Síolta QAP as a comparison group. It is based on a sample of children from the 2012/13 Free Pre‐School Year. We have seen in Chapter One that NEYAI was set up with the objective of generating a national evidence‐base for policy and practice in the early years sector. However this objective was not reflected in the design of the initiative, since projects were selected before an evaluation framework was put in place and on the basis of criteria which did not relate to their possible role in a systematic research design. This gave rise to challenges in creating a viable research design and, because there is a ‘rule’ in evaluation that ‘design trumps analysis’103, we have had to find ways of overcoming these challenges. We begin therefore by setting out the challenges and our response to them (section 2.2). In light of that, we describe the logic model informing both NEYAI and Síolta QAP since that is also the conceptual road‐map for the evaluation (section 2.3). We then describe the research design in terms of approach (confirmatory programme evaluation), research questions, and data analysis (section 2.4). The questionnaires used to generate the data are described (section 2.5) followed by the sample (section 2.6) and ethical considerations (section 2.7). We conclude the chapter by setting out the limitations of the study (section 2.8).
2.2 Challenges in Creating the Research Design
The overall objective of NEYAI and Síolta QAP can be stated in relatively simple terms: to improve the capacity of early years services, especially staff capacity, in order to improve outcomes for children and their parents. Equally, the questions at the heart of the evaluation can also be stated in relatively simple terms: • Do NEYAI and Síolta QAP have an impact on staff capacity and child outcomes, when all
measured sources of variation are taken into account? • If NEYAI or Síolta, or both, have an impact, what are the ‘active ingredients’ associated with
improved staff capacity and child outcomes? These questions are similar to those used in other evaluations, such as the evaluation of Head Start in the US104 and, to some extent, the Prevention and Early Intervention Programme (PEIP) in Ireland105, but with the important difference that our analysis examines all changes in child outcomes and not just the programme effects attributable to NEYAI and Síolta QAP. This is an important difference since
102 Bronfrenbrenner and Morris, 2006:797‐798. 103 This is the title of a widely cited article: ‘For objective causal inference design trumps analysis’ (Rubin, 2008). 104 The two main research questions in the evaluation of Head Start are: (i) What difference does Head Start
make to key outcomes of development and learning (and in particular, the multiple domains of school readiness) for low‐income children? What difference does Head Start make to parental practices that contribute to children’s school readiness? (ii) Under what circumstances does Head Start achieve the greatest impact? What works for which children? What Head Start services are most related to impact? (Puma, Bell, Cook, Heid, Broene, Jenkins, Mashburn and Downer, 2012:xiii).
105 For a summary of 10 of these evaluations, see McAvoy, Purdy, MacEvilly and Sneddon, 2013.

30
our analysis focuses on all measured sources of ‘naturally occurring variation’106 in outcomes to find success factors or ‘active ingredients’ associated with improved outcomes. This approach is similar to the influential EPPE107 study in the UK which also used statistical analysis rather than experimental design to identify sources of variation in children’s pre‐school experiences and outcomes. By contrast, many programme evaluations focus almost exclusively on comparing group means between intervention and control groups to determine whether or not programme participation improves outcomes. These studies, because they are based on random allocation of children to intervention and control groups, are capable of assessing the average impact of a programme, but this is at the expense of not fully exploiting the potential to learn from other sources of variation, including variations within the programme. Designing a research project in order to answer these research questions with robust scientific evidence is not a simple undertaking. That is why it is useful to begin by setting out some of the challenges encountered in preparing and implementing this research design. NEYAI is multi‐faceted in many senses of the term: multi‐programme (11 different interventions), multi‐theme (covering different aspects of child and parent well‐being using a range of new and existing programmes), multi‐target group (covering children in the entire 0‐6 age‐range), multi‐site (each project works with different early years centres), multi‐agency (each project comprises a lead organisation and at least two other organisations), and multi‐level (initiative‐level, project‐level and thematic‐level). Unlike a standard ‘programme’ evaluation – where programme is understood as a defined set of inputs and processes, often manualised, and delivered to either a population or specific target group – each NEYAI project has its own unique programme, or in some cases, set of programmes. It is challenging to create a robust research design in this context because the level of complexity is so great that it is almost impossible to control for all the sources of variation that have been built into NEYAI108. In that sense, this could be described an evaluation of 11 programmes rather than one programme. While these challenges are not unique to the evaluation of NEYAI – since similar challenges were encountered in the evaluation of Springboard109 in Ireland and Sure Start110 in Britain – it is important to document them not just as limitations on the research design but as a source of learning about the design of similar programmes in the future which need to take more account of the research requirements for producing robust scientific evidence. In responding to these challenges, it was decided to focus on one age‐range of children, namely those qualifying for the Free Pre‐School Year (3 years 2 months to 4 years 7 months). This decision was
106 Sammons, 2010a:25. 107 EPPE refers to Effective Pre‐school, Primary and Education Project. This has since become EPPSE which refers
Effective Pre‐school, Primary and Secondary Education 3‐14 Project (EPPSE 3‐14). Details at www.ioe.ac.uk 108 In systems theory, a distinction is sometimes made between three types of systems which are relevant to
bringing about change: a mess, a problem and a puzzle. A mess is ‘a complex issue that does not have a defined form’ (Mansfield, 2010:117). A problem ‘has a defined form or structure, ie, it has components with attributes and variables, and we know something about how these variables interact. However it does not have any single clear‐cut solution’ (Ibid). Finally, ‘a puzzle is a well‐defined and well‐structured problem with a specific solution’ (Ibid) Applying this to the introduction of change of technology in large organisations, one writer observed: ‘One of the greatest mistakes that can be made when dealing with a mess is to carve off part of the mess, treat it as a problem and then solve it as a puzzle – ignoring its links with other aspects of the mess’ (Pidd, 1969).
109 ‘It is important to note that the diversity of interventions which constitute the Springboard programme pose a challenge for the evaluation since it is not possible to link outcomes to specific therapeutic inputs, given that the inputs vary widely in their approach and content. In other words, the design of the Springboard programme – which is similar to the design of many other family support programmes – limits the capacity of the evaluation to elucidate the mechanisms by which programme inputs are linked to programme outcomes’ (McKeown, Haase and Pratschke, 2006; see also 2001).
110 ‘The great diversity among SSLPs [Sure Start Local Projects] posed a particular set of challenges for the National Evaluation in that there were not several hundred programmes delivering one well‐defined intervention, but several hundred unique and multifaceted interventions operating in different places’ (Melhuish and Hall, 2007:16). Similarly, Rutter has observed that ‘there is no such thing as Sure Start in the sense of a defined programme with a definable intervention strategy (despite government implying the contrary). Instead, it constitutes a large ‘family’ of programmes that involve as much diversity as commonality.’ (Rutter, 2006:138).

31
necessary to allow for one set of standardised instruments to be applied across a clearly defined age‐group. It is also consistent with the concept of early childhood as comprising three phases: birth to 18 months; 18 months to three years; three to six years111, bearing in mind that there is no single instrument capable of providing a global measure of developmental outcomes across these first six years of life. At the same time, this design facilitated evaluation of the largest single investment ever made by the State in early years services through the Free Pre‐School Year. A practical consequence of this design is that NEYAI activities for children outside this age‐range or outside early years settings (for example in primary schools) have had to be excluded from the evaluation. A further challenge in the evaluation is that, while some NEYAI projects are delivering programmes that are well‐developed and already evidence‐based, other programmes appear to be at a much earlier stage in the cycle of programme design and development. This poses a challenge because interventions which are not substantial and sustained are unlikely to produce a measurable impact. This follows logically from the fact that the best programmes for children and their parents tend to produce relatively small effects sizes112. For example, early years programmes like High Scope113, Early Head Start114, Effective Pre‐School and Primary Education Project115, all have small effects. The same applies to family support programmes like Sure Start116 and Springboard117. None of this implies that small effects are not worthwhile since small changes for large numbers of children will bring better outcomes than big changes for small numbers118; only that interventions which are ‘light’ in their
111 This is how early childhood is conceptualised by the Department of Education and Skills (2010c:26): ‘Early
years education spans the first six years of life. It is conceptualised in three phases, birth to eighteen months, eighteen months to three years and three years to six years.’
112 The formula for calculating the effect size involves subtracting the mean at baseline from the mean at follow‐up and dividing by their pooled standard deviation. The convention, referred to as ‘Cohen’s d’, is that a coefficient between 0.2 and 0.5 indicates a small effect, between 0.5 and 0.8 indicates a moderate effect, and above 0.8 indicates a large effect (Cohen, 1992; Van Belle, 2002:31). As an example, an effect size of 0.8 means that the score of the average person at follow‐up is 0.8 standard deviations above the average person at baseline, and hence exceeds 79% of the baseline scores. Unlike statistical significance, the effect size statistic is independent of the group size and therefore considered more informative and meaningful. The Centre for the Study and Prevention of Violence at University of Colorado in Boulder, USA which selects 'Blueprints Model Programs' on the basis of 'the most rigorous tests of effectiveness in the field', requires that all Blueprint programmes have 'at least moderate effect sizes' (http://www.colorado.edu/cspv/blueprints). The Promising Practices Network run by the Rand Corporation defines a programme as 'proven' where, inter alia, 'at least one outcome is changed by 20%, 0.25 standard deviations or more' which implies impacts at lower threshold of effects (http://www.promisingpractices.net) (see also Shonkoff and Phillips, 2000:342‐343).
113 The overall effect size of the High Scope Perry Pre‐School Programme in the US when participants reached the age of 23 was 0.36 (Schweinhart and Weikhart, 1997; Schweinhart, 2004; Schweinhart, Montie, Xiang, Barnett, Belfield, Nores, 2005). At age 14, reading and math scores improved by 0.33 standard deviations, a very significant achievement given that the US achievement gap in reading and math gaps between low‐income and middle‐income children at kindergarten entry is about 0.50 standard deviations (Barnett, 2011: 975).
114 The evaluation of Early Head Start found that ‘overall impacts were modest, with effect sizes in the 10 to 20 percent range, although impacts were considerably larger for some subgroups, with some effect sizes in the 20 to 50 percent range. The overall pattern of favorable impacts is promising, particularly since some of the outcomes that the programs improved are important predictors of later school achievement and family functioning’ (Mathematica Policy Research, 2002:xxv).
115 The effect size of high quality pre‐school for children at the age of 11, according to the Effective Pre‐School and Primary Education Project, was: 0.23 for pro‐social behaviour, 0.25 for self‐regulation, 0.29 for English, 0.34 for Mathematics, (Sammons, 2010c:128‐130).
116 The effect size of Sure Start when children were five years old, was 0.12 for Body Mass Index and 0.10 for physical health; for parents, it was 0.24 for harsh discipline, 0.29 for chaos in the home and 0.27 for home learning environment (National Evaluation of Sure Start Team, 2010:29).
117 The effect size of Springboard on children’s strengths and difficulties was 0.30; for parents, it was 0.23 for communication between parent and child (McKeown, Haase and Pratschke, 2006).
118 The lifetime rate of return to the High Scope Perry Pre‐School Programme in the US – based on data to age 40 – is estimated to be between 7% and 10%, above the post‐World War II stock market rate of return on equity which is about 5.8% (Heckman, Moon, Pinto, Savelyev and Yavitz, 2009).

32
design, intensity and duration are less likely to show any measurable effect119. For that reason, the evaluation team encouraged NEYAI projects to include in the evaluation only those interventions which were substantial and sustained. The definition of what constituted a substantial and sustained intervention was left to each individual project based on their judgement that it was capable of producing a measurable impact on children and/or their parents, or indirectly on staff. A related challenge is that even well‐developed and evidence‐based programmes, particularly those designed to improve the practice skills of staff, can take time to have an effect on child outcomes. The relatively short duration of this evaluation – involving an average duration of 200 days between wave 1 (the baseline) and wave 2 (the follow‐up) – means that it may be difficult to identify improvements in staff capacity during this period and even more difficult to link these to child outcomes. This was the experience of the Early Years Programme in the Childhood Development Initiative which undertook a two‐year intervention to build capacity in the early years sector120. The evaluation of that intervention, based on a randomised control design, found that while there were improvements in child development outcomes in both intervention and control groups, ‘there was no positive or negative programme effect on child cognitive and language end‐phase outcome scores’121. The authors suggest that the lack of effect associated with the intervention may be due to the fact that training occurred during rather than prior to the first year of programme implementation which ‘can result in little or no programme effects in the first year’122. They explain further that ‘it took a year for programme implementation to bed‐in’ and suggested that ‘it may take even longer for changes to filter down from the practitioner to the child level and ‘sleeper’ effects, such as the mediation of improved social skills or better home‐learning environment, may result in longer term benefits for children’123. In this evaluation, as explained below, we frame the research question more broadly in terms of ‘active ingredients’ associated with improved child outcomes, irrespective of whether these are due to NEYAI or not, since this allows the study to generate insights about all measured influences on child outcomes and not just the intervention. A final challenge was finding a suitable matched comparison group for NEYAI that could address the counterfactual question: what would have happened in the absence of NEYAI? The challenge here is
119 This draws attention to the possibility that inferences about the economic return from investment in
childcare ‐ based on intensive and expensive programmes like the Perry Pre‐School Programme delivered 50 years ago in Michigan and which combined childcare with home visiting – may not be valid when applied to less intensive and expensive programmes like the Free Pre‐School Year.
120 The intervention involved a number of interconnected components as follows: ‘Intervention at Early Years practitioner level included training all intervention Early Years practitioners in the delivery of the HighScope curriculum and the Síolta framework (non‐mandatory), having an extra Early Years practitioner to allow a ratio of 1:5 and having a designated staff member (not included in the ratio) to work with parents, called the parent/carer facilitator (PCF). The role of the PCF was designed to support learning between the home and Early Years environments and to create better working relationships between parents and children. It was required that senior childcare practitioners had a degree‐level qualification or equivalent in early childhood care and education, while the childcare workers were required to have at least a FETAC Level 5 qualification in childcare or equivalent. In practice, practitioners operated a key worker system and worked a 37‐hour week, which, being longer than typical childcare working weeks, allowed for curriculum and daily planning and individualised record‐keeping. Early Years practitioners also engaged in home visits (target of 4 per year) with families of Early Years service children as a means of bridging the Early Years service–home‐learning gap. Children were referred to a designated intervention speech and language therapist (whose caseload consisted of intervention children only), as required, and the therapist held assessment and therapy sessions in the Early Years services. Children were also referred to psychological, primary health and social service professionals as necessary and these referral processes were supported by networks developed by the delivering agency, supported by CDI. In order to bridge the gap in provision in the summer months, children were offered a summer programme in the month of July, which was less formally structured and offered opportunities for parent involvement, day trips and sustained outdoor activities. Early Years practitioners also aimed to aid transition between school and Early Years services by liaising with receiving schools and preparing children for the transition to school.’ (Hayes, Siraj‐Blatchford, Keegan and Goulding, 2013:8).
121 Hayes, Siraj‐Blatchford, Keegan and Goulding, 2013:2. 122 Hayes, Siraj‐Blatchford, Keegan and Goulding, 2013:62. 123 Hayes, Siraj‐Blatchford, Keegan and Goulding, 2013:62.

33
that the only scientific way of creating a matched comparison group is through random allocation124, but this option was ruled out by selection of NEYAI projects prior to the evaluation; it is also ruled out by the fact that 95% of eligible children are enrolled in the Free Pre‐School Year which also makes it very difficult to find a matched sample of children who are not in the programme. In light of this, we decided to address a different question: what comparison group would give us the most useful insights from the point of view of building an evidence‐base for the entire early years sector? This led to the decision that Síolta QAP was the most promising comparison group for the following reasons: • Síolta is the nationally accepted and approved standard for all early years services in Ireland. It is
therefore the standard against which every early years centre is to be measured. By implication, it is the standard against which NEYAI should be measured.
• Síolta QAP is a substantial and sustained intervention to improve quality. It is therefore an intervention that is comparable in its aims and objectives to NEYAI.
• A number of centres are Síolta‐validated, or close to it, and deemed to have reached the standard (Table 3.1 above). In common parlance, these centres could be described as ‘the best’ and the benchmark against which all early years centres, including NEYAI, should be measured.
• Equally, within the formal Síolta QAP, there are centres which have been validated and others which have not. This variation provides an opportunity to assess if there is a difference between validated and non‐validated centres in terms of child outcomes. In other words, by using this comparison group, the evaluation can address an additional question which is fundamental to assessing the effectiveness of a standards‐based approach to quality improvement in the early years sector: to what extent does meeting Síolta standards result in improved child outcomes? Currently, this is no more than a reasonable but untested assumption.
• Within Síolta QAP, there is also variation in the family and socio‐economic characteristics of children attending the early years centres. Given the strong association between childhood adversity and child outcomes – which moreover tend to be greater in their impact than even the best early years service – the analysis of this variation will strengthen the analysis of how adversity affects child outcomes, and the value‐added of Síolta in that context. This overcomes a limitation of NEYAI, and many similar action‐research projects, because an exclusive focus on disadvantaged areas can only examine variations within that disadvantaged group whereas a more inclusive focus on areas of affluence‐and‐deprivation allows one to examine variations between these groups and therefore the wider set of factors that need to be addressed in order to weaken the link between childhood adversity and child outcomes.
2.3 Logic Model for Evaluation
In order to design a framework for the evaluation, it is necessary to develop a logic model for NEYAI and Síolta QAP. A logic model is normally defined as a graphical representation of a programme depicting the logical sequence between inputs, outputs and outcomes125. In other words, a logic model describes the way an initiative is believed to make an impact and therefore takes account of the intervention and the population it is expected to benefit (input), the pathways or ‘active ingredients’ by which the intervention is believed to work (outputs or pathways), and the results that are expected (outcomes). It is called a ‘logic’ model because it is based on ‘if‐then logic’ which
124 The effect of random allocation is to ensure that both groups are matched on measured as well as
unmeasured characteristics. 125 The following is a standard explanation of how logic models work in practice: ‘Many who use logic models
talk about them as a series of “if‐then” sequences. … . If you have certain resources, then you will be able to provide activities, produce services or products for targeted individuals or groups. If you reach those individuals or groups, then they will benefit in certain specific ways in the short term. If the short‐term benefits are achieved to the extent expected, then the medium‐term benefits can be accomplished. If the medium‐term benefits for participants/organizations/decision‐makers are achieved to the extent expected, then you would expect the longer‐term improvements and final impact in terms of social, economic, environmental, or civic changes to occur. This is the foundation of logic models and the theory of causal association. Such “if‐then” relationships may seem too simple and linear for the complex programs and environments in which we work. However, in working out these sequences, we uncover gaps in logic, clarify assumptions, and more clearly understand how investments are likely to lead to results’ (Taylor‐Powell & Henert, 2008).

34
describes the underlying theory of change in the programme by showing how (or ‘if’) inputs are transformed into outputs and why (or ‘then’) these pathways lead to outcomes. The logic model is important from the perspective of any evaluation because it simultaneously describes the theory behind the programme and facilitates identification of different categories of data that need to be collected in order to test if the programme is achieving its expected outcomes and, if so, how. At the same time, logic models can provide a somewhat static and linear representation of a programme and, for that reason, they are not necessarily an accurate representation how a programme is implemented in practice and cannot account for outcomes that are unexpected or unintended. That is why logic models are simply a guide to the theory of change in a programme and are best regarded as a set of hypotheses about the programme that will be tested by the evaluation126. Figure 2.1 summarises a simple logic model for NEYAI and Síolta QAP. It is informed by the stated aims and objectives of both programmes as well as evidence from other evaluations about how these types of quality improvement programmes usually work.
Figure 2.1 Logic Model for Evaluation of NEYAI and Síolta QAP
The left‐hand side of the diagram depicts the inputs which we label NEYAI and Síolta QAP – both conceptualised as programmes within the Free Pre‐School Year ‐ and these include the interventions delivered to children (and parents where applicable) as well as training and mentoring of staff. The right‐hand side depicts the outcomes which are conceptualised as improved staff capacity and improved child outcomes. The dotted line between staff capacity and child outcomes denotes the research question about whether improvements in staff capacity (where they occurred) influenced improvements in child outcomes. At the centre of the logic model is the hypothesised pathways by which inputs are transformed into outcomes, also called the mediating and moderating influences. These include variations in the child’s environment, especially personal and family circumstances and the area where they live; variations within and between NEYAI and Síolta QAP in the type, focus, mode of delivery, duration and intensity of interventions; and variations in the local and national service context which may influence implementation of the programme.
126 For that reason, the proper use of a logic model requires awareness of its limitations since ‘the logic model is
a model – not reality. It depicts assumed causal connections not true cause‐effect relationships’ (Taylor‐Powell & Henert, 2008). Limitations of logic modelling include the following: (i) a logic model represents intention, it is not reality; (ii) it focuses on expected outcomes so people may overlook unintended outcomes (positive and negative); (iii) it focuses on positive change – change isn’t always positive; (iv) it may simplify the complex nature of causal attribution where many factors influence process and outcomes; (v) it doesn’t address whether we are doing the right thing – we may get caught up in creating a logic model and lose track of whether the program is the right thing to do; and (vi) may stifle creativity and spontaneity. (Ibid).
NEYAI
Síolta
What changes in
staff capacity?
Free
Pre‐Schoo
l Year
Mediating & Moderating Influences Variation in child environment: ‐ Child, parent & family characteristics ‐ Target area & target group Variation in interventions: ‐ Type & focus ‐ Mode of delivery ‐ Duration ‐ Intensity Variation in service environment: ‐ Local availability & coordination of services ‐ National policies, funding & initiatives
What changes in
child outcomes?

35
2.4 Research Design
The research design is based on an approach that is sometimes referred to as confirmatory programme evaluation127. This approach simultaneously assesses the impact of a programme and the pathways by which that impact may have come about. In order to do this, it is necessary to have a clear understanding of the theory which informs the programme –outlined in the logic model above – and to test the theory against the evidence. The principle steps in confirmatory programme evaluation are: 1. Specify programme theory and processes that are expected to affect outcomes. 2. Identify and measure outcomes and their timing over the short, intermediate, and long term. 3. Collect or obtain data on hypothesised mediators of the programme theory and key background
variables necessary to identify programme impact. 4. Estimate main effects of programme participation for the total group and relevant subgroups,
quantifying the temporality, size, gradient, specificity, consistency, and coherence of programme effects.
5. Where main effects are detected, test hypothesised causal mechanisms of the programme theory to account for estimated effects.
6. Interpret the pattern of findings to facilitate generalisation and knowledge transfer. 7. Identify formative uses of findings for programme improvement, including modifications to
programme theory, programme implementation, and analysis of programme effects. Based on this approach, the research design will answer the following questions: • Do NEYAI and Síolta QAP have a net impact on staff and children, when all measured variation is
taken into account? • If NEYAI or Síolta QAP, or both, have a net impact, what are the ‘active ingredients’ associated
with better outcomes for staff and children? • What is the distribution of ‘active ingredients’ associated with better outcomes between NEYAI
centres and Síolta QAP centres? • In those centres which have some, or all, of the ‘active ingredients’ associated with better
outcomes, what are the more qualitative aspects of some of those centres, as revealed through case studies?
The main data sources to answer these questions are a staff questionnaire, a child assessment questionnaire and a parent questionnaire, and these are described in the next section.
127 According to Reynolds who first used the term, ‘Confirmatory evaluation is a theory‐driven methodology for
investigating the effects of social and educational programs. In a theory‐driven impact evaluation, the explicit theory of the program is highlighted to establish an a priori model of how the program is expected to exert its influence. Causal uncertainty is reduced through an examination of the empirical pattern of findings against the expectations inherent in the program. … Confirmatory evaluation attempts to strengthen causal inference through systematic investigation of the nature of the relationship between program participation and outcome. Special emphasis is given to testing causal mechanisms that are associated with program effectiveness. A major tenet of confirmatory program evaluation is that the plausibility of an estimated effect can be strengthened through systematic testing of causal mechanisms and other aspects of the program‐outcome link, such as consistency and specificity of estimated effects. In the confirmatory evaluation approach, the theory of the program is used to document and interpret the pattern of findings to strengthen confidence in program‐outcome links. … Three key questions addressed are: Is program participation independently and consistently associated with key outcomes? Do the estimated effects vary by background characteristics, such as child and family attributes, or by program components? What are the processes or pathways through which participation leads to effectiveness in the short term and over time?’ (Reynolds, 2005:2401‐2; see also 2004; 2002).

36
2.5 Questionnaires The three main sources of data used to answer the research questions outlined in the previous section are a staff questionnaire, a child assessment questionnaire and a parent questionnaire. A detailed guide to each question in these questionnaires is in the Research Protocol128.
2.5.1 Staff Questionnaire
The purpose of the Staff Questionnaire is to assess the capacity of staff and its possible determinants. The concepts and instruments used in the Staff Questionnaire are summarised in Table 2.1. The Staff Questionnaire was completed on‐line in about 30‐40 minutes – at www.neyai‐evaluation.ie – by early years staff in each centre participating in the evaluation, excluding administrative and support staff. Prior to implementation, the questionnaire was piloted in two early years centres which are not part of this evaluation.
Table 2.1 Staff Questionnaire
Question Concept Instrument
SECTION A: Background Characteristics
A1‐2 Gender and age CSO question
A3‐6 Parenting and marital status CSO Census
A7.9 Language and ethnic background CSO question
SECTION B: Qualifications and Experience
B1‐2 Education Adapted CSO question
B3‐5 Qualifications in early years GUI‐Infant Cohort question
B6‐8 Time working in early years and in centre
GUI‐Infant Cohort question
B9 Role in early years centre Bespoke question
B10‐12 Employment status including hours worked
Bespoke question
B13‐15 On‐the‐job training received ESRI scale129
B16‐17 Feeling prepared for your work Bespoke question
SECTION C: Work and Workplace
C1.1‐10.1 Workplace ESRI scale130
C9.1‐9.5 Staff supports Bespoke question, informed Síolta Standard 10: Organisation; Standard 11: Professional Practice
C11.1‐11.9 Work engagement Utrecht Work Engagement Scale – Shorted Version (UWES‐9)131.
128 McKeown, Haase and Belsky, 2011. 129 Used in the 2003 and 2009 Changing Workplace Survey (O’Connell, Russell, Williams and Blackwell, 2004;
O’Connell, Russell, Watson and Byrne, 2010). 130 Used in the 2003 and 2009 Changing Workplace Survey (O’Connell, Russell, Williams and Blackwell, 2004;
O’Connell, Russell, Watson and Byrne, 2010). 131 Schaufeli, Bakker, Salanova, 2006.

37
SECTION D: Staff‐Child and Staff‐Parent Relationships
D1.1‐1.12 Staff‐Child Relationship Bespoke question, based on Adult Engagement Observation Schedule132
D2.1‐2.10 Staff‐Child Purposive Conversations
Bespoke question, informed by Síolta and Aistear Standards on interactions; also informed by French, 2011133
D3.1‐3.12 Staff‐Parent Relationship Bespoke question, informed by Síolta and Aistear Standards on parents and families
D4.1‐4.5 Contact with Other Services Bespoke question
SECTION E: Personal Well‐Being
E1.1‐1.20 Personality traits Positive and Negative Affect Scales (PANAS)134
E2.1‐2.5 Satisfaction with Life Satisfaction with Life Scale135
E3.1‐3.8 Depression Center for Epidemiologic Studies Depression Scale (CES‐D) Scale136
E4.1‐4.8 Hope The Hope Scale137
E5.1‐5.6 Optimism Life Orientation Test – Revised (LOT‐R), Generalised Optimism Versus Pessimism138.
E6.1‐6.10 Self‐Esteem Rosenberg Self‐Esteem Scale139.
E7.1 to 7.8 Emotional Intelligence Trait Emotional Intelligence Questionnaire (TEIque‐SF)140
E8.1‐8.11 Support Networks Bespoke question
E8.12 Overall Support GUI Infant Questionnaire
E9.1 Degree of financial difficulty CSO Survey of Income and Living Conditions141
SECTION F: Quality of Childcare Centre
F1.1 Estimated child satisfaction Bespoke question
F1.2 Estimated parent satisfaction Adapted from GUI scale – Infant Cohort.
A limitation of the Staff Questionnaire is that it is based solely on self‐report with no independent observation or assessment of how staff interact with children. This is a significant limitation since self‐reports may not correlate with behaviour. At the same time, this limitation also applies to the Parent Questionnaire; it is also well‐known that parental self‐reports are highly predictive of outcomes for their children.
132 Bertram, 1996:Ch 4; Pascal and Bertram, 1999. 133 French, 2011. 134 Adapted from Watson, Clark, and Tellegen, 1988. 135 Diener, Lucas and Oishi, 2002:70. 136 Reproduced in McDowell, 2006:350‐358. 137 Snyder, Rand and Sigmon, 2002:268‐270 138 In Carver and Scheier, 2004. 139 In Heatherton and Wyland, 2004. 140 Available at: www.psychometriclab.com. Cooper and Petrides, 2010. 141 CSO Survey of Income and Living Conditions in 2009, 2010.

38
2.5.2 Child Assessment Questionnaire
The purpose of the Child Assessment Questionnaire is to assess the well‐being of each child across a range of domains that are recognised as central to child development, including: physical health; social competence; emotional maturity; language & cognitive skills; communication skills. The assessment was carried out in each early years centre by the Childcare Leader and Childcare Worker who had a thorough knowledge of the child, and knew to the child for at least a month. The assessment took about 30‐40 minutes and results were entered on‐line by early years staff at www.neyai‐evaluation.ie. Prior to implementation, the Child Assessment Questionnaire was piloted in two early years centres which are not part of this evaluation. The concepts and instruments used in the Staff Questionnaire are summarised in Table 2.2.
Table 2.2 Child Assessment Questionnaire
Question Concept Instrument
SECTIONS A‐D: Early Development Instrument
A‐D Child development Early Development Instrument (EDI)
Emotion Regulation
E1‐24 Emotion Regulation Emotion Regulation Checklist (ERC)142
Staff‐Child Relationship
F1.1‐2.14 Staff relationship to child Pianta Student‐Teacher Relationship Scale143
F3.1‐F3.2 Staff relationship to child GUI ‐ Infant Cohort
F3.1‐F3.2 Staff concerns about child Adapted from GUI ‐ Centre‐based Carer
SECTION G: Child’s Attendance at Centre
G1 How long known this child Bespoke question
G2‐4 Child’s attendance GUI ‐ Infant Cohort
G5‐6 Child’s absences Growing Up in Australia: Teacher Questionnaire
G7 Parental involvement in child’s learning and education
Growing Up in Australia: Teacher Questionnaire
G8 Informal discussion with parent Growing Up in Australia: Teacher Questionnaire
SECTION H: Special Services for Child
H1 Needs requiring special services Growing Up in Ireland: Teacher Questionnaire
H2.1‐2.5 Extra services for child Growing Up in Ireland: Teacher Questionnaire
H3.1‐3.3 Contact with any other agency Bespoke question
SECTION I: Height and Weight of Child
I1 Child’s height Use height measure or equivalent, as in GUI
I2 Child’s weight Use mechanical weighing scales, as in GUI
142 Shields and Cicchetti, 1997. 143 Pianta, 2001.

39
2.5.3 Parent Questionnaire
The Parent Questionnaire assessed the well‐being of each mother across a wide range of domains that are recognised as central to personal and parental well‐being, and the well‐being of children. It was completed using a face‐to‐face interview with the mother of the ‘focus child’, the latter defined as the child attending the early years centre who had been selected to participate in the evaluation. The decision to focus on the mother was based on the consideration that, since only one parent could be interviewed, for consistency this should be the mother, particularly since one‐parent households were more likely to be headed by a mother. This is a well‐established convention but the consequence of excluding fathers is recognised in terms of understanding their role in lives of children and families. The Child Assessment Questionnaire described above was completed for each focus child. Each parent was interviewed in the home or early years centre, or elsewhere if that is her preference, and at a time that is agreed with the interviewer144. The Parent Questionnaire is similar to a questionnaire that has been used in numerous studies by members of the research team145 – with the addition of some new instruments mainly from the GUI146. For those reasons, it is considered unnecessary to pilot it147. The concepts and instruments used in the Parent Questionnaire are summarised in Table 2.3.
Table 2.3 Parent Questionnaire
Question Concept Instrument
SECTION A: Background Information
A1‐18 Demographic characteristics CSO questions
SECTION B: Neighbourhood
B1.1‐2.3 Local Problems GUI scale
B3.1‐3.3 Trust and Reciprocity Adapted from UK Social Capital Module of the General Household Survey 2000148
B3.4‐3.5 Trust European Values Study 1981, 1990, 1999/00149
B4.1‐4.11 Support Networks Bespoke question
B4.12 Overall Support GUI ‐ Infant Questionnaire.
144 The decision to interview mothers only is based entirely on practical considerations since interviewing
fathers as well as mothers is beyond the resources of the evaluation. However the Parent Questionnaire contains two questions on the father’s involvement with the child, based on similar questions used in the GUI, the Sure Start evaluation and the Millennium Cohort Study: ‘How often can you count on him if you need him to take care of the child?’ and ‘Overall how close would you say he is to your child?’.
145 McKeown, Haase, Pratschke, Lanigan, Burke, Murphy, and Allen, 2008:23‐28; McKeown and Haase, 2007; Haase, McKeown, and Pratschke, 2008; Haase, 2009.
146 Pratschke, Haase and McKeown, 2011. GUI refers to Growing Up in Ireland: National Longitudinal Study of Children; available at: www.growingup.ie. GUI is based on two cohorts of children: 8,570 nine‐year old children on whom data was collected ‘between September 2007 and June 2008’ (Williams, Greene, Doyle, Harris, Layte, McCoy, McCrory, Murray, Nixon, O’Dowd, O’Moore, Quail, Smyth, Swords and Thornton, 2009:16); and 11,100 nine‐month old children on whom data was collected ‘between September 2008 and April 2009’ (Williams, Greene, McNally, Murray and Quail, 2010:21).
147 Of note is the fact that some of the longer multi‐item questions from the GUI have been shortened, notably Pianta Child‐Parent Relationship Scale, Parental Stress Scale, and Dyadic Adjustment Scale; this was done following latent variable analysis and resulted in deleting those items which added little to the overall measurement of the concept or its components.
148 Coulthard, Walker and Morgan, 2002. Also and used in Ireland by the Institute of Public Health in Ireland (Balanda and Wilde, 2003).
149 For analysis see Fahey, Hayes and Sinnott, 2005:179; also used in the US in the National Opinion Research Center’s General Social Survey (see Kim, Baum, Ganz, Subramanian and Kawachi, 2011; Glaeser, Laibson, Scheinkman and Soutter, 2000).
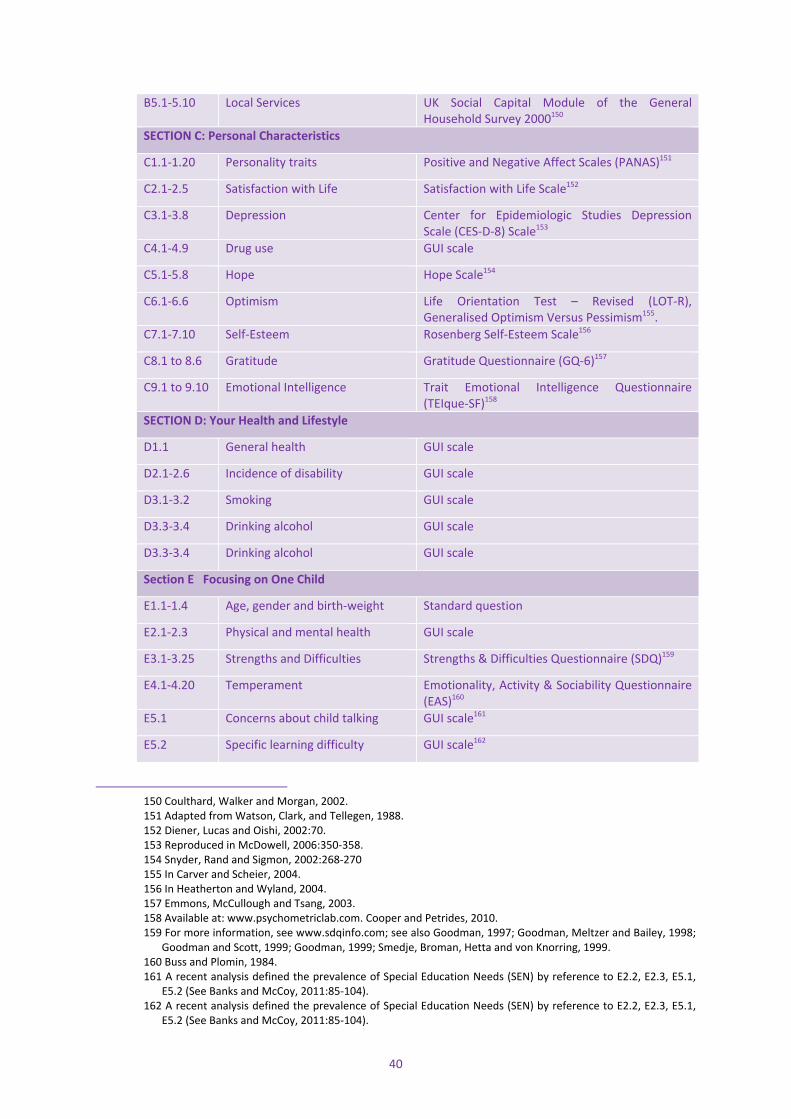
40
B5.1‐5.10 Local Services UK Social Capital Module of the General Household Survey 2000150
SECTION C: Personal Characteristics
C1.1‐1.20 Personality traits Positive and Negative Affect Scales (PANAS)151
C2.1‐2.5 Satisfaction with Life Satisfaction with Life Scale152
C3.1‐3.8 Depression Center for Epidemiologic Studies Depression Scale (CES‐D‐8) Scale153
C4.1‐4.9 Drug use GUI scale
C5.1‐5.8 Hope Hope Scale154
C6.1‐6.6 Optimism Life Orientation Test – Revised (LOT‐R), Generalised Optimism Versus Pessimism155.
C7.1‐7.10 Self‐Esteem Rosenberg Self‐Esteem Scale156
C8.1 to 8.6 Gratitude Gratitude Questionnaire (GQ‐6)157
C9.1 to 9.10 Emotional Intelligence Trait Emotional Intelligence Questionnaire (TEIque‐SF)158
SECTION D: Your Health and Lifestyle
D1.1 General health GUI scale
D2.1‐2.6 Incidence of disability GUI scale
D3.1‐3.2 Smoking GUI scale
D3.3‐3.4 Drinking alcohol GUI scale
D3.3‐3.4 Drinking alcohol GUI scale
Section E Focusing on One Child
E1.1‐1.4 Age, gender and birth‐weight Standard question
E2.1‐2.3 Physical and mental health GUI scale
E3.1‐3.25 Strengths and Difficulties Strengths & Difficulties Questionnaire (SDQ)159
E4.1‐4.20 Temperament Emotionality, Activity & Sociability Questionnaire (EAS)160
E5.1 Concerns about child talking GUI scale161
E5.2 Specific learning difficulty GUI scale162
150 Coulthard, Walker and Morgan, 2002. 151 Adapted from Watson, Clark, and Tellegen, 1988. 152 Diener, Lucas and Oishi, 2002:70. 153 Reproduced in McDowell, 2006:350‐358. 154 Snyder, Rand and Sigmon, 2002:268‐270 155 In Carver and Scheier, 2004. 156 In Heatherton and Wyland, 2004. 157 Emmons, McCullough and Tsang, 2003. 158 Available at: www.psychometriclab.com. Cooper and Petrides, 2010. 159 For more information, see www.sdqinfo.com; see also Goodman, 1997; Goodman, Meltzer and Bailey, 1998;
Goodman and Scott, 1999; Goodman, 1999; Smedje, Broman, Hetta and von Knorring, 1999. 160 Buss and Plomin, 1984. 161 A recent analysis defined the prevalence of Special Education Needs (SEN) by reference to E2.2, E2.3, E5.1,
E5.2 (See Banks and McCoy, 2011:85‐104). 162 A recent analysis defined the prevalence of Special Education Needs (SEN) by reference to E2.2, E2.3, E5.1,
E5.2 (See Banks and McCoy, 2011:85‐104).

41
E6.1‐6.21 Child’s diet GUI scale
SECTION F: Relationship with Child
F1.1 Having fun with child Pianta Child‐Parent Relationship Scale163
F2.1‐F2.30 Child‐Parent Relationship Pianta Student‐Teacher Relationship Scale164; sub‐scales: Closeness; Conflict; Dependence
F3.1‐F3.2 Breastfeeding GUI scale
F4.1‐4.5 Family time together GUI scale
F5.1‐5.4 TV, etc in child’s bedroom GUI scale
F6.1‐6.5 Home Learning Environment Home Learning Environment (HLE) Scale165
F7.1‐7.4 Home Chaos Confusion, Hubbub and Order Scale166
F8.1‐8.18 Parental Stress Parental Stress Scale167; sum of 18 items
F9 Discipline Strategy GUI scale; constructed as sum of items F9.2‐F9.9
F10.1‐10.15 Events in life of child GUI scale
SECTION G: Relationship with Your Partner
G1‐G7 Couple relationship Dyadic Adjustment Scale168
G8.1‐8.4 Couple relationship Ineffective Arguing Inventory169
G9.1‐9.6 Father involvement Scale used in Sure Start evaluation170.
SECTION H: Your Assessment of the Childcare Centre
H1.1‐1.8 Quality of Care for Children Bespoke question
H2.1‐2.11 Quality of Care for Parents Bespoke question
H3.1‐3.2 Satisfaction with early years centre
GUI scale – Infant Cohort.
H3.3‐3.5 Helpfulness of early years centre Bespoke question
2.6 Sample Design
The sample design built upon the initial decision to focus on one age‐range of children, namely those qualifying for the Free Pre‐School Year (3 years 2 months to 4 years 7 months). As explained (section 2.2), this decision was made in response to the challenges of evaluating a multi‐faceted programme like NEYAI. Centres in NEYAI and Síolta QAP were then selected to participate in the study. NEYAI centres were selected by each project; where a centre was deemed by the project to be in receipt of a substantial and sustained intervention from NEYAI. By contrast, Síolta QAP centres were randomly selected from a list of 140 centres participating in the formal Síolta QAP, with provision for using randomly selected replacements where a centre was unable or unwilling to participate. However, as the sample was assembled, every replacement had to be used to generate the final sample of 21 Síolta QAP centres. One could describe this selection process as ‘random’ but in practice it is a convenience sample made up of those Síolta QAP centres that were willing and able to participate.
163 Pianta, 1992. 164 Pianta, 2001. 165 Melhuish, 2010a; Melhuish, et al, 2008. 166 Matheny, Wachs, Ludwig and Phillips, 1995. 167 Berry and Jones, 1995. 168 Sharpley and Rogers, 1984, derived from Spanier 1976. 169 Kurdek, 1994. 170 National Evaluation of Sure Start Team, 2005a:44‐45.

42
The skewedness of the Síolta QAP sample, relative to all centres in the formal Síolta QAP, has already been noted above with over two thirds validated or pending validation (Table 1.4). In consequence our Síolta QAP sample comprises a group of centres that, in terms of the nationally approved standard for early years care and education, could be seen as among the best in the country. This is arguably functional to the study, as these centres provide a benchmark of quality and a test of whether meeting Síolta standards has the effect of improving child outcomes relative to those in NEYAI and to those who have not been validated. In light of this sample design, it is important to emphasise that this is not a representative sample of centres or children in the Free Pre‐School Year or NEYAI and Síolta QAP. This means that the results cannot necessarily be extended to the wider population of children participating in the Free Pre‐School Year or to NEYAI and Síolta QAP as a whole. Reflecting the focus of NEYAI which was targeted at disadvantaged areas, Table 2.4 shows that NEYAI and Síolta QAP centres are located in areas with the same mean deprivation score (‐8.4); in other words, the centres are located in more disadvantaged areas compared to early years centres in Ireland (0.0). The majority of NEYAI (75%) and Síolta QAP (87%) centres are community‐based providers, unlike the generality of early years centres where only a quarter are community‐based (26%). Also, the mean number of places per centre in the Free Pre‐School Year in NEYAI (20.1) and Síolta QAP (28.9) is higher than the national average for all early years centres (16.3). These statistics underline the specificities of the sample and highlight the need for caution in making inferences from the study. For the purposes of data analysis in Chapter Five, we will proceed as if the children in the sample were drawn from a single population. Although we know this was not the case, by controlling for the characteristics of children and their families in all models we aim to obtain reliable estimates.
2.7 Sample of Children and Parents The sample of children in each participating centre was based on a list of all children in the Free Pre‐School Year. A random selection of children was made by the evaluators; by extension, parents of those children were automatically selected for the sample. Sample size was based on the principle that it should be adequate to provide estimates for the overall NEYAI programme and each of its 11 individual projects. Based on this principle, and taking account of sample attrition171 it was decided that a minimum sample of 35 children (and their parents) was required in each of the 11 NEYAI projects, yielding at total sample of 385. By extension, this was also the proposed sample for Síolta QAP, yielding a projected total sample of 770 at baseline and follow‐up. In tandem with determining the sample size, and in order to minimise the amount of extraneous variation within the sample, it was decided to confine the sample to the Free Pre‐School Year (children aged 3 years 2 months to 4 years 7 months) in order to maximise the possibility of finding an impact where there is one (a true positive) and being confident that if no impact is found it is also genuine (a true negative)172. The projected sample size is larger than many studies of early years programmes which use treatment/control comparisons173.
171 The sample of 35 has built‐in provision for a drop‐out of 5 cases per project, equivalent to an attrition rate of
14%. 172 Conversely, we avoided the risk of splitting the sample into two age‐cohorts of children (such as 0‐3 years /
3‐5 years) since this would run the risk of producing inconclusive results because the resulting sample would lack the power to draw any statistically‐significant conclusions about either age‐cohort. An additional consideration was that the measurement instruments used to assess 0‐3 year old children are quite different to those used for 3‐5 year olds with the result that including both age‐groups would effectively involve two separate studies.
173 One of the more celebrated evaluations of a pre‐school programme ‐ HighScope which was first introduced into Perry Elementary School in the Michigan city of Ypsilanti in 1960 and has tracked children from then till age 40 – is based on a combined sample of 123 (58 in the treatment group and 65 in the control group) (Schweinhart, Montie, Xiang, Barnett, Belfield and Nores, 2005). The name ‘HighScope’ refers to the high purposes and far‐reaching mission of a model of education originating in the USA. Similarly, the Carolina Abecedarian Early Intervention Project was based on just 111 infants born between 1972 and 1977 of which 57 were in the treatment group and 54 in the control group. An overwhelming majority (98 percent) of the children who participated in the experiment were African‐American. Another well‐known programme, The Incredible Years Programme, is based on a series of evaluations with samples in the 25‐35 range (see

43
Table 2.4: NEYAI and Síolta QAP Sample Compared to Childcare Sector in Ireland
ID Project Deprivation Mean Score174
No ECCE Places per Centre(v)
Community Provider %
01 BC Ballyfermot ‐18.6 30.3 75.002 CC Canal Communities ‐14.0 11.7 60.003 CK Cork ‐12.0 16.6 100.004 CN Clondalkin ‐8.6 19.4 100.005 DD Dublin Docklands 3.5 13.0 80.006 DL Donegal ‐10.3 27.8 40.007 FL Fingal 1.1 20.3 71.408 LD Longford ‐17.7 18.3 100.009 LK Limerick ‐16.5 22.3 100.010 RO Rialto 6.6 7 66.711 TT Tallaght ‐9.0 21 66.721 EI ECI(i) ‐6.7 29.1 85.7
22 BS Barnardos ‐3.9 26.6 83.3
23 PP PEIP(ii) ‐20.4 33.3 80.0
24 BC BCCN(iii) ‐8.6 37.0 100.0
25 IS Irish Steiner(iv) ‐1.1 13.0 100.0
NEYAI ‐8.4 20.1 75.0 Síolta (in evaluation) ‐8.4 28.9 87.0 Síolta (not in evaluation) ‐3.4 18.6 43.6 Other Childcare Centres 0.3 16.1 24.2 All Childcare Centres 0.0 16.3 25.7
(i) ECI (Early Childhood Ireland) refers to centres in the Síolta QAP which were mentored by this organisation. (ii) PEIP (Prevention and Early Intervention Programme) refers to centres in the Síolta QAP which were mentored by organisations in this programme.
(iii) BCCN (Border Counties Childhood Network) refers to centres in the Síolta QAP which were mentored by this organisation.
(iv) Irish Steiner (Irish Steiner Kindergarten Association) refers to centres in the Síolta QAP which were mentored by this organisation.
(v) Based on data supplied by Department of Children and Youth Affairs. The actual sample of children (448) is lower than the proposed sample (770). Table 2.5 shows that the actual sample in NEYAI is 258, as against 385; in Síolta QAP, the sample is 190, which is also considerably lower than proposed. The difference between the actual and proposed sample is due to the substantial and unexpected difficulties encountered in collecting data, including: (i) data collection in each centre was mediated through NEYAI and Síolta QAP projects and these project‐level responses varied considerably; (ii) early years centres varied in their capacity to participate in the evaluation but almost all seem to have found it burdensome on top of existing work; (iii) obtaining parental consent to participate in the evaluation was a challenge, due to parents being too busy, disinterested, or having language difficulties; (iv) the focus on children in the age group eligible for the Free Pre‐School Year did not fit the target group of some NEYAI projects, whose focus is on parenting
Webster‐Stratton, 1981; Webster‐Stratton, 1984; Webster‐Stratton, 1994; Webster‐Stratton and Hammond, 1997; Webster‐Stratton, Reid and Hammond, 2004; Spaccarelli, Cotler and Penman, 1992).
174 The deprivation score is based on the Pobal Haase‐Pratschke Index which was created by Trutz Haase and Jonathan Pratschke with funding from Pobal (Haase & Pratschke, 2005, 2008). The index is based on the understanding, verified by confirmatory factor analysis, that affluence and deprivation has three dimensions which they refer to as: demographic profile, social class composition, labour market situation. The index combines these dimensions into a single score which is calculated at Electoral District level (3,409 units) and Small Area level (14,937 units). It has a mean score of zero and a standard deviation of ten; consequently nearly all scores are situated within three standard deviations of the mean, ranging between ‐30 and +30. Based on this index, areas are classified as ‘disadvantaged’ (score of ‐10 to ‐20), ‘very disadvantaged’ (score of ‐20 to ‐30), or ‘extremely disadvantaged’ (score of < ‐30). Further details at www.pobal.ie and www.trutzhaase.eu.

44
(FL project) or family support (CC project); (v) unique local difficulties delayed data collection in some NEYAI projects (LD and TT projects); (vi) data collected at wave 1 could not be used without matching wave 2 data due to children leaving some centres. Notwithstanding these difficulties, the response rate between wave 1 and wave 2 was 89%, similar to the response rate achieved, for example, in the second wave of the GUI 9‐year old cohort (90%)175. As a consequence, robust inferences about project‐level effects cannot be made and the overall power of the analysis is lower than initially intended.
Table 2.5: Sample of Children and Parents in NEYAI and Síolta QAP
Project
Total Childcare Centres
n
Childcare Centres Wave 2
n
Total Number of Children
(v) n
Sample of
Children Wave 1
N
Sample of Children Wave 2
n
Response Rate
Wave 2/1%
01 Ballyfermot 4 3 49 35 20 57 02 Canal Communities (7) 1 (7) 1 35 9 8 89 03 Cork 5 5 94 30 30 100 04 Clondalkin 8 7 160 40 30 75 05 Dublin Docklands 5 5 52 39 37 95 06 Donegal 10 10 278 40 39 98 07 Fingal 7 3 80 11 9 82 08 Longford 4 1 99 6 6 100 09 Limerick 4 3 29 18 18 100 10 Rialto 3 3 21 29 24 83 11 Tallaght 8 8 187 41 37 90 21 ECI(i) 7 7 204 60 58 97 22 Barnardos 6 5 133 46 46 100 23 PEIP(ii) 5 4 134 33 24 73 24 BCCN(iii) 3 3 147 47 46 98 25 Irish Steiner(iv) 2 2 26 20 16 80
NEYAI 59 49 1,084 298 258 87 Síolta QAP 23 21 644 206 190 92 All Projects 82 70 1,728 504 448 89
(i) ECI (Early Childhood Ireland) refers to centres in the Síolta QAP which were mentored by this organisation. (ii) PEIP (Prevention and Early Intervention Programme) refers to centres in the Síolta QAP which were mentored by organisations in this programme.
(iii) BCCN (Border Counties Childhood Network) refers to centres in the Síolta QAP which were mentored by this organisation.
(iv) Irish Steiner (Irish Steiner Kindergarten Association) refers to centres in the Síolta QAP which were mentored by this organisation.
As regards the sample composition, nine out of ten children were aged 4‐5 years and evenly divided between boys and girls (Tables 2.6 and 2.7). A quarter (25%) of children have parents not born in Ireland and 15% of these parents did not have English as their first language (NESB – Non‐English Speaking Background) yielding a higher proportion of foreign national children than in the population in 2011 (8%)176. The proportion of Traveller children (1%) is the same as in the population in 2011 (1%)177. Children’s socio‐economic status, measured by their parents’ education (Table 2.8) and degree of financial in making ends meet (Table 2.9), is significantly more disadvantaged by comparison with the average child in Ireland. Data on the home learning environment is also
175 www.growingup.ie 176 Department of Children and Youth Affairs, 2012:29. 177 Department of Children and Youth Affairs, 2012:26.

45
presented (Table 2.10) but there is no comparable Irish data on this variable which would help position the sample in a wider context.
Table 2.6: Age (at 1st September 2013) of Children in NEYAI and Síolta QAP
Project Under 3‐8 %
3‐8 to 3‐10 %
3‐11 to 4‐1 %
4‐2 to 4‐4 %
4‐5 and over %
Total %
NEYAI 0.8 3.1 6.7 13.3 76.1 100.0Síolta QAP 2.1 3.7 4.7 13.7 75.8 100.0All Projects 1.3 3.4 5.8 13.5 76.0 100.0
Table 2.7: Gender of Children in NEYAI and Síolta QAP
Project Male %
Female %
Total %
n
NEYAI 46.9 53.1 100.0 258Síolta QAP 53.2 46.8 100.0 190All Projects 49.6 50.4 100.0 448
Table 2.8: Highest Level of Education of Parents of Children in NEYAI and Síolta QAP
Project
Lower SecondaryLevel 1‐3
%
Leaving CertificateLevel 4&5
%
3rd Level non‐degreeLevel 6
%
3rd Level Degree
Level 7&8 %
Total n
n
NEYAI 24.5 32.9 25.6 11.2 100 258Síolta QAP 14.8 30.0 28.9 17.9 100 190All Projects 20.3 31.7 27.0 14.1 100 448Ireland* 33.4 36.0 4.7 25.8 100 2.9m
**Source: Census of Population 2011.Based on those whose full‐time education has ceased and excludes those whose highest completed education is not stated.
Note: In the National Framework of Qualifications178, Level 4&5 is equivalent to a Leaving Certificate; Level 6 is a third‐level non‐degree qualification; Level 7&8 is a third‐level degree qualification; Level 9&10 is a third‐level post‐degree qualification.
178 www.qqi.ie In 2012, Quality and Qualifications Ireland was formed by merging FETAC and HETAC along with
NQAI (National Qualifications Authority of Ireland) and IUQB (Irish Universities Quality Board).

46
Table 2.9: Difficulty Making Ends Meet of Parents of Children in NEYAI and Síolta QAP
Project
With great Difficulty
%
With Difficulty
%
With some
Difficulty%
Fairly easy %
Easily/ very easily
%
Total %
Total n
NEYAI 11.2 28.7 42.2 14.3 3.5 100 258Síolta QAP 7.9 23.7 45.8 17.9 4.7 100 190All Projects 9.8 26.6 43.8 15.8 4.0 100 448Ireland* 13.7 17.0 34.6 24.6 10.1 100 11,587
*Source: CSO Survey of Income and Living Conditions in 2010, 2012. March, Dublin: Stationery Office.
Table 2.10: Home Learning Environment of Children in NEYAI & Síolta QAP Combined
Project 1 Day or less %
2‐4 Days%
5‐7 Days %
Total %
Total n
How often did you (or your partner) look at books with the child or read stories with him/her in last week?
5 26 69 100 448
How often has the child done activities involving painting or drawing in last week?
5 34 61 100 448
How often did you (or your partner) recite nursery rhymes or sing songs with your child in last week?
5 26 69 100 448
How often has the child played at recognising letters, words, shapes or numbers in last week?
5 32 63 100 448
2.8 Sample of Staff
The sample of staff in selected centres was based on all early years staff but excluding staff in administration or support services. A total of 747 staff completed the Staff Questionnaire at both wave 1 and wave 2 (Table 2.11). This is equivalent to three quarters (76%) of all early years staff in those centres which is a relatively high response rate. Of the 747 staff who completed the Staff Questionnaire, 201 also completed the Child Questionnaire. Staff in NEYAI and Síolta QAP have somewhat higher levels of education compared to the early years sector as a whole at Level 6 (41% compared to 37%) and Level 7 (19% compared to 13%) (Table 2.12). However employment patterns are broadly the same with less than half (48%) employed full‐time, similar to the early years sector (46%), but this is radically different from the rest of the Irish economy where more than three quarter of all workers are employed full‐time (77%) (Table 2.13). We measured various aspects of the workplace in early years centres, as experienced by staff, and compared this with national data for the same measures179 (Table 2.14). This showed that staff in NEYAI and Síolta QAP centres are more satisfied with their job compared to the national average, with the exception of their earnings where the level of dissatisfaction was high (45%). Early years staff have greater commitment to their organisation compared to the average Irish worker where
179 The same scales were used in the Changing Workplace Survey carried out in 2003 (O’Connell, Russell,
Williams and Blackwell, 2004) and 2009 (O’Connell, Russell, Watson and Byrne, 2010). The 2003 survey was based on 5,198 respondents while the 2009 survey was based on 5,110 respondents. One study used both waves of the survey to compare changes in work pressure and found ‘a significant increase in work pressure between 2003 and 2009. Staff reductions and company reorganisation are both associated with increased work pressure, as is current job insecurity’ (Russell and McGinnity, 2013).

47
commitment includes a sense of pride and loyalty to the organisation as well as willingness to work harder in order to help it succeed. Staff reported more job pressure compared to workers in Ireland but, on the actual scale, the pressure is not great. Early years staff also reported less job autonomy compared to the average Irish worker but experienced less work‐family conflict. Workplace consultation is higher in the early years sector and staff‐management relations are also better. Early years staff also have strongly positive perceptions of their managers and the vast majority of early years staff feel valued and supported. The overall incidence of bullying – being subjected to bullying or harassment at work in the past six months – is low. We also measured the work engagement of staff which is the extent to which staff find their work energising, absorbing and are dedicated to it180. These aspects of work have the quality of ‘flow’181 and correspond with an orientation which sees work as primarily a calling rather than a career or a job182. Work engagement in this sense is ‘the opposite of burnout’183. The results show that early years staff have a high level of work engagement which is also higher by comparison with most other occupations in 10 different countries (Table 2.15).
180 This was measured using the Utrecht Work Engagement Scale – Shorted Version (UWES‐9) (Schaufeli,
Bakker, Salanova, 2006). This scale was validated using a sample of 14,521 respondents in a wide range of occupations in 10 different countries (Australia, Belgium, Canada, Finland, France, Germany, Netherlands, Norway, Spain, South Africa).
181 ‘Flow experiences occur when we become engaged in controllable but challenging tasks or activities that require considerable skill and which are intrinsically motivating’ (Carr, 2004:58).
182 Work orientation is typically differentiated according to whether it is primarily a job orientation (focus on financial rewards and necessity rather than pleasure or fulfillment; not a major positive part of life), career orientation (focus on advancement), or calling orientation (focus on enjoyment of fulfilling, socially useful work) (Wrzesniewski, 2002).
183 Schaufeli, Bakker, Salanova, 2006:703.

48
Table 2.11: Sample of Early Years Staff in NEYAI and Síolta QAP
Project Total Childcare
Centres n
Childcare Centres Wave 1&2
n
Sample of Staff Wave 1&2
N 01 Ballyfermot 4 3 4802 Canal Communities (7) 1 (7) 1 2103 Cork 5 5 1904 Clondalkin 8 7 10205 Dublin Docklands 5 5 8306 Donegal 10 10 7007 Fingal 7 3 4508 Longford 4 1 3309 Limerick 4 3 3810 Rialto 3 3 1911 Tallaght 8 8 6521 ECI(i) 7 7 5822 Barnardos 6 5 5723 PEIP(ii) 5 4 5724 BCCN(iii) 3 3 2725 Irish Steiner(iv) 2 2 5
NEYAI 59 49 543 Síolta QAP 23 21 204 All Projects 82 70 747
(i) ECI (Early Childhood Ireland) refers to centres in the Síolta QAP which were mentored by this organisation. (ii) PEIP (Prevention and Early Intervention Programme) refers to centres in the Síolta QAP which were mentored by organisations in this programme.
(iii) BCCN (Border Counties Childhood Network) refers to centres in the Síolta QAP which were mentored by this organisation.
(iv) Irish Steiner (Irish Steiner Kindergarten Association) refers to centres in the Síolta QAP which were mentored by this organisation.
Table 2.12: Highest Level of Education of Staff in NEYAI and Síolta QAP (Wave 2)
Project
Lower SecondaryLevel 1‐4
%
Leaving CertificateLevel 5
%
3rd Level non‐degreeLevel 6
%
3rd Level Degree
Level 7&8 %
Total %
n
NEYAI 23 17 40 20 100 258Síolta QAP 17 22 44 18 100 190All Projects 21 18 41 19 100 448Early Years Sector* 8 42 37 13 100 12,838Ireland** 33 36 5 26 100 2.9m
*Source: Pobal Annual Survey of the Early Years Sector 2012 (Pobal, 2013:43). This refers to early years qualifications only and excludes non‐accredited courses (2.8%) and courses accredited outside Ireland (1.1%). Based on responses from 60% of centres (n=12,838). Note that ’<Level 5’ includes those with no qualifications in early years.
**Source: Census of Population 2011.Based on those whose full‐time education has ceased and excludes those whose highest completed education is not stated.
Note: In the National Framework of Qualifications184, Level 4&5 is equivalent to a Leaving Certificate; Level 6 is a third‐level non‐degree qualification; Level 7&8 is a third‐level degree qualification; Level 9&10 is a third‐level post‐degree qualification.
184 www.qqi.ie In 2012, Quality and Qualifications Ireland was formed by merging FETAC and HETAC along with
NQAI (National Qualifications Authority of Ireland) and IUQB (Irish Universities Quality Board).

49
Table 2.13: Type of Employment (Wave 2)
Project Full‐time
%
Part‐time %
Employment Scheme
%
Total %
NEYAI 48.6 32.0 19.3 100.0Síolta QAP 53.4 29.6 17.0 100.0All Projects 49.9 31.4 18.7 100.0Early Years Sector* 46.0 40.4 13.6 100.0Irish economy** 76.5 23.5 100.0
*Source: Pobal Annual Survey of the Early Years Sector 2011 (Pobal, 2012:32). **Source: National Skills Bulletin 2012 (Expert Group on Future Skills Needs, 2013:87).
Table 2.14: Work and Workplace Quality (Wave 2)
Work & Workplace Quality (scoring range) NEYAI Síolta QAP All Projects Ireland*
Job Satisfaction (‐2 to +2) 0.95 1.03 0.97 0.95Organisational Commitment (‐2 to +2) 0.73 0.82 0.75 0.67Job Pressure (‐2 to +2) 0.61 0.47 0.57 0.32Job Autonomy (0 to +3) 1.23 1.17 1.21 1.62Work‐Family Conflict (0 to +3.5) 1.51 1.38 1.47 1.52Workplace Consultation (0 to +4) 2.83 3.01 2.88 2.75Perceptions of Manager (‐2 to +2) 1.29 1.51 1.35 n/aStaff‐Management Relations (+1 to +5) 4.32 4.47 4.36 4.13Support in Childcare Centre (‐2 to +2) 1.02 1.29 1.09 n/aBullying (‐2 to +2) 1.83 1.97 1.86 n/a
*Source: Changing Workplace Survey 2009 (O’Connell, Russell, Watson and Byrne, 2010).
Table 2.14: Engagement with Work (Wave 2)
Work Engagement Scale Vigour(i) Dedication(ii) Absorption(iii)NEYAI 4.37 4.99 4.59Síolta QAP 4.48 5.05 4.62All Projects 4.40 5.01 4.60International Comparisons* Educators 4.4 4.4 3.7Health & Social Workers 3.9 4.2 3.5Blue‐collar Workers 3.5 3.4 2.7
*Source: Schaufeli, Bakker, Salanova, 2006. All Items scored from 0 (never) to +6 (always). (i) Vigour is the quality of feeling energetic and resilient at work. (ii) Dedication is the experience of work as motivating and inspiring. (iii) Absorption is the quality of being engrossed and immersed in one’s work.
2.9 Data Analysis
Data analysis involved four related components. First, descriptive statistics were prepared which compared data from wave 1 and wave 2 in order to estimate the change in children’s EDI scores during the Free Pre‐School Year. These results are reported in Chapter Four and provide a preliminary indication of the impact of the Free Pre‐School Year in NEYAI and Síolta QAP centres. Second, cross‐tabulations, correlations and ANOVA (analysis of variance) were carried out to identify associations between the dependent variables (children’s EDI scores) and a range of potential explanatory variables. Only those explanatory variables which showed a statistically significant bivariate relationship with the dependent variables were considered for the subsequent multivariate analysis.

50
Third, Structural Equation Modelling (SEM) was used to analyse the specific contribution of a range of factors to child outcomes. Unlike classical linear regression analysis, SEM allows multi‐dimensional constructs (such as child outcomes, social class, mother’s well‐being, parent‐child relationships) to be measured using latent variable modelling. The SEM analysis also includes variables like the child’s age, gender and ethnicity, NEYAI/Síolta QAP projects as possible influences on child outcomes. These models were estimated using EQS 6.1 Structural Equation Modelling Software and the results of this analysis are reported in Chapter Five and their implications explored in Chapter Seven. Fourth, a case study was used to illustrate how a training intervention improved staff skills to develop children’s speech, language and communication. This case study is based on one NEYAI project only and was selected because a local evaluation185 showed that staff in three centres which also participated in the national evaluation186 received a well‐designed and executed training intervention that measurably improved their capacity to develop children’s speech, language and communication. Similar training interventions have been undertaken in other NEYAI and Síolta QAP projects187 but the availability of a robust local evaluation for this intervention – the Language Enrichment Programme – made this a generic and ready‐made illustration of how quality can be improved within the Free Pre‐School Year, and within the early years sector generally. The results of this analysis are reported in Chapter Six. Full results of the data analysis, including SEM models, are detailed in a separate Technical Report (McKeown, Haase and Pratschke, 2014b).
2.10 Ethical Considerations
The main ethical and legal requirement in the study was to ensure that the right of children, parents and staff to privacy and confidentiality was respected at all times. This right is enshrined in the Data Protection Acts 1988 and 2003. With this in mind, the signed consent of each parent was obtained by early years staff before each child was assessed and before the parent’s contact details were passed over to the evaluation team in order to arrange and carry out the parent interview. The parent consent form explained the nature and purpose of the study and guaranteed that the parent’s and child’s privacy and confidentiality would be protected at all times. In addition to parental consent, the evaluation ensured privacy and confidentiality by using numerical identifiers on all questionnaires; no names or other personal identifiers are written on any of the questionnaires. All data collection, data entry and data storage was based on these numerical identifiers so that personal information was never collected and stored with the research data, making them anonymous. All data derived from the questionnaires was stored on password‐protected computers, encrypted, and user‐restricted.
2.11 Limitations of Study
It is appropriate, by way of concluding this chapter, to indicate some of the limitations of this evaluation, with a view to assessing the twin dangers of producing a ‘false positive’188 (such as claiming a programme has an impact when it has not) or a ‘false negative’189 (such as claiming that a programme has no impact when it has). It could be argued that the risk of a false negative has more serious consequences than a false positive. This is because a false negative may close off the
185 French, 2014. 186 The three centres in the evaluation were Cherry Orchard Community Childcare Service (details at
www.cherryorchardcommunitychildcareservice.com), St. Vincent’s Early Childhood Development Service (Details at www.docchildandfamily.ie) and St. Ultan’s Nursery and Early Childhood Education Unit (Details at www.stultans.ie). However many more centres in Ballyfermot participated in NEYAI, including infant classes in primary schools, but not in the evaluation.
187 For example, the Language Enrichment Programme is based on the Hanen method and a number of NEYAI projects are also using this method including Happy Talk in Cork and the Dublin SW Inner City Demonstration Model. Similarly, many projects used mentoring, including all of the Síolta projects.
188 A false positive is the term used to refer to a finding that is wrongly thought to be statistically significant, also referred to as Type I error because the null hypothesis is wrongly rejected.
189 A false negative is the term used to refer to a finding that is thought to be not‐statistically‐significant when it is, also referred to as Type II error because the null hypothesis is wrongly accepted.

51
possibility of finding more effective ways to improve staff capacity and child outcomes190, similar to the scenario in scientific research where a false negative may close off valuable lines of further inquiry191. At the same time, the danger of false positives should not be underestimated, and may indeed be the more usual scenario, since programmes claiming to having a positive impact – the de facto claim of every programme! ‐ could turn out to be ‘false positives’ if a scientific evaluation were ever carried out. There is no ‘control group’ of children, staff or centres who are not in NEYAI, Síolta QAP or the Free Pre‐School Year. This means that we cannot evaluate the impact of these programmes by comparison with ‘doing nothing’. The reason for this is simple: in order to establish a ‘control group’ a process of random allocation is necessary and this is precluded by the way these programmes have been set up. That is why the focus of the evaluation is on ‘naturally occurring variation’192 in outcomes between children who attended the Free Pre‐School Year in order to identify the active ingredients associated with those outcomes. As indicated, this is similar to the influential EPPE study in the UK which used statistical analysis rather than experimental design to identify the sources of variation in children’s pre‐school experiences and outcomes, particularly the sources of variation within the pre‐school setting. A second limitation, particularly from the perspective of evaluating NEYAI and Síolta QAP, is that the evaluation focuses on a selective age‐range of children in the Free Pre‐School Year (aged between 3 years 2 months and 4 years 7 months) even though NEYAI and Síolta QAP are targeted at all children aged 0‐6 years. For that reason, the study is not a representative sample of children in NEYAI and Síolta QAP. The reason for this limitation, as explained above (Section 2.3), is that a robust evaluation of all children aged 0‐6 would require at least two separate studies with separate instruments and methods of data collection. At the same time, there is substantial consensus among experts in early childhood that some of the most significant developments in the life of a child take place in the period from 0‐3 years, such that all subsequent developments build on experiences during those years193. That is why, as observed in a recent edition of Science, ‘age 4 cannot be characterized as “early” with respect to brain development’194. It is recognised that other studies in Ireland, most notably the
190 This risk was also highlighted by the authors of the first impact report on Sure Start Programme: ‘readers of
this report need to appreciate the critical distinction between evaluations reporting (1) no evidence of effectiveness and (2) the lack of effectiveness. That is, a conclusion that “no evidence of effectiveness could be detected”, is distinctly different from concluding that the programme is ineffective in realizing its goals of enhancing child development and family functioning. In other words, absence of evidence (of effectiveness) is not evidence of absence of effectiveness. The critical distinction is between detecting evidence of effectiveness and lack of effectiveness. This distinction is particularly important for this report as it focuses on an intervention that is not necessarily well established in many places for children and families who have not been studied repeatedly over time.’ (National Evaluation of Sure Start Team, 2005a:3).
191 The eminent child psychologist and founder of the bioecological model of human development, Urie Bronfrenbrenner (1917‐2005), also observed that, from the scientific perspective of discovery rather than verification, ‘Type I errors can entail an even greater risk than errors of Type II’ because ‘dismissing as invalid a finding that points the way to a fuller and more precise explanation for the phenomenon under investigation may result in a greater loss than that produced by accepting a finding that is highly significant because of as yet undifferentiated and thereby confounded factors producing the phenomenon in question (e.g., the failure to distinguish Process from Context). The greater risk in the discovery process of dismissing findings as Type 1 errors is further compounded by the phenomenon of magnification of early environmental differences over time’ (Bronfrenbrenner and Morris, 2006:802).
192 Sammons, 2010a:25. 193 For example, a recent report on early intervention in the early years observed that: 'babies are born with 25
per cent of their brains developed, and there is then a rapid period of development so that by the age of 3 their brains are 80 per cent developed' (Allen, 2011:xviii; see also Perry, 2006).
194 Shonkoff, 2011:983. The author adds: ‘If early childhood policy and practice focused more explicit attention on buffering young children from the neurodevelopmental consequences of toxic stress, then scientists, practitioners, and policy‐makers could work together to design and test creative new interventions that combine both cognitive‐linguistic stimulation with protective interactions that mitigate the harmful effects of significant adversity, beginning as early as possible and continuing throughout preschool. For this two‐pronged approach to succeed, new strategies will be needed to strengthen the capacities of parents and providers of early care and education (beyond the provision of additional information and supports) to help young children cope with stress.’ (Ibid:983‐983)

52
infant‐cohort of 11,000 children in the GUI as well as evaluations of the Prevention and Early Intervention Programme, have huge potential to contribute to the evidence‐base on children below the age of 3 years. A third limitation is that most of the data used in the evaluation are based on self‐report by parents and staff as well as staff assessments of children. This is an appropriate and tried‐and‐tested method of data collection, particularly where it involves the use of instruments whose validity and reliability has been well‐established. Nevertheless, these instruments cannot provide the type of insight and independent perspective that comes from direct observation, such as observing interactions (e.g. parent‐child interactions, staff‐child interactions, staff‐parent interactions) or the settings in which those interactions occur (such as the way home or early years centre is organised, equipped, decorated, etc.). Numerous studies of the early years sector testify to the power of direct observation as a robust method for yielding scientific insights into the processes of care and education that cannot be obtained through self‐report instruments alone195. This limitation implies that certain aspects of care and education provided though NEYAI and Síolta QAP will not be evaluated – or at least not in the detail that would be possible through direct observation – such as the pedagogical skills of staff196 or the interaction styles of parents197. It also means that there is at least some potential for confounding due to the differential propensity of observers to attribute higher or lower ratings, an issue that we will return to in Chapters Four and Five. At the same time, the case study reported in Chapter Six, is based on direct observation and partly overcomes this limitation. A fourth limitation is that the effective sample of 448 children, with matched data on parents and staff, is relatively small when considering the range of influences on which data was collected, thus limiting the power to identify statistically significant relationships. As already explained, it was not possible to meet the target sample of 770 children. A fifth and final limitation is that the evaluation cannot assess if impacts of NEYAI, Síolta QAP or the Free Pre‐School Year, where identified, are sustainable. All of these programmes aim to produce a lasting advantage for children but there is no provision to follow children, parents or staff over time to see what benefits might be evident, other things being equal, 2, 3, 5 or even 10 years after the intervention. Many of the studies which have left a lasting legacy on the early years sector have involved waves of data collection and analysis over many years198. In general, these studies suggest that all effects tend to diminish over time; however larger effects (such as effect sizes in the region of 0.3 for programmes like High Scope) tend to last for many years while smaller effects (such as effect sizes below 0.2 for programmes like Head Start and Early Head Start) tend to disappear within a year or two199. This suggests that the size of the initial effect may provide an early indication regarding its
195 Noteworthy examples include the Effective Pre‐School and Primary Education Project (EPPE) (Siraj‐
Blatchford, 2010a) and the NICHD Study of Early Child Care and Youth Development (NICHD Early Child Care Research Network, 2006a, 2006b).
196 It is well‐established that the pedagogical skills of childcare staff have a significant influence on a wide range of child outcomes (Pianta, Barnett, Burchinal and Thornburg, 2009). In broad terms, these skills vary along a continuum from ‘adult‐directed’ to ‘child‐directed’. Studies confirm that cognitive gains are associated with both ‘adult‐directed’ learning (Barnett, 2011:977) and ‘child‐directed’ learning (Siraj‐Blatchford, 2010a:157) while gains in socio‐emotional development and executive function are likely to require a balance of both.
197 Parent‐child interactions are recognised as foundational to human development: ‘Especially in its early phases, but also throughout the life course, human development takes place through … interaction … . To be effective, the interaction must occur on a fairly regular basis over extended periods of time’ (Bronfenbrenner and Morris, 2006:797). These interactions are heavily influenced by the sensitivity of the adult, particularly the mother, and involve acceptance, responsiveness and warmth towards the child (Whittaker, Jones, See, Meisch and Westbrook, 2011:83‐84).
198 The outstanding example of this is HighScope which was first introduced into Perry Elementary School in the Michigan city of Ypsilanti in 1960 and has tracked children from age 3 to 40 (Schweinhart, Montie, Xiang, Barnett, Belfield and Nores, 2005; Heckman, Moon, Pinto, Savelyev and Yavitz, 2009; Heckman and Kautz, 2013; see also Heckman, Pinto and Savelyev, 2013).
199 Barnett, 2011:976; see also Camilli, Vargas, Ryan and Barnett, 2010; Nores and Barnett, 2009. Some measures recommended to improve the effect size of Early Head Start (EHS) and Head Start (HS) also draw attention to the active ingredients in early years programmes: ‘EHS and HS might improve their results by providing richer educational experiences. EHS could increase and improve both parenting education and
53
sustainability. Nevertheless, this limitation needs to be kept in mind, since the sustainability of impacts, where identified, can only be assumed rather than established.
direct classroom experiences. HS may need to focus more resources on the classroom to recruit and retain better teachers. Improving teaching practices may also require increased spending on supervision and coaching of teaching staff. Without budget increases, these changes would require a reduction in program resources devoted to other activities (for example, social services and adult education).’ (Ibid:977)

54
3 Concept and Measurement of Child Outcomes ‘A growing consensus reached among educators, among media writers, among researchers in economics find that children of poor SES are not prepared for college because they were not prepared for school to begin with. The most effective intervention for the children of poor SES should be directed at the preschool stage so that these children are prepared for school and college. The question is then, does preschool experience have long‐term positive effects on school performance and labor market success? This is the main issue that we address in this paper and corroborates the evidence … that early intervention is effective.’200 James Heckman, Nobel Laureate in Economics in 2000, Professor at University of Chicago and University College Dublin.
3.1 Introduction The term ‘child outcomes’ refers to the level of a child’s development in areas that are central to normal and healthy development: physical health and well‐being; social competence; emotional maturity; language and cognitive development; communication skills and general knowledge. These outcomes were measured using the Early Development Instrument (EDI), an instrument that is now used in many countries to assess the development of children around the ages of 4‐5201. EDI scores are an assessment by the child’s educator of the child’s performance on selected behaviours and tasks and, in that sense, are a measure of the child’s skills in those domains202. The EDI is an appropriate instrument for assessing the impact of the Free Pre‐School Year since the object of this programme is to enhance the child’s development and capacity to learn in the year before starting primary school: ‘The objective of the ECCE [Early childhood Care and Education] programme is to make early learning in a formal setting available to eligible children in the year before they commence primary school. To achieve this, services participating in the pre‐school year are required to provide age‐appropriate activities and programmes to children. … . The object of the programme is to benefit children in the key developmental period by providing a free pre‐school year in the year before they start primary school.’203 The EDI is sometimes referred to as a measure of ‘school readiness’204. This term is difficult to define205 and its use runs the risk of implying that readiness is an attribute of the child without reference to the child’s family, community, pre‐school, school, or wider context of family policy and services for children and families. For that reason, we prefer to think of school readiness as having a
200 Heckman and Raut, 2013:5. 201 Details at the Offord Centre for Child Studies, McMaster University, Hamilton, Ontario.
www.offordcentre.com 202 This understanding is informed by Heckman who states: ‘all psychological measurements are calibrated on
measured behavior or “tasks” broadly defined. A task could be an IQ test, a personality questionnaire, job performance, school attendance, completion of high school, participation in crime, or performance in an experiment. … . performance on any task or any observed behavior can be used to measure skills’. (Heckman and Kautz, 2013:13‐14).
203 Website of Department of Children and Youth Affairs: www.dcya.ie. 204 For example, the authors of the EDI state: ‘The EDI assesses a child’s school readiness in five general domains
of child development’ (Janus, Brinkman, Duku, Hertzman, Santos, Sayers and Schroeder, 2007:4). 205 ‘In the research literature, there is a great heterogeneity of theories and practices regarding the construct(s)
of readiness, readiness to learn, school readiness, or readiness to learn at school, and this diversity reflects the historical and cultural diversity inherent to theories and practices pertaining to learning and schooling. This diversity is not only indicative of the complexity of these issues, but it also hints at their societal relevance. After all, a society’s collectively endorsed perceptions of school readiness define at what age school starts, can influence admission decisions for individual children, can affect educational practices at the (pre)school, and can even shape the social structuring of family and community life. Therefore, recurrent debates about school readiness have been highly contentious, as opinions on education are based on a blend of people’s values, political ideologies, social and cultural norms, habits, knowledge, research evidence, intuitions, experiences, economic constraints, and feasibility considerations.’ (Guhn and Goelman, 2011:6).

55
number of different elements: children’s readiness to learn; pre‐school and school readiness to support children’s learning; capacity of families and communities to provide developmental opportunities for children; public policies and services which support all parents and children but especially those facing adversity. Given this understanding, the EDI measure’s one aspect of school readiness – the child’s readiness to learn ‐ but requires a wider frame of reference for understanding the factors which influence it. That is the main focus of this report. Given the centrality of the EDI to our analysis, it is appropriate to describe its properties in some detail. We begin therefore with a brief overview of the EDI domains (Section 3.2) and describe its psychometric properties (section 3.3). We explain why the EDI is appropriate for assessing pre‐school children (section 3.4) and show how EDI scores in the NEYAI and Síolta QAP centres at the beginning (wave 1) and the end (wave 2) of the Free Pre‐School Year compare with those found in other studies (Section 3.5). Given that the focus of this study is to assess the overall effect of the Free Pre‐School Year as well as its distributional effect on children who are developmentally vulnerable, we provide illustrations of what ‘vulnerable’ means in the context of the EDI (section 3.6). Finally, we present a brief summary of the main points (section 3.7).
3.2 Domains of EDI
The Early Development Instrument (EDI) was developed in Canada at the Offord Centre for Child Studies in McMaster University, Hamilton (close to Toronto). It measures five domains that are widely regarded as covering the essential aspects of a child’s normal development: physical health and well‐being; social competence; emotional maturity; language and cognitive development; communication skills and general knowledge. The assessment of each child can be carried out by a teacher, early years worker or parent, without the additional training that is normally required when using more specialised, clinically‐oriented scales. In this study, the assessment of each child was carried out by the early years worker most familiar with the child. Figure 3.1 summarises the five domains and 16 sub‐domains of the EDI, including examples of some items used to measure each.
Figure 3.1: Domains, Sub‐Domains and Sample Items in Early Development Instrument
EDI Domain (5) Sub‐Domain (16 in total) Example items (104 in total)
Physical health and well‐being (3 /13)
Physical readiness for school day
arrives at school hungry
Physical independence has well‐coordinated movements Gross and fine motor skills is able to manipulate objects
Social competence (4 / 26)
Overall social competence is able to get along with other childrenResponsibility and respect accepts responsibility for actions Approaches to learning works independently Readiness to explore new things
Is eager to explore new items
Emotional maturity (4 / 30)
Pro‐social and helping behaviour
helps other children in distress
Anxious and fearful behaviour appears unhappy or sad Aggressive behaviour gets into physical fights Hyperactivity and inattention is restless
Language and cognitive development (4 / 26)
Basic literacy is able to write own name Interest in literacy/numeracy,and uses memory
is interested in games involving numbers
Advanced literacy is able to read sentences Basic numeracy is able to count to 20
Communication skills and general knowledge (0 / 8)
No subdomains
is able to clearly communicate one’s own needs and understand others; shows interest in general knowledge about the world
Source: EDI Handbook (Janus, Brinkman, Duku, Hertzman, Santos, Sayers, & Schroeder, 2007:5.

56
EDI results for each domain are generally presented as percentiles of the population or sample, and labelled as in Figure 3.2. These percentiles apply to children aged 3 years 8 months and over. The EDI convention is to identify ‘vulnerable’ children by those who score in the lowest decile on one or more domain. Some studies identify vulnerable children after controlling for age206 which is consistent with the chronology of child development, but others do not207. None control for gender although the developmental trajectories of boys and girls are known to diverge during the early years208.
Figure 3.2: Classification of EDI Scores
Not Ready for School – ‘Not on Track’ Ready for School – ‘On track’ Developmentally
vulnerable Developmentally at risk Ready Very Ready
Below the 10th percentile
Between the 10th and 25th percentile
Between the 25th and 50th percentile
Above the 50th percentile
Source: EDI Handbook (Janus, Brinkman, Duku, Hertzman, Santos, Sayers, & Schroeder, 2007:7). 3.3 Psychometric Properties of EDI
A growing number of studies have established that EDI has good internal and test‐retest reliability and external validity209. The EDI Handbook states: ‘The EDI’s psychometric properties have proven to be acceptable. The EDI’s simplicity, ease of use, and low cost all lend themselves easily to community‐wide implementation. Data collected for whole populations of children have the advantage of giving the community the true picture and, especially in conjunction with other locally relevant data, allow for making useful recommendations and provide a baseline for future assessments of progress.’210 The Language and Cognitive domain of EDI has convergent validity with the Peabody Picture Vocabulary Test (PPVT), a widely used test of children’s receptive vocabulary and often taken as a proxy for child intelligence. One study211 found the EDI Language and Cognitive domain had ‘high specificity and low sensitivity’212 which means that, for this domain at least, the EDI is better at predicting which children are not vulnerable (true negatives) rather than which children are vulnerable (true positives). Another study also identified the Language and Cognitive domain as ‘only one of the five EDI domain scores [with] sufficient convergent and discriminant validity to enable
206 ‘The classification of developmentally vulnerable is age‐standardised, with the 10th percentile calculated for
4‐year‐olds, 5‐year‐olds and 6‐year‐olds separately.’ (Brinkman, Gialamas, Rahman, Mittinty, Gregory, Silburn, Goldfeld, Zubrick, Carr, Janus, Hertzman and Lynch, 2012:4).
207 Janus and Duke, 2007; Curtin, Madden, Staines and Perry, 2013. 208 The EDI shows consistent gender differences across all countries which is consistent with well‐documented
evidence on the slower rate of development of boys in the early years. Naturally, this does not imply that these gender differences may not be affected by environmental factors in the broadest sense (see Brinkman, et al 2012:11; Janus and Duke, 2007:396) but including gender as a predictor of vulnerability is questionable.
209 Janus, Offord, 2007; Forget‐Dubois, Lemelin, Boivin, and Dionne, 2007; Janus, Brinkman, and Duku, 2011; Guhn, Zumbo, Janus and Hertzman, 2011; Guhn and Goelman, 2011; Hymel, LeMare and McKee, 2011.
210 Janus and Offord, 2007:18; Janus, Brinkman, Duku, Hertzman, Santos, Sayers, and Schroeder, 2007. 211 This was based a sample for which there was valid data for both the EDI and PPVT: 2,083 children in Canada,
642 in Australia, and 156 in Jamaica. The correlations of EDI Language and Cognitive domain and the Peabody Picture Vocabulary Test ranged from 0.30 to 0.38 in the three countries indicating ‘some evidence for the convergent validity of the EDI’ (Janus, Brinkman, and Duku, 2011:Table3). Note that ‘low sensitivity’ means that a low proportion of positives were correctly identified (e.g. the percentage of children who have difficulties in language and cognitive development, sometimes called the true positive rate). ‘High specificity’ means that a high proportion of negatives are correctly identified (e.g. the percentage of children who do not have difficulties in language and cognitive development, sometimes called the true negative rate).
212 Note that ‘low sensitivity’ means that a low proportion of positives were correctly identified (e.g. the percentage of children who have difficulties in language and cognitive development, sometimes called the true positive rate). ‘High specificity’ means that a high proportion of negatives are correctly identified (e.g. the percentage of children who do not have difficulties in language and cognitive development, sometimes called the true negative rate).

57
interpretation’213. This study also found that ‘overall EDI scores (averaged across the five EDI domains) were significantly correlated with both standardized measures of school readiness … suggesting that the overall EDI score may provide a reasonably valid index of school readiness’214. The EDI has been shown to predict future academic achievement. For example, a study in Australia shows that ‘the EDI at age 5 is strongly and consistently associated with standardized tests of literacy and numeracy at ages 8, 10 and 12’215. The Handbook emphasises that the EDI is a ‘population measure’216, which means that while measurements are collected at the level of each individual child, the scores are aggregated and interpreted at school, neighbourhood, region or country level. In other words, the EDI ‘is not suitable for determining or supporting any diagnosis for an individual child; for example, one cannot use the EDI questionnaire to indicate that a child has a learning disability.’217 It has been suggested that the exclusive focus on population‐level interpretations of EDI scores reflects a philosophical and practical orientation towards interventions at community and population level, and may even be a necessary rebalancing of a tendency in public policy to focus exclusively on individual‐level interventions218. However, since individual‐level EDI scores are statistically valid measurements and since, more generally, teacher ratings of a child’s early development are known to be good predictors of later academic achievement219, the case for focusing exclusively on ‘population‐level’ applications of EDI
213 Hymel, LeMare and McKee, 2011. This study was based on a sample of 267 children in British Columbia,
Canada, and compared teacher EDI scores with the scores of non‐teacher assessors using a range of psychometrically robust instruments for each domain in order to test both convergent and discriminant validity while also controlling for the problem of ‘shared method variance’. Convergent validity was indicated by higher correlations between scores of teachers and non‐teachers for the same domain while discriminant validity was indicated by low or non‐existent correlations for different domains. Specifically, it showed that ‘The strongest case for convergent validity was observed for the EDI Language / Cognition domains, an area that is typically included in traditional readiness assessments. In the present study, scores in the EDI Language / Cognition domain correlated most strongly with conceptually similar indices of readiness including the Bracken SRC [School Readiness Composite] (.65) and its subscales, the CCTOPP [Comprehensive Test of Phonological Awareness] assessment of phonological awareness (.40), and the ESIK [Early Screening Instrument – Kindergarten] total score (.44) and its subscales of Language / Cognition and Number Concepts (.38, .33). Regarding discriminant validity, the correlation between EDI Language/Cognition domain scores and scores on the Relationship Questionnaire (social competence, r= .16) were significantly lower than those observed between EDI Language/Cognition domain and the Bracken SRC (t=‐8.27, p,.001)’ (Hymel, LeMare and McKee, 2011).
214 ‘Overall EDI scores (averaged across the five EDI domains) were significantly correlated with both standardized measures of school readiness (ESI‐K, Bracken SRC) and with direct, child‐based indices of early social (Relationship Questionnaire) and academic competencies (CTOPP, phonemic awareness) thought to be important to school success. The magnitude of these correlations was moderate. … . Taken together, these findings provide correlational evidence that support the construct validity of the overall EDI score with respect to direct, expert‐administered school readiness assessments, suggesting that the overall EDI score may provide a reasonably valid index of school readiness’. (Hymel, LeMare and McKee, 2011).
215 This was based on a sample of 1,823 children in Western Australia for which there was matched data on EDI scores at age 5 and standardised literacy and numeracy scores for the same children at ages 8, 10 and 12 (Brinkman, Gregory, Harris, Hart, Blackmore and Janus, 2013:704)
216 ‘The EDI as an instrument for measuring population health has the most value when implemented for an entire group of children within a geographical community. However, it can also be used in project evaluation or as a research tool for more restricted population groups. In such cases, the results should be interpreted within the research design framework, since EDI applicability will be dependent on the design of the project.’ (Janus, Brinkman, Duku, Hertzman, Santos, Sayers, & Schroeder, 2007:6).
217 Janus, Brinkman, Duku, Hertzman, Santos, Sayers, and Schroeder, 2007:10. 218 ‘The caution against individual‐level interpretations reflects the population health orientation of the two
major Canadian proponents of the EDI … but is also a reaction to the historically poor predictive validity of child‐level school readiness measures. ... Individual scores are meaningful, but philosophically and practically, the focus of potential score use and interpretation, as well as interventions, is at a community, rather than individual level. … Population‐level school readiness data, which can be linked to other large‐scale data relating to children’s development, makes possible the shift from the traditional individual differences approach to development, to the current emphasis on the social determinants of population health.’ (Forer and Zumbo, 2011).
219 For a review, see Forer and Zumbo, 2011.
58
may be difficult to sustain in all circumstances. It may also be difficult to sustain from a human development perspective, which gives primacy to proximal interactions as the engine of child development; moreover the ecological layers around the child and family lend themselves to multi‐level statistical analysis. In view of this, our approach is to analyse changes in EDI scores at individual‐level, project‐level and programme‐level since each of these levels is appropriate to the purposes of the evaluation. Moreover, this multi‐level approach also facilitates analysis of the policy implications at each level220.
3.4 Appropriateness of EDI for Pre‐School Children Given that EDI is normally used for children attending primary school – mainly 4‐5 year olds and not with children aged less than 3 years 8 months ‐ and is normally completed by teachers rather than early years workers, the evaluation team made the decision to use EDI after consultation with its authors221. Table 3.1 shows that the vast majority of children (95%) in our sample were aged 3 years 10 months at wave 1 and therefore well within the threshold for using the EDI. It also shows that, for each age group, scores at wave 2 are consistently higher than at wave 1, which implies the scale is measuring progress in child development in each EDI domain. Table 3.2 shows that girls have consistently higher scores at waves 1 and 2, as found in all other studies222. These findings suggest
220 It is of note that the provincial government in British Columbia, Canada, has set a goal of reducing the
proportion of developmentally vulnerable children from 25% to 15% by 2015. This is essentially an individual‐level rather than a population‐level application of EDI since a population‐level approach would frame the goal in terms of reducing the percent of neighbourhoods that have developmentally vulnerable children. Naturally, these two levels are not mutually exclusive. Commenting on this, two researchers at the University of British Columbia observed that: ‘The provincial goal, as currently defined, inadvertently encourages interventions designed to impact individual students. By focusing on individual students rather than communities, there is also the possible unintended consequence that the goal could be achieved by focusing interventions or resources on more population‐rich parts of the province, like the Greater Vancouver area’ (Forer and Zumbo, 2011).
221 In a series of emails in July 2011, the evaluators asked the following questions of Magdelena Janus, one of the authors of the EDI: ‘First, given that our study is a pre‐post longitudinal evaluation, with a comparison group, our interest in using the EDI is primarily in assessing the impact of the ECCE Programme between the beginning and end of the ECCE year; the actual thresholds reached by the groups of children, at baseline or follow‐up, are also important but somewhat secondary from an evaluation perspective. In view of that, we would appreciate your advice on whether the EDI could be used with slightly younger children (such as 3 years and 6 months), while mindful that normative data can only be used for the 4‐6 age group? Second, the EDI will be completed by the Pre‐school Leader who, while not technically a teacher, is qualified in early education to third‐level diploma level or above.’ Her reply was: ‘The EDI during its testing phase was actually validated for children at both JK and SK levels, which in Canada could be as early as 3 years 8 months. It has since been used with children younger than our main group (which is the 5‐year‐olds). Especially since you are planning to track the progress, there should not be a problem. As to the other question, I believe the final decision will have to be made by you considering the main qualification for completion of the EDI, and that is a thorough knowledge of the child’s behaviour. In population implementations, we make sure the teacher has at least 4 months to observe the child in school (or preschool) setting. The difference between the EDI and some other direct‐test measures is that it does not rely on testing a child on the only testable aspects of their development – cognitive and communication, but also puts emphasis on the other aspects – social, emotional, and physical stamina – which can only come from reliable observation. It is very hard for me to judge to what extent the Pre‐school Leaders will have that knowledge. It may be just terminology – if this title is an equivalent of the Early Childhood Educator, who is with children in the classroom, I am sure that they will be the most appropriate people to do this’.
222 Cognitive development was consistently higher for girls than boys in the three‐year old cohort of the GUI (Williams, Murray, McCrory and McNally, 2013:63). ‘Children in Growing Up in Ireland undertook two standardised tests, administered directly by the interviewer in the home. These tests were the Picture Similarities and Naming Vocabulary scales from the British Abilities Scales (BAS; Elliott, Smith & McCulloch, 1996), measuring reasoning/problem‐solving and vocabulary respectively. In the Picture Similarities test, children were shown a page with four pictures and given a card with a fifth picture on it. The child was asked to match the card to one of the four pictures based on some shared characteristic or construct (e.g. a card showing a stamp was matched to the picture of an addressed envelope). In the Naming Vocabulary test, the interviewer showed the child pictures of everyday objects (e.g. a shoe) and the child had to say the name of the object (in English). Only children whose Primary Caregiver judged them to have sufficient English attempted the vocabulary test.’ (Williams, Murray, McCrory and McNally, 2013:62).

59
that our dataset is internally consistent and broadly consistent with the age/gender pattern of EDI scores in other samples. Other considerations also informed the decision to use EDI for this study: (i) it can be compiled by the child’s educator rather than external specialists or observers223; (ii) there is no comparable global measure of child development for this age‐range of children; (iii) it is used extensively in Canada, Australia and other countries including Ireland224; (iv) the main focus of the evaluation is on changes in the overall EDI scores between wave 1 and 2 rather than the performance of children relative to national population norms.
Table 3.1: EDI Scores by Age of Children in NEYAI and Síolta QAP at Wave 1 and Wave 2
n Age Wave 1 Mean score Wave 1
Std. Wave 1
Mean score Wave 2
Std. Wave 2
Physical Wellbeing 21 Under 3‐10 8.87 1.06 9.03 1.51 26 3‐11 to 4‐1 8.83 1.14 9.01 1.14 60 4‐2 to 4‐4 8.84 1.26 8.91 1.15 341 4‐5 and over 8.92 1.37 9.19 1.17
Social Competence 21 Under 3‐10 7.01 1.85 7.92 1.80 26 3‐11 to 4‐1 7.27 1.93 7.49 2.10 60 4‐2 to 4‐4 7.41 1.99 7.77 1.92 341 4‐5 and over 8.03 1.90 8.46 1.80
Emotional Maturity 21 Under 3‐10 7.30 1.41 7.73 1.24 26 3‐11 to 4‐1 7.56 1.38 7.58 1.57 60 4‐2 to 4‐4 7.18 1.61 7.63 1.64 341 4‐5 and over 7.73 1.50 7.96 1.56
Language & Cognitive Skills 21 Under 3‐10 3.87 1.43 4.93 2.25 26 3‐11 to 4‐1 4.50 2.00 5.63 1.97 60 4‐2 to 4‐4 4.63 1.54 5.81 1.98 341 4‐5 and over 5.65 1.88 6.81 1.97
Communication Skills 21 Under 3‐10 7.47 2.66 7.44 2.42 26 3‐11 to 4‐1 6.43 3.19 6.82 3.28 60 4‐2 to 4‐4 6.99 3.04 7.56 2.84 341 4‐5 and over 8.06 2.63 8.61 2.31
223 EDI can also be completed by parents but their assessments tend to be give higher ratings for the child’s
abilities. 224 The full list of countries where the EDI has been implemented are: Australia, Canada, Chile, Egypt, England,
Holland, Ireland, Jamaica, Kenya, Kosovo, Mexico, Moldova, Mozambique, New Zealand, USA (www.offordcentre.com).

60
Table 3.2: EDI Scores by Gender of Children in NEYAI and Síolta QAP at Wave 1 and Wave 2
n Gender Wave 1 Mean score Wave 1
Std. Wave 1
Mean score Wave 2
Std. Wave 2
Physical Wellbeing 222 Male 8.74 1.44 8.96 1.25 226 Female 9.06 1.19 9.3 1.09
Social Competence 222 Male 7.41 2.1 7.86 2.08 226 Female 8.28 1.65 8.71 1.5
Emotional Maturity 222 Male 7.27 1.61 7.52 1.68 226 Female 7.98 1.33 8.23 1.35
Language & Cognitive Skills 222 Male 4.99 1.89 6.11 2.07 226 Female 5.73 1.85 6.92 1.96
Communication Skills 222 Male 7.31 2.95 7.84 2.77 226 Female 8.27 2.48 8.78 2.13
3.5 EDI Scores for NEYAI and Síolta QAP in Comparative Context
Table 3.3 presents mean scores on each EDI domain for NEYAI and Síolta QAP, along with comparative data. This indicates that NEYAI and Síolta QAP scores on all domains – with the exception of language & cognitive skills – do not vary greatly when compared with other samples. This may seem somewhat surprising, since the children in NEYAI and Síolta QAP are 10‐20 months younger than children in the other samples. One possible explanation is that the EDI was completed by teachers in most of the other samples and they tend to give lower scores than parents, for example, as Table 3.3 shows in the case of the Dublin Preparing for Life Programme225. This suggests that the early years staff may be closer to parents than to teachers in how they assess a child’s development and learning using the EDI. Another possible, and perhaps more plausible explanation is that these domains are less age‐sensitive than language & cognitive skills, since the latter is the only domain where NEYAI and Síolta QAP scores are significantly below those of children in other samples. The particular sensitivity of language & cognitive skills to the child’s age, and to changes in NEYAI and Síolta QAP between waves 1 and 2, suggest that this is a key EDI domain. Moreover, as the studies referred to above indicate226, the EDI domain of language & cognitive skills has greater validity than other EDI domains.
The evidence presented in Table 3.3 suggests that the EDI cannot be interpreted in the same way as OECD measurements of well‐defined competencies such as reading and numeracy (e.g. PISA227, PIRLS228, TIMMS229), and for which there are agreed international norms. It also suggests that comparison of EDI scores between different samples and populations is likely to be fraught with difficulties due to cultural differences between and within countries in assessing the more context‐sensitive items of the EDI. For that reason, the authors of the EDI state that ‘the EDI needs to be validated and tested for reliability within each country prior to being able to compare across countries’230. In addition, since EDI scores are sensitive to the frame of reference of those who
225 More details about this programme at www.preparingforlife.ie 226 Janus, M., Brinkman, S., and Duku, E., 2011; Hymel, LeMare and McKee, 2011. 227 Programme for International Student Assessment (PISA). 228 Progress in International Reading Literacy Study (PIRLS). 229 Trends in International Mathematics and Science Study (TIMSS). 230 Janus, Brinkman and Duke, 2011.

61
complete it – such as teachers, early years workers or parents – between‐group comparisons may be less useful than within‐group comparisons231. Even within‐group comparisons – such as how teachers score the EDI232 or define special education needs233 – may not be independent of the characteristics of the teacher. In this study, we also found that staff who scored higher on the negative affect scale gave consistently lower assessments of children compared to other staff (see Figures 5.2 and 5.3 below). We base the entire analysis on ‘within‐group’ comparisons – since EDI scores are of pre‐school children assessed by their early years workers – and this is the safest way of using the EDI.
Table 3.3: EDI Scores for NEYAI and Síolta QAP in Comparative Context
Year Study Assessor Mean Age Mean Median SD
Yrs/Mths (0‐10) (0‐10) Physical Health and Wellbeing
2012/13 NEYAI & Síolta QAP: Wave 1 Educator 3/11 8.9 9.2 1.3 NEYAI & Síolta QAP: Wave 2 Educator 4/6 9.1 9.6 1.2
2008/9 Dublin Preparing for Life Parent 4/9 ‐ ‐ Dublin Preparing for Life Teacher 4/9 ‐ ‐
2010/11 Cork Primary Schools Teacher 5/6 8.8 / 8.1 1.4 / 2.02012 East Lothian Scotland Teacher 5/6 8.9 ‐ 2005/6/7 Canadian Children Teacher 5/8 8.8 1.3 2012 Australian Children Teacher 5/7 9.1 9.6 1.3
231 One study, based on children in the Preparing for Life Programme catchment area, compared the EDI scores
of parents and teachers and found that ‘Caregivers rated children as being more socially competent, more emotionally mature, and as displaying higher levels of language and cognitive development and communication and general knowledge than did teachers.’ (Doyle, Finnegan and McNamara, 2012:382). Significantly, the same study also observed: ‘this study supports research indicating that teacher reports of school readiness using the S‐EDI are more reliable than caregiver ratings (e.g. Janus et al. 2005). The teacher alpha reliabilities exceeded those of caregivers (the majority of whom were parents) on almost every domain and subdomain, indicating greater internal consistency of the S‐EDI with teacher reports. It is therefore recommended that school readiness surveys using the S‐EDI adopt teacher reports as the primary measurement tool and that a different or amended instrument is needed when measuring school readiness using parent or caregiver reports.’ (Ibid:385).
232 In Canada, one study has estimated that 19‐25% of variability in EDI scores is attributable to teacher and classroom characteristics giving rise to an unknown amount of ‘construct‐irrelevant’ variability such as whether a teacher is more lenient in rating than another, is less experienced or qualified, applies a different standard to different groups of children, or influenced by the size of the class (Forer and Zumbo, 2011).
233 In Ireland, this has been illustrated by a study, based on the 9‐year old cohort of the GUI, which found that teachers with less than three years’ experience were less likely to assess a child as having special education needs (SEN) compared to more experienced teachers; an exception is learning difficulties which were more likely to be identified by teachers with more than 30 years’ experience (McCoy, Banks and Shevlin, 2012). The authors suggest some reasons for this: ‘such as fewer students with SEN being allocated to these teachers or more recent graduates being less likely to over‐identify, preferring to adopt more inclusive education approaches.’ (McCoy, Banks and Shevlin, 2012:16).
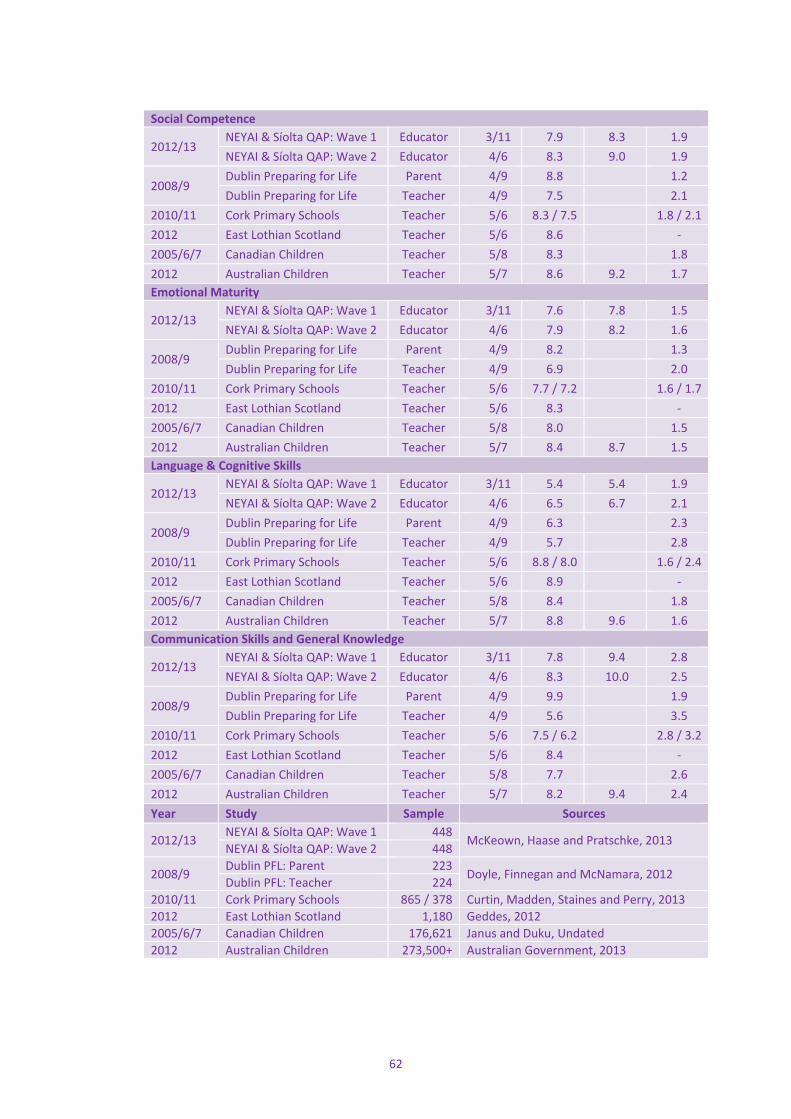
62
Social Competence
2012/13 NEYAI & Síolta QAP: Wave 1 Educator 3/11 7.9 8.3 1.9 NEYAI & Síolta QAP: Wave 2 Educator 4/6 8.3 9.0 1.9
2008/9 Dublin Preparing for Life Parent 4/9 8.8 1.2 Dublin Preparing for Life Teacher 4/9 7.5 2.1
2010/11 Cork Primary Schools Teacher 5/6 8.3 / 7.5 1.8 / 2.12012 East Lothian Scotland Teacher 5/6 8.6 ‐ 2005/6/7 Canadian Children Teacher 5/8 8.3 1.8 2012 Australian Children Teacher 5/7 8.6 9.2 1.7 Emotional Maturity
2012/13 NEYAI & Síolta QAP: Wave 1 Educator 3/11 7.6 7.8 1.5 NEYAI & Síolta QAP: Wave 2 Educator 4/6 7.9 8.2 1.6
2008/9 Dublin Preparing for Life Parent 4/9 8.2 1.3 Dublin Preparing for Life Teacher 4/9 6.9 2.0
2010/11 Cork Primary Schools Teacher 5/6 7.7 / 7.2 1.6 / 1.72012 East Lothian Scotland Teacher 5/6 8.3 ‐ 2005/6/7 Canadian Children Teacher 5/8 8.0 1.5 2012 Australian Children Teacher 5/7 8.4 8.7 1.5 Language & Cognitive Skills
2012/13 NEYAI & Síolta QAP: Wave 1 Educator 3/11 5.4 5.4 1.9 NEYAI & Síolta QAP: Wave 2 Educator 4/6 6.5 6.7 2.1
2008/9 Dublin Preparing for Life Parent 4/9 6.3 2.3 Dublin Preparing for Life Teacher 4/9 5.7 2.8
2010/11 Cork Primary Schools Teacher 5/6 8.8 / 8.0 1.6 / 2.42012 East Lothian Scotland Teacher 5/6 8.9 ‐ 2005/6/7 Canadian Children Teacher 5/8 8.4 1.8 2012 Australian Children Teacher 5/7 8.8 9.6 1.6 Communication Skills and General Knowledge
2012/13 NEYAI & Síolta QAP: Wave 1 Educator 3/11 7.8 9.4 2.8 NEYAI & Síolta QAP: Wave 2 Educator 4/6 8.3 10.0 2.5
2008/9 Dublin Preparing for Life Parent 4/9 9.9 1.9 Dublin Preparing for Life Teacher 4/9 5.6 3.5
2010/11 Cork Primary Schools Teacher 5/6 7.5 / 6.2 2.8 / 3.22012 East Lothian Scotland Teacher 5/6 8.4 ‐ 2005/6/7 Canadian Children Teacher 5/8 7.7 2.6 2012 Australian Children Teacher 5/7 8.2 9.4 2.4 Year Study Sample Sources
2012/13 NEYAI & Síolta QAP: Wave 1 448
McKeown, Haase and Pratschke, 2013 NEYAI & Síolta QAP: Wave 2 448
2008/9 Dublin PFL: Parent 223
Doyle, Finnegan and McNamara, 2012 Dublin PFL: Teacher 224
2010/11 Cork Primary Schools 865 / 378 Curtin, Madden, Staines and Perry, 20132012 East Lothian Scotland 1,180 Geddes, 20122005/6/7 Canadian Children 176,621 Janus and Duku, Undated 2012 Australian Children 273,500+ Australian Government, 2013

63
3.6 Summary
The Early Development Instrument (EDI), now used in many countries to assess the development of children around the ages of 4‐5, measures ‘child outcomes’ in five areas: physical health and well‐being; social competence; emotional maturity; language and cognitive development; communication skills and general knowledge. It is normally used on children at the start of primary school and completed by teachers rather than early years workers. For that reason, the evaluation team made the decision to use EDI after consulting with its authors, but also because the EDI has acceptable psychometric properties, as demonstrated by a growing number of studies. Other considerations informed the decision to use EDI for this study: (i) it can be administered by the child’s educator rather than external specialists or observers; (ii) there is no comparable global measure of child development for this age‐range of children; (iii) it is already being used extensively in Canada, Australia and other countries, as well as in Ireland; (iv) the main focus of the evaluation is on changes in EDI scores between start (wave 1) and end (wave 2) of the Free Pre‐School Year rather than comparing the performance of children relative to national population norms. In order to assess how the EDI performs in this study we compared mean scores on each EDI domain for NEYAI and Síolta QAP with similar data from a range of countries, namely Canada, Australia, Scotland and Ireland. This indicated that NEYAI and Síolta QAP scores on all domains – with the exception of language & cognitive skills – do not vary greatly when compared with other samples. This appears somewhat surprising since children in NEYAI and Síolta QAP are 10‐20 months younger than children in the other samples. This may be due to the fact that early years workers differ from teachers in how they assess children or because language & cognitive skill is a more age‐sensitive EDI domain. The latter explanation seems most likely, itself a significant finding and consistent with other studies which have shown that the EDI measurement of language & cognitive skills has greater validity than other EDI domains. The EDI is not well‐suited to making ‘between‐group’ comparisons, such as between children in different countries or settings, or using different assessors of the child, and in line with the advice of the authors, we focus exclusively on ‘within‐group’ comparisons since the analysis is based entirely on variations within a group of pre‐school children assessed by their early years workers at waves 1 and 2.
The EDI scores can be presented as mean scores and percentiles. The EDI convention is that children below the 10th percentile are deemed ‘developmentally vulnerable’, those between the 10th and 25th percentile are ‘developmentally at risk’, and those above the 25th percentile are ‘on track’. We use absolute scores, mean scores and percentiles throughout the analysis.

64
4 Describing Child Outcomes ‘The highest performing education systems across OECD countries are those that combine high quality and equity. In such education systems, the vast majority of students can attain high level skills and knowledge that depend on their ability and drive, more than on their socio‐economic background. … . The benefits of investing in equity in education outweigh the costs for both individuals and societies and … equity can and should go hand‐in‐hand with quality. Furthermore … investing in equity in education is economically efficient, in particular if investments are made early on. … . In the current context of international economic recession, this evidence becomes more relevant than ever.’ 234 Organisation for Economic Cooperation and Development, Report on PISA Results in 2009.
4.1 Introduction This chapter describes outcomes based in a sample of children who attended centres in NEYAI and Síolta QAP and who participated in the 2012/13 Free Pre‐School Year. It is written from the perspective that a successful pre‐school system is one which improves outcomes for all pre‐school children while simultaneously narrowing the gap in outcomes between children. This is also the stated goal for early years education by the Department of Education and Skills (DES): ‘Provide a quality inclusive school and early years education system with improved learning outcomes’235 [emphasis added]. This approach is also recognised as being central to the assessment pre‐school programmes236 and school systems generally237.
Underpinning this perspective is a moral vision that every child, without exception, has a natural potential to do well and to flourish; by extension, children who face adversity need extra care and education to help them grow and do as well as other children. But this perspective also has an economic rationale, since investment in the early years provides a good return to public funds in terms of lifetime benefits to individuals and society relative to the opportunity cost (or ‘opportunity lost’) of not making this investment238. The strength of the economic argument, as Nobel Laureate James Heckman has shown239, rests not just on improving overall child outcomes but also on the
234 OECD, 2012a:14. 235 Department of Education and Skills, 2011a:6. 236 ‘School readiness initiatives should be judged not only on the basis of their effectiveness in improving the
performance of the children they reach, but also on the extent to which they make progress in reducing significant disparities that are observed at school entry in the skills of young children with different background (Shonkoff and Phillips, 2000:6).
237 In the OECD understanding, a successful school system is efficient at improving outcomes for all students as well as equitable outcomes in terms of ‘inclusion’ (meaning all students reach a basic minimum level of education) and ‘fairness’ (meaning that personal or socio‐economic circumstances do not hinder educational success) (OECD, 2012a:15; 2010b:27). The converse is school failure which is increasingly used as the way to look at student failure: ‘The idea that students fail because of their own personal shortcomings (academic or otherwise) is being superseded by the idea of school failure. The cause of – and responsibility for – students’ failure is now seen increasingly as a deficient or inadequate provision of education by schools, and by extension, school systems. It is the failure of schools to provide education appropriate to different needs that leads students to fail. In this way school failure is, therefore, also an issue of equity. Reorienting educational systems towards the goal of promoting equity is advanced as the necessary redress of student failure.’ (OECD, 2012a:17).
238 ‘Educational equity is often discussed as a moral issue. Another way to think about equity is as a way to promote productivity and economic efficiency. As an economist, I focus on the economic value of equalizing educational opportunities and achievement in order to identify the most effective way to increase productivity. … . The logic is quite clear from an economic standpoint. We can invest early to close disparities and prevent achievement gaps, or we can pay to remediate disparities, when they are harder and more expensive to close. Either way we are going to pay. And, we’ll have to do both for a while. But, there is an important difference between the two approaches. Investing early allows us to shape the future; investing later chains us to fixing the missed opportunities of the past.’ (Heckman, 2011).
239 ‘Investment in early education for disadvantaged children from birth to age 5 helps reduce the achievement gap, reduce the need for special education, increase the likelihood of healthier lifestyles, lower the crime rate, and reduce overall social costs. In fact, every dollar invested in high‐quality early childhood education produces a 7 to 10 per cent per annum return on investment. Policies that provide early childhood

65
benefits of ‘closing the gap’ between outcomes. With this understanding, our analysis focuses on both the overall level of outcomes and the gap in outcomes during the Free Pre‐School Year.
Applying this approach, we estimate changes in the development of all children during the Free Pre‐School Year (the ‘level‐effect’) as well as the gap between children (the ‘distribution‐effect’). Based on this understanding, we use the Early Development Instrument (EDI) to assess change in the development of all children between the beginning of the Free Pre‐School Year (wave 1) and the end (wave 2), but also assess how this change is distributed between children. The chapter is largely descriptive in the sense that it describes changes in child outcomes and how they vary. Specifically, we look at variation in child outcomes across five domains of child development, the difference in outcomes between children in the lowest decile and other children, whether the children attended a centre which participated in the NEYAI or Síolta QAP and, within Síolta QAP, whether the centre was validated or not, as well as indicating the specific NEYAI or Síolta QAP project to which the centre belonged. These sources of variation in child outcomes do not imply that they are the cause of the variation. For that reason, a full explanation of why outcomes vary between children, taking all measured sources of variation into account and based on Structural Equation Modelling, is the theme of the next chapter. We begin with a brief overview of the sample’s representativeness and relevance for assessing child outcomes during the Free Pre‐School Year (Section 4.2). We then present the overall change in EDI scores between wave 1 and wave 2 (section 4.3). This is followed by analysis of the gap in outcomes between children (section 4.4). Differences in child outcomes between NEYAI and Síolta QAP are compared (section 4.5), including variations within the Síolta QAP sample between child outcomes in validated and non‐validated centres (section 4.6). We also present project‐level variations in child outcomes (section 4.7) and cite evidence from some local evaluations which either corroborate or are consistent with the findings presented here (section 4.8). The chapter concludes with a summary of findings (section 4.9).
4.2 Representativeness and Relevance of Sample
In Ireland, there were approximately 66,000 children in the Free Pre‐School Year in 2011240. This study covers less than 1% of these: 448 in total, comprising 258 (58%) in NEYAI and 190 (42%) in Síolta QAP. This is a convenience sample of children because the centres which they attended were not randomly selected for reasons explained in Chapter Two. NEYAI centres were selected on the basis of NEYAI programme criteria, all in disadvantaged areas, but not all NEYAI centres participated in the evaluation. Siolta centres were randomly selected but, since many did not accept the invitation to participate in the study, the resulting sample includes only the centres which were willing to participate. Overall, the sample contains an over‐representation of disadvantaged children and the under‐representation of advantaged children by comparison with the national population. In addition, our impression is that the sample comprises the more able centres in NEYAI and Siolta, and this impression is reinforced by anecdotal evidence on centres which did not participate or subsequently dropped out. These considerations imply that inferences from this study to the wider population of children in the 2012/13 Free Pre‐School Year cannot be justified. This is a limitation of the study since, without a representative picture of outcomes in the Free Pre‐School Year, it is not possible to assess its national impact on child development, particularly at entry to primary school. Our goal is thus to identify what happened to a group of children who participated in the 2012/13 Free Pre‐School Year, since this may offer important insights into how outcomes are generated for all children. We believe that the findings of this study may have relevance for all children in the Free Pre‐School Year, and possibly for the early years sector more generally.
educational resources to the most disadvantaged children produce greater social and economic equity.’ (Heckman, 2011).
240 Department of Children and Youth Affairs, 2012b:66‐67.
66
4.3 Overall Child Outcomes
Child outcomes are defined in this chapter as the difference in mean scores in each EDI domain between wave 1 (the baseline) and wave 2 (the follow‐up). This is expressed using ‘Cohen’s d’, and has the advantage of showing the size of change in standardised units (the pooled standard deviation of scores at waves 1 and 2) thereby making it possible to compare the size of change across different sub‐groups of children. The convention for interpreting the results – though not without its critics241 – is that a coefficient of 0.2 indicates a small difference, 0.5 indicates a medium difference, and 0.8 indicates a large difference242. In practice, statistically‐significant differences of 0.2 and above may also be substantively important243. Figure 4.1 summarises the change between waves 1 and 2 in each EDI domain for the entire sample of 448 children: all programmes (NEYAI and Síolta QAP), all projects (11 in NEYAI, 5 in Síolta QAP), all centres (49 in NEYAI, 21 in Síolta QAP) and all children (258 in NEYAI, 190 in Síolta QAP). This shows that the overall change is 0.27, slightly higher in NEYAI (0.29) than in Síolta QAP (0.25). As conventionally understood, this is a small change. The scale of change is broadly similar across domains, with the exception of language & cognitive skills (0.59), where it is much higher. This may reflect greater sensitivity in the EDI instrument to measuring changes in language & cognitive skills and the fact that this domain has also been established as having greater validity than other EDI domains244. The changes summarised in Figure 4.1 combine two processes of child development which cannot be separated without a control group: (i) natural growth (ii) pre‐school experience. Since this study does not have a control group of children who stayed at home, we do not know how much of this development is attributable to the Free Pre‐School Year. It is worth adding that a consequence of introducing a universal Free Pre‐School Year in 2010 is that it is more difficult to assess the impact of this programme by comparison with children who stay at home (the ‘do nothing’ option). At the same time, it is also important to remember that the impact of pre‐school, and early years services
241 ‘Cohen does acknowledge the danger of using terms like 'small', 'medium' and 'large' out of context. Glass et
al. (1981, p104) are particularly critical of this approach, arguing that the effectiveness of a particular intervention can only be interpreted in relation to other interventions that seek to produce the same effect. They also point out that the practical importance of an effect depends entirely on its relative costs and benefits. In education, if it could be shown that making a small and inexpensive change would raise academic achievement by an effect size of even as little as 0.1, then this could be a very significant improvement, particularly if the improvement applied uniformly to all students, and even more so if the effect were cumulative over time.’ (Coe, 2002).
242 This convention was set by Jacob Cohen on the basis that medium is ‘an effect likely to be visible to the naked eye of a careful observer’ (Cohen, 1992:156) with small and large thresholds being set at equal distances below and above this respectively, including the consideration that small is ‘noticeably smaller than medium but not so small as to be trivial’ (Ibid). The example of a person’s height, which Cohen also used, illustrates this. The average Irish person is 5’7” or 170 cm (standard deviation, 8cm) which implies that a medium difference in height between two people (.5 of 8cm) would be 4cm; a small difference (.2 of 8cm) would be 1.6cm and a large difference (.8 of 8cm) would be 6.4cm. In this example a medium difference in height would probably be noticeable ‘to the naked eye of a careful observer’ but a small difference would not. However and over the longer term, the cumulative effect of small changes can be significant and substantial. This is illustrated in a recent study which found that the average height of males in 15 European countries over a century (1871‐1980) increased by 11cm, about 1cm per decade. The author described this finding as ‘truly unprecedented’ and suggests the following explanation: ‘The evidence suggests that the most important proximate source of increasing height was the improving disease environment as reflected by the fall in infant mortality. Rising income and education and falling family size had more modest effects. Improvements in health care are hard to identify, and the effects of welfare state spending seem to have been small.’ (Hatton, 2013:1).
243 In the area of children and families, for example, the Promising Practices Network run by the Rand Corporation defines a programme’s effectiveness as 'proven' where, inter alia, 'at least one outcome is changed by 20%, 0.25 standard deviations or more' (http://www.promisingpractices.net) (see also Shonkoff and Phillips, 2000:342‐343). Others set a higher effect size such as The Centre for the Study and Prevention of Violence at University of Colorado in USA which requires that its 'Blueprints Model Programs' have 'at least moderate effect sizes' (http://www.colorado.edu/cspv/blueprints).
244 Janus, Brinkman and Duku, 2011; Hymel, LeMare and McKee, 2011.

67
generally, has largely been settled in international research with the clear conclusion that high quality, multi‐year, pre‐school programmes are beneficial, especially for disadvantaged children.
Figure 4.1: Change in Child Outcomes in Total Sample
Note: Improvements are measured using ‘Cohen‘s d’ and defined as Small (=0.2), Medium (0.5 ), or Large ( 0.8). Findings from US studies, based on estimates of the effect size of childcare by comparison with home care, indicate that larger effect sizes (in the region of 0.3 for programmes like High Scope) tend to last for many years while smaller effect sizes (below 0.2 for programmes like Head Start and Early Head Start) tend to disappear within a year or two245. Similarly the EPPE study in the UK found that children who attended pre‐school, compared to those who did not, showed benefits throughout primary school, but the sustainability of these benefits depended on the quality of pre‐school: ‘low quality and less effective pre‐school has only a fairly small benefit on children’s longer term outcomes at age 11. … . Conversely, medium (the common experience for our sample) and particularly high quality pre‐school shows significant benefits for children’s cognitive and social/behavioural outcomes at age 11’246.
4.4 Gap in Outcomes Between Children
An important indicator of effectiveness of the Free Pre‐School Year, as of pre‐school and school systems generally, is whether it reduces the gap in outcomes between children who are vulnerable or at risk compared to all other children. From an economic perspective, this distributional effect is potentially more important than the overall effect, since reducing the gap in outcomes between children could bring more benefits and fewer costs, other things being equal, compared to simply raising the overall level of outcomes. Three possible scenarios can be envisaged: gap narrows, gap widens, gap unchanged – and the OECD, based on PISA data, has documented instances of each in its analysis of school systems, observing that the worst case scenario is where schools widen the gap in outcomes, giving rise to a ‘double handicap’ for disadvantaged children since the negative impact of
245 Barnett, 2011:976; see also Camilli, Vargas, Ryan and Barnett, 2010; Nores and Barnett, 2009. Some
measures recommended to improve the effect size of Early Head Start (EHS) and Head Start (HS) also draw attention to the active ingredients in early years programmes: ‘EHS and HS might improve their results by providing richer educational experiences. EHS could increase and improve both parenting education and direct classroom experiences. HS may need to focus more resources on the classroom to recruit and retain better teachers. Improving teaching practices may also require increased spending on supervision and coaching of teaching staff. Without budget increases, these changes would require a reduction in program resources devoted to other activities (for example, social services and adult education).’ (Ibid:977)
246 Sammons, 2010c:146.
68
background is amplified by an ineffective school247. In this section we focus on the gap in outcomes based on all children in all centres. As explained in Chapter Three, the EDI approach defines children as: ‘developmentally vulnerable’ if their scores fall in the lowest 10% on one or more domain; ‘developmentally at risk’ if their scores fall between the lowest 10% and 25% on one or more domain; and ‘on track’ if their scores are above the lowest 25% of scores (see Figure 3.2). This approach works best where there are national EDI norms to establish the proportion of children in a sub‐sample who fall below these norms or where, as in a study of children in Junior Infant classes in primary schools in Cork city, the cut‐off points in the sample are highly correlated with those found in larger national samples elsewhere248. It is less useful in the context of this study because there are no national norms for pre‐school children who have been assessed by early years workers. Since this is the first study to do so, we follow the EDI method of identifying children in different deciles of EDI scores – without the labels ‘vulnerable’ and ‘at risk’ ‐ since this classification is internally consistent within the dataset, but mindful that a child’s scores in this sample may not necessarily be the same if assessed by their teachers when they enter primary school. One way of expressing the gap between children is by reference to progress of the ‘average child’ during the Free Pre‐School Year. In the area of language & cognitive skills, for example, the maximum gap between children from different social class backgrounds (comparing the least and most advantaged children while controlling for all other influences) is about half the progress of the ‘average child’ between wave 1 and wave 2. Given that our sample is skewed towards more disadvantaged children (section 2.6), this is likely to under‐estimate the national gap between children in the Free Pre‐School Year since more advantaged children are under‐represented. For comparative purposes, it is worth noting that UK evidence indicates an income‐related gap of one year in vocabulary skills among 5‐year olds249 while the SES‐related gap in reading skills among the highest achieving 15‐year old boys is 2.5 years compared to 1.5 years in Ireland250; other evidence from the UK and the US shows that these income‐related gaps in cognitive outcomes tend to grow over time251. It is worth adding that the class‐related gap between children in the Free Pre‐School
247 Based on its analysis of PISA, the OECD concluded that ‘disadvantaged schools tend to reinforce students’
socioeconomic inequalities. This represents a double handicap for disadvantaged students, since schools do not mitigate the negative impact of the students’ disadvantaged background and on the contrary amplify its negative effect on their performance. Furthermore, evidence also shows that in countries where schools tend to be more segregated, the impact of the school’s socio‐economic intake is higher.’ (OECD, 2012a:107).
248 This is the case with a sample of 1,243 children in the Junior Infant classes of 42 primary schools in Cork city in 2009. Children in the lowest 10% of scores in one or more of the EDI domains were classed as ‘vulnerable’. The authors comment that: ‘In the absence of an Irish normative sample, to ensure the validity of the cut‐off points, data were also scored against Canadian normative data. There was a 99% correlation between ‘vulnerability’ using the Irish and Canadian cut‐off points. In four of the five domains, there was 100% correlation between vulnerability using the Irish and Canadian cut‐off points.’ (Curtin, Madden, Staines and Perry, 2013:4).
249 This is based on analysis of the Millennium Cohort Survey (MCS) which is a nationally representative sample of 12,644 British children who were followed from birth and were 5 years old in 2006 and 2007. It found that ‘low‐income children lag their middle‐income counterparts at school entry by nearly one year in vocabulary, and by smaller but still substantial amounts in other types of cognitive development’ (Waldfogel and Washbrook, 2010:36). The authors add: ‘While schools can do a great deal to equalize achievement among children who start at different levels, their job would be a great deal easier if children started school on a more equal footing. In addition, school‐age children are aware of their standing relative to their peers, and such early gaps may affect low‐income children’s attitudes towards school and their aspirations for school attainment.’ (Waldfogel and Washbrook, 2010:16).
250 This is based on analysis of PISA (Programme for International Student Assessment) data on the reading skills of English 15‐year olds in 2009. It found that: ‘High achieving boys from the most advantaged family backgrounds in England are roughly two and a half years ahead of their counterparts in the least advantaged households by the age of 15. In Scotland, the gap is almost three years.’ (Jerrim, 2013:3). The same study also reported that the corresponding gap for boys in Ireland was 1.5 years (Ibid:8).
251 A study of cognitive ability among British children found that the difference in average percentile ranks between children from high and low socio‐economic status, defined on the basis of parental occupation, widened from around 13 points at just under two years to nearly 30 points at age 10 (Feinstein, 2003; see also Goodman, Sibieta and Washbook, E., 2009). In the US, differences in average percentile rank in maths

69
Year does not imply that this gap could be closed in half a Free Pre‐School Year since children progress at different rates and, other things being equal, more advantaged children are likely to progress more rapidly. The question of how the gradient in EDI scores evolved between the beginning and end of the Free Pre‐School Year is central to the study and to the evaluation of this programme. Given the importance and complexity of this issue, a full statistical analysis is undertaken in Chapter Five which allows conclusions to be drawn about whether the gap between children widened, narrowed or remained unchanged during the Free Pre‐School Year.
4.5 Child Outcomes in NEYAI and Síolta QAP One of the questions which prompted this study was to find out if centres in NEYAI had an impact on child outcomes and how this compared to outcomes of centres in Síolta QAP. As explained in Chapter Two, it was decided to compare these programmes since Síolta is the nationally approved standard for all early years services in Ireland, and a number of centres have been validated as meeting this standard. The comparison involved asking the evaluation question: is there a statistically significant difference in outcomes between children in NEYAI and Síolta QAP centres during the Free Pre‐School Year? A preliminary answer to this question is provided in Figure 4.2 and shows that, as measured by Cohen’s d, NEYAI had a slightly larger change (0.29) compared to Síolta QAP (0.25), and one which was larger in the area of language & cognitive skills (0.62) compared to in Síolta QAP (0.54). This is due in part to the fact that, in all five domains, baseline scores of children at wave 1 were lower in NEYAI than in Síolta QAP. A more accurate answer to the question is presented in Chapter Five (Figures 5.2 and 5.3) and shows that, when all measured sources of variation are taken into account, there is no statistically significant difference in outcomes between children attending NEYAI and Síolta QAP centres.
Figure 4.2: Changes in Child Outcomes in NEYAI and Síolta QAP
Note: Change is measured using ‘Cohen‘s d’ and defined as Small (=0.2), Medium (0.5 ), or Large ( 0.8). At face value, this is a somewhat unexpected result since Síolta QAP is a substantial and sustained intervention to improve quality; it involved a two‐year 12‐step Quality Assurance Programme (2010‐2013) delivered by Síolta Mentors with progress and validation based on a portfolio to demonstrate
tests between children from the bottom and top family income quartiles, rose from about 14 points at age six to 23 points at age twelve (Heckman, 2008).

70
that Síolta standards were being met within the centre (see section 1.4 above); moreover the programme occurred earlier and lasted longer than NEYAI (at least longer than the one‐year intervention period of this NEYAI evaluation) and, for that reason, children in Síolta QAP centres might be expected to show greater improvement than in NEYAI centres. By contrast, NEYAI is essentially a funding programme for quality improvement in 11 different ‘demonstration projects’ and the evaluation covered just one year of its quality improvement process. Moreover not all NEYAI projects focused exclusively on quality improvement or on early years settings.
Figure 4.3 gives a more detailed breakdown of change by number of centres in NEYAI and Síolta QAP. This shows that NEYAI has a wider range of outcomes compared to Síolta QAP. For example, NEYAI has more centres with both large changes and very small changes compared to Síolta QAP; but half the Síolta QAP centres have small changes (50%), more than twice that of NEYAI (18%). Again, this is due in part to the fact that, in all five domains, baseline scores of children at wave 1 were lower in NEYAI than in Síolta QAP.
Figure 4.3: Size of Change in Child Outcomes in NEYAI and Síolta QAP
Note: Change is measured using ‘Cohen‘s d’. Very Small (<0.2), Small (≥0.2<0.5), Medium (≥0.5<0.8), or Large (≥0.8).
4.6 Child Outcomes in Validated and Non‐Validated Síolta QAP Centres
Further insight into Síolta QAP can be found by comparing variations within this group of centres. Figure 4.4 compares the outcomes of those centres which have been validated on all 16 Síolta standards (or their validation is pending) with those who have not been validated (including those no longer pursuing validation). This shows that Síolta QAP centres which have been validated do not have larger effects than non‐validated centres. No inferences can be drawn from this data alone but the analysis in Chapter Five, which shows no statistically significant difference between NEYAI and Síolta QAP, implies that validated centres are not significantly different from other centres.

71
Figure 4.4: Size of Change in Outcomes in Síolta QAP Validated and Non‐Validated Centres
Notes: (i) Validated = centres already validated plus centres who have submitted for validation (ii) Non‐validated = centres who may submit in future or no longer participating (iii) Includes 4 NEYAI centres in Síolta QAP (iv) Change is measured using ‘Cohen‘s d’. Very Small (<0.2), Small (≥0.2<0.5), Medium (≥0.5<0.8), or Large (≥0.8).
4.7 Project‐Level Variations in Child Outcomes NEYAI and Síolta QAP comprise 11 projects and 5 mentoring organisations respectively, each comprising clusters within the 70 early years centres in the sample. We analysed the differences between these projects in terms of the effect size in each centre and the number of centres involved. The results in Table 4.1 are gross effect sizes and therefore do not control for the intake characteristics of children; Chapter Five shows that these intake characteristics are highly diverse. In addition, other limitations to the data in Table 4.1 need to be borne in mind: (i) most centres had less than 10 children in the evaluation and 15 had less than four children (and were therefore excluded from this part of the analysis) with the result that it is not reliable to draw centre‐level conclusions from the data; (ii) the assessment of each project or centre does not take account of how effective it was in reducing the gap in outcomes between children and, in light of the small numbers in each centre, this would not be meaningful; (iii) aggregation of highly diverse centres within NEYAI projects and Síolta QAP projects can create the misleading impression that these centres have more in common than is the case. For these reasons, the project‐level and centre‐level findings reported here should not be given the same importance as findings based on the entire sample. Bearing these caveats in mind, the results in Table 4.1 show the NEYAI projects which had bigger effect sizes in more centres: these were found in Donegal (Professional Pedagogy Project), Dublin Docklands (Early Years Numeracy Project), Ballyfermot (Early Years Language & Learning Initiative), and Cork City (Happy Talk Project). Within the Síolta mentoring organisations, bigger effect sizes in more centres were found in Barnardos and the Border Counties Childhood Network. No inferences can be drawn about the effectiveness of any NEYAI or Síolta QAP project on the basis of this data alone since that would require statistical analysis of the all factors which influence the effect size in each centre; moreover a larger sample would be required in each centre to undertake such an analysis.
4.8 Summary The findings in this chapter show that children attending the Free Pre‐School Year improved in all domains of the EDI but particularly in the area of language & cognitive skills. These improvements combine two processes of child development which cannot be separated without a control group: (i) natural growth (ii) pre‐school experience. Since the study does not have a control group of children

72
who stayed at home, we do not know how much of this development is attributable to the Free Pre‐School Year. An important indicator of effectiveness of pre‐school care, as of school systems generally, is whether it reduces the gap in outcomes between children. One way of expressing the gap is in terms of how children perform relative to national or international norms. This is not a realistic option for this study since there are no national norms in Ireland for pre‐school children who have been assessed by early years workers using the EDI. We found only a small difference in child outcomes between NEYAI (.29) and Síolta QAP (.25), although there is wide diversity in the change in scores within each, and somewhat greater diversity in NEYAI than in Síolta QAP. Further analysis presented in Chapter Five shows that, when all measured sources of variation are taken into account, there is no statistically significant difference in outcomes between children attending NEYAI and Síolta QAP centres. In the next chapter, we present a more detailed statistical analysis of determinants of the change in scores for children in our samples, including an assessment of whether the gap between these children widened, narrowed or remained unchanged during the Free Pre‐School Year.
Table 4.1: Size of Change in Child Outcomes in NEYAI and Síolta QAP Projects
Project Sample of Children n (i)
Large Change
Medium Change
Small Change
Smaller Change
Total Centres
Mean
NEYAI 258 0.29Ballyfermot 20 2 0 1 0 3 0.68Canal* 8 0 0 1 0 1* 0.32Cork 30 1 1 0 1 3 0.29Clondalkin 30 2 0 2 4 0.19Docklands 37 1 2 0 1 4 0.40Donegal 39 2 3 1 3 9 0.26Fingal 9 ‐ ‐ 1 0 1 0.11Longford 6 1 0 0 0 1 0.81Limerick 18 1 0 1 1 3 0.14Rialto 24 0 1 0 1 2 0.49Tallaght 37 0 0 2 2 4 0.12Síolta QAP 190 0.25ECI(i) 58 0 1 4 1 6 0.20Barnardos 46 1 1 1 1 4 0.20PEIP(ii) 24 0 1 1 1 3 0.16BCCN(iii) 46 0 2 1 0 3 0.47Steiner(iv) 16 0 0 2 0 2 0.29All Projects 448 0.27
Notes: *Canal Communities is a family support initiative rather than a early years initiative; as such, its results are not comparable to other centres.
(i) ECI (Early Childhood Ireland) refers to centres in the Síolta QAP which were mentored by this organisation. (ii) PEIP (Prevention and Early Intervention Programme) refers to centres in the Síolta QAP which were mentored by organisations in this programme.
(iii) BCCN (Border Counties Childhood Network) refers to centres in the Síolta QAP which were mentored by this organisation.
(iv) Irish Steiner (Irish Steiner Kindergarten Association) refers to centres in the Síolta QAP which were mentored by this organisation.
(v) Includes only early years centres which had four or more children in the evaluation. (vi Improvements are measured using ‘Cohen ‘s d’ and defined as Small (0.2), Medium (0.5), Large (0.8).

73
5 Explaining Child Outcomes ‘Giving every child the best start in life is crucial. The foundations for virtually every aspect of human development – physical, intellectual and emotional – are laid in early childhood. What happens during these early years, starting in the womb, has lifelong effects on many aspects of health and well‐being – from obesity, heart disease and mental health, to educational achievement and economic status. To have an impact on health inequalities we need to address the social gradient in children’s access to positive early experiences. Later interventions, although important, are considerably less effective if they have not had good early foundations.’252 Professor Sir Michael Marmot, University College London in ‘The Marmot Review’, a study of health inequalities across England in 2010.
5.1 Introduction This chapter analyses the determinants of developmental outcomes for children who attended a selection of centres in NEYAI and Síolta QAP and participated in the Free Pre‐School Year. Given that the study was designed to evaluate NEYAI and Síolta QAP, the influence of these programmes on developmental outcomes is also assessed along with all other variables in the dataset. Child outcomes, as indicated earlier, were measured using the Early Development Instrument (EDI). This involves assessing how well a child performs selected tasks in each EDI domain, comprising over 100 tasks in total, and is based on the judgement of a staff member who worked directly with the child (see Table 3.1 above for illustrations of these tasks). The child’s performance of each EDI task is essentially a measure of the skill required to perform ordinary tasks of living and learning which are appropriate to a child of this age‐group. Skills in this sense are capacities to function, enabling a child to live life fully and achieve his/her potential. From a developmental perspective, the skills acquired at each stage of a person’s life, at whatever age, are building blocks for skills acquired at a next stage – since ‘skill begets skill’ – and is the reason why early acquisition of skills is foundational for later skills253. Our analysis of the determinants of outcomes is informed by the bioecological model of human development which emphasises both the immediate and wider societal influences on the child as well as the child’s own contribution to development254. Based on that understanding, we present results in terms of three sets of influences on outcomes during the Free Pre‐School Year: (i) child characteristics (ii) family and social system characteristics (iii) pre‐school system characteristics. This way of presenting the results makes sense from a theoretical perspective but is also intended to be useful from the perspective of designing responses, both in policy as well as in practice, which enhance child outcomes.
252 Marmot Review, 2010:94. 253 ‘Skills enable people. They are capacities to function. Greater levels of skill foster social inclusion and
promote economic and social mobility. They generate economic productivity and create social well‐being. Skills give agency to people to shape their lives in the present and to create future skills. … . Many policymakers share a common desire to develop human potential. However, current policy discussions focus on promoting skills by improving schools. In this very narrow view, the success of schools is measured by scores on exams used to monitor performance … . This focus is a consequence of a very limited conceptualization of human capabilities that assumes that achievement tests capture the important life skills. This emphasis misses important dimensions of human flourishing. It does not recognize that skills are multiple in nature. Nor does it recognize the importance of families and communities in creating skills. While schools are important, they are not the sole producers of the skills that matter. Both cognitive and character skills are crucial to success in economic and social life. Character skills include perseverance (“grit"), self‐control, trust, attentiveness, self‐esteem and self‐efficacy, resilience to adversity, openness to experience, empathy, humility, tolerance of diverse opinions, and the ability to engage productively in society. … . A strong base of cognitive and character skills is universally valued across different cultures, religions, and societies. There are reliable ways to measure them, and there are proven ways to enhance them and to evaluate efforts to foster them.’ (Heckman and Kautz, 2013:5‐6).
254 Bronfrenbrenner and Morris, 2006.
74
The presentation of results on determinants of outcomes in the Free Pre‐School Year begins by setting out the broad categories of skill to be explained: (i) social & emotional skills (ii) language & cognitive skills (section 5.2). We then provide an overview of results focusing on their statistical properties and the amount of variance explained by the models (section 5.3). As indicated, the results are reported and interpreted according to whether the outcome is associated with characteristics of the child (section 5.4), the family and social system (section 5.5), or the pre‐school system (section 5.6). The chapter concludes with a summary of findings (section 5.7).
5.2 Child Skills and Child Outcomes It is conventional in evaluating the outcome of early years programmes to distinguish between cognitive skills (including language and numeracy) and socio‐emotional skills (including physical development and personality traits). More recently, these outcomes have been referred to as cognitive skills and character skills respectively255 and a re‐analysis of the long‐term outcomes of pre‐school and similar programmes – notably Perry256 and Abecedarian257 – concluded that ‘character skills predict later‐life outcomes with the same, or greater, strength as measures of cognition’258 while also showing that ‘high‐quality early childhood programs have lasting and beneficial effects on character skills’259. In line with this understanding, we decided to separately analyse the determinants
255 See notably, Heckman and Kautz, 2013; Heckman and Raut, 2013; Heckman, Pinto and Savelyev, 2013;
Heckman, Moon, Pinto, Savelyev and Yavitz, 2009. 256 The Perry Pre‐School Project was first introduced in 1960 into Perry Elementary School in the city of Ypsilanti,
Michigan. Children attended 2.5 hours of centre‐based pre‐school five days a week for two years, based on High Scope principles and delivered by trained teachers. In addition, home visits promoted parent‐child relationships. Perry has tracked participants till age 27 – is based on a combined sample of 123 (58 in the treatment group and 65 in the control group). A recent summary of effects based on follow‐up to age 37 reads: ‘Perry treatment effects arise primarily from lasting changes in character skills, not from changes in IQ. … . The treatment group of both genders improved their teacher‐reported externalizing behaviour, a skill related to Agreeableness and Conscientiousness. For girls, the programme also improved Openness to Experience (proxied by academic motivation). … . The programme improved scores on the California Achievement Test (CAT), even though it did not have a lasting effect on IQ. This evidence is consistent with the evidence … that achievement test scores depend strongly on character skills … . Achievement tests measure general knowledge. The acquisition of general knowledge (crystallized intelligence) depends on persistence, curiosity, and focus.’ (Heckman and Kautz, 2013:44‐45; see also Heckman, Pinto and Savelyev, 2013).
257 The Abecedarian Early Intervention Project in Carolina involved an intervention with infants born between 1972 and 1977 of which 57 were in the treatment group and 54 in the control group. The intervention lasted from the child was six weeks old until pre‐school entry. It was full‐day childcare five days a week, 50 weeks a year. It had a medical and nutritional component, with weekly home visits to parents. An overwhelming majority (98 percent) of the were African‐American. A recent summary of effects based on follow‐up to age 30 reads: ‘In contrast to Perry, ABC [Abecedarian] led to lasting improvements in IQ. For girls, the program improved IQ through age 21. The effect for boys was positive but was less precisely estimated. Girls and boys also scored better on achievement tests. ABC likely improved IQ because it started at an earlier age than Perry. Very early childhood appears to be a critical period for shaping IQ. As with Perry, the benefits of the ABC program differ across genders. For girls, the program improved educational attainment, reduced participation in criminal activity, decreased substance abuse, and improved internalizing and externalizing behavior. Like the Perry program, ABC improved employment and health for males and produced substantial improvements in character skills.’ (Heckman and Kautz, 2013:47).
258 Heckman and Kautz, 2013:88. 259 Heckman and Kautz, 2013:89. One aspect of character which has received considerable research attention is
self‐control, an umbrella term covering attributes such as self‐regulation, conscientiousness, delay of gratification, impulsivity, inattention‐hyperactivity. In the taxonomy of the Big Five character skills, referred to by the acronym OCEAN (Openness to Experience, Conscientiousness, Extraversion, Agreeableness, and Neuroticism), self‐control is close to conscientiousness. The importance of childhood self‐control is highlighted in a longitudinal study ‐ based on the Dunedin Multidisciplinary Health and Development Study which tracked 1,037 children from birth (in 1972/3) to 32 years with 96% retention rate – which found that ‘childhood self‐control predicts physical health, substance dependence, personal finances, and criminal offending outcomes, following a gradient of self‐control. Effects of children’s self‐control could be disentangled from their intelligence and social class as well as from mistakes they made as adolescents’ (Moffitt, et al, 2011:2693). The same study included analysis of a cohort of 500 sibling‐pairs – based on the Environmental Risk Longitudinal Twin Study (E‐Risk) in England and Wales which tracks the development of a

75
of language & cognitive skills. We then undertook a latent variable analysis260 of the remaining EDI domains and found that physical, social and emotional domains constitute a single latent concept which we label throughout as ‘social & emotional skills’. This is summarised in Figure 5.1. The latent variable analysis also established that the domain of communication and general knowledge measures a separate set of skills; we constructed a model of the determinants of this domain but do not report it here since it added no additional insight into the determinants of outcomes of the Free Pre‐School Year.
5.3 Explanatory Models of Skill Development in Pre‐School Children Figures 5.2 and 5.3 summarise the statistically significant influences on (i) social & emotional skills and (ii) language & cognitive skills. These models were produced using Structural Equation Modelling (SEM) to estimate the explanatory role of various potential determinants of these skill sets; all models were estimated using EQS 6.1 Structural Equation Modelling Software. Unlike classical linear regression analysis, SEM allows multi‐dimensional constructs (in this case, social class, mother’s well‐being, parent‐child relationship and staff commitment, as summarised in Figure 5.4) to be measured using latent variable modelling techniques as represented by the oval shapes. The analysis also includes individual constructs (like child’s age, gender and NESB261; NEYAI/Síolta QAP; duration) as represented by the rectangular shapes. The full results of the SEM models are detailed in a separate Technical Report (McKeown, Haase and Pratschke, 2014b). These are well‐fitting models, judging by a range of fit indices and diagnostic tests262
representative birth cohort of 2,232 twin children born in 1994/5 – found that ‘the sibling with lower self‐control had poorer outcomes, despite shared family background. This study argued that cultivating childhood self‐control could reduce societal costs, save taxpayers money, and promote prosperity’ (Ibid).
260 Latent variables are based on the understanding that some phenomena, such as those considered in this analysis, are not directly observable but can be observed indirectly through their measurement. This understanding assumes that a latent variable exists, at least as a theoretical construct, and is the cause of each respondent’s observed scores. That is why, in latent variable analysis, the graphic representation shows the direction of causality from the latent variable to the manifest measurements. Leaving aside the philosophical question of whether a latent variable is ‘real’ (or different from anything else that is claimed to be ‘real’), the advantages of latent variable analysis are that it facilitates greater conceptual clarity about apparently different measurements, allows for reduction of multiple data points to more simplified conceptual and statistical aggregates, and these in turn give rise to more robust measurement which yields more reliable estimates of statistically and substantively significant findings.
261 NESB refers to Non‐English Speaking Background, measured by mother’s response to the question: ‘Is English your first language?’. The acronym is widely used in Australia.
262 CFI equal to or greater than 0.95 and an SRMR equal to or less than 0.07.
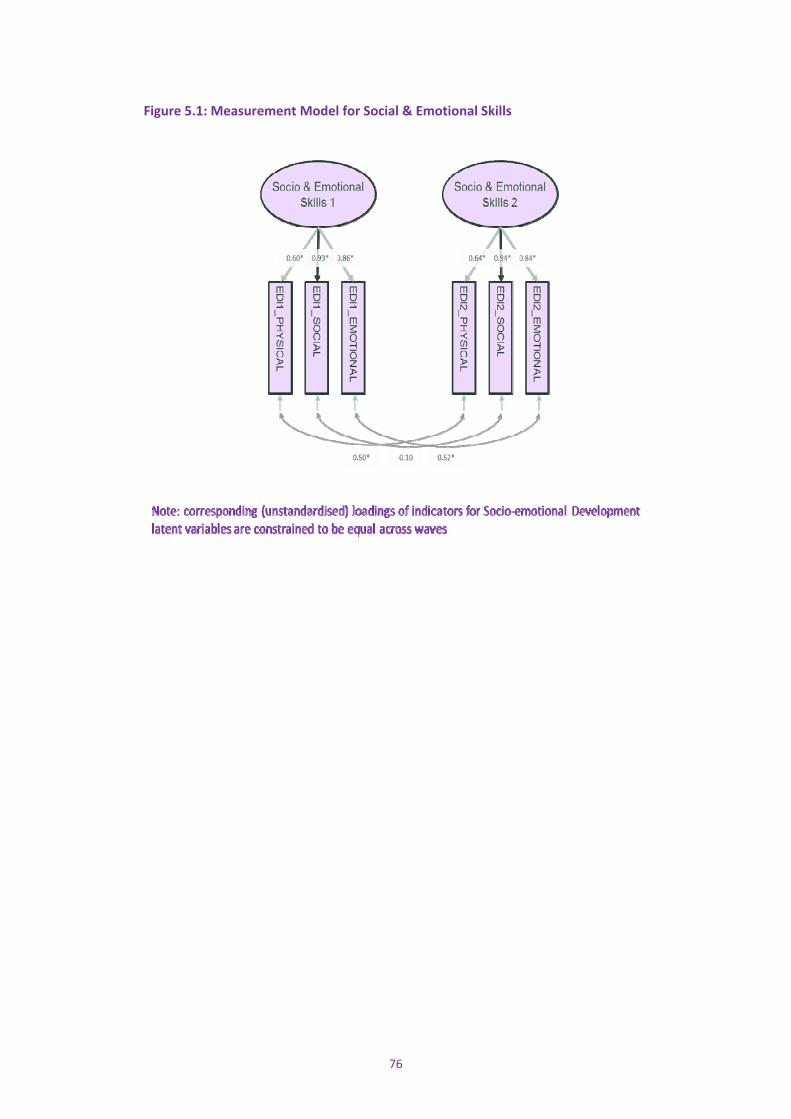
76
Figure 5.1: Measurement Model for Social & Emotional Skills

77
Figure 5.2: Structural Equation Model of Influences on Children’s Social & Emotional Skills
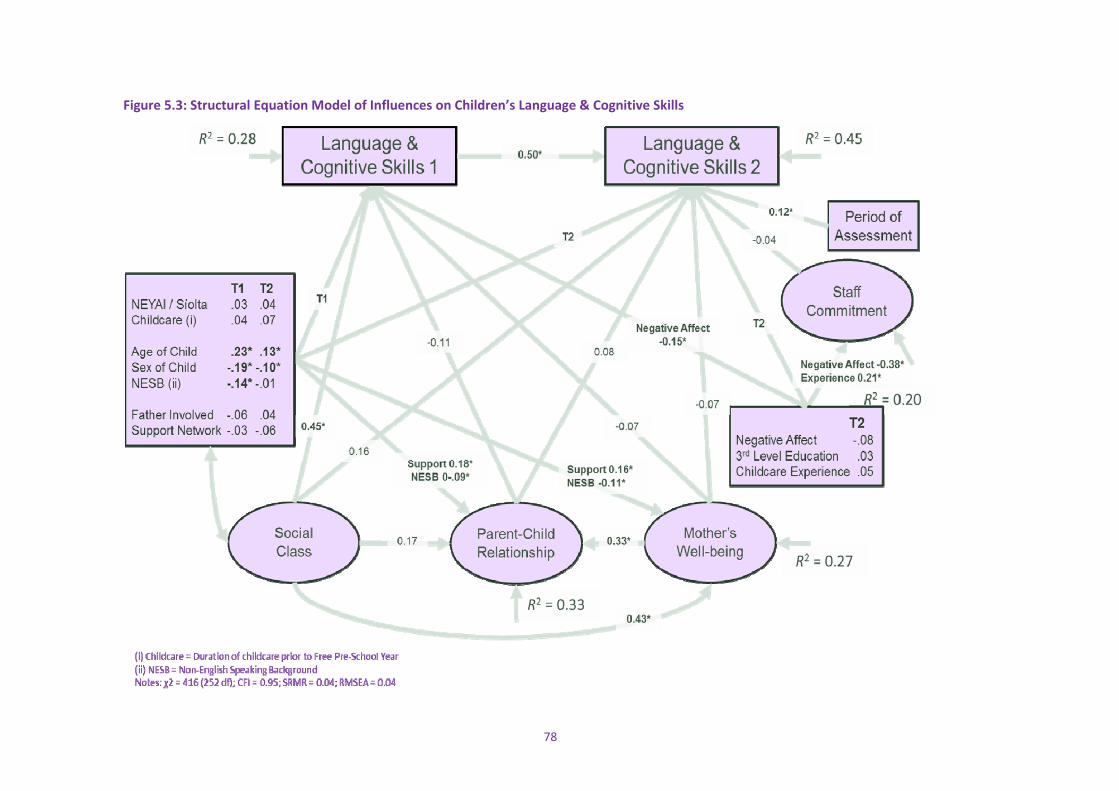
78
Figure 5.3: Structural Equation Model of Influences on Children’s Language & Cognitive Skills

79
Figure 5.4: Measurement Models for Latent Concepts Used in Analysis
80
Overall, the amount of variance explained (denoted by R2) at wave 1 is 22% in social & emotional skills and 28% in language & cognitive skills, similar to that found in other studies263. A substantially larger amount of variance in the wave 2 scores is explained (66% for social & emotional skills, 45% for language & cognitive skills), on account of the relative stability in scores over time. The amount of variance explained at wave 1 – the time when the children in our samples entered the Free Pre‐School Year – draws attention to the fact that relatively little is known about what has influenced the child’s development up to that point. This is due to the absence of data from earlier stages of the child’s life, particularly the ‘person characteristics’264 of both the child and his or her parents and the ‘proximal processes’265 which connect them. Comprehensive data of this type is difficult to collect and, for that reason, is rarely collected, even in well‐funded longitudinal studies. As Bronfrenbrenner observed: ‘Most developmental research treats the cognitive and socio‐emotional characteristics of the person as dependent variables; that is, as measures of developmental outcomes. Far less often are such characteristics examined as precursors and producers of later development’266. Figure 5.5 provides further insights from the perspective of neuroscience, which shows that neural pathways for sensory, language and higher cognitive function have already passed their peak stages of development before the child enters pre‐school267. That is why, as observed in a recent edition of Science, ‘age 4 cannot be characterized as “early” with respect to brain development’268. These neural pathways are the outcomes of multiple gene‐environment interactions so that ‘a child exposed to consistent, predictable, nurturing, and enriched experiences will develop neurobiological capabilities that will increase the child’s chance for health, happiness, productivity and creativity. … . If a child is neglected – if he or she hears fewer words, has fewer relational opportunities, receives less physical comfort, and has less love – the rapidly organizing networks in the brain that mediate language, social affiliation, and attachment will not receive sufficient patterned, repetitive activation to develop normally. … . The therapeutic implications of this … cannot be overstated. Repetition, repetition, repetition: Neural systems – and children – change with repetition.’269 Figures 5.2 and 5.3 show the stability of the EDI scores over time for social & emotional skills (.78) and language & cognitive skills (.50). This means that the distribution of skills within the sample of children is more stable for social & emotional skills but slightly less so with regard to language &
263 For example, in the EPPE study the regression model for 3‐4 year olds for social/behavioural development, R2
= 0.12; however in a regression model with the same sample for cognitive development R2 = 0.46. Commenting on the latter, the authors note: ‘This is high in relation to most studies of cognitive development in the early years.’ (Melhuish, Sylva, Sammons, Siraj‐Blatchford and Taggart, 2001:25).
264 Bronfrenbrenner distinguishes three types of person characteristics: ‘force characteristics’ (such as impulsiveness which may be developmentally disruptive or curiosity which may be developmentally generative); ‘resource characteristics’ (such as genetic defects, low birth weight, physical handicap); and ‘demand characteristics’ (such as fussy versus happy, hyperactive versus passive). (Bronfrenbrenner and Morris, 2006:810‐813).
265 ‘Examples of enduring patterns of proximal process are found in feeding or comforting a baby, playing with a young child, child‐child activities, group or solitary play, reading, learning new skills, athletic activities, problem solving, caring for others in distress, making plans, performing complex tasks, and acquiring new knowledge and know‐how. … . Proximal processes are posited as the primary engines of development.’ (Bronfrenbrenner and Morris, 2006:797‐798).
266 Bronfrenbrenner and Morris, 2006:810. 267 ‘All functional capacities in the brain are dependent to some degree upon the presence of appropriately
timed, appropriately patterned signals that will specifically stimulate the neutral systems mediating that function. … . Patterned, repetitive activity changes the brain. … . A child exposed to consistent, predictable, nurturing, and enriched experiences will develop neurobiological capabilities that will increase the child’s chance for health, happiness, productivity and creativity. … . If a child is neglected – if he or she hears fewer words, has fewer relational opportunities, receives less physical comfort, and has less love – the rapidly organizing networks in the brain that mediate language, social affiliation, and attachment will not receive sufficient patterned, repetitive activation to develop normally. … . The therapeutic implications of this … cannot be overstated. Repetition, repetition, repetition: Neural systems – and children – change with repetition’ (Perry, 2006:36‐37).
268 Shonkoff, 2011:983. 269 Perry, 2006:36‐37.

81
cognitive skills. In other words, children with more or better skills at the beginning of the study period tended to have more or better skills at the end of this period, whilst those with weaker skills at the beginning tended to remain in a weaker position at the end of the study. This happens because the broad parameters on a child’s progress during the Free Pre‐School Year have already been set by the child’s development during the previous 3‐4 years.
Figure 5.5: Human Brain Development
Source: InBrief: The Science of Early Childhood Development. Available at www.developingchild.harvard.edu.
5.4 Child Influences The models include three attributes of children which are known to influence their social & emotional skills and language & cognitive skills: age, gender and NESB (Non‐English Speaking Background). The gender of a child clearly denotes a bio‐social attribute which has life‐long implications, being an important element in how the child defines itself and is defined by others. NESB is defined by whether or not the mother’s first language is English and, as an attribute of the child, it denotes a qualitatively different starting point in life compared to other Irish children who speak English as a first language. Age represents the child’s unfolding development over time but the precise attributes which cause this unfolding, as already indicated, are largely unknown. In that sense, although age is treated as an ‘explanatory’ variable, what exactly it explains is not entirely clear other than the fact that skills (the dependent variable) change chronologically.

82
5.4.1 Gender Gender has a substantial influence on social & emotional skills as well as language & cognitive skills, with boys having a significant time‐lag270. At the start of the period of study, boys were significantly behind girls in social & emotional skills (‐.24), and this differential remained unchanged during the Free Pre‐School Year. Boys also lagged behind girls in language & cognitive skills at the first wave (‐.19), and this gap continued to widen during the year (‐.10). The gap between boys and girls is not unexpected and is in line with international evidence, including evidence based on the EDI (see Chapter Three). The gap in development between boys and girls tends to close at around age 8‐9271. For example, international tests of Irish fourth class pupils (9‐11 year olds) confirm that the gender gap closes for cognitive skills, although a gender gap remains in reading skills ‘in Ireland and in almost every country’272. Subsequent gender gaps open up among 15‐year olds but this may be more related to the social aspects of gender rather than different developmental pathways of boys and girls in the early years273. These results indicate that in our samples, gender‐related gaps in children’s skills either remained unchanged (in the case of social & emotional skills) or widened (in the case of language & cognitive skills) during the Free Pre‐School Year.
5.4.2 Age Age is a significant influence on initial language & cognitive skills at the first wave of data collection (.23) and older children also develop these skills more rapidly during the year (.13) which results in a widening of the gap. We found no association between age and social & emotional skills. This is likely due to the fact, as indicated in Chapter Three (section 3.5), that scores in this domain do not vary greatly by comparison with other EDI samples, even though children in our sample are 10‐20 months younger than children in these other samples. This means that, in the assessment of early years staff, children’s social & emotional skills are not strongly related to their age. By contrast, scores on language & cognitive skills are significantly below those of children in other samples, in line with expectations confirmed by studies274, and may reflect the fact that the EDI domain of language &
270 This is similar to the pattern among three year olds in the GUI albeit based on different measurement
instruments. Based on the Strengths and Difficulties Questionnaire, the authors found that ‘Boys were significantly more likely than girls to score in the problematic range of the SDQ total difficulties scale’ (Williams, Murray, McCrory and McNally, 2013:68). As regards language, the authors found that ‘boys had a higher rate of speech developing slowly’ (Williams, Murray, McCrory and McNally, 2013:68). The authors add: ‘A worrying finding was that only one in three (33 per cent) of all children affected by a speech or language problem had received treatment for the problem.’ (Ibid).
271 A study of receptive vocabulary development in children between 4–8 years based on the Longitudinal Study of Australian Children found no gender differences at 8 years: ‘The results of meta‐analyses concur with the results of the present study, that gender differences in language ability are negligible. Convergent evidence for negligible gender differences in language ability is that the prevalence of language impairment in the general population is 8% for boys and 6% for girls and not significantly different.’ (Taylor, Christensen, Lawrence, Mitrou, Zubrick, 2013:18).
272 In 2011, Ireland along with 34 other countries took part in an assessment of fourth class pupils (9‐11 years) in reading, mathematics and science based on PIRLS (Progress in International Reading Literacy Study) and TIMSS (Trends in International Maths and Science Study). In Ireland, the stratified random sample comprised 151 schools, 221 classes, and 4,825 pupils who were assessed in March / April 2011. There were no significant gender differences in Ireland (or across TIMSS as a whole) for overall performance on mathematics and science. In contrast, girls performed much better on the reading assessment, in Ireland and in almost every country that took part in PIRLS.’ (Eivers and Clerkin, 2013:8). The results, published in June 2013, also revealed that ‘Irish pupils performed above the international study centrepoints of 500 on all three domains. Their best performance was on reading, followed by mathematics, then science.
273 The results of PISA 2012, in Ireland and in all participating countries, found gender differences in favour of boys for mathematics and in favour of girls for reading (OECD, 2013; Perkins, Shiel, Merriman, Cosgrove and Moran, 2013).
274 Janus, M., Brinkman, S., and Duku, E., 2011; Hymel, LeMare and McKee, 2011.

83
cognitive skills has greater validity than other EDI domains and is more sensitive to the age group included in this study.
5.4.3 NESB (Non‐English Speaking Background) A substantial minority of children in the sample (15%) are from NESB backgrounds. This is not unexpected given that in 2010, for example, there were 75,000 children born in Ireland, over 20% of them to mothers not themselves born in Ireland275. In this study, a child is defined as NESB where the mother’s first language is not English (excluding mothers whose first language is Irish). Children with NESB have weaker social & emotional skills (‐.11) and weaker language & cognitive skills (‐.14) at the first wave, similar to the GUI profile of 3‐year old children276. However, the gap in social & emotional skills narrowed during the year (.10) but the differential in language & cognitive skills remained unchanged. It is clear therefore that significant progress is made by NESB children, pointing to a strong integrative effect while also pointing to residual difficulties associated with this background. Given that age and gender differences in child development are normal among 3‐4 year olds, except where children are assessed as having ‘special needs’277, this positive impact on NESB is the most significant finding to emerge from this part of the analysis. The way in which the negative influence of NESB is reduced in relation to social & emotional skills is a strong indicator that the Free Pre‐School Year may be helpful for these children. The benefits of interacting with staff and other children is the most likely reason for this positive impact on NESB children. NESB is an attribute of the mother as well as the child and the analysis also revealed that mothers with NESB have consistently weaker well‐being compared to other mothers. This means they have lower self‐esteem, optimism, life satisfaction and positive affect. Although mothers with NESB do not have weaker support networks compared to other mothers, their weaker well‐being is a cause of concern both in its own right and because of its negative impact on the parent‐child relationship which, as we shall see in the next section, adversely affects children and their performance.
275 CSO Report on Vital Statistics 2010, 2012:24. 276 Among three year olds in the GUI: ‘those who did not speak it [English] as their first language were at a
significant disadvantage. ... . While this is not to suggest that children who do not speak English as a first language necessarily have a poorer vocabulary in their first language, it does raise issues in relation to a potential disadvantage for them if, and more likely when, they start formal schooling in English.’ (Williams, Murray, McCrory and McNally, 2013:65).
277 The concept of ‘special education needs’ (SEN) is defined in the EPSEN Act 2006 [Education of Persons with Special Education Needs] as children with an ‘enduring disability’ and a condition which results in them learning differently ‘from a person without that condition’. Judgements about whether a child is classified as SEN, as reported to the Department of Education and Skills, fall into two broad categories: those based on objective / medical criteria such as visual or speech impairment and those based on subjective / normative criteria such as emotional and behavioural difficulties, and learning difficulties. Analysis of teachers’ assessment of SEN in the 9‐year old cohort of the GUI revealed that children classified as SEN due to physical disability and speech impairment did not vary by social class or type of school but children in other SEN categories, notably EBD, were much more likely if the child was a boy, came from an economically inactive household, the mother had lower levels of education and a single parent, and the child was attending the most disadvantaged (DEIS) school (McCoy, Banks and Shevlin, 2012). Children classified as SEN due to a learning disability were similar to children with EBD but with the important difference that these children are more likely to be identified if they did not attend a disadvantaged school. The authors interpret this finding as indicating a tendency among teachers to ‘over‐identify’ EBD and ‘under‐identify’ learning difficulties in the most disadvantaged (DEIS) schools, and offer the following as a possible explanation: ‘Perhaps it is that teachers in these contexts are more likely to identify EBD in response to greater levels of disciplinary problems in these schools, difficulties which take precedence over the learning difficulties students may have. In any case, one might ask, what are the implications of greater levels of EBD labelling for the students attending these schools ‐ in terms of their educational progress, peer relations and their social and emotional identities?’ (McCoy, Banks and Shevlin, 2012:17).
84
5.5 Family and Social System Influences The family and social system refers to influences on the child which are both within the family but linked, through social class, to the family’s resources and position within society. These influences, by and large, pre‐exist the child’s entry into the world; some of them may change in the period prior to the child’s entry to pre‐school but are unlikely, in the generality of cases, to change significantly during the Free Pre‐School Year itself. For that reason, we feel justified in interpreting the influences of the family and social system as causally related to the child’s development. The family and social system is measured by three latent concepts: social class, mother’s well‐being and the parent‐child relationship. Data were also collected on the couple relationship – current relationship if living with a partner, previous relationship if not – but since nearly a quarter of parents were not living with a partner, this data could not be combined into a single model and was excluded. Figure 5.4 above summarises the observed variables which manifest these latent variables. Social class, as conventionally defined in research, denotes the resources available to a child, adult or family. It is usually measured, depending on data availability, in terms of education, employment, income and assets. This understanding informs the latent concept of social class shown in Figure 5.4 – which includes mother’s education, occupation, and financial problems as core aspects – since these are also known to have a pronounced social gradient on child outcomes278. However we extend the concept of social class to include two other resources which are relevant to child development, notably the home learning environment279 and the child’s diet280. These additional aspects are also part of the family’s resources, operating as risk and protective factors on the child’s development in much the same way as more conventional aspects of social class. Extensive research in Ireland and elsewhere has established that these additional dimensions ‐ home learning environment281 and child diet282 ‐ have a pronounced social gradient which adds to the case for combining them into a single gradient or latent variable of social class. The factor loadings in Figure 5.4 also support the case for thinking about social class as manifesting through these different aspects, with the home learning
278 Analysis of the 9‐year old GUI cohort found that: ‘Better educated parents have better educated children and
children who also, to a more limited degree, enjoy better social‐emotional adjustment and physical health. … . Children’s outcomes are thus strongly conditioned by mother’s social background, her cognitive (educational) and emotional resources (early experience of poverty/timing of family formation) as well as the current socioeconomic status of the household (poverty).’ (Fahey, Keilthy and Polek, 2012:79 and 84).
279 The home learning environment was measured by the frequency of mother reading to the child, doing activities involving painting or drawing, reciting nursery rhymes or singing songs, playing with letters, words, shapes or numbers. Frequency was measured as: rarely or never; 1 day per week; 2 days per week; 3 days per week; 4 days per week; 5 days per week; 6 days per week; 7 days per week.
The EPPE study in UK used the same scale and tracked children from ages 3‐11 years, finding it that: ‘The Home Learning Environment (HLE) in the pre‐school period has association with all aspects of children’s cognitive and social development and for much of a child’s life is one of the most powerful influences upon development.’ (Melhuish, 2010a:67; see also Melhuish, et al, 2008).
280 Child’s diet was measured by frequency of ‘healthy foods’ (such as fresh fruit, cooked vegetables, raw vegetables and salad, eggs, meat, fish) and ‘unhealthy foods’ (such as crisps, biscuits, soft drinks, burger, sausage, chips) eaten by the child in the previous 24 hours. Frequency was measured as: not at all; once; more than once.
281 The GUI report on three year olds states that: ‘Reading to the child every day was more common in homes where the Primary Caregiver had degree‐level education or above (70 per cent) than in homes where the Primary Caregiver’s education was at lower secondary or less (39 per cent), although in a multivariate analysis reading frequency did not fully account for the differences according to parental education observed earlier (or vice versa).’ (Williams, Murray, McCrory and McNally, 2013:64‐65).
282 The GUI report on 3‐year olds states that: ‘Numerous studies in Ireland indicate that dietary quality is strongly patterned by socio‐economic status … a trend which is also seen in parental responses to the Growing Up in Ireland dietary inventory, even at this early age. … . Parental education was strongly and positively associated with fruit and vegetable consumption, and strongly and inversely related to consumption of energy‐dense foods such as crisps, chips and hamburgers/hotdogs, and with non‐diet fizzy drinks’ (Williams, Murray, McCrory and McNally, 2013: 37). The GUI report on 9‐year olds states that: ‘The higher the educational level of the mother the greater was the child’s consumption of fruit and vegetables and the lower was the child’s consumption of energy dense snack foods.’ (Williams, Greene, Doyle, Harris, Layte, McCoy, McCrory, Murray, Nixon, O’Dowd, O’Moore, Quail, Smyth, Swords, and Thornton, 2009.:63).

85
environment having the strongest factor loading on social class (.50) followed by mother’s education (.41), occupation (.41), child diet (.38) and financial problems (.37). These aspects are usually presented as independent of each other – the convention in regression analysis – but there is a stronger case, theoretically and empirically, for treating them as interdependent aspects of the same underlying reality. This offers a clearer and simpler way of analysing how social class influences the outcomes of the Free Pre‐School Year, and is more relevant to policy and practice. The instruments used to measure all of these aspects of social class are listed in Table 2.3 above. Mother’s well‐being is a latent concept which is based on four observed aspects – optimism, life satisfaction, positive affect and self‐esteem – all measured with recognised scales, which are treated as item parcels (see Table 2.3 above). Figure 5.4 shows that self‐esteem has the strongest factor loading on this latent variable (.82) followed by life satisfaction (.64), optimism (.57) and positive affect (.54). Conceptually, mother’s well‐being is a cognitive and emotional relationship to the self and the life of the self; and it is assessed by the self along a continuum from positive to negative and is foundational to the person’s experience of being, and the awareness of being well or unwell. Parent‐child relationship is a latent concept based on three observed aspects – conflict, stress and dependency – all measured with scales which are used in the GUI (see Table 2.3 above). Figure 5.4 shows that the parent‐child relationship is associated with the mother’s experience of conflict with the child (‐0.83), whether parenting is experienced as stressful (‐.77), and whether the child is experienced overly‐dependent (‐.47). Conceptually, this way of measuring the parent‐child relationship, which reflects the mother’s perspective only, implies a continuum between what might be termed a ‘relaxed parent‐child relationship’ (associated with less conflict and stress) and a ‘demanding parent‐child relationship’ (associated with more conflict and stress). This latent concept is essentially a measure of ‘parenting style’ but differs from the more conventional understanding of parenting styles (authoritative, authoritarian, permissive)283 because it sees the parent‐child relationship as reflecting both a relationship with the child and with the self. In other words, parents with a more ‘relaxed parent‐child relationship’ have less conflict with the child but also experience the parenting role as less stressful; conversely, a more ‘demanding parent‐child relationship’ involves more conflict with the child but also more stress for the parent. In this representation of parenting style, low scores represent a more ‘demanding parent‐child relationship’ and high scores represent a more ‘relaxed parent‐child relationship’ but there is no presumption that one style is better or worse than the other. Social Class Within the family and social system, as summarised in Figures 5.2 and 5.3, social class is the main determinant of children’s social & emotional skills and language & cognitive skills. The direct influence of social class is particularly pronounced on the child’s language & cognitive skills at the first wave of data collection (.45), indicating that a one standard deviation improvement in the child’s social class position would improve his or her language & cognitive skills by half of a standard deviation. Of all the measured influences on the child, none are nearly as powerful as the influence of social class on language & cognitive skills. This influence remained unchanged during the Free Pre‐School Year which means that the gap in children’s language & cognitive skills remained the same. In the absence of a control group of children who stayed at home, we do not know whether the gap between socially advantaged and disadvantaged children would have grown wider, remained the same or, in the
283 This is exemplified by the work of Baumrind (1971; 1991) and Maccoby and Martin (1983). It differentiates
parenting styles according to the degree of responsiveness and control of a parent towards a child, giving rise to fourfold classification of parenting styles: (i) authoritative (high‐responsive, high‐control); (ii) authoritarian (low‐responsive, high‐control); (iii) permissive‐indulgent (high‐responsive, low‐control); (iv) permissive‐neglectful (low‐responsive, low‐control). Using this concept, a survey of 1,353 parents in Ireland in 2010 reported ‘a dominance of an authoritative style of parenting among parents in Ireland. Less frequently, parents engaged in behaviours that characterise an authoritarian style of parenting. Echoing this trend was the relatively low levels of physical punishment reported by parents, with parents relying more on inductive forms of discipline. In contrast with previous research, no clear trends in parenting styles emerged according to socio‐economic status or education level of parents. Generally, the research has found that children from different socio‐economic strata experience different parenting.’ (Halpenny, Nixon and Watson, 2010:90‐91).

86
unlikely event, reduced. Nevertheless, it is clear that reducing the gap between children in their language & cognitive skills requires more than just one year of pre‐school – even a year of the highest possible quality – given the formative influence exercised by the child’s experiences prior to entering the Free Pre‐School Year. Children’s social & emotional skills are also influenced by social class, which is once again the biggest source of differentiation in these skills at the first wave of data collection (.24). As with language & cognitive skills, the influence of social class was unchanged during the year which means that the gap in children’s social & emotional skills remained the same; once again we cannot say whether this is directly attributable to the Free Pre‐School Year. The finding that children’s skills at the first wave of data collection are differentiated by social class is not new or unexpected, particularly regarding language & cognitive skills284. This was a major finding of the first landmark study on children’s language development which was carried out in response to a pre‐school intervention in the US in the 1960s, as part of the “war on poverty”, and which failed to improve the everyday language of disadvantaged children285. That study found that children’s language and cognitive development in pre‐school was strongly influenced by the quantity and quality of words they experienced in earlier years, itself directly related to the child’s social class background286. These differences, in turn, accurately predicted children’s language skills at age 9‐10. The findings of that study have been replicated and extended in other longitudinal studies, which have identified the amount of child‐directed speech in the home as a key mediator which improves the child’s language‐processing skills and which in turn facilitates language growth287; significantly, one of these studies found almost as much variation in children’s vocabulary and language processing
284 Hart and Risley, 1995; Melhuish, Sylva, Sammons, Siraj‐Blatchford and Taggart, 2001:25; Fernald, Marchman
and Weisleder, 2013 Melhuish, Sylva, Sammons, Siraj‐Blatchford and Taggart, 2001:25. 285 The study was prompted by observing the limitations of a pre‐school intervention: ‘We found we could easily
increase the size of the children’s vocabularies by teaching them new words. But we could not accelerate the rate of vocabulary growth so that it would continue beyond direct teaching; we could not change the developmental trajectory.’ (Hart and Risley, 1995; 2003).
286 Hart and Risley, 1995; 2003. This was a two year observational study, based on an hour’s observation each month, of 42 families where there was a 1‐2 year‐old child. The families were in three SES categories: 13 professional; 23 working‐class; 6 welfare. Two key findings emerged. First, there was substantial variation in the average number of words per hour heard by each child; the average child on welfare had half as much language experience per hour (616 words per hour) as the average working‐class child (1,251 words per hour) and less than one‐third that of the average child in a professional family (2,153 words per hour). Second, there was substantial variation in the ‘quality’ and not just the ‘quantity’ of words in terms of the ratio of encouragement or discouragement; in professional families the ratio was 6 encouragement to 1 discouragement; in working class families it was 2 encouragements to 1 encouragement; in welfare families it was 1 encouragement to 2 discouragements. The authors drew the following implications: ‘We learned from the longitudinal data that the problem of skill differences among children at the time of school entry is bigger, more intractable, and more important than we had thought. . …. . Estimating, as we did, the magnitude of the differences in children’s cumulative experience before the age of 3 gives an indication of how big the problem is. Estimating the hours of intervention needed to equalize children’s early experience makes clear the enormity of the effort that would be required to change children’s lives. And the longer the effort is put off, the less possible the change becomes. We see why our brief, intense efforts during the War on Poverty did not succeed. But we also see the risk to our nation and its children that makes intervention more urgent than ever.’ (Hart and Risley, 2003).
287 One of these is a longitudinal study of 48 infants (26 females) from 18 to 24 months from low‐SES (20) and high‐SES (28) families (Fernald, Marchman and Weisleder, 2013). The study found that, at 18 months, infants in low‐SES families had 67 fewer words compared to high‐SES (174‐107=67); by 24 months, the gap had grown to (442‐288=154). According to the authors, this is ‘the first evidence’ of SES‐related disparities in language skills at 18 months. The authors also found ‘reliable links between skills in early spoken language processing and vocabulary development’ (Ibid:243). They write: ‘the most noteworthy finding was that those infants who experienced more and richer language were also more efficient in real‐time language processing 6 months later, compared to those who heard less maternal talk. One interpretation of these findings is that having the opportunity for rich and varied engagement with language from an attentive caretaker provides the infant not only with models for language learning, but also with valuable practice in interpreting language in real time. Thus, child‐directed talk sharpens the processing skills used in online comprehension, enabling faster learning of new vocabulary.’ (Ibid).

87
skills within lower‐SES families as between them and higher‐SES families288. Consistent with this, findings from the GUI three‐year old cohort show that cognitive development was significantly higher for ‘children living in homes where somebody read to them every day’289. Similarly, the study of children in Junior Infant classes in primary schools in Cork city found that ‘the strongest predictor of vulnerability on EDI scores was storytelling. Children who were never told stories in the previous week were over five times as likely to be vulnerable compared with children who were told stories every day. This supports numerous studies which show a link between reading stories and literacy development and with broader aspects of development.’290 It is clear therefore that the pivotal role of social class in children’s language & cognitive skills, which is displayed by children in the Free Pre‐School Year, is consistent with a wider body of Irish and international evidence. The finding that the gap in children’s language & cognitive skills remained unchanged is also consistent with other studies. It is well documented in longitudinal studies of children in the UK291 and Australia292 that disparities in language & cognitive skills which emerge in the early years, and which are associated with social class, tend to persist. However the persistence of social class disparities is a matter of degree and the EPPE study concluded that: ‘Whilst not eliminating disadvantage, pre‐school can help to ameliorate the effects of social disadvantage and can provide children with a better start to school. Therefore, investing in good quality pre‐school provision can be seen as an effective means of achieving targets concerning social exclusion and breaking cycles of disadvantage’293. The extent to which social class will continue to differentiate between children’s language & cognitive skills depends, as we have seen, on the child’s experiences during the three years prior to pre‐school, but also on the child’s subsequent experience of pre‐school and school. Looking at the years prior to pre‐school, the developmental gap between children in vocabulary and language processing skills, now measurable at 18 months294 though detectable earlier through neuroscience295 (Figure 5.5), is
288 This is a longitudinal study of 29 Spanish‐learning infants (19 females) tested at ages 19 to 24 months, all
from low‐SES families (Weisleder and Fernald, 2013). The study found that the amount of child‐directed words used in a 10‐hour period varied 18‐fold (from 670 words in one family to 12,000 in another), nearly as large as the 20‐fold variation found between low‐SES and high‐SES in another study (Hart and Risley, 1995). The study found that variations in child‐directed speech predicted variations in vocabulary learning, possibly because ‘more diverse language from caregivers provides children with more models to learn from’, and possibly because ‘infants who hear more talk have more opportunities to interpret language and to exercise skills vital to word learning’ (Ibid:7). The authors conclude: ‘Our results reveal that caregiver talk has direct as well as indirect influences on lexical development. More exposure to child‐directed speech not only provides more models for learning words but also sharpens infants’ emerging lexical processing skills, with cascading benefits for vocabulary learning.’ (Ibid:8).
289 Williams, Murray, McCrory and McNally, 2013:64. 290 Curtin, Madden, Staines and Perry, 2013:6. 291 This was the conclusion of a study on vocabulary development in children aged between 3‐5 years based on
the UK Millennium Cohort Study which found that while all children improved, the gap between low‐SES and high‐SES children ‘remains rather stable or even widens slightly during this period. … . In sum, there is no catching‐up process of low‐SES children.’ (Becker, 2011:83).
292 This was the conclusion of a study on receptive vocabulary development in children aged between 4–8 years based on the Longitudinal Study of Australian Children: ‘The largest gap in receptive vocabulary abilities at 8 years was between children with and without socio‐economic area disadvantage. The concerning pattern of change over time for these children was slower growth and increasing disparity.’ (Taylor, Christensen, Lawrence, Mitrou, Zubrick, 2013:18).
293 Sylva, Melhuish, Sammons, Siraj‐Blatchford and Taggart, 2004:3. Also: ‘Our results reveal that children who are multiply disadvantaged (in terms of a range of child, family and home learning environment characteristics) show much better attainment than similarly disadvantaged children in the home sample at the start of primary school (age rising to 5). Again this finding points to the positive impact of pre‐school experience on cognitive development for particularly vulnerable groups of young children’ (Sammons, 2010b:96).
294 Fernald, Marchman and Weisleder, 2013. 295 ‘All functional capacities in the brain are dependent to some degree upon the presence of appropriately
timed, appropriately patterned signals that will specifically stimulate the neutral systems mediating that function. … . Patterned, repetitive activity changes the brain. … . A child exposed to consistent, predictable, nurturing, and enriched experiences will develop neurobiological capabilities that will increase the child’s chance for health, happiness, productivity and creativity. … . If a child is neglected – if he or she hears fewer words, has fewer relational opportunities, receives less physical comfort, and has less love – the rapidly

88
induced by the amount of child‐directed talk which the child experiences from adults in the home; this gap, if unaddressed, creates a ‘developmental cascade’296 with implications for the child’s present and future well‐being, including educational success and subsequent career opportunities. A brief summary of this research states: ‘In summary, it can be stated that social differences in children’s language skills emerge very early. Various linguistic studies have demonstrated that it is essential for children’s language development how their parents communicate with them. It is important how often and in which way their parents interact with them. Also economic and sociological studies have found large SES differences in children’s language skills at an early age. ‘What parents do with their children in terms of familial activities partly accounts for these differences.’297 Results from evaluation of Ireland’s School Support Programme under DEIS298 show that improvements in reading and mathematics occurred over the programme period (2007‐2013) with greater improvements in second class299 than in sixth class300. This suggests that remediation efforts such as DEIS can reduce the impact of social class on language & cognitive skills, particularly for younger children, but earlier intervention would likely make these interventions even more effective with potentially more extensive benefits for the family as well as the child. As indicated, the finding that social class is the most powerful influence on the development of children’s skills in the Free Pre‐school Year is not new and is consistent with the national understanding of educational disadvantage as defined in the Education Act (1998): ‘...the impediments to education arising from social or economic disadvantage which prevent students from deriving appropriate benefit from the education in schools’. However, the findings presented here show that the child’s experiences during the three years prior to pre‐school, mainly at home, are more powerful predictors of children’s final skill levels than what happens during pre‐school. This has radical implications not only because it draws attention to the importance of even earlier intervention than pre‐school – or conversely, extending the pre‐school system to earlier years – but also highlights that these interventions need to take place in the family and social system and not just in the pre‐school system.
5.5.1 Parent‐Child Relationship and Mother’s Well‐Being The influence on child outcomes of the parent‐child relationship and mother’s well‐being are considered together because, in association with social class, these form a significant triangle of influences within the family and social system. Figures 5.2 and 5.3 show that there is a strong and statistically significant association between social class and mother’s well‐being (.43) and between mother’s well‐being and the parent‐child relationship (.34 and .33). Given that some elements of social class – notably the mother’s education and occupation – pre‐exist the parent‐child relationship and may also pre‐exist the mother’s well‐being, we can further state that social class indirectly influences child outcomes through its effects on the mother, in addition to the direct influences described earlier. Thus the influence of social class is diffuse, but the main route is from the mother’s social class to her personal well‐being which, in turn influences the parent‐child relationship and ultimately the child. Linked to this core triangle of influences is the mother’s support network –
organizing networks in the brain that mediate language, social affiliation, and attachment will not receive sufficient patterned, repetitive activation to develop normally. … . The therapeutic implications of this … cannot be overstated. Repetition, repetition, repetition: Neural systems – and children – change with repetition’ (Perry, 2006:36‐37).
296 Fernald, Marchman and Weisleder, 2013:244. 297 Becker, B., 2011:73. 298 DEIS (an acronym for Delivering Equality of Opportunity in Schools) was launched in May 2005 and is the
policy instrument of the Department of Education and Skills to address educational disadvantage. DEIS comprises 658 primary schools (336 urban/town schools and 322 rural primary schools) and 194 second level schools.
299 In urban DEIS schools reading scores of second class pupils in the lowest percentile fell from 22% in 2007 to 11% in 2013; in mathematics the corresponding fall was from 22% in 2007 to 13% in 2013 (Weir and Denner, 2013:Table 6 and Table 12).
300 In urban DEIS schools, reading scores of sixth class pupils in the lowest percentile fell from 28% in 2007 to 20% in 2013; in mathematics the corresponding fall was from 31% in 2007 to 23% in 2013 (Weir and Denner, 2013:Table 6 and Table 12).
89
notably those people inside and outside the home who are there to give help if needed – which directly influences both the parent‐child relationship (.18) and her well‐being (.16). For mothers whose first language is not English (NESB), this attribute is an additional and negative influence on her well‐being (‐.12 and .11). Cumulatively therefore, the parent‐child relationship carries a wider set of influences which impact on the child’s skills and on their progress. Figure 5.2 shows that the parent‐child relationship has a positive influence on the child’s social & emotional skills (.16) at the first wave of data collection, but does not directly affect the child’s progress. This means that children have better social & emotional skills when there is a more ‘relaxed parent‐child relationship’ which is associated with less conflict and stress. Figures 5.3 shows that the parent‐child relationship has a negative influence on the child’s language & cognitive skills at the first wave, but this is just below the threshold of statistical significance. This suggests that children have better language & cognitive skills when there is a more ‘demanding parent‐child relationship’ which is associated with more conflict and stress. These findings underline how the parent‐child relationship is an active ingredient in the development of children’s skills. Specifically, the findings show that parent‐child relationships are a conduit by which the child is influenced by the mother’s social class, her personal well‐being and support networks, including whether she speaks English as a first language. This illustrates why the development of children’s skills cannot be dissociated from the wider family and social system; by implication, this wider set of cascading influences need to be taken into account in considering how to improve developmental outcomes. Two implications are prompted by these findings. The first suggests that, since different parenting styles seem to have different impacts on the development of children’s skills, at least within this study, there is not a single way to be an effective parent. Parents who have a more ‘relaxed parent‐child relationship’ tend to facilitate children’s social & emotional skills while parents with a more ‘demanding parent‐child relationship’ tend to facilitate children’s language & cognitive skills. At the same time, it is recognised that a common root of all parenting styles is the attachment between parent and child since this bond301 is known to be foundational for the child’s developing sense of self302 because it creates an internalised working model of interactions for the child which normally lasts throughout adult life303. In addition, attachment shapes parental responsiveness to the child, both emotional and cognitive, which is known to promote child development304. Viewed from this
301 A recent review of research on the role of attachment in child development concluded: ‘The bond that
children develop with their parents, particularly as a babies and toddlers, is fundamental to their flourishing. … . Children without secure parental bonds are more likely to have behaviour and literacy problems. … . Boys growing up in poverty are two and a half times less likely to display behaviour problems at school if they have secure attachments with parents in the early years. Those without strong bonds may be more likely to be NEET [Not in Education, Employment or Training], and less likely to be socially mobile and get good jobs in later life. … . Many children do not have secure attachments. Around 1 in 4 children avoid their parents when they are upset, because they ignore their needs. A further 15 per cent resist their parents because they cause them distress. … . The strongest predictor for children being insecurely attached is having a parent who is not securely attached themselves.’ (Moullin, Waldfogel and Washbrook, 2014:4‐5)
302 ‘In order to develop – intellectually, emotionally, socially and morally – a child requires, for all of them, the same thing: participation in progressively more complex reciprocal activity, on a regular basis over extended periods of time with one or more other persons with whom the child develops a strong, mutual, irrational attachment, and who are committed to that child’s development, preferably for life’ (Bronfrenbrenner and Morris, 2006:816).
303 Three main types of attachment and associated interaction‐styles are identified in attachment theory : secure attachment, insecure‐avoidant attachment, and insecure‐anxious attachment (Bowlby, 1979; Ainsworth, 1991). A secure style is where others are regarded as reliable and available and is associated with a warm, positive and reassuring style of interaction. An insecure‐avoidant style is where others are regarded as uninterested or unavailable and is associated with an interaction style that is cold, competitive and controlled. An insecure‐anxious style is where others are seen as unreliable or difficult and leads to an interaction style characterised by anxiety, stress and lack of confidence.
304 ‘Responsiveness is an aspect of supportive parenting described across different theories and research frameworks (e.g. attachment, socio‐cultural) as playing an important role in providing a strong foundation for children to develop optimally. … . Acceptance of the child’s interests with responses that are prompt and

90
wider perspective, our findings suggest that a balance of relaxed and demand styles of parenting is conducive to the development of children’s skills while mindful that this presumes there is already a solid foundation of parental attachment and responsiveness to the child. The second implication suggests a wider understanding of the parent‐child relationship as part of a core triangle which includes the mother’s social class and her personal well‐being. This means that children are affected not just by the mother’s style of interaction – such as the balance between relaxed and demand styles of parenting as expressions of parental attachment and responsiveness to the child – but also by her social class, personal well‐being and social isolation which also affect the child’s development and skills. Specifically, this means seeing the parent‐child relationship as a conduit for a wider set of influences on the child. Clearly, therefore, supporting parents so that children achieve better outcomes involves a wider set of supports for more vulnerable parents. It is important to frame these findings in the wider context of the bio‐ecological model of child development. This model gives primordial importance to ‘interactions’ as the engine of child development (and human development generally). Interactions are not just personal or, in the case of children, confined to narrowly‐defined ‘parent‐child relationships’. A wider concept of interactions is envisaged in the bio‐ecological model which states, as its first principle, that ‘human development takes place through processes of progressively more complex reciprocal interaction between an active, evolving biopsychological human organism [the child] and the persons, objects and symbols in its immediate environment. To be effective, the interaction must occur on a fairly regular basis over extended periods of time.’305 [insertion and emphasis added]. From this perspective, and in light of the findings presented in this study, it is clear that social class and mother’s well‐being constitute ‘persons, objects and symbols’ in the child’s ‘immediate environment’ and it is the child’s interactions which are the catalyst for developing social & emotional skills and language & cognitive skills.
5.6 Pre‐School System Influences The pre‐school system, as defined in this study, refers primarily to attributes of staff working in early years centres, including their personal characteristics, professional qualifications, work experience, work commitment, relationships with children and quality of the workplace. These attributes are recognised to be important elements of the pre‐school system but are not exhaustive of it. Our concept of the pre‐school system also includes whether the centre participated in NEYAI and Síolta QAP, the two quality improvement initiatives which gave rise to the study and from which the sample of children was drawn. In addition, the amount of time spent by a child in an early years centre prior to participating in the Free Pre‐School Year is treated as an attribute of the pre‐school system, since it is relevant to assessing the more generic relationship between the duration of early years services and child outcomes. A significant absence from our measurement of the pre‐school system is the environment of each centre306 since this would have required direct observation of centres which was outside the scope of the study.
contingent to what the child signals supports learning, in part, by facilitating the child’s development of mechanisms for coping with stress and novelty in his or her environment. With repeated positive experiences, a trust and bond develop between the child and parent that promote the child’s continued engagement in learning activities with his or her parent. Thus, these affective‐emotional behaviours communicate the parent’s interest and acceptance, fostering self‐regulation and cooperation, critically important behaviours for effective learning to occur. From a socio‐cultural viewpoint, cognitively responsive behaviours (e.g. maintaining versus redirecting interests, rich verbal input) are thought to facilitate higher levels of learning because they provide a structure or scaffold for the young child’s immature skills, such as developing attentional and cognitive capacities. Responsive behaviours in this framework promote joint engagement and reciprocity in the parent‐child interaction and help a child learn to assume a more active and ultimately independent role in the learning process.’ (Landry, 2008).
305 ‘In order to develop – intellectually, emotionally, socially and morally – a child requires, for all of them, the same thing: participation in progressively more complex reciprocal activity, on a regular basis over extended periods of time with one or more other persons with whom the child develops a strong, mutual, irrational attachment, and who are committed to that child’s development, preferably for life’ (Bronfrenbrenner and Morris, 2006:797).
306 This is normally measured using ECERS or ECERS‐R (Early Childhood Environment Rating Scale – Revised) which comprises 7 dimensions and 43 items scored on a 7‐point scale (1=inadequate 3=minimal/adequate

91
The results in Figures 5.2 and 5.3 indicate that the amount of time spent by a child in an early years centre prior to Wave 1 of this study is a statistically significant influence on the child’s progress in social & emotional skills (.06); there is also a positive influence on progress in language & cognitive skills but it is just below the threshold of statistical significance (.07). This is an important result particularly in view of limitations imposed by a relatively small sample and the absence of a control group. The amount of time spent in early years care and education, prior the Free Pre‐School Year, has a small but beneficial effect, proportional to the time spent in an early years centre. On average, children spent more than twice as long in an early years centre prior to the Free Pre‐School Year (15 months) compared to the time spent in the Free Pre‐School Year (7 months) (Tables 5.1 and 5.2).
Table 5.1: Time Spent by Child in an Early Years Centre Prior to Free Pre‐School Year
Project Up to 1 year %
1‐2 years %
2‐3 years%
More than 3 years
%
Total %
Total n
Mean (Mths)
NEYAI 47.7% 31.4% 13.6% 7.4% 100.0% 258 Síolta QAP 54.7% 25.8% 13.2% 6.3% 100.0% 190 All Projects 50.7% 29.0% 13.4% 6.9% 100.0% 448 15 mths
Table 5.2: Period between Assessments at Wave 1 and Wave 2 in Free Pre‐School Year
Project Up to 100
days %
101–200 days %
201–300days %
More than 300 days
%
Total %
Total n
Mean (Mths)
NEYAI 15.5 22.9 48.1 13.6 100 258 Síolta QAP 3.7 57.4 38.9 ‐ 100 190 All Projects 10.5 37.5 44.2 7.8 100 448 7 mths
Further analysis revealed that the amount of time spent by a child in an early years centre prior to the Free Pre‐School Year is positively correlated with social class, which suggests that children from more advantaged social class backgrounds may also have stronger skills because they spend more time in an early years centre. This finding has wider significance since the association between social class and early years care and education has also been found in the 3‐year old cohort of the GUI: ‘use of non‐parental childcare was strongly related to the socio‐demographic characteristics of the household’307. It has also been found in the 15‐year old cohort who participated in Ireland’s PISA 2012 assessments308.
5=good 7=excellent). The seven dimensions are: space & furnishings; personal care routines; language & reasoning activities; interactions; programme structure; parents & staff (Cryer, Harms and Riley, 2003; Sylva, Siraj‐Blatchford and Taggart, 2006). The EPPE study found that ECERS‐R was a reliable predictor of child outcomes: ‘Scores on the ECERS‐R were related to positive social‐behavioural outcomes at aged 7 and 11. There were some positive cognitive outcomes found at age 7, but by the age of 11 the ECERS‐R quality scores were not related to cognitive outcomes in children’ (Sylva, 2010:86). Also of note is the EPPE finding that ‘Children who attended settings that had higher quality scores on ECERS‐E [ECERS‐Extension, covering literacy, mathematics, science & environment, diversity] had better academic outcomes (English and Mathematics) when they were aged 7 and also 11. Moreover, quality scores on the ECERS‐E in pre‐school settings were also related to many positive social‐behavioural outcomes at ages 7 and 11 as well’ (Ibid).
307 ‘The use of non‐parental childcare was strongly related to the socio‐demographic characteristics of the household. Those from more educated backgrounds were significantly more likely to avail of non‐parental childcare … . Research from elsewhere has shown that children of parents from more affluent and more highly educated backgrounds are significantly more likely to be in centre‐based care and less likely to be in relative care, while the reverse is true for those from less advantaged and less highly educated backgrounds’ (Williams, Murray, McCrory, McNally, 2013:95).
308 ‘Students in Ireland who never attended preschool perform significantly less well than students who had attended for a year or less and those who attended for more than a year, on all domains, with the exception of computer‐based mathematics. The difference between those who have never attended and those who attended for a year or less was almost 15 points for print mathematics. However, this relationship appears to

92
The finding that duration in an early years centre has an influence on outcomes of the Free Pre‐School Year is consistent with numerous landmark evaluations of early childhood programmes309 which have found a positive relationship between programme duration and child outcomes. More recent evidence from the EPPE study in the UK reported a similar finding: ‘duration (a child’s time at pre‐school in months) was related to gains in terms of three important cognitive skills (Language, Pre‐reading and Early number concepts) at school entry. … . In general, the longer a child was in a target pre‐school centre, the stronger the positive impact on attainment’310. Similarly, recent US evidence based on children who attended pre‐school in Chicago (Child‐Parent Centers ‐ CPC) and were followed‐up over a longer period found that: ‘Relative to children who attended one year of CPC preschool, the two‐year group is significantly less likely to receive special education or be abused or neglected or to commit crimes. The findings provide support for the long‐term benefits of greater exposure to preschool.’311 The implications of this in the wider context of the study and particularly in the context of considering the possibility of a second Free Pre‐School Year are examined in Chapter Seven below. The results in Figures 5.2 and 5.3 also indicate that whether the child attended a centre in NEYAI or Síolta QAP made no difference to outcomes, which implies that neither quality improvement programme had a marked advantage over the other; participating in Síolta QAP or being Síolta‐validated had no discernable impact on outcomes when all other influences were taken into account. The analysis also revealed that none of the staff attributes which we measured had any effect on children’s progress during the Free Pre‐School Year. As indicated, this included personal characteristics, professional qualifications, work experience, work commitment, relationships with children and quality of the workplace, all of which were tested. However, negative affect had a negative influence on how staff assessed the skills of children at the start of the Free Pre‐School Year and also reduced their commitment to work (defined in terms of dedication to, absorption in and vigour at work) but had no effect on outcomes. The finding that staff characteristics and whether a centre was in NEYAI or Síolta QAP had no statistically significant influence on outcomes in the Free Pre‐School Year invites comment. It needs to be seen in the context that pre‐school interventions generally tend to have relatively small effects on child outcomes, as this study also confirms. It also implies that specific characteristics of the pre‐school system – such as staff characteristics or whether a centre participated in NEYAI or Síolta QAP – inevitably have correspondingly smaller effects which are more difficult to detect, especially with relatively small samples, as in this study. Typically, relatively large sample sizes are required to measure these influences and it is possible that absence of evidence on the influence of the pre‐school system is a ‘false negative’, that is, a conclusion that there is no impact when there is312. In other words, the absence of evidence does not necessarily imply absence of impact. It is also acknowledged that our measurement of the pre‐school system is largely confined to staff self‐report and this is unlikely to capture all important aspects of quality, particularly those detectable through direct observation of the environment of each centre. It is also important to see these findings in the wider context of research on school systems generally and not just pre‐school systems. Within that wider field of research, much of the variance in child outcomes across school systems is explained by attributes of the child and the child’s background rather than school systems, as in this
be related to ESCS as students from higher ESCS families are more likely to have had at least one year of pre‐school education.’ (Perkins, Shiel, Merriman, Cosgrove and Moran, 2013:xvi. See also OECD, 2013a; 2013b; 2010a:98).
309 Examples include studies of the Abecedarian Project (Campbell and Ramey, 1995), the Chicago Child‐Parent Centers (Reynolds, 1994; Reynolds and Temple, 1998), and the Infant Health and Development Program (Ramey, et al., 1992).
310 Sammons, 2010b:98‐99. 311 Arteaga, Humpage, Reynolds and Temple, 2013. The US evidence is based on data from a cohort of 1,500
students in the Chicago Longitudinal Study who enrolled in the Chicago Public Schools in the mid‐1980s. Many of these students participated in a high‐quality preschool program called Child‐Parent Centers (CPC) for one or two years. (Arteaga, Humpage, Reynolds and Temple, 2013).
312 A false negative is also referred to as Type II error because the null hypothesis is wrongly accepted. By contrast, a false positive is referred to as Type I error because the null hypothesis is wrongly rejected.
93
study. This emerges clearly from international studies, such as PIRLS & TIMMS313 and PISA314. In light of this, the finding in this study that no attribute of the pre‐school system – apart from duration of in an early years centre prior to the Free Pre‐School Year – is associated with better outcomes for children is not as surprising as might first appear. It is also worth recalling that ‘absence of evidence is not evidence of absence’ which in this context means that, just because we have not identified active ingredients in the pre‐school system does not mean they do not exist; it only means that the study has been unable to detect them. This also underlines why the study’s limitations, enumerated earlier (section 2.9), need to be borne in mind.
5.7 Summary This chapter analysed the determinants of child development, based on a sample of children who attended centres in NEYAI and Síolta QAP. The analysis identified three sets of influences on child outcomes: (i) child characteristics (ii) family and social system characteristics (iii) pre‐school system characteristics. Beginning with child characteristics, we found that the development of children’s skills during the Free Pre‐School Year was influenced by three attributes of the child: gender, age and NESB (Non‐English Speaking Background). Recognising that age and gender differences in child development are normal among 3‐4 year olds and tend to converge around at the ages of 9‐11, we found that gender‐related gaps in language & cognitive skills continued to widen over the course of the study, but that gender‐related gaps in social & emotional skills remained unchanged. We also found that age is a significant influence on children’s language & cognitive skills (but not on social & emotional skills), with older children having an advantage which continued to grow. Children with NESB had weaker social & emotional skills and language & cognitive skills at the first wave. The gap between them and other children narrowed in the case of social & emotional skills while remaining unchanged for language & cognitive skills. This result suggests that the Free Pre‐School Year may be an effective instrument for promoting the integration of children from new communities, probably because of the benefits of interacting with staff and other children in a new environment. Within the family and social system, the two main influences on child outcomes are social class and the parent‐child relationship. The concept of social class includes mother’s education, occupation, and financial problems but also includes two other resources which are relevant to child development, the home learning environment and the child’s diet. The analysis revealed that social class is the main determinant of children’s social & emotional skills and especially children’s language & cognitive skills. The results show that the gap between the skills of children in our samples at the beginning of the Free Pre‐School Year continued unchanged during that year. The parent‐child relationship is also a key source of influence on the development of children’s skills. Children tend to have stronger social & emotional skills when there is a more ‘relaxed parent‐child relationship’ (associated with less conflict and stress); there is also a suggestion that children have better language & cognitive skills when there is a more ‘demanding parent‐child relationship’ (associated with more conflict and stress). This suggests that parent‐child relationships may require a balance between relaxed and demand styles of parenting since children’s skills are affected by different aspects of this relationship. These findings underline how social class and parent‐child relationships are active ingredients in child development, simultaneously weaving their influence within the family and social system and the pre‐school system. This perspective underlines why development of children’s skills through the Free Pre‐School Year cannot be dissociated from the wider family and social system; by implication, this wider
313 Multilevel modelling of Irish results from 2011 PIRLS (Progress in International Reading Literacy Study) and
TIMSS (Trends in International Maths and Science Study) found that: ‘the only variable at the school level that was consistently related to achievement was pupil average age.’ (Cosgrove, and Creaven, 2013:217).
314 ‘Across the OECD, 11% of all variation in student reading performance can be attributed to differences across countries, while 34% arises from differences among schools and the remaining 55% can be attributed to differences among individual students.’ (OECD, 2010a:27).
94
set of cascading influences needs to be taken into account in considering how to improve the outcomes of the Free Pre‐School Year. Within the pre‐school system, we found that duration in an early years centre prior to the Free Pre‐School Year influenced the progress of children during that year. This is consistent with numerous landmark evaluations of early childhood programmes, including more recent evaluations which have found a positive relationship between programme duration and child outcomes. However we found no significant difference in outcomes between children attending a centre in NEYAI or Síolta QAP, when all other variations between children are taken into account. Similarly, we found that none of the staff attributes which we measured had any effect on children’s progress during the Free Pre‐School Year.

95
6 Illustrating A Way of Improving Quality in Pre‐School ‘The best approaches to professional development align (conceptually and empirically) the requisite knowledge of practices (interactions and implementation of curriculum) effective for improving child outcomes (e.g., language development or early literacy) with extensive opportunities for observation of high‐quality instructional interaction through analysis and viewing of multiple video examples; skills training in identifying appropriate (or inappropriate) responses to children’s cues and how teacher responses can contribute to students’ literacy and growth of their language skills; and repeated opportunities for individualized feedback and support for high quality and effectiveness in one’s own instruction, implementation, and interactions with children. Conceptually, effective professional development can be characterized as a system of supports to teachers or caregivers in which paths can be traced from inputs to teachers, to teacher inputs to children, to children’s skill gains.’ 315 Robert Pianta, Professor of Education, University of Virginia USA, specialist in early childhood education.
6.1 Introduction This chapter illustrates a way of improving staff quality in the Free Pre‐School Year. Being a case study, it is based on one NEYAI project only and was selected because a robust local evaluation316 showed that staff in three centres which also participated in the national evaluation317 received a well‐designed and executed training intervention that measurably improved their capacity to develop children’s speech, language and communication. Similar training interventions have been undertaken in other NEYAI and Síolta QAP projects318 but the availability of a robust local evaluation for this intervention ‐ the Language Enrichment Programme ‐ makes it a generic and ready‐made illustration of how quality can be improved within the Free Pre‐School Year, and within the early years sector generally. This is an important case study for a number of reasons: language & cognitive skills are strong predictors of later academic achievement319; these skills are highlighted in Síolta and Aistear; specific training is required to develop children’s language and cognitive development, a staff capacity that is
315 Pianta, 2011:8. 316 French, 2014. 317 The three centres in the evaluation were Cherry Orchard Community Childcare Service (details at
www.cherryorchardcommunitychildcareservice.com), St. Vincent’s Early Childhood Development Service (Details at www.docchildandfamily.ie) and St. Ultan’s Nursery and Early Childhood Education Unit (Details at www.stultans.ie). However many more centres in Ballyfermot participated in NEYAI, including infant classes in primary schools, but not in the evaluation.
318 For example, the Language Enrichment Programme is based on the Hanen method and a number of NEYAI projects are also using this method including Happy Talk in Cork and Dublin SW Inner City Demonstration Model. Similarly, many projects used mentoring, including all of the Síolta projects. A review of the precursor of Happy Talk, which was focused on pre‐primary (infant) classes in two primary schools, concluded that ‘The early indications of impact from the pilot are good: it produced clearly measurable improvements in children’s speech and language. It will take some years before the long‐term impact can be assessed, however’ (Deane, 2009:27). Local evaluations of most NEYAI projects will be finalised by mid‐2014.
319 This is based on meta‐analysis of six large‐scale longitudinal studies, two of which are nationally representative samples of US children, two are drawn from multi‐site studies of US children, and one each of children from Britain and Canada. The main conclusions were: ‘Our meta‐analytic results indicate that such early math concepts as knowledge of numbers and ordinality were the most powerful predictors of later learning (the average effect size of school‐entry math skills was .34 and every bit as large as early reading skills in predicting later reading achievement). Less powerful, but also consistent, predictors across studies were early language and reading skills such as vocabulary, knowing letters, words and beginning and ending word sounds (the average effect size across our studies was .17), and attention skills (average effect size .10). The average effect sizes of externalizing and internalizing problem behaviors and social skills were close to zero.’ (Duncan, et al., 2007:1143).

96
variously referred to as ‘sustained shared thinking’320 and ‘extended purposive conversations’321; this is an area of weaknesses in the Irish pre‐school system322 and related services323.
As with the national evaluation, this local evaluation is limited by the absence of a control group and longitudinal follow‐up after the intervention. Nevertheless, the local evaluation showed that the Language Enrichment Programme improved staff skills, based on direct observation of these skills before and after the training324. Further analysis from the perspective of the national evaluation
320 In the UK, the Effective Pre‐School and Primary Education Project (EPPE) carried structured observational
studies of 12 of the 141 early years settings in the EPPE project. It found that: ‘The ‘excellent’ settings were thus found to encourage ‘sustained shared thinking’, a concept that came to be defined as any episode in which two or more individuals ‘worked together’ in an intellectual way to solve a problem, clarify a concept, evaluate activities, extend a narrative, etc. … . The research found that this did not happen very frequently. … Our investigations of adult‐child interaction suggest that periods of ‘sustained shared thinking’ are a necessary prerequisite for excellence in the early years practice, and it is especially powerful when it is also encouraged in the home by parents. … . The evidence also suggested that adult ‘modelling’ often combined with sustained periods of shared thinking, and open‐ended questioning, was associated with better cognitive achievement. However, open‐ended questions were found to make up only 5.1 per cent of the questioning used in the case study settings. … . Adults need, therefore, to create opportunities to extend child‐initiated play as well as teacher‐initiated group work, as both of these have been found to be important vehicles for promoting learning.’ (Siraj‐Blatchford, 2010a:157‐158). In Ireland, observational studies were carried out of three early years settings in which three staff were video‐taped during six ‘scheduled small group learning experiences’ (French, 2011). The author found that interactions between staff and children tended to lack ‘extended purposive conversations’, a synonym for ‘sustained shared thinking’. Specifically, the study found that: ‘The three educators presented as calm, sensitive and responsive to all of the children in their care. They focused on building strong, caring and reciprocal interpersonal relationships with them. Such positive relationships seemed to provide the children with a secure foundation enabling them to focus on their learning experiences without apparent anxiety or fear of reprimand. The educators demonstrated warmth, physical affection and empathy. All three affirmed and encouraged children regularly. … . Looking across the data in relation to the three educators, one common thread appeared to be little emphasis on engagement in purposive conversations designed to develop children’s thinking and language. This is evidenced by the few open‐ended questions. While acknowledging the brief time of data gathering, few of the interactions analysed were in relation to scaffolding and modelling in the SGLEs [scheduled small group learning experiences]. … . This raises serious questions about whether there is sufficient emphasis on strategies to extend conversations in educators’ initial training. EPCs [extended purposive conversations] between educators and children are critical for the development of language and thinking for all children but particularly those in the focus settings.’ (French 2011:155‐6).
321 ‘The literature suggests that interaction strategies that engage children in extended purposive conversations are especially effective in enhancing children’s educational outcomes. These strategies involve establishing a supportive interpersonal environment, encouraging versus praising children, active listening, discussing/questioning and modelling whilst providing opportunities to enable episodes of extended purposive conversations.’ (French, 2014:7).
322 A study of 26 pre‐schools throughout Ireland in 2012 assessed the provision of literacy, maths, science, environment and diversity using the Curricular Subscales in the Early Childhood Environmental Rating Scale Extension (ECERS/E) and concluded: ‘The study reveals a minimal standard in the provision of literacy and maths. Provision in science and environment and diversity are inadequate.’ (Neylon, 2014:99). The study adds: ‘The findings have implications concerning the capacity of pre‐school services to implement quality and curriculum frameworks Síolta and Aistear and question the appropriateness of the current pre‐school inspection systems in improving standards.’ (Ibid). See also French 2011.
323 For example, the average waiting time for Speech and Language Therapy for children in some early years services is 15‐18 months (Hayes, Siraj‐Blatchford, Keegan, and Goulding, 2013).
324 It is acknowledged that staff capacity in these centres may also have improved as a consequence of participating in Aistear training. The extent of this influence is impossible to determine but, based on a separate evaluation of this intervention, is likely to have had a small effect. The evaluation of this training concluded: ‘There were more mixed views voiced by both the participants and stakeholders about the impact of the training on educators’ everyday practice. Most of the participants and some stakeholders reported positively on how the course had changed aspects of daily practice in terms of the room layout and play areas provided (physical environment), the use of more appropriate pedagogical strategies to ensure effective learning through play, greater engagement in reflective practice and the enhanced profile ascribed to play in their setting/classroom context in terms of more time and value. However, others considered the training to have only marginally impacted on practice, either because many of the participants were already familiar
97
revealed that outcomes in this project were no different to other NEYAI and Síolta QAP projects when all factors were taken into account. The analysis also revealed that this project is virtually indistinguishable from other projects in terms of the characteristics of staff, children or parents. This suggests that no special staff attributes are required for this programme to have a similar impact in other centres. The case study therefore is an illustration of one way to improve quality, but it is not suggested that this is the only way. We begin by giving a brief description of the Language Enrichment Programme (Section 6.2) and its evaluation (Section 6.3). The results of the evaluation are presented in terms of the impact on staff‐child interactions (Section 6.4) and the quality of settings (Section 6.5). Based on this analysis, we summarise the impact of the Language Enrichment Programme on staff capacity and, by inference, on child outcomes (Section 6.6).
6.2 The Language Enrichment Programme The Language Enrichment Programme is based on the Hanen Programme325 and its purpose was to develop staff capacity to facilitate growth in children’s speech, language and communication. Although the programme included other strands which were delivered to parents and children326, staff training was the main focus of the evaluation327. The programme was delivered by a Speech and Language Therapist (SLT) with 25 years of experience working with staff and children in settings which included clinics, nurseries, day care centres, community groups and primary schools328. The purpose of the programme was to equip staff with three clusters of strategies which are known to facilitate growth in children’s speech, language and communication. The first cluster is referred to as ‘child‐oriented strategies’ and these are designed to encourage children to initiate and engage in conversational interactions so that educators can then provide responsive language input on the child’s topic of interest. Specific strategies include: observe, wait and listen (OWL); be face‐to‐face;
with the content addressed within the Ballyfermot Aistear Training or the incorrect issues had been targeted.’ (Walsh, McMillan and Doherty, 2013:5).
325 Details at www.hanen.org The Hanen Programme is based on the book, Learning Language and Loving It (Weitzman, and Greenberg, 2002). The Hanen method is based on five premises about how to cultivate children’s skills in speech, language and communication: (i) Educators can positively influence children’s acquisition of language and literacy through frequent, high quality interactions in which educators practice linguistic responsiveness. (ii) Responsive language input is essential to children’s language development. Responsive language input builds on the child’s focus or topic is more easily processed by the child and therefore the child redirects more cognitive resources to learn language. (iii) Children benefit from being involved in extended interactions in which they are full and active participants where they can refine and practice their communication skills, learn the rules of conversation with educators who model progressively complex language relevant to the child’s topic. (iv) Children’s exposure to a wide and variable vocabulary predicts subsequent vocabulary growth. (v) Exposure to decontextualised language in the context of everyday interactions is essential to children’s language and literacy outcomes. Children need engagement in extended discourse where they are obliged to use language in abstract and complex ways and in contexts that are removed from the here and now, such as in dialogic reading (which is shared storybook reading where children talk about the story).
326 The two other strands involved. (i) Eight one‐hour sessions with parents focussed on the development of early communication followed by shared activity with the children (‘Parent and Child Group’); for the first half hour of the session, parents were to be given tips and ideas by the SLT on how to enrich communication with their child and invited to discuss ideas and seek advice. The parents were then to be joined by their children for a DVD of ‘Ra Ra Lion’ and some games, songs and interaction together. The games focussed on one of five core skills: paying attention and listening, understanding what is said, learning new words, making longer sentences and talking socially. (ii) Eight one‐hour sessions with a small group of children and their early years educators (‘Listening Group’); this group was delivered by the SLT immediately after the Parent and Child group and was for approximately one hour per week over eight weeks. For the younger children the focus was on making sure that the children learn to take turns and wait. The older children were actively taught the skill of listening. One or two staff from the settings participated also in these groups so the skills of the SLT were passed on.
327 French, 2014. 328 The Speech and Language Therapist was Patricia Curtis of Apley Speech & Language Services; details at
www.apleyslt.com
98
follow the child’s lead (imitate, interpret, comment); join‐in and play. The second cluster is referred to as ‘interaction‐promoting strategies’ and these are designed to encourage extended, balanced conversations between educators and children in both one‐to‐one and small group interactions. These strategies involve listening carefully to the children, tailoring responses to their interests and not dominating the conversation. Specific strategies include: cue the child to take a turn; use a variety of questions to encourage conversation; balance comments and questions; scan small groups (such as carefully observe each child to facilitate her/his participation and interaction). The third cluster is referred to as ‘language‐modelling strategies’, which are designed to build children’s receptive and expressive language skills as well as their emergent literacy knowledge. This is done by providing models of more advanced oral language and emergent literacy knowledge. Specific strategies include: using a variety of labels (nouns, verbs, adjectives including unfamiliar words); expand on what the child says; extend the topic (by modelling decontextualized language). The Language Enrichment Programme involved three full days of training for staff. The first day focused on different styles of communication with children and introduced staff to the strategy of Observe, Wait, Listen (OWL), which is the hallmark of this programme; observe the children, wait for the children to make the first move, listen to what the children have to say. The second day linked language and literacy through story‐reading, particularly ‘dialogic reading’, which is having a dialogue with children about the story. The third day focussed on peer interaction between children, encouraging children to interact with each other as staff withdrew to the margins. The training was delivered on Saturdays; 20 staff commenced and 18 completed the course. Following each training day, the SLT had a one‐hour session with each member of staff. During this session, the SLT video‐recorded each staff member interacting with children in her usual work setting. Each staff member was then invited to watch the video and to assess her practice; she was then offered feedback and analysis by the SLT based on the video. This was an intense process for both SLT and staff, since three video‐recordings were made of each operator and this generated nearly 60 one‐to‐one recordings and feedback sessions over the year. The average cost of the Language Enrichment Programme, taking all its strands into account including administrative overheads for the year, was approximately €10k per centre, less than the cost per centre of the Síolta QAP (€13.5k)329.
6.3 Evaluation of Language Enrichment Programme The evaluation design mirrored the national evaluation, in that baseline data was collected at the start of the intervention in April 2012 (wave 1) and towards the end of the intervention in June 2013 (wave 2). It also mirrored the national evaluation, in that it focused on staff working with 3‐4 year‐old children in the Free Pre‐School Year, who were also part of the national evaluation. Four types of data were collected and analysed by the evaluator. The first set of data involved an assessment of the first video (wave 1) and the second video (wave 2) made by the SLT of the 18 staff who participated in both waves. These videos were analysed using the Hanen Teacher Interaction and Language Rating Scale. This scale has 11 items, each item corresponding to a staff strategy for interacting with children, and was rated on a seven‐point frequency scale using the categories ‘almost never’ (1), ‘sometimes’ (3), ‘frequently (5), and consistently (7). The 11 strategy items, along with examples of each, are summarised in Table 6.1.
329 Department of Education and Skills, 2013b:22.

99
Table 6.1: Hanen Teacher Interaction and Language Rating Scale
Staff Interaction Strategy
Example
Wait and Listen Wait for children to initiate, use slow pace and let children finish their message
Follow the Lead
Respond to children’s initiations, use animation, avoid directions and vague acknowledgments
Join‐in and play (not used) Evaluated only if the children were are preverbal or at one‐word stage, build on child’s focus of interest without dominating
Face‐to‐Face Adjust physical level to be face‐to‐face with children
Use a Variety of Questions Encourage conversation, use open‐ended questions – what happened? how did you do that? why do you think that happened? Avoid test and rhetorical questions
Encourage Verbal Turn‐Taking Invite the child to take a turn, respond with animation, wait for a response, balancing turn‐taking
Imitate (not used) Imitate the actions, gestures, sounds of pre‐verbal children
Scan
Carefully observe each child to facilitate her/his participation and interaction in small groups; imitate the actions, gestures, sounds of pre‐verbal children
Use a Varity of labels Use nouns, verbs, adjectives and include unfamiliar words
Expand Expand on what the child says
Extend the Topic Model decontextualized language
Source: French, 2014:40‐41. The second set of data involved an assessment of setting quality at the beginning and end of the programme using the Preschool Program Quality Assessment (PQA). Originated as part of HighScope, the Preschool PQA is reliable and valid and appropriate for use in all early childhood settings. The PQA covers four domains and 39 dimensions of quality – learning environment, daily routine, adult‐child interaction, curriculum planning and assessment – as summarised in Table 6.2. Quality along each dimension is rated on a five‐point scale, based on observing the setting and interviewing staff, including a photographic record of the environment.
Table 6.2: Preschool Program Quality Assessment (PQA) Scale
Programme Quality Domains
Example
Learning Environment The dimensions of learning environment include safety and health, a focus on outdoor space, defined interest areas which are logically located and which have organised and labelled materials, which are varied, open‐ended, and plentiful and reflect the diversity of the children in the setting. Finally attention is paid to how children’s work is displayed.
Daily Routine The dimensions of daily routine include consistency, flexibility and sufficient time for each part of the day to include time for child planning, child‐initiated activities and child review/recall. Other segments of the day include small and large group times, choices during transition times and clean‐up, meal‐times and outside time.
Adult‐Child Interaction Adult children interaction includes meeting basic physical needs, handling separation from home, having a warm and caring atmosphere, support for child communication, support for non‐English speakers, adults as partners in play, encouragement of children’s initiatives, support for child learning at group times, opportunities for child exploration, acknowledgement of children’s

100
efforts, encouragement for peer interactions, independent problem‐solving and conflict resolution.
Curriculum Planning and Assessment
Curriculum planning and assessment focuses on the curriculum model, team‐teaching, comprehensive child records, anecdotal note‐taking by staff and use of child observation measures.
Source: French, 2014:42. The third set of data involved a literacy and numeracy indicator scale adapted by the evaluator from the ECERS‐R scale330. It contains six literacy criteria and four numeracy criteria as summarised in Table 6.3. Literacy and numeracy scores were rated as either minimal, moderate or maximal.
Table 6.3: Literacy and Numeracy Indicator Scale
Literacy and numeracy criteria Example
Environmental print Educators and children together discuss how a particular spoken‐word is written down; words are on labels, photos, take‐away menus in the home corner.
Book and literacy areas Rug and cushions or comfortable seating, a wide range of books including reference books, children are encouraged/directed to books for information, books are included in learning areas outside the book corner.
Educator reading with the children
Discussion about print and letters as well as content with young children, evidence of one‐to‐one reading with some children, children explore the books, turn the pages and return to pages, stories are led by the children.
Sounds in words Clapping games, jumping with young children, attention to linking sounds to letters.
Emergent writing/mark‐making
Pencils and paper, mark‐making (or writing) area, staff and children pass messages to each other; emergent writing is displayed for others to see.
Talking and listening Educators observe, wait and listen, educators accept and extend children’s verbal contributions in conversation, children reflect on things they did, open‐ended questions used to extend the children’s language, children are encouraged to turn‐take and listen, children are encouraged to ask questions.
Counting and the application of counting
Children counting at registration, role play, snack time; one‐to‐one correspondence encouraged both indoors and outdoors, maths area with number games, posters featuring numbers, number songs, rhymes, the language of maths is observed ‐ 1st, 2nd, 3rd.
Shape and space children supported to generalise shape
Circle, square, triangle, rectangle used across a variety of contexts, for example, art activities, construction activities, group play arrangements, role play, properties of two or three dimensional shapes, understanding the properties of different shapes (three sides of a triangle), tessellation (fit shapes snugly together) supported.
Sorting, matching and comparing
Children know why a set of shapes are alike; language of sorting, comparing or matching is used in a variety of contexts and experiences.
Reading and writing simple numbers
Planned and free‐play experiences involving numbers, written numbers linked to a practical purpose in play, pricing items in a shop corner, measuring, ‘3’ written next to three apples, number shapes available.
Source: French, 2014:42‐44.
330 Sylva, Siraj‐Blatchford and Taggart, 2006.

101
The fourth set of data involved interviews with 18 staff members and their managers at the end of the programme. The interviews focused on three main questions: (i) In what way has the Language Enrichment Programme training impacted on your practice to date? (ii) If you were to choose one key area of learning for you as a result of the Language Enrichment Programme training what would that be? (iii) Can you give at least two concrete examples of how your practice has changed (if any)? As noted in the evaluation report, these questions facilitated wider discussion of the programme and its impact: ‘the discussions touched on the use of video, the process of the training, any criticisms, and any conflicts with what they know in addition to other queries’331.
6.4 Impact of Programme on Staff‐Child Interactions There was a significant improvement across the three centres in staff‐child interactions, based on analysis of videos at wave 1 and wave 2 using the Hanen Teacher Interaction and Language Rating Scale. The areas of greatest improvement related to ‘observe, wait and listen’ (OWL), which is the core interaction strategy of the programme. Specifically, the areas where strategies changed most were: wait and listen (waiting for children to initiate, using slow pace and letting children finish their message); use a variety of questions (questions to encourage conversations); and turn‐taking (invite the child to take a turn, respond with animation, wait for a response, balancing turn‐taking); being face‐to‐face (adjusting to the child’s physical level); and follow the lead (respond to children’s initiations, use animation, avoid directions). The areas where strategies changed least were: expand (expand on what the child says) and extend (model decontextualised language). Commenting on the latter finding, the evaluator explained that this is ‘not surprising’ because ‘the ability to engage in extended purposive conversations with children takes a high degree of knowledge, skill and experience.’ 332. These findings were corroborated by interviews with staff on how their practice changed as a result of the Language Enrichment Programme. This was strongly influenced by the process of learning to Observe, Wait and Listen (OWL) as exemplified by the following quotations: ‘The biggest impact was about observing the children and waiting for the children to make the first move, because we normally ask them the question first. With the Observe Wait and Listen that worked really very well, waiting for the children to talk to you first, instead of you asking them, ‘do you want this, do you want that’?’ ‘Another thing I picked up on was not interrupting their play ... . It was after the training that I found out, wait, observe them on one side, see what they’re doing, that’s how you can get all the language they have, it comes out when they are talking to each other.’ ‘Give everybody a chance to talk. This educator told of a boy who had developed a stammer. He can’t get out what he wants to say at greeting‐time or message‐board. Now we all as a group (educator and children) give him the time to say what he wants to say. They (the children) are modelling me. So when they see that I’m just sitting, looking at him, they sit and they wait and now we do that with everybody. It has really helped … every day he has something to say … which is fantastic and he is quite comfortable with the fact that he has this stammer … he knows that I’m not going to say “hurry up” … “take your time”. I’ve been able to say to the Mam and Dad ”just give him a chance, say nothing and just let him get it out ‐ even if it takes him 10 minutes”. The children have all become aware … I repeat what he has said … and it is like this relief comes over him ‐ “phew – she heard me”.’ The Language Enrichment Programme also generated changes in story‐time including positioning children, not correcting their language or perspective, relinquishing conversational control in story reading, creating an appropriate environment for dialogic reading, extending vocabulary, spending more time reading a story. The following are illustrations of how staff perceived these changes: ‘The training changed the way I interact with the children when reading a story. I always put the reluctant child face‐to‐face with me and try my best to get them involved more with lots of eye contact and open‐ended questions. I use the OWL technique and l find it works.’ ‘How to draw in some children – where to locate children (was a key learning point) – the quiet ones need to be opposite you … The chatterboxes don’t need to be right in front of you; they will get your
331 French, 2014:44. 332 French, 2014:51.

102
attention anyway. Thinking about all that … you think you are doing all that anyway, but in reality with ratios of one to 10 children you do need to be aware of the quieter children.’ ‘Since doing the training, I now look at books differently. I now take my time when reading stories and let the children give their input during story time. I explain a lot of the words now that I realise the children might not know their meaning. Whereas before, at story time, l would insist on the class to be quiet while I read the story and they could only ask questions at the end. Since changing story time the children stay more engaged and are happy to sit, listen and join in in telling stories'. A further impact of the Language Enrichment Programme was that staff started to notice significant differences in the language abilities and personalities of children: ‘I think probably the biggest and the best advice I got from Trish (the SLT) was that they have different abilities with regard to language. There was always one real vocal child in the room, and a really shy child, and when I started giving him more attention and focus less on the more vocal, I’ve seen the biggest difference. He did have the language, but he just didn’t necessarily have the confidence, and he couldn’t get it out.’ ‘The biggest thing is that we are more aware of the children and their language and their communication, especially those that would be considered the quiet children. I think that staff are noticing those children a lot more.’ ‘I’m more conscious during circle time and more aware to let the quieter children talk. If one of the more talkative children are speaking over quieter ones, I am more aware to say ‘it’s ‘so‐and‐so’s’ turn to talk now’, to let each child contribute their views.’ ‘I learned a lot around the reluctant learners and the sociable ones. I thought all the children were sociable, but through the video I realised they weren’t. I realised the sociable children were pushing their way in and I was nearly neglecting the children who weren’t so vocal … One boy asked me a question, but because I was so caught up with another child, he looked so deflated because I hadn’t answered his question. That has really stuck with me. I do answer their questions now. It (the training) has made me very aware of what happens when you get caught up in a situation and the impact on the other children and how easy it is to upset a child by not answering a question.’ ‘My own awareness of the individual needs of the children within the group has risen – you were aware of their needs but I now have the language to go with it ‐ the reluctant child, the passive child, or the sociable child.’
6.5 Impact of Programme on Setting Quality There were significant improvements in the setting quality of all three centres, based on observations at wave 1 and wave 2 using the Preschool Program Quality Assessment (PQA) Scale. The areas of greatest improvement were in relation to the daily routine and the learning environment, but there were also changes in adult‐child interactions and curriculum. These changes, according to the evaluation, ‘are consistent with the areas of change targeted by the intervention’333. Changes were also observed using the literacy and numeracy indicator scale. These changes were more pronounced in the areas of environmental print, counting/application of counting, educator reading stories, and emergent writing/mark‐making. More changes were observed in literacy than in numeracy which, according to the evaluation, ‘is not surprising as the Programme is focused more on early literacy’334.Significantly, the evaluator adds: ‘since early numerical skills not only predict later abilities in numeracy, but also predict later abilities in literacy, equal attention should be paid to early numeracy.’335 These findings were corroborated by interviews with staff and how their setting had changed as a result of the Language Enrichment Programme: ‘Before the Hanen programme there were some elements that we were addressing such as we were labelling areas of classroom, areas of play, but… we’ve zoned in on that in more detail.’
333 French, 2014:71. 334 French, 2014:76. 335 French, 2014:78.

103
‘Pictures of various foods (dairy, meats, fruits, vegetables) in the shop area, labelled and stuck on to the shop front. So they can see the food groups separated as you would in a real shop. We are hoping to help them use the pictures in tidying up their play. We have money, coins, paper money, a cash register emphasising numeracy.’ ‘We have labelled all activities and objects within each room and all labelling is at child’s level.’ ‘Children … are encouraged to write their own names – there’s a lot more print available to the children now.’ ‘One of the biggest issues we had before the programme was the staff using a lot of templates during arts and crafts – where you’d have eight identical Santa’s on the wall. Now they use blank pages more ... children paint and talk about it afterwards and for staff to label the different parts of the picture.’ ‘Story time is a huge element of our day‐to‐day routine. Children love exploring books and even more so now that we have created our quiet cosy area … gets away from the hustle and bustle of all the free‐play. They can explore books and I’ve noticed children telling each other their own versions of stories.’ ‘She (the SLT) drew our attention to the importance of them seeing you writing – gives importance to what they are talking about ... and then to transform those scribbles on a page on to a poster on the wall. They are so proud of it and love it.’ ‘They are planning what they want to read. One of them said they wanted to write a book. They have become very interested in writing and numbers. They want to write their names so we support them.’ ‘We do a lot more writing now. We’ve created a small writing area after the last session. It is a very popular area of the room. If anyone wants to be quiet they can go in there and there are pens and paper and envelopes and post‐its... One of the children wanted to write a letter to (a colleague). I wrote Dear … he wrote his name, did a drawing and put it in an envelope and dropped it down to her.’
6.6 Factors Facilitating Programme Implementation The evaluation identified a number of factors which contributed to the successful implementation of the Language Enrichment Programme. These include the engagement of managers and the readiness of staff, the use of video feedback and the unique skills of the SLT, particularly her strengths‐based approach and ability to model the three clusters of strategies that are at the heart of effective interactions with children: child‐oriented strategies; interaction‐promoting strategies, language‐modelling strategies. The interviews with staff revealed both the challenges of being video‐recorded as well as the benefits of insightful but sensitive video‐feedback: ‘Video is a very powerful tool. It is amazing to watch yourself; a bit cringy at times.’ ‘I think the video sessions really helped me, and I still refer back to them, even though at the time I used to dread doing them, but looking back it was really where I learnt the most, how to interact with the kids.’ ‘It was practical, it’s something that you’re doing, and you’re able to see, and they stood out, those moments stood out more for me, than, obviously if you’re just rooting it out of a book. So while we probably dreaded doing them, they were how we learnt the most.’ ‘Everything’s happening at one time, when you step away and start to talk about what you can see on the video, that’s when it’s like, a magic moment, it all comes together. You see where the children are at, you see what you’re doing or what you’re not doing – you know, I could see from a video of me doing a story with the babies, well, that baby wasn’t looking where I was looking, that’s where you figured that out.’ ‘It was horrible... but it was very good, it’s good to see yourself and look back at so many things that you do that you are not even conscious and aware of that you do.’ ‘Videos are a great idea, I didn’t like doing it. But, you see what you did and what you could do differently in situations. Need to see yourself – your body language.’ ‘To be honest, I was dreading the video, but it really is helpful, when you look back at yourself.’ The evaluation also highlighted the key role of the SLT in using video‐recording and feedback to best effect: ‘The SLT was particularly skilled; she combined a strengths‐based focus with expertise to model the required strategies onsite, to suggest new approaches and encourage practice of those approaches and to pick up on the language issues of the children.’336
336 French, 2014:69.

104
6.7 Summary This chapter illustrated a way of improving staff quality in the Free Pre‐School Year. Being a case study, it is based on one NEYAI project only and was selected because a robust local evaluation showed that staff in three centres which also participated in the national evaluation received a well‐designed and executed training intervention that measurably improved their capacity to develop children’s speech, language and communication. Similar training interventions have been undertaken in other NEYAI and Síolta QAP projects but the availability of a robust local evaluation for this intervention ‐ the Language Enrichment Programme ‐ makes it a generic and ready‐made illustration of how quality can be improved within the Free Pre‐School Year, and within the early years sector generally. This is an important case study for a number of reasons: language & cognitive skills are strong predictors of later academic achievement; these skills are highlighted in Síolta and Aistear; specific training is required to develop children’s language and cognitive development, a staff capacity that is variously referred to as ‘sustained shared thinking’ and ‘extended purposive conversations’; this is an area of weaknesses in the Irish pre‐school system.
As with the national evaluation, this local evaluation is limited by the absence of a control group and longitudinal follow‐up after the intervention. Nevertheless, the local evaluation showed that the Language Enrichment Programme improved staff skills, based on direct observation of these skills before and after the training. Further analysis from the perspective of the national evaluation revealed that outcomes in this project were no different to other NEYAI and Síolta QAP projects when all factors were taken into account. The analysis also revealed that this project is virtually indistinguishable from other projects in terms of the characteristics of staff, children or parents. This suggests that no special staff attributes are required for this programme to have a similar impact in other centres. The case study therefore is an illustration of one way to improve quality, but it is not suggested that this is the only way. The Language Enrichment Programme was based on the Hanen Programme and involved three full‐days of training for staff, all on Saturdays. Following each training day, the Speech and Language Therapist (SLT) had a one‐hour session with each member of staff. During this session, the SLT video‐recorded each staff interacting with children in her own work setting; each staff was then invited to watch the video and assess her own practice; she was then offered feedback and analysis by the SLT based on the video. The average cost of the Language Enrichment Programme, taking all its strands into account including administrative overheads for the year, was approximately €10k per centre, less than the cost per centre of the Síolta QAP (€13.5k).
Results of the evaluation showed that there was a significant improvement across all three centres in staff‐child interactions, with greatest improvement in the interaction strategy called, Observe, Wait, Listen (OWL) which is the hallmark of this programme. Significant changes also occurred in story‐time including the positioning of children, creating an appropriate environment for dialogic reading (which is having a dialogue about the story) and spending more time reading a story. A further impact of the Language Enrichment Programme was that staff started to notice significant differences in the language abilities and personalities of children. Improvements were also observed in the quality of each setting notably in the daily routine and learning environment but also in adult‐child interactions and the curriculum. Similarly, changes were observed in literacy and numeracy content of the environment. The evaluation identified a number of factors which contributed to the successful implementation of the Language Enrichment Programme including the engagement of managers, the readiness of staff, the use of video feedback, and the unique skills of the SLT particularly her strengths‐based approach and ability to model the three clusters of strategies that are at the heart of effective interactions with children: child‐oriented strategies; interaction‐promoting strategies, language‐modelling strategies. The findings of this case study are consistent with ‘the best approaches’ to professional development of early years educators and teachers, as summarised by Robert Pianta at the beginning of this chapter, because they combine knowledge of effective interaction strategies with the use of video‐

105
recording for self‐analysis and expert individualised feedback on how staff interact with children. An important implication of the case study is that no special staff attributes are required for this intervention to work effectively, other than being delivered with the same concepts, techniques and skills. The fact that staff in Ballyfermot centres are no different to those in other centres shows the potential of this intervention, particularly in settings where the effects of social class and NESB (Non‐English Speaking Background) have a pronounced and adverse effect on child outcomes, especially in language & cognitive skills. In addition, the success of this intervention at improving staff capacity may have particular relevance in centres where children have language difficulties, since the lack of specialist services for these children is recognised to be widespread.

106
7 Summary and Conclusions ‘Children are more at risk of poverty or social exclusion than the overall population in a large majority of EU countries; children growing up in poverty or social exclusion are less likely than their better‐off peers to do well in school, enjoy good health and realise their full potential later in life; … . Preventing the transmission of disadvantage across generations is a crucial investment in Europe’s future, as well as a direct contribution to the Europe 2020 Strategy for smart, sustainable and inclusive growth, with long‐term benefits for children, the economy and society as a whole; … . Tackling disadvantage in early years is an important means of stepping up efforts to address poverty and social exclusion in general. Prevention is most effectively achieved through integrated strategies that combine support to parents to access the labour market with adequate income support and access to services that are essential to children’s outcomes, such as quality (pre‐school) education, health, housing and social services, as well as opportunities to participate and use their rights, which help children live up to their full potential and contribute to their resilience … . The most successful strategies in addressing child poverty have proved to be those underpinned by policies improving the well‐being of all children, whilst giving careful consideration to children in particularly vulnerable situations.’337 European Commission on investing in children to breaking the cycle of disadvantage.
7.1 Introduction
This study is an evaluation of the National Early Years Access Initiative (NEYAI), a three‐year programme (2011‐2014) to improve quality and outcomes in the early years sector. NEYAI comprises 11 projects mainly located in disadvantaged areas of Dublin, Cork and Limerick and two rural locations in Longford/Westmeath and Donegal. It was officially launched by the Minister for Children & Youth Affairs in June 2011 who referred to NEYAI as being made up of local demonstration projects with ‘a focus on evidence‐based practice and ongoing project evaluation for the purpose of advising future policy and the mainstream provision’338. This national evaluation report, along with reports from local evaluations in each project, and a separate evaluation of the NEYAI Learning Community, constitute the body of evidence generated by NEYAI339. NEYAI projects are multi‐dimensional in their activities, implementing multiple programmes (such as staff training and mentoring, parenting courses, family support services, interagency collaborations), across multiple sites, with all age‐ranges of children from birth to six, and including their parents. This diversity of activity, much of it unique to each project, created challenges for the national evaluation because it was necessary to find a common theme across all projects which would allow a coherent and systematic approach to the evaluation. In response to these challenges, the evaluation focused on one age‐group of children, namely those attending the 2012/13 Free Pre‐School Year, and compared child outcomes in NEYAI with those in the Síolta Quality Assurance Programme (Síolta QAP). Síolta QAP is a 12‐step quality improvement process for early years centres; it is supported by mentors with progress and validation based on a portfolio to demonstrate that Síolta standards are being met in each centre. The rationale for this research design is that NEYAI and Síolta QAP both share the same broad aim of improving quality in the early years sector while Síolta QAP occurred earlier and lasted longer than NEYAI (at least longer than the intervention period of the NEYAI evaluation) thereby providing a validated standard or benchmark of quality. The fact that this study is based entirely on children who participated in the 2012/13 Free Pre‐School Year also provides an opportunity to consider some aspects of this programme even if the study is not based on a representative sample of children in the Free Pre‐School Year and was not specifically designed as an evaluation of this programme. Nevertheless the sample provides some of the first
337 European Commission, 2013a. 338 Minister for Children and Youth Affairs, 2012b. NEYAI was officially launched by the Minister for Children &
Youth Affairs in June 2011. In a speech to Seanad Éireann in that year, the Minister referred to NEYAI as being made up of ‘a select number of local demonstration projects’ with ‘a focus on evidence‐based practice and ongoing project evaluation for the purpose of advising future policy and the mainstream provision’.
339 Copies of NEYAI reports are available at: www.pobal.ie; www.kieranmckeown.ie; www.trutzhaase.eu
107
evidence available on the Free Pre‐School Year particularly on the factors which influenced child outcomes during that year. From the perspective of the wider education system, the sample provides a basis for exploring the extent to which Ireland may have a successful pre‐school system which we define as a system to improve outcomes for all pre‐school children while simultaneously narrowing the gap in outcomes between children. This definition is informed by internationally‐recognised approaches to assessing school systems generally, especially in OECD340 and by experts in early child development341, and is also the stated goal for early years education by the Department of Education and Skills (DES): ‘Provide a quality inclusive school and early years education system with improved learning outcomes’342 [emphasis added]. It is also the implicit understanding in the vision of the present Government (2011‐present) which expresses Irish society’s commitment to every child: ‘that growing up in Ireland means you have the best start in life available anywhere in the world.’343 A variety of terms are used to refer to the care and education of children under the age of six, such as ‘early years’, ‘pre‐school’ or ‘childcare’, and it may be useful to begin with a clarification. In Ireland, the sector is officially known by the term ‘early childhood care and education’ (ECCE), a term also used by UNESCO. By contrast, the preferred term in OECD and EU publications is ‘early childhood education and care’ (ECEC). There is also a preference in Ireland for the term ‘pre‐school’ rather than the OECD term ‘pre‐primary’, although ‘infant classes’ (itself a uniquely odd term) in primary school are effectively ‘pre‐primary’344 but not ‘pre‐school’. In keeping with these differences in terminology, while also contributing to its perplexity, the Free Pre‐School Year is also known by its more formal title Early Childhood Care and Education (ECCE) Programme. Whether or not these different terms denote any difference in philosophical perspective or have any policy and practice implications is a matter of speculation, but some reform and standardisation of the language might be timely. Adopting a pragmatic perspective, we use the term ‘early years’ rather than ‘childcare’ but also use the term ‘pre‐school’ depending on the context.
340 In the OECD understanding, a successful school system is efficient at improving outcomes for all students as
well as equitable in terms of ‘inclusion’ (meaning all students reach a basic minimum level of education) and ‘fairness’ (meaning that personal or socio‐economic circumstances do not hinder educational success) (OECD, 2012a:15; 2010b:27). The converse is ‘school failure’ which is increasingly used as the way to re‐frame ‘student failure’: ‘The idea that students fail because of their own personal shortcomings (academic or otherwise) is being superseded by the idea of school failure. The cause of – and responsibility for – students’ failure is now seen increasingly as a deficient or inadequate provision of education by schools, and by extension, school systems. It is the failure of schools to provide education appropriate to different needs that leads students to fail. In this way school failure is, therefore, also an issue of equity. Reorienting educational systems towards the goal of promoting equity is advanced as the necessary redress of student failure.’ (OECD, 2012a:17).
341 ‘School readiness initiatives should be judged not only on the basis of their effectiveness in improving the performance of the children they reach, but also on the extent to which they make progress in reducing significant disparities that are observed at school entry in the skills of young children with different background (Shonkoff and Phillips, 2000:6).
342 Department of Education and Skills, 2011a:6. 343 Minister for Children and Youth Affairs, 2012a:viii. 344 ‘Primary schools in Ireland are unusual in that they enrol large numbers of pupils who are younger than the
compulsory age of attendance at six years. In effect, this means that nearly half of four‐year‐olds and almost all five‐year‐olds are enrolled in the Infant classes of primary schools. There is often confusion about whether pupils in Infant classes in Ireland should be classified as pre‐primary (ISCED 0) or primary (ISCED 1)1. The Department of Education and Skills frequently uses the latter classification and most Irish people would consider pupils in Infants classes as attending primary school. However, in international contexts such as PIRLS and TIMSS, Infant classes are often classified as pre‐primary. The manual for ISCED (OECD, 1999) partly adds to the confusion, as the table for Ireland includes eight grades under primary/ISCED 1, but also notes that “Programme is divided into two ISCED levels in the UOE [UNESCO/OECD/EUROSTAT] data collection. For UOE reporting, ISCED level 0 comprises the first two years of this programme” (p. 92). The main basis for the distinction is the length of the school day, which is shorter for Infants classes.’ (Lewis and Archer, 2013:16). Note that ISCED, or the International Standard Classification of Education, is a multidimensional framework designed to facilitate international comparisons of educational statistics and to reflect educational pathways in the OECD indicators (OECD, 1999). Note also that UOE refers to the database on education statistics compiled by UNESCO, OECD and EUROSTAT on the basis of national administrative sources according to international standards, definitions and classifications.’ (Lewis and Archer, 2013:16).

108
Underpinning this perspective is a moral vision that every child, without exception, has a natural potential to do well and to flourish; by extension, children who face adversity need extra care and education to help them flourish and do as well as other children. But this perspective also has an economic rationale since investment in early years provides a good return to public funds in terms of lifetime benefits to individuals and society relative to the opportunity cost (or ‘opportunity lost’) of not making this investment345. The strength of the economic argument, as Nobel Laureate James Heckman has shown346, rests more on the benefits to disadvantaged children since that is where the biggest economic gains and cost savings arise. With this understanding, our analysis focuses on both the overall level of outcomes in the Free Pre‐School Year as well as gaps in those outcomes.
It is well‐established that pre‐school education produces beneficial and lasting effects on children, but only if it is high quality. This is accepted by all authoritative reviews of the landmark studies in this field, to cite just three recent examples347. However this evidence alone does not prove that the Free Pre‐School Year is an effective intervention. The study comes at a time when the early years sector in Ireland, defined as the care and education of children aged 0‐6, has experienced significant development in four main areas: (i) publication in 2006 of Síolta (National Framework for Early Childhood Education) and Aistear in 2009 (National Early Childhood Curriculum Framework); (ii) introduction in 2010 of the Free Pre‐School Year for every child between 3 years 2 months and 4 years 7 months; (iii) selective implementation of Síolta and Aistear as well as other initiatives to improve quality in early years through Prevention and Early Intervention Programme (PEIP) and its successor the Area‐Based Childhood (ABC) Programme, plus the National Early Years Access Initiative (NEYAI); (iv) introduction in 2014 of the National Quality Support Service (NQSS) and the National Policy Framework for Children & Young People (2014‐2020). Before summarising the results, we briefly describe the sample since this sets parameters on making wider inferences from the study (section 7.2). We then outline how we measured child outcomes and their influences (section 7.3). Against this background, we summarise the overall outcomes (section 7.4) and their influences (section 7.5). We then then explain what influenced those outcomes under the three broad headings: child characteristics (section 7.6), family and social system characteristics
345 ‘Educational equity is often discussed as a moral issue. Another way to think about equity is as a way to
promote productivity and economic efficiency. As an economist, I focus on the economic value of equalizing educational opportunities and achievement in order to identify the most effective way to increase productivity. … . The logic is quite clear from an economic standpoint. We can invest early to close disparities and prevent achievement gaps, or we can pay to remediate disparities, when they are harder and more expensive to close. Either way we are going to pay. And, we’ll have to do both for a while. But, there is an important difference between the two approaches. Investing early allows us to shape the future; investing later chains us to fixing the missed opportunities of the past.’ (Heckman, 2011).
346 ‘Investment in early education for disadvantaged children from birth to age 5 helps reduce the achievement gap, reduce the need for special education, increase the likelihood of healthier lifestyles, lower the crime rate, and reduce overall social costs. In fact, every dollar invested in high‐quality early childhood education produces a 7 to 10 per cent per annum return on investment. Policies that provide early childhood educational resources to the most disadvantaged children produce greater social and economic equity.’ (Heckman, 2011).
347 In 2009, a review by Robert Pianta concluded that: ‘Compelling evidence from well‐controlled research shows that preschool programs have lasting positive effects on young children’s cognitive and social development. … . However, there is no evidence whatsoever that the average preschool program produces benefits in line with what the best programs produce.’ (Pianta, 2009:49‐50). In 2011, a special section in the Science journal on early years education observed: ‘long‐term studies on the effects of early childhood interventions, which indicate that an appropriate schooling of children as young as 3 years old produces remarkably large benefits for society, even in cases where the children do not perform significantly better academically. … why has so little of what we have learned from research about schooling been incorporated into the way that most school systems function?’ (Alberts, 2011:919). In 2013, a team led by James Heckman noted: ‘A growing literature establishes that high quality early childhood interventions targeted toward disadvantaged children have substantial impacts on later life outcomes. Little is known about the mechanisms producing these impacts. … . Experimentally induced changes in personality traits explain a sizable portion of adult treatment effects.’ (Heckman, Pinto and Savelyev, 2013:1).

109
(section 7.7); pre‐school system characteristics (section 7.8). In the final section we draw conclusions about the implications arising from the study (section 7.9).
7.2 Sample
In Ireland, there are approximately 4,300 early years centres. This study covers nearly 2% of these: 70 in total, 49 in NEYAI and 21 in Síolta QAP. Similarly, the estimated number of staff employed in the early years sector in Ireland is 21,000. This study covers nearly 4% of these staff (759) with about three quarters in the NEYAI sample (553) and one quarter in the Síolta QAP sample (206). The number of children in the Free Pre‐School Year in Ireland in 2012 was around 66,000. This study covers less than 1% of these (448), just over half in NEYAI (258) and just under half in Síolta QAP (190). The sample design was built upon an initial decision to focus on one age‐range of children, namely those qualifying for the Free Pre‐School Year (3 years 2 months to 4 years 7 months), since this was judged to be the most appropriate way of evaluating a multi‐faceted programme like NEYAI. Centres in NEYAI and Síolta QAP were then selected to participate in the study. The sample of children was randomly selected from a list of all children in each centre in the Free Pre‐School Year. Reflecting the focus of NEYAI, centres in the study are mainly located in more disadvantaged areas compared to early years centres in Ireland; hhowever not all centres in the sample are situated in highly deprived areas. The sample includes a range of children from different social backgrounds but, on average, they are more disadvantaged by comparison with the national population of children. The majority of NEYAI (75%) and Síolta QAP (87%) centres are community‐based providers, unlike the generality of early years centres in Ireland which are private and only a quarter (26%) are community‐based. The sample of staff was based on all early years staff in the selected centres and a high proportion of these (76%) completed the questionnaires. The results show that staff in NEYAI and Síolta QAP have somewhat higher levels of education (at Levels 6 and 7)348 compared to the early years sector. Employment patterns indicate that less than half (48%) are employed full‐time, similar to the early years sector (46%) but radically different from the rest of the Irish economy where more than three quarter of all workers are employed full‐time (77%). In terms of their experience of work and the workplace, staff in NEYAI and Síolta QAP have consistently more positive attitudes compared to Irish workers generally. Specifically, they are more satisfied with their job, except for their earnings. They have greater commitment to their organisation although they also report more job pressure and less autonomy compared to the average Irish worker. Workplace consultation is higher in this sample compared to workplaces in Ireland and staff‐management relations are better; staff in the sample also have positive perceptions of their manager and feel valued and supported. NEYAI and Síolta QAP staff have a high level of commitment to work, finding it energising, absorbing and are dedicated to it; this is a higher level of work commitment compared to other occupations in 10 different countries. These aspects of the sample are important because they indicate that NEYAI and Síolta QAP centres are good places for staff to work and the data also provides an opportunity to analyse if the characteristics of staff and their workplace have any impact on child outcomes. In light of this sample design, which was determined largely by the design of NEYAI, it is important to note that this is not a representative sample of centres, staff or children in NEYAI, Síolta QAP or the Free Pre‐School Year. This means that the results cannot be extended directly to the wider population of children participating in these programmes. Other limitations with the research design should also be noted. First, the effective sample of 448 children, with matched data on parents and staff, is relatively small when considering the range of influences on which data was collected, thus limiting the power to identify statistically significant relationships. Second, there is no ‘control group’ of children, staff or centres to evaluate the impact of NEYAI, Síolta QAP or the Free Pre‐School Year by
348 In the National Framework of Qualifications, Level 4&5 is equivalent to a Leaving Certificate; Level 6 is a
third‐level non‐degree qualification; Level 7&8 is a third‐level degree qualification; Level 9&10 is a third‐level post‐degree qualification. See www.qqi.ie.

110
comparison with ‘doing nothing’. The reason for this is simple: in order to establish a ‘control group’ a process of random allocation is necessary and this was precluded by the way these programmes were set up. Third, most of the data used in the evaluation are based on self‐report by parents and staff as well as staff assessments of children. This is an appropriate and tried‐and‐tested method of measurement, particularly where it involves instruments whose validity and reliability has been well‐established, as in this study. Nevertheless, these instruments cannot provide the type of insight and independent perspective that comes from direct observation of quality in an early years setting, such as observing the interactions between staff and children within each setting, but this would have required a much larger research budget. Finally, data on parents was collected from mothers only and was based on the consideration that, since only one parent could be interviewed, for consistency this should be the mother, particularly since one‐parent households were more likely to be headed by a mother. This is a well‐established convention but the consequence of excluding fathers is recognised in terms of giving visibility to their role in lives of children and families bearing in mind that a growing body of research shows that fathers and mothers ‘influence their children in similar rather than dissimilar ways’349.
7.3 Measuring Outcomes
The measurement of child outcomes in this context involved assessing how well a child performs selected tasks in each domain of the Early Development Instrument (EDI), an instrument that is now used in many countries, notably Canada and Australia, to assess the development of children around the ages of 4‐5. The EDI comprises over 100 tasks in the areas of physical health and well‐being; social competence; emotional maturity; language and cognitive development; communication skills and general knowledge (see Table 3.1 above for illustrations of these tasks). The child’s performance on each EDI task is assessed by staff members who work directly with the child and is essentially a measure of the skill required to perform ordinary tasks of living and learning which are appropriate to a child of this age‐group. Skills in this sense are capacities to function, enabling a child to live life fully and achieve his/her potential350. These skills are increasingly referred to as character skills and
349 A review of studies on the influence of fathers on children concluded: ‘First, fathers and mothers seem to
influence their children in similar rather than dissimilar ways. … . Stated differently, students of socialization have consistently found that parental warmth, nurturance, and closeness are associated with positive child outcomes regardless of whether the parent involved is a mother or a father. The important dimensions of parental influence are those that have to do with parental characteristics rather than gender‐related characteristics. Second, as research has unfolded, psychologists have been forced to conclude that the characteristics of individual fathers – such as their masculinity, intellect, and even their warmth – are much less important, formatively speaking, than are the characteristics of the relationships that they have established with their children. Children who have secure, supportive, reciprocal, and sensitive relationships with their parents are much more likely to be well adjusted psychologically than are individuals whose relationships with their parents (mothers or fathers) are less satisfying. Likewise, the amount of time that fathers and children spend together is probably much less important than what they do with that time and how fathers, mothers, children, and other important people in their lives perceive and evaluate the father‐child relationship. Third, we have come to see that the family context is often at least as important as the individual relationships within the family. Fathers must thus be viewed in the broader familial context; positive paternal influences are more likely to occur not only when there are supportive father‐child relationships but when the fathers’ relationships with their partners, ex‐partners, and presumably other children establish a positive familial context. Marital harmony is a consistent correlate of child adjustment, whereas marital conflict is a consistent and reliable correlate of child maladjustment. Fourth, these factors all underscore the fact that fathers play multiple roles in the family and that their success in these diverse roles influences the ways in which they affect their children’s development and adjustment. Fathers have beneficial effects on their children when they have supportive and nurturant relationships with them as well as their siblings, when they are competent and feel fulfilled as bread‐winners, when they are successful and supportive partners, and so on. Fifth, the nature of paternal influences may vary substantially depending on individual and cultural values. … . A successful father, as defined in terms of his children’s development, is one whose role performance matches the demands and prescriptions of his sociocultural and familial context. This means that high parental involvement may have positive effects in some circumstances and negative effects in others. The same is true of low paternal involvement.’ (Lamb and Tamis‐Lemonda, 2004:10‐11). See also McKeown, 2001a; 2001b; McKeown, Ferguson, and Rooney, 1998.
350 ‘Skills enable people. They are capacities to function. Greater levels of skill foster social inclusion and promote economic and social mobility. They generate economic productivity and create social well‐being.

111
cognitive skills and a re‐analysis of the long‐term outcomes of pre‐school and similar programmes has concluded that character skills predict later‐life outcomes with ‘the same, or greater, strength’ as cognitive skills351. From a developmental perspective, the skills acquired at each stage of a person’s life, at whatever age, are building blocks for skills acquired at a next stage – since ‘skill begets skill’ – and is the reason why early acquisition of skills is foundational for later skills. Results are reported in terms of the five EDI domains and in more summary form in terms of two broad categories which we refer to as ‘social & emotional skills’ (which includes physical health & well‐being as part of this label) and ‘language & cognitive skills’. The study is based on a before‐and‐after assessment of a sample of 448 children who participated in NEYAI and Síolta QAP; assessments were carried out by staff towards the beginning of the Free Pre‐School Year (wave 1) and again, after an interval of about 7 months (wave 2). It is acknowledged that, in the absence of a control group, we cannot be certain if the changes observed in this sample of children would have happened anyway. It is also acknowledged that this is not a representative sample of children in either NEYAI or Síolta QAP or in the Free Pre‐School Year. Nor is it a representative sample of centres or staff in the early years sector. Nevertheless, the study offers important insights into the factors that influence the development of these children by focusing on ‘naturally occurring variation’. Our overall approach to the study is informed by the bioecological model of human development which emphasises the immediate and wider societal influences on the child as well as the child’s own contribution to its development352. In other words, in order to understand what happens to a child during the Free Pre‐School Year – or indeed during any period – it is necessary to assess how child outcomes are affected by three sets of influences: (i) child characteristics (ii) family and social system characteristics (iii) pre‐school system characteristics. We use this three‐fold classification of influences in presenting the results because it makes sense from a theoretical perspective, since it includes all dimensions of the child’s life, but is also intended to be useful from the perspective of helping to design responses, both in policy as well as in practice, which enhance child outcomes. In other words, understanding how children may be affected by the Free Pre‐School Year, or how to improve its outcomes, involves a wider focus than the pre‐school system alone.
7.4 Changes in Outcomes
The children in our samples improved in all domains of the EDI; the improvement was greater in the area of language & cognitive skills but this seems to be due to the greater sensitivity of the EDI to measuring change in this area. These improvements combine two processes of child development which cannot be separated without a control group: (i) natural growth and (ii) impact of pre‐school. Since the study does not have a control group of children who stayed at home, we do not know how much of this development is attributable to the Free Pre‐School Year.
Skills give agency to people to shape their lives in the present and to create future skills. … . Many policymakers share a common desire to develop human potential. However, current policy discussions focus on promoting skills by improving schools. In this very narrow view, the success of schools is measured by scores on exams used to monitor performance … . This focus is a consequence of a very limited conceptualization of human capabilities that assumes that achievement tests capture the important life skills. This emphasis misses important dimensions of human flourishing. It does not recognize that skills are multiple in nature. Nor does it recognize the importance of families and communities in creating skills. While schools are important, they are not the sole producers of the skills that matter. Both cognitive and character skills are crucial to success in economic and social life. Character skills include perseverance (“grit"), self‐control, trust, attentiveness, self‐esteem and self‐efficacy, resilience to adversity, openness to experience, empathy, humility, tolerance of diverse opinions, and the ability to engage productively in society. … . A strong base of cognitive and character skills is universally valued across different cultures, religions, and societies. There are reliable ways to measure them, and there are proven ways to enhance them and to evaluate efforts to foster them.’ (Heckman and Kautz, 2013:5‐6).
351 Heckman and Kautz, 2013:88. 352 Bronfrenbrenner and Morris, 2006.

112
7.5 Overview of Influences on Outcomes The study is based on the premise that children’s development is influenced by the three sets of determinants: child characteristics; family and social system characteristics; pre‐school system characteristics. Our analysis of these influences, graphically summarised in Figure 7.1, is the centre‐piece of the study and the foundation of the main findings, conclusions and implications. Leaving details aside, there are three core findings of the study.
Figure 7.1 Summary of Influences on Child Outcomes During Free Pre‐School Year
First, the analysis shows that the distribution of skills within the sample of children is stable over time. This is particularly the case with regard to ‘social & emotional skills’, but slightly less so with regard to ‘language & cognitive skills’. In other words, children with more or better skills at the beginning of the study period tended to have more or better skills at the end of this period, whilst those with weaker skills at the beginning tended to remain in a weaker position at the end of the study. This indicates that the broad parameters on a child’s progress during the Free Pre‐School Year have already been set by the child’s development during the previous 3‐4 years. Similar to other studies in this field, our analysis explained about a quarter of the variation between children at the start of the Free Pre‐School Year which implies, which implies that most of what shapes a child’s development up to that time depends on individual factors (e.g. genetic factors) and other unmeasured characteristics of the child and his or her environment. Acknowledging the uniqueness of each child – because there are more things that make children different than similar ‐ is an inescapable fact of the research and foundational to understanding and supporting child development. Second, and again consistent with other studies, we found that child characteristics as well as family and social system characteristics were the largest measurable influences on development. The pre‐school system also influenced child outcomes, but to a considerably lesser extent. On reflection, this finding is not surprising since child and family characteristics are present from the child’s birth whereas the Free Pre‐School Year, as we have measured it, represents about 3% of the child’s entire waking life up to that point. This does not imply that early years services are not important, particularly since they have added importance for children whose development may be vulnerable

113
precisely because of family and social circumstances. However it does imply that in order to understand what happens during the Free Pre‐School Year, and how it might be improved, requires one to look at all significant influences on child outcomes and not just those in the pre‐school system. Third, the study found significant gaps between the skills of children at the outset, in both social & emotional skills and language & cognitive skills. For the most part, these gaps remained unchanged or widened during the following seven months. Given that a successful pre‐school system is one which improves outcomes for all pre‐school children, while simultaneously narrowing the gap in outcomes between children, this is an important issue. The economic rationale for investment in the early years rests on improving overall child outcomes, especially for disadvantaged children, but the additional benefits of ‘closing the gap’ between outcomes can also be substantial. This does not imply that the Free Pre‐School Year is not a good investment, or that it does not have a positive impact on disadvantaged children, but it suggests that, as currently organised, the Free Pre‐School Year does not contribute strongly to a reduction in the skills gap that separates different groups of children. The implications of these and related findings are discussed later. We now present more detail on what influenced these outcomes.
7.6 Influence of Child Characteristics
The child’s gender, age and Non‐English‐Speaking Background (NESB) have a significant influence on skills, affecting both the starting point for children (wave 1) and their progress (wave 2) during the Free Pre‐School Year. In this study, a child is defined as NESB where the mother’s first language is not English (excluding mothers whose first language is Irish).
7.6.1 Gender There is a significant time‐lag in the development of boys compared to girls in both social & emotional skills and language & cognitive skills. This is not unexpected as it is in line with international evidence. The results indicate that, when other factors are taken into account, gender‐related gaps remain unchanged (in the case of social & emotional skills) or widen (in the case of language & cognitive skills). The international literature suggests that gender differences tend to converge by the age of 9‐11 years.
7.6.2 Age
Age is a significant influence on language & cognitive skills (but not on social & emotional skills) at the first wave of data collection and continues to influence progress during the following year. Older children generally begin the Free Pre‐School Year with an advantage in terms of language & cognitive skills and this advantage continues to grow.
7.6.3 NESB: Non‐English Speaking Background
NESB children have weaker social & emotional skills and weaker language & cognitive skills, a difference which was also found in the GUI profile of 3‐year old children. However, the gap in social & emotional skills between these and other children narrowed over time, pointing to an integrative effect of the pre‐school experience, although the gap in language & cognitive skills remained unchanged.
Given that age and gender differences in child development are normal among 3‐4 year olds, except where children are diagnosed as having ‘special needs’, the positive impact of the Free Pre‐School Year on the social & emotional skills of NESB children is a noteworthy finding. NESB children, as we shall see, are similar to other children in terms of socio‐economic status but somewhat different in terms of family characteristics.

114
7.7 Influence of Family and Social System
The ‘family and social system’, as we use it in this study, refers to influences on the child which originate within the family but are linked to the family’s resources in society. This system is specified by way of three latent concepts: social class, mother’s well‐being and parent‐child relationship. The concept of social class denotes the family’s resources (material, social and cultural) and comprises mother’s education, occupation, and financial problems but also includes two other resources which are relevant to child development, notably the home learning environment and child’s diet. Mother’s well‐being is based on four observed aspects of the person: optimism, life satisfaction, positive affect and self‐esteem. Parent‐child relationship is based on how a parent relates to a child along three dimensions: conflict, dependency and stress. All concepts are measured with recognised scales, many of them also used in the GUI.
7.7.1 Social Class
Within the family and social system, social class is the main determinant of children’s social & emotional skills and language & cognitive skills. It is one of the biggest sources of differentiation between children in our sample. In the case of language & cognitive skills, social class creates the largest gap between children. The size of this gap can be expressed in standard deviations by stating that a one unit change in a child’s social class is associated with a half unit change in a child’s language & cognitive skills. This gap remained unchanged during the Free Pre‐School Year. In the case of social & emotional skills, social class is also associated with a gap between children. The size of this gap can be expressed by stating that a one standard deviation unit change in a child’s social class is associated with a quarter unit change in a child’s social & emotional skills. Once again, this gap between children remained unchanged during the year. The finding that children’s skills at the first wave of data collection are differentiated by social class is not new or unexpected, particularly as far as language & cognitive skills are concerned; this has been replicated in numerous international353 and Irish studies354. Similarly, the finding that the gap in children’s language & cognitive skills continued unchanged during the Free Pre‐School Year is also consistent with other studies355. This study, despite the relatively short period of seven months between wave 1 and wave 2, is testimony to just how strong this influence is when compared to other influences and, as discussed below, the scale of the challenge required to reduce preventable class‐related gaps between children.
7.7.2 Parent‐Child Relationships
Parent‐child relationships are a significant influence on children’s social & emotional skills and language & cognitive skills. The study found that a mother’s well‐being is the main influence on the parent‐child relationship which, in turn, is influenced by her social class, support networks and NESB. From the perspective of a child, this suggests that a child’s experience of the world is mediated through the parent‐child relationship and the mother’s experience of the world as reflected in the mirror of her personal well‐being and the resources (material, social and cultural) available to her. The study also found evidence to suggest that different parenting styles have different impacts on children’s skills. Specifically, parents who have a more ‘relaxed parent‐child relationship’ (mainly associated with less conflict and stress) tend to facilitate children’s social & emotional skills while parents with a more ‘demanding parent‐child relationship’ (mainly associated with more conflict and
353 Hart and Risley, 1995; Melhuish, Sylva, Sammons, Siraj‐Blatchford and Taggart, 2001:25; Fernald, Marchman
and Weisleder, 2013 Melhuish, Sylva, Sammons, Siraj‐Blatchford and Taggart, 2001:25. 354 Williams, Murray, McCrory and McNally, 2013:64. Curtin, Madden, Staines and Perry, 2013:6. 355 Taylor, Christensen, Lawrence, Mitrou, Zubrick, 2013:18; Becker, 2011:83.

115
stress) tend to facilitate children’s language & cognitive skills. This implies that parent‐child relationships involve a balance between relaxed and demanding styles of parenting since children’s skills are affected differently by each style.
These findings on the family and social system underline how social class and parent‐child relationships constitute an interdependent set of active ingredients which influence the child’s progress during the Free Pre‐School Year, simultaneously weaving their influence in both the family and social system and the pre‐school system. This perspective underlines why development of children’s skills cannot be dissociated from the wider family and social system and, as discussed below, this wider set of cascading influences needs to be taken into account when considering how to improve child outcomes generally and not just during the Free Pre‐School Year.
7.8 Influence Pre‐School System
Within the pre‐school system, we found that the amount of time a child spent in an early years centre prior to the Free Pre‐School Year – which in this sample averaged 15 months (compared to 7 months spent in the Free Pre‐School Year) – had a positive influence on the child’s progress during that year. This is an interesting result which is consistent with numerous landmark evaluations of early childhood programmes356, including more recent evaluations357, which have found a positive relationship between programme duration and child outcomes but only for children who are aged two years and older358. The finding clearly suggests that early years care and education has a positive influence on child outcomes. The analysis also found that duration in an early years centre prior to the Free Pre‐School Year was positively correlated with social class which suggests that children from more advantaged social class backgrounds have stronger skills, at least in part, because they start attending an early years centre at an earlier age. Conversely, it suggests that more disadvantaged children may face the ‘double disadvantage’ associated with lack of resources combined with less as well as later access to early years services. An important determinant of child outcomes during the Free Pre‐School Year may therefore be earlier entry and longer duration in an early years centre, at least for children aged two and older. This finding has wider significance since it is consistent with other studies ‐ based on much larger samples of Irish children, both the 3‐year old cohort of the GUI359 and the 15‐year old cohort who participated in Ireland’s PISA 2012 assessments360 ‐ which also show that usage of early years services has a social gradient.
356 Examples include studies of the Abecedarian Project (Campbell and Ramey, 1995), the Chicago Child‐Parent
Centers (Reynolds, 1994; Reynolds and Temple, 1998), and the Infant Health and Development Program (Ramey, et al., 1992).
357 Examples include the EPPE study in the UK (Sammons, 2010b) and the Chicago Longitudinal Study in the US (Arteaga, Humpage, Reynolds and Temple, 2013).
358 Studies have consistently shown that the effects of duration depend upon the age of the child. EPPE for example has found negative effects of long hours in early years services for some children before the age of 2 and especially before the age of 1. The EPPE reports are careful to specify that the benefits of longer durations are from the age of 2 upwards (with every additional month from the age of 2 up leading to larger benefits). It is also worth noting that longer durations do not mean longer hours. Both EPPE and NICHD found some negative effects of long hours, and EPPE found that the benefits of part‐time provision are as great as the benefits of full‐time provision.
359 ‘The use of non‐parental childcare was strongly related to the socio‐demographic characteristics of the household. Those from more educated backgrounds were significantly more likely to avail of non‐parental childcare … . Research from elsewhere has shown that children of parents from more affluent and more highly educated backgrounds are significantly more likely to be in centre‐based care and less likely to be in relative care, while the reverse is true for those from less advantaged and less highly educated backgrounds’ (Williams, Murray, McCrory, McNally, 2013:95).
360 ‘Students in Ireland who never attended preschool perform significantly less well than students who had attended for a year or less and those who attended for more than a year, on all domains, with the exception of computer‐based mathematics. The difference between those who have never attended and those who attended for a year or less was almost 15 points for print mathematics. However, this relationship appears to be related to ESCS as students from higher ESCS families are more likely to have had at least one year of pre‐school education.’ (Perkins, Shiel, Merriman, Cosgrove and Moran, 2013:xvi. See also OECD, 2013a; 2013b; 2010a:98).

116
The analysis also indicates that whether the child attended a centre in NEYAI or Síolta QAP made no difference to outcomes, which implies that neither quality improvement programme had a marked advantage over the other. The analysis also revealed that none of the self‐reported attributes of staff or their workplace – which included personal characteristics, professional qualifications, work experience, work commitment, quality of workplace, interactions with children and parents – had any statistically significant effect on these children’s progress during the Free Pre‐School Year. These findings may, once again, be related to the relatively small sample size used in this study and the short duration of the intervention; but they may also be due to our reliance on staff self‐report measures of quality rather than direct observation of early years settings. However, it also needs to be seen in the wider context of educational research which shows that pre‐school systems, like school systems generally as measured through international studies such as PIRLS & TIMMS361 and PISA362, tend to have less influence on child outcomes compared to child and family characteristics. It follows logically that if the pre‐school system has a relatively small effect on outcomes then individual aspects of the pre‐school system will have correspondingly smaller effects which are more difficult to detect in small samples, as this study confirms. The possibility that this finding may therefore be a ‘false negative’363 cannot be discounted, but a much larger sample combined with observational measures of quality would be needed to prove that.
7.9 Implications of Study
This final section draws some broad conclusions from the main findings of the study. The implications of the study extend well beyond the confines of the pre‐school system to include all influences on child outcomes. Our conclusions stop short of making recommendations, since this requires a wider consultative process, particularly involving those with responsibility for formulating and implementing recommendations364. For that reason, we will simply draw out the implications of the study as clearly as possible, summarising the report’s evidence and insights. We identify six implications which seem to invite action: considering a second Free Pre‐School Year; improving quality and outcomes in the pre‐school system; measuring quality and outcomes in the pre‐school system; addressing the pervasive influence of social class; supporting parents; integrating new communities.
7.9.1 Considering a Second Free Pre‐School Year
The introduction of a universal Free Pre‐School Year in 2010 is widely regarded as a success since the vast majority of parents (around 95%) have been enrolling their eligible children. One of the consequences of that decision is that it is no longer possible to assess the impact of the Free Pre‐
361 Multilevel modelling of Irish results from 2011 PIRLS (Progress in International Reading Literacy Study) and
TIMSS (Trends in International Maths and Science Study) found that: ‘the only variable at the school level that was consistently related to achievement was pupil average age.’ (Cosgrove, and Creaven, 2013:217).
362 ‘Across the OECD, 11% of all variation in student reading performance can be attributed to differences across countries, while 34% arises from differences among schools and the remaining 55% can be attributed to differences among individual students.’ (OECD, 2010a:27).
363 In research, it is conventional to refer to risks which can arise when making inferences about the impact of a variable. One risk is a ‘false negative’ which can arise from claiming that a variable has no impact when it has. Another risk is a ‘false positive’ which can arise from claiming a variable has an impact when it has not.
364 This study provides evidence to support recommendations but this is necessarily only part of a wider process leading to decision and action. It is increasingly recognised, particularly in light of failures to implement recommendations, that making recommendations requires a consultative approach. This was highlighted in a recent report into whether recommendations from five different child abuse inquiries were implemented. The report recommended a more consultative approach since ‘a consultative approach would provide clarity, prevent misinterpretation and promote ownership. It should also ensure that the recommendations are informed by all relevant sources of information, knowledge and expertise, and it should ultimately render them more feasible and cost‐effective. It is further suggested that recommendations should be framed in a way that illustrates the rationale for change, promotes learning, cites evidence, identifies the organisation or sector responsible for their implementation, and outlines them in such a way that progress in their application will be easy to evaluate’ (Buckley and O’Nolan, 2013:106). Based on this perspective, the authors recommend the acronym CLEAR as a template for making recommendations: Case for change; Learning‐oriented; Evidence‐based; Assign responsibility; Review (Buckley and 2013:104).
117
School Year by comparison with doing nothing or doing something different, since it would be extremely difficult to draw a matched sample of children who do not attend the Free Pre‐School Year. The present study therefore cannot directly contribute to such assessment. It is true that the decision to introduce a Free Pre‐School Year is well‐supported by evidence, much of it cited in this report, which shows that pre‐school education produces beneficial and lasting effects on children, but only if it is high quality, multi‐year and preferably accompanied by additional support services for vulnerable families. This evidence alone, however, is not sufficient to prove that the existing Free Pre‐School Year is effective, bearing in mind that it is not a multi‐year programme, it does not meet the same standards of quality found in landmark studies of effective pre‐school programmes such as Perry365 and Abecedarian366, and additional support services for vulnerable families are not a routine part of the programme. Consideration of a second Free Pre‐School Year is prompted by the fact that this is a ‘commitment’ in the National Policy Framework for Children & Young People (2014‐2020)367. Given that the Free Pre‐School Year is an ‘early’ intervention – at least early in the life of a child if not necessarily early in the development of a child ‐ the question of a second such year might usefully be framed in terms of whether it is ‘early enough’. Some findings in this study are relevant to a wider discussion of this issue because they identify sources of ‘naturally occurring variation’368 in the skills of children, including socially‐generated gaps between children which seem difficult to change. It may be useful, therefore, to assemble and assess the evidence which could inform a decision about a second Free Pre‐School Year, acknowledging that other factors which are not considered here, such as resources, will also inform this decision. The study shows that children in NEYAI and Síolta QAP improved in all domains of the EDI during the Free Pre‐School Year but the absence of a control group of children means that we do not know whether this would have happened anyway even if the children stayed at home. Nevertheless, it is consistent with a wider body of international evidence on pre‐school programmes and suggests that it is at least likely that the overall objective of the Free Pre‐School Year ‐ ‘to benefit children in the key developmental period … before they start primary school’369 – is being achieved to some degree.
365 The Perry Pre‐School Project was first introduced in 1960 into Perry Elementary School in the city of Ypsilanti,
Michigan. Children attended 2.5 hours of centre‐based pre‐school five days a week for two years, based on High Scope principles and delivered by trained teachers. In addition, home visits promoted parent‐child relationships. Perry has tracked participants till age 27 – is based on a combined sample of 123 (58 in the treatment group and 65 in the control group). A recent summary of effects based on follow‐up to age 37 reads: ‘Perry treatment effects arise primarily from lasting changes in character skills, not from changes in IQ. … . The treatment group of both genders improved their teacher‐reported externalizing behaviour, a skill related to Agreeableness and Conscientiousness. For girls, the programme also improved Openness to Experience (proxied by academic motivation). … . The programme improved scores on the California Achievement Test (CAT), even though it did not have a lasting effect on IQ. This evidence is consistent with the evidence … that achievement test scores depend strongly on character skills … . Achievement tests measure general knowledge. The acquisition of general knowledge (crystallized intelligence) depends on persistence, curiosity, and focus.’ (Heckman and Kautz, 2013:44‐45; see also Heckman, Pinto and Savelyev, 2013).
366 The Abecedarian Early Intervention Project in Carolina involved an intervention with infants born between 1972 and 1977 of which 57 were in the treatment group and 54 in the control group. The intervention lasted from the child was six weeks old until pre‐school entry. It was full‐day childcare five days a week, 50 weeks a year. It had a medical and nutritional component, with weekly home visits to parents. An overwhelming majority (98 percent) of the were African‐American. A recent summary of effects based on follow‐up to age 30 reads: ‘In contrast to Perry, ABC [Abecedarian] led to lasting improvements in IQ. For girls, the program improved IQ through age 21. The effect for boys was positive but was less precisely estimated. Girls and boys also scored better on achievement tests. ABC likely improved IQ because it started at an earlier age than Perry. Very early childhood appears to be a critical period for shaping IQ. As with Perry, the benefits of the ABC program differ across genders. For girls, the program improved educational attainment, reduced participation in criminal activity, decreased substance abuse, and improved internalizing and externalizing behavior. Like the Perry program, ABC improved employment and health for males and produced substantial improvements in character skills.’ (Heckman and Kautz, 2013:47).
367 Department of Children and Youth Affairs, 2014:30 and 71. 368 Sammons, 2010a:25. 369 Website of Department of Children and Youth Affairs: www.dcya.ie.

118
A robust finding of the study is that disparities between children observed at the beginning of the year tend to be maintained over the course of that year. In fact, what happens before the Free Pre‐School Year has a much greater influence on the distribution of skills at the end of the year than what happens during that year. This has radical implications. First, the Free Pre‐School Year begins after substantial development has already taken place in the child’s life. These developments are measurable in terms of the child’s social & emotional skills and language & cognitive skills, which already display substantial gaps between children and which, because they are socially‐generated, may also be partially preventable.. In that sense, the Free Pre‐School Year may be ‘early’ in the life of a child but is not ‘early’ from the perspective of child development. Second, the pre‐school system is intimately connected to the child’s family and social system to the extent that a child’s experiences at home are more significant drivers of outcomes than what happens during pre‐school370. This draws attention to the importance of even earlier intervention but also highlights that interventions need to take place in the family and social system and not just in the pre‐school system. By implication, it also highlights the need, as recommended by the Expert Advisory Group on the Early Years Strategy, for ‘strong coordination mechanisms across Government departments’ as well as bringing together ‘in a single Government department all policy responsibility for early care and education services, including their funding, quality assurance, curriculum development, training and workforce development.’371. The case for earlier intervention – whether through the pre‐school system, the family system, or both – rests not just on the general principle that earlier is better and more effective than later but also on the evidence of this study that class‐related disparities in the skills of children are already well‐established before the Free Pre‐School Year and remain comparatively stable throughout this period. International research cited in this report shows that socially‐related developmental gaps between children in vocabulary and language processing skills are measurable at 18 months372 (and detectable even earlier373). It is clear from this study that the Free Pre‐School Year, in its current form, does not have the capacity to significantly reduce or close these developmental gaps and that considerable staff skills will be required to do so, as well as additional complementary initiatives. This is because child development is incremental, which implies that early advantages (and disadvantages) will tend to be reproduced (if not reinforced) by universal interventions alone. That is why some of the most
370 This echoes the ‘primary conclusion’ of the landmark NICHD study on child care in the US: ‘parenting matters
much more than does child care’ (NICHD Study of Early Child Care and Youth Development, 2006a:113). One of the researchers on this study, Robert Pianta, explains its significance for early childhood education: ‘the kinds of experiences children get in an early childhood education program contribute to children’s readiness for school, but relative to what happens at home these programs are icing on the cake. Most of the hard work in getting children ready and having the skills to be successful in school resides in the experiences they have at home. I think for a long time we hoped we could see programs compensating for what happens at home, but there is not a lot of evidence for that’ (Pianta, 2002:9).
371 Expert Advisory Group on the Early Years Strategy, 2013:26. Part of the grounds for these recommendations are stated as follows: ‘National governments typically separate responsibilities for different domains of life across different departments. While this separation of responsibilities makes administrative sense, it does not always ensure that the best interests of young children are maintained. For example, in Ireland, responsibility for the funding of early care and education services (including the Free Pre‐School Year) lies with the Department of Children and Youth Affairs, while the Department of Education and Skills has policy responsibility for much of what determines the quality of those services (including the Síolta QAP quality framework, the Aistear curriculum framework and the development of the workforce), as well as the Early Start programme. Finally, responsibility for inspection of early care and education services rests with the HSE/Child and Family Agency.’ (Expert Advisory Group on the Early Years Strategy, 2013:25).
372 Fernald, Marchman and Weisleder, 2013. 373 ‘All functional capacities in the brain are dependent to some degree upon the presence of appropriately
timed, appropriately patterned signals that will specifically stimulate the neutral systems mediating that function. … . Patterned, repetitive activity changes the brain. … . A child exposed to consistent, predictable, nurturing, and enriched experiences will develop neurobiological capabilities that will increase the child’s chance for health, happiness, productivity and creativity. … . If a child is neglected – if he or she hears fewer words, has fewer relational opportunities, receives less physical comfort, and has less love – the rapidly organizing networks in the brain that mediate language, social affiliation, and attachment will not receive sufficient patterned, repetitive activation to develop normally. … . The therapeutic implications of this … cannot be overstated. Repetition, repetition, repetition: Neural systems – and children – change with repetition’ (Perry, 2006:36‐37).

119
effective early years interventions combine centre‐based programmes for children with family support services for more vulnerable parents. It is well‐known that the economic benefits of investment in the early years rests on improving overall child outcomes but additional benefits of ‘closing the gap’ between outcomes can also be substantial. The strength of the economic argument374 rests on the return on investment that comes from the large benefits accruing to disadvantaged children in terms of lifetime benefits to individuals and society; in other words, the opportunity cost (or ‘opportunity lost’) of poor outcomes is greater than the cost of reducing it375. Given that the economic evidence for pre‐school is typically built on landmark studies which show a return on investment from high‐quality multi‐year pre‐school programmes, the results of this study suggest that the Free Pre‐School Year will deliver the economic returns found elsewhere if, but only if, the investment is sufficient to produce a high‐quality, multi‐year, pre‐school programme. The study also shows that the amount of time spent by a child in an early years centre prior to the Free Pre‐School Year had a positive influence on progress during that year which, even allowing for limitations in the research design, suggests that earlier entry to and longer duration in an early years centre has a beneficial effect. This is consistent with numerous landmark evaluations which have found a positive relationship between duration of pre‐school and child outcomes, though only for children aged two years and older. In addition, the finding that the amount of time spent by a child in an early years centre is also positively correlated with social class is significant and in line with findings of much larger samples of Irish children. As already indicated, it suggests that more disadvantaged children face the ‘double disadvantage’ associated with lack of resources combined with less and later access to early years care and education. Extending pre‐school provision to earlier years would address this inequity and could be especially beneficial for children from less advantaged backgrounds, although it is impossible to provide estimates of the potential benefit on the basis of the present study. The need to improve quality in the Irish pre‐school system is well‐recognised and this study strengthens the case for doing so by highlighting, among other things, the substantial skills that are required of staff to reduce preventable class‐related gaps between children, particularly in the area of language & cognitive skills. There is also an argument in favour of improving quality in the pre‐school system as a pre‐condition to further expanding pre‐school provision. But it could also be argued that extending pre‐school provision, even if equivalent in quality to current provision, would be beneficial in overall terms, given the finding that the amount of time spent by a child in an early years centre has a beneficial effect on outcomes in the Free Pre‐School Year. This finding does not imply that quality is adequate in all early years settings – and some centres may even be sub‐standard and potentially harmful to children and need to be removed from the system – but the positive influence of earlier and longer intervention highlights that the existing pre‐school system has beneficial effects. This suggests that improving pre‐school quality and extending pre‐school provision are both beneficial options whether considered separately or together. It might therefore be useful to consider the option of a second Free Pre‐School Year and the option of improving quality in the pre‐school system as separately beneficial rather than making one option conditional on the other. Whether both
374 ‘Investment in early education for disadvantaged children from birth to age 5 helps reduce the achievement
gap, reduce the need for special education, increase the likelihood of healthier lifestyles, lower the crime rate, and reduce overall social costs. In fact, every dollar invested in high‐quality early childhood education produces a 7 to 10 per cent per annum return on investment. Policies that provide early childhood educational resources to the most disadvantaged children produce greater social and economic equity.’ (Heckman, 2011).
375 ‘Educational equity is often discussed as a moral issue. Another way to think about equity is as a way to promote productivity and economic efficiency. As an economist, I focus on the economic value of equalizing educational opportunities and achievement in order to identify the most effective way to increase productivity. … . The logic is quite clear from an economic standpoint. We can invest early to close disparities and prevent achievement gaps, or we can pay to remediate disparities, when they are harder and more expensive to close. Either way we are going to pay. And, we’ll have to do both for a while. But, there is an important difference between the two approaches. Investing early allows us to shape the future; investing later chains us to fixing the missed opportunities of the past.’ (Heckman, 2011).

120
options combined would be sufficient to reduce the aforementioned gaps, without also strengthening family supports for vulnerable parents, remains unlikely. The question of how to balance universal and targeted measures within the pre‐school system is a matter of debate. For example, a second Free Pre‐School Year could be provided universally, like the first, or targeted at more vulnerable children, or involve a combination of both universal and targeted provision with additional resources directed at the most disadvantaged children. Targeting is complementary to universal provision and an important component of the developmental welfare state, variously referred to as ‘tailored universalism’376, ‘progressive universalism’377 and ‘proportionate universalism’378. One of the strengths of the Free Pre‐School Year is universal provision and, on balance, this is worth maintaining since universal provision is known to improve uptake by more disadvantaged families379; it can also facilitate more interaction between children from different backgrounds; and there is the consideration that a substantial proportion of Irish families could not afford pre‐school unless it was free380. However, extending universal pre‐school provision without targeting additional resources at those who are more disadvantaged is unlikely to disrupt class‐related disparities between children’s skills that are documented by this study. This means that targeting additional resources will be required in some parts of the pre‐school system, either in addition to universal provision as recommended by the Expert Advisory Group on the Early Years Strategy381, or instead of it if universal provision is not affordable. This model of combining universal and targeted
376 This is the term used by the National Economic and Social Council: ‘The Council supports an approach that
can be termed ‘tailored universalism’. This means that, in so far as possible, mainstream providers embrace the challenge of adjusting their services to accommodate a more diverse public, including a public whose individual members have different requirements if they are to have an equal opportunity to benefit from the service. This route is consciously preferred to the alternative of developing wholly separate service provision for atypical groups. … . Two complementary strategies can be distinguished for strengthening inclusive service provision; the first focuses on … enhancing the responsiveness and quality associated with public service providers ; a second supports measures that give people on low incomes access to privately produced services’ (National Economic and Social Council, 2005:203).
377 This is the term used by the Expert Advisory Group on the Early Years Strategy: ‘The Expert Advisory Group advocates the approach described in The Agenda for Children’s Services (OMC, 2007) as ‘progressive universalism’ (i.e. ‘help to all and extra help to those who need it most’). There is a strong case for universal, inclusive provision of high‐quality services and supports, to ensure that all children benefit. In line with the principle of progressive universalism, some children attending or receiving universal services need additional support. This may include groups such as children living in poverty, Travellers, Roma, children with intellectual and other disabilities, and children with chronic health needs. In early childhood, universal services act in a preventative capacity, with additional targeted services acting as a form of early intervention.’ (Expert Advisory Group on the Early Years Strategy, 2013:14). The commissioning strategy of the Child and Family Agency also includes progressive universalism as a principle of commissioning in the agency: ‘There will be a focus on a progressive universalist approach to providing a continuum of seamless support to all children and families. A balanced approach will be struck between developing primary prevention and early intervention services whilst maintaining secondary and tertiary services with a re‐distribution of resources to areas of high need’ (Child and Family Agency, 2013:11)
378 This is the term used in Australia (Brinkman, et al, 2012:2). 379 In a study of early years services in England and seven other OECD countries ‐ Australia, France, Germany,
New Zealand, Netherlands, Norway, US – it was found that ‘free and universal provision is the most effective way to achieve high enrolment rates: New Zealand and France, alongside Britain, provide good examples for children aged three and up.’ (Gambaro, Stewart, and Waldfogel, 2013; 2014).
380 ‘There was a very high take‐up of the Free Preschool Year scheme (95%). Most significantly, one in four families who had availed of it said they would not have been able to provide preschool for their child had it not been for the scheme. This rose to more than one in three among more disadvantaged families.’ (Growing Up In Ireland, 2013).
381 ‘There is an overwhelming need … for additional, targeted services and supports for some children and families that can be built on a base of universal services, helping to ensure effective access routes to the targeted services. Universal services then act in a preventative capacity, with additional targeted services acting as a form of early intervention. … . The early years strategy should improve access routes to specialist support services for children, such as speech and language therapy, to ensure effective access for all children who need such services. As far as possible, additional supports should be brought into local settings that families use daily, such as early care and education services, rather than requiring young children to travel to clinical settings.’ (Expert Advisory Group on the Early Years Strategy, 2013:2 and 15).

121
provision is already well‐established in the education system through the DEIS382 programme in primary and secondary schools; and a second Free Pre‐School Year would be fit well with the wider objectives of the national literacy and numeracy strategy which recognises the foundational role of early childhood experiences for the success of this strategy383. It is also worth emphasising that implementing targeted programmes in a way that is fair requires the inclusion of all disadvantaged children and not just those living in disadvantaged areas since there is a substantial body of evidence to show that the majority of ‘poor people’ do not live in ‘poor areas’384. At the same time, given the extensive network of early years centres throughout the country, targeting disadvantaged children using small area deprivation scores could be an effective way of doing this. The newly‐formed Child and Family Agency, as its name suggests, also has an important and potentially expanded role in supporting children during the early years, especially targeting services at vulnerable families where normal healthy child development may be at risk385. The infrastructure of the pre‐school system in Ireland is built on a network of approximately 4,300 early years centres. Putting this in the wider context of education, the number of early years centres is greater than all first‐level schools (3,300) and second‐level schools (723) combined386. There is evidence of surplus physical capacity within this system at least in terms of available places387 but questions about staff capacity and overall quality remain, as already indicated.
382 DEIS (an acronym for Delivering Equality of Opportunity in Schools) was launched in May 2005 and is the
policy instrument of the Department of Education and Skills to address educational disadvantage. DEIS comprises 658 primary schools (336 urban/town schools and 322 rural primary schools) and 194 second level schools. Results of an evaluation show that improvements in reading and mathematics occurred over the DEIS programme period (2007‐2013) with greater improvements in second class than in sixth class (Weir and Denner, 2013:Table 6 and Table 12). This suggests that remediation efforts such as DEIS can reduce the impact of social class on language & cognitive skills, particularly for younger children, but earlier intervention would likely make these interventions even more effective with potentially more extensive benefits for the family as well as the child.
383 The national literacy and numeracy strategy contains a list of nearly 40 actions to improve capacity in the early years sector, in order to improve literacy and numeracy outcomes. This is based on recognition that: ‘Early childhood, the period from birth to six years of age, is a time of significant opportunity for learning. During these early years, children take their first steps along their journey of lifelong learning.’ (Department of Education and Skills, 2011b:10) But the strategy is also based on the recognition that: ‘Children from socially and economically disadvantaged backgrounds are significantly more likely to experience difficulties in literacy and numeracy achievement than other children. … . Raising the educational attainment of these lowest performing students who are most at risk of failure, is vitally important because of the enormous impact improvement can have on the life‐chances of these young people and also because it fosters greater equity in the education system and society in general.’ (Department of Education and Skills, 2011b:61‐62).
384 ‘ESRI research indicates that targeting resources on disadvantaged schools is not enough to counter educational inequality. Survey evidence indicates that, at least in the second‐level sector, over half of disadvantaged young people are attending non‐designated disadvantaged (DEIS) schools, and thus do not benefit from such targeted support.’ (Smyth and McCoy, 2009:2).
385 The Child and Family Agency was established in January 2014 for the purpose of providing a more integrated approach to all services and supports for children and families. The agency includes many services which have a role to play in supporting the healthy development of children: child welfare and protection, family support, pre‐school inspection services, educational welfare, detention schools, domestic and sexual violence. But it also excludes, at least at this stage in the agency’s life, many services which are central to supporting the healthy development of children most notably public health nursing which is the only universal service in Ireland in contact with all families around the birth of a child. Similarly the new agency does not include speech and language services although this is an area where early intervention is known to be more effective even though the average waiting time for Speech and Language Therapy for children in some early years services is 15‐18 months (Hayes, Siraj‐Blatchford, Keegan, and Goulding, 2013). All of these services were recommended for inclusion in the new agency by the Task Force on Child and Family Support Agency (2012:25).
386 Department of Education and Skills, 2012. 387 The Pobal Annual Survey of the Early Years Sector 2012, based on a survey of 4,356 early years centres and a
response rate of 72%, found that ‘fewer than one‐third (30.8%) of respondents reported their services to be full. … . Services reported a total of 23,614 vacant childcare places. … . This pattern remains relatively unchanged from 2011 and continues to present a stark picture of the ongoing (indeed perhaps intensifying) challenges facing some parts of the childcare sector as a result of the economic downturn and reduced family incomes translating into reduced demand for centre‐based childcare.’ (Pobal, 2013:11‐12).

122
7.9.2 Improving Quality and Outcomes in Early Years System
It is Government policy to ‘improve the quality of the pre‐school year’388. Consistent with this, the Minister for Children and Youth Affairs introduced the Pre‐School Quality Agenda in October 2013 comprising a new National Early Years Support Service (NEYSS, costing €2.5m in 2014), training support for staff (costing €1.5m in 2014) and improvements in the Pre‐School Inspectorate (costing €1.1m in 2014)389. It has already been acknowledged that this study is limited from the perspective of measuring quality – due to the absence of direct observation of settings and the interactions between staff and children within those settings – with the result that just two findings are relevant to improving quality in the early years system. The first finding is that there is no significant difference in outcomes between centres in NEYAI and Síolta QAP when all other sources of variation are taken into account. This is a somewhat unexpected result since Síolta QAP is a substantial and sustained intervention to improve quality in early years settings; it involved a 12‐step Quality Assurance Programme (2010‐2013) delivered by Síolta Mentors with progress and validation based on a portfolio to demonstrate that Síolta standards were being met within the centre; moreover the programme occurred earlier and lasted longer than NEYAI (at least longer than the intervention period of the NEYAI evaluation). By contrast, NEYAI is essentially a funding programme for quality improvement in 11 different ‘demonstration projects’ and the evaluation covered about a year of this quality improvement process. Moreover not all NEYAI projects focused exclusively on quality improvement or indeed on early years settings. We have already emphasised that the study’s methodological limitations invite a cautious interpretation of these findings. It is beyond the scope of this study to undertake a thorough examination of the reasons why the Síolta QAP, including its process of validation, is not associated with better child outcomes than NEYAI. We have already highlighted how the methodological limitations of the study may have influenced this result, and it is also possible that NEYAI was a particularly effective intervention, producing results which are comparable to those obtained by Síolta QAP. Keeping those limitations in mind, it is nevertheless useful to reflect on the possibility that Síolta QAP may not be having the impact on quality and outcomes that is intended and explore possible reasons for this. One possibility is that, since Síolta QAP is a mentoring programme, the focus of mentoring may not have addressed sufficiently the skills and practices of staff in their day‐to‐day interactions with children or parents, or indeed other active ingredients associated with child outcomes390. Another possible reason is that the central role of reflective practice in this model of quality improvement – which requires staff to ‘have appropriate levels of skill and knowledge to help you assess the quality of both your practice and the environment’391 – may have presumed that staff already had capacities which the programme was designed to promote392. As a recent review of quality in Irish education observed, the value of reflective practice depends on having objective data on performance as a basis for reflection393.
388 Department of Taoiseach, 2011:39. 389 Minister for Children and Youth Affairs, 2013a. 390 This possibility is suggested by the fact that the focus of mentoring within the Síolta QAP programme, as
described in the report on its initial implementation, was on providing information, advice and support to staff on how to meet Síolta QAP standards (Goodbody Economic Consultants, 2011b:35‐36).
391 Síolta QAP Manual (Department of Education and Skills, 2010a:16). 392 This possibility is also suggested in the report on the initial implementation of Síolta QAP since both staff and
the Síolta QAP Mentors identified ‘lack of reflective/articulation skills’ as an impediment to quality improvement (Goodbody Economic Consultants, 2011b:51‐52).
393 The review of the Irish school system was carried out by the National Economic and Social Council (2012) which noted that: ‘there are some critical pieces missing, of which two are especially important: (1) the general absence of a culture and discipline of reflective practice within schools based upon relatively objective evidence rather than subjective impressions and (2) the absence of a provision of a national data and standards framework which provides a secure basis for judgment about quality and improvement. The first is absolutely dependent on the second whilst the second is redundant without the first. Processes of internal review within classrooms and schools need some external standards of quality and performance as a yardstick for benchmarking. And external standards of excellence are of limited use if they are not used to impel deeper, diagnostic enquiry into why certain problems of teaching and learning are manifesting

123
Whatever the reasons, it is possible that Síolta QAP, and its validation process, may not have impacted sufficiently on the knowledge, skills and competencies of staff to make a significant difference to outcomes. This suggests that a challenge may need to be faced in terms of how best to implement Síolta, and possibly Aistear as well. The frameworks and standards embodied in Síolta and Aistear are likely to remain the bedrock of quality but the current model for implementing Síolta may need to be re‐examined since we have not been able to establish a demonstrable link between superior quality and outcomes in Síolta QAP, at least when compared with NEYAI.
The second finding that is relevant to improving quality in the early years system is based on an in‐depth case study394 which showed how a well‐designed and executed training intervention can measurably improve the capacity of staff to develop children’s speech, language and communication. This is an important case study for a number of reasons: language & cognitive skills are strong predictors of later academic achievement395; these skills are highlighted in Síolta396 and Aistear397; specific staff training is required to acquire skills – variously referred to as ‘sustained shared thinking’398 and ‘extended purposive conversations’399 – in order to facilitate children’s language and
themselves and how they might be ameliorated.’ (Jordan and O’Donnell, 2013:25). It could be argued that these critical pieces are also missing from the pre‐school and early years sector as well.
394 French, 2014. 395 This is based on meta‐analysis of six large‐scale longitudinal studies, two of which are nationally
representative samples of US children, two are drawn from multi‐site studies of US children, and one each of children from Britain and Canada. The main conclusions were: ‘Our meta‐analytic results indicate that such early math concepts as knowledge of numbers and ordinality were the most powerful predictors of later learning (the average effect size of school‐entry math skills was .34 and every bit as large as early reading skills in predicting later reading achievement). Less powerful, but also consistent, predictors across studies were early language and reading skills such as vocabulary, knowing letters, words and beginning and ending word sounds (the average effect size across our studies was .17), and attention skills (average effect size .10). The average effect sizes of externalizing and internalizing problem behaviors and social skills were close to zero.’ (Duncan, et al., 2007:1143).
396 Department of Education and Skills, 2010a. 397 National Council for Curriculum and Assessment, 2009. 398 In the UK, the Effective Pre‐School and Primary Education Project (EPPE) carried structured observational
studies of 12 of the 141 early years settings in the EPPE project. It found that: ‘The ‘excellent’ settings were thus found to encourage ‘sustained shared thinking’, a concept that came to be defined as any episode in which two or more individuals ‘worked together’ in an intellectual way to solve a problem, clarify a concept, evaluate activities, extend a narrative, etc. … . The research found that this did not happen very frequently. … Our investigations of adult‐child interaction suggest that periods of ‘sustained shared thinking’ are a necessary prerequisite for excellence in the early years practice, and it is especially powerful when it is also encouraged in the home by parents. … . The evidence also suggested that adult ‘modelling’ often combined with sustained periods of shared thinking, and open‐ended questioning, was associated with better cognitive achievement. However, open‐ended questions were found to make up only 5.1 per cent of the questioning used in the case study settings. … . Adults need, therefore, to create opportunities to extend child‐initiated play as well as teacher‐initiated group work, as both of these have been found to be important vehicles for promoting learning.’ (Siraj‐Blatchford, 2010a:157‐158). In Ireland, observational studies were carried out of three early years settings in which three staff were video‐taped during six ‘scheduled small group learning experiences’ (French, 2011). The author found that interactions between staff and children tended to lack ‘extended purposive conversations’, a synonym for ‘sustained shared thinking’. Specifically, the study found that: ‘The three educators presented as calm, sensitive and responsive to all of the children in their care. They focused on building strong, caring and reciprocal interpersonal relationships with them. Such positive relationships seemed to provide the children with a secure foundation enabling them to focus on their learning experiences without apparent anxiety or fear of reprimand. The educators demonstrated warmth, physical affection and empathy. All three affirmed and encouraged children regularly. … . Looking across the data in relation to the three educators, one common thread appeared to be little emphasis on engagement in purposive conversations designed to develop children’s thinking and language. This is evidenced by the few open‐ended questions. While acknowledging the brief time of data gathering, few of the interactions analysed were in relation to scaffolding and modelling in the SGLEs [scheduled small group learning experiences]. … . This raises serious questions about whether there is sufficient emphasis on strategies to extend conversations in educators’ initial training. EPCs [extended purposive conversations] between educators and children are critical for the development of language and thinking for all children but particularly those in the focus settings.’ (French 2011:155‐6).

124
cognitive development; this is a known area of weaknesses in the Irish pre‐school system400 and related services401. Similar training interventions have been undertaken in other NEYAI and Síolta QAP projects402 but the availability of a robust local evaluation for this intervention ‐ the Language Enrichment Programme403 ‐ makes it a ready‐made illustration of how quality can be improved within the Free Pre‐School Year, and within the early years sector generally. As with the national evaluation, this local evaluation is limited by the absence of a control group and longitudinal follow‐up after the intervention. Nevertheless, the local evaluation showed that the Language Enrichment Programme improved staff skills, based on direct observation of those skills before and after the training. However it is also worth noting that child outcomes in this project were not significantly different from those observed in other centres when all other factors were taken into account; the small sample of children in this project (20) may be one reason for this. The local evaluation found significant quality improvements in the three centres404 which participated in this training programme particularly in staff‐child interactions; the greatest improvement occurred in the interaction strategy called, ‘OWL: Observe, Wait, Listen’ which is the hallmark of this programme: observe the children, wait for the children to make the first move, listen to what the children have to say. Further analysis from the perspective of the national evaluation revealed that this project is virtually indistinguishable from other NEYAI and Síolta QAP projects in terms of the characteristics of staff, children or parents. This suggests that no special staff attributes are required for this programme to have a similar impact in other centres. The case study therefore is an illustration of one way to improve quality, although it is not suggested that this is the only way. Full details of the case study can be read in Chapter Six.
The case study is relevant to the wider issue of improving quality in early years and may offer a possible model of continuous professional development that could be used by the National Quality
399 ‘The literature suggests that interaction strategies that engage children in extended purposive conversations
are especially effective in enhancing children’s educational outcomes. These strategies involve establishing a supportive interpersonal environment, encouraging versus praising children, active listening, discussing/questioning and modelling whilst providing opportunities to enable episodes of extended purposive conversations.’ (French, 2014:7).
400 A study of 26 pre‐schools throughout Ireland in 2012 assessed the provision of literacy, maths, science, environment and diversity using the Curricular Subscales in the Early Childhood Environmental Rating Scale Extension (ECERS/E) and concluded: ‘The study reveals a minimal standard in the provision of literacy and maths. Provision in science and environment and diversity are inadequate.’ (Neylon, 2014:99). The study adds: ‘The findings have implications concerning the capacity of pre‐school services to implement quality and curriculum frameworks Síolta QAP and Aistear and question the appropriateness of the current pre‐school inspection systems in improving standards.’ (Ibid). See also French 2011.
401 For example, the average waiting time for Speech and Language Therapy for children in some early years services is 15‐18 months (Hayes, Siraj‐Blatchford, Keegan, and Goulding, 2013).
402 For example, the Language Enrichment Programme is based on the Hanen method and a number of NEYAI projects are also using this method including Happy Talk in Cork and Dublin SW Inner City Demonstration Model. Similarly, many projects used mentoring, including all of the Síolta QAP projects. A review of the precursor of Happy Talk, which was focused on pre‐primary (infant) classes in two primary schools, concluded that ‘The early indications of impact from the pilot are good: it produced clearly measurable improvements in children’s speech and language. It will take some years before the long‐term impact can be assessed, however’ (Deane, 2009:27). Local evaluations of most NEYAI projects will be finalised by mid‐2014.
403 The Language Enrichment Programme is based on the Hanen Programme and involved three full‐days of training for staff, all on Saturdays. Following each training day, the Speech & Language Therapist (SLT) had a one‐hour session with each member of staff. During this session, the SLT video‐recorded each staff interacting with children in her own work setting; each staff was then invited to watch the video and assess her own practice; she was then offered feedback and analysis by the SLT based on the video. The average cost of the Language Enrichment Programme, taking all its strands into account including administrative overheads for the year, was approximately €10k per centre, less than the cost per centre of the Síolta QAP Quality Assurance Programme (€13.5k).
404 The three centres in the evaluation were Cherry Orchard Community Childcare Service (details at www.cherryorchardcommunitychildcareservice.com), St. Vincent’s Early Childhood Development Service (Details at www.docchildandfamily.ie) and St. Ultan’s Nursery and Early Childhood Education Unit (Details at www.stultans.ie). However many more centres in Ballyfermot participated in NEYAI, including infant classes in primary schools, but not in the evaluation.

125
Support Service (NQSS)405. The methodology of the programme is consistent with ‘the best approaches’406 to professional development of early years educators and teachers because it involves combining knowledge of effective adult‐child interaction strategies and the use of video‐recording for self‐analysis and expert individualised feedback on how staff interact with children. It is also consistent with what is known about the skills required of staff to develop children’s language and communication skills: knowledge of how spoken language is developed, ability to assess linguistic abilities of children and capacity to promote spoken language as needed’407.
7.9.3 Measuring Quality and Outcomes in Early Years System
One way of verifying the quality of Ireland’s early years system is by measuring child outcomes. This is necessary in order to show the link between implementing quality frameworks and standards on the one hand and better outcomes for children on the other. Making this link, rather than assuming it408, is a significant challenge since the measurement of outcomes, even for the narrower age‐range of children in Free Pre‐School Year, is not without difficulty. This does not imply that pre‐school children should be continuously tested – a separate issue – but periodic assessment of quality and outcomes is an important aspect of checking the overall performance of the early years system. This study addressed the challenge of measuring outcomes in the Free Pre‐School Year by using the Early Development Instrument (EDI). The EDI is widely used internationally, particularly in Canada and Australia, but normally with children attending primary school – mainly 4‐5 year olds and not with children aged less than 3 years 8 months – and is normally completed by teachers rather than early years workers409. This is the first study to use EDI in a pre‐school setting where it was completed by
405 ‘The service will employ graduates in early childhood care and education who will work directly with services
to improve quality including assisting services to implement the Siolta framework and Aistear curriculum for 0 to 6 years. (cost: €2.5m in 2014)’ (Minister for Children and Youth Affairs, 2013a).
406 ‘The best approaches to professional development align (conceptually and empirically) the requisite knowledge of practices (interactions and implementation of curriculum) effective for improving child outcomes (e.g., language development or early literacy) with extensive opportunities for observation of high‐quality instructional interaction through analysis and viewing of multiple video examples; skills training in identifying appropriate (or inappropriate) responses to children’s cues and how teacher responses can contribute to students’ literacy and growth of their language skills; and repeated opportunities for individualized feedback and support for high quality and effectiveness in one’s own instruction, implementation, and interactions with children. Conceptually, effective professional development can be characterized as a system of supports to teachers or caregivers in which paths can be traced from inputs to teachers, to teacher inputs to children, to children’s skill gains.’ (Pianta, 2011:8).
407 Shiel, Cregan, McGough, and Archer, 2012:22. ‘Interactive strategies, which expand children’s oral responses through prompts, open‐ended questions, expansions and recasts have also been found to be effective. Moreover, there is evidence that gains in language ability can be achieved with relatively small shifts in the details of conversational exchange and social‐emotional engagement in pre‐school classes. Prerequisites for effective early language teaching include care‐giver/teacher knowledge of how spoken language is developed, the ability to assess the linguistic development of children, and the capacity to promote spoken language as needed. Strategies such as use of language enrichment groups, talking time, and shared reading have also been shown to be more or less effective in developing children’s language skills, with level of intensity being an important variable.’ (Ibid).
408 For example, the existence of this link seems to be assumed in the recommendation of the Expert Group on the Early Years Strategy for ‘a national plan for the phased, supported and simultaneous implementation of the Síolta QAP and Aistear frameworks, to achieve their roll‐out at all levels of the early care and education system, including in all services and at the levels of inspectors and trainers themselves. Core elements of both frameworks should be extracted and prioritised for implementation. Development of the implementation plan should include a comprehensive review of all current quality assurance tools (including both Síolta QAP and Aistear, as well as the Pre‐School Regulations and the new National Standards) to ensure that their implementation is coherent and integrated. The review should include an assessment of whether amendments are needed to any of these tools to ensure their mutual coherence and effective joint implementation.’ (Expert Group on the Early Years Strategy, 2013:19).
409 Details at the Offord Centre for Child Studies, McMaster University, Hamilton, Ontario. www.offordcentre.com

126
early years staff. The decision to use EDI, including permission to use the instrument which is protected by copyright, was made after consulting with its authors410. The results of the study show that EDI scores were internally consistent, mirroring the child’s gender and chronological development but with greater sensitivity to changes in language & cognitive skills than social & emotional skills; the scores also showed considerable stability between waves 1 and 2 and were also broadly consistent with the pattern of scores from international studies. The significance of this finding, in conjunction with robust statistical analysis, shows that the EDI provides a realistic and reliable option for assessing outcomes associated with the Free Pre‐School Year. The EDI Handbook emphasises that this instrument is a ‘population measure’411 which means that while measurements are collected at the level of each individual child, the EDI is not suitable for child‐level assessments. This is relevant to the national literacy and numeracy strategy which recognises that early years practitioners require ‘continuing professional development to enhance their ability to use a range of assessment for learning (AfL) and assessment of learning (AoL) approaches’412. It is also recognised that assessment for learning is an area in need of development so that early childhood curriculum and assessment frameworks are aligned and support each other413. The application of the EDI to assess national outcomes of the Free Pre‐School Year provides a way of assessing the quality of early years services. As already stated, existing frameworks and standards embodied in Síolta and Aistear remain the bedrock of quality, but the measurement of outcomes is the only way of verifying that their implementation is creating experiences for children which result in better outcomes such as improved social & emotional skills and language & cognitive skills. Naturally, this would be helped if the outcomes of these frameworks, and of the Free Pre‐School Year, were stated more explicitly414.
410 In a series of emails in July 2011, the evaluators asked the following questions of Magdelena Janus, one of
the authors of the EDI: ‘First, given that our study is a pre‐post longitudinal evaluation, with a comparison group, our interest in using the EDI is primarily in assessing the impact of the ECCE Programme between the beginning and end of the ECCE year; the actual thresholds reached by the groups of children, at baseline or follow‐up, are also important but somewhat secondary from an evaluation perspective. In view of that, we would appreciate your advice on whether the EDI could be used with slightly younger children (such as 3 years and 6 months), while mindful that normative data can only be used for the 4‐6 age group? Second, the EDI will be completed by the Pre‐school Leader who, while not technically a teacher, is qualified in early education to third‐level diploma level or above.’ Her reply was: ‘The EDI during its testing phase was actually validated for children at both JK and SK levels, which in Canada could be as early as 3 years 8 months. It has since been used with children younger than our main group (which is the 5‐year‐olds). Especially since you are planning to track the progress, there should not be a problem. As to the other question, I believe the final decision will have to be made by you considering the main qualification for completion of the EDI, and that is a thorough knowledge of the child’s behaviour. In population implementations, we make sure the teacher has at least 4 months to observe the child in school (or preschool) setting. The difference between the EDI and some other direct‐test measures is that it does not rely on testing a child on the only testable aspects of their development – cognitive and communication, but also puts emphasis on the other aspects – social, emotional, and physical stamina – which can only come from reliable observation. It is very hard for me to judge to what extent the Pre‐school Leaders will have that knowledge. It may be just terminology – if this title is an equivalent of the Early Childhood Educator, who is with children in the classroom, I am sure that they will be the most appropriate people to do this’.
411 ‘The EDI as an instrument for measuring population health has the most value when implemented for an entire group of children within a geographical community. However, it can also be used in project evaluation or as a research tool for more restricted population groups. In such cases, the results should be interpreted within the research design framework, since EDI applicability will be dependent on the design of the project.’ (Janus, Brinkman, Duku, Hertzman, Santos, Sayers, & Schroeder, 2007:6).
412 Department of Education and Skills, 2011a:80. 413 In the case of oral language development for 3‐8 year olds, it has been noted that ‘consideration needs to be
given to the structure of the new oral language (and English) framework, and how this might align with a corresponding assessment framework. It seems particularly important to align curriculum and assessment frameworks from the outset, since understanding and implementation of the curriculum can be supported by assessment based on the framework (and vice versa).’ (Shiel, Cregan, McGough, and Archer, 2012:57).
414 It has been noted, for example, that Aistear is framed in terms of ‘learning goals’ rather than ‘learning outcomes’ and, from the perspective of oral language, ‘Aistear does not currently support the generation of

127
The absence of comprehensive data on quality in early years services has been noted by the Expert Advisory Group on the Early Years Strategy and is the basis of one of its recommendations: ‘carry out a baseline audit of the quality of early care and education services immediately. This should involve assessment of quality in a representative sample of services, using internationally recognised tools for measuring quality. Its aims should be both to inform implementation priorities for the Early Years Strategy and also to provide a baseline for subsequent assessment of the impact of quality‐raising measures adopted by the strategy.’415 In light of the findings of this report, it might be added that there is also an absence of comprehensive data on the outcomes of pre‐school and early years services generally and, for the reasons stated, both gaps need to be filled simultaneously. In other words, the measurement of quality should be linked to the measurement of outcomes, particularly for children in the Free Pre‐School Year where the EDI has been identified as a reliable way of doing so. Taking a wider perspective on the evidence‐base that is required to support the Pre‐School Quality Agenda, it is clear that continuous national assessment of the Free Pre‐School Year is essential. This will require a much larger sample than this study, one which is representative of the entire population in question, and a longitudinal design over a much longer period. In addition to collecting new data, there is also need to do further analysis of existing datasets like GUI. Specifically, a full SEM analysis of the GUI infant cohort ‐ based on a merged dataset of over 8,000 children at age 9 months (wave 1), 3 years (wave 2) and 5 years (wave 3) ‐ would generate evidence and insight on all influences on child outcomes, including the role of early years services; this could be done with greater robustness and precision than has been possible with the relatively small sample used in this study.
7.9.4 Addressing the Pervasive Influence of Social Class
Social class, as conventionally defined in research, denotes the resources available to a child, adult or family. A conceptual innovation in this study involved extending the conventional concept of social class – which includes mother’s education, occupation and financial resources, which are known to have a pronounced social gradient on child outcomes – to include other resources which are also relevant to child development, notably the home learning environment and the child’s diet, which are highly correlated with the aforementioned variables. These additional aspects are also part of the family’s resources, operating as risk and protective factors on child development in much the same way as more conventional aspects of social class. As indicated, social class is the main determinant of children’s social & emotional skills and especially their language & cognitive skills; by implication, social class is also the main socially‐generated source of gaps in the skills of children at the start of the Free Pre‐School Year. The significance of this finding is far‐reaching because it identifies an active ingredient in early child development. For children who are most disadvantaged, these class‐related differentials, if unaddressed, have consequences though childhood and into adult life because they shape capacity to learn skills, both character and cognitive416, while also influencing the person’s self‐concept and related capacity to experience well‐being.
an overall indicator of a child’s competence in oral language, which teachers may need for reporting purposes.’ (Shiel, Cregan, McGough, and Archer, 2012:27).
415 Expert Advisory Group on the Early Years Strategy, 2013:19. 416 The distinction between character and cognitive skills is now widely used in the context of human
development, particularly of children and young people (See notably, Heckman and Kautz, 2013; Heckman and Raut, 2013; Heckman, Pinto and Savelyev, 2013; Heckman, Moon, Pinto, Savelyev and Yavitz, 2009; Gutman and Schoon, 2013). A re‐analysis of the long‐term outcomes of pre‐school and similar programmes concluded that ‘character skills predict later‐life outcomes with the same, or greater, strength as measures of cognition’ (Heckman and Kautz, 2013:88) while also showing that ‘high‐quality early childhood programs have lasting and beneficial effects on character skills’ (Heckman and Kautz, 2013:89). A review of research on non‐cognitive or character skills concluded that ‘evidence is strongest’ for the positive influence of character on cognitive skills in the following areas: ‘Children’s perception of their ability, their expectations of future success, and the extent to which they value an activity influence their motivation and persistence leading to improved academic outcomes, especially for low‐attaining pupils. Within school, effective teaching, the school environment, and social and emotional learning programmes (SEL) can play an important role in developing key non‐cognitive skills.’ (Gutman and Schoon, 2013:2).

128
Other studies have treated the home learning environment as a separate influence on child development and found that it is ‘one of the most powerful influences upon development’417. Consistent with this, other studies have found that reading to a child has a positive influence on the cognitive development of 3‐year olds418; reading stories also improves a child’s skills at entry to primary school419; the quantity and quality of child‐directed speech in the home predicts a child’s vocabulary and language processing skills420; and number of books in the home influences academic performance of fourth class pupils (9‐11 year olds)421. Building on these findings, our study shows that the home learning environment is strongly influenced by structured differences in material, social and cultural resources, and is thus a statistically reliable indicator of the broader concept of social class that we have used in this study. The child’s diet ‐ measured by frequency of ‘healthy foods’ and ‘unhealthy foods’ in the previous 24 hours – is also treated as an indicator of social class which is closely aligned with the mother’s education. Other studies have examined the separate influence of diet on child development. For example, findings from the infant cohort of the GUI show that about a quarter of 3‐year old Irish children are overweight (19%) or obese (6%)422. In many respects, diet and home learning environment seem to operate through similar processes because parents shape their children’s eating behaviour not only through the foods that are available in the home, but also through parental
417 The EPPE study in UK tracked children from 3‐11 years and found that: ‘The Home Learning Environment
(HLE) in the pre‐school period has associations with all aspects of children’s cognitive and social development and for much of a child’s life is one of the most powerful influences upon development.’ (Melhuish, 2010a:67; see also Melhuish, et al, 2008). ‘The Home Learning Environment (HLE) in the pre‐school period has association with all aspects of children’s cognitive and social development and for much of a child’s life is one of the most powerful influences upon development.’ (Melhuish, 2010a:67); see also Melhuish, et al, 2008).
418 The GUI report on three year olds states that: ‘Reading to children taking part in Growing Up in Ireland was likewise associated with higher scores not just on the Naming Vocabulary test but also on the Picture Similarities assessment.’ (Williams, Murray, McCrory and McNally, 2013:64‐65).
419 A study of 1,243 children in the Junior Infant classes of 42 primary schools in Cork city in 2009 found that ‘the strongest predictor of vulnerability on EDI scores was storytelling. Children who were never told stories in the previous week were over five times as likely to be vulnerable compared with children who were told stories every day. This supports numerous studies which show a link between reading stories and literacy development and with broader aspects of development.’ (Curtin, Madden, Staines and Perry, 2013:6).
420 In a landmark study, Hart and Risley (1995) estimated that by 36 months, the children they observed from advantaged families had heard 30 million more words directed to them compared to those growing up in poverty, a stunning difference that predicted important long‐term outcomes. A similar SES gradient was reported in a more recent study: ‘significant disparities in vocabulary and language processing efficiency were already evident at 18 months between infants from higher‐ and lower‐SES families, and by 24 months there was a 6‐month gap between SES groups in processing skills critical to language development.’ (Fernald, Marchman and Weisleder, 2013:234).
421 Analysis was based on the 2011 results of PIRLS (Progress in International Reading Literacy Study) and TIMSS (Trends in International Maths and Science Study): ‘Results indicated that several pupil‐level variables were associated with achievement in all three domains (reading, mathematics and science): these were books and children’s books at home, maternal (but not paternal) education, number of full‐time jobs in pupils’ households (all positively associated), and having a TV in the bedroom, owning an iPhone, and experiencing bullying on a “frequent” basis (all negatively related to achievement). Just one school‐level variable was significantly associated with achievement in all three domains – school average age (the older the average age, the higher the expected achievement scores).’ (Cosgrove and Creaven, 2013:201).
422 ‘In total, 76 per cent of the children were classified as non‐overweight, 19 per cent as overweight and 6 per cent as obese. This means that one quarter of all three‐year‐old children in Ireland had a BMI beyond the range that is considered healthy for this age group.’ (Williams, Murray, McCrory, McNally, 2013:35). The report adds: ‘Numerous studies in Ireland indicate that dietary quality is strongly patterned by socio‐economic status … a trend which is also seen in parental responses to the Growing Up in Ireland dietary inventory, even at this early age. … . Parental education was strongly and positively associated with fruit and vegetable consumption, and strongly and inversely related to consumption of energy‐dense foods such as crisps, chips and hamburgers/hotdogs, and with non‐diet fizzy drinks’ (Williams, Murray, McCrory and McNally, 2013: 37). The GUI report on 9‐year olds states that: ‘The higher the educational level of the mother the greater was the child’s consumption of fruit and vegetables and the lower was the child’s consumption of energy dense snack foods.’ (Williams, Greene, Doyle, Harris, Layte, McCoy, McCrory, Murray, Nixon, O’Dowd, O’Moore, Quail, Smyth, Swords, and Thornton, 2009:63).

129
example and parenting practices423. This underlines how parents create the child’s environment, with food being one aspect of it, creating experiences which give rise to differences in child outcomes that are observable in this age‐group of children. One of the innovations in this study is to treat diet as an aspect of social class thereby illustrating how it is also part of a wider set of inter‐linked experiences for children and their parents. This underlines the importance of a holistic approach to child development which focuses on the major factors influencing development, in addition to the specific behaviours or characteristics that express their effects. A strength of the concept of social class presented here – and an indicator of its pervasive influence – is its intergenerational character. The child’s environment is simultaneously the parent’s environment. That is why mother’s education, occupation and financial difficulties are integral parts of a shared family environment. This underlines how social class has an inter‐generational aspect and why children with weaker skills are more likely to have parents who also have weaker skills. This means that improving outcomes has a longer‐term intergenerational aspect which involves improving levels of education, employability and incomes amongst vulnerable parents. Viewed from this perspective, there is a clear linkage between the five benchmark targets for education and training in the Europe 2020 Strategy424 which Ireland has adopted: 6. at least 95% of children between 4 years old and the age for starting compulsory primary
education should participate in early childhood education;
7. the share of early leavers from education and training should be less than 10%;
8. the share of low‐achieving 15‐years olds in reading, mathematics and science should be less than
15%;
9. the share of 30‐34 year olds with tertiary educational attainment should be at least 40%;
10. an average of at least 15 % of adults should participate in lifelong learning.
The understanding of social class presented here represents an extension of conventional measures of poverty and disadvantage to reflect more adequately the multifaceted nature of social class and how child poverty affects child development.425. Child poverty means lacking any of the resources necessary for child development which are social, cultural as well as material. It is obvious that a family’s financial resources are important (including the education and employment of parents) but so too is the child’s diet and home learning environment as well as the quality of interactions within the family426. Poverty in this wider understanding gives rise to disparities in social & emotional skills and language & cognitive skills that were evident when children entered the study. Understanding the pervasive influence of social class on child outcomes is an essential step towards improving outcomes for children. It is also an essential step in developing services for children – including the coordination of early years services with other services for children and families – and needs to take full account of the impact which lack of resources (in the widest sense) has on child development.
423 This is based on analysis of how healthy and unhealthy eating habits are transmitted from parent to child,
based on analysis of the GUI’s 9‐year old cohort (Keane, Layte, Harrington, Kearney, Perry, 2012). 424 European Commission, 2011b. 425 Child poverty is conventionally defined as a child living in a household that is ‘at risk of poverty’ (living in a
household with on equivalised household disposable income below the 60% median) or in ‘consistent poverty’ (living in a household with an household with on equivalised household disposable income below the 60% median who also experience at least two forms of enforced deprivation). In 2010, the latest year for which data is available, 18.8% of children were at risk of poverty, higher when compared to 15.8% of all households. Similarly in that year, 9.3% of children were in consistent poverty, higher when compared to 6.2% of all households. (CSO, 2012; Department of Children and Youth Affairs, 2012b).
426 ‘Family disadvantage is poorly assessed by conventional measures of poverty that focus on family income flows and parental education. The absence of parental guidance, nourishment, and encouragement is the most damaging condition for child development. Absence of quality parenting stimulation, attachment, encouragement, and support is the true measure of child poverty.’ (Heckman and Kautz, 2013:7).

130
7.9.5 Supporting Parents
Supporting parents is one of the ‘transformational goals’ in the National Policy Framework for Children & Young People (2014‐2020)427 and an integral part of the parenting support strategy of the Child & Family Agency428. Parent‐child relationships are a significant influence on children’s social & emotional skills and language & cognitive skills. The study found that this relationship is part of a wider social context that needs to be taken into account, especially when considering how to support vulnerable parents. The analysis reveals that the main influence on parent‐child relationships is the mother’s well‐being; this in turn reflects her resources as indicated by social class, support networks and NESB. In other words, a significant part of a child’s experience of the world, and what the world offers, is mediated through the mother’s experience of the world as reflected in the mirror of her personal well‐being and her relationship with the child. This web of influences on the parent‐child relationship is illustrated in Figure 7.2. The study also found evidence to suggest that different parenting styles have different impacts on children’s skills. Specifically, parents who have a more ‘relaxed parent‐child relationship’ (mainly associated with less conflict and stress) tend to facilitate children’s social & emotional skills while parents with a more ‘demanding parent‐child relationship’ (mainly associated with more conflict and stress) tend to facilitate children’s language & cognitive skills. The interpretation of this finding recognises that a common root of all parenting styles is the attachment between parent and child since this bond429 is known to be foundational for every child; through the attachment bond, the child develops a sense of self430 and an internalised working model of interactions which normally lasts throughout adult life431. In addition, parental responsiveness to the child432, both emotional and
427 Department of Children and Youth Affairs, 2014:26‐28. 428 This is contained in six Family Support Documents: Gillen, Landy, Devaney, and Canavan, 2013; Crawley,
Simring, Harrison, Landy, and Gillen, 2013; Devaney, Canavan, Landy, and Gillen, 2013; Gillen, Landy, Devaney, Canavan, 2013; Landy Coen, Gillen, and Tuohy, 2013; Gillen, Morrissey, Gaynor, and Tuohy, 2013.
429 A recent review of research on the role of attachment in child development concluded: ‘The bond that children develop with their parents, particularly as a babies and toddlers, is fundamental to their flourishing. … . Children without secure parental bonds are more likely to have behaviour and literacy problems. … . Boys growing up in poverty are two and a half times less likely to display behaviour problems at school if they have secure attachments with parents in the early years. Those without strong bonds may be more likely to be NEET [Not in Education, Employment or Training], and less likely to be socially mobile and get good jobs in later life. … . Many children do not have secure attachments. Around 1 in 4 children avoid their parents when they are upset, because they ignore their needs. A further 15 per cent resist their parents because they cause them distress. … . The strongest predictor for children being insecurely attached is having a parent who is not securely attached themselves.’ (Moullin, Waldfogel and Washbrook, 2014:4‐5)
430 ‘In order to develop – intellectually, emotionally, socially and morally – a child requires, for all of them, the same thing: participation in progressively more complex reciprocal activity, on a regular basis over extended periods of time with one or more other persons with whom the child develops a strong, mutual, irrational attachment, and who are committed to that child’s development, preferably for life’ (Bronfrenbrenner and Morris, 2006:816).
431 Three main types of attachment and associated interaction‐styles are identified in attachment theory : secure attachment, insecure‐avoidant attachment, and insecure‐anxious attachment (Bowlby, 1979; Ainsworth, 1991). A secure style is where others are regarded as reliable and available and is associated with a warm, positive and reassuring style of interaction. An insecure‐avoidant style is where others are regarded as uninterested or unavailable and is associated with an interaction style that is cold, competitive and controlled. An insecure‐anxious style is where others are seen as unreliable or difficult and leads to an interaction style characterised by anxiety, stress and lack of confidence.
432 ‘Responsiveness is an aspect of supportive parenting described across different theories and research frameworks (e.g. attachment, socio‐cultural) as playing an important role in providing a strong foundation for children to develop optimally. … . Acceptance of the child’s interests with responses that are prompt and contingent to what the child signals supports learning, in part, by facilitating the child’s development of mechanisms for coping with stress and novelty in his or her environment. With repeated positive experiences, a trust and bond develop between the child and parent that promote the child’s continued engagement in learning activities with his or her parent. Thus, these affective‐emotional behaviours communicate the parent’s interest and acceptance, fostering self‐regulation and cooperation, critically important behaviours for effective learning to occur. From a socio‐cultural viewpoint, cognitively responsive behaviours (e.g. maintaining versus redirecting interests, rich verbal input) are thought to facilitate higher
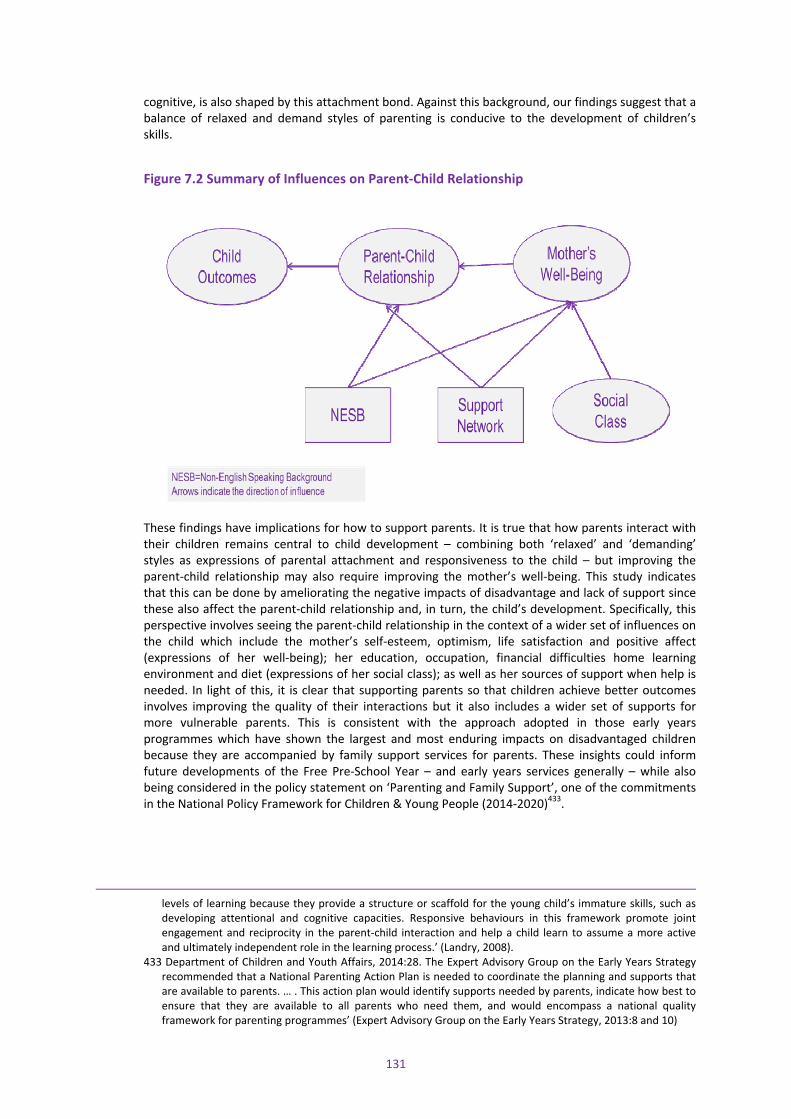
131
cognitive, is also shaped by this attachment bond. Against this background, our findings suggest that a balance of relaxed and demand styles of parenting is conducive to the development of children’s skills.
Figure 7.2 Summary of Influences on Parent‐Child Relationship
These findings have implications for how to support parents. It is true that how parents interact with their children remains central to child development – combining both ‘relaxed’ and ‘demanding’ styles as expressions of parental attachment and responsiveness to the child – but improving the parent‐child relationship may also require improving the mother’s well‐being. This study indicates that this can be done by ameliorating the negative impacts of disadvantage and lack of support since these also affect the parent‐child relationship and, in turn, the child’s development. Specifically, this perspective involves seeing the parent‐child relationship in the context of a wider set of influences on the child which include the mother’s self‐esteem, optimism, life satisfaction and positive affect (expressions of her well‐being); her education, occupation, financial difficulties home learning environment and diet (expressions of her social class); as well as her sources of support when help is needed. In light of this, it is clear that supporting parents so that children achieve better outcomes involves improving the quality of their interactions but it also includes a wider set of supports for more vulnerable parents. This is consistent with the approach adopted in those early years programmes which have shown the largest and most enduring impacts on disadvantaged children because they are accompanied by family support services for parents. These insights could inform future developments of the Free Pre‐School Year – and early years services generally – while also being considered in the policy statement on ‘Parenting and Family Support’, one of the commitments in the National Policy Framework for Children & Young People (2014‐2020)433.
levels of learning because they provide a structure or scaffold for the young child’s immature skills, such as developing attentional and cognitive capacities. Responsive behaviours in this framework promote joint engagement and reciprocity in the parent‐child interaction and help a child learn to assume a more active and ultimately independent role in the learning process.’ (Landry, 2008).
433 Department of Children and Youth Affairs, 2014:28. The Expert Advisory Group on the Early Years Strategy recommended that a National Parenting Action Plan is needed to coordinate the planning and supports that are available to parents. … . This action plan would identify supports needed by parents, indicate how best to ensure that they are available to all parents who need them, and would encompass a national quality framework for parenting programmes’ (Expert Advisory Group on the Early Years Strategy, 2013:8 and 10)

132
7.9.6 Integrating New Communities
Ireland is an increasingly multi‐cultural society. In 2010 there were 75,000 children born in Ireland, over 20% of them to mothers not themselves born in Ireland434. Reflecting this trend, a substantial minority of children in the study (15%) are described as NESB (Non‐English Speaking Background) because the mother’s first language is not English (excluding mothers whose first language is Irish). An important finding of the study is that the Free Pre‐School Year had a positive impact on children with NESB. Nevertheless the gap in language & cognitive skills remained unchanged, indicating that further support is required435 including initiatives which develop the skills of staff to address the needs of these children436. However, this study suggests that the Free Pre‐School Year has the potential to have a positive effect on promoting the integration of children from new communities, probably because of the benefits of interacting with staff and other children in a new environment. NESB is an attribute of the mother as well as the child and the analysis revealed that NESB mothers, though similar to other mothers in terms socio‐economic status, have consistently weaker well‐being. This means that they tend to have lower self‐esteem, optimism, life satisfaction and positive affect. The reasons for this are not apparent since no data was collected on the country of origin of NESB mothers, their reasons for coming to Ireland, how long they have been living here, or the circumstances in which they are living here. Nevertheless their weaker well‐being is a cause of concern in its own right but also because this has a negative impact on the parent‐child relationship and on their children’s development.
7.10 Concluding Comment This study is part of a larger body of evidence generated by NEYAI on different aspects of early years services in Ireland. The study focused on child outcomes in pre‐school and, while this represents just one strand of work in NEYAI, it has particular national relevance in the context of the Free Pre‐School Year because it provides some of the first evidence available on the determinants of child outcomes during that year. The evidence presented showed that this sample of children improved their social & emotional skills and especially their language & cognitive skills during the Free Pre‐School Year but, without a matched control group of children not in the programme, it is impossible to know how much of this improvement is attributable to natural child development and how much to the impact of pre‐school. The study is on firmer ground in explaining why children varied in their progress during the Free Pre‐School Year and the three main findings merit repeating since they have radical implications for the future direction of the Free Pre‐School Year and early years services generally. First, child development is characterised by change and stability which, in the context of the Free Pre‐School
434 CSO Report on Vital Statistics 2010, 2012:24. 435 This was also the conclusion of an earlier study on the needs of immigrant children in Ireland’s primary and
secondary schools. Its recommendations are relevant to the pre‐school system: ‘a number of areas [which] would further enhance provision for immigrant students in Irish schools. First, language support provision would benefit from a greater emphasis on combining withdrawal and within‐class support, flexibility (e.g. tapering) in resource allocation, training and support for specialist and mainstream teachers, and access to suitable teaching resources and materials. Second, language support within the school needs to be situated within the wider context, in terms of language support for the adult population and access to translation/interpretation services for schools. Third, social integration is likely to benefit from the promotion of intercultural awareness within and outside schools, consistent practice regarding bullying, and the use of student mentors to counter such behaviour.’ (Smyth, Darmody, McGinnity and Byrne, 2009:2‐3).
436 In 2010, the Department of Education and Skills allocated €0.513 million Dormant Account funding for a Pre‐school Initiative for Children from Minority Groups to support pre‐school services to undertake accredited equality and diversity training through the City and County Childcare Committee (CCC) network. The funding was to support enrolment, retention and integration of children from minority groups in mainstream settings to ensure the best outcomes for all children. Applications from all 33 CCCs were approved with training and mentoring provided to staff in 160 centres across nearly all counties in 2011‐2012. An independent evaluation, carried out by Duffy and Gibbs (2013) found a significant increase in educators' knowledge, skills and attitudes in relation to diversity and equality.

133
Year, means that the parameters of a child’s progress are set by the child’s starting point: children who start with more skills make more progress while those who start with less skills make less progress. Second, the main influence on a child’s starting point, and therefore on progress during the Free Pre‐School Year, is the child’s family particularly the relationships and resources within the family which are essential for child development. Third, the gaps in skills between children which were evident at the start of the Free Pre‐School Year tended to remain unchanged or even widened and, without remediation, these gaps are likely to persist throughout primary and secondary school and possibly into adulthood. These findings, which are consistent with a much larger body of international and Irish evidence on pre‐school and school systems, have radical implications because they frame the Free Pre‐School Year in the wider context of a child’s life. It is easily forgotten that the Free Pre‐School Year represents just 3% of a child’s entire life up to that time and, although it comes relatively early in the life of a child, it is not early in terms of child development. This supports the case for earlier intervention, particularly where a child’s family circumstances are not conducive to normal healthy development. It also underlines why improving child outcomes and reducing socially‐generated gaps in child outcomes cannot be the sole responsibility of Ireland’s early years system, even if it has a substantial and potentially more important role to play. The findings of this study also underline why the economic case for early years services is typically built on the long‐term outcomes of programmes which are high quality, multi‐year and include family support and related services for vulnerable parents. These landmark programmes address all key influences on child outcomes which are identified in this study. It is clear that the Free Pre‐School Year does not meet the standard of these landmark programmes and, for that reason, will only deliver the expected economic return on investment if, but only if, that investment is sufficient to produce a programme of equivalent standard. In other words, all the evidence indicates that further progress is required to create a more successful early years system, including a more successful Free Pre‐School Year, in order to improve outcomes for all children while simultaneously narrowing the gap in outcomes between children.

134
8 Bibliography Abidin, RR., 1990. Parenting Stress Index Short Form: Test Manual. Charlottesville, VA: Department of Pediatrics, University of Virginia. Agenda for Children’s Services 2007. A Policy Handbook, December, Dublin: Office of the Minister for Children. Available at www.omc.ie Ainsworth, MDS., 1991. ‘Attachments and other Affectional Bonds Across the Life Cycle’, in Parkes, CM., Stevenson‐Hindle, J., and Marris, P., (Editors), Attachment Across the Life Cycle, pp.33‐51, New York: Tavistock/Routledge. Alberts, B., 2011. ‘Getting Education Right’, Science, Vol 333, 19, August, p.919. Allen, G., 2011. Early Intervention: The Next Steps, An Independent Report to Her Majesty’s Government, January, London: Cabinet Office. Arteaga, I., Humpage, S., Reynolds, A., Temple, J., 2013. One Year of Preschool or Two ‐Is It Important for Adult Outcomes? Results from the Chicago Longitudinal Study of the Child‐Parent Centers, Economics of Education Review, Available online 6 August. Australian Government, 2011. A Snapshot of Early Childhood Development in Australia: Australian Early Development Index (AEDI), National Report 2009, Re‐issue – March 2011. Available at www.aedi.org.au Australian Government, 2013. A Snapshot of Early Childhood Development in Australia 2012: Australian Early Development Index (AEDI), National Report, April. Available at www.aedi.org.au Asay, TP., and Lambert, MJ., 1999. ‘The Empirical Case for the Common Factors in Therapy: Quantitative Findings’, in Hubble, MA., Duncan, BL., and Miller, SD, (Editors), The Heart and Soul of Change: What Works in Therapy, Washington DC: American Psychological Association, pp.33‐56. Balanda, KP., and Wilde, J., 2003. Inequalities in Perceived Health: A Report on the All‐Ireland Social Capital and Health Survey, Dublin: The Institute of Public Health in Ireland. Banks, J., and McCoy, S., 2011. A Study on the Prevalence of Special Educational Needs, NCSE Research Reports No. 9, Trim, co. Meath: National Council for Special Education. Available at: www.ncse.ie Banks, J., Shevlin, M., and McCoy, S., 2012. ‘Disproportionality in special education: identifying children with emotional behavioural difficulties in Irish primary schools’, European Journal of Special Needs Education, Available online: 13 Apr 2012. Barlow, L., and Scott, J., 2010. Safeguarding in the 21st Century – Where to now? Dartington: Research in Practice. Barth, R., Lee, B., Lindsey, M., Collins, K., Strieder, F., Chorpita, B., Becker, K., & Sparks, J., 2012. ‘Evidence‐based practice at a crossroads: The timely emergence of common elements and common factors’, Research on Social Work Practice, 22 (1), 109–119. Barnes McGuire J., 1997. The reliability and validity of a questionnaire describing neighbourhood characteristics relevant to families an young children living in urban areas. Journal of Community Psychology, 25, 551–566. Barnes, J., 2007. ‘Targeting deprived areas: the nature of the Sure Start Local Programme Neighbourhoods’, in Belsky, J., Barnes, J., and Melhuish, E., (Editors), The National Evaluation of Sure Start: Does area‐based early intervention work?, Bristol: The Policy Press, pp.25‐44.
135
Barnes, J., 2010. ‘From evidence‐base to practice: implementation of the Nurse Family Partnership programme in England’, Journal of Children’s Services, Volume 5, Issue 4, pp. 4‐17. Barnett, WS., 1996. Lives in the balance: Age 27 benefit‐cost analysis of the High / Scope Perry Preschool Program, Ypsilanti, MI: High / Scope Press. Barnett, WS., 2011. ‘Effectiveness of Early Educational Intervention’, Science, Vol 333, 19, August, pp.975‐977. Bate, P., Mendel, P., and Robert, G., 2008. Organizing for Quality: The Improvement Journeys of Leading Hospitals in Europe and the United States: Oxford: Radcliffe Publishing. Baumrind, D. (1971) ‘Current patterns of parental authority’, Developmental Psychology Monographs, Vol. 4, No. 1, Part 2. Baumrind, D. (1991) ‘Does causally relevant research support a blanket injunction against disciplinary spanking by parents?’, Invited Address at the 109th Annual Convention of the American Psychological Association, August 2001. Becker, B., 2011. ‘Social disparities in children’s vocabulary in early childhood. Does pre‐school education help to close the gap?’, The British Journal of Sociology, Volume 62, Issue 1, 69‐88. Belsky, J., Barnes, J., and Melhuish, E., (Editors), 2007. The National Evaluation of Sure Start: Does area‐based early intervention work?, Bristol: The Policy Press, pp.133‐153. Belsky, J., and Melhuish, E., 2007. ‘Impact of Sure Start Local Programmes on children and families’, in Belsky, J., Barnes, J., and Melhuish, E., (Editors), The National Evaluation of Sure Start: Does area‐based early intervention work?, Bristol: The Policy Press, pp.133‐153. Belsky, J., 2009. ‘Early Day Care and Infant‐Mother Attachment Security’, Encyclopaedia on Early Childhood, Montreal: Centre on Excellence for Early Childhood Development. Available at: www.child‐encyclopedia.com Belsky, J., 2010. ‘Early Day Care and Infant‐Mother Attachment Security’, Encyclopaedia of Early Childhood Development, Available at: http://www.child‐encyclopedia.com Ben‐Arieh, A., 2006. ‘Measuring and monitoring the well‐being of young children around the world’, Background paper prepared for the Education for All Global Monitoring Report 2007 Strong foundations: early childhood care and education. Available at: www.unesco.org Benson, JF., 1987. Working More Creatively with Groups, Reprinted in 1995. London: Routledge. Bergin, A., 2009. ‘Job Mobility in Ireland’, The Economic and Social Review, Vol 40, No 1, Spring, pp.15‐48. Berry, JO., and Jones, WH., 1995. ‘The Parental Stress Scale: Initial psychometric evidence’, Journal of Social and Personal Relationships, 12, 463‐472. Bertram, A.D. 1996. Effective early childhood educators: developing a methodology for improvement, Volumes 1&2, Coventry University, Unpublished PhD Thesis. Bowlby, J., 1979. The Making and Breaking of Affectional Bonds, London: Tavistock. Bradford Hill, A., 1965. ‘The Environment and Disease: Association or Causation?, Proceedings of the Royal Society of Medicine, 58:295‐300. Briggs‐Gowan MJ., Carter, AS., Irwin, JR, Wachtel, K., Cicchetti, DV., 2004. ‘The Brief Infant

136
‐Toddler Social and Emotional Assessment: screening for social‐emotional problems and delays in competence’, J Pediatr Psychol. March, 29(2):143‐55. Brinkman, S., Gregory, T., Harris, J., Hart, B., Blackmore, S., and Janus, M., 2013. ‘Associations Between the Early Development Instrument at Age 5, and Reading and Numeracy Skills at Ages 8, 10 and 12: a Prospective Linked Data Study’, Child Indicators Research, 6:695–708. Brinkman, S., Gialamas, A., Rahman, A., Mittinty, M., Gregory, T., Silburn, S., Goldfeld, S., Zubrick, S Carr, V., Janus, M., Hertzman, C., Lynch, J., 2012. ‘Jurisdictional, socioeconomic and gender inequalities in child health and development: analysis of a national census of 5‐year‐olds in Australia’, BMJ Open Bronfenbrenner, U.,1970. Two worlds of childhood: U.S and U.S.S.R. New York: Pocket Books. Bronfenbrenner, U., and Morris, P., 2006. ‘The Bioecological Model of Human Development’, in Lerner, RMV., Damon, W., & Lerner, RMS., (Editors), Handbook of Child Psychology, Vol. 1: Theoretical Models of Human Development, 793‐828. Hoboken, NJ: Wiley. Brooks‐Gunn, J., and Markman, L., 2005. ‘The Contribution of Parenting to Ethnic and Racial Gaps in School Readiness’, The Future of Children, Vol. 15 / No. 1 / Spring, 139‐168. Buckley, H., and O’Nolan, C., 2013. An examination of recommendations from inquiries into events in families and their interactions with State services, and their impact on policy and practice, November, Dublin: Department of Children and Youth Affairs. Available at www.dcya.ie Buss, AH., and Plomin, R., 1984. Temperament: Early Developing Personality Traits, Hillsdale, NJ: Lawrence Erlbaum Associates). Camilli, G., Vargas, S., Ryan, S., Barnett, WS., 2010. ‘Meta‐Analysis of the Effects of Early Education Interventions on Cognitive and Social Development’, Teachers College Record, Vol 112, No 3, March, 579‐620 Campbell, FA., & Ramey, CT., 1995. ‘Cognitive and school outcomes for high risk African‐ American students at middle adolescence: Positive effects of early intervention’. American Educational Research Journal, 32, 743‐772. Cartwright, F., 2011. PISA in Ireland, 2000‐2009: Factors affecting inferences about changes in student proficiency over time, Prepared for the Educational Research Centre, St Patrick’s College, Drumcondra, Dublin. Carver, CS., and Scheier, M., 2004. ‘Optimism’, in Lopez, SJ., and Snyder, CR., (Editors), Positive Psychological Assessment: A Handbook of Models and Measures, pp.75‐87, Washington DC, American Psychological Association Carr, A., 2004. Positive Psychology: The science of happiness and human strengths, Hove and New York: Brunner‐Routledge. CfBT Education Trust, 2010. An International Perspective on Integrated Children’s Services. Available at www.cfbt.com Child & Family Agency, 2013. Commissioning Strategy. Available at www.childandfamilyresearch.ie Clerkin, A., 2013. ‘Teachers and teaching practices’ in Eivers, E., and. Clerkin, A., (Editors), National Schools, International Contexts: Beyond the PIRLS and TIMSS test results, pp.77‐104, Dublin: Educational Research Centre. Available at www.erc.ie

137
Clerkin, A., and Creaven, AM., 2013. ‘Pupil Engagement’ in Eivers, E., and. Clerkin, A., (Editors), National Schools, International Contexts: Beyond the PIRLS and TIMSS test results, pp.33‐54, Dublin: Educational Research Centre. Available at www.erc.ie Coe, R., 2002. ‘It’s the Effect Size, Stupid: What effect size is and why it is important’, Paper presented at the Annual Conference of the British Educational Research Association, University of Exeter, England, 12‐14 September 2002. Cohen, J., 1992. ‘A Power Primer’, Psychological Bulletin, Vol 112, No 1, pp.155‐159. Commission on Patient Safety and Quality Assurance, 2008. Building a Culture of Patient Safety, July, Dublin: Stationery Office. Available at www.doh.ie Controller and Auditor General, 2007. Ballymun Regeneration, November, Dublin: Controller and Auditor General. Available at www.audgen.gov.ie Controller and Auditor General, 2006. Educational Disadvantage Initiatives in the Primary Sector, June Dublin: Controller and Auditor General. Available at www.audgen.gov.ie Cooper, A and Petrides, KV., 2010. ‘A Psychometric Analysis of the Trait Emotional Intelligence Questionnaire–Short Form (TEIQue–SF) Using Item Response Theory’, Journal of Personality Assessment, 92:5, 449‐457. Available at: www.psychometriclab.com Cosgrove, J., and Creaven, AM., 2013. ‘Understanding Achievement in PIRLS and TIMMS’ in Eivers, E., and. Clerkin, A., (Editors), National Schools, International Contexts: Beyond the PIRLS and TIMSS test results, pp.201‐227, Dublin: Educational Research Centre. Available at www.erc.ie Coulthard, M., Walker, A., and Morgan, A., 2002. People’s Perceptions of their Neighbourhood and Community Involvement, The Office for National Statistics, London: The Stationery Office. Crawley, M., Simring, K., Harrison, C., Landy, F., and Gillen, A., 2013. Meitheal ‐ a national practice model for all agencies working with children, young people and their families, Family Support Document No:2. Dublin: Child and Family Agency. CSO, 2003. Census 2002: Volume 2 Ages and Marital Status. Dublin: Stationery Office. Available at www.cso.ie CSO Report on Vital Statistics 2010, 2012. November. Dublin: Stationery Office. Available at www.cso.ie. CSO Census 2011, 2012a. This is Ireland: Highlights from Census 2011, Part 1. Dublin: Stationery Office. Available at www.cso.ie. CSO Quarterly National Household Survey in 2007, 2009. Childcare, Quarter 4 2007. Dublin: Stationery Office. Available at www.cso.ie. CSO Survey of Income and Living Conditions in 2010, 2012. March, Dublin: Stationery Office. Available at www.cso.ie. CSO Quarterly National Household Survey, 2011. Health Status and Health Service Utilisation, Quarter 3 2010. Dublin: Stationery Office. Available at www.cso.ie. CSO, 2013. Population and Labour Force Projections 2016‐2046, April. Dublin: Stationery Office. Available at www.cso.ie Cryer, D., Harms, T., & Riley, C., 2003. All About the ECERS‐R: A detailed guide in words and pictures.
138
Cunha, F., Heckman, JJ., Lochner, L., Masterov, DV., 2006. ‘Interpreting The Evidence On Life Cycle Skill Formation’, in Hanushek, EA., and Welch, F., (Editors), Handbook Of The Economics Of Education, Volume 1, Elsevier, Chapter 12, pp.698‐747. Currie, J. and D., Thomas, 1995. Does Head Start make a difference? American Economic Review, June, 85(3), 341–364. Curtin, M., Madden, J., Staines, A., and Perry, I, 2013. ‘Determinants of vulnerability in early childhood development in Ireland: a cross‐sectional study’, BMJ Open, 2013;3:e002387. doi:10.1136. Available at bmjopen.bmj.com Davey, G., (Editor), 2005. Encyclopaedic Dictionary of Psychology, London: Macmillian Data Protection Commissioner, 2007. Data Protection Guidelines on Research in the Health Sector, Portarlington: Office of the Data Protection Commissioner. Available at: http://www.dataprotection.ie Deane, C., 2009. Review of The Glen Early Language and Learning Pilot Project, Cork: Cork City Partnership and HSE. Available at www.corkcitypartnership.ie Deming, D., 2009. Early childhood intervention and life‐cycle skill development: Evidence from Head Start. American Economic Journal: Applied Economics, July, 1(3), 111–134. Department of Children and Youth Affairs, 2012a. Statement of Strategy, March, Dublin: Government Publications. Available at www.dcya.ie Department of Children and Youth Affairs, 2012b. State of the Nation’s Children – Ireland 2012, December, Dublin: Government Publications. Available at www.dcya.ie Department of Children and Youth Affairs, 2014. National Policy Framework for Children & Young People (2014‐2020), April, Dublin: Department of Children and Youth Affairs. Available at www.dcya.ie Department of Education and Science, 1999. Ready to Learn: White Paper on Early Childhood Education, Dublin: The Stationery Office. Department of Education and Skills, 2009, A Workforce Development Plan for the Early Childhood Care and Education Sector in Ireland, June, Dublin: Department of Education and Skills. Department of Education and Skills, 2010a. Síolta: The National Quality Framework for Early Childhood Education, Second Edition, Dublin: Government Publications. Available at: www.education.ie Department of Education and Skills, 2010b, A Workforce Development Plan for the Early Childhood Care and Education Sector in Ireland, November, Dublin: Department of Education and Skills. Available at: www.education.ie Department of Education and Skills, 2010c. Better Literacy and Numeracy for Children and Young People: A Draft National Plan to Improve Literacy and Numeracy in Schools, November, Dublin: Department of Education and Skills. Available at: www.education.ie Department of Education and Skills, 2011a. Statement of Strategy 2011‐2014, Dublin: Department of Education and Skills. Available at: www.education.ie Department of Education and Skills, 2011b. Literacy and numeracy for learning and life: National strategy to improve literacy and numeracy among children and young people 2011‐2020. Dublin: Department of Education and Skills. Available at: www.education.ie

139
Department of Education and Skills, 2012. Key Statistics 2011/2012, Released on 3rd September 2012, Dublin: Department of Education and Skills. Available at: www.education.ie Department of Education and Skills, 2013a. Education at a Glance 2013: OECD Indicators A Country Profile For Ireland, Key Facts, Statistics Section, June. Dublin: Department of Education and Skills. Available at www.education.ie Department of Education and Skills, 2013b. Final Report on the Development and Implementation of the Síolta Quality Assurance Programme, Early Years Education Policy Unit, December, Dublin: Department of Education and Skills. Available at www.education .ie Department of Education and Skills, 2014. Retention Rates of Pupils in Second Level Schools: 2007 Entry Cohort, Dublin: Department of Education and Skills. Available at www.education .ie Devaney, C., Canavan, J., Landy, F., and Gillen, A., 2013. What works in family support? Child and Family Agency Parenting Support Strategy, Family Support Document No:3, Dublin: Child and Family Agency.
Diener, E., Lucas, RE., and Oishi, S., 2002. ‘Subjective Well‐Being: The Science of Happiness and Life Satisfaction’, in Snyder, CR., and Lopez, S., (Editors), Handbook of Positive Psychology, pp.63‐73, New York: Oxford University Press. Dixon, N., and Pearce, M., 2010. Guide to Ensuring Data Quality in Clinical Audits, Healthcare Quality Quest,. Available at www.hqip.org.uk Dizikes, P. 2011. ‘When the Butterfly Effect Took Flight’, MIT Technology Review, 22 February. Donaldson, 2011. Teaching Scotland’s future ‐ Report of a review of teacher education in Scotland, Edinburgh: The Scottish Government. Available at: www.scotland.gov.uk Dooley, B., and Fitzgerald, A., 2012. My World Survey: National Study of Youth Mental Health in Ireland, Dublin: Headstrong – The National Centre for Youth Mental Health and UCD School of Psychology. Available at: www.headstrong.ie Doyle, O., Finnegan, S., and McNamara, K., 2012. ‘Differential caregiver and teacher ratings of school readiness in a disadvantaged community’, European Early Childhood Education Research Journal, Vol 20, No. 3, September, 371‐389. Doyle, O., and McNamara, K., 2011. ‘Breaking the Cycle of Deprivation: An Experimental Evaluation of an Early Childhood Intervention’, Barrington Lecture 2011‐12, Journal of the Statistical and Social Inquiry Society of Ireland, Vol XLI, pp.92‐111. Doyle, O., 2012. Report on Children’s Profile at School Entry 2008‐2011, March, Geary WP2011/08, Dublin: UCD Geary Institute. Available at: www.geary.ucd.ie. Duffy, M., and Gibbs, A., 2013. Pre‐school education for children from minority groups: Evaluation report. Duggan, C., and Corrigan, C., 2009. A literature review of inter‐agency work with a particular focus on children services, Dublin: Children’s Acts Advisory Board. Dunst, CJ., Trivette, CM., and Hamby, DW., 2006. Technical Manual for Measuring and Evaluating Family Support Program Quality and Benefits, Ashville North Carolina: Winterberry Press. Dunst, CJ., Hamby, DW., and Brookfield, J., 2007. ‘Modelling the Effects of Early Childhood Intervention Variables on Parent and Family Well‐Being’, Journal of Applied Quantitative Methods, Vol 2, No 3, Fall, pp.268‐288

140
Duncan, BL., 2010. On Becoming a Better Therapist, Washington DC: American Psychological Association. Available at: www.heartandsoulofchange.com Duncan, G., 2011. The Importance of Academic Skills for PreK‐3rd, A Report to the Foundation for Child Development. Duncan, G., Dowsett, C., Claessens, A., Magnuson, K., Huston, A., Klebanov, P., Pagani, L., Feinstein, L., Engel, M., Brooks‐Gunn, J., Sexton, H., Duckworth, K. and Japel, C., 2007. ‘School readiness and later achievement’, Developmental Psychology, 43, 1428‐1446. Early Childhood Ireland, 2013, NEYAI Interim Report: Addressing the Gaps between Training and Practice, South Dublin NEYAI Project, Dublin: CPLN Area Partnership. Eivers, E., and. Clerkin, A., 2013. ‘PIRLS and TIMSS Overview’ in Eivers, E., and. Clerkin, A., (Editors), National Schools, International Contexts: Beyond the PIRLS and TIMSS test results, pp.1‐14, Dublin: Educational Research Centre. Available at www.erc.ie Emmons, RA., McCullough, ME., and Tsang, JA., 2003. ‘The Assessment of Gratitude’, Lopez, SJ., and Snyder, CR., (Editors), Positive Psychological Assessment: A Handbook of Models and Measures, Washington DE: American Psychological Association, pp.327‐341. Erikson, E., 1950. Childhood and Society, London and New York: WW Norton & Co. Winner of the Pulitzer Prize and the National Book Award. European Council, 2009. Council conclusions of 12 May 2009 on a strategic framework for European cooperation in education and training (‘ET 2020’), C 119/2, Official Journal of the European Union, 28.5.2009. European Commission, 2011a. Early Childhood Education and Care: Providing all our children with the best start for the world of tomorrow, Communication from the Commission, COM(2011) 66 final, Brussels, 17.2.2011. European Commission, 2011b. Progress Towards the Common European Objectives in Education and Training: Indicators and Benchmarks 2010/2011, Commission staff working document. European Commission, 2012. The 2012 Ageing Report: Economic and budgetary projections for the 27 EU Member States (2010‐2060), May, Brussels: European Commission. Available at: http://ec.europa.eu European Commission, 2013a. Recommendation of 20.2.2013 on Investing in children: breaking the cycle of disadvantage, February, Brussels: European Commission. Available at: http://ec.europa.eu European Commission, 2013b. Barcelona Objectives: The development of childcare facilities for young children in Europe with a view to sustainable and inclusive growth, Report from the Commission to the European Parliament, the Council, the European Economic and Social Committee and the Committee of the Regions, May, Brussels: European Commission. Available at: http://ec.europa.eu Eurydice, 2009. Early Childhood Education and Care in Europe: Tackling Social and Cultural Inequalities, Brussels: Education, Audiovisual and Cultural Executive Agency. Available at: www.eurydice.org Exodea Consulting, 2013. Happy Talk NEYAI Consortium: Evaluation Report II, October. Expert Advisory Group on the Early Years Strategy, 2013. Right from the Start: Report of Expert Advisory Group on the Early Years Strategy, Dublin: Government Publications. Available at www.dcya.ie

141
Expert Group on Future Skills Needs, 2012. National Skills Bulletin 2012 A Study by the Skills and Labour Market Research Unit (SLMRU) in FÁS for the Expert Group on Future Skills Needs. Available at: www.forfas.ie Fantuzzo, JW., Bulotsky‐Shearer, R., Fusco, RA., McWayne, C., 2005. ‘An investigation of preschool classroom behavioral adjustment problems and social–emotional school readiness competencies’, Early Childhood Research Quarterly, 20, pp. 259–275 Fahey, T., Hayes, BC., and Sinnott, R., 2005. Conflict and Consensus: A Study of values and attitudes in the Republic of Ireland and Northern Ireland, Dublin: Institute of Public Administration. Feinstein, L., 2003. ‘Inequality in the Early Cognitive Development of British Children in the 1970 Cohort’ Economica 70, 73–97. Fernald, A., Marchman, VA., and Weisleder, A., 2013. ‘SES differences in language processing skill and vocabulary are evident at 18 months’, Developmental Science, 16:2, pp 234–248 Field, F., 2010. The Foundation Years: Preventing poor children becoming poor adults: The report of the Independent Review on Poverty and Life Chances, December, London: Cabinet Office. Available at: www.frankfield.co.uk. Forer, B., and Zumbo, B., 2011. ‘Validation of Multilevel Constructs: Validation Methods and Empirical Findings for the EDI’, Social Indicators Research, 103(2), 231-265. Forget‐Dubois, N., Lemelin, J. P., Boivin, M., & Dionne, G., 2007. ‘Predicting early school achievement with the EDI: a longitudinal population‐based study’, Early Education and Development, 18(3), 405–426. Fredrickson, B., 2002. ‘Positive Emotions’, in Snyder, CR., and Lopez, S., Editors, Handbook of Positive Psychology, pp.257‐276, New York: Oxford University Press. French, G., 2011. Towards Extended Purposive Conversations: An Exploration of Interactions between Three Educators and Young Children in Early Childhood Education and Care Settings in Urban Areas Designated as Disadvantaged, Doctorate in Education (EdD), St. Patrick’s College, Drumcondra, Dublin 9. French, G., 2013. ‘Aistear: A journey without a map’, ChildLinks: The Journal of Barnardos’ Training and Resource Service, Issue 2, pp.2‐8. French, G., 2014. Observe, Wait, Listen – let them talk: Evaluation of the Language Enrichment Programme of the Ballyfermot Early Years Language and Learning Initiative, January, Dublin: Ballyfermot / Chapelizod Partnership. Fromm, E., 1956. The Art of Loving, New York: Harper. Fullan, M., 2010. ‘The Big Ideas Behind Whole System Reform’, Education Canada, Volume 50, Number 3, pp.24‐27. Available at: www.cea‐ace.ca Gambaro, L., Stewart, K., and Waldfogel, J., 2013. Equal access to high quality early education and care? Evidence from England and lessons from other countries, Centre for Analysis of Social Exclusion (CASE), CaseBrief 32, March, London School of Economics and Political Science. Available at www.lse.ac.uk Gambaro, L., Stewart, K., and Waldfogel, J., (Editors) 2014. Equal Access to Quality Care: Providing High Quality Early Childhood Education and Care to Disadvantaged Families, Bristol: The Policy Press. Geddes, R., 2012. Early Development Instrument Report: East Lothian Pilot, Scottish Collaboration for Public Health Research and Policy, July. Available at: www.scphrp.ac.uk

142
Gerard, AB., 1994. Parent‐Child Relationship Inventory (PCRI): Manual, Los Angeles: Western Psychological Services. Gibaud‐Wallston, J., & Wandersaman, LP., 1978. ‘Development and utility of the parenting sense of competence scale’. Paper presented at the meeting of the American Psychological Association, Toronto. Gibran, K., 1980. The Prophet, London: William Henneman. First published in 1926. Gillen, A., Landy, F., Devaney, C., and Canavan, J., 2013. Guidance for the implementation of an area based approach to prevention, partnership and family support, Child and Family Agency Parenting Support Strategy, Family Support Document No:1, Dublin: Child and Family Agency. Gillen, A., Landy, F., Devaney, C., and Canavan, J., 2013. Commissioning strategy, Child and Family Agency Parenting Support Strategy, Family Support Document No:4, Dublin: Child and Family Agency. Gillen, A., Morrissey, M., Gaynor, J., and Tuohy, O., 2013. 50 key messages to accompany investing in families: supporting parents to improve outcomes for children, Child and Family Agency Parenting Support Strategy, Family Support Document No:6, Dublin: Child and Family Agency.
Glaeser, EL., Laibson, DI., Scheinkman, JA., and Soutter, CL.,2000. ‘Measuring Trust’, Quarterly Journal of Economics, August, 811‐846. Glass, GV., McGaw, B. and Smith, ML., 1981. Meta‐Analysis in Social Research. London: Sage. Gleeson, J., 2012. ‘The professional knowledge base and practice of Irish post‐primary teachers: what is the research evidence telling us?’ Irish Educational Studies, Volume 31, Issue 1, 1‐17. Goldstein, H., 2003. Multilevel Statistical Models (3rd edition). London: Arnold. Goodbody Economic Consultants, 2011a. Children 2020: Cost‐benefit Analysis, November, Dublin: Start Strong. www.startstrong.ie Goodbody Economic Consultants, 2011b. Evaluation of Initial Implementation of Síolta – Final Report, December, Dublin: Department of Education & Skills. Goodman, A., Sibieta, L., and Washbook, E., 2009. ‘Inequalities in educational outcomes among children aged 3 to 16’, Report for the National Equality Panel. Goodman, R., 1997. ‘The Strengths and Difficulties Questionnaire: A Research Note’, Journal of Child Psychology and Psychiatry, Volume 38, Number 5, pp. 581‐586. Goodman, R., Meltzer, H., and Bailey, V., 1998. ‘The Strengths and Difficulties Questionnaire: A Pilot Study on the Validity of the Self‐Report Version’, European Child and Adolescent Psychiatry, Volume 7, pp. 125‐130. Goodman, R., and Scott, S., 1999. ‘Comparing the Strengths and Difficulties Questionnaire and the Child Behaviour Checklist: Is Small Beautiful?’, Journal of Abnormal Child Psychology, Volume 27, Number 1, pp. 17‐24. Goodman, R., 1999. ‘The Extended Version of the Strengths and Difficulties Questionnaires a Guide to Psychiatric Caseness and Consequent Burden’, Journal of Child Psychology and Psychiatry, Volume 40, Number 5, pp. 791‐799. Goodman, R., Renfrew, D., and Mullick, M., 2000. ‘Predicting type of psychiatric disorder from Strengths and Difficulties Questionnaire (SDQ) in child mental health clinics in London and Dhaka’, European Child Adolescent Psychology, Volume 9, pp. 129‐134

143
Gordon, EW., 2011. ‘The Gordon Commission and the Narrative toward Why’, Bulletin, Volume 1, Issue No 1, September. Available at www.gordoncommission.org. Gordon Commission, 2013. To Assess, To Teach, To Learn: A Vision for the Future of Assessment, Final Report. Available at www.gordoncommission.org. Growing Up In Ireland, 2013. Key Findings No. 1: Infant Cohort (At 5 Years), Transition To School Among Five‐Year‐Olds, November, Dublin: Department of Children and Youth Affairs. Available at: www.growingup.ie Guhn, M., and Goelman, H., 2011. ‘Bioecological Theory, Early Child Development and the Validation of the Population‐Level Early Development Instrument’, Social Indicators Research, 103(2), 193‐217. Guhn, M., Zumbo, B., Janus, M., & Hertzman, C., 2011. ‘Validation theory and research for a population‐level measure of children’s development, wellbeing, and school readiness’, Social Indicators Research, 103(2), 183–191. Gurria, A., 2010. Foreword to PISA 2009 Results, OECD. Available at: www.oecd.org. Gutman, L., and Schoon, I., 2013. The impact of non‐cognitive skills on outcomes for young people: Literature review, November, London: Institute of Education University of London and UK Cabinet Office. Haase, T., McKeown, K., and Pratschke, J., 2009. The Well‐being of Children, Families & Neighbourhoods: Analysis of data emanating from five studies of Well‐being for Barnardos, Respond! Housing Association, Bray and County Wicklow Partnerships, and Liberties Regeneration Area, Unpublished. Haase, T., 2009. The Well‐being of Residents in the Liberties Regeneration Area. Dublin City Council in association with the Dublin Inner City Partnership and The Digital Hub. Haase, T. and Pratschke, J., 2008. The New Measures of Deprivation in the Republic of Ireland – An Inter‐temporal and Spatial Analysis of Data from the Census of Population, 1991, 1996, 2002 and 2006. Dublin: Pobal. Available at: www.pobal.ie and www.trutzhaase.eu Haase, T., McKeown, K., and Pratschke, J., 2008. Children, Families and Neighbourhoods in the Bay Area: A Study for Bray Community consortium, Bray: Bray Partnership. Haase, T. and Pratschke, J., 2005. Deprivation and its Spatial Articulation in the Republic of Ireland – New Measures of Deprivation based on the Census of Population, 1991, 1996 and 2002, Dublin: Pobal., 60 pages. Available at: www.pobal.ie and www.trutzhaase.eu Halpenny, A., Nixon, E., and Watson, D., 2010. Parents’ Perspectives on Parenting Styles and Disciplining Children, Dublin: Office of the Minister for Children and Youth Affairs. Available at www.dcya.gov.ie Harris, A., 2011. ‘System improvement through collective capacity building’, Journal of Educational Administration, Vol. 49 No. 6, pp. 624‐636 Hart, B., and Risley, T. 1995. Meaningful differences in the everyday experience of young American children. Baltimore, MD: Brookes Publishing. Hart, B., and Risley, T., 2003. ‘The Early Catastrophe: The 30 Million Word Gap by Age 3, American Educator, Spring. Hayes, N., Siraj‐Blatchford, I., Keegan, S. and Goulding, E., 2013. Evaluation of the Early Years Programme of the Childhood Development Initiative. Dublin: Childhood Development Initiative (CDI).

144
Health Information and Quality Authority, 2010. Draft National Standards for Safer Better Healthcare, Consultation Document, September, Dublin: Health Information and Quality Authority. Available at: www.hiqa.ie Heatherton, TF., and Wyland, CL., 2004. ‘Assessing Self‐Esteem’, in Lopez, SJ., and Snyder, CR., (Editors), Positive Psychological Assessment: A Handbook of Models and Measures, pp.219‐233, Washington DC, American Psychological Association Heckman, J., Moon, SH., Pinto, R., Savelyev, PA., and Yavitz, A., 2009. ‘The Rate Of Return To The High/Scope Perry Preschool Program’, The National Bureau of Economic Research (NBER): NBER Working Paper Series, Working Paper 15471, Cambridge, Massachusetts. Available at www.nber.org Heckman, J., 2011. ‘The Economics of Inequality: The Value of Early Childhood Education’, American Educator, Spring, pp.31‐36. Heckman, J., 2008. Schools, Skills, and Synapses, IZA Discussion Paper 3515, Bonn. Heckman, J., and Kautz., 2013. Fostering and Measuring Skills: Interventions That Improve Character and Cognition, NBER Working Paper 19656, Cambridge MA: National Bureau Of Economic Research. Heckman, J., and Raut, LK., 2013. Intergenerational Long Term Effects of Preschool: Structural Estimates from a Discrete Dynamic Programming Model, IZA DP No. 7415, May, Bonn: Institute for the Study of Labor. Heckman, J., Pinto, R., and Savelyev, PA., 2013. ‘Understanding the Mechanisms Through Which an Influential Early Childhood Program Boosted Adult Outcomes, American Economic Review. Howe, D., 1999. ‘The Main Change Agent in Psychotherapy is the Relationship Between Therapist and Client’, in Feltham, C., (Editor), Controversies in Psychotherapy and Counselling, London: Sage Publications, pp.95‐103. Hubble, MA., Duncan, BL., and Miller, SD., (Editors), 1997. The Heart and Soul of Change: What Works in Therapy, Washington: American Psychological Association. Hymel, S., Le Mare, L., and McKee, W. (2011). The Early Development Instrument (EDI): An examination of convergent and discriminant validity. Social Indicators Research, 103(2), 267‐282. Inquiry Team to the Roscommon Child Care Case, 2010. Report to the Health Service Executive, November, Dublin: Health Services Executive. Available at www.hse.ie Institute of Medicine and National Research Council. 2012. The early childhood care and education workforce: Challenges and opportunities: A workshop report. Washington, DC: The National Academies Press. Janssen, AL., Macleod, RD., and Walker, ST., 2008. ‘Recognition, reflection, and role models: Critical elements in education about care in medicine’, Palliative and Supportive Care (), 6, 389–395. Janus, M., and Offord, D., 2000. Readiness to learn at school. Canadian Journal of Policy Research, 2, 71–75. Janus, M., and Duku, E., 2007. ‘The School Entry Gap: Socioeconomic, Family, and Health Factors Associated With Children’s School Readiness to Learn’, Early Education and Development, 18(3), 375–403. Janus, M., Brinkman, S., Duku, E., Hertzman, C., Santos, R., Sayers, M. & Schroeder, J., 2007. The Early Development Instrument: A Population‐based measure for communities. A handbook on development, properties, and use. Offord Centre for Child Studies, Hamilton, ON. Available at: www.offordcentre.com

145
Janus, M., Offord, D., 2007. ‘Psychometric properties of the Early Development Instrument (EDI): A teacher‐completed measure of children’s readiness to learn at school entry’, Canadian Journal of Behavioural Science, 2007, Vol 39, No. 1, 1‐22.. Available at: www.offordcentre.com Janus, M., Brinkman, S., and Duku, E., 2011. ‘Validity and Psychometric Properties of the Early Development Instrument in Canada, Australia, United States, and Jamaica’, Social Indicators Research, Volume 103, Issue 2 , pp 283‐297. Janus, M., and Duku, E., Undated. Normative Data for the Early Development Instrument. Available at: www.offordcentre.com Jerrim, J., 2013. The Reading Gap: The socio‐economic gap in children’s reading skills: A cross‐national comparison using PISA 2009, July, London: Sutton Trust. Available at www.suttontrust.com Jordan, E., and O’Donnell, R., 2013. ‘Developmental welfare requires quality, standards and accountability in Irish education’, in O'Toole, F., (Editor), Why Education Matters: The Importance of Education to Ireland's Economy and Society, Dublin: Association of Secondary Teachers Ireland (ASTI), pp.23‐26. Jung, CG., 1953. Collected Works of C G Jung: The Development of Personality: Pantheon Books. Kaplan, D., 2000. Structural Equation Modelling: Advanced Methods and Applications. London: Sage Publications. Keane, E, Layte, R, Harrington, J, Kearney, PM, Perry, IJ., 2012. ‘Measured Parental Weight Status and Familial Socio‐Economic Status Correlates with Childhood Overweight and Obesity at Age 9’, PLoS ONE August, Volume 7, Issue 8. Kennedy, K., Dunphy, E., Dwyer, B., Hayes, G., McPhillips, T., Marsh, J., O’Connor, M., Shiel, G., 2012. Literacy in Early Childhood and Primary Education (3‐8 years), Commissioned Research Report No.15 for National Council for Curriculum and Assessment. Available at: www.erc.ie and www.ncca.ie Kim, D., Baum, CF., Ganz, ML., Subramanian, SV., and Kawachi, I.,2011. ‘The contextual effects of social capital on health: A cross‐national instrumental variable analysis, Social Science and Medicine, 73, 1689‐1697. Kurdek, L., 1994. ‘Conflict resolution styles in gay, lesbian, heterosexual nonparent, and heterosexual parent couples’, Journal of Marriage and the Family, 56, pp. 705‐722. Lamb, ME, and Tamis‐Lemonda, CS., 2004. ‘The Role of the Father: An Introduction’, in Lamb, ME., (Editor), The Role of the Father in Child Development, Fourth Edition, New Jersey: John Wiley and Sons, pp.1‐31. Landry, S., 2008, ‘The role of parents in early childhood learning’, February, Encyclopaedia on Early Childhood, Montreal: Centre on Excellence for Early Childhood Development. Available at: www.child‐encyclopedia.com Landy F., Coen, L., Gillen, A., and Tuohy, O., 2013. Investing in families: Supporting parents to improve outcomes for children, Child and Family Agency Parenting Support Strategy, Family Support Document No:5, Dublin: Child and Family Agency. Layzer, J., Goodson, B., Bernstein, L., and Price, C., 2001. National Evaluation of Family Support Programs: Volume A: The Meta‐Analysis, April, Cambridge MA: ABT Associates Inc. Lewis, M., and Archer, P., 2013. ‘Features of policy and provision’ in Eivers, E., and. Clerkin, A., (Editors), National Schools, International Contexts: Beyond the PIRLS and TIMSS test results, pp.13‐32, Dublin: Educational Research Centre. Available at www.erc.ie

146
Kane, T., McCaffrey, D., Miller, T., and Staiger, D., 2013. Have We Identified Effective Teachers?, Bill and Melinda Gates Foundation. Available at: www.gatesfoundation.org Leana, CR., 2011. ‘The Missing Link in School Reform’, Stanford Social Innovation Review. Liu, H., and Stein, M., 2013. ‘Feeding Behaviour of Infants and Young Children and Its Impact on Child Psychosocial and Emotional Development’ Encyclopaedia on Early Childhood Development, Available at: http://www.child‐encyclopedia.com Lord Laming, 2003. The Victoria Climbié Inquiry, Report, January, London: Crown Copyright. Maccoby, E.E. and Martin, J.A. (1983) ‘Socialization in the context of the family: Parent–child interaction’. In: P.H. Mussen (Series Ed.) and E.M. Hetherington (Volume Ed.), Handbook of Child Psychology. Volume 4: Socialization, personality and social development (4th edition). New York: Wiley, pp. 1‐101. MacMahon, B., 1955. ‘The Windows of Wonder’ in The Red Petticoat London: McMillan. MacMahon, B., 1992. The Master, Dublin: Poolbeg. Malone, A., and Smith, G., 2010. ‘Developing schools as professional learning communities: The TL21 experience’, US‐China Education Review, September, Volume 7, No.9, pp.624‐636 Marmot Review, 2010. Fair Society, Healthy Lives: Strategic Review of Health Inequalities in England post‐2010. Available at www.instituteofhealthequity.org Mathematica Policy Research, 2002. Making a Difference in the Lives of Infants and Toddlers and Their Families: The Impacts of Early Head Start, Volume 1: Final Technical Report, Washington DC: US Department of Health and Human Services. Available at: www. mathematica‐mpr.com Matheny, AP., Wachs T., Ludwig, JL., Phillips, K., 1995. ‘Bringing order out of chaos: Psychometric characteristics of the Confusion, Hubbub and Order Scale’, Journal of Applied Developmental Psychology 1995; 16: 429–444. McAvoy, H., Purdy, J., Mac Evilly, C. and Sneddon, H. 2013. Prevention and Early Intervention in Children and Young People’s Services: Child Health and Development. Dublin: Centre for Effective Services. Available at www.effectiveservices.org McCoy, S., and Smyth, E., 2013. ‘Improving second level education’, in O'Toole, F., (Editor), Why Education Matters: The Importance of Education to Ireland's Economy and Society, Dublin: Association of Secondary Teachers Ireland (ASTI), pp.34‐37. McCoy, S., Banks, J., and Shevlin, M., 2012. ‘School matters: how context influences the identification of different types of special educational needs’, Irish Educational Studies, Available online: 26 Apr 2012. McCrory, C., and Layte, R., 2012. ‘Breastfeeding and Risk of Overweight and Obesity at Nine Years of Age’, Social Science & Medicine, Vol 75, Issue 2, July. McDermott, B., Parsons, M., and O’Sullivan, H., 2011. ‘School as a Professional Learning Community: Theory and Practice’, InTouch – Irish National Teachers Organisation (INTO). Available at: www.into.ie McDowell, I., 2006. Measuring Health: A Guide to Rating Scales and Questionnaires, New York: Oxford University Press, pp.350‐358.

147
McKeown, K., 1997. Developing Childcare Services in Disadvantaged Areas: An Evaluation of the Pilot Childcare Initiative (1994‐1995), January, Dublin: Area Development Management Limited. Available at www.kieranmckeown.ie McKeown, K., Ferguson, H., and Rooney, D., 1998. Changing Fathers? Fatherhood and Family Life in Modern Ireland. Cork: Collins Press. Available at www.kieranmckeown.ie McKeown, K., 2001a. ‘Families and Single Fathers’, Administration: Journal of the Institute of Public Administration, Volume 49, Number 1, Spring. Available at www.kieranmckeown.ie McKeown, K., 2001b. Fathers and Families: Research and Reflection on Key Questions, Report for Department of Health and Children. . Available at www.doh.ie and www.kieranmckeown.ie McKeown, K., Haase, T., and Pratschke, J., 2001. Springboard: Promoting Family Well‐Being Through Family Support Services, December, Dublin: Department of Health and Children. Available at www.doh.ie and www.kieranmckeown.ie McKeown, K., Pratschke, J., and Haase, T., 2003. Family Well‐Being: What Makes a Difference?, November, Jointly published by Department of Social & Family Affairs, Family Support Agency and The Céifin Centre in Shannon, Co. Clare. Available at www.welfare.ie and www.kieranmckeown.ie McKeown, K., and Haase, T., 2006. The mental health of children and the factors which influence it: A study of families in Ballymun. Dublin: youngballymun. Available at www.youngballymun.org and www.kieranmckeown.ie McKeown, K., Haase, T., and Pratschke, J., 2006. ‘Evaluating Springboard: Impact of a family support programme in Ireland’, Journal of Children’s Services, Volume 1, Issue 1, April, pp.16‐27. Available at www.kieranmckeown.ie McKeown, K., and Haase, T., 2007. Understanding the Needs of Children – A Study of Needs and their Determinants in Limerick and Thurles, Unpublished, Dublin: Barnardos. McKeown, K., Haase, T., Pratschke, J., Lanigan, C., Burke, S., Murphy, N., and Allen, L., 2008. The Well Being of Parents, Children & Neighbourhoods: A National Study of Families in Respond! Housing Estates, Dublin and Waterford: Respond!. Available at www.kieranmckeown.ie McKeown, K., 2011. ‘Inter‐Agency Cooperation in Services for Children and Families: On why a good inter‐agency process alone may not guarantee better outcomes’, Administration: Journal of the Institute of Public Administration, Volume 59, No 2, pp.27‐48. Available at www.kieranmckeown.ie McKeown, K., Haase, T., and Belsky, J., 2011. Research Protocol for National Early Years Access Initiative (2011‐2014). Available at: www.neyai‐evaluation.ie and www.kieranmckeown.ie McKeown, K., 2012. ‘Inter‐Agency Cooperation in Services for Children and Families: Does it improve outcomes’, Journal of Children’s Services, Volume 7, Issue 3, pp.191–200. Available at www.kieranmckeown.ie McKeown, K., 2013. ‘Using Evidence to Develop Services for Children and Families: Some Considerations and Challenges for the Child & Family Support Agency’, Administration: Journal of the Institute of Public Administration, Volume 61, No 1, pp.3‐30. Available at www.kieranmckeown.ie McKeown, K., Haase, T., and Pratschke, J., 2014a. A Study of Child Outcomes in Pre‐School: Evaluation of National Early Years Access Initiative & Síolta Quality Assurance Programme, Main Report, May, Dublin: Pobal. Available at www.pobal.ie; www.kieranmckeown.ie; www.trutzhaase.eu McKeown, K., Haase, T., and Pratschke, J., 2014b. A Study of Child Outcomes in Pre‐School: Evaluation of National Early Years Access Initiative & Síolta Quality Assurance Programme, Technical Report, May, Dublin: Pobal. Available at www.pobal.ie; www.kieranmckeown.ie; www.trutzhaase.eu

148
McKeown, K., 2014. Evaluation of the Learning Community in the National Early Years Access Initiative, May, Dublin: Pobal. Available at www.pobal.ie; www.kieranmckeown.ie Mansfield, J., 2010. The nature of change or the law of unintended consequences. London, England: Imperial College Press. Mathers, S., Eisenstadt, N., Sylva, K., Soukakou, E., and Ereky‐Stevens, K., 2014. Sound Foundations: A Review of the Research Evidence on Quality of Early Childhood Education and Care for Children Under Three ‐ Implications for Policy and Practice, January, London: Sutton Trust. Available at www.suttontrust.com Mathis, W., 2012. ‘Research‐based options for education policymaking: Preschool Education’, National Education Policy Center. Available at www.nepc.colorado.edu. Meadows, P., 2006. Cost‐effectiveness of implementing SSLPs: An interim report. London: DfES. Available at www.surestart.gov.uk. Melhuish, E., 2004. A literature review of the impact of early years provision upon young children, with emphasis given to children from disadvantaged backgrounds: Report to the Comptroller and Auditor General. London: National Audit Office. Melhuish, E., Sylva, K., Sammons, P., Siraj‐Blatchford, I., and Taggart, B. 2001. The Effective Provision of Pre‐school Education Project, Technical Paper 7: Social/behavioural and cognitive development at 3‐4 years in relation to family background. London: Institute of Education/DfES. Melhuish, E., Belsky, J., Anning, A., Ball, M., Barnes, J., Romaniuk, H., Leyland, A., and the NESS Research Team, 2007. ‘Variation in community intervention programmes and consequences for children and families: the example of Sure Start Local Programmes’ Journal of Child Psychology and Psychiatry 48:6 (2007), pp 543–551. Melhuish, E., Phan, MB., Sylva, K., Sammons, P., Siraj‐Blatchford, I., Taggart, B., 2008. ‘Effects of the Home Learning Environment and Preschool Center Experience upon Literacy and Numeracy Development in Early Primary School’, Journal of Social Issues, Vol. 64, No. 1, 2008, pp. 95—114. Melhuish, E., 2010a. ‘Why children, parents and home learning are important’, in Sylva, K., Melhusih, E., Sammons, P., Siraj‐Blatchford, I., Taggart, B., Early Childhood Matters: Evidence from the Effective Pre‐School and Primary Education Project, Oxford: Routledge, pp.44‐69. Melhuish, E., 2010b. Impact of the Home Learning Environment on Child Cognitive Development: Secondary Analysis of Data from ‘Growing Up in Scotland’, Edinburgh: Scottish Government Social Research. Melhuish, E., and Hall, D., 2007. ‘The policy background to Sure Start’, in Belsky, J., Barnes, J., and Melhuish, E., (Editors), The National Evaluation of Sure Start: Does area‐based early intervention work?, Bristol: The Policy Press, pp.3‐21. Melhuish, E., Belsky, J., MacPherson, K. and Cullis, A., 2010. The quality of group childcare settings used by 3‐4 year old children in Sure Start local programme areas and the relationship with child outcomes, London: Department for Education. Mihaly, K., McCaffrey, D., Staiger, and Lockwood, J., 2013. A Composite Estimator of Effective Teaching. Bill and Melinda Gates Foundation. Available at: www.gatesfoundation.org Miłosz, C., 2001. ‘Love’, New and Collected Poems 1931‐2001. p.50, London: Penguin Press.

149
Minister for Children and Youth Affairs, 2012a. Foreword to Statement of Strategy, March, Dublin: Government Publications. Available at: www.dcya.ie Minister for Children and Youth Affairs, 2012b. ‘Statement by Minister Frances Fitzgerald ‐ Early invention and family support services’, Seanad Éireann, Wednesday 7th March. Available at www.dcya.ie Minister for Children and Youth Affairs, 2013a. ‘Government investing in important reforms for children and families ‐ Fitzgerald’, Tuesday 15th October. Available at: www.dcya.ie Minister for Children and Youth Affairs, 2013b. ‘Speech by Ms Frances Fitzgerald T.D., The Minister for Children and Youth Affairs at the Launch of National Association of Childhood Professionals’, Friday 7th June, The Clock Tower, Marlborough Street, Dublin 1. Minister for Children and Youth Affairs, 2013c. ‘Government announces €30m investment in new ABC (Area‐Based Childhood) Programme ‐ Minister Fitzgerald confirms 13 sites to benefit from new early intervention programme’, Wednesday 27th November. Available at: www.dcya.ie Minister for Children and Youth Affairs, 2013d. ‘Minister for Children and Youth Affairs Welcomes the Establishment of the Child and Family Agency’, Tuesday 31st December. Available at: www.dcya.ie Moffitt, TE., Arseneault, L., Belsky, D., Dickson, N., Hancox, RJ., Harrington, HL., Houts, R., Poulton, R., Roberts, BW., Ross, S., Sears, MR., Thomson, WM., Caspia, A., 2011. ‘A gradient of childhood self‐control predicts health, wealth, and public safety’, PNAS: Proceedings of the national Academy of Sciences of the United States, February 15, Vol.108, No.7, pp.2693–2698. Available at: www.pnas.org Mooney, O., Patterson, V., O’Connor, M., and Chantler, A., 2010. A Study of Progression in Irish Higher Education: A report by the Higher Education Authority, October, Dublin: Higher Education Authority. Available at: www.hea.ie Mona Mourshed, M., Chijioke, C., and Barber, M., 2010. How the world’s most improved school systems keep getting better, McKinsey & Company. Available at: www.mckinsey.com Morrison, T., 2010. ‘The Strategic Leadership of Complex Practice: Opportunities and Challenges’, Child Abuse Review, Vol 19:312‐329. Moullin, S., Waldfogel, J., and Washbrook, E., 2014. Baby Bonds: Parenting, attachment and a secure base for children, March, London: Sutton Trust. Available at www.suttontrust.com Murray, A., McCrory, C., Thornton, M., Williams, J., Quail, A., Swords, L., Doyle, E., and Harris, E., 2011. Growing Up in Ireland National Longitudinal Study of Children: Design, Instrumentation and Procedures for the Child Cohort, Technical Report No 1, Dublin: Office of the Minister for Children and Youth Affairs. National Children’s Strategy: Our Children – Their Lives, 2000. November, Dublin: Stationery Office. Available at www.dohc.ie National Competitiveness Council, 2009, Statement on Education and Training, February, Dublin: National Competitiveness Council. Available at: http://www.competitiveness.ie National Council for Curriculum and Assessment, 2009. Aistear: The Early Childhood Curriculum Framework, Dublin: National Council for Curriculum and Assessment. Available at www.ncca.ie National Council for Curriculum and Assessment, 2012. Strategic Plan 2012‐2015. Available at www.ncca.ie. National Council for Curriculum and Assessment and Early Childhood Ireland, 2013. Aistear in Action initiative: Final Report, A collaboration between NCCA and Early Childhood Ireland.

150
National Council for Special Education, 2013. Supporting Students with Special Educational Needs in Schools, NCSE Policy Advice Paper No 4, Trim co Meath: National Council for Special Education. Available at: www.ncse.ie National Economic and Social Council, 2005. The Developmental Welfare State, May, Dublin: National Economic and Social Council. Available at: www.nesc.ie National Economic and Social Council, 2012. Quality and Standards in Human Services: The School System, Dublin: National Economic and Social Council. Available at: www.nesc.ie National Evaluation of Sure Start Team, 2005a. Early Impacts of Sure Start Local Programmes on Children and Families, Report 13, London: Birkbeck University of London. Available at: www.ness.bbk.ac.uk National Evaluation of Sure Start Team, 2005b. Variation in Sure Start Local Programmes’ Effectiveness: Early Preliminary Findings, Report 14, London: Birkbeck University of London. Available at: www.ness.bbk.ac.uk National Evaluation of Sure Start Team, 2010. The Impact of Sure Start Local Programmes on Child Development and Family Functioning: Report of the Longitudinal Study of 5‐year‐old Children and their Families. London: Department for Education. Available at: www.ness.bbk.ac.uk Needleman, J., 1996. On Love: Is the Meaning of Life to be Found in Love?, London: Arkana Penguin Books. Nelson, Westhues and MacLeod, 2003. ‘A Meta‐Analysis of Longitudinal Research on Preschool Prevention Programs for Children’, Prevention and Treatment, Volume 6, Article 31, December. Nic Gabhainn, S., and Mullan, E., 2003. ‘Self‐esteem norms for Irish young people’, Psychological Reports, 92829‐830. NICHD Early Child Care Research Network, 1999. ‘Child Outcomes When Child Care Center Classes Meet Recommended Standards For Quality’, American Journal of Public Health, 89, 1072‐1077. NICHD Study of Early Child Care and Youth Development, 2006a. ‘Child‐Care Effect Sizes for the NICHD Study of Early Child Care and Youth Development’, American Psychologist, February‐March, Volume 61, No. 2, pp.99‐116. NICHD Study of Early Child Care and Youth Development, 2006b. Findings for Children Up to Age 4.5 Years, Washington, DC: U.S. Government Printing Office. Avaialble at: http://www.nichd.nih.gov/publications Nores, M., and Barnett, WS., 2009. Benefits of early childhood interventions across the world: (Under) Investing in the very young’, Economics of Education Review, 1‐12. Norris, DJ., 2011. ‘Raising the educational requirements for teachers in infant toddler classrooms: Implications for institutions of higher education’, Journal of Early Childhood Education, 31(2), 146–158. O’Connell, P., Russell, H., Williams, J., and Blackwell, S., 2004. The Changing Workplace: A Survey of Employees’ Views and Experiences, Dublin: Economic and Social Research Institute. O’Connell, P., Russell, H., Watson, D., and Byrne, D., 2010. The Changing Workplace: A Survey of Employees’ Views and Experiences, Dublin: Economic and Social Research Institute.

151
Ó Duibhir, P., Cummins, J., 2012. Towards an Integrated Language Curriculum in Early Childhood and Primary Education (3‐12 years), Commissioned Research Report No.15 for National Council for Curriculum and Assessment. Available at: www.erc.ie and www.ncca.ie OMC, 2007. The Agenda for Children’s Services: A Policy Handbook, Office of the Minister for Children. Dublin: Government Publications. Available at: www.childandfamilyresearch.ie Lewis, M., and Peter Archer, P., 2013. ‘Features of policy and provision’ in E. Eivers, E., and. Clerkin, A., (Editors), National Schools, international contexts: Beyond the PIRLS and TIMSS test results. Dublin: Educational Research Centre. Available at www.erc.ie Neylon, G., 2014. ‘An analysis of Irish pre‐school practice and pedagogy using the early childhood environmental four curricular subscales’, Irish Educational Studies, Volume 33, Issue 1, pp. 99‐116 OECD, 1999. Classifying educational programmes. Manual for ISCED‐97 implementation in OECD countries. Available at: www.oecd.org. OECD, 2010a. PISA 2009 Results: Overcoming Social Background – Equity in Learning Opportunities and Outcomes (Volume II), Paris: OECD. Available at: www.oecd.org. OECD, 2010b. PISA 2009 Results: What Makes a School Successful? – Resources, Policies and Practices (Volume IV) Paris: OECD. Available at: www.oecd.org. OECD, 2011. Research Brief: Qualifications, Education and Professional Development Matter, Paris: OECD. Available at: www.oecd.org. OECD, 2012a. Equity and Quality in Education: Supporting Disadvantaged Students and Schools, Paris: OECD. Available at: www.oecd.org. OECD, 2012b. Education Today 2013: The OECD Perspective, Paris: OECD. Available at: www.oecd.org. OECD, 2012c. Start Strong III: A Quality Toolbox for Early Childhood Education and Care, Paris: OECD. Available at: www.oecd.org. OECD, 2013a. What Students know and can do: Student Performance in Mathematics, Reading and Science (Volume I), Paris: OECD. Available at: www.oecd.org. OECD, 2013b. What Makes a School Successful: Resources, Policies and Practices (Volume IV), Paris: OECD. Available at: www.oecd.org. OECD, 2013c. Education Indicators in Focus – 2013/01 (January), Paris: OECD. Available at: www.oecd.org. OECD, 2013d. Does it matter which school a student attends?, PISA IN FOCUS 2013/04 (April), Paris: OECD. Available at: www.oecd.org. Ofsted, 2010. Good professional development in schools How does leadership contribute? Crown copyright. Available at: www.ofsted.gov.uk Oliver, C., Mooney, A., and Stratham, J., 2010. Integrated Working: A Review of Evidence, Leeds: Children’s Workforce Development Council. Ou, SR., 2005. ‘Pathways of long‐term effects of an early intervention program on educational attainment: Findings from the Chicago longitudinal study, Applied Developmental Psychology, 26, pp.578‐611.

152
Pascal, C., and Bertram, T., 1999. The Effective Early Learning Project: The Quality of Adult Engagement in Early Childhood Settings in the UK, Paper Presented at 9th EECERA Conference, Helsinki, Finland, 1‐4 September. Perkins, R., Cosgrove, J. Moran, G., and Shiel, G. 2010. PISA 2009: Results for Ireland and Changes since 2000. Dublin: Educational Research Centre. Available at: www.erc.ie Perkins, R., Shiel, G., Merriman, B., Cosgrove, J., Moran, G., 2013. Learning for Life: The Achievements of 15‐year‐olds in Ireland on Mathematics, Reading Literacy and Science in PISA 2012, Dublin: Educational Research Centre. Available at www.erc.ie Perry, BD, 2006. ‘Applying Principles of Neurodevelopment to Clinical Work with Maltreated and Traumatised Children’, in Boyd Webb, N., (Editor), Working with Traumatized Youth in Child Welfare, New York: The Guilford Press. Pianta, RC., 1992. Child‐parent relationship scale. Unpublished. University of Virginia. Pianta, RC., 2001. Teacher‐student relationship scale. Odessa FL: PAR. Pianta, RC., 2002. ‘Robert Pianta Talks About Kindergarten Transition’, Fine Forum, Issue 4, Spring, Harvard Family Research Project, pp.8‐11. Pianta, RC., Barnett, WS., Burchinal, M., and Thornburg, KR., 2009. ‘The Effects of Preschool Education: What We Know, How Public Policy Is or Is Not Aligned With the Evidence Base, and What We Need to Know’, Psychological Science in the Public Interest, 10(2) 49–88. Pianta, R, 2011. ‘Individualized and Effective Professional Development Supports in Early Care and Education Settings’, Zero to Three, September, 4‐8. Pidd, M., 1969. Tools for Thinking, Wiley. Pil, FK., and Leana, CR., 2009. ‘Applying organizational research to public school reform: the effects of teacher human and social capital on student performance’, Academy of Management Journal, Vol. 52, No. 6, 1101–1124 Plato, 2003. The Last Days of Socrates, London: Penguin Books. Pobal, 2013. Pobal Annual Survey of the Early Years Sector 2012. Available at: www.pobal.ie Popper, K., 1963. Conjectures and Refutations: The Growth of Scientific Knowledge, London: Routledge. Pratschke, J., McKeown, K., and Haase, T., 2011. The Well‐Being of Families in Ireland. Forthcoming. Pratschke, J., Haase, T., and McKeown, K., 2011. ‘Well‐being and the Family System: A Structural Equation Model of Individual, Relational and Contextual Influences’, Growing Up in Ireland Third Annual Research Conference, D4 Berkley Hotel, Dublin, 1 December. Available at: www.growingup.ie Puma, M., Bell, S., Cook, R., Heid, C., Broene, P., Jenkins, F., Mashburn, A., and Downer J., 2012. Third Grade Follow‐up to the Head Start Impact Study Final Report, OPRE [Office of Planning, Research and Evaluation] Report No 2012‐45, Washington, DC: Office of Planning, Research and Evaluation, Administration for Children and Families, U.S. Department of Health and Human Services. Available at www.acf.hhs.gov Rafferty, M., and Colgan, A., 2009. Organisational Case Studies of Inter‐Agency Co‐operation in the Delivery of Children’s Services, CAAB Research Report No 5, Dublin: Children Acts Advisory Board. Available at: www.caab.ie
153
Ramey, CT., Bryant, DM., Wasik, BH., Sparling, JJ., Fendt, KH., and LaVange, LM., 1992. ‘Infant ‘Health and Development Program for low birth weight, premature infants: Program elements, family participation, and child intelligence’, Pediatrics, 89, 454‐465. Redmond, B., 2006. Reflection in Action: Developing Reflective Practice in Health and Social Services, Aldershot: Ashgate Publishing. Reynolds, A.J., 1994. ‘Effects of a preschool plus follow‐on intervention for children at risk’, Developmental Psychology, 30, 787‐804. Reynolds, A J., and Temple, J.A., 1998. ‘Extended early childhood intervention and school achievement: Age 13 findings from the Chicago Longitudinal Study’, Child Development, 69, 231‐246. Reynolds, AJ., 2002. ‘Early childhood interventions: Knowledge, practice and policy’, Focus, Vol 22, No 1, Special Issue, pp.112‐117. Reynolds, AJ., 2004. ‘Research on early childhood interventions in the confirmatory mode’, Children and Youth Services Review, 26 (2004) 15–38. Reynolds, AJ., 2005. ‘Confirmatory Program Evaluation: Applications To Early Childhood Interventions’, Teachers College Record Volume 107, Number 10, October, pp. 2401‐2425. Robinson, M., Atkinson, M., and Downing, D., 2008. Integrated Children’s Services: Enablers, Challenges and Impacts, Slough: National Foundation for Educational Research. Rogers, CR., 1957. ‘The Necessary and Sufficient Conditions of Therapeutic Personality Change’, Journal of Consulting Psychology, Volume 21, pp.95‐103 Rothstein, J. & Mathis, W.J. 2013. ‘Review of “Have We Identified Effective Teachers?” and “A Composite Estimator of Effective Teaching”: Culminating findings from the Measures of Effective Teaching Project’, Boulder, CO: National Education Policy Center. Available at: www.nepc.colorado.edu. Rubin, DB., 2008. ‘For objective causal inference design trumps analysis’, Annals Appl Stat, 2:808–40. Russell, H., McGinnity, F., 2013. ‘Under Pressure: The Impact of Recession on Employees in Ireland’, British Journal of Industrial Relations, Published online 27 March 2013, 1‐22. Rutter, M., 2006. ‘Is Sure Start an Effective Preventive Intervention?’, Child and Adolescent Mental Health, Volume 11, No. 3, pp. 135–141 Sammons, P., 2010a. ‘The EPPE research design: An educational effectiveness focus’, in Sylva, K., Melhusih, E., Sammons, P., Siraj‐Blatchford, I., Taggart, B., Early Childhood Matters: Evidence from the Effective Pre‐School and Primary Education Project, Oxford: Routledge, pp.24‐43. Sammons, P., 2010b. ‘Does pre‐school make a difference? Identifying the impact of pre‐school on children’s cognitive and social behavioural development at different ages’, in Sylva, K., Melhusih, E., Sammons, P., Siraj‐Blatchford, I., Taggart, B., Early Childhood Matters: Evidence from the Effective Pre‐School and Primary Education Project, Oxford: Routledge, pp.92‐113. Sammons, P., 2010c. ‘Do the benefits of pre‐school last? Investigating pupil outcomes to the end of Key State 2 (aged 11)’, in Sylva, K., Melhusih, E., Sammons, P., Siraj‐Blatchford, I., Taggart, B., Early Childhood Matters: Evidence from the Effective Pre‐School and Primary Education Project, Oxford: Routledge, pp.114‐148. Schaufeli, WB., Bakker, AB., Salanova, M., 2006. ‘The Measurement of Work Engagement With a Short Questionnaire: A Cross‐National Study’, Educational and Psychological Measurement, Volume 66, Number 4, August, pp.701‐716

154
Schleicher, A., 2013. ‘Is the sky the limit for educational improvement?’, in O'Toole, F., (Editor), Why Education Matters: The Importance of Education to Ireland's Economy and Society, Dublin: Association of Secondary Teachers Ireland (ASTI), pp.9‐12. Schweinhart, LJ., and Weikhart, DP., 1997. ‘The High / Scope Preschool curriculum comparison study through age 23’, Early Childhood Research Quarterly, Volume 12, pp.117‐143. Schweinhart, LJ., 2004. ‘The High / Scope Preschool Study Through Age 40’, Ypsilanti, MI: High / Scope Press. Available at www.highscope.org Schweinhart, LJ., Montie, J., Xiang, Z., Barnett, WS., Belfield, CR., Nores, M., 2005. Lifetime Effects: The High/Scope Perry Preschool Study Through Age 40. High/Scope Press, Ypsilanti, MI. Available through: www.highscope.org Sharpley, C. F. & Rogers, H. J., 1984. ‘Preliminary Validation of the Abbreviated Spanier Dyadic Adjustment Scale: Some Psychometric Data Regarding a Screening Test of Marital Adjustment’, Educational and Psychological Measurement, 44: 1045–1049. Sheikh, AA., 2008. The Data Protection Acts 1988 and 2003: Some Implications for Public Health and Medical Research, HRB Discussion Document, July, Dublin: Health Research Board. Available at: http://www.hrb.ie Shiel, G., Cregan, Á., McGough, A., and Archer, P., 2012. Oral Language in Early Childhood and Primary Education (3‐8 years), Commissioned Research Report No.14 for National Council for Curriculum and Assessment. Available at: www.erc.ie and www.ncca.ie Shields, A., and Cicchetti, D., 1997. ‘Emotion Regulation Among School‐Age Children: The Development and Validation of a New Criterion Q‐Sort Scale’, Developmental Psychology, Vol. 33, No. 6, pp. 906‐916. Shields, A., Dickstein. S., Seifer, R., Giusti, L., Dodge‐Magee, K., Spritz, B., 2001. ‘Emotional competence and early school adjustment: A study of preschoolers at risk’, Early Education and Development, 12 (1), 73‐96. Shonkoff, JP., and Phillips, DA., (Editors), 2000. From Neurons to Neighbourhoods: The Science of Early Childhood Development, Washington DC: National Academy Press. Shonkoff, JP., 2011. ‘Protecting Brains, Not Simply Stimulating Minds’, Science, Vol 333, 19 August, 982‐983. Siraj‐Blatchford, I., 2010a. ‘A focus on pedagogy: Case studies of effective practice’, in Sylva, K., Melhusih, E., Sammons, P., Siraj‐Blatchford, I., Taggart, B., Early Childhood Matters: Evidence from the Effective Pre‐School and Primary Education Project, Oxford: Routledge, pp.149‐165. Siraj‐Blatchford, I., 2010b. ‘Learning in the home and at school: how working class children ‘succeed against the odds’’, British Educational Research Journal, 36:3, 463‐482. Smedje, H., Broman, JE., Hetta, J., and von Knorring, AL., 1999. ‘Psychometric Properties of the Strengths and Difficulties Questionnaire’, European Child and Adolescent Psychiatry, Volume 8, pp. 63‐70. Smyth, E.,�and McCoy, S., 2009. ‘Investing in Education’, ESRI Research Bulletin 2009/3/3. Available at www.esri.ie Smyth, E.,�Darmody, M., McGinnity, F., and Byrne, D., 2009. ‘What Do We Know About Large Scale Immigration and Irish Schools?’, ESRI Research Bulletin 2009/2/6. Available at www.esri.ie

155
Smyth, E., and McCoy, S., 2011. Improving Second‐Level Education: Using Evidence for Policy Development, Renewal Series Paper 5, December, Dublin: The Economic and Social Research Institute. Available at www.esri.ie Snyder, CR., Rand, KL., and Sigmon, DR., 2002. ‘Hope Theory: A Member of the Positive Psychology Family’, in Snyder, CR., and Lopez, S., (Editors), Handbook of Positive Psychology, pp.257‐276, New York: Oxford University Press Spanier, GB., 1976. ‘Measuring Dyadic Adjustment: New Scales for Assessing the Quality of Marriage and Similar Dyads’, Journal of Marriage and the Family, February, Volume 38, pp. 15‐28 Spaccarelli, S., Cotler, S., and Penman, D., 1992. ‘Problem‐Solving Skills Training as a Supplement to Behavioural Parent Training’, Cognitive Therapy and Research, Volume 16, Number 1, pp.1‐18. Sprenkle, DH., Blow, AJ., and Dickey, MH., 1999. ‘Common Factors and Other Non‐technique Variables in Marriage and Family Therapy’, in Hubble, MA., Duncan, BL., and Miller, SD., (Editors), The Heart and Soul of Change: What Works in Therapy, Washington: American Psychological Association, pp. 329‐359. Statham, J., 2011. A review of international evidence on interagency working, to inform the development of Children’s Services Committees in Ireland, August, Dublin: Department of Children and Youth Affairs. Available at: www.dcya.ie Statham, J., and Smith, M., 2010. Issues in Earlier Intervention: Identifying and supporting children with additional needs, March, London: Department for Children, Schools & Families and Thomas Coram Research Unit, Institute of Education, University of London. Available at: www.dcsf.uk. Statham, J., and Harris, A., and Glenn, M., 2010. Strengthening family wellbeing and community cohesion through the role of schools and extended services, May London: The Centre for Excellence and Outcomes in Children and Young People’s Services (C4EO). Available at: www.c4eo.org.uk. Steele, J., Hamilton, L., Stecher, B.,2010. Incorporating Student Performance Measures into Teacher Evaluation Systems, Rand Corporation. Available at: www.rand.org Straus, M., Hamby, S, Finkelhor, D., and Runyan, D., 1995. Identification of Child Abuse with the Parent‐Child Conflict Tactics Scales (CTSPC): Development and Psychometric data for a National sample of American parents. Durham, NH: Family Research Laboratory, University of New Hampshire. Sylva, K.,, Melhuish, E., Sammons, P., Siraj‐Blatchford, I., and Taggart, B., 2004. The Effective Provision of Pre‐School Education (EPPE) Project: Findings from Pre‐school to end of Key Stage1, November. Available at www.ioe.ac.uk Sylva, K., Siraj‐Blatchford, I., and Taggart, B. 2006. Assessing quality in the early years: Early Childhood Environment Rating Scale (ECERS‐E), Extension (ECECRS‐E) Four Curricular Subscales. Stoke on Trent: Trentham Books. Sylva, K., 2010. ‘Quality in early childhood settings’, in Sylva, K., Melhusih, E., Sammons, P., Siraj‐Blatchford, I., Taggart, B., Early Childhood Matters: Evidence from the Effective Pre‐School and Primary Education Project, Oxford: Routledge, pp.70‐92. Task Force on the Child and Family Support Agency, 2012. Report of the Task Force on the Child and Family Support Agency, July, Dublin: Government Publications. Available at: www.dcya.ie Taylor CL., Christensen, D., Lawrence, D., Mitrou, F., Zubrick, SR., 2013. ‘Risk Factors for Children’s Receptive Vocabulary Development from Four to Eight Years in the Longitudinal Study of Australian Children’, PLoS ONE 8(9), September, 1‐20.

156
Taylor‐Powell, E., and Henert, E., 2008. Developing a logic model: Teaching and training guide. Madison, WI: University of Wisconsin‐Extension, Cooperative Extension, Program Development and Evaluation. http://www.uwex.edu/ces/pdande Thompson, R., 2010. ‘Origins of Attachment Security in Day Care and at Home: Comments on Belsky’, Encyclopaedia on Early Childhood, Montreal: Centre of Excellence for Early Childhood Development. Available at: www.child‐encyclopedia.com UCD Geary Institute, 2010. Abbreviated Report on Children’s Profile at School Entry 2009‐2010: Evaluation of the Preparing for Life Early Childhood Intervention Programme, Dublin: UCD Geary Institute. Available at: wwwgeary.ucd.ie Van Belle, G., 2002. Statistical Rules of Thumb, New York and London: John Wiley and Sons. Van der Gaag, J. and Tan, J.P. 1998. The Benefits of Early Child Development Programs: An Economic Analysis. Washington, D.C.: World Bank. Vieluf, S., Kaplan, D., Klieme, E., Bayer, S., 2012. Teaching Practices and Pedagogical Innovations: Evidence OECD. Available at: www.OECD.org Waldfogel, J., and Washbrook, E., 2010. Low income and early cognitive development in the UK, February, London: Sutton Trust. Available at www.suttontrust.com Walsh, G., McMillan, D., and Doherty, A., 2013. An Evaluation of the Ballyfermot Early Years Learning Initiative to promote Quality Improvement in Early Years Settings through the Use of the Aistear Framework, November, Dublin: Ballyfermot / Chapelizod Partnership. Welsh Assembly Government, 2008. School Effectiveness Framework: Building effective learning communities together, Cardiff: Department of Children, Education, Lifelong Learning and Skills, Welsh Assembly. Available at www.wales.gov.uk Watson, D., Clark, L., and Tellegen, A., 1988. ‘Development and Validation of Brief Measures of Positive and Negative Affect: The PANAS Scales’, Journal of Personality and Social Psychology, 54(6), 1063‐1070. Webster‐Stratton, C., 1981. ‘Modification of Mothers’ Behaviours and attitudes Through Videotape Modelling Group Discussion’, Behaviour Therapy, Vol. 12, pp.634‐642. Webster‐Stratton, C., 1984. ‘A Randomized trial of two parent training programs for families with conduct‐disordered children’, Journal of Consulting and Clinical Psychology, Volume 52, Number 4, pp.666‐678. Webster‐Stratton, C., 1994. ‘Advancing Videotape Parent Training: A Comparison Study’, Journal of Consulting and Clinical Psychology, Volume 62, Number 3, pp.583‐591. Webster‐Stratton, C., and Hammond, M., 1997. ‘Treating Children with Early‐Onset Conduct Problems: A Comparison of Child and Parent Training Interventions’, Journal of Consulting and Clinical Psychology, Vol. 65, No. 1, pp.93‐109. Webster‐Stratton, C., Reid, J., and Hammond, M., 2004. ‘Treating Children with Early‐Onset Problems: Intervention Outcomes for Parent, Child and Teacher Training’, Journal of Clinical Child and Adolescent Psychology, Vol. 33, No. 1, pp.105‐124. Weir, S., and Denner, S., 2013. The evaluation of the School Support Programme under DEIS: Changes in pupil achievement in urban primary schools between 2007 and 2013, Bulletin Report, December, Dublin: Educational Research Centre, St Patrick’s College, Dublin 9. Available at: www.erc.ie

157
Weisleder, A., and Fernald, A., 2013. ‘Talking to Children Matters: Early Language Experience Strengthens Processing and Builds Vocabulary’, Psychological Science, XX(X) 1–.10 Weitzman, E. and Greenberg J., 2002. Learning Language and Loving It (2nd ed.), Toronto, Canada: Hanen Programme. Whittaker, JEV., Jones Harden, B., See, HM., Meisch, AD., and Westbrook, TR., 2011. ‘Family risks and protective factors: Pathways to Early Head Start toddlers’ social–emotional functioning’, Early Childhood Research Quarterly, 26, 74–86. Williams, J., Greene, S., Doyle, E., Harris, E., Layte, R., McCoy, S., McCrory, C., Murray, A., Nixon, E., O’Dowd, T., O’Moore, M., Quail, A., Smyth, E., Swords, L., and Thornton, M., 2009. Growing Up in Ireland: National Longitudinal Study of Children – The Lives of Year‐Olds, Dublin: Department of Children and Youth Affairs. Available at: www.growingup.ie Williams, J., Greene, S., McNally, S., Murray, A., and Quail, A., 2010. Growing Up in Ireland: National Longitudinal Study of Children – The Infants and Their Families, Dublin: Department of Children and Youth Affairs. Available at: www.growingup.ie Williams, J., Murray, A., McCrory, C., McNally, S., 2013. Growing Up in Ireland: National Longitudinal Study of Children Development From Birth To Three Years, Report 5, Dublin: Department of Children and Youth Affairs. Available at: www.growingup.ie WRC Social and Economic Consultants, 2010. More than the Sum of its Parts: An Evaluation of Ballymun Network for Assisting Children and Young People (2005‐2010), Main and Summary Report. December, Available at: www.youngballymun.org Wrzesniewski, A., 2002. 'It's Not Just a Job', Shifting Meanings of Work in the Wake of 9/11’, September, Vol 11, No 3, Journal of Management Inquiry, 220‐234. Zaffron, S., and Logan, D., 2009. The Three Laws of Performance: Rewriting the future of your organisation and your life, San Francisco: Jossey‐Bass. Zigler, E., Pfannenstiel, J., Seitz, V., 2008. ‘The Parents as Teachers Program and School Success: A Replication and Extension’, J Primary Prevent (2008) 29:103–120.


The National Early Years Access Initiative 2O1O-2O14The National Early Years Access Initiative (NEYAI) is a
collaboration between a number of funding partners namely, theDepartment of Children and Youth Affairs(DCYA), the Departmentof Education and Skills (DES), the Mount Street Club Trust, The
Atlantic Philanthropies and the Board of Pobal.
© Pobal 2014All rights reserved. No part of this publication may be reproduced, stored in a retrieval system or transmitted in any form or by any means, electronic,
mechanical, photocopying or otherwise, without the prior permission of Pobal.
ISBN number: 978-1-904262-41-1