Evaluation of MODIS LAI, fAPAR and the relation between fAPAR and NDVI in a semi-arid environment...
18
Evaluation of MODIS LAI, fAPAR and the relation between fAPAR and NDVI in a semi-arid environment using in situ measurements Rasmus Fensholt * , Inge Sandholt, Michael Schultz Rasmussen Institute of Geography, University of Copenhagen, Øster Voldgade 10, DK-1350 Copenhagen, Denmark Received 4 August 2003; received in revised form 16 April 2004; accepted 18 April 2004 Abstract On global and regional scales, earth observation (EO)-based estimates of leaf area index (LAI) provide valuable input to climate and hydrologic modelling, while fraction of absorbed photosynthetically active radiation (fAPAR) is a key variable in the assessment of vegetation productivity and yield estimates. Validation of moderate resolution imaging spectroradiometer (MODIS) LAI and fAPAR products is an important prerequisite to using these variables for global modelling or for local water resource modelling and net primary production (NPP) assessment, as in semi-arid West Africa and Senegal. In situ measurements of LAI and fAPAR from three sites in semi-arid Senegal were carried out in 2001 and 2002 for comparison with remotely sensed MODIS data. The seasonal dynamics of both in situ LAI and fAPAR were captured well by MODIS LAI and fAPAR. MODIS LAI is overestimated by approximately 2–15% and the overall level of fAPAR is overestimated by 8–20%. Both MODIS LAI and fAPAR are characterised by a moderate offset, which is slightly higher than can be explained by model and input data uncertainty. In situ fAPAR and normalised differential vegetation index (NDVI) for three different vegetation types showed a strong linear relationship, suggesting that covariance between fAPAR and NDVI is insensitive to variations in leaf angle distribution (LAD) and vegetative heterogeneity. A strong linear relation also exists between MODIS fAPAR and NDVI but with different regression coefficients than the in situ relation because of MODIS’ tendency to overestimate fAPAR. The fAPAR/NDVI relations found here, however, do not apply on a global scale but are only valid for similar sun-sensor view geometry and soil colour. D 2004 Elsevier Inc. All rights reserved. Keywords: fAPAR; In situ measurements; LAI; MODIS; NDVI; Sahel; Semi-arid 1. Introduction Leaf area index (LAI) and fraction of photosynthetically active radiation absorbed by vegetation (fAPAR) represent two biophysically complementary ways of describing the earth’s vegetated surfaces. LAI is generally defined as the one-sided green leaf area per unit ground area in broadleaf canopies (Myneni et al., 1997) and LAI gives an estimate of the green leaf area of terrestrial vegetation. fAPAR is a measure of how large a fraction of the sunlight leaves absorb in the 0.4–0.7 Am spectrum and fAPAR thus expresses a canopy’s energy absorption capacity. Moderate resolution imaging spectroradiometer (MODIS) global cov- erage satellite products of LAI and fAPAR (Collection 4) have been released to the public recently. On a global scale, both LAI and fAPAR are key variables in many climatic models (Sellers et al., 1996, 1997) and models of net primary production (NPP) (Running et al., 1999). In the context of resource management goals laid out by the Kyoto protocol (United Nations, 1992), earth observation (EO) of these variables is the most effective means of collecting data on a regular basis. On a regional scale, EO estimates of LAI can provide valuable information for hydrological model- ling (Andersen et al., 2002; Kite & Pietrorino, 1996) and fAPAR is a key variable in the assessment of vegetation productivity (Prince, 1991a,b). When estimating the productivity of terrestrial ecosys- tems from satellite images, canopy spectral measures of vegetation intensity in relative units must be converted into quantitative biophysical variables. This conversion has been performed using models of varying complexity. Top-down statistical models provide an empirical rela- tionship between variables. A number of statistical studies (Rasmussen, 1992; Tucker et al., 1983, 1985) have ana- lysed the direct relation between the integrated normalised differential vegetation index (NDVI) from the NOAA 0034-4257/$ - see front matter D 2004 Elsevier Inc. All rights reserved. doi:10.1016/j.rse.2004.04.009 * Corresponding author. Tel.: +45-35322526. E-mail address: [email protected] (R. Fensholt). www.elsevier.com/locate/rse Remote Sensing of Environment 91 (2004) 490 – 507
-
Upload
independent -
Category
Documents
-
view
1 -
download
0
Transcript of Evaluation of MODIS LAI, fAPAR and the relation between fAPAR and NDVI in a semi-arid environment...
www.elsevier.com/locate/rse
Remote Sensing of Environment 91 (2004) 490–507
Evaluation of MODIS LAI, fAPAR and the relation between fAPAR and
NDVI in a semi-arid environment using in situ measurements
Rasmus Fensholt*, Inge Sandholt, Michael Schultz Rasmussen
Institute of Geography, University of Copenhagen, Øster Voldgade 10, DK-1350 Copenhagen, Denmark
Received 4 August 2003; received in revised form 16 April 2004; accepted 18 April 2004
Abstract
On global and regional scales, earth observation (EO)-based estimates of leaf area index (LAI) provide valuable input to climate and
hydrologic modelling, while fraction of absorbed photosynthetically active radiation (fAPAR) is a key variable in the assessment of
vegetation productivity and yield estimates. Validation of moderate resolution imaging spectroradiometer (MODIS) LAI and fAPAR products
is an important prerequisite to using these variables for global modelling or for local water resource modelling and net primary production
(NPP) assessment, as in semi-arid West Africa and Senegal. In situ measurements of LAI and fAPAR from three sites in semi-arid Senegal
were carried out in 2001 and 2002 for comparison with remotely sensed MODIS data. The seasonal dynamics of both in situ LAI and fAPAR
were captured well by MODIS LAI and fAPAR. MODIS LAI is overestimated by approximately 2–15% and the overall level of fAPAR is
overestimated by 8–20%. Both MODIS LAI and fAPAR are characterised by a moderate offset, which is slightly higher than can be
explained by model and input data uncertainty. In situ fAPAR and normalised differential vegetation index (NDVI) for three different
vegetation types showed a strong linear relationship, suggesting that covariance between fAPAR and NDVI is insensitive to variations in leaf
angle distribution (LAD) and vegetative heterogeneity. A strong linear relation also exists between MODIS fAPAR and NDVI but with
different regression coefficients than the in situ relation because of MODIS’ tendency to overestimate fAPAR. The fAPAR/NDVI relations
found here, however, do not apply on a global scale but are only valid for similar sun-sensor view geometry and soil colour.
D 2004 Elsevier Inc. All rights reserved.
Keywords: fAPAR; In situ measurements; LAI; MODIS; NDVI; Sahel; Semi-arid
1. Introduction
Leaf area index (LAI) and fraction of photosynthetically
active radiation absorbed by vegetation (fAPAR) represent
two biophysically complementary ways of describing the
earth’s vegetated surfaces. LAI is generally defined as the
one-sided green leaf area per unit ground area in broadleaf
canopies (Myneni et al., 1997) and LAI gives an estimate of
the green leaf area of terrestrial vegetation. fAPAR is a
measure of how large a fraction of the sunlight leaves
absorb in the 0.4–0.7 Am spectrum and fAPAR thus
expresses a canopy’s energy absorption capacity. Moderate
resolution imaging spectroradiometer (MODIS) global cov-
erage satellite products of LAI and fAPAR (Collection 4)
have been released to the public recently. On a global scale,
both LAI and fAPAR are key variables in many climatic
0034-4257/$ - see front matter D 2004 Elsevier Inc. All rights reserved.
doi:10.1016/j.rse.2004.04.009
* Corresponding author. Tel.: +45-35322526.
E-mail address: [email protected] (R. Fensholt).
models (Sellers et al., 1996, 1997) and models of net
primary production (NPP) (Running et al., 1999). In the
context of resource management goals laid out by the Kyoto
protocol (United Nations, 1992), earth observation (EO) of
these variables is the most effective means of collecting data
on a regular basis. On a regional scale, EO estimates of LAI
can provide valuable information for hydrological model-
ling (Andersen et al., 2002; Kite & Pietrorino, 1996) and
fAPAR is a key variable in the assessment of vegetation
productivity (Prince, 1991a,b).
When estimating the productivity of terrestrial ecosys-
tems from satellite images, canopy spectral measures of
vegetation intensity in relative units must be converted into
quantitative biophysical variables. This conversion has been
performed using models of varying complexity.
Top-down statistical models provide an empirical rela-
tionship between variables. A number of statistical studies
(Rasmussen, 1992; Tucker et al., 1983, 1985) have ana-
lysed the direct relation between the integrated normalised
differential vegetation index (NDVI) from the NOAA
R. Fensholt et al. / Remote Sensing of Environment 91 (2004) 490–507 491
AVHRR and yield or NPP. This approach is only applica-
ble on local to regional scale because it is based on the
assumption that incoming radiation and its conversion to
dry matter are constant in time and space, which is not the
case on a larger scale.
The intermediate level of model complexity is charac-
terised by parametric models, which represent complex
photosynthetic processes using a few biophysical variables.
The ongoing research has sought to establish more phys-
ically based relationships between vegetation development
and NDVI through the use of parametric models. Theo-
retically, most of these models originate from the light use
efficiency (LUE) concept proposed by Monteith (1972)
and seek to describe light absorption by plant canopies
through a relation between NDVI and fAPAR (Begue,
1993; Goward & Huemmrich, 1992; Hanan et al., 1995;
Le Roux et al., 1997). fAPAR is still expressed as a ratio
but can be converted into absorbed photosynthetically
active radiation (APAR) usually expressed in MJ/m2 by
multiplying the fAPAR ratio by incoming PAR. Using the
LUE concept for modelling of NPP is contingent on a
robust relationship between the biophysical variables
fAPAR and NDVI. Numerous authors have studied this
relation and there is general agreement that a stronger
relation exists between fAPAR and NDVI than between
LAI and NDVI (Myneni et al., 1995, 2002). Based on
satellite data, the relationship between NDVI and fAPAR
has been found to be linear or approximately linear for
green vegetation (Prince & Goward, 1995; Ruimy et al.,
1994) and by radiative transfer models (Begue, 1993;
Carlson & Ripley, 1997; Goward & Huemmrich, 1992;
Myneni & Williams, 1994). Gobron et al. (2000) propose a
new mathematical approach to derive vegetation index
formulae optimized to estimate the same vegetation prop-
erty fraction of fAPAR to assure as much as possible a
one-to-one relationship between VI and fAPAR. This
approach is used in the design of the MERIS vegetation
index (MGVI). Few studies have, however, tested the
relation against in situ measurements. Hatfield et al.
(1984) find a linear relation for wheat and Begue (1991)
finds a linear relation for millet. Lind and Fensholt (1999)
likewise demonstrate a linear relation between fAPAR and
NDVI for millet, grass savannah and sorghum, but Le
Roux et al. (1997) find the relation to be nonlinear for
humid savannah grassland. A number of factors are found
to influence the parameters of this linear relation. These
can be divided into external factors, including atmospheric
influence and view angle geometry, and canopy-related
factors, including leaf angle distribution (LAD), canopy
heterogeneity, soil–canopy reflectance interactions and
senescent material in the canopy. Based on a radiation
transfer model, Begue (1993) found the relation between
fAPAR and NDVI to be sensitive to varying solar zenith
angles, Van Leeuwen and Huete (1996) found that the
presence of dead leaves may alter the relation and Huete et
al. (1999) concluded that the relation between fAPAR and
NDVI is site-specific and often only valid when calibrated
for a given soil type.
Bottom-up models include highly complex ecosystem
simulation models describing the detailed interaction among
incoming radiation, individual leaves and the canopy as a
whole. These models often require a number of input
variables, which can be difficult to derive from EO data.
In practice, many of these variables are simulated in
additional models and stored in lookup tables. Coupling
EO data with in-depth ecosystem understanding thereby
enables spatially distributed estimation of vegetation
productivity.
MODIS LAI and fAPAR products are derived from a
global-scale process model. Retrieval of the variables is
based on biome-specific algorithms assigned specific a
priori assumptions about LAD and constants on, for exam-
ple, leaf, wood, litter and soil optical properties (Knyazikhin
et al., 1998a,b). This approach minimises the number of
unknowns when solving the inverse problem of retrieving
LAI and fAPAR from the atmospherically corrected and
bidirectional reflectance distribution function (BRDF) cor-
rected MODIS channel 1–7 (Myneni et al., 2000). The
algorithms compare observed surface reflectance to mod-
elled values for a broad range of canopy structures and soil
patterns representing natural conditions all stored in a
lookup table. Solving the inverse problem results either in
no solutions, a unique solution or multiple solutions for a
given set of reflectance properties. A given solution is
accepted if the uncertainty between observed and modelled
reflectance is less than the uncertainty on the observed
reflectance (Privette et al., 2002). The mean values of LAI
and fAPAR averaged over all acceptable solutions will
thereby be the final output. If no solution exists, a backup
routine using biome-specific conversion algorithms of the
vegetation index is applied for LAI and fAPAR assessment
(Myneni et al., 1997). For a detailed description of MODIS
fAPAR and LAI modelling, see Knyazikhin et al. (1999)
and Myneni et al. (2002).
Modelled LAI and fAPAR evidently simplifies reality,
and the validity of the modelling shortcuts must be tested
for a number of sites representing all the biomes included
in the model. Validation is an important step before using
models for global forecasting as evidenced by the recent
experiences of the Intergovernmental Panel on Climate
Change (IPCC) recently. Using the products for water
resource modelling and NPP assessment in a regional or
national context (like in the semi-arid West Africa and
Senegal), it is, however, equally important that the prod-
ucts are validated. The current study sites form part of the
global ‘‘fluxnet’’ subsites, currently the only sites covering
the grass savannah in West African Sahel. The aim of this
paper is twofold: to provide validation of the MODIS LAI
and fAPAR products for a semi-arid grass savannah in
Senegal, using in situ measured time series of these
variables, and to analyse the possibilities and constraints
of establishing a robust relationship between NDVI and
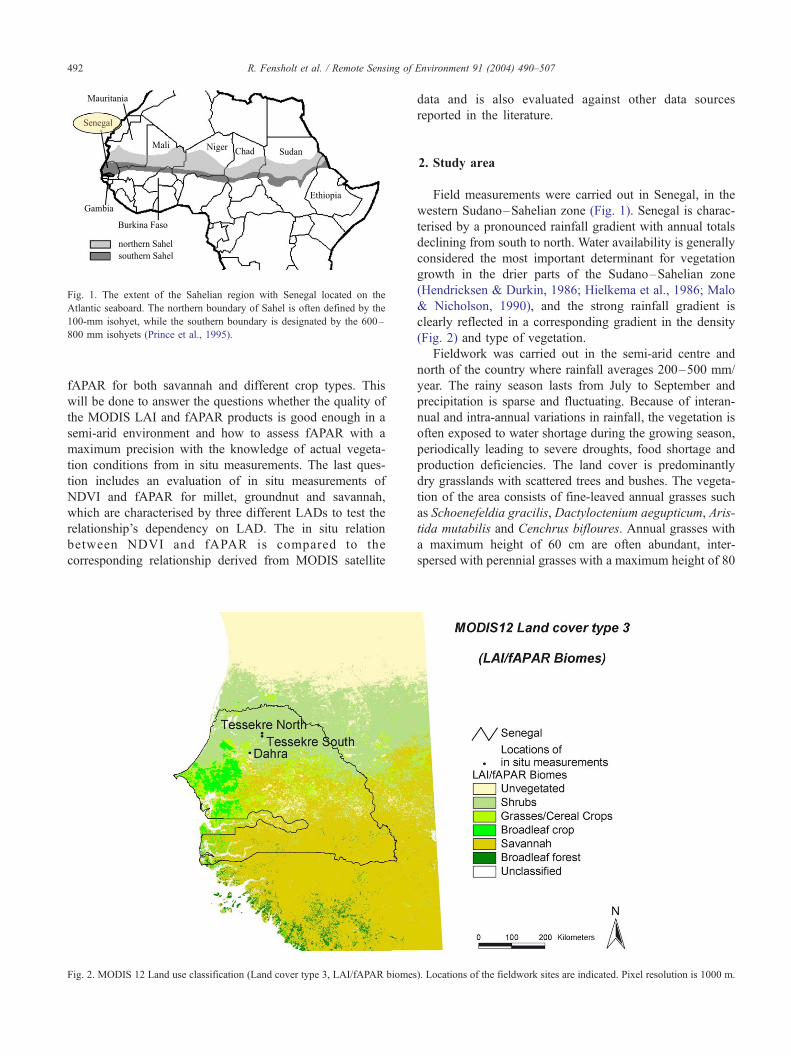
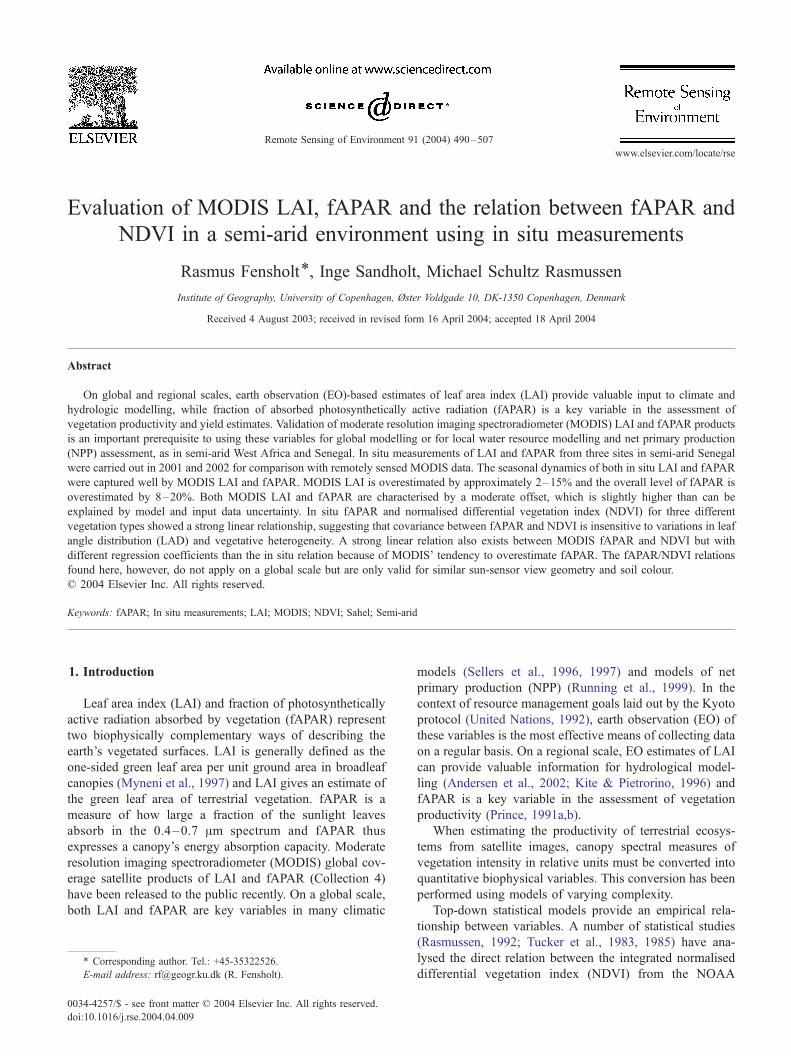
Fig. 1. The extent of the Sahelian region with Senegal located on the
Atlantic seaboard. The northern boundary of Sahel is often defined by the
100-mm isohyet, while the southern boundary is designated by the 600–
800 mm isohyets (Prince et al., 1995).
R. Fensholt et al. / Remote Sensing of Environment 91 (2004) 490–507492
fAPAR for both savannah and different crop types. This
will be done to answer the questions whether the quality of
the MODIS LAI and fAPAR products is good enough in a
semi-arid environment and how to assess fAPAR with a
maximum precision with the knowledge of actual vegeta-
tion conditions from in situ measurements. The last ques-
tion includes an evaluation of in situ measurements of
NDVI and fAPAR for millet, groundnut and savannah,
which are characterised by three different LADs to test the
relationship’s dependency on LAD. The in situ relation
between NDVI and fAPAR is compared to the
corresponding relationship derived from MODIS satellite
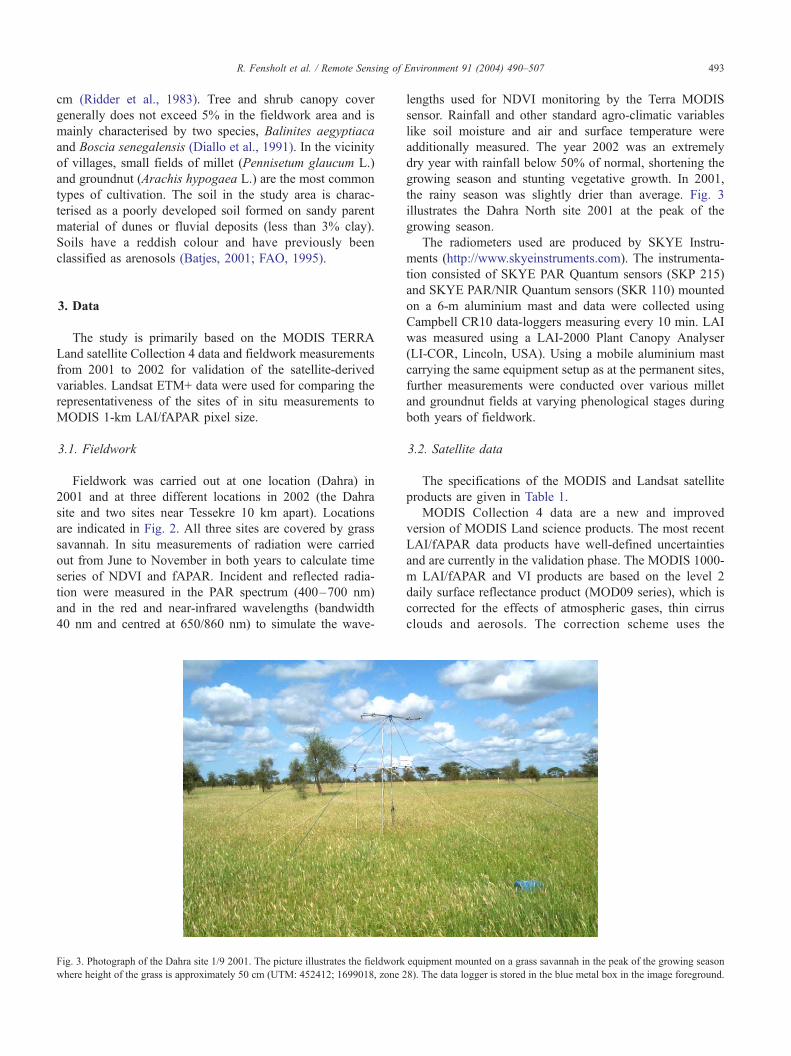
Fig. 2. MODIS 12 Land use classification (Land cover type 3, LAI/fAPAR biomes
data and is also evaluated against other data sources
reported in the literature.
2. Study area
Field measurements were carried out in Senegal, in the
western Sudano–Sahelian zone (Fig. 1). Senegal is charac-
terised by a pronounced rainfall gradient with annual totals
declining from south to north. Water availability is generally
considered the most important determinant for vegetation
growth in the drier parts of the Sudano–Sahelian zone
(Hendricksen & Durkin, 1986; Hielkema et al., 1986; Malo
& Nicholson, 1990), and the strong rainfall gradient is
clearly reflected in a corresponding gradient in the density
(Fig. 2) and type of vegetation.
Fieldwork was carried out in the semi-arid centre and
north of the country where rainfall averages 200–500 mm/
year. The rainy season lasts from July to September and
precipitation is sparse and fluctuating. Because of interan-
nual and intra-annual variations in rainfall, the vegetation is
often exposed to water shortage during the growing season,
periodically leading to severe droughts, food shortage and
production deficiencies. The land cover is predominantly
dry grasslands with scattered trees and bushes. The vegeta-
tion of the area consists of fine-leaved annual grasses such
as Schoenefeldia gracilis, Dactyloctenium aegupticum, Aris-
tida mutabilis and Cenchrus bifloures. Annual grasses with
a maximum height of 60 cm are often abundant, inter-
spersed with perennial grasses with a maximum height of 80
). Locations of the fieldwork sites are indicated. Pixel resolution is 1000 m.
R. Fensholt et al. / Remote Sensing of Environment 91 (2004) 490–507 493
cm (Ridder et al., 1983). Tree and shrub canopy cover
generally does not exceed 5% in the fieldwork area and is
mainly characterised by two species, Balinites aegyptiaca
and Boscia senegalensis (Diallo et al., 1991). In the vicinity
of villages, small fields of millet (Pennisetum glaucum L.)
and groundnut (Arachis hypogaea L.) are the most common
types of cultivation. The soil in the study area is charac-
terised as a poorly developed soil formed on sandy parent
material of dunes or fluvial deposits (less than 3% clay).
Soils have a reddish colour and have previously been
classified as arenosols (Batjes, 2001; FAO, 1995).
3. Data
The study is primarily based on the MODIS TERRA
Land satellite Collection 4 data and fieldwork measurements
from 2001 to 2002 for validation of the satellite-derived
variables. Landsat ETM+ data were used for comparing the
representativeness of the sites of in situ measurements to
MODIS 1-km LAI/fAPAR pixel size.
3.1. Fieldwork
Fieldwork was carried out at one location (Dahra) in
2001 and at three different locations in 2002 (the Dahra
site and two sites near Tessekre 10 km apart). Locations
are indicated in Fig. 2. All three sites are covered by grass
savannah. In situ measurements of radiation were carried
out from June to November in both years to calculate time
series of NDVI and fAPAR. Incident and reflected radia-
tion were measured in the PAR spectrum (400–700 nm)
and in the red and near-infrared wavelengths (bandwidth
40 nm and centred at 650/860 nm) to simulate the wave-
Fig. 3. Photograph of the Dahra site 1/9 2001. The picture illustrates the fieldwork
where height of the grass is approximately 50 cm (UTM: 452412; 1699018, zone 2
lengths used for NDVI monitoring by the Terra MODIS
sensor. Rainfall and other standard agro-climatic variables
like soil moisture and air and surface temperature were
additionally measured. The year 2002 was an extremely
dry year with rainfall below 50% of normal, shortening the
growing season and stunting vegetative growth. In 2001,
the rainy season was slightly drier than average. Fig. 3
illustrates the Dahra North site 2001 at the peak of the
growing season.
The radiometers used are produced by SKYE Instru-
ments (http://www.skyeinstruments.com). The instrumenta-
tion consisted of SKYE PAR Quantum sensors (SKP 215)
and SKYE PAR/NIR Quantum sensors (SKR 110) mounted
on a 6-m aluminium mast and data were collected using
Campbell CR10 data-loggers measuring every 10 min. LAI
was measured using a LAI-2000 Plant Canopy Analyser
(LI-COR, Lincoln, USA). Using a mobile aluminium mast
carrying the same equipment setup as at the permanent sites,
further measurements were conducted over various millet
and groundnut fields at varying phenological stages during
both years of fieldwork.
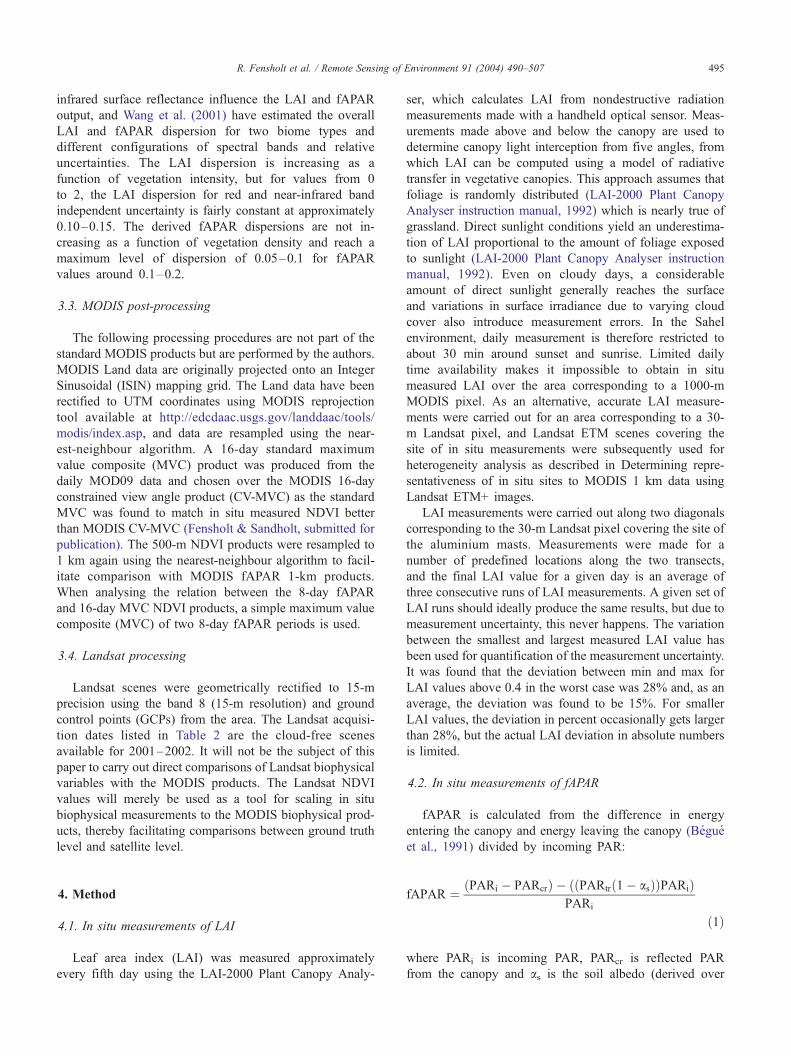
3.2. Satellite data
The specifications of the MODIS and Landsat satellite
products are given in Table 1.
MODIS Collection 4 data are a new and improved
version of MODIS Land science products. The most recent
LAI/fAPAR data products have well-defined uncertainties
and are currently in the validation phase. The MODIS 1000-
m LAI/fAPAR and VI products are based on the level 2
daily surface reflectance product (MOD09 series), which is
corrected for the effects of atmospheric gases, thin cirrus
clouds and aerosols. The correction scheme uses the
equipment mounted on a grass savannah in the peak of the growing season
8). The data logger is stored in the blue metal box in the image foreground.
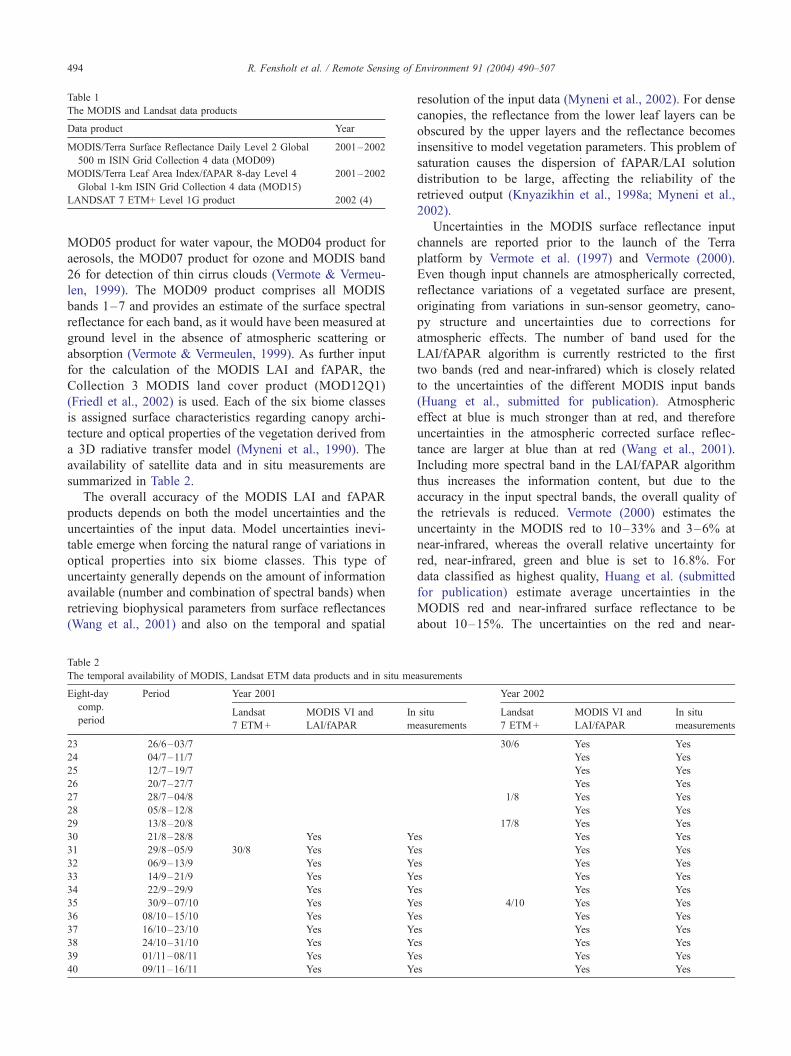
Table 1
The MODIS and Landsat data products
Data product Year
MODIS/Terra Surface Reflectance Daily Level 2 Global
500 m ISIN Grid Collection 4 data (MOD09)
2001–2002
MODIS/Terra Leaf Area Index/fAPAR 8-day Level 4
Global 1-km ISIN Grid Collection 4 data (MOD15)
2001–2002
LANDSAT 7 ETM+ Level 1G product 2002 (4)
R. Fensholt et al. / Remote Sensing of Environment 91 (2004) 490–507494
MOD05 product for water vapour, the MOD04 product for
aerosols, the MOD07 product for ozone and MODIS band
26 for detection of thin cirrus clouds (Vermote & Vermeu-
len, 1999). The MOD09 product comprises all MODIS
bands 1–7 and provides an estimate of the surface spectral
reflectance for each band, as it would have been measured at
ground level in the absence of atmospheric scattering or
absorption (Vermote & Vermeulen, 1999). As further input
for the calculation of the MODIS LAI and fAPAR, the
Collection 3 MODIS land cover product (MOD12Q1)
(Friedl et al., 2002) is used. Each of the six biome classes
is assigned surface characteristics regarding canopy archi-
tecture and optical properties of the vegetation derived from
a 3D radiative transfer model (Myneni et al., 1990). The
availability of satellite data and in situ measurements are
summarized in Table 2.
The overall accuracy of the MODIS LAI and fAPAR
products depends on both the model uncertainties and the
uncertainties of the input data. Model uncertainties inevi-
table emerge when forcing the natural range of variations in
optical properties into six biome classes. This type of
uncertainty generally depends on the amount of information
available (number and combination of spectral bands) when
retrieving biophysical parameters from surface reflectances
(Wang et al., 2001) and also on the temporal and spatial
Table 2
The temporal availability of MODIS, Landsat ETM data products and in situ me
Eight-day Period Year 2001
comp.
periodLandsat
7 ETM+
MODIS VI and
LAI/fAPAR
In
m
23 26/6–03/7
24 04/7–11/7
25 12/7–19/7
26 20/7–27/7
27 28/7–04/8
28 05/8–12/8
29 13/8–20/8
30 21/8–28/8 Yes Ye
31 29/8–05/9 30/8 Yes Ye
32 06/9–13/9 Yes Ye
33 14/9–21/9 Yes Ye
34 22/9–29/9 Yes Ye
35 30/9–07/10 Yes Ye
36 08/10–15/10 Yes Ye
37 16/10–23/10 Yes Ye
38 24/10–31/10 Yes Ye
39 01/11–08/11 Yes Ye
40 09/11–16/11 Yes Ye
resolution of the input data (Myneni et al., 2002). For dense
canopies, the reflectance from the lower leaf layers can be
obscured by the upper layers and the reflectance becomes
insensitive to model vegetation parameters. This problem of
saturation causes the dispersion of fAPAR/LAI solution
distribution to be large, affecting the reliability of the
retrieved output (Knyazikhin et al., 1998a; Myneni et al.,
2002).
Uncertainties in the MODIS surface reflectance input
channels are reported prior to the launch of the Terra
platform by Vermote et al. (1997) and Vermote (2000).
Even though input channels are atmospherically corrected,
reflectance variations of a vegetated surface are present,
originating from variations in sun-sensor geometry, cano-
py structure and uncertainties due to corrections for
atmospheric effects. The number of band used for the
LAI/fAPAR algorithm is currently restricted to the first
two bands (red and near-infrared) which is closely related
to the uncertainties of the different MODIS input bands
(Huang et al., submitted for publication). Atmospheric
effect at blue is much stronger than at red, and therefore
uncertainties in the atmospheric corrected surface reflec-
tance are larger at blue than at red (Wang et al., 2001).
Including more spectral band in the LAI/fAPAR algorithm
thus increases the information content, but due to the
accuracy in the input spectral bands, the overall quality of
the retrievals is reduced. Vermote (2000) estimates the
uncertainty in the MODIS red to 10–33% and 3–6% at
near-infrared, whereas the overall relative uncertainty for
red, near-infrared, green and blue is set to 16.8%. For
data classified as highest quality, Huang et al. (submitted
for publication) estimate average uncertainties in the
MODIS red and near-infrared surface reflectance to be
about 10–15%. The uncertainties on the red and near-
asurements
Year 2002
situ
easurements
Landsat
7 ETM+
MODIS VI and
LAI/fAPAR
In situ
measurements
30/6 Yes Yes
Yes Yes
Yes Yes
Yes Yes
1/8 Yes Yes
Yes Yes
17/8 Yes Yes
s Yes Yes
s Yes Yes
s Yes Yes
s Yes Yes
s Yes Yes
s 4/10 Yes Yes
s Yes Yes
s Yes Yes
s Yes Yes
s Yes Yes
s Yes Yes
R. Fensholt et al. / Remote Sensing of Environment 91 (2004) 490–507 495
infrared surface reflectance influence the LAI and fAPAR
output, and Wang et al. (2001) have estimated the overall
LAI and fAPAR dispersion for two biome types and
different configurations of spectral bands and relative
uncertainties. The LAI dispersion is increasing as a
function of vegetation intensity, but for values from 0
to 2, the LAI dispersion for red and near-infrared band
independent uncertainty is fairly constant at approximately
0.10–0.15. The derived fAPAR dispersions are not in-
creasing as a function of vegetation density and reach a
maximum level of dispersion of 0.05–0.1 for fAPAR
values around 0.1–0.2.
3.3. MODIS post-processing
The following processing procedures are not part of the
standard MODIS products but are performed by the authors.
MODIS Land data are originally projected onto an Integer
Sinusoidal (ISIN) mapping grid. The Land data have been
rectified to UTM coordinates using MODIS reprojection
tool available at http://edcdaac.usgs.gov/landdaac/tools/
modis/index.asp, and data are resampled using the near-
est-neighbour algorithm. A 16-day standard maximum
value composite (MVC) product was produced from the
daily MOD09 data and chosen over the MODIS 16-day
constrained view angle product (CV-MVC) as the standard
MVC was found to match in situ measured NDVI better
than MODIS CV-MVC (Fensholt & Sandholt, submitted for
publication). The 500-m NDVI products were resampled to
1 km again using the nearest-neighbour algorithm to facil-
itate comparison with MODIS fAPAR 1-km products.
When analysing the relation between the 8-day fAPAR
and 16-day MVC NDVI products, a simple maximum value
composite (MVC) of two 8-day fAPAR periods is used.
3.4. Landsat processing
Landsat scenes were geometrically rectified to 15-m
precision using the band 8 (15-m resolution) and ground
control points (GCPs) from the area. The Landsat acquisi-
tion dates listed in Table 2 are the cloud-free scenes
available for 2001–2002. It will not be the subject of this
paper to carry out direct comparisons of Landsat biophysical
variables with the MODIS products. The Landsat NDVI
values will merely be used as a tool for scaling in situ
biophysical measurements to the MODIS biophysical prod-
ucts, thereby facilitating comparisons between ground truth
level and satellite level.
4. Method
4.1. In situ measurements of LAI
Leaf area index (LAI) was measured approximately
every fifth day using the LAI-2000 Plant Canopy Analy-
ser, which calculates LAI from nondestructive radiation
measurements made with a handheld optical sensor. Meas-
urements made above and below the canopy are used to
determine canopy light interception from five angles, from
which LAI can be computed using a model of radiative
transfer in vegetative canopies. This approach assumes that
foliage is randomly distributed (LAI-2000 Plant Canopy
Analyser instruction manual, 1992) which is nearly true of
grassland. Direct sunlight conditions yield an underestima-
tion of LAI proportional to the amount of foliage exposed
to sunlight (LAI-2000 Plant Canopy Analyser instruction
manual, 1992). Even on cloudy days, a considerable
amount of direct sunlight generally reaches the surface
and variations in surface irradiance due to varying cloud
cover also introduce measurement errors. In the Sahel
environment, daily measurement is therefore restricted to
about 30 min around sunset and sunrise. Limited daily
time availability makes it impossible to obtain in situ
measured LAI over the area corresponding to a 1000-m
MODIS pixel. As an alternative, accurate LAI measure-
ments were carried out for an area corresponding to a 30-
m Landsat pixel, and Landsat ETM scenes covering the
site of in situ measurements were subsequently used for
heterogeneity analysis as described in Determining repre-
sentativeness of in situ sites to MODIS 1 km data using
Landsat ETM+ images.
LAI measurements were carried out along two diagonals
corresponding to the 30-m Landsat pixel covering the site of
the aluminium masts. Measurements were made for a
number of predefined locations along the two transects,
and the final LAI value for a given day is an average of
three consecutive runs of LAI measurements. A given set of
LAI runs should ideally produce the same results, but due to
measurement uncertainty, this never happens. The variation
between the smallest and largest measured LAI value has
been used for quantification of the measurement uncertainty.
It was found that the deviation between min and max for
LAI values above 0.4 in the worst case was 28% and, as an
average, the deviation was found to be 15%. For smaller
LAI values, the deviation in percent occasionally gets larger
than 28%, but the actual LAI deviation in absolute numbers
is limited.
4.2. In situ measurements of fAPAR
fAPAR is calculated from the difference in energy
entering the canopy and energy leaving the canopy (Begue
et al., 1991) divided by incoming PAR:
fAPAR ¼ ðPARi � PARcrÞ � ððPARtrð1� asÞÞPARiÞPARi
ð1Þ
where PARi is incoming PAR, PARcr is reflected PAR
from the canopy and as is the soil albedo (derived over
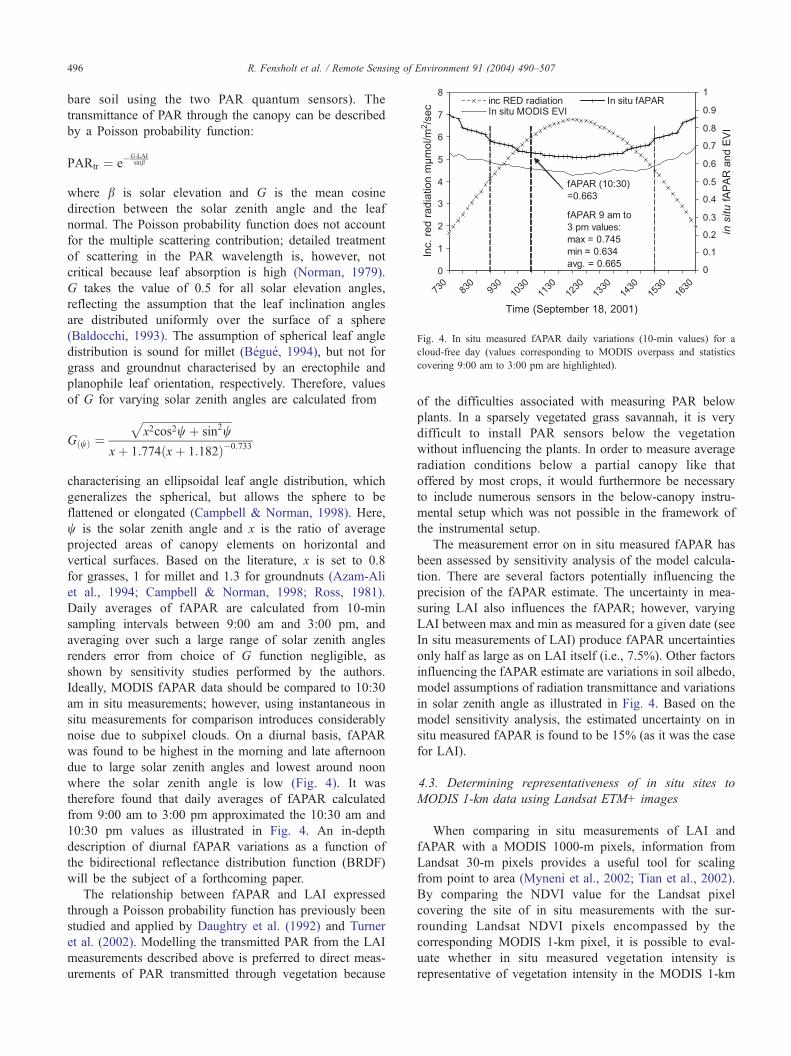
Fig. 4. In situ measured fAPAR daily variations (10-min values) for a
cloud-free day (values corresponding to MODIS overpass and statistics
covering 9:00 am to 3:00 pm are highlighted).
R. Fensholt et al. / Remote Sensing of Environment 91 (2004) 490–507496
bare soil using the two PAR quantum sensors). The
transmittance of PAR through the canopy can be described
by a Poisson probability function:
PARtr ¼ e�G�LAIsinb
where b is solar elevation and G is the mean cosine
direction between the solar zenith angle and the leaf
normal. The Poisson probability function does not account
for the multiple scattering contribution; detailed treatment
of scattering in the PAR wavelength is, however, not
critical because leaf absorption is high (Norman, 1979).
G takes the value of 0.5 for all solar elevation angles,
reflecting the assumption that the leaf inclination angles
are distributed uniformly over the surface of a sphere
(Baldocchi, 1993). The assumption of spherical leaf angle
distribution is sound for millet (Begue, 1994), but not for
grass and groundnut characterised by an erectophile and
planophile leaf orientation, respectively. Therefore, values
of G for varying solar zenith angles are calculated from
GðwÞ ¼ffiffiffiffiffiffiffiffiffiffiffiffiffiffiffiffiffiffiffiffiffiffiffiffiffiffiffiffiffiffiffiffix2cos2w þ sin2w
p
xþ 1:774ðxþ 1:182Þ�0:733
characterising an ellipsoidal leaf angle distribution, which
generalizes the spherical, but allows the sphere to be
flattened or elongated (Campbell & Norman, 1998). Here,
w is the solar zenith angle and x is the ratio of average
projected areas of canopy elements on horizontal and
vertical surfaces. Based on the literature, x is set to 0.8
for grasses, 1 for millet and 1.3 for groundnuts (Azam-Ali
et al., 1994; Campbell & Norman, 1998; Ross, 1981).
Daily averages of fAPAR are calculated from 10-min
sampling intervals between 9:00 am and 3:00 pm, and
averaging over such a large range of solar zenith angles
renders error from choice of G function negligible, as
shown by sensitivity studies performed by the authors.
Ideally, MODIS fAPAR data should be compared to 10:30
am in situ measurements; however, using instantaneous in
situ measurements for comparison introduces considerably
noise due to subpixel clouds. On a diurnal basis, fAPAR
was found to be highest in the morning and late afternoon
due to large solar zenith angles and lowest around noon
where the solar zenith angle is low (Fig. 4). It was
therefore found that daily averages of fAPAR calculated
from 9:00 am to 3:00 pm approximated the 10:30 am and
10:30 pm values as illustrated in Fig. 4. An in-depth
description of diurnal fAPAR variations as a function of
the bidirectional reflectance distribution function (BRDF)
will be the subject of a forthcoming paper.
The relationship between fAPAR and LAI expressed
through a Poisson probability function has previously been
studied and applied by Daughtry et al. (1992) and Turner
et al. (2002). Modelling the transmitted PAR from the LAI
measurements described above is preferred to direct meas-
urements of PAR transmitted through vegetation because
of the difficulties associated with measuring PAR below
plants. In a sparsely vegetated grass savannah, it is very
difficult to install PAR sensors below the vegetation
without influencing the plants. In order to measure average
radiation conditions below a partial canopy like that
offered by most crops, it would furthermore be necessary
to include numerous sensors in the below-canopy instru-
mental setup which was not possible in the framework of
the instrumental setup.
The measurement error on in situ measured fAPAR has
been assessed by sensitivity analysis of the model calcula-
tion. There are several factors potentially influencing the
precision of the fAPAR estimate. The uncertainty in mea-
suring LAI also influences the fAPAR; however, varying
LAI between max and min as measured for a given date (see
In situ measurements of LAI) produce fAPAR uncertainties
only half as large as on LAI itself (i.e., 7.5%). Other factors
influencing the fAPAR estimate are variations in soil albedo,
model assumptions of radiation transmittance and variations
in solar zenith angle as illustrated in Fig. 4. Based on the
model sensitivity analysis, the estimated uncertainty on in
situ measured fAPAR is found to be 15% (as it was the case
for LAI).
4.3. Determining representativeness of in situ sites to
MODIS 1-km data using Landsat ETM+ images
When comparing in situ measurements of LAI and
fAPAR with a MODIS 1000-m pixels, information from
Landsat 30-m pixels provides a useful tool for scaling
from point to area (Myneni et al., 2002; Tian et al., 2002).
By comparing the NDVI value for the Landsat pixel
covering the site of in situ measurements with the sur-
rounding Landsat NDVI pixels encompassed by the
corresponding MODIS 1-km pixel, it is possible to eval-
uate whether in situ measured vegetation intensity is
representative of vegetation intensity in the MODIS 1-km
Table 3
NDVI values of Landsat pixels covering the site of in situ measurements
and statistics of the 1111 pixels encompassed by the 1-km MODIS pixel
covering the location of in situ measurements; Grass savanna 2002
Fieldwork
site
NDVI statistics 01/08
2002
17/08
2002
04/10
2002
Dahra Landsat pixel value
for fieldwork site
0.150 0.210 0.180
Mean of area 0.144 0.203 0.176
Standard deviation
of area
0.009 0.012 0.011
Minimum of area 0.120 0.140 0.140
Maximum of area 0.180 0.260 0.250
Tessekre
North
Landsat pixel value
for fieldwork site
0.150 0.120 0.220
Mean of area 0.146 0.123 0.225
Standard deviation
of area
0.011 0.014 0.027
Minimum of area 0.120 0.090 0.180
Maximum of area 0.210 0.240 0.420
Tessekre
South
Landsat pixel value
for fieldwork site
0.160 0.140 0.350
Mean of area 0.162 0.138 0.342
Standard deviation
of area
0.009 0.013 0.033
Minimum of area 0.130 0.100 0.210
Maximum of area 0.210 0.230 0.410
R. Fensholt et al. / Remote Sensing of Environment 91 (2004) 490–507 497
pixel. Table 3 provides statistics of the three sites: the
NDVI value of the Landsat pixel covering the site of in
situ measurements and min, max, mean and standard
deviation of the 1111 Landsat pixels encompassed by the
MODIS 1-km pixel, respectively. The analysis of Landsat
NDVI pixel variance demonstrates that the areas around
the study sites are, in general, extremely homogenous with
respect to vegetation intensity. In all cases, the single
Landsat pixel NDVI value covering the sites of in situ
measurements is very close to the overall average of the
1111 pixels, and interpixel variance is very low revealing
that the vegetation density in the area in fact is very
homogeneous as also seen in Fig. 3. Based on this
heterogeneity analysis, the sites of in situ measurements
are found to be directly comparable to MODIS 1-km
satellite data. A detailed examination of the relation
between NDVI derived from in situ, Landsat and MODIS,
respectively, is reported in Fensholt and Sandholt (submit-
ted for publication).
5. Results and discussion
5.1. Comparison of in situ LAI measurements and MODIS
LAI
The 2001 and 2002 time series of LAI are pictured in
Fig. 5. The consequence of limited rainfall in 2002 is
clearly seen in the difference on the level of LAI at Dahra
between 2001 and 2002. Eight-day MODIS LAI values are
presented with their corresponding nonzero quality control
(QC) flags, which are explained in Table 4. It can be seen
that in two cases (QC flag 2), it was not possible to
produce a LAI value from the standard algorithms, so a
backup algorithm using MODIS NDVI is used instead.
This backup algorithm ensures a LAI (and fAPAR) value
for each composite period, though the quality of the
underlying NDVI pixel is also questionable because of
cloud interference. To facilitate direct comparison between
8-day MODIS values and in situ measured values, curves
are fitted to the MODIS 8-day data and daily data
interpolated. This was done using a four-parameter Gauss-
ian fit in the TableCurve software version 4 (www.systat.
com/products/TableCurve2D). The values of r2 are gener-
ally high justifying the comparative approach; however, for
2001, the r2 is lower presumably due to the September 6
LAI value, a possible outlier. This value is assigned QC
flag 2, signifying that it originates from a MODIS NDVI
value and is probably influenced by clouds.
The seasonal dynamics of LAI are captured reasonably
well, as can be seen when comparing the in situ data points
to the MODIS data in Fig. 5. Vegetative growth was much
more intense in 2001 than 2002: even the modest level of
vegetation intensity characterising the start of growing
season 2001 is never reached in 2002. As can be seen in
Fig. 6A, in situ and MODIS LAI values agree quite well
(LAI values of 1.5–2.5) with a slope close to the 1:1 line
and r2 value of 0.81. MODIS LAI values are slightly
overestimated with values 0.03–0.2 above in situ measure-
ments. This level is close to the overall uncertainty of the in
situ measured LAI, with several points lying within the
limits of the error bars. One value is, however, 0.4 larger,
and this range of values corresponds to an overestimation of
approximately 2–15%.
Scale dependency on the LAI measurements influences
the overall level of the values. The probability of spatial
variability in the soil background reflectance is larger for
coarse resolution pixels compared to fine resolution pixels.
When the spatial resolution of satellite data is decreased,
pixels are therefore likely to contain an increased amount
of radiation reflected from the background, causing an
underestimation of LAI (Tian et al., 2000). The magnitude
of underestimation also increases as vegetation heteroge-
neity increases, and Tian et al. (2002) found a 1-km
MODIS LAI pixel to be underestimated by 5% compared
to field measurements if resolution of the data is not
considered in the retrieval technique. The site in Botswana
is, however, more heterogeneous (with woodland and
adjacent shrubland patches) than the sites in Senegal and
the heterogeneity influence is therefore not expected to be
pronounced in this study. The 2001 MODIS LAI values
are, however, marginally higher than the in situ measured
data as indicated by the regression intercept of 0.13. The
highest in situ value of LAI in 2002 for the three sites is
just below 1 and the agreement between in situ measure-
ments and MODIS data are of varying quality (Fig. 6B–
D). Because of the very low dynamic range of data, it is,
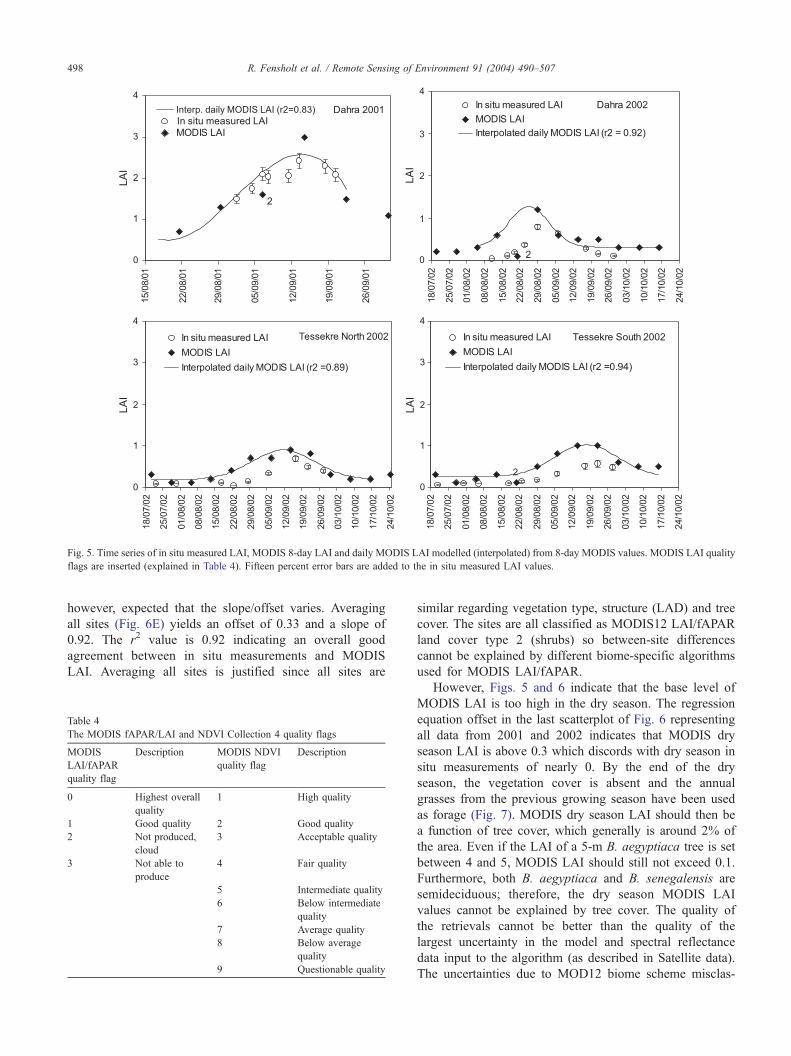
Fig. 5. Time series of in situ measured LAI, MODIS 8-day LAI and daily MODIS LAI modelled (interpolated) from 8-day MODIS values. MODIS LAI quality
flags are inserted (explained in Table 4). Fifteen percent error bars are added to the in situ measured LAI values.
R. Fensholt et al. / Remote Sensing of Environment 91 (2004) 490–507498
however, expected that the slope/offset varies. Averaging
all sites (Fig. 6E) yields an offset of 0.33 and a slope of
0.92. The r2 value is 0.92 indicating an overall good
agreement between in situ measurements and MODIS
LAI. Averaging all sites is justified since all sites are
Table 4
The MODIS fAPAR/LAI and NDVI Collection 4 quality flags
MODIS
LAI/fAPAR
quality flag
Description MODIS NDVI
quality flag
Description
0 Highest overall
quality
1 High quality
1 Good quality 2 Good quality
2 Not produced,
cloud
3 Acceptable quality
3 Not able to
produce
4 Fair quality
5 Intermediate quality
6 Below intermediate
quality
7 Average quality
8 Below average
quality
9 Questionable quality
similar regarding vegetation type, structure (LAD) and tree
cover. The sites are all classified as MODIS12 LAI/fAPAR
land cover type 2 (shrubs) so between-site differences
cannot be explained by different biome-specific algorithms
used for MODIS LAI/fAPAR.
However, Figs. 5 and 6 indicate that the base level of
MODIS LAI is too high in the dry season. The regression
equation offset in the last scatterplot of Fig. 6 representing
all data from 2001 and 2002 indicates that MODIS dry
season LAI is above 0.3 which discords with dry season in
situ measurements of nearly 0. By the end of the dry
season, the vegetation cover is absent and the annual
grasses from the previous growing season have been used
as forage (Fig. 7). MODIS dry season LAI should then be
a function of tree cover, which generally is around 2% of
the area. Even if the LAI of a 5-m B. aegyptiaca tree is set
between 4 and 5, MODIS LAI should still not exceed 0.1.
Furthermore, both B. aegyptiaca and B. senegalensis are
semideciduous; therefore, the dry season MODIS LAI
values cannot be explained by tree cover. The quality of
the retrievals cannot be better than the quality of the
largest uncertainty in the model and spectral reflectance
data input to the algorithm (as described in Satellite data).
The uncertainties due to MOD12 biome scheme misclas-

Fig. 6. Scatterplots of in situ measured LAI and daily MODIS LAI interpolated from 8-day values. (A) Dahra 2001, (B) Dahra 2002, (C) Tessekre North 2002,
(D) Tessekre South 2002 and (E) all sites. Fifteen percent error bars are added to the in situ measured LAI values.
R. Fensholt et al. / Remote Sensing of Environment 91 (2004) 490–507 499
sification and/or biome mixtures within 1-km pixel can be
assumed negligible because of the homogeneous areas of
fieldwork with respect to vegetation type and number of
Fig. 7. Photograph of the Dahra site 7/5 2001. The picture illustrates the fieldwork
452412; 1699018, zone 28).
species. Moreover, in case of misclassification between
biomes characterised by distinctly different structure, the
potential error in retrieved LAI and fAPAR can be large,
equipment mounted on a grass savannah in the end of the dry season (UTM:
R. Fensholt et al. / Remote Sensing of Environment 91 (2004) 490–507500
but the biomes represented in this area (shrubs; biome 2
and savannas; biome 4) are spectrally and structurally
similar biomes, meaning that the retrieved LAI/fAPAR
values are acceptable even though a given pixel has been
misclassified (Myneni et al., 2002). Uncertainty due to
saturation problems of the retrieved values because of
dense vegetation is not likely to be encountered in sparse
biomes such as grasses and shrubs (Myneni et al., 2002).
Uncertainties in the surface reflectance product, however,
set a limit to the minimum LAI retrievable from MODIS
satellite data. Variations in surface reflectance due to varia-
tions in LAI must exceed the variations originating from
uncertainties in surface reflectance to be treated as reliable
in the LAI/fAPAR algorithm. The uncertainty in the input
data was described in Satellite data. Wang et al. (2001)
estimated the dispersion on LAI to approximately 0.10–
0.15 for two distinctly different biomes, and from this
MODIS LAI, values will therefore never be smaller than
0.1 even if no vegetation is present. The dry season values
around 0.3 are, however, slightly larger than the a priori
minimum LAI value.
Few studies validating MODIS LAI are currently avail-
able. Privette et al. (2002) suggest a good agreement
between MODIS LAI and in situ measured LAI for semi-
arid woodland and savannah in Southern African Kalahari.
Fernandes et al. (2002) found the Collection 3 MODIS LAI
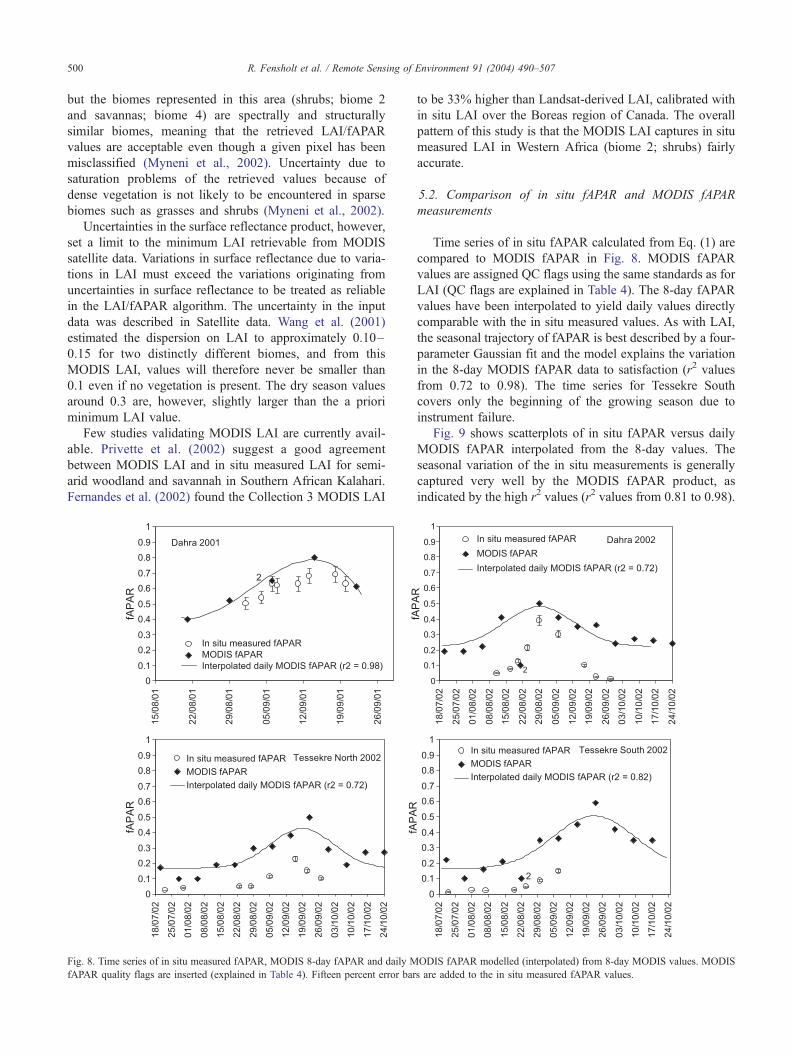
Fig. 8. Time series of in situ measured fAPAR, MODIS 8-day fAPAR and daily M
fAPAR quality flags are inserted (explained in Table 4). Fifteen percent error bar
to be 33% higher than Landsat-derived LAI, calibrated with
in situ LAI over the Boreas region of Canada. The overall
pattern of this study is that the MODIS LAI captures in situ
measured LAI in Western Africa (biome 2; shrubs) fairly
accurate.
5.2. Comparison of in situ fAPAR and MODIS fAPAR
measurements
Time series of in situ fAPAR calculated from Eq. (1) are
compared to MODIS fAPAR in Fig. 8. MODIS fAPAR
values are assigned QC flags using the same standards as for
LAI (QC flags are explained in Table 4). The 8-day fAPAR
values have been interpolated to yield daily values directly
comparable with the in situ measured values. As with LAI,
the seasonal trajectory of fAPAR is best described by a four-
parameter Gaussian fit and the model explains the variation
in the 8-day MODIS fAPAR data to satisfaction (r2 values
from 0.72 to 0.98). The time series for Tessekre South
covers only the beginning of the growing season due to
instrument failure.
Fig. 9 shows scatterplots of in situ fAPAR versus daily
MODIS fAPAR interpolated from the 8-day values. The
seasonal variation of the in situ measurements is generally
captured very well by the MODIS fAPAR product, as
indicated by the high r2 values (r2 values from 0.81 to 0.98).
ODIS fAPAR modelled (interpolated) from 8-day MODIS values. MODIS
s are added to the in situ measured fAPAR values.
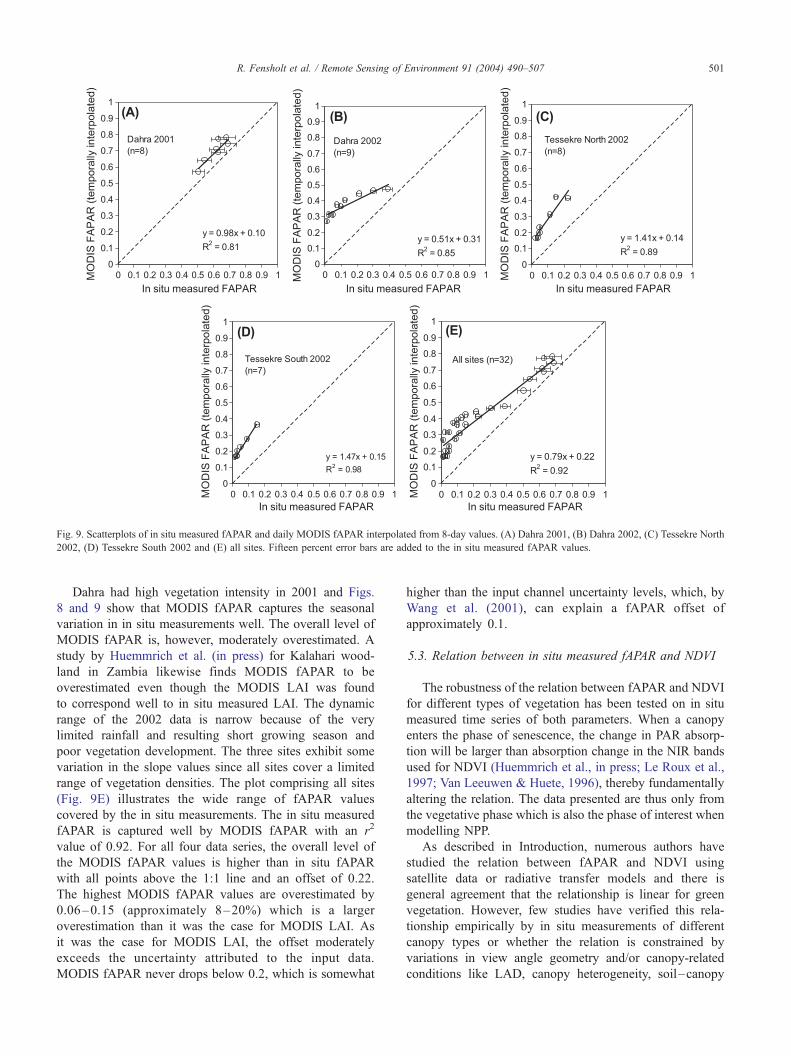
Fig. 9. Scatterplots of in situ measured fAPAR and daily MODIS fAPAR interpolated from 8-day values. (A) Dahra 2001, (B) Dahra 2002, (C) Tessekre North
2002, (D) Tessekre South 2002 and (E) all sites. Fifteen percent error bars are added to the in situ measured fAPAR values.
R. Fensholt et al. / Remote Sensing of Environment 91 (2004) 490–507 501
Dahra had high vegetation intensity in 2001 and Figs.
8 and 9 show that MODIS fAPAR captures the seasonal
variation in in situ measurements well. The overall level of
MODIS fAPAR is, however, moderately overestimated. A
study by Huemmrich et al. (in press) for Kalahari wood-
land in Zambia likewise finds MODIS fAPAR to be
overestimated even though the MODIS LAI was found
to correspond well to in situ measured LAI. The dynamic
range of the 2002 data is narrow because of the very
limited rainfall and resulting short growing season and
poor vegetation development. The three sites exhibit some
variation in the slope values since all sites cover a limited
range of vegetation densities. The plot comprising all sites
(Fig. 9E) illustrates the wide range of fAPAR values
covered by the in situ measurements. The in situ measured
fAPAR is captured well by MODIS fAPAR with an r2
value of 0.92. For all four data series, the overall level of
the MODIS fAPAR values is higher than in situ fAPAR
with all points above the 1:1 line and an offset of 0.22.
The highest MODIS fAPAR values are overestimated by
0.06–0.15 (approximately 8–20%) which is a larger
overestimation than it was the case for MODIS LAI. As
it was the case for MODIS LAI, the offset moderately
exceeds the uncertainty attributed to the input data.
MODIS fAPAR never drops below 0.2, which is somewhat
higher than the input channel uncertainty levels, which, by
Wang et al. (2001), can explain a fAPAR offset of
approximately 0.1.
5.3. Relation between in situ measured fAPAR and NDVI
The robustness of the relation between fAPAR and NDVI
for different types of vegetation has been tested on in situ
measured time series of both parameters. When a canopy
enters the phase of senescence, the change in PAR absorp-
tion will be larger than absorption change in the NIR bands
used for NDVI (Huemmrich et al., in press; Le Roux et al.,
1997; Van Leeuwen & Huete, 1996), thereby fundamentally
altering the relation. The data presented are thus only from
the vegetative phase which is also the phase of interest when
modelling NPP.
As described in Introduction, numerous authors have
studied the relation between fAPAR and NDVI using
satellite data or radiative transfer models and there is
general agreement that the relationship is linear for green
vegetation. However, few studies have verified this rela-
tionship empirically by in situ measurements of different
canopy types or whether the relation is constrained by
variations in view angle geometry and/or canopy-related
conditions like LAD, canopy heterogeneity, soil–canopy

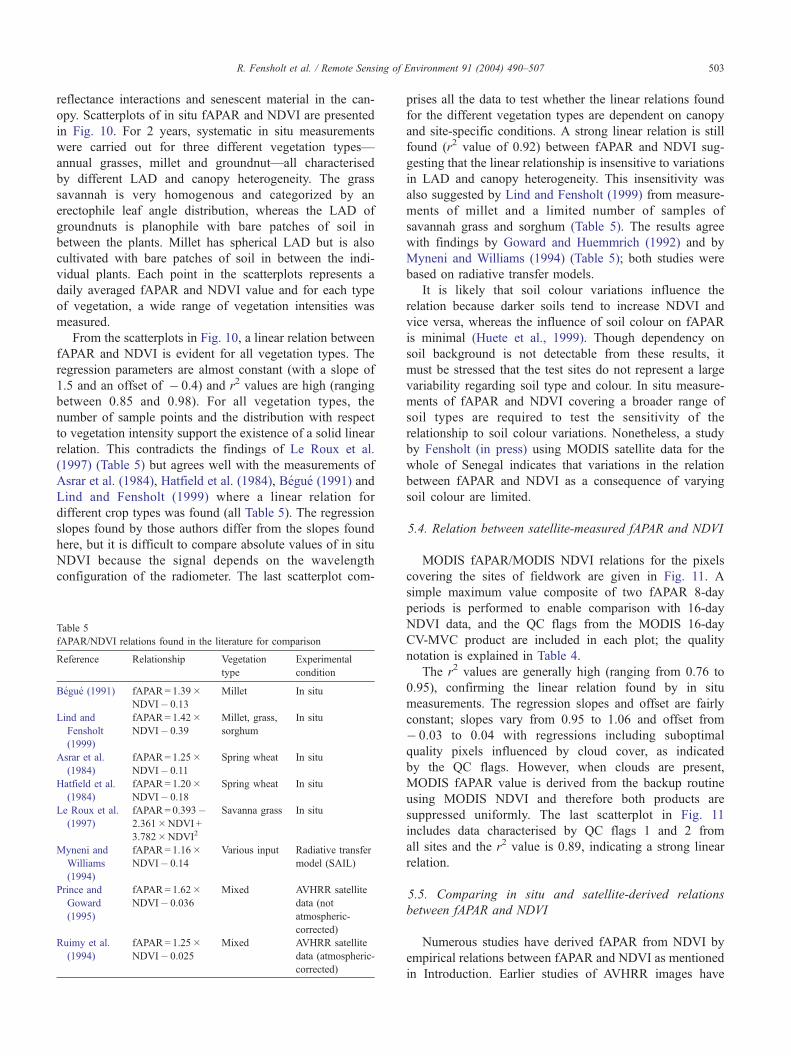
Fig. 10. Scatterplots of in situ measured fAPAR and NDVI for three different vegetation types characterised by different LAD and canopy heterogeneity:
annual grasses, millet and groundnut 2001 and 2002. All data are from the growing phase. Fifteen percent error bars are added to the in situ measured fAPAR
values.
R. Fensholt et al. / Remote Sensing of Environment 91 (2004) 490–507502
R. Fensholt et al. / Remote Sensing of Environment 91 (2004) 490–507 503
reflectance interactions and senescent material in the can-
opy. Scatterplots of in situ fAPAR and NDVI are presented
in Fig. 10. For 2 years, systematic in situ measurements
were carried out for three different vegetation types—
annual grasses, millet and groundnut—all characterised
by different LAD and canopy heterogeneity. The grass
savannah is very homogenous and categorized by an
erectophile leaf angle distribution, whereas the LAD of
groundnuts is planophile with bare patches of soil in
between the plants. Millet has spherical LAD but is also
cultivated with bare patches of soil in between the indi-
vidual plants. Each point in the scatterplots represents a
daily averaged fAPAR and NDVI value and for each type
of vegetation, a wide range of vegetation intensities was
measured.
From the scatterplots in Fig. 10, a linear relation between
fAPAR and NDVI is evident for all vegetation types. The
regression parameters are almost constant (with a slope of
1.5 and an offset of � 0.4) and r2 values are high (ranging
between 0.85 and 0.98). For all vegetation types, the
number of sample points and the distribution with respect
to vegetation intensity support the existence of a solid linear
relation. This contradicts the findings of Le Roux et al.
(1997) (Table 5) but agrees well with the measurements of
Asrar et al. (1984), Hatfield et al. (1984), Begue (1991) and
Lind and Fensholt (1999) where a linear relation for
different crop types was found (all Table 5). The regression
slopes found by those authors differ from the slopes found
here, but it is difficult to compare absolute values of in situ
NDVI because the signal depends on the wavelength
configuration of the radiometer. The last scatterplot com-
Table 5
fAPAR/NDVI relations found in the literature for comparison
Reference Relationship Vegetation
type
Experimental
condition
Begue (1991) fAPAR= 1.39�NDVI� 0.13
Millet In situ
Lind and
Fensholt
(1999)
fAPAR= 1.42�NDVI� 0.39
Millet, grass,
sorghum
In situ
Asrar et al.
(1984)
fAPAR= 1.25�NDVI� 0.11
Spring wheat In situ
Hatfield et al.
(1984)
fAPAR= 1.20�NDVI� 0.18
Spring wheat In situ
Le Roux et al.
(1997)
fAPAR= 0.393�2.361�NDVI +
3.782�NDVI2
Savanna grass In situ
Myneni and
Williams
(1994)
fAPAR= 1.16�NDVI� 0.14
Various input Radiative transfer
model (SAIL)
Prince and
Goward
(1995)
fAPAR= 1.62�NDVI� 0.036
Mixed AVHRR satellite
data (not
atmospheric-
corrected)
Ruimy et al.
(1994)
fAPAR= 1.25�NDVI� 0.025
Mixed AVHRR satellite
data (atmospheric-
corrected)
prises all the data to test whether the linear relations found
for the different vegetation types are dependent on canopy
and site-specific conditions. A strong linear relation is still
found (r2 value of 0.92) between fAPAR and NDVI sug-
gesting that the linear relationship is insensitive to variations
in LAD and canopy heterogeneity. This insensitivity was
also suggested by Lind and Fensholt (1999) from measure-
ments of millet and a limited number of samples of
savannah grass and sorghum (Table 5). The results agree
with findings by Goward and Huemmrich (1992) and by
Myneni and Williams (1994) (Table 5); both studies were
based on radiative transfer models.
It is likely that soil colour variations influence the
relation because darker soils tend to increase NDVI and
vice versa, whereas the influence of soil colour on fAPAR
is minimal (Huete et al., 1999). Though dependency on
soil background is not detectable from these results, it
must be stressed that the test sites do not represent a large
variability regarding soil type and colour. In situ measure-
ments of fAPAR and NDVI covering a broader range of
soil types are required to test the sensitivity of the
relationship to soil colour variations. Nonetheless, a study
by Fensholt (in press) using MODIS satellite data for the
whole of Senegal indicates that variations in the relation
between fAPAR and NDVI as a consequence of varying
soil colour are limited.
5.4. Relation between satellite-measured fAPAR and NDVI
MODIS fAPAR/MODIS NDVI relations for the pixels
covering the sites of fieldwork are given in Fig. 11. A
simple maximum value composite of two fAPAR 8-day
periods is performed to enable comparison with 16-day
NDVI data, and the QC flags from the MODIS 16-day
CV-MVC product are included in each plot; the quality
notation is explained in Table 4.
The r2 values are generally high (ranging from 0.76 to
0.95), confirming the linear relation found by in situ
measurements. The regression slopes and offset are fairly
constant; slopes vary from 0.95 to 1.06 and offset from
� 0.03 to 0.04 with regressions including suboptimal
quality pixels influenced by cloud cover, as indicated
by the QC flags. However, when clouds are present,
MODIS fAPAR value is derived from the backup routine
using MODIS NDVI and therefore both products are
suppressed uniformly. The last scatterplot in Fig. 11
includes data characterised by QC flags 1 and 2 from
all sites and the r2 value is 0.89, indicating a strong linear
relation.
5.5. Comparing in situ and satellite-derived relations
between fAPAR and NDVI
Numerous studies have derived fAPAR from NDVI by
empirical relations between fAPAR and NDVI as mentioned
in Introduction. Earlier studies of AVHRR images have
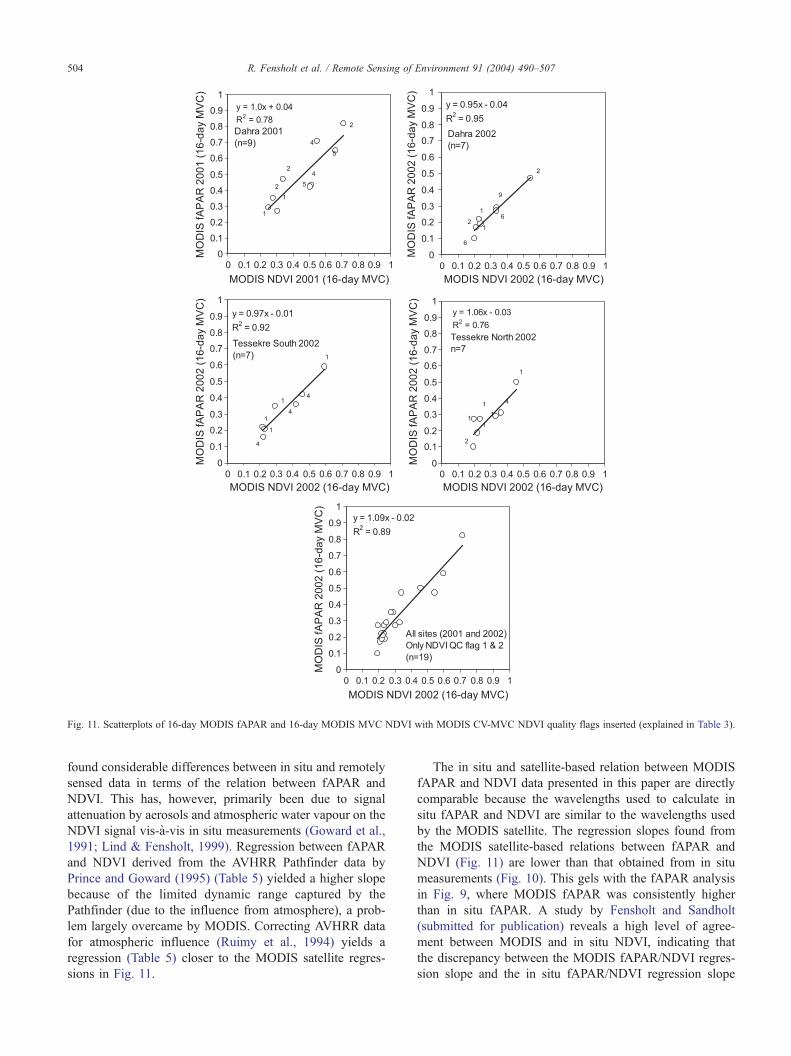
Fig. 11. Scatterplots of 16-day MODIS fAPAR and 16-day MODIS MVC NDVI with MODIS CV-MVC NDVI quality flags inserted (explained in Table 3).
R. Fensholt et al. / Remote Sensing of Environment 91 (2004) 490–507504
found considerable differences between in situ and remotely
sensed data in terms of the relation between fAPAR and
NDVI. This has, however, primarily been due to signal
attenuation by aerosols and atmospheric water vapour on the
NDVI signal vis-a-vis in situ measurements (Goward et al.,
1991; Lind & Fensholt, 1999). Regression between fAPAR
and NDVI derived from the AVHRR Pathfinder data by
Prince and Goward (1995) (Table 5) yielded a higher slope
because of the limited dynamic range captured by the
Pathfinder (due to the influence from atmosphere), a prob-
lem largely overcame by MODIS. Correcting AVHRR data
for atmospheric influence (Ruimy et al., 1994) yields a
regression (Table 5) closer to the MODIS satellite regres-
sions in Fig. 11.
The in situ and satellite-based relation between MODIS
fAPAR and NDVI data presented in this paper are directly
comparable because the wavelengths used to calculate in
situ fAPAR and NDVI are similar to the wavelengths used
by the MODIS satellite. The regression slopes found from
the MODIS satellite-based relations between fAPAR and
NDVI (Fig. 11) are lower than that obtained from in situ
measurements (Fig. 10). This gels with the fAPAR analysis
in Fig. 9, where MODIS fAPAR was consistently higher
than in situ fAPAR. A study by Fensholt and Sandholt
(submitted for publication) reveals a high level of agree-
ment between MODIS and in situ NDVI, indicating that
the discrepancy between the MODIS fAPAR/NDVI regres-
sion slope and the in situ fAPAR/NDVI regression slope
R. Fensholt et al. / Remote Sensing of Environment 91 (2004) 490–507 505
only to a limited extent can originate from the NDVI data.
It must, however, be stressed that even thoughMODISNDVI
values are based on atmospherically corrected data, the
sensor view angles in a 16-day composite image may still
vary considerably which introduces instability in the assess-
ment of fAPAR fromNDVI. The relation is also dependent on
solar zenith angle as illustrated in Fig. 4; even though fAPAR
and NDVI respond similar to diurnal solar zenith variations,
the different sensitivity makes the relation dependent on the
solar zenith angle. Despite the apparent insensitivity of the
fAPAR/NDVI relation to LAD, the BRDF thus introduces
instability in the assessment of fAPAR from NDVI. The
satellite-derived fAPAR/NDVI relations found here and the
relation to the in situ measured fAPAR and NDVI data
therefore do not apply on a global scale but is only valid
for similar sun-sensor BRDF.
6. Conclusion
At three different sites in semi-arid Senegal, West Africa,
in 2001 and 2002, MODIS LAI and fAPAR products have
been evaluated against in situ measurements. All sites are
characterised by a homogeneous cover of annual grasses
and a tree cover of maximum 2%. The seasonal dynamics of
both in situ LAI and fAPAR was captured fairly accurately
by MODIS LAI (r2 values of 0.23–0.96) and fAPAR (r2
values of 0.81–0.98). Both products were characterised by a
moderate offset, LAI having an offset of approximately 0.3
and fAPAR an offset of approximately 0.2–0.25. These
values indicate dry-season MODIS LAI and fAPAR base
levels which conflicts with actual dry-season field condi-
tions, where grass vegetation is all absent. The overall level
of the MODIS fAPAR values is higher than in situ fAPAR
with all points above the 1:1 line. The highest MODIS
fAPAR values from 2001 are overestimated by 0.06–0.15
(approximately 8–20%) which is a larger overestimation
than was the case for MODIS LAI (0.03–0.4, approximate-
ly 2–15%). These findings apply only to the LAI/fAPAR
biome class 2 (shrubs); additional studies are needed in
other regions characterised by same biome class, as well as
for other biomes, to determine to what extent offsets and
overestimation of fAPAR apply in other regions and biomes.
In situ measurements of fAPAR and NDVI (calculated
using the same wavelengths as MODIS NDVI) were con-
ducted for three different vegetation types during the field
campaign 2001 and 2002. Measurements were taken at
various phenological stages to cover a range of vegetation
intensities, and the three vegetation types were characterised
by different leaf angle distributions and homogeneity:
erectophile and homogeneous grasses, spherical and
clumped millet and planophile and clumped groundnut. A
strong linear relation was found between fAPAR and NDVI
(r2 ranging from 0.85 to 0.98) for each vegetation type.
Plotting all types together changed neither the coefficients
of explanation nor the regression parameters, confirming
that the relation between fAPAR and NDVI is insensitive to
variations in LAD and heterogeneity.
From MODIS data, a linear relation was also found
between fAPAR and NDVI. However, the regression coef-
ficients differ from those characterising the in situ data
because of the offset in the MODIS fAPAR data. The
fAPAR/NDVI relation insensitivity to LAD enables simple
empirical modelling of fAPAR from satellite NDVI; how-
ever, it must be stressed that such empirical relations are
dependent on solar and view zenith angle geometry and soil
colour variations. The satellite-derived fAPAR/NDVI rela-
tions found here and the relation to the in situ measured
fAPAR and NDVI data therefore do not apply on a global
scale but is only valid for similar sun-sensor view geometry
and soil colour.
Validation of MODIS fAPAR and LAI is an ongoing
process. Results from the fluxnet validation sites and sub-
sites around the world will be used to adjust and refine
MODIS fAPAR and LAI, thereby approaching real-world
levels for all biomes and continents. The current study
suggests that MODIS LAI reproduce the real-world LAI
for the semi-arid Senegal quite accurately, whereas MODIS
fAPAR is overestimated.
Acknowledgements
The study is funded by the Danish Research Councils,
ESA-related research, grant no. 9902490. Scientific equip-
ment for fieldwork is funded by the Danish Research
Agency, Danish Agricultural and Veterinary Research
Council grant no. 23-01-0153. The authors would like to
thank the MODIS Land Discipline Group for creating and
sharing the MODIS LAND data sets. The Centre de Suivi
Ecologique in Dakar is warmly acknowledged for providing
logistic support. The authors would also like to thank the
staff at Institut Senegalais de Recherhes Agronomiques
(ISRA) in Dahra for support during the fieldwork. Also,
Jørn Torp Pedersen, Mette Wolstrup Pedersen and Anette
Nørgaard deserve thanks for their fieldwork assistance.
Finally, we thank the anonymous reviewers for their sug-
gestions for improving this paper.
References
Andersen, J., Dybkjaer, G., Jensen, K. H., Refsgaard, J. C., & Rasmussen,
K. (2002). Use of remotely sensed precipitation and leaf area index in a
distributed hydrological model. Journal of Hydrology, 30, 34–50.
Asrar, G., Fuchs, M., Kanemasu, E. T., & Hatfield, J. L. (1984). Estimating
absorbed photosynthetic radiation and leaf area index from spectral
reflectance in wheat. Agronomy Journal, 76, 300–306.
Azam-Ali, S. N., Crout, N. M. J., & Bradley, R. G. (1994). Perspectives in
modelling resource capture by crops. In J. L. Monteith, R. K. Scott, &
M. H. Unsworth (Eds.), Resource capture by crops. Proceedings of
Easter schools in agricultural science ( pp. 125–148). Nottingham,
UK: Nottingham University Press.
Baldocchi, D. D. (1993). Scaling water vapour and carbon dioxide ex-
R. Fensholt et al. / Remote Sensing of Environment 91 (2004) 490–507506
change from leaves to canopy: Rules and tools. In J. R. Ehleringer, & C.
B. Field (Eds.), Scaling physiological processes (1st ed.) (pp. 77–114).
London, UK: Academic Press.
Batjes, N. H. (2001). Options for increasing carbon sequestration in West
African soils: An exploratory study with special focus on Senegal. Land
Degradation and Development, 12, 131–142.
Begue, A. (1991). Estimation de la production primaire en zone Sahelienne
a partir de donnees radiometriques. PhD thesis, Universite Paris VII.
Begue, A. (1993). Leaf area index, intercepted photosynthetically active
radiation, and spectral vegetation indices: A sensitivity analysis for
regular-clumped canopies. Remote Sensing of Environment, 46, 45–59.
Begue, A. (1994). Hapex 2 Sahel Documentation. http://www.orstom.fr/
hapex/doc/ipar.txt
Begue, A., Desprat, J. F., Imbernon, J., & Baret, F. (1991). Radiation use
efficiency of pearl millet in the Sahelian zone. Agricultural and Forest
Meteorology, 56, 93–110.
Campbell, S. G., & Norman, J. M. (1998). An introduction to environmen-
tal biophysics (2nd ed.). New York, NY: Springer-Verlag.
Carlson, T. N., & Ripley, D. A. (1997). On the relation between NDVI,
fractional vegetation cover, and leaf area index. Remote Sensing of
Environment, 62(3), 241–252.
Daughtry, C. S. T., Gallo, K. P., Goward, S. N., Prince, S. D., & Kustas, W.
P. (1992). Spectral estimates of absorbed radiation and phytomass pro-
duction in corn and soybean canopies. Remote Sensing of Environment,
39, 141–152.
Diallo, O., Diouf, A., Hanan, N. P., Ndiaye, A., & Prevost, Y. (1991).
AVHRR monitoring of savannah primary production in Senegal, West
Africa. International Journal of Remote Sensing, 12(6), 1259–1279.
FAO. (1995). Digital soil map of the world and derived soil properties.
Land and Water Digital Media Series, vol. 1. Rome: FAO.
Fensholt, R. (in press). Earth Observation of Vegetation Status in the Sahe-
lian and Sudanian West Africa: Comparison of TERRA MODIS and
NOAA AVHRR satellite data. International Journal of Remote Sensing.
Fensholt, R., & Sandholt, I. (submitted for publication). Validation of the
MODIS and NOAA AVHRR vegetation indices with in situ measure-
ments in a semi-arid environment. Remote Sensing of Environment.
Fernandes, R., Leblanc, S., Butson, C., Latifovic, R., & Pavlic, G. (2002).
Derivation and evaluation of coarse resolution LAI estimates over
Canada. IGARSS 2002 IEEE International Geoscience and Remote
Sensing Symposium and the 24th Canadian Symposium on Remote
Sensing, June 24–28, 2002, Toronto, Canada.
Friedl, M. A., McIver, D. K., Hodges, J. C. F., Zhang, X. Y., Muchoney, D.,
Strahler, A. H., Woodcock, C. E., Gopal, S., Schneider, A., & Cooper,
A. (2002). Global land cover mapping from MODIS: Algorithms and
early results. Remote Sensing of Environment, 83, 287–302.
Gobron, N., Pinty, B., Verstraete, M. M., & Widlowski, J. L. (2000).
Advanced vegetation indices optimized for up-coming sensors: Design,
performance and applications. IEEE Transactions on Geoscience and
Remote Sensing, 38, 2489–2505.
Goward, S. N., & Huemmrich, K. F. (1992). Vegetation canopy PAR absorp-
tance and the normalized difference vegetation index: An assessment
using the SAIL model. Remote Sensing of Environment, 39, 119–140.
Goward, S. N., Markham, B., Dye, D. G., Dulaney, W., & Yang, J. (1991).
Normalized difference vegetation index measurements from the ad-
vanced very high resolution radiometer. Remote Sensing of Environ-
ment, 35, 257–277.
Hanan, N. P., Prince, S. D., & Begue, A. (1995). Estimation of absorbed
photosynthetically active radiation and vegetation net production effi-
ciency using satellite data. Agricultural and Forest Meteorology, 76,
259–276.
Hatfield, J. L., Asrar, G., & Kanemasu, E. T. (1984). Intercepted photo-
synthetically active radiation estimated by spectral reflectance. Remote
Sensing of Environment, 14, 65–75.
Hendricksen, B. L., & Durkin, J. W. (1986). Growing period and drought
early warning in Africa using satellite data. International Journal of
Remote Sensing, 7(11), 1583–1608.
Hielkema, J. U., Prince, S. D., & Astle, W. L. (1986). Rainfall and vege-
tation monitoring in the Savannah Zone of the Democratic Republic of
Sudan using the NOAA advanced very high re-solution radiometer.
International Journal of Remote Sensing, 7(11), 1499–1513.
Huang, D., Yang, W., Tan, B., Shabanov, N. V., Knyazikhin, Y., & Myneni,
R. B. (2003, August). Evaluation of Collection 3 MODIS LAI products
with respect to input data uncertainties—case study for grasses. Remote
Sensing of Environment (Submitted for publication).
Huemmrich, K. F., Privette, J. L., Mukelabai, M., Myneni, R. B., & Knya-
zikhin, Y. (in press). Time-series validation of MODIS land biophysical
products in a Kalahari Woodland, Africa. International Journal of Re-
mote Sensing.
Huete, A. R, Justice, C. O., & Van Leeuwen, W. J. D. (1999). MODIS
Vegetation Index (MOD 13). Version 3. Algorithm Theoretical Basis
Document. http://modis.gsfc.nasa.gov/data/atbd/land_atbd.html
Kite, G. W., & Pietrorino, A. (1996). Remote sensing applications in hy-
drological modelling. Hydrological Sciences Journal, 41(4), 563–587.
Knyazikhin, Y., Glassy, J., Privette, J. L., Tian, P., Lotsch, A., Zhang,
Y., Wang, Y., Morisette, J. T., Votava, P., Myneni, R. B., Nemani, R.
R., & Running, S. W. (1999). MODIS Leaf Area Index (LAI) and
fraction of photosynthetically active radiation absorbed by vegetation
(fPAR). Product (MOD15) Algorithm Theoretical Basis Document.
Knyazikhin, Y., Martonchik, J. V., Diner, D. J., Myneni, R. B., Verstraete,
M., Pinty, B., & Gobron, N. (1998a). Estimation of vegetation canopy
leaf area index and fraction of absorbed photosynthetically active radi-
ation from atmosphere-corrected MISR data. Journal of Geophysical
Research, D: Atmospheres, 103, 32239–32256.
Knyazikhin, Y., Martonchik, J. V., Myneni, R. B., Diner, D. J., & Running,
S. W. (1998b). Synergistic algorithm for estimating vegetation canopy
leaf area index and fraction of absorbed photosynthetically active radi-
ation from MODIS and MISR data. Journal of Geophysical Research,
D: Atmospheres, 103, 32257–32275.
LAI-2000 Plant Canopy Analyser instruction manual. (1992). Lincoln,
Nebraska 68504, USA: LI-COR.
Le Roux, X., Gauthier, H., Begue, A., & Sinoquet, H. (1997). Radiation
absorption and use by humid savannah grassland. Assessment using
remote sensing and modelling. Agricultural and Forest Meteorology,
85, 117–132.
Lind, M., & Fensholt, R. (1999). The spatio-temporal relationship between
rainfall and vegetation development in Burkina Faso. Geografisk Tids-
skrift/Danish Journal of Geography. Special Issue, 2, 43–55.
Malo, A. R., & Nicholson, S. E. (1990). A study of rainfall and vegetation
dynamics in the African Sahel using normalized difference vegetation
index. Journal of Arid Environments, 19, 1–24.
Monteith, J. L. (1972). Solar radiation and productivity in tropical ecosys-
tems. Journal of Applied Ecology, 9, 747–766.
Myneni, R., Running, S. W., Glassy, J., & Votova, P. (2000). User’s Guide:
fPAR, LAI (ESDT: MOD15A2) 8-day Composite. NASA MODIS
Land Algorithm.
Myneni, R. B., Asrar, G., & Gerstl, S. A. W. (1990). Radiative transfer in
three-dimensional leaf canopies. Transport Theory and Statistical Phys-
ics, 19, 205–250.
Myneni, R. B., Hall, F. G., Sellers, P. J., & Marshak, A. L. (1995). The
interpretation of spectral vegetation indexes. IEEE Transactions on
Geoscience and Remote Sensing, 33(2), 481–486.
Myneni, R. B., Knyazikhin, Y., Privette, J. L., Glassy, J., Tian, Y., Wang, Y.,
Hoffman, S., Song, X., Zhang, Y., Smith, G. R., Lotsch, A., Friedl, M.,
Morisette, J. T., Votava, P., Nemani, R. R., & Running, S. W. (2002).
Global products of vegetation leaf area and fraction absorbed PAR from
year one of MODIS data. Remote Sensing of Environment, 83, 214–231.
Myneni, R. B., Nemani, R. R., & Running, S. W. (1997). Estimation of
global leaf area index and absorbed PAR using radiative transfer
model. IEEE Transactions on Geoscience and Remote Sensing, 35,
1380–1393.
Myneni, R. B., & Williams, D. L. (1994). On the relationship between
FAPAR and NDVI. Remote Sensing of Environment, 49, 200–211.
Norman,J.M.(1979).Modelingthecompletecropcanopy.InB.J.Barfield,Gerber,
Gerber, & J. F. Gerber (Eds.), Modification of the aerial environment
R. Fensholt et al. / Remote Sensing of Environment 91 (2004) 490–507 507
of plants (pp. 249–277). St. Joseph, MO: American Society of Agri-
cultural Engineers.
Prince, S. D. (1991a). Lite remote sensing of primary production: Compar-
ison of results for Sahelian grasslands 1981–1988. International Jour-
nal of Remote Sensing, 12, 1301–1311.
Prince, S. D. (1991b). A model of regional primary production for use with
coarse resolution satellite data. International Journal of Remote Sens-
ing, 12, 1313–1330.
Prince, S. D., Kerr, Y. H., Goutorbe, J. -P., Lebel, T., Tinge, A., Bessemou-
lin, P., Brouwer, J., Dolman, A. J., Engman, E. T., Gash, J. H. C.,
Hoepffner, M., Kabat, P., Monteny, B., Said, F., Sellers, P., & Wallace,
J. (1995). Geographical, biological and remote sensing aspects of the
hydrologic atmospheric pilot experiment in the Sahel (HAPEX-Sahel).
Remote Sensing of Environment, 51, 215–234.
Prince, S. D., & Goward, S. N. (1995). Global primary production: A
remote sensing approach. Journal of Biogeography, 22, 815–835.
Privette, J. L., Myneni, R. B., Knyazikhin, Y., Mukelabai, M., Roberts, G.,
Tian, Y., Wang, Y., & Leblanc, S. G. (2002). Early spatial and temporal
validation of MODIS LAI product in the Southern Africa Kalahari.
Remote Sensing of Environment, 83, 232–243.
Rasmussen, M. S. (1992). Assessment of millet yields and production in
northern Burkina Faso using integrated NDVI from the AVHRR. Inter-
national Journal of Remote Sensing, 13, 3431–3442.
Ridder, N., Stroosnijder, L., Cisse, A. M., & van Kelulen, H. (1983).
Productivity of Sahelian rangelands, a study of the soils, the vegetation
and the exploitation of the natural resources. PPS course book, vol. 1
( pp. 7–34). Wageningen, Netherlands: Agricultural University.
Ross, J. (1981). The radiation regime and architecture of plant stands. The
Hague: Dr W Junk.
Ruimy, A., Saugier, B., & Dedieu, G. (1994). Methodology for the esti-
mation of terrestrial net primary production from remotely sensed data.
Journal of Geophysical Research, 99(D3), 5263–5283.
Running, S. W., Nemani, R., Glassy, J. M., & Thornton, P. E. (1999).
MODIS daily photosynthesis (PSN) and annual net primary production
(NPP) product (MOD17). Algorithm Theoretical Basis Document Ver-
sion 3.0.
Sellers, P. J., Dickinson, R. E., Randall, D. A., Betts, A. K., Hall, F. G., Berry,
J. A., Collatz, C. J., Denning, A. S., Mooney, H. A., Nobre, C. A., & Sato,
N. (1997). Modelling the exchanges of energy, water, and carbon be-
tween the continents and the atmosphere. Science, 275, 502–509.
Sellers, P. J., Los, S. O., Tucker, C. J., Justice, C. O., Dazlich, D. A.,
Collatz, G. J., & Randall, D. A. (1996). A revised land surface param-
eterization (SiB2) for atmospheric GCMs: Part II. The generation of
global fields of terrestrial biophysical parameters from satellite data.
Journal of Climate, 9, 706–737.
Tian, Y., Woodcock, C. E., Wang, Y., Privette, J. L., Shabanov, N. V., Zhou,
L., Zhang, Y., Buermann, W., Dong, J., Veikkanen, B., Hame, T.,
Ozdogan, M., Knyazikhin, Y., & Myneni, R. B. (2002). Multiscale
analysis and validation of the MODIS LAI product: I. Uncertainty
assessment. Remote Sensing of Environment, 83, 414–430.
Tian, Y., Zhang, Y., Knyazikhin, Y., Myneni, R. B., Glassy, J., Dedieu, G.,
& Running, S. W. (2000). Prototyping of MODIS LAI and fPAR algo-
rithm with LASUR and LANDSAT data. IEEE Transactions on Geo-
science and Remote Sensing, 38, 2387–2401.
Tucker, C. J., Vanpraet, C. L., Boerwinkel, E., & Gaston, A. (1983). Sat-
ellite remote sensing of total dry matter production in the Senegalese
Sahel. Remote Sensing of Environment, 13, 461–474.
Tucker, C. J., Vanpraet, C. L., Sharman, M. J., & van Ittersum, G. (1985).
Satellite remote sensing of total herbaceous biomass production in the
Senegalese Sahel: 1980–1984. Remote Sensing of Environment, 17,
233–249.
Turner, D. P., Gower, S. T., Cohen,W. B., Gregory,M., &Maiersperger, T. K.
(2002). Effects of spatial variability in light use efficiency on satellite-
based NPP monitoring. Remote Sensing of Environment, 80, 397–405.
United Nations (1992). UNITED NATIONS FRAMEWORK CONVEN-
TION ON CLIMATE CHANGE. http://unfccc.int/resource/docs/
convkp/conveng.pdf
Van Leeuwen, W. J. D., & Huete, A. R. (1996). Effects of standing litter on
the biophysical interpretation of plant canopies with spectral indices.
Remote Sensing of Environment, 55, 123–138.
Vermote, E. (2000). Product accuracy/uncertainty: MOD09, surface reflec-
tance; atmospheric correction algorithm product. In MODIS Data Prod-
ucts Catalog (EOS AM Platform). http://modarch.gsfc.nasa.gov/
MODIS/RESULTS/DATAPROD/
Vermote, E. F., El Saleous, N. Z., Justice, C. O., Kaufman, Y. J., Privette, J.,
Remer, L., Roger, J. C., & Tanre, D. (1997). Atmospheric correction
visible to middle infrared EOS-MODIS data over land surface, back-
ground, operational algorithm and validation. Journal of Geophysical
Research, 102(14), 17131–17141.
Vermote, E. F., & Vermeulen, A. (1999). Atmospheric correction algorithm:
Special reflectances (MOD09), ATBD version 4.0.
Wang, Y. J., Tian, Y. H., Zhang, Y., El Saleous, N., Knyazikhin, Y., Ver-
mote, E., & Myneni, R. B. (2001). Investigation of product accuracy as
a function of input and model uncertainties—Case study with SeaWiFS
and MODIS LAI/fPAR algorithm. Remote Sensing of Environment,
78(3), 299–313.