Evaluation of mentum deformities of Chironomus spp. (Chironomidae: Diptera) larvae using modified...
12
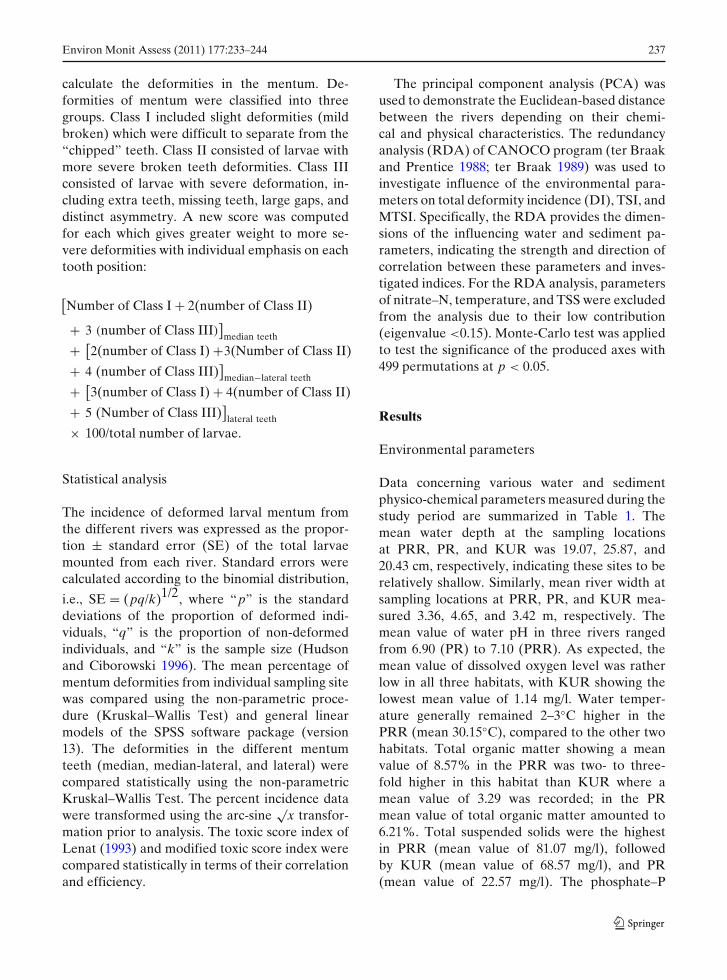
Environ Monit Assess (2011) 177:233–244 DOI 10.1007/s10661-010-1630-1 Evaluation of mentum deformities of Chironomus spp. (Chironomidae: Diptera) larvae using modified toxic score index (MTSI) to assess the environmental stress in Juru River Basin, Penang, Malaysia Salman Abdo Al-Shami · Mad Rawi Che Salmah · Ahmad Abu Hassan · Mohd Nor Siti Azizah Received: 11 August 2009 / Accepted: 26 July 2010 / Published online: 10 August 2010 © Springer Science+Business Media B.V. 2010 Abstract Morphological mentum deformities which represent sublethal effect of exposure to different types of pollutants were evaluated in Chironomus spp. larvae inhabiting three polluted rivers of Juru River Basin in northwestern peninsular Malaysia. Using mentum deformity incidences, the modified toxic score index (MTSI) was developed based on Lenat’s toxic score index (TSI). The suggested MTSI was compared with TSI in terms of its effectiveness to identify different pollutants including heavy metals. The MTSI showed stronger relationship to total deformity incidence expressed as percentage. Additionally, the multivariate RDA model showed higher capability of MTSI to explain the variations in heavy metal contents of the river sediments. The MTSI was recommended in bioassessment of water and sediment quality using the mentum deformities of Chironomus spp. larvae from aquatic ecosystems re- S. A. Al-Shami (B ) · M. R. Che Salmah · A. Abu Hassan · M. N. Siti Azizah School of Biological Sciences, Universiti Sains Malaysia (USM), 11800 Penang, Malaysia e-mail: [email protected] M. N. Siti Azizah Centre for Marine and Coastal Studies, Universiti Sains Malaysia, Penang, Malaysia ceiving anthropogenic, agricultural, or industrial discharges. Keywords Chironomus spp. · Mentum deformities · River pollution · Toxic score index Introduction In freshwater ecosystems, chironomids are con- sidered to be ideal bioassay organisms since they spend most of their larval stages in the water where they are exposed to toxicants in both water and sediments. These criteria make them suit- able organisms for ecotoxicological monitoring (Warwick 1985; Ingersoll and Nelson 1990; Vermeulen 1995; Al-Shami et al. 2010a, b). When continuously exposed to stress or pollution, late instars of some chironomid larvae frequently de- velop deformities in the mouthparts, especially the mentum. An existing hypothesis based on field observations is that the deformities in benthic midge larvae are a reflection of the environmental pollution due to heavy metals, radioactivity, or- ganic pesticides, and other xenobiotics (Bird 1994; Vermeulen 1995; Servia et al. 1998; Watanabe et al. 2000; Reynolds and Ferrington 2001, 2002; Martinez et al. 2004; Al-Shami et al. 2010a). The occurrence of developmental deformities in chironomids appears to be a general stress
Transcript of Evaluation of mentum deformities of Chironomus spp. (Chironomidae: Diptera) larvae using modified...
Environ Monit Assess (2011) 177:233–244DOI 10.1007/s10661-010-1630-1
Evaluation of mentum deformities of Chironomus spp.(Chironomidae: Diptera) larvae using modified toxicscore index (MTSI) to assess the environmental stressin Juru River Basin, Penang, Malaysia
Salman Abdo Al-Shami · Mad Rawi Che Salmah ·Ahmad Abu Hassan · Mohd Nor Siti Azizah
Received: 11 August 2009 / Accepted: 26 July 2010 / Published online: 10 August 2010© Springer Science+Business Media B.V. 2010
Abstract Morphological mentum deformitieswhich represent sublethal effect of exposure todifferent types of pollutants were evaluated inChironomus spp. larvae inhabiting three pollutedrivers of Juru River Basin in northwesternpeninsular Malaysia. Using mentum deformityincidences, the modified toxic score index (MTSI)was developed based on Lenat’s toxic scoreindex (TSI). The suggested MTSI was comparedwith TSI in terms of its effectiveness to identifydifferent pollutants including heavy metals. TheMTSI showed stronger relationship to totaldeformity incidence expressed as percentage.Additionally, the multivariate RDA modelshowed higher capability of MTSI to explainthe variations in heavy metal contents of theriver sediments. The MTSI was recommendedin bioassessment of water and sediment qualityusing the mentum deformities of Chironomusspp. larvae from aquatic ecosystems re-
S. A. Al-Shami (B) · M. R. Che Salmah ·A. Abu Hassan · M. N. Siti AzizahSchool of Biological Sciences,Universiti Sains Malaysia (USM),11800 Penang, Malaysiae-mail: [email protected]
M. N. Siti AzizahCentre for Marine and Coastal Studies,Universiti Sains Malaysia, Penang, Malaysia
ceiving anthropogenic, agricultural, or industrialdischarges.
Keywords Chironomus spp. · Mentumdeformities · River pollution · Toxic score index
Introduction
In freshwater ecosystems, chironomids are con-sidered to be ideal bioassay organisms since theyspend most of their larval stages in the waterwhere they are exposed to toxicants in both waterand sediments. These criteria make them suit-able organisms for ecotoxicological monitoring(Warwick 1985; Ingersoll and Nelson 1990;Vermeulen 1995; Al-Shami et al. 2010a, b). Whencontinuously exposed to stress or pollution, lateinstars of some chironomid larvae frequently de-velop deformities in the mouthparts, especiallythe mentum. An existing hypothesis based on fieldobservations is that the deformities in benthicmidge larvae are a reflection of the environmentalpollution due to heavy metals, radioactivity, or-ganic pesticides, and other xenobiotics (Bird 1994;Vermeulen 1995; Servia et al. 1998; Watanabeet al. 2000; Reynolds and Ferrington 2001, 2002;Martinez et al. 2004; Al-Shami et al. 2010a).
The occurrence of developmental deformitiesin chironomids appears to be a general stress

234 Environ Monit Assess (2011) 177:233–244
response to a wide range of environmental con-taminants (Vermeulen 1995). Nevertheless, mor-phological deformities in larval chironomid popu-lations in uncontaminated environments can alsooccur but are relatively less severe and less fre-quent than those occurring under the stressedconditions (Warwick 1985). The larval deformitiescan provide a useful tool for assessing aquaticpollution, specifically that relate to industrialwastes and agricultural runoff (Wiederholm 1984;Warwick 1985; De Bisthoven and Gerhardt 2003;Lenat 1993; Vermeulen 1995; Dickman and Rygiel1996; Hamalainen 1999; Bhattacharyay et al. 2005;MacDonald and Taylor 2006).
The pollution of aquatic ecosystems inMalaysia has emerged as a major ecologicalproblem coinciding with rapid industrializationand urbanization. In 1994, The Malaysian De-partment of Environment (DOE) classified theJuru River (situated in northeastern peninsularMalaysia) as “very polluted” based on the WaterQuality Index categorization by the DOE (DOE1994). In Malaysia, considerable efforts havebeen made in the past two decades to analyzechemical pollution in several rivers (includingthe Juru River basin; e.g., Mat and Maah 1994;Lim and Kiu 1995). However, relatively muchless attention has been paid to utilization ofaquatic organisms for purposes of environmentalbioassessments (Morse et al. 2007; Al-Shami et al.2010a). Moreover, the utility of alterations inchironomid larval head capsule morphology, suchas deformation, phenodeviations, asymmetries,etc., has proven to be useful in indicatingaquatic pollution-related stress in many countriesincluding Malaysia (Al-Shami et al. 2010a),Canada (Warwick 1985; MacDonald and Taylor2006), Sweden (Wiederholm 1984; De Bisthovenand Gerhardt 2003), Italy (Veroli et al. 2010), andIndia (Bhattacharyay et al. 2005).
The application of chironomid deformities asbioindicators of pollution stresses has been re-viewed and illustrated primarily for bioassessmentpurposes (Hamalainen 1999). Moreover, effortsto demonstrate the relationship of deformity in-cidence in chironomid larvae with water and sed-iment quality have also been documented (forreview see Vermeulen 1995). In this context, manyresearchers have developed several deformity in-
dices based on deformities in different chironomidlarval head capsule structures to identify levels ofseverity of particular stressors. For instance, thepioneering index of severity of antennal defor-mities of Warwick (1985) was based on antennaldeformities of Chironomus larvae. However, thetoxic score index (TSI) proposed by Lenat (1993)was calculated based on the mentum malforma-tion of Chironomus larvae. It categorized the de-formities of mentum into three classes: Class Iincludes slight deformities which are difficult toseparate from the “chipped” teeth; Class II con-sists of larvae with more conspicuous deformi-ties, such as extra teeth, missing teeth, large gaps,and distinct asymmetry; and in Class III are in-cluded the larvae that suffer severe deformation,including at least two Class II characters. The TSIscoring calculations assumed that the response ofmentum teeth to the environmental stress is equal.The TSI can be computed (Lenat 1993) as follows:
[Number of Class I + 2(number of Class II)+ 3(number of Class III)]× 100/total number of larvae.
The TSI was designed to be applied mainly incases of organic pollution bioassessments (Lenat1993). However, various Malaysian rivers are re-ported to be polluted with different organic andinorganic pollutants including heavy metals fromdifferent agricultural, anthropogenic, and indus-trial sources (Azrina et al. 2006; Al-Shami et al.2010a; Fulazzaky et al. 2010). Therefore, it wasnecessary to further develop the TSI analysis andwiden its application to involve assessment of in-organic and organic pollution stresses. As statedabove, the TSI scoring calculations assumed thatthe response of mentum teeth to the environmen-tal stress is equal. In other words, the deforma-tion in any mentum was given the same weightregardless of the teeth position. De Bisthoven andGerhardt (2003), however, recommended that thedifferent mentum teeth should be scored inde-pendently since their response to the differentpollutants might be varied.
The aim of this study was to evaluate the sever-ity of mentum deformities in Chironomus spp.larvae collected from three small rivers receiv-ing different discharges using a modified toxic

Environ Monit Assess (2011) 177:233–244 235
score index (MTSI) developed based on Lenat’stoxic score index (Lenat 1993). Additionally, theeffectiveness of the MTSI and TSI was comparedin terms of their relationship to organic and in-organic pollutants. Consequently, several recom-mendations were suggested.
Materials and methods
Study area and sampling sites
The Juru River system, located at approximately05◦22′ N latitude and 100◦28′ E longitude origi-nates from the Bukit Mertajam hills in Penang,northwestern Malaysia. It receives several smallrivers which flow through urban settings thatare grossly polluted with industrial, agricultural,and domestic wastes which discharge directly intothese rivers. For the present study, three smallrivers, [Permatang Rawa River (PRR), KilangUbi River (KUR), and Pasir River (PR)] inthe Juru River system were selected (Fig. 1).The PRR receives some discharges from nearbypaddy fields; these discharges may contain chemi-cal as well as organic and inorganic contaminants.The KUR receives industrial discharges from thenearby garment and rubber factories, while the
pollution source in PR is primarily due to anthro-pogenic activities from residential units situatedalong the course of this river.
Physico-chemical parameters of water
On each sampling occasion, measurements ofphysico-chemical parameters, such as water pH,water temperature, and dissolved oxygen (DO)were made in situ at three randomly selected lo-cations at each sampling site in a river. Dissolvedoxygen and water temperature were measuredwith a YSI-57 meter (YSI Inc., Yellow Springs,OH, USA), whereas water pH was measured witha Termo-Orion Model 210 pH meter.
To analyze selected chemical parameters ofwater, three separate samples of water from eachsite were randomly collected using acid-washed(HCl 0.1 N) 500-ml plastic bottles. Each appro-priately labeled bottle was thoroughly rinsed outwith the river water immediately prior to col-lecting a sample. All water samples were trans-ported to the laboratory in an ice chest andkept at 4◦C until analyzed. The total suspendedsolids (TSS) were estimated using the methodof Tomar (1999). The ammonium–N, nitrate–N, and phosphate–P, chloride, sulfate, and alu-minum contents of the water were measured at
Fig. 1 Map of the JuruRiver Basin showingapproximate locationsof sampling sites forPermatang Rawa River(PRR), Pasir River (PR),and Kilang Ubi River(KUR), Penang, Malaysia

236 Environ Monit Assess (2011) 177:233–244
appropriate wavelength using a YSI 9100 pho-tometer test kit. The distilled water was used asblank.
Sediment samples
At each sampling site, three sediment sampleswere also randomly collected using a grab samplerand these samples were air dried in the laboratory.Total organic matter (TOM) in these samples wasanalyzed following the method of Faithful (2002).The non-residual metals in the sediment sampleswere analyzed as representative for heavy metalcontamination in the river sediment. Non-residualmetals are not part of the silicate matrix but havebeen incorporated into the sediment from aque-ous solutions by processes such as adsorption andorganic complexation. Thus, they include thoseoriginating from polluted waters (Shriadah 1998).These were analyzed following the method ofChester and Voutsinou (1981). Briefly, 5 g each ofa dried sediment sample were placed in a 100-mlwide neck glass flask to which 75 ml of 0.5 N HClwas added and the flask mechanically shaken forapproximately 16 h. The solutions were allowed tostand for a few minutes prior to suction filteringthrough 0.45 μm filter paper. The filtrates werethen sprayed directly into an Atomic AbsorptionSpectrophotometer (Flame AAS; PerkinElmer,Model A Analyst 100) using appropriate lampsand settings.
Chironomid larval sampling and deformitiesinvestigation
Chironomid larvae were randomly collected ona monthly basis from November 2007 to March2008 by sampling benthos across an approximately100 m stretch in each river using a D-shapedaquatic net. Permanent slide mounts of chirono-mid larvae were prepared to examine morpho-logical deformities in the larvae following themethod of Epler (2001). The slide-mounted lar-vae were identified to genus level using appropri-ate taxonomic keys (Epler 2001; Cranston 2004).No attempt was made to identify the larvae tospecies level because of taxonomic difficulties inthe identification of chironomid immature stages(Warwick 1985). The mental plates of fourth in-star larval Chironomus spp. was examined fordeformities at ×400 magnification.
Calculations of modified toxic score index
As illustrated in Fig. 2, the mentum of Chirono-mus spp. larva has 15 darkly pigmented teethcomprising a tripartite median arrangement ofone large tooth flanked on either side by a sin-gle smaller tooth (median, M) and two larger(median-lateral, ML) and four smaller outer teethon either side (lateral, L; Cranston 2004). Theoccurrence of the deformities was classified ac-cording to these tooth positions. A modified toxicscore index of Lenat (1993) was developed to
Fig. 2 The mentum ofChironomus spp. larvaeillustrating the differentmentum teeth; M medianteeth, ML median-lateralteeth, and L lateral teeth
Environ Monit Assess (2011) 177:233–244 237
calculate the deformities in the mentum. De-formities of mentum were classified into threegroups. Class I included slight deformities (mildbroken) which were difficult to separate from the“chipped” teeth. Class II consisted of larvae withmore severe broken teeth deformities. Class IIIconsisted of larvae with severe deformation, in-cluding extra teeth, missing teeth, large gaps, anddistinct asymmetry. A new score was computedfor each which gives greater weight to more se-vere deformities with individual emphasis on eachtooth position:
[Number of Class I + 2(number of Class II)
+ 3 (number of Class III)]
median teeth
+ [2(number of Class I) +3(Number of Class II)
+ 4 (number of Class III)]
median−lateral teeth
+ [3(number of Class I) + 4(number of Class II)
+ 5 (Number of Class III)]
lateral teeth
× 100/total number of larvae.
Statistical analysis
The incidence of deformed larval mentum fromthe different rivers was expressed as the propor-tion ± standard error (SE) of the total larvaemounted from each river. Standard errors werecalculated according to the binomial distribution,
i.e., SE = (pq/k)1/2, where “p” is the standarddeviations of the proportion of deformed indi-viduals, “q” is the proportion of non-deformedindividuals, and “k” is the sample size (Hudsonand Ciborowski 1996). The mean percentage ofmentum deformities from individual sampling sitewas compared using the non-parametric proce-dure (Kruskal–Wallis Test) and general linearmodels of the SPSS software package (version13). The deformities in the different mentumteeth (median, median-lateral, and lateral) werecompared statistically using the non-parametricKruskal–Wallis Test. The percent incidence datawere transformed using the arc-sine
√x transfor-
mation prior to analysis. The toxic score index ofLenat (1993) and modified toxic score index werecompared statistically in terms of their correlationand efficiency.
The principal component analysis (PCA) wasused to demonstrate the Euclidean-based distancebetween the rivers depending on their chemi-cal and physical characteristics. The redundancyanalysis (RDA) of CANOCO program (ter Braakand Prentice 1988; ter Braak 1989) was used toinvestigate influence of the environmental para-meters on total deformity incidence (DI), TSI, andMTSI. Specifically, the RDA provides the dimen-sions of the influencing water and sediment pa-rameters, indicating the strength and direction ofcorrelation between these parameters and inves-tigated indices. For the RDA analysis, parametersof nitrate–N, temperature, and TSS were excludedfrom the analysis due to their low contribution(eigenvalue <0.15). Monte-Carlo test was appliedto test the significance of the produced axes with499 permutations at p < 0.05.
Results
Environmental parameters
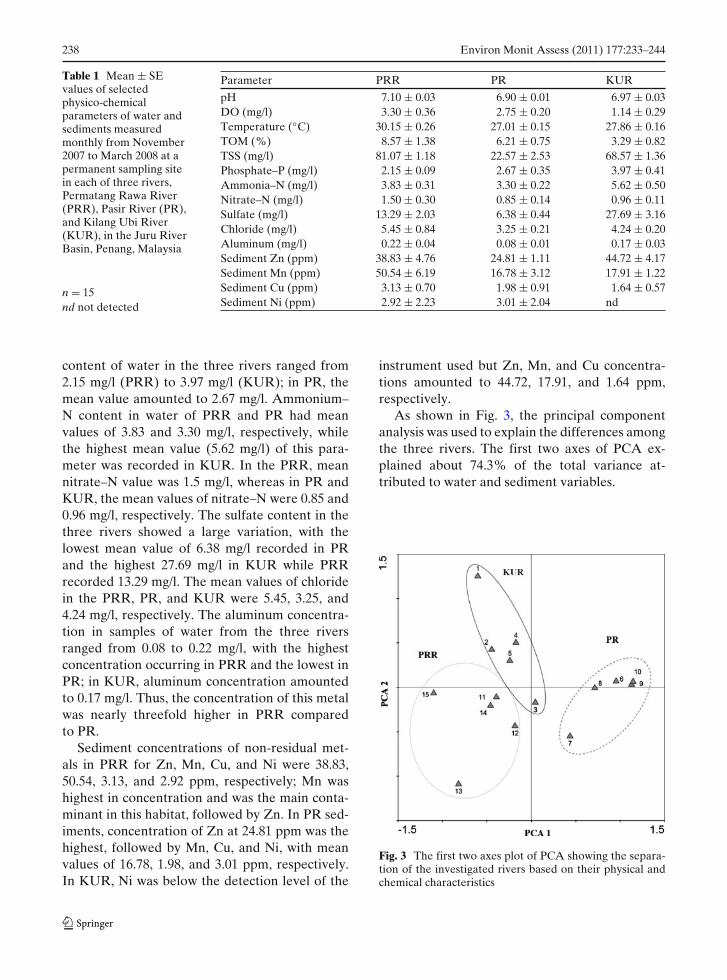
Data concerning various water and sedimentphysico-chemical parameters measured during thestudy period are summarized in Table 1. Themean water depth at the sampling locationsat PRR, PR, and KUR was 19.07, 25.87, and20.43 cm, respectively, indicating these sites to berelatively shallow. Similarly, mean river width atsampling locations at PRR, PR, and KUR mea-sured 3.36, 4.65, and 3.42 m, respectively. Themean value of water pH in three rivers rangedfrom 6.90 (PR) to 7.10 (PRR). As expected, themean value of dissolved oxygen level was ratherlow in all three habitats, with KUR showing thelowest mean value of 1.14 mg/l. Water temper-ature generally remained 2–3◦C higher in thePRR (mean 30.15◦C), compared to the other twohabitats. Total organic matter showing a meanvalue of 8.57% in the PRR was two- to three-fold higher in this habitat than KUR where amean value of 3.29 was recorded; in the PRmean value of total organic matter amounted to6.21%. Total suspended solids were the highestin PRR (mean value of 81.07 mg/l), followedby KUR (mean value of 68.57 mg/l), and PR(mean value of 22.57 mg/l). The phosphate–P
238 Environ Monit Assess (2011) 177:233–244
Table 1 Mean ± SEvalues of selectedphysico-chemicalparameters of water andsediments measuredmonthly from November2007 to March 2008 at apermanent sampling sitein each of three rivers,Permatang Rawa River(PRR), Pasir River (PR),and Kilang Ubi River(KUR), in the Juru RiverBasin, Penang, Malaysia
n = 15nd not detected
Parameter PRR PR KUR
pH 7.10 ± 0.03 6.90 ± 0.01 6.97 ± 0.03DO (mg/l) 3.30 ± 0.36 2.75 ± 0.20 1.14 ± 0.29Temperature (◦C) 30.15 ± 0.26 27.01 ± 0.15 27.86 ± 0.16TOM (%) 8.57 ± 1.38 6.21 ± 0.75 3.29 ± 0.82TSS (mg/l) 81.07 ± 1.18 22.57 ± 2.53 68.57 ± 1.36Phosphate–P (mg/l) 2.15 ± 0.09 2.67 ± 0.35 3.97 ± 0.41Ammonia–N (mg/l) 3.83 ± 0.31 3.30 ± 0.22 5.62 ± 0.50Nitrate–N (mg/l) 1.50 ± 0.30 0.85 ± 0.14 0.96 ± 0.11Sulfate (mg/l) 13.29 ± 2.03 6.38 ± 0.44 27.69 ± 3.16Chloride (mg/l) 5.45 ± 0.84 3.25 ± 0.21 4.24 ± 0.20Aluminum (mg/l) 0.22 ± 0.04 0.08 ± 0.01 0.17 ± 0.03Sediment Zn (ppm) 38.83 ± 4.76 24.81 ± 1.11 44.72 ± 4.17Sediment Mn (ppm) 50.54 ± 6.19 16.78 ± 3.12 17.91 ± 1.22Sediment Cu (ppm) 3.13 ± 0.70 1.98 ± 0.91 1.64 ± 0.57Sediment Ni (ppm) 2.92 ± 2.23 3.01 ± 2.04 nd
content of water in the three rivers ranged from2.15 mg/l (PRR) to 3.97 mg/l (KUR); in PR, themean value amounted to 2.67 mg/l. Ammonium–N content in water of PRR and PR had meanvalues of 3.83 and 3.30 mg/l, respectively, whilethe highest mean value (5.62 mg/l) of this para-meter was recorded in KUR. In the PRR, meannitrate–N value was 1.5 mg/l, whereas in PR andKUR, the mean values of nitrate–N were 0.85 and0.96 mg/l, respectively. The sulfate content in thethree rivers showed a large variation, with thelowest mean value of 6.38 mg/l recorded in PRand the highest 27.69 mg/l in KUR while PRRrecorded 13.29 mg/l. The mean values of chloridein the PRR, PR, and KUR were 5.45, 3.25, and4.24 mg/l, respectively. The aluminum concentra-tion in samples of water from the three riversranged from 0.08 to 0.22 mg/l, with the highestconcentration occurring in PRR and the lowest inPR; in KUR, aluminum concentration amountedto 0.17 mg/l. Thus, the concentration of this metalwas nearly threefold higher in PRR comparedto PR.
Sediment concentrations of non-residual met-als in PRR for Zn, Mn, Cu, and Ni were 38.83,50.54, 3.13, and 2.92 ppm, respectively; Mn washighest in concentration and was the main conta-minant in this habitat, followed by Zn. In PR sed-iments, concentration of Zn at 24.81 ppm was thehighest, followed by Mn, Cu, and Ni, with meanvalues of 16.78, 1.98, and 3.01 ppm, respectively.In KUR, Ni was below the detection level of the
instrument used but Zn, Mn, and Cu concentra-tions amounted to 44.72, 17.91, and 1.64 ppm,respectively.
As shown in Fig. 3, the principal componentanalysis was used to explain the differences amongthe three rivers. The first two axes of PCA ex-plained about 74.3% of the total variance at-tributed to water and sediment variables.
Fig. 3 The first two axes plot of PCA showing the separa-tion of the investigated rivers based on their physical andchemical characteristics
Environ Monit Assess (2011) 177:233–244 239
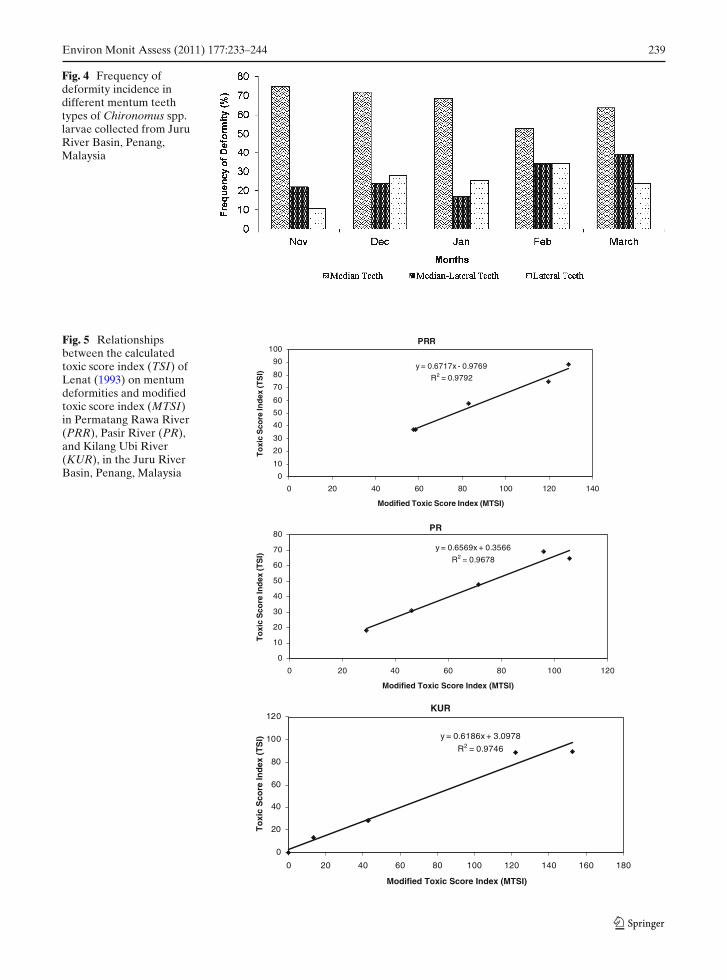
Fig. 4 Frequency ofdeformity incidence indifferent mentum teethtypes of Chironomus spp.larvae collected from JuruRiver Basin, Penang,Malaysia
Fig. 5 Relationshipsbetween the calculatedtoxic score index (TSI) ofLenat (1993) on mentumdeformities and modifiedtoxic score index (MTSI)in Permatang Rawa River(PRR), Pasir River (PR),and Kilang Ubi River(KUR), in the Juru RiverBasin, Penang, Malaysia
PRR
y = 0.6717x - 0.9769
R2 = 0.9792
0
10
20
30
40
50
60
70
80
90
100
0 20 40 60 80 100 120 140
Modified Toxic Score Index (MTSI)
To
xic
Sco
re In
dex
(TS
I)
PR
y = 0.6569x + 0.3566
R2 = 0.9678
0
10
20
30
40
50
60
70
80
0 20 40 60 80 100 120
Modified Toxic Score Index (MTSI)
To
xic
Sco
re In
dex
(TS
I)
KUR
y = 0.6186x + 3.0978
R2 = 0.9746
0
20
40
60
80
100
120
0 20 40 60 80 100 120 140 160 180
Modified Toxic Score Index (MTSI)
To
xic
Sco
re In
dex
(T
SI)
240 Environ Monit Assess (2011) 177:233–244
Deformity indices and levels of environmentalparameters
A total of 616 individuals of Chironomus spp.larvae were collected from the three rivers and theincidences of mentum deformities were 27.9%,20.87%, and 30.19% in the PRR, PR, KUR, re-spectively. The percent incidence of any mentumdeformities was not significantly different amongrivers (Kruskal–Wallis, p > 0.05). Furthermore,the mentum teeth were not significantly differentaccording to the type of deformation (mild bro-ken, severe broken, fused, and missing) in thethree rivers (p > 0.05). However, levels of de-formities in the different mentum teeth (median,median-lateral, and lateral teeth) was significantlydifferent (Kruskal–Wallis Test, X2 = 73.82, p <
0.05) as shown in Fig. 4. Hence, it was interestinglysupportive for the suggested calculations of themodified toxic score index. Before starting thecomparison between the TSI and suggested MTSI,the validity of the MTSI’s calculation was exam-
ined for any undesired bias. For that purpose, alinear regression of the MTSI against TSI valueswas plotted separately for each river (Fig. 5). Theanalysis confirmed the validity of our assumption;linearity was very high (R2 > 0.96) in each river.
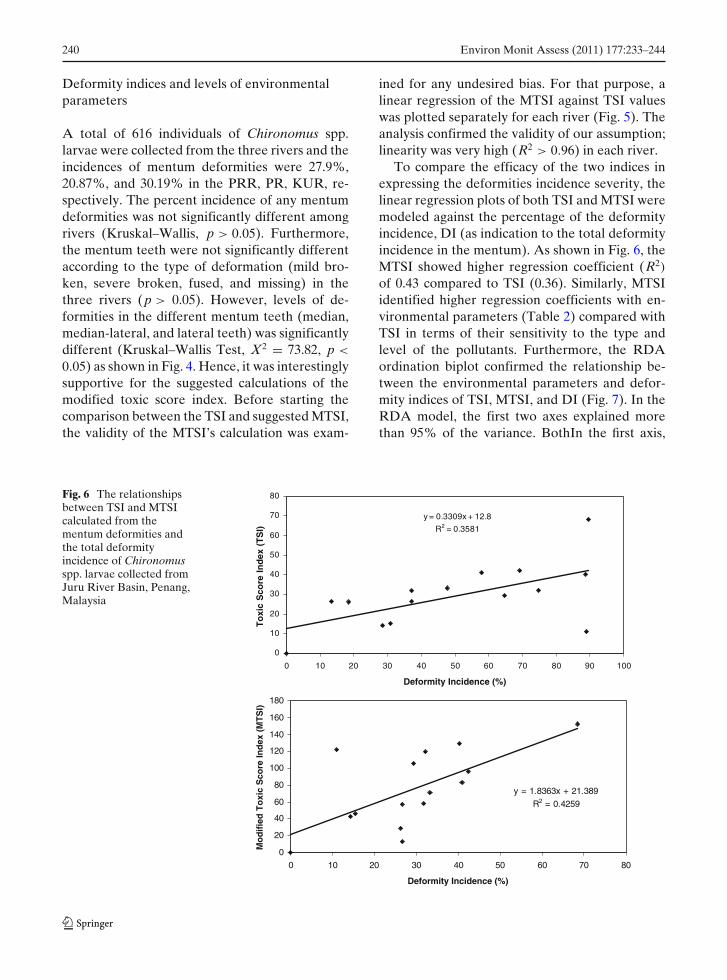
To compare the efficacy of the two indices inexpressing the deformities incidence severity, thelinear regression plots of both TSI and MTSI weremodeled against the percentage of the deformityincidence, DI (as indication to the total deformityincidence in the mentum). As shown in Fig. 6, theMTSI showed higher regression coefficient (R2)
of 0.43 compared to TSI (0.36). Similarly, MTSIidentified higher regression coefficients with en-vironmental parameters (Table 2) compared withTSI in terms of their sensitivity to the type andlevel of the pollutants. Furthermore, the RDAordination biplot confirmed the relationship be-tween the environmental parameters and defor-mity indices of TSI, MTSI, and DI (Fig. 7). In theRDA model, the first two axes explained morethan 95% of the variance. BothIn the first axis,
Fig. 6 The relationshipsbetween TSI and MTSIcalculated from thementum deformities andthe total deformityincidence of Chironomusspp. larvae collected fromJuru River Basin, Penang,Malaysia
y = 0.3309x + 12.8
R2 = 0.3581
0
10
20
30
40
50
60
70
80
0 10 20 30 40 50 60 70 80 90 100
Deformity Incidence (%)
To
xic
Sco
re I
nd
ex (
TS
I)
y = 1.8363x + 21.389
R2 = 0.4259
0
20
40
60
80
100
120
140
160
180
0 10 20 30 40 50 60 70 80
Deformity Incidence (%)
Mo
dif
ied
To
xic
Sco
re In
dex
(M
TS
I)
Environ Monit Assess (2011) 177:233–244 241
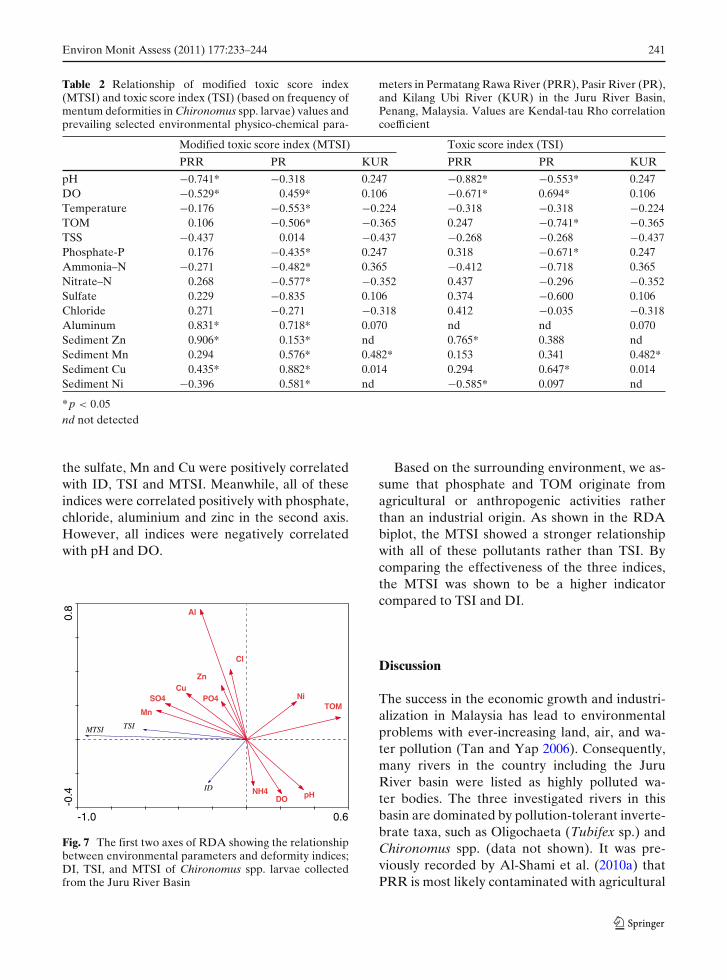
Table 2 Relationship of modified toxic score index(MTSI) and toxic score index (TSI) (based on frequency ofmentum deformities in Chironomus spp. larvae) values andprevailing selected environmental physico-chemical para-
meters in Permatang Rawa River (PRR), Pasir River (PR),and Kilang Ubi River (KUR) in the Juru River Basin,Penang, Malaysia. Values are Kendal-tau Rho correlationcoefficient
Modified toxic score index (MTSI) Toxic score index (TSI)
PRR PR KUR PRR PR KUR
pH −0.741* −0.318 0.247 −0.882* −0.553* 0.247DO −0.529* 0.459* 0.106 −0.671* 0.694* 0.106Temperature −0.176 −0.553* −0.224 −0.318 −0.318 −0.224TOM 0.106 −0.506* −0.365 0.247 −0.741* −0.365TSS −0.437 0.014 −0.437 −0.268 −0.268 −0.437Phosphate-P 0.176 −0.435* 0.247 0.318 −0.671* 0.247Ammonia–N −0.271 −0.482* 0.365 −0.412 −0.718 0.365Nitrate–N 0.268 −0.577* −0.352 0.437 −0.296 −0.352Sulfate 0.229 −0.835 0.106 0.374 −0.600 0.106Chloride 0.271 −0.271 −0.318 0.412 −0.035 −0.318Aluminum 0.831* 0.718* 0.070 nd nd 0.070Sediment Zn 0.906* 0.153* nd 0.765* 0.388 ndSediment Mn 0.294 0.576* 0.482* 0.153 0.341 0.482*Sediment Cu 0.435* 0.882* 0.014 0.294 0.647* 0.014Sediment Ni −0.396 0.581* nd −0.585* 0.097 nd
*p < 0.05
nd not detected
the sulfate, Mn and Cu were positively correlatedwith ID, TSI and MTSI. Meanwhile, all of theseindices were correlated positively with phosphate,chloride, aluminium and zinc in the second axis.However, all indices were negatively correlatedwith pH and DO.
-1.0 0.6
-0.4
0.8
TSI
ID
MTSI
pHDO
TOMPO4
NH4
SO4
Cl
Al
Zn
Mn
CuNi
Fig. 7 The first two axes of RDA showing the relationshipbetween environmental parameters and deformity indices;DI, TSI, and MTSI of Chironomus spp. larvae collectedfrom the Juru River Basin
Based on the surrounding environment, we as-sume that phosphate and TOM originate fromagricultural or anthropogenic activities ratherthan an industrial origin. As shown in the RDAbiplot, the MTSI showed a stronger relationshipwith all of these pollutants rather than TSI. Bycomparing the effectiveness of the three indices,the MTSI was shown to be a higher indicatorcompared to TSI and DI.
Discussion
The success in the economic growth and industri-alization in Malaysia has lead to environmentalproblems with ever-increasing land, air, and wa-ter pollution (Tan and Yap 2006). Consequently,many rivers in the country including the JuruRiver basin were listed as highly polluted wa-ter bodies. The three investigated rivers in thisbasin are dominated by pollution-tolerant inverte-brate taxa, such as Oligochaeta (Tubifex sp.) andChironomus spp. (data not shown). It was pre-viously recorded by Al-Shami et al. (2010a) thatPRR is most likely contaminated with agricultural
242 Environ Monit Assess (2011) 177:233–244
chemicals applied periodically to the surround-ing paddy fields. The KUR receives industrialdischarges from garment and rubber factories.However, PR is polluted primarily with domesticwastes resulting from anthropogenic activities inthe surrounding residential areas of this river.The PCA ordination analysis was effective indifferentiating between the three rivers based ondifferent inputs and chemical parameter values.Aruga et al. (1993) also documented the relation-ship of the various pollution factors together withtheir mutual importance in evaluating the generaldegree of pollution of rivers.
De Bisthoven and Gerhardt (2003) suggestedthat investigation of morphological abnormalitiesin individual organisms might prove particularlyuseful in determining the biological effects of con-taminants in aquatic ecosystems although com-paratively little is known about how individualorganisms react to contaminants. It appears thatdifferent deformities may be caused by specificchemicals (Warwick and Tisdale 1988) or combi-nation of different chemicals (Veroli et al. 2010).Madden et al. (1992) found increasing frequenciesof deformities as levels of metal, coal tar, urbanor agricultural runoff, and pesticides elevated. Itis also known that heavy metal contamination isa major cause of deformities in the chironomidlarvae (Martinez et al. 2004; Bhattacharyay et al.2005; Al-Shami et al. 2010a). In our previous study(Al-Shami et al. 2010a), we found that deformityincidence in the larval menta in the Juru river wasrelatively high compared to other similar studiesin other rivers of the temperate region (e. g.,Bird 1994; Dickman and Rygiel 1996). Concurringwith Vermeulen (1995), this study showed thatChironomus spp. midge larval mentum is highlysusceptible to deformation, therefore, these de-formations are potentially important indicatorsof the effects of the water and sediment-boundcontaminants (De Bisthoven and Gerhardt 2003).
The results of the present study revealed thatthe deformities in median teeth was the mostfrequent compared to median-lateral and lateral.This implies that the sensitivity of the medianteeth to pollution stress was highest followedby median-lateral and lateral teeth, respectively.Although the TSI scores efficiently describe theoverall severity of the mentum deformities, it ne-
glects the possible variation of response by thedifferent mental teeth types. However, the newlydeveloped MTSI could differentiate the defor-mity occurrence in the mentum based on teethtype. The median teeth were found to be moresusceptible to stress. The median-lateral and lat-eral teeth seemed to be less sensitive to pol-lution effects. This is reflected in the differentseverity of the deformity incidence. Chironomusspp. larvae are filterer in their feeding (Cranston2004) and probably that the peripheral teeth(median-lateral and lateral) are not in direct con-tact with the polluted sediments compared to themedian teeth.
The MTSI appeared more efficient than TSIin explaining the influence of environmental vari-ables on the severity of mental deformities ofChironomus spp. larvae collected from the threerivers in Juru River Basin. The former showedstronger correlation to the DI. It implies thatMTSI showed better indication and representa-tion to the total deformity incidence expressed asa percent. Presumably, the TSI was more specificto organic loading pollution and might be notapplicable in other cases (e.g., inorganic or heavymetal contamination). Additionally, the biplot ofthe RDA multivariate analysis was sufficientlyconvincing to support the MTSI calculations andshowed stronger correlation with different organicand inorganic pollutants. It is well establishedthat multivariate analyses such as RDA have thepotential to identify the environmental variablesthat best explain the variance pattern of the or-ganismal response (Gonzalez et al. 2003; De Jongeet al. 2008; Al-Shami et al. 2010a).
It is known that heavy metals contamination isa major cause of deformities in the chironomid lar-val mentum (Martinez et al. 2004; De Bisthovenand Gerhardt 2003; Bhattacharyay et al. 2005;MacDonald and Taylor 2006; Al-Shami et al.2010a). Compared to the TSI, the MTSI revealedmore significant relationships with heavy metalpresence in PPR and PR sediments. In concur-rence, the RDA ordination plot showed that theMTSI was more efficient in detecting heavy metalpollution effects, especially contamination withMn and Cu. Further studies on developing anappropriate bioassessment index using chirono-mid larvae deformities should include other head
Environ Monit Assess (2011) 177:233–244 243
capsule structures such as antennae, mandibles,and epipharynges.
Conclusion
In conclusion, the present study demonstrated theapplication of the mentum deformities incidencein environmental stress assessment of the aquaticecosystems. The newly developed MTSI of thementum deformities in Chironomus spp. larvaewas able to identify different organic and inor-ganic pollutants including heavy metals. It couldserve as a useful and empirical tool in assessmentof pollution of aquatic habitats receiving anthro-pogenic, agricultural, and industrial discharges.
Acknowledgements The authors are grateful to Schoolof Biological Sciences, USM for providing facilities toconduct this research. Gratitude is expressed to Mr. MohdShukri, Muthu, Shahbuddin, and Miss Khatijah for theirhelp during sampling and analysis of samples. This studywas partially funded by the Research University Grant1001/BIOLOGI/ 630166, awarded to the second and thirdauthors.
References
Al-Shami, S., Rawi, C. S. M., Nor, S. A. M., Ahmad, A. H.,& Ali, A. (2010a). Morphological deformities in Chi-ronomus spp. (Diptera: Chironomidae) larvae as atool for impact assessment of anthropogenic and en-vironmental stresses on three rivers in the Juru RiverSystem, Penang, Malaysia. Environmental Entomol-ogy, 39, 210–222.
Al-Shami, S. A., Salmah, M. R. C., Abu Hassan, A., &Azizah, M. N. S. (2010b). Temporal distribution oflarval Chironomidae (Diptera) in experimental ricefields in Penang, Malaysia. Journal of Asia-Pacif icEntomology, 13, 17–22.
Aruga, R., Negro, G., & Ostacoli, G. (1993). Multivariatedata-analysis applied to the investigation of river pol-lution. Fresenius Journal of Analytical Chemistry, 346,968–975.
Azrina, M. Z., Yap, C. K., Ismail, A. R., & Tan, S. G.(2006). Anthropogenic impacts on the distribution andbiodiversity of benthic macroinvertebrates and waterquality of the Langat River, Peninsular Malaysia. Eco-toxicology and Environmental Safety, 64, 337–347.
Bhattacharyay, G., Sadhu, A. K., Mazumdar, A., &Chaudhuri, P. K. (2005). Antennal deformities of chi-ronomid larvae and their use in biomonitoring ofheavy metal pollutants in the River Damodar of WestBengal, India. Environmental Monitoring and Assess-ment, 108, 67–84.
Bird, G. A. (1994). Use of chironomid deformities to as-sess environmental degradation in the Yamaska River,Quebec. Environmental Monitoring and Assessment,30, 163–175.
Chester, R., & Voutsinou, F. G. (1981). The initial as-sessment of trace metal pollution in coastal sediment.Marine Pollution Bulletin, 12, 84–91.
Cranston, P. S. (2004). Chironomidae. In C. M. Yule& H. S. Yong (Eds.), The freshwater invertebratesof Malaysia and Singapore. Malaysia: Academy ofScience.
De Bisthoven, L. J., & Gerhardt, A. (2003). Chironomidae(Diptera, Nematocera) fauna in three small streamsof Skania, Sweden. Environmental Monitoring andAssessment, 83, 89–102.
De Jonge, M., de Vijuer, B. V., Blust, R., & Bervoets, L.(2008). Responses of aquatic organisms to metal pol-lution in a lowland river in Flanders: A comparison ofdiatoms and macroinvertebrates. Science of the TotalEnvironment, 407, 615–629.
Dickman, M., & Rygiel, G. (1996). Chironomid larval de-formity frequencies, mortality and diversity in heavy-metal contaminated sediments of a Canadian riverinewetland. Environment International, 22(6), 693–703.
DOE (Department of Environment, Malaysia) (1994).Classif ication of Malaysian rivers (Vol. 8B), JuruRiver. Department of Environment, Ministry of Sci-ence, Technology and the Environment, Putrajaya,Malaysia.
Epler, J. H. (2001). Identif ication manual for the larval Chi-ronomidae (Diptera) of North and South Carolina. Aguide to the taxonomy of the midges of the southeasternUnited States, including Florida. Special PublicationSJ2001-SP13. North Carolina Department of Environ-mental and Natural Resources, Raleigh, NC.
Faithful, N. T. (2002). Methods in agricultural chemistryanalysis. UK: CABI Publishing.
Fulazzaky, M. A., Teng, W. S., & Mohd Masirin, M. I.(2010). Assessment of water quality status for theSelangor River in Malaysia. Water Air and SoilPollution, 205, 63–77.
Gonzalez, C. M., Pignata, M. L., & Orellana, L. (2003).Applications of redundancy analysis for the detectionof chemical response patterns to air pollution in lichen.Science of the Total Environment, 312, 245–253.
Hamalainen, H. (1999). Critical appraisal of the indexes ofchironomid larvae deformities and their use in bioindi-cation. Annales Zoologici Fennici, 36, 179–186.
Hudson, L. A., & Ciborowski, J. J. (1996). Spatial andtaxonomic variation in incidence of mouthpart defor-mities in midge larvae (Diptera: Chironomidae, Chi-ronomini). Canadian Journal of Fisheries and AquaticScience, 53, 297–304.
Ingersoll, C. G., & Nelson, M. K. (1990). Testing sedimenttoxicity with Hyalella azteca (Amphipoda) and Chi-ronomus riparius (Diptera). In W. G. Landis & W. H.V. D. Schalie (Eds.), Aquatic toxicology and risk as-sessment. Philadelphia: American Society for Testingand Materials.
Lenat, D. R. (1993). Mentum deformities of Chirono-mus larvae to evaluate the effects of toxicity and or-
244 Environ Monit Assess (2011) 177:233–244
ganic loading in streams. Journal of North AmericanBenthological Society, 12(3), 265–269.
Lim, P. E., & Kiu, M. Y. (1995). Determination and speci-ation of heavy metals in sediment of the Juru River,Penang, Malaysia. Environmental Monitoring andAssessment, 35, 85–95.
MacDonald, E. E., & Taylor, B. R. (2006). Incidence ofmentum deformities in midge larvae (Diptera: Chi-ronomidae) from North Nova Scotia, Canada. Hydro-biologia, 563, 277–287.
Madden, C. P., Suter, P. J., Nicholas, B. C., & Austin, A. D.(1992). Deformities in chironomid larvae as indicatorof pollution (pesticide) stress. Netherlands Journal ofAquatic Ecology, 26, 551–557.
Martinez, E. A., Moore, B. C., Schaumloffel, J., &Dasgupta, N. (2004). Teratogenic versus mutagenicabnormalities in chironomid larvae exposed to Zincand Lead. Archive of Environmental contaminationand Toxicology, 47, 193–198.
Mat, L., & Maah, M. J. (1994). Sediment trace metal con-centrations from the mudflats of Kuala Juru and KualaMuda of Malaysia. Bulletin of Environmental Contam-ination and Toxicology, 53, 740–746.
Morse, J. C., Bae, Y. J., Munkhjargal, G., Sangpradub, N.,Tanida, K., Vshivkova, T. S., et al. (2007). Freshwaterbiomonitoring with macroinvertebrates in East Asia.Frontiers in Ecology and the Environment, 5, 33–42.
Reynolds, S. K., & Ferrington, L. C. (2001). Temporal andtaxonomic patterns of mouthpart deformities in larvalmidges (Diptera: Chironomidae) in relation to sedi-ment chemistry. Journal of Freshwater Ecology, 16(1),15–27.
Reynolds, S. K., & Ferrington, L. C. (2002). Differentialmorphological responses of Chironomid larvae to se-vere heavy metal exposure (Diptera: Chironomidae).Journal of the Kansas Entomological Society, 75(3),172–184.
Servia, M. J., Cobo, F., & Gonzales, M. A. (1998). Defor-mities in larval Prodiamesa olivacea (Meigen, 1818)(Diptera: Chironomidae) and their use as bioindica-tors of toxic sediment stress. Hydrobiologia, 385, 153–162.
Shriadah, M. A. (1998). Metals pollution in marine sed-iments of the United Arab Emirates creeks alongthe Arabian Gulf shoreline. Bulletin of EnvironmentalContamination and Toxicology, 60, 417–424.
Tan, S. G., & Yap, C. K. (2006). Biochemical and molecularindicators in aquatic ecosystems: current status andfurther applications in Malaysia. Aquatic EcosystemHealth and Management, 9(2), 227–236.
ter Braak, C. J. F. (1989). CANOCO—an extension of dec-orana to analyze species–environment relationships.Hydrobiologia, 184, 169–170.
ter Braak, C. J. F., & Prentice, I. C. (1988). A theory ofgradient analysis. Advances in Ecological Research, 18,271–317.
Tomar, M. (1999). Quality assessment of water and wastewater. New York: Lewis Publishers.
Vermeulen, V. C. (1995). Elaborating chironomid defor-mities as bioindication of toxic sediment stress: Thepotential application of mixture toxicity concepts.Annales Zoologici Fennici, 32, 265–285.
Veroli, A. D., Selvaggi, R., Pellegrino, R. M., & Goretti,E. (2010). Sediment toxicity and deformities of chi-ronomid larvae in Lake Piediluco. Chemosphere, 79,33–39.
Warwick, W. F. (1985). Morphological abnormalities inChironomidae (Diptera) larvae as measures of toxicstress in fresh-water ecosystems—Indexing antennaldeformities in Chironomus Meigen. Canadian Journalof Fisheries and Aquatic Sciences, 42, 1881–1914.
Warwick, W. F., & Tisdale, N. A. (1988). Morpho-logical deformities in Chironomus, Cryptochirono-mus, and Procladius (Diptera: Chironomidae) fromtwo differentially stressed sites in Tobin lakes,Saskatchewan. Canadian Journal of Fisheries andAquatic Science, 45, 1123–1144.
Watanabe, N. C., Harada, S., & Komai, Y. (2000). Long-term recovery from mine drainage disturbance of amacroinvertebrate community in the Ichi-kawa river,Japan. Hydrobiologia, 429, 171–180.
Wiederholm, T. (1984). Incidence of deformed chirono-mid larvae (Diptera: Chironomidae) in Swedish lakes.Hydrobiologia, 109, 243–249.