Evaluation of hydrogen and methane-fuelled solid oxide fuel cell systems for residential...
15
Evaluation of hydrogen and methane-fuelled solid oxide fuel cell systems for residential applications: System design alternative and parameter study P. Kazempoor a,b, *, V. Dorer a , F. Ommi b a EMPA Swiss Federal Laboratories for Material Testing and Research, Building Technologies Laboratory, CH-8600 Du ¨ bendorf, Switzerland b Department of Mechanical Engineering, Faculty of Engineering, Tarbiat Modares University, Tehran, Iran article info Article history: Received 14 June 2009 Received in revised form 24 July 2009 Accepted 31 July 2009 Available online 27 August 2009 Keywords: Solid oxide fuel cell Intermediate temperature Hydrogen fuel Methane fuel System model Residential application abstract Design-point and part-load characteristics of a solid oxide fuel cell (SOFC) system, fuelled by methane and hydrogen, are investigated for its prospective use in the residential application. As a part of this activity, a detailed SOFC cell model is developed, evaluated and extended to a stack model. Models of all the required balance of plant components are also developed and are integrated to build a system model. Using this model, two system base cases for methane and hydrogen fuels are introduced. Cogeneration relevant performance figures are investigated for different system configurations and cell param- eters i.e. fuel utilization, fuel flow rate, operation voltage and extent of internal fuel reforming. The results show high combined heat and power efficiencies for both cases, with higher thermal-to-electric ratio and lower electric efficiency for the hydrogen-fuelled cases. Performance improvements with radiation air pre-heaters and anode gas recycling are presented and the respective application limits discussed. ª 2009 Professor T. Nejat Veziroglu. Published by Elsevier Ltd. All rights reserved. 1. Introduction Buildings worldwide contribute significantly to the high and still increasing energy consumption. Therefore, measures for reduction have received increasing attention. Building inte- grated co- and polygeneration are emerging technologies with the potential to reduce primary energy consumption and associated greenhouse gas emissions. With their high electric efficiency, high exhaust gas temperature and wide range of capacity covering all types of buildings from single family homes to large scale commercial buildings; SOFC systems are expected to play an important role in distributed energy generation and in building integrated co- and polygeneration. However, there are a lot of uncertainties about the best layout of the SOFC system in terms of feasibility, performance, economics and controllability. Therefore, the development and evaluation of building integrated micro- and small-scale co- and polygeneration SOFC systems require experimental setups or detailed models on cell, stack and system levels. A few detailed SOFC system models have been developed for the Abbreviations: CHP, combined heat and power; CSTR, stirred tank reactors; BoP, balance of plant; PEN, positive-electrode/electrolyte/ negative electrode; SC, steam to carbon ratio; SOFC, solid oxide fuel cell; SR, steam reforming; TER, thermal-to-electric ratio; TPB, triple phase boundary; WGS, water gas shift reaction; RAP, radiation air pre-heater; PCU, power conditioning unit. * Corresponding author. EMPA Swiss Federal Laboratories for Material Testing and Research, Building Technologies Laboratory, CH-8600 Dubendorf, Switzerland. Tel.: þ41 44 823 42 75; fax: þ41 44 823 40 09. E-mail addresses: [email protected], [email protected], [email protected] (P. Kazempoor). Available at www.sciencedirect.com journal homepage: www.elsevier.com/locate/he 0360-3199/$ – see front matter ª 2009 Professor T. Nejat Veziroglu. Published by Elsevier Ltd. All rights reserved. doi:10.1016/j.ijhydene.2009.07.119 international journal of hydrogen energy 34 (2009) 8630–8644
Transcript of Evaluation of hydrogen and methane-fuelled solid oxide fuel cell systems for residential...

i n t e r n a t i o n a l j o u r n a l o f h y d r o g e n e n e r g y 3 4 ( 2 0 0 9 ) 8 6 3 0 – 8 6 4 4
Avai lab le at www.sc iencedi rect .com
journa l homepage : www.e lsev ie r . com/ loca te /he
Evaluation of hydrogen and methane-fuelled solid oxide fuelcell systems for residential applications: System designalternative and parameter study
P. Kazempoor a,b,*, V. Dorer a, F. Ommi b
a EMPA Swiss Federal Laboratories for Material Testing and Research, Building Technologies Laboratory, CH-8600 Dubendorf, Switzerlandb Department of Mechanical Engineering, Faculty of Engineering, Tarbiat Modares University, Tehran, Iran
a r t i c l e i n f o
Article history:
Received 14 June 2009
Received in revised form
24 July 2009
Accepted 31 July 2009
Available online 27 August 2009
Keywords:
Solid oxide fuel cell
Intermediate temperature
Hydrogen fuel
Methane fuel
System model
Residential application
Abbreviations: CHP, combined heat and ponegative electrode; SC, steam to carbon ratiophase boundary; WGS, water gas shift react
* Corresponding author. EMPA Swiss FederalDubendorf, Switzerland. Tel.: þ41 44 823 42
E-mail addresses: pejman.kazempoor@em0360-3199/$ – see front matter ª 2009 Profesdoi:10.1016/j.ijhydene.2009.07.119
a b s t r a c t
Design-point and part-load characteristics of a solid oxide fuel cell (SOFC) system, fuelled
by methane and hydrogen, are investigated for its prospective use in the residential
application. As a part of this activity, a detailed SOFC cell model is developed, evaluated
and extended to a stack model. Models of all the required balance of plant components are
also developed and are integrated to build a system model. Using this model, two system
base cases for methane and hydrogen fuels are introduced. Cogeneration relevant
performance figures are investigated for different system configurations and cell param-
eters i.e. fuel utilization, fuel flow rate, operation voltage and extent of internal fuel
reforming. The results show high combined heat and power efficiencies for both cases,
with higher thermal-to-electric ratio and lower electric efficiency for the hydrogen-fuelled
cases. Performance improvements with radiation air pre-heaters and anode gas recycling
are presented and the respective application limits discussed.
ª 2009 Professor T. Nejat Veziroglu. Published by Elsevier Ltd. All rights reserved.
1. Introduction homes to large scale commercial buildings; SOFC systems are
Buildings worldwide contribute significantly to the high and
still increasing energy consumption. Therefore, measures for
reduction have received increasing attention. Building inte-
grated co- and polygeneration are emerging technologies with
the potential to reduce primary energy consumption and
associated greenhouse gas emissions. With their high electric
efficiency, high exhaust gas temperature and wide range of
capacity covering all types of buildings from single family
wer; CSTR, stirred tank r; SOFC, solid oxide fuel cion; RAP, radiation air prLaboratories for Material75; fax: þ41 44 823 40 09.
pa.ch, p_kazempoor@msor T. Nejat Veziroglu. Pu
expected to play an important role in distributed energy
generation and in building integrated co- and polygeneration.
However, there are a lot of uncertainties about the best layout
of the SOFC system in terms of feasibility, performance,
economics and controllability. Therefore, the development
and evaluation of building integrated micro- and small-scale
co- and polygeneration SOFC systems require experimental
setups or detailed models on cell, stack and system levels. A
few detailed SOFC system models have been developed for the
eactors; BoP, balance of plant; PEN, positive-electrode/electrolyte/ell; SR, steam reforming; TER, thermal-to-electric ratio; TPB, triplee-heater; PCU, power conditioning unit.Testing and Research, Building Technologies Laboratory, CH-8600
odares.ac.ir, [email protected] (P. Kazempoor).blished by Elsevier Ltd. All rights reserved.

Nomenclature
Latin letters
A Area, m2
Ci Molar concentration of components i, mol m�3
Dh Hydraulic diameter, m
E0 Standard equilibrium potential, V_E Fuel and air enthalpy energy flow, J s�1
ECH4 Methane activation energy, J mol�1
F Faraday constant (¼96485 C mol�1)
f Friction factor
H Height, m
HHV Higher heating value, J mol�1
i Cell current, A
J Current density, A m�2
J0 Exchange current density, A
K Pre-exponential constant
Kc Flow conductance, kg pa�1 s�1
Keq,WGS Equilibrium coefficient for water gas shift reaction
KWGS Pre-exponential constant of water gas shift
reaction, mol s�1 m�2 Pa�1
L Length, m
LHV Lower heating value, J mol�1
_m Mass-flow rate, kg s�1
_Mfeed Feed flow rate to cell or stack, kg s�1
_n Molar flow rate, mol s�1
NCh Channel number
ne Number of electrons transferred per
electrochemical reaction_nH2 ;consumed H2 consumed in each channel, mol s�1
p Partial pressure, Pa
P Pressure, Pa
PAC,Net Net system AC power output, W_QCHP System output heat, J s�1
_q Heat flux, W m�2
R Gas constant, J k�1 mol�1
Re Reynolds number
Req,ohm Equivalent ohmic resistance, U
rj Rate of reaction j, mol m�2 s�1
T Temperature, K
Tex SOFC system exhaust gas temperature
t Thickness, m
uA Air velocity, m s�1
UF Fuel utilization
uF Fuel velocity, m s�1
VNernst Nernst cell potential, V
Vop Cell voltage, V
W Width, m
Wa Actual compressor work, W
WBlower Blower power, W
WComp Fuel compressor power, W
Ws Isentropic compressor work, W
Xi Molar fraction of specie i
Greek letters
b Electron transfer coefficient
G Non-dimensional parameter
d Thickness, m
DP Pressure drop, Pa
DX Length of discretized element, m
h Efficiency, %
hact Activation polarization, V
hdiff Diffusion polarization, V
hohm Ohmic polarization, V
lCell Air excess ratio
m Dynamic viscosity, kg m�1 s�1
ni,j Stoichiometric coefficient of component i in
reaction j
r Density, kg m�3
U Non-dimensional parameter
Super scripts
0 Open circuit/feed conditions (fuel and air channel
inlet)/standard condition
cond Conduction
conv Convection
Rad Radiation
Subscripts
A,Air Air
act Activation
An Anode
b Bulk
Ca Cathode
Ch Channel
Eff. Efficiency
El. Electrolyte
F,Fuel Fuel
Ic Interconnector
In Inlet
Out Outlet
Ox Oxidation
Red Reduction
Stack SOFC stack
Sy System
i n t e r n a t i o n a l j o u r n a l o f h y d r o g e n e n e r g y 3 4 ( 2 0 0 9 ) 8 6 3 0 – 8 6 4 4 8631
building application, many models are more focused on gas
turbine–SOFC cycles performance analysis for a large systems.
Braun [1] investigated micro-cogeneration systems for resi-
dential applications. Presenting the effect of the different
system configurations on SOFC system performance, espe-
cially for cogeneration, Autissier [2] applied multi-objective
optimization methods to his system model. Finkenrath [3]
developed a system model for larger scale SOFC systems.
To bridge the still existing gap between the many more
sophisticated SOFC stack models and the few existing
system models, this paper presents SOFC cell, stack and
system models, some of them adapted and generalized
from existing literature, which are especially developed
for the analysis of building integrated co- and polygenera-
tion SOFC systems. In more detail, the goals of the paper
are:
i n t e r n a t i o n a l j o u r n a l o f h y d r o g e n e n e r g y 3 4 ( 2 0 0 9 ) 8 6 3 0 – 8 6 4 48632
(i) To compare methane- and hydrogen-fuelled SOFC
systems.
(ii) To evaluate varying system alternatives.
(iii) To gain knowledge on system behaviour by parametric
studies.
(iv) And finally to develop a model which can easily be used to
generate the input characteristic curves for the IEA ECBCS
Annex 42 fuel cell cogeneration model [4], which uses
a pragmatic ‘‘grey box’’ approach. For a specific device,
the grey box model has to be calibrated using perfor-
mance data gained from laboratory tests. However, these
model parameters can also be derived using a detailed
fuel cell system model.
Based on these goals, such a detailed SOFC cell model was
developed; based on the mass, momentum and energy conser-
vation equations (besides the electrochemical analysis and fuel
kinetic reaction). It is briefly presented here. The cell model is
extended to a system model. Models for the necessary balance
of plant (BoP) components were also developed and integrated
into an SOFC system model which can be used specifically for
co- and polygeneration. The system model is kept very flexible
and can be used to simulate both high and middle temperature
SOFC systems with any kind of fuel. In this paper, besides
the model description, two base cases for hydrogen and
methane fuel are introduced. For each case, design-point
and off-design-point operations, system design alternatives,
and also parametric analyses on cell and system levels in terms
of energy performance are presented and compared.
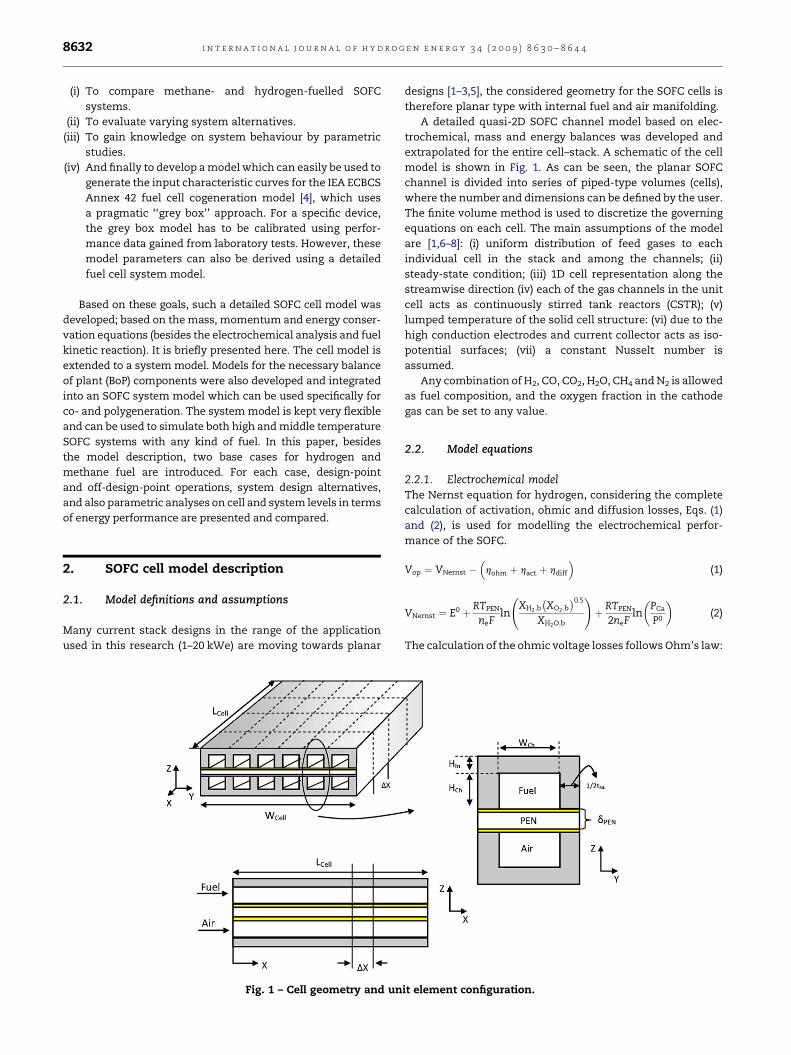
2. SOFC cell model description
2.1. Model definitions and assumptions
Many current stack designs in the range of the application
used in this research (1–20 kWe) are moving towards planar
Fig. 1 – Cell geometry and un
designs [1–3,5], the considered geometry for the SOFC cells is
therefore planar type with internal fuel and air manifolding.
A detailed quasi-2D SOFC channel model based on elec-
trochemical, mass and energy balances was developed and
extrapolated for the entire cell–stack. A schematic of the cell
model is shown in Fig. 1. As can be seen, the planar SOFC
channel is divided into series of piped-type volumes (cells),
where the number and dimensions can be defined by the user.
The finite volume method is used to discretize the governing
equations on each cell. The main assumptions of the model
are [1,6–8]: (i) uniform distribution of feed gases to each
individual cell in the stack and among the channels; (ii)
steady-state condition; (iii) 1D cell representation along the
streamwise direction (iv) each of the gas channels in the unit
cell acts as continuously stirred tank reactors (CSTR); (v)
lumped temperature of the solid cell structure: (vi) due to the
high conduction electrodes and current collector acts as iso-
potential surfaces; (vii) a constant Nusselt number is
assumed.
Any combination of H2, CO, CO2, H2O, CH4 and N2 is allowed
as fuel composition, and the oxygen fraction in the cathode
gas can be set to any value.
2.2. Model equations
2.2.1. Electrochemical modelThe Nernst equation for hydrogen, considering the complete
calculation of activation, ohmic and diffusion losses, Eqs. (1)
and (2), is used for modelling the electrochemical perfor-
mance of the SOFC.
Vop ¼ VNernst ��
hohm þ hact þ hdiff
�(1)
VNernst ¼ E0 þ RTPEN
neFln
XH2 ;b
�XO2 ;b
�0:5
XH2O;b
!þ RTPEN
2neFln
�PCa
P0
�(2)
The calculation of the ohmic voltage losses follows Ohm’s law:
it element configuration.

i n t e r n a t i o n a l j o u r n a l o f h y d r o g e n e n e r g y 3 4 ( 2 0 0 9 ) 8 6 3 0 – 8 6 4 4 8633
hohm ¼ iReq;ohm (3)
In the present model, the method presented in Ref. [6] is used
for the calculation of the ohmic equivalent resistance. In this
method it is assumed that the current flow path is directed
perpendicularly to the cell plane. Then the resistance of the
cell, estimated by subdividing the cell into three parts, namely
air channel interconnector, solid structure of anode, electro-
lyte and cathode layers (PEN), and fuel channel inter-
connector, all of which act as series of resistances.
The activation losses are due to the energy barrier to be
overcome in order for the electrochemical reaction to occur,
and can be characterized by the Butler–Volmer equation [9]:
J ¼ J0
�exp
�bneFhact
RTPEN
�� exp
� ð1� bÞneFhact
RTPEN
�(4)
The complete form of Eq. (4) with b¼ 0.5 is considered in the
present model [9]. The values and equations suggested in
Ref. [10] were selected to calculate the anode, J0,An, and
cathode, J0,Ca, exchange current densities as a function of the
gas compositions in the fuel and air channels and PEN
temperature.
The diffusion polarization can be described in a variety of
ways. In this research, two levels of diffusion phenomena
between the bulk gas phase to the electrode surface and
between electrode surface and triple phase boundary (TPB)
have been applied in the model as follows [11,12]:
hdiff;Ca ¼RTPEN
4Fln
�XO2 ;b
XO2 ;TPB
�(5)
hdiff;An ¼RTPEN
2Fln
�XH2bXH2O;TPB
XH2O;bXH2 ;TPB
�(6)
In the present model, binary diffusion is considered to calcu-
late the gas concentrations in the electrode surfaces. Both
ordinary diffusion and Knudsen diffusion may occur simul-
taneously in the porous media and the effect of these can be
considered with the effective diffusion coefficient [12].
Therefore, the diffusion between the surfaces and TPB is
calculated considering the effective diffusion coefficient.
2.2.2. Material balancesThe mass balance sub-model calculates the compositions in
the fuel and air channels due to the electrochemical reactions,
water–gas-shift reaction (WGS), mass transfer of the chemical
species, and internal methane steam reforming reaction (SR).
The mass balance equations for both air and fuel channels can
be written as:
uFvCi;F
vx¼X
j
ni;jrj1
HFCi;Fjx¼0:0¼C0
i
i˛fCH4;CO2;CO;H2O;H2;N2g j˛fOx;WGS;SRg (7)
uAvCi;A
vx¼ ni;jrj
1
HACi;Ajx¼0:0 ¼ C0
i i˛fN2;O2g j˛fRedg (8)
Local rate of reactants and products to the electric current can
be calculated by Faraday’s law [7]:
rOx ¼ rRed ¼J
2F(9)
The following equations are used to calculate SR [10] and WGS
reactions [7,13]:
rSR ¼ KpCH4 exp
�� ECH4
RTF
�(10)
rWGS ¼ KWGSpCO
1� pCO2
pH2
Keq;WGSpCOpH2O
!(11)
2.2.3. Energy balancesIn the SOFC energy analysis, the different temperature
layers can be used to calculate the temperature profiles in
the SOFC. Different approaches with one to five tempera-
ture layers are presented in the literature [1,7,13]. However,
there are no guidelines available how to properly select
temperature layers [13]. To improve the accuracy of the
present model, five temperature layers have been consid-
ered, namely PEN, air channel, fuel channel, air inter-
connector and fuel interconnector. In the middle of
a planar SOFC stack, the air and fuel side interconnectors
of adjacent cells could be considered as one temperature
layer, but a separate temperature layer is used here for
future investigations of the cells at the boundaries of the
stack. A schematic of the energy flow for a unit element is
shown in Fig. 2.
In Fig. 2, _ERea, _EPro are the energies related to the mass
transfer of reaction products and to the reactants between
bulk gases and PEN or vice versa. _qRadPEN;Ic is the radiation heat
exchange between PEN and interconnector. It is calculated
based on Ref. [14].
2.2.4. Pressure losses in the SOFC fuel and air channelsIn the SOFC channels, the gas flow is not isothermal, but the
flow can be assumed to be laminar and fully developed due to
the small size of the channels [15]. The fully developed
laminar flow solutions of the Navier–Stokes equations or
steady Hagen–Poiseuille analysis can be used for the calcula-
tion of the pressure losses [16].
Considering the definition of the hydraulic diameter and
the related Reynolds number, the mass-flow rate in the
channel, in function of the net pressure difference from the
channel inlet to the outlet, is calculated as [16]:
_m ¼�
1Ref
DhACh
2LCh
r
m
�ðPIn � POutÞ ¼ KcðPIn � POutÞ (12)
where m is the dynamic viscosity of the fluid. The constant Kc,
flow conductance,
Kc ¼�
1Ref
DhACh
2LCh
r
m
�(13)
characterizes the proportionality between the mass-flow rate
in a channel and the net pressure difference from inlet to
outlet. In the present model, the flow conductance Kc is con-
structed based on the viscous effects in the channels.
2.2.5. Gas and solid material propertiesThe following methods are used to calculate the gas and solid
material properties:
i n t e r n a t i o n a l j o u r n a l o f h y d r o g e n e n e r g y 3 4 ( 2 0 0 9 ) 8 6 3 0 – 8 6 4 48634
(i) The enthalpy of the mixture is evaluated by a molar
mixing law [17] and the enthalpy of each species calcu-
lated based on the exact gas temperature.
(ii) The heat transfer coefficients, needed to solve the energy
balance equations, are calculated with a constant Nusselt
number, an assumption confirmed as a good approxi-
mation in the literature [1,6,7,13].
(iii) Due to the electrochemical reaction the mass transfer of
the reactants and products, the gas mixture composition
is not constant along the channel length. Therefore, the
dynamic viscosity and thermal conductivity of the
mixture vary. The kinetic theory of gases is used to
consider this effect [15].
(iv) Data presented in Ref. [5] have been assumed for the
temperature dependent specific resistivity of the solid
parts, needed for calculation of ohmic polarization.
(v) The Fuller equation is used to calculate the binary diffu-
sion coefficients [15]. The Knudsen diffusion coefficients
are calculated based on the average molecular speed of
each component [11]. The effective diffusion coefficients
are calculated based on the binary and Knudsen diffusion
coefficients, considering the mixing rule [11].
3. System components model description
The system component models are needed to model the
operation and to assess the SOFC system performance. In
the capacity range considered in this research, (1–20 kWe), the
following BoP components have been considered, taking into
account the specific requirements for the envisaged residen-
tial application, such as, system size, system simplicity and
also economic criteria [1–3,5]: Fuel compressor, air blower,
water pump, air and fuel ejector, external fuel pre-reformer,
gas to gas heat exchanger, gas to water heat exchanger, DC to
AC inverter, desulphurizer, RAP and air filter. Each component
was individually modelled in the present work. A brief
Fig. 2 – Energy flows f
introduction to these system component models is given in
the sub-sections below. Economics are also of great impor-
tance in any SOFC development. For systems’ evaluations
however, few reliable cost data are available. In the frame of
this paper, no economic evaluations were performed, but
economic criteria were considered to select the system
components and operating points, using the result of some
previous and similar systems [14].
3.1. Compressor, blower and pump models
In the system model; compressors, pump and blower have
been modelled in a similar way, based on the efficiencies
expressions:
hComp ¼Isentropic compressor work
Actual compressor work¼Ws
Wa(14)
3.2. Desulphurizer
A literature review showed that the desulphurizer model is
neglected in some SOFC system models [3,12]. However, some
of the available models demonstrate that at least the pressure
loss in the desulphurizer must be considered in the SOFC
system design [1,18]. In the present model, a constant pres-
sure drop value of 0.01 bar, as suggested in Ref. [19] for the
5 kWe SOFC system, and adiabatic conditions, are assumed.
3.3. Heat exchanger analysis
Three types of heat exchangers are considered in the present
research, namely fuel pre-heater, water boiler and air pre-
heater. For all three types, the hot fluid stream is the exhaust
burner gas. Because of the higher SOFC operation tempera-
ture, air and fuel pre-heaters might be used in any system
design, but a water boiler may not be needed when anode gas
recycling is applied.
or a unit element.

Fig. 3 – (a) RAP structure and its integration to the stack; (b)
energy flow for an RAP.
i n t e r n a t i o n a l j o u r n a l o f h y d r o g e n e n e r g y 3 4 ( 2 0 0 9 ) 8 6 3 0 – 8 6 4 4 8635
The Effectiveness–NTU method [20] has been applied to
calculate the output characteristic of the heat exchangers.
This method is more appropriate when the output tempera-
ture of the cold and hot streams is not defined.
3.4. Fuel and air ejectors
In SOFC systems, water must be added to the anodic stream
for hydrocarbon reforming. Since the anodic exhaust stream
is rich in steam (about 40–45% in mass) and poor in carbon
monoxide, the recirculation of a part of this gas produces
enough water vapour in the anodic inlet. A water line with
a specific pump and boiler can also be used for this purpose.
However, depending on the system size, the efficiency, oper-
ation life and capital costs of the system may be improved by
anode stream recycling. In SOFC systems, ejectors or tradi-
tional blowers can be used for recycling the anodic stream.
However, taking into account that the recirculation is carried
out at a temperature just over 650 �C while the temperature in
the stack is close to 1000 �C for SOFCs, the use of an ejector is
less risky.
Thus, a suitable ejector model must be included in the
SOFC system model. In order to keep the model as generic as
possible in regard to overall system performance, a lumped
model method as suggested in Ref. [21] is applied, considering
(i) steady-state situation, (ii) constant cross-section mixing,
and (iii) isentropic expansion of the actuating fluid.
In this work, the amount of recycle is defined as the frac-
tion of the anode outlet molar flow that is recirculated back to
the pre-reformer inlet.
Besides the anode gas recycling (AGR), an ejector is also
used for recycling the cathodic stream. Using cathode gas
recycling (CGR) can effectively decrease the air access ratio to
the system and consequently size and cost of the air pre-
heater.
3.5. Pre-reformer
In a reformer, at high temperatures (700–1100 �C) and in the
presence of a metal-based catalyst (nickel), steam reacts with
methane to yield CO and H2. The carbon monoxide can also be
converted to CO2 and H2 by WGS reaction. Thus, the following
processes are considered in the pre-reformer of the present
model:
(i) Pre-heating of the fuel mixture to the desired pre-
reformer and inlet SOFC fuel temperature. In fact, in the
present model the fuel pre-heating is coupled with the
pre-reformer.
(ii) Conversion of higher hydrocarbons to methane and
partial conversion of methane to hydrogen.
(iii) WGS reaction
Considering a steady-state and adiabatic pre-reformer
operation, the material balance equations were written for
each component [12]. To solve the set of equations governed
by material balances, two additional equations must be
added. In the pre-reformer, the SR and WGS reactions are
considered in equilibrium conditions and the two additional
equations are added to the material balance equations [12].
3.6. Radiation air pre-heater
In the SOFC operation efficiency range (electric efficiency
about 30–55% LHV), the amount of waste heat is notable and
must be considered in any system design [22]. Radiation air
pre-heater (RAP) [22] and indirect internal reformer (IIR) [12]
are promising components to manage waste heat. Both of
them are built in such way that radiation is the governing
transfer mechanism for waste heat from the stack.
An example of an RAP design and its integration into the
stack are shown in Fig. 3(a). As can be seen, two RAP elements
are attached to the stack. The stack is cooled by conduction to
the external stack wall, radiation to the adjacent RAP walls,
and convection to a reduced airflow through the RAP.
In an SOFC system, a high air excess ratio is needed to cool
the SOFC stack. The high airflow ratio leads to increased size
and cost of the system components, especially the air pre-
heater. Therefore, in this research, an RAP is considered to
reduce the air pre-heater heat exchanger size and thus cost.
The following advantages can also be allocated to RAPs [22]:
(i) As RAPs are designed to selectively remove the heat from
the hottest parts of the stack, the cell performance can be
improved. The results of a well-designed RAP are
a smooth temperature distribution inside the stack and
a longer stack life.
(ii) Lower air access ratio may be used for the system.
(iii) RAPs can easily be used in the SOFC network, to increase
the system compactness and modularization capacity.
The same and practical configuration that has been sug-
gested in Ref [22] is used here. Two RAPs are used in this
configuration for each stack. The horizontal airflow in the RAP
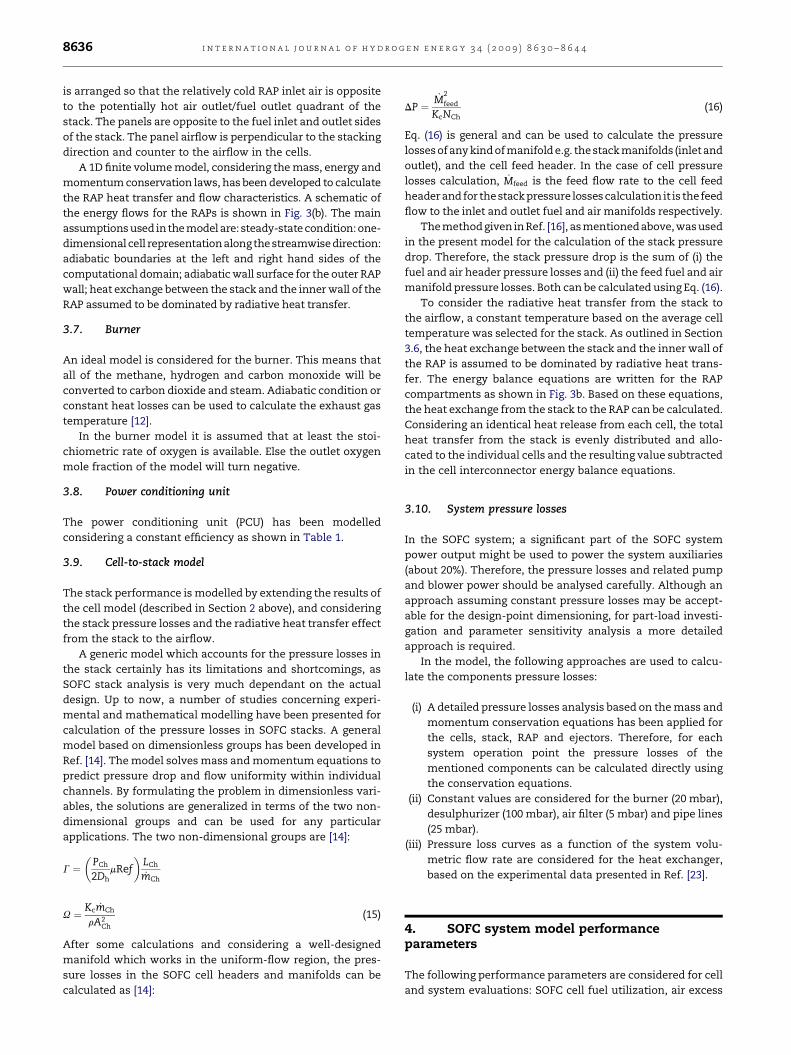
i n t e r n a t i o n a l j o u r n a l o f h y d r o g e n e n e r g y 3 4 ( 2 0 0 9 ) 8 6 3 0 – 8 6 4 48636
is arranged so that the relatively cold RAP inlet air is opposite
to the potentially hot air outlet/fuel outlet quadrant of the
stack. The panels are opposite to the fuel inlet and outlet sides
of the stack. The panel airflow is perpendicular to the stacking
direction and counter to the airflow in the cells.
A 1D finite volume model, considering the mass, energy and
momentum conservation laws, has been developed to calculate
the RAP heat transfer and flow characteristics. A schematic of
the energy flows for the RAPs is shown in Fig. 3(b). The main
assumptions used inthe model are: steady-state condition: one-
dimensional cell representationalong the streamwisedirection:
adiabatic boundaries at the left and right hand sides of the
computational domain; adiabatic wall surface for the outer RAP
wall; heat exchange between the stack and the inner wall of the
RAP assumed to be dominated by radiative heat transfer.
3.7. Burner
An ideal model is considered for the burner. This means that
all of the methane, hydrogen and carbon monoxide will be
converted to carbon dioxide and steam. Adiabatic condition or
constant heat losses can be used to calculate the exhaust gas
temperature [12].
In the burner model it is assumed that at least the stoi-
chiometric rate of oxygen is available. Else the outlet oxygen
mole fraction of the model will turn negative.
3.8. Power conditioning unit
The power conditioning unit (PCU) has been modelled
considering a constant efficiency as shown in Table 1.
3.9. Cell-to-stack model
The stack performance is modelled by extending the results of
the cell model (described in Section 2 above), and considering
the stack pressure losses and the radiative heat transfer effect
from the stack to the airflow.
A generic model which accounts for the pressure losses in
the stack certainly has its limitations and shortcomings, as
SOFC stack analysis is very much dependant on the actual
design. Up to now, a number of studies concerning experi-
mental and mathematical modelling have been presented for
calculation of the pressure losses in SOFC stacks. A general
model based on dimensionless groups has been developed in
Ref. [14]. The model solves mass and momentum equations to
predict pressure drop and flow uniformity within individual
channels. By formulating the problem in dimensionless vari-
ables, the solutions are generalized in terms of the two non-
dimensional groups and can be used for any particular
applications. The two non-dimensional groups are [14]:
G ¼�
PCh
2DhmRef
�LCh
_mCh
U ¼ Kc _mCh
rA2Ch
(15)
After some calculations and considering a well-designed
manifold which works in the uniform-flow region, the pres-
sure losses in the SOFC cell headers and manifolds can be
calculated as [14]:
DP ¼_M
2
feed
KcNCh(16)
Eq. (16) is general and can be used to calculate the pressure
losses of any kind of manifold e.g. the stack manifolds (inlet and
outlet), and the cell feed header. In the case of cell pressure
losses calculation, _Mfeed is the feed flow rate to the cell feed
header and for thestack pressure losses calculation it is thefeed
flow to the inlet and outlet fuel and air manifolds respectively.
The method given in Ref. [16], as mentionedabove, was used
in the present model for the calculation of the stack pressure
drop. Therefore, the stack pressure drop is the sum of (i) the
fuel and air header pressure losses and (ii) the feed fuel and air
manifold pressure losses. Both can be calculated using Eq. (16).
To consider the radiative heat transfer from the stack to
the airflow, a constant temperature based on the average cell
temperature was selected for the stack. As outlined in Section
3.6, the heat exchange between the stack and the inner wall of
the RAP is assumed to be dominated by radiative heat trans-
fer. The energy balance equations are written for the RAP
compartments as shown in Fig. 3b. Based on these equations,
the heat exchange from the stack to the RAP can be calculated.
Considering an identical heat release from each cell, the total
heat transfer from the stack is evenly distributed and allo-
cated to the individual cells and the resulting value subtracted
in the cell interconnector energy balance equations.
3.10. System pressure losses
In the SOFC system; a significant part of the SOFC system
power output might be used to power the system auxiliaries
(about 20%). Therefore, the pressure losses and related pump
and blower power should be analysed carefully. Although an
approach assuming constant pressure losses may be accept-
able for the design-point dimensioning, for part-load investi-
gation and parameter sensitivity analysis a more detailed
approach is required.
In the model, the following approaches are used to calcu-
late the components pressure losses:
(i) A detailed pressure losses analysis based on the mass and
momentum conservation equations has been applied for
the cells, stack, RAP and ejectors. Therefore, for each
system operation point the pressure losses of the
mentioned components can be calculated directly using
the conservation equations.
(ii) Constant values are considered for the burner (20 mbar),
desulphurizer (100 mbar), air filter (5 mbar) and pipe lines
(25 mbar).
(iii) Pressure loss curves as a function of the system volu-
metric flow rate are considered for the heat exchanger,
based on the experimental data presented in Ref. [23].
4. SOFC system model performanceparameters
The following performance parameters are considered for cell
and system evaluations: SOFC cell fuel utilization, air excess
Table 1 – Input parameters for the base cases.
Parameters Value Parameters Value
SOFC stack input parameters
Anode thickness (m) 500� 10�6 Average current
density (A m�2)
5000
Cathode thickness (m) 50� 10�6 Air excess ratio Case (A): 10
Case (B): 12.5
Electrolyte thickness (m) 20� 10�6 Max. PEN allowable
temperature increase (K)
<100
Interconnector thickness (m) 0.5� 10�3 Stack configuration Co-flow
Cell active
area (width�height) (mm2)
100� 120 Air and fuel
inlet temperatures
to cells (K)
1023
Channel height,
fuel and air sides (m)
1� 10�3 Number of channels,
fuel and air sides
25
Channel width,
fuel and air sides (m)
3� 10�3 Number of cells 150
Fuel utilization (%) 80 Cell electrochemical
and thermal
properties (Eqs. (1)–(6) parameters)
Ref. [7]
System input parameters – base cases
Anode recycling
ratio (%)
Case (A): 0 Fuel and air input
temperature to system (�C)
15
Case (B): 60
Extent of methane
reforming
(percent of external reforming)
0 Cathode recycling
ratio (%)
0
Compressor efficiency (%) 68 Steam to carbon
ratio to cells
and reformer
>2
Blower efficiency (%) 73 Whole system
exhaust gas temperature (�C)
50
DC/AC convertor
efficiency (%)
92 System heat
losses (W)
5% of AC power
Air feed 21% O2, 79% N2 Inlet pressure (Pa) 101,325
Fuel feed
to the systems
Case (A): 95% H2þ 5% H2O
Case (B): 100% CH4
i n t e r n a t i o n a l j o u r n a l o f h y d r o g e n e n e r g y 3 4 ( 2 0 0 9 ) 8 6 3 0 – 8 6 4 4 8637
ratio, cell–stack efficiency, electric efficiency and CHP effi-
ciency respectively. They are defined as:
UF;Ch ¼_nH2 ;consumed�
4 _nCH4þ _nCO þ _nH2
�An;In
(17)
lCell ¼�
_nO2
�Ca;In�
2 _nCH4 þ 0:5ð _nCO þ _nH2Þ
An;In
(18)
hCell–Stack ¼PDC
ð _nFHHVFÞAn;In
(19)
hSy;E ¼PAC;Net
ð _nFHHVFÞSy;In
(20)
hCHP ¼PAC;Net þ _QCHP
ð _nFHHVFÞSy;In
(21)
For the calculation of the CHP efficiency, the amount of heat
available from the SOFC system for a constant exhaust gas
temperature after the exhaust/water heat exchanger of 50 �C
was considered. In reality, the efficiency depends of course on
the temperature level of the heat extraction fluid cycle. Some
real SOFC devices like the Hexis micro-CHP device even allow
for condensation in the exhaust gas, e.g. in low temperature
space heating applications, thus increasing the CHP efficiency.
On the other hand, when coupling an SOFC device to a ther-
mally driven chiller, heat normally has to be provided at
temperatures of at least 75 �C.
The thermal-to-electric ratio (TER) is another parameter
that can be used for the evaluation in residential applica-
tion. This parameter shows the thermal energy load to the
base electricity demand of a home. It is highly dependent
on some parameters like location, building type, design
usage patterns [1]. The annual hourly average domestic hot
water TER for a modest (200 m2) home in the US can range
from 0.7 to 1.0 [1] and the requested hot water temperature
is about 60 �C.
5. System configuration and parameters
All of the components models presented in the previous
sections are implemented in the EES software [24] to build the
system model. An example of the model input data is shown
in Table 1.

i n t e r n a t i o n a l j o u r n a l o f h y d r o g e n e n e r g y 3 4 ( 2 0 0 9 ) 8 6 3 0 – 8 6 4 48638
Although, as mentioned, both SOFC temperature opera-
tions can be investigated using the present model; the inter-
mediate temperature SOFC cell design is considered here. This
design is being developed for lower temperature operation to
mitigate the problems of materials degradation [5].
Except the cell geometrical parameters, the data presented
in Ref. [7] for the material properties of an intermediate
temperature direct internal reforming (IT-DIR) SOFC were
used as input values to the cell model. The remaining input
data are shown in Table 1. The most important operational
constraints for the SOFC stack are the maximum cell
allowable temperature increase (DTPEN¼ (TPEN,max� TPEN,min)
<100 K) and the steam to carbon ratio (SC) of the fuel input to
the stack (SC> 2).
The amount of AGR is determined from the specification of
the SC of the fresh fuel–AGR mixture. In methane-fuelled
systems incorporating AGR, the SC ratio is defined as,
SC ¼_nH2O;AGR
_nCH4 ;Sy þ _nCO;AGR þ _nCH4 ;AGR(22)
To avoid any carbon decomposition (SC> 2), about 60% of the
anodic stream must be recirculated. As a starting point for the
parameter variation, two base cases were selected: Case (A)
a simple SOFC system for hydrogen fuel (Fig. 5), Case (B) an
SOFC system for methane fuel and with anode gas recycling
only (Fig. 6).
The anode gas recycling was selected instead of the water
line for the methane-fuelled system because of its significant
role in improving the efficiency and reducing the cost of an
SOFC system [1,5,18]. Table 1 shows the input data and the
assumptions made for these base cases.
Besides the base cases, different system alternatives were
examined, incorporating additional components to the base
cases. The effect of the different cell parameters was inves-
tigated and parameter values for an optimised system were
identified. Based on literature [1–3,18], the following parame-
ters were considered for a comprehensive study of the cell
operating parameters on the system performance: extent of
methane external reforming (by system design alternatives),
fuel utilization, fuel flow rate, and cell operational voltage.
The choice of these parameters is dependent on which
parameters can be regulated with active control measures and
Fig. 4 – Current density and PEN temperature profiles along
the cell length, input data from Ref. [7].
also on how much the manipulation of these parameters
results in changes in performance indices, such as cell power
and efficiency.
The air excess ratio to the system could also be considered
as an operating parameter but here it was not investigated
separately. Here, for each change of operational parameter,
the air excess ratio was varied such to control the
DTPEN< 100 K condition.
6. Results
6.1. Cell model evaluation
As the SOFC stack is an important component in the system,
the cell model should be evaluated. The data presented for the
two sets of benchmark test (BMT) for high temperature (HT)
SOFC cell design [25] (based on [26]), and for an IT SOFC [7]
were selected for the model evaluation. In Table 2, as an
example, present model results are compared with results in
Ref. [7] for an IT SOFC in both co- and counter-flow cell
designs. The results show good accuracy of the present model
for both cell designs. Different cell modelling approaches are
identified as the source of the few discrepancies observed in
comparison with results in Ref. [7]. However, the present
model results are expected to be more accurate than those
given in Ref. [7], as in the 1D SOFC model presented in Ref. [7],
the interconnector rib effect was not considered. Due to this
rib effect the present results for the cell performance param-
eters like power output and cell efficiency show lower values
than data presented in Ref. [7] (an example of the distributed
parameters is shown in Fig. 4).
6.2. Base cases results
Considering the data presented in Table 1, examples of the
systems process flow diagram for both base cases, described
in Section 5, are shown in Figs. 5 and 6. As mentioned, Case (A)
is a hydrogen-fuelled SOFC system. Hydrogen can be supplied
to the system in different ways. In the present model, a low
pressure hydrogen fuel mixture (95% H2þ 5% H2O) and air
(21% O2þ 79% N2) at 15 �C enter to the system and are
compressed in the fuel compressor and blower respectively.
Before entering the SOFC stack, both flow streams are pre-
heated to the cell operation temperature (750 �C). The burner
exhaust gas is used here to pre-heat both streams (an air
bypass line is used to prevent the burner temperature rising
above 950 �C, in order to allow for lower burner material cost).
After pre-heating, the remaining thermal energy of the burner
exhaust gas can be used for co- or polygeneration in a heat
recovery heat exchanger. As shown in Fig. 5, the SOFC module
operating at 0.78 V produces about 7.02 kW of DC power and
5.27 kW of net AC power. The cell–stack, electric efficiency
and CHP efficiency for this system are about 42.5%, 31.7% and
79.5% (HHV) respectively. Considering 50 �C as the whole
system exhaust gas temperature, about 6.46 kW amount of
heat is available for co- and polygeneration.
Fig. 6 shows the process flow diagram of Case (B), i.e. the
methane-fuelled SOFC system. Pure methane (100% CH4) and
air (21% O2þ 79% N2) at 15 �C enter the system and are
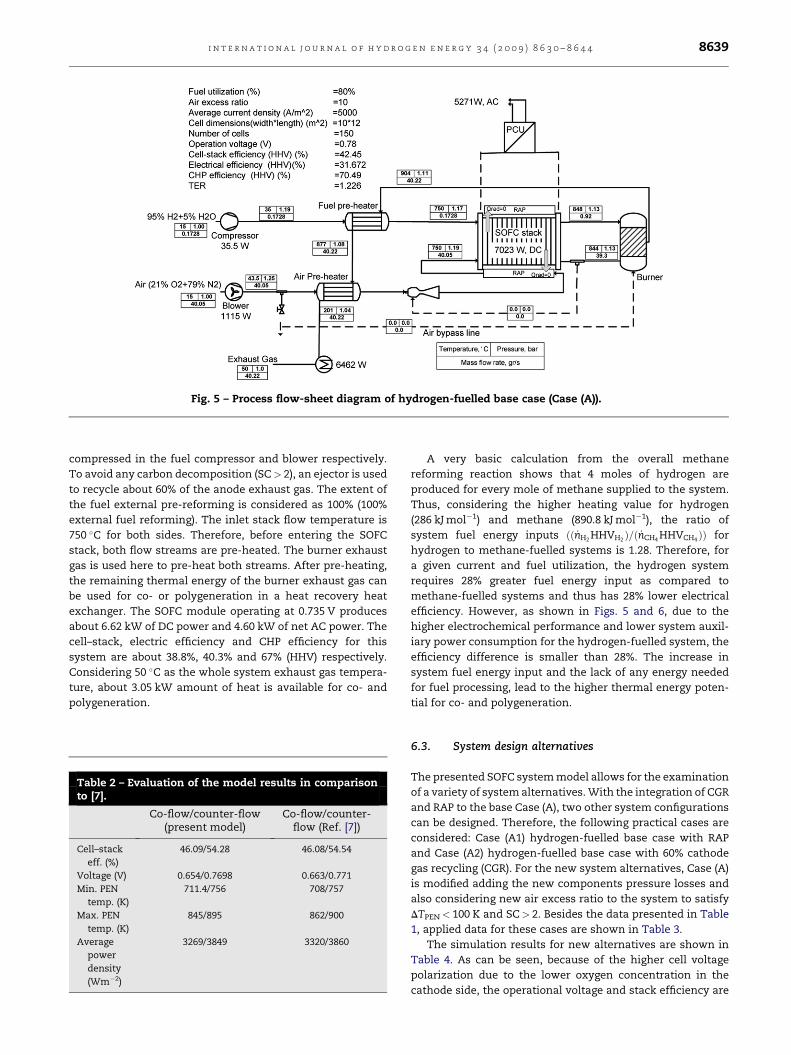
Fig. 5 – Process flow-sheet diagram of hydrogen-fuelled base case (Case (A)).
i n t e r n a t i o n a l j o u r n a l o f h y d r o g e n e n e r g y 3 4 ( 2 0 0 9 ) 8 6 3 0 – 8 6 4 4 8639
compressed in the fuel compressor and blower respectively.
To avoid any carbon decomposition (SC> 2), an ejector is used
to recycle about 60% of the anode exhaust gas. The extent of
the fuel external pre-reforming is considered as 100% (100%
external fuel reforming). The inlet stack flow temperature is
750 �C for both sides. Therefore, before entering the SOFC
stack, both flow streams are pre-heated. The burner exhaust
gas is used here to pre-heat both streams. After pre-heating,
the remaining thermal energy of the burner exhaust gas can
be used for co- or polygeneration in a heat recovery heat
exchanger. The SOFC module operating at 0.735 V produces
about 6.62 kW of DC power and 4.60 kW of net AC power. The
cell–stack, electric efficiency and CHP efficiency for this
system are about 38.8%, 40.3% and 67% (HHV) respectively.
Considering 50 �C as the whole system exhaust gas tempera-
ture, about 3.05 kW amount of heat is available for co- and
polygeneration.
Table 2 – Evaluation of the model results in comparisonto [7].
Co-flow/counter-flow(present model)
Co-flow/counter-flow (Ref. [7])
Cell–stack
eff. (%)
46.09/54.28 46.08/54.54
Voltage (V) 0.654/0.7698 0.663/0.771
Min. PEN
temp. (K)
711.4/756 708/757
Max. PEN
temp. (K)
845/895 862/900
Average
power
density
(Wm�2)
3269/3849 3320/3860
A very basic calculation from the overall methane
reforming reaction shows that 4 moles of hydrogen are
produced for every mole of methane supplied to the system.
Thus, considering the higher heating value for hydrogen
(286 kJ mol�1) and methane (890.8 kJ mol�1), the ratio of
system fuel energy inputs ðð _nH2 HHVH2 Þ=ð _nCH4 HHVCH4 ÞÞ for
hydrogen to methane-fuelled systems is 1.28. Therefore, for
a given current and fuel utilization, the hydrogen system
requires 28% greater fuel energy input as compared to
methane-fuelled systems and thus has 28% lower electrical
efficiency. However, as shown in Figs. 5 and 6, due to the
higher electrochemical performance and lower system auxil-
iary power consumption for the hydrogen-fuelled system, the
efficiency difference is smaller than 28%. The increase in
system fuel energy input and the lack of any energy needed
for fuel processing, lead to the higher thermal energy poten-
tial for co- and polygeneration.
6.3. System design alternatives
The presented SOFC system model allows for the examination
of a variety of system alternatives. With the integration of CGR
and RAP to the base Case (A), two other system configurations
can be designed. Therefore, the following practical cases are
considered: Case (A1) hydrogen-fuelled base case with RAP
and Case (A2) hydrogen-fuelled base case with 60% cathode
gas recycling (CGR). For the new system alternatives, Case (A)
is modified adding the new components pressure losses and
also considering new air excess ratio to the system to satisfy
DTPEN< 100 K and SC> 2. Besides the data presented in Table
1, applied data for these cases are shown in Table 3.
The simulation results for new alternatives are shown in
Table 4. As can be seen, because of the higher cell voltage
polarization due to the lower oxygen concentration in the
cathode side, the operational voltage and stack efficiency are

Fig. 6 – Process flow-sheet diagram of methane-fuelled base case (Case (B)).
Table 3 – System alternatives input parameter besidedata presented in Table 1.
Case(A1)
Case(A2)
Case(B1)
Case(B2)
Case(B3)
Case(B4)
Case(B5)
Anode
recycling
ratio (%)
0 0 60 60 60 60 60
Extent of
methane
reforming
(%)
0 0 30 0 0 30 30
Cathode
recycling
ratio (%)
0 60 0 0 60 0 60
Air excess
ratio (–)
8 4.12 8.6 10 5.77 6.5 4.05
i n t e r n a t i o n a l j o u r n a l o f h y d r o g e n e n e r g y 3 4 ( 2 0 0 9 ) 8 6 3 0 – 8 6 4 48640
lower for the two new cases. Although the new components
i.e. RAP and air ejector pressure losses are added to the new
case models, the lower airflow rate leads to the lower auxiliary
power consumption in air line. For both air and fuel lines the
total pressure losses are shown in Table 4. The lower system
auxiliary power consumption can improve the system
performance parameters, i.e. net AC power output and CHP
efficiencies. Since the radiation heat transfer from the stack to
the RAP is limited, the results also show that the incorporation
of CGR to the system is more effective than an RAP. The TER
values clearly indicate that a higher thermal-to-electric ratio
can be achieved by the hydrogen-fuelled system, but with the
disadvantage of a lower electric efficiency.
With the integration of CGR, DIR, AGR and RAP (separately or
simultaneously) to the base Case (B), several other system
configurations can be designed. However, to avoid any
complexity and to reduce the system cost, some of them are not
practical e.g. only one option between the CGR and RAP might be
used. Therefore, the following practical cases are considered:
Case (B1) methane-fuelled base case with 70% internal reform-
ing (IR); Case (B2) methane-fuelled base case with RAP; Case (B3)
methane-fuelled base case with 60% CGR; Case (B4) methane-
fuelled base case with RAP and 70% IR; and finally Case (B5)
methane-fuelled base case with 60% CGR and 70% IR. To model
these new system alternatives, Case (B) is modified adding the
new components pressure losses and also considering new air
excess ratio to the system to satisfy the requirements
DTPEN< 100 K and SC> 2. The power consumption for the fuel
processing also must be added in the model when it is applied.
Besides the data presented in Table 1, data applied for these
alternative cases are shown in Table 3. The results of the present
simulation for the above mentioned methane-fuelled cases are
given in Table 4. They show that the cell operational voltages for
all of the additional cases are lower in comparison to the base
case (B) due to the higher cell polarization. The comparison also
shows that partial methane internal reforming can improve the
cell–stack, electric efficiency and CHP efficiency effectively
whereas the cell operational voltage and power output are
decreased.
Also the system performance parameters are improved for
all of the additional cases in comparison to the Case (B).
System performance parameters are significantly improved in
Case (B4) and Case (B5) where anode gas recycling and IR,
besides CGR or RAP, are employed. However, adding CGR is
more effective in regard to system performance parameters
i.e. net AC power, electric efficiency and CHP efficiency. The
TER values vary between 0.63 and 0.74 for these cases and thus
show the higher system potential for electricity generation.
As discussed in the previous section, the results also
clearly indicate that the hydrogen-fuelled systems do not offer
any electric efficiency advantages over methane-fuelled
systems. Stack output parameters, amount of air excess ratio
and system pressure losses might be accounted as the main
differences between system alternatives results.

Table 4 – Simulation results for the base cases and the system alternative cases.
Systemconfiguration
Vop
(V)PDC
(W)WBlower
(W)WComp
(W)PAC,Net
(W)hcell–stack (%)
HHVhSy,E (%)
HHVhCHP (%)
HHVTER(–)
Tex
(K)DP air line
(mbar)DP fuel line
(mbar)
Hydrogen-fuelled SOFC system
Base case (A) 0.78 7023 1115 35.5 5271 42.45 31.67 70.49 1.226 201 227 187
Case (A1) 0.779 7016 955.3 35.5 5464 42.4 32.83 72.13 1.197 242 256 187
Case (A2) 0.778 7002 739.2 35.5 5667 42.32 34.05 75.69 1.223 426 407 187
Methane-fuelled SOFC system
Base case (B) 0.735 6617 1469 14.9 4604 38.83 40.32 67.0 0.66 109 251 406
Case (B1) 0.695 6251 960.8 14.9 4709 42.93 41.82 72.27 0.728 148 238 406
Case (B2) 0.734 6606 1250 14.9 4813 38.76 42.14 70.01 0.661 127 270 406
Case (B3) 0.733 6604 889.1 14.9 5171 38.75 45.28 76.57 0.691 217 396 406
Case (B4) 0.683 6149 703.2 14.9 4939 42.22 43.25 75.26 0.740 191 242 406
Case (B5) 0.692 6229 534.5 14.9 5181 42.78 45.37 78.86 0.738 300 332 406
i n t e r n a t i o n a l j o u r n a l o f h y d r o g e n e n e r g y 3 4 ( 2 0 0 9 ) 8 6 3 0 – 8 6 4 4 8641
6.4. Parameter study
6.4.1. Influence of fuel utilization factorThe influence of fuel utilization factor on net AC power,
electric efficiency and CHP efficiency is shown in Figs. 7 and 8
respectively for two cases with a constant inlet fuel flow rate
(0.1728 gr/s for the hydrogen-fuelled cases and 0.2058 gr/s for
the methane-fuelled cases). These methane-fuelled cases are
selected because of the higher system performance and
hereafter they will be used for parameters sensitivity analysis.
Although, in general, higher fuel utilization can increase
the reaction rate of the exothermic electrochemical oxidation
and sequentially the cell temperature and air excess ratio to
the system, increasing the stack power output dominates the
increasing auxiliary power consumption. Therefore, as shown
in Figs. 7 and 8, increasing the fuel utilization factor can
effectively increase the efficiency, except in the high fuel
utilization region (about <90%). The efficiency increases at
higher rate for the hydrogen-fuelled cases than for the
methane-fuelled cases, but decreases in the high fuel utili-
zation operating region for all the cases. In this region, the cell
performance is mass transfer limited, which dramatically
increases the cell polarization, resulting in a reduced
maximum power and, consequentially, efficiency.
Fig. 7 – Net AC power; electric efficiency and CHP efficiency
vs. fuel utilization factor, for the hydrogen-fuelled cases.
Figs. 7 and 8 also show the CHP efficiency as a function of
the fuel utilization. As can be seen; the higher the fuel utili-
zation, the lower the CHP efficiency. This is because of (i) the
lower amount of fuel which is supplied to the burner (leading
to lower both burner exhaust gas temperature and thermal
energy potential), and (ii) higher air excess ratio and auxiliary
power consumption.
For lower fuel utilization, also a lower air excess ratio is
needed to control the cell temperature. In this research, the
minimum allowable air excess ratio is 2. Therefore, especially
for the methane-fuelled cases, the slope of the CHP efficien-
cies curves decreases between 35% and 45% fuel utilization.
This limitation also affects the performance of the Case (A1)
and Case (A4) where the RAP is integrated to the system.
6.4.2. Influence of inlet fuel flow rateSince the rate of the electrochemical reaction and the cell
current are almost proportional to the fuel flow rate, a lower
cell voltage results when increasing the fuel flow rate due to
the higher cell ohmic and activation polarization. The present
results show that the cell voltage decreases about 24% for the
hydrogen-fuelled systems and about 27% for the methane-
fuelled systems when increasing the fuel flow rate from 0.1 to
Fig. 8 – Net AC power; electric efficiency and CHP efficiency
vs. fuel utilization factor, for the methane-fuelled cases.
Fig. 10 – Net AC power; electric efficiency and CHP
efficiency vs. fuel flow rate to the system, for the methane-
fuelled cases.
i n t e r n a t i o n a l j o u r n a l o f h y d r o g e n e n e r g y 3 4 ( 2 0 0 9 ) 8 6 3 0 – 8 6 4 48642
0.4 gr/s (at constant fuel utilization i.e. 80%). Although the cell
voltage is lower for the higher flow rate, the cell and stack
power outputs increase due to the higher cell reaction rate and
current. A higher cell reaction rate increases the cell
maximum temperature and therefore, a higher air excess
ratio is needed to control the cell temperature gradient.
Figs. 9 and 10 illustrate the net AC power as a function of
the fuel flow rate for both fuel cases. As can be seen, although
a higher airflow rate and consequentially a higher blower
power is needed for increased fuel flow rates, the net AC
power output increases when increasing the fuel flow rate.
However, the increase rate is more pronounced until the
middle of the selected domain and it is nearly zero at the end
due to the higher blower power consumption. The cases in
Fig. 9 show quite a similar variation pattern except Case (A1).
Since a constant geometry, based on the system design point,
is considered for the RAP in Case (A1), the RAP pressure losses
become very high where for air excess ratios exceeding about
12 (for the selected methane-fuelled system). This parameter
is lower because of the IR. Therefore, for an SOFC system,
the RAP geometry should be designed not only based on the
design point but also on part-load operation points. The
results indicate that an integrated SOFC system with RAP is
not very suitable for systems operating within a broad power
range.
Figs. 9 and 10 also illustrate the electric and CHP efficien-
cies as a function of fuel utilization factor. As can be seen,
lower electric and CHP efficiencies can be expected for higher
fuel flow rate. However, the increasing rate is higher for the
methane-fuelled systems due to the higher voltage decreasing
rate.
6.4.3. Influence of cell operational voltageConsidering constant fuel utilization (80%, which is controlled
by the airflow rate to the system during load variation), the
results presented in the previous section can be extended to
show how the system performance parameters change during
the part-load operation or changing operational voltage. As
mentioned, the cell voltage, electric efficiency and CHP
Fig. 9 – Net AC power; electric efficiency and CHP efficiency
vs. fuel flow rate to the system, for the hydrogen-fuelled
cases.
efficiency are lower for increased inlet fuel flow rates. There-
fore, at lower cell voltage, lower electric and CHP efficiencies
and higher fuel flow rate and net AC power output are
expected. Figs. 11 and 12 show net AC power, electric effi-
ciency and CHP efficiency as a function of the cell voltage for
both fuel cases. The limitations concerning the RAP dimen-
sioning apply also here.
7. Conclusions
Generalized SOFC system models were presented which are
specifically developed for the analysis the building integrated
co- and polygeneration SOFC system. As a part of this activity,
a detailed SOFC cell model was developed and was introduced
here in brief. The cell model was evaluated for both HT and IT
cell designs and an example of the evaluation cases was
Fig. 11 – Net AC power; electric efficiency and CHP
efficiency vs. cell voltage, for the hydrogen-fuelled cases.

Fig. 12 – Net AC power; electric efficiency and CHP
efficiency vs. cell voltage, for the methane-fuelled cases.
i n t e r n a t i o n a l j o u r n a l o f h y d r o g e n e n e r g y 3 4 ( 2 0 0 9 ) 8 6 3 0 – 8 6 4 4 8643
presented here. The cell model was extended to the stack
model and integrated into a generic SOFC system model. The
model was employed to analyse two base case SOFC systems
fuelled by hydrogen and methane respectively. System
configurations were varied by incorporating internal reform-
ing, anode recycling, cathode recycling, and RAP, and evalu-
ated for optimal efficiencies. Results of variation studies for cell
parameters i.e. fuel utilization, inlet fuel flow rate, and opera-
tional voltage were show optimised system operation points.
The main conclusions of this research are:
1 Lower electric efficiency, higher TER and higher cell–stack
efficiency were observed for all of the hydrogen-fuelled
cases in comparison to the methane-fuelled cases.
2 The stack output parameters, amount of air excess ratio
and system pressure losses might be accounted as the
main differences between the system alternatives results.
3 For both fuel cases, the incorporation of cathode gas
recycling to the base cases effectively improved the elec-
tric and CHP efficiencies. For the hydrogen-fuelled base
case about 7% higher electric and CHP efficiencies and for
the methane-fuelled base case about 11% and 12% higher
electric and CHP efficiencies respectively were observed
4 Although internal reforming can decrease the cell opera-
tion voltage and stack power output, higher electric and
CHP efficiencies resulted due to the lower auxiliary power
consumption.
5 The incorporation of RAPs to the system is an effective way
to decrease the air excess ratio rate and consequentially
the auxiliary power consumption. Since the RAP is
designed based on the design-point characteristic in this
research, it has been observed that there are some uncer-
tainties about how to dimension and operate the RAP when
the cell parameters deviate much from the design values,
especially because high pressure losses may arise in the
RAP.
6 The cell parameter sensitivity analysis showed (i) higher
net AC power and lower electrical efficiency and CHP effi-
ciency for fuel flow rates above the design value; (ii) higher
AC power and electric efficiency and lower CHP efficiency
for higher fuel utilizations (except at fuel utilizations above
90% for the methane-fuelled cases); and (iii) higher electric
and CHP efficiencies, and lower power output in the part-
load operation or for the higher voltage values.
The work presented clearly showed the problems and
limitations related to SOFC polygeneration performance eval-
uation using a generic SOFC model. However, such approach
proved to be a relatively easy and straightforward way to
optimize different SOFC cell and system configurations. Such,
the model may contribute to bridge the still existing gap
between the more sophisticated SOFC stack and system
models on the one hand, and the simple black box models,
often used in building simulation tools, on the other hand.
In an ongoing research, the results of this study have been
employed to derive SOFC system performance data for energy
and environmental impact studies of building integrated
SOFC co- and polygeneration systems, using transient whole
building and plant simulation tools.
Acknowledgements
Mr. Kazempoor would like to thank Dr. M. Santarelli (Asso-
ciate Professor, Dipartimento di Energetica, Politecnico di
Torino) and Dr. N. Woudstra (Associate Professor, Process &
Energy Lab., Delft University of Technology) for helpful
discussions. The support of the Iran Renewable Energies
Organization, Fuel cell Steering Committee for this work is
acknowledged.
r e f e r e n c e s
[1] Braun RJ, Klein SA, Reindl DT. Evaluation of systemconfigurations for solid oxide fuel cell-based micro-combined heat and power generators in residentialapplications. Journal of Power Sources 2006;158:1290–305.
[2] Autissier N. Small scale SOFC systems: design, optimization,and experimental results. PhD thesis, EPFL; 2008.
[3] Finkenrath M. Simulation und Analyse des dynamischenVerhaltens von Kraftwerken mit oxidkeramischerBrennstoffzelle (SOFC). PhD thesis, Julich University; 2005.
[4] Kelly N, Beausoleil-Morrison I. Specifications for modellingfuel cell and combustion-based residential cogenerationdevices within whole-building simulation programs. IEAECBCS Annex 42 report, ISBN 978-0-662-47116-5; 2007.
[5] Pyke SH, Burnett AJ, Leah RT. System development for planarSOFC based power plant. ETSU F/01/00195/REP; 2002.
[6] Campanari S, Iora P. Definition and sensitivity analysis ofa finite volume SOFC model for a tubular cell geometry.Journal of Power Sources 2004;132:113–26.
[7] Aguiar P, Adjiman CS, Brandon NP. Anode-supportedintermediate-temperature direct internal reforming solidoxide fuel cell: part II. Model-based dynamic performanceand control. Journal of Power Sources 2005;147:136–47.
[8] Selimovic A. Modelling of solid oxide fuel cells applied to theanalysis of integrated systems with gas turbines. PhD thesis,Sweden: Lund University; 2002.
[9] Chan SH, Khor KA, Xia ZT. A complete polarization model ofa solid oxide fuel cell and its sensitivity to the change of cellcomponent thickness. Journal of Power Sources 2001;93:130–40.

i n t e r n a t i o n a l j o u r n a l o f h y d r o g e n e n e r g y 3 4 ( 2 0 0 9 ) 8 6 3 0 – 8 6 4 48644
[10] Achenbach E. Three-dimensional and time-dependentsimulation of a planar solid oxide fuel cell stack. Journal ofPower Sources 1994;49:333–48.
[11] Campanari S, Iora P. Comparison of finite volume SOFCmodels for the simulation of a planar cell geometry. FuelCells 2005;5:34–51.
[12] Stiller C. Design, operation and control modelling of SOFC/GThybrid systems. PhD thesis, Norwegian University of Scienceand Technology; 2006.
[13] Xi H. Dynamic modeling and control of planar SOFC powersystems. PhD thesis, The University of Michigan; 2007.
[14] Braun RJ. Optimal design and operation of solid oxide fuelcell systems for small-scale stationary applications. PhDthesis, University of Wisconsin-Madison; 2002.
[15] Yuan J, Rokni M, Sunden B. Simulation of fully developedlaminar heat and mass transfer in fuel cell ducts withdifferent cross-sections. International Journal of Heat andMass Transfer 2003;46:809–21.
[16] Kee RJ, Korada P, Walters K, Pavol M. A generalized model ofthe flow distribution in channel networks of planar fuel cells.Journal of Power Sources 2002;109:148–59.
[17] Poling BE, Prausnitz JM, O’Connell JP. The properties of gasesand liquids. 5th ed. McGraw-Hill; 2004.
[18] Palsson J. Thermodynamic modeling and performance ofcombined solid oxide fuel cell and gas turbine systems. PhDthesis, Lund Uinversity; 2002.
[19] Little D. Conceptual design of POX/SOFC 5 kW net system.Morgantown, WV: Department of Energy, National EnergyTechnology Laboratory, Final Report; 2001.
[20] Incropera FP, Dewitt DP, Bergman TL, Lavine AS.Introduction to heat transfer. 5th ed. John Wiley & Sons;2007.
[21] Ferrari ML, Traverso A, Magistri L, Massardo AF. Influence ofthe anodic recirculation transient behaviour on the SOFChybrid system performance. Journal of Power Sources 2005;149:22–32.
[22] Krist K, Jewulski J. A radiation-based approach to planar solidoxide fuel cell modules. Journal of Materials Engineering andPerformance 2006;15:468–73.
[23] Entwicklungs- und Vertriebsgesellschaft BrennstoffzellembH. EBZ Demonstration unit for solid oxide fuel cells.http://www.ebz-dresden.de/.
[24] Engineering Equation Solver (EES). F-Chart Software. www.Fchart.com; 2000.
[25] Nagel FP, Schildhauer TJ, Biollaz SMA, Wokaun A.Performance comparison of planar, tubular and Delta8 solidoxide fuel cells using a generalized finite volume model.Journal of Power Sources 2008;184:143–64.
[26] Achenbach E. Annex II: modelling and evaluation ofadvanced solid oxide fuel cells. IEA Program on R, D&D onadvanced fuel cells: final report of activity A2.Forschungszentrum Julich, Germany; 1996.