EVALUATION OF DIFFERENT WEED MANAGEMENT ...
145
EVALUATION OF DIFFERENT WEED MANAGEMENT PRACTICES FOR MAXIMUM GROWTH AND YIELD OF WHEAT VARIETIES MD. GOLAM MOSTAFA DEPARTMENT OF AGRONOMY SHER-E-BANGLA AGRICULTURAL UNIVERSITY DHAKA-1207 DECEMBER, 2017
-
Upload
khangminh22 -
Category
Documents
-
view
1 -
download
0
Transcript of EVALUATION OF DIFFERENT WEED MANAGEMENT ...
EVALUATION OF DIFFERENT WEED MANAGEMENT
PRACTICES FOR MAXIMUM GROWTH AND YIELD OF
WHEAT VARIETIES
MD. GOLAM MOSTAFA
DEPARTMENT OF AGRONOMY
SHER-E-BANGLA AGRICULTURAL UNIVERSITY
DHAKA-1207
DECEMBER, 2017

EVALUATION OF DIFFERENT WEED MANAGEMENT
PRACTICES FOR MAXIMUM GROWTH AND YIELD OF
WHEAT VARIETIES
By
MD. GOLAM MOSTAFA
Registration No. 12-04924
A Thesis
Submitted to the Faculty of Agriculture,
Sher-e-Bangla Agricultural University, Dhaka,
in partial fulfilment of the requirements
for the degree of
MASTER OF SCIENCE
IN
AGRONOMY
SEMESTER: JULY-DECEMBER, 2017
Approved by:
(Prof. Dr. Md. Fazlul Karim)
Supervisor
(Prof. Dr. H. M. M. Tariq Hossain)
Co-supervisor
(Prof. Dr. Md. Shahidul Islam)
Chairman
Examination Committee

DEPARTMENT OF AGRONOMY
Sher-e-Bangla Agricultural University
Sher-e-Bangla Nagar, Dhaka-1207 PABX: 9110351 & 9144270-79
CERTIFICATE
This is to certify that the thesis entitled “EVALUATION OF
DIFFERENT WEED MANAGEMENT PRACTICES FOR
MAXIMUM GROWTH AND YIELD OF WHEAT VARIETIES”
submitted to the Faculty of Agriculture, Sher-e-Bangla
Agricultural University, Dhaka, in partial fulfillment of the
requirements for the degree of MASTER OF SCIENCE (MS) in
AGRONOMY, embodies the results of a piece of bona fide research
work carried out by MD. GOLAM MOSTAFA, Registration. No. 12-
04924 under my supervision and guidance. No part of this thesis
has been submitted for any other degree or diploma.
I further certify that such help or source of information as has been
availed of during the course of this investigation has duly been
acknowledged.
Dated:
Dhaka, Bangladesh
(Prof. Dr. Md. Fazlul Karim)
Supervisor

DEDICATED TO
MY
BELOVED PARENTS

i
ACKNOWLEDGEMENT
Alhamdulillah, all praises are due to the almighty Allah Rabbul Al-Amin for His
kindness and infinite mercy in all the endeavors the author to let him successfully
completed the research work and the thesis leading to Master of Science.
The author would like to express his heartfelt gratitude and most sincere appreciations
to his Supervisor Prof. Dr. Md. Fazlul Karim, Department of Agronomy, Sher-e-
Bangla Agricultural University, Dhaka, for his valuable guidance, advice, immense
help, encouragement and support throughout the study. Likewise grateful appreciation
is conveyed to Co-Supervisor Prof. Dr. H. M. M. Tariq Hossain, Department of
Agronomy, Sher-e-Bangla Agricultural University, Dhaka, for constant
encouragement, cordial suggestions, constructive criticisms and valuable advice to
complete the thesis.
The author expresses his deepest respect and boundless gratitude to all the respected
teachers of the Department of Agronomy, Sher-e-Bangla Agricultural University,
Dhaka, for their valuable teaching, sympathetic co-operation, and inspirations
throughout the course of this study and research work.
The author wishes to extend his special thanks to Md. Ahsan Habib, Md. Rashed Bin-
Hafiz and Shiuli Paul for their help during experimentation. Special thanks to all other
friends for their support and encouragement to complete this study.
The author is deeply indebted to his parents, brothers, sisters and other relatives for
their moral support, encouragement and love with cordial understanding.
Finally, the author appreciates the assistance rendered by the staff members of the
Department of Agronomy, Sher-e-Bangla Agricultural University Farm, Dhaka, who
have helped him during the period of study.
The Author

ii
EVALUATION OF DIFFERENT WEED MANAGEMENT
PRACTICES FOR MAXIMUM GROWTH AND YIELD OF
WHEAT VARIETIES
ABSTRACT
A field experiment was conducted in medium fertile soil at Sher-e-Bangla
Agricultural University (90º37´ E longitude and 23º77´ N latitude), Dhaka,
Bangladesh during November 2017 to April 2018 in rabi season with a view to
evaluate the performance of wheat varieties under different weed control methods.
The experiment was carried out with three varieties i.e. BARI Gom-28, BARI Gom-
29 and BARI Gom-30 in the main plot and five weed management methods viz.
control (no weeding), two hand weeding at 20 and 40 DAS, Panida 33EC
(Pendimethalin) @ 2000 ml ha-1 at 5 DAS pre-emergence, Afinity 50.75WP
(Isoproturon) 1500 g ha-1 at 25 DAS as post-emergence herbicide and Panida 33EC
(Pendimethalin) @ 2000 ml ha-1 at 5 DAS + Afinity 50.75WP (Isoproturon)1500 g ha-
1 at 25 DAS in the sub plot in split plot design. Nine different major weed species
were found in the field such as Cynodon dactylon, Cyperus rotundus, Echinochloa
colonum, Eleusine indica, Chenopodium album, Alternanthera philoxeroides,
Brassica kaber, Ieliotropium indicum, Vicia sativa. Results reveled that BARI Gom-
30 contributed the highest grain yield 3.01 t ha-1. Pre-emergence application of Panida
33EC controlled weeds significantly which showed highest growth followed by yield
achieved in wheat. BARI Gom-30 in combination with Panida 33EC produced the
highest grain yield 3.52 t ha-1 while the lowest grain yield 2.09 t ha-1 was obtained
from BARI Gom-28 with no weeding treatment. Results reveled that Panida 33EC
(pre-emergence) was found more effective to controlling weeds in wheat as the
benefit cost ratio was 1.41. Results of the study finally reveled that Panida 33EC
might be considered as a feasible option for combating weed and ensuring higher
yield in wheat cultivation.

iii
LIST OF CONTENTS
Chapter Title Page No.
ACKNOWLEDGEMENT i
ABSTRACT ii
LIST OF CONTENTS iii
LIST OF TABLES viii
LIST OF FIGURES ix
LIST OF APPENDICES x
LIST OF PLATES xii
LIST OF ACRONYMS xiii
I INTRODUCTION 1
II REVIEW OF LITERATURE 4
2.1 Biology of wheat 4
2.2 Weed flora in wheat crop 5
2.3 Yield losses caused by weed in wheat 6
2.4 Critical period of crop-weed competition 7
2.5 Effect of variety 8
2.6 Effect of weed management 9
2.6.1 Effect on weed population and weed biomass 9
2.6.2 Effect on weed control efficiency 11
2.6.3 Effect on weed density 12
2.7.1 Effect on growth characters 14
2.7.1.1 Effect on plant height 14
2.7.1.2 Effect on total dry matter production 14
2.7.2 Effect on yield contributing characters 15
2.7.2.1 Effect on effective tillers 15
2.7.2.2 Effect on leaf area index 16
2.7.2.3 Effect on spike length 17
2.7.2.4 Effect on spikelets spike-1 17
2.7.2.5 Effect on filled grains spike-1 18
2.7.2.6 Effect of weight of 1000 grain 19
2.7.2.7 Effect on grain yield 19
iv
LIST OF CONTENTS (contd.)
Chapter Title Page No.
2.7.2.8 Effect on straw yield 23
2.7.2.9 Effect on biological yield 24
2.7.2.10 Effect on harvest index 25
2.8.1 Effect on cost benefit ratio 25
III MATERIALS AND METHODS 27
3.1 Location 27
3.2 Soil 27
3.3 Climate 27
3.4 Treatments 28
3.5 Plant materials and features 28
3.6 Properties of herbicides 29
3.7 Land preparation 31
3.8 Design and layout 32
3.9 Fertilizer application 32
3.10 Seed treatment 32
3.11 Seed sowing 32
3.12 Intercultural operations 32
3.12.1 Thinning 32
3.12.2 Weeding 33
3.12.3 Irrigation and drainage 33
3.12.4 Plant protection measures 33
4.2.3 Combined effect of variety and weed control methods 33
3.12.5 General observations of the experimental field 33
3.13 Harvest and post-harvest operation 33
3.14 Collection of data 34
3.14.1 Weed parameters 34
3.14.2 Crop growth parameters 35
3.14.3 Yield Contributing Characters 35
3.14.4 Yield Characters 35
3.15 Procedure of sampling for growth study during the crop
growth period
35
3.16 Procedure of data collection for yield and yield components 36
3.17 Economic analysis 38
3.18 Statistical analysis 39

v
LIST OF CONTENTS (contd.)
Chapter Title Page No.
IV RESULTS AND DISCUSSION 40
4.1 Infested weed species in the experimental field 40
4.2 Weed population 41
4.2.1 Effect of variety 41
4.2.2 Effect of weed control methods 42
4.2.3 Combined effect of variety and weed control methods 43
4.3 Weed biomass 45
4.3.1 Effect of variety 45
4.3.2 Effect of weed control methods 45
4.3.3 Combined effect of variety and weed control methods 46
4.4 Weed control efficiency 47
4.4.1 Effect of variety 47
4.4.2 Effect of weed control methods 48
4.4.3 Combined effect of variety and weed control methods 49
4.5 Crop growth characters 50
4.5.1 Plant height 50
4.5.1.1 Effect of variety 50
4.5.1.2 Effect of weed control methods 51
4.5.1.3 Combined effect of variety and weed control methods 52
4.5.2 Leaf area index 54
4.5.2.1 Effect of variety 54
4.5.2.2 Effect of weed control methods 55
4.5.2.3 Combined effect of variety and weed control methods 56
4.5.3 Above ground dry matter production 57
4.5.3.1 Effect of variety 57
4.5.3.2 Effect of weed control methods 58
4.5.3.3 Combined effect of variety and weed control methods 59

vi
LIST OF CONTENTS (contd.)
Chapter Title Page No.
4.5.4 Crop growth rate (CGR) 60
4.5.4.1 Effect of variety 60
4.5.4.2 Effect of weed control methods 61
4.5.4.3 Combined effect of variety and weed control methods 62
4.5.5 Relative growth rate (RGR) 63
4.5.5.1 Effect of variety 63
4.5.5.2 Effect of weed control methods 63
4.5.5.3 Combined effect of variety and weed control methods 64
4.6 Yield contributing characters
65
4.6.1 Spike length 65
4.6.1.1 Effect of variety 66
4.6.1.2 Effect of weed control methods 66
4.6.1.3 Combined effect of variety and weed control methods 67
4.6.2 Spikelets spike-1 67
4.6.2.1 Effect of variety 67
4.6.2.2 Effect of weed control methods 68
4.6.2.3 Combined effect of variety and weed control methods 69
4.6.3 Grains spike-1 69
4.6.3.1 Effect of variety 69
4.6.3.2 Effect of weed control methods 70
4.6.3.3 Combined effect of variety and weed control methods 71
4.6.4 1000 grain weight 71
4.6.4.1 Effect of variety 71
4.6.4.2 Effect of weed control methods 72
4.6.4.3 Combined effect of variety and weed control methods 73
4.7 Yield characters 74
4.7.1 Grain yield 74
4.7.1.1 Effect of variety 74

vii
LIST OF CONTENTS (contd.)
Chapter Title Page No.
4.7.1.2 Effect of weed control methods 75
4.7.1.3 Combined effect of variety and weed control methods 76
4.7.2 Straw yield 77
4.7.2.1 Effect of variety 77
4.7.2.2 Effect of weed control methods 77
4.7.2.3 Combined effect of variety and weed control methods 78
4.7.3 Biological yield 78
4.7.3.1 Effect of variety 78
4.7.3.2 Effect of weed control methods 79
4.7.3.3 Combined effect of variety and weed control methods 80
4.7.4 Harvest index 80
4.7.4.1 Effect of variety 80
4.7.4.2 Effect of weed control methods 81
4.7.4.3 Combined effect of variety and weed control methods 82
4.8 Economic performance of different weed control
treatments
83
4.8.1 Gross return 84
4.8.2 Net return 84
4.8.3 Benefit Cost ratio 85
V SUMMARY AND CONCLUSION 86
REFERENCES 89
APPENDICES 105

viii
LIST OF TABLES
Table Title Page No.
01 Weed species found in the experimental plots in wheat 41
02 Combined effect of variety and different weed
managements on the number of weeds on wheat fields
44
03 Combined effect of variety and different weed
managements on the number of weeds on wheat fields
50
04 Combined effect of variety and different weed
managements on the plant height of wheat at different
days after sowing
53
05 Combined effect of variety and different weed
managements on the Weed biomass m-2 (g) in wheat field
56
06 Combined effect of variety and different weed
managements on total dry matter plant-1 of wheat at
different days after sowing
59
07 Combined effect of variety and different weed
managements on the crop growth rate of wheat at different
days after sowing
62
08 Combined effect of variety and different weed
managements on the relative growth rate of wheat at
different days after sowing
65
09 Combined effect of variety and different weed
managements on the yield contributing characters of wheat
73
10 Combined effect of variety and different weed
managements on the yield characters of wheat
82
11 Cost of production, return and Benefit cost ratio (BCR) of
wheat under different treatments
84

ix
LIST OF FIGURES
Figure Title Page No.
01 Effect of variety on the number of weeds on wheat field at
different days after sowing
42
02 Effect of different weed managements on the number of
weeds on wheat field at different days after sowing
43
03 Effect of variety on the weed biomass m-2 (g) in wheat field 45
04 Effect of different weed managements on the weed biomass
m-2 (g) in wheat field
46
05 combined effect of variety and different weed managements
on the weed biomass m-2 (g) in wheat field
47
06 Effect of variety on the weed control efficiency on wheat
field at different days after sowing
48
07 Effect of different weed managements on the weed control
efficiency on wheat field at different days after sowing
49
08 Effect of variety on the plant height of wheat at different
days after sowing
51
09 Effect of different weed managements on the plant height of
wheat at different days after sowing
52
10 Effect of variety on the leaf area plant-1 of wheat at different
days after showing
54
11 Effect of different weed managements on the leaf area index
of wheat at different days after sowing
55
12 Effect of variety on the above ground dry weight plant-1 of
wheat at different days after sowing
57
13 Effect of different weed managements on the above ground
dry weight plant-1 of wheat at different days after sowing
58
14 Effect of variety on the crop growth rate of wheat at
different days after sowing
60
15 Effect of different weed managements on the crop growth
rate of wheat at different days after sowing
61
16 Effect of variety on the relative growth rate of wheat at
different days after sowing
63
17 Effect of different weed managements on the relative
growth rate of wheat at different days after sowing
64
x
LIST OF FIGURES (Contd.)
Figure Title Page No.
18 Effect of variety on the length of spike of wheat 66
19 Effect of different weed managements on the length of
spike of wheat
67
20 Effect of variety on the number of spikelets spike-1 of wheat 68
21 Effect of different weed managements on the number of
spikelets spike-1 of wheat
69
22 Effect of variety on the number of grains spike-1 of wheat 70
23 Effect of different weed managements on the number of
grains spike-1 of wheat
71
24 Effect of variety on the number of weight of 1000-grains of
wheat
72
25 Effect of different weed managements on the weight of
1000-grains of wheat
73
26 Effect of variety on the grain yield of wheat 75
27 Effect of different weed managements on the grain yield of
wheat
76
28 Effect of variety on the straw yield of wheat 77
29 Effect of different weed managements on the straw yield of
wheat
78
30 Effect of variety on the biological yield of wheat 79
31 Effect of different weed managements on the biological
yield of wheat
80
32 Effect of variety on the harvest index of wheat 81
33 Effect of different weed managements on the harvest index
of wheat
82
34 Effect of weed control methods on benefit cost ratio (%) of
Wheat.
85

xi
LIST OF APPENDICES
Appendix Title Page No.
I Map showing the experimental site under study 105
II Characteristics of soil of experimental field 106
II.A Morphological characteristics of the experimental field 106
II.B The initial physical and chemical characteristics of soil of
the experimental site (0 - 15 cm depth)
106
III Monthly meteorological information during the period from
November, 2017 to April, 2018
107
IV Means square values for the number of weeds on wheat at
different days after transplanting
107
V Means square values for weed control efficiency (%) and
weed biomass (g m-2) of wheat at different days after
transplanting
108
VI Means square values for plant height of wheat at different
days after transplanting
108
VII Means square values for leaf area index of wheat at
different days after transplanting
109
VIII Means square values for above ground dry matter
production of wheat at different days after transplanting
109
IX Means square values for Crop growth rate (CGR) and
Relative growth rate (RGR) of wheat at different days after
transplanting
110
X Means square values for the yield contributing characters of
wheat at different days after transplanting
110
XI Means square values for the yield contributing characters of
wheat at different days after transplanting
111
XII Operation wise break up of labor required per hectare (ha)
of wheat
111
XIII Cost of production per hectare of wheat excluding weeding
cost
113
XIV Weeding cost of different weed control treatments for one
hectare of land of wheat.
114
XV Economic performance of different weed control
treatments
114
xii
LIST OF PLATES
Plate Title Page No.
01 Field view of unweeded (control) plot of wheat 121
02 Field view of two hand weeding treated plot 122
03 Field view of Panida 33EC treated wheat plot 123
04 Field view of Afinity 50.75WP treated plot 124
05 Field view of Panida 33EC + Afinity 50.75WP treated 125

xiii
LIST OF ACRONYMS
% = Percent
µg = Micro gram 0C = Degree Celsius
AEZ = Agro-Ecological Zone
AIS = Agriculture Information Service
B:C = Benefit Cost ratio
BARI = Bangladesh Agricultural Research Institute
BBS = Bangladesh Bureau of Statistics
cm = Centi-meter
CV% = Percentage of coefficient of variance
cv. = Cultivar
DAS = Days after sowing
DF = Degree of freedom
EC = Emulsifiable Concentrate
et al. = And others
etc. = Etcetera
FAO = Food and Agricultural Organization
g = Gram
ha-1 = Per hectare
HI = Harvest Index
hr = Hour
Kg = Kilogram
LAI = Leaf area index
LSD = Least significant difference
LSD = Least Significant Difference
m = Meter
Max = Maximum
Min = Minimum
mm = Millimeter
MP = Muriate of Potash
N = Nitrogen
No. = Number
NPK = Nitrogen, Phosphorus and Potassium
NS = Non-significant
ppm = Parts per million
RCBD = Randomized complete block design
SAU = Sher-e-Bangla Agricultural University
SRDI = Soil Resources and Development Institute
T = Ton
TSP = Triple Super Phosphate
viz. = Videlicet (namely)
WCE = Weed Control Efficiency
WP = Wettable Powder
Wt. = Weight

1

2
Chapter I
INTRODUCTION
Wheat (Triticum aestivum L.) is a cereal grain cultivated worldwide and one-third of the
world's people depend on it for their nourishment and provender. World production of
wheat was 734.1 million tons (FAO, 2016), and 757.52 million tons (Statista, 2018)
making it the third most produced cereal after maize and rice.
According to USDA (2018) currently more than 65% of wheat crop is used for food,
Wheat grain contains 33% Protein, 29% Carbohydrate, 5% Fat, 17% for animal feed and
12% in industrial applications. CIMMYT predicted that demand for wheat in the
developing world is projected to increase 70% by 2050 from now, although Global
2017/18 wheat supplies are reduced, primarily on lower production forecasts for
Australia, Russia even in United States. (USDA,2018).
By considering annual production Wheat is the third important cereal after rice and maize
in Bangladesh (BBS, 2018) covering an area estimated 4,15,339 hectares in 2016-2017
and average yield of wheat has been estimated 13,11,473 metric tons at 3.16 metric tons
per hectare (BBS, 2018).
Wheat provides 20 percent of the calories and protein people consume globally. An
estimated that, 80 million farmers in the developing world rely on wheat for their
livelihoods. Certainly, the crop is at risk from new and more aggressive pests and
diseases, diminishing water resources, limited available land and unstable weather
conditions related to climate change (www.cimmyt.org.net)
Among various factors responsible for low yield, weed infestation and their management
is one of the important factors. Weed competes with crop plants for water, nutrients,
space and solar radiation resulting in reduction of yield by 20 to 50% (Bhan,1998). In
order to sustain global agriculture food production, the importance of protecting arable
crops against negative yield effect from weeds is well recognized. The prevailing climatic
and edaphic conditions are highly favorable for luxuriant growth of numerous species of
weeds which offer a keen competition with wheat crop.

3
Shaban et al. (2009) reported that reduction in wheat yield due to the broad leaf
weed competition were 27.5 and 19.2%, whereas due to grass weed were 43.7 and
33.2%, respectively, in both seasons, which indicates that annual grasses weeds were
more aggressive.
The low temperature during winter season favors germination and growth of important
weeds like Chenopodium sp. (Hirano et al., 1993). Some other scientists observed that
the broadleaf weeds were predominant in wheat field. Number of weed species in wheat
field varied from country to country and up to 45% weed species have been reported in
Pakistan (Qureshi and Bhatti, 2001), 33% in Iran (Buczek et al., 2011), 90 % in India
(Rao, 2000) and 73% in Bangladesh (Begum et al., 2003). Besides other crops weed is a
major problem for maximizing higher yields of wheat and unchecked weed growth
reduces crop yield up to 57% (Singh et al., 1997). Moreover, weeds are alternate hosts to
insects, pathogenic fungi and nematodes such as common broad-leaved weeds for
Fusarium, wild grasses and grassy weeds for wheat streak mosaic virus and its vector and
wheat curl mite (Ito et al., 2012). Weeds are one of the major constraints and weed
control is the key factor in increasing yield of wheat (Shehzad et al., 2012).
In a wheat field, variety of weeds grown are generally classified into three groups
namely, grasses, sedges and broadleaf weeds according to their morphological character.
Monocot and Dicot weeds include Phalaris minor, Avena fatua, Polypogon monspliensis,
Cyperus rotundus and Cynodon dactylon. In Bangladesh the traditional and conventional
methods of weed control practices include preparatory land tillage, hand weeding by hoe
and hand pulling. Usually two or more hand weeding are normally done for growing a
wheat crop depending upon the nature of weeds, their intensity of infestation and the crop
grown. However, hand weeding is highly labor-intensive (as much as 90 person/days/ ha)
(Roder, 2001).
Hand or manual weeding though very effective and commonly adopted in Bangladesh is
expensive, tedious, time consuming and often become uneconomic for the purpose of
cultivation. Furthermore, labor shortage in our agriculture is alarming. Chemical weed
control is an important alternative as it is easier and cheaper than hand weeding.
Herbicide have shown to be beneficial and very effective means of controlling weeds in
4
wheat because they are quite effective and efficient (Azad et al., 1997). In contrast,
chemical methods lead to environmental pollution and negative impact on public health
(Phuong et al., 2005). However, herbicide selectivity and application dose may reduce
the pollution in some extent. This valuable issue needs to be examined in weed
management practices that help keeping lower weed population and better control.
Pendimethalin is a new selective both pre-emergence and post-emergence herbicide
belonging to dinitroaniline group with mode of action of mitosis inhibition (Hoffer et al.,
2006) and being developed for the control of annual grassy weeds in cereal crops
including wheat and barley. Pendimethalin controls grassy weeds as well as against broad
leaf weeds.
It was reported that Pendimethalin and sulfosulfuron were recommended as alternative
herbicides against isoproturon resistant Phalaris minor. But resistance against these
herbicides was also reported (Dhawan et al., 2009), necessitating the search for new
herbicide molecules. Hence, it is essential to identify suitable combination of pre-
emergence and post-emergence herbicide with broadleaf weed herbicides molecules viz.
Pendimethalin, isoproturon, metsulfuron-methyl, carfentrazone-ethyl and 2,4-D for
managing complex weed flora in wheat.
Therefore, the need was felt to study the effect of different herbicides along or
combination to control weeds in wheat, and to boost up the productivity. In view of
above disscusion, the present investigation is undertaken with the following objectives:
Objectives:
1. To evaluate the varietal difference in respect of growth and yield of wheat.
2. To assess the effectivity of different weed management practices in wheat field
3. Assessment of combine effect of variety and weed managements regarding yield
improvement of wheat crop.
4.To evaluate the economic performance of wheat varieties under different weed
management practices.

5

6
Chapter II
Review of Literature
2.1 Biology of wheat
Triticum is a genus of the family Graminae (Poaceae) commonly known as the grass
family and of the cultivated wheats, common wheat, T. aestivum, is economically by far
the most important.
T. aestivum L. as described by Lersten (1987), which is a mid-tall annual or winter annual
grass with flat leaf blades and a terminal floral spike consisting of perfect flowers. The
vegetative stage of the plant is characterized by tillers bearing axillary leafy culms.
Culms comprise five to seven nodes with three to four foliage leaves in itself.
wheat bears the uppermost or flag leaf, subtends the inflorescence. Each culm produces a
composite spike or inflorescence, the basic unit of which is termed the spikelet. Spikelets
are born on a main axis, or rachis, and are separated by short internodes, each spikelet is a
condensed reproductive shoot consisting of two subtending sterile bracts or glumes. The
glumes enclose two to five florets which are born on a short rachilla (Kirby, 2002).
Wheat florets contain three stamens with large anthers and the pistil which consists of a
single ovary, with a single ovule, two styles, and two branching plumose stigmas at the
end of each style. T. aestivum L. is hexaploid (AABBDD) with a total of 42
chromosomes (2n=42, six times seven chromosomes).
The cultivation of wheat began with wild einkorn and emmer (Cook and Veseth, 1991).
The earliest plant breeding efforts with these wheats probably gave rise to plants with
heads that did not shatter to facilitate harvest. Also, hull-less types were selected by early
farmers for ease of threshing. In terms of plant adaptation, hexaploid (6n) wheat
cultivation was adapted to cool climates due to the contribution of winter hardiness traits
present on the "D" genome. However, wheat plants were further adapted for cultivation in
different environments via flowering behavior. Spring wheat is planted in locations with
severe winters which flowers in the same year yielding grain in about 90 days. Generally
winter wheat is grown in locations with less severe winters. Winter wheat will only head

7
after it has received a cold treatment (vernalization) and is therefore, planted in the fall
and harvested in the spring of the following year. Wheat varieties were adapted for
cultivation in dry climates through the introduction of dwarf traits resulting in small
plants that required less water yet produced good grain yield which may severely affected
by weed infestation. Modern wheat cultivars have been developed to resist various weeds
and diseases such as rusts and smuts. In addition to weed and disease resistance, wheat
breeding also focuses on increasing overall grain yield as well as grain quality (starch and
protein) (CFIA, 2018).
Modern wheat breeding programs focus on the improvement of agronomic and grain
quality traits with capability of resistance to weeds. Agronomic traits include weed
resistance, winter hardiness, drought tolerance, disease and insect resistance, straw
strength, plant height, resistance to shattering, grain yield, and harvest ability. Grain
quality traits include seed colour, shape, test weight, protein concentration and type,
starch concentration and type, and flour performance (Knott, 1987).
In consequence, During the domestication of modern wheat, key traits were modified that
benefited early farmers but eliminated the ability of the resulting wheat races to survive
in the wild. Manipulation of wheat genetics has led to ever increasing gains in yield and
grain quality, while decreasing the ability of wheat to survive in the wild. In fact, after
hundreds of years of cultivation in North America and throughout the world, there have
been no reports of wheat becoming an invasive pest viz weed, insects and
microorganisms (CFIA, 2018).
2.2 Weed flora in wheat crop
Weed flora form integral part of each and every agrophytocoensis. Thus, their
interference with crop is natural. Because of their high competitive ability and
allelopathic influence, weed cause an irreversible damage to crops in term of growth and
yield. Knowledge on the composition of weed flora in a particular crop and their correct
identity are necessary to formulate effective measures for their management and control.
Sufficient sunshine and favourable temperature with adequate irrigation and nutrients in
rabi season provide a very congenial conditions for rapid growth of various weed species
over the country. Weeding at early stages of crop growth in wheat cultivation is a very
8
important practice because heavy infestation of weeds hampers the crop growth as well
as greater reduction in wheat yield.
Slow growth of wheat plants during early growth stage provide favourable conditions for
the growth of various weed species at the time of germination and also subsequent
growth periods. Hence, an attempt has been made to review the literature pertaining to
weed flora observed in the wheat field at various locations under different agro-
ecological situations in our country.
The major weed flora in wheat observed by Kamrozzaman et al. (2015) consisted of
Chenopodium album (Bathua shak), Portulaca oleracea(nunia), Oxalis europea (amrul),
Rumex maritius (bon palong), Cyperus rotundus(mutha), Cynodon dactylon(durba), and
Digitaria sanguinalis (bisha grass).
Field experiment was conducted at Hisar (Haryana) on sandy loam soil. Balyan et al.
(1999) investigated that experimental field was infested with the natural populations of
grass weeds viz., Phalaris minor and Avena ludoviciana and broad leaf weeds viz.,
Chenopodium album, Lathirus aphaca, Vicia sativa, Convolvulus arvensis and Fumaria
parviflora.
2.3 Yield losses caused by weed in wheat
Weeds constitute a major limiting factor in successful crop production and cause
enormous yield losses which, however, depend upon nature and intensity of the weed
flora, duration of crop-weed competition, various soil factors and agro-climatic
conditions prevailing under a particular agro-ecological zone (AEZ).
On-farm experiments were carried out by Karim (1987) reported that weed plays a
crucial role lowering the ultimate yield 33% in Bangladesh. Most of the weed
competition in that the critical period of crop weed competition.
In India, among total annual losses of agricultural produce from various pests, weed
account for 45 percent, insects 25 percent, diseases 20 percent and other pest 5 percent
(Rao, 2001).

9
Panwar et al. (1995) while working on a sandy loam soil at Hisar (Haryana) found that
the grain yield of wheat was reduced from 52.1 to 54.2% when plots were weedy for the
whole season during both years.
Result of an experiment conducted at G. B. Pant University of Agri & Tech., Pantnagar
in 1989 to 1991 revealed that grain yield of wheat was reduced to the extent of 51.2%
under unweeded control (Kumar and Singh, 1996).
Weeds cause yield reduction upto 15-50 percent depending upon the weed density and
weed species (Jat et al., 2003).
The field experiment was carried out during the winter seasons of 1994-95 and 1995-96
at Jabalpur (MP) by Dixit and Bhan (1997) and reported that the presence of weeds for
whole seasons reduced the potential yield of wheat by 40.1 and 38.9% in the respective
year.
An experiment was conducted at IARI, New Delhi during winter seasons of 1998-99 and
1999-2000 on sandy loam soil by Pandey and Verma (2004). They recoded about 35%
reduction in average grain yield due to weed competition.
Singh and Singh (2005) executed experiment at Pantnagar (Uttaranchal) during winter
seasons of 2002-2005. They reported that on an average there was more than 66%
reduction in the grain yield of wheat due to mixed population of weeds in weedy plots.
2.4 Critical period of crop-weed competition
Weeds that germinate along with crop are enormous damaging than the later emerging
weeds. There is a period of time (time span) before and after which presence of weeds
does not cause any appreciable reduction in crop yield, as irrecoverable loss has been
done. Hence, establishing the critical period of crop weed competition is essential to
develop economical and effective weed control measures.
Results of an experiment carried out at Anand (Gujarat) in India, on crop-weed
competition in wheat revealed that the critical period of crop weed competition ranged
between 30 to 45 DAS (Anonymous, 1994).

10
Saraswat and Mishra (1998) found that the critical period of crop weed competition
varies from 30-45 DAS of wheat crop.
Chopra et al. (1999) while working on sandy loam soil to find out the critical period of
competition between weeds and wheat crop, during the rabi seasons at Agriculture Farm,
Meerut noted that the 6.28, 8.09, 20.93 and 24.96% reduction in seed yield, when weeds
were allowed to compete with the crop for initial period of 15, 30, 45 and 60 days and
removed thereafter, respectively.
Khan et al. (2002) carried out a field experiment at Peshawar (Pakistan) during the rabi
season of 2000-01 and found that weed competition for the first 42 days did not reduced
significantly the yield of wheat. However, when weeds were allowed to compete beyond
42 days, that is up to 56 days or longer, a significant reduction in yield was observed. A
weed free period up to 45 days or more resulted in a grain yield statistically similar to
season long weed free conditions. Therefore, the critical period of weed crop competition
was determined as the period between 42 and 56 days after sowing in wheat life cycle.
2.5 Effect of variety
Variety itself is the genetical factor which contributes a lot for producing yield and yield
components. Different researcher reported the effect of wheat varieties on yield
contributing component and grain yield. Some available information and literature related
to the effect of variety on the yield of wheat are discussed below.
Variety is an important factor which influences the plant population per unit area,
availability of sunlight, nutrient competition, photosynthesis, respiration etc.
which ultimately influence the growth and development of the wheat crops. In
agronomic point of view, weed management for modern wheat cultivation has
become an important issue. Considering the above points, available literature
was reviewed under different variety and weed control of wheat.
An experiment was conducted by Sultana et al. (2012) at Agronomy Field Laboratory of
Rajshahi University to evaluate the effect of variety and weeding regime on yield and
yield components of wheat. Four varieties viz. Prodip -V1, Gourab -V2, Shatabdi -V3,
Bijoy -V4 and five weeding treatments. The results indicated that Prodip produced the

11
highest grain yield (5.33 t ha-1
) followed by Gourab (4.85 t ha-1
), while the lowest grain
yield (3.98 t ha-1
) was obtained from Shatabdi. The highest grain yield (5.09 t ha-1
) was
obtained in Weed free (W1) followed by W3 (Two hand weeding) (4.89 t ha-1
) and the
lowest grain yield (4.13 t ha-1
) was obtained in no weeding treatment (W0). The highest
grain yield (5.64 t ha-1
) was obtained from the combination of Prodip and weed free
treatment (V1W1) and the lowest (3.57 t ha-1
) was obtained from the combination between
Shatabdi and no weeding treatment (V4W0).
2.6 Effect of weed management
Weed is one of the most limiting factors for successful wheat production. Among various
cultural practices, weed control plays a vital role in the production and yield of wheat
through controlling the weeds as well as make the environment favorable for wheat
production. To assess the present study attempts have been made to incorporate some of
the important findings of different scientists and research workers in this country and
elsewhere of the world.
2.6.1 Effect on weed population and weed biomass
Singh and Saha (2001) observed that pendimethalin @ 1 kg ha-1
at pre-emergence,
isoproturon @ 1.5 kg ha-1
at post-emergence, 2,4-D @ 1.5 kg ha-1
at post-emergence,
combination of pendimethalin 0.5 kg ha-1
pre-emergence + isoproturon 1 kg ha-1
post-
emergence and pendimethalin 0.5 kg ha-1
pre-emergence + 2,4-D 1 kg ha-1
post-
emergence recorded significantly lower weed biomass and weed index and higher weed
control efficiency over weedy check treatment.
Nayak et al. (2003) executed a field trial during rabi 1998-99 on clayey soil. Results
revealed that the weed biomass was minimum under hand weeding and was at par with
2,4-D (0.5 kg ha-1
) alone and in combination with metsulfuron methyl were applied.
Furthermore, weed control efficiency was maximum (94.15%) in hand weeding closely
followed by 2,4-D 0.5 kg ha-1
+ metsulfuron methyl 4 g ha-1
(90.98%) and 2,4-D 0.5 kg
ha-1
(89.90%). Again, post-emergence application of metsulfuron methyl at 3 to 5 g ha-1
and 2,4-D 0.75 kg ha-1
gave excellent control of broad leaved weeds species than farmers
practices and weedy check at Kota (Rajasthan).

12
A field experiment was carried out by by Prasad et al. (2005) at Varanasi (UP) in India
during rabi seasons of 2000-01 and 2001-02 on sandy clay loam soil. The results
indicated that post-emergence application of isoproturon + 2,4-D (1 + 0.5 kg ha-1
)
significantly reduced the population and dry matter production of weeds over weedy
check.
Chahal et al. (2003) reported that application of clodinafop (60 g ha-1
) reduced the
population and dry matter accumulation of Phalaris minor by 92.5% and 90.6%,
respectively and hence resulted 53.9% higher grain yield over unweeded check.
Kumar et al. (2003) conducted a field experiment during 1996-97 and 1997-98 and
concluded that application of sulfosulfuron significantly controlled all the weed
species and reduces their dry weight over weedy check. The maximum response
was recorded at lowest level, i.e., 20 g ha-1
.
Tomar et al. (2004) reported that all the weed management treatments significantly
decreased the dry matter production of weeds over the unweeded control.
Application of isoguard 1 kg ha-1
gave the maximum yield (4348 kg ha-1
.) and next
best treatments were clodinofop 60 g ha-1
+ metribuzin 150 g ha-1
(4298 kg ha-1
),
sulfosulfuron 25 g ha-1
(4167 kg ha-1
) and metribuzin 250 g ha-1
resulting in higher
W.C.E.(87.8 - 94.3%).
Gopinath et al. (2007) reported that all herbicides provided significant control of
weeds compared to weedy check. Pendimethalin at 2000 g ha-1
and sulfosulfuron at 33 g
ha being at par with each other recorded significantly lower weed dry weight
compared to tank mix spray of isoproturon (750 g ha-1
) + 2, 4 –D (500 g ha-1
) and
weedy check.
Kaur et al. (2018) conducted a field experiment with 8 treatments viz, Weed free, Weedy
check, Pendimethalin 2.5L ha-1
, Pendimethalin 3.75 L ha-1
, Clodinofop 400 g ha-1
,
Sulfosulfuron 32.5g ha-1
, Pinoxaden 1000 ml ha-1
, Atlantis 400 g ha-1
and replicated
thrice.
Sharma and Sharma (1997) carried out field experiment at Bajaura (Kullu) in India
during winter season of 1993-94 and 1994-95 for the control of complex weed flora in

13
wheat. It was reported that post-emergence application of metsulfuron methyl 4 g ha-1
was found very effective against all the broad leaf weeds, however it's combination with
isoproturon (1.25 kg ha-1
) most effectively controlled all the weeds and gave higher yield
over rest of the weed management practices. Sole application of metsulfuron methyl up to
8 g ha-1
as post-emergence were found effective against broad leaved weeds (Balyan et
al., 1999, Chopra et al., 2001 and Sardana et al., 2001) and even its combination with
isoproturon for the control of all the weeds (Sardana et al., 2001 and Singh and Singh,
2002) under various agro-ecological situations in India.
Field experiments were conducted at Pusa (Bihar) in India during the rabi season of
1989-90 and 1990-91 by Pandey et al. (1997). The results revealed that pendimethalin 1
kg ha-1
and isoproturon 1 kg ha-1
recorded significantly lower weed number and weed dry
biomass and recorded maximum weed control efficiency over weedy check. Hence,
effectiveness of pendimethalin at 1 kg ha-1
as pre-emergence application wheat crop is
well documented in later studies (Jain et al., 1998, Chopra et al., 2001and Singh and
Singh, 2004).
2.6.2 Effect on weed control efficiency
A field experiment was conducted by Mustari et al.(2014) at the experimental farm of the
Bangabandhu Sheikh Mujibur Rahman Agricultural University (BSMRAU), Gazipur,
Bangladesh, found that Carfentrazone-ethyl performed the best in terms of weed control
efficiency (79.68%), while Pendimethalin performed the worst (52.74%). Carfentrazone-
ethyl + Isoproteuron contributed to the highest tillers per unit area (226.3 m-2
) and the
highest total dry matter (1342 g m-2
). The study revealed that, combined ingredient
herbicide Carfentrazone-ethyl + Isoproteuron as well as Carfentrazone-ethyl alone might
used at field level due to their better weed control efficiency.
Studies conducted by Singh et al. (1994) at Jabalpur in India during 1990-91 on weed
control in wheat revealed that the pre-emergence application of isoproturon 1 kg ha-1
had
95.12% weed control efficiency which was almost equal to hand weeding (93.85%)
treatment. Isoproturon @ 1 kg ha-1
pre or postemergence controlled almost all the annual
monocot and dicot weeds.

14
An experiment was conducted by Bhan and Dixit (1998), in wheat crop at National
Research Center for Weed Science, Maharjpur Jabalpur (M.P.) in India. They noted that
the pre-emergence pendimethalin application was not as effective as isoproturon. The
greatest weed control efficiency was recorded with 1.0 kg ha-1
isoproturon applied just
before irrigation. Pre-irrigation 1.0 kg/ha isoproturon had a weed control efficiency
almost 80 percent. However, effectiveness of isoproturon has been reported particularly
against grassy weeds where its problem is severe (Balyan et al., 1999 and Singh and
Singh, 2002).
Zahoor et al. (2012) observed significant differences among various herbicide
application rates. The highest weed control efficiency of 84.97% was recorded
in plots where hand weeding was done. It was at par with B. Super at 0.35 kg
ha-1
(78.02) and MCPA at 0.65 kg ha-1
(76.30).
Hossain (2008) found that presence of weed in the crop field was significantly
affected by different herbicide application at different rates. He observed that
lowest dry weight of weed 12.27 and 7.11 kg ha in the treatment of Sencor
70WG @ 0.60 Kg ha at 20 DAS and 45 DAS respectively and the highest dry
weights of weeds were observed in control plots at 20 DAS, 45 DAS.
Hari et al. (2006) conducted an experiment during the winter seasons of
200 1/02 and 2002/03 in India, to study the effect of weed control treatments in
wheat sown by zero-tillage [no-tillage] method. They recorded significant
improve in grain yield with the use of Glyphosate + Sulfosulfuron and
Glyphosate + Sulfosuifliron + Metsulfuron (each applied at different lime)
during both years.
Kaur et al. (2018) reported that the weed control efficiency among the weed control
management practices ranged from 61.3 to 100 %. The highest weed control efficiency
was found in weed free plots followed by pendimethalin @ 3.75 L /ha (76.9%). Whereas,
the lowest result recorded in no weeding treatment.
2.6.3 Effect on weed density

15
Nariyal et al. (2007) found that field trial was conducted during rabi season on wheat
at G.B. Pant University of Agriculture & Technology, Pantnagar. Phalaris minor,
Chenopodium album, Medicago denticulata, Coronopus didymus, Melilotus indica
and Rumex acetosella were the major weed species in the experimental field. All the
weed control treatments caused significant reduction in the density and dry weight of
total weeds over weedy check at 60 days stage of crop growth. The lowest density
and dry weight of weeds were recorded with sulfosulfuron at 25 g ai/ha + surfactant
at 1250 ml/ha, which was followed by pinoxaden at 45 or 50 g ai/ha, application of
pinaxaden 45 or 50 g ai/ha at 30 days after sowing was very effective for the control
of Phalaris minor.
Zand et al. (2007) observed that metsulfuron methyl plus sulfosulfuron at 36 g a.i./ha
is a suitable option for the post-emergence control of broadleaved and grass weeds
in wheat. This treatment almost resulted in the highest grain yield at different
locations too.
Singh and Singh (2004) investigated an experiment at Jodhpur (Rajasthan) in India
during rabi season 1998-99 and 1999-2000. They found that pendimethalin 0.75 kg ha-1
integrated with one hand weeding reduced significantly the density of Chenopodium spp.
as well as other weed species.
Field experiment was tried at Junagadh (Gujarat) in India during winter season of 1993-
94 to 1997-98 on Vertisol (Sukhadia et al., 2000). The results showed that all the weed
management treatments significantly reduced the weed density and weed dry weight as
compared with unweeded control treatment. The lowest dry weight of weeds was
observed under pendimethalin 1 kg ha-1
preemergence + 1 Hand weeding at 30 DAS and
this treatment also registered the highest (93%) weed control efficiency.
Ashrafi et al. (2009) reported that minimum weed density/m2 and maximum spikelets/
spike, grain/spike, grain yield, harvest index and net income were found with broad
spectrum (grasses + broad leaf) herbicides.
Chhokar et al. (2008) reported that post-emergence clodinafop (60 g ha-1
), fenoxaprop
(120 g ha-1
), pinoxaden + S (30 g ha-1
plus 0.5% surfactant), metsulfuron + S (12–
16
15 g + 625 ml surfactant ha-1
) and sulfosulfuron + S (25 g ha-1
+0.35% surfactant) and
pre-emergence fluazolate (150 g ha-1
) and pendimethalin (1250 g ha-1
) were very
effective in controlling Phalaris minor and improving wheat yields.
2.7.1 Effect on growth characters
2.7.1.1 Effect on plant height
Sultana et al. (2012) concluded that the plant height was significantly affected by
weeding regime. The longest plant (101.59 cm) was obtained from the weed free
treatment, which was statistically similar with one hand weeding treatment. The shortest
plant (95.40 cm) was recorded in no weeding (control treatment) treatment.
Acker (2010) carried out an experiment to assess the effect of weed management
practices on yield attributes and yield of wheat. The result indicated that higher weeding
frequency increased plant height by 20-30% compared to no weed control treatments.
Sultana (2009) proposed that weeding operation had significant effect on plant height of
wheat. However, the longest plant height (89.96 cm) at harvest was with W2 (Two
weeding at 30 and 60 DAS) and the minimum (87.76 cm) was observed from no weeding
(W0) treatment.
Field trial was carried out at Ranchi (Jharkhand) in India on sandy clay loam soil by
Singh and Saha (2001).They found that pendimethalin @ 1 kg ha-1
pre-emergence,
isoproturon @ 1.5 kg ha-1
post-emergence, 2,4-D @ 1.5 kg ha-1
post-emergence,
combination of pendimethalin 0.5 kg ha-1
pre-emergence + isoproturon 1 kg ha-1
post-
emergence and pendimethalin 0.5 kg ha-1
pre-emergence + 2,4-D 1 kg ha-1
post-
emergence recorded significantly taller plants, greater number of effective tillers and
fertile spikelets as compared to weedy check. Similarly, Yadav et al., (2001) reported that
application of pendimethalin @ 2.0 kg ha-1
pre-emergence recorded significantly higher
number of tillers plant-1
, grains ear-1
and test weight over weedy control.

17
2.7.1.2 Effect on total dry matter production
Zahoor et al. (2012) executed an experiment to assess the optimum herbicide level in
wheat production. The result indicated that, among different herbicide rates, the lowest
weed biomass (15.97 gm-2
) was recorded in hand weeded plots followed by Buctril Super
at 0.45 kg ha-1
, MCPA 0.65 kg ha-1
and Buctril Super at 0.25 kg ha-1
. While the highest
values of weed biomass (127.22 gm-2
) was reported in weedy plots over two years of
field study.
Acker (2010) carried out an experiment to assess the effect of weed management
practices on yield attributes and yield of wheat and he found that dry matter accumulation
of wheat increased by 12-20% than the weedy check.
Sultana (2009) concluded that weeding frequency had significant effect on dry weight of
wheat plants. The highest values of dry weight plant-1 (4.60, 9.06, 14.06 and 16.99 g at
30, 60, 90 DAS and at harvest, respectively) and the lowest dry weight plant-1 (3.84,
7.16, 10.77 and 13.60 at 30, 60, 90 DAS and at harvest, respectively) was recorded with
W0 (No weeding).
2.7.2 Effect on yield contributing characters
2.7.2.1 Effect on effective tillers
Sultana et al. (2012) reported that the highest number of effective tillers plant-1
(4.95)
was observed in weed free treatment followed by two hand weeding treatment (4.49) and
the lowest number of fertile tillers plant-1
(3.27) was produced by no weeding treatment.
She found that different duration of crop weed competition had significant effect on
effective tillers m-2
of wheat. The highest effective tillers m-2
(246.70) was with W2 (Two
weeding at 30 and 60 DAS) and the lowest spikes m-2
(185.40) was observed in with W0
(No weeding).
Sujoy et al. (2006) conducted a field experiment to determine different weed
management practices in wheat. They proposed that hand weeding at 21 and 35 days after
sowing was effective in controlling the weeds in the field and this treatment recorded the
highest values for number of effective tillers m-2
.

18
For the control of weeds in wheat, a field experiment was conducted at Ludhiana in India
during 1994-95 and 1995-96 by Walia et al. (1997). They observed that on an average of
two years, application of metsulfuron at 10 and 20 g ha-1
, 2,4-D 0.5 and 0.8 kg ha-1
and
their combinations recorded significantly higher number of effective tillers over
unweeded control treatment. However, application of metsulfuron up to 5 g ha-1
has been
improved various growth and yield attributes of wheat viz., plant height, effective tillers,
number of spikes, number of grains ear-1
, spike length and test weight at various locations
in India were reported by Sardana et al., 2001, Sharma and Thakur, 2002, Jat et al., 2003
and Singh and Ali, 2004.
Singh and Kundra (2003) reported that fenoxaprop and sulfosulfuron provided effective
control of Phalaris minor in wheat field. Significantly increase in grain yield of wheat
under sulfosulfuron over that under isoproturon was supported by more numbers of
effective tillers and other yield contributing characters of wheat.
Hossain (2008) carried out a field trial and observed that the number of tillers plant-1
increased with the effectiveness of herbicide treatments. He mentioned that the highest
number of tillers plant-1
(2.52. 5.89. 6.01 and 6.10) was shown by Sencor 70WG @
0.40kg ha-1
at 30. 60. 90 DAS and at harvest respectively.
2.7.2.2 Effect on leaf area index
Pandey and Kumar (2005) conducted a field experiment at Pusa (Bihar) in India during
the winter seasons of 2000-01 and 2001-02 on clay loam soil. They reported that hand
weeding at 30 DAS, post-emergence application of 2,4-D (SS) 800 g ha-1
and isoproturon
750 g ha-1
produced significantly higher effective tillers, leaf area index (60 DAS), length
of ear and grains per ear over weedy check.
Sheibani and Ghadiri (2012) remarked that the integration of herbicides significantly
increased the wheat leaf area index. However, competition between weeds and wheat
reduced wheat leaf area index in the weedy check condition.
Bharat et al. (2012) proposed that weed control treatments significantly increased dry
matter production, LAI, CGR, number of spikes, number of grains/ear and grain as well
as straw yield of wheat compared to weedy check. The maximum value of these

19
parameters was recorded in tank-mix application of sulfosulfuron + 2,4-D, fenoxaprop +
metribuzin and clodinafop + metsulfuron, Maximum grain yield was recorded in weed
free (5.05 t/ha), but the highest B:C ratio was observed with isoproturon + 2,4-D.
However, the unchecked weed growth of wheat caused 40.3% reduction in grain yield.
Bhikhubhai R.V. (2006) reported that significantly higher leaf area index was observed
under pendimethalin 1 kg ha-1
pre-em. + 1 HW and remained at par with rest of the
treatments, except treatments isoproturon 0.75 kg ha-1
pre-em. + 1 HW and unweeded
control.
2.7.2.3 Effect on spike length
The field experiment was conducted at Varanasi (UP) during rabi seasons of 2000-01 and
2001-02 on sandy clay loam soil by Prasad et al. (2005). They found that post-emergence
application of isoproturon + 2,4-D (1 + 0.5 kg ha-1
) produced significantly higher values
of ear heads and grain yield over weedy plots.
Sultana (2009) executed a field experiment and found that significant effect on spike
length of wheat due to weed control treatments. She reported that higher duration of crop-
weed competition resulted shorter spike, whereas less duration showed longer spike. The
result indicated that longest spike (10.29 cm) was with W2 (Two weeding at 30 and 60
DAS) and the shortest spike length (9.45 cm) was record in W0 (No weeding).
A field experiment was executed by Pandey et al. (2000) at Pusa (Bihar) in India on clay
loam soil. They reported that weed control through herbicides viz., post-emergence
application of isoproturon 1.0 kg ha-1
, 2,4-D 0.8 kg ha-1
and combination of isoproturon
0.5 kg ha-1
+ 2,4-D 0.125 kg ha-1
recorded significantly higher values of plant height,
effective tillers, CGR, RGR, ear length, test weight than weedy check.
Hossain (2008) recorded that the highest spike lengths (7.25, 12.12 and 12.47 cm) from
the treatment of Sencor 70WG @ 0.40 kg ha-1 at 60 DAS, 90 DAS and at harvest
respectively. He reported that a gradual trend of increased length of spike was found in
all the herbicides with increased rate of application in compare to the control plots of
wheat.

20
2.7.2.4 Effect on spikelets spike-1
Singh and Singh (1996) executed an experiment at Ghaghraghat in India and concluded
that the herbicidal treatments produced higher yield attributes like spikelets ear-1
, ear
length, effective tiller plant-1
and 1000 grain weight than weedy check.
Singh and Singh (2004) investigated a field experiment at Jodhpur (Rajasthan) In India
during winter seasons of 1998-99 and 1999-2000.They observed that pre-emergence
application of pendimethalin at 0.75 kg ha-1
supplemented by one hand weeding or 2,4-D
0.5 kg ha-1
at 30 DAS gave significantly higher spikes m-2
, grains spike-1
, 1000 grain
weight due to better weed control.
Sultana (2012) observed that the highest number of spikelets spike-1
(39.19)
was with W2 (Two weeding at 30 and 60 DAS) and the lowest number of
spikelets spike-1(25.81) was recorded with W0 (No weeding) treatments. Chahal et al.
(1986) also observed that variety differed in the number of total spikelets spike-1
.
Hossain (2008) reported that number of spikelets spike-1
increased with types
of herbicides and then doses of application. There was no significant effect among the
said parameter at 60 DAS but at 90 DAS and at harvest it varied significantly.
The highest values of spikelets spike-1
(5.98 and 6.08 cm) were recorded in
Sencor 70WG @ 0.40 kg ha-1
at 90 DAS and at harvest, respectively.
2.7.2.5 Effect on filled grains spike-1
Acker (2010) carried out an experiment to find out the effect of weed
management practices on yield attributes and yield of wheat. He reported that the
grains spike-1
increased by 8-12% due to higher weed control frequencies and
the weedy check produced the lowest filled grain spike-1
.
Sultana (2009) mentioned that significant effect on number of filled grains spike-1
was found with weeding at different days after sowing of wheat. She reported that
the highest number of filled grains spike-1
(32.94) was with W2 (Two weeding
at 30 and 60 DAS) where the lowest (23.98) was with W0 (no weeding).

21
Sujoy et al. (2006) conducted a field experiment to assess different weed
management practices in wheat. They reported that hand weeding at 21 and 35
days after sowing (DAS) was effective in controlling the weeds in the field.
And it produced the highest number of filled grain spike-1
of wheat.
2.7.2.6 Effect of weight of 1000 grain
Sultana et al. (2012) conducted an experiment and found that the highest 1000-grain
weight was measured in weed free treatment whereas the lowest (47.30g) was measured
in
no weeding treatment. However, two hand weeding treatment was statistically similar to
weed free condition in producing 1000-grain weight of wheat.
Kaur et al. (2018) conducted a field experiment with 8 treatments viz, Weed-free, Weedy
check, Pendimethalin 2.5L ha-1
, Pendimethalin 3.75 L ha-1
, Clodinofop 400 g ha-1
,
Sulfosulfuron 32.5 g ha-1
, Pinoxaden 1000 ml ha-1
, Atlantis 400 g ha-1
and replicated
thrice. Results revealed that Pendimethalin (3.75 L ha-1
) was found effective to control
weed population and produced higher number of effective tillers, 1000 grain weight and
enhanced the yield upto 43.1% over weedy check.
Sultana (2009) found that the highest 1000 grains weight (45.44 g) was with treatment
W2
(Two weeding at 30 and 60 DAS) and the lowest 1000 grains weight (43.21 g)
was observed with W0 (no weeding).
2.7.2.7 Effect on grain yield
A field experiment was conducted by Mustari et al. (2014) at the experimental farm of
the Bangabandhu Sheikh Mujibur Rahman Agricultural University (BSMRAU), Gazipur,
Bangladesh, found that Carfentrazone-ethyl + Isoproteuron also contributed to the highest
grain yield of 3.56 t ha-1
with the highest harvest index (HI) of 0.42. Carfentrazone-ethyl
+ Isoproteuron accompanied by one hand weeding also contributed to statistically
identical grain yield of 3.33 t ha-1
. Single ingredient Carfentrazone-ethyl alone and when
accompanied with one hand weeding also contributed to statistically similar grain yields
of 3.26 t ha-1
and 3.46 t ha-1
, respectively. The study revealed that, combined ingredient

22
herbicide Carfentrazone-ethyl + Isoproteuron as well as Carfentrazone-ethyl alone might
used at field level due to their better weed control efficiency, favourable effect on crop
growth and development and higher grain yield.
Zahoor et al. (2012) found that the data pertaining to grain yield as influenced by various
herbicide application rates showed significant effect among different treatments. They
indicated that the highest grain yield of 2678 kg ha-1
was recorded with the application of
Buctril super 0.45 kg ha-1
.
Sultana et al. (2012) investigated that the grain yield of wheat was significantly varied by
weeding regime. The highest grain yield (5.09 t ha-1
) was obtained from weed free
treatment followed by two hand weeding treatment (4.89t ha-1
). The lowest grain yield
(4.13t ha-1
) was produced by no weeding treatment.
Sultana (2009) found that the highest grain yield (3.74 t ha-1
) was with W2 (Two weeding
at 30 and 60 DAS). On the other hand the lowest grain yield (2.57 t ha-1
) was observed
with W0 (no weeding).
Dodamani and Das (2013) conducted an experiment to evaluate and compare the
interference of common lambsquarters (CL) in response to Nitrogen with that of natural
weed infestations, and to determine its economic threshold (ET) in wheat.
A field experiment was executed for three consecutive years (186-87 to 1988-89) to study
the effect of weed control methods on wheat at Majhera (U.P.) in India. Singh (1997)
recorded that all the weed control treatments significantly increased the grain yield over
the weedy check. The percentage increase in grain yield over unweeded control was 42.2,
23.2 and 8.2 under 2 hand weeding (25 and 45 DAS), isoproturon 1.5 kg ha-1
and 2
mechanical hoeing (25 and 45 DAS), respectively. Similar results were found out by
Nayak et al. (2003).
Banga et al. (2003) concluded that the sulfosulfuron at 25 g/ha being superior to its
lower doses (15 and 20 g/ha) provided 87% control of Avena ludoviciana, Phalaris
minor and Rumex retroflex in wheat resulting in yield and yield attributing characters
statistically similar to weed free.

23
Azad (1997) reported that the unweeded control had gave significantly less grain and
straw yields than hand weeding and pre and post-emergence application of isoproturon.
Field studies for the control of weeds in wheat were conducted in 1994-95 and 1995-96 at
CCS, HAU, Regional Research Station, Karnal on a clay loam soils by Singh et al.
(1998). The result indicated that during both the years the minimum grain yield (4280,
3267 kg ha-1
) were recorded under weedy check which were significantly lower than
weed free and herbicide treated plots.
Sujoy et al. (2006) conducted a field experiment to assess different weed management
practices in wheat. They reported that hand weeding at 21 and 35 days after sowing
(DAS) was effective in controlling the weeds in the field. And it produced the highest
values of grain yield compared to other weed control treatments.
Shah and Habibullah (2005) investigated that the chemical weed control as the best weed
control methods except hand weeding. The highest grain yield of 3.80 t kg ha-1
was
recorded with chemical weed control followed by hand hoeing (3.70 t kg ha-1
)
Jarwar and Arain (2005) executed an experiment in Pakistan to assess the effect of post
emergence chemical weed control on weed density and grain yield of wheat during rabi
seasons of 200 1-02 and 2002-03. The result indicated that maximum wheat grain yield
of 3285.71 and 3071.42 kg ha-1
was also obtained in Topik 15 WP at 250 g ha-1
during
both years.
Smeia et al. (2005) found out that predominant weeds in the field were Chenopodium
album, Anagallis arvensis, Parthenium hvsterophorus, Vicia hirsuta and Phalaris
minor.They recorded that, next to weed-free plots, lower weed population was recorded
in the Isoproturon+2,4-I) treatment followed by Isoproturon at 1000 g ha-1
. After 80 days,
next to weedfree plots, maximum plant dry weights were observed in the plots treated
with Sulfosulfuron at 30 g ha-1
. The highest growth and yield of wheat was recorded with
Sulfosulfuron at 30 g ha-1
.
Iffat (2010) proposed that maximum yield losses of 76% in wheat variety Inqalab 91
were caused by P. annua followed by 75% by C. didymus whereas other weeds caused
60-70% yield losses. Therefore, in case of wheat variety Punjab 96, maximum yield

24
reduction of 55% was caused by R. dentatus followed by P. minor (28%), M denticulate,
C. album (23%) and C. didymus (10%).
Acker (2010) carried out an experiment to determine the effect of weed
management practices on yield attributes and yield of wheat. He concluded that
the highest yield components and yields of wheat were recorded under three
weeding at 15, 35 and 60 DAS than two weeding at 15 and 35 DAS. However, the yield
increase was 4.48 and 8.52% higher under three weeding at 15, 35 and 60
DAS.
Sardana et al. (2001) found that higher grain yield with tank mix application of
isoproturon+2, 4-D at 940+500 g/ha (51.6 q/ha) followed by metribuzin at 175 g/ha (50.3
q/ha). Application of 2,4D at 500 g/ha, metribuzin at 125 and 225 g/ha, metsulfuron at 4
g/ha alone and isoproturon at 940 g/ha+ metsulfuron at 4 g/ha produced lower but
statistically similar grain yield as compared to isoproturon at 940 g/ha + 2,4-D at 500
g/ha and metribuzin at 175 g/ha.
Singh et al. (2002a) found that weed infestation during the crop period causes
more than 53 per cent reduction in grain yield, depending on the weed densities and
type of weed species present.
Singh et al. (2002b) observed that Phalaris minor was controlled effectively by the
application of clodinofop – propargyl @ 50 and 60 g/ha PoE. In consequence,
isoproturon (500 and 750 g/ha) caused reduction in the density of Chenopodium album
and Melilotus alba.
Ritu Singh (2014), reported that the grain and straw yield was also significantly affected
by the different treatments of herbicides showing beneficial effect of medium dose of
herbicide on growth and yield of wheat parameters. The medium dose recorded 91.34%
and 65.97% increase in grain and straw yield respectively as compared to other two
doses. However, again pendimethalin recorded maximum grain yield with 45.05%
followed by metsulfuron and 2,4-D with 24.22 and 8.31% respectively.
Walia and Singh (2006) also recorded more than 36% reduction in grain yield due to
unchecked growth of weeds. The grain yield was increased significantly due to

25
different herbicidal treatments over weedy check and gave grain yield at par with
weed free.
Tripathi et al. (2008) found that uncontrolled weeds on an average reduced the grain
yield of wheat by more than 46%.
Pandey et al. (1997) investigated a field experiment at Pusa (Bihar) in India. According
to results they reported that hand weeding and herbicidal weed control treatments gave
significantly higher grain and straw yields that the weedy check.
Singh et al. (2008) found that the post emergence application of sulfosulfuron (0.025
kg/ha) produced maximum grain yield of wheat which was at par with pre-emergence
application of pendimethalin (1.0 kg ha-1
) and hand hoeing twice.
Verma et al. (2008) achieved higher grain yield (2.97 t ha-1
) with the post emergence
application of sulfosulfuron as compared to isoproturon and pendimethalin.
Infestation of weed throughout the crop growth period caused 43.63% reduction in
grain yield of wheat. Season long weed free environment obtained significantly
higher grain yield (3.57 t ha-1
), yield attributes and nutrient uptake over rest of the
weed control measures.
Amin et al. (2008) reported that herbicidal treatments increased grain yield as compared
with un-weeded and hand weeding treatments.
2.7.2.8 Effect on straw yield
A field experiment was executed at Bihar by Pandey et al. (2005) on clay loam soil. The
result indicated that hand weeding resulted in the maximum increase in grain and straw
yields, being significantly higher than that obtained under post emergence application of
2,4-D (SS) 0.8 kg ha-1
and isoproturon 0.75 kg ha-1
alone but at par with that obtained in
mixture of 2,4-D (SS) 0.4 kg ha-1
+ isoproturon 0.4 kg ha-1
.
Sultana et al. (2012) concluded that the straw yield of wheat varied significantly
due to different weeding regime. The maximum straw yield (7.67 t ha-1
) was
measured by weed free treatment and the lowest straw yield (6.45 t ha-1
) was
produced by no weeding treatment.
26
Kaur et al. (2018) concluded that grain and straw yield differed significantly due to
different weed control treatments. Weed control treatments performed significantly
higher grain and straw yield than weedy check. The higher grain and straw yield was
recorded with application of pendimethalin @ 3.75 L ha-1
(5.19 and 8.29 t ha-1
respectively). On the other hand, lower grain and straw yield was recorded with weedy
check (3.63 and 6.77 t ha-1
respectively) owing to severe crop weed competition which
resulted in reduction in the expression of yield components such as effective tillers per m-
2 (347.2).
Sultana (2009) observed significant effect on straw yield of wheat due to
weeding frequencies at different crop life cycle. She found that the highest
straw yield (5.02 t ha-1
) at harvest was with W2 (Two weeding at 30 and 60
DAS) and the lowest straw yield (4.83 t ha-1
) was observed with W0 (No
weeding).
Sujoy et al. (2006) found that hand weeding at 21 and 35 days after sowing
(DAS) was effective in controlling the weeds in the field and it produced the
highest straw yield compared to other weed control treatments.
Pandey and Dwivedi (2007) studied that application of sulfosulfuron was found at par
with hand weeding treatment for controlling weeds and producing higher grain yield.
Verma et al. (2007) reported that application of sulfosulfuron reduced the uptake of
nutrient by weeds and significantly increased by crop which resulted in higher grain and
straw yield and it was at par with fenoxaprop-p-ethyl and significantly superior over rest
of the herbicidal treatments. Weed free treatment established significantly higher yield
attributes, grain and straw yield and reduced the nutrient depletion by weeds over rest of
the weed control treatments.
Ritu Singh (2014), conducted a field experiment to find out the performance of different
herbicides and in this trial the use of pendimethalin @1000 g ai. proved best for wheat
field, which may have exerted a positive effect on wheat yield as compared to other
herbicides as noticed at harvesting. Metribuzin @ 250 g ai. proved least effective
herbicide from the point of view of wheat growth and yield. Hence, metsulfuron methyl,

27
2,4-D and clodinafop were not so effective as compared to pendimethalin for wheat. Use
of NPK showed beneficial with herbicide for wheat growth and yield in this field study.
2.7.2.9 Effect on biological yield
Zahoor et al. (2012) found that the mean for different treatments differed significantly for
biological yield. Among different application rates, the highest biological yield of 7.2 t
ha-l was recorded with the application of Buctril super at 0.45 kg ha
-1 and the lowest
biological yield (6.88 t ha-1
) was recorded in weedy plots.
Sujoy et al. (2006) revealed that hand weeding at 21 and 35 days after sowing
(DAS) was effective in controlling the weeds in the field and it produced the
highest biological yield compared to other weed control treatments.
2.7.2.10 Effect on harvest index
Sultana (2009) found significant variation as affected by weeding. She found that the
highest harvest index (42.19%) was with W2 (Two weeding at 30 and 60 DAS) and the
lowest harvest index (34.15%) was observed with W0 (no weeding).
Hossain (2008) concluded that harvest index was significantly affected by different
herbicide application at different rates. He reported that the highest harvest index
(46.69%) in the treatment of Sencor 70WG @ 0.40 kg ha-1
and the lowest in control plots
(no weed control).
Sujoy et al. (2006) found that hand weeding at 21 and 35 days after sowing
(DAS) was effective in controlling the weeds in the field which produced the
highest harvest index compared to other weed control treatments.
2.8.1 Effect on cost benefit ratio
Zahoor et al. (2012) mentioned that the weed control treatments provided higher
monetary returns than the weedy check treatment. They concluded that Buctril super at
0.45 kg ha-1
was the most economical treatment with the highest benefit cost ratio (1.52)
that was followed by Buctril super at 0.35 kg ha-1
(1.46) and MCPA at 0.65 kg ha-1
in
agro-climatic conditions of Rawalpindi, Pakistan.

28
Hossain (2008) found the the highest benefit cost ratio (1.50) from Sencor 70WG at rate
of 0.40 kg ha-1
and the lowest benefit cost ratios from the control (no weed control).
A field experiment was carried out at Pusa (Bihar) in India by Pandey et al. (2005). They
recorded that net return under hand weeding, post-emergence application of 2,4-D (SS)
0.8 kg ha-1
, isoproturon 0.75 kg ha-1
alone and 2,4-D (SS) 0.4 kg ha-1
+ isoproturon 0.4 kg
ha-1
being at par among themselves significantly excelled the weedy check.
Dhiman and Rohitashav (2006) conducted a field experiment to evaluate the economics
of different establishment methods (conventional tillage, zero tillage, strip till drill and
bed planting) and weed management practices (hand weeding at 30 and 50 days after
sowing (DAS). They found that Strip till drill + Isoproturon and zero tillage +
Isoproturon recorded the highest benefit cost ratios of 2.09 and 2.05 respectively.
Jain et al. (2007) reported that maximum benefit cost ratio was obtained with zero
tillage along with application of pre-emergence herbicide followed by 2,4-D.
Jat et al. (2004) investigated a field experiment at Udaipur (Rajasthan). They observed
that maximum benefit cost ratio (3.60) was found from isoproturon (0.75 kg ha-1
at 30
DAS) followed by pendimethalin 1 kg ha-1
as pre-emergence (3.15).
Sharma and Singh (2011) observed that mechanical weeding twice at 15 and 30
DAS proved the most effective treatment in reducing weeds dry weight which was at
par with sulfosulfuron 25 g/ha and gave significantly higher grain yield and NPK
uptake by wheat than weedy check. Mechanical weeding at 15 and 30 DAS
registered the highest (35.4 - 45.1%) increase in grain yield over weedy check, but
highest net return (27,620–32,224 kg/ha) and benefit : cost ratio (1.79–1.89) was
obtained with sulfosulfuron (25 g/ha).
An investigation was executed by during the winter season 1997-98 and 1998-99 at
Morena (MP) on sandy loam soil. The results indicated that application of pendimethalin
@ 2.0 kg ha-1
pre-emergence recorded significantly higher net return over weedy control
(Yadav et al., 2001).

29

30
Chapter III
MATERIALS AND METHODS
This chapter presents a brief description about experimental period, site description,
climatic condition, crop or planting materials, treatments, experimental design and layout,
crop growing procedure, fertilizer application, intercultural operations, data collection
and statistical analysis.
3.1 Location
The field experiment was conducted at the Agronomy field laboratory, Sher-e-Bangla
Agricultural University, Dhaka-1207 during the period from November to April, 2017-
2018. The location of the experimental site has been shown in Appendix I.
3.2 Soil
The soil of the experimental field area belonged to the Modhupur tract (AEZ No. 28). It
was commonly a medium high land with non-calcarious dark grey soil, slightly acidic in
reaction with low organic matter content. The selected experimental plot was above flood
level and sufficient sunshine was available having available irrigation and drainage
system during the experimental period. Soil samples from 0-15 cm depths were collected
from experimental field. The analyses were done under the supervision of Soil Resources
Development Institute (SRDI), Dhaka. The pH value of the soil was 5.7. The physical
and chemical properties of the experimental field soil have been shown in Appendix II.
3.3 Climate
The experimental area is situated in the sub-tropical climatic zone and characterized by
heavy rainfall during the months of April to September (kharif Season) and scanty
rainfall during the rest period of the year (Biswas, 1987). The rabi season (October to
March) is characterized by moderately low temperature and plenty of sunshine from
November to February (SRDI, 1991). The detailed meteorological data in respect of air
temperature, relative humidity, total precipitation and soil temperature recorded by the

31
weather Station of Bangladesh, Sher-e-Bangla Nagar, Dhaka during the period of study
have been presented in Appendix III.
3.4 Treatments
The experiment consisted of two factors as mentioned below:
a) Factor A: Varieties (3)
I. V1= BARI Gom-28
II. V2= BARI Gom-29
III. V3= BARI Gom-30
b) Factor B: Weed control (5)
I. W0 = No weeding (Control)
II. W1 = Two hand weeding at 20 DAS and 40 DAS
III. W2 = Panida 33EC (Pendimethalin) @ 2000 ml ha-1
at 5 DAS (pre-emergence)
IV. W3 =Afinity 50.75WP (Isoproturon) @ 1500 g ha-1
at 25 DAS (post-emergence)
V. W4 = Panida 33EC (Pendimethalin) @ 2000 ml ha-1
at 5 DAS + Afinity
50.75WP (Isoproturon) @ 1500 g ha-1
at 25 DAS
3.5 Plant materials and features
Wheat Research Centre, Bangladesh Agricultural Research Institute (BARI) Joydebpur,
Gazipur so far released 32 wheat varieties. Among them wheat cultivar BARI Gom -28,
BARI Gom -29 and BARI Gom-30 were used as plant materials for the present study.
These varieties are recommended for commercial cultivation in Bangladesh during rabi
season. The features of these three varieties are presented below:
BARI Gom-28: BARI Gom-28 is one of the recommended varieties for commercial
cultivation in Bangladesh. The variety is semi-dwarf in height 95-100 cm with high yield
potential as released in 2012. The grain yield ranges from 4.0-5.5 t ha-1
under optimum
management. It requires 55-60 days to heading and 102-108 days to mature, Flag leaf
straight, glum of lower portion of spikelet shoulder medium broad and indented, lip tall
(>12.1 mm) and spine has present in lip. Spike is medium with 45-50 grains per spike.

32
Grains are amber white in color, bright and medium in size (1000-grain weight 43-48 g).
The variety is tolerant to terminal heat stress giving 15-20% higher yield and 10 days
early than BARI Gom -21 (Shatabdi). The variety is tolerant to leaf rust and leaf spot
disease (blight). The variety is suitable for growing both in optimum and late seeding
condition. (Krishi Projukti Hatboi, 2017)
BARI Gom-29: BARI Gom-29 is another recommended variety for commercial
cultivation in Bangladesh. The variety is semi-dwarf in height 95-100 cm with high yield
potential as released in 2014. The grain yield ranges from 4.0-5 t ha-1
under optimum
management. It requires 55-60 days to heading and 102-108 days to mature, Tiller
straight in seedling, plant deep green, very few hair present in upper node of culm. Flag
leaf straight, glum of lower portion of spikelet shoulder medium broad and indented, lip
tall (>12.1 mm) and spine has present in lip. Spike is medium with 45-50 grains per
spike. Grains are amber white in color, bright and medium in size (1000 grain weight 44-
48 g). The variety is tolerant to leaf rust and leaf blight. (Krishi projukti hatboi, 2017)
BARI Gom-30: BARI Gom -30 is one of update high yielding recommended varieties
for commercial cultivation in Bangladesh released by Wheat Research Centre,
Bangladesh Agricultural Research Institute (BARI) in 2014. Most important features of
the variety are short duration, plant height 95-100 cm. Number of tiller/plant 4-5, 55-60
days require for spike initiation, crop duration 102-108 days, spike broad, grain/spike 45-
50, grain white, bright and medium, 1000 grain weight 44-48 g, tiller straight in seedling,
plant deep green, very few hair presents in upper node of culm. Flag leaf straight, glum of
lower portion of spikelet shoulder medium broad and indented, lip tall (>12.1 mm) and
spine has present in lip. The grain yield ranges from 4.0-5.5 t ha-1
under optimum
management This variety tolerant to leaf rust and leaf spot disease (blight) and heat
tolerant too. (Krishi Projukti Hatboi, 2017)
3.6 Properties of herbicides
(a) Pendimethalin
Chemical name: 3,4-Dimethyl-2,6-dinitro-N-pentan-3-yl-aniline

33
Trade name And Manufactures: Panida 33 EC (Auto Crop Care Limited), Monsoon
330 EC ( Alpha Agro Limited), Fist 33 EC ( United Phosphorus Bangladesh Ltd)
,Pendulum 330 EC (ACI Formulations Limited), Tough 30 EC (MAP Agro Industries
Limited)
Mode of Action: Pendimethalin does not inhibit seed germination but rather inhibit early
seedling growth shortly after seed germination. This is caused by the disruption of cell
division in certain plant. It inhibits both cell division and cell elongation in shoot and root
meristem of susceptible weed species. Hence, growth is inhibited directly following
absorption through shoot and hypocotyls (Shakya N. 2016).
Uses: Pendimethalin is a dinitroaniline group herbicide, can controls annual grasses and
certain broad leaf weeds in many crops. It is applied pre-emergence, early post
emergence and pre-plant incorporated depending on the crop even after ecology. As it has
lower volatility, it does not require soil incorporation with adequate rainfall or overhead
irrigation because of. Certain crops like rice, wheat, cotton, soybean, groundnut, peas and
sunflower can physiologically tolerate to pendimethalin, so pre-plant incorporation or
pre-emergence may also be used here. However, crops like wheat, rice, maize, seeded
onion and carrots tolerate pendimethalin because the seeds are placed below herbicide
layer, where only pre-emergence spray is used.
(b) Isoproturon
Chemical name: N-(4-isopropyl phenyl)-N, N-diethyl urea.

34
Trade name and Manufactures: Affinity 50.75 WP (FMC Chemical International AG)
Mode of Action: This is both pre and post-emergence selective herbicide. It function
principally by absorption through the roots and leaves. (Shakya N., 2016).
Uses: Isoproturon is a versatile herbicide for the control of annual grass weeds,
particularly, wild oat (Avena fatua) and canary grass (Phalaris minor) in wheat. Besides,
it will also controls some broad leaf weeds like Anagallis, Melilotus, Convolvulus and
Chenopodium spp. This is active on the susceptible weeds, both as pre and post-
emergence treatments. It is very generally applied as spray treatments, 30-35 days after
sowing of winter grains, soon after the first irrigation of the crop. The annual grasses at
this stage are young and tends to be susceptible to isoproturon. Its optimum rates are
0.75- 1.0 kg ha-1
on medium soils and up to 1.5 kg ha-1
in the heavy soils.
3.7 Land preparation
The land of the experimental field was first opened on November 5, 2017 with a power
tiller. Then it was exposed to the sunshine for 7 days prior to the next ploughing.
Thereafter, the land was ploughed and cross-ploughed to obtain good tilth. Deep
ploughing was done to produce an optimum tilth, which was necessary to get better yield
of the crop. Laddering was done in order to break the soil clods into small pieces
followed by each ploughing. All the weeds and stubbles were removed from the
experimental field. The soil was treated with insecticides at the time of final ploughing.
Insecticides Furadan 5G was used @ 8 kg ha-1
to protect young plants from the attack of
mole cricket, ants, and cutworms. The experimental field was then divided into unit plots
and prepared before seed sowing.

35
3.8 Design and layout
The experiment was laid out in a split plot design with three replications. The size of the
individual plot was 3.50 m x 2.50 m and total numbers of plots were 45. There were 15
treatment combinations. Each block was divided into 15 unit plots and the treatments
were assigned in the unit plots at random. Variety was placed along the main plot and
treatments were placed along the sub plot. Layout of the experiment was done on
November 10, 2017 with inter plot spacing of 0.50 m and inter block spacing of 1 m.
3.9 Fertilizer application
All the fertilizers were applied at the rate of BARI recommended dose as 150 kg ha-1
TSP, 50 kg ha-1
MOP, 120 kg ha-1
Gypsum (BARI, 2011). Fertilizers other than nitrogen
were given during final land preparation. The whole amount of all the fertilizers except
urea were applied at the time of final land preparation and thoroughly incorporated with
soil with the help of a spade.
3.10 Seed treatment
Seeds were treated with Vitavex-200 @ 0.25% before sowing to prevent seeds from the
attack of soil borne disease. Furadan @1.2 kg ha-1
was also used against wireworm and
mole cricket.
3.11 Seed sowing
Seeds were sown on November 14, 2017 continuously in 20 cm apart rows opened by
specially made iron hand tine followed by light irrigation on row. The seed rate was 120
kg ha-1
. After sowing, the seeds were covered with soil and slightly pressed by hands.
3.12 Intercultural operations
The following intercultural operations were done for ensuring the normal growth and
development of the crop.
3.12.1 Thinning
Emergence of seedling was completed within 10 days after sowing. Overcrowded
seedlings were thinned out for two times. First thinning was done after 15 days of sowing

36
which is done to remove unhealthy and lineless seedlings. The second thinning was done
15 days after first thinning keeping one or two or three healthy seedlings in each hill
according to the treatment.
3.12.2 Weeding
Weeding was done as per the experiment treatment.
3.12.3 Irrigation and drainage
The experimental plots required three irrigations during the crop growth season and
sometimes drainages were done at the time of heavy irrigation. The first irrigation was
done at 20 DAS, crown root initiation stage. Second irrigation was provided at 50 DAS
which is the maximum tillering stage of wheat and the last irrigation was done a 72 DAS,
grain filling stage. Proper drainage system was also made for draining out excess water.
3.12.4 Plant protection measures
There were negligible infestations of insect-pests during the crop growth
period. The experimental crop was not infected with any disease and no fungicide was
used. Mole cricket and cutworm attacked the crop during the early growing stages of
seedlings. Spraying Diazinon 60EC controlled these insects was done at optimum doses.
The insecticide was sprayed three times at seven days interval.
3.12.5 General observations of the experimental field
Regular observations were carried out to see the growth stages of the crop. In general, the
field looked nice with normal green plants which were vigorous and luxuriant in the
treatment plots than that of control plots.
3.13 Harvest and post-harvest operation
The maturity of crop was determined when 85% to 90% of the grains become golden
yellow in color. Harvesting of all three varieties were done 1st and 2
nd March, 2018 as
thevarieties are almost synchronize with their maturity. From the centre of each plot 1 m2
was harvested to assess yield of individual treatment and converted into ton ha-1
. The
harvested crop of each plot was bundled separately, tagged properly and brought to
37
threshing floor. The bundles were dried in open sunshine, threshed and then grains were
cleaned properly. The grain and straw weights for each experimental plot were recorded
after proper drying in sun. Before harvesting, ten hills were selected randomly outside the
sample area of each plot and cut at the ground level for collecting data on yield
contributing characters.
3.14 Collection of data
3.14.1 Weed parameters
Weed population
The data on weed infestation as well as population were collected from each unit
plot at 20 days interval up to 100 DAS. A plant quadrate of 1.0 m2 was placed at
three different spots of 8.75 m2 of the plot. The middle quadrate was remained
undisturbed for yield contributing data. The infesting species of weeds within the first
and
third quadrate were identified and their number was counted species wise
alternately at different dates.
Weed biomass
The weeds inside each quadrate for density count were uprooted, cleaned and
separated species wise. The collected weeds were first dried in the sun and then
kept in an electrical oven for 72 hours maintaining a constant temperature of
800c. After drying, weight of each species was taken and expressed to g m
-2.
Weed control efficiency (%)
According to Sawant and Jadav (1985) weed control efficiency was calculated with the
following formula:

38
Where,
D = Dry weight of weeds in unweeded treatment
DWT = Dry weight of weeds in weed control treatment
3.14.2 Crop growth parameters
a) Plant height (cm) at 20 days interval up to harvest.
b) Dry matter weight of plant at 20 days interval including partitioning of different
parts.
c) Crop Growth Rate (g m-2
day-1
)
d) Relative Growth Rate (g m-2
day-1
)
e) Leaf area index
3.14.3 Yield Contributing Characters
a. Length of spike (cm)
b. Number of spikelets spike-1
(no.)
c. Number of grains spike-1
(no.)
d. Weight of 1000 grains (g)
3.14.4 Yield Characters
a. Grain yield (t ha-1
)
b. Straw yield (t ha-1
)
c. Biological yield (t ha-1
)
d. Harvest index (%)
3.15 Procedure of sampling for growth study during the crop growth period
Plant height
The height of the wheat plants was recorded from 20 days after sowing (DAS) at 20 days
interval up to harvest, beginning from the ground level up to tip of the flag leaf was
measured as height of the plant. The average height of ten plants was considered as the
height of the plant for each plot.

39
Number of tillers m-2
Total tiller number was taken from 20 DAS at 20 days interval up to 100 DAS. The
average number of tillers of one linear meter was counted and then multiplied with wheat
row per meter.
Total above ground dry matter weight (g plant-1
)
The total dry matter production was calculated from the summation of dry matter weight
of shoots and the weight was expressed in g plant-1
.
Crop growth rate (g m-2
day-1
)
Crop growth rate was calculated by using the following standard formula (Radford, 1967
and Hunt, 1978) as shown below:
Where,
W1= Total plant dry matter at time T1
W2 = Total plant dry matter at time T2
Relative growth rate (g m-2
day-1
)
Relative growth rate was calculated by using the following formula (Radford,1967) as
shown below:
Where,
W1 = Total plant dry matter at time T1
W2 = Total plant dry matter at time T2
3.16 Procedure of data collection for yield and yield components

40
For assessing yield parameters except the grain and straw yields data were collected from
10 randomly selected hills from each plots. For yield measurement, an area of 1.0 m2
from center of each plot was harvested.
Spike length
The length of spike was measured by using a meter scale. The measurement was taken
from the base to tip of the spike. Average length of spike was taken from ten randomly
selected spikes from inner row plants of each plot. Data was recorded at harvest time.
Mean data was expressed in centimeter (cm).
Spikelets spike-1
Data on the number of spikelets spike-1
was counted. Ten spike bearing plants were
randomly selected and the average data were collected from inner rows of each plot
except harvest area during the time of harvesting.
Filled grains spike-1
The total number of filled grains from randomly selected 10 spikes were counted and
average of which gave the number of filled grains spike-1
. Grain having food material
inside were considered as filled grain.
Weight of 1000 grains
One thousand cleaned dried grains were randomly collected from the seed stock obtained
from 10 plants of each plot and were sun dried properly at 14% moisture content and
weight by using an electric balance.
Grain and straw yield
An area of 1.0 m2
was harvested for yield measurement. The crop of each plot was
bundled separately, tagged properly and brought to threshing floor. The bundles were
dried in open sunshine, threshed and then grains were cleaned. The grain and straw
weights for each plot were recorded after proper drying in sun.
Biological yield
Biological yield was calculated by using the following formula:

41
Biological yield= Grain yield + straw yield
Harvest index
According to Gardner et al. (1985), harvest index is the relationship between grain yield
and biological yield.
It was calculated by using the following formula:
3.17 Economic analysis
From beginning to ending of the experiment, individual cost data on all the
heads of expenditure in each treatment were recorded carefully and classified
according to Mian and Bhuiya (1977) as well as posted under different heads of
cost of production. The rates of different items in wheat were given in Appendix xii.
Input cost
Input costs were divided into two parts. These were as follows:
A. Non-material cost (labor)
The human labor was obtained from adult male laborers. Eight working hours
of a laborer was considered as a man day. The mechanical labor came from the
tractor. A period of eight working hours of a tractor was taken to be tractor a day.
B. Material cost
The seed of wheat varieties BARI Gom -28, BARI Gom -29 and BARI Gom -30, was
purchased from BARI Headquarter @ Tk.120 per kg. Chemical fertilizers e.g. Prilled
urea, Urea super granules, TSP, MP, Gypsum and Zinc sulphate were bought from the
authorized dealer at Savar, Dhaka. Irrigation was done from the existing facilities of

42
irrigation system of the Sher-e-Bangla Agricultural University field. Herbicides,
fungicide and insecticide were bought from the respective dealers at local market.
Overhead cost
The interest on input cost was calculated for 6 months @ Tk. 12.5% per year based on the
interest rate of the Bangladesh Krishi Bank. The value of land varies from place to place
and also from year to year. In this study, the value of land was taken Tk. 200000 per
hectare. The interest on the value of land was calculated @ 12.5% per year for 2 months
for nursery and 4 months for main field.
Miscellaneous overhead cost
It was arbitrarily taken to be 5% of the total running capital. Total cost of
production has been given in Appendix XIII.
Gross return
Gross return from wheat cultivation (Tk. ha-1
) = Value of grain
(Tk ha-1
) + Value of straw (Tk ha-1
).
Net return
Net return was calculated by using the following formula:
Net return (Tk. ha-1
) = Gross return (Tk. ha-1
) – Total cost of production (Tk. ha-1
)
Benefit cost ratio (BCR)
Benefit cost ratio indicated whether the cultivation is profitable or not which
was calculated as follows:
3.18 Statistical analysis
The recorded data were subjected to statistical analysis. Analysis of variance was done
following two factor split plot design with the help of computer package MSTAT-C. The
mean differences among the treatments were adjusted by Least significant difference
(LSD) at 5% level of significance.

43

44
Chapter IV
RESULTS AND DISCUSSION
This chapter comprises presentation and discussion of the results obtained from a study to
investigate the influence of different methods of weed control on the growth,
development and yield of wheat varieties cv. BARI Gom-28, BARI Gom-29 and BARI
Gom-30. The results of the weed parameters, crop growth and yield characters and
economic evaluation of the production of the crop as tested have been presented and
discussed in this chapter.
4.1 Different weed species observed in the experimental field:
It is a general observation that conditions favorable for growing wheat are also favorable
for exuberant growth of numerous kinds of weeds that compete with crop plants. This
competition of weeds tends to increase when the weed density increases and interfere
with the crop growth and development resulting poor yield. Nine weed species belonging
to seven families were found to infest the experimental crop. Local name, common name,
morphological type, scientific name, and family of the weed species have been presented
in Table 1. The density and dry weight of different weeds varied considerably in various
weed control treatments.
The most important weeds of the experimental plot were Cynodon dactylon, Cyperus
rotundus, Echinochloa colonum, Eleusine indica, Chenopodium album, Alternanthera
philoxeroides, Brassica kaber, Heliotropium indicum, Vicia sativa etc.
Among the nine species three were grasses, one sedge, and five were broad leaved (Table
1). Hossain et al. (2010) reported that dominant weed species in the experimental wheat
field were Eleusine indica, Cynodon dactylon, Echinochloa colonum, Parapholis strigosa
setaria glauca, Digitaria spp., Chenopodium album, Blumea lacera, Enydra fluctuans
etc. The present result varied a little bit and this might be due to location and seasonal
variation.

45
Table 1: Weed species found in the experimental plots in wheat
SL
No.
Local name Common
name
Types Scientific name Family
1 Durba Bermuda
grass
Grass
Cynodon dactylon Poaceae
2 Mutha Nutsedge Sedge Cyperus rotundus Cyperaceae
3 Choto
shama
Jungle rice Grass Echinochloa colonum Poaceae
4 Chapra
Indian
goose grass
Grass Eleusine indica Poaceae
5 Bathua Lambsquarter Broad
leaf
Chenopodium album Chenopodiaceae
6 Malanch Alligator
weed
Broad
leaf
Alternanthera
philoxeroides
Amaranthaceae
7 Ban sarisha Wild mustard Broad
leaf
Brassica kaber
Brassicaceae
8 Hatishur Wild clary Broad
leaf
Heliotropium indicum Boraginaceae
9 Ban masur Wild lentil Broad
leaf
Vicia sativa Fabaceae
4.2 Weed population
Weed competes with another weed plants for their existence. In this experiment, several
weed species were found to dominate the field (Table 1). This might be due to crop-weed
competition, weed-weed competition or allelopathic effect (chemical secretion of one
plant that inhibit the growth of other plants) of one plant to others. However, occurrence
of weed in the crop field mainly depends on various environmental factors (climate,
relative humidity, rainfall etc.) and abiotic factors (soil types, topography of land etc.).
4.2.1 Effect of Variety
There was significant variation observed on weed population for varietal variation and
number of weed except at 80 DAS (Fig. 1 and Appendix IV). It was
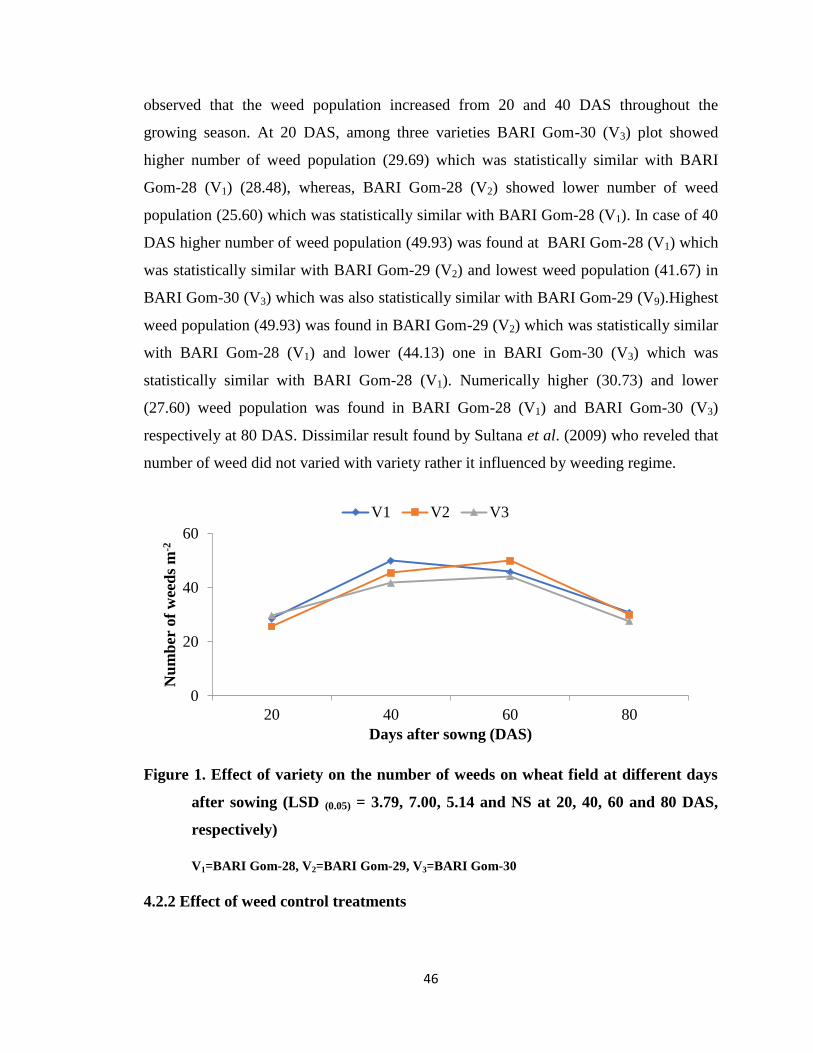
46
observed that the weed population increased from 20 and 40 DAS throughout the
growing season. At 20 DAS, among three varieties BARI Gom-30 (V3) plot showed
higher number of weed population (29.69) which was statistically similar with BARI
Gom-28 (V1) (28.48), whereas, BARI Gom-28 (V2) showed lower number of weed
population (25.60) which was statistically similar with BARI Gom-28 (V1). In case of 40
DAS higher number of weed population (49.93) was found at BARI Gom-28 (V1) which
was statistically similar with BARI Gom-29 (V2) and lowest weed population (41.67) in
BARI Gom-30 (V3) which was also statistically similar with BARI Gom-29 (V9).Highest
weed population (49.93) was found in BARI Gom-29 (V2) which was statistically similar
with BARI Gom-28 (V1) and lower (44.13) one in BARI Gom-30 (V3) which was
statistically similar with BARI Gom-28 (V1). Numerically higher (30.73) and lower
(27.60) weed population was found in BARI Gom-28 (V1) and BARI Gom-30 (V3)
respectively at 80 DAS. Dissimilar result found by Sultana et al. (2009) who reveled that
number of weed did not varied with variety rather it influenced by weeding regime.
Figure 1. Effect of variety on the number of weeds on wheat field at different days
after sowing (LSD (0.05) = 3.79, 7.00, 5.14 and NS at 20, 40, 60 and 80 DAS,
respectively)
V1=BARI Gom-28, V2=BARI Gom-29, V3=BARI Gom-30
4.2.2 Effect of weed control treatments
0
20
40
60
20 40 60 80
Nu
mb
er o
f w
eed
s m
-2
Days after sowng (DAS)
V1 V2 V3

47
Weed control treatments had significant variation on the weed population of the
experimental wheat field (Fig. 2). It was observed that the weed population was highest
in case of no weed control measures were taken. Thus, the control (W0) recorded the
highest number of weeds per plots. But, in case of hand weeding (W1) treatment weed
population reduced almost by two-third than that of the control plot in 40, 60 and 80
DAS. At 20,40 and 80 DAS Panida 33EC (W2) showed lower number of weed population
(21.36, 27.33 and 19.56 respectively) and it indicated that effectiveness to control of
weed as pre-emergence which was statistically similar with combine treatment Panida
33EC+Afinity 50.75WP (W4). At 60 DAS lower number of weed population was
recorded at W4 (Panida 33EC+Afinity 50.75WP). This result was agreement with Kaur et
al. (2018) that Pendimethalin (3.75 L/ha) was found effective to control weed population.
Figure 2. Effect of different weed managements on the number of weeds on wheat
field at different days after sowing (LSD (0.05) = 3.26, 5.45, 4.85 and 3.48 at 20,
40, 60 and 80 DAS, respectively)
W0= No weeding, W1= Two hand weeding, W2=Panida 33EC, W3= Afinity 50.75WP,
W4=Panida 33EC+Afinity 50.75WP
4.2.3 Combined effect of variety and weed control treatment
For variety and weed management combination, significant variation was observed for
weed density throughout the growing period shown in Table 2. At 20 DAS, the highest
0
25
50
75
100
20 40 60 80
Nu
mb
er o
f w
eed
s m
-2
Days after sowing (DAS)
W0 W1 W2 W3 W4

48
weed population (42.67 m-2
) was recorded from the combination of BARI Gom-30 and
no weeding (V2W0) which was statistically similar with V1W0 and V3W0. The lowest
weed population (19.67 m-2
) was recorded from combination of BARI Gom-30 and
panida 33EC (V2W2) which was statistically similar to V1W2, V1W4, V2W1, V2W4, V3W1
and V3W2. At 40 DAS, the highest weed population (96.67 m-2
) was observed from
combination of BARI Gom-30 and no weeding (V2W0) which was statistically similar
with V1W0 and V3W0. The lowest weed population (19.00 m-2
) was recorded from the
combination of BARI Gom-30 and panida 33EC (V2W2) which was statistically similar
to V1W1, V2W4 and V3W4.Highest weed population (86.00 m-2
) was observed from the
combinations of BARI Gom-30 and no weeding (V2W0) at 60 DAS which was
statistically similar with V1W0 and V3W0.
Table 2. Combined effect of variety and different weed managements on the number
of weeds on wheat fields
Treatment
combinations
Weeds m-2
(no.) at different days after sowing (DAS)
20 40 60 80
V1W0 38.67 ab 89.33 a 83.67 a 62.00 a
V1W1 27.67 d-f 24.00 fg 26.00 f 20.67 d-g
V1W2 22.09 f-h 28.67 ef 39.67 d 26.67 b-d
V1W3 29.67 de 60.00 b 53.33 bc 28.00 bc
V1W4 24.33 e-h 47.67 c 26.00 f 16.33 gh
V2W0 37.00 bc 93.00 a 80.00 a 56.67 a
V2W1 24.00 f-h 42.67 cd 21.67 f 24.33 b-e
V2W2 19.67 h 34.33 de 51.00 c 17.67 f-h
V2W3 25.33 e-g 29.33 ef 61.00 b 29.67 b
V2W4 22.00 gh 27.67 e-g 36.00 de 21.67 d-g
V3W0 42.67 a 96.67 a 86.00 a 58.00 a
V3W1 24.12 e-h 29.67 ef 27.33 f 18.67 e-h
V3W2 22.33 f-h 19.00 g 30.00 ef 14.33 h
V3W3 32.67 cd 40.33 cd 49.67 c 24.00 b-e
V3W4 26.67 e-g 22.67 fg 27.67 ef 23.00 c-f
LSD (0.05) 5.65 9.44 8.41 6.02
CV (%) 12.00 12.27 10.71 12.14
W0= No weeding, W1= Two hand weeding, W2=Panida 33EC, W3= Afinity 50.75WP,
W4=Panida 33EC+Afinity 50.75WP
V1=BARI Gom-28, V2=BARI Gom-29, V3=BARI Gom-30

49
The lowest weed population (21.67 m-2
) was observed from the combinations of BARI
Gom-29 and two hand weeding (V2W1) which was statistically similar with V1W1, V1W4,
V2W1, V3W1, V3W2 and V3W4. Finaly at 80 DAS, the highest weed population (62.00 m-
2) was observed under the combinations of BARI Gom-28 and no weeding (V1W0) which
was statistically similar with V2W0 and V3W0.Minimum weed population (14.33 m-2
) was
observed from the combinations of BARI Gom-30 and panida 33EC (V2W2) which was
statistically similar to V1W4, V2W2 and V3W1.
4.3 Weed biomass
4.3.1 Effect of variety
Significant variation was observed on weed biomass for varietal variation (Fig. 3 and
Appendix V). The highest weed biomass (122.5 g m-2
) was recorded from BARI Gom-28
(V1) which was statistically similar with BARI Gom-29 (V2) and lowest weed biomass
(98.83 g m-2
) recorded from BARI Gom-29 (V2). Similar result found by Singh and Saha
(2001) that pendimethalin @ 1 kg ha-1
pre-emergence, isoproturon @ 1.5 kg ha-1
post-
emergence, 2,4-D @ 1.5 kg ha-1
post-emergence lower weed biomass and weed index
and higher weed control efficiency over weedy check treatment.
Figure 3. Effect of variety on the weed biomass m-2
(g) in wheat field (LSD (0.05) =
9.14)
V1=BARI Gom-28, V2=BARI Gom-29, V3=BARI Gom-30
0
35
70
105
140
V1 V2 V3
Wee
d b
iom
ass
m-2
(g)
Variety

50
4.3.2 Effect of weed control treatments
Significant variation was observed on weed biomass for different weed control
treatments shown in Figure 4 and Appendix V. The highest weed biomass (147.8 gm-2
)
was recorded from no weeding treatment (W0) and hence the lowest weed biomass
(75.34gm-2
) was recorded from Panida 33EC + Afinity 50.75WP(W4).No weeding (W1)
showed the highest weed biomass which provided the highest accumulation of weed dry
matter per unit area Hence, combine treating Panida 33EC + Afinity 50.75WP
(W4)showed the better control over the weed resulting least dry matter accumulation of
weed i.e., lowest weed biomass in cases of all weed species. Second better control over
weed performed two hand weeding (W1) treatment resulted weed biomass (98.48 gm-2
)
finally. This result was also similar with the findings of Tomar et al. (2004), Prasad et al.
(2005), Nayak et al. (2003) and Singh and Saha (2001), but dissimilar result was found
by Mustari et al. (2014) that pendimethalin performed worst.
Figure 4. Effect of different weed managements on the weed biomass m-2
(g) in
wheat field (LSD (0.05) = 12.18)
W0= No weeding, W1= Two hand weeding, W2=Panida 33EC, W3= Afinity 50.75 WP,
W4=Panida 33EC+Afinity 50.75 WP
0
20
40
60
80
100
120
140
160
W0 W1 W2 W3 W4
Dry
wei
ght
of
wee
d m
-2 (g
)
Weed control methods

51
4.3.3 Combined effect of variety and weed control treatment
Significant variation was observed for weed biomass under different variety and weed
management combinations (Fig. 5). The highest weed biomass (157.3 g m-2
) was
observed from BARI Gom-28 (V1) and no weeding combination (V1W0), which was
statistically similar with V2W0, and V3W0 and the lowest weed biomass (57.61 g m-2
) was
recorded from BARI Gom-30 (V3) and Panida 33EC + Afinity 50.75WP (V3W4). Second
least dry matter accumulation weed was found in the combination BARI Gom-29 and
Panida 33EC + Afinity 50.75WP (V2W4) which was statistically similar with V1W4,
V2W1, V3W1 and V3W2. Dissimilar result was found by Mustari et al. (2014) that
pendimethalin performed worst in some wheat varieties in combined.
Figure 5. Combined effect of variety and different weed managements on the Weed
biomass m-2
(g) in wheat field (LSD (0.05) = 21.10)
V1=BARI Gom-28, V2=BARI Gom-29, V3=BARI Gom-30
4.4 Weed control efficiency
4.4.1 Effect of Variety
Significant variation was observed for weed control efficiency due to varietal
variation which was recorded at 20 and 60 DAS shown in Figure 6 and Appendix V. At
0
20
40
60
80
100
120
140
160
180
W0 W1 W2 W3 W4
Dry
we
igh
t o
f w
ee
d m
-2 (g
)
Weed control methods
V1
V2
V3

52
20, BARI Gom-29 (V2) recorded the highest weed control efficiency (30.72 %) which
was statistically similar with BARI Gom-30 (V3) (30.72%) and the lowest weed control
efficiency (26.06%) was recorded from BARI Gom-28 (V1). Hence, similar result was
found that higher and lower efficiency (56.50% and 44.02% in BARI Gom-30 and BARI
Gom-28 respectively) whose both were statistically similar with other one. In
consequence, Khatun et al. (2007) observed that weed control efficiency significantly
varies in different varieties.
Figure 6. Effect of variety on the weed control efficiency on wheat field at different
days after sowing (LSD (0.05) = 3.24 and 7.44 at 20 and 40DAS, respectively)
V1=BARI Gom-28, V2=BARI Gom-29, V3=BARI Gom-30
4.4.2 Effect of weed control treatments
For different weed management treatments, significant variation was observed in case of
weed control efficiency (Fig. 7 and Appendix V). Both 20 and 40 DAS, Panida 33EC +
Afinity 50.75 WP (W4) treatment scored the highest weed control efficiency (45.46 %
and 70.36% at 20 and 40 DAS respectively) and the lowest weed control efficiency (0.00
% and 0.00%) were observed under no weeding treatment (W0). The treatments showed
lower efficiency which might be due to emergence of some new weed species at later
stages. Second highest weed control efficiency (37.86% and 64.05%) were recorded in
case of panida 33 EC (W2) which were statistically similar with W1 (two hand weeding).
0
10
20
30
40
50
60
20 40Wee
d c
on
trol
effi
cien
cy (
%)
Days after sowing (DAS)
V1 V2 V3

53
This result was in agreement with the findings of Kaur et al. (2018), and Zahoor et al.
(2012). On the other hand, this result was dissimilar with Singh et al. (1994) who found
that isoproturon 1 kg ha-1
had 95.12% weed control efficiency which was almost equal to
hand weeding (93.85%) treatment weed control efficiency. Furthermore, dissimilar result
was reported by Mustari et al. (2014) that Carfentrazone-ethyl performed the best in
terms of weed control efficiency (79.68%), while Pendimethalin performed the worst
(52.74%).
Figure 7. Effect of different weed managements on the weed control efficiency on
wheat field at different days after sowing (LSD (0.05) = 3.55 and 4.45 at 20 and
40 DAS, respectively)
W0= No weeding, W1= Two hand weeding, W2= Panida 33 EC, W3= Afinity 50.75 WP, W4=
Panida 33 EC + Afinity 50.75 WP
4.4.3 Combined effect of variety and weed control treatments
Significant variation was observed for weed control efficiency under different variety and
weed control treatment combinations (Table 3). Both 20 and 40 DAS, the highest weed
control efficiency (46.89% and 79.90% 20 and 40 DAS respectively) was recorded form
combinations of BARI Gom-30 (V3) and panida 33EC (V3W2), which was statistically
0
10
20
30
40
50
60
70
80
20 40
We
ed
co
ntr
ol e
ffic
ien
cy (
%)
Days after sowing (DAS)
W0 W1 W2 W3 W4

54
similar (46.53 % and 76.22% at 20 and 40 DAS respectively) with V3W4. The lowest
weed control efficiency (0.00%) was observed under all the varieties (BARI Gom-28
(V1), BARI Gom-29 (V2), and BARI Gom-30 (V3) and no weeding treatment
combinations (V1W0, V2W0 and V3W0).
Table 3. Combined effect of variety and different weed managements on the number
of weeds on wheat fields
Treatment
combinations
Weed control efficiency (%) at different days
after sowing (DAS)
20 40
V1W0 0.00 h 0.00 i
V1W1 28.14 fg 73.11 a-c
V1W2 42.96 a-c 67.98 cd
V1W3 22.79 g 33.02 h
V1W4 36.42 de 45.99 g
V2W0 0.00 h 0.00 i
V2W1 35.28 de 54.01 f
V2W2 36.84 c-e 63.22 de
V2W3 31.46 ef 68.40 cd
V2W4 40.33 b-d 69.93 b-d
V3W0 0.00 h 0.00 i
V3W1 43.03 ab 68.74 b-d
V3W2 46.89 a 79.90 a
V3W3 23.04 g 57.63 ef
V3W4 46.53 a 76.22 ab
LSD (0.05) 6.14 7.71
CV (%) 12.61 9.05
W0= No weeding, W1= Two hand weeding, W2= Panida 33 EC, W3= Afinity 50.75 WP, W4=
Panida 33 EC +Afinity 50.75 WP
V1=BARI Gom-28, V2=BARI Gom-29, V3=BARI Gom-30
4.5 Crop growth parameters
4.5.1 Plant height
4.5.1.1 Effect of variety

55
Plant height varied significantly due to varietal variation throughout the going period
(Fig. 8 and Appendix VI). At 20 DAS, BARI Gom-30 (V3) scored the highest plant
height (23.88 cm) which was statistically similar (22.99 cm) with BARI Gom-29 (V2).
The lowest plant height (22.90 cm) was observed in BARI Gom-28 (V1) which is
statistically similar (22.99 cm) with BARI Gom-29 (V2). At 40 DAS, BARI Gom-30 (V3)
was recorded the tallest plant (51.43 cm) and BARI Gom-28 (V1) was recorded the
lowest plant height (48.03 cm). In case of 60 DAS, the highest plant height (76.93 cm)
was recorded , BARI Gom-30 (V3)which was statistically similar (22.99 cm) with BARI
Gom-29 (V2), whether the lowest plant height (62.64 cm) was recorded from BARI
Gom-28(V1).According to 80 DAS and at harvest plant height are not varied significantly
but numerically the highest (83.35 cm and 88.47 cm) and lowest plant height (78.88 cm
and 82.31 cm) were recorded respectively which are not statistically similar from each
other. This result was in agreement with Sultana et al. (2012) who described that plant
height varies significantly among varieties.
Figure 8. Effect of variety on the plant height of wheat at different days after sowing
(LSD (0.05) =0.95, 1.33, 6.43, NS AND NS at 20, 40, 60, 80 DAS and harvest,
respectively)
V1=BARI Gom-28, V2=BARI Gom-29, V3=BARI Gom-30
4.5.1.2 Effect of weed control treatment

56
There was significant variation observed for plant height due to different weed control
treatments (Fig. 9 and Appendix VI). Throughout the growing period, Panida 33EC (W2)
scored the highest plant height (23.60, 53.30, 75.85, 82.80 and 87.23 cm at 20, 40, 60, 80
DAS and at harvest) while no weeding treatment (W0) attained the lowest (22.61, 45.73,
65.15, 78.42 and 80.87 cm at 20, 40, 60, 80 DAS and at harvest) plant height. The results
were in agreement with the findings of Sultana et al. (2012) who found that the highest
plant height was observed in completely weed free condition throughout the crop growth
period with chemical weed control method and next in two hand weeding treatment
whereas lowest value was observed in no weeding treatment. The results were in
consistence with the findings of Acker (2010) and Sultana (2009). The reduction in plant
height of wheat plant due to weed competition was also reported by Pandey et al. (2002).
Figure 9. Effect of different weed managements on the plant height of wheat at
different days after sowing (LSD (0.05) = NS, 4.62, 7.30, NS and NS at 20, 40,
60, 80 DAS and harvest, respectively)
W0= No weeding, W1= Two hand weeding, W2=Panida 33EC, W3= Afinity 50.75WP,
W4=Panida 33EC+Afinity 50.75WP
4.5.1.3 Combined effect of variety and weed control treatments
Plant height was significantly affected by the combined effect of variety and weed
control shown in Table 4. At 20 DAS, highest plant height (25.08 cm) was recorded from
0
25
50
75
100
20 40 60 80 At harvest
Pla
nt
hei
gh
t (c
m)
Days after sowing (DAS)
W0 W1 W2 W3 W4

57
the combination of BARI Gom-30 and two hand weeding (V3W1) which was statistically
similar with V1W1, V1W2, V1W3, V1W4, V2W0, V2W1, V2W2, V2W4, V3W0, V3W2, V3W3
and V3W4 and the lowest (21.40 cm) was obtained from BARI Gom-28 and no weeding
combination (V1W0) which was statistically similar with V1W1, V1W2, V1W4, V2W0,
V2W1, V2W2, V2W3, V2W4,V3W0,V3W3 and V3W4. Combination of BARI Gom-30 and
Panida 33EC (V3W2) scored the highest plant height (55.92 cm) at 40 DAS which was
statistically similar with V1W1, V1W2, V2W1, V2W2, V2W3, V2W4, V3W1, V3W4 and
V3W4. On the other hand, the lowest plant height (43.41 cm) was recorded from the
combination of BARI Gom-28 and no weeding combination (V1W0) which was
statistically similar with V1W3, V1W4, V2W0, V2W1, V2W3, V2W4, V3W0, V3W3 and
V3W4. At 60 DAS highest plant height (80.27cm) was recorded from the combinations of
BARI Gom-30 and Panida 33EC (V3W2) which was statistically similar with V1W1,
V1W2, V2W0, V2W1, V2W2, V2W3, V2W4, V3W0, V3W1, V3W3 and V3W4. The lowest
plant height was recorded from the combinations of BARI Gom-28 and no weeding
combination (V1W0) (51.77) which was statistically similar with V1W3.
Table 4. Combined effect of variety and different weed managements on the plant
height of wheat at different days after sowing
Treatment
combinations
Plant height (cm) at different days after sowing (DAS)
20 40 60 80 At harvest
V1W0 21.40 c 43.41 d 51.77 d 75.87 77.57 b
V1W1 22.29 a-c 51.46 a-c 68.02 a-c 79.53 84.07 ab
V1W2 23.53 a-c 52.32 a-c 70.96 ab 78.07 85.40 ab
V1W3 24.99 ab 45.74 cd 57.33 cd 81.00 81.13 ab
V1W4 22.31 a-c 47.23 b-d 65.11 bc 79.93 83.39 ab
V2W0 23.99 a-c 46.15 b-d 69.89 a-c 79.13 79.80 ab
V2W1 23.18 a-c 50.31 a-d 74.67 ab 82.07 86.07 ab
V2W2 22.39 a-c 51.66 a-c 76.33 ab 84.20 86.23 ab
V2W3 21.73 bc 49.65 a-d 71.24 ab 82.47 83.07 ab
V2W4 23.67 a-c 50.50 a-d 73.53 ab 82.67 86.13 ab
V3W0 22.45 a-c 47.62 b-d 73.80 ab 80.27 85.23 ab
V3W1 25.08 a 53.96 ab 78.13 a 85.67 90.33 a
V3W2 24.88 ab 55.92 a 80.27 a 86.13 90.07 a
V3W3 23.04 a-c 49.28 a-d 75.26 ab 82.33 88.93 ab
V3W4 23.94 a-c 50.36 a-d 77.20 ab 82.33 87.80 ab

58
LSD (0.05) 3.30 8.00 12.65 NS 12.34
CV (%) 8.43 9.55 10.59 10.48 8.61
W0= No weeding, W1= Two hand weeding, W2=Panida 33EC, W3= Afinity 50.75WP,
W4=Panida 33EC+Afinity 50.75WP
V1=BARI Gom-28, V2=BARI Gom-29, V3=BARI Gom-30
The plant height at 80 DAS was non-significant, hence, the highest plant height
(86.13cm) was found in combination of BARI Gom-30 and Panida 33EC (V3W2), while
the lowest one (75.87 cm) was recorded from BARI Gom-28 and no weeding
combination (V1W0). At harvest, BARI Gom-30 and two hand weeding (V3W1) treatment
combination achieved the highest plant height (93.33 cm) which was statistically similar
with V1W1, V1W2, V1W3, V1W4, V2W0, V2W1, V2W2, V2W3, V2W4, V3W0, V3W2 and
V3W4. The lowest plant height (77.57 cm) was recorded from the combinations of BARI
Gom-28 and no weeding combination (V1W0) which was statistically similar with V1W1,
V1W2, V1W3, V1W4, V2W0, V2W1, V2W2, V2W3, V2W4, V3W0, V3W3 and V3W4.
4.6.2 Leaf area index
4.6.2.1 Effect of variety
Leaf area index of wheat increased significantly due to various type of wheat cultivar at
different days after sowing (Fig. 10 and appendix VII). BARI Gom-30(V3) showed
exponential highest result throughout the growing stage. The highest (0.23) leaf area
index was obtained from BARI Gom-30 (V3) which was statistically par with BARI
Gom-29 (V3) at 40 DAS and the lowest result (0.15) found in BARI Gom-28 (V1).

59
Figure 10. Effect of variety on the leaf area index of wheat at different days after
showing (LSD (0.05) =0.31,0.067 and 0.093 at 40,60 and 80 DAS respectively)
V1=BARI Gom-28, V2=BARI Gom-29, V3=BARI Gom-30
At 60 DAS, the highest leaf area index (0.78) was recorded from the BARI Gom-30(V3)
and lowest leaf area index (0.61) which was similar with BARI Gom-29 (V2). In case of
80 DAS, highest leaf area index (1.21) recorded in BARI Gom-30 (V3) and lowest leaf
area index (0.97). Similar result in a research of Sultana et al. (2012).
4.5.2.2 Effect of weed control methods
Weed control methods had significant influence on the leaf area index of wheat at
different days after sowing (Fig. 11 and appendix VII). The indicated that Pnida 33EC
(W2) showed exponentially highest Leaf area index, whereas, no weeding treatment
showed lowest result. The highest leaf area index (0.46, 1.94 and 2.46 at 40, 60 and 80
DAS respectively) were obtained from the treatment panida 33EC and the lowest leaf
area index (0.42, 1.58 and 2.06 at 40, 60 and 80 DAS respectively) were recorded in
control (W0).
0
0.2
0.4
0.6
0.8
1
1.2
1.4
40DAS 60DAS 80DAS
Leaf
are
a in
dex
Days after sowing (DAS)
V1
V2
V3

60
Figure 11. Effect of different weed managements on the leaf area index of wheat at
different days after sowing (LSD (0.05) = 0.052, 0.178 and 0.223 at 40, 60 and
80 DAS, respectively)
W0= No weeding, W1= Two hand weeding, W2=Panida 33EC, W3= Afinity 50.75WP,
W4=Panida 33EC+Afinity 50.75WP
Mandal et al. (2014) concluded that maximum LAI was found from W3 (1.3) while
minimum from W0 (0.9) which was similar with the findings and significantly higher
leaf area index was observed under pendimethalin 1 kg ha-1
pre-em. +
1 HW (T1) by (Bhikhubhai, R. V.,2006).
4.5.2.3 Combined effect of variety and weed control treatment
Different treatment combinations variety and weed control method showed significant
influence on the leaf area index of wheat at different days after sowing (Table 5). The
combination of BARI Gom-30 and Panida 33EC (V3W2) reveled the highest leaf area
index (2.15 and 2.64) in case of 40 and 60 DAS respectively. At 80 DAS, the highest leaf
area index (3.04) was recorded in combination treatment BARI Gom-30 and two hand
weeding (V3W2). On the other hand, treatment combination V1W0 (BARI Gom-28 and no
weeding) showed the lowest leaf area index (1.33, 1.73 and 2.04 at 40, 60 and 80 DAS
respectively) throughout the growing season.
Table 5. Combined effect of variety and different weed managements on the Leaf
area index (cm2) in wheat field .
0
0.5
1
1.5
2
2.5
3
40 60 80
Leaf
are
a In
de
x
Different days after sowing (DAS)
W0 W1 W2 W3 W4

61
Treatment
combinations
Leaf area index (cm2) at different days after sowing (DAS)
40 60 80
V1W0 1.33 f 1.73 e 2.04 e
V1W1 1.67 c-e 2.23 b-d 2.43 b-e
V1W2 1.74 b-e 2.31 a-d 2.57 a-d
V1W3 1.45 ef 1.93 de 2.15 de
V1W4 1.53 d-f 2.08 c-e 2.35 b-e
V2W0 1.67 c-e 2.12 c-e 2.18 de
V2W1 1.86 a-c 2.35 a-c 2.46 b-e
V2W2 1.94a-c 2.43 a-c 2.63a-d
V2W3 1.71 c-e 2.20 b-d 2.28 c-e
V2W4 1.79 b-d 2.28 a-d 2.39 b-e
V3W0 1.74 b-e 2.32 a-d 2.52 b-e
V3W1 2.03 ab 2.51 ab 3.04 a
V3W2 2.15 a 2.64a 2.81 ab
V3W3 1.81 b-d 2.37 a-c 2.69 a-c
V3W4 1.93 a-c 2.44 a-c 2.74 a-c
LSD (0.05) 3.12 3.89 4.88
CV (%) 10.62 11.51 11.19
W0= No weeding, W1= Two hand weeding, W2=Panida 33EC, W3= Afinity 50.75WP,
W4=Panida 33EC+Afinity 50.75WP
V1=BARI Gom-28, V2=BARI Gom-29, V3=BARI Gom-30
4.5.3 Above ground dry matter production
4.5.3.1 Effect of variety
Dry matter is the material which was dried to a certain constant weight. Above ground
dry matter (AGDM) production indicates the production potential of a relevant crop. A
high
AGDM production is the first pre-requisite for high yield. AGDM of roots, leaves,
leaf sheath + stem and or panicles of all varieties were measured at 20, 40,
60 DAS and at harvest. It was evident from Figure 12 that irrespective of treatments
AGDM of all the varieties significantly varied at all sampling dates except 20 DAS.
Figure
12 shows that BARI Gom-30 (V3) achieved the highest dry matter throughout the

62
growing period (0.52, 5.66,9.73 and 12.44 g per plant at 20, 40, 60and at 80 DAS
respectively). Lower amount of dry matter production was observed in BARI Gom-28
(V1) throughout the growing period. This may be due to the highest number of tiller
mortality. Dissimilar results were reported by Sultana et al. (2006) who stated that
cultivar Prodip accumulated higher amount of vegetative dry matter than the other
cultivar.
Figure 12. Effect of variety on the above ground dry weight plant-1
of wheat at
different days after sowing (LSD (0.05) =NS, 0.55, 0.87 and 1.01 at 20, 40, 60
and 80 DAS, respectively)
V1=BARI Gom-28, V2=BARI Gom-29, V3=BARI Gom-30
4.5.3.2 Effect of weed control treatment
Total dry matter (AGDM) increased exponentially with time. AGDM was
significantly influenced by different weed control treatments (Fig. 13 and
Appendix VIII). Hence, from the early stages distinct differences were visible among
the weed control treatments in AGDM production. The lowest AGDM throughout
the growing period was found in unweeded treatment (W0). All of the weed
control treatments gave statistically similar results from 20 to 80 DAS except Afinity
50.75WP (W3) were 8.804 (g) and 11.20 (g) at 60 and 80 DAS respectively. Among all
the weed control treatments, Panida 33EC (W2) achieved the highest
0
5
10
15
20 40 60 80
ab
ov
e gro
un
d d
ry w
eig
ht
pla
nt-1
(g)
Days after sowing (DAS)
V1 V2 V3

63
AGDM (0.5156 g, 5.570 g, 9.84 g and 12.86 g at 20, 40, 60 and at 80 DAS respectively)
throughout the growing period. It was reported that weedy check produces minimum
AGDM and hand weeding produces higher AGDM followed by Buctril Super at 0.45 kg
ha-1
, MCPA 0.65 kg ha-1
and Buctril Super at 0.25 kg ha-1
Zahoor et al. (2012).
Figure 13. Effect of different weed managements on the above ground dry weight
plant-1
of wheat at different days after sowing (LSD (0.05) = 0.04 , 0.59, 0.98
and 1.31 at 20, 40, 60 and 80 DAS, respectively)
W0= No weeding, W1= Two hand weeding, W2=Panida 33EC, W3= Afinity 50.75WP,
W4=Panida 33EC+Afinity 50.75WP
4.5.3.3 Combined effect of variety and weed control treatment
The combined of weed control treatments and variety had significant effect on
AGDM production throughout the growing period (Table 6). All the weed
control treatments gave higher AGDM over time and gave lower AGDM at no
weeding. The treatment combination of BARI Gom-30 and Panida 33EC (V3W2)
produced the highest AGDM (0.5533 g ,5.933 g, 10.43 g and 13.47 g at 20, 40, 60 and at
80 DAS respectively) throughout the growing period. It might be due to the luxuriant
growth of weeds up to harvest in the treatment plot that were controlled by
Panida 33EC.
0
5
10
15
20 40 60 80ab
ove
gro
un
d d
ry w
eigh
t p
lan
t-1 (
g)
Days after sowing (DAS)
W0 W1 W2 W3 W4

64
Table 6. Combined effect of variety and different weed managements on total dry
matter plant-1
of wheat at different days after sowing
Treatment
combinations
Above ground dry weight plant-1
(g) at different days
after sowing (DAS)
20 40 60 80
V1W0 0.43 c 3.59 d 7.41 d 9.70 d
V1W1 0.53ab 4.99 a-c 8.73 a-d 11.55 a-d
V1W2 0.49 a-c 5.12 a-c 8.98 a-d 12.06 a-c
V1W3 0.44 c 4.27 cd 8.25cd 10.39 cd
V1W4 0.45 c 4.57 b-d 8.57 b-d 10.89 b-d
V2W0 0.49 a-c 5.01 a-c 8.27 cd 10.99 b-d
V2W1 0.50 a-c 5.55 ab 9.59 a-c 12.84 ab
V2W2 0.50 a-c 5.66 a 10.11 ab 13.05 ab
V2W3 0.46bc 5.32 ab 8.87 a-d 11.35 a-d
V2W4 0.47bc 5.43ab 9.48 a-c 12.44 a-c
V3W0 0.48 a-c 5.41 ab 9.01 a-d 11.69 a-d
V3W1 0.47 bc 5.80 a 10.31 a 12.85 ab
V3W2 0.55 a 5.93 a 10.43 a 13.47 a
V3W3 0.55 a 5.49 ab 9.30 a-c 11.87 a-d
V3W4 0.53 ab 5.67 a 9.65a-c 12.33 a-c
LSD (0.05) 0.08 1.03 1.70 2.27
CV (%) 10.12 11.73 11.06 11.38
W0= No weeding, W1= Two hand weeding, W2=Panida 33EC, W3= Afinity 50.75WP,
W4=Panida 33EC+Afinity 50.75WP
V1=BARI Gom-28, V2=BARI Gom-29, V3=BARI Gom-30
4.5.4 Crop growth rate (CGR)
4.5.4.1 Effect of variety
Crop growth rate (CGR) is a measure of the increase in size, mass or number of crops
over a period of time. The increase further can be plotted as a logarithmic or exponential
curve in many cases. It varied significantly due to variety shown in (Fig. 14 and
Appendix IX). At 20-40 DAS, BARI Gom-30 (V3) scored the highest CGR (12.86 g m-2
d-1
) which was statistically similar (12.27 g m-2
d-1
) with BARI Gom-29 (V2). The lowest
CGR (10.10 g m-2
d-1
) was observed from BARI Gom-28 (V1). On 40-60 DAS, Crop
growth rate (CGR) was non-significantly influenced by different variety but numerically

65
highest CGR (10.20 g m-2
d-1
) found in BARI Gom-30 (V3) and lowest CGR (9.682 g m-2
d-1
) was found in BARI Gom-29 (V2). In case of 60-80 DAS, the highest CGR (7.244 g
m-2
d-1
) was recorded by BARI Gom-29 (V2) which was statistically similar (6.755 g m-2
d-1
) with BARI Gom-30 (V3). Whether the lowest CGR (6.329 g m-2
d-1
) was recorded
from BARI Gom-28 (V2) which was statistically similar (6.755 g m-2
d-1
) with BARI
Gom-30 (V3).
Figure 14. Effect of variety on the crop growth rate of wheat at different days after
sowing (LSD (0.05) = 1.34, NS and 0.61 at 20-40, 40-60 and 60-80 DAS,
respectively)
V1=BARI Gom-28, V2=BARI Gom-29, V3=BARI Gom-30
4.5.4.2 Effect of weed control treatments
The growth rate of wheat crop was significantly influenced by different weed control
treatments over time (Fig. 15 and Appendix IX). Unweeded treatment (W0) showed the
lowest CGR throughout the growing period except 20-40 DAS (5.993 g m-2
d-1
) which is
statistically similar with treatments no weeding (W1) and Panida 33EC + Afinity
50.75WP (W4). It revealed that severe weed infestation might hamper the growth and
development of wheat plants drastically (Figure 15). At 20-40 DAS, treatment W2
(Panida 33CE) gave the highest CGR (7.556 g m-2
d-1
) which was statistically similar to
2 0 - 4 0 4 0 - 6 0 6 0 - 8 0
Cro
p g
row
th r
ate
(g
m-2
d-1
)
Days after sowing (DAS)
V1 V2 V3

66
two hand weeding (W1) treatment (7.276 g m-2
d-1
). Even At 60-80DAS, the treatment
W2 (Panida 33CE) gave the highest CGR (12.64 g m-2
d-1
) which was statistically similar
with two hand weeding (W1). At 40-60 DAS, treatment W2 gave the highest CGR (10.68
g m-2
d-1
) which was statistically similar with two hand weeding (W1) and Panida 33EC +
Afinity 50.75WP(W4Dissimilar result was found by Pandey et al. (2000) that weed
control through herbicides viz., post-emergence application of isoproturon 1.0 kg ha-1
,
2,4-D 0.8 kg ha-1
and combination of isoproturon 0.5 kg ha-1
+ 2,4-D 0.125 kg ha-1
gave
higher CGR and RGR.
Figure 15. Effect of different weed managements on the crop growth rate of wheat
at different days after sowing (LSD (0.05) =1.37, 1.03 and 0.78 at 20-40, 40-60
and 60-80 DAS, respectively)
W0= No weeding, W1= Two hand weeding, W2=Panida 33EC, W3= Afinity 50.75WP,
W4=Panida 33EC+Afinity 50.75WP
4.5.4.3 Combined effect of variety and weed control treatment
The combined effect of weed control treatments and variety significantly influenced the
CGR throughout the growing period (Table 7). In most of the treatment combinations,
CGR increased gradually up to 20-60 DAS and then declined. At the beginning of the
crop growth (20-40 DAS) V3W1 showed the highest CGR (11.27 g m-2
d-1
). At 40-60
DAS, V3W1 showed the highest CGR (12.86 g m-2
d-1
). At 60-80 DAS, V2W1 gave the
0
2
4
6
8
10
12
14
W0 W1 W2 W3 W4
Cro
p g
row
th r
ate
(g m
-2 d
-1)
Days after sowing (DAS)
20-40 40-60 60-80

67
highest CGR (8.47 g m-2
d-1
) among all the treatment combinations. It implied that
different weed control treatments effectively controlled the weeds.
Table 7. Combined effect of variety and different weed managements on the crop
growth rate of wheat at different days after sowing
Treatment
combinations
Crop growth rate (g m-2
d-1
) at different days after sowing
(DAS)
20-40 40-60 60-80
V1W0 9.49a-c 7.90 d 5.73ef
V1W1 9.35 bc 11.15 a-c 7.04 b-e
V1W2 9.67 a-c 11.56 a-c 7.71 ab
V1W3 9.93 a-c 9.58 cd 5.35 f
V1W4 10.03 ab 10.31 bc 5.80ef
V2W0 8.16c 11.29 a-c 6.80 b-e
V2W1 10.10 ab 12.62 ab 8.47 a
V2W2 11.14 a 12.90 a 7.35 a-d
V2W3 8.85bc 12.16 ab 6.21 d-f
V2W4 10.16 ab 12.39 ab 7.39 a-d
V3W0 9.010 bc 12.31 ab 6.72 b-e
V3W1 11.27 a 13.34 a 6.32 c-f
V3W2 11.24 a 13.45 a 7.60 a-c
V3W3 9.54a-c 12.34 ab 6.42 b-f
V3W4 9.94 ab 12.86 a 6.72 b-e
LSD (0.05) 1.79 2.38 1.36
CV (%) 10.75 12 11.9
W0= No weeding, W1= Two hand weeding, W2=Panida 33EC, W3= Afinity 50.75WP,
W4=Panida 33EC+Afinity 50.75WP
V1=BARI Gom-28, V2=BARI Gom-29, V3=BARI Gom-30
4.5.5 Relative growth rate (RGR)
4.5.5.1 Effect of Variety
Relative growth rate (RGR) is the increase of materials per unit of plant materials per
unit of time. RGR of wheat plant varied non-significantly due to variety shown in
Figure 16. At 20-40 DAS, BARI Gom-28 (V1) was recorded the highest

68
RGR (0.03140 g m-2
d-1
) and BARI Gom-29 (V2) was recorded the lowest RGR
(0.0272 g m-2
d-1
). On 40-60 DAS, BARI Gom-29 (V2) scored the highest RGR (0.1203 g
m-2
d-1
) numerically. The lowest RGR (0.1127 g m-2
d-1
) was observed for BARI Gom-20
(V1). In case of 60-80 DAS, the highest RGR (0.01353 g m-2
d-1
)
was recorded from BARI Gom-29 (V2) whether the lowest RGR (0.0122 g hill-1
day-1
) was recorded from BARI Gom-30 (V3).
Figure 16. Effect of variety on the relative growth rate of wheat at different days
after sowing (LSD (0.05) =NS, NS and NS at 20-40, 40-60 and 60-80 DAS,
respectively)
V1=BARI Gom-28, V2=BARI Gom-29, V3=BARI Gom-30
4.5.5.2 Effect of weed control treatment
Relative growth rate was non-significantly affected by different weed control treatments
throughout the time (Fig. 17). At 20-40 DAS, the highest RGR (0.02944 g m-2
d-1
)
attained by the treatments W0 (no weeding) and lowest RGR (0.02811 g m-2
d-1
).
Treatment W1 (Two hand weeding) gave the highest RGR (0.1194 g m-2
d-1
) at 40-60
DAS, While, W0 treatment (no weeding) gave lowest RGR (0.1142 g m-2
d-1
) (Fig. 17).
However, numerical highest value of RGR (0.01367 g m-2
d-1
) at 60-80 DAS and the
lowest RGR (0.01211 g m-2
d-1
) revealed in treatment W3 (Afinity 50.75WP). Dissimilar
result was found by Pandey et al. (2000) that weed control through herbicides viz., post-
0
0.02
0.04
0.06
0.08
0.1
0.12
0.14
2 0 - 4 0 4 0 - 6 0 6 0 - 8 0
Re
lati
ve g
row
th r
ate
(g
m-2
d-
1)
Days after sowing (DAS)
V1 V2 V3
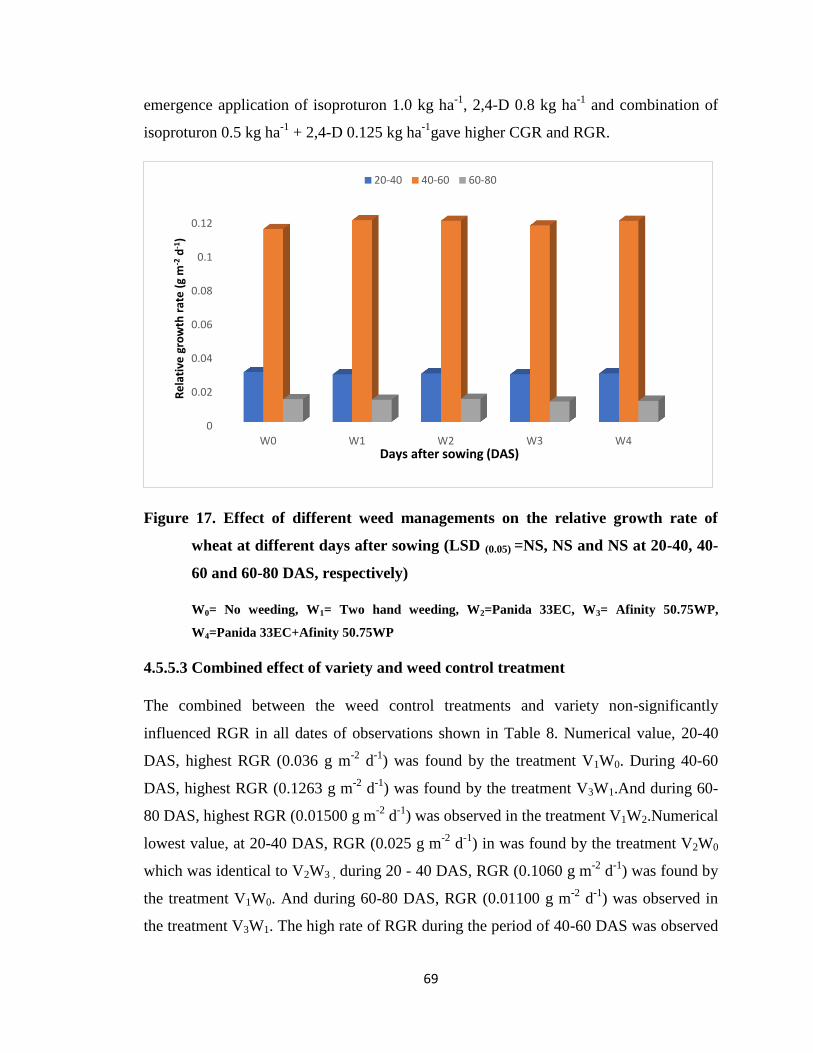
69
emergence application of isoproturon 1.0 kg ha-1
, 2,4-D 0.8 kg ha-1
and combination of
isoproturon 0.5 kg ha-1
+ 2,4-D 0.125 kg ha-1
gave higher CGR and RGR.
Figure 17. Effect of different weed managements on the relative growth rate of
wheat at different days after sowing (LSD (0.05) =NS, NS and NS at 20-40, 40-
60 and 60-80 DAS, respectively)
W0= No weeding, W1= Two hand weeding, W2=Panida 33EC, W3= Afinity 50.75WP,
W4=Panida 33EC+Afinity 50.75WP
4.5.5.3 Combined effect of variety and weed control treatment
The combined between the weed control treatments and variety non-significantly
influenced RGR in all dates of observations shown in Table 8. Numerical value, 20-40
DAS, highest RGR (0.036 g m-2
d-1
) was found by the treatment V1W0. During 40-60
DAS, highest RGR (0.1263 g m-2
d-1
) was found by the treatment V3W1.And during 60-
80 DAS, highest RGR (0.01500 g m-2
d-1
) was observed in the treatment V1W2.Numerical
lowest value, at 20-40 DAS, RGR (0.025 g m-2
d-1
) in was found by the treatment V2W0
which was identical to V2W3 , during 20 - 40 DAS, RGR (0.1060 g m-2
d-1
) was found by
the treatment V1W0. And during 60-80 DAS, RGR (0.01100 g m-2
d-1
) was observed in
the treatment V3W1. The high rate of RGR during the period of 40-60 DAS was observed
0
0.02
0.04
0.06
0.08
0.1
0.12
W0 W1 W2 W3 W4
Re
lati
ve g
row
th r
ate
(g
m-2
d-1
)
Days after sowing (DAS)
20-40 40-60 60-80
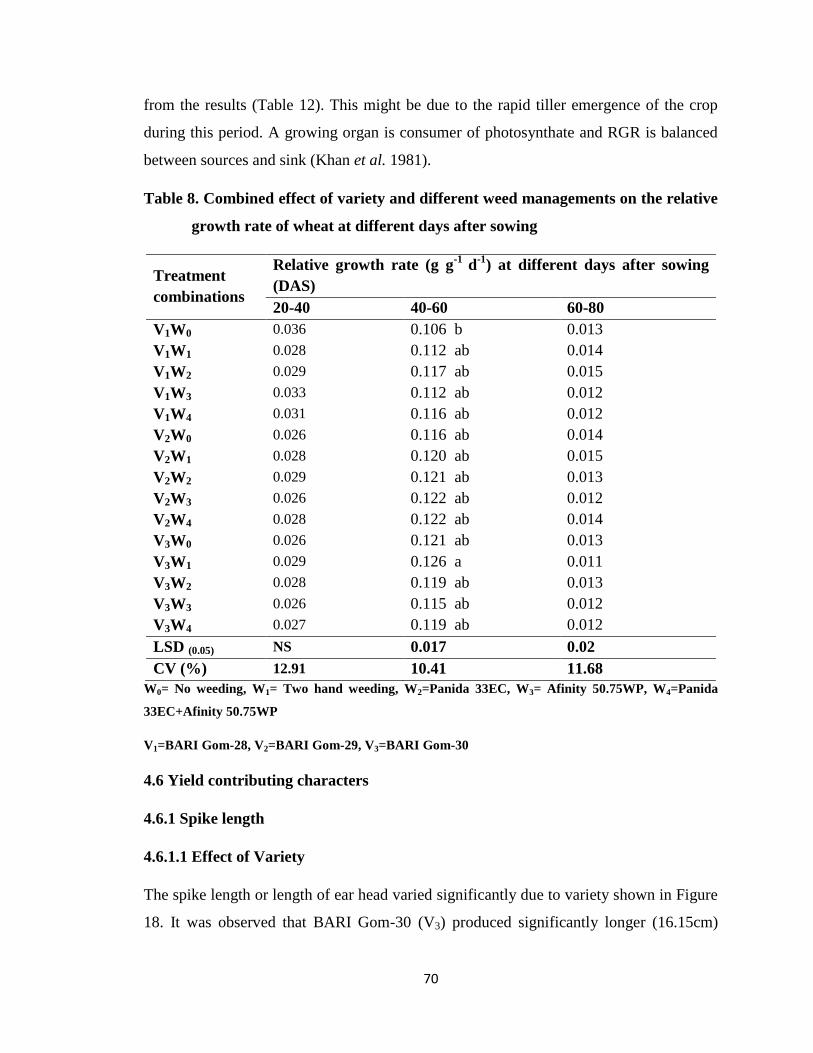
70
from the results (Table 12). This might be due to the rapid tiller emergence of the crop
during this period. A growing organ is consumer of photosynthate and RGR is balanced
between sources and sink (Khan et al. 1981).
Table 8. Combined effect of variety and different weed managements on the relative
growth rate of wheat at different days after sowing
Treatment
combinations
Relative growth rate (g g-1
d-1
) at different days after sowing
(DAS)
20-40 40-60 60-80
V1W0 0.036 0.106 b 0.013
V1W1 0.028 0.112 ab 0.014
V1W2 0.029 0.117 ab 0.015
V1W3 0.033 0.112 ab 0.012
V1W4 0.031 0.116 ab 0.012
V2W0 0.026 0.116 ab 0.014
V2W1 0.028 0.120 ab 0.015
V2W2 0.029 0.121 ab 0.013
V2W3 0.026 0.122 ab 0.012
V2W4 0.028 0.122 ab 0.014
V3W0 0.026 0.121 ab 0.013
V3W1 0.029 0.126 a 0.011
V3W2 0.028 0.119 ab 0.013
V3W3 0.026 0.115 ab 0.012
V3W4 0.027 0.119 ab 0.012
LSD (0.05) NS 0.017 0.02
CV (%) 12.91 10.41 11.68
W0= No weeding, W1= Two hand weeding, W2=Panida 33EC, W3= Afinity 50.75WP, W4=Panida
33EC+Afinity 50.75WP
V1=BARI Gom-28, V2=BARI Gom-29, V3=BARI Gom-30
4.6 Yield contributing characters
4.6.1 Spike length
4.6.1.1 Effect of Variety
The spike length or length of ear head varied significantly due to variety shown in Figure
18. It was observed that BARI Gom-30 (V3) produced significantly longer (16.15cm)

71
spike which was statistically similar with BARI Gom-29 (V2) and again the shortest
panicle length (13.8 cm) was measured from BARI Gom-28 (V1) which was statistically
similar with BARI Gom-29 (V2). Similar result found that different wheat varieties show
different spike length by sultana et.al.(2012).
Figure 18. Effect of variety on the length of spike(cm) of wheat (LSD (0.05) =1.42)
V1=BARI Gom-28, V2=BARI Gom-29, V3=BARI Gom-30
4.6.1.2 Effect of weed control treatments
The Spike length varied non-significantly due to weed control treatments shown in
Figure 19. But it was observed that numerically longest panicle length (15.77 cm) was
recorded at the treatment W2 (Panida 33EC).While the shortest (14.34 cm)
spike length was observed from control treatment (W0). Hossain (2008) recorded that a
gradual trend of increase length of spike was found in all the herbicides with increased
rate of application compared to the control plots of wheat and found the highest spike
lengths (7.25, 12.12 and 12.47 cm) from the treatment of Sencor 70WG @ 0.40 kg ha-1
at
60 DAS, 90 DAS and at harvest respectively.

72
Figure 19. Effect of different weed managements on the length of spike of wheat
(LSD (0.05) =NS)
W0= No weeding, W1= Two hand weeding, W2=Panida 33EC, W3= Afinity 50.75WP,
W4=Panida 33EC+Afinity 50.75WP
4.6.1.3 Combined effect of variety and weed control treatments
Spike length was significantly affected by the combined effect of variety and weed
control (Table 9). The longest (29.91 cm) panicle was observed from the combination
BARI Gom-30 with panida 33EC (V3W2) which was statistically similar with all other
treatment combination except V1W0 and V1W3. On the contrary, smallest spike was
found in treatment combination V1W0 (BARI Gom-28 and no hand weeding) which was
statistically similar with V1W1, V1W2, V1W3, V1W4, V2W0, V2W1, V2W3, V2W4, V3W0
(table no).
4.6.2 Spikelets spike-1
4.6.2.1 Effect of variety
The number of spikelets spike-1
varied significantly due to Varieties (Fig. 20). It was
observed that BARI Gom-30 (V3) produced significantly higher number of spikelets
spike-1
(14.76) spike which was statistically similar with BARI Gom-29 (V2) and the
lowest number of spikelets spike-1
(13.22) was measured from BARI Gom-28 (V1) plots

73
which was statistically similar with BARI Gom-29 (V2). Sultana et al. (2012) observed
that significantly the highest number of spikelets spike-1
(20.42) was produced by Prodip
which was statistically simillar with Gourab and the lowest (18.19) was produced by
Bijoy. Chahal et al. (1986) also observed that variety differed in case of the number of
spikelets spike-1
.
Figure 20. Effect of variety on the number of spikelets spike-1
of wheat (LSD (0.05)
=1.34)
V1=BARI Gom-28, V2=BARI Gom-29, V3=BARI Gom-30
4.6.2.2 Effect of weed control treatment
Number of spikelets spike-1
also varied significantly due to different weed control
methods (fig. 21). It was observed that the number of spikelets spike-1
was highest
(14.68) in the treatment of panida 33EC (W2) that was also statistically similar with all
other treatments except no weeding (W0) which gave the lowest (13.27) number of
spikelets spike-1
. Singh and Singh (2004) investigated the similar result that pre-
emergence application of pendimethalin at 0.75 kg ha-1
supplemented by one hand
weeding or 2,4-D 0.5 kg ha-1
at 30 DAS gave significantly higher spikes m-2
.

74
Figure 21. Effect of different weed managements on the number of spikelets spike-1
of wheat (LSD (0.05) =1.39)
W0= No weeding, W1= Two hand weeding, W2=Panida 33EC, W3= Afinity 50.75WP,
W4=Panida 33EC+Afinity 50.75WP
4.6.2.3 Combined effect of variety and weed control treatment
Different treatment combinations of variety and weed control method produced
significant variation in case of number of spikelets spike-1
(Table 9). The treatment
combination of V3W2 (BARI Gom-30 with panida 33EC) produced the highest (15.43)
number of spikelets spike-1
which was statistically similar with all other treatment
combination except V1W0 and V1W3. However, the lowest (12.40) number of spikelets
spike-1
was obtained from the treatment combination of V1W0 which was statistically
similar with almost all other treatment combination except highest giving combination
BARI Gom-30 with panida 33EC (V3W2) and BARI Gom-30 and two hand weeding
(V3W1).
4.6.3 Grains spike-1
4.6.3.1 Effect of variety
Significant variation was observed in number of filled grain spike-1
due to the effect of
variety shown in Figure 22. The highest number filled grain spike-1
(42.66) was found in
12
12.5
13
13.5
14
14.5
15
W0 W1 W2 W3 W4
Nu
mb
er o
f sp
ikel
ets
spik
e-1
Weed control methods
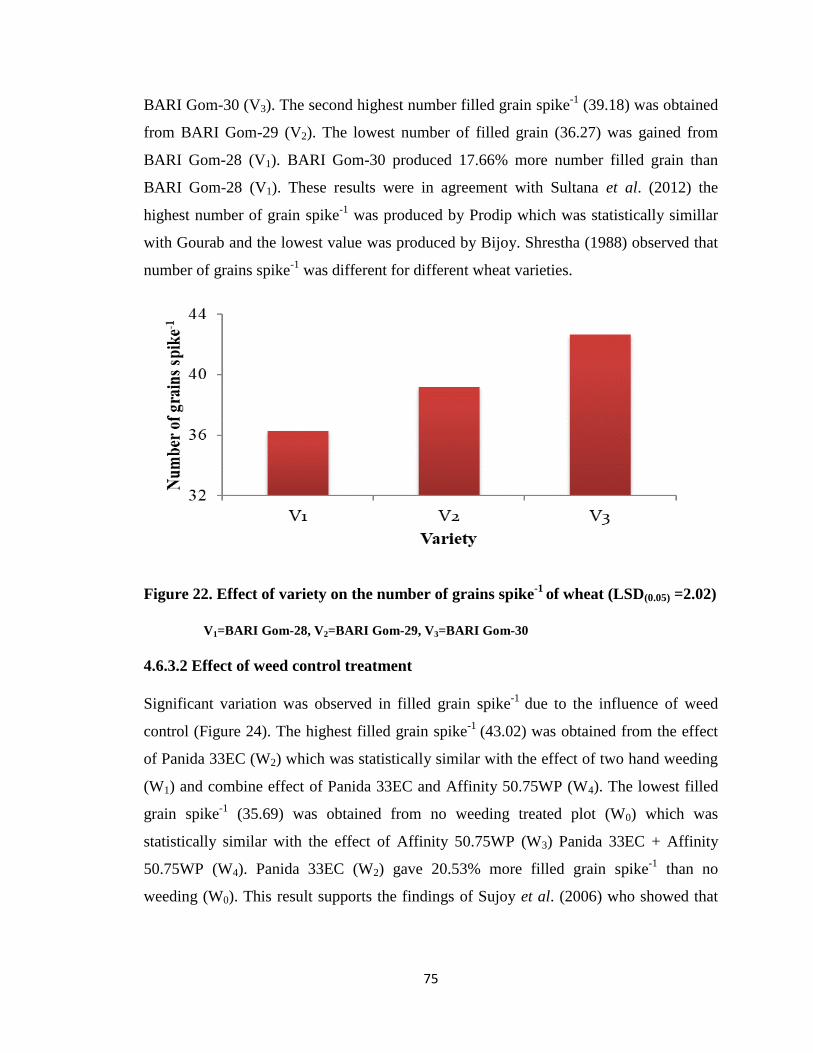
75
BARI Gom-30 (V3). The second highest number filled grain spike-1
(39.18) was obtained
from BARI Gom-29 (V2). The lowest number of filled grain (36.27) was gained from
BARI Gom-28 (V1). BARI Gom-30 produced 17.66% more number filled grain than
BARI Gom-28 (V1). These results were in agreement with Sultana et al. (2012) the
highest number of grain spike-1
was produced by Prodip which was statistically simillar
with Gourab and the lowest value was produced by Bijoy. Shrestha (1988) observed that
number of grains spike-1
was different for different wheat varieties.
Figure 22. Effect of variety on the number of grains spike-1
of wheat (LSD(0.05) =2.02)
V1=BARI Gom-28, V2=BARI Gom-29, V3=BARI Gom-30
4.6.3.2 Effect of weed control treatment
Significant variation was observed in filled grain spike-1
due to the influence of weed
control (Figure 24). The highest filled grain spike-1
(43.02) was obtained from the effect
of Panida 33EC (W2) which was statistically similar with the effect of two hand weeding
(W1) and combine effect of Panida 33EC and Affinity 50.75WP (W4). The lowest filled
grain spike-1
(35.69) was obtained from no weeding treated plot (W0) which was
statistically similar with the effect of Affinity 50.75WP (W3) Panida 33EC + Affinity
50.75WP (W4). Panida 33EC (W2) gave 20.53% more filled grain spike-1
than no
weeding (W0). This result supports the findings of Sujoy et al. (2006) who showed that

76
application of herbicide contributed mainly increasing the number of grain spike-1
and
that findings agreement with the findings of Acker (2010).
Figure 23. Effect of different weed managements on the number of grains spike-1
of
wheat (LSD (0.05) =4.71)
W0= No weeding, W1= Two hand weeding, W2=Panida 33EC, W3= Afinity 50.75WP,
W4=Panida 33EC+Afinity 50.75 WP
4.6.3.3 Combined effect of variety and weed control treatments
Significant variation was obtained in number of filled grain spike-1
due to the combined
effect of variety and weed control treatment (Table 9). The highest number filled grain
spike-1
(47.38) was obtained from the combined effect of BARI Gom-30 with panida
33EC (V3W2) which was statistically at par with V2W1, V2W2, V3W1, V3W3, andV3W4.
The lowest filled grain spike-1
(32.99) was found from the combined effect of BARI
Gom-28 with no weeding (V1W0) which was statistically similar with all other treatment
combination except V2W1, V2W2, V3W1, and V3W4.
4.6.4 1000 grain weight
4.6.4.1 Effect of variety

77
Weight of 1000 grains showed non-significant variation among the varieties (Figure 24).
However, BARI Gom-30 (V3) produced highest 1000 grain weight (50.84 g). The second
highest 1000 grain weight (48.95 g) was found in BARI Gom-29 (V2) (Figure 24). The
lowest 1000 grain weight (46.82 g) was obtained from BARI Gom-28(V1). Similar
Figure 24. Effect of variety on the number of weight of 1000-grains of wheat (LSD
(0.05) =NS)
V1=BARI Gom-28, V2=BARI Gom-29, V3=BARI Gom-30
findings were reported by Sultana et al. (2012) that variety did not differ significantly in
respect of 1000-grain weight rather than weight of 1000-grain varied significantly due to
weeding regime.
4.6.4.2 Effect of weed control treatment
Effect of weed control method showed significant variation in 1000 grain weight. Panida
33EC (W2) gave the highest 1000 grain weight (51.51 g) which was statistically similar
with all other treatments except no weeding(W0) (Figure 25). The lowest 1000 grain
weight (46.23g) was found from no weeding (W0) which also was statistically similar
with all other treatments except highest giving treatment Panida 33EC (W2). This finding
was in agreement with Kaur et al. (2018) that Pendimethalin (3.75 L/ha) was found

78
effective to control weed population and produced higher number of 1000 grain weight
and enhanced the yield upto 43.1% over weedy check.
Figure 25. Effect of different weed managements on the weight of 1000-grains of
wheat (LSD (0.05) =4.69)
W0= No weeding, W1= Two hand weeding, W2=Panida 33EC, W3= Afinity 50.75WP,
W4=Panida 33EC+Afinity 50.75 WP
4.6.4.3 Combined effect of variety and weed control treatments
Combined effect of variety and weeding method showed significant variation in 1000
grain weight shown in Table 9. The highest grain weight (53.57g) was found from the
combined effect of BARI Gom-30 with panida 33EC (V3W2) which was statistically
similar with all treatment combination except V1W0 and V1W3. The lowest grain weight
(43.68 g) was found with the combined effect of BARI Gom-28 with no weeding (V1W0)
which was statistically similar with all other treatments except V3W1(BARI Gom-30 and
two hand weeding) andV3W2 (BARI Gom-30 with panida 33EC). This result supports the
findings of Sultana et. all. (2012) who reported that weight of 1000 grains varied
significantly due to various weed control treatments.

79
Table 9. Combined effect of variety and different weed managements on the yield
contributing characters of wheat
Treatment
combinations
Spikelets
spike-1
Grains
spike-1
Length of
spike (cm)
1000 grain
weight (g)
V1W0 12.40 c 32.99 d 13.20 d 43.68 c
V1W1 13.80 a-c 37.57 b-d 14.31 a-d 48.49 a-c
V1W2 13.94 a-c 39.06 b-d 14.60 a-d 49.84 a-c
V1W3 12.78 bc 35.03 cd 13.31 cd 45.14 bc
V1W4 13.20 a-c 36.70 cd 13.93 b-d 46.97 a-c
V2W0 13.22 a-c 35.76 cd 14.33 a-d 46.10 a-c
V2W1 14.27 a-c 41.87 a-c 15.87 a-d 50.04 a-c
V2W2 14.67 a-c 42.63 a-c 16.00 ab 51.12 a-c
V2W3 13.61 a-c 36.68 cd 14.63 a-d 48.28 a-c
V2W4 14.00 a-c 38.93 b-d 15.46 a-d 49.20 a-c
V3W0 14.20 a-c 38.30 b-d 15.49 a-d 48.91 a-c
V3W1 15.07 ab 45.49 ab 16.40 ab 51.97 ab
V3W2 15.43 a 47.38 a 16.70 a 53.57 a
V3W3 14.41 a-c 39.57 a-d 15.93 a-c 49.51 a-c
V3W4 14.67 a-c 42.53 a-c 16.23 ab 50.27 a-c
LSD (0.05) 2.40 8.15 2.67 8.13
CV (%) 10.21 12.29 10.50 9.87
W0= No weeding, W1= Two hand weeding, W2=Panida 33EC, W3= Afinity 50.75WP,
W4=Panida 33EC+Afinity 50.75
V1=BARI Gom-28, V2=BARI Gom-29, V3=BARI Gom-30
4.7 Yield characters
4.7.1 Grain yield
4.7.1.1 Effect of variety
Grain yield varied significantly for different varieties shown in Figure 26 and Appendix
XI. The highest grain yield (3.007 t ha-1
) was recorded by BARI Gom-30 (V3). The
second highest grain yield (2.71 t ha-1
) was recorded from BARI Gom-29 (V3). The
lowest grain yield (2.416 t ha-1
) was recorded from BARI Gom-28 (V1). This result was
similar with Sultana et al. (2012) who found that Prodip produced the highest grain yield

80
(5.33 t ha-1
) followed by Gourab (4.85 t ha-1
), while the lowest grain yield (3.98 t ha-1
)
was obtained from Shatabdi.
Figure 26. Effect of variety on the grain yield of wheat (LSD (0.05) =0.08)
V1=BARI Gom-28, V2=BARI Gom-29, V3=BARI Gom-30
4.7.1.2 Effect of weed control treatments
Significant variation was observed for grain yield due to different weed control
treatments (Fig. 27 and Appendix XI). The highest grain yield (3.124 t ha-1
) was recorded
from Panida 33EC (W2) which was statistically similar with two hand weeding (W1) and
the lowest yield (2.374 t ha-1
) was obtained from no weeding treatment (W0) which was
similar with Afinity 50.75WP (W4). Similar findings were reported by Zahoor et al.
(2012) that the application of Buctril super gave 0.45 kg ha-1
grain yield. Dissimilar
results were found by Azad et. al. (2010) stated that pre and post-emergence application
of isoproturon give higher grain yield rather than weedy check.
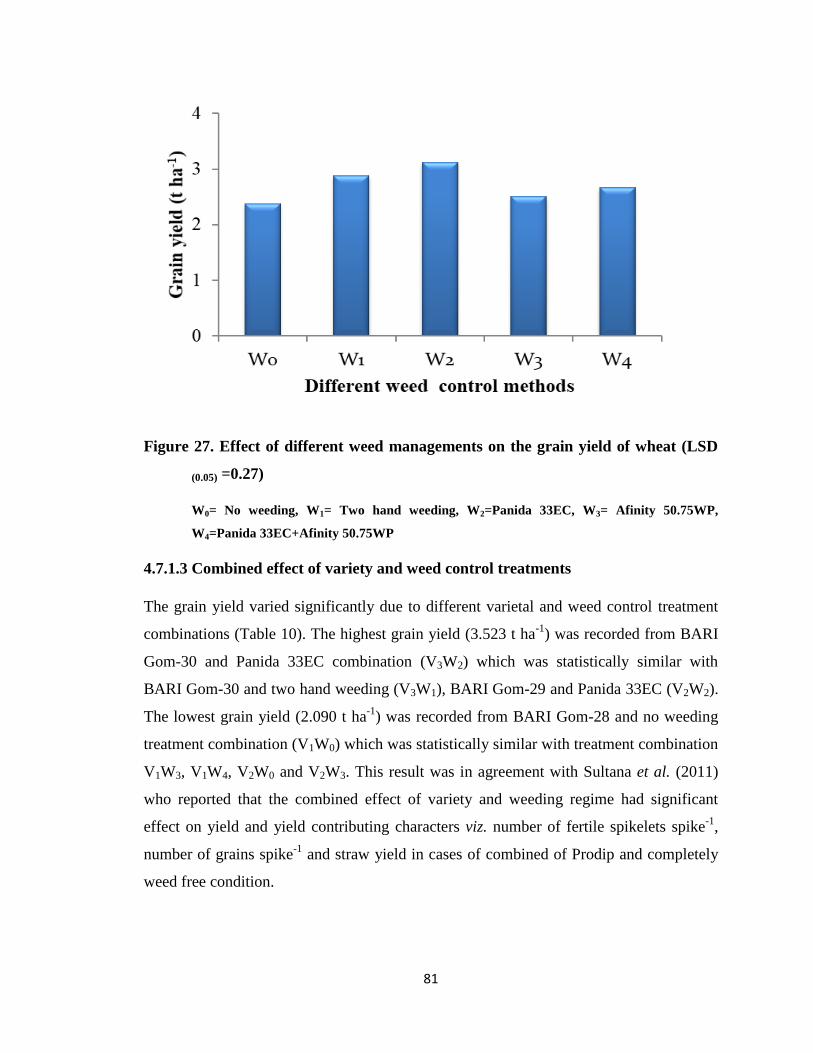
81
Figure 27. Effect of different weed managements on the grain yield of wheat (LSD
(0.05) =0.27)
W0= No weeding, W1= Two hand weeding, W2=Panida 33EC, W3= Afinity 50.75WP,
W4=Panida 33EC+Afinity 50.75WP
4.7.1.3 Combined effect of variety and weed control treatments
The grain yield varied significantly due to different varietal and weed control treatment
combinations (Table 10). The highest grain yield (3.523 t ha-1
) was recorded from BARI
Gom-30 and Panida 33EC combination (V3W2) which was statistically similar with
BARI Gom-30 and two hand weeding (V3W1), BARI Gom-29 and Panida 33EC (V2W2).
The lowest grain yield (2.090 t ha-1
) was recorded from BARI Gom-28 and no weeding
treatment combination (V1W0) which was statistically similar with treatment combination
V1W3, V1W4, V2W0 and V2W3. This result was in agreement with Sultana et al. (2011)
who reported that the combined effect of variety and weeding regime had significant
effect on yield and yield contributing characters viz. number of fertile spikelets spike-1
,
number of grains spike-1
and straw yield in cases of combined of Prodip and completely
weed free condition.
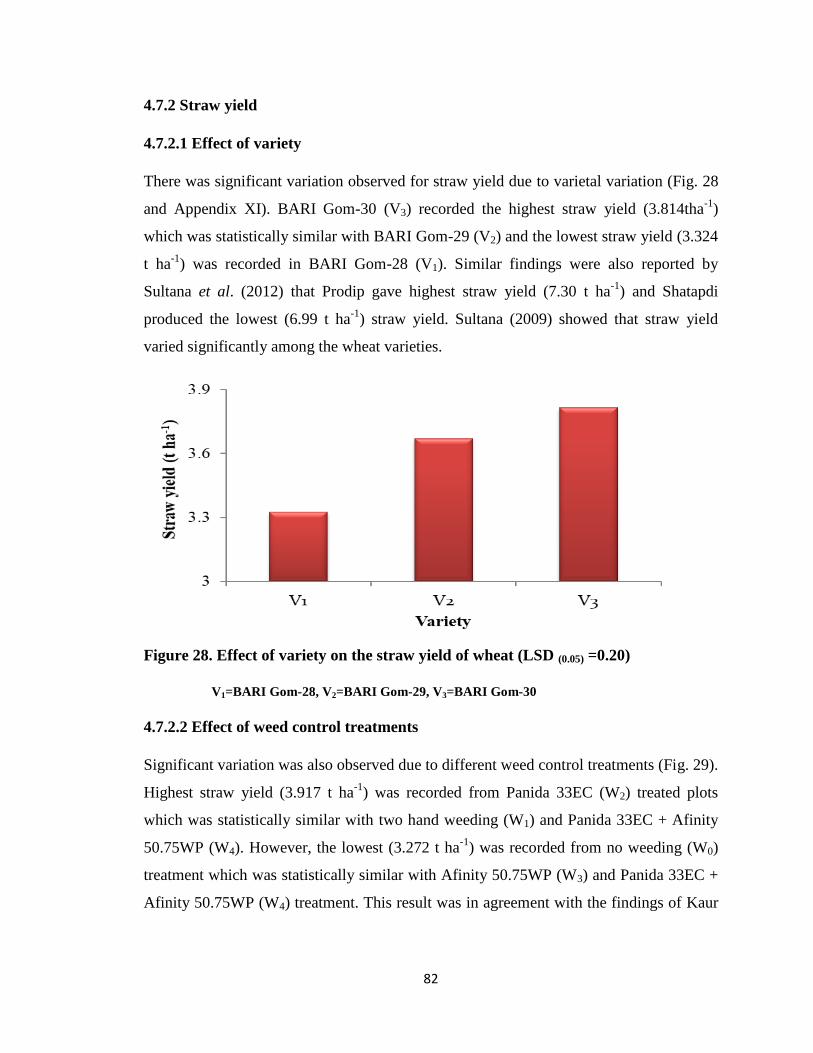
82
4.7.2 Straw yield
4.7.2.1 Effect of variety
There was significant variation observed for straw yield due to varietal variation (Fig. 28
and Appendix XI). BARI Gom-30 (V3) recorded the highest straw yield (3.814tha-1
)
which was statistically similar with BARI Gom-29 (V2) and the lowest straw yield (3.324
t ha-1
) was recorded in BARI Gom-28 (V1). Similar findings were also reported by
Sultana et al. (2012) that Prodip gave highest straw yield (7.30 t ha-1
) and Shatapdi
produced the lowest (6.99 t ha-1
) straw yield. Sultana (2009) showed that straw yield
varied significantly among the wheat varieties.
Figure 28. Effect of variety on the straw yield of wheat (LSD (0.05) =0.20)
V1=BARI Gom-28, V2=BARI Gom-29, V3=BARI Gom-30
4.7.2.2 Effect of weed control treatments
Significant variation was also observed due to different weed control treatments (Fig. 29).
Highest straw yield (3.917 t ha-1
) was recorded from Panida 33EC (W2) treated plots
which was statistically similar with two hand weeding (W1) and Panida 33EC + Afinity
50.75WP (W4). However, the lowest (3.272 t ha-1
) was recorded from no weeding (W0)
treatment which was statistically similar with Afinity 50.75WP (W3) and Panida 33EC +
Afinity 50.75WP (W4) treatment. This result was in agreement with the findings of Kaur

83
et al. (2018) Ritu Singh (2014), Salam et al. (2010), and Sujoy et al. (2006) who revealed
that weeding had significant variation on straw yield of wheat.
Figure 29. Effect of different weed managements on the straw yield of wheat (LSD
(0.05) =0.41)
W0= No weeding, W1= Two hand weeding, W2=Panida 33EC, W3= Afinity 50.75WP,
W4=Panida 33EC+Afinity 50.75WP
4.7.2.3 Combined effect of variety and weed control treatments
The straw yield varied significantly due to different varietal and weed control treatment
combinations (Table 10). The highest straw yield (4.093t ha-1
) was obtained from the
combination BARI Gom-30 and Panida 33EC (V3W2) which was at par with almost all
other combination except V1W0, V1W3 and V2W0. The lowest (3.27 t ha-1
) was found
from the combination BARI Gom-28 with no weeding (V1W0) which was at par with
V1W1, V1W3, V1W4, V2W0, V2W3 and V3W0. Similar results were also observed by
Sultana et al. (2012) in cases of prodip and two hand weeding.
4.7.3 Biological yield
4.7.3.1 Effect of variety
The biological yield affected significantly due to variety shown in Figure 30 and
Appendix XI. It was observed that BARI Gom-30 (V3) produced significantly
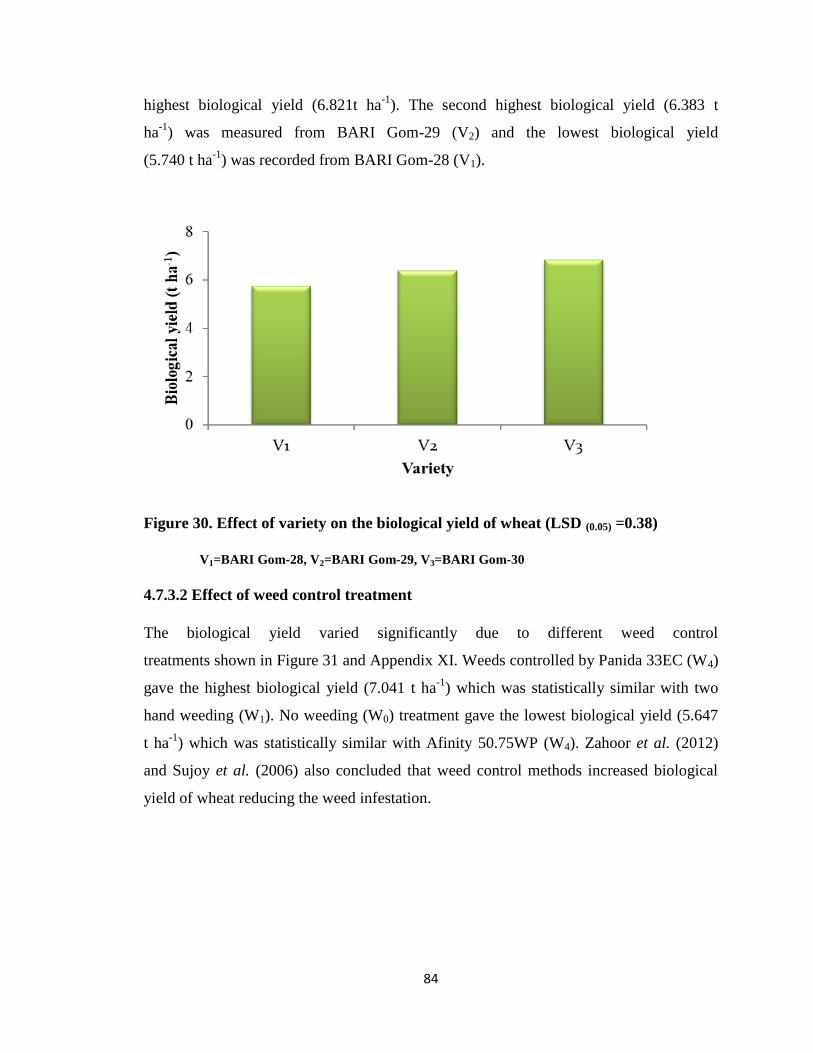
84
highest biological yield (6.821t ha-1
). The second highest biological yield (6.383 t
ha-1
) was measured from BARI Gom-29 (V2) and the lowest biological yield
(5.740 t ha-1
) was recorded from BARI Gom-28 (V1).
Figure 30. Effect of variety on the biological yield of wheat (LSD (0.05) =0.38)
V1=BARI Gom-28, V2=BARI Gom-29, V3=BARI Gom-30
4.7.3.2 Effect of weed control treatment
The biological yield varied significantly due to different weed control
treatments shown in Figure 31 and Appendix XI. Weeds controlled by Panida 33EC (W4)
gave the highest biological yield (7.041 t ha-1
) which was statistically similar with two
hand weeding (W1). No weeding (W0) treatment gave the lowest biological yield (5.647
t ha-1
) which was statistically similar with Afinity 50.75WP (W4). Zahoor et al. (2012)
and Sujoy et al. (2006) also concluded that weed control methods increased biological
yield of wheat reducing the weed infestation.
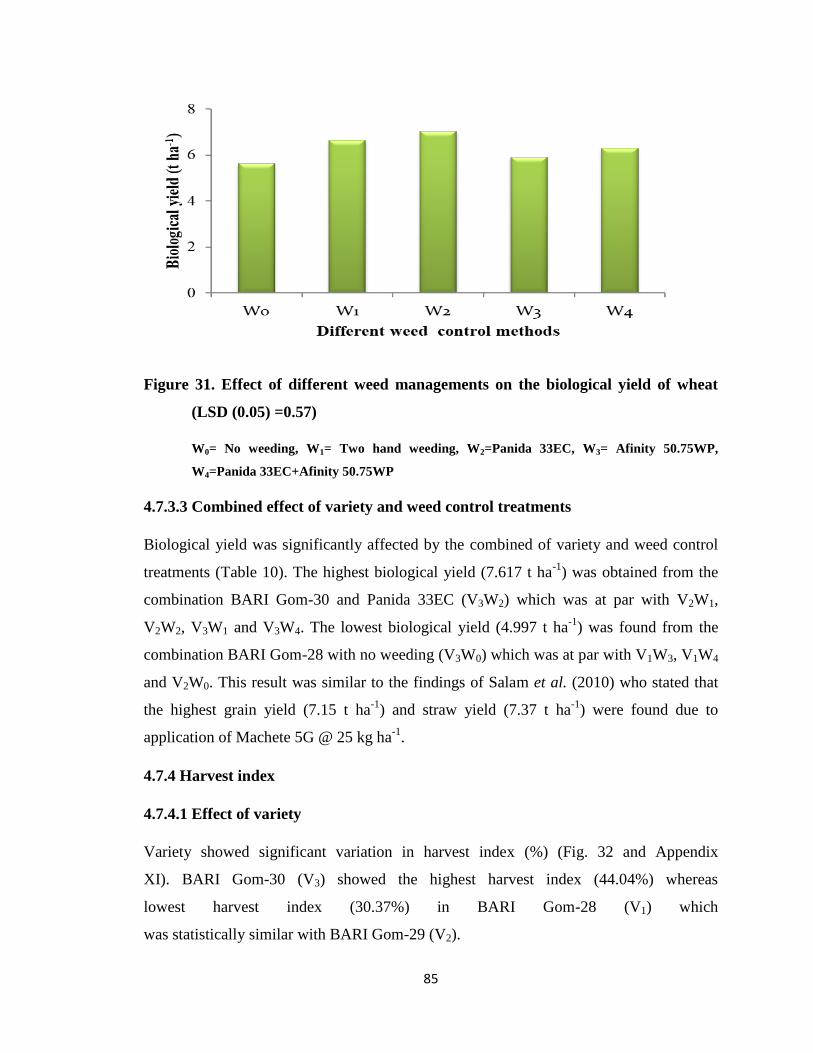
85
Figure 31. Effect of different weed managements on the biological yield of wheat
(LSD (0.05) =0.57)
W0= No weeding, W1= Two hand weeding, W2=Panida 33EC, W3= Afinity 50.75WP,
W4=Panida 33EC+Afinity 50.75WP
4.7.3.3 Combined effect of variety and weed control treatments
Biological yield was significantly affected by the combined of variety and weed control
treatments (Table 10). The highest biological yield (7.617 t ha-1
) was obtained from the
combination BARI Gom-30 and Panida 33EC (V3W2) which was at par with V2W1,
V2W2, V3W1 and V3W4. The lowest biological yield (4.997 t ha-1
) was found from the
combination BARI Gom-28 with no weeding (V3W0) which was at par with V1W3, V1W4
and V2W0. This result was similar to the findings of Salam et al. (2010) who stated that
the highest grain yield (7.15 t ha-1
) and straw yield (7.37 t ha-1
) were found due to
application of Machete 5G @ 25 kg ha-1
.
4.7.4 Harvest index
4.7.4.1 Effect of variety
Variety showed significant variation in harvest index (%) (Fig. 32 and Appendix
XI). BARI Gom-30 (V3) showed the highest harvest index (44.04%) whereas
lowest harvest index (30.37%) in BARI Gom-28 (V1) which
was statistically similar with BARI Gom-29 (V2).
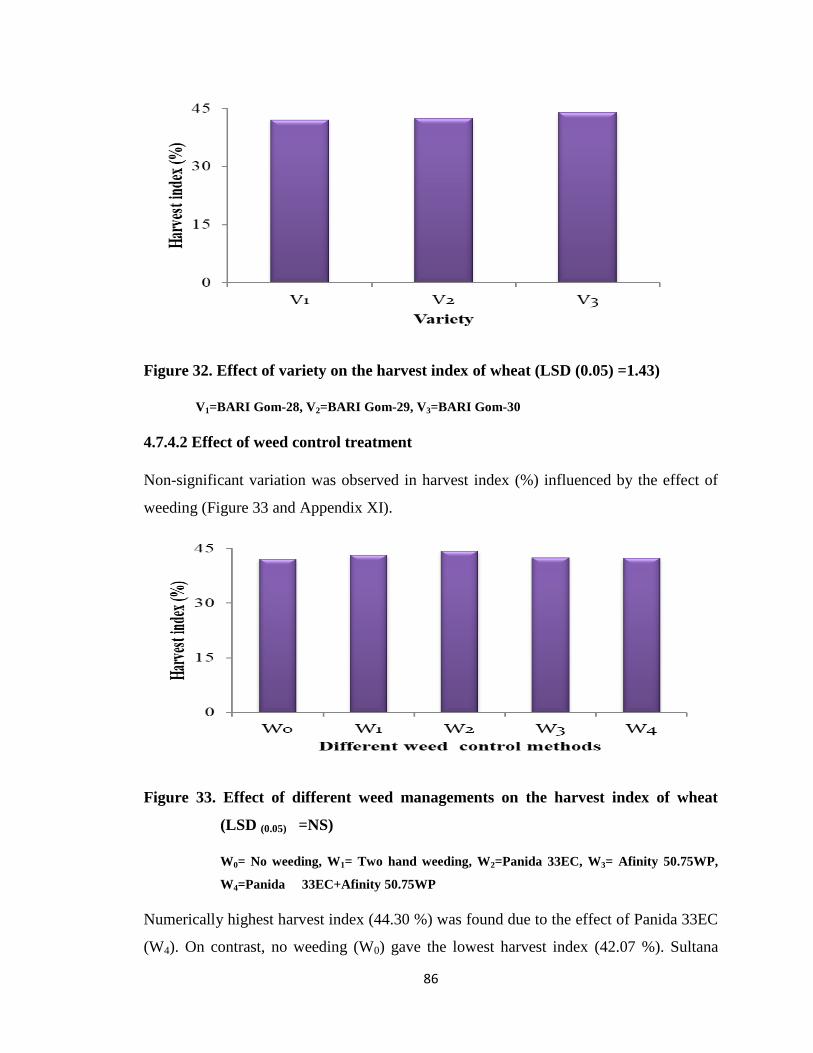
86
Figure 32. Effect of variety on the harvest index of wheat (LSD (0.05) =1.43)
V1=BARI Gom-28, V2=BARI Gom-29, V3=BARI Gom-30
4.7.4.2 Effect of weed control treatment
Non-significant variation was observed in harvest index (%) influenced by the effect of
weeding (Figure 33 and Appendix XI).
Figure 33. Effect of different weed managements on the harvest index of wheat
(LSD (0.05) =NS)
W0= No weeding, W1= Two hand weeding, W2=Panida 33EC, W3= Afinity 50.75WP,
W4=Panida 33EC+Afinity 50.75WP
Numerically highest harvest index (44.30 %) was found due to the effect of Panida 33EC
(W4). On contrast, no weeding (W0) gave the lowest harvest index (42.07 %). Sultana

87
(2009) and Sujoy et al. (2006) found significant variation in harvest index of wheat due
to weed control treatments.
4.7.4.3 Combined effect of variety and weed control treatment
Combined effect of variety and weeding treatment showed non-significant variation in
harvest index (%) (Table 10). Numerically highest harvest index (46.33%) was observed
from the combined effect of BARI Gom-30 with panida 33EC (V3W2). The second
highest harvest index (45.56%) was recorded from the combined effect of BARI Gom-30
with two hand weeding (V3W1) treatments. Hence, the lowest harvest index (41.51%)
was obtained from the combined of BARI Gom-30 with combine treating of panida 33EC
and Afinity 50.75WP (V1W4).
Table 10. Combined effect of variety and different weed managements on the yield
characters of wheat
Treatment
combinations
Grain yield (t
ha-1
)
Straw yield (t
ha-1
)
Biological
yield (t ha-1
)
Harvest index
(%)
V1W0 2.09 g 2.91 d 5.00 e 41.80
V1W1 2.57 d-f 3.51 a-d 6.08 cd 42.20
V1W2 2.69 d-f 3.64 a-c 6.33 b-d 42.51
V1W3 2.27 fg 3.08 cd 5.36 de 42.43
V1W4 2.46 d-g 3.47 a-d 5.93 c-e 41.51
V2W0 2.43 e-g 3.33 b-d 5.76 c-e 42.21
V2W1 2.79 c-e 3.87 ab 6.66 a-c 41.85
V2W2 3.16 a-c 4.01 ab 7.17 ab 44.05
V2W3 2.54 d-g 3.50 a-d 6.05 cd 42.26
V2W4 2.64 d-f 3.63 a-c 6.27 b-d 42.24
V3W0 2.60 d-f 3.58 a-d 6.18 cd 42.21
V3W1 3.29 ab 3.94 ab 7.23 ab 45.56
V3W2 3.52 a 4.09 a 7.62 a 46.33
V3W3 2.70 c-f 3.65 a-c 6.35 bc 42.70
V3W4 2.92 b-d 3.81 ab 6.73 a-c 43.41
LSD (0.05) 0.46 0.71 0.98 NS
CV (%) 10.18 11.60 9.23 11.50
W0= No weeding, W1= Two hand weeding, W2=Panida 33EC, W3= Afinity 50.75WP,
W4=Panida 33EC+Afinity 50.75WP
V1=BARI Gom-28, V2=BARI Gom-29, V3=BARI Gom-30
88
4.8 Economic performance of different weed control treatments
The cost of production and return of unit plot of Wheat varieties (cv. BARI Gom-28,
BARI Gom-29, and BARI Gom-30) converted into hectare and discussed below.
Economic performance of wheat varieties (cv. BARI Gom-28, BARI Gom-29, and BARI
Gom-30) was varied for different weed control treatments in the present experiment. The
cost of production was varied mainly for the weeding cost and grain yield. The weeding
cost was varied mainly for laborers and material required under different weed control
measures.
In case of no weeding measure, there was no involvement of cost for weed control. In the
treatment two hand weeding (W1), 15 laborers were required for weeding ha-1
. In case of
herbicidal treatments, panida 33EC (W2) only a laborer was used for herbicide spraying.
The weeding cost was Tk. 850.00 the treatment of panida 33EC (W2) Including herbicide
cost. The highest cost of production was (Tk. 58385.6 ha-1
) for the treatment W1 (two
hand weeding) and the lowest cost of production was (Tk. 53135.6 ha-1
) for the treatment
no weeding (W0) treatment (Appendix XII).
4.8.1 Gross return
Gross return was influenced by different weed control treatments (Table 11).
The highest gross return (Tk. 75761.52 ha-1
) was obtained from the treatment
Panida 33EC (W2) and the lowest gross return (Tk. 57906.62 ha-1
) was
obtained from no weeding treatment (W0). The second highest gross return (Tk.
70128.48 ha-1
) was obtained from two hand weeding (W1).
4.8.2 Net return
Net return varied in different weed control treatments (Table 11). The highest net return
(Tk. 21775.92 ha-1
) was obtained from the treatment Panida 33EC (W2). The second
highest net return (Tk. 16142.88ha-1
) was obtained from the treatment (W1). Lowest net
return (Tk. 4771.02 ha-1
) was achieved from the unweeded treatment (W0) (Appendix
XV).

89
Table 11. Cost of production, return and Benefit cost ratio (BCR) of wheat under
different treatments
Treat
ments
Cost of production (Tk./ha) Gross return (Tk/ha) Net
income
(tk./ha)
BCR
Fixed
cost of
production
Weedin
g
cost
Total
cost
From
grain
From
straw
Total
W0 53135.6
0 53135.6 53979.12 3924 57906.
62
4771.02 1.09
W1 53135.6
5250 58385.6 65594.88 4533.6 70128.
48
16142.88 1.20
W2 53135.6
850 53985.6 71061.12 4700.4 75761.
52
21775.92 1.41
W3 53135.6
750 53885.6 57167.76 4092 61259.
76
7374.16 1.14
W4 53135.6
1250 54385.6 60903.02 4357.2 65260.
22
10874.62 1.20
W0= No weeding, W1= Two hand weeding, W2=Panida 33EC, W3= Afinity 50.75WP, W4=Panida
33EC+Afinity 50.75WP
4.8.3 Benefit Cost ratio
Benefit cost ratio varied in different weed control treatments (Fig. 34). It was evident that
the herbicidal plots gave the higher BCR than the other treatments. Among all the
treatments, Panida 33EC (W2) gave the highest BCR (1.41). The second highest BCR
(1.20) was given by the treatment two hand weeding(W1). The unweeded treatment (W0)
showed the lowest BCR (1.09). This might be because of less production due to higher
weeds competition. Two hand weeding treatment (W2) also performed well with BCR
(1.20) but labor involvement was a crucial issue. It can be concluded from economic
point of view that herbicidal control might serve as most beneficial means of weed
control with synergistic and compatible with the crops and relevant weed species. Zahoor
et al. (2012), Hossain (2008), Dhiman and Rohitashav (2006) also found highest benefit
cost ratio using chemical herbicides. This result supported the findings of Bharat et al.
(2012) who concluded that the highest B:C ratio was observed with isoproturon + 2,4-D.

90
Figure 34. Effect of weed control methods on benefit cost ratio (%) of Wheat.
W0= No weeding, W1= Two hand weeding, W2=Panida 33EC, W3= Afinity 50.75WP,
W4=Panida 33EC+Afinity 50.75WP
0
0.2
0.4
0.6
0.8
1
1.2
1.4
1.6
W0 W1 W2 W3 W4
Ben
efit
co
st r
atio
Different weed control methods

91

92
Chapter V
SUMMARY AND CONCLUSION
The present piece of work was done at the Agronomy field, Sher-e-Bangla Agricultural
University, Dhaka-1207, during the period from November to April, 2017-2018 to find
out the influence of different weed control methods on the growth and yield of wheat
varieties cv. BARI Gom-28, BARI Gom-29 and BARI Gom-30.
The experiment was laid out in a split plot design with three replications. The size of the
individual plot was 3.50 m x 2.50 m and total numbers of plots were 45. There were 15
treatment combinations. Varieties (3) were placed along the main plot and treatments (5)
were placed along the sub plot. The weeding treatments were no weeding (W0), two hand
weeding at 20 DAS and 40 DAS (W1), Panida 33EC (Pendimethalin) was applied @
2000 g ha-1
at 5 DAS for 3-5 days as pre-emergence herbicide. Afinity 50.75 WP
(Isoprotouron)was applied @ 1500 g ha-1
at 25 DAS when weeds were 2-3 leaf stage as
post-emergence herbicide, and Panida 33EC (Pendimethalin) + Afinity 50.75WP
(Isoprotouron): It was applied @ 2000 g ha-1
at 5 DAS for 3-5 days as pre-emergence
herbicide and Afinity 50.75WP (Isoprotouron) was applied @ 1500 g ha-1
at 25 DAS
when weeds were 2-3 leaf stage as post-emergence herbicide.
Seeds were collected from the Wheat Research Centre, Bangladesh Agricultural
university Research Institute (BARI), Joydebpur, Gazipur. Germination test of collected
seed was done in the laboratory before sowing and germination was found to be 95%.
The land of the experimental field was first opened on November 5, 2017 with a power
tiller. Then it was exposed to the sunshine for 7 days prior to the next ploughing and
cross-ploughed was done to obtain good tilth, which was necessary to get better yield of
the crop. Laddering was done in order to break the soil clods into small pieces followed
by each ploughing. All the weeds and stubbles were removed from the experimental
field. The soil was treated with insecticides at the time of final ploughing. Insecticides
Furadan 5G was used @ 8 kg ha-1
to protect young plants from the attack of insects. Lay
93
out of the experiment was done on November 13, 2017 with inter plot spacing of 0.50 m
and inter block spacing of 1 m. Sowing was done on the next day
The data on weed parameters were collected from 20 DAS to 80 DAS. Weed parameters
such as total weed population (no. m-2
); weed biomass (g m-2
) and weed control
efficiency (%) were examined. The data on growth parameters viz. plant height, above
ground dry matter weight m-2
, crop growth rate and relative growth rate were recorded
during the period from 20 to 60 DAS. At harvest, characters like plant height, no of
spikelet spike-1
, total grains spike-1
, length of spike, 1000 grain weight, grain yield, straw
yield, biological yield and harvest index were recorded. To determine the economic
feasibility of different weed control methods on wheat, total cost of production, gross
return and net return were calculated to determine the benefit cost ratio (BCR).
Nine weed species infested the experimental plots belonging to eleven families. The most
important weeds of the experimental plots were Cynodond actylon, Cyperus rotundus,
Echinochloa colonum, Eleusine indica, Chenopodium album, Alternanthera
philoxeroides, Brassica kaber, Ieliotropium indicum, Vicia sativa etc.
Weed density, relative weed density, weed biomass and weed control efficiency were
significantly influenced by the weed control treatments. The highest weed density and
weed biomass were observed in the no weeding treatment throughout the growing period.
The lowest weed biomass were found in the from Panida 33EC +Afinity 50.75WP (W4)
treatment was at par with two hand weeding.
Highest Weed control efficiency (45.46 % and 70.36% at 20 and 40 DAS respectively)
was highest by Panida 33EC + Afinity 50.75 WP (W4) treatment whereas, the lowest
weed control efficiency (0.00%) was observed under no weeding treatment (W0). In this
experiment, Sedge and grass weeds dominated the crop field throughout the growing
period. The highest number of weed population was found in no weeding treatment
throughout the growing period and Panida 33EC + Afinity50.75WP (W4) was performed
lowering the weed number.
Different weed control treatments had significant effect on crop growth parameters viz.
plant height, plant dry weight, crop growth rate (CGR) and relative growth rate (RGR) at

94
different DAS. The highest plant height was observed in BARI Gom-30 with Panida
33EC (V3W2) 24.88, 55.92, 80.27, 86.13 and 90.07cm at 20, 40, 60 DAS and at harvest
respectively. The combination of BARI Gom-30 and Panida 33EC (V3W2) reveled the
highest leaf area index (2.15 and 2.64) in case of 40 and 60 DAS respectively.
Above ground dry weight m-2
(g) was highest in BARI Gom-30 with Panida 33EC
(V3W2) 0.55 5.93, 10.43 and 13.47 g per plant at 20, 40, 60 and 80 DAS respectively.
Crop growth rate (CGR) and relative growth rate (RGR) was highest in BARI Gom-30
and combined of V3W2 and V3W2 in most cases.
Weed control treatments had significant effect on the yield and yield contributing
characters viz. spike length (15.77 cm), spikelets spike-1
(14.68), no of grain spike-1
grain
yield (43.02), straw yield (3.917 t ha-1
), 1000 grain weight (51.51 g), harvest index (44.30
%) and biological yield (7.041 t ha-1
) was highest in BARI Gom-30 and Panida 33EC
(V3W2) treatment.
From the economic point of view, it was observed that the benefit cost ratio was the
highest (1.41) from Panida 33EC (W2) treatment which was followed by two hand
weeding (W1), Panida 33EC + Afinity 50.75WP (W4), Afinity 50.75WP (W3) and no
weeding (W0) (1.20, 1.15, 1.13 and 1.07, respectively).
Based on the results of the present experiment, the following conclusion can be drawn:
1) BARI Gom-30 was proved superior over other varieties in respect of growth and
yield.
2) Panida 33 EC as pre-emergence herbicide was found to be the effective means of
controlling weeds from economic point of view.
3) BARI Gom-30 treated with Panida 33EC at pre-emergence showed the best
performance in form term of grain yield, straw yield and harvest index.

95

96
REFERENCES
Acker, I. (2010). Grain yield and quality of wheat depending on the level of
nitrogen fertilization form applied. Bangladesh Agron. J. 8(2): 129-133.
Amin, A., Khan, M. A., Hassan, G., Marwat, K. B., Rashid, H. and Nawab, K. (2008).
Weed control efficacy and economics of pre-emergence herbicides in maize (Zea
mays). The Australian J. Plant Sci. Biotech.,2(2): 72-75.
Anderson, R. L. (1985). Environmental effect on metsulfuron and chlorsulfuron
bioactivity in soil. J. Environ. quality, 14(4): 517-521.
Angiras, N. N. and Sharma, V. (1996). Influence of row orientation, row spacing and
weed control methods on physiological performance on irrigated wheat. Indian J.
Agron., 41(1): 41-47.
Anonymous (1994). Project coordinators report. AICRP on weed control, Jabalpur. p-27.
Anonymous (1998). AGRESCO report of Department of Agronomy, Gujarat Agricultural
University, Junagadh.
Anonymous (2004). “Disrtictwise area, production and yield per hectare of important
food and non-food crops in Gujarat state.” Directorate of Agriculture, Gujarat
State, Gandhinagar.
Ashrafi, Z. Y., Sadeghi, S., Mashhadi, H. R. (2009). Study of integrate methods chemical
and cultural control of weeds to wheat (Triticum aestivum L.) CAB Abstracts J.
Agric. Sci., (Tornto), 1(2): 113-119.
Azad, B. S. (1997). Influence of nitrogen and isoproturon on nutrient uptake by weed and
wheat. Indian J. Agron., 42(3) :471-473.
Azad, B. S. and Singh, H. (1997). Effect of weed control measures and nitrogen on
productivity of wheat. Indian J. Agron., 42(1): 98-103.
Azad, B. S. Singh, H. and Gupta, S. C. (1997). Effect of plant density, dose of herbicide
and time of nitrogen application on weed suppression and its efficiency in wheat
(Triticum aestivum L.). Env. Ecol., 15(3): 665-668.

97
Balyan, R. S. and Malik, R. K. (2000). New herbicides for Jangli palak (Rumex
retroflexus L.). Indian J. Weed Sci., 32(1 & 2): 86-88.
Balyan, R. S., Yadav, A., Pahwa, S. K. and Malik, R. K. (1999). Reponse of fenoxaprop
and other herbicides on isoproturon resistant and susceptible biotypes of little
seed canary grass and other weeds in wheat. Indian J. Weed Sci., 31(1 & 2): 38-
43.
Banga, R. S., Yadav, Ashok and Malik, R. K. (2003). Bio-efficacy of flufenacet and
sulfosulfuron alone and in combination against weed flora in wheat. Indian J.
Weed Sci., 35(3 & 4): 179-182.
BBS (Bangladesh Bureau of Statistics). (2018). Yearbook of Agricultural Statistics-2017.
Statistics and Informatics Division (SID), Ministry of Planning. Govt, of the
people’s Republic of Bangladesh, Dhaka,78-79.
Begum, M., Iqbal, M. Z., Karim, R. S. M., and Mamun A. A. (2003). Weed flora of
wheat, mustard and lentil grown in old Brahmaputra flood plain soils of
Bangladesh. Bangladesh J. Agric. Sci. 30:129-134.
Bhan, M. and Kewat, M. L. (2002). Persistence of pendimethalin in medium black soil
following pre-emergence application to soybean. Indian J. Weed Sci., 34(1 & 2):
137-138.
Bhan, V. M. (1998). Status of research on weed science and its impact. Presented at
seventeenth meeting of the Governing Body of the ICAR, New Delhi, on June
1998.
Bhan, V. M. and Dixit, A. (1998). Influence of isoproturon application for controlling
Phalaris minor in wheat. World-Weeds, 5(1-2): 53-56.
Bhardwaj, A. K., Singh, R. K., Singh, S. P., Singh, Y., Singh, G. Misra, R. D., Singh, M.
and Kumar, A. (2004). Weed management in zero till sown wheat. Indian J. of
Weed Sci., 36(3 & 4): 175-177.

98
Bhikhubhai R. V. (2006). Efficacy of herbicides in wheat (Triticum aestivum) and
assessment of their persistence through bioassay technique, MS thesis, Junagadh
Agric.Univ. Junagadh,India.
Biswas, P. K. (1987). A study on the relative merits of mixed cropping under two
levels of irrigations. MS Thesis, Dept. Agron. Bangladesh Agric.
Univ. Mymensingh. pp. 38-40.
Buczek J, Szpunar-Krok, E, and Bobrecka-Jamro, D. (2011). Yield and weed infestation
of winter wheat in dependence on sowing density and agricultural practice level.
Acta Scientiarum Polonorum. Agricultura .10 p.
Chahal, P. S., Brar, H. S. and Walia, U. S. (2003). Management of Phalaris minor in
wheat through integrated approach. Indian J. Weed Sci., 35(1/2): 1-5.
Chhokar, R. S., Singh, Samar and Sharma, R. K. (2008). Herbicides for control
isoproturon-resistant little seed canary grass (Phalaris minor) in wheat. Crop
Protec, 27(3 & 5): 719-726.
Chopra, N., Singh, H. and Tripathi, H. P. (1999). Critical period of weed crop
competition in wheat. Indian J. Weed Sci., 31(3 & 4): 151-154.
Chopra, N., Singh, H., Tripathi, H. P. and Chopra, N. K. (2001). Performance of
metsulfuron methyl and pendimethalin alone and their mixtures with isoproturon
on weed control in wheat. Indian J. Agron., 46(2): 239-245.
Cook, R. J. and Veseth, R. J. (1991). Wheat Health Management. The American
Phytopathologic Soc., St. Paul, MN.
Deshmukh, S. V., Kale, H. B. and Atale, S. B. (1995). Effect of 2,4-D, Isoproturon and
isoguard plus on weed control in irrigated late sown wheat. Indian J. Agron.
40(2): 296-297.
Dhawan, R.S., Punia, S.S., Singh, S., Yadav, D. and Malik, R.K. (2009). Productivity of
wheat (Triticum aestivum) as affected by continuous use of new herbicides for
management of little seed canary grass (Phalaris minor). Indian J. Agron. 54(1):
58-62.
99
Dhiman, S. and Rohitashav, S. (2006). Studies on the economics of alternative
wheat establishment methods and weed management practices. Ann.
Agric. Res. 27(11): 89-92.
Dixit, A. and Bhan, V. M. (1997). Weed control efficacy of isoproturon applied at
different concentration and its combination with 2,4-D in wheat. Indian J. Weed
Sci., 29(1 & 2) : 11-14.
Dodamani, B. M. and Das, T. K. (2013). Density and nitrogen effects on
interference and economic threshold of common lambsquarters in
wheat. J. Pest Sci. 86(3): 611-619.
Dwivedi, R. K., Bajpai, R. P., Chaudhary, S. K. and Mishra, R. K. (1996). Integrated
weed control in wheat in northern hill region of Chhattisgarh. Indian J. Weed Sci.,
28(3 & 4): 189-190.
FAO (Food and Agricultural Organization). (2013). Statistical Year Book. MO. UN,
Italy, Rome. pp. 1-289.
FAO (Food and Agricultural Organization). (2016). Statistical Yearbook. Food and
Agriculture Organization, Rome, Italy.
Gill, G. S. and Kumar, V. (1969). Weed index – a new method for reporting weed control
trials. Indian J. Agron. 16(2): 96-98.
Gogoi, A. K. and Kalita, H. (1995). Effect of seeding methods and herbicides on weeds
and growth and yield of wheat. Indian J. Agron. 40(2): 209-211.
Gomez, A. and Gomez, A. (1984). “Statistical procedure for agricultural research” 2nd
Edition, John Willey and Sons, New York.
Gopinath, K. A., Kumar, Narendra, Pande, Harit and Bisht, J. K. (2007). Bio-efficacy of
herbicides in wheat under zero and conventional tillage system. Indian J. Weed.
Sci., 39(3 & 4): 201-204.

100
Hari, 0., Nandal, D. P. and Dhiman, S. D. (2006). Weed control in wheat
(Triticum aestivum) sown by zero-tillage. Indian. J. Agron., 51(3): 199-
201.
Hirano, M. S. and Narag, R. S. (1993). Yield analysis in robi saeson (Barssica napas sub
sp. olefera var. annua) to irrigation. Indian J. Agron. 38(2): 257-265.
Hoffer, U., Muehlebach, M., Hole, S. and Zoschke, A. (2006). Pinoxaden for broad
spectrum grass weed management in cereal crops. J. Plant Disease Protec. 20(5):
989-995.
Hossain, A., Chowdhury, M. A. S., Jahan, T., Sarker, M. A. I. and Akhter, M.
M. (2010). Competitive ability of wheat cultivars against weeds.
Bangladesh J. Weed Sci. 1(1): 63-70.
Hossain, M. A. (2008). Performance of herbicide on weed suppression towards
growth and yield of wheat. MS Thesis, SAU, Dhaka, Bangladesh.
http://www.cimmyt.org/global-wheat-research.
https://www.statista.com/statistics/263977/world-grain-production-by-type/.
Iffat, S. (2010). Influence of irrigation efficiency, weed control and anti
transpirants on the growth, yield and water use efficiency of wheat. PKV
Res. J. 24(1): 54-55.
Ito, D., Miller, Z., Menalled, F, Moffet, M, and Burrows, M. (2012). Relative
susceptibility among alternative host species prevalent in the great plains to wheat
streak mosaic virus. Plant Disease, 96: 1185-1192.
Jackson, M. L. (1967). “Soil chemical Analysis” Prentice Hall of India Pvt. Ltd., New
Delhi, pp.327-350.
Jain, M. P., Lidder, R. S. and Jain, K. K. (1998). Weed management in wheat. World-
weeds, 5(1-2): 125-130.

101
Jain, Namrata, Mishra, J. S., Kewat, M. L. and Jain, Vinamarta (2007). Effect of tillage
and herbicides on grain yield and nutrient uptake by wheat and weed. Indian J.
Agron., 52(3): 131-134.984-987.
Jarwar, A. D. and Arain, M. A. (2005). Chemical weed control in wheat.
Pakistan. J. Weed Sci. Res. 11(1-12): 11-15.
Jat, A. S., Dadheech, R. C. Ram, B. and Jat, M. L. (2004). Effect of herbicides,
phosphorus and phosphate solubilizers on growth, yield and weed control
efficiency of wheat in Central Plateau and Hills zone of India. Indian J. Agron.
49(1): 53-56.
Jat, R. S., Nepalia, V. and Jat, R. L. (2003). Effect of weed control and sowing methods
on production potential of wheat. Indian J. Agron, 48(3): 192-195.
Johnson, C. M. and Ulrich, A. (1969). “Analytical method for use in plant analysis”
California Agriculture Expert Stn., Bulletin. P. 766.
Joshi, N. C. (2002). “Manual of weed control”. Research publication 7615-B, East Azad
nagar, Delhi-110051.
Kamrozzaman, M. M., Khan, M. A. H., Ahmed, S., and Quddus, A. F. M. R. (2015).
Effect of herbicide in controlling broadleaf and sedge weeds in wheat (Triticum
aestivum L.). Sci. J. Krishi Foundation, The Agriculturists. 13(2): 54-61 (2015).
Karim S. M. R. (1987). Estimate of crop losses due to weeds in Bangladesh. Abs. 2nd
Ann. conf.
Bangladesh Soc. Agron. BARI. Joydebpur. pp. 13-20.
Karim S. M. R., Mamun A. A. (1988). Crop weed competition: Analysis of some perspectives.
Bangladesh J. Agril. Sci. 15(1): 65-73.
Kaur, E., Sharma, R., and Singh, N.D. (2018) Efficacy of Pre-Emergence and Post-
Emergence Herbicides on Weed Control and Yield in Wheat. Int. J. Curr.
Microbiol. App. Sci. 7(2): 883-887.
Kaur, L., Walia, U. S. and Brar, L.S. (1996). Chemical control of mixed population of
wild oat and broad leaf weeds in wheat. Indian J. Weed Sci., 28 (1 & 2): 40-43.

102
Khan, M. A. H., Jensen, H. E. and Jensen, S. E. (1981). Barley crop
development, yield and light energy utilization under field condition.
Cereal Res. Comm. 9(2):191-195.
Khan, M. A., Hassan, G., Shah, W. A. and Afridi, M. Z. (2002). Duration effect of weed
competition on the yield and yield component of wheat. Sarhad J. Agric., 18(3):
335-337.
Kirby, E. J. M. (2002), Botany of the wheat plant. In: BC Curtis, S Rajaram, H Gomez,
Macpherson, eds. Breed wheat Improvement and production, Food and
Agriculture organization, Rome.
Knott, D. R. (1987). The Application of Breed Procedures to Wheat. In: Heyne, E.G.
(ed). Wheat and Wheat Improvement. American Society of Agronomy. Madison,
WI. pp. 419-427.
Krishi projukti hatboi (Handbook on agro-technology), (2017). Bangladesh Agricultural
Research Institute (BARI), Gazipur -1701, Bangladesh.
Krishnamurty, K., Rajashekara, B. G., Raghunath, G., Jagannath, M. K. and Prasad, T. V.
R. (1975). Herbicidal efficiency index in sorghum. Indian J. Weed Sci., 7(2): 75-
79.
Kulshrestha, G. and Yaduraju, N. T. (1987). Persistance of pendimethalin in soil
following pre-emergence application to wheat. Indian J. Agron., 32(3): 271-274.
Kumar, D., Angiras, N. N., Singh, Y. and Rana, S. S. (2005). Influence of integrated
weed management practices on weed competition for nutrients in wheat. Indian J.
Agric. Res. 39(2):110-115.
Kumar, S. and Singh, G. (1996). Effect of mixture of isoproturon and tralkoxydim on the
control of wild oat in wheat. Indian J. Weed Sci., 28(1 & 2): 1-3.
Kumar, Sunil, Malik, R.K. and Singh, R.C. (2003). Effect of sulfosulfuron on Density
and Dry weight of weed under varied irrigations in wheat. Indian J. Weed Sci.,
35(1 & 2): 10-14.

103
Kurchania, S. P., Bhalla, C. S. and Paradkar, N. R. (2000). Bio-efficacy of metsulfuron
methyl and 2,4-D combinations for broad leaf weed control in wheat. Indian J.
Weed Sci., 32(1 & 2): 67-69.
Lersten, N.R. (1987). Morphology and Anatomy of the Wheat Plant. In: Heyne, E.G.
(ed). Wheat and Wheat Improvement. American Soc. Agron. Madison, WI. pp.
33-75.
Malik, R. S., Yadav, S. K., and Malik, R. K. (1995). Nutients uptake by
wheat and associated weeds as influenced by herbicides. Indian
J. Weed Sci., 27(1 & 2): 63-66.
Malik, R. S., Yadav, S. K., Malik, R. K. and Panwar, R. S. (1995). Effect of herbicides
and fertilizer levels on weed control and nutrient uptake by wheat and associated
weeds. Indian J. Weed Sci., 27(3 & 4): 164-166.
Mamun, M. A. A., Shultana, R., Islam, S. A., Badshah, M. A., Bhuiyan, M. K. A., and
Mridha, A. J. (2011). Bio-efficacy of bensulfuron methyl + pretilachlor 6.6% GR
against weed suppression in transplanted rice. Bangladesh J. Weed Sci. 1: 8-11.
Mandal, M. S. H. Ali, M. H., Amin, A. K. M. R., Masum, S. M., Mehraj, H., (2014).
Assessment of different weed control methods on growth and yield of wheat. Int.
J. Agron. Agric. Res. 5(5):65-73.
Mani, V. S., Pandita, M. L., Gautam, K. C. and Bhagwandas (1973). Weed killing
chemical in potato cultivation. PANS, 23(8): 17-18.
Mustari, S., Bari, M. N., Islam, M. R., Karim, A.J.M S. (2014) evaluation of selected
herbicides on weed control efficiency and yield of
wheat. J. Sci. Foundation, 12(2): 27-33.
Naik, K. R., Gogulwar, N. M. and Tiwari, J. P. (1997). Effect of weed control under
different moisture regime and nitrogen on wheat. Indian J. Agron. 42(2): 300-305.
Nariyal, M. C., Rohitashav, Singh, Tripathi, S. S. L. and Mishra, O. P. (2007). Effect of
pinoxaden 5 EC on weeds in wheat crop. Biennial conference on Weed
Management in Modern Agriculture: Emerging Challenges and Opportunities,
104
February 27-28, 2008. I.S.W.S., N.R.C.W.S., and R.A.U., Pusa (Bihar),
Abstracts: 117.
Nayak, S., Rawat, A. K. and Sharma, R. S. (2003). Effect of metsulfuron methyl and 2,4-
D alone and in combination for control of broad leaf weeds in irrigated wheat.
Jawaharlal Nehru Krishi Vishwa Vidyalaya Res. J. 37(1): 104-106.
Olsen, S.R., Cole, V.C., Watanable, F.S. and Dean, L.A. (1954). “Estimation of available
phosphorus in soil by extraction with sodium bicarbonate”. USDA, Circular
No.939, US Govt. Printing Office, Washington DC.
Pahwa, S. K. and Bajaj, K. (1997). Persistence of trifluralin and pendimethalin in soils
incubated at different temperatures. Indian J. Weed Sci., 29(3 & 4): 178-182.
Pandey, A. K. and Prakash, V. (2003). Studies on weed crop competition in rainfed wheat
under mid-hill conditions of north-west Himalayas. Indian J. Weed Sci., 35(1 &
2): 107-108.
Pandey, A. K., Prashad, K., Singh, P. and Singh, R. D. (1998). Comparative yield loss
assessment and crop weed association in major winter crops of mid-hills of
Himalayas. Indian J. Weed Sci., 30(1 & 2): 54-57.
Pandey, I. B. and Kumar, K. (2005). Response of wheat to seeding methods and weed
management. Indian J. Agron. 50(1): 48-51.
Pandey, I. B., Mishra, S. S. and Singh, S. J. (1997). Effect of seed furrow mulching,
nitrogen rate and weed management practices on growth and yield of late sown
wheat. Indian J. Agron.,42(3) :463-467.
Pandey, I. B., Mishra, S. S., Singh, H. and Prasad, N. (2000). Nutrient uptake by wheat
and associated weeds as influenced by fertilizer levels and weed management.
Indian J. Weed Sci., 32(1 & 2): 31-32.
Pandey, I. B., Sharma, S. L., Tiwari, S. and Bharti, V. (2001). Effect of tillage and weed
management on grain yield and nutrients removal by wheat and weeds. Indian J.
Weed Sci, 33(3 & 4) :1070-111.

105
Pandey, I. B., Sharma, S. L., Tiwari, S. and Mishra, S. S. (2005). Economics of tillage
and weed-management system for wheat after lowland rice. Indian J. Agron.,
50(1): 44-47.
Pandey, I. B., Thakur, S. S., Singh, S. J. and Mishra, S. S. (2000). Effect of fertilizer and
weed management on nutrient economy and yield of wheat. Indian J. Agron.
45(3): 596-601.
Pandey, J. and Verma, A. K. (2004). Effect of isoproturon tank mixed with metsulfuron
and 2,4-D on weeds and yield of wheat. Indian J. Agron., 49(2): 114-116.
Pandey. I. B., Mishra, S. S., Singh, S. J and Thakur, S. S. (1997). Dynamics of weed
growth, N-depletition and yield synthesis in wheat as influenced by nitrogen rates,
seed furrow mulching and weed management under late sown conditions in north
Bihar. Indian J. Weed Sci., 29(3 & 4): 120-124.
Panwar, R. S., Rathi, S. S., Malik, R. S. and Malik, R. K. (1995). Effect of broad leaf
herbicides alone and in combination with chlortoluron on weed control in wheat.
Indian J. Weed Sci., 27 (3 & 4): 148-151.
Patel, H. C. and Upadhyay, P. N. (1991). Integrated weed management in irrigated wheat.
Indian J. Weed Sci., 22(1 & 2): 89-91.
Phuhong, L. T., Denich, M., Vlek, P. L. G. and Balasubramanian, V. (2005). Suppressing
weeds in direct seeded lowland rice: effects of methods and rates of seeding. J.
Agron. Crop Sci. 191:185-194.
Poonia, B. L., Jain, N. K. and Singh, S. K. (2001). Weed management in wheat with
special reference to Asphodelus tenuifolius. Indian J. Agron., 33(3 & 4): 100-103.
Prasad, S., Singh, Y., Singh, R. P. and Singh, G. (2005). Effect of crop establishment,
weed control methods and time of nitrogen application on late sown wheat. Indian
J. Agron., 37(1 & 2) :93-95.
Qureshi, R. and Bhatti, G. R. (2001). Determination of weed communities in wheat field
of district Sukhur. Pakistan J. Bot., 33: 109-115.

106
Rao, V. S. (2000). Principles of Weed Science (2nd ed.). Oxford and IBH Publishing Co.
Pvt. Ltd. New Delhi, India.
Rao, V. S. (2001). “Principles of weed science”. Oxford and IBH publishing co., New
Delhi, pp 2-3.
Richards, L. A. (1954) “Diagnosis and improvement of Saline -Alkali soils”. USDA
Hand Book No. 60, Washington DC, USA.
Roder, W. (2001). Slash-and-burn rice systems in the hills of northern Lao
PDR. In: Description, challenges and Opportunities, IRRI, Los Banos,
Philippines, p. 201.
Salam, M. A., Islam, M. M., Islam, M. S. and Rahman, M. H. (2010). Effects
of herbicides on weed control and yield performance of Binadhan-5
grown in boro season. Bangladesh J. Weed Sci. 1(1): 15-22.
Saraswat, V. N. and Mishra, J. S. (1998). Status of weed management research in wheat.
Pestology, 23(5): 5-11.
Sardana, V., Walia, U. S. and Mahajan, G. (2001). Management of broad leaf weeds in
wheat. Indian J. Weed Sci., 33(1 & 2): 69-71.
Shaban, S.A., Soliman, S. Yehia, Z.R., El-Attar, M.H. (2009). Weed competition effect
on some Triticum aestivum quality and quantity. CAB Abstracts, Egyptian J.
Agron., 31(2): 135-147.
Shah, N. H. and Habibullah, N. (2005). Effect of different methods of weed
control on the yield and yield components of wheat. Pakistan I Weed
Sci. Res. 11(3 & 4): 97-101.
Shakya N. (2016). Effect of weed management practices on growth and yield of wheat
(Triticum aestivum). MS thesis, Rajmata Vijayaraje Scindia Krishi Vishwa
Vidyalaya, Gwalior, India.

107
Shakya, N. (2016). Effect of weed management practices on growth and yield
of wheat [Triticum aestivum (l.)]. MS thesis, Rajmata Vijayaraje Scindia Krishi
Vishwa Vidyalaya, Gowalior. India.
Sharma, J. J. and Sharma, V. (1997). Management of complex weed flora with herbicides
mixtures in wheat. Indian J. Weed Sci.,29(3 & 4): 125-128.
Sharma, N. and Angiras, N. N. (1996). Studies on standardization of bioassay techniques
and its use in estimation of pendimethalin residues in soil under wheat + sarson
intercropping system. Indian J. Weed Sci. 28(1 & 2): 82-84.
Sharma, V. and Thakur, D. R. (2002). Integrated weed management in wheat under sub-
humid agro-climate of Himachal Pradesh. Indian J. Weed Sci., 34(1 & 2): 20-23.
Shehzad. M. A., Maqsood, M., Anwar-ul-Haq, M., Niaz, A. (2012). Efficacy of various
herbicides against weeds in wheat (Triticum aestivum L.). African. J. Biotech. 11:
791-799.
Singh, G. and Singh, N. (2002). Bio-efficacy of metsulfuron methyl in combination with
isoproturon for control of grassy and non-grassy weeds in wheat. Indian J. Weed
Sci., 34(1 & 2): 9-12.
Singh, G. and Singh, O. P. (1996). Response of late sown wheat to seeding methods and
weed control measures in Hood-prone areas. Indian J. Agron., 41(2): 237-242
Singh, G. and Singh, V. P. (2005). Compatibility of clodinafop-propargyl and
fenoxaprop-p-ethyl with carfentrazone-ethyl, metsulfurom methyl and 2,4-D.
Indian J. Weed Sci., 37(1 & 2): 1-5.
Singh, G., Singh, V. P. and Singh, M. (2004). Effect of carfentrazone- ethyl on non-
grassy weeds and wheat yield. Indian J. Weed Sci., 36(1 & 2): 19-20.
Singh, G., Singh, V. P., Singh, R. K. and Saxena, A. (2002). Bio-efficacy of
herbicides inzero –till wheat in rice-wheat cropping system. Indian J. Weed Sci.,
39: 5-8.

108
Singh, Govindra, Singh, Mahendra and Singh, V. P. (2002a). Effect of Clodinafop
propargyl on weed and wheat yield. Indian J. Weed Sci., 34(3 & 4): 165-166.
Singh, Govindra, Singh, Mahendra and Singh, V. P. (2002b). Effect of doses and
stages of application of sulfosulfuron on weeds and wheat yield. Indian J. Weed
Sci., 34(3 & 4): 172 –174
Singh, K. M. and Singh, R. N. (1996). Effect of boron fertilization and weed control
methods on yield and yield attributes of wheat. Indian J. Agron., 39(3): 365- 370.
Singh, P. and Ali, M. (2004). Efficacy of metsulfuron methyl on weeds in wheat and its
residual effects on succeeding soybean crop grown on Vertisol of Rajasthan.
Indian J. Weed Sci., 36(1 & 2): 34-37.
Singh, R. (2014), Evaluation of different herbicides with NPK on growth and yield of
wheat (Triticum aestivum L.) in field trial of Aligarh soil, Int. J. Sci. Res.
3(9),110-147.
Singh, R. and Singh, B. (2004). Effect of irrigation time and weed management practices
on weeds and wheat yield. Indian J. Weed Sci., 36(1 & 2): 25-27.
Singh, R. K., Singh, D. K. and Singh, R. P. (1997). Weed crop competition in wheat as
affected by different weed species. Indian J. Weed Sci., 29(3 & 4): 199.
Singh, S. K. and Saha, G. P. (2001). Produtivity and profitability of wheat as influenced
by cultural and chemical weed control. Indian J. Agron., 46(3): 475-479.
Singh, S. S. and Vaishya, R. D. (1993). Studies on residues of herbicides in post-harvest
soil of wheat by bioassay technique. A paper published in International
Symposium on integrated weed management for sustainable agriculture. Indian
Soc.weed sci. 2: 109-111.
Singh, S. S., Ehsanullah, M., Mishra, S. S. and Singh, S. (1996). Weed control in wheat
under rice-wheat system of north Bihar. Indian J. Agron. 41(2): 243-246.
Singh, V. P. (1997). Response of rain-fed wheat to nitrogen and weed control methods at
low hill and valley situations. Indian J. Agron., 42(2): 288-292.

109
Singh, V. P., Kurchania, S. P. and Tiwari, J. P. (1994). Evaluation of fluroxypyr and
isoproturon against weeds in wheat. Proc. 13th
National Symposium on Integrated
Inputs Management for Efficient Crop production, Coimbatore, 22-25 February,
1994, pp.48-49.
Singh, V., Singh, S. and Malik, R. K. (1998). Performance of new herbicides against
Phalaris minor in wheat. Indian J. Weed Sci. 30(3 & 4): 121-123.
Singhal, V. (2003). Indian Agriculture, Published by Indian Economic Data Research
Centre, New Delhi.
Smeia, W., Lone, B. A. and Ansar-ul-Haq, S. (2005). Weed management in
late sown wheat using different herbicides. Environ. Ecol, 23(3): 546-
548.
Subbaiah, B.V. and Asija, G.L. (1956). A rapid procedure for the estimation of available
nitrogen in soil. Current Science, 25(7): 259-260.
Sujoy, D., Sarkar, A. K., Bhattacharya, S. P. and Abhijit, S. (2006). Effect of
various weed management practices in wheat. Environ. Ecol. 24(3):
620-622.
Sukhadia, N. M., Ramani, B. B., Modhwadia, M. M. and Asodaria, K. B. (2000).
Integrated weed management in groundnut-wheat crop sequence. Indian J.
Agron., 45(2): 253-256.
Sultana, M. R., AIim, M. A., Hossain, M. B., Karmaker, S. and Islam, M. S.
(2012). Effect of Variety and Weed Management Practices on Yield and
Yield Attributes of Wheat. J. Environ. Sci. Nail. Resources. 5(2):
91-96.
Sultana, S. (2009). Influence of nitrogen level and weeding on the performance
of wheat. MS Thesis, SAU, Dhaka, Bangladesh.
Tewari, A. N., Rathi, K. S. and Singh, B. (1998). Efficacy of metsulfuron methyl on
associated weeds in wheat. Indian J. Weed Sci. 68(2): 121-122.

110
Thakur, S. S., Pandey, I. B., Singh, S. J. and Mishra, S. S. (1998). Nitrogen uptake and
productivity of late sown wheat as influenced by row spacing and weed
management. Indian J. Agron., 43(3): 518-523.
The Canadian Food Inspection Agency (CFIA) (2018), The Biology of Triticum aestivum
L. (Wheat).Torento,Canada.
Tomar, S. S., Jain, P. C. and Paradkar, N. R. (2004). Effect of post-emergence
herbicide on weed control in wheat (Triticum aestivum). National symposium on
Resource conservation and Agricultural Productivity, Ludhiyana, Punjab, pp.
216-217.
Tripathi, S. S., Singh, R. and Singh, Virpal (2008). Bio-efficacy of SYM-8424 against
grassy weeds in wheat. Indian J. Weed Sci., 40(1 & 2): 198-99.
USDA (United States Department of Agriculture). (2018). World agricultural supply and
demand estimates, economic research service and foreign agricultural service, p.
18.
Vala, G. S. M. S. (2000). Integrated weed management in wheat.MS thesis, Gujarat
Agricultural University, Sardar Krushinagar.
Verma, S. K., S. B. Singh, Rajvir Sharma, O. P. Rai and Singh, G. (2008). Effect
if cultivars and herbicides on grain yield and nutrient uptake by wheat (Triticum
aestivum) and weeds under zero-tillage system. Indian J. Agril. Sci. 78 (11): 984-
987.
Walia, U. S. and Brar, L. S. (1996). Performance of new herbicides for controlling wild
canary grass in wheat. Indian J. Weed Sci., 28(1 & 2): 70-73.
Walia, U. S., Brar, L. S. and Dhaliwal, B. K. (1996). Performance of tralkoxydim for the
control of wild oat in wheat. Indian J. Weed Sci., 28(3 & 4): 156-159.
Walia, U. S., Brar, L. S. and Singh, K. J. (1997). Control of Rumex spinosus with
sulfonyl urea herbicides in wheat. Indian J. Weed Sci. 29(3 & 4): 103-105.

111
Walia, U. S., Ramanjit, K., Kler, D. S. and Kaur, R. (2000). Determining residual effects
of new herbicides applied to control P. minor from wheat on the succeeding crops
through bioassay. Environ.Ecol. 18(1): 130-133.
Walia, U. S., Singh, K. and Walia, S. S. (2002). Determining residual effects of
Isoproturon applied at graded level through bioassay and analytical procedures.
Indian J. Weed Sci., Indian J. Weed Sci. 34(1 & 2): 16-19.
Walia, U. S. and Singh, B. (2006). Performance of triasulfuron and carfentrazone ethyl
against broad leaf weeds in wheat. Indian J. Weed Sci. 38(3 & 4): 237-239.
Yadav, A. Faroda, A. S., Malik, R. K., Yadav, D. B. and Kumar, V. (1993). Degradation
of pendimethalin application in wheat under different irrigation levels. A paper
published in International Symposium on integrated weed management for
sustainable agriculture. Indian Soc. of weed sci. 2: 111-112.
Yadav, A., Malik, R. K., Punia, S. S., Mehta, R., Bir, D. Amarjeet and Bellinder, R. R.
(2004). Studies on carry over effects of herbicides applied in wheat on the
succeeding crops in rotation. Indian J. Weed Sci., 36(1 & 2): 15-18.
Yadav, D. B., S. Singh, R. K. Malik and Yadav A. (1997). Persistence of metsulfuron-
methyl in soil. Indian J. Weed Sci., 29(3 & 4): 138-141.
Yadav, R. P., Shrivastava, U. K. and Dwivedi, S. C. (2001). Response of wheat and
associated weeds to irrigation schedule and pendimethalin. Indian Journal of
Agron., 46(1): 122-125.
Zahoor, F., Malik, M. A., Mehmood, K., Rasheed, M., Ansar, R., Hussain, M.,
Kazmi, M. H. and Jamil, M. (2012). Optimizing herbicide use in wheat
(Triticum aestivum) under rain-fed conditions. African J. Agric. Res.
7(35): 4858-4866.
Zand, Exkandar, Baghestani, Mohammad Ali, Soufizadeh, Saeid, Eskandari, Mousavi,
Karim and Barjasteh, (2007). Evaluation of some newly registered herbicides for
weed control in wheat (Triticum aestivum L.) in Iran. Crop Protec. 26(9): 1349-
1358.

112

113
APPENDICES
Appendix I. Map showing the experimental site under study
= Experimental site
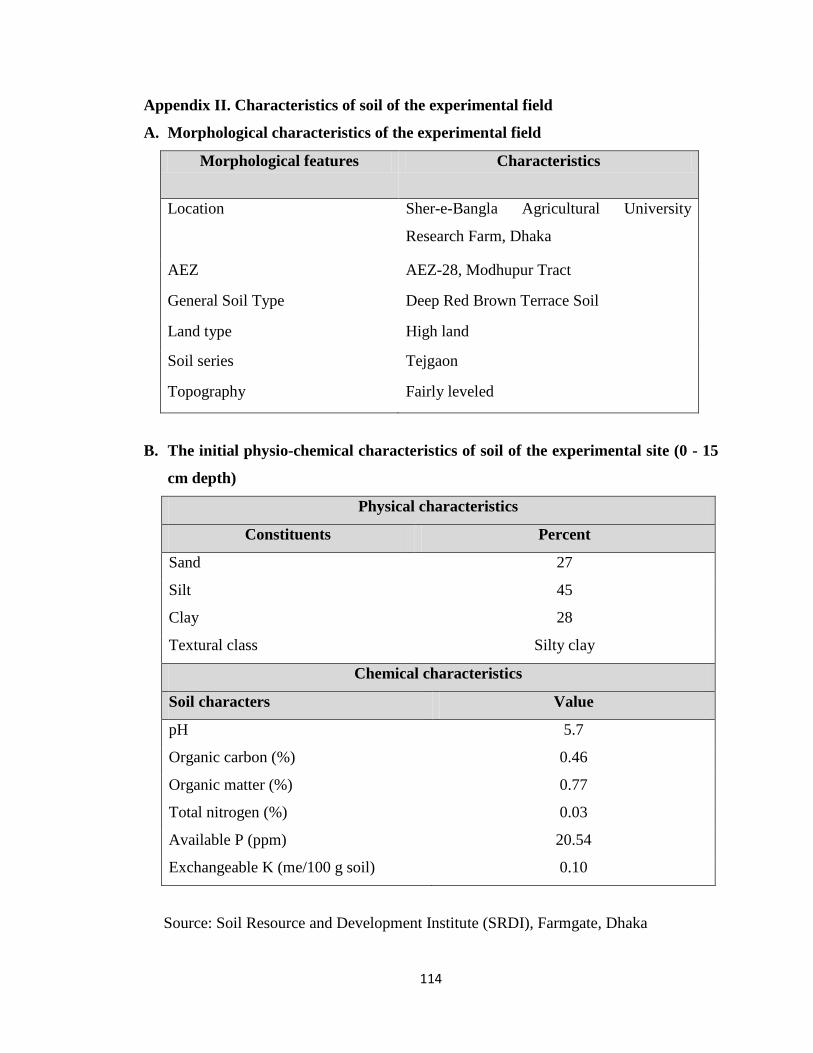
114
Appendix II. Characteristics of soil of the experimental field
A. Morphological characteristics of the experimental field
Morphological features Characteristics
Location Sher-e-Bangla Agricultural University
Research Farm, Dhaka
AEZ AEZ-28, Modhupur Tract
General Soil Type Deep Red Brown Terrace Soil
Land type High land
Soil series Tejgaon
Topography Fairly leveled
B. The initial physio-chemical characteristics of soil of the experimental site (0 - 15
cm depth)
Physical characteristics
Constituents Percent
Sand 27
Silt 45
Clay 28
Textural class Silty clay
Chemical characteristics
Soil characters Value
pH 5.7
Organic carbon (%) 0.46
Organic matter (%) 0.77
Total nitrogen (%) 0.03
Available P (ppm) 20.54
Exchangeable K (me/100 g soil) 0.10
Source: Soil Resource and Development Institute (SRDI), Farmgate, Dhaka

115
Appendix III. Monthly meteorological information during the period from
November, 2017 to April, 2018
Year Month
Air temperature (0C) Relative humidity
(%)
Total rainfall
(mm) Maximum Minimum
2017 November 28.10 11.83 58.18 47
December 25.00 9.46 69.53 0
2018
January 25.20 12.80 69 00
February 27.30 16.90 66 39
March 31.70 19.20 57 23
April 32.20 21.20 59 24
Source: Metrological Centre, Agargaon, Dhaka (Climate Division)
Appendix IV. Means square values for the number of weeds on wheat at different
days after transplanting
Source of
variance
Degrees
of
Freedom
Means square values at different days after transplanting
20 DAS 40D AS 60 DAS 80 DAS
Replication 2 0.08 0.87 31.20
19.29
Variety (V) 2
66.26*
257.06*
134.60*
40.29ns
Error (a) 4 13.97 47.63 25.70 14.89
Weeding (W) 4 444.24*
6604.39 *
4933.70*
2520.72*
VxW 8 8.95* 371.87*
109.27*
48.12*
Error (b) 24 11.22 31.38 24.89 12.77
*Significant at 5% level
ns- Non-significant

116
Appendix V. Means square values for weed control efficiency (%) and weed biomass
(g m-2
) of wheat at different days after transplanting
Source of
variance
Degrees
of
Freedom
Means square values at different days after transplanting
weed control efficiency (%) weed biomass (g m-2
)
20 DAS 40 DAS At harvest
Replication 2 16.40
28.20 353.23
Variety (V) 2
93.57*
587.44*
2164.52*
Error (a) 4 10.21 53.81 81.23
Weeding (W) 4 2796.61*
7544.93* 6738.58*
VxW 8 43.43*
421.05*
57.46*
Error (b) 24 13.28 20.91 156.83
*Significant at 5% level
ns- Non-significant
Appendix VI. Means square values for plant height of wheat at different days after
transplanting
Source of
variance
Degrees
of
Freedom
Means square values at different days after transplanting
20 DAS 40DAS 60 DAS 80 DAS At harvest
Replication 2 19.29
20.60 86.03
37.02
9.34
Variety (V) 2
4.33*
43.31* 822.36* 79.75ns
148.71ns
Error (a) 4 0.87 1.713 40.28 26.61 124.08
Weeding
(W)
4 1.35ns 80.79*
168.06*
27.46ns 59.32
ns
VxW 8 5.47*
5.22* 29.42* 6.57ns 2.88*
Error (b) 24 3.84 22.54 56.36 72.88 53.59
*Significant at 5% level
ns- Non-significant

117
Appendix VII. Means square values for leaf area index of wheat at different days
after transplanting
Source of
variance
Degrees of
Freedom
Means square values at different days after transplanting
40 DAS 60 DAS 80 DAS
Replication 2 1.74 445.62
1226.47
Variety (V) 2
87.45*
5774.87*
5896.62*
Error (a) 4 14.15 235.60 273.49
Weeding (W) 4 28.74*
1921.71*
2276.09*
VxW 8 2.26* 35.83* 138.13*
Error (b) 24 8.37 342.85 533.92
*Significant at 5% level
ns- Non-significant
Appendix VIII. Means square values for above ground dry matter production of
wheat at different days after transplanting
Source of
variance
Degrees
of
Freedom
Means square values at different days after transplanting
20 DAS 40 DAS 60 DAS 80 DAS
Replication 2 0.013
0.294 0.556 0.355
Variety (V) 2
0.009ns
5.457* 7.030* 9.728*
Error (a) 4 0.003 0.289 0.729 0.995
Weeding
(W)
4 0.003*
1.151* 3.612* 6.473*
VxW 8 0.004*
0.157* 0.084* 0.124*
Error (b) 24 0.002 0.370 1.019 1.811
*Significant at 5% level
ns- Non-significant

118
Appendix IX. Means square values for Crop growth rate (CGR) and Relative
growth rate (RGR) of wheat at different days after transplanting
Source of
variance
Degrees
of
Freedom
Means square values at different days after transplanting
Crop growth rate (CGR) Relative growth rate (RGR)
20-40
DAS
40-60
DAS
60-80
DAS
20-40
DAS
40-60
DAS
60-80
DAS
Replication 2 0.91 3.58
0.80
0.0001 0.0001 0.0001
Variety (V) 2
31.72*
1.37ns
3.15*
0.0001ns
0.0001ns
0.0001ns
Error (a) 4 1.74 0.60 0.36 0.0001 0.0001 0.0001
Weeding(W) 4 6.52*
4.45*
3.64*
0.0001ns
0.0001ns
0.0001ns
VxW 8 0.89* 1.52*
1.11*
0.0001*
0.0001ns
0.0001ns
Error (b) 24 1.99 1.12 0.65 0.0001 0.0001 0.0001
*Significant at 5% level
ns- Non-significant
Appendix X. Means square values for the yield contributing characters of wheat at
different days after transplanting
Source of
variance
Degrees
of
Freedom
Means square values at different days after
transplanting
Spikelets
spike-1
Grains
spike-1
Length of
spike (cm)
1000 grain
weight (g)
Replication 2 5.33 12.53 6.459 4.15
Variety (V) 2 8.81* 153.25* 19.788* 60.63ns
Error (a) 4 1.75 3.982 1.968 28.58
Weeding (W) 4 2.90* 83.88* 3.244 ns 38.56*
VxW 8 0.04* 2.29* 0.091* 0.87*
Error (b) 24 2.035 23.40 2.510 23.26
*Significant at 5% level
ns- Non-significant
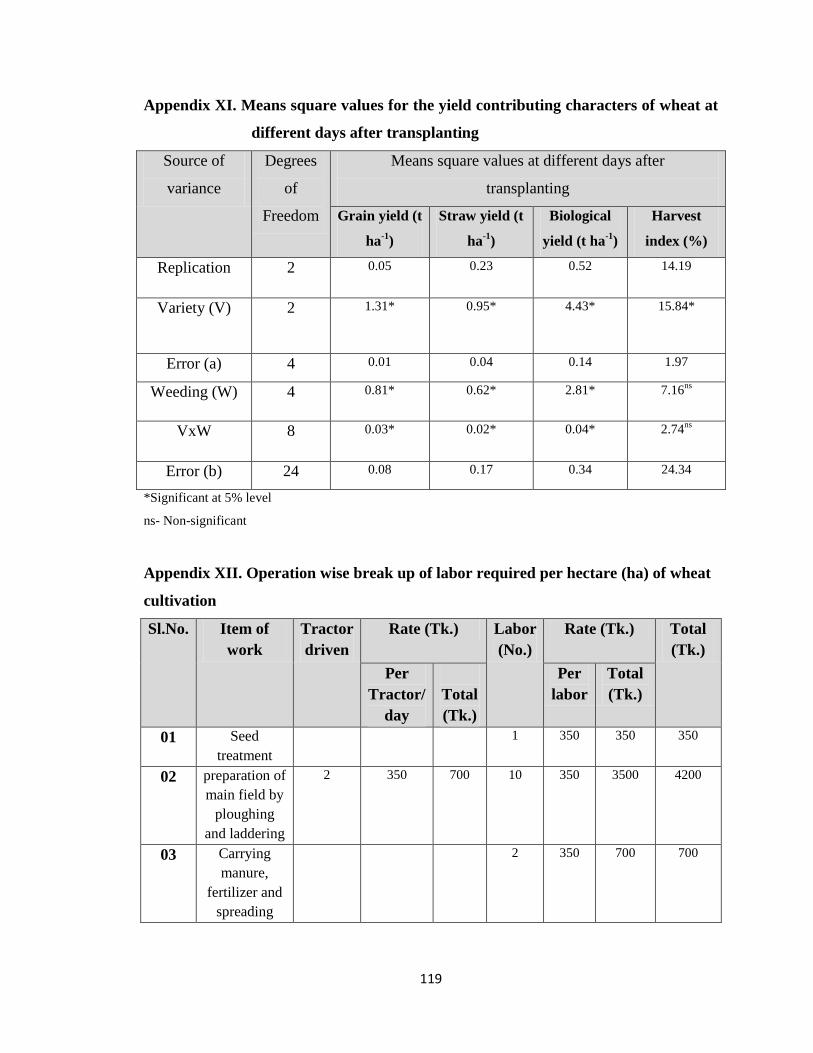
119
Appendix XI. Means square values for the yield contributing characters of wheat at
different days after transplanting
Source of
variance
Degrees
of
Freedom
Means square values at different days after
transplanting
Grain yield (t
ha-1
)
Straw yield (t
ha-1
)
Biological
yield (t ha-1
)
Harvest
index (%)
Replication 2 0.05 0.23 0.52 14.19
Variety (V) 2
1.31* 0.95* 4.43* 15.84*
Error (a) 4 0.01 0.04 0.14 1.97
Weeding (W) 4 0.81* 0.62* 2.81* 7.16ns
VxW 8 0.03* 0.02* 0.04* 2.74ns
Error (b) 24 0.08 0.17 0.34 24.34
*Significant at 5% level
ns- Non-significant
Appendix XII. Operation wise break up of labor required per hectare (ha) of wheat
cultivation
Sl.No. Item of
work
Tractor
driven
Rate (Tk.) Labor
(No.)
Rate (Tk.) Total
(Tk.)
Per
Tractor/
day
Total
(Tk.)
Per
labor
Total
(Tk.)
01 Seed
treatment
1 350 350 350
02 preparation of
main field by
ploughing
and laddering
2 350 700 10 350 3500 4200
03 Carrying
manure,
fertilizer and
spreading
2 350 700 700

120
04 Trimming,
spading
of corners
and
removing
stubbles
2 350 700 700
05 Sowing seeds
and
other
operations
6 350 2100 2100
06 Thinning
2 350 700 700
07 Irrigation (2
times)
2 350 700 700
08 Fertilizer and
pesticide
applying
2 350 700 700
09 Harvesting,
binding
and carrying
etc.
5 350 1750 1750
10 Threshing
and
winnowing
5 350 1750 1750
11 Drying and
heaping
2 350 700 700
12 Storing
2 350 700 700
Grand
total=
15050

121
Appendix XIII. Cost of production per hectare of wheat cultivation excluding
weeding cost
Material cost:
Sl.No. Items Quantity Rate Cost (Tk.)
01 Cost of seed 120kg/ha 100tk/kg 12000
02 Cost of manures and
fertilizers
a) Cowdung 8ton/ha 250tk/ton 2000
b) Urea 100kg 15tk/kg 1500
c)TSP 120kg 30 tk/kg 3600
d) MOP 80kg 15 tk/kg 1200
e) Gypsum 110kg 8 tk/kg 880
f) Boron 2 kg 250tk/kg 500
03 Cost of irrigation
water (2 times) 1200
04 Cost of pesticide 500
Grand total= 23380
Total input cost (Running capital) = (15050 +23380) Tk. = 38380 Tk.
Overhead cost:
Sl No. Items Cost (Tk.)
01 Tax of land for 6 month 150
02 Interest of running capital @7% for
6 month 2686.6
03
Interest on fixed capital taking the
value of land as Tk. 1 Lakh for 6
months or Leasing value of 1 ha for
6 month
10000
04 Miscellaneous (approximately 5% of
the running capital) 1919
Total= 14755.6
Total cost of production (excluding weeding cost) = Running capital + Overhead
cost = (38380 + 14755.6) Tk = 53135.6 Tk.

122
Appendix XIV. Weeding cost of different weed control treatments for one hectare of
land of wheat.
Treatments No. of labor Labor cost Herbicide cost Total Weeding cost
No weeding (W0) 0 0 - 0
two hand weeding
(W1) 15 5250 - 5250
Panida 33EC (W2) 1 350 500 850
Afinity 50.75WC
(W3) 1 350 400 750
Panida 33EC +
Afinity 50.75WC 1 350 1000 1250
Appendix XV. Economic performance of different weed control treatments
In case of all weeding method, same cost was 53135.6 Tk.
1 Mon= 37.32 Kg.
1 mon grain = 850 Tk. i.e.,1ton grain price = 850/37.32 x 1000= 22776Tk.
1 ton straw= 1200 Tk.
W0 =No weeding
Input Output
Labor Cost = 0
Total cost = 53135.6 Tk.
Grain yield = 2.37 t ha-1
= 2.37 x 22776= 53979.12 Tk.
Straw yield = 3.27 t ha-1
= 3.27 x 1200= 3924Tk.
Total Income: 57906.62 Tk.
BCR: 1.07 Tk. return per Tk. invested
W1= two hand weeding
Input Output
Labor Cost = 350 x 15 =5250Tk.
Total Cost = 53135.6 +5250 Tk.
=58385.6Tk.
Grain yield = 2.88 t ha-1
= 2.88 x 22776= 65594.88 Tk.
Straw yield = 3.778 t ha-1
= 3.778 x 1200= 4533.6 Tk.
Total Income: 70128.48 Tk.
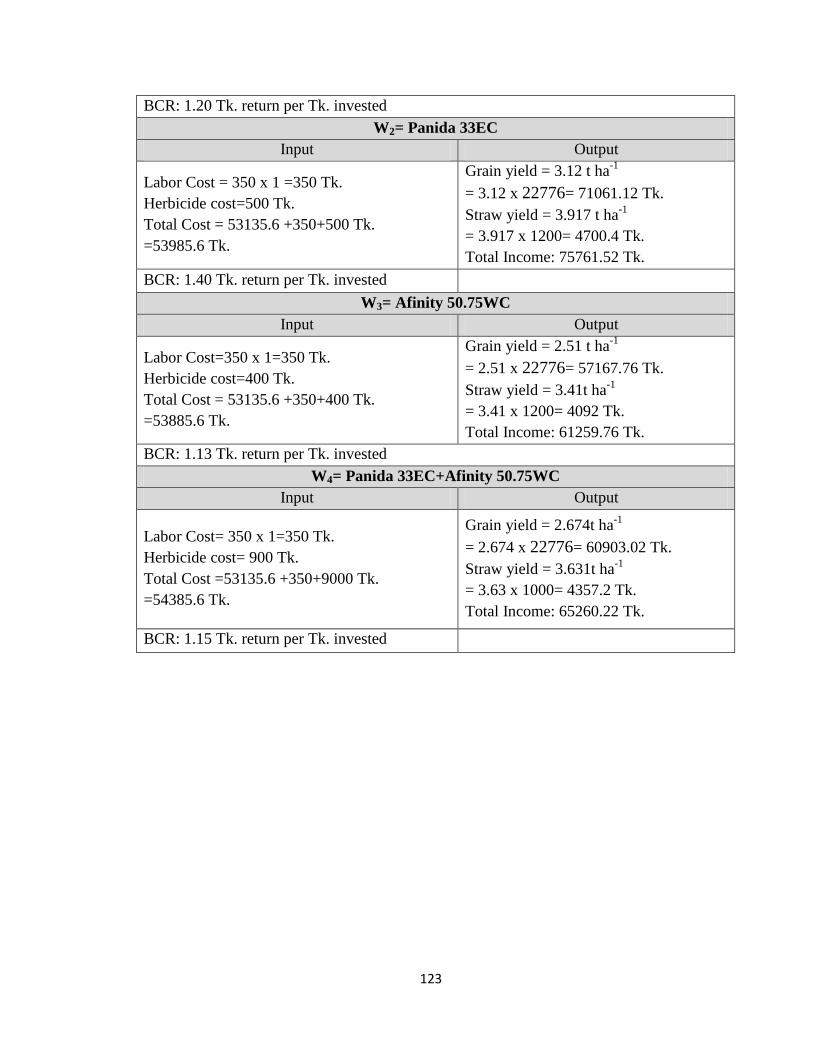
123
BCR: 1.20 Tk. return per Tk. invested
W2= Panida 33EC
Input Output
Labor Cost = 350 x 1 =350 Tk.
Herbicide cost=500 Tk.
Total Cost = 53135.6 +350+500 Tk.
=53985.6 Tk.
Grain yield = 3.12 t ha-1
= 3.12 x 22776= 71061.12 Tk.
Straw yield = 3.917 t ha-1
= 3.917 x 1200= 4700.4 Tk.
Total Income: 75761.52 Tk.
BCR: 1.40 Tk. return per Tk. invested
W3= Afinity 50.75WC
Input Output
Labor Cost=350 x 1=350 Tk.
Herbicide cost=400 Tk.
Total Cost = 53135.6 +350+400 Tk.
=53885.6 Tk.
Grain yield = 2.51 t ha-1
= 2.51 x 22776= 57167.76 Tk.
Straw yield = 3.41t ha-1
= 3.41 x 1200= 4092 Tk.
Total Income: 61259.76 Tk.
BCR: 1.13 Tk. return per Tk. invested
W4= Panida 33EC+Afinity 50.75WC
Input Output
Labor Cost= 350 x 1=350 Tk.
Herbicide cost= 900 Tk.
Total Cost =53135.6 +350+9000 Tk.
=54385.6 Tk.
Grain yield = 2.674t ha-1
= 2.674 x 22776= 60903.02 Tk.
Straw yield = 3.631t ha-1
= 3.63 x 1000= 4357.2 Tk.
Total Income: 65260.22 Tk.
BCR: 1.15 Tk. return per Tk. invested

124
LIST OF PLATES
Plate 1: Field view of unweeded (control) plot of wheat
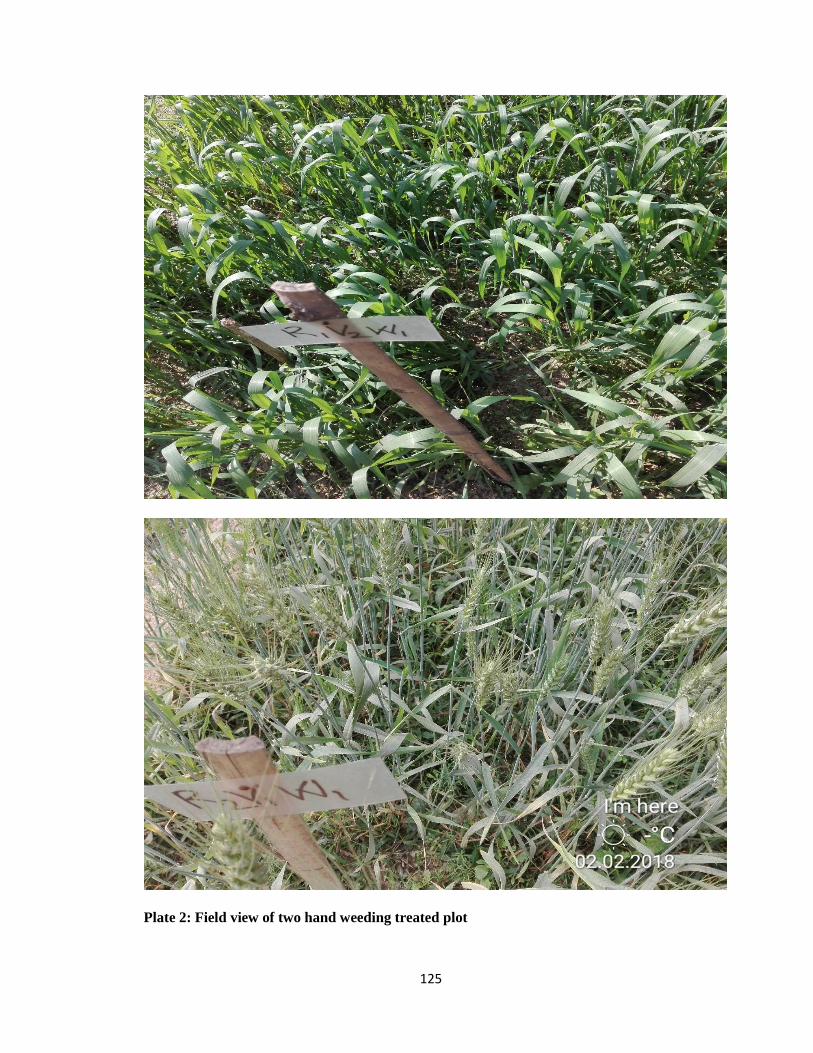
125
Plate 2: Field view of two hand weeding treated plot

126
Plate 3: Field view of Panida 33EC treated wheat plot

127
Plate 4: Field view of Afinity 50.75WP treated plot
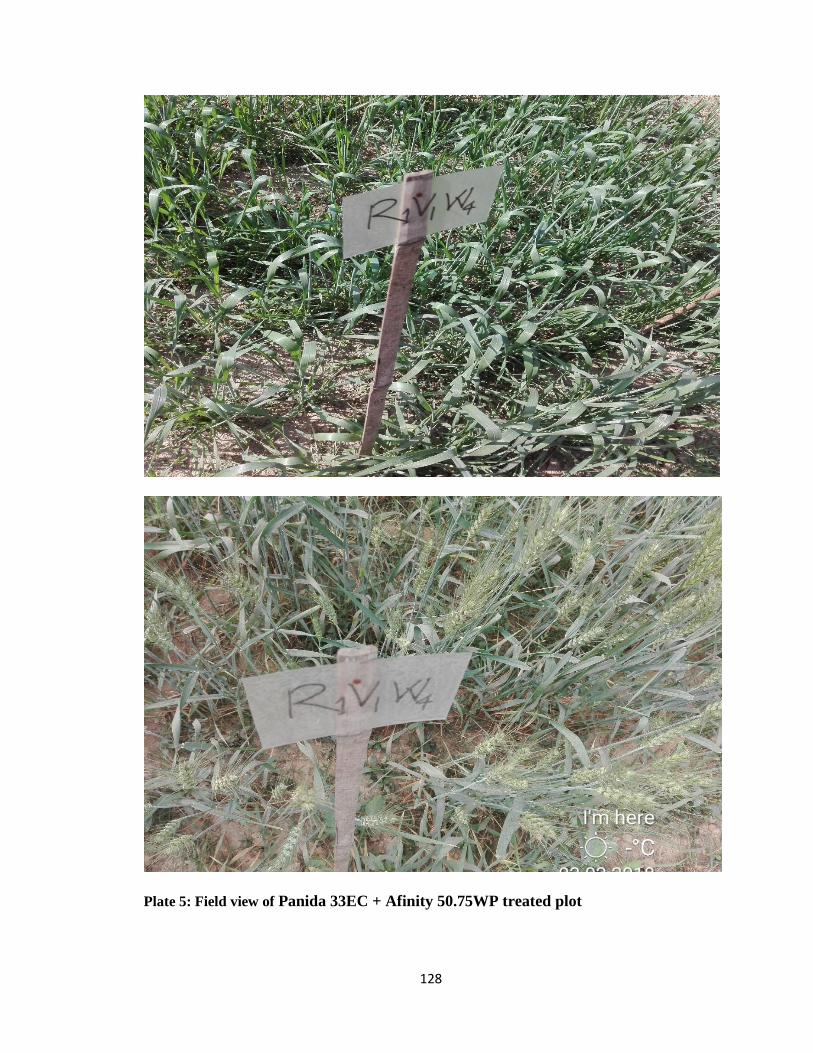
128
Plate 5: Field view of Panida 33EC + Afinity 50.75WP treated plot