Evaluation of binding and thermodynamic characteristics of interactions between a citrus flavonoid...
9
Evaluation of binding and thermodynamic characteristics of interactions between a citrus flavonoid hesperitin with protein and effects of metal ions on binding Ashwini H. Hegde • B. Sandhya • J. Seetharamappa Received: 19 August 2010 / Accepted: 3 December 2010 / Published online: 16 December 2010 Ó Springer Science+Business Media B.V. 2010 Abstract The mechanism of interaction of a non-glyco- sidic citrus flavonoid, hesperitin (HES) with bovine serum albumin (BSA) was studied by UV–vis absorption, fluores- cence, FT-IR, circular dichroism, fluorescence anisotropy and synchronous fluorescence spectroscopy in phosphate buffer of pH 7.4. Fluorescence data revealed that the fluo- rescence quenching of BSA by HES was the result of the formed complex of HES–BSA. The binding constants and thermodynamic parameters at four different temperatures, the location of binding, and the nature of binding force were determined. The hydrogen bonds interactions were found to be the predominant intermolecular forces to stabilize the complex. The conformation of BSA was discussed by syn- chronous fluorescence and CD methods. The alterations of protein secondary structure upon complexation with HES were evident from the gradual decrease in a-helicity. The distance between the donor (BSA) and acceptor (flavonoid) was calculated from the fluorescence resonance energy transfer and found to be 1.978 nm. Common ions viz., Zn 2? , K ? , Cu 2? , Ni 2? , Mn 2? and Co 2? were found to influence the binding of flavonoid to protein. Keywords Non-glycosidic citrus flavonoid Bovine serum albumin Secondary structure Fluorescence anisotropy Introduction Flavonoids exist widely in vegetable kingdom as poly- phenolic compounds. They are the constituents of fruits, vegetables, nuts, grains, bark, roots, stems, flowers, plant- derived beverages such as tea, wine, cocoa and fruit juices. Several beneficial properties have been attributed to these dietary compounds, including antioxidant, anti-inflamma- tory, anti-allergic, anti-viral, anti-bacterial, anti-protozoal, anti-fungal and anti-carcinogenic effects. The best descri- bed property of almost every group of flavonoids is their capacity to act as antioxidants able to scavenge free radi- cals and reactive oxygen species which are associated with several forms of tissue damage and disease, including cancer, atherosclerosis, neuronal degeneration, rheumatoid arthritis as well as with aging [1]. Knowledge of these small molecule-protein interactions is important to under- stand how proteins function in biological systems. The pharmacological actions of drugs are produced in many instances due to binding to protein molecules. Binding of drug to plasma proteins or tissue proteins also has phar- macological implications as it affects rates of absorption, distribution and excretion, can lead to allergic and toxic reactions and displace endogenous substances. Therefore, studies on this aspect can provide information on the structural features that determine the therapeutic effec- tiveness of drugs and will be much helpful in clinical research. In the present study, we have employed the bovine protein as model target protein because of its lone- standing interest in the protein community and 76% structural homology with human serum albumin [2]. It is composed of a single polypeptide chain with 585 amino acids and two tryptophan residues located in subdomains IA and IIA, respectively. BSA has a wide range of physi- ological functions involving the binding, transport and A. H. Hegde B. Sandhya J. Seetharamappa (&) Department of Chemistry, Karnatak University, Dharwad 580003, Karnataka, India e-mail: [email protected] 123 Mol Biol Rep (2011) 38:4921–4929 DOI 10.1007/s11033-010-0634-9
-
Upload
independent -
Category
Documents
-
view
1 -
download
0
Transcript of Evaluation of binding and thermodynamic characteristics of interactions between a citrus flavonoid...

Evaluation of binding and thermodynamic characteristicsof interactions between a citrus flavonoid hesperitin with proteinand effects of metal ions on binding
Ashwini H. Hegde • B. Sandhya • J. Seetharamappa
Received: 19 August 2010 / Accepted: 3 December 2010 / Published online: 16 December 2010
� Springer Science+Business Media B.V. 2010
Abstract The mechanism of interaction of a non-glyco-
sidic citrus flavonoid, hesperitin (HES) with bovine serum
albumin (BSA) was studied by UV–vis absorption, fluores-
cence, FT-IR, circular dichroism, fluorescence anisotropy
and synchronous fluorescence spectroscopy in phosphate
buffer of pH 7.4. Fluorescence data revealed that the fluo-
rescence quenching of BSA by HES was the result of the
formed complex of HES–BSA. The binding constants and
thermodynamic parameters at four different temperatures,
the location of binding, and the nature of binding force were
determined. The hydrogen bonds interactions were found to
be the predominant intermolecular forces to stabilize the
complex. The conformation of BSA was discussed by syn-
chronous fluorescence and CD methods. The alterations of
protein secondary structure upon complexation with HES
were evident from the gradual decrease in a-helicity. The
distance between the donor (BSA) and acceptor (flavonoid)
was calculated from the fluorescence resonance energy
transfer and found to be 1.978 nm. Common ions viz., Zn2?,
K?, Cu2?, Ni2?, Mn2? and Co2? were found to influence the
binding of flavonoid to protein.
Keywords Non-glycosidic citrus flavonoid �Bovine serum albumin � Secondary structure �Fluorescence anisotropy
Introduction
Flavonoids exist widely in vegetable kingdom as poly-
phenolic compounds. They are the constituents of fruits,
vegetables, nuts, grains, bark, roots, stems, flowers, plant-
derived beverages such as tea, wine, cocoa and fruit juices.
Several beneficial properties have been attributed to these
dietary compounds, including antioxidant, anti-inflamma-
tory, anti-allergic, anti-viral, anti-bacterial, anti-protozoal,
anti-fungal and anti-carcinogenic effects. The best descri-
bed property of almost every group of flavonoids is their
capacity to act as antioxidants able to scavenge free radi-
cals and reactive oxygen species which are associated with
several forms of tissue damage and disease, including
cancer, atherosclerosis, neuronal degeneration, rheumatoid
arthritis as well as with aging [1]. Knowledge of these
small molecule-protein interactions is important to under-
stand how proteins function in biological systems. The
pharmacological actions of drugs are produced in many
instances due to binding to protein molecules. Binding of
drug to plasma proteins or tissue proteins also has phar-
macological implications as it affects rates of absorption,
distribution and excretion, can lead to allergic and toxic
reactions and displace endogenous substances. Therefore,
studies on this aspect can provide information on the
structural features that determine the therapeutic effec-
tiveness of drugs and will be much helpful in clinical
research. In the present study, we have employed the
bovine protein as model target protein because of its lone-
standing interest in the protein community and 76%
structural homology with human serum albumin [2]. It is
composed of a single polypeptide chain with 585 amino
acids and two tryptophan residues located in subdomains
IA and IIA, respectively. BSA has a wide range of physi-
ological functions involving the binding, transport and
A. H. Hegde � B. Sandhya � J. Seetharamappa (&)
Department of Chemistry, Karnatak University,
Dharwad 580003, Karnataka, India
e-mail: [email protected]
123
Mol Biol Rep (2011) 38:4921–4929
DOI 10.1007/s11033-010-0634-9

delivery of fatty acids, porphyrins, bilirubin, tryptophan,
thyroxin and steroids.
Hesperitin (HES) (30,5,7-trihydroxy-40methoxyflava-
none) (Fig. 1) is the aglycone form of hesperidin, occurring
in citrus fruits. It belongs to group of flavonones having
different biological and pharmacological functions com-
pared with quercetin and other types of flavonoids [3]. It
has antioxidant, anti-inflammatory, anti-allergic, hypolipi-
demic, vasoprotective and anti-carcinogenic actions.
Therefore, the study of interaction between the protein and
HES is imperative. We have employed spectroscopic
methods to understand the mechanism of interaction
between HES and BSA as these methods are sensitive and
relatively easy to use. They have advantages over con-
ventional methods such as affinity and size exclusion
chromatography, equilibrium dialysis, ultrafiltration and
ultracentrifugation, which suffer from lack of sensitivity,
long analysis time or both and use of protein concentrations
far in excess of the dissociation constant for the drug-
protein complex and for drug-protein interaction studies.
Fourier transform infrared (FT-IR), circular dichroism
(CD) and synchronous fluorescence spectroscopy gave
valuable insights on the overall secondary structure of
protein in various conditions [4–6].
Some researchers have reported the interactions of
proteins with flavonoids by spectral techniques [7–10].
However, these studies have not dealt with conformational
changes in secondary structure of protein by CD mea-
surements, fluorescence anisotropy and FTIR, the effects of
metal ions on binding or displacement experiments with
different site probes. Further, no attempt has been made to
investigate the interaction of HES with BSA. Hence, it was
thought worthwhile to investigate the mechanism of
interaction of HES with BSA by different spectroscopic
techniques viz., steady state fluorescence, synchronous
fluorescence, fluorescence anisotropy, UV–visible, circular
dichroism and FT-IR.
Experimental procedures
Reagents
BSA (Fraction V, fatty acid free) and HES were obtained
from Sigma Chemical Company, St. Louis, USA. A stock
solution of 250 lM BSA was prepared in 0.1 M phosphate
buffer of pH 7.4 containing 0.15 M NaCl. Due to limited
solubility of HES in phosphate buffer, the stock solution of
HES (1000 lM) was prepared using 10% DMSO as the
co-solvent. All other materials employed were of analytical
reagent grade and Millipore water was used throughout the
study.
Instrumental
Fluorescence measurements were performed on a spectro-
fluorimeter Model F-7000 (Hitachi, Japan) equipped with a
150 W Xenon lamp and a slit width of 5 nm. The CD
measurements were made on a JASCO-715 spectropolar-
imeter (Tokyo, Japan) using a 0.1 cm cell at 0.2 nm
intervals, with 3 scans averaged for each CD spectrum in
the range of 200–250 nm. The absorption spectra were
recorded on a double beam CARY 50-BIO UV–vis spec-
trophotometer (Varian, Australia) equipped with a 150 W
Xenon lamp and a slit width of 5 nm. FT-IR measurements
were performed at room temperature on a Thermo Nicolet-
5700 FTIR spectrometer (Waltham, MA, USA) equipped
with a germanium attenuated total reflection (ATR)
accessory.
Procedures
Based on preliminary experiments, the concentration of
BSA was kept constant at 2.5 lM while that of HES was
varied from 0 to 22.5 lM in both fluorescence and UV
absorption studies. Fluorescence spectra were recorded at
289, 294, 299 and 304 K in the range of 300–500 nm upon
excitation at 296 nm. Absorption spectra were noted down
in the range of 250–370 nm at room temperature. The CD
spectra of protein–flavonoid mixtures (1:0, 1:1 and 1:2)
were recorded in the range of 200–250 nm. The FT-IR
spectra of BSA in the presence and absence of the drug
were recorded at room temperature in the range of
1530–1670 cm-1. The displacement experiments were
performed using different site probes viz., warfarin, ibu-
profen and digitoxin for site I, II and III, respectively by
keeping the concentration of protein and probe constant
(2.5 lM each). The fluorescence spectra of flavonoid–BSA
system were recorded in presence of cations viz Ca2?,
Ni2?, Cu2?, Co2? and Zn2? upon excitation at 296 nm.
The overall concentration of BSA and common ions were
fixed at 2.5 lM.
O
OH
HO
O
OH
OCH3
Fig. 1 Strucure of hesperitin
4922 Mol Biol Rep (2011) 38:4921–4929
123

Results and discussion
Analysis of fluorescence quenching of serum
albumin by HES
Fluorescence measurements give information about the
molecular environment in a vicinity of the chromophore
molecules. By measuring the intrinsic fluorescence of BSA,
the accessibility of protein to the quencher can be esti-
mated. This information helps to predict the binding
mechanism of HES to BSA. Figure 2 shows the quenching
of fluorescence intensity of BSA upon the addition of a
series of concentrations of HES in physiological condition
(pH 7.4) at kex = 296 nm. The quenching mechanism is
usually classified as either dynamic quenching or static
quenching. The collisional quenching or dynamic
quenching results from collision between the fluorophore
and a quencher while static quenching results from non-
fluorescent complex formation in ground state of the
fluorophore.
HES caused the concentration dependent quenching of
the intrinsic fluorescence of BSA without changing the
emission maximum and shape of the peaks. The fluores-
cence quenching data were analyzed using the Stern–
Volmer equation [11] shown below:
F0=F ¼ 1þ Kqs0 Q½ � ¼ 1þ KSV Q½ � ð1Þ
where F and F0 are the steady-state fluorescence intensities
in the presence and absence of quencher, respectively. Kq is
the quenching rate constant, s0 is the average lifetime of the
protein in the absence of the drug and its value was reported
to be 10-8 s [12], KSV is the Stern–Volmer quenching
constant and [Q] is the concentration of quencher
(flavonoid). The plot of F0/F versus [Q] (Fig. 3a) yielded
the straight line. However, it did not define the quenching
type and additional information was required for this
determination. In order to determine the quenching type, the
effect of temperature on the interaction of HES with BSA
was studied. The KSV values increase with increase in
temperature for dynamic quenching while it is reverse for
static quenching. The values of KSV were observed to be
decreased with increase in temperature in the present
study. Further, the maximum scatter collisional quenching
constant of various quenchers with the biopolymer is
reported to be 2.0 9 1010 l mol-1 s-1 [12]. The higher
values of rate constants of the protein quenching procedure
initiated by HES indicated that the quenching was not
initiated by dynamic quenching, but probably by static
quenching resulting from the formation of HES–BSA
complex. For static quenching mechanism, the data were
analyzed using the modified Stern–Volmer equation shown
below:
F0= F0 � Fð Þ ¼ 1=faKa Q½ � þ 1=fa ð2Þ
where F and F0 are the fluorescence intensities of protein
with and without HES, respectively; Ka is the modified
Stern–Volmer association constant, [Q] is the concentra-
tion of quencher and fa is the fraction of the initial
0
50
100
150
200
250
300 350 400 450 500
Wavelength (nm)
Inte
nsit
y
1
10
Fig. 2 Quenching of fluorescence intensity of BSA (2.5 lM) upon
the addition of increasing amounts of HES: (1) 0, (2) 2.5, (3) 5, (4)
7.5, (5) 10, (6) 12.5, (7) 15, (8) 17.5, (9) 20 and (10) 22.5 lM
1
1.2
1.4
1.6
1.8
2
2.2
2.4
2.6
2.8
0.00E+00 2.00E-06 4.00E-06 6.00E-06 8.00E-06 1.00E-05 1.20E-05
[Q]
F 0/F
0
2
4
6
8
10
12
14
0.00E+00 2.00E+05 4.00E+05 6.00E+05 8.00E+05 1.00E+06
1/[Q]
F0/
F0-
F
a
b
Fig. 3 a The Stern–Volmer plot for binding of HES with BSA at
289 K (circle), 293 K (triangle), 299 (square) and 305 K (diamond)
and b Modified Stern–Volmer plot at 289 K (diamond), 293 K
(square), 299 (triangle) and 305 K (circle). Decrease in KSV values
with increase in temperature indicate the presence of static quenching
in the binding of HES to BSA
Mol Biol Rep (2011) 38:4921–4929 4923
123

fluorescence that is accessible to quencher. The plot of
F0/(F0 - F) versus 1/[Q] (Fig. 3b) yielded fa-1 as the
intercept on y axis and (fa K)-1 as the slope. The corre-
sponding results are shown in Table 1.
Analysis of binding equilibria
For static quenching interaction, the binding constant and
number of binding sites can be obtained from the equation
shown below [13]:
logðF0 � FÞ=F ¼ log Kþ n log Q½ � ð3Þ
where K and n are the binding constant and the number of
binding sites, respectively. Thus, the plot of log (F0 - F)/
F versus log [Q] (Figure not shown) yielded the values of
K and n (Table 1). From the values of n, it may be inferred
that there is one independent class of binding sites on BSA
for HES.
Binding mode
The thermodynamic parameters for protein interactions can
be accounted for the main forces contributing to protein
stability. The action force between a small molecule and a
biomolecule may include hydrogen bonding, van der Waals
force, electrostatic force and hydrophobic interactions [14].
Therefore, the thermodynamic parameters which depend
on temperatures were evaluated to further characterize the
acting forces between BSA and HES. The thermodynamic
parameters, enthalpy change (DH�), entropy change (DS�)
and free energy change (DG�) were evaluated using the
following equations:
logK ¼ �DH�=2:303RT þ DS�=2:303R ð4ÞDG� ¼ DH� � TDS� ð5Þ
where K and R are the binding constant and gas constant,
respectively. The plot of log K versus 1/T enabled the
determination of values of DH� and DS� (Figures not
shown). The corresponding results are shown in Table 1.
The positive entropy change occurs when the water
molecules that are arranged in an orderly fashion around
the ligand and the protein acquires a more random con-
figuration as a result of hydrophobic interactions. The
negative DG� meant that the binding process was sponta-
neous. In the present study, the negative DH� value may
not be attributed to electrostatic interactions as higher
negative DH� value would be observed whenever there is
hydrogen bonding [15, 16]. So, we propose that the
hydrophobic forces and hydrogen bonding play a signifi-
cant role in the binding of HES to BSA.
Binding site
Sudlow et al. [17] have suggested two distinct binding sites
on protein, sites I and II. Site I of BSA shows affinity for
warfarin, phenylbutazone etc., while site II for ibuprofen,
flufenamic acid etc. Digitoxin binding is independent of
sites I and II [18, 19]. In order to determine the specificity
of the HES binding, displacement experiments were per-
formed with warfarin, ibuprofen and digitoxin as per
Sudlow’s classification of the binding sites. The binding
constant values of HES–BSA were calculated to be
0.98 9 105, 1.24 9 105 and 1.32 9 105 M-1 in presence
of warfarin, ibuprofen and digitoxin, respectively. It was
evident that the warfarin (site I) showed a significant dis-
placement of flavonoid suggesting that both HES and
warfarin compete for the same binding site on BSA. Fur-
ther, due to the similarity of the structures of HES and
warfarin [20], we consider that the HES most likely binds
at the site I located in subdomain II A near Trp 214.
Energy transfer between flavonoid and protein
Fluorescence resonance energy transfer (FRET) is a dis-
tance dependent interaction between the different elec-
tronic excited states of fluorescent molecules in which
excitation energy is transferred from one molecular system
(donor) to another molecular system (acceptor) without
emission of a photon from the former molecular system.
The overlap of UV absorption spectrum of HES with
fluorescence emission spectrum of BSA is shown in Fig. 4.
The spectral studies suggested that HES interacted with
BSA. The distance, r between the tryptophan in BSA and
the bound flavonoid could be determined using FRET [21].
However, the r value calculated for flavonoid–BSA system
is actually the average distance between the bound
Table 1 Binding parameters of HES–BSA interaction
T(K) Modified Stern–Volmer
constant, (L mol-1)
R2 K (L mol-1) n DG� (KJ mol-1) DH� (KJ mol-1) DS� (J mol-1 K-1)
289 1.39 9 105 0.9993 5.96 9 105 1.13 -31.96
294 1.06 9 105 0.9988 2.5 9 105 1.07 -30.39 -164.568 0.4568
299 0.97 9 105 0.9979 1.29 9 105 1.03 -29.26
305 0.58 9 105 0.9822 0.15 9 105 0.87 -24.31
4924 Mol Biol Rep (2011) 38:4921–4929
123

flavonoid and the tryptophan residue. The efficiency of
energy transfer, E, is calculated using the equation:
E ¼ 1� F0=F ¼ R60=R6
0 þ r6 ð6Þ
where F and F0 are the fluorescence intensities of BSA in
presence and absence of HES, and R0 is the critical
distance when the transfer efficiency is 50%. It is
calculated as follows:
R60 ¼ 8:8 � 10�25 k2 N�4 U J ð7Þ
where k2 is the spatial orientation factor of dipole, N is the
refractive index of the medium, U is the fluorescence
quantum yield of donor and J is the overlap integral of
fluorescence emission spectrum of donor and absorption
spectrum of the acceptor. J is determined using the
following equation:
J ¼ RFðkÞeðkÞk4Dk=RFðkÞDk ð8Þ
where F(k) is the fluorescence intensity of the donor of
wavelength k, and e(k) is the molar absorption coefficient of
the acceptor at wavelength k. In the present case,k2 = 2/3,
N = 1.36 and U = 0.15 [10]. From Eqs. 6–8, we obtained
that J = 12.753 9 10-16 cm3 L mol-1, R0 = 1.86 nm, E =
0.4146 and r = 1.978 nm. The donor to acceptor distance,
r \ 8 nm [22] indicated that the energy transfer from BSA
to HES occurred with high probability.
The effect of metal ions on the binding
of flavonoid to protein
The binding reaction between a molecule and the serum
albumin would be influenced by some metal ions both in
vitro and in vivo. BSA has high affinity metal-binding site
at N-terminus [23]. So, the binding aspect of HES–BSA
was studied in presence of common ions viz., K?, Co2?,
Cu2?, Ni2? and Mn2? at 298 K. As evident from Table 2,
the binding constant values of HES–BSA decreased in
presence of these ions indicating the shortening of storage
time of drug in blood plasma. All these results indicated
that the quenching efficiency of drug was influenced by the
metal ions.
Effect of Zn2? on flavonoid–protein interaction
In blood plasma, zinc is bound and transported by albumin.
The concentration of zinc in blood plasma stays relatively
constant regardless of zinc intake. Zinc is found in nearly
100 specific enzymes. It is typically the second most
abundant transition metal in organisms. A study estimated
that about 10% of human proteins (2800) potentially bind
zinc, in addition to hundreds which transport and traffic
zinc. The metal ion also has a flexible coordination
geometry, which allows proteins using it to rapidly shift
conformations to perform biological reactions. In the
present study, the K value of HES–BSA decreased in
presence of different concentrations of Zn2? as shown in
Table 3. Therefore, the complexation of Zn2? with protein
reduced the binding affinity of HES to BSA and increased
the concentration of free HES. In other words, it shortened
the retention time HES in blood and facilitated the easy
release of the drug.
Alterations of protein secondary structure induced
by drug binding
UV–visible absorption studies
Generally, bathochromic and hypochromic shifts are
observed in the absorption spectra of proteins if they bind
to small molecules. The absorption maximum of free BSA
at 279 nm was found to be shifted to 285 nm (Fig. 5). This
slight red shift could be attributed to formation of complex
between protein and flavonoid [24]. Further, the UV
absorption intensity of BSA increased with increase in the
concentration of flavonoid.
0
50
100
150
200
250
300 350 400 450
Wavelength (nm)
Flu
ores
cenc
e In
tens
ity
0
0.05
0.1
0.15
0.2
Abs
orba
nce
x
y
Fig. 4 The overlap of the fluorescence spectrum of BSA [x] with
absorption spectrum of HES [y]. The distance, r between the
tryptophan in BSA (donor) and the bound flavonoid (acceptor) could
be determined with the aid of overlap of emission spectrum with
absorption spectrum
Table 2 Effects of common ions on binding of BSA with HES
System Association constant (M-1)
Without metal ion 1.29 ± 0.012 9 105
K? 1.17 ± 0.023 9 105
Co2? 1.20 ± 0.024 9 105
Cu2? 1.14 ± 0.015 9 105
Ni2? 0.98 ± 0.024 9 105
Mn2? 1.25 ± 0.026 9 105
Mol Biol Rep (2011) 38:4921–4929 4925
123

Synchronous fluorescence spectra
The synchronous fluorescence spectra give information
about the molecular environment in the vicinity of chro-
mosphere molecules [25]. These spectra were obtained by
simultaneously scanning excitation and emission mono-
chromators. When the Dk between excitation wavelength
and emission wavelength was 15 nm, the synchronous
fluorescence indicated characteristics of tyrosine residues
and when Dk was 60 nm, it provided the characteristic
information of tryptophan residues. Synchronous fluores-
cence spectra of BSA in presence of HES obtained when
Dk = 15 and 60 nm are shown in Fig. 6a, b, respectively.
It is apparent from figures that the emission maximum of
tyrosine residues did not exhibit a significant shift while a
marginal red shift (from 288 to 290 nm) was noticed when
Dk = 60. This indicated that the polarity around the tryp-
tophan residues was increased while the hydrophobicity
decreased [26]. However, the microenvironment around the
tyrosine residue was not affected during the binding pro-
cess [27].
Fluorescence anisotropy studies
Fluorescence polarization is a technique specially applied
to study molecular interactions. The anisotropy (r) is
defined as the difference between the fluorescence intensity
emitted parallel and perpendicular (IVV and IVH) divided by
the total intensity. Protein interactions can be detected
when one of the interacting partner is fused to a fluoro-
phore- upon binding of the partner molecule, a larger more
stable complex is formed which will tumble more slowly in
the solution, thus increasing the polarization of the emitted
light. Small fluorescent molecules have low polarization
values while large molecules caused by binding of other
molecules have large values.
In order to ascertain the binding of flavonoid to BSA, we
measured the fluorescence anisotropy of HES in the pres-
ence of different concentrations of BSA and it was calcu-
lated from fluorescence intensity measurement employing
a vertical excitation polarizer and a vertical horizontal
emission polarizer according to the equation as shown
below [28].
r ¼ IVV � GIVHð Þ = IVV þ 2GIVHð Þ ð9Þ
where IVV is the intensity of emitted light measured in the
direction parallel to excitation and IVH is the intensity of
emitted light measured in the direction perpendicular to
excitation. The G factor is the instrument grating correction
Table 3 Effect of Zn2? on binding of BSA with HES
Concentration of zinc Binding constant (K), M-1
0 lM 1.29 9 105
250 lM 1.002 9 105
500 lM 0.93 9 105
1 mM 0.87 9 105
0
0.05
0.1
0.15
0.2
0.25
0.3
0.35
0.4
250 270 290 310 330 350 370
Wavelength(nm)
Abs
orba
nce
10
1
Fig. 5 Absorption spectra of BSA and HES–BSA system, BSA
concentration was maintained at (1) 2.5 lM and HES concentration
was varied (2) 2.5, (3) 5, (4) 7.5, (5) 10, (6) 12.5, (7) 15, (8) 17.5, (9)
20 and (10) 22.5 lM. These spectra indicate the formation of a
complex between BSA and HES
0
20
40
60
80
100
120
140
280 290 300 310 320 330
Wavelength (nm)
Flu
ores
cenc
e In
tens
ity 1
10
0
400
800
1200
300 320 340 360 380Wavelength (nm)
Flu
ores
cenc
e In
tens
ity 1
10
a
b
Fig. 6 The effect of HES on the synchronous fluorescence spectra of
BSA, a Dk = 15 nm; b Dk = 60 nm. (1) [BSA] = 2.5 lM; (2)
[HES] = 2.5, (3) 5, (4) 7.5, (5) 10, (6) 12.5, (7) 15, (8) 17.5, (9) 20
and (10) 22.5 lM. A marginal red shift in the emission maximum at
Dk = 60 reveal the changes in the microenvironment of tryptophan
residue
4926 Mol Biol Rep (2011) 38:4921–4929
123

factor and is equal to IHV/IHH. Figure 7 presented the
variation of the fluorescence anisotropy value for HES with
the addition of BSA. The plot showed that the anisotropy of
HES increased from -0.0975 (in absence of BSA) to
0.0718 (in presence of 12.5 lmol L-1 BSA) and gradually
levelled after this concentration of protein. This revealed
that the flavonoid molecule was moved from aqueous
buffer phase to protein environment where enhanced
rigidity was observed. So, the rotational diffusion was
enhanced leading to lesser depolarization of its emission
and greater anisotropy.
Circular dichroism studies
CD, a sensitive technique to monitor the conformational
changes in the protein, is employed in the present study.
The CD spectra of proteins in the region of 200–250 nm
are sensitive to changes in the contributions of the sec-
ondary structures such as a-helices, b-sheets, unordered
structure, as well as the random coils to the overall
conformation.
The CD spectra of BSA in the absence and presence of
HES (lines 1–3) are shown in Fig. 8. The molar ratios of
BSA to HES maintained were 1:0, 1:1 and 1:2. The CD
spectra of BSA exhibited two negative minima at 208 and
220 nm, which are the typical characterization of the
a-helix structure of proteins. The addition of flavonoid to
protein decreased the band intensity at these wavelengths
without any significant shift in the peaks. This indicated
that the flavonoid changed the secondary structure of BSA
upon interaction with the drug.
The CD results are expressed in terms of mean residue
ellipticity (MRE) in deg cm2 dmol-1 according to the
following equation:
MRE ¼ observed CD mdegð Þ = Cpnl� 10� �
ð10Þ
where Cp is the molar concentration of the protein, n is the
number of amino acid residues and l is the path length. The
a-helical contents of free and combined BSA are calculated
from MRE values at 208 nm using the equation [29]:
a-helix %ð Þ ¼ �MRE208 � 4000ð Þ = 33000� 4000ð Þ½ �� 100 ð11Þ
where MRE208 is the observed MRE value at 208 nm, 4000
is the MRE of the a-form and random coil conformation
cross at 208 nm and 33,000 is the MRE value of a pure
a-helix at 208 nm. Using the above equation, the a-helicity
in the secondary structure of BSA was determined. It
decreased from 60.98% in free BSA to 51.16% in HES–
BSA. This revealed that there was a change in a-helicity of
protein upon interaction [30]. Further, the CD spectra of
BSA in the presence and absence of HES are observed to
be similar in shape indicating that the structure of BSA is
also predominantly a-helical even after binding to drug.
FT-IR analysis
Additional evidence regarding interaction between HES
and BSA was obtained from FT-IR spectroscopic results
[31]. IR spectrum of protein exhibits a number of amide
bands, which represent different vibrations of the peptide
moiety. Of all the amide bands of the peptide group, the
single most widely used one in studies of protein secondary
structures is the amide I. The amide I and amide II peaks
occur in the region of 1600–1700 and 1500–1600 cm-1,
respectively. Since amide I band is more sensitive to the
changes in protein secondary structure compared to amide
II, amide I band is more useful for the studies of secondary
structure. In the amide I region, the observed stretching
frequency of C=O hydrogen bonded to NH moieties is
dependent upon the secondary structure adopted by the
peptide chain. The FT-IR spectra of free BSA and HES–
BSA (Fig. 9a, b) in phosphate buffer solution were
-0.15
-0.1
-0.05
0
0.05
0.1
0.00E+00 8.00E-06 1.60E-05 2.40E-05 3.20E-05 4.00E-05
Concentration of BSA
Fuo
resc
ence
ani
sotr
opy
Fig. 7 Variation of the fluorescence anisotropy value of HES with
the addition of different concentrations of BSA (0–12.5 lM);
[HES] = 10 lM [kex = 320 nm]
-100
-80
-60
-40
-20
0
20
40
200 210 220 230 240 250
Wavelength (nm)
MR
E
3
1
Fig. 8 CD spectra of (a) BSA (5 lM) in absence (1) and presence of
5 (2) and 10 lM (3) of HES. The addition of HES to BSA decreases
the a-helicity of protein
Mol Biol Rep (2011) 38:4921–4929 4927
123
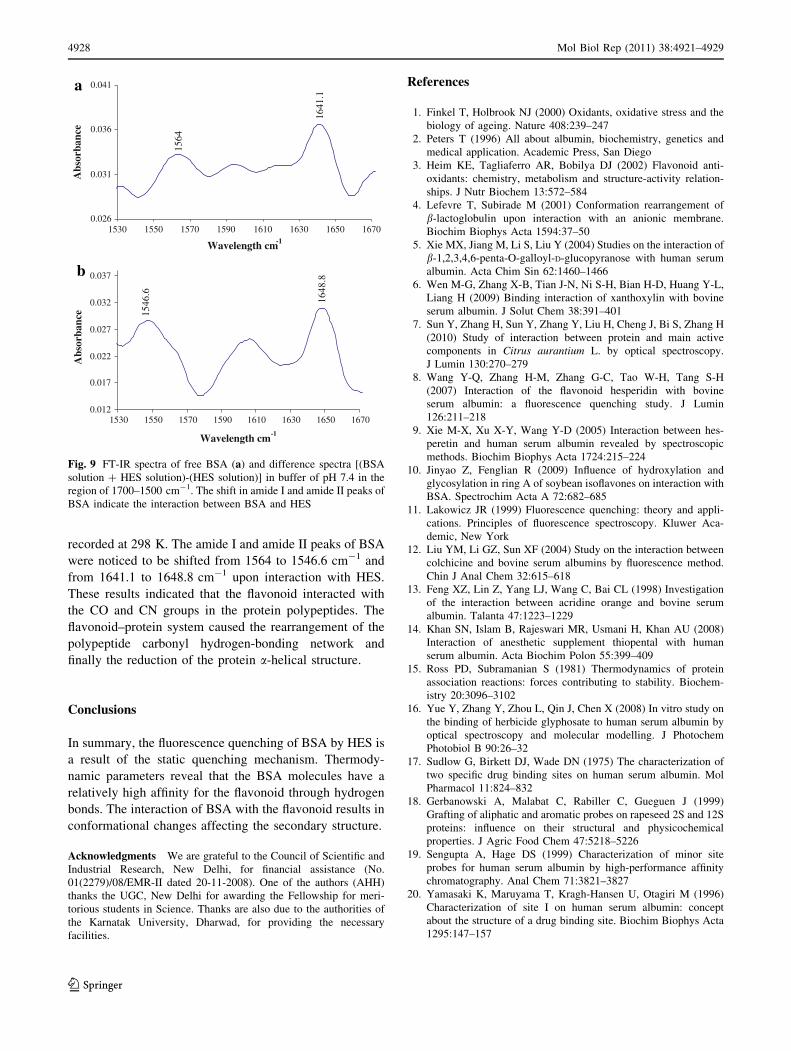
recorded at 298 K. The amide I and amide II peaks of BSA
were noticed to be shifted from 1564 to 1546.6 cm-1 and
from 1641.1 to 1648.8 cm-1 upon interaction with HES.
These results indicated that the flavonoid interacted with
the CO and CN groups in the protein polypeptides. The
flavonoid–protein system caused the rearrangement of the
polypeptide carbonyl hydrogen-bonding network and
finally the reduction of the protein a-helical structure.
Conclusions
In summary, the fluorescence quenching of BSA by HES is
a result of the static quenching mechanism. Thermody-
namic parameters reveal that the BSA molecules have a
relatively high affinity for the flavonoid through hydrogen
bonds. The interaction of BSA with the flavonoid results in
conformational changes affecting the secondary structure.
Acknowledgments We are grateful to the Council of Scientific and
Industrial Research, New Delhi, for financial assistance (No.
01(2279)/08/EMR-II dated 20-11-2008). One of the authors (AHH)
thanks the UGC, New Delhi for awarding the Fellowship for meri-
torious students in Science. Thanks are also due to the authorities of
the Karnatak University, Dharwad, for providing the necessary
facilities.
References
1. Finkel T, Holbrook NJ (2000) Oxidants, oxidative stress and the
biology of ageing. Nature 408:239–247
2. Peters T (1996) All about albumin, biochemistry, genetics and
medical application. Academic Press, San Diego
3. Heim KE, Tagliaferro AR, Bobilya DJ (2002) Flavonoid anti-
oxidants: chemistry, metabolism and structure-activity relation-
ships. J Nutr Biochem 13:572–584
4. Lefevre T, Subirade M (2001) Conformation rearrangement of
b-lactoglobulin upon interaction with an anionic membrane.
Biochim Biophys Acta 1594:37–50
5. Xie MX, Jiang M, Li S, Liu Y (2004) Studies on the interaction of
b-1,2,3,4,6-penta-O-galloyl-D-glucopyranose with human serum
albumin. Acta Chim Sin 62:1460–1466
6. Wen M-G, Zhang X-B, Tian J-N, Ni S-H, Bian H-D, Huang Y-L,
Liang H (2009) Binding interaction of xanthoxylin with bovine
serum albumin. J Solut Chem 38:391–401
7. Sun Y, Zhang H, Sun Y, Zhang Y, Liu H, Cheng J, Bi S, Zhang H
(2010) Study of interaction between protein and main active
components in Citrus aurantium L. by optical spectroscopy.
J Lumin 130:270–279
8. Wang Y-Q, Zhang H-M, Zhang G-C, Tao W-H, Tang S-H
(2007) Interaction of the flavonoid hesperidin with bovine
serum albumin: a fluorescence quenching study. J Lumin
126:211–218
9. Xie M-X, Xu X-Y, Wang Y-D (2005) Interaction between hes-
peretin and human serum albumin revealed by spectroscopic
methods. Biochim Biophys Acta 1724:215–224
10. Jinyao Z, Fenglian R (2009) Influence of hydroxylation and
glycosylation in ring A of soybean isoflavones on interaction with
BSA. Spectrochim Acta A 72:682–685
11. Lakowicz JR (1999) Fluorescence quenching: theory and appli-
cations. Principles of fluorescence spectroscopy. Kluwer Aca-
demic, New York
12. Liu YM, Li GZ, Sun XF (2004) Study on the interaction between
colchicine and bovine serum albumins by fluorescence method.
Chin J Anal Chem 32:615–618
13. Feng XZ, Lin Z, Yang LJ, Wang C, Bai CL (1998) Investigation
of the interaction between acridine orange and bovine serum
albumin. Talanta 47:1223–1229
14. Khan SN, Islam B, Rajeswari MR, Usmani H, Khan AU (2008)
Interaction of anesthetic supplement thiopental with human
serum albumin. Acta Biochim Polon 55:399–409
15. Ross PD, Subramanian S (1981) Thermodynamics of protein
association reactions: forces contributing to stability. Biochem-
istry 20:3096–3102
16. Yue Y, Zhang Y, Zhou L, Qin J, Chen X (2008) In vitro study on
the binding of herbicide glyphosate to human serum albumin by
optical spectroscopy and molecular modelling. J Photochem
Photobiol B 90:26–32
17. Sudlow G, Birkett DJ, Wade DN (1975) The characterization of
two specific drug binding sites on human serum albumin. Mol
Pharmacol 11:824–832
18. Gerbanowski A, Malabat C, Rabiller C, Gueguen J (1999)
Grafting of aliphatic and aromatic probes on rapeseed 2S and 12S
proteins: influence on their structural and physicochemical
properties. J Agric Food Chem 47:5218–5226
19. Sengupta A, Hage DS (1999) Characterization of minor site
probes for human serum albumin by high-performance affinity
chromatography. Anal Chem 71:3821–3827
20. Yamasaki K, Maruyama T, Kragh-Hansen U, Otagiri M (1996)
Characterization of site I on human serum albumin: concept
about the structure of a drug binding site. Biochim Biophys Acta
1295:147–157
0.026
0.031
0.036
0.041
1530 1550 1570 1590 1610 1630 1650 1670
Wavelength cm-1
Abs
orba
nce
1564
1641
.1
0.012
0.017
0.022
0.027
0.032
0.037
1530 1550 1570 1590 1610 1630 1650 1670
Wavelength cm-1
Abs
orba
nce 15
46.6
1648
.8
a
b
Fig. 9 FT-IR spectra of free BSA (a) and difference spectra [(BSA
solution ? HES solution)-(HES solution)] in buffer of pH 7.4 in the
region of 1700–1500 cm-1. The shift in amide I and amide II peaks of
BSA indicate the interaction between BSA and HES
4928 Mol Biol Rep (2011) 38:4921–4929
123

21. Forster T, Sinanoglu O (1996) Modern quantum chemistry, vol 3.
Academic Press, New York
22. Jurasekova Z, Marconi G, Sanchez-Cortes S, Torreggiani A
(2009) Spectroscopic and molecular modeling studies on the
binding of the flavonoid luteolin and human serum albumin.
Biopolymers 91:917–927
23. Predki PF, Harford C, Brar P, Sarkar B (1992) Further charac-
terization of the N-terminal copper(I1)-and nickel(I1)-binding
motif of protein. Biochem J 287:211–215
24. Cui F, Zhang Q, Yan Y, Yao X, Qu G, Lu Y (2008) Study of
characterization and application on the binding between 5-iodo-
uridine with HSA by spectroscopic and modeling. Carbohydr
Polym 73:464–472
25. Zhou J, Wu X, Gu X, Zhou L, Song K, Wei S, Feng Y, Shen J
(2009) Spectroscopic studies on the interaction of hypocrellin A
and haemoglobin. Spectrochim Acta Part A 72:151–155
26. Klajnert B, Bryszewska M (2002) Fluorescence studies on
PAMAM dendrimers interactions with bovine serum albumin.
Bioelectrochemistry 55:33–35
27. Stan D, Matei I, Mihailescu C, Savin M, Matache M, Hillebrand
M, Baciu I (2009) Spectroscopic investigations of the binding
interaction of a new indanedione derivative with human and
bovine serum albumins. Molecules 14:1614–1626
28. Bentley KL, Thompson LK, Klebe RJ, Horowitz PM (1985)
Fluorescence polarization: a general method for measuring ligand
binding and membrane microviscosity. BioTechniques 3:356–365
29. Lu ZX, Cui T, Shi QL (1987) Applications of circular dichroism
and optical rotatory dispersion in molecular biology, 1st edn.
Science Press, Beijing
30. Mandal P, Ganguly T (2009) Fluorescence spectroscopic char-
acterization of the interaction of human adult hemoglobin and
two isatins, 1-methylisatin and 1-phenylisatin: a comparative
study. J Phys Chem B 113:14904–14913
31. Li Y, He WY, Dong Y, Sheng F, Hu Z (2006) Human serum
albumin interaction with formononetin studied using fluorescence
anisotropy, FT-IR spectroscopy and molecular modeling meth-
ods. Bioorg Med Chem 14:1431
Mol Biol Rep (2011) 38:4921–4929 4929
123