
Evaluation of Behavioral Guidance Structure on Juvenile Salmonid Passage and Survival at Bonneville...
192
PNNL-20338 Prepared for the U.S. Army Corps of Engineers, Portland District, under an Interagency Agreement with the U.S. Department of Energy Contract DE-AC05-76RL01830 Evaluation of Behavioral Guidance Structure on Juvenile Salmonid Passage and Survival at Bonneville Dam in 2009 DM Faber J Kim GR Ploskey T Fu MA Weiland ES Fischer D Deng TJ Monter JS Hughes JR Skalski Final Report March 2011
-
Upload
independent -
Category
Documents
-
view
2 -
download
0
Transcript of Evaluation of Behavioral Guidance Structure on Juvenile Salmonid Passage and Survival at Bonneville...

PNNL-20338
Prepared for the U.S. Army Corps of Engineers, Portland District, under an Interagency Agreement with the U.S. Department of Energy Contract DE-AC05-76RL01830
Evaluation of Behavioral Guidance Structure on Juvenile Salmonid Passage and Survival at Bonneville Dam in 2009 DM Faber J Kim GR Ploskey T Fu MA Weiland ES Fischer D Deng TJ Monter JS Hughes JR Skalski Final Report March 2011


PNNL-20338
Evaluation of Behavioral Guidance Structure on Juvenile Salmonid Passage and Survival at Bonneville Dam in 2009 FINAL REPORT DM Faber J Kim GR Ploskey T Fu MA Weiland ES Fischer D Deng TJ Monter1 JS Hughes JR Skalski2 March 2011 Prepared for the U.S. Army Corps of Engineers Portland District, under an Interagency Services Agreement with the U.S. Department of Energy Contract DE-AC05-76RL01830 Pacific Northwest National Laboratory Richland, Washington 99352 1 Pacific State Fisheries Commission 2 Columbia Basin Research


iii
Abstract
Pacific Northwest National Laboratory (PNNL) conducted an acoustic-telemetry study at Bonneville Dam in 2009 to evaluate the effects of a behavioral guidance structure (BGS) in the Bonneville Dam second powerhouse forebay on fish passage and survival through the second powerhouse (B2), the dam as a whole, and through the first powerhouse and spillway combined. The BGS was deployed to increase the survival of fish passing through B2 by increasing the percentage of outmigrating smolts entering the B2 Corner Collector (B2CC)—a surface flow outlet known to be a relatively benign route for downstream passage at this dam. The study relied on releases of live Juvenile Salmon Acoustic Telemetry System tagged smolts in the Columbia River and used acoustic telemetry to evaluate the approach, passage, and survival of passing juvenile salmon. Study results indicated that having turbine 11 in service is important for providing flow conditions that are comparable to those observed in pre-BGS years (2004 and 2005) and in 2008. This study supports the U.S. Army Corps of Engineers continual effort to improve conditions for juvenile anadromous fish passing through Columbia River dams.


v
Executive Summary
Fish passage and survival are often evaluated to identify ways to improve conditions for juvenile anadromous fish passing through Columbia River dams. In 2009, Pacific Northwest National Laboratory (PNNL) conducted an acoustic-telemetry study at Bonneville Dam for the Portland District of the U.S. Army Corps of Engineers. The study evaluated the effects of a 700-ft-long and 10-ft-deep behavioral guidance structure (BGS) located in the forebay of the Bonneville Dam second powerhouse (B2) for the second time and estimated passage and survival of yearling Chinook salmon (CH1), subyearling Chinook salmon (CH0), and juvenile steelhead (STH) passing downstream through this powerhouse, the dam as a whole, and through B1 and the spillway combined. The BGS was deployed to increase the survival of fish passing through B2 by increasing the percentage of outmigrating smolts entering the B2 Corner Collector (B2CC)—a surface flow outlet known to be a relatively benign route for downstream passage at this dam.
Fish longer than 95 mm were collected at the John Day Dam Smolt Monitoring Facility and surgically implanted with Juvenile Salmon Acoustic Telemetry System (JSATS) and passive integrated transponder (PIT) tags. Post-surgery, the fish were held overnight in tanks supplied with a continuous flow of river water to allow time for recovery and then released upstream near Roosevelt, Washington, as part of two concurrent survival studies evaluating juvenile smolt-passage survival at John Day Dam and the B2. The volitional movements of the tagged migrants were subsequently tracked through the B2 forebay to their eventual route of passage. Passage location was recorded and incorporated with detections from three downstream survival arrays to produce survival estimates. The tracked positions of fish in the forebay and passage distribution at B2 were evaluated to determine behavior relative to the BGS location.
The BGS increased passage percentage into the B2CC for CH1 by up to 9%, but no improvements were observed for CH0 or STH when comparing 2008 results to passage distributions observed in 2004 and 2005 radio-telemetry studies. The majority of STH and CH1 navigated past the BGS and through the south gap (area between the downstream tip of the BGS and Cascade Island), which was closest to the B2CC, whereas equal proportions of CH0 navigated through the south and north gaps between the BGS and shorelines. The B2CC efficiency was always higher for fish passing through the south gap compared to fish passing through the north gap or under the BGS. Overall, the B2CC efficiency was very high for STH (59%), followed by CH1 (40.1%), and then CH0 (51.8%). Downstream migrants appeared to navigate downstream proportionally to water velocities in the thalweg when their downstream pathways were plotted in relation to the BGS and the B2 forebay.
There were significant operational differences at B2 between spring and summer. During spring, turbine unit 15 (in the center of the powerhouse) was offline, and during summer turbine unit 11 (adjacent to the B2CC) was offline. Because of the operational differences, it was difficult to compare passage percentages when the BGS was not present but all units were operating, which was the case in 2004 and 2005. The BGS design was based on total powerhouse operation. The outage of these units may have altered flow along the upstream side of the BGS and around the BGS enough to influence the discovery of the B2CC for smolts, thereby affecting the efficiency of the B2CC.
In the relatively high flow year of 2008, there was a high survival rate of outmigrating smolts passing through all routes of B2. Paired- and triple-release survival estimates for CH1 were at or near 100% for

vi
the B2CC and the juvenile bypass system (JBS), and slightly lower for turbine routes (97%–98%). Similarly, CH0 had paired- and triple-release survival estimates near 100% for the B2CC and JBS, but had comparatively lower turbine survival rates (95%–97%). These estimates and corresponding confidence limits would have met the current Biological Opinion (BiOp) standards set in 2008 for survival past Columbia and Snake river dams. Because there were no control releases, STH survival was evaluated using single-release Cormack-Jolly-Seber models. These estimates include mortality between the dam and the downstream survival arrays, where we found estimates near 98% survival for all routes at B2 through the tailrace. We found that there were no obvious seasonal survival trends in the spring for CH1 or STH, but there was a very significant trend in the summer. The CH0 showed a strong decline in survival for all routes passing through B2 as the summer progressed. It is possible that residualization (reverse smoltification) decreased flow, and increasing temperatures may have contributed to this trend because these variables were all significantly correlated with the decreasing survival. Nevertheless, the survival of CH0 was still above the 93% standard set by the 2008 BiOp.
In summary, the BGS benefitted the collection efficiency and effectiveness for CH1 passing through the B2CC, but did not change STH or CH0 collection efficiency compared to prior study years. The B2CC passage efficiency for STH is very high with or without the BGS. Survival estimates for all smolts passing downstream through B2 were very high using triple-, paired-, and single-release Cormack-Jolly-Seber modeling methods and would meet current BiOp standards. Turbine unit 11 provides flow into the south of the B2 where the B2CC is located; thus, the fact that this unit was off during summer may have reduced B2CC efficiency for CH0. To satisfactorily test the effect the BGS has on improving the B2CC efficiency for CH0, Turbine 11 should be operational throughout the testing period. Detailed survival and passage metrics are summarized below in Tables ES1.1 through ES1.5.
Table ES.1. Summary of Survival Estimates for Yearling Chinook Salmon Released into the Lower Columbia River and Regrouped Passing Through Routes at Bonneville Dam(a)
Bonneville Corner
Collector
Juvenile Bypass System B2 Turbines
Bonneville 2nd Powerhouse
Bonneville 1st Powerhouse and Spillway
Bonneville Dam and Forebay
Single-Release Survival
0.998 (0.003) 0.974 (0.043) 0.971 (0.027) 0.981 (0.013) 0.947 (0.013) 0.957 (0.009)
Relative-Release Survival 0.975 (0.043) 0.972 (0.027) 0.983 (0.013) 0.949 (0.013) 0.959 (0.010)
(a) Cormack-Jolly-Seber single-release and relative-release survival estimates are shown. Survival estimates were variance or sample-weighted (N-weighted) as appropriate based on chi-square results and sample size. One-half 95% confidence intervals are reported in parentheses.

vii
Table ES.2. Summary of Survival Estimates for Juvenile Steelhead Released into the Lower Columbia River and Regrouped Passing Through Routes at Bonneville Dam(a)
B2 Corner Collector (B2CC)
Juvenile Bypass System B2 Turbines
Bonneville 2nd Powerhouse
Bonneville 1st Powerhouse and Spillway
Bonneville Dam and Forebay
Single-Release Survival
0.993 (0.020) 0.956 (0.035) 0.939 (0.050) 0.972 (0.016) 0.954 (0.010) 0.961 (0.006)
Relative-Release Survival 0.964 (0.040) 0.946 (0.054) 0.979 (0.026) 0.961 (0.022) 0.968 (0.021)
(a) Cormack-Jolly-Seber single-release and relative-release survival estimates are shown. Survival estimates were variance or sample-weighted (N-weighted) as appropriate based on chi-square results and sample size. One-half 95% confidence intervals are reported in parentheses.
Table ES.3. Summary of Survival Estimates for Subyearling Chinook Salmon Released into the Lower Columbia River and Regrouped Passing Through Routes at Bonneville Dam(a)
B2 Corner Collector (B2CC)
Juvenile Bypass System B2 Turbines
Bonneville 2nd Powerhouse
Bonneville 1st Powerhouse
and and Spillway
Bonneville Dam and Forebay
Single-Release Survival
0.942 (0.054) 0.881 (0.064) 0.939 (0.065) 0.934 (0.041) 0.883 (0.024) 0.903 (0.029)
Relative-Release Survival 0.935 (0.111) 0.997 (0.093) 0.991 (0.071) 0.938 (0.057) 0.959 (0.063)
(a) Cormack-Jolly-Seber single-release and relative-release survival estimates are shown. Survival estimates were variance or sample-weighted (N-weighted) as appropriate based on chi-square results and sample size. One-half 95% confidence intervals are reported in parentheses.
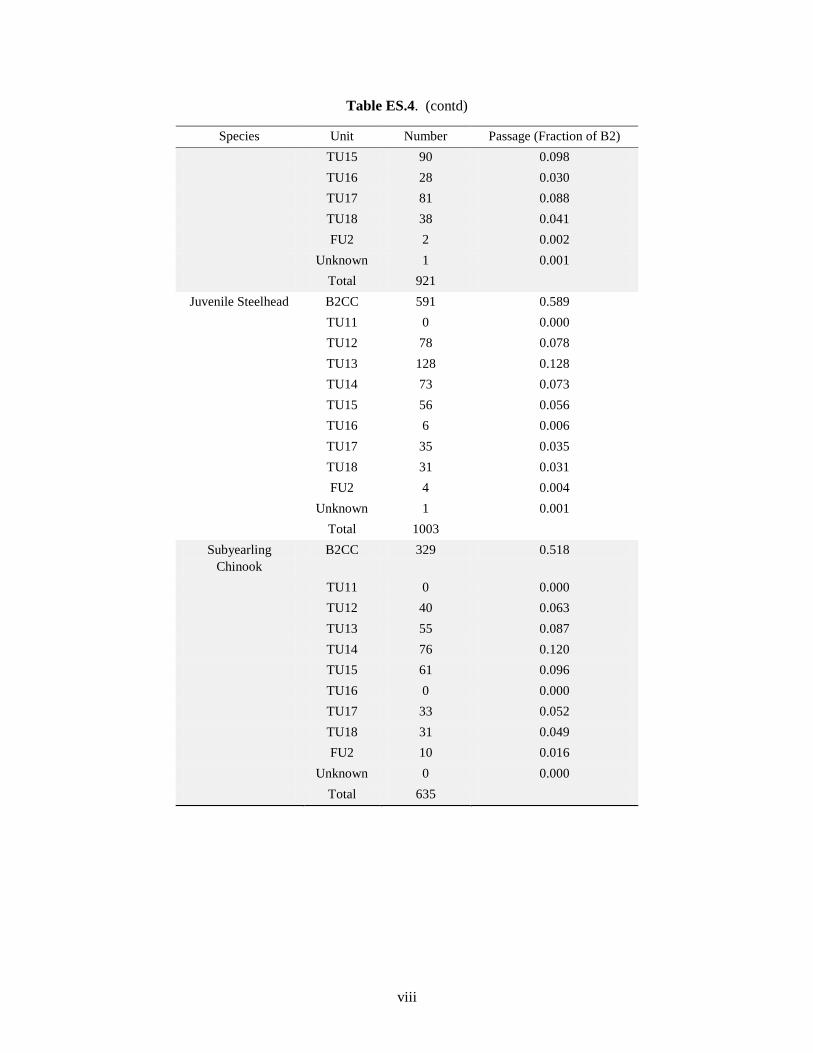
Table ES.4. Passage Numbers and Associated Percentage for Tagged Juvenile Salmon and Steelhead Migrating Downstream Through B2 Routes
Species Unit Number Passage (Fraction of B2) Yearling Chinook B2CC 369 0.401
TU11 0 0.000 TU12 75 0.081 TU13 143 0.155 TU14 94 0.102
viii
Table ES.4. (contd)
Species Unit Number Passage (Fraction of B2) TU15 90 0.098 TU16 28 0.030 TU17 81 0.088 TU18 38 0.041 FU2 2 0.002 Unknown 1 0.001 Total 921
Juvenile Steelhead B2CC 591 0.589 TU11 0 0.000 TU12 78 0.078 TU13 128 0.128 TU14 73 0.073 TU15 56 0.056 TU16 6 0.006 TU17 35 0.035 TU18 31 0.031 FU2 4 0.004 Unknown 1 0.001 Total 1003
Subyearling Chinook
B2CC 329 0.518
TU11 0 0.000 TU12 40 0.063 TU13 55 0.087 TU14 76 0.120 TU15 61 0.096 TU16 0 0.000 TU17 33 0.052 TU18 31 0.049 FU2 10 0.016 Unknown 0 0.000 Total 635
ix
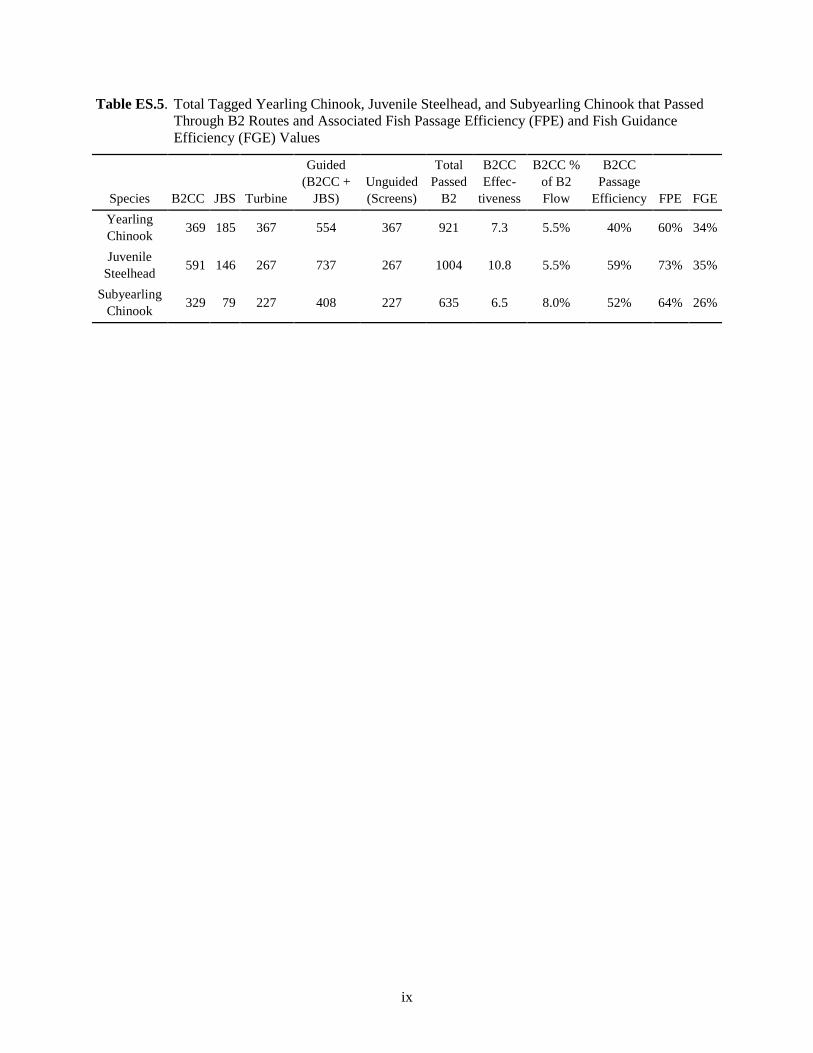
Table ES.5. Total Tagged Yearling Chinook, Juvenile Steelhead, and Subyearling Chinook that Passed Through B2 Routes and Associated Fish Passage Efficiency (FPE) and Fish Guidance Efficiency (FGE) Values
Species B2CC JBS Turbine
Guided (B2CC +
JBS) Unguided (Screens)
Total Passed
B2
B2CC Effec-
tiveness
B2CC % of B2 Flow
B2CC Passage
Efficiency FPE FGE Yearling Chinook 369 185 367 554 367 921 7.3 5.5% 40% 60% 34%
Juvenile Steelhead 591 146 267 737 267 1004 10.8 5.5% 59% 73% 35%
Subyearling Chinook 329 79 227 408 227 635 6.5 8.0% 52% 64% 26%


xi
Preface
The U.S. Army Corps of Engineers (USACE) Portland District (CENWP), contracted with the Pacific Northwest National Laboratory (PNNL), in Richland, Washington, to conduct an acoustic-telemetry survival study at the Bonneville Dam in 2008. The project took place as a part of a call for proposals titled SPE-P-08-1: Evaluation of a Behavioral Guidance Structure at Bonneville Dam Second Powerhouse. PNNL assembled a study team consisting of staff from PNNL, the Pacific States Marine Fisheries Commission (PSMFC), and the University of Washington. The Portland District provided all funding and oversight.


xiii
Acknowledgments
Many people made valuable contributions to this study and deserve acknowledgment. The Pacific States Marine Fisheries Commission (PSMFC) supervisors at the John Day Dam Smolt Monitoring Facility (Greg Kovalchuk) and at the Bonneville Dam Juvenile Monitoring Facility (Dean Ballinger) were helpful in coordinating fish collections with daily fish sampling at the respective locations. Seasonal PSMFC staff also helped with tagging fish: Terry Goss, Matt Meyer, and Randy Wall. Rick Martinson supervised the PSMFC staff.
Mr. Dennis Schwartz served as the USACE Contracting Officers Technical Representative and provided valuable coordination between researchers and Bonneville Dam personnel. Mr. Brad Eppard contributed many valuable suggestions on study design and implementation, and furnished dam operations data.
Jonathon Rerecich and Ben Hausmann, of the Bonneville Lock and Dam Project, provided pre-work safety orientations and facilitated coordination between researchers and the Bonneville Project. The project supplied electricity to trailers on the north and south ends of the spillway, and set up clearances on the electric bus line supplying power to cranes on the spillway when researchers needed access to spillway piers. The rigging crew at Bonneville Dam was particularly helpful as well.
Many PNNL staff assisted by providing surgery training (Rich Brown and Kate Deters), fish tagging, transport, and release (Aaron Cushing, Matt Wilberding, Chris Anderson, and Kathleen Carter), tag-life study support (Jim Boyd, Andy Solcz, and Scott Carpenter), Juvenile Salmon Acoustic Telemetry System development (Eric Choi, Brian LaMarche, Daniel Deng, Tao Fu, Thomas Seim, and Thomas Carlson), and database entry and management (Jessica Carter). Aaron Cushing also prepared permit applications. Dr. Kenneth Ham was helpful in improving an autonomous node time correction program and developing filters for autonomous node data. David Geist was the Ecology Group Manager at PNNL, and Dr. Stephan Schlahta was the Product-Line Manager during this study.
Advanced Telemetry Systems (ATS), Inc. manufactured the acoustic tags. Autonomous and dam-mounted hydrophones were manufactured by Sonic Concepts, Seattle, Washington. Precision Acoustic Systems, also in Seattle, made the quad channel receivers and conducted node acceptance tests for PNNL. Cascade Aquatics, Inc. in Ellensburg, Washington, activated and delivered the acoustic tags. Schlosser Machine Shop fabricated anchors for autonomous nodes and frames for star clusters that were deployed in the spillway forebay.


xv
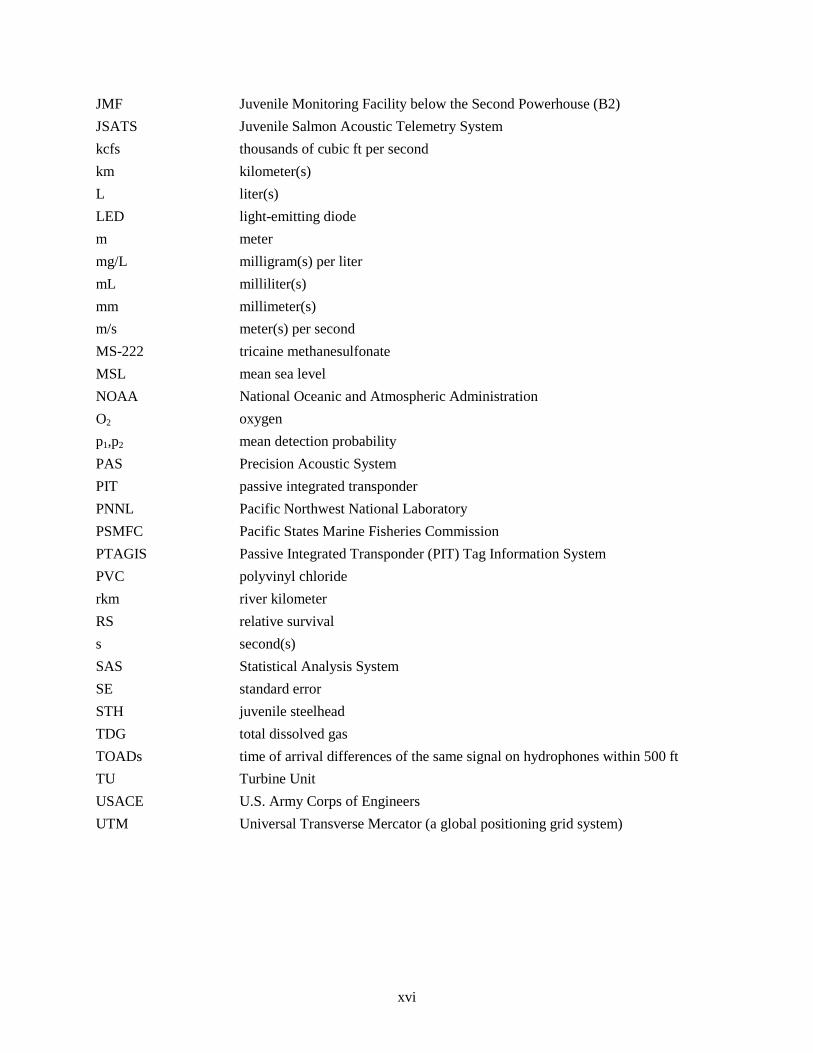
Acronyms and Abbreviations
ATS Advanced Telemetry Systems® B1 Bonneville Powerhouse 1 B2 Bonneville Powerhouse 2 B2CC Bonneville Powerhouse 2 Corner Collector B2 JBS Bonneville Powerhouse 2 Juvenile Bypass System BiOp Biological Opinion BON Bonneville Dam BTW0 egress survival array BTW1 primary survival array BTW2 secondary survival array BTW3 tertiary survival array BPA Bonneville Power Administration BTW Bonneville tailwater °C degree(s) Celsius or Centigrade CENWP Corps of Engineers, Northwest, Portland CF CompactFlash (card) cfs cubic feet per second CH0 subyearling Chinook salmon CH1 yearling Chinook salmon CI confidence interval (95%) CJS Cormack-Jolly-Seber model CL confidence limit (± ½ 95%) cm centimeter(s) CSV comma-separated variables CV2 coefficient of variation squared D dead-fish detection probability DART Data Access in Real Time FCRPS Federal Columbia River Power System FU Fish Unit ft foot(feet) g gram(s) gal gallon(s) GB gigabyte(s) GPS global positioning system hr hour(s) JBS Juvenile Bypass System
xvi
JMF Juvenile Monitoring Facility below the Second Powerhouse (B2) JSATS Juvenile Salmon Acoustic Telemetry System kcfs thousands of cubic ft per second km kilometer(s) L liter(s) LED light-emitting diode m meter mg/L milligram(s) per liter mL milliliter(s) mm millimeter(s) m/s meter(s) per second MS-222 tricaine methanesulfonate MSL mean sea level NOAA National Oceanic and Atmospheric Administration O2 oxygen p1,p2 mean detection probability PAS Precision Acoustic System PIT passive integrated transponder PNNL Pacific Northwest National Laboratory PSMFC Pacific States Marine Fisheries Commission PTAGIS Passive Integrated Transponder (PIT) Tag Information System PVC polyvinyl chloride rkm river kilometer RS relative survival s second(s) SAS Statistical Analysis System SE standard error STH juvenile steelhead TDG total dissolved gas TOADs time of arrival differences of the same signal on hydrophones within 500 ft TU Turbine Unit USACE U.S. Army Corps of Engineers UTM Universal Transverse Mercator (a global positioning grid system)

xvii
Contents
Abstract ................................................................................................................................................. iii Executive Summary .............................................................................................................................. v Preface .................................................................................................................................................. xi Acknowledgments ................................................................................................................................. xiii Acronyms and Abbreviations ............................................................................................................... xv 1.0 Introduction .................................................................................................................................. 1.1
1.1 Background .......................................................................................................................... 1.1 1.2 Study Overview .................................................................................................................... 1.4 1.3 2009 Study Objectives and Tasks ........................................................................................ 1.4 1.4 Definitions ............................................................................................................................ 1.6 1.5 Report Contents and Organization ....................................................................................... 1.6
2.0 Materials and Methods ................................................................................................................. 2.1 2.1 Fish Collection ..................................................................................................................... 2.1
2.1.1 The Collection and Tagging Site ............................................................................... 2.1 2.1.2 Federal and State Permitting ..................................................................................... 2.1 2.1.3 Sampling Methods ..................................................................................................... 2.1
2.2 Fish Tagging ......................................................................................................................... 2.3 2.2.1 JSATS Acoustic Micro-Transmitter .......................................................................... 2.3 2.2.2 Fish Collection and Tagging Procedures ................................................................... 2.3 2.2.3 Fish Recovery and Holding ....................................................................................... 2.4
2.3 Transport and Release .......................................................................................................... 2.5 2.4 Detection of Tagged Fish ..................................................................................................... 2.6
2.4.1 Nodes Within Arrays ................................................................................................. 2.7 2.4.2 Autonomous Node Rigging ....................................................................................... 2.10 2.4.3 Node Retrieval, Servicing, and Redeployment ......................................................... 2.11
2.5 Project Discharge and Water Temperature .......................................................................... 2.11 2.6 Data Processing and Validation ........................................................................................... 2.12 2.7 Tag-Life Study ..................................................................................................................... 2.13 2.8 Statistical Methods ............................................................................................................... 2.13
2.8.1 Release-Recapture Designs and Analyses ................................................................. 2.14 2.8.2 Positioning of Tagged Fish ....................................................................................... 2.18
3.0 Results .......................................................................................................................................... 3.1 3.1 Environmental Conditions .................................................................................................... 3.1
3.1.1 Project Discharge and Temperature .......................................................................... 3.1 3.2 Tests of Assumptions ........................................................................................................... 3.2
3.2.1 Representativeness of the Tagged Fish Population ................................................... 3.2
xviii
3.2.2 Tag-Life Versus Travel Time Through Survival Detection Arrays .......................... 3.6 3.2.3 Effect of Detections or Capture Histories on Detection and Survival ....................... 3.6 3.2.4 Assessment of Mixing for Paired-Release Survival Estimates ................................. 3.6
3.3 Detection and Survival of Juvenile Steelhead and Yearling and Subyearling Chinook Salmon .................................................................................................................................. 3.9 3.3.1 Tag-Life Study Correction ........................................................................................ 3.10 3.3.2 Detection and Survival of Juvenile Steelhead in Spring ........................................... 3.10 3.3.3 Detection and Survival of Yearling Chinook Salmon in Spring ............................... 3.11 3.3.4 Detection and Survival of Subyearling Chinook Salmon in Summer ....................... 3.12 3.3.5 Temporal and Dam Operations Effects on Survival.................................................. 3.14
3.4 Travel Times and Rates ........................................................................................................ 3.18 3.5 Diel Distributions ................................................................................................................. 3.19 3.6 Passage Distribution at Bonneville Powerhouse 2 ............................................................... 3.20 3.7 Forebay Distributions ........................................................................................................... 3.22
3.7.1 Horizontal Distributions ............................................................................................ 3.22 3.7.2 B2 Corner Collector Discovery Efficiency ............................................................... 3.26 3.7.3 Vertical ...................................................................................................................... 3.26
3.8 Forebay and Passage Distribution Relative to BGS Deployment ........................................ 3.33 3.9 Data Continuity .................................................................................................................... 3.39
4.0 Discussion ..................................................................................................................................... 4.1 4.1 Environmental Conditions .................................................................................................... 4.1
4.1.1 Project Discharge and Temperature .......................................................................... 4.1 4.1.2 Effects of Discharge and Temperature on Passage and Survival Rates .................... 4.1
4.2 Tests of Survival Model Assumptions ................................................................................. 4.2 4.2.1 Run Timing, Rejection Rates, and Length Frequency Comparisons ........................ 4.2 4.2.2 Tag-Life Study Correction ........................................................................................ 4.2 4.2.3 Burnham Tests........................................................................................................... 4.2 4.2.4 Mixing ....................................................................................................................... 4.2
4.3 Context for 2009 Survival Estimates.................................................................................... 4.3 4.4 Travel Time and Rates ......................................................................................................... 4.6 4.5 Diel Distributions ................................................................................................................. 4.6 4.6 Passage Distribution at Bonneville Powerhouse 2 ............................................................... 4.6
4.6.1 Yearling Chinook Salmon ......................................................................................... 4.8 4.6.2 Juvenile Steelhead ..................................................................................................... 4.8 4.6.3 Subyearling Chinook Salmon .................................................................................... 4.8
4.7 Forebay Distribution ............................................................................................................ 4.9 4.8 Forebay and Passage Distributions Relative to the BGS ..................................................... 4.9 4.9 Data Continuity .................................................................................................................... 4.10
5.0 Recommendations ........................................................................................................................ 5.1

xix
6.0 References .................................................................................................................................... 6.1 Appendix A – Fish-Tagging Tables ...................................................................................................... A.1 Appendix B – Hydrophone and Autonomous Node Deployment Tables ............................................. B.1 Appendix C – Capture History, Detection, and Survival Tables .......................................................... C.1 Appendix D – Fish Guidance and Passage Efficiency Tables .............................................................. D.1

xx
Figures
1.1 The Behavioral Guidance Structure with One Section Shown out of the Water; and as Deployed in the Forebay of the Bonneville Dam Second Powerhouse....................................... 1.2
1.2 Study Area from Bonneville Dam Downstream to Oak Point, Washington ............................... 1.3 1.3 Aerial View of Bonneville Dam.................................................................................................. 1.3 2.1 The ATS JSATS Acoustic Micro-Transmitter and a PIT Tag .................................................... 2.3 2.2 Surgical Implantation of PIT and Acoustic Tags in the John Day Smolt Monitoring Facility ... 2.4 2.3 Post-Surgery Holding Tank with Recovery Buckets .................................................................. 2.5 2.4 Side and Bottom View of a Node Top ........................................................................................ 2.7 2.5 Maps Showing Approximate Locations of Underwater Listening Devices in Deployed
Arrays for this Study ................................................................................................................... 2.8 2.6 BGS Deployment in the B2 Forebay ........................................................................................... 2.9 2.7 Three-Dimensional Depiction of the B2 Forebay Showing the Hydrophone Locations ............ 2.9 2.8 Autonomous Node Rigging ......................................................................................................... 2.10 2.9 Autonomous Node Retrieval ....................................................................................................... 2.11 2.10 Schematic of the Release-Recapture Design Used to Estimate Bonneville Dam-Passage
Survival in 2009 .......................................................................................................................... 2.15 3.1 Average Daily Rate of Water Discharge Through Bonneville Dam and Its Spillway in 2009
Relative to Averages for the Preceding 10-Year Period ............................................................. 3.1 3.2 Average Daily Water Temperature in 2009 Versus the Average Daily Estimates for a
10-Year Period from 1999 Through 2008 ................................................................................... 3.2 3.3 Smolt Monitoring Program Passage Index for Bonneville Dam in 2009 Relative to the
Time Period that Tagged Fish Released Upstream of John Day Dam Were Passing Through the Dam ....................................................................................................................................... 3.3
3.4 Length Frequencies of Tagged and Untagged Juvenile Steelhead, Yearling Chinook Salmon Smolts, and Subyearling Chinook Salmon Smolts ...................................................................... 3.5
3.5 Percent of Acoustic Tags Transmitting and Cumulative Frequency of Arrival at the Tertiary Survival Detection Array for Three Runs of Juvenile Salmonids Studied in 2009 ....... 3.6
3.6 Cumulative Time of Arrival of Yearling Chinook Salmon Smolts at the Forebay Array and B2CC and Arrival Hour at the Tertiary Array of Individuals Known to Have Passed the Forebay Array and the B2CC ...................................................................................................... 3.7
3.7 Cumulative Time of Arrival of Juvenile Steelhead at the Forebay Array and B2CC and Arrival Hour at the Tertiary Array of Individuals Known to Have Passed the Forebay Array and the B2CC .............................................................................................................................. 3.8
3.8 Cumulative Time of Arrival of Subyearling Chinook Salmon Smolts at the Forebay Array and B2CC and Arrival Hour at the Tertiary Array of Individuals Known to Have Passed the Forebay Array and the B2CC ................................................................................................ 3.9
3.9 Comparison of Day and Night Passage Survival Estimates for Juvenile Steelheads in 2009 ..... 3.11 3.10 Comparison of Day and Night Passage Survival Estimates for Yearling Chinook Salmon
Smolts in 2009............................................................................................................................. 3.12

xxi
3.11 Comparison of Day and Night Passage Survival Estimates for Subyearling Chinook Salmon Smolts in 2009............................................................................................................................. 3.14
3.12 Plot of Survival Rates by Virtual Release Dates for Yearling Chinook Salmon Smolts Passing Through B2 Turbines or the B2 JBS or Through Bonneville Dam, B2, the B2CC, or B1 and Spillway Combined .................................................................................................... 3.14
3.13 Plot of Survival Rates by Virtual Release Dates for Juvenile Steelheads Passing Through B2 Turbines or the B2 JBS or Through Bonneville Dam, B2, the B2CC, or B1 and Spillway Combined .................................................................................................................................... 3.15
3.14 Plot of Survival Rates and Residualization Combined by Virtual Release Dates for Subyearling Chinook Salmon Smolts Passing Through the B2 JBS, B2 Turbines or B1 and the Spillway Combined, or Bonneville Dam, B2, or the B2CC .................................................. 3.16
3.15 Diel Passage Distribution of Tagged Yearling Chinook Salmon Detected Arriving and Passing Through Bonneville Dam............................................................................................... 3.19
3.16 Diel Passage Distribution of Tagged Juvenile Steelhead Detected Arriving at and Passing Through Bonneville Dam ............................................................................................................ 3.20
3.17 Diel Passage Distribution of Tagged Subyearling Chinook Salmon Detected Arriving at and Passing Through Bonneville Dam............................................................................................... 3.20
3.18 Total Number of Fish Tracked Within 10-m x 10-m Grids During Daytime and Nighttime and for Yearling Chinook Salmon Smolts Approaching B2 ....................................................... 3.23
3.19 Total Number of Fish Tracked Within 10-m x 10-m Grids During Daytime and Nighttime for Juvenile Steelhead Approaching B2 ...................................................................................... 3.24
3.20 Total Number of Fish Tracked Within 10-m x 10-m Grids During Daytime and Nighttime for Subyearling Chinook Salmon Approaching B2 .................................................................... 3.25
3.21 Corner Collector Discovery by Forebay Location ...................................................................... 3.27 3.22 Corner Collector Discovery by Forebay Location ...................................................................... 3.28 3.23 Corner Collector Discovery by Forebay Location ...................................................................... 3.29 3.24 Vertical Distribution of Tracked Yearling Chinook Salmon Smolts by Forebay Location ........ 3.30 3.25 Vertical Distribution of Tracked Juvenile Steelhead by Forebay Location ................................ 3.31 3.26 Vertical Distribution of Tracked Subyearling Chinook Salmon Smolts by Forebay
Location ...................................................................................................................................... 3.32 3.27 Approach Route Relative to the BGS for All Tagged Fish ......................................................... 3.33 3.28 Surface-Water Stream Traces for Scenario 6, Which Had Turbine Unit 11 Out of Service ....... 3.36 3.29 Surface-Water Stream Traces for Scenario 1, Which Had Turbine Unit 11 in Service .............. 3.36 4.1 Plot of Survival Estimates for Yearling Chinook Salmon from USGS Studies in 2002,
2004, and 2005 and PNNL Studies in 2008 and 2009 ................................................................ 4.4 4.2 Plot of Survival Estimates for Juvenile Steelhead in USGS Studies in 2004 and 2005 and
PNNL Studies in 2008 and 2009 ................................................................................................. 4.5 4.3 Plot of Survival Estimates for Subyearling Chinook Salmon Smolts from USGS Studies
Conducted in 2004 and 2005 and PNNL Studies in 2008 and 2009. .......................................... 4.6
xxii
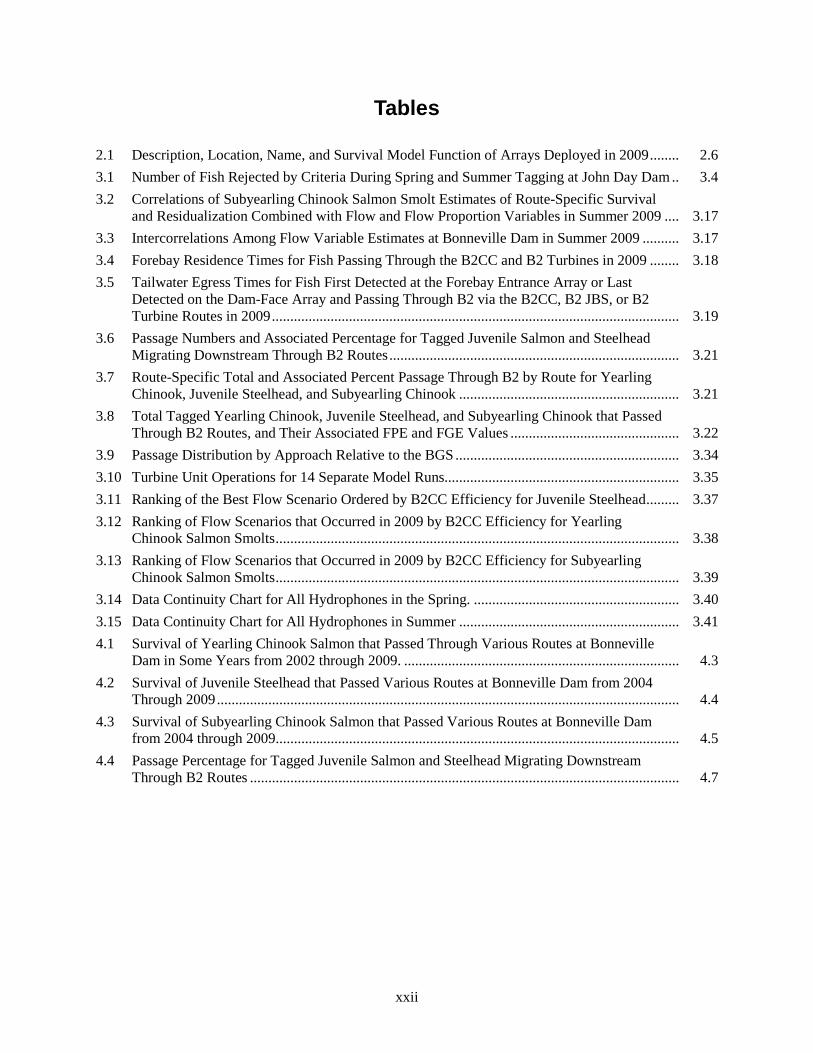
Tables
2.1 Description, Location, Name, and Survival Model Function of Arrays Deployed in 2009 ........ 2.6 3.1 Number of Fish Rejected by Criteria During Spring and Summer Tagging at John Day Dam .. 3.4 3.2 Correlations of Subyearling Chinook Salmon Smolt Estimates of Route-Specific Survival
and Residualization Combined with Flow and Flow Proportion Variables in Summer 2009 .... 3.17 3.3 Intercorrelations Among Flow Variable Estimates at Bonneville Dam in Summer 2009 .......... 3.17 3.4 Forebay Residence Times for Fish Passing Through the B2CC and B2 Turbines in 2009 ........ 3.18 3.5 Tailwater Egress Times for Fish First Detected at the Forebay Entrance Array or Last
Detected on the Dam-Face Array and Passing Through B2 via the B2CC, B2 JBS, or B2 Turbine Routes in 2009 ............................................................................................................... 3.19
3.6 Passage Numbers and Associated Percentage for Tagged Juvenile Salmon and Steelhead Migrating Downstream Through B2 Routes ............................................................................... 3.21
3.7 Route-Specific Total and Associated Percent Passage Through B2 by Route for Yearling Chinook, Juvenile Steelhead, and Subyearling Chinook ............................................................ 3.21
3.8 Total Tagged Yearling Chinook, Juvenile Steelhead, and Subyearling Chinook that Passed Through B2 Routes, and Their Associated FPE and FGE Values .............................................. 3.22
3.9 Passage Distribution by Approach Relative to the BGS ............................................................. 3.34 3.10 Turbine Unit Operations for 14 Separate Model Runs................................................................ 3.35 3.11 Ranking of the Best Flow Scenario Ordered by B2CC Efficiency for Juvenile Steelhead ......... 3.37 3.12 Ranking of Flow Scenarios that Occurred in 2009 by B2CC Efficiency for Yearling
Chinook Salmon Smolts .............................................................................................................. 3.38 3.13 Ranking of Flow Scenarios that Occurred in 2009 by B2CC Efficiency for Subyearling
Chinook Salmon Smolts .............................................................................................................. 3.39 3.14 Data Continuity Chart for All Hydrophones in the Spring. ........................................................ 3.40 3.15 Data Continuity Chart for All Hydrophones in Summer ............................................................ 3.41 4.1 Survival of Yearling Chinook Salmon that Passed Through Various Routes at Bonneville
Dam in Some Years from 2002 through 2009. ........................................................................... 4.3 4.2 Survival of Juvenile Steelhead that Passed Various Routes at Bonneville Dam from 2004
Through 2009 .............................................................................................................................. 4.4 4.3 Survival of Subyearling Chinook Salmon that Passed Various Routes at Bonneville Dam
from 2004 through 2009 .............................................................................................................. 4.5 4.4 Passage Percentage for Tagged Juvenile Salmon and Steelhead Migrating Downstream
Through B2 Routes ..................................................................................................................... 4.7

1.1
1.0 Introduction
In a continual effort to improve conditions for juvenile anadromous fish passing through Columbia River dams, the U.S. Army Corps of Engineers (USACE) Portland District (CENWP) has funded numerous evaluations of fish passage and survival. In 2008 and 2009, the CENWP asked the Pacific Northwest National Laboratory (PNNL) to conduct an acoustic-telemetry study to evaluate a prototype behavioral guidance structure (BGS) that was installed in the forebay of Bonneville Dam’s Washington shore powerhouse (Powerhouse 2 or B2). The BGS was designed to increase the passage of juvenile salmonids into the B2 Corner Collector (B2CC)—a surface flow outlet that usually affords high survival for yearling Chinook salmon (CH1; Oncorhynchus tshawytscha), juvenile steelhead (STH; O. mykiss), and subyearling Chinook salmon (CH0) passing through B2. To evaluate the BGS in 2009, we studied the approach and passage distribution CH1 and STH in spring and of CH0 in summer relative to the BGS location. In addition, we estimated route-specific survival these salmonids passing downstream through B2. All fish detected on a forebay entrance array located 2 km upstream of B2 were regrouped to form a virtual release for estimating forebay and dam-passage survival down to a survival detection array located 42 km downstream of the dam. The forebay virtual release also was subdivided divided to estimate forebay and dam passage survival for fish subsequently detected passing through B2 (B2 passage survival) or not passing through B2 (i.e., B1 or spillway passage survival).
1.1 Background
Justification for this study is based on Action 11 in the 2008 Federal Columbia River Power System (FCRPS) Biological Opinion (BiOp; NOAA 2008):
Action 11 – Powerhouse Improvement Actions – “Providing or enhancing powerhouse surface flow outlets” and “Making improvements to juvenile bypass systems.”
The post-construction evaluations of the new B2CC at B2 in 2004 and 2005 indicated that mean B2CC passage efficiency was significantly higher for steelhead (70%) than it was for CH1 (33%) or for subyearling Chinook salmon (39%) (Evans et al. 2006; Reagan et al. 2006; Adams et al. 2006). Survival studies by Counihan et al. (2006a, b) indicated that the B2CC is a preferred route of passage because survival of juveniles passing through the B2CC was as high as or higher than that of juveniles passing through any other route. In an effort to further improve this efficiency for yearling and subyearling Chinook salmon smolts, the USACE installed a shallow-draft, 700-ft-long, 10-ft-deep BGS in the forebay of B2 for the 2008 migration season (Figure 1.1). Strategically locating the BGS was expected to significantly increase the efficiency of the B2CC for passing smolts and thereby increasing B2 and dam-passage survival rates.
Behavioral guidance structures have been used at several hydropower projects in the Pacific Northwest to divert outmigrating smolts from turbines. In 1998, a large BGS was installed in the forebay of Lower Granite Dam on the Snake River in Washington. This BGS was a steel curtain 330 m long and 17 to 24 m deep. The purpose of the BGS was to alter the forebay distribution of smolts migrating downstream by guiding them away from turbines on the south side of the dam and toward a surface bypass collector to the north. Using radio telemetry and hydroacoustics, U.S. Geological Survey (USGS) and PNNL studies showed that about 80% of the fish moving toward the south turbines were successfully diverted north (Johnson et al. 2005). Further investigations showed how forebay distribution was affected

1.2
by the presence of the BGS at Lower Granite Dam. Several acoustic-telemetry studies revealed that the deep BGS in addition to a shallow-draft floating log-boom were both successful at diverting fish from the main thalweg to downstream locations better suited to increase survival through the dam (Cash et al. 2002). Hence, the design of the B2 BGS sought to take advantage of the major concepts learned from the deployment at Lower Granite Dam, and a shallow draft BGS was installed at B2 to divert outmigrating smolts toward the B2CC.
Figure 1.1. The Behavioral Guidance Structure with One Section Shown out of the Water (Top); and as
Deployed in the Forebay of the Bonneville Dam Second Powerhouse (B2; Bottom)
The distance between the uppermost release site near Roosevelt, Washington, and the last survival array at Oak Point, Washington, was 304 km. (An array is a group of autonomous underwater receivers (nodes) deployed to listen for acoustic tags passing through a cross section of the river.) Excluding distances traveled by fish released at sites upstream of Bonneville Dam, the study area covered about 150 km of the lower Columbia River from Bonneville Dam to Oak Point, Washington, at river kilometer (rkm) 86 (Figure 1.2). Cabled underwater hydrophones were deployed throughout the B2 forebay and on each of the turbine piers to detect the passage of tagged fish and to assign the last detections of tags to the bay where fish passed through B2. A primary survival detection array of underwater listening devices was deployed near Lady Island and Camas, Washington. Detection data derived from the primary array and two downstream arrays deployed by a post-FCRPS survival study were used to create detection histories and estimate the survival of smolts through Bonneville Dam and B2.

1.3
Figure 1.2. Study Area from Bonneville Dam Downstream to Oak Point, Washington. The background
image was derived from Google Maps.
Bonneville Lock and Dam consist of several structures that together span the Columbia River between Oregon and Washington near rkm 234.3, about 64 km east of Portland, Oregon (Figure 1.2). From the Oregon shore north toward Washington, Bonneville Dam is composed of a navigation lock, 10-turbine Powerhouse 1 (B1), Bradford Island, an 18-bay spillway, Cascades Island, and 8-turbine B2 (Figure 1.3). The spillway and B1 were constructed between 1933 and 1937 without specific regard for protecting juvenile salmonids migrating downstream. Construction of B2 began in 1974 and was completed in 1982. The CENWP operates Bonneville Dam for hydroelectric power generation for the Bonneville Power Administration (BPA) and the Bonneville Lock for navigation.
Figure 1.3. Aerial View of Bonneville Dam. JMF = Juvenile Monitoring Facility; B1 = Powerhouse 1;
B2 = Powerhouse 2.
1.4
1.2 Study Overview
The study reported here used acoustic telemetry to evaluate the approach, passage, and survival of juvenile salmon passing through B2 in relation to the BGS located in the upstream forebay of B2 (Figure 1.1). This study relied on releases of live Juvenile Salmon Acoustic Telemetry System (JSATS) tagged smolts in the Columbia River about 156 km upstream of Bonneville Dam for a John Day Dam survival study. Releases totaled 3470 CH1 and 3471 STH in spring, 3461 CH0) in summer. Fish releases were spread over a period of 31 consecutive days in spring and over a period of 29 consecutive days in summer. Fish were collected at the John Day Dam Smolt Monitoring Facility (SMF) and held overnight before surgery so that they were not overly stressed. Smolts longer than 95 mm were surgically implanted with JSATS and passive integrated transponder (PIT) tags and held another night to allow time for fish to recover from surgery. Fish tagged the previous day were released by a PNNL team in the morning and evening each day. All times in this report are in Pacific Standard Time (PST). All fish that survived to reach Bonneville Dam were regrouped into virtual releases on a Bonneville forebay array for estimating Bonneville Dam-passage survival. Fish detected on the B2 dam-face array were regrouped by route (B2CC, turbine, or Juvenile Bypass System [JBS]) to form virtual releases of fish passing through B2 routes. Detections of PIT tags in the B2 JBS and B2CC and of acoustic detections on hydrophones in a B2 JSATS array were used to assign routes of passage. Fish entering the B2 forebay were detected on a forebay and dam-face array consisting of 34 hydrophones mounted on the edges of the forebay and along the dam face. Fish detected on the powerhouse hydrophones were assigned a route of passage relative to the BGS location, as well as a bay of passage based upon three-dimensional (3D) tracking and the location of the last of at least four detections of implanted acoustic tags.
There were no reference releases of fish downstream of Bonneville Dam in 2009, so most survival estimates were based on single-release survival models, which accounted for losses of fish that occurred as fish travelled from a virtual release point down through 42 km of tailwater. Three arrays of autonomous nodes in survival detection arrays were located approximately 42, 121, and 148 km downstream of the dam.
Survival rates of fish passing through the B2CC were relatively high in 2009, as estimates had been in previous years, so we were comfortable using B2CC passage as a reference release for making paired-release estimates of dam-passage, B2-passage, B2 JBS-passage, and B2 turbine-passage survival rates.
1.3 2009 Study Objectives and Tasks
The primary objective of the acoustic-telemetry study was to evaluate the effect of the BGS on the passage and survival of juvenile salmon passing through B2 routes in comparison to prior years. Tasks undertaken to accomplish the objectives included the following:
1. PNNL evaluated the performance of the BGS for guiding CH1, STH, and CH0 to the B2CC by calculating a variety of statistical metrics. These metrics were estimated by type of fish, season, and for day or night periods:
a. BGS guidance efficiency = Number of fish guided along the BGS/number detected in the B2 forebay.
b. B2 FPE (fish passage efficiency) = (number of fish passing through in the B2CC + number passing through the B2 JBS)/ numbers passing through B2.

1.5
c. B2CC passage efficiency = number of fish passing into the B2CC/number passing through B2.
d. B2CC passage effectiveness = B2CC passage efficiency/proportion of B2 flow to the B2CC.
e. B2 FGE (fish guidance efficiency) = number of PIT or acoustic tags detected in the B2 JBS/number tracked passing into turbines.
f. Turbine passage = number entering turbines.
g. Turbine passage efficiency = number entering turbines/B2 passage.
2. A PNNL team collected juvenile salmonids at the John Day Dam SMF. The team surgically implanted 3470 CH1 and 3471 STH in spring and 3461 CH0in summer with JSATS acoustic and PIT tags. They released the tagged fish in the morning and evening into the Columbia River near Roosevelt, Washington, about 41 km upstream of John Day Dam over a period of 31 consecutive days in spring and over a period of 29 consecutive days in summer. These releases of treatment fish above Bonneville Dam provided the opportunity for tagged fish to be detected on a B2 forebay array to create virtual releases to estimate dam-passage survival or to be regrouped into virtual releases passing through B2 routes. There were no reference releases of fish downstream of Bonneville Dam in 2009.
3. A PNNL team deployed and maintained a cabled system of 34 hydrophones on nine turbine piers and throughout the forebay to detect the passage of tagged fish migrating downstream. Hydrophone detections were used to assign a route of passage for fish based upon the location of the last of at least four detections within 60 seconds of 3D tracking of movements. Detections of PIT tags in the B2 JBS and the B2CC and of acoustic detections on hydrophones in a B2 dam-face array were used to assign the route of passage at B2.
4. A PNNL team deployed and maintained an array of four autonomous nodes at rkm 236 about 2 km upstream of the Bonneville Dam spillway to detect tagged smolts arriving at the dam and to create virtual releases for estimating dam-passage survival.
5. A PNNL team also deployed and maintained a primary survival detection array with nine autonomous underwater nodes near Lady Island, which is located about 42 km downstream of the dam at rkm 192. The primary array along with two downstream arrays deployed near Kalama, Washington (rkm 113), and near Oak Point, Washington (rkm 86), by a post-FCRPS survival study were used to estimate dam-passage, B2-passage, B1- and spillway-passage (also B1- + spillway-passage), and B2 route-specific survival rates using single-release survival models.
6. We also estimated survival by route of passage based upon detection histories of treatment and reference fish at the primary, secondary, and tertiary tailwater arrays, using paired- and triple-release survival models. Routes were pooled by type (e.g., JBS, B2CC, or turbines). All survival estimates were accompanied by an estimate of the one-half 95% confidence interval (1/2 95% CI).
7. We tested a hypotheses comparing the 2008 passage metrics with the BGS installed to mean estimates for 2004 and 2005 before the BGS was deployed (by fish type), including:
Ho: survival in 2008 when the BGS is installed is not significantly higher than mean survival for 2004 and 2005.
8. We also tested the efficiency of the B2CC PIT-tag reader from the direct release and virtual release of dual-tagged (PIT/acoustic) fish released into the mouth of B2CC by the post-FCRPS study.

1.6
1.4 Definitions
In this report, we define estimates of single-, paired- and triple-release survival by the upstream and downstream boundaries of the reach of interest. The following additional definitions are needed to clarify paired-release survival metrics.
Forebay is the reach of river immediately upstream of the dam where operations at the dam are the primary contributing factor to the velocity and direction of water flow. The upstream boundary of a forebay is where a significant alteration in water-flow allocation through dam operational changes affects water velocity or direction. The downstream boundary is the upstream face of the dam. The Bonneville Dam forebay entrance array was located 2 km upstream of B2.
Tailrace is the reach of river immediately downstream of the dam where dam operations are the primary factor affecting the velocity and direction of water flow. The upstream boundary of the tailrace is the downstream face of the dam and the downstream boundary is where operational changes at the dam no longer affect the direction of water flow, and mixing from the spillway and powerhouse is complete.
Tailwater in this study is the reach of river downstream of the tailrace to the point where saltwater mixing occurs. Tailwater is synonymous with reservoir or pool when it lies between two dams, but Bonneville Dam is the last dam on the lower Columbia River. The National Oceanic and Atmospheric Administration (NOAA) Fisheries release site was about 2 km downstream of the spillway adjacent to the USACE boat launch and near the upstream boundary of the tailwater.
Passage-route survival is the probability of survival for fish passing through any individual route (e.g., spillway, B2CC, B2 turbines, or B2 JBS) to the boundary between the tailrace and tailwater where reference fish were released. In this study, passage route survival was estimated for fish passing through the B2CC, the JBS, or B2 turbines. The numbers of fish tracked to individual turbine units were too low to warrant the calculation of their survival by individual turbine. Estimates of turbine-specific survival lacked the precision required to detect significant differences in survival among individual turbines.
1.5 Report Contents and Organization
The ensuing sections of this report present the materials and methods used in conducting the acoustic telemetry behavior and survival study at B2 (Section 2.0) and the study results (Section 3.0). Section 4.0 describes the environment and 2008 outmigration conditions and discusses the results of the study, including dead-fish detection, detection performance, egress rates, and the detection and survival of CH1 and STH smolts in spring and CH0 smolts in summer. Recommendations are provided in Section 5.0, followed by a reference list in Section 6.0. Finally, Appendixes A, B, C, and D, respectively, contain tables of fish-tagging and release data; hydrophone and autonomous node deployment information; capture history, detection, and survival data; and fish guidance and passage efficiency data.

2.1
2.0 Materials and Methods
This chapter describes materials and methods used for the 2009 passage and dam survival study at B2 at Bonneville Dam. Tasks included fish collection, tagging, release, and detection of tagged migrating fish, followed by data processing and analysis. We also describe methods used in a tag-life study that supported all JSATS acoustic-tag studies conducted in 2009.
2.1 Fish Collection
The tagging sites, practices related to permitting requirements, and sampling methods for fish collection are described first.
2.1.1 The Collection and Tagging Site
Staff collected CH1, CH0, and STH from the John Day Dam (JDA) SMF. The SMF is situated on the south side of JDA at the downriver edge of the JBS where bypassed juvenile salmonids and other fishes are routed through a series of flumes and dewatering structures. Smolts can be diverted into the SMF as part of a sample of the JBS population for routine smolt monitoring (Martinson et al. 2006) or directed into the tailrace through an outfall pipe located downstream of the facility. Routinely sampled smolts also were rerouted to the tailrace outfall after they were examined unless they were selected for tagging as part of this study of survival rates.
2.1.2 Federal and State Permitting
Records were kept on all smolts handled and collected (both target and non-target species) for permit accounting. Collections were conducted in conjunction with routine sampling at the SMF to minimize handling impacts. Surgical candidates collected from routine SMF target sample sizes were accounted for under permits issued to the SMF. Additional fish needed to meet research needs (beyond SMF goals) were accounted for under separate federal and state permits. A federal scientific take permit was authorized for this study by the NOAA Fisheries Hydropower Division’s FCRPS Branch and administered by NOAA (permit number 13-09PNNL40). The Oregon Department of Fish and Wildlife authorized take for this study under permit number P14273. The federal and Oregon permits were both authorized under the 2004 FCRPS BiOp. All requirements and guidelines of both permits were met and reports of collection and release were reported to both agencies.
2.1.3 Sampling Methods
Juvenile salmonids were diverted from the JBS and routed into a 1795-gal holding tank in the SMF. About 150–200 smolts and other fishes were crowded with a panel net into a 20- by 24-in. pre-anesthetic chamber. Water levels in the chamber were lowered to about 8 in. (48 L) at which point fish were anesthetized with 60 mL of a stock tricaine methanesulfonate (MS-222) solution prepared at a concentration of 50 g/L. Once they were anesthetized, fish were routed into the examination trough. Technicians added MS-222 as needed to maintain sedation, and 5 to 10 mL of PolyAquaTM was added to reduce fish stress. Water temperatures were monitored in the main holding tank and in the examination trough, and water in the trough was refreshed before temperatures there increased more than 2º C above those observed in the main holding tank.
2.2
Once they were in the examination trough, smolts targeted for surgical procedures were evaluated in accordance with the following specific acceptance and rejection criteria:
• Qualifying (Acceptable) Conditions
– size >95 mm
– visible elastomer tag(s) present or absent
– adipose-fin clipped or unclipped
– presence of trematodes, copepods, leeches
– short operculum
– healed (moderate) injuries (e.g., bird strikes)
– <3% fungal patch
– minor fin blood
– partial descaling (3–19%)
– STH with eroded pectoral or ventral fins (likely hatchery STH).
• Disqualifying Conditions
– >20% descaling
– body punctures (showing blood, e.g., predator marks, bird strikes, head wounds, nose/snout injuries)
– obvious signs of bacterial kidney disease
– eye hemorrhage or pop eye
– >3% coverage with fungus
– deformed
– holdovers (fish not “spring” CH1 or “summer” CH0)
– PIT- or radio-tagged or other post-surgical fishes
– notable operculum damage (except short operculum)
– presence of columnaris, furuncles
– injured caudal peduncles
– injured caudal fins
– fin hemorrhage.
Non-target species and fish that did not meet the above criteria were released to the river through the SMF holding system after a 30-minute recovery period. Accepted fish were counted and released into transfer buckets containing fresh river water before being moved to one of six 80-gal pre-surgery holding tanks, where they were held for 18 to 30 hours before surgery. The pre-surgery holding duration depended on the time of collection and the time of tagging on the next day.

2.3
2.2 Fish Tagging
Acoustic tags were surgically implanted in the fish, which were held for recovery as described here, prior to their being released.
2.2.1 JSATS Acoustic Micro-Transmitter
The specifications of the JSATS acoustic tags used in 2009 (Figure 2.1) were as follows:
• dimensions (mm) = 12 long x 5.21 wide x 3.77 deep
• mass (g) = 0.43 in air and 0.29 in water
• volume (mL) = 0.14.
The nominal pulse repetition interval (PRI) was one ping every 3 seconds, and this rate provided an expected tag life of at least 23 days. Each pulse from a JSATS tag contains a complex phase-encoded signal that uniquely identifies the transmitting tag without varying pulse duration. Within 1 to 5 days of being implanted in fish, each tag was acoustically activated by Cascade Aquatics, Inc., using a Pinger dish designed by Advanced Telemetry Systems® (ATS) to activate or deactivate tags.
Figure 2.1. The ATS JSATS Acoustic Micro-Transmitter (Top) and a PIT Tag (Bottom)
2.2.2 Fish Collection and Tagging Procedures
The number of personnel on hand was the biggest contributor to ensuring that all tagged fish were handled as efficiently and un-intrusively as possible to minimize handling times. One individual was responsible for anesthetizing fish and delivering them to be weighed and measured. Two people were responsible for weighing, measuring, and recording data; three to four people performed surgeries to implant tags in the fish; and one or two people were responsible for moving tagged fish into the post-surgery tanks.
Fish were netted in small groups from the 80-gal holding tanks and placed in a 5-gal “knockdown” bucket with water and 20 mL of a 40-g/L stock solution of MS-222. Once a fish lost equilibrium, it was transferred to a processing table in a small container of river water. Each fish was measured (fork length ±1 mm), the species type and whether its adipose fin was intact or clipped were recorded on a GTCO CalComp Drawing Board VI digitizer board. Fish were weighed (±0.01 g) on an Ohaus Navigator scale and returned to the small transfer container along with an assigned PIT tag and an activated acoustic tag. Length, weight, species type, tag codes, and fin clip were all added automatically into the tagging

2.4
database by PIT Tag Information System P3 software to minimize human error. The transfer container, fish, and tags were assigned a recovery bucket number and passed to a surgeon for tag implantation.
An established protocol was used in the tagging process to help minimize the handling impact on tagged fish. All surgical instruments were sterilized daily in an autoclave and each surgeon used four complete sets of instruments during each day’s tagging. When a set was not being used, it was placed in a 70% ethanol solution for approximately 10 minutes. The instruments were then transferred to a distilled water bath for 10 minutes to remove residual ethanol and any remaining particles, before being used again. To reduce the disruption of the mucus membrane at the incision, Poly-Aqua was used to help replace the membrane that was removed from the fish’s epidermal layers. Anesthesia buckets were kept within ±1 ºC of river temperature. Anesthesia solutions were either replaced or cooled with ice when temperatures exceeded protocols. Recovery buckets were also kept within ± 1 ºC of river water temperature.
During surgery (Figure 2.2), each fish was placed ventral side up and a gravity-fed anesthesia supply line was placed into its mouth. The dilution of this “maintenance” line was 40 mg/L. A 6–8-mm incision, using a #15 stainless steel surgical blade or a Micro-Sharp stab scalpel with a 5-mm blade (depending on the surgeon’s preference), was made ventrally, 3 mm from and parallel to the mid-ventral line and equidistant from the pelvic girdle and pectoral fin. The PIT tag was inserted first, followed by the acoustic tag. Both tags were inserted toward the anterior portion of the fish. Two interrupted sutures of 5-0 monofilament with an RB-1 needle were used to close the incision. With the incision closed, fish were then taken to an aerated recovery bucket containing river water.
Figure 2.2. Surgical Implantation of PIT and Acoustic Tags in the John Day Smolt Monitoring Facility
2.2.3 Fish Recovery and Holding
Tagged fish were placed in 5-gal aerated recovery buckets and closely monitored until fish reestablished equilibrium. Each bucket held two to seven fish depending on the size of the fish and the number to be released at each site. The buckets were then carried to a larger holding tank where they were supplied with a continuous feed of river water (Figure 2.3). Fish were held and monitored for 18 to 30 hours prior to being released. The large holding tanks were insulated to keep the water temperature within acceptable limits.

2.5
Figure 2.3. Post-Surgery Holding Tank with Recovery Buckets
2.3 Transport and Release
To transport tagged fish, a ¾-ton truck was outfitted with one 180-gal Bonar insulated tote and one 70-gal Bonar insulated tote. The 180-gal tote could hold ten 5-gal fish buckets, and the 70-gal tote could hold four 5-gal fish buckets. The totes had snug-fitting lids and some extra space inside so that ice could be added for cooling on hot days. A network of valves and plastic tubing was attached to an oxygen tank for delivering oxygen to the totes from a 2200-psi oxygen tank during transport. The Bonar totes were filled with fresh river water before fish buckets were removed from the post-surgery holding tanks and placed in the totes. Air lines were then placed into the totes. A YSI meter was used to measure the dissolved oxygen and the temperature of water in the totes before and after transport to make sure that these properties stayed within acceptable limits.
Just before fish were released in the river, fish buckets were opened to check for dead fish. Every dead fish was scanned with a BioMark portable transceiver PIT-tag scanner to identify the implanted PIT-tag code. The associated acoustic tag code was identified later from tagging data that recorded all pairs of PIT and acoustic tags implanted in fish the previous day. In 2009, there were no tailrace reference releases of tagged dead fish to determine whether dead fish were detected on downstream survival-detection arrays. Therefore, PIT and acoustic tags in dead fish were recovered, sterilized, and implanted in a live fish the next day. Post-tagging, pre-release mortalities were low for each run of fish studied in 2009 (CH1 = 0.2%; STH = 0%; CH0 = 0.46%).
The JSATS tagged fish from each of the three stocks were released 41 rkm upstream of John Day Dam near Roosevelt, Washington. The tagging information for every fish is summarized in Appendix A. Fish usually were released from a boat at three locations along a line transect across the river, unless river conditions were too rough for safe boat operation. The release location on the Oregon side of the channel had the longest fetch (i.e., distance with uninterrupted exposure to wind) followed by the mid-channel location. Sometimes the Oregon location, and less often the Oregon and mid-channel locations, had to be skipped because strong winds generated waves that could swamp or capsize a boat. On one occasion (July 12 at 2000 hours), river conditions were too rough to release fish from a boat, so the crew released fish from a nearby point of land that extended out into the river from the Washington shore.
2.6
For boat releases, fish buckets were moved from the Bonar transport totes into the stern of boat. In preparation for fish releases, the boat operator maneuvered the boat to each of five fixed fish release locations along a line transect across the width of the river based on waypoint marks displayed on an electronic global positioning system (GPS) map display and put the motor in neutral. Roughly 20% of the fish were released at each of the five locations by submerging individual buckets in the water so that fish could swim out on their own volition. The release site and time were recorded on field data sheets to the nearest minute in Pacific Daylight Time, and times were later converted to PST to match all other data.
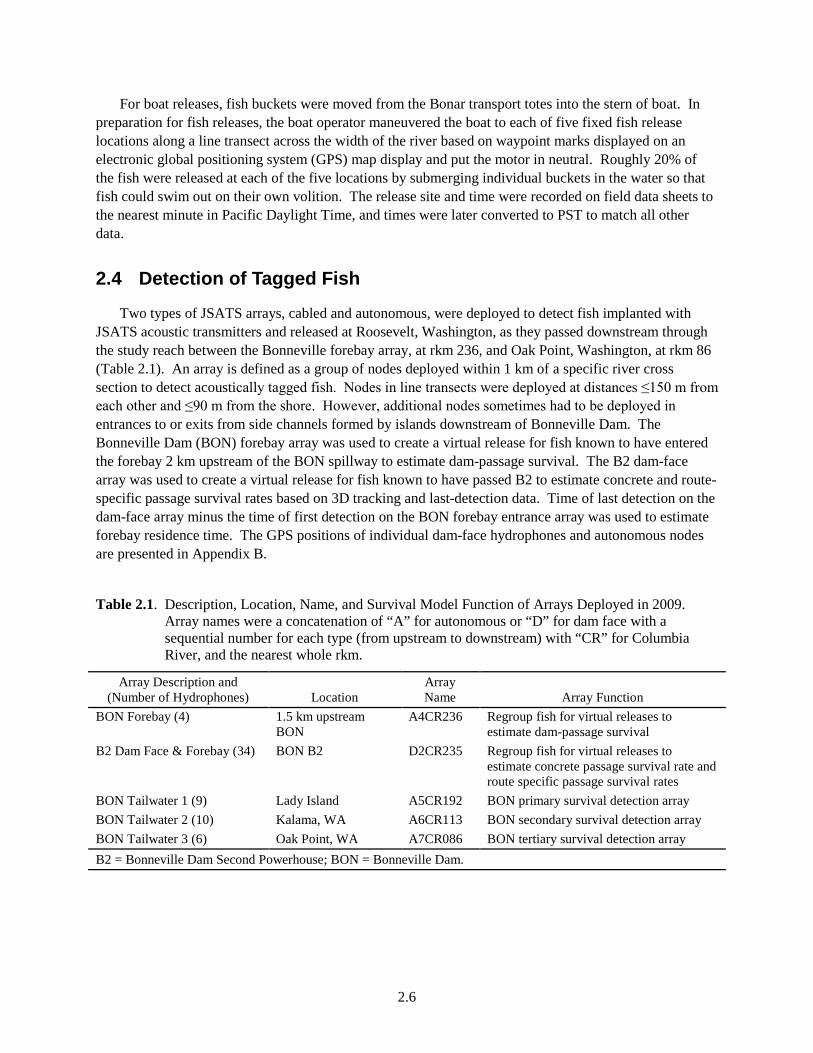
2.4 Detection of Tagged Fish
Two types of JSATS arrays, cabled and autonomous, were deployed to detect fish implanted with JSATS acoustic transmitters and released at Roosevelt, Washington, as they passed downstream through the study reach between the Bonneville forebay array, at rkm 236, and Oak Point, Washington, at rkm 86 (Table 2.1). An array is defined as a group of nodes deployed within 1 km of a specific river cross section to detect acoustically tagged fish. Nodes in line transects were deployed at distances ≤150 m from each other and ≤90 m from the shore. However, additional nodes sometimes had to be deployed in entrances to or exits from side channels formed by islands downstream of Bonneville Dam. The Bonneville Dam (BON) forebay array was used to create a virtual release for fish known to have entered the forebay 2 km upstream of the BON spillway to estimate dam-passage survival. The B2 dam-face array was used to create a virtual release for fish known to have passed B2 to estimate concrete and route-specific passage survival rates based on 3D tracking and last-detection data. Time of last detection on the dam-face array minus the time of first detection on the BON forebay entrance array was used to estimate forebay residence time. The GPS positions of individual dam-face hydrophones and autonomous nodes are presented in Appendix B.
Table 2.1. Description, Location, Name, and Survival Model Function of Arrays Deployed in 2009. Array names were a concatenation of “A” for autonomous or “D” for dam face with a sequential number for each type (from upstream to downstream) with “CR” for Columbia River, and the nearest whole rkm.
Array Description and (Number of Hydrophones) Location
Array Name Array Function
BON Forebay (4) 1.5 km upstream BON
A4CR236 Regroup fish for virtual releases to estimate dam-passage survival
B2 Dam Face & Forebay (34) BON B2 D2CR235 Regroup fish for virtual releases to estimate concrete passage survival rate and route specific passage survival rates
BON Tailwater 1 (9) Lady Island A5CR192 BON primary survival detection array BON Tailwater 2 (10) Kalama, WA A6CR113 BON secondary survival detection array BON Tailwater 3 (6) Oak Point, WA A7CR086 BON tertiary survival detection array B2 = Bonneville Dam Second Powerhouse; BON = Bonneville Dam.
2.7
2.4.1 Nodes Within Arrays
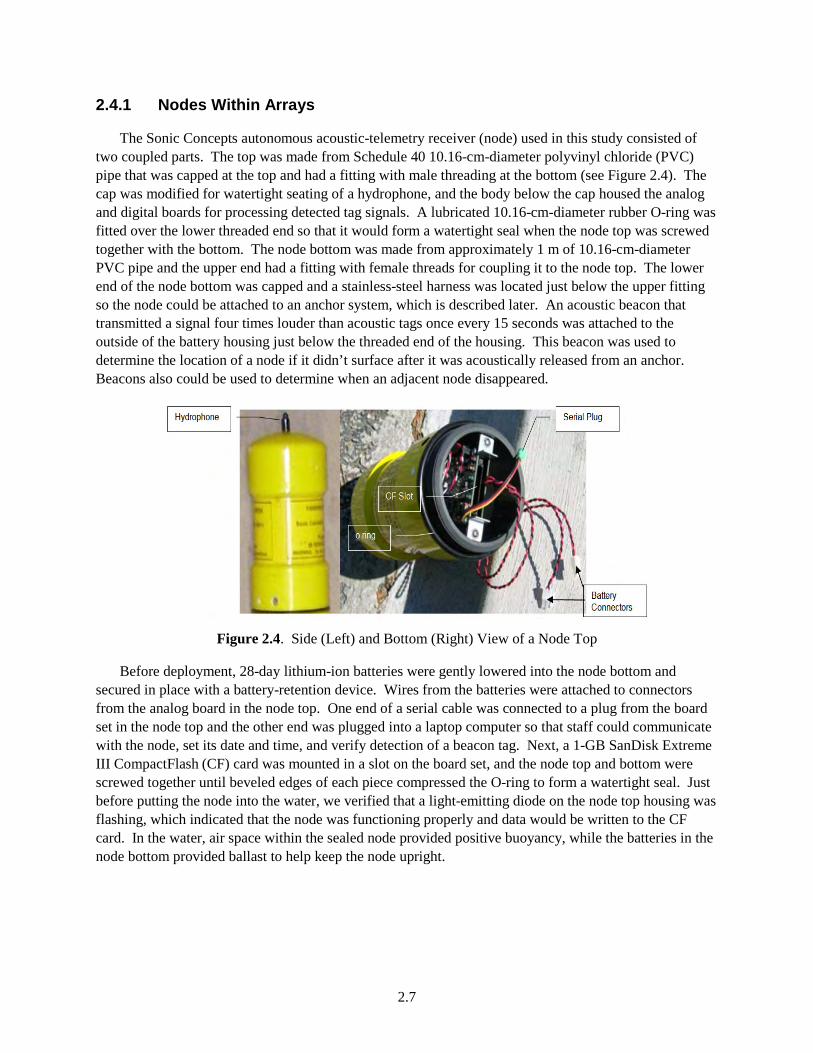
The Sonic Concepts autonomous acoustic-telemetry receiver (node) used in this study consisted of two coupled parts. The top was made from Schedule 40 10.16-cm-diameter polyvinyl chloride (PVC) pipe that was capped at the top and had a fitting with male threading at the bottom (see Figure 2.4). The cap was modified for watertight seating of a hydrophone, and the body below the cap housed the analog and digital boards for processing detected tag signals. A lubricated 10.16-cm-diameter rubber O-ring was fitted over the lower threaded end so that it would form a watertight seal when the node top was screwed together with the bottom. The node bottom was made from approximately 1 m of 10.16-cm-diameter PVC pipe and the upper end had a fitting with female threads for coupling it to the node top. The lower end of the node bottom was capped and a stainless-steel harness was located just below the upper fitting so the node could be attached to an anchor system, which is described later. An acoustic beacon that transmitted a signal four times louder than acoustic tags once every 15 seconds was attached to the outside of the battery housing just below the threaded end of the housing. This beacon was used to determine the location of a node if it didn’t surface after it was acoustically released from an anchor. Beacons also could be used to determine when an adjacent node disappeared.
Figure 2.4. Side (Left) and Bottom (Right) View of a Node Top
Before deployment, 28-day lithium-ion batteries were gently lowered into the node bottom and secured in place with a battery-retention device. Wires from the batteries were attached to connectors from the analog board in the node top. One end of a serial cable was connected to a plug from the board set in the node top and the other end was plugged into a laptop computer so that staff could communicate with the node, set its date and time, and verify detection of a beacon tag. Next, a 1-GB SanDisk Extreme III CompactFlash (CF) card was mounted in a slot on the board set, and the node top and bottom were screwed together until beveled edges of each piece compressed the O-ring to form a watertight seal. Just before putting the node into the water, we verified that a light-emitting diode on the node top housing was flashing, which indicated that the node was functioning properly and data would be written to the CF card. In the water, air space within the sealed node provided positive buoyancy, while the batteries in the node bottom provided ballast to help keep the node upright.

2.8
2.4.1.1 Bonneville Forebay Array
The cabled hydrophone system that was deployed in the B2 forebay was designed to detect passage location at B2 and track movement of tagged smolts relative to the BGS deployment (see Figures 2.5 through and 2.7). The 19 dam-mounted hydrophones were used to detect tagged juvenile salmonids from about 50 m upstream of B2 and their passage into the turbine or B2CC. The hydrophones monitoring the BGS were used to track fish about 50 m upstream and adjacent to the BGS, including monitoring the fish passing through the north and south gaps. Tracking successive positions of tagged fish required us to synchronize digital signal processing cards to within 0.4 µs using five GPSs and Meinberg GPS time cards. Individual hydrophones on B2 piers were baffled with plastic cones lined with an anechoic material throughout the sampling periods in 2008 to exclude loud noises emanating from turbines or B2CC downstream of hydrophones. The pier-mounted hydrophones were angled toward specific units to determine the route of passage based on the last detection of the tag. Baffling these hydrophones greatly increased the ratio of tag signals relative to background noise levels, and significantly increased the percentage of successful tag decodes. Table B.1 (in Appendix B) provides GPS coordinates and depths of cabled hydrophones deployed in the B2 forebay that were used to accomplish these tasks.
a. BON Forebay Entrance Array (4 Nodes-red squares
in upper right) & B2 Dam-Face Array (34 cabled Hydrophones – at yellow dots)
b. Primary Array (9 Nodes)
c. Secondary Array (6 Nodes)
d. Tertiary Array (4 Nodes)
Figure 2.5. Maps Showing Approximate Locations of Underwater Listening Devices in Deployed Arrays for this Study. Twenty-three autonomous node locations are marked with red squares, and the 19 cabled hydrophones deployed on B2 turbine piers appear as a thick red line on the forebay side of B2. Flow is from right to left in all panels.
2.9
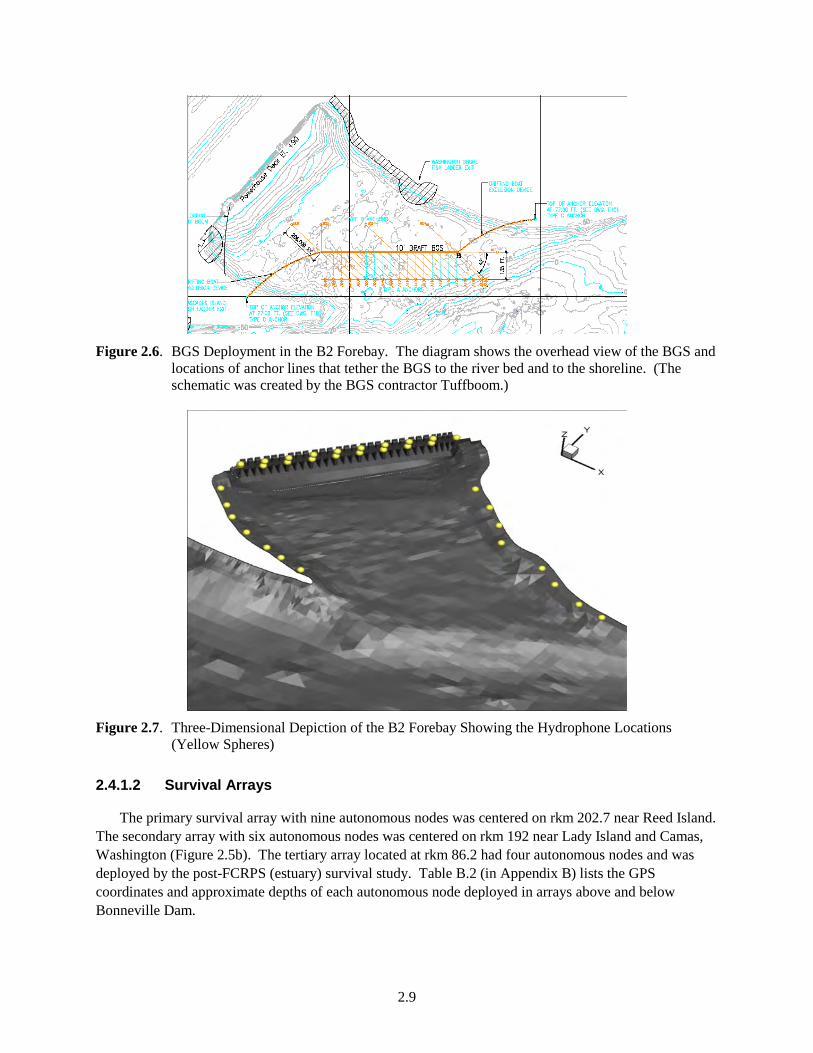
Figure 2.6. BGS Deployment in the B2 Forebay. The diagram shows the overhead view of the BGS and
locations of anchor lines that tether the BGS to the river bed and to the shoreline. (The schematic was created by the BGS contractor Tuffboom.)
Figure 2.7. Three-Dimensional Depiction of the B2 Forebay Showing the Hydrophone Locations
(Yellow Spheres)
2.4.1.2 Survival Arrays
The primary survival array with nine autonomous nodes was centered on rkm 202.7 near Reed Island. The secondary array with six autonomous nodes was centered on rkm 192 near Lady Island and Camas, Washington (Figure 2.5b). The tertiary array located at rkm 86.2 had four autonomous nodes and was deployed by the post-FCRPS (estuary) survival study. Table B.2 (in Appendix B) lists the GPS coordinates and approximate depths of each autonomous node deployed in arrays above and below Bonneville Dam.
2.10
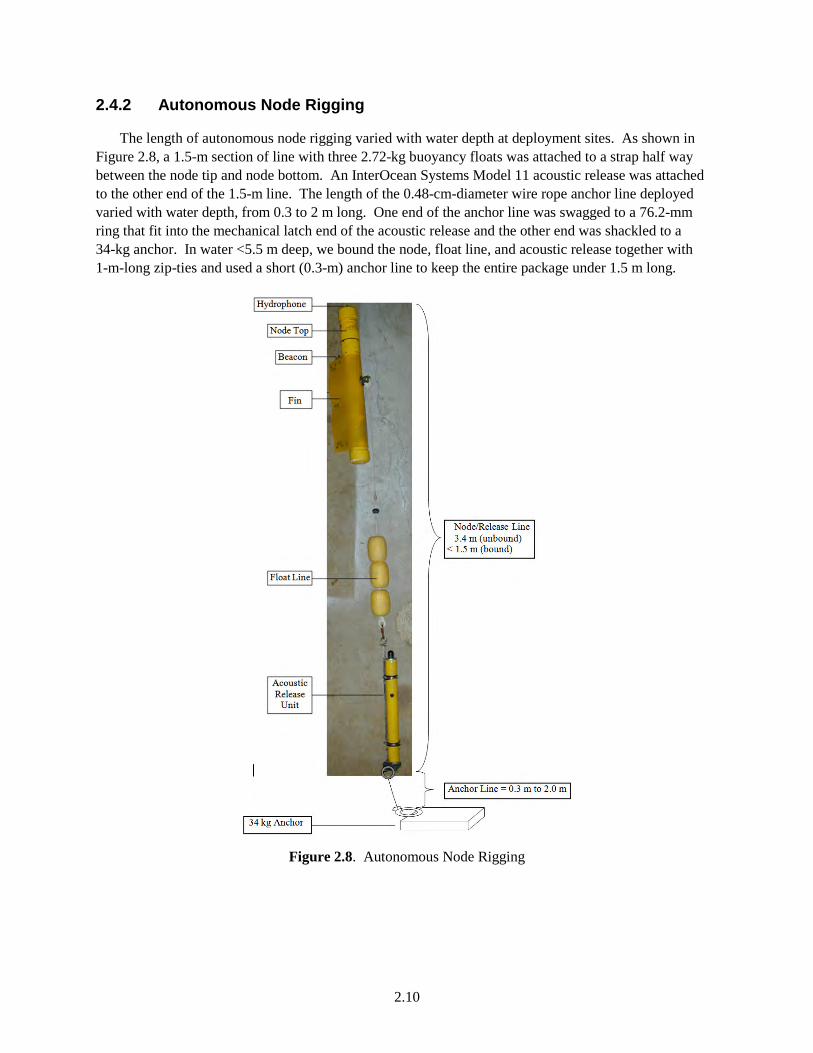
2.4.2 Autonomous Node Rigging
The length of autonomous node rigging varied with water depth at deployment sites. As shown in Figure 2.8, a 1.5-m section of line with three 2.72-kg buoyancy floats was attached to a strap half way between the node tip and node bottom. An InterOcean Systems Model 11 acoustic release was attached to the other end of the 1.5-m line. The length of the 0.48-cm-diameter wire rope anchor line deployed varied with water depth, from 0.3 to 2 m long. One end of the anchor line was swagged to a 76.2-mm ring that fit into the mechanical latch end of the acoustic release and the other end was shackled to a 34-kg anchor. In water <5.5 m deep, we bound the node, float line, and acoustic release together with 1-m-long zip-ties and used a short (0.3-m) anchor line to keep the entire package under 1.5 m long.
Figure 2.8. Autonomous Node Rigging
2.11
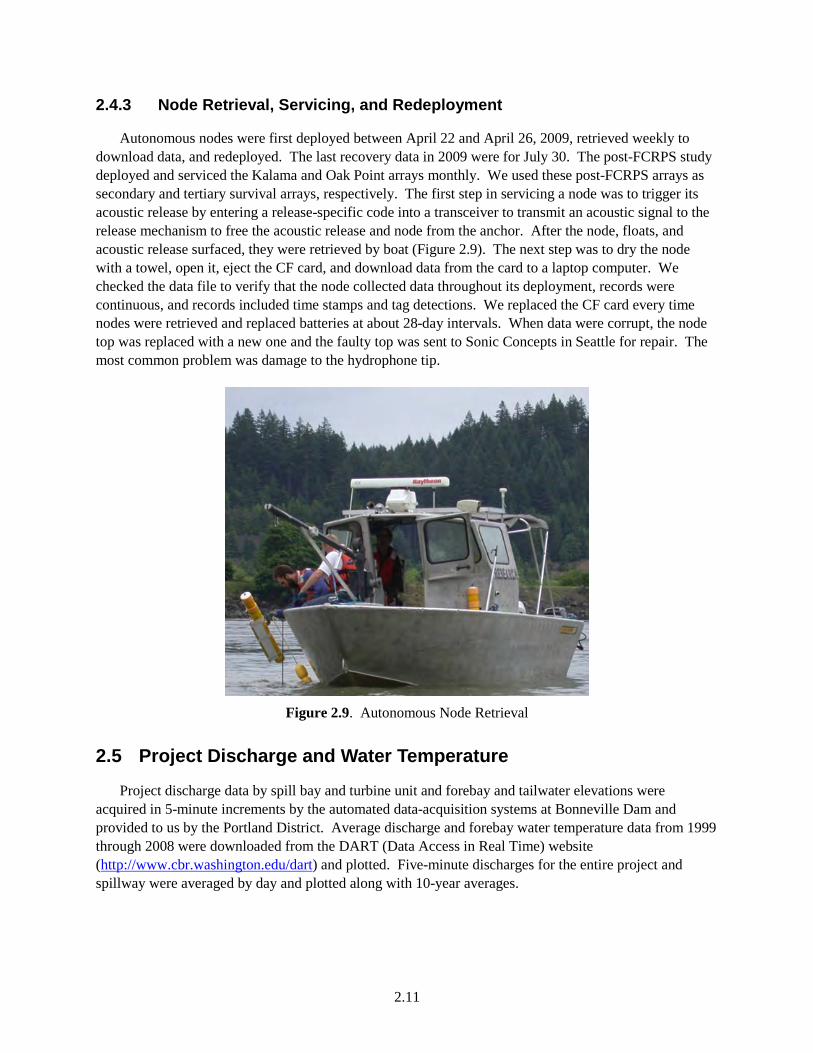
2.4.3 Node Retrieval, Servicing, and Redeployment
Autonomous nodes were first deployed between April 22 and April 26, 2009, retrieved weekly to download data, and redeployed. The last recovery data in 2009 were for July 30. The post-FCRPS study deployed and serviced the Kalama and Oak Point arrays monthly. We used these post-FCRPS arrays as secondary and tertiary survival arrays, respectively. The first step in servicing a node was to trigger its acoustic release by entering a release-specific code into a transceiver to transmit an acoustic signal to the release mechanism to free the acoustic release and node from the anchor. After the node, floats, and acoustic release surfaced, they were retrieved by boat (Figure 2.9). The next step was to dry the node with a towel, open it, eject the CF card, and download data from the card to a laptop computer. We checked the data file to verify that the node collected data throughout its deployment, records were continuous, and records included time stamps and tag detections. We replaced the CF card every time nodes were retrieved and replaced batteries at about 28-day intervals. When data were corrupt, the node top was replaced with a new one and the faulty top was sent to Sonic Concepts in Seattle for repair. The most common problem was damage to the hydrophone tip.
Figure 2.9. Autonomous Node Retrieval
2.5 Project Discharge and Water Temperature
Project discharge data by spill bay and turbine unit and forebay and tailwater elevations were acquired in 5-minute increments by the automated data-acquisition systems at Bonneville Dam and provided to us by the Portland District. Average discharge and forebay water temperature data from 1999 through 2008 were downloaded from the DART (Data Access in Real Time) website (http://www.cbr.washington.edu/dart) and plotted. Five-minute discharges for the entire project and spillway were averaged by day and plotted along with 10-year averages.

2.12
2.6 Data Processing and Validation
As in previous studies (Ploskey et al. 2007b, 2009), tag-detection data from JSATS autonomous nodes were processed in two ways as a quality-control measure, and we found no significant difference in detection and survival estimates based upon detection histories. One method involved using TagViz software, and the other involved processing data with programs written in the Statistical Analysis System code.
Tag, release, and detection data were merged together into separate data sets for autonomous and cabled systems, and system-specific filtering rules were applied to decoded data to identify detections and generate detection histories for every tag. To filter out false positive detections, which are detections of otherwise valid tag codes, we ran post-processing programs according to the filtering rules for autonomous and cabled systems.
The rules for autonomous nodes were as follows:
1. Tag codes were among those assigned to tags that were implanted in released fish.
2. Tag codes were detected after the release date and time.
3. Decodes of the same tag within 0.156 second of the previous decode were deleted (multipath filter).
4. A detection event was initiated when the time interval between any four identical decodes was ≤47.8 seconds (3-s tags) or ≤79 seconds (5-s tags). Once started, the event continued until the time lapse between any two successive decodes exceeded the same respective time intervals.
5. The time spacing between these detections had to match the PRI of the tag, or be a multiple of the PRI for the detections to be kept in the valid detection file.
The data collected by the JSATS cabled hydrophones were binary time-domain waveform files that had a high probability of containing Binary Phase Shift Keying (BPSK) to representing tag codes. The BPSK is a digital modulation technique that transmits messages by altering the phase of the carrier wave. Waveform data were post-processed with software to produce comma-separated variable (CSV) files with decodes and time of arrival data. Several filtering algorithms were then applied to the raw results from the decoding utilities to exclude spurious data and false positives.
The rules for cabled hydrophones at B2 included the following steps for filtering cabled array data from B2 hydrophones to produce a clean detection data set:
1. Decodes of a tag code within 0.156 seconds of a previous decode of the same code were assumed to be multipath and were deleted.
2. Invalid detection events were deleted. A detection event was started when the time interval between any four identical decodes was ≤47.8 seconds (3-s tags), ≤79 seconds (5-s tags), or ≤157 seconds (10-s tags). Once started, the event continued until the time lapse between any two successive decodes exceeded the same time durations.
3. Decodes within valid detection events, as described in Step 2 above, were deleted if the time interval from the original decode in the series did not closely match an even multiple of one of the modes of the estimated PRI.

2.13
4. Remaining detection events for tag codes that were not used during the study year were flagged as orphans in hope of explaining the presence of those codes at a later date. Flagged detections were not used in any analysis unless they were explained. Resources for resolving issues included the list of codes of tags implanted in fish, lists of codes of beacons deployed on autonomous nodes or in forebays, and coordination with other researchers in the Columbia River basin.
5. We flagged the remaining detections that occurred before a tag was released, at sites upstream of the listed release location, or on upstream arrays after a series of detections on downstream arrays. Analysts attempted to explain and resolve the flagged problems by examining all available information in the tagging, release, autonomous array, and cabled array data sets. Flagged detections were not used in any analysis unless the spatial or temporal discrepancies were explained and resolved. Discrepancies might be explained by fish being released at the wrong site or incorrect data and time settings on an autonomous node.
The final results from the steps above included a complete detection history for each tag: detection time, detection hydrophone location, and the signal-to-noise ratio.
Tracking fish movements through the forebay involved calculating a series of fish positions in 3D space from differences in the time of arrival of coded signals from each tag at four or more hydrophones (Watkins and Schevill 1972; Foy 1976; Spiesberger and Fristrup 1990; Wahlberg et al. 2001). If more than four hydrophones detected the same tag signal, the four with the best geometric configuration for 3D tracking were then selected (Wahlberg et al. 2001; Ehrenberg and Steig 2002).
2.7 Tag-Life Study
For the tag-life study conducted to support the JDA and BON survival studies, 98 acoustic tags (3-s ping rate) were randomly chosen from two manufacturing batches of ATS tags used in this 2009 study. Nine acoustic tags were already activated when received by PNNL for the tag-life study; thus only 89 tags were used in the tag-life analysis. The acoustic tags were divided into two approximately equal size groups and tag life was monitored separately for each group, but tag-life data from both manufacturing batches were pooled for analysis. All acoustic tags were enclosed in water-filled plastic bags and suspended from a rotating foam ring within a 2-m (diameter) fiberglass tank. Two 90º x 180º hydrophones were positioned 90° apart in the bottom of the tank and angled upward at approximately 60° to maximize coverage for detecting acoustic signals. Hydrophones were cabled to a quad-channel receiver that amplified all acoustic signals. All acoustic signals were then saved, decoded, and post-processed. Post-processing software calculated the number of hourly decodes for each acoustic tag, and therefore tag failure times could be determined within ±1 hour. Tag life expectancy was 23 days for all acoustic tags in this study.
2.8 Statistical Methods
Using upstream releases of acoustic-tagged CH1, CH0, and STH smolts, we examined passage dynamics and survival through B2. Specific statistical objectives included the following:
1. Estimate virtual-release dam-passage survival of CH1, STH, and CH0 smolts using a single-release-recapture model.

2.14
2. Estimate virtual-release dam-passage survival of the same runs of fish based on a paired-release model that used the single-release survival rate of fish regrouped on the forebay array and then passing through the dam as treatment fish and the survival rate of fish that passed through the B2CC as the rate for a reference release group.
3. Estimate concrete-passage and route-specific survival rates for CH1, STH, and CH0 smolts passing through B2 using a single-release-recapture model.
4. Estimate paired-release concrete-passage survival rates for CH1, STH, and CH0smolts passing through B2 using a paired-release model. Treatment fishes in the paired-release model were from single-release estimates of survival for fish passing through B2 and reference release fishes were those that passed through the B2CC. The assumption for this model is that the survival rate of fish passing through the B2CC and tailrace would be just as high or higher than the rate for fish released in the tailrace, which has been true in previous years.
5. Estimate relative route-specific survival rate and passage proportions for all tagged runs passing through the B2, JBS, and B2CC.
6. Estimate passage distribution of outmigrating smolts relative to the approach distribution of smolts relative to the deployment of the BGS.
2.8.1 Release-Recapture Designs and Analyses
The three downstream survival detection arrays produced 23 = 8 possible capture histories for each release group (111, 011, 101, 001, 110, 010, 100, and 000), where a 1 indicates detection, and a zero indicates no detection on each of three successive survival-detection arrays. For example, “111” indicates detection on all three arrays, whereas “010” indicates that detection on the second array but not on the first or third arrays. We input counts associated with each of the eight capture history probabilities into the Survival with Proportional Hazards (SURPH 2.2b) software developed at the University of Washington (Lady et al. 2001) and generated single-release Cormack (1964), Jolly (1965), Seber (1965) (CJS) estimates of survival and its variance for each run of fish and virtual release grouping (usually pooled over several days). There were no true paired-release estimates because true reference releases were not made in 2009, although we did treat B2CC-passage survivals as reference-release survival estimates to provide paired-release estimates of dam, B2-concrete, and route-specific survival rates for B2. The design for estimating dam-passage survival rates is illustrated in Figure 2.10, with single-release estimates of dam-passage detection and survival shown on the right side of the diagram and single-release estimates of B2CC-passage detection and survival rates shown on the right side. Analogous estimates were produced for B2-concrete-passage survival and B2 route-specific survivals.
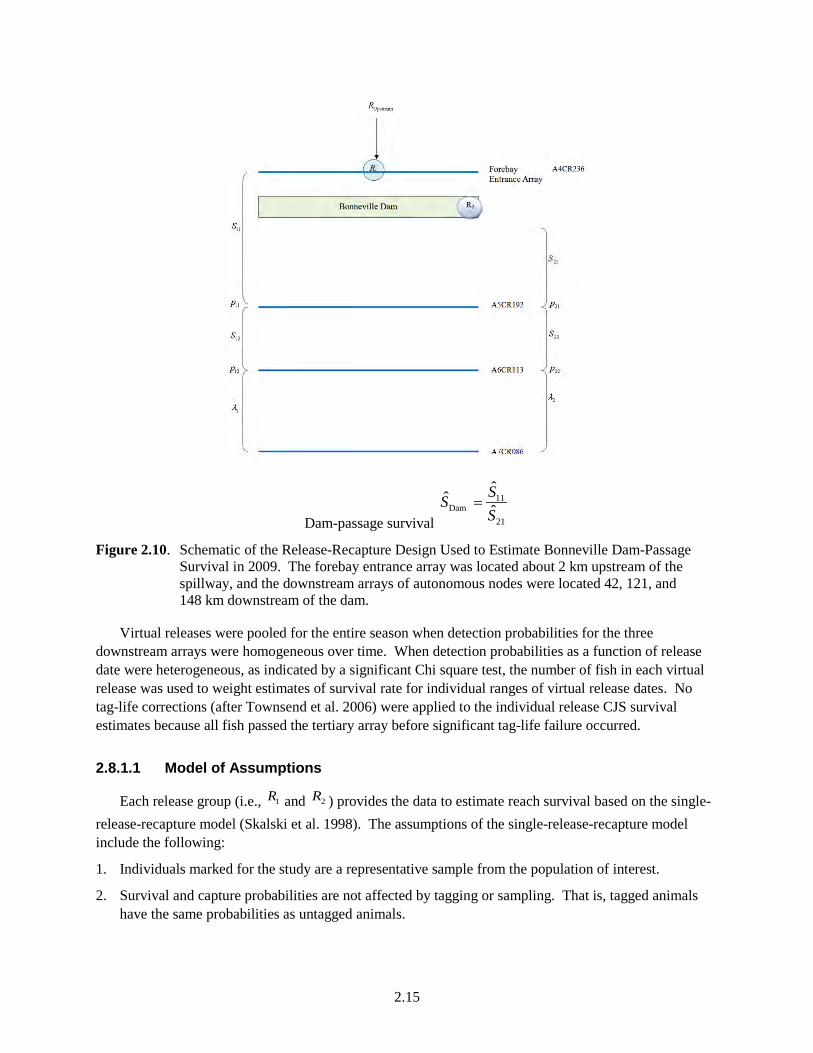
2.15
Dam-passage survival
11Dam
21
ˆˆˆSSS
=
Figure 2.10. Schematic of the Release-Recapture Design Used to Estimate Bonneville Dam-Passage Survival in 2009. The forebay entrance array was located about 2 km upstream of the spillway, and the downstream arrays of autonomous nodes were located 42, 121, and 148 km downstream of the dam.
Virtual releases were pooled for the entire season when detection probabilities for the three downstream arrays were homogeneous over time. When detection probabilities as a function of release date were heterogeneous, as indicated by a significant Chi square test, the number of fish in each virtual release was used to weight estimates of survival rate for individual ranges of virtual release dates. No tag-life corrections (after Townsend et al. 2006) were applied to the individual release CJS survival estimates because all fish passed the tertiary array before significant tag-life failure occurred.
2.8.1.1 Model of Assumptions
Each release group (i.e., 1R and 2R ) provides the data to estimate reach survival based on the single-release-recapture model (Skalski et al. 1998). The assumptions of the single-release-recapture model include the following:
1. Individuals marked for the study are a representative sample from the population of interest.
2. Survival and capture probabilities are not affected by tagging or sampling. That is, tagged animals have the same probabilities as untagged animals.

2.16
3. All sampling events are “instantaneous.” That is, sampling occurs over a negligible distance relative to the length of the intervals between sampling events.
4. The fate of each tagged individual is independent of the fate of all others.
5. All tagged individuals alive at a sampling location have the same probability of surviving until the end of that event.
6. All tagged individuals alive at a sampling location have the same probability of being detected at that event.
7. All tags are correctly identified and the status of the smolt (i.e., alive or dead), is correctly assessed.
The first assumption concerns making inferences from the sample to the target population. For example, if inferences are sought to Chinook salmon smolts, then the sample of tagged fish should be drawn from that class of fish. Otherwise, nonstatistical inferences are necessary to justify the similarity between the target population and the representation of acoustic-tagged fish. These assumptions could also be violated if smolts selected for acoustic tagging are, on average, larger than the population of smolts in general.
Assumption (2) again relates to making inferences about the population of interest (i.e., untagged fish). If tagging has a detrimental effect on survival, then survival estimates from the single release-recapture design will tend to be negatively biased (i.e., underestimated). This is compensated for with the selection of the triple-release model for the ultimate survival estimate.
The third assumption specifies that mortality is negligible immediately in the vicinity of the sampling stations, so that the estimated mortality is related to the river reaches in question and not the sampling event. In the case of outmigrating smolts, the time they spend in the vicinity of a hydrophone array is brief and short, relative to the size of the river reaches in question. This assumption is for the sake of mathematical convenience and should be fulfilled by the nature of the outmigration dynamics and deployment of the hydrophone array.
The assumption of independence (4) implies that the survival or death of one smolt has no effect on the fates of others. In the larger river system with tens of thousands of smolts, this is likely true. Furthermore, this assumption is common to all tag analyses with little or no evidence collected to suggest it is not generally true. Nevertheless, violations of assumption (4) have little effect on the point estimate, but might bias the variance estimate with precision being less than calculated.
Assumption (5) specifies that a smolt’s prior detection history has no effect on subsequent survival. This could be violated if some smolts were self-trained to repeatedly go through turbine or spill routes or, alternatively, avoid routes because of prior experience. This occurrence is unlikely and can be determined from the detection histories of the individual smolts. The lack of handling following initial release of acoustic-tagged smolts further minimizes the risk that subsequent detections influence survival. Similarly, assumption (6) could be violated if downstream detections are influenced by the upstream passage routes taken by the smolts. Violation of this assumption is minimized by placing hydrophone arrays across the breadth of the river or below the mixing zones for smolts following different passages at the dam.

2.17
Assumption (7) implies that the smolts do not lose their tags and are not subsequently misidentified as dead or not captured, nor are dead fish falsely recorded as alive at detection locations. The use of surgically implanted tags should minimize the chance of tag loss. Tag loss and tag failure would tend to result in a negative bias (i.e., underestimation) of smolt survival rates. The possibility of tag failure will depend on travel time relative to battery life. Dead fish drifting downstream could also result in a false-positive detections and upwardly bias survival estimates.
To estimate survival components from the paired releases, two additional assumptions for valid survival estimates are necessary. These assumptions are as follows:
1. Survival in the lower river segment of the first reach is conditionally independent of survival in the upper river segment.
2. Releases 1R and 2R experience the same survival probabilities in the lower river segment of the first reach they share in common.
Assumption (8) implies that there is no synergistic relationship between survival processes in the two river segments within the first reach. In other words, smolts that survive the first river segment are no more or less susceptible to mortality in the second river segment than smolts released in the second river segment. Assumption (9) is satisfied by the in-river mixing of the release groups but can also be satisfied if the survival processes are stable over the course of smolt passage by the releases. A stable survival process might well be expected for one to a few days under similar flow and spill conditions.
2.8.1.2 Tests of Assumptions Within a Release
For the single-release-recapture model to be valid, certain data patterns should be evident from the capture histories. Both releases 1R and 2R permit tests of goodness-of-fit to the release-recapture model. A series of tests of assumptions was performed to determine the validity of the model (i.e., goodness-of-fit). The data from release 1R can be summarized by an m-array matrix of the form shown below.
Release Site
Recovery Site
A5CR192 (2) A6CR113 (3) A7CR086 (4)
Forebay (1) 12m 13m 14m
A5CR192 (2) 23m 24m
A6CR113 (3) 34m
The value of ijm is the number of smolts detected at site i that are next detected at site j .
Burnham et al. (1987:65[71-74]) present a series of tests of assumptions called Test 2 that examine whether upstream or downstream detections affect downstream survival and/or detection. For release 1R , a contingency table test was performed, as follows:

2.18
Test 2.2 13m 14m (2.1)
23m 24m 21χ
Burnham et al. (1987:65 [71-74]) also present a series of tests of assumptions called Test 3 that examine whether upstream capture histories affect downstream survival or capture.
For release 1R , a contingency table of the following form can be constructed:
Capture History At A7CR086
1 0 (2.2) Capture History to
A6CR113
01 =011 =010
11 =111 =110 21χ
This contingency table tested whether survival and detection parameters depend on prior capture histories at the first two arrays.
2.8.1.3 Tests of Mixing
For the estimates of project survival to be valid, the detection data need to conform to the assumptions of the statistical model. One assumption is that there is downstream mixing of treatment and reference release groups. Inasmuch as there were no true tailrace reference release groups in 2009, and the quasi-reference virtual release through the B2CC was really just a subset of treatment fish passing through B2, mixing was ensured and did not need to be tested.
2.8.1.4 Tag-Life Correction
In 2009, all runs of fish passed the tertiary survival detection array in less time than it took for tag failure to occur in the tag-life study, so no corrections were required for this study.
2.8.1.5 Model Fitting
Unless otherwise noted, straight lines and curves on graphs are linear and quadratic fits using ordinary least-squares regression. We only considered the use of higher-order polynomials when r2 increased by ≥0.05.
2.8.2 Positioning of Tagged Fish
Tracking tagged fish using three or more hydrophones is a common technique that uses time-of-arrival differences (TOADs) of signal among hydrophones to calculate the position of a tagged fish. Usually, the technique requires a three-hydrophone array for two-dimensional (2D) tracking and four-hydrophone array for 3D tracking. For this study, only 2D tracking was performed.

2.19
Positioning a tagged fish followed the following procedure: consider a transmitting source (tag) in a four-hydrophone array. The boldface letters indicate matrices or vectors. The source (S) and receiver (r) position vectors are defined as follows:
3,2,1,0),,(
),,(T
T
==
=
izyx
sss
iiii
zyx
r
S
(2.3)
The distance between transmitting source and receivers gives
3,2,1,0,)()()()( 20
2222 =+=−+−+− iTtczsysxs iiziyix (2.4)
where c is the speed of sound, 0T is the time of travel from the source to the reference receiver (receiver
0), and it is the TOAD between receiver i and the reference receiver. With it measured by the common clock, the source position vector and 0T are the four unknowns to be solved by the four distance equations.
There are several mathematical ways to obtain the exact solutions to the equations above (Watkins and Schevill 1972; Fang 1990; Spiesberger and Fristrup 1990; Juell and Westerberg 1993; Wahlberg et al. 2001). Wahlberg et al. (2001) applied a synthesis of the methods used by Watkins and Schevill (1971) and Spiesberger and Fristrup (1990). It has the advantage of giving the same mathematical form for 2D and 3D array systems, and for both minimum number of receivers arrays and over-determined arrays.
The detailed steps for 2D tracking are as follows:
• Pool together all detections of the same signal from different hydrophones. If more than four hydrophones detect the same tag signal, select the four with the best geometry configuration for 2D tracking (Wahlberg et al. 2001; Ehrenberg and Steig 2002). Compute TOADs directly from detection time because all hydrophones are synchronized to a universal GPS clock with accuracy within 0.4 μs.
• Apply tracking solvers to estimate 3D locations and output solutions that are physical and within the
pre-specified T∆ (10 μs for B2 in the current study).
• Apply order 3 median filtering (Lim 1990) for removing spurious locations and smoothing fish tracks.
• Assign tagged fish to the nearest 10-m grid vertex within the tracking volume covered by the hydrophones monitoring the upstream side BGS.
• Base the route-of-passage assignment relative to the BGS and to dam routes solely on the last detection of the nearest hydrophone monitoring the passage route, and not on the 2D positioning of the fish. Use 2D tracks only to map the distribution of tagged fish relative to the BGS.


3.1
3.0 Results
Evaluation results described in the following sections begin with a description of environmental conditions present during the study, followed by tests of survival model assumptions and detection and survival rates of the three targeted runs of fish passing through BON, B2, and all B2 routes. Next we present the effects of dam operations on survival over time and travel times and rates, followed by distributions of B2 passage rates by time of day; forebay and B2 fish passage rates relative to BGS deployment. The continuity of data, historic survival and passage data, and B2CC PIT detector performance are described in the final sections.
3.1 Environmental Conditions
Environmental conditions during the 2009 study included seasonal changes in water temperature, tailrace elevation, and the discharge of water through Bonneville Dam and the spillway. Seasonal trends in water discharge and temperature were plotted alongside averages for the previous 10 years to provide context for 2009 trends.
3.1.1 Project Discharge and Temperature
Daily estimates of water discharge through the dam and spillway were above the previous 10-year average during a period from May 19 through June 11 and were at or below average earlier in spring and later in summer (Figure 3.1). Average water temperatures were up to 1 degree above the daily average during the preceding 10-year period after June 1, but were at or up to 1 degree below the preceding 10-year average in late April and May (Figure 3.2).
Figure 3.1. Average Daily Rate of Water Discharge Through Bonneville Dam and Its Spillway in 2009
Relative to Averages for the Preceding 10-Year Period

3.2
Figure 3.2. Average Daily Water Temperature in 2009 Versus the Average Daily Estimates for a
10-Year Period from 1999 Through 2008
3.2 Tests of Assumptions
Testable assumptions for the survival model in this study are assumptions that the tagged sample is representative of the population of interest, all tags identify samples correctly as alive or dead, all fish releases experience the same survival probabilities in the upper reaches as in the lower reaches, and survival and capture probabilities are not affected by tagging (addressed by the triple-release model).
3.2.1 Representativeness of the Tagged Fish Population
Measures that indicate the representativeness of the tagged population to larger population of studied smolts migrating downstream through the lower Columbia River include run timing, rejection rates of fish selected for tagging, and a comparison of length frequency distributions of tagged and untagged fish.
3.2.1.1 Run Timing of Juvenile Salmonids
Smolt indexes, based on data provided by DART (Columbia River Data Access in Real Time; www.cbr.washington/dart/dart.html), were used to create figures comparing run timing past Bonneville Dam to the time period that tagged smolts arrived at the dam from the upstream release site (Figure 3.3). Tagged fish arrived at the dam daily during periods when 79% of CH1, 93% of the STH, and 80.4% of CH0 runs were passing through the dam.

3.3
Figure 3.3. Smolt Monitoring Program Passage Index for Bonneville Dam in 2009 (Lines) Relative to
the Time Period that Tagged Fish Released Upstream of John Day Dam Were Passing Through the Dam

3.4
3.2.1.2 Rejection Rates for Tagging
During spring and summer tagging seasons, only 91 fish (0.82%) were rejected for tagging. The low rejection rate indicates that most fish were acceptable for tagging. Fish that were rejected during the tagging process were placed in a recovery tank to allow for the anesthesia to be displaced from their system before they were released. The total number of fish rejected and reason for their rejection are listed below in Table 3.1.
Table 3.1. Number of Fish Rejected by Criteria During Spring and Summer Tagging at John Day Dam
Fish Run Rejection Criteria Number Rejected
Yearling Chinook salmon
BKD 2 Fungus 4 Lacerations 4 Operc. damage 5 Popeye 1 Skel. Deform 1
Steelhead
Already tagged 1 Damaged eye 2 Descaling 5 Fungus 10 Lacerations 3 Operc. damage 3 PIT tag 1 Popeye 2 Size 24
Subyearling Chinook salmon
Descaling 3 Lacerations 10 Operc. damage 4 Size 5
Total Fish Collected 10,922 Number of Fish Rejected 90 Percent Total Fish Rejected 0.82%
3.2.1.3 Length Frequency Comparisons
Length frequency distributions of tagged and untagged fish of each run of fish collected at the JDA SMF were very similar (Figure 3.4) in 2009.

3.5
Figure 3.4. Length Frequencies of Tagged and Untagged Juvenile Steelhead (Top), Yearling Chinook
Salmon Smolts (Middle), and Subyearling Chinook Salmon Smolts (Bottom)
Additional information about fish selected for tagging and released upstream of Bonneville Dam are presented in Appendix A.

3.6
3.2.2 Tag-Life Versus Travel Time Through Survival Detection Arrays
Nine acoustic tags were already activated when received by PNNL for the tag-life study, so only 89 tags were used in the tag-life analysis. Tag-life data from both manufacturing batches were pooled for analysis. Mean (SE) time to tag failure was 30 days (range = 24–49 days). Over 95% of tags were still transmitting 30 days after activation, and the cumulative frequency of arrivals of tagged fish of each run at the tertiary survival detection array reached 100% before there was any failure of acoustic tags tested in the tag-life study (Figure 3.5). Consequently, no tag-life correction was required or performed in 2009.
Figure 3.5. Percent of Acoustic Tags Transmitting (Tag Life) and Cumulative Frequency of Arrival at
the Tertiary Survival Detection Array for Three Runs of Juvenile Salmonids Studied in 2009
3.2.3 Effect of Detections or Capture Histories on Detection and Survival
Burnham Test 2 and Test 3 were performed to determine whether upstream detections or capture histories affected downstream survival or detection. Virtual release groups of fish passing through B2 were compared to downstream detection at survival arrays during both the spring and summer, but most Test 2 and Test 3 results for individual releases were not significant (at α = 0.05) or could not be calculated. This included 95.1% percent of Test 2 and 98.4% of Test 3 results for STH; 98.4% of Test 2 and 100% of Test 3 results for CH1; and 98.3% of Test 2 and 100% of Test 3 results for CH0).
3.2.4 Assessment of Mixing for Paired-Release Survival Estimates
Because there were no BON tailrace reference releases in 2009, we used virtual releases of fish passing through the B2CC as reference releases for making paired-release estimates of survival for fish passing through the dam, B2, and all B2 routes other than the B2CC. Fish released above John Day Dam passed through the B2CC, the dam, and other B2 routes at all hours of the day and consequently were well mixed in the common tailwater downstream (see Figures 3.6, 3.7, and 3.8).

3.7
Figure 3.6. Cumulative Time of Arrival of Yearling Chinook Salmon Smolts at the Forebay Array and
B2CC (Top) and Arrival Hour at the Tertiary Array of Individuals Known to Have Passed the Forebay Array (Red Circles) and the B2CC (Black Dots; Bottom)

3.8
Figure 3.7. Cumulative Time of Arrival of Juvenile Steelhead at the Forebay Array and B2CC (Top) and
Arrival Hour at the Tertiary Array of Individuals Known to Have Passed the Forebay Array (Red Circles) and the B2CC (Black Dots; Bottom)

3.9
Figure 3.8. Cumulative Time of Arrival of Subyearling Chinook Salmon Smolts at the Forebay Array
and B2CC (Top) and Arrival Hour at the Tertiary Array of Individuals Known to Have Passed the Forebay Array (Red Circles) and the B2CC (Black Dots; Bottom)
3.3 Detection and Survival of Juvenile Steelhead and Yearling and Subyearling Chinook Salmon
Single-release CJS models were used to extract survival information from the outmigrating smolts implanted with acoustic tags for fish passing through Bonneville Dam, B2, the B2CC, B2 turbines, and B2 JBS (Cormack 1964; Skalski 1998). We also used survival estimates for fish passing through the B2CC as a reference release for fish regrouped to form virtual releases for other routes of passage. There were no tailrace reference releases in 2009. We evaluated tag life relative to the age of tags at the time tagged fish arrived at the tertiary survival detection array downstream of Bonneville Dam to determine whether a tag-life correction would be required. Survival estimates were generated by route of passage

3.10
through B2 (including turbines, JBS, and B2CC), and B2 as a whole for each group of smolts. Detailed detection histories and survival estimates for the dam-, B1+ spillway-, and B2-passage routes are presented in Appendix C. Only the highlights of survival results are described in this section of the report.
3.3.1 Tag-Life Study Correction
Examination of the tag-life curve and arrival distributions of fish at the tertiary survival detection array at Oak Point, Washington, revealed that nearly 100% of each run of fish arrived before the time of first tag failure. Consequently, no tag-life corrections were applied to the 2009 survival estimates.
3.3.2 Detection and Survival of Juvenile Steelhead in Spring
Releases of STH in the Lower Columbia River were analyzed using a single-release model because there were no STH reference releases in the tailrace downstream of Bonneville Dam. Capture histories and single-release survival estimates, as well as paired-release estimates using B2CC passage survival as a reference release for dam-, B1- and spillway-, B2-concrete-, B2 JBS-, and B2 turbine-passage fish are tabulated in Appendix C, Section C.1.
The STH released in the JDA pool near Roosevelt, Washington, and detected by the BON forebay array were identified and grouped in virtual releases, and subsequent capture histories were recorded for each of 15 consecutive time blocks in spring (Table C.1). The weighted mean single-release estimate of dam-passage survival was 0.961 (95% CI = 0.955-0.967; Table C.2), and a paired-release estimated relative to B2CC-passage survival was 0.970 (95% CI = 0.957-0.983; Table C.5).
Steelheads detected on the forebay entrance array but not detected passing through B2 most likely passed through B1 and the spillway, and their subsequent capture histories are recorded in Table C.6. The weighted mean single-release survival estimates for these fish was 0.954 (95% CI = 0.944-0.964; Table C.7). A paired-release estimate of B1+ spillway-passage survival was 0.962 (95% CI = 0.947-0.977; Table C.10).
Just over 1000 STH that passed through B2 were grouped in 15 virtual releases by date of passage, and subsequent capture histories for each release are enumerated in Table C.11. The weighted mean single-release survival rate for B2-concrete-passed fish was 0.975 (95% CI = 0.966-0.984; Table C.12). The paired-release rate, using B2CC-passage survival rates (Table C.14) as a reference was 0.984 (95% CI = 0.969-0.999; Table C.15).
Point estimates of survival rates for juvenile STH passing through the B2 JBS (single-release rate = 0.969; paired-release rate = 0.977) were a little higher than those for STH passing through B2 turbines (single-release rate = 0.943; paired-release rate = 0.951). However, these differences were not significant (P(T<t) one-tailed test > 0.3) because of high variability among virtual-release estimates.
The weighted mean single-release estimate of survival for the 594 juvenile STH passing through the B2CC at B2 was 0.992 (95% CI = 0.981-1.003; Table C.14).
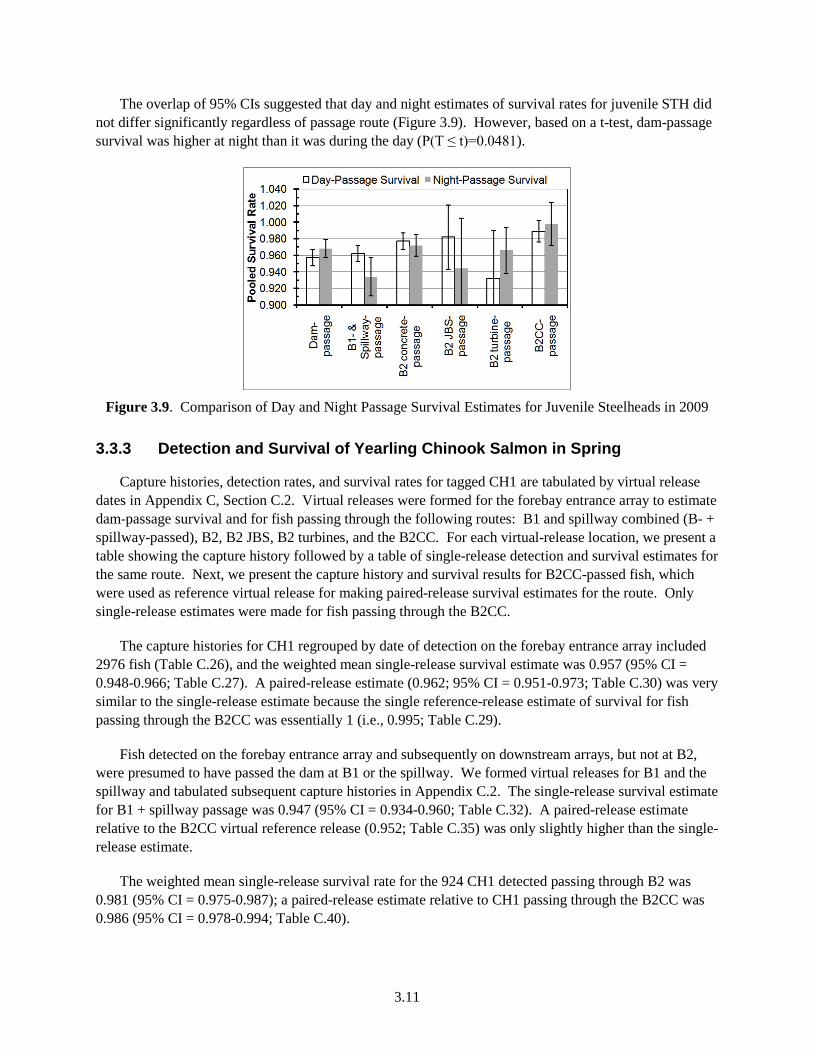
3.11
The overlap of 95% CIs suggested that day and night estimates of survival rates for juvenile STH did not differ significantly regardless of passage route (Figure 3.9). However, based on a t-test, dam-passage survival was higher at night than it was during the day (P(T ≤ t)=0.0481).
Figure 3.9. Comparison of Day and Night Passage Survival Estimates for Juvenile Steelheads in 2009
3.3.3 Detection and Survival of Yearling Chinook Salmon in Spring
Capture histories, detection rates, and survival rates for tagged CH1 are tabulated by virtual release dates in Appendix C, Section C.2. Virtual releases were formed for the forebay entrance array to estimate dam-passage survival and for fish passing through the following routes: B1 and spillway combined (B- + spillway-passed), B2, B2 JBS, B2 turbines, and the B2CC. For each virtual-release location, we present a table showing the capture history followed by a table of single-release detection and survival estimates for the same route. Next, we present the capture history and survival results for B2CC-passed fish, which were used as reference virtual release for making paired-release survival estimates for the route. Only single-release estimates were made for fish passing through the B2CC.
The capture histories for CH1 regrouped by date of detection on the forebay entrance array included 2976 fish (Table C.26), and the weighted mean single-release survival estimate was 0.957 (95% CI = 0.948-0.966; Table C.27). A paired-release estimate (0.962; 95% CI = 0.951-0.973; Table C.30) was very similar to the single-release estimate because the single reference-release estimate of survival for fish passing through the B2CC was essentially 1 (i.e., 0.995; Table C.29).
Fish detected on the forebay entrance array and subsequently on downstream arrays, but not at B2, were presumed to have passed the dam at B1 or the spillway. We formed virtual releases for B1 and the spillway and tabulated subsequent capture histories in Appendix C.2. The single-release survival estimate for B1 + spillway passage was 0.947 (95% CI = 0.934-0.960; Table C.32). A paired-release estimate relative to the B2CC virtual reference release (0.952; Table C.35) was only slightly higher than the single-release estimate.
The weighted mean single-release survival rate for the 924 CH1 detected passing through B2 was 0.981 (95% CI = 0.975-0.987); a paired-release estimate relative to CH1 passing through the B2CC was 0.986 (95% CI = 0.978-0.994; Table C.40).

3.12
The weighted mean single-release survival estimate for JBS-passed CH1 in spring was high (0.984; 95% CI = 0.971-0.997; Table C.42), as was a paired-release estimate (relative to B2CC-passage survival) of 0.988 (95% CI = 0.975-1.001; Table C.45). The single-release estimate of JBS-passed survival did not differ significantly (P(T≤t) = 0.0563) from the single-release estimate of turbine-passage survival (0.965; 95% CI = 0.945-0.985; Table C.47). A paired-release estimate of turbine-passage survival for CH1 was 0.970 (95% CI = 0.950-0.990).
The weighted mean single-release estimate of survival for the 369 CH1 passing through the B2CC at B2 was 0.995 (95% CI = 0.990-1.000; Table C.29).
The overlap of 95% CIs suggested that day and night estimates of survival rates for CH1 did not differ significantly regardless of passage route (Figure 3.10). However, based on a t-test, JBS-passage survival was statistically higher at night than it was during the day (P=0.0328). Whether a mean difference of 1.5% is biologically meaningful given a combined sample size of 185 fish may be a more important question. The weighted mean single-release survival estimate for tagged fish passing through the B2 JBS was 0.984 (Table C.42), and a paired-release estimate using B2CC-passage survival as a reference was only slightly higher (0.988; Table C.45). Turbine-passage survival (mean weighted single release = 0.965 [Table C.47]) was slightly lower than the point estimate for JBS-passed CH1, and the same was true for the paired-release point estimate for turbine-passed fish (0.970; Table C.50).
Figure 3.10. Comparison of Day and Night Passage Survival Estimates for Yearling Chinook Salmon
Smolts in 2009
3.3.4 Detection and Survival of Subyearling Chinook Salmon in Summer
Releases of CH0 near Roosevelt, Washington, were analyzed using single-release and paired-release-recapture models. Fish were regrouped to form virtual releases based on detections on the forebay entrance array (for estimating dam-passage survival), the B2 dam-face array, or by tracking into a specific route of passage such as the B2CC or B2 turbines. PIT-tag detections in the JBS were used differentiate between guided and unguided fish. Fish that were detected on the forebay entrance array but not at B2 were presumed to have passed through the B1 or the spillway and virtual releases were formed for B1- + spillway-passed fish. Capture-history data were generated from three arrays of autonomous nodes located downstream of Bonneville Dam.

3.13
Capture histories, detection rates, and survival rates for tagged CH0 are tabulated by virtual release dates in Appendix C, Section C.3. For each virtual-release location listed in the previous paragraph, we present a table showing the capture history followed by a table of single-release detection and survival estimates for the same route. Next we present the capture-history and survival results for B2CC-passed fish, which were used as reference virtual releases to making paired-release survival estimates for every route except the B2CC (the last table for each route).
The capture histories for CH0 regrouped by date of detection on the forebay entrance array included 1999 fish (Table C.51), and the weighted mean single-release survival estimate was 0.903 (95% CI = 0.974-0.932; Table C.52). A paired-release estimate (0.959; 95% CI = 0.896-1.022; Table C.55) was nearly 6% higher than the single-release estimate because single-release survival for fish passing through the B2CC was only 0.942 in summer (Table C.54).
Fish detected on the forebay entrance array and subsequently on downstream arrays but not at B2 were presumed to have passed the dam at B1 or the spillway. We formed virtual releases for B1 and the spillway and tabulated subsequent capture histories for 1368 fish in Table C.56. The single-release survival estimate for B1 and spillway passage was 0.883 (95% CI = 0.852-0.914; Table C.57). A paired-release estimate (0.930; Table C.60) relative to the B2CC virtual-reference single-release estimate of 0.949 (Table C.59) was equal to the BiOp standard for CH0.
The weighted mean single-release survival rate for the 635 CH0 detected passing through B2 was 0.941 (95% CI = 0.902-0.977); apaired-release estimate (relative to the survival of CH0 passing through the B2CC) was 0.991 (95% CI = 0.928-1.054; Table C.65).
Only 79 CH0 passed through the JBS in summer 2009 (Table C.66) and their single-release survival to the primary array 42 km downstream of Bonneville Dam was 0.886 (95% CI = 0.847-0.925; Table C.67). Relative to B2CC-passage survival, a paired-release estimate for JBS-passage survival was 0.933 (95% CI = 0.871-1.027; Table C.70). The single-release estimate of turbine-passage survival based on 227 fish was 0.947 (Table C.72), 6.1% higher than the single-release estimate of JBS-passage survival, and this difference was significant (P(T<t) one tail = 0.0470).
The weighted mean single-release estimate of survival for the 329 CH0 passing through the B2CC at B2 was 0.942 (95% CI = 0.888-0.996; Table C.54). Estimates prior to July 12 averaged 0.982, whereas estimates after that averaged 0.744.
The overlap of 95% CIs suggested that day and night estimates of survival rates for CH0 smolts did not differ significantly regardless of passage route (Figure 3.11). Using t-tests, we reached the same conclusions for survival rates for CH0 passing through B1 + spillway, B2, B2 turbines, and the B2CC. However, t-tests indicated that dam-passage survival was significantly higher at night (0.979) than it was during the day (0.926) (P(T<t) one tailed = 0.0227), and the same was true for B2 JBS-passage survival (night = 0.971; day = 0.845; P(T<t) one tailed = 0.0168).
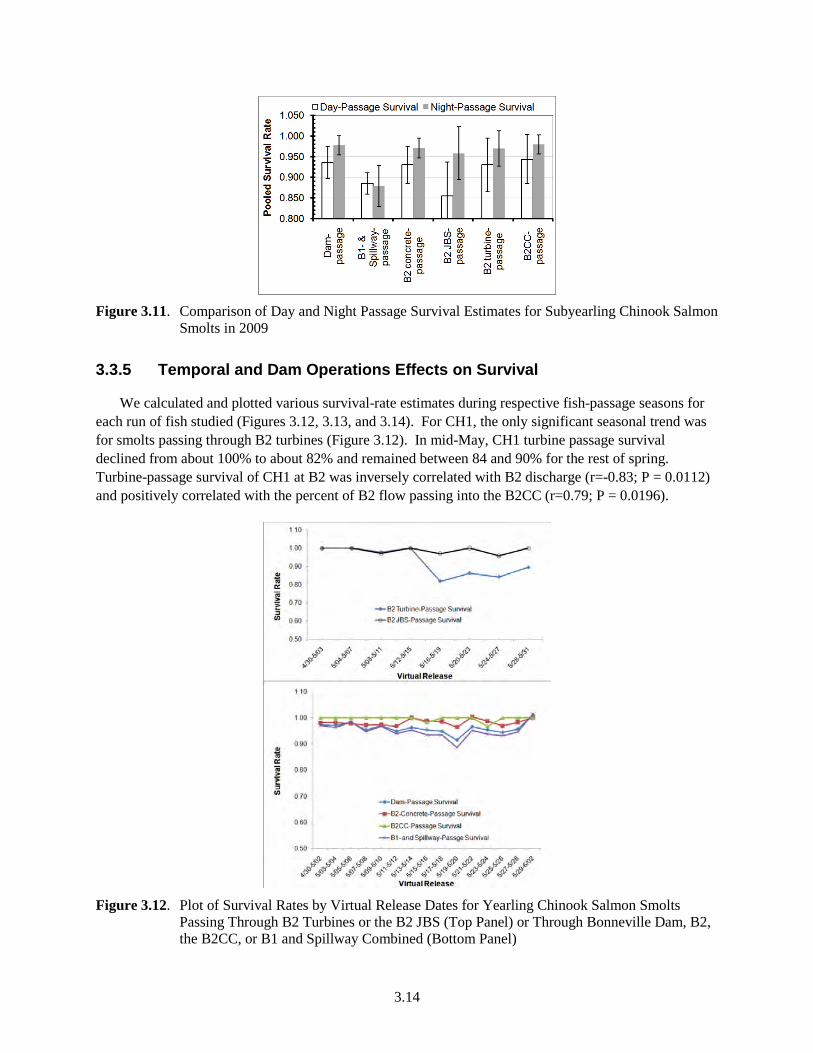
3.14
Figure 3.11. Comparison of Day and Night Passage Survival Estimates for Subyearling Chinook Salmon
Smolts in 2009
3.3.5 Temporal and Dam Operations Effects on Survival
We calculated and plotted various survival-rate estimates during respective fish-passage seasons for each run of fish studied (Figures 3.12, 3.13, and 3.14). For CH1, the only significant seasonal trend was for smolts passing through B2 turbines (Figure 3.12). In mid-May, CH1 turbine passage survival declined from about 100% to about 82% and remained between 84 and 90% for the rest of spring. Turbine-passage survival of CH1 at B2 was inversely correlated with B2 discharge (r=-0.83; P = 0.0112) and positively correlated with the percent of B2 flow passing into the B2CC (r=0.79; P = 0.0196).
Figure 3.12. Plot of Survival Rates by Virtual Release Dates for Yearling Chinook Salmon Smolts
Passing Through B2 Turbines or the B2 JBS (Top Panel) or Through Bonneville Dam, B2, the B2CC, or B1 and Spillway Combined (Bottom Panel)

3.15
There were no significant seasonal trends in the survival rate of juvenile STH during spring 2009 (Figure 3.13), and there were only a few significant correlations of survival rates with flow variables. The survival of fish passing through B2 was positively correlated with spillway discharge (r=0.58; P=0.0233) and with discharge through B1 and the spillway combined (r=0.53; P=0.0430). Turbine passage survival at B2 was inversely correlated with BON discharge and discharge through B1 and the spillway combined. JBS survival at B2 was positively correlated with BON discharge.
Figure 3.13. Plot of Survival Rates by Virtual Release Dates for Juvenile Steelheads Passing Through
B2 Turbines or the B2 JBS (Top Panel) or Through Bonneville Dam, B2, the B2CC, or B1 and Spillway Combined (Bottom Panel)
Except for B2 turbine passage survival, survival rates of CH0 smolts passing through other routes declined significantly in summer (Figure 3.14). The trend in turbine passage survival also would have been significant if the estimate for the July 15–23 virtual release were dropped because it was based on only 21 fish.
There were many correlations of route-specific survival rates for CH0 with flow and flow proportion variables (Table 3.2). Most major discharge rates (e.g., B1, B1SPILL, BON, and B2) were highly intercorrelated, so there was little justification to explore further with multiple regression techniques. In addition, the proportion of flow through the B2CC relative to the dam or just B2 usually was inversely correlated with discharge through all major routes (Table 3.3).

3.16
Figure 3.14. Plot of Survival Rates and Residualization Combined by Virtual Release Dates for
Subyearling Chinook Salmon Smolts Passing Through the B2 JBS (Top), B2 Turbines or B1 and the Spillway Combined (Middle), or Bonneville Dam, B2, or the B2CC (Bottom)

3.17
Table 3.2. Correlations of Subyearling Chinook Salmon Smolt Estimates of Route-Specific Survival and Residualization Combined with Flow and Flow Proportion Variables in Summer 2009. Sample sizes for survival estimates were 15 for dam passage (Dam), B2 passage (B2), and B2CC passage; 10 for B2 turbine passage; and 5 for B2 JBS passage.
Survival Pearson Correlation Coefficients; Prob > |r| under H0: Rho=0 Dam B1SPILL B1 BON P_B2CCBON B2CC B2 BSPILL
0.69072 0.67365 0.64626 -0.62031 -0.52846 0.51095 0.46915
0.0044 0.0059 0.0092 0.0136 0.0428 0.0516 0.0777 B2 B1 B1SPILL BON P_B2CCBON B2 P_B2CCB2 B2CC
0.66957 0.65516 0.64301 -0.61137 0.55868 -0.41959 -0.35434
0.0063 0.008 0.0097 0.0155 0.0304 0.1195 0.195 B2CC B1 BON B2 B1SPILL P_B2CCBON P_B2CCB2 B2CC
0.52904 0.5142 0.49865 0.4908 -0.48789 -0.3607 -0.17983
0.0426 0.0499 0.0585 0.0632 0.065 0.1866 0.5213 Turbine BSPILL B1SPILL B1 BON B2CC P_B2CCBON P_B2
0.60387 0.51509 0.43557 0.42079 -0.39475 -0.38892 -0.35955
0.0645 0.1276 0.2083 0.2259 0.2589 0.2667 0.3075 JBS BSPILL P_B2CCBON B2 BON P_B2CCB2 B1SPILL B1
0.55984 -0.42561 0.41631 0.40801 -0.39636 0.39507 0.35617
0.3264 0.4749 0.4857 0.4953 0.5089 0.5104 0.5563 Flow and flow proportion abbreviations are as follows: B1 = Powerhouse 1 kcfs; B1Spill = B1 and Spillway kcfs combined; B2 = Powerhouse 2 kcfs; B2CC = B2 Corner Collector kcfs; BON = dam kcfs; BSPILL = Spillway kcfs; P_B2 = proportion of dam discharge through B2; P_B1SPILL = proportion of dam discharge through B1 and the spillway; P_B2CCBON = proportion of dam discharge through the B2CC; P_B2CCB2 = proportion of B2 discharge through the B2CC.
Table 3.3. Intercorrelations Among Flow Variable Estimates at Bonneville Dam in Summer 2009. Sample sizes for survival estimates were 15 for dam passage (Dam), B2 passage (B2), and B2CC passage; 10 for B2 turbine passage; and 5 for B2 JBS passage.
Flow Estimate Pearson Correlation Coefficients; Prob > |r| under H0: Rho=0 B1 B1SPILL BON P_B2CCBON B2 P_B2CCB2 B2CC BSPILL
0.99386 0.98191 -0.93441 0.86345 -0.73896 -0.46404 0.4411
<.0001 <.0001 <.0001 <.0001 0.0016 0.0814 0.0998 BSPILL B1SPILL B1 BON P_B2CCBON P_B1SPILL P_B2 B2CC
0.53768 0.4411 0.42635 -0.40511 0.40057 -0.40057 -0.37924
0.0387 0.0998 0.113 0.1341 0.139 0.139 0.1633 B2 P_B2CCBON P_B2CCB2 BON B1 B1SPILL P_B2 P_B1SPILL
-0.95837 -0.95165 0.93753 0.86345 0.83691 0.51068 -0.51068
<.0001 <.0001 <.0001 <.0001 <.0001 0.0517 0.0517 BON B1 P_B2CCBON B1SPILL B2 P_B2CCB2 B2CC BSPILL
0.98191 -0.97842 0.97505 0.93753 -0.843 -0.44419 0.42635
<.0001 <.0001 <.0001 <.0001 <.0001 0.0972 0.113 B1SPILL B1 BON P_B2CCBON B2 P_B2CCB2 BSPILL B2CC
0.99386 0.97505 -0.92781 0.83691 -0.71905 0.53768 -0.48271
<.0001 <.0001 <.0001 <.0001 0.0025 0.0387 0.0684 P_B2CCB2 B2 P_B2CCBON BON B1 B1SPILL P_B1SPILL P_B2
-0.95165 0.91936 -0.843 -0.73896 -0.71905 0.64448 -0.64448
<.0001 <.0001 <.0001 0.0016 0.0025 0.0095 0.0095

3.18
Table 3.3. (contd)
Flow Estimate Pearson Correlation Coefficients; Prob > |r| under H0: Rho=0 P_B2CCBON BON B2 B1 B1SPILL P_B2CCB2 B2CC BSPILL
-0.97842 -0.95837 -0.93441 -0.92781 0.91936 0.51645 -0.40511
<.0001 <.0001 <.0001 <.0001 <.0001 0.0487 0.1341 P_B2 P_B2CCB2 B2 BSPILL P_B2CCBON BON B2CC B1SPILL
-0.64448 0.51068 -0.40057 -0.31092 0.18587 0.06661 -0.03342
0.0095 0.0517 0.139 0.2593 0.5072 0.8135 0.9059 Flow and flow proportion abbreviations are as follows: B1 = Powerhouse 1 kcfs; B1Spill = B1 and Spillway kcfs combined; B2 = Powerhouse 2 kcfs; B2CC = B2 Corner Collector kcfs; BON = dam kcfs; BSPILL = Spillway kcfs; P_B2 = proportion of dam discharge through B2; P_B1SPILL = proportion of dam discharge through B1 and the spillway; P_B2CCBON = proportion of dam discharge through the B2CC; P_B2CCB2 = proportion of B2 discharge through the B2CC.
3.4 Travel Times and Rates
Forebay residence times were slightly shorter for B2 turbine-passed fish than for B2CC-passed fish, and the forebay residence times shortest for CH1 and longest for STH (Table 3.4). Forebay residence times for CH0 were almost twice as long as those of CH1, but shorter than those for juvenile STH.
Table 3.4. Forebay Residence Times for Fish Passing Through the B2CC and B2 Turbines in 2009
Run First Detected Last Detected Travel Time (h)
Median Mean Standard Error Steelhead Forebay at CR236 B2CC 1.67 3.26 0.22
Forebay at CR236 B2 Turbine 1.49 3.23 0.27 Yearling Chinook Forebay at CR236 B2CC 0.48 0.79 0.06
Forebay at CR236 B2 Turbine 0.39 0.76 0.11 Subyearling Chinook Forebay at CR236 B2CC 0.84 1.35 0.09 Forebay at CR236 B2 Turbine 0.53 1.30 0.25
Travel times were calculated from the first detection on the forebay entrance array at rkm 236 until the time of last detection on the primary survival detection array at rkm 192 (distance = 44 km) or from the last detection on the B2 dam-face array at rkm 234 to the primary array (distance = 42 km). With one exception for turbine-passed fish, median travel times were longer for summer run CH0 than they were for spring run CH1 and STH, and STH had the shortest median travel times to the primary array (Table 3.5). For each run of fish, the longest median egress times to the primary array were posted by fish passing through the JBS route. This also was true for mean egress times except for STH traveling from the forebay array to the primary array.
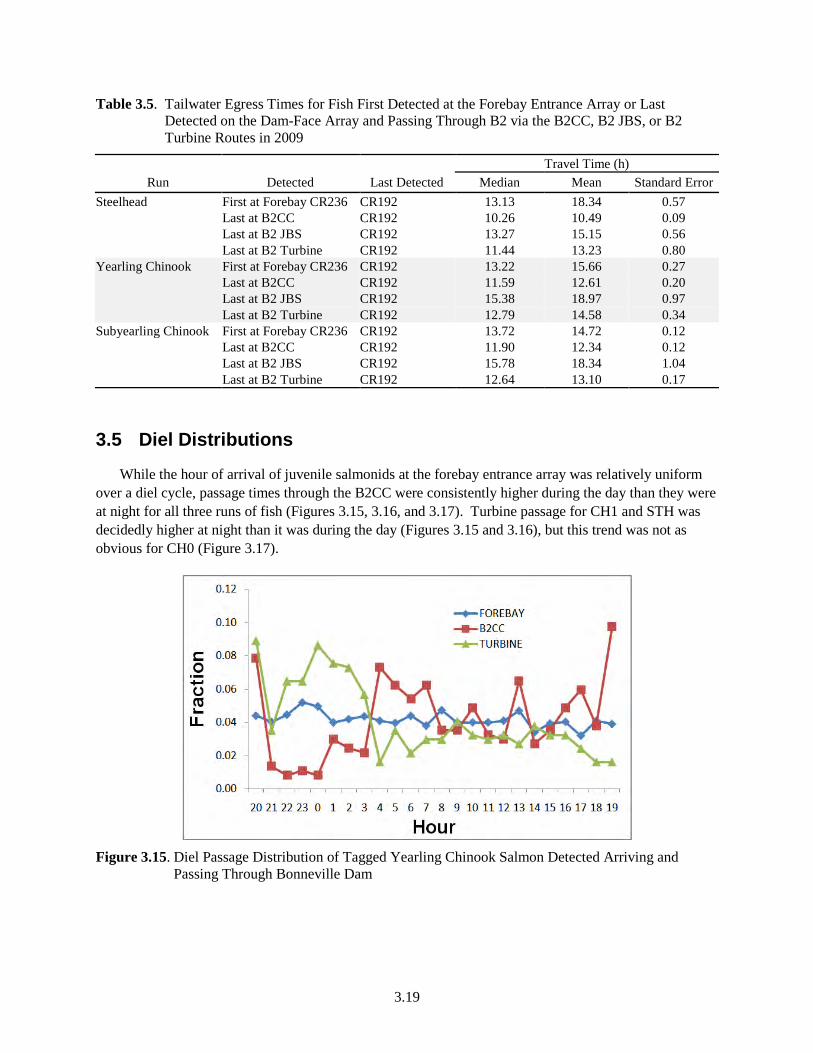
3.19
Table 3.5. Tailwater Egress Times for Fish First Detected at the Forebay Entrance Array or Last Detected on the Dam-Face Array and Passing Through B2 via the B2CC, B2 JBS, or B2 Turbine Routes in 2009
Run Detected Last Detected Travel Time (h)
Median Mean Standard Error Steelhead First at Forebay CR236 CR192 13.13 18.34 0.57
Last at B2CC CR192 10.26 10.49 0.09
Last at B2 JBS CR192 13.27 15.15 0.56
Last at B2 Turbine CR192 11.44 13.23 0.80 Yearling Chinook First at Forebay CR236 CR192 13.22 15.66 0.27
Last at B2CC CR192 11.59 12.61 0.20
Last at B2 JBS CR192 15.38 18.97 0.97
Last at B2 Turbine CR192 12.79 14.58 0.34 Subyearling Chinook First at Forebay CR236 CR192 13.72 14.72 0.12
Last at B2CC CR192 11.90 12.34 0.12
Last at B2 JBS CR192 15.78 18.34 1.04 Last at B2 Turbine CR192 12.64 13.10 0.17
3.5 Diel Distributions
While the hour of arrival of juvenile salmonids at the forebay entrance array was relatively uniform over a diel cycle, passage times through the B2CC were consistently higher during the day than they were at night for all three runs of fish (Figures 3.15, 3.16, and 3.17). Turbine passage for CH1 and STH was decidedly higher at night than it was during the day (Figures 3.15 and 3.16), but this trend was not as obvious for CH0 (Figure 3.17).
Figure 3.15. Diel Passage Distribution of Tagged Yearling Chinook Salmon Detected Arriving and
Passing Through Bonneville Dam

3.20
Figure 3.16. Diel Passage Distribution of Tagged Juvenile Steelhead Detected Arriving at and Passing
Through Bonneville Dam
Figure 3.17. Diel Passage Distribution of Tagged Subyearling Chinook Salmon Detected Arriving at and
Passing Through Bonneville Dam
3.6 Passage Distribution at Bonneville Powerhouse 2
The B2CC passed significantly more fish of each run than did individual B2 turbines, and even though unit 11 was out of service throughout the study, the percent of each run passing through turbines 12–13 on the south end was higher than the percent passing through turbines 15–18 and a single fish turbine on the north end of B2 (Table 3.6). For each run, the B2CC passed a higher percentage of fish than the combined percentage for all B2 turbines, and turbine passage percentages were higher than JBS percentages by a factor of 2 for CH1, 1.73 for STH, and 3 for CH0 (Table 3.7).

3.21
Table 3.6. Passage Numbers and Associated Percentage for Tagged Juvenile Salmon and Steelhead Migrating Downstream Through B2 Routes
Species Unit N Passage (%)
Yea
rling
Chi
nook
B2CC 369 40.1% TU11 0 0% TU12 75 8.1% TU13 143 15.5% TU14 94 10.2% TU15 90 9.8% TU16 28 3.0% TU17 81 8.8% TU18 38 4.1% FU12 2 0.2%
Unknown 1 0.1%
Juve
nile
Ste
elhe
ad
B2CC 591 59.0% TU11 0 0% TU12 78 7.8% TU13 128 12.7% TU14 73 7.3% TU15 56 5.6% TU16 6 0.6% TU17 35 3.5% TU18 31 3.1% FU12 4 0.4%
Unknown 1 0.1%
Suby
earli
ng C
hino
ok
B2CC 329 51.8% TU11 0 0% TU12 40 6.3% TU13 55 8.7% TU14 76 12.0% TU15 61 9.6% TU16 0 0% TU17 33 5.2% TU18 31 4.9% FU12 10 1.6%
Unknown 0 0
Table 3.7. Route-Specific Total and Associated Percent Passage Through B2 by Route for Yearling Chinook, Juvenile Steelhead, and Subyearling Chinook
Species Route Number Passage (%)
Yearling Chinook
B2CC 369 40% JBS 185 20%
Turbine 367 40% Total 921

3.22
Table 3.7. (contd)
Species Route Number Passage (%)
Juvenile Steelhead
B2CC 591 59% JBS 146 15%
Turbine 267 26% Total 1004
Subyearling Chinook
B2CC 329 52% JBS 79 12%
Turbine 227 36% Total 635
Table 3.8 shows the numbers of fish passing through B2 routes (B2CC, turbine, JBS) as well as passage efficiency estimates (FPE, FGE, B2CC efficiency) and B2CC effectiveness. Fish passage efficiency (FPE) is the number of fish passing through non-turbine routes (the JBS or the B2CC) versus the total number passing through B2. Fish guidance efficiency (FGE) is the total number of fish passing through the JBS versus the number passing through turbines and the JBS, and it reflects the efficiency of submerged traveling screens. The passage efficiency of the B2CC is the proportion of fish passing into the B2CC relative to the total number passing through B2. The passage-effectiveness of the B2CC is the proportion of B2 fish passing into B2CC divided by the proportion of B2 water flowing through the B2CC.
Table 3.8. Total Tagged Yearling Chinook, Juvenile Steelhead, and Subyearling Chinook that Passed Through B2 Routes, and Their Associated FPE and FGE Values
Species B2CC JBS Turbine Guided (B2CC
or JBS) Unguided (Screens) Total FPE FGE
B2CC Efficiency
B2CC Effectiveness
Yearling Chinook 369 185 367 554 367 921 60% 34% 40% 7.33
Juvenile Steelhead 591 146 267 737 267 1004 73% 35% 59% 10.77
Subyearling Chinook 329 79 227 408 227 635 64% 26% 52% 6.47
3.7 Forebay Distributions
This section presents results on horizontal distributions of smolts in the B2 forebay, B2CC discovery efficiencies, and vertical distributions in the forebay.
3.7.1 Horizontal Distributions
In general, CH1, juvenile STH, and CH0 had higher densities of tracked fish on the Cascade Island (south) and Washington shore (north) sides of the powerhouse, and differences were more pronounced during the daytime than they were at night (Figures 3.18, 3.19, 3.20).

3.23
Figure 3.18. Total Number of Fish Tracked Within 10-m x 10-m Grids During Daytime (Left) and Nighttime (Right) and for Yearling Chinook
Salmon Smolts Approaching B2. Sphere size and color are a function of the number of fish in detected in each grid for all of the springtime period, and individual fish are only counted once per grid. Grids without tracked fish are not displayed; however the entire B2 forebay was included in this analysis.
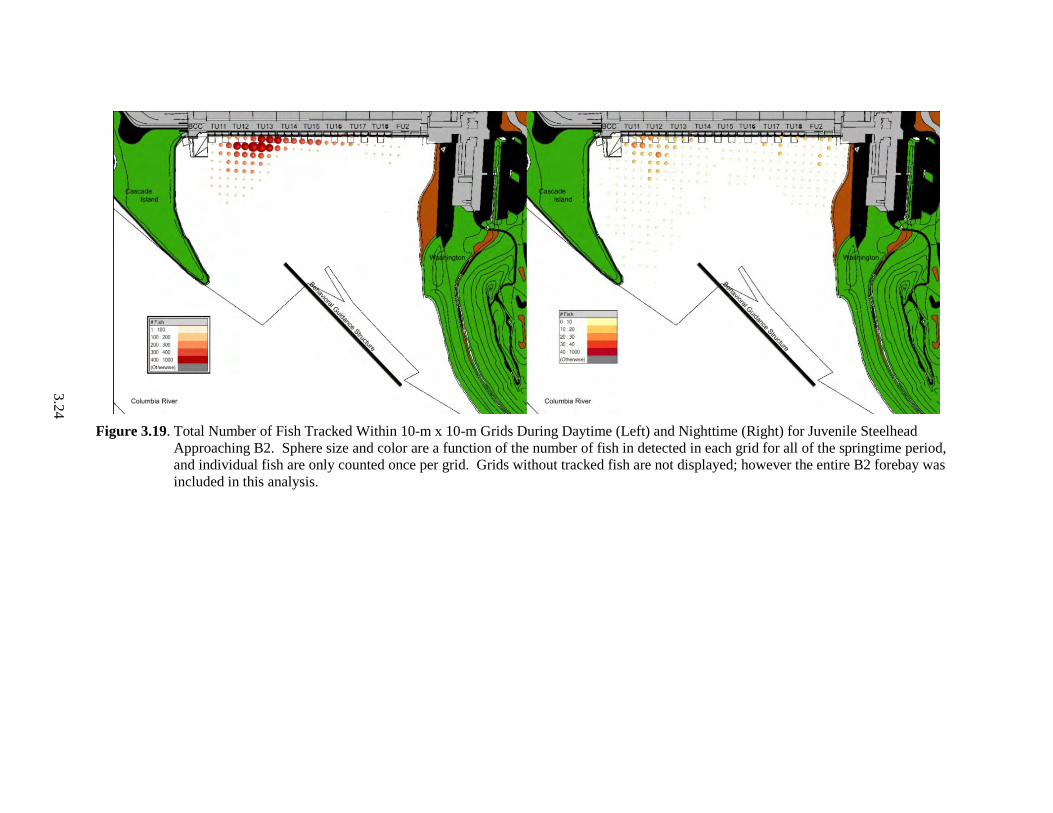
3.24
Figure 3.19. Total Number of Fish Tracked Within 10-m x 10-m Grids During Daytime (Left) and Nighttime (Right) for Juvenile Steelhead
Approaching B2. Sphere size and color are a function of the number of fish in detected in each grid for all of the springtime period, and individual fish are only counted once per grid. Grids without tracked fish are not displayed; however the entire B2 forebay was included in this analysis.
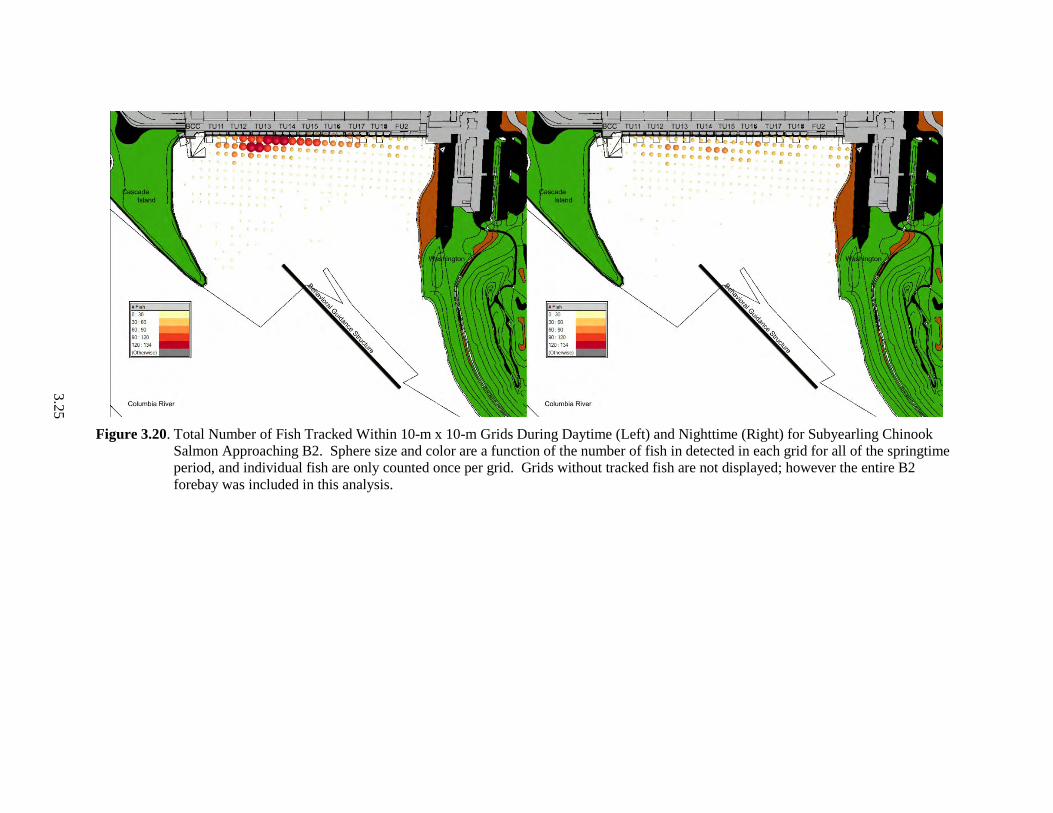
3.25
Figure 3.20. Total Number of Fish Tracked Within 10-m x 10-m Grids During Daytime (Left) and Nighttime (Right) for Subyearling Chinook
Salmon Approaching B2. Sphere size and color are a function of the number of fish in detected in each grid for all of the springtime period, and individual fish are only counted once per grid. Grids without tracked fish are not displayed; however the entire B2 forebay was included in this analysis.
3.26
3.7.2 B2 Corner Collector Discovery Efficiency
The percent of fish that passed through the B2CC that also were tracked in 10- x 10-m grids in the forebay provides an indication of B2CC discovery efficiency, and it usually was concentrated on the south end of the powerhouse, usually upstream of units 11 and 12 (Figures 3.21, 3.22, 3.23). The extent of the discovery area was higher during the daytime than it was at night, and during the day, it extended north to include some area upstream of unit 13 as well as upstream of units 11 and 12 for STH (Figure 3.22) and CH0 (Figure 3.23).
3.7.3 Vertical
Fish from all three runs were distributed higher in the water column when detected upstream of the B2CC and units 11–13 than were fish detected upstream of units 14–18 and the Fish Unit, and fish tended to be deeper at night than they were during the day (Figures 3.25–3.27). Juvenile STH showed universal preference for the upper water column regardless of location during the daytime (Figure 3.26). At night, distributions at the middle of B2 and at the north end were bimodal, with an obvious peak near the surface and another at depth (right-hand plot in Figures 3.25–3.27).

3.27
Figure 3.21. Corner Collector Discovery by Forebay Location. Shown is the total percent of fish passing through the B2CC that were tracked
within 10-m x 10-m grids during daytime (Left) and nighttime (Right) for yearling Chinook salmon approaching B2. Sphere size and color are a function of the percent of fish passing into the B2CC for all of the spring sampling period. Grids had a minimum of 5 fish in order to compute the B2CC efficiency; and grids that did not meet these criteria are not shown.

3.28
Figure 3.22. Corner Collector Discovery by Forebay Location. Shown is the total percent of fish passing through the B2CC that were tracked
within 10-m x 10-m grids during daytime (left) and nighttime (right) for juvenile steelhead approaching B2. Sphere size and color are a function of the percent of fish passing into the B2CC for all of the spring sampling period. Grids had a minimum of 5 fish in order to compute the B2CC efficiency; and grids that did not meet these criteria are not shown.

3.29
Figure 3.23. Corner Collector Discovery by Forebay Location. Shown is the total percent of fish passing through the B2CC that were tracked
within 10-m x 10-m grids during daytime (left) and nighttime (right) for subyearling Chinook salmon approaching B2. Sphere size and color are a function of the percent of fish passing into the B2CC for all of the spring sampling period. Grids had a minimum of 5 fish in order to compute the B2CC efficiency; and grids that did not meet these criteria are not shown.
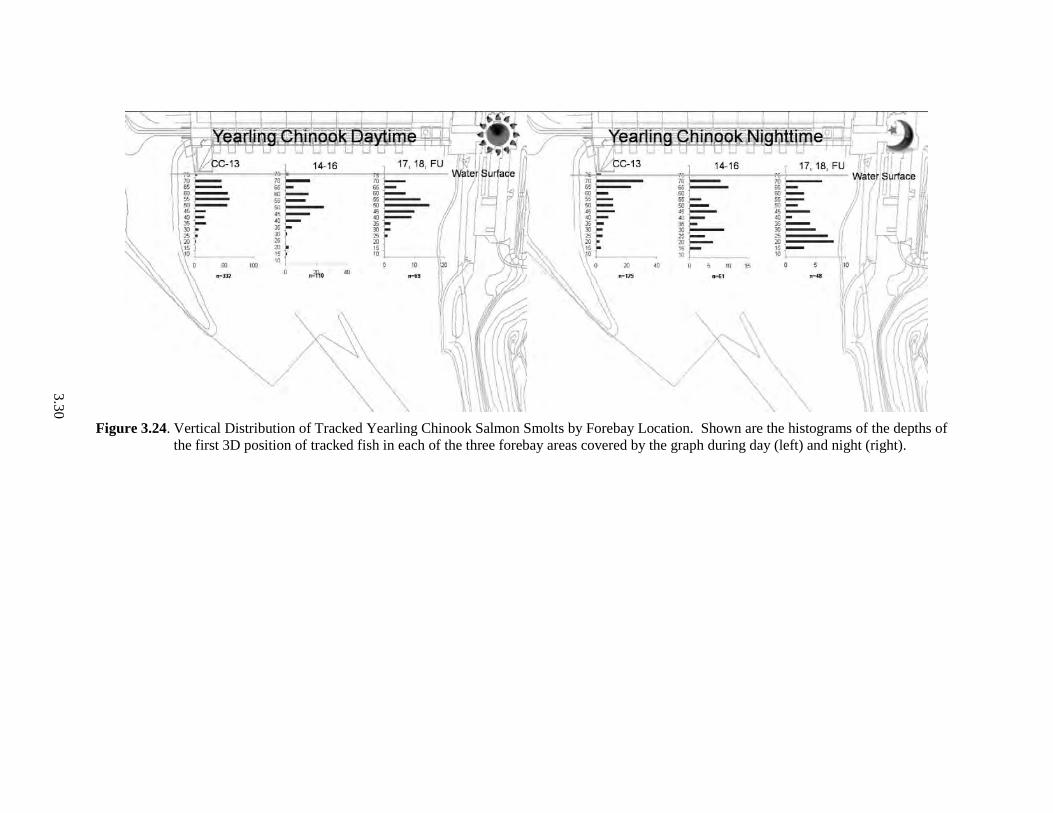
3.30
Figure 3.24. Vertical Distribution of Tracked Yearling Chinook Salmon Smolts by Forebay Location. Shown are the histograms of the depths of
the first 3D position of tracked fish in each of the three forebay areas covered by the graph during day (left) and night (right).
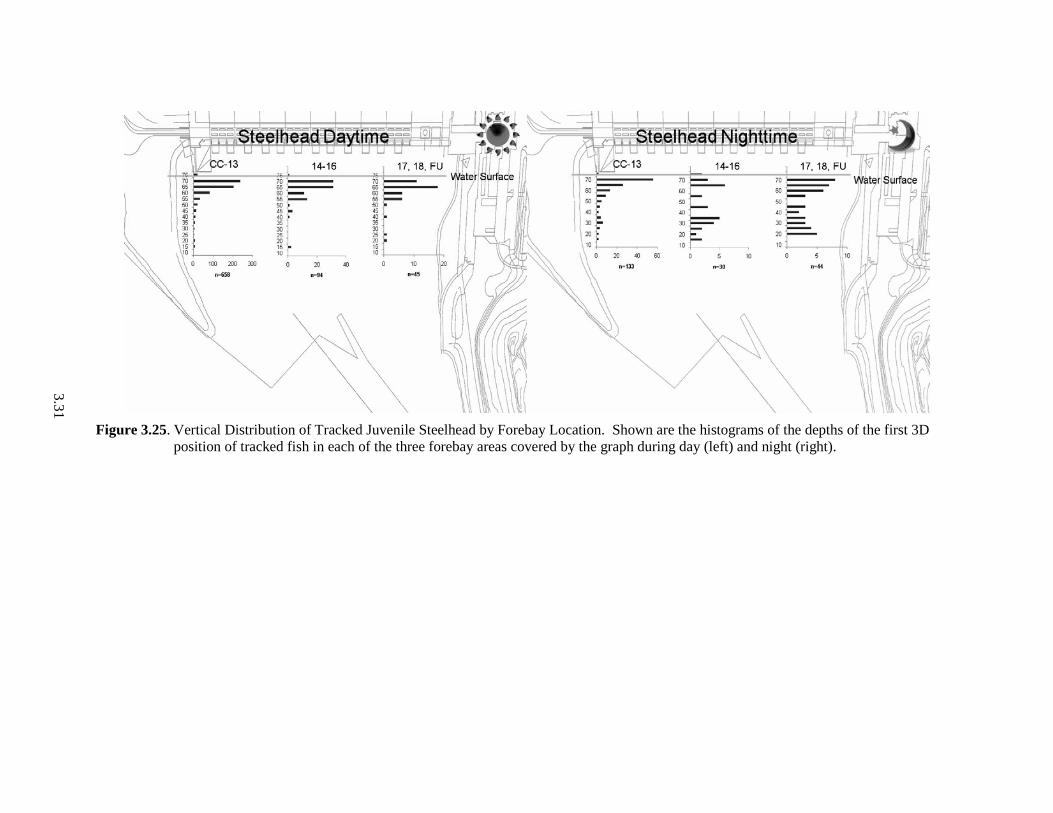
3.31
Figure 3.25. Vertical Distribution of Tracked Juvenile Steelhead by Forebay Location. Shown are the histograms of the depths of the first 3D
position of tracked fish in each of the three forebay areas covered by the graph during day (left) and night (right).
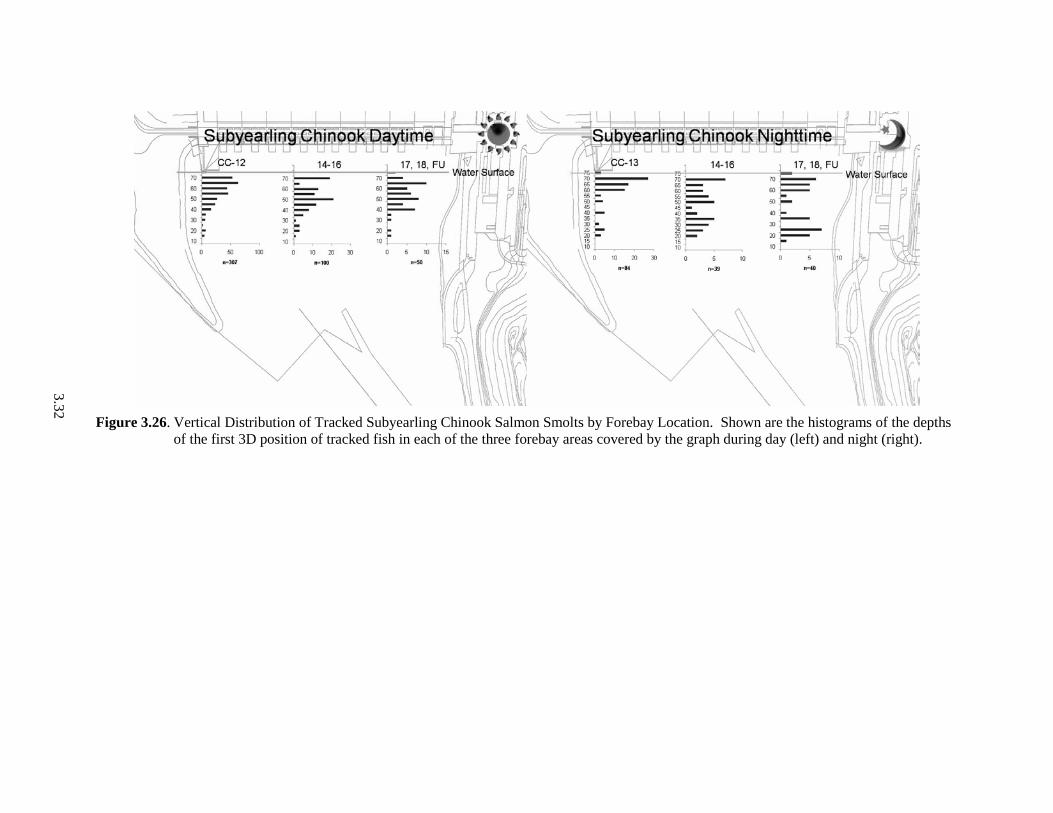
3.32
Figure 3.26. Vertical Distribution of Tracked Subyearling Chinook Salmon Smolts by Forebay Location. Shown are the histograms of the depths
of the first 3D position of tracked fish in each of the three forebay areas covered by the graph during day (left) and night (right).

3.33
3.8 Forebay and Passage Distribution Relative to BGS Deployment
The relative distribution of passage for tagged fish approaching the BGS and eventually passing through B2 routes was compared. Fish that approached were classified as either passing through the “north gap” near the Washington shoreline, where no BGS sections were deployed; or “guided,” where fish were observed passing between the downstream edge of the BGS and Cascade Island. All classifications of tagged fish were based upon the detections of fish on hydrophones along the Washington and Cascade Island shoreline. Because detection range of hydrophones is limited to about 100 m, the detection of fish approaching and passing by the BGS was determined only by the sequence of detections of hydrophones. The percent of fish passing through the south gap was much higher than the number passing through the north gap (Figure 3.27). Most guided fish passed in greater proportions through the B2CC than did the north gap fish, and north gap fish passed in greater proportions through the turbines than they did through the B2CC (Table 3.9). From 45 50% of fish passing under the BGS passed B2 through turbines.
South Gap (n)
South Gap %
North Gap (n)
North Gap %
Yearling Chinook salmon 571 64.7% 312 35.3% Juvenile Steelhead 829 84.7% 150 15.3% Subyearling Chinook salmon 476 76.3% 148 23.7%
Figure 3.27. Approach Route Relative to the BGS for All Tagged Fish. In 2009, we could only monitor the gaps between the BGS and Cascade Island and between the BGS and the Washington shoreline because no hydrophones were deployed on the BGS.
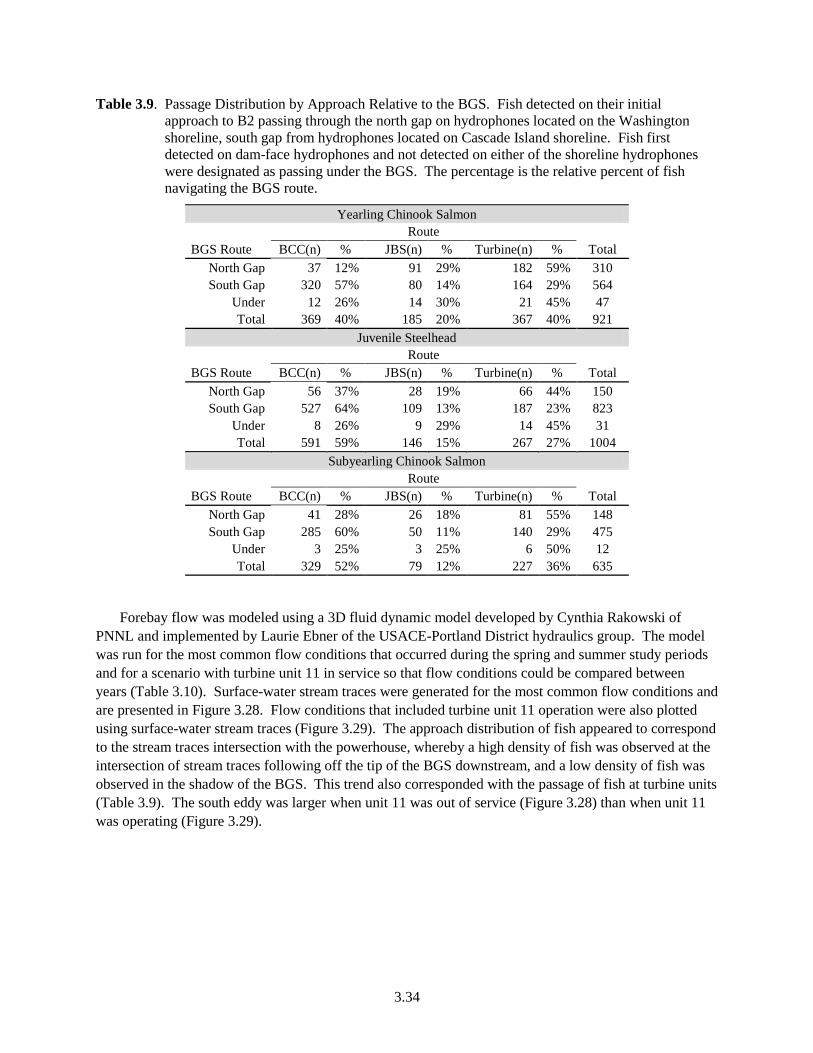
3.34
Table 3.9. Passage Distribution by Approach Relative to the BGS. Fish detected on their initial approach to B2 passing through the north gap on hydrophones located on the Washington shoreline, south gap from hydrophones located on Cascade Island shoreline. Fish first detected on dam-face hydrophones and not detected on either of the shoreline hydrophones were designated as passing under the BGS. The percentage is the relative percent of fish navigating the BGS route.
Yearling Chinook Salmon
Route
BGS Route BCC(n) % JBS(n) % Turbine(n) % Total North Gap 37 12% 91 29% 182 59% 310 South Gap 320 57% 80 14% 164 29% 564
Under 12 26% 14 30% 21 45% 47 Total 369 40% 185 20% 367 40% 921
Juvenile Steelhead
Route
BGS Route BCC(n) % JBS(n) % Turbine(n) % Total North Gap 56 37% 28 19% 66 44% 150 South Gap 527 64% 109 13% 187 23% 823
Under 8 26% 9 29% 14 45% 31 Total 591 59% 146 15% 267 27% 1004
Subyearling Chinook Salmon
Route
BGS Route BCC(n) % JBS(n) % Turbine(n) % Total North Gap 41 28% 26 18% 81 55% 148 South Gap 285 60% 50 11% 140 29% 475
Under 3 25% 3 25% 6 50% 12 Total 329 52% 79 12% 227 36% 635
Forebay flow was modeled using a 3D fluid dynamic model developed by Cynthia Rakowski of PNNL and implemented by Laurie Ebner of the USACE-Portland District hydraulics group. The model was run for the most common flow conditions that occurred during the spring and summer study periods and for a scenario with turbine unit 11 in service so that flow conditions could be compared between years (Table 3.10). Surface-water stream traces were generated for the most common flow conditions and are presented in Figure 3.28. Flow conditions that included turbine unit 11 operation were also plotted using surface-water stream traces (Figure 3.29). The approach distribution of fish appeared to correspond to the stream traces intersection with the powerhouse, whereby a high density of fish was observed at the intersection of stream traces following off the tip of the BGS downstream, and a low density of fish was observed in the shadow of the BGS. This trend also corresponded with the passage of fish at turbine units (Table 3.9). The south eddy was larger when unit 11 was out of service (Figure 3.28) than when unit 11 was operating (Figure 3.29).

3.35
Table 3.10. Turbine Unit Operations for 14 Separate Model Runs. Runs were completed using a 3D computational fluid dynamic model.
All on Low T11&16 off
Low T11&16 off
High All on High T11 off Low T11 off High B2 Unit Scenario 1 Scenario 2 Scenario 3 Scenario 5 Scenario 6 Scenario 7
F2 2.6 2.6 2.6 2.6 2.6 2.6 T11 13.1 0 0 17.7 0 0 T12 13.1 13.1 17.7 17.7 13.1 17.7 T13 13.2 13.2 17.7 17.7 13.2 17.7 T14 14.7 14.7 17.7 17.7 14.7 17.7 T15 12.7 12.7 17.7 17.7 12.7 17.7 T16 13.3 0 0 17.8 13.3 17.8 T17 12.7 12.7 17.7 17.7 12.7 17.7 T18 12.8 12.8 17.4 17.4 12.8 17.4
T11,15 off
Low T11,13,16 off
Low T11,16 off
Low T11,17 off
Low T11,16 off High T11 off Low B2 Unit Scenario 9 Scenario 10 Scenario 11 Scenario 12 Scenario 13 Scenario 14
F2 2.6 2.6 2.6 2.6 2.6 2.6 T11 0 0 0 0 0 0 T12 13.1 13.1 12.1 13.1 17.7 12.1 T13 13.2 0 12.2 13.2 17.7 12.2 T14 14.7 14.7 12.1 12.1 13.7 12.1 T15 0 12.7 12.1 12.1 17.7 12.1 T16 13.3 0 0 12.1 0 12.1 T17 12.7 12.7 12.7 0 17.7 12.7 T18 12.8 12.8 12.8 12.8 17.7 12.8
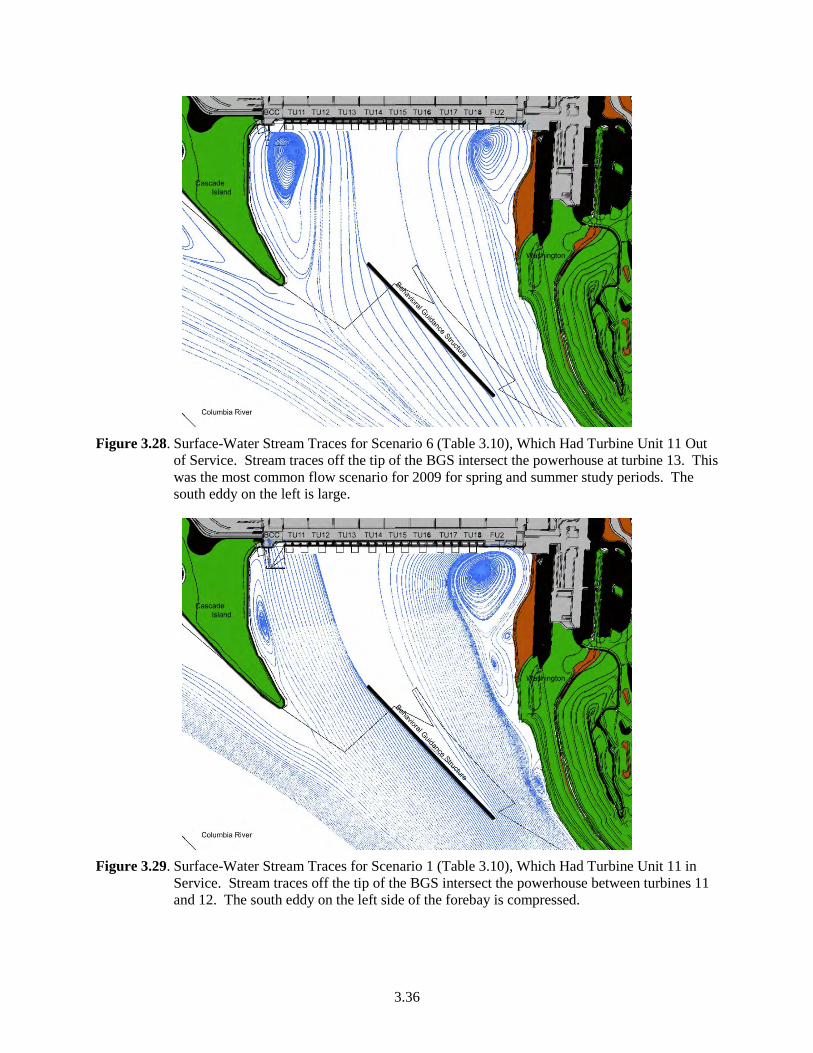
3.36
Figure 3.28. Surface-Water Stream Traces for Scenario 6 (Table 3.10), Which Had Turbine Unit 11 Out
of Service. Stream traces off the tip of the BGS intersect the powerhouse at turbine 13. This was the most common flow scenario for 2009 for spring and summer study periods. The south eddy on the left is large.
Figure 3.29. Surface-Water Stream Traces for Scenario 1 (Table 3.10), Which Had Turbine Unit 11 in
Service. Stream traces off the tip of the BGS intersect the powerhouse between turbines 11 and 12. The south eddy on the left side of the forebay is compressed.

3.37
In spring 2009, Flow Scenario 12 produced the highest B2CC passage efficiency for STH (Table 3.11) and the second highest efficiency for CH1 (Table 3.12). Scenario 12 provided a B2CC efficiency that was 9.5% higher than the next best scenario for STH, but 1.7% separated the highest and second efficiencies for CH1.
Table 3.11. Ranking of the Best Flow Scenario (Table 3.10) Ordered by B2CC Efficiency for Juvenile Steelhead. A fish was assigned to a flow scenario if the operating discharge for each unit was within 2.5 kcfs. If the flow conditions did not meet this criterion during the time a fish passed, it was assigned to Scenario 20, thereby encompassing all operations outside the flow scenarios that were modeled.

3.38
Table 3.12. Ranking of Flow Scenarios that Occurred in 2009 (Unit 11 Out of Service) by B2CC Efficiency for Yearling Chinook Salmon Smolts. A fish was assigned to a flow scenario if the operating discharge for each unit was within 2.5 kcfs. If the flow conditions did not meet this criterion during the time a fish passed, it was assigned to Scenario 20, thereby encompassing all operations outside the flow scenarios that were modeled.
The top B2CC passage efficiencies associated with flow scenarios 20, 2, and 3 were within 4% of each other, ranging from 50% to 54% (Table 3.13).

3.39
Table 3.13. Ranking of Flow Scenarios that Occurred in 2009 (Unit 11 Out of Service) by B2CC Efficiency for Subyearling Chinook Salmon Smolts. A fish was assigned to a flow scenario if the operating discharge for each unit was within 2.5 kcfs. If the flow conditions did not meet this criteria during the time a fish passed, it was assigned to Scenario 20, thus encompassing all operations outside the flow scenarios that were modeled.
3.9 Data Continuity
Some of the cabled hydrophones malfunctioned during the data collection period, which resulted in gaps in the detection field in spring (Table 3.14) and summer (Table 3.15). In all cases, only one hydrophone was non-functional at a time and accompanying redundant hydrophones were still functional to monitor all routes. In designing deployments, we spaced hydrophones closely enough to provide overlap in fields of detection, and this is reflected in the high percentage of multiple-hydrophone detections.

3.40
Table 3.14. Data Continuity Chart for All Hydrophones in the Spring. Increasing from red to green, color indicates the number of detections per hydrophone. Black indicates that data were not collected due to a malfunctioning channel. Listed from top to bottom are hydrophones located on B2 piers, hydrophones monitoring the north gap and south gap, hydrophones deployed on buoys upstream of the BGS, and hydrophones located on the upstream and downstream side of BGS.
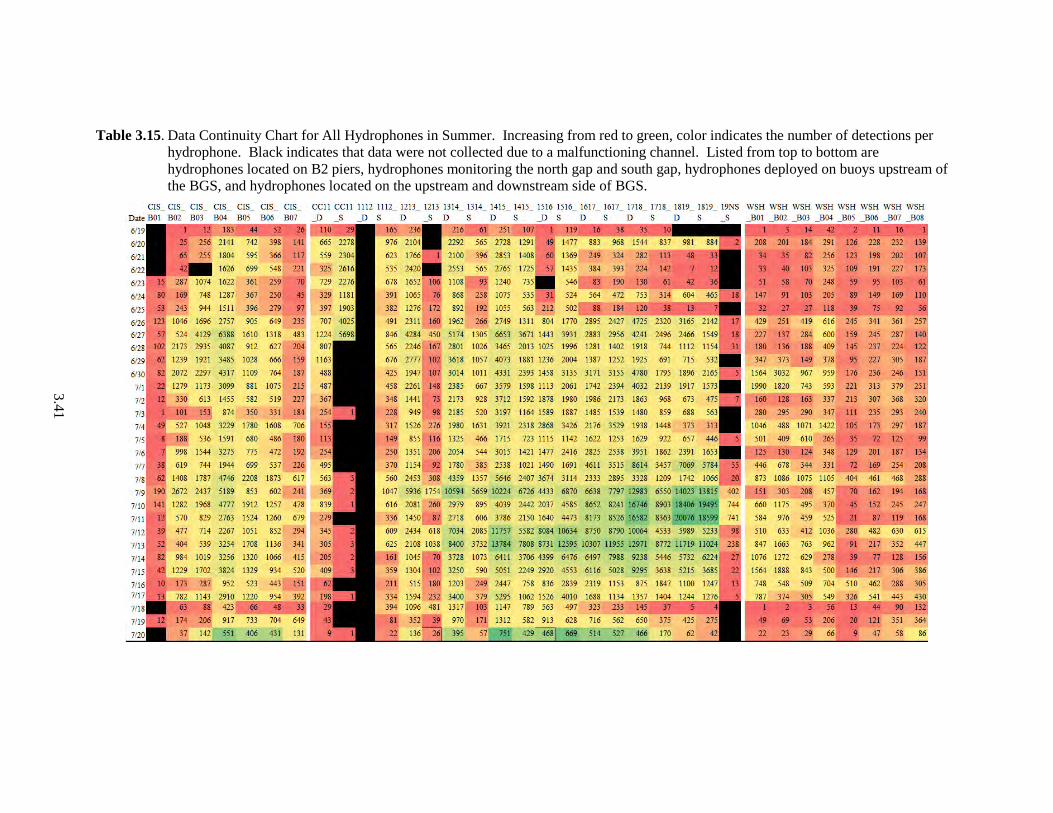
3.41
Table 3.15. Data Continuity Chart for All Hydrophones in Summer. Increasing from red to green, color indicates the number of detections per hydrophone. Black indicates that data were not collected due to a malfunctioning channel. Listed from top to bottom are hydrophones located on B2 piers, hydrophones monitoring the north gap and south gap, hydrophones deployed on buoys upstream of the BGS, and hydrophones located on the upstream and downstream side of BGS.


4.1
4.0 Discussion
The results related to environmental conditions and effects, assumptions of the survival model, context for 2009 survival estimates for each run of fish, travel time and rates, diel distributions, B2 passage distributions, B2 forebay distributions, fish guidance by the BGS, and data continuity are discussed below.
4.1 Environmental Conditions
Observations of environmental conditions fall include water discharge from the dam and spillway and seasonal trends in water temperature relative to 10-year averages, as well as the run timing of smolts.
4.1.1 Project Discharge and Temperature
In 2009, water discharges through Bonneville Dam and its spillway usually were similar to the previous 10-year average except for the period from May 19 through June 11 when discharges were above average. Dam discharge was below average during the second half of summer, but spill discharge was maintained at average levels to fulfill BiOp mandates. Water temperatures were about 2 degrees above the previous 10-year average during the second half of spring and first half of summer even though discharge was above average during that time. High water temperatures can increase fish susceptibility to disease (Tiffan et al. 2000) and can be an additional stressor on young Chinook salmon, particularly those that are not well fed (Cobleigh 2003). Observed water temperatures in 2009 were below critical levels for juvenile Chinook salmon (Brett 1952), and survival rates were high.
4.1.2 Effects of Discharge and Temperature on Passage and Survival Rates
Several relationships were evident between river discharge and survival and passage. The most significant was the decline in survival that was observed in CH0 over the summer season for all routes passing through B2, which was also observed in 2008. As noted by Ploskey et al. (2007b), the loss of fish to residualization in summer could produce such a trend. However, survival in 2009 was correlated with B2 discharge (r = 0.58), as it was in summer of 2008 (r = 0.80). This had the potential to affect survival. Another correlate with the dropping discharge was the rising river temperature. Dropping flows and rising temperatures could have synergistic effects on CH0 survival, because travel rate and an increasing physiological stressor (temperature) have shown to increase mortality (Tiffan 2000). Discharge, temperature, and residualization could highly influence the tailrace survival of CH0, but discerning the most influential of these variables and their synergies would be difficult from this study alone.
Operational conditions at B2 also appeared to affect survival. For instance, single-release survival of CH1 was worse when B2 turbines passed more water. This is intuitive because turbine routes consistently had the lowest survival estimate, and passed more fish proportionally when flow through the turbines was higher. Again, reduced travel rates associated with high river discharge have been shown to benefit juvenile salmon survival (Raymond 1979; Sims and Ossiander 1981; Cada 1997). Discharge and increasing forebay elevation (therefore B2CC discharge) also seemed to benefit survival for CH1 and CH0, but relations to STH survival were not significant.

4.2
Finally, collection efficiencies and effectiveness were also affected by B2 flow. The FPE decreased for CH1 and CH0 as discharge increased. This relationship is expected because increasing flow into the turbines decreases the proportion of flow passing through B2 into the relatively fixed discharge of the B2CC. This effect may be mitigated by strictly adhering to unit priority for flows that benefit B2CC passage, but when full capacity of the powerhouse is reached there are no obvious options available to keep FPE at those high levels.
4.2 Tests of Survival Model Assumptions
We tested a number of assumptions about the tagged fish population relative to the run at large as monitored at the JDA SMF, including run timing, rejection rates during fish selection for tagging, and comparison of length frequency distributions for tagged and untagged fish.
4.2.1 Run Timing, Rejection Rates, and Length Frequency Comparisons
Arrival of most tagged fish at Bonneville Dam was temporally similar to the bulk of the respective runs of fish studied in 2009. Arrivals occurred when 93.3% of the STH, 79% of CH1, and 80.4% of CH0 passed the dam.
The rejection rate for tagging was very low (0.82%), and this indicates that the vast majority (99.18%) of fish were acceptable for tagging and that tagged fish were of similar condition to fish in the run at large. Length frequencies of tagged and untagged fish sampled in the SMF were very similar (Figure 3.4) and this similarity clearly indicates that tagged fish were representative of the population passing through the JDA SMF and that size-selective bias was minimal in 2009.
4.2.2 Tag-Life Study Correction
The 100% cumulative arrival of tagged fish at the tertiary survival detection array was expressed as days since tag activation, and it occurred at least 10 days before the time of first tag failure in the tag-life study, so no tag-life corrections to survival estimates were required in this year of study.
4.2.3 Burnham Tests
We ran Burnham Test 2 and Test 3 and found that >95% could not be calculated or were not significant. High detection probabilities present in acoustic-tag studies frequently render these tests incalculable. These tests are most appropriate when fish are physically recaptured or segregated during capture. Acoustic-tag studies do not use physical recaptures to detect fish, and therefore these tests are not particularly relevant or informative for acoustic-tag studies.
4.2.4 Mixing
Homogeneous arrival of release groups at downstream detection sites is an important assumption of a paired-release survival model. We treated fish passing through the B2CC as reference releases for calculating paired-release survival estimates for virtual releases of fish through the forebay entrance array, B2 turbines, and the B2 JBS. Visual inspection of the time of arrival of fish in forebay virtual releases
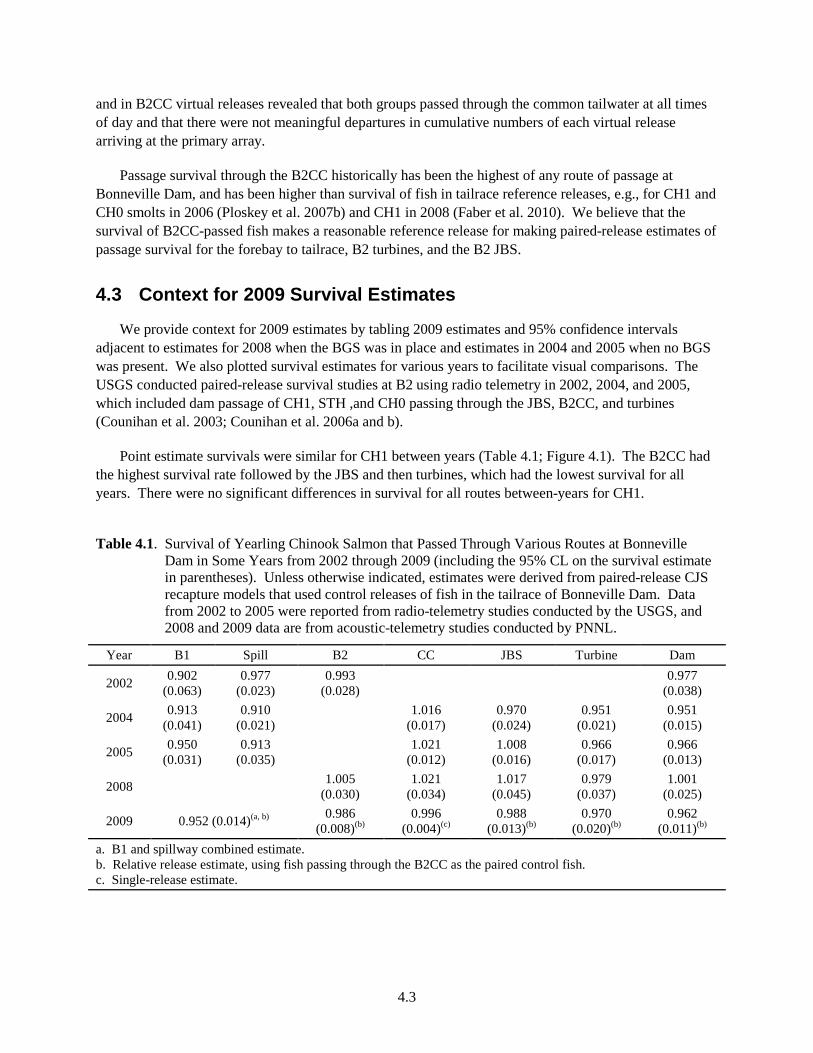
4.3
and in B2CC virtual releases revealed that both groups passed through the common tailwater at all times of day and that there were not meaningful departures in cumulative numbers of each virtual release arriving at the primary array.
Passage survival through the B2CC historically has been the highest of any route of passage at Bonneville Dam, and has been higher than survival of fish in tailrace reference releases, e.g., for CH1 and CH0 smolts in 2006 (Ploskey et al. 2007b) and CH1 in 2008 (Faber et al. 2010). We believe that the survival of B2CC-passed fish makes a reasonable reference release for making paired-release estimates of passage survival for the forebay to tailrace, B2 turbines, and the B2 JBS.
4.3 Context for 2009 Survival Estimates
We provide context for 2009 estimates by tabling 2009 estimates and 95% confidence intervals adjacent to estimates for 2008 when the BGS was in place and estimates in 2004 and 2005 when no BGS was present. We also plotted survival estimates for various years to facilitate visual comparisons. The USGS conducted paired-release survival studies at B2 using radio telemetry in 2002, 2004, and 2005, which included dam passage of CH1, STH ,and CH0 passing through the JBS, B2CC, and turbines (Counihan et al. 2003; Counihan et al. 2006a and b).
Point estimate survivals were similar for CH1 between years (Table 4.1; Figure 4.1). The B2CC had the highest survival rate followed by the JBS and then turbines, which had the lowest survival for all years. There were no significant differences in survival for all routes between-years for CH1.
Table 4.1. Survival of Yearling Chinook Salmon that Passed Through Various Routes at Bonneville Dam in Some Years from 2002 through 2009 (including the 95% CL on the survival estimate in parentheses). Unless otherwise indicated, estimates were derived from paired-release CJS recapture models that used control releases of fish in the tailrace of Bonneville Dam. Data from 2002 to 2005 were reported from radio-telemetry studies conducted by the USGS, and 2008 and 2009 data are from acoustic-telemetry studies conducted by PNNL.
Year B1 Spill B2 CC JBS Turbine Dam
2002 0.902 (0.063)
0.977 (0.023)
0.993 (0.028)
0.977 (0.038)
2004 0.913 (0.041)
0.910 (0.021)
1.016 (0.017)
0.970 (0.024)
0.951 (0.021)
0.951 (0.015)
2005 0.950 (0.031)
0.913 (0.035)
1.021 (0.012)
1.008 (0.016)
0.966 (0.017)
0.966 (0.013)
2008 1.005
(0.030) 1.021
(0.034) 1.017
(0.045) 0.979
(0.037) 1.001
(0.025)
2009 0.952 (0.014)(a, b) 0.986 (0.008)(b)
0.996 (0.004)(c)
0.988 (0.013)(b)
0.970 (0.020)(b)
0.962 (0.011)(b)
a. B1 and spillway combined estimate. b. Relative release estimate, using fish passing through the B2CC as the paired control fish. c. Single-release estimate.

4.4
Figure 4.1. Plot of Survival Estimates for Yearling Chinook Salmon from USGS Studies in 2002, 2004,
and 2005 and PNNL Studies in 2008 and 2009. The plot shows the survival point estimates and the estimates for dam-passage survival have standard error bars.
For STH, the only among-year difference in route-specific survival estimates was for turbines, where passage survival was higher in 2008 than it was in 2004, 2005, and 2009, which were similar and had overlapping 95% CIs (Table 4.2; Figure 4.2).
Table 4.2. Survival of Juvenile Steelhead that Passed Various Routes at Bonneville Dam from 2004 Through 2009 (including the 95% CI on the survival estimate in parentheses). Unless otherwise indicated, estimates were derived from paired-release CJS recapture models that used control releases of fish in the tailrace of Bonneville Dam. Data from 2002 to 2005 were reported from radio-telemetry studies conducted by USGS, and 2008 and 2009 data are from acoustic-telemetry studies conducted by PNNL.
Year B1 Spill B2 CC JBS Turbine Dam
2004 0.965 (0.034)
0.979 (0.023) 1.030 (0.017) 0.951 (0.038) 0.889 (0.038) 0.991
(0.016)
2005 0.933 (0.030)
0.955 (0.016) 1.009 (0.012) 0.956 (0.029) 0.868 (0.035) 0.963
(0.013)
2008(a) 0.982 (0.019) 0.984 (0.027) 0.984 (0.039) 0.982 (0.024) 0.972 (0.010)
2009 0.961 (0.021)(b, c) 0.979 (0.026)(c)3
0.993 (0.020)(a)
0.964 (0.040)(c)
0.946 (0.054)(c)
0.968 (0.021)(c)
a. Single-release estimate or estimates. b. B1 and spillway combined estimate. c. Relative release estimate, using fish through the B2CC as the paired control fish.

4.5
Figure 4.2. Plot of Survival Estimates for Juvenile Steelhead in USGS Studies in 2004 and 2005 and
PNNL Studies in 2008 and 2009. The plot shows the survival point estimates and the one for dam-passage survival includes standard error bars.
The only significant among-year differences in survival estimates for CH0 were for dam-passage and turbine-passage rates (Table 4.3; Figure 4.3). The dam-passage estimate for 2008 was significantly higher than the estimates in 2004 and 2005, but the 2008 estimate did not appear to differ from the 2009 estimates based on overlapping ½ 95% CIs. As with STH, turbine-passed CH0 also had significantly lower survival rates in 2004 and 2005 than did CH0 passing through turbines in 2008 and 2009, for unknown reasons.
Table 4.3. Survival of Subyearling Chinook Salmon that Passed Various Routes at Bonneville Dam from 2004 through 2009 (including the 95% CI on the survival estimate in parentheses). Unless otherwise indicated, estimates were derived from paired-release CJS recapture models that used control releases of fish in the tailrace of Bonneville Dam. Data from 2002 to 2005 were reported from radio-telemetry studies conducted by USGS, and 2008 and 2009 data are from acoustic-telemetry studies conducted by PNNL.
Year B1 Spill B2 CC JBS Turbine Dam
2004 0.831 (0.110)
0.876 (0.025)
0.980 (0.023)
0.926 (0.048)
0.825 (0.037)
0.891 (0.020)
2005 0.976 (0.072)
0.911 (0.018)
1.013 (0.015)
0.984 (0.028)
0.895 (0.028)
0.938 (0.014)
2008 0.981
(0.016) 0.996
(0.016) 0.991
(0.024) 0.954
(0.020) 0.970
(0.014)
2009 0.930 (0.062)(a, b) 0.991 (0.063)(b)
0.942 (0.054)(a)
0.933 (0.087)(b)
0.998 (0.079)(b)
0.959 (0.063)(b)
a. Single-release estimate or estimates. b. B1 and spillway combined estimate. c. Relative release estimate, using fish passing through the B2CC as the paired control fish.
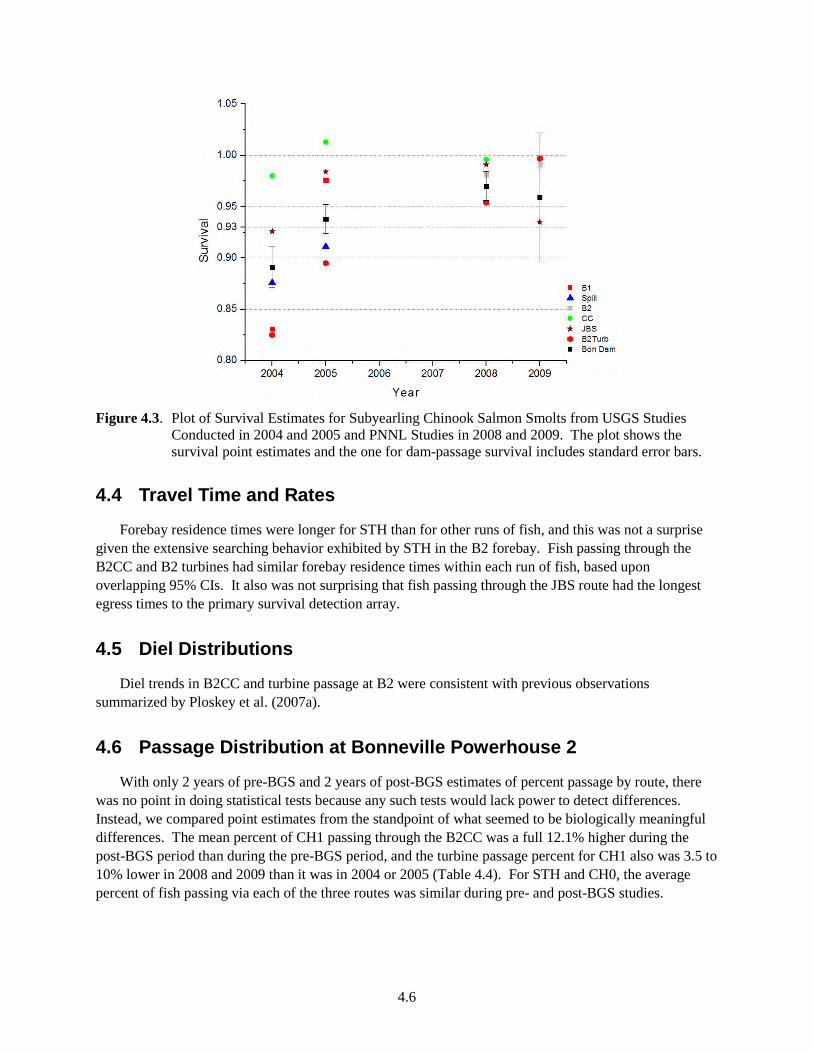
4.6
Figure 4.3. Plot of Survival Estimates for Subyearling Chinook Salmon Smolts from USGS Studies
Conducted in 2004 and 2005 and PNNL Studies in 2008 and 2009. The plot shows the survival point estimates and the one for dam-passage survival includes standard error bars.
4.4 Travel Time and Rates
Forebay residence times were longer for STH than for other runs of fish, and this was not a surprise given the extensive searching behavior exhibited by STH in the B2 forebay. Fish passing through the B2CC and B2 turbines had similar forebay residence times within each run of fish, based upon overlapping 95% CIs. It also was not surprising that fish passing through the JBS route had the longest egress times to the primary survival detection array.
4.5 Diel Distributions
Diel trends in B2CC and turbine passage at B2 were consistent with previous observations summarized by Ploskey et al. (2007a).
4.6 Passage Distribution at Bonneville Powerhouse 2
With only 2 years of pre-BGS and 2 years of post-BGS estimates of percent passage by route, there was no point in doing statistical tests because any such tests would lack power to detect differences. Instead, we compared point estimates from the standpoint of what seemed to be biologically meaningful differences. The mean percent of CH1 passing through the B2CC was a full 12.1% higher during the post-BGS period than during the pre-BGS period, and the turbine passage percent for CH1 also was 3.5 to 10% lower in 2008 and 2009 than it was in 2004 or 2005 (Table 4.4). For STH and CH0, the average percent of fish passing via each of the three routes was similar during pre- and post-BGS studies.
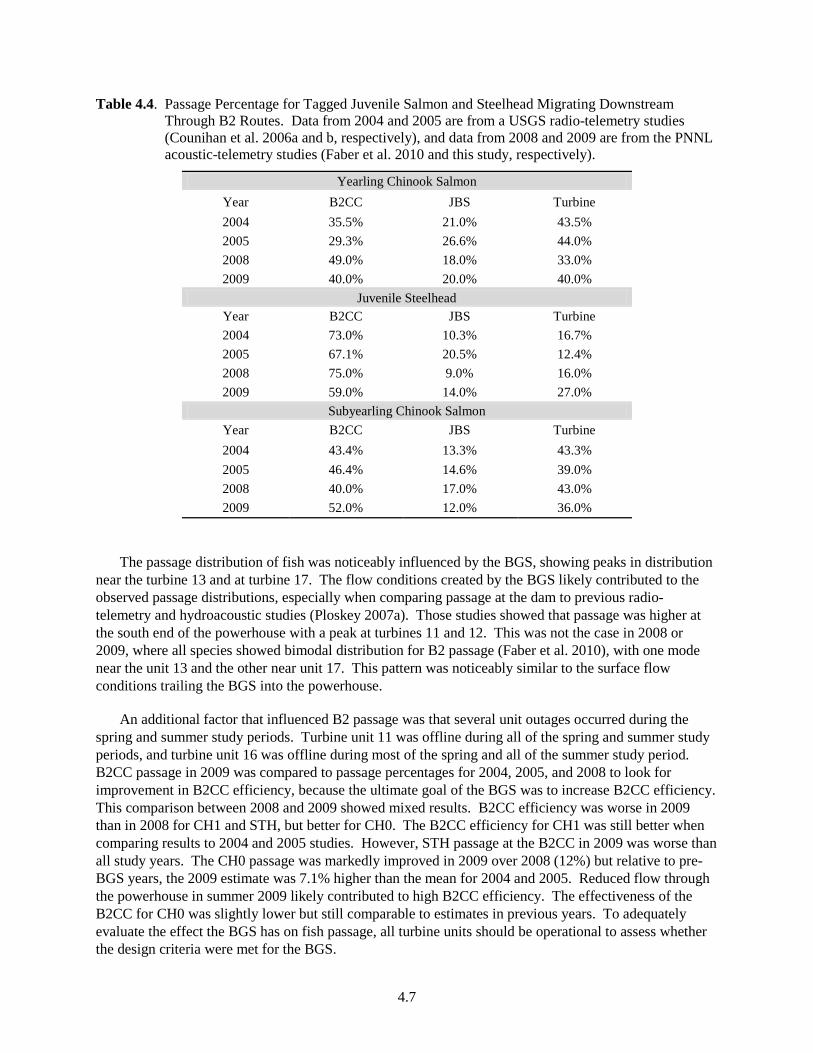
4.7
Table 4.4. Passage Percentage for Tagged Juvenile Salmon and Steelhead Migrating Downstream Through B2 Routes. Data from 2004 and 2005 are from a USGS radio-telemetry studies (Counihan et al. 2006a and b, respectively), and data from 2008 and 2009 are from the PNNL acoustic-telemetry studies (Faber et al. 2010 and this study, respectively).
Yearling Chinook Salmon Year B2CC JBS Turbine 2004 35.5% 21.0% 43.5% 2005 29.3% 26.6% 44.0% 2008 49.0% 18.0% 33.0% 2009 40.0% 20.0% 40.0%
Juvenile Steelhead Year B2CC JBS Turbine 2004 73.0% 10.3% 16.7% 2005 67.1% 20.5% 12.4% 2008 75.0% 9.0% 16.0% 2009 59.0% 14.0% 27.0%
Subyearling Chinook Salmon Year B2CC JBS Turbine 2004 43.4% 13.3% 43.3% 2005 46.4% 14.6% 39.0% 2008 40.0% 17.0% 43.0% 2009 52.0% 12.0% 36.0%
The passage distribution of fish was noticeably influenced by the BGS, showing peaks in distribution near the turbine 13 and at turbine 17. The flow conditions created by the BGS likely contributed to the observed passage distributions, especially when comparing passage at the dam to previous radio-telemetry and hydroacoustic studies (Ploskey 2007a). Those studies showed that passage was higher at the south end of the powerhouse with a peak at turbines 11 and 12. This was not the case in 2008 or 2009, where all species showed bimodal distribution for B2 passage (Faber et al. 2010), with one mode near the unit 13 and the other near unit 17. This pattern was noticeably similar to the surface flow conditions trailing the BGS into the powerhouse.
An additional factor that influenced B2 passage was that several unit outages occurred during the spring and summer study periods. Turbine unit 11 was offline during all of the spring and summer study periods, and turbine unit 16 was offline during most of the spring and all of the summer study period. B2CC passage in 2009 was compared to passage percentages for 2004, 2005, and 2008 to look for improvement in B2CC efficiency, because the ultimate goal of the BGS was to increase B2CC efficiency. This comparison between 2008 and 2009 showed mixed results. B2CC efficiency was worse in 2009 than in 2008 for CH1 and STH, but better for CH0. The B2CC efficiency for CH1 was still better when comparing results to 2004 and 2005 studies. However, STH passage at the B2CC in 2009 was worse than all study years. The CH0 passage was markedly improved in 2009 over 2008 (12%) but relative to pre-BGS years, the 2009 estimate was 7.1% higher than the mean for 2004 and 2005. Reduced flow through the powerhouse in summer 2009 likely contributed to high B2CC efficiency. The effectiveness of the B2CC for CH0 was slightly lower but still comparable to estimates in previous years. To adequately evaluate the effect the BGS has on fish passage, all turbine units should be operational to assess whether the design criteria were met for the BGS.
4.8
4.6.1 Yearling Chinook Salmon
About 40% of CH1 passed through the B2CC, and 60% passed into turbines, although 20% of those entering turbines were guided by screens to the JBS. Therefore, in-turbine screens resulted in nearly equal proportions passing through the B2CC and turbines (40% each). There was a strong diel component to passage distribution, which showed that CH1 strongly preferred the B2CC during daylight hours, and during nighttime their passage distribution shifted to favor turbine passage. This is consistent with prior research on surface bypass (Faber et al. 2001; Cash et al. 2002, 2005) near powerhouses, where there is more directed movement with the flow during nighttime, but during daytime hours fish are less likely to sound and pass through turbines. Passage timing also had a strong diel component, whereby CH1 passed through the B2CC primarily during the waxing and waning of sunlight, and turbine passage peaked during nighttime hours. This did not comport with their arrival time in the forebay, which showed no distinct peaks for all hours. This suggests that CH1 were delaying in the forebay before finally passing through the dam during one of the observed peaks. The B2CC had high collection effectiveness—seven times as many CH1 entered the B2CC proportional to the flow passing through the entire B2. This boosted FPE for CH1 at B2 to 60%, which was a slight improvement from the radio-telemetry studies conducted in 2004 and 2005 that showed the FPE was 56% in both years, and B2CC collection efficiency was 35% and 29% for 2004 and 2005, respectively. However, the effectiveness and FPE were reduced from 2008 results which showed a B2CC effectiveness of 11 and an FPE of 67%. Turbine unit 11 was operational in 2008 and not operational in 2009, a likely contributing factor to the reduction in corner collector passage for CH1.
4.6.2 Juvenile Steelhead
The STH preferred the B2CC over any other route of passage in 2009. In fact, survival estimates for STH passing through turbines had larger standard errors because so few tagged STH chose turbines as a route of passage at B2. In total, 59% of tagged STH passed through the B2CC, followed by 14% through the JBS and 27% through the turbines. Passage distribution also had a strong diel component with the majority of fish passing through the B2CC during the day and peaking in hours before sunset. Similar to CH1, STH preferred the B2CC in greater proportions during daylight hours (80%) than during nighttime hours (60%). However, STH FGE at night was lower than CH1 FGE at night. The FPE for STH also was high, with 73% of fish traveling through non-turbine passage routes, mostly due to the large proportion of fish passing into the B2CC. These passage estimates are somewhat lower than the pre-BGS radio-telemetry results, which put B2CC efficiency at 73% in 2004 and 67 % in 2005 and B2 FPE at 83% in 2004 and 87% in 2005. Again, the operation of B2 without turbine unit 11 was a likely contributing factor to the observed reduction in B2CC efficiency, resulting in a reduced FPE relative to 2008 estimates.
4.6.3 Subyearling Chinook Salmon
A large proportion of CH0 passed through the B2CC in 2009, and they passed in greater proportions than in all previous years. Approximately 52% of the total number of CH0 passed through the B2CC compared to 36% passing through turbines and 12% through the JBS. The likely reason for this increase in B2CC passage was that total discharge passing through B2 was much less than in previous summers. So B2CC efficiency increased, but the effectiveness of the B2CCwas similar, if not lower than previous years. This is because the proportion of flow passing into the B2CC compared to the rest of the

4.9
powerhouse was much higher than in previous years. Notwithstanding the lower flow conditions, the B2CC-passage efficiency and FPE were comparable to the radio-telemetry results in 2004 and 2005 when turbine unit 11 was operational. For instance, the FPE in 2004 and 2005 was 56% and 61%, which compares well with the 2009 FPE of CH0 at 64%. Similarly, the B2CC-passage efficiency was 43% and 46% in 2004 and 2005, compared to a slightly higher estimate of 52% in 2009. The diel pattern of CH0 passing through B2 was close to that of CH1. There were peaks in passage just after sunrise and just prior to sunset at the B2CC, and a nighttime peak in turbine passage. The passage of CH0 did not correspond to the relative flat diel distribution of arrival at the forebay entrance array, which suggests that some fish delayed in the forebay.
4.7 Forebay Distribution
For all three runs of fish, the forebay BGS resulted in bimodal distributions upstream of the dam face but downstream of the BGS. Presumably this is due to the “flow shadow” projected by the 10-ft draft of the BGS, and its influence of distributing fish to either side of the powerhouse. However, the trend of higher concentrations of fish at the southern end of the powerhouse was evident even in years before the BGS was deployed (Ploskey et al. 2007a). Fish passing through the gap between the BGS and the north shore or that were guided by the BGS toward the south end of the powerhouse presumably caused the bi-modal distribution within 30 m of the dam face in 2009.
4.8 Forebay and Passage Distributions Relative to the BGS
In the spring and summer of 2009, smolts that passed through the South Gap between the BGS and Cascade Island entered the B2CC in much greater proportions than fish passing through the North Gap. Presumably, this was due to a much better discovery efficiency of the B2CC opening for South Gap fish compared to the fish passing through the North Gap or fish passing under the BGS. The graphs showing B2CC discovery efficiency also support this observation.
When examining distributions of fish relative to the BGS position, it was evident that the majority of smolts were intersecting the powerhouse in a similar manner to the stream traces following the surface flow from the BGS. This was particularly true during the springtime when the peak distribution of fish was skewed toward turbine unit 13, and fewer fish intersected near the center of the powerhouse. This was also reflected in the relative passage distribution of fish moving past the BGS, where we observed fewer passing through the North Gap for all species. The forebay distribution of fish was consistent for all runs of fish studied.
Smolts passing through the South Gap, under the BGS, or through the North Gap were used to define passage proportions at the dam. The percent of fish passing through the B2CC relative to the rest of B2 was always greater for fish navigating through the South Gap than for fish passing under the BGS or through the North Gap, most probably because the B2CC was located on the south side of the powerhouse and was more accessible to those fish. Similarly, fish passing through the North Gap tended to pass through turbines in higher proportions than those that passed through the B2CC. This was especially evident when examining CH1 and CH0 distributions at the dam. Fish that navigated under the BGS during springtime passed through the B2CC in similar proportions to those passing through the turbine units. The deep distribution of these fish could prevent the discovery of the relatively shallow B2CC entrance; whereas the turbine units would be easily reached relatively quickly after the fish passed

4.10
under the BGS. The BGS does appear to increase B2CC efficiency for fish that navigated to the South Gap, and the majority of fish passed via this route in 2009. However, the combined efficiency and effectiveness of the B2CC was consistent with results from 2004 and 2005 without the BGS in place (Counihan et al. 2006a and b, respectively), presumably because fish that did not pass through the South Gap were less likely to pass into the B2CC. This suggests that if the zone of influence of the BGS could be expanded to include fish passing through the north gap that the B2CC efficiency would improve. However, differing turbine unit priorities and varying unit outages, including turbine 11 in spring and turbine 16 in summer may confound this conclusion.
4.9 Data Continuity
The B2 hydrophones and cables were well maintained and we encountered no appreciable loss of data at any one route through the dam. This was in part due to redundant deployments of hydrophones, whereby if one hydrophone was incapacitated, then another was monitoring the same route until the hydrophone could be replaced. The shoreline hydrophones also functioned well, and no appreciable data loss was observed during the 2009 study season. This is in contrast to the 2008 season, where we did experience loss in data due to inaccessible hydrophones that were incapacitated during high flow events, and could not be maintained. In 2009, all hydrophones were accessible for maintenance to mitigate for this circumstance.

5.1
5.0 Recommendations
The following recommendations are derived from the study results:
• Having turbine 11 in service is important for providing flow conditions that are comparable to those observed in pre-BGS years (2004 and 2005) and in 2008. If the maintenance schedule permits and if the BGS is going to be tested again in 2010, we highly recommend running turbine 1 throughout spring and summer seasons.

6.1
6.0 References
Adams NS, RE Reagan, SD Evans, MJ Farley, LS Wright, and DW Rondorf. 2006. Movement, Distribution, and Passage Behavior of Radio-Tagged Juvenile Chinook Salmon and Steelhead at Bonneville Dam, 2005. Draft Annual Report by the U.S. Geological Survey, Columbia River Research Laboratory, Cook, Washington, for the U.S. Army Engineer District, Portland, Oregon.
Brett JR. 1952. “Temperature Tolerance in Young Pacific Salmon, Genus Oncorhynchus.” Journal of the Fisheries Research Board of Canada 9:265-323.
Burnham KP, DR Anderson, GC White, C Brownie, and KH Pollock. 1987. “Design and Analysis Methods for Fish Survival Estimates Based on Release-recapture.” American Fisheries Society Monograph 5.
Cash KM, NS Adams, TW Hatton, EC Jones, and DW Rondorf. 2002. Three-Dimensional Tracking to Evaluate the Operation of the Lower Granite Surface Bypass Collector and Behavioral Guidance Structure During 2000. Report by U.S. Geological Survey for U. S. Army Corps of Engineers, contract W68SBV00104592, Walla Walla, Washington.
Cash KM, DM Faber, TW Hatton, EC Jones, RJ Magie, NM Swyers, RK Burns, MD Sholtis, SA Zimmerman, JS Hughes, TL Gilbride, NS Adams, and DW Rondorf. 2005. Three-Dimensional Behavior and Passage of Juvenile Salmonids at The Dalles Dam, 2004. Final report for the U.S. Army Corps of Engineers, Portland, Oregon (Contract W66QKZ40278562), by the U.S. Geological Survey and Pacific Northwest National Laboratory, Richland, Washington.
Cobleigh MM. 2003. Stress, Growth and Survival of Juvenile Chinook Salmon. MS Thesis, University of Washington, Seattle, Washington.
Cormack RM. 1964. “Estimates of Survival from the Sightings of Marked Animals.” Biometrika 51:429-438.
Counihan, TD, GS Holmberg, and JH Petersen. 2003. Survival Estimates of Migrant Juvenile Salmonids through Bonneville Dam Using Radio-Telemetry, 2002. Annual report prepared for the U.S. Army Corps of Engineers, Portland District, Portland, Oregon, by the U.S. Geological Survey, Cook, Washington.
Counihan TD, AL Puls, CE Walker, JM Hardiman, and GS Holmberg. 2006a. Survival Estimates of Migrant Juvenile Salmonids through The Dalles Dam Using Radiotelemetry, 2004. Final Report of Research prepared by the U.S. Geological Survey, Cook, Washington, for the U.S. Army Corps of Engineers, Portland, Oregon.
Counihan TD, AL Puls, CE Walker, JM Hardiman, and GS Holmberg. 2006b. Survival Estimates of Migrant Juvenile Salmonids through The Dalles Dam Using Radiotelemetry, 2005. Final Report of Research prepared by the U.S. Geological Survey, Cook, Washington, for the U.S. Army Corps of Engineers, Portland, Oregon.
Ehrenberg JE and TW Steig. 2002. “A Method for Estimating the Position Accuracy of Acoustic Fish Tags.” ICES Journal of Marine Science 59:140-149.

6.2
Evans S, L Wright, R Reagan, N Adams, and D Rondorf. 2006. Passage Behavior of Radio-Tagged Subyearling Chinook Salmon at Bonneville Dam, 2004: Revised for Corrected Spill. Annual Report prepared by the U.S. Geological Survey, Columbia River Research Laboratory, Cook, Washington for the U.S. Army Engineer District, Portland, Oregon.
Faber DM, MA Weiland, RA Moursund, TJ Carlson, N Adams, and D Rondorf. 2001. Evaluation of the Fish Passage Effectiveness of Bonneville I Prototype Surface Collector Using Three-Dimensional Ultrasonic Fish Tracking. PNNL-13526, Pacific Northwest National Laboratory, Richland, Washington.
Faber DM, GR Ploskey, MA Weiland, Z Deng, JS Hughes, RL McComas, J Kim, RL Townsend, T Fu, JR Skalski, and ES Fischer. 2010. Evaluation of a Behavioral Guidance Structure at Bonneville Dam Second Powerhouse including Passage Survival of Juvenile Salmon and Steelhead using Acoustic Telemetry, 2008. PNNL-18753, Pacific Northwest National Laboratory, Richland, Washington.
Johnson GE, SM Anglea, NS Adams, and TO Wik. 2005. “Evaluation of a Prototype Surface Flow Bypass for Juvenile Salmon and Steelhead at the Powerhouse of Lower Granite Dam, Snake River, Washington, 1996–2000.” North American Journal of Fisheries Management 25(1):138-151.
Jolly GM. 1965. “Explicit estimates from capture-recapture data with both death and immigration - Stochastic model.” Biometrika 52, 225-247.
Juell J-E and H Westerberg. 1993. “An ultrasonic telemetric system for automatic positioning of individual fish used to track Atlantic salmon (Salmo salar L.) in a sea cage.’’ Aquacultural Eng. 12, 1-18.
Martinson R, G Kovalchuk, and D Ballinger. 2006. Monitoring of Downstream Salmon and Steelhead at Federal Hydroelectric Facilities, 2005-2006 Annual Report. Project No. 198712700, BPA Report DOE/BP-00022085-2, Bonneville Power Administration, Portland, Oregon.
NOAA (National Atmospheric and Oceanic Administration) Fisheries. 2008. Biological Opinion – Consultation on Remand for Operation of the Federal Columbia River Power System, 11 Bureau of Reclamation Projects in the Columbia Basin and ESA Section 10(a)(1)(A) Permit for Juvenile Fish Transportation Program. National Marine Fisheries Service (NOAA Fisheries) – Northwest Region, Seattle, Washington. Available at: http://www.salmonrecovery.gov/.
Ploskey GR, GE Johnson, AE Giorgi, RL Johnson, JR Stevenson, CR Schilt, PN Johnson, and DS Patterson. 2007. Synthesis of Biological Research on Juvenile Fish Passage and Survival at Bonneville Dam through 2005. PNNL-15041, prepared for the U.S. Army Corps of Engineers, Portland District, Portland, Oregon, by Pacific Northwest National Laboratory, Richland, Washington.
Ploskey, GR, GE Johnson, AE Giorgi, RL Johnson, JR Stevenson, CR Schilt, PN Johnson, and DS Patterson. 2007a. Synthesis of Biological Reports on Juvenile Fish Passage and Survival at Bonneville Dam, 1939-2005. PNNL-15041, Pacific Northwest National Laboratory, Richland, Washington.
Ploskey GR, MA Weiland, JS Hughes, SA Zimmerman, RE Durham, ES Fischer, J Kim, RL Townsend, JR Skalski, and RL McComas. 2007b. Acoustic Telemetry Studies of Juvenile Chinook Salmon Survival at the Lower Columbia Projects in 2006. PNNL-16560, Pacific Northwest National Laboratory, Richland, Washington.

6.3
Ploskey GR, MA Weiland, DM Faber, Z Deng, GE Johnson, JS Hughes, SR Zimmerman, AW Cushing, MC Wilberding, RL Townsend, JR Skalski, J Kim, ES Fischer, MM Meyer, RL McComas, and JP Everett. 2009. Survival of Juvenile Salmonids Passing Bonneville Dam and Spillway in 2008. Draft Technical Report prepared for the U.S. Army Corps of Engineers, Portland District, by the Pacific Northwest National Laboratory, Richland, Washington.
Raymond HL. 1979. “Effects of dams and impoundments on migrations of juvenile chinook salmon and steelhead from the Snake River, 1966 to 1975.” Transactions of the American Fisheries Society 108: 505-29.Reagan R, S Evans, L Wright, M Farley, N Adams, and D Rondorf. 2006. Passage Behavior of Radio-Tagged Yearling Chinook Salmon and Steelhead at Bonneville Dam, 2004 (revised for corrected spill). Annual Report by the U.S. Geological Survey, Columbia River Research Laboratory, Cook, Washington for the U.S. Army Engineer District, Portland, Oregon.
Seber GAF. 1965. “A Note on the Multiple Recapture Census.” Biometrika 52:249-259.
Sims C and F Ossiander. 1981. Migrations of Juvenile Chinook Salmon and Steelhead in the Snake River, from 1973-1979, a Research Summary. Report to the U.S. Army Corps of Engineers (Contract DACW68-78-0038) by National Marine Fisheries Service, Northwest Fisheries Science Center, Seattle, Washington.
Skalski, JR, SG Smith, RN Iwamoto, JG Williams, and A Hoffmann. 1998. “Use of PIT-tags to Estimate Survival of Migrating Juvenile Salmonids in the Snake and Columbia Rivers.” Canadian Journal of Fisheries and Aquatic Sciences 55:1484-1493.
Spiesberger JL and KM Fristrup. 1990. “Passive Localization of Calling Animals and Sensing of their Acoustic Environment Using Acoustic Tomography.” American Naturalist 135:107-153.
Tiffan KF, DW Rondorf, and PG Wagner. 2000. “Physiological Development and Migratory Behavior of Subyearling Chinook Salmon in the Columbia River.” North American Journal of Fisheries Management 20:28-40.
Townsend RL, JR Skalski, P Dillingham, and TW Steig. 2006. “Correcting Bias in Survival Estimation Resulting from Tag Failure in Acoustic and Radiotelemetry Studies.” Journal of Agricultural Biology and Environmental Statistics 11:183-196.
Wahlberg M, B Mohl, and PT Madsen. 2001. “Estimating source position accuracy of a large-aperture hydrophone array for bioacoustics.” Journal of Acoustics Soc. Am. 109(1):397-406.
Watkins WA and WE Schevill. 1974. “Listening to Hawaiian spinner porpoises, Stenella cf. longirostris, with a three-dimensional hydrophone array.” Journal of Mammalogy 55:319-328.


Appendix A
Fish-Tagging Tables


A.1
Appendix A
Fish-Tagging Tables
Table A.1. Yearling Chinook Salmon and Steelhead Tagged at the JDA SMF and Released Near Roosevelt, Washington in Spring 2009
Tag Date Release Date Number Tagged Species Number Released
4/26/2009 4/27/2009 229 Steelhead 115 Yearling Chinook 114
4/27/2009 4/28/2009 232 Steelhead 116 Yearling Chinook 116
4/28/2009 4/29/2009 231 Steelhead 115 Yearling Chinook 116
4/29/2009 4/30/2009 231 Steelhead 116 Yearling Chinook 115
4/30/2009 5/1/2009 225 Steelhead 110 Yearling Chinook 115
5/1/2009 5/2/2009 231 Steelhead 116 Yearling Chinook 115
5/2/2009 5/3/2009 237 Steelhead 120 Yearling Chinook 117
5/3/2009 5/4/2009 232 Steelhead 116 Yearling Chinook 116
5/4/2009 5/5/2009 232 Steelhead 116 Yearling Chinook 116
5/5/2009 5/6/2009 232 Steelhead 116 Yearling Chinook 116
5/6/2009 5/7/2009 229 Steelhead 115 Yearling Chinook 114
5/7/2009 5/8/2009 231 Steelhead 116 Yearling Chinook 115
5/8/2009 5/9/2009 230 Steelhead 115 Yearling Chinook 115
5/9/2009 5/10/2009 233 Steelhead 116 Yearling Chinook 117
5/10/2009 5/11/2009 230 Steelhead 115 Yearling Chinook 115
5/11/2009 5/12/2009 232 Steelhead 116 Yearling Chinook 116
5/12/2009 5/13/2009 230 Steelhead 115 Yearling Chinook 115
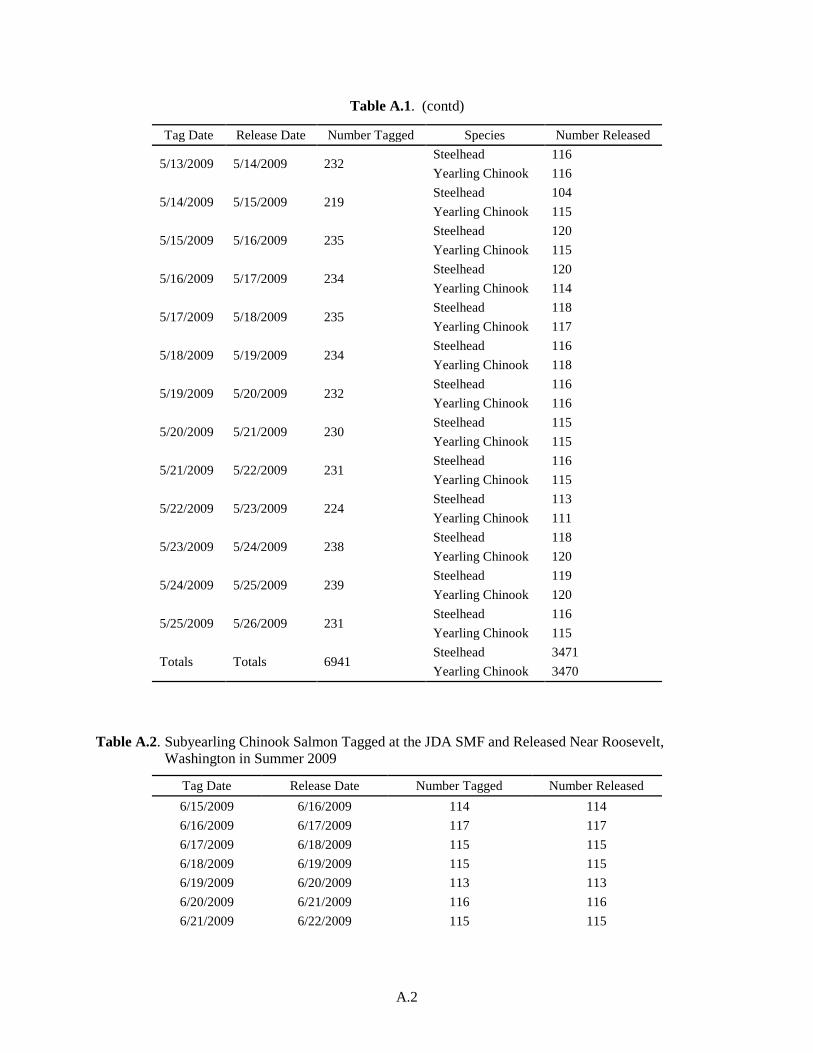
A.2
Table A.1. (contd)
Tag Date Release Date Number Tagged Species Number Released
5/13/2009 5/14/2009 232 Steelhead 116 Yearling Chinook 116
5/14/2009 5/15/2009 219 Steelhead 104 Yearling Chinook 115
5/15/2009 5/16/2009 235 Steelhead 120 Yearling Chinook 115
5/16/2009 5/17/2009 234 Steelhead 120 Yearling Chinook 114
5/17/2009 5/18/2009 235 Steelhead 118 Yearling Chinook 117
5/18/2009 5/19/2009 234 Steelhead 116 Yearling Chinook 118
5/19/2009 5/20/2009 232 Steelhead 116 Yearling Chinook 116
5/20/2009 5/21/2009 230 Steelhead 115 Yearling Chinook 115
5/21/2009 5/22/2009 231 Steelhead 116 Yearling Chinook 115
5/22/2009 5/23/2009 224 Steelhead 113 Yearling Chinook 111
5/23/2009 5/24/2009 238 Steelhead 118 Yearling Chinook 120
5/24/2009 5/25/2009 239 Steelhead 119 Yearling Chinook 120
5/25/2009 5/26/2009 231 Steelhead 116 Yearling Chinook 115
Totals Totals 6941 Steelhead 3471 Yearling Chinook 3470
Table A.2. Subyearling Chinook Salmon Tagged at the JDA SMF and Released Near Roosevelt, Washington in Summer 2009
Tag Date Release Date Number Tagged Number Released 6/15/2009 6/16/2009 114 114 6/16/2009 6/17/2009 117 117 6/17/2009 6/18/2009 115 115 6/18/2009 6/19/2009 115 115 6/19/2009 6/20/2009 113 113 6/20/2009 6/21/2009 116 116 6/21/2009 6/22/2009 115 115
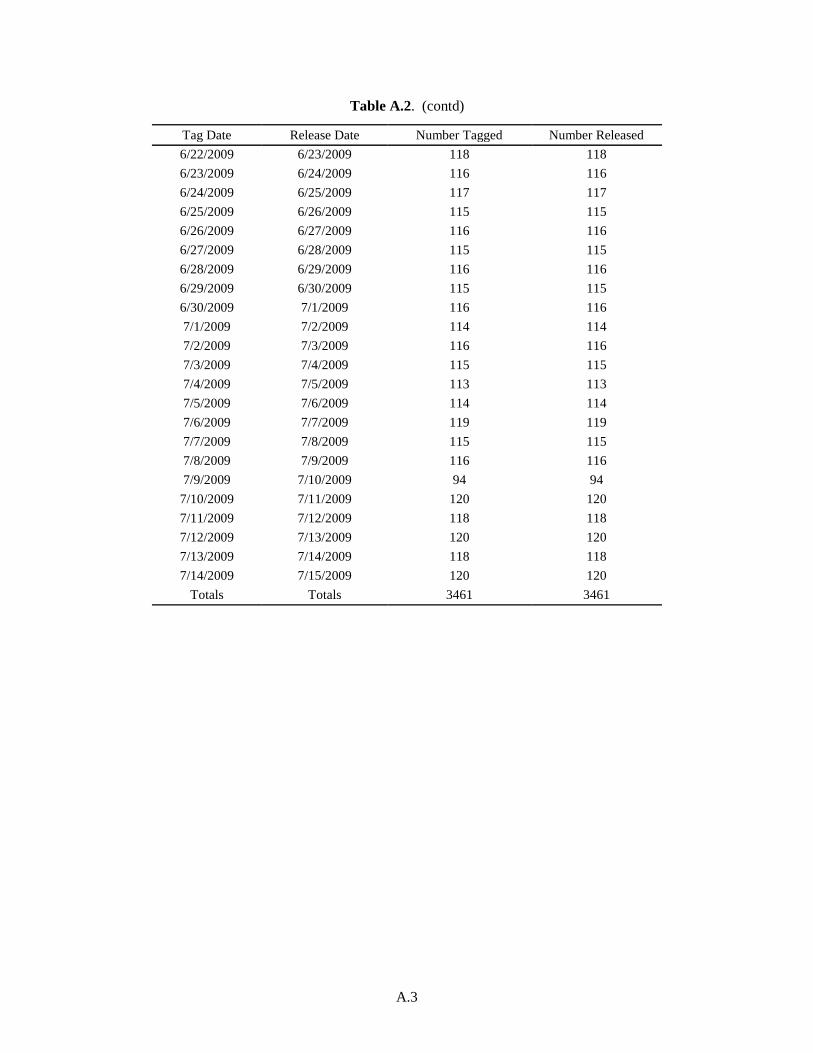
A.3
Table A.2. (contd)
Tag Date Release Date Number Tagged Number Released 6/22/2009 6/23/2009 118 118 6/23/2009 6/24/2009 116 116 6/24/2009 6/25/2009 117 117 6/25/2009 6/26/2009 115 115 6/26/2009 6/27/2009 116 116 6/27/2009 6/28/2009 115 115 6/28/2009 6/29/2009 116 116 6/29/2009 6/30/2009 115 115 6/30/2009 7/1/2009 116 116 7/1/2009 7/2/2009 114 114 7/2/2009 7/3/2009 116 116 7/3/2009 7/4/2009 115 115 7/4/2009 7/5/2009 113 113 7/5/2009 7/6/2009 114 114 7/6/2009 7/7/2009 119 119 7/7/2009 7/8/2009 115 115 7/8/2009 7/9/2009 116 116 7/9/2009 7/10/2009 94 94
7/10/2009 7/11/2009 120 120 7/11/2009 7/12/2009 118 118 7/12/2009 7/13/2009 120 120 7/13/2009 7/14/2009 118 118 7/14/2009 7/15/2009 120 120
Totals Totals 3461 3461


Appendix B
Hydrophone and Autonomous Node Deployment Tables

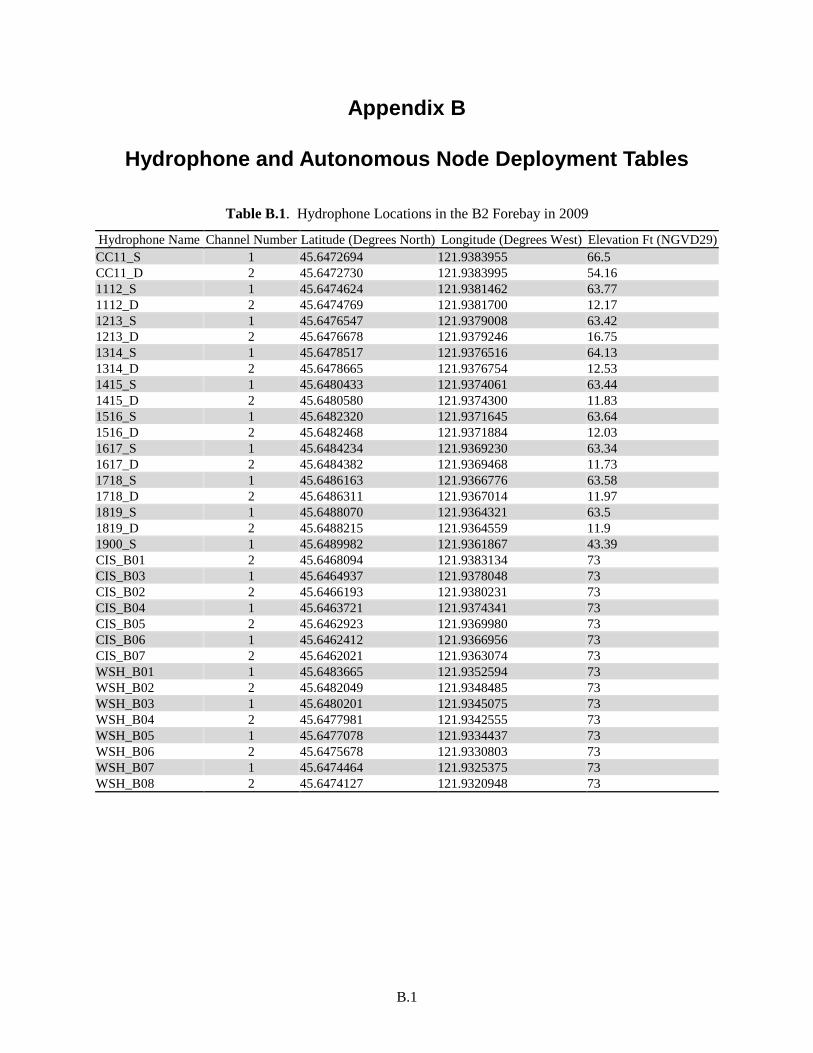
B.1
Appendix B
Hydrophone and Autonomous Node Deployment Tables
Table B.1. Hydrophone Locations in the B2 Forebay in 2009
Hydrophone Name Channel Number Latitude (Degrees North) Longitude (Degrees West) Elevation Ft (NGVD29) CC11_S 1 45.6472694 121.9383955 66.5 CC11_D 2 45.6472730 121.9383995 54.16 1112_S 1 45.6474624 121.9381462 63.77 1112_D 2 45.6474769 121.9381700 12.17 1213_S 1 45.6476547 121.9379008 63.42 1213_D 2 45.6476678 121.9379246 16.75 1314_S 1 45.6478517 121.9376516 64.13 1314_D 2 45.6478665 121.9376754 12.53 1415_S 1 45.6480433 121.9374061 63.44 1415_D 2 45.6480580 121.9374300 11.83 1516_S 1 45.6482320 121.9371645 63.64 1516_D 2 45.6482468 121.9371884 12.03 1617_S 1 45.6484234 121.9369230 63.34 1617_D 2 45.6484382 121.9369468 11.73 1718_S 1 45.6486163 121.9366776 63.58 1718_D 2 45.6486311 121.9367014 11.97 1819_S 1 45.6488070 121.9364321 63.5 1819_D 2 45.6488215 121.9364559 11.9 1900_S 1 45.6489982 121.9361867 43.39 CIS_B01 2 45.6468094 121.9383134 73 CIS_B03 1 45.6464937 121.9378048 73 CIS_B02 2 45.6466193 121.9380231 73 CIS_B04 1 45.6463721 121.9374341 73 CIS_B05 2 45.6462923 121.9369980 73 CIS_B06 1 45.6462412 121.9366956 73 CIS_B07 2 45.6462021 121.9363074 73 WSH_B01 1 45.6483665 121.9352594 73 WSH_B02 2 45.6482049 121.9348485 73 WSH_B03 1 45.6480201 121.9345075 73 WSH_B04 2 45.6477981 121.9342555 73 WSH_B05 1 45.6477078 121.9334437 73 WSH_B06 2 45.6475678 121.9330803 73 WSH_B07 1 45.6474464 121.9325375 73 WSH_B08 2 45.6474127 121.9320948 73
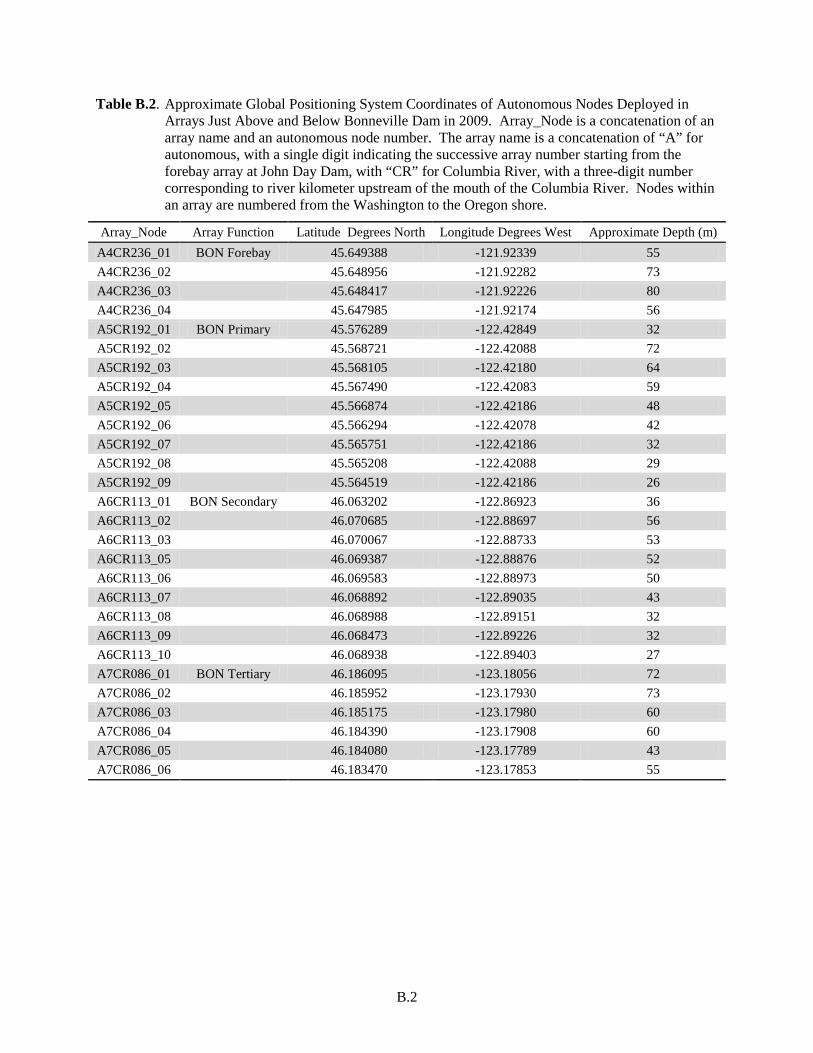
B.2
Table B.2. Approximate Global Positioning System Coordinates of Autonomous Nodes Deployed in Arrays Just Above and Below Bonneville Dam in 2009. Array_Node is a concatenation of an array name and an autonomous node number. The array name is a concatenation of “A” for autonomous, with a single digit indicating the successive array number starting from the forebay array at John Day Dam, with “CR” for Columbia River, with a three-digit number corresponding to river kilometer upstream of the mouth of the Columbia River. Nodes within an array are numbered from the Washington to the Oregon shore.
Array_Node Array Function Latitude Degrees North Longitude Degrees West Approximate Depth (m) A4CR236_01 BON Forebay 45.649388 -121.92339 55 A4CR236_02 45.648956 -121.92282 73 A4CR236_03 45.648417 -121.92226 80 A4CR236_04 45.647985 -121.92174 56 A5CR192_01 BON Primary 45.576289 -122.42849 32 A5CR192_02 45.568721 -122.42088 72 A5CR192_03 45.568105 -122.42180 64 A5CR192_04 45.567490 -122.42083 59 A5CR192_05 45.566874 -122.42186 48 A5CR192_06 45.566294 -122.42078 42 A5CR192_07 45.565751 -122.42186 32 A5CR192_08 45.565208 -122.42088 29 A5CR192_09 45.564519 -122.42186 26 A6CR113_01 BON Secondary 46.063202 -122.86923 36 A6CR113_02 46.070685 -122.88697 56 A6CR113_03 46.070067 -122.88733 53 A6CR113_05 46.069387 -122.88876 52 A6CR113_06 46.069583 -122.88973 50 A6CR113_07 46.068892 -122.89035 43 A6CR113_08
46.068988 -122.89151 32
A6CR113_09 46.068473 -122.89226 32 A6CR113_10 46.068938 -122.89403 27 A7CR086_01 BON Tertiary 46.186095 -123.18056 72 A7CR086_02 46.185952 -123.17930 73 A7CR086_03 46.185175 -123.17980 60 A7CR086_04 46.184390 -123.17908 60 A7CR086_05 46.184080 -123.17789 43 A7CR086_06 46.183470 -123.17853 55

Appendix C
Capture History, Detection, and Survival Tables

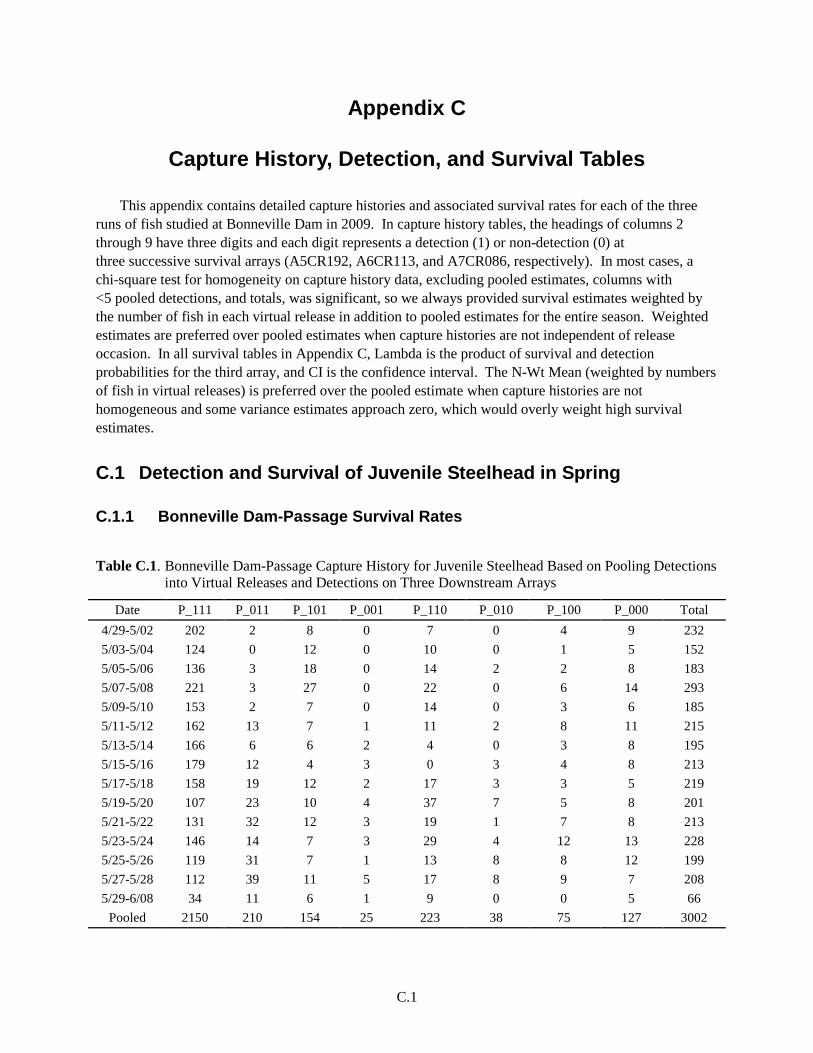
C.1
Appendix C
Capture History, Detection, and Survival Tables
This appendix contains detailed capture histories and associated survival rates for each of the three runs of fish studied at Bonneville Dam in 2009. In capture history tables, the headings of columns 2 through 9 have three digits and each digit represents a detection (1) or non-detection (0) at three successive survival arrays (A5CR192, A6CR113, and A7CR086, respectively). In most cases, a chi-square test for homogeneity on capture history data, excluding pooled estimates, columns with <5 pooled detections, and totals, was significant, so we always provided survival estimates weighted by the number of fish in each virtual release in addition to pooled estimates for the entire season. Weighted estimates are preferred over pooled estimates when capture histories are not independent of release occasion. In all survival tables in Appendix C, Lambda is the product of survival and detection probabilities for the third array, and CI is the confidence interval. The N-Wt Mean (weighted by numbers of fish in virtual releases) is preferred over the pooled estimate when capture histories are not homogeneous and some variance estimates approach zero, which would overly weight high survival estimates.
C.1 Detection and Survival of Juvenile Steelhead in Spring
C.1.1 Bonneville Dam-Passage Survival Rates
Table C.1. Bonneville Dam-Passage Capture History for Juvenile Steelhead Based on Pooling Detections into Virtual Releases and Detections on Three Downstream Arrays
Date P_111 P_011 P_101 P_001 P_110 P_010 P_100 P_000 Total 4/29-5/02 202 2 8 0 7 0 4 9 232 5/03-5/04 124 0 12 0 10 0 1 5 152 5/05-5/06 136 3 18 0 14 2 2 8 183 5/07-5/08 221 3 27 0 22 0 6 14 293 5/09-5/10 153 2 7 0 14 0 3 6 185 5/11-5/12 162 13 7 1 11 2 8 11 215 5/13-5/14 166 6 6 2 4 0 3 8 195 5/15-5/16 179 12 4 3 0 3 4 8 213 5/17-5/18 158 19 12 2 17 3 3 5 219 5/19-5/20 107 23 10 4 37 7 5 8 201 5/21-5/22 131 32 12 3 19 1 7 8 213 5/23-5/24 146 14 7 3 29 4 12 13 228 5/25-5/26 119 31 7 1 13 8 8 12 199 5/27-5/28 112 39 11 5 17 8 9 7 208 5/29-6/08 34 11 6 1 9 0 0 5 66
Pooled 2150 210 154 25 223 38 75 127 3002
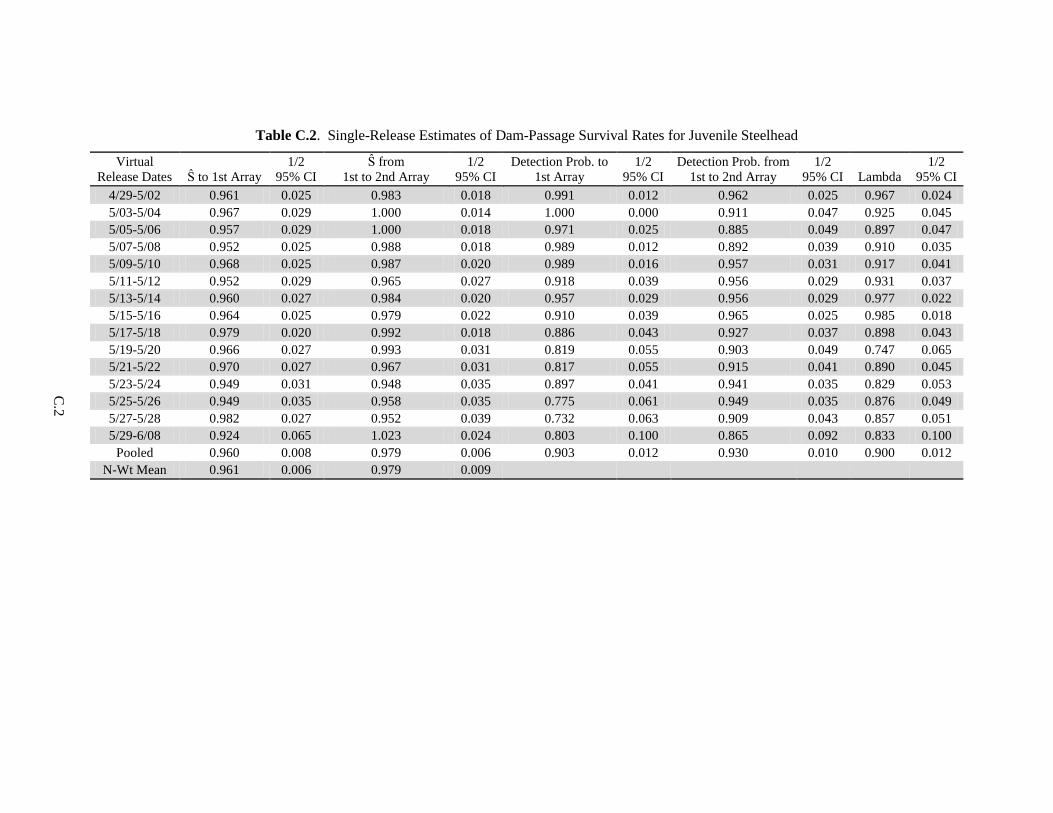
C
.2
Table C.2. Single-Release Estimates of Dam-Passage Survival Rates for Juvenile Steelhead
Virtual Release Dates Ŝ to 1st Array
1/2 95% CI
Ŝ from 1st to 2nd Array
1/2 95% CI
Detection Prob. to 1st Array
1/2 95% CI
Detection Prob. from 1st to 2nd Array
1/2 95% CI Lambda
1/2 95% CI
4/29-5/02 0.961 0.025 0.983 0.018 0.991 0.012 0.962 0.025 0.967 0.024 5/03-5/04 0.967 0.029 1.000 0.014 1.000 0.000 0.911 0.047 0.925 0.045 5/05-5/06 0.957 0.029 1.000 0.018 0.971 0.025 0.885 0.049 0.897 0.047 5/07-5/08 0.952 0.025 0.988 0.018 0.989 0.012 0.892 0.039 0.910 0.035 5/09-5/10 0.968 0.025 0.987 0.020 0.989 0.016 0.957 0.031 0.917 0.041 5/11-5/12 0.952 0.029 0.965 0.027 0.918 0.039 0.956 0.029 0.931 0.037 5/13-5/14 0.960 0.027 0.984 0.020 0.957 0.029 0.956 0.029 0.977 0.022 5/15-5/16 0.964 0.025 0.979 0.022 0.910 0.039 0.965 0.025 0.985 0.018 5/17-5/18 0.979 0.020 0.992 0.018 0.886 0.043 0.927 0.037 0.898 0.043 5/19-5/20 0.966 0.027 0.993 0.031 0.819 0.055 0.903 0.049 0.747 0.065 5/21-5/22 0.970 0.027 0.967 0.031 0.817 0.055 0.915 0.041 0.890 0.045 5/23-5/24 0.949 0.031 0.948 0.035 0.897 0.041 0.941 0.035 0.829 0.053 5/25-5/26 0.949 0.035 0.958 0.035 0.775 0.061 0.949 0.035 0.876 0.049 5/27-5/28 0.982 0.027 0.952 0.039 0.732 0.063 0.909 0.043 0.857 0.051 5/29-6/08 0.924 0.065 1.023 0.024 0.803 0.100 0.865 0.092 0.833 0.100
Pooled 0.960 0.008 0.979 0.006 0.903 0.012 0.930 0.010 0.900 0.012 N-Wt Mean 0.961 0.006 0.979 0.009
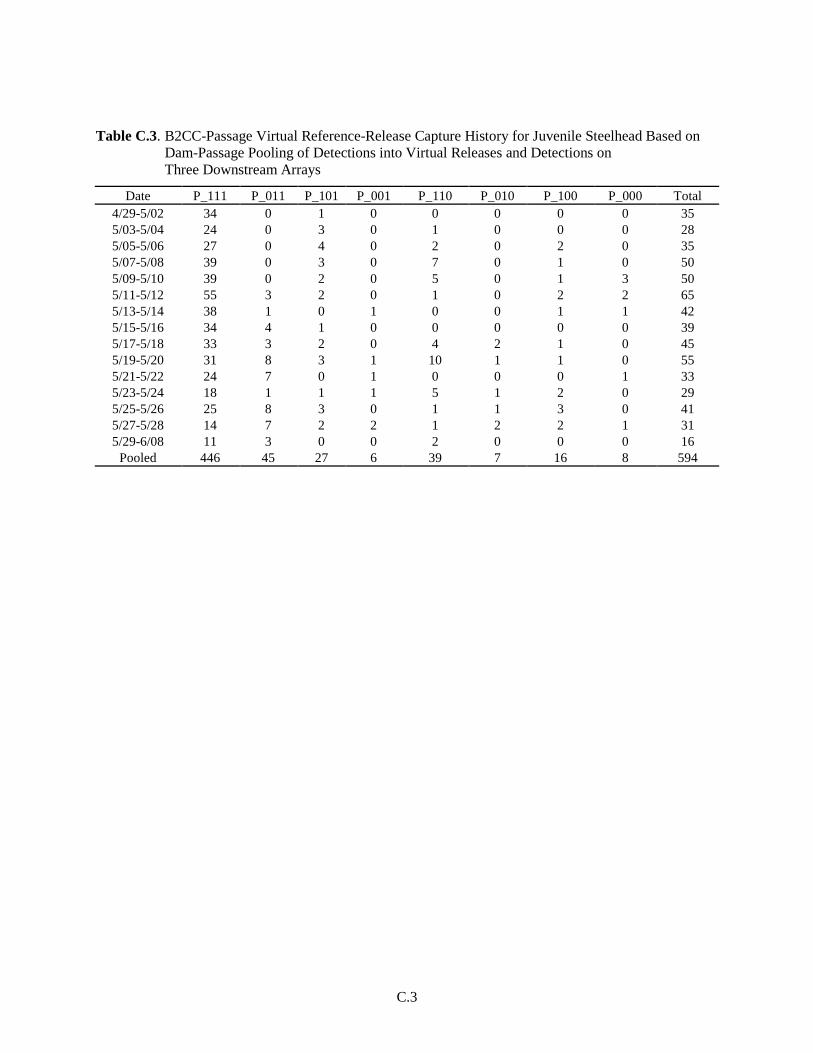
C.3
Table C.3. B2CC-Passage Virtual Reference-Release Capture History for Juvenile Steelhead Based on Dam-Passage Pooling of Detections into Virtual Releases and Detections on Three Downstream Arrays
Date P_111 P_011 P_101 P_001 P_110 P_010 P_100 P_000 Total 4/29-5/02 34 0 1 0 0 0 0 0 35 5/03-5/04 24 0 3 0 1 0 0 0 28 5/05-5/06 27 0 4 0 2 0 2 0 35 5/07-5/08 39 0 3 0 7 0 1 0 50 5/09-5/10 39 0 2 0 5 0 1 3 50 5/11-5/12 55 3 2 0 1 0 2 2 65 5/13-5/14 38 1 0 1 0 0 1 1 42 5/15-5/16 34 4 1 0 0 0 0 0 39 5/17-5/18 33 3 2 0 4 2 1 0 45 5/19-5/20 31 8 3 1 10 1 1 0 55 5/21-5/22 24 7 0 1 0 0 0 1 33 5/23-5/24 18 1 1 1 5 1 2 0 29 5/25-5/26 25 8 3 0 1 1 3 0 41 5/27-5/28 14 7 2 2 1 2 2 1 31 5/29-6/08 11 3 0 0 2 0 0 0 16
Pooled 446 45 27 6 39 7 16 8 594

C
.4
Table C.4. Single-Release Estimates of B2CC-Passage Reference-Release Survival Rates for Juvenile Steelhead
Virtual Release Dates Ŝ to 1st Array
1/2 95% CI
Ŝ from 1st to 2nd Array
1/2 95% CI
Detection Prob. to 1st Array
1/2 95% CI
Detection Prob. from 1st to 2nd Array
1/2 95% CI Lambda
1/2 95% CI
4/29-5/02 1.000 0.000 1.000 0.000 1.000 0.000 0.971 0.055 1.000 0.000 5/03-5/04 1.000 0.000 1.004 0.010 1.000 0.000 0.889 0.118 0.960 0.076 5/05-5/06 1.000 0.000 0.951 0.078 1.000 0.000 0.871 0.118 0.931 0.092 5/07-5/08 1.000 0.000 0.991 0.041 1.000 0.000 0.929 0.078 0.848 0.104 5/09-5/10 0.940 0.067 0.984 0.043 1.000 0.000 0.951 0.067 0.886 0.094 5/11-5/12 0.971 0.043 0.967 0.045 0.951 0.055 0.967 0.045 0.983 0.033 5/13-5/14 0.977 0.047 0.974 0.049 0.950 0.067 0.975 0.049 1.000 0.000 5/15-5/16 1.000 0.000 1.000 0.000 0.897 0.096 0.974 0.049 1.000 0.000 5/17-5/18 1.003 0.006 0.982 0.051 0.886 0.094 0.947 0.071 0.857 0.106 5/19-5/20 1.004 0.008 0.998 0.049 0.815 0.104 0.907 0.086 0.780 0.116 5/21-5/22 0.970 0.059 1.000 0.000 0.750 0.151 0.969 0.061 1.000 0.000 5/23-5/24 1.009 0.016 0.945 0.110 0.889 0.118 0.905 0.125 0.760 0.167 5/25-5/26 1.023 0.029 0.911 0.102 0.763 0.135 0.917 0.090 0.943 0.076 5/27-5/28 1.009 0.092 0.913 0.143 0.607 0.180 0.840 0.143 0.875 0.133 5/29-6/08 1.000 0.000 1.000 0.000 0.813 0.192 1.000 0.000 0.875 0.163
Pooled 0.990 0.010 0.975 0.016 0.898 0.025 0.937 0.022 0.914 0.024 N-Wt Mean 0.992 0.011 0.975 0.015

C.5
Table C.5. Paired-Release Estimates of Dam-Passage Survival Rates for Juvenile Steelhead. S11 is survival of virtual releases of fish passing through the dam, and S12 is survival of virtual releases of fish passing through the B2CC.
Population Ŝ to Tailrace (Ŝ11/Ŝ21) 1/2 95% CI 4/29-5/02 0.961 0.025 5/03-5/04 0.967 0.027 5/05-5/06 0.957 0.029 5/07-5/08 0.952 0.024 5/09-5/10 1.030 0.078 5/11-5/12 0.980 0.053 5/13-5/14 0.983 0.055 5/15-5/16 0.964 0.025 5/17-5/18 0.976 0.020 5/19-5/20 0.962 0.028 5/21-5/22 1.000 0.066 5/23-5/24 0.941 0.034 5/25-5/26 0.930 0.044 5/27-5/28 0.973 0.093 5/29-6/08 0.924 0.065
Pooled 0.970 0.012 N-Wt Mean 0.970 0.013
C.1.2 B1- and Spillway-Passage Survival Rates
Table C.6. B1- and Spillway-Passage Capture Histories for Juvenile Steelhead Based on Pooling Detections into Virtual Releases and Detections on Three Downstream arrays (A5CR192, A6CR113, A7CR086)
Date P_111 P_011 P_101 P_001 P_110 P_010 P_100 P_000 Total 4/29-5/02 118 1 6 0 7 0 3 6 141 5/03-5/04 80 0 6 0 6 0 0 4 96 5/05-5/06 99 3 14 0 10 1 0 7 134 5/07-5/08 153 2 22 0 12 0 5 9 203 5/09-5/10 89 2 5 0 8 0 1 2 107 5/11-5/12 94 10 4 1 9 1 6 9 134 5/13-5/14 108 4 4 1 4 0 2 6 129 5/15-5/16 131 6 3 3 0 3 4 7 157 5/17-5/18 103 12 8 2 11 1 2 4 143 5/19-5/20 55 13 7 2 25 5 4 7 118 5/21-5/22 96 20 12 2 19 1 6 6 162 5/23-5/24 89 10 6 2 20 2 9 10 148 5/25-5/26 69 22 4 1 7 6 4 12 125 5/27-5/28 85 27 9 2 14 5 7 6 155 5/29-6/08 22 5 6 1 6 0 0 5 45
Pooled 1391 137 116 17 158 25 53 100 1997
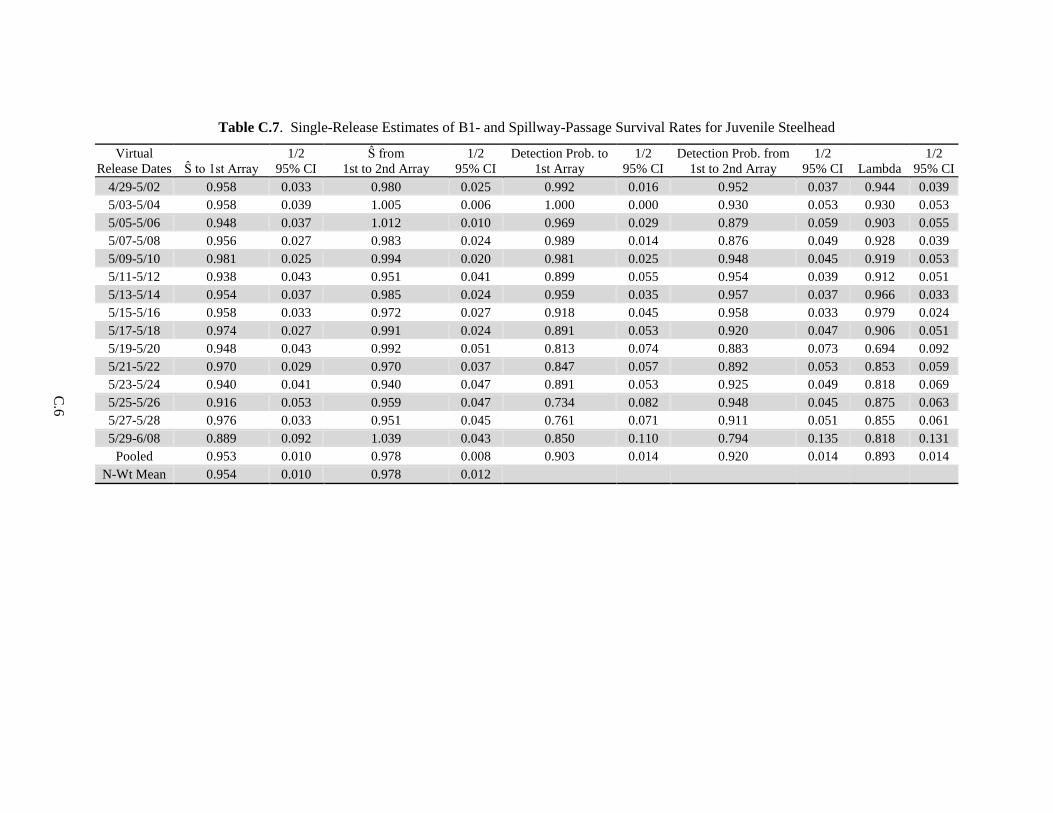
C
.6
Table C.7. Single-Release Estimates of B1- and Spillway-Passage Survival Rates for Juvenile Steelhead
Virtual Release Dates Ŝ to 1st Array
1/2 95% CI
Ŝ from 1st to 2nd Array
1/2 95% CI
Detection Prob. to 1st Array
1/2 95% CI
Detection Prob. from 1st to 2nd Array
1/2 95% CI Lambda
1/2 95% CI
4/29-5/02 0.958 0.033 0.980 0.025 0.992 0.016 0.952 0.037 0.944 0.039 5/03-5/04 0.958 0.039 1.005 0.006 1.000 0.000 0.930 0.053 0.930 0.053 5/05-5/06 0.948 0.037 1.012 0.010 0.969 0.029 0.879 0.059 0.903 0.055 5/07-5/08 0.956 0.027 0.983 0.024 0.989 0.014 0.876 0.049 0.928 0.039 5/09-5/10 0.981 0.025 0.994 0.020 0.981 0.025 0.948 0.045 0.919 0.053 5/11-5/12 0.938 0.043 0.951 0.041 0.899 0.055 0.954 0.039 0.912 0.051 5/13-5/14 0.954 0.037 0.985 0.024 0.959 0.035 0.957 0.037 0.966 0.033 5/15-5/16 0.958 0.033 0.972 0.027 0.918 0.045 0.958 0.033 0.979 0.024 5/17-5/18 0.974 0.027 0.991 0.024 0.891 0.053 0.920 0.047 0.906 0.051 5/19-5/20 0.948 0.043 0.992 0.051 0.813 0.074 0.883 0.073 0.694 0.092 5/21-5/22 0.970 0.029 0.970 0.037 0.847 0.057 0.892 0.053 0.853 0.059 5/23-5/24 0.940 0.041 0.940 0.047 0.891 0.053 0.925 0.049 0.818 0.069 5/25-5/26 0.916 0.053 0.959 0.047 0.734 0.082 0.948 0.045 0.875 0.063 5/27-5/28 0.976 0.033 0.951 0.045 0.761 0.071 0.911 0.051 0.855 0.061 5/29-6/08 0.889 0.092 1.039 0.043 0.850 0.110 0.794 0.135 0.818 0.131
Pooled 0.953 0.010 0.978 0.008 0.903 0.014 0.920 0.014 0.893 0.014 N-Wt Mean 0.954 0.010 0.978 0.012

C.7
Table C.8. B2CC-Passage Capture History for Juvenile Steelhead Based on B1- and Spillway-Passage Pooling of Detections into Virtual Releases and Detections on Three Downstream Arrays (A5CR192, A6CR113, A7CR086)
Date P_111 P_011 P_101 P_001 P_110 P_010 P_100 P_000 Total 4/29-5/02 34 0 1 0 0 0 0 0 35 5/03-5/04 24 0 3 0 1 0 0 0 28 5/05-5/06 27 0 4 0 2 0 2 0 35 5/07-5/08 39 0 3 0 7 0 1 0 50 5/09-5/10 39 0 2 0 5 0 1 3 50 5/11-5/12 55 3 2 0 1 0 2 2 65 5/13-5/14 38 1 0 1 0 0 1 1 42 5/15-5/16 34 4 1 0 0 0 0 0 39 5/17-5/18 33 3 2 0 4 2 1 0 45 5/19-5/20 31 8 3 1 10 1 1 0 55 5/21-5/22 24 7 0 1 0 0 0 1 33 5/23-5/24 18 1 1 1 5 1 2 0 29 5/25-5/26 25 8 3 0 1 1 3 0 41 5/27-5/28 14 7 2 2 1 2 2 1 31 5/29-6/08 11 3 0 0 2 0 0 0 16
Pooled 446 45 27 6 39 7 16 8 594

C
.8
Table C.9. Single-Release Estimates of B2CC-Passage Survival Rates for Juvenile Steelhead
Virtual Release Dates Ŝ to 1st Array
1/2 95% CI
Ŝ from 1st to 2nd Array
1/2 95% CI
Detection Prob. to 1st Array
1/2 95% CI
Detection Prob. from 1st to 2nd Array
1/2 95% CI Lambda
1/2 95% CI
4/29-5/02 1.000 0.000 1.000 0.000 1.000 0.000 0.971 0.055 1.000 0.000 5/03-5/04 1.000 0.000 1.004 0.010 1.000 0.000 0.889 0.118 0.960 0.076 5/05-5/06 1.000 0.000 0.951 0.078 1.000 0.000 0.871 0.118 0.931 0.092 5/07-5/08 1.000 0.000 0.991 0.041 1.000 0.000 0.929 0.078 0.848 0.104 5/09-5/10 0.940 0.067 0.984 0.043 1.000 0.000 0.951 0.067 0.886 0.094 5/11-5/12 0.971 0.043 0.967 0.045 0.951 0.055 0.967 0.045 0.983 0.033 5/13-5/14 0.977 0.047 0.974 0.049 0.950 0.067 0.975 0.049 1.000 0.000 5/15-5/16 1.000 0.000 1.000 0.000 0.897 0.096 0.974 0.049 1.000 0.000 5/17-5/18 1.003 0.006 0.982 0.051 0.886 0.094 0.947 0.071 0.857 0.106 5/19-5/20 1.004 0.008 0.998 0.049 0.815 0.104 0.907 0.086 0.780 0.116 5/21-5/22 0.970 0.059 1.000 0.000 0.750 0.151 0.969 0.061 1.000 0.000 5/23-5/24 1.009 0.016 0.945 0.110 0.889 0.118 0.905 0.125 0.760 0.167 5/25-5/26 1.023 0.029 0.911 0.102 0.763 0.135 0.917 0.090 0.943 0.076 5/27-5/28 1.009 0.092 0.913 0.143 0.607 0.180 0.840 0.143 0.875 0.133 5/29-6/08 1.000 0.000 1.000 0.000 0.813 0.192 1.000 0.000 0.875 0.163
Pooled 0.990 0.010 0.975 0.016 0.898 0.025 0.937 0.022 0.914 0.024 N-Wt Mean 0.992 0.011 0.975 0.015
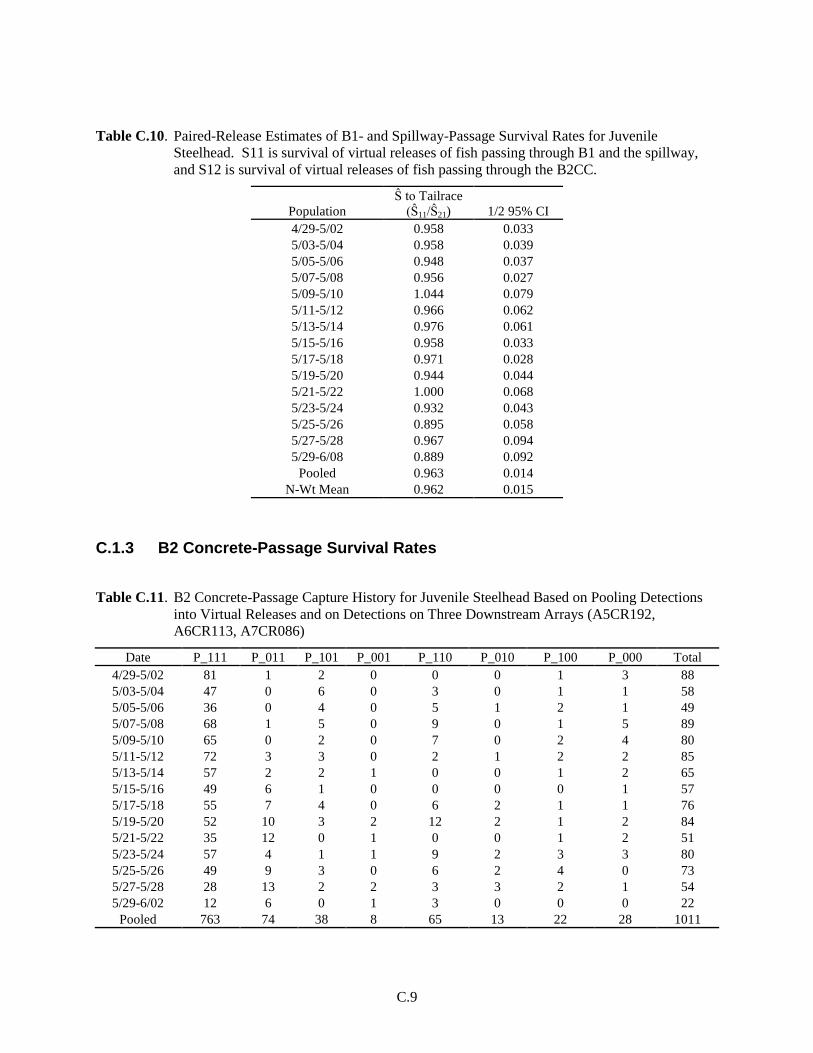
C.9
Table C.10. Paired-Release Estimates of B1- and Spillway-Passage Survival Rates for Juvenile Steelhead. S11 is survival of virtual releases of fish passing through B1 and the spillway, and S12 is survival of virtual releases of fish passing through the B2CC.
Population Ŝ to Tailrace
(Ŝ11/Ŝ21) 1/2 95% CI 4/29-5/02 0.958 0.033 5/03-5/04 0.958 0.039 5/05-5/06 0.948 0.037 5/07-5/08 0.956 0.027 5/09-5/10 1.044 0.079 5/11-5/12 0.966 0.062 5/13-5/14 0.976 0.061 5/15-5/16 0.958 0.033 5/17-5/18 0.971 0.028 5/19-5/20 0.944 0.044 5/21-5/22 1.000 0.068 5/23-5/24 0.932 0.043 5/25-5/26 0.895 0.058 5/27-5/28 0.967 0.094 5/29-6/08 0.889 0.092
Pooled 0.963 0.014 N-Wt Mean 0.962 0.015
C.1.3 B2 Concrete-Passage Survival Rates
Table C.11. B2 Concrete-Passage Capture History for Juvenile Steelhead Based on Pooling Detections into Virtual Releases and on Detections on Three Downstream Arrays (A5CR192, A6CR113, A7CR086)
Date P_111 P_011 P_101 P_001 P_110 P_010 P_100 P_000 Total 4/29-5/02 81 1 2 0 0 0 1 3 88 5/03-5/04 47 0 6 0 3 0 1 1 58 5/05-5/06 36 0 4 0 5 1 2 1 49 5/07-5/08 68 1 5 0 9 0 1 5 89 5/09-5/10 65 0 2 0 7 0 2 4 80 5/11-5/12 72 3 3 0 2 1 2 2 85 5/13-5/14 57 2 2 1 0 0 1 2 65 5/15-5/16 49 6 1 0 0 0 0 1 57 5/17-5/18 55 7 4 0 6 2 1 1 76 5/19-5/20 52 10 3 2 12 2 1 2 84 5/21-5/22 35 12 0 1 0 0 1 2 51 5/23-5/24 57 4 1 1 9 2 3 3 80 5/25-5/26 49 9 3 0 6 2 4 0 73 5/27-5/28 28 13 2 2 3 3 2 1 54 5/29-6/02 12 6 0 1 3 0 0 0 22
Pooled 763 74 38 8 65 13 22 28 1011
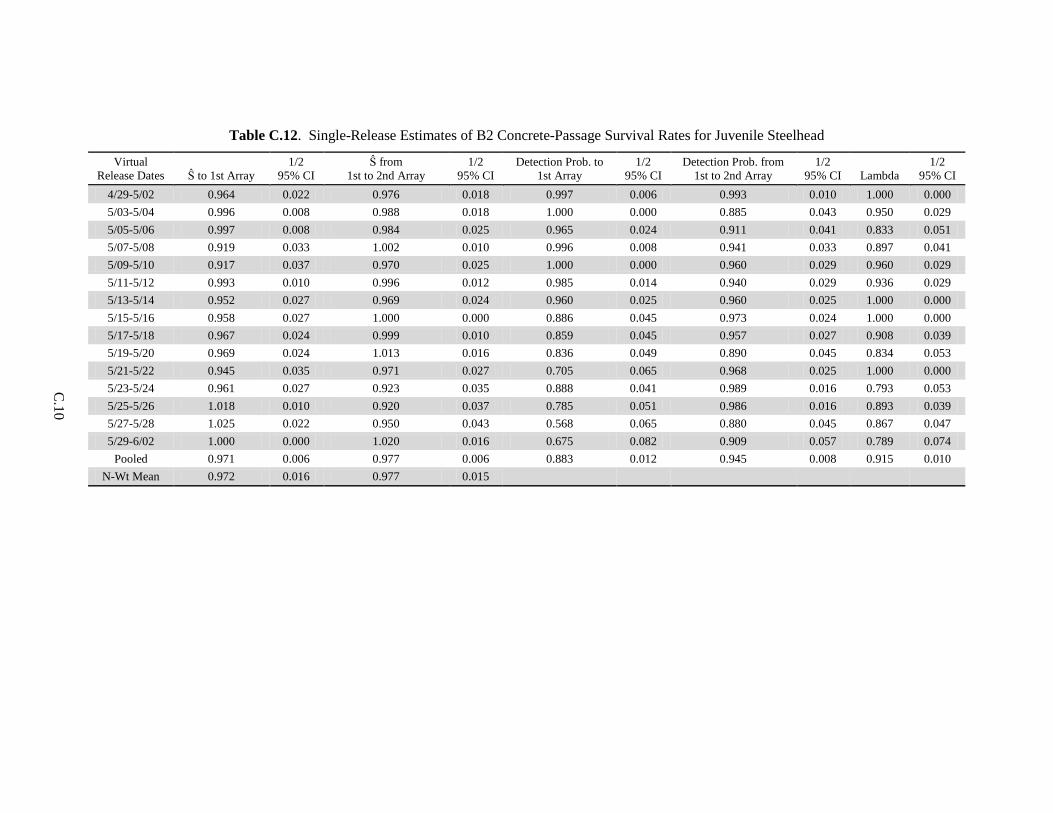
C
.10
Table C.12. Single-Release Estimates of B2 Concrete-Passage Survival Rates for Juvenile Steelhead
Virtual Release Dates Ŝ to 1st Array
1/2 95% CI
Ŝ from 1st to 2nd Array
1/2 95% CI
Detection Prob. to 1st Array
1/2 95% CI
Detection Prob. from 1st to 2nd Array
1/2 95% CI Lambda
1/2 95% CI
4/29-5/02 0.964 0.022 0.976 0.018 0.997 0.006 0.993 0.010 1.000 0.000 5/03-5/04 0.996 0.008 0.988 0.018 1.000 0.000 0.885 0.043 0.950 0.029 5/05-5/06 0.997 0.008 0.984 0.025 0.965 0.024 0.911 0.041 0.833 0.051 5/07-5/08 0.919 0.033 1.002 0.010 0.996 0.008 0.941 0.033 0.897 0.041 5/09-5/10 0.917 0.037 0.970 0.025 1.000 0.000 0.960 0.029 0.960 0.029 5/11-5/12 0.993 0.010 0.996 0.012 0.985 0.014 0.940 0.029 0.936 0.029 5/13-5/14 0.952 0.027 0.969 0.024 0.960 0.025 0.960 0.025 1.000 0.000 5/15-5/16 0.958 0.027 1.000 0.000 0.886 0.045 0.973 0.024 1.000 0.000 5/17-5/18 0.967 0.024 0.999 0.010 0.859 0.045 0.957 0.027 0.908 0.039 5/19-5/20 0.969 0.024 1.013 0.016 0.836 0.049 0.890 0.045 0.834 0.053 5/21-5/22 0.945 0.035 0.971 0.027 0.705 0.065 0.968 0.025 1.000 0.000 5/23-5/24 0.961 0.027 0.923 0.035 0.888 0.041 0.989 0.016 0.793 0.053 5/25-5/26 1.018 0.010 0.920 0.037 0.785 0.051 0.986 0.016 0.893 0.039 5/27-5/28 1.025 0.022 0.950 0.043 0.568 0.065 0.880 0.045 0.867 0.047 5/29-6/02 1.000 0.000 1.020 0.016 0.675 0.082 0.909 0.057 0.789 0.074
Pooled 0.971 0.006 0.977 0.006 0.883 0.012 0.945 0.008 0.915 0.010 N-Wt Mean 0.972 0.016 0.977 0.015
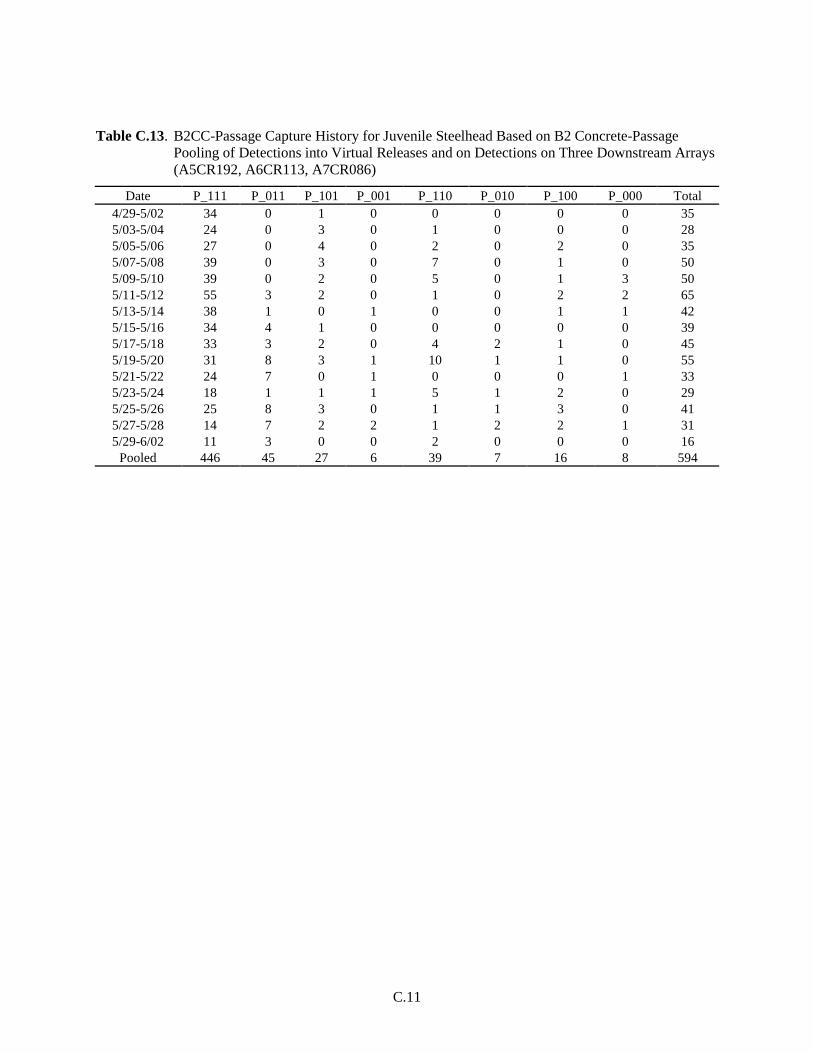
C.11
Table C.13. B2CC-Passage Capture History for Juvenile Steelhead Based on B2 Concrete-Passage Pooling of Detections into Virtual Releases and on Detections on Three Downstream Arrays (A5CR192, A6CR113, A7CR086)
Date P_111 P_011 P_101 P_001 P_110 P_010 P_100 P_000 Total 4/29-5/02 34 0 1 0 0 0 0 0 35 5/03-5/04 24 0 3 0 1 0 0 0 28 5/05-5/06 27 0 4 0 2 0 2 0 35 5/07-5/08 39 0 3 0 7 0 1 0 50 5/09-5/10 39 0 2 0 5 0 1 3 50 5/11-5/12 55 3 2 0 1 0 2 2 65 5/13-5/14 38 1 0 1 0 0 1 1 42 5/15-5/16 34 4 1 0 0 0 0 0 39 5/17-5/18 33 3 2 0 4 2 1 0 45 5/19-5/20 31 8 3 1 10 1 1 0 55 5/21-5/22 24 7 0 1 0 0 0 1 33 5/23-5/24 18 1 1 1 5 1 2 0 29 5/25-5/26 25 8 3 0 1 1 3 0 41 5/27-5/28 14 7 2 2 1 2 2 1 31 5/29-6/02 11 3 0 0 2 0 0 0 16
Pooled 446 45 27 6 39 7 16 8 594
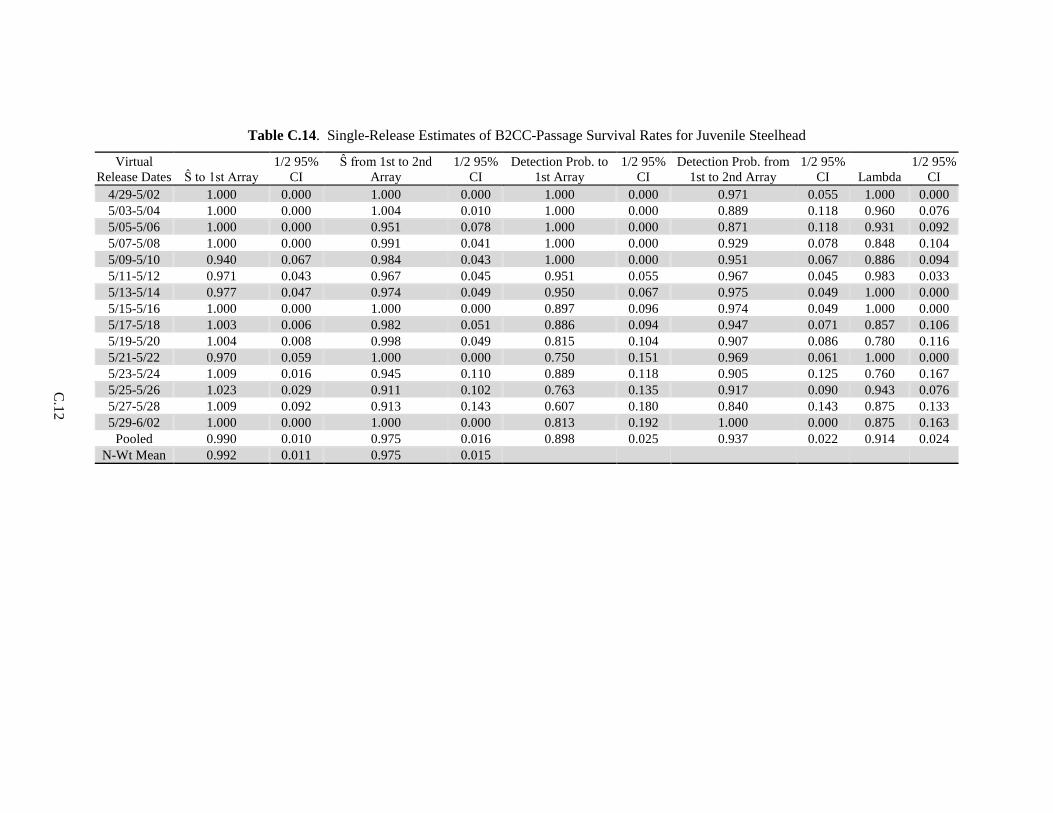
C
.12
Table C.14. Single-Release Estimates of B2CC-Passage Survival Rates for Juvenile Steelhead
Virtual Release Dates Ŝ to 1st Array
1/2 95% CI
Ŝ from 1st to 2nd Array
1/2 95% CI
Detection Prob. to 1st Array
1/2 95% CI
Detection Prob. from 1st to 2nd Array
1/2 95% CI Lambda
1/2 95% CI
4/29-5/02 1.000 0.000 1.000 0.000 1.000 0.000 0.971 0.055 1.000 0.000 5/03-5/04 1.000 0.000 1.004 0.010 1.000 0.000 0.889 0.118 0.960 0.076 5/05-5/06 1.000 0.000 0.951 0.078 1.000 0.000 0.871 0.118 0.931 0.092 5/07-5/08 1.000 0.000 0.991 0.041 1.000 0.000 0.929 0.078 0.848 0.104 5/09-5/10 0.940 0.067 0.984 0.043 1.000 0.000 0.951 0.067 0.886 0.094 5/11-5/12 0.971 0.043 0.967 0.045 0.951 0.055 0.967 0.045 0.983 0.033 5/13-5/14 0.977 0.047 0.974 0.049 0.950 0.067 0.975 0.049 1.000 0.000 5/15-5/16 1.000 0.000 1.000 0.000 0.897 0.096 0.974 0.049 1.000 0.000 5/17-5/18 1.003 0.006 0.982 0.051 0.886 0.094 0.947 0.071 0.857 0.106 5/19-5/20 1.004 0.008 0.998 0.049 0.815 0.104 0.907 0.086 0.780 0.116 5/21-5/22 0.970 0.059 1.000 0.000 0.750 0.151 0.969 0.061 1.000 0.000 5/23-5/24 1.009 0.016 0.945 0.110 0.889 0.118 0.905 0.125 0.760 0.167 5/25-5/26 1.023 0.029 0.911 0.102 0.763 0.135 0.917 0.090 0.943 0.076 5/27-5/28 1.009 0.092 0.913 0.143 0.607 0.180 0.840 0.143 0.875 0.133 5/29-6/02 1.000 0.000 1.000 0.000 0.813 0.192 1.000 0.000 0.875 0.163
Pooled 0.990 0.010 0.975 0.016 0.898 0.025 0.937 0.022 0.914 0.024 N-Wt Mean 0.992 0.011 0.975 0.015
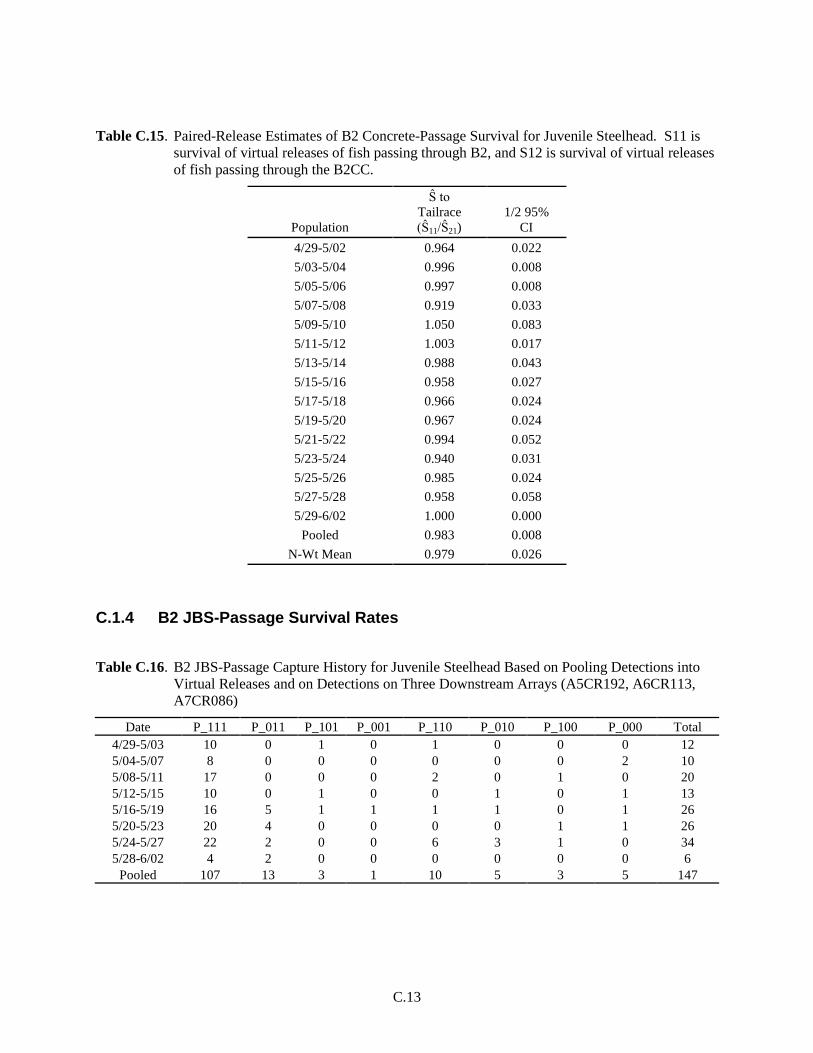
C.13
Table C.15. Paired-Release Estimates of B2 Concrete-Passage Survival for Juvenile Steelhead. S11 is survival of virtual releases of fish passing through B2, and S12 is survival of virtual releases of fish passing through the B2CC.
Population
Ŝ to Tailrace (Ŝ11/Ŝ21)
1/2 95% CI
4/29-5/02 0.964 0.022 5/03-5/04 0.996 0.008 5/05-5/06 0.997 0.008 5/07-5/08 0.919 0.033 5/09-5/10 1.050 0.083 5/11-5/12 1.003 0.017 5/13-5/14 0.988 0.043 5/15-5/16 0.958 0.027 5/17-5/18 0.966 0.024 5/19-5/20 0.967 0.024 5/21-5/22 0.994 0.052 5/23-5/24 0.940 0.031 5/25-5/26 0.985 0.024 5/27-5/28 0.958 0.058 5/29-6/02 1.000 0.000
Pooled 0.983 0.008 N-Wt Mean 0.979 0.026
C.1.4 B2 JBS-Passage Survival Rates
Table C.16. B2 JBS-Passage Capture History for Juvenile Steelhead Based on Pooling Detections into Virtual Releases and on Detections on Three Downstream Arrays (A5CR192, A6CR113, A7CR086)
Date P_111 P_011 P_101 P_001 P_110 P_010 P_100 P_000 Total 4/29-5/03 10 0 1 0 1 0 0 0 12 5/04-5/07 8 0 0 0 0 0 0 2 10 5/08-5/11 17 0 0 0 2 0 1 0 20 5/12-5/15 10 0 1 0 0 1 0 1 13 5/16-5/19 16 5 1 1 1 1 0 1 26 5/20-5/23 20 4 0 0 0 0 1 1 26 5/24-5/27 22 2 0 0 6 3 1 0 34 5/28-6/02 4 2 0 0 0 0 0 0 6
Pooled 107 13 3 1 10 5 3 5 147
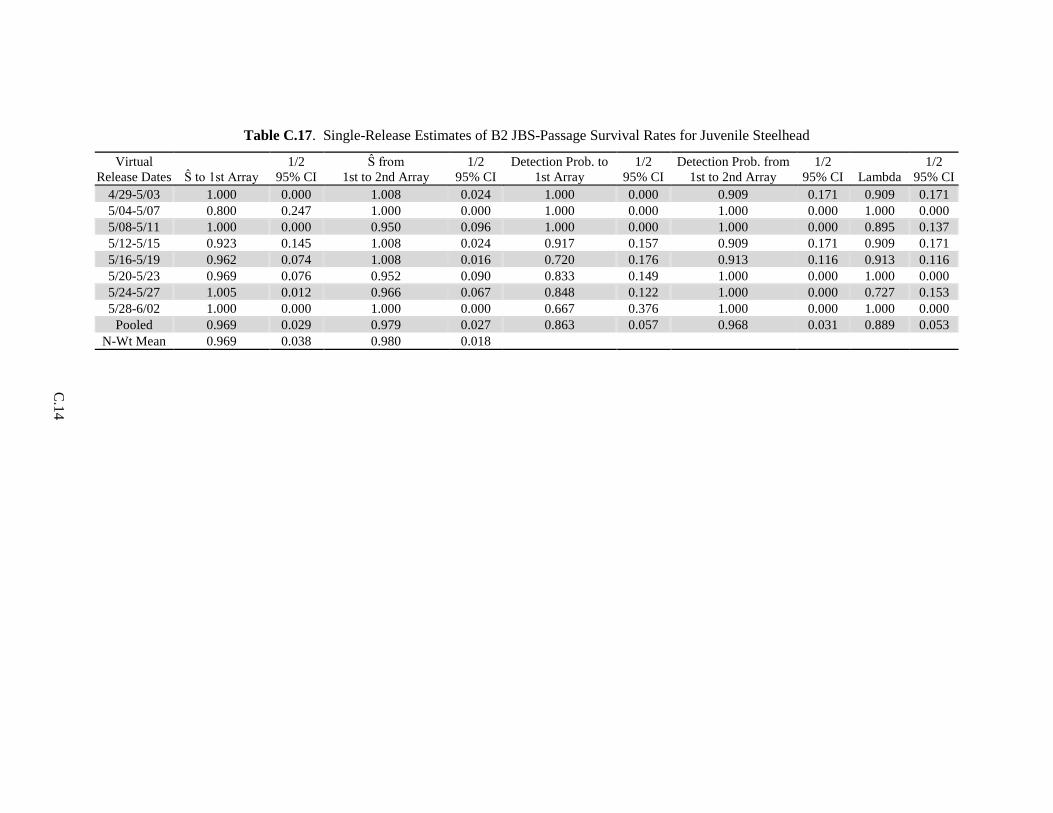
C
.14
Table C.17. Single-Release Estimates of B2 JBS-Passage Survival Rates for Juvenile Steelhead
Virtual Release Dates Ŝ to 1st Array
1/2 95% CI
Ŝ from 1st to 2nd Array
1/2 95% CI
Detection Prob. to 1st Array
1/2 95% CI
Detection Prob. from 1st to 2nd Array
1/2 95% CI Lambda
1/2 95% CI
4/29-5/03 1.000 0.000 1.008 0.024 1.000 0.000 0.909 0.171 0.909 0.171 5/04-5/07 0.800 0.247 1.000 0.000 1.000 0.000 1.000 0.000 1.000 0.000 5/08-5/11 1.000 0.000 0.950 0.096 1.000 0.000 1.000 0.000 0.895 0.137 5/12-5/15 0.923 0.145 1.008 0.024 0.917 0.157 0.909 0.171 0.909 0.171 5/16-5/19 0.962 0.074 1.008 0.016 0.720 0.176 0.913 0.116 0.913 0.116 5/20-5/23 0.969 0.076 0.952 0.090 0.833 0.149 1.000 0.000 1.000 0.000 5/24-5/27 1.005 0.012 0.966 0.067 0.848 0.122 1.000 0.000 0.727 0.153 5/28-6/02 1.000 0.000 1.000 0.000 0.667 0.376 1.000 0.000 1.000 0.000
Pooled 0.969 0.029 0.979 0.027 0.863 0.057 0.968 0.031 0.889 0.053 N-Wt Mean 0.969 0.038 0.980 0.018

C.15
Table C.18. B2CC-Passage Capture History for Juvenile Steelhead Based on B2 JBS-Passage Pooling of Detections into Virtual Releases and on Detections on Three Downstream Arrays (A5CR192, A6CR113, A7CR086)
Date P_111 P_011 P_101 P_001 P_110 P_010 P_100 P_000 Total 4/29-5/03 47 0 3 0 0 0 0 0 50 5/04-5/07 55 0 7 0 6 0 3 0 71 5/08-5/11 81 1 5 0 9 0 1 4 101 5/12-5/15 89 4 1 1 1 0 3 2 101 5/16-5/19 69 8 3 1 10 2 2 0 95 5/20-5/23 42 13 2 1 5 2 0 1 66 5/24-5/27 42 14 6 1 5 2 6 0 76 5/28-6/02 21 5 0 2 3 1 1 1 34
Pooled 446 45 27 6 39 7 16 8 594
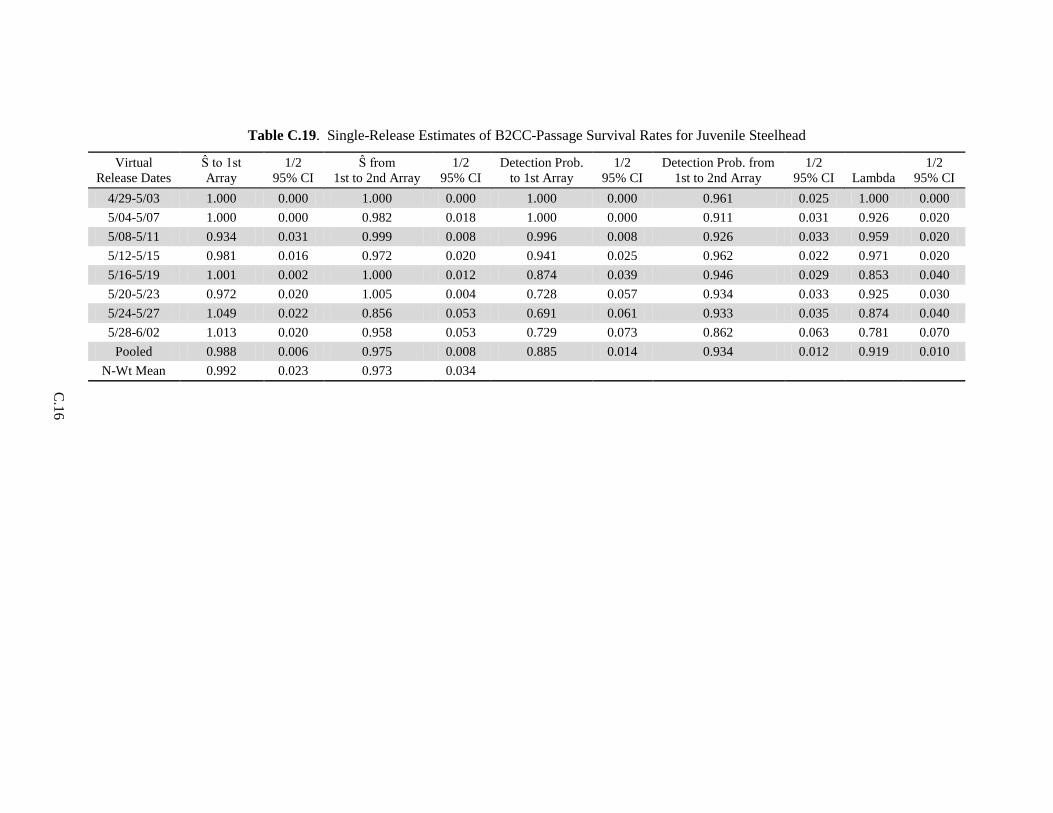
C
.16
Table C.19. Single-Release Estimates of B2CC-Passage Survival Rates for Juvenile Steelhead
Virtual Release Dates
Ŝ to 1st Array
1/2 95% CI
Ŝ from 1st to 2nd Array
1/2 95% CI
Detection Prob. to 1st Array
1/2 95% CI
Detection Prob. from 1st to 2nd Array
1/2 95% CI Lambda
1/2 95% CI
4/29-5/03 1.000 0.000 1.000 0.000 1.000 0.000 0.961 0.025 1.000 0.000 5/04-5/07 1.000 0.000 0.982 0.018 1.000 0.000 0.911 0.031 0.926 0.020 5/08-5/11 0.934 0.031 0.999 0.008 0.996 0.008 0.926 0.033 0.959 0.020 5/12-5/15 0.981 0.016 0.972 0.020 0.941 0.025 0.962 0.022 0.971 0.020 5/16-5/19 1.001 0.002 1.000 0.012 0.874 0.039 0.946 0.029 0.853 0.040 5/20-5/23 0.972 0.020 1.005 0.004 0.728 0.057 0.934 0.033 0.925 0.030 5/24-5/27 1.049 0.022 0.856 0.053 0.691 0.061 0.933 0.035 0.874 0.040 5/28-6/02 1.013 0.020 0.958 0.053 0.729 0.073 0.862 0.063 0.781 0.070
Pooled 0.988 0.006 0.975 0.008 0.885 0.014 0.934 0.012 0.919 0.010 N-Wt Mean 0.992 0.023 0.973 0.034

C.17
Table C.20. Paired-Release Estimates of B2 JBS-Passage Survival Rates for Juvenile Steelhead
Population Ŝ to Tailrace
(Ŝ11/Ŝ21) 1/2 95% CI 4/29-5/03 1.000 0.000 5/04-5/07 0.800 0.247 5/08-5/11 1.041 0.040 5/12-5/15 0.940 0.150 5/16-5/19 0.959 0.074 5/20-5/23 0.984 0.083 5/24-5/27 0.980 0.025 5/28-6/02 1.020 0.063
Pooled 0.979 0.031 N-Wt Mean 0.977 0.041
C.1.5 B2-Turbine Passage Survival Rates
Table C.21. B2 Turbine-Passage Capture History for Juvenile Steelhead Based on Pooling Detections into Virtual Releases and on Detections on Three Downstream Arrays (A5CR192, A6CR113, A7CR086)
Date P_111 P_011 P_101 P_001 P_110 P_010 P_100 P_000 Total 4/29-5/03 58 1 2 0 1 0 2 3 67 5/04-5/07 11 0 1 0 3 1 0 4 20 5/08-5/11 40 1 2 0 3 0 0 2 48 5/12-5/15 24 2 2 0 0 0 0 0 28 5/16-5/19 21 2 1 0 1 0 0 1 26 5/20-5/23 24 3 0 0 5 0 0 5 37 5/24-5/27 28 5 0 0 2 0 1 0 36 5/28-6/02 4 2 0 1 1 0 0 0 8
Pooled 210 16 8 1 16 1 3 15 270

C
.18
Table C.22. Single-Release Estimate of B2-Turbine-Passage Survival Rates for Juvenile Steelhead
Virtual Release Dates Ŝ to 1st Array
1/2 95% CI
Ŝ from 1st to 2nd Array
1/2 95% CI
Detection Prob. to 1st Array
1/2 95% CI
Detection Prob. from 1st to 2nd Array
1/2 95% CI Lambda
1/2 95% CI
4/29-5/03 0.948 0.029 0.944 0.031 0.995 0.010 0.989 0.016 0.995 0.010 5/04-5/07 0.810 0.076 1.069 0.055 0.901 0.065 0.843 0.100 0.589 0.114 5/08-5/11 0.983 0.024 1.006 0.006 0.991 0.018 0.916 0.053 0.925 0.051 5/12-5/15 1.000 0.000 1.000 0.000 0.981 0.025 0.935 0.047 1.000 0.000 5/16-5/19 0.902 0.065 1.000 0.000 0.932 0.057 0.986 0.027 0.986 0.027 5/20-5/23 0.856 0.061 1.000 0.000 0.894 0.057 1.000 0.000 0.823 0.071 5/24-5/27 1.013 0.012 0.941 0.043 0.782 0.069 1.000 0.000 0.944 0.037 5/28-6/02 1.000 0.000 1.069 0.067 0.452 0.151 0.735 0.149 0.758 0.147
Pooled 0.939 0.016 0.982 0.010 0.904 0.020 0.954 0.014 0.908 0.020 N-Wt Mean 0.943 0.046 0.986 0.029
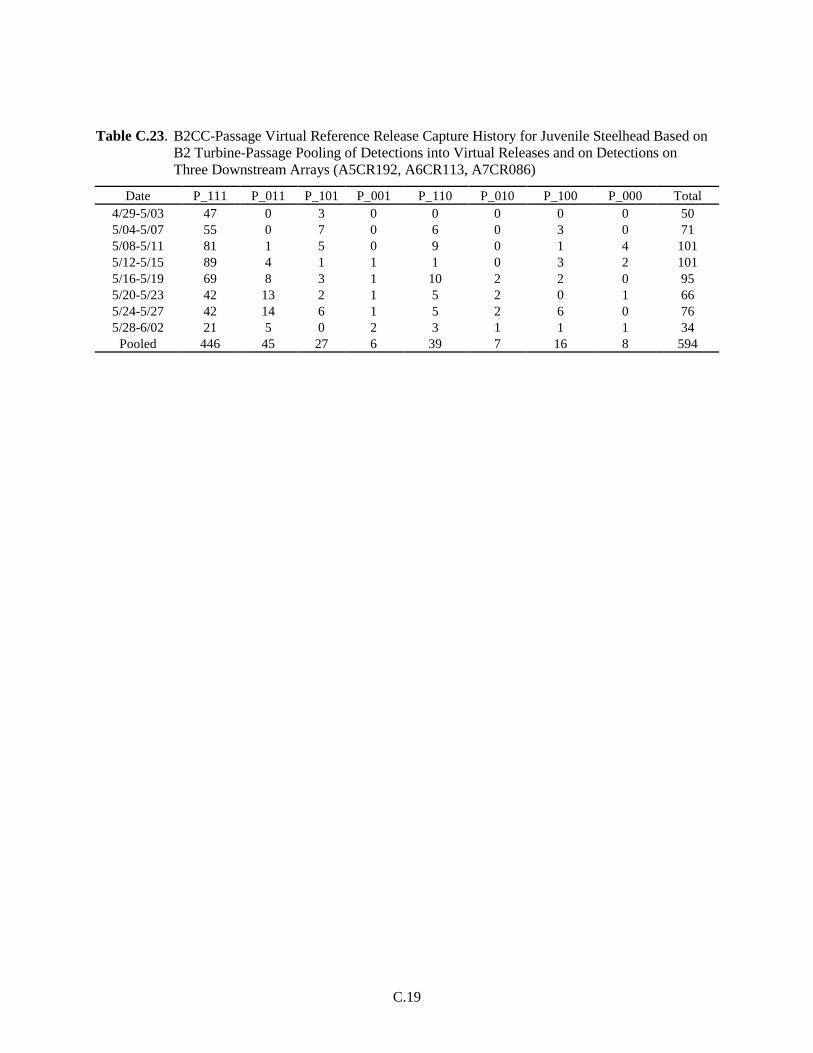
C.19
Table C.23. B2CC-Passage Virtual Reference Release Capture History for Juvenile Steelhead Based on B2 Turbine-Passage Pooling of Detections into Virtual Releases and on Detections on Three Downstream Arrays (A5CR192, A6CR113, A7CR086)
Date P_111 P_011 P_101 P_001 P_110 P_010 P_100 P_000 Total 4/29-5/03 47 0 3 0 0 0 0 0 50 5/04-5/07 55 0 7 0 6 0 3 0 71 5/08-5/11 81 1 5 0 9 0 1 4 101 5/12-5/15 89 4 1 1 1 0 3 2 101 5/16-5/19 69 8 3 1 10 2 2 0 95 5/20-5/23 42 13 2 1 5 2 0 1 66 5/24-5/27 42 14 6 1 5 2 6 0 76 5/28-6/02 21 5 0 2 3 1 1 1 34
Pooled 446 45 27 6 39 7 16 8 594

C
.20
Table C.24. Single-Release Estimate of B2CC-Passage Survival Rates for Juvenile Steelhead
Virtual Release Dates Ŝ to 1st Array
1/2 95% CI
Ŝ from 1st to 2nd Array
1/2 95% CI
Detection Prob. to 1st Array
1/2 95% CI
Detection Prob. from 1st to 2nd Array
1/2 95% CI Lambda
1/2 95% CI
4/29-5/03 1.000 0.000 1.000 0.000 1.000 0.000 0.940 0.067 1.000 0.000 5/04-5/07 1.000 0.000 0.969 0.049 1.000 0.000 0.887 0.078 0.902 0.074 5/08-5/11 0.961 0.037 0.995 0.022 0.990 0.020 0.943 0.049 0.901 0.061 5/12-5/15 0.982 0.027 0.968 0.035 0.948 0.045 0.979 0.029 0.989 0.022 5/16-5/19 1.003 0.004 0.983 0.033 0.882 0.065 0.951 0.047 0.865 0.071 5/20-5/23 0.985 0.029 1.006 0.008 0.754 0.104 0.948 0.057 0.887 0.078 5/24-5/27 1.025 0.024 0.910 0.078 0.757 0.100 0.889 0.078 0.889 0.078 5/28-6/02 0.980 0.061 0.969 0.078 0.750 0.151 0.929 0.096 0.867 0.122
Pooled 0.990 0.010 0.975 0.016 0.898 0.025 0.937 0.022 0.914 0.024 N-Wt Mean 0.991 0.014 0.975 0.021

C.21
Table C.25. Paired-Release Estimates of B2 Turbine-Passage Survival Rates for Juvenile Steelhead
Population Ŝ to Tailrace
(Ŝ11/Ŝ21) 1/2 95% CI 4/29-5/03 0.948 0.029 5/04-5/07 0.810 0.076 5/08-5/11 1.023 0.047 5/12-5/15 1.018 0.028 5/16-5/19 0.899 0.065 5/20-5/23 0.869 0.067 5/24-5/27 0.988 0.025 5/28-6/02 1.020 0.063
Pooled 0.948 0.018 N-Wt Mean 0.951 0.049
C.2 Detection and Survival of Yearling Chinook Salmon in Spring
C.2.1 Bonneville Dam-Passage Survival Rates
Table C.26. Bonneville Dam-Passage Capture History for Yearling Chinook Salmon Based on Pooling Detections into Virtual Releases and Detections on Three Downstream Arrays (A5CR192, A6CR113, A7CR086)
Date P_111 P_011 P_101 P_001 P_110 P_010 P_100 P_000 Total 4/30-5/02 137 0 9 0 1 0 5 4 156 5/03-5/04 124 0 5 0 2 0 2 4 137 5/05-5/06 141 4 19 0 6 0 3 3 176 5/07-5/08 199 3 23 0 13 0 8 12 258 5/09-5/10 200 5 7 1 0 0 5 7 225 5/11-5/12 172 6 12 0 3 0 4 11 208 5/13-5/14 200 8 19 0 2 0 2 9 240 5/15-5/16 166 9 19 3 2 0 4 10 213 5/17-5/18 139 20 19 0 5 1 5 11 200 5/19-5/20 156 24 16 3 11 2 5 21 238 5/21-5/22 183 29 7 0 14 3 4 9 249 5/23-5/24 154 9 10 0 19 4 5 10 211 5/25-5/26 114 27 10 3 28 5 3 12 202 5/27-5/28 122 26 4 5 21 7 2 9 196 5/29-6/02 40 11 4 1 7 1 3 0 67
Pooled 2247 181 183 16 134 23 60 132 2976

C
.22
Table C.27. Single-Release Estimates of Dam-Passage Survival Rates for Yearling Chinook Salmon
Virtual Release Dates Ŝ to 1st Array
1/2 95% CI
Ŝ from 1st to 2nd Array
1/2 95% CI
Detection Prob. to 1st Array
1/2 95% CI
Detection Prob. from 1st to 2nd Array
1/2 95% CI Lambda
1/2 95% CI
4/30-5/02 0.974 0.025 0.968 0.027 1.000 0.000 0.938 0.039 0.993 0.014 5/03-5/04 0.971 0.027 0.985 0.022 1.000 0.000 0.961 0.033 0.984 0.022 5/05-5/06 0.983 0.020 0.987 0.020 0.976 0.024 0.884 0.049 0.960 0.031 5/07-5/08 0.954 0.025 0.973 0.024 0.987 0.014 0.898 0.039 0.940 0.031 5/09-5/10 0.970 0.024 0.976 0.020 0.972 0.022 0.962 0.025 1.000 0.000 5/11-5/12 0.947 0.031 0.980 0.020 0.969 0.025 0.937 0.035 0.983 0.020 5/13-5/14 0.963 0.024 0.992 0.012 0.965 0.024 0.916 0.035 0.990 0.014 5/15-5/16 0.953 0.029 0.980 0.022 0.944 0.033 0.896 0.043 0.989 0.016 5/17-5/18 0.948 0.031 0.974 0.025 0.885 0.047 0.893 0.045 0.963 0.029 5/19-5/20 0.915 0.037 0.980 0.024 0.863 0.047 0.904 0.041 0.932 0.035 5/21-5/22 0.966 0.024 0.983 0.020 0.864 0.043 0.968 0.024 0.926 0.033 5/23-5/24 0.954 0.029 0.980 0.024 0.933 0.035 0.942 0.035 0.876 0.047 5/25-5/26 0.944 0.033 0.997 0.024 0.813 0.057 0.916 0.043 0.810 0.059 5/27-5/28 0.957 0.029 0.996 0.020 0.795 0.059 0.943 0.037 0.841 0.055 5/29-6/02 1.012 0.016 0.955 0.065 0.794 0.100 0.909 0.076 0.862 0.088
Pooled 0.957 0.008 0.982 0.006 0.921 0.010 0.925 0.010 0.939 0.010 N-Wt Mean 0.957 0.009 0.982 0.005

C.23
Table C.28. B2CC-Passage Capture History for Yearling Chinook Salmon Based on Dam-Passage Pooling of Detections into Virtual Releases and Detections on Three Downstream Arrays (A5CR192, A6CR113, A7CR086)
Date P_111 P_011 P_101 P_001 P_110 P_010 P_100 P_000 Total 4/30-5/02 6 0 1 0 0 0 1 0 8 5/03-5/04 16 0 2 0 0 0 0 0 18 5/05-5/06 13 1 6 0 1 0 0 0 21 5/07-5/08 16 0 3 0 0 0 0 0 19 5/09-5/10 28 0 1 0 0 0 1 0 30 5/11-5/12 23 2 4 0 1 0 0 0 30 5/13-5/14 20 0 1 0 0 0 0 0 21 5/15-5/16 39 3 7 1 0 0 1 1 52 5/17-5/18 24 3 2 0 0 0 0 0 29 5/19-5/20 28 4 2 0 1 0 0 0 35 5/21-5/22 16 5 0 0 1 0 0 0 22 5/23-5/24 24 1 2 0 1 0 1 1 30 5/25-5/26 16 7 3 0 2 1 0 0 29 5/27-5/28 17 2 0 1 1 0 0 0 21 5/29-6/02 3 1 0 0 0 0 0 0 4
Pooled 289 29 34 2 8 1 4 2 369
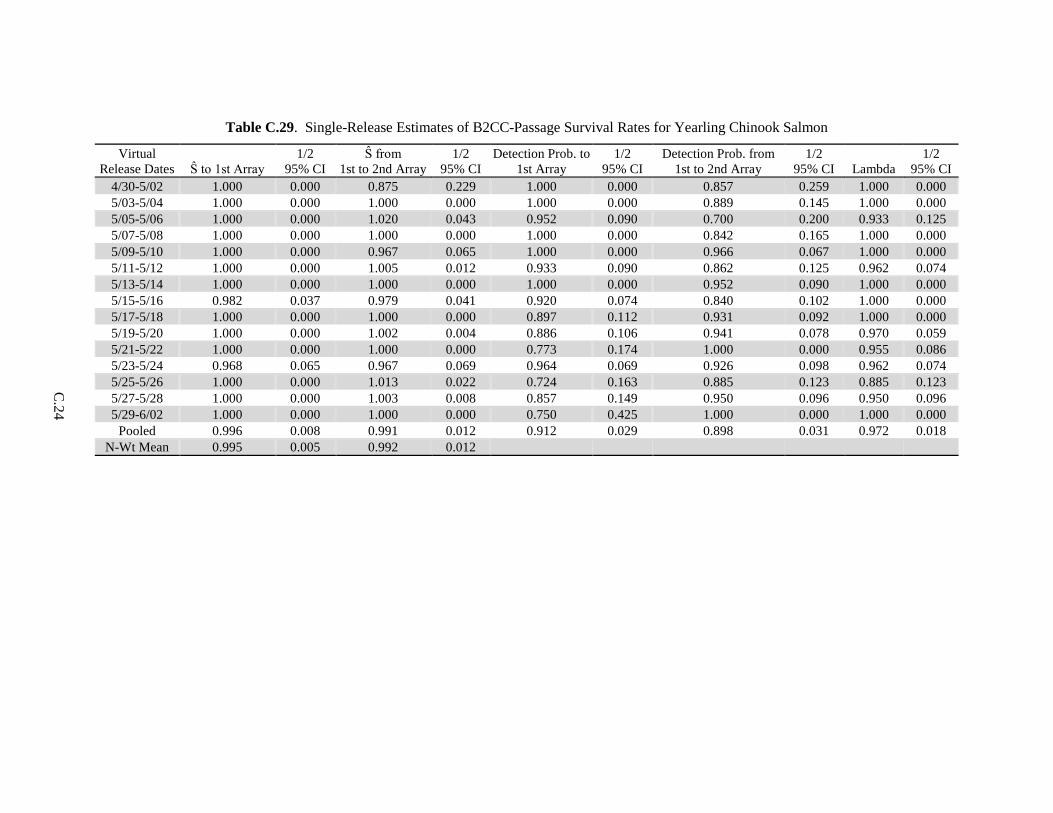
C
.24
Table C.29. Single-Release Estimates of B2CC-Passage Survival Rates for Yearling Chinook Salmon
Virtual Release Dates Ŝ to 1st Array
1/2 95% CI
Ŝ from 1st to 2nd Array
1/2 95% CI
Detection Prob. to 1st Array
1/2 95% CI
Detection Prob. from 1st to 2nd Array
1/2 95% CI Lambda
1/2 95% CI
4/30-5/02 1.000 0.000 0.875 0.229 1.000 0.000 0.857 0.259 1.000 0.000 5/03-5/04 1.000 0.000 1.000 0.000 1.000 0.000 0.889 0.145 1.000 0.000 5/05-5/06 1.000 0.000 1.020 0.043 0.952 0.090 0.700 0.200 0.933 0.125 5/07-5/08 1.000 0.000 1.000 0.000 1.000 0.000 0.842 0.165 1.000 0.000 5/09-5/10 1.000 0.000 0.967 0.065 1.000 0.000 0.966 0.067 1.000 0.000 5/11-5/12 1.000 0.000 1.005 0.012 0.933 0.090 0.862 0.125 0.962 0.074 5/13-5/14 1.000 0.000 1.000 0.000 1.000 0.000 0.952 0.090 1.000 0.000 5/15-5/16 0.982 0.037 0.979 0.041 0.920 0.074 0.840 0.102 1.000 0.000 5/17-5/18 1.000 0.000 1.000 0.000 0.897 0.112 0.931 0.092 1.000 0.000 5/19-5/20 1.000 0.000 1.002 0.004 0.886 0.106 0.941 0.078 0.970 0.059 5/21-5/22 1.000 0.000 1.000 0.000 0.773 0.174 1.000 0.000 0.955 0.086 5/23-5/24 0.968 0.065 0.967 0.069 0.964 0.069 0.926 0.098 0.962 0.074 5/25-5/26 1.000 0.000 1.013 0.022 0.724 0.163 0.885 0.123 0.885 0.123 5/27-5/28 1.000 0.000 1.003 0.008 0.857 0.149 0.950 0.096 0.950 0.096 5/29-6/02 1.000 0.000 1.000 0.000 0.750 0.425 1.000 0.000 1.000 0.000
Pooled 0.996 0.008 0.991 0.012 0.912 0.029 0.898 0.031 0.972 0.018 N-Wt Mean 0.995 0.005 0.992 0.012
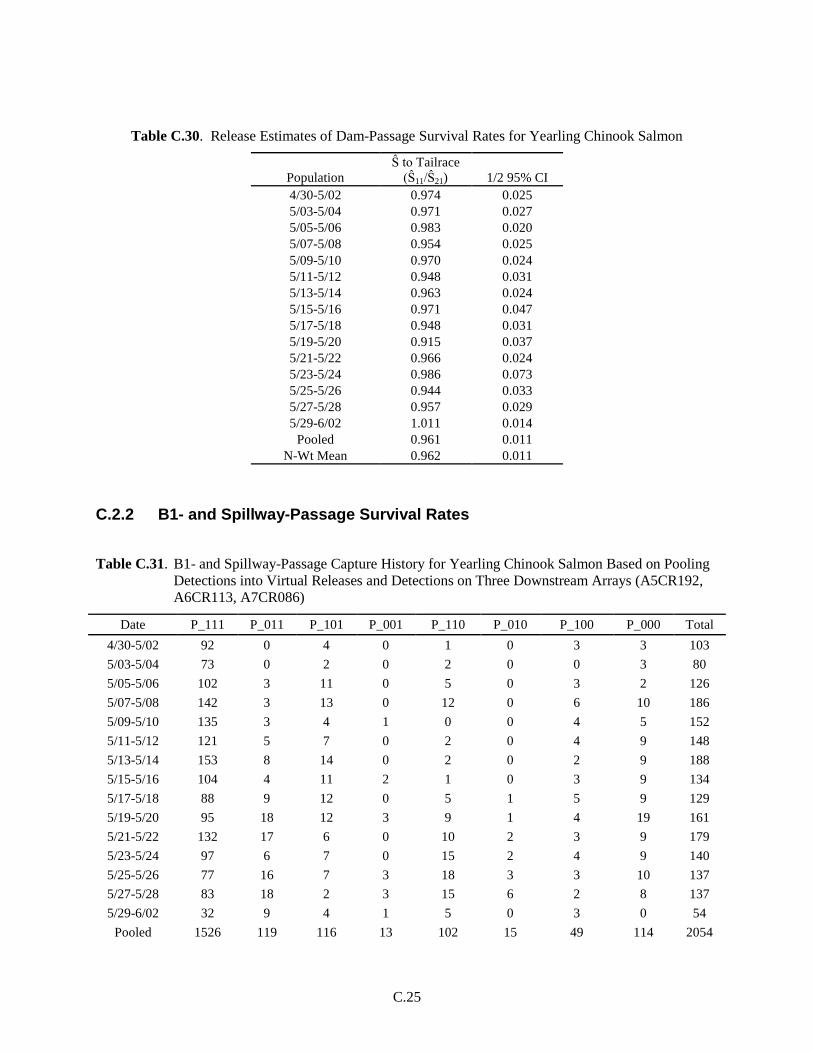
C.25
Table C.30. Release Estimates of Dam-Passage Survival Rates for Yearling Chinook Salmon
Population Ŝ to Tailrace
(Ŝ11/Ŝ21) 1/2 95% CI 4/30-5/02 0.974 0.025 5/03-5/04 0.971 0.027 5/05-5/06 0.983 0.020 5/07-5/08 0.954 0.025 5/09-5/10 0.970 0.024 5/11-5/12 0.948 0.031 5/13-5/14 0.963 0.024 5/15-5/16 0.971 0.047 5/17-5/18 0.948 0.031 5/19-5/20 0.915 0.037 5/21-5/22 0.966 0.024 5/23-5/24 0.986 0.073 5/25-5/26 0.944 0.033 5/27-5/28 0.957 0.029 5/29-6/02 1.011 0.014
Pooled 0.961 0.011 N-Wt Mean 0.962 0.011
C.2.2 B1- and Spillway-Passage Survival Rates
Table C.31. B1- and Spillway-Passage Capture History for Yearling Chinook Salmon Based on Pooling Detections into Virtual Releases and Detections on Three Downstream Arrays (A5CR192, A6CR113, A7CR086)
Date P_111 P_011 P_101 P_001 P_110 P_010 P_100 P_000 Total 4/30-5/02 92 0 4 0 1 0 3 3 103 5/03-5/04 73 0 2 0 2 0 0 3 80 5/05-5/06 102 3 11 0 5 0 3 2 126 5/07-5/08 142 3 13 0 12 0 6 10 186 5/09-5/10 135 3 4 1 0 0 4 5 152 5/11-5/12 121 5 7 0 2 0 4 9 148 5/13-5/14 153 8 14 0 2 0 2 9 188 5/15-5/16 104 4 11 2 1 0 3 9 134 5/17-5/18 88 9 12 0 5 1 5 9 129 5/19-5/20 95 18 12 3 9 1 4 19 161 5/21-5/22 132 17 6 0 10 2 3 9 179 5/23-5/24 97 6 7 0 15 2 4 9 140 5/25-5/26 77 16 7 3 18 3 3 10 137 5/27-5/28 83 18 2 3 15 6 2 8 137 5/29-6/02 32 9 4 1 5 0 3 0 54
Pooled 1526 119 116 13 102 15 49 114 2054

C
.26
Table C.32. Single-Release Estimates of B1- and Spillway-Passage Survival Rates for Yearling Chinook Salmon
Virtual Release Dates Ŝ to 1st Array
1/2 95% CI
Ŝ from 1st to 2nd Array
1/2 95% CI
Detection Prob. to 1st Array
1/2 95% CI
Detection Prob. from 1st to 2nd Array
1/2 95% CI Lambda
1/2 95% CI
4/30-5/02 0.971 0.033 0.970 0.033 1.000 0.000 0.958 0.039 0.989 0.022 5/03-5/04 0.963 0.041 1.001 0.002 1.000 0.000 0.973 0.037 0.973 0.037 5/05-5/06 0.985 0.022 0.979 0.027 0.975 0.027 0.905 0.053 0.955 0.039 5/07-5/08 0.947 0.033 0.971 0.027 0.982 0.020 0.918 0.043 0.924 0.041 5/09-5/10 0.968 0.027 0.972 0.027 0.972 0.027 0.965 0.029 1.000 0.000 5/11-5/12 0.940 0.039 0.971 0.029 0.963 0.031 0.947 0.037 0.984 0.022 5/13-5/14 0.953 0.031 0.989 0.016 0.955 0.031 0.920 0.041 0.988 0.018 5/15-5/16 0.934 0.043 0.976 0.027 0.951 0.039 0.893 0.055 0.991 0.018 5/17-5/18 0.934 0.045 0.961 0.039 0.913 0.051 0.890 0.059 0.942 0.045 5/19-5/20 0.887 0.051 0.976 0.033 0.841 0.061 0.883 0.055 0.919 0.049 5/21-5/22 0.952 0.031 0.983 0.022 0.886 0.049 0.961 0.029 0.925 0.041 5/23-5/24 0.938 0.041 0.976 0.033 0.937 0.043 0.936 0.045 0.858 0.063 5/25-5/26 0.932 0.045 0.989 0.035 0.823 0.067 0.903 0.057 0.816 0.071 5/27-5/28 0.946 0.039 0.988 0.027 0.787 0.071 0.953 0.041 0.828 0.067 5/29-6/02 1.014 0.018 0.943 0.076 0.804 0.110 0.891 0.090 0.891 0.090
Pooled 0.947 0.010 0.977 0.008 0.922 0.012 0.927 0.012 0.934 0.012 N-Wt Mean 0.947 0.013 0.977 0.006

C.27
Table C.33. B2CC-Passage Capture History for Yearling Chinook Salmon Based on B1- and Spillway-Passage Pooling of Detections into Virtual Releases and Detections on Three Downstream Arrays (A5CR192, A6CR113, A7CR086)
Date P_111 P_011 P_101 P_001 P_110 P_010 P_100 P_000 Total 4/30-5/02 6 0 1 0 0 0 1 0 8 5/03-5/04 16 0 2 0 0 0 0 0 18 5/05-5/06 13 1 6 0 1 0 0 0 21 5/07-5/08 16 0 3 0 0 0 0 0 19 5/09-5/10 28 0 1 0 0 0 1 0 30 5/11-5/12 23 2 4 0 1 0 0 0 30 5/13-5/14 20 0 1 0 0 0 0 0 21 5/15-5/16 39 3 7 1 0 0 1 1 52 5/17-5/18 24 3 2 0 0 0 0 0 29 5/19-5/20 28 4 2 0 1 0 0 0 35 5/21-5/22 16 5 0 0 1 0 0 0 22 5/23-5/24 24 1 2 0 1 0 1 1 30 5/25-5/26 16 7 3 0 2 1 0 0 29 5/27-5/28 17 2 0 1 1 0 0 0 21 5/29-6/02 3 1 0 0 0 0 0 0 4
Pooled 289 29 34 2 8 1 4 2 369
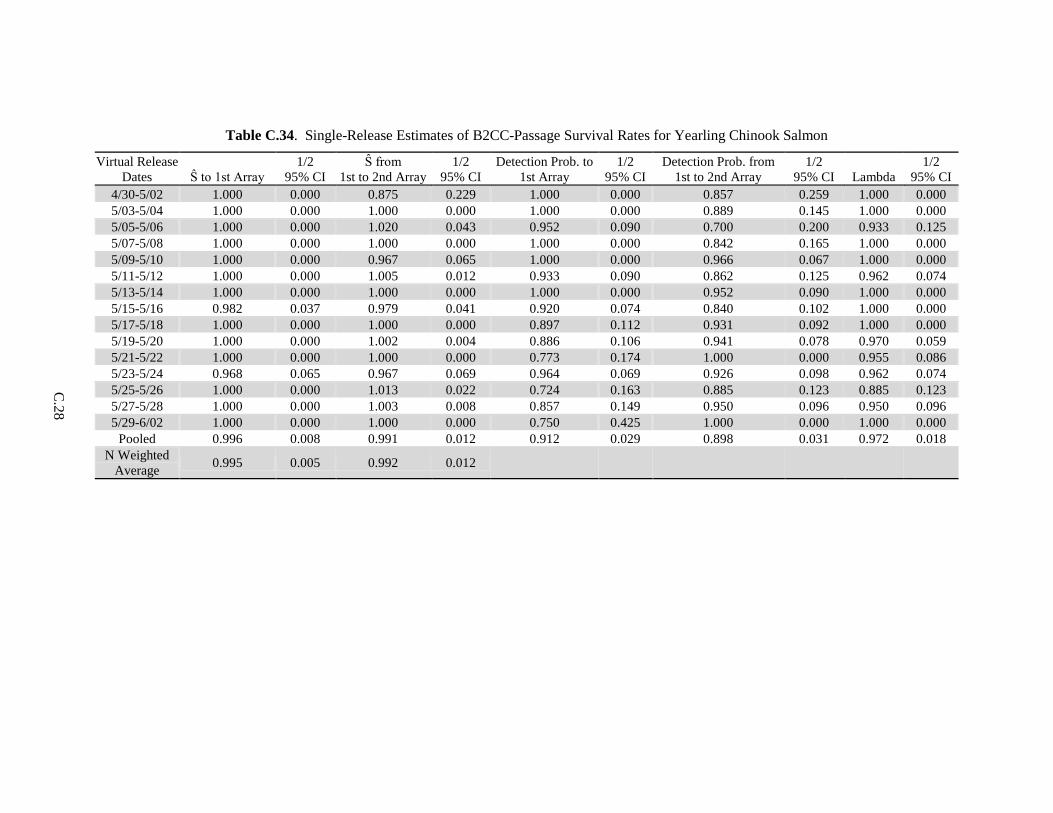
C
.28
Table C.34. Single-Release Estimates of B2CC-Passage Survival Rates for Yearling Chinook Salmon
Virtual Release Dates Ŝ to 1st Array
1/2 95% CI
Ŝ from 1st to 2nd Array
1/2 95% CI
Detection Prob. to 1st Array
1/2 95% CI
Detection Prob. from 1st to 2nd Array
1/2 95% CI Lambda
1/2 95% CI
4/30-5/02 1.000 0.000 0.875 0.229 1.000 0.000 0.857 0.259 1.000 0.000 5/03-5/04 1.000 0.000 1.000 0.000 1.000 0.000 0.889 0.145 1.000 0.000 5/05-5/06 1.000 0.000 1.020 0.043 0.952 0.090 0.700 0.200 0.933 0.125 5/07-5/08 1.000 0.000 1.000 0.000 1.000 0.000 0.842 0.165 1.000 0.000 5/09-5/10 1.000 0.000 0.967 0.065 1.000 0.000 0.966 0.067 1.000 0.000 5/11-5/12 1.000 0.000 1.005 0.012 0.933 0.090 0.862 0.125 0.962 0.074 5/13-5/14 1.000 0.000 1.000 0.000 1.000 0.000 0.952 0.090 1.000 0.000 5/15-5/16 0.982 0.037 0.979 0.041 0.920 0.074 0.840 0.102 1.000 0.000 5/17-5/18 1.000 0.000 1.000 0.000 0.897 0.112 0.931 0.092 1.000 0.000 5/19-5/20 1.000 0.000 1.002 0.004 0.886 0.106 0.941 0.078 0.970 0.059 5/21-5/22 1.000 0.000 1.000 0.000 0.773 0.174 1.000 0.000 0.955 0.086 5/23-5/24 0.968 0.065 0.967 0.069 0.964 0.069 0.926 0.098 0.962 0.074 5/25-5/26 1.000 0.000 1.013 0.022 0.724 0.163 0.885 0.123 0.885 0.123 5/27-5/28 1.000 0.000 1.003 0.008 0.857 0.149 0.950 0.096 0.950 0.096 5/29-6/02 1.000 0.000 1.000 0.000 0.750 0.425 1.000 0.000 1.000 0.000
Pooled 0.996 0.008 0.991 0.012 0.912 0.029 0.898 0.031 0.972 0.018 N Weighted
Average 0.995 0.005 0.992 0.012

C.29
Table C.35. Paired-Release Estimates of B1- and Spillway-Passage Survival Rates for Yearling Chinook Salmon
Population Ŝ to Tailrace
(Ŝ11/Ŝ21) 1/2 95% CI 4/30-5/02 0.971 0.033 5/03-5/04 0.963 0.041 5/05-5/06 0.985 0.022 5/07-5/08 0.947 0.033 5/09-5/10 0.968 0.027 5/11-5/12 0.940 0.039 5/13-5/14 0.953 0.031 5/15-5/16 0.951 0.057 5/17-5/18 0.934 0.045 5/19-5/20 0.887 0.051 5/21-5/22 0.952 0.031 5/23-5/24 0.969 0.077 5/25-5/26 0.932 0.045 5/27-5/28 0.946 0.039 5/29-6/02 1.014 0.018
Pooled 0.951 0.012 N-Wt Mean 0.952 0.014
C.2.3 B2 Concrete-Passage Survival Rates
Table C.36. B2 Concrete-Passage Capture History for Yearling Chinook Salmon Based on Pooling Detections into Virtual Releases and on Detections on Three Downstream Arrays (A5CR192, A6CR113, A7CR086)
Date P_111 P_011 P_101 P_001 P_110 P_010 P_100 P_000 Total 4/30-5/02 45 0 5 0 0 0 2 1 53 5/03-5/04 51 0 3 0 0 0 2 1 57 5/05-5/06 37 1 8 0 1 0 0 1 48 5/07-5/08 56 0 10 0 1 0 2 2 71 5/09-5/10 68 2 3 0 0 0 1 2 76 5/11-5/12 52 2 5 0 1 0 0 2 62 5/13-5/14 47 0 5 0 0 0 0 0 52 5/15-5/16 58 5 8 1 1 0 1 1 75 5/17-5/18 54 9 7 0 0 0 0 1 71 5/19-5/20 62 8 4 0 2 1 1 3 81 5/21-5/22 51 11 1 0 4 1 1 0 69 5/23-5/24 57 4 3 0 4 2 1 1 72 5/25-5/26 37 11 3 0 10 2 0 2 65 5/27-5/28 38 8 2 2 6 1 0 1 58 5/29-6/02 9 2 0 0 2 1 0 0 14
Pooled 722 63 67 3 32 8 11 18 924

C
.30
Table C.37. Single-Release Estimates of B2 Concrete-Passage Survival Rates for Yearling Chinook Salmon
Virtual Release Dates Ŝ to 1st Array
1/2 95% CI
Ŝ from 1st to 2nd Array
1/2 95% CI
Detection Prob. to 1st Array
1/2 95% CI
Detection Prob. from 1st to 2nd Array
1/2 95% CI Lambda
1/2 95% CI
4/30-5/02 0.981 0.037 0.962 0.053 1.000 0.000 0.900 0.082 1.000 0.000 5/03-5/04 0.982 0.033 0.964 0.049 1.000 0.000 0.944 0.061 1.000 0.000 5/05-5/06 0.979 0.041 1.004 0.010 0.979 0.041 0.826 0.110 0.974 0.049 5/07-5/08 0.972 0.039 0.974 0.039 1.000 0.000 0.848 0.086 0.982 0.033 5/09-5/10 0.974 0.035 0.986 0.027 0.973 0.037 0.959 0.045 1.000 0.000 5/11-5/12 0.968 0.043 1.002 0.004 0.967 0.045 0.915 0.071 0.982 0.035 5/13-5/14 1.000 0.000 1.000 0.000 1.000 0.000 0.904 0.080 1.000 0.000 5/15-5/16 0.988 0.025 0.987 0.029 0.918 0.063 0.875 0.076 0.984 0.031 5/17-5/18 0.986 0.027 1.000 0.000 0.871 0.078 0.900 0.071 1.000 0.000 5/19-5/20 0.965 0.041 0.988 0.029 0.883 0.073 0.946 0.051 0.959 0.045 5/21-5/22 1.003 0.006 0.984 0.033 0.824 0.090 0.984 0.031 0.925 0.063 5/23-5/24 0.987 0.027 0.989 0.031 0.914 0.065 0.953 0.051 0.910 0.069 5/25-5/26 0.969 0.041 1.012 0.016 0.794 0.100 0.941 0.065 0.800 0.102 5/27-5/28 0.983 0.033 1.011 0.014 0.807 0.102 0.920 0.074 0.868 0.092 5/29-6/02 1.000 0.000 1.000 0.000 0.786 0.216 1.000 0.000 0.786 0.216
Pooled 0.982 0.010 0.991 0.008 0.917 0.018 0.918 0.018 0.952 0.014 N-Wt Mean 0.981 0.006 0.990 0.008
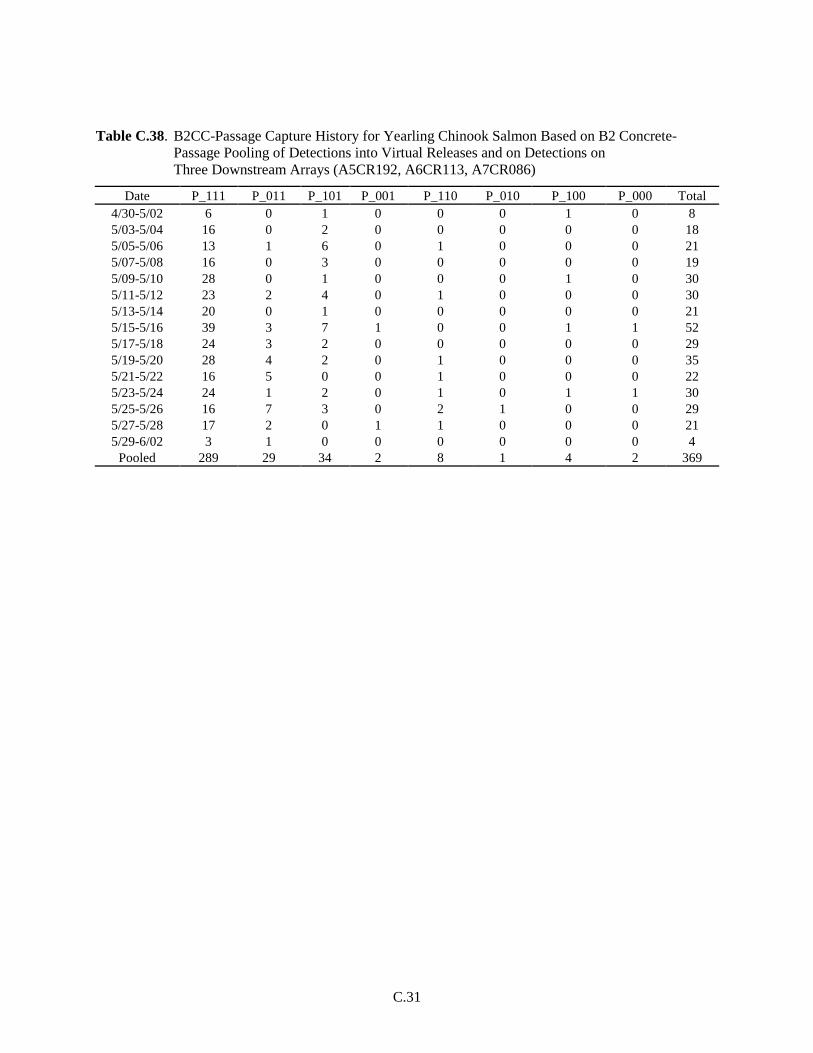
C.31
Table C.38. B2CC-Passage Capture History for Yearling Chinook Salmon Based on B2 Concrete-Passage Pooling of Detections into Virtual Releases and on Detections on Three Downstream Arrays (A5CR192, A6CR113, A7CR086)
Date P_111 P_011 P_101 P_001 P_110 P_010 P_100 P_000 Total 4/30-5/02 6 0 1 0 0 0 1 0 8 5/03-5/04 16 0 2 0 0 0 0 0 18 5/05-5/06 13 1 6 0 1 0 0 0 21 5/07-5/08 16 0 3 0 0 0 0 0 19 5/09-5/10 28 0 1 0 0 0 1 0 30 5/11-5/12 23 2 4 0 1 0 0 0 30 5/13-5/14 20 0 1 0 0 0 0 0 21 5/15-5/16 39 3 7 1 0 0 1 1 52 5/17-5/18 24 3 2 0 0 0 0 0 29 5/19-5/20 28 4 2 0 1 0 0 0 35 5/21-5/22 16 5 0 0 1 0 0 0 22 5/23-5/24 24 1 2 0 1 0 1 1 30 5/25-5/26 16 7 3 0 2 1 0 0 29 5/27-5/28 17 2 0 1 1 0 0 0 21 5/29-6/02 3 1 0 0 0 0 0 0 4
Pooled 289 29 34 2 8 1 4 2 369

C
.32
Table C.39. Single-Release Estimates of B2CC-Passage Survival Rates for Yearling Chinook Salmon
Virtual Release Dates Ŝ to 1st Array
1/2 95% CI
Ŝ from 1st to 2nd Array
1/2 95% CI
Detection Prob. to 1st Array
1/2 95% CI
Detection Prob. from 1st to 2nd Array
1/2 95% CI Lambda
1/2 95% CI
4/30-5/02 1.000 0.000 0.875 0.229 1.000 0.000 0.857 0.259 1.000 0.000 5/03-5/04 1.000 0.000 1.000 0.000 1.000 0.000 0.889 0.145 1.000 0.000 5/05-5/06 1.000 0.000 1.020 0.043 0.952 0.090 0.700 0.200 0.933 0.125 5/07-5/08 1.000 0.000 1.000 0.000 1.000 0.000 0.842 0.165 1.000 0.000 5/09-5/10 1.000 0.000 0.967 0.065 1.000 0.000 0.966 0.067 1.000 0.000 5/11-5/12 1.000 0.000 1.005 0.012 0.933 0.090 0.862 0.125 0.962 0.074 5/13-5/14 1.000 0.000 1.000 0.000 1.000 0.000 0.952 0.090 1.000 0.000 5/15-5/16 0.982 0.037 0.979 0.041 0.920 0.074 0.840 0.102 1.000 0.000 5/17-5/18 1.000 0.000 1.000 0.000 0.897 0.112 0.931 0.092 1.000 0.000 5/19-5/20 1.000 0.000 1.002 0.004 0.886 0.106 0.941 0.078 0.970 0.059 5/21-5/22 1.000 0.000 1.000 0.000 0.773 0.174 1.000 0.000 0.955 0.086 5/23-5/24 0.968 0.065 0.967 0.069 0.964 0.069 0.926 0.098 0.962 0.074 5/25-5/26 1.000 0.000 1.013 0.022 0.724 0.163 0.885 0.123 0.885 0.123 5/27-5/28 1.000 0.000 1.003 0.008 0.857 0.149 0.950 0.096 0.950 0.096 5/29-6/02 1.000 0.000 1.000 0.000 0.750 0.425 1.000 0.000 1.000 0.000
Pooled 0.996 0.008 0.991 0.012 0.912 0.029 0.898 0.031 0.972 0.018 N-Wt Mean 0.995 0.005 0.992 0.012
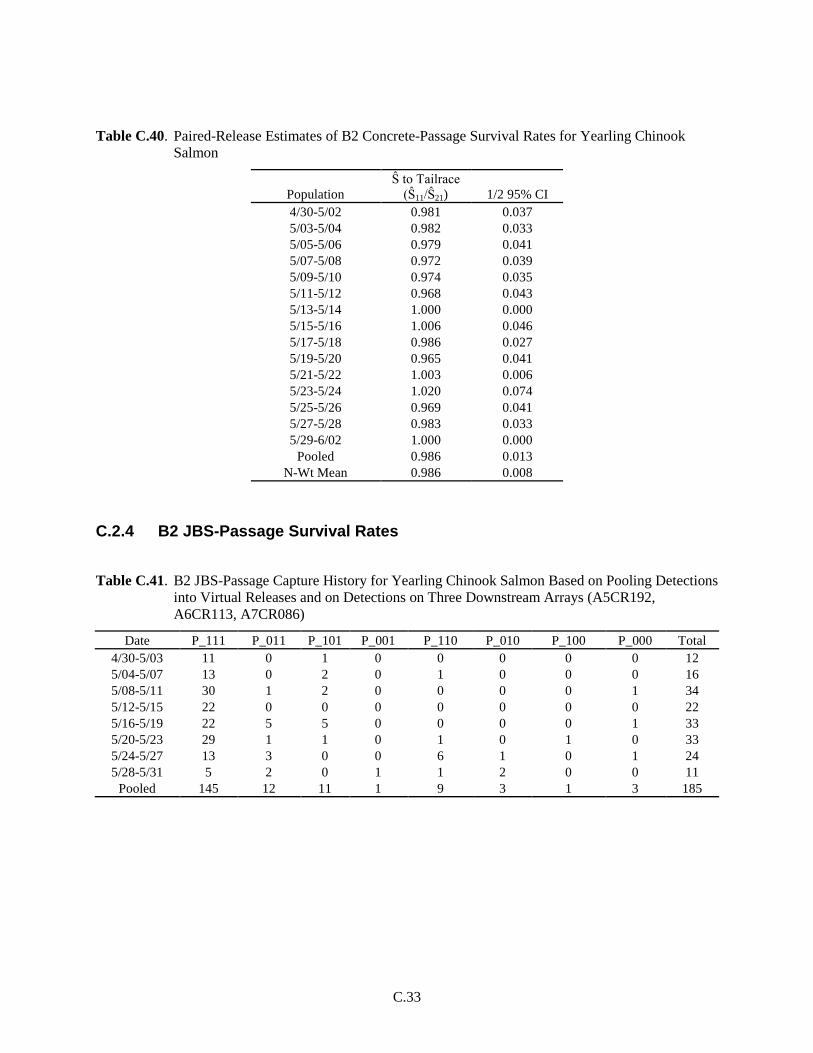
C.33
Table C.40. Paired-Release Estimates of B2 Concrete-Passage Survival Rates for Yearling Chinook Salmon
Population Ŝ to Tailrace
(Ŝ11/Ŝ21) 1/2 95% CI 4/30-5/02 0.981 0.037 5/03-5/04 0.982 0.033 5/05-5/06 0.979 0.041 5/07-5/08 0.972 0.039 5/09-5/10 0.974 0.035 5/11-5/12 0.968 0.043 5/13-5/14 1.000 0.000 5/15-5/16 1.006 0.046 5/17-5/18 0.986 0.027 5/19-5/20 0.965 0.041 5/21-5/22 1.003 0.006 5/23-5/24 1.020 0.074 5/25-5/26 0.969 0.041 5/27-5/28 0.983 0.033 5/29-6/02 1.000 0.000
Pooled 0.986 0.013 N-Wt Mean 0.986 0.008
C.2.4 B2 JBS-Passage Survival Rates
Table C.41. B2 JBS-Passage Capture History for Yearling Chinook Salmon Based on Pooling Detections into Virtual Releases and on Detections on Three Downstream Arrays (A5CR192, A6CR113, A7CR086)
Date P_111 P_011 P_101 P_001 P_110 P_010 P_100 P_000 Total 4/30-5/03 11 0 1 0 0 0 0 0 12 5/04-5/07 13 0 2 0 1 0 0 0 16 5/08-5/11 30 1 2 0 0 0 0 1 34 5/12-5/15 22 0 0 0 0 0 0 0 22 5/16-5/19 22 5 5 0 0 0 0 1 33 5/20-5/23 29 1 1 0 1 0 1 0 33 5/24-5/27 13 3 0 0 6 1 0 1 24 5/28-5/31 5 2 0 1 1 2 0 0 11
Pooled 145 12 11 1 9 3 1 3 185

C
.34
Table C.42. Single-Release Estimates of B2 JBS-Passage Survival Rates for Yearling Chinook Salmon
Virtual Release Dates Ŝ to 1st Array
1/2 95% CI
Ŝ from 1st to 2nd Array
1/2 95% CI
Detection Prob. to 1st Array
1/2 95% CI
Detection Prob. from 1st to 2nd Array
1/2 95% CI Lambda
1/2 95% CI
4/30-5/03 1.000 0.000 1.000 0.000 1.000 0.000 0.917 0.157 1.000 0.000 5/04-5/07 1.000 0.000 1.010 0.024 1.000 0.000 0.867 0.172 0.929 0.135 5/08-5/11 0.971 0.057 1.000 0.000 0.970 0.059 0.939 0.082 1.000 0.000 5/12-5/15 1.000 0.000 1.000 0.000 1.000 0.000 1.000 0.000 1.000 0.000 5/16-5/19 0.970 0.059 1.000 0.000 0.844 0.125 0.844 0.125 1.000 0.000 5/20-5/23 1.001 0.002 0.970 0.061 0.969 0.061 0.968 0.063 0.968 0.063 5/24-5/27 0.958 0.080 1.000 0.000 0.826 0.155 1.000 0.000 0.696 0.188 5/28-5/31 1.000 0.000 1.039 0.090 0.545 0.294 0.875 0.229 0.700 0.284
Pooled 0.984 0.018 0.999 0.012 0.912 0.041 0.929 0.039 0.929 0.039 N-Wt Mean 0.984 0.013 0.998 0.012
Ŝ
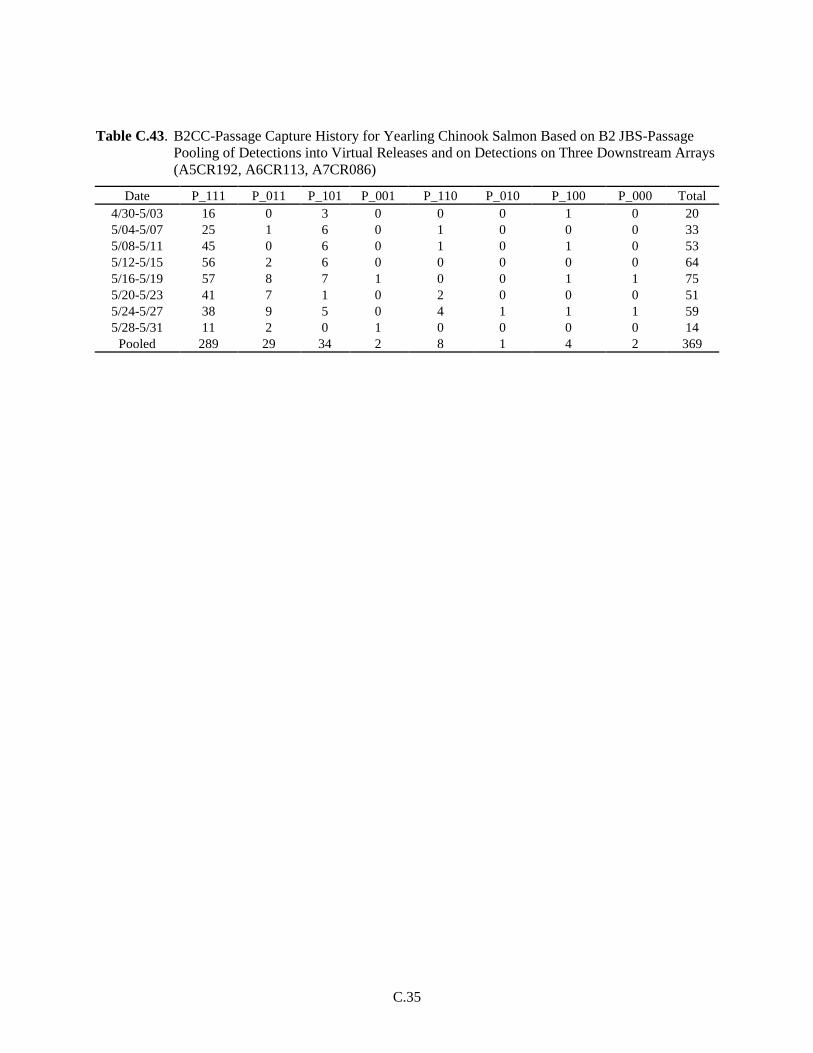
C.35
Table C.43. B2CC-Passage Capture History for Yearling Chinook Salmon Based on B2 JBS-Passage Pooling of Detections into Virtual Releases and on Detections on Three Downstream Arrays (A5CR192, A6CR113, A7CR086)
Date P_111 P_011 P_101 P_001 P_110 P_010 P_100 P_000 Total 4/30-5/03 16 0 3 0 0 0 1 0 20 5/04-5/07 25 1 6 0 1 0 0 0 33 5/08-5/11 45 0 6 0 1 0 1 0 53 5/12-5/15 56 2 6 0 0 0 0 0 64 5/16-5/19 57 8 7 1 0 0 1 1 75 5/20-5/23 41 7 1 0 2 0 0 0 51 5/24-5/27 38 9 5 0 4 1 1 1 59 5/28-5/31 11 2 0 1 0 0 0 0 14
Pooled 289 29 34 2 8 1 4 2 369

C
.36
Table C.44. Single-Release Estimates of B2CC-Passage Survival Rates for Yearling Chinook Salmon
Virtual Release Dates Ŝ to 1st Array
1/2 95% CI
Ŝ from 1st to 2nd Array
1/2 95% CI
Detection Prob. to 1st Array
1/2 95% CI
Detection Prob. from 1st to 2nd Array
1/2 95% CI Lambda
1/2 95% CI
4/30-5/03 1.000 0.000 0.950 0.096 1.000 0.000 0.842 0.165 1.000 0.000 5/04-5/07 1.000 0.000 1.007 0.016 0.970 0.059 0.813 0.135 0.963 0.071 5/08-5/11 1.000 0.000 0.984 0.037 1.000 0.000 0.882 0.088 0.978 0.043 5/12-5/15 1.000 0.000 1.000 0.000 0.969 0.043 0.906 0.071 1.000 0.000 5/16-5/19 0.989 0.025 0.985 0.029 0.877 0.074 0.890 0.073 1.000 0.000 5/20-5/23 1.000 0.000 1.001 0.002 0.863 0.094 0.980 0.039 0.960 0.055 5/24-5/27 0.987 0.033 0.988 0.043 0.825 0.098 0.904 0.080 0.904 0.080 5/28-5/31 1.000 0.000 1.000 0.000 0.786 0.216 0.929 0.135 1.000 0.000
Pooled 0.996 0.008 0.991 0.012 0.912 0.029 0.898 0.031 0.972 0.018 N-Wt Mean 0.996 0.004 0.991 0.009
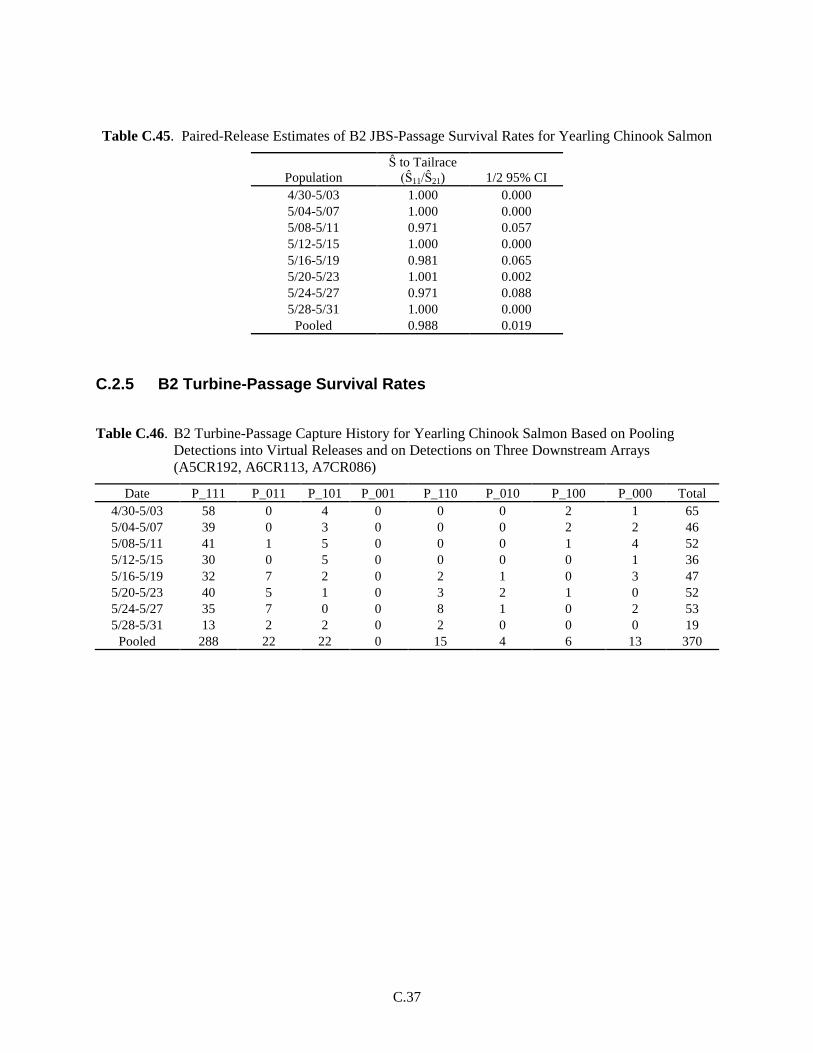
C.37
Table C.45. Paired-Release Estimates of B2 JBS-Passage Survival Rates for Yearling Chinook Salmon
Population Ŝ to Tailrace
(Ŝ11/Ŝ21) 1/2 95% CI 4/30-5/03 1.000 0.000 5/04-5/07 1.000 0.000 5/08-5/11 0.971 0.057 5/12-5/15 1.000 0.000 5/16-5/19 0.981 0.065 5/20-5/23 1.001 0.002 5/24-5/27 0.971 0.088 5/28-5/31 1.000 0.000
Pooled 0.988 0.019
C.2.5 B2 Turbine-Passage Survival Rates
Table C.46. B2 Turbine-Passage Capture History for Yearling Chinook Salmon Based on Pooling Detections into Virtual Releases and on Detections on Three Downstream Arrays (A5CR192, A6CR113, A7CR086)
Date P_111 P_011 P_101 P_001 P_110 P_010 P_100 P_000 Total 4/30-5/03 58 0 4 0 0 0 2 1 65 5/04-5/07 39 0 3 0 0 0 2 2 46 5/08-5/11 41 1 5 0 0 0 1 4 52 5/12-5/15 30 0 5 0 0 0 0 1 36 5/16-5/19 32 7 2 0 2 1 0 3 47 5/20-5/23 40 5 1 0 3 2 1 0 52 5/24-5/27 35 7 0 0 8 1 0 2 53 5/28-5/31 13 2 2 0 2 0 0 0 19
Pooled 288 22 22 0 15 4 6 13 370
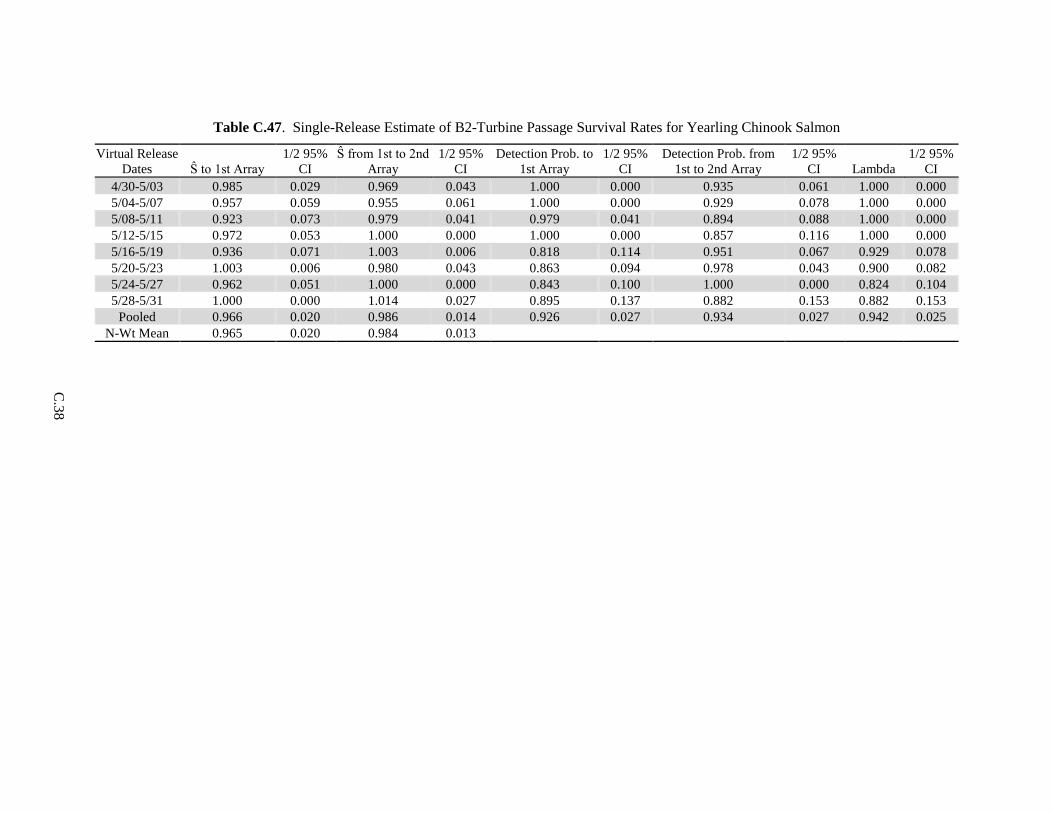
C
.38
Table C.47. Single-Release Estimate of B2-Turbine Passage Survival Rates for Yearling Chinook Salmon
Virtual Release Dates Ŝ to 1st Array
1/2 95% CI
Ŝ from 1st to 2nd Array
1/2 95% CI
Detection Prob. to 1st Array
1/2 95% CI
Detection Prob. from 1st to 2nd Array
1/2 95% CI Lambda
1/2 95% CI
4/30-5/03 0.985 0.029 0.969 0.043 1.000 0.000 0.935 0.061 1.000 0.000 5/04-5/07 0.957 0.059 0.955 0.061 1.000 0.000 0.929 0.078 1.000 0.000 5/08-5/11 0.923 0.073 0.979 0.041 0.979 0.041 0.894 0.088 1.000 0.000 5/12-5/15 0.972 0.053 1.000 0.000 1.000 0.000 0.857 0.116 1.000 0.000 5/16-5/19 0.936 0.071 1.003 0.006 0.818 0.114 0.951 0.067 0.929 0.078 5/20-5/23 1.003 0.006 0.980 0.043 0.863 0.094 0.978 0.043 0.900 0.082 5/24-5/27 0.962 0.051 1.000 0.000 0.843 0.100 1.000 0.000 0.824 0.104 5/28-5/31 1.000 0.000 1.014 0.027 0.895 0.137 0.882 0.153 0.882 0.153
Pooled 0.966 0.020 0.986 0.014 0.926 0.027 0.934 0.027 0.942 0.025 N-Wt Mean 0.965 0.020 0.984 0.013

C.39
Table C.48. B2CC-Passage Capture History for Yearling Chinook Salmon Based on B2 Turbine-Passage Pooling of Detections into Virtual Releases and on Detections on Three Downstream Arrays (A5CR192, A6CR113, A7CR086)
Date P_111 P_011 P_101 P_001 P_110 P_010 P_100 P_000 Total 4/30-5/03 16 0 3 0 0 0 1 0 20 5/04-5/07 25 1 6 0 1 0 0 0 33 5/08-5/11 45 0 6 0 1 0 1 0 53 5/12-5/15 56 2 6 0 0 0 0 0 64 5/16-5/19 57 8 7 1 0 0 1 1 75 5/20-5/23 41 7 1 0 2 0 0 0 51 5/24-5/27 38 9 5 0 4 1 1 1 59 5/28-5/31 11 2 0 1 0 0 0 0 14
Pooled 289 29 34 2 8 1 4 2 369

C
.40
Table C.49. Single-Release Estimate of B2CC-Passage Survival Rates for Yearling Chinook Salmon
Virtual Release Dates Ŝ to 1st Array
1/2 95% CI
Ŝ from 1st to 2nd Array
1/2 95% CI
Detection Prob. to 1st Array
1/2 95% CI
Detection Prob. from 1st to 2nd Array
1/2 95% CI Lambda
1/2 95% CI
4/30-5/03 1.000 0.000 0.950 0.096 1.000 0.000 0.842 0.165 1.000 0.000 5/04-5/07 1.000 0.000 1.007 0.016 0.970 0.059 0.813 0.135 0.963 0.071 5/08-5/11 1.000 0.000 0.984 0.037 1.000 0.000 0.882 0.088 0.978 0.043 5/12-5/15 1.000 0.000 1.000 0.000 0.969 0.043 0.906 0.071 1.000 0.000 5/16-5/19 0.989 0.025 0.985 0.029 0.877 0.074 0.890 0.073 1.000 0.000 5/20-5/23 1.000 0.000 1.001 0.002 0.863 0.094 0.980 0.039 0.960 0.055 5/24-5/27 0.987 0.033 0.988 0.043 0.825 0.098 0.904 0.080 0.904 0.080 5/28-5/31 1.000 0.000 1.000 0.000 0.786 0.216 0.929 0.135 1.000 0.000
Pooled 0.996 0.008 0.991 0.012 0.912 0.029 0.898 0.031 0.972 0.018 N-Wt Mean 0.996 0.004 0.991 0.009

C.41
Table C.50. Paired-Release Estimates of B2 JBS-Passage Survival Rates for Yearling Chinook Salmon
Population Ŝ to Tailrace
(Ŝ11/Ŝ21) 1/2 95% CI 4/30-5/03 0.985 0.029 5/04-5/07 0.957 0.059 5/08-5/11 0.923 0.073 5/12-5/15 0.972 0.053 5/16-5/19 0.946 0.075 5/20-5/23 1.003 0.006 5/24-5/27 0.975 0.061 5/28-5/31 1.000 0.000
Pooled 0.970 0.021 N-Wt Mean 0.970 0.020
C.3 Detection and Survival of Subyearling Chinook Salmon in Summer
C.3.1 Bonneville Dam-Passage Survival Rates
Table C.51. Bonneville Dam-Passage Capture History for Subyearling Chinook Salmon Based on Pooling Detections into Virtual Releases and Detections on Three Downstream Arrays (A5CR192, A6CR113, A7CR086)
Date P_111 P_011 P_101 P_001 P_110 P_010 P_100 P_000 Total 6/18-6/19 35 1 2 0 4 0 1 1 44 6/20-6/21 120 1 7 0 26 0 4 8 166 6/22-6/23 105 6 16 1 32 0 6 9 175 6/24-6/25 95 4 9 2 21 4 8 10 153 6/26-6/27 119 2 7 0 33 1 11 10 183 6/28-6/29 88 0 4 0 20 0 9 4 125 6/30-7/01 83 2 0 0 11 0 14 13 123 7/02-7/03 111 0 2 0 8 0 10 15 146 7/04-7/05 80 0 4 0 13 0 9 11 117 7/06-7/07 62 1 3 0 10 1 13 7 97 7/08-7/09 104 1 5 0 9 0 18 24 161 7/10-7/11 80 1 2 0 6 0 18 21 128 7/12-7/13 80 0 3 0 6 0 18 26 133 7/14-7/15 54 0 2 0 11 0 26 7 100 7/16/7/23 68 0 6 0 11 0 33 30 148
Pooled 1284 19 72 3 221 6 198 196 1999

C
.42
Table C.52. Single-Release Estimates of Dam-Passage Survival Rates for Subyearling Chinook Salmon
Virtual Release Dates Ŝ to 1st Array
1/2 95% CI
Ŝ from 1st to 2nd Array
1/2 95% CI
Detection Prob. to 1st Array
1/2 95% CI
Detection Prob. from 1st to 2nd Array
1/2 95% CI Lambda
1/2 95% CI
6/18-6/19 0.978 0.043 0.981 0.047 0.976 0.047 0.947 0.071 0.900 0.092 6/20-6/21 0.952 0.033 0.984 0.025 0.994 0.012 0.945 0.039 0.823 0.061 6/22-6/23 0.950 0.033 0.992 0.035 0.956 0.031 0.867 0.059 0.776 0.069 6/24-6/25 0.939 0.039 0.959 0.043 0.926 0.045 0.900 0.057 0.798 0.071 6/26-6/27 0.946 0.033 0.947 0.039 0.981 0.022 0.945 0.039 0.781 0.065 6/28-6/29 0.968 0.031 0.933 0.047 1.000 0.000 0.957 0.041 0.815 0.073 6/30-7/01 0.897 0.055 0.870 0.063 0.979 0.029 1.000 0.000 0.885 0.065 7/02-7/03 0.897 0.049 0.925 0.045 1.000 0.000 0.982 0.024 0.933 0.045 7/04-7/05 0.906 0.053 0.921 0.053 1.000 0.000 0.952 0.045 0.860 0.071 7/06-7/07 0.931 0.053 0.858 0.074 0.974 0.035 0.955 0.051 0.851 0.080 7/08-7/09 0.852 0.055 0.871 0.057 0.992 0.016 0.955 0.039 0.921 0.049 7/10-7/11 0.838 0.065 0.832 0.073 0.989 0.022 0.976 0.033 0.931 0.053 7/12-7/13 0.805 0.067 0.834 0.071 1.000 0.000 0.964 0.039 0.930 0.053 7/14-7/15 0.930 0.051 0.725 0.092 1.000 0.000 0.964 0.049 0.831 0.092 7/16/7/23 0.797 0.065 0.729 0.082 1.000 0.000 0.919 0.063 0.861 0.076
Pooled 0.904 0.014 0.896 0.016 0.983 0.006 0.946 0.012 0.852 0.018 N-Wt Mean 0.903 0.029 0.894 0.042

C.43
Table C.53. B2CC-Passage Capture History for Subyearling Chinook Salmon Based on Dam-Passage Pooling of Detections into Virtual Releases and Detections on Three Downstream Arrays (A5CR192, A6CR113, A7CR086)
Date P_111 P_011 P_101 P_001 P_110 P_010 P_100 P_000 Total 6/18-6/19 2 0 0 0 0 0 0 0 2 6/20-6/21 14 0 1 0 4 0 2 0 21 6/22-6/23 22 0 2 0 6 0 0 0 30 6/24-6/25 12 0 1 2 7 1 0 0 23 6/26-6/27 26 0 2 0 4 1 2 1 36 6/28-6/29 28 0 3 0 8 0 0 0 39 6/30-7/01 23 1 0 0 3 0 2 0 29 7/02-7/03 10 0 1 0 1 0 2 1 15 7/04-7/05 9 0 2 0 1 0 0 0 12 7/06-7/07 18 0 0 0 1 0 3 1 23 7/08-7/09 21 0 3 0 1 0 1 0 26 7/10-7/11 15 1 0 0 0 0 3 2 21 7/12-7/13 13 0 2 0 2 0 6 7 30 7/14-7/15 9 0 0 0 2 0 0 1 12 7/16/7/23 5 0 0 0 0 0 1 4 10
Pooled 227 2 17 2 40 2 22 17 329
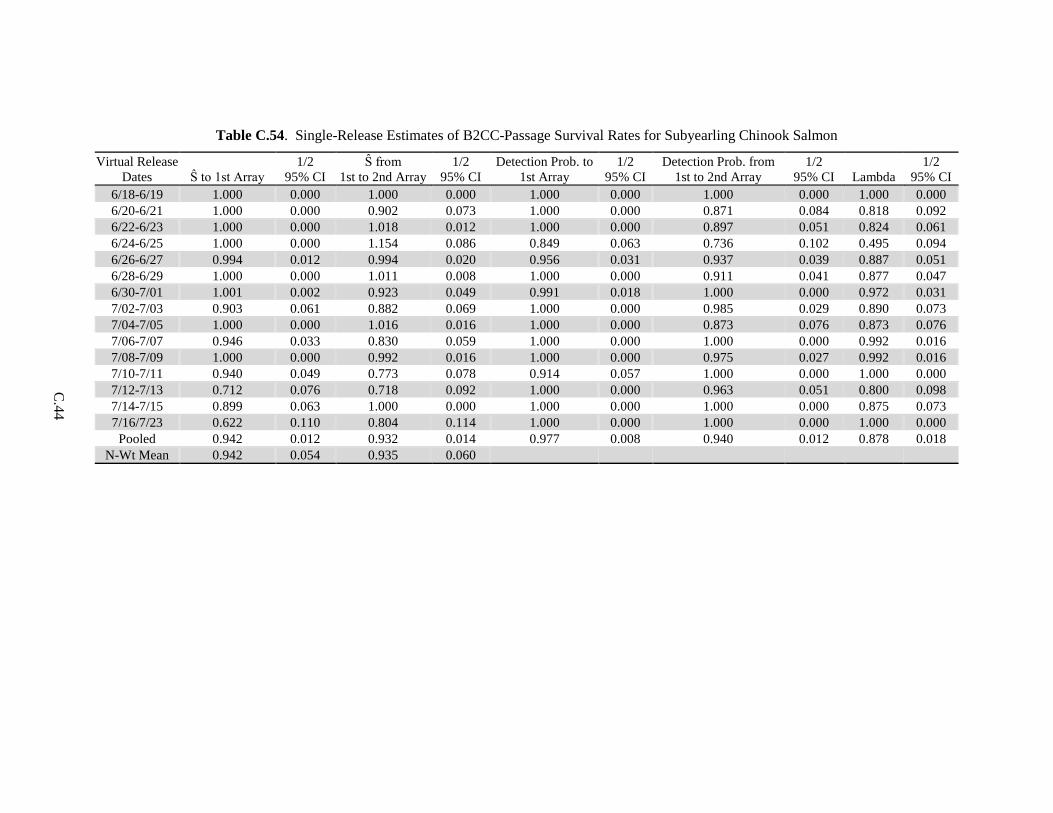
C
.44
Table C.54. Single-Release Estimates of B2CC-Passage Survival Rates for Subyearling Chinook Salmon
Virtual Release Dates Ŝ to 1st Array
1/2 95% CI
Ŝ from 1st to 2nd Array
1/2 95% CI
Detection Prob. to 1st Array
1/2 95% CI
Detection Prob. from 1st to 2nd Array
1/2 95% CI Lambda
1/2 95% CI
6/18-6/19 1.000 0.000 1.000 0.000 1.000 0.000 1.000 0.000 1.000 0.000 6/20-6/21 1.000 0.000 0.902 0.073 1.000 0.000 0.871 0.084 0.818 0.092 6/22-6/23 1.000 0.000 1.018 0.012 1.000 0.000 0.897 0.051 0.824 0.061 6/24-6/25 1.000 0.000 1.154 0.086 0.849 0.063 0.736 0.102 0.495 0.094 6/26-6/27 0.994 0.012 0.994 0.020 0.956 0.031 0.937 0.039 0.887 0.051 6/28-6/29 1.000 0.000 1.011 0.008 1.000 0.000 0.911 0.041 0.877 0.047 6/30-7/01 1.001 0.002 0.923 0.049 0.991 0.018 1.000 0.000 0.972 0.031 7/02-7/03 0.903 0.061 0.882 0.069 1.000 0.000 0.985 0.029 0.890 0.073 7/04-7/05 1.000 0.000 1.016 0.016 1.000 0.000 0.873 0.076 0.873 0.076 7/06-7/07 0.946 0.033 0.830 0.059 1.000 0.000 1.000 0.000 0.992 0.016 7/08-7/09 1.000 0.000 0.992 0.016 1.000 0.000 0.975 0.027 0.992 0.016 7/10-7/11 0.940 0.049 0.773 0.078 0.914 0.057 1.000 0.000 1.000 0.000 7/12-7/13 0.712 0.076 0.718 0.092 1.000 0.000 0.963 0.051 0.800 0.098 7/14-7/15 0.899 0.063 1.000 0.000 1.000 0.000 1.000 0.000 0.875 0.073 7/16/7/23 0.622 0.110 0.804 0.114 1.000 0.000 1.000 0.000 1.000 0.000
Pooled 0.942 0.012 0.932 0.014 0.977 0.008 0.940 0.012 0.878 0.018 N-Wt Mean 0.942 0.054 0.935 0.060
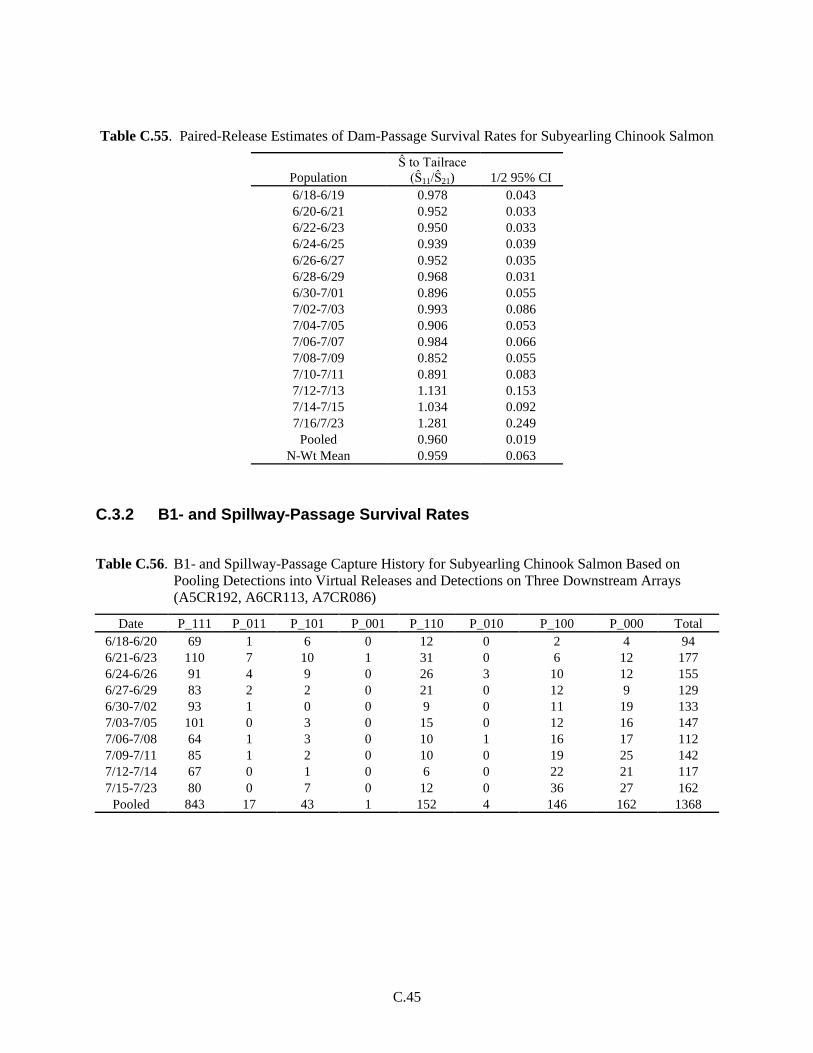
C.45
Table C.55. Paired-Release Estimates of Dam-Passage Survival Rates for Subyearling Chinook Salmon
Population Ŝ to Tailrace
(Ŝ11/Ŝ21) 1/2 95% CI 6/18-6/19 0.978 0.043 6/20-6/21 0.952 0.033 6/22-6/23 0.950 0.033 6/24-6/25 0.939 0.039 6/26-6/27 0.952 0.035 6/28-6/29 0.968 0.031 6/30-7/01 0.896 0.055 7/02-7/03 0.993 0.086 7/04-7/05 0.906 0.053 7/06-7/07 0.984 0.066 7/08-7/09 0.852 0.055 7/10-7/11 0.891 0.083 7/12-7/13 1.131 0.153 7/14-7/15 1.034 0.092 7/16/7/23 1.281 0.249
Pooled 0.960 0.019 N-Wt Mean 0.959 0.063
C.3.2 B1- and Spillway-Passage Survival Rates
Table C.56. B1- and Spillway-Passage Capture History for Subyearling Chinook Salmon Based on Pooling Detections into Virtual Releases and Detections on Three Downstream Arrays (A5CR192, A6CR113, A7CR086)
Date P_111 P_011 P_101 P_001 P_110 P_010 P_100 P_000 Total 6/18-6/20 69 1 6 0 12 0 2 4 94 6/21-6/23 110 7 10 1 31 0 6 12 177 6/24-6/26 91 4 9 0 26 3 10 12 155 6/27-6/29 83 2 2 0 21 0 12 9 129 6/30-7/02 93 1 0 0 9 0 11 19 133 7/03-7/05 101 0 3 0 15 0 12 16 147 7/06-7/08 64 1 3 0 10 1 16 17 112 7/09-7/11 85 1 2 0 10 0 19 25 142 7/12-7/14 67 0 1 0 6 0 22 21 117 7/15-7/23 80 0 7 0 12 0 36 27 162
Pooled 843 17 43 1 152 4 146 162 1368

C
.46
Table C.57. Single-Release Estimates of B1- and Spillway-Passage Survival Rates for Subyearling Chinook Salmon
Virtual Release Dates Ŝ to 1st Array
1/2 95% CI
Ŝ from 1st to 2nd Array
1/2 95% CI
Detection Prob. to 1st Array
1/2 95% CI
Detection Prob. from 1st to 2nd Array
1/2 95% CI Lambda
1/2 95% CI
6/18-6/20 0.958 0.041 0.989 0.033 0.989 0.022 0.921 0.061 0.854 0.076 6/21-6/23 0.934 0.037 0.979 0.033 0.950 0.033 0.914 0.049 0.791 0.065 6/24-6/26 0.926 0.043 0.946 0.047 0.947 0.037 0.913 0.055 0.766 0.074 6/27-6/29 0.932 0.045 0.902 0.055 0.981 0.025 0.977 0.031 0.802 0.076 6/30-7/02 0.858 0.059 0.903 0.055 0.990 0.020 1.000 0.000 0.913 0.055 7/03-7/05 0.891 0.051 0.912 0.049 1.000 0.000 0.971 0.031 0.871 0.061 7/06-7/08 0.852 0.067 0.833 0.078 0.975 0.035 0.956 0.049 0.855 0.078 7/09-7/11 0.825 0.063 0.838 0.067 0.990 0.020 0.977 0.031 0.896 0.061 7/12-7/14 0.821 0.069 0.772 0.084 1.000 0.000 0.985 0.029 0.918 0.063 7/15-7/23 0.833 0.057 0.741 0.076 1.000 0.000 0.920 0.057 0.870 0.069
Pooled 0.884 0.018 0.883 0.020 0.979 0.008 0.951 0.014 0.846 0.022 N-Wt Mean 0.883 0.031 0.882 0.052
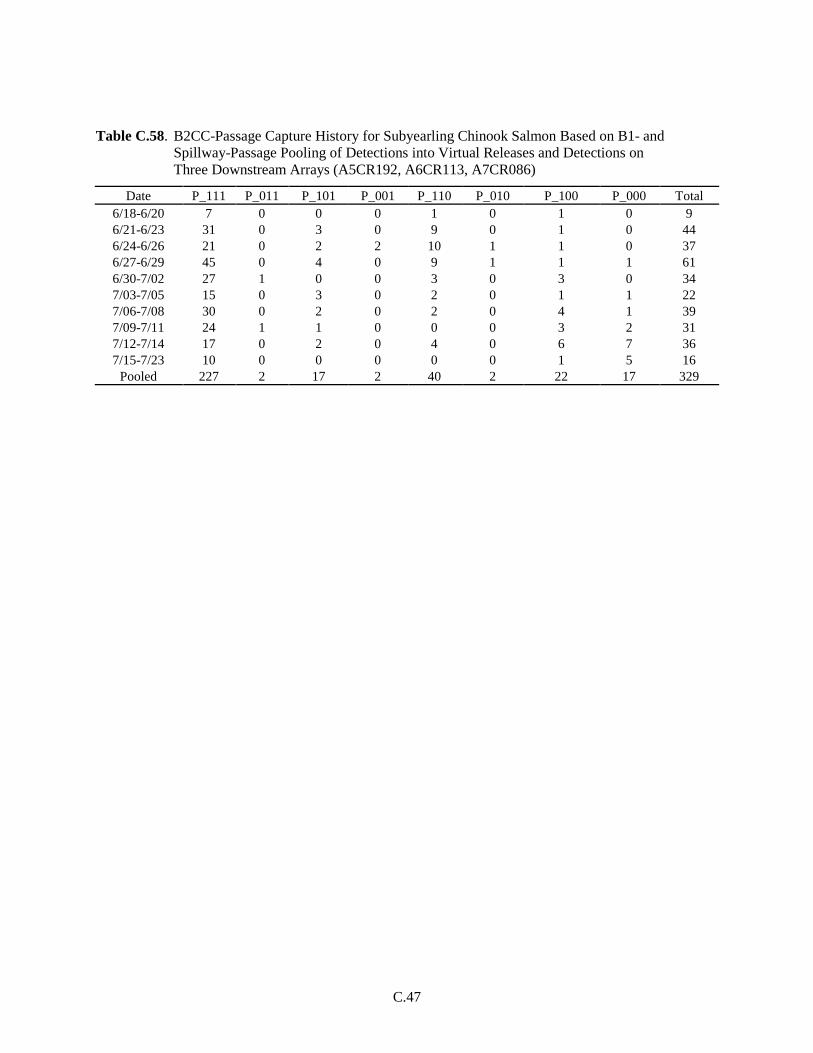
C.47
Table C.58. B2CC-Passage Capture History for Subyearling Chinook Salmon Based on B1- and Spillway-Passage Pooling of Detections into Virtual Releases and Detections on Three Downstream Arrays (A5CR192, A6CR113, A7CR086)
Date P_111 P_011 P_101 P_001 P_110 P_010 P_100 P_000 Total 6/18-6/20 7 0 0 0 1 0 1 0 9 6/21-6/23 31 0 3 0 9 0 1 0 44 6/24-6/26 21 0 2 2 10 1 1 0 37 6/27-6/29 45 0 4 0 9 1 1 1 61 6/30-7/02 27 1 0 0 3 0 3 0 34 7/03-7/05 15 0 3 0 2 0 1 1 22 7/06-7/08 30 0 2 0 2 0 4 1 39 7/09-7/11 24 1 1 0 0 0 3 2 31 7/12-7/14 17 0 2 0 4 0 6 7 36 7/15-7/23 10 0 0 0 0 0 1 5 16
Pooled 227 2 17 2 40 2 22 17 329

C
.48
Table C.59. Single-Release Estimates of B2CC-Passage Survival Rates for Subyearling Chinook Salmon
Virtual Release Dates Ŝ to 1st Array
1/2 95% CI
Ŝ from 1st to 2nd Array
1/2 95% CI
Detection Prob. to 1st Array
1/2 95% CI
Detection Prob. from 1st to 2nd Array
1/2 95% CI Lambda
1/2 95% CI
6/18-6/20 1.000 0.000 0.889 0.206 1.000 0.000 1.000 0.000 0.875 0.229 6/21-6/23 1.000 0.000 0.997 0.053 1.000 0.000 0.912 0.096 0.775 0.129 6/24-6/26 1.002 0.006 1.027 0.090 0.917 0.090 0.840 0.143 0.656 0.165 6/27-6/29 0.984 0.031 0.998 0.037 0.983 0.033 0.918 0.076 0.818 0.102 6/30-7/02 1.003 0.006 0.909 0.098 0.968 0.063 1.000 0.000 0.903 0.104 7/03-7/05 0.955 0.086 0.971 0.100 1.000 0.000 0.833 0.172 0.882 0.153 7/06-7/08 0.974 0.049 0.898 0.098 1.000 0.000 0.938 0.084 0.938 0.084 7/09-7/11 0.939 0.088 0.893 0.114 0.962 0.074 0.962 0.074 1.000 0.000 7/12-7/14 0.806 0.129 0.809 0.153 1.000 0.000 0.895 0.137 0.810 0.169 7/15-7/23 0.688 0.227 0.909 0.171 1.000 0.000 1.000 0.000 1.000 0.000
Pooled 0.950 0.024 0.939 0.029 0.979 0.016 0.923 0.033 0.845 0.043 N-Wt Mean 0.949 0.054 0.940 0.044

C.49
Table C.60. Paired-Release Estimates of B1- and Spillway-Passage Survival Rates for Subyearling Chinook Salmon
Population Ŝ to Tailrace
(Ŝ11/Ŝ21) 1/2 95% CI 6/18-6/20 0.958 0.041 6/21-6/23 0.934 0.037 6/24-6/26 0.924 0.043 6/27-6/29 0.947 0.055 6/30-7/02 0.855 0.059 7/03-7/05 0.933 0.100 7/06-7/08 0.875 0.081 7/09-7/11 0.879 0.106 7/12-7/14 1.019 0.184 7/15-7/23 1.211 0.409
Pooled 0.931 0.030 N-Wt Mean 0.930 0.062
C.3.3 B2 Concrete-Passage Survival Rates
Table C.61. B2 Concrete-Passage Capture History for Subyearling Chinook Salmon Based on Pooling Detections into Virtual Releases and on Detections on Three Downstream Arrays (A5CR192, A6CR113, A7CR086)
Date P_111 P_011 P_101 P_001 P_110 P_010 P_100 P_000 Total 6/18-6/19 6 0 1 0 2 0 0 0 9 6/20-6/21 39 0 1 0 9 0 2 0 51 6/22-6/23 35 0 7 0 8 0 1 2 53 6/24-6/25 31 0 2 2 9 1 2 0 47 6/26-6/27 55 0 4 0 7 1 3 3 73 6/28-6/29 42 0 3 0 10 0 1 0 56 6/30-7/01 42 1 0 0 5 0 5 0 53 7/02-7/03 23 0 1 0 2 0 3 3 32 7/04-7/05 16 0 2 0 2 0 2 1 23 7/06-7/07 27 0 2 0 2 0 4 1 36 7/08-7/09 41 0 3 0 3 0 4 4 55 7/10-7/11 28 1 0 0 0 0 6 5 40 7/12-7/13 27 0 2 0 2 0 6 11 48 7/14-7/15 18 0 0 0 5 0 6 3 32 7/16/7/23 11 0 1 0 3 0 7 5 27
Pooled 441 2 29 2 69 2 52 38 635

C
.50
Table C.62. Single-Release Estimates of B2 Concrete-Passage Survival Rates for Subyearling Chinook Salmon
Virtual Release Dates Ŝ to 1st Array
1/2 95% CI
Ŝ from 1st to 2nd Array
1/2 95% CI
Detection Prob. to 1st Array
1/2 95% CI
Detection Prob. from 1st to 2nd Array
1/2 95% CI Lambda
1/2 95% CI
6/18-6/19 1.000 0.000 1.037 0.090 1.000 0.000 0.857 0.259 0.750 0.300 6/20-6/21 1.000 0.000 0.965 0.055 1.000 0.000 0.975 0.049 0.813 0.110 6/22-6/23 0.962 0.051 1.012 0.051 1.000 0.000 0.833 0.114 0.814 0.116 6/24-6/25 1.003 0.006 0.982 0.071 0.933 0.073 0.886 0.106 0.756 0.131 6/26-6/27 0.960 0.045 0.965 0.049 0.985 0.029 0.932 0.065 0.873 0.082 6/28-6/29 1.000 0.000 0.995 0.039 1.000 0.000 0.933 0.073 0.808 0.108 6/30-7/01 1.002 0.004 0.904 0.080 0.979 0.041 1.000 0.000 0.896 0.086 7/02-7/03 0.906 0.102 0.900 0.112 1.000 0.000 0.958 0.080 0.920 0.106 7/04-7/05 0.957 0.084 0.920 0.123 1.000 0.000 0.889 0.145 0.889 0.145 7/06-7/07 0.972 0.053 0.890 0.106 1.000 0.000 0.931 0.092 0.931 0.092 7/08-7/09 0.927 0.069 0.926 0.074 1.000 0.000 0.932 0.074 0.932 0.074 7/10-7/11 0.880 0.104 0.824 0.127 0.966 0.067 1.000 0.000 1.000 0.000 7/12-7/13 0.771 0.120 0.842 0.120 1.000 0.000 0.931 0.092 0.931 0.092 7/14-7/15 0.906 0.102 0.793 0.147 1.000 0.000 1.000 0.000 0.783 0.169 7/16/7/23 0.815 0.147 0.694 0.200 1.000 0.000 0.917 0.157 0.786 0.216
Pooled 0.941 0.018 0.920 0.024 0.989 0.008 0.935 0.022 0.862 0.029 N-Wt Mean 0.941 0.036 0.918 0.041

C.51
Table C.63. B2CC-Passage Capture History for Subyearling Chinook Salmon Based on B2 Concrete-Passage Pooling of Detections into Virtual Releases and on Detections on Three Downstream Arrays (A5CR192, A6CR113, A7CR086)
Date P_111 P_011 P_101 P_001 P_110 P_010 P_100 P_000 Total 6/18-6/19 2 0 0 0 0 0 0 0 2 6/20-6/21 14 0 1 0 4 0 2 0 21 6/22-6/23 22 0 2 0 6 0 0 0 30 6/24-6/25 12 0 1 2 7 1 0 0 23 6/26-6/27 26 0 2 0 4 1 2 1 36 6/28-6/29 28 0 3 0 8 0 0 0 39 6/30-7/01 23 1 0 0 3 0 2 0 29 7/02-7/03 10 0 1 0 1 0 2 1 15 7/04-7/05 9 0 2 0 1 0 0 0 12 7/06-7/07 18 0 0 0 1 0 3 1 23 7/08-7/09 21 0 3 0 1 0 1 0 26 7/10-7/11 15 1 0 0 0 0 3 2 21 7/12-7/13 13 0 2 0 2 0 6 7 30 7/14-7/15 9 0 0 0 2 0 0 1 12 7/16/7/23 5 0 0 0 0 0 1 4 10
Pooled 227 2 17 2 40 2 22 17 329

C
.52
Table C.64. Single-Release Estimates of B2CC-Passage Survival Rates for Subyearling Chinook Salmon
Virtual Release Dates Ŝ to 1st Array
1/2 95% CI
Ŝ from 1st to 2nd Array
1/2 95% CI
Detection Prob. to 1st Array
1/2 95% CI
Detection Prob. from 1st to 2nd Array
1/2 95% CI Lambda
1/2 95% CI
6/18-6/19 1.000 0.000 1.000 0.000 1.000 0.000 1.000 0.000 1.000 0.000 6/20-6/21 1.000 0.000 0.918 0.131 1.000 0.000 0.933 0.125 0.778 0.192 6/22-6/23 1.000 0.000 1.018 0.029 1.000 0.000 0.917 0.110 0.786 0.153 6/24-6/25 1.000 0.000 1.087 0.120 0.870 0.137 0.800 0.202 0.600 0.216 6/26-6/27 0.974 0.055 0.952 0.082 0.970 0.059 0.929 0.096 0.839 0.129 6/28-6/29 1.000 0.000 1.022 0.029 1.000 0.000 0.903 0.104 0.778 0.135 6/30-7/01 1.003 0.006 0.929 0.096 0.963 0.071 1.000 0.000 0.889 0.118 7/02-7/03 0.933 0.125 0.864 0.186 1.000 0.000 0.909 0.171 0.909 0.171 7/04-7/05 1.000 0.000 1.019 0.045 1.000 0.000 0.818 0.227 0.900 0.186 7/06-7/07 0.957 0.084 0.864 0.143 1.000 0.000 1.000 0.000 0.947 0.100 7/08-7/09 1.000 0.000 0.967 0.074 1.000 0.000 0.875 0.133 0.955 0.086 7/10-7/11 0.914 0.129 0.833 0.172 0.937 0.120 1.000 0.000 1.000 0.000 7/12-7/13 0.767 0.151 0.753 0.184 1.000 0.000 0.867 0.172 0.867 0.172 7/14-7/15 0.917 0.157 1.000 0.000 1.000 0.000 1.000 0.000 0.818 0.227 7/16/7/23 0.600 0.304 0.833 0.298 1.000 0.000 1.000 0.000 1.000 0.000
Pooled 0.950 0.024 0.939 0.029 0.979 0.016 0.923 0.033 0.845 0.043 N-Wt Mean 0.949 0.048 0.938 0.048

C.53
Table C.65. Paired-Release Estimates of B2 Concrete-Passage Survival
Population Ŝ to Tailrace
(Ŝ11/Ŝ21) 1/2 95% CI 6/18-6/19 1.000 0.000 6/20-6/21 1.000 0.000 6/22-6/23 0.962 0.051 6/24-6/25 1.003 0.006 6/26-6/27 0.986 0.072 6/28-6/29 1.000 0.000 6/30-7/01 0.999 0.007 7/02-7/03 0.971 0.170 7/04-7/05 0.957 0.084 7/06-7/07 1.016 0.105 7/08-7/09 0.927 0.069 7/10-7/11 0.963 0.177 7/12-7/13 1.005 0.252 7/14-7/15 0.988 0.202 7/16/7/23 1.358 0.730
Pooled 0.991 0.031 N-Wt Mean 0.991 0.063
C.3.4 B2 JBS-Passage Survival Rates
Table C.66. B2 JBS-Passage Capture History for Subyearling Chinook Salmon Based on Pooling Detections into Virtual Releases and on Detections on Three Downstream Arrays (A5CR192, A6CR113, A7CR086)
Date P_111 P_011 P_101 P_001 P_110 P_010 P_100 P_000 Total 6/18-6/23 7 0 1 0 3 0 1 2 14 6/24-6/29 14 0 1 0 3 0 1 1 20 6/30-7/05 10 0 0 0 0 0 2 2 14 7/06-7/11 13 0 1 0 0 0 2 2 18 7/12-7/23 7 0 1 0 1 0 2 2 13
Pooled 51 0 4 0 7 0 8 9 79

C
.54
Table C.67. Single-Release Estimates of B2 JBS-Passage Survival Rates for Subyearling Chinook Salmon
Virtual Release Dates Ŝ to 1st Array
1/2 95% CI
Ŝ from 1st to 2nd Array
1/2 95% CI
Detection Prob. to 1st Array
1/2 95% CI
Detection Prob. from 1st to 2nd Array
1/2 95% CI Lambda
1/2 95% CI
6/18-6/23 0.857 0.184 0.952 0.182 1.000 0.000 0.875 0.229 0.700 0.284 6/24-6/29 0.950 0.096 0.959 0.104 1.000 0.000 0.933 0.125 0.824 0.180 6/30-7/05 0.857 0.184 0.833 0.212 1.000 0.000 1.000 0.000 1.000 0.000 7/06-7/11 0.889 0.145 0.875 0.163 1.000 0.000 0.929 0.135 1.000 0.000 7/12-7/23 0.846 0.196 0.831 0.235 1.000 0.000 0.875 0.229 0.875 0.229
Pooled 0.886 0.071 0.894 0.076 1.000 0.000 0.927 0.069 0.879 0.084 N-Wt Mean 0.886 0.039 0.895 0.054
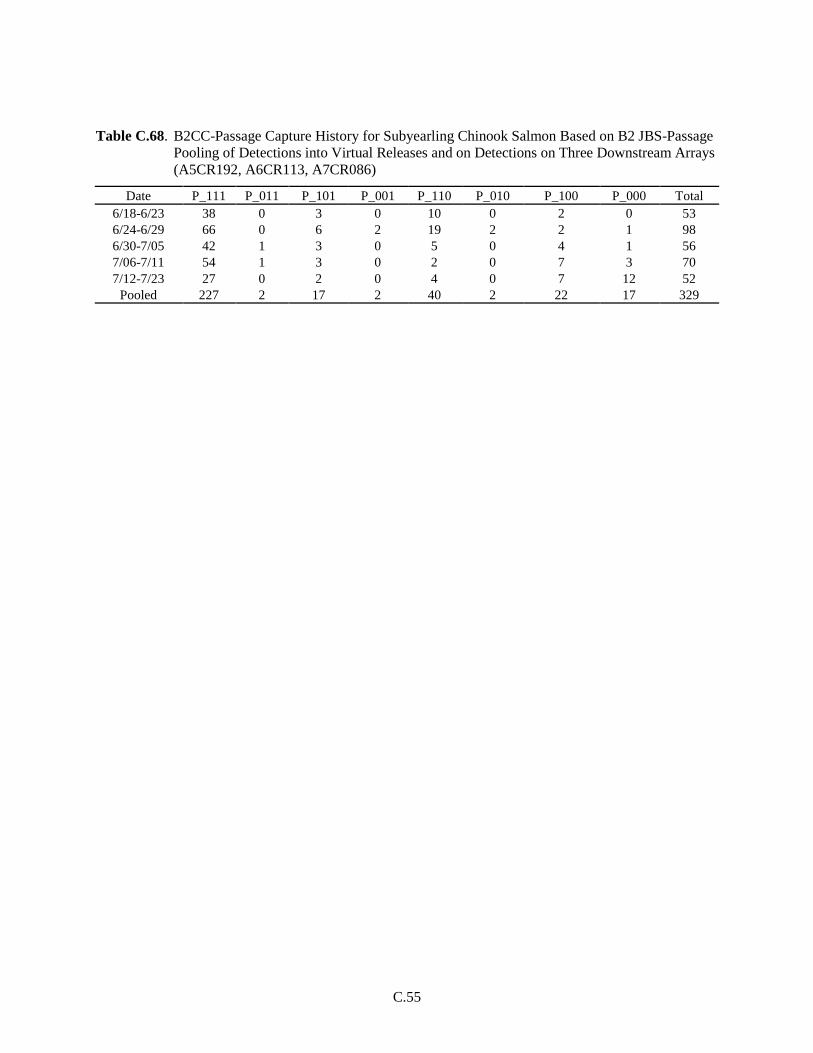
C.55
Table C.68. B2CC-Passage Capture History for Subyearling Chinook Salmon Based on B2 JBS-Passage Pooling of Detections into Virtual Releases and on Detections on Three Downstream Arrays (A5CR192, A6CR113, A7CR086)
Date P_111 P_011 P_101 P_001 P_110 P_010 P_100 P_000 Total 6/18-6/23 38 0 3 0 10 0 2 0 53 6/24-6/29 66 0 6 2 19 2 2 1 98 6/30-7/05 42 1 3 0 5 0 4 1 56 7/06-7/11 54 1 3 0 2 0 7 3 70 7/12-7/23 27 0 2 0 4 0 7 12 52
Pooled 227 2 17 2 40 2 22 17 329

C
.56
Table C.69. Single-Release Estimates of B2CC-Passage Survival Rates for Subyearling Chinook Salmon
Virtual Release Dates
Ŝ to 1st Array 1/2 95% CI
Ŝ from 1st to 2nd Array 1/2 95% CI
Detection Prob. to 1st
Array 1/2 95% CI
Detection Prob. from 1st to 2nd
Array 1/2 95% CI Lambda 1/2 95% CI 6/18-6/23 1.000 0.000 0.977 0.055 1.000 0.000 0.927 0.080 0.792 0.116 6/24-6/29 0.991 0.020 1.005 0.037 0.958 0.041 0.892 0.071 0.759 0.090 6/30-7/05 0.984 0.035 0.932 0.071 0.980 0.037 0.935 0.071 0.896 0.086 7/06-7/11 0.959 0.047 0.896 0.074 0.983 0.033 0.948 0.057 0.965 0.047 7/12-7/23 0.769 0.114 0.832 0.120 1.000 0.000 0.931 0.092 0.871 0.118
Pooled 0.950 0.024 0.939 0.029 0.979 0.016 0.923 0.033 0.845 0.043 N-Wt Mean 0.949 0.078 0.938 0.060

C.57
Table C.70. Paired Release Estimates of B2 JBS-Passage Survival Rates for Subyearling Chinook Salmon
Population Ŝ to Tailrace
(Ŝ11/Ŝ21) 1/2 95% CI 6/18-6/23 0.857 0.184 6/24-6/29 0.959 0.099 6/30-7/05 0.871 0.190 7/06-7/11 0.927 0.158 7/12-7/23 1.100 0.302
Pooled 0.933 0.078 N-Wt Mean 0.933 0.087
C.3.5 B2 Turbine-Passage Survival Rates
Table C.71. B2 Turbine-Passage Capture History for Subyearling Chinook Salmon Based on Pooling Detections into Virtual Releases and on Detections on Three Downstream Arrays (A5CR192, A6CR113, A7CR086)
Date P_111 P_011 P_101 P_001 P_110 P_010 P_100 P_000 Total 6/18-6/20 14 0 1 0 4 0 0 0 19 6/21-6/23 21 0 4 0 2 0 0 0 27 6/24-6/26 23 0 2 0 3 0 2 1 31 6/27-6/29 25 0 0 0 1 0 1 0 27 6/30-7/02 20 0 0 0 3 0 3 0 26 7/03-7/05 9 0 0 0 1 0 1 1 12 7/06-7/08 13 0 1 0 3 0 2 1 20 7/09-7/11 16 0 0 0 0 0 3 4 23 7/12-7/14 14 0 0 0 0 0 2 5 21 7/15-7/23 8 0 0 0 5 0 8 0 21
Pooled 163 0 8 0 22 0 22 12 227
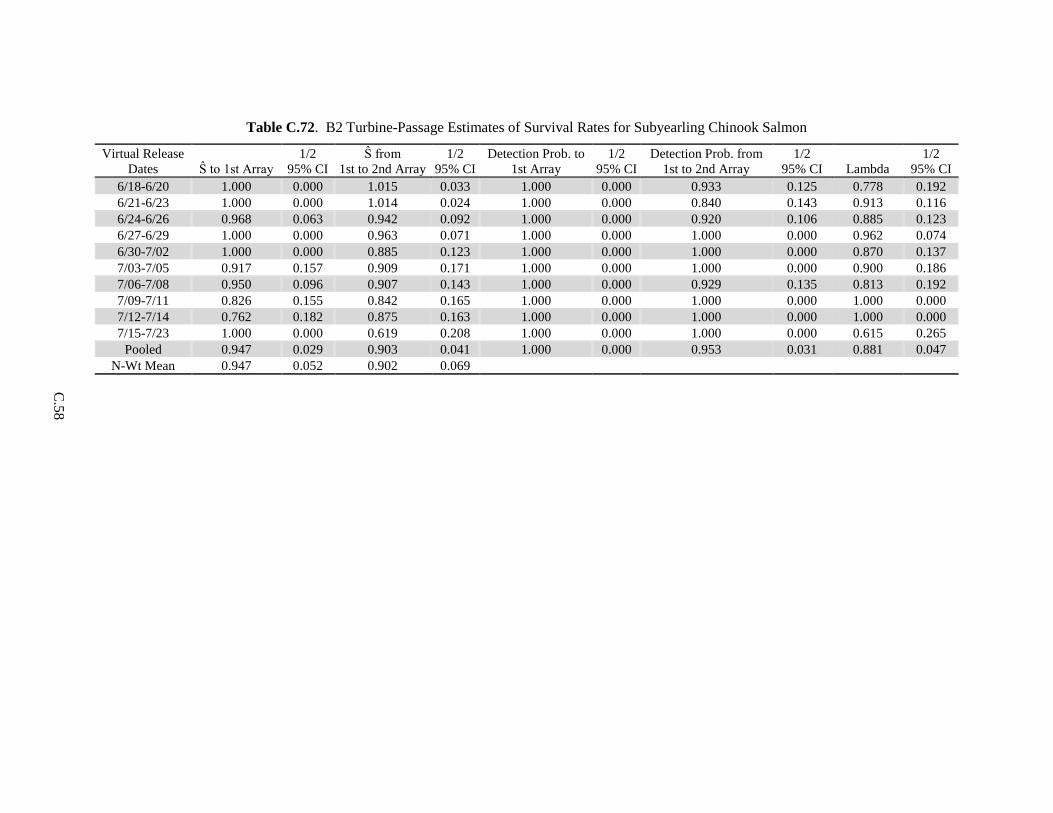
C
.58
Table C.72. B2 Turbine-Passage Estimates of Survival Rates for Subyearling Chinook Salmon
Virtual Release Dates Ŝ to 1st Array
1/2 95% CI
Ŝ from 1st to 2nd Array
1/2 95% CI
Detection Prob. to 1st Array
1/2 95% CI
Detection Prob. from 1st to 2nd Array
1/2 95% CI Lambda
1/2 95% CI
6/18-6/20 1.000 0.000 1.015 0.033 1.000 0.000 0.933 0.125 0.778 0.192 6/21-6/23 1.000 0.000 1.014 0.024 1.000 0.000 0.840 0.143 0.913 0.116 6/24-6/26 0.968 0.063 0.942 0.092 1.000 0.000 0.920 0.106 0.885 0.123 6/27-6/29 1.000 0.000 0.963 0.071 1.000 0.000 1.000 0.000 0.962 0.074 6/30-7/02 1.000 0.000 0.885 0.123 1.000 0.000 1.000 0.000 0.870 0.137 7/03-7/05 0.917 0.157 0.909 0.171 1.000 0.000 1.000 0.000 0.900 0.186 7/06-7/08 0.950 0.096 0.907 0.143 1.000 0.000 0.929 0.135 0.813 0.192 7/09-7/11 0.826 0.155 0.842 0.165 1.000 0.000 1.000 0.000 1.000 0.000 7/12-7/14 0.762 0.182 0.875 0.163 1.000 0.000 1.000 0.000 1.000 0.000 7/15-7/23 1.000 0.000 0.619 0.208 1.000 0.000 1.000 0.000 0.615 0.265
Pooled 0.947 0.029 0.903 0.041 1.000 0.000 0.953 0.031 0.881 0.047 N-Wt Mean 0.947 0.052 0.902 0.069

C.59
Table C.73. B2CC-Passage Capture History for Subyearling Chinook Salmon Based on B2 Turbine-Passage Pooling of Detections into Virtual Releases and on Detections on Three Downstream Arrays (A5CR192, A6CR113, A7CR086)
Date P_111 P_011 P_101 P_001 P_110 P_010 P_100 P_000 Total 6/18-6/20 7 0 0 0 1 0 1 0 9 6/21-6/23 31 0 3 0 9 0 1 0 44 6/24-6/26 21 0 2 2 10 1 1 0 37 6/27-6/29 45 0 4 0 9 1 1 1 61 6/30-7/02 27 1 0 0 3 0 3 0 34 7/03-7/05 15 0 3 0 2 0 1 1 22 7/06-7/08 30 0 2 0 2 0 4 1 39 7/09-7/11 24 1 1 0 0 0 3 2 31 7/12-7/14 17 0 2 0 4 0 6 7 36 7/15-7/23 10 0 0 0 0 0 1 5 16
Pooled 227 2 17 2 40 2 22 17 329

C
.60
Table C.74. Single-Release Estimates of B2CC-Passage Survival Rates for Subyearling Chinook Salmon
Virtual Release Dates Ŝ to 1st Array
1/2 95% CI
Ŝ from 1st to 2nd Array
1/2 95% CI
Detection Prob. to 1st Array
1/2 95% CI
Detection Prob. from 1st to 2nd Array
1/2 95% CI Lambda
1/2 95% CI
6/18-6/20 1.000 0.000 0.889 0.206 1.000 0.000 1.000 0.000 0.875 0.229 6/21-6/23 1.000 0.000 0.997 0.053 1.000 0.000 0.912 0.096 0.775 0.129 6/24-6/26 1.002 0.006 1.027 0.090 0.917 0.090 0.840 0.143 0.656 0.165 6/27-6/29 0.984 0.031 0.998 0.037 0.983 0.033 0.918 0.076 0.818 0.102 6/30-7/02 1.003 0.006 0.909 0.098 0.968 0.063 1.000 0.000 0.903 0.104 7/03-7/05 0.955 0.086 0.971 0.100 1.000 0.000 0.833 0.172 0.882 0.153 7/06-7/08 0.974 0.049 0.898 0.098 1.000 0.000 0.938 0.084 0.938 0.084 7/09-7/11 0.939 0.088 0.893 0.114 0.962 0.074 0.962 0.074 1.000 0.000 7/12-7/14 0.806 0.129 0.809 0.153 1.000 0.000 0.895 0.137 0.810 0.169 7/15-7/23 0.688 0.227 0.909 0.171 1.000 0.000 1.000 0.000 1.000 0.000
Pooled 0.950 0.024 0.939 0.029 0.979 0.016 0.923 0.033 0.845 0.043 N-Wt Mean 0.949 0.054 0.940 0.044
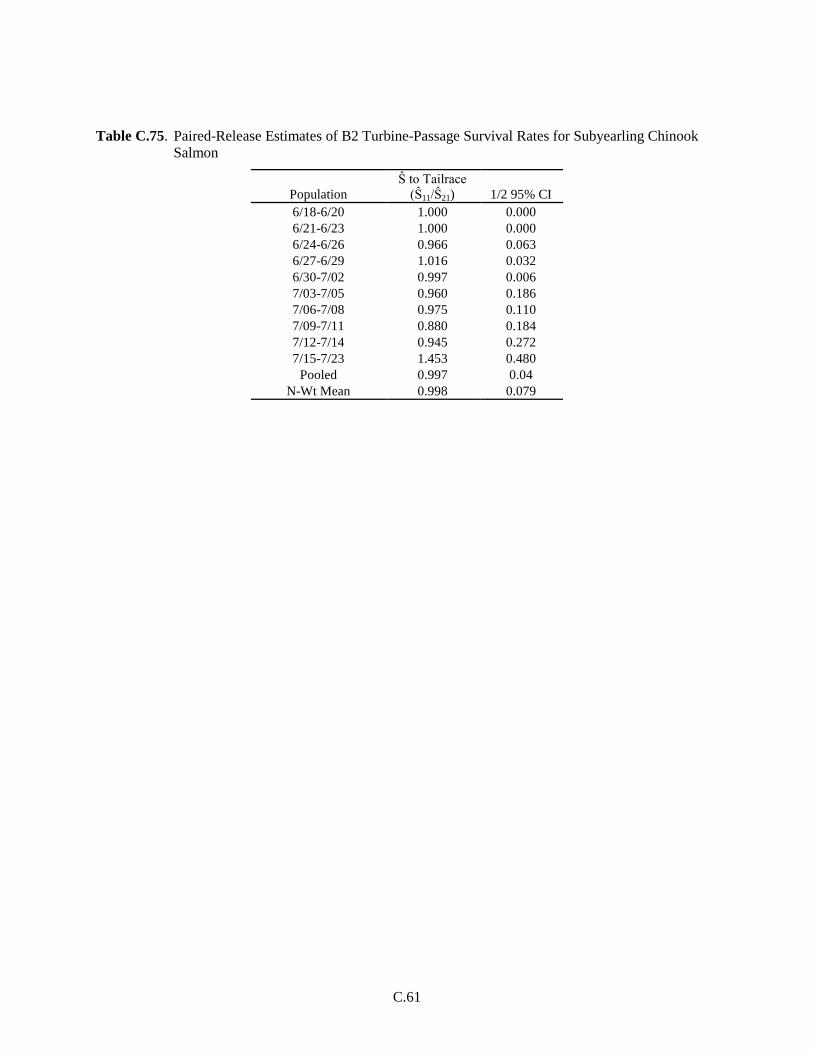
C.61
Table C.75. Paired-Release Estimates of B2 Turbine-Passage Survival Rates for Subyearling Chinook Salmon
Population Ŝ to Tailrace
(Ŝ11/Ŝ21) 1/2 95% CI 6/18-6/20 1.000 0.000 6/21-6/23 1.000 0.000 6/24-6/26 0.966 0.063 6/27-6/29 1.016 0.032 6/30-7/02 0.997 0.006 7/03-7/05 0.960 0.186 7/06-7/08 0.975 0.110 7/09-7/11 0.880 0.184 7/12-7/14 0.945 0.272 7/15-7/23 1.453 0.480
Pooled 0.997 0.04 N-Wt Mean 0.998 0.079


Appendix D
Fish Guidance and Passage Efficiency Tables

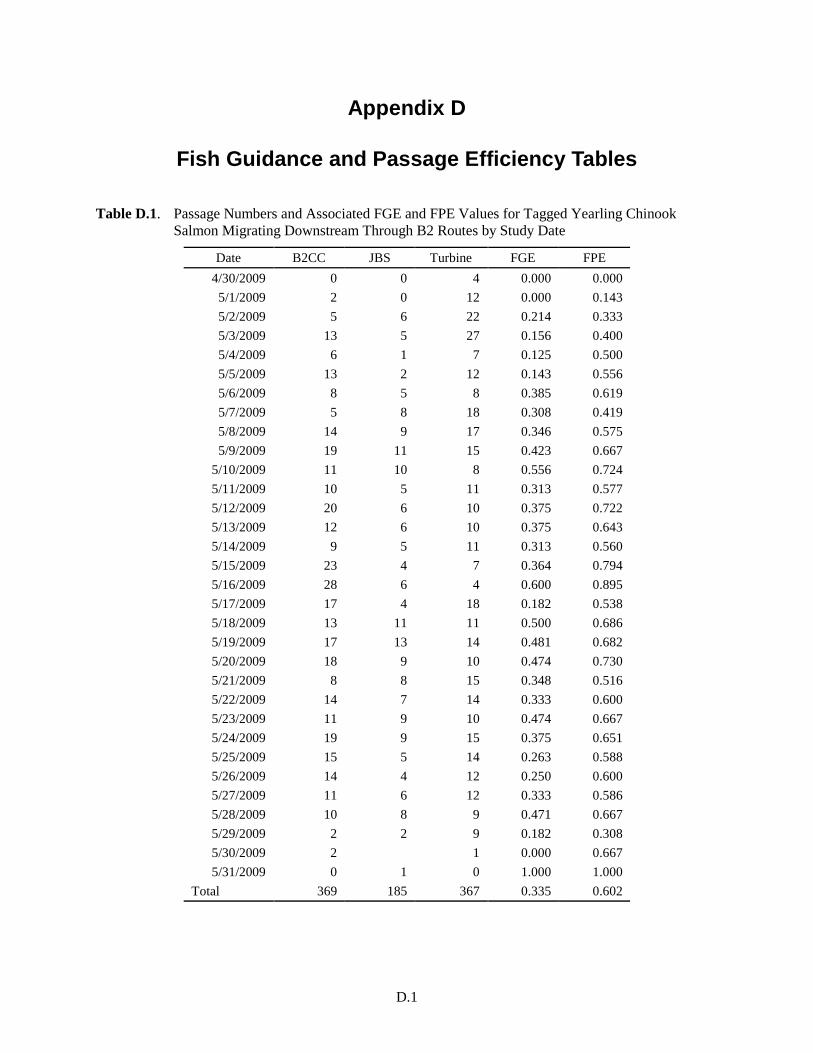
D.1
Appendix D
Fish Guidance and Passage Efficiency Tables
Table D.1. Passage Numbers and Associated FGE and FPE Values for Tagged Yearling Chinook Salmon Migrating Downstream Through B2 Routes by Study Date
Date B2CC JBS Turbine FGE FPE 4/30/2009 0 0 4 0.000 0.000
5/1/2009 2 0 12 0.000 0.143 5/2/2009 5 6 22 0.214 0.333 5/3/2009 13 5 27 0.156 0.400 5/4/2009 6 1 7 0.125 0.500 5/5/2009 13 2 12 0.143 0.556 5/6/2009 8 5 8 0.385 0.619 5/7/2009 5 8 18 0.308 0.419 5/8/2009 14 9 17 0.346 0.575 5/9/2009 19 11 15 0.423 0.667
5/10/2009 11 10 8 0.556 0.724 5/11/2009 10 5 11 0.313 0.577 5/12/2009 20 6 10 0.375 0.722 5/13/2009 12 6 10 0.375 0.643 5/14/2009 9 5 11 0.313 0.560 5/15/2009 23 4 7 0.364 0.794 5/16/2009 28 6 4 0.600 0.895 5/17/2009 17 4 18 0.182 0.538 5/18/2009 13 11 11 0.500 0.686 5/19/2009 17 13 14 0.481 0.682 5/20/2009 18 9 10 0.474 0.730 5/21/2009 8 8 15 0.348 0.516 5/22/2009 14 7 14 0.333 0.600 5/23/2009 11 9 10 0.474 0.667 5/24/2009 19 9 15 0.375 0.651 5/25/2009 15 5 14 0.263 0.588 5/26/2009 14 4 12 0.250 0.600 5/27/2009 11 6 12 0.333 0.586 5/28/2009 10 8 9 0.471 0.667 5/29/2009 2 2 9 0.182 0.308 5/30/2009 2 1 0.000 0.667 5/31/2009 0 1 0 1.000 1.000
Total 369 185 367 0.335 0.602
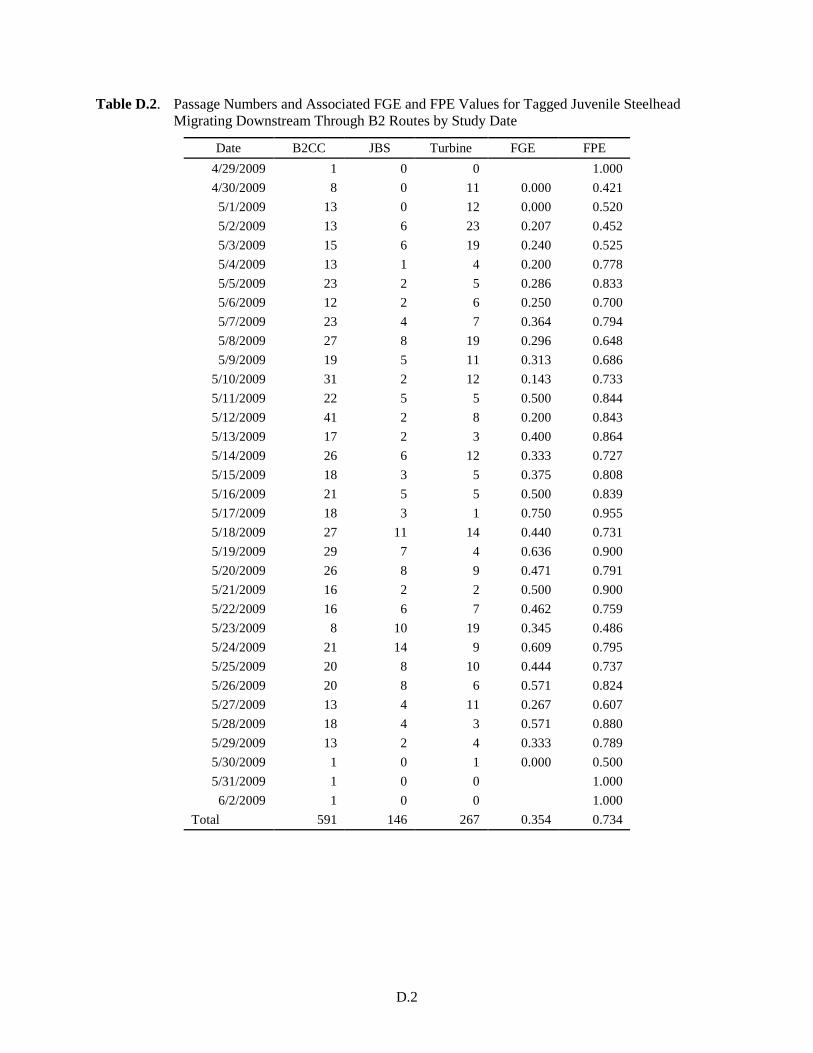
D.2
Table D.2. Passage Numbers and Associated FGE and FPE Values for Tagged Juvenile Steelhead Migrating Downstream Through B2 Routes by Study Date
Date B2CC JBS Turbine FGE FPE 4/29/2009 1 0 0 1.000 4/30/2009 8 0 11 0.000 0.421
5/1/2009 13 0 12 0.000 0.520 5/2/2009 13 6 23 0.207 0.452 5/3/2009 15 6 19 0.240 0.525 5/4/2009 13 1 4 0.200 0.778 5/5/2009 23 2 5 0.286 0.833 5/6/2009 12 2 6 0.250 0.700 5/7/2009 23 4 7 0.364 0.794 5/8/2009 27 8 19 0.296 0.648 5/9/2009 19 5 11 0.313 0.686
5/10/2009 31 2 12 0.143 0.733 5/11/2009 22 5 5 0.500 0.844 5/12/2009 41 2 8 0.200 0.843 5/13/2009 17 2 3 0.400 0.864 5/14/2009 26 6 12 0.333 0.727 5/15/2009 18 3 5 0.375 0.808 5/16/2009 21 5 5 0.500 0.839 5/17/2009 18 3 1 0.750 0.955 5/18/2009 27 11 14 0.440 0.731 5/19/2009 29 7 4 0.636 0.900 5/20/2009 26 8 9 0.471 0.791 5/21/2009 16 2 2 0.500 0.900 5/22/2009 16 6 7 0.462 0.759 5/23/2009 8 10 19 0.345 0.486 5/24/2009 21 14 9 0.609 0.795 5/25/2009 20 8 10 0.444 0.737 5/26/2009 20 8 6 0.571 0.824 5/27/2009 13 4 11 0.267 0.607 5/28/2009 18 4 3 0.571 0.880 5/29/2009 13 2 4 0.333 0.789 5/30/2009 1 0 1 0.000 0.500 5/31/2009 1 0 0 1.000
6/2/2009 1 0 0 1.000 Total 591 146 267 0.354 0.734

D.3
Table D.3. Passage Numbers and Associated FGE and FPE Values for Tagged Subyearling Chinook Migrating Downstream Through B2 Routes by Study Date
Date B2CC JBS Turbine FGE FPE 6/18/2009 0 0 1 0.000 0.000 6/19/2009 1 0 5 0.000 0.167 6/20/2009 8 7 13 0.350 0.536 6/21/2009 14 2 9 0.182 0.640 6/22/2009 18 2 11 0.154 0.645 6/23/2009 12 3 7 0.300 0.682 6/24/2009 11 3 13 0.188 0.519 6/25/2009 12 2 6 0.250 0.700 6/26/2009 14 3 12 0.200 0.586 6/27/2009 22 7 14 0.333 0.674 6/28/2009 17 2 8 0.200 0.704 6/29/2009 22 3 5 0.375 0.833 6/30/2009 15 0 8 0.000 0.652
7/1/2009 14 6 10 0.375 0.667 7/2/2009 5 3 8 0.273 0.500 7/3/2009 10 2 3 0.400 0.800 7/4/2009 5 1 4 0.200 0.600 7/5/2009 7 2 5 0.286 0.643 7/6/2009 12 2 5 0.286 0.737 7/7/2009 11 3 3 0.500 0.824 7/8/2009 16 4 10 0.286 0.667 7/9/2009 10 3 12 0.200 0.520
7/10/2009 13 3 6 0.333 0.727 7/11/2009 8 3 7 0.300 0.611 7/12/2009 21 3 9 0.250 0.727 7/13/2009 9 2 4 0.333 0.733 7/14/2009 5 5 8 0.385 0.556 7/15/2009 7 1 6 0.143 0.571 7/16/2009 2 0 2 0.000 0.500 7/17/2009 6 1 8 0.111 0.467 7/18/2009 1 0 1 0.000 0.500 7/19/2009 0 1 1 0.500 0.500 7/20/2009 1 0 3 0.000 0.250
Total 329 79 227 0.258 0.643


PNNL-20338
Distribution
No. of No. of Copies Copies
Distr.1
OFFSITE 15 Paper copies & PDF Dennis Schwartz and Brad Eppard USACE District, Portland CENWP-PM-E 333 SW 1st Avenue (R. Duncan Plaza) Portland, OR 97204-3495 10 Paper copies and PDF Gene Ploskey 390 Evergreen Drive P.O. Box 241 North Bonneville, WA 98639
ONSITE 3 Paper copies & PDF Pacific Northwest National Laboratory KD Ham K6-85 DR Geist K6-85 PNNL Library