Evaluation of a small volume renourishment strategy on a narrow Mediterranean beach
13
Evaluation of a small volume renourishment strategy on a narrow Mediterranean beach G. Basterretxea a, ⁎ , A. Orfila a , A. Jordi a , J.J. Fornós b , J. Tintoré a a IMEDEA(CSIC-UIB), Miquel Marques, 21, 07190 Esporles, Spain b Dept. Ciències de la Terra, UIB, Crta. Valldemossa, km 7.5, 07122 Palma, Spain Received 22 February 2006; received in revised form 30 October 2006; accepted 30 October 2006 Available online 13 December 2006 Abstract A renourishment strategy for width maintenance of a Mediterranean beach was evaluated using historical aerial photographs and topographic surveys. The 5.5 km Can Picafort beach (Balearic Islands, Spain) consists of urbanised areas with associated anthropogenic pressures, and a Natural Park extending for about 1.5 km where a backshore dune and a lagoon system have been preserved. With the exception of this protected area the beach has been recurrently nourished over the past 20 years using relatively small volumes of sand (b 40 000 m 3 ). Historical shoreline analysis provides evidence of a reduction in shoreline variability since the beach fill program was started in 1987. The last replenishment, in May 2002, provided an opportunity for assessing this nourishment strategy. Longevity estimations based on beach fill performance indicate that partial regenerations have only a limited life span (few years). Moreover, it is suggested that decreased shoreline variability could be a side-effect related to the ‘extra’ amount of sediment supplied to the active beach. Both aspects should be considered in beach nourishment decision-making. © 2006 Elsevier B.V. All rights reserved. Keywords: Nourishment; Beach evolution; Beach variability 1. Introduction Since the mid-1980's beach nourishment has been persistently used to maintain beach width along the Spa- nish coasts, mainly for recreational purposes. Indeed, according to Hamm et al. (1998), Spain is one of the biggest beach nourishing countries in Europe. The exten- ded use of beach fills is in response to the social pressures of a recreational tourism-based economy for which the beach is a major asset, and for which shoreline retreat is perceived as a major threat. The most common practice among beach managers is the use of sand replenishment for beach maintenance following severe winters. Small volume nourishment along the shoreline has been the preferred method of restoration, since it is regarded as having an immediate effect, and is considered more envi- ronmentally acceptable than other solutions. However, the performance of this management practice for shoreline stabilisation has rarely been assessed. Shore nourishment projects consist of a volumetric replenishment of adequate quantities of sand from an ex- ternal source to advance the shoreline seaward (Dean, 2002). The artificially generated shoreline can be con- sidered as a perturbation in the natural evolution of the shore, the form of which is a consequence of the interaction of factors such as wave climate, sediment characteristics and the geologic framework. The planform and profile anomaly caused by the addition of new sediment is Geomorphology 88 (2007) 139 – 151 www.elsevier.com/locate/geomorph ⁎ Corresponding author. Tel.: +34 971611734; fax: +34 971611761. E-mail address: [email protected] (G. Basterretxea). 0169-555X/$ - see front matter © 2006 Elsevier B.V. All rights reserved. doi:10.1016/j.geomorph.2006.10.019
Transcript of Evaluation of a small volume renourishment strategy on a narrow Mediterranean beach

2007) 139–151www.elsevier.com/locate/geomorph
Geomorphology 88 (
Evaluation of a small volume renourishment strategy ona narrow Mediterranean beach
G. Basterretxea a,⁎, A. Orfila a, A. Jordi a, J.J. Fornós b, J. Tintoré a
a IMEDEA(CSIC-UIB), Miquel Marques, 21, 07190 Esporles, Spainb Dept. Ciències de la Terra, UIB, Crta. Valldemossa, km 7.5, 07122 Palma, Spain
Received 22 February 2006; received in revised form 30 October 2006; accepted 30 October 2006Available online 13 December 2006
Abstract
A renourishment strategy for width maintenance of a Mediterranean beach was evaluated using historical aerial photographs andtopographic surveys. The 5.5 km Can Picafort beach (Balearic Islands, Spain) consists of urbanised areas with associated anthropogenicpressures, and a Natural Park extending for about 1.5 km where a backshore dune and a lagoon system have been preserved. With theexception of this protected area the beach has been recurrently nourished over the past 20 years using relatively small volumes of sand(b40 000 m3). Historical shoreline analysis provides evidence of a reduction in shoreline variability since the beach fill program wasstarted in 1987. The last replenishment, in May 2002, provided an opportunity for assessing this nourishment strategy. Longevityestimations based on beach fill performance indicate that partial regenerations have only a limited life span (few years). Moreover, it issuggested that decreased shoreline variability could be a side-effect related to the ‘extra’ amount of sediment supplied to the active beach.Both aspects should be considered in beach nourishment decision-making.© 2006 Elsevier B.V. All rights reserved.
Keywords: Nourishment; Beach evolution; Beach variability
1. Introduction
Since the mid-1980's beach nourishment has beenpersistently used to maintain beach width along the Spa-nish coasts, mainly for recreational purposes. Indeed,according to Hamm et al. (1998), Spain is one of thebiggest beach nourishing countries in Europe. The exten-ded use of beach fills is in response to the social pressuresof a recreational tourism-based economy for which thebeach is a major asset, and for which shoreline retreat isperceived as a major threat. The most common practiceamong beach managers is the use of sand replenishment
⁎ Corresponding author. Tel.: +34 971611734; fax: +34 971611761.E-mail address: [email protected] (G. Basterretxea).
0169-555X/$ - see front matter © 2006 Elsevier B.V. All rights reserved.doi:10.1016/j.geomorph.2006.10.019
for beach maintenance following severe winters. Smallvolume nourishment along the shoreline has been thepreferred method of restoration, since it is regarded ashaving an immediate effect, and is considered more envi-ronmentally acceptable than other solutions.However, theperformance of this management practice for shorelinestabilisation has rarely been assessed.
Shore nourishment projects consist of a volumetricreplenishment of adequate quantities of sand from an ex-ternal source to advance the shoreline seaward (Dean,2002). The artificially generated shoreline can be con-sidered as a perturbation in the natural evolution of theshore, the form of which is a consequence of the interactionof factors such as wave climate, sediment characteristicsand the geologic framework. The planform and profileanomaly caused by the addition of new sediment is

140 G. Basterretxea et al. / Geomorphology 88 (2007) 139–151
expected to be readjusted by natural diffusion and advec-tion processes, both in the cross-shore and alongshoredirections, altering the transport gradients at least tem-porarily (Work and Dean, 1995). If the volume filled issmall (compared with the total volume of sand of thebeach), nourished sand will be quickly dispersed over andmixedwith the original deposit (e.g.Guillén andHoekstra,1997) without the natural dynamics of the shore beingsignificantly distorted. The rate at which this process takesplace depends on the ‘energy’ of the system, but also onthe way that the relevant processes controlling beachmorphodynamics operate. For example, in most Mediter-ranean areas storms are relatively scarce and mainly occurduring winter. Enhanced sediment transport during theseevents produces a stepwise behaviour that has clear impli-cations in the case of small nourishments where not only
Fig. 1. Map of Can Picafort beach extending from Can Picafort Marina to Grannourishment are shown in the upper right panel.
the life span but also the temporal evolution of the shore-line is important.
Benedet et al. (2004) emphasise the importance ofunderstanding the form-process continuums to achieve thedesired response of nourished morphodynamic systems.Predictions of the shoreline evolution after renourishmentrequire knowledge of the seasonal and inter-annual res-ponse of the beach. Additionally, natural beach variabilityshould be characterised prior to any actuation, to avoidnourishing areas which would accrete anyway and to opti-mise fill volumes in areas which exhibit oscillatory beha-viours (Stive et al., 2002). Long-term shoreline analysisbased on aerial photo-interpretation or remote sensedimagery allows for the distinction between oscillatorybehaviours and erosive tendencies (White and El Asmar,1999; Janke, 2002; Moore and Griggs, 2002), but does not
Canal (Mallorca). The location of the ‘sand borrowing’ areas for beach

Fig. 2. Wave rise diagrams at station WANA2075039(39.875 N, 3.375 E) for different seasons (years 1996–2003). Mean seasonal variation in waveparameters (Hs and Tp) for the same period show calmer conditions in summer (below).
141G. Basterretxea et al. / Geomorphology 88 (2007) 139–151
provide information on the factors that control the observedmorphology variations of the beach. Models incorporatingrelationships between beach morphology and environmen-
tal conditions and stresses (i.e. wave forcing) thereforebecome necessary, to varying degrees, to interpret bothnatural and human induced morphodynamic adjustments.
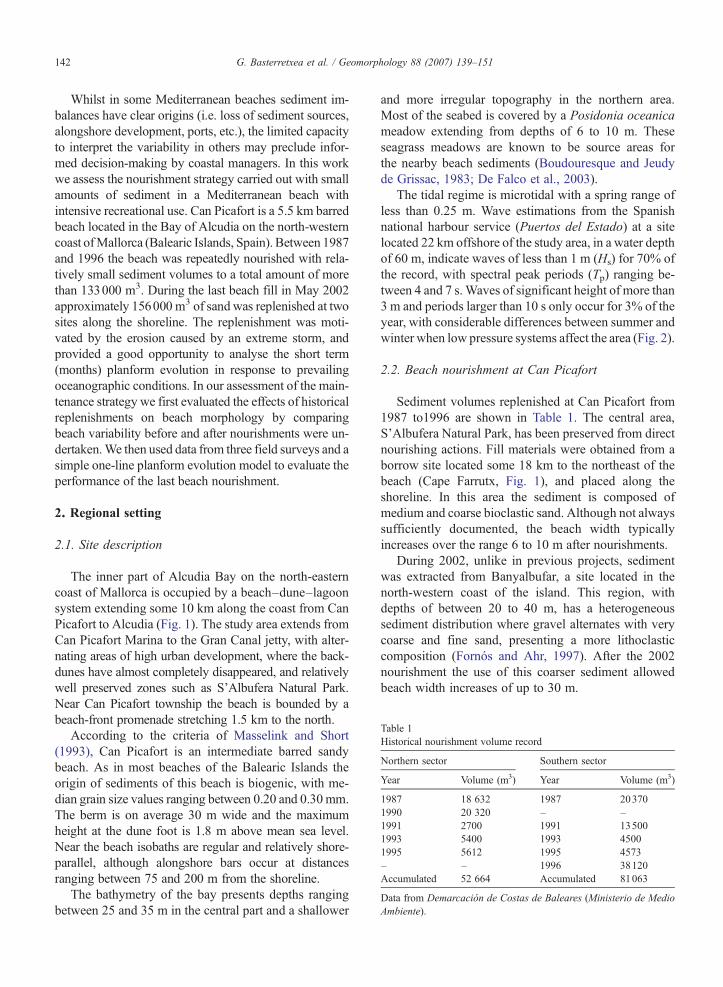
Table 1Historical nourishment volume record
Northern sector Southern sector
Year Volume (m3) Year Volume (m3)
1987 18 632 1987 203701990 20 320 – –1991 2700 1991 135001993 5400 1993 45001995 5612 1995 4573– – 1996 38120Accumulated 52 664 Accumulated 81063
Data from Demarcación de Costas de Baleares (Ministerio de MedioAmbiente).
142 G. Basterretxea et al. / Geomorphology 88 (2007) 139–151
Whilst in some Mediterranean beaches sediment im-balances have clear origins (i.e. loss of sediment sources,alongshore development, ports, etc.), the limited capacityto interpret the variability in others may preclude infor-med decision-making by coastal managers. In this workwe assess the nourishment strategy carried out with smallamounts of sediment in a Mediterranean beach withintensive recreational use. Can Picafort is a 5.5 km barredbeach located in the Bay of Alcudia on the north-westerncoast ofMallorca (Balearic Islands, Spain). Between 1987and 1996 the beach was repeatedly nourished with rela-tively small sediment volumes to a total amount of morethan 133000 m3. During the last beach fill in May 2002approximately 156000 m3 of sand was replenished at twosites along the shoreline. The replenishment was moti-vated by the erosion caused by an extreme storm, andprovided a good opportunity to analyse the short term(months) planform evolution in response to prevailingoceanographic conditions. In our assessment of the main-tenance strategy we first evaluated the effects of historicalreplenishments on beach morphology by comparingbeach variability before and after nourishments were un-dertaken.We then used data from three field surveys and asimple one-line planform evolution model to evaluate theperformance of the last beach nourishment.
2. Regional setting
2.1. Site description
The inner part of Alcudia Bay on the north-easterncoast of Mallorca is occupied by a beach–dune–lagoonsystem extending some 10 km along the coast from CanPicafort to Alcudia (Fig. 1). The study area extends fromCan Picafort Marina to the Gran Canal jetty, with alter-nating areas of high urban development, where the back-dunes have almost completely disappeared, and relativelywell preserved zones such as S'Albufera Natural Park.Near Can Picafort township the beach is bounded by abeach-front promenade stretching 1.5 km to the north.
According to the criteria of Masselink and Short(1993), Can Picafort is an intermediate barred sandybeach. As in most beaches of the Balearic Islands theorigin of sediments of this beach is biogenic, with me-dian grain size values ranging between 0.20 and 0.30mm.The berm is on average 30 m wide and the maximumheight at the dune foot is 1.8 m above mean sea level.Near the beach isobaths are regular and relatively shore-parallel, although alongshore bars occur at distancesranging between 75 and 200 m from the shoreline.
The bathymetry of the bay presents depths rangingbetween 25 and 35 m in the central part and a shallower
and more irregular topography in the northern area.Most of the seabed is covered by a Posidonia oceanicameadow extending from depths of 6 to 10 m. Theseseagrass meadows are known to be source areas forthe nearby beach sediments (Boudouresque and Jeudyde Grissac, 1983; De Falco et al., 2003).
The tidal regime is microtidal with a spring range ofless than 0.25 m. Wave estimations from the Spanishnational harbour service (Puertos del Estado) at a sitelocated 22 km offshore of the study area, in a water depthof 60 m, indicate waves of less than 1 m (Hs) for 70% ofthe record, with spectral peak periods (Tp) ranging be-tween 4 and 7 s.Waves of significant height of more than3 m and periods larger than 10 s only occur for 3% of theyear, with considerable differences between summer andwinter when low pressure systems affect the area (Fig. 2).
2.2. Beach nourishment at Can Picafort
Sediment volumes replenished at Can Picafort from1987 to1996 are shown in Table 1. The central area,S'Albufera Natural Park, has been preserved from directnourishing actions. Fill materials were obtained from aborrow site located some 18 km to the northeast of thebeach (Cape Farrutx, Fig. 1), and placed along theshoreline. In this area the sediment is composed ofmedium and coarse bioclastic sand. Although not alwayssufficiently documented, the beach width typicallyincreases over the range 6 to 10 m after nourishments.
During 2002, unlike in previous projects, sedimentwas extracted from Banyalbufar, a site located in thenorth-western coast of the island. This region, withdepths of between 20 to 40 m, has a heterogeneoussediment distribution where gravel alternates with verycoarse and fine sand, presenting a more lithoclasticcomposition (Fornós and Ahr, 1997). After the 2002nourishment the use of this coarser sediment allowedbeach width increases of up to 30 m.
143G. Basterretxea et al. / Geomorphology 88 (2007) 139–151
3. Methods
3.1. Historical shoreline variability
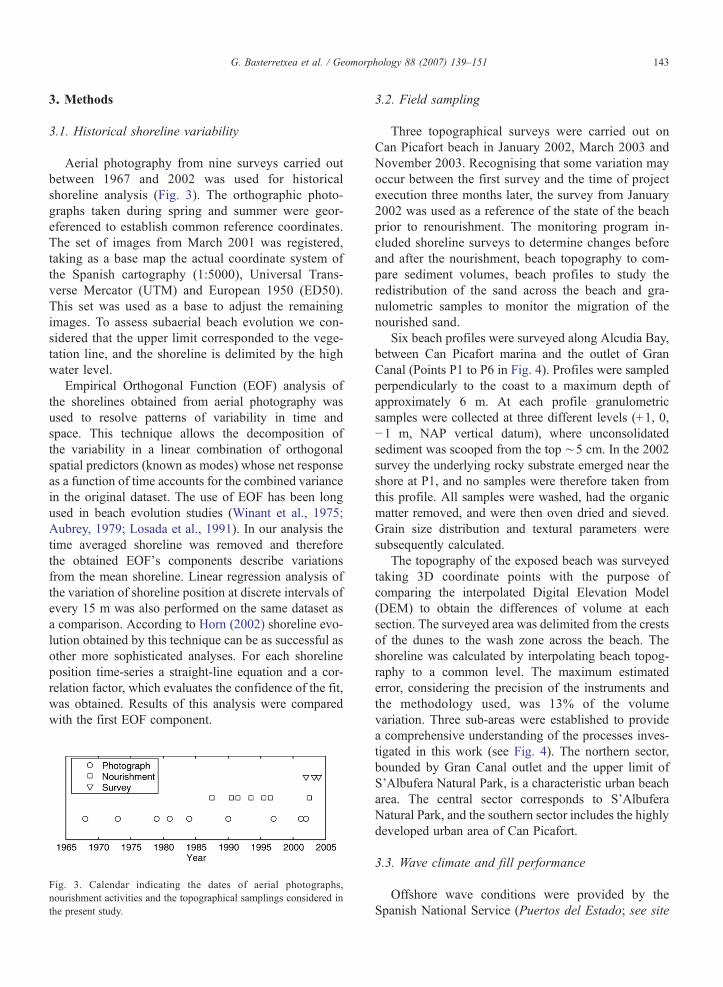
Aerial photography from nine surveys carried outbetween 1967 and 2002 was used for historicalshoreline analysis (Fig. 3). The orthographic photo-graphs taken during spring and summer were geor-eferenced to establish common reference coordinates.The set of images from March 2001 was registered,taking as a base map the actual coordinate system ofthe Spanish cartography (1:5000), Universal Trans-verse Mercator (UTM) and European 1950 (ED50).This set was used as a base to adjust the remainingimages. To assess subaerial beach evolution we con-sidered that the upper limit corresponded to the vege-tation line, and the shoreline is delimited by the highwater level.
Empirical Orthogonal Function (EOF) analysis ofthe shorelines obtained from aerial photography wasused to resolve patterns of variability in time andspace. This technique allows the decomposition ofthe variability in a linear combination of orthogonalspatial predictors (known as modes) whose net responseas a function of time accounts for the combined variancein the original dataset. The use of EOF has been longused in beach evolution studies (Winant et al., 1975;Aubrey, 1979; Losada et al., 1991). In our analysis thetime averaged shoreline was removed and thereforethe obtained EOF's components describe variationsfrom the mean shoreline. Linear regression analysis ofthe variation of shoreline position at discrete intervals ofevery 15 m was also performed on the same dataset asa comparison. According to Horn (2002) shoreline evo-lution obtained by this technique can be as successful asother more sophisticated analyses. For each shorelineposition time-series a straight-line equation and a cor-relation factor, which evaluates the confidence of the fit,was obtained. Results of this analysis were comparedwith the first EOF component.
Fig. 3. Calendar indicating the dates of aerial photographs,nourishment activities and the topographical samplings considered inthe present study.
3.2. Field sampling
Three topographical surveys were carried out onCan Picafort beach in January 2002, March 2003 andNovember 2003. Recognising that some variation mayoccur between the first survey and the time of projectexecution three months later, the survey from January2002 was used as a reference of the state of the beachprior to renourishment. The monitoring program in-cluded shoreline surveys to determine changes beforeand after the nourishment, beach topography to com-pare sediment volumes, beach profiles to study theredistribution of the sand across the beach and gra-nulometric samples to monitor the migration of thenourished sand.
Six beach profiles were surveyed along Alcudia Bay,between Can Picafort marina and the outlet of GranCanal (Points P1 to P6 in Fig. 4). Profiles were sampledperpendicularly to the coast to a maximum depth ofapproximately 6 m. At each profile granulometricsamples were collected at three different levels (+1, 0,−1 m, NAP vertical datum), where unconsolidatedsediment was scooped from the top ∼5 cm. In the 2002survey the underlying rocky substrate emerged near theshore at P1, and no samples were therefore taken fromthis profile. All samples were washed, had the organicmatter removed, and were then oven dried and sieved.Grain size distribution and textural parameters weresubsequently calculated.
The topography of the exposed beach was surveyedtaking 3D coordinate points with the purpose ofcomparing the interpolated Digital Elevation Model(DEM) to obtain the differences of volume at eachsection. The surveyed area was delimited from the crestsof the dunes to the wash zone across the beach. Theshoreline was calculated by interpolating beach topog-raphy to a common level. The maximum estimatederror, considering the precision of the instruments andthe methodology used, was 13% of the volumevariation. Three sub-areas were established to providea comprehensive understanding of the processes inves-tigated in this work (see Fig. 4). The northern sector,bounded by Gran Canal outlet and the upper limit ofS'Albufera Natural Park, is a characteristic urban beacharea. The central sector corresponds to S'AlbuferaNatural Park, and the southern sector includes the highlydeveloped urban area of Can Picafort.
3.3. Wave climate and fill performance
Offshore wave conditions were provided by theSpanish National Service (Puertos del Estado; see site

Fig. 4. Position of sector divisions and cross-shore beach profiles (P1 to P6). Areas renourished during 2002 are highlighted in yellow. (Forinterpretation of the references to colour in this figure legend, the reader is referred to the web version of this article.)
144 G. Basterretxea et al. / Geomorphology 88 (2007) 139–151
description) and propagated to the study area assuminglinear wave theory. Daily averages (4 data per day) ofHs, Tp and wave direction were used as input in themodel (see below).
The performance of the last beach fill at CanPicafort (2002) was simulated using a simple analyticalmodel (e.g. Work and Dean, 1995; Dean, 1996). Thismodel predicts shoreline displacement y, following asimple relation with changes in sand volume per unitlength V, e.g.,
Dy ¼ Vh⁎ þ hB
ð1Þ
the planform evolution can then be obtained based onthe continuity equation for sediments,
AyAt
þ 1h⁎ þ hB
AQAx
¼ 0 ð2Þ
where x is the alongshore coordinate, t is time, hB theberm height above still water, h⁎ the depth of theeffective longshore sand transport and Q the sedimentflux in the x direction.
Assuming long wave linear theory, (i.e. Cg ¼ffiffiffiffiffigh
p)
where g is the gravity and h the local water depth, Q canbe expressed as:
Q ¼ KH5=2b
ffiffiffiffiffiffiffiffig=j
p16ðs−1Þð1−nÞ sinð2hbÞ ð3Þ
where K is a dimensionless constant relating im-mersed weights to alongshore energy flux, Hb is thebreaking wave height, κ=Hb/h is the so-calledbreaking index, s=ρs/ρ is the specific density of thesediment (where ρs is the sediment density and ρ isseawater density), n is the porosity of the sedimentand θb is the breaking wave angle (Dean and Dal-rymple, 2002). Eq. (3) can be linearised and combined
145G. Basterretxea et al. / Geomorphology 88 (2007) 139–151
with Eq. (2) to obtain the diffusion equation (Pelnard-Considere, 1956):
AyAt
¼ eA2yAx2
ð4Þ
where ε is the shoreline diffusion coefficient withdimensions of m2/s, which can be obtained assumingsmall angles of wave incidence as,
e ¼ KH5=2b
ffiffiffiffiffiffiffiffig=j
p8ðs−1Þð1−nÞðhB þ h⁎Þ ð5Þ
For an infinitely straight beach, where a superimposedshape is given by y(x,0)=g(x), the solution to Eq. (4) is,
yðx; tÞ ¼ 1
2ffiffiffiffiffiffiffiket
pZ l
−lgðnÞe− ðx−nÞ2
4εt dn ð6Þ
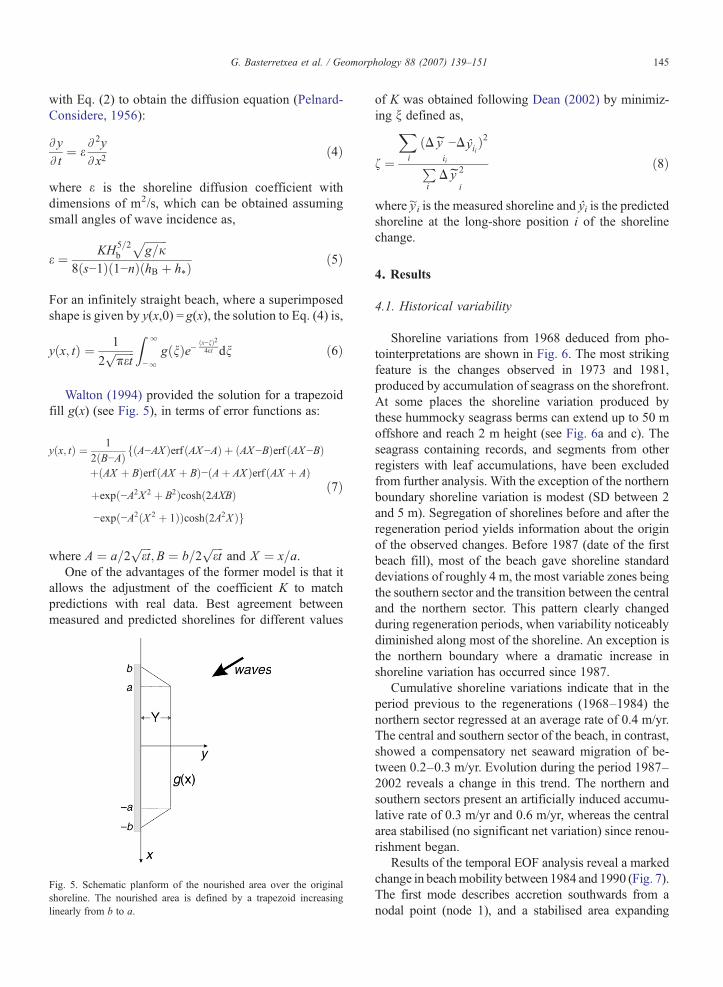
Walton (1994) provided the solution for a trapezoidfill g(x) (see Fig. 5), in terms of error functions as:
yðx; tÞ ¼ 12ðB−AÞ fðA−AX Þerf ðAX−AÞ þ ðAX−BÞerf ðAX−BÞþðAX þ BÞerf ðAX þ BÞ−ðAþ AX Þerf ðAX þ AÞþexpð−A2X 2 þ B2Þcoshð2AXBÞ−expð−A2ðX 2 þ 1ÞÞcoshð2A2X Þg
ð7Þ
where A ¼ a=2ffiffiffiffiet
p;B ¼ b=2
ffiffiffiffiet
pand X ¼ x=a.
One of the advantages of the former model is that itallows the adjustment of the coefficient K to matchpredictions with real data. Best agreement betweenmeasured and predicted shorelines for different values
Fig. 5. Schematic planform of the nourished area over the originalshoreline. The nourished area is defined by a trapezoid increasinglinearly from b to a.
of K was obtained following Dean (2002) by minimiz-ing ξ defined as,
f ¼
Xi
ðDfyii
−DŷiiÞ2
PiDfy 2
i
ð8Þ
where y~i is the measured shoreline and ŷi is the predictedshoreline at the long-shore position i of the shorelinechange.
4. Results
4.1. Historical variability
Shoreline variations from 1968 deduced from pho-tointerpretations are shown in Fig. 6. The most strikingfeature is the changes observed in 1973 and 1981,produced by accumulation of seagrass on the shorefront.At some places the shoreline variation produced bythese hummocky seagrass berms can extend up to 50 moffshore and reach 2 m height (see Fig. 6a and c). Theseagrass containing records, and segments from otherregisters with leaf accumulations, have been excludedfrom further analysis. With the exception of the northernboundary shoreline variation is modest (SD between 2and 5 m). Segregation of shorelines before and after theregeneration period yields information about the originof the observed changes. Before 1987 (date of the firstbeach fill), most of the beach gave shoreline standarddeviations of roughly 4 m, the most variable zones beingthe southern sector and the transition between the centraland the northern sector. This pattern clearly changedduring regeneration periods, when variability noticeablydiminished along most of the shoreline. An exception isthe northern boundary where a dramatic increase inshoreline variation has occurred since 1987.
Cumulative shoreline variations indicate that in theperiod previous to the regenerations (1968–1984) thenorthern sector regressed at an average rate of 0.4 m/yr.The central and southern sector of the beach, in contrast,showed a compensatory net seaward migration of be-tween 0.2–0.3 m/yr. Evolution during the period 1987–2002 reveals a change in this trend. The northern andsouthern sectors present an artificially induced accumu-lative rate of 0.3 m/yr and 0.6 m/yr, whereas the centralarea stabilised (no significant net variation) since renou-rishment began.
Results of the temporal EOF analysis reveal a markedchange in beachmobility between 1984 and 1990 (Fig. 7).The first mode describes accretion southwards from anodal point (node 1), and a stabilised area expanding

Fig. 6. (a) Change in position of the shoreline obtained from aerialphotographs. The plotted positions are relative to the 1968 shoreline.Major changes arise from seagrass accumulation alongshore in the1973, 1981 and 2002 photographs. (b) Standard deviation of theshorelines over the 33 year period (total) and for the periods before andafter the regenerations began. (c) Photograph showing sea-grassaccumulations along the shoreline (see arrows).
Fig. 7. (a) First and second EOF modes of shoreline variation. Thedashed line indicates the shoreline variation as depicted from linearregression analysis, which is roughly coincident with the first EOFmode. (b) Temporal amplitudes of the EOFs.
146 G. Basterretxea et al. / Geomorphology 88 (2007) 139–151
northwards. This mode accounts for 52% of the variance.The temporal trend of this mode indicates that thesechanges mainly occurred between 1968 and 1984, andstabilising by 2001 when a noticeable seaward shift tookplace. The second mode (29% of the variance) displaysthree areas of oscillatory variation and alternatingdirection, delimited by the previous node and anothernode located southward (node 2). The northern andsouthern areas decrease inwidth to 1984 and then increaseto the original shoreline. Conversely, the internodal zoneexhibits an opposite trend in variation. It should be notedthat this internodal area roughly corresponds to theextension of the Natural Reserve, although it is somewhatshifted to the south.
The first EOF mode is consistent with the linearregression analysis. Positive and negative slopes indicateaccretive and erosive tendencies, respectively. Major
discrepancies between both lines occur at points of lowcorrelation in the linear fit. Mean slope values providenumerical information about shoreline evolution in thetimeframe considered, and agree with EOF modes on thethree internodal subdivisions. According to these estima-tions the beach presented erosion rates of 0.23 m/yr northfrommode 1, whilst the central and southern sectors gaveaccretion at average rates of +0.3 m/yr. This tendencyvaried after 1987 when only the southern sector showedaccretion (+0.81±0.33m/yr) and no significant tendencywas observed in the other sectors.
4.2. Field surveys
Beach profiles along Can Picafort present a narrowberm and alongshore bars with variable cross-shorepositions (Fig. 8 upper panel). Berms display slopesranging between 6 and 12% in the northern sector, 5 and7% in southern sector, whereas a slope around 10% isobserved in the central sector. The submerged beachslope is gentle (1 to 2%), and increases towards the northwhere the beach is less exposed to storm waves from theN and NE. Considerable longshore bars (N1 m) mayoccur at most exposed sites (P1 and P2) following stormevents. Near Can Picafort Marina the underlying rockybed partially arises in these situations. As illustrated inFig. 8 (lower panels) emplacement of new sedimentvaried for both the emergent and the submerged beachalong the nearshore. However, net sediment depositionwas not perceptible beyond the surf zone (i.e. 60 m fromthe shoreline).

Fig. 8. Beach profiles at Can Picafort on March 2003 (top panel). Differences between profiles before (January 2002) and after the beach-fill (Marchand November 2003) at P2, P4 and P5 (panels below).
147G. Basterretxea et al. / Geomorphology 88 (2007) 139–151
Volumetric and beachwidth variations based on profilechanges are presented in Table 2. Intensive mechanicalredistribution, including dune restoration, biased drybeach measurements at P6 and the reference value for thisprofile has therefore been omitted. Subaerial beach widthvariation clearly shows a generalised increase after thenourishment, and a subsequent reduction in the followingmonths. The widening mainly affects P2 and P5, closer to
able 2olume changes in beach profiles and subaerial width change betweene 2002 and 2003 surveys
Survey Profile
P1 P2 P3 P4 P5 P6
each widthvariation (m)
1–2 +4.6 +13.5 +0.6 +4.1 +9.6 –2–3 −0.2 −3.0 −3.8 −3.5 −1.5 +3.0Total +4.4 +10.5 −3.2 +0.6 +8.1 –
ubaerialvolumechange(m3/m)
1–2 +1.9 +10.1 −5.5 +9.1 +12.1 –2–3 +1.0 +0.4 +2.5 −5.8 +1.0 −4.1Total +2.9 +10.4 −3.0 +3.3 +13.1 –
ubmergedvolumechange(m3/m)
1–2 −3.6 +28.1 −48.4 −1.9 +22.2 +112–3 +19.0 −32.2 +33.1 +1.1 +7.8 −4.1Total +15.4 −4.1 −15.3 −0.8 +30 +6.9
urvey 1 (January 2002), Survey 2 (March 2003) and Survey 3ovember 2003).
Table 3Mean grain size (D50 mm)
Year Level (m) Profile
P1 P2 P3 P4 P5 P6
2002 1 0.27 0.42 0.25 0.29 0.23 0.310 – 0.31 0.23 0.27 0.34 0.32−1 – 0.30 0.25 0.25 0.20 0.27
2003 1 0.20 0.25 0.30 0.30 0.22 0.400 – 1.45 0.21 1.51 0.30 0.23−1 – 0.19 0.24 1.66 0.19 0.17
The number of profile and the level from which it was obtained isindicated.
TVth
B
S
S
S(N
the centroid of the beach fill (see next section), and to asmaller extent to P4 and P1. Profile 2 exhibits the largestvariation (13.5 m) both in width and in dry beach volume.Although not directly nourished, Profile 1 appears tobenefit from the adjacent sediment increase. In terms ofthe submerged volume change most of the sediment wasdeposited on the shoreline and, with the exception of P2and P5, the submerged beach morphology was little af-fected. Indeed, even though a 4 m beach width increase isobserved at P4, the submerged profile presents a netvolume loss. The comparison of the digital elevationmodels for the subaerial beach reveals a net volume ofaccretion of 47376 m3 between January 2002 and March2003, which is about 30% of the replenished volume. An

Fig. 9. (a) Monthly shoreline evolution obtained from the diffusion equation. The dotted line indicates the initial planform g(x). Grey lines are themeasured shoreline position at March 2003 (month 10) and November 2003 (month 18). (b) Daily wave regime (Hs) used as an input for themodelling analysis.
148 G. Basterretxea et al. / Geomorphology 88 (2007) 139–151
additional reduction of 17% occurred in the following8 months.
Granulometric characteristics along the profiles aredocumented in Table 3. Before the beach fill Can Pica-fort had a quite homogeneous sediment distribution.Textural parameters indicated that both the subaerial andsubmerged beach were composed by well sorted fineand medium sand (D50=0.28±0.05 mm) of biogenic
Fig. 10. Low passed weekly averages of Hs (a) and Tp (b) (maximumvalues in black and mean values in grey). Western directions are shownas negative values (c). Data from Puertos del Estado at WANA2075039(39.875° N, 3.375° E).
origin, with median values ranging between 0.20 and0.42 mm. With some exceptions sediments were mod-erately well-sorted to well-sorted and presented platy-kurtic to mesokurtic peakedness. Only two samples (atP4 and P5) had a small percentage of finer fractions(mud). The results of the two analyses subsequent to thebeach fill reveal a change in the granulometric char-acteristics of the sediment. D50 values show finer sedi-ment in most of the profiles, particularly in thesubmerged areas. However, at P2 and P4 exceptionallycoarser sediments were observed D50N0.9 mm). Thisvery coarse sand extends shoreward at P4 and presents abimodal distribution with poor sorting at both sites.
4.3. Wave climate and fill performance
Notwithstanding the fact that the initial conditionswere based on reported average values of beach wide-ning and replenished volumes, the simple one-linemodel reproduced the planform evolution reasonablywell (Fig. 9a). It is noticeable that the sediment does notspread as much in the lateral directions as predicted bythe model. A value of K=0.36, lower than the widelyused 0.77 (Komar and Inman, 1970), provided a best-fitbetween predicted and measured shorelines. This isconsistent with the findings of del Valle et al. (1993)who reported a decrease in K with increasing grain size.
Comparisons between the modelled shorelinechanges and the daily wave regime (Fig. 9b) emphasisethe importance of storm episodes in planform evolution.More than 30% of the maximum beach width is diffusedby the storms occurring between November 2002 and

149G. Basterretxea et al. / Geomorphology 88 (2007) 139–151
March 2003. An intense episode of wave action (HsN6 m)occurring on April 2003 also entailed a rapid shorelineevolution. Conversely, during the milder summer condi-tions of 2003, the shoreline remained virtually static.
As illustrated in Fig. 10 conditions can vary notice-ably from the average ‘low energy’ state at Can Picafort.For example, during the winters of 2002 and 2003 theestimation of Hs of up to 6 m which were provided byPuertos del Estado in the nearest WANA point contrastswith previous mild years. This annual variation becomesimportant in the case of short lifespan nourishments, asis the case of Can Picafort where the model yields anourishment half-life of some 0.7 years. Besides theabovementioned intra-annual variability, inter-annualvariations are also important in terms of beach manage-ment. Fig. 9 shows that the winters of 2001–2002 and2002–2003 were particularly energetic compared withprevious years, and the project lifespan could be some-what expanded, although not significantly in terms ofbeach use in the case of milder winters.
5. Discussion
From the results of the historical shoreline evolution,based on aerial photographs and EOF analysis, it can beinferred that prior to 1987 Can Picafort beach did notexhibit significant regression. Most of the beach re-shaping could be attributed to alongshore evolutionpatterns, and to temporal readjustments in response toprevailing sea conditions that generated shoreline mob-ility averaging ±4m. Indeed, themost important tendencycould be interpreted as a slight anticlockwise beachrotation. This shoreline variability, although low, may besignificant in terms of the recreational use of the beachconsidering that the bermwidth at certain locations is onlysome 20 m. Nourishment could thus be a sustainable wayto manage this problem, provided that coastal processesare appropriately considered (Phillips and Jones, 2006).
Prior to beach renourishment the transition betweenthe northern and central sectors, and the urban area of CanPicafort were themost variable areas. These zones alreadyexhibited a high degree of backshore development at thattime, and a link between urbanisation and shoreline va-riation could be regarded as an explanation for the highervariability at these sites. The presence of resorts andseawall structures limits the volume of available sedimentthat can be drawn upon during extreme changes to thesystem, thus affecting beach recovery rates (Hill et al.,2004).
Conservation of the dune fields in the central sector(Natural Park) would be a major factor to consider in themanagement strategy since they provide stability to the
system and, most importantly, because almost 75% of theMediterranean coastal dunes have been damaged or de-stroyed as a result of tourism activities (Géhu, 1985). Thesediment budget in this sector benefits from the balancedbudget provided by dune erosion. Indeed, the narrownessof beach (between 15 and 20m in the Natural Park area), acharacteristic feature in the vicinity of Mediterraneandune fields (Van der Meulen and Salman, 1996), favoursthis process during storm events. Preservation of the na-tural area is, however, in conflict with the beach fillstrategy since the existence of an unnourished zone alongthe Natural Park shortens the longevity of the project bylimiting the length of the renourished areas. The man-agement approach that avoids replenishment in this areabut allows up and downstream fills should therefore bereviewed, since in either case the shoreline becomesaffected.
In a study of the sediment transport on a beach inAustralia, Clarke and Eliot (1988) concluded that long-term changes could be explained by onshore–offshoresediment movement, whereas short-term changes inbeach morphology resulted from longshore transport.This bi-modal concept of shoreline behaviour helps toreconcile the above mentioned variability with shorelinestabilisation as a result of the renourishment strategy atCan Picafort beach. Unlike other areas with strongshoreline retreat (e.g. Li et al., 2006) reiterative sedimentreplenishment has been shown to be effective in helpingto maintain a somewhat static position of the shoreline. Aplausible explanation is that the rate of supply of artificialsediment (N12000 m3/yr) is significant when comparedto the estimated alongshore transport rates (between 1500and 5000m3/yr). This extra amount of sediment, providedas a result of lateral diffusion, would allow formorphodynamic adjustments whilst the shoreline remainsrelatively fixed. The success of this artificial profilefeeding for beach maintenance cannot be generalised,since it will rely on factors such as beach profilecharacteristics, geological framework, distribution of theimported sediment, compatibility between native andimported sediment and the oceanographic conditions.
Another aspect characterising the beach nourishmentstrategy at Can Picafort is that although performed rapidlyat a relatively low environmental cost, small volume andfragmented nourishments present a low temporal persis-tence. Despite the fact that renourishment is generallypresented by coastal managers as a palliative strategy fordry beach loss, nourishment performance estimationsdemonstrate that, on a yearly basis, the efficiency of thismethod is doubtful. This could be partially attributed tothe change to a more dissipative morphodynamic stateduring storms, which would favour transference of large
150 G. Basterretxea et al. / Geomorphology 88 (2007) 139–151
amounts of sediment on the submerged part of the activeprofile thus adding to rapid project deterioration (seeJenkins and Keehn, 2001). Bruun (1996) discusses theimportance of simulating the natural profile duringnourishment operations in order to diminish the expo-nential decay of the beach fills. Our field surveys showthat only 30% of the volume supplied was present on thenourishment sites 10 months after the project was carriedout, which appears to be consistent with a rapid sedimentredistribution along the submerged profile. Planformerosion rates appear to be somewhat lower than volumeloss, and only 20% of the total beach expansion is erodedduring the same period. However, as suggested by beachprofile data, this surface maintenance is presumablyaccomplished by sediment transport from the upper to thelower foreshore. The rate of this transference is controlled,among other factors, by the amount of sediment availablein the berm which is dependent on hB, and by theoccurrence of enhanced energy events where thecombined action of waves and wind carries sedimentfrom the berm crest into the influence of nearshoredynamics. This process has been reported to occur in otherMediterranean beaches related to sea level fluctuationsinduced by barometric variations and wind effects (e.g.Basterretxea et al., 2004), and it has been reported to playthe most significant role in shaping the beachmorphologyof other microtidal regions (Sanderson et al., 2000).
Although the relation between project longevity andberm height is contained in the model presented, in-creased cross-shore transport during storm episodes is afactor that is not considered in simple one-dimensionalmodels. Furthermore, berm erosion as a shoreline feedingmechanism is most effective in renourished areas but isfairly limited in the adjacent shorelines. This is consistentwith differences in the model performance between theseareas. Similar problems in beach fill studies have beenpreviously reported by Walton et al. (2005).
6. Conclusions
Between 1987 and 1996 Can Picafort beach wasrepeatedly nourished with small sediment volumes. Thistechnique allows the rapid recovery of available beachfor recreational uses after major storms or particularlyhard winters. The lifetime of the increased beach surfacehas been shown to be low, among other causes, becauseof the presence of an unnourished area in the centre ofthe beach. Moreover, due to the relatively small amountof sediment deposited, the magnitude of beach wideningis also low, and could only be considered as a benefit forbeach exploitation over short timescales (one or twotourism seasons). However, as depicted from aerial
photographs, periodic replenishments may significantlydecrease beach mobility. Another advantage lies in thereduced impact to nearby ecosystems and, in somecases, its higher cost effectiveness (e.g.Bruun, 1993;Muñoz-Perez et al., 2001).
Acknowledgements
This work has been carried out as part of MEET,MONIPLAYAS (Govern Balear) and LIFE-POSIDO-NIA (LIFE00/NAT/E/007303) projects. Valuable com-ments from F. Morales and two anonymous reviewersare greatly appreciated. Field assistance was providedby Carles Homs, Félix Álvarez, Miguel McMinn andAna Rodriguez. We are also indebted to Clima Marítimo(Puertos del Estado) who provided wave estimations,and to Demarcación de Costas de Baleares (Ministeriode Medio Ambiente) for the useful information and dataon Can Picafort beach renourishment.
References
Aubrey, D.G., 1979. Seasonal patterns of onshore/offshore sedimenttransport. J. Geophys. Res. 84 (C10), 6347–6354.
Basterretxea, G., Orfila, A., Jordi, A., Casas, B., Lynett, P., Liu, P.L.F.,Duarte, C.M., Tintoré, J., 2004. Seasonal dynamics of a microtidalpocket beach with Posidonia oceanica seabeds (Mallorca, Spain).J. Coast. Res. 20, 1155–1164.
Benedet, L., Finkl, C., Campbell, T., Klein, A., 2004. Predicting theeffect of beach nourishment and cross-shore sediment variation onbeach morphodynamic assessment. Coast. Eng. 51, 839–861.
Boudouresque, C.F., Jeudy de Grissac, A., 1983. L'herbier à Posidoniaoceanica en Méditeranée: les interactions entre le plant et lesédiment. J. Rech. Océanogr. 8 (2–3), 99–122.
Bruun, P., 1993. Economic aspects of backpassing: new-type profilingby new-type equipment. J. Coast. Res. 9, 1106–1109.
Bruun, P., 1996. Interdependence of beach fill volumes and repetitionintervals. J. Waterw. Port Coast. Ocean Eng. 122, 103.
Clarke, D.J., Eliot, I.G., 1988. Low-frequency changes of sedimentvolume on the beachface atWarilla Beach, New SouthWales, 1975–1985. Mar. Geol. 79, 189–211.
Dean, R.G., 1996. Beach nourishment performance: planformconsiderations. Shore Beach 64, 36–39.
Dean, R.G., 2002. Beach Nourishment: Theory and Practice.Advanced Series on Ocean Engineering, vol. 18. World ScientificPublishing Co, Singapore.
Dean, R.G., Dalrymple, A., 2002. Coastal Processes with EngineeringApplications. Cambridge University Press, Cambridge, UK.
De Falco, G., Molinaroli, E., Baroli, M., Bellacicco, S., 2003. Grainsize and compositional trends of sediments from Posidoniaoceanica meadows to the beach shore, Sardinia, westernMediterranean. Estuar. Coast. Shelf Sci. 58, 299–309.
del Valle, R., Medina, R., Losada, M.A., 1993. Dependence of coeffi-cient K on grain size. J. Waterw. Port Coast. Ocean Eng. 119 (5),568–574.
Fornós, J.J., Ahr, W.M., 1997. Temperate carbonates on a modern, lowenergy, isolated ramp: the Balearic Platform, Spain. J. Sediment.Res. 67, 364–373.

151G. Basterretxea et al. / Geomorphology 88 (2007) 139–151
Géhu, J.M., 1985. European Dune and Shoreline Vegetation. Councilof Europe, Strasbourg.
Guillén, J., Hoekstra, P., 1997. Sediment distribution in the nearshorezone: grain size evolution in response to shoreface nourishment(Island of Terschelling, The Netherlands). Estuar. Coast. Shelf Sci.45, 639–652.
Hamm, L., Hanson, H., Capobianco, M., Dette, H.H., Lechuga, A.,Spanhoff, R., 1998. Beach fills in European projects: practices andobjectives. Proc. ICCE 1998, pp. 3060–3073.
Hill, H.W., Kelley, J.T., Belknap, D.F., Dickson, S.M., 2004. Theeffects of storms and storm-generated currents on sand beaches inSouthern Maine, USA. Mar. Geol. 210, 149–168.
Horn, D.P., 2002. Mesoscale beach processes. Prog. Phys. Geogr. 26,271–289.
Janke, J.R., 2002. An analysis of the current stability of the Dune Fieldat Great Sand Dunes National Monument using temporal TMimagery. Remote Sens. Environ. 83, 488–497.
Jenkins, M., Keehn, S., 2001. Effects of beach nourishment onequilibrium profile and closure depth. Proc. Coastal DynamicsV01, Lund, Sweden, pp. 888–897.
Komar, P.D., Inman, D.L., 1970. Longshore transport on beaches.J. Geophys. Res. 75 (30), 5514–5527.
Li, F., Dyt, C., Griffiths, C., 2006. Multigrain sedimentation/erosionmodel based on cross-shore equilibrium sediment distribution:application to nourishment design. Estuar. Coast. Shelf Sci. 67,664–672.
Losada, M.A., Medina, R., Vidal, C., Roldan, A., 1991. Historicalevolution and morphological analysis of ’el Puntal’ Spit, Santander(Spain). J. Coast. Res. 7, 711–722.
Masselink, G., Short, A.D., 1993. The effect of tide range on beachmorphodynamics: a conceptual beach model. J. Coast. Res. 9,785–800.
Moore, L., Griggs, G.B., 2002. Long-term cliff retreat and erosionhotspots along the central shores of the Monterey Bay NationalMarine Sanctuary. Mar. Geol. 191, 265–283.
Muñoz-Perez, J.J., Lopez de SanRoman-Blanco,B., Gutierrez-Mas, J.M.,Moreno, L., Cuenca, G.J., 2001. Cost of beach maintenance in theGulf of Cadiz (SW Spain). Coast. Eng. 42, 143–153.
Pelnard-Considere, R., 1956. Essai de theorie de l'evolution des formsde rivages en plage de sable et de galets. Fourth Journees del'Hydralique, les energies de la Mer. Question III, Rapport, vol. 1,pp. 289–298.
Phillips, M.R., Jones, A.L., 2006. Erosion and tourism infrastructure inthe coastal zone: problems, consequences and management. Tour.Manage. 27, 517–524.
Sanderson, P.G., Eliot, I., Hegge, B., Maxwell, S., 2000. Regionalvariation of coastal morphology in southern Australia: a synthesis.Geomorphology 34, 73–88.
Stive, M.J.F., Spanhoff, R., Capobianco, M., Hamm, L., Dette, H.,Hanson, H., Steetzel, H., Larson, M., 2002. Variability of shore andshoreline evolution. Coast. Eng. 47, 211–235.
Van der Meulen, F., Salman, H.P.M., 1996. Management ofMediterranean coastal dunes. Ocean Coast. Manag. 30 (2–3),177–195.
Walton Jr., T.L., 1994. Shoreline solution for tapered beach fill.J. Waterw. Port Coast. Ocean Eng. 120, 651–655.
Walton Jr., T.L., Cheng, J., Wang, R., Manausa, M., 2005. Modeling ofthree beach fill projects. Ocean Eng. 32, 557–569.
Winant, C.D., Inman, D.L., Nordstrom, C.E., 1975. Description ofseasonal beach changes using empirical eigenfunctions. J. Geophys.Res. 80, 1979–1986.
White, K., El Asmar, H.M., 1999. Monitoring changing position ofcoastlines using Thematic Mapper imagery, an example from theNile Delta. Geomorphology 29, 93–105.
Work, P.A., Dean, R.G., 1995. Assessment and prediction of beachnourishment evolution. J. Waterw. Port Coast. Ocean Eng. 121,182–189.