Evaluation of a post-fire tree mortality model for western USA conifers
11
CSIRO PUBLISHING www.publish.csiro.au/journals/ijwf International Journal of Wildland Fire, 2007, 16, 679–689 Evaluation of a post-fire tree mortality model for western USA conifers Sharon M. Hood A,C , Charles W. McHugh A , Kevin C. Ryan A , Elizabeth Reinhardt A and Sheri L. Smith B A US Department of Agriculture Forest Service, Rocky Mountain Research Station, Fire Sciences Laboratory, 5775 US Highway 10W, Missoula, MT 59808, USA. B Forest Health Protection, Region 5, Northeastern California Shared Service Area, Forest Service, US Department of Agriculture, 2550 Riverside Drive, Susanville, CA 96130, USA. C Corresponding author. Email: [email protected] Abstract. Accurately predicting fire-caused mortality is essential to developing prescribed fire burn plans and post-fire salvage marking guidelines. The mortality model included in the commonly used USA fire behaviour and effects models, the First Order Fire Effects Model (FOFEM), BehavePlus, and the Fire and Fuels Extension to the Forest Vegetation Simulator (FFE-FVS), has not been tested with independently collected post-fire tree mortality data. The model predicts mortality for a wide range of conifer species based on crown scorch and species-specific bark thickness. We evaluated the mortality model on 13 western USA conifers: subalpine fir, red fir, white fir, Douglas-fir, incense cedar, western larch, western hemlock, Engelmann spruce, whitebark pine, lodgepole pine, ponderosa pine, Jeffrey pine, and sugar pine. Predicted stand-level mortality was within ±20% of observed mortality for all species except incense cedar, western larch, red fir, and western hemlock. Individual tree mortality prediction was most accurate for subalpine fir, incense cedar, ponderosa pine, and Jeffrey pine. Evaluation of the model provides managers with an accuracy assessment for estimating the probability of mortality for the majority of western USA conifers when using the mortality model to make land management decisions. A Additional keywords: BehavePlus, FFE-FVS, FOFEM, model accuracy, prescription, salvage, tree survival. Introduction Accurate prediction of post-fire tree mortality is critical for making sound land management decisions such as developing prescribed burning prescriptions and post-fire salvage marking guidelines. Most post-fire logistic regression mortality models are species-specific and incorporate morphological injury vari- ables as well as tree attributes (i.e. size, bark thickness). Most models have been developed for western United States (USA) conifers (Peterson and Arbaugh 1989; Saveland et al. 1990; Harrington 1993; Regelbrugge and Conard 1993; Mutch and Parsons 1998; Stephens and Finney 2002; McHugh and Kolb 2003; Keyser et al. 2006; Sieg et al. 2006; Thies et al. 2006; Hood et al. 2007; Hood and Bentz 2007). Logistic regression mortality models have also been developed for some species in Canadian (Beverly and Martell 2003; Hély et al. 2003), Euro- pean (Rigolot 2004), and South American (Barlow et al. 2003) forests. Managers in the USA often use the mortality model included in the First Order Fire Effects Model (FOFEM v. 5.0), Behave- Plus (v. 3.0), and the Fire and Fuels Extension to the Forest Vegetation Simulator (FFE-FVS, Suppose v. 1.19A) to evaluate fuel treatment and silvicultural prescription options (Reinhardt A The use of trade or firm names in the present paper is for reader information and does not imply endorsement by the US Department of Agriculture of any product or service. This paper was written and prepared by US Government employees on official time, and therefore is in the public domain and not subject to copyright. et al. 1997; Andrews et al. 2003; Reinhardt and Crookston 2003). The mortality model form is the same in all three of the fire behaviour and effects software programs. Ryan and Reinhardt (1988) developed the original logistic regression mortality model used in today’s USA fire behaviour and effects models. Ryan and Amman (1994) updated the orig- inal model to the form currently used in FFE-FVS, FOFEM, and BehavePlus. The Ryan and Amman mortality model (R-A model) includes a bark thickness term based on species and diameter at breast height (DBH), allowing the user to cal- culate predicted mortality using one model for a wide range of species. Besides bark thickness, the R-A model’s only other input is percentage crown volume scorched, an easily and quickly determined fire-injury variable. The R-A model uses percentage crown volume scorched and bark thickness to predict 3-year post-fire tree mortality. The model predicts that probability of mortality declines with increasing tree size and increases with increasing crown scorch in the form: P m = 1/(1 + exp(−1.941 + 6.316(1 − exp(−0.3937BT )) − 0.000535(CVS 2 ))) (1) © IAWF 2007 10.1071/WF06122 1049-8001/07/060679
Transcript of Evaluation of a post-fire tree mortality model for western USA conifers

CSIRO PUBLISHING
www.publish.csiro.au/journals/ijwf International Journal of Wildland Fire, 2007, 16, 679–689
Evaluation of a post-fire tree mortality modelfor western USA conifers
Sharon M. HoodA,C, Charles W. McHughA, Kevin C. RyanA,Elizabeth ReinhardtA and Sheri L. SmithB
AUS Department of Agriculture Forest Service, Rocky Mountain Research Station,Fire Sciences Laboratory, 5775 US Highway 10 W, Missoula, MT 59808, USA.
BForest Health Protection, Region 5, Northeastern California Shared Service Area, Forest Service,US Department of Agriculture, 2550 Riverside Drive, Susanville, CA 96130, USA.
CCorresponding author. Email: [email protected]
Abstract. Accurately predicting fire-caused mortality is essential to developing prescribed fire burn plans and post-firesalvage marking guidelines. The mortality model included in the commonly used USA fire behaviour and effects models,the First Order Fire Effects Model (FOFEM), BehavePlus, and the Fire and Fuels Extension to the Forest VegetationSimulator (FFE-FVS), has not been tested with independently collected post-fire tree mortality data. The model predictsmortality for a wide range of conifer species based on crown scorch and species-specific bark thickness. We evaluatedthe mortality model on 13 western USA conifers: subalpine fir, red fir, white fir, Douglas-fir, incense cedar, westernlarch, western hemlock, Engelmann spruce, whitebark pine, lodgepole pine, ponderosa pine, Jeffrey pine, and sugar pine.Predicted stand-level mortality was within ±20% of observed mortality for all species except incense cedar, westernlarch, red fir, and western hemlock. Individual tree mortality prediction was most accurate for subalpine fir, incense cedar,ponderosa pine, and Jeffrey pine. Evaluation of the model provides managers with an accuracy assessment for estimatingthe probability of mortality for the majority of western USA conifers when using the mortality model to make landmanagement decisions.A
Additional keywords: BehavePlus, FFE-FVS, FOFEM, model accuracy, prescription, salvage, tree survival.
Introduction
Accurate prediction of post-fire tree mortality is critical formaking sound land management decisions such as developingprescribed burning prescriptions and post-fire salvage markingguidelines. Most post-fire logistic regression mortality modelsare species-specific and incorporate morphological injury vari-ables as well as tree attributes (i.e. size, bark thickness). Mostmodels have been developed for western United States (USA)conifers (Peterson and Arbaugh 1989; Saveland et al. 1990;Harrington 1993; Regelbrugge and Conard 1993; Mutch andParsons 1998; Stephens and Finney 2002; McHugh and Kolb2003; Keyser et al. 2006; Sieg et al. 2006; Thies et al. 2006;Hood et al. 2007; Hood and Bentz 2007). Logistic regressionmortality models have also been developed for some species inCanadian (Beverly and Martell 2003; Hély et al. 2003), Euro-pean (Rigolot 2004), and South American (Barlow et al. 2003)forests.
Managers in the USA often use the mortality model includedin the First Order Fire Effects Model (FOFEM v. 5.0), Behave-Plus (v. 3.0), and the Fire and Fuels Extension to the ForestVegetation Simulator (FFE-FVS, Suppose v. 1.19A) to evaluatefuel treatment and silvicultural prescription options (Reinhardt
A The use of trade or firm names in the present paper is for reader information and does not imply endorsement by the US Department of Agriculture of anyproduct or service. This paper was written and prepared by US Government employees on official time, and therefore is in the public domain and not subjectto copyright.
et al. 1997;Andrews et al. 2003; Reinhardt and Crookston 2003).The mortality model form is the same in all three of the firebehaviour and effects software programs.
Ryan and Reinhardt (1988) developed the original logisticregression mortality model used in today’s USA fire behaviourand effects models. Ryan and Amman (1994) updated the orig-inal model to the form currently used in FFE-FVS, FOFEM,and BehavePlus. The Ryan and Amman mortality model(R-A model) includes a bark thickness term based on speciesand diameter at breast height (DBH), allowing the user to cal-culate predicted mortality using one model for a wide rangeof species. Besides bark thickness, the R-A model’s only otherinput is percentage crown volume scorched, an easily and quicklydetermined fire-injury variable.
The R-A model uses percentage crown volume scorchedand bark thickness to predict 3-year post-fire tree mortality.The model predicts that probability of mortality declines withincreasing tree size and increases with increasing crown scorchin the form:
Pm = 1/(1 + exp(−1.941 + 6.316(1 − exp(−0.3937BT ))
− 0.000535(CVS2))) (1)
© IAWF 2007 10.1071/WF06122 1049-8001/07/060679
680 Int. J. Wildland Fire S. M. Hood et al.
where Pm, probability of mortality; BT, bark thickness (cm);CVS, percentage of pre-fire crown volume scorched.
FFE-FVS, FOFEM, and BehavePlus are used to predict firebehaviour and effects based on topography, fuels, weather, andstand conditions. For comparing silvicultural prescriptions andcreating prescribed burn plans, either the expected flame lengthor scorch height is used to estimate crown length scorched (VanWagner 1973; Reinhardt and Ryan 1988). The scorch variableused in the R-A model is the percentage of pre-fire needle volumekilled in the crown and assumes that needle kill and bud kill areequal. The crown volume scorched variable is calculated usingthe form:
CVS = 100CLS(2CL − CLS/CL2) (2)
where CVS, crown volume scorched (%); CLS, crown lengthscorched (m); CL, crown length (m).
FFE-FVS, FOFEM, and BehavePlus use a set of standardisedbark thickness equations where bark thickness is assumed to havea liner relationship to DBH in the form:
BT = v(DBH ) (3)
where BT, bark thickness (cm); v, species specific multiplier;DBH, diameter at breast height (cm).
The species-specific multipliers, v, are modified from theequations used in the base FVS model. They are scaled toreflect increasing bark thickness and fire tolerance (Lutes 2001;Reinhardt and Crookston 2003).
Although the R-A model is now widely used as a silvicul-tural tool in the western USA, it was developed from a relativelysmall sample of seven western coniferous species (n = 2356) andonly from prescribed fires in the Pacific north-west and northernRockies (see Ryan and Reinhardt 1988 for site descriptions).Thepredictive accuracy of the model has not been assessed for firesoutside the original study’s geographic area, for wildfires, or forother tree species except ponderosa pine (Pinus ponderosa P. &C. Lawson) (Weatherby et al. 1994; Finney 1999). The speciesincluded in the original model development were Douglas-fir(Pseudotsuga menziesii (Mirbel) Franco), western larch (Larixoccidentalis Nutt.), Engelmann spruce (Picea engelmannii Parryex Engelm.), lodgepole pine (Pinus contorta Dougl. ex Loud.),subalpine fir (Abies lasiocarpa (Hook.) Nutt.), western red cedar(Thuja plicata Donn ex D. Don), and western hemlock (Tsugaheterophylla (Raf.) Sarg.).
We evaluated the R-A model using fire-injury data amassedfrom numerous post-fire tree mortality studies across the westernUSA in order to assess (1) individual tree predictive accuracy;(2) stand-level predictive accuracy; and (3) differences in predic-tive accuracies among fires by species. Individual tree accuracyis useful for developing post-fire salvage guidelines to mark indi-vidual trees for harvest based on a predicted probability that thetrees will soon die (USDA Forest Service 1996a, 1996b; Smithand Cluck 2007). Stand-level accuracy is useful for developingprescribed fire burn plans to predict mortality levels in orderto achieve desired future stand structures and for comparingsilvicultural or fuel treatments.
Accuracy for prediction of mortality 3 years after burningwas assessed for all species used in the development of the orig-inal model, with the exception of western red cedar because
independent fire injury data were not available. In addition, weassessed model accuracy for white fir (Abies concolor (Gord.& Glend.) Lindl. ex Hildebr.), red fir (A. magnifica A. Murr.),incense cedar (Calocedrus decurrens (Torr.) Florin), whitebarkpine (Pinus albicaulis Engelm.), Jeffrey pine (P. jeffreyi Grev. &Balf.), ponderosa pine, and sugar pine (P. lambertiana Dougl.).
Methods
Study sitesWe pooled the 14 803 sample trees used in the current analysisfrom numerous fire-injury studies collected for 13 coniferousspecies from 21 fires in Arizona, California, Idaho, Montana,and Wyoming (Table 1). Three year post-fire tree mortality wasused for all fires. Fires occurred between 1982 and 2002 andincluded both prescribed fires and wildfires. Sample trees covera broad range of diameters and crown injury (Table 2). Speciesare listed by order of increasing bark thickness for all figuresand tables. Although some data used for the model validationare unpublished, most of the fires have been described elsewhere(Table 1).
MeasurementsCrown scorch and DBH, the two variables required to test theR-A model, were assessed on all trees within 1 year after fire.Percentage crown volume scorched was estimated for all speciesexcept red fir and sugar pine. For these species, crown length andcrown length scorched were measured and percentage crownvolume scorched was calculated using Eqn 2. Both crown vol-ume scorched and crown length scorched values are based onthe portions of the pre-fire crown that were either scorched orconsumed.
The R-A model does not differentiate between crown needlescorch and crown bud kill. Although these variables are approx-imately equal for most species, the difference can be substantialfor some species such as ponderosa pine, Jeffrey pine, and west-ern larch (Wagener 1961; Dieterich 1979; Ryan and Reinhardt1988; Hood et al. 2007). Both crown bud kill and crown needlescorch were assessed on 5635 ponderosa and Jeffrey pine trees.Crown bud kill equals the percentage of pre-fire crown volumewhere buds were killed either by heated air (scorched) or directflame contact (consumed). Crown scorch equals the percentageof the pre-fire crown volume where needles were either scorchedor consumed and could include areas with live and dead buds.We tested model accuracy using both crown injury variables forthese trees. We excluded the Dauber, Side, and Bridger-Knollfires in Arizona from the crown kill analysis because these treeshad no crown bud kill data.
We calculated the bark thickness from the DBH measure-ments using the species-specific equations in Reinhardt andCrookston (2003) (Eqn 3). Because of morphological similar-ities, the ponderosa and Jeffrey pines from fires in Californiawere grouped into one yellow pine category during data collec-tion.Therefore, we used the ponderosa pine equation to calculatebark thickness for all yellow pines.
Data analysisWe used general linear mixed models (GLMM) to test for dif-ferences in crown volume scorched and DBH between live

Evaluating USA post-fire tree mortality models Int. J. Wildland Fire 681
Table 1. Summary of fire data used to test the Ryan and Amman (R-A) mortality modelSpecies: LP, lodgepole pine; WP, whitebark pine; ES, Engelmann spruce; RF, red fir; WH, western hemlock; SF, subalpine fir; WF, white fir; IC, incense
cedar; JP, Jeffrey pine; PP, ponderosa pine; DF, Douglas-fir; WL, western larch; SP, sugar pine
Fire name State Fire type Month, year Species No. trees Reference
Dauber Arizona Prescribed Sept. 1995 PP 222 McHugh and Kolb 2003Bridger-Knoll Arizona Wild June 1996 PP 833 McHugh and Kolb 2003Side Arizona Wild May 1996 PP 312 McHugh and Kolb 2003Rodeo-Chediski Arizona Wild June 2002 PP 698 S. Hood, unpubl. dataA
Barkley California Wild Sept. 1994 SP 20 Smith 1995Bucks California Wild Aug. 1999 RF, SP 127 Hood et al. 2007Storrie California Wild Aug. 2000 RF 97 Hood et al. 2007Star California Wild Aug. 2001 SP 74 Hood et al. 2007Cone California Wild Sept. 2002 JP, PP 1064 Hood et al. 2007McNally California Wild July 2002 WF, IC, JP, PP 3754 Hood et al. 2007Oops Idaho Wild Oct. 1982 DF, WH 151 K. Ryan, unpubl. dataA
Air Patrol Montana Wild Aug. 1988 PP 505 Finney 1999Brewer Montana Wild June 1988 PP 627 Finney 1999Early Bird Montana Wild June 1988 PP 616 Finney 1999Canyon Creek Montana Wild Sept. 1988 WL 69 K. Ryan, unpubl. dataA
Mussigbrod Montana Wild Aug. 2000 SF, WP, LP, ES, DF 1102 Hood and Bentz 2007Moose Montana Wild Aug. 2001 SF, WL, WP, LP, ES, DF 1266 Hood and Bentz 2007Lubrecht Montana Prescribed April 2002 WL, LP, PP, DF 1696 Gundale et al. 2005Tenderfoot Montana Prescribed Sept. 2002 SF, WP, LP, ES 961 Hardy et al. 2006Yellowstone Wyoming Wild June 1988 SF, LP, ES, DF 310 Ryan and Amman 1994Green Knoll Wyoming Wild Aug. 2001 SF, LP, DF 299 Hood and Bentz 2007
AData on file at Rocky Mountain Research Station, Fire Sciences Laboratory, Missoula, MT, USA.
Table 2. Mean, standard error, median, and range of crown scorch and diameter at breast height (DBH) by species of trees used to test the Ryanand Amman (R-A) mortality model
Species are listed in order of increasing bark thickness using bark thickness equations in Fire and Fuels Extension to the ForestVegetation Simulator (FFE-FVS)
Species No. trees Crown scorch (%) DBH (cm)
Mean ± s.e. Median Range Mean ± s.e. Median Range
Lodgepole pine 1550 29 ± 1.0 5 0–100 21.2 ± 0.2 19.8 10.2–56.4Whitebark pine 154 27 ± 3.0 5 0–100 23.0 ± 0.6 22.6 12.4–58.9Engelmann spruce 266 36 ± 2.1 25 0–100 32.5 ± 0.9 30.2 10.4–85.1Red fir 209 60 ± 2.2 71 0–99 42.1 ± 1.2 38.9 15.2–104.6Western hemlock 147 22 ± 2.3 10 0–100 27.3 ± 0.6 27.2 13.0–44.2Subalpine fir 905 68 ± 1.3 90 0–100 19.8 ± 0.3 17.8 10.2–75.2White fir 1880 71 ± 0.6 75 0–95 60.3 ± 0.5 57.2 25.4–152.7Incense cedar 788 44 ± 1.2 50 0–95 51.6 ± 0.9 43.7 25.4–166.4Yellow pineA 7004 58 ± 0.5 70 0–100 41.7 ± 0.3 35.1 6.3–178.1Douglas-fir 1482 35 ± 0.9 20 0–100 33.2 ± 0.4 30.0 10.2–105.4Western larch 309 34 ± 2.2 10 0–100 35.8 ± 0.8 35 10.2–98.8Sugar pine 109 71 ± 2.7 81 0–100 67.7 ± 1.7 68.8 26.2–106.4
AIncludes ponderosa and Jeffrey pine.
and dead trees, including fire as a random effect when sam-ple trees were distributed across multiple fires (Littell et al.1996). When sample trees came from only one fire, we usedWilcoxon–Mann–Whitney tests to test for differences betweenlive and dead trees. P-values less than or equal to 0.05 in theGLMM and Wilcoxon–Mann–Whitney tests were consideredstatistically significant.
We calculated the predicted probability of mortality (Pm) forall trees (n = 14 803) using the R-A model (Eqn 1). Predictiveaccuracy of the R-A model by species was then assessed at the
individual tree level and stand level. We evaluated individualtree accuracy using classification tables and Receiver OperatorCharacteristic (ROC) curves. Stand-level mortality was assessedby comparing actual v. predicted mortality across 0.1 Pm classes.
Classification tables allow the user to determine classificationaccuracy of a model based on the selected Pm. Trees with val-ues above the selected cutoff probability are classified as dead,whereas trees below the cutoff probability are classified as live.The selected cutoff level determines the model accuracy. Stud-ies have typically reported model accuracy based on either Pm
682 Int. J. Wildland Fire S. M. Hood et al.
equal to 0.5 or 0.6 (Ryan and Reinhardt 1988; Regelbrugge andConard 1993; Keyser et al. 2006; Thies et al. 2006). The classifi-cation data presented for the present study display the percentageof trees that were correctly predicted as live and dead (total cor-rect), the percentage of trees the model predicted to die andthat were observed dead (correctly predicted mortality), and thepercentage of trees the model predicted to live and that wereobserved live (correctly predicted survival) from Pm 0.1 to 0.9.
Data from the classification tables are shown as figures forease of interpretation and comparison by species. High cor-rectly predicted mortality values indicate the majority of treespredicted to die did so within 3 years after fire. Conversely,low correctly predicted mortality values indicate many treespredicted to die survived for at least 3 years after fire (mor-tality overpredicted). High correctly predicted survival valuesmean that the majority of trees predicted to live survived at least3 years after fire. Alternatively, low correctly predicted survivalvalues mean that many trees predicted to live died within 3 years(mortality underpredicted).
To see how well the model predicts individual tree mortality,both correctly predicted survival and mortality must be exam-ined. These are not the inverse of each other as one may firstassume. For example, the correctly predicted mortality rate maybe very high because a higher, conservative cutoff point waschosen. In this case, the majority of trees predicted to die doin fact die. However, because of this higher cutoff point, manytrees predicted to survive end up dying. This lowers the correctlypredicted survival rates.
Saveland and Neuenschwander (1990) first advocated theuse of ROC curves for tree mortality model evaluation. Severalauthors since have used ROC methodology to evaluate logis-tic regression models (Regelbrugge and Conard 1993; Stephensand Finney 2002; Beverly and Martell 2003; McHugh and Kolb2003; Rigolot 2004; Keyser et al. 2006; Sieg et al. 2006; Thieset al. 2006; Hood et al. 2007; Hood and Bentz 2007). The ROCcurve is a plot of the probability of a true positive prediction (treeclassified and observed dead) v. the probability of a false posi-tive prediction (tree classified as dead when it is alive) across thecontinuous Pm cutoff ranges from 0 to 1 (Saveland and Neuen-schwander 1990; Bradley 1996). The ROC reflects the accuracyof the model in classifying live and dead trees, with a valueof 0.5 being no better than chance and 1.0 indicating a perfectfit. Hosmer and Lemeshow (2000) report ROC values equal to0.5 suggest no discrimination from a 50–50 chance, and val-ues between 0.7 and 0.8 are acceptable discrimination, between0.8 and 0.9 are excellent discrimination, and greater than 0.9are considered outstanding discrimination. Swets (1996) usedsimilar guidelines.
When using the model to predict stand-level mortality, thecalculated Pm equals the percentage of the trees in a stand thatare predicted to die by tree species and size class. To test stand-level model accuracy, we grouped trees into 0.1 Pm classes byspecies after calculating the Pm for each tree. Predicted mortal-ity equalled the respective Pm class (e.g. Pm class 0.8 equalled80% predicted mortality). We then calculated the actual percent-age of trees in each Pm group that died (observed mortality). Wecompared actual v. predicted group mortality by subtracting thepredicted mortality from the observed mortality. Positive dif-ferences reveal where the R-A model overpredicts stand-level
post-fire mortality, whereas negative differences indicate wherestand-level post-fire mortality is underpredicted. We calculatedoverall stand-level accuracy by summing the predicted mortalityof each group and subtracting the summed value from the totalobserved mortality.
We used this process for all species except Engelmannspruce. FFE-FVS, FOFEM, and BehavePlus predict 80% post-fire spruce mortality, regardless of injury or size class. TheEngelmann spruce used in the R-A model development had veryhigh observed mortality, regardless of crown scorch level. Themodel developers chose the 80% mortality ‘floor’ for the soft-ware packages so that the predictions would better match theobservations (E. Reinhardt, pers. comm.). Therefore, we com-pared observed mortality v. the predicted 80% mortality forEngelmann spruce.
Model accuracy for predicting individual tree and stand-levelmortality was compared among different fires for lodgepolepine, Engelmann spruce, subalpine fir, yellow pine, and Douglas-fir using the same methods as described above, as these specieswere sampled from multiple fires. For these species, we onlyused sites that included more than 100 sample trees.
Results
Dead trees had significantly higher crown scorch than live treesfor all species tested (Table 3). The relationship of DBH betweenlive and dead trees was not as clear. Dead trees had significantlysmaller diameters than live trees for lodgepole pine, westernhemlock, yellow pine, Douglas-fir, and western larch. However,there were no significant differences in DBH between live anddead trees for whitebark pine, Engelmann spruce, red fir, sub-alpine fir, incense cedar, and sugar pine. Dead white fir, yellowpines from the McNally fire, and Douglas-fir from the GreenKnoll fire had significantly larger diameters than live trees.
Individual tree mortalityThe model most accurately classified subalpine fir (ROC = 0.91),followed closely by incense cedar (ROC = 0.88) (Table 3). Redfir (ROC = 0.65) and Engelmann spruce (ROC = 0.69) were theleast accurately classified. Comparisons of ROC values for indi-vidual fires showed large fluctuations in accuracy. In the yellowpine group, ROC values ranged from a high of 0.93 for theBridger-Knoll fire to a low of 0.68 for the McNally fire. Douglas-fir ROC values ranged from a high of 0.88 for the Lubrecht fireto a low of 0.64 for the Green Knoll fire.
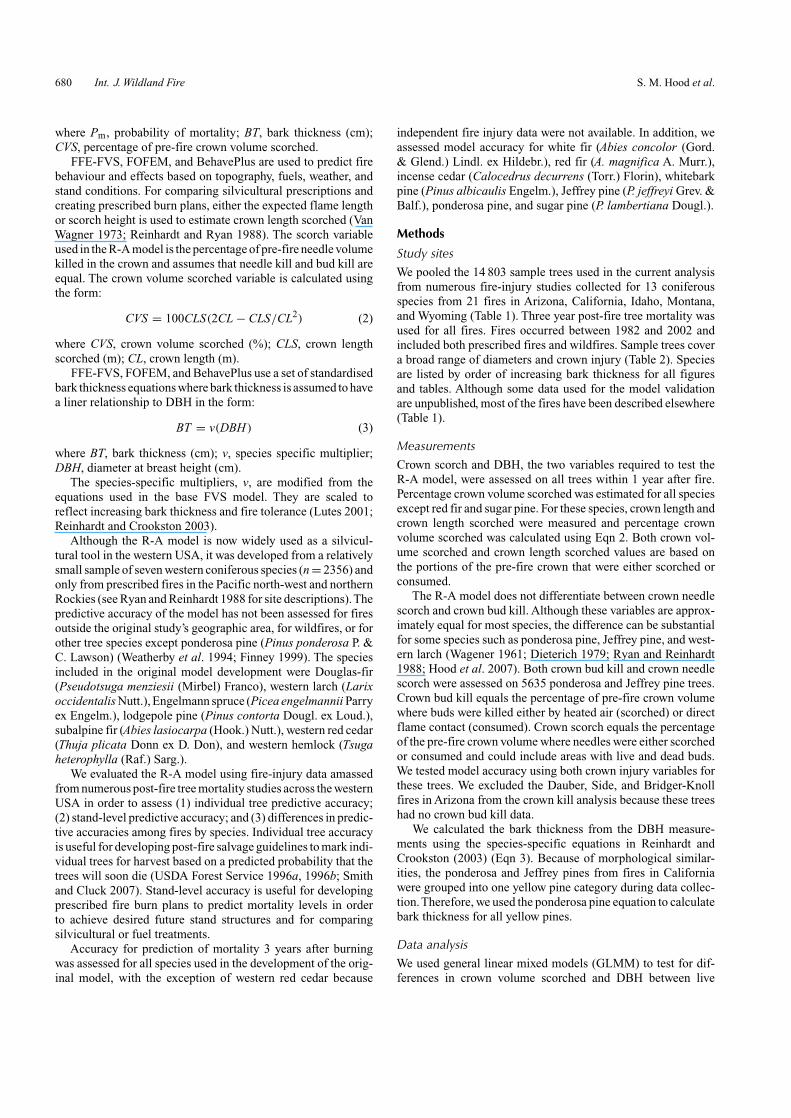
Individual tree survival was most accurately predicted forred fir, incense cedar, and western larch, whereas individual treemortality accuracy was the lowest (Fig. 1d, h, k). Mortality wasvery low (<17%) for these species (Table 3). When observedpost-fire mortality was very low, the model overpredicted mor-tality, but predicted survival very accurately. Large fluctuationsin correctly predicted survival for lodgepole and whitebark pinewere due to the model predicting very few trees to survive(Fig. 1a, b). In this situation, a few misclassified trees causedlarge differences in the percentage of correctly classified trees.
Accuracy of predicted individual tree mortality generallyincreased with increasing Pm (Fig. 1). The exception was sugarpine. This again was due to the model predicting very few treesto die. At Pm = 0.9, only two trees were predicted to die and of
Evaluating USA post-fire tree mortality models Int. J. Wildland Fire 683
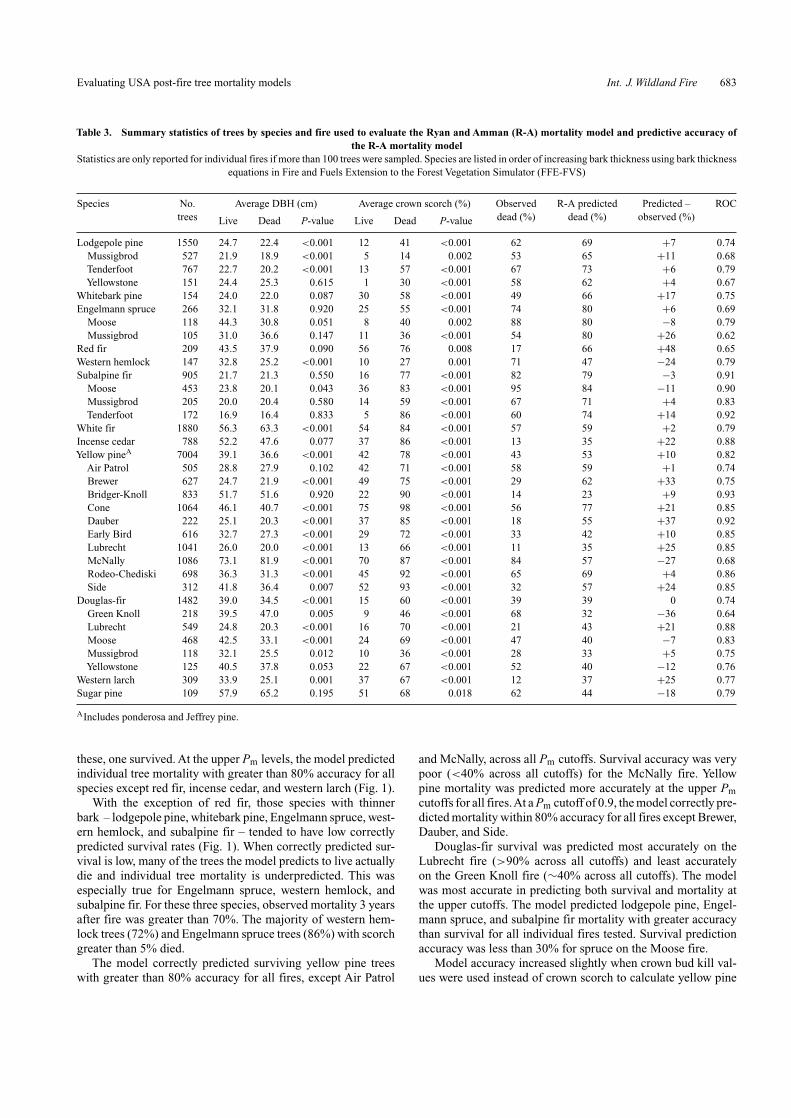
Table 3. Summary statistics of trees by species and fire used to evaluate the Ryan and Amman (R-A) mortality model and predictive accuracy ofthe R-A mortality model
Statistics are only reported for individual fires if more than 100 trees were sampled. Species are listed in order of increasing bark thickness using bark thicknessequations in Fire and Fuels Extension to the Forest Vegetation Simulator (FFE-FVS)
Species No. Average DBH (cm) Average crown scorch (%) Observed R-A predicted Predicted – ROCtrees Live Dead P-value Live Dead P-value dead (%) dead (%) observed (%)
Lodgepole pine 1550 24.7 22.4 <0.001 12 41 <0.001 62 69 +7 0.74Mussigbrod 527 21.9 18.9 <0.001 5 14 0.002 53 65 +11 0.68Tenderfoot 767 22.7 20.2 <0.001 13 57 <0.001 67 73 +6 0.79Yellowstone 151 24.4 25.3 0.615 1 30 <0.001 58 62 +4 0.67
Whitebark pine 154 24.0 22.0 0.087 30 58 <0.001 49 66 +17 0.75Engelmann spruce 266 32.1 31.8 0.920 25 55 <0.001 74 80 +6 0.69
Moose 118 44.3 30.8 0.051 8 40 0.002 88 80 −8 0.79Mussigbrod 105 31.0 36.6 0.147 11 36 <0.001 54 80 +26 0.62
Red fir 209 43.5 37.9 0.090 56 76 0.008 17 66 +48 0.65Western hemlock 147 32.8 25.2 <0.001 10 27 0.001 71 47 −24 0.79Subalpine fir 905 21.7 21.3 0.550 16 77 <0.001 82 79 −3 0.91
Moose 453 23.8 20.1 0.043 36 83 <0.001 95 84 −11 0.90Mussigbrod 205 20.0 20.4 0.580 14 59 <0.001 67 71 +4 0.83Tenderfoot 172 16.9 16.4 0.833 5 86 <0.001 60 74 +14 0.92
White fir 1880 56.3 63.3 <0.001 54 84 <0.001 57 59 +2 0.79Incense cedar 788 52.2 47.6 0.077 37 86 <0.001 13 35 +22 0.88Yellow pineA 7004 39.1 36.6 <0.001 42 78 <0.001 43 53 +10 0.82
Air Patrol 505 28.8 27.9 0.102 42 71 <0.001 58 59 +1 0.74Brewer 627 24.7 21.9 <0.001 49 75 <0.001 29 62 +33 0.75Bridger-Knoll 833 51.7 51.6 0.920 22 90 <0.001 14 23 +9 0.93Cone 1064 46.1 40.7 <0.001 75 98 <0.001 56 77 +21 0.85Dauber 222 25.1 20.3 <0.001 37 85 <0.001 18 55 +37 0.92Early Bird 616 32.7 27.3 <0.001 29 72 <0.001 33 42 +10 0.85Lubrecht 1041 26.0 20.0 <0.001 13 66 <0.001 11 35 +25 0.85McNally 1086 73.1 81.9 <0.001 70 87 <0.001 84 57 −27 0.68Rodeo-Chediski 698 36.3 31.3 <0.001 45 92 <0.001 65 69 +4 0.86Side 312 41.8 36.4 0.007 52 93 <0.001 32 57 +24 0.85
Douglas-fir 1482 39.0 34.5 <0.001 15 60 <0.001 39 39 0 0.74Green Knoll 218 39.5 47.0 0.005 9 46 <0.001 68 32 −36 0.64Lubrecht 549 24.8 20.3 <0.001 16 70 <0.001 21 43 +21 0.88Moose 468 42.5 33.1 <0.001 24 69 <0.001 47 40 −7 0.83Mussigbrod 118 32.1 25.5 0.012 10 36 <0.001 28 33 +5 0.75Yellowstone 125 40.5 37.8 0.053 22 67 <0.001 52 40 −12 0.76
Western larch 309 33.9 25.1 0.001 37 67 <0.001 12 37 +25 0.77Sugar pine 109 57.9 65.2 0.195 51 68 0.018 62 44 −18 0.79
AIncludes ponderosa and Jeffrey pine.
these, one survived. At the upper Pm levels, the model predictedindividual tree mortality with greater than 80% accuracy for allspecies except red fir, incense cedar, and western larch (Fig. 1).
With the exception of red fir, those species with thinnerbark – lodgepole pine, whitebark pine, Engelmann spruce, west-ern hemlock, and subalpine fir – tended to have low correctlypredicted survival rates (Fig. 1). When correctly predicted sur-vival is low, many of the trees the model predicts to live actuallydie and individual tree mortality is underpredicted. This wasespecially true for Engelmann spruce, western hemlock, andsubalpine fir. For these three species, observed mortality 3 yearsafter fire was greater than 70%. The majority of western hem-lock trees (72%) and Engelmann spruce trees (86%) with scorchgreater than 5% died.
The model correctly predicted surviving yellow pine treeswith greater than 80% accuracy for all fires, except Air Patrol
and McNally, across all Pm cutoffs. Survival accuracy was verypoor (<40% across all cutoffs) for the McNally fire. Yellowpine mortality was predicted more accurately at the upper Pmcutoffs for all fires.At a Pm cutoff of 0.9, the model correctly pre-dicted mortality within 80% accuracy for all fires except Brewer,Dauber, and Side.
Douglas-fir survival was predicted most accurately on theLubrecht fire (>90% across all cutoffs) and least accuratelyon the Green Knoll fire (∼40% across all cutoffs). The modelwas most accurate in predicting both survival and mortality atthe upper cutoffs. The model predicted lodgepole pine, Engel-mann spruce, and subalpine fir mortality with greater accuracythan survival for all individual fires tested. Survival predictionaccuracy was less than 30% for spruce on the Moose fire.
Model accuracy increased slightly when crown bud kill val-ues were used instead of crown scorch to calculate yellow pine

684 Int. J. Wildland Fire S. M. Hood et al.
Sub
alpi
ne fi
r
Sug
ar p
ine
0.0
0.2
0.4
0.6
0.8
1.0
Wes
tern
larc
h
0.0
0.2
0.4
0.6
0.8
1.0
Wes
tern
hem
lock
020406080100
(f)
Pre
dict
ed p
roba
bilit
y of
mor
talit
y (P
m)
(c)
Lodg
epol
e pi
ne
020406080100
(h)
Yel
low
pin
e
0.0
0.2
0.4
0.6
0.8
1.0
020406080100
(g)
Dou
glas
-fir
0.0
0.2
0.4
0.6
0.8
1.0
Tot
al c
orre
ctC
orre
ctly
pre
dict
ed m
orta
lity
Cor
rect
ly p
redi
cted
sur
viva
l
Ince
nse
ceda
r
Red
fir
Whi
te fi
r
Observed percent of trees in each Pm class
(j)
(i)
(a)
(e)
Eng
elm
ann
spru
ce(d
)W
hite
bark
pin
e(b
)
(k)
(l)
Fig
.1.
Cla
ssif
icat
ion
accu
racy
of(a
)lod
gepo
lepi
ne,(
b)w
hite
bark
pine
,(c)
Eng
elm
ann
spru
ce,(
d)re
dfi
r,(e
)wes
tern
hem
lock
,(f)
suba
lpin
efi
r,(g
)whi
tefi
r,(h
)inc
ense
ceda
r,(i
)yel
low
pine
(pon
dero
saan
dJe
ffre
ypi
ne),
(j)
Dou
glas
-fir
,(k)
wes
tern
larc
h,an
d(l
)su
gar
pine
usin
gth
eR
yan
and
Am
man
(R-A
)m
orta
lity
mod
elto
pred
icti
ndiv
idua
ltre
em
orta
lity
.Spe
cies
are
arra
nged
inor
der
ofin
crea
sing
bark
thic
knes
sus
ing
bark
thic
knes
seq
uati
ons
inth
eFi
rean
dF
uels
Ext
ensi
onto
the
Fore
stV
eget
atio
nS
imul
ator
(FF
E-F
VS
).L
arge
fluc
tuat
ions
inac
cura
cyca
nre
sult
whe
nfe
wtr
ees
are
pred
icte
dto
eith
erliv
eor
die
(a,b
,can
dl)
.For
exam
ple,
whe
nlo
dgep
ole
pine
Pm
=0.
3,tw
otr
ees
wer
epr
edic
ted
toliv
ean
dbo
thliv
ed.A
tPm
=0.
4,ni
nelo
dgep
ole
tree
sw
ere
pred
icte
dto
live,
butf
ive
died
.Whe
nsu
gar
pine
Pm
=0.
9,tw
otr
ees
wer
epr
edic
ted
todi
e,bu
tone
lived
.

Evaluating USA post-fire tree mortality models Int. J. Wildland Fire 685
probability of mortality (ROC = 0.81 v. 0.79). When kill wasused in the model, no surviving trees over 75-cm DBH were pre-dicted to die. Rather, mortality was underpredicted for the largertrees. Mortality was overpredicted for trees less than 75 cm, espe-cially for trees between 13-cm and 50-cm DBH with crown killlevels between 30 and 70% and scorch levels greater than 75%.
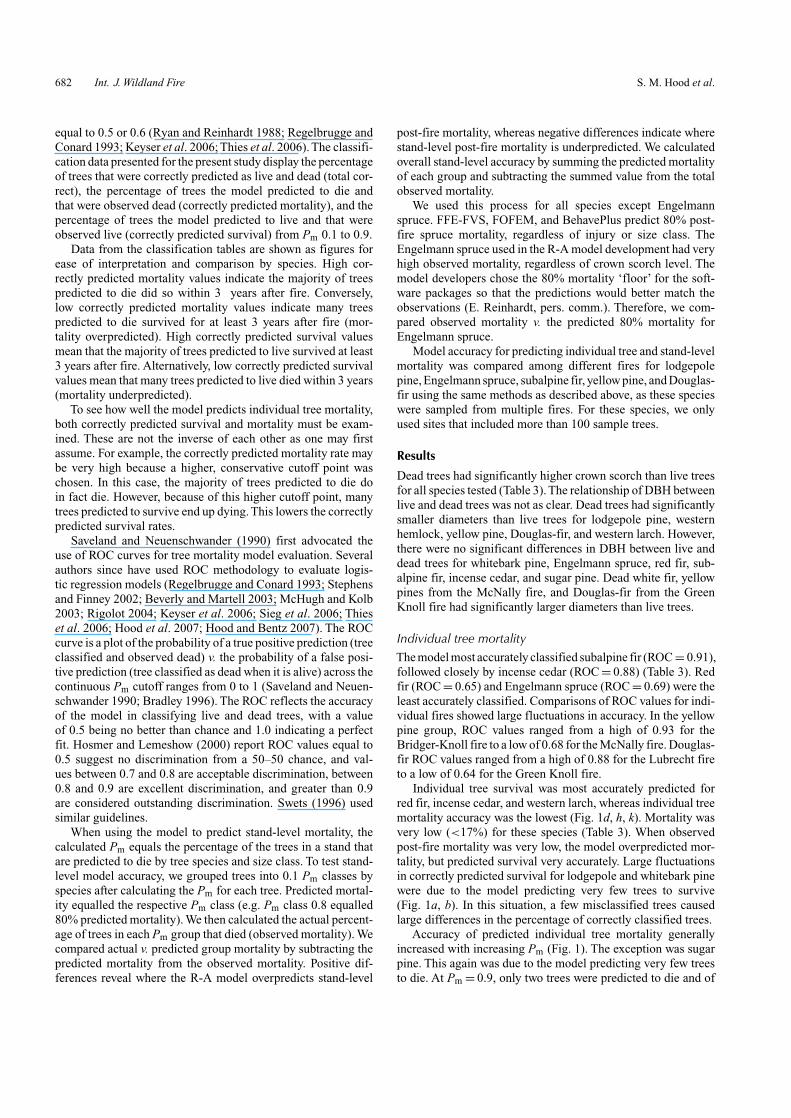
Stand-level mortalityOverall stand-level mortality was most overpredicted for red fir,incense cedar, and western larch (Table 3). Observed mortalitywas also the lowest for these three species, and the majority ofdead trees had greater than 95% scorch. Western hemlock andsugar pine mortality were most underpredicted. Overall stand-level mortality was predicted extremely accurately for subalpinefir, white fir, and Douglas-fir (Table 3).
The model overpredicted stand-level mortality across nearlyall Pm levels for all species except western hemlock, subalpinefir, white fir, and sugar pine (Fig. 2). White fir stand-level mor-tality was predicted within 10% for all Pm levels (Fig. 2g). Therewas no clear trend in over- or underprediction for subalpine firacross all Pm levels (Fig. 2f). Western hemlock and sugar pinemortality were underpredicted (Fig. 2e, l). Douglas-fir mortal-ity was also underpredicted when Pm values were less than 0.2(Fig. 2j).
When differences in individual fires were examined, themodel overpredicted yellow pine mortality across all Pm levelsfor all fires except the McNally and Air Patrol fires. Mortal-ity on the Air Patrol fire was underpredicted for Pm levels lessthan 0.4 and was overpredicted above this level. Mortality onthe McNally fire was underpredicted across all Pm levels. TheLubrecht fire was the only fire where Douglas-fir mortality wasoverpredicted across all Pm levels. Douglas-fir mortality wasmost underpredicted on the Green Knoll and Yellowstone fires(Table 3). Lodgepole pine, Engelmann spruce, and subalpinefir mortality was overpredicted for all fires except the Moosefire. For this fire, Engelmann spruce and subalpine fir wereunderpredicted and lodgepole pine was not sampled (Table 3).
Discussion
Mortality prediction for red fir, incense cedar, and western larchwas particularly poor, whereas survival prediction was mostaccurate. The overprediction of mortality suggests that thesespecies can survive higher levels of crown scorch than the otherspecies tested.The low accuracy of red fir could be due to the cal-culated percentage crown volume scorch values based on crownlength scorched measurements (Eqn 2). However, it is most likelydue to the low bark thickness factor given to red fir. The bark ofyoung red fir trees is thin, but becomes thick, roughly fissured,and fire-resistant with age (Cope 1993). Stephens and Finney(2002) reported that incense cedar can survive high levels ofcrown scorch and Regelbrugge and Conard (1993) concludedthat incense cedar could survive higher relative bark char heightsthan ponderosa pine. Western larch is considered one of the mostfire-tolerant western USA species (Flint 1925; Smith and Fisher1997). It is unique among the western USA conifers because it isdeciduous. It also has extremely thick bark and woody structuresaround the buds that protect them from heat injury (Ryan 1982a;Peterson and Ryan 1986). Because of these features, crown kill
would likely be a more appropriate indicator of actual crowninjury than crown scorch. The western larch trees used in thepresent study to test the model had higher crown scorch (34%;Table 2) than the larch trees used for original model develop-ment (15%; Ryan and Reinhardt 1988). This discrepancy couldalso explain differences in reported model predictive accuracybetween the original Ryan and Reinhardt (1988) study and thecurrent study.
Most misclassified surviving yellow pine trees had highcrown scorch, leading to lower correctly predicted mortalityrates and therefore, an overprediction of mortality. This trendwas across all size classes. This is likely due to the ability ofyellow pine to recover from high levels of scorch if crown kill islow (Wagener 1961; Harrington 1993). Crown scorch averaged27% higher than crown kill for false positive trees (predictedto die but lived, cutoff = 0.5). FFE-FVS, FOFEM, and Behave-Plus predict scorch height based on Van Wagner’s scorch heightmodel (1973). This model works for the majority of specieswhere scorch and kill are approximately equal. Currently, themodels are not able to predict both crown scorch and kill forthe few species where these values can differ, such as westernlarch, ponderosa pine, and Jeffrey pine. When available, crownkill estimates should be used in place of crown scorch estimatesto predict Pm for these species.
Most dead yellow pine trees that were predicted to live (falsenegatives) were larger than 75-cm DBH. Yellow pines on theMcNally fire were the largest in the study and dead trees on thisfire had larger diameters than live trees (Table 3). This suggeststhat other factors not accounted for in the model, such as stemor root injury, bark beetle attacks, or post-fire environmentalconditions, contributed to tree death.
Bole char was a significant factor in predicting mortality inthe Bridger, Side, and Dauber fires (McHugh and Kolb 2003).Post-fire insect attacks also contributed to ponderosa pine mor-tality in these fires, mostly from Ips species and Dendroctonusspecies (McHugh et al. 2003). Cambium kill and the presenceof red turpentine beetle (Dendroctonus valens) were also sig-nificant variables influencing yellow pine mortality in the Coneand McNally fires (Hood et al. 2007). Although red turpentinebeetles are not normally considered a direct cause of tree mor-tality, they can predispose trees to fatal attacks from other barkbeetles (Bradley and Tueller 2001). Perrakis and Agee (2006)also reported strong associations between western pine beetle(D. brevicomis) and red turpentine beetle attacks and post-fireponderosa pine mortality.
Other explanations are that older trees cannot survive highlevels of crown scorch as well as younger trees or they experi-enced extensive cambium injury at the bases. Older trees mayhave less carbohydrates available to repair injury owing to higherrespiration and lower photosynthetic capacities than youngertrees (Ryan et al. 1997; McHugh and Kolb 2003). Older pon-derosa and Jeffrey pine trees may have deep duff accumulationsaround the tree bases. These deep duff mounds can lead to basalinjury and tree mortality from smouldering combustion (Ryanand Frandsen 1991; Swezy and Agee 1991).
The range of yellow pine tree diameters from the McNally firehad little overlap with those used in the R-A model development(Ryan and Reinhardt 1988) or the other fires evaluated in thepresent study. This highlights the danger in extrapolating model

686 Int. J. Wildland Fire S. M. Hood et al.
Yel
low
pin
e
0.0
0.2
0.4
0.6
0.8
1.0
�0.
6
�0.
4
�0.
2
0.0
0.2
0.4
0.6
Dou
glas
-fir
0.0
0.2
0.4
0.6
0.8
1.0
Wes
tern
larc
h
0.0
0.2
0.4
0.6
0.8
1.0
Sug
ar p
ine
0.0
0.2
0.4
0.6
0.8
1.0
Ince
nse
ceda
rW
hite
fir
Sub
alpi
ne fi
r
Red
fir
Eng
elm
ann
spru
ceW
hite
bark
pin
eLo
dgep
ole
pine
�0.
6
�0.
4
�0.
2
0.0
0.2
0.4
0.6
Wes
tern
hem
lock
�0.
6
�0.
4
�0.
2
0.0
0.2
0.4
0.6
(a)
(b)
(c)
(d)
(e)
(f)
(g)
(h)
(i)(j
)(k
)(l
)
1633
30
26 1
7 4
3
18
Difference in predicted versus actual mortality
Pre
dict
ed p
roba
bilit
y of
mor
talit
y (P
m)
2 7
53
179
471
350
8040
8
8110
610
913
714
614
917
220
137
840
1
5866
32 2
722
148
712
63
6
10 1
712
6
12
15
19 2
6 8
6
188
138
89
39
39 4
943
42
67
94
14
8 1
2
8
7
11 1
916
12
2
1
2
10 2
650
22
7
36
607
735
642
478
490
424
394
533
688
2013
2
817
30
48
89 6
654
591
218
9313
013
818
225
786
5064
265
4 9
25
3329
28
28 2
916
65
Fig
.2.
Dif
fere
nce
betw
een
pred
icte
dan
dob
serv
edst
and-
leve
lpre
dict
edm
orta
lity
for1
0pr
edic
ted
prob
abil
ity
ofm
orta
lity
clas
sesf
or(a
)lod
gepo
lepi
ne,(
b)w
hite
bark
pine
,(c)
Eng
elm
ann
spru
ce,
(d)
red
fir,
(e)
wes
tern
hem
lock
,(f
)su
balp
ine
fir,
(g)
whi
tefi
r,(h
)in
cens
ece
dar,
(i)
yell
owpi
ne(p
onde
rosa
and
Jeff
rey
pine
),(j
)D
ougl
as-f
ir,
(k)
wes
tern
larc
h,an
d(l
)su
gar
pine
usin
gth
eR
yan
and
Am
man
(R-A
)m
orta
lity
mod
el.S
peci
esar
ear
rang
edin
orde
rof
incr
easi
ngba
rkth
ickn
ess
usin
gba
rkth
ickn
ess
equa
tion
sin
the
Fire
and
Fue
lsE
xten
sion
toth
eFo
rest
Veg
etat
ion
Sim
ulat
or(F
FE
-FV
S).
Num
bers
atbo
ttom
offi
gure
sar
enu
mbe
rsof
tree
spe
rpr
obab
ilit
yof
mor
tali
ty(P
m)
clas
s.V
alue
sgr
eate
rth
anze
rore
flec
tan
over
pred
icti
onin
stan
d-le
velm
orta
lity
for
that
Pm
clas
s.V
alue
sle
ssth
anze
rore
flec
tan
unde
rpre
dict
ion.

Evaluating USA post-fire tree mortality models Int. J. Wildland Fire 687
results beyond the range of data used for development. Ninetypercent of the trees used to develop the R-A model were below68.6-cm DBH and 75% were below 51.3-cm DBH (K. Ryan,pers. comm.). Also, no ponderosa or Jeffrey pine data were usedin the R-A model development. In contrast, 90% of the yellowpines in the McNally fire were above 55.1-cm DBH and 75%were above 61.5-cm DBH. Our results are only from one fire,but they suggest that the R-A model should be applied withcaution in areas where the majority of trees are greater than55-cm DBH.
The underprediction in Douglas-fir mortality at low Pm levelsis likely due to Douglas-fir beetle (Dendroctonus pseudotsugae)attacking and killing fire-injured trees that would likely havesurvived if not attacked. Weatherby et al. (1994) also reportedthat the model underpredicted larger diameter Douglas-fir mor-tality because of Douglas-fir beetle attacks. Douglas-fir beetleswere observed on all the fires containing Douglas-fir study treesand they contributed to post-fire tree mortality. On the GreenKnoll, Moose, and Mussigbrod fires, Douglas-fir beetle eitherstrip- or mass-attacked 50% of the Douglas-firs greater than23-cm DBH, and beetles caused an estimated additional 25%post-fire mortality (Hood and Bentz 2007). Ryan and Amman(1996) reported that 71% of the Douglas-fir trees sampled inthe Yellowstone fires were attacked by Douglas-fir beetle. TheLubrecht prescribed burn was the only fire where few Douglas-fir beetle attacks were observed (Hood and Bentz 2007). It wasalso the only fire where stand-level Douglas-fir mortality waslargely overpredicted.
The Douglas-fir bark beetle is attracted to larger-diameter,fire-injured trees and can cause additional mortality among treesthat would be expected to survive moderate levels of fire-injury(Rasmussen et al. 1996; Ryan and Amman 1996). The R-Amodel does not directly account for secondary mortality agentssuch as bark beetles. However, some mortality models includean insect attack variable (McHugh et al. 2003; Sieg et al. 2006;Hood et al. 2007; Hood and Bentz 2007). When bark beetlesare a concern after fire, a mortality model that includes insectattacks would likely be more accurate than the R-A model.
Mortality prediction would likely be improved by incorpo-rating a stem injury variable into the model. Ryan and Reinhardt(1988) also reported that measured cambium injury would be abetter predictor of tree mortality than bark thickness.The numer-ous post-fire tree mortality models and guidelines that include astem injury variable indicate this as well (Wagener 1961; Peter-son and Arbaugh 1989; McHugh and Kolb 2003; Thies et al.2006; Hood et al. 2007).
Accuracy may also be improved by using other bark thick-ness equations. The simplified bark thickness equations used inFOFEM, FFE-FVS, and BehavePlus warrant further research.Bark thickness may vary by site, geographic location, andheight above ground (Ryan 1982b), and numerous bark thicknessequations exist for individual species. Localised bark thicknessequations may more accurately reflect a tree’s natural resistanceto cambium damage from fire and thus result in more accuratepredictions of tree mortality.
When bark is thin, even very light charring can kill thecambium (Ryan 1982a). Even with low crown scorch, exten-sive girdling caused from the fire can result in tree death. Byonly basing probability of mortality on crown scorch and bark
thickness, stem and root injuries are not considered. Jones et al.(2004) developed a stem heating model to predict cambium deathfrom fire exposure. In the future, their model has the potential tobe incorporated into the USA fire behaviour and effects modelsto predict cambium injury for use as an input into a mortal-ity model that includes a stem injury variable. This applicationwould be especially useful when planning prescribed burns andcould possibly improve post-fire mortality predictions.
The data used to develop the R-A model came exclusivelyfrom prescribed fires (Ryan and Reinhardt 1988). However,there was no clear difference in model performance between theprescribed fires and wildfires evaluated here. This supports thetheory that tree mortality from fire injury is related to fire inten-sity and fuel consumption. Intensity and consumption are usuallylower in prescribed fires than wildfires, resulting in lower fireinjury levels. Therefore, it seems that mortality models devel-oped using the full range of fire injuries (low-to-high crownscorch and low-to-high cambium damage) could be applied toeither prescribed fires or wildfires with equal accuracy.
Conclusions
For the current study, we examined the accuracy of a widely usedUSA tree mortality model on numerous western USA conifer-ous species over much wider geographic ranges and fire types(wildfire and prescribed fire). We evaluated the efficacy of themodel in predicting mortality of several species not included inthe development of the original model. Few independent evalua-tions of this commonly used post-fire tree mortality model havebeen completed before the present study (but see Weatherbyet al. 1994; Finney 1999). This evaluation provides managersin the USA with an assessment of the model’s accuracy whenpredicting tree mortality and survival after fire in order to betterunderstand the strengths and weaknesses of the model.
The R-A mortality model is widely accessible to managersin the USA through several fire behaviour and effects softwarepackages. It is easily applied to any species as long as crownscorch and DBH are known. For prescribed burn planning pur-poses, the model proved to be a useful and relatively accuratemethod for predicting stand-level post-fire tree mortality. It cor-rectly predicted overall mortality within ±20% of the observedmortality for the majority of species tested. These species werelodgepole pine, whitebark pine, Engelmann spruce, subalpinefir, white fir, ponderosa pine, Jeffrey pine, Douglas-fir, and sugarpine. However, correctly predicted mortality was quite variablewhen individual fires were examined and model accuracy maybe lower for some fires, as indicated by the data. Red fir, incensecedar, and western larch stand-level mortality was overpredicted.Western hemlock was the only species tested where stand-levelmortality was greatly underpredicted.
Managers can expect less mortality than the model pre-dicts when burning in incense cedar, western larch, and redfir forests. Managers can also expect higher mortality than themodel predicts when planning prescribed burns in stands of west-ern hemlock if tree boles are charred. Post-fire tree mortalitypredicted using FFE-FVS, FOFEM, or BehavePlus is depen-dant on anticipated fire behaviour. Deviations from expected firebehaviour during actual prescribed burning will result in lowerstand-level tree mortality prediction accuracy.

688 Int. J. Wildland Fire S. M. Hood et al.
The R-A model was less accurate for predicting individualtree mortality. Individual tree mortality predictions are used todevelop post-fire salvage marking guidelines. For this purpose,other species-specific mortality models developed from indi-vidual geographic areas may be more accurate. Species-specificmodels often include other variables, such as stem injury andinsect attacks, that can increase prediction accuracy. The specieswe tested that provided excellent discrimination (ROC ≥ 0.8)were subalpine fir, incense cedar, and yellow pine. The R-Amodel was especially poor at classifying Engelmann spruce, redfir, and very large diameter yellow pine.
The classification figures we developed allow managers tosee correctly predicted mortality and survival based on a rangeof Pm values. These figures can help managers determine ifaccuracy is acceptable and choose a Pm level for developmentof marking guidelines. Poor predictions of mortality will leadto cutting many trees that may have lived, but poor predictionsof survival will leave many trees that may die. Managers canpredict future forest stand structure by examining the accuracyof the chosen Pm level.
Tree mortality models can provide assistance for develop-ing more accurate prescribed burn plans and post-fire salvagemarking guidelines. However, they should be used in conjunc-tion with other factors to meet overall management objectives.Mortality models are intended as a starting point for tree andstand assessments, and managers should augment their decisioncriteria after considering localised environmental and tree phys-iological factors such as long-term drought and associated treestress, overall stand health and condition, bole and root injury,as well as the location of population centres and species of barkbeetles and their potential effect on tree survival.
There is a need for independent evaluations of other exist-ing tree mortality models. These models include many differentvariables and report accuracy in various ways, making compar-isons difficult. In addition, many models were developed withlocalised data and likely have little inter-regional applicability.Systematic evaluations could identify limitations to individualmodels such as the geographic range, tree sizes, and types of fireinjuries. There is also a need to contrast model accuracies withtheir complexity. Evaluations of this kind could greatly improveour understanding of which models should be applied in whichsituations and can help identify the species and situations forwhich accurate models do not currently exist.
AcknowledgementsOur work includes the efforts of the many people who collected a hugebody of post-fire tree injury and mortality data over the past 20 years.Without their cooperation and willingness to share data from numerousstudies, this work could not have been accomplished. We thank Rudy Kingfor providing a statistical review of our methods. The comments of twoanonymous reviewers, Mark Finney, Michael Harrington, and Thomas Kolbgreatly improved this manuscript. The Joint Fire Science Program fundedthis research (05-2-1-105).
ReferencesAndrews PL, Bevins CD, Seli RC (2003) BehavePlus fire modeling sys-
tem, version 2.0: User’s guide. USDA Forest Service, Rocky MountainResearch Station, General Technical Report RMRS-GTR-106WWW.(Ogden, UT)
Barlow J, Lagan BO, Peres CA (2003) Morphological correlates of fire-induced tree mortality in a central Amazonian forest. Journal of TropicalEcology 19, 291–299. doi:10.1017/S0266467403003328
Beverly JL, Martell DL (2003) Modeling Pinus strobus mortality followingprescribed fire in Quetico Provincial Park, north-western Ontario. Cana-dian Journal of Forest Research 33, 740–751. doi:10.1139/X02-209
Bradley AP (1996) ROC curves and the χ2 test. Pattern Recognition Letters17, 287–294. doi:10.1016/0167-8655(95)00121-2
Bradley T, Tueller P (2001) Effects of fire on bark beetle presence on Jeffreypine in the Lake Tahoe basin. Forest Ecology and Management 142,205–214. doi:10.1016/S0378-1127(00)00351-0
Cope AB (1993) Abies magnifica. Fire effects information system. USDAForest Service, Rocky Mountain Research Station, Fire Sciences Lab-oratory. (Missoula, MT) Available at http://www.fs.fed.us/database/feis/[Verified 2 August 2006]
Dieterich JH (1979) Recovery potential of fire-damaged south-westernponderosa pine. USDA Forest Service, Research Note RM-379. (FortCollins, CO)
Finney M (1999) Fire-related mortality of ponderosa pine in easternMontana. USDA Forest Service, RMRS Fire Sciences Laboratory,Unpublished Report INT-93800-RJVA. (Missoula, MT)
Flint R (1925) Fire resistance of Northern Rocky Mountain conifers. IdahoForester 7, 40–43.
Gundale MJ, DeLuca TH, Fiedler CE, Ramsey PW, Harrington MG, GannonJE (2005) Restoration treatments in a Montana ponderosa pine forest:effects on soil physical, chemical and biological properties. Forest Ecol-ogy and Management 213, 25–38. doi:10.1016/J.FORECO.2005.03.015
Hardy C, Smith HY, McCaughey W (2006) The use of silviculture and pre-scribed fire to manage stand structure and fuel profiles in a multi-agedlodgepole pine forest. In ‘Fuels Management – How to Measure Success:Conference Proceedings’. 28–30 March 2006, Portland, OR. (Eds PLAndrews, B Butler) pp. 451–464. USDA Forest Service, Rocky MountainResearch Station, Proceedings RMRS-P-41. (Fort Collins, CO)
Harrington MG (1993) Predicting Pinus ponderosa mortality from dormantseason and growing season fire injury. International Journal of WildlandFire 3, 65–72. doi:10.1071/WF9930065
Hély C, Flannigan M, BergeronY (2003) Modeling tree mortality followingwildfire in the south-eastern Canadian mixed-wood boreal forest. ForestScience 49, 566–576.
Hood SM, Bentz B (2007) Predicting post-fire Douglas-fir beetle attacksand tree mortality in the Northern Rocky Mountains. Canadian Journalof Forest Research 37, 1058–1069.
Hood SM, Smith SL, Cluck DR (2007) Delayed tree mortality following firein northern California. In ‘Restoring Fire-Adapted Ecosystems: Proceed-ings of the 2005 National Silviculture Workshop’. 6–10 June 2005,TahoeCity, CA. (Ed. RF Powers) pp. 261–283. USDA Forest Service, PacificSouthwest Research Station, General Technical Report PSW-GTR-203.(Albany, CA)
Hosmer DW, Lemeshow S (2000) ‘Applied Logistic Regression.’ 2nd edn.(Wiley: New York)
Jones JL, Webb BW, Jimenez DM, Reardon J, Butler B (2004) Developmentof an advanced one-dimensional stem heating model for applicationin surface fires. Canadian Journal of Forest Research 34, 20–30.doi:10.1139/X03-187
Keyser TL, Smith FW, Lentile LB, Shepperd WD (2006) Modeling post-firemortality of ponderosa pine following a mixed-severity wildfire in theBlack Hills: the role of tree morphology and direct fire effects. ForestScience 52, 530–539.
Littell RC, Milliken GA, Stroup WW, Wolfinger RD (1996) ‘SAS Systemfor Mixed Models.’ (SAS Institute: Cary, NC)
Lutes D (2001) Diameter bark thickness relationships. USDA Forest Service,Missoula Fire Sciences Lab, Unpublished report. (Missoula, MT)
McHugh C, Kolb TE (2003) Ponderosa pine mortality following fire innorthern Arizona. International Journal of Wildland Fire 12, 7–22.doi:10.1071/WF02054
Evaluating USA post-fire tree mortality models Int. J. Wildland Fire 689
McHugh C, Kolb TE, Wilson JL (2003) Bark beetle attacks on ponderosapine following fire in northern Arizona. Environmental Entomology 32,510–522.
Mutch LS, Parsons DJ (1998) Mixed conifer forest mortality and estab-lishment before and after prescribed fire in Sequoia National Park,California. Forest Science 44, 341–355.
Perrakis DDB, Agee JK (2006) Seasonal fire effects on mixed-conifer for-est structure and ponderosa pine resin properties. Canadian Journal ofForest Research 36, 238–254. doi:10.1139/X05-212
Peterson DL,Arbaugh MJ (1989) Estimating post-fire survival of Douglas-firin the Cascade Range. Canadian Journal of Forest Research 19, 530–533.doi:10.1139/X89-084
Peterson DL, Ryan KC (1986) Modeling post-fire conifer mortalityfor long-range planning. Environmental Management 10, 797–808.doi:10.1007/BF01867732
Rasmussen LA, Amman GD, Vandygriff JC, Oakes RD, Munson AS,Gibson KE (1996) Bark beetle and wood borer infestation in theGreaterYellowstoneArea during 4 post-fire years. USDA Forest Service,Intermountain Research Station, Research Paper INT-RP-487. (Ogden,UT)
Regelbrugge JC, Conard SG (1993) Modelling tree mortality follow-ing wildfire in Pinus ponderosa forests in the Central Sierra Nevadaof California. International Journal of Wildland Fire 3, 139–143.doi:10.1071/WF9930139
Reinhardt E, Crookston N (2003) The Fire and Fuels Extension to the ForestVegetation Simulator. USDA Forest Service, Rocky Mountain ResearchStation, General Technical Report RMRS-GTR-116. (Ogden, UT)
Reinhardt ED, Ryan KC (1988) How to estimate tree mortality resultingfrom underburning. Fire Management Notes 49, 30–36.
Reinhardt ED, Keane RE, Brown JK (1997) First Order Fire EffectsModel: FOFEM 4.0. User’s guide. USDA Forest Service, IntermountainResearch Station, GeneralTechnical Report INT-GTR-344. (Ogden, UT)
Rigolot E (2004) Predicting post-fire mortality of Pinus halepensis Mill.and Pinus pinea L. Plant Ecology 171, 139–151. doi:10.1023/B:VEGE.0000029382.59284.71
Ryan KC (1982a) Techniques for assessing fire damage to trees. In ‘Pro-ceedings of the Symposium: Fire, its Field Effects’. 19–21 October1982, Jackson, WY. (Ed. J Lotan) pp. 1–11. (Intermountain Fire Council:Missoula, MT)
Ryan KC (1982b) Evaluating potential tree mortality from prescribed burn-ing. In ‘Site Preparation and Fuels Management on Steep Terrain:Proceedings of a Symposium’. 15–17 February 1982, Spokane, WA.(Ed. DM Baumgartner) pp. 167–179. (Washington State UniversityCooperative Extension: Pullman, WA)
Ryan KC, Amman GD (1994) Interactions between fire-injured trees andinsects in the greaterYellowstone area. In ‘Plants and their Environments:Proceedings of the First Biennial Scientific Conference on the GreaterYellowstone Ecosystem’. 16–17 September 1991, Yellowstone NationalPark,WY. (Ed. DG Despain) pp. 259–271. US Department of the Interior,National Park Service, Natural Resources Publication Office, TechnicalReport NPS/NRYELL/NRTR. (Denver, CO)
Ryan KC, Amman GD (1996) Bark beetle activity and delayed tree mor-tality in the Greater Yellowstone Area following the 1988 fires. In ‘TheEcological Implications of Fire in Greater Yellowstone: Proceedings ofthe Second Biennial Conference on the GreaterYellowstone Ecosystem’.19–21 September 1993,Yellowstone National Park, WY. (Ed. J Greenlee)pp. 151–158. (International Association of Wildland Fire: Fairfield, WA)
http://www.publish.csiro.au/journals/ijwf
Ryan KC, Frandsen WH (1991) Basal injury from smouldering fires inmature Pinus ponderosa. International Journal of Wildland Fire 1,107–118. doi:10.1071/WF9910107
Ryan KC, Reinhardt ED (1988) Predicting post-fire mortality of sevenwestern conifers. Canadian Journal of Forest Research 18, 1291–1297.doi:10.1139/X88-199
Ryan MG, Binkley D, Fownes JH (1997) Age-related decline in forest pro-ductivity: pattern and process. Advances in Ecological Research 27,213–262.
Saveland JM, Neuenschwander LF (1990) A signal detection framework toevaluate models of tree mortality following fire damage. Forest Science36, 66–76.
Saveland JM, Bakken SR, Neuenschwander LF (1990) Predicting mortalityand scorch height from prescribed burning for ponderosa pine in northernIdaho. University of Idaho, College of Forestry, Wildlife, and RangeSciences, Bulletin Number 53. (Moscow, ID)
Sieg CH, McMillin JD, Fowler JF, Allen KK, Negron JF, Wadleigh LL,Anhold JA, Gibson KE (2006) Best predictors for post-fire mortalityof ponderosa pine trees in the Intermountain West. Forest Science 52,718–728.
Smith JK, Fisher WC (1997) Fire ecology of the forest habitat hypes ofNorthern Idaho. USDA Forest Service, Intermountain Research Station,General Technical Report INT-GTR-363. (Ogden, UT)
Smith SL, Cluck DR (2007) ‘Fire Salvage Marking Guidelines.’ USDAForest Service, Forest Health Protection, Region 5 RO-07-01.(Susanville, CA)
Stephens SL, Finney MA (2002) Prescribed fire mortality of SierraNevada mixed conifer tree species: effects of crown damage and for-est floor combustion. Forest Ecology and Management 162, 261–271.doi:10.1016/S0378-1127(01)00521-7
Swets JA (1996) ‘Signal Detection Theory and ROC Analysis in Psychologyand Diagnostics: Collected Papers.’(Lawrence ErlbaumAssociates, Inc.:Mahwah, NJ)
Swezy DM, Agee JK (1991) Prescribed fire effects on fine-root and treemortality in old-growth ponderosa pine. Canadian Journal of ForestResearch 21, 626–634. doi:10.1139/X91-086
Thies WG, Westlind DJ, Loewen M, Brenner G (2006) Prediction of delayedmortality of fire-damaged ponderosa pine following prescribed fires ineastern Oregon, USA. International Journal of Wildland Fire 15, 19–29.doi:10.1071/WF05025
USDA Forest Service (1996a) Side Fire salvage sale project record.Coconino National Forest, Peaks Ranger District. (Flagstaff, AZ)
USDA Forest Service (1996b) Bridger salvage environmental assessment.Kaibab National Forest, North Kaibab Ranger District. (Fredonia, AZ)
Van Wagner CE (1973) Height of crown scorch in forest fires. CanadianJournal of Forest Research 3, 373–378. doi:10.1139/X73-055
Wagener WW (1961) Guidelines for estimating the survival of fire-damagedtrees in California. USDA Forest Service, Pacific Southwest Forest andRange Experiment Station, Miscellaneous Paper 60. (Berkeley, CA)
Weatherby JC, Mocettini P, Gardner BR (1994) A biological evaluation oftree survivorship within the Lowman Fire boundary, 1989–1993. USDAForest Service, Intermountain Region, State and Private Forestry ForestPest Management, Report No. R4–94–06. (Boise, ID)
Manuscript received 16 September 2006, accepted 4 April 2007