Evaluating the Effectiveness of Landlord Interventions
20
SERC DISCUSSION PAPER 219 Social Tenants' Health: Evaluating the Effectiveness of Landlord Interventions Paul Cheshire (LSE and SERC) Stephen Gibbons (LSE and SERC) Jemma Mouland (Former Head of Policy, Family Mosaic, London) August 2017
-
Upload
khangminh22 -
Category
Documents
-
view
1 -
download
0
Transcript of Evaluating the Effectiveness of Landlord Interventions

SERC DISCUSSION PAPER 219
Social Tenants' Health: Evaluating the Effectiveness of Landlord Interventions
Paul Cheshire (LSE and SERC)Stephen Gibbons (LSE and SERC) Jemma Mouland (Former Head of Policy, Family Mosaic, London)
August 2017

This work is part of the research programme of the Urban Research Programme of the Centre for Economic Performance funded by a grant from the Economic and Social Research Council (ESRC). The views expressed are those of the authors and do not represent the views of the ESRC. © P. Cheshire, S. Gibbons and J. Mouland, submitted 2017.

Social Tenants’ Health: Evaluating the Effectiveness of Landlord Interventions
Paul Cheshire* Stephen Gibbons* Jemma Mouland**
August 2017
* Spatial Economics Research Centre and Department of Geography and Environment, London School of Economics ** Former Head of Policy, Family Mosaic, London The study was initiated and funded by Family Mosaic. Ethical approval was obtained through the London School of Economics ethics board. The Big Lottery Fund provided funding for the Friends Who Do Lunch initiative, which was run as part of this pilot project. The authors are responsible for all errors and interpretation.

Abstract Objectives: To test whether a social landlord can improve health outcomes for older tenants and reduce their NHS usage by simple interventions. Design: Randomised controlled trial. Setting: Social housing in five London Boroughs. Participants: 547 individuals over 50 years of age. Intervention: Baseline and two follow-up assessments of individual’s health and use of medical services undertaken by health professionals. In the treated groups, individuals were given health care and support at two different levels. 25 individuals had to be removed from the trial because early assessments revealed critical and untreated health issues. Main outcome measures: Self-reported health and wellbeing ratings and NHS usage. Conclusions: Even simple interventions to a targeted group (older and poorer people), can produce significant reductions in NHS usage. Significant reductions were found for 1) planned hospital usage; 2) nights in hospital; and 3) for emergency GP usage. Well-being scores improved in the most strongly treated group but these were not statistically significant. Perhaps the single most important finding was that the early health evaluations revealed that 4.5% of the total sample – not in the most deprived section of the population – had such severe health problems that significant and immediate intervention was required. Keywords: randomised control trial, social housing, health interventions JEL Classifications: I18; C93; R29
1
1. Introduction
There is overwhelming evidence that poor health is associated with low income at an
individual level (Jones and Wildman, 2008; Benzeval, 2014). Since basic economics implies
that people with low incomes live in neighbourhoods with low-cost housing, these
neighbourhoods inevitably have concentrations of people with a range of income-related
disadvantages such as poor health, disabilities and lower educational attainment (Cheshire
et al., 2014, Chapter 3). The Marmot Review (Marmot, 2010) focused attention on such
inequalities highlighting, for example, that people living in the poorest neighbourhoods in
England will on average die seven years earlier than people living in the richest, and will on
average spend 17 more years disabled.
This sorting of low income people into low cost housing suggests a role for providers of low
cost housing to be involved in community health interventions. Registered Social Landlords
house some of the most vulnerable citizens, and have a unique level of access to people who
may not be engaged with health and other public services through existing channels. There
is to date no evidence of which we are aware that landlords may be able to play a part in
interventions effectively to promote improved health and wellbeing for their tenants. This
study therefore aimed to fill this gap and test the hypothesis that through the utilisation of
their landlord status to gain access to tenants, higher rates of engagement could be obtained
with vulnerable people to improve their health and well-being. To test the impacts of the
interventions we used a randomised controlled trial.
The study focused on providing interventions for a group of people aged over-50 who lived
in socially provided ‘general needs accommodation’ in London. An older demographic was
selected since this group has the highest usage of NHS services and greatest health needs.
The key objective of this study was therefore:
To test whether a social landlord, Family Mosaic, could improve the health and
wellbeing of their over-50s general-needs tenant population with simple
interventions.
The two services that were tested were:
1. A signposting service from the Neighbourhood Manager (a frontline staff member
responsible for managing a group of properties).
2. An intensive handholding service from a specialised team of health and wellbeing
support workers.
In the rest of this paper we first discuss the trial design and the interventions for each of the
two treated groups. We then discuss the health outcomes measured, the sample and the
process of randomisation. The process and set up of the study is presented in Section 3 and
in Section 4 we describe the outcomes for the three groups: the control group and two
treated groups. In the final section we discuss the implications of the study.
2
2. Methods
2.1 Trial Design
A parallel three-arm randomised control trial was used, with an even-split random
allocation across three groups: a control group (Group 1), a lightly-treated, ‘signposted’
group (Group 2) and an intensively treated ‘handholding’ group (Group 3). Details of the
interventions are described below.
The first stage for all participants was a base-line health check. At this initial stage some
participants were identified as having conditions which posed an immediate threat to their
health and wellbeing, even their life. This meant they could not risk being placed in either
the control or signposted groups so they were removed from the study and placed in a sub-
group 3b. This group was directed to their GP or hospital for treatment where necessary, but
otherwise received the same services as those in Group 3. People placed in this group were
excluded from the main analysis since they were non-randomly drawn from the treatment
and control groups based on their severe health needs but the results, if they are included,
are briefly noted in Section 3.4. Fifteen individuals were identified at the point of first
assessment, and a further 10 either at, or before the 9 month assessment point. So in total 25
people – or some 4.5 percent of the population – were immediately identified on the basis of
a simple health assessment as suffering serious, often life threatening conditions for which
they were receiving no treatment.
2.2 Participants
The eligibility criteria for participants were set as:
Aged 50 or more
Living in a General Needs Family Mosaic property: that is ordinary social housing –
not housing aimed at the elderly or physically disabled. Participants did not have to
be the main tenant.
Living in the borough of Hackney, Islington, Hammersmith and Fulham, Kensington
and Chelsea or Haringey
Data on eligibility was gathered from Family Mosaic’s central database of household data.
Data on secondary household members is less comprehensive and so on occasions other
eligible household members would be referred to us via the lead tenants that we
approached. There was no restriction on multiple household members taking part in the
study, although none did.
2.3 Interventions
As noted above two types of interventions were tested in this study:
The ‘signposting’ intervention (Group 2) was provided by the Neighbourhood Manager, the
social housing provider’s frontline staff member responsible for managing the properties
and tenancies within a given patch. The intervention entailed the Neighbourhood Manager
reviewing the assessments carried out (see Section 2.4) and identifying any needs from
these. They would then refer participants to a suite of interventions available (see Appendix
3
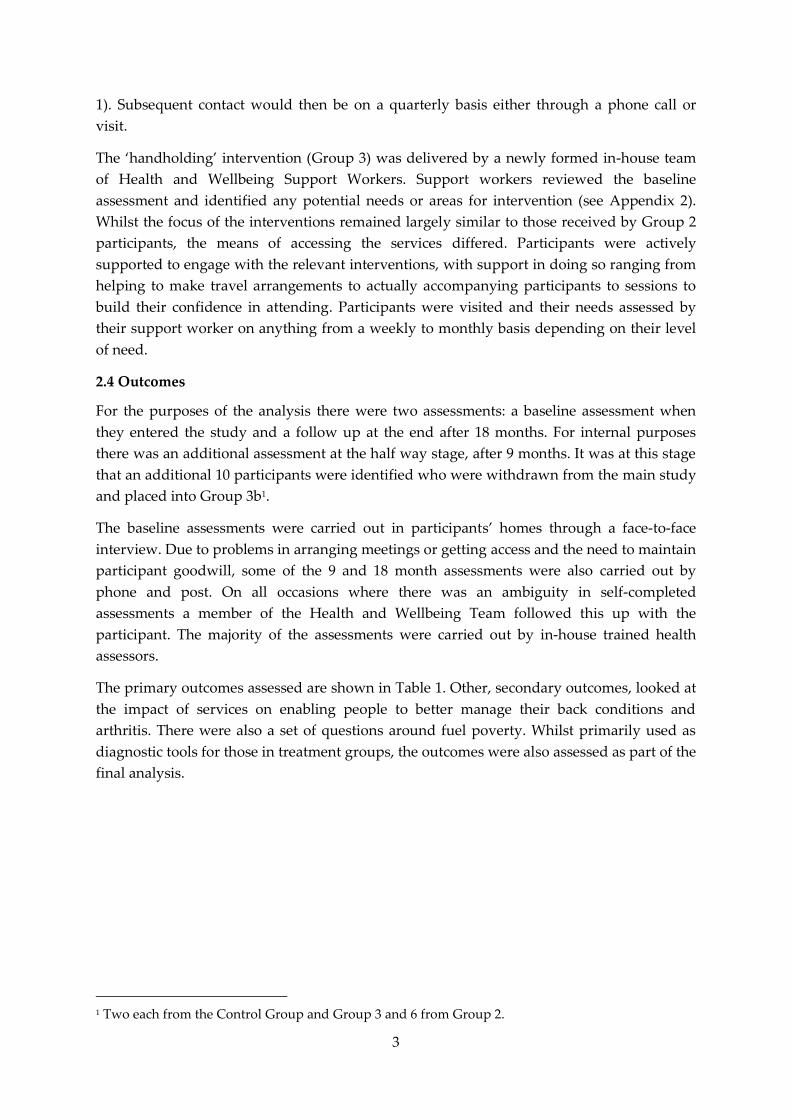
1). Subsequent contact would then be on a quarterly basis either through a phone call or
visit.
The ‘handholding’ intervention (Group 3) was delivered by a newly formed in-house team
of Health and Wellbeing Support Workers. Support workers reviewed the baseline
assessment and identified any potential needs or areas for intervention (see Appendix 2).
Whilst the focus of the interventions remained largely similar to those received by Group 2
participants, the means of accessing the services differed. Participants were actively
supported to engage with the relevant interventions, with support in doing so ranging from
helping to make travel arrangements to actually accompanying participants to sessions to
build their confidence in attending. Participants were visited and their needs assessed by
their support worker on anything from a weekly to monthly basis depending on their level
of need.
2.4 Outcomes
For the purposes of the analysis there were two assessments: a baseline assessment when
they entered the study and a follow up at the end after 18 months. For internal purposes
there was an additional assessment at the half way stage, after 9 months. It was at this stage
that an additional 10 participants were identified who were withdrawn from the main study
and placed into Group 3b1.
The baseline assessments were carried out in participants’ homes through a face-to-face
interview. Due to problems in arranging meetings or getting access and the need to maintain
participant goodwill, some of the 9 and 18 month assessments were also carried out by
phone and post. On all occasions where there was an ambiguity in self-completed
assessments a member of the Health and Wellbeing Team followed this up with the
participant. The majority of the assessments were carried out by in-house trained health
assessors.
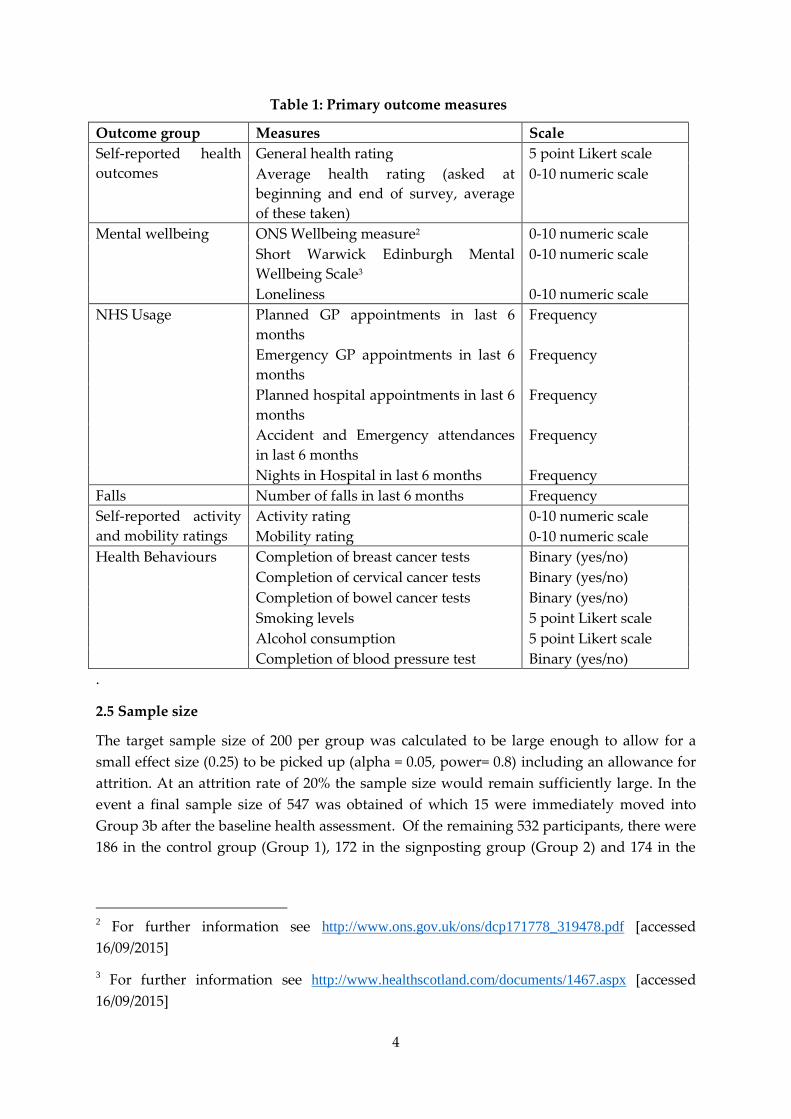
The primary outcomes assessed are shown in Table 1. Other, secondary outcomes, looked at
the impact of services on enabling people to better manage their back conditions and
arthritis. There were also a set of questions around fuel poverty. Whilst primarily used as
diagnostic tools for those in treatment groups, the outcomes were also assessed as part of the
final analysis.
1 Two each from the Control Group and Group 3 and 6 from Group 2.
4
Table 1: Primary outcome measures
Outcome group Measures Scale
Self-reported health
outcomes
General health rating 5 point Likert scale
Average health rating (asked at
beginning and end of survey, average
of these taken)
0-10 numeric scale
Mental wellbeing ONS Wellbeing measure2 0-10 numeric scale
Short Warwick Edinburgh Mental
Wellbeing Scale3
0-10 numeric scale
Loneliness 0-10 numeric scale
NHS Usage Planned GP appointments in last 6
months
Frequency
Emergency GP appointments in last 6
months
Frequency
Planned hospital appointments in last 6
months
Frequency
Accident and Emergency attendances
in last 6 months
Frequency
Nights in Hospital in last 6 months Frequency
Falls Number of falls in last 6 months Frequency
Self-reported activity
and mobility ratings
Activity rating 0-10 numeric scale
Mobility rating 0-10 numeric scale
Health Behaviours Completion of breast cancer tests Binary (yes/no)
Completion of cervical cancer tests Binary (yes/no)
Completion of bowel cancer tests Binary (yes/no)
Smoking levels 5 point Likert scale
Alcohol consumption 5 point Likert scale
Completion of blood pressure test Binary (yes/no)
.
2.5 Sample size
The target sample size of 200 per group was calculated to be large enough to allow for a
small effect size (0.25) to be picked up (alpha = 0.05, power= 0.8) including an allowance for
attrition. At an attrition rate of 20% the sample size would remain sufficiently large. In the
event a final sample size of 547 was obtained of which 15 were immediately moved into
Group 3b after the baseline health assessment. Of the remaining 532 participants, there were
186 in the control group (Group 1), 172 in the signposting group (Group 2) and 174 in the
2 For further information see http://www.ons.gov.uk/ons/dcp171778_319478.pdf [accessed
16/09/2015]
3 For further information see http://www.healthscotland.com/documents/1467.aspx [accessed
16/09/2015]

5
handholding group (Group 3). A further 10 were moved to Group3b at the interim
assessment (see Section 2.1).
2.6 Randomisation
The entire process of random number generation and assignment was carried out through
an automated function in the data entry system. A restricted randomisation was used, with
stratification by age (over and under 70) and gender. No blocking was used.
2.7 Blinding
Assessors were not told about the assignment group of participants, but those providing
support (either the neighbourhood manager or support worker) necessarily were.
Towards the end of the study it was not always possible to maintain blind assessments since
the assessors were in-house and so occasionally interacting with participants or aware of
their cases. Due to demands on resources, support workers occasionally carried out
assessments, but never of their own clients.
Furthermore, during the process of assessment, discussion of the participant’s health
sometimes resulted in a disclosure of treatment (for example, if a participant referred to their
support worker). This was primarily an issue for those in Group 3, whereas for those in
Group 2 and the control group the intervention difference was less marked.
2.8 Statistical methods
ANOVA/Mixed ANOVA was used to analyse the between-group differences in mean
baseline outcomes and improvements in these outcomes during the trial. Non-parametric
ANOVAs (Kruskal-Wallis) were also run on variables where there were outliers as a check
on the ANOVA results. The results of the Mixed ANOVAs are reported except for those
cases – in particular outcomes relating to NHS usage – where there was evidence of outliers
and a contradiction with non-parametric results. In these cases non parametric Kruskal
Wallis tests are reported.
When handling categorical dependent variables, Chi-Square analysis was used with Phi and
Cramer’s V as an estimate of effect size.
3 Results
3.1 Participants
Overall, 77% of the original sample4 was retained through to the point of final assessment.
The main cause of sample attrition – 64 cases – was the inability to make contact with
participants to conduct their final assessment, a further 25 opted out, 12 left Family Mosaic
accommodation and 14 died. The highest attrition rates were amongst the control group
(52), followed by group 2 (38) then group 3 (25). However, a Chi-Square Analysis did not
4 Excluding those moved to 3b

6
reveal any statistically significant differences in attrition rates between groups at the 5%
level in terms of demography, gender or ethnicity.
3.2 Recruitment
Recruitment to the study began in January 2013 through a process of mail-outs, phone calls
and door knocking. The first assessments were carried out in February 2013. Recruitment
continued for a period of 12 months in order to achieve a sample size as close to the original
target of 600 as possible. Recruitment ended in February 2014 despite the sample still being
below the target so as to ensure the study could be completed within a 3 year time frame.
The trial continued for a period of 29 months, with all final assessments completed by May
2015. The intended assessment timeframe was 18 months but because of unexpected
difficulties with final assessments, some had to be carried out beyond the 18 month period.
In order to minimise retention problems and ensure access to participants some assessments
were brought forward. As a result of these adjustments, on average each participant was in
the study for a period of 606 days (approx. 20 months). However, those receiving an
intervention received it for only 18 months. The duration of participation was even across
groups, with Group 1 and 3 participants being in the study for an average of 605 days and
Group 2 608 days.
3.3 Sample characteristics
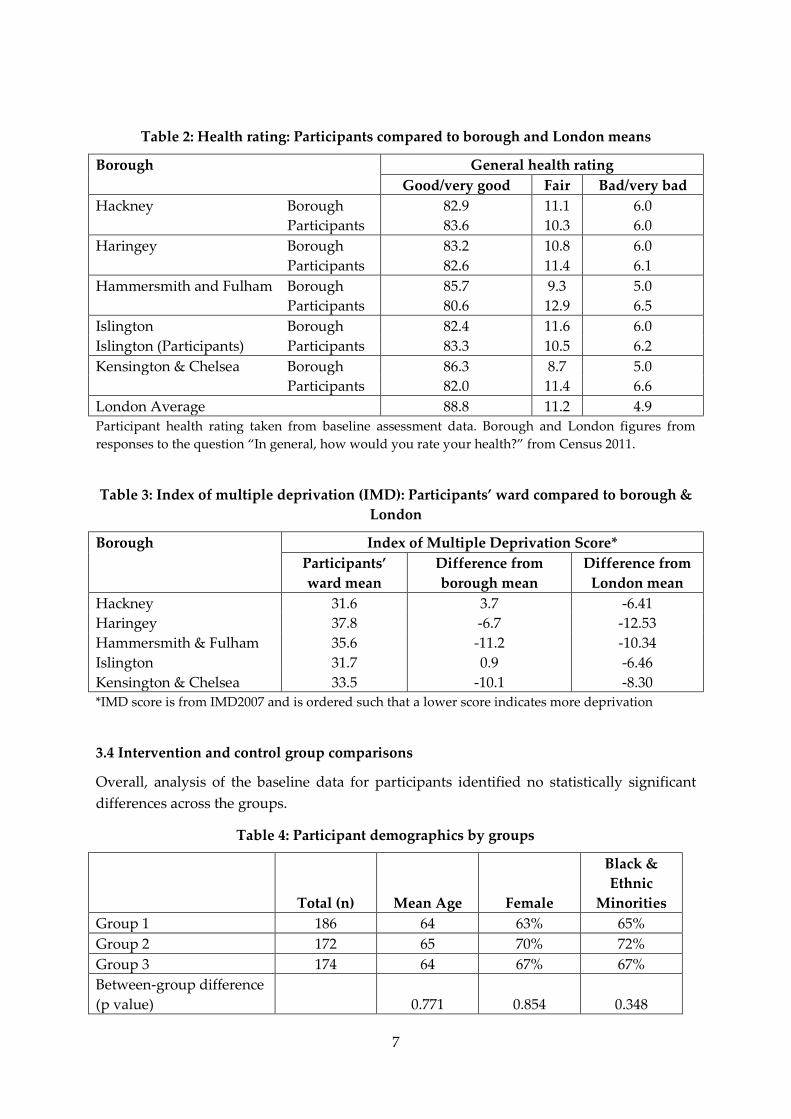
Table 2 and shows individual participant health ratings from the baseline assessment and
comparison health ratings taken from Census 2011 for the boroughs in the study and for
London. Table 3 reports the Index of Multiple Deprivation (IMD 2007) for ward of residence,
compared to borough of residence and London. As expected given the low income, social
housing based sample, health and deprivation indicators were worse for each of the five
boroughs in the study than they were for London as a whole. Participant’s residential wards
were more deprived than their Boroughs in Haringey, Hammersmith and Fulham, and
Kensington and Chelsea. The mean IMD score for participants in both Hackney and
Islington was slightly better than the mean for their boroughs. Similarly the health status of
participants, although clearly worse than London as a whole, was not always obviously
worse than that for their Boroughs although the differences were more marked in the two
most prosperous Boroughs, Hammersmith and Fulham and Chelsea and Kensington. Thus
our participants were drawn from populations exhibiting low but not the lowest IMD and
on average had health measures below, but not an order of magnitude below London’s. Our
study was dealing with deprived individuals but not the most deprived.
7
Table 2: Health rating: Participants compared to borough and London means
Borough General health rating
Good/very good Fair Bad/very bad
Hackney Borough 82.9 11.1 6.0
Participants 83.6 10.3 6.0
Haringey Borough 83.2 10.8 6.0
Participants 82.6 11.4 6.1
Hammersmith and Fulham Borough 85.7 9.3 5.0
Participants 80.6 12.9 6.5
Islington Borough 82.4 11.6 6.0
Islington (Participants) Participants 83.3 10.5 6.2
Kensington & Chelsea Borough 86.3 8.7 5.0
Participants 82.0 11.4 6.6
London Average 88.8 11.2 4.9
Participant health rating taken from baseline assessment data. Borough and London figures from
responses to the question “In general, how would you rate your health?” from Census 2011.
Table 3: Index of multiple deprivation (IMD): Participants’ ward compared to borough &
London
Borough Index of Multiple Deprivation Score*
Participants’
ward mean
Difference from
borough mean
Difference from
London mean
Hackney 31.6 3.7 -6.41
Haringey 37.8 -6.7 -12.53
Hammersmith & Fulham 35.6 -11.2 -10.34
Islington 31.7 0.9 -6.46
Kensington & Chelsea 33.5 -10.1 -8.30
*IMD score is from IMD2007 and is ordered such that a lower score indicates more deprivation
3.4 Intervention and control group comparisons
Overall, analysis of the baseline data for participants identified no statistically significant
differences across the groups.
Table 4: Participant demographics by groups
Total (n) Mean Age Female
Black &
Ethnic
Minorities
Group 1 186 64 63% 65%
Group 2 172 65 70% 72%
Group 3 174 64 67% 67%
Between-group difference
(p value) 0.771 0.854 0.348

8
A total of 94% of the original 532 participants identified themselves as suffering from one or
more long-term health conditions, with on average each suffering from three (that is
excluding the 15 transferred to group 3b after their initial assessment). On average
participants rated their health ‘fair’.
Table 5: Averages on key health variables by groups
Group 1 Group 2 Group 3
Between groups
difference (p
value)
No. long-term health conditions 3.07 3.60 3.64 0.960
S.E. (0.17) (0.18) (0.19)
General health rating 3.56 3.07 3.20 0.462
S.E. (0.08) (0.08) (0.07)
SWEMWB rating (35= max) 24.45 24.70 25.06 0.625
S.E. (0.39) (0.45) (0.42)
ONS wellbeing rating (40= max) 22.51 22.70 22.63 0.933
S.E. (0.38) (0.43) (0.42)
Loneliness rating (5= not lonely) 3.58 3.55 3.61 0.890
S.E. (0.09) (0.09) (0.09)
Planned GP appointments* 3.52 4.22 3.98 0.226
S.E. (0.28) (0.35) (0.34)
Emergency GP appointments* 0.45 0.24 0.38 0.182
S.E. (0.10) (0.06) (0.08)
Planned hospital appointments* 1.98 2.59 3.18 0.253
S.E. (0.25) (0.35) (0.61)
A&E attendances* 0.38 0.40 0.27 0.500
S.E. (0.08) (0.09) (0.07)
Nights in hospital 0.94 1.19 0.85 0.286
S.E. (0.27) (0.41) (0.32)
Falls (in 6 months)* 0.65 0.55 0.32 0.533
S.E. (0.14) (0.09) (0.06)
Activity levels (10= highly active) 5.58 5.25 5.89 0.097
S.E. (0.20) (0.21) (0.19)
Mobility levels (10= highly mobile) 6.98 6.61 7.36 0.230
S.E. (0.19) (0.20) (0.18)
* Mean in past 6 months.
In a 6 month period all participants together had made a total of 2073 planned and 192
emergency visits to their GP, 1369 planned hospital appointments, 185 visits to A&E and
spent 528 nights in hospital. The breakdown of participants’ baseline health is shown in
Table 5.

9
3.5 Numbers analysed
Analysis was undertaken on two separate datasets. An as-treated (AT) analysis was
conducted for all 408 participants who completed their time in the study. An intention-to-
treat (ITT) analysis was conducted on an imputed dataset for the 532 participants with a
valid first assessment.
The ITT dataset was produced through multiple imputation, where missing data points
were replaced with substituted values calculated through the expectation-maximisation
(EM) algorithm. According to Blankers et al (2010) of the non-highly computing intensive
methods, this gives amongst the most reliable estimates and, indeed, differs very little on
their criteria from the most efficient of all methods for generating ITT data sets, multiple
imputations from the Amelia II algorithm. A Little’s test was conducted and there was no
evidence to suggest that data was not Missing Completely At Random (Chi-Square =
48182.277, DF = 49747, p= 1.000). Some invalid data points were produced by the imputation
(some slightly negative scores on the NHS usage for example) but on rounding to one
decimal place virtually all negative values became zeros, and so this imputation was treated
as valid. The numbers of cases in each group in the ITT and AT samples are shown in Table
6.
Table 6: Total numbers analysed by group for ITT and AT analysis
Intention to Treat As Treated
Group 1 186 133
Group 2 172 128
Group 3 174 147
The outcomes reported below are estimated on the basis of the ITT analysis since this avoids
problems of non-random attrition from the sample. For purposes of comparison, the results
of the AT analysis are reported in Section 3.6.
3.5 Final Outcomes
This section summarises the findings of comparisons between the baseline and final
assessment scores for each group on a range of indicators. The more significant results for
NHS usage are shown in Table 7.
Health ratings
On self-reported health ratings, two measures were used; a general health rating out of five
and an average health rating (out of 10) which was taken at the beginning and end of the
survey. This latter score was calculated by taking an average of the two responses to the
question.
There was a general, albeit slight (within 1 decimal point), improvement in scores across the
groups but the ANOVA analysis identified no significant difference between groups
(general health, p= 0.674, average health p= 0.487).

10
Wellbeing indicators
Short Warwick Edinburgh Mental Wellbeing (SWEMWB) Scale: Whilst group 3 witnessed a
slight improvement in their SWEMWB (+0.21), both groups 1 (-0.1) and 2 (-0.9) experienced a
decline. ANOVA analysis revealed a substantial interaction between study group and time
(F(2, 529) = 2.593, p= 0.076, n2= 0.01). Post-hoc analysis identified significant differences between
groups 2 and 3 (p=0.019) with group 2’s wellbeing being on average 1.5 (±1.3) points lower.
ONS Wellbeing Scale: There was a general decline in ONS scores across the groups, but we
found no significant differences between groups for the ONS wellbeing measures, (F(2,525) =
1.029, p= 0.358, n2= 0.004).
Loneliness and connections to community: There were slight but not statistically significant
improvements in loneliness scores, but reductions in scores on connection to community
were witnessed across all groups. The measures used for loneliness and social isolation are
however less reliable indicators of wellbeing as they are not validated measures. ANOVA
analysis revealed no significant differences for loneliness (F(2,525) = 0.717, p=0.489, n2= 0.003) or
social isolation (F(2,525) = 1.10, p= 0.334, n2= 0.004).
NHS usage
Analysis of the difference in usage of individual NHS services revealed three significant
results. A Kruskal-Wallis test revealed significant differences for emergency GP visits,
planned hospital appointments and nights in hospital. The overall findings are reported in
Table 7 and the p-values for pairwise comparisons of outcomes with significant differences
in Table 8.
Table 7: Baseline and Final Change in NHS Usage per Person and Kruskal-Wallis tests
Planned GP
visits (%
change)
Emergency
GP visits
(% change)
Planned
Hospital
appointment
(% change)
A&E
attendances
(% change)
Nights in
Hospital
(% change)
Group 1 4.28 22.62 11.11 -13.16 17.14
Group 2 4.68 129.16 -3.47 -17.50 -33.66
Group 3 -10.97 -15.15 -38.99 2.13 -61.49
Kruskal-Wallis independent samples tests for differences between groups in change in NHS usage
H statistic 1.598 5.704 10.746 1.175 7.655
p-value 0.450 0.058 0.005 0.556 0.022
Table 8: Planned hospital appointments: Kruskal-Wallis p-values for pairwise
comparisons (outcomes with significant differences in Table 7)
Group comparison Emergency GP visits Planned hospital Nights in hospital
G2-G1 p-value 0.128 0.404 0.007
G3-G1 p-value 0.379 0.001 0.570
G2-G1 p-value 0.018 0.024 0.442
11
Group 3 reduced their usage of GPs for emergency visits by 15.1 percent (10 appointments)
against Group 2’s 124 percent increased usage (52 appointments). This reduction was
statistically significant (p= 0.045). The control group increased their visits by 23 percent (19
appointments) but this was not significantly different to Group 3. Group 2’s usage was also
not significantly different from that of the control group
On planned hospital appointments, Group 3’s usage reduced (by 39%, 216 appointments or
1.24 per person) while Group 1’s usage increased (by 11%, 41 appointments, 0.22 per
person). This difference is significant (p= 0.004). Group 3 also reduced their usage by much
more than group 2 (where planned appointments fell by only 3.5%, 16 appointments or 0.09
per person). Again the difference between Group 3 and Group 2 is significant (p=0.065)
Number of nights in hospital fell for Group 2 (by 33.7% or 68 nights in total) while Group 1
increased their usage (by 17.1% or 30 nights), the difference being significant (p=0.022).
Although nights spent in hospital by Group 3 also fell (by 61.5% or 91 nights) the difference
between Group 1 and Group 2 is non-significant, due to a high variance in the number of
nights within Group 3 (20.217).
Absolute differences in outcomes on the other measures – number of falls per person,
activity and mobility and preventative behaviour such as screening test – were negligible
and no differences between groups were significant. Nor were there any significant
differences in outcomes for those in fuel poverty compared to those who were not.
As-treated analysis
An as-treated analysis was also carried out for comparison. Within the as-treated analysis
the only outcome where significant differences were identified between the groups was for
planned hospital appointments (F(2, 391)= 5.366, p= 0.05) and SWEMWB scores (F(2, 391)= 3.790,
p= 0.023) although the signs and absolute values for other measures of NHS usage were
similar to the ITT results.
3.4 Group 3b
In some ways the finding that in a randomly selected sample of social housing tenants aged
over 50, some 4.5 percent had urgent – in most cases life-threatening but untreated health
problems - is both the most interesting and most disturbing finding revealed by the whole
study. All 25 in this group either had no GP or had no contact with any external medical
help except for emergency visits to A&E. Examples were a case of sickle cell anaemia who
was not registered with a GP but went to A&E when taken seriously ill or a recluse with
serious heart problems who although registered with a GP only left the house once a week
for basic shopping.
As Table 9 reveals there was an absolute improvement on every single measure following
their assignments to the most intensively treated group, although these differences are not
significant given the small sample size. 5 There were improvements on wellbeing scores,
5 An alternative approach is simply to redo the analysis adding all the participants assigned to Group
3b to an enlarged Group 3 – a Group containing all those provided with the most intensive

12
self-reported health and activity/ mobility ratings and reductions in all forms of NHS usage.
As for the intensively treated group, Group 3, the most notable change in NHS usage was in
planned hospital appointments, with a net reduction of 58 across the 25 Group 3
participants. Other notable changes included the improvements in wellbeing, particularly on
the ONS rating (increased average score by 7 ± 1.9).
3.5 Supplementary Analysis
Interventions
The impact of different types of services and interventions was also assessed. The only
significant results appear interestingly perverse. Holding group and other interventions
constant, significant interactions were identified between information provision (such as the
timetable for activities or healthy eating advice) and planned GP appointments. Those
receiving information increased their GP attendances by an average of 2 visits within a 6
month period (B= 1.88, p= 0.027).
Significant interactions were also identified between attendance at activities (both those run
by Family Mosaic and those available in the local community) and self-reported health
ratings, with those attending activities reporting slightly lower levels of general health in
their second assessment (B= -0.369, p= 0.005).
intervention. This has the effect of increasing the significance of the differences in outcomes where
there were already statistically significant differences but does not generate any additional significant
outcomes.
Table 9: Mean differences for Group 3b
Average change in
scores (over 18 months) Standard Error
General health 0.4 0.2
Planned GP appointments -1.2 1.3
Emergency GP appointments -0.5 0.2
Planned hospital appointments -2.2 1.9
A&E attendances -0.4 0.2
Nights in hospital -0.9 0.9
ONS score 6.6 1.9
SWEMWB score 1.0 1.6
Loneliness score 0.2 0.5
Community connection score 0.3 0.2
Falls score -0.5 0.7
Activity score 1.1 0.7
Mobility score 1.0 0.9

13
Both these apparently perverse results, however, are consistent with the observation
discussed below in relation to ‘harms’ that raising expectations seemed to cause negative
effects if those expectations could not be met.
Harms
The only significant adverse effect identified was for Group 2 on their SWEMWB score.
Feedback from staff delivering the service for this Group (who received only ‘signposting’)
highlighted the difficulties in delivering health and wellbeing interventions, both in terms of
time available and the limited involvement entailed. Signposting in isolation was judged not
to be enough to translate into actual action, with a resultant sense that participants may have
felt frustrated by becoming aware of services which could potentially be helpful, but not
feeling confident or able to actually take advantage of them.
Qualitative analysis of the reflections gathered from participants at the end of the study
support this hypothesis, with the main difficulty and negative experience of participants
being that they had difficulties in attending activities (mainly due to timing or location) and
that more support would have been beneficial. By contrast, this was infrequently mentioned
by those in group 3, suggesting that having a support worker helped to overcome these
issues.
4 Conclusions
The study’s participants were drawn from the tenants aged over 50 living – apparently
successfully – in decent social housing provided by a housing association with a substantial
waiting list. A randomised controlled trial found that quite minor health interventions
involving guidance from support workers generated improvements on a range of outcomes,
and significant ones for the most intensively treated group related to NHS usage. On
standard costings, using national values, the difference in NHS usage between the control
group and intensively supported group implies annual savings of £757.50p per person
(DoH, 2014: Table 1). In contrast, there was no evidence of a positive effect from the sign-
posting intervention: even some indication that this intervention might have a negative
impact on wellbeing.
As was discussed in section 2.2 the participants’ status on the Index of Multiple Deprivation
or health indicators was below that of the London average and in most – but not all cases –
below that of their borough averages. Although disadvantaged, however, they were far
from representing the most vulnerable in society. Nevertheless a baseline health assessment
revealed that 4.5 percent of them needed immediate health interventions. In many cases the
participants with urgent health needs were not registered with a GP nor on the radar of
other support services. Some just attended A & E when they had a health crisis; others were
reclusive. This finding suggests not only a lack of co-ordination in health provision but the
possibility of a useful role for social landlords to exploit the advantage of access their
position gives them to act as agencies for improving the health of their tenants while saving
significant National Health Service resources. This warrants further investigation.
14
A limitation of the study was the inability to access NHS patient data. Records had
originally been expected to be provided in anonymised form but re-organisation of NHS
records at the time of the study made this impossible, making it necessary to rely on self-
reporting of hospital usage. There may also be concerns of sample selection, with those with
greater subjective health needs being more likely to participate. This may be reflected in the
difference between the responses to the initial scoping survey of 360 over 50s residents,
where only 71% (±4.97%) reported one or more long term health conditions, compared to
92% (±2.27%) of the study sample. On other measures the sample was representative of the
broader over 50s general-needs London tenant population making the generalizability of the
findings strong.
Other studies (for example, Bardsley et al., 2013; or Elkan et al., 2001) have indicated the
challenges in identifying significant changes in health when evaluating community-based
interventions for older people, particularly during periods of service innovation. Our study
is consistent with this conclusion: there were improvements in health outcomes for the most
intensively treated group but these were not statistically significant although reduced NHS
usage was.
References
Bardsley M, Steventon A, Smith J, Dixon J. Evaluating Integrated and Community-Based
Centre: How do we know what works? Nuffield Trust; 2013. [Available online at:
https://www.nuffieldtrust.org.uk/research/evaluating-integrated-and-community-based-
care-how-do-we-know-what-works, accessed 1st March 2017]
Benzeval M, Bond L, Campbell M, Egan M, Lorenc T, Petticrew, M et al. How Does Money
Influence Health? Joseph Rowntree Foundation, York; 2014
Blankers M, Koeter MWJ and Schippers GM. Missing Data Approaches in eHealth Research:
Simulation Study and a Tutorial for Nonmathematically Inclined Researchers. J Med
Internet Res. 2010 Oct-Dec; 12(5): [Available online at: doi: 10.2196/jmir.1448
Cheshire PC, Nathan MA, Overman, HG. Urban Economics and Urban Policy: Challenging
Conventional Policy Wisdom. Cheltenham: Edward Elgar; 2014.
DoH (Department of Health). NHS Reference Costs 2013 to 2014. 2014;
https://www.gov.uk/government/publications/nhs-reference-costs-2013-to-2014.
Elkan R, Kendrick D, Dewey M, Hewitt M, Robinson J, Blair M, et al. Effectiveness of home
based support for older people: systematic review and meta-analysis. BMJ : British Medical
Journal. 2001 323(7315):719.
Jones AM Wildman J. Health, income and relative deprivation: evidence form the BHPS.
Health Econ. 2008 Mar; 27(2):308-24. doi: 10.1016/j.jhealeco.2007.05.007. Epub 2007 Dec 4.
Marmot M. Fair Society, Healthy Lives. Strategic review of health inequalities in England
post-2010. Department for International Development 2010; ISBN 9780956487001

15
Appendix 1: Group 2 Interventions on Offer
1. Sign post to GP or other health service.
2. Sign post to community groups/social activity (non- FM)
3. Signpost to Social and Financial inclusion team -welfare rights
4. Signpost to Social and Financial inclusion team –employment team
5. Signpost to Social and Financial inclusion team –social inclusion
6. Refer to gas team/boiler repair/energy advice/draft proofing
7. Refer to handyman service
8. Refer to Housing Options team
9. Report repair
10. Advice around home safety, including warmth/condensation and slips, trips and falls hazards
11. Advice and support around areas of general health (Diabetes, blood pressure, BMI), back pain and
mobility or mental health
12. Provide direct minor assistance around home e.g. change light bulbs
13. Complete grant application
Appendix 2: Group 3 Interventions on Offer
1. Support access to GP or other health service:
a) GP
b) IAPT
c) Occupational therapy
d) Physiotherapy
e) Other acute or community hospital service
f) Other NHS mental health service
g) Other health related service (provided by community or third sector organisation)
2. Support access to community groups/social activity (non- FM)
3. Support access to Social and Financial inclusion team -welfare rights
4. Support access to Social and Financial inclusion team –employment team
5. Support access to Social and Financial inclusion team –social inclusion
6. Refer to gas team/boiler repair/energy advice/draft proofing
7. Refer to handyman service
8. Refer to Housing Options team
9. Report repair
10. Advice around home safety, Inc. warmth/condensation and slips, trips and falls hazards
11. Advice and support around areas of general health (Diabetes, blood pressure, BMI), back pain and
mobility or mental health
12. Provide direct minor assistance around home e.g. change light bulbs

Spatial Economics Research Centre (SERC)London School of EconomicsHoughton StreetLondon WC2A 2AE
Web: www.spatialeconomics.ac.uk