Evaluating the current status of red drum (Sciaenops ocellatus ...
109
Evaluating the current status of red drum (Sciaenops ocellatus) in offshore waters of the North Central Gulf of Mexico: age and growth, abundance, and mercury concentration Crystal LouAllen Hightower SEDAR49-RD-02 May 2016
-
Upload
khangminh22 -
Category
Documents
-
view
2 -
download
0
Transcript of Evaluating the current status of red drum (Sciaenops ocellatus ...

Evaluatingthecurrentstatusofreddrum(Sciaenopsocellatus)inoffshorewatersoftheNorthCentralGulfofMexico:ageandgrowth,
abundance,andmercuryconcentration
CrystalLouAllenHightower
SEDAR49-RD-02
May2016

THE UNIVERSITY OF SOUTH ALABAMA
COLLEGE OF ARTS AND SCIENCES
EVALUATING THE CURRENT STATUS OF RED DRUM (SCIAENOPS
OCELLATUS) IN OFFSHORE WATERS OF THE NORTH CENTRAL GULF OF MEXICO: AGE AND GROWTH, ABUNDANCE, AND MERCURY
CONCENTRATION
BY
Crystal LouAllen Hightower
A Thesis
Submitted to the Graduate Faculty of the University of South Alabama
in partial fulfillment of the requirements for the degree of
Master of Science
in
Marine Sciences
July 2013
Approved: Date: ________________________________________________________________________Chair of Thesis Committee: Dr. Sean P. Powers ________________________________________________________________________ Committee Member: Dr. William F. Patterson, III ________________________________________________________________________ Committee Member: Dr. Gregory W. Stunz ________________________________________________________________________ Chair of Department: Dr. Sean P. Powers ________________________________________________________________________ Director of Graduate Studies: Dr. S. L. Varghese ________________________________________________________________________ Dean of the Graduate School: Dr. B. Keith Harrison

EVALUATING THE CURRENT STATUS OF RED DRUM (SCIAENOPS OCELLATUS) IN OFFSHORE WATERS OF THE NORTH CENTRAL GULF OF
MEXICO: AGE AND GROWTH, ABUNDANCE, AND MERCURY CONCENTRATION
A Thesis
Submitted to the Graduate Faculty of the University of South Alabama
in partial fulfillment of the requirements for the degree of
Master of Science
in
Marine Sciences
by Crystal LouAllen Hightower
B.S., University of North Alabama, 2006 July 2013

ii
ACKNOWLEDGEMENTS
I am most thankful for the support of my family during this time. They have never
stopped encouraging me and always supported my pursuit and love of the marine
sciences. My father, Frankie LouAllen, always taught me that with hard work and
perseverance, success is achievable. My mother, Nancy Hatton Cabler, always believed
in my dreams and was a constant source of encouragement and support. I would like to
thank my husband, Travis Hightower, for his understanding and patience during the past
two years.
I would like to thank my boss and research mentor, Dr. Sean Powers for believing
in my abilities and allowing me the opportunity of pursuing a graduate degree. I also
thank my committee members and fisheries science mentors, Dr. Will Patterson and Dr.
Greg Stunz. They were available to answer any questions and provided insight and
guidance during this process.
I would like to thank the University of South Alabama and the Dauphin Island
Sea Lab and especially Nancy Merrill, Angie McKinnell, and Sally Brennan for helping
at every step of my progress. Thanks to Powers Lab manager, Stan Bosarge, for time
spent teaching me ArcGIS and always making sure I had enough field help. Thank you to
Dr. J. Marcus Drymon for always finding the time to assist and teach and especially for
helping during my database crisis. Thanks to Lei Hu who worked magic with the longline
database, making it easy to query and get the data I needed. Thanks to the Powers Lab
graduate students: Dr. Steven Scyphers, Dr. Matthew Ajemian, Dr. Glenn Miller,

iii
Matthew Kenworthy, and Lindsay Kramer for their assistance with coursework, field
collection, stats questions, and writing advice. A special thanks to graduate students:
Trey Spearman, Andrea Kroetz, Natalie Cumbaa, Whitney Scheffel and Meagan
Schrandt for field help collecting Red Drum, lots of help with otolith processing, and data
analyses. Thanks to Lanaya Fitzgerald for her field help and keeping me sane by being
my pre- and post-work surf buddy! Thank you Powers Lab technicians: Laura Stone,
Claire Pabody, Kevan Gregalis, Lauren Showalter, Lela Schlenker, Dan Blakely,
Nicholas Bawden, Kate Nixon, and Jay Jackson for making this research possible
collecting fish, ordering supplies and processing fish often on nights and weekends.
Thanks to Powers Lab interns: Pavel Diemens, Payson Clark, Ben Dickey, Jessica Hill,
Arjun Joshi, Brian Klimek, Jennifer Chiu, Brian McKenna, Chris Free, Danielle Perez,
Nick Adams, and Mark Kirk for their infectious curiosity and willingness to help with
anything, even weighing gonads. Thanks to the DISL boat captains and crew: Tom
Guoba, Russell Wilson, Rodney Collier, Willy Johnston, and John Hunt. Thanks to the
Mobile Jaycees for the introduction of the special Red Drum category at the ADSFR and
allowing me to collect more samples in one weekend than in an entire year. Thanks to the
Alabama Marine Resources Division for collecting and sharing Red Drum gillnet data.

iv
TABLE OF CONTENTS
Page LIST OF TABLES ...............................................................................................................v LIST OF FIGURES ........................................................................................................... vi
ABSTRACT ..................................................................................................................... viii
GENERAL INTRODUCTION ............................................................................................1
OBJECTIVES AND HYPOTHESES ………………………………………………….....6 CHAPTER 1: AGE AND GROWTH, MORTALITY ESTIMATES, AND
ABUNDANCE... .....................................................................................................7 Introduction ..............................................................................................................7 Methods....................................................................................................................9 Results ....................................................................................................................16 Discussion ..............................................................................................................21 CHAPTER 2: MERCURY CONCENTRATIONS IN RED DRUM ................................27 Introduction ............................................................................................................27 Methods..................................................................................................................30 Results ....................................................................................................................36 Discussion ..............................................................................................................39 CONCLUSIONS AND RECOMMENDATIONS ............................................................45 LITERATURE CITED ......................................................................................................47 APPENDICES ...................................................................................................................53 BIOGRAPHICAL SKETCH .............................................................................................94

v
LIST OF TABLES
Appendix Table Page 1. State allowable bag and size limits for Red Drum .................................................53 2. Parameter estimates for standard von Bertalanffy growth equations ....................54
3. Literature parameter estimates for standard von Bertalanffy growth equation .....55
4. Literature parameter estimates for ‘double von Bertalanffy’ growth equation .....56
5. Abundance index values for the 2006-2012 fishery-independent longline ..........57 6. Mean size and total Hg values for Red Drum in the Gulf of Mexico ...................58

vi
LIST OF FIGURES
Appendix Figure Page 1. Catch data for Red Drum in the Gulf of Mexico (1950-2010) .............................59 2. Locations of standardized fishery-independent surveys with starting and ending
dates ......................................................................................................................60 3. Location of the fishery-dependent Alabama Deep Sea Fishing Rodeo .................61 4. Sampling locations for all fishery-independent longline surveys (2006-2012) ....62 5. Average Red Drum CPUE (fish/100 hooks/hr) for fish caught on dead versus live
bait..........................................................................................................................63 6. Condition indices plotted by month for all Red Drum samples.............................64 7. Age distribution (A) and length frequency (B) of all Red Drum in this study
(2010-2012)............................................................................................................65 8. Age distributions of all Red Drum in this study by gear type (2010-2012) ..........66 9. Length frequencies of all Red Drum in this study by gear type (2010-2012) .......67 10. Length at age for all Red Drum in this study (2010-2012) ....................................68
11. Von Bertalanffy growth function (solid line) and double von Bertalanffy growth function (dashed line) fit to the age at length data for all Red Drum in this study (2010-2012)............................................................................................................69
12. Catch curve regressions for the fishery-independent longline (n = 400) and fishery-dependent ADSFR (n = 344) (2008-2012) ................................................70
13. Age versus distance from shore for Red Drum caught using the 2010-2012 fishery-independent longline .................................................................................71
14. Catch per unit effort of Red Drum for all fishery-independent longline surveys (2006-2012)............................................................................................................72
15. Observed fishery-independent longline CPUE index by month (2006-2012) .......73

vii
16. Nominal fishery-independent longline CPUE index by year (2006-2012) ...........74
17. Fishery-independent longline abundance indices by year (2006-2012) ................75
18. Locations of fishery-independent longline Red Drum sampled for mercury and stable isotope analysis ............................................................................................76
19. Fishery-independent and fishery-dependent length frequencies for Red Drum sampled for mercury and stable isotopes ...............................................................77
20. Fishery-independent and fishery-dependent age distributions for Red Drum sampled for mercury and stable isotopes ...............................................................78
21. Fishery-independent Red Drum total Hg versus natural total length (NTL) .........79
22. Fishery-independent Red Drum total Hg versus age .............................................80
23. Fishery-independent Red Drum total Hg versus trophic level...............................81
24. Fishery-dependent Red Drum total Hg versus natural total length (NTL) ............82
25. Fishery-dependent Red Drum total Hg versus age ................................................83 26. Fishery-dependent Red Drum total Hg versus trophic level ..................................84
27. Fishery-independent and fishery-dependent length frequency and age distribution
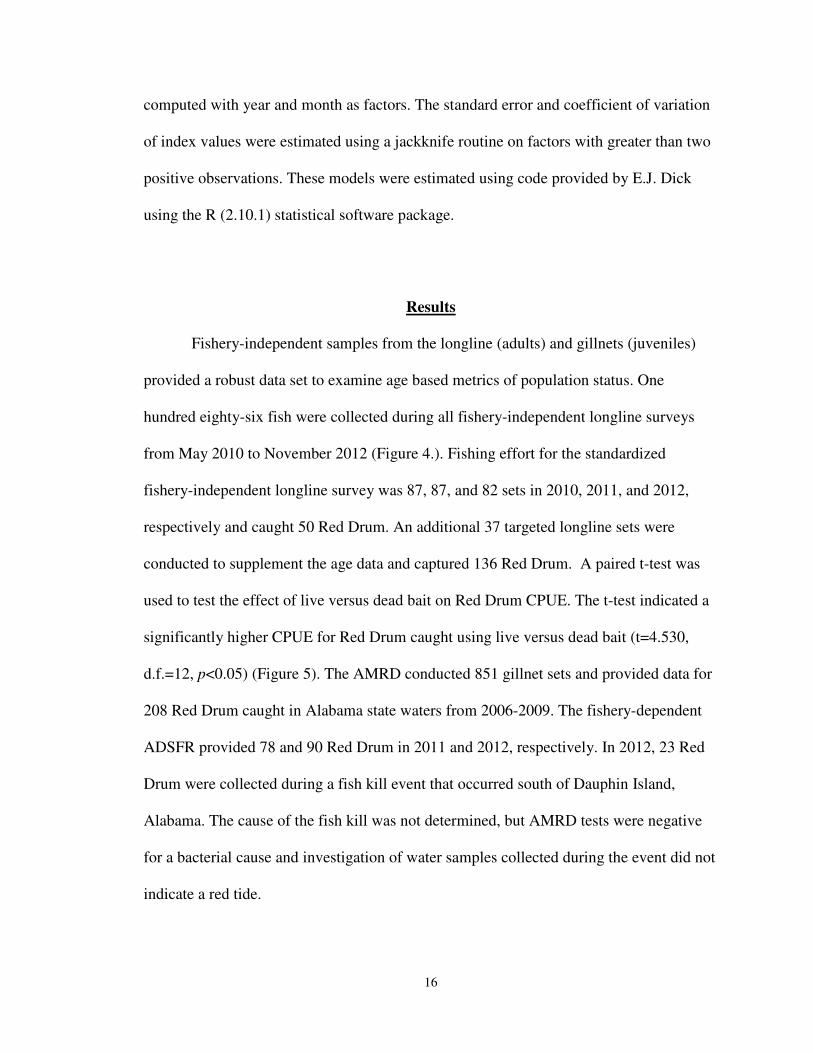
for King Mackerel sampled for mercury and stable isotopes ...............................85 28. Mean total mercury for all species samples at the 2011 Alabama Deep Sea
Fishing Rodeo .......................................................................................................86
29. Fishery-dependent King Mackerel total Hg versus natural total length (NTL) .....87
30. Fishery-dependent King Mackerel total Hg versus age .........................................88
31. Fishery-dependent King Mackerel total Hg versus trophic level ..........................89
32. Fishery-dependent King Mackerel and Red Drum total Hg versus size and ANCOVA results ...................................................................................................90
33. Fishery-dependent King Mackerel and Red Drum total Hg versus subset sizes and ANCOVA results ...................................................................................................91
34. Fishery-dependent King Mackerel and Red Drum total Hg versus age and ANCOVA results for subset sizes ..........................................................................92
35. Fishery-dependent King Mackerel and Red Drum stable isotope biplot ...............93

viii
ABSTRACT
LouAllen Hightower, Crystal, M.S., University of South Alabama, July 2013. Evaluating the Current Status of Red Drum (Sciaenops ocellatus) in Offshore Waters of the North Central Gulf of Mexico: Age and Growth, Abundance, and Mercury Concentration. Chair of Committee: Sean P. Powers, Ph.D.
Red Drum is a demersal sciaenid that occurs throughout the Gulf of Mexico
(GOM). Over the last two decades, GOM Red Drum has been overfished, and a harvest
ban has existed in federal waters since 1987. As a result, there is a lack of quantitative
data to describe the current status of the adult spawning stock. Here, I addressed several
issues relevant to evaluating the current status of the stock. Specifically, I: 1) examined
age composition, growth, and mortality in adult Red Drum in offshore waters of the north
central GOM from 2010-2012 using otoliths from fishery-independent and -dependent
sources, 2) developed an index of relative abundance for Red Drum in the north central
GOM with fishery-independent catch data from 2006-2012, and 3) determined the
relationship between total mercury (Hg) concentration and Red Drum size and age.
Recreational catch has increased over the past 26 years. Age composition and growth
rates showed an increase in average age during the current moratorium, but an absence of
5-10 year old fish. The abundance index showed a declining trend. My results suggest
that the public should limit consumption of Red Drum > 660 mm total length due to high
total Hg concentrations. My results provide clear indication of success immediately
following the moratorium, but also point out increased fishing mortality in state waters
and a potential human health risk of allowing anglers to keep large Red Drum.

1
GENERAL INTRODUCTION
The life history of GOM Red Drum (Sciaenops ocellatus) has been studied
extensively. At early ages (0-6 years), Red Drum is primarily characterized as a demersal
fish, feeding on bottom dwelling fish and invertebrates; however, as they age they exhibit
traits of a coastal pelagic, such as long (up to 700km) migrations across the GOM and a
more piscivorous diet (Overstreet, 1983; Peters and McMichael, 1987; Scharf and
Schlicht, 2000). Red Drum is an estuarine-dependent fish with estuarine residence
occurring at the larval and juvenile stages and offshore residence after reaching maturity
(3-6 years) occupying the continental shelf (Pearson, 1929; Beckman et al., 1988; Davis,
1990; Murphy and Taylor, 1990). Their spawning season is light and temperature-
dependent and occurs mostly during the fall from August to November in the GOM. Red
Drum are batch spawners and form large spawning aggregations near bay and Gulf
passes making them vulnerable to fishing in state waters (Pearson, 1929; Overstreet,
1983; Holt et al., 1985).
Results from early GOM Red Drum studies indicated no real trend in landings
from the 1890s to the 1920s (Higgins and Lord, 1927); however, Pearson (1929)
highlighted that data were lacking to conduct appropriate statistical analyses and argued
that fishing effort had probably increased in the early 1900s. With increased fishing
efficiency and introduction of a purse seine fishery in the 1980s due to the popularity of

2
the dish “blackened redfish,” the commercial catch of Red Drum increased from 2.5
million pounds in the early 1980s to over 14 million pounds per year by 1986 (NMFS,
2011), which led to its overfished status (Figure 1). Since 1987, federal waters have been
closed to recreational and commercial fishing due to stock depletion.
The current management strategy for Red Drum, as prescribed by the GOM Red
Drum Fishery Management Plan, includes a harvest moratorium in federal waters and
management via escapement rates calculated by state agencies in state waters (Gulf of
Mexico Fishery Management Council, 1987). Escapement is estimated as the ratio of the
observed cumulative survival of a group of Red Drum through age 4 to that group’s
potential cumulative survival through age 4 if it hadn’t been fished (Murphy, 2005;
Powers and Burns, 2010). These values are estimated using yearly fishing mortality for
ages 0-4, calculated based on age distributions of fish caught using fishery-independent
surveys and fishery-dependent recreational creel surveys. The current escapement rate for
managing Red Drum in GOM States is set at a minimum of 30% (40% in Florida);
however, there is some fishing mortality of older Red Drum in the population (Murphy,
2005). Fishing mortality of older Red Drum in state waters must be considered for an
accurate assessment of the species. Recent data are sparse for older Red Drum,
precluding an understanding of the current status of the spawning population.
The most recent extensive sampling for GOM Red Drum was completed during
the 1980s in conjunction with the purse seine fishery, and in the 1990s based on a
National Marine Fisheries Service (NMFS) tag-and-recapture program and scientific
collections off the west coast of Florida and discussed the relevance of nearshore
recreational fishing pressure on the status of the stock (Beckman et al., 1988; Wilson and

3
Nieland, 1994; Murphy and Crabtree, 2001; Porch et al., 2002). Declining escapement
rates were estimated in the latest Gulf-wide stock assessment in 2000; although, rates
were high enough that the species was estimated to no longer be subjected to overfishing
and was thought to have recovered from its overfished status (Porch, 2000; Hogarth,
2004). According to the federal status of marine fisheries, the GOM Red Drum stock
status is now listed as “undefined,” largely due to uncertainty regarding age structure and
population estimates (Hogarth, 2004).
Recent evidence indicates the recovery of older age classes of Red Drum in
offshore waters of the GOM. Two Marine Fisheries Initiative (MARFIN) studies
provided estimates of age structure and population size of the Red Drum stock and both
studies indicated recovery of older age classes off Tampa Bay, FL and Alabama,
respectively. Winner et al. (2009) conducted purse seine sampling of Red Drum schools
off Tampa Bay, Florida in a study designed to repeat earlier methods of Murphy and
Crabtree (2001). Older Red Drum were encountered in higher frequencies, mean size was
significantly larger, and there was a significant shift in the length frequency towards
larger sizes of fish a decade after the first Tampa Bay, FL study in the late 1990s
(Winner, 2009; Murphy and Crabtree, 2001). Powers et al. (2012) aged 428 Red Drum
collected with bottom longline in coastal Alabama from 2006-2010 and also found high
frequencies of older (>10 years) age class Red Drum. Interestingly, Red Drum older than
24 years had a lower frequency of occurrence; these older Red Drum represented pre-
moratorium fish (i.e. fish born before 1986) and provide an indication of the effectiveness
of the current management scheme.

4
Despite the apparent success of the harvest moratorium in rebuilding GOM Red
Drum spawning biomass, the abundance of adult Red Drum in federal waters has been
difficult to assess without catch data. Powers et al. (2012) attempted to estimate adult Red
Drum abundance with spotter planes. Aerial surveys were useful for distribution and
presence/absence data but too costly and inaccurate for estimating abundance. Powers et
al. (2012) suggested fishery-independent bottom longline sampling as an efficient method
for obtaining an abundance index for Red Drum. While such an index should be a
valuable tool for assessing Red Drum stock status, the limited time series of sampling
(2006-2010) prevents the inclusion of the Alabama data in any formal stock assessment. I
continued this time series through 2012 for these data to be available for the next stock
assessment.
In February 2010, the Gulf of Mexico Fishery Management Council (Gulf
Council) met to discuss the status of GOM Red Drum. The Gulf Council recommended
that the overfishing limit remain at near zero for GOM federal waters based on the lack of
current data on offshore adult populations, and that a small quota (20,000 Red Drum) be
set and devoted to scientific study. The second recommendation was to conduct a stock
assessment in state and federal waters at the earliest opportunity. This stock assessment
would include age composition of Red Drum in offshore waters and include all
applicable inshore data collected within state waters. The working group also
recommended that mercury (Hg) concentrations in various age and size groups of Red
Drum be collected (Powers and Burns, 2010).
Although not part of most stock assessments, Hg is important to investigate when
considering the management of a consumed fish. Mercury is a toxic metal that

5
bioaccumulates in tissues of long-lived fishes and can pose health risks to humans when
consumed in large quantities, with monomethylmercury (MeHg) being the most toxic
form of Hg (NRC, 2000). While the accumulation of Hg in marine fishes in the GOM has
been well established (Ache et al., 2000), Hg concentrations above the United States
Food and Drug Administration (FDA) action limit (1.0 ppm) and the Florida action limit
(0.5-1.5 ppm) have only recently been reported for Red Drum (Adams and Onorato,
2005; Winner, 2009; Stunz and Robillard, 2011). Red Drum are likely candidates for
bioaccumulation of Hg because they spend their early years in coastal estuaries, forage on
the benthos, are long lived, and grow to large sizes (Pearson, 1929; Beckman et al., 1988;
Murphy and Taylor, 1990). Management of this species should include this aspect of
public health to limit human exposure to fish with elevated Hg concentrations.
Management of Red Drum is difficult due to their life history and movement
across state and federal boundaries. Assessment has further been delayed due to a lack of
up-to-date data from all areas of the GOM. This assessment included typical
measurements of age and growth, abundance, and mortality coupled with a current
ecotoxicological assessment of Red Drum in state and federal waters. This study will
contribute these valuable data from the north central region of the GOM to this
assessment. The Red Drum continues to be one of the more popular sportfish in the GOM
and proper management will ensure it continues to be abundant for generations to come.

6
OBJECTIVES AND HYPOTHESES
The overall objective of this study was to examine the population ecology of Red
Drum in the northern Gulf of Mexico south of Alabama, an area that is considered Red
Drum essential fish habitat. Data from this study will be made available to managers to
conduct a current stock assessment.
The specific objectives were:
Objective 1: Examine age composition, growth, and mortality in adult Red Drum in
offshore waters of the north central Gulf of Mexico from 2010-2012
Objective 2: Develop a bottom longline abundance index for Red Drum in offshore
waters of the north central Gulf of Mexico.
Objective 3: Determine the relationship between total mercury concentrations, age, and
size of Red Drum.
H0, 1: There is no relationship between total mercury concentration and size of Red Drum.
HA, 1: There is a positive relationship between total mercury concentration and size of
Red Drum
H0, 2: There is no relationship between total mercury concentration and age of Red Drum.
HA, 2: There is a positive relationship between total mercury concentration and age of Red
Drum

7
CHAPTER 1: AGE AND GROWTH, MORTALITY ESTIMATES, AND
ABUNDANCE
Introduction
Red Drum in the Gulf of Mexico (GOM) have been overfished since the late
1980s. In an effort to stop overfishing, a recreational and commercial harvest moratorium
was established in 1987 for the federal waters of the GOM (Gulf of Mexico Fishery
Management Council, 1987). This species continues to be one of the more popular
sportfish in state waters. Due to the apparent return of large spawning aggregations in the
northern GOM over the past decade, managers are being urged by fishermen to open
federal waters to recreational fishing (Powers and Burns, 2010). The official status of the
stock was characterized as undefined in the latest assessment in the early 2000s (Porch,
2000). Over a decade later, the status of the stock remains unknown (Hogarth, 2004).
Management of Red Drum is difficult due to several factors, including
movements across state and federal boundaries. Although the recreational fishery in state
waters is mostly limited to the removal of juveniles, the current management plans for
four out of five GOM states include opportunities to keep large, sexually mature fish
(Table 1). Data needed to define the current status of the stock include samples of adult
Red Drum historically collected through fishery-dependent methods. The absence of a
federal fishery has limited the amount of fishery-dependent sampling that can be
conducted. Consequently, research has moved to collection using fishery-independent

8
methods and recreational catch from state waters to gain data for age, growth, mortality
and abundance estimates.
Powers et al. (2012) conducted a fishery-independent longline survey in the
northern GOM from 2006-2010. They discussed the circular issue of needing a current
Red Drum stock assessment but lacking long-term standardized studies of offshore adults
to conduct such an assessment. They concluded that increased fishery-independent
longline effort could potentially sample the amount of Red Drum needed from offshore
waters to examine the current status of the stock. This, coupled with inshore collections
available from state agencies, could address the lack of available data.
The 2006 reauthorization of the Magnusun-Stevens Fishery Conservation and
Management Act included a congressionally-mandated deadline to end overfishing by
setting annual catch limits (ACL) for species with fisheries management plans by the
year 2011 (MSFCMA, 2006). In July 2010, the Gulf of Mexico Fishery Management
Council set an acceptable biological catch (ABC) to determine the ACL. They set the
ABC at 20,000 Red Drum for scientific study until a stock assessment could be
conducted. Using fishery-independent gillnets and longline surveys, a shore-based
sampling opportunity during a 2012 fish kill, and fishery-dependent samples from the
Alabama Deep Sea Fishing Rodeo (ADSFR), I collected traditional data to investigate
age and growth, abundance, and mortality of Red Drum from the north central GOM
needed to evaluate population dynamics and vital rates to inform managers of the current
status of the stock.

9
Methods
Since May 2006, Red Drum were collected using fishery-independent longline
surveys and were sampled through November 2012. All longline set locations were
randomly selected within the study area. From May 2006 through November 2008,
sampling was stratified in blocks along the continental shelf (east to west; Figure 2A) as
well as across the shelf (north to south; Figure 2B) with a depth range of approximately
2-20 m. In 2009, transect sampling was conducted between 88°30′ and 87°30′W (the
longitudinal boundaries of Alabama) extending sampling southward to approximately
200 m depth (Figure 2C). In 2010, the Fisheries Ecology Lab at the University of South
Alabama in conjunction with the Alabama Department of Conservation and Natural
Resources conducted Southeastern Monitoring and Assessment Program (SEAMAP)
bottom longline sets in nearshore waters of coastal Alabama. Four stations were sampled
monthly (March-October) from inside Mobile Bay and Mississippi Sound as well as
offshore (Figure 2D). From 2010-2012, targeted longline sets at the inlets near
Mississippi Sound and Mobile Bay were also conducted (March-November) to increase
catch of Red Drum for age, growth, and mortality estimation.
For all longline sets, a commercial-style bottom longline gear setup was used. A
monofilament mainline (1000 lb. test, 1 nautical mile length) was deployed through a
block off the stern of the research vessel. High flier buoys were used at the start and end
of each set. Five kg weights (start, mid-set, end set), and 3.66 m monofilament gangions
(318 kg test) with 15/0 Mustad 39960D circle hooks were clipped to the mainline during
deployment. Bottom longline effort was 100 hooks fished for one hour soak time. Soak
time was determined from the time the last high flier buoy was deployed until the first

10
high flier buoy was retrieved to begin the haul back (Driggers et al., 2008). For all
surveys, except the targeted effort sets, hooks were baited with dead Atlantic Mackerel
(Scomber scombrus). For the targeted sampling effort, whole live Atlantic Croaker
(Micropogonias undulatus) alternated on every other hook with Atlantic Mackerel. All
fish were boated, measured to the nearest mm, and weighed to the nearest 0.1 kg. Haul
back speed was approximately 3.5 - 4 knots. In addition, a hydrolab cast was made during
the soak time to measure surface and bottom temperature, salinity, and dissolved oxygen.
A paired t-test was used to test the effect of bait type on CPUE.
For all Red Drum captured on the longline, standard morphometrics, otoliths,
gonads and intraperitoneal fat were sampled from each fish. Standard length (SL), fork
length (FL) natural total length (NTL) and stretch total length (STL) to the nearest mm
and mass to the nearest 0.1 kg were recorded. Sagittal otoliths were removed and stored
dry for future processing. Gonads and any intraperitoneal fat were removed and weighed
to the nearest gram and gonadosomatic (GSI) and intraperitoneal fat (IPF) indices were
calculated. Gonadosomatic and IPF indices are measures of condition where gonad mass
or intraperitoneal fat mass is divided by total body mass then multiplied by 100 (Wilson
and Nieland, 1994; Craig et al., 1995). The GSI and IPF provide information on the
relative investment of energy used for reproduction and growth (McGoogan and Gatlin,
1988; Wilson and Nieland, 1994). A Fulton condition index was also calculated by
dividing the mass of the fish by TL3 and multiplying by 100,000 (Ricker, 1975).
Additional fishery-independent data including standard morphometrics and ages
were collected by the Alabama Marine Resources Division (AMRD) using experimental
gillnets in Alabama state waters. These age and length data were collected during

11
monthly gillnet sampling from 2006 to 2009. These data were not included in the
abundance index but were used to increase the number of smaller individuals to improve
estimates of parameters in Red Drum growth models.
Red Drum were also sampled for standard morphometrics, otoliths, gonads and
fat through a fishery-dependent source, the Alabama Deep Sea Fishing Rodeo (ADSFR).
The ADSFR was held in July 2009 and 2011, and fish were caught within territorial
waters of the ADSFR. The ADSFR was cancelled in 2010 because of the Deepwater
Horizon Oil Spill. The coordinates for the ADSFR territorial waters are: north: all bays
and inlets of the GOM; east: 85°W longitude; south: 28°N latitude; and, west: 91°W
longitude (Figure 3). Anglers who brought in a Red Drum above the slot limit size (660
mm TL) were entered into a random drawing for prizes. Alabama state law allows one
Red Drum above 26 inches total length per day, and all fishing was conducted in
accordance with state regulations.
Sagittal otoliths were used to estimate ages of Red Drum in this study. Sagittal
otoliths for age determination of GOM Red Drum were first used by Beckman et al. in
1988. Otolith processing techniques for this study were conducted according to the
methods for thin sectioning described in the Gulf of Mexico Marine Fisheries
Commission otolith manual (VanderKooy and Guidon-Tisdel, 2003) and Beckman et al.
(1988). The left otolith was processed, leaving the right otolith for use when the left was
not available or when there was a disagreement between otolith readers (Beckman et al.,
1988). Otoliths were cut along the transverse plane as close to the core as possible with a
Model 1010 Hillquist Thin-Sectioning Petrographic Saw. Sectioned otoliths were
polished with a Crystal Master 6 Plus polishing wheel affixed with a Buehler microfiber

12
polishing cloth treated with 0.3 µm aluminum oxide powder and water. Polished sections
were placed sectioned side down on a glass microscope slide and secured using Loctite
349TM ultraviolet adhesive. The slides were placed under a blacklight overnight to cure.
The remaining otolith section was trimmed with the cut-off saw followed by the precision
grinder to grind the otolith until it reached approximately 50 µm. The slide was then
polished on the Crystal Master 6 Plus with aluminum oxide and water, cleaned, and
covered with Flo-Texx liquid cover slip to remove scratches. All otoliths were aged
independently by two readers. Average percent error (APE) was calculated to ensure
correct integer ages using the following equation:
APE = 100% x �
�∑
�������
�����
where, R was the number of readings of individual j, Xij was the age i, determined for
individual j, and Xj was the mean age among readers. Integer age was determined by
counting number of opaque zones. Year at birth was estimated for all Red Drum by
subtracting opaque zone count from year of capture with the assumption that the initial
annulus was deposited during the winter of year two (Beckman et al., 1988).
To estimate growth parameters for Red Drum in this study, von Bertalanffy and
double von Bertalanffy growth curves were fit to both males and females for the
complete data set, fishery-independent (gillnet and longline) data and fishery-dependent
(ADSFR). The von Bertalanffy growth curve was calculated using the following
equation:
Lt = L∞ [1 – eK(t-t
0)],

13
where Lt is total length at time t, L∞ is the asymptotic length, e is the base of natural
logarithms, K is the von Bertalanffy growth coefficient, t is age, and t0 is the theoretical
age at which total length equals zero (von Bertalanffy, 1938). The ‘double von
Bertalanffy’ growth parameters as described by Condrey et al. (1988) were calculated
with the following equation:
Lt = { L∞ [1 - e
-K(t-t1
)] if t < tp
L∞ [1 - e-K(t-t
2)] if t > tp
tp = (k2t2-k1t1)/(k2-k1)
where t is age, L∞ is the asymptotic length, k1, k2 describe instantaneous growth
coefficients, and t1, t2 are the age intercept parameters. The models were fit using Excel
and the R (2.10.1) statistical software package with the FSA add-in (Koenker and Ng,
2012). Differences in growth curves between males and females were tested with a
likelihood ratio test (Kimura, 1980; Haddon, 2000). The growth model with the most
parsimonious fit was selected based on the Akaike information criterion (AIC) calculated
using the following equation:
AIC = 2k-2ln(L)
where k is the number of parameters in the model and L is the maximized value of the
likelihood function for the model. The results from these growth models were compared
to similar equations calculated previously for Red Drum in the GOM (Tables 2 and 3).

14
These growth parameters were compared with those of previous studies by using the
following conversion provided by Goodyear (1996): total length = 1.092(fork length)-
1.01.
A catch curve was computed to estimate total mortality (Z) by fitting a linear
regression to the fully-recruited ages in a scatterplot of the natural log of numbers versus
age. Two methods were employed to estimate natural mortality (M) from the maximum
observed longevity. Hoenig’s (1983) regression equation was used to predict M from tmax
(maximum age observed) using the equation:
ln(M) = 1.44-0.982*ln(tmax).
A simpler rule-of-thumb approach evaluated by Hewitt and Hoenig (2005) using P = 0.05
(the proportion of the population that survives to the tmax) was also used.
� =−ln(�)����
Because Z= M + F, F can be estimated if you have accurate estimates of Z and M. These
three estimates were calculated using the entire 2008-2012 data set including that from
Powers et al. (2012). The estimates were then compared to those of previous studies.
Spatial analysis of the fishery-independent longline Red Drum data was
conducted to elucidate the age distribution and abundance of Red Drum in state and
federal waters of the GOM. This was done by plotting the state/federal boundary and a

15
selection process using ArcGIS v10.1. I examined age versus distance from shore to
verify the age distribution of Red Drum available to recreational fishermen in state waters
and those protected in federal waters. Red Drum abundance, using the fishery-
independent longline survey from 2006-2012, was examined by location in state or
federal boundary waters. A one-way ANOVA was used to test for differences in CPUE
between state and federal waters.
Powers et al. (2012) concluded that an abundance index could be calculated using
standardized bottom longline catch data. In their approach, all fishery-independent
longline catch data were converted to nominal CPUE, expressed as fish caught/100
hooks/hour. Differences in nominal CPUE by month and year were tested using one-way
ANOVAs. If significance was detected by the model, Tukey’s HSD post hoc analysis
was performed. To standardize CPUE for an abundance index, the delta-lognormal index
(dGLM) of relative abundance (Iy) as described by Lo et al. (1992) and Ingram et al.
(2010) was estimated as
Iy = cypy,
where cy is the estimate of mean CPUE for positive catches only for year y, and py is the
estimate of mean probability of occurrence during year y. Both cy and py are estimated
using generalized linear models. Data used to estimate abundance for positive catches (c)
and probability of occurrence (p) are assumed to have lognormal and binomial
distributions, respectively. The final index was the product of the back-transformed year
effects from the two above mentioned general linear models (GLMs). All GLMs were
16
computed with year and month as factors. The standard error and coefficient of variation
of index values were estimated using a jackknife routine on factors with greater than two
positive observations. These models were estimated using code provided by E.J. Dick
using the R (2.10.1) statistical software package.
Results
Fishery-independent samples from the longline (adults) and gillnets (juveniles)
provided a robust data set to examine age based metrics of population status. One
hundred eighty-six fish were collected during all fishery-independent longline surveys
from May 2010 to November 2012 (Figure 4.). Fishing effort for the standardized
fishery-independent longline survey was 87, 87, and 82 sets in 2010, 2011, and 2012,
respectively and caught 50 Red Drum. An additional 37 targeted longline sets were
conducted to supplement the age data and captured 136 Red Drum. A paired t-test was
used to test the effect of live versus dead bait on Red Drum CPUE. The t-test indicated a
significantly higher CPUE for Red Drum caught using live versus dead bait (t=4.530,
d.f.=12, p<0.05) (Figure 5). The AMRD conducted 851 gillnet sets and provided data for
208 Red Drum caught in Alabama state waters from 2006-2009. The fishery-dependent
ADSFR provided 78 and 90 Red Drum in 2011 and 2012, respectively. In 2012, 23 Red
Drum were collected during a fish kill event that occurred south of Dauphin Island,
Alabama. The cause of the fish kill was not determined, but AMRD tests were negative
for a bacterial cause and investigation of water samples collected during the event did not
indicate a red tide.

17
Examination of condition indices demonstrated a strong period of pre-spawning,
especially for females (Figure 6). Using the 2010-2012 fishery-independent longline and
fishery-dependent ADSFR data, values for Fulton condition index (n=350) were
consistent across months. There was a slight peak in GSI (n=341) and decline in IPF
(n=341) signaling spawning in October but, the current data set did not contain fish
collected during September (Figure 6A). The data were combined with Powers et al.
(2012) to cover dates from 2008-2012 and the GSI and IPF reflected the fall spawning
season (Figure 6B). There was no significant difference between males and females for
the Fulton condition and IPF indices; however, GSI was significantly greater for females
(0.688 ± 0.037) than males (0.323 ± 0.024) (Mann-Whitney U test, U = 111141,
p<0.0001).
Differences in selectivity between fishery-independent bottom longlines and
gillnets and fishery-dependent hook and line allowed a broad survey of Red Drum age
structure. Five hundred and seventy two Red Drum were aged in this study. Age
composition and length frequency were calculated for both fishery-independent and
fishery-dependent samples (Figures 7A-B). The APE for all Red Drum in this study was
0.002 resulting in 99.998% agreement between two independent readers. The youngest
fish in this study was 0 years old and collected in an AMRD gillnet and the oldest fish
was 40 and collected during the 2011 ADSFR using hook and line (Figure 8). The highest
proportion age class for the fishery-independent longline was age 20 and the size range
was 759-1067 mm. The fishery-dependent ADSFR provided younger fish with 3 year
olds being the highest proportion covering a size range of 446-1040 mm (Figure 9). The
AMRD gillnet provided the most fish from 0-2 ages and 179-889 mm size classes. The

18
length frequency of the samples collected during the 2012 fish kill indicated the affected
fish were large with 75% of the fish collected greater than 900 mm. The age distribution
for the fish kill Red Drum was evenly distributed with fish varying in age from 4-26
years old. Kolmogorov-Smirnov comparisons of two distributions were used to test for
differences in age distribution and length frequencies between all fishery-independent
and dependent samples. The K-S tests showed the distributions were significantly
different for both age distribution (D = 0.503, p<0.0001) and length frequency (D =
0.467, p<0.0001). Fish caught during the fishery-independent longline were longer and
older than those caught during the fishery-dependent ADSFR.
Growth parameters differed between sex and collection type. Length at age was
plotted for all sampling gears and used to calculate growth parameters (Figure 10). Von
Bertalanffy and double von Bertalanffy growth models were first fit using all Red Drum
data with both sexes combined (von Bertalanffy, 1938; Porch et al., 2002) (Tables 2-4)
(Figure 11). The double von Bertalanffy function resulted in higher values for k2 than k1
indicating faster growth after age five, which would not be accurate based on the length
at age data. Also, because of relatively large sizes (approximately 200-400 mm) at age
zero, t2 was so small (-84.5) it was considered biologically meaningless. To investigate
more meaningful parameters, the double von Bertalanffy function fit was forced through
zero (making t1, t2=0). The L∞ for the double von Bertalanffy forced through zero was
slightly smaller (938) and k1 (0.56) was greater than k2 (0.40). The AIC calculated for the
standard von Bertalanffy was slightly lower (6357) than the double von Bertalanffy
growth function (6404) and much lower than the von Bertalanffy growth function forced
through zero (7319); thus, the standard von Bertalanffy function was evaluated to be the

19
most parsimonious fit. The the standard von Bertalanffy growth function for all gear
types with both sexes combined and for males and females separately were fit to the data.
Sex was determined for 427 Red Drum from fishery-dependent and -independent sources
and had a 1:1.4 male to female ratio. A likelihood ratio test showed a difference in model
fit between males and females (χ2 = 18.26, df = 1, P<0.05). The L∞ was larger for females
(953 mm) than it was for males (928 mm), growth coefficients were very similar between
the sexes, and t0 was identical for males vs. females for the main model. L∞ was slightly
larger for fishery-independent data versus fishery-dependent data. The k was larger and
the t0 was smaller for fishery-dependent data (k = 0.27, t0 = -2.6) compared to fishery-
independent data (k = 0.24, t0 = -1.6).
Several methods used to calculate Red Drum mortality reflected differences in
mortality estimates with collection type. Catch curve regressions were plotted starting
with the ages fully selected for the fishery-independent longline (20 years old) and
fishery-dependent hook and line (3 years old). Total mortality (Z) was estimated as 0.25
for fishery-independent catch and 0.08 for fishery-dependent catch (Figure 12). Hoenig’s
(1983) model and Hewitt and Hoenig’s (2005) rule-of-thumb model to estimate M were
calculated using a tmax of 40 years. Hoenig’s (1983) model calculated M at 0.11 and the
Hewitt and Hoenig (2005) rule-of-thumb model calculated M at 0.07. Fishing mortality
was estimated between 0.14 to 0.18 for fishery-independent catch and 0 to 0.01 for
fishery-dependent catch when using the Hoenig (1983) and Hewitt and Hoenig (2005)
estimates for M, respectively.
Age and length distributions and abundance of fishery-independent longline Red
Drum were examined spatially to examine any differences between state and federal

20
waters. Since 2006, longline sets were evenly distributed in state versus federal waters
with 57% and 43% effort in each boundary, respectively (Figure 4). Spatial analysis of
the fishery-independent longline data showed that the age (D = 0.484, p<0.0001) and
length distributions (D = 0.507, p<0.0001) were significantly different for Red Drum
caught in state versus federal waters. Fish were older and larger in state waters. Average
ages were 18 years in state and 13 years federal waters. Average length was 929 mm
within state waters and 866 mm in federal waters. Further analysis of fishery-independent
longline ages, as a function of distance from shore, showed there was a weak negative
correlation with age and distance from shore (r = -0.414, p<0.0001) (Figure 13).
Abundance of fishery-independent longline Red Drum also differed by location. Red
Drum mean CPUE was significantly higher in state (0.954 ± 0.114) versus federal waters
(0.343 ± 0.072) (one-way ANOVA, F1, 732 = 17.707, p<0.0001) (Figure 14).
Temporal analyses of Red Drum abundance resulted in differences in CPUE by
month and year. The observed abundance of Red Drum displayed a seasonal catch trend
with significantly different CPUE by month (one-way ANOVA, F11, 732 = 7.131,
p<0.0001). The Tukey HSD post hoc analysis indicated significantly lower CPUE
occurring in the summer (June-September) and the highest CPUE in January, March,
April, and October (Figure 15). The observed index also revealed a slight significant
difference in CPUE by year (one-way ANOVA, F6, 732 = 2.276, p<0.05); however, a
Tukey HSD post-hoc test did not show significant differences (Figure 16). The dGLM
calculated for abundance by year showed similar results with apparent non-significance
between CPUE and year; although, there was a declining trend (Table 5) (Figure 17).

21
Discussion
Traditional stock assessment data, obtained by sampling commercial and
recreational fisheries, are no longer available during harvest moratoriums and must be
collected using alternative sampling strategies. Fishery-independent sampling can play a
vital role in data collection needed to manage species during harvest bans (Powers et al.,
2012). In the case of Red Drum, current fishery-independent longline sampling by the
NMFS could provide data for abundance estimates; however, to be useful for determining
age and growth, mortality, and condition of the entire population, the full range of sizes
and ages of fish in that population must be included. A combination of fishery-
independent gears can be used to collect the entire range of sizes and ages present in the
population. A unique opportunity for data collection exists when fishes under federal
harvest moratoriums have life histories that include movements in and out of separately
managed state waters. Since recreational harvest is allowed in state waters, I had the
opportunity to supplement my fishery-independent data with fishery-dependent
collections at a recreational tournament.
Improvements made to fishery-independent longline sampling techniques as well
as current information regarding seasonal CPUE trends (Powers et al., 2012) have
increased numbers of Red Drum collected for an age and growth study. The use of live
Atlantic Croaker as bait for targeted sets almost doubled Red Drum CPUE. The targeted
inlet longline sets produced greater than twice the Red Drum than the random sets with
less than 15% of the effort. Coordinating sampling at the inlets during the months of
March through November as suggested by Powers et al. (2012) has been effective in

22
collecting samples for age and growth but cannot be included in the standardized
abundance index because it is not consistent with methods dating back to the original
longline sets in 2006.
Condition indices were similar to previous studies; however, spawning condition
of fish was not completely depicted in the two-year time frame of this study. Previously
reported GSI values for Red Drum in the northern GOM range between approximately
0.5 and 8.5 for fish captured between May and November (Wilson and Nieland, 1994).
Although the GSI was consistent with previous studies, I did not catch red drum in the
2010-2012 longline sampling during the important spawning month of September. When
combined with Powers et al. (2012) condition data, the 2008-2012 GSI and IPF indices
reflected changes in reproductive indices during spawning and accurately depicted the
spawning season.
The age distribution in this study provided evidence for the initial effectiveness of
the federal fishery closure with a distinct increase in the relative proportion of Red Drum
from post-moratorium age classes. The length frequency and age distribution of Red
Drum in this study reflects a bimodal distribution of ages and lengths. Fishery-dependent
ADSFR and fishery-independent gillnet collections represented fish less than 5 years old
and the fishery-independent longline represented a majority of those 15-25 years old
(Figure 9). The age classes comprising 5-10 year olds were infrequent in the collections.
The length range of these ages would be approximately 700-1000 mm. Although the
entire size range of Red Drum in this study included these sizes, the range of sizes
contributing significantly to the overall fishery-independent length frequency of Red
Drum was approximately 300-500 mm for gillnet and 900-1000 mm for the longline.

23
Gear selectivity of the gillnet was shown to be a dome-shaped length distribution that is
common for size selective gears such as gillnets (Figure 9). The longline represents a
knife-edge, flat-topped distribution because the gear is highly selective for larger sizes
based on the large hook size and the distribution would continue without overfishing and
natural mortality (Figure 9). Low abundance of the 800-850 mm size class was also seen
in the fishery-dependent length frequency. There is no evidence to suggest that
recreational fishermen would choose gear to select against this size range; therefore, it is
possible that the size and thus age class underrepresented in this study is due to absence
in the population. Based on the fishery-independent and fishery-dependent collections,
the absence of the 5-10 year olds may be due to sampling bias, but is more likely due to
fishing mortality in state waters.
Spatial analysis of Red Drum age distribution for the fishery-independent longline
in state versus federal waters actually showed significantly larger, older fish collected in
state waters. Age as a function of distance from shore also showed a negative relationship
(Figure 13). Authors suggest that Red Drum susceptible to recreational fishing in state
waters are ages 0-4 (Murphy and Taylor, 1990; Murphy and Crabtree, 2001). Although
the fishery-dependent (ADSFR) age distribution supports this, it also clearly shows that
in states where oversize fish are allowed to be kept, older fish are available for harvest in
state waters. A 2008 AMRD Red Drum assessment stated that large fish (>26 in/660 mm
TL) comprised approximately 34% and 37% of the samples collected in Alabama by
NMFS Marine Recreational Fishery Statistics Survey (MRFSS) and AMRD biological
sampling (otolith) surveys, respectively (AMRD, 2008). Given this information and the

24
age distribution, the federal harvest moratorium does not fully protect older age classes of
Red Drum from harvest; it simply lessens overall fishing mortality.
Von Bertalanffy growth function parameters differed from previous studies
mostly due to differing sample collection methods that leads to different length and age
distributions. Because the fishery-independent longline selects for older fish, gillnet data
were necessary for biologically meaningful growth parameter estimates. Previous studies
that sampled larger, older fish (Beckman et al., 1988; Powers et al., 2012) had artificially
large negative estimates for t0 because they did not adequately sample young fish in the
population. The t0 in my study was similar to that of Murphy and Taylor (1990) because
in both studies, several gears were employed to attempt collection of all sizes of Red
Drum. Inclusion of the gillnet data also led to a smaller L∞ than estimated in previous
studies. This is also the area of the growth curve where the aforementioned age data are
lacking, that could also lead to differing estimates of L∞. Comparisons between my
Alabama growth parameters with those from other states are further complicated by
different collection methods. The relatively low L∞ is most like that reported in Texas for
a study that included smaller fish collected using gillnet surveys (Porch, 2000). Another
possibility for low estimates of L∞ could be due to the higher population density of Red
Drum post-moratorium; previous studies were conducted within 10 years of the harvest
moratorium and might not be representative of the current population.
Total, natural, and fishing mortality of Red Drum reflected the effect of increased
fishing pressure in state waters. Natural mortality estimates for Red Drum in this study
were low and similar to recent studies. Total mortality estimates for Red Drum in the
fishery-independent collections were similar to those previously published between 0.1

25
and 0.3 y-1 (Porch, 2000). The catch curve Z estimates using fishery-independent and
fishery-dependent methods highlight the importance of fishery-independent collection
since the samples collected by fishermen at the ADSFR provided a 0.08 y-1 estimate of
total mortality, much lower than any of the fishery-independent samples (0.25 y-1) and
those in previous studies. Hoenig (1983) and Hewitt and Hoenig (2005) methods of
estimating M based on longevity and proportion of the population surviving to 40 years
were 0.11 and 0.07 y-1, respectively. These estimates were fairly consistent with those
from other post-moratorium studies; although, the mortality estimates made by catch
curve analysis were lower than those recently reported in a Florida stock assessment
(Porch, 2000; Murphy, 2009). Fishing mortality also reflected the increase in state
recreational fishing pressure, as F was more than twice as high as M for the fishery
independent bottom longline catch.
The observed nominal abundance of Red Drum calculated by month in this survey
continued to be consistent with that of the Powers et al. (2012). This was the primary
reason the targeted sampling was conducted from March-November and proved to be
successful in achieving a larger sample size than the previous study. Yearly nominal
abundance data showed a declining trend in CPUE, as did the standardized dGLM index.
These models, coupled with clear trends of increased catch in state waters, indicate that
the recreational fishery existing in Alabama state waters could be a significant source of
mortality for all Red Drum, especially the large adults thought to be protected by the
moratorium in federal waters.
Gulf of Mexico Red Drum have undergone the strictest form of fisheries
management and have clearly increased in abundance over the past two decades. This is a

26
success story in terms of increasing older age classes; however, recreational fishing
pressure in state waters remains high. This study provides the information needed as well
as underscores the importance of spatial analysis of data to investigate current fishing
mortality in state waters. State fisheries in Louisiana, Mississippi, and Alabama exhibit a
great deal of fishing pressure on large adults that can negatively impact the spawning
stock in protected federal waters. This is supported by the current recreational catch data
and my fishery-independent and -dependent age, mortality and abundance data; however,
gear selectivity is still an issue that complicates understanding the underrepresented size
and age classes. Although escapement rates are high enough for this fishery to no longer
be undergoing overfishing, according to my study as well as the 2000 stock assessment
the abundance seems to be declining in recent years (Porch, 2000).
For fisheries undergoing harvest bans, such as Red Drum in the GOM, alternative
collection strategies must be developed. Future studies are also needed that cover gear
types selective for the entire range of sizes to determine if missing 5-10 year olds in this
study were due to gear selectivity or recreational fishing mortality. Fishery-independent
longlines are effective for collecting samples needed to examine population dynamics of
Red Drum; however, smaller hook sizes may be necessary to deal with gear selectivity
issues. Tournament sampling is cost-effective and can provide a snapshot of the
population vulnerable to recreational fishing mortality in state waters. Proper
management of this species will be dependent on these types of collections and analyses
to determine if the status of GOM Red Drum continues to be overfished.

27
CHAPTER 2: MERCURY CONCENTRATIONS IN RED DRUM
Introduction
Gulf of Mexico (GOM) Red Drum have an interesting management history that
includes a dichotomous management strategy with a state managed recreational fishery
and a total federal harvest ban. In the late 1980s, the popularity of the blackened redfish
recipe led to severe overfishing and a harvest moratorium was mandated for federal
waters of the GOM. The moratorium has been in place for the past twenty six years, and
signs of improvement have been seen in the form of large spawning schools returning to
coastal waters and an increase in older age classes of fish. Although escapement rates
have met the 30% goals, recreational fishing in state waters continues to have an impact
(Porch, 2000). As pressure increases to reopen the fishery in federal waters, several issues
need to be examined under current conditions.
In addition to the current population status of Red Drum (Chapter 1), human
health issues may need to be addressed given the established relationship between long-
lived marine fish and mercury (Hg) levels. Although Red Drum are not conventionally
thought to contain high Hg concentrations, they are likely candidates for high Hg because
they forage in the benthos, are long lived, and grow to large sizes (Pearson, 1929;
Beckman et al., 1988; Murphy and Taylor, 1990). Red Drum also undergo an ontogenetic
diet shift from invertebrates to fish that would also likely increase Hg bioaccumulation

28
and biomagnification (Peters and McMichael, 1987; Scharf and Schlicht, 2000; Adams
and Onorato, 2005). Authors of several GOM studies have reported total Hg
concentrations above 1 ppm for Red Drum (Ache et al., 2000; Adams and Onorato, 2005;
Winner et al., 2009; Stunz and Robillard, 2011; and Harris et al., 2012). As with any fish
that is long lived and feeds at upper trophic levels, managers of Red Drum should not
only examine traditional stock assessment data, but also include this aspect of public
health to limit human exposure to fish with elevated Hg concentrations.
Mercury is a chemical element that comes from natural and anthropogenic
sources (U.S. EPA, 1997; U.S. DHHS, 1999; NRC, 2000). Mercury can be introduced
into the environment in small concentrations when rocks erode, volcanoes erupt, and
when soil decomposes. Anthropogenic inputs such as burning fossil fuels, mining, and
chlor-alkali production add to the amount of Hg in the atmosphere (Morel et al., 1998 and
Fitzgerald, 2007). Mercury is introduced into the marine environment through
atmospheric deposition via precipitation and wet deposition through riverine inputs. Once
in the marine environment, inorganic Hg can become methylated, particularly by sulfate
reducing bacteria, and then become bioavailable (Morel et al., 1998 and Fitzgerald,
2007). Monomethylmercury (MeHg) is the most toxic and bioavailable form of Hg in the
environment. The MeHg form can bioaccumulate in fish tissues over time and
biomagnify through the aquatic food web, leading to fish containing high concentrations
of Hg in their tissues (U.S. DHHS, 1999; NRC, 2000). Currently, the Environmental
Protection Agency (EPA) has a MeHg criterion at 0.3 ppm, and the United States Food
and Drug Administration (FDA) action limit is 1.0 ppm. Because of the high
consumption of marine sportfish by US Gulf Coast residents, public awareness pertaining

29
to fishes with Hg concentrations greater than advisory limits is needed to maintain good
public health (U.S. EPA, 2004).
Recent studies of Hg concentrations in Red Drum tissues conducted in Florida
and Texas showed that larger size classes of Red Drum accumulated Hg above the
acceptable limits (Adams and Onorato, 2005; Winner et al., 2009; and Stunz and
Robillard, 2011). Adams and Onorato (2005) measured total Hg concentrations in Red
Drum across several estuaries in Florida and found total Hg concentrations ranged from
0.020 to 3.6 ppm. Analysis of Hg-length relationships over the entire study area indicated
a significant exponential relationship between total Hg and fish length (Adams and
Onorato, 2005). Winner et al. (2009) also found a strong positive exponential relationship
between total Hg and fish length in Tampa Bay, FL. Authors of both papers concluded
that the maximum size limit in Florida waters (686 mm TL) effectively restricts access to
Red Drum above the Florida advisory limits (0.5-1.5 ppm). Stunz and Robillard (2011)
also reported a positive relationship between total Hg and Red Drum length off the Texas
coast. Mean ± standard deviation total Hg for Red Drum in their study ranged from 0.090
± 0.005 ppm in Aransas Bay to 1.024 ± 0.181 ppm in Surf near Port Aransas. These
elevated Hg concentrations of Red Drum in Texas waters pose a particular problem in
that the Texas slot size for Red Drum includes larger fish (508-711 mm TL) and two
“over the slot” Red Drum per angler per year may be kept (Table 1). Given this
allowance of larger fish to recreational anglers, human consumption of contaminated fish
is likely.
While Hg concentrations for Red Drum have been studied in Florida and Texas,
Red Drum Hg data are lacking from the central region of the GOM. To assess the breadth

30
of Hg contamination of Red Drum in the GOM, more studies are needed in Alabama,
Mississippi, and Louisiana. Currently, four out of the five Gulf States allow anglers to
keep oversized Red Drum. Each state manages catch limits for Red Drum in their waters
separately from that of the other Gulf States (Table 1). The allowable catch limits for all
Gulf States except Florida present the possibility of human consumption of high total Hg
concentrated Red Drum. Quantifying concentrations of Hg in GOM Red Drum is
essential for effectively setting advisory and management limits to reduce the
consumption of contaminated fish. In this study, I measured total Hg concentrations in
GOM Red Drum and examined relationships between total Hg and size and age of Red
Drum from fishery-independent longline surveys and fishery-dependent collections at the
2011 Alabama Deep Sea Fishing Rodeo (ADSFR). I also compared fishery-dependent
collected Red Drum Hg concentrations to that of the fishery-dependent collected King
Mackerel, a GOM fish with known elevated Hg concentrations (Adams and McMichael,
2007).
Methods
In 2010 and 2011, Red Drum were sampled in the northern GOM using a fishery-
independent bottom longline (Figure 18). The Fisheries Ecology Lab at the University of
South Alabama in conjunction with the Alabama Department of Conservation and
Natural Resources conducted monthly Southeastern Monitoring and Assessment Program
(SEAMAP) bottom longline sets in nearshore waters of coastal Alabama. Four stations
were sampled monthly (March-October) from inside Mobile Bay and Mississippi Sound

31
as well as offshore. Targeted sampling at fixed stations was also conducted to increase
catch of Red Drum for age distribution and Hg analysis. For all longline sets, a
commercial-style bottom longline gear setup was used. A monofilament mainline (1000
lb. test, 1 nautical mile length) was deployed through a block off the stern of the research
vessel. High flier buoys were used at the start and end of each set. Five kg weights (start,
mid-set, end set), and 3.66 m monofilament gangions (318 kg test) with 15/0 Mustad
39960D circle hooks were clipped to the mainline during deployment. Bottom longline
effort was 100 hooks fished for one hour soak time. Soak time was determined from the
time the last high flier buoy was deployed and until the first high flier buoy was retrieved
to begin the haul back (Driggers et al., 2008). For the SEAMAP surveys, all 100 hooks
were baited with Atlantic Mackerel (Scomber scombrus). For the targeted sampling
effort, whole live Atlantic Croaker (Micropogonias undulatus) alternated on every other
hook for a total of 50 Atlantic Mackerel and 50 Atlantic Croaker. All fish and sharks
possible to lift were boated, measured to the nearest mm, and weighed to the nearest 0.1
kg. Haul back speed is approximately 3.5 - 4 knots. In addition, a hydrolab cast was made
during the soak time where surface and bottom measurements of temperature, salinity,
and dissolved oxygen were recorded.
To cover the sizes and ages of Red Drum landed by GOM recreational fishermen,
I also conducted a fishery-dependent survey. Standard morphometrics, gonads,
intraperitoneal fat, otoliths and muscle tissue samples were collected at the 2011 ADSFR
for analysis. The ADSFR was held July 15-17 and fish were caught within territorial
waters of the ADSFR. The coordinates for the ADSFR territorial waters are: north: all
bays and inlets of the GOM; east: 85°W longitude; south: 28°N latitude; and, west: 91°W

32
longitude (Figure 3). Anglers who collected a legal Red Drum including those above the
slot limit size (660 mm TL) were entered into a random drawing for prizes. There was no
award by weight for Red Drum, so anglers were not given incentive to bring in their
largest fish. Alabama state law allows one Red Drum above 26 inches per day and all
fishing was conducted in accordance with state regulations. In addition to Red Drum,
tissue samples of each species sampled during the 2011 ADSFR (n=20, if possible) were
analyzed to compare total Hg concentrations.
For both fishery-independent and fishery-dependent collections, standard
morphometrics, otoliths, gonads, intraperitoneal fat, and muscle tissue were sampled
from each fish. Standard length (SL), fork length (FL) natural total length (NTL; without
the tail pinched) and stretch total length (STL; with the tail pinched) to the nearest mm
and mass to the nearest 0.1 kg were recorded. Sagittal otoliths were removed and stored
dry for future processing. For Red Drum only, gonads and any intraperitoneal fat were
removed and weighed to the nearest gram and gonadosomatic (GSI) and intraperitoneal
fat (IPF) indices were calculated. Gonadosomatic and IPF indices are measures of
condition where gonad mass or intraperitoneal fat mass is divided by total body mass
then multiplied by 100 (Wilson and Nieland, 1994; Craig et al., 1995). The GSI and IPF
can elucidate the relative investment of energy used for reproduction and growth
(McGoogan and Gatlin, 1988; Wilson and Nieland, 1994). A Fulton condition index was
also calculated by dividing the mass of the fish by TL3 and multiplying by 100,000
(Ricker, 1975).
Otolith processing techniques for Red Drum and King Mackerel in this study
were conducted according to the methods for thin sectioning described in the Gulf of

33
Mexico Marine Fisheries Commission otolith manual (VanderKooy and Guidon-Tisdel,
2003) and Beckman et al. (1988). The left sagittal otolith was processed, leaving the right
otolith for use when the left was not available or when there was a disagreement between
otolith readers (Beckman et al., 1988). Otoliths were cut along the transverse plane as
close to the core as possible with a Model 1010 Hillquist Thin-Sectioning Petrographic
Saw. Sectioned otoliths were polished with a Crystal Master 6 Plus polishing wheel
affixed with a Buehler microfiber polishing cloth treated with 0.3 µm aluminum oxide
powder and water. Polished sections were placed sectioned side down on a glass
microscope slide and secured using Loctite 349TM ultraviolet adhesive. The slides were
placed under a blacklight overnight to cure. The remaining otolith section was trimmed
with the cut-off saw followed by the precision grinder to grind the otolith until it reached
approximately 50 µm. The slide was then polished on the Crystal Master 6 Plus with
aluminum oxide and water, cleaned, and covered with Flo-Texx liquid cover slip to
remove scratches. All otoliths were aged independently by two readers. Average percent
error (APE) was calculated to ensure correct integer ages using the following equation:
APE = 100% x �
�∑
�������
�����
where, R was the number of readings of individual j, Xij was the age i, determined for
individual j, and Xj was the mean age among readers. Integer age was determined by
counting number of opaque zones.
Fish muscle tissue was collected to measure total Hg concentrations using a direct
Hg analyzer. Muscle tissue for Hg and stable isotopes was excised from a fish's left
dorsal area above the lateral line. This represents the area where fillets are obtained for

34
human consumption (Adams and McMichael, 2001). A clean stainless steel knife was
used to take small fillet samples (5 g) from each fish. Skin and scales were left intact to
reduce possible freezer burn and changes in wet weight. Tissue samples were placed in
clean scintillation tubes and frozen. Tissue samples were shipped frozen to the National
Marine Fisheries Service’s (NMFS) Laboratory in Beaufort, North Carolina to be
analyzed for total Hg using a modified EPA method 7473: Hg in Solids and Solutions by
Thermal Decomposition, Amalgamation, and Atomic Absorption Spectrophotometry
using a Milestone Direct Hg Analyzer-80. Because more than 95% of total Hg found in
fish tissue is the monomethyl form, total Hg is an accurate proxy for MeHg in fish (Grieb
et al., 1990; Bloom, 1992). Wet muscle tissue aliquots of 0.1 to 0.2 g were cut from fillets
and analyzed directly against aqueous Hg standards prepared in 2% hydrochloric acid.
Associated quality assurance samples included four reference materials, National
Research Council of Canada (NRCC) TORT-2, DORM-2, DOLT-3, and a scallop sample
prepared at the NMFS Beaufort laboratory. Method blanks, replicate samples, and spike
recovery samples were also included. In terms of accuracy, mean measured
concentrations of the certified reference materials (CRMs) TORT-2 and DORM-2 from
the NRCC were within the certified confidence intervals. Precision estimated as the
coefficient of variation (CV = 100% x standard deviation/mean) was about 4-5% for both
CRMs and 6% for the two in-house reference materials of lower Hg concentration
(NRCC tissue and scallop).
Total Hg in Red Drum and King Mackerel was analyzed by size and age using a
series of univariate tests. Analysis of covariance (ANCOVA) was used to examine any
significant difference between fishery-dependent Red Drum and King Mackerel total Hg

35
concentrations to remove variance in total Hg associated with differences in size and age.
The total Hg data were checked for normality and homogeneity of variances. A subset of
the data that included only sizes that overlapped between Red Drum and King Mackerel
was taken to compare total Hg between similar sizes of fish. The subset of overlapping
lengths for Red Drum and King Mackerel total Hg data were also analyzed using
ANCOVA.
Stable isotope analysis was conducted using muscle tissue samples for several
fish in this study (n=20 each species). Samples for stable isotopes were taken from the
same muscle tissue used for Hg analysis, freeze dried, and ground into a homogenous
powder. The powder was weighed and packed into tin capsules for instrumental analysis
at the University of California, Davis. The isotope ratios were measured with an isotope
ratio mass spectrophotometer. The ratios were depicted using the standard δ notation as
parts per mil (‰) differences from a standard:
δx = [(Rsample/ Rstandard)-1] x 1000
where, x = 13C and 15N, R= ratio of 13C/12C and 15N/14N, R standard = atmospheric
diatomic nitrogen, VPDB, and Canyon Diablo troilite for C and N respectively. The δ
values for C and N were used to describe the relative trophic positions of Red Drum and
other species in the GOM sampled at the 2011 ADSFR. Trophic level was calculated for
Red Drum and King Mackerel using the following equation:
TL=λ + (δ15Nc-δ15Nbase)/∆n

36
where, λ is the trophic level of the base of the food web, δ15Nc and δ15Nbase are the
nitrogen isotope values of the consumer and base, respectively, and ∆n is the trophic
fractionation factor for nitrogen. I set λ=1 (a primary producer) to reduce the propagation
of error associated with the variability in ∆n (Vander Zanden and Rassmussen, 2001). I
used δ15N values chosen from primary producers (POM) for values that were collected
within my study area (Rooker, 2006). I chose a fish tissue specific ∆n value of 2.5 for
bulk fish tissue following the experimentally determined trophic fractionation factors for
shark tissues (Wells et al., 2008). Values of δ15N and trophic position estimates were used
to examine biomagnification of Hg in Red Drum and King Mackerel using univariate
tests.
Results
In 2010-2011, 71 Red Drum were sampled for traditional morphometrics,
condition indices, age, total Hg concentrations, and the stable isotope ratios δ13C and
δ15N by fishery-independent bottom longline in GOM waters south of Alabama (Figure
18). Approximately 91% of these fish were caught in state waters. The size distribution of
these fish ranged from 776-1041 mm NTL (Figure 19). The ages ranged from 3-31 years
old (Figure 20). Total Hg for these fish ranged from 0.22-1.1 ppm and mean total Hg was
0.67 ppm. Maximum total Hg was 1.1 ppm for an 894 mm, 17 year old fish. For fishery-
independent Red Drum samples, there was no significant relationship between Hg and
any of the condition indices (Hg vs. GSI, p=0.818; Hg vs. IPF, p=0.919; and Hg vs.

37
Fulton, p=0.406). There was a weak positive relationship between total Hg and NTL
(R2=0.081, p=0.016) (Figure 21) but, there was a strong positive relationship between
total Hg and age (R2= 0.381, p<0.0001) (Figure 22). Stable isotope δ15N measurements
ranged from 14.2-16.3 ‰, and resulted in a small trophic level range from 3.5-4.3. Mean
trophic level calculated for the fishery-independent Red Drum was 3.9. There was no
significant relationship between total Hg and δ15N or total Hg and trophic level (p=0.877)
(Figure 23).
Similar to fishery-independent analyses, traditional morphometrics, condition
indices, age, total Hg concentrations, and stable isotope ratios for δ13C and δ15N were
examined for 74 Red Drum at the 2011 ADSFR (Figure 3). All of these fish were caught
within state waters. The length distribution of the fishery-dependent Red Drum ranged
from 565-816 mm NTL (Figure 19). The age distribution ranged from 1-40 years old
(Figure 20). Total Hg for the fishery-dependent Red Drum ranged from 0.12-1.2 ppm and
mean total Hg was 0.47 ppm. Maximum total Hg for fishery-dependent Red Drum of 1.2
ppm was measured in a 1010 mm NTL, 26 year old fish. For fishery-dependent Red
Drum there was no significant relationship between total Hg and IPF (p=0.309), but there
was a significant weak positive relationship between total Hg and GSI (p<0.05) and total
Hg and Fulton’s condition index (p<0.05). There was a significant positive relationship
between total Hg and length (R2=0.611, p<0.0001) (Figure 24) and total Hg and age (R2=
0.749, p<0.0001) (Figure 25). Stable isotope δ15N measurements ranged from 11.5-15.4
‰, and resulted in a trophic level range from 2.4-4.0. Mean trophic level calculated for
the fishery-independent Red Drum was 3.5. There was a significant positive relationship
between total Hg and δ15N or total Hg and trophic level (R2=0.347, p<0.01) (Figure 26).

38
To compare total Hg concentrations of fishery-dependent Red Drum to a species
of known high Hg concentrations, I examined 49 King Mackerel for standard
morphometrics, age, total Hg, and stable isotope ratios of δ13C and δ15N from the fishery-
dependent ADSFR samples. King Mackerel length ranged from 810-1534 mm NTL and
age from 1-16 years old (Figure 27). Total Hg ranged from 0.24-3.5 ppm and mean total
Hg for King Mackerel was 1.3 ppm, the fifth highest mean Hg concentration of all
species sampled at the 2011 ADSFR (Figure 28). The maximum total Hg for King
Mackerel (3.5 ppm) was for a 1534 mm NTL, 16 year old fish, the largest and oldest
King Mackerel in this study. There was a significant positive relationship between King
Mackerel total Hg and length (R2=0.507, p<0.0001) (Figure 29) and total Hg and age
(R2=0.321, p<0.0001) (Figure 30). Stable isotope δ15N ranged from 14.4-16.4 ‰, and
resulted in trophic level range from 3.6-4.3. Mean trophic level for King Mackerel was
4.0. Due to the small range of trophic levels in my King Mackerel data set, there was no
significant relationship between total Hg and δ15N or trophic level (p=0.966) (Figure 31).
Mercury level did not differ between Red Drum and King Mackerel when the
effect of length was used as a covariate. The total Hg data were non-normal (Shapiro-
Wilk test; W= 0.973, p<0.05) and variances were heterogeneous (Levene’s test;
F=47.086, p<0.0001); therefore the data were log transformed. There was a significant
difference in mean total Hg between Red Drum and King Mackerel when all of the
variance associated with length was considered, but the Type I Sum of Squares (SS)
analysis showed no significant difference between species of fish but a significant
difference in NTL; however, there was also significant interaction between species and
length (Figure 32). Because one assumption of ANCOVA (homogeneity in regression

39
coefficients) was violated with an interaction between length and species, data were used
for a subset of samples with equal size range (810-1020 mm NTL). The subset was
checked for normality and homogeneity of variances and were both normal (Shapiro-
Wilk; W=0.987, p>0.05) and variances were homogeneous (Levene’s test; F=1.158,
p>0.05). An ANCOVA was run on the subset of data and there was a significant effect in
the main model and the Type I SS showed that this significance was attributed to length
only (p<0.01) and there was no significant difference between species and no interaction
(p>0.05) (Figure 33). The Tukey’s HSD post-hoc analysis also confirmed that when the
covariate of NTL was considered, there was no significant difference in mean total Hg
between Red Drum and King Mackerel. In another ANCOVA, with age as the covariate,
there was a strong significant difference in total Hg between species when age is
considered (p<0.0001) but there was no interaction between species and age (p=0.213)
(Figure 34).
Discussion
Gulf of Mexico Red Drum are no longer undergoing overfishing due to aggressive
management in federal waters; however, it is unknown if they are still overfished. The
current status of the stock is still listed as undefined but will soon be assessed Gulfwide
(Hogarth, 2004; Powers and Burns, 2010). If GOM Red Drum management strategies are
reevaluated and regulations are relaxed on the harvest of large Red Drum, managers
should consider how these new regulations could impact public health.

40
This study provides Hg concentrations for Red Drum from the central region of
the northern GOM. Similar to previous studies in other areas of the GOM, large Red
Drum in my study area had elevated total Hg concentrations in their tissues.
Approximately 80% of all Red Drum in this study had tissues that contained
concentrations greater than the 0.3 ppm EPA criterion and 5% were above the 1.0 ppm
FDA action limit. Total Hg among both fishery-independent and fishery-dependent Red
Drum ranged from 0.12 to 1.2 ppm. This is a smaller range than Adams and Onorato
(2005) found in Florida and is closer to that reported by Stunz and Robillard (2011) in
Texas (Table 6). Mean total Hg for large fishery-independent (0.64 ppm) and fishery-
dependent Red Drum (0.47 ppm) samples in this study was comparable to the mean total
Hg reported in Texas (0.46 ppm) and Florida studies, but was lower than Tampa Bay
offshore samples (1.7 ppm; Adams and Onorato, 2005) and greater than the 686 mm TL
size class in Tampa Bay (1.03 ppm; Winner, 2009). The length distribution was similar to
Tampa Bay offshore but contained a number of fish smaller than the largest size class
collected by Winner et al. (2009). However, when the data were sorted into lengths
greater than 686 mm TL, my mean total Hg concentration was 0.60 ppm. This was still
lower than the total Hg for Red Drum in Tampa Bay studies. These differences are likely
due to differences in environmental Hg concentrations at each location; however, neither
study made environmental measurements to elucidate this.
For species undergoing harvest moratoriums, fishery-independent data are useful
to gather information that would normally be collected from the commercial fishery
(Powers, 2012). I collaborated with an ongoing SEAMAP bottom longline to collect Red
Drum samples for Hg analysis. Fishery-independent Red Drum total Hg was positively

41
associated with NTL. This was statistically significant; however, the relationship was
weak. Based on the length frequency distribution and current knowledge of the gear, the
bottom longline gear is size selective for large Red Drum and produced a narrow range of
sizes that resulted in this weak relationship. I would expect a stronger positive
relationship if the gear were altered to include a larger size range of fish. The significant
relationship does point out that even with size selective gear, Red Drum bioaccumulate
Hg in their tissues as they grow. Fishery-independent Red Drum total Hg was also
positively associated with age. This was a stronger relationship, compared to the total Hg
vs. NTL, and showed that as Red Drum age they continue to bioaccumulate Hg in their
tissues. Total Hg vs. age could provide a more precise method for comparisons. This is
especially true for studies using different types of length measurements where data must
be converted. It is well known that Red Drum are easily aged using otoliths and this type
of analysis could be included in future studies (Beckman, 1988; VanderKooy and
Guidon-Tisdel, 2003).
Because Red Drum migrate in and out of state waters throughout life, it is
possible to supplement fishery-independent sampling in offshore waters with fishery-
dependent collections in state waters. These fishery-dependent samples represent what is
potentially available for human consumption. Sociological studies also support the
popularity of consumption of this fish in the northern GOM (Nystrom, 2007). The
fishery-dependent Red Drum in this study also had elevated total Hg in their tissues.
There were strong positive relationships between total Hg and NTL and total Hg and age
of fishery-dependent Red Drum, further supporting bioaccumulation of Hg as Red Drum

42
grow larger and older. Total Hg for ADSFR Red Drum was also positively associated
with δ15N and trophic level suggesting biomagnification of Hg with ontogenetic diet shift.
King Mackerel total Hg concentrations in this study were comparable to previous
measurements in Florida (Adams and McMichael, 2007). The mean size of King
Mackerel in this study (1057 mm FL and 1139 mm NTL) was slightly larger that of the
Florida study (1024 mm FL) but was inclusive of lengths > 750 mm FL in the Florida
study. Despite this size difference, mean total Hg was slightly lower in this study (1.28
ppm) than in the Florida study (1.51 ppm); although, both studies mean total Hg
concentrations were above the 1.0 ppm FDA action limit. Approximately 98% of King
Mackerel in this study had total Hg concentrations greater than the 0.3 ppm EPA criterion
and 57% of King Mackerel in this study had total Hg concentrations greater than or equal
to the 1.0 ppm FDA limit. Similar to this study, Adams and McMichael (2007) also
reported significant positive relationships between total Hg in King Mackerel tissues with
size and age. This supports my conclusion of bioaccumulation of total Hg in King
Mackerel as they grow.
Diet is the main source of Hg bioaccumulation in fish tissues. The life history of
the Red Drum and their ontogenetic shift in diet from mostly invertebrates to fish as Red
Drum reach adulthood lends itself to an increase in the rate of Hg bioaccumulation as
Red Drum age (Peters and McMichael, 1987; Scharf and Schlicht, 2000; Adams and
Onorato, 2005). In contrast, King Mackerel are continuous piscivores throughout their
life history leading to an overall higher trophic level and faster rate of Hg
bioaccumulation over time (Adams and McMichael, 2007). This difference in diet is
likely the main reason there are differences in total Hg concentrations between the two

43
species. According to their stable isotope ratios, King Mackerel were feeding at a higher
trophic level than Red Drum (Figure 35).
Awareness among Gulf Coast residents concerning high-risk fish consumption
varies. University of South Alabama sociologists conducted a 2004 telephone poll of
Alabama and Mississippi Gulf Coast residents to evaluate fish consumption. Specifically,
they were concerned with consumption of high-risk fish, or those with elevated
concentrations of MeHg. They found that the average Gulf Coast resident was aware of
the MeHg risk to health but only 63% of individuals in this study were aware of
advisories concerning MeHg in fish. This study group consumed an average of 23.7
pounds of fish per year and 3.69 pounds of Red Drum per year, the eighth most
consumed fish species reported in the study (Nystrom, 2007).
Consumption advisories for King Mackerel exist in every GOM state (U.S. EPA,
2012). The Hg status of this species is widely known because state and federal agencies
have conducted public outreach concerning limiting consumption. This is important due
to high concentrations of Hg in King Mackerel and potential for Hg poisoning especially
in children and women of childbearing age. Based on my analyses, when the variance in
mean total Hg due to differing sizes was accounted for, there was no significant
difference in total Hg concentrations between similar sized Red Drum and King
Mackerel. In other words, large Red Drum in this study had statistically similar Hg
concentrations as smaller King Mackerel (Figure 33). This finding should create a simple
and effective strategy for explaining elevated Hg concentrations in large Red Drum.
Management strategies may be reconsidered after the next GOM Red Drum stock
assessment. All five of the GOM states have advisories regarding consumption of fish

44
with elevated Hg concentrations. Some of these species include sharks, King Mackerel,
and tilefish. Recently, Florida added Red Drum to their fish advisory list (FL DOH,
2013). I suggest that other GOM states consider adding large (>660 mm NTL) Red Drum
to their list of species of concern. Cooperation from GOM states is needed for
management plans that limit Hg exposure from marine fishes in their waters. Mean total
Hg for large Red Drum in this study was less than the FDA action limit but greater than
the EPA Criterion. All Red Drum with total Hg above 1.0 ppm were larger than the
current Alabama slot size (660 mm NTL); thus, the current slot size can effectively limit
Hg exposure to humans (Figure 24). Florida is also the only GOM state that does not
allow over the slot sized Red Drum to be kept (Table 1). In addition to advisory lists, it
would be prudent of the GOM state agencies to reevaluate the amount of over the slot
size Red Drum to be kept based on Hg concentrations of Red Drum in their waters.
Future studies are needed across the GOM to effectively assess and monitor the
concentrations of Hg in Red Drum so this public health issue may be included in
management strategies.

45
CONCLUSIONS AND RECOMMENDATIONS
A GOM Red Drum SEDAR stock assessment, utilizing the most up-to-date data
available, is needed. Red Drum continues to be one of the most popular sportfish in the
northern GOM and is widely considered good to eat. This creates a significant amount of
recreational fishing mortality in state waters that is affecting the abundance of large
offshore Red Drum. The age distribution, mortality, and abundance data reflects the need
to decrease the amount of large Red Drum allowed to be kept in state waters. This will
decrease the overall pounds of Red Drum harvested and should increase the number of
teenage fish in the population. Alabama currently allows one oversized Red Drum to be
kept per day. A more reasonable management strategy is seen in Texas where fishermen
are allowed to keep one Red Drum per year with an opportunity to apply for another,
resulting in only two oversized Red Drum collected per year. Florida has a strict
management strategy of zero oversized Red Drum allowed to be kept. Alabama managers
should consider the other GOM states management strategies and their effectiveness.
Similar to other GOM studies, large Red Drum in this study contained high
concentrations of Hg in their tissues. It is important that this information be reported to
public health agencies so they might make appropriate recommendations for consumption
advisories. Currently, the slot limits in Alabama and Florida limit exposure to Red Drum
with mean total Hg concentrations greater than EPA and FDA advisory limits. Managers

46
across the GOM states should also consider this important public health issue when
creating fishing limits for over the slot size fish.
Future studies are needed in Mississippi, Louisiana, and Texas to gain the most
complete picture of Red Drum Hg concentrations across the northern GOM. Further
fishery-independent longline surveys are needed in the northern GOM to compare to my
standardized abundance index. For a fishery undergoing harvest moratorium in federal
waters, fishery-independent studies coupled with fishery-dependent collections in state
waters are necessary to collect these data.

LITERATURE CITED

47
LITERATURE CITED
Ache, B.W., J.D. Boyle, and C.E. Morse. 2000. A Survey of the Occurrence of Mercury in the Fishery Resources of the Gulf
of Mexico. Prepared by Battelle for the U.S. EPA Gulf of Mexico Program, Stennis Space Center, MS. January 2000.
Adams, D.H. and R.H. McMichael, Jr. 2001. Mercury levels in marine and estuarine fishes of Florida. Florida Marine
Research Institute Technical Report TR-6. 35p. Adams, D.H. and R.H. McMichael Jr.
2007. Mercury in king mackerel, Scomberomorus cavalla, and spanish mackerel, S.
maculatus, from waters of the south-eastern USA: regional and historical trends. Mar. Freshwat. Res. 58:187-193.
Adams, D.H. and G.V. Onorato.
2005. Mercury concentrations in red drum Sciaenops ocellatus from estuarine and offshore waters of Florida. Mar. Poll. Bull. 50:291-300.
Alabama Marine Resources Division (AMRD).
2008. Red drum assessment. Prepared for the Gulf of Mexico Fishery Management Council, Scientific and Statistical Committee, May 2010. 9 p.
Beckman, D.W., C.A. Wilson, and A.L. Stanley.
1988. Age and growth of red drum, Sciaenops ocellatus, from offshore waters of the Gulf of Mexico. Fish. Bull. 87:17-28.
Bloom, N.S.
1992. On the chemical form of mercury in edible fish and marine invertebrate tissue. Can. J. Fish. Aquat. Sci. 49:1010–1017.
Craig, S.R., W.H. Neill, and D.M. Gatlin.
1995. Effects of dietary lipid and environmental salinity on growth, body composition, and cold tolerance of juvenile red drum (Sciaenops ocellatus). Fish Physiol. Biochem. 14:49-61.
Condrey, R., D.W. Beckman, and C.A. Wilson.
1988. Management implications of a new growth model for red drum. Appendix D.

48
in J.A. Shepard [Ed.], Louisiana red drum research, MARFIN Final Report. Davis, J.T.
1990. Red Drum: Biology and life history. Southern Regional Aquaculture Center, College Station, TX, 2 p.
Driggers, W.B., G.W. Ingram, M.A. Grace, C.T. Gledhill, T.A. Henwood, C.N. Horton,
and C.M Jones. 2008. Pupping areas and mortality rates of young tiger sharks Galeocerdo cuvier in
the western North Atlantic Ocean. Aquat. Biol. 2:161-170. Fitzgerald, W.F., C.H Lamborg, and C.R. Hammerschmidt.
2007. Marine Biogeochemical Cycling of Mercury. Chem. Rev. 107:641-662. Goodyear, C.P.
1996. Status of the red drum stocks of the Gulf of Mexico: Report for 1996. USDOC, NMFS, SEFC, Miami Laboratory Contribution MIA95/96-47.
Grieb, T.M., C.T. Driscoll, S.P. Gloss, C.L. Schofield, G.L. Bowie, and D.B. Porcella.
1990. Factors affecting mercury accumulation in fish in the upper Michigan peninsula. Environ. Toxicol. Chem. 9:919–930.
Gulf of Mexico Fishery Management Council, 1987. Amendment number 1 and
environmental assessment and supplemental regulatory impact review, regulatory flexibility analysis for the Red Drum fishery of the Gulf of Mexico.
Haddon, M.
2000. Modeling and quantitative methods in fisheries. Chapman and Hall/CRC, Boca Raton, FL.
Harris, R., C. Pollman, W. Landing, D. Evans, D. Axelrad, D. Hutchinson, S. Morey, D.
Rumbold, D. Dukhovskoy, D. Adams, K. Vijayaraghavan, C. Holmes, R.D. Atkinson, T. Myers, and E. Sunderland.
2012. Mercury in the Gulf of Mexico: sources to receptors. Environ. Res. http://dx.doi.org/10.1016/j.envres.2012.08.001.
Hewitt, D.A. and J.M. Hoenig.
2005. Comparison of two approaches for estimating natural mortality based on longevity. Fish. Bull. 103:433-437.
Higgins, E. and R. Lord.
1927. Preliminary report on the marine fisheries in Texas. U.S. Fish Commission Annual Report 4:167-199.
Hoenig, J.M.

49
1983. Empirical use of longevity data to estimate mortality rates. Fish. Bull. 82:898-903.
Hogarth, W.T.
2004. A message from the NOAA assistant administrator for fisheries; Welcome to NOAA’s National Marine Fisheries Service report on the status of the U.S. fisheries for 2004. NOAA, Washington D.C.
Holt, G.J., S.A. Holt, and C.R. Arnold.
1985. Diel periodicity of spawning in sciaenids. Mar. Ecol. Prog. Ser. 27:1-7. Ingram, G.W., Jr., W.J. Richards, J.T. Lamkin, and B. Muhling.
2010. Annual indices of Atlantic bluefin tuna (Thunnus thynnus) larvae in the Gulf of Mexico developed using delta-lognormal and multivariate models. Aquat. Living Resour. 23:35-47.
Koenker, R and P. Ng.
2012. SparseM: Sparse Linear Algebra. R package version 0.96. http://CRAN.R-project.org/package=SparseM
Kimura, D.K.
1980. Likelihood methods for the von Bertalanffy growth curve. Fish. Bull. 4:765-776.
Lo, N.C.H., L.D. Jacobson, and J.L. Squire.
1992. Indices of relative abundance from fish spotter data based on delta-lognormal models. Can. J. Fish. Aquat. Sci. 49:2515-2526.
McGoogan, B.B., and D.M. Gatlin.
1998. Metabolic requirements of red drum, Sciaenops ocellatus, for protein and energy based on weight gain and body composition. J. Nutr. 128:123-129.
Morel, F.M., A.M. Kraepiel, and M. Amyot.
1998. The Chemical cycle and Bioaccumulation of Mercury. Annu. Rev. Ecol. Syst. 29:543-566.
Murphy, M.D.
2009. An assessment of the status of red drum in Florida waters through 2007. Report to the Florida Fish and Wildlife Conservation Commission from the Fish and Wildlife Research Institute, St. Petersburg, FL. 35p.
Murphy, M.D.
2005. A stock assessment of red drum, Sciaenops ocellatus, in Florida: status of the stocks through 2003. Report to the Florida Fish and Wildlife Conservation

50
Commission from the Fish and Wildlife Research Institute, St. Petersburg, FL. 36p.
Murphy, M.D., and R.E. Crabtree.
2001. Changes in the age structure of nearshore adult red drum off west-central Florida related to recruitment and fishing mortality. N. Am. J. Fish. Manage. 21:671-678.
Murphy, M.D. and R.G. Taylor.
1990. Reproduction, growth, and mortality of red drum Sciaenops ocellatus in Florida waters. Fish. Bull. 88:531-542.
NMFS Landings Data.
2011. http://www.st.nmfs.noaa.gov/st1/commercial/index.html Accessed on 03/15/2013.
NRC (National Research Council).
2000. Toxicological effects of methylmercury. National Academy of Sciences, National Academy Press. 368p.
Nystrom, M.F.
2007. Methylmercury contamination, perceived health risks, and high-risk seafood consumption: A study of marine recreational fish consumers in the coastal counties of Alabama and Mississippi. MS Thesis. University of South Alabama, Mobile, AL. 2007. Print.
Overstreet, R.M.
1983. Aspects of the biology of the red drum, Sciaenops ocellatus, in Mississippi. Gulf Res. Rep. Supp. 1:45-68.
Pearson, J.C.
1929. Natural history and conservation of redfish and other sciaenids on the Texas coast. Bull. U.S. Bur. Fish. 4:129-214.
Peters, K.M., and R.H. McMichael Jr.
1987. Early life history of the red drum, Sciaenops ocellatus, in Tampa Bay, Florida. Estuaries. 10:92-107.
Porch, C.E.
2000. Status of the red drum stocks of the Gulf of Mexico. Southeast Fisheries Science Center, Sustainable Fisheries Division Contribution: SFD-99/00-85. 62p.
Porch, C.E., C.A. Wilson, and D.L. Nieland.
2002. A new growth model for red drum (Sciaenops ocellatus) that accommodates, seasonal and ontogenic changes in growth rates. Fish. Bull. 100:149-152.

51
Powers, S.P. and K. Burns.
2010. Summary report of the red drum special working group for the Gulf of Mexico Fishery Management Council. Special Red Drum Assessment Report. Prepared for the Gulf of Mexico Fishery Management Council, Scientific and Statistical Committee.
Powers, S.P., C.L. Hightower, J.M. Drymon, and M.W. Johnson.
2012. Age composition and distribution of red drum (Sciaenops ocellatus) in offshore waters of the north central Gulf of Mexico: an evaluation of a stock under a federal harvest moratorium. Fish. Bull. 110:283-292.
Ricker, W.E.
1975. Computation and Interpretation of Biological Statistics of Fish Populations. J. Fish. Res. Board Can. 191:1-382.
Rooker, J.R., J.P. Turner, and S.A. Holt.
2006. Trophic ecology of Sargassum-associated fishes in the Gulf of Mexico determined from stable isotopes and fatty acids. Mar. Ecol. Prog. Ser. 313:249-259.
Scharf, F.S. and K.K. Schlicht.
2000. Feeding habits of red drum, Sciaenops ocellatus, in Galveston Bay, Texas: seasonal diet variation and predator-prey size relationships. Estuaries. 23:128-139.
Stunz, G.W. and M. Robillard.
2011. Contaminant level of fishes in several coastal bend estuaries: screening investigation. Technical Report for the Coastal Bend Bays and Estuaries Program. 22 p.
U.S. DHHS.
1999. Toxicological profile for mercury, http://www.atsdr.cdc.gov/toxprofiles/tp46.pdf. Accessed on 04/01/2013.
U.S. EPA (Environmental Protection Agency).
1997. Mercury study: Report to Congress. Volume III: Fate and transport of mercury in the environment. EPA-452/R-97-005. U.S. EPA, Washington, DC.
U.S. EPA (Environmental Protection Agency).
2004. National Listing of Fish Advisories, EPA-823-F-04-016. U.S. EPA, Washington, DC.
U.S. EPA (Environmental Protection Agency).
2012. National Coastal Condition Report IV. EPA-842-R-10-003. U.S. EPA,

52
Office of Research and Development, Washington, DC. VanderKooy, S.J. and K. Guidon-Tisdel.
2003. A practical handbook for determining the ages of Gulf of Mexico fishes, 128p. Gulf States Mar. Fish. Comm., Oceans Spring, MS.
Vander Zanden, M. J. and J. B. Rasmussen.
2001. Variation in d15N and d13C trophic fractionation: Implications for aquatic food web studies. Limnol. Oceanogr. 46:2061-2066.
von Bertalanffy, L.
1938. A quantitative theory of organic growth (inquiries on growth laws II). Hum. Biol. 10:181-213.
Wells, R.J.D., J.H. Cowan Jr., and B. Fry.
2008. Feeding ecology of red snapper Lutjanus campechanus in the northern Gulf of Mexico. Mar. Ecol. Prog. Ser. 361:213-225.
Wilson, C.A. and D.L. Nieland.
1994. Reproductive biology of red drum, Sciaenops ocellatus, from the neritic waters of the northern Gulf of Mexico. Fish. Bull. 92:841-850.
Winner, B.L., K.E. Flaherty, J. Vecchio, M.D. Murphy, and T.S. Switzer.
2009. Size and age structure, and catch-and-release mortality estimates of sub-adult and adult red drum (Sciaenops ocellatus) in the Tampa Bay estuary and nearshore Gulf of Mexico waters. Fish and Wildlife Research Institute, Florida Fish and Wildlife Conservation Commission, St. Petersburg, FL. MARFIN Final Report.

APPENDICES

Appendix A: Tables 1-6

53
Table 1. State allowable bag and size limits for Red Drum.
State Bag (#) and Size Limit (TL in)
AL 3 16-26” 1 can be > 26”/day
FL 1 18-27”
LA 5 16” minimum 1 can be > 27”/day
MS 3 18” minimum 1 can be > 30”/day
TX 3 20-28” 1 over slot size with RD tag/year
Plus 1 with Bonus RD tag/year

54
Table 2. Parameter estimates for standard von Bertalanffy growth equations. Data were analyzed by the following categories: combined sexes, males, and females for fishery-dependent and independent collections.
Hightower Thesis L∞
(NTL mm) k t0
All Data
Combined Sexes 946 0.32 -1.2
Males 928 0.31 -1.4
Females 953 0.32 -1.4
Fishery-Independent
Combined Sexes 950 0.24 -1.6
Males 933 0.24 -1.9
Females 964 0.22 -2.1
Fishery-Dependent
Combined Sexes 947 0.27 -2.6
Males 935 0.25 -2.9
Females 955 0.28 -2.4

55
Table 3. Literature parameter estimates for standard von Bertalanffy growth equation. Lengths were converted to natural total length if necessary using equations derived by Goodyear (1996).
Area, Study L∞ (NTL mm) k t0
TX,LA,MS,AL
Beckman et al., 1988
Males 991 0.137 -7.74
Females 1105 0.088 -11.29
Alabama
Powers et al., (2012)
Males
1007
0.110
-10.00
Females 1052 0.109 -10.00
Hightower Thesis
Combined Males and Females 946 0.320 -1.20
Males 928 0.310 -1.40
Females 953 0.320 -1.40
Florida
Murphy and Taylor, 1990
Combined Males and Females 1019 0.450 0.03

56
Table 4. Literature parameter estimates for ‘double von Bertalanffy’ growth equation. Total lengths reported by Porch (2000) were converted from inches to mm and compared to parameters estimated in this study.
Area, Study L∞ (NTL mm) k1 k2 t1
t2
Texas
M. Fisher 982 0.313 0.146 0.184 4.78
LA,MS,AL
Wilson and Nieland 1017 0.402 0.195 0.038 3.06
Hightower Thesis 947 0.33 1.13 -1.2 -84.5
Florida
M. Murphy 1019 0.413 0.114 -0.056 8.39

57
Table 5. Abundance index values for the 2006-2012 fishery-independent longline.
Year n Observed
mean
Obs
se
dGLM
mean
dGLM
se
dGLM
cv positive index binomial index
2006 93 0.65 0.18 1.03 1.03 1.00 3.71 0.28
2007 148 1.00 0.22 0.98 0.89 0.91 3.26 0.30
2008 141 0.84 0.15 0.83 0.80 0.97 2.95 0.28
2009 94 0.86 0.27 0.55 0.70 1.27 2.94 0.19
2010 87 0.62 0.18 0.52 0.63 1.22 2.62 0.20
2011 87 0.30 0.10 0.21 0.33 1.58 2.02 0.10
2012 82 0.22 0.08 0.18 0.30 1.65 2.05 0.09

58
Table 6. Mean size and total Hg values for Red Drum in the Gulf of Mexico. Lengths from Adams and Onorato, 2005 were converted using the following equation from Porch, 2000: total length=1.184(standard length) + 0.420.
Total Length (mm) Total Hg (ppm)
Study Location Number Mean Min. Max. Mean s.e. Min. Max.
This Study
Fishery-Independent Dauphin Island, AL 71 935 776 1041 0.67 0.023 0.22 1.1
Fishery-Dependent Dauphin Island, AL 74 816 565 1020 0.47 0.034 0.12 1.2
Adams and Onorato, 2005 Choctawhatchee Bay, FL 15 483 214 736 0.17 0.025 0.050 0.35
Apalachicola, FL 86 534 410 732 0.20 0.011 0.057 0.69
Cedar Key, FL 133 472 264 718 0.18 0.0067 0.061 0.55
Tampa Bay Inshore, FL 98 608 237 906 0.26 0.022 0.042 1.8
Tampa Bay Offshore, FL 139 901 665 1175 1.7 0.057 0.30 3.6
Charlotte Harbor, FL 34 607 331 832 0.28 0.031 0.055 0.72
Shark River Slough-Everglades,FL 20 478 324 663 0.25 0.016 0.097 0.4
Florida Keys-Florida Bay, FL 42 538 273 744 0.50 0.068 0.11 2.7
Indian River Lagoon, FL 145 615 292 1267 0.37 0.034 0.020 2.2
Stunz and Robillard, 2011 Aransas Bay, TX 4 570 527 611 0.090 0.005 0.083 0.104
Corpus Christi Bay, TX 2 713 511 915 0.120 0.046 0.074 0.166
Nueces Bay, TX 4 577 523 659 0.576 0.069 0.451 0.721
Upper Laguna Madre, TX 4 597 558 654 0.193 0.055 0.122 0.358
Surf 5 945 804 1018 1.024 0.181 0.498 1.542
Ache et al., 2000 Gulfwide 364 NA NA NA 0.31 0.020 0.005 2.7
Gulfwide 442 NA NA NA 0.65 0.038 0.001 4.62

Appendix B: Figures 1-35

Figure 1. Catch data for Red Drumfrom National Marine Fisheries Service, Fisheries Onephase-https://www.st.nmfs.noaa.gov/apex/foss/f?p=114:9:882289119646183March 2013).
59
Red Drum in the Gulf of Mexico (1950-2010). Data available from National Marine Fisheries Service, Fisheries One-Stop-Shop (FOSS) landings
https://www.st.nmfs.noaa.gov/apex/foss/f?p=114:9:882289119646183
). Data available Shop (FOSS) landings
https://www.st.nmfs.noaa.gov/apex/foss/f?p=114:9:882289119646183 (accessed

60
Figure 2. Locations of standardized fishery-independent surveys with starting and ending dates. A. DISL/NMFS Cooperative longline (2006-2008) B. DISL transect survey (2007-2008) C. DISL shark longline survey (2009 only) and D. SEAMAP survey (2010-2012). Randomized block surveys were supplemented with transect sampling along a randomly selected line of longitude.

Figure 3. Location of thecollection boundary is the shaded area: longitude; south: 28°N latitude; in to the Alabama Deep Sea Fishing Rodeo weigh station in Dauphin Island, Alabama.
61
Location of the fishery-dependent Alabama Deep Sea Fishing Rodeo. Fish collection boundary is the shaded area: north: all bays and inlets of the GOM
atitude; and, west: 91°W longitude. All fish entered are brought p Sea Fishing Rodeo weigh station in Dauphin Island, Alabama.
dependent Alabama Deep Sea Fishing Rodeo. Fish of the GOM; east: 85°W
. All fish entered are brought p Sea Fishing Rodeo weigh station in Dauphin Island, Alabama.

62
Figure 4. Sampling locations for all fishery-independent bottom longline surveys 2006-2012.

Figure 5. Average Red Drumlive bait.
63
Red Drum CPUE (fish/100 hooks/hr) for fish caught on dead v
hr) for fish caught on dead versus

64
Figure 6. Condition Indices plotted by month for all Red Drum samples. A. Condition indices for this study (2010-2012) and B. Condition indices for this study combined with Powers et al. (2012) (2008-2012).

65
Figure 7. Age distribution (A) and length frequency (B) of all Red Drum in this study (2010-2012).
A
B

Figure 8. Age distributions of all
66
. Age distributions of all Red Drum in this study by gear type (2010(2010-2012).

Figure 9. Length frequencies of all
67
. Length frequencies of all Red Drum in this study by gear type (2010-2012).

Figure 10. Length at age for all
68
Length at age for all Red Drum in this study (2010-2012).

Figure 11. Von Bertalanffy growth function (solid line) and double von Bertalanffy growth function (dashed line) fit to the age at length data for all (2010-2012).
69
Von Bertalanffy growth function (solid line) and double von Bertalanffy growth function (dashed line) fit to the age at length data for all Red Drum
Von Bertalanffy growth function (solid line) and double von Bertalanffy Red Drum in this study

70
Figure 12. Catch curve regressions for the fishery-independent longline (n = 400) and fishery-dependent ADSFR (n = 344) (2008-2012). Total Mortality (Z) was estimated as the slope of the linear regression to the fully-recruited ages in a scatterplot of the natural log of numbers versus age. Annual survival (S) was calculated as the exponential of Z.

Figure 13. Age versus distance from shore for Red Drum caught using the 2010fishery-independent longline.
71
versus distance from shore for Red Drum caught using the 2010independent longline.
versus distance from shore for Red Drum caught using the 2010-2012

Figure 14. Catch per unit effort of (2006-2012).
72
Catch per unit effort of Red Drum for all fishery-independent longline surveys
independent longline surveys

Figure 15. Observed fishery
73
Observed fishery-independent longline CPUE index by month (2006independent longline CPUE index by month (2006-2012).

Figure 16. Nominal fisheryError bars represent standard error of the mean.
74
fishery-independent longline CPUE index by year (2006Error bars represent standard error of the mean.
independent longline CPUE index by year (2006-2012).

Figure 17. Fishery-independent longline abundance indices by year (2006
75
independent longline abundance indices by year (2006independent longline abundance indices by year (2006-2012).

76
Figure 18. Locations of fishery-independent longline Red Drum sampled for mercury and stable isotope analysis.

77
Figure 19. Fishery-independent and fishery-dependent length frequencies for Red Drum sampled for mercury and stable isotopes.

Figure 20. Fishery-independent and fisherysampled for mercury and stable isotopes.
78
independent and fishery-dependent age distributions for sampled for mercury and stable isotopes.
dependent age distributions for Red Drum

Figure 21. Fishery-independent Red line indicates the upper slot size for Alabama (660 mm NTL).
79
ndependent Red Drum total Hg versus natural total lRed line indicates the upper slot size for Alabama (660 mm NTL).
length (NTL).

Figure 22. Fishery-independent
80
ndependent Red Drum total Hg versus age.

Figure 23. Fishery-independent
81
independent Red Drum total Hg versus trophic level.

Figure 24. Fishery-dependent line indicates the upper slot size for Alabama (660 mm NTL).
82
ependent Red Drum total Hg versus natural total length (NTL).the upper slot size for Alabama (660 mm NTL).
total Hg versus natural total length (NTL). Red

Figure 25. Fishery-dependent
83
ependent Red Drum total Hg versus age.

Figure 26. Fishery-dependent
84
ependent Red Drum total Hg versus trophic level.

Figure 27. Fishery-independent and fisherydistribution for King Mackerel
85
independent and fishery-dependent length frequency and age King Mackerel sampled for mercury and stable isotopes.
dependent length frequency and age
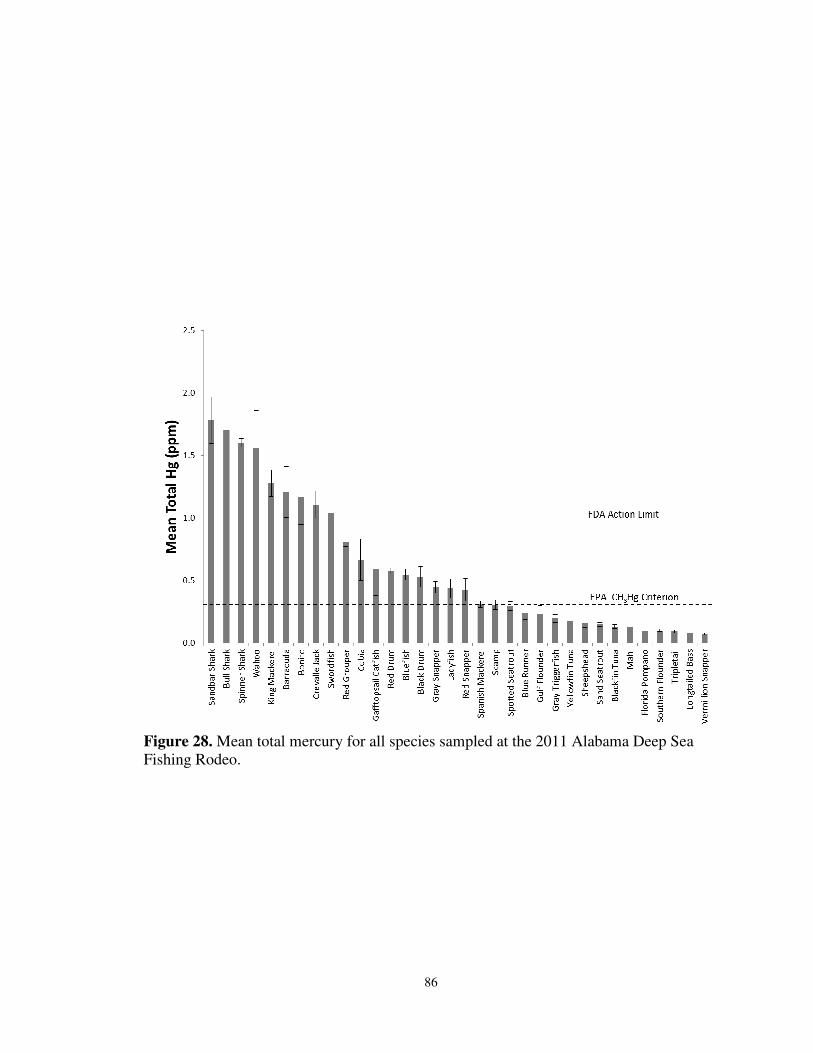
Figure 28. Mean total mercury for all species sampled at the 2011 Alabama Deep Sea Fishing Rodeo.
86
Mean total mercury for all species sampled at the 2011 Alabama Deep Sea
Mean total mercury for all species sampled at the 2011 Alabama Deep Sea

Figure 29. Fishery-dependent
87
ependent King Mackerel total Hg versus natural total length (NTL).total Hg versus natural total length (NTL).

Figure 30. Fishery-dependent
88
ependent King Mackerel total Hg versus age.

Figure 31. Fishery-dependent
89
ependent King Mackerel total Hg versus trophic level.
total Hg versus trophic level.

Figure 32. Fishery-dependentANCOVA results.
90
ependent King Mackerel and Red Drum total Hg versus sizetotal Hg versus size and

Figure 33. Fishery-dependentand ANCOVA results.
91
ependent King Mackerel and Red Drum total Hg versus
total Hg versus subset sizes

Figure 34. Fishery-dependentANCOVA results for subset
92
ependent King Mackerel and Red Drum total Hg versus age subset sizes.
total Hg versus age and
Figure 35. Fishery-dependent
93
ependent King Mackerel and Red Drum stable isotope biplotstable isotope biplot.

BIOGRAPHICAL SKETCH

94
BIOGRAPHICAL SKETCH
Name of Author: Crystal LouAllen Hightower Place of Birth: Decatur, Alabama Date of Birth: March 15, 1983 Graduate and Undergraduate School Attended: University of South Alabama University of North Alabama Degrees Awarded: Master of Marine Sciences, 2013, Mobile, Alabama Bachelor of Marine Biology, 2006, Florence, Alabama Awards and Honors: Graduate Research Assistantship, University of South Alabama 2011- 2013 Graduate Summer Teaching Assistantship, Dauphin Island Sea Lab, 2011-2013