Evaluating national innovation systems–Key insights from the Finnish INNOEVAL survey
135
Keskusteluaiheita – Discussion papers No. 1196 Annu Kotiranta, Tuomo Nikulainen, Antti-Jussi Tahvanainen, Matthias Deschryvere, and Mika Pajarinen EVALUATING NATIONAL INNOVATION SYSTEMS – KEY INSIGHTS FROM THE FINNISH INNOEVAL SURVEY ETLA, The Research Institute of the Finnish Economy – Lönnrotinkatu 4B, FIN-00120 Helsinki, Finland. Tel: (+) 358-9-609 90 207, Fax: (+) 358-9-601 753, e-mail: [email protected] The report is part of the International Evaluation of the Finnish National Innovation System, financed by the Ministry of Education and the Ministry of Employment and the Economy (www.evaluation.fi ). ISSN 0781-6847 28.10.2009 ETLA ELINKEINOELÄMÄN TUTKIMUSLAITOS THE RESEARCH INSTITUTE OF THE FINNISH ECONOMY Lönnrotinkatu 4 B 00120 Helsinki Finland Tel. 358-9-609 900 Telefax 358-9-601 753 World Wide Web: http://www.etla.fi/
-
Upload
independent -
Category
Documents
-
view
1 -
download
0
Transcript of Evaluating national innovation systems–Key insights from the Finnish INNOEVAL survey
Keskusteluaiheita – Discussion papers
No. 1196
Annu Kotiranta, Tuomo Nikulainen, Antti-Jussi Tahvanainen,
Matthias Deschryvere, and Mika Pajarinen
EVALUATING NATIONAL INNOVATION SYSTEMS
– KEY INSIGHTS FROM THE FINNISH INNOEVAL SURVEY
ETLA, The Research Institute of the Finnish Economy – Lönnrotinkatu 4B, FIN-00120 Helsinki, Finland. Tel: (+) 358-9-609 90 207, Fax: (+) 358-9-601 753, e-mail: [email protected] The report is part of the International Evaluation of the Finnish National Innovation System, financed by the Ministry of Education and the Ministry of Employment and the Economy (www.evaluation.fi ).
ISSN 0781-6847 28.10.2009
ETLA ELINKEINOELÄMÄN TUTKIMUSLAITOS THE RESEARCH INSTITUTE OF THE FINNISH ECONOMY Lönnrotinkatu 4 B 00120 Helsinki Finland Tel. 358-9-609 900 Telefax 358-9-601 753 World Wide Web: http://www.etla.fi/

KOTIRANTA, Annu, NIKULAINEN, Tuomo, TAHVANAINEN, Antti-Jussi, DESCHRYVERE, Matthias, PAJARINEN, Mika, EVALUATING NATIONAL INNOVATION SYSTEMS – KEY INSIGHTS FROM THE FINNISH INNOEVAL SURVEY, Helsinki: ETLA, Elinkeinoelämän Tutkimuslaitos, The Research Institute of the Finnish Economy, 2009, 131 p. (Keskusteluaiheita, Discussion Papers ISSN 0781-6847; no. 1196).
ABSTRACT: This paper aims to provide new insights into the analysis of National Innovation Systems
(NIS). Whereas the common approach is to analyze specific parts or a defined set of actors and their
interactions, this paper attempts to take a more systemic approach by analyzing results of 13 surveys
directed to different sets of actors related to the Finnish NIS. The focus is on the overall complexity of
the system, the demand- and user-based dimensions of innovative activities and policies, internation-
alisation of innovative activities, public support for high growth companies, regional innovation poli-
cies, and educational policies. The results are mostly descriptive and the emphasis is on the most
important findings of the surveys. In addition to the main findings, the paper includes all question-
naires and a description of the complete data set.
KEYWORDS: National Innovation System, evaluation, Finland, survey
JEL-codes: O30, O38
KOTIRANTA, Annu, NIKULAINEN, Tuomo, TAHVANAINEN, Antti-Jussi, DESCHRYVERE, Matthias, PAJARINEN, Mika, EVALUATING NATIONAL INNOVATION SYSTEMS – KEY INSIGHTS FROM THE FINNISH INNOEVAL SURVEY, Helsinki: ETLA, Elinkeinoelämän Tutkimuslaitos, The Research Institute of the Finnish Economy, 2009, 131 s. (Keskusteluaiheita, Discussion Papers ISSN 0781-6847; no. 1196).
TIIVISTELMÄ: Tämä selvitys tarjoaa uusia näkökulmia kansallisten innovaatiojärjestelmien tutkimuk-
seen. Selvitys analysoi ja tiivistää 13 yksittäistä, innovaatiojärjestelmän eri toimijoille suunnattua kyse-
lyä hyödyntäen laaja-alaisempaa lähestymistapaa kuin perinteiset tutkimukset, jotka usein keskittyvät
järjestelmän rajattuihin osa-alueisiin tai toimijaryhmiin. Selvityksessä perehdytään erityisesti innovaa-
tiojärjestelmän kompleksisuuteen, innovaatiotoiminnan ja -politiikan kysyntä- ja käyttäjälähtöisyyteen
sekä alueellisuuteen, innovaatiotoiminnan kansainvälistymiseen, lupaavien kasvuyritysten saamaan
julkiseen tukeen, ja koulutuspolitiikkaan. Tulokset ovat pääosin kuvailevia, ja niiden raportoinnissa
keskitytään vain näistä merkittävimpiin. Selvitys sisältää tulosten lisäksi myös alkuperäiset kyselyrun-
got ja kyselyillä tuotettujen aineistojen tyhjentävät kuvaukset.
AVAINSANAT: Kansallinen innovaatiojärjestelmä, arviointi, Suomi, kysely
JEL-koodit: O30, O38
GLOSSARY OF ACRONYMS AKA Academy of Finland (Suomen Akatemia)
FFI Foundation for Finnish Inventions (Keksintösäätiö)
NIS National Innovation System (Kansallinen innovaatiojärjestelmä)
OPM Ministry of Education (Opetusministeriö)
PRO Public Research Organisation (Julkinen tutkimuslaitos)
RIC Research and Innovation Council (Tiede- ja innovaationeuvosto - TIN)
STM Ministry of Social Affairs and Health (Sosiaali- ja terveysministeriö)
TEM Ministry of Employment and Economy (Työ- ja elinkeinoministeriö)
TESI Finnish Industry Investment Ltd (Suomen Teollisuussijoitus Oy)
VM Ministry of Finance (Valtiovarainministeriö)
VTT Technical Research Centre of Finland (Valtion teknillinen tutkimuslaitos)

TABLE OF CONTENTS 1. INTRODUCTION .................................................................................................................1 2. UNDERSTANDING THE COMPLEXITY OF NATIONAL INNOVATION SYSTEMS ...........................2
2.1. Different opinions about the Finnish national innovation system..........................................2 2.2. The national innovation system and its complexity.............................................................3 2.3. Overlapping activities between public and private actors in innovation services ....................5 2.4. Ongoing reforms in the NIS .............................................................................................6 2.5. Public research organisations in need of clear-cut role demarcation.....................................7 2.6. SHOKs in the Finnish innovation system............................................................................8
3. DEMAND AND USER DRIVEN INNOVATION.........................................................................10
3.1. Technology-push vs. demand-pull ..................................................................................10 3.2. Sources of innovation....................................................................................................10 3.3. Public procurement .......................................................................................................12
4. GLOBALISATION AND BUSINESS – INNOVATION IN A BORDERLESS WORLD ........................13 5. GROWTH ENTREPRENEURSHIP AND FINANCE ....................................................................14
5.1. Financing of companies in times of financial instability and economic distress ....................15 6. REGIONAL INNOVATION POLICY .......................................................................................17 7. EDUCATION, RESEARCH AND ECONOMY ............................................................................18
7.1. Allocation of labour across tasks.....................................................................................18 7.2. Patterns of cooperation .................................................................................................19 7.3. Reform of the Universities Act ........................................................................................22
8. FINAL REMARKS ...............................................................................................................25 APPENDIX I - Survey practicalities..............................................................................................27 APPENDIX II - Graphical presentation of the survey results ..........................................................30 APPENDIX III - Complete data tables .........................................................................................75

1. INTRODUCTION
This paper presents some of the key findings from surveys conducted as part of the evaluation of the Finnish innovation system
(see also www.evaluation.fi). The surveys were conducted in the spring of 2009 in order to map opinions about the current
innovation system, discuss ongoing reforms, and collect specific information about the actors of the Finnish national innovation
system (NIS). In total 13 different internet-surveys were sent out to over 10 000 actors of the Finnish innovation system. Par-
ticipation turned out to be more than satisfying with the average response rate of the 13 surveys being nearly 40 %. In addition
to companies utilizing the system, participants also comprised ministries, the higher education sector, intermediaries, financiers,
municipalities, public research organisations, associations, and foundations. In this paper a selection of the most interesting
results is picked out for closer examination. The paper has several appendixes: survey practicalities (Appendix I), tables of all
results (II), figures of all results (III), survey questionnaires in English (IV), and survey questionnaires in Finnish (V).
Some of the 13 respondent groups are further divided or aggregated into groups for analytical purposes (see Appendix I). For
example companies are divided according to their innovation activities (innovative and non-innovative companies) with innova-
tive companies being further divided according to their size (less or more than 50 employees). Companies were considered
innovative, if they performed innovation activities during the last three years. In similar fashion, public sector actors are divided
into four subgroups. The first sub-group “education supporting organizations” includes the Academy of Finland (AKA) and the
Ministry of Education (OPM), the second sub-group “innovation supporting organizations” includes the Finnish Funding Agency
for Technology and Innovation (Tekes) and the Ministry of Employment and the Economy (TEM). A third sub- group “other
ministries” includes all other ministries. The remaining governmental organizations, such as Finnish Industry Investment (TESI),
Research and Innovation Council (RIC), and Sitra are categorized in a fourth sub-group “other public sector organizations”. The
regional innovation actors are referred to with the term “intermediaries” and can be divided into two groups, TE-centres (re-
gional public Employment and Economic Development Centres) and other intermediaries. Last group consists of two sub-groups
of private sector financiers: banks, and business angels and venture capitalists. The response rates for the aggregate groups
are presented in Table 1.
Table 1 Number of respondents and response rate of the survey
Answers Sent Resp. rate
Associations 26 68 38.2%Companies 1026 8747 11.7%Foundations 58 151 38.4%Intermediaries 88 189 46.6%Municipalities 80 315 25.4%Private financiers 26 196 32.3%Public actors 82 158 51.9%Research organisations 14 29 48.3%University department heads 219 541 40.5%University rectors 28 45 62.2%Total 1647 10439 39.5%
(Total) (Total) (Average) The aim of this paper is not to summarize all of the results but to highlight some key findings. For this reason the appendixes
are frequently referred to for further details. In particular, Appendix II and Appendix III are cited to direct the reader to seek
more statistics on individual questions. The citations to appendixes and specific questions are made in footnotes.
The rest of the paper is structured as follows. Section 2 discusses the complexity of the Finnish national innovation system and
gives an overview of the overlapping activities of the different actors of the NIS. Section 3 discusses the demand- and user-
driven aspects of innovation policies and companies’ innovation activities. Section 4 highlights the international dimensions of
innovative activities. Section 5 presents results related to growth entrepreneurship and financing. Section 6 focuses on regional
dimensions of national innovation policies. Section 7 addresses aspects of the higher education system. And finally, Section 8
concludes with final remarks.
2
2. UNDERSTANDING THE COMPLEXITY OF NATIONAL INNOVATION SYSTEMS
“In order to meet global challenges, innovation policy must be broad-based and comprehensive. Piecemeal policy measures will
not suffice in ensuring a pioneering position in innovation activity, and thus growth in national productivity and competitive
ability.”
– National Innovation Policy (2008)
2.1. Different opinions about the Finnish national innovation system
A national innovation system can be defined as follows:
• … the network of institutions in the public and private sectors, whose activities and interactions initiate, import,
modify and diffuse new technologies. (Freeman, 1987)
• … the elements and relationships which interact in the production, diffusion and use of new, and economically use-
ful, knowledge ... and are either located within or rooted inside the borders of a nation state. (Lundvall, 1992)
• ... a set of institutions whose interactions determine the innovative performance ... of national firms. (Nelson, 1993)
• … the national institutions, their incentive structures and their competencies, that determine the rate and direction
of technological learning (or the volume and composition of change generating activities) in a country. (Patel and
Pavitt, 1994)
• … that set of distinct institutions which jointly and individually contribute to the development and diffusion of new
technologies and which provides the framework within which governments form and implement policies to influence
the innovation process. As such it is a system of interconnected institutions to create, store and transfer the knowl-
edge, skills and artefacts which define new technologies. (Metcalfe, 1995)
Source: Wikipedia
Based on these conceptualisations, one could state that a national innovation system can be loosely defined as the interaction
and flow of information, resources and technology between individuals, companies and institutions involved in the innovative
process on the national level. But as is evident from above, there is no universal definition of what constitutes a national inno-
vation system. Therefore, the discussion of the definitions of national innovation systems is largely omitted in this paper, in
particular as this aspect is further elaborated in the main report related to the evaluation of the Finnish innovation system
(REF). In the following the focus will be on the survey results.1
The respondents of the survey were not only asked to rate the current Finnish innovation system (NIS) on a grading scale from
4 to 10, but also the NIS as it was five years ago and the NIS as it is expected to be after five years. The average opinion
indicates that the system is rated somewhat above satisfactory (7½). However, there are noteworthy differences between
respondent groups. Especially large differences are to be found between companies and public actor respondents. While com-
panies give only an average grade of less than satisfactory (7), the innovation and education supporting governmental organi-
zations rate the system’s performance as “good” (8). In Figure 1 the average opinions of some selected groups illustrate the
development of the grading2.
1 Henceforth the surveys are referred to as “survey” due to the extensive overlap in the surveys – see Appendix I for more details. 2 For more information, see Appendix II pages 37-38 and Appendix III page 81.

3
Figure 1 Grading the NIS - 5 years ago, today, and in 5 years
Smaller innovative firms
Gov.: Innovation support gov. orgs.
Gov.: Education support gov. orgs.
Education: University department heads
Education: University rectors
6.3
6.8
7.3
7.8
8.3
8.8
5 years ago Today In 5 years
7.8
7.3
7.0
7.0
6.7
6.5
8.0
7.8
7.4
7.3
7.1
7.0
8.6
8.2
7.8
7.8
7.4
7.4
Average
Smaller innovative firms
Gov.: Innovation support gov. orgs.
Gov.: Education support gov. orgs.
Education: University department heads
Education: University rectors
6.3
6.8
7.3
7.8
8.3
8.8
5 years ago Today In 5 years
7.8
7.3
7.0
7.0
6.7
6.5
8.0
7.8
7.4
7.3
7.1
7.0
8.6
8.2
7.8
7.8
7.4
7.4
Average
It is perceived that the development has been and will continue to be positive. The university rectors are the most optimistic
respondent group when it comes to the development of the system - interestingly the department heads are more careful in
their grading.
2.2. The national innovation system and its complexity
As the various definitions indicated, the NIS is a network of different actors interacting through a variety of different modes.
The respondents were asked to evaluate the overall complexity of the regime constituted by the public sector actors in the
Finnish NIS. On average, the system was viewed as rather complex although some variation does exist. The university
rectors have a dismal view of the complexity of the system compared to their colleagues at the polytechnics and university
department heads. The education supporting government organizations stand out as the only group that considers the
system as rather simple.3 This provides an interesting starting point for analyzing the interaction and importance of actors to
each other.
The respondents were also asked to choose on a scale from “not at all important” (=1 point) to “very important” (=4 points) to
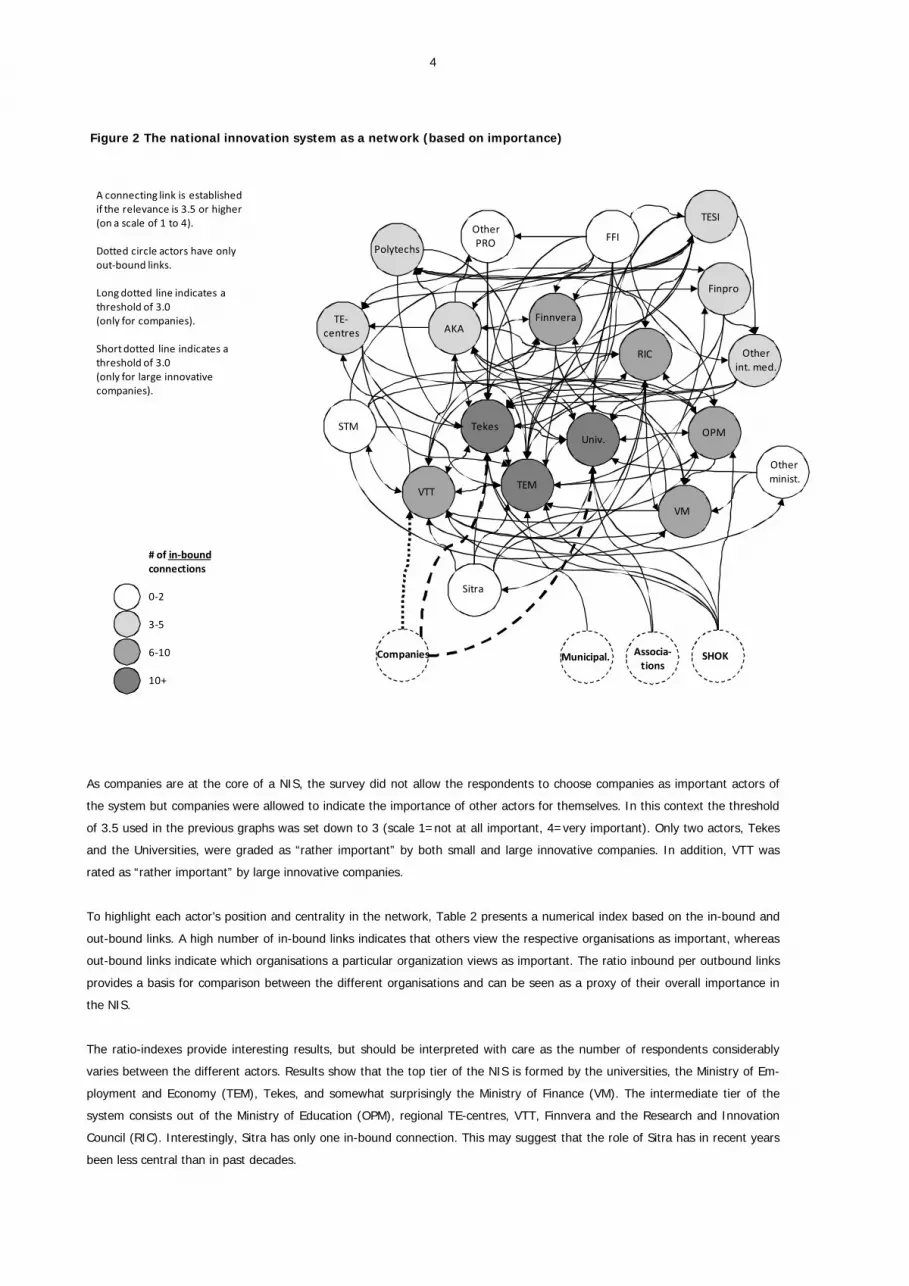
indicate who were important actors in the Finnish NIS from their own perspective. The results are illustrated in Figure 2 where
the connections rated as “very important” (more than 3.5 points) are drawn.4
3 For more information, see Appendix II page 39 and Appendix III page 81. 4 For more information, see Appendix II pages 40-41 and Appendix III pages 82-88.
4
Figure 2 The national innovation system as a network (based on importance)
AKA
Polytechs
Finnvera
Finpro
Associa‐tions
Municipal.
Otherint. med.
Otherminist.
OtherPRO
OPM
RIC
SHOK
Sitra
STM
TE‐centres
Tekes
TEM
TESI
VM
Univ.
VTT
Companies
FFI
# of in‐boundconnections
0‐2
3‐5
6‐10
10+
A connecting link is establishedif the relevance is 3.5 or higher(on a scale of 1 to 4).
Dotted circle actors have onlyout‐bound links.
Long dotted line indicates a threshold of 3.0(only for companies).
Short dotted line indicates a threshold of 3.0(only for large innovativecompanies).
As companies are at the core of a NIS, the survey did not allow the respondents to choose companies as important actors of
the system but companies were allowed to indicate the importance of other actors for themselves. In this context the threshold
of 3.5 used in the previous graphs was set down to 3 (scale 1=not at all important, 4=very important). Only two actors, Tekes
and the Universities, were graded as “rather important” by both small and large innovative companies. In addition, VTT was
rated as “rather important” by large innovative companies.
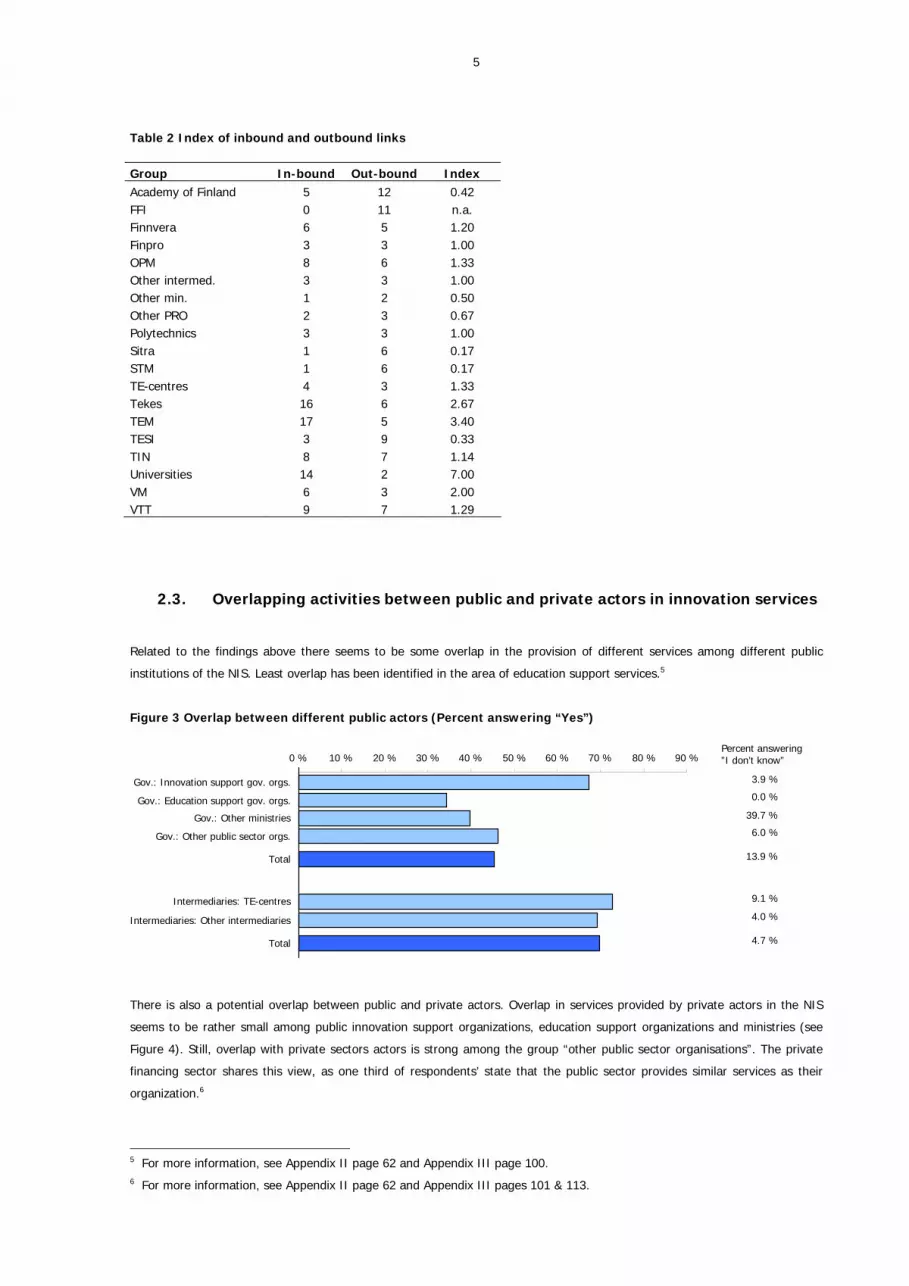
To highlight each actor’s position and centrality in the network, Table 2 presents a numerical index based on the in-bound and
out-bound links. A high number of in-bound links indicates that others view the respective organisations as important, whereas
out-bound links indicate which organisations a particular organization views as important. The ratio inbound per outbound links
provides a basis for comparison between the different organisations and can be seen as a proxy of their overall importance in
the NIS.
The ratio-indexes provide interesting results, but should be interpreted with care as the number of respondents considerably
varies between the different actors. Results show that the top tier of the NIS is formed by the universities, the Ministry of Em-
ployment and Economy (TEM), Tekes, and somewhat surprisingly the Ministry of Finance (VM). The intermediate tier of the
system consists out of the Ministry of Education (OPM), regional TE-centres, VTT, Finnvera and the Research and Innovation
Council (RIC). Interestingly, Sitra has only one in-bound connection. This may suggest that the role of Sitra has in recent years
been less central than in past decades.
5
Table 2 Index of inbound and outbound links
Group In-bound Out-bound Index Academy of Finland 5 12 0.42 FFI 0 11 n.a. Finnvera 6 5 1.20 Finpro 3 3 1.00 OPM 8 6 1.33 Other intermed. 3 3 1.00 Other min. 1 2 0.50 Other PRO 2 3 0.67 Polytechnics 3 3 1.00 Sitra 1 6 0.17 STM 1 6 0.17 TE-centres 4 3 1.33 Tekes 16 6 2.67 TEM 17 5 3.40 TESI 3 9 0.33 TIN 8 7 1.14 Universities 14 2 7.00 VM 6 3 2.00 VTT 9 7 1.29
2.3. Overlapping activities between public and private actors in innovation services
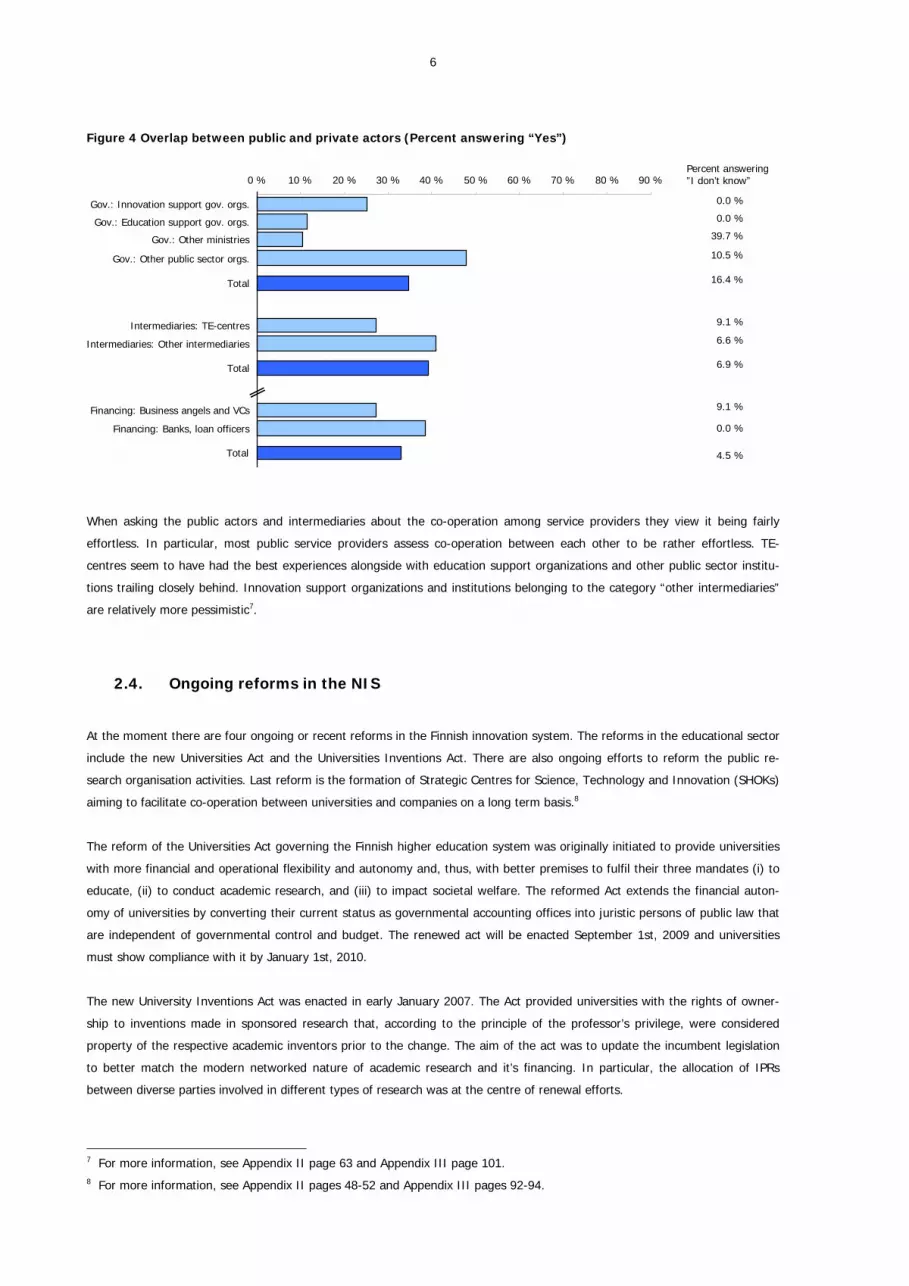
Related to the findings above there seems to be some overlap in the provision of different services among different public
institutions of the NIS. Least overlap has been identified in the area of education support services.5
Figure 3 Overlap between different public actors (Percent answering “Yes”)
3.9 %
0.0 %
39.7 %
6.0 %
13.9 %
9.1 %
4.0 %
4.7 %
0 % 10 % 20 % 30 % 40 % 50 % 60 % 70 % 80 % 90 %
Gov.: Innovation support gov. orgs.
Gov.: Education support gov. orgs.
Gov.: Other ministries
Gov.: Other public sector orgs.
Total
Intermediaries: TE-centres
Intermediaries: Other intermediaries
Total
Percent answering”I don’t know”
There is also a potential overlap between public and private actors. Overlap in services provided by private actors in the NIS
seems to be rather small among public innovation support organizations, education support organizations and ministries (see
Figure 4). Still, overlap with private sectors actors is strong among the group “other public sector organisations”. The private
financing sector shares this view, as one third of respondents’ state that the public sector provides similar services as their
organization.6
5 For more information, see Appendix II page 62 and Appendix III page 100. 6 For more information, see Appendix II page 62 and Appendix III pages 101 & 113.
6
Figure 4 Overlap between public and private actors (Percent answering “Yes”)
0.0 %
0.0 %
39.7 %
10.5 %
16.4 %
9.1 %
6.6 %
6.9 %
9.1 %
0.0 %
Gov.: Innovation support gov. orgs.
Gov.: Education support gov. orgs.
Gov.: Other ministries
Gov.: Other public sector orgs.
Total
Intermediaries: TE-centres
Intermediaries: Other intermediaries
Total
Financing: Business angels and VCs
Financing: Banks, loan officers
0 % 10 % 20 % 30 % 40 % 50 % 60 % 70 % 80 % 90 %Percent answering”I don’t know”
Total 4.5 %
When asking the public actors and intermediaries about the co-operation among service providers they view it being fairly
effortless. In particular, most public service providers assess co-operation between each other to be rather effortless. TE-
centres seem to have had the best experiences alongside with education support organizations and other public sector institu-
tions trailing closely behind. Innovation support organizations and institutions belonging to the category “other intermediaries”
are relatively more pessimistic7.
2.4. Ongoing reforms in the NIS
At the moment there are four ongoing or recent reforms in the Finnish innovation system. The reforms in the educational sector
include the new Universities Act and the Universities Inventions Act. There are also ongoing efforts to reform the public re-
search organisation activities. Last reform is the formation of Strategic Centres for Science, Technology and Innovation (SHOKs)
aiming to facilitate co-operation between universities and companies on a long term basis.8
The reform of the Universities Act governing the Finnish higher education system was originally initiated to provide universities
with more financial and operational flexibility and autonomy and, thus, with better premises to fulfil their three mandates (i) to
educate, (ii) to conduct academic research, and (iii) to impact societal welfare. The reformed Act extends the financial auton-
omy of universities by converting their current status as governmental accounting offices into juristic persons of public law that
are independent of governmental control and budget. The renewed act will be enacted September 1st, 2009 and universities
must show compliance with it by January 1st, 2010.
The new University Inventions Act was enacted in early January 2007. The Act provided universities with the rights of owner-
ship to inventions made in sponsored research that, according to the principle of the professor’s privilege, were considered
property of the respective academic inventors prior to the change. The aim of the act was to update the incumbent legislation
to better match the modern networked nature of academic research and it’s financing. In particular, the allocation of IPRs
between diverse parties involved in different types of research was at the centre of renewal efforts.
7 For more information, see Appendix II page 63 and Appendix III page 101. 8 For more information, see Appendix II pages 48-52 and Appendix III pages 92-94.

7
In the following, we will focus on the latter two reforms, and save a more detailed discussion of university related initiatives for
later when the higher education sector is examined.
2.5. Public research organisations in need of clear-cut role demarcation
The information needs of ministries and public agencies active in and responsible for the different sectors of the Finnish econ-
omy are partially attended to by public research organisations. The so-called sector research conducted in these organisations
serves the development of policies and services of the respective parent ministries. The sector research infrastructure consists
of 20 separate public research organisations covering five sectors: the primary production, secondary production, health and
social, environment and energy, as well as societal and cultural sectors. The public research organisations have constituted an
integrated part of the Finnish national innovation system for decades.
The sector research infra-structure has been criticized for its considerable overlap with research conducted at universities, on the
one hand, while other needs for information (e.g. the evaluation of potential impacts of certain policy measures) are not covered at
systemically by the infrastructure, on the other hand. In particular, some of the research carried out by the current sector research
infrastructure can be argued to be more fitting to the role and competence base of universities instead. Lastly, public research
organisations have been argued to fail in providing information on inter-sector issues that are central in a systemic environment
such as an economy. Wide-spanning reforms of the infrastructure have been on the agenda since 2005, but have so far been
unable to produce significant results due to compromise-ridden solutions during the implementation of these reforms.
The survey provides evidence regarding the universities’ ability to better match the needs of ministries. Figure 5 presents a break-
down of answers regarding the question how well public research organisations match the information needs of respondents as
compared to universities and polytechnics. It is somewhat surprising to observe that ministries and other public sector organisations
systematically assess universities and polytechnics to achieve a slightly better match than public research organisations.9
Figure 5 Match between organisations and information needs
3.7 %
0.0 %
0.0 %
9.2 %
5.9 %
7.4 %
0.0 %
2.9 %
1.5 %
2.2 %
-0.4 -0.2Scale average(2.5 points) 0.2 0.4 0.6 0.8 1
Gov.: Innovation support gov. orgs.
Gov.: Education support gov. orgs.
Gov.: Other ministries
Gov.: Other public sector orgs.
Total
Gov.: Innovation support gov. orgs.
Gov.: Education support gov. orgs.
Gov.: Other ministries
Gov.: Other public sector orgs.
Total
-0.4 -0.2 0.2 0.4 0.6 0.8 1Scale average(2.5 points)
”I don’t know”Scale: 1 = Not at all, 4 = Very well
”I don’t know”Scale: 1 = Not at all, 4 = Very well
Public research organizations
Universities and polytechnics
9 For more information, see Appendix II pages 66-67 and Appendix III page 104.

8
Figure 6 below shows the views of respondents according to which the state research infrastructure would benefit from a com-
prehensive restructuring and, thereby, affect positive impact on the performance of the national innovation system as a whole.
It is particularly interesting to note that ministries as the primary principals of public research organizations seem to be among
the most convinced proponents of a potential reform. Other parties especially sympathetic to the initiative include universities
and risk financiers. The latter might be interested in more flexible policies regarding research spin-outs that often represent
lucrative investment opportunities.10
Figure 6 Views to the statement that “The potential reform of public research organisations would enhance the system’s performance”
-0.50 0.50 1.00 1.50
Firms: Smaller innovative firms
Firms: Larger innovative firms
Firms: Other firms
Gov.: Innovation support gov. orgs.
Gov.: Education support gov. orgs.
Gov.: Other ministries
Gov.: Other public sector orgs.
Education: University department heads
Education: University rectors
Education: Polytechnic rectors
Associations
Municipalities
Research: Public research institutes
Research: Other research instititutes
Intermediaries: TE-centres
Intermediaries: Other intermediaries
Financing: Business angels and VCs
25.0 %
18.2 %
0.0 %
14.3 %
19.2 %
7.7 %
11.8 %
9.1 %
33.3 %
27.5 %
0.0 %
14.3 %
0.0 %
46.6 %
39.7 %
40.1 %
”I dont know”
50.0 %
Scale average(2.5 points)
Scale: 1 = Completely disagree, 4 = Completely agree
2.6. SHOKs in the Finnish innovation system
The need for strategic choices in national innovation policy emerged from several government-initiated reports identifying a number of
global challenges for Finland. It was concluded that the public actors of the Finnish innovation system should aim at increasing private
and public investments in R&D activities. These investments have traditionally been distributed rather evenly over all innovative activity
in Finland. Through Strategic Centres for Science, Technology and Innovation (SHOK is the Finnish acronym) the aim is to break with
this tradition and lay more emphasis on the economic relevance of innovative activity as the decisive criterion for public funding.
In SHOKs companies, universities, research institutes, and other partners agree on a joint strategic research agenda, a vision of the
projected needs of companies regarding the development of technology five to ten years into the future. The agenda is then jointly
formulated into several long-term research programs including their segmentation into individual projects. In the programs, partici-
pants develop shared know-how, shared technology and service platforms, and utilize shared research environments and tools. The
research programs serve the purpose of creating a shared strategic foundation of knowledge and the basis for the development of
10 For more information, see Appendix II page 51 and Appendix III page 94.

9
applications. Hence, the defining nature of research efforts and technology development in SHOK programs is mainly long-term and
pre-competitive. Results arising from SHOK research programs can be applied in projects either within or outside SHOKs.
The respondents showed somewhat bipolar reactions to the introduction of SHOKs, in particular among companies and universi-
ties, two of their major stakeholders. The former express a pronouncedly optimistic view of SHOKs while the latter are much
less convinced of its impact on the innovation system. While the optimism of companies is rather understandable given the
unique opportunity to directly influence the long-term orientation of basic research in academia, the access to cutting-edge
competence shared by participants and the streamlined procedures regarding SHOK-funding by Tekes, the less enthusiastic
response of university department heads especially echoes a much more complex set of challenges related to the actual imple-
mentation of SHOKs (see also Tahvanainen 2009a and 2009b). To shed more light on the negative perception of university
department heads their reactions are broken down by scientific field in Figure 7.11
Figure 7 Do SHOKs enhance the performance of the national innovation system? (University department heads by discipline)
0% 20% 40% 60% 80% 100%
Engineering and techn
Humanities
Medical sciences
Natural sciences
Social sciences
Disagree
Agree
The dominance of pessimistic views in engineering and other technological fields is especially striking. While over 60% of re-
spondents active in these fields of science are not convinced of the benefits of SHOKs, only a fourth shares an optimistic view.
Humanities and social sciences provide a similar but less extreme response. Only medical and natural sciences are more con-
vinced than not of a positive impact of SHOKs. The clearly negative responses of engineering and other technical fields are
most probably attributable to their predominance in SHOKs implying a higher stake in any outcomes thereof and, thus, also a
higher susceptibility to the possible negative repercussions as described in Tahvanainen (2009).
For instance, Nikulainen and Tahvanainen (2009) argue that, in contrast to allocation strategies based on politically charged
agendas, SHOKs enable the allocation of resources on the basis of expected economic and societal impact, corporate strategies,
and the existing knowledge base. Furthermore, through intensive, institutionalized, and strongly interdisciplinary co-operation
between previously isolated parties, SHOK participants are able to tap into a shared pool of knowledge, a critical mass of exper-
tise. This leads potentially to entirely new approaches in research enabling the emergence of (i) radical innovations, (ii) an
increase in the quality of research, and (iii) a further reinforcement of the strong interaction between central knowledge pro-
ducers (academia) and its users (industry). Such integrated co-operation implicitly emphasizes application- and problem-driven
modes of research that are more potent in spawning competitively relevant technology than is research conducted within the
confines of single scientific disciplines.
11 For more information, see Appendix II page 50 and Appendix III page 94.

10
3. DEMAND AND USER DRIVEN INNOVATION
”The national supply of public expert and financing services will be updated to meet the needs of demand and user oriented
innovation activity. Moreover, new operating forms and incentives will be created in support of the broad-based interaction
required for genuinely demand and user-oriented innovation activity.”
– National Innovation Policy (2008)
3.1. Technology-push vs. demand-pull
One of the four primary dimensions of the new innovation strategy is demand and user orientation. In the survey respondents
were asked to evaluate the orientation of the current Finnish innovation policy on a five-step-scale from “strong technology
push” to “strong demand pull”. As illustrated in the graph below, none of the actors granted a grade above the scale average 3
and, thus, considered the national policy rather technology -driven. Companies were somewhat united in their opinions,
whereas the most extreme evaluations were given by the financiers, university rectors, and governmental innovation supporting
organizations (see Figure 8).12
Figure 8 Technology push and demand pull
University rectors
Municipalities
Polytech. rectors
Innov. support org.
BAs & VCs
Firms: Large inn.
Firms: Other1 2 32.5 4 5
Strongtech-push
Strongdemand-pull
Firms: Small inn.
Tech-push and demand-pull in balance
3x
3.2. Sources of innovation
Even though the innovation system itself is considered rather technology –driven, most of the companies utilize end-users in
their innovation processes. Based on the survey, roughly 60% of companies use their end-users for getting regular feedback
12 For more information, see Appendix II page 42 and Appendix III page 89.

11
from their customers and one fourth of the companies involve their end-users in the actual innovation activities. These so called
“lead-users” are not only providing information on their need but also actually engaging in the process of innovating. Only
about 15 % of the companies do not have any significant role for their end-users in the innovation process.13 Figure 9 adds
more information on the sources of innovation by mapping the respective importance of different sources of innovation. The
percentage represents the fraction of companies naming the foreign or domestic source as “very important” and the figure in
parenthesis as “important” or “very important”. The single most important source is company’s own employees, since 88% of
companies name their own employees as a “very important” source of innovation.14
Figure 9 Sources of innovation
Company/groupemployees88% (97%)
Suppliers32% (80%)
Any grp ofcustomers
76% (97%)
Consumers,end-users
42% (72%)
Otherbusinesses65% (93%)
The publicsector
12% (37%)
Polytechnics11% (47%)
Universities20% (59%)
Competitors20% (71%)
Consultants9% (36%)
Private research o.8% (37%)
Public research o.11% (48%)
While the figure above presents the importance of different sources, regardless of their origin, Table 3 shows the relation be-
tween domestic and foreign sources of innovation. Whereas domestic and foreign suppliers are considered equally important
sources of innovation (multiplier of 1.0), is the importance of polytechnics almost completely due to the domestic polytechnics,
since companies consider the domestic polytechnics 7.7 times more important than foreign ones. Furthermore, companies’ own
employees, who form the most important source of innovation, are also a strongly domestic resource.
Table 3 The relationship between the importance of domestic and foreign actors as sources of innovation15
Ratio Domestic Foreigndomestic/foreign
very important very important at least important very important at least important
Suppliers 1.0 22 % (72%) 23 % (60%)Competitors 1.1 15 % (62%) 13 % (48%)Private research organizations 1.6 5 % (32%) 3 % (19%)Consultants 1.8 7 % (33%) 4 % (19%)Other businesses 1.8 59 % (89%) 33 % (61%)Consumers/end users 1.9 38 % (68%) 20 % (43%)Any grp. of customers 1.9 72 % (95%) 38 % (65%)Universities 2.5 18 % (54%) 7 % (27%)Public research organizations 2.8 9 % (43%) 3 % (20%)Company/group employees 3.2 86 % (97%) 27 % (40%)The public sector 4.9 12 % (35%) 2 % (11%)Polytechnics 7.7 11 % (47%) 1 % (13%)
13 For more information, see Appendix II page 60 and Appendix III pages 98-99. 14 For more information, see Appendix II pages 58-59 and Appendix III pages 96-98. 15 First column presents the ratio between the fractions of companies naming the domestic and international source of innova-
tion as “very important”. A multiplier of 1 stands for equally important, and a multiplier grater than 1 means that the domestic
source is x times more important than the foreign source.
12
3.3. Public procurement
In addition to providing a solid framework to promote demand- and user driven innovation activities, the public sector has the
possibility to boost innovativeness by using innovativeness as one of their criteria in public procurement. For example, only
about one fifth of the municipalities reported having an explicit strategy or agenda related to innovation activities, and only 8%
of the municipalities use innovativeness as one of the central criteria in the selection of service or goods suppliers. Neverthe-
less, nearly three out of four municipalities are convinced that public procurement is a viable way to promote innovation.16
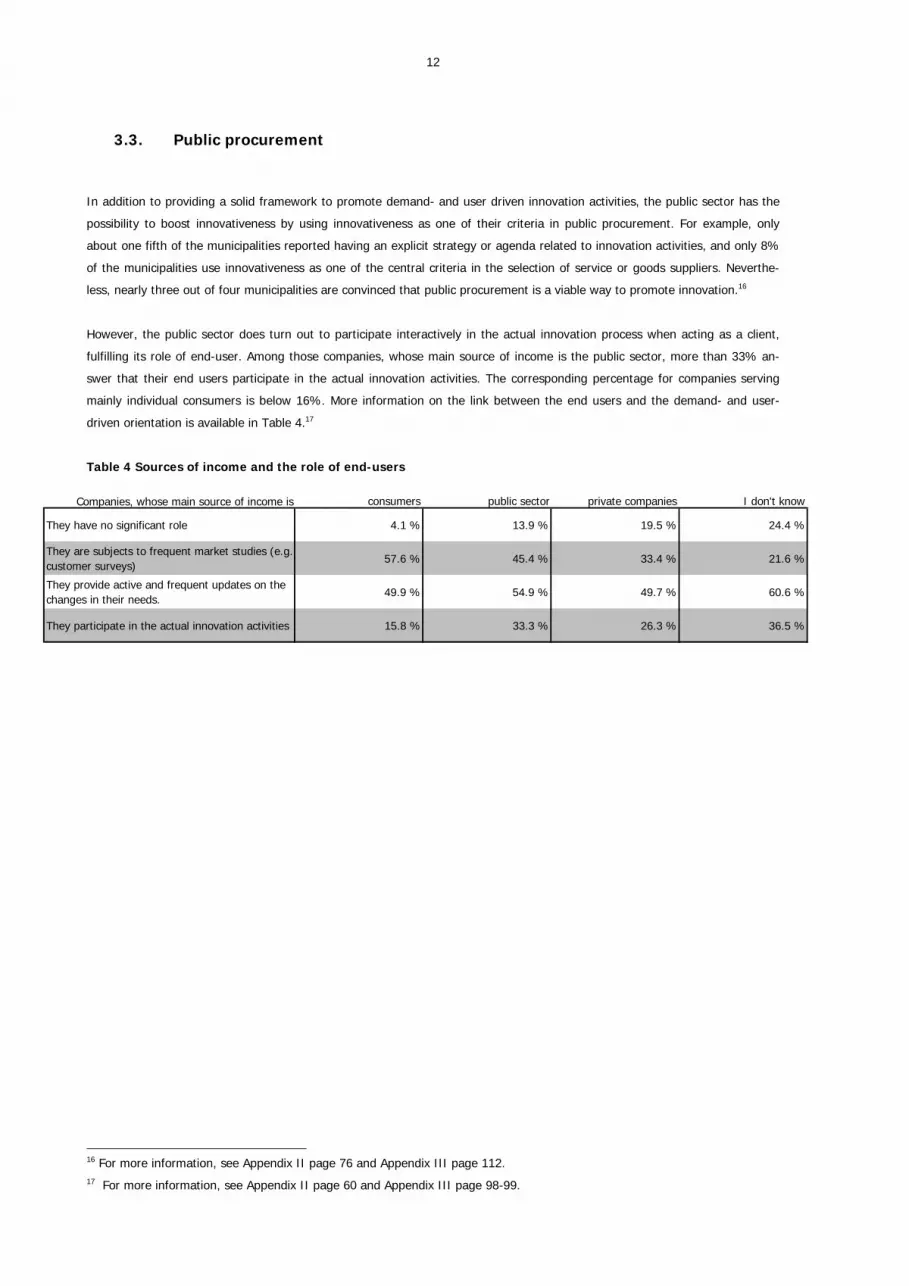
However, the public sector does turn out to participate interactively in the actual innovation process when acting as a client,
fulfilling its role of end-user. Among those companies, whose main source of income is the public sector, more than 33% an-
swer that their end users participate in the actual innovation activities. The corresponding percentage for companies serving
mainly individual consumers is below 16%. More information on the link between the end users and the demand- and user-
driven orientation is available in Table 4.17
Table 4 Sources of income and the role of end-users
Companies, whose main source of income is consumers public sector private companies I don't know
They have no significant role 4.1 % 13.9 % 19.5 % 24.4 %
They are subjects to frequent market studies (e.g. customer surveys)
57.6 % 45.4 % 33.4 % 21.6 %
They provide active and frequent updates on the changes in their needs.
49.9 % 54.9 % 49.7 % 60.6 %
They participate in the actual innovation activities 15.8 % 33.3 % 26.3 % 36.5 %
16 For more information, see Appendix II page 76 and Appendix III page 112. 17 For more information, see Appendix II page 60 and Appendix III page 98-99.

13
4. GLOBALISATION AND BUSINESS – INNOVATION IN A BORDERLESS WORLD
“Connecting and positioning Finland in the global knowledge and value networks requires ability to participate and influence
these networks, international mobility of experts and determined development of the attractiveness of the Finnish innovation
environment.”
– National Innovation Policy (2008)
Examining the fraction of exporting and importing companies among the survey respondents helps to grasp aspects of interna-
tionalization in the sample. Nearly half of the respondent companies engage either in export or import activities or both with
15% of the companies being solely importers, 6% exporters, and 26% importers and exporters. The residual of 53 % only sells
and buys products and/or services on Finnish markets. However, looking at these figures from the innovation perspective does
change results slightly. It is notable that innovative companies are in general more international than non-innovative compa-
nies. Among those firms having had innovation activities during the last three years more than 7% are exporters, whereas the
corresponding fraction among the non-innovative companies is around 4%. A similar trend is observed when looking at the
fraction of companies having foreign subsidiaries. 14% of the innovative companies maintain subsidiaries abroad while only 9%
of non-innovative companies have subsidiaries located outside Finland.
The fact that innovative companies are more internationally oriented than non-innovative companies is also supported by the
results presented in Figure 10. It is noteworthy to mention that the respondent group “other firms” deem international networks
even less important than municipalities. The respondent groups considering international networks even more important than
national networks include universities as well as business angels and venture capitalists.18
Figure 10 How important are national/international networks for your organization? (1=not at all important, 4=very important)
National networks International networks
4.9 %
0.0 %
0.0 %
0.4 %
0.0 %
-0.4Scale average(2.5 points) 0.8 1.6
Firms: Smaller innovative firms
Firms: Larger innovative firms
Firms: Other firms
Municipalities
Financing: Business angels and VCs
1.4 %
0.6 %
4.2 %
0.0 %
0.0 %
-0.4 0.8 1.6Percent answering
”I don’t know”Percent answering
”I don’t know”Scale average(2.5 points)
0.0 %
0.0 %
Education: University department heads
Education: University rectors
0.0 %
0.0 %
18 For more information, see Appendix II page 47 and Appendix III page 92.
14
5. GROWTH ENTREPRENEURSHIP AND FINANCE
“By means of taxation, experienced capital investors and business experts will be motivated to commit themselves to the devel-
opment of enterprises aiming at rapid growth and internationalisation. … Company taxation and insolvency legislation will be
developed so as to encourage small innovative businesses to generate growth and take risks, and to create prospects for serial
entrepreneurship.“
– National Innovation Policy (2008)
Improving the Finnish environment to support growth companies is a major development guideline in the innovation strategy of
the Finnish government. Measuring the success of the Finnish innovation policy by the number of high growth companies is said
to return low marks. One way to stimulate the emergence of new growth companies could be the use of tax incentives. Al-
though many of the new growth companies do not make any profits for several years to come, a tax incentive regarding their
future earnings and profit sharing could set a strong incentive for entrepreneurs and financiers to engage in the project and
could therefore be part of the innovation strategy of the Finnish government. The surveys asked both companies and financiers
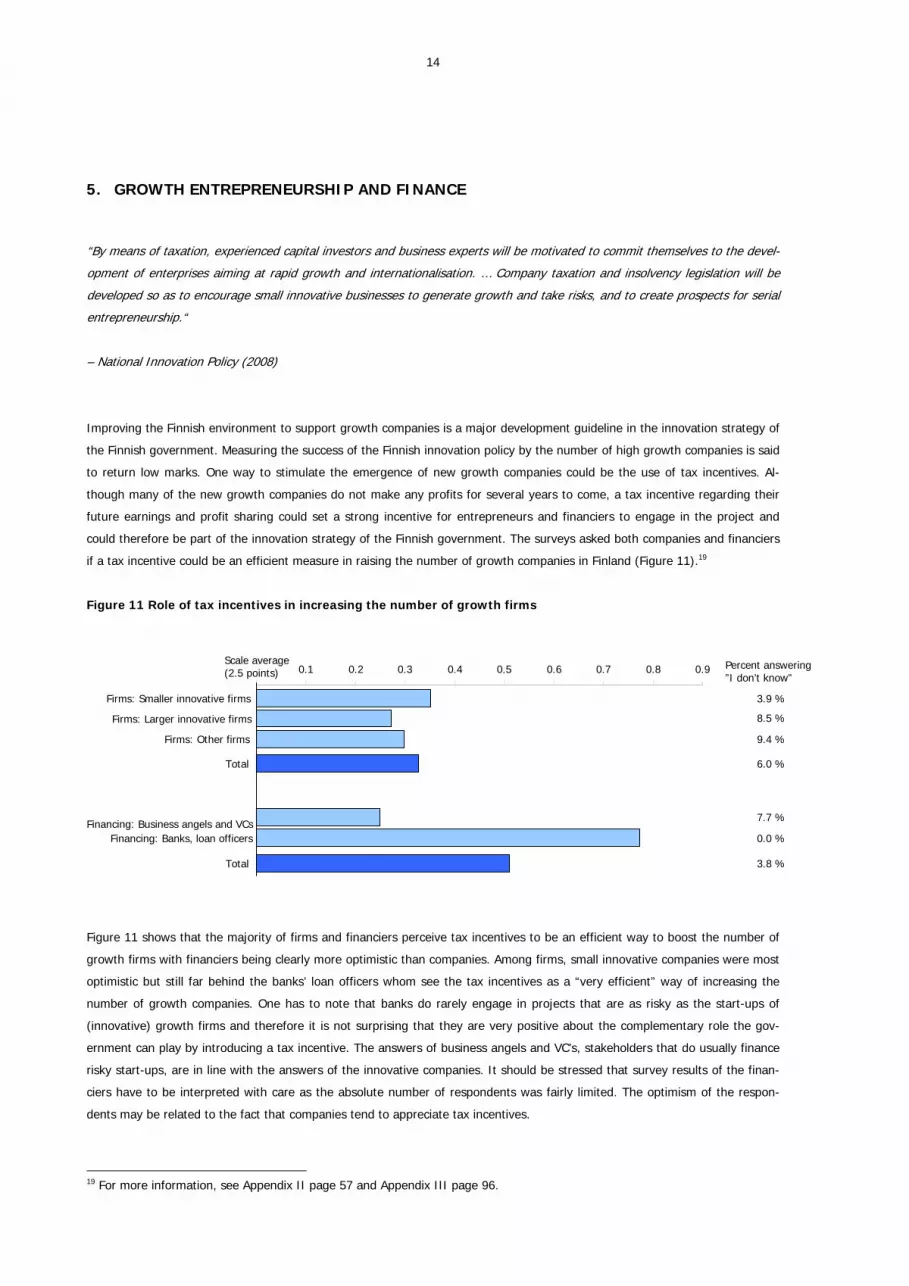
if a tax incentive could be an efficient measure in raising the number of growth companies in Finland (Figure 11).19
Figure 11 Role of tax incentives in increasing the number of growth firms
3.9 %
8.5 %
9.4 %
6.0 %
7.7 %
0.0 %
3.8 %
Scale average(2.5 points) 0.1 0.2 0.3 0.4 0.5 0.6 0.7 0.8 0.9
Firms: Smaller innovative firms
Firms: Larger innovative firms
Firms: Other firms
Total
Financing: Business angels and VCsFinancing: Banks, loan officers
Total
Percent answering”I don’t know”
Figure 11 shows that the majority of firms and financiers perceive tax incentives to be an efficient way to boost the number of
growth firms with financiers being clearly more optimistic than companies. Among firms, small innovative companies were most
optimistic but still far behind the banks’ loan officers whom see the tax incentives as a “very efficient” way of increasing the
number of growth companies. One has to note that banks do rarely engage in projects that are as risky as the start-ups of
(innovative) growth firms and therefore it is not surprising that they are very positive about the complementary role the gov-
ernment can play by introducing a tax incentive. The answers of business angels and VC’s, stakeholders that do usually finance
risky start-ups, are in line with the answers of the innovative companies. It should be stressed that survey results of the finan-
ciers have to be interpreted with care as the absolute number of respondents was fairly limited. The optimism of the respon-
dents may be related to the fact that companies tend to appreciate tax incentives.
19 For more information, see Appendix II page 57 and Appendix III page 96.

15
Figure 12 Ranking of policy measures that were found to be important for the operations (share of small innova-tive companies)
0% 10% 20% 30% 40% 50% 60% 70% 80% 90% 100%
A motivating company and capital taxation scheme
The convenience of public administrative procedures
A generally positive attitude towards risk taking in society
The readiness of universities and polytechnics to cooperate
The availability of risk financing
Guidance and information provided by the public sector
Financial support provided by the public sector
Figure 12 focuses on smaller innovative companies identifying aspects of public policy being perceived as important for their
operations. The innovation system survey revealed that taxation issues do seem to matter the most. Lowering taxes can be an
important measure to release substantial financial means in companies for purposes of developing the business. So, it is not
surprising that a motivating tax scheme regarding both corporate profits and capital gains and promoting entrepreneurship is in
great demand. Indeed, in company surveys most firms ask for lower taxes as this general policy measure applies to the whole
company population contrary to other measures that target a subset of the company population. Overall, business representa-
tives prefer broad tax measures whereas governments tend to prefer targeted subsidies with a limited impact on their budget.
Other aspects of public policy that are marked as important by a high share of companies (as they are still more general) are a
well functioning public administration and a generally positive attitude towards risk taking. In addition companies, especially the
innovative ones, seem to support measures that improve the view towards risk taking in society.20
The role of financing does vary over business cycles and is expected to play a particularly crucial role in times of economic
distress. In the following some survey results dealing with the impact of the ongoing financial crisis are discussed.
5.1. Financing of companies in times of financial instability and economic distress
Based on the survey data, it is possible to measure the impact of the ongoing global financial crisis on the investments of Fin-
nish companies. Results show that the financial instability negatively affected the investments of roughly one third of the com-
pany population. For innovative companies the share is twice as large as that of non-innovative firms (Figure 13). Larger inno-
vative companies seem to be affected even more than their smaller counterparts. Roughly one third of the financiers had a
client base of which at least half of their clients had to cancel investments due to the financial crises. The share is slightly
higher for business angels and VC’s than for banks, not really surprising.21
20 For more information, see Appendix II page 55 and Appendix III page 95-96. 21 For more information, see Appendix II page 60 and Appendix III page 99.
16
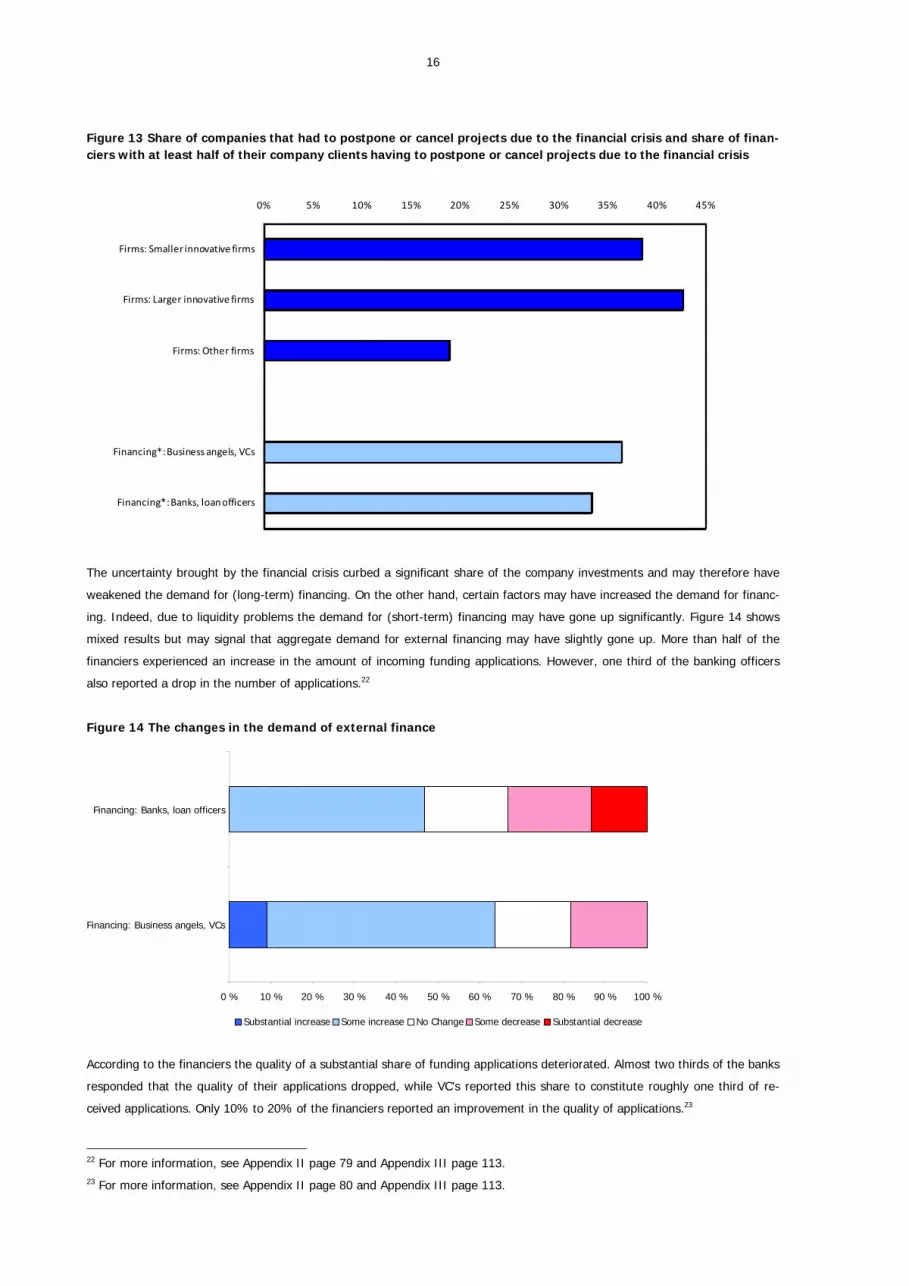
Figure 13 Share of companies that had to postpone or cancel projects due to the financial crisis and share of finan-ciers with at least half of their company clients having to postpone or cancel projects due to the financial crisis
0% 5% 10% 15% 20% 25% 30% 35% 40% 45%
Firms: Smaller innovative firms
Firms: Larger innovative firms
Firms: Other firms
Financing*: Business angels, VCs
Financing*: Banks, loan officers
The uncertainty brought by the financial crisis curbed a significant share of the company investments and may therefore have
weakened the demand for (long-term) financing. On the other hand, certain factors may have increased the demand for financ-
ing. Indeed, due to liquidity problems the demand for (short-term) financing may have gone up significantly. Figure 14 shows
mixed results but may signal that aggregate demand for external financing may have slightly gone up. More than half of the
financiers experienced an increase in the amount of incoming funding applications. However, one third of the banking officers
also reported a drop in the number of applications.22
Figure 14 The changes in the demand of external finance
0 % 10 % 20 % 30 % 40 % 50 % 60 % 70 % 80 % 90 % 100 %
Financing: Business angels, VCs
Financing: Banks, loan officers
Substantial increase Some increase No Change Some decrease Substantial decrease
According to the financiers the quality of a substantial share of funding applications deteriorated. Almost two thirds of the banks
responded that the quality of their applications dropped, while VC’s reported this share to constitute roughly one third of re-
ceived applications. Only 10% to 20% of the financiers reported an improvement in the quality of applications.23
22 For more information, see Appendix II page 79 and Appendix III page 113. 23 For more information, see Appendix II page 80 and Appendix III page 113.

17
Financiers tightened their funding criteria as a response to the higher economic uncertainty and the elevated risk of company
failures. A second factor that may have contributed to the tightening is the financial instability of the banking sector itself. As
the capital base of many banks has shrunk rapidly have financial institutions become even more risk averse. More than 80% of
bank officers report to have tightened their criteria for obtaining corporate credit. For business angels and VC’s that share is 4
times smaller (20%) as the criteria of risk financiers are usually more stringent than those of banks.24
6. REGIONAL INNOVATION POLICY
“The specialisation of regions in their strengths will increase their critical mass of expertise and improve their ability to link with
expertise and value networks vital to their own development. Furthermore, regionally decentralised research, development and
innovation activity will become a national resource when pooled into networked innovation communities. A country of Finland’s
size can only host a few diversified, internationally competitive centres of innovation.”
– National Innovation Policy (2008)
The Finnish NIS is well-established on the grass-root level with several hundreds of local actors working across the country. For
this survey alone, 189 questionnaires were sent out to local intermediaries who, according to the survey data, allocate on aver-
age 50% of their man-power to innovation activities and/or innovation support functions. The intermediaries include for exam-
ple science parks, technology centres, and local development centres. Among the publicly funded TE-centres the corresponding
share of man-power allocated to innovation support is 20%. In addition to the local intermediaries also municipalities were
contacted. About 86 % of the 80 municipalities answering to the survey had dedicated at least some of their proprietary funds
to supporting and/or stimulating local innovation activities. The most common form of support was financing, which was pro-
vided by almost all of the respondents. 70% of the municipalities provided facilities, and more than one half offered information
services related to innovation activities.25
The aim of the national innovation policy is to promote innovation activities on a national level rather than to be an explicit
extension of regional policy. Both policies should be compatible, however. In the survey, the respondents were asked to evalu-
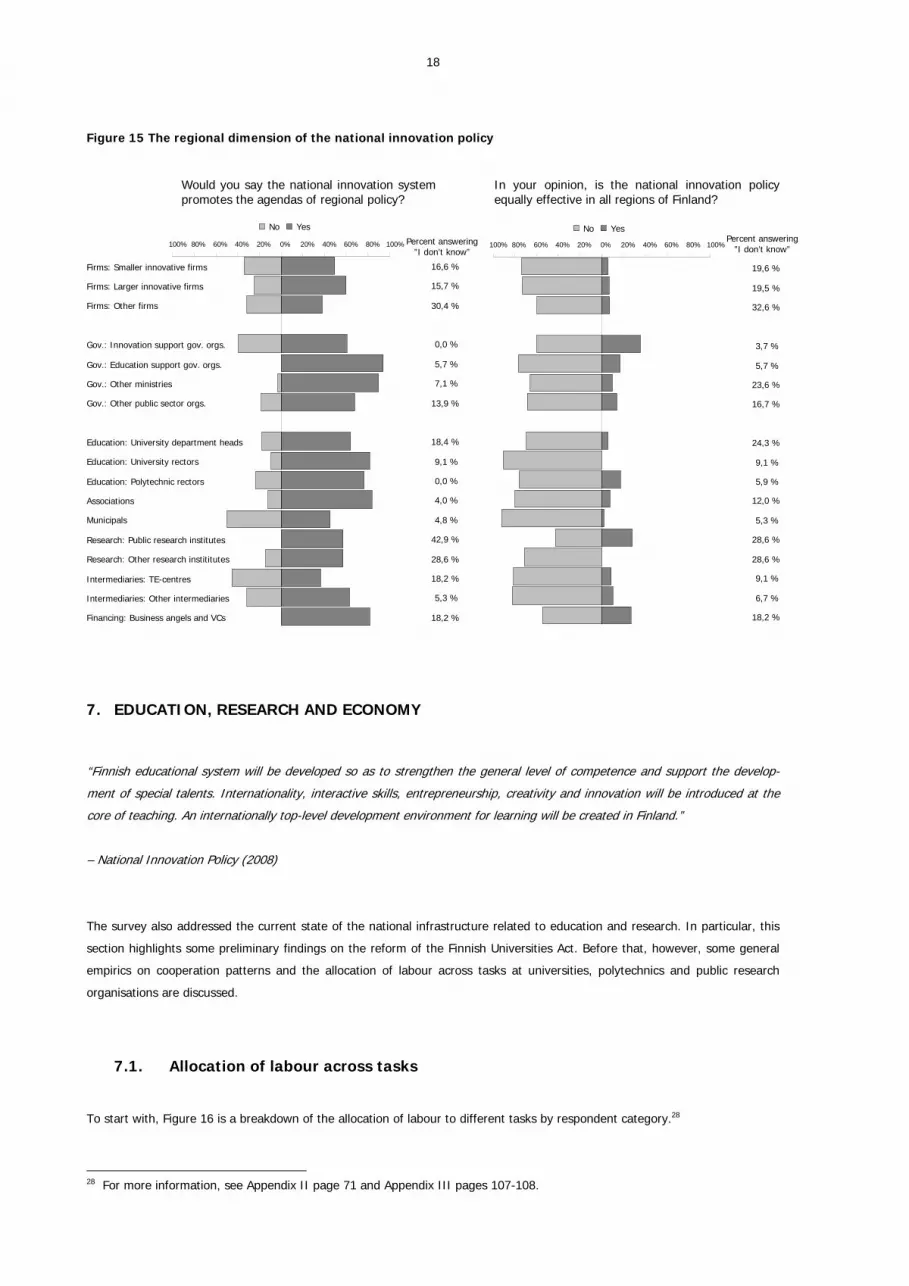
ate, whether the national innovation policy also promotes the agendas of regional policy. According to the results of the survey,
the Finnish NIS does seem to have a strong regional agenda, since the clear majority of respondents believe the national inno-
vation system to promote the agendas of regional policy. More than 90 % of the governmental education support organizations
agree with this view. The respondent groups disagreeing most strongly with the claim are the governmental innovation support
organizations, municipalities, and TE-centres.26
While the national innovation policy is regarded as implementing regional agendas as well, the respondents simultaneously
claim it to be unequally efficient in different regions of Finland. In particular, the local actors, such as municipalities and all
intermediaries, consider that there are regional biases in the policy across the country. The percentages of respondents agree-
ing and disagreeing with the statements of the regional dimensions of the innovation policy are presented in Figure 15.27
24 For more information, see Appendix II page 80 and Appendix III page 113. 25 For more information, see Appendix II page 75 and Appendix III page 112. 26 For more information, see Appendix II page 45 and Appendix III page 91. 27 For more information, see Appendix II page 46 and Appendix III page 91.
18
Figure 15 The regional dimension of the national innovation policy
Would you say the national innovation system promotes the agendas of regional policy?
In your opinion, is the national innovation policy equally effective in all regions of Finland?
Firms: Smaller innovative firms
Firms: Larger innovative firms
Firms: Other firms
Gov.: Innovation support gov. orgs.
Gov.: Education support gov. orgs.
Gov.: Other ministries
Gov.: Other public sector orgs.
Education: University department heads
Education: University rectors
Education: Polytechnic rectors
Associations
Municipals
Research: Public research institutes
Research: Other research instititutes
Intermediaries: TE-centres
Intermediaries: Other intermediaries
Financing: Business angels and VCs
No Yes No Yes
16,6 %
15,7 %
30,4 %
0,0 %
5,7 %
7,1 %
13,9 %
18,4 %
9,1 %
0,0 %
4,0 %
4,8 %
42,9 %
28,6 %
18,2 %
5,3 %
18,2 %
100% 80% 60% 40% 20% 0% 20% 40% 60% 80% 100% Percent answering”I don’t know”
19,6 %
19,5 %
32,6 %
3,7 %
5,7 %
23,6 %
16,7 %
24,3 %
9,1 %
5,9 %
12,0 %
5,3 %
28,6 %
28,6 %
9,1 %
6,7 %
18,2 %
Percent answering”I don’t know”100% 80% 60% 40% 20% 0% 20% 40% 60% 80% 100%
7. EDUCATION, RESEARCH AND ECONOMY
“Finnish educational system will be developed so as to strengthen the general level of competence and support the develop-
ment of special talents. Internationality, interactive skills, entrepreneurship, creativity and innovation will be introduced at the
core of teaching. An internationally top-level development environment for learning will be created in Finland.”
– National Innovation Policy (2008)
The survey also addressed the current state of the national infrastructure related to education and research. In particular, this
section highlights some preliminary findings on the reform of the Finnish Universities Act. Before that, however, some general
empirics on cooperation patterns and the allocation of labour across tasks at universities, polytechnics and public research
organisations are discussed.
7.1. Allocation of labour across tasks
To start with, Figure 16 is a breakdown of the allocation of labour to different tasks by respondent category.28
28 For more information, see Appendix II page 71 and Appendix III pages 107-108.
19
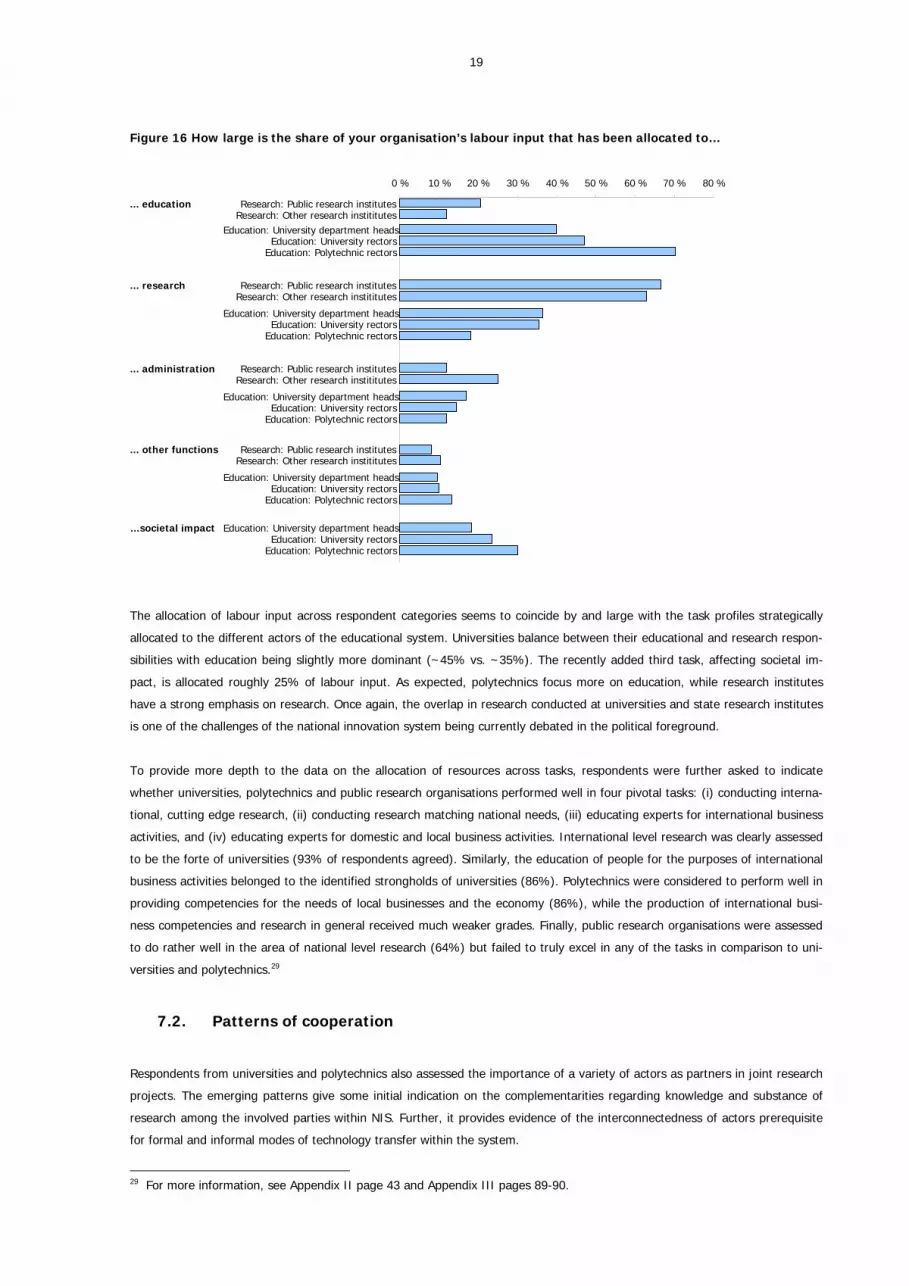
Figure 16 How large is the share of your organisation’s labour input that has been allocated to…
0 % 10 % 20 % 30 % 40 % 50 % 60 % 70 % 80 %
Research: Public research institutesResearch: Other research instititutes
Education: University department headsEducation: University rectors
Education: Polytechnic rectors
Research: Public research institutesResearch: Other research instititutes
Education: University department headsEducation: University rectors
Education: Polytechnic rectors
Research: Public research institutesResearch: Other research instititutes
Education: University department headsEducation: University rectors
Education: Polytechnic rectors
Research: Public research institutesResearch: Other research instititutes
Education: University department headsEducation: University rectors
Education: Polytechnic rectors
Education: University department headsEducation: University rectors
Education: Polytechnic rectors
... education
... research
... administration
... other functions
…societal impact
The allocation of labour input across respondent categories seems to coincide by and large with the task profiles strategically
allocated to the different actors of the educational system. Universities balance between their educational and research respon-
sibilities with education being slightly more dominant (~45% vs. ~35%). The recently added third task, affecting societal im-
pact, is allocated roughly 25% of labour input. As expected, polytechnics focus more on education, while research institutes
have a strong emphasis on research. Once again, the overlap in research conducted at universities and state research institutes
is one of the challenges of the national innovation system being currently debated in the political foreground.
To provide more depth to the data on the allocation of resources across tasks, respondents were further asked to indicate
whether universities, polytechnics and public research organisations performed well in four pivotal tasks: (i) conducting interna-
tional, cutting edge research, (ii) conducting research matching national needs, (iii) educating experts for international business
activities, and (iv) educating experts for domestic and local business activities. International level research was clearly assessed
to be the forte of universities (93% of respondents agreed). Similarly, the education of people for the purposes of international
business activities belonged to the identified strongholds of universities (86%). Polytechnics were considered to perform well in
providing competencies for the needs of local businesses and the economy (86%), while the production of international busi-
ness competencies and research in general received much weaker grades. Finally, public research organisations were assessed
to do rather well in the area of national level research (64%) but failed to truly excel in any of the tasks in comparison to uni-
versities and polytechnics.29
7.2. Patterns of cooperation
Respondents from universities and polytechnics also assessed the importance of a variety of actors as partners in joint research
projects. The emerging patterns give some initial indication on the complementarities regarding knowledge and substance of
research among the involved parties within NIS. Further, it provides evidence of the interconnectedness of actors prerequisite
for formal and informal modes of technology transfer within the system.
29 For more information, see Appendix II page 43 and Appendix III pages 89-90.

20
Figure 17 How significant was the role of the following actors in cooperative projects of your department in the last three years? (1=None, 4=Very large)
0.0 %
0.0 %0.0 %
0.0 %
0.0 %0.0 %
University rectorsPolytechnic rectors
University department headsUniversity rectors
Polytechnic rectors
University department heads
University rectorsPolytechnic rectors
University department headsUniversity rectors
Polytechnic rectors
University department heads
University rectorsPolytechnic rectors
University department heads
University rectorsPolytechnic rectors
University department headsUniversity rectors
Polytechnic rectors
University department heads
University rectorsPolytechnic rectors
Domestic universities
Foreign universities
Polytechnics
Public researchorganizations
Private researchorganizations
Open internetcommunities
Domestic companies
Foreign companies
University department heads
0.0 %
0.0 %0.0 %
0.0 %
0.0 %0.0 %
0.5 %
0.0 %0.0 %
0.5 %
0.0 %0.0 %
2.0 %
0.0 %0.0 %
2.0 %
0.0 %0.0 %
5.9 %
0.0 %5.9 %
5.9 %
0.0 %5.9 %
0.0 %
0.0 %0.0 %
0.0 %
0.0 %0.0 %
1.5 %
0.0 %0.0 %
1.5 %
0.0 %0.0 %
0.0 %
0.0 %0.0 %
0.0 %
0.0 %0.0 %
-1 -0.5Scale average
(2.5 points) 0.5 1 1.5Percent answering”I don’t know”
Figure 17 reveals that collaboration beyond the boundaries of the respondents’ own institutional contexts seems rather scarce.
Universities tend to collaborate almost exclusively with other universities, domestic and foreign, while polytechnics are some-
what more active in cooperating also with companies.30
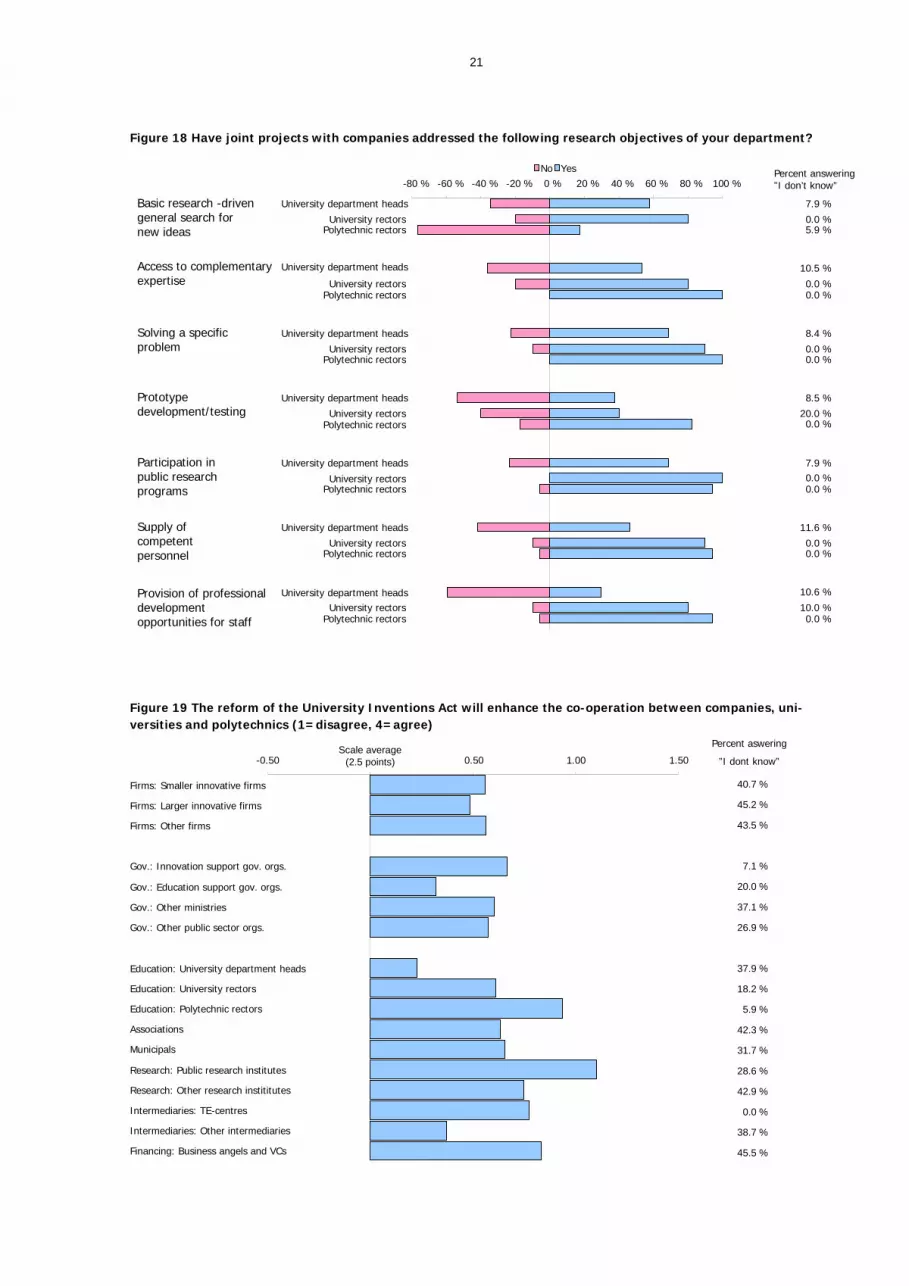
Since cooperation between companies and academic institutions has received much attention in Finnish innovation policy, Fig-
ure 18 sheds more light on the motivations of universities and polytechnics to engage in cooperation with corporate entities.
Respondents provided yes/no –answers indicating the objectives of joint research projects with companies. The sheer opportu-
nity to participate in publicly funded research programs, i.e. the opportunity to access external funding, is clearly the primary
motivation to enter joint projects for universities. With the dawn of the reform of the Universities Act this motivation will proba-
bly gain further importance as universities will become financially independent of the state and will have more incentives to
compete for external funding. Access to complementary expertise and competent personnel was also deemed important. The
nature of joint projects seemed to be slightly more oriented towards solving given problems than towards a more academic
exploration for new ideas.31
How does the reform of the University Inventions Act affect the opportunities to collaborate then? The Act came into being after a
lengthy preparation process initiated by the Ministry of Employment and the Economy. Its objective was to create a harmonized IPR-
environment that would streamline IPR-related policies in modern day research projects with participants from very different types of
institutions. One major change was to award universities with ownership rights to IP emerging from government funded research.
30 For more information, see Appendix II page 72 and Appendix III page 109. 31 For more information, see Appendix II page 73 and Appendix III pages 109-110.
21
Figure 18 Have joint projects with companies addressed the following research objectives of your department?
7.9 %
0.0 %5.9 %
10.5 %
0.0 %0.0 %
8.4 %
0.0 %0.0 %
8.5 %
20.0 %0.0 %
7.9 %0.0 %0.0 %
11.6 %
0.0 %0.0 %
10.6 %
10.0 %0.0 %
University department heads
University rectorsPolytechnic rectors
University department heads
University rectorsPolytechnic rectors
University department heads
University rectorsPolytechnic rectors
University department heads
University rectorsPolytechnic rectors
University department heads
University rectorsPolytechnic rectors
University department heads
University rectorsPolytechnic rectors
University department headsUniversity rectors
Polytechnic rectors
-80 % -60 % -40 % -20 % 0 % 20 % 40 % 60 % 80 % 100 %YesNo
Prototype development/testing
Solving a specific problem
Supply of competent personnel
Participation in public research programs
Provision of professional development opportunities for staff
Basic research -driven general search for new ideas
Access to complementaryexpertise
Percent answering”I don’t know”
Figure 19 The reform of the University Inventions Act will enhance the co-operation between companies, uni-versities and polytechnics (1=disagree, 4=agree)
-0.50 0.50 1.00 1.50
Firms: Smaller innovative firms
Firms: Larger innovative firms
Firms: Other firms
Gov.: Innovation support gov. orgs.
Gov.: Education support gov. orgs.
Gov.: Other ministries
Gov.: Other public sector orgs.
Education: University department heads
Education: University rectors
Education: Polytechnic rectors
Associations
Municipals
Research: Public research institutes
Research: Other research instititutes
Intermediaries: TE-centres
Intermediaries: Other intermediaries
Financing: Business angels and VCs
38.7 %
0.0 %
42.9 %
28.6 %
31.7 %
42.3 %
5.9 %
18.2 %
37.9 %
26.9 %
37.1 %
20.0 %
7.1 %
43.5 %
45.2 %
40.7 %
45.5 %
Percent aswering
”I dont know”Scale average
(2.5 points)

22
Figure 19 provides a breakdown of respondents’ expectations on whether the reform will have a positive effect on cooperation.
On average, none of the respondent groups provided a negative estimate. The most optimistic respondents included polytech-
nics and public research organisations. Among the less optimistic ones were education support organisations, university de-
partment heads and companies. It has to be noted that, on average, even these actors seemed to agree with positive expecta-
tions at least to some extent. The less optimistic stance of education support organizations is somewhat surprising as they took
on an active role in preparing the Act.32 For more details on the Act and its expected effects on university research see Tahva-
nainen (2009a and 2009b).
7.3. Reform of the Universities Act
The Finnish education system is currently undergoing major changes of which the most significant one is the ongoing renewal
of the Universities Act governing the Finnish higher education system in its entirety. It was originally initiated to provide univer-
sities with more financial and operational flexibility and autonomy and, thus, with better premises to fulfil their three mandates
(i) to educate, (ii) to conduct academic research, and (iii) to impact societal welfare. The transfer of university technology to
societal use is considered one focal means to contribute to the latter mission.
The most central of changes is the conversion of universities from being governmental institutions into independent juristic
persons of public law. Despite their independence, however, universities will continue to uphold the governmental responsibility
to fulfil their public mission as mandated in the educational and research policies. The administration of universities will be
reformed in a way that enables them to operate better and more independently in their new economic position. The election of
university board members will still be handled internally but the share of external members will increase to at least 50 percent,
including the chairman. The task of external board members is to set down strategic university policies, to allocate resources,
and to develop universities as organizations. Internal decision making power of the university community will be increased in
issues of education and research with the objective to promote autonomy and self-direction.
Another major reform will be the conversion of the university employees’ status from civil servant to contract based employee.
At the same time the rights to negotiate the terms of employment contracts is transferred to the universities. These reforms are
expected to provide universities with more flexible tools for designing better incentive systems and for practicing better human
resource policy.
In contrast, the degrees granted by universities and the educational responsibilities related to them will still be governed by
decree of the Council of State. In parallel, the allocation of educational responsibilities among different universities will be gov-
erned by decree of the Ministry of Education. This is to ensure that the system provides an appropriate amount of higher edu-
cation and that it does not exhibit too much internal overlap.
After the reform, universities as independent juristic persons will be excluded from the governmental budget system. This does
not imply, however, that they will not continue to receive governmental funding anymore as universities will annually be as-
signed funding by way of governmental budgeting for carrying out the tasks allotted to them in the Universities Act. What truly
extends the set of funding tools universities could tap into are the more flexible possibilities to retain profits from universities’
own business activities, donations, capital income, contract education, and tuition from students originating from outside the
European Economic Area.
The autonomy will motivate universities to set strategic targets by focusing resources on their respective strategic areas of
research, for example. This, in turn, will help universities to profile and position them within the national innovation system.
32 For more information, see Appendix II page 52 and Appendix III page 94.

23
This will also have direct positive effects on the development of regions around universities through industry cooperation and
the emergence of new companies. Especially the supply of contract research and consulting services should be easier under the
reformed regime. Furthermore, the reform should enable universities to enhance their interactive capabilities with their sur-
rounding environments and to adapt more swiftly to changes. This flexibility is expected to have a positive effect on innovation
and the labour demand driven supply of education in general.
The following four figures show how survey respondents anticipate the reform to affect the innovation system with regard to
some of its most central agendas discussed above. The figures present the average responses of each respondent category as a
deviation from the scale average (2.5).
Figure 20 Will the reform of the Universities Act promote INTERNATIONALIZATION?
Percent aswering
”I dont know”
25.2 %
24.2 %
18.4 %
0.0 %
14.3 %
27.9 %
11.6 %
13.8 %
0.0 %
0.0 %
3.9 %
9.3 %
28.6 %
14.3 %
0.0 %
19.2 %
9.1 %
-0.50 0.50 1.00 1.50
Firms: Smaller innovative firms
Firms: Larger innovative firms
Firms: Other firms
Gov.: Innovation support gov. orgs.
Gov.: Education support gov. orgs.
Gov.: Other ministries
Gov.: Other public sector orgs.
Education: University department heads
Education: University rectors
Education: Polytechnic rectors
Associations
Municipals
Research: Public research institutes
Research: Other research instititutes
Intermediaries: TE-centres
Intermediaries: Other intermediaries
Financing: Business angels and VCs
Scale average(2.5 points)
Overall, respondents assessed the reform’s impact on the internationalization of the innovation system as rather positive. Inter-
nationalization has often been argued to be central to strengthening and improving innovation capabilities and the quality of
research. Most enthusiastic proponents included ministries, university management, associations, intermediaries and risk finan-
ciers. Companies, university department heads, and private research institutes were only slightly less optimistic about the im-
pact. The differences in attitude might reflect the fact that the latter respondents will be more directly affected by the changes
required by the reform and, thus, weigh possible opportunities and threats more carefully.33
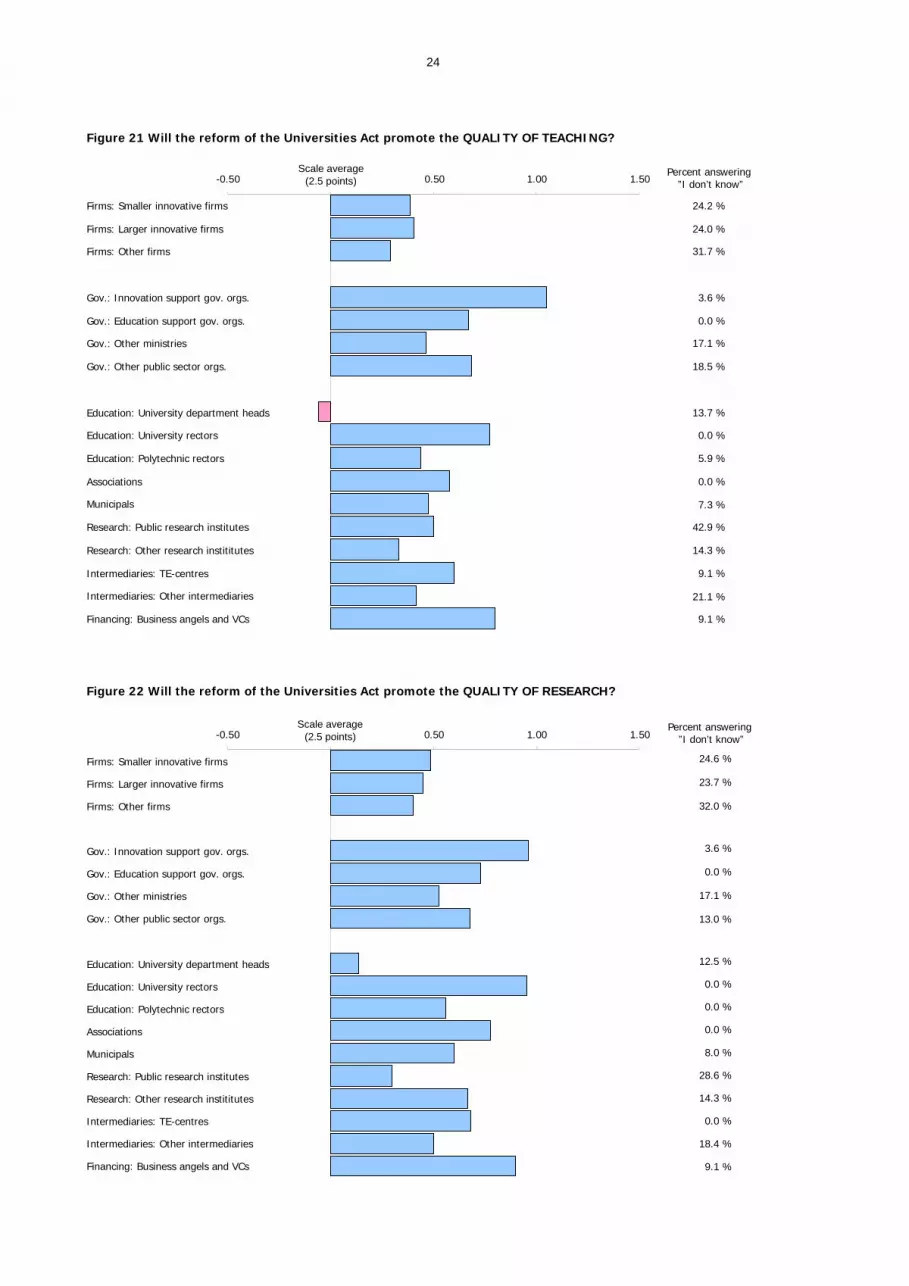
The reform’s expected impact on the quality of teaching received fairly similar appraisals. To be more precise, respondents were
only slightly less optimistic regarding the impact on teaching than that on internationalization. The expectations of university
department heads, in particular, were rather pessimistic.34
33 For more information, see Appendix II pages 48-49 and Appendix III pages 92-93. 34 For more information, see Appendix II pages 48-49 and Appendix III pages 92-93.
24
Figure 21 Will the reform of the Universities Act promote the QUALITY OF TEACHING?
24.2 %
24.0 %
31.7 %
3.6 %
0.0 %
17.1 %
18.5 %
13.7 %
0.0 %
5.9 %
0.0 %
7.3 %
42.9 %
14.3 %
9.1 %
21.1 %
9.1 %
-0.50 0.50 1.00 1.50
Firms: Smaller innovative firms
Firms: Larger innovative firms
Firms: Other firms
Gov.: Innovation support gov. orgs.
Gov.: Education support gov. orgs.
Gov.: Other ministries
Gov.: Other public sector orgs.
Education: University department heads
Education: University rectors
Education: Polytechnic rectors
Associations
Municipals
Research: Public research institutes
Research: Other research instititutes
Intermediaries: TE-centres
Intermediaries: Other intermediaries
Financing: Business angels and VCs
Percent answering”I don’t know”
Scale average(2.5 points)
Figure 22 Will the reform of the Universities Act promote the QUALITY OF RESEARCH?
-0.50 0.50 1.00 1.50
Firms: Smaller innovative firms
Firms: Larger innovative firms
Firms: Other firms
Gov.: Innovation support gov. orgs.
Gov.: Education support gov. orgs.
Gov.: Other ministries
Gov.: Other public sector orgs.
Education: University department heads
Education: University rectors
Education: Polytechnic rectors
Associations
Municipals
Research: Public research institutes
Research: Other research instititutes
Intermediaries: TE-centres
Intermediaries: Other intermediaries
Financing: Business angels and VCs
18.4 %
0.0 %
14.3 %
28.6 %
8.0 %
0.0 %
0.0 %
0.0 %
12.5 %
13.0 %
17.1 %
0.0 %
3.6 %
32.0 %
23.7 %
24.6 %
9.1 %
Percent answering”I don’t know”
Scale average(2.5 points)

25
With regard to the reform’s impact on the quality of research respondents drew a slightly more optimistic picture. The grading
patterns across respondent groups were similar to those of the previous two questions: companies and university department
heads were more pessimistic, while ministries, university rectors, associations and financiers numbered among a more optimis-
tic group.
Figure 23 Will the reform of the Universities Act promote the SOCIETAL IMPACT?
-0.50 0.00 0.50 1.00 1.50
Firms: Smaller innovative firms
Firms: Larger innovative firms
Firms: Other firms
Gov.: Innovation support gov. orgs.
Gov.: Education support gov. orgs.
Gov.: Other ministries
Gov.: Other public sector orgs.
Education: University department heads
Education: University rectors
Education: Polytechnic rectors
Associations
Municipalities
Research: Public research institutes
Research: Other research instititutes
Intermediaries: TE-centres
Intermediaries: Other intermediaries
Financing: Business angels and VCs
Percent aswering
”I dont know”
15.1 %
9.1 %
28.6 %
16.7 %
14.3 %
0.0 %
0.0 %
12.4 %
9.8 %
14.3 %
0.0 %
9.8 %
30.8 %
26.2 %
23.8 %
3.9 %
9.1 %
As Figure 23 reveals, the University Act’s implications regarding the various actors’ possibilities to affect societal impact spawn
rather positive expectations. In particular, innovation and education support organisations are convinced of the reform in this
regard. Also university rectors and financiers share the same view. As one of the main agendas of the reform is to strongly
promote financial, managerial and academic flexibility at universities, one might expect this to positively affect opportunities
regarding the commercialization of research findings, research spin-off investment activities, cooperative research, industry-
university joint ventures, and recruitment of professional management etc., factors all directly linked to societal impact.35
8. FINAL REMARKS
This report provided some key insights of the extensive survey conducted for the support of the evaluation of the Finnish innova-
tion system. The report highlighted the broad-based view of the innovation system revealing the complexity of the system and the
existence of overlaps between public actors. In addition, the demand- and user-driven aspects of the NIS were addressed identify-
ing the sources of innovation and providing evidence of the system’s generally technology-driven nature. Companies seemed to
represent the exception drawing on the demand side of the market place as a source of innovation. In this regard, international
and domestic networks were viewed as important by the more innovative companies, a result that cannot be deemed very surpris-
35 For more information, see Appendix II page 50 and Appendix III page 93.

26
ing. Furthermore, regarding public policies related to the promotion of entrepreneurship it was found that private financiers, in
particular, would consider tax incentives to enhance growth orientated entrepreneurship. To extend on the topic of innovation
policy, most of the respondents claimed the national innovation policy to promote regional policy agendas. The respondents further
argued that these agendas are unequally effective in the different regions of Finland. The higher education sector in general re-
ported that the currently undergoing reforms have a positive impact on the sector but, interestingly, university department heads
as a specific respondent group systematically greeted these changes less enthusiastically.
The respondents were also asked about the impact of the Finnish national innovation strategy, published in the fall of 2008, to
their own organisation. Respondents from different sections of the public sector were asked to indicate the degree to which
they have been active in implementing the strategy in their own activities. It was found that most of the public actors have
taken action to incorporate the implications of the national innovation strategy into their agendas (Figure 24).36
Figure 24 The new national innovation strategy was published in July 2008 and the related government commu-nication was handed to the parliament in October 2008. How has your organization reacted to these docu-ments?
0 % 10 % 20 % 30 % 40 % 50 % 60 % 70 % 80 % 90 % 100 %
Gov.: Innovation support gov. orgs.
Gov.: Education support gov. orgs.
Gov.: Other ministries
Gov.: Other public sector orgs.
Total
Intermediaries: TE-centres
Intermediaries: Other intermediaries
Total
The organization has not familiarized itself with the strategy/communication.
Single individuals have familiarized themselves based on their own interest.
Official meetings have been held regarding the topic.
An official planning process has been initiated regarding the topic.
SOME practical measures have been carried out based on them.
SEVERAL practical measures have been carried out based on them.
The measures invoked by the document(s), have already been carried out in full.
With the exception of the group designated “other ministries” public actors have taken action to implement the agenda of the
national innovation strategy. While a good half of intermediaries are still in the process of familiarizing themselves with the strategy
documents, ministries belonging to the category “other ministries” are clearly the least prepared. The respondents were also asked
whether the strategy required changes in the activities of the public organisations in question, and the respondents from innovation
and education support organisations identified a need for change in the light of the innovation strategy. Other ministries and public
actors are more inclined to state that the strategy has less of an impact on their activities.37 In addition, we were interested in how
the strategy has helped in steering the activities of the respective organisation. With the exception of innovation support organisa-
tions, the strategy receives relatively low grades on how much it has helped in this respect.38
The insights presented in this report should be viewed as complementary to the main reports of the evaluation providing more
concrete and analytic conclusions and recommendations.
36 For more information, see Appendix II page 67 and Appendix III page 104. 37 For more information, see Appendix II page 68 and Appendix III page 104. 38 For more information, see Appendix II page 68 and Appendix III page 105.

Appendix I - Survey practicalities
27
APPENDIX I - Survey practicalities
This survey was executed in the early spring of 2009 as a part of the evaluation of the Finnish national innovation system (NIS).
The survey aims at mapping the opinions about the current innovation system, discussing the ongoing reforms, and collecting
information about the actors of the Finnish NIS. In total ten different internet-surveys were sent out39 per e-mail to over 10 000
actors of the Finnish innovation system. The participation rate was more than satisfying, since the average response rate of the
ten surveys was nearly 40 %. The INNOEVAL survey can be considered as one of the biggest national innovation surveys, since
not only the companies utilizing the system, but also the organizations of the innovation system, education sector, intermediar-
ies, financers, and foundations were contacted simultaneously.
Altogether eleven different surveys (full questionnaires available in the Appendixes IV and V) were sent out to the actors of the
innovation system. Some of these respondent groups are further divided into subgroups for this report. The division, including
the number of respondents, is illustrated in Table A1. On the left the original ten groups which received their personal survey,
the more detailed division used in this report on the right.
Companies are divided into subgroups according to their innovation activities (innovative and non-innovative companies) and
the innovative companies are further separated according to their size (less or more than 50 employees). The companies are
considered innovative, if they had innovation activities during the last three years.
Public sector actors are divided into four subgroups. Group “education supporting organizations” includes the Academy of
Finland (AKA) and Ministry of Education (OPM), group “innovation supporting organizations” includes the Finnish Funding for
Technology and Innovation (Tekes) and the Ministry of Employment and the Economy (TEM). The group “other ministries”
includes all other ministries. The remaining governmental organizations, such as Industry Investment, Research and Innovation
Council (RIC), and Sitra, are in group “other public sector organizations”.
The regional innovation actors, intermediaries, are also divided into two groups, TE-centres (regional public Employment and
Economic Development Centres) and other intermediaries.
The group “financing” consists of banks’ loan officers in one subgroup and business angels (BAs) and venture capitalists (VCs)
in other subgroup.
Table A1: Number of respondents and response rate of the survey
Answers Sent Resp. rate
Associations 26 68 38.2%Companies 1026 8747 11.7%Foundations 58 151 38.4%Intermediaries 88 189 46.6%Municipalities 80 315 25.4%Private financiers 26 196 32.3%Public actors 82 158 51.9%Research organisations 14 29 48.3%University department heads 219 541 40.5%University rectors 28 45 62.2%Total 1647 10439 39.5%
(Total) (Total) (Average)
39 Business angels were contacted personally.

Appendix I - Survey practicalities
28
Figure A1: The respondent groups and number of respondents
Foundations (n=58)
Companies (n=1026)
Public sector actors (n=82)
University department heads (n=219)
University and polytechnic rectors (n=28)
Associations (n=26)
Municipalities (n=80)
Research institutes (n=14)
Intermediaries (n=88)
Other intermediaries (n=77)
Small innovative firms (n=485)
Large innovative firms (n=215)
Other firms (n=326)
Polytechnic rectors (n=17)
Public research institutes (n=7)
Other research institutes (n=7)
TE-centres (n=11)
University rectors (n=11)
Innovation supporting org. (n=22)
Education supporting org. (n=14)
Other ministries (n=19)
Other public sector org. (n=27)
Financing (n=26)
Business angels and VCs (n=11)
Banks (loan officers) (n=15)
All of the surveys (excluding foundations and banks) had first 13 questions in common. Therefore, the first 13 questions are
reported simultaneously in the Appendixes II and III. After the questions identical to most of the respondent groups, the rest of
each survey is described separately. If the same question is posed to more than one of the nine original respondent groups, are
the results presented only once. Table A2 presents the overlapping questions, where the bolded figures show, where the results
are presented.

Appendix I - Survey practicalities
29
Table A2: The overlap and presentation of questions in Appendixes II and III.
Companies Public actors Intermediaries Research org. Univ. Depart. Rectors Associations Municipalities Foundations BAs and VCs Banks1 1 1 1 1 1 1 1 1 1 12 2 2 2 2 2 2 2 2 23 3 3 3 3 3 3 3 3 34 4 4 4 4 4 4 4 4 45 5 5 5 5 5 5 5 56 6 6 6 6 6 6 6 67 7 7 7 7 7 7 7 78 8 8 8 8 8 8 8 8 29 9 9 9 9 9 9 9 9
10 10 10 10 10 10 10 10 1011 11 11 11 11 11 11 11 1112 12 12 12 12 12 12 12 1213 13 13 13 13 13 13 13 13
14 14 15 15 16 5 16 16 17 17 18 18 19 19 20 20 21 21 22 22 23 23 24 24 25 25
17 26 26 14 3 27 14 30 28 17 33 29 14 34 30 15 35 31 16 36 32 17 16 14 14 15 15 16 16 17 17
18 15 4 18 6
19 720 821 9
22 10

Appendix II - Graphical presentation of the survey results
30
APPENDIX II - Graphical presentation of the survey results
1. Questions posed to ALL RESPONDENTS
1.1. The average grade for the innovation system slightly above satisfactory
In questions 1 to 3 the respondent were asked to rate the innovation system at the moment, five years ago, and in five years, on a grading scale from 4 to 10. The answers of some selected groups of respondents are illustrated above. The average opin-ion states that the system is somewhat above satisfactory (7½). However, there are noteworthy differences between respon-dent groups. Especially large differences are to be found between firm- and public actor respondents. While firms give only an average grade of less than satisfactory (7), do innovation and education supporting governmental organizations see the system performing around “good” (8). The graph illustrates the deviations from the scale average, which is grade 7. Q1: How would you grade the Finnish national innovation system (NIS) AT THE MOMENT? (Scale 4 - 10)
Scale average
(grade 7)-0.5 0.5 1.0 1.5
Firms: Smaller innovative firms
Firms: Larger innovative firms
Firms: Other firms
Gov.: Innovation support gov. orgs.
Gov.: Education support gov. orgs.
Gov.: Other ministries
Gov.: Other public sector orgs.
Education: University department heads
Education: University rectors
Education: Polytechnic rectors
Associations
Municipalities
Research: Public research institutes
Research: Other research instititutes
Intermediaries: TE-centres
Intermediaries: Other intermediaries
Foundations
Financing: Business angels and VCs
Financing: Banks, loan officers
In the following questions the respondents were asked to analyze the system five years ago and in five years. In graph Q1-3 the average opinion and some selected groups illustrate the trends of the grading.

Appendix II - Graphical presentation of the survey results
31
Q1-3: If you evaluated the system as it was/is/will be 5 YEARS AGO/TODAY/in 5 YEARS, how would you grade it? (Scale 4 -10)
Smaller innovative firms
Gov.: Innovation support gov. orgs.
Gov.: Education support gov. orgs.
Education: University department heads
Education: University rectors
6.3
6.8
7.3
7.8
8.3
8.8
5 years ago Today In 5 years
7.8
7.3
7.0
7.0
6.7
6.5
8.0
7.8
7.4
7.3
7.1
7.0
8.6
8.2
7.8
7.8
7.4
7.4
Average
On average it is seen that the development has been and will continue to be positive, as the average grade approaches “good” (8). The university rectors are the most optimistic respondent group when it comes to the development of the system - interest-ingly the department heads are far more careful in their grading. All of the grades are presented in table Table Q1-3 Table Q1-3: If you evaluated the system as it was/is/will be 5 YEARS AGO/TODAY/in 5 YEARS, how would you grade it? (Scale 4 -10)
5 years ago today in 5 years
Firms: Smaller innovative firms 6.7 7.0 7.4Firms: Larger innovative firms 6.9 7.2 7.5Firms: Other firms 6.6 7.0 7.5
Gov.: Innovation support gov. orgs. 7.8 7.8 8.2Gov.: Education support gov. orgs. 7.3 8.0 8.6Gov.: Other ministries 6.5 7.1 7.8Gov.: Other public sector orgs. 7.2 7.4 8.1
Education: University department heads 7.0 7.3 7.4Education: University rectors 6.5 7.1 7.8Education: Polytechnic rectors 6.8 7.6 8.1Associations 7.0 7.6 8.2Municipals 7.1 7.5 7.9Research: Public research institutes 8.4 8.3 8.0Research: Other research instititutes 7.5 7.6 7.7Intermediaries: TE-centres 7.4 7.4 7.8Intermediaries: Other intermediaries 6.9 7.3 7.9Foundations 7.0 7.5 7.7Financing: Business angels, VCs 6.7 7.5 7.8Financing: Banks, loan officers - 7.2 -
Average 7.1 7.4 7.9

Appendix II - Graphical presentation of the survey results
32
1.2. The national innovation system as a whole is considered rather complex
In question 4 the respondents evaluated the NIS as a whole. They graded the system on a scale from 1 to 4, where 1 stands for very complicated and 4 for very simple. The average grade for the system is below the scale average which indicates that according to the average opinion, the NIS is rather complicated. The university rectors have a dismal view of the complexity of the system compared to their colleagues at the polytechnics and university department heads. The education supporting gov-ernment organizations stand out as the only group that considers the system rather simple. The graph illustrates the deviations from the neutral grading scale average 2.5. Q4: How would you describe the regime constituted by the PUBLIC SECTOR actors in the NIS? (1=very complex, 4=very simple)
14.3 %
12.9 %
38.2 %
0.0 %
0.0 %
0.0 %
0.0 %
14.3 %
9.1 %
5.9 %
8.0 %
1.3 %
0.0 %
0.0 %
0.0 %
2.6 %
17.5 %
Percent answering”I don’t know”-1 -0.8 -0.6 -0.4 -0.2
Scale average(2.5 points) 0.2
Firms: Smaller innovative firms
Firms: Larger innovative firms
Firms: Other firms
Gov.: Innovation support gov. orgs.
Gov.: Education support gov. orgs.
Gov.: Other ministries
Gov.: Other public sector orgs.
Education: University department heads
Education: University rectors
Education: Polytechnic rectors
Associations
Municipalities
Research: Public research institutes
Research: Other research instititutes
Intermediaries: TE-centres
Intermediaries: Other intermediaries
Foundations
Financing: Business angels and VCs 0.0 %
1.3. The innovation system has three key players
In question 5 the respondents chose on a scale from “not at all important” (=1 point) to “very important” (=4 points) who were the most important actors in the NIS from their perspective. The results are illustrated below where the in- and out-bound connections rated as “very important” (more than 3.5 points) are drawn. Interestingly, the Finnish innovation fund Sitra, has only one in-bound connection.
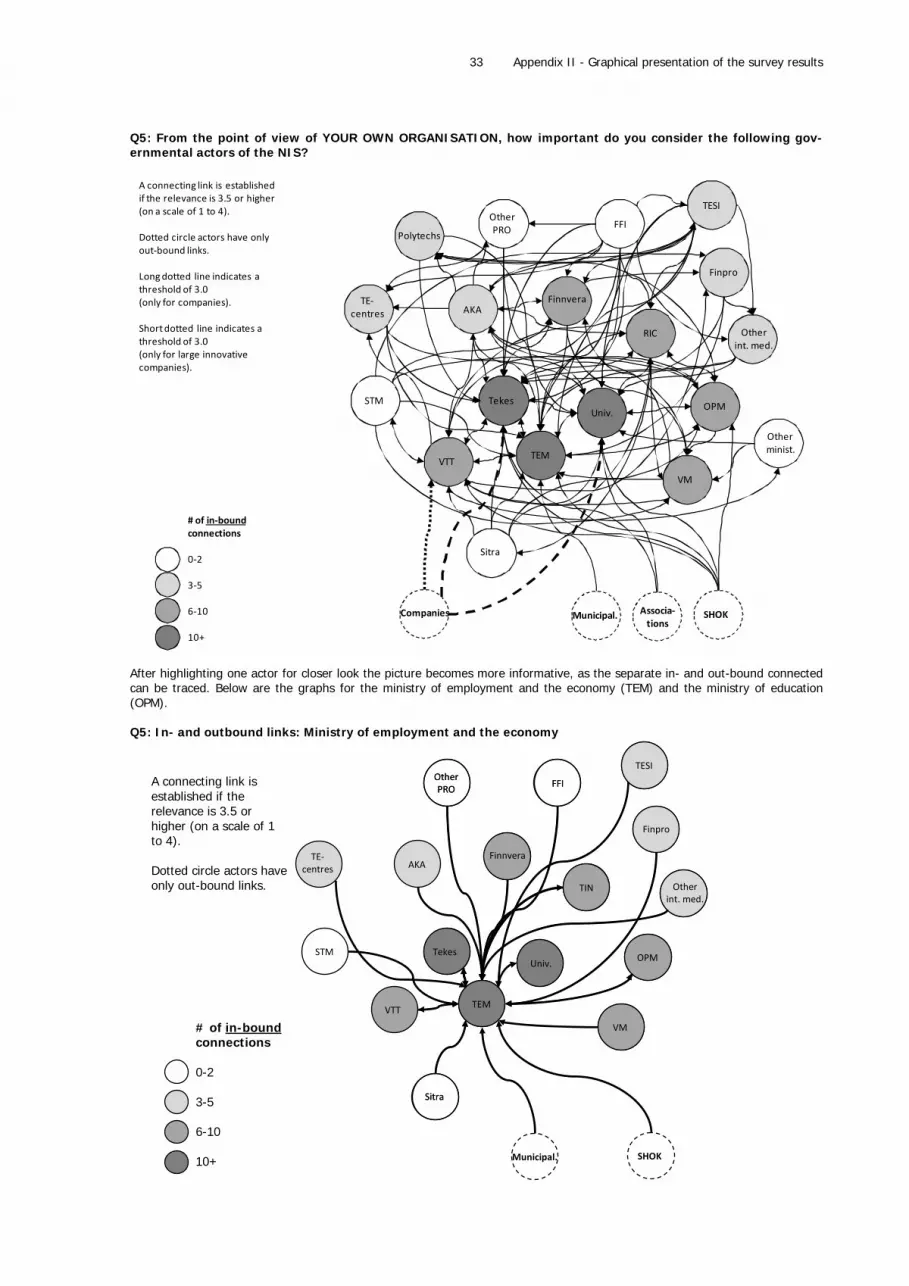
Appendix II - Graphical presentation of the survey results
33
Q5: From the point of view of YOUR OWN ORGANISATION, how important do you consider the following gov-ernmental actors of the NIS?
AKA
Polytechs
Finnvera
Finpro
Associa‐tions
Municipal.
Otherint. med.
Otherminist.
OtherPRO
OPM
RIC
SHOK
Sitra
STM
TE‐centres
Tekes
TEM
TESI
VM
Univ.
VTT
Companies
FFI
# of in‐boundconnections
0‐2
3‐5
6‐10
10+
A connecting link is establishedif the relevance is 3.5 or higher(on a scale of 1 to 4).
Dotted circle actors have onlyout‐bound links.
Long dotted line indicates a threshold of 3.0(only for companies).
Short dotted line indicates a threshold of 3.0(only for large innovativecompanies).
After highlighting one actor for closer look the picture becomes more informative, as the separate in- and out-bound connected can be traced. Below are the graphs for the ministry of employment and the economy (TEM) and the ministry of education (OPM). Q5: In- and outbound links: Ministry of employment and the economy
AKAFinnvera
Finpro
Otherint. med.
OtherPRO
OPM
TIN
Sitra
Tekes
TEM
TESI
VM
Univ.
FFI
AKAFinnvera
Finpro
Municipal.
Otherint. med.
OPM
TIN
SHOK
Sitra
STM
TE‐centres
Tekes
TESI
VM
VTT
FFI
TEM
OtherPRO
Univ.
AKA
A connecting link is established if the relevance is 3.5 orhigher (on a scale of 1 to 4).
Dotted circle actors haveonly out-bound links.
# of in-boundconnections
0-2
3-5
6-10
10+

Appendix II - Graphical presentation of the survey results
34
Q5: In- and out-bound links, Ministry of education
AKA
Polytechs
OPM
TIN
SHOK
Sitra
STM
TEM
Univ.Tekes
VM
A connecting link is established if the relevance is 3.5 orhigher (on a scale of 1 to 4).
Dotted circle actors haveonly out-bound links.
# of in-boundconnections
0-2
3-5
6-10
10+
The companies were not on the list of actors, who could have been chosen as important actors of the system. However, com-panies themselves did choose the most important actors from their perspective. The threshold of 3.5 used in the previous graphs is set down to only 3 (scale 1=not at all important, 4=very important). Still only two actors, Tekes and the Universities are named as “rather important” by both small and large innovative companies. In addition, VTT (Governments technical re-search centre) is rated as “rather important” by large innovative companies. Q5: Out-bound links, companies
TekesUniv.
VTT
Companies
Dotted circle actors haveonly out-bound links.
Long dotted line indicates a threshold of 3.0(only innovativecompanies).
Short dotted line indicatesa threshold of 3.0(only large innovativecompanies).
# of in-boundconnections
0-2
3-5
6-10
10+
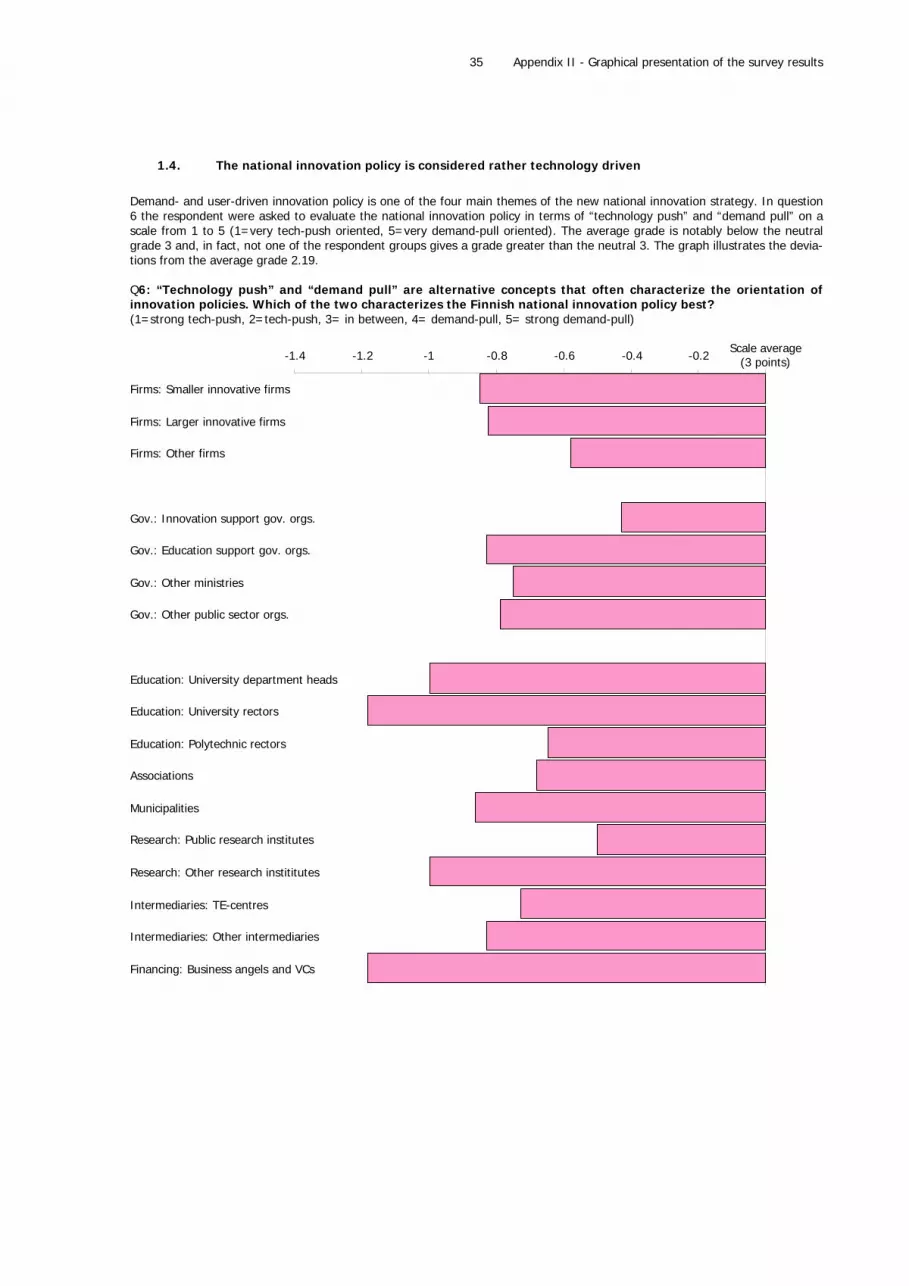
Appendix II - Graphical presentation of the survey results
35
1.4. The national innovation policy is considered rather technology driven
Demand- and user-driven innovation policy is one of the four main themes of the new national innovation strategy. In question 6 the respondent were asked to evaluate the national innovation policy in terms of “technology push” and “demand pull” on a scale from 1 to 5 (1=very tech-push oriented, 5=very demand-pull oriented). The average grade is notably below the neutral grade 3 and, in fact, not one of the respondent groups gives a grade greater than the neutral 3. The graph illustrates the devia-tions from the average grade 2.19. Q6: “Technology push” and “demand pull” are alternative concepts that often characterize the orientation of innovation policies. Which of the two characterizes the Finnish national innovation policy best? (1=strong tech-push, 2=tech-push, 3= in between, 4= demand-pull, 5= strong demand-pull)
-1.4 -1.2 -1 -0.8 -0.6 -0.4 -0.2Scale average
(3 points)
Firms: Smaller innovative firms
Firms: Larger innovative firms
Firms: Other firms
Gov.: Innovation support gov. orgs.
Gov.: Education support gov. orgs.
Gov.: Other ministries
Gov.: Other public sector orgs.
Education: University department heads
Education: University rectors
Education: Polytechnic rectors
Associations
Municipalities
Research: Public research institutes
Research: Other research instititutes
Intermediaries: TE-centres
Intermediaries: Other intermediaries
Financing: Business angels and VCs
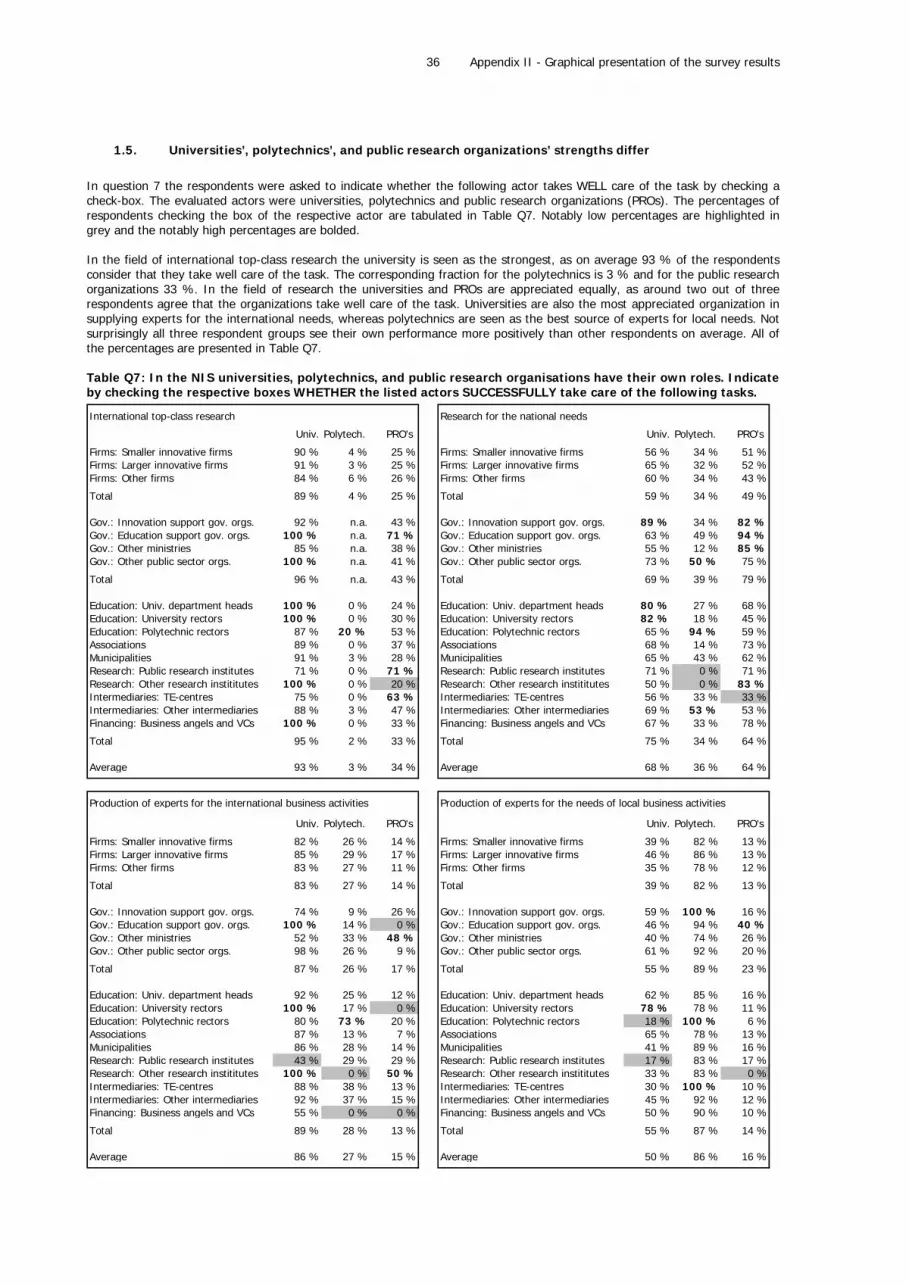
Appendix II - Graphical presentation of the survey results
36
1.5. Universities’, polytechnics’, and public research organizations’ strengths differ
In question 7 the respondents were asked to indicate whether the following actor takes WELL care of the task by checking a check-box. The evaluated actors were universities, polytechnics and public research organizations (PROs). The percentages of respondents checking the box of the respective actor are tabulated in Table Q7. Notably low percentages are highlighted in grey and the notably high percentages are bolded. In the field of international top-class research the university is seen as the strongest, as on average 93 % of the respondents consider that they take well care of the task. The corresponding fraction for the polytechnics is 3 % and for the public research organizations 33 %. In the field of research the universities and PROs are appreciated equally, as around two out of three respondents agree that the organizations take well care of the task. Universities are also the most appreciated organization in supplying experts for the international needs, whereas polytechnics are seen as the best source of experts for local needs. Not surprisingly all three respondent groups see their own performance more positively than other respondents on average. All of the percentages are presented in Table Q7. Table Q7: In the NIS universities, polytechnics, and public research organisations have their own roles. Indicate by checking the respective boxes WHETHER the listed actors SUCCESSFULLY take care of the following tasks.
International top-class research Research for the national needs
Univ. Polytech. PRO's Univ. Polytech. PRO's
Firms: Smaller innovative firms 90 % 4 % 25 % Firms: Smaller innovative firms 56 % 34 % 51 %Firms: Larger innovative firms 91 % 3 % 25 % Firms: Larger innovative firms 65 % 32 % 52 %Firms: Other firms 84 % 6 % 26 % Firms: Other firms 60 % 34 % 43 %
Total 89 % 4 % 25 % Total 59 % 34 % 49 %
Gov.: Innovation support gov. orgs. 92 % n.a. 43 % Gov.: Innovation support gov. orgs. 89 % 34 % 82 %Gov.: Education support gov. orgs. 100 % n.a. 71 % Gov.: Education support gov. orgs. 63 % 49 % 94 %Gov.: Other ministries 85 % n.a. 38 % Gov.: Other ministries 55 % 12 % 85 %Gov.: Other public sector orgs. 100 % n.a. 41 % Gov.: Other public sector orgs. 73 % 50 % 75 %
Total 96 % n.a. 43 % Total 69 % 39 % 79 %
Education: Univ. department heads 100 % 0 % 24 % Education: Univ. department heads 80 % 27 % 68 %Education: University rectors 100 % 0 % 30 % Education: University rectors 82 % 18 % 45 %Education: Polytechnic rectors 87 % 20 % 53 % Education: Polytechnic rectors 65 % 94 % 59 %Associations 89 % 0 % 37 % Associations 68 % 14 % 73 %Municipalities 91 % 3 % 28 % Municipalities 65 % 43 % 62 %Research: Public research institutes 71 % 0 % 71 % Research: Public research institutes 71 % 0 % 71 %Research: Other research instititutes 100 % 0 % 20 % Research: Other research instititutes 50 % 0 % 83 %Intermediaries: TE-centres 75 % 0 % 63 % Intermediaries: TE-centres 56 % 33 % 33 %Intermediaries: Other intermediaries 88 % 3 % 47 % Intermediaries: Other intermediaries 69 % 53 % 53 %Financing: Business angels and VCs 100 % 0 % 33 % Financing: Business angels and VCs 67 % 33 % 78 %
Total 95 % 2 % 33 % Total 75 % 34 % 64 %
Average 93 % 3 % 34 % Average 68 % 36 % 64 %
Production of experts for the international business activities Production of experts for the needs of local business activities
Univ. Polytech. PRO's Univ. Polytech. PRO's
Firms: Smaller innovative firms 82 % 26 % 14 % Firms: Smaller innovative firms 39 % 82 % 13 %Firms: Larger innovative firms 85 % 29 % 17 % Firms: Larger innovative firms 46 % 86 % 13 %Firms: Other firms 83 % 27 % 11 % Firms: Other firms 35 % 78 % 12 %
Total 83 % 27 % 14 % Total 39 % 82 % 13 %
Gov.: Innovation support gov. orgs. 74 % 9 % 26 % Gov.: Innovation support gov. orgs. 59 % 100 % 16 %Gov.: Education support gov. orgs. 100 % 14 % 0 % Gov.: Education support gov. orgs. 46 % 94 % 40 %Gov.: Other ministries 52 % 33 % 48 % Gov.: Other ministries 40 % 74 % 26 %Gov.: Other public sector orgs. 98 % 26 % 9 % Gov.: Other public sector orgs. 61 % 92 % 20 %
Total 87 % 26 % 17 % Total 55 % 89 % 23 %
Education: Univ. department heads 92 % 25 % 12 % Education: Univ. department heads 62 % 85 % 16 %Education: University rectors 100 % 17 % 0 % Education: University rectors 78 % 78 % 11 %Education: Polytechnic rectors 80 % 73 % 20 % Education: Polytechnic rectors 18 % 100 % 6 %Associations 87 % 13 % 7 % Associations 65 % 78 % 13 %Municipalities 86 % 28 % 14 % Municipalities 41 % 89 % 16 %Research: Public research institutes 43 % 29 % 29 % Research: Public research institutes 17 % 83 % 17 %Research: Other research instititutes 100 % 0 % 50 % Research: Other research instititutes 33 % 83 % 0 %Intermediaries: TE-centres 88 % 38 % 13 % Intermediaries: TE-centres 30 % 100 % 10 %Intermediaries: Other intermediaries 92 % 37 % 15 % Intermediaries: Other intermediaries 45 % 92 % 12 %Financing: Business angels and VCs 55 % 0 % 0 % Financing: Business angels and VCs 50 % 90 % 10 %
Total 89 % 28 % 13 % Total 55 % 87 % 14 %
Average 86 % 27 % 15 % Average 50 % 86 % 16 %

Appendix II - Graphical presentation of the survey results
37
1.6. NIS’s ability to support growth entrepreneurship and generate rapidly growing companies is
graded as fair
In question 8 the respondents were asked how they grade the NIS in promoting growth entrepreneurship and generating rap-idly growing companies in Finland on a scale from 4 to 10. The average grade 6.4 is below the neutral grade 7 but there is significant diversity among the respondents. The most satisfied respondent group is the municipals who grant the grade “satis-factory” (7.0). The lowest score “fair” (6.0) is given by the non-public research institutes. Among the group firms the respon-dent group of smaller innovative firms stand out, as they deviate downwards from the grades of the larger innovative and other firms. The graph illustrates the deviations from the scale average 7. Q8: One of the objectives of the NIS is to promote growth entrepreneurship and generate rapidly growing com-panies in Finland. How would you grade the system in this respect? (Scale 4 -10)
Scale average(grade 7)-1.00 -0.80 -0.60 -0.40 -0.20
Firms: Smaller innovative firms
Firms: Larger innovative firms
Firms: Other firms
Gov.: Innovation support gov. orgs.
Gov.: Education support gov. orgs.
Gov.: Other ministries
Gov.: Other public sector orgs.
Education: University department heads
Education: University rectors
Education: Polytechnic rectors
Associations
Municipalities
Research: Public research institutes
Research: Other research instititutes
Intermediaries: TE-centres
Intermediaries: Other intermediaries
Financing: Business angels and VCs
Financing: Banks, loan officers
Average grade of groups
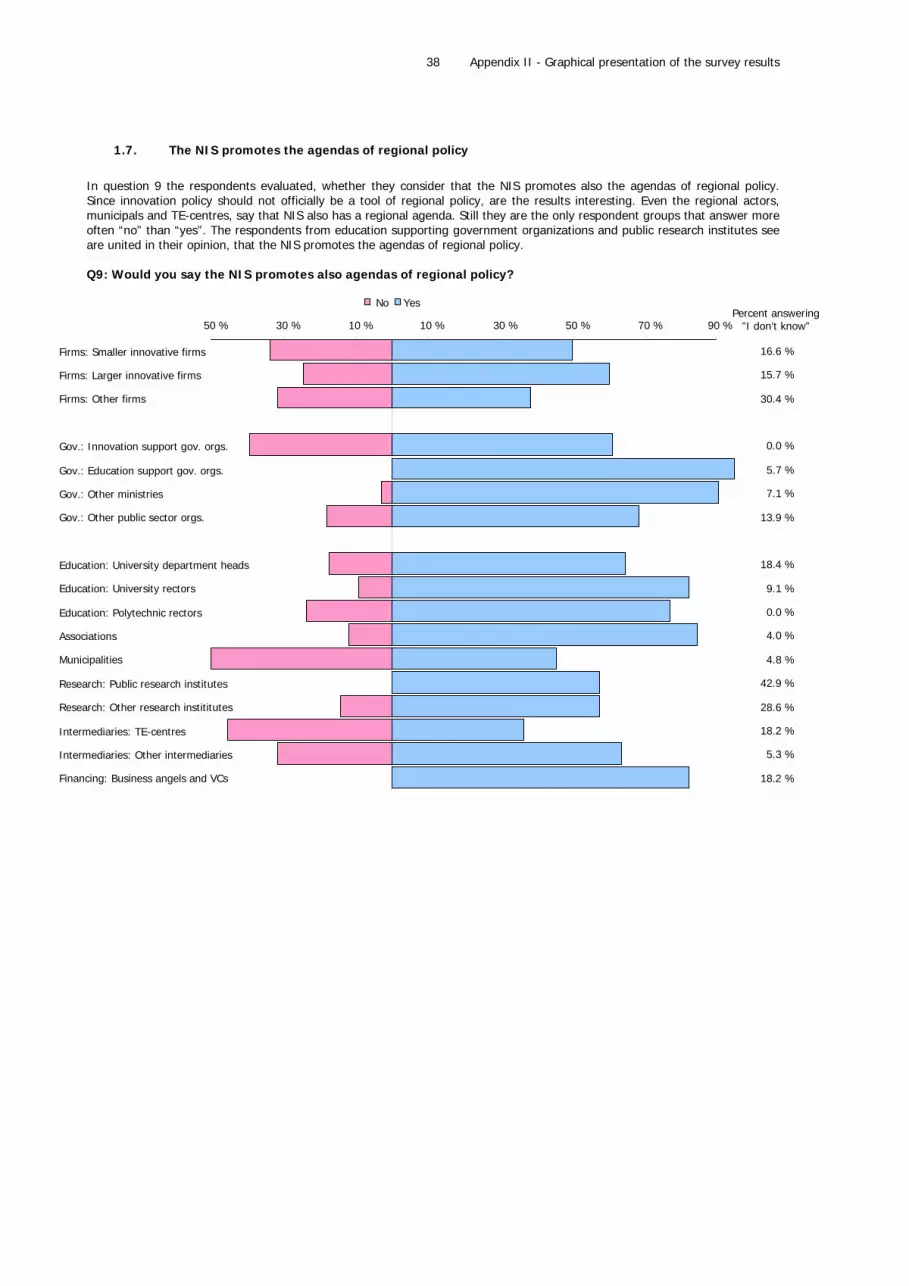
Appendix II - Graphical presentation of the survey results
38
1.7. The NIS promotes the agendas of regional policy
In question 9 the respondents evaluated, whether they consider that the NIS promotes also the agendas of regional policy. Since innovation policy should not officially be a tool of regional policy, are the results interesting. Even the regional actors, municipals and TE-centres, say that NIS also has a regional agenda. Still they are the only respondent groups that answer more often “no” than “yes”. The respondents from education supporting government organizations and public research institutes see are united in their opinion, that the NIS promotes the agendas of regional policy. Q9: Would you say the NIS promotes also agendas of regional policy?
16.6 %
15.7 %
30.4 %
0.0 %
5.7 %
7.1 %
13.9 %
18.4 %
9.1 %
0.0 %
4.0 %
4.8 %
42.9 %
28.6 %
18.2 %
5.3 %
18.2 %
50 % 30 % 10 % 10 % 30 % 50 % 70 % 90 %
Firms: Smaller innovative firms
Firms: Larger innovative firms
Firms: Other firms
Gov.: Innovation support gov. orgs.
Gov.: Education support gov. orgs.
Gov.: Other ministries
Gov.: Other public sector orgs.
Education: University department heads
Education: University rectors
Education: Polytechnic rectors
Associations
Municipalities
Research: Public research institutes
Research: Other research instititutes
Intermediaries: TE-centres
Intermediaries: Other intermediaries
Financing: Business angels and VCs
No YesPercent answering
”I don’t know”

Appendix II - Graphical presentation of the survey results
39
1.8. The efficiency of the national innovation policy differs across Finland
In the previous question the respondent evaluated the regional policy -dimension of the NIS. In question 10 the respondents were asked, if the national innovation policy is equally effective in all regions of Finland. The general opinion is clear - in all of the respondent groups the majority of individual respondents see that the national innovation policy is not equally effective in all regions of Finland. Even from the governmental innovation supporting organizations (Tekes and TEM), 60 % of the respon-dents believe, that there are efficiency differences across regions. Q10: In your opinion, is the NATIONAL innovation policy equally effective in all regions of Finland?
19.6 %
19.5 %
32.6 %
3.7 %
5.7 %
23.6 %
16.7 %
24.3 %
9.1 %
5.9 %
12.0 %
5.3 %
28.6 %
28.6 %
9.1 %
6.7 %
18.2 %
100 % 80 % 60 % 40 % 20 % 0 20 % 40 %
Firms: Smaller innovative firms
Firms: Larger innovative firms
Firms: Other firms
Gov.: Innovation support gov. orgs.
Gov.: Education support gov. orgs.
Gov.: Other ministries
Gov.: Other public sector orgs.
Education: University department heads
Education: University rectors
Education: Polytechnic rectors
Associations
Municipalities
Research: Public research institutes
Research: Other research instititutes
Intermediaries: TE-centres
Intermediaries: Other intermediaries
Financing: Business angels and VCs
YesNo Percent answering”I don’t know”

Appendix II - Graphical presentation of the survey results
40
1.9. National networks slightly more important than international networks
In questions 11 and 12 the respondents were asked to evaluate the importance of national and international networks for their organization on a scale from not at all important (=1) to very important (=4). As the average grade in both of the questions rises above 3, are both national and international networks seen as important for the activities of the organization. However, national networks are on average graded somewhat more important than international networks. Interestingly companies are in both questions below the general average and the group “other firms” see the importance of international networks as “not very important”. Q11-12: How important are NATIONAL/INTERNATIONAL networks for the activities of your organisation? (1=not at all important, 4=very important) National networks International networks
4.9 %
0.0 %
0.0 %
0.0 %
0.0 %
0.0 %
0.0 %
0.0 %
0.0 %
0.0 %
0.0 %
0.0 %
0.0 %
1.3 %
0.0 %
0.4 %
0.0 %
-0.4Scale average(2.5 points) 0.8 1.6
Firms: Smaller innovative firms
Firms: Larger innovative firms
Firms: Other firms
Gov.: Innovation support gov. orgs.
Gov.: Education support gov. orgs.
Gov.: Other ministries
Gov.: Other public sector orgs.
Education: University department heads
Education: University rectors
Education: Polytechnic rectors
Associations
Municipalities
Research: Public research institutes
Research: Other research instititutes
Intermediaries: TE-centres
Intermediaries: Other intermediaries
Financing: Business angels and VCs
1.4 %
0.6 %
4.2 %
0.0 %
0.0 %
0.0 %
0.0 %
0.0 %
0.0 %
0.0 %
0.0 %
0.0 %
0.0 %
0.0 %
0.0 %
1.3 %
0.0 %
-0.4 0.8 1.6Percent answering
”I don’t know”Percent answering
”I don’t know”Scale average(2.5 points)

Appendix II - Graphical presentation of the survey results
41
1.10. The respondents carefully optimistic about the impacts of the forthcoming reforms.
In question 13 the respondents evaluated 6 statements concerning the ongoing reforms in the Finnish innovation system. In the following the results for each statement are compared separately. The grading scale was from “completely disagree” (=1 points) to “completely agree” (=4 points). The graphs illustrate the deviation from the scale average, which is the “neutral” grade equalling 2.5. Respondent groups deviating downwards from the neutral 2.5 are plotted in red and the group averages deviating upwards are in blue. On the right is the fraction of respondents for each group answering “I don’t know”. The first four statements handle the forthcoming reform of the universities act (Yliopistouudistus). In all four statements the average grade is around the grade 3, “somewhat agree”. Regardless of the statement, the following remarks can be made. It can be noted that the companies’ level of agreement is in all four questions rather homogenous. An interesting detail is, that in all four questions concerning the reform of the universities act the University department heads seem to have very different levels of agreement - the rectors have great confidence in the results of the act, whereas the department heads are more pessimistic. Q13: The forthcoming reform of the UNIVERSITIES ACT (Yliopistouudistus) will promote… Q13_a: …internationalization.
Percent aswering
”I dont know”
25.2 %
24.2 %
18.4 %
0.0 %
14.3 %
27.9 %
11.6 %
13.8 %
0.0 %
0.0 %
3.9 %
9.3 %
28.6 %
14.3 %
0.0 %
19.2 %
9.1 %
-0.50 0.50 1.00 1.50
Firms: Smaller innovative firms
Firms: Larger innovative firms
Firms: Other firms
Gov.: Innovation support gov. orgs.
Gov.: Education support gov. orgs.
Gov.: Other ministries
Gov.: Other public sector orgs.
Education: University department heads
Education: University rectors
Education: Polytechnic rectors
Associations
Municipalities
Research: Public research institutes
Research: Other research instititutes
Intermediaries: TE-centres
Intermediaries: Other intermediaries
Financing: Business angels and VCs
Scale average(2.5 points)
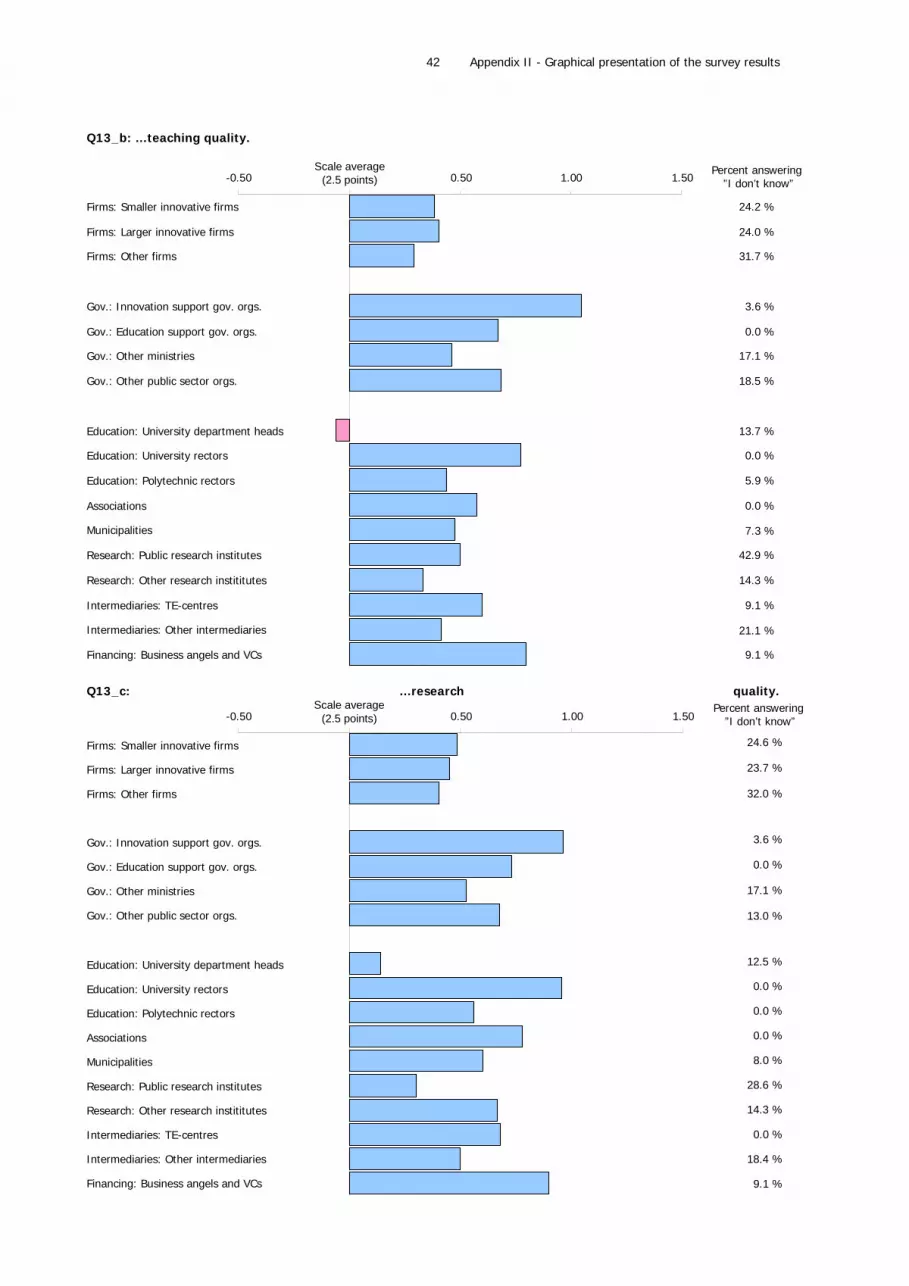
Appendix II - Graphical presentation of the survey results
42
Q13_b: …teaching quality.
24.2 %
24.0 %
31.7 %
3.6 %
0.0 %
17.1 %
18.5 %
13.7 %
0.0 %
5.9 %
0.0 %
7.3 %
42.9 %
14.3 %
9.1 %
21.1 %
9.1 %
-0.50 0.50 1.00 1.50
Firms: Smaller innovative firms
Firms: Larger innovative firms
Firms: Other firms
Gov.: Innovation support gov. orgs.
Gov.: Education support gov. orgs.
Gov.: Other ministries
Gov.: Other public sector orgs.
Education: University department heads
Education: University rectors
Education: Polytechnic rectors
Associations
Municipalities
Research: Public research institutes
Research: Other research instititutes
Intermediaries: TE-centres
Intermediaries: Other intermediaries
Financing: Business angels and VCs
Percent answering”I don’t know”
Scale average(2.5 points)
Q13_c: …research quality.
-0.50 0.50 1.00 1.50
Firms: Smaller innovative firms
Firms: Larger innovative firms
Firms: Other firms
Gov.: Innovation support gov. orgs.
Gov.: Education support gov. orgs.
Gov.: Other ministries
Gov.: Other public sector orgs.
Education: University department heads
Education: University rectors
Education: Polytechnic rectors
Associations
Municipalities
Research: Public research institutes
Research: Other research instititutes
Intermediaries: TE-centres
Intermediaries: Other intermediaries
Financing: Business angels and VCs
18.4 %
0.0 %
14.3 %
28.6 %
8.0 %
0.0 %
0.0 %
0.0 %
12.5 %
13.0 %
17.1 %
0.0 %
3.6 %
32.0 %
23.7 %
24.6 %
9.1 %
Percent answering”I don’t know”
Scale average(2.5 points)
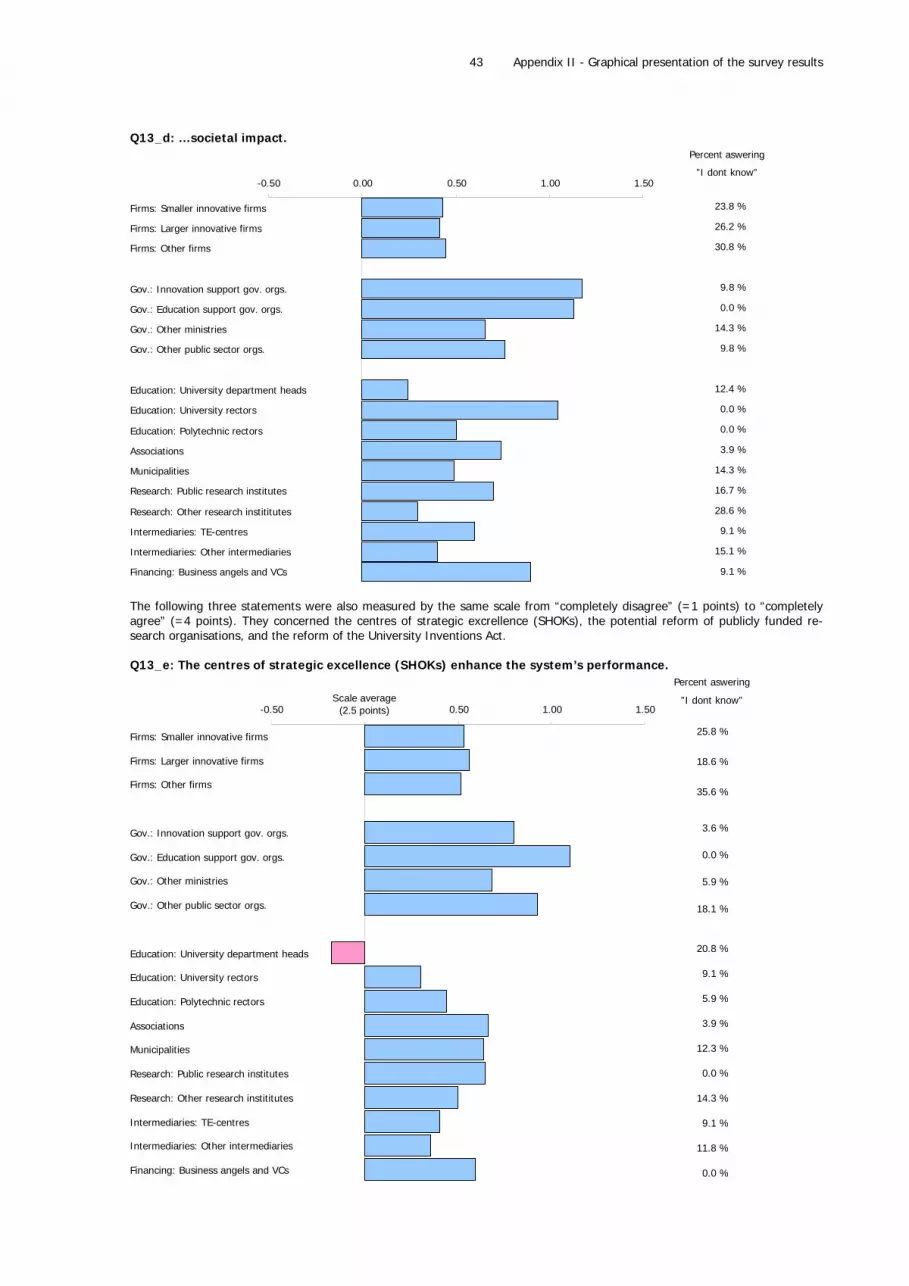
Appendix II - Graphical presentation of the survey results
43
Q13_d: …societal impact.
-0.50 0.00 0.50 1.00 1.50
Firms: Smaller innovative firms
Firms: Larger innovative firms
Firms: Other firms
Gov.: Innovation support gov. orgs.
Gov.: Education support gov. orgs.
Gov.: Other ministries
Gov.: Other public sector orgs.
Education: University department heads
Education: University rectors
Education: Polytechnic rectors
Associations
Municipalities
Research: Public research institutes
Research: Other research instititutes
Intermediaries: TE-centres
Intermediaries: Other intermediaries
Financing: Business angels and VCs
Percent aswering
”I dont know”
15.1 %
9.1 %
28.6 %
16.7 %
14.3 %
0.0 %
0.0 %
12.4 %
9.8 %
14.3 %
0.0 %
9.8 %
30.8 %
26.2 %
23.8 %
3.9 %
9.1 %
The following three statements were also measured by the same scale from “completely disagree” (=1 points) to “completely agree” (=4 points). They concerned the centres of strategic excrellence (SHOKs), the potential reform of publicly funded re-search organisations, and the reform of the University Inventions Act. Q13_e: The centres of strategic excellence (SHOKs) enhance the system’s performance.
-0.50 0.50 1.00 1.50
Firms: Smaller innovative firms
Firms: Larger innovative firms
Firms: Other firms
Gov.: Innovation support gov. orgs.
Gov.: Education support gov. orgs.
Gov.: Other ministries
Gov.: Other public sector orgs.
Education: University department heads
Education: University rectors
Education: Polytechnic rectors
Associations
Municipalities
Research: Public research institutes
Research: Other research instititutes
Intermediaries: TE-centres
Intermediaries: Other intermediaries
Financing: Business angels and VCs
Percent aswering
”I dont know”
25.8 %
18.6 %
35.6 %
3.6 %
0.0 %
5.9 %
18.1 %
20.8 %
9.1 %
5.9 %
3.9 %
12.3 %
0.0 %
14.3 %
9.1 %
11.8 %
0.0 %
Scale average(2.5 points)

Appendix II - Graphical presentation of the survey results
44
The graph concerning the centres of strategic excellence (SHOKs) provides several interesting results. University department heads, “the grass-roots -level actors”, are well below the average, whereas all public actors believe in the positive impacts of the SHOKs. Especially education supporting government organizations have high hopes for the SHOKs, as their average answer is “completely agree”. Q13_f: The potential reform of publicly funded research organisations would enhance the system’s performance.
-0.50 0.50 1.00 1.50
Firms: Smaller innovative firms
Firms: Larger innovative firms
Firms: Other firms
Gov.: Innovation support gov. orgs.
Gov.: Education support gov. orgs.
Gov.: Other ministries
Gov.: Other public sector orgs.
Education: University department heads
Education: University rectors
Education: Polytechnic rectors
Associations
Municipalities
Research: Public research institutes
Research: Other research instititutes
Intermediaries: TE-centres
Intermediaries: Other intermediaries
Financing: Business angels and VCs
25.0 %
18.2 %
0.0 %
14.3 %
19.2 %
7.7 %
11.8 %
9.1 %
33.3 %
27.5 %
0.0 %
14.3 %
0.0 %
46.6 %
39.7 %
40.1 %
Percent aswering
”I dont know”
50.0 %
Scale average(2.5 points)
The sixth statement asks about the respondents opinions about the potential reform of publicly funded research organizations. Interestingly, the public research institutes see the potential reform in the most negative light followed by the group of other ministries. The companies are again very homogenous in their opinion and it must be noted that the fraction of companies answering “I don’t know” ranges from 40 to 47 percentages.
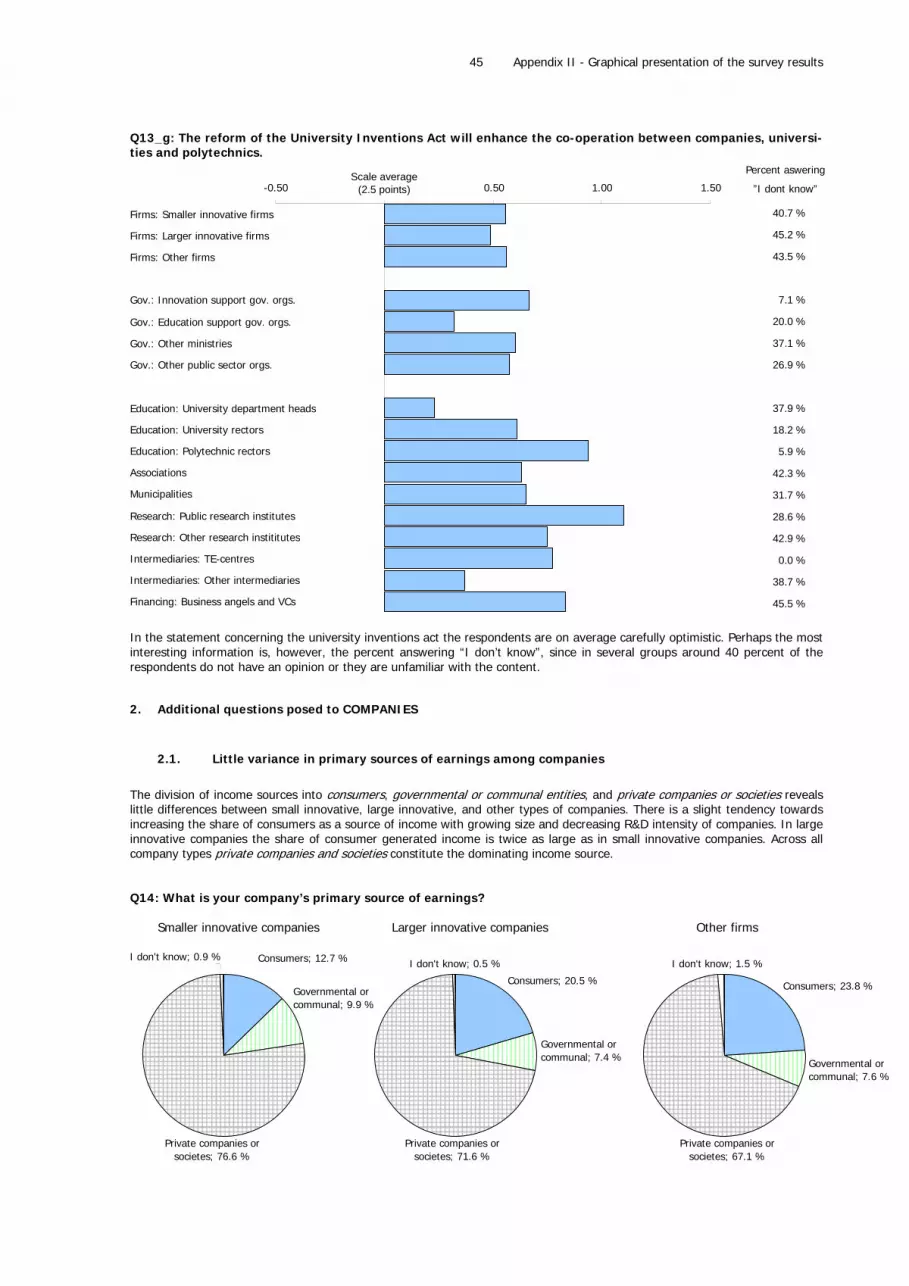
Appendix II - Graphical presentation of the survey results
45
Q13_g: The reform of the University Inventions Act will enhance the co-operation between companies, universi-ties and polytechnics.
-0.50 0.50 1.00 1.50
Firms: Smaller innovative firms
Firms: Larger innovative firms
Firms: Other firms
Gov.: Innovation support gov. orgs.
Gov.: Education support gov. orgs.
Gov.: Other ministries
Gov.: Other public sector orgs.
Education: University department heads
Education: University rectors
Education: Polytechnic rectors
Associations
Municipalities
Research: Public research institutes
Research: Other research instititutes
Intermediaries: TE-centres
Intermediaries: Other intermediaries
Financing: Business angels and VCs
38.7 %
0.0 %
42.9 %
28.6 %
31.7 %
42.3 %
5.9 %
18.2 %
37.9 %
26.9 %
37.1 %
20.0 %
7.1 %
43.5 %
45.2 %
40.7 %
45.5 %
Percent aswering
”I dont know”Scale average
(2.5 points)
In the statement concerning the university inventions act the respondents are on average carefully optimistic. Perhaps the most interesting information is, however, the percent answering “I don’t know”, since in several groups around 40 percent of the respondents do not have an opinion or they are unfamiliar with the content.
2. Additional questions posed to COMPANIES
2.1. Little variance in primary sources of earnings among companies
The division of income sources into consumers, governmental or communal entities, and private companies or societies reveals little differences between small innovative, large innovative, and other types of companies. There is a slight tendency towards increasing the share of consumers as a source of income with growing size and decreasing R&D intensity of companies. In large innovative companies the share of consumer generated income is twice as large as in small innovative companies. Across all company types private companies and societies constitute the dominating income source. Q14: What is your company’s primary source of earnings?
Smaller innovative companies
Consumers; 12.7 %
Governmental orcommunal; 9.9 %
Private companies orsocietes; 76.6 %
I don't know; 0.9 %
Larger innovative companies
Consumers; 20.5 %
Governmental orcommunal; 7.4 %
Private companies orsocietes; 71.6 %
I don't know; 0.5 %
Other firms
Consumers; 23.8 %
Governmental orcommunal; 7.6 %
Private companies orsocietes; 67.1 %
I don't know; 1.5 %
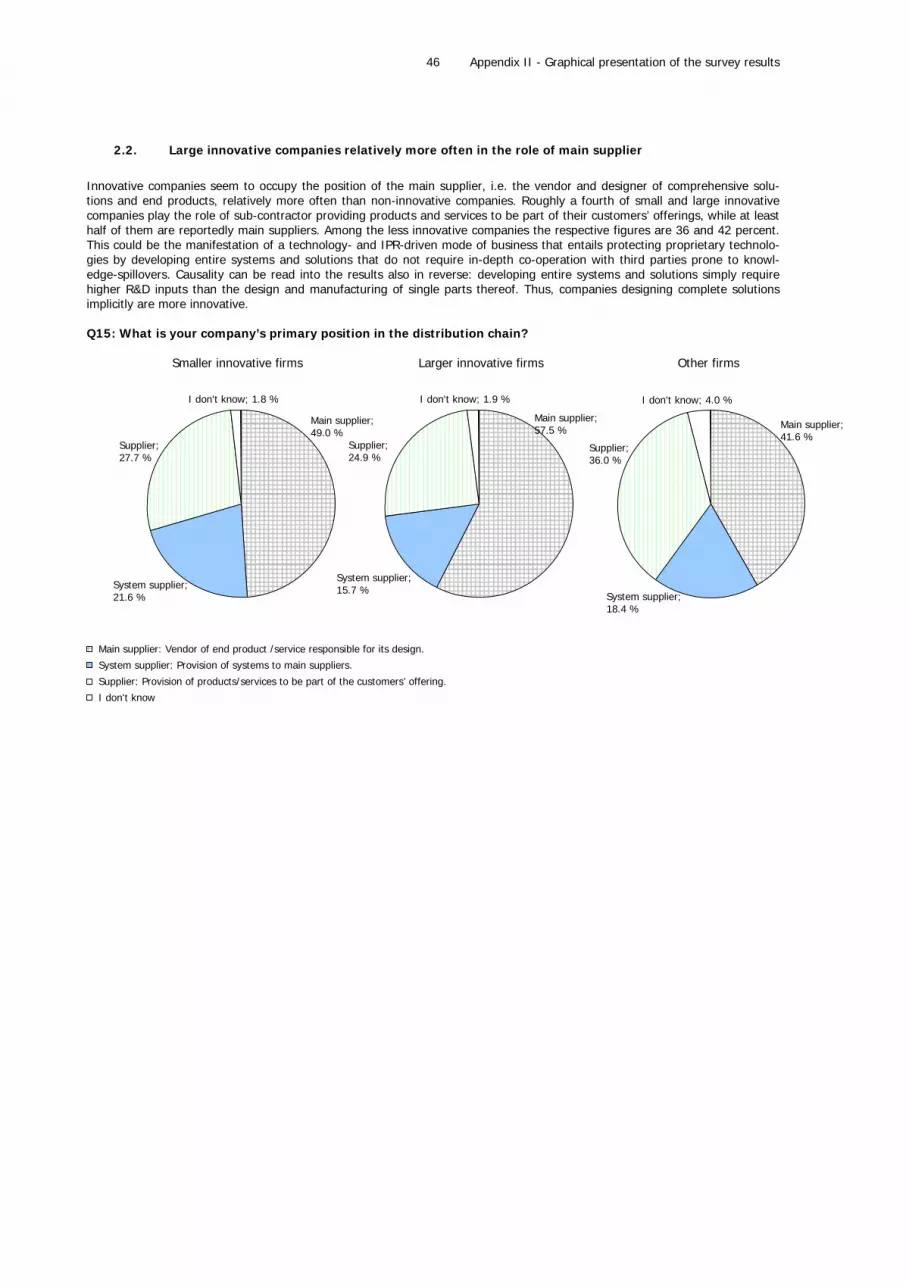
Appendix II - Graphical presentation of the survey results
46
2.2. Large innovative companies relatively more often in the role of main supplier
Innovative companies seem to occupy the position of the main supplier, i.e. the vendor and designer of comprehensive solu-tions and end products, relatively more often than non-innovative companies. Roughly a fourth of small and large innovative companies play the role of sub-contractor providing products and services to be part of their customers’ offerings, while at least half of them are reportedly main suppliers. Among the less innovative companies the respective figures are 36 and 42 percent. This could be the manifestation of a technology- and IPR-driven mode of business that entails protecting proprietary technolo-gies by developing entire systems and solutions that do not require in-depth co-operation with third parties prone to knowl-edge-spillovers. Causality can be read into the results also in reverse: developing entire systems and solutions simply require higher R&D inputs than the design and manufacturing of single parts thereof. Thus, companies designing complete solutions implicitly are more innovative. Q15: What is your company’s primary position in the distribution chain? Smaller innovative firms
Main supplier; 49.0 %
System supplier; 21.6 %
Supplier; 27.7 %
I don't know; 1.8 %
Larger innovative firms
Main supplier; 57.5 %
System supplier; 15.7 %
Supplier; 24.9 %
I don't know; 1.9 %
Other firms
Main supplier; 41.6 %
System supplier; 18.4 %
Supplier; 36.0 %
I don't know; 4.0 %
Main supplier: Vendor of end product /service responsible for its design.
System supplier: Provision of systems to main suppliers.
Supplier: Provision of products/services to be part of the customers’ offering.
I don't know
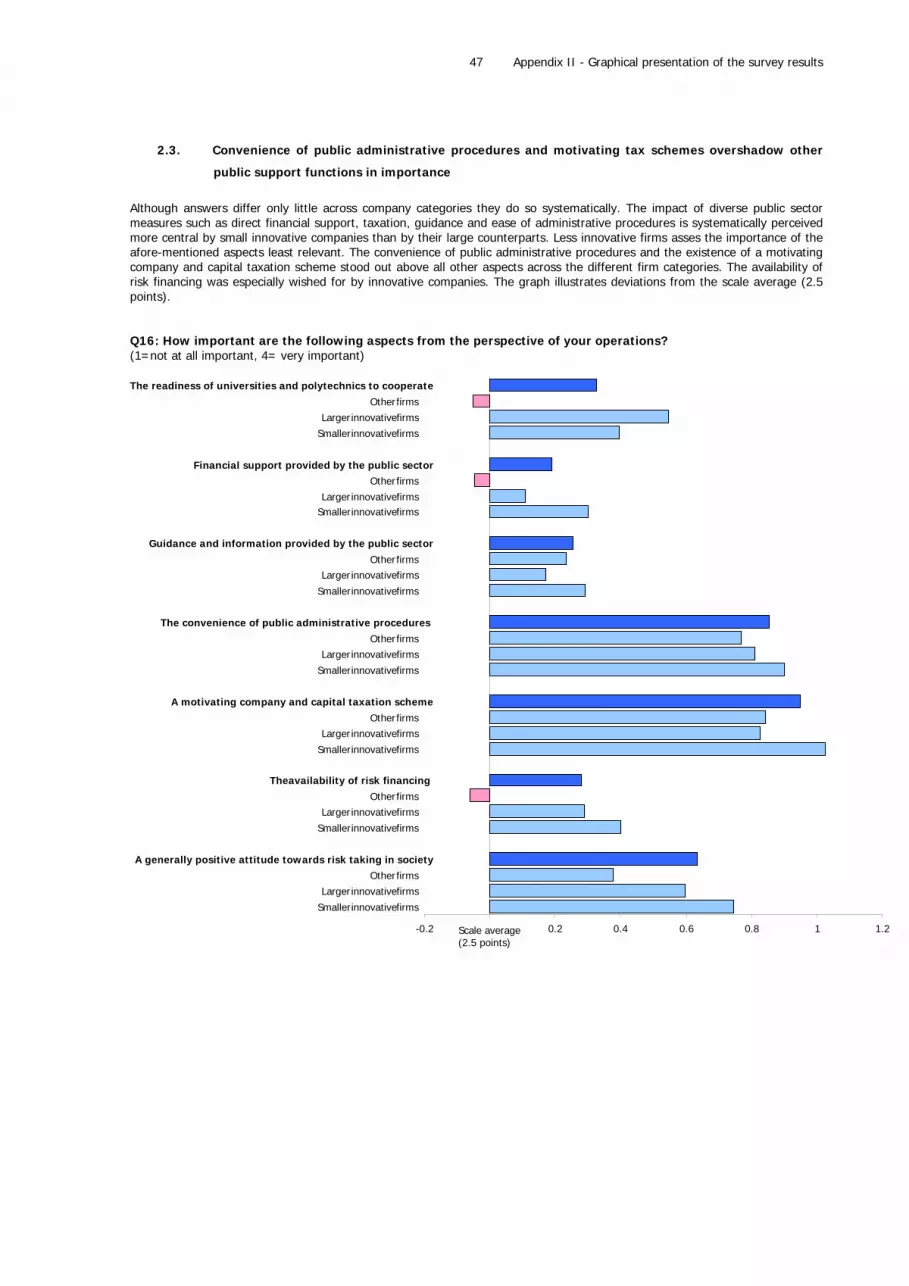
Appendix II - Graphical presentation of the survey results
47
2.3. Convenience of public administrative procedures and motivating tax schemes overshadow other
public support functions in importance
Although answers differ only little across company categories they do so systematically. The impact of diverse public sector measures such as direct financial support, taxation, guidance and ease of administrative procedures is systematically perceived more central by small innovative companies than by their large counterparts. Less innovative firms asses the importance of the afore-mentioned aspects least relevant. The convenience of public administrative procedures and the existence of a motivating company and capital taxation scheme stood out above all other aspects across the different firm categories. The availability of risk financing was especially wished for by innovative companies. The graph illustrates deviations from the scale average (2.5 points). Q16: How important are the following aspects from the perspective of your operations? (1=not at all important, 4= very important)
-0.2 0.2 0.4 0.6 0.8 1 1.2
Smallerinnovativefirms
LargerinnovativefirmsOtherfirms
A generally positive attitude towards risk taking in society
Smallerinnovativefirms
LargerinnovativefirmsOtherfirms
Theavailability of risk financing
Smallerinnovativefirms
LargerinnovativefirmsOtherfirms
A motivating company and capital taxation scheme
Smallerinnovativefirms
LargerinnovativefirmsOtherfirms
The convenience of public administrative procedures
Smallerinnovativefirms
LargerinnovativefirmsOtherfirms
Guidance and information provided by the public sector
SmallerinnovativefirmsLargerinnovativefirms
OtherfirmsFinancial support provided by the public sector
Smallerinnovativefirms
LargerinnovativefirmsOtherfirms
The readiness of universities and polytechnics to cooperate
Scale average(2.5 points)
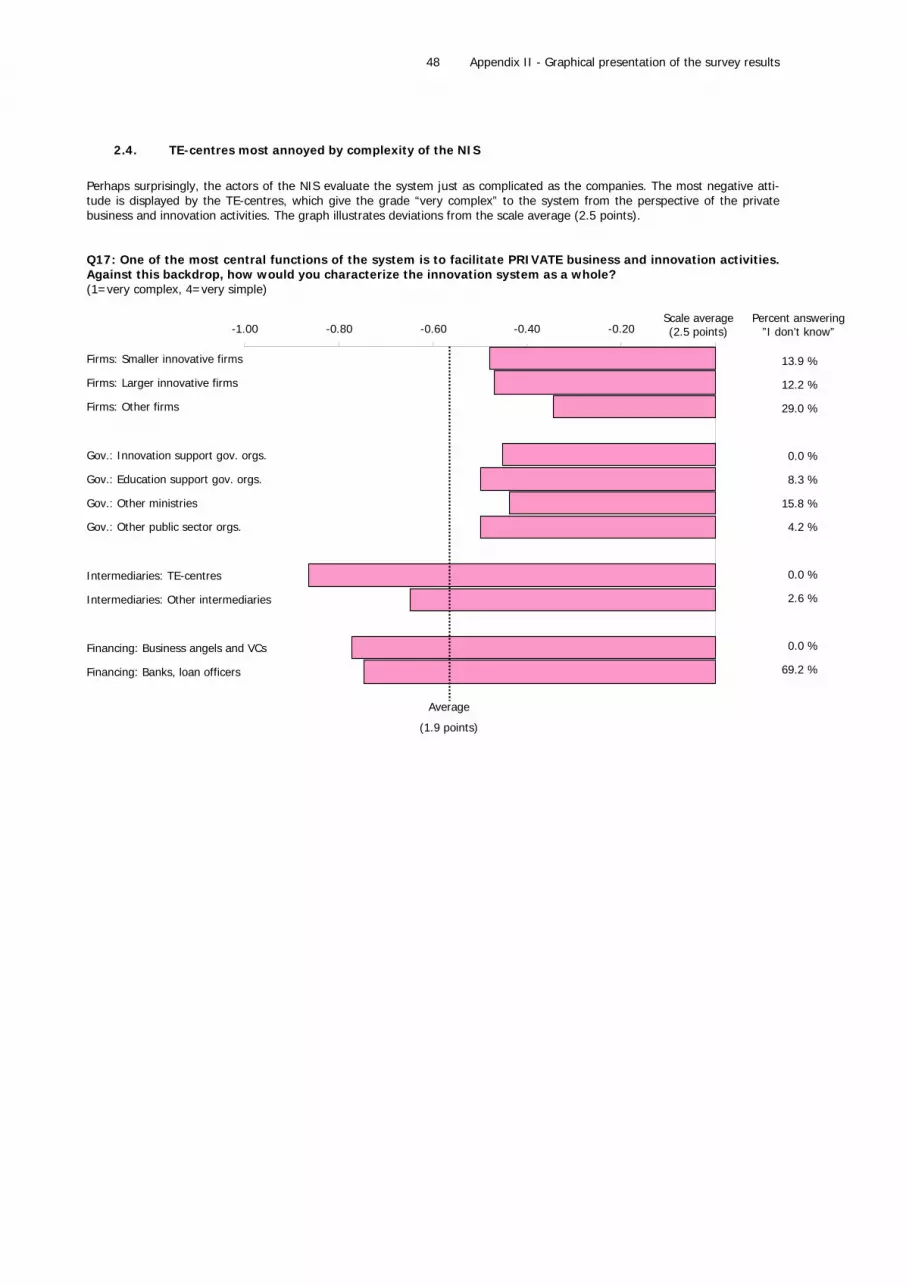
Appendix II - Graphical presentation of the survey results
48
2.4. TE-centres most annoyed by complexity of the NIS
Perhaps surprisingly, the actors of the NIS evaluate the system just as complicated as the companies. The most negative atti-tude is displayed by the TE-centres, which give the grade “very complex” to the system from the perspective of the private business and innovation activities. The graph illustrates deviations from the scale average (2.5 points). Q17: One of the most central functions of the system is to facilitate PRIVATE business and innovation activities. Against this backdrop, how would you characterize the innovation system as a whole? (1=very complex, 4=very simple)
13.9 %
12.2 %
29.0 %
0.0 %
8.3 %
15.8 %
4.2 %
0.0 %
2.6 %
Percent answering”I don’t know”
0.0 %
69.2 %
0.0 %
0.0 %
0.0 %
-1.00 -0.80 -0.60 -0.40 -0.20Scale average(2.5 points)
Firms: Smaller innovative firms
Firms: Larger innovative firms
Firms: Other firms
Gov.: Innovation support gov. orgs.
Gov.: Education support gov. orgs.
Gov.: Other ministries
Gov.: Other public sector orgs.
Intermediaries: TE-centres
Intermediaries: Other intermediaries
Financing: Business angels and VCs
Financing: Banks, loan officers
Average
(1.9 points)

Appendix II - Graphical presentation of the survey results
49
2.5. Companies across categories estimate tax incentive schemes efficient in generating new start-ups
Favourable estimations of the efficiency of potential tax incentive schemes to spawn new growth companies uniformly over-weigh pessimistic ones across all three company categories. Aggregate positive estimations range from 57% to 64% depending on company type. Among firms, small innovative companies were most optimistic but still far behind the Banks’ loan officers, of whom more than 60 percent see the tax incentives as a “very efficient” way of increasing the number of growth companies. Q18: The emergence of new growth companies could be facilitated by providing them with tax incentives re-garding their future earnings and profit sharing. How efficient are such tax incentives in increasing the number of growth companies? (1=Not at all efficient, 4=Very efficient)
3.9 %
8.5 %
9.4 %
6.0 %
7.7 %
0.0 %
3.8 %
Scale average(2.5 points) 0.1 0.2 0.3 0.4 0.5 0.6 0.7 0.8 0.9
Firms: Smaller innovative firms
Firms: Larger innovative firms
Firms: Other firms
Total
Financing: Business angels and VCsFinancing: Banks, loan officers
Total
Percent answering”I don’t know”
2.6. Two thirds of the respondents innovative companies
Q19: Has your company engaged in innovation activities in the last three years?
21 %
47 %
32 %
Yes (large innovative companies, n=215)Yes (small innovative companies, n=485)No (others, n=326)
The following questions were only asked from those respondents, who answered “Yes” to question Q19.

Appendix II - Graphical presentation of the survey results
50
2.7. Market forces overweigh public actors in impacting corporate R&D
It is immediately evident that market related forces, namely b-2-b clients, suppliers, consumers, and competitors, have the most impact on companies’ innovation activities across both categories of innovative companies with the larger ones assessing the impact to be slightly stronger. Other private and all public actors listed in the survey were not assigned nearly as much importance. Universities constitute an unsurprising exception, as university interaction has traditionally been a stronghold of Finnish innovation activity. Client companies represent the most important external source of impact, while the employees of the own organization were clearly assessed the most important asset for innovation activities overall. Q20: How important are the following DOMESTIC actors from the perspective of your company’s innovation activities? (Scale: 1=not at all important, 4= very important)
-1 -0.5 0.5 1 1.5
Smaller innovative firms
Larger innovative firms
Employees of your company/corporation
Smaller innovative firms
Larger innovative firms
Device and materials suppliers
Smaller innovative firms
Larger innovative firms
Client companies
Smaller innovative firms
Larger innovative firms
Consumers / end users
Smaller innovative firms
Larger innovative firms
Municipalities or the government
Smaller innovative firms
Larger innovative firms
Competitors
Smaller innovative firms
Larger innovative firms
Consultants / consulting agencies
Smaller innovative firms
Larger innovative firms
Private research organisations
Smaller innovative firms
Larger innovative firms
Public research organisations
Smaller innovative firms
Larger innovative firms
Universities
Smaller innovative firms
Larger innovative firms
Polytechnics
Scale average(2.5 points)

Appendix II - Graphical presentation of the survey results
51
2.8. Foreign actors influence corporate innovation activities to a lesser extent than domestic ones
As in the case of domestic actors also foreign actors impacting corporate innovation activities of Finnish companies are domi-nated by market players rather than public actors. B-2-b clients, suppliers, consumers, and competitors have the most impact on companies’ innovation activities across both categories of innovative companies with the larger ones assessing the impact to be slightly stronger. Other private and all public actors listed in the survey were not assigned nearly as much importance. Sur-prisingly, employees of the own organization received relatively low scores in importance. On the other hand it has to be pointed out that even the most influential foreign actors received only mediocre scores when compared to the respective do-mestic ones. Q21: How important are the following FOREIGN actors from the perspective of your company’s innovation ac-tivities? (Scale: 1=not at all important, 4= very important)
-1.5 -1 -0.5 Scale average(2.5 points)
0.5 1
Smaller innovative firms
Larger innovative firms
Employees of your company/corporation
Smaller innovative firms
Larger innovative firms
Device and materials suppliers
Smaller innovative firms
Larger innovative firms
Client companies
Smaller innovative firms
Larger innovative firms
Consumers / end users
Smaller innovative firms
Larger innovative firms
Municipalities or the government
Smaller innovative firms
Larger innovative firms
Competitors
Smaller innovative firms
Larger innovative firms
Consultants / consulting agencies
Smaller innovative firms
Larger innovative firms
Private research organisations
Smaller innovative firms
Larger innovative firms
Public research organisations
Smaller innovative firms
Larger innovative firms
Universities
Smaller innovative firms
Larger innovative firms
Polytechnics
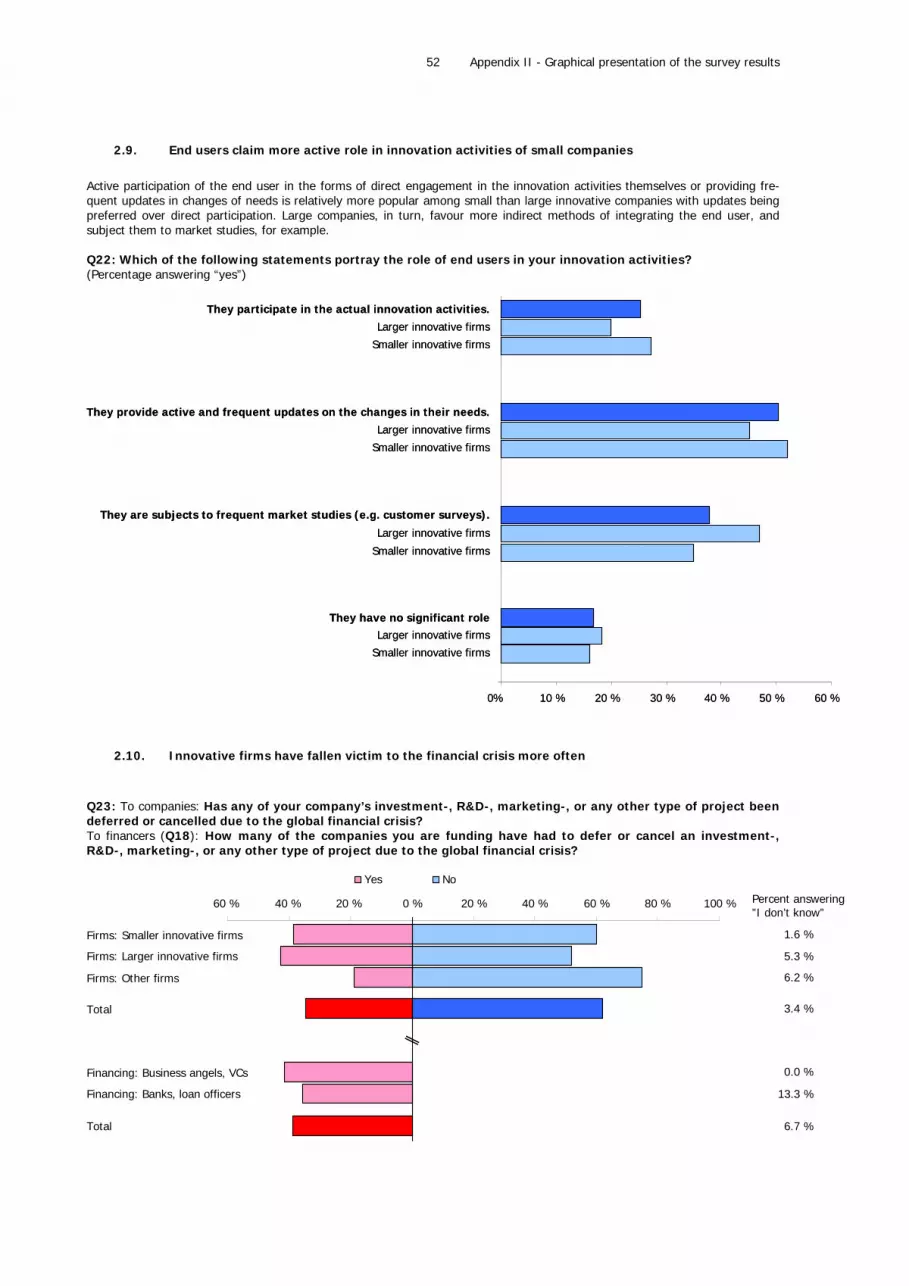
Appendix II - Graphical presentation of the survey results
52
2.9. End users claim more active role in innovation activities of small companies
Active participation of the end user in the forms of direct engagement in the innovation activities themselves or providing fre-quent updates in changes of needs is relatively more popular among small than large innovative companies with updates being preferred over direct participation. Large companies, in turn, favour more indirect methods of integrating the end user, and subject them to market studies, for example. Q22: Which of the following statements portray the role of end users in your innovation activities? (Percentage answering “yes”)
0% 10 % 20 % 30 % 40 % 50 % 60 %
Smaller innovative firms
Larger innovative firmsThey have no significant role
Smaller innovative firms
Larger innovative firms
They are subjects to frequent market studies (e.g. customer surveys).
Smaller innovative firms
Larger innovative firms
They provide active and frequent updates on the changes in their needs.
Smaller innovative firms
Larger innovative firms
They participate in the actual innovation activities.
2.10. Innovative firms have fallen victim to the financial crisis more often
Q23: To companies: Has any of your company’s investment-, R&D-, marketing-, or any other type of project been deferred or cancelled due to the global financial crisis? To financers (Q18): How many of the companies you are funding have had to defer or cancel an investment-, R&D-, marketing-, or any other type of project due to the global financial crisis?
1.6 %
5.3 %
6.2 %
3.4 %
0.0 %
13.3 %
6.7 %
60 % 40 % 20 % 0 % 20 % 40 % 60 % 80 % 100 %
Firms: Smaller innovative firms
Firms: Larger innovative firms
Firms: Other firms
Total
Financing: Business angels, VCs
Financing: Banks, loan officers
Total
Yes No
Percent answering”I don’t know”
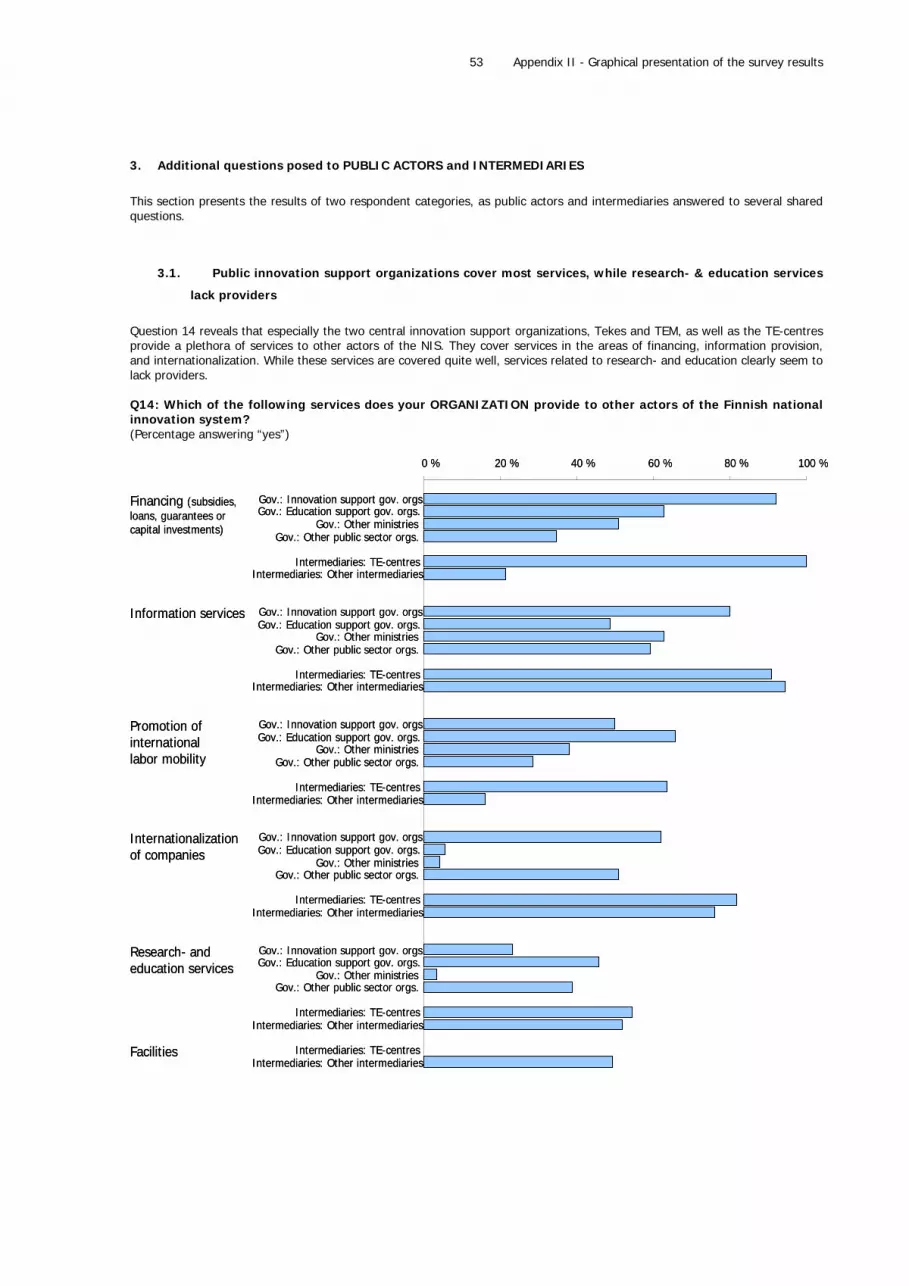
Appendix II - Graphical presentation of the survey results
53
3. Additional questions posed to PUBLIC ACTORS and INTERMEDIARIES
This section presents the results of two respondent categories, as public actors and intermediaries answered to several shared questions.
3.1. Public innovation support organizations cover most services, while research- & education services
lack providers
Question 14 reveals that especially the two central innovation support organizations, Tekes and TEM, as well as the TE-centres provide a plethora of services to other actors of the NIS. They cover services in the areas of financing, information provision, and internationalization. While these services are covered quite well, services related to research- and education clearly seem to lack providers. Q14: Which of the following services does your ORGANIZATION provide to other actors of the Finnish national innovation system? (Percentage answering “yes”)
0 % 20 % 40 % 60 % 80 % 100 %
Gov.: Innovation support gov. orgs.Gov.: Education support gov. orgs.
Gov.: Other ministriesGov.: Other public sector orgs.
Intermediaries: TE-centresIntermediaries: Other intermediaries
Gov.: Innovation support gov. orgs.Gov.: Education support gov. orgs.
Gov.: Other ministriesGov.: Other public sector orgs.
Intermediaries: TE-centresIntermediaries: Other intermediaries
Gov.: Innovation support gov. orgs.Gov.: Education support gov. orgs.
Gov.: Other ministriesGov.: Other public sector orgs.
Intermediaries: TE-centresIntermediaries: Other intermediaries
Gov.: Innovation support gov. orgs.Gov.: Education support gov. orgs.
Gov.: Other ministriesGov.: Other public sector orgs.
Intermediaries: TE-centresIntermediaries: Other intermediaries
Gov.: Innovation support gov. orgs.Gov.: Education support gov. orgs.
Gov.: Other ministriesGov.: Other public sector orgs.
Intermediaries: TE-centresIntermediaries: Other intermediaries
Intermediaries: TE-centresIntermediaries: Other intermediaries
Financing (subsidies, loans, guarantees orcapital investments)
Information services
Promotion of international labor mobility
Internationalizationof companies
Research- and education services
Facilities

Appendix II - Graphical presentation of the survey results
54
3.2. Considerable overlap in the provision of services among public actors of the NIS
In line with the findings reported in conjunction with question 14, there seems to be quite some overlap in the provision of different services among different public institutions of the NIS. Least overlap has been identified in the area of education support services. Q15: Would you say that other PUBLIC actors provide similar services than your organization? (Percentage answering “Yes”)
3.9 %
0.0 %
39.7 %
6.0 %
13.9 %
9.1 %
4.0 %
4.7 %
0 % 10 % 20 % 30 % 40 % 50 % 60 % 70 % 80 % 90 %
Gov.: Innovation support gov. orgs.
Gov.: Education support gov. orgs.
Gov.: Other ministries
Gov.: Other public sector orgs.
Total
Intermediaries: TE-centres
Intermediaries: Other intermediaries
Total
Percent answering”I don’t know”
3.3. Overlap between public and private actors less severe
Overlap with services provided by private actors in the NIS seems to be rather small among public innovation support organiza-tions, education support organizations and ministries. Still, overlap with private sectors actors is strong among other public sector organizations. The private financing sector shares this view, as one third of respondents see, that the public sector pro-vides similar services as their organization. Q16: To public actors & intermediaries: Would you say that other PRIVATE actors provide similar services than your organization? (Percentage answering “Yes”) To financiers (Q5): Would you say that PUBLIC actors provide similar services than your organization? (Percentage answering “Yes”)
0.0 %
0.0 %
39.7 %
10.5 %
16.4 %
9.1 %
6.6 %
6.9 %
9.1 %
0.0 %
Gov.: Innovation support gov. orgs.
Gov.: Education support gov. orgs.
Gov.: Other ministries
Gov.: Other public sector orgs.
Total
Intermediaries: TE-centres
Intermediaries: Other intermediaries
Total
Financing: Business angels and VCs
Financing: Banks, loan officers
0 % 10 % 20 % 30 % 40 % 50 % 60 % 70 % 80 % 90 %Percent answering”I don’t know”
Total 4.5 %
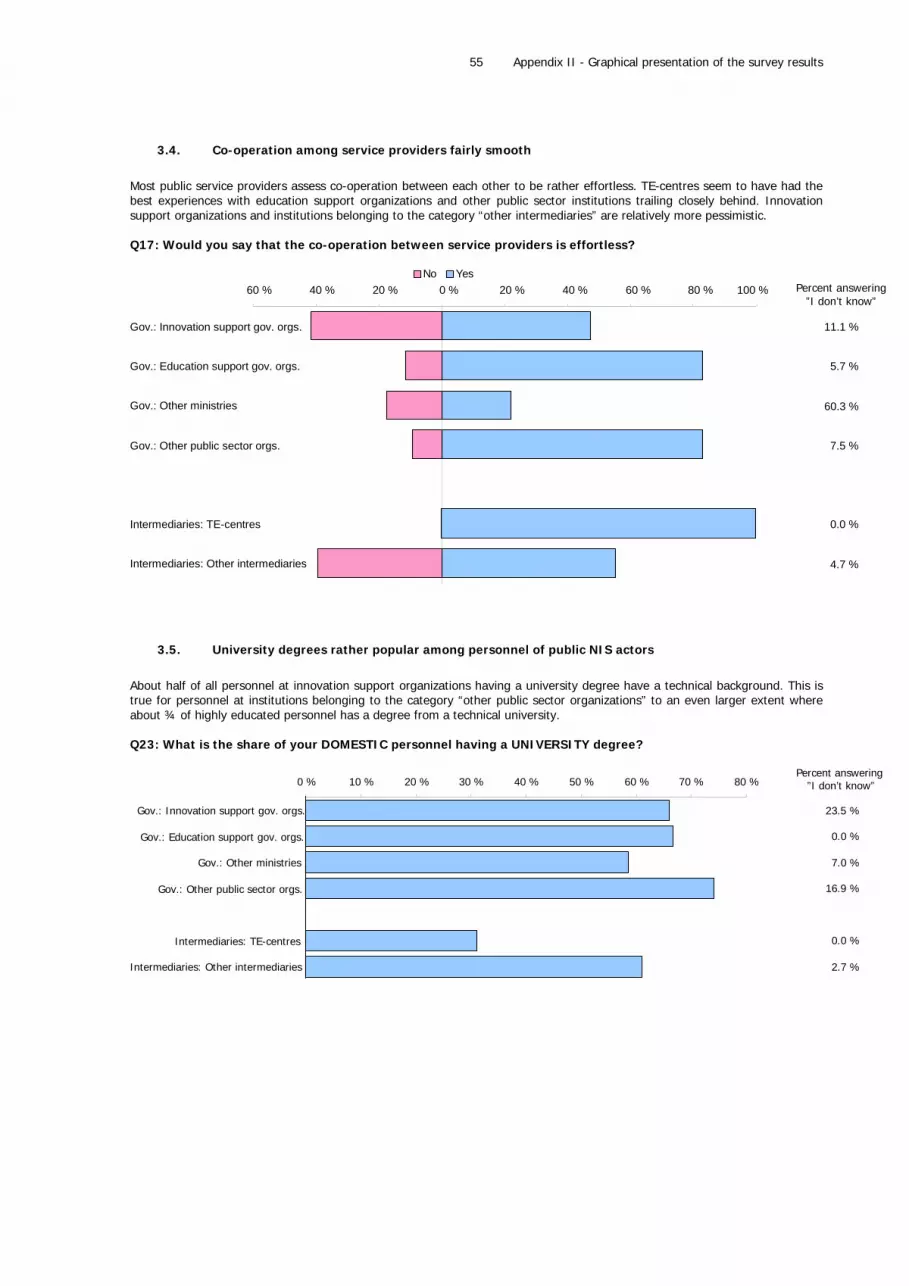
Appendix II - Graphical presentation of the survey results
55
3.4. Co-operation among service providers fairly smooth
Most public service providers assess co-operation between each other to be rather effortless. TE-centres seem to have had the best experiences with education support organizations and other public sector institutions trailing closely behind. Innovation support organizations and institutions belonging to the category “other intermediaries” are relatively more pessimistic. Q17: Would you say that the co-operation between service providers is effortless?
11.1 %
5.7 %
60.3 %
7.5 %
0.0 %
4.7 %
60 % 40 % 20 % 0 % 20 % 40 % 60 % 80 % 100 %
Gov.: Innovation support gov. orgs.
Gov.: Education support gov. orgs.
Gov.: Other ministries
Gov.: Other public sector orgs.
Intermediaries: TE-centres
Intermediaries: Other intermediaries
YesNoPercent answering
”I don’t know”
3.5. University degrees rather popular among personnel of public NIS actors
About half of all personnel at innovation support organizations having a university degree have a technical background. This is true for personnel at institutions belonging to the category “other public sector organizations” to an even larger extent where about ¾ of highly educated personnel has a degree from a technical university. Q23: What is the share of your DOMESTIC personnel having a UNIVERSITY degree?
23.5 %
0.0 %
7.0 %
16.9 %
0.0 %
2.7 %
0 % 10 % 20 % 30 % 40 % 50 % 60 % 70 % 80 %
Gov.: Innovation support gov. orgs.
Gov.: Education support gov. orgs.
Gov.: Other ministries
Gov.: Other public sector orgs.
Intermediaries: TE-centres
Intermediaries: Other intermediaries
Percent answering”I don’t know”

Appendix II - Graphical presentation of the survey results
56
3.6. Technically educated personnel in high demand at innovation support organizations
Q24: What is the share of your DOMESTIC personnel having TECHNICAL UNIVERSITY degree?
41.2 %
22.6%
10.9 %
19.5 %
9.1 %
5.3 %
Gov.: Innovation support gov. orgs.
Gov.: Education support gov. orgs.
Gov.: Other ministries
Gov.: Other public sector orgs.
Intermediaries: TE-centres
Intermediaries: Other intermediaries
0 % 10 % 20 % 30 % 40 % 50 % 60 % 70 % 80 %Percent answering
”I don’t know”
3.7. Funding provided by public actors of the NIS in line with their respective missions
When questioned for the primary recipients of their funding, the responses of public actors were very much in line with their respective missions. Innovation support organizations provide most of their funding to private companies and research organi-zations, universities and public research institutes, and regional operators. Education support organizations fund mainly univer-sities, polytechnics, and public research institutes. TE-centres, having a regional mission, support private companies, universi-ties, polytechnics, and municipalities and their co-operation. Actors in the category “other public sector organizations” are mainly there for supporting private companies.

Appendix II - Graphical presentation of the survey results
57
Q25: Who are the primary users of your services or financing? (Percentage answering “Yes”)
0 % 10 % 20 % 30 % 40 % 50 % 60 % 70 % 80 % 90 % 100 %0 % 10 % 20 % 30 % 40 % 50 % 60 % 70 % 80 % 90 % 100 %
Gov.: Innovation support gov. orgs.Gov.: Education support gov. orgs.
Gov.: Other ministriesGov.: Other public sector orgs.
Intermediaries: TE-centresIntermediaries: Other intermediaries
Gov.: Innovation support gov. orgs.Gov.: Education support gov. orgs.
Gov.: Other ministriesGov.: Other public sector orgs.
Intermediaries: TE-centresIntermediaries: Other intermediaries
Gov.: Innovation support gov. orgs.Gov.: Education support gov. orgs.
Gov.: Other ministriesGov.: Other public sector orgs.
Intermediaries: TE-centresIntermediaries: Other intermediaries
Gov.: Innovation support gov. orgs.Gov.: Education support gov. orgs.
Gov.: Other ministriesGov.: Other public sector orgs.
Intermediaries: TE-centresIntermediaries: Other intermediaries
Gov.: Innovation support gov. orgs.Gov.: Education support gov. orgs.
Gov.: Other ministriesGov.: Other public sector orgs.
Intermediaries: TE-centresIntermediaries: Other intermediaries
Gov.: Innovation support gov. orgs.Gov.: Education support gov. orgs.
Gov.: Other ministriesGov.: Other public sector orgs.
Intermediaries: TE-centresIntermediaries: Other intermediaries
Gov.: Innovation support gov. orgs.Gov.: Education support gov. orgs.
Gov.: Other ministriesGov.: Other public sector orgs.
Intermediaries: TE-centresIntermediaries: Other intermediaries
Gov.: Innovation support gov. orgs.Gov.: Education support gov. orgs.
Gov.: Other ministriesGov.: Other public sector orgs.
Intermediaries: TE-centresIntermediaries: Other intermediaries
Gov.: Innovation support gov. orgs.Gov.: Education support gov. orgs.
Gov.: Other ministriesGov.: Other public sector orgs.
Intermediaries: TE-centresIntermediaries: Other intermediaries
Gov.: Innovation support gov. orgs.Gov.: Education support gov. orgs.
Gov.: Other ministriesGov.: Other public sector orgs.
Intermediaries: TE-centresIntermediaries: Other intermediaries
Gov.: Innovation support gov. orgs.Gov.: Education support gov. orgs.
Gov.: Other ministriesGov.: Other public sector orgs.
Intermediaries: TE-centresIntermediaries: Other intermediaries
Private companies
Private research organizations
Other private organizations
Private persons
Edu./research: Universities
Edu./research: Polytechnics
Edu./research: Othereducational institutes
Public: Research institues
Public: Municipalities
Public: Other regionaloperators (TE-centers, Centers of Expertise or Technoloy etc.)
Public: Other national operators
Question Q26 has been covered in conjunction with companies, see section 3.4.
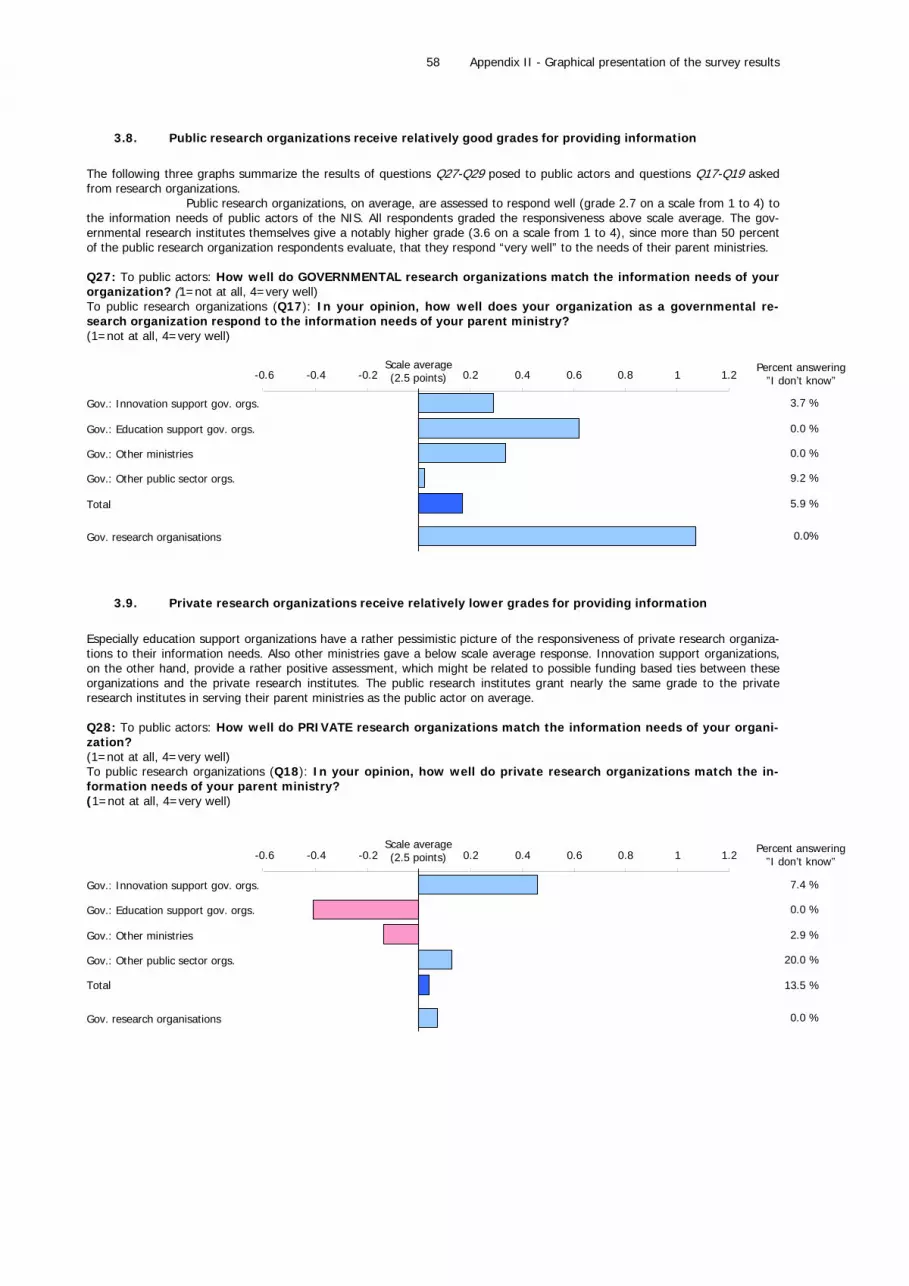
Appendix II - Graphical presentation of the survey results
58
3.8. Public research organizations receive relatively good grades for providing information
The following three graphs summarize the results of questions Q27-Q29 posed to public actors and questions Q17-Q19 asked from research organizations. Public research organizations, on average, are assessed to respond well (grade 2.7 on a scale from 1 to 4) to the information needs of public actors of the NIS. All respondents graded the responsiveness above scale average. The gov-ernmental research institutes themselves give a notably higher grade (3.6 on a scale from 1 to 4), since more than 50 percent of the public research organization respondents evaluate, that they respond “very well” to the needs of their parent ministries. Q27: To public actors: How well do GOVERNMENTAL research organizations match the information needs of your organization? (1=not at all, 4=very well) To public research organizations (Q17): In your opinion, how well does your organization as a governmental re-search organization respond to the information needs of your parent ministry? (1=not at all, 4=very well)
3.7 %
0.0 %
0.0 %
9.2 %
5.9 %
0.0%
-0.6 -0.4 -0.2Scale average(2.5 points) 0.2 0.4 0.6 0.8 1 1.2
Gov.: Innovation support gov. orgs.
Gov.: Education support gov. orgs.
Gov.: Other ministries
Gov.: Other public sector orgs.
Total
Gov. research organisations
Percent answering”I don’t know”
3.9. Private research organizations receive relatively lower grades for providing information
Especially education support organizations have a rather pessimistic picture of the responsiveness of private research organiza-tions to their information needs. Also other ministries gave a below scale average response. Innovation support organizations, on the other hand, provide a rather positive assessment, which might be related to possible funding based ties between these organizations and the private research institutes. The public research institutes grant nearly the same grade to the private research institutes in serving their parent ministries as the public actor on average. Q28: To public actors: How well do PRIVATE research organizations match the information needs of your organi-zation? (1=not at all, 4=very well) To public research organizations (Q18): In your opinion, how well do private research organizations match the in-formation needs of your parent ministry? (1=not at all, 4=very well)
7.4 %
0.0 %
2.9 %
20.0 %
13.5 %
0.0 %
Gov.: Innovation support gov. orgs.
Gov.: Education support gov. orgs.
Gov.: Other ministries
Gov.: Other public sector orgs.
Total
Gov. research organisations
-0.6 -0.4 -0.2 0.2 0.4 0.6 0.8 1 1.2Scale average(2.5 points)
Percent answering”I don’t know”
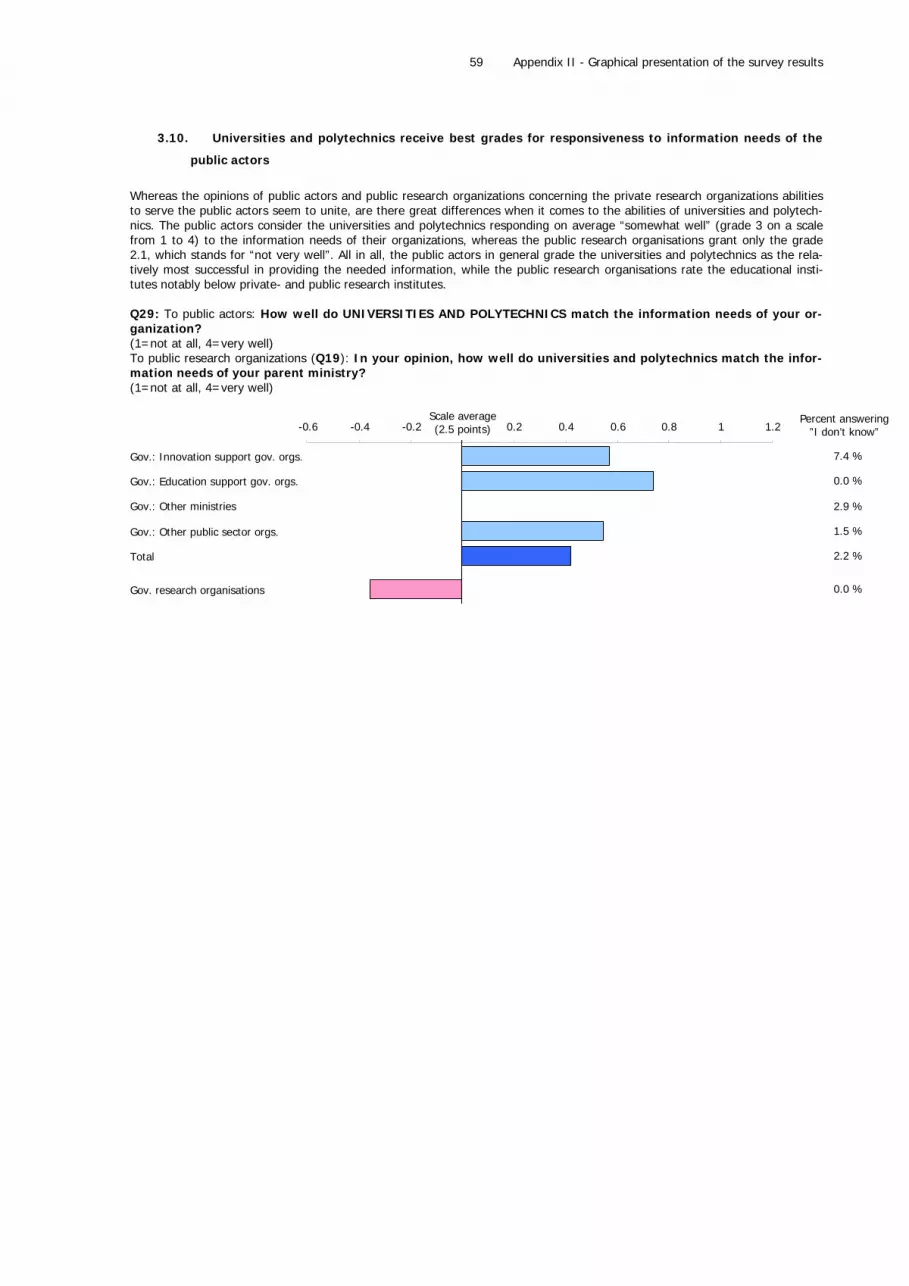
Appendix II - Graphical presentation of the survey results
59
3.10. Universities and polytechnics receive best grades for responsiveness to information needs of the
public actors
Whereas the opinions of public actors and public research organizations concerning the private research organizations abilities to serve the public actors seem to unite, are there great differences when it comes to the abilities of universities and polytech-nics. The public actors consider the universities and polytechnics responding on average “somewhat well” (grade 3 on a scale from 1 to 4) to the information needs of their organizations, whereas the public research organisations grant only the grade 2.1, which stands for “not very well”. All in all, the public actors in general grade the universities and polytechnics as the rela-tively most successful in providing the needed information, while the public research organisations rate the educational insti-tutes notably below private- and public research institutes. Q29: To public actors: How well do UNIVERSITIES AND POLYTECHNICS match the information needs of your or-ganization? (1=not at all, 4=very well) To public research organizations (Q19): In your opinion, how well do universities and polytechnics match the infor-mation needs of your parent ministry? (1=not at all, 4=very well)
7.4 %
0.0 %
2.9 %
1.5 %
2.2 %
0.0 %
Gov.: Innovation support gov. orgs.
Gov.: Education support gov. orgs.
Gov.: Other ministries
Gov.: Other public sector orgs.
Total
Gov. research organisations
-0.6 -0.4 -0.2 0.2 0.4 0.6 0.8 1 1.2Scale average(2.5 points)
Percent answering”I don’t know”
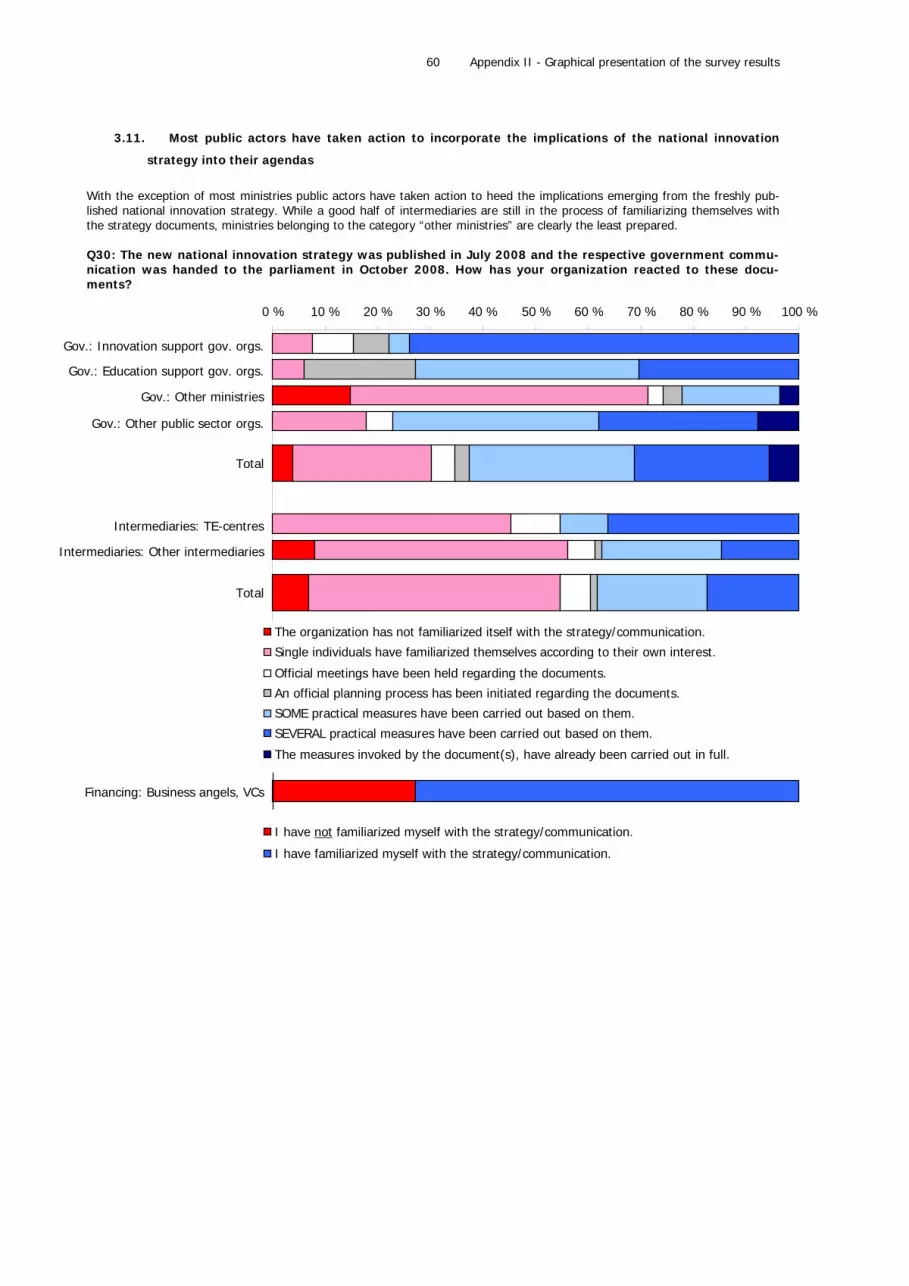
Appendix II - Graphical presentation of the survey results
60
3.11. Most public actors have taken action to incorporate the implications of the national innovation
strategy into their agendas
With the exception of most ministries public actors have taken action to heed the implications emerging from the freshly pub-lished national innovation strategy. While a good half of intermediaries are still in the process of familiarizing themselves with the strategy documents, ministries belonging to the category “other ministries” are clearly the least prepared. Q30: The new national innovation strategy was published in July 2008 and the respective government commu-nication was handed to the parliament in October 2008. How has your organization reacted to these docu-ments?
0 % 10 % 20 % 30 % 40 % 50 % 60 % 70 % 80 % 90 % 100 %
Gov.: Innovation support gov. orgs.
Gov.: Education support gov. orgs.
Gov.: Other ministries
Gov.: Other public sector orgs.
Total
Intermediaries: TE-centres
Intermediaries: Other intermediaries
Total
Financing: Business angels, VCs
The organization has not familiarized itself with the strategy/communication.
Single individuals have familiarized themselves according to their own interest.
Official meetings have been held regarding the documents.
An official planning process has been initiated regarding the documents.
SOME practical measures have been carried out based on them.
SEVERAL practical measures have been carried out based on them.
The measures invoked by the document(s), have already been carried out in full.
I have not familiarized myself with the strategy/communication.
I have familiarized myself with the strategy/communication.
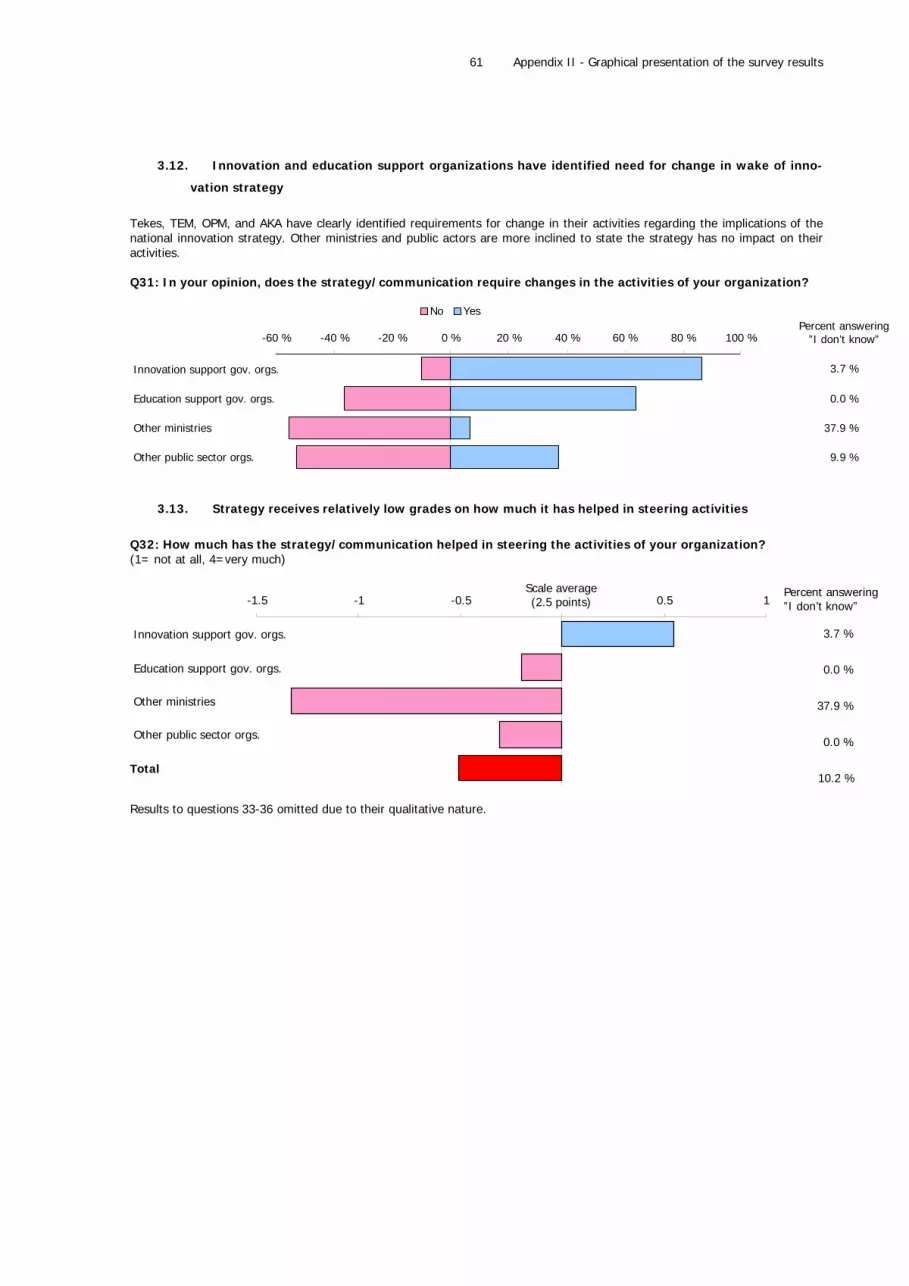
Appendix II - Graphical presentation of the survey results
61
3.12. Innovation and education support organizations have identified need for change in wake of inno-
vation strategy
Tekes, TEM, OPM, and AKA have clearly identified requirements for change in their activities regarding the implications of the national innovation strategy. Other ministries and public actors are more inclined to state the strategy has no impact on their activities. Q31: In your opinion, does the strategy/communication require changes in the activities of your organization?
3.7 %
0.0 %
37.9 %
9.9 %
-60 % -40 % -20 % 0 % 20 % 40 % 60 % 80 % 100 %
Innovation support gov. orgs.
Education support gov. orgs.
Other ministries
Other public sector orgs.
YesNoPercent answering
”I don’t know”
3.13. Strategy receives relatively low grades on how much it has helped in steering activities
Q32: How much has the strategy/communication helped in steering the activities of your organization? (1= not at all, 4=very much)
3.7 %
0.0 %
37.9 %
0.0 %
10.2 %
-1.5 -1 -0.5Scale average(2.5 points) 0.5 1
Innovation support gov. orgs.
Education support gov. orgs.
Other ministries
Other public sector orgs.
Total
Percent answering”I don’t know”
Results to questions 33-36 omitted due to their qualitative nature.

Appendix II - Graphical presentation of the survey results
62
4. Additional questions posed to RESEARCH ORGANIZATIONS
4.1. Public funding the most important funding source
Question 14 mapped the financing sources of research institutes and intermediaries. For the intermediaries the government and municipalities are important sources of funding, whereas non-public research institutes get most of their funding from Tekes and the EU. The same question was also posed to the intermediaries (Q 27). Q14: What are your sources of funding? If your funding structure varies from year to year, please answer using the average of the last three years.
0 % 10 % 20 % 30 % 40 % 50 % 60 % 70 %
Intermediaries: TE-centresIntermediaries: Other intermediaries
Research: Public research institutesResearch: Other research instititutes
Intermediaries: TE-centresIntermediaries: Other intermediaries
Research: Public research institutesResearch: Other research instititutes
Intermediaries: TE-centresIntermediaries: Other intermediaries
Research: Public research institutesResearch: Other research instititutes
Intermediaries: TE-centresIntermediaries: Other intermediaries
Research: Public research institutesResearch: Other research instititutes
Intermediaries: Other intermediaries
Research: Public research institutesResearch: Other research instititutes
Intermediaries: Other intermediaries
Research: Public research institutesResearch: Other research instititutes
Intermediaries: TE-centresIntermediaries: Other intermediaries
Research: Public research institutesResearch: Other research instititutes
Intermediaries: Other intermediaries
Research: Public research institutesResearch: Other research instititutes
Government’s budget
Municipalities
EU
Tekes
Other public sources
Private companies
Privatefoundations
Other private sources

Appendix II - Graphical presentation of the survey results
63
4.2. Public decision making and information for the public good research institutes’ the most important
instances for research institutes
In question 15 the research institutes were asked to evaluate, to which extent they serve the named instances on a scale from “not at all” (=1 points) to “very much” (=4 points). The most important instances are public decision making on national level and providing information for the public good. The graph illustrates the deviation from the grading scale average 2.5 points. Q15: To what extent does your research serve the following instances? (1=not at all, 4=very much)
-0.4Scale average(2.5 points) 0.4 0.8 1.2
Public research institutes
Other research institutes
Total
Public research institutes
Other research institutes
Total
Public research institutes
Other research institutes
Total
Public research institutes
Other research institutes
Total
Public research institutes
Other research institutes
Total
Public decision makingon national level
Public decision makingon regional level
Public decision makingon international level
Companies
We provide informationfor the public good
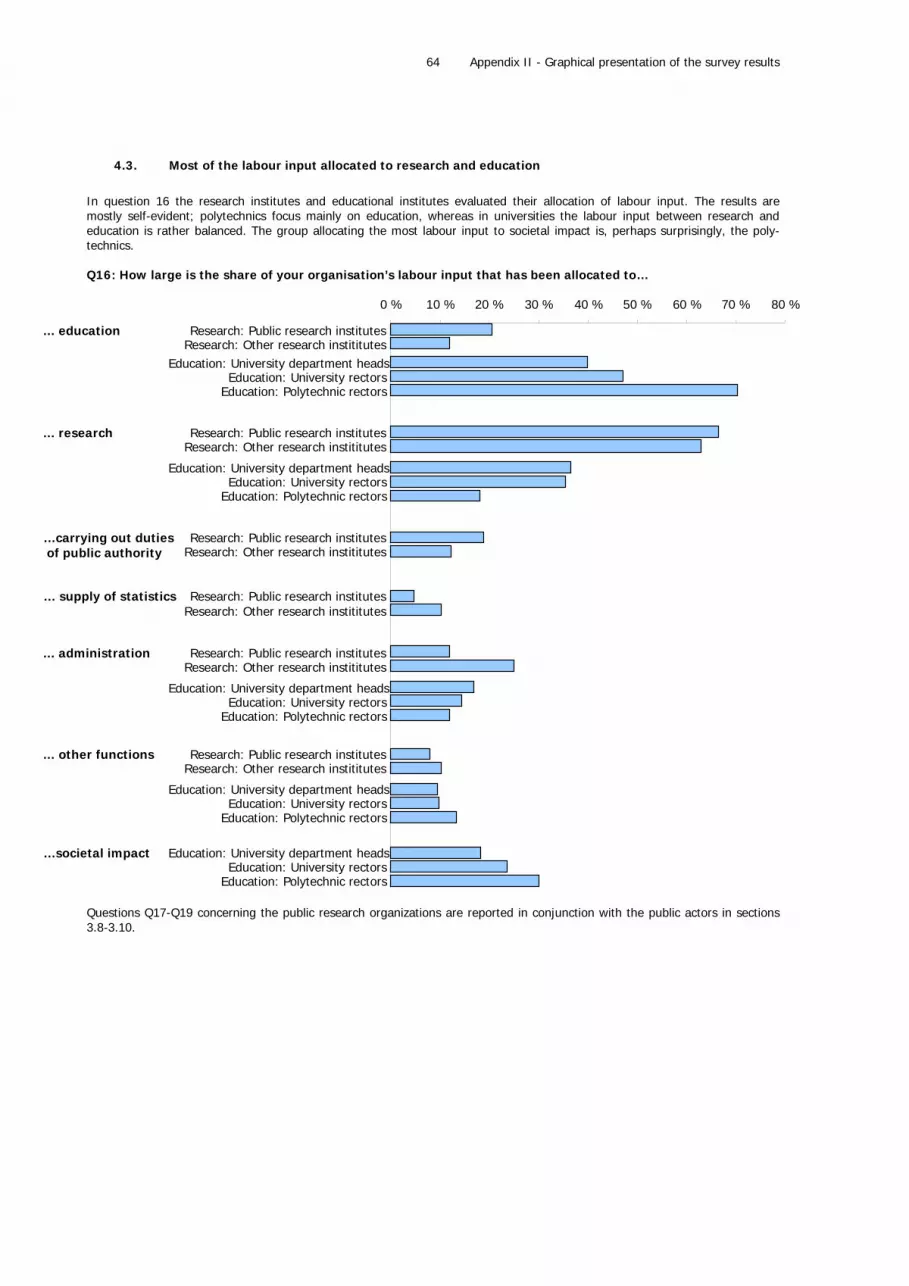
Appendix II - Graphical presentation of the survey results
64
4.3. Most of the labour input allocated to research and education
In question 16 the research institutes and educational institutes evaluated their allocation of labour input. The results are mostly self-evident; polytechnics focus mainly on education, whereas in universities the labour input between research and education is rather balanced. The group allocating the most labour input to societal impact is, perhaps surprisingly, the poly-technics. Q16: How large is the share of your organisation’s labour input that has been allocated to…
0 % 10 % 20 % 30 % 40 % 50 % 60 % 70 % 80 %
Research: Public research institutesResearch: Other research instititutes
Education: University department headsEducation: University rectors
Education: Polytechnic rectors
Research: Public research institutesResearch: Other research instititutes
Education: University department headsEducation: University rectors
Education: Polytechnic rectors
Research: Public research institutesResearch: Other research instititutes
Research: Public research institutesResearch: Other research instititutes
Research: Public research institutesResearch: Other research instititutes
Education: University department headsEducation: University rectors
Education: Polytechnic rectors
Research: Public research institutesResearch: Other research instititutes
Education: University department headsEducation: University rectors
Education: Polytechnic rectors
Education: University department headsEducation: University rectors
Education: Polytechnic rectors
... education
... research
…carrying out dutiesof public authority
… supply of statistics
... administration
... other functions
…societal impact
Questions Q17-Q19 concerning the public research organizations are reported in conjunction with the public actors in sections 3.8-3.10.

Appendix II - Graphical presentation of the survey results
65
5. Additional questions posed to UNIVERSITY and POLYTECHNIC RECTORS and UNIVERSITY DEPARTMENT
HEADS
Results to question 14 are reported in conjunction with those for research organizations (Q16) in section 4.3.
5.1. Universities most significant and private research organizations least significant partners in coop-
eration
Unsurprisingly the educational sector regarded universities in Finland and abroad the most significant partners in cooperative projects. Domestic companies received also rather positive grades, especially from rectors at polytechnics. All other actors received only below scale average grades with private research organizations performing least well. Respondents were asked to rate the given options on a scale from 1 (not at all important) to 4 (very important). The figure below displays answers as point deviations from the scale average (2.5). Q15: How significant was the role of the following actors in cooperative projects of your department in the last three years? (1=None, 4=Very large)
0.0 %
0.0 %0.0 %
0.0 %
0.0 %0.0 %
University rectorsPolytechnic rectors
University department headsUniversity rectors
Polytechnic rectors
University department heads
University rectorsPolytechnic rectors
University department headsUniversity rectors
Polytechnic rectors
University department heads
University rectorsPolytechnic rectors
University department heads
University rectorsPolytechnic rectors
University department headsUniversity rectors
Polytechnic rectors
University department heads
University rectorsPolytechnic rectors
Domestic universities
Foreign universities
Polytechnics
Public researchorganizations
Private researchorganizations
Open internetcommunities
Domestic companies
Foreign companies
University department heads
0.0 %
0.0 %0.0 %
0.0 %
0.0 %0.0 %
0.5 %
0.0 %0.0 %
0.5 %
0.0 %0.0 %
2.0 %
0.0 %0.0 %
2.0 %
0.0 %0.0 %
5.9 %
0.0 %5.9 %
5.9 %
0.0 %5.9 %
0.0 %
0.0 %0.0 %
0.0 %
0.0 %0.0 %
1.5 %
0.0 %0.0 %
1.5 %
0.0 %0.0 %
0.0 %
0.0 %0.0 %
0.0 %
0.0 %0.0 %
-1 -0.5Scale average
(2.5 points) 0.5 1 1.5Percent answering”I don’t know”
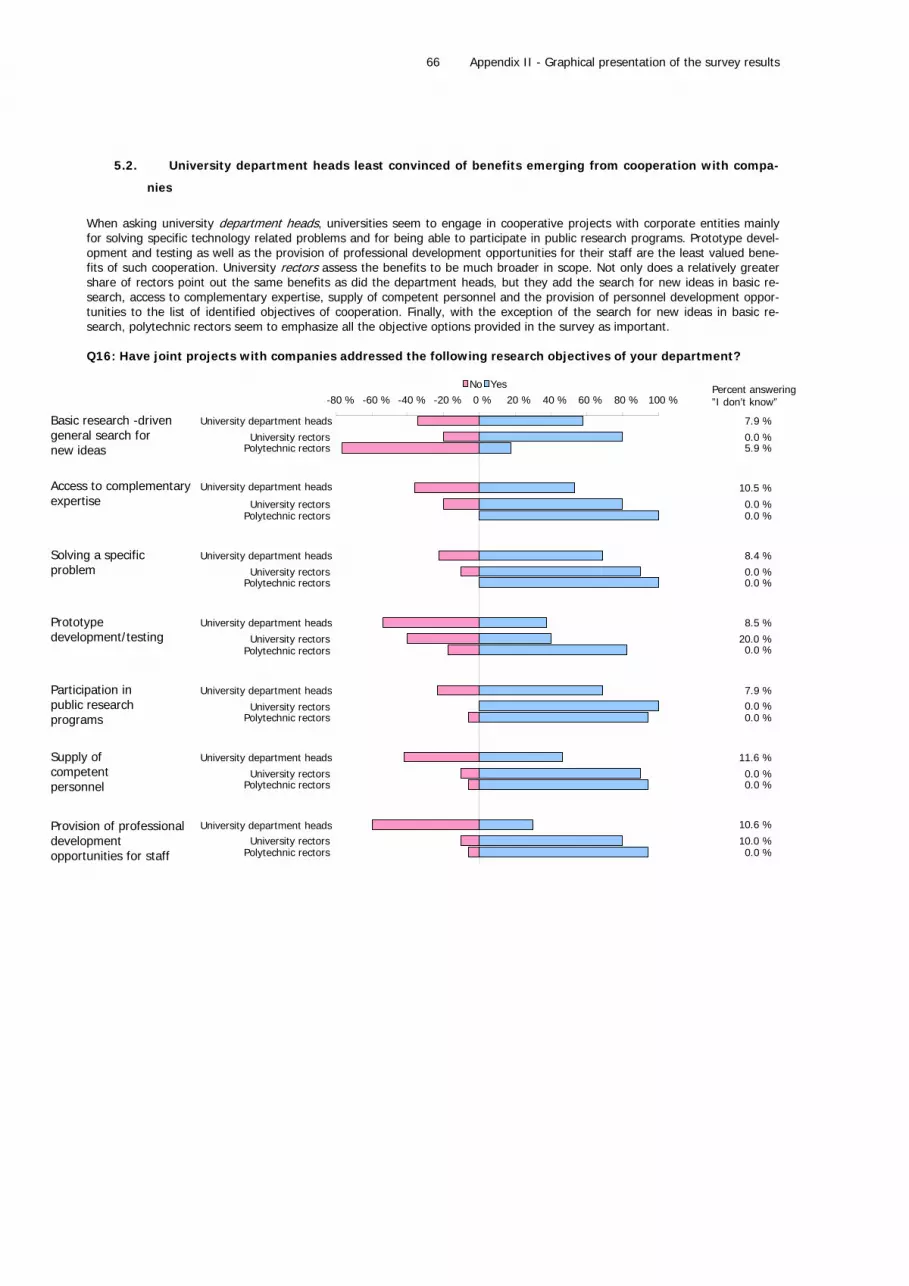
Appendix II - Graphical presentation of the survey results
66
5.2. University department heads least convinced of benefits emerging from cooperation with compa-
nies
When asking university department heads, universities seem to engage in cooperative projects with corporate entities mainly for solving specific technology related problems and for being able to participate in public research programs. Prototype devel-opment and testing as well as the provision of professional development opportunities for their staff are the least valued bene-fits of such cooperation. University rectors assess the benefits to be much broader in scope. Not only does a relatively greater share of rectors point out the same benefits as did the department heads, but they add the search for new ideas in basic re-search, access to complementary expertise, supply of competent personnel and the provision of personnel development oppor-tunities to the list of identified objectives of cooperation. Finally, with the exception of the search for new ideas in basic re-search, polytechnic rectors seem to emphasize all the objective options provided in the survey as important. Q16: Have joint projects with companies addressed the following research objectives of your department?
7.9 %
0.0 %5.9 %
10.5 %
0.0 %0.0 %
8.4 %
0.0 %0.0 %
8.5 %
20.0 %0.0 %
7.9 %0.0 %0.0 %
11.6 %
0.0 %0.0 %
10.6 %
10.0 %0.0 %
University department heads
University rectorsPolytechnic rectors
University department heads
University rectorsPolytechnic rectors
University department heads
University rectorsPolytechnic rectors
University department heads
University rectorsPolytechnic rectors
University department heads
University rectorsPolytechnic rectors
University department heads
University rectorsPolytechnic rectors
University department headsUniversity rectors
Polytechnic rectors
-80 % -60 % -40 % -20 % 0 % 20 % 40 % 60 % 80 % 100 %YesNo
Prototype development/testing
Solving a specific problem
Supply of competent personnel
Participation in public research programs
Provision of professional development opportunities for staff
Basic research -driven general search for new ideas
Access to complementaryexpertise
Percent answering”I don’t know”
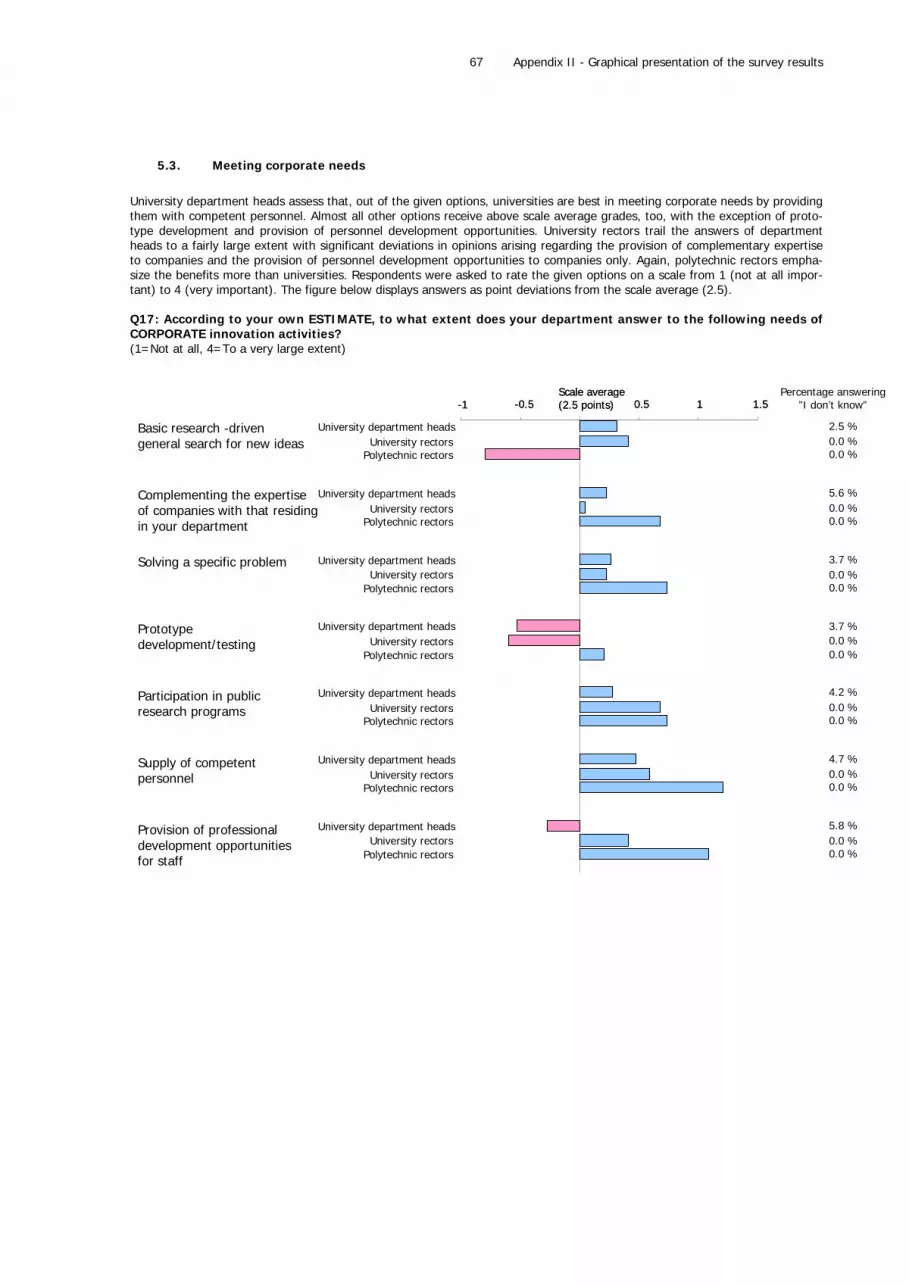
Appendix II - Graphical presentation of the survey results
67
5.3. Meeting corporate needs
University department heads assess that, out of the given options, universities are best in meeting corporate needs by providing them with competent personnel. Almost all other options receive above scale average grades, too, with the exception of proto-type development and provision of personnel development opportunities. University rectors trail the answers of department heads to a fairly large extent with significant deviations in opinions arising regarding the provision of complementary expertise to companies and the provision of personnel development opportunities to companies only. Again, polytechnic rectors empha-size the benefits more than universities. Respondents were asked to rate the given options on a scale from 1 (not at all impor-tant) to 4 (very important). The figure below displays answers as point deviations from the scale average (2.5). Q17: According to your own ESTIMATE, to what extent does your department answer to the following needs of CORPORATE innovation activities? (1=Not at all, 4=To a very large extent)
2.5 %0.0 %0.0 %
5.6 %0.0 %0.0 %
3.7 %0.0 %0.0 %
3.7 %0.0 %0.0 %
4.2 %0.0 %0.0 %
4.7 %0.0 %0.0 %
5.8 %0.0 %0.0 %
University department headsUniversity rectors
Polytechnic rectors
University department headsUniversity rectors
Polytechnic rectors
University department headsUniversity rectors
Polytechnic rectors
University department headsUniversity rectors
Polytechnic rectors
University department headsUniversity rectors
Polytechnic rectors
University department headsUniversity rectors
Polytechnic rectors
University department headsUniversity rectors
Polytechnic rectors
Basic research -driven general search for new ideas
-1 -0.5Scale average(2.5 points) 0.5 1 1.5-1 -0.5Scale average(2.5 points) 0.5 1 1.5
Complementing the expertise of companies with that residing in your department
Solving a specific problem
Prototypedevelopment/testing
Participation in public research programs
Supply of competentpersonnel
Provision of professional development opportunitiesfor staff
Percentage answering”I don’t know”
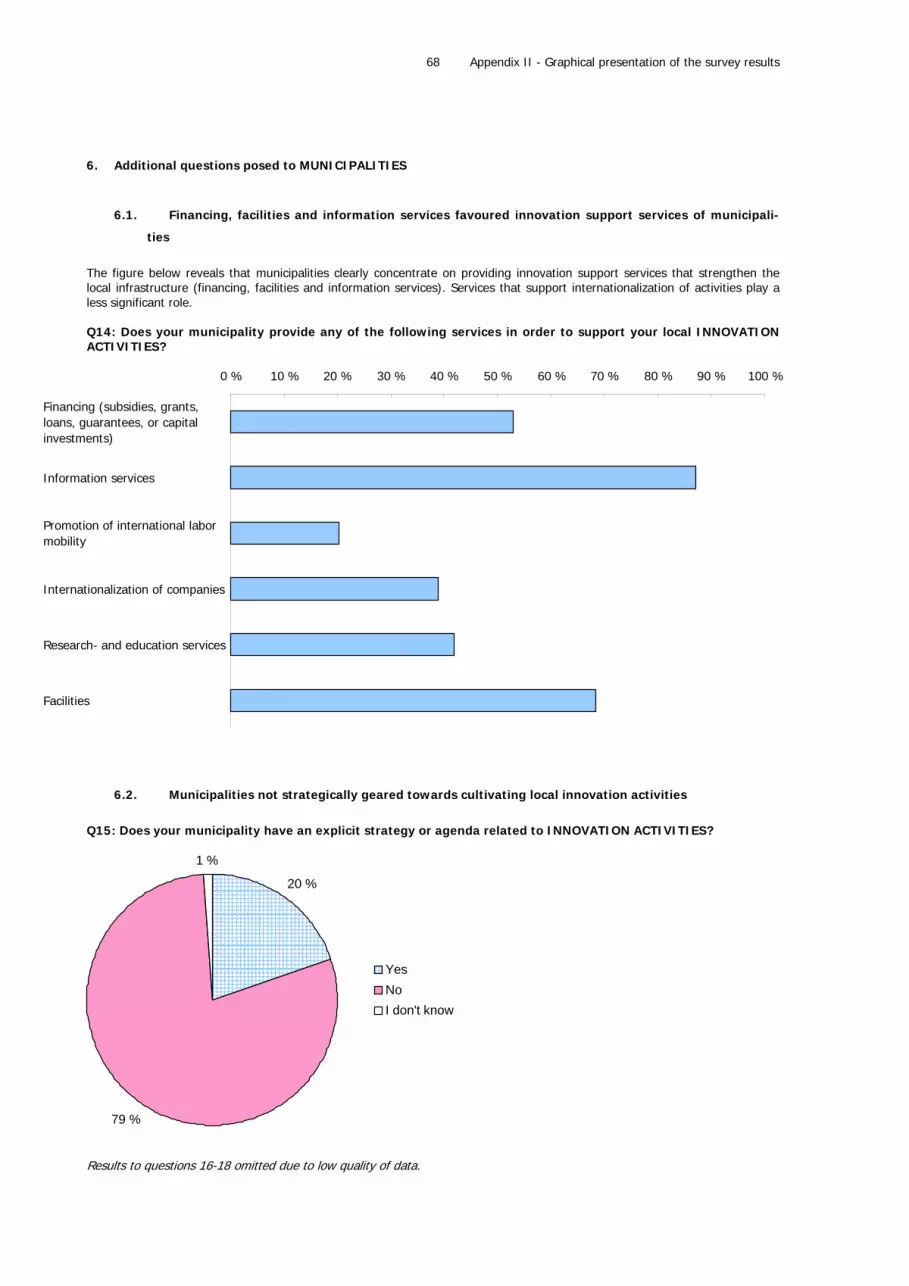
Appendix II - Graphical presentation of the survey results
68
6. Additional questions posed to MUNICIPALITIES
6.1. Financing, facilities and information services favoured innovation support services of municipali-
ties
The figure below reveals that municipalities clearly concentrate on providing innovation support services that strengthen the local infrastructure (financing, facilities and information services). Services that support internationalization of activities play a less significant role. Q14: Does your municipality provide any of the following services in order to support your local INNOVATION ACTIVITIES?
0 % 10 % 20 % 30 % 40 % 50 % 60 % 70 % 80 % 90 % 100 %
Financing (subsidies, grants,loans, guarantees, or capitalinvestments)
Information services
Promotion of international labormobility
Internationalization of companies
Research- and education services
Facilities
6.2. Municipalities not strategically geared towards cultivating local innovation activities
Q15: Does your municipality have an explicit strategy or agenda related to INNOVATION ACTIVITIES?
20 %
79 %
1 %
YesNoI don't know
Results to questions 16-18 omitted due to low quality of data.

Appendix II - Graphical presentation of the survey results
69
6.3. Lack of innovation support strategies apparent in municipal procurement choices
Q19: Has innovativeness been a central criterion in the selection of service providers or goods suppliers in your municipality?
33 %
50 %
8 %
9 %
NeverSeldomOftenI don't know
6.4. Municipalities convinced of the potential impact of strategic procurement choices on the further-
ance of local innovation activities
Q20: Would you say it is possible to support the promotion of innovation activities through public procurement?
73 %
18 %
9 %
YesNoI don't know
Despite not applying a strategic approach to procurement that would support local innovation activities (see Q19 and Q20) municipalities believe in its potential impact.

Appendix II - Graphical presentation of the survey results
70
7. Additional questions posed to FOUNDATIONS
7.1. Most foundations convinced of their increasing importance as part of the NIS
Almost 60% of foundations think that the role of foundations in the NIS is increasing in the future. A third of foundations think there will be no change in impact. Q5: How would you assess the development of the importance of foundations in the Finnish innovation system in the next five years?
4 %
30 %
57 %
9 %
Decreasing
No change
Increasing
I don't know
7.2. Mixed feelings on the restrictiveness of legislation and its impact on support possibilities of foun-
dations
Q6: Should the legislation regarding foundations be reformed to improve foundations’ possibilities to support science, arts, and research?
43 %
35 %
22 %
No need for changesYes (how?)I don’t know
The respondents chose one of the above options. In addition, in the YES -option respondents were presented with the possibil-ity to input an open answer.
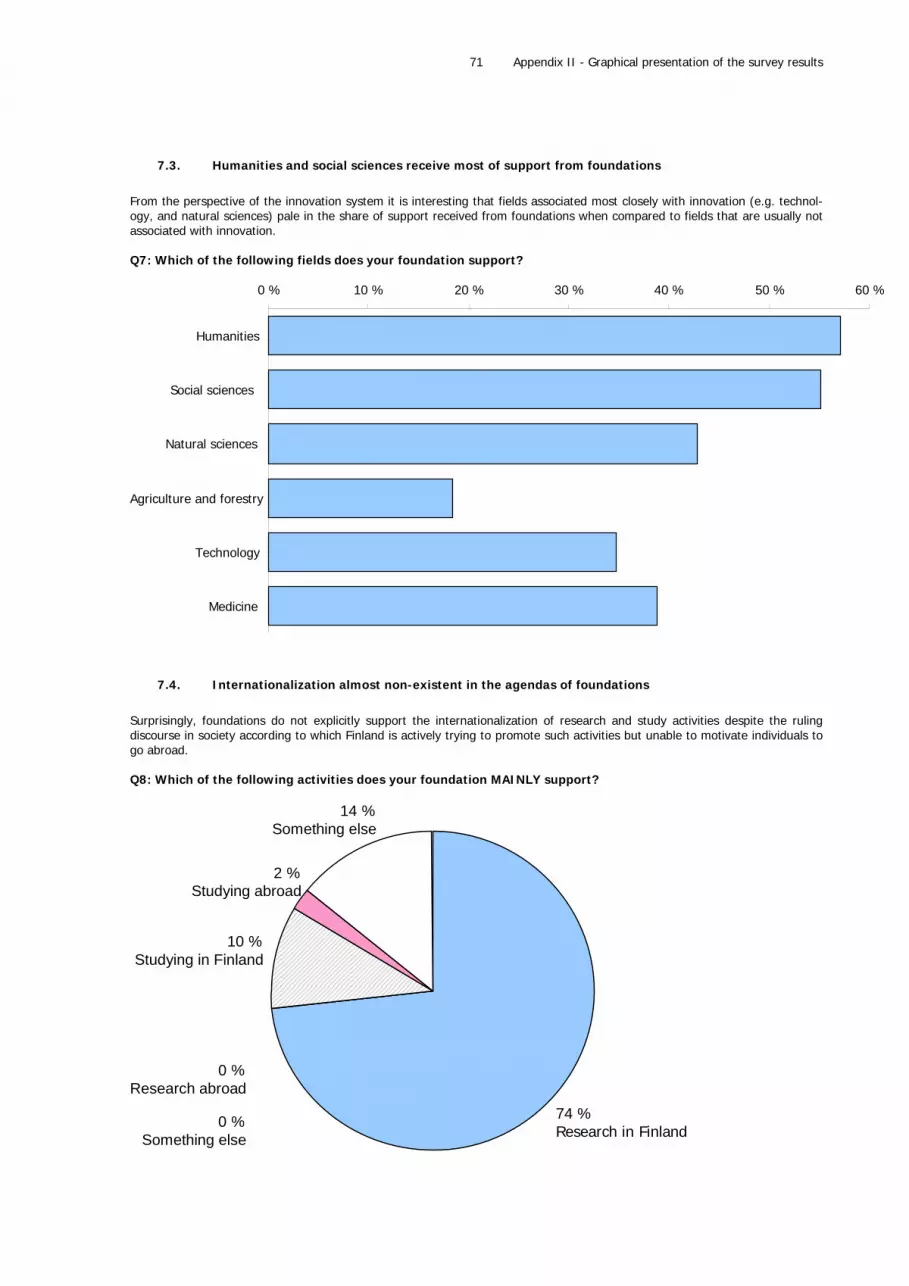
Appendix II - Graphical presentation of the survey results
71
7.3. Humanities and social sciences receive most of support from foundations
From the perspective of the innovation system it is interesting that fields associated most closely with innovation (e.g. technol-ogy, and natural sciences) pale in the share of support received from foundations when compared to fields that are usually not associated with innovation. Q7: Which of the following fields does your foundation support?
0 % 10 % 20 % 30 % 40 % 50 % 60 %
Humanities
Social sciences
Natural sciences
Agriculture and forestry
Technology
Medicine
7.4. Internationalization almost non-existent in the agendas of foundations
Surprisingly, foundations do not explicitly support the internationalization of research and study activities despite the ruling discourse in society according to which Finland is actively trying to promote such activities but unable to motivate individuals to go abroad. Q8: Which of the following activities does your foundation MAINLY support?
74 %Research in Finland
0 %Something else
10 %Studying in Finland
2 %Studying abroad
0 %Research abroad
14 %Something else
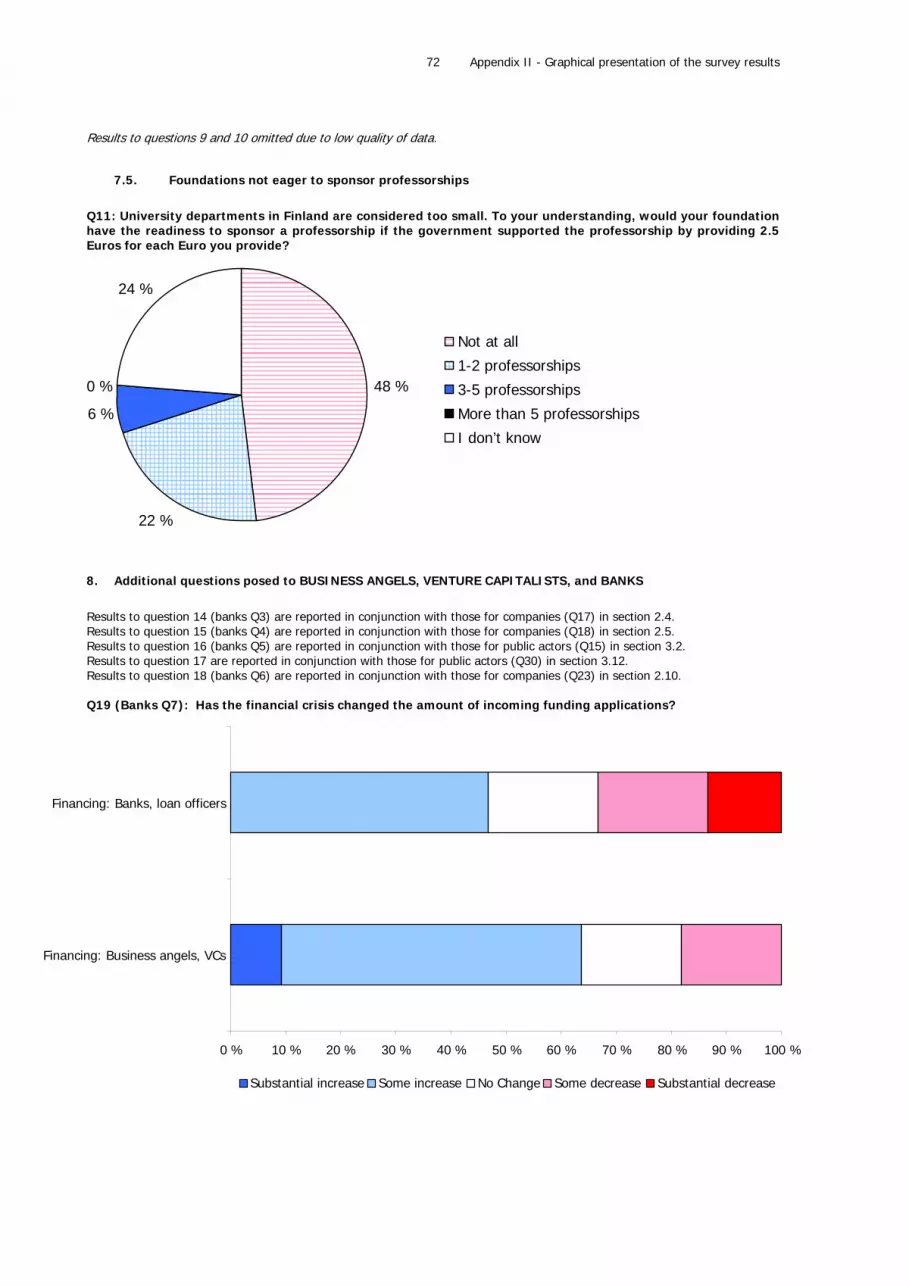
Appendix II - Graphical presentation of the survey results
72
Results to questions 9 and 10 omitted due to low quality of data.
7.5. Foundations not eager to sponsor professorships
Q11: University departments in Finland are considered too small. To your understanding, would your foundation have the readiness to sponsor a professorship if the government supported the professorship by providing 2.5 Euros for each Euro you provide?
48 %
22 %
6 %
0 %
24 %
Not at all
1-2 professorships
3-5 professorships
More than 5 professorships
I don’t know
8. Additional questions posed to BUSINESS ANGELS, VENTURE CAPITALISTS, and BANKS
Results to question 14 (banks Q3) are reported in conjunction with those for companies (Q17) in section 2.4. Results to question 15 (banks Q4) are reported in conjunction with those for companies (Q18) in section 2.5. Results to question 16 (banks Q5) are reported in conjunction with those for public actors (Q15) in section 3.2. Results to question 17 are reported in conjunction with those for public actors (Q30) in section 3.12. Results to question 18 (banks Q6) are reported in conjunction with those for companies (Q23) in section 2.10. Q19 (Banks Q7): Has the financial crisis changed the amount of incoming funding applications?
0 % 10 % 20 % 30 % 40 % 50 % 60 % 70 % 80 % 90 % 100 %
Financing: Business angels, VCs
Financing: Banks, loan officers
Substantial increase Some increase No Change Some decrease Substantial decrease
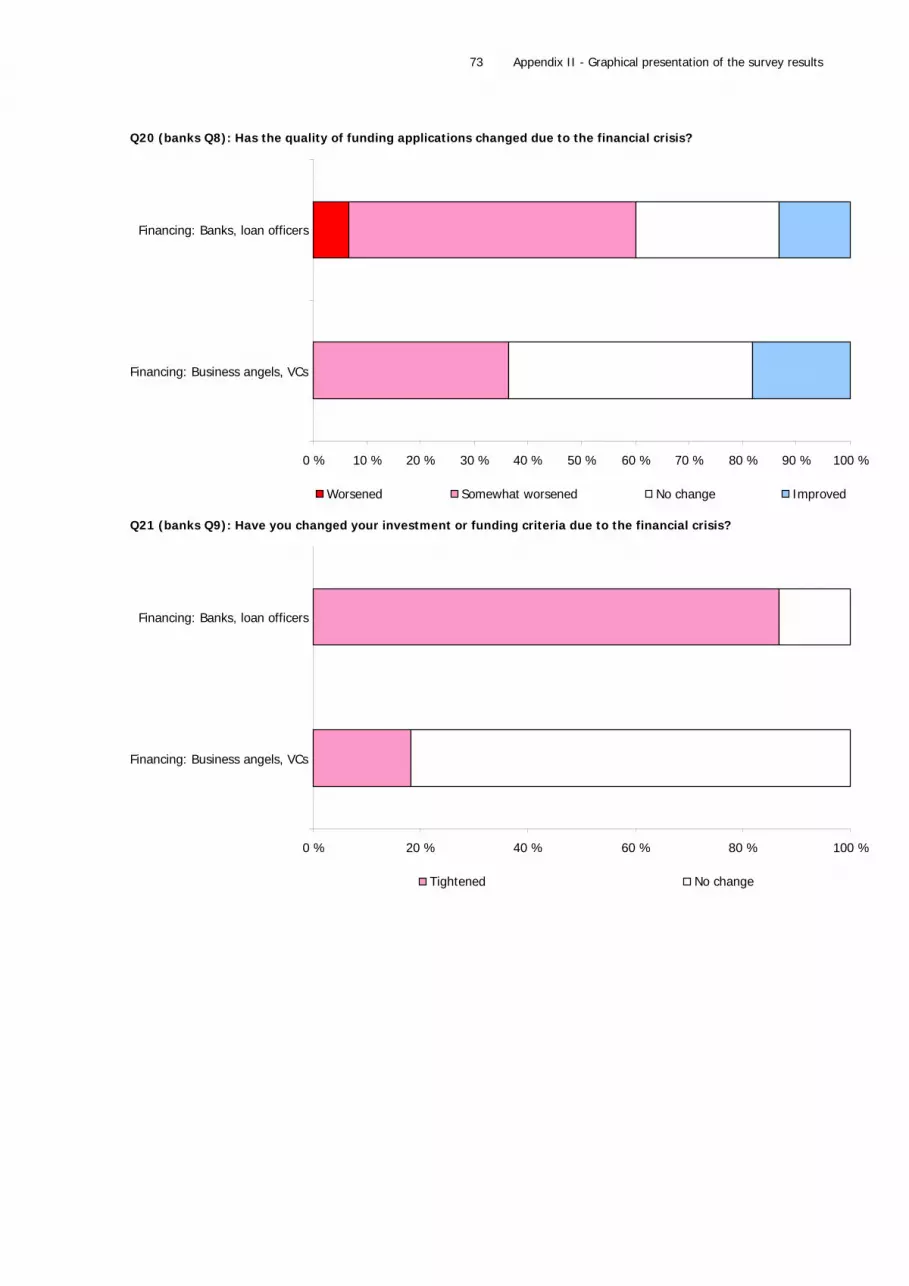
Appendix II - Graphical presentation of the survey results
73
Q20 (banks Q8): Has the quality of funding applications changed due to the financial crisis?
0 % 10 % 20 % 30 % 40 % 50 % 60 % 70 % 80 % 90 % 100 %
Financing: Business angels, VCs
Financing: Banks, loan officers
Worsened Somewhat worsened No change Improved Q21 (banks Q9): Have you changed your investment or funding criteria due to the financial crisis?
0 % 20 % 40 % 60 % 80 % 100 %
Financing: Business angels, VCs
Financing: Banks, loan officers
Tightened No change
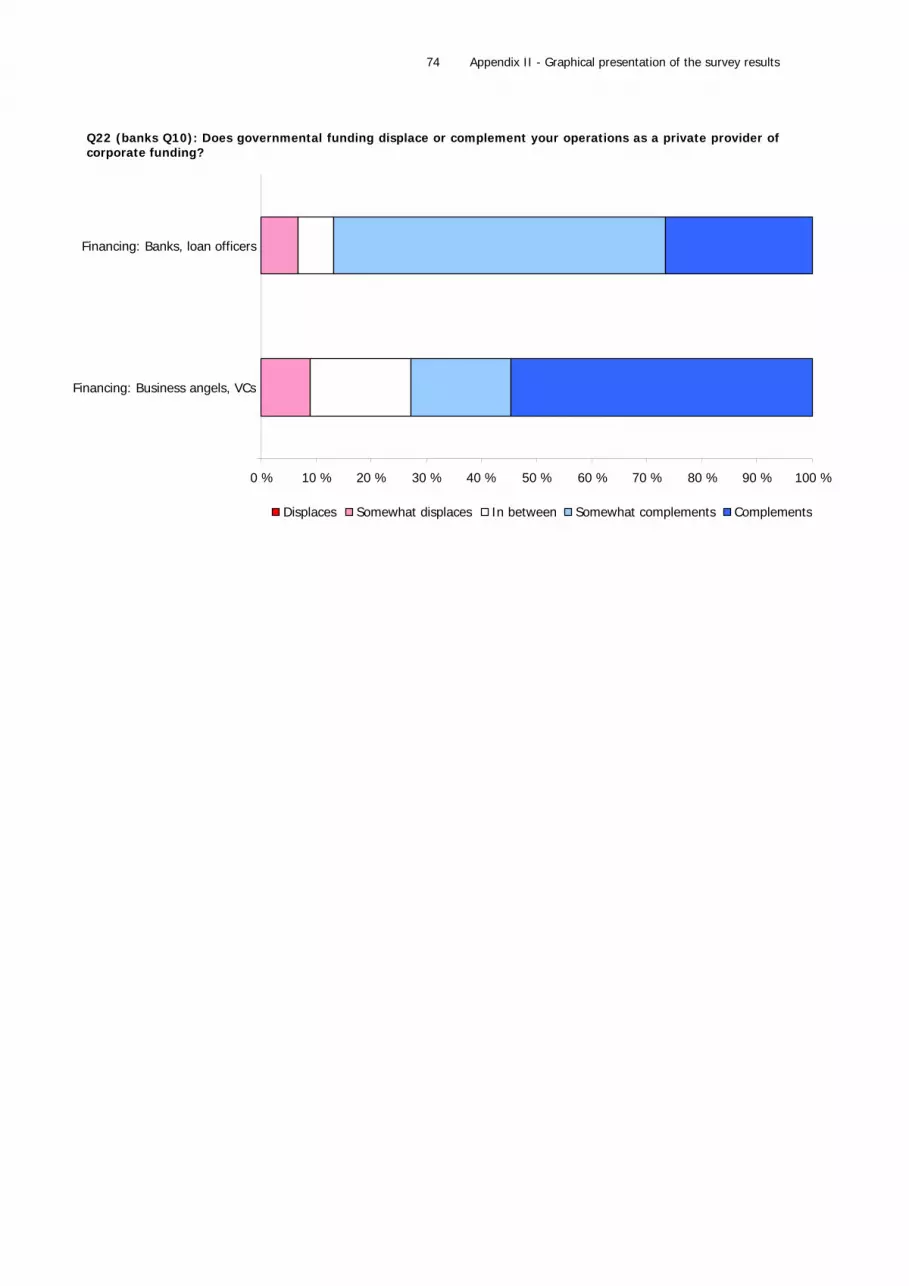
Appendix II - Graphical presentation of the survey results
74
Q22 (banks Q10): Does governmental funding displace or complement your operations as a private provider of corporate funding?
0 % 10 % 20 % 30 % 40 % 50 % 60 % 70 % 80 % 90 % 100 %
Financing: Business angels, VCs
Financing: Banks, loan officers
Displaces Somewhat displaces In between Somewhat complements Complements

Appendix III - Complete data tables
75
APPENDIX III - Complete data tables
QUESTIONS 1-13
1-3 How would you grade the national innovation system…5 years ago today in 5 years
Firms: Smaller innovative firms 6.7 7.0 7.4Firms: Larger innovative firms 6.9 7.2 7.5Firms: Other firms 6.6 7.0 7.5
Gov.: Innovation support gov. orgs. 7.8 7.8 8.2Gov.: Education support gov. orgs. 7.3 8.0 8.6Gov.: Other ministries 6.5 7.1 7.8Gov.: Other public sector orgs. 7.2 7.4 8.1
Education: University department heads 7.0 7.3 7.4Education: University rectors 6.5 7.1 7.8Education: Polytechnic rectors 6.8 7.6 8.1Associations 7.0 7.6 8.2Municipalities 7.1 7.5 7.9Research: Public research institutes 8.4 8.3 8.0Research: Other research instititutes 7.5 7.6 7.7Intermediaries: TE-centres 7.4 7.4 7.8Intermediaries: Other intermediaries 6.9 7.3 7.9Foundations 7.0 7.5 7.7Financing: Business angels and VCs 6.7 7.5 7.8Financing: Banks, loan officers - 6.7 -
Average 7.1 7.4 7.9
4 How would you describe the regime constituted by the PUBLIC SECTOR actors in the NIS?
Very simple Rather simpleRather
complicated Very simple I don't know
Firms: Smaller innovative firms 1.4 % 13.1 % 55.1 % 16.1 % 14.3 %Firms: Larger innovative firms 0.5 % 14.5 % 56.5 % 15.7 % 12.9 %Firms: Other firms 0.6 % 13.0 % 39.4 % 8.9 % 38.2 %
Total 1.0 % 13.3 % 50.1 % 13.6 % 22.0 %
Gov.: Innovation support gov. orgs. 6.3 % 12.5 % 60.7 % 20.5 % 0.0 %Gov.: Education support gov. orgs. 12.5 % 42.5 % 40.0 % 5.0 % 0.0 %Gov.: Other ministries 3.6 % 2.9 % 93.6 % 0.0 % 0.0 %Gov.: Other public sector orgs. 0.0 % 16.7 % 63.9 % 19.4 % 0.0 %
Total 2.2 % 14.8 % 69.2 % 13.8 % 0.0 %
Education: University department heads 0.5 % 13.4 % 54.8 % 17.1 % 14.3 %Education: University rectors 0.0 % 0.0 % 54.6 % 36.4 % 9.1 %Education: Polytechnic rectors 0.0 % 11.8 % 64.7 % 17.7 % 5.9 %Associations 0.0 % 12.0 % 64.0 % 16.0 % 8.0 %Municipalities 0.0 % 15.0 % 66.1 % 17.6 % 1.3 %Research: Public research institutes 0.0 % 28.6 % 71.4 % 0.0 % 0.0 %Research: Other research instititutes 0.0 % 14.3 % 42.9 % 42.9 % 0.0 %Intermediaries: TE-centres 0.0 % 9.1 % 54.6 % 36.4 % 0.0 %Intermediaries: Other intermediaries 0.0 % 6.6 % 55.3 % 35.5 % 2.6 %Foundations 0.0 % 10.5 % 59.7 % 12.3 % 17.5 %Financing: Business angels and VCs 0.0 % 9.1 % 45.5 % 45.5 % 0.0 %
Total 0.2 % 11.8 % 58.0 % 20.5 % 9.5 %

Appendix III - Complete data tables
76
5
5a Finnish Funding Agency for Technology and Innovation (TEKES)
Not at all important
Not very important Rather important Very important I don't know
Firms: Smaller innovative firms 7.4 % 16.2 % 27.9 % 45.6 % 2.9 %Firms: Larger innovative firms 4.7 % 12.7 % 34.5 % 44.6 % 3.5 %Firms: Other firms 15.6 % 27.3 % 24.0 % 22.1 % 11.0 %
Total 9.1 % 18.5 % 28.0 % 39.1 % 5.2 %
Gov.: Innovation support gov. orgs. 0.0 % 0.0 % 3.6 % 96.4 % 0.0 %Gov.: Education support gov. orgs. 0.0 % 0.0 % 0.0 % 100.0 % 0.0 %Gov.: Other ministries 7.1 % 7.1 % 13.6 % 57.9 % 14.3 %Gov.: Other public sector orgs. 0.0 % 0.0 % 5.6 % 93.1 % 1.4 %
Total 1.7 % 1.7 % 7.0 % 85.3 % 4.3 %
Education: University department heads 10.6 % 9.7 % 21.7 % 56.5 % 1.5 %Education: University rectors 0.0 % 10.0 % 10.0 % 80.0 % 0.0 %Education: Polytechnic rectors 0.0 % 0.0 % 5.9 % 94.1 % 0.0 %Associations 0.0 % 0.0 % 28.0 % 72.0 % 0.0 %Municipalities 2.3 % 15.1 % 34.1 % 46.0 % 2.5 %Research: Public research institutes 0.0 % 0.0 % 14.3 % 85.7 % 0.0 %Research: Other research instititutes 0.0 % 0.0 % 28.6 % 71.4 % 0.0 %Intermediaries: TE-centres 0.0 % 0.0 % 18.2 % 81.8 % 0.0 %Intermediaries: Other intermediaries 2.6 % 2.6 % 17.1 % 77.6 % 0.0 %Financing: Business angels and VCs 0.0 % 0.0 % 9.1 % 90.9 % 0.0 %
Total 1.6 % 3.7 % 18.7 % 75.6 % 0.4 %
5b Finnish Innovation Fund (Sitra)
Not at all important
Not very important Rather important Very important I don't know
Firms: Smaller innovative firms 19.7 % 39.4 % 24.4 % 8.7 % 7.8 %Firms: Larger innovative firms 15.4 % 39.5 % 24.5 % 12.0 % 8.6 %Firms: Other firms 27.3 % 28.1 % 17.4 % 9.9 % 17.3 %
Total 21.0 % 36.4 % 22.5 % 9.6 % 10.5 %
Gov.: Innovation support gov. orgs. 12.5 % 30.4 % 53.6 % 3.6 % 0.0 %Gov.: Education support gov. orgs. 0.0 % 32.5 % 67.5 % 0.0 % 0.0 %Gov.: Other ministries 3.6 % 25.0 % 10.0 % 47.1 % 14.3 %Gov.: Other public sector orgs. 1.4 % 24.1 % 61.6 % 13.0 % 0.0 %
Total 2.6 % 25.3 % 49.0 % 19.7 % 3.5 %
Education: University department heads 15.3 % 46.8 % 23.7 % 10.3 % 3.9 %Education: University rectors 10.0 % 30.0 % 50.0 % 10.0 % 0.0 %Education: Polytechnic rectors 0.0 % 11.8 % 70.6 % 17.7 % 0.0 %Associations 0.0 % 12.0 % 60.0 % 28.0 % 0.0 %Municipalities 5.6 % 23.0 % 39.0 % 29.9 % 2.5 %Research: Public research institutes 0.0 % 28.6 % 57.1 % 14.3 % 0.0 %Research: Other research instititutes 0.0 % 42.9 % 28.6 % 28.6 % 0.0 %Intermediaries: TE-centres 9.1 % 27.3 % 54.6 % 9.1 % 0.0 %Intermediaries: Other intermediaries 14.7 % 42.7 % 26.7 % 13.3 % 2.7 %Financing: Business angels and VCs 0.0 % 63.6 % 27.3 % 9.1 % 0.0 %
Total 5.5 % 32.9 % 43.7 % 17.0 % 0.9 %
From the point of view of YOUR OWN ORGANISATION, how important do you consider the following governmentalactors of the NIS? Please choose ONE alternative for each organisation.

Appendix III - Complete data tables
77
5c The Academy of Finland
Not at all important
Not very important Rather important Very important I don't know
Firms: Smaller innovative firms 33.3 % 37.1 % 14.2 % 5.0 % 10.4 %Firms: Larger innovative firms 27.6 % 36.2 % 21.1 % 4.1 % 10.9 %Firms: Other firms 39.3 % 26.4 % 10.8 % 5.1 % 18.5 %
Total 33.9 % 34.1 % 14.6 % 4.8 % 12.7 %
Gov.: Innovation support gov. orgs. 0.0 % 0.0 % 41.1 % 58.9 % 100.0 %Gov.: Education support gov. orgs. 5.0 % 0.0 % 5.0 % 90.0 % 100.0 %Gov.: Other ministries 0.0 % 14.3 % 27.9 % 57.9 % 100.0 %Gov.: Other public sector orgs. 0.0 % 26.9 % 29.6 % 43.5 % 100.0 %
Total 0.3 % 20.1 % 28.3 % 51.3 % 100.0 %
Education: University department heads 1.9 % 1.9 % 14.1 % 81.6 % 0.5 %Education: University rectors 0.0 % 0.0 % 27.3 % 72.7 % 0.0 %Education: Polytechnic rectors 11.8 % 35.3 % 35.3 % 17.7 % 0.0 %Associations 4.0 % 36.0 % 24.0 % 36.0 % 0.0 %Municipalities 14.5 % 40.4 % 19.4 % 21.9 % 3.8 %Research: Public research institutes 0.0 % 0.0 % 85.7 % 14.3 % 0.0 %Research: Other research instititutes 0.0 % 0.0 % 28.6 % 71.4 % 0.0 %Intermediaries: TE-centres 9.1 % 36.4 % 27.3 % 27.3 % 0.0 %Intermediaries: Other intermediaries 14.7 % 40.0 % 34.7 % 8.0 % 2.7 %Financing: Business angels and VCs 9.1 % 54.6 % 27.3 % 9.1 % 0.0 %
Total 6.5 % 24.5 % 32.4 % 36.0 % 0.7 %
5d Ministry of employment and the economy (TEM)
Not at all important
Not very important Rather important Very important I don't know
Firms: Smaller innovative firms 12.2 % 22.1 % 34.7 % 25.0 % 5.9 %Firms: Larger innovative firms 9.6 % 22.8 % 39.7 % 24.4 % 3.5 %Firms: Other firms 10.0 % 20.2 % 39.6 % 19.7 % 10.5 %
Total 11.2 % 21.7 % 36.9 % 23.5 % 6.7 %
Gov.: Innovation support gov. orgs. 6.3 % 0.0 % 3.6 % 86.6 % 3.6 %Gov.: Education support gov. orgs. 0.0 % 0.0 % 10.0 % 90.0 % 0.0 %Gov.: Other ministries 7.1 % 0.0 % 17.9 % 60.7 % 14.3 %Gov.: Other public sector orgs. 0.0 % 1.4 % 29.2 % 69.4 % 0.0 %
Total 2.2 % 0.9 % 23.4 % 69.9 % 3.7 %
Education: University department heads 16.1 % 32.2 % 30.2 % 14.2 % 7.3 %Education: University rectors 10.0 % 10.0 % 60.0 % 20.0 % 0.0 %Education: Polytechnic rectors 0.0 % 0.0 % 52.9 % 41.2 % 5.9 %Associations 0.0 % 12.0 % 32.0 % 52.0 % 4.0 %Municipalities 1.1 % 4.9 % 33.8 % 59.7 % 0.6 %Research: Public research institutes 0.0 % 0.0 % 28.6 % 71.4 % 0.0 %Research: Other research instititutes 0.0 % 42.9 % 14.3 % 42.9 % 0.0 %Intermediaries: TE-centres 0.0 % 0.0 % 18.2 % 81.8 % 0.0 %Intermediaries: Other intermediaries 2.6 % 9.2 % 14.5 % 72.4 % 1.3 %Financing: Business angels and VCs 0.0 % 18.2 % 27.3 % 54.6 % 0.0 %
Total 3.0 % 12.9 % 31.2 % 51.0 % 1.9 %
5e Ministry of education (OPM)
Not at all important
Not very important Rather important Very important I don't know
Firms: Smaller innovative firms 22.8 % 30.1 % 26.0 % 13.9 % 7.1 %Firms: Larger innovative firms 17.4 % 31.3 % 29.0 % 14.9 % 7.4 %Firms: Other firms 19.1 % 29.1 % 26.9 % 9.7 % 15.3 %
Total 20.8 % 30.0 % 26.8 % 13.0 % 9.4 %
Gov.: Innovation support gov. orgs. 6.3 % 0.0 % 40.2 % 53.6 % 0.0 %Gov.: Education support gov. orgs. 0.0 % 0.0 % 17.5 % 82.5 % 0.0 %Gov.: Other ministries 7.4 % 3.7 % 58.5 % 30.4 % 0.0 %Gov.: Other public sector orgs. 0.0 % 14.4 % 47.7 % 36.6 % 1.4 %
Total 2.2 % 9.9 % 47.6 % 39.5 % 0.9 %
Education: University department heads 2.9 % 8.8 % 21.1 % 64.7 % 2.5 %Education: University rectors 0.0 % 9.1 % 18.2 % 72.7 % 0.0 %Education: Polytechnic rectors 0.0 % 0.0 % 23.5 % 70.6 % 5.9 %Associations 0.0 % 24.0 % 28.0 % 48.0 % 0.0 %Municipalities 1.1 % 13.5 % 36.2 % 49.3 % 0.0 %Research: Public research institutes 0.0 % 28.6 % 71.4 % 0.0 % 0.0 %Research: Other research instititutes 0.0 % 14.3 % 71.4 % 14.3 % 0.0 %Intermediaries: TE-centres 0.0 % 27.3 % 45.5 % 27.3 % 0.0 %Intermediaries: Other intermediaries 10.5 % 26.3 % 42.1 % 17.1 % 4.0 %Financing: Business angels and VCs 9.1 % 54.6 % 0.0 % 36.4 % 0.0 %
Total 2.4 % 20.6 % 35.7 % 40.0 % 1.2 %

Appendix III - Complete data tables
78
5f Ministry of social affairs and health (STM)Not at all important
Not very important Rather important Very important I don't know
Firms: Smaller innovative firms 33.9 % 34.5 % 14.5 % 8.1 % 9.0 %Firms: Larger innovative firms 25.8 % 38.4 % 17.2 % 9.3 % 9.3 %Firms: Other firms 25.0 % 35.9 % 18.0 % 6.1 % 15.0 %
Total 30.1 % 35.6 % 15.9 % 7.8 % 10.6 %
Gov.: Innovation support gov. orgs. 9.8 % 31.3 % 49.1 % 9.8 % 0.0 %Gov.: Education support gov. orgs. 5.0 % 5.0 % 72.5 % 17.5 % 0.0 %Gov.: Other ministries 10.7 % 25.0 % 57.9 % 6.4 % 0.0 %Gov.: Other public sector orgs. 12.5 % 43.5 % 31.0 % 9.7 % 3.2 %
Total 11.4 % 35.6 % 41.6 % 9.5 % 2.0 %
Education: University department heads 23.0 % 32.8 % 27.9 % 9.8 % 6.4 %Education: University rectors 10.0 % 70.0 % 10.0 % 10.0 % 0.0 %Education: Polytechnic rectors 0.0 % 23.5 % 70.6 % 5.9 % 0.0 %Associations 20.8 % 58.3 % 8.3 % 12.5 % 0.0 %Municipalities 3.4 % 16.3 % 36.8 % 43.6 % 0.0 %Research: Public research institutes 0.0 % 85.7 % 14.3 % 0.0 % 0.0 %Research: Other research instititutes 28.6 % 57.1 % 14.3 % 0.0 % 0.0 %Intermediaries: TE-centres 0.0 % 63.6 % 36.4 % 0.0 % 0.0 %Intermediaries: Other intermediaries 19.7 % 52.6 % 19.7 % 1.3 % 6.6 %Financing: Business angels and VCs 36.4 % 36.4 % 18.2 % 9.1 % 0.0 %
Total 14.2 % 49.6 % 25.6 % 9.2 % 1.3 %
5g Ministry of Finance (VM)
Not at all important
Not very important Rather important Very important I don't know
Firms: Smaller innovative firms 19.9 % 27.5 % 27.2 % 18.7 % 6.7 %Firms: Larger innovative firms 14.1 % 25.8 % 33.6 % 19.7 % 6.8 %Firms: Other firms 17.4 % 23.6 % 26.0 % 18.9 % 14.1 %
Total 18.2 % 26.1 % 28.0 % 19.0 % 8.7 %
Gov.: Innovation support gov. orgs. 6.3 % 17.0 % 24.1 % 52.7 % 0.0 %Gov.: Education support gov. orgs. 0.0 % 5.0 % 22.5 % 72.5 % 0.0 %Gov.: Other ministries 0.0 % 3.6 % 17.1 % 79.3 % 0.0 %Gov.: Other public sector orgs. 0.0 % 13.0 % 40.3 % 45.4 % 1.4 %
Total 0.4 % 10.4 % 32.4 % 55.9 % 0.9 %
Education: University department heads 14.2 % 18.6 % 30.9 % 27.9 % 8.3 %Education: University rectors 0.0 % 0.0 % 90.0 % 10.0 % 0.0 %Education: Polytechnic rectors 0.0 % 17.7 % 41.2 % 35.3 % 5.9 %Associations 4.0 % 28.0 % 24.0 % 44.0 % 0.0 %Municipalities 4.8 % 18.8 % 22.5 % 53.4 % 0.6 %Research: Public research institutes 0.0 % 28.6 % 42.9 % 28.6 % 0.0 %Research: Other research instititutes 0.0 % 28.6 % 42.9 % 28.6 % 0.0 %Intermediaries: TE-centres 9.1 % 45.5 % 27.3 % 18.2 % 0.0 %Intermediaries: Other intermediaries 21.3 % 32.0 % 24.0 % 18.7 % 4.0 %Financing: Business angels and VCs 0.0 % 18.2 % 45.5 % 36.4 % 0.0 %
Total 5.3 % 23.6 % 39.1 % 30.1 % 1.9 %
5h Other ministries
Not at all important
Not very important Rather important Very important I don't know
Firms: Smaller innovative firms 27.4 % 38.1 % 19.0 % 4.4 % 11.1 %Firms: Larger innovative firms 19.1 % 46.1 % 19.8 % 3.4 % 11.7 %Firms: Other firms 22.3 % 37.7 % 16.1 % 4.7 % 19.3 %
Total 24.5 % 39.4 % 18.4 % 4.3 % 13.4 %
Gov.: Innovation support gov. orgs. 10.2 % 63.0 % 26.9 % 0.0 % 0.0 %Gov.: Education support gov. orgs. 0.0 % 27.5 % 67.5 % 5.0 % 0.0 %Gov.: Other ministries 0.0 % 33.6 % 52.1 % 10.7 % 3.6 %Gov.: Other public sector orgs. 5.6 % 17.1 % 58.8 % 8.3 % 10.2 %
Total 4.1 % 24.9 % 55.7 % 8.1 % 7.2 %
Education: University department heads 15.3 % 46.8 % 24.1 % 2.5 % 11.3 %Education: University rectors 0.0 % 80.0 % 20.0 % 0.0 % 0.0 %Education: Polytechnic rectors 0.0 % 52.9 % 35.3 % 11.8 % 0.0 %Associations 8.3 % 54.2 % 29.2 % 4.2 % 4.2 %Municipalities 5.8 % 35.6 % 39.0 % 16.8 % 2.8 %Research: Public research institutes 0.0 % 42.9 % 28.6 % 28.6 % 0.0 %Research: Other research instititutes 14.3 % 42.9 % 28.6 % 0.0 % 14.3 %Intermediaries: TE-centres 9.1 % 63.6 % 27.3 % 0.0 % 0.0 %Intermediaries: Other intermediaries 22.7 % 48.0 % 21.3 % 2.7 % 5.3 %Financing: Business angels and VCs 27.3 % 45.5 % 9.1 % 9.1 % 9.1 %
Total 10.3 % 51.2 % 26.2 % 7.6 % 4.7 %
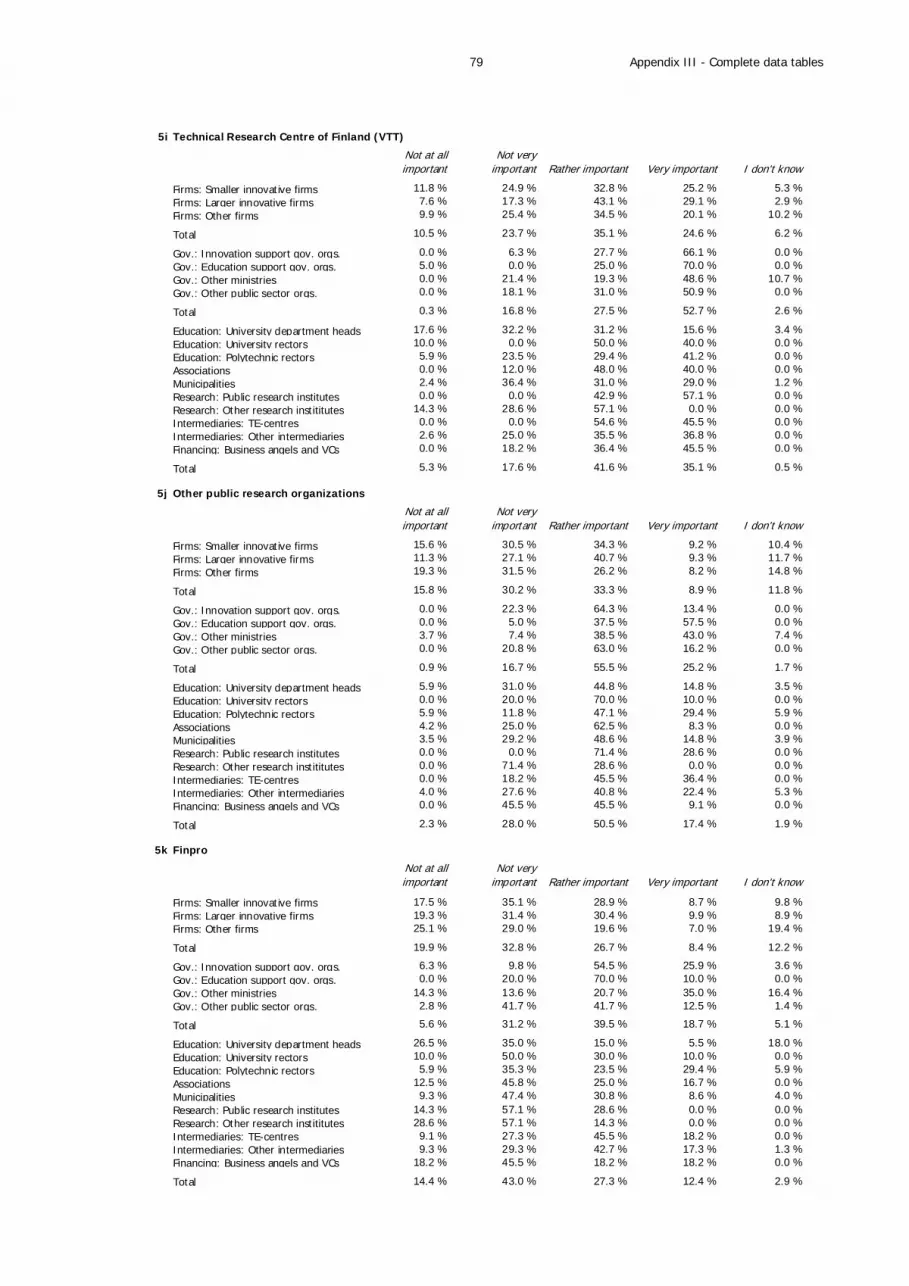
Appendix III - Complete data tables
79
5i Technical Research Centre of Finland (VTT)
Not at all important
Not very important Rather important Very important I don't know
Firms: Smaller innovative firms 11.8 % 24.9 % 32.8 % 25.2 % 5.3 %Firms: Larger innovative firms 7.6 % 17.3 % 43.1 % 29.1 % 2.9 %Firms: Other firms 9.9 % 25.4 % 34.5 % 20.1 % 10.2 %
Total 10.5 % 23.7 % 35.1 % 24.6 % 6.2 %
Gov.: Innovation support gov. orgs. 0.0 % 6.3 % 27.7 % 66.1 % 0.0 %Gov.: Education support gov. orgs. 5.0 % 0.0 % 25.0 % 70.0 % 0.0 %Gov.: Other ministries 0.0 % 21.4 % 19.3 % 48.6 % 10.7 %Gov.: Other public sector orgs. 0.0 % 18.1 % 31.0 % 50.9 % 0.0 %
Total 0.3 % 16.8 % 27.5 % 52.7 % 2.6 %
Education: University department heads 17.6 % 32.2 % 31.2 % 15.6 % 3.4 %Education: University rectors 10.0 % 0.0 % 50.0 % 40.0 % 0.0 %Education: Polytechnic rectors 5.9 % 23.5 % 29.4 % 41.2 % 0.0 %Associations 0.0 % 12.0 % 48.0 % 40.0 % 0.0 %Municipalities 2.4 % 36.4 % 31.0 % 29.0 % 1.2 %Research: Public research institutes 0.0 % 0.0 % 42.9 % 57.1 % 0.0 %Research: Other research instititutes 14.3 % 28.6 % 57.1 % 0.0 % 0.0 %Intermediaries: TE-centres 0.0 % 0.0 % 54.6 % 45.5 % 0.0 %Intermediaries: Other intermediaries 2.6 % 25.0 % 35.5 % 36.8 % 0.0 %Financing: Business angels and VCs 0.0 % 18.2 % 36.4 % 45.5 % 0.0 %
Total 5.3 % 17.6 % 41.6 % 35.1 % 0.5 %
5j Other public research organizations
Not at all important
Not very important Rather important Very important I don't know
Firms: Smaller innovative firms 15.6 % 30.5 % 34.3 % 9.2 % 10.4 %Firms: Larger innovative firms 11.3 % 27.1 % 40.7 % 9.3 % 11.7 %Firms: Other firms 19.3 % 31.5 % 26.2 % 8.2 % 14.8 %
Total 15.8 % 30.2 % 33.3 % 8.9 % 11.8 %
Gov.: Innovation support gov. orgs. 0.0 % 22.3 % 64.3 % 13.4 % 0.0 %Gov.: Education support gov. orgs. 0.0 % 5.0 % 37.5 % 57.5 % 0.0 %Gov.: Other ministries 3.7 % 7.4 % 38.5 % 43.0 % 7.4 %Gov.: Other public sector orgs. 0.0 % 20.8 % 63.0 % 16.2 % 0.0 %
Total 0.9 % 16.7 % 55.5 % 25.2 % 1.7 %
Education: University department heads 5.9 % 31.0 % 44.8 % 14.8 % 3.5 %Education: University rectors 0.0 % 20.0 % 70.0 % 10.0 % 0.0 %Education: Polytechnic rectors 5.9 % 11.8 % 47.1 % 29.4 % 5.9 %Associations 4.2 % 25.0 % 62.5 % 8.3 % 0.0 %Municipalities 3.5 % 29.2 % 48.6 % 14.8 % 3.9 %Research: Public research institutes 0.0 % 0.0 % 71.4 % 28.6 % 0.0 %Research: Other research instititutes 0.0 % 71.4 % 28.6 % 0.0 % 0.0 %Intermediaries: TE-centres 0.0 % 18.2 % 45.5 % 36.4 % 0.0 %Intermediaries: Other intermediaries 4.0 % 27.6 % 40.8 % 22.4 % 5.3 %Financing: Business angels and VCs 0.0 % 45.5 % 45.5 % 9.1 % 0.0 %
Total 2.3 % 28.0 % 50.5 % 17.4 % 1.9 %
5k Finpro
Not at all important
Not very important Rather important Very important I don't know
Firms: Smaller innovative firms 17.5 % 35.1 % 28.9 % 8.7 % 9.8 %Firms: Larger innovative firms 19.3 % 31.4 % 30.4 % 9.9 % 8.9 %Firms: Other firms 25.1 % 29.0 % 19.6 % 7.0 % 19.4 %
Total 19.9 % 32.8 % 26.7 % 8.4 % 12.2 %
Gov.: Innovation support gov. orgs. 6.3 % 9.8 % 54.5 % 25.9 % 3.6 %Gov.: Education support gov. orgs. 0.0 % 20.0 % 70.0 % 10.0 % 0.0 %Gov.: Other ministries 14.3 % 13.6 % 20.7 % 35.0 % 16.4 %Gov.: Other public sector orgs. 2.8 % 41.7 % 41.7 % 12.5 % 1.4 %
Total 5.6 % 31.2 % 39.5 % 18.7 % 5.1 %
Education: University department heads 26.5 % 35.0 % 15.0 % 5.5 % 18.0 %Education: University rectors 10.0 % 50.0 % 30.0 % 10.0 % 0.0 %Education: Polytechnic rectors 5.9 % 35.3 % 23.5 % 29.4 % 5.9 %Associations 12.5 % 45.8 % 25.0 % 16.7 % 0.0 %Municipalities 9.3 % 47.4 % 30.8 % 8.6 % 4.0 %Research: Public research institutes 14.3 % 57.1 % 28.6 % 0.0 % 0.0 %Research: Other research instititutes 28.6 % 57.1 % 14.3 % 0.0 % 0.0 %Intermediaries: TE-centres 9.1 % 27.3 % 45.5 % 18.2 % 0.0 %Intermediaries: Other intermediaries 9.3 % 29.3 % 42.7 % 17.3 % 1.3 %Financing: Business angels and VCs 18.2 % 45.5 % 18.2 % 18.2 % 0.0 %
Total 14.4 % 43.0 % 27.3 % 12.4 % 2.9 %

Appendix III - Complete data tables
80
5l Foundation for Finnish inventions
Not at all important
Not very important Rather important Very important I don't know
Firms: Smaller innovative firms 26.2 % 36.2 % 19.1 % 9.2 % 9.4 %Firms: Larger innovative firms 24.9 % 40.9 % 18.8 % 5.0 % 10.4 %Firms: Other firms 31.5 % 28.5 % 13.3 % 11.3 % 15.4 %
Total 27.4 % 35.0 % 17.5 % 9.0 % 11.2 %
Gov.: Innovation support gov. orgs. 6.3 % 29.5 % 50.9 % 9.8 % 3.6 %Gov.: Education support gov. orgs. 5.0 % 67.5 % 22.5 % 5.0 % 0.0 %Gov.: Other ministries 25.0 % 31.4 % 24.3 % 9.3 % 10.0 %Gov.: Other public sector orgs. 5.6 % 52.8 % 33.3 % 6.9 % 1.4 %
Total 10.3 % 47.0 % 31.6 % 7.6 % 3.5 %
Education: University department heads 30.1 % 38.9 % 13.3 % 8.9 % 8.9 %Education: University rectors 10.0 % 40.0 % 40.0 % 10.0 % 0.0 %Education: Polytechnic rectors 5.9 % 41.2 % 23.5 % 29.4 % 0.0 %Associations 8.0 % 44.0 % 36.0 % 12.0 % 0.0 %Municipalities 11.6 % 49.4 % 18.6 % 15.1 % 5.3 %Research: Public research institutes 28.6 % 42.9 % 28.6 % 0.0 % 0.0 %Research: Other research instititutes 42.9 % 42.9 % 0.0 % 0.0 % 14.3 %Intermediaries: TE-centres 0.0 % 9.1 % 36.4 % 54.6 % 0.0 %Intermediaries: Other intermediaries 7.9 % 32.9 % 36.8 % 22.4 % 0.0 %Financing: Business angels and VCs 18.2 % 36.4 % 27.3 % 18.2 % 0.0 %
Total 16.3 % 37.8 % 26.1 % 17.0 % 2.8 %
5m Universities
Not at all important
Not very important Rather important Very important I don't know
Firms: Smaller innovative firms 6.3 % 19.2 % 33.8 % 36.7 % 4.1 %Firms: Larger innovative firms 4.7 % 9.5 % 40.1 % 42.9 % 2.8 %Firms: Other firms 15.7 % 22.9 % 26.5 % 25.5 % 9.4 %
Total 8.5 % 18.4 % 33.0 % 34.8 % 5.3 %
Gov.: Innovation support gov. orgs. 0.0 % 0.0 % 100.0 % 0.0 % 100.0 %Gov.: Education support gov. orgs. 5.0 % 5.0 % 77.5 % 12.5 % 100.0 %Gov.: Other ministries 7.1 % 39.3 % 53.6 % 0.0 % 100.0 %Gov.: Other public sector orgs. 0.0 % 26.4 % 73.6 % 0.0 % 100.0 %
Total 2.1 % 26.2 % 70.9 % 0.9 % 100.0 %
Education: University department heads 0.0 % 1.0 % 6.8 % 89.3 % 2.9 %Education: University rectors 0.0 % 0.0 % 9.1 % 72.7 % 18.2 %Education: Polytechnic rectors 0.0 % 0.0 % 11.8 % 82.4 % 5.9 %Associations 0.0 % 8.0 % 32.0 % 60.0 % 0.0 %Municipalities 0.0 % 11.6 % 33.5 % 53.1 % 1.8 %Research: Public research institutes 0.0 % 0.0 % 14.3 % 85.7 % 0.0 %Research: Other research instititutes 0.0 % 0.0 % 14.3 % 85.7 % 0.0 %Intermediaries: TE-centres 0.0 % 0.0 % 36.4 % 63.6 % 0.0 %Intermediaries: Other intermediaries 2.7 % 5.3 % 32.0 % 60.0 % 0.0 %Financing: Business angels and VCs 0.0 % 0.0 % 54.6 % 45.5 % 0.0 %
Total 0.3 % 2.6 % 24.5 % 69.8 % 2.9 %
5n Polytechnics
Not at all important
Not very important Rather important Very important I don't know
Firms: Smaller innovative firms 11.3 % 25.5 % 36.4 % 22.5 % 4.2 %Firms: Larger innovative firms 5.9 % 20.3 % 47.4 % 23.7 % 2.6 %Firms: Other firms 9.2 % 25.6 % 34.2 % 22.4 % 8.5 %
Total 9.8 % 24.6 % 37.8 % 22.7 % 5.1 %
Gov.: Innovation support gov. orgs. 6.3 % 3.6 % 63.4 % 26.8 % 0.0 %Gov.: Education support gov. orgs. 0.0 % 10.0 % 27.5 % 62.5 % 0.0 %Gov.: Other ministries 10.7 % 25.0 % 40.7 % 20.7 % 2.9 %Gov.: Other public sector orgs. 5.6 % 34.7 % 38.0 % 21.8 % 0.0 %
Total 6.5 % 28.5 % 39.7 % 24.7 % 0.7 %
Education: University department heads 14.0 % 38.7 % 37.2 % 9.2 % 1.0 %Education: University rectors 0.0 % 20.0 % 60.0 % 20.0 % 0.0 %Education: Polytechnic rectors 0.0 % 0.0 % 5.9 % 88.2 % 5.9 %Associations 8.0 % 28.0 % 52.0 % 12.0 % 0.0 %Municipalities 0.0 % 11.4 % 44.6 % 42.8 % 1.2 %Research: Public research institutes 0.0 % 57.1 % 28.6 % 14.3 % 0.0 %Research: Other research instititutes 14.3 % 57.1 % 14.3 % 0.0 % 14.3 %Intermediaries: TE-centres 0.0 % 0.0 % 81.8 % 18.2 % 0.0 %Intermediaries: Other intermediaries 1.3 % 15.8 % 35.5 % 47.4 % 0.0 %Financing: Business angels and VCs 9.1 % 54.6 % 27.3 % 9.1 % 0.0 %
Total 4.7 % 28.3 % 38.7 % 26.1 % 2.2 %

Appendix III - Complete data tables
81
5o Local Te-centres
Not at all important
Not very important Rather important Very important I don't know
Firms: Smaller innovative firms 12.3 % 21.5 % 33.8 % 28.4 % 4.1 %Firms: Larger innovative firms 16.2 % 25.8 % 31.6 % 22.8 % 3.6 %Firms: Other firms 13.8 % 22.2 % 32.2 % 23.0 % 8.9 %
Total 13.4 % 22.4 % 33.0 % 25.9 % 5.3 %
Gov.: Innovation support gov. orgs. 6.3 % 17.0 % 70.5 % 6.3 % 0.0 %Gov.: Education support gov. orgs. 0.0 % 5.0 % 60.0 % 35.0 % 0.0 %Gov.: Other ministries 25.0 % 31.4 % 23.6 % 13.6 % 6.4 %Gov.: Other public sector orgs. 1.5 % 41.2 % 45.6 % 10.3 % 1.5 %
Total 7.6 % 34.4 % 42.9 % 12.6 % 2.5 %
Education: University department heads 18.9 % 37.9 % 26.7 % 10.7 % 5.8 %Education: University rectors 10.0 % 30.0 % 50.0 % 10.0 % 0.0 %Education: Polytechnic rectors 0.0 % 11.8 % 47.1 % 41.2 % 0.0 %Associations 12.0 % 28.0 % 52.0 % 8.0 % 0.0 %Municipalities 2.1 % 21.7 % 18.6 % 55.8 % 1.8 %Research: Public research institutes 0.0 % 42.9 % 28.6 % 28.6 % 0.0 %Research: Other research instititutes 42.9 % 14.3 % 28.6 % 0.0 % 14.3 %Intermediaries: TE-centres 0.0 % 0.0 % 18.2 % 81.8 % 0.0 %Intermediaries: Other intermediaries 2.6 % 6.6 % 34.2 % 56.6 % 0.0 %Financing: Business angels and VCs 0.0 % 18.2 % 54.6 % 27.3 % 0.0 %
Total 8.9 % 21.1 % 35.8 % 32.0 % 2.2 %
5p Finnvera
Not at all important
Not very important Rather important Very important I don't know
Firms: Smaller innovative firms 12.5 % 24.9 % 29.6 % 27.9 % 5.2 %Firms: Larger innovative firms 18.3 % 33.1 % 24.5 % 18.1 % 6.0 %Firms: Other firms 15.9 % 27.0 % 24.3 % 21.8 % 10.9 %
Total 14.4 % 26.9 % 27.3 % 24.6 % 6.8 %
Gov.: Innovation support gov. orgs. 0.0 % 10.7 % 47.3 % 38.4 % 3.6 %Gov.: Education support gov. orgs. 0.0 % 20.0 % 42.5 % 37.5 % 0.0 %Gov.: Other ministries 14.3 % 14.3 % 30.7 % 31.4 % 9.3 %Gov.: Other public sector orgs. 0.0 % 54.2 % 25.0 % 19.4 % 1.4 %
Total 3.5 % 39.2 % 29.1 % 24.9 % 3.4 %
Education: University department heads 27.3 % 37.1 % 12.2 % 2.4 % 21.0 %Education: University rectors 20.0 % 40.0 % 30.0 % 10.0 % 0.0 %Education: Polytechnic rectors 17.7 % 35.3 % 17.7 % 23.5 % 5.9 %Associations 20.0 % 24.0 % 52.0 % 4.0 % 0.0 %Municipalities 2.3 % 21.7 % 37.2 % 37.6 % 1.4 %Research: Public research institutes 28.6 % 42.9 % 28.6 % 0.0 % 0.0 %Research: Other research instititutes 28.6 % 28.6 % 42.9 % 0.0 % 0.0 %Intermediaries: TE-centres 0.0 % 9.1 % 54.6 % 36.4 % 0.0 %Intermediaries: Other intermediaries 6.6 % 18.4 % 48.7 % 26.3 % 0.0 %Financing: Business angels and VCs 0.0 % 0.0 % 36.4 % 63.6 % 0.0 %
Total 15.1 % 25.7 % 36.0 % 20.4 % 2.8 %
5q Industry Investment
Not at all important
Not very important Rather important Very important I don't know
Firms: Smaller innovative firms 28.0 % 34.7 % 20.2 % 5.4 % 11.7 %Firms: Larger innovative firms 28.9 % 35.8 % 17.3 % 4.8 % 13.2 %Firms: Other firms 32.5 % 26.2 % 15.4 % 5.5 % 20.5 %
Total 29.4 % 32.7 % 18.4 % 5.3 % 14.3 %
Gov.: Innovation support gov. orgs. 0.0 % 20.4 % 54.6 % 21.3 % 3.7 %Gov.: Education support gov. orgs. 0.0 % 25.0 % 37.5 % 37.5 % 0.0 %Gov.: Other ministries 7.1 % 39.3 % 22.9 % 10.7 % 20.0 %Gov.: Other public sector orgs. 9.7 % 34.7 % 36.6 % 17.6 % 1.4 %
Total 7.8 % 34.2 % 34.5 % 17.6 % 6.0 %
Education: University department heads 35.0 % 28.6 % 12.3 % 4.4 % 19.7 %Education: University rectors 20.0 % 40.0 % 30.0 % 10.0 % 0.0 %Education: Polytechnic rectors 41.2 % 11.8 % 17.7 % 23.5 % 5.9 %Associations 20.8 % 29.2 % 45.8 % 4.2 % 0.0 %Municipalities 9.3 % 47.1 % 26.4 % 9.6 % 7.6 %Research: Public research institutes 28.6 % 28.6 % 14.3 % 28.6 % 0.0 %Research: Other research instititutes 42.9 % 14.3 % 14.3 % 14.3 % 14.3 %Intermediaries: TE-centres 0.0 % 36.4 % 63.6 % 0.0 % 0.0 %Intermediaries: Other intermediaries 10.8 % 40.5 % 32.4 % 12.2 % 4.1 %Financing: Business angels and VCs 0.0 % 9.1 % 63.6 % 27.3 % 0.0 %
Total 20.9 % 28.5 % 32.1 % 13.4 % 5.2 %

Appendix III - Complete data tables
82
5r Expertise and technology centres
Not at all important
Not very important Rather important Very important I don't know
Firms: Smaller innovative firms 16.3 % 29.3 % 30.5 % 15.8 % 8.1 %Firms: Larger innovative firms 14.0 % 32.6 % 33.3 % 11.1 % 9.0 %Firms: Other firms 18.2 % 27.7 % 28.5 % 11.9 % 13.7 %
Total 16.4 % 29.4 % 30.5 % 13.9 % 9.8 %
Gov.: Innovation support gov. orgs. 12.5 % 19.6 % 30.4 % 33.9 % 3.6 %Gov.: Education support gov. orgs. 0.0 % 17.5 % 42.5 % 40.0 % 0.0 %Gov.: Other ministries 4.4 % 25.2 % 27.8 % 42.6 % 0.0 %Gov.: Other public sector orgs. 0.0 % 38.9 % 33.3 % 25.0 % 2.8 %
Total 1.8 % 33.1 % 32.6 % 30.4 % 2.1 %
Education: University department heads 16.0 % 33.0 % 34.5 % 8.7 % 7.8 %Education: University rectors 10.0 % 40.0 % 40.0 % 0.0 % 10.0 %Education: Polytechnic rectors 0.0 % 5.9 % 47.1 % 47.1 % 0.0 %Associations 8.3 % 25.0 % 58.3 % 8.3 % 0.0 %Municipalities 2.4 % 15.0 % 33.7 % 46.5 % 2.4 %Research: Public research institutes 0.0 % 14.3 % 57.1 % 28.6 % 0.0 %Research: Other research instititutes 57.1 % 14.3 % 28.6 % 0.0 % 0.0 %Intermediaries: TE-centres 0.0 % 9.1 % 72.7 % 18.2 % 0.0 %Intermediaries: Other intermediaries 4.0 % 9.3 % 25.3 % 58.7 % 2.7 %Financing: Business angels and VCs 0.0 % 18.2 % 45.5 % 27.3 % 9.1 %
Total 9.8 % 18.4 % 44.3 % 24.3 % 3.2 %
5s Research and innovation council
Not at all important
Not very important Rather important Very important I don't know
Firms: Smaller innovative firms 28.7 % 30.3 % 15.5 % 5.1 % 20.4 %Firms: Larger innovative firms 24.1 % 33.9 % 16.4 % 2.2 % 23.4 %Firms: Other firms 27.4 % 28.8 % 15.5 % 5.1 % 23.3 %
Total 27.5 % 30.6 % 15.7 % 4.5 % 21.7 %
Gov.: Innovation support gov. orgs. 0.0 % 9.8 % 20.5 % 69.6 % 0.0 %Gov.: Education support gov. orgs. 0.0 % 5.7 % 11.4 % 82.9 % 0.0 %Gov.: Other ministries 3.7 % 18.4 % 47.1 % 30.9 % 0.0 %Gov.: Other public sector orgs. 0.0 % 15.3 % 46.3 % 35.2 % 3.2 %
Total 0.9 % 15.1 % 42.5 % 39.5 % 2.0 %
Education: University department heads 12.8 % 27.0 % 28.9 % 15.7 % 15.7 %Education: University rectors 0.0 % 20.0 % 40.0 % 40.0 % 0.0 %Education: Polytechnic rectors 5.9 % 5.9 % 29.4 % 58.8 % 0.0 %Associations 12.0 % 32.0 % 32.0 % 24.0 % 0.0 %Municipalities 15.4 % 33.3 % 26.0 % 18.9 % 6.3 %Research: Public research institutes 0.0 % 14.3 % 28.6 % 57.1 % 0.0 %Research: Other research instititutes 14.3 % 0.0 % 71.4 % 14.3 % 0.0 %Intermediaries: TE-centres 20.0 % 0.0 % 60.0 % 0.0 % 20.0 %Intermediaries: Other intermediaries 18.7 % 18.7 % 41.3 % 10.7 % 10.7 %Financing: Business angels and VCs 27.3 % 45.5 % 9.1 % 0.0 % 18.2 %
Total 12.6 % 19.7 % 36.7 % 24.0 % 7.1 %
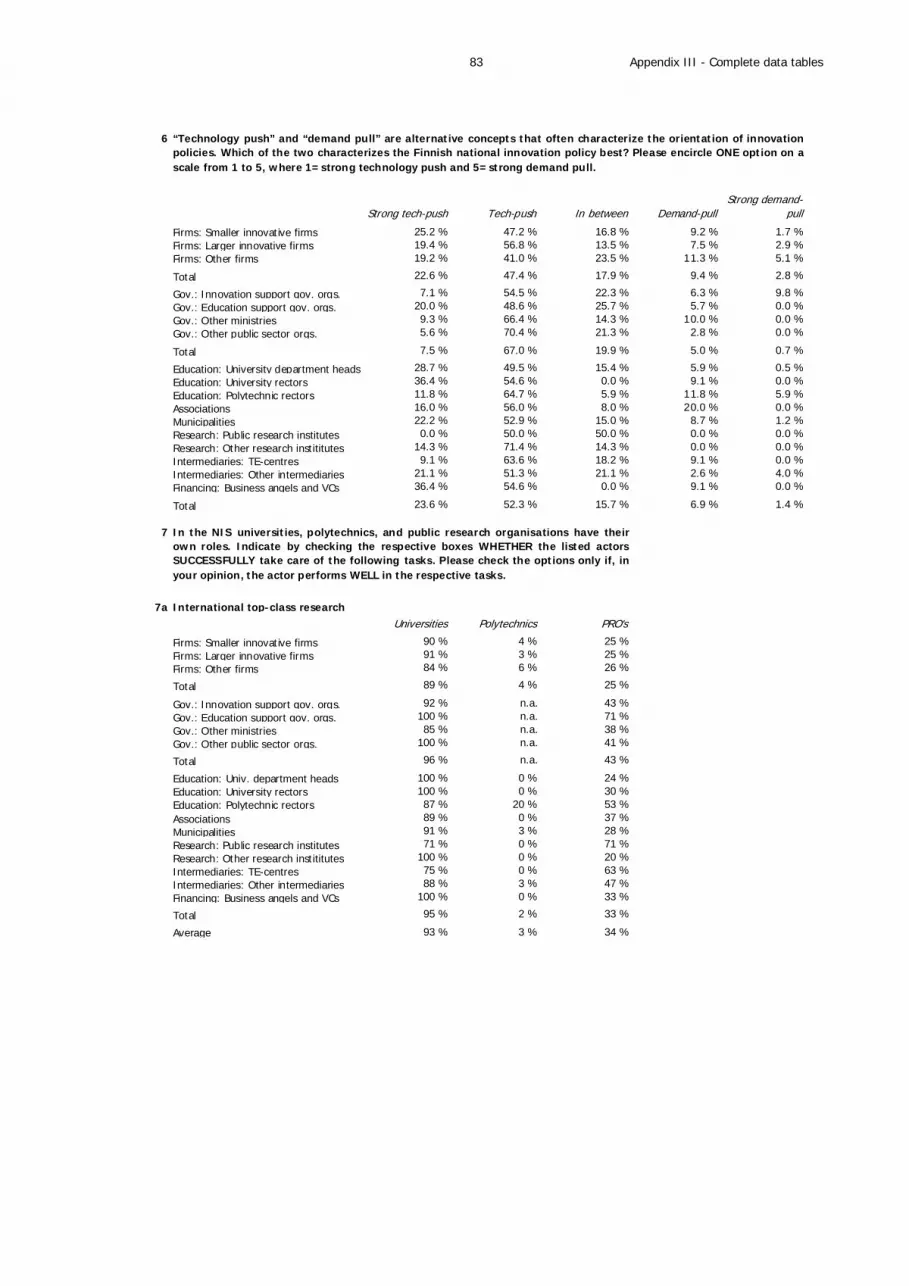
Appendix III - Complete data tables
83
6
Strong tech-push Tech-push In between Demand-pullStrong demand-
pull
Firms: Smaller innovative firms 25.2 % 47.2 % 16.8 % 9.2 % 1.7 %Firms: Larger innovative firms 19.4 % 56.8 % 13.5 % 7.5 % 2.9 %Firms: Other firms 19.2 % 41.0 % 23.5 % 11.3 % 5.1 %
Total 22.6 % 47.4 % 17.9 % 9.4 % 2.8 %
Gov.: Innovation support gov. orgs. 7.1 % 54.5 % 22.3 % 6.3 % 9.8 %Gov.: Education support gov. orgs. 20.0 % 48.6 % 25.7 % 5.7 % 0.0 %Gov.: Other ministries 9.3 % 66.4 % 14.3 % 10.0 % 0.0 %Gov.: Other public sector orgs. 5.6 % 70.4 % 21.3 % 2.8 % 0.0 %
Total 7.5 % 67.0 % 19.9 % 5.0 % 0.7 %
Education: University department heads 28.7 % 49.5 % 15.4 % 5.9 % 0.5 %Education: University rectors 36.4 % 54.6 % 0.0 % 9.1 % 0.0 %Education: Polytechnic rectors 11.8 % 64.7 % 5.9 % 11.8 % 5.9 %Associations 16.0 % 56.0 % 8.0 % 20.0 % 0.0 %Municipalities 22.2 % 52.9 % 15.0 % 8.7 % 1.2 %Research: Public research institutes 0.0 % 50.0 % 50.0 % 0.0 % 0.0 %Research: Other research instititutes 14.3 % 71.4 % 14.3 % 0.0 % 0.0 %Intermediaries: TE-centres 9.1 % 63.6 % 18.2 % 9.1 % 0.0 %Intermediaries: Other intermediaries 21.1 % 51.3 % 21.1 % 2.6 % 4.0 %Financing: Business angels and VCs 36.4 % 54.6 % 0.0 % 9.1 % 0.0 %
Total 23.6 % 52.3 % 15.7 % 6.9 % 1.4 %
7
7a International top-class researchUniversities Polytechnics PRO's
Firms: Smaller innovative firms 90 % 4 % 25 %Firms: Larger innovative firms 91 % 3 % 25 %Firms: Other firms 84 % 6 % 26 %
Total 89 % 4 % 25 %
Gov.: Innovation support gov. orgs. 92 % n.a. 43 %Gov.: Education support gov. orgs. 100 % n.a. 71 %Gov.: Other ministries 85 % n.a. 38 %Gov.: Other public sector orgs. 100 % n.a. 41 %
Total 96 % n.a. 43 %
Education: Univ. department heads 100 % 0 % 24 %Education: University rectors 100 % 0 % 30 %Education: Polytechnic rectors 87 % 20 % 53 %Associations 89 % 0 % 37 %Municipalities 91 % 3 % 28 %Research: Public research institutes 71 % 0 % 71 %Research: Other research instititutes 100 % 0 % 20 %Intermediaries: TE-centres 75 % 0 % 63 %Intermediaries: Other intermediaries 88 % 3 % 47 %Financing: Business angels and VCs 100 % 0 % 33 %
Total 95 % 2 % 33 %
Average 93 % 3 % 34 %
“Technology push” and “demand pull” are alternative concepts that often characterize the orientation of innovationpolicies. Which of the two characterizes the Finnish national innovation policy best? Please encircle ONE option on ascale from 1 to 5, where 1=strong technology push and 5=strong demand pull.
In the NIS universities, polytechnics, and public research organisations have theirown roles. Indicate by checking the respective boxes WHETHER the listed actorsSUCCESSFULLY take care of the following tasks. Please check the options only if, inyour opinion, the actor performs WELL in the respective tasks.

Appendix III - Complete data tables
84
7b Research for the national needsUniversities Polytechnics PRO's
Firms: Smaller innovative firms 56 % 34 % 51 %Firms: Larger innovative firms 65 % 32 % 52 %Firms: Other firms 60 % 34 % 43 %
Total 59 % 34 % 49 %
Gov.: Innovation support gov. orgs. 89 % 34 % 82 %Gov.: Education support gov. orgs. 63 % 49 % 94 %Gov.: Other ministries 55 % 12 % 85 %Gov.: Other public sector orgs. 73 % 50 % 75 %
Total 69 % 39 % 79 %
Education: Univ. department heads 80 % 27 % 68 %Education: University rectors 82 % 18 % 45 %Education: Polytechnic rectors 65 % 94 % 59 %Associations 68 % 14 % 73 %Municipalities 65 % 43 % 62 %Research: Public research institutes 71 % 0 % 71 %Research: Other research instititutes 50 % 0 % 83 %Intermediaries: TE-centres 56 % 33 % 33 %Intermediaries: Other intermediaries 69 % 53 % 53 %Financing: Business angels and VCs 67 % 33 % 78 %
Total 75 % 34 % 64 %
Average 68 % 36 % 64 %
7c Prod. of competence for international business activitiesUniversities Polytechnics PRO's
Firms: Smaller innovative firms 82 % 26 % 14 %Firms: Larger innovative firms 85 % 29 % 17 %Firms: Other firms 83 % 27 % 11 %
Total 83 % 27 % 14 %
Gov.: Innovation support gov. orgs. 74 % 9 % 26 %Gov.: Education support gov. orgs. 100 % 14 % 0 %Gov.: Other ministries 52 % 33 % 48 %Gov.: Other public sector orgs. 98 % 26 % 9 %
Total 87 % 26 % 17 %
Education: Univ. department heads 92 % 25 % 12 %Education: University rectors 100 % 17 % 0 %Education: Polytechnic rectors 80 % 73 % 20 %Associations 87 % 13 % 7 %Municipalities 86 % 28 % 14 %Research: Public research institutes 43 % 29 % 29 %Research: Other research instititutes 100 % 0 % 50 %Intermediaries: TE-centres 88 % 38 % 13 %Intermediaries: Other intermediaries 92 % 37 % 15 %Financing: Business angels and VCs 55 % 0 % 0 %
Total 89 % 28 % 13 %
Average 86 % 27 % 15 %
7d Prod. of competence for local business activitiesUniversities Polytechnics PRO's
Firms: Smaller innovative firms 39 % 82 % 13 %Firms: Larger innovative firms 46 % 86 % 13 %Firms: Other firms 35 % 78 % 12 %
Total 39 % 82 % 13 %
Gov.: Innovation support gov. orgs. 59 % 100 % 16 %Gov.: Education support gov. orgs. 46 % 94 % 40 %Gov.: Other ministries 40 % 74 % 26 %Gov.: Other public sector orgs. 61 % 92 % 20 %
Total 55 % 89 % 23 %
Education: Univ. department heads 62 % 85 % 16 %Education: University rectors 78 % 78 % 11 %Education: Polytechnic rectors 18 % 100 % 6 %Associations 65 % 78 % 13 %Municipalities 41 % 89 % 16 %Research: Public research institutes 17 % 83 % 17 %Research: Other research instititutes 33 % 83 % 0 %Intermediaries: TE-centres 30 % 100 % 10 %Intermediaries: Other intermediaries 45 % 92 % 12 %Financing: Business angels and VCs 50 % 90 % 10 %
Total 55 % 87 % 14 %
Average 50 % 86 % 16 %
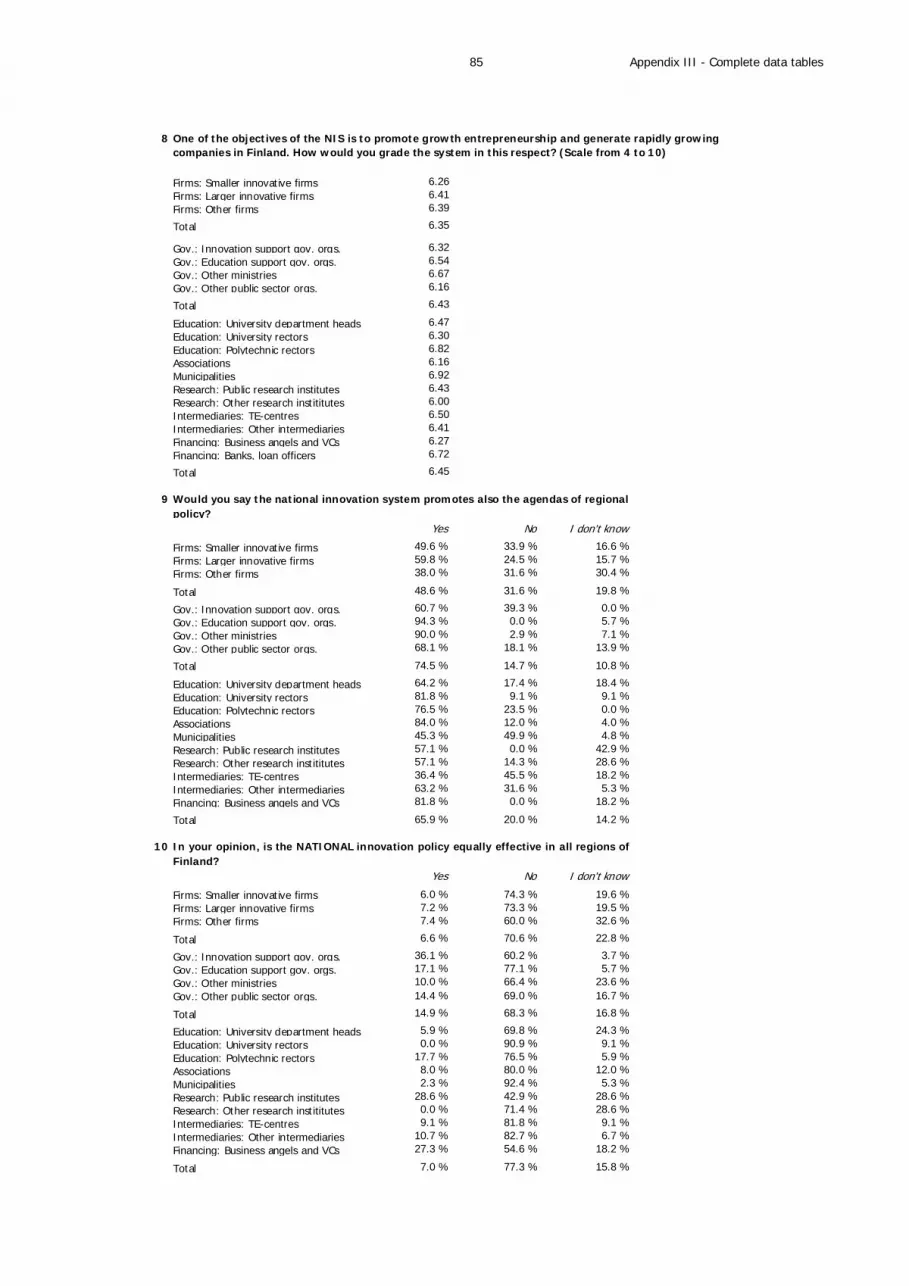
Appendix III - Complete data tables
85
8
Firms: Smaller innovative firms 6.26Firms: Larger innovative firms 6.41Firms: Other firms 6.39
Total 6.35
Gov.: Innovation support gov. orgs. 6.32Gov.: Education support gov. orgs. 6.54Gov.: Other ministries 6.67Gov.: Other public sector orgs. 6.16
Total 6.43
Education: University department heads 6.47Education: University rectors 6.30Education: Polytechnic rectors 6.82Associations 6.16Municipalities 6.92Research: Public research institutes 6.43Research: Other research instititutes 6.00Intermediaries: TE-centres 6.50Intermediaries: Other intermediaries 6.41Financing: Business angels and VCs 6.27Financing: Banks, loan officers 6.72
Total 6.45
9
Yes No I don't know
Firms: Smaller innovative firms 49.6 % 33.9 % 16.6 %Firms: Larger innovative firms 59.8 % 24.5 % 15.7 %Firms: Other firms 38.0 % 31.6 % 30.4 %
Total 48.6 % 31.6 % 19.8 %
Gov.: Innovation support gov. orgs. 60.7 % 39.3 % 0.0 %Gov.: Education support gov. orgs. 94.3 % 0.0 % 5.7 %Gov.: Other ministries 90.0 % 2.9 % 7.1 %Gov.: Other public sector orgs. 68.1 % 18.1 % 13.9 %
Total 74.5 % 14.7 % 10.8 %
Education: University department heads 64.2 % 17.4 % 18.4 %Education: University rectors 81.8 % 9.1 % 9.1 %Education: Polytechnic rectors 76.5 % 23.5 % 0.0 %Associations 84.0 % 12.0 % 4.0 %Municipalities 45.3 % 49.9 % 4.8 %Research: Public research institutes 57.1 % 0.0 % 42.9 %Research: Other research instititutes 57.1 % 14.3 % 28.6 %Intermediaries: TE-centres 36.4 % 45.5 % 18.2 %Intermediaries: Other intermediaries 63.2 % 31.6 % 5.3 %Financing: Business angels and VCs 81.8 % 0.0 % 18.2 %
Total 65.9 % 20.0 % 14.2 %
10
Yes No I don't know
Firms: Smaller innovative firms 6.0 % 74.3 % 19.6 %Firms: Larger innovative firms 7.2 % 73.3 % 19.5 %Firms: Other firms 7.4 % 60.0 % 32.6 %
Total 6.6 % 70.6 % 22.8 %
Gov.: Innovation support gov. orgs. 36.1 % 60.2 % 3.7 %Gov.: Education support gov. orgs. 17.1 % 77.1 % 5.7 %Gov.: Other ministries 10.0 % 66.4 % 23.6 %Gov.: Other public sector orgs. 14.4 % 69.0 % 16.7 %
Total 14.9 % 68.3 % 16.8 %
Education: University department heads 5.9 % 69.8 % 24.3 %Education: University rectors 0.0 % 90.9 % 9.1 %Education: Polytechnic rectors 17.7 % 76.5 % 5.9 %Associations 8.0 % 80.0 % 12.0 %Municipalities 2.3 % 92.4 % 5.3 %Research: Public research institutes 28.6 % 42.9 % 28.6 %Research: Other research instititutes 0.0 % 71.4 % 28.6 %Intermediaries: TE-centres 9.1 % 81.8 % 9.1 %Intermediaries: Other intermediaries 10.7 % 82.7 % 6.7 %Financing: Business angels and VCs 27.3 % 54.6 % 18.2 %
Total 7.0 % 77.3 % 15.8 %
One of the objectives of the NIS is to promote growth entrepreneurship and generate rapidly growingcompanies in Finland. How would you grade the system in this respect? (Scale from 4 to 10)
Would you say the national innovation system promotes also the agendas of regional policy?
In your opinion, is the NATIONAL innovation policy equally effective in all regions ofFinland?

Appendix III - Complete data tables
86
11 How important are NATIONAL networks for the activities of your organisation?Not at all important
Not very important Rather important Very important I don't know
Firms: Smaller innovative firms 2.3 % 16.3 % 41.2 % 39.9 % 0.4 %Firms: Larger innovative firms 1.2 % 17.1 % 40.5 % 41.2 % 0.0 %Firms: Other firms 4.8 % 26.5 % 44.8 % 19.1 % 4.9 %
Total 2.7 % 19.0 % 41.9 % 35.0 % 1.4 %
Gov.: Innovation support gov. orgs. 0.0 % 9.8 % 10.7 % 79.5 % 0.0 %Gov.: Education support gov. orgs. 0.0 % 0.0 % 5.7 % 94.3 % 0.0 %Gov.: Other ministries 0.0 % 6.4 % 25.0 % 68.6 % 0.0 %Gov.: Other public sector orgs. 0.0 % 0.0 % 19.4 % 80.6 % 0.0 %
Total 0.0 % 2.3 % 19.4 % 78.4 % 0.0 %
Education: University department heads 0.5 % 5.4 % 37.3 % 56.9 % 0.0 %Education: University rectors 0.0 % 0.0 % 45.5 % 54.6 % 0.0 %Education: Polytechnic rectors 0.0 % 0.0 % 11.8 % 88.2 % 0.0 %Associations 4.0 % 4.0 % 12.0 % 80.0 % 0.0 %Municipalities 1.1 % 9.9 % 51.0 % 38.0 % 0.0 %Research: Public research institutes 0.0 % 0.0 % 42.9 % 57.1 % 0.0 %Research: Other research instititutes 0.0 % 0.0 % 57.1 % 42.9 % 0.0 %Intermediaries: TE-centres 0.0 % 0.0 % 18.2 % 81.8 % 0.0 %Intermediaries: Other intermediaries 0.0 % 7.9 % 17.1 % 73.7 % 1.3 %Financing: Business angels and VCs 0.0 % 0.0 % 63.6 % 36.4 % 0.0 %
Total 0.5 % 4.9 % 31.2 % 63.1 % 0.3 %
12 How important are INTERNATIONAL networks for the activities of your organisation?Not at all important
Not very important Rather important Very important I don't know
Firms: Smaller innovative firms 9.8 % 29.3 % 34.5 % 25.1 % 1.4 %Firms: Larger innovative firms 8.2 % 22.3 % 34.3 % 34.7 % 0.5 %Firms: Other firms 29.3 % 32.5 % 22.9 % 11.1 % 4.2 %
Total 14.3 % 28.8 % 31.6 % 23.4 % 1.9 %
Gov.: Innovation support gov. orgs. 0.0 % 9.8 % 24.1 % 66.1 % 0.0 %Gov.: Education support gov. orgs. 0.0 % 0.0 % 22.9 % 77.1 % 0.0 %Gov.: Other ministries 0.0 % 6.4 % 12.9 % 80.7 % 0.0 %Gov.: Other public sector orgs. 0.0 % 6.9 % 46.8 % 46.3 % 0.0 %
Total 0.0 % 6.6 % 35.5 % 57.9 % 0.0 %
Education: University department heads 0.0 % 1.5 % 24.0 % 74.5 % 0.0 %Education: University rectors 0.0 % 0.0 % 18.2 % 81.8 % 0.0 %Education: Polytechnic rectors 0.0 % 5.9 % 29.4 % 64.7 % 0.0 %Associations 4.0 % 4.0 % 36.0 % 56.0 % 0.0 %Municipalities 18.4 % 49.1 % 24.1 % 8.4 % 0.0 %Research: Public research institutes 0.0 % 0.0 % 42.9 % 57.1 % 0.0 %Research: Other research instititutes 0.0 % 0.0 % 42.9 % 57.1 % 0.0 %Intermediaries: TE-centres 0.0 % 9.1 % 72.7 % 18.2 % 0.0 %Intermediaries: Other intermediaries 1.3 % 26.3 % 32.9 % 38.2 % 1.3 %Financing: Business angels and VCs 0.0 % 9.1 % 9.1 % 81.8 % 0.0 %
Total 0.5 % 7.3 % 28.5 % 63.4 % 0.3 %
13
13a …internationalization.Completely
disagreeSomewhat
disagree Somewhat agree Completely agree I don't know
Firms: Smaller innovative firms 3.5 % 9.0 % 44.3 % 18.1 % 25.2 %Firms: Larger innovative firms 2.6 % 11.2 % 40.2 % 21.9 % 24.2 %Firms: Other firms 2.8 % 9.9 % 38.3 % 18.4 % 30.6 %
Total 3.2 % 9.6 % 42.1 % 18.9 % 26.2 %
Gov.: Innovation support gov. orgs. 6.5 % 0.0 % 38.0 % 55.6 % 0.0 %Gov.: Education support gov. orgs. 0.0 % 0.0 % 48.6 % 37.1 % 14.3 %Gov.: Other ministries 0.0 % 7.1 % 44.3 % 20.7 % 27.9 %Gov.: Other public sector orgs. 0.0 % 0.0 % 53.2 % 35.2 % 11.6 %
Total 0.4 % 1.7 % 49.7 % 33.1 % 14.9 %
Education: University department heads 8.4 % 19.2 % 37.4 % 21.2 % 13.8 %Education: University rectors 9.1 % 0.0 % 45.5 % 45.5 % 0.0 %Education: Polytechnic rectors 12.5 % 0.0 % 50.0 % 37.5 % 0.0 %Associations 3.9 % 0.0 % 57.7 % 34.6 % 3.9 %Municipalities 4.8 % 5.8 % 54.4 % 25.7 % 9.3 %Research: Public research institutes 0.0 % 0.0 % 57.1 % 14.3 % 28.6 %Research: Other research instititutes 0.0 % 14.3 % 57.1 % 14.3 % 14.3 %Intermediaries: TE-centres 0.0 % 9.1 % 54.6 % 36.4 % 0.0 %Intermediaries: Other intermediaries 1.4 % 13.7 % 37.0 % 28.8 % 19.2 %Financing: Business angels and VCs 0.0 % 9.1 % 18.2 % 63.6 % 9.1 %
Total 6.0 % 14.3 % 40.3 % 26.6 % 12.9 %
What do you think about the following statements? Please choose ONE alternative for each reform.

Appendix III - Complete data tables
87
13b …quality of teaching.Completely
disagreeSomewhat
disagree Somewhat agree Completely agree I don't know
Firms: Smaller innovative firms 3.2 % 16.7 % 41.7 % 14.3 % 24.2 %Firms: Larger innovative firms 4.0 % 16.3 % 38.5 % 17.1 % 24.0 %Firms: Other firms 6.3 % 15.4 % 32.9 % 13.7 % 31.7 %
Total 4.1 % 16.3 % 39.0 % 14.7 % 25.9 %
Gov.: Innovation support gov. orgs. 0.0 % 0.0 % 43.8 % 52.7 % 3.6 %Gov.: Education support gov. orgs. 0.0 % 14.3 % 54.3 % 31.4 % 0.0 %Gov.: Other ministries 0.0 % 20.7 % 44.3 % 17.9 % 17.1 %Gov.: Other public sector orgs. 0.0 % 7.4 % 51.4 % 22.7 % 18.5 %
Total 0.0 % 10.6 % 49.3 % 24.1 % 16.0 %
Education: University department heads 14.2 % 29.3 % 33.7 % 9.3 % 13.7 %Education: University rectors 0.0 % 9.1 % 54.6 % 36.4 % 0.0 %Education: Polytechnic rectors 5.9 % 23.5 % 35.3 % 29.4 % 5.9 %Associations 3.9 % 15.4 % 50.0 % 30.8 % 0.0 %Municipalities 4.4 % 13.3 % 55.1 % 19.8 % 7.3 %Research: Public research institutes 0.0 % 0.0 % 57.1 % 0.0 % 42.9 %Research: Other research instititutes 0.0 % 14.3 % 71.4 % 0.0 % 14.3 %Intermediaries: TE-centres 0.0 % 0.0 % 81.8 % 9.1 % 9.1 %Intermediaries: Other intermediaries 2.6 % 18.4 % 40.8 % 17.1 % 21.1 %Financing: Business angels and VCs 0.0 % 9.1 % 45.5 % 36.4 % 9.1 %
Total 8.9 % 22.9 % 39.9 % 14.6 % 13.8 %
13c ...quality of research.Completely
disagreeSomewhat
disagree Somewhat agree Completely agree I don't know
Firms: Smaller innovative firms 4.0 % 13.0 % 38.8 % 19.7 % 24.6 %Firms: Larger innovative firms 4.0 % 15.7 % 36.7 % 19.9 % 23.7 %Firms: Other firms 5.1 % 13.5 % 32.7 % 16.8 % 32.0 %
Total 4.2 % 13.6 % 36.9 % 19.0 % 26.2 %
Gov.: Innovation support gov. orgs. 6.3 % 0.0 % 33.0 % 57.1 % 3.6 %Gov.: Education support gov. orgs. 0.0 % 0.0 % 77.1 % 22.9 % 0.0 %Gov.: Other ministries 0.0 % 20.7 % 39.3 % 22.9 % 17.1 %Gov.: Other public sector orgs. 0.0 % 13.0 % 45.8 % 28.2 % 13.0 %
Total 0.4 % 13.2 % 45.3 % 28.6 % 12.5 %
Education: University department heads 13.0 % 23.0 % 34.0 % 17.5 % 12.5 %Education: University rectors 9.1 % 0.0 % 27.3 % 63.6 % 0.0 %Education: Polytechnic rectors 5.9 % 11.8 % 52.9 % 29.4 % 0.0 %Associations 4.0 % 12.0 % 36.0 % 48.0 % 0.0 %Municipalities 2.4 % 12.6 % 50.1 % 26.9 % 8.0 %Research: Public research institutes 0.0 % 14.3 % 57.1 % 0.0 % 28.6 %Research: Other research instititutes 0.0 % 14.3 % 42.9 % 28.6 % 14.3 %Intermediaries: TE-centres 0.0 % 0.0 % 81.8 % 18.2 % 0.0 %Intermediaries: Other intermediaries 1.3 % 17.1 % 43.4 % 19.7 % 18.4 %Financing: Business angels and VCs 0.0 % 9.1 % 36.4 % 45.5 % 9.1 %
Total 8.2 % 18.4 % 38.9 % 22.7 % 11.8 %
13d …societal impact.Completely
disagreeSomewhat
disagree Somewhat agree Completely agree I don't know
Firms: Smaller innovative firms 4.4 % 16.6 % 35.2 % 20.0 % 23.8 %Firms: Larger innovative firms 6.0 % 15.3 % 31.6 % 21.0 % 26.2 %Firms: Other firms 4.0 % 11.6 % 38.1 % 15.6 % 30.8 %
Total 4.6 % 15.1 % 35.2 % 19.2 % 25.9 %
Gov.: Innovation support gov. orgs. 0.0 % 6.3 % 17.0 % 67.0 % 9.8 %Gov.: Education support gov. orgs. 0.0 % 0.0 % 37.1 % 62.9 % 0.0 %Gov.: Other ministries 0.0 % 17.9 % 36.4 % 31.4 % 14.3 %Gov.: Other public sector orgs. 0.0 % 5.9 % 54.9 % 29.4 % 9.8 %
Total 0.0 % 8.6 % 46.4 % 34.7 % 10.3 %
Education: University department heads 11.0 % 17.4 % 42.3 % 16.9 % 12.4 %Education: University rectors 0.0 % 9.1 % 27.3 % 63.6 % 0.0 %Education: Polytechnic rectors 6.3 % 18.8 % 43.8 % 31.3 % 0.0 %Associations 0.0 % 19.2 % 34.6 % 42.3 % 3.9 %Municipalities 2.3 % 23.8 % 32.4 % 27.4 % 14.3 %Research: Public research institutes 0.0 % 0.0 % 66.7 % 16.7 % 16.7 %Research: Other research instititutes 0.0 % 14.3 % 57.1 % 0.0 % 28.6 %Intermediaries: TE-centres 9.1 % 0.0 % 54.6 % 27.3 % 9.1 %Intermediaries: Other intermediaries 5.5 % 20.6 % 35.6 % 23.3 % 15.1 %Financing: Business angels and VCs 0.0 % 0.0 % 54.6 % 36.4 % 9.1 %
Total 7.7 % 16.6 % 41.4 % 22.7 % 11.6 %

Appendix III - Complete data tables
88
13e The centres of strategic excellence (SHOK) enhance the system’s performance.Completely
disagreeSomewhat
disagree Somewhat agree Completely agree I don't know
Firms: Smaller innovative firms 3.2 % 11.3 % 39.7 % 20.0 % 25.8 %Firms: Larger innovative firms 3.4 % 10.0 % 46.4 % 21.6 % 18.6 %Firms: Other firms 2.3 % 7.3 % 42.1 % 12.8 % 35.6 %
Total 3.0 % 10.1 % 41.5 % 18.6 % 26.8 %
Gov.: Innovation support gov. orgs. 0.0 % 13.4 % 41.1 % 42.0 % 3.6 %Gov.: Education support gov. orgs. 0.0 % 5.7 % 28.6 % 65.7 % 0.0 %Gov.: Other ministries 3.7 % 0.0 % 65.9 % 24.4 % 5.9 %Gov.: Other public sector orgs. 1.4 % 16.7 % 9.7 % 54.2 % 18.1 %
Total 1.8 % 11.8 % 26.4 % 47.0 % 13.1 %
Education: University department heads 12.4 % 32.7 % 30.7 % 3.5 % 20.8 %Education: University rectors 0.0 % 36.4 % 36.4 % 18.2 % 9.1 %Education: Polytechnic rectors 5.9 % 17.7 % 47.1 % 23.5 % 5.9 %Associations 0.0 % 23.1 % 34.6 % 38.5 % 3.9 %Municipalities 4.6 % 12.4 % 37.3 % 33.4 % 12.3 %Research: Public research institutes 0.0 % 28.6 % 28.6 % 42.9 % 0.0 %Research: Other research instititutes 0.0 % 28.6 % 28.6 % 28.6 % 14.3 %Intermediaries: TE-centres 0.0 % 27.3 % 45.5 % 18.2 % 9.1 %Intermediaries: Other intermediaries 5.3 % 17.1 % 51.3 % 14.5 % 11.8 %Financing: Business angels and VCs 9.1 % 0.0 % 63.6 % 27.3 % 0.0 %
Total 8.4 % 26.9 % 37.5 % 12.0 % 15.2 %
13fCompletely
disagreeSomewhat
disagree Somewhat agree Completely agree I don't know
Firms: Smaller innovative firms 2.8 % 7.8 % 34.1 % 15.3 % 40.1 %Firms: Larger innovative firms 2.6 % 6.5 % 38.6 % 12.6 % 39.7 %Firms: Other firms 1.6 % 8.2 % 34.7 % 9.0 % 46.6 %
Total 2.5 % 7.7 % 35.1 % 13.3 % 41.5 %
Gov.: Innovation support gov. orgs. 0.0 % 11.1 % 31.5 % 57.4 % 0.0 %Gov.: Education support gov. orgs. 0.0 % 5.7 % 37.1 % 42.9 % 14.3 %Gov.: Other ministries 0.0 % 24.3 % 59.3 % 16.4 % 0.0 %Gov.: Other public sector orgs. 0.0 % 0.0 % 37.3 % 35.3 % 27.5 %
Total 0.0 % 7.3 % 42.4 % 32.5 % 17.8 %
Education: University department heads 5.0 % 7.5 % 35.8 % 18.4 % 33.3 %Education: University rectors 0.0 % 9.1 % 36.4 % 45.5 % 9.1 %Education: Polytechnic rectors 0.0 % 0.0 % 52.9 % 35.3 % 11.8 %Associations 0.0 % 11.5 % 38.5 % 42.3 % 7.7 %Municipalities 5.0 % 10.4 % 41.0 % 24.3 % 19.2 %Research: Public research institutes 14.3 % 14.3 % 42.9 % 14.3 % 14.3 %Research: Other research instititutes 0.0 % 0.0 % 71.4 % 28.6 % 0.0 %Intermediaries: TE-centres 0.0 % 9.1 % 27.3 % 45.5 % 18.2 %Intermediaries: Other intermediaries 1.3 % 5.3 % 42.1 % 26.3 % 25.0 %Financing: Business angels and VCs 0.0 % 0.0 % 20.0 % 30.0 % 50.0 %
Total 3.3 % 6.8 % 38.3 % 24.6 % 27.1 %
13g
Completely disagree
Somewhat disagree Somewhat agree Completely agree I don't know
Firms: Smaller innovative firms 3.3 % 6.6 % 32.9 % 16.6 % 40.7 %Firms: Larger innovative firms 2.7 % 7.1 % 33.3 % 11.7 % 45.2 %Firms: Other firms 0.6 % 8.2 % 34.7 % 13.0 % 43.5 %
Total 2.5 % 7.0 % 33.4 % 14.9 % 42.2 %
Gov.: Innovation support gov. orgs. 3.6 % 6.3 % 54.5 % 28.6 % 7.1 %Gov.: Education support gov. orgs. 0.0 % 20.0 % 54.3 % 5.7 % 20.0 %Gov.: Other ministries 0.0 % 3.6 % 49.3 % 10.0 % 37.1 %Gov.: Other public sector orgs. 5.6 % 11.1 % 28.7 % 27.8 % 26.9 %
Total 3.7 % 9.5 % 37.1 % 22.2 % 27.6 %
Education: University department heads 4.4 % 15.3 % 35.0 % 7.4 % 37.9 %Education: University rectors 9.1 % 0.0 % 45.5 % 27.3 % 18.2 %Education: Polytechnic rectors 0.0 % 11.8 % 29.4 % 52.9 % 5.9 %Associations 3.9 % 3.9 % 30.8 % 19.2 % 42.3 %Municipalities 2.2 % 3.7 % 43.6 % 18.7 % 31.7 %Research: Public research institutes 0.0 % 0.0 % 28.6 % 42.9 % 28.6 %Research: Other research instititutes 0.0 % 0.0 % 42.9 % 14.3 % 42.9 %Intermediaries: TE-centres 0.0 % 0.0 % 72.7 % 27.3 % 0.0 %Intermediaries: Other intermediaries 2.7 % 13.3 % 34.7 % 10.7 % 38.7 %Financing: Business angels and VCs 0.0 % 0.0 % 36.4 % 18.2 % 45.5 %
Total 3.5 % 12.0 % 35.9 % 13.3 % 35.3 %
The possible reform of publicly funded research organisations would enhance the system’s performance.
The reform of the University Inventions Act will enhance the co-operation between companies, universities and polytechnics.
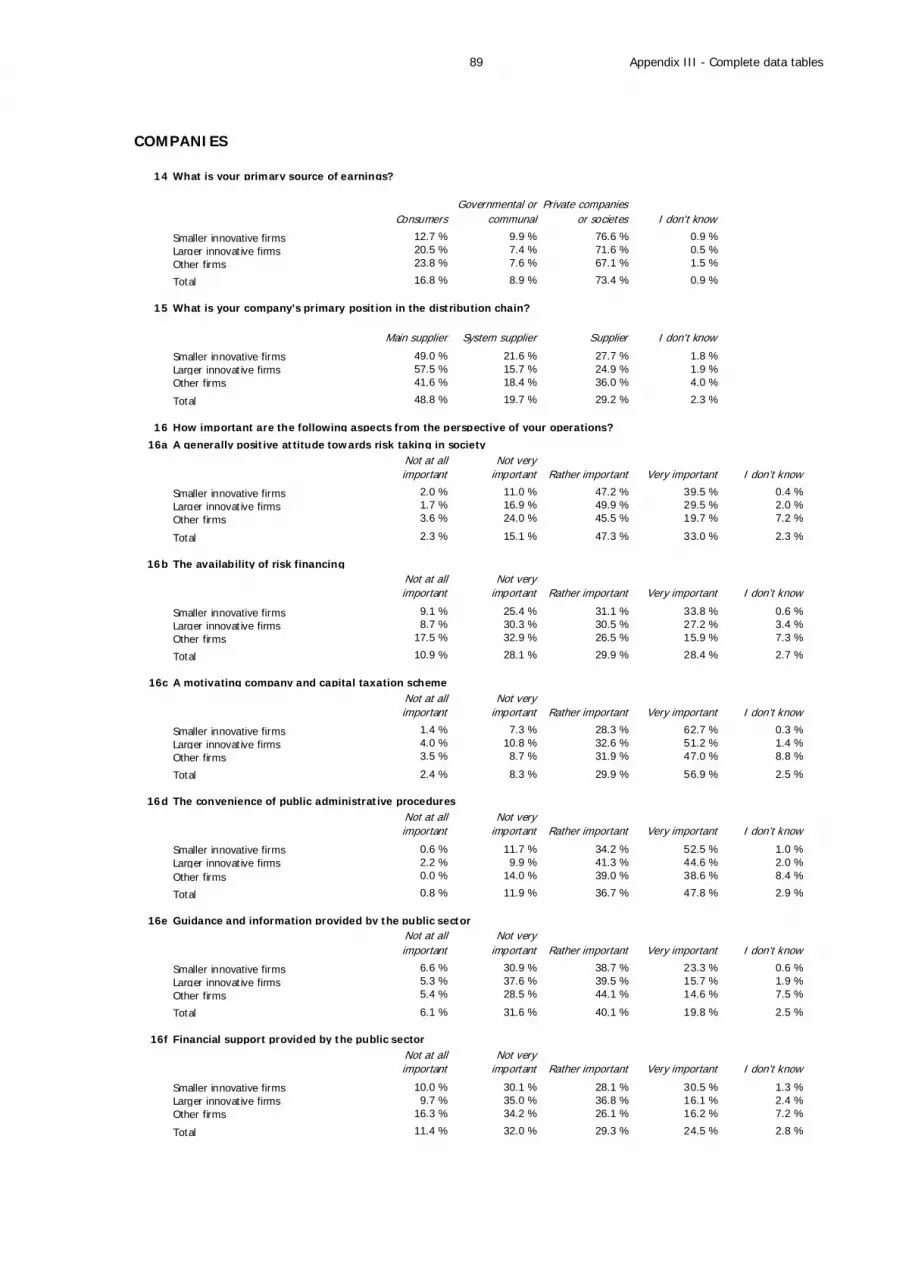
Appendix III - Complete data tables
89
COMPANIES
14 What is your primary source of earnings?
ConsumersGovernmental or
communalPrivate companies
or societes I don't know
Smaller innovative firms 12.7 % 9.9 % 76.6 % 0.9 %Larger innovative firms 20.5 % 7.4 % 71.6 % 0.5 %Other firms 23.8 % 7.6 % 67.1 % 1.5 %
Total 16.8 % 8.9 % 73.4 % 0.9 %
15 What is your company’s primary position in the distribution chain?
Main supplier System supplier Supplier I don't know
Smaller innovative firms 49.0 % 21.6 % 27.7 % 1.8 %Larger innovative firms 57.5 % 15.7 % 24.9 % 1.9 %Other firms 41.6 % 18.4 % 36.0 % 4.0 %
Total 48.8 % 19.7 % 29.2 % 2.3 %
16 How important are the following aspects from the perspective of your operations?
16a A generally positive attitude towards risk taking in societyNot at all important
Not very important Rather important Very important I don’t know
Smaller innovative firms 2.0 % 11.0 % 47.2 % 39.5 % 0.4 %Larger innovative firms 1.7 % 16.9 % 49.9 % 29.5 % 2.0 %Other firms 3.6 % 24.0 % 45.5 % 19.7 % 7.2 %
Total 2.3 % 15.1 % 47.3 % 33.0 % 2.3 %
16b The availability of risk financing Not at all important
Not very important Rather important Very important I don’t know
Smaller innovative firms 9.1 % 25.4 % 31.1 % 33.8 % 0.6 %Larger innovative firms 8.7 % 30.3 % 30.5 % 27.2 % 3.4 %Other firms 17.5 % 32.9 % 26.5 % 15.9 % 7.3 %
Total 10.9 % 28.1 % 29.9 % 28.4 % 2.7 %
16c A motivating company and capital taxation schemeNot at all important
Not very important Rather important Very important I don’t know
Smaller innovative firms 1.4 % 7.3 % 28.3 % 62.7 % 0.3 %Larger innovative firms 4.0 % 10.8 % 32.6 % 51.2 % 1.4 %Other firms 3.5 % 8.7 % 31.9 % 47.0 % 8.8 %
Total 2.4 % 8.3 % 29.9 % 56.9 % 2.5 %
16d The convenience of public administrative proceduresNot at all important
Not very important Rather important Very important I don’t know
Smaller innovative firms 0.6 % 11.7 % 34.2 % 52.5 % 1.0 %Larger innovative firms 2.2 % 9.9 % 41.3 % 44.6 % 2.0 %Other firms 0.0 % 14.0 % 39.0 % 38.6 % 8.4 %
Total 0.8 % 11.9 % 36.7 % 47.8 % 2.9 %
16e Guidance and information provided by the public sectorNot at all important
Not very important Rather important Very important I don’t know
Smaller innovative firms 6.6 % 30.9 % 38.7 % 23.3 % 0.6 %Larger innovative firms 5.3 % 37.6 % 39.5 % 15.7 % 1.9 %Other firms 5.4 % 28.5 % 44.1 % 14.6 % 7.5 %
Total 6.1 % 31.6 % 40.1 % 19.8 % 2.5 %
16f Financial support provided by the public sector Not at all important
Not very important Rather important Very important I don’t know
Smaller innovative firms 10.0 % 30.1 % 28.1 % 30.5 % 1.3 %Larger innovative firms 9.7 % 35.0 % 36.8 % 16.1 % 2.4 %Other firms 16.3 % 34.2 % 26.1 % 16.2 % 7.2 %
Total 11.4 % 32.0 % 29.3 % 24.5 % 2.8 %
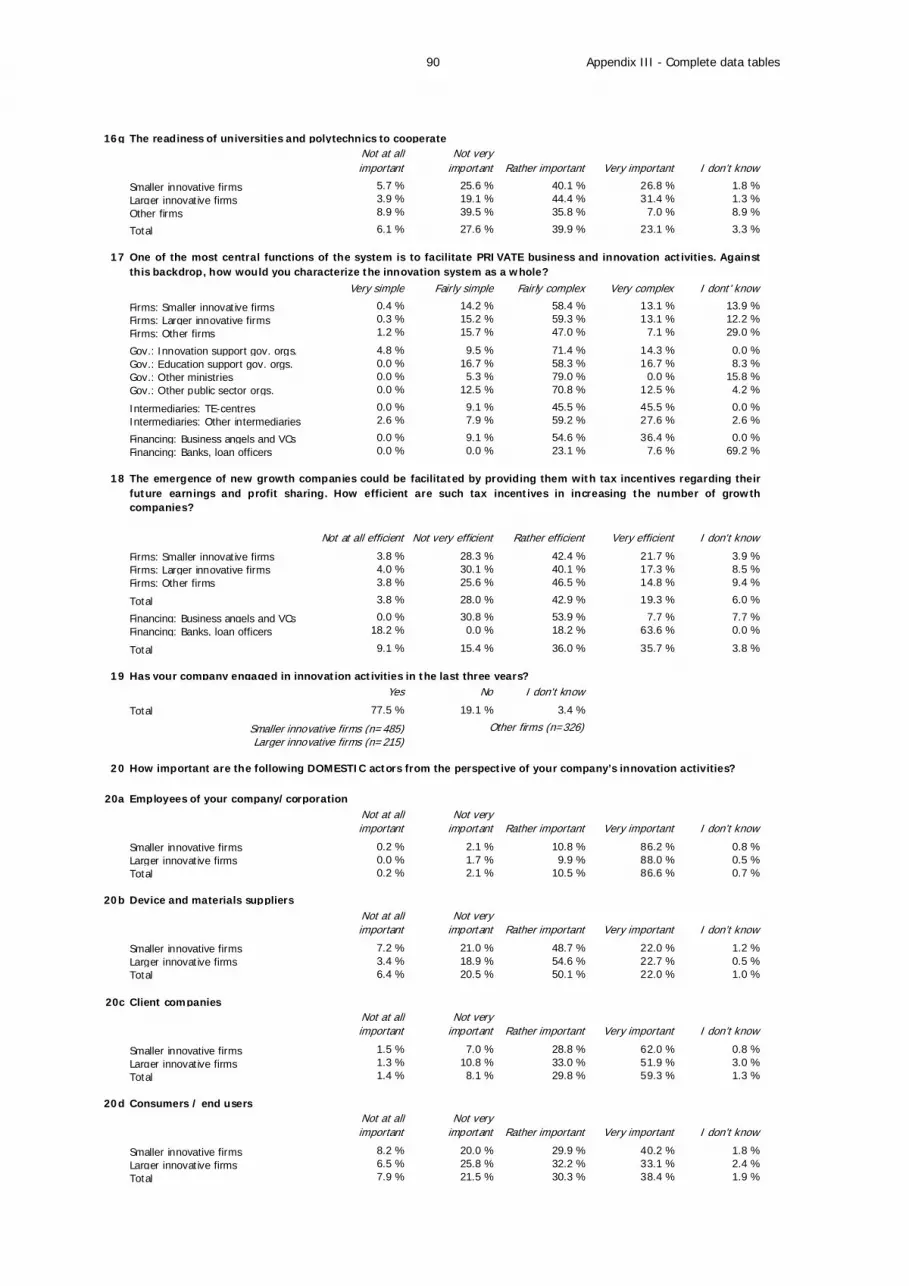
Appendix III - Complete data tables
90
16g The readiness of universities and polytechnics to cooperateNot at all important
Not very important Rather important Very important I don’t know
Smaller innovative firms 5.7 % 25.6 % 40.1 % 26.8 % 1.8 %Larger innovative firms 3.9 % 19.1 % 44.4 % 31.4 % 1.3 %Other firms 8.9 % 39.5 % 35.8 % 7.0 % 8.9 %
Total 6.1 % 27.6 % 39.9 % 23.1 % 3.3 %
17
Very simple Fairly simple Fairly complex Very complex I dont' know
Firms: Smaller innovative firms 0.4 % 14.2 % 58.4 % 13.1 % 13.9 %Firms: Larger innovative firms 0.3 % 15.2 % 59.3 % 13.1 % 12.2 %Firms: Other firms 1.2 % 15.7 % 47.0 % 7.1 % 29.0 %
Gov.: Innovation support gov. orgs. 4.8 % 9.5 % 71.4 % 14.3 % 0.0 %Gov.: Education support gov. orgs. 0.0 % 16.7 % 58.3 % 16.7 % 8.3 %Gov.: Other ministries 0.0 % 5.3 % 79.0 % 0.0 % 15.8 %Gov.: Other public sector orgs. 0.0 % 12.5 % 70.8 % 12.5 % 4.2 %
Intermediaries: TE-centres 0.0 % 9.1 % 45.5 % 45.5 % 0.0 %Intermediaries: Other intermediaries 2.6 % 7.9 % 59.2 % 27.6 % 2.6 %
Financing: Business angels and VCs 0.0 % 9.1 % 54.6 % 36.4 % 0.0 %Financing: Banks, loan officers 0.0 % 0.0 % 23.1 % 7.6 % 69.2 %
18
Not at all efficient Not very efficient Rather efficient Very efficient I don't know
Firms: Smaller innovative firms 3.8 % 28.3 % 42.4 % 21.7 % 3.9 %Firms: Larger innovative firms 4.0 % 30.1 % 40.1 % 17.3 % 8.5 %Firms: Other firms 3.8 % 25.6 % 46.5 % 14.8 % 9.4 %
Total 3.8 % 28.0 % 42.9 % 19.3 % 6.0 %
Financing: Business angels and VCs 0.0 % 30.8 % 53.9 % 7.7 % 7.7 %Financing: Banks, loan officers 18.2 % 0.0 % 18.2 % 63.6 % 0.0 %
Total 9.1 % 15.4 % 36.0 % 35.7 % 3.8 %
19 Has your company engaged in innovation activities in the last three years?Yes No I don't know
Total 77.5 % 19.1 % 3.4 %
20
20a Employees of your company/corporationNot at all important
Not very important Rather important Very important I don’t know
Smaller innovative firms 0.2 % 2.1 % 10.8 % 86.2 % 0.8 %Larger innovative firms 0.0 % 1.7 % 9.9 % 88.0 % 0.5 %Total 0.2 % 2.1 % 10.5 % 86.6 % 0.7 %
20b Device and materials suppliersNot at all important
Not very important Rather important Very important I don’t know
Smaller innovative firms 7.2 % 21.0 % 48.7 % 22.0 % 1.2 %Larger innovative firms 3.4 % 18.9 % 54.6 % 22.7 % 0.5 %Total 6.4 % 20.5 % 50.1 % 22.0 % 1.0 %
20c Client companiesNot at all important
Not very important Rather important Very important I don’t know
Smaller innovative firms 1.5 % 7.0 % 28.8 % 62.0 % 0.8 %Larger innovative firms 1.3 % 10.8 % 33.0 % 51.9 % 3.0 %Total 1.4 % 8.1 % 29.8 % 59.3 % 1.3 %
20d Consumers / end usersNot at all important
Not very important Rather important Very important I don’t know
Smaller innovative firms 8.2 % 20.0 % 29.9 % 40.2 % 1.8 %Larger innovative firms 6.5 % 25.8 % 32.2 % 33.1 % 2.4 %Total 7.9 % 21.5 % 30.3 % 38.4 % 1.9 %
One of the most central functions of the system is to facilitate PRIVATE business and innovation activities. Againstthis backdrop, how would you characterize the innovation system as a whole?
The emergence of new growth companies could be facilitated by providing them with tax incentives regarding theirfuture earnings and profit sharing. How efficient are such tax incentives in increasing the number of growthcompanies?
Other firms (n=326)Smaller innovative firms (n=485)Larger innovative firms (n=215)
How important are the following DOMESTIC actors from the perspective of your company’s innovation activities?
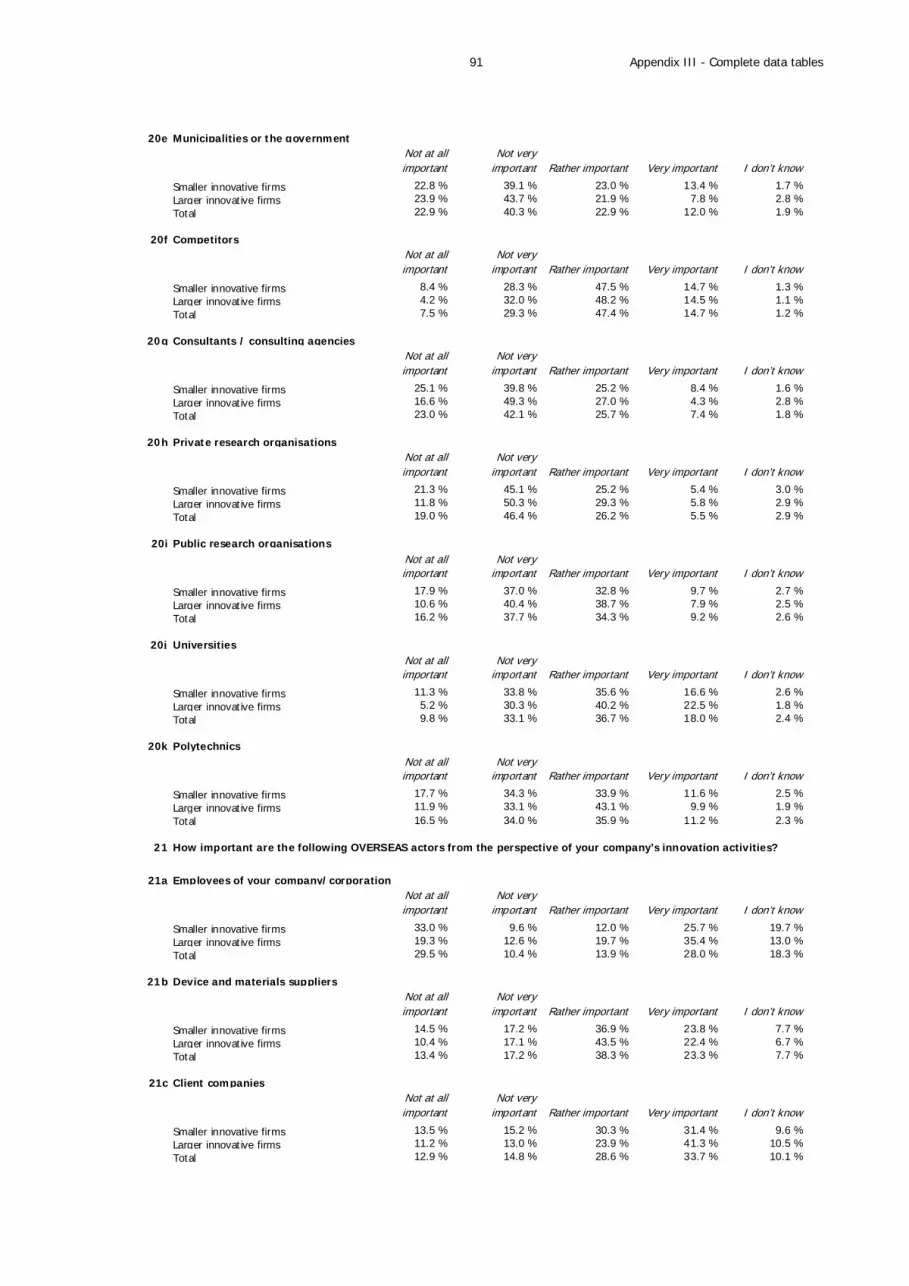
Appendix III - Complete data tables
91
20e Municipalities or the governmentNot at all important
Not very important Rather important Very important I don’t know
Smaller innovative firms 22.8 % 39.1 % 23.0 % 13.4 % 1.7 %Larger innovative firms 23.9 % 43.7 % 21.9 % 7.8 % 2.8 %Total 22.9 % 40.3 % 22.9 % 12.0 % 1.9 %
20f CompetitorsNot at all important
Not very important Rather important Very important I don’t know
Smaller innovative firms 8.4 % 28.3 % 47.5 % 14.7 % 1.3 %Larger innovative firms 4.2 % 32.0 % 48.2 % 14.5 % 1.1 %Total 7.5 % 29.3 % 47.4 % 14.7 % 1.2 %
20g Consultants / consulting agenciesNot at all important
Not very important Rather important Very important I don’t know
Smaller innovative firms 25.1 % 39.8 % 25.2 % 8.4 % 1.6 %Larger innovative firms 16.6 % 49.3 % 27.0 % 4.3 % 2.8 %Total 23.0 % 42.1 % 25.7 % 7.4 % 1.8 %
20h Private research organisationsNot at all important
Not very important Rather important Very important I don’t know
Smaller innovative firms 21.3 % 45.1 % 25.2 % 5.4 % 3.0 %Larger innovative firms 11.8 % 50.3 % 29.3 % 5.8 % 2.9 %Total 19.0 % 46.4 % 26.2 % 5.5 % 2.9 %
20i Public research organisationsNot at all important
Not very important Rather important Very important I don’t know
Smaller innovative firms 17.9 % 37.0 % 32.8 % 9.7 % 2.7 %Larger innovative firms 10.6 % 40.4 % 38.7 % 7.9 % 2.5 %Total 16.2 % 37.7 % 34.3 % 9.2 % 2.6 %
20j UniversitiesNot at all important
Not very important Rather important Very important I don’t know
Smaller innovative firms 11.3 % 33.8 % 35.6 % 16.6 % 2.6 %Larger innovative firms 5.2 % 30.3 % 40.2 % 22.5 % 1.8 %Total 9.8 % 33.1 % 36.7 % 18.0 % 2.4 %
20k PolytechnicsNot at all important
Not very important Rather important Very important I don’t know
Smaller innovative firms 17.7 % 34.3 % 33.9 % 11.6 % 2.5 %Larger innovative firms 11.9 % 33.1 % 43.1 % 9.9 % 1.9 %Total 16.5 % 34.0 % 35.9 % 11.2 % 2.3 %
21
21a Employees of your company/corporationNot at all important
Not very important Rather important Very important I don’t know
Smaller innovative firms 33.0 % 9.6 % 12.0 % 25.7 % 19.7 %Larger innovative firms 19.3 % 12.6 % 19.7 % 35.4 % 13.0 %Total 29.5 % 10.4 % 13.9 % 28.0 % 18.3 %
21b Device and materials suppliersNot at all important
Not very important Rather important Very important I don’t know
Smaller innovative firms 14.5 % 17.2 % 36.9 % 23.8 % 7.7 %Larger innovative firms 10.4 % 17.1 % 43.5 % 22.4 % 6.7 %Total 13.4 % 17.2 % 38.3 % 23.3 % 7.7 %
21c Client companiesNot at all important
Not very important Rather important Very important I don’t know
Smaller innovative firms 13.5 % 15.2 % 30.3 % 31.4 % 9.6 %Larger innovative firms 11.2 % 13.0 % 23.9 % 41.3 % 10.5 %Total 12.9 % 14.8 % 28.6 % 33.7 % 10.1 %
How important are the following OVERSEAS actors from the perspective of your company’s innovation activities?

Appendix III - Complete data tables
92
21d Consumers / end usersNot at all important
Not very important Rather important Very important I don’t know
Smaller innovative firms 25.7 % 19.8 % 22.7 % 21.1 % 10.7 %Larger innovative firms 18.1 % 26.6 % 23.8 % 20.9 % 10.6 %Total 23.7 % 21.5 % 22.8 % 21.1 % 10.9 %
21e Municipalities or the governmentNot at all important
Not very important Rather important Very important I don’t know
Smaller innovative firms 46.3 % 29.8 % 9.3 % 2.8 % 11.8 %Larger innovative firms 43.0 % 34.9 % 9.7 % 1.8 % 10.6 %Total 45.3 % 31.1 % 9.3 % 2.5 % 11.7 %
21f CompetitorsNot at all important
Not very important Rather important Very important I don’t know
Smaller innovative firms 18.8 % 25.8 % 34.6 % 12.9 % 8.0 %Larger innovative firms 12.8 % 24.6 % 40.3 % 14.9 % 7.4 %Total 17.2 % 25.5 % 35.9 % 13.3 % 8.1 %
21g Consultants / consulting agenciesNot at all important
Not very important Rather important Very important I don’t know
Smaller innovative firms 40.2 % 31.3 % 13.6 % 5.0 % 9.9 %Larger innovative firms 30.7 % 37.5 % 18.6 % 2.2 % 11.0 %Total 37.7 % 32.8 % 14.8 % 4.3 % 10.4 %
21h Private research organisationsNot at all important
Not very important Rather important Very important I don’t know
Smaller innovative firms 37.8 % 30.5 % 15.1 % 4.5 % 12.1 %Larger innovative firms 31.6 % 37.0 % 19.4 % 0.9 % 11.1 %Total 36.1 % 32.1 % 16.1 % 3.6 % 12.1 %
21i Public research organisationsNot at all important
Not very important Rather important Very important I don’t know
Smaller innovative firms 39.0 % 28.5 % 16.6 % 3.4 % 12.5 %Larger innovative firms 33.0 % 31.5 % 20.7 % 3.4 % 11.4 %Total 37.3 % 29.3 % 17.6 % 3.4 % 12.4 %
21j UniversitiesNot at all important
Not very important Rather important Very important I don’t know
Smaller innovative firms 32.9 % 27.8 % 19.9 % 7.9 % 11.5 %Larger innovative firms 28.0 % 34.4 % 22.5 % 6.2 % 8.9 %Total 31.6 % 29.5 % 20.5 % 7.4 % 11.1 %
21k PolytechnicsNot at all important
Not very important Rather important Very important I don’t know
Smaller innovative firms 46.5 % 27.7 % 10.9 % 1.8 % 13.0 %Larger innovative firms 40.4 % 28.5 % 17.2 % 0.5 % 13.4 %Total 44.8 % 28.0 % 12.4 % 1.5 % 13.3 %
22 Which of the following statements portray the role of end users in your innovation activities?
22a They have no significant roleYes No
Smaller innovative firms 16.1 % 83.9 %Larger innovative firms 18.2 % 81.8 %Total 16.7 % 83.3 %
22b They are subjects to frequent market studies (e.g. customer surveys)Yes No
Smaller innovative firms 35.0 % 65.0 %Larger innovative firms 46.9 % 53.1 %Total 37.8 % 62.2 %

Appendix III - Complete data tables
93
22c They provide active and frequent updates on the changes in their needs.Yes No
Smaller innovative firms 52.1 % 48.0 %Larger innovative firms 45.1 % 54.9 %Total 50.5 % 49.5 %
22d They participate in the actual innovation activities.Yes No
Smaller innovative firms 27.2 % 72.8 %Larger innovative firms 19.9 % 80.1 %Total 25.4 % 74.6 %
23
Yes No I don't know
Firms: Smaller innovative firms 38 % 60 % 1.6 %Firms: Larger innovative firms 43 % 52 % 5.3 %Firms: Other firms 19 % 75 % 6.2 %
Total 35 % 62 % 3.4 %
Has any of your company’s investment-, R&D-, marketing-, or any other type ofproject been deferred or cancelled due to the global financial crisis?

Appendix III - Complete data tables
94
PUBLIC ACTORS AND INTERMEDIARIES
14
14a
Yes No
Gov.: Innovation support gov. orgs. 92.0 % 8.0 %Gov.: Education support gov. orgs. 62.9 % 37.1 %Gov.: Other ministries 50.9 % 49.2 %Gov.: Other public sector orgs. 34.7 % 65.3 %
Intermediaries: TE-centres 100.0 % 0.0 %Intermediaries: Other intermediaries 21.3 % 78.7 %
14b Information servicesYes No
Gov.: Innovation support gov. orgs. 80.0 % 20.0 %Gov.: Education support gov. orgs. 48.6 % 51.4 %Gov.: Other ministries 62.7 % 37.3 %Gov.: Other public sector orgs. 59.2 % 40.8 %
Intermediaries: TE-centres 90.9 % 9.1 %Intermediaries: Other intermediaries 94.7 % 5.3 %
14c Promotion of international labor mobilityYes No
Gov.: Innovation support gov. orgs. 50.0 % 50.0 %Gov.: Education support gov. orgs. 65.7 % 34.3 %Gov.: Other ministries 38.1 % 61.9 %Gov.: Other public sector orgs. 28.6 % 71.4 %
Intermediaries: TE-centres 63.6 % 36.4 %Intermediaries: Other intermediaries 16.0 % 84.0 %
14d Internationalization of companiesYes No
Gov.: Innovation support gov. orgs. 62.0 % 38.0 %Gov.: Education support gov. orgs. 5.7 % 94.3 %Gov.: Other ministries 4.2 % 95.8 %Gov.: Other public sector orgs. 51.0 % 49.0 %
Intermediaries: TE-centres 81.8 % 18.2 %Intermediaries: Other intermediaries 76.0 % 24.0 %
14e Research- and education servicesYes No
Gov.: Innovation support gov. orgs. 23.0 % 77.0 %Gov.: Education support gov. orgs. 45.7 % 54.3 %Gov.: Other ministries 3.4 % 96.6 %Gov.: Other public sector orgs. 38.8 % 61.2 %
Intermediaries: TE-centres 54.6 % 45.5 %Intermediaries: Other intermediaries 52.0 % 48.0 %
14f FacilitiesYes No
Intermediaries: TE-centres 0.0 % 100.0 %Intermediaries: Other intermediaries 49.3 % 50.7 %
15
Yes No I don't know
Gov.: Innovation support gov. orgs. 67.31 % 28.85 % 3.85 %Gov.: Education support gov. orgs. 34.29 % 65.71 % 0.00 %Gov.: Other ministries 39.71 % 20.59 % 39.71 %Gov.: Other public sector orgs. 46.27 % 47.76 % 5.97 %
Total 45.29 % 40.82 % 13.89 %
Intermediaries: TE-centres 72.73 % 18.18 % 9.09 %Intermediaries: Other intermediaries 69.33 % 26.67 % 4.00 %
Total 69.77 % 25.58 % 4.65 %
Financing (subsidies, grants, loans, guarantees, or capitalinvestments)
Would you say that other PUBLIC actors provide similar services than yourorganization?
Which of the following services does your ORGANIZATION provideto other actors of the Finnish national innovation system?
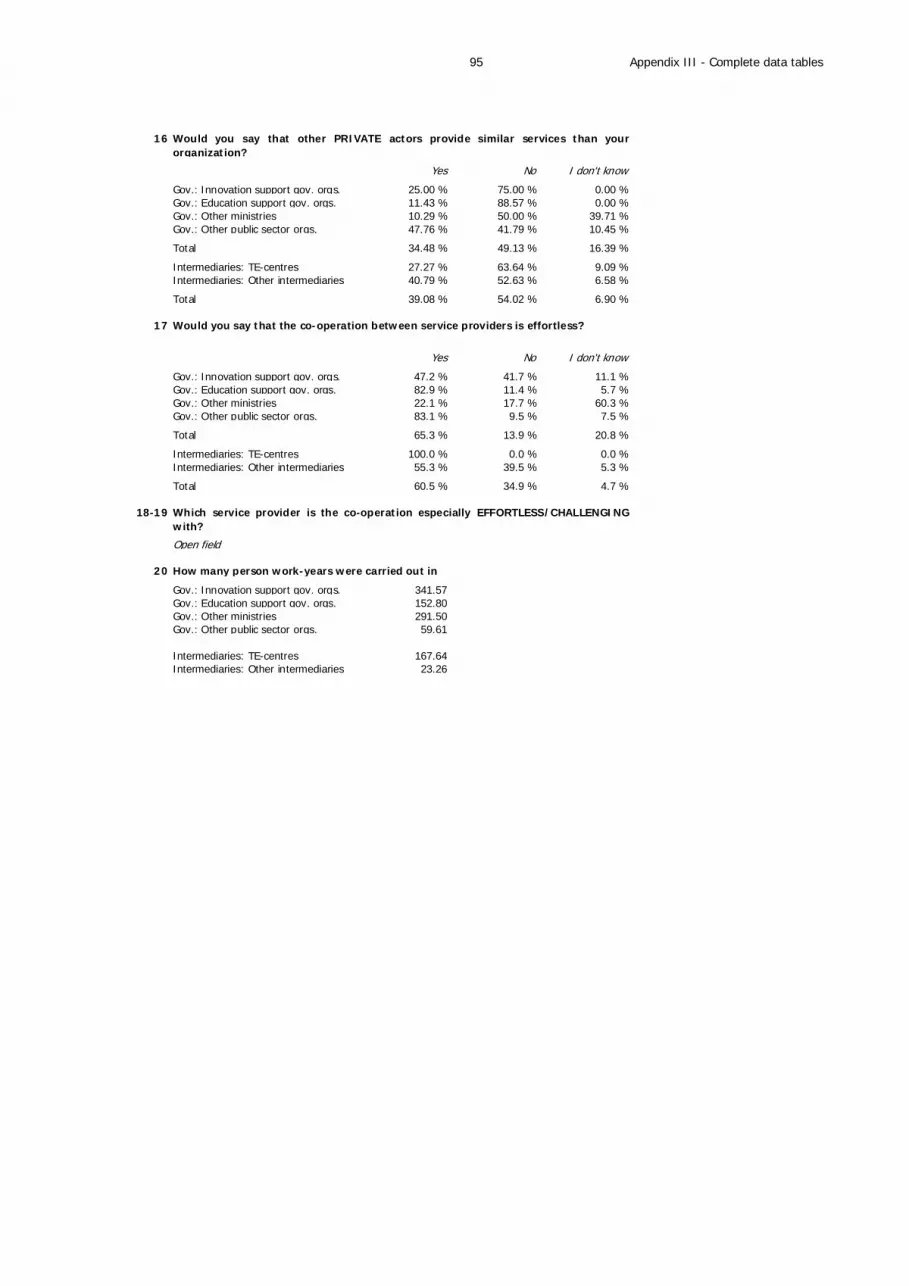
Appendix III - Complete data tables
95
16
Yes No I don't know
Gov.: Innovation support gov. orgs. 25.00 % 75.00 % 0.00 %Gov.: Education support gov. orgs. 11.43 % 88.57 % 0.00 %Gov.: Other ministries 10.29 % 50.00 % 39.71 %Gov.: Other public sector orgs. 47.76 % 41.79 % 10.45 %
Total 34.48 % 49.13 % 16.39 %
Intermediaries: TE-centres 27.27 % 63.64 % 9.09 %Intermediaries: Other intermediaries 40.79 % 52.63 % 6.58 %
Total 39.08 % 54.02 % 6.90 %
17
Yes No I don't know
Gov.: Innovation support gov. orgs. 47.2 % 41.7 % 11.1 %Gov.: Education support gov. orgs. 82.9 % 11.4 % 5.7 %Gov.: Other ministries 22.1 % 17.7 % 60.3 %Gov.: Other public sector orgs. 83.1 % 9.5 % 7.5 %
Total 65.3 % 13.9 % 20.8 %
Intermediaries: TE-centres 100.0 % 0.0 % 0.0 %Intermediaries: Other intermediaries 55.3 % 39.5 % 5.3 %
Total 60.5 % 34.9 % 4.7 %
18-19
Open field
20
Gov.: Innovation support gov. orgs. 341.57Gov.: Education support gov. orgs. 152.80Gov.: Other ministries 291.50Gov.: Other public sector orgs. 59.61
Intermediaries: TE-centres 167.64Intermediaries: Other intermediaries 23.26
Would you say that other PRIVATE actors provide similar services than yourorganization?
Would you say that the co-operation between service providers is effortless?
How many person work-years were carried out in
Which service provider is the co-operation especially EFFORTLESS/CHALLENGINGwith?
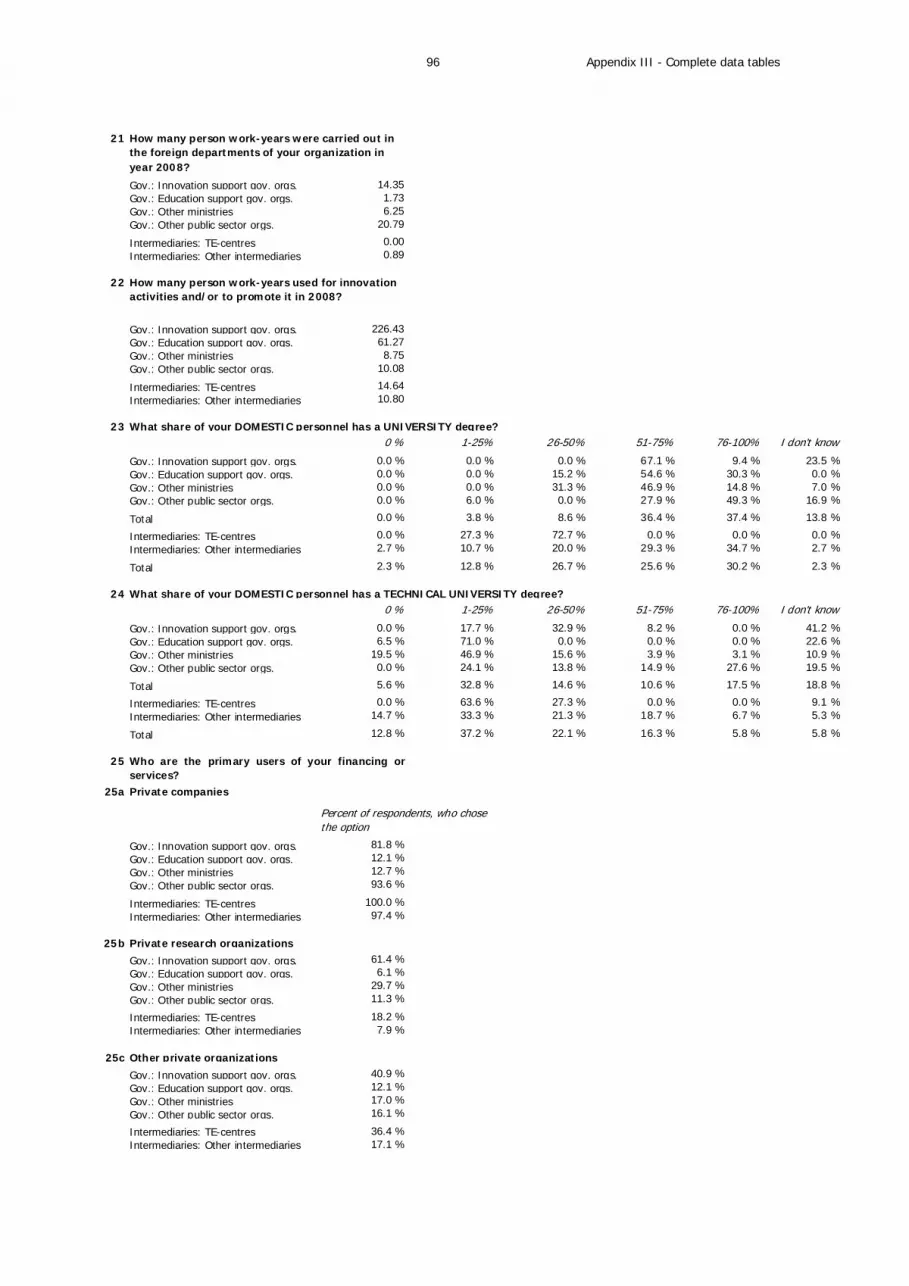
Appendix III - Complete data tables
96
21
Gov.: Innovation support gov. orgs. 14.35Gov.: Education support gov. orgs. 1.73Gov.: Other ministries 6.25Gov.: Other public sector orgs. 20.79
Intermediaries: TE-centres 0.00Intermediaries: Other intermediaries 0.89
22
Gov.: Innovation support gov. orgs. 226.43Gov.: Education support gov. orgs. 61.27Gov.: Other ministries 8.75Gov.: Other public sector orgs. 10.08
Intermediaries: TE-centres 14.64Intermediaries: Other intermediaries 10.80
23 What share of your DOMESTIC personnel has a UNIVERSITY degree?0 % 1-25% 26-50% 51-75% 76-100% I don't know
Gov.: Innovation support gov. orgs. 0.0 % 0.0 % 0.0 % 67.1 % 9.4 % 23.5 %Gov.: Education support gov. orgs. 0.0 % 0.0 % 15.2 % 54.6 % 30.3 % 0.0 %Gov.: Other ministries 0.0 % 0.0 % 31.3 % 46.9 % 14.8 % 7.0 %Gov.: Other public sector orgs. 0.0 % 6.0 % 0.0 % 27.9 % 49.3 % 16.9 %
Total 0.0 % 3.8 % 8.6 % 36.4 % 37.4 % 13.8 %
Intermediaries: TE-centres 0.0 % 27.3 % 72.7 % 0.0 % 0.0 % 0.0 %Intermediaries: Other intermediaries 2.7 % 10.7 % 20.0 % 29.3 % 34.7 % 2.7 %
Total 2.3 % 12.8 % 26.7 % 25.6 % 30.2 % 2.3 %
24 What share of your DOMESTIC personnel has a TECHNICAL UNIVERSITY degree?0 % 1-25% 26-50% 51-75% 76-100% I don't know
Gov.: Innovation support gov. orgs. 0.0 % 17.7 % 32.9 % 8.2 % 0.0 % 41.2 %Gov.: Education support gov. orgs. 6.5 % 71.0 % 0.0 % 0.0 % 0.0 % 22.6 %Gov.: Other ministries 19.5 % 46.9 % 15.6 % 3.9 % 3.1 % 10.9 %Gov.: Other public sector orgs. 0.0 % 24.1 % 13.8 % 14.9 % 27.6 % 19.5 %
Total 5.6 % 32.8 % 14.6 % 10.6 % 17.5 % 18.8 %
Intermediaries: TE-centres 0.0 % 63.6 % 27.3 % 0.0 % 0.0 % 9.1 %Intermediaries: Other intermediaries 14.7 % 33.3 % 21.3 % 18.7 % 6.7 % 5.3 %
Total 12.8 % 37.2 % 22.1 % 16.3 % 5.8 % 5.8 %
25
25a Private companies
Gov.: Innovation support gov. orgs. 81.8 %Gov.: Education support gov. orgs. 12.1 %Gov.: Other ministries 12.7 %Gov.: Other public sector orgs. 93.6 %
Intermediaries: TE-centres 100.0 %Intermediaries: Other intermediaries 97.4 %
25b Private research organizations
Gov.: Innovation support gov. orgs. 61.4 %Gov.: Education support gov. orgs. 6.1 %Gov.: Other ministries 29.7 %Gov.: Other public sector orgs. 11.3 %
Intermediaries: TE-centres 18.2 %Intermediaries: Other intermediaries 7.9 %
25c Other private organizations
Gov.: Innovation support gov. orgs. 40.9 %Gov.: Education support gov. orgs. 12.1 %Gov.: Other ministries 17.0 %Gov.: Other public sector orgs. 16.1 %
Intermediaries: TE-centres 36.4 %Intermediaries: Other intermediaries 17.1 %
Who are the primary users of your financing orservices?
How many person work-years were carried out in the foreign departments of your organization in year 2008?
Percent of respondents, who chose the option
How many person work-years used for innovation activities and/or to promote it in 2008?

Appendix III - Complete data tables
97
25d Private persons
Gov.: Innovation support gov. orgs. 9.1 %Gov.: Education support gov. orgs. 15.2 %Gov.: Other ministries 4.2 %Gov.: Other public sector orgs. 8.1 %
Intermediaries: TE-centres 18.2 %Intermediaries: Other intermediaries 30.3 %
25e Education/research: Universities
Gov.: Innovation support gov. orgs. 77.3 %Gov.: Education support gov. orgs. 87.9 %Gov.: Other ministries 41.5 %Gov.: Other public sector orgs. 29.0 %
Intermediaries: TE-centres 81.8 %Intermediaries: Other intermediaries 43.4 %
25f Education/research: Polytechnics
Gov.: Innovation support gov. orgs. 48.9 %Gov.: Education support gov. orgs. 36.4 %Gov.: Other ministries 8.5 %Gov.: Other public sector orgs. 14.5 %
Intermediaries: TE-centres 63.6 %Intermediaries: Other intermediaries 44.7 %
25g
Gov.: Innovation support gov. orgs. 8.0 %Gov.: Education support gov. orgs. 24.2 %Gov.: Other ministries 8.5 %Gov.: Other public sector orgs. 8.1 %
Intermediaries: TE-centres 36.4 %Intermediaries: Other intermediaries 9.2 %
25h Public: Research institutes
Gov.: Innovation support gov. orgs. 83.0 %Gov.: Education support gov. orgs. 69.7 %Gov.: Other ministries 71.2 %Gov.: Other public sector orgs. 37.1 %
Intermediaries: TE-centres 45.5 %Intermediaries: Other intermediaries 13.2 %
25i Public: Municipalities
Gov.: Innovation support gov. orgs. 37.5 %Gov.: Education support gov. orgs. 6.1 %Gov.: Other ministries 33.1 %Gov.: Other public sector orgs. 25.8 %
Intermediaries: TE-centres 81.8 %Intermediaries: Other intermediaries 47.4 %
25j
Gov.: Innovation support gov. orgs. 52.3 %Gov.: Education support gov. orgs. 6.1 %Gov.: Other ministries 3.4 %Gov.: Other public sector orgs. 29.0 %
Intermediaries: TE-centres 45.5 %Intermediaries: Other intermediaries 27.6 %
25k Public: Other national operators
Gov.: Innovation support gov. orgs. 26.1 %Gov.: Education support gov. orgs. 24.2 %Gov.: Other ministries 32.2 %Gov.: Other public sector orgs. 38.7 %
Intermediaries: TE-centres 18.2 %Intermediaries: Other intermediaries 13.2 %
26
See companies, question 17.
Education/research: Other educational institutes
Public: Other regional operators (TE-centers,Centers of Expertise or Technology, etc.)
One of the most central functions of the system is to facilitate PRIVATE business and innovation activities. Againstthis backdrop, how would you characterize the innovation system as a whole?
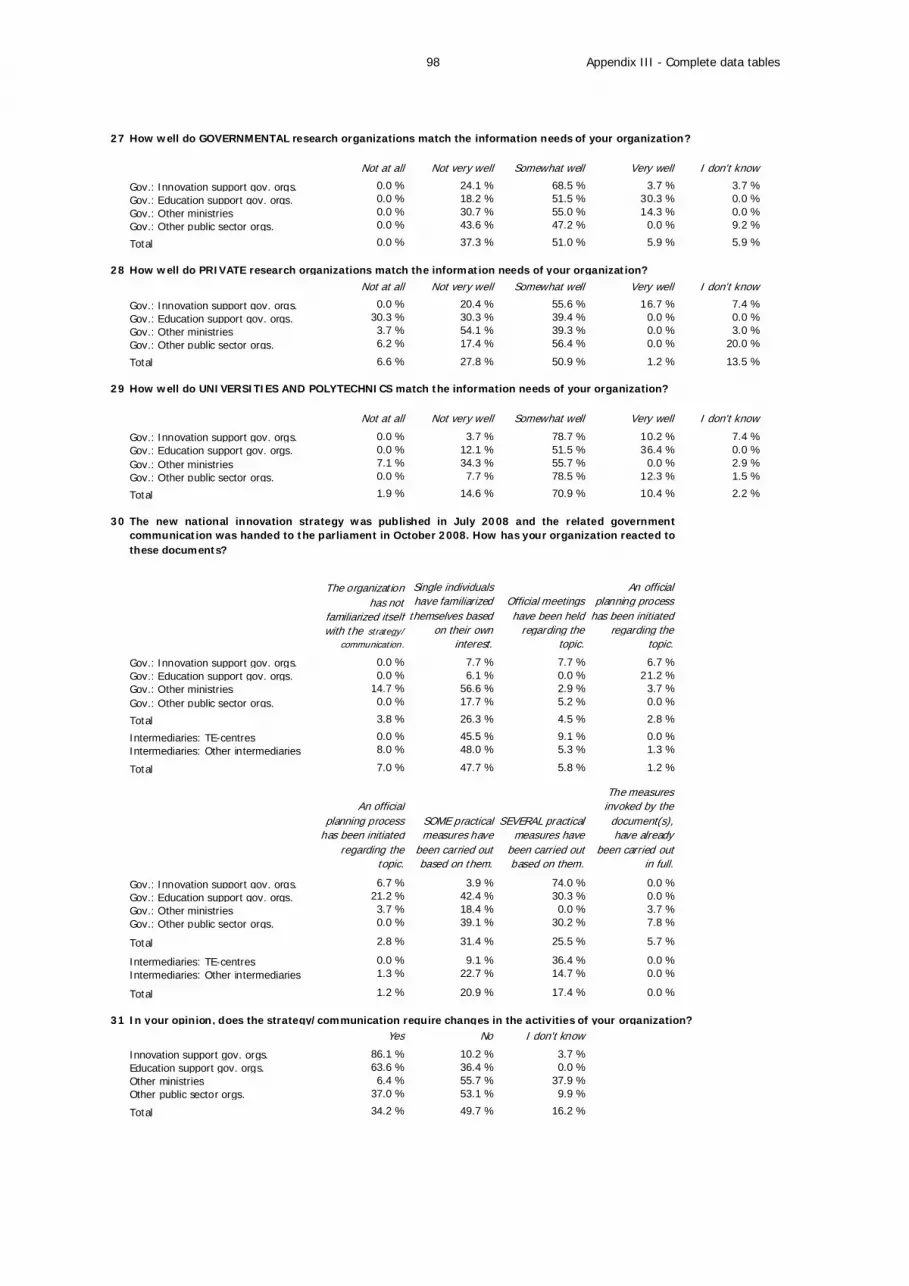
Appendix III - Complete data tables
98
27
Not at all Not very well Somewhat well Very well I don't know
Gov.: Innovation support gov. orgs. 0.0 % 24.1 % 68.5 % 3.7 % 3.7 %Gov.: Education support gov. orgs. 0.0 % 18.2 % 51.5 % 30.3 % 0.0 %Gov.: Other ministries 0.0 % 30.7 % 55.0 % 14.3 % 0.0 %Gov.: Other public sector orgs. 0.0 % 43.6 % 47.2 % 0.0 % 9.2 %
Total 0.0 % 37.3 % 51.0 % 5.9 % 5.9 %
28Not at all Not very well Somewhat well Very well I don't know
Gov.: Innovation support gov. orgs. 0.0 % 20.4 % 55.6 % 16.7 % 7.4 %Gov.: Education support gov. orgs. 30.3 % 30.3 % 39.4 % 0.0 % 0.0 %Gov.: Other ministries 3.7 % 54.1 % 39.3 % 0.0 % 3.0 %Gov.: Other public sector orgs. 6.2 % 17.4 % 56.4 % 0.0 % 20.0 %
Total 6.6 % 27.8 % 50.9 % 1.2 % 13.5 %
29
Not at all Not very well Somewhat well Very well I don't know
Gov.: Innovation support gov. orgs. 0.0 % 3.7 % 78.7 % 10.2 % 7.4 %Gov.: Education support gov. orgs. 0.0 % 12.1 % 51.5 % 36.4 % 0.0 %Gov.: Other ministries 7.1 % 34.3 % 55.7 % 0.0 % 2.9 %Gov.: Other public sector orgs. 0.0 % 7.7 % 78.5 % 12.3 % 1.5 %
Total 1.9 % 14.6 % 70.9 % 10.4 % 2.2 %
30
The organization has not
familiarized itself with the strategy/
communication.
Single individuals have familiarized
themselves based on their own
interest.
Official meetings have been held
regarding the topic.
An official planning process
has been initiated regarding the
topic.
Gov.: Innovation support gov. orgs. 0.0 % 7.7 % 7.7 % 6.7 %Gov.: Education support gov. orgs. 0.0 % 6.1 % 0.0 % 21.2 %Gov.: Other ministries 14.7 % 56.6 % 2.9 % 3.7 %Gov.: Other public sector orgs. 0.0 % 17.7 % 5.2 % 0.0 %
Total 3.8 % 26.3 % 4.5 % 2.8 %
Intermediaries: TE-centres 0.0 % 45.5 % 9.1 % 0.0 %Intermediaries: Other intermediaries 8.0 % 48.0 % 5.3 % 1.3 %
Total 7.0 % 47.7 % 5.8 % 1.2 %
An official planning process
has been initiated regarding the
topic.
SOME practical measures have
been carried out based on them.
SEVERAL practical measures have
been carried out based on them.
The measures invoked by the document(s), have already
been carried out in full.
Gov.: Innovation support gov. orgs. 6.7 % 3.9 % 74.0 % 0.0 %Gov.: Education support gov. orgs. 21.2 % 42.4 % 30.3 % 0.0 %Gov.: Other ministries 3.7 % 18.4 % 0.0 % 3.7 %Gov.: Other public sector orgs. 0.0 % 39.1 % 30.2 % 7.8 %
Total 2.8 % 31.4 % 25.5 % 5.7 %
Intermediaries: TE-centres 0.0 % 9.1 % 36.4 % 0.0 %Intermediaries: Other intermediaries 1.3 % 22.7 % 14.7 % 0.0 %
Total 1.2 % 20.9 % 17.4 % 0.0 %
31 In your opinion, does the strategy/communication require changes in the activities of your organization? Yes No I don't know
Innovation support gov. orgs. 86.1 % 10.2 % 3.7 %Education support gov. orgs. 63.6 % 36.4 % 0.0 %Other ministries 6.4 % 55.7 % 37.9 %Other public sector orgs. 37.0 % 53.1 % 9.9 %
Total 34.2 % 49.7 % 16.2 %
How well do UNIVERSITIES AND POLYTECHNICS match the information needs of your organization?
How well do GOVERNMENTAL research organizations match the information needs of your organization?
How well do PRIVATE research organizations match the information needs of your organization?
The new national innovation strategy was published in July 2008 and the related governmentcommunication was handed to the parliament in October 2008. How has your organization reacted tothese documents?

Appendix III - Complete data tables
99
32 How much has the strategy/communication helped in steering the activities of your organization? Not at all Not very much Somewhat Very much I don't know
Innovation support gov. orgs. 3.7 % 21.3 % 26.9 % 44.4 % 3.7 %Education support gov. orgs. 0.0 % 69.7 % 30.3 % 0.0 % 0.0 %Other ministries 13.6 % 42.1 % 6.4 % 0.0 % 37.9 %Other public sector orgs. 23.4 % 43.2 % 24.0 % 9.4 % 0.0 %
Total 18.0 % 43.0 % 20.0 % 8.9 % 10.2 %
33
Open field
34
Open field
35
Open field
36
Open field
In your opinion, what is the most significant OPPORTUNITY regarding Finland’s innovation strategy in the 2010’s?Input your response in the open field below.
In your opinion, what is the most important THREAT regarding Finland’s innovation strategy in the 2010’s? Inputyour response in the open field below.
In your opinion, what is the most significant STRENGTH of Finland’s innovation system in the 2010’s? Input your
In your opinion, what is the most significant WEAKNESS of Finland’s innovation system in the 2010’s? Input yourresponse in the open field below.
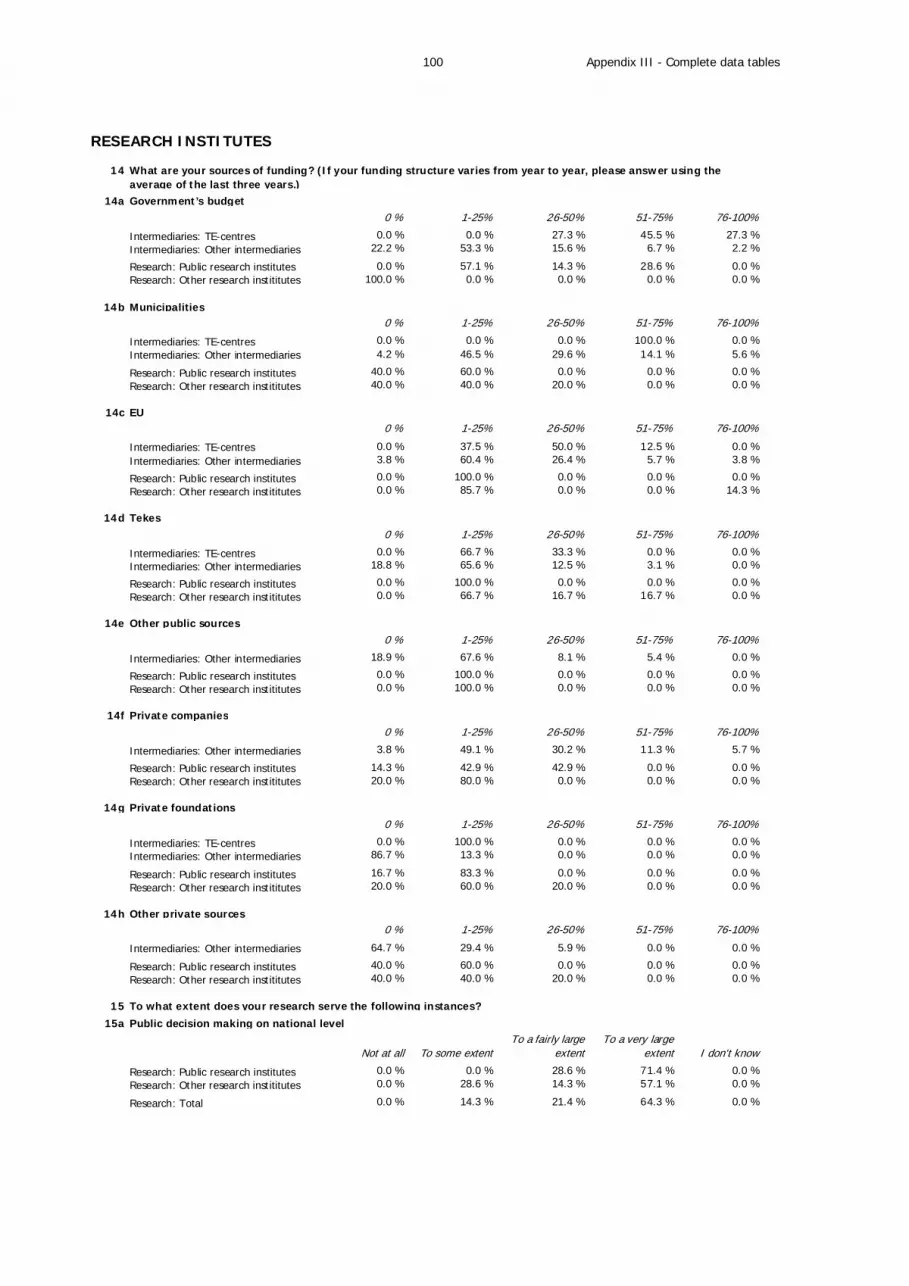
Appendix III - Complete data tables
100
RESEARCH INSTITUTES
14
14a Government’s budget0 % 1-25% 26-50% 51-75% 76-100%
Intermediaries: TE-centres 0.0 % 0.0 % 27.3 % 45.5 % 27.3 %Intermediaries: Other intermediaries 22.2 % 53.3 % 15.6 % 6.7 % 2.2 %
Research: Public research institutes 0.0 % 57.1 % 14.3 % 28.6 % 0.0 %Research: Other research instititutes 100.0 % 0.0 % 0.0 % 0.0 % 0.0 %
14b Municipalities0 % 1-25% 26-50% 51-75% 76-100%
Intermediaries: TE-centres 0.0 % 0.0 % 0.0 % 100.0 % 0.0 %Intermediaries: Other intermediaries 4.2 % 46.5 % 29.6 % 14.1 % 5.6 %
Research: Public research institutes 40.0 % 60.0 % 0.0 % 0.0 % 0.0 %Research: Other research instititutes 40.0 % 40.0 % 20.0 % 0.0 % 0.0 %
14c EU0 % 1-25% 26-50% 51-75% 76-100%
Intermediaries: TE-centres 0.0 % 37.5 % 50.0 % 12.5 % 0.0 %Intermediaries: Other intermediaries 3.8 % 60.4 % 26.4 % 5.7 % 3.8 %
Research: Public research institutes 0.0 % 100.0 % 0.0 % 0.0 % 0.0 %Research: Other research instititutes 0.0 % 85.7 % 0.0 % 0.0 % 14.3 %
14d Tekes0 % 1-25% 26-50% 51-75% 76-100%
Intermediaries: TE-centres 0.0 % 66.7 % 33.3 % 0.0 % 0.0 %Intermediaries: Other intermediaries 18.8 % 65.6 % 12.5 % 3.1 % 0.0 %
Research: Public research institutes 0.0 % 100.0 % 0.0 % 0.0 % 0.0 %Research: Other research instititutes 0.0 % 66.7 % 16.7 % 16.7 % 0.0 %
14e Other public sources0 % 1-25% 26-50% 51-75% 76-100%
Intermediaries: Other intermediaries 18.9 % 67.6 % 8.1 % 5.4 % 0.0 %
Research: Public research institutes 0.0 % 100.0 % 0.0 % 0.0 % 0.0 %Research: Other research instititutes 0.0 % 100.0 % 0.0 % 0.0 % 0.0 %
14f Private companies0 % 1-25% 26-50% 51-75% 76-100%
Intermediaries: Other intermediaries 3.8 % 49.1 % 30.2 % 11.3 % 5.7 %
Research: Public research institutes 14.3 % 42.9 % 42.9 % 0.0 % 0.0 %Research: Other research instititutes 20.0 % 80.0 % 0.0 % 0.0 % 0.0 %
14g Private foundations0 % 1-25% 26-50% 51-75% 76-100%
Intermediaries: TE-centres 0.0 % 100.0 % 0.0 % 0.0 % 0.0 %Intermediaries: Other intermediaries 86.7 % 13.3 % 0.0 % 0.0 % 0.0 %
Research: Public research institutes 16.7 % 83.3 % 0.0 % 0.0 % 0.0 %Research: Other research instititutes 20.0 % 60.0 % 20.0 % 0.0 % 0.0 %
14h Other private sources0 % 1-25% 26-50% 51-75% 76-100%
Intermediaries: Other intermediaries 64.7 % 29.4 % 5.9 % 0.0 % 0.0 %
Research: Public research institutes 40.0 % 60.0 % 0.0 % 0.0 % 0.0 %Research: Other research instititutes 40.0 % 40.0 % 20.0 % 0.0 % 0.0 %
15 To what extent does your research serve the following instances?
15a Public decision making on national level
Not at all To some extentTo a fairly large
extentTo a very large
extent I don't know
Research: Public research institutes 0.0 % 0.0 % 28.6 % 71.4 % 0.0 %Research: Other research instititutes 0.0 % 28.6 % 14.3 % 57.1 % 0.0 %
Research: Total 0.0 % 14.3 % 21.4 % 64.3 % 0.0 %
What are your sources of funding? (If your funding structure varies from year to year, please answer using the average of the last three years.)
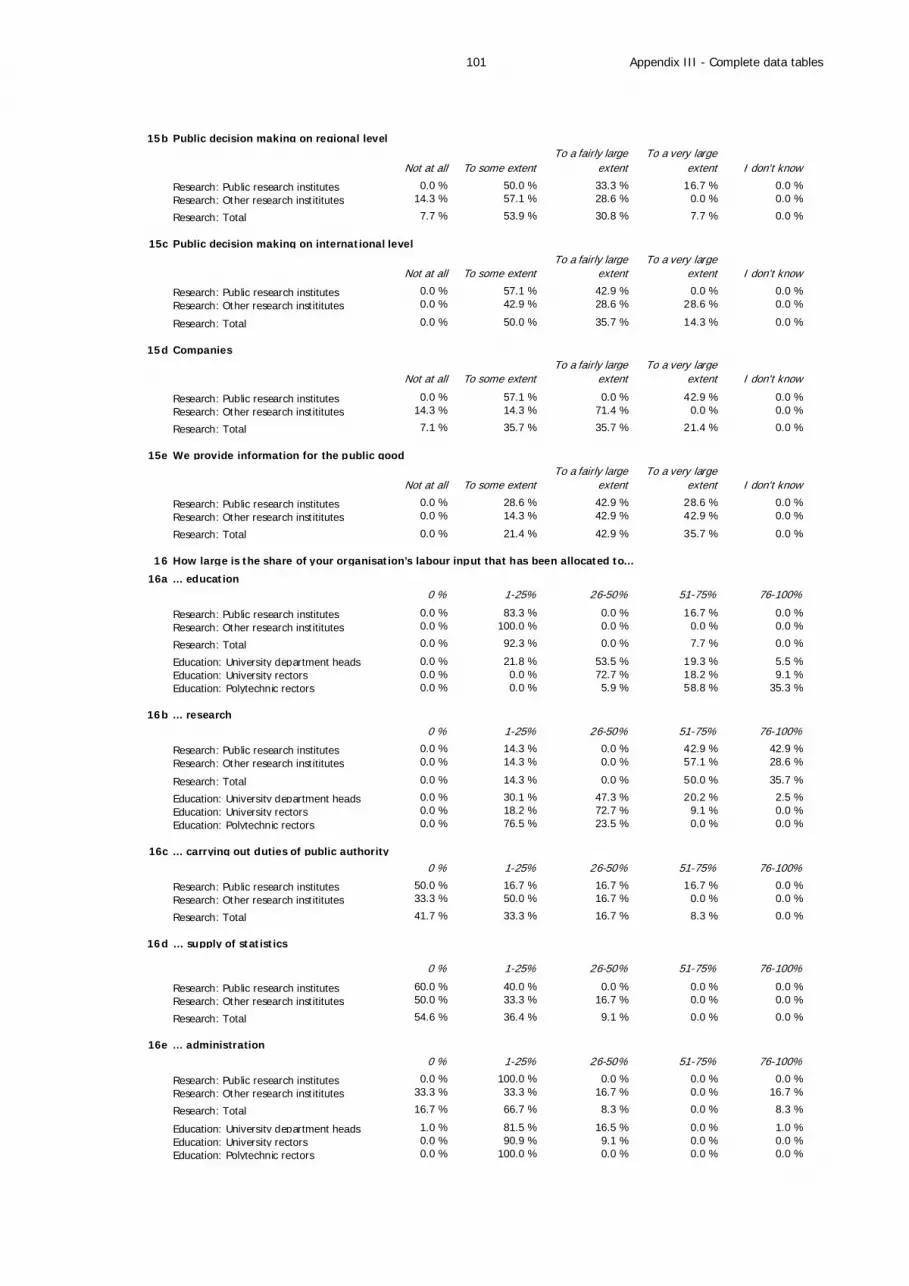
Appendix III - Complete data tables
101
15b Public decision making on regional level
Not at all To some extentTo a fairly large
extentTo a very large
extent I don't know
Research: Public research institutes 0.0 % 50.0 % 33.3 % 16.7 % 0.0 %Research: Other research instititutes 14.3 % 57.1 % 28.6 % 0.0 % 0.0 %
Research: Total 7.7 % 53.9 % 30.8 % 7.7 % 0.0 %
15c Public decision making on international level
Not at all To some extentTo a fairly large
extentTo a very large
extent I don't know
Research: Public research institutes 0.0 % 57.1 % 42.9 % 0.0 % 0.0 %Research: Other research instititutes 0.0 % 42.9 % 28.6 % 28.6 % 0.0 %
Research: Total 0.0 % 50.0 % 35.7 % 14.3 % 0.0 %
15d Companies
Not at all To some extentTo a fairly large
extentTo a very large
extent I don't know
Research: Public research institutes 0.0 % 57.1 % 0.0 % 42.9 % 0.0 %Research: Other research instititutes 14.3 % 14.3 % 71.4 % 0.0 % 0.0 %
Research: Total 7.1 % 35.7 % 35.7 % 21.4 % 0.0 %
15e We provide information for the public good
Not at all To some extentTo a fairly large
extentTo a very large
extent I don't know
Research: Public research institutes 0.0 % 28.6 % 42.9 % 28.6 % 0.0 %Research: Other research instititutes 0.0 % 14.3 % 42.9 % 42.9 % 0.0 %
Research: Total 0.0 % 21.4 % 42.9 % 35.7 % 0.0 %
16 How large is the share of your organisation’s labour input that has been allocated to…
16a ... education0 % 1-25% 26-50% 51-75% 76-100%
Research: Public research institutes 0.0 % 83.3 % 0.0 % 16.7 % 0.0 %Research: Other research instititutes 0.0 % 100.0 % 0.0 % 0.0 % 0.0 %
Research: Total 0.0 % 92.3 % 0.0 % 7.7 % 0.0 %
Education: University department heads 0.0 % 21.8 % 53.5 % 19.3 % 5.5 %Education: University rectors 0.0 % 0.0 % 72.7 % 18.2 % 9.1 %Education: Polytechnic rectors 0.0 % 0.0 % 5.9 % 58.8 % 35.3 %
16b ... research0 % 1-25% 26-50% 51-75% 76-100%
Research: Public research institutes 0.0 % 14.3 % 0.0 % 42.9 % 42.9 %Research: Other research instititutes 0.0 % 14.3 % 0.0 % 57.1 % 28.6 %
Research: Total 0.0 % 14.3 % 0.0 % 50.0 % 35.7 %
Education: University department heads 0.0 % 30.1 % 47.3 % 20.2 % 2.5 %Education: University rectors 0.0 % 18.2 % 72.7 % 9.1 % 0.0 %Education: Polytechnic rectors 0.0 % 76.5 % 23.5 % 0.0 % 0.0 %
16c ... carrying out duties of public authority0 % 1-25% 26-50% 51-75% 76-100%
Research: Public research institutes 50.0 % 16.7 % 16.7 % 16.7 % 0.0 %Research: Other research instititutes 33.3 % 50.0 % 16.7 % 0.0 % 0.0 %
Research: Total 41.7 % 33.3 % 16.7 % 8.3 % 0.0 %
16d … supply of statistics
0 % 1-25% 26-50% 51-75% 76-100%
Research: Public research institutes 60.0 % 40.0 % 0.0 % 0.0 % 0.0 %Research: Other research instititutes 50.0 % 33.3 % 16.7 % 0.0 % 0.0 %
Research: Total 54.6 % 36.4 % 9.1 % 0.0 % 0.0 %
16e ... administration0 % 1-25% 26-50% 51-75% 76-100%
Research: Public research institutes 0.0 % 100.0 % 0.0 % 0.0 % 0.0 %Research: Other research instititutes 33.3 % 33.3 % 16.7 % 0.0 % 16.7 %
Research: Total 16.7 % 66.7 % 8.3 % 0.0 % 8.3 %
Education: University department heads 1.0 % 81.5 % 16.5 % 0.0 % 1.0 %Education: University rectors 0.0 % 90.9 % 9.1 % 0.0 % 0.0 %Education: Polytechnic rectors 0.0 % 100.0 % 0.0 % 0.0 % 0.0 %

Appendix III - Complete data tables
102
16f ... other functions
0 % 1-25% 26-50% 51-75% 76-100%
Research: Public research institutes 33.3 % 66.7 % 0.0 % 0.0 % 0.0 %Research: Other research instititutes 14.3 % 85.7 % 0.0 % 0.0 % 0.0 %
Total 20.0 % 80.0 % 0.0 % 0.0 % 0.0 %
Education: University department heads 26.1 % 72.6 % 0.6 % 0.0 % 0.6 %Education: University rectors 18.2 % 81.8 % 0.0 % 0.0 % 0.0 %Education: Polytechnic rectors 25.0 % 66.7 % 0.0 % 8.3 % 0.0 %
16g … societal impact0 % 1-25% 26-50% 51-75% 76-100%
Education: University department heads 0.5 % 81.4 % 12.1 % 5.5 % 0.5 %Education: University rectors 0.0 % 72.7 % 9.1 % 18.2 % 0.0 %Education: Polytechnic rectors 0.0 % 64.7 % 11.8 % 11.8 % 11.8 %
17
Not at all Not very well To some extent Very well I don't know
Research: Public research institutes 0.0 % 0.0 % 42.9 % 57.1 % 0.0 %
18
Not at all Not very well To some extent Very well I don't know
Research: Public research institutes 0.0 % 42.9 % 57.1 % 0.0 % 0.0 %
19
Not at all Not very well To some extent Very well I don't know
Research: Public research institutes 0.0 % 85.7 % 14.3 % 0.0 % 0.0 %
In your opinion, how well do private research organizations respond to the information needs of your parent ministry?
In your opinion, how well do universities and polytechnics respond to the information needs of your parent ministry?
In your opinion, how well does your organization as a governmental research organization respond to the information needs of your parent ministry?

Appendix III - Complete data tables
103
EDUCATION
15
15a Domestic universitiesNone Small Fairly large Very large I don't know
University department heads 0.0 % 15.2 % 34.3 % 50.5 % 0.0 %
University rectors 0.0 % 0.0 % 45.5 % 54.6 % 0.0 %Polytechnic rectors 0.0 % 11.8 % 76.5 % 11.8 % 0.0 %
15b Foreign universitiesNone Small Fairly large Very large I don't know
University department heads 1.0 % 16.2 % 41.7 % 41.2 % 0.0 %
University rectors 0.0 % 0.0 % 81.8 % 18.2 % 0.0 %Polytechnic rectors 0.0 % 29.4 % 47.1 % 23.5 % 0.0 %
15c PolytechnicsNone Small Fairly large Very large I don't know
University department heads 41.2 % 42.2 % 14.2 % 2.5 % 0.0 %
University rectors 0.0 % 63.6 % 36.4 % 0.0 % 0.0 %Polytechnic rectors 0.0 % 0.0 % 29.4 % 70.6 % 0.0 %
15d Public research organizationsNone Small Fairly large Very large I don't know
University department heads 18.1 % 36.8 % 34.3 % 10.3 % 0.5 %
University rectors 9.1 % 18.2 % 54.6 % 18.2 % 0.0 %Polytechnic rectors 5.9 % 52.9 % 35.3 % 5.9 % 0.0 %
15e Private research institutesNone Small Fairly large Very large I don't know
University department heads 50.0 % 37.3 % 9.3 % 1.5 % 2.0 %
University rectors 27.3 % 63.6 % 9.1 % 0.0 % 0.0 %Polytechnic rectors 11.8 % 76.5 % 5.9 % 5.9 % 0.0 %
15f Open internet communitiesNone Small Fairly large Very large I don't know
University department heads 25.6 % 41.4 % 22.7 % 4.4 % 5.9 %
University rectors 9.1 % 63.6 % 27.3 % 0.0 % 0.0 %Polytechnic rectors 5.9 % 17.7 % 52.9 % 17.7 % 5.9 %
15g Domestic companiesNone Small Fairly large Very large I don't know
University department heads 14.8 % 32.0 % 27.1 % 26.1 % 0.0 %
University rectors 9.1 % 18.2 % 45.5 % 27.3 % 0.0 %Polytechnic rectors 0.0 % 11.8 % 47.1 % 41.2 % 0.0 %
15h Foreign companies
None Small Fairly large Very large I don't know
University department heads 44.1 % 35.3 % 15.7 % 3.4 % 1.5 %
University rectors 18.2 % 54.6 % 18.2 % 9.1 % 0.0 %Polytechnic rectors 23.5 % 58.8 % 11.8 % 5.9 % 0.0 %
16
16a Basic research -driven general search for new ideasYes No I don't know
University department heads 57.6 % 34.6 % 7.9 %
University rectors 80.0 % -20.0 % 0.0 %Polytechnic rectors 17.7 % -76.5 % 5.9 %
16b Access to complementary expertiseYes No I don't know
University department heads 53.4 % 36.1 % 10.5 %
University rectors 80.0 % 20.0 % 0.0 %Polytechnic rectors 100.0 % 0.0 % 0.0 %
How significant was the role of the following actors in cooperative projects of your department/organization in the last three years?
Have joint projects with companies addressed the following research objectives of your department?

Appendix III - Complete data tables
104
16c Solving a specific problemYes No I don't know
University department heads 69.1 % 22.5 % 8.4 %
University rectors 90.0 % 10.0 % 0.0 %Polytechnic rectors 100.0 % 0.0 % 0.0 %
16d Prototype development/testingYes No I don't know
University department heads 37.6 % 54.0 % 8.5 %
University rectors 40.0 % 40.0 % 20.0 %Polytechnic rectors 82.4 % 17.7 % 0.0 %
16e Participation in public research programsYes No I don't know
University department heads 68.6 % 23.6 % 7.9 %
University rectors 100.0 % 0.0 % 0.0 %Polytechnic rectors 94.1 % 5.9 % 0.0 %
16f Supply of competent personnelYes No I don't know
University department heads 46.3 % 42.1 % 11.6 %
University rectors 90.0 % 10.0 % 0.0 %Polytechnic rectors 94.1 % 5.9 % 0.0 %
16g Provision of professional development opportunities for staffYes No I don't know
University department heads 29.8 % 59.6 % 10.6 %
University rectors 80.0 % 10.0 % 10.0 %Polytechnic rectors 94.1 % 5.9 % 0.0 %
17
17a Basic research -driven general search for new ideas
Not at all To some extentTo a fairly large
extentTo a very large
extent I don't know
University department heads 11.28 % 24.10 % 33.85 % 28.21 % 2.56 %
University rectors 18.18 % 9.09 % 36.36 % 36.36 % 0.00 %Polytechnic rectors 47.06 % 35.29 % 17.65 % 0.00 % 0.00 %
17b Access to complementary expertise
Not at all To some extentTo a fairly large
extentTo a very large
extent I don't know
University department heads 11.3 % 24.6 % 37.4 % 21.0 % 5.6 %
University rectors 18.2 % 27.3 % 36.4 % 18.2 % 0.0 %Polytechnic rectors 0.0 % 11.8 % 58.8 % 29.4 % 0.0 %
17c Solving a specific problem
Not at all To some extentTo a fairly large
extentTo a very large
extent I don't know
University department heads 9.4 % 23.4 % 44.3 % 19.3 % 3.7 %
University rectors 9.1 % 18.2 % 63.6 % 9.1 % 0.0 %Polytechnic rectors 0.0 % 5.9 % 64.7 % 29.4 % 0.0 %
According to your own ESTIMATE, to what extent does your department answer to the following needs of CORPORATE innovation activities?
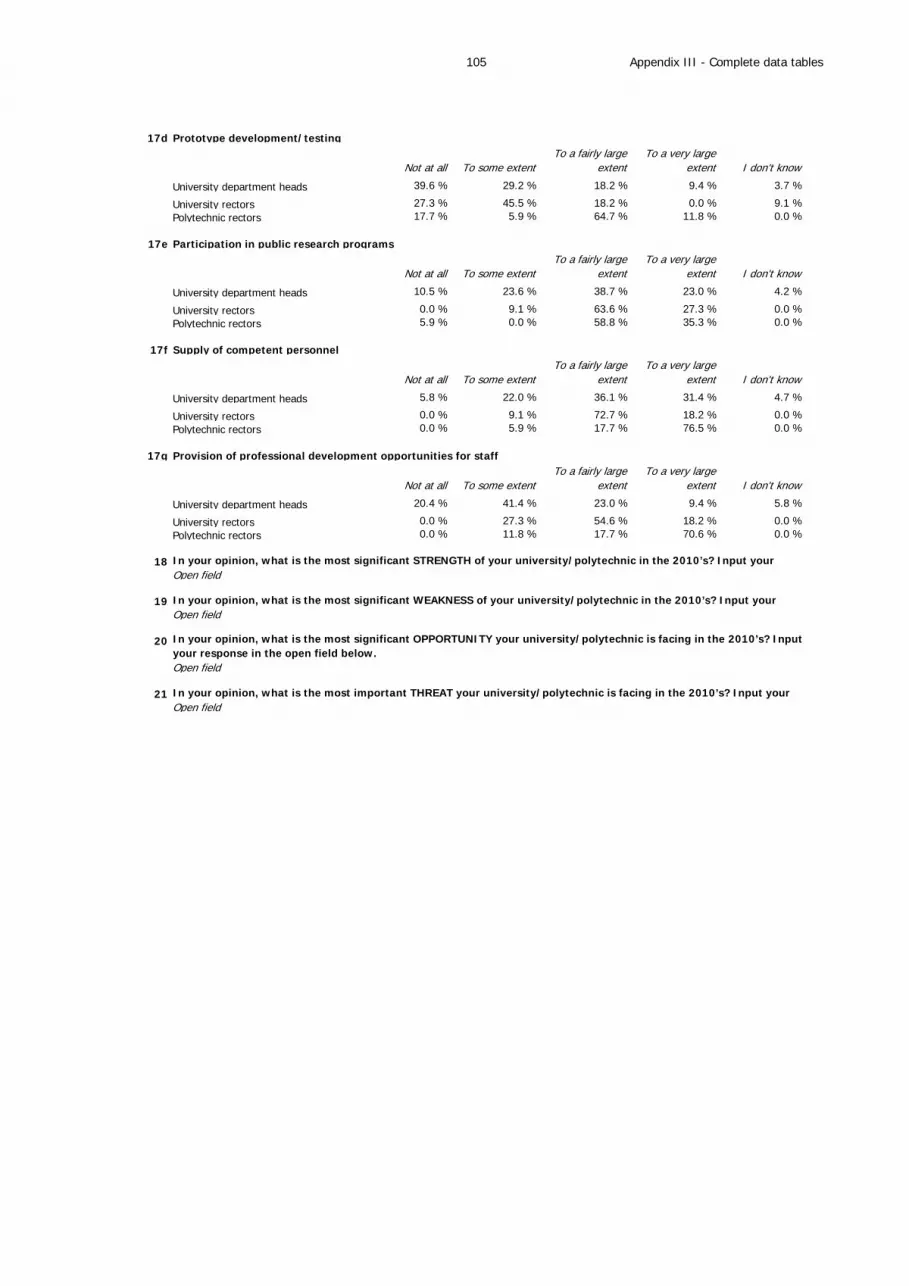
Appendix III - Complete data tables
105
17d Prototype development/testing
Not at all To some extentTo a fairly large
extentTo a very large
extent I don't know
University department heads 39.6 % 29.2 % 18.2 % 9.4 % 3.7 %
University rectors 27.3 % 45.5 % 18.2 % 0.0 % 9.1 %Polytechnic rectors 17.7 % 5.9 % 64.7 % 11.8 % 0.0 %
17e Participation in public research programs
Not at all To some extentTo a fairly large
extentTo a very large
extent I don't know
University department heads 10.5 % 23.6 % 38.7 % 23.0 % 4.2 %
University rectors 0.0 % 9.1 % 63.6 % 27.3 % 0.0 %Polytechnic rectors 5.9 % 0.0 % 58.8 % 35.3 % 0.0 %
17f Supply of competent personnel
Not at all To some extentTo a fairly large
extentTo a very large
extent I don't know
University department heads 5.8 % 22.0 % 36.1 % 31.4 % 4.7 %
University rectors 0.0 % 9.1 % 72.7 % 18.2 % 0.0 %Polytechnic rectors 0.0 % 5.9 % 17.7 % 76.5 % 0.0 %
17g Provision of professional development opportunities for staff
Not at all To some extentTo a fairly large
extentTo a very large
extent I don't know
University department heads 20.4 % 41.4 % 23.0 % 9.4 % 5.8 %
University rectors 0.0 % 27.3 % 54.6 % 18.2 % 0.0 %Polytechnic rectors 0.0 % 11.8 % 17.7 % 70.6 % 0.0 %
18Open field
19Open field
20
Open field
21Open field
In your opinion, what is the most significant OPPORTUNITY your university/polytechnic is facing in the 2010’s? Inputyour response in the open field below.
In your opinion, what is the most important THREAT your university/polytechnic is facing in the 2010’s? Input your
In your opinion, what is the most significant STRENGTH of your university/polytechnic in the 2010’s? Input your
In your opinion, what is the most significant WEAKNESS of your university/polytechnic in the 2010’s? Input your

Appendix III - Complete data tables
106
MUNICIPALITIES
14
Financing (subsidies, grants, loans, guarantees,
or capital investments)Information
services
Promotion of international
labor mobilityInternationalizatio
n of companies
Research- and education
services Facilities
52.9 % 87.2 % 20.4 % 38.8 % 41.8 % 68.5 %
15
Yes No I don't know
19.6 % 79.2 % 1.2 %
16
Open field Euros
17
Open field Euros
18 What was your municipality’s total budget in 2008?
Open field Euros
19
Never Seldom Often I don't know
32.5 % 50.2 % 8.1 % 9.1 %
20
Yes No I don't know
72.9 % 18.1 % 9.0 %
Has your municipality an explicit strategy or agenda related toINNOVATION ACTIVITIES?
Has innovativeness been a central criterion in the selection of service providers orgoods suppliers in your municipality?
Would you say it is possible to support the promotion of innovationactivities through public procurement?
Does your municipality provide any of the following services in order to support your local INNOVATION ACTIVITIES?
How much PROPRIETORY FUNDING did your municipality use to promote INNOVATION ACTIVITIES in 2008?
How much national or international (incl. EU-funding) public funding was used IN ADDITION TO YOUR OWN FUNDING to support innovation activities in 2008?

Appendix III - Complete data tables
107
FOUNDATIONS
5
Decreasing No change Increasing I don't know
3.6 % 30.4 % 57.1 % 8.9 %
6
No need for changes Yes (how?) I don’t know
43.6 % 34.6 % 21.8 %
7 Which of the following fields does your foundation support?
HumanitiesSocial sciences Natural sciences
Agriculture and forestry Technology Medicine
57.1 % 55.1 % 42.9 % 18.4 % 34.7 % 38.8 %
8
Research in FinlandResearch abroad
Studying in Finland Studying abroad Conference trips Something else
73.5 % 0.0 % 10.2 % 2.0 % 0.0 % 14.3 %
11
Not at all1-2 professor -
ships3-5 professor-
shipsMore than 5
professor- ships I don’t know
48.0 % 22.0 % 6.0 % 0.0 % 24.0 %
How would you assess the development of the importance of foundations in theFinnish innovation system in the next five years?
Should the legislation regarding foundations be reformed to
University departments in Finland are considered too small. To your understanding, would yourfoundation have the readiness to sponsor a professorship if the government supported theprofessorship by providing 2.5 Euros for each Euro you provide?
Which of the following activities does your foundation MAINLY support? (Please choose only one)
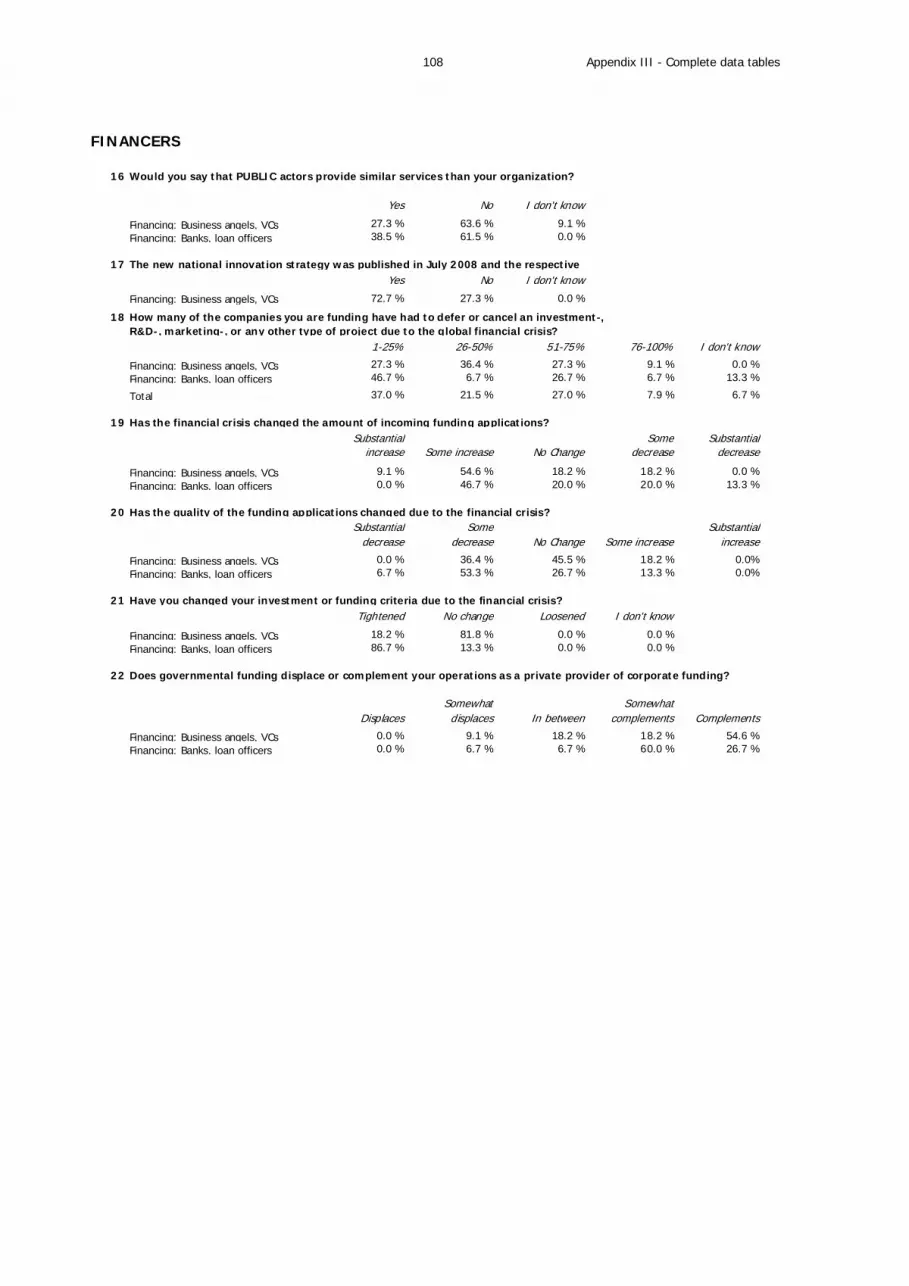
Appendix III - Complete data tables
108
FINANCERS
16
Yes No I don't know
Financing: Business angels, VCs 27.3 % 63.6 % 9.1 %Financing: Banks, loan officers 38.5 % 61.5 % 0.0 %
17Yes No I don't know
Financing: Business angels, VCs 72.7 % 27.3 % 0.0 %
18
1-25% 26-50% 51-75% 76-100% I don't know
Financing: Business angels, VCs 27.3 % 36.4 % 27.3 % 9.1 % 0.0 %Financing: Banks, loan officers 46.7 % 6.7 % 26.7 % 6.7 % 13.3 %
Total 37.0 % 21.5 % 27.0 % 7.9 % 6.7 %
19 Has the financial crisis changed the amount of incoming funding applications?Substantial
increase Some increase No ChangeSome
decreaseSubstantial
decrease
Financing: Business angels, VCs 9.1 % 54.6 % 18.2 % 18.2 % 0.0 %Financing: Banks, loan officers 0.0 % 46.7 % 20.0 % 20.0 % 13.3 %
20 Has the quality of the funding applications changed due to the financial crisis? Substantial
decreaseSome
decrease No Change Some increaseSubstantial
increase
Financing: Business angels, VCs 0.0 % 36.4 % 45.5 % 18.2 % 0.0%Financing: Banks, loan officers 6.7 % 53.3 % 26.7 % 13.3 % 0.0%
21 Have you changed your investment or funding criteria due to the financial crisis?Tightened No change Loosened I don't know
Financing: Business angels, VCs 18.2 % 81.8 % 0.0 % 0.0 %Financing: Banks, loan officers 86.7 % 13.3 % 0.0 % 0.0 %
22
DisplacesSomewhat displaces In between
Somewhat complements Complements
Financing: Business angels, VCs 0.0 % 9.1 % 18.2 % 18.2 % 54.6 %Financing: Banks, loan officers 0.0 % 6.7 % 6.7 % 60.0 % 26.7 %
How many of the companies you are funding have had to defer or cancel an investment-, R&D-, marketing-, or any other type of project due to the global financial crisis?
The new national innovation strategy was published in July 2008 and the respective
Does governmental funding displace or complement your operations as a private provider of corporate funding?
Would you say that PUBLIC actors provide similar services than your organization?

Appendix IV - Questionnaires in English
109
APPENDIX IV - Questionnaires in English
1. Questions posed to ALL RESPONDENTS
EVALUATION OF THE FINNISH NATIONAL INNOVATION SYSTEM The Research institute of the Finnish Economy (ETLA) is carrying out a survey related to the evaluation of the Finnish innova-tion system (www.evaluation.fi) which we would like you to answer to. The evaluation was assigned and is supported by the ministry of employment and the economy (TEM) and the ministry of education (OPM). The aim is to collect general views on the characteristics of the innovation system. The NATIONAL INNOVATION SYSTEM (NIS) refers to the totality of private and public actors participating in producing and applying knowledge and information to promote the welfare of Finnish citizens. 1) How would you grade the Finnish national innovation system (NIS) AT THE MOMENT? Scale 4 - 10 / I don’t know 2) If you evaluated the system as it was 5 YEARS AGO, how would you grade it? Scale 4 - 10 / I don’t know 3) Taking into account the ongoing and future reforms, what grade would you give to the NIS as you anticipate it to be IN 5 YEARS? Scale 4 - 10 / I don’t know 4) How would you describe the regime constituted by the PUBLIC SECTOR actors in the NIS? Very simple / Rather simple / Rather complex / Very complex/ I don’t know 5) From the point of view of YOUR OWN ORGANISATION, how important do you consider the following govern-mental actors of the NIS? Please choose ONE alternative for each organisation.
Not at all important
Not very important
Rather important
Very impor-tant
I don’t know
Tekes O O O O O Sitra O O O O O The Academy of Finland O O O O O Ministry of employment and the economy O O O O O Ministry of education O O O O O Ministry of social affairs and health O O O O O Ministry of finance O O O O O Other ministries O O O O O Technical Research Centre of Finland (VTT) O O O O O Other public research organisations O O O O O Finpro O O O O O Foundation for Finnish Inventions O O O O O Universities O O O O O Polytechnics O O O O O Local TE-centres O O O O O Industry Investment O O O O O Finnvera O O O O O Centres of Expertise or Technology O O O O O Research and Innovation council (Science and technology policy council) O O O O O
6) “Technology push” and “demand pull” are alternative concepts that often characterize the orientation of innovation policies. Which of the two characterizes the Finnish national innovation policy best? Please encircle ONE option on a scale from 1 to 5, where 1=strong technology push and 5=strong demand pull. (Technology push) 1 2 3 4 5 (Demand pull) 7) In the NIS universities, polytechnics, and public research organisations have their own roles. Indicate by checking the respective boxes WHETHER the listed actors SUCCESSFULLY take care of the following tasks. Please check the options only if, in your opinion, the actor performs WELL in the respective tasks.
International top-class research
Research for na-tional needs
Prod. of compe-tence for interna-tional business
activities
Prod. of compe-tence for local
business activities
Universities Polytechnics Public research organisations
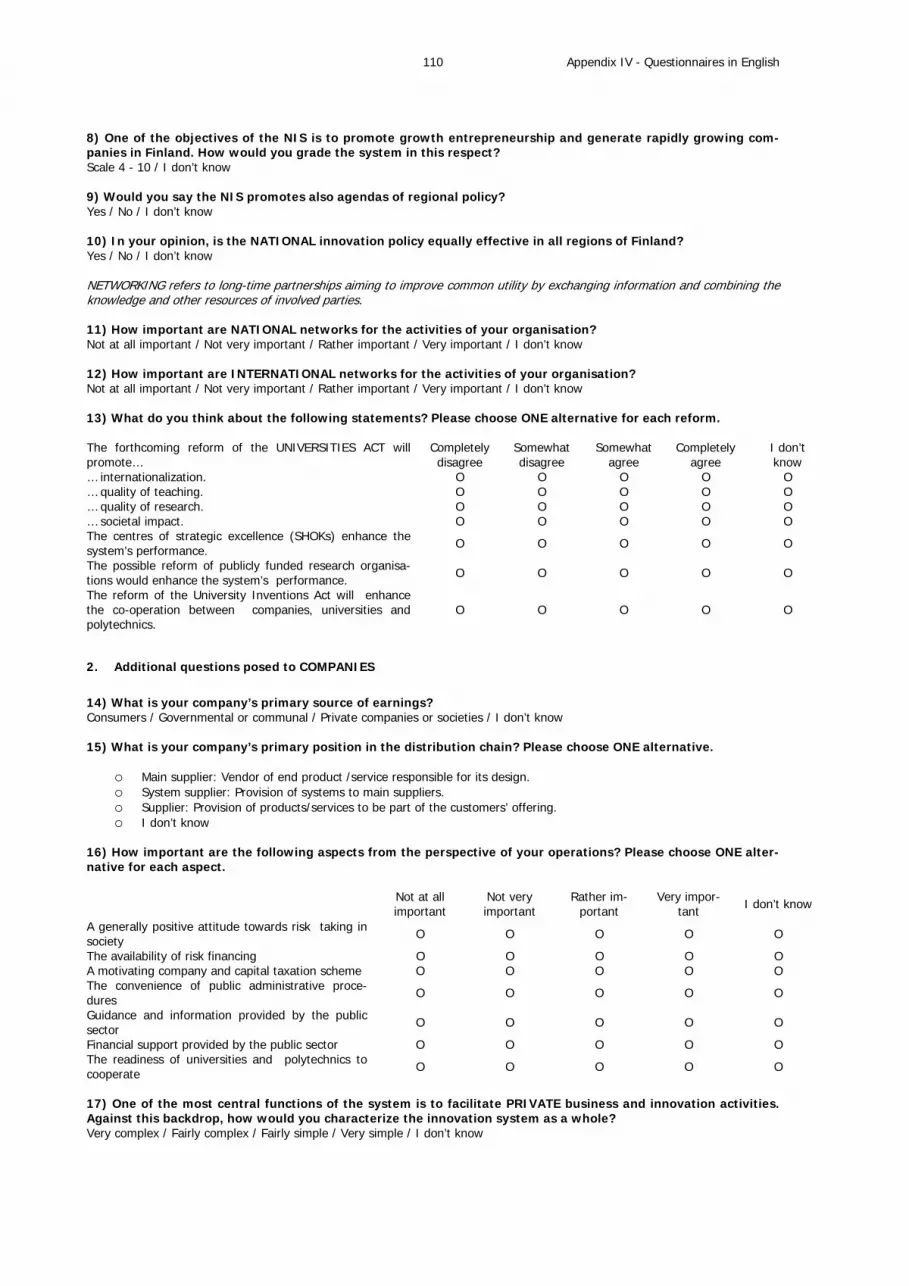
Appendix IV - Questionnaires in English
110
8) One of the objectives of the NIS is to promote growth entrepreneurship and generate rapidly growing com-panies in Finland. How would you grade the system in this respect? Scale 4 - 10 / I don’t know 9) Would you say the NIS promotes also agendas of regional policy? Yes / No / I don’t know 10) In your opinion, is the NATIONAL innovation policy equally effective in all regions of Finland? Yes / No / I don’t know NETWORKING refers to long-time partnerships aiming to improve common utility by exchanging information and combining the knowledge and other resources of involved parties. 11) How important are NATIONAL networks for the activities of your organisation? Not at all important / Not very important / Rather important / Very important / I don’t know 12) How important are INTERNATIONAL networks for the activities of your organisation? Not at all important / Not very important / Rather important / Very important / I don’t know 13) What do you think about the following statements? Please choose ONE alternative for each reform. The forthcoming reform of the UNIVERSITIES ACT will promote…
Completely disagree
Somewhat disagree
Somewhat agree
Completely agree
I don’t know
… internationalization. O O O O O … quality of teaching. O O O O O … quality of research. O O O O O … societal impact. O O O O O The centres of strategic excellence (SHOKs) enhance the system’s performance. O O O O O
The possible reform of publicly funded research organisa-tions would enhance the system’s performance. O O O O O
The reform of the University Inventions Act will enhance the co-operation between companies, universities and polytechnics.
O O O O O
2. Additional questions posed to COMPANIES
14) What is your company’s primary source of earnings? Consumers / Governmental or communal / Private companies or societies / I don’t know 15) What is your company’s primary position in the distribution chain? Please choose ONE alternative.
o Main supplier: Vendor of end product /service responsible for its design. o System supplier: Provision of systems to main suppliers. o Supplier: Provision of products/services to be part of the customers’ offering. o I don’t know
16) How important are the following aspects from the perspective of your operations? Please choose ONE alter-native for each aspect.
Not at all important
Not very important
Rather im-portant
Very impor-tant I don’t know
A generally positive attitude towards risk taking in society O O O O O
The availability of risk financing O O O O O A motivating company and capital taxation scheme O O O O O The convenience of public administrative proce-dures O O O O O
Guidance and information provided by the public sector O O O O O
Financial support provided by the public sector O O O O O The readiness of universities and polytechnics to cooperate O O O O O
17) One of the most central functions of the system is to facilitate PRIVATE business and innovation activities. Against this backdrop, how would you characterize the innovation system as a whole? Very complex / Fairly complex / Fairly simple / Very simple / I don’t know

Appendix IV - Questionnaires in English
111
18) The emergence of new growth companies could be facilitated by providing them with tax incentives regard-ing their future earnings and profit sharing. How efficient are such tax incentives in increasing the number of growth companies? Not at all efficient / Not very efficient / Rather efficient / Very efficient / I don’t know INNOVATION ACTIVITIES aim at creating or adopting new or substantially improved products, services, or production or distri-bution methods. 19) Has your company engaged in innovation activities in the last three years? Yes / No / I don’t know If you answered “Yes”, please answer also the following questions. If you answered “No”, you can stop here. 20) How important are the following DOMESTIC actors from the perspective of your company’s innovation ac-tivities? Please choose ONE alternative for each actor.
Not at all important
Not very important
Rather impor-tant Very important I don’t know
Employees of your company/corporation O O O O O Device and materials suppliers O O O O O Client companies O O O O O Consumers / end users O O O O O Municipalities or the government O O O O O Competitors O O O O O Consultants / consulting agencies O O O O O Private research organisations O O O O O Public research organisations O O O O O Universities O O O O O Polytechnics O O O O O 21) How important are the following FOREIGN actors from the perspective of your company’s innovation activi-ties? Please choose ONE alternative for each actor.
Not at all important
Not very important
Rather impor-tant Very important I don’t know
Employees of your company/corporation O O O O O Device and materials suppliers O O O O O Client companies O O O O O Consumers / end users O O O O O Municipalities or the government O O O O O Competitors O O O O O Consultants / consulting agencies O O O O O Private research organisations O O O O O Public research organisations O O O O O Universities O O O O O Polytechnics O O O O O 22) Which of the following statements portray the role of end users in your innovation activities? Please choose ONE or SEVERAL of the options.
They have no significant role. They are subject to frequent market studies (e.g. customer surveys). They provide active and frequent updates on the changes in their needs. They participate in the actual innovation activities.
23) Has any of your company’s investment-, R&D-, marketing-, or any other type of project been deferred or cancelled due to the global financial crisis? Yes / No / I don’t know
Additional questions posed to PUBLIC ACTORS
14) Which of the following services does your ORGANIZATION provide to other actors of the Finnish national innovation system? The respondents chose ONE or SEVERAL of the following options.
Financing (subsidies, grants, loans, guarantees, or capital investments) Information services Promotion of international labor mobility Internationalization of companies Research- and education services

Appendix IV - Questionnaires in English
112
15) Would you say that other PUBLIC actors provide similar services than your organization? Yes / No / I don’t know 16) Would you say that other PRIVATE actors provide similar services than your organization? Yes / No / I don’t know 17) Would you say that the co-operation between service providers is effortless? Yes / No / I don’t know 18) Which service provider is the co-operation especially EFFORTLESS with? Input your answer in the open field below. Open field 19) Which service provider is the co-operation especially CHALLENGING with? Input your answer in the open field below. Open field Person-work year refers to one person’s regular annual working time. 20) How many person-work years were carried out in the DOMESTIC departments of your organization in 2008? Open field. 21) How many person-work years were carried out in the FOREIGN departments of your organization in 2008? Open field. INNOVATION ACTIVITIES aim at creating or adopting new or substantially improved products, services, or production and distribution methods. 22) How many person-work years were used in your organization for innovation activities and/or to promote them in 2008? Open field 23) What is the share of your DOMESTIC personnel having a UNIVERSITY degree? 0 % / 1-25 % / 26–50% / 51–75% / 76–100% / I don’t know 24) What is the share of your DOMESTIC personnel having TECHNICAL UNIVERSITY degree? 0 % / 1-25 % / 26–50% / 51–75% / 76–100% / I don’t know 25) Who are the primary users of your services or financing? The respondents chose ONE or SEVERAL of the following options:
Private companies Private research organizations Other private organizations Private persons Education/research: Universities Education/research: Polytechnics Education/research: Other educational institutes Public: Research institutes Public: Municipalities Public: Other regional operators (TE-centers, Centers of Expertise or Technology, etc.) Public: Other national operators
26) One of the most central functions of the system is to facilitate PRIVATE business and innovation activities. Against this backdrop, how would you characterize the innovation system as a whole? Very complex / Fairly complex / Fairly simple / Very simple / I don’t know 27) How well do GOVERNMENTAL research organizations match the information needs of your organization? Not at all / Not very well / To some extent / Very well / I don’t know 28) How well do PRIVATE research organizations match the information needs of your organization? Not at all / Not very well / To some extent / Very well / I don’t know 29) How well do UNIVERSITIES AND POLYTECHNICS match the information needs of your organization? Not at all / Not very well / To some extent / Very well / I don’t know 30) The new national innovation strategy was published in July 2008 and the respective government communi-cation was handed to the parliament in October 2008. How has your organization reacted to these documents? The respondents chose ONE of the following options.
o The organization has not familiarized itself with the strategy/communication. o Single individuals have familiarized themselves according to their own interest.

Appendix IV - Questionnaires in English
113
o Official meetings have been held regarding the documents. o An official planning process has been initiated regarding the documents. o SOME practical measures have been carried out based on them. o SEVERAL practical measures have been carried out based on them. o The measures invoked by the document(s), have already been carried out in full.
31) In your opinion, does the strategy/communication require changes in the activities of your organization? Yes / No / I don’t know 32) How much has the strategy/communication helped in steering the activities of your organization? Not at all / Not very much / Somewhat / Very much / I don’t know 33) In your opinion, what is the most significant STRENGTH of Finland’s innovation system in the 2010’s? Input your response in the open field below. Open field 34) In your opinion, what is the most significant WEAKNESS of Finland’s innovation system in the 2010’s? Input your response in the open field below. Open field 35) In your opinion, what is the most significant OPPORTUNITY regarding Finland’s innovation strategy in the 2010’s? Input your response in the open field below. Open field 36) In your opinion, what is the most important THREAT regarding Finland’s innovation strategy in the 2010’s? Input your response in the open field below. Open field
3. Additional questions posed to INTERMEDIARIES
14) Which of the following services does your ORGANIZATION provide to other actors of the Finnish national innovation system? The respondents chose ONE or SEVERAL of the options below:
Financing (subsidies, grants, loans, guarantees, or capital investments) Information services Promotion of international labor mobility Internationalization of companies Research- and education services
15) Would you say that other PUBLIC actors provide similar services than your organization? Yes / No / I Don’t know 16) Would you say that other PRIVATE actors provide similar services than your organization? Yes / No / I Don’t know 17) Would you say that the co-operation between the service providers is effortless? Yes / No / I Don’t know 18) Which service provider is the co-operation especially EFFORTLESS with? Input your answer in the open field below. Open field 19) Which service provider is the co-operation especially CHALLENGING with? Input your answer in the open field below. Open field Person-work year refers to one person’s regular annual working time. 20) How many person-work years were carried out in the DOMESTIC departments of your organization in year 2008? Open field 21) How many person-work years were carried out in the FOREIGN departments of your organization in year 2008? Open field INNOVATION ACTIVITIES aim at creating or adopting new or substantially improved products, services, or production or distri-bution methods.

Appendix IV - Questionnaires in English
114
22) How many person-work years were allocated to innovation activities and/or to promote them in your or-ganization in 2008? Open field 23) What is the share of your DOMESTIC personnel having a UNIVERSITY degree? 0 % / 1-25 % / 26–50% / 51–75% / 76–100% / I don’t know 24) What is the share of your DOMESTIC personnel having a TECHNICAL UNIVERSITY degree? 0 % / 1-25 % / 26–50% / 51–75% / 76–100% / I don’t know 25) Who are the primary users of your services or funding? The respondents chose ONE or SEVERAL of the following options:
Private companies Private research organizations Other private organizations Private individuals Education/research: Universities Education/research: Polytechnics Education/research: Other educational institutes Public: Research institutes Public: Municipalities Public: Other regional operators (TE-centers, Centers of Expertise or Technology, etc.) Public: Other national operators
26) One of the most central functions of the system is to facilitate PRIVATE business and innovation activities. Against this backdrop, how would you characterize the innovation system as a whole? Very simple / Fairly simple / Fairly complex / Very complex / I don’t know 27) What are your sources of funding? If your funding structure varies from year to year, please answer using the average of the last three years. Respondents assigned each of the listed sources a respective share of total funding on the scale 0% / 1-25% / 26-50% / 51-75% / 76-100%. Government’s budget Municipalities EU Tekes Other public sources Private companies Private foundations Other private sources 28) The new national innovation strategy was published in July 2008 and the respective government communi-cation was handed to the parliament in October 2008. How has your organization reacted to these documents? The respondents chose ONE of the following options.
o The organization has not familiarized itself with the strategy/communication. o Single individuals have familiarized themselves according to their own interest. o Official meetings have been held regarding the documents. o An official planning process has been initiated regarding the documents. o SOME practical measures have been carried out based on them. o SEVERAL practical measures have been carried out based on them. o The measures invoked by the document(s), have already been carried out in full.
29) In your opinion, what is the most significant STRENGTH of Finland’s innovation system in the 2010’s? Input your response in the open field below. Open field 30) In your opinion, what is the most significant WEAKNESS of Finland’s innovation system in the 2010’s? Input your response in the open field below. Open field 31) In your opinion, what is the most significant OPPORTUNITY regarding Finland’s innovation strategy in the 2010’s? Input your response in the open field below. Open field 32) In your opinion, what is the most important THREAT regarding Finland’s innovation strategy in the 2010’s? Input your response in the open field below. Open field

Appendix IV - Questionnaires in English
115
4. Additional questions posed to RESEARCH ORGANIZATIONS
14) What are your sources of funding? If your funding structure varies from year to year, please answer using the average of the last three years. Respondents assigned each of the listed sources a respective share of total funding on the scale 0% / 1-25% / 26-50% / 51-75% / 76-100%. Government’s budget Municipalities EU Tekes Other public sources Private companies Private foundations Other private sources 15) To what extent does your research serve the following instances? Respondents assigned one of the following options to each of the aspects listed below. Not at all / To some extent / To a fairly large extent / To a very large extent / I don’t know Public decision making on national level Public decision making on regional level Public decision making on international level Companies We provide information for the public good 16) How large is the share of your organisation’s labour input that has been allocated to… Respondents assigned each of the listed tasks a respective share of total labour input on the scale 0% / 1-25% / 26-50% / 51-75% / 76-100%. ... education ... research ... carrying out duties of public authority … supply of statistics ... administration ... other functions 17) In your opinion, how well does your organization as a governmental research organization respond to the information needs of your parent ministry? Not at all / Not very well / To some extent / Very well / I don’t know 18) In your opinion, how well do private research organizations match the information needs of your parent ministry? Not at all / Not very well / To some extent / Very well / I don’t know 19) In your opinion, how well do universities and polytechnics match the information needs of your parent min-istry? Not at all / Not very well / To some extent / Very well / I don’t know
5. Additional questions posed to DEPARTMENT HEADS
14) How large is the share of your department’s labour input that has been allocated to… Respondents assigned each of the listed tasks a respective share of total labour input on the scale 0% / 1-25% / 26-50% / 51-75% / 76-100%. ... education ... research ... exerting societal impact ... administration ... other functions 15) How significant was the role of the following actors in cooperative projects of your department in the last three years? Respondents assessed each of the listed actors on the scale none / small / fairly large / very large / I don’t know. Domestic universities Foreign universities Polytechnics

Appendix IV - Questionnaires in English
116
Public research organizations Private research organizations Open internet communities Domestic companies Foreign companies 16) Have joint projects with companies addressed the following research objectives of your department? For each of the listed objectives respondents chose ONE of the options Yes / No / I don’t know. Basic research -driven general search for new ideas Access to complementary expertise Solving a specific problem Prototype development/testing Participation in public research programs Supply of competent personnel Provision of professional development opportunities for staff 17) According to your own ESTIMATE, to what extent does your department answer to the following needs of CORPORATE innovation activities? Respondents assessed the correspondence of their activities with the listed corporate needs on the scale not at all / to some extent / to a fairly large extent / to a very large extent / I don’t know. Basic research -driven general search for new ideas Access to complementary expertise Solving a specific problem Prototype development/testing Participation in public research programs Supply of competent personnel Provision of professional development opportunities for staff
6. Additional questions posed to UNIVERSITY and POLYTECHNICS PRINCIPALS
14) How large is the share of your university’s/polytechnic’s labour input that has been allocated to… Respondents assigned each of the listed tasks a respective share of total labour input on the scale 0% / 1-25% / 26-50% / 51-75% / 76-100%. ... education ... research ... exerting societal impact ... administration ... other functions 15) How significant was the role of the following actors in cooperative projects of your university/polytechnic in the last three years? Respondents assessed each of the listed actors on the scale none / small / fairly large / very large / I don’t know. Domestic universities Foreign universities Polytechnics Public research organizations Private research organizations Open internet communities Domestic companies Foreign companies 16) Have cooperative projects with companies addressed the following research objectives of your univer-sity/polytechnic? For each of the listed objectives respondents chose ONE of the options Yes / No / I don’t know. Basic research -driven general search for new ideas Access to complementary expertise Solving a specific problem Prototype development/testing Participation in public research programs Supply of competent personnel Provision of professional development opportunities for staff

Appendix IV - Questionnaires in English
117
17) According to your own ESTIMATE, to what extent does your university/polytechnic answer to the following needs of CORPORATE innovation activities? Respondents assessed themselves in regard to the listed corporate needs on the scale not at all / to some extent / to a fairly large extent / to a very large extent / I don’t know. Basic research -driven general search for new ideas Access to complementary expertise Solving a specific problem Prototype development/testing Participation in public research programs Supply of competent personnel Provision of professional development opportunities for staff 18) In your opinion, what is the most significant STRENGTH of your university/polytechnic in the 2010’s? Input your response in the open field below. Open field 19) In your opinion, what is the most significant WEAKNESS of your university/polytechnic in the 2010’s? Input your response in the open field below. Open field 20) In your opinion, what is the most significant OPPORTUNITY your university/polytechnic is facing in the 2010’s? Input your response in the open field below. Open field 21) In your opinion, what is the most important THREAT your university/polytechnic is facing in the 2010’s? Input your response in the open field below. Open field
7. Additional questions posed to ASSOCIATIONS
14) In your opinion, what is the most significant STRENGTH of Finland’s innovation system in the 2010’s? Input your response in the open field below. Open field 15) In your opinion, what is the most significant WEAKNESS of Finland’s innovation system in the 2010’s? Input your response in the open field below. Open field 16) In your opinion, what is the most significant OPPORTUNITY regarding Finland’s innovation strategy in the 2010’s? Input your response in the open field below. Open field 17) In your opinion, what is the most important THREAT regarding Finland’s innovation strategy in the 2010’s? Input your response in the open field below. Open field
8. Additional questions posed to MUNICIPALITIES
INNOVATION ACTIVITIES aim at creating or adopting new or substantially improved products, services, or production or distri-bution methods. 14) Does your municipality provide any of the following services in order to support your local INNOVATION ACTIVITIES? The respondents chose ONE or SEVERAL of the options below. Financing (subsidies, grants, loans, guarantees, or capital investments) Information services Promotion of international labor mobility Internationalization of companies Research- and education services Facilities 15) Does your municipality have an explicit strategy or agenda related to INNOVATION ACTIVITIES? Yes / No / I don’t know 16) How much PROPRIETORY FUNDING did your municipality use to promote INNOVATION ACTIVITIES in 2008? Open field Euros

Appendix IV - Questionnaires in English
118
17) How much national or international (incl. EU-funding) public funding was used IN ADDITION TO YOUR OWN FUNDING to support innovation activities in 2008? Open field Euros 18) What was your municipality’s total budget in 2008? Open field Euros 19) Has innovativeness been a central criterion in the selection of service providers or goods suppliers in your municipality? Never / Seldom / Often / Always / I don’t know 20) Would you say it is possible to support the promotion of innovation activities through public procurement? Yes / No / I don’t know
9. Additional questions posed to FOUNDATIONS
5) How would you assess the development of the importance of foundations in the Finnish innovation system in the next five years? Decreasing / No change / Increasing / I don’t know 6) Should the legislation regarding foundations be reformed to improve foundations’ possibilities to support science, arts, and research? The respondents chose ONE of the following options. In addition, with respect to the YES –option, respondents were presented with the possibility to input an open answer. No need for changes / Yes (how?): Open field. / I don’t know 7) Which of the following fields does your foundation support? The respondents chose ONE or SEVERAL of the following options: Humanities / Social sciences / Natural sciences / Agriculture and forestry / Technology / Medicine 8) Which of the following activities does your foundation MAINLY support? Please choose only one: Research in Finland / Research abroad / Studying in Finland / Studying abroad / Conference trips / Other 9) What is the overall sum of grants and/or scholarships you provided in 2008? Open field Euros 10) How many individuals received your grants and/or scholarships in 2008? (Including individual members of research groups.) Open field. Euros 11) University departments in Finland are considered too small. To your understanding, would your foundation have the readiness to sponsor a professorship if the government supported the professorship by providing 2.5 Euros for each Euro you provide? Not at all / 1-2 professorships / 3-5 professorships / More than 5 professorships /I don’t know
10. Additional questions posed to VENTURE CAPITALISTS and BUSINESS ANGELS
14) One of the most central functions of the system is to facilitate PRIVATE business and innovation activities. Against this backdrop, how would you characterize the innovation system as a whole? Very simple / Fairly simple / Fairly complex / Very complex / I don’t know 15) The emergence of new growth companies could be facilitated by providing them with tax incentives regard-ing their future earnings and profit sharing. How efficient are such tax incentives in increasing the number of growth companies? Not at all efficient / Not very efficient / Rather efficient / Very efficient / I don’t know 16) Would you say that PUBLIC actors provide similar services than your organization? Yes / No / I don’t know 17) The new national innovation strategy was published in July 2008 and the respective government communi-cation was handed to the parliament in October 2008. Have you familiarized yourself with them? Yes / No / I don’t know 18) How many of the companies you are funding have had to defer or cancel an investment-, R&D-, marketing-, or any other type of project due to the global financial crisis? 0% / 1-25 % / 26–50% / 51–75% / 76–100% / I don’t know 19) Has the financial crisis changed the amount of incoming funding applications? Substantial increase / Some increase / No change / Some decrease / Substantial decrease

Appendix IV - Questionnaires in English
119
20) Has the quality of funding applications changed due to the financial crisis? Substantial increase / Some increase / No change / Some decrease / Substantial decrease 21) Have you changed your investment or funding criteria due to the financial crisis? Tightened / No change / Loosened / I don’t know When answering to the following question, please, think of the supply and demand of corporate funding in the context of NOR-MAL economic conditions, i.e. after the passing of the current financial crisis. 22) Does governmental funding displace or complement your operations as a private provider of corporate fund-ing? Respondents answered on a scale from 1-5 with 1 signifying substantial displacement and 5 substantial complementarity. (Displaces) 1 2 3 4 5 (Complements)
11. Additional questions posed to BANKS (Banks did not answer to the first 13 questions)
1) How would you grade the Finnish national innovation system (NIS) AT THE MOMENT? Scale 4 - 10 / I don’t know 2) One of the objectives of the NIS is to promote growth entrepreneurship and generate rapidly growing com-panies in Finland. How would you grade the system in this respect? Scale 4 - 10 / I don’t know 3) One of the most central functions of the system is to facilitate PRIVATE business and innovation activities. Against this backdrop, how would you characterize the innovation system as a whole? Very simple / Fairly simple / Fairly complex / Very complex / I don’t know 4) The emergence of new growth companies could be facilitated by providing them with tax incentives regard-ing their future earnings and profit sharing. How efficient are such tax incentives in increasing the number of growth companies? Not at all efficient / Not very efficient / Rather efficient / Very efficient / I don’t know 5) Would you say that PUBLIC actors provide similar services than your organization? Yes / No / I don’t know 6) How many of the companies you are funding have had to defer or cancel an investment-, R&D-, marketing-, or any other type of project due to the global financial crisis? 0% / 1-25 % / 26–50% / 51–75% / 76–100% / I don’t know 7) Has the financial crisis changed the amount of incoming funding applications? Substantial increase / Some increase / No change / Some decrease / Substantial decrease 8) Has the quality (eligibility/risk) of the funding applications changed due to the financial crisis? Substantial increase / Some increase / No change / Some decrease / Substantial decrease 9) Have you changed your investment or funding criteria due to the financial crisis? Tightened / No change / Loosened / I don’t know When answering to the following question, please, think of the supply and demand of corporate funding in the context of NOR-MAL economic conditions, i.e. after the passing of the current financial crisis. 10) Does governmental funding displace or complement your operations as a private provider of corporate fund-ing? Respondents answered on a scale from 1-5 with 1 signifying substantial displacement and 5 substantial complementarity. (Displaces) 1 2 3 4 5 (Complements)

Appendix V - Questionnaires in Finnish
120
APPENDIX V - Questionnaires in Finnish
1. Kaikille vastaajille esitetyt kysymykset
SUOMEN INNOVAATIOJÄRJESTELMÄN ARVIOINTI Elinkeinoelämän Tutkimuslaitos ETLA toteuttaa Suomen innovaatiojärjestelmän arviointiin (www.evaluation.fi) liittyvän kyselyn, johon toivomme teidän vastaavan. Arviointi toteutetaan Työ ja elinkeinoministeriön (TEM) sekä Opetusministeriön (OPM) toi-meksiannosta ja tukemana. Kyselyllä kerätään laajasti organisaatioiden ja vaikuttajien yleiskäsityksiä järjestelmän piirteistä. INNOVAATIOJÄRJESTELMÄLLÄ tarkoitetaan niiden yksityisten ja julkisten organisaatioiden muodostamaa kokonaisuutta, jotka osallistuvat tiedon ja osaamisen tuottamiseen ja soveltamiseen. Järjestelmän tavoitteena on edistää suomalaisten hyvinvointia. 1) Minkä arvosanan annatte Suomen innovaatiojärjestelmälle TÄLLÄ HETKELLÄ? Asteikko 4-10 / En osaa sanoa 2) Jos arvioitte järjestelmää 5 VUOTTA SITTEN, niin minkä arvosanan antaisitte sille? Asteikko 4-10 / En osaa sanoa 3) Näköpiirissä ja meneillään olevien muutosten valossa, minkä arvosanan uskoisitte antavanne innovaatiojär-jestelmälle 5 VUODEN PÄÄSTÄ? Asteikko 4-10 / En osaa sanoa 4) Millaiseksi arvioitte julkisten toimijoiden muodostaman kokonaisuuden innovaatiojärjestelmässä? Erittäin yksinkertainen / Melko yksinkertainen / Melko monimutkainen / Erittäin monimutkainen / En osaa sanoa 5) Kuinka tärkeinä pidätte OMAN ORGANISAATIONNE näkökulmasta seuraavia Suomen innovaatiojärjestelmän julkisia toimijoita?
Ei lainkaan tärkeä
Ei kovin tärkeä Melko tärkeä Erittäin tärkeä En osaa
sanoa Tekes O O O O O Sitra O O O O O Suomen Akatemia O O O O O Työ ja elinkeinoministeriö O O O O O Opetusministeriö O O O O O Sosiaali ja terveysministeriö O O O O O Valtiovarainministeriö O O O O O Muut ministeriöt O O O O O VTT O O O O O Muut julkiset tutkimuslaitokset O O O O O Finpro O O O O O Keksintösäätiö O O O O O Yliopistot ja tiedekorkeakoulut O O O O O Ammattikorkeakoulut O O O O O Paikalliset TE-keskukset O O O O O Finnvera O O O O O Teollisuussijoitus O O O O O Osaamis- tai teknologiakeskukset O O O O O Tiede ja teknologianeuvosto* O O O O O *Nykyinen nimi: Tutkimus ja innovaationeuvosto. 6) Usein innovaatiopolitiikka nähdään teknologiavetoisena TAI kysyntä ja käyttäjälähtöisenä. Millaisena näette Suomen innovaatiopolitiikan? Vastaajat arvioivat asteikolla 1-5 Täysin teknologiavetoinen) 1 2 3 4 5 (Täysin kysyntä- ja käyttäjälähtöinen) 7) Innovaatiojärjestelmässä korkeakouluilla ja julkisilla tutkimuslaitoksilla on omat tehtävänsä. Valitse, JOS kyseiset toimijat hoitavat seuraavia tehtäviä HYVIN.
Kansainvälinen huippu-tutkimus
Tutkimus koti-maisiin tarpeisiin
Osaajia kansain-välisen liiketoimin-
nan. tarpeisiin
Osaajia paikallisen elinkeinoelämän
tarpeisiin Yliopistot ja tiedekorkeakoulut Ammattikorkeakoulut Julkiset tutkimuslaitokset

Appendix V - Questionnaires in Finnish
121
8) Innovaatiojärjestelmän yhtenä tavoitteena on edistää kasvuyrittäjyyttä ja luoda Suomeen nopeasti kasvavia yrityksiä. Minkä arvosanan annatte järjestelmän onnistumiselle tässä tehtävässä? Asteikko 4-10 / En osaa sanoa 9) Katsotteko, että harjoitetulla innovaatiopolitiikalla hoidetaan myös ALUEPOLIITTISIA tavoitteita? Kyllä / Ei / En osaa sanoa 10) Onko KANSALLISEN tason innovaatiopolitiikka mielestänne yhtä tehokasta Suomen eri alueilla? Kyllä / Ei / En osaa sanoa VERKOSTOITUMISELLA tarkoitetaan pidempiaikaista kumppanuutta, jossa tavoitellaan yhteistä hyötyä tietoja vaihtamalla sekä kunkin osaamista tai muita resursseja yhdistelemällä. 11) Kuinka tärkeitä KANSALLISET verkostot ovat organisaationne toiminnassa? Ei lainkaan tärkeä / Ei kovin tärkeä / Melko tärkeä / Erittäin tärkeä / En osaa sanoa 12) Kuinka tärkeitä KANSAINVÄLISET verkostot ovat organisaationne toiminnassa? Ei lainkaan tärkeä / Ei kovin tärkeä / Melko tärkeä / Erittäin tärkeä / En osaa sanoa 13) Mitä mieltä olette seuraavista väittämistä?
Tuleva YLIOPISTOUUDISTUS edistää … Täysin eri
mieltä Melko eri
mieltä
Melko samaa mieltä
Täysin samaa mieltä
En osaa sanoa
… kansainvälistymistä. O O O O O … opetuksen laatua. O O O O O … tutkimuksen laatua. O O O O O … yhteiskunnallista vaikuttavuutta. O O O O O Strategisen huippuosaamisen keskittymät (SHOK) edistävät järjestelmän toimintaa. O O O O O
Sektoritutkimuslaitosten mahdollinen uudistaminen edistäisi järjestelmän toimintaa. O O O O O
Yliopistokeksintölain muutos helpottaa yhteistyötä yritysten ja korkeakoulujen välillä. O O O O O
2. Vain YRITYKSILLE esitetyt kysymykset
14) Mistä yrityksenne tulot pääosin tulevat? Kuluttajilta / Valtion tai kunnan toimijoilta / Yksityisiltä yrityksiltä tai yhteisöiltä / En osaa sanoa 15) Mikä on yrityksenne pääasiallinen asema toimitusketjussa? Vastaajat valitsivat YHDEN alla olevista vaihtoehdoista.
o Päähankkija: Suunnittelusta vastaava lopputuotteen/ palvelun myyjä. o Järjestelmätoimittaja: Tarjoaa kokonaisuuksia päähankkijoille. o Alihankkija: Tuotteet/palvelut osaksi asiakkaan tarjontaan. o En osaa sanoa
16) Kuinka tärkeitä seuraavat seikat ovat toimintanne kannalta?
Ei lainkaan tärkeä
Ei kovin tärkeä Melko tärkeä Erittäin
tärkeä En osaa sanoa
Yleinen myönteinen suhtautuminen riskinottoon O O O O O Riskirahan saatavuus O O O O O Kannustava yritys ja pääomaverotus O O O O O Julkisten hallinnollisten menettelyjen keveys O O O O O Julkisen sektorin neuvonta ja tiedontarjonta O O O O O Julkisen sektorin rahallinen tuki O O O O O Korkeakoulujen valmius yritysyhteistyöhön O O O O O 17) Yksi järjestelmän tärkeimmistä tehtävistä on YKSITYISEN yritys- ja innovaatiotoiminnan edistäminen. Tästä näkökulmasta, millaiseksi arvioitte innovaatiojärjestelmän kokonaisuuden? Erittäin yksinkertainen / Melko yksinkertainen / Melko monimutkainen / Erittäin monimutkainen / En osaa sanoa 18) Nopeasti kasvavien yrityksien syntyä voitaisiin tukea antamalla niiden tuleviin voittoihin ja voitonjakoon kohdistuvia verohelpotuksia. Kuinka tehokas tapa tämä olisi kasvattaa kasvuyrityksien määrää? Ei lainkaan tehokas / Ei kovin tehokas / Melko tehokas / Erittäin tehokas / En osaa sanoa INNOVAATIOTOIMINTA tähtää uusien tai olennaisesti parannettujen tuotteiden, palveluiden tai tuotanto ja jakelumenetelmien keksimiseen tai käyttöönottoon.
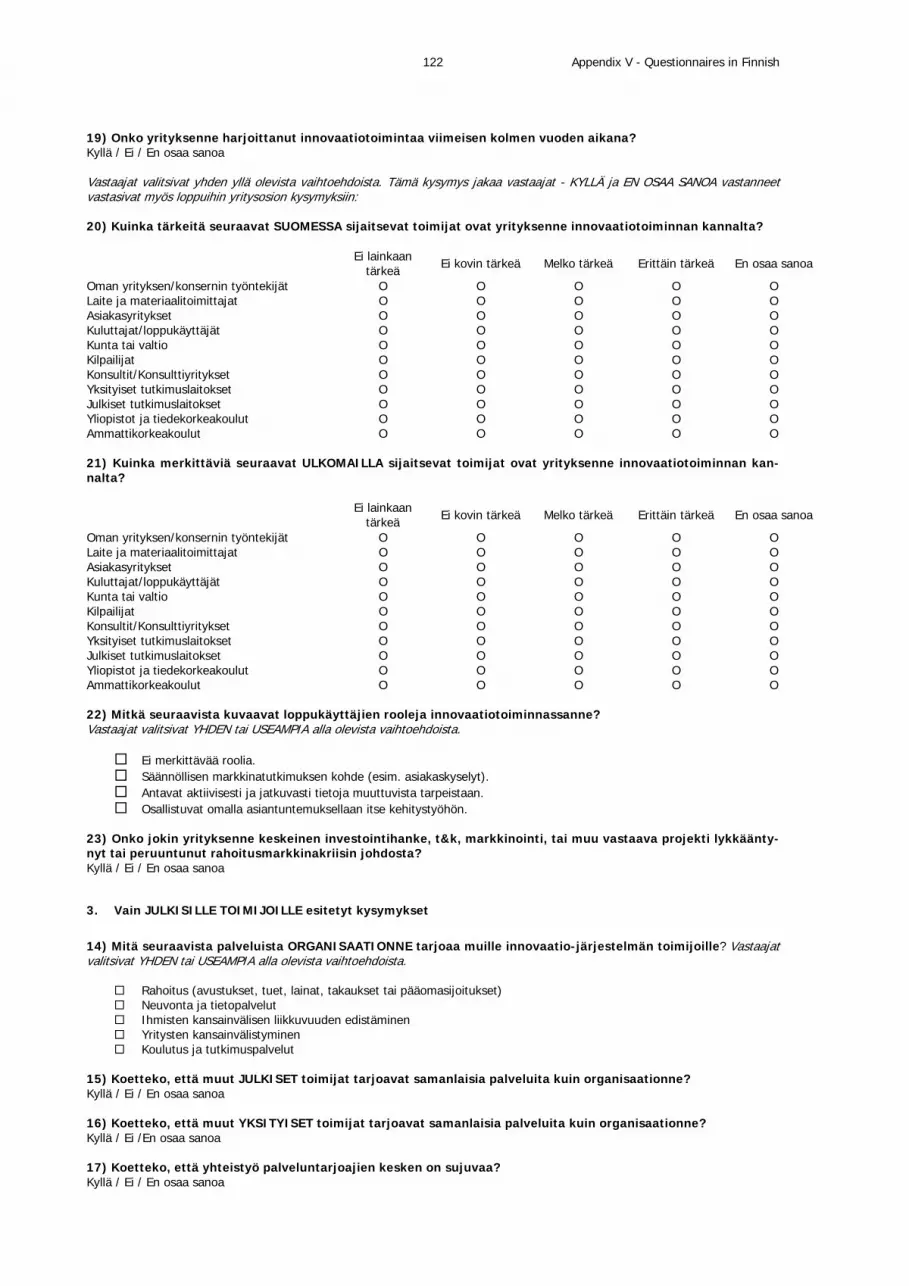
Appendix V - Questionnaires in Finnish
122
19) Onko yrityksenne harjoittanut innovaatiotoimintaa viimeisen kolmen vuoden aikana? Kyllä / Ei / En osaa sanoa Vastaajat valitsivat yhden yllä olevista vaihtoehdoista. Tämä kysymys jakaa vastaajat - KYLLÄ ja EN OSAA SANOA vastanneet vastasivat myös loppuihin yritysosion kysymyksiin: 20) Kuinka tärkeitä seuraavat SUOMESSA sijaitsevat toimijat ovat yrityksenne innovaatiotoiminnan kannalta?
Ei lainkaan tärkeä Ei kovin tärkeä Melko tärkeä Erittäin tärkeä En osaa sanoa
Oman yrityksen/konsernin työntekijät O O O O O Laite ja materiaalitoimittajat O O O O O Asiakasyritykset O O O O O Kuluttajat/loppukäyttäjät O O O O O Kunta tai valtio O O O O O Kilpailijat O O O O O Konsultit/Konsulttiyritykset O O O O O Yksityiset tutkimuslaitokset O O O O O Julkiset tutkimuslaitokset O O O O O Yliopistot ja tiedekorkeakoulut O O O O O Ammattikorkeakoulut O O O O O 21) Kuinka merkittäviä seuraavat ULKOMAILLA sijaitsevat toimijat ovat yrityksenne innovaatiotoiminnan kan-nalta?
Ei lainkaan tärkeä Ei kovin tärkeä Melko tärkeä Erittäin tärkeä En osaa sanoa
Oman yrityksen/konsernin työntekijät O O O O O Laite ja materiaalitoimittajat O O O O O Asiakasyritykset O O O O O Kuluttajat/loppukäyttäjät O O O O O Kunta tai valtio O O O O O Kilpailijat O O O O O Konsultit/Konsulttiyritykset O O O O O Yksityiset tutkimuslaitokset O O O O O Julkiset tutkimuslaitokset O O O O O Yliopistot ja tiedekorkeakoulut O O O O O Ammattikorkeakoulut O O O O O 22) Mitkä seuraavista kuvaavat loppukäyttäjien rooleja innovaatiotoiminnassanne? Vastaajat valitsivat YHDEN tai USEAMPIA alla olevista vaihtoehdoista.
Ei merkittävää roolia. Säännöllisen markkinatutkimuksen kohde (esim. asiakaskyselyt). Antavat aktiivisesti ja jatkuvasti tietoja muuttuvista tarpeistaan. Osallistuvat omalla asiantuntemuksellaan itse kehitystyöhön.
23) Onko jokin yrityksenne keskeinen investointihanke, t&k, markkinointi, tai muu vastaava projekti lykkäänty-nyt tai peruuntunut rahoitusmarkkinakriisin johdosta? Kyllä / Ei / En osaa sanoa
3. Vain JULKISILLE TOIMIJOILLE esitetyt kysymykset
14) Mitä seuraavista palveluista ORGANISAATIONNE tarjoaa muille innovaatio-järjestelmän toimijoille? Vastaajat valitsivat YHDEN tai USEAMPIA alla olevista vaihtoehdoista.
Rahoitus (avustukset, tuet, lainat, takaukset tai pääomasijoitukset) Neuvonta ja tietopalvelut Ihmisten kansainvälisen liikkuvuuden edistäminen Yritysten kansainvälistyminen Koulutus ja tutkimuspalvelut
15) Koetteko, että muut JULKISET toimijat tarjoavat samanlaisia palveluita kuin organisaationne? Kyllä / Ei / En osaa sanoa 16) Koetteko, että muut YKSITYISET toimijat tarjoavat samanlaisia palveluita kuin organisaationne? Kyllä / Ei /En osaa sanoa 17) Koetteko, että yhteistyö palveluntarjoajien kesken on sujuvaa? Kyllä / Ei / En osaa sanoa

Appendix V - Questionnaires in Finnish
123
18) Kenen palveluntarjoajan kanssa yhteistyö on erityisen SUJUVAA? Kirjoita vastaus alla olevaan kenttään. Avoin kenttä 19) Kenen palveluntarjoajan kanssa yhteistyö on erityisen HAASTEELLISTA? Kirjoita vastaus alla olevaan kent-tään. Avoin kenttä HENKILÖTYÖVUODELLA tarkoitetaan yhden henkilön säännöllistä vuosityöaikaa. 20) Montako henkilötyövuotta organisaationne KOTIMAISISSA yksiköissä tehtiin vuonna 2008? Avoin kenttä 21) Montako henkilötyövuotta organisaationne ULKOMAISISSA yksiköissä tehtiin vuonna 2008? Avoin kenttä INNOVAATIOTOIMINTA tähtää uusien tai olennaisesti parannettujen tuotteiden, palveluiden tai tuotanto ja jakelumenetelmien keksimiseen tai käyttöönottoon. 22) Montako henkilötyövuotta organisaatiossanne käytettiin innovaatiotoimintaan ja/tai sen edistämiseen vuonna 2008? Avoin kenttä 23) Mikä osa SUOMEN henkilöstöstänne on suorittanut YLIOPISTO tai tiedekorkea-koulututkinnon? 0% / 1-25% / 26-50% / 51-75% / 76-100% / En osaa sanoa 24) Mikä osa SUOMEN henkilöstöstänne on suorittanut TEKNISEN YLIOPISTO tai tiedekorkeakoulututkinnon? 0% / 1-25% / 26-50% / 51-75% / 76-100% / En osaa sanoa 25) Ketkä ovat pääasialliset rahoituksenne tai palveluidenne käyttäjät? Vastaajat valitsivat YHDEN tai USEAMPIA vaihtoehtoja.
Yksityiset yritykset Yksityiset tutkimuslaitokset Yksityiset muut organisaatiot Yksityiset henkilöt Opetus/tutkimus: Yliopistot ja tiedekorkeakoulut Opetus/tutkimus: Ammattikorkeakoulut Opetus/tutkimus: Muut oppilaitokset Julkiset: Tutkimuslaitokset Julkiset: Kunnat Julkiset: Muut alueelliset toimijat (TE-keskukset, Osaamis- ja teknologiakeskukset, yms.) Julkiset: Muut kansallisen tason toimijat
26) Yksi järjestelmän tärkeimmistä tehtävistä on YKSITYISEN yritys ja innovaatio-toiminnan edistäminen. Tästä näkökulmasta, millaiseksi arvioitte innovaatio-järjestelmän kokonaisuuden? Erittäin yksinkertainen / Melko yksinkertainen / Melko monimutkainen / Erittäin monimutkainen / En osaa sanoa 27) Miten hyvin VALTION sektoritutkimuslaitokset vastaavat organisaationne tieto-tarpeisiin? Ei lainkaan / Ei kovin hyvin / Melko hyvin / Erittäin hyvin/ En osaa sanoa 28) Miten hyvin YKSITYISET tutkimuslaitokset vastaavat organisaationne tieto-tarpeisiin? Ei lainkaan / Ei kovin hyvin / Melko hyvin / Erittäin hyvin / En osaa sanoa 29) Miten hyvin KORKEAKOULUT vastaavat organisaationne tietotarpeisiin? Ei lainkaan / Ei kovin hyvin / Melko hyvin / Erittäin hyvin / En osaa sanoa 30) Uusi kansallinen innovaatiostrategia julkaistiin 6/2008 ja innovaatiopoliittinen selonteko annettiin edus-kunnalle 10/2008. Millä tavalla organisaationne on reagoinut niihin? Vastaajat valitsivat YHDEN vaihtoehdoista.
o Organisaatiossa ei ole tutustuttu strategiaan/selontekoon. o Yksittäiset henkilöt ovat tutustuneet oman mielenkiintonsa pohjalta. o Aiheeseen liittyen on pidetty virallisia kokouksia. o Aiheeseen liittyen on käynnistetty virallinen suunnitteluprosessi. o Niiden pohjalta on tehty JOITAIN käytännön toimenpiteitä. o Niiden pohjalta on tehty USEITA käytännön toimenpiteitä. o Niiden aiheuttamat toimenpiteet ovat jo kokonaisuudessaan läpivietyjä.
31) Edellyttääkö strategia/selonteko mielestänne muutoksia organisaationne toiminnassa? Kyllä / Ei / En osaa sanoa

Appendix V - Questionnaires in Finnish
124
32) Kuinka paljon strategia/selonteko on auttanut organisaationne toiminnan ohjaamisessa? Ei lainkaan / Ei kovin paljon / Melko paljon / Erittäin paljon / En osaa sanoa 33) Minkä katsotte olevan Suomen innovaatiojärjestelmän merkittävin VAHVUUS 2010-luvulla? Kirjoita vastaus alla olevaan kenttään. Avoin kenttä 34) Minkä katsotte olevan Suomen innovaatiojärjestelmän merkittävin HEIKKOUS 2010-luvulla? Kirjoita vastaus alla olevaan kenttään. Avoin kenttä 35) Minkä katsotte olevan Suomen innovaatiojärjestelmän merkittävin MAHDOL-LISUUS 2010-luvulla? Kirjoita vastaus alla olevaan kenttään. Avoin kenttä 36) Minkä katsotte olevan Suomen innovaatiojärjestelmän merkittävin UHKA 2010- luvulla? Kirjoita vastaus alla olevaan kenttään. Avoin kenttä
4. Vain VÄLITTÄJÄORGANISAATIOILLE esitetyt kysymykset
14) Mitä seuraavista palveluista ORGANISAATIONNE tarjoaa muille innovaatio-järjestelmän toimijoille? Vastaa-jat valitsivat YHDEN tai USEAMPIA vaihtoehtoja.
Rahoitus (avustukset, tuet, lainat, takaukset tai pääomasijoitukset) Neuvonta ja tietopalvelut Ihmisten kansainvälisen liikkuvuuden edistäminen Yritysten kansainvälistyminen Koulutus ja tutkimuspalvelut Toimitilat
15) Koetteko, että muut JULKISET toimijat tarjoavat samanlaisia palveluita kuin organisaationne? Kyllä / Ei / En osaa sanoa 16) Koetteko, että muut YKSITYISET toimijat tarjoavat samanlaisia palveluita kuin organisaationne? Kyllä / Ei / En osaa sanoa 17) Koetteko, että yhteistyö palveluntarjoajien kesken on sujuvaa? Kyllä/ Ei / En osaa sanoa 18) Kenen palveluntarjoajan kanssa yhteistyö on erityisen SUJUVAA? Kirjoita vastaus alla olevaan kenttään. Avoin kenttä 19) Kenen palveluntarjoajan kanssa yhteistyö on erityisen HAASTEELLISTA? Kirjoita vastaus alla olevaan kent-tään. Avoin kenttä HENKILÖTYÖVUODELLA tarkoitetaan yhden henkilön säännöllistä vuosityöaikaa. 20) Montako henkilötyövuotta organisaationne KOTIMAISISSA yksiköissä tehtiin vuonna 2008? Avoin kenttä 21) Montako henkilötyövuotta organisaationne ULKOMAISISSA yksiköissä tehtiin vuonna 2008? Avoin kenttä INNOVAATIOTOIMINTA tähtää uusien tai olennaisesti parannettujen tuotteiden, palveluiden tai tuotantoja jakelumenetelmien keksimiseen tai käyttöönottoon. 22) Montako henkilötyövuotta organisaatiossanne käytettiin innovaatiotoimintaan ja/tai sen edistämiseen vuonna 2008? Avoin kenttä 23) Mikä osa SUOMEN henkilöstöstänne on suorittanut YLIOPISTO tai tiedekorkea-koulututkinnon? 0% / 1-25% / 26-50% / 51-75% / 76-100% / En osaa sanoa 24) Mikä osa SUOMEN henkilöstöstänne on suorittanut TEKNISEN yliopisto- tai tiede-korkeakoulututkinnon? 0% / 1-25% / 26-50% / 51-75% / 76-100% / En osaa sanoa

Appendix V - Questionnaires in Finnish
125
25) Ketkä ovat pääasialliset rahoituksenne tai palveluidenne käyttäjät? Vastaajat valitsivat YHDEN tai USEAM-PIA vaihtoehtoja.
Yksityiset yritykset Yksityiset tutkimuslaitokset Yksityiset muut organisaatiot Yksityiset henkilöt Opetus/tutkimus: Yliopistot ja tiedekorkeakoulut Opetus/tutkimus: Ammattikorkeakoulut Opetus/tutkimus: Muut oppilaitokset Julkiset: Tutkimuslaitokset Julkiset: Kunnat Julkiset: Muut alueelliset toimijat (TE-keskukset, Osaamis- ja teknologiakeskukset, yms.) Julkiset: Muut kansallisen tason toimijat
26) Yksi järjestelmän tärkeimmistä tehtävistä on YKSITYISEN yritys- ja innovaatiotoiminnan edistäminen. Tästä näkökulmasta, millaiseksi arvioitte innovaatiojärjestelmän kokonaisuuden? Erittäin yksinkertainen / Melko yksinkertainen / Melko monimutkainen / Erittäin monimutkainen / En osaa sanoa 27) Mitkä ovat organisaationne rahoituksen lähteet? Mikäli rahoitusrakenteenne vaihtelee paljon vuodesta toiseen, niin vastatkaa käyttäen viimeisen kolmen vuoden keskiarvoja. Vastaajat osoittivat kunkin alla luetellun lähteen osuuden asteikolla 0% / 1-25% / 26-50% / 51-75% / 76-100%. Valtion budjetti Kunnat EU Tekes Julkiset muut tahot Yksityiset yritykset Yksityiset säätiöt Yksityiset muut tahot 28) Uusi kansallinen innovaatiostrategia julkaistiin 6/2008 ja innovaatiopoliittinen selonteko annettiin edus-kunnalle 10/2008. Millä tavalla organisaationne on reagoinut niihin? Vastaajat valitsivat yhden vaihtoehdoista.
o Organisaatiossa ei ole tutustuttu strategiaan/selontekoon. o Yksittäiset henkilöt ovat tutustuneet oman mielenkiintonsa pohjalta. o Aiheeseen liittyen on pidetty virallisia kokouksia. o Aiheeseen liittyen on käynnistetty virallinen suunnitteluprosessi. o Niiden pohjalta on tehty JOITAIN käytännön toimenpiteitä. o Niiden pohjalta on tehty USEITA käytännön toimenpiteitä. o Niiden aiheuttamat toimenpiteet ovat jo kokonaisuudessaan läpivietyjä.
29) Minkä katsotte olevan Suomen innovaatiojärjestelmän merkittävin VAHVUUS 2010-luvulla? Kirjoita vastaus alla olevaan kenttään. Avoin kenttä. 30) Minkä katsotte olevan Suomen innovaatiojärjestelmän merkittävin HEIKKOUS 2010-luvulla? Kirjoita vastaus alla olevaan kenttään. Avoin kenttä 31) Minkä katsotte olevan Suomen innovaatiojärjestelmän merkittävin MAHDOLLI-SUUS 2010-luvulla? Kirjoita vastaus alla olevaan kenttään. Avoin kenttä 32) Minkä katsotte olevan Suomen innovaatiojärjestelmän merkittävin UHKA 2010-luvulla? Kirjoita vastaus alla olevaan kenttään. Avoin kenttä

Appendix V - Questionnaires in Finnish
126
5. Vain TUTKIMUSLAITOKSILLE esitetyt kysymykset
14) Mitkä ovat organisaationne rahoituksen lähteet? (Mikäli rahoitusrakenteenne vaihtelee paljon vuodesta toiseen, niin vastatkaa koskien keskimäärin viimeisen kolmen vuoden aikana. Vastaajat osoittivat kunkin alla luetellun lähteen osuuden asteikolla 0% / 1-25% / 26-50% / 51-75% / 76-100%. Valtion budjetti Kunnat EU Tekes Julkiset muut tahot Yksityiset yritykset Yksityiset säätiöt Yksityiset muut tahot 15) Missä määrin tutkimuksenne palvelee seuraavia tahoja? Vastaajat valitsivat jokaista alla lueteltua tahoa kohden YHDEN vaihtoehdoista Ei lainkaan / Jonkin verran / Melko paljon / Erittäin paljon / En osaa sanoa. Julkista päätöksentekoa kansallisella tasolla Julkista päätöksentekoa alueellisella tasolla Julkista päätöksentekoa kansainvälisellä tasolla Yrityksiä Olemme yleishyödyllinen tiedontuottaja 16) Kuinka suuri osuus organisaationne työpanoksesta on ... Vastaajat osoittivat kullekin alla luetelluista tehtävistä näiden osuuden kokonaistyöpanoksesta asteikolla 0% / 1-25% / 26-50% / 51-75% / 76-100%. …koulutusta …tutkimusta …viranomaistehtävien hoitamista …tilastotuotantoa …hallintoa …muita tehtäviä 17) Miten hyvin katsotte, että te, valtion sektoritutkimuslaitoksena vastaatte isäntä-ministeriönne tietotarpei-siin? Ei lainkaan / Ei kovin hyvin / Melko hyvin / Erittäin hyvin / En osaa sanoa 18) Miten hyvin katsotte yksityisten tutkimuslaitosten vastaavan isäntäministeriönne tietotarpeisiin? Ei lainkaan / Ei kovin hyvin / Melko hyvin / Erittäin hyvin / En osaa sanoa 19) Miten hyvin katsotte korkeakoulujen vastaavan isäntäministeriönne tietotarpeisiin? Ei lainkaan / Ei kovin hyvin / Melko hyvin / Erittäin hyvin / En osaa sanoa
6. Vain YLIOPISTOJEN LAITOSJOHTAJILLE esitetyt kysymykset
14) Kuinka suuri osuus laitoksenne työpanoksesta on ... Vastaajat osoittivat kullekin alla luetelluista tehtävistä näiden osuuden kokonaistyöpanoksesta asteikolla 0% / 1-25% / 26-50% / 51-75% / 76-100%. …koulutusta …tutkimusta …viranomaistehtävien hoitamista …tilastotuotantoa …hallintoa …muita tehtäviä 15) Kuinka merkittävä rooli seuraavilla tahoilla on ollut kolmen viimeisen vuoden aikana laitoksenne toteutta-missa yhteistyöprojekteissa? Vastaajat arvioivat alla lueteltujen tahojen merkittävyyttä asteikolla Ei merkitystä / Vähän / Melko paljon / Erittäin paljon /En osaa sanoa. Kotimaiset yliopistot Ulkomaiset yliopistot Ammattikorkeakoulut

Appendix V - Questionnaires in Finnish
127
Julkiset tutkimuslaitokset Yksityiset tutkimuslaitokset Avoimet verkkoyhteisöt Kotimaiset yritykset Ulkomaiset yritykset 16) Laitoksenne näkökulmasta, ovatko yhteistyöprojektit yritysten kanssa liittyneet seuraaviin tutkimustarpei-siin? Vastaajat valitsivat jokaista alla lueteltua tutkimustarvetta kohden YHDEN vaihtoehdoista Kyllä / Ei / En osaa sanoa. Perustutkimukseen pohjautuva uusien ideoiden etsiminen Pääsy osaamistanne täydentävään asiantuntemukseen Tietyn ongelman ratkaiseminen Prototyypin kehittäminen/testaus Julkiseen ohjelmaan osallistuminen Osaavan työvoiman tarjonta Työntekijöiden täydennyskoulutus 17) Missä määrin KOETTE laitoksenne toiminnan vastaavan seuraaviin YRITYSTEN innovaatiotoiminnan tarpei-siin? Vastaajat arvioivat omien toimintojensa vastaavuutta alla listattuihin yritystarpeisiin asteikolla Ei lainkaan / Ei kovin paljon / Melko paljon / Erittäin paljon / En osaa sanoa. Perustutkimukseen pohjautuva uusien ideoiden etsiminen Pääsy yrityksen osaamista täydentävään asiantuntemukseen Tietyn ongelman ratkaiseminen Prototyypin kehittäminen/testaus Julkiseen ohjelmaan osallistuminen Osaavan työvoiman tarjonta Työntekijöiden täydennyskoulutus
Vain YLIOPISTO- JA AMK-REHTOREILLE esitetyt kysymykset
14) Kuinka suuri osuus korkeakoulunne työpanoksesta on... Vastaajat osoittivat kullekin alla luetelluista tehtävistä näiden osuuden kokonaistyöpanoksesta asteikolla 0% / 1-25% / 26-50% / 51-75% / 76-100%. …koulutusta …tutkimusta …viranomaistehtävien hoitamista …tilastotuotantoa …hallintoa …muita tehtäviä 15) Kuinka merkittävä rooli seuraavilla tahoilla on ollut kolmen viimeisen vuoden aikana korkeakoulunne to-teuttamissa yhteistyöprojekteissa? Vastaajat arvioivat alla lueteltujen tahojen merkittävyyttä asteikolla Ei merkitystä / Vähän / Melko paljon / Erittäin paljon /En osaa sanoa. Kotimaiset yliopistot Ulkomaiset yliopistot Ammattikorkeakoulut Julkiset tutkimuslaitokset Yksityiset tutkimuslaitokset Avoimet verkkoyhteisöt Kotimaiset yritykset Ulkomaiset yritykset 16) Korkeakoulunne näkökulmasta, ovatko yhteistyöprojektit yritysten kanssa liittyneet seuraaviin tutkimustar-peisiin? Vastaajat valitsivat jokaista alla lueteltua tutkimustarvetta kohden yhden vaihtoehdoista Kyllä / Ei / En osaa sanoa. Perustutkimukseen pohjautuva uusien ideoiden etsiminen Pääsy osaamistanne täydentävään asiantuntemukseen Tietyn ongelman ratkaiseminen Prototyypin kehittäminen/testaus Julkiseen ohjelmaan osallistuminen Osaavan työvoiman tarjonta Työntekijöiden täydennyskoulutus
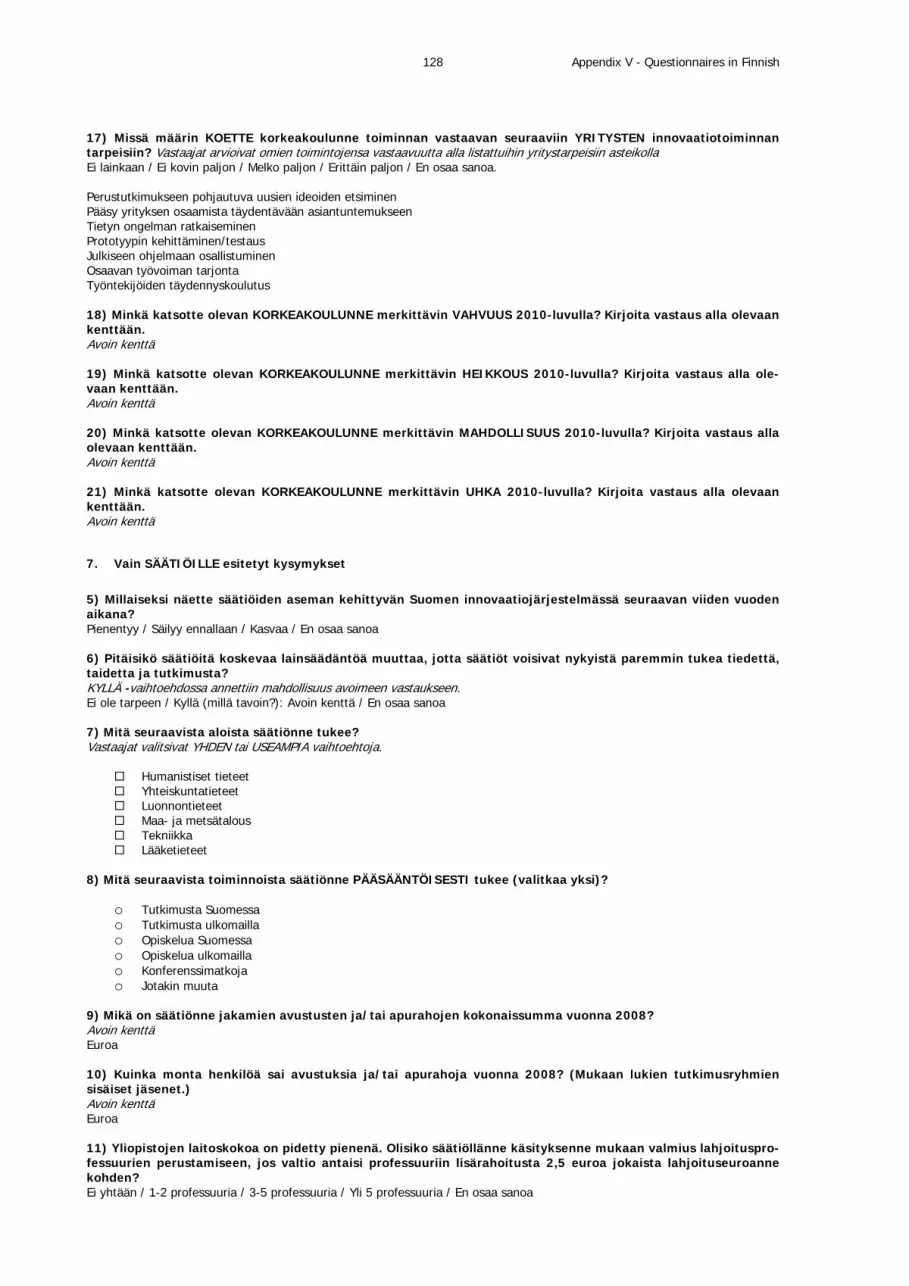
Appendix V - Questionnaires in Finnish
128
17) Missä määrin KOETTE korkeakoulunne toiminnan vastaavan seuraaviin YRITYSTEN innovaatiotoiminnan tarpeisiin? Vastaajat arvioivat omien toimintojensa vastaavuutta alla listattuihin yritystarpeisiin asteikolla Ei lainkaan / Ei kovin paljon / Melko paljon / Erittäin paljon / En osaa sanoa. Perustutkimukseen pohjautuva uusien ideoiden etsiminen Pääsy yrityksen osaamista täydentävään asiantuntemukseen Tietyn ongelman ratkaiseminen Prototyypin kehittäminen/testaus Julkiseen ohjelmaan osallistuminen Osaavan työvoiman tarjonta Työntekijöiden täydennyskoulutus 18) Minkä katsotte olevan KORKEAKOULUNNE merkittävin VAHVUUS 2010-luvulla? Kirjoita vastaus alla olevaan kenttään. Avoin kenttä 19) Minkä katsotte olevan KORKEAKOULUNNE merkittävin HEIKKOUS 2010-luvulla? Kirjoita vastaus alla ole-vaan kenttään. Avoin kenttä 20) Minkä katsotte olevan KORKEAKOULUNNE merkittävin MAHDOLLISUUS 2010-luvulla? Kirjoita vastaus alla olevaan kenttään. Avoin kenttä 21) Minkä katsotte olevan KORKEAKOULUNNE merkittävin UHKA 2010-luvulla? Kirjoita vastaus alla olevaan kenttään. Avoin kenttä
7. Vain SÄÄTIÖILLE esitetyt kysymykset
5) Millaiseksi näette säätiöiden aseman kehittyvän Suomen innovaatiojärjestelmässä seuraavan viiden vuoden aikana? Pienentyy / Säilyy ennallaan / Kasvaa / En osaa sanoa 6) Pitäisikö säätiöitä koskevaa lainsäädäntöä muuttaa, jotta säätiöt voisivat nykyistä paremmin tukea tiedettä, taidetta ja tutkimusta? KYLLÄ -vaihtoehdossa annettiin mahdollisuus avoimeen vastaukseen. Ei ole tarpeen / Kyllä (millä tavoin?): Avoin kenttä / En osaa sanoa 7) Mitä seuraavista aloista säätiönne tukee? Vastaajat valitsivat YHDEN tai USEAMPIA vaihtoehtoja.
Humanistiset tieteet Yhteiskuntatieteet Luonnontieteet Maa- ja metsätalous Tekniikka Lääketieteet
8) Mitä seuraavista toiminnoista säätiönne PÄÄSÄÄNTÖISESTI tukee (valitkaa yksi)?
o Tutkimusta Suomessa o Tutkimusta ulkomailla o Opiskelua Suomessa o Opiskelua ulkomailla o Konferenssimatkoja o Jotakin muuta
9) Mikä on säätiönne jakamien avustusten ja/tai apurahojen kokonaissumma vuonna 2008? Avoin kenttä Euroa 10) Kuinka monta henkilöä sai avustuksia ja/tai apurahoja vuonna 2008? (Mukaan lukien tutkimusryhmien sisäiset jäsenet.) Avoin kenttä Euroa 11) Yliopistojen laitoskokoa on pidetty pienenä. Olisiko säätiöllänne käsityksenne mukaan valmius lahjoituspro-fessuurien perustamiseen, jos valtio antaisi professuuriin lisärahoitusta 2,5 euroa jokaista lahjoituseuroanne kohden? Ei yhtään / 1-2 professuuria / 3-5 professuuria / Yli 5 professuuria / En osaa sanoa

Appendix V - Questionnaires in Finnish
129
8. Vain JÄRJESTÖILLE esitetyt kysymykset
14) Minkä katsotte olevan Suomen innovaatiojärjestelmän merkittävin VAHVUUS 2010-luvulla? Kirjoita vastaus alla olevaan kenttään. Avoin kenttä 15) Minkä katsotte olevan Suomen innovaatiojärjestelmän merkittävin HEIKKOUS 2010-luvulla? Kirjoita vastaus alla olevaan kenttään. Avoin kenttä 16) Minkä katsotte olevan Suomen innovaatiojärjestelmän merkittävin MAHDOL-LISUUS 2010-luvulla? Kirjoita vastaus alla olevaan kenttään. Avoin kenttä 17) Minkä katsotte olevan Suomen innovaatiojärjestelmän merkittävin UHKA 2010-luvulla? Kirjoita vastaus alla olevaan kenttään. Avoin kenttä

Appendix V - Questionnaires in Finnish
130
9. Vain KUNNILLE esitetyt kysymykset
INNOVAATIOTOIMINTA tähtää uusien tai olennaisesti parannettujen tuotteiden, palveluiden tai tuotanto ja jakelumenetelmien keksimiseen tai käyttöönottoon. 14) Onko kunnallanne seuraavia palveluita liittyen kuntanne alueella tapahtuvan INNOVAATIOTOIMINNAN tukemiseen? Vastaajat valitsivat YHDEN tai USEAMPIA vaihtoehtoja.
Rahoitus (avustukset, tuet, lainat, takaukset tai pääomasijoitukset) Neuvonta- ja tietopalvelut Ihmisten kansainvälisen liikkuvuuden edistäminen Yritysten kansainvälistyminen Koulutus- ja tutkimuspalvelut Toimitilat
15) Onko kunnallanne INNOVAATIOTOIMINTAAN liittyvää strategiaa tai innovaatio-poliittista ohjelmaa? Kyllä / Ei / En osaa sanoa 16) Kuinka paljon kuntanne käytti OMAA RAHAA innovaatiotoiminnan edistämiseen vuonna 2008? Avoin kenttä Euroa 17) Kuinka paljon kuntanne käytti OMAN RAHAN LISÄKSI julkista kansallisista tai kansainvälisistä (ml. EU) rahaa innovaatiotoiminnan tukemiseen vuonna 2008? Avoin kenttä Euroa 18) Mikä oli kuntanne kokonaisbudjetti vuonna 2008? Avoin kenttä Euroa 19) Onko kuntanne hankinnoissa sovellettu PALVELUN TAI TAVARANTOIMITTAJAN innovatiivisuutta hankinta-kriteerinä? Ei koskaan / Harvoin / Usein / Aina / En osaa sanoa 20) Näettekö, että julkisilla hankinnoilla voidaan vaikuttaa innovaatiotoiminnan edistämiseen? Kyllä / Ei / En osaa sanoa
10. Vain PÄÄOMASIJOITTAJILLE ja YRITYSENKELEILLE esitetyt kysymykset
14) Yksi järjestelmän tärkeimmistä tehtävistä on YKSITYISEN yritys- ja innovaatiotoiminnan edistäminen. Tästä näkökulmasta, millaiseksi arvioitte innovaatiojärjestelmän kokonaisuuden? Erittäin yksinkertainen / Melko yksinkertainen / Melko monimutkainen / Erittäin monimutkainen / En osaa sanoa 15) Nopeasti kasvavien yrityksien syntyä voitaisiin tukea antamalla niiden tuleviin voittoihin ja voitonjakoon kohdistuvia verohelpotuksia. Kuinka tehokas tapa tämä olisi kasvattaa kasvuyrityksien määrää? Ei lainkaan tehokas / Ei kovin tehokas / Melko tehokas / Erittäin tehokas / En osaa sanoa 16) Koetteko, että muut JULKISET toimijat tarjoavat samanlaisia palveluita kuin organisaationne? Kyllä / Ei / En osaa sanoa 17) Uusi kansallinen innovaatiostrategia julkaistiin 6/2008 ja innovaatiopoliittinen selonteko annettiin edus-kunnalle 10/2008. Oletteko tutustuneet niihin? Kyllä / Ei / En osaa sanoa 18) Arvioikaa, kuinka monessa (rahoittamassanne) asiakasyrityksessänne on keskeinen investointihanke, t&k-, markkinointi-, tai muu vastaava projekti lykkääntynyt tai peruuntunut rahoitusmarkkinakriisin johdosta? 0% / 1-25% / 26-50% / 51-75% / 76-100% / En osaa sanoa 19) Onko kriisi muuttanut teille tulleiden rahoituspyyntöjen määrää? Lisääntyneet selvästi / Lisääntyneet jonkin verran / Ei muutosta / Vähentyneet jonkin verran / Vähentyneet selvästi / En osaa sanoa 20) Onko rahoituspyyntöjen laatu (rahoituskelpoisuus/riski) muuttunut kriisin johdosta? Huonontuneet selvästi / Huonontuneet jonkin verran / Ei muutosta / Parantuneet jonkin verran / Parantuneet selvästi / En osaa sanoa 21) Oletteko muuttaneet omia sijoitus- / rahoituskriteereitänne kriisin vuoksi? Kiristyneet / Ei muutosta / Löystyneet / En osaa sanoa Vastatessanne seuraavaan kysymykseen, ajatelkaa yritysrahoituksen tarjontaa ja kysyntää NORMAALIolosuhteissa eli tämän-hetkisen rahoituskriisin rauettua.
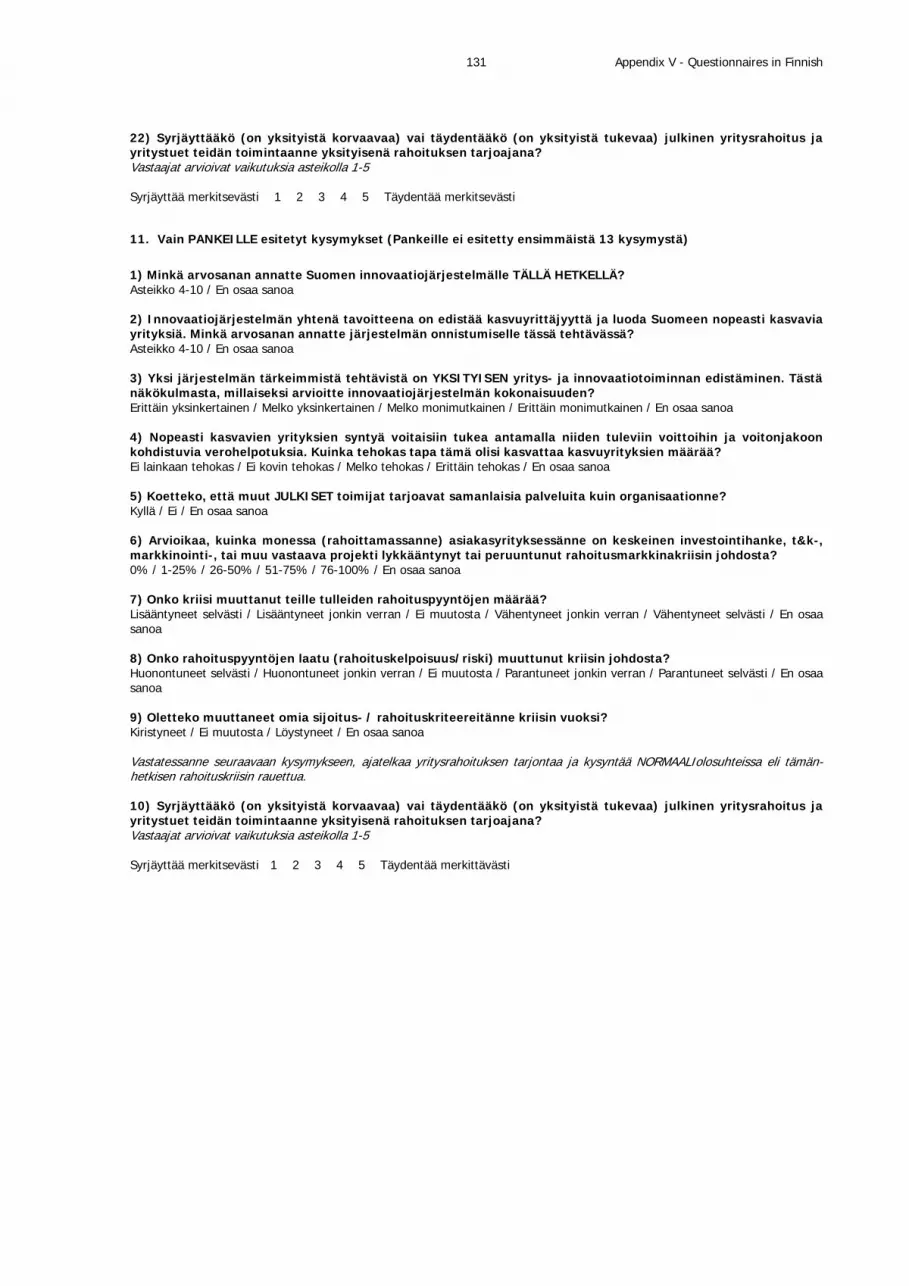
Appendix V - Questionnaires in Finnish
131
22) Syrjäyttääkö (on yksityistä korvaavaa) vai täydentääkö (on yksityistä tukevaa) julkinen yritysrahoitus ja yritystuet teidän toimintaanne yksityisenä rahoituksen tarjoajana? Vastaajat arvioivat vaikutuksia asteikolla 1-5 Syrjäyttää merkitsevästi 1 2 3 4 5 Täydentää merkitsevästi
11. Vain PANKEILLE esitetyt kysymykset (Pankeille ei esitetty ensimmäistä 13 kysymystä)
1) Minkä arvosanan annatte Suomen innovaatiojärjestelmälle TÄLLÄ HETKELLÄ? Asteikko 4-10 / En osaa sanoa 2) Innovaatiojärjestelmän yhtenä tavoitteena on edistää kasvuyrittäjyyttä ja luoda Suomeen nopeasti kasvavia yrityksiä. Minkä arvosanan annatte järjestelmän onnistumiselle tässä tehtävässä? Asteikko 4-10 / En osaa sanoa 3) Yksi järjestelmän tärkeimmistä tehtävistä on YKSITYISEN yritys- ja innovaatiotoiminnan edistäminen. Tästä näkökulmasta, millaiseksi arvioitte innovaatiojärjestelmän kokonaisuuden? Erittäin yksinkertainen / Melko yksinkertainen / Melko monimutkainen / Erittäin monimutkainen / En osaa sanoa 4) Nopeasti kasvavien yrityksien syntyä voitaisiin tukea antamalla niiden tuleviin voittoihin ja voitonjakoon kohdistuvia verohelpotuksia. Kuinka tehokas tapa tämä olisi kasvattaa kasvuyrityksien määrää? Ei lainkaan tehokas / Ei kovin tehokas / Melko tehokas / Erittäin tehokas / En osaa sanoa 5) Koetteko, että muut JULKISET toimijat tarjoavat samanlaisia palveluita kuin organisaationne? Kyllä / Ei / En osaa sanoa 6) Arvioikaa, kuinka monessa (rahoittamassanne) asiakasyrityksessänne on keskeinen investointihanke, t&k-, markkinointi-, tai muu vastaava projekti lykkääntynyt tai peruuntunut rahoitusmarkkinakriisin johdosta? 0% / 1-25% / 26-50% / 51-75% / 76-100% / En osaa sanoa 7) Onko kriisi muuttanut teille tulleiden rahoituspyyntöjen määrää? Lisääntyneet selvästi / Lisääntyneet jonkin verran / Ei muutosta / Vähentyneet jonkin verran / Vähentyneet selvästi / En osaa sanoa 8) Onko rahoituspyyntöjen laatu (rahoituskelpoisuus/riski) muuttunut kriisin johdosta? Huonontuneet selvästi / Huonontuneet jonkin verran / Ei muutosta / Parantuneet jonkin verran / Parantuneet selvästi / En osaa sanoa 9) Oletteko muuttaneet omia sijoitus- / rahoituskriteereitänne kriisin vuoksi? Kiristyneet / Ei muutosta / Löystyneet / En osaa sanoa Vastatessanne seuraavaan kysymykseen, ajatelkaa yritysrahoituksen tarjontaa ja kysyntää NORMAALIolosuhteissa eli tämän-hetkisen rahoituskriisin rauettua. 10) Syrjäyttääkö (on yksityistä korvaavaa) vai täydentääkö (on yksityistä tukevaa) julkinen yritysrahoitus ja yritystuet teidän toimintaanne yksityisenä rahoituksen tarjoajana? Vastaajat arvioivat vaikutuksia asteikolla 1-5 Syrjäyttää merkitsevästi 1 2 3 4 5 Täydentää merkittävästi