Evaluating employee assistance policy in an HMO-based alcoholism project
12
Evaluation and Program Planning, Vol. 8, pp. 183-194, 1985 Printed in the USA. All rights reserved. 0149-7189185 $3.00 + .OO Copyright Q 1985 Pergamon Press Ltd EVALUATING EMPLOYEE ASSISTANCE POLICY IN AN HMO-BASED ALCOHOLISM PROJECT SANDRA L. PUTNAM Brown University and Rhode Island Department of Health ROBERT L. STOUT Brown University and Butler Hospital, Providence, Rhode Island ABSTRACT One aspect of successful employee assistance program (EAP) implementation is the adoption of a formal, written policy, reflecting company commitment to EAP guidelines and goals. This study of criteria predictive of such policy adoption was conducted at the occupational al- coholism project of a New England health maintenance organization (HMO). Data on nearly 400 organizations contacted by occupational program consultants (OPCs) over a Z&month period were collected by questionnaire and interview. One third of these organizations adopted employee assistance policies and set about establishing formal programs. Stepwke multiple regression is the principal method used to pinpoint the correlates of policy adoption. Two of the most important of these are the attitudes of contact persons within the organiza- tion toward alcoholism and employee assistance programs, particularly their admission of alcohol problems within their social networks; and the consultants’persistence and marketing skills. The adopting organizations also had reputations for being progressive, and actively concerned about employee welfare; they tended to be large, their executives autonomous, and their union membership rates high. Inhibiting policy acceptance were fears that a written policy would jeopardize the reputation and image of the organization, and that an employee assis- tance program would remove internal control of personal procedures. The adequacy of the evaluative data and methods are discussed, and recommendations are offered in the interests of streamlining the efforts of OPCs and of achieving greater penetration of targeted organiza- tions. INTRODUCTION Little systematic research has been done to isolate vari- through August 31, 1977. Fully one third (126) of the ables associates with the acceptance and implementa- organizations contacted by the project’s occupational tion of employee assistance programs (EAPs) (Masi dz Spencer, 1977; Trite, 1980). This paper addresses the ‘The project was funded by a grant from the National Institute on lack, by presenting the findings of a retrospective Alcohol Abuse and Alcoholism (NIAAA) (DHEW grant #AAO2210). study of 377 organizations contacted through one oc- It uses the “broad brush” or employee assistance approach to the cupational alcoholism project, operating within a health identification and referral of troubled employees. The focus is on maintenance organization (HMO).’ The study’s time job performance deterioration, not on its specific causes, although frame extends for 20 months, from January 1, 1976 in many cases, alcoholism is found to play a major role (Scramm, 1977). This is a revision of a paper presented at the seventh annual meeting of the Association of Labor-Management Administrators and Con- sultants on Alcoholism (ALMACA) held in San Diego, California, October 3-6, 1978. The author gratefully acknowledges the contributions of Dr. Ian R. H. Rockett, Rhode Island Department of Health, who made excellent and insightful comments on the manuscript; Gregg Healy and Wendy Wolfson, who painstakingly and faithfully collected the data for the study; and RIGHA counselors and consultants, who made the study possible. Reprint requests should be sent to Sandra L. Putnam, Office of Health Policy, RI Dept. of Health, Providence, RI 02908. 183
-
Upload
independent -
Category
Documents
-
view
1 -
download
0
Transcript of Evaluating employee assistance policy in an HMO-based alcoholism project
Evaluation and Program Planning, Vol. 8, pp. 183-194, 1985 Printed in the USA. All rights reserved.
0149-7189185 $3.00 + .OO Copyright Q 1985 Pergamon Press Ltd
EVALUATING EMPLOYEE ASSISTANCE POLICY IN AN HMO-BASED ALCOHOLISM PROJECT
SANDRA L. PUTNAM
Brown University and Rhode Island Department of Health
ROBERT L. STOUT
Brown University and Butler Hospital, Providence, Rhode Island
ABSTRACT
One aspect of successful employee assistance program (EAP) implementation is the adoption of a formal, written policy, reflecting company commitment to EAP guidelines and goals. This study of criteria predictive of such policy adoption was conducted at the occupational al- coholism project of a New England health maintenance organization (HMO). Data on nearly 400 organizations contacted by occupational program consultants (OPCs) over a Z&month period were collected by questionnaire and interview. One third of these organizations adopted employee assistance policies and set about establishing formal programs. Stepwke multiple regression is the principal method used to pinpoint the correlates of policy adoption. Two of the most important of these are the attitudes of contact persons within the organiza- tion toward alcoholism and employee assistance programs, particularly their admission of alcohol problems within their social networks; and the consultants’persistence and marketing skills. The adopting organizations also had reputations for being progressive, and actively concerned about employee welfare; they tended to be large, their executives autonomous, and their union membership rates high. Inhibiting policy acceptance were fears that a written policy would jeopardize the reputation and image of the organization, and that an employee assis- tance program would remove internal control of personal procedures. The adequacy of the evaluative data and methods are discussed, and recommendations are offered in the interests of streamlining the efforts of OPCs and of achieving greater penetration of targeted organiza- tions.
INTRODUCTION
Little systematic research has been done to isolate vari- through August 31, 1977. Fully one third (126) of the ables associates with the acceptance and implementa- organizations contacted by the project’s occupational tion of employee assistance programs (EAPs) (Masi dz Spencer, 1977; Trite, 1980). This paper addresses the ‘The project was funded by a grant from the National Institute on lack, by presenting the findings of a retrospective Alcohol Abuse and Alcoholism (NIAAA) (DHEW grant #AAO2210).
study of 377 organizations contacted through one oc- It uses the “broad brush” or employee assistance approach to the
cupational alcoholism project, operating within a health identification and referral of troubled employees. The focus is on
maintenance organization (HMO).’ The study’s time job performance deterioration, not on its specific causes, although
frame extends for 20 months, from January 1, 1976 in many cases, alcoholism is found to play a major role (Scramm, 1977).
This is a revision of a paper presented at the seventh annual meeting of the Association of Labor-Management Administrators and Con- sultants on Alcoholism (ALMACA) held in San Diego, California, October 3-6, 1978.
The author gratefully acknowledges the contributions of Dr. Ian R. H. Rockett, Rhode Island Department of Health, who made excellent and insightful comments on the manuscript; Gregg Healy and Wendy Wolfson, who painstakingly and faithfully collected the data for the study; and RIGHA counselors and consultants, who made the study possible.
Reprint requests should be sent to Sandra L. Putnam, Office of Health Policy, RI Dept. of Health, Providence, RI 02908.
183
184 SANDRA L. PUTNAM and ROBERT L. STOUT
consultants adopted employee assistance policies and sistance policies. The goal is to pinpoint factors that established programs during that period. facilitate, and those that impede, policy adoption in
One of the main purposes of this study is to develop contacted organizations. This is important insofar as criteria to help predict successful outcome of con- policy adoption is a first and essential step in program sultants’ outreach efforts. The primary measure used implementation and usage. The extent to which such to indicate program success here is the propensity of an assumption is justified is discussed in the following organizations, once contacted, to adopt employee as- section.
BACKGROUND OF THE OCCUPATIONAL PROGRAM
Because relatively few EAPs are located in HMOs, a description of this project is needed to set the stage for the analysis. The HMO, Rhode Island Group Health Association, as the only federally qualified health maintenance organization in Rhode Island, provides prepaid, comprehensive health care coverage and ser- vices to a membership of 40,000 persons. Until recently, the services of the occupational alcoholism project were among those offered at the HMO. The project served not only companies that offered HMO coverage as an employee benefit, but all employers in Rhode Island, on the order of some state-run EAPs. This ap- proach contrasts with that of other projects that ex- clusively serve one large company or organization (Trite & Roman, 1972).
The project included both an outreach and a treat- ment component. The former employed three occupa- tional program consultants (OPCs) to contact a range of businesses, organizations, and agencies’ within Rhode Island in order to encourage employer coopera- tion in the confrontation and referral of problem em- ployees, as a means of early identification of alcoholics in the workplace. This was achieved through an orga- nization’s adoption of an employee assistance (EAP)
policy and the implementation of a formal program, using deteriorating job performance criteria and the supervisor’s defined work role as key elements. The policies were largely patterned after the model found in McGuirk (1980). Among consultants’ other activities were training supervisors in EAP techniques and guide- lines; disseminating information concerning alcohol- ism and the program; providing consultation services to supervisors, union officials, and top management personnel to foster referrals; and assuming an ad- vocate role on behalf of the employee whose job was in jeopardy but who had sought and was cooperating in treatment.
During the study period, professional diagnosis, evaluation, and treatment of alcoholism and other problems among referred employees as well as HMO members were provided by 12 counselors, 6 of whom were specialists in the treatment of alcoholics. This tie- in of outreach and treatment services within a single agency provides an integrated network of services for clients. However, the project’s association with the HMO represents an important difference between this program and other non-HMO-based programs, the precise implications of which are unknown.
DATA AND METHODS
Contacted Organizations The 377 organizations contacted over the study period were targeted for consultant contact on the basis of criteria that may have increased the chances of policy adoption among them, but which make them unrepre- sentative of Rhode Island organizations generally. The selection process disproportionately favored larger Rhode Island organizations (those with 100 or more employees), cities and towns, and labor unions.
The typical contacted organization under study was a private corporation (72Vo), engaged in manufactur- ing (54%), autonomous in decision making, with no parent company (75%). It offered HMO coverage (62010), was non-unionized (6OVo), and was 10 times
‘Along with factories and service organizations like banks, and in-
surance companies, other contacted organizations included labor
unions; city, town, and state governments; hospitals, social service
agencies; and military installations. These will henceforth be encom- passed in the term organizations.
larger than the average Rhode Island manufacturing organization (the mean organization population size was 470; the mode was 125). It employed mainly wage laborers (60%), although 11% of all organizations employed salaried personnel alone.
The average organization was first contacted through its personnel department (46%), with middle- level managers and owners or chief executives being the points of entry in 22% and 16% of organizations, respectively. Organizations were generally “assigned” to the consultant by the project director (30%) or were contacted through community activities, such as cham- ber of commerce luncheons, featuring consultant pre- sentations of the employee assistance program to area business persons (18%). Consultant contact was main- tained for an average of 6 months, although 32% of the organizations were contacted for less than 1 month. As noted, one third of all organizations adopted EAP policies.
Evaluating Employee Assistance Policy 185
Research Questions Although self-selected, the sample of organizations
contacted by consultants over the study period is suited for studying the first step in employee assistance pro- gram implementation, policy adoption. The relation- ship between policy adoption and program implemen- tation or policy usage is an empirical question and will be addressed as such in the Results section of this paper. The first research question is: What types of organizations tend to adopt policies and under what general circumstances? A related question is: What set of variables best predicts policy adoption in contacted organizations? Data were subjected to contingency table analysis for the descriptive statistics to address the first research question. Stepwise multiple regres- sion techniques were used to develop equations predic- tive of policy adoption to answer the second question.
Data Sources The data were gathered from three basic sources. First, data were culled from forms provided by the funding body, NIAAA, called Organization Contact and Pro- file forms. These were completed by consultants and submitted monthly for computer processing. They contain standardized information on the nature of the companies and on the first and each subsequent con- tact made (Copies of these forms are available from the author on request.) Second, data were derived from various internal qualitative program reports, referred to as Call Reports. They were filled out by program consultants at the time of each contact. These reports document the date, location, and person con- tacted in each organization visited, as well as the pur- pose and the results of each meeting. Included are any problems encountered and any remarks or opinions expressed either by the key contact or by the consultant concerning the encounter. Although these forms were developed for internal management purposes, they contained more detailed and openended information on the process of policy adoption and implementation than was allowed for in the NIAAA reports. Finally, structured interviews were conducted by the first author with the consultants. Detailed evaluative and attitudinal data were elicited to supplement data de- rived from other sources. Each consultant was asked about every organization s/he contacted, whether or not a policy was adopted. Their opinions were sought concerning the ease of entry, factors that helped and hindered the policy adoption process, and the extent of program implementation to date. In most cases, this interviewing was done some time after a contact was made. These data therefore reflect more memory bias than other data sources.
In contrast to a number of studies that report data from supervisors alone (Roman, 1977; Williams & Moffat, 1975), only consultants were asked to provide data in this study. The perspective is clearly that of the HMO’s program rather than the companies served by it. It was decided at the beginning of the study that ac- cess to company personnel records would be foregone for fear of seeming to violate principles of confiden- tiality that are so essential to the proper operation of an EAP. All staff members agreed that the credibility of the relatively new occupational program might be damaged if care were not taken to tread lightly in this area. The research design was therefore tailored to utilize available in-house data. The practical exigencies of the evaluation setting thus dictated the way in which the research was designed and carried out, a situation encountered by most evaluators.
Dependent and Independent Variables This study is exploratory in nature, as little systematic research has been done to date in the growing field of occupational programming. Hypothesis testing seems premature at such an early stage in the growth of this research area. The aim is rather to generate testable hypotheses. Consequently, no attempt is made to pre- structure the analysis.
The dependent or criterion variable is categorical. It is defined as the presence or absence of policy adop- tion. The prediction of policy adoption was effected from more than 60 independent or predictor variables. Variables available as predictors from the three data sources were grouped into three main categories:
1. Structural (S) variables, bearing on the type and nature of the organization-its size, autonomy in decision making, the presence of a union and the level of union representation, the composition of the work force, etc. These are derived mainly from NIAAA data sources.
2. Problems (P) encountered and Factors Facilitating (FF) policy adoption- reported in both written and verbal form by occupational program consultants, when describing their experience in contacted orga- nizations. These were coded primarily from call re- ports and from structured interviews.
3. Consultant Activity (OPC) variables, concerning the nature and extent of consultant contact within organizations. These include the type of visit lnade- whether for initial contact, training, liaison; the duration, in months, of the contact; the num- bers of meetings held and personnel trained. These variables came from all three data sources and were seen as most under the direct influence of OPCs and the EAP.

186 SANDRA L. PUTNAM and ROBERT L. STOUT
RESULTS
Policies and Programs The usefulness of this study depends largely on the ex- tent to which policy adoption leads to successful pro- gram implementation. The underlying assumption here is that once a formal policy is adopted, implementa- tion and policy usage generally follow. From another point of view, it is assumed that getting the organiza- tion to adopt the policy is a major hurdle OPCs must face and that it is here that much of the success of their efforts may be judged.
Justification for this perspective comes from pre- viously published work by the present authors (Put- nam & Stout, 1982) and from the results of the Exe- cutive Caravan Survey (Roman, 1977). Putnam and Stout (1982) found that the presence of a written policy was an essential ingredient for program success, measured in terms of the numbers of employee referrals to one community treatment resource, an HMO coun- seling department. The presence of such a policy was the single most important variable in increased chances of employee referrals, explaining 43% of the variance in referral rates (r = .65; p < .0001).3 Roman (1977) reporting on the results of the Executive Caravan Sur- vey, concludes a comparison of successful and unsuc- cessful occupational alcoholism programs by noting that the only significant correlates of case handling or policy usage were the presence of an EAP policy and broader awareness of and experience with alcohol problems among managers.
Tables 1 and 2 illustrate this point, showing that policy organizations do indeed differ significantly from nonpolicy organizations in the absolute number of referred employees and in referral rates per 1,000 employees. In this sample, 403 employees were referred from 126 policy organizations, with an average of 3.2 referrals per company or 0.167 mean referrals per 1,000 employees per month. This compares with 1.4 employees referred on average (351 in all) from 251 nonpolicy companies, for a mean of 0.055 employee referrals per 1,000 per month.
If referral rates seem low, for instance, at 0.2 per 1,000 employees per month, they must be viewed in light of the “well worker” effect, whereby the employed are, by and large, healthier than the unem- ployed, controlling for age, and the fact that relatively few adult males, who comprise the majority of the employed population, seek counseling. It must also be remembered that the rates are monthly, not yearly, averages. In addition, they are not volume measures. They take account of first counseling encounters only. No subsequent counseling visits or medical care visits are included. Indeed, cases, not visits, are the units here. Seven hundred and fifty employees of contacted companies first visited the HMO counseling depart- ment during the 20-month study period, an average of 2 per company. This is a substantial number of refer- rals both from the company’s and the program’s point of view.
TABLE 1 NUMBER AND PERCENTAGE OF REFERRALS OF ORGANIZATIONAL EMPLOYEES TO HMO
COUNSELING FROM COMPANIES WITH EAP POLICIES AND WITHOUT EAP POLICIES.
Number of Referrals
Policy Status Non-Policy Policy
Organizations Organizations
Number Percent Number Percent
Total Organizations
Number
None 170 72.6 62 49.2 232 l-3 45 19.3 45 35.7 90 4-9 14 6.0 8 6.4 22 10 or more 5 2.1 11 0.7 16 Totals 234 100.0 126 100.0 360 x2 = 23.63, df = 3, p = < .OOOOl
‘Here referral rates are used as indicators of policy usage. They are defined as the number of first counseling contacts per 1000
employees per month. The absolute number of referrals (which is obtained from client data forms collected in the HMO’s counseling
department) is weighted by the size of the company (the number of
employees at first OPC contact) and by the number of months be- tween the date of policy adoption and the end of the study period.
The range in numbers of referrals is 1 to 141, with a mean of 2 per organization or 0.088 referrals per 1,000 per month.
Evaluating Employee Assistance Policy 187
TABLE 2 REFERRAL RATES PER THOUSAND EMPLOYEES FROM ALL CONTACTED COMPANIES
BEFORE AND AFTER EAP POLICY ADOPTION
Referral Rates Before Policy Adoption Per Thousand
Employees Number Percent
None 273 76.3 0.0-l .o 68 19.0 1 .o-2.0 11 3.0 2.0-3.0 1 I
1.7 3.0+ 5 Totals 358 100.0 x1 = 22.0, df = 4, p = <.OOOOi
After Policy Adoption
Number Percent
66 54.8 42 33.9
6 4.8 2 6
6.5
124 100.0
Totals Number
341 110
17 3
11
482
Paper Programs This is not to say that “paper programs” do not exist. Paper programs are those with written policies but no other signs of formal programs, particularly no super- visory training in EAP principles and techniques, no top management or union endorsement of or support for the program, and no follow-up activities by con- sultants. They tend to occur where union-management relations are poor, with minimal provision of employee benefits, and so-called “sweatshop” conditions. Only 18 such programs were identified in this sample. When they are compared with the 81 organizations with fully implemented programs, it was found that paper pro- grams are associated with significantly lower referral rates. Their mean is 0.08, compared with a mean of 0.4 for the fully implemented programs (F = 5.08, p < .05).
Thus, supervisory training, which was provided in three quarters of policy organizations, is critical to program success, measured by increased referrals (Put- nam & Stout, 1982). In paper programs, where OPCs are not allowed to train supervisors, they generally distribute EAP literature in the belief that doing something is better than doing nothing. However, in the absence of training and other direct program sup- port, such as OPC follow-up, literature distribution is found to have little or no effect on referrals. It is the same as doing nothing.
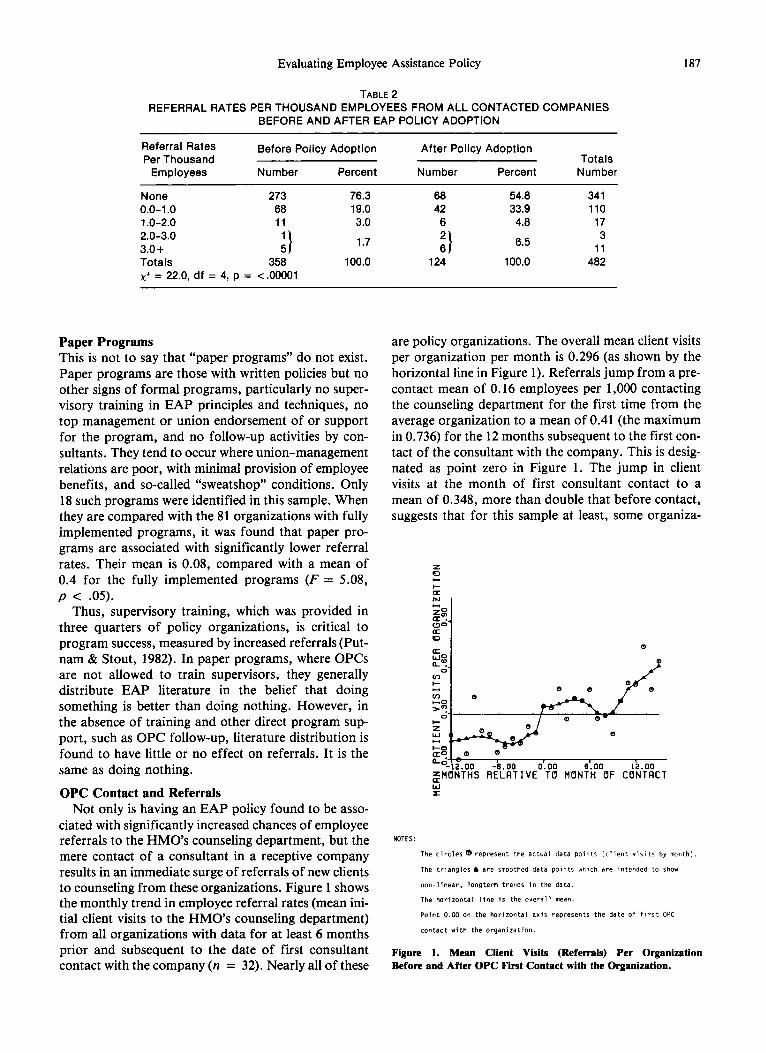
OPC Contact and Referrals Not only is having an EAP policy found to be asso-
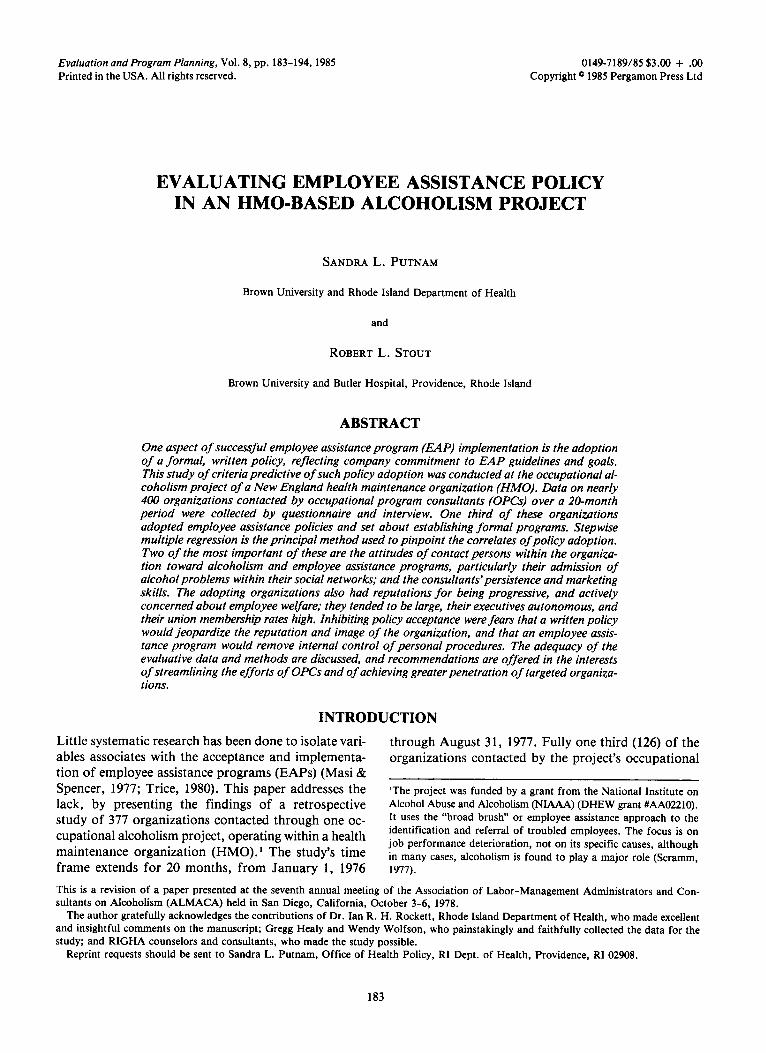
ciated with significantly increased chances of employee referrals to the HMO’s counseling department, but the mere contact of a consultant in a receptive company results in an immediate surge of referrals of new clients to counseling from these organizations. Figure 1 shows the monthly trend in employee referral rates (mean ini- tial client visits to the HMO’s counseling department) from all organizations with data for at least 6 months prior and subsequent to the date of first consultant contact with the company (n = 32). Nearly all of these
are policy organizations. The overall mean client visits per organization per month is 0.296 (as shown by the horizontal line in Figure 1). Referrals jump from a pre- contact mean of 0.16 employees per 1,000 contacting the counseling department for the first time from the average organization to a mean of 0.41 (the maximum in 0.736) for the 12 months subsequent to the first con- tact of the consultant with the company. This is desig- nated as point zero in Figure 1. The jump in client visits at the month of first consultant contact to a mean of 0.348, more than double that before contact, suggests that for this sample at least, some organiza-
% a?_
0
z w t
C8 a 0
e=-12.00 -6.00 0.00 6.00 12.00 ,$H6NTHS RELATIVE T6 MONTH OF CCINTACT
Y
NOTES:
The circles d represent the actual data points (client visits by month).
The triangles A are smoothed data points which are intended to show
non-linear, longterm trends in the data.
The horizontal line is the overall mean.
Paint 0.00 on the horizontal axis represents the date of first OPC
contact with the organization.
Figure 1. Mean Client Visits (Referrals) Per Organization Before and After OPC First Contact with the Organization.

188 SANDRA L. PUTNAM and ROBERT L. STOUT
tions immediately respond to the contact by making use of consultant services to refer employees to treat- ment.
The phenomenon illustrated in Figure 1 has been noted by consultants. It features an initial rush of ob- vious problem employees referred from contacted or- ganizations to counseling, followed by a period of con- solidation of the program, after which the policy is used more routinely and with increasing confidence by managers and union officials. There is a significant in- crease in mean client visits after consultant contact with the company (p = .015). The fact that contact by an occupational program consultant results in a sus- tained increase in the initial employee contact rate of 0.25 referrals per 1,000 employees per organization per month, averaged across the organizations in this sam- ple, argues powerfully for the existence of an important relationship between what consultants do in organiza- tions to get policies adopted and the first contacts of organizational employees with the HMO’s counseling treatment facility.
Characteristics of Policy Organizations Because policy adoption is thus critical to EAP suc- cess, it is important to ask what characteristics dif- ferentiate policy and nonpolicy organizations in this sample. Based on contingency table analysis, organiza- tions that adopted employee assistance policies (policy organizations) and those that did not (nonpolicy orga- nizations) differed significantly on a number of struc- tural dimensions. The majority of both policy and nonpolicy organizations were private corporations, but more nonpolicy organizations were colleges or universities and hospitals or health care agencies, while more policy organizations were labor unions, govern- ment agencies, and professionals organizations (p = .003). More nonpolicy than policy organizations were engaged in wholesale and retail trade, in banking, in- surance and real estate, and in delivering professional services (p = .006). Autonomy in decision making was related to policy status. Fewer policy than non- policy organizations had parent organizations and lacked autonomy in decision making (p = .02).
A highly significant relationship was also observed between unionization and policy status. More policy organizations had unions (p = .0004) and were highly unionized, that is, had a union membership rate of 60% or more of the work force (p = .015). Policy organizations tended to be larger than nonpolicy orga- nizations, with only 23% of the former employing less than 125 persons, compared with 33% for nonpolicy organizations, and 29% employing 500 or more, com- pared with 21% of nonpolicy organizations. Salaried employees also tended to predominate in nonpolicy organizations, and such organizations were slightly less likely to offer HMO coverage as an employee
benefit than were policy organizations (59% compared with 68% of policy organizations).
The nature and the extent of consultant activity varied by policy status. In policy organizations, the initial contact was likely to be either the owner or chief executive or a union official; while in nonpolicy orga- nizations, the point of entry to the organization was likely to be the personnel department, middle-level management, or the medical department (p = .OOl). The source of first contact was slightly more apt to be an HMO employee or counseling client, community activities, a personal contact of the consultant, or a union officer in policy organizations. Entry into a company through random, unplanned calls was more closely associated with nonpolicy status. Such a “blind” approach does not appear to work well for OPCs. Finally, policy organizations tended to have been con- tacted earlier, more frequently, more intensively, and over a longer period by consultants than was the case for nonpolicy organizations. Each of these relation- ships was highly significant (p < .OOOl).
Although this analysis suggests some important link- ages between policy adoption and certain structural and consultant activity factors, treated separately, the joint effects of these variables must be determined. How important are these elements, taken together with other variables, in predicting policy adoption?
Predicting Policy Adoption A stepwise linear discriminant function analysis was done to select an optimal set of variables for predicting policy adoption in the 375 organizations studied. The predictor variables included organizational structure measures, problems and facilitating factors encountered when the OPCs made contact with the organizations, and measures of the actions taken by the OPCs. The analysis was done using the BA4DP Stepwise Discrimi- nant Analysis Program 7M (Dixon et al., 1983, Chapter 18.4), with a value of F-to-enter of 3.0. Eighteen predictor variables were selected by this procedure, which was followed by a linear regression to illuminate the results further. Thirty-seven percent of the vari- ance of the criterion variable was accounted for. Using these 18 predictors, it is possible to predict policy adoption with 78% accuracy (jackknifed estimate with a uniform prior).
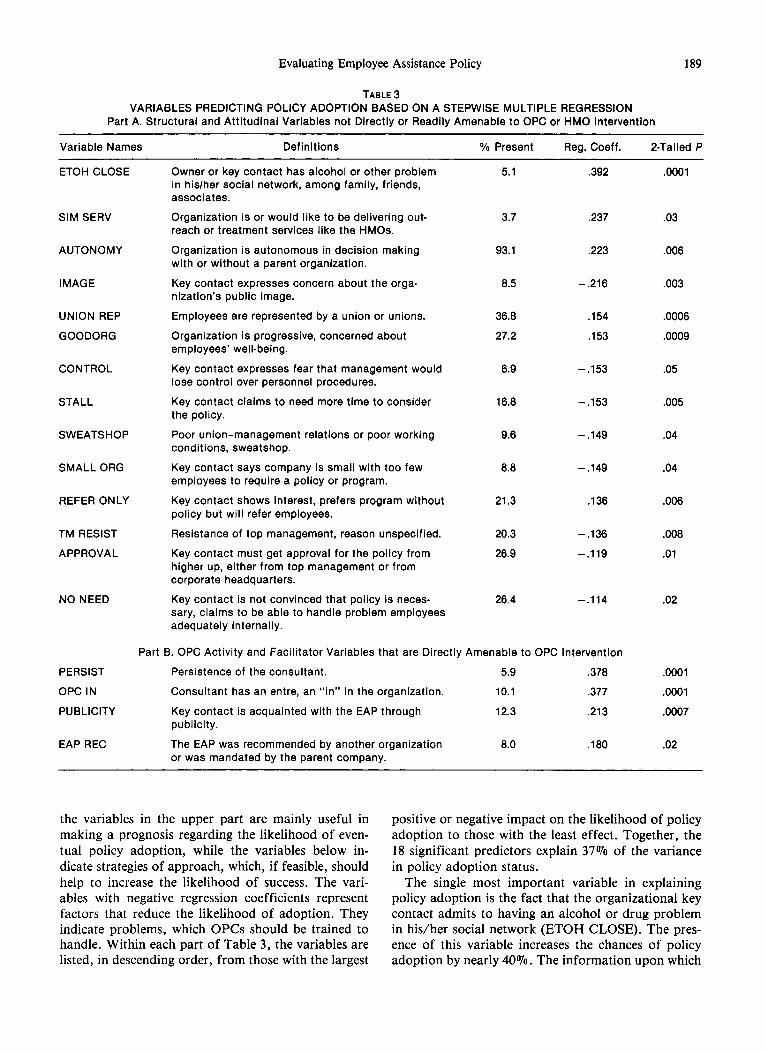
The results are reported in Table 3, which lists the variables found to influence the likelihood of policy adoption. The table is divided into two parts. The var- iables and situational or attitudinal problems (P) or facilitating factors (FF), which cannot be directly or readily changed by an outside organization or outside consultants. The bottom portion of the table contains OPC activity (OPC) variables and facilitating factors (FF), which are at least potentially under the control of the OPCs and amenable to their intervention. Thus,
Evaluating Employee Assistance Policy
TABLE 3
189
VARIABLES PREDICTING POLICY ADOPTION BASED ON A STEPWISE MULTIPLE REGRESSION Part A. Structural and Attitudinal Variables not Directly or Readily Amenable to OPC or HMO Intervention
Variable Names Definitions % Present Reg. Coeff. P-Tailed P
ETOH CLOSE
SIM SERV
AUTONOMY
IMAGE
UNION REP
GOODORG
CONTROL
STALL
SWEATSHOP
SMALL ORG
REFER ONLY
TM RESIST
APPROVAL
NO NEED
PERSIST
OPC IN
PUBLICITY
EAP REC
Owner or key contact has alcohol or other problem in his/her social network, among family, friends, associates.
Organization is or would like to be delivering out- reach or treatment services like the HMOs.
Organization is autonomous in decision making with or without a parent organization.
Key contact expresses concern about the orga- nization’s public image.
Employees are represented by a union or unions.
Organization is progressive, concerned about employees’ well-being.
Key contact expresses fear that management would lose control over personnel procedures.
Key contact claims to need more time to consider the policy.
Poor union-management relations or poor working conditions, sweatshop.
Key contact says company is small with too few employees to require a policy or program.
Kev contact shows interest, prefers prooram without
5.1
3.7 .237 .03
93.1 .223 .006
a.5 -.216 ,003
36.8
27.2
6.9
.154
.153
-.153
-.153
.0006
.0009
.05
16.8 .005
9.6 -.149 .04
a.8 -.149 .04
21.3 .136 .006
.392
policy but will refer employees. -
Resistance of top management, reason unspecified.
Key contact must get approval for the policy from higher up, either from top management or from corporate headquarters.
20.3 -.136 .ooa
26.9 -.119 .Ol
Key contact is not convinced that policy is neces- sary, claims to be able to handle problem employees adequately internally.
26.4 -.114
Part B. OPC Activity and Facilitator Variables that are Directly Amenable to OPC Intervention
Persistence of the consultant. 5.9 .378
Consultant has an entre, an “in” in the organization. 10.1 .377
Key contact is acquainted with the EAP through 12.3 ,213 publicity.
The EAP was recommended by another organization or was mandated by the parent company.
6.0 ,180
.02
.OOOl
.OOOl
.0007
.02
.OOOl
the variables in the upper part are mainly useful in making a prognosis regarding the likelihood of even- tual policy adoption, while the variables below in- dicate strategies of approach, which, if feasible, should help to increase the likelihood of success. The vari- ables with negative regression coefficients represent factors that reduce the likelihood of adoption. They indicate problems, which OPCs should be trained to handle. Within each part of Table 3, the variables are listed, in descending order, from those with the largest
positive or negative impact on the likelihood of policy adoption to those with the least effect. Together, the 18 significant predictors explain 37% of the variance in policy adoption status.
The single most important variable in explaining policy adoption is the fact that the organizational key contact admits to having an alcohol or drug problem in his/her social network (ETOH CLOSE). The pres- ence of this variable increases the chances of policy adoption by nearly 40%. The information upon which
190 SANDRA L. PUTNAM and ROBERT L. STOUT
this variable was coded came from consultant reports and structured interviews. For example, one consultant reported:
At first contact, the plant manager felt no need for the program, because they hire low-income workers, a lot of women, but he was responsive to the pitch that the pro- gram is available to family members. The plant manager’s brother-in-law has the problem [alcoholism].
From call reports for policy organizations came sug- gestions that OPCs frequently learned, during the ini- tial interview, of an “alcoholism link,” which could serve as a lever to facilitate policy adoption, if handled correctly. Persons mentioned as being problem drinkers by informants ranged from close relatives, such as a father or a brother, to valued employees, such as a sec- retary or supervisor. Such informants often occupied high company positions, typically being owners or company presidents, town or city managers, or per- sonnel directors. A consultant wrote:
The owner was very receptive. A relative-employee has an alcohol problem that is disruptive, and he has not known how to handle it. He welcomed the program as a way to get his brother into treatment.
This is an important finding, as it suggests that key contacts will be more receptive to instituting an em- ployee assistance policy if they are willing to admit to the presence of, and personal experience with, alcohol problems in their own social networks. It is supported by a major result from the Executive Caravan Survey (Roman, 1977). Although this situation was not very prevalent, being reported in only 5% (19) of the orga- nizations contacted, it led to policy adoption in nearly every case.
It also helps considerably in terms of policy adop- tion if the organization or agency contacted is deliver- ing a similar service to that of the occupational alco- holism project or the HMO’s counseling department (SIM SERV). An example is a community action pro- gram or a community mental health center. Such agen- cies are disposed to use consultants’ services to expand and improve their own service delivery. The presence of this variable increases the likelihood of policy adop- tion by 24%.
Some structural variables also influence policy adop- tion. The most important of these is the autonomy (AUTONOMY) of the organization, which increases the likelihood of policy adoption by 22%. This finding supports that of other researchers and appears to be related to another finding from this study, that in organizations where the key contact needs to get ap- proval for the policy and the program from higher up, either from corporate headquarters or from top man- agement personnel (APPROVAL), the chances of
policy adoption are reduced by 12%. The presence of a union in a contacted organization (UNION REP) in- creases the chances of policy adoption by 15 % . This supports Roman’s assertion that “cooperative orienta- tions within organized labor . . . are an essential ingre- dient for enhancing policy adoption” (Roman, 1978).
The most important variable that reduces the likelihood of employees assistance policy adoption is the key contact’s expressed concern for jeopardizing the organization’s public image, should a policy be adopted (IMAGE). It is associated with a 22% decline in policy adoption chances. This concern is primarily raised in organizations whose employees tend to be highly visible to the public, for example, health care providers, banks, insurance companies, and colleges or universities. As noted earlier, all of these tended to be non-adopters. Illustrative of an attitude of am- bivalence is the consultant’s opinion of a call at a local hospital. It summarizes the double-bind perceived by contacts in a number of “prestige” organizations: “They do not want the word to get out about alcohol- or drug-involved employees; yet they do want to help people.”
From an occupational consultant’s statement con- cerning a large insurance company comes the sugges- tion that: “The president of the company does not want to write a policy. He does not feel it is necessary. He doesn’t want to use the word alcohol because of the stigma.” The call report of a bank suggests that the vice-president politely conveyed the same message from above: “The president says it is too sensitive an issue for a bank. They must consider their public im- age; yet they have problems within management.”
Not unexpectedly, the fact that the organization was reported by the consultant to be progressive and con- cerned with employee welfare (GOODORG) increases the likelihood of policy adoption by 15%. Conversely, a 15% reduction in the chances of policy adoption is associated with consultants’ reports that a barrier to their efforts was poor union-management relations or generally poor working conditions, sometimes described by them as “sweatshop conditions” (SWEATSHOP).
Another important deterrent to policy adoption, decreasing its chances by 15%, is the concern, on the part of management, that policy adoption would in- volve loss of control over internal, established person- nel procedures (CONTROL). These organizations tend to be factories with a high proportion of unskilled workers, often Portuguese-speaking, usually females, with high turnover rates. It appears that in such orga- nizations, which are rarely unionized, management prefers to terminate, rather than to rehabilitate, troubled employees. Of one such organization, a con- sultant said: “There is a reluctance on the part of management to rock the boat with Potuguese-speaking emloyees; they [management] do not want to lose their
Evaluating Employee Assistance Policy 191
freedom to terminate problem employees.” Frequently, key contacts admitted that owners, generally of small companies, would prefer to fire low income employees in the textile or jewelry industry than to refer them. The very high turnover of employees in such factories attests to the potential for job trouble among such em- ployees, who are not easily reached by EAPs.
A rather surprising result of this analysis is that where the key contact was reported to have initially resisted policy adoption but agreed to refer troubled employees to help sources (REFER ONLY), the chances of eventual policy adoption were increased by about 14%. This suggests that, given time and fol- low-up by consultants, such organizations tend to adopt policies. Thus, despite a key contact’s early ex- pressed reluctance to adopt a policy, the fact that she or he is willing to refer employees to treatment is de- cisive. This implies acceptance of employee assistance principles. It most often leads to requests for consul- tant involvement in liaison activities; and meeting and conferring with supervisors, union officials, and other key contacts to direct problem employees to appropri- ate treatment, In turn, this ultimately leads to policy adoption.
It was further found that policy adoption is unlikely where the key contact stalls without giving concrete reasons for the delay (STALL) or when top manage- ment was reported by the consultant as resisting the policy and the program for unspecified reasons (TM RESIST). The chances of a policy are reduced by 15% and 14%, respectively. Similarly, where key contacts have cited the small size of their organizations as an objection to the program (SMALL ORG), the chances of policy adoption are decreased by about 15%. Finally, in cases where the key contact asserts that she or he is not convinced that an employee assistance policy or program is needed and claims that the organization is able to deal with its own troubled employees (NO NEED), the likelihood of policy adoption is reduced by 11%. This objection was cited in 26% of all the organizations contacted.
Among the variables shown in Table 3B which are most amenable to OPC intervention and which repre- sent activities and factors productive of policy adop- tion is the fact that the consultant had an “in” in the organization, either through previous job experience or through personal acquaintance with the key contact or another employee (OPC IN). As one occupational consultant said in an early interview: “The most suc-
cessful approach to selling policies is knowing the name of a contact or being referred by another busi- ness to, say, the personnel director. Personal contact is primary.” Both this and the self-reported persistence (PERSIST) of the consultant in pursuing the policy in- crease the chances of policy adoption by 38%.
Policy adoption chances are increased by 21% where the key contact was previously acquainted with the HMO’s program and the employee assistance con- cept through publicity (PUBLICITY). This consisted mainly of a media campaign of radio and television spots, newspaper advertisements and articles, and billboards and bus cards. The chances of policy adop- tion are increased by 18% where an employee assis- tance program was recommended or mandated by another organization (EAP REQ. This covers the situation in government agencies, for example, where directives to establish such programs are sent down from above as well as informal word-of-mouth recom- mendations to key contacts from acquaintances em- ployed in Rhode Island policy org~izations.
These two variables, along with SIM SERV, may be considered as “predisposing,” in that the organiza- tional key contacts seem to have been predisposed, either through favorable exposure to employee assis- tance program publicity, through the convergence of professional activities, or through contact with person- nel in organizations where the policy is in force and is advocated, to adopt policies and to initiate programs. Consultants are seen as being able to supply the needed expertise and resources for implementing their pro- grams. Policies are secured in such organizations with little of the resistance sometimes encountered by con- sultants.
In conclusion, while it has been found by other re- searchers that having a high proportion of troubled employees among the work force motivates organiza- tions to initiate occupational programs (Roman, 1978; DHEW, 1974), this study suggests that a number of at- titudinal or situational variables influence the decision to adopt or to reject a policy, and that a combination of structural and consultant activity variables, prob- lems, and facilitating factors best predicts policy adop- tion in this population of contacted organizations. These results have implications for the strategies that consultants might productively pursue to combat some of the fears and misconceptions concerning employee assistance programs outlined above.
DISCUSSION AND RECOMMENDATIONS
A number of general programmatic recommendations combine to generate policy adoption than negative emerge from these findings. First, it is noteworthy that ones combine to thwart it, and the relative strength of variables that facilitate policy adoption outweigh those the former in explaining policy adoption is greater. that impede it overall; that is, more positive variables Second, only two structural variables-autonomy
192 SANDRA L. PUTNAM and ROBERT L. STOUT
and the presence of a union-show up as significant predictors of policy adoption. All other predictors are attitudinal/situational variables or are related to the nature and extent of consultants’ activity in organiza- tions. They are consequently subject to change to vary- ing degrees. It appears, thus, that any organization can be a policyadopter. Although it helps if it is autono- mous in decision making and is unionized, the attitudes of key contacts and the selling skills of consultants are more critical determinants of policy adoption.
A clear need exists for consultants to be trained to handle situations, infrequent as they may be, in which the key contacts bring up the presence of alcohol or drug problems in their social networks. Occasionally, presentation of EAP program information can open the floodgates of feeling and concern, leading to inter- personal exchange similar to a “counseling session.” The contact’s desire for information, his or her prac- tical questions about how to handle the problem, should not be ignored by consultants. Consultants need to be able to deal appropriately with the interpersonal situa- tion and to turn it to account for a policy and pro- gram. The skills called for in these cases probably in- volve both objectivity and sympathy, as well as a sound knowledge of the nature of alcoholism and its effects on family members and friends, in addition to the al- coholic (Presnell, 1967).
Further, it appears to make sense for consultants to concentrate initial policy thrusts on organizations with unions that are decision-autonomous and to expect re- sistance in small companies, particularly factories, where working conditions are poor, workers are largely unskilled, and incentives for change in personnel pro- cedures or employee benefits are lacking. However, because blue-collar, employed males seem to be at the highest risk of problem drinking (Marden, N.D.), these smaller organizations may have relatively more alcoholic employees and should not be overlooked, in- sofar as the goal is the identification and treatment of alcoholism in the workplace generally. Similarly, setting up EAP programs at breweries, liquor distributors, restaurants, bars, and lounges, although not a high priority for program managers, has the potential for having a great impact on alcoholism because these are high-risk occupational settings (Fillmore & Caetano, 1980).
Campaigns to publicize employee assistance con- cepts and principles using the mass media appear to make some key contacts more receptive to policy adop- tion, when exposure has occurred prior to the consul- tant’s initial contact. Similarly, it appears that in a small state like Rhode Island, the reputation of the HMO and of the occupational alcoholism project itself had spread throughout parts of the business community. This word-of-mouth factor accounted for unplanned exposure of the program and seems to have fostered
some acceptance of employee assistance policies. It further appears that consultants should avoid insisting strictly on policy adoption as the essential prerequisite of program implementation, refusing to render liaison or support services in the absence of a policy. In cases where the key contact is receptive to the employee assistance approach and agrees to utilize consultants’ liaison and training services to confront and refer troubled employees, initial recalcitrance may be elim- inated with experience of the program, and policy adoption may follow. Reluctant converts are often the most zealous.
As noted, when the policy or program is rejected by top management for unspecified reasons or when the key contact appears to be stalling, policy adoption is unlikely. Attempts on the part of program consultants to elicit more specific objections from key contacts seem advisable. With clarification of the nature of the resistance, concrete steps may be taken to overcome it. Hand in hand with this goes the need for developing and testing techniques for successfully countering key contacts’ expressed objections to the employee assis- tance policy or approach. The need for such strategies is especially apparent in three areas:
1. to address concerns for the preservation of the or- ganization’s public image;
2. to address concerns for the loss of management control over personnel procedures; and
3. to address the fairly common objection that the organization does not need an employee assistance program, having customary methods for handling problem employees and job performance problems, usually through termination.
These program objections seem to have stalemated policy adoption efforts in a range of hard-to-reach companies, among them banks, insurance companies, hospitals, colleges, and small factories. Developing effective methods for overcoming them should in- crease both an occupational alcoholism project’s potential organizational clientele and the probability of early identification of alcohol problems in groups where they have been ignored or “hidden.” Such groups include white-collar workers and top executives, health care professionals, especially nurses and physicians, as well as unskilled laborers, and female and minority employees. Insofar as employee assistance policies and programs both may be geared to reach these groups and may be made compatible with the personnel poli- cies and the union-management agreements in con- tacted organizations, the better are the chances that the high economic and social costs of alcoholism on the job may be reduced.
Finally, to evaluators and researchers, this research design and methodology may prove useful under similar
Evaluating Employee Assistance Policy 193
circumstances to these, specifically where only pro- grammatic data are available to evaluate a type of pro- gram that has rarely been studied. Given the exploratory nature of this study, the method of stepwise variable selection is appropriate. Of 60 possible predictors, 18 were significant. They provide a model of factors that increase and decrease the chances of policy adoption among contacted organizations.
In future research, OPC activity should be assessed carefully. We have identified the roadblocks and facil- itating factors, as well as the OPC tactics that influ- enced policy adoption, using current strategies for ap- proaching organizations. Only empirical studies can determine if improvements in OPC tactics can mitigate the effects of some of the problems encountered or can take even more advantage of facilitating factors al- ready present in organizations.
Consultants’ efforts at inducing employee assistance
policy adoption and program implementation may have been affected by the existence of some unique facets of the Rhode Island scene. The usual employers in the state are small manufacturers and the workforce is mainly blue-collar/manual. It seems likely that problem drinking is more common in Rhode Island than in the United States as a whole. Indeed, evidence from the National Institute of Alcohol Abuse and Al- coholism (NIAAA, 1978) shows that Rhode Island ranks ninth in the country in reported deaths due to alcohol-related causes, including alcoholic psychosis, cirrhosis of the liver, and accidental alcohol overdose. Nevertheless, the fact that this research confirms a number of the impressions of other writers in the field bodes well for the more general interest of these results and lends credence to the applicability of this method (Roman, 1977; Trite, Beyer, & Hunt 1978; Trite 1980).
The field of occupational programming and EAPs provides a challenge to researchers to apply tried and tested methods to a new research area. With more complete data, for instance, combining data from company or organizational records with program data, the question of what makes a successful EAP program can be better answered, because “outcome success” can be viewed from more than one perspec- tive. Further exploration is needed of the relationship of policy adoption and program implementation, in- cluding comparison of results obtained using various self-reported and objective measures of policy usage and consideration of the way in which specific dif- ferences in programs may affect program outcome.
FURTHER RESEARCH NEEDED
Finally, further research is needed to refine the methods of data analysis to study the process leading to policy adoption. A longitudinal analysis would answer the question of how long it takes to get certain companies to adopt policies and implement programs, and after what period might OPCs be well advised to give up on a company. Survival analysis, for example, would indicate how long a typical company takes to respond to OPC efforts, along with the nature and ex- tent of the response. It would also be useful to learn what stages organizations go through before adopting policies and what affects their passage through these stages.
REFERENCES
DEPARTMENT OF HEALTH, EDUCATION, AND WELFARE. (1974, June). Problem drinkers on the job. In Alcohol health: New
knowledge (Chapter VIII). Washington, DC: U.S. Government Printing Office.
McGUIRK, T. R. (1980). Evaluation and development of employee assistance programs. Alcohol Health and Research World, 4, 17-21.
DIXON, W. J., BROWN, M. B., ENGELMAN, L. et al. (1983). BMDP Statistical Software, 1983 Printing. Berkeley, CA: Univer- sity of California Press.
NATIONAL INSTITUTE ON ALCOHOL ABUSE AND ALCO- HOLISM (NIAAA) (1978, September). National Status Report Up- date, (Vol. 2). Rockville, MD: Author.
PRESNELL, G. (1967). Folklore and fact about employees with al- coholism, Journal of Occupational Medicine, 9, 87-94.
FILLMORE, K. M., & CAETANO, R. (1980, May). Epidemiology of occupational alcoholism. Paper presented at the National In- stitute of Alcohol Abuse and Alcoholism’s Workshop on Alcoholism in the Workplace, Reston, VA.
PUTNAM, S. L., & STOUT, R. L. (1982). Union-related correlates of employee referrals to an occupational alcoholism project in a health maintenance organization, Journal of Occupational Medi- cine, 24, 225-233.
MARDEN, P. G. (no date). A procedure for estimating the poten- ROMAN, P. M. (1977). Occupational alcoholism programming in tial clientele of alcoholism service programs. Prepared for the Divi- major American corporations: The 1976 Executive Caravan Survey. sion of Special Treatment and Rehabilitation Programs, National Report submitted in part for inclusion in the Third Alcohol and Institute of Alchol Abuse and Alcoholism, Rockville, MD. Health Report to Congress to the NIAAA, Rockville, Md.
MASI, F. A., &SPENCER, G. E. (1977). Alcoholism and employee assistance programs in industry: A new frontier for social work. Social Thought, 4, 19-27.
ROMAN, P. M. (1978, March). The current status of occupational alcoholism: Review and documentation. New Orleans, LA: Tulane University.

194 SANDRA L. PUTNAM and ROBERT L. STOUT
SCHRAMM, C. J. (Ed). (1977). Alcoholism and its treatment in in- TRICE, H. M. & ROMAN, P. M. (1972). Spirits and demons at dustry. Baltimore: Johns Hopkins University Press. work: Alcohol and other drugs on the job (2nd ed.). Ithaca, NY:
New York State School of Industrial and Labor Relations, Cornell TRICE, H. M. (1980). Job-based alcoholism and employee assistance programs. Alcohol Health and Research World, 4, 4-16.
University.
TRICE, H. M., BEYER, J. M., HUNT, R. E. (1976). Evaluating implementation of a job-based alcoholism policy. Journal of Studies on Alcohol, 39, 448-465.
WILLIAMS, R. L. & MOFFAT, G. H. (Eds.). (1975). Occupational alcoholism programs. Springfield, IL: Charles C Thomas.