
Evaluating customer relationship dynamics in healthcare sector through indoor patients' judgement
25
See discussions, stats, and author profiles for this publication at: https://www.researchgate.net/publication/241675665 Evaluating customer relationship dynamics in healthcare sector through indoor patients' judgement Article in Management Research Review · May 2011 DOI: 10.1108/01409171111136176 CITATIONS 12 READS 132 2 authors, including: Some of the authors of this publication are also working on these related projects: Role of entrepreneurship in hospitals View project Hardeep Chahal University of Jammu 70 PUBLICATIONS 199 CITATIONS SEE PROFILE All content following this page was uploaded by Hardeep Chahal on 18 September 2014. The user has requested enhancement of the downloaded file. All in-text references underlined in blue are linked to publications on ResearchGate, letting you access and read them immediately.
-
Upload
jammuuniversity -
Category
Documents
-
view
2 -
download
0
Transcript of Evaluating customer relationship dynamics in healthcare sector through indoor patients' judgement
Seediscussions,stats,andauthorprofilesforthispublicationat:https://www.researchgate.net/publication/241675665
Evaluatingcustomerrelationshipdynamicsinhealthcaresectorthroughindoorpatients'judgement
ArticleinManagementResearchReview·May2011
DOI:10.1108/01409171111136176
CITATIONS
12
READS
132
2authors,including:
Someoftheauthorsofthispublicationarealsoworkingontheserelatedprojects:
RoleofentrepreneurshipinhospitalsViewproject
HardeepChahal
UniversityofJammu
70PUBLICATIONS199CITATIONS
SEEPROFILE
AllcontentfollowingthispagewasuploadedbyHardeepChahalon18September2014.
Theuserhasrequestedenhancementofthedownloadedfile.Allin-textreferencesunderlinedinbluearelinkedtopublicationsonResearchGate,lettingyouaccessandreadthemimmediately.
Evaluating customer relationshipdynamics in healthcare sector
through indoor patients’judgement
Hardeep Chahal and Neetu KumariDepartment of Commerce, University of Jammu, Jammu, India
Abstract
Purpose – This paper aims to examine the three dynamics of customer relationship management(CRM), namely, service quality (SQ), customer satisfaction (CS) and customer loyalty (CL) (long-termrelationship) in the healthcare sector. It specifically investigates the effects of physical environmentquality (PEQ) and interaction quality (IQ) and significant components of SQ on outcome SQdimensions, namely, CS and CL.
Design/methodology/approach – A total of 400 indoor patients from departments such as, generalmedicine, pediatrics, general surgery, gynecology, ENT and orthopedics were selected usingproportionate stratified random sampling from May-August 2007. Personal contact approach wasused for contacting the respondents. Data validity and reliability were duly assessed using exploratoryfactor analysis. The data were then analyzed using structural equation modeling through AMOS.
Findings – Based on data analysis, the direct effect of CRM dynamics, i.e. PEQ and IQ on SQ andtheir ultimate effect on CS and CL is found to be significant. However, the model fit values came outpoor as p (CMIN) (0.000), CMIN/DF (2,605.41), RMSEA (0.263), NFI (0.076), RFI (20.066), IFI (0.078),TLI (20.069) and CFI (0.074).
Research limitations/implications – The cross-sectional research design of the study does notoffer nearly the same insight into the dynamics of CR as a longitudinal design study. The studyanalysed overall CS and CL as the major focus of the study was on the PEQ and IQ to understandimpact of SQ on CRM outcomes and has ignored some antecedents that could help and explaincustomer perception more concretely. Further future studies could consider broader organizationimage typologies and measures in understanding CRM dynamics such as organizational excellenceand customer value. This could become the future agenda for the upcoming studies.
Practical implications – PEQ needs to be improved by focusing on cleanliness of wards and toilets,peaceful atmosphere, supportive and additional facilities, clean drinking water, clean beddings, specialservices to the needy. IQ hospitals should organize training programmes to inculcate better attitudinaland behavioural skills to understand patients, giving them proper care, listening to and answeringtheir queries. For better process quality, hospitals need to focus on effective administrationfunctioning. The study concludes that there is need to improve CRM dynamics (PEQ and IQ) in thepublic healthcare to accomplish CRM objectives (CS and CL).
Originality/value – This study provides some important insights for CRM theory and practice. Anunderstanding of SQ, CS and loyalty dynamics is a first step toward effective service management andthe retention of customers in the long term. Three-way interactions between the main effects of SQ, CSand loyalty yield additional insight into the relative importance of physical environment and IQ incustomers’ decision to be loyal, and that can provide a pave way for accomplishing CRM objectives.
Keywords Customer relationship management, Customer service quality, Customer satisfaction,Customer loyalty, Health care
Paper type Research paper
The current issue and full text archive of this journal is available at
www.emeraldinsight.com/2040-8269.htm
MRR34,6
626
Management Research ReviewVol. 34 No. 6, 2011pp. 626-648q Emerald Group Publishing Limited2040-8269DOI 10.1108/01409171111136176
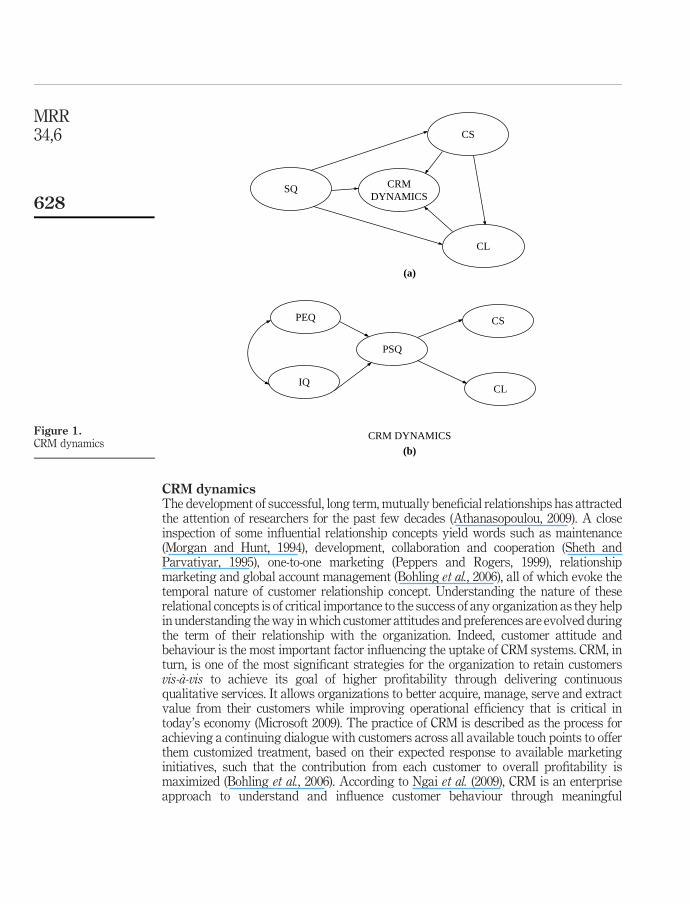
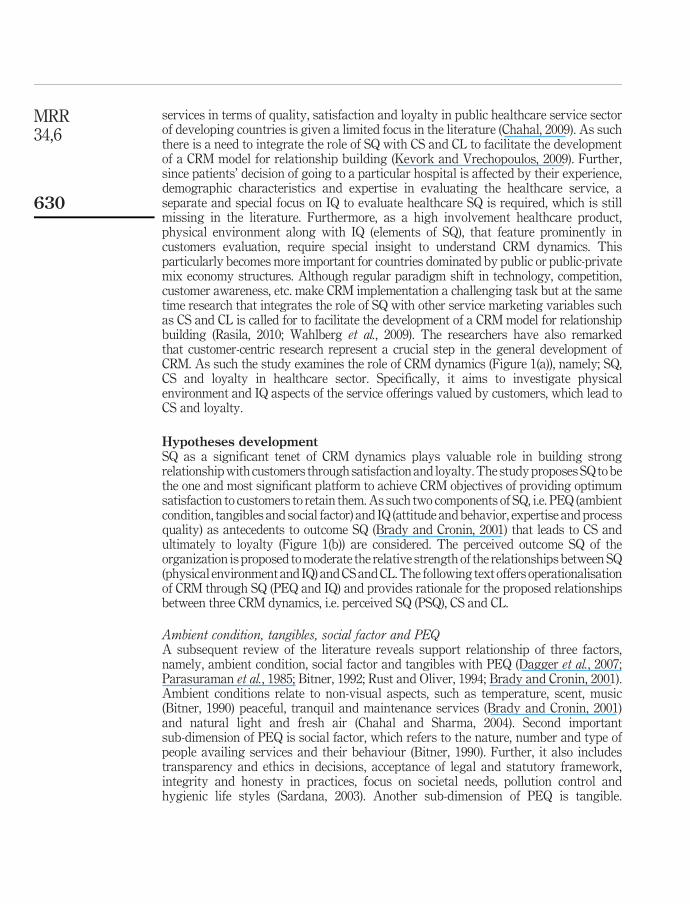
IntroductionResearch regarding service quality (SQ) remains popular in the marketing literature. Thesustained effort to study SQ stems from its relationship with a number of keyperformance measures such as customer satisfaction (CS), customer loyalty (CL),customer relationship management (CRM), employee satisfaction, performance,word-of-mouth referral, price insensitivity, sales growth, market share andproductivity (Boulding et al., 1993; Zeithaml et al., 1996; Santouridis and Trivellas,2010). In industries characterized by parity products, very often it is SQ thatdistinguishes an organization from its competitors (Kevork and Vrechopoulos, 2009). Asbusinesses pursue long-term relationships with customers to maximize their lifetimevalue, they need to be particularly concerned with how customers’ view about the variedchanges the concern makes over the time of the service offering. More recently, withincreasing focus on CRM, scholars have begun to consider the importance of managing afirm’s portfolio of customers ( Johnson and Selnes, 2004). Such studies underscore theimportance of dynamic SQ models of service exchange relationships. Taking our leadfrom such researches, this study considers SQ (composite of physical environmentquality (PEQ) of organization and quality of interaction with service providers) and itsimpact on satisfaction and loyalty, the two significant CRM outcomes in context ofcredence services, i.e. healthcare. In general, parlance as customer-organizationrelationship extends, the impact of operational SQ results into two significant changes.First, learning effects, by virtue of consistent and repeated transactions of customerswith an organization, results in CS and CL (Zineldin, 2006, 2005). This experiential modelof learning supports the notion that an individual’s knowledge and evaluation reflectsupon positive actions such as consistent care, confidence in the services, their relativesand friends and customer retention (loyalty) and better long-term relationships with thefirm (Gwinner et al., 1998). Second, the learning effect also results in escalation in the sizeand complexity of the transactions between the customer and organisation (Reinartz andKumar, 2003). Besides, satisfaction and loyalty, the long-term customer – organizationrelationship also brings additional benefits for customers that include increasedconfidence in the services, trust on service providers, commitment, social engagementand improved opportunities for customization (Vesel and Zabkar, 2010). Further,long-term relationship with the firm enables customers to know their service provider ona personal level, and can expect preferential treatment as the firm gets to know theirpreferences better and above all, have less anxiety about service performance. In thiscontext, the study makes an attempt to understand the relative importance of CRMdynamics in general (Figure 1(a) and (b)) and SQ components, namely, PEQ andinteraction quality (IQ) and their impact on CS and loyalty (Figure 2) in particular.
This research paper is constructed in the following way. At the beginning, paperdiscusses about the research significance and provides some background on CRMdimensions. The next section provides discussion on hypotheses and depictsrelationships between the variables within the hypothesized research model. Themethodology section describes the sampling approach and the data collection procedureand discusses the psychometric properties of the measures used. After presenting theresults, the study concludes with discussion focusing on significant relationshipmarketing strategies to maximize customer retention followed by implicationsfor management. Next, study limitations and directions for future research arehighlighted.
Customerrelationship
dynamics
627
CRM dynamicsThe development of successful, long term, mutually beneficial relationships has attractedthe attention of researchers for the past few decades (Athanasopoulou, 2009). A closeinspection of some influential relationship concepts yield words such as maintenance(Morgan and Hunt, 1994), development, collaboration and cooperation (Sheth andParvatiyar, 1995), one-to-one marketing (Peppers and Rogers, 1999), relationshipmarketing and global account management (Bohling et al., 2006), all of which evoke thetemporal nature of customer relationship concept. Understanding the nature of theserelational concepts is of critical importance to the success of any organization as they helpin understanding the way in which customer attitudes and preferences are evolved duringthe term of their relationship with the organization. Indeed, customer attitude andbehaviour is the most important factor influencing the uptake of CRM systems. CRM, inturn, is one of the most significant strategies for the organization to retain customersvis-a-vis to achieve its goal of higher profitability through delivering continuousqualitative services. It allows organizations to better acquire, manage, serve and extractvalue from their customers while improving operational efficiency that is critical intoday’s economy (Microsoft 2009). The practice of CRM is described as the process forachieving a continuing dialogue with customers across all available touch points to offerthem customized treatment, based on their expected response to available marketinginitiatives, such that the contribution from each customer to overall profitability ismaximized (Bohling et al., 2006). According to Ngai et al. (2009), CRM is an enterpriseapproach to understand and influence customer behaviour through meaningful
Figure 1.CRM dynamics
CRMDYNAMICS
CL
CS
SQ
PEQ
IQ
PSQ
CS
CL
CRM DYNAMICS
(a)
(b)
MRR34,6
628
communications to improve customer acquisition, customer retention, CL and customerprofitability. Sumathy and Tamilselvan (2008) consider CRM as a strategy to managecustomer relationship and to optimize CS and loyalty in an organized way(Maruthamuther and Kavitha, 2008). An important contribution on the dynamics ofmarketing relationships was made by Dwyer et al. (1987) who view relationships asever-changing phenomena that require continuous adjustments to the service offerings tomeet the changing needs of customers. As customer-organization relationships develop,customers become increasingly entrenched to relationship-specific investments (Joneset al., 2000). As their expertise and experience with both the firm and the service categorygrow, they become better at evaluating alternative product offerings and make specificinvestments in the relationship as relationships mature. The extent of such investments isa function of time and the stage of such relationship development. Relationship-specificexperience increases customers’ perceptions of the costs of switching between providers.The notion that expectations of customer-organization relationships change as therelationship matures is supported by various studies on customer life-cycle variables andrelationship strength. Choi et al. (2005), for example, reveal that age has a direct effect onCS while Sharma and Chahal (2005) show that life-cycle demographics (e.g. age, maritalstatus and education) influence the relationship between satisfaction and loyalty.
Though research on CRM in the marketing literature is attracting significantattention from last two decades, however, comprehensive tool to evaluate credence
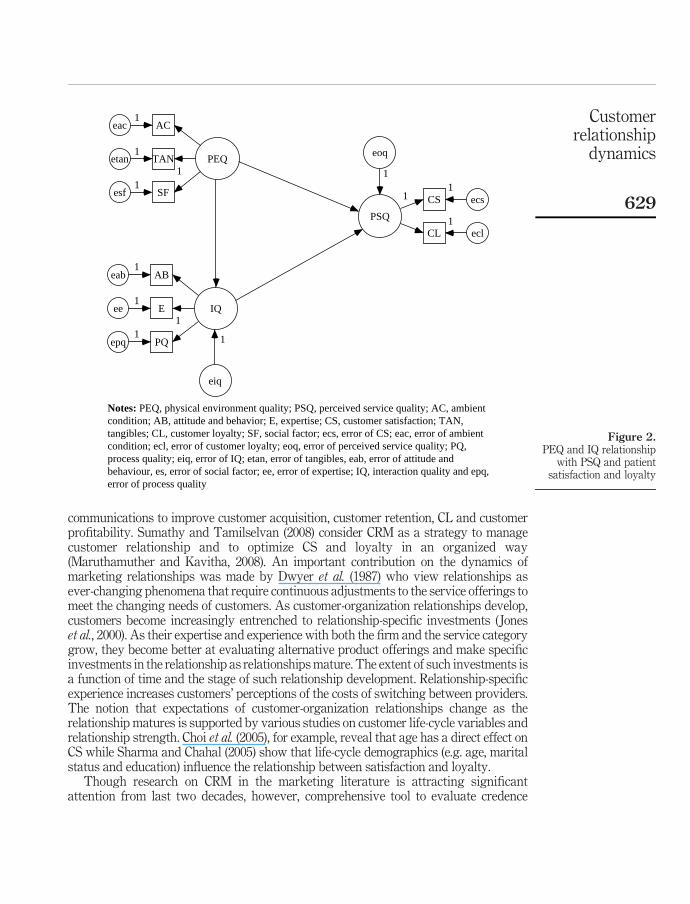
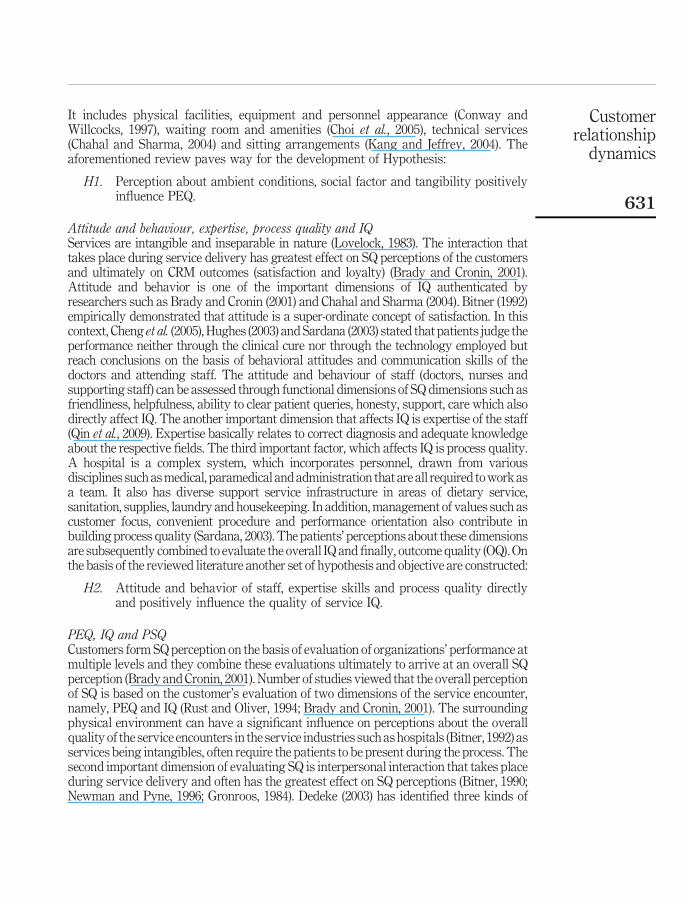
Figure 2.PEQ and IQ relationship
with PSQ and patientsatisfaction and loyalty
PEQ
IQ
PSQ
SFesf
11
TANetan1
ACeac1
PQepq
11
Eee1
ABeab1
CS ecs11
CL ecl1
eiq
Notes: PEQ, physical environment quality; PSQ, perceived service quality; AC, ambientcondition; AB, attitude and behavior; E, expertise; CS, customer satisfaction; TAN,tangibles; CL, customer loyalty; SF, social factor; ecs, error of CS; eac, error of ambientcondition; ecl, error of customer loyalty; eoq, error of perceived service quality; PQ,process quality; eiq, error of IQ; etan, error of tangibles, eab, error of attitude andbehaviour, es, error of social factor; ee, error of expertise; IQ, interaction quality and epq,error of process quality
eoq
1
1
Customerrelationship
dynamics
629
services in terms of quality, satisfaction and loyalty in public healthcare service sectorof developing countries is given a limited focus in the literature (Chahal, 2009). As suchthere is a need to integrate the role of SQ with CS and CL to facilitate the developmentof a CRM model for relationship building (Kevork and Vrechopoulos, 2009). Further,since patients’ decision of going to a particular hospital is affected by their experience,demographic characteristics and expertise in evaluating the healthcare service, aseparate and special focus on IQ to evaluate healthcare SQ is required, which is stillmissing in the literature. Furthermore, as a high involvement healthcare product,physical environment along with IQ (elements of SQ), that feature prominently incustomers evaluation, require special insight to understand CRM dynamics. Thisparticularly becomes more important for countries dominated by public or public-privatemix economy structures. Although regular paradigm shift in technology, competition,customer awareness, etc. make CRM implementation a challenging task but at the sametime research that integrates the role of SQ with other service marketing variables suchas CS and CL is called for to facilitate the development of a CRM model for relationshipbuilding (Rasila, 2010; Wahlberg et al., 2009). The researchers have also remarkedthat customer-centric research represent a crucial step in the general development ofCRM. As such the study examines the role of CRM dynamics (Figure 1(a)), namely; SQ,CS and loyalty in healthcare sector. Specifically, it aims to investigate physicalenvironment and IQ aspects of the service offerings valued by customers, which lead toCS and loyalty.
Hypotheses developmentSQ as a significant tenet of CRM dynamics plays valuable role in building strongrelationship with customers through satisfaction and loyalty. The study proposes SQ to bethe one and most significant platform to achieve CRM objectives of providing optimumsatisfaction to customers to retain them. As such two components of SQ, i.e. PEQ (ambientcondition, tangibles and social factor) and IQ (attitude and behavior, expertise and processquality) as antecedents to outcome SQ (Brady and Cronin, 2001) that leads to CS andultimately to loyalty (Figure 1(b)) are considered. The perceived outcome SQ of theorganization is proposed to moderate the relative strength of the relationships between SQ(physical environment and IQ) and CS and CL. The following text offers operationalisationof CRM through SQ (PEQ and IQ) and provides rationale for the proposed relationshipsbetween three CRM dynamics, i.e. perceived SQ (PSQ), CS and CL.
Ambient condition, tangibles, social factor and PEQA subsequent review of the literature reveals support relationship of three factors,namely, ambient condition, social factor and tangibles with PEQ (Dagger et al., 2007;Parasuraman et al., 1985; Bitner, 1992; Rust and Oliver, 1994; Brady and Cronin, 2001).Ambient conditions relate to non-visual aspects, such as temperature, scent, music(Bitner, 1990) peaceful, tranquil and maintenance services (Brady and Cronin, 2001)and natural light and fresh air (Chahal and Sharma, 2004). Second importantsub-dimension of PEQ is social factor, which refers to the nature, number and type ofpeople availing services and their behaviour (Bitner, 1990). Further, it also includestransparency and ethics in decisions, acceptance of legal and statutory framework,integrity and honesty in practices, focus on societal needs, pollution control andhygienic life styles (Sardana, 2003). Another sub-dimension of PEQ is tangible.
MRR34,6
630
It includes physical facilities, equipment and personnel appearance (Conway andWillcocks, 1997), waiting room and amenities (Choi et al., 2005), technical services(Chahal and Sharma, 2004) and sitting arrangements (Kang and Jeffrey, 2004). Theaforementioned review paves way for the development of Hypothesis:
H1. Perception about ambient conditions, social factor and tangibility positivelyinfluence PEQ.
Attitude and behaviour, expertise, process quality and IQServices are intangible and inseparable in nature (Lovelock, 1983). The interaction thattakes place during service delivery has greatest effect on SQ perceptions of the customersand ultimately on CRM outcomes (satisfaction and loyalty) (Brady and Cronin, 2001).Attitude and behavior is one of the important dimensions of IQ authenticated byresearchers such as Brady and Cronin (2001) and Chahal and Sharma (2004). Bitner (1992)empirically demonstrated that attitude is a super-ordinate concept of satisfaction. In thiscontext, Cheng et al. (2005), Hughes (2003) and Sardana (2003) stated that patients judge theperformance neither through the clinical cure nor through the technology employed butreach conclusions on the basis of behavioral attitudes and communication skills of thedoctors and attending staff. The attitude and behaviour of staff (doctors, nurses andsupporting staff) can be assessed through functional dimensions of SQ dimensions such asfriendliness, helpfulness, ability to clear patient queries, honesty, support, care which alsodirectly affect IQ. The another important dimension that affects IQ is expertise of the staff(Qin et al., 2009). Expertise basically relates to correct diagnosis and adequate knowledgeabout the respective fields. The third important factor, which affects IQ is process quality.A hospital is a complex system, which incorporates personnel, drawn from variousdisciplines such as medical, paramedical and administration that are all required to work asa team. It also has diverse support service infrastructure in areas of dietary service,sanitation, supplies, laundry and housekeeping. In addition, management of values such ascustomer focus, convenient procedure and performance orientation also contribute inbuilding process quality (Sardana, 2003). The patients’ perceptions about these dimensionsare subsequently combined to evaluate the overall IQ and finally, outcome quality (OQ). Onthe basis of the reviewed literature another set of hypothesis and objective are constructed:
H2. Attitude and behavior of staff, expertise skills and process quality directlyand positively influence the quality of service IQ.
PEQ, IQ and PSQCustomers form SQ perception on the basis of evaluation of organizations’ performance atmultiple levels and they combine these evaluations ultimately to arrive at an overall SQperception (Brady and Cronin, 2001). Number of studies viewed that the overall perceptionof SQ is based on the customer’s evaluation of two dimensions of the service encounter,namely, PEQ and IQ (Rust and Oliver, 1994; Brady and Cronin, 2001). The surroundingphysical environment can have a significant influence on perceptions about the overallquality of the service encounters in the service industries such as hospitals (Bitner, 1992) asservices being intangibles, often require the patients to be present during the process. Thesecond important dimension of evaluating SQ is interpersonal interaction that takes placeduring service delivery and often has the greatest effect on SQ perceptions (Bitner, 1990;Newman and Pyne, 1996; Gronroos, 1984). Dedeke (2003) has identified three kinds of
Customerrelationship
dynamics
631
interaction, namely, customer to staff (social interaction), customer to technology(technology interaction), third customer to product (product interaction). Brady andCronin had used IQ as one of important and dimensions of SQ in their hierarchicalapproach, which comprised three sub-dimensions, namely, attitude, behavior andexpertise. Both dimensions directly affect overall SQ of the organization. In other words,physical environment and IQ are important ingredients of overall SQ. Based on this thefollowing hypothesis and objective of the study are framed:
H3. PEQ and IQ contribute positively to PSQ.
PSQ, CS and CLPhysical environment and IQ have the potential to contribute differentially to customerattitudes and behaviors. Positive perceptions about SQ are likely to be positivelyassociated with customers’ attitudes toward the organization and their likelihood ofremaining associated with the organization. The empirical support to this assertion iswell-established in the literature (Yim et al., 2005; Bloemer et al., 1999; Cronin et al., 2000;Zeithaml et al., 1996) which later results in CS and CL. Customers evaluate these serviceoutcomes after service delivery (Gronroos, 1984; Rust and Oliver, 1994; Brady and Cronin,2001). Satisfaction is the basic tenet of CRM outcome. Satisfaction is perceptual differencebetween prior expectations and post-performance of the product (Tse and Wilton, 1988). Itis the satisfaction level only which propels patients to choose the same hospital next time(Sardana, 2003) and transforms patient satisfaction into patient loyalty. A number ofdimensions, such as physician care, nursing care, supporting staff behavior, convenientvisiting hours, availability of emergency aid (Sardana, 2003) and food, roomcharacteristics and treatment (Raftopoulos, 2005), all related to SQ have been suggestedin the literature that influence patient satisfaction. Overall, doctors, nurses, management,facilities and cleanliness are the major factors, which affect satisfaction (Chahal andSharma, 2004). CL is another important outcome of SQ; it is a consumer’s intent to remainassociated with an organization (Zeithaml et al., 1996). It represents a commitment by thecustomer to purchase more and varied products from the organization and to help it wherepossible and to recommend it to others (e.g. through word-of-mouth recommendations).Besides, use of behavioral intentions perspective also helps in recognizing spurious loyalwho have a low relative attitude toward the organization but are constrained to repeatpurchase (Ruyter et al., 1998). CRM as an enterprise approach to understanding andinfluencing customer behaviour through meaningful communications in order to improvecustomer acquisition, customer retention, CL and customer profitability (Ngai et al., 2009).
To the extent that both physical environment and interaction SQ contribute to CSand loyalty through PSQ, the study hypothesized that:
H4. PSQ positively influence CS and CL.
Socio-demographic factorsGender, education, age, income and profession are important factors for studying theperception of consumers as health needs vary according to these factors and also becauseof their intensity in moderating the relationship between satisfaction and loyalty (Choiet al., 2005; Sharma and Chahal, 2005). Accordingly, customers assign different weights todifferent quality dimensions of healthcare services such as doctors, nurses, medicalassistants, management, sanitation, cleanliness and other supportive medical facilities.
MRR34,6
632
The gender is considered as significant factor to influence the level of PSQ (Parasuramanet al., 1985) and is considered as a strong discriminating factor. Number of studies foundthat the females are more satisfied than males with regard to healthcare services (Sharmaand Chahal, 2005). The second demographic characteristics, education, also plays vitalrole in determining the utilization pattern of health services. The researchers found thatthe low educational status of the patients restrict their thinking and deprive them fromgaining knowledge about what they ought to be provided at the hospitals for their welfare.Thus, they can be easily satisfied with whatever they are provided in the hospitals. On theother hand, the better educated class is quite conscious of its rights and expects goodquality care services. Degree of healthcare satisfaction would be high among those whohave lower educational status (Sharma and Chahal, 2005). Similarly, income also affectslevel of satisfaction of patients. Lower income customers generally learns to live with theirillness rather than use their small stock of financial resources for recovery. Such personswould be satisfied with healthcare services even if they are of poor quality, while higherincome group customers because of their better standards of living prefer qualityhealthcare services. Further, attitude of customers toward healthcare service is alsoaffected by nature of occupation. Sharma and Chahal (2005) found business classcustomers to be more satisfied than service class customers in Indian settings as businesscustomers availing public healthcare services are generally less educated and less awaredand hence, comparatively more satisfied than service customers. Besides, age is anotherfactor that influences patient satisfaction and loyalty. Choi et al. (2005) found that olderpatient tend to be more satisfied with healthcare services than younger customers. Theolder patients valued continuity (i.e. “see the same doctor on every visit”) while theyounger ones want healthcare that is technically proficient. This led to the development offollowing hypothesis:
H5. The demographic characteristics of the patients affect their level ofsatisfaction and loyalty.
Research methodologySampleThe study on CRM dynamics vis-a-vis and SQ, satisfaction and loyalty is based onprimary data collected from indoor patients of Udhampur District Hospital admitted.The pre-testing (35 respondents) was conducted initially for two reasons. First, tocheck face and content validity of the items for the four different constructs. Second, todetermine sample size for final data collection. The study used following formula forfinal sample size determination (Malhotra, 2003, p. 375):
n ¼ pð1 2 pÞz2=D2
where:
n ¼ sample size;
CL ¼ confidence level (95 per cent);
p ¼ population proportion (0.32);
D ¼ level of precision (p 2 p ¼ ^0.05); and
Z ¼ 1.96.
Customerrelationship
dynamics
633
This resulted in the sample size of 380 for the study which was rounded off to 400 forthe final survey. The survey was conducted between May and August 2007 andpatients associated with the hospital for more than three years and present more thanfour to five stay in six departments, namely, general medicine, pediatrics, generalsurgery, gynecology, ENT and orthopedics were contacted. The proportionatestratified random sampling was used for final data collection. This efforts resulted inselection of 74 patients from general medicine, 74 from paediatrics, 88 from generalsurgery, 74 patients from gynecology, 30 patients from ENT, 60 from orthopedicsdepartment thereby making total sample equal to 400.
MeasuresAll measures PEQ, IQ and OQ used in the study were extracted from existing scales onSQ, satisfaction and loyalty (Brady and Cronin, 2001; Gronroos, 1984; Chahal andSharma, 2004; Choi et al., 2004). The wordings of scale items were adapted to suit thepublic healthcare sector. All constructs used a five-point Likert-type scale, with anchorsof strongly agree (5) and strongly disagree (1). PSQ was measured through 77 statementsrelated to PEQ and IQ. The PEQ relates to the visual aspects related elements of servicedelivery (e.g. ambient condition, tangibles and social factor) and contains 39 items.Further, IQ relates to interaction with service provider-related aspects of the service (e.g.attitude and behaviour, expertise and process quality) and contains 38 items. OQcomprises CS and CL. CS, defined as psychological satisfaction of consumer, is measuredwith help of 13 items taken from Bloemer studies such as Sardana (2003), Chahal andSharma (2004) and Choi et al. (2004) whereas CL, defined as customers’ intentions to staywith and level of commitment to the organization, is measured using 15 items scalederived from the works of Corbin et al. (2001) and Ruyter et al. (1998).
Data purificationExploratory factor analysis is conducted for data reduction and summarizations todelete items from the initial battery of items based on statistical and theoreticalgrounds. Before initiating exploratory factor analysis, response scores for negativeitems were changed and all items were checked for normal distribution. Later, from astatistical standpoint, the item to total correlation coefficient was considered, andvalues that were well below other item – total correlations (,0.03) were targeted fordeletion. This also checked the significance of inter-correlation among items asrequired for effective factor structure identification. The study used principalcomponent analysis with varimax rotation for factor analysis. Varimax rotation beingthe best rotation procedure as it maximises the number of items with high loadings onone factor, thereby enhancing the interpretability of the factors (Malhotra, 2003, p. 595).The eigen value equal to or more than one criterion is used to determine number offactors to be extracted and Kaiser-Meyer-Olkin (KMO) value $0.50 is used to find outrelevancy of data reduction and grouping for factor analysis. Further Bartlett test ofsphericity is used to identify the significance of correlation coefficients among thevariables and degree of correlation coefficient $0.30 is used as criterion for selection ofitems (Hair et al., 1995). The pre-testing efforts resulted in modifying the schedule withthe deletion of seven items, namely, four from PEQ, i.e. tangibles (three items), socialfactor (one item) and three from IQ, i.e. attitude and behavior (one item), expertise (oneitem) and process quality (one item) and patient satisfaction (one item). We also then
MRR34,6
634
verified that the deletion of these items do not change or harm the intended meaning ofthe constructs of which they were a part.
Reliability and validityReliability of the scale is checked to know the extent to which scale produces consistentresults of measurements repeatedly (Hair et al., 1995). The internal consistency usingsplit half method is used to assess the reliability of the scale (Malhotra, 2003; Hair et al.,1995; Tull and Hawkins, 2005). The overall Cronbach alpha value for the sample is foundto 0.951 for PSQ scale. Further the Cronbach alpha values for PEQ and IQ are arrived at0.883 and 0.922, respectively, indicating the internal consistency and reliability of thesample. The reliability of the data was also examined by dividing the respondents intotwo equal halves to examine if the variation in both the halves is within the range ofsampling. Overall, the results (a values .0.7) indicate internal consistency in theresponses of the respondents of the two half samples (Table I).
The face and content validity of the scales were, duly assessed through review ofliterature and deliberations with the subject experts, doctors and patients for theselection of items in the schedule at the time of pre-testing. The KMO, measure ofsampling adequacy, variance explained and communalities values are examined tocheck the construct validity of the scales (Hair et al., 1995). All values are foundacceptable which support construct validity of the scales (Table I).
Further, convergent validity of the construct was checked by examining theconceptual and empirical criteria among the items used (Parasuraman et al., 1985). Thedegree of correlation coefficient values between respective overall sub-dimensions ofPEQ and IQ and overall PEQ and IQ, ranged between 0.780 and 0.907 indicating highdegree of convergent validity (Table I). Discriminant validity of the constructs was alsoassessed. The degree of correlation coefficient values among unassociated componentsof PEQ and IQ ranged between 0.146 and 0.323 (Table I) which indicated discriminantvalidity.
Demographic profileThe sample of indoor patients from tertiary public referral hospital (Udhampur, NorthIndia) consisted of 66.5 per cent females and 33.5 per cent males. Majority of theinpatients were high school pass outs (77 per cent) where as only 13 per cent weregraduates and post-graduates and rest were illiterates. Majority of the inpatients wereyoung whose age fell between 20 and 40 years (67 per cent) and about 26 per cent agedbetween 40 and 60 years. Further majority of respondents (65 per cent) weredependents, i.e. housewives, students, etc. and this was followed by service classrespondents (23 per cent) and rest belonged to business class and professional groups.Income-wise, majority of respondents (66 per cent) belong to income group second withincome between Rs 5,000 and 10,000.
Data analysisAs per reliability, convergent and discriminant validity results, all scales met thepsychometric property requirements. Factor analysis with principal component methodand varimax rotation, was once again applied on all sub-dimensions of four constructs,namely, PEQ, IQ, CS and CL to identify significant factors structure. Both KMO andinter-item correlation values for the four constructs were well above the threshold
Customerrelationship
dynamics
635

Con
ver
gen
tv
alid
ity
Dis
crim
inan
tv
alid
ity
Rel
iab
ilit
y
Dim
ensi
ons
Cor
r.S
ign
ifica
nce
Dim
ensi
ons
Cor
r.O
ver
all
(n¼
400)
Su
b-s
amp
leI
(n1¼
1-20
0)S
ub
-sam
ple
II(n
1¼
201-
400)
PE
QA
C0.
863
0.00
0C
ong
este
den
vir
onm
ent
0.26
90.
883
0.88
80.
878
TA
N0.
860
0.00
0U
ncl
ean
was
hro
oms
0.24
6S
F0.
786
0.00
0C
ong
este
dw
ard
s0.
222
Un
fun
ctio
nal
X-r
ayfa
cili
ty0.
222
Imp
rop
erd
isp
osal
ofw
asta
ges
0.03
0IQ
AB
0.85
10.
000
Un
coop
erat
ive
staf
f2
0.14
60.
922
0.92
80.
916
E0.
832
0.00
0In
adeq
uat
ely
com
pet
ent
0.32
3P
Q0.
854
0.00
0P
oor
lab
orat
ory
serv
ices
0.25
60.
745
0.69
00.
720
CS
PS
Q0.
861
0.00
0P
oor
ph
ysi
cal
env
iron
men
t2
0.20
2C
LP
SQ
0.90
70.
000
Wil
ln
otv
isit
sam
eh
osp
ital
agai
n0.
239
0.74
50.
738
0.75
0O
ver
all
0.95
10.
954
0.94
9
Notes:
PE
Q,p
hy
sica
len
vir
onm
ent
qu
alit
y;A
C,a
mb
ien
tco
nd
itio
n;T
AN
,tan
gib
les;
SF
,soc
ial
fact
or;I
Q,i
nte
ract
ion
qu
alit
y;A
B,a
ttit
ud
ean
db
ehav
iou
r;E
,ex
per
tise
;P
Q,
pro
cess
qu
alit
y;
PS
Q,
per
ceiv
edse
rvic
eq
ual
ity
;C
S,
cust
omer
sati
sfac
tion
;C
L,
cust
omer
loy
alty
;P
E,
ph
ysi
cal
env
iron
men
t;S
C,
staf
fco
mp
eten
ce;
T,
tru
st;
CR
,cr
itic
alra
tio;
RW
,st
and
ard
ized
reg
ress
ion
wei
gh
t;R
2,
squ
are
mu
ltip
leco
rrel
atio
n;
CM
IN,x
2v
alu
e;P
,p
rob
abil
ity
lev
el;
DF
,d
egre
eof
free
dom
;R
MS
EA
,ro
otm
ean
squ
are
erro
rof
app
rox
imat
ion
;N
FI,
nor
med
fix
ind
ex;
RF
I,re
lati
ve
fit
ind
ex;
IFI,
incr
emen
tal
fit
ind
ex;
TL
I,T
uck
er-L
ewis
coef
fici
ents
;C
FI,
com
par
ativ
efi
tin
dex
Table I.Dimension wiseconvergent validity,discriminant validity andCronbach alpha valuesfor CRM scale
MRR34,6
636
criteria. The detailed analysis for PEQ, IQ, OQ-CS and CL is explained in the followingsections (Table II).
Physical environment qualityAmbient condition, first sub-dimension of PEQ explained about 62.70 per cent of variance.The specific items of first factor of ambient condition include “natural light” (0.58),“cleanliness of hospital” (0.70), “internal atmosphere” (0.67), “peaceful wards” (0.81) and“cleanliness of wards” (0.80). However, only single item, i.e. “proper placement of beds” withhigh positive factor loading value of 0.91 is found in second factor. Similarly, two factors ofsub-dimension tangibles are emerged. The first factor include items, namely, “telephonefacilities” (0.81), “availability of oxygen services” (0.75), “cleaned bed sheets” (0.80) and“drinking water facilities” (0.81). This factor explained 40.15 per cent of variance out of64.52. And the factor two is found to be the function of “well equipped operation theatre”(0.81) and “good technical services” (0.85) items. The third sub-dimension of PEQ, i.e. socialfactor also comprises two factors. The first factor include “equitable treatment to patients”(0.83), “hygienically life style” (0.70), “special services to needy” (0.79) and “societalcommitment” (0.55) whereas “integrity and honesty in medical practices” (0.75) and “overallimpression” (0.77), “employee role toward social responsibility” (0.50) are found to beingredients of second factor. Both factors explained variance about 57.83 per cent.
Interaction qualityThe first sub-dimension of IQ, i.e. attitude and behavior is found to be function of fourfactors which explained about 73.19 per cent of variance. The first factor include items onnurses and these include “nurses behavior with friends and relatives” (0.79), “explainationabout technical treatment” (0.73), “attitude and behavior” (0.84), “helpful and supportive”(0.57) “caring” (0.78), “answer queries satisfactorily” (0.83) and “listening ability” (0.83).The second factor contains four items on doctor and these include “communication withstaff” (0.76), “helpful and supportive” (0.83), “attitude” (0.75) and “patient involvement”(0.726). The statements regarding supportive staff “availability” (0.78), “attitude andbehavior” (0.84), “friendly and helpful” (0.76) fall under factor 3. However, two items,namely, “professional values” (0.64) and “answer queries satisfactory” (0.71), relating todoctors fall under factor 4. The second sub-dimension of IQ, i.e. expertise comprise of twofactors that explained 48.96 per cent of variance. Eight items, namely, “physicianexpertise” (0.81), “operational competence” (0.69), “technical staff’s expertise” (0.71),“correct diagnosis” (0.79), “nursing expertise” (0.82), “technical knowledge” (0.71) and“explain logically” (0.64) are more significant and fall under factor one. By applying factoranalysis only one statement, namely, “overall competent” (0.95) came under factor 2. Thethird sub-dimension process quality comprises two factors. The first factor include “goodhousekeeping services” (0.81), “listening ability of supportive staff” (0.77), “interactionwith frontline staff” (0.70) and “grievances handling system” (0.82) items that explained31.89 per cent of variance out of total variance of 56.49 per cent. The second factor includeitems, namely, “administrative function” (0.71), “laboratory services” (0.65) and “bloodbank services” (0.84).
Outcome qualityThe application of factor analysis resulted in two factors of CS sub-dimension ofservice OQ. The first factor comprises five items, namely, “up to date healthcare
Customerrelationship
dynamics
637

PEQ
Ambient
condition
Tangibles
Socialfactor
MV
FL
CV
MV
FL
CV
MV
FL
CV
F1.
Nat
ura
lli
gh
t3.
590.
580.
48F
1.T
elep
hon
efa
cili
ties
4.26
0.81
0.70
F1.
Eq
uit
able
trea
tmen
tto
pat
ien
ts3.
610.
830.
70
F1.
Cle
anli
nes
s3.
400.
700.
69F
1.O
xy
gen
serv
ices
4.25
0.75
0.61
F1.
Hy
gie
nic
life
sty
le3.
350.
700.
57F
1.In
tern
alat
mos
ph
ere
3.36
0.67
0.60
F1.
Cle
anb
edsh
eets
4.19
0.80
0.71
F1.
Sp
ecia
lse
rvic
esto
nee
dy
3.30
0.79
0.64
F1.
Pea
cefu
lw
ard
s3.
350.
810.
67F
1.C
onti
nu
ous
wat
erse
rvic
e4.
010.
810.
70F
1.S
ocie
tal
com
mit
men
t3.
050.
550.
50
F1.
Hy
gie
nic
ally
clea
nw
ard
s3.
290.
800.
69F
2.W
ell-
equ
ipp
edop
erat
ion
thea
tre
3.58
0.81
0.72
F2.
Inte
gri
tyan
dh
ones
ty2.
820.
750.
74
F2.
Pro
per
pla
cem
ent
ofb
eds
2.63
.914
0.84
F2.
Goo
dte
chn
ical
serv
ices
3.39
0.85
0.75
F2.
Ov
eral
lim
pre
ssio
n2.
700.
770.
79F
2.S
ocia
lre
spon
sib
ilit
y2.
570.
590.
80IQ
Attitudeand
behaviour
Expertise
Process
quality
F1.
Beh
avio
rw
ith
you
rfr
ien
ds
and
rela
tiv
e3.
160.
790.
80F
1.P
hy
sici
anex
per
tise
3.87
0.81
0.67
F1.
Goo
dh
ouse
-kee
pin
gse
rvic
es3.
440.
810.
67
F1.
Ex
pla
inab
out
tech
nic
altr
eatm
ent
3.02
0.73
0.70
F1.
Op
erat
ion
com
pet
ence
3.85
0.69
0.59
F1.
Lis
ten
ing
abil
ity
ofsu
pp
orti
ve
staf
f3.
340.
770.
62
F1.
Att
itu
de
and
beh
avio
r2.
960.
840.
76F
1.T
ech
nic
alst
aff
are
exp
erti
se3.
770.
710.
64F
1.In
tera
ctio
nw
ith
fron
tlin
est
aff
3.28
0.70
0.50
F1.
Hel
pfu
lan
dsu
pp
orti
ve
2.96
0.57
0.68
F1.
Dia
gn
osis
dis
ease
sco
rrec
tly
3.70
0.79
0.67
F1.
Gri
evan
ces
han
dli
ng
syst
em2.
920.
620.
41
F1.
Car
ing
2.91
0.78
0.67
F1.
Nu
rsin
gex
per
tise
3.65
0.82
0.71
F2.
Ad
min
istr
ativ
efu
nct
ion
2.65
0.71
0.55
F1.
An
swer
qu
erie
s2.
800.
830.
75F
1.T
ech
nic
alk
now
led
ge
3.65
0.71
0.64
F2.
Lab
orat
ory
serv
ices
2.48
0.65
0.46
(continued
)
Table II.Factor-wise mean,factor loading andcommunalities for PEQ,IQ and SOQ
MRR34,6
638

F1.
Lis
ten
ing
abil
ity
2.76
0.83
0.78
F1.
Ex
pla
inlo
gic
ally
3.12
0.64
0.41
F2.
Blo
odb
ank
serv
ices
2.36
0.84
0.71
F2.
Com
mu
nic
atio
nw
ith
staf
f3.
710.
760.
68F
2.O
ver
all
com
pet
ent
3.39
0.95
0.94
F2.
Hel
pfu
lan
dsu
pp
orti
ve
3.61
0.83
0.77
F2.
Att
itu
de
3.51
0.75
0.71
F2.
Pat
ien
tin
vol
vem
ent
3.44
0.72
0.55
F3.
Av
aila
bil
ity
3.68
0.78
0.69
F3.
Att
itu
de
and
beh
avio
ur
3.57
0.84
0.83
F3.
Fri
end
lyan
dh
elp
ful
3.47
0.76
0.75
F4.
Pro
fess
ion
alv
alu
es3.
320.
640.
74F
4.A
nsw
erq
uer
ies
3.21
0.71
0.79
Ser
vic
eO
QCS
CL
F1.
Up
-to-
dat
ete
chn
iqu
e2.
810.
670.
80F
1.H
osp
ital
3.48
0.87
0.96
F1.
Goo
dte
chn
ical
faci
liti
es2.
600.
760.
81F
1.P
hy
sici
an3.
400.
880.
77F
1.In
doo
rse
rvic
es2.
520.
850.
73F
1.P
rice
effe
ctiv
enes
s3.
370.
650.
47F
1.C
onsc
iou
snes
sto
war
dp
atie
nt
par
tici
pat
ion
2.29
0.73
0.85
F1.
Tru
st3.
370.
620.
55
F1.
Pat
ien
tp
arti
cip
atio
n2.
130.
640.
77F
2.Q
ual
ity
ofca
re2.
480.
750.
66F
2.T
reat
men
ts3.
820.
770.
70F
2.E
mot
ion
alat
tach
men
t2.
250.
830.
70F
2.S
up
por
tin
gst
aff
3.45
0.76
0.69
F3.
Pre
fere
nce
over
pri
vat
eh
osp
ital
s3.
360.
810.
67
F2.
Doc
tors
3.14
0.63
0.81
F3.
Pos
itiv
ep
erce
pti
on2.
630.
810.
66
Table II.
Customerrelationship
dynamics
639
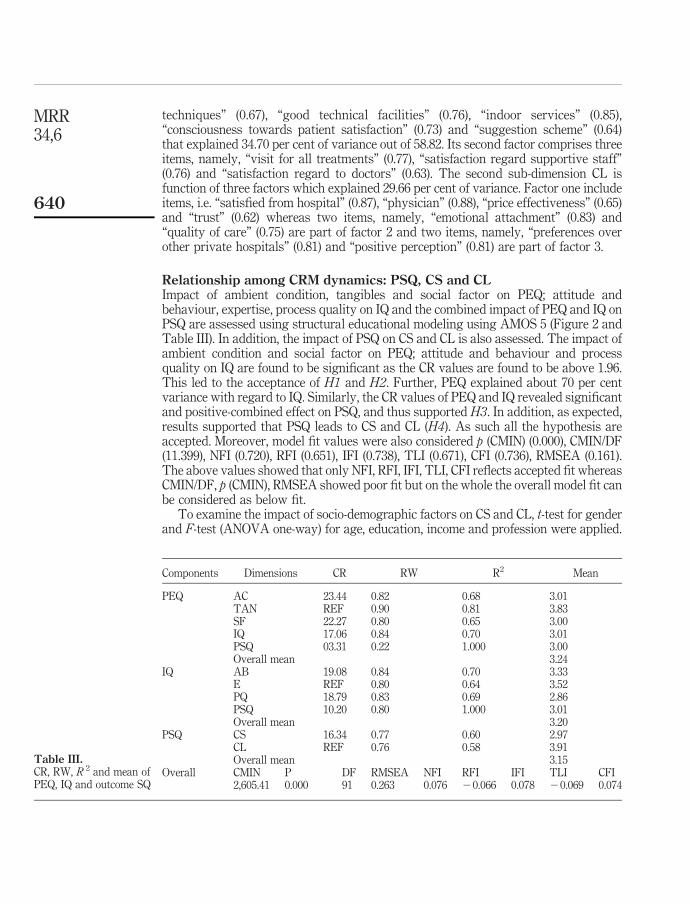
techniques” (0.67), “good technical facilities” (0.76), “indoor services” (0.85),“consciousness towards patient satisfaction” (0.73) and “suggestion scheme” (0.64)that explained 34.70 per cent of variance out of 58.82. Its second factor comprises threeitems, namely, “visit for all treatments” (0.77), “satisfaction regard supportive staff”(0.76) and “satisfaction regard to doctors” (0.63). The second sub-dimension CL isfunction of three factors which explained 29.66 per cent of variance. Factor one includeitems, i.e. “satisfied from hospital” (0.87), “physician” (0.88), “price effectiveness” (0.65)and “trust” (0.62) whereas two items, namely, “emotional attachment” (0.83) and“quality of care” (0.75) are part of factor 2 and two items, namely, “preferences overother private hospitals” (0.81) and “positive perception” (0.81) are part of factor 3.
Relationship among CRM dynamics: PSQ, CS and CLImpact of ambient condition, tangibles and social factor on PEQ; attitude andbehaviour, expertise, process quality on IQ and the combined impact of PEQ and IQ onPSQ are assessed using structural educational modeling using AMOS 5 (Figure 2 andTable III). In addition, the impact of PSQ on CS and CL is also assessed. The impact ofambient condition and social factor on PEQ; attitude and behaviour and processquality on IQ are found to be significant as the CR values are found to be above 1.96.This led to the acceptance of H1 and H2. Further, PEQ explained about 70 per centvariance with regard to IQ. Similarly, the CR values of PEQ and IQ revealed significantand positive-combined effect on PSQ, and thus supported H3. In addition, as expected,results supported that PSQ leads to CS and CL (H4). As such all the hypothesis areaccepted. Moreover, model fit values were also considered p (CMIN) (0.000), CMIN/DF(11.399), NFI (0.720), RFI (0.651), IFI (0.738), TLI (0.671), CFI (0.736), RMSEA (0.161).The above values showed that only NFI, RFI, IFI, TLI, CFI reflects accepted fit whereasCMIN/DF, p (CMIN), RMSEA showed poor fit but on the whole the overall model fit canbe considered as below fit.
To examine the impact of socio-demographic factors on CS and CL, t-test for genderand F-test (ANOVA one-way) for age, education, income and profession were applied.
Components Dimensions CR RW R2 Mean
PEQ AC 23.44 0.82 0.68 3.01TAN REF 0.90 0.81 3.83SF 22.27 0.80 0.65 3.00IQ 17.06 0.84 0.70 3.01PSQ 03.31 0.22 1.000 3.00Overall mean 3.24
IQ AB 19.08 0.84 0.70 3.33E REF 0.80 0.64 3.52PQ 18.79 0.83 0.69 2.86PSQ 10.20 0.80 1.000 3.01Overall mean 3.20
PSQ CS 16.34 0.77 0.60 2.97CL REF 0.76 0.58 3.91Overall mean 3.15
Overall CMIN P DF RMSEA NFI RFI IFI TLI CFI2,605.41 0.000 91 0.263 0.076 20.066 0.078 20.069 0.074
Table III.CR, RW, R 2 and mean ofPEQ, IQ and outcome SQ
MRR34,6
640
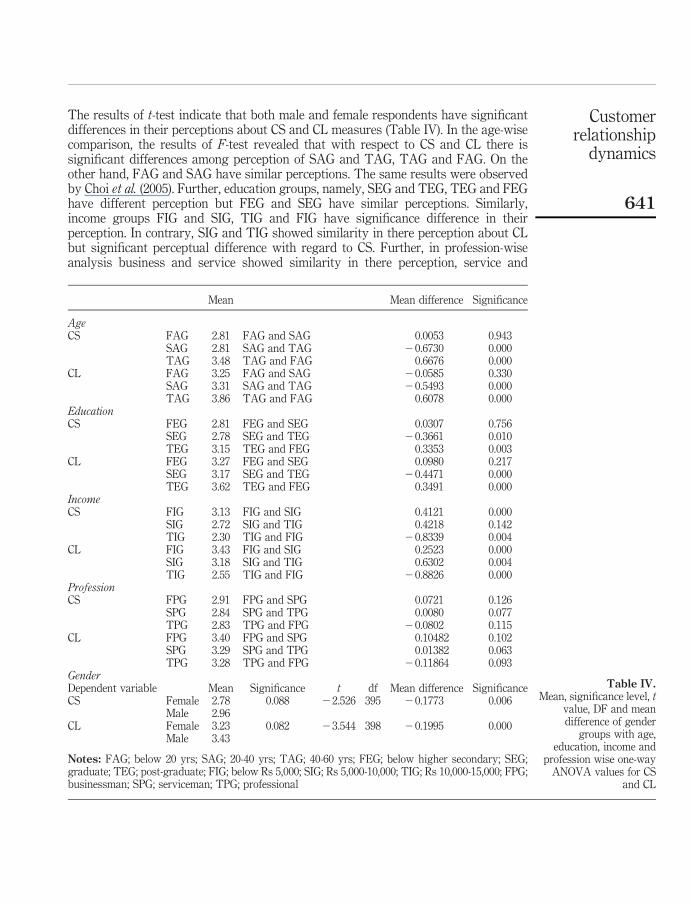
The results of t-test indicate that both male and female respondents have significantdifferences in their perceptions about CS and CL measures (Table IV). In the age-wisecomparison, the results of F-test revealed that with respect to CS and CL there issignificant differences among perception of SAG and TAG, TAG and FAG. On theother hand, FAG and SAG have similar perceptions. The same results were observedby Choi et al. (2005). Further, education groups, namely, SEG and TEG, TEG and FEGhave different perception but FEG and SEG have similar perceptions. Similarly,income groups FIG and SIG, TIG and FIG have significance difference in theirperception. In contrary, SIG and TIG showed similarity in there perception about CLbut significant perceptual difference with regard to CS. Further, in profession-wiseanalysis business and service showed similarity in there perception, service and
Mean Mean difference Significance
AgeCS FAG 2.81 FAG and SAG 0.0053 0.943
SAG 2.81 SAG and TAG 20.6730 0.000TAG 3.48 TAG and FAG 0.6676 0.000
CL FAG 3.25 FAG and SAG 20.0585 0.330SAG 3.31 SAG and TAG 20.5493 0.000TAG 3.86 TAG and FAG 0.6078 0.000
EducationCS FEG 2.81 FEG and SEG 0.0307 0.756
SEG 2.78 SEG and TEG 20.3661 0.010TEG 3.15 TEG and FEG 0.3353 0.003
CL FEG 3.27 FEG and SEG 0.0980 0.217SEG 3.17 SEG and TEG 20.4471 0.000TEG 3.62 TEG and FEG 0.3491 0.000
IncomeCS FIG 3.13 FIG and SIG 0.4121 0.000
SIG 2.72 SIG and TIG 0.4218 0.142TIG 2.30 TIG and FIG 20.8339 0.004
CL FIG 3.43 FIG and SIG 0.2523 0.000SIG 3.18 SIG and TIG 0.6302 0.004TIG 2.55 TIG and FIG 20.8826 0.000
ProfessionCS FPG 2.91 FPG and SPG 0.0721 0.126
SPG 2.84 SPG and TPG 0.0080 0.077TPG 2.83 TPG and FPG 20.0802 0.115
CL FPG 3.40 FPG and SPG 0.10482 0.102SPG 3.29 SPG and TPG 0.01382 0.063TPG 3.28 TPG and FPG 20.11864 0.093
GenderDependent variable Mean Significance t df Mean difference SignificanceCS Female 2.78 0.088 22.526 395 20.1773 0.006
Male 2.96CL Female 3.23 0.082 23.544 398 20.1995 0.000
Male 3.43
Notes: FAG; below 20 yrs; SAG; 20-40 yrs; TAG; 40-60 yrs; FEG; below higher secondary; SEG;graduate; TEG; post-graduate; FIG; below Rs 5,000; SIG; Rs 5,000-10,000; TIG; Rs 10,000-15,000; FPG;businessman; SPG; serviceman; TPG; professional
Table IV.Mean, significance level, t
value, DF and meandifference of gender
groups with age,education, income and
profession wise one-wayANOVA values for CS
and CL
Customerrelationship
dynamics
641
professional have significant difference and the professional and business showedsimilar perception about CS and different perception about CL. Overall, results indicatethat there is significant difference in the perception of demographic groups (Sharmaand Chahal, 2003), namely, male and female, education group S (SEG and TEG, TEGand FEG), income groups (FIG and SIG, TIG and FIG) and profession-based groups(service and professional, professional and business) with respect to CS and CL.
DiscussionOverall, we find support for all the five hypothesized relationships. The finding ofpositive and significant main effects of physical environment and IQ on SQ are as perservice researchers’ perceptions (Brady and Cronin, 2001; Chahal and Sharma, 2004).
Physical environment qualityAmong three PEQ sub-dimensions, customers are quite appreciative about the tangiblefacilities of the hospital, both technical as well as supportive, followed by overallambient condition and social responsibility in general. The results indicate that itemsrelating to ambience of the hospital such as proper arrangement for natural light, overallcleanliness of hospital, good internal atmosphere, peaceful wards and hygienically cleanwards are significant items with average scores. This is followed by somewhat lesssignificant item, i.e. proper placement of beds, which scored below average mean score.Further in tangibles availability of oxygen services, telephone services, clean bed sheetsand continuous pure drinking water facility with above average mean score arecomparatively more significant followed by well-equipped operation theatre and goodtechnical services with average mean score values. Finally, equitable treatment topatients, hygienic life style, special services to poor and needy patients, societalcommitment are important first factors items followed by factor second items, namely,integrity and honesty in medical practices, overall impression and employee role towardsocial responsibility with below average mean score under social factor sub-dimensionof PEQ. Overall, results indicate that there is a need to given more consideration to theaforesaid items to make PEQ competitive and to contribute more to CS and loyalty.
Interaction qualityThe antecedent of SQ is IQ. The result indicates that expertise of staff is somewhat moresignificant in terms of degree of SQ followed by attitude and behaviour and processquality. The staff expertise is found to be the function of items, namely, physicianexpertise, operation competence, technical staff expertise, correct diagnosis of diseases,nursing expertise, technical knowledge and explaining logically the ailment andtreatment procedure to patients. All items are contributing averagely to SQ. The secondsub-dimension attitude and behaviour is found to be function of four factors, namely;nurses, doctors’ attitude, technical and supportive staff and doctors behaviour. Themean score values of attitude and behavior show average level of patient satisfactionfor doctors, technical and supportive staff and dissatisfaction with respect to nurses.The results suggests that there is a need for hospital administration to organize trainingprogramme that can inculcate positive attitudinal and behavioral response of staff withrespect to characteristics such as helpful, supportive and caring nature, satisfactoryanswers to patients, queries, listening ability, explanation about technical treatment,etc. to enhance patient satisfaction for nurses. Further, finally, housekeeping services,
MRR34,6
642
listening ability of supportive staff, interaction with frontline staff and grievanceshandling system are important factors followed by comparatively less significant factorsecond items, namely, supportive facilities included administrative function, laboratoryservices and blood bank services which reflect satisfactory process quality. Overall,process quality is perceived to have below average contribution to SQ.
Customer satisfactionFurther the study finds that SQ leads to patient satisfaction and patient loyalty. Consumersatisfaction, an outcome of SQ, is function of up-to-date healthcare techniques, goodtechnical facilities, indoor services, consciousness toward patient participation (all withbelow average mean score values) followed by less important factor items, namely, visitfor all treatment, satisfaction regard to supporting staff and satisfaction regard to doctors.
Customer loyaltyWith respect to loyalty patient prefer public hospital over other private hospitals becauseof trust, price effectiveness and well-known doctors. However, overall quality of care andoverall negative perception contribute negatively to loyalty dimension. The satisfactionand loyalty when examined individually reflected near to average mean score, indicatingthe need of service provider to look concretely into the SQ dimensions vis-a-vis need toimprove CRM dynamics in the public healthcare to accomplish CRM objectives.
The overall composite impact of sub-dimensions of PEQ and IQ on respective overallPEQ and overall IQ indicate their significant positive contribution as all CR values areabove threshold value of 1.96 at 95 per cent level of significance. In terms of relativestrength of squared multiple correlation and regression weights, tangible variablefollowed by ambient condition and social factor contribute quite significantly to PEQ.However, relationship between PEQ and PSQ and IQ and PSQ though significant is weakfor PSQ and process quality and very strong for IQ and PSQ. Further PSQ and CS and PSQrelationship are also found to be significant in terms of critical ratio, regression weightsand square multiple correlation values. The overall mean score is below average for CSand above average for patient loyalty. The somewhat higher value of CL in relation to CSindicate presence of some moderating factors like customer value which need to beexamined to know the real impact of SQ on CS and loyalty.
Implications for managementManagerial implicationsSeveral managerial implications emerge from this study to operationalise CRM strategy.First, and perhaps most important, services firms must pay attention to both the physicalenvironment and IQ in their service offering to attain CS and retain customers’ loyalty. Ascustomer are demanding much more than only medical treatment of ailments such as goodambient condition and interaction with doctors and nurses adequate efforts should bemade by hospital on additional benefits to be given to customers to sustain stiffcompetition prevailing in healthcare sector. While providing value-added customerservices, superior returns though remains a primary goal but at the same time serviceprovider also need to recognize that elements of the service process can create loyal andcommitted customers. Further, encouraging and enabling service personnel are requiredto be engaged with customers in a friendly manner, to communicate openly, and to retain asense of empathy for situations, which will lead to increased loyalty and patronage.
Customerrelationship
dynamics
643
Furthermore, management should also understand the overall service impact and kept inmind that over a series of transactions, customers may build switching costs through thedevelopment of personal relationships and the accumulation of organization benefits interms of technology and good ambience and as such will remain associated with thehospital. This consequently breeds complacency within organizations because of the factthat long-term customers will continue to be loyal despite fluctuations in SQ. The studysuggest, that both physical environment and IQ of the service will remain consistentlyimportant even as switching costs increase with the development of relationships. Thus,understanding how customers prioritize the importance of physical environment and IQ ofSQ will lead to building positive image in eyes of customer and leads to satisfaction ofpatients and help in building long-term relationship with firms. To the extent thatorganization image develops overtime, providers must continually change the emphasisin their service interactions with customer according to their changing requirements.
Research implicationThere are several implications for further research. The most obvious extension is tore-investigate the interrelationships between SQ and other service constructs, i.e.satisfaction and loyalty to manage customer relationship. The marketing literature hasmade great strides in understanding SQ relationship with satisfaction and loyalty.Determining whether our conceptualization can help overcome the customer problemshould be of great interest to researchers. Moreover, any improvement in the ability tocapture SQ perceptions will enhance the understanding of customer relationship.Specifically, the PEQ and IQ are important attributes of SQ it is what a customer “gets”from a service experience. Given the interest in investigating SQ our conceptualizationcould be extended to analyze SQ from an employee perspective in different settings willcome out with new and useful findings.
Study limitations and directions for future researchThe foregoing recommendations should be considered in the light of some of thelimitations of this study. The study took a snapshot of customers and unable to followindividual customers over time. Clearly cross-sectional research design does not offernearly the same insight into the dynamics of customer relationships with a firm as alongitudinal design. As such a longitudinal design would afford greater insight intothis in the future. The study’s focus on a single healthcare unit may also limit theextent to which the findings can be generalized. Another limitation of our sample isthat our findings cannot be generalized to business-to-business relationships wherethere is likely to be an even greater emphasis on technical SQ as a determinant of CL.Further, it is plausible that the nature of the observed relationships would change withservices that are higher or lower in credence properties (e.g. higher education andairline services, respectively) as the potential for customers building expectation islikely to vary significantly across these industries and thus requires different path tooperationalise CRM, which need to be studied in the future. In addition, the relativeimportance of the role of service personnel in the delivery of physical environment andIQ is also likely to vary between such industries. Nonetheless, study recognizes theneed for future replication of our model in alternative service industries. Further,the research model has omitted certain antecedents of satisfaction and loyalty likeperceived value that could help and explain customer perception more concretely as
MRR34,6
644
the major focus of the research was on the physical environment and IQ provided bythe unit to understand impact of SQ on CRM outcomes. Furthermore, future studiesmay consider broader organization image typologies and measures in understandingCRM dynamics such as organizational excellence and customer value. This would alsoallow researchers to consider and analyze moderation effects between SQ and CS andloyalty and image. Despite these limitations, this study provides some importantinsights for CRM theory and practice. There is strong support for the view thatcustomers change the way they evaluate a firm’s service as switching costs and imagevary. An understanding of SQ, CS and loyalty dynamics is a first step toward effectiveservice management and the retention of customers in the long term.
References
Athanasopoulou, P. (2009), “Relationship quality: a critical literature review and researchagenda”, European Journal of Marketing, Vol. 43 Nos 5/6, pp. 583-610.
Bitner, M.J. (1990), “Evaluating service encounters: the effects of physical surrounding andemployee responses”, Journal of Marketing, Vol. 54 No. 2, pp. 69-81.
Bitner, M.J. (1992), “Servicescapes: the impact of physical surroundings on customer andemployee”, Journal of Marketing, Vol. 54, pp. 69-82.
Bloemer, J., de Ruyter, K. and Wetzels, M. (1999), “Linking perceived service quality and serviceloyalty: a multi-dimensional perspective”, European Journal of Marketing, Vol. 33,January, pp. 1082-106.
Bohling, T., Bowman, D., Lavalle, S., Mittal, V., Narayandas, D., Ramani, G. and Varadarajan, R.(2006), “CRM implementation: effectiveness, issues and insights”, Journal of ServiceResearch, Vol. 9 No. 2, pp. 184-94.
Boulding, W., Kalra, A., Staelin, R. and Zeithamal, V. (1993), “A dynamic process model ofservice quality: from expectations to behavioral intentions”, Journal of MarketingResearch, Vol. 30, pp. 7-27.
Brady, M.K. and Cronin, J.J. Jr (2001), “Some new thoughts on conceptualizing perceived servicequality: a hierarchical approach”, Journal of Marketing, Vol. 65, July, pp. 34-49.
Chahal, H. (2009), “Two component customer relationship management model for health careservices”, paper presented at 1st IIMA International Conference on Advanced DataAnalysis, Business Analytics and Intelligence ( June 5-6), Indian Institute of Management,Ahmedabad.
Chahal, H. and Sharma, R.D. (2004), “Managing health care service quality in a primary healthcare centre”, Metamorphosis, Vol. 3 No. 2, pp. 112-31.
Cheng, B.W., Chang, C. and Liu, I. (2005), “Establishing customer relationship managementframework in nursing home”, Total Quality Management, Vol. 16 No. 5, pp. 607-29.
Choi, K.-S., Cho, W.-H., Lee, S., Lee, H. and Kim, C. (2004), “The relationship among quality, value,satisfaction and behavioral intention in health care provider choice: a South Koreanstudy”, Journal of Business Research, Vol. 57, pp. 913-21.
Choi, K.-S., Lee, H., Kim, C. and Lee, S. (2005), “The service quality dimensions and patientsatisfaction relationships in South Korea: comparison across gender, age, and types ofservice”, Journal of Service Marketing, Vol. 19 No. 3, pp. 140-9.
Conway, T. and Willcocks, S. (1997), “The role of expectations in the perception of health carequality developing a conceptual model”, International Journal of Health Care QualityAssurance, Vol. 10 No. 3, pp. 131-40.
Customerrelationship
dynamics
645
Corbin, C.L., Kelley, S.W. and Schwartz, R.W. (2001), “Concepts in service marketing for healthcare professionals”, The American Journal of Surgery, Vol. 181, pp. 1-7.
Cronin, J.J. Jr, Brady, M.K. and Hult, G.T.M. (2000), “Assessing the effects of quality, value, andcustomer satisfaction on consumer behavioral intentions in service environments”, Journalof Retailing, Vol. 76, Summer, pp. 193-218.
Dagger, T.S., Sweeney, J.C. and Johnson, L.W. (2007), “A hierarchical model of health servicequality: scale development and investigation of an integrated model”, Journal of ServiceResearch, Vol. 10 No. 2, pp. 123-42.
Dedeke, A. (2003), “Service quality: a fulfillment-oriented and interactions-centered approach”,Managing Service Quality, Vol. 13 No. 4, pp. 276-89.
Dwyer, F.R., Schurr, P.H. and Oh, S. (1987), “Developing buyer-seller relationships”, Journal ofMarketing, Vol. 51, April, pp. 11-27.
Gronroos, C. (1984), “A service quality model and its marketing implications”, European Journalof Marketing, Vol. 18 No. 4, pp. 36-44.
Gwinner, K.P., Gremler, D.D. and Bitner, M.J. (1998), “Relational benefits in services industries:the customer’s perspective”, Journal of the Academy of Marketing Science, Vol. 26, Spring,pp. 101-14.
Hair, J.J., Anderson, R.E., Tatham, R.L. and Black (1995), Multivariate Data Analysis withReadings, Prentice-Hall, Upper Saddle River, NJ, pp. 87-135.
Hughes, T. (2003), “Marketing challenges is e-banking: stand alone or integrated”, Journal ofMarketing Management, Vol. 19, pp. 1067-85.
Johnson, M.D. and Selnes, F. (2004), “Customer portfolio management: toward a dynamic theoryof exchange relationships”, Journal of Marketing, Vol. 68, April, pp. 1-17.
Jones, M.A., Mothersbaugh, D.L. and Beatty, S.E. (2000), “Switching barriers and repurchaseintentions in services”, Journal of Retailing, Vol. 76, Summer, pp. 259-74.
Kang, G.-D. and Jeffrey, J. (2004), “Service quality dimensions: an examination of Gronroosservice quality model”, Managing Service Quality, Vol. 14 No. 4, pp. 266-77.
Kevork, E.K. and Vrechopoulos, A.P. (2009), “CRM literature: conceptual and functional insightsby keyword analysis”, Marketing Intelligence Planning, Vol. 27 No. 1, pp. 48-85.
Lovelock, C.H. (1983) “Classifying services to gain strategic marketing insights”, Journal ofMarketing, Vol. 47, pp. 9-20.
Malhotra, N.K. (2003), Marketing Research – An Applied Orientation, Pearson Education,Singapore.
Maruthamuther, K. and Kavitha, R. (2008), “CRM in hospital services”, in Shanmugasundaram,S. (Ed.), Customer Relationship Management – Modern Trends and Perspectives, PHI, NewDelhi, pp. 237-40.
Morgan, R.M. and Hunt, S.D. (1994), “The commitment-trust theory of relationship marketing”,Journal of Marketing, Vol. 58, July, pp. 20-38.
Newman, K. and Pyne, T. (1996), “Quality matters: junior doctors’ perceptions”, Journal ofManagement in Medicine, Vol. 10 No. 4, pp. 12-23.
Ngai, E.N.T., Xiu, L. and Chau, D.C.K. (2009), “Application of data mining techniques in customerrelationship management: a literature review and classification”, Expert System withApplications, Vol. 36, pp. 2592-602.
Parasuraman, A., Zeithaml, V.A. and Berry, L.L. (1985), “A conceptual model of service qualityand its implication for future research”, Journal of Marketing, Vol. 49, pp. 41-50.
MRR34,6
646

Peppers, D. and Rogers, M. (1999), One to One Field Book: The Complete Toolkit for Implementinga 1 to 1 Marketing Program, Capstone, Oxford.
Qin, S., Zhao, L. and Yi, X. (2009), “Impacts of customer services on relationship quality:an empirical study in China”, Managing Service Quality, Vol. 19 No. 4, pp. 391-409.
Raftopoulos, V. (2005), “A grounded theory for patients’ satisfaction with quality of hospitalcare”, ICUS and Nursing Web Journal, Vol. 22, pp. 1-15.
Rasila, H. (2010), “Customer relationship quality in landlord-tenant relationship”, PropertyManagement, Vol. 28 No. 2, pp. 80-92.
Reinartz, W.J. and Kumar, V. (2003), “The impact of customer relationship characteristics onprofitable lifetime duration”, Journal of Marketing, Vol. 67, January, pp. 77-99.
Rust, R.T. and Oliver, R.L. (1994), “Service quality: insights and managerial implications fromthe frontlines”, Service Quality: New Directions in theory and Practice, Sage, NewburyPark, CA, pp. 1-19.
Ruyter, K., Wetzels, M. and Blomer, J. (1998), “On the relationship between perceived servicequality, service loyalty and switching costs”, International Journal of Service IndustryManagement, Vol. 9 No. 5, pp. 436-53.
Santouridis, I. and Trivellas, P. (2010), “Investigating the impact of service quality and customersatisfaction on customer loyalty in mobile telephony in Greece”, The TQM Journal, Vol. 22No. 3, pp. 330-43.
Sardana, G.D. (2003), “Performance grading of hospitals: a conceptual framework”, Productivity,Vol. 44 No. 3, pp. 450-65.
Sharma, R.D. and Chahal, H. (2003), “Patient satisfaction in government outpatient services inIndia”, Decision, Vol. 30 No. 2, July-December.
Sharma, R.D. and Chahal, H. (2005), “Patient satisfaction in public health care system – a casestudy”, The Indian Journal of Social Work, Vol. LVI No. 4, pp. 444-54.
Sheth, J.N. and Parvatiyar, A. (1995), “The evolution of relationship marketing”, InternationalBusiness Review, Vol. 4, December, pp. 397-418.
Sumathy, M. and Tamilselvan, M. (2008), CRM: Concepts and Implementation. CustomerRelationship Management: Modern Trends and Practices, Prentice-Hall, New Delhi, pp. 3-8.
Tse, D.K. and Wilton, P.C. (1988), “Models of consumer satisfaction formation: an extension”,Journal of Marketing Research, Vol. 15, May, pp. 204-12.
Tull, D.S. and Hawkins, D.I. (2005), Marketing Research – Measurement and Methods, 6th ed.,Prentice Hall of India, New Delhi.
Vesel, P. and Zabkar, V. (2010), “Comprehension of relationship quality in the retailenvironment”, Managing Service Quality, Vol. 20 No. 3, pp. 213-35.
Wahlberg, O., Strandberg, C., Sundberg, H. and Sandberg, K.W. (2009), “Trends, topics andunder researched areas in CRM research”, International Journal of Public InformationSystems, Vol. 3, pp. 191-208.
Yim, F., Anderson, R. and Swaminathan, S. (2005), “Customer relationship management: itsdimensions and effect on customer outcomes”, Journal of Personal Selling and SalesManagement, Vol. XXIV No. 4, pp. 263-78.
Zeithaml, V.A., Berry, L.L. and Parasuraman, A. (1996), “The behavioral consequences of servicequality”, Journal of Marketing, Vol. 60, pp. 31-46.
Zineldin, M. (2005), “Quality and customer relationship management (CRM) as competitivestrategy in the Swedish banking industry”, The TQMMagazine, Vol. 17 No. 4, pp. 329-44.
Customerrelationship
dynamics
647
http://emerald-prod.literatumonline.com/action/showLinks?crossref=10.1016%2F0969-5931%2895%2900018-6
Zineldin, M. (2006), “The royalty of loyalty: CRM, quality and retention”, Journal of ConsumerMarketing, Vol. 23 No. 7, pp. 430-7.
Further reading
Chen, J.-S., Rebecca Yen, H.J., Li, E.Y. and Ching, R.K.H. (2009), “Measuring CRM effectiveness:construct development, validation and application of a process-oriented model”, TotalQuality Management, Vol. 20 No. 3, pp. 283-99.
Hair, J.F., Anderson, R.E., Tatham, R.L. and Black, W.C. (2003), Multivariate Data Analysis,Pearson Education, Delhi.
About the authorsHardeep Chahal (PhD, University of Jammu, India) is an Associate Professor in the Departmentof Commerce. Her research interests focus on services marketing with emphasis on consumersatisfaction and loyalty, SQ, brand equity and market orientation. Her research work has beenacknowledged in refereed international journals such as Managing Service Quality, Journal ofHealth Management, Total Quality Management and Business Excellence, International Journalof Business and Globalisation, International Journal of Indian Culture and Business Managementand national journals of international repute such as Vikalpa, Metamorphosis, Decisions, Journalof Social Work, Vision, Journal of Services Research and Journal of Rural Development. She hasalso co-edited books on research methodology in commerce and management and strategicservice marketing. She currently serves on the Editorial Boards of the International Journal ofHealth Quality and Assurance (Emerald), Journal of Services Research (India) and the Journal ofSocial Sciences (University of Jammu). Hardeep Chahal is the corresponding author and can becontacted at: [email protected]
Neetu Kumari is a Doctoral Fellow at Department of Commerce, University of Jammu, India.She completed her MPhil project on SQ and Service Performance Relationship in HealthcareSector. Neetu Kumari has presented papers in various national seminars and conferences.
To purchase reprints of this article please e-mail: [email protected] visit our web site for further details: www.emeraldinsight.com/reprints
MRR34,6
648
This article has been cited by:
1. Arun Kumar Agariya, Deepali Singh. 2014. CRM Index Development and Validation in Indian BankingSector. International Journal of Customer Relationship Marketing and Management 3:2, 10-32. [CrossRef]
2. Ismail Bakan, Tuba Buyukbese, Burcu Ersahan. 2014. The impact of total quality service (TQS) onhealthcare and patient satisfaction: An empirical study of Turkish private and public hospitals. TheInternational Journal of Health Planning and Management 29:10.1002/hpm.v29.3, 292-315. [CrossRef]
3. Mei‐Ling Wang. 2013. Implementing CRM in nursing homes: the effects on resident satisfaction.Managing Service Quality: An International Journal 23:5, 388-409. [Abstract] [Full Text] [PDF]
4. Hardeep Chahal, Shivani Mehta. 2013. Modeling patient satisfaction construct in the Indian health carecontext. International Journal of Pharmaceutical and Healthcare Marketing 7:1, 75-92. [Abstract] [FullText] [PDF]