EUR 23758 EN -2008 Possible Application of Non-Testing Methods in Setting Environmental Quality...
47
EUR 23758 EN - 2008 Possible Application of Non-Testing Methods in Setting Environmental Quality Standards (EQS) Mark Crane 1 , Chris Watts 1 , Klaus Daginnus 2 and Andrew Worth 2 1 wca environment limited, Faringdon, SN7 7YR, UK 2 European Commission, Joint Research Centre, Institute for Health & Consumer Protection
-
Upload
independent -
Category
Documents
-
view
0 -
download
0
Transcript of EUR 23758 EN -2008 Possible Application of Non-Testing Methods in Setting Environmental Quality...
EUR 23758 EN - 2008
Possible Application of Non-Testing Methods in Setting Environmental Quality Standards (EQS)
Mark Crane1, Chris Watts1, Klaus Daginnus2 and Andrew Worth2
1 wca environment limited, Faringdon, SN7 7YR, UK 2 European Commission, Joint Research Centre, Institute for Health & Consumer Protection
The mission of the IHCP is to provide scientific support to the development and implementation of EU policies related to health and consumer protection. The IHCP carries out research to improve the understanding of potential health risks posed by chemical, physical and biological agents from various sources to which consumers are exposed. European Commission Joint Research Centre Institute for Health and Consumer Protection Contact information Address:JRC Institute for Health & Consumer Protection, TP 581 E-mail: [email protected] Tel.: +39 0332 789566 Fax: +39 0332 786717 http:// http://ecb.jrc.europa.eu/QSAR http://ec.europa.eu/dgs/jrc/ Legal Notice Neither the European Commission nor any person acting on behalf of the Commission is responsible for the use which might be made of this publication. A great deal of additional information on the European Union is available on the Internet. It can be accessed through the Europa server: http://europa.eu/ JRC 50067 EUR 23758 EN ISSN 1018-5593 Luxembourg: Office for Official Publications of the European Communities © European Communities, 2008 Reproduction is authorised provided the source is acknowledged
Printed in Italy
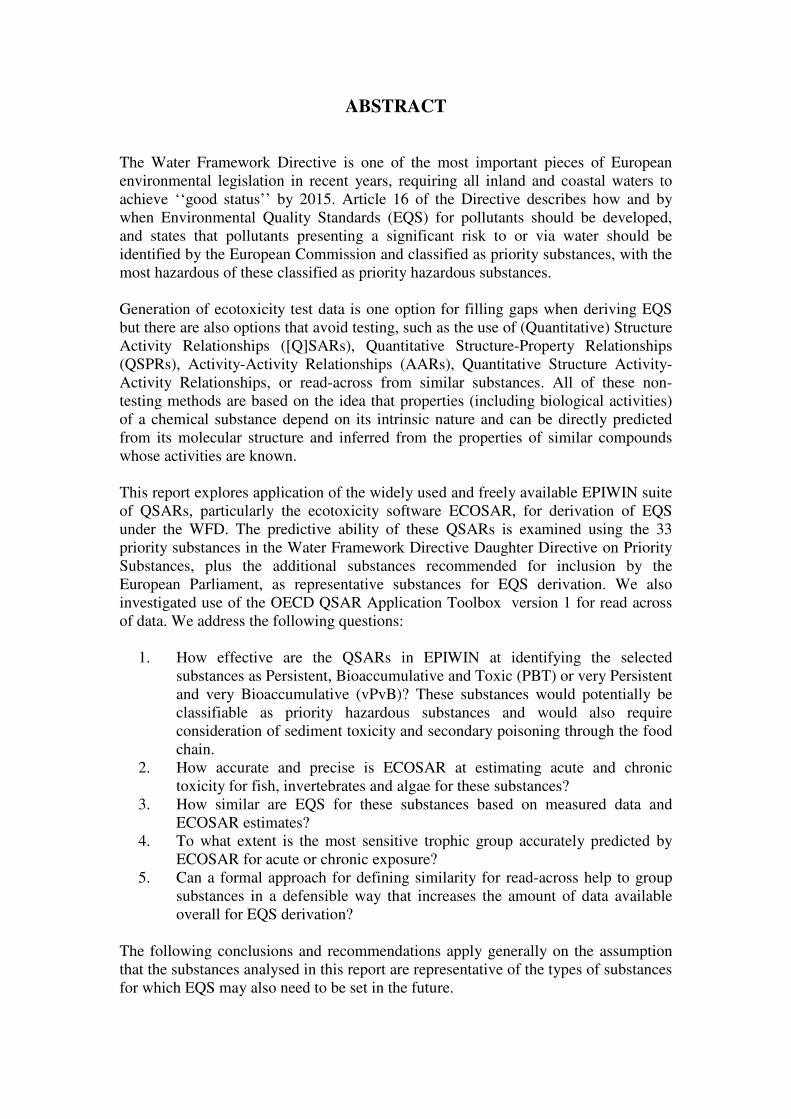
ABSTRACT
The Water Framework Directive is one of the most important pieces of European
environmental legislation in recent years, requiring all inland and coastal waters to
achieve ‘‘good status’’ by 2015. Article 16 of the Directive describes how and by
when Environmental Quality Standards (EQS) for pollutants should be developed,
and states that pollutants presenting a significant risk to or via water should be
identified by the European Commission and classified as priority substances, with the
most hazardous of these classified as priority hazardous substances.
Generation of ecotoxicity test data is one option for filling gaps when deriving EQS
but there are also options that avoid testing, such as the use of (Quantitative) Structure
Activity Relationships ([Q]SARs), Quantitative Structure-Property Relationships
(QSPRs), Activity-Activity Relationships (AARs), Quantitative Structure Activity-
Activity Relationships, or read-across from similar substances. All of these non-
testing methods are based on the idea that properties (including biological activities)
of a chemical substance depend on its intrinsic nature and can be directly predicted
from its molecular structure and inferred from the properties of similar compounds
whose activities are known.
This report explores application of the widely used and freely available EPIWIN suite
of QSARs, particularly the ecotoxicity software ECOSAR, for derivation of EQS
under the WFD. The predictive ability of these QSARs is examined using the 33
priority substances in the Water Framework Directive Daughter Directive on Priority
Substances, plus the additional substances recommended for inclusion by the
European Parliament, as representative substances for EQS derivation. We also
investigated use of the OECD QSAR Application Toolbox version 1 for read across
of data. We address the following questions:
1. How effective are the QSARs in EPIWIN at identifying the selected
substances as Persistent, Bioaccumulative and Toxic (PBT) or very Persistent
and very Bioaccumulative (vPvB)? These substances would potentially be
classifiable as priority hazardous substances and would also require
consideration of sediment toxicity and secondary poisoning through the food
chain.
2. How accurate and precise is ECOSAR at estimating acute and chronic
toxicity for fish, invertebrates and algae for these substances?
3. How similar are EQS for these substances based on measured data and
ECOSAR estimates?
4. To what extent is the most sensitive trophic group accurately predicted by
ECOSAR for acute or chronic exposure?
5. Can a formal approach for defining similarity for read-across help to group
substances in a defensible way that increases the amount of data available
overall for EQS derivation?
The following conclusions and recommendations apply generally on the assumption
that the substances analysed in this report are representative of the types of substances
for which EQS may also need to be set in the future.
LIST OF ABBREVIATIONS
AA Annual average concentration (arithmetic mean)
AAR Activity-Activity Relationships
AF Assessment Factor
BCF Bioconcentration Factor
ChV Chronic Toxicity Value
EQS Environmental Quality Standards
MAC Maximum Allowable Concentration
MoA Mode of Action
NOEC No Observed Effect Concentration
OECD Organisation for Economic Co-operation and Development
PAH Polyaromatic hydrocarbons
PBT Persistent, Bioaccumulative and Toxic substance
PNEC Predicted No Effect Concentration
Kow Octanol-water partition coefficient
QAAR Quantitative Structure Activity-Activity Relationship
QSAR Quantitative Structure-Activity Relationship
QSPR Quantitative Structure-Property Relationship
REACH Registration, Evaluation, Authorisation and Restriction of
Chemicals
TGD European Technical Guidance Document on Risk Assessment
vPvB very Persistent and very Bioaccumulative
WFD Water Framework Directive
CONTENTS
1. Introduction................................................................................................................1
2. Methods......................................................................................................................7
2.1 Available computational methods for deriving EQS ....................................................... 7
2.2 Methods used in this report.............................................................................................. 9
3. Results and discussion .............................................................................................14
3.1 Mode of action ............................................................................................................... 14
3.2 PBT/vPvB ...................................................................................................................... 14
3.3 Relationships between ECOSAR acute and chronic estimates and measured data for
fish, invertebrates and algae................................................................................................. 17
3.4 Environmental Quality Standards .................................................................................. 17
3.5 Most sensitive trophic level ........................................................................................... 29
3.6 Opportunities for read-across......................................................................................... 32
4. Conclusions and Recommendations ........................................................................36
5. References................................................................................................................38
1
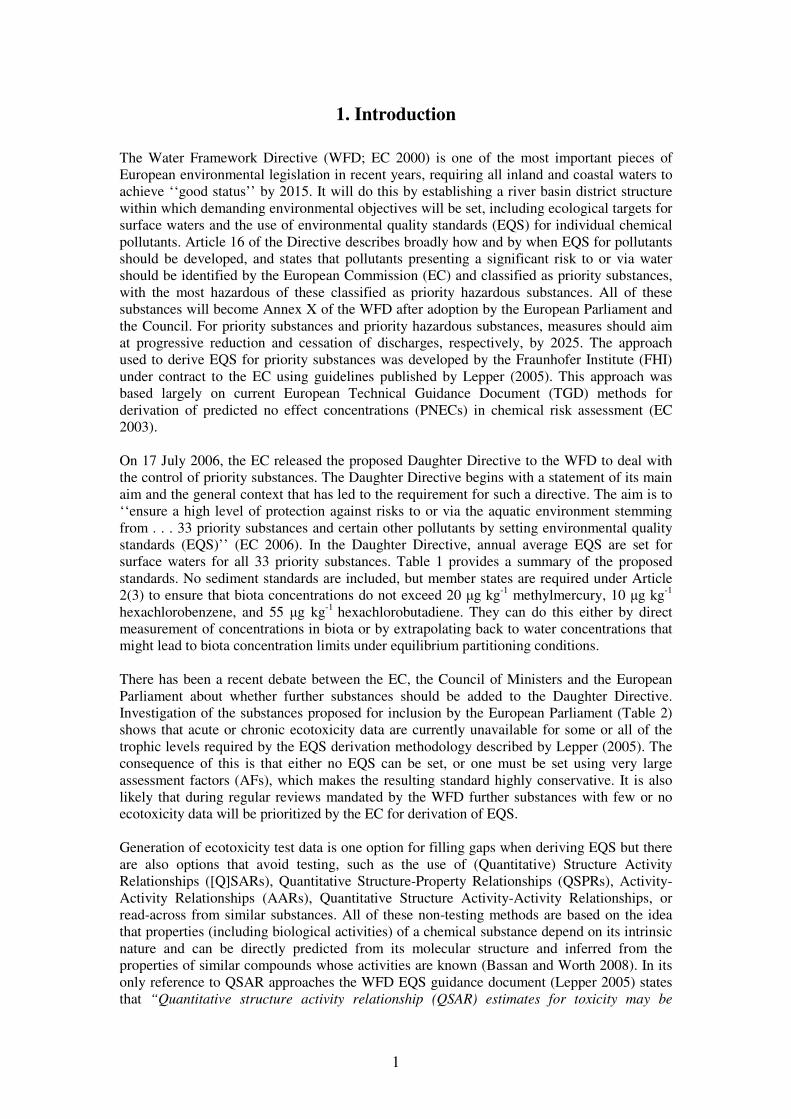
1. Introduction
The Water Framework Directive (WFD; EC 2000) is one of the most important pieces of
European environmental legislation in recent years, requiring all inland and coastal waters to
achieve ‘‘good status’’ by 2015. It will do this by establishing a river basin district structure
within which demanding environmental objectives will be set, including ecological targets for
surface waters and the use of environmental quality standards (EQS) for individual chemical
pollutants. Article 16 of the Directive describes broadly how and by when EQS for pollutants
should be developed, and states that pollutants presenting a significant risk to or via water
should be identified by the European Commission (EC) and classified as priority substances,
with the most hazardous of these classified as priority hazardous substances. All of these
substances will become Annex X of the WFD after adoption by the European Parliament and
the Council. For priority substances and priority hazardous substances, measures should aim
at progressive reduction and cessation of discharges, respectively, by 2025. The approach
used to derive EQS for priority substances was developed by the Fraunhofer Institute (FHI)
under contract to the EC using guidelines published by Lepper (2005). This approach was
based largely on current European Technical Guidance Document (TGD) methods for
derivation of predicted no effect concentrations (PNECs) in chemical risk assessment (EC
2003).
On 17 July 2006, the EC released the proposed Daughter Directive to the WFD to deal with
the control of priority substances. The Daughter Directive begins with a statement of its main
aim and the general context that has led to the requirement for such a directive. The aim is to
‘‘ensure a high level of protection against risks to or via the aquatic environment stemming
from . . . 33 priority substances and certain other pollutants by setting environmental quality
standards (EQS)’’ (EC 2006). In the Daughter Directive, annual average EQS are set for
surface waters for all 33 priority substances. Table 1 provides a summary of the proposed
standards. No sediment standards are included, but member states are required under Article
2(3) to ensure that biota concentrations do not exceed 20 µg kg-1
methylmercury, 10 µg kg-1
hexachlorobenzene, and 55 µg kg-1
hexachlorobutadiene. They can do this either by direct
measurement of concentrations in biota or by extrapolating back to water concentrations that
might lead to biota concentration limits under equilibrium partitioning conditions.
There has been a recent debate between the EC, the Council of Ministers and the European
Parliament about whether further substances should be added to the Daughter Directive.
Investigation of the substances proposed for inclusion by the European Parliament (Table 2)
shows that acute or chronic ecotoxicity data are currently unavailable for some or all of the
trophic levels required by the EQS derivation methodology described by Lepper (2005). The
consequence of this is that either no EQS can be set, or one must be set using very large
assessment factors (AFs), which makes the resulting standard highly conservative. It is also
likely that during regular reviews mandated by the WFD further substances with few or no
ecotoxicity data will be prioritized by the EC for derivation of EQS.
Generation of ecotoxicity test data is one option for filling gaps when deriving EQS but there
are also options that avoid testing, such as the use of (Quantitative) Structure Activity
Relationships ([Q]SARs), Quantitative Structure-Property Relationships (QSPRs), Activity-
Activity Relationships (AARs), Quantitative Structure Activity-Activity Relationships, or
read-across from similar substances. All of these non-testing methods are based on the idea
that properties (including biological activities) of a chemical substance depend on its intrinsic
nature and can be directly predicted from its molecular structure and inferred from the
properties of similar compounds whose activities are known (Bassan and Worth 2008). In its
only reference to QSAR approaches the WFD EQS guidance document (Lepper 2005) states
that “Quantitative structure activity relationship (QSAR) estimates for toxicity may be
2
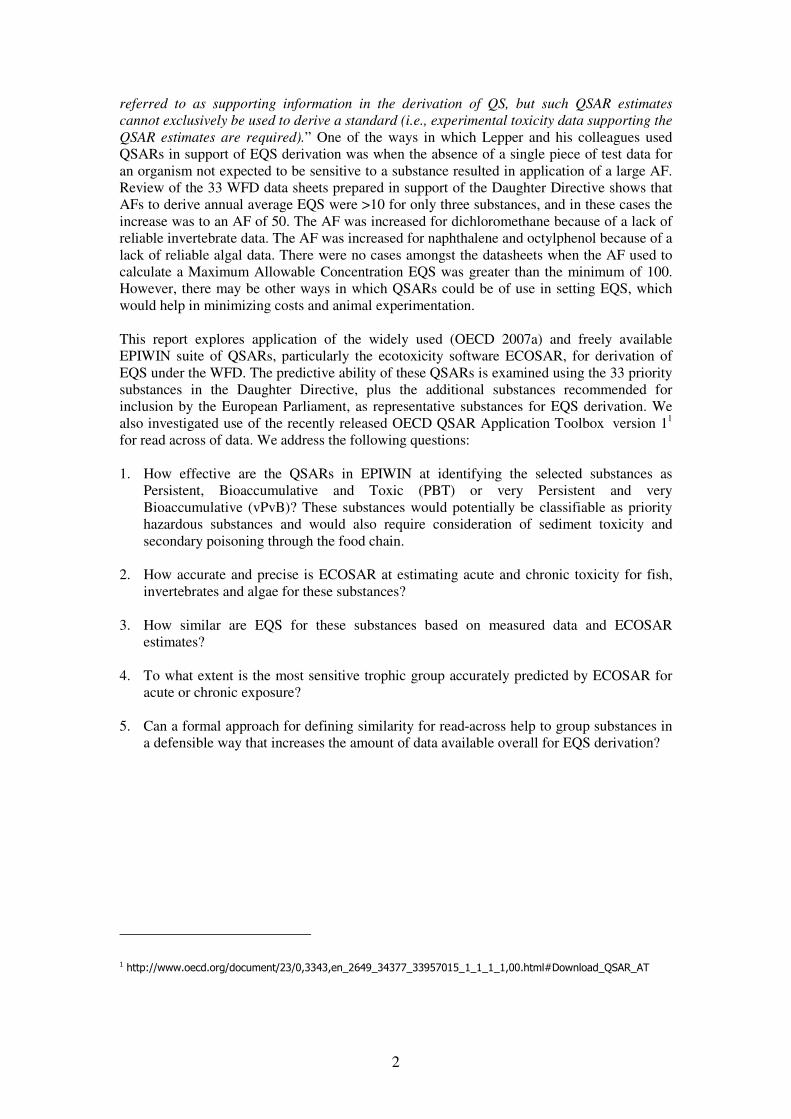
referred to as supporting information in the derivation of QS, but such QSAR estimates
cannot exclusively be used to derive a standard (i.e., experimental toxicity data supporting the
QSAR estimates are required).” One of the ways in which Lepper and his colleagues used
QSARs in support of EQS derivation was when the absence of a single piece of test data for
an organism not expected to be sensitive to a substance resulted in application of a large AF.
Review of the 33 WFD data sheets prepared in support of the Daughter Directive shows that
AFs to derive annual average EQS were >10 for only three substances, and in these cases the
increase was to an AF of 50. The AF was increased for dichloromethane because of a lack of
reliable invertebrate data. The AF was increased for naphthalene and octylphenol because of a
lack of reliable algal data. There were no cases amongst the datasheets when the AF used to
calculate a Maximum Allowable Concentration EQS was greater than the minimum of 100.
However, there may be other ways in which QSARs could be of use in setting EQS, which
would help in minimizing costs and animal experimentation.
This report explores application of the widely used (OECD 2007a) and freely available
EPIWIN suite of QSARs, particularly the ecotoxicity software ECOSAR, for derivation of
EQS under the WFD. The predictive ability of these QSARs is examined using the 33 priority
substances in the Daughter Directive, plus the additional substances recommended for
inclusion by the European Parliament, as representative substances for EQS derivation. We
also investigated use of the recently released OECD QSAR Application Toolbox version 1
1
for read across of data. We address the following questions:
1. How effective are the QSARs in EPIWIN at identifying the selected substances as
Persistent, Bioaccumulative and Toxic (PBT) or very Persistent and very
Bioaccumulative (vPvB)? These substances would potentially be classifiable as priority
hazardous substances and would also require consideration of sediment toxicity and
secondary poisoning through the food chain.
2. How accurate and precise is ECOSAR at estimating acute and chronic toxicity for fish,
invertebrates and algae for these substances?
3. How similar are EQS for these substances based on measured data and ECOSAR
estimates?
4. To what extent is the most sensitive trophic group accurately predicted by ECOSAR for
acute or chronic exposure?
5. Can a formal approach for defining similarity for read-across help to group substances in
a defensible way that increases the amount of data available overall for EQS derivation?
1 http://www.oecd.org/document/23/0,3343,en_2649_34377_33957015_1_1_1_1,00.html#Download_QSAR_AT
3
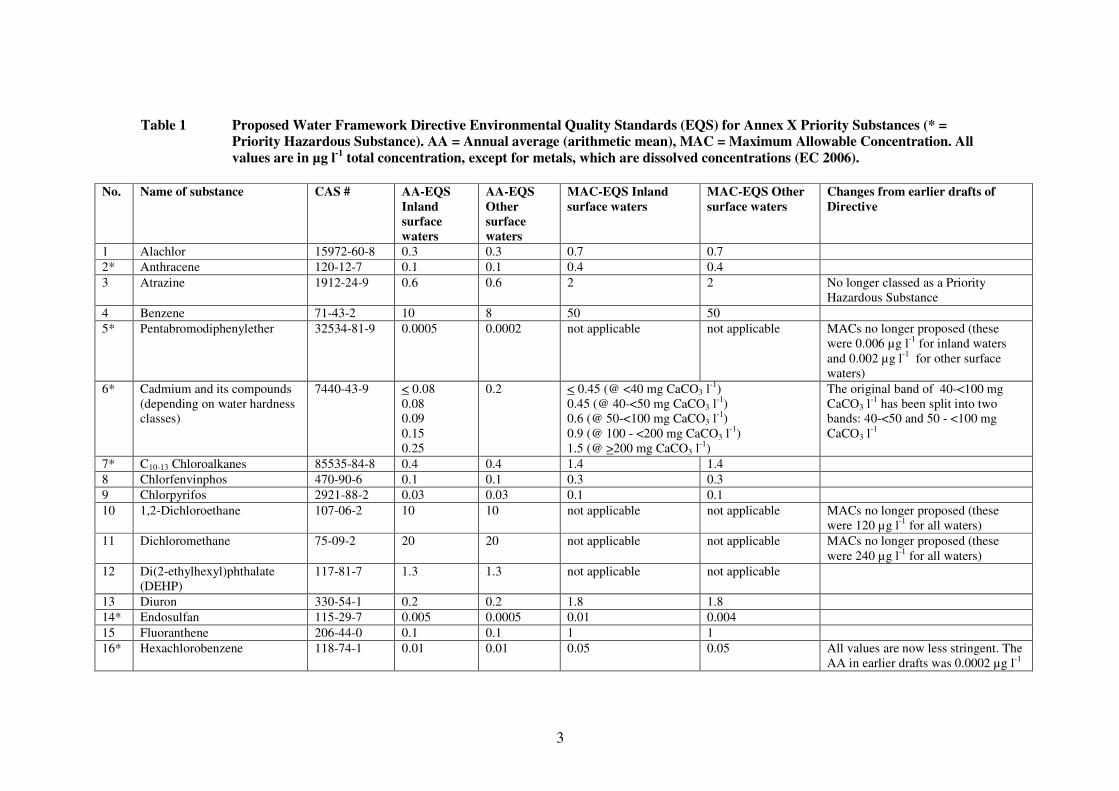
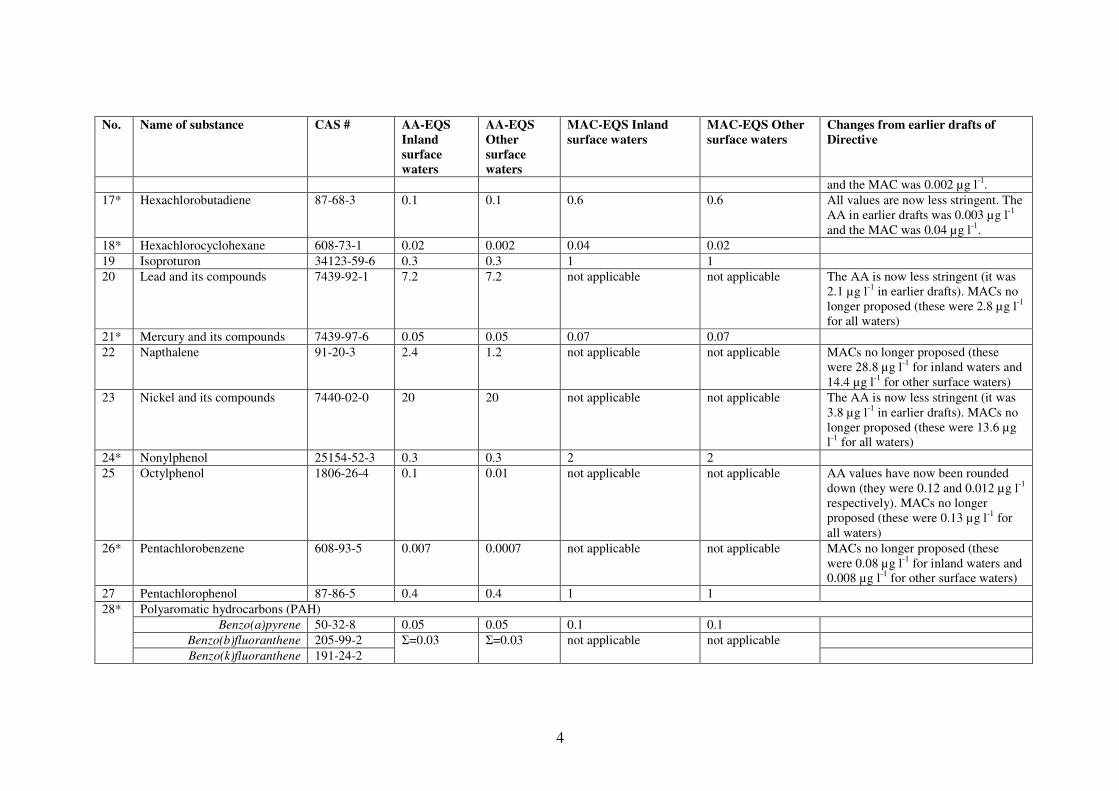
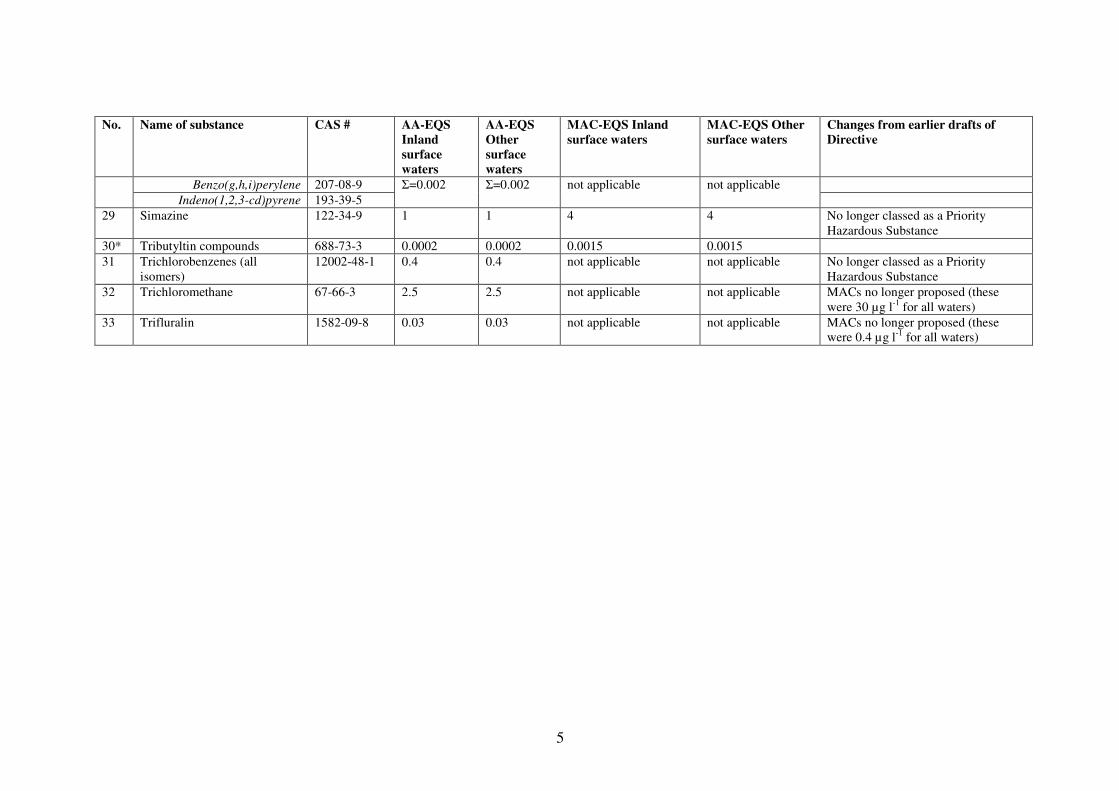
Table 1 Proposed Water Framework Directive Environmental Quality Standards (EQS) for Annex X Priority Substances (* =
Priority Hazardous Substance). AA = Annual average (arithmetic mean), MAC = Maximum Allowable Concentration. All
values are in µg l-1
total concentration, except for metals, which are dissolved concentrations (EC 2006).
No. Name of substance CAS # AA-EQS
Inland
surface
waters
AA-EQS
Other
surface
waters
MAC-EQS Inland
surface waters
MAC-EQS Other
surface waters
Changes from earlier drafts of
Directive
1 Alachlor 15972-60-8 0.3 0.3 0.7 0.7
2* Anthracene 120-12-7 0.1 0.1 0.4 0.4
3 Atrazine 1912-24-9 0.6 0.6 2 2 No longer classed as a Priority
Hazardous Substance
4 Benzene 71-43-2 10 8 50 50
5* Pentabromodiphenylether 32534-81-9 0.0005 0.0002 not applicable not applicable MACs no longer proposed (these
were 0.006 µg l-1
for inland waters
and 0.002 µg l-1
for other surface
waters)
6* Cadmium and its compounds
(depending on water hardness
classes)
7440-43-9 < 0.08
0.08
0.09
0.15
0.25
0.2 < 0.45 (@ <40 mg CaCO3 l-1
)
0.45 (@ 40-<50 mg CaCO3 l-1
)
0.6 (@ 50-<100 mg CaCO3 l-1)
0.9 (@ 100 - <200 mg CaCO3 l-1
)
1.5 (@ >200 mg CaCO3 l-1
)
The original band of 40-<100 mg
CaCO3 l-1
has been split into two
bands: 40-<50 and 50 - <100 mg
CaCO3 l-1
7* C10-13 Chloroalkanes 85535-84-8 0.4 0.4 1.4 1.4
8 Chlorfenvinphos 470-90-6 0.1 0.1 0.3 0.3
9 Chlorpyrifos 2921-88-2 0.03 0.03 0.1 0.1
10 1,2-Dichloroethane 107-06-2 10 10 not applicable not applicable MACs no longer proposed (these
were 120 µg l-1
for all waters)
11 Dichloromethane 75-09-2 20 20 not applicable not applicable MACs no longer proposed (these
were 240 µg l-1
for all waters)
12 Di(2-ethylhexyl)phthalate
(DEHP)
117-81-7 1.3 1.3 not applicable not applicable
13 Diuron 330-54-1 0.2 0.2 1.8 1.8
14* Endosulfan 115-29-7 0.005 0.0005 0.01 0.004
15 Fluoranthene 206-44-0 0.1 0.1 1 1
16* Hexachlorobenzene 118-74-1 0.01 0.01 0.05 0.05 All values are now less stringent. The
AA in earlier drafts was 0.0002 µg l-1
4
No. Name of substance CAS # AA-EQS
Inland
surface
waters
AA-EQS
Other
surface
waters
MAC-EQS Inland
surface waters
MAC-EQS Other
surface waters
Changes from earlier drafts of
Directive
and the MAC was 0.002 µg l-1
.
17* Hexachlorobutadiene 87-68-3 0.1 0.1 0.6 0.6 All values are now less stringent. The
AA in earlier drafts was 0.003 µg l-1
and the MAC was 0.04 µg l-1
.
18* Hexachlorocyclohexane 608-73-1 0.02 0.002 0.04 0.02
19 Isoproturon 34123-59-6 0.3 0.3 1 1
20 Lead and its compounds 7439-92-1 7.2 7.2 not applicable not applicable The AA is now less stringent (it was
2.1 µg l-1
in earlier drafts). MACs no
longer proposed (these were 2.8 µg l-1
for all waters)
21* Mercury and its compounds 7439-97-6 0.05 0.05 0.07 0.07
22 Napthalene 91-20-3 2.4 1.2 not applicable not applicable MACs no longer proposed (these
were 28.8 µg l-1
for inland waters and
14.4 µg l-1
for other surface waters)
23 Nickel and its compounds 7440-02-0 20 20 not applicable not applicable The AA is now less stringent (it was
3.8 µg l-1
in earlier drafts). MACs no
longer proposed (these were 13.6 µg
l-1
for all waters)
24* Nonylphenol 25154-52-3 0.3 0.3 2 2
25 Octylphenol 1806-26-4 0.1 0.01 not applicable not applicable AA values have now been rounded
down (they were 0.12 and 0.012 µg l-1
respectively). MACs no longer
proposed (these were 0.13 µg l-1
for
all waters)
26* Pentachlorobenzene 608-93-5 0.007 0.0007 not applicable not applicable MACs no longer proposed (these
were 0.08 µg l-1
for inland waters and
0.008 µg l-1
for other surface waters)
27 Pentachlorophenol 87-86-5 0.4 0.4 1 1
Polyaromatic hydrocarbons (PAH)
Benzo(a)pyrene 50-32-8 0.05 0.05 0.1 0.1
Benzo(b)fluoranthene 205-99-2
28*
Benzo(k)fluoranthene 191-24-2
Σ=0.03 Σ=0.03 not applicable not applicable
5
No. Name of substance CAS # AA-EQS
Inland
surface
waters
AA-EQS
Other
surface
waters
MAC-EQS Inland
surface waters
MAC-EQS Other
surface waters
Changes from earlier drafts of
Directive
Benzo(g,h,i)perylene 207-08-9
Indeno(1,2,3-cd)pyrene 193-39-5
Σ=0.002 Σ=0.002 not applicable not applicable
29 Simazine 122-34-9 1 1 4 4 No longer classed as a Priority
Hazardous Substance
30* Tributyltin compounds 688-73-3 0.0002 0.0002 0.0015 0.0015
31 Trichlorobenzenes (all
isomers)
12002-48-1 0.4 0.4 not applicable not applicable No longer classed as a Priority
Hazardous Substance
32 Trichloromethane 67-66-3 2.5 2.5 not applicable not applicable MACs no longer proposed (these
were 30 µg l-1
for all waters)
33 Trifluralin 1582-09-8 0.03 0.03 not applicable not applicable MACs no longer proposed (these
were 0.4 µg l-1
for all waters)
6
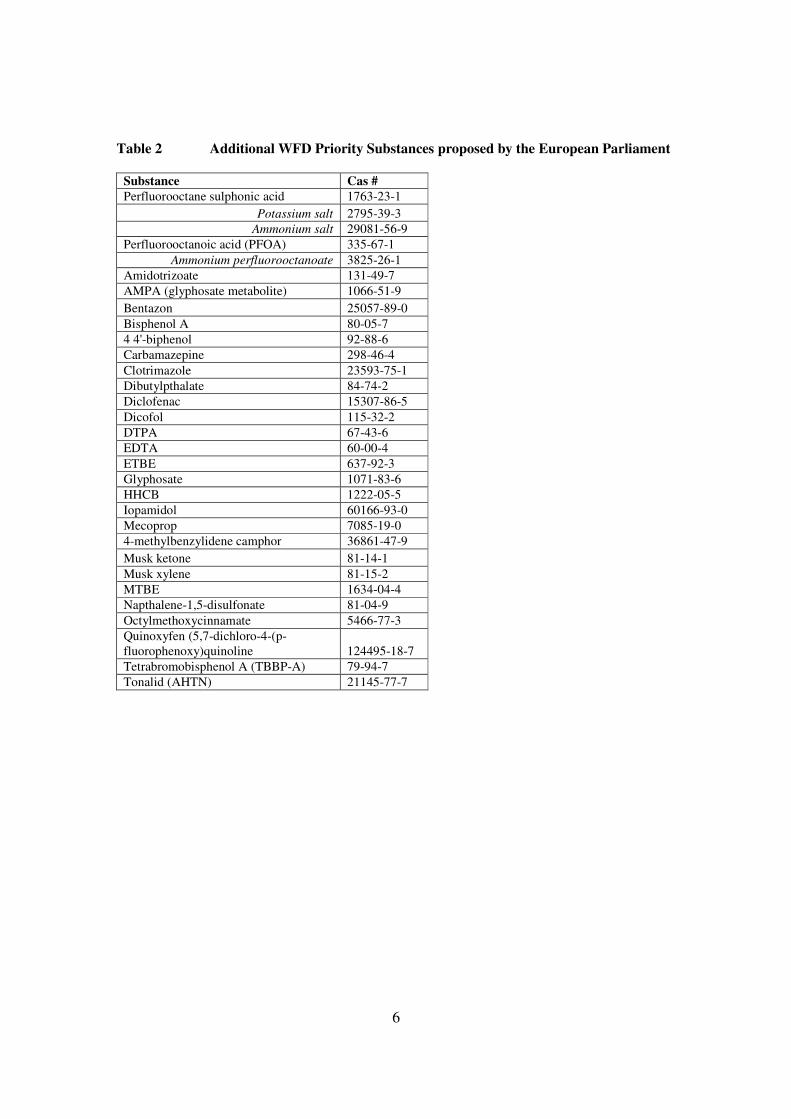
Table 2 Additional WFD Priority Substances proposed by the European Parliament
Substance Cas #
Perfluorooctane sulphonic acid 1763-23-1
Potassium salt 2795-39-3
Ammonium salt 29081-56-9
Perfluorooctanoic acid (PFOA) 335-67-1
Ammonium perfluorooctanoate 3825-26-1
Amidotrizoate 131-49-7
AMPA (glyphosate metabolite) 1066-51-9
Bentazon 25057-89-0
Bisphenol A 80-05-7
4 4'-biphenol 92-88-6
Carbamazepine 298-46-4
Clotrimazole 23593-75-1
Dibutylpthalate 84-74-2
Diclofenac 15307-86-5
Dicofol 115-32-2
DTPA 67-43-6
EDTA 60-00-4
ETBE 637-92-3
Glyphosate 1071-83-6
HHCB 1222-05-5
Iopamidol 60166-93-0
Mecoprop 7085-19-0
4-methylbenzylidene camphor 36861-47-9
Musk ketone 81-14-1
Musk xylene 81-15-2
MTBE 1634-04-4
Napthalene-1,5-disulfonate 81-04-9
Octylmethoxycinnamate 5466-77-3
Quinoxyfen (5,7-dichloro-4-(p-
fluorophenoxy)quinoline 124495-18-7
Tetrabromobisphenol A (TBBP-A) 79-94-7
Tonalid (AHTN) 21145-77-7
7
2. Methods
2.1 Available computational methods for deriving EQS
There have been several recent reviews of available QSARs and QSPRs (referred to collectively
as QSARs from now on in this report) for estimating persistence, bioaccumulation and aquatic
toxicity, which are the most relevant endpoints for EQS derivation. Under REACH it is possible
to use data from QSARs instead of experimental data if four conditions are fulfilled (Bassan and
Worth 2008):
1. The model used is shown to be scientifically valid.
2. The model used is applicable to the chemical of interest.
3. The prediction is relevant for the regulatory purpose.
4. Appropriate documentation on the method and result is given (e.g., by using the QSAR
Model Reporting Format recommended by the European Commission2).
It seems reasonable to expect the same standards applied to the acceptability of QSARs under the
REACH regulations to apply equally to their use when deriving EQS under the Water Framework
Directive.
Estimation of persistence
Pavan and Worth (2006, 2008) review the estimation models for biodegradation used in many
jurisdictions to assess whether a substance is likely to persist in the environment. They point out
that under the WFD persistency in the environment is an important criterion for the prioritisation
of chemicals as dangerous to the aquatic environment. Most current biodegradability QSARs,
such as BIOWIN, use an approach in which a substance is decomposed into several fragments
and the model expresses biodegradability as a function of the contribution of each fragment in the
molecule. These types of models are successful in predicting ready biodegradability for between
72-80% of substances and non-ready biodegradability for between 80-85% of substances.
BIOWIN v4.02 provides a battery of models that give a qualitative yes/no prediction for ready
biodegradability. The USEPA’s PBT profiler3 takes the results from the BIOWIN 3 module and
converts these to DT50 estimates in days, which can then be used for comparison with regulatory
criteria for persistence. In contrast, the EU TGD and REACH guidance suggest that the outputs
from BIOWIN 1 and 2 should be used conservatively to confirm that a substance is not readily
biodegradable, with outputs predicting fast biodegradation not taken into account. In support of
this, Pavan and Worth (2006) also suggest that BIOWIN 5 and 6 can be used more reliably to
predict that a substance is not degradable. However, since the P criterion in PBT is expressed in
days, qualitative yes/no outputs will need to be converted into quantitative outputs in a way
similar to the PBT profiler.
2 http://ecb.jrc.ec.europa.eu/qsar/qsar-tools/index.php?c=QRF 3 www.pbtprofiler.net
8
Estimation of bioaccumulation
Pavan et al. (2006, 2008) review QSAR models for bioconcentration and describe how initial
attempts to model log BCF by log Kow alone were unsatisfactory. The BCFWIN software
(Meylan et al. 1999) in EPIWIN is based on measured BCF data for 694 chemicals, and includes
different models for different log Kow ranges, and correction factors for certain functional
groups. However, it tends to underestimate bioaccumulation potential. Dimitrov et al. (2003)
proposed a model for evaluating maximum bioconcentration potential (log BCFMAX) which
identifies all chemicals with high bioconcentration potential, but produces a large number of false
positives. Dimitrov et al. (2005) introduced a further model based on the log BCFMAX approach –
the BCF base-line – which allows reduction of bioconcentration potential by use of mitigating
properties such as molecular size, flexibility, ionisation and biotransformation. This approach to
modelling BCF has been incorporated into the CATABOL software.
Some approaches to estimating BCF, such as solvatochromic descriptor and molecular
connectivity index and fragment constant approaches do not require log Kow as an input
parameter. However, despite advances in the use of alternative parameters, log Kow remains a
key parameter in many estimates of bioaccumulation. Dearden and Worth (2007) provide clear,
step-by-step guidance on how to select software and QSPRs for estimating physicochemical
properties such as log Kow. They suggest that QSPR estimates for such parameters should be
obtained from at least two different software packages or methods, including use of measured
values if these are available. However, they caution against unquestioning preference of measured
over estimated values. This is because the applicability domain of property prediction software
uses training sets of many thousands of diverse chemicals so it is wide, and experimentally-
derived values are also subject to error (e.g., a mean error on log Kow of ~0.3 log unit). Dearden
et al. (2003) compared estimates of log Kow by 14 software programs for a 138-chemical test set.
They found that for the top six software packages 88.4 - 94.2% of predicted values were within +
0.5 log units of measured values (EPIWIN’s KOWWIN=89.1%) and the standard error ranged
from 0.27 - 0.34 log unit (KOWWIN=0.34). Sakuratani et al. (2007) also found that for a test set
of 134 simple organic chemicals KOWWIN predicted log Kow for the majority (130) reasonably
well and with a smaller standard error than several other programs.
Other promising approaches for estimating B in PBT include partial order ranking (Walker and
Carlsen 2002, Carlsen and Walker 2003) and structurally-based PBT screening (Papa and
Gramaticus 2006).
In risk assessment and EQS derivation the identification of bioaccumulation in potential food
items, such as fish, triggers further investigation of possible secondary poisoning up the food
chain from contaminated fish to mammalian and avian predators. This is why biota-based EQS
are proposed by the EC for hexachlorobenzene, hexachorobutadiene and methyl mercury. It
would be very useful in EQS derivation if QSARs for mammalian toxicity were available that
could translate estimates of priority substance concentration in fish into estimates of toxicity in
predatory mammals. Unfortunately, however, when compared with aquatic toxicity QSARs (see
later) there is only a small number of published mammalian toxicity QSARs and their accuracy is
questionable (Tsakovska et al. 2008). It is therefore not currently possible to use QSARs to
estimate secondary poisoning with sufficient reliability to help in the derivation of EQS.
Estimation of aquatic toxicity
Netzeva et al. (2007, 2008) review the use of QSARs for estimating aquatic toxicity. These are
generally based on functional classes, mode or mechanism of action, or statistical analyses of

9
descriptor properties for fish, invertebrates or algae. ECOSAR, implemented in EPIWIN, uses
several class-specific log Kow-based QSARs based on measured data to provide estimates for
fish, invertebrates and algae. Several other QSAR software applications are available for
estimating toxicity and there is a very extensive literature on QSARs for specific combinations of
chemical classes, modes of action and organisms.
However, the utility and predictive power of currently available models can be rather low. For
example, de Roode et al. (2006) examined ECOSAR, TOPKAT and two QSARs for polar and
non-polar narcosis. They found that the QSARs were unable to provide estimates for 28% of the
test set they used. Correlations between measured and estimated effects were significant for
TOPKAT and the QSAR for polar narcosis, but poor for ECOSAR and the non-polar narcosis
QSAR. When the authors allowed up to a 5-fold difference between estimated and measured
values, “correct” predictions occurred for 77%, 54%, 68% and 91% respectively for ECOSAR,
TOPKAT, and the polar and non-polar QSARs. Netzeva and Worth (2007) found a good
correlation (r2=0.81) between acute fish toxicity estimates by ECOSAR and TOPKAT for 341
pthalates, but the limited availability of measured data for these substances precluded
comparisons of estimated and measured values.
Netzeva et al. (2007) concluded from their extensive review that narcosis is the best represented
MoA for QSAR models, and that more and better quality QSAR models for estimating aquatic
toxicity are available in the order fish > daphnid > algae. This is probably because of the greater
expense in running studies with fish, so there is greater value in avoiding these through use of a
computational approach. They also identified the usefulness of compilations of QSAR estimates
(e.g., the Danish QSAR database accessed via the ECB website4, especially in the light of
increasingly complex QSAR modelling approaches.
2.2 Methods used in this report
The utility of QSARs for the derivation of WFD EQS was examined by using currently
prioritised and proposed substances as a case study. Metals and metalloids were excluded from
analysis in this report because aquatic toxicity QSARs are unavailable for these substances in
ECOSAR, and the utility of read-across for different salts of the same metal has been
demonstrated in previous work (Worth and Patlewicz 2007).
Toxtree v1.02 (Ideaconsult, http://ecb.jrc.it/qsar/qsar-tools/index.php?c=TOXTREE) was used to
assign a mode of action (MoA) class to each substance according to the Verhaar rules (Verhaar et
al. 1992). Estimates of persistence, bioaccumulation and aquatic ecotoxicity were made with the
EPI Suite v3.2 collection of QSARs (http://www.epa.gov/oppt/exposure/pubs/episuitedl.htm).
Specifically, BIOWIN (Boethling et al. 1994) was used to estimate persistence with the DT50 in
days calculated according to criteria in the USEPA’s PBT profiler5, BCFWIN (Meylan et al.
1999) was used to estimate bioaccumulation, and ECOSAR (Meylan and Howard 1998) was used
to estimate aquatic ecotoxicity. ECOSAR estimates were rejected if substance properties or
aquatic toxicity predictions fell outside QSAR domains or above estimated solubility limits.
Predicted log Kow results were used initially in this study although experimental log Kow
4 http://ecbqsar.jrc.it/ 5 www.pbtprofiler.net
10
measurements would also normally be used if available. We chose to use predicted rather than
experimental values in order to simulate the likely implications of QSAR use for EQS derivation
if substances are proposed for EQS for which there are no experimental log Kow data.
EQS for each substance based on measured ecotoxicity values were taken, where available, from
reports to the European Commission by either the Fraunhofer Institute or INERIS6. These are
subsequently referred to in this report as WFD data sheets. EQS based on QSAR estimates alone
were calculated using the assessment factors in Lepper (2005) as if the QSAR estimates were
themselves measured data.
Guidance on grouping of substances for read-across (OECD 2007b) was used to identify
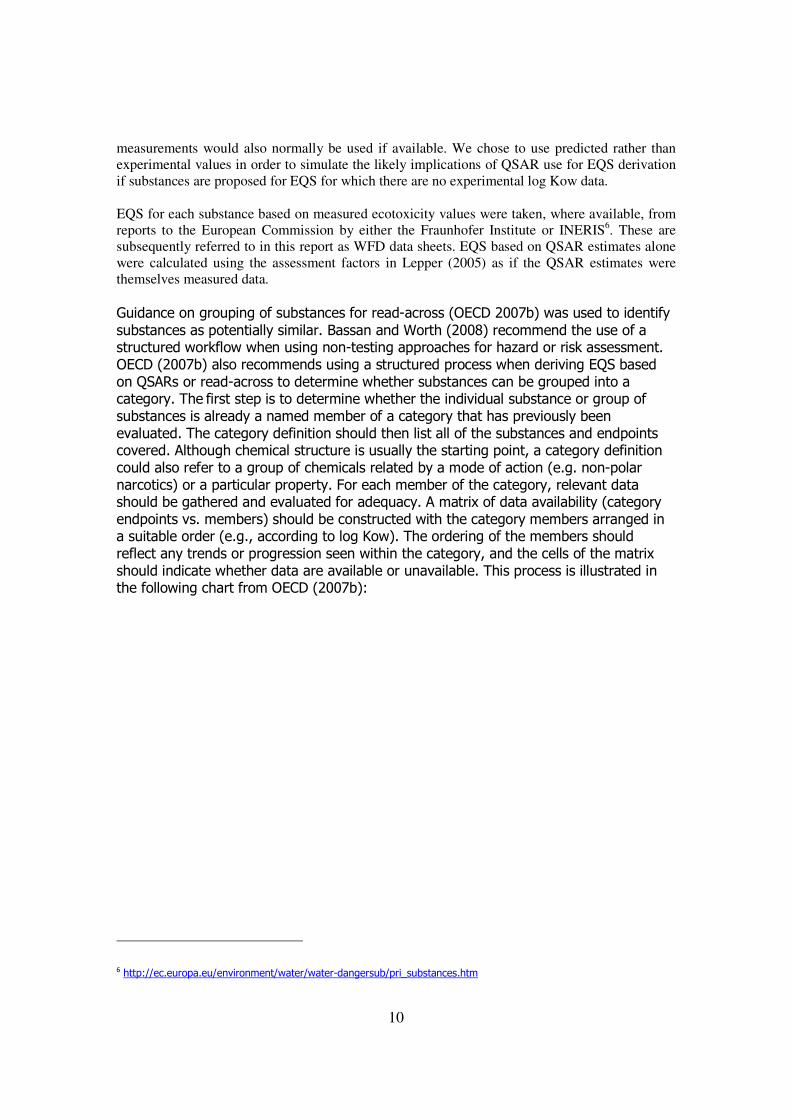
substances as potentially similar. Bassan and Worth (2008) recommend the use of a structured workflow when using non-testing approaches for hazard or risk assessment. OECD (2007b) also recommends using a structured process when deriving EQS based on QSARs or read-across to determine whether substances can be grouped into a category. The first step is to determine whether the individual substance or group of substances is already a named member of a category that has previously been evaluated. The category definition should then list all of the substances and endpoints covered. Although chemical structure is usually the starting point, a category definition could also refer to a group of chemicals related by a mode of action (e.g. non-polar narcotics) or a particular property. For each member of the category, relevant data should be gathered and evaluated for adequacy. A matrix of data availability (category endpoints vs. members) should be constructed with the category members arranged in a suitable order (e.g., according to log Kow). The ordering of the members should reflect any trends or progression seen within the category, and the cells of the matrix should indicate whether data are available or unavailable. This process is illustrated in the following chart from OECD (2007b):
6 http://ec.europa.eu/environment/water/water-dangersub/pri_substances.htm
11
Start
Develop category
hypothesis and definition
Identify individual members
of the category
Check whether the
substance is a member of a
suitable category that has
been already defined
Gather data for each
category member
Evaluation of the category
and fill data gaps
Evaluate available data
for adequacy
Stopyes
new or more data
Document the finalized
category and its rationale
Category approach may not
be feasible
Stop
revise category by adding /
removing members and/or
endpoints
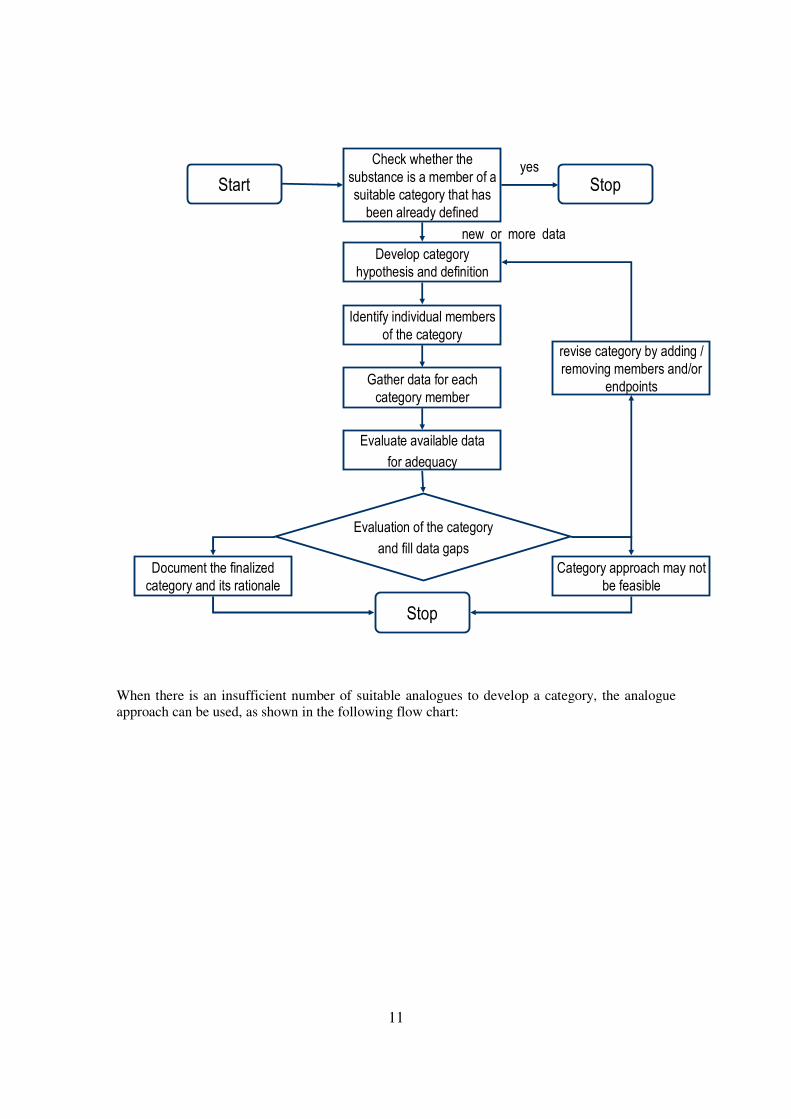
When there is an insufficient number of suitable analogues to develop a category, the analogue
approach can be used, as shown in the following flow chart:
12
6. document the analog
approach
Start
Search for
additional analogues
adequate
Not adequate
3. Data evaluation for
adequacy
4. Construct a matrix of data
availability
1. Identification of potential
analogues
2. Data gathering for
analogues
5. Assess adequacy
of analog approach,
and fill data gaps
Stop
Seven PAHs selected as priority substances were used to illustrate the use of the category
approach because of the availability of data for these substances, their identification as priority
substances, and previous work on grouping of PAHs into categories in EC WFD substance
datasheets. The seven substances were anthracene, fluoranthene, benzo-a-pyrene, benzo-b-
fluoranthene, benzo-g,h,i-perylene, benzo-k-fluoranthene, and indeno(1,2,3-cd)pyrene.
KOWWIN (Meylan and Howard 1995) was used to estimate log Kow for each of these
substances.
The OECD QSAR Application Toolbox v1 was also used in this approach to identify suitable
analogues from which to read across data to indeno(1,2,3-cd)pyrene. The target substance
(indeno(1,2,3-cd)pyrene) was profiled mechanistically by superfragment, EcoSAR classification,
13
OASIS acute toxicity MOA, DNA binding, protein binding, organic functional groups, Cramer
classification, and Verhaar classification.
Data from ecotoxicity tests were then gathered from the ECETOC, ECOTOX and OASIS aquatic
databases. As expected, no data were available for indeno(1,2,3-cd)pyrene, so a category was
defined on the basis of the EcoSAR classification (neutral organics), containing 2639 substances
in the OECD toolbox database. Ecotoxicological data were gathered for these substances from the
ECETOC, ECOTOX and OASIS aquatic databases and then sorted so that only the following
data were used for gap filling: fish (any species) NOEC data for studies of >30d duration, 21-d
Daphnia magna NOECs; and 72-h NOECs for any algal species. This produced 36 analogues
for read-across to a chronic fish NOEC, 38 analogues for read-across to a D. magna chronic
NOEC, and 11 analogues for read-across to a 72-h algal NOEC. Both the read-across (average
value of five nearest neighbours) and trend analysis functions (using logKow as the predictor) in
the OECD toolbox were used to fill ecotoxicity data gaps for indeno(1,2,3-cd)pyrene.
14
3. Results and discussion
3.1 Mode of action
A total of 61 organic substances remained after metals and metalloids were removed from the list
(Table 3). Toxtree identified 13 as Class 1 MoA (narcosis/baseline toxicity), 3 as Class 2 MoA
(less inert compounds), 14 as Class 3 MoA (unspecific reactivity), none as Class 4 MoA
(compounds acting by a specific mechanism), and 31 as Class 5 MoA (not possible to classify).
Hence the MoA of just over half of the substances prioritised by either the EC or the European
Parliament could not be classified by the Verhaar rules, and less than a quarter of them were
classified as operating via narcosis, which is the MoA for which most QSARs are currently
available.
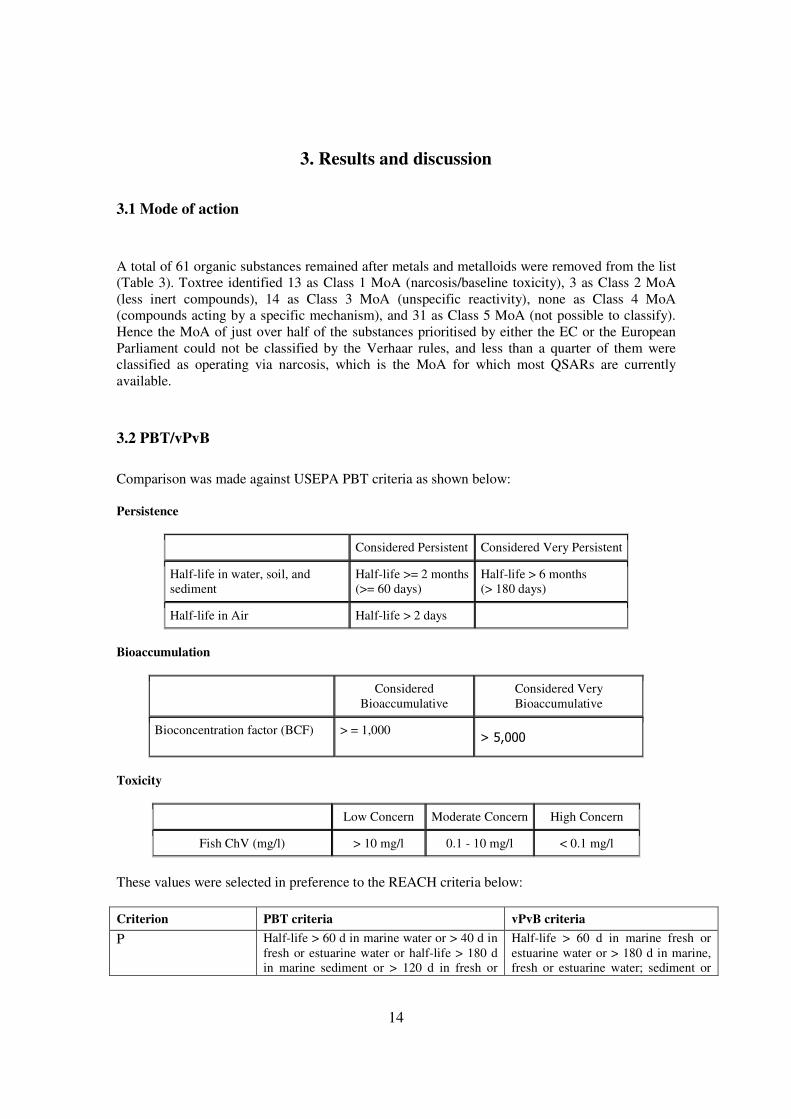
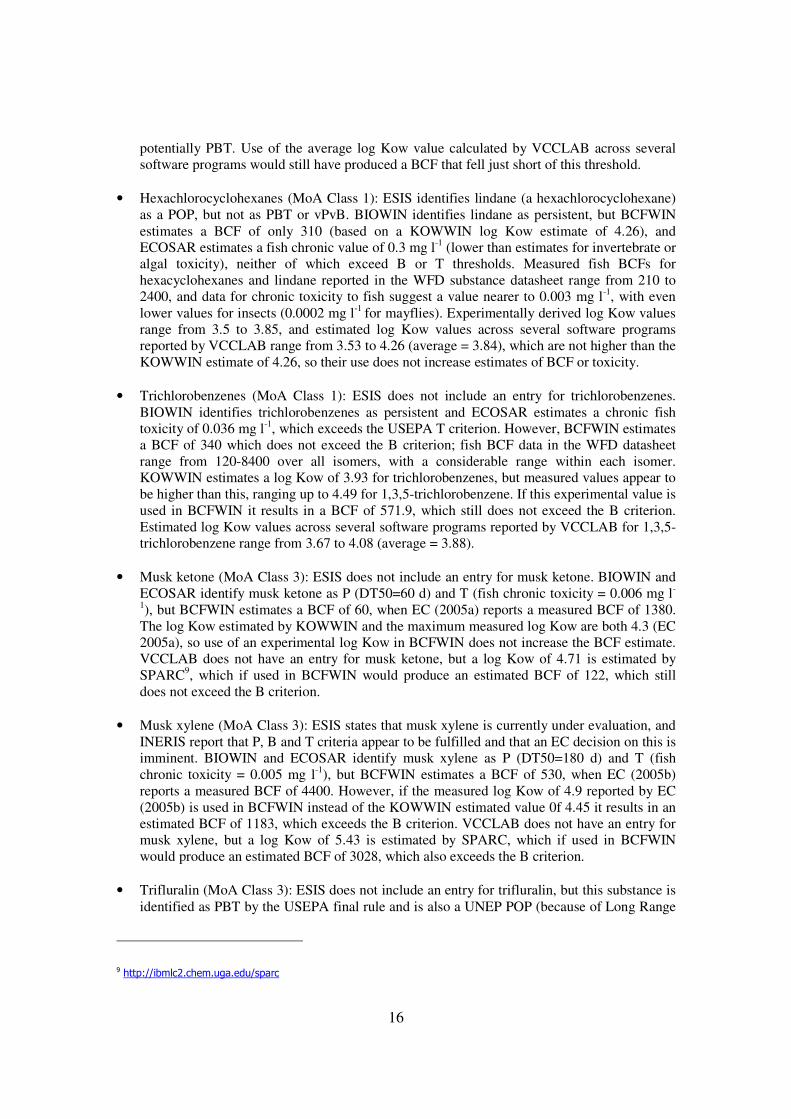
3.2 PBT/vPvB
Comparison was made against USEPA PBT criteria as shown below:
Persistence
Considered Persistent Considered Very Persistent
Half-life in water, soil, and
sediment
Half-life >= 2 months
(>= 60 days)
Half-life > 6 months
(> 180 days)
Half-life in Air Half-life > 2 days
Bioaccumulation
Considered
Bioaccumulative
Considered Very
Bioaccumulative
Bioconcentration factor (BCF) > = 1,000 > 5,000
Toxicity
Low Concern Moderate Concern High Concern
Fish ChV (mg/l) > 10 mg/l 0.1 - 10 mg/l < 0.1 mg/l
These values were selected in preference to the REACH criteria below:
Criterion PBT criteria vPvB criteria
P Half-life > 60 d in marine water or > 40 d in
fresh or estuarine water or half-life > 180 d
in marine sediment or > 120 d in fresh or
Half-life > 60 d in marine fresh or
estuarine water or > 180 d in marine,
fresh or estuarine water; sediment or
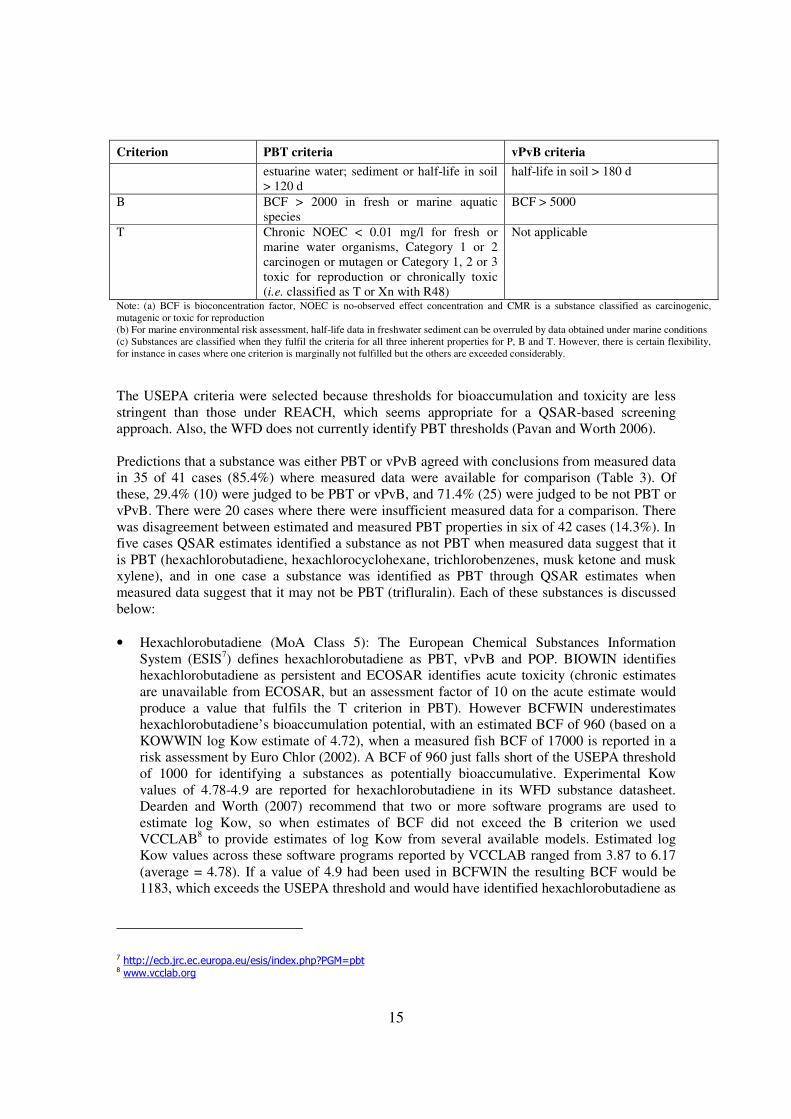
15
Criterion PBT criteria vPvB criteria
estuarine water; sediment or half-life in soil
> 120 d
half-life in soil > 180 d
B BCF > 2000 in fresh or marine aquatic
species
BCF > 5000
T Chronic NOEC < 0.01 mg/l for fresh or
marine water organisms, Category 1 or 2
carcinogen or mutagen or Category 1, 2 or 3
toxic for reproduction or chronically toxic
(i.e. classified as T or Xn with R48)
Not applicable
Note: (a) BCF is bioconcentration factor, NOEC is no-observed effect concentration and CMR is a substance classified as carcinogenic,
mutagenic or toxic for reproduction
(b) For marine environmental risk assessment, half-life data in freshwater sediment can be overruled by data obtained under marine conditions
(c) Substances are classified when they fulfil the criteria for all three inherent properties for P, B and T. However, there is certain flexibility,
for instance in cases where one criterion is marginally not fulfilled but the others are exceeded considerably.
The USEPA criteria were selected because thresholds for bioaccumulation and toxicity are less
stringent than those under REACH, which seems appropriate for a QSAR-based screening
approach. Also, the WFD does not currently identify PBT thresholds (Pavan and Worth 2006).
Predictions that a substance was either PBT or vPvB agreed with conclusions from measured data
in 35 of 41 cases (85.4%) where measured data were available for comparison (Table 3). Of
these, 29.4% (10) were judged to be PBT or vPvB, and 71.4% (25) were judged to be not PBT or
vPvB. There were 20 cases where there were insufficient measured data for a comparison. There
was disagreement between estimated and measured PBT properties in six of 42 cases (14.3%). In
five cases QSAR estimates identified a substance as not PBT when measured data suggest that it
is PBT (hexachlorobutadiene, hexachlorocyclohexane, trichlorobenzenes, musk ketone and musk
xylene), and in one case a substance was identified as PBT through QSAR estimates when
measured data suggest that it may not be PBT (trifluralin). Each of these substances is discussed
below:
• Hexachlorobutadiene (MoA Class 5): The European Chemical Substances Information
System (ESIS7) defines hexachlorobutadiene as PBT, vPvB and POP. BIOWIN identifies
hexachlorobutadiene as persistent and ECOSAR identifies acute toxicity (chronic estimates
are unavailable from ECOSAR, but an assessment factor of 10 on the acute estimate would
produce a value that fulfils the T criterion in PBT). However BCFWIN underestimates
hexachlorobutadiene’s bioaccumulation potential, with an estimated BCF of 960 (based on a
KOWWIN log Kow estimate of 4.72), when a measured fish BCF of 17000 is reported in a
risk assessment by Euro Chlor (2002). A BCF of 960 just falls short of the USEPA threshold
of 1000 for identifying a substances as potentially bioaccumulative. Experimental Kow
values of 4.78-4.9 are reported for hexachlorobutadiene in its WFD substance datasheet.
Dearden and Worth (2007) recommend that two or more software programs are used to
estimate log Kow, so when estimates of BCF did not exceed the B criterion we used
VCCLAB8 to provide estimates of log Kow from several available models. Estimated log
Kow values across these software programs reported by VCCLAB ranged from 3.87 to 6.17
(average = 4.78). If a value of 4.9 had been used in BCFWIN the resulting BCF would be
1183, which exceeds the USEPA threshold and would have identified hexachlorobutadiene as
7 http://ecb.jrc.ec.europa.eu/esis/index.php?PGM=pbt 8 www.vcclab.org
16
potentially PBT. Use of the average log Kow value calculated by VCCLAB across several
software programs would still have produced a BCF that fell just short of this threshold.
• Hexachlorocyclohexanes (MoA Class 1): ESIS identifies lindane (a hexachlorocyclohexane)
as a POP, but not as PBT or vPvB. BIOWIN identifies lindane as persistent, but BCFWIN
estimates a BCF of only 310 (based on a KOWWIN log Kow estimate of 4.26), and
ECOSAR estimates a fish chronic value of 0.3 mg l-1
(lower than estimates for invertebrate or
algal toxicity), neither of which exceed B or T thresholds. Measured fish BCFs for
hexacyclohexanes and lindane reported in the WFD substance datasheet range from 210 to
2400, and data for chronic toxicity to fish suggest a value nearer to 0.003 mg l-1
, with even
lower values for insects (0.0002 mg l-1
for mayflies). Experimentally derived log Kow values
range from 3.5 to 3.85, and estimated log Kow values across several software programs
reported by VCCLAB range from 3.53 to 4.26 (average = 3.84), which are not higher than the
KOWWIN estimate of 4.26, so their use does not increase estimates of BCF or toxicity.
• Trichlorobenzenes (MoA Class 1): ESIS does not include an entry for trichlorobenzenes.
BIOWIN identifies trichlorobenzenes as persistent and ECOSAR estimates a chronic fish
toxicity of 0.036 mg l-1
, which exceeds the USEPA T criterion. However, BCFWIN estimates
a BCF of 340 which does not exceed the B criterion; fish BCF data in the WFD datasheet
range from 120-8400 over all isomers, with a considerable range within each isomer.
KOWWIN estimates a log Kow of 3.93 for trichlorobenzenes, but measured values appear to
be higher than this, ranging up to 4.49 for 1,3,5-trichlorobenzene. If this experimental value is
used in BCFWIN it results in a BCF of 571.9, which still does not exceed the B criterion.
Estimated log Kow values across several software programs reported by VCCLAB for 1,3,5-
trichlorobenzene range from 3.67 to 4.08 (average = 3.88).
• Musk ketone (MoA Class 3): ESIS does not include an entry for musk ketone. BIOWIN and
ECOSAR identify musk ketone as P (DT50=60 d) and T (fish chronic toxicity = 0.006 mg l-
1), but BCFWIN estimates a BCF of 60, when EC (2005a) reports a measured BCF of 1380.
The log Kow estimated by KOWWIN and the maximum measured log Kow are both 4.3 (EC
2005a), so use of an experimental log Kow in BCFWIN does not increase the BCF estimate.
VCCLAB does not have an entry for musk ketone, but a log Kow of 4.71 is estimated by
SPARC9, which if used in BCFWIN would produce an estimated BCF of 122, which still
does not exceed the B criterion.
• Musk xylene (MoA Class 3): ESIS states that musk xylene is currently under evaluation, and
INERIS report that P, B and T criteria appear to be fulfilled and that an EC decision on this is
imminent. BIOWIN and ECOSAR identify musk xylene as P (DT50=180 d) and T (fish
chronic toxicity = 0.005 mg l-1
), but BCFWIN estimates a BCF of 530, when EC (2005b)
reports a measured BCF of 4400. However, if the measured log Kow of 4.9 reported by EC
(2005b) is used in BCFWIN instead of the KOWWIN estimated value 0f 4.45 it results in an
estimated BCF of 1183, which exceeds the B criterion. VCCLAB does not have an entry for
musk xylene, but a log Kow of 5.43 is estimated by SPARC, which if used in BCFWIN
would produce an estimated BCF of 3028, which also exceeds the B criterion.
• Trifluralin (MoA Class 3): ESIS does not include an entry for trifluralin, but this substance is
identified as PBT by the USEPA final rule and is also a UNEP POP (because of Long Range
9 http://ibmlc2.chem.uga.edu/sparc
17
Transport). However, despite this and although BIOWIN, BCFWIN and ECOSAR identify
trifluralin as PBT, measured data on persistence reported in the WFD substance datasheet
suggest a worst case DT50 in water of 13 days, which does not meet the minimum P
criterion.
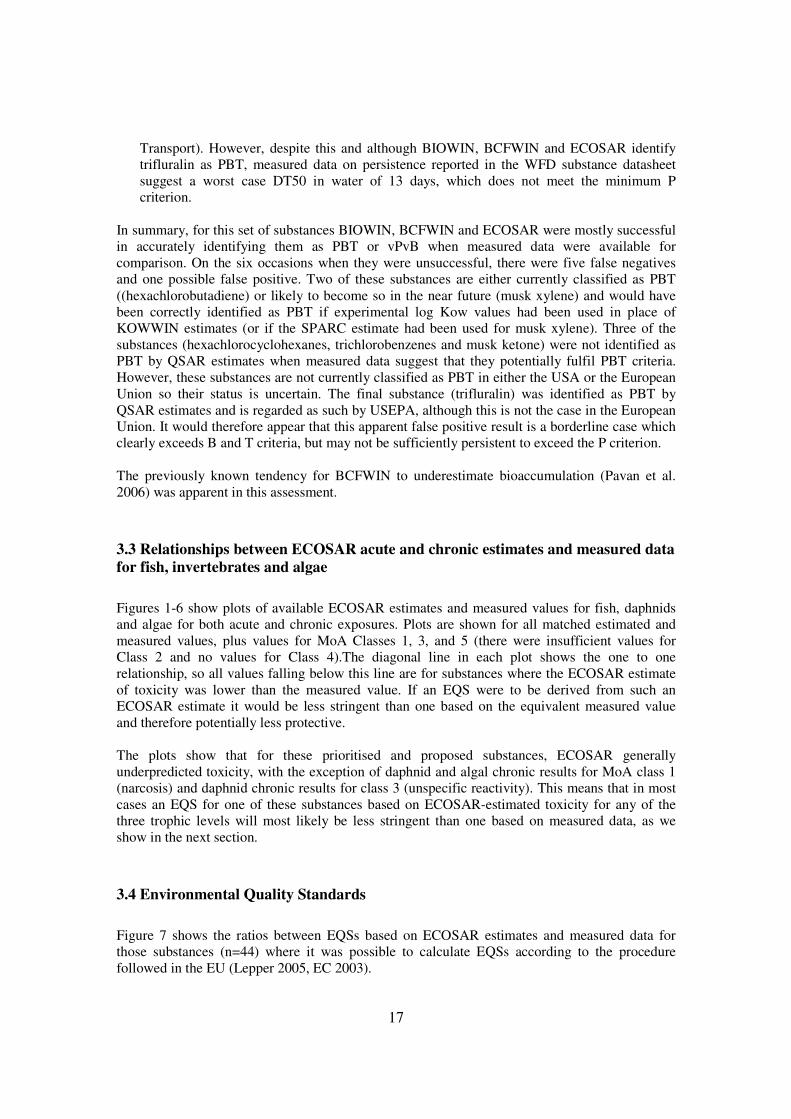
In summary, for this set of substances BIOWIN, BCFWIN and ECOSAR were mostly successful
in accurately identifying them as PBT or vPvB when measured data were available for
comparison. On the six occasions when they were unsuccessful, there were five false negatives
and one possible false positive. Two of these substances are either currently classified as PBT
((hexachlorobutadiene) or likely to become so in the near future (musk xylene) and would have
been correctly identified as PBT if experimental log Kow values had been used in place of
KOWWIN estimates (or if the SPARC estimate had been used for musk xylene). Three of the
substances (hexachlorocyclohexanes, trichlorobenzenes and musk ketone) were not identified as
PBT by QSAR estimates when measured data suggest that they potentially fulfil PBT criteria.
However, these substances are not currently classified as PBT in either the USA or the European
Union so their status is uncertain. The final substance (trifluralin) was identified as PBT by
QSAR estimates and is regarded as such by USEPA, although this is not the case in the European
Union. It would therefore appear that this apparent false positive result is a borderline case which
clearly exceeds B and T criteria, but may not be sufficiently persistent to exceed the P criterion.
The previously known tendency for BCFWIN to underestimate bioaccumulation (Pavan et al.
2006) was apparent in this assessment.
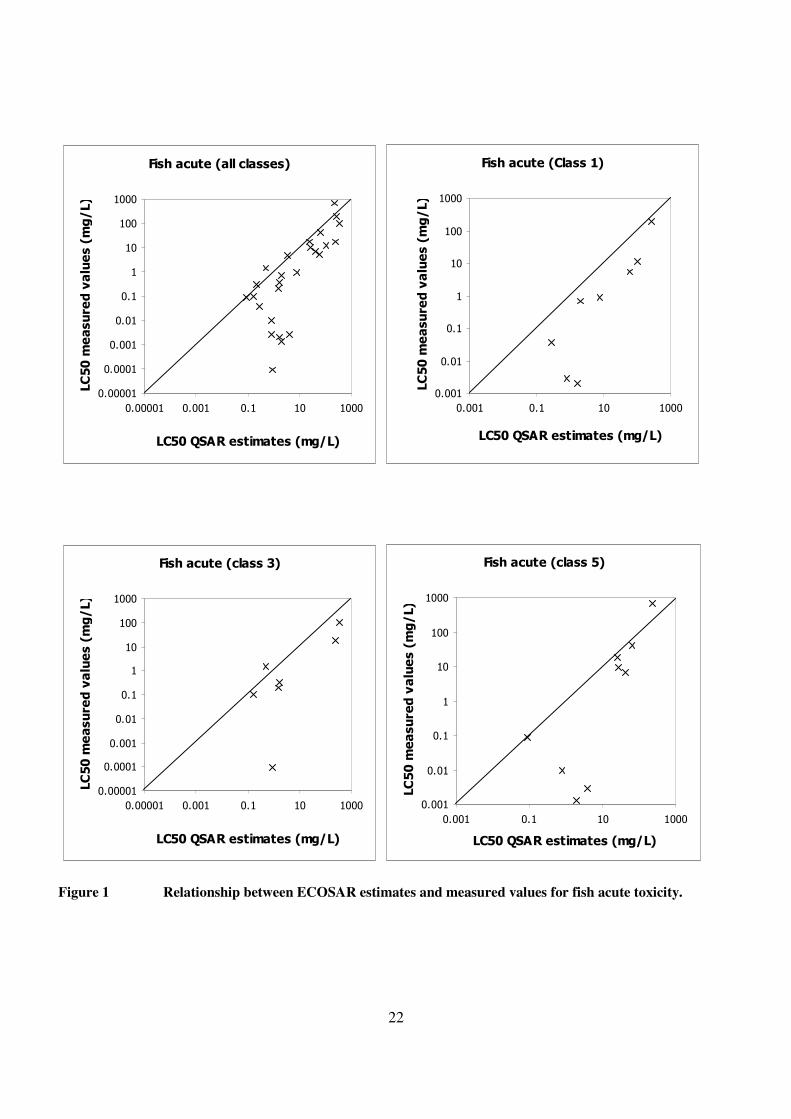
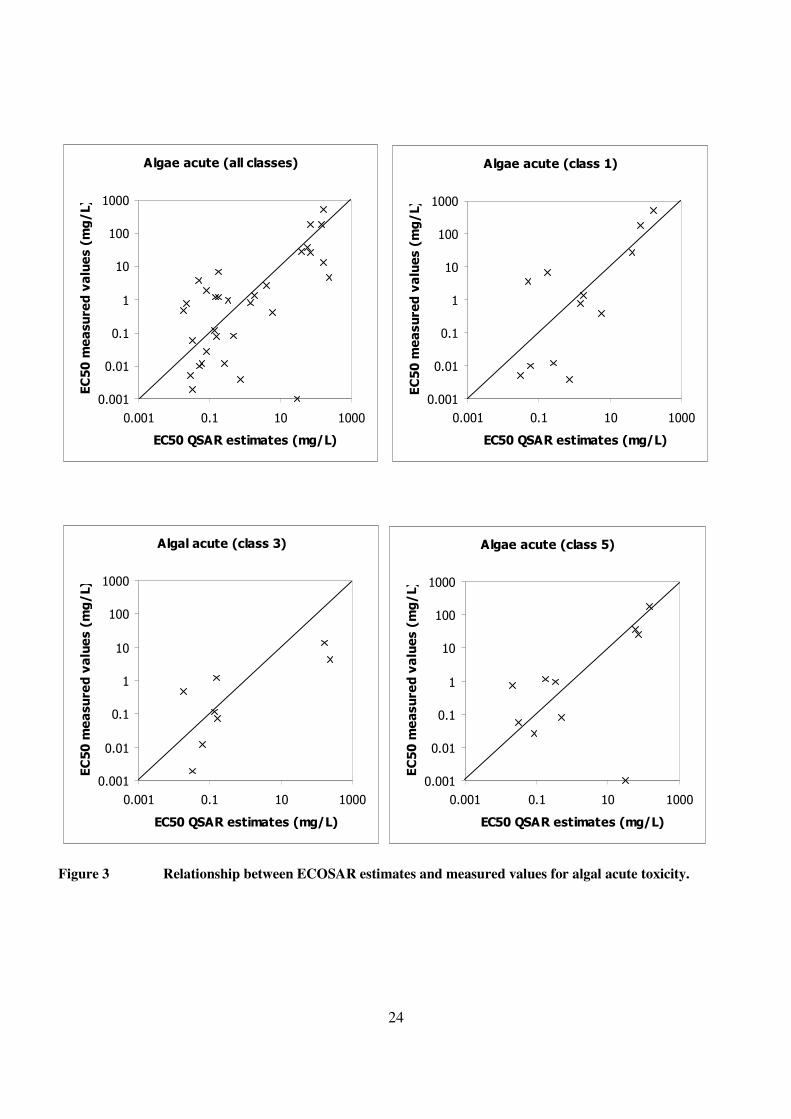
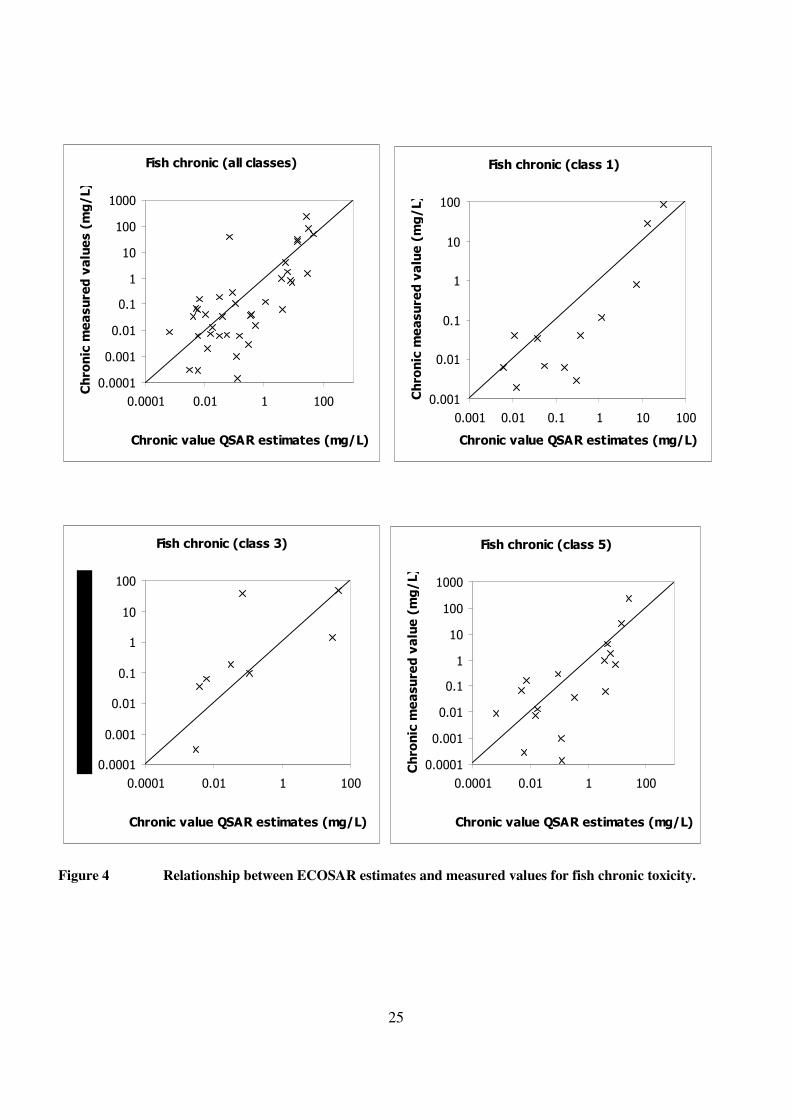
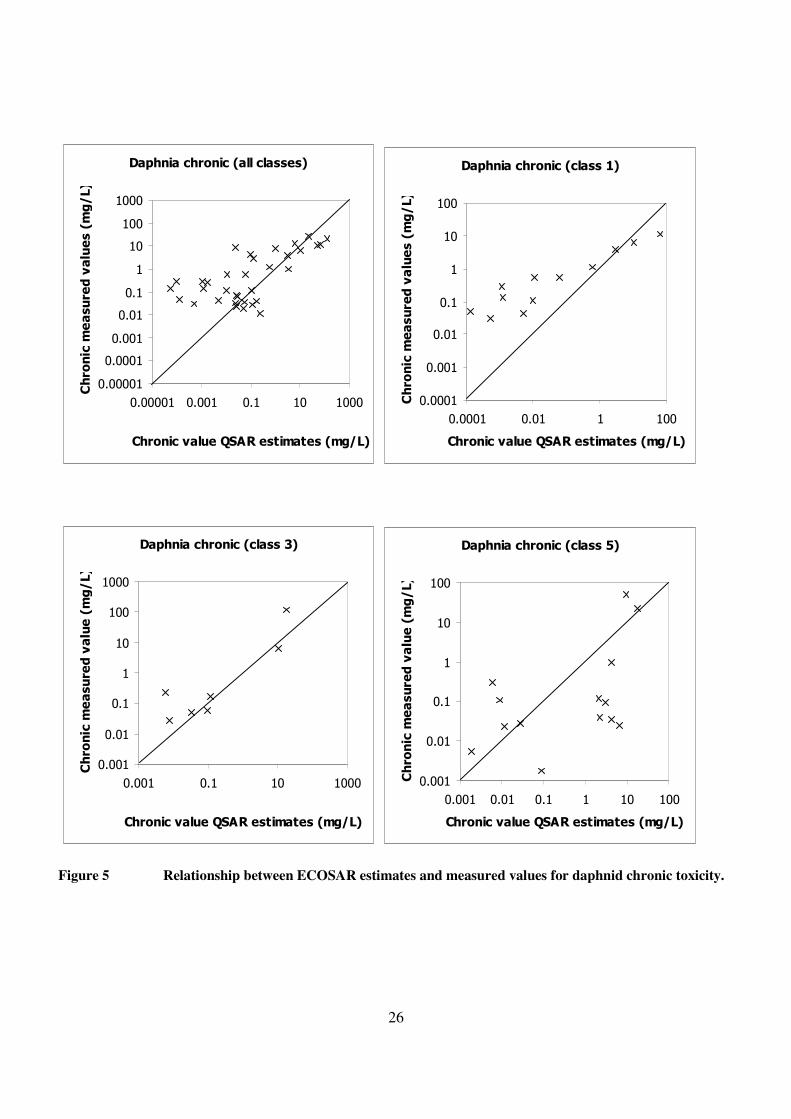
3.3 Relationships between ECOSAR acute and chronic estimates and measured data
for fish, invertebrates and algae
Figures 1-6 show plots of available ECOSAR estimates and measured values for fish, daphnids
and algae for both acute and chronic exposures. Plots are shown for all matched estimated and
measured values, plus values for MoA Classes 1, 3, and 5 (there were insufficient values for
Class 2 and no values for Class 4).The diagonal line in each plot shows the one to one
relationship, so all values falling below this line are for substances where the ECOSAR estimate
of toxicity was lower than the measured value. If an EQS were to be derived from such an
ECOSAR estimate it would be less stringent than one based on the equivalent measured value
and therefore potentially less protective.
The plots show that for these prioritised and proposed substances, ECOSAR generally
underpredicted toxicity, with the exception of daphnid and algal chronic results for MoA class 1
(narcosis) and daphnid chronic results for class 3 (unspecific reactivity). This means that in most
cases an EQS for one of these substances based on ECOSAR-estimated toxicity for any of the
three trophic levels will most likely be less stringent than one based on measured data, as we
show in the next section.
3.4 Environmental Quality Standards
Figure 7 shows the ratios between EQSs based on ECOSAR estimates and measured data for
those substances (n=44) where it was possible to calculate EQSs according to the procedure
followed in the EU (Lepper 2005, EC 2003).

18
Use of ECOSAR estimates alone when deriving PNECs led to more stringent (i.e. lower) EQS
values for 13 substances (29%), and to less stringent (i.e. higher) EQS values for 31 substances
(71%). Approximately half (48%) of the EQS based on QSAR estimates were within a factor of
10 of the EQS based on measured data. However, for several substances, including some from
each of MoA classes 1, 3 and 5, EQS based on ECOSAR estimates alone differed from those
based on measured values by more than a hundred-fold. Such estimates would therefore be an
unreliable sole basis for setting EQS.
19
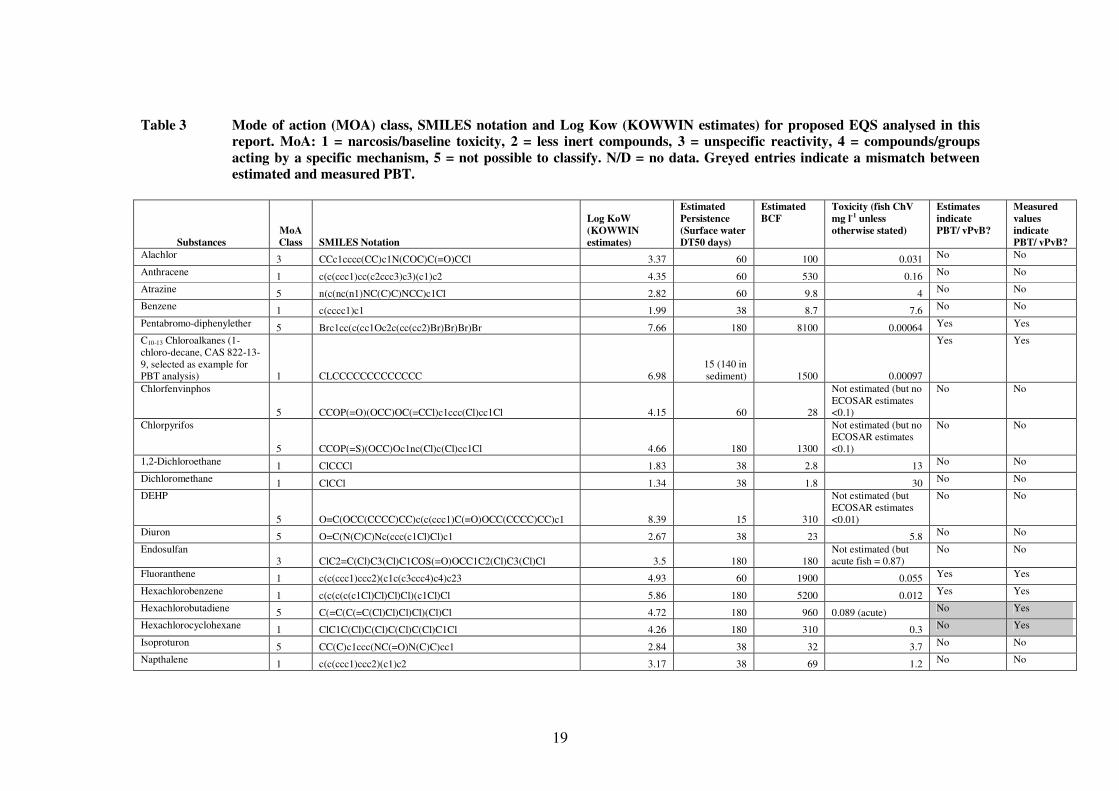
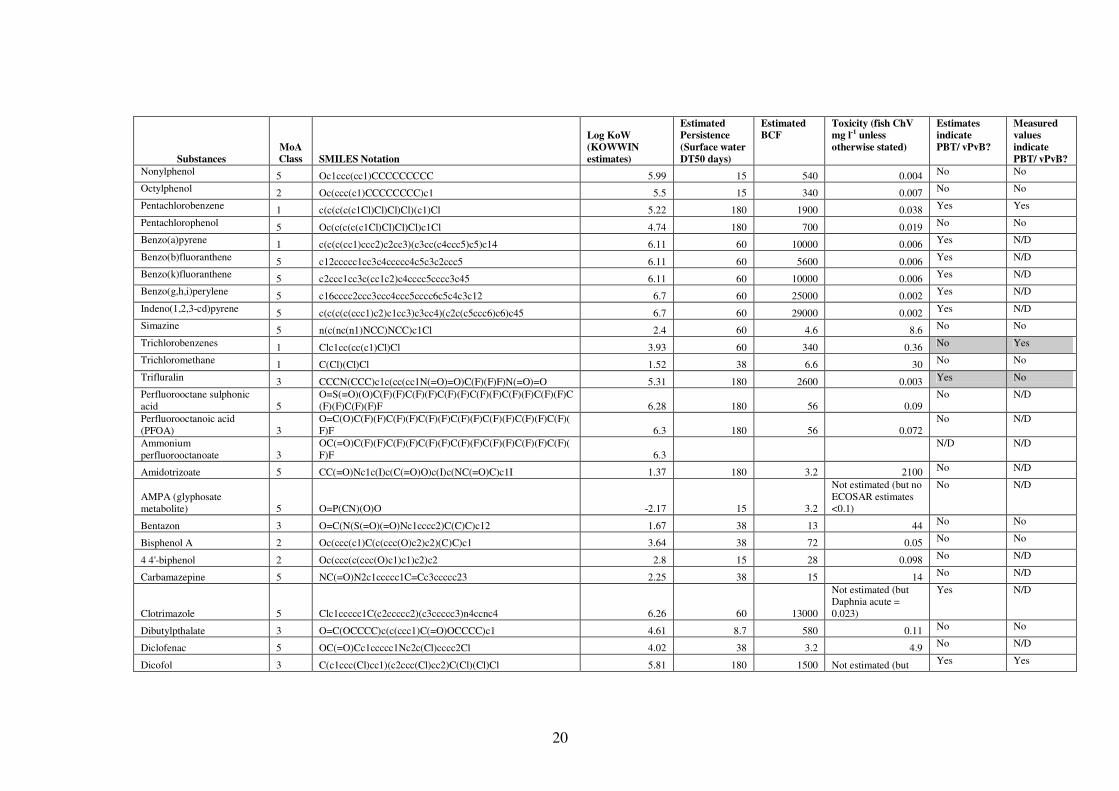
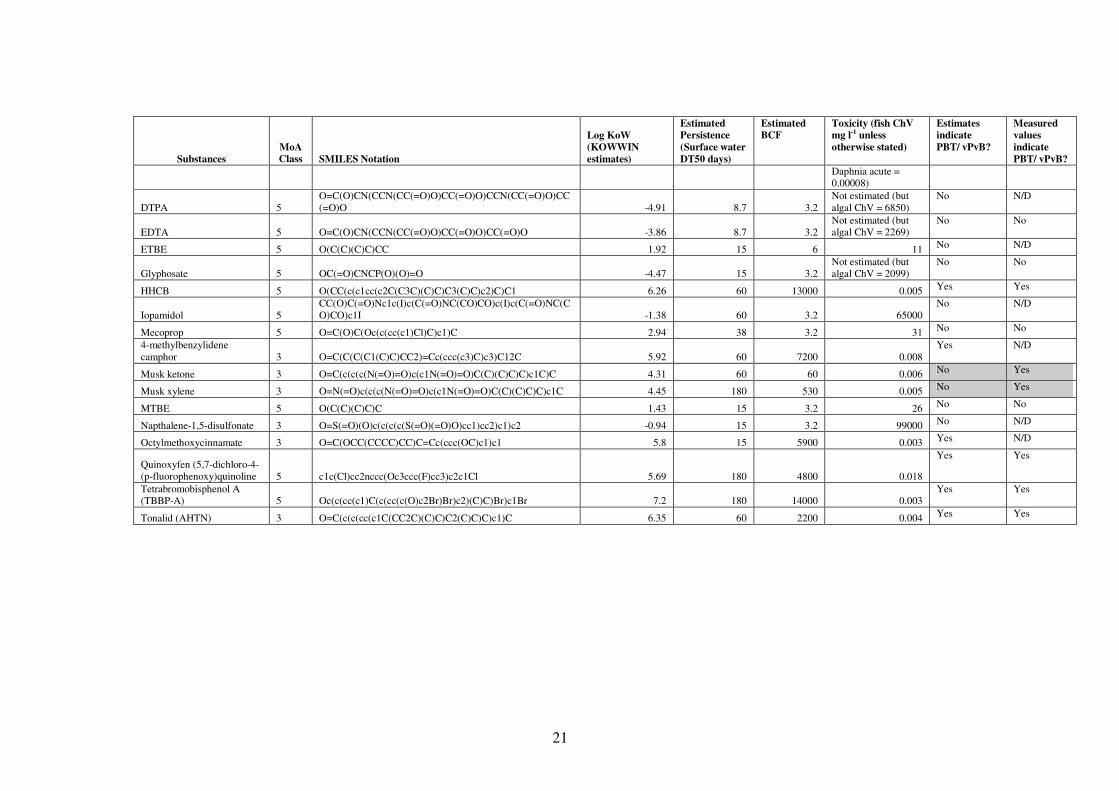
Table 3 Mode of action (MOA) class, SMILES notation and Log Kow (KOWWIN estimates) for proposed EQS analysed in this
report. MoA: 1 = narcosis/baseline toxicity, 2 = less inert compounds, 3 = unspecific reactivity, 4 = compounds/groups
acting by a specific mechanism, 5 = not possible to classify. N/D = no data. Greyed entries indicate a mismatch between
estimated and measured PBT.
Substances
MoA
Class SMILES Notation
Log KoW
(KOWWIN
estimates)
Estimated
Persistence
(Surface water
DT50 days)
Estimated
BCF
Toxicity (fish ChV
mg l-1 unless
otherwise stated)
Estimates
indicate
PBT/ vPvB?
Measured
values
indicate
PBT/ vPvB?
Alachlor 3 CCc1cccc(CC)c1N(COC)C(=O)CCl 3.37 60 100 0.031 No No
Anthracene 1 c(c(ccc1)cc(c2ccc3)c3)(c1)c2 4.35 60 530 0.16 No No
Atrazine 5 n(c(nc(n1)NC(C)C)NCC)c1Cl 2.82 60 9.8 4 No No
Benzene 1 c(cccc1)c1 1.99 38 8.7 7.6 No No
Pentabromo-diphenylether 5 Brc1cc(c(cc1Oc2c(cc(cc2)Br)Br)Br)Br 7.66 180 8100 0.00064 Yes Yes
C10-13 Chloroalkanes (1-
chloro-decane, CAS 822-13-
9, selected as example for
PBT analysis) 1 CLCCCCCCCCCCCCC 6.98
15 (140 in
sediment) 1500 0.00097
Yes Yes
Chlorfenvinphos
5 CCOP(=O)(OCC)OC(=CCl)c1ccc(Cl)cc1Cl 4.15 60 28
Not estimated (but no
ECOSAR estimates
<0.1)
No No
Chlorpyrifos
5 CCOP(=S)(OCC)Oc1nc(Cl)c(Cl)cc1Cl 4.66 180 1300
Not estimated (but no
ECOSAR estimates
<0.1)
No No
1,2-Dichloroethane 1 ClCCCl 1.83 38 2.8 13 No No
Dichloromethane 1 ClCCl 1.34 38 1.8 30
No No
DEHP
5 O=C(OCC(CCCC)CC)c(c(ccc1)C(=O)OCC(CCCC)CC)c1 8.39 15 310
Not estimated (but
ECOSAR estimates
<0.01)
No No
Diuron 5 O=C(N(C)C)Nc(ccc(c1Cl)Cl)c1 2.67 38 23 5.8 No No
Endosulfan
3 ClC2=C(Cl)C3(Cl)C1COS(=O)OCC1C2(Cl)C3(Cl)Cl 3.5 180 180
Not estimated (but
acute fish = 0.87)
No No
Fluoranthene 1 c(c(ccc1)ccc2)(c1c(c3ccc4)c4)c23 4.93 60 1900 0.055 Yes Yes
Hexachlorobenzene 1 c(c(c(c(c1Cl)Cl)Cl)Cl)(c1Cl)Cl 5.86 180 5200 0.012 Yes Yes
Hexachlorobutadiene 5 C(=C(C(=C(Cl)Cl)Cl)Cl)(Cl)Cl 4.72 180 960 0.089 (acute) No Yes
Hexachlorocyclohexane 1 ClC1C(Cl)C(Cl)C(Cl)C(Cl)C1Cl 4.26 180 310 0.3 No Yes
Isoproturon 5 CC(C)c1ccc(NC(=O)N(C)C)cc1 2.84 38 32 3.7 No No
Napthalene 1 c(c(ccc1)ccc2)(c1)c2 3.17 38 69 1.2 No No
20
Substances
MoA
Class SMILES Notation
Log KoW
(KOWWIN
estimates)
Estimated
Persistence
(Surface water
DT50 days)
Estimated
BCF
Toxicity (fish ChV
mg l-1 unless
otherwise stated)
Estimates
indicate
PBT/ vPvB?
Measured
values
indicate
PBT/ vPvB?
Nonylphenol 5 Oc1ccc(cc1)CCCCCCCCC 5.99 15 540 0.004 No No
Octylphenol 2 Oc(ccc(c1)CCCCCCCC)c1 5.5 15 340 0.007 No No
Pentachlorobenzene 1 c(c(c(c(c1Cl)Cl)Cl)Cl)(c1)Cl 5.22 180 1900 0.038 Yes Yes
Pentachlorophenol 5 Oc(c(c(c(c1Cl)Cl)Cl)Cl)c1Cl 4.74 180 700 0.019 No No
Benzo(a)pyrene 1 c(c(c(cc1)ccc2)c2cc3)(c3cc(c4ccc5)c5)c14 6.11 60 10000 0.006 Yes N/D
Benzo(b)fluoranthene 5 c12ccccc1cc3c4ccccc4c5c3c2ccc5 6.11 60 5600 0.006
Yes N/D
Benzo(k)fluoranthene 5 c2ccc1cc3c(cc1c2)c4cccc5cccc3c45 6.11 60 10000 0.006
Yes N/D
Benzo(g,h,i)perylene 5 c16cccc2ccc3ccc4ccc5cccc6c5c4c3c12 6.7 60 25000 0.002
Yes N/D
Indeno(1,2,3-cd)pyrene 5 c(c(c(c(ccc1)c2)c1cc3)c3cc4)(c2c(c5ccc6)c6)c45 6.7 60 29000 0.002 Yes N/D
Simazine 5 n(c(nc(n1)NCC)NCC)c1Cl 2.4 60 4.6 8.6 No No
Trichlorobenzenes 1 Clc1cc(cc(c1)Cl)Cl 3.93 60 340 0.36 No Yes
Trichloromethane 1 C(Cl)(Cl)Cl 1.52 38 6.6 30 No No
Trifluralin 3 CCCN(CCC)c1c(cc(cc1N(=O)=O)C(F)(F)F)N(=O)=O 5.31 180 2600 0.003 Yes No
Perfluorooctane sulphonic
acid 5
O=S(=O)(O)C(F)(F)C(F)(F)C(F)(F)C(F)(F)C(F)(F)C(F)(F)C
(F)(F)C(F)(F)F 6.28 180 56 0.09
No N/D
Perfluorooctanoic acid
(PFOA) 3
O=C(O)C(F)(F)C(F)(F)C(F)(F)C(F)(F)C(F)(F)C(F)(F)C(F)(
F)F 6.3 180 56 0.072
No N/D
Ammonium
perfluorooctanoate 3
OC(=O)C(F)(F)C(F)(F)C(F)(F)C(F)(F)C(F)(F)C(F)(F)C(F)(
F)F 6.3
N/D N/D
Amidotrizoate 5 CC(=O)Nc1c(I)c(C(=O)O)c(I)c(NC(=O)C)c1I 1.37 180 3.2 2100 No N/D
AMPA (glyphosate
metabolite) 5 O=P(CN)(O)O -2.17 15 3.2
Not estimated (but no
ECOSAR estimates
<0.1)
No N/D
Bentazon 3 O=C(N(S(=O)(=O)Nc1cccc2)C(C)C)c12 1.67 38 13 44 No No
Bisphenol A 2 Oc(ccc(c1)C(c(ccc(O)c2)c2)(C)C)c1 3.64 38 72 0.05 No No
4 4'-biphenol 2 Oc(ccc(c(ccc(O)c1)c1)c2)c2 2.8 15 28 0.098 No N/D
Carbamazepine 5 NC(=O)N2c1ccccc1C=Cc3ccccc23 2.25 38 15 14 No N/D
Clotrimazole 5 Clc1ccccc1C(c2ccccc2)(c3ccccc3)n4ccnc4 6.26 60 13000
Not estimated (but
Daphnia acute =
0.023)
Yes N/D
Dibutylpthalate 3 O=C(OCCCC)c(c(ccc1)C(=O)OCCCC)c1 4.61 8.7 580 0.11 No No
Diclofenac 5 OC(=O)Cc1ccccc1Nc2c(Cl)cccc2Cl 4.02 38 3.2 4.9 No N/D
Dicofol 3 C(c1ccc(Cl)cc1)(c2ccc(Cl)cc2)C(Cl)(Cl)Cl 5.81 180 1500 Not estimated (but Yes Yes
21
Substances
MoA
Class SMILES Notation
Log KoW
(KOWWIN
estimates)
Estimated
Persistence
(Surface water
DT50 days)
Estimated
BCF
Toxicity (fish ChV
mg l-1 unless
otherwise stated)
Estimates
indicate
PBT/ vPvB?
Measured
values
indicate
PBT/ vPvB?
Daphnia acute =
0.00008)
DTPA 5
O=C(O)CN(CCN(CC(=O)O)CC(=O)O)CCN(CC(=O)O)CC
(=O)O -4.91 8.7 3.2
Not estimated (but
algal ChV = 6850)
No N/D
EDTA 5 O=C(O)CN(CCN(CC(=O)O)CC(=O)O)CC(=O)O -3.86 8.7 3.2
Not estimated (but
algal ChV = 2269)
No No
ETBE 5 O(C(C)(C)C)CC 1.92 15 6 11 No N/D
Glyphosate 5 OC(=O)CNCP(O)(O)=O -4.47 15 3.2
Not estimated (but
algal ChV = 2099)
No No
HHCB 5 O(CC(c(c1cc(c2C(C3C)(C)C)C3(C)C)c2)C)C1 6.26 60 13000 0.005 Yes Yes
Iopamidol 5
CC(O)C(=O)Nc1c(I)c(C(=O)NC(CO)CO)c(I)c(C(=O)NC(C
O)CO)c1I -1.38 60 3.2 65000
No N/D
Mecoprop 5 O=C(O)C(Oc(c(cc(c1)Cl)C)c1)C 2.94 38 3.2 31 No No
4-methylbenzylidene
camphor 3 O=C(C(C(C1(C)C)CC2)=Cc(ccc(c3)C)c3)C12C 5.92 60 7200 0.008
Yes N/D
Musk ketone 3 O=C(c(c(c(N(=O)=O)c(c1N(=O)=O)C(C)(C)C)C)c1C)C 4.31 60 60 0.006 No Yes
Musk xylene 3 O=N(=O)c(c(c(N(=O)=O)c(c1N(=O)=O)C(C)(C)C)C)c1C 4.45 180 530 0.005 No Yes
MTBE 5 O(C(C)(C)C)C 1.43 15 3.2 26 No No
Napthalene-1,5-disulfonate 3 O=S(=O)(O)c(c(c(c(S(=O)(=O)O)cc1)cc2)c1)c2 -0.94 15 3.2 99000 No N/D
Octylmethoxycinnamate 3 O=C(OCC(CCCC)CC)C=Cc(ccc(OC)c1)c1 5.8 15 5900 0.003 Yes N/D
Quinoxyfen (5,7-dichloro-4-
(p-fluorophenoxy)quinoline 5 c1c(Cl)cc2nccc(Oc3ccc(F)cc3)c2c1Cl 5.69 180 4800 0.018
Yes Yes
Tetrabromobisphenol A
(TBBP-A) 5 Oc(c(cc(c1)C(c(cc(c(O)c2Br)Br)c2)(C)C)Br)c1Br 7.2 180 14000 0.003
Yes Yes
Tonalid (AHTN) 3 O=C(c(c(cc(c1C(CC2C)(C)C)C2(C)C)C)c1)C 6.35 60 2200 0.004 Yes Yes
22
Fish acute (all classes)
0.00001
0.0001
0.001
0.01
0.1
1
10
100
1000
0.00001 0.001 0.1 10 1000
LC50 QSAR estimates (mg/L)
LC50 measured values (mg/L)
Fish acute (Class 1)
0.001
0.01
0.1
1
10
100
1000
0.001 0.1 10 1000
LC50 QSAR estimates (mg/L)LC50 measured values (mg/L)
Fish acute (class 3)
0.00001
0.0001
0.001
0.01
0.1
1
10
100
1000
0.00001 0.001 0.1 10 1000
LC50 QSAR estimates (mg/L)
LC50 measured values (mg/L)
Fish acute (class 5)
0.001
0.01
0.1
1
10
100
1000
0.001 0.1 10 1000
LC50 QSAR estimates (mg/L)
LC50 measured values (mg/L)
Figure 1 Relationship between ECOSAR estimates and measured values for fish acute toxicity.

23
Daphnia acute (all classes)
0.0001
0.001
0.01
0.1
1
10
100
1000
10000
0.0001 0.01 1 100 10000
LC50 QSAR estimates (mg/L)
LC50 measured values (mg/L)
Daphnia acute (class 1)
0.001
0.01
0.1
1
10
100
1000
0.001 0.1 10 1000
LC50 QSAR estimates (mg/L)
LC50 measured values (mg/L)
Daphnia acute (Class 3)
0.01
0.1
1
10
100
1000
0.01 0.1 1 10 100 1000
LC50 QSAR estimates (mg/L)
LC50 measured values (mg/L)
Daphnia acute (class 5)
0.0001
0.001
0.01
0.1
1
10
100
1000
0.0001 0.01 1 100
LC50 QSAR estimates (mg/L)
LC50 measured values (mg/L)
Figure 2 Relationship between ECOSAR estimates and measured values for daphnid acute toxicity.
24
Algae acute (all classes)
0.001
0.01
0.1
1
10
100
1000
0.001 0.1 10 1000
EC50 QSAR estimates (mg/L)
EC50 measured values (mg/L)
Algae acute (class 1)
0.001
0.01
0.1
1
10
100
1000
0.001 0.1 10 1000
EC50 QSAR estimates (mg/L)
EC50 measured values (mg/L)
Algal acute (class 3)
0.001
0.01
0.1
1
10
100
1000
0.001 0.1 10 1000
EC50 QSAR estimates (mg/L)
EC50 measured values (mg/L)
Algae acute (class 5)
0.001
0.01
0.1
1
10
100
1000
0.001 0.1 10 1000
EC50 QSAR estimates (mg/L)
EC50 measured values (mg/L)
Figure 3 Relationship between ECOSAR estimates and measured values for algal acute toxicity.
25
Fish chronic (all classes)
0.0001
0.001
0.01
0.1
1
10
100
1000
0.0001 0.01 1 100
Chronic value QSAR estimates (mg/L)
Chronic measured values (mg/L)
Fish chronic (class 1)
0.001
0.01
0.1
1
10
100
0.001 0.01 0.1 1 10 100
Chronic value QSAR estimates (mg/L)
Chronic measured value (mg/L)
Fish chronic (class 3)
0.0001
0.001
0.01
0.1
1
10
100
0.0001 0.01 1 100
Chronic value QSAR estimates (mg/L)
Fish chronic (class 5)
0.0001
0.001
0.01
0.1
1
10
100
1000
0.0001 0.01 1 100
Chronic value QSAR estimates (mg/L)
Chronic measured value (mg/L)
Figure 4 Relationship between ECOSAR estimates and measured values for fish chronic toxicity.
26
Daphnia chronic (all classes)
0.00001
0.0001
0.001
0.01
0.1
1
10
100
1000
0.00001 0.001 0.1 10 1000
Chronic value QSAR estimates (mg/L)
Chronic measured values (mg/L)
Daphnia chronic (class 1)
0.0001
0.001
0.01
0.1
1
10
100
0.0001 0.01 1 100
Chronic value QSAR estimates (mg/L)
Chronic measured values (mg/L)
Daphnia chronic (class 3)
0.001
0.01
0.1
1
10
100
1000
0.001 0.1 10 1000
Chronic value QSAR estimates (mg/L)
Chronic measured value (mg/L)
Daphnia chronic (class 5)
0.001
0.01
0.1
1
10
100
0.001 0.01 0.1 1 10 100
Chronic value QSAR estimates (mg/L)
Chronic measured value (mg/L)
Figure 5 Relationship between ECOSAR estimates and measured values for daphnid chronic toxicity.
27
Algae chronic (all classes)
0.0001
0.001
0.01
0.1
1
10
100
1000
0.0001 0.01 1 100
Chronic value QSAR estimates (mg/L)
Chronic measured value (mg/L)
Algae chronic (class 1)
0.0001
0.001
0.01
0.1
1
10
100
1000
0.01 0.1 1 10 100 1000
Chronic value QSAR estimate (mg/L)
Chronic measured value (mg/L)
Algae chronic (class 3)
0.0001
0.001
0.01
0.1
1
10
100
0.0001 0.01 1 100
Chronic value QSAR estimates (mg/L)
Chronic measured value (mg/L)
Algae chronic (class 5)
0.0001
0.001
0.01
0.1
1
10
100
1000
0.0001 0.01 1 100
Chronic value QSAR estimates (mg/L)
Chronic measured value (mg/L)
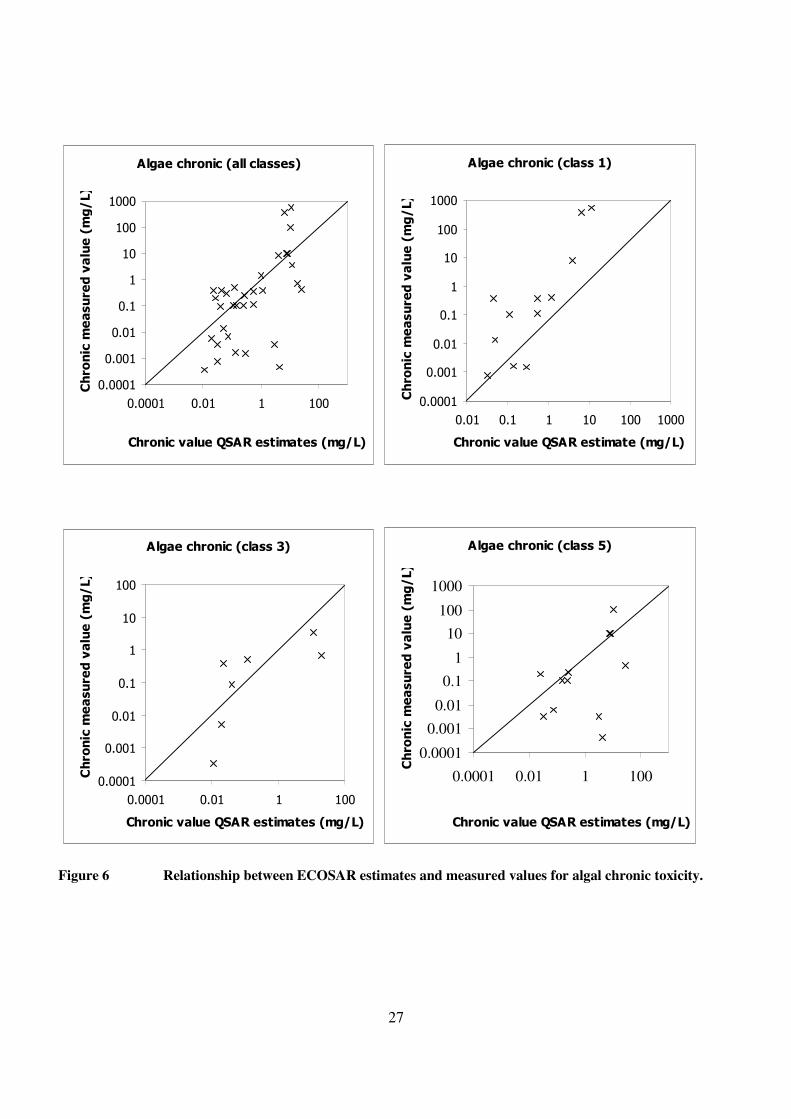
Figure 6 Relationship between ECOSAR estimates and measured values for algal chronic toxicity.
28
0.001
0.01
0.1
1
10
100
1000
10000
Perflu
oroocta
noic a
cid (3
)
PBDE (5
)
PFOS (5
)
Tetra
bromobisp
henol A
(5)
Musk ketone (5
)
HHCB (5
)
Tonalid
(3)
Hexachlorobutadiene (5
)
Dibutylpthalate (3
)
MTBE (5
)
Musk xy
lene (3
)
1,2-Dich
loroethane (1
)
Dich
loromethane (1
)
Nonylphenol (5
)
C10-13 Chloroalkanes (1
)
Alachlor (3
)
Quinoxyfen (5
)
Bisp
henol A
(2)
Pentachlorobenzene (1
)
Benzene (1
)
Diclo
fenac (5
)
Octy
lphenol (2
)
Pentachlorophenol (5
)
Trich
loromethane (3
)
Trich
lorobenzenes (1
)
Triflu
ralin
(3)
Benzo(a)pyrene (1
)
Dico
fol (3
)
Mecoprop (5
)
Benzo(k)flu
oranthene (5
)
Bentazon (3
)
Napthalene (1
)
Fluoranthene (1
)
Chlorfe
nvinphos (5
)
Atra
zine (5
)
Sim
azin
e (5
)
Chlorpyrifo
s (5)
Hexachlorobenzene (1
)
Anthracene (1
)
Endosulfa
n (3
)
Carbamazepine (5
)
Isoproturon (5
)
Hexachlorocyclo
hexane(1)
Diuron (5
)
Substance (and Verhaar MoA class)
Ratio estimated:m
easured
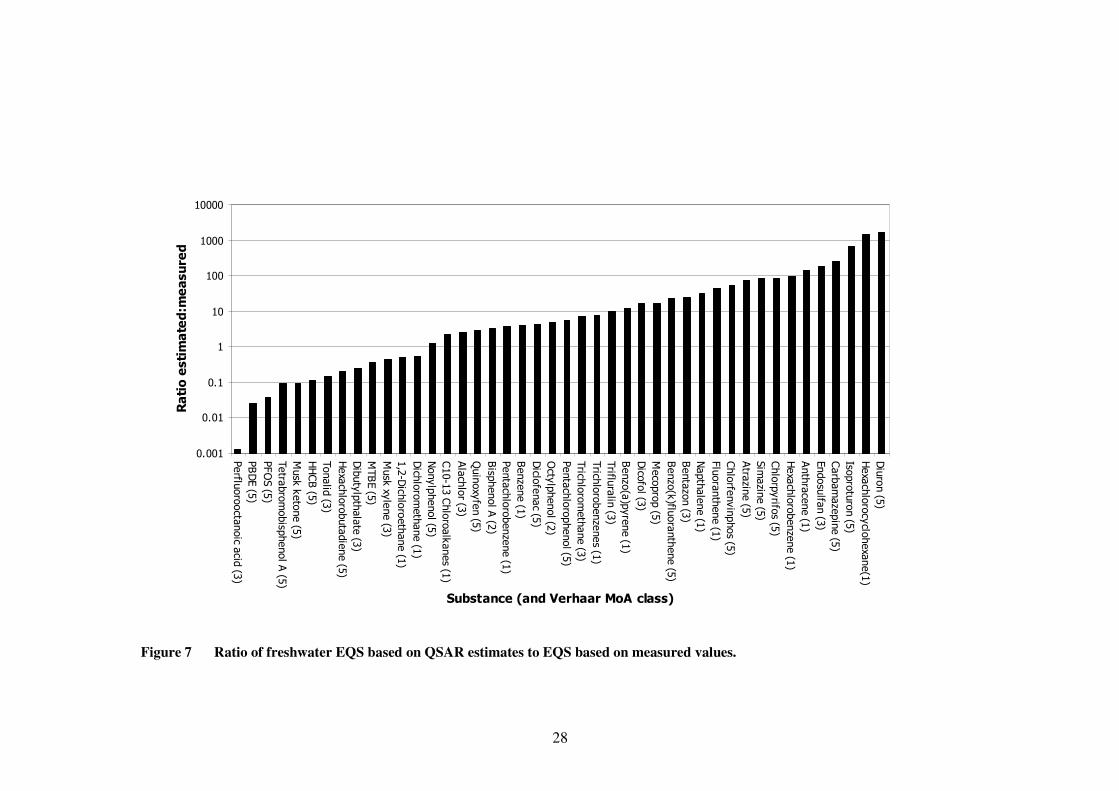
Figure 7 Ratio of freshwater EQS based on QSAR estimates to EQS based on measured values.
29
3.5 Most sensitive trophic level
The results above suggest that it would be unwise to rely solely on ECOSAR estimates when
deriving an EQS. However, can these estimates be used to identify the most sensitive trophic
group (fish, invertebrates or algae) so that data gaps can be filled efficiently by directing testing
towards the most sensitive trophic group?
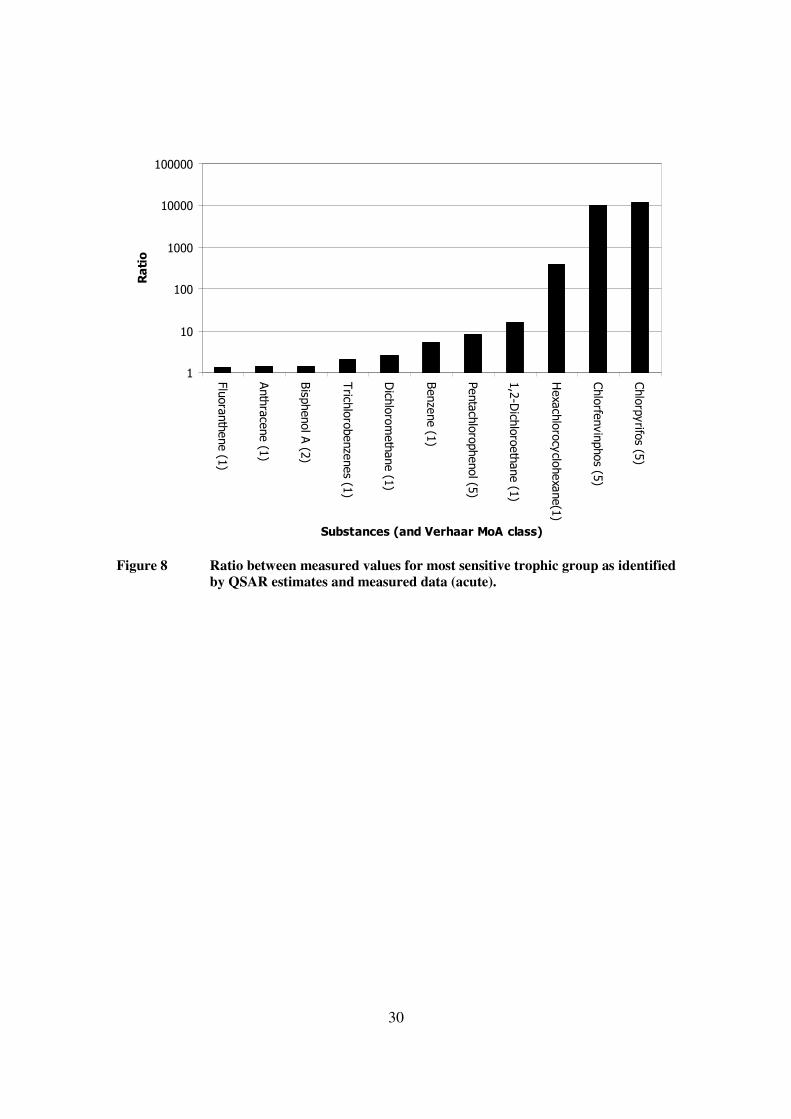
There were 18 substances for which complete base set ECOSAR estimates and measured data
were available for acute toxicity to fish, daphnids and algae. ECOSAR predicted the most
sensitive trophic group in seven of 18 cases (39%). In those cases where the most sensitive
trophic group was not predicted correctly, the difference in measured values for the ECOSAR
predicted and measured data trophic group ranged from just over 1 to 12000 (Figure 8).
There were 28 substances for which there were ECOSAR estimates and measured data for
chronic toxicity to fish, daphnids and algae. ECOSAR predicted the most sensitive trophic group
in nine of 28 cases (32%). In those cases where the most sensitive trophic group was not
predicted correctly, the difference in measured values for the ECOSAR predicted and measured
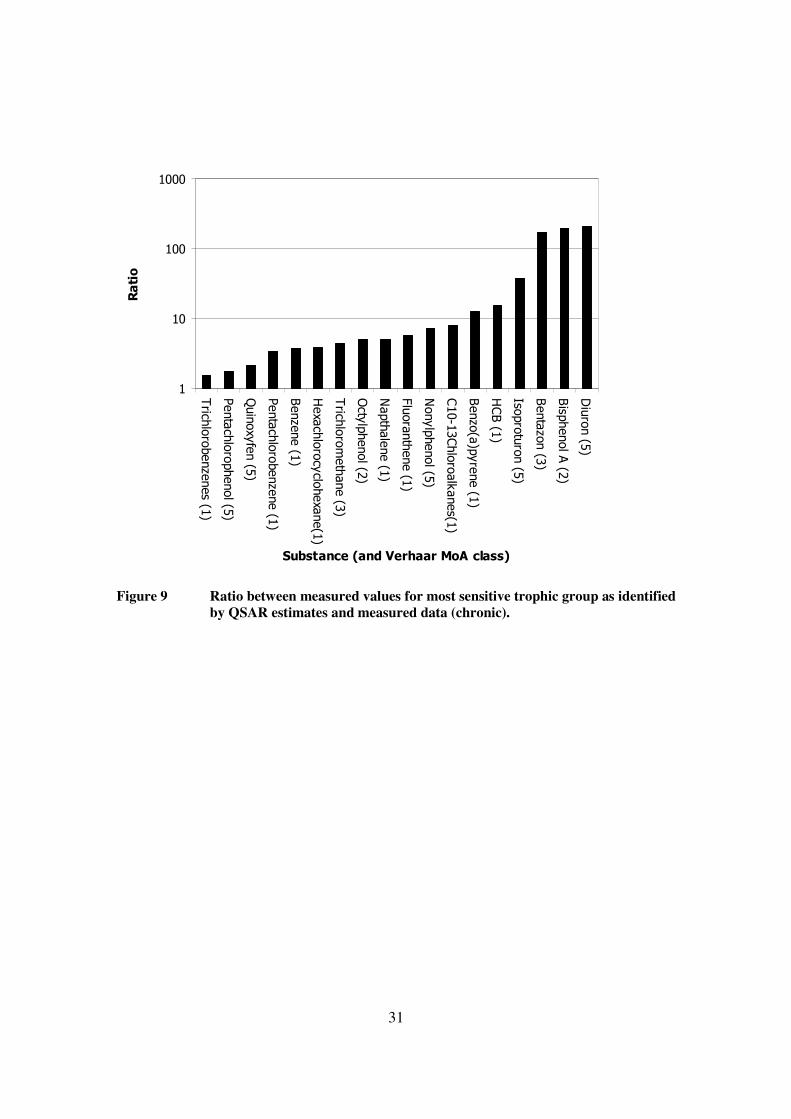
trophic group ranged from just over 1.5 to 657 (Figure 9).
These results suggest that for the types of substances for which EQS may be required, ECOSAR
cannot be used to identify the most sensitive trophic group for empirical testing with an
acceptable degree of reliability.
However, there are some occasions when there is a full measured acute base set of toxicity data
for fish, invertebrates and algae, but one or more measured chronic data are missing. The effect of
this is usually to increase the assessment factor from 10 to 50 (if one NOEC is missing), or from
10 to 100 (if two NOECs are missing) in line with guidance in the TGD (2003) and Lepper
(2005). There were 26 substances in the dataset for which there were both acute and chronic
measured data for fish, daphnids and algae. In 15 cases (58%) the most sensitive trophic group in
the acute data set was also the most sensitive trophic group in the chronic data set. For the 11
substances where this was not the case, the difference in measured chronic values between the
expected and observed most sensitive trophic group was less than ~5-fold for eight substances,
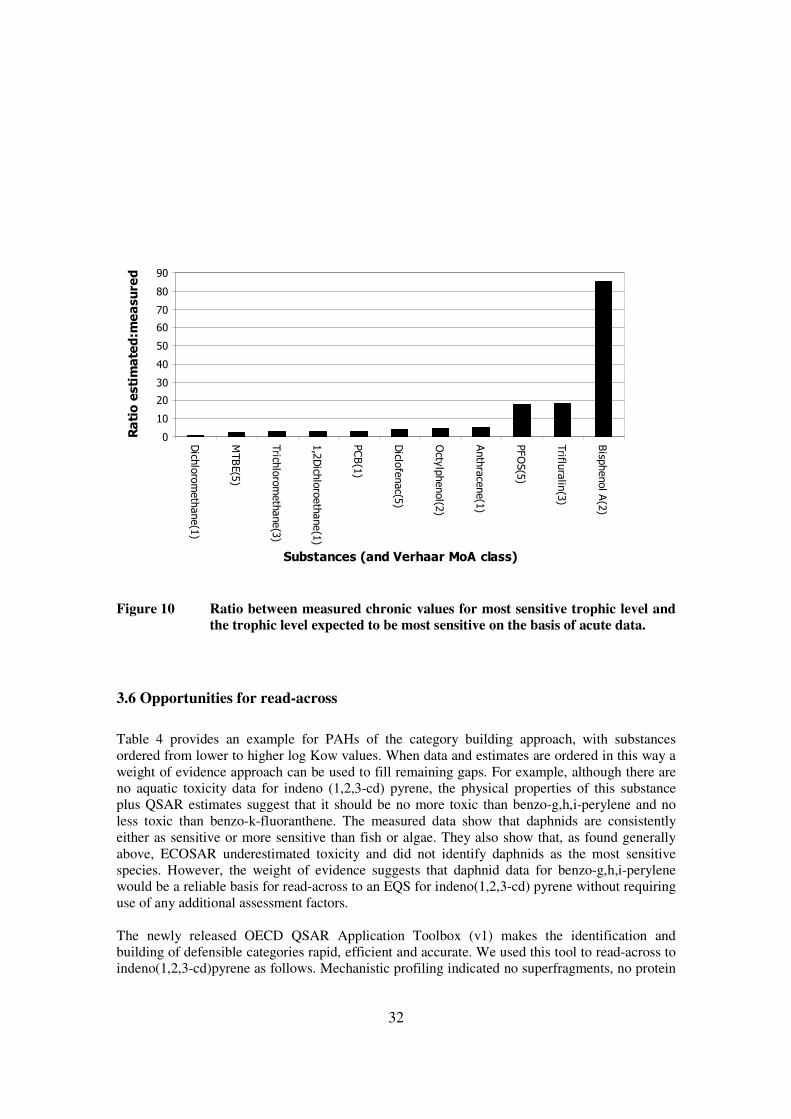
and less than ~18-fold for a further two substances (Figure 10). The difference was larger for the
endocrine active substance, bisphenol A, because algae were marginally more sensitive than fish
and daphnids in the acute dataset, but the effects of bisphenol A on fish reproduction in chronic
tests occurred at much lower levels than those affecting algal population growth. If these results
are generally representative, it should be possible to use an ECOSAR estimate to fill a gap in a
chronic dataset with a reasonable degree of confidence if the acute measured dataset does not
identify the gap as potentially for the most sensitive trophic group. A precautionary assessment
factor of 20 could be added to the PNEC derived from the most sensitive measured datum to
account for the possibility that it is not from the most sensitive trophic group. However, this
assessment factor would be lower than the factors of 50 and 100 that might currently be added if
the TGD (2003) and Lepper (2005) approaches were followed.
30
1
10
100
1000
10000
100000
Fluoranthene (1
)
Anthracene (1
)
Bisp
henol A
(2)
Trich
lorobenzenes (1
)
Dich
loromethane (1
)
Benzene (1
)
Pentachlorophenol (5
)
1,2-D
ichloroethane (1
)
Hexachlorocyclo
hexane(1)
Chlorfe
nvinphos (5
)
Chlorpyrifo
s (5)
Substances (and Verhaar MoA class)
Ratio
Figure 8 Ratio between measured values for most sensitive trophic group as identified
by QSAR estimates and measured data (acute).
31
1
10
100
1000
Trich
lorobenzenes (1
)
Pentachlorophenol (5
)
Quinoxyfen (5
)
Pentachlorobenzene (1
)
Benzene (1
)
Hexachlorocyclo
hexane(1)
Trich
loromethane (3
)
Octy
lphenol (2
)
Napthalene (1
)
Fluoranthene (1
)
Nonylphenol (5
)
C10-13Chloroalkanes(1
)
Benzo(a)pyrene (1
)
HCB (1
)
Isoproturon (5
)
Bentazon (3
)
Bisp
henol A
(2)
Diuron (5
)
Substance (and Verhaar MoA class)
Ratio
Figure 9 Ratio between measured values for most sensitive trophic group as identified
by QSAR estimates and measured data (chronic).
32
0
10
20
30
40
50
60
70
80
90
Dich
loromethane(1)
MTBE(5)
Trich
loromethane(3)
1,2Dich
loroethane(1)
PCB(1)
Diclo
fenac(5
)
Octy
lphenol(2
)
Anthracene(1)
PFOS(5)
Triflu
ralin
(3)
Bisp
henol A
(2)
Substances (and Verhaar MoA class)
Ratio estimated:m
easured
Figure 10 Ratio between measured chronic values for most sensitive trophic level and
the trophic level expected to be most sensitive on the basis of acute data.
3.6 Opportunities for read-across
Table 4 provides an example for PAHs of the category building approach, with substances
ordered from lower to higher log Kow values. When data and estimates are ordered in this way a
weight of evidence approach can be used to fill remaining gaps. For example, although there are
no aquatic toxicity data for indeno (1,2,3-cd) pyrene, the physical properties of this substance
plus QSAR estimates suggest that it should be no more toxic than benzo-g,h,i-perylene and no
less toxic than benzo-k-fluoranthene. The measured data show that daphnids are consistently
either as sensitive or more sensitive than fish or algae. They also show that, as found generally
above, ECOSAR underestimated toxicity and did not identify daphnids as the most sensitive
species. However, the weight of evidence suggests that daphnid data for benzo-g,h,i-perylene
would be a reliable basis for read-across to an EQS for indeno(1,2,3-cd) pyrene without requiring
use of any additional assessment factors.
The newly released OECD QSAR Application Toolbox (v1) makes the identification and
building of defensible categories rapid, efficient and accurate. We used this tool to read-across to
indeno(1,2,3-cd)pyrene as follows. Mechanistic profiling indicated no superfragments, no protein
33
binding, and failed to classify by either Cramer or Verhaar criteria. The program identified
organic functional groups as arene and fused polycyclic aromatic, and DNA binding as polycyclic
aromatic hydrocarbon. The EcoSAR classification was neutral organic, and OASIS acute toxicity
MOA was basesurface narcotic. We defined a category on the basis of the EcoSAR classification
and then gathered chronic fish, daphnid and algal data, as described in the methods section of this
report.
The result of read-across to indeno(1,2,3-cd)pyrene for chronic fish toxicity (n=36 analogues)
was a NOEC of 0.000112 mg l-1
using the read-across function and 0.0013 mg l-1
or 0.0002 mg l-1
using, respectively, a linear (r2=0.34) or quadratic (r
2=0.4) trend analysis function. This agrees
well with the ecotoxicity trend data shown in table 4, indicating that indeno(1,2,3-cd)pyrene is
between two to ten times more toxic to fish when compared with benzo-k-fluoranthene, if the
trend analysis result is used. Gap filling by interpolation was possible for fish, making this
estimate more reliable than gap filling by extrapolation, and allowing a high degree of confidence
to be placed on estimated results.
The result of read-across for chronic daphnid toxicity (n=38 analogues) was a NOEC of 0.0467
mg l-1
using the read-across function and 0.0023 mg l-1
or 0.0000594 mg l-1
using, respectively, a
linear (r2=0.61) or quadratic (r
2=0.65) trend analysis function. The result from linear extrapolation
is about one order of magnitude higher than a value obtained by interpolation between values for
benzo-a-pyrene and benzo-g,h,i-perylene in table 4, and the result from quadratic extrapolation is
about the same as the value for benzo-g,h,i-perylene. This indicates that use of the value for the
latter should be precautionary. Although gap filling was by extrapolation, the relatively good
model fits as shown by the r2 values, indicate that a reasonable degree of confidence can be
placed on estimated results.
The result of read-across for chronic algal toxicity (n=11 analogues) was a NOEC of 1.24 mg l-1
using the read-across function and 0.643 mg l-1
or 0.00088 mg l-1
using, respectively, a linear
(r2=0.0022) or quadratic (r
2=0.078) trend analysis function. The “analogues” for which suitable
algal data were available turned out to have much lower logKow values than indeno(1,2,3-
cd)pyrene, leading to a substantial degree of extrapolation rather than interpolation of toxicity
data for gap filling. The linear extrapolation value contrasts markedly with measured values in
Table 4, but the quadratic extrapolation produces a result very similar to measured values for
benzo-a-pyrene and benzo-g,h,i-perylene. However, the very poor fit of both the linear and
quadratic models as shown by the r2 values suggests that only low confidence should be placed on
estimated results.

34
Table 4 Example of read-across matrix for PAHs proposed as WFD EQS.
Substance Anthracene Fluoranthene Benzo-a-pyrene Benzo-b-
fluoranthene
Benzo-k-
fluoranthene
Indeno(1,2,3-cd)
pyrene
Benzo-g,h,i-
perylene
CAS RN 120-12-7 206-44-0 50-32-8 205-99-2 207-08-9 193-39-5 191-24-2
SMILES c(c(ccc1)cc(c2ccc3
)c3)(c1)c2
c(c(ccc1)ccc2)(c
1c(c3ccc4)c4)c2
3
c(c(c(cc1)ccc2)c2
cc3)(c3cc(c4ccc5
)c5)c14
c12ccccc1cc3c4ccc
cc4c5c3c2ccc5
c2ccc1cc3c(cc1c2)c4
cccc5cccc3c45
c(c(c(c(ccc1)c2)c1
cc3)c3cc4)(c2c(c5c
cc6)c6)c45
c16cccc2ccc3ccc4c
cc5cccc6c5c4c3c1
2
Molecular
weight 178.24 202.26 252.32 252.32 252.32 276.34 276.34
log Kow
4.35 (KOWIN);
3.45-4.54 (EC
datasheet)
4.93 (KOWIN);
5.13-5.33 (EC
datasheet)
6.11 (KOWIN);
5.97-6.15 (EC
datasheet)
6.11 (KOWIN);
6.04-6.57 (EC
datasheet)
6.11 (KOWIN); 6-
6.84 (EC datasheet)
6.7 (KOWIN);
4.19-6.4 (EC
datasheet)
6.7 (KOWIN);
6.18-7.23 (EC
datasheet)
Water
solubility
(mg/L)
3.177 (ECOSAR);
0.32-0.41 (EC
datasheet)
0.9232
(ECOSAR);
0.22-0.265 (EC
datasheet)
0.07207
(ECOSAR);
0.0034-0.0045
(EC datsheet)
0.07207
(ECOSAR); No
data (EC datasheet)
0.07207 (ECOSAR);
0.00055-0.0011 (EC
datasheet)
0.01974
(ECOSAR);
0.00005-0.357 (EC
datasheet)
0.01974
(ECOSAR);
0.00016- 0.0003
(EC datasheet)
Biodegradati
on (surface
water DT50
(d))
60 (BIOWIN); 150
(EC datasheet)
60 (BIOWIN);
No information
(EC datasheet)
60 (BIOWIN);
No information
(EC datasheet)
60 (BIOWIN); No
information (EC
datasheet)
60 (BIOWIN); No
information (EC
datasheet)
60 (BIOWIN); No
information (EC
datasheet)
60 (BIOWIN); No
information (EC
datasheet)
Bioaccumula
tion (fish)
530
(BCFWIN);162-
9370 (EC
datasheet)
1900
(BCFWIN);
1700 (EC
datasheet
(calculated))
10000(BCFWIN)
; 146-2700 (EC
datasheet)
5600 (BCFWIN);
No information
(EC datasheet)
10000 (BCFWIN);
8750 (EC datasheet
(calculated))
25000 (BCFWIN);
No information
(EC datasheet)
29000 (BCFWIN);
28183
(crustaceans, EC
datasheet)
Fish (FW) 96-h
LC50 = 0.817
Fish (FW) 96-h
LC50 = 0.264
Fish (SW) 96-h
LC50=0.583
Fish (SW) 96-h
LC50=0.249
Acute
toxicity
(mg/L)
ECOSAR
Daphnid 48-h
LC50 =1.029
Daphnid 48-h
LC50 =0.346
Fish and daphnid QSAR cutoff at log Kow=5 Fish and daphnid QSAR cutoff at log
Kow=5
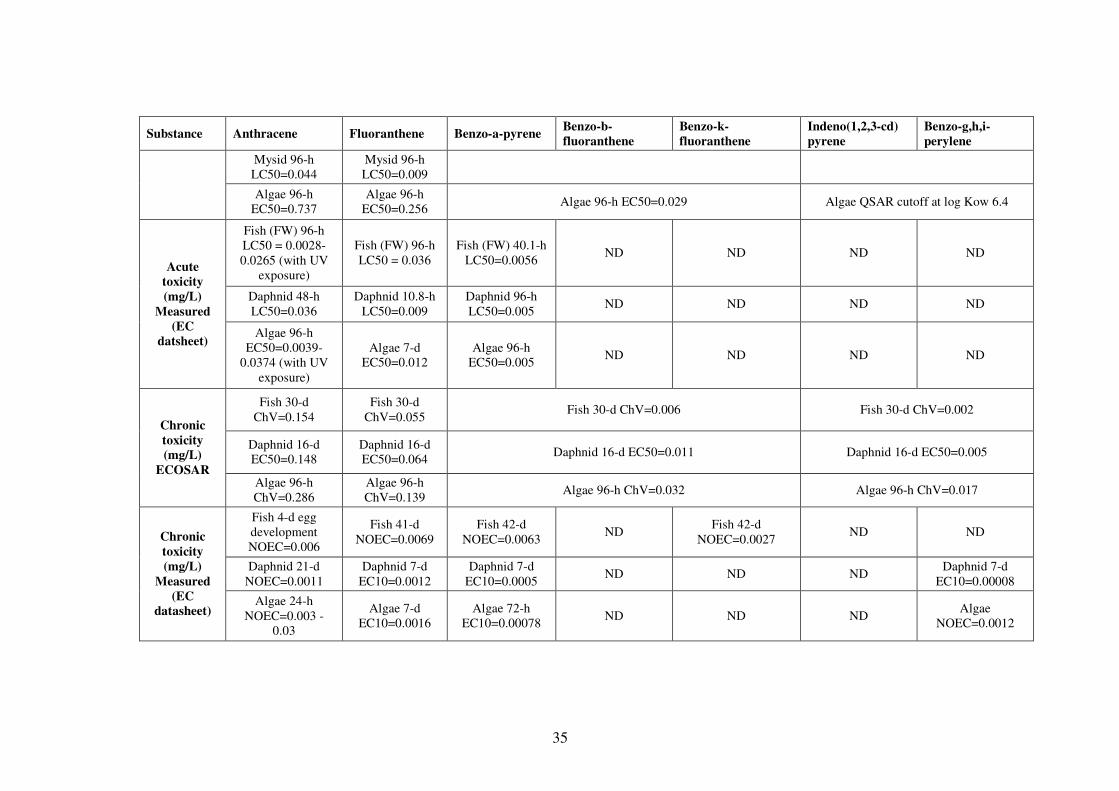
35
Substance Anthracene Fluoranthene Benzo-a-pyrene Benzo-b-
fluoranthene
Benzo-k-
fluoranthene
Indeno(1,2,3-cd)
pyrene
Benzo-g,h,i-
perylene
Mysid 96-h
LC50=0.044
Mysid 96-h
LC50=0.009
Algae 96-h
EC50=0.737
Algae 96-h
EC50=0.256 Algae 96-h EC50=0.029 Algae QSAR cutoff at log Kow 6.4
Fish (FW) 96-h
LC50 = 0.0028-
0.0265 (with UV
exposure)
Fish (FW) 96-h
LC50 = 0.036
Fish (FW) 40.1-h
LC50=0.0056 ND ND ND ND
Daphnid 48-h
LC50=0.036
Daphnid 10.8-h
LC50=0.009
Daphnid 96-h
LC50=0.005 ND ND ND ND
Acute
toxicity
(mg/L)
Measured
(EC
datsheet) Algae 96-h
EC50=0.0039-
0.0374 (with UV
exposure)
Algae 7-d
EC50=0.012
Algae 96-h
EC50=0.005 ND ND ND ND
Fish 30-d
ChV=0.154
Fish 30-d
ChV=0.055 Fish 30-d ChV=0.006 Fish 30-d ChV=0.002
Daphnid 16-d
EC50=0.148
Daphnid 16-d
EC50=0.064 Daphnid 16-d EC50=0.011 Daphnid 16-d EC50=0.005
Chronic
toxicity
(mg/L)
ECOSAR Algae 96-h
ChV=0.286
Algae 96-h
ChV=0.139 Algae 96-h ChV=0.032 Algae 96-h ChV=0.017
Fish 4-d egg
development
NOEC=0.006
Fish 41-d
NOEC=0.0069
Fish 42-d
NOEC=0.0063 ND
Fish 42-d
NOEC=0.0027 ND ND
Daphnid 21-d
NOEC=0.0011
Daphnid 7-d
EC10=0.0012
Daphnid 7-d
EC10=0.0005 ND ND ND
Daphnid 7-d
EC10=0.00008
Chronic
toxicity
(mg/L)
Measured
(EC
datasheet) Algae 24-h
NOEC=0.003 -
0.03
Algae 7-d
EC10=0.0016
Algae 72-h
EC10=0.00078 ND ND ND
Algae
NOEC=0.0012
36
4. Conclusions and Recommendations
The following conclusions and recommendations apply on the assumption that the substances
analysed in this report are representative of the types of substances for which EQS may also need
to be set in the future.
1. Identification of a substance as potentially PBT/vPvB is quite reliable using BIOWIN,
BCFWIN and ECOSAR. However, reduction of the criteria thresholds for identifying a
substance as potentially PBT when screened using only QSARs from those currently
recommended by REACH would reduce the probability that substances fulfilling PBT criteria
are missed. For example, in their QSAR-based PBT profiler (http://www.pbtprofiler.net/),
USEPA considers a BCF>1000 as indicating bioaccumulation potential and toxicity of <0.1
mg l-1
as indicating high concern.
2. The use of both measured and KOWWIN estimated log Kow values when estimating BCF
with BCFWIN will also reduce the incidence of false negative results, as will the use of at
least one other estimation program (e.g., VCCLAB or SPARC), although this will inevitably
lead to an increase in false positive results at this screening stage, which is appropriate.
3. Mammalian toxicity QSARs are not sufficiently reliable at present for use in estimating
secondary poisoning EQS. Therefore, if a substance is identified as bioaccumulative,
measured toxicity values (e.g., on rats or mink) are currently necessary for assessment of
secondary poisoning.
4. Sole reliance on QSARS in ECOSAR for estimating acute or chronic toxicity, and the
subsequent use of these results for setting an EQS, is not recommended because of the
tendency for ECOSAR to underestimate toxicity for the types of substances prioritised or
proposed for EQS derivation, sometimes by a substantial amount.
5. Read-across using a weight of evidence approach and all relevant measured and estimated
values for physical and ecotoxicological properties could be a valuable approach for deriving
EQS if measured data are available for interpolation to the substance and endpoint(s) of
interest, or if a reliable trend with low variability exists. The OECD QSAR Application
Toolbox is a highly useful tool for read across, but should be used in a weight of evidence
approach along with construction of a more traditional matrix of a few closely related
analogues. The de minimis dataset for reliable read-across should consist of:
a. Evidence of a consistent and reliable trend within a category of relevance to the
endpoint of interest (e.g., a monotonic increase in log Kow with an increase in
measured BCF and toxicity).
b. Consistent and reliable measured values to identify the most sensitive trophic
group, if toxicity is the endpoint of interest.
c. Reliable measured data for the endpoint of interest that allow interpolation to a
value for the substance of interest.
d. QSAR estimates may be useful in a weight of evidence role for supporting read-
across, but should not be used to replace the measured values identified in a – c
above.
6. For a single substance for which reliable read-across is not possible the minimum data
requirement for setting a freshwater chronic EQS, such as an annual average, should be a full
freshwater acute toxicity base set, plus chronic data for the most sensitive trophic group in the

37
acute data set. If validated QSARs are available for this substance they can be used to
estimate chronic toxic values for the two least acutely sensitive trophic groups. However, it
would be prudent to apply an assessment factor >10 (probably 20) to the single measured
chronic datum. This would account in most cases for any acute to chronic uncertainties in
trophic level sensitivity.
7. Practical outstanding research needs of relevance to EQS derivation are:
a. Further work on how to quantify substance persistence on the basis of QSAR
biodegradation outputs such as BIOWIN.
b. Comparison of bioaccumulation QSARs on substances likely to be prioritised for
EQS derivation, in order to select a model that is more accurate than BCFWIN.
The model proposed by Dimitrov et al. (2005) seems to show particular promise.
38
5. References
Bassan A, Worth A. 2008. The integrated use of models for the properties and effects of
chemicals by means of a structured workflow. QSAR & Combinatorial Science 27:6-20.
Boethling RS, Howard PH, Meylan WM, Stiteler W, Beauman J, Tirado N. 1994. Group
contribution method for predicting probability and rate of aerobic biodegradation.
Environmental Science and Technology 28:459-465.
Carlsen L, Walker JD. 2003. QSARs for prioritising PBT substances to promote pollution
prevention. QSAR & Combinatorial Science 22:49-57.
Dearden JC, Netzeva TI, Bibby R. 2003. A comparison of commercially available software
for the prediction of partition coefficient. In: Ford M, Livingstone D, Dearden J, van de
Waterbeemd H (Eds), Designing Drugs and Crop Protectants, Problems and Solutions.
Blackwell, Oxford, UK, pp 168-169.
Dearden J, Worth A. 2007. In silico prediction of physicochemical properties. EUR 23051
EN, European Commission Joint Research Centre, Ispra, Italy.
http://ecb.jrc.ec.europa.eu/qsar/publications/
De Roode D, Hoekzema C, De Vries-Buitenweg S, van de Waart B, van der Howeven J.
2006. QSARs in ecotoxicological risk assessment. Regulatory Toxicology & Pharmacology
45:24-35.
Dimitrov SD, Dimitrova NC, Walker JD, Veith GD, Mekenyan OG. 2003. Bioconcentration
potential predictions based on molecular attributes – an early warning approach for chemicals
found in humans, birds, fish and wildlife. QSAR & Combinatorial Science 22:58-67.
Dimitrov SD, Dimitrova NC, Parkerton TF, Comber M, Bonnell M, Mekenyan O. 2005.
Base-line model for identifying the bioaccumulation potential of chemicals. SAR & QSAR in
Environmental Research 16:531-554.
[EC] European Commission. 2000. Directive 2000/60/EC of the European Parliament and of
the Council of 23 October 2000 establishing a framework for Community action in the field
of water policy. Official Journal of the European Communities L327/1,22 December 2000.
[EC] European Commission. 2003. Technical Guidance Document in support of Commission
Directive 93/67/EEC on risk assessment for new notified substances, Commission Regulation
(EC) No. 1488/94 on Risk Assessment for Existing Substances and Directive 98/8/EC of the
European Parliament and of the Council concerning the placing of biocidal products on the
market. Ispra (IT): EC.
[EC] European Commission. 2005a. European Union Risk Assessment Report, 5-Tert-Butyl-
2,4,6-Trinitro-m-Xylene (Musk Ketone). 3rd priority list, volume 55. Rapporteur Member
States: The Netherlands. Final report.
http://ecb.jrc.ec.europa.eu/DOCUMENTS/Existing-
Chemicals/RISK_ASSESSMENT/REPORT/muskxylenereport322.pdf.
[EC] European Commission. 2005b. European Union Risk Assessment Report, 4'-Tert-Butyl-
2',6'-Dimethyl-3',5'-Dinitroacetophenone (Musk Xylene). 3rd priority list, volume 62.
Rapporteur Member States: The Netherlands. Final report.
39
http://ecb.jrc.ec.europa.eu/qsar/publications/DOCUMENTS/Existing-
Chemicals/RISK_ASSESSMENT/REPORT/ muskketonereport321.pdf
[EC] European Commission. 2006. Proposal for a Directive of the European Parliament and
of the Council on Environmental Quality Standards in the Field Water Quality Standards in
Europe—Integr Environ Assess Manag 3, 2007 295 of Water Policy and Amending Directive
2000/60/EC. COM(2006) 397 final. Brussels (BE): EC.
Euro Chlor. 2002. Risk Assessment for the Marine Environment. OSPARCOM Region: North
Sea – Hexachlorobutadiene
Intrinsik. 2008. Approaches to developing benchmarks for data-limited substances for the
protection of aquatic life. Project 60020 Draft Report to Environment Canada, Ottawa,
Canada.
Lepper P. 2005. Manual on the methodological framework to derive environmental quality
standards for priority substances in accordance with Article 16 of the Water Framework
Directive (2000/60/EC). Schmallenberg (DE): Fraunhofer-Institute Molecular Biology and
Applied Ecology.
Meylan, W.M. and P.H. Howard. 1995. Atom/fragment contribution method for estimating
octanol-water partition coefficients. J. Pharm. Sci. 84: 83-92.
Meylan WM, Howard PH. 1998. User’s Guide for the ECOSAR Class Program. MS-
Windows Version 0.99d. Syracuse Research Corporation, North Syracuse, NY.
Meylan WM, Howard PH, Boethling RS, Aronson D, Printup H, Gouchie S. 1999. Improved
method for estimating bioconcentration factor (BCF) from octanol-water partition coefficient.
Environmental Toxicology and Chemistry 18:664-672.
Netzeva T, Worth A. 2007. Classification of pthalates according to their (Q)SAR predicted
acute toxicity to fish: a case study. EUR 22623 EN, European Commission Joint Research
Centre, Ispra, Italy. http://ecb.jrc.ec.europa.eu/qsar/publications/
Netzeva TI, Pavan M, Worth AP. 2008. Review of data sources, QSARs and integrated
testing strategies for aquatic toxicity. EUR 22943 EN, European Commission Joint Research
Centre, Ispra, Italy. http://ecb.jrc.ec.europa.eu/qsar/publications/
Netzeva TI, Pavan M, Worth AP. 2008. Review of (Quantitative) Structure-Activity
Relationships for acute aquatic toxicity. QSAR & Combinatorial Science 27:77-90.
OECD. 2007a. report on the Regulatory Uses and Applications in OECD Member Countries
of (Quantitative) Structure-Activity Relationship [(Q)SAR] Models in the Assessment of New
and Existing Chemicals. ENV/JM/MONO(2006)25, Organisation for Economic Co-operation
and Development, Paris, France.
OECD. 2007b. Guidance on Grouping of Chemicals. ENV/JM/MONO(2007)28 Series on
Testing and Assessment Number 80, Organisation for Economic Co-operation and
Development, Paris, France.
Papa E, Gramatica P. 2006. Structurally-based PBT profiler: the PBT index from molecular
structure. SETAC Europe 16th Annual Meeting, the Hague, the Netherlands.
Pavan M, Netzeva TI, Worth AP. 2006. Review of QSAR models for bioconcentration. EUR
22327 EN, European Commission Joint Research Centre, Ispra, Italy.
40
http://ecb.jrc.ec.europa.eu/qsar/publications/
Pavan M, Netzeva TI, Worth AP. 2008. Review of literature-based Quantitative Structure-
Activity Relationship models for bioconcentration. QSAR & Combinatorial Science 27:21-
31.
Pavan & Worth AP. 2006. Review of QSAR models for ready biodegradation. EUR 22355
EN, European Commission Joint Research Centre, Ispra, Ita.
Pavan & Worth AP. 2008. Review of estimation models for biodegradation. QSAR &
Combinatorial Science 27:32-40.
Sakuratani Y, Kasai K, Noguchi Y, Yamada J. 2007. Comparison of predictivities of log P
calculation models based on experimental data for 134 simple organic compounds. QSAR &
Combinatorial Science 26:109-116.
Vehaar HJM, van Leeuven C, Hermens JLM. 1992. Classifying environmental pollutants. 1.
Structure-activity relationships for prediction of aquatic toxicity. Chemosphere 25:471-491.
Tsakovska I, Lessigiarska I, Netzeva T, Worth AP. 2008. A mini review of mammalian
toxicity (Q)SAR models. QSAR & Combinatorial Science 27:41-48.
Walker JD, Carlsen L. 2002. QSARs for identifying and prioritizing substances with
persistence and bioconcentration potential. SAR & QSAR in Environmental Research 13:713-
725.
Worth A, Patlewicz G. 2007. A Compendium of Case Studies that helped to shape the
REACH Guidance on Chemical Categories and Read Across. EUR 22481 EN, European
Commission Joint Research Centre, Ispra, Italy.
http://ecb.jrc.ec.europa.eu/qsar/publications/
European Commission
EUR 23758 EN – Joint Research Centre – Institute for Health and Consumer Protection Title: Possible Application of Non-Testing Methods in Setting Environmental Quality Standards (EQS) Author(s): Crane M, Watts C, Daginnus K and Worth A Luxembourg: Office for Official Publications of the European Communities 2008 – 40 pp. – 21 x 29.7 cm EUR – Scientific and Technical Research series – ISSN 1018-5593 Abstract The Water Framework Directive is one of the most important pieces of European environmental legislation in recent years, requiring all inland and coastal waters to achieve ‘‘good status’’ by 2015. Article 16 of the Directive describes how and by when Environmental Quality Standards (EQS) for pollutants should be developed, and states that pollutants presenting a significant risk to or via water should be identified by the European Commission and classified as priority substances, with the most hazardous of these classified as priority hazardous substances. Generation of ecotoxicity test data is one option for filling gaps when deriving EQS but there are also options that avoid testing, such as the use of (Quantitative) Structure Activity Relationships ([Q]SARs), Quantitative Structure-Property Relationships (QSPRs), Activity-Activity Relationships (AARs), Quantitative Structure Activity-Activity Relationships, or read-across from similar substances. All of these non-testing methods are based on the idea that properties (including biological activities) of a chemical substance depend on its intrinsic nature and can be directly predicted from its molecular structure and inferred from the properties of similar compounds whose activities are known. This report explores application of the widely used and freely available EPIWIN suite of QSARs, particularly the ecotoxicity software ECOSAR, for derivation of EQS under the WFD. The predictive ability of these QSARs is examined using the 33 priority substances in the Water Framework Directive Daughter Directive on Priority Substances, plus the additional substances recommended for inclusion by the European Parliament, as representative substances for EQS derivation. We also investigated use of the OECD QSAR Application Toolbox version 1 for read across of data.
The mission of the JRC is to provide customer-driven scientific and technical support for the conception, development, implementation and monitoring of EU policies. As a service of the European Commission, the JRC functions as a reference centre of science and technology for the Union. Close to the policy-making process, it serves the common interest of the Member States, while being independent of special interests, whether private or national.