ETHOLOGICAL PERSPECTIVE ON THE STUDY OF BULLYING
76
ETHOLOGICAL PERSPECTIVE ON THE STUDY OF BULLYING MARGARIDA MONTEIRO DA COSTA CARVALHO FERREIRA Master’s Dissertation in Legal Medicine 2015
-
Upload
khangminh22 -
Category
Documents
-
view
2 -
download
0
Transcript of ETHOLOGICAL PERSPECTIVE ON THE STUDY OF BULLYING
ETHOLOGICAL PERSPECTIVE ON THE STUDY OF
BULLYING
MARGARIDA MONTEIRO DA COSTA CARVALHO FERREIRA
Master’s Dissertation in Legal Medicine
2015

MARGARIDA MONTEIRO DA COSTA CARVALHO FERREIRA
ETHOLOGICAL PERSPECTIVE ON THE STUDY OF BULLYING
Candidature dissertation to the degree of
Master in Legal Medicine submitted to
Institute of Biomedical Sciences Abel
Salazar of University of Porto
Supervisor: Professora Doutora Liliana de
Sousa
Category: Associate Professor
Affiliation: Institute of Biomedical
Sciences Abel Salazar, University of
Porto

The animals themselves are always more
important than the books that have been
written about them.
Niko Tinbergen, 1953 (as cited in McGrew, 2004)
(…) we animals are the most complicated
and perfectly designed pieces of machinery
in the known universe (…) it is hard to see
why anyone studies anything else.
Richard Dawkins, 1989 (as cited in Barnard, 2004)

i
ACKNOWLEDGMENTS
This project would not have been possible without the help and support of many people.
My deepest thanks to my supervisor Professora Doutora Liliana de Sousa for accepting me
as well as my project, for all the knowledge, guidance, motivation and constant availability.
Without her I would not have had the opportunity to work with such impressive subjects.
I would like to express my gratitude to Agrupamento de Escolas João da Silva Correia and
to Escola do Ensino Básico de 2º e 3º Ciclos de São João da Madeira, in the persons of
Prof. Margarida Violante and Prof. Paulo Bastos, for authorizing the project to be conducted
in their school, as well as to all the people working there for giving me such attention and
time.
My thanks and appreciations also go to all my family and friends for the constant support.

ii
iii
ABSTRACT
Bullying is a phenomenon extremely pervasive throughout the lives of all its participants. It
represents a form of pro-active aggressive behavior occurring in contexts of power
imbalances and frequently being a repeated experience. Bullying is ubiquitous, with its
worldwide prevalence of victimization lying mainly over the 20% mark and almost reaching
the 40% mark in Portugal. Its deleterious outcomes range from low academic achievement
and some somatizations, to severe depression, suicides and homicides, hence the extreme
medico-legal pertinence in understanding and preventing it. So far, the majority of the
studies regarding bullying behaviors have resorted to indirect measures such as surveys
and questionnaires, and only few have employed ethological methods and concepts to their
design.
The main objective of the present work was to approach bullying through an ethological
standpoint in an attempt to gain a more comprehensive insight into this problematic. More
specifically, we aimed to, resorting to naturalistic observations, identify a dominance
hierarchy within a group of adolescents in school and to analyze a possible relation between
rank order and engaging in bullying behaviors.
Resorting to a sample of 6 male adolescents, rank orders were assessed and dominance
indices were calculated for each subject. A focal instantaneous sampling was employed to
measure both the frequencies and the durations of dominance-related behaviors. The
sampling points took place every 30 sec, making a total of 2,5 minutes of sampling period
per subject, within a 15-minute observation. A focal-only sampling was used as well in order
to record, per subject, every behavior occurring in a bullying context.
The results of this study revealed a rank ordering among the sample, with the top ranking
element engaging significantly more in non-aggressive/non-intentionally aggressive
dominance behaviors than the other hierarchical categories; the bottom rank subject
displaying significantly more submissive behaviors; and with the individual occupying the
second dominant position in the hierarchy exhibiting statistically significantly more
aggressive behaviors in bullying contexts than the other categories of dominance, with the
exception of the most dominant element.
Together, these results support the hypothesis that engaging in bullying behaviors may be
an antisocial, aggressive attempt to achieve dominance within a group. However, further
studies at a larger scale and resorting to other methods (such as audiovisual recordings)
should be conducted in order to increase the statistical power of the results of this study.
iv
Keywords
Bullying; Ethology; Naturalistic observations; Aggression; Dominance; Submission;
Hierarchy
Abbreviations
CD – counter dominance
GSHS – Global school-based student health survey
H0 – null hypothesis
Ha – alternative hypothesis
HBSC - Health Behaviour in School-aged Children
obs – observation
OOS – out-of-sight
PA – physical attack
POD – physical/object displacement
RG – recognition
SB – submission
sec – seconds
SD – subtle dominance
TR – threat
UNICEF – United Nations Children’s Fund
VA – verbal attack

v
RESUMO
O bullying é um fenómeno extremamente intrusivo nas vidas de todos os seus
participantes. Apresenta-se como uma forma de agressão pró-ativa que ocorre em
contextos de desequilíbrio de poder e, na sua maioria, de forma repetida. Para além de
ubíquo, o bullying exibe uma prevalência considerável, com os valores de vitimização a
nível mundial localizados maioritariamente acima dos 20% e alcançando quase os 40% em
Portugal. Os seus efeitos deletérios variam desde baixo desempenho académico e
algumas somatizações, a depressão grave, suicídios e homicídios, daí a extrema
pertinência médico-legal na compreensão e prevenção deste fenómeno. Até à data, a
maioria dos estudos sobre comportamentos de bullying tem recorrido a medidas indiretas,
como inquéritos e questionários, sendo que poucos empregaram métodos etológicos no
seu desenho.
O principal objetivo do presente trabalho foi a abordagem ao bullying através de uma
perspetiva etológica numa tentativa de obter uma visão mais abrangente sobre esta
problemática. Mais especificamente, teve como objetivo, recorrendo a observações
naturalistas, a identificação de uma hierarquia de dominância dentro de um grupo de
adolescentes em contexto escolar e a análise de uma possível relação entre uma
ordenação hierárquica e o envolvimento em comportamentos de bullying.
Recorrendo a uma amostra de seis adolescentes do sexo masculino, foram avaliadas as
ordens de classificação hierárquica e calculados os índices de dominância para cada
sujeito de estudo. Uma amostragem instantânea focal foi empregue para medir tanto as
frequências como as durações de comportamentos relacionados com dominância. Os
pontos de amostragem ocorreram a cada 30seg, perfazendo 2,5 minutos de período de
amostragem por indivíduo, num total de 15 minutos de observação. Uma amostragem
apenas focal foi utilizada para registar, por sujeito, cada comportamento ocorrido em
contexto de bullying.
Os resultados deste estudo revelaram a existência de uma ordem hierárquica entre a
amostra, com o elemento do topo do ranking significativamente mais envolvido em
comportamentos de dominância não agressivos ou não intencionalmente agressivos do
que as outras categorias hierárquicas; com o membro que ocupa o último lugar na
hierarquia a exibir significativamente mais comportamentos submissos; e com o indivíduo
relativo à segunda posição na hierarquia mostrando-se estatisticamente mais agressivo e
perpetrando mais comportamentos de bullying quando comparado com todas as outras
categorias de dominância, com exceção do elemento mais dominante.
vi
Em conjunto, estes resultados apoiam a hipótese de que o envolvimento em
comportamentos de bullying pode consistir numa tentativa antissocial e agressiva para
alcançar uma posição de dominância dentro de um grupo. No entanto, devem ser
realizados estudos adicionais, a uma escala maior e recorrendo a outros métodos (tais
como gravações audiovisuais), a fim de aumentar o poder estatístico dos resultados deste
estudo.
Palavras-chave
Bullying; Etologia; Observações naturalistas; Agressão; Dominância; Submissão;
Hierarquia
Abreviaturas
CD – contra dominância; counter dominance
GSHS – Global school-based student health survey
H0 – hipótese nula
Ha – hipótese alternativa
HBSC - Health Behaviour in School-aged Children
obs – observação; observation
OOS – fora do campo de visão; out-of-sight
PA – ataque físico; physical attack
POD – remoção de posição e/ou objeto; physical/object displacement
RG – reconhecimento; recognition
SB – submissão; submission
sec – segundos; seconds
SD – dominância subtil; subtle dominance
TR – ameaça; threat
UNICEF – Fundo das Nações Unidas para a Infância; United Nations Children’s Fund
VA – ataque verbal; verbal attack
vii
INDEX
ACKNOWLEDGMENTS ................................................................................................................................. I
ABSTRACT ..................................................................................................................................................... III
RESUMO ......................................................................................................................................................... V
LIST OF ILLUSTRATIONS ........................................................................................................................... IX
LIST OF TABLES .......................................................................................................................................... XI
INTRODUCTION ............................................................................................................................................ 1
1. ETHOLOGY, THE SCIENCE OF BEHAVIOR ....................................................................................... 1
1.1. WHAT IS ETHOLOGY AND WHY STUDY ANIMAL BEHAVIOR? ................................................................... 1
1.1.1. Definition of behavior .................................................................................................................. 2
1.1.2. The Ethological method - why study bullying through an ethological perspective? .......... 4
2. SCHOOL BULLYING, A PERVASIVE EXPERIENCE .......................................................................... 8
2.1. CHARACTERIZATION OF THE PHENOMENON.......................................................................................... 8
2.1.1. Definition ...................................................................................................................................... 9
2.1.2. Forms of bullying ....................................................................................................................... 10
2.1.3. Participants ................................................................................................................................ 13
2.1.4. Negative outcomes and severity............................................................................................. 14
2.1.5. Prevalence ................................................................................................................................. 16
2.1.6. Intervention and prevention ..................................................................................................... 17
2.1.7. Other Bullying Contexts ........................................................................................................... 17
3. A LOOK AT SCHOOL BULLYING THROUGH AN ETHOLOGICAL PERSPECTIVE ................... 18
3.1. IS BULLYING ADAPTIVE? ...................................................................................................................... 18
3.2. BULLYING FROM AN ETHOLOGICAL STANDPOINT ................................................................................ 19
3.2.1. On Aggression ........................................................................................................................... 19
3.2.2. Social dominance ...................................................................................................................... 19
3.2.3. Intra-specific aggression, dominance hierarchies and bullying: what relation? ............... 20
3.3.3. Biological determinism? ........................................................................................................... 21
OBJECTIVES ................................................................................................................................................ 23
METHODOLOGY ......................................................................................................................................... 24
1. SCHOOL CHARACTERIZATION .......................................................................................................... 24
2. SAMPLE CHARACTERIZATION ........................................................................................................... 25
3. CRITERIA FOR SITE AND SAMPLE SELECTION ............................................................................ 26
viii
4. OBSERVATION PROTOCOL ................................................................................................................. 26
4.1. PHASE A OBSERVATIONS ..................................................................................................................... 28
4.1.1. Phase A1: elaboration of a behavioral catalog ...................................................................... 28
4.1.2. Phase A2: identification of the elements of a group .............................................................. 30
4.2. PHASE B OBSERVATIONS ..................................................................................................................... 31
4.2.1. Dyadic interaction matrix .......................................................................................................... 31
4.2.2. Instantaneous sampling of the subjects’ behavior ................................................................ 32
4.2.3. Frequency of bullying behaviors .............................................................................................. 32
4.4. ETHICAL CONSIDERATIONS .................................................................................................................. 32
5. DATA TREATMENT ................................................................................................................................. 33
5.1. TREATMENT OF REVERSALS ................................................................................................................ 33
5.2. LINEARITY AND DOMINANCE INDICES ................................................................................................... 33
5.3. STATISTICS ........................................................................................................................................... 34
5.3.1. Statistical hypotheses ............................................................................................................... 35
5.3.2. Statistical variables .................................................................................................................... 37
RESULTS ....................................................................................................................................................... 38
1. PRE-STATISTICAL ANALYSIS .............................................................................................................. 38
1.1. DYADIC INTERACTION MATRIX .............................................................................................................. 38
1.2. LINEARITY ............................................................................................................................................. 38
1.3. DOMINANCE INDICES ............................................................................................................................ 39
2. STATISTICAL ANALYSIS ....................................................................................................................... 39
2.1. DESCRIPTIVE STATISTICS..................................................................................................................... 39
2.2. INFERENTIAL STATISTICS – TESTING OF STATISTICAL HYPOTHESIS .................................................... 42
DISCUSSION ................................................................................................................................................. 46
GROUPS OF HUMAN ADOLESCENTS DISPLAY RANK ORDERINGS ................................................................ 46
INDIVIDUALS OCCUPYING TOP RANK POSITIONS IN THE HIERARCHY DISPLAY MORE FREQUENTLY
DOMINANCE BEHAVIORS BUT ARE NOT NECESSARILY THE MOST AGGRESSIVE ONES ................................ 46
INDIVIDUALS OCCUPYING BOTTOM RANK POSITIONS IN THE HIERARCHY DISPLAY MORE FREQUENTLY
SUBMISSIVE BEHAVIORS .............................................................................................................................. 47
THE FREQUENCY OF PERPETRATING BULLYING BEHAVIORS IS HIGHER IN INDIVIDUALS AIMING AT THE TOP
RANK POSITION IN A HIERARCHY, THUS BEING THE MOST AGGRESSIVE ONES ........................................... 47
CONCLUSIONS ............................................................................................................................................ 48
REFERENCES .............................................................................................................................................. 49
APPENDICES ................................................................................................................................................ 54
ix
LIST OF ILLUSTRATIONS
Figure 1. Schematic diagram representing organism-environment relationships. Arrows
indicate the direction of the interaction. Adapted from Lehner (1996, p. 152) ....................... 3
Figure 2. Schematic representation of the relation of Tinbergen’s four questions to the
analysis of proximate and ultimate causation. Adapted from Lehner (1996, p. 8). ............... 5
Figure 3. Examples of behaviors representative of each form of bullying. Adapted from
Rigby (2003, p. 10) ........................................................................................................................ 12
Figure 4. Schematic representation of the relationships between the roles of bullying ... 14
Figure 5. Percentage, by country, of adolescents from 13 to 15 years of age who reported
being bullied at least once in the past couple of months. From UNICEF (2014, p. 121) ... 16
Figure 6. Characterization of the student population attending the E.B. 2,3 school in São
João da Madeira during the academic year of 2014/2015 ...................................................... 24
Figure 7. Architectural plan of the school complex. A – Entrance; B – Classroom block; C
– Administration and secretary block; D – Teachers’ room; E – Recreation room; F –
Cafeteria; G – Canteen; H – Library; I – Study room; J – Multipurpose rooms; K –
Gymnasium; L – Sports ground; M – Storage unit; N – Parking lot ....................................... 25
Figure 8. Age characterization of the phase B sample ........................................................... 26
Figure 9. Number of observations and respective duration in minutes, per phase and in
total .................................................................................................................................................. 27
Figure 10. Representation of the observation sites and of the area covered by the
researcher field view. The yellow circles indicate the different positions assumed by the
researcher during the observations while the red area represents the total area of sight (a
combination of the field views of the researcher for each observation position). ................ 27
Figure 11. Catalog compiling the behaviors displayed by the students during their time in-
between classes. ........................................................................................................................... 30
Figure 12. List of dominance-related behaviors. X represents the winners of the interactions
while Y stands for the losers. Recognition (RG) and Submission (SB) behaviors initiated by
Y and directed to X were accounted as a victory by X/loss by Y. Categories marked with an
asterisk (*) comprise behaviors that, when markedly intentional and occurring in a clear
power imbalance, can be considered bullying. ......................................................................... 31
Figure 13. Landau’s linearity index equation. 𝑛 indicates the number of group elements,
while 𝑣𝑎 stands for the number of group elements dominated by “a”; ℎ ranges from 0 to 1
(Lehner, 1996, p. 333). ................................................................................................................. 33
x
Figure 14. Dominance index equation. 𝑊 represents each member’s total number of
victories in dyadic interactions and 𝑇 indicates each member’s total number of interactions
with others; 𝐷𝐼 varies from 0 to 1 (Lehner, 1996, p. 336)........................................................ 34
Figure 15. Bar chart representing the difference in the total mean durations*, in seconds,
of the various behaviors presented by children in the playground. The maximum possible
value for the mean duration corresponds to the total of the sampling period per observation
which is 2,5 minutes (150 seconds). .......................................................................................... 40
Figure 16. Bar charts representing the difference in the mean frequencies* of the various
behaviors presented by children in the playground across the various dominance
categories. The maximum possible value for the mean frequency corresponds to the
number of individual sampling points per observation which is 5. ......................................... 41
Figure 17. Bar chart representing the difference in the mean values of frequency of bullying
behaviors across the various dominance categories. .............................................................. 41
Figure 18. Graphical representations of pairwise comparisons after Kruskal-Wallis test
concerning both the durations and frequencies of the significant dominance-related
behaviors. Red lines represent statistical significant differences, whereas black lines
correspond to non-significant differences. Yellow highlights indicate the category of
dominance that stands out. A – SD and DSD; B – CD and DCD; C – RG and DRG; D – SB
and DSB .......................................................................................................................................... 44
Figure 19. Graphical representations of pairwise comparisons after Kruskal-Wallis test
concerning the frequency of bullying behaviors. Red lines represent statistical significant
differences, whereas black lines correspond to non-significant differences. Yellow highlights
indicate the category of dominance that stands out. ................................................................ 45
xi
LIST OF TABLES
Table 1. Dyadic interaction matrix showing a possible hierarchical order of the group
members, rearranged after the treatment of reversals ............................................................ 38
Table 2. Calculation of Landau’s linearity index (ℎ) for the analysed hierarchy. 𝑛 indicates
the number of group elements, while 𝑣𝑎 stands for the number of group elements dominated
by “a”; ℎ ranges from 0 to 1 (Lehner, 1996, p. 333). ............................................................... 38
Table 3. Number of wins, losses and encounters per subject, as well as the respective
dominance indices. Dominance indices (𝐷𝐼) are calculated by dividing the number of wins
(𝑊) of each element of the group by their total number of encounters with others (𝑇), and
vary between 0 and 1 (Lehner, 1996, p. 336). 𝐷𝐼 values are presented rounded to three
decimal places. .............................................................................................................................. 39
Table 4. Hypothesis test summary after Kruskal-Wallis analysis for both the frequencies
and durations of dominance-related behaviors*, comprising a description of the null
hypothesis (H0), the corresponding p value and the subsequent decision. The p value
considered was 0,05. .................................................................................................................... 42
Table 5. Test statistics after Kruskal-Wallis analysis for those dominance-related behaviors
found significant in the hypothesis test. df – degrees of freedom. ......................................... 43
Table 6. Significances of pairwise comparisons after Kruskal-Wallis analysis. Each line
tests the null hypothesis that the distributions across each pair are the same. The p value
considered was 0,05. Colored cells highlight the significant values. ..................................... 44
Table 7. Hypothesis test summary after Kruskal-Wallis analysis for the frequencies of
bullying behaviors comprising a description of the null hypothesis (H0), the corresponding p
value and the subsequent decision. p value considered was 0,05. ...................................... 45
Table 8. Test statistics after Kruskal-Wallis analysis for the frequency of bullying behaviors.
df – degrees of freedom. .............................................................................................................. 45
Table 9. Significances of pairwise comparisons after Kruskal-Wallis analysis. Each line
tests the null hypothesis that the distributions across each pair are the same. The p value
considered was 0,05. Colored cells highlight the significant values. ..................................... 45

xii
1
INTRODUCTION
1. Ethology, the science of behavior
1.1. What is ethology and why study animal behavior?
Ethology is a sub-discipline of Biology concerned with the study of animal behavior within
its natural settings; that is, without artificial variation of environmental parameters and
disturbance to the subjects (Moreno & Muñoz-Delgado, 2007; Rajecki, 1983; Vieira, 1989).
Throughout the years, several meanings were given to the term and numerous intellectuals
devoted their time to the study of various aspects of behavior, from Aristotle in Ancient
Greece to Charles Darwin, in the late 19th century (Moreno & Muñoz-Delgado, 2007).
Nevertheless, the actual scientific significance attributed to Ethology is due to the works of
Konrad Lorenz, Nikolas Tinbergen and Karl von Frisch, who studied the behavior of various
animal species in their natural environment and who shared, because of that, the Nobel
Prize in Medicine and Physiology in 1973 (Barnard, 2004; Moreno & Muñoz-Delgado,
2007).
Lorenz (1960a, as cited in Lehner, 1996, p. 2) outlined Ethology “as the application of
orthodox biological methods to the problems of behavior”; whereas Tinbergen (1963, p.
411) described it as “the biological study of behavior”, guided by the “biological method”
and in which the “description of observable phenomena” plays a vital role.
Thus, the term Ethology may be defined as the “scientific study of animal behavior”
(Dugatkin, 2014, p. 26) characterized by the Ethological method (that is, with a great
emphasis on naturalistic observations) (Rajecki, 1983); a definition widely accepted by the
behavioral research community (e.g., Calafate (1996), Barnard (2004), Savin-Williams
(1987), among others).
This perception of Ethology implies that the behavior presented by any living organism
reflects the biological program of its species, which means that it represents a phenotypic
trait as much as anatomical or physiological ones (Cosnier, 1986; Jones, 1972; Michel &
Moore, 1995). One must not forget, however, that any “individual exists in time and space
in a dynamic state, continually under the influence of its environment, continually imposing
its own effects upon the environment” (Lehner, 1996, p. 152). For that reason, behavior, as
any other trait, is dependent on the relations established between the organism that displays
it and its surroundings. Hence, Calafate (1996) emphasizes its importance and outlines the
object of Ethology as the spontaneous behavior exhibited by an individual in its natural
background. Moreover, since the functional and adaptive significance of any behavior is
2
only acquired in its natural settings, to fully understand an organism, one must study it in its
regular contexts (Tinbergen, 1963; Vieira, 1989).
In fact, humans have always been reliant on naturalistic observations of animal behavior in
order to assure their survival (Alcock, 2001; Dugatkin, 2014). For instance, our hunter-
gatherer ancestors had to understand the behavior of both their preys and their predators,
otherwise, “we humans wouldn’t be here today” (Dugatkin, 2014, p. 4).
In 1992, Drickamer and Vessey (as cited in Lehner, 1996, p. 2) listed seven present-day
reasons to study animal behavior: “1) Curiosity about the living world; 2) Learn about
relationships between animals and their environments; 3) Establish general principles
common to all behavior; 4) Better understand our own behavior; 5) Desire to preserve and
maintain the environment; 6) Conserve and protect endangered species; 7) Control
economically costly animal pests”.
Thereby, Ethology must be considered in an interdisciplinary manner, somewhere between
the Natural and Human sciences, because it interacts with a number of other disciplines
such as Physiology, Genetics, Ecology, Sociobiology, Comparative Psychology,
Taxonomy, Molecular Biology, Paleontology, Anthropology, among others, without losing
its own identity (Vieira, 1989).
1.1.1. Definition of behavior
The basis to any scientific study is the definition and clarification of its underlying concepts.
Ethology, deriving from Biology, is no exception. For that reason, the concept of behavior
must be defined in a careful, clear and concise way.
The definition proposed by Tinbergen (as cited in Dugatkin, 2014, p. 6) portrays behavior
as “the total movements made by the intact animal”, a description that integrates virtually
the totality of an animal’s actions. However, not all actions can be considered behavior.
Levitis et al. (2009, as cited in Dugatkin, 2014) provide a simple but understandable
example: an increase in body temperature leads to sweating in response but sweating is
not considered a behavior by itself. Conversely, if an animal seeks shade because of the
heat (and its subsequent perspiration), that action can be considered a behavior.
The same authors elaborated a paper were they reviewed what constitutes behavior to 174
behavioral researchers. The results showed the lack of a universally accepted definition,
varying from Raven and Johnson’s “What an animal does” in 1989 to “All observable or
otherwise measurable muscular and secretory responses (or lack thereof in some cases)
and related phenomena such as changes in blood flow and surface pigments in response
3
to changes in an animal’s internal and external environment”, proposed by Grier and Burk,
in 1992. (Levitis et al., 2009, as cited in Dugatkin, 2014, p. 7).
Hence, Dugatkin (2014, p. 7) proposed defining behavior as “the coordinated responses of
whole living organisms to internal and/or external stimuli”, a definition that stresses the
distinction between organ and organism. Employing the aforementioned example, sweating
due to increased body temperature is an organ-level response whilst moving to shade
because of the heat and perspiration represents a coordination of responses at an
organism-level (Dugatkin, 2014). And as Barnard (2004, p. 284) stated, “ultimately all
behavior develops through a combination of genetic and environmental influences”, the
internal and external stimuli proposed by Dugatkin, respectively.
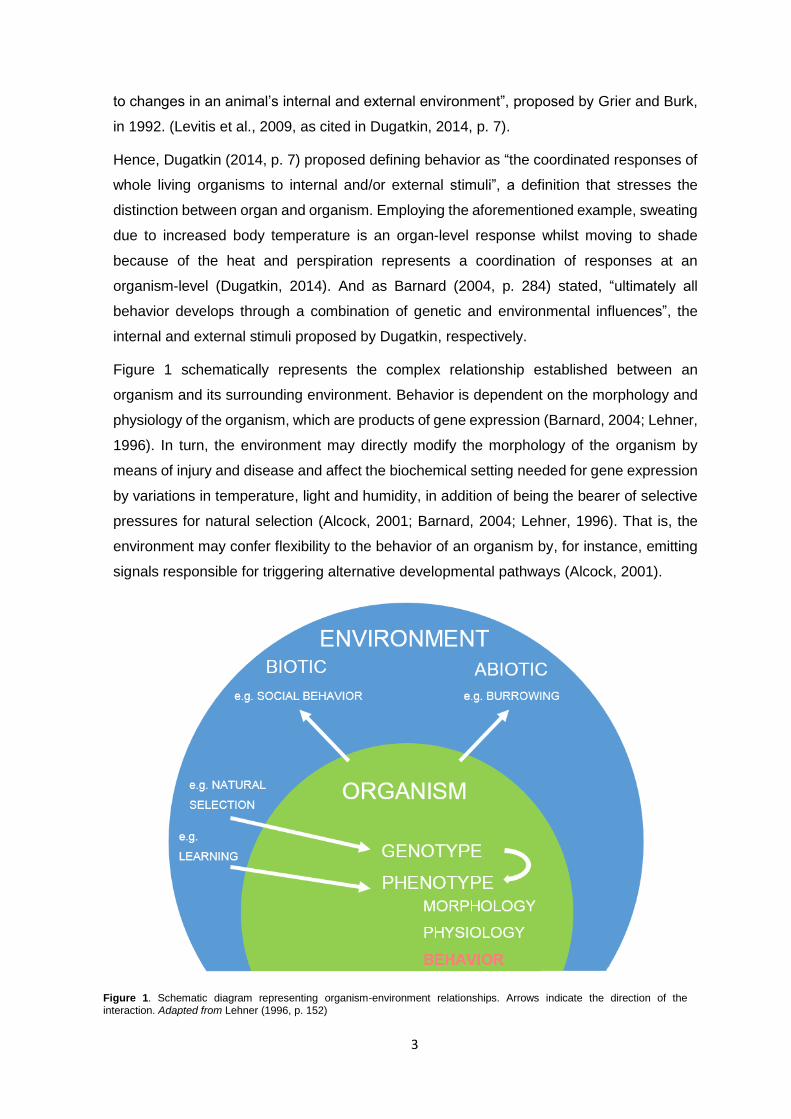
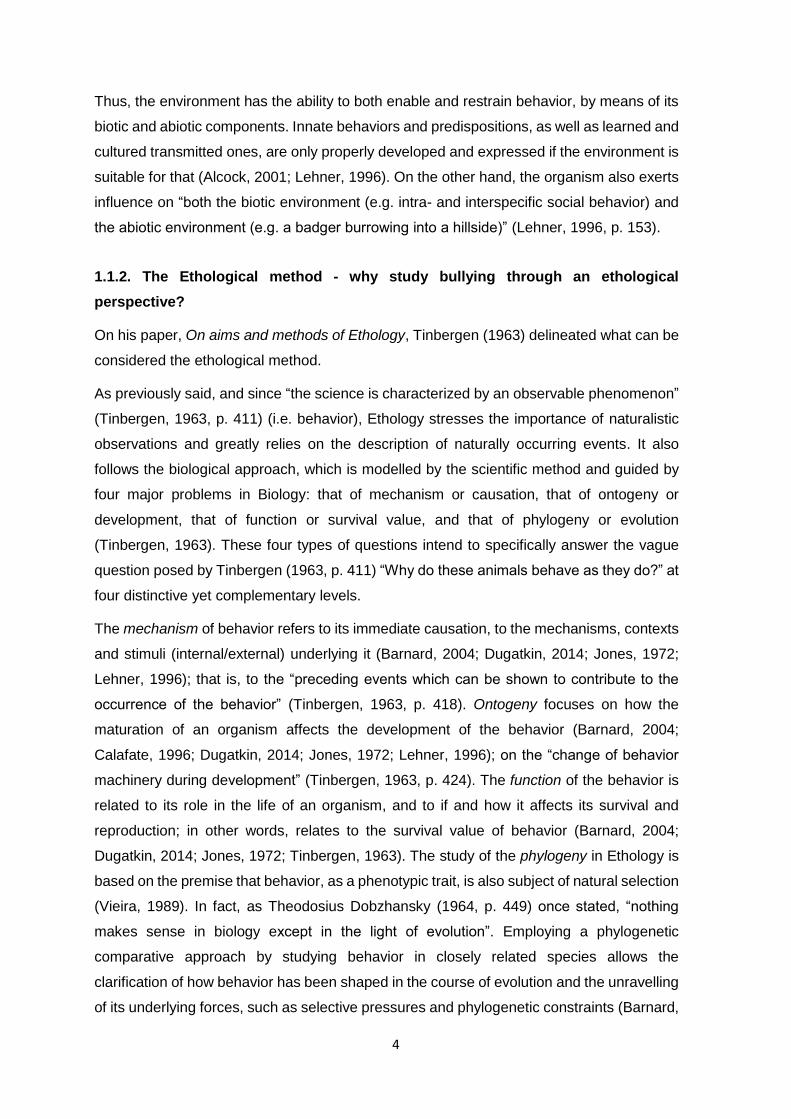
Figure 1 schematically represents the complex relationship established between an
organism and its surrounding environment. Behavior is dependent on the morphology and
physiology of the organism, which are products of gene expression (Barnard, 2004; Lehner,
1996). In turn, the environment may directly modify the morphology of the organism by
means of injury and disease and affect the biochemical setting needed for gene expression
by variations in temperature, light and humidity, in addition of being the bearer of selective
pressures for natural selection (Alcock, 2001; Barnard, 2004; Lehner, 1996). That is, the
environment may confer flexibility to the behavior of an organism by, for instance, emitting
signals responsible for triggering alternative developmental pathways (Alcock, 2001).
Figure 1. Schematic diagram representing organism-environment relationships. Arrows indicate the direction of the interaction. Adapted from Lehner (1996, p. 152)
4
Thus, the environment has the ability to both enable and restrain behavior, by means of its
biotic and abiotic components. Innate behaviors and predispositions, as well as learned and
cultured transmitted ones, are only properly developed and expressed if the environment is
suitable for that (Alcock, 2001; Lehner, 1996). On the other hand, the organism also exerts
influence on “both the biotic environment (e.g. intra- and interspecific social behavior) and
the abiotic environment (e.g. a badger burrowing into a hillside)” (Lehner, 1996, p. 153).
1.1.2. The Ethological method - why study bullying through an ethological
perspective?
On his paper, On aims and methods of Ethology, Tinbergen (1963) delineated what can be
considered the ethological method.
As previously said, and since “the science is characterized by an observable phenomenon”
(Tinbergen, 1963, p. 411) (i.e. behavior), Ethology stresses the importance of naturalistic
observations and greatly relies on the description of naturally occurring events. It also
follows the biological approach, which is modelled by the scientific method and guided by
four major problems in Biology: that of mechanism or causation, that of ontogeny or
development, that of function or survival value, and that of phylogeny or evolution
(Tinbergen, 1963). These four types of questions intend to specifically answer the vague
question posed by Tinbergen (1963, p. 411) “Why do these animals behave as they do?” at
four distinctive yet complementary levels.
The mechanism of behavior refers to its immediate causation, to the mechanisms, contexts
and stimuli (internal/external) underlying it (Barnard, 2004; Dugatkin, 2014; Jones, 1972;
Lehner, 1996); that is, to the “preceding events which can be shown to contribute to the
occurrence of the behavior” (Tinbergen, 1963, p. 418). Ontogeny focuses on how the
maturation of an organism affects the development of the behavior (Barnard, 2004;
Calafate, 1996; Dugatkin, 2014; Jones, 1972; Lehner, 1996); on the “change of behavior
machinery during development” (Tinbergen, 1963, p. 424). The function of the behavior is
related to its role in the life of an organism, and to if and how it affects its survival and
reproduction; in other words, relates to the survival value of behavior (Barnard, 2004;
Dugatkin, 2014; Jones, 1972; Tinbergen, 1963). The study of the phylogeny in Ethology is
based on the premise that behavior, as a phenotypic trait, is also subject of natural selection
(Vieira, 1989). In fact, as Theodosius Dobzhansky (1964, p. 449) once stated, “nothing
makes sense in biology except in the light of evolution”. Employing a phylogenetic
comparative approach by studying behavior in closely related species allows the
clarification of how behavior has been shaped in the course of evolution and the unravelling
of its underlying forces, such as selective pressures and phylogenetic constraints (Barnard,
5
2004; Calafate, 1996; Dugatkin, 2014; Jones, 1972; Lehner, 1996; Michel & Moore, 1995;
Tinbergen, 1963).
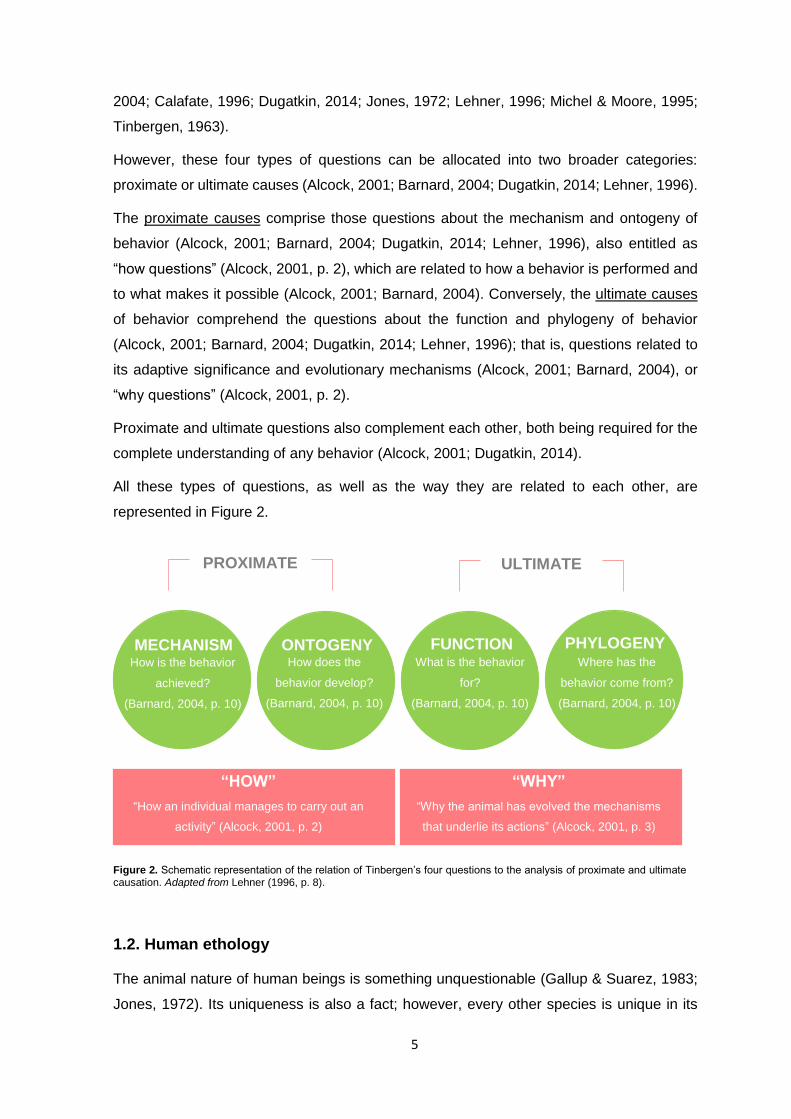
However, these four types of questions can be allocated into two broader categories:
proximate or ultimate causes (Alcock, 2001; Barnard, 2004; Dugatkin, 2014; Lehner, 1996).
The proximate causes comprise those questions about the mechanism and ontogeny of
behavior (Alcock, 2001; Barnard, 2004; Dugatkin, 2014; Lehner, 1996), also entitled as
“how questions” (Alcock, 2001, p. 2), which are related to how a behavior is performed and
to what makes it possible (Alcock, 2001; Barnard, 2004). Conversely, the ultimate causes
of behavior comprehend the questions about the function and phylogeny of behavior
(Alcock, 2001; Barnard, 2004; Dugatkin, 2014; Lehner, 1996); that is, questions related to
its adaptive significance and evolutionary mechanisms (Alcock, 2001; Barnard, 2004), or
“why questions” (Alcock, 2001, p. 2).
Proximate and ultimate questions also complement each other, both being required for the
complete understanding of any behavior (Alcock, 2001; Dugatkin, 2014).
All these types of questions, as well as the way they are related to each other, are
represented in Figure 2.
1.2. Human ethology
The animal nature of human beings is something unquestionable (Gallup & Suarez, 1983;
Jones, 1972). Its uniqueness is also a fact; however, every other species is unique in its
MECHANISM How is the behavior
achieved?
(Barnard, 2004, p. 10)
ONTOGENY How does the
behavior develop?
(Barnard, 2004, p. 10)
FUNCTION What is the behavior
for?
(Barnard, 2004, p. 10)
PHYLOGENY Where has the
behavior come from?
(Barnard, 2004, p. 10)
“HOW”
“How an individual manages to carry out an
activity” (Alcock, 2001, p. 2)
“WHY”
“Why the animal has evolved the mechanisms
that underlie its actions” (Alcock, 2001, p. 3)
PROXIMATE ULTIMATE
Figure 2. Schematic representation of the relation of Tinbergen’s four questions to the analysis of proximate and ultimate causation. Adapted from Lehner (1996, p. 8).
6
particular way (Alcock, 2001; Jones, 1972). Furthermore, many of the phenomena
associated to the uniqueness of Homo sapiens such as culture, religion, tool fabrication and
use, language, reason and self-awareness, can also be found among other species (see
Appendix A), suggesting that these inter-specific differences might “be a matter of degree
rather than of kind” (Gallup & Suarez, 1983, p. 11). Ultimately, Man is a “biological
phenomenon” (Gallup & Suarez, 1983, p. 5), a living organism under the influence of the
same physiological determinants and subject to natural selection as any other animal
(Alcock, 2001; Gallup & Suarez, 1983). Therefore, a much more comprehensive
understanding of human behavior can be achieved if an ethological approach is employed.
Human ethology, defined as the biology of human behavior and characterized by the
application of ethological concepts and methods to its study, is a discipline that puts the
accent on the observation and description of the conduct of Homo sapiens in its natural
environment in an attempt to understand and clarify it (Calafate, 1996; Cosnier, 1986; Klein,
2000; Moreno & Muñoz-Delgado, 2007; Savin-Williams, 1987).
Human behavior not only is shaped by selective pressures of natural selection but also is
strongly influenced by different cultural environments (Alcock, 2001; Barnard, 2004; Fox &
Fleising, 1976; Savin-Williams, 1987). It is essential, however, to recognize that humans
don’t act only “biologically” or “culturally”. Most of the time, Man “behaves in a predictable
way” (Eibl-Eibesfeldt, 1977, p. 163), which means that its conduct is, at least partly,
predetermined by evolution (Barnard, 2004; Eibl-Eibesfeldt, 1977; Savin-Williams, 1987).
Nevertheless, evolutionary theory only acknowledges the tendency of certain natural
selected traits to promote inclusive fitness of its bearers (Alcock, 2001), thus not being a
synonym for “biological determinism” (Eibl-Eibesfeldt, 1977, p. 167). If, on the one hand,
some traits preserved in time may not remain as adaptive as they once were, on the other
hand, the cultural component of human behavior makes it somewhat malleable, allowing
humans to control their conducts, even the innate ones (Alcock, 2001; Eibl-Eibesfeldt,
1977).
Therefore, Human Ethology, guided by the synthetic theory of evolution (Fox & Fleising,
1976), employs ethological methods in order to “explain, not justify” (Alcock, 2001, p. 486)
human behavior. It also acknowledges the existence, not of a “primate pattern” (Savin-
Williams, 1987, p. 25), but rather of a “common heritage” (Eibl-Eibesfeldt, 1977, p. 180) in
behavior among closely related species. Hence, “cross-species research” (Savin-Williams,
1987, p. 25) provides the theoretical basis for understanding human behavior (Alcock, 2001;
Eibl-Eibesfeldt, 1977; Savin-Williams, 1987), and may “reveal specific and ubiquitous
characteristics of human development” (Michel & Moore, 1995, p. 415).
7
To date, the majority of behavioral studies concerning the human species have heavily
relied on a traditional psychological approach that resorts to experimentation in “contrived,
staged settings” (Savin-Williams, 1987, p. 9) and to auto- and hetero-reports (Atlas &
Pepler, 1998; Barrett & Stulp, 2013; Berger, 2007; Michel & Moore, 1995; Savin-Williams,
1987; Zivin, 1983). The latter, considered indirect measures, can take the form of interviews,
questionnaires and rating scales/checklists, among others (Jones, 1972; Michel & Moore,
1995; Pellegrini, 1998; McGrew, 1972, as cited in Rajecki, 1983, p. 79; Richards & Bernal,
1972). However, this methodology may prove to be disadvantageous if employed in an
exclusive way in research of human behavior.
First, it focuses mainly on the individual (Savin-Williams, 1987; Vieira, 1989; Zivin, 1983)
and attempts to “assess personality phenomena” (Savin-Williams, 1987, p. 190) through a
trait model, i.e., by examining personality attributes that individuals may “have a certain
amount of” (Zivin, 1983, p. 187). Consequently, and because human beings are not isolated
entities, it tends to disregard the social context of behavior (Savin-Williams, 1987; Zivin,
1983).
Then, the results obtained by reports, regardless of the source, may not reflect the actual
behavior under study (Michel & Moore, 1995). Indeed, many aspects are highly likely to
affect the outcomes of these tests, namely the design of the research, the way a situation
was perceived as well as the ability to report it and even cases of purposeful deception
(Berger, 2007; Craig et al., 2000; Jones, 1972; Richards & Bernal, 1972; Smith et al., 1999).
For instance, ambiguously defined concepts may lead to misinterpretation of the questions
posed. Similarly, low age, cognitive impairment and self-conscious emotions (such as pride
or shame) may diminish/alter the perception of certain events and, thus, the ability to report
them. There can also be the case that the individuals submitted to the tests deliberately
lead the researchers in the wrong direction. Consequently, the findings from this type of
tests are somewhat limited since they reflect “only what people say and leave unanswered
the question of what they actually do”, as stated by Barrett and Stulp (2013, p. 41).
Lastly, the laboratory study of behavior also presents some disadvantages. Since it requires
carefully controlled conditions, this type of research provides high internal validity if the
protocol is meticulously designed and followed (Pepler & Craig, 1995). However, and
because the experimental settings are artificial, the behavior under analysis is not
spontaneous but rather a reaction to the circumstances imposed by the researcher or even
to the presence of the researcher itself and may not be representative of normative contexts
(Cosnier, 1986; Pepler & Craig, 1995; Savin-Williams, 1987). Also, some natural occurring
conditions are unethical to replicate thus being impossible to comprehensively study
behavior (especially human) (Pepler & Craig, 1995). Both the reactivity displayed by the
8
participants and the ethical limitations imposed make drawing conclusions difficult and the
generalization of the results flawed, lowering the external validity of this methodology
(Barrett & Stulp, 2013; Pepler & Craig, 1995; Savin-Williams, 1987).
Therefore, and considering the emphasis placed by Ethology on the direct observation and
description of naturally occurring behavior, a multi-method approach combining both the
psychological and ethological methodologies may prove to be extremely advantageous
when investigating the complex phenomena of human behavior (Archer, 1995; Barrett &
Stulp, 2013; Berger, 2007; Cosnier, 1986; Lehner, 1996; Michel & Moore, 1995; Moreno &
Muñoz-Delgado, 2007; Pellegrini, 1998; Pepler & Craig, 1995; Rajecki, 1983; Savin-
Williams, 1987). Thereby, the strengths of each method are enhanced as well as their
weaknesses minimized.
In the end, Human Ethology is not about portraying Man as “nothing but another ape” (Eibl-
Eibesfeldt, 1997, p. 21) but simply recognizing its natural history and applying ethological
methods to the study of its behavior. After all, as stated by Washburn and Dolhinow (1983,
p. 28),“If our goal is to understand human behavior, we must begin our study with human
beings”.
2. School Bullying, a pervasive experience
2.1. Characterization of the phenomenon
Friendships, peer interactions and social life play an essential role in the lives of children of
all ages. Adolescents turn to their peers more often than to their parents, and having friends
has been shown to be an essential contribution to greater social competence, sense of well-
being and self-esteem. Since it is where children spend most of their day at, school is where
predominantly friendship bonds are established and groups are formed (UNICEF, 2014).
On the other hand, and because it’s where most peer interactions occur, schools, as well
as routes to and from it, are the most common scenarios for bullying episodes (Farrington
& Ttofi, 2009; Lisboa et al., 2009; Ttofi & Farrington, 2011; UNICEF, 2014; Vreeman &
Carroll, 2007). Within the school setting, bullying is more likely to take place in the
playground because it’s where there is the least amount of adult supervision (Atlas & Pepler,
1998; Craig et al., 2000; Pellegrini, 1998; Pereira et al., 2004; Rigby, 2002; Vreeman &
Carroll, 2007).
Various research investigations showed that, despite variations in its prevalence, bullying
is a ubiquitous phenomenon affecting a substantial proportion of children across countries,
9
cultures, socioeconomic status, age groups and gender (Berger, 2007; Book et al., 2012;
García & Margallo, 2014; Lisboa et al., 2009; Volk et al., 2012). Furthermore, evidence of
this phenomenon has been found in records from a number of historical civilizations (e.g.
Greek, Roman), showing that bullying is also not exclusively linked to modern human
societies (Book et al., 2012; Volk et al., 2012).
Even though it constitutes a very serious form of peer aggression and is one of the most
common forms of school violence, the matter of bullying is still widely taken as a natural,
character forming, part of growing up (Arseneault et al., 2010; Lisboa et al., 2009; Matos et
al., 2009; Olweus, 2013; Smith & Brain, 2000; Wong & Schonlau, 2013). Notwithstanding
these beliefs, bullying causes a great deal of suffering to the victims and is a violation of the
child’s rights (Aluede et al., 2008; United Nations).
Therefore, it becomes imperative to clarify the concepts inherent to the phenomenon and
acknowledge that it is more than a child’s play.
2.1.1. Definition
When, around the late 1960’s and early 1970’s, research on bullying first began to emerge,
it was acknowledged under the term “mobbing”, alluding to the ethological concept of a
“collective attack by a group of animals on an animal of another species, which is usually
larger and a natural enemy of the group” (Olweus, 2013, p. 753). However, Dan Olweus, a
Swedish academic and one of the pioneers in the study of bullying, raised some doubts
concerning the suitability of the application of the term “mobbing” to this phenomenon and,
as a result, he suggested designating it as bully/victim problems (i.e. bullying). This same
researcher was also responsible for the currently most accepted definition of bullying.
According to Olweus, bullying is a form of aggressive behavior that encompasses three
defining features: intentionality, imbalance of power and (some) repetitiveness (Olweus,
2013).
The intentionality of the behavior implies a kind of proactive, deliberate and purposive
aggression in which there is a clear desire/intent to cause fear, distress or harm, as opposed
to reactive aggression (Lisboa et al., 2009; Olweus, 2013; Ttofi & Farrington, 2011). This
means that bullying is unprovoked by the victim, which excludes such motives as retaliation,
among others. In turn, the power imbalance feature entails a difference of strength between
the participants that makes extremely difficult for the victim to defend him or herself. This
asymmetrical power relationship can be real or perceived, ranging from actually being
physically abler to hurt others or being numerically superior, to being more confident,
assertive, socially competent and/or more popular. Lastly, the repetitiveness of the
behaviors reflects the chronic character that most of bullying situations acquire. However,
10
Olweus (2013, p. 757) doesn’t consider it as an “absolutely necessary criterion” but rather
recognizes it as a means of demonstrating the intentional component inherent to the
phenomenon. Furthermore, the events may be so strong and traumatizing that a single
occurrence may be enough to bring about extremely deleterious consequences to the
victim, similar to those resultant from continuous bullying (Atlas & Pepler, 1998; Costa &
Pereira, 2010; Evans et al., 2014; Garandeau & Cillessen, 2006; Lisboa et al., 2009;
Olweus, 2013; Reijntjes et al., 2013; Rigby, 2002, 2003, 2004; Smith & Brain, 2000; Ttofi &
Farrington, 2011; Weisfeld & Weisfeld, 2013).
Although the conjunction of the three features mentioned above is what qualifies certain
behaviors as bullying, it’s the power asymmetry that distinguishes it from other forms of
aggression (Olweus, 2013). Therefore, it’s not bullying when victimization occurs between
people of the same strength (physical, psychological, verbal), when the use of forcefulness
is justifiable (e.g. dentists and teachers in their practice, among others) or when children
are playfully fighting/teasing each other (Dake et al., 2003; Rigby, 2003, 2004). However,
and despite the imbalance of power being one of its defining characteristics, to be
considered bullying it must occur between individuals of the same age group (children-
children; adults-adults). When aggression is perpetrated by adults towards children, it’s
considered maltreatment rather than bullying (Arseneault et al., 2010).
In sum, and according to Ken Rigby (2002, p. 51), an Australian researcher also widely
acknowledged in this field of investigation, “Bullying involves a desire to hurt + hurtful action
+ a power imbalance + (typically) repetition + an unjust use of power + evident enjoyment
by the aggressor and generally a sense of being oppressed on the part of the victim.”.
As Shaw et al. (2013) stated, providing a clear and succinct definition ensures the correct
identification of bullying through the recognition of its three key elements, its distinction from
other forms of aggression, as well as a more comprehensive and collective perception of
the phenomenon.
2.1.2. Forms of bullying
In general, bullying events can occur either directly or indirectly (Berger, 2007; Garandeau
& Cillessen, 2006). Furthermore, they can also fit into one (or more) of five specific
categories: physical, verbal, gestural, relational and cyber (Olweus, 2013; Rigby, 2003).
Direct or, as children call it, “to my face” (Berger, 2007, p. 95) bullying involves the bully
directly confronting the victim (Arseneault et al., 2010; Atlas & Pepler, 1998). On the other
hand, indirect or “behind my back” (Berger, 2007, p. 95) bullying is characterized by the lack
of direct conflict (Garandeau & Cillessen, 2006). Because the presence of the bully is not
11
an absolute requirement, this type of hurtful actions are easier to occur, harder to detect
and self-defense from the victim is nearly impossible since he/she does not know whom to
blame (Arseneault et al., 2010; Berger, 2007). Thereby, direct forms of bullying are the most
easily identifiable and entail a higher probability of being caught, punishment and retaliation.
(Volk et al., 2012).
Physical bullying refers to aggressive physical behaviors directed at the victim and/or
his/her property (Shaw et al., 2013). While direct physical bullying involves such behaviors
as physical aggression (e.g. hitting and kicking, among others), extortion and weapon
usage, indirect forms include bullies getting another person to assault the victim, as well as
hiding or removing the victim’s belongings (Berger, 2007; Matos & Gonçalves, 2009; Rigby,
2003).
Verbal forms of bullying use written or spoken language as a means to distress others
(Doğruer & Yaratan, 2014; Evans et al., 2014). This type of bullying comprises, among
others, actions like insults and threats (direct verbal bullying) or defamation and anonymous
phone calls (indirect verbal bullying) (Rigby, 2003). Additionally, this kind of abuse is the
most frequently reported and observed (Berger, 2007; Craig et al., 2000; Matos et al., 2009;
Melim & Pereira, 2012).
Gestural bullying concerns the bully’s facial or bodily posture. It can take the form of
menacing, threatening and/or offensive gestures, signs and stares, either directly or behind
the victim’s back (Rigby, 2003).
Relational bullying behaviors aim at damaging someone’s reputation and disrupting his/hers
social relationships. These goals can be achieved either directly through ostracism and the
formation of overt coalitions against the victim, or indirectly by manipulating the victim’s
social image before others (Rigby, 2003; Shaw et al., 2013).
With the advent of technology and the multiplicity of means of communication, new ways of
perpetrating bullying emerged (Bauman et al., 2013). Cyberbullying consists in the use of
technologies to hurt others (Hinduja & Patchin, 2010). In this form of bullying, bullies resort
to emails, text messages, social networks, websites and blogs to threaten, offend,
intimidate, defame, exclude, impersonate and/or humiliate someone (UNICEF, 2014). Due
to the wide range of behaviors that it comprises, cyberbullying can overlap with other forms
of bullying, namely verbal and relational. Additionally, it is also not possible to distinguish
between direct and indirect means of cyberbullying because the identity of the bully remains
unknown in the majority of the events.
12
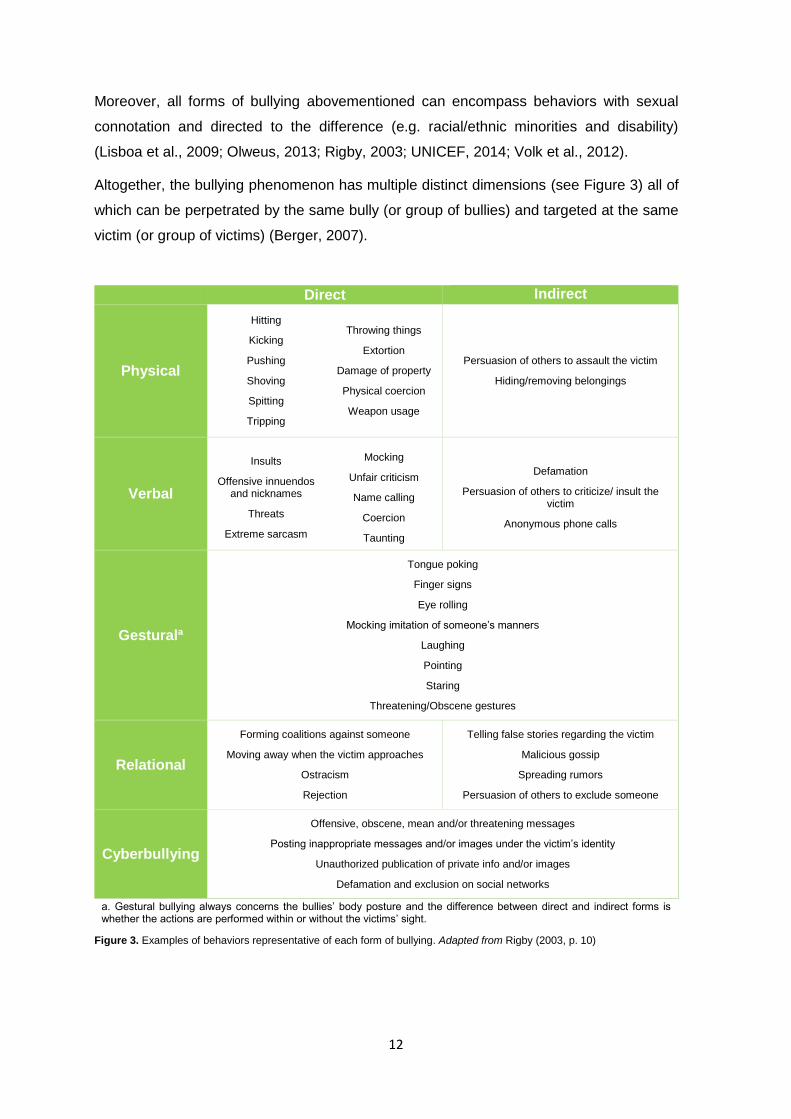
Moreover, all forms of bullying abovementioned can encompass behaviors with sexual
connotation and directed to the difference (e.g. racial/ethnic minorities and disability)
(Lisboa et al., 2009; Olweus, 2013; Rigby, 2003; UNICEF, 2014; Volk et al., 2012).
Altogether, the bullying phenomenon has multiple distinct dimensions (see Figure 3) all of
which can be perpetrated by the same bully (or group of bullies) and targeted at the same
victim (or group of victims) (Berger, 2007).
Direct Indirect
Physical
Hitting
Kicking
Pushing
Shoving
Spitting
Tripping
Throwing things
Extortion
Damage of property
Physical coercion
Weapon usage
Persuasion of others to assault the victim
Hiding/removing belongings
Verbal
Insults
Offensive innuendos and nicknames
Threats
Extreme sarcasm
Mocking
Unfair criticism
Name calling
Coercion
Taunting
Defamation
Persuasion of others to criticize/ insult the victim
Anonymous phone calls
Gesturala
Tongue poking
Finger signs
Eye rolling
Mocking imitation of someone’s manners
Laughing
Pointing
Staring
Threatening/Obscene gestures
Relational
Forming coalitions against someone
Moving away when the victim approaches
Ostracism
Rejection
Telling false stories regarding the victim
Malicious gossip
Spreading rumors
Persuasion of others to exclude someone
Cyberbullying
Offensive, obscene, mean and/or threatening messages
Posting inappropriate messages and/or images under the victim’s identity
Unauthorized publication of private info and/or images
Defamation and exclusion on social networks
a. Gestural bullying always concerns the bullies’ body posture and the difference between direct and indirect forms is whether the actions are performed within or without the victims’ sight.
Figure 3. Examples of behaviors representative of each form of bullying. Adapted from Rigby (2003, p. 10)
13
2.1.3. Participants
The bullying phenomenon goes beyond the bully/victim dyad, thus representing a social
dynamic which is influenced and affected, either directly or indirectly, by peers (Craig &
Pepler, 1995; Garandeau & Cillessen, 2006; O'Connell et al., 1999; Salmivalli et al., 1996;
Strøm et al., 2013; Sutton & Smith, 1999). Moreover, observations of bullying in the
playground revealed that peers were, at some extent, associated with this experience in
85% of its episodes (Craig & Pepler, 1995).
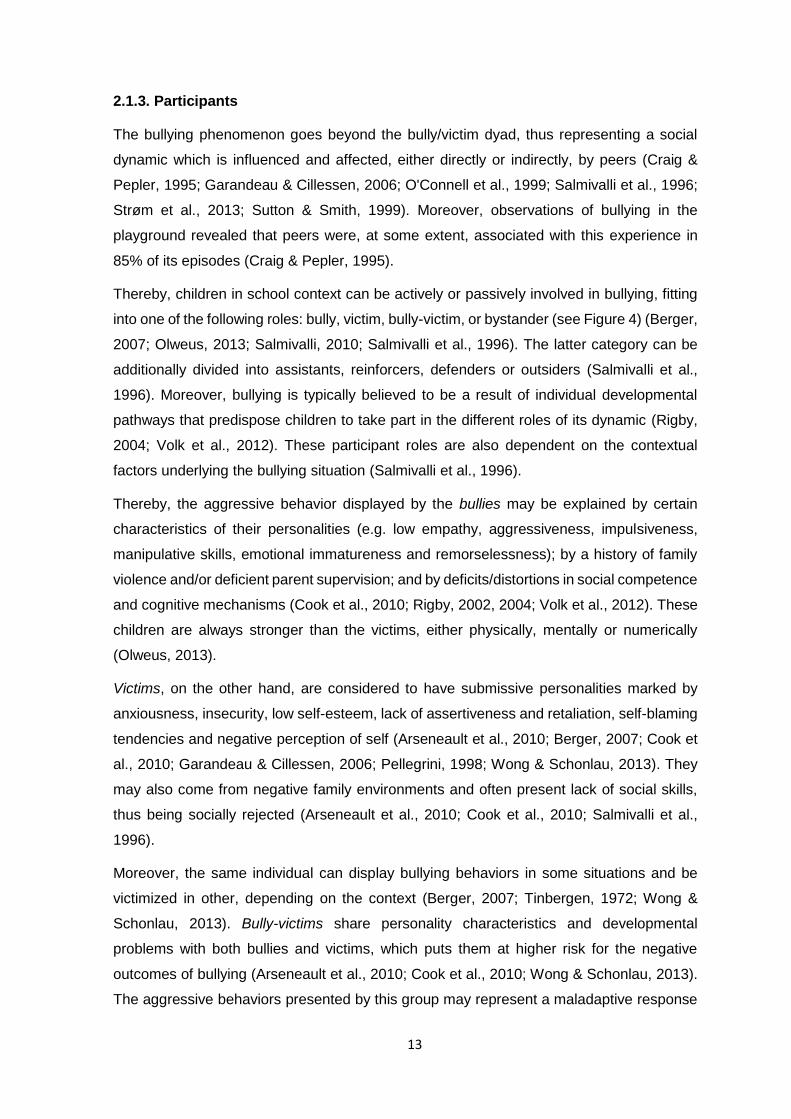
Thereby, children in school context can be actively or passively involved in bullying, fitting
into one of the following roles: bully, victim, bully-victim, or bystander (see Figure 4) (Berger,
2007; Olweus, 2013; Salmivalli, 2010; Salmivalli et al., 1996). The latter category can be
additionally divided into assistants, reinforcers, defenders or outsiders (Salmivalli et al.,
1996). Moreover, bullying is typically believed to be a result of individual developmental
pathways that predispose children to take part in the different roles of its dynamic (Rigby,
2004; Volk et al., 2012). These participant roles are also dependent on the contextual
factors underlying the bullying situation (Salmivalli et al., 1996).
Thereby, the aggressive behavior displayed by the bullies may be explained by certain
characteristics of their personalities (e.g. low empathy, aggressiveness, impulsiveness,
manipulative skills, emotional immatureness and remorselessness); by a history of family
violence and/or deficient parent supervision; and by deficits/distortions in social competence
and cognitive mechanisms (Cook et al., 2010; Rigby, 2002, 2004; Volk et al., 2012). These
children are always stronger than the victims, either physically, mentally or numerically
(Olweus, 2013).
Victims, on the other hand, are considered to have submissive personalities marked by
anxiousness, insecurity, low self-esteem, lack of assertiveness and retaliation, self-blaming
tendencies and negative perception of self (Arseneault et al., 2010; Berger, 2007; Cook et
al., 2010; Garandeau & Cillessen, 2006; Pellegrini, 1998; Wong & Schonlau, 2013). They
may also come from negative family environments and often present lack of social skills,
thus being socially rejected (Arseneault et al., 2010; Cook et al., 2010; Salmivalli et al.,
1996).
Moreover, the same individual can display bullying behaviors in some situations and be
victimized in other, depending on the context (Berger, 2007; Tinbergen, 1972; Wong &
Schonlau, 2013). Bully-victims share personality characteristics and developmental
problems with both bullies and victims, which puts them at higher risk for the negative
outcomes of bullying (Arseneault et al., 2010; Cook et al., 2010; Wong & Schonlau, 2013).
The aggressive behaviors presented by this group may represent a maladaptive response
14
to the victimization they suffer; that is, they may constitute redirected aggression (Wong &
Schonlau, 2013).
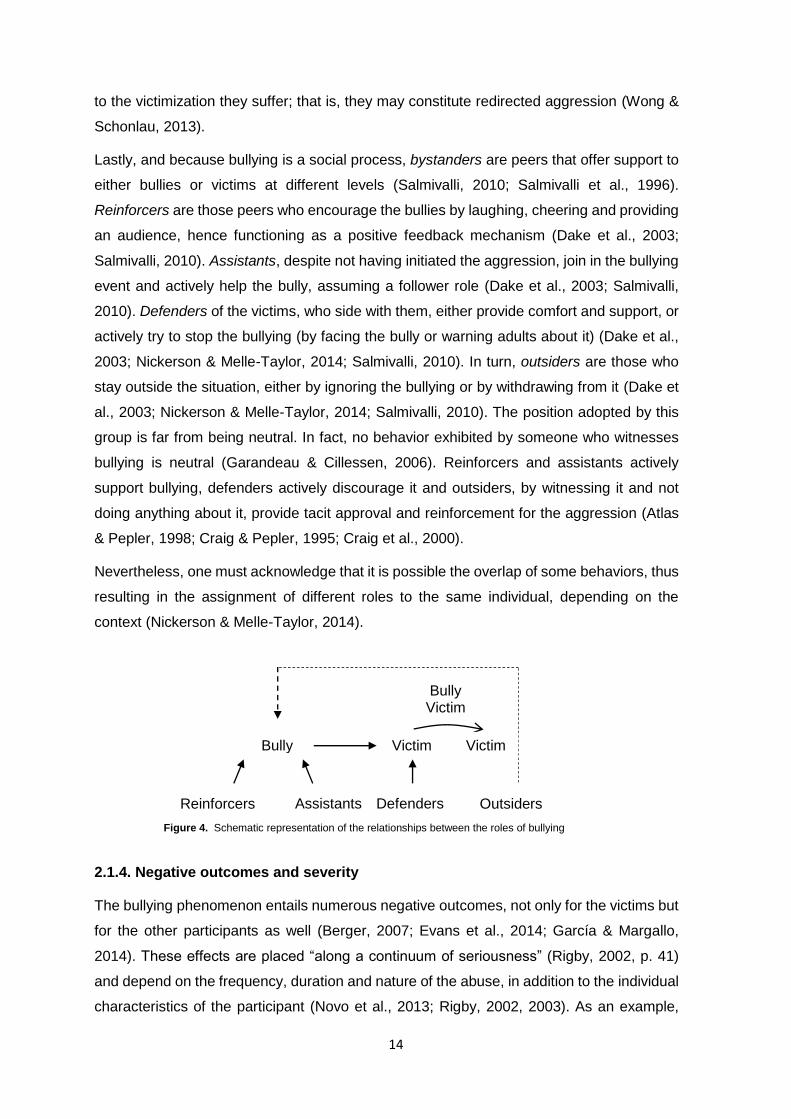
Lastly, and because bullying is a social process, bystanders are peers that offer support to
either bullies or victims at different levels (Salmivalli, 2010; Salmivalli et al., 1996).
Reinforcers are those peers who encourage the bullies by laughing, cheering and providing
an audience, hence functioning as a positive feedback mechanism (Dake et al., 2003;
Salmivalli, 2010). Assistants, despite not having initiated the aggression, join in the bullying
event and actively help the bully, assuming a follower role (Dake et al., 2003; Salmivalli,
2010). Defenders of the victims, who side with them, either provide comfort and support, or
actively try to stop the bullying (by facing the bully or warning adults about it) (Dake et al.,
2003; Nickerson & Melle-Taylor, 2014; Salmivalli, 2010). In turn, outsiders are those who
stay outside the situation, either by ignoring the bullying or by withdrawing from it (Dake et
al., 2003; Nickerson & Melle-Taylor, 2014; Salmivalli, 2010). The position adopted by this
group is far from being neutral. In fact, no behavior exhibited by someone who witnesses
bullying is neutral (Garandeau & Cillessen, 2006). Reinforcers and assistants actively
support bullying, defenders actively discourage it and outsiders, by witnessing it and not
doing anything about it, provide tacit approval and reinforcement for the aggression (Atlas
& Pepler, 1998; Craig & Pepler, 1995; Craig et al., 2000).
Nevertheless, one must acknowledge that it is possible the overlap of some behaviors, thus
resulting in the assignment of different roles to the same individual, depending on the
context (Nickerson & Melle-Taylor, 2014).
2.1.4. Negative outcomes and severity
The bullying phenomenon entails numerous negative outcomes, not only for the victims but
for the other participants as well (Berger, 2007; Evans et al., 2014; García & Margallo,
2014). These effects are placed “along a continuum of seriousness” (Rigby, 2002, p. 41)
and depend on the frequency, duration and nature of the abuse, in addition to the individual
characteristics of the participant (Novo et al., 2013; Rigby, 2002, 2003). As an example,
Victim Bully
Reinforcers Assistants Defenders Outsiders
Victim
Bully Victim
Figure 4. Schematic representation of the relationships between the roles of bullying
15
occasional episodes of name-calling or exclusion might be related with low levels of
severity; more systematic and cruel actions such as threats and physical abuse might be
involved with intermediate levels; and particularly damaging actions extended over a
considerable period of time (serious physical assaults, total exclusion, among others) might
result in highly severe consequences (Rigby, 2002).
Compared to children non-involved in bullying, victims report worse school performance
and academic achievement; exhibit more physical health problems such as sleep
disturbances, enuresis, headaches, abdominal pain, fatigue and neck, shoulder and back
pain; and have lowered mental health, which reflects in depression, generalized anxiety,
stress, schizophrenia and psychopathology (Arseneault et al., 2010; Dake et al., 2003; Novo
et al., 2013; Vreeman & Carroll, 2007). Bullying victimization is, as well, correlated with a
heightened risk for substance abuse, and for suicide ideation and both failed and successful
suicide attempts (Hepburn et al., 2012; Tharp-Taylor et al., 2009). Moreover, there are
reports of bullying-related homicides, often in the form of school shootings (Berger, 2007;
Dake et al., 2003). In fact, the severity of the outcomes is increased by the co-occurrence
of multiple types of victimization (Berger, 2007; Wang et al., 2010).
Like victims, bullies suffer more from psychological and physical disorders than non-
involved children (Evans et al., 2014; Liang et al., 2007; Shaw et al., 2013; Vreeman &
Carroll, 2007). This also holds true for the higher likelihood of risky behaviors as substance
abuse or carrying weapons, social impairment, academic failure and suicide ideation (Evans
et al., 2014; García & Margallo, 2014; Richards & Bernal, 1972; UNICEF, 2014).
Additionally, repeatedly perpetrating bullying behaviors is highly correlated with criminal
misconduct (Berger, 2007; Dake et al., 2003; García & Margallo, 2014; Olweus, 2011).
Bullying also impacts the lives of those who witness it. It’s usual for bystanders to develop
negative feelings towards the school environment, as well as to perform lower academically
(Berger, 2007; Doğruer & Yaratan, 2014). Furthermore, peers may experience severe
anxiety, stress, discomfort and fear of becoming the next victim (Atlas & Pepler, 1998;
Doğruer & Yaratan, 2014). As Berger (2007, p. 107) stated, “children who see bullying, day
after day, absorb harmful lessons: bystanders should not intervene; victims deserve their
fate; power beats fairness; adults do not care about children”.
Lastly, bully-victims are at most risk when compared with both non-involved children and
the other participating groups, cumulating the deleterious effects of the bullies and the
victims (Liang et al., 2007).
The concern about this phenomenon extends beyond a short-term perspective. Research
indicates that the outcomes of being involved in bullying during childhood and adolescence
16
persist into adulthood, contributing to a generation of socially and emotionally maladjusted
adults responsible for overloading social support systems (either due to unemployment,
incapacity pensions or being in prison) (García & Margallo, 2014; Jiang et al., 2011; Kim et
al., 2011; Klomek et al., 2008; Olweus, 2011, 2013).
As a result of both its short- and long-term effects, bullying is a matter extremely relevant in
the medico-legal area. Therefore, it is particularly important a more comprehensive
understanding of the phenomenon, aiming at a more successful intervention and
prevention.
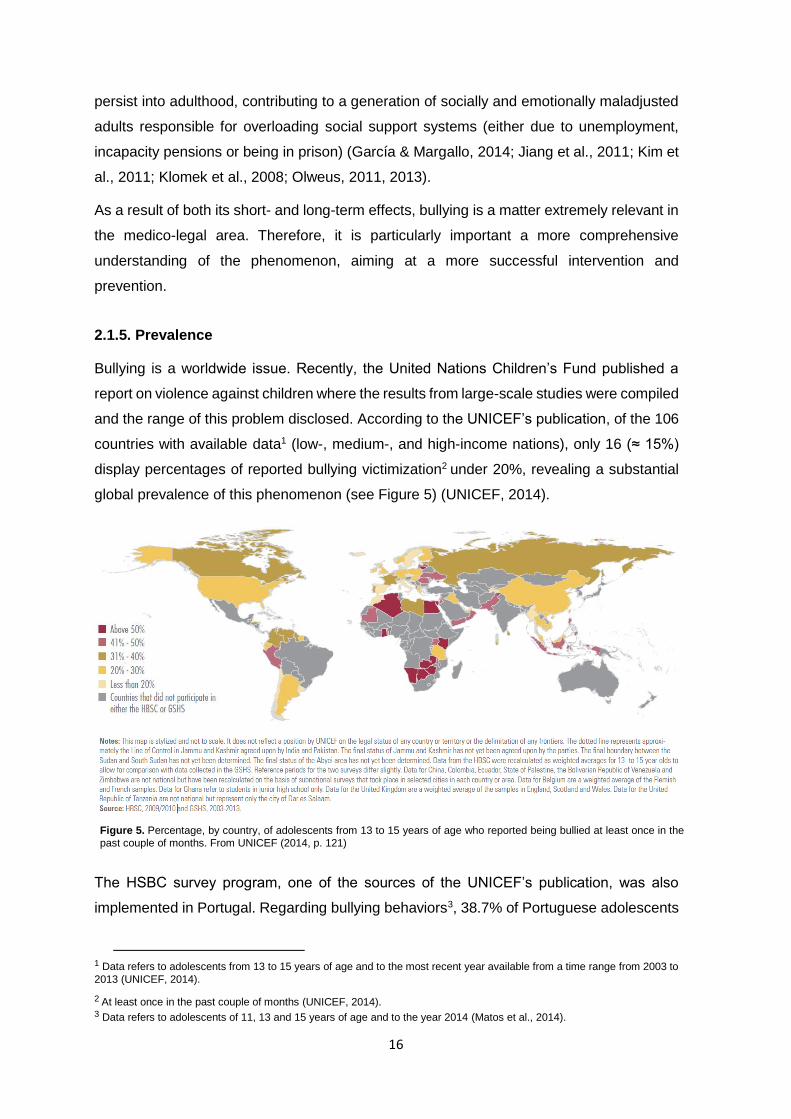
2.1.5. Prevalence
Bullying is a worldwide issue. Recently, the United Nations Children’s Fund published a
report on violence against children where the results from large-scale studies were compiled
and the range of this problem disclosed. According to the UNICEF’s publication, of the 106
countries with available data1 (low-, medium-, and high-income nations), only 16 (≈ 15%)
display percentages of reported bullying victimization2 under 20%, revealing a substantial
global prevalence of this phenomenon (see Figure 5) (UNICEF, 2014).
The HSBC survey program, one of the sources of the UNICEF’s publication, was also
implemented in Portugal. Regarding bullying behaviors3, 38.7% of Portuguese adolescents
1 Data refers to adolescents from 13 to 15 years of age and to the most recent year available from a time range from 2003 to
2013 (UNICEF, 2014).
2 At least once in the past couple of months (UNICEF, 2014).
3 Data refers to adolescents of 11, 13 and 15 years of age and to the year 2014 (Matos et al., 2014).
Figure 5. Percentage, by country, of adolescents from 13 to 15 years of age who reported being bullied at least once in the
past couple of months. From UNICEF (2014, p. 121)
17
reported being victimized in school in the past couple months, whereas 30.9% admitted
having bullied others in the same time interval (Matos et al., 2014). These results, in line
with those presented by UNICEF, reflect the normative character of the phenomenon, thus
highlighting the importance of implementing prevention and intervention programs.
2.1.6. Intervention and prevention
Several prevention and intervention programs are currently being implemented in schools
around the world, focusing on various elements positively correlated with a decrease in
bullying behaviors, such as: improvement of playground supervision; application of strict
disciplinary methods; parent meetings and training; implementation of an anti-bullying policy
encompassing the whole school community; and promotion of school conferences and use
of institutional videos (Evans et al., 2014; Farrington & Ttofi, 2009; Ttofi & Farrington, 2009,
2011). Nevertheless, such programs have been shown to reduce bullying in about 20%,
which is a somewhat limited success (Berger, 2007; Evans et al., 2014; Farrington & Ttofi,
2009; Frisén et al., 2012; Ttofi & Farrington, 2009, 2011; Vreeman & Carroll, 2007).
Since it results in numerous deleterious repercussions for all its participants and has a
considerable prevalence worldwide, bullying is a phenomenon extremely relevant from a
medico-legal point of view, thus becoming imperative the optimization of anti-bullying
programs in order to maximize their success in reducing its occurrence and minimizing its
effects.
2.1.7. Other Bullying Contexts
Bullying is not exclusive to school settings. Other contexts where bullying has been reported
include, among others, the workplace, prisons, military forces, sports teams, nursing
homes, universities and domestic environments (Craig et al., 2000; Doğruer & Yaratan,
2014; Horton, 2011; Rayner & Hoel, 1997; Rigby, 2002). All these settings have in common
the potential to generate power imbalances and, subsequently, to promote aggressive
abuse of power.
In fact, every situation where individuals are required to interact with each other for a period
of time and have a limited choice over whom to interact with are likely to foster bullying
behaviors, thereby demonstrating the pervasive nature of the phenomenon (Horton, 2011;
Rigby, 2002).
18
3. A look at school bullying through an ethological perspective
3.1. Is bullying adaptive?
Childhood aggression is commonly regarded as the result of deficits and distortions in social
information processing and cognitive mechanisms, as well as of the imitation of aggressive
role-models. Likewise, bullying is typically considered as being the result of maladaptive
development, coming up as a deviant way to cope with the environment (Archer, 2001; Volk
et al., 2012). According to this perspective, besides being physically stronger than average,
bullies tend to be more aggressive and less empathic; academically, socially and mentally
challenged; probably coming from dysfunctional and oppressive households; and not
integrated into their communities (Berger, 2007; Cook et al., 2010; Rigby, 2004).
However, this theory does not seem enough to explain the high prevalence and the ubiquity
of the phenomenon (Volk et al., 2012). Moreover, and in addition to the fact that aggression
may be a successful strategy in certain contexts, research has indicated that some children
involved in bullying behaviors as perpetrators are generally smart and popular students and,
mainly, do not lack social skills (Archer, 2001; Doğruer & Yaratan, 2014; Smith & Brain,
2000). In fact, they often possess various attributes commonly regarded by society as
positive, such as assertiveness, risk taking, and leadership, organizational and analytical
skills (Simplicio, 2013).
Additionally, children who engage in bullying behaviors seem to do so in a goal-directed
manner, striving for power, admiration, high status and dominance (Olthof et al., 2011;
Reijntjes et al., 2013; Simplicio, 2013; Weisfeld & Weisfeld, 2013). In fact, peers actually
respect, like and acknowledge these children (Berger, 2007; Reijntjes et al., 2013; Simplicio,
2013).
Therefore, bullying may be more than just a set of maladaptive conducts, merely justified
by the psychosocial traits of the individuals (Horton, 2011; Volk et al., 2012). An alternative
hypothesis suggests that bullying may also serve an evolutionary purpose, which means
that this kind of behaviors are probably strategic and possibly have an adaptive function
(Book et al., 2012; Reijntjes et al., 2013; Rigby, 2002; Volk et al., 2012; Weisfeld & Weisfeld,
2013).
19
3.2. Bullying from an ethological standpoint
3.2.1. On Aggression
Aggressive conducts, due to their hostile nature and tendency to violate social norms, are
typically seen as “socially incompetent behaviors” (Olthof et al., 2011, p. 340). However,
from an evolutionary perspective, aggression is regarded as a set of functional responses,
or strategies, to a number of problems that emerged in the course of evolution (Archer,
2001; Olthof et al., 2011).
Such conceptualization of aggression implies an inherent purpose. On his book On
Aggression (1963), Konrad Lorenz described intra-specific aggression, or “aggression in
the proper and narrower sense of the word” (p. 26), as having a species-preserving function.
Aggression towards elements of the same species can be motivated by, essentially, three
proximate goals: more mating opportunities (in order to, ultimately, perpetuate their genes);
proper distribution of individuals (so the resources don’t become over-exploited); and
hierarchical social organization (contributing to the stability and viability of the group, where
everyone knows their place and where top positions usually entail preferential access to
available resources) (Dugatkin, 2014; Lorenz, 1963; Morris, 1967; Olthof et al., 2011; Rigby,
2002).
Despite being displayed species-wide and presenting an adaptive component, aggression
can be extremely costly. Engaging in aggressive behaviors involves a cost-benefit analysis,
in which the costs of endangering one’s survival must be largely outweighed by the benefits
accruing from such conducts. (Benenson, 2009; Dugatkin, 2014). This is probably the
reason why asymmetrical fighting is the norm in the animal world, which includes human
beings (Gat, 2010).
3.2.2. Social dominance
Aggression is a key component in establishing dominance. Ethology regards social
dominance not as an individual trait, but rather as a property of interpersonal relationships,
which means that individuals only are dominant or submissive within a context of social
interaction (Reijntjes et al., 2013; Savin-Williams, 1987; Watts, 2010). Accordingly, an
individual is considered dominant when his/hers aggressive behaviors result in the peer’s
submission (Martin, 2009; Olthof et al., 2011; Reijntjes et al., 2013; Watts, 2010).
When dyadic interactions occur frequently within a relatively cohesive group, it is possible
to assort the elements of that group according to a rank order, thus resulting in dominance
hierarchies (Barnard, 2004; Dugatkin, 2014; Martin, 2009; Strayer & Strayer, 1976). High
20
status individuals occupying top positions in dominance hierarchies are rewarded with
preferential access to both material and social resources (Dugatkin, 2014; Gat, 2010;
Hawley, 1999; Pellegrini, 2002; Pellegrini & Bartini, 2001; Reijntjes et al., 2013; Savin-
Williams, 1987; Watts, 2010). Thereby, such hierarchical organization is a reflection of the
power asymmetries between the individuals in a context of resource allocation (Hawley,
1999; Watts, 2010). As Pellegrini (2002, p. 26) stated, “dominance is not an end in and of
itself, but is indicative of individuals’ access to desired resources”. Moreover, research
indicates that dominance may be gratifying on its own (irrespective of other desired
resources) due to the central role dominant individuals play within the social life of the group
(Hawley, 1999; Savin-Williams, 1979).
The establishment of dominance-based hierarchies has also proven to be advantageous to
the group as a whole, rather than just to those at the top, contributing to its viability and
stability (Savin-Williams, 1979). By knowing their relative place in the social order, each
member has the ability to predict and avoid intra-group aggression (due to the high
probability of defeat) (Pellegrini, 2002; Savin-Williams, 1979, 1987; Strayer & Strayer, 1976;
Watts, 2010).
Dominance hierarchies are commonly found in social species including, among others,
ants, wolves, hyenas, non-human primates, and humans (Hawley, 1999; Martin, 2009;
Savin-Williams, 1987; Strayer & Strayer, 1976; Volk et al., 2012; Watts, 2010).
3.2.3. Intra-specific aggression, dominance hierarchies and bullying: what relation?
Considering the notions and purposes of aggression and social dominance addressed in
the previous sections, it is possible to draw some parallels between these ethological
concepts and bullying behaviors, thus supporting the theory that this phenomenon may
have an adaptive basis.
Firstly, the expression of bullying constitutes an asymmetrical aggression and, likewise, is
liable to entail costs and a cost-benefit evaluation (Pellegrini, 1998). The immediate costs
for bullies include being caught and punished, retaliation and rejection, and the cost-benefit
analysis they perform is reflected in the form of bullying in which they choose to engage
(Archer, 2001; Pellegrini, 1998; Volk et al., 2012). For instance, direct physical aggression,
despite being more effective in the short-run, is more risky than indirect relational forms
(Archer, 2001). The diversity of bullying forms also suggests that each form may have
resulted as a response to different selective pressures (Volk et al., 2012).
Bullying and intra-specific aggression possibly have some purposes in common as well.
When confronted with why they engage in such behaviors, the bullies’ most frequent
21
answers are “to feel powerful” and “to look cool” (Reijntjes et al., 2013, p. 225), meaning
that bullies are moved by a desire of occupying a central, dominant position in the group
(Caravita & Cillessen, 2012; Olthof et al., 2011; Sutton & Smith, 1999). Accordingly,
research indicates that bullies are actually perceived as popular, being both socially
prestigious and influential (Caravita & Cillessen, 2012; Hawley, 1999; Juvonen & Galván,
2009; Olthof et al., 2011; Olweus, 2013; Sutton & Smith, 1999). Thereby, engaging in
bullying behaviors is probably a way of achieving high levels of social dominance (Caravita
& Cillessen, 2012; Pellegrini, 1998; Reijntjes et al., 2013).
Resorting to bullying to obtain social dominance is a frequent and well-studied occurrence
in non-human social species. By the same token, some studies have found that humans
also make use of asymmetrical aggressive behaviors to form dominance hierarchies,
particularly children of all ages, from toddlers to adolescents (Hawley, 1999; Martin, 2009;
Savin-Williams, 1976, 1979, 1980, 1987; Strayer & Strayer, 1976). Additionally, confined,
“caged” settings, a category where schools usually fit, appear to favor aggression and
vertical stratification (Martin, 2009; Rajecki, 1983).
Furthermore, and consistent with an adaptive perspective, bullying is also found to be
positively correlated with high levels of resource control (Reijntjes et al., 2013, p. 25).
Desirable resources for children and adolescents can be material, social and informational
(Reijntjes et al., 2013, p. 25), and may include: preferential access to toys/other play related
materials and to the most attractive sites within the schoolyard; food and money; esteem,
respect and admiration from peers; and more dating opportunities (Book et al., 2012; Dake
et al., 2003; Gat, 2010; Hawley, 1999; Pellegrini, 2002; Reijntjes et al., 2013; Savin-
Williams, 1987; Volk et al., 2012). As a consequence of leading to such high rewards,
bullying behaviors become self-reinforcing (Craig & Pepler, 1995; Craig et al., 2000;
Potegal, 1979; Reijntjes et al., 2013).
In summary, bullying behaviors may constitute a coercive strategy to enhance one’s social
status and achieve social dominance, as a means of acquiring desired resources.
3.3.3. Biological determinism?
It is imperative, however, to recognize that being adaptive does not make the behavior
inevitable, nor does predispositions entail fatalism (Juvonen & Galván, 2009; Savin-
Williams, 1987; Volk et al., 2012). Prosocial behaviors constitute an equally, if not more,
effective option in attaining high levels of dominance and in acquiring and controlling
resources (Hawley, 1999; Reijntjes et al., 2013; Rigby, 2002).
22
By understanding why some children choose to engage in bullying behaviors, it is possible
to adapt prevention and intervention programs in order to reduce the motivation to do so.
Such programs may gain from improving the cost-benefit ratios of bullying, rather than by
just increasing its costs through sanctions (Volk et al., 2012). This can be done, for instance,
by offering prosocial alternatives to bullies and/or by resorting to the peer group to deprive
them from an audience (Book et al., 2012; Craig et al., 2000; Olthof et al., 2011; Reijntjes
et al., 2013; Salmivalli, 2010; Simplicio, 2013; Volk et al., 2012).
In conclusion, bullying neither is solely the result of a maladaptive development nor it is a
predetermined, immutable set of behaviors. In fact, and as acknowledged by Gat (2010, p.
216), “there are highly complex interactions at work (...) underpinned by a simple
evolutionary rationale”.
23
OBJECTIVES
Although some studies have been conducted resorting to direct observations of bullying
behaviors in school contexts, the majority of worldwide research on this matter has
employed indirect measures. In accordance with the global trend, Portuguese research on
the bullying phenomenon has also exclusively made use of surveys and questionnaires. In
view of that, this study proposes an ethological approach to the study of school bullying.
More specifically, we aimed to, resorting to naturalistic observations, determine if groups of
human adolescents are organized into a hierarchical order, and if there is a relationship
between occupying a certain position in a dominance hierarchy and engaging in bullying
behaviors.
In particular, we proposed:
1. To elaborate a catalog of the behaviors displayed by adolescents during recreation
time in school;
2. To identify those behaviors related to dominance/submission and bullying;
3. To identify a dominance hierarchy;
4. To evaluate, per each member of the hierarchy, the frequency and time budget of
the abovementioned behaviors;
5. To compare the data obtained.
Accordingly, our research hypotheses are:
1. Groups of human adolescents display rank orderings;
2. Individuals occupying top rank positions in the hierarchy display more frequently
dominance behaviors but are not necessarily the most aggressive ones;
3. Individuals occupying bottom rank positions in the hierarchy display more frequently
submissive behaviors;
4. The frequency of perpetrating bullying behaviors is higher in individuals aiming at
the top rank positions in a hierarchy, thus being the most aggressive ones.
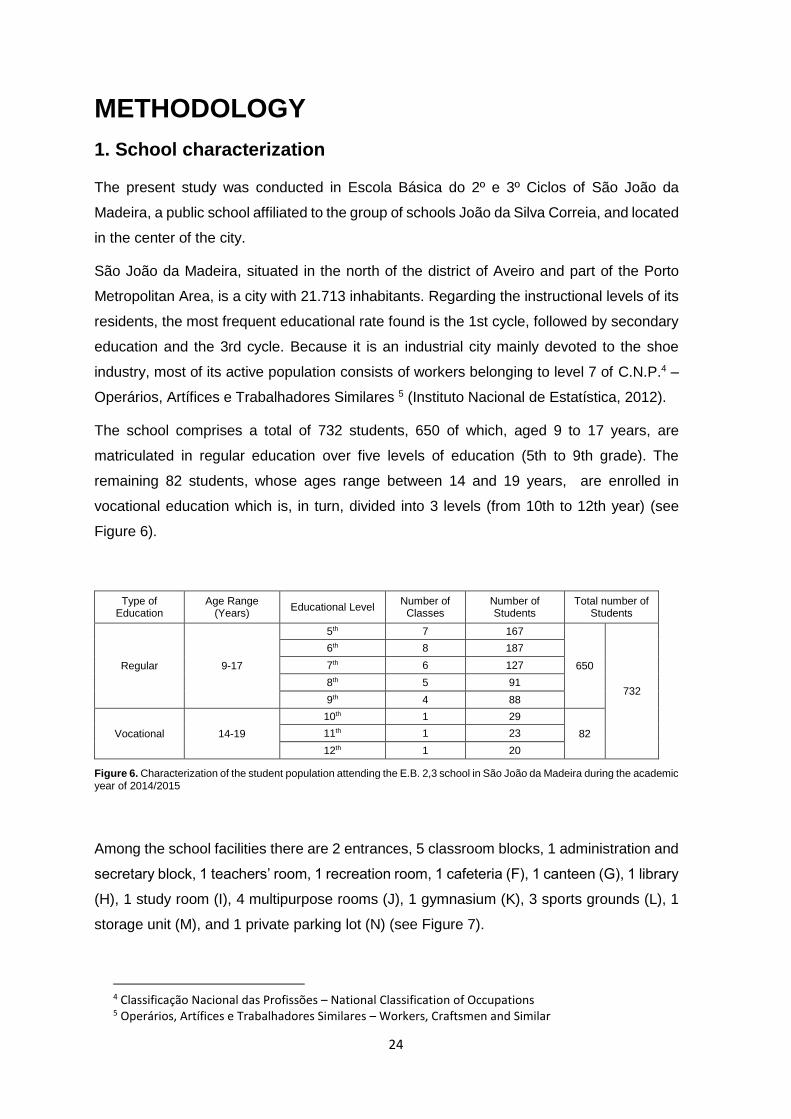
24
METHODOLOGY
1. School characterization
The present study was conducted in Escola Básica do 2º e 3º Ciclos of São João da
Madeira, a public school affiliated to the group of schools João da Silva Correia, and located
in the center of the city.
São João da Madeira, situated in the north of the district of Aveiro and part of the Porto
Metropolitan Area, is a city with 21.713 inhabitants. Regarding the instructional levels of its
residents, the most frequent educational rate found is the 1st cycle, followed by secondary
education and the 3rd cycle. Because it is an industrial city mainly devoted to the shoe
industry, most of its active population consists of workers belonging to level 7 of C.N.P.4 –
Operários, Artífices e Trabalhadores Similares 5 (Instituto Nacional de Estatística, 2012).
The school comprises a total of 732 students, 650 of which, aged 9 to 17 years, are
matriculated in regular education over five levels of education (5th to 9th grade). The
remaining 82 students, whose ages range between 14 and 19 years, are enrolled in
vocational education which is, in turn, divided into 3 levels (from 10th to 12th year) (see
Figure 6).
Type of Education
Age Range (Years)
Educational Level Number of
Classes Number of Students
Total number of Students
Regular 9-17
5th 7 167
650
732
6th 8 187
7th 6 127
8th 5 91
9th 4 88
Vocational 14-19
10th 1 29
82 11th 1 23
12th 1 20
Figure 6. Characterization of the student population attending the E.B. 2,3 school in São João da Madeira during the academic year of 2014/2015
Among the school facilities there are 2 entrances, 5 classroom blocks, 1 administration and
secretary block, 1 teachers’ room, 1 recreation room, 1 cafeteria (F), 1 canteen (G), 1 library
(H), 1 study room (I), 4 multipurpose rooms (J), 1 gymnasium (K), 3 sports grounds (L), 1
storage unit (M), and 1 private parking lot (N) (see Figure 7).
4 Classificação Nacional das Profissões – National Classification of Occupations 5 Operários, Artífices e Trabalhadores Similares – Workers, Craftsmen and Similar
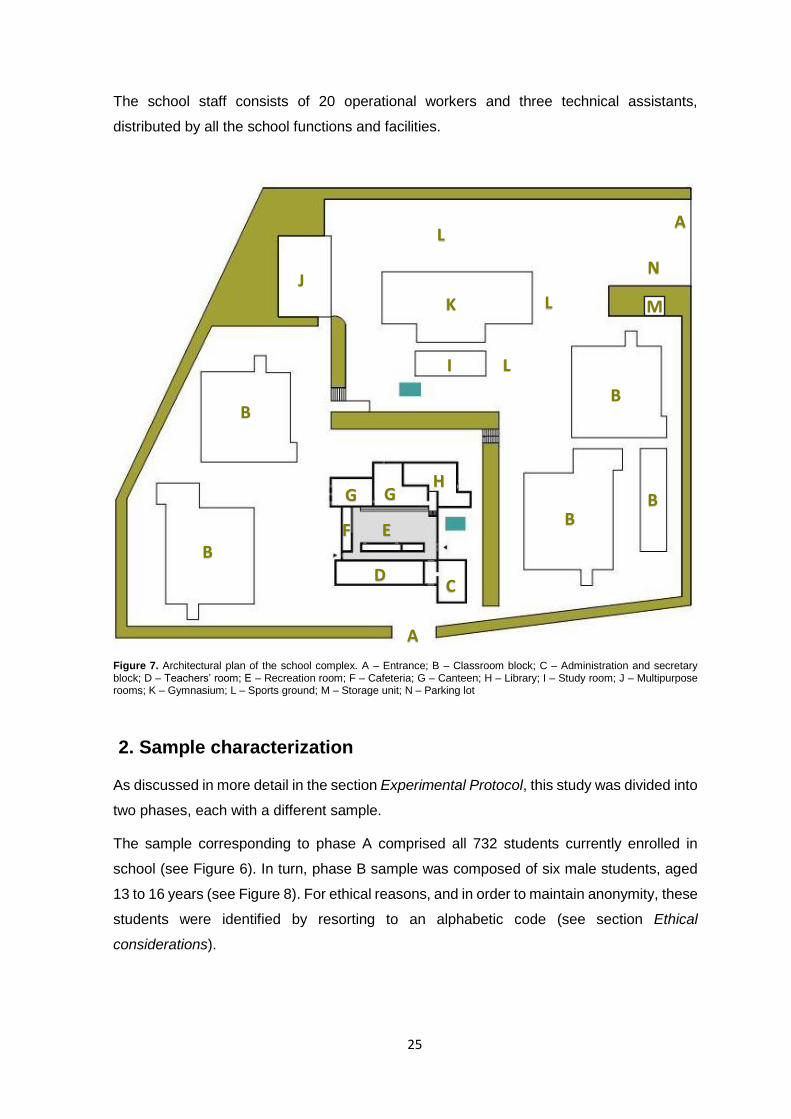
25
The school staff consists of 20 operational workers and three technical assistants,
distributed by all the school functions and facilities.
Figure 7. Architectural plan of the school complex. A – Entrance; B – Classroom block; C – Administration and secretary block; D – Teachers’ room; E – Recreation room; F – Cafeteria; G – Canteen; H – Library; I – Study room; J – Multipurpose rooms; K – Gymnasium; L – Sports ground; M – Storage unit; N – Parking lot
2. Sample characterization
As discussed in more detail in the section Experimental Protocol, this study was divided into
two phases, each with a different sample.
The sample corresponding to phase A comprised all 732 students currently enrolled in
school (see Figure 6). In turn, phase B sample was composed of six male students, aged
13 to 16 years (see Figure 8). For ethical reasons, and in order to maintain anonymity, these
students were identified by resorting to an alphabetic code (see section Ethical
considerations).
A
B
B
B
B
B
C D
E F
G H
G
I
A
J
K
L
L
L
N
M
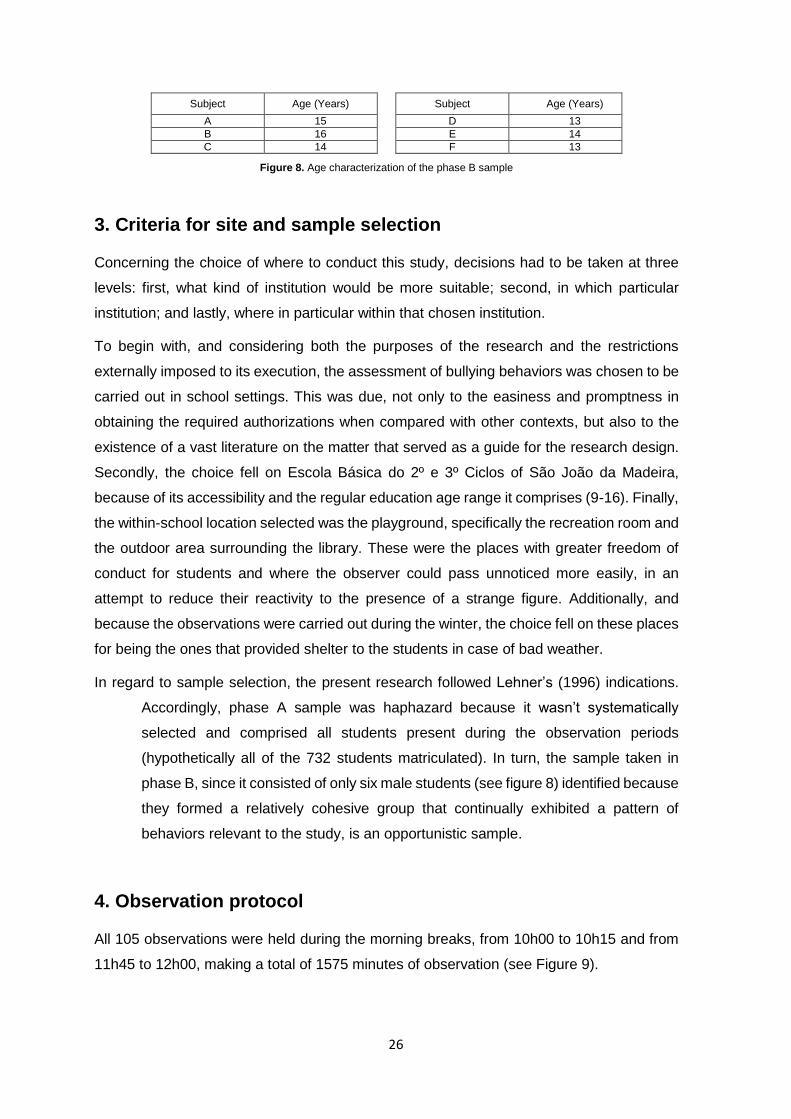
26
Subject Age (Years) Subject Age (Years) A 15 D 13 B 16 E 14 C 14 F 13
Figure 8. Age characterization of the phase B sample
3. Criteria for site and sample selection
Concerning the choice of where to conduct this study, decisions had to be taken at three
levels: first, what kind of institution would be more suitable; second, in which particular
institution; and lastly, where in particular within that chosen institution.
To begin with, and considering both the purposes of the research and the restrictions
externally imposed to its execution, the assessment of bullying behaviors was chosen to be
carried out in school settings. This was due, not only to the easiness and promptness in
obtaining the required authorizations when compared with other contexts, but also to the
existence of a vast literature on the matter that served as a guide for the research design.
Secondly, the choice fell on Escola Básica do 2º e 3º Ciclos of São João da Madeira,
because of its accessibility and the regular education age range it comprises (9-16). Finally,
the within-school location selected was the playground, specifically the recreation room and
the outdoor area surrounding the library. These were the places with greater freedom of
conduct for students and where the observer could pass unnoticed more easily, in an
attempt to reduce their reactivity to the presence of a strange figure. Additionally, and
because the observations were carried out during the winter, the choice fell on these places
for being the ones that provided shelter to the students in case of bad weather.
In regard to sample selection, the present research followed Lehner’s (1996) indications.
Accordingly, phase A sample was haphazard because it wasn’t systematically
selected and comprised all students present during the observation periods
(hypothetically all of the 732 students matriculated). In turn, the sample taken in
phase B, since it consisted of only six male students (see figure 8) identified because
they formed a relatively cohesive group that continually exhibited a pattern of
behaviors relevant to the study, is an opportunistic sample.
4. Observation protocol
All 105 observations were held during the morning breaks, from 10h00 to 10h15 and from
11h45 to 12h00, making a total of 1575 minutes of observation (see Figure 9).
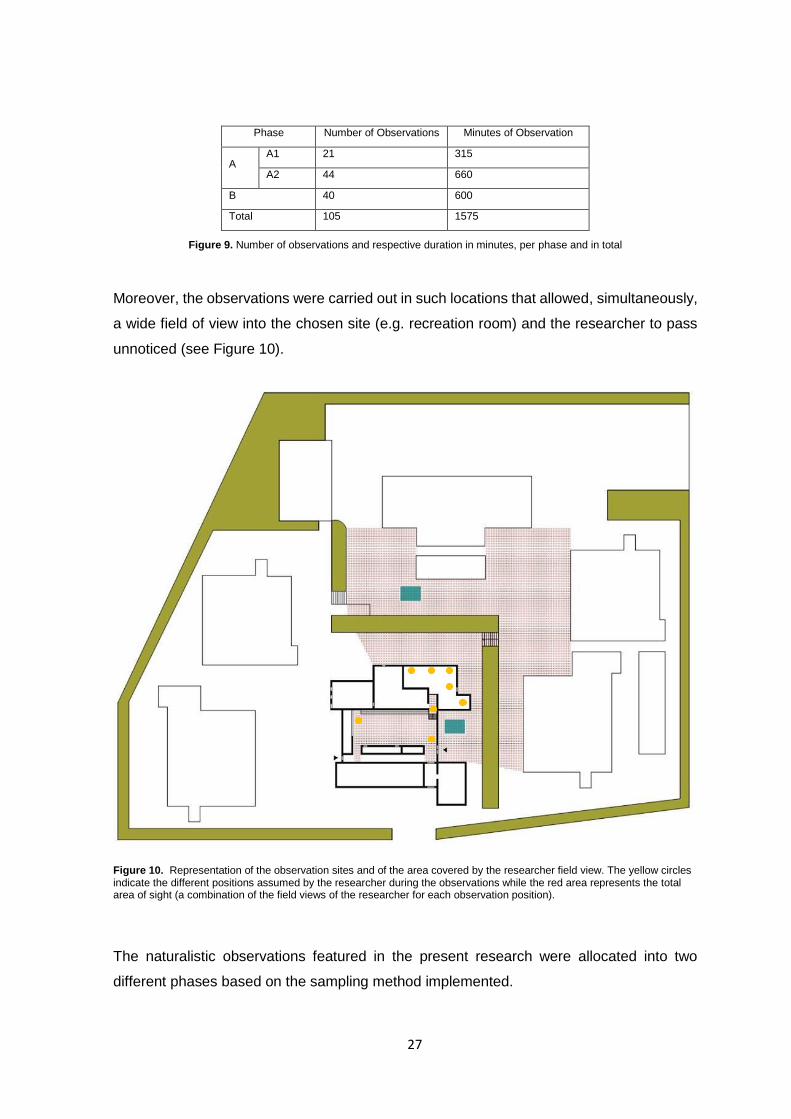
27
Phase Number of Observations Minutes of Observation
A A1 21 315
A2 44 660
B 40 600
Total 105 1575
Figure 9. Number of observations and respective duration in minutes, per phase and in total
Moreover, the observations were carried out in such locations that allowed, simultaneously,
a wide field of view into the chosen site (e.g. recreation room) and the researcher to pass
unnoticed (see Figure 10).
Figure 10. Representation of the observation sites and of the area covered by the researcher field view. The yellow circles indicate the different positions assumed by the researcher during the observations while the red area represents the total area of sight (a combination of the field views of the researcher for each observation position).
The naturalistic observations featured in the present research were allocated into two
different phases based on the sampling method implemented.
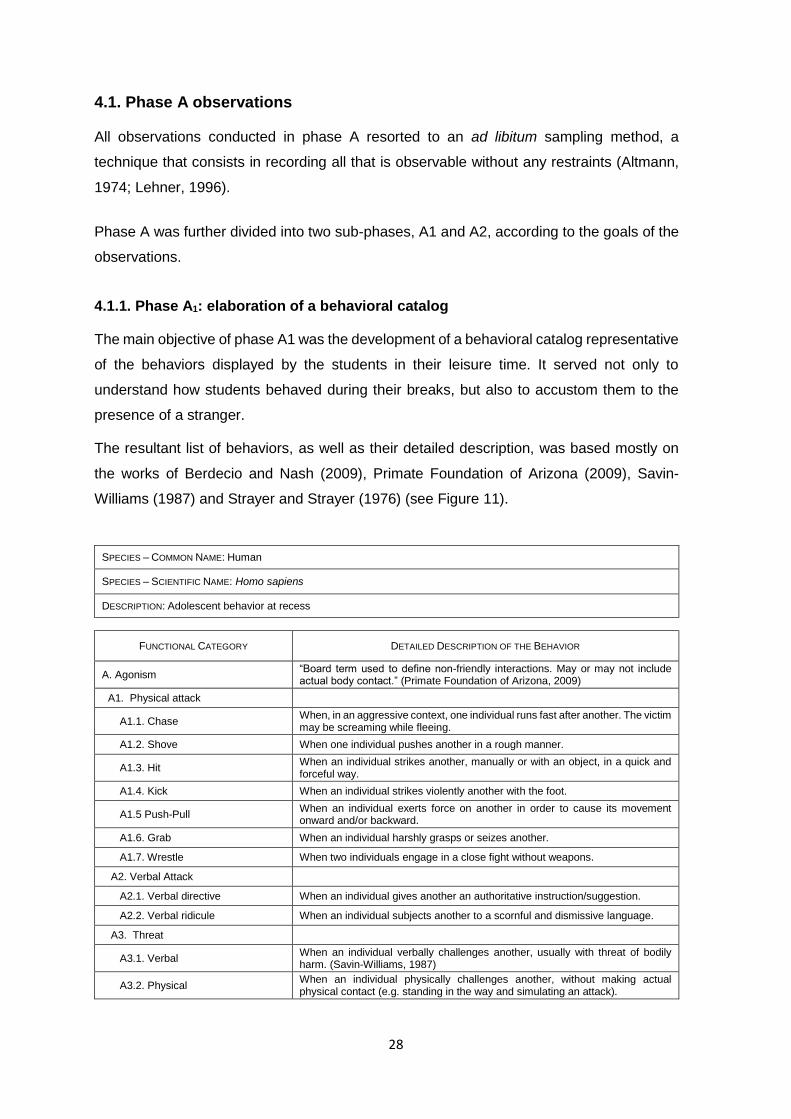
28
4.1. Phase A observations
All observations conducted in phase A resorted to an ad libitum sampling method, a
technique that consists in recording all that is observable without any restraints (Altmann,
1974; Lehner, 1996).
Phase A was further divided into two sub-phases, A1 and A2, according to the goals of the
observations.
4.1.1. Phase A1: elaboration of a behavioral catalog
The main objective of phase A1 was the development of a behavioral catalog representative
of the behaviors displayed by the students in their leisure time. It served not only to
understand how students behaved during their breaks, but also to accustom them to the
presence of a stranger.
The resultant list of behaviors, as well as their detailed description, was based mostly on
the works of Berdecio and Nash (2009), Primate Foundation of Arizona (2009), Savin-
Williams (1987) and Strayer and Strayer (1976) (see Figure 11).
SPECIES – COMMON NAME: Human
SPECIES – SCIENTIFIC NAME: Homo sapiens
DESCRIPTION: Adolescent behavior at recess
FUNCTIONAL CATEGORY DETAILED DESCRIPTION OF THE BEHAVIOR
A. Agonism “Board term used to define non-friendly interactions. May or may not include actual body contact.” (Primate Foundation of Arizona, 2009)
A1. Physical attack
A1.1. Chase When, in an aggressive context, one individual runs fast after another. The victim may be screaming while fleeing.
A1.2. Shove When one individual pushes another in a rough manner.
A1.3. Hit When an individual strikes another, manually or with an object, in a quick and forceful way.
A1.4. Kick When an individual strikes violently another with the foot.
A1.5 Push-Pull When an individual exerts force on another in order to cause its movement onward and/or backward.
A1.6. Grab When an individual harshly grasps or seizes another.
A1.7. Wrestle When two individuals engage in a close fight without weapons.
A2. Verbal Attack
A2.1. Verbal directive When an individual gives another an authoritative instruction/suggestion.
A2.2. Verbal ridicule When an individual subjects another to a scornful and dismissive language.
A3. Threat
A3.1. Verbal When an individual verbally challenges another, usually with threat of bodily harm. (Savin-Williams, 1987)
A3.2. Physical When an individual physically challenges another, without making actual physical contact (e.g. standing in the way and simulating an attack).
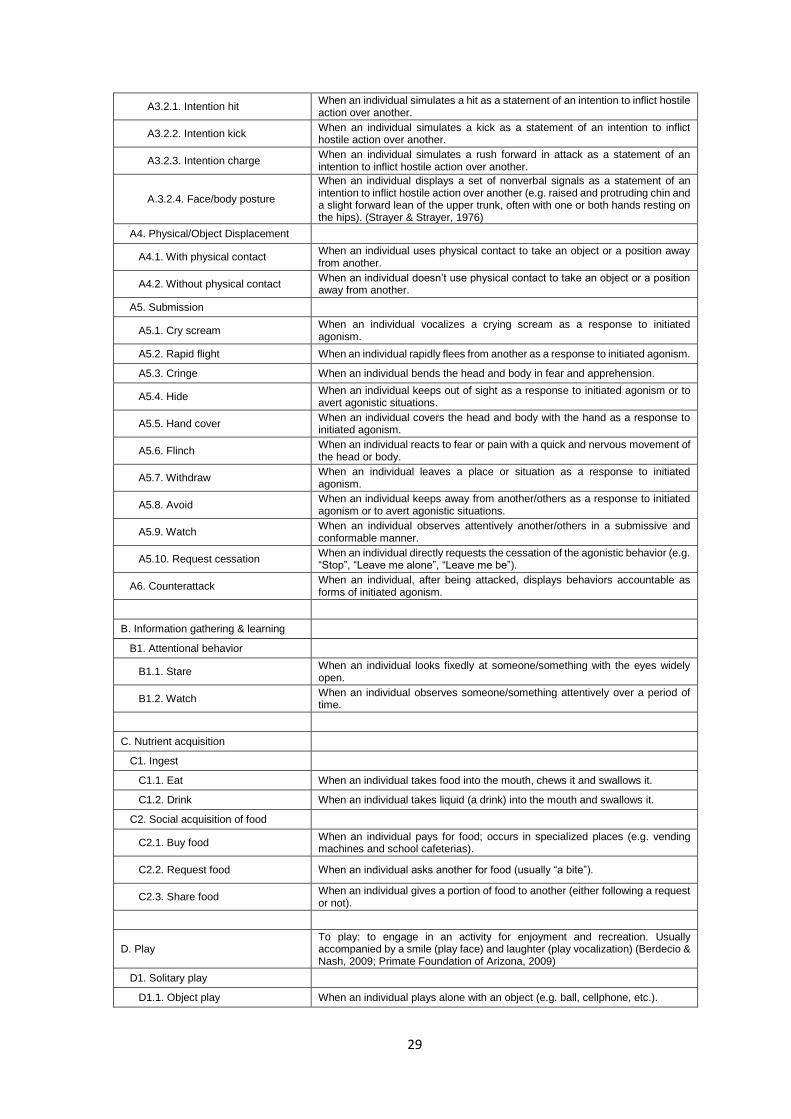
29
A3.2.1. Intention hit When an individual simulates a hit as a statement of an intention to inflict hostile action over another.
A3.2.2. Intention kick When an individual simulates a kick as a statement of an intention to inflict hostile action over another.
A3.2.3. Intention charge When an individual simulates a rush forward in attack as a statement of an intention to inflict hostile action over another.
A.3.2.4. Face/body posture
When an individual displays a set of nonverbal signals as a statement of an intention to inflict hostile action over another (e.g. raised and protruding chin and a slight forward lean of the upper trunk, often with one or both hands resting on the hips). (Strayer & Strayer, 1976)
A4. Physical/Object Displacement
A4.1. With physical contact When an individual uses physical contact to take an object or a position away from another.
A4.2. Without physical contact When an individual doesn’t use physical contact to take an object or a position away from another.
A5. Submission
A5.1. Cry scream When an individual vocalizes a crying scream as a response to initiated agonism.
A5.2. Rapid flight When an individual rapidly flees from another as a response to initiated agonism.
A5.3. Cringe When an individual bends the head and body in fear and apprehension.
A5.4. Hide When an individual keeps out of sight as a response to initiated agonism or to avert agonistic situations.
A5.5. Hand cover When an individual covers the head and body with the hand as a response to initiated agonism.
A5.6. Flinch When an individual reacts to fear or pain with a quick and nervous movement of the head or body.
A5.7. Withdraw When an individual leaves a place or situation as a response to initiated agonism.
A5.8. Avoid When an individual keeps away from another/others as a response to initiated agonism or to avert agonistic situations.
A5.9. Watch When an individual observes attentively another/others in a submissive and conformable manner.
A5.10. Request cessation When an individual directly requests the cessation of the agonistic behavior (e.g. “Stop”, “Leave me alone”, “Leave me be”).
A6. Counterattack When an individual, after being attacked, displays behaviors accountable as forms of initiated agonism.
B. Information gathering & learning
B1. Attentional behavior
B1.1. Stare When an individual looks fixedly at someone/something with the eyes widely open.
B1.2. Watch When an individual observes someone/something attentively over a period of time.
C. Nutrient acquisition
C1. Ingest
C1.1. Eat When an individual takes food into the mouth, chews it and swallows it.
C1.2. Drink When an individual takes liquid (a drink) into the mouth and swallows it.
C2. Social acquisition of food
C2.1. Buy food When an individual pays for food; occurs in specialized places (e.g. vending machines and school cafeterias).
C2.2. Request food When an individual asks another for food (usually “a bite”).
C2.3. Share food When an individual gives a portion of food to another (either following a request or not).
D. Play To play: to engage in an activity for enjoyment and recreation. Usually accompanied by a smile (play face) and laughter (play vocalization) (Berdecio & Nash, 2009; Primate Foundation of Arizona, 2009)
D1. Solitary play
D1.1. Object play When an individual plays alone with an object (e.g. ball, cellphone, etc.).
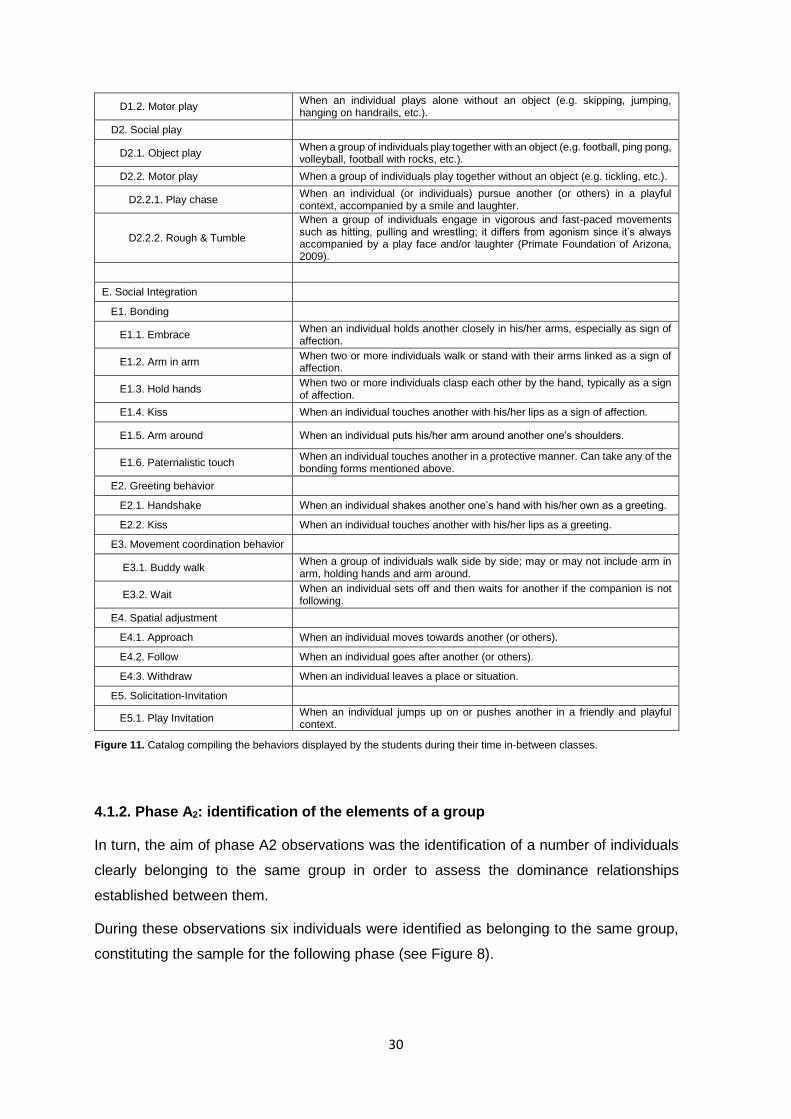
30
D1.2. Motor play When an individual plays alone without an object (e.g. skipping, jumping, hanging on handrails, etc.).
D2. Social play
D2.1. Object play When a group of individuals play together with an object (e.g. football, ping pong, volleyball, football with rocks, etc.).
D2.2. Motor play When a group of individuals play together without an object (e.g. tickling, etc.).
D2.2.1. Play chase When an individual (or individuals) pursue another (or others) in a playful context, accompanied by a smile and laughter.
D2.2.2. Rough & Tumble
When a group of individuals engage in vigorous and fast-paced movements such as hitting, pulling and wrestling; it differs from agonism since it’s always accompanied by a play face and/or laughter (Primate Foundation of Arizona, 2009).
E. Social Integration
E1. Bonding
E1.1. Embrace When an individual holds another closely in his/her arms, especially as sign of affection.
E1.2. Arm in arm When two or more individuals walk or stand with their arms linked as a sign of affection.
E1.3. Hold hands When two or more individuals clasp each other by the hand, typically as a sign of affection.
E1.4. Kiss When an individual touches another with his/her lips as a sign of affection.
E1.5. Arm around When an individual puts his/her arm around another one’s shoulders.
E1.6. Paternalistic touch When an individual touches another in a protective manner. Can take any of the bonding forms mentioned above.
E2. Greeting behavior
E2.1. Handshake When an individual shakes another one’s hand with his/her own as a greeting.
E2.2. Kiss When an individual touches another with his/her lips as a greeting.
E3. Movement coordination behavior
E3.1. Buddy walk When a group of individuals walk side by side; may or may not include arm in arm, holding hands and arm around.
E3.2. Wait When an individual sets off and then waits for another if the companion is not following.
E4. Spatial adjustment
E4.1. Approach When an individual moves towards another (or others).
E4.2. Follow When an individual goes after another (or others).
E4.3. Withdraw When an individual leaves a place or situation.
E5. Solicitation-Invitation
E5.1. Play Invitation When an individual jumps up on or pushes another in a friendly and playful context.
Figure 11. Catalog compiling the behaviors displayed by the students during their time in-between classes.
4.1.2. Phase A2: identification of the elements of a group
In turn, the aim of phase A2 observations was the identification of a number of individuals
clearly belonging to the same group in order to assess the dominance relationships
established between them.
During these observations six individuals were identified as belonging to the same group,
constituting the sample for the following phase (see Figure 8).
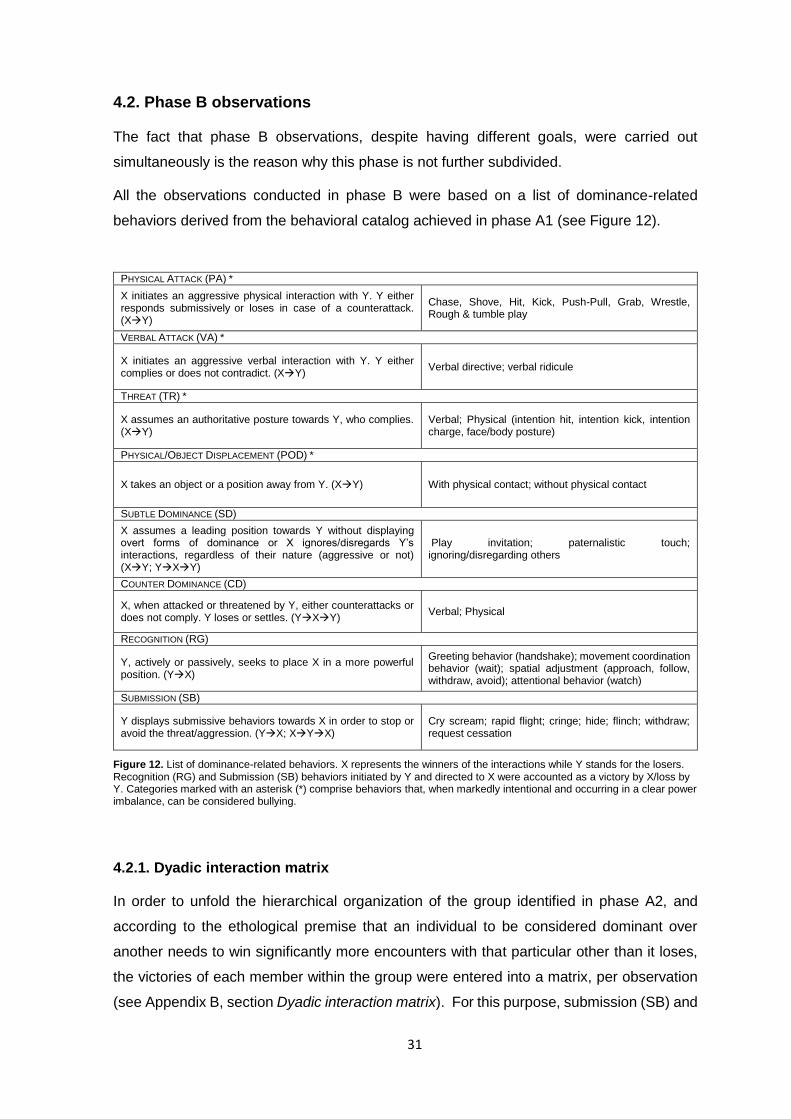
31
4.2. Phase B observations
The fact that phase B observations, despite having different goals, were carried out
simultaneously is the reason why this phase is not further subdivided.
All the observations conducted in phase B were based on a list of dominance-related
behaviors derived from the behavioral catalog achieved in phase A1 (see Figure 12).
PHYSICAL ATTACK (PA) *
X initiates an aggressive physical interaction with Y. Y either responds submissively or loses in case of a counterattack. (XY)
Chase, Shove, Hit, Kick, Push-Pull, Grab, Wrestle, Rough & tumble play
VERBAL ATTACK (VA) *
X initiates an aggressive verbal interaction with Y. Y either complies or does not contradict. (XY)
Verbal directive; verbal ridicule
THREAT (TR) *
X assumes an authoritative posture towards Y, who complies. (XY)
Verbal; Physical (intention hit, intention kick, intention charge, face/body posture)
PHYSICAL/OBJECT DISPLACEMENT (POD) *
X takes an object or a position away from Y. (XY) With physical contact; without physical contact
SUBTLE DOMINANCE (SD)
X assumes a leading position towards Y without displaying overt forms of dominance or X ignores/disregards Y’s interactions, regardless of their nature (aggressive or not) (XY; YXY)
Play invitation; paternalistic touch; ignoring/disregarding others
COUNTER DOMINANCE (CD)
X, when attacked or threatened by Y, either counterattacks or does not comply. Y loses or settles. (YXY)
Verbal; Physical
RECOGNITION (RG)
Y, actively or passively, seeks to place X in a more powerful position. (YX)
Greeting behavior (handshake); movement coordination behavior (wait); spatial adjustment (approach, follow, withdraw, avoid); attentional behavior (watch)
SUBMISSION (SB)
Y displays submissive behaviors towards X in order to stop or avoid the threat/aggression. (YX; XYX)
Cry scream; rapid flight; cringe; hide; flinch; withdraw; request cessation
Figure 12. List of dominance-related behaviors. X represents the winners of the interactions while Y stands for the losers. Recognition (RG) and Submission (SB) behaviors initiated by Y and directed to X were accounted as a victory by X/loss by Y. Categories marked with an asterisk (*) comprise behaviors that, when markedly intentional and occurring in a clear power imbalance, can be considered bullying.
4.2.1. Dyadic interaction matrix
In order to unfold the hierarchical organization of the group identified in phase A2, and
according to the ethological premise that an individual to be considered dominant over
another needs to win significantly more encounters with that particular other than it loses,
the victories of each member within the group were entered into a matrix, per observation
(see Appendix B, section Dyadic interaction matrix). For this purpose, submission (SB) and
32
recognition (RG) behaviors were accounted as victories of the receiver (see Figure 12).
Moreover, all these observations were conducted using a focal sampling technique.
4.2.2. Instantaneous sampling of the subjects’ behavior
With the purpose of determining an approximation of the time spent in each behavior (in
general and per individual) we resorted to a focal instantaneous sampling (see Appendix B,
section Instantaneous sampling of the subjects’ behavior). Accordingly, the behavior
exhibited by the members of the group was recorded five times every 30 seconds, making
a total of 2.5 minutes (150 seconds) of sampling period per element and per observation.
Because the subjects might not be within the researcher’s field of view the entire 15 minutes
of the interval, the starting order of observation was often changed (although on a regular
basis, e.g.: A-B-C-D-E-F; B-C-D-E-F-A; C-D-E-F-A-B; and so forth) so that all the members
of the group were equally observed.
4.2.3. Frequency of bullying behaviors
Whenever a dominance-related behavior was perpetrated in a clear imbalance of power
and was markedly intentional, it was accounted as a bullying behavior. Because the
observations had to be carried out from a distance that minimized the subjects reactivity,
the only criteria for considering a behavior imbalanced in terms of power was the physical
or numerical strength. Moreover, the intentionality of the behavior was assessed taking into
account the perpetrator’s body posture (e.g. insisting on the behavior) and the receiver’s
reaction and expression (e.g. fleeing; sad face). To register the frequencies of bullying
behaviors was employed a focal sampling method (see Appendix B, section Frequency of
bullying behaviors).
4.4. Ethical considerations
The present study, because it involved underage children, had to be sensitive to a number
of ethical issues.
The first concern was the protection of the identity of the subjects. In order to avoid reactivity
and to ensure the genuineness of the behaviors, the subjects were unware of the intentions
of the researcher. Therefore, the identification of the members was conducted resorting to
an alphabetical code.
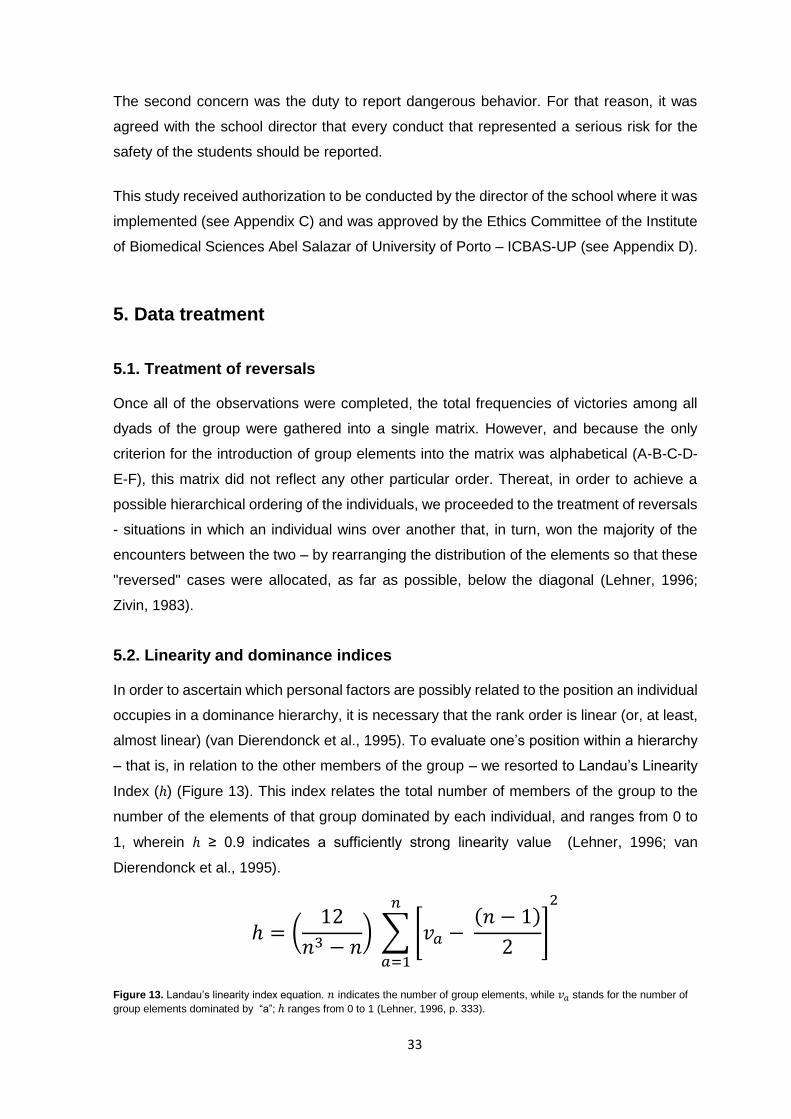
33
The second concern was the duty to report dangerous behavior. For that reason, it was
agreed with the school director that every conduct that represented a serious risk for the
safety of the students should be reported.
This study received authorization to be conducted by the director of the school where it was
implemented (see Appendix C) and was approved by the Ethics Committee of the Institute
of Biomedical Sciences Abel Salazar of University of Porto – ICBAS-UP (see Appendix D).
5. Data treatment
5.1. Treatment of reversals
Once all of the observations were completed, the total frequencies of victories among all
dyads of the group were gathered into a single matrix. However, and because the only
criterion for the introduction of group elements into the matrix was alphabetical (A-B-C-D-
E-F), this matrix did not reflect any other particular order. Thereat, in order to achieve a
possible hierarchical ordering of the individuals, we proceeded to the treatment of reversals
- situations in which an individual wins over another that, in turn, won the majority of the
encounters between the two – by rearranging the distribution of the elements so that these
"reversed" cases were allocated, as far as possible, below the diagonal (Lehner, 1996;
Zivin, 1983).
5.2. Linearity and dominance indices
In order to ascertain which personal factors are possibly related to the position an individual
occupies in a dominance hierarchy, it is necessary that the rank order is linear (or, at least,
almost linear) (van Dierendonck et al., 1995). To evaluate one’s position within a hierarchy
– that is, in relation to the other members of the group – we resorted to Landau’s Linearity
Index (ℎ) (Figure 13). This index relates the total number of members of the group to the
number of the elements of that group dominated by each individual, and ranges from 0 to
1, wherein ℎ ≥ 0.9 indicates a sufficiently strong linearity value (Lehner, 1996; van
Dierendonck et al., 1995).
ℎ = (12
𝑛3 − 𝑛) ∑ [𝑣𝑎 −
(𝑛 − 1)
2]
𝑛
𝑎=1
2
Figure 13. Landau’s linearity index equation. 𝑛 indicates the number of group elements, while 𝑣𝑎 stands for the number of
group elements dominated by “a”; ℎ ranges from 0 to 1 (Lehner, 1996, p. 333).
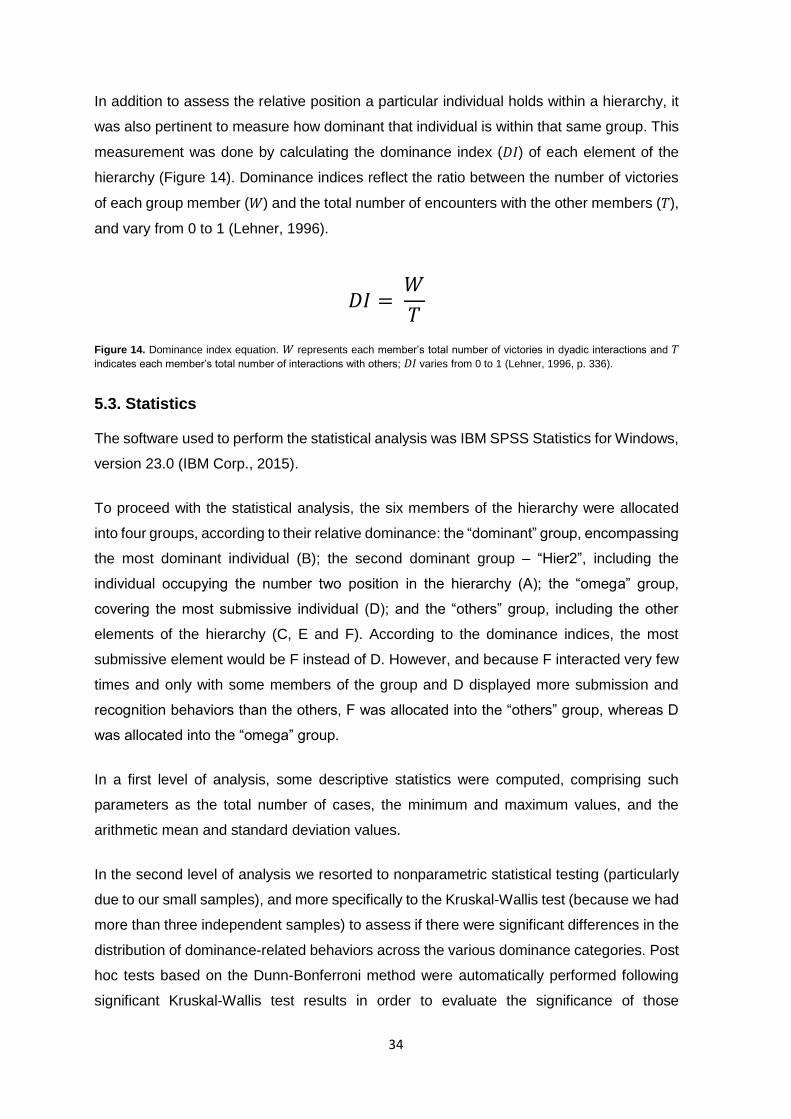
34
In addition to assess the relative position a particular individual holds within a hierarchy, it
was also pertinent to measure how dominant that individual is within that same group. This
measurement was done by calculating the dominance index (𝐷𝐼) of each element of the
hierarchy (Figure 14). Dominance indices reflect the ratio between the number of victories
of each group member (𝑊) and the total number of encounters with the other members (𝑇),
and vary from 0 to 1 (Lehner, 1996).
𝐷𝐼 = 𝑊
𝑇
Figure 14. Dominance index equation. 𝑊 represents each member’s total number of victories in dyadic interactions and 𝑇
indicates each member’s total number of interactions with others; 𝐷𝐼 varies from 0 to 1 (Lehner, 1996, p. 336).
5.3. Statistics
The software used to perform the statistical analysis was IBM SPSS Statistics for Windows,
version 23.0 (IBM Corp., 2015).
To proceed with the statistical analysis, the six members of the hierarchy were allocated
into four groups, according to their relative dominance: the “dominant” group, encompassing
the most dominant individual (B); the second dominant group – “Hier2”, including the
individual occupying the number two position in the hierarchy (A); the “omega” group,
covering the most submissive individual (D); and the “others” group, including the other
elements of the hierarchy (C, E and F). According to the dominance indices, the most
submissive element would be F instead of D. However, and because F interacted very few
times and only with some members of the group and D displayed more submission and
recognition behaviors than the others, F was allocated into the “others” group, whereas D
was allocated into the “omega” group.
In a first level of analysis, some descriptive statistics were computed, comprising such
parameters as the total number of cases, the minimum and maximum values, and the
arithmetic mean and standard deviation values.
In the second level of analysis we resorted to nonparametric statistical testing (particularly
due to our small samples), and more specifically to the Kruskal-Wallis test (because we had
more than three independent samples) to assess if there were significant differences in the
distribution of dominance-related behaviors across the various dominance categories. Post
hoc tests based on the Dunn-Bonferroni method were automatically performed following
significant Kruskal-Wallis test results in order to evaluate the significance of those
35
differences across pairs of the dominance categories. The level of significance considered
was p<0.05.
5.3.1. Statistical hypotheses
In Statistics, the null hypotheses (H0) are the ones that the researcher tries to reject in order
to be able to accept the alternative hypotheses (Ha), equivalent to the research hypotheses
and the ones that the researcher wants to verify (Lehner, 1996).
Accordingly, our null (H0) and alternative hypotheses (Ha), both general and specific, are:
Ha 1: The distribution of the frequency of dominance-related behaviors is significantly
different across categories of dominance.
Ha 1.1: The distribution of the frequency of PA is significantly different across
categories of dominance.
Ha 1.2: The distribution of the frequency of VA is significantly different across
categories of dominance.
Ha 1.3: The distribution of the frequency of TR is significantly different across
categories of dominance.
Ha 1.4: The distribution of the frequency of POD is significantly different
across categories of dominance.
Ha 1.5: The distribution of the frequency of SD is significantly different across
categories of dominance.
Ha 1.6: The distribution of the frequency of CD is significantly different across
categories of dominance.
Ha 1.7: The distribution of the frequency of RG significantly different across
categories of dominance.
Ha 1.8: The distribution of the frequency of SB is significantly different across
categories of dominance.
Ha 2: The distribution of the duration of dominance-related behaviors is significantly
different across categories of dominance.
Ha 2.1: The distribution of the duration of PA is significantly different across
categories of dominance.
Ha 2.2: The distribution of the duration of VA is significantly different across
categories of dominance.
Ha 2.3: The distribution of the duration of TR is significantly different across
categories of dominance.
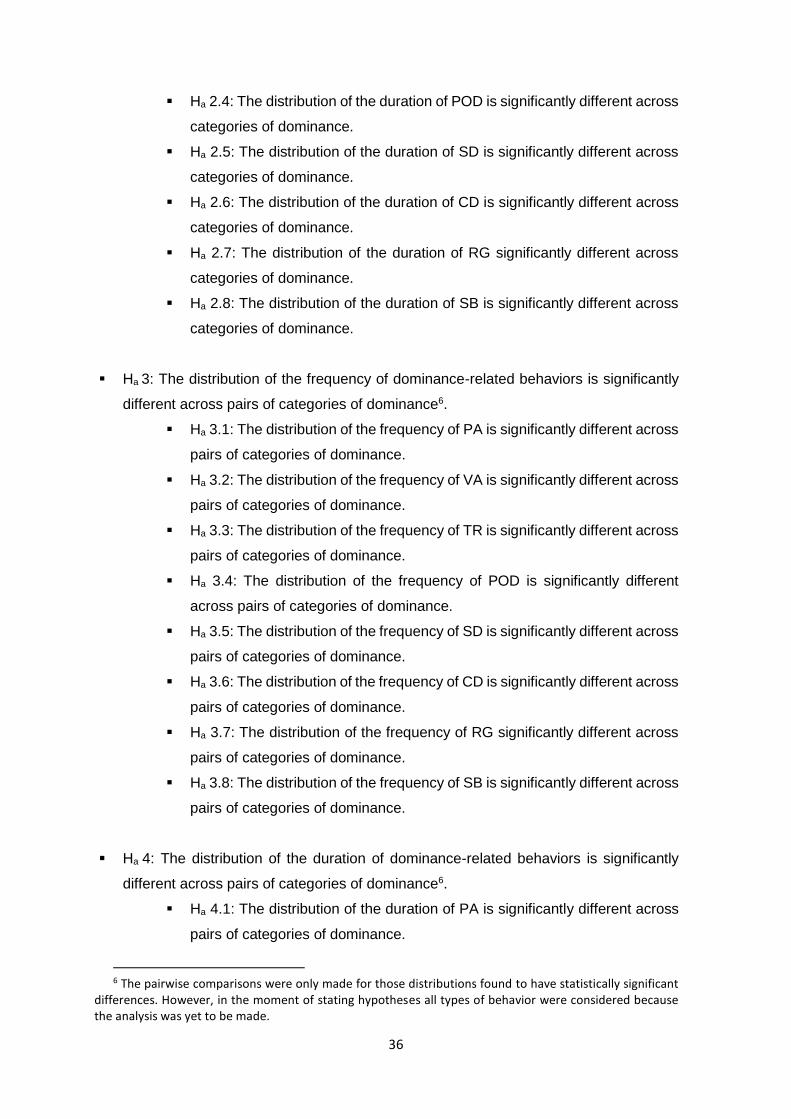
36
Ha 2.4: The distribution of the duration of POD is significantly different across
categories of dominance.
Ha 2.5: The distribution of the duration of SD is significantly different across
categories of dominance.
Ha 2.6: The distribution of the duration of CD is significantly different across
categories of dominance.
Ha 2.7: The distribution of the duration of RG significantly different across
categories of dominance.
Ha 2.8: The distribution of the duration of SB is significantly different across
categories of dominance.
Ha 3: The distribution of the frequency of dominance-related behaviors is significantly
different across pairs of categories of dominance6.
Ha 3.1: The distribution of the frequency of PA is significantly different across
pairs of categories of dominance.
Ha 3.2: The distribution of the frequency of VA is significantly different across
pairs of categories of dominance.
Ha 3.3: The distribution of the frequency of TR is significantly different across
pairs of categories of dominance.
Ha 3.4: The distribution of the frequency of POD is significantly different
across pairs of categories of dominance.
Ha 3.5: The distribution of the frequency of SD is significantly different across
pairs of categories of dominance.
Ha 3.6: The distribution of the frequency of CD is significantly different across
pairs of categories of dominance.
Ha 3.7: The distribution of the frequency of RG significantly different across
pairs of categories of dominance.
Ha 3.8: The distribution of the frequency of SB is significantly different across
pairs of categories of dominance.
Ha 4: The distribution of the duration of dominance-related behaviors is significantly
different across pairs of categories of dominance6.
Ha 4.1: The distribution of the duration of PA is significantly different across
pairs of categories of dominance.
6 The pairwise comparisons were only made for those distributions found to have statistically significant
differences. However, in the moment of stating hypotheses all types of behavior were considered because the analysis was yet to be made.
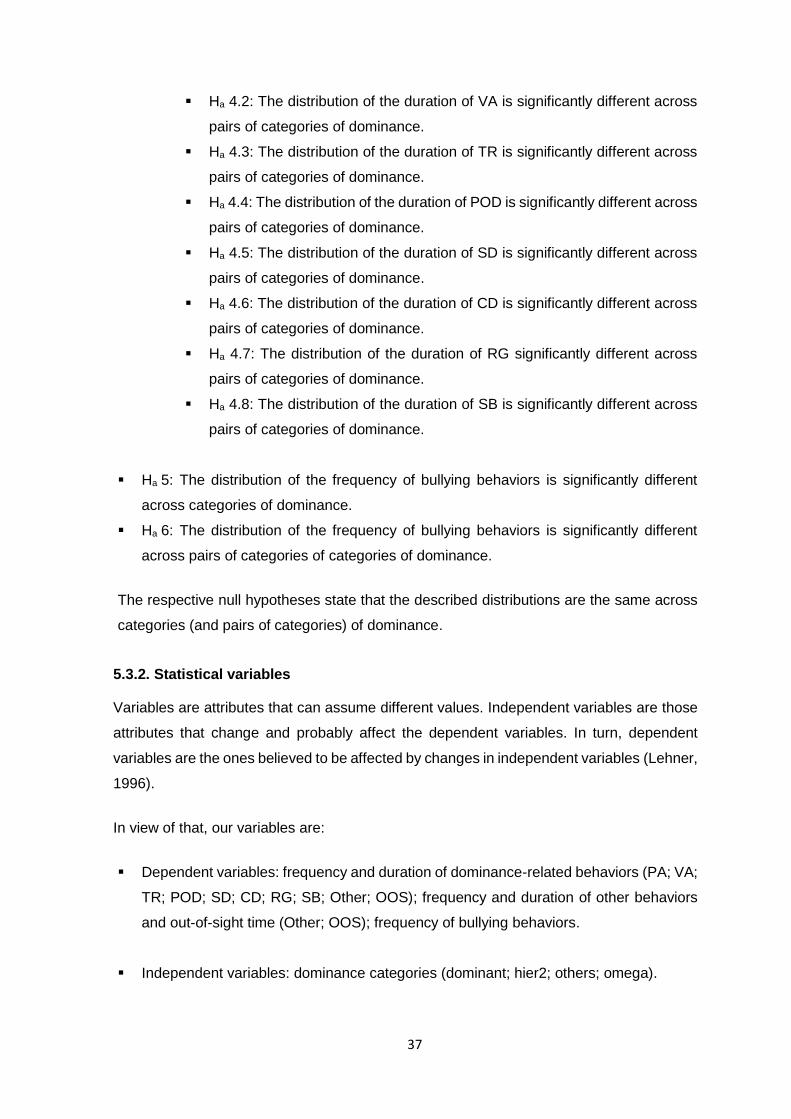
37
Ha 4.2: The distribution of the duration of VA is significantly different across
pairs of categories of dominance.
Ha 4.3: The distribution of the duration of TR is significantly different across
pairs of categories of dominance.
Ha 4.4: The distribution of the duration of POD is significantly different across
pairs of categories of dominance.
Ha 4.5: The distribution of the duration of SD is significantly different across
pairs of categories of dominance.
Ha 4.6: The distribution of the duration of CD is significantly different across
pairs of categories of dominance.
Ha 4.7: The distribution of the duration of RG significantly different across
pairs of categories of dominance.
Ha 4.8: The distribution of the duration of SB is significantly different across
pairs of categories of dominance.
Ha 5: The distribution of the frequency of bullying behaviors is significantly different
across categories of dominance.
Ha 6: The distribution of the frequency of bullying behaviors is significantly different
across pairs of categories of categories of dominance.
The respective null hypotheses state that the described distributions are the same across
categories (and pairs of categories) of dominance.
5.3.2. Statistical variables
Variables are attributes that can assume different values. Independent variables are those
attributes that change and probably affect the dependent variables. In turn, dependent
variables are the ones believed to be affected by changes in independent variables (Lehner,
1996).
In view of that, our variables are:
Dependent variables: frequency and duration of dominance-related behaviors (PA; VA;
TR; POD; SD; CD; RG; SB; Other; OOS); frequency and duration of other behaviors
and out-of-sight time (Other; OOS); frequency of bullying behaviors.
Independent variables: dominance categories (dominant; hier2; others; omega).
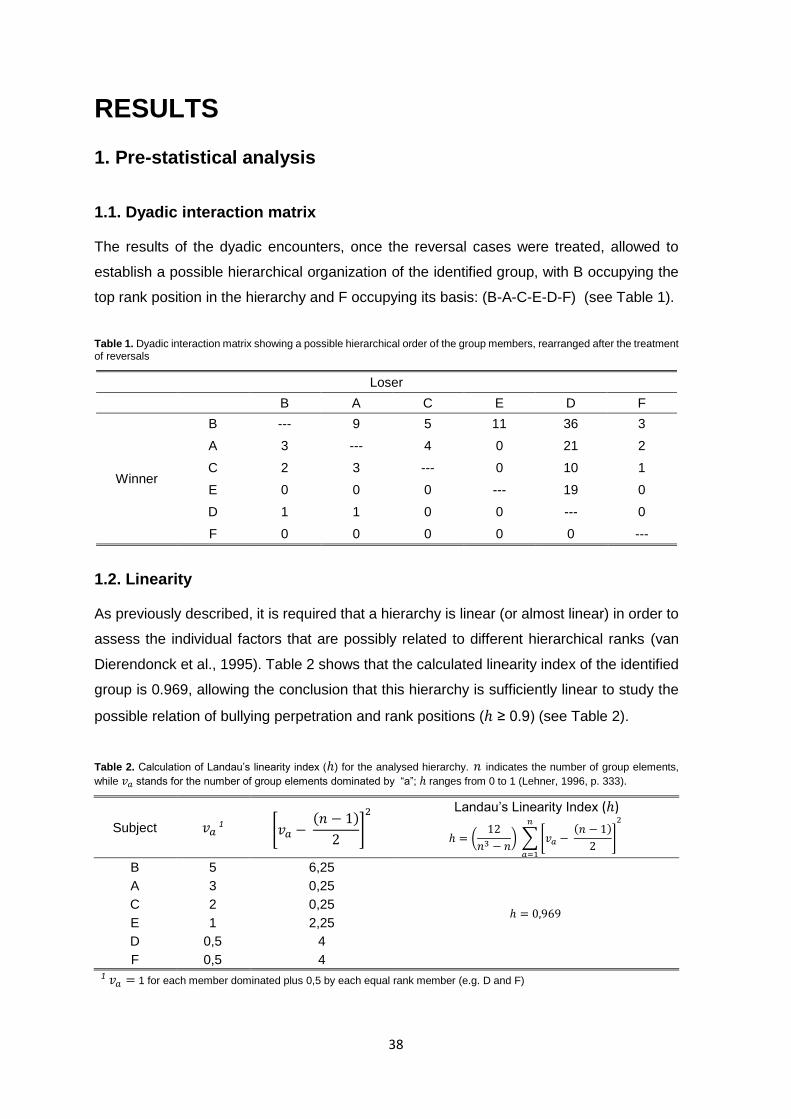
38
RESULTS
1. Pre-statistical analysis
1.1. Dyadic interaction matrix
The results of the dyadic encounters, once the reversal cases were treated, allowed to
establish a possible hierarchical organization of the identified group, with B occupying the
top rank position in the hierarchy and F occupying its basis: (B-A-C-E-D-F) (see Table 1).
Table 1. Dyadic interaction matrix showing a possible hierarchical order of the group members, rearranged after the treatment of reversals
Loser
B A C E D F
Winner
B --- 9 5 11 36 3
A 3 --- 4 0 21 2
C 2 3 --- 0 10 1
E 0 0 0 --- 19 0
D 1 1 0 0 --- 0
F 0 0 0 0 0 ---
1.2. Linearity
As previously described, it is required that a hierarchy is linear (or almost linear) in order to
assess the individual factors that are possibly related to different hierarchical ranks (van
Dierendonck et al., 1995). Table 2 shows that the calculated linearity index of the identified
group is 0.969, allowing the conclusion that this hierarchy is sufficiently linear to study the
possible relation of bullying perpetration and rank positions (ℎ ≥ 0.9) (see Table 2).
Table 2. Calculation of Landau’s linearity index (ℎ) for the analysed hierarchy. 𝑛 indicates the number of group elements,
while 𝑣𝑎 stands for the number of group elements dominated by “a”; ℎ ranges from 0 to 1 (Lehner, 1996, p. 333).
Subject 𝑣𝑎 1 [𝑣𝑎 −
(𝑛 − 1)
2]
2
Landau’s Linearity Index (ℎ)
ℎ = (12
𝑛3 − 𝑛) ∑ [𝑣𝑎 −
(𝑛 − 1)
2]
𝑛
𝑎=1
2
B 5 6,25
ℎ = 0,969
A 3 0,25
C 2 0,25
E 1 2,25
D 0,5 4
F 0,5 4 1 𝑣𝑎 = 1 for each member dominated plus 0,5 by each equal rank member (e.g. D and F)
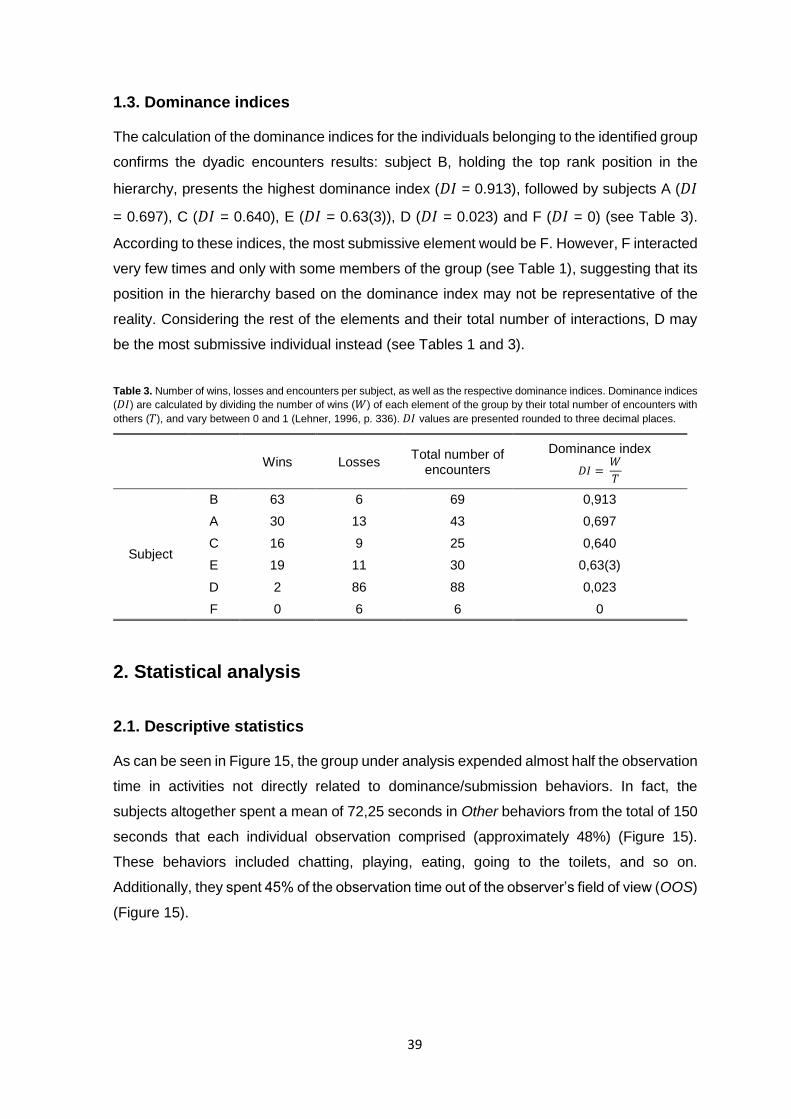
39
1.3. Dominance indices
The calculation of the dominance indices for the individuals belonging to the identified group
confirms the dyadic encounters results: subject B, holding the top rank position in the
hierarchy, presents the highest dominance index (𝐷𝐼 = 0.913), followed by subjects A (𝐷𝐼
= 0.697), C (𝐷𝐼 = 0.640), E (𝐷𝐼 = 0.63(3)), D (𝐷𝐼 = 0.023) and F (𝐷𝐼 = 0) (see Table 3).
According to these indices, the most submissive element would be F. However, F interacted
very few times and only with some members of the group (see Table 1), suggesting that its
position in the hierarchy based on the dominance index may not be representative of the
reality. Considering the rest of the elements and their total number of interactions, D may
be the most submissive individual instead (see Tables 1 and 3).
Table 3. Number of wins, losses and encounters per subject, as well as the respective dominance indices. Dominance indices
(𝐷𝐼) are calculated by dividing the number of wins (𝑊) of each element of the group by their total number of encounters with
others (𝑇), and vary between 0 and 1 (Lehner, 1996, p. 336). 𝐷𝐼 values are presented rounded to three decimal places.
Wins Losses Total number of
encounters
Dominance index
𝐷𝐼 = 𝑊
𝑇
Subject
B 63 6 69 0,913
A 30 13 43 0,697
C 16 9 25 0,640
E 19 11 30 0,63(3)
D 2 86 88 0,023
F 0 6 6 0
2. Statistical analysis
2.1. Descriptive statistics
As can be seen in Figure 15, the group under analysis expended almost half the observation
time in activities not directly related to dominance/submission behaviors. In fact, the
subjects altogether spent a mean of 72,25 seconds in Other behaviors from the total of 150
seconds that each individual observation comprised (approximately 48%) (Figure 15).
These behaviors included chatting, playing, eating, going to the toilets, and so on.
Additionally, they spent 45% of the observation time out of the observer’s field of view (OOS)
(Figure 15).
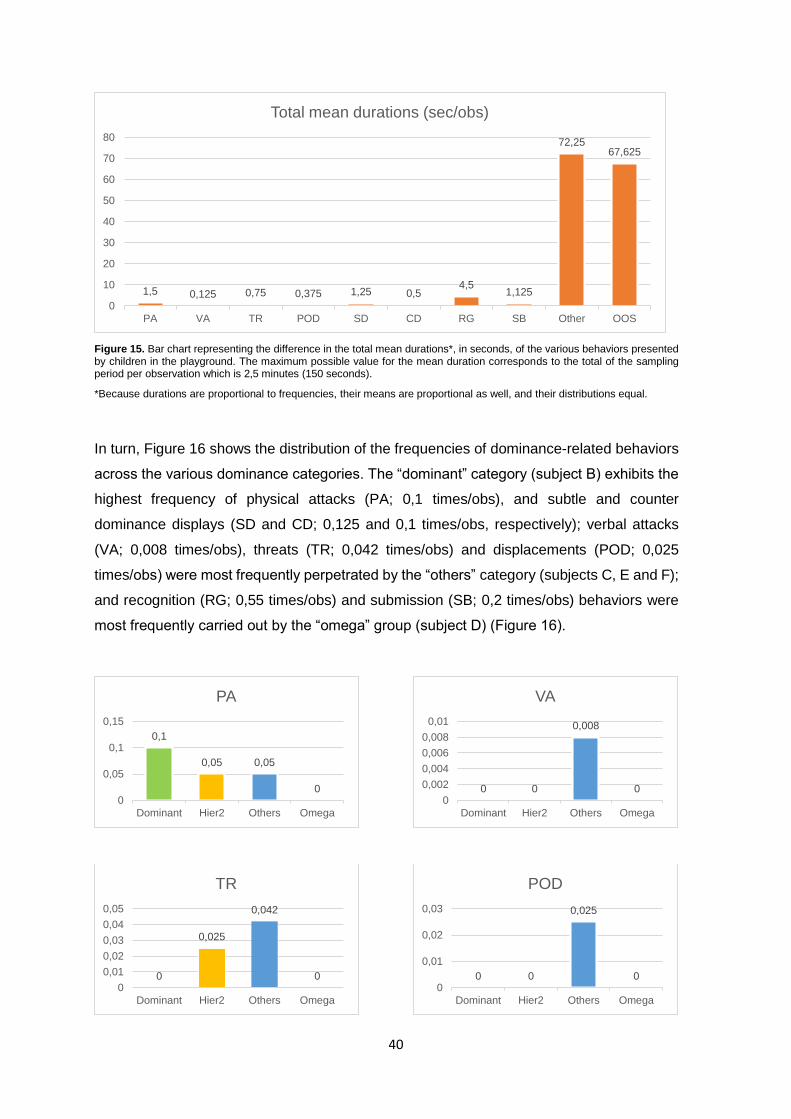
40
Figure 15. Bar chart representing the difference in the total mean durations*, in seconds, of the various behaviors presented by children in the playground. The maximum possible value for the mean duration corresponds to the total of the sampling period per observation which is 2,5 minutes (150 seconds).
*Because durations are proportional to frequencies, their means are proportional as well, and their distributions equal.
In turn, Figure 16 shows the distribution of the frequencies of dominance-related behaviors
across the various dominance categories. The “dominant” category (subject B) exhibits the
highest frequency of physical attacks (PA; 0,1 times/obs), and subtle and counter
dominance displays (SD and CD; 0,125 and 0,1 times/obs, respectively); verbal attacks
(VA; 0,008 times/obs), threats (TR; 0,042 times/obs) and displacements (POD; 0,025
times/obs) were most frequently perpetrated by the “others” category (subjects C, E and F);
and recognition (RG; 0,55 times/obs) and submission (SB; 0,2 times/obs) behaviors were
most frequently carried out by the “omega” group (subject D) (Figure 16).
1,5 0,125 0,75 0,375 1,25 0,54,5
1,125
72,2567,625
0
10
20
30
40
50
60
70
80
PA VA TR POD SD CD RG SB Other OOS
Total mean durations (sec/obs)
0,1
0,05 0,05
00
0,05
0,1
0,15
Dominant Hier2 Others Omega
PA
0 0
0,008
00
0,002
0,004
0,006
0,008
0,01
Dominant Hier2 Others Omega
VA
0
0,025
0,042
00
0,01
0,02
0,03
0,04
0,05
Dominant Hier2 Others Omega
TR
0 0
0,025
00
0,01
0,02
0,03
Dominant Hier2 Others Omega
POD
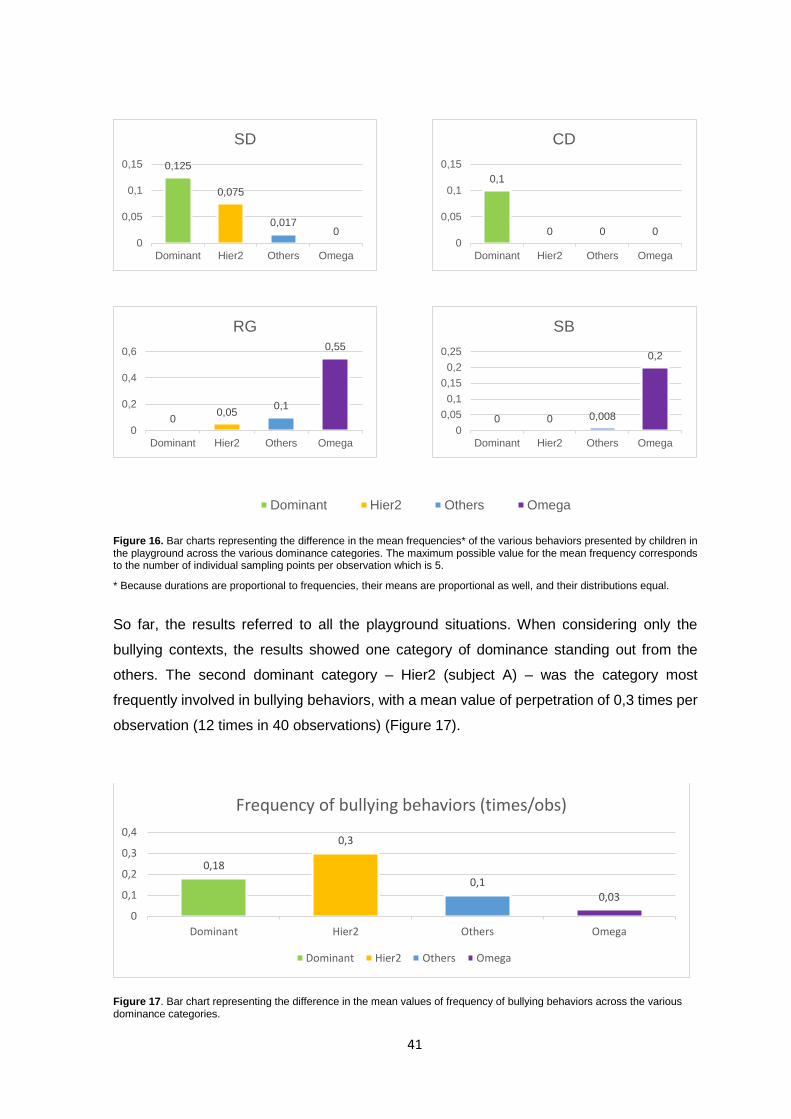
41
Figure 16. Bar charts representing the difference in the mean frequencies* of the various behaviors presented by children in the playground across the various dominance categories. The maximum possible value for the mean frequency corresponds to the number of individual sampling points per observation which is 5.
* Because durations are proportional to frequencies, their means are proportional as well, and their distributions equal.
So far, the results referred to all the playground situations. When considering only the
bullying contexts, the results showed one category of dominance standing out from the
others. The second dominant category – Hier2 (subject A) – was the category most
frequently involved in bullying behaviors, with a mean value of perpetration of 0,3 times per
observation (12 times in 40 observations) (Figure 17).
Figure 17. Bar chart representing the difference in the mean values of frequency of bullying behaviors across the various dominance categories.
0,125
0,075
0,0170
0
0,05
0,1
0,15
Dominant Hier2 Others Omega
SD
0,1
0 0 00
0,05
0,1
0,15
Dominant Hier2 Others Omega
CD
00,05
0,1
0,55
0
0,2
0,4
0,6
Dominant Hier2 Others Omega
RG
0 0 0,008
0,2
0
0,05
0,1
0,15
0,2
0,25
Dominant Hier2 Others Omega
SB
Dominant Hier2 Others Omega
0,18
0,3
0,10,03
0
0,1
0,2
0,3
0,4
Dominant Hier2 Others Omega
Frequency of bullying behaviors (times/obs)
Dominant Hier2 Others Omega
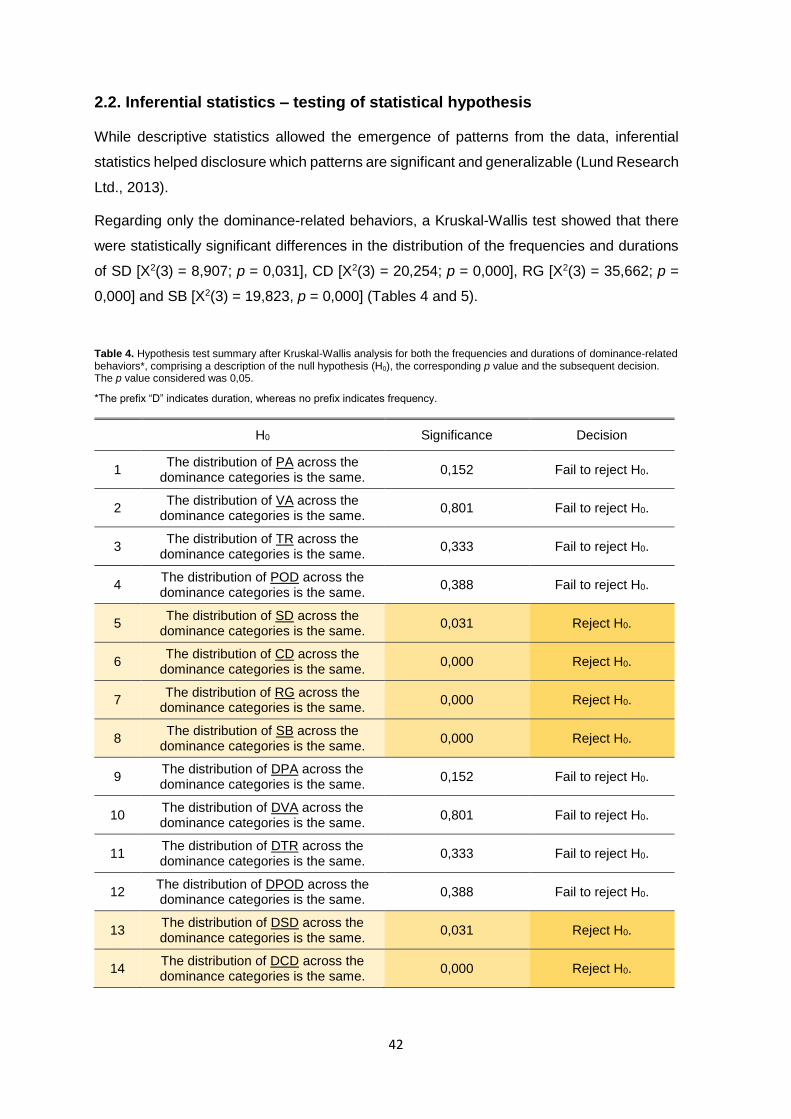
42
2.2. Inferential statistics – testing of statistical hypothesis
While descriptive statistics allowed the emergence of patterns from the data, inferential
statistics helped disclosure which patterns are significant and generalizable (Lund Research
Ltd., 2013).
Regarding only the dominance-related behaviors, a Kruskal-Wallis test showed that there
were statistically significant differences in the distribution of the frequencies and durations
of SD [X2(3) = 8,907; p = 0,031], CD [X2(3) = 20,254; p = 0,000], RG [X2(3) = 35,662; p =
0,000] and SB [X2(3) = 19,823, p = 0,000] (Tables 4 and 5).
Table 4. Hypothesis test summary after Kruskal-Wallis analysis for both the frequencies and durations of dominance-related behaviors*, comprising a description of the null hypothesis (H0), the corresponding p value and the subsequent decision. The p value considered was 0,05.
*The prefix “D” indicates duration, whereas no prefix indicates frequency.
H0 Significance Decision
1 The distribution of PA across the
dominance categories is the same. 0,152 Fail to reject H0.
2 The distribution of VA across the
dominance categories is the same. 0,801 Fail to reject H0.
3 The distribution of TR across the
dominance categories is the same. 0,333 Fail to reject H0.
4 The distribution of POD across the dominance categories is the same.
0,388 Fail to reject H0.
5 The distribution of SD across the
dominance categories is the same. 0,031 Reject H0.
6 The distribution of CD across the
dominance categories is the same. 0,000 Reject H0.
7 The distribution of RG across the
dominance categories is the same. 0,000 Reject H0.
8 The distribution of SB across the
dominance categories is the same. 0,000 Reject H0.
9 The distribution of DPA across the dominance categories is the same.
0,152 Fail to reject H0.
10 The distribution of DVA across the dominance categories is the same.
0,801 Fail to reject H0.
11 The distribution of DTR across the dominance categories is the same.
0,333 Fail to reject H0.
12 The distribution of DPOD across the dominance categories is the same.
0,388 Fail to reject H0.
13 The distribution of DSD across the dominance categories is the same.
0,031 Reject H0.
14 The distribution of DCD across the dominance categories is the same.
0,000 Reject H0.
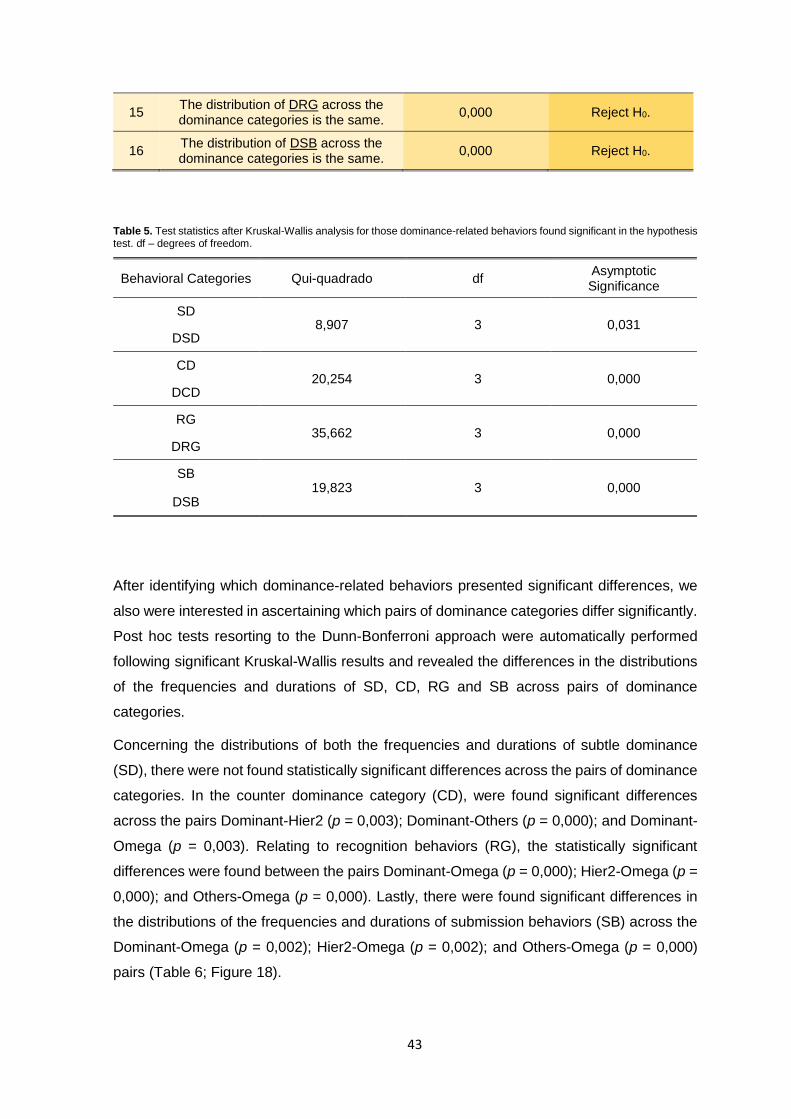
43
15 The distribution of DRG across the dominance categories is the same.
0,000 Reject H0.
16 The distribution of DSB across the dominance categories is the same.
0,000 Reject H0.
Table 5. Test statistics after Kruskal-Wallis analysis for those dominance-related behaviors found significant in the hypothesis test. df – degrees of freedom.
Behavioral Categories Qui-quadrado df Asymptotic Significance
SD 8,907 3 0,031
DSD
CD 20,254 3 0,000
DCD
RG 35,662 3 0,000
DRG
SB 19,823 3 0,000
DSB
After identifying which dominance-related behaviors presented significant differences, we
also were interested in ascertaining which pairs of dominance categories differ significantly.
Post hoc tests resorting to the Dunn-Bonferroni approach were automatically performed
following significant Kruskal-Wallis results and revealed the differences in the distributions
of the frequencies and durations of SD, CD, RG and SB across pairs of dominance
categories.
Concerning the distributions of both the frequencies and durations of subtle dominance
(SD), there were not found statistically significant differences across the pairs of dominance
categories. In the counter dominance category (CD), were found significant differences
across the pairs Dominant-Hier2 (p = 0,003); Dominant-Others (p = 0,000); and Dominant-
Omega (p = 0,003). Relating to recognition behaviors (RG), the statistically significant
differences were found between the pairs Dominant-Omega (p = 0,000); Hier2-Omega (p =
0,000); and Others-Omega (p = 0,000). Lastly, there were found significant differences in
the distributions of the frequencies and durations of submission behaviors (SB) across the
Dominant-Omega (p = 0,002); Hier2-Omega (p = 0,002); and Others-Omega (p = 0,000)
pairs (Table 6; Figure 18).
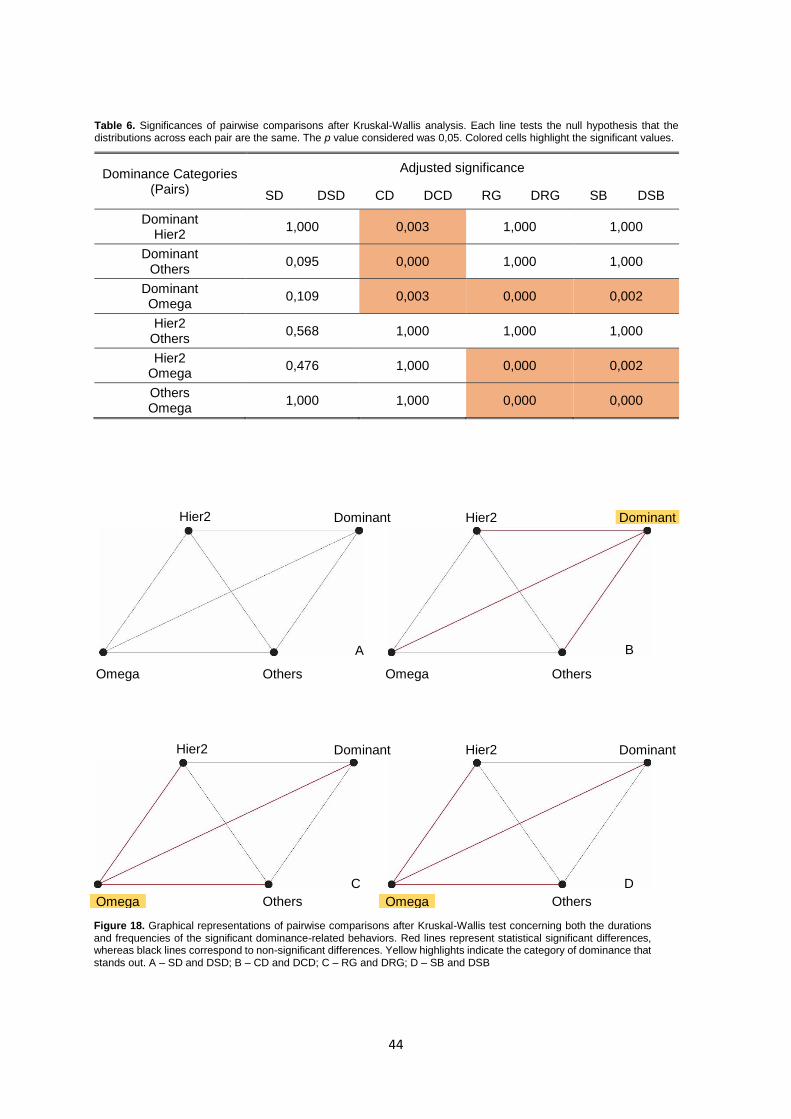
44
Table 6. Significances of pairwise comparisons after Kruskal-Wallis analysis. Each line tests the null hypothesis that the distributions across each pair are the same. The p value considered was 0,05. Colored cells highlight the significant values.
Dominance Categories (Pairs)
Adjusted significance
SD DSD CD DCD RG DRG SB DSB
Dominant Hier2
1,000 0,003 1,000 1,000
Dominant Others
0,095 0,000 1,000 1,000
Dominant Omega
0,109 0,003 0,000 0,002
Hier2 Others
0,568 1,000 1,000 1,000
Hier2 Omega
0,476 1,000 0,000 0,002
Others Omega
1,000 1,000 0,000 0,000
A B
C D
Dominant
Omega
Omega Others Omega Others
Hier2
Omega Others
Dominant Hier2
Others
Hier2 Dominant Hier2 Dominant
Figure 18. Graphical representations of pairwise comparisons after Kruskal-Wallis test concerning both the durations and frequencies of the significant dominance-related behaviors. Red lines represent statistical significant differences, whereas black lines correspond to non-significant differences. Yellow highlights indicate the category of dominance that stands out. A – SD and DSD; B – CD and DCD; C – RG and DRG; D – SB and DSB
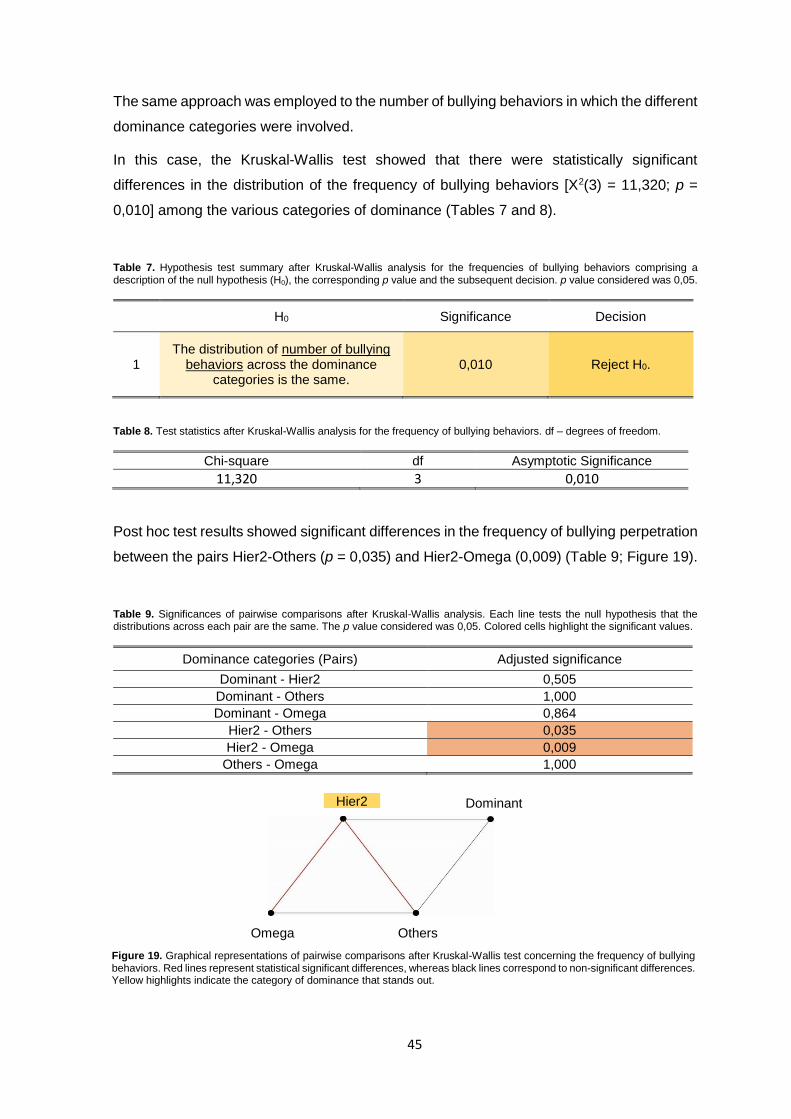
45
The same approach was employed to the number of bullying behaviors in which the different
dominance categories were involved.
In this case, the Kruskal-Wallis test showed that there were statistically significant
differences in the distribution of the frequency of bullying behaviors [X2(3) = 11,320; p =
0,010] among the various categories of dominance (Tables 7 and 8).
Table 7. Hypothesis test summary after Kruskal-Wallis analysis for the frequencies of bullying behaviors comprising a description of the null hypothesis (H0), the corresponding p value and the subsequent decision. p value considered was 0,05.
H0 Significance Decision
1 The distribution of number of bullying
behaviors across the dominance categories is the same.
0,010 Reject H0.
Table 8. Test statistics after Kruskal-Wallis analysis for the frequency of bullying behaviors. df – degrees of freedom.
Chi-square df Asymptotic Significance
11,320 3 0,010
Post hoc test results showed significant differences in the frequency of bullying perpetration
between the pairs Hier2-Others (p = 0,035) and Hier2-Omega (0,009) (Table 9; Figure 19).
Table 9. Significances of pairwise comparisons after Kruskal-Wallis analysis. Each line tests the null hypothesis that the distributions across each pair are the same. The p value considered was 0,05. Colored cells highlight the significant values.
Dominance categories (Pairs) Adjusted significance
Dominant - Hier2 0,505
Dominant - Others 1,000
Dominant - Omega 0,864
Hier2 - Others 0,035
Hier2 - Omega 0,009
Others - Omega 1,000
Figure 19. Graphical representations of pairwise comparisons after Kruskal-Wallis test concerning the frequency of bullying behaviors. Red lines represent statistical significant differences, whereas black lines correspond to non-significant differences. Yellow highlights indicate the category of dominance that stands out.
Omega Others
Hier2 Dominant
46
DISCUSSION
The main goals of this work were the assessment of a hierarchical organization among
human adolescents; the determination of which behaviors are most frequently associated
with the different ranks; and the analysis of whether or not there is a rank most frequently
associated with engaging in bullying behaviors.
In order to ensure the clarity in the transmission of information, we will discuss the results
obtained as answers to the research hypotheses stated in the Objectives chapter.
Groups of human adolescents display rank orderings
The results of the pre-statistical analysis showed the existence of an almost linear
hierarchical organization among the members of the identified group, whose direction and
order were confirmed by the linearity and individual dominance indices, respectively. These
results are in accordance with the literature, where dominance hierarchies have been found
beyond the non-human species, especially in children and adolescents (Savin-Williams,
1976, 1979, 1980; Strayer & Strayer, 1976); and where vertical stratification is believed to
be most likely to occur in “caged” groups and among boys (Martin, 2009; Rajecki, 1983;
Savin-Williams, 1987).
Individuals occupying top rank positions in the hierarchy display more
frequently dominance behaviors but are not necessarily the most aggressive
ones
Our results also revealed that the members of the identified hierarchy spent the majority of
their free time in the playground engaged in behaviors not exclusively related to
dominance/submission – behavioral category Other. However, statistically significant
differences were found in some dominance behaviors, namely in the distributions of the
frequencies and durations of counter dominance (CD) across the different hierarchical
categories. The category that exhibited these behaviors significantly more was the
“Dominant” one, which comprises subject B, the individual occupying the top rank in the
identified hierarchy. The fact that the behavioral category significantly associated with the
top rank position in the hierarchy is one of the least aggressive (either non-aggressive or
non-intentionally aggressive) supports our hypothesis and is consistent with the literature
(Barnard, 2004).

47
Individuals occupying bottom rank positions in the hierarchy display more
frequently submissive behaviors
Concerning the submissive behaviors – recognition (RG) and submission (SB) – there were
also found statistically significant differences in their frequencies and durations distributions
across the different categories of dominance, being the “Omega” category (subject D) the
one that exhibited these behaviors significantly more. These results are also in accordance
with the hypothesis listed and with the literature reviewed. In fact, as Barnard (2004) stated,
“dominance is not equivalent to aggressiveness (…) what matters is that dominants tend to
‘win’ encounters, even though this may be due to passive, sometimes barely discernible,
deference by lower rankers”.
The frequency of perpetrating bullying behaviors is higher in individuals
aiming at the top rank position in a hierarchy, thus being the most aggressive
ones
During all 40 observations, every markedly intentional aggressive act occurring in a clear
imbalance of power was accounted per individual and, based on it, the mean frequencies
of bullying perpetration per subject per observation were calculated. The results indicated
statistically significant differences in the distribution of the frequencies of bullying
perpetration across the categories of dominance. The category most frequently engaged in
bullying behaviors was the “second dominant” one, which comprises the second rank
individual in the hierarchy, subject A. A pairwise comparison allowed to see that subject A
was statistically more involved in bullying than the “Others” (subjects C, E and F) and
“Omega” (subject D) categories but this difference was not statistically significant when
compared with the subject B (Dominant category), the top rank individual in the hierarchy.
Together, these results support our hypothesis that bullying may be a non-prosocial,
aggressive attempt to achieve dominance within a group, being congruent with those found
in the literature (Barnard, 2004; Caravita & Cillessen, 2012; Pellegrini, 1998; Reijntjes et al.,
2013; Savin-Williams, 1987).

48
CONCLUSIONS
School bullying has traditionally been studied resorting to indirect measures such as
surveys and questionnaires, and only few studies have employed ethological methods in
their designs. In actual fact, no ethological-based bullying study was found in the literature
concerning the Portuguese population. In view of the previously mentioned, this work
approached the bullying phenomenon in school context through ethological methods and
concepts.
The results of this work clearly indicate that human adolescents, like many other non-human
social species, aggregate into hierarchical organized groups, which may have implications
on the behaviors each rank order displays. As expected, the statistically significant
differences were found in the perpetration of both dominant (non-aggressive/non-
intentionally aggressive) and submissive behaviors (most frequently exhibited by the top
and low rank individuals, respectively). Moreover, and also as expected, the group element
that were most frequently engaged in bullying behaviors was the one occupying the second
rank in the hierarchy, suggesting that involvement in intentional, power imbalanced (and
commonly repeated) aggression may be a non-prosocial way of pursuing dominance.
However, this study faced some limitations both in its design and execution. In the first
place, the relative short time for the development and application of the project restricted
the conditions under which it could be undertaken. Secondly, and so that the reactivity levels
of the subject regarding the observer were maintained as low as possible, the perception of
some categories of behavior might have been conditioned, when compared to others. As
an example, the low frequencies/durations recorded for the verbal attacks and threats may
have been due to distance the observer had to keep in relation to the observed.
Furthermore, at some point during the observations, the play objects available (such as
ping-pong tables and paddles) were inaccessible, which may also have conditioned the
frequencies/durations of displacement behaviors. Other limitations of the current study
relate to the small sample size and constitution (only 6 male individuals of just one school).
Having all the above mentioned in consideration, future investigation in the subject and
resorting to the same methods should comprise more schools from all around the country,
more and more diverse groups (either in gender, age, ethnicity or social class), and more
effective and efficient observation techniques, such as audiovisual recording.
Nevertheless, the current study must be regarded as an important first step for a more
comprehensive understanding and more effective prevention of the bullying phenomenon
in Portugal.
49
REFERENCES
Alcock, J. (2001). Animal Behavior: An Evolutionary Approach (7th ed.). Massachusetts, USA: Sinauer Associates, Inc.
Altmann, J. (1974). Observational study of behavior: sampling methods. Behaviour, 49, 227-265. Aluede, O., Adeleke, F., Omoike, D., & Afen-Akpaida, J. (2008). A review of the extent, nature,
chareacteristics and effects of Bullying behaviour in schools. Journal of Instructional Psychology, 35(2), 151-158.
Archer, J. (1995). What can ethology offer the psychological study of human aggression? Aggressive Behavior, 21, 243-255.
Archer, J. (2001). A strategic approach to aggression. Social Development, 10(2), 267-271. Arseneault, L., Bowes, L., & Shakoor, S. (2010). Bullying victimization in youths and mental health
problems: "Much ado about nothing"? Psychological Medicine, 40, 717-729. Atlas, R., & Pepler, D. (1998). Observations of bullying in the classroom. The Journal of Educational
Research, 92(2), 86-99. Barnard, C. J. (2004). Animal Behavior: mechanism, development, function and evolution. Essex,
England: Pearson Education Limited. Barrett, L., & Stulp, G. (2013). Four more reasons why ethology matters: Tinbergen and the human
sciences. Human Ethology Bulletin: Special Issue on Tinbergen, 28(4), 39-49. Bauman, S., Toomey, R. B., & Walker, J. L. (2013). Associations among bullying, cyberbullying, and
suicide in high school students. Journal of Adolescence, 36, 341-350. Benenson, J. F. (2009). Sex Differences in Aggression From an Adaptive Perspective. In M. J. Harris
(Ed.), Bullying, Rejection, and Peer Victimization (pp. 171-198). New York: Springer. Berdecio, S., & Nash, L. T. (2009, 2011). Chimpanzee 8. Retrieved 17/11/2014, from
http://www.ethosearch.org/research/ethogram/112/functional Berger, K. S. (2007). Update on Bullying at School: Science Forgotten? Developmental Review, 27,
90-126. Book, A. S., Volk, A. A., & Hosker, A. (2012). Adolescent bullying and personality: an adaptive
approach. Personality and Individual Diferences, 52, 218-223. Calafate, L. C. (1996). Etologia da Criança: Uma Perspectiva Descritiva do Comportamento do
Homem. Saber Educar, 1, 69-84. Caravita, S. C. S., & Cillessen, A. H. N. (2012). Agentic or Communal? Associations between
interpersonal goals, popularity, and bullying in middle childhood and early adolescence. Social Development, 21(2), 376-395.
Cook, C. R., Williams, K. R., Guerra, N. G., Kim, T. E., & Sadek, S. (2010). Predictors of bullying and victimization in childhood and adolescence: a meta-analytic investigation. School Psychology Quarterly, 25(2), 65-83.
Cosnier, J. (1986). Ethology: a trandisciplinary discipline. In J. L. Camus & J. Cosnier (Eds.), Ethology and psychology (pp. 19-28). Toulouse: Privat, I.E.C.
Costa, P., & Pereira, B. (2010). O bullying na escola: a prevalência e o sucecsso escolar. Paper presented at the I Seminário Internacional "Contributos da Psicologia em Contextos Educativos", Braga: Instituto de Educação da Universidade do Minho.
Craig, W. M., & Pepler, D. (1995). Peer processes in bullying and victimization: an observational study. Exceptionality Education Canada, 5(3&4), 81-95.
Craig, W. M., Pepler, D., & Atlas, R. (2000). Observations of bullying in the playground and in the classroom. School Psychology International, 21, 22-36.
Dake, J. A., Price, J. H., & Telljohann, S. K. (2003). The nature and extent of bullying at school. Journal of School Health, 73(5), 173-180.
Dobzhansky, T. (1964). Biology, Molecular and Organismic. American Zoologist, 4, 443-452. Doğruer, N., & Yaratan, H. (2014). Developing a bullying scale for use with university students. Social
Behavior and Personality, 42(Suppl.), S81-S92.
50
Dugatkin, L. A. (2014). Principles of Animal Behavior (3rd ed.). New York, USA: W. W. Norton & Company, Inc.
Eibl-Eibesfeldt, I. (1977). The biological unity of mankind: human ethology, concepts and implications. Prospects: quarterly review of education, VII(2), 163-183.
Eibl-Eibesfeldt, I. (1997). Human Ethology: Origins and Prospects of a New Discipline. In K. Atzwanger, K. Grammer, K. Schäfer & A. Schmitt (Eds.), New Aspects of Human Ethology. New York: Plenum Press.
Evans, C. B. R., Fraser, M. W., & Cotter, K. L. (2014). The effectiveness of school-based bullying prevention programs: A systematic review. Aggression and Violent Behavior, 19, 532-544.
Farrington, D. P., & Ttofi, M. M. (2009). School-based programs to reduce bullying and victimization. Campbell Systematic Reviews, (6).
Fox, R., & Fleising, U. (1976). Human Ethology. Annual Review of Anthropology, 5, 265-288. Frisén, A., Hasselblad, T., & Holmqvist, K. (2012). What actually makes bullying stop? Reports from
former victims. Journal of Adolescence, 35, 981-990. Gallup, G. G., & Suarez, S. D. (1983). Overcoming Our Resistance to Animal Research: Man in
Comparative Perspective. In D. W. Rajecki (Ed.), Comparing Behavior: Studying Man Studying Animals. New Jersey: Lawrence Erlbaum Associates, Inc.
Garandeau, C. F., & Cillessen, A. H. N. (2006). From indirect aggression to invisible aggression: A conceptual view on bullying and peer group manipulation. Aggression and Violent Behavior, 11, 612-625.
García, A. I. S., & Margallo, E. M. (2014). Bullying: What's going on? A bibliographic review of last twelve months. Procedia - Social and Behavioral Sciences, 132, 269-276.
Gat, A. (2010). Why war? Motivations for Fighting in the Human State of Nature. In P. M. Kappeler & J. B. Silk (Eds.), Mind the Gap - Tracing the Origins of Human Universals (pp. 197-220). Verlag; Berlin; Heidelberg: Springer.
Hawley, P. H. (1999). The ontogenesis of social dominance: a strategy-based evolutionary perspective. Developmental Review, 19, 97-132.
Hepburn, L., Azrael, D., Molnar, B., & Miller, M. (2012). Bullying and suicidal behaviors among urban high school youth. Journal of Adolescent Health, 51, 93-95.
Hinduja, S., & Patchin, J. W. (2010). Bullying, cyberbullying, and suicide. Archives of Suicide Research, 14(3), 206-221.
Horton, P. (2011). School bullying and social and moral orders. Children & Society, 25, 268-277. IBM Corp. (2015). IBM SPSS Statistics for Windows (Version 23.0). Armonk, NY: IBM Corp. Instituto Nacional de Estatística. (2012). Censos 2011 Resultados Definitivos - Região Norte. Lisboa,
Portugal. Jiang, D., Walsh, M., & Augimeri, L. K. (2011). The linkage between childhood bullying behaviour
and future offending. Criminal Justice and Behavior, 21, 128-135. Jones, N. B. (1972). Characteristics of Ethological Studies of Human Behaviour. In N. B. Jones (Ed.),
Ethological Studies of Child Behaviour. Cambridge: Cambridge University Press. Juvonen, J., & Galván, A. (2009). Bullying as a Means to Foster Compliance. In M. J. Harris (Ed.),
Bullying, Rejection, and Peer Victimization (pp. 299-318). New York: Springer. Kim, M. J., Catalano, R. F., Haggerty, K. P., & Abbott, R. D. (2011). Bullying at elementary school and
problem behaviour in young adulthood: A study of bullying, violence and substance use from age 11 to 21. Criminal Behaviour and Mental Health, 21, 136-144.
Klein, Z. (2000). The Ethological Approach to the Study of Human Behavior. Neuroendocrinology Letters, 21, 477-481.
Klomek, A. B., Sourander, A., Kumpulainen, K., Piha, J., Tamminen, T., Moilanen, I., . . . Gould, M. S. (2008). Childhood bullying as a risk for later depression and suicidal ideation among Finnish males. Journal of Affective Disorders, 109, 47-55.
Lehner, P. N. (1996). Handbook of Ethological Methods (2nd ed.). United Kingdom: Cambridge University Press.
51
Liang, H., Flisher, A. J., & Lombard, C. J. (2007). Bullying, violence, and risk behavior in South African school students. Child Abuse & Neglect, 31, 161-171.
Lisboa, C., Braga, L. d. L., & Ebert, G. (2009). O fenômeno buyyling ou vitimização entre pares na atualidade: definições, formas de manifestação e possibilidades de intervenção. Contextos Clínicos, 2(1), 59-71.
Lorenz, K. (1963). On Aggression (2005 ed.). London: Taylor and Francis e-Library. Lund Research Ltd. (2013). Laerd Statistics - Descriptive and Inferential Statistics. Retrieved 27-06-
2015, from https://statistics.laerd.com/statistical-guides/descriptive-inferential-statistics.php
Martin, J. L. (2009). Formation and stabilization of vertical hierarchies among adolescents: towards a quantitative ethology of dominance among humans. Social Psychology Quarterly, 72(3), 241-264.
Matos, M. G. d., & Gonçalves, S. P. (2009). Bullying nas escolas: comportamentos e percepções. Psicologia, Saúde e Doenças, 10(1), 3-15.
Matos, M. G. d., Simões, C., Camacho, I., Reis, M., & Equipa do Projecto Aventura Social. (2014). A Saúde dos Adolescentes Portugueses - Relatório do Estudo HBSC 2014 Health Behaviour in School-Aged Children: World Health Organization, Direcção Geral de Saúde, Projecto Aventura Social.
Matos, M. G. d., Simões, C., Gaspar, T., & Equipa do Projecto Aventura Social. (2009). Violência ente pares no contexto escolar em Portugal, nos últimos 10 anos. Interacções, 13, 98-124.
McGrew, W. C. (2004). The Cultured Chimpanzee: Reflections on Cultural Primatology. Cambridge, United Kingdom: Camridge University Press.
Melim, M., & Pereira, B. (2012). Bullying escolar: Os padrões de agressão. Paper presented at the II Seminário Internacional "Contributos da Psicologia em Contextos Educativos", Braga: Instituto de Educação da Universidade do Minho.
Michel, G. F., & Moore, C. L. (1995). Animal Behavior, Ethology, and Human Development Developmental Psychobiology: An Interdisciplinary Science. Cambridge, Massachusetts: The MIT Press.
Moreno, C. B., & Muñoz-Delgado, J. (2007). An account on the history of ethology. Suma Psicológica, 14(2), 213-224.
Morris, D. (1967). The Naked Ape. Canada: Bantam Books of Canada Ltd. Nickerson, A. B., & Melle-Taylor, D. (2014). Empathetic responsiveness, group norms, and prosocial
affiliations in bullying roles. Social Psychology Quarterly, 29(1), 99-109. Novo, M., Seijo, D., Vilariño, M., & Vázquez, M. J. (2013). Frecuencia e intensidad en el acoso
escolar: ¿Qué es qué en la victimización? Revista Iberoamericana de Psicologia y Salud, 4(2), 1-15.
O'Connell, P., Pepler, D., & Craig, W. (1999). Peer involvement in bullying: insights and challenges. Journal of Adolescence, 22, 437-452.
Olthof, T., Goossens, F. A., Vermande, M. M., Aleva, E. A., & Meulen, M. v. d. (2011). Bullying as strategic behavior: Relations with desired and acquired dominance in the peer group. Journal of School Psychology, 49, 339-359.
Olweus, D. (2011). Bullying at school and later criminality: Findings from three Swedish community samples of males. Criminal Behaviour and Mental Health, 21, 151-156.
Olweus, D. (2013). School Bullying: Development and Some Important Challenges. Annual Review of Clinical Psychology, 9, 751-780.
Pellegrini, A. D. (1998). Bullies and victims in school: a review and call for research. Journal of Applied Developmental Psychology, 19(2), 165-176.
Pellegrini, A. D. (2002). Affiliative and aggressive dimensions of dominance and possible functions during early adolescence. Aggression and Violent Behavior, 7, 21-31.
Pellegrini, A. D., & Bartini, M. (2001). Dominance in early adolescent boys: affiliative and aggressive dimensions and possible functions. Merrill-Palmer Quarterly, 47(1), 142-163.
52
Pepler, D., & Craig, W. M. (1995). A peek behind the fence: naturalistic observations of aggressive children with remote audiovisual recording. Developmental Psychology, 31(4), 548-559.
Pereira, B., Mendonça, D., Neto, C., Valente, L., & Smith, P. K. (2004). Bullying in Portuguese Schools. School Psychology International, 25(2), 241-254.
Potegal, M. (1979). The reinforcing value of several types of aggressive behavior: a review. Aggressive Behavior, 5, 353-373.
Primate Foundation of Arizona. (2009, 2011). Chimpanzee 6. Retrieved 17/11/2014, from http://www.ethosearch.org/research/ethogram/92/functional
Rajecki, D. W. (1983). Succesful Comparative Psychology: Four Case Histories. In D. W. Rajecki (Ed.), Comparing Behavior: Studying Man Studying Animals. New Jersey: Lawrence Erlbaum Associates, Inc.
Rayner, C., & Hoel, H. (1997). A summary review of literature relating to workplace bullying. Journal of Community & Applied Social Psychology, 7, 181-191.
Reijntjes, A., Vermande, M. M., Goossens, F. A., Olthof, T., van de Schoot, R., Aleva, L., & van der Meulen, M. (2013). Developmental trajectories of bullying and social dominance in youth. Child Abuse & Neglect, 37, 224-234.
Richards, M. P. M., & Bernal, J. F. (1972). An Ethological Study of Mother-Infant Interactions. In N. B. Jones (Ed.), Ethological Studies of Child Behaviour. Cambridge: Cambridge University Press.
Rigby, K. (2002). New Perspectives on Bullying. London: Jessica Kingsley Publishers. Rigby, K. (2003). Stop the Bullying - A Handbook for Schools (2nd ed.). Melbourne: Acer Press. Rigby, K. (2004). Addressing Bullying in Schools: Theoretical Perspectives and their Implications.
School Psychology International, 25(3), 287-300. Salmivalli, C. (2010). Bullying and the peer group: a review. Aggression and Violent Behavior, 15,
112-120. Salmivalli, C., Lagerspetz, K., Björkqvist, K., Österman, K., & Kaukiainen, A. (1996). Bullying as a
group process: participant roles and their relations to social status within the group. Aggressive Behavior, 22, 1-15.
Savin-Williams, R. C. (1976). An ethological study of dominance formation and maintenance in a group of human adolescents. Child Development, 47, 972-979.
Savin-Williams, R. C. (1979). Dominance hierarchies in groups of early adolescents. Child Development, 50(4), 923-934.
Savin-Williams, R. C. (1980). Dominance hierarchies in groups of middle to late adolescent males. Journal of Youth and Adolescence, 9(1), 75-85.
Savin-Williams, R. C. (1987). Adolescence: An Ethological Perspective. New York: Springer Science + Business Media
Shaw, T., Dooley, J. J., Cross, D., Zubrick, S. R., & Waters, S. (2013). The forms of bullying scale (FBS): validity and reliability estimates for a measure of bullying victimization and perpetration in adolescence. Psychological Assessment, 25(4), 1045-1057.
Simplicio, J. S. C. (2013). How to effectively use positive character attributes exhibited by bullies to change negative behaviors. Journal of Instructional Psychology, 40(1), 27-31.
Smith, P. K., & Brain, P. (2000). Bullying in Schools: Lessons from two decades of research. Aggressive Behavior, 26, 1-9.
Smith, P. K., Madsen, K. C., & Moody, J. C. (1999). What causes the age decline in reports of being bullied at school? Towards a developmental analysis of risks of being bullied. Educational Research, 41(3), 267-285.
Strayer, F. F., & Strayer, J. (1976). An ethological analysis of social agonism and dominance relations among preschool children. Child Development, 47(4), 980-989.
Strøm, I. F., Thoresen, S., Wentzel-Larsen, T., & Dyb, G. (2013). Violence, bullying and academic achievement: A study of 15-year-old adolescents and their school environment. Child Abuse & Neglect, 37, 243-251.
53
Sutton, J., & Smith, P. K. (1999). Bullying as a group process: an adaptation of the participant role approach. Aggressive Behavior, 25, 97-111.
Tharp-Taylor, S., Haviland, A., & D'Amico, E. J. (2009). Victimization from mental and physical bullying and substance use in early adolescence. Addictive Behaviors, 34, 561-567.
Tinbergen, N. (1963). On aims and methods of ethology. Zeitschrift für Tierpsychologie, 20, 410-433.
Tinbergen, N. (1972). Functional Ethology and the Human Sciences. Paper presented at the The Croonian Lecture.
Ttofi, M. M., & Farrington, D. P. (2009). What works in preventing bullying: effective elements of anti-bullying programmes. Journal of Aggression, Conflict and Peace Research, 1(1), 13-24.
Ttofi, M. M., & Farrington, D. P. (2011). Effectiveness of school-based programs to reduce bullying: a systematic and meta-analytic review. Journal of Experimental Criminology, 7, 27-56.
UNICEF. (2014). Hidden in plain sight: a statistical analysis of violence against children. New York: United Nations Children's Fund.
United Nations. The Universal Declaration of Human Rigths. Retrieved 06-02-2015, from http://www.un.org/en/documents/udhr/index.shtml
van Dierendonck, M. C., de Vries, H., & Schilder, M. B. H. (1995). An Analysis of Dominance, Its Behavioural Parameters and Possible Determinants in a Herd of Icelandic Horses in Captivity. Netherlands Journal of Zoology, 45(3-4), 362-385.
Vieira, A. B. (1989). Fundamentos gerais da Etologia. Análise Psicológica, 1-2-3(VII), 23-31. Volk, A. A., Camilleri, J. A., Dane, A. V., & Marini, Z. A. (2012). Is adolescent bullying an evolutionary
adaptation? Aggressive Behavior, 38, 222-238. Vreeman, R. C., & Carroll, A. E. (2007). A systematic review of school-based interventions to prevent
bullying. Archives of Pediatrics and Adolescent Medicine, 161, 78-88. Wang, J., Iannotti, R. J., Luk, J. W., & Nansel, T. R. (2010). Co-occurrence of victimization from five
subtypes of bullying: physical, social exclusion, spreading rumors, and cyber. Journal of Pediatric Psychology, 35(10), 1103-1112.
Washburn, S. L., & Dolhinow, P. C. (1983). Comparison of Human Behaviors. In D. W. Rajecki (Ed.), Comparing Behavior: Studying Man Studying Animals. New Jersey: Lawrence Erlbaum Associates, Inc.
Watts, D. P. (2010). Dominance, Power, and Politics in Nonhuman and Human Primates. In P. M. Kappeler & J. B. Silk (Eds.), Mind the Gap - Tracing the Origins of Human Universals (pp. 109-138). Verlag; Berlin; Heidelberg: Springer.
Weisfeld, C. C., & Weisfeld, G. E. (2013). Defining normal on the playground: what would Tinbergen do? Human Ethology Bulletin, 28(4), 12-22.
Wong, J. S., & Schonlau, M. (2013). Does bully victimization predict future deliquency? A propensity score matching approach. Criminal Justice and Behavior, 40(11), 1184-1208.
Zivin, G. (1983). Hybrid Models: Modifications in Models of Social Behavior That Are Borrowed Across Species and Up Evolutionary Grades. In D. W. Rajecki (Ed.), Comparing Behavior: Studying Man Studying Animals. New Jersey: Lawrence Erlbaum Associates, Inc.
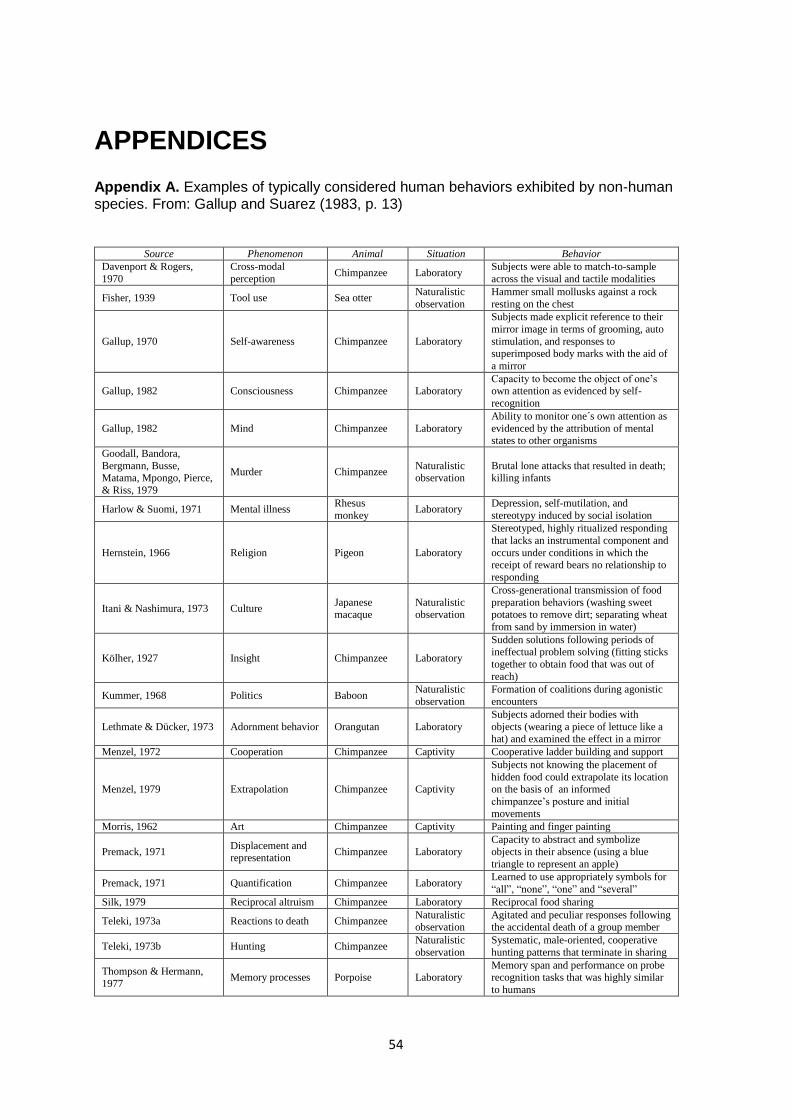
54
APPENDICES
Appendix A. Examples of typically considered human behaviors exhibited by non-human species. From: Gallup and Suarez (1983, p. 13)
Source Phenomenon Animal Situation Behavior
Davenport & Rogers,
1970
Cross-modal
perception Chimpanzee Laboratory
Subjects were able to match-to-sample
across the visual and tactile modalities
Fisher, 1939 Tool use Sea otter Naturalistic
observation
Hammer small mollusks against a rock
resting on the chest
Gallup, 1970 Self-awareness Chimpanzee Laboratory
Subjects made explicit reference to their
mirror image in terms of grooming, auto
stimulation, and responses to
superimposed body marks with the aid of
a mirror
Gallup, 1982 Consciousness Chimpanzee Laboratory Capacity to become the object of one’s own attention as evidenced by self-
recognition
Gallup, 1982 Mind Chimpanzee Laboratory
Ability to monitor one´s own attention as
evidenced by the attribution of mental states to other organisms
Goodall, Bandora,
Bergmann, Busse, Matama, Mpongo, Pierce,
& Riss, 1979
Murder Chimpanzee Naturalistic observation
Brutal lone attacks that resulted in death; killing infants
Harlow & Suomi, 1971 Mental illness Rhesus
monkey Laboratory
Depression, self-mutilation, and
stereotypy induced by social isolation
Hernstein, 1966 Religion Pigeon Laboratory
Stereotyped, highly ritualized responding
that lacks an instrumental component and
occurs under conditions in which the receipt of reward bears no relationship to
responding
Itani & Nashimura, 1973 Culture Japanese macaque
Naturalistic observation
Cross-generational transmission of food
preparation behaviors (washing sweet potatoes to remove dirt; separating wheat
from sand by immersion in water)
Kölher, 1927 Insight Chimpanzee Laboratory
Sudden solutions following periods of ineffectual problem solving (fitting sticks
together to obtain food that was out of
reach)
Kummer, 1968 Politics Baboon Naturalistic
observation
Formation of coalitions during agonistic
encounters
Lethmate & Dücker, 1973 Adornment behavior Orangutan Laboratory
Subjects adorned their bodies with
objects (wearing a piece of lettuce like a hat) and examined the effect in a mirror
Menzel, 1972 Cooperation Chimpanzee Captivity Cooperative ladder building and support
Menzel, 1979 Extrapolation Chimpanzee Captivity
Subjects not knowing the placement of
hidden food could extrapolate its location on the basis of an informed
chimpanzee’s posture and initial
movements
Morris, 1962 Art Chimpanzee Captivity Painting and finger painting
Premack, 1971 Displacement and representation
Chimpanzee Laboratory
Capacity to abstract and symbolize
objects in their absence (using a blue
triangle to represent an apple)
Premack, 1971 Quantification Chimpanzee Laboratory Learned to use appropriately symbols for
“all”, “none”, “one” and “several”
Silk, 1979 Reciprocal altruism Chimpanzee Laboratory Reciprocal food sharing
Teleki, 1973a Reactions to death Chimpanzee Naturalistic observation
Agitated and peculiar responses following the accidental death of a group member
Teleki, 1973b Hunting Chimpanzee Naturalistic
observation
Systematic, male-oriented, cooperative
hunting patterns that terminate in sharing
Thompson & Hermann,
1977 Memory processes Porpoise Laboratory
Memory span and performance on probe recognition tasks that was highly similar
to humans
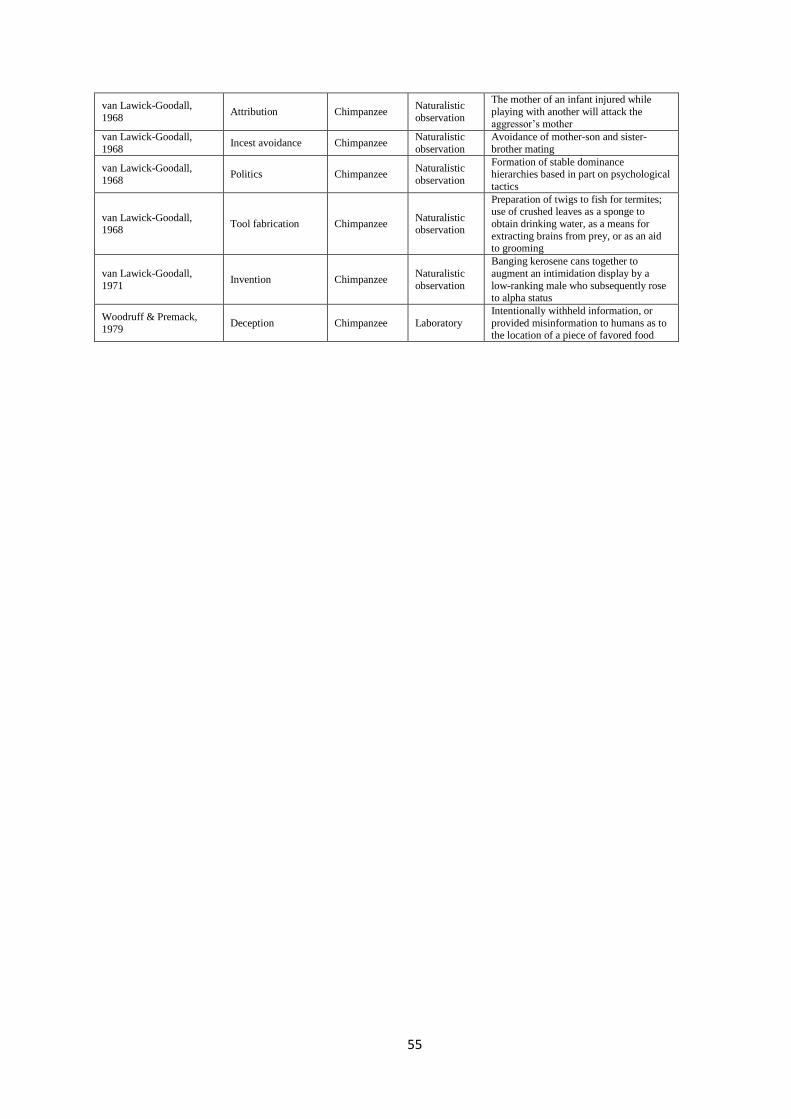
55
van Lawick-Goodall,
1968 Attribution Chimpanzee
Naturalistic
observation
The mother of an infant injured while
playing with another will attack the
aggressor’s mother
van Lawick-Goodall,
1968 Incest avoidance Chimpanzee
Naturalistic
observation
Avoidance of mother-son and sister-
brother mating
van Lawick-Goodall,
1968 Politics Chimpanzee
Naturalistic
observation
Formation of stable dominance hierarchies based in part on psychological
tactics
van Lawick-Goodall, 1968
Tool fabrication Chimpanzee Naturalistic observation
Preparation of twigs to fish for termites; use of crushed leaves as a sponge to
obtain drinking water, as a means for
extracting brains from prey, or as an aid to grooming
van Lawick-Goodall,
1971 Invention Chimpanzee
Naturalistic
observation
Banging kerosene cans together to
augment an intimidation display by a
low-ranking male who subsequently rose to alpha status
Woodruff & Premack,
1979 Deception Chimpanzee Laboratory
Intentionally withheld information, or
provided misinformation to humans as to the location of a piece of favored food
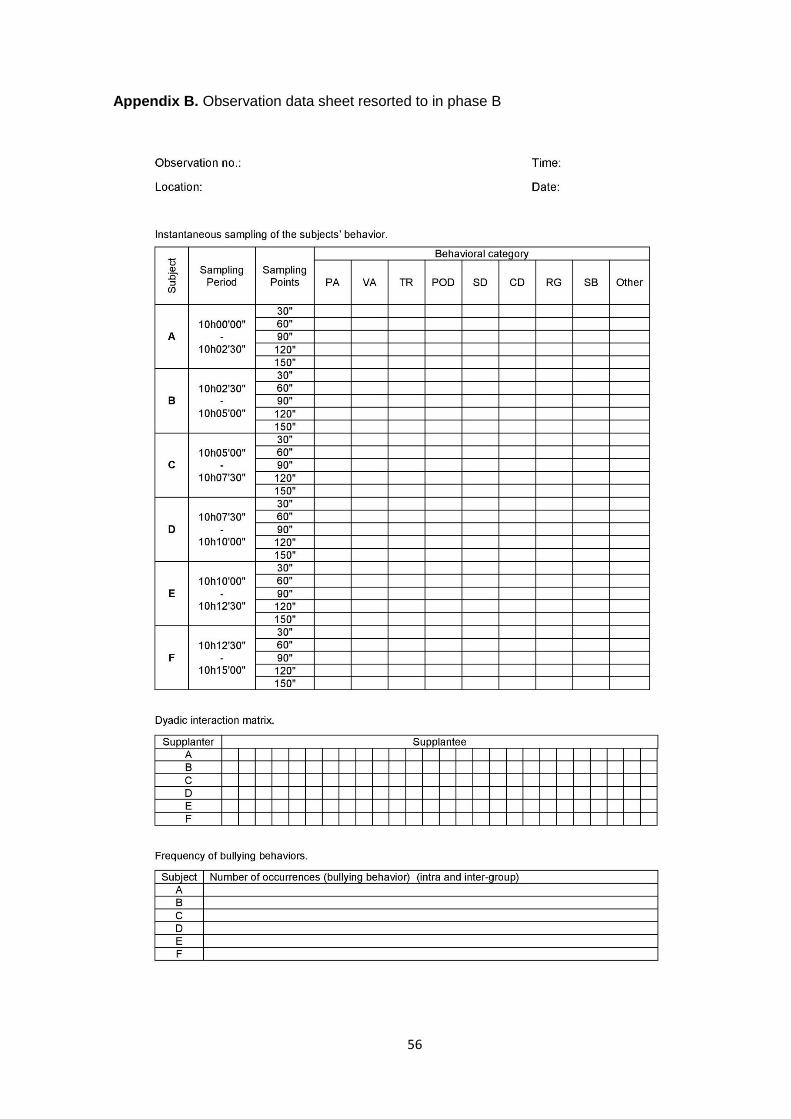
56
Appendix B. Observation data sheet resorted to in phase B
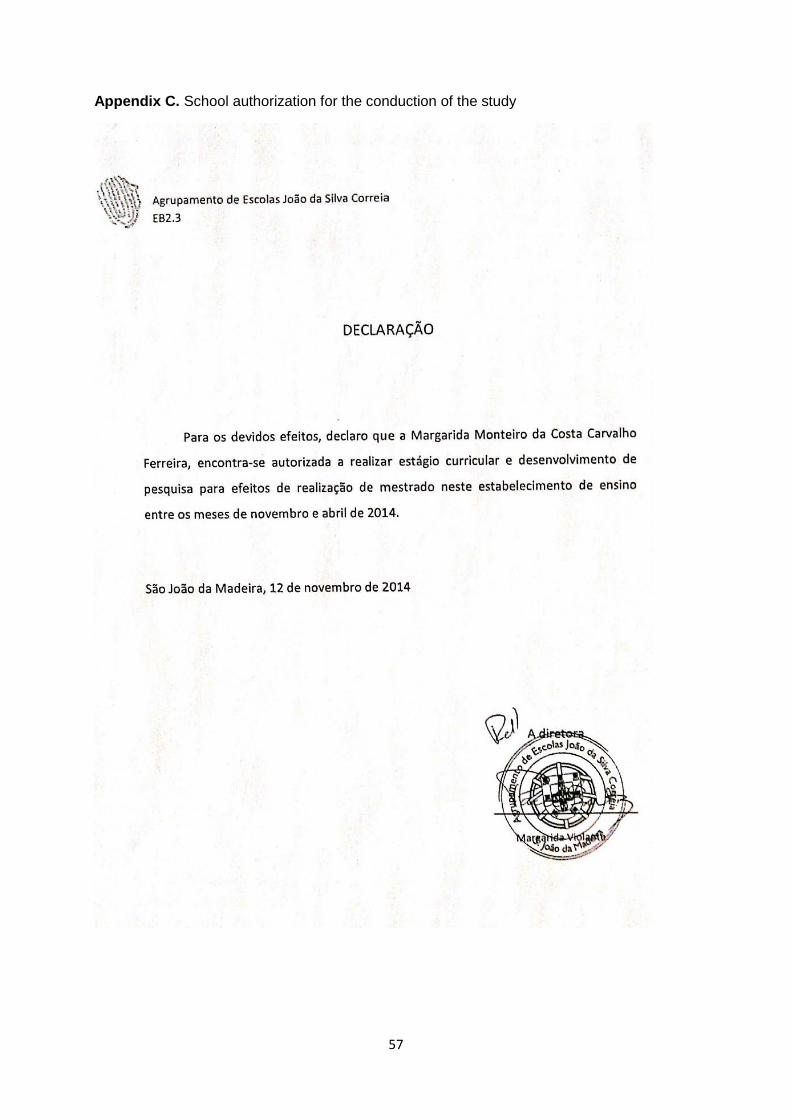
57
Appendix C. School authorization for the conduction of the study
58
Appendix D. Written approval from the Ethics Committee of the Institute of Biomedical Sciences Abel Salazar of University of Porto – ICBAS-UP for the implementation of the study