Estimation of environmental sensitivity of genetic merit for milk production traits using a random...
9
J. Dairy Sci. 86:3756–3764 American Dairy Science Association, 2003. Estimation of Environmental Sensitivity of Genetic Merit for Milk Production Traits Using a Random Regression Model M. P. L. Calus and R. F. Veerkamp Animal Sciences Group, Division Animal Resources Development P.O. Box 65, 8200 AB Lelystad, The Netherlands ABSTRACT The objective of this study was to estimate effects of environmental sensitivity of milk production traits for several environmental parameters and to investigate the impact of combining traits with different environ- mental sensitivity in an economic index. Variance com- ponents and breeding values were estimated for milk, fat, and protein yield, and fat and protein percentage by applying a random regression on values of an envi- ronmental parameter for each sire. Fourteen environ- mental parameters were defined and fitted to data con- sisting of 151,696 heifers in 6780 herds in The Nether- lands with first-lactation records for milk production, somatic cell count, body condition score, and number of inseminations. Milk, fat, and protein yield showed environmental sensitivity in combination with 12 envi- ronmental parameters. Herd-year averages of protein, body condition score, age at calving, calving interval, and peak date of calving explained most genotype by environment interaction, mainly resulting from scaling effects. Almost all genetic correlations across environ- ments were 0.99 or higher. Although heterogeneity of genetic variances was considerable, heterogeneity of heritabilities was limited. Scaling had a large effect on the weights of the economic index, but environmental sensitivities of milk, fat, and protein yields were ap- proximately of equal magnitude. Consequently, very little reranking occurred based on the economic index. (Key words: environmental sensitivity, environmental parameter, genotype × environment interaction, ran- dom regression model) Abbreviation key: EP = environmental parameter, ES = environmental sensitivity, GxE = genotype × envi- ronment interaction, HYS = herd-year-season. Received January 19, 2003. Accepted June 13, 2003. Corresponding author: M. P. L. Calus; e-mail: [email protected]. 3756 INTRODUCTION The phenomenon that different genotypes respond differently to changes in their environments is known as genotype × environment interaction (GxE) or as dif- ferences in environmental sensitivity (ES) of genotypes (Falconer and Mackay, 1996). This interaction can cause reranking of animals across environments or a change of scale, i.e., variance, across environments (Lynch and Walsh, 1998). Traditionally, animal breed- ers are more concerned about reranking of animals than about differences in scale between environments be- cause differences in scale do not affect the ranking of the animals for the considered trait. However, reranking of animals across environments is limited for milk produc- tion traits (Veerkamp et al., 1995b; Cromie, 1999; Calus et al., 2002), although there is evidence that variances and heritabilities vary (Veerkamp et al., 1995b; Cromie, 1999; Calus et al., 2002). Scaling effects can be ac- counted for in the breeding value estimation model (Meuwissen et al., 1996) and do not influence the rank- ing of sires, based on a single trait. However, if scaling effects are different for traits that are combined to- gether in an economic index, the relative importance among the traits might change and cause reranking based on this economic index (Namkoong, 1985). In that case it might be more appropriate to include environ- mental sensitivity in breeding decisions rather than to correct for it in the statistical model. An environmental parameter (EP) reflects the envi- ronment encountered by the animals. An EP can reflect production level of a herd (Veerkamp and Goddard, 1998; Calus et al., 2002; Kolmodin et al., 2002), or other characteristics of the herd, such as average calving in- terval or average age at calving (Fikse et al., 2003). Describing GxE for dairy cattle with a covariance func- tion of an EP is recently described for a limited number of EP (Veerkamp and Goddard, 1998; Calus et al., 2002; Kolmodin et al., 2002; Fikse et al., 2003). The use of an EP in a covariance function has the advantage that environments are treated as a continuum, rather than a set of arbitrarily defined groups of the data. The EBV
-
Upload
independent -
Category
Documents
-
view
1 -
download
0
Transcript of Estimation of environmental sensitivity of genetic merit for milk production traits using a random...

J. Dairy Sci. 86:3756–3764 American Dairy Science Association, 2003.
Estimation of Environmental Sensitivityof Genetic Merit for Milk Production TraitsUsing a Random Regression Model
M. P. L. Calus and R. F. VeerkampAnimal Sciences Group,Division Animal Resources DevelopmentP.O. Box 65, 8200 AB Lelystad, The Netherlands
ABSTRACT
The objective of this study was to estimate effects ofenvironmental sensitivity of milk production traits forseveral environmental parameters and to investigatethe impact of combining traits with different environ-mental sensitivity in an economic index. Variance com-ponents and breeding values were estimated for milk,fat, and protein yield, and fat and protein percentageby applying a random regression on values of an envi-ronmental parameter for each sire. Fourteen environ-mental parameters were defined and fitted to data con-sisting of 151,696 heifers in 6780 herds in The Nether-lands with first-lactation records for milk production,somatic cell count, body condition score, and numberof inseminations. Milk, fat, and protein yield showedenvironmental sensitivity in combination with 12 envi-ronmental parameters. Herd-year averages of protein,body condition score, age at calving, calving interval,and peak date of calving explained most genotype byenvironment interaction, mainly resulting from scalingeffects. Almost all genetic correlations across environ-ments were 0.99 or higher. Although heterogeneity ofgenetic variances was considerable, heterogeneity ofheritabilities was limited. Scaling had a large effect onthe weights of the economic index, but environmentalsensitivities of milk, fat, and protein yields were ap-proximately of equal magnitude. Consequently, verylittle reranking occurred based on the economic index.(Key words: environmental sensitivity, environmentalparameter, genotype × environment interaction, ran-dom regression model)
Abbreviation key: EP = environmental parameter,ES = environmental sensitivity, GxE = genotype × envi-ronment interaction, HYS = herd-year-season.
Received January 19, 2003.Accepted June 13, 2003.Corresponding author: M. P. L. Calus; e-mail: [email protected].
3756
INTRODUCTION
The phenomenon that different genotypes responddifferently to changes in their environments is knownas genotype × environment interaction (GxE) or as dif-ferences in environmental sensitivity (ES) of genotypes(Falconer and Mackay, 1996). This interaction cancause reranking of animals across environments or achange of scale, i.e., variance, across environments(Lynch and Walsh, 1998). Traditionally, animal breed-ers are more concerned about reranking of animals thanabout differences in scale between environments be-cause differences in scale do not affect the ranking of theanimals for the considered trait. However, reranking ofanimals across environments is limited for milk produc-tion traits (Veerkamp et al., 1995b; Cromie, 1999; Caluset al., 2002), although there is evidence that variancesand heritabilities vary (Veerkamp et al., 1995b; Cromie,1999; Calus et al., 2002). Scaling effects can be ac-counted for in the breeding value estimation model(Meuwissen et al., 1996) and do not influence the rank-ing of sires, based on a single trait. However, if scalingeffects are different for traits that are combined to-gether in an economic index, the relative importanceamong the traits might change and cause rerankingbased on this economic index (Namkoong, 1985). In thatcase it might be more appropriate to include environ-mental sensitivity in breeding decisions rather than tocorrect for it in the statistical model.
An environmental parameter (EP) reflects the envi-ronment encountered by the animals. An EP can reflectproduction level of a herd (Veerkamp and Goddard,1998; Calus et al., 2002; Kolmodin et al., 2002), or othercharacteristics of the herd, such as average calving in-terval or average age at calving (Fikse et al., 2003).Describing GxE for dairy cattle with a covariance func-tion of an EP is recently described for a limited numberof EP (Veerkamp and Goddard, 1998; Calus et al., 2002;Kolmodin et al., 2002; Fikse et al., 2003). The use ofan EP in a covariance function has the advantage thatenvironments are treated as a continuum, rather thana set of arbitrarily defined groups of the data. The EBV

ENVIRONMENTAL SENSITIVITY OF MILK PRODUCTION 3757
of an animal, which is divided into an environmentindependent and an environment dependent part, isalso called reaction norm (Falconer and Mackay, 1996).The simplest form of a covariance function describesthe ES of the genotype as a linear function of the EP,but higher order functions are possible. Covariancefunctions can be estimated by a two-step procedure orby random regression models (Van der Werf et al.,1998).
The objective of this paper is to estimate ES for milkproduction traits for a range of EP in order to identifythose EP that gave most ES and to investigate theeffects of ES on reranking in the Dutch economic index(INET) combining milk, fat, and protein yields.
MATERIALS AND METHODS
Data
The data contained first-lactation test-day records formilk production traits and SCC, date of first calving,date of each insemination, and BCS for 271,606 heiferscalving in 1998 and 1999 from 12,347 Dutch dairyherds. A few criteria were used to select the data for theestimation of variance components of milk productiontraits. Each heifer needed at least five test-day recordsduring the period of 5 to 305 DIM of which at least onewas on or after 180 DIM; heifers that calved at an ageof less than 640 or more than 1310 d were deleted.These criteria decreased the number to 267,120 heifersin 11,602 herds. Selected animals were deleted if theirherd did not meet the criteria of the EP, which areexplained later. To calculate EP, for each herd-year aminimum number of four records were needed for calv-ing interval, as this EP was most restrictive, and fiverecords for other EP. A total of 151,696 mostly Holstein-Friesian and Meuse-Rhine-Yssel heifers in 6780 rela-tively large herds were eventually selected. Each herd-year contained an average of 14 heifers.
In the pedigree file, a maximum of five generationsof sires were included, together with the pedigrees ofdams of first and second generations of sires and thesires’ maternal grandsires. A total of 4769 sires withdaughters in the data were identified. Sires had onaverage 32 daughters. The relationship matrix con-tained 14,382 animals.
Traits
Five traits were evaluated: average daily milk yield,fat yield, protein yield, fat percentage, and protein per-centage. Milk, fat, and protein yield were calculated asthe average of the test-day yields between 5 and 305DIM. Fat and protein percentage were calculated as
Journal of Dairy Science Vol. 86, No. 11, 2003
the average yield of fat and protein divided by the aver-age milk yield.
Environmental Parameters
Environmental parameters were calculated for eachherd-year level, based on calving date. Potentially alarge number of EP could be defined, but parametersused here were chosen because they: 1) reflect manage-ment and environment, 2) are obtainable from the avail-able data, 3) are continuous rather than categorical,i.e., the parameter is expressed on a scale rather thandefined in several classes, and 4) are not too stronglycorrelated with each other. Each parameter was aver-aged over all heifers calving in the relevant herd-year.For parameters that reflected traits with more recordsper lactation, first an average was calculated for eachselected animal.
Test-day record parameters. Average protein andSCC were calculated from test-day records in 1998 and1999. Each SCC test-day record was transformed to aSCS, by SCS = log10(SCC). Persistency was calculatedin two different ways. First, persistency was calculatedfor each animal from the ratio of milk production onthe test-day closest to 60 DIM to milk production on thetest-day closest to 240 DIM (Zwald et al., 2001), bothin a range of 42 d around those. Second, persistencywas taken as the highest test-day milk production of aheifer divided by its average test-day milk production.This last parameter is called relative peak milk yield.
Age at calving and herd size parameters. Aver-age age at calving and number of freshened heiferswere calculated over all heifers that calved during theyear, regardless how many days they produced. In bothyears, the change in number of freshened heifers wasset to the difference between 1998 and 1999.
Energy balance parameters. Energy balance re-flects the ability of management to tune the feed intaketo the energy requirements and therefore indicateswhether tissue reserves are mobilized or deposited inthe cow. Body condition score reflects cumulated energybalance (Chilliard et al., 1991). Body condition scorewas measured during classification and only once dur-ing the first lactation. Average BCS was calculated fromall classified heifers in a herd that calved in the sameyear. Other traits that reflect energy balance arechange in fat percentage and fat over protein ratio (DeVries and Veerkamp, 2000). Change in fat percentagewas calculated as the difference in fat percentage onthe test-day closest to 77 DIM and the test-day closestto 14 DIM (De Vries and Veerkamp, 2000), both in therange from 10 to 100 DIM. Fat over protein ratio wascalculated by test day and then averaged across testdays.

CALUS AND VEERKAMP3758
Calving and insemination parameters. Calvinginterval is the period between first and second calving.The number of inseminations required for a successfulsecond calving was estimated during first lactation. Theherd calving pattern was represented by peak date ofcalving and distribution of calving dates over the year.The peak date of calving shows the date around whichthe heifers are calving and the distribution of the calv-ing dates shows whether the heifers are calving nearthat date or throughout the whole year. Average dayof calving can be calculated by numbering each day ofthe year from 1 to 365 and obtaining the average ofthe renumbered calving dates (Zwald et al., 2001). Adisadvantage of this method is that a nonequal distribu-tion of calving during a year, e.g., if the peak date ofcalving does not fall on July 1st, leads to an underesti-mation or an overestimation of the peak date of calving.Here, a slightly different procedure is used. The peakdate of calving is calculated by iteratively repeating thefollowing procedure: 1) calculate the average of calvingdates (Zwald et al., 2001) and 2) define a maximal timeperiod in the same calendar year with the average ofstep 1 as central point. For instance, with an averagecalving date of d 140, the new period ranges from d 0to 280. If the period became shorter than 182 d, it wasexpanded over the borders of the calendar year. Insemi-nation data from 1997 and 2000 were available to makethis expansion feasible. The time period in step 1 isin the first iteration the calendar year and in lateriterations the period defined in step 2 in the previousiteration. Steps 1 and 2 are repeated until the averageday of calving no longer changes. The converged aver-age day of calving is considered to be the peak date ofcalving. For a few herds, two peaks of calving in a yearmade convergence impossible. If convergence had notoccurred after 1000 iterations, the average day of calv-ing of all 1000 iterations was taken. Values for 1999were adjusted by substracting 365 d to come to thesame standard as in 1998. The distribution of calvingdates during the year was calculated by the use of aninterval of 182 d and one of 365 d, both centered on thepeak date of calving. The distribution of calving dateswas calculated as the ratio of the number of calvingdates in the short interval to the number of calvingdates in the long interval.
Estimating Variance Components andEnvironmental Sensitivity
Variance components were estimated by using a siremodel. Environmental sensitivity was modeled byapplying a random regression for each sire, represent-ing its EBV, on values of an EP for the herds in whichhis daughters were producing. A fixed linear and qua-
Journal of Dairy Science Vol. 86, No. 11, 2003
dratic regression for age at calving was included, aswas a fixed effect to account for herd-year-season (HYS)groups. Furthermore, a fixed polynomial was also ap-plied to the EP, to account for the average effect in eachenvironment. An HYS effect was not fully covered bythe herd-year effect. In each situation, only one EP wasused for both the random regression for sires and thefixed regression for herd-year. The residual variancewas calculated for 10 equally sized groups, based onincreasing EP, to include heterogeneous residual vari-ances in the model.
The HYS groups were defined by a method that opti-mizes the composition of HYS groups based on the calv-ing dates and intervals between consecutive calvingdates in a herd (Crump et al., 1997). Initially, the crite-ria of a maximum period of 91 d and a minimum of fiveanimals per HYS group were applied. If some animalswere not assigned to an HYS group based on thesecriteria, they were forced to join one by relaxing thecriterion for the maximum period. The same was ap-plied to animals from groups that had fewer than fiveanimals, to force them to join another HYS group.The applied model was:
Yijklmnoq = µ + HYSi + γ0 *AGEj + γ1*(AGEj)2
+ ∑10
k=0
βkPkm + ∑S
l=0
αlnPlm + Eijklmnoq
where:Yijklmnoq is the performance of heifer q,µ is the average performance over all animals,HYSi is the effect of herd-year-season group i,γ0 and γ1 are coefficients of linear and quadratic fixedregression on age at calving j in days, respectively,AGEj is age at calving in days of heifer q,βk is coefficient k of a fixed regression on element k ofthe orthogonal polynomials of all environments,Pkm is element k of the orthogonal polynomial resem-bling an environmental parameter of environment m,αln is coefficient l of the random regression on the or-thogonal polynomials of all environments of the daugh-ters for sire n,Plm is element l of the orthogonal polynomial resem-bling an environmental parameter of environment m,s is the largest significant coefficient l of the randomregression, andEijklmnoq is the residual effect of heifer q in environmentm within group of environments o (o = 1, 2, …, 10).
The order of the polynomials for the fixed regressionon an EP was arbitrarily set to 10 in each situation.For the random regression, the order of the polynomialwas increased per combination of trait and EP untilthe extra added components of the next order did not
ENVIRONMENTAL SENSITIVITY OF MILK PRODUCTION 3759
significantly improve the fit of the model or the varianceof the extra component was zero. The log likelihoodratio test (Kirkpatrick et al., 1990) was used to comparethe fit of two models with consecutive orders of poly-nomials.
The sire variances for values of an EP are calculatedas ΦSΦ’, where Φ is a matrix with polynomial coeffi-cients for a value of the EP on each row and S is an n× n matrix, where n is the highest order of the polyno-mial + 1, with variances of each random regressioncoefficient on the diagonal and covariances between therandom regression coefficients on the off-diagonals. Theresidual variance was calculated for 10 differentgroups. Residual covariances between groups were as-sumed to be zero. Covariances between sire and resid-ual effects were assumed to be zero and not takeninto account.
Several criteria can be defined to rank EP based onthe given amount of GxE. In this study, we used theabsolute change in sire variances between 25 and 75%of the environmental scale as an indicator of change insire variance across environments and therefore of thegiven amount of GxE. To check the results of the ran-dom regression model, a multitrait model was appliedfor selected combinations of traits and EP. The programASREML (Gilmour et al., 2002) was used for allanalyses.
Economic Index
The Dutch INET is an economic index that includesmilk, fat, and protein yield and is calculated as INET= −0.08 × EBV(milk yield) + 1 × EBV(fat yield) + 6 ×EBV(protein yield). The INET was used to investigatethe effects of ES on the combination of milk, fat, andprotein yields. First, the INET was calculated based on
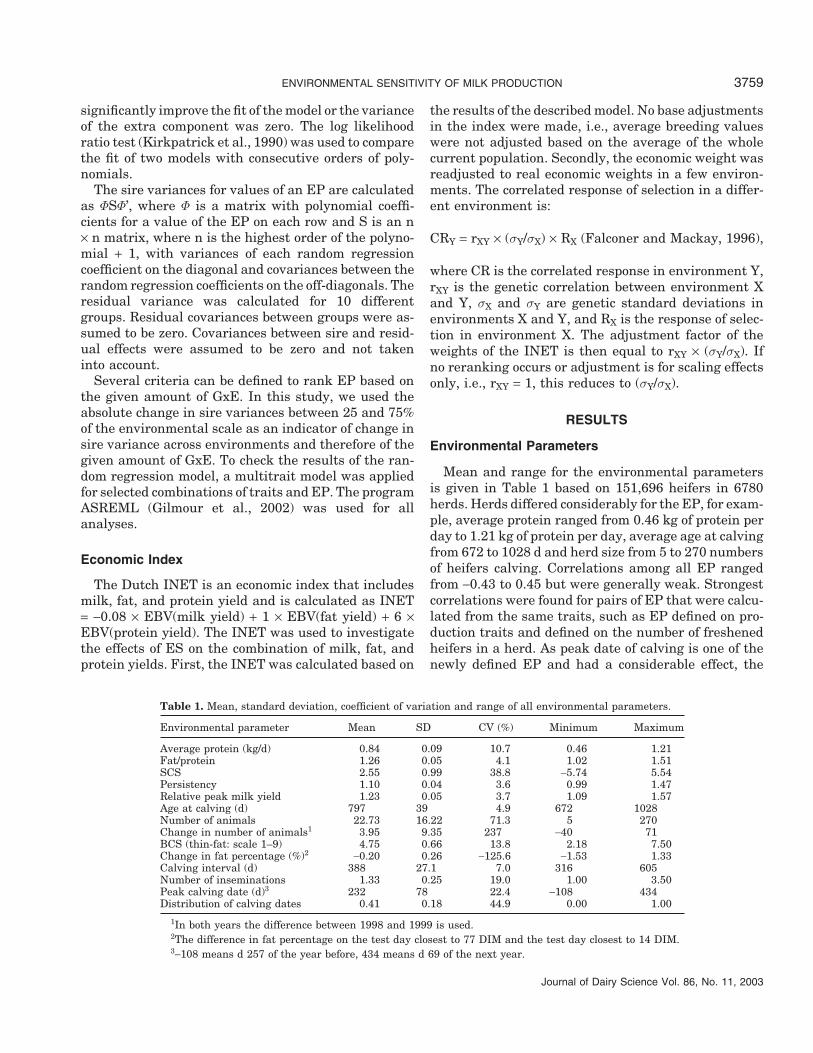
Table 1. Mean, standard deviation, coefficient of variation and range of all environmental parameters.
Environmental parameter Mean SD CV (%) Minimum Maximum
Average protein (kg/d) 0.84 0.09 10.7 0.46 1.21Fat/protein 1.26 0.05 4.1 1.02 1.51SCS 2.55 0.99 38.8 −5.74 5.54Persistency 1.10 0.04 3.6 0.99 1.47Relative peak milk yield 1.23 0.05 3.7 1.09 1.57Age at calving (d) 797 39 4.9 672 1028Number of animals 22.73 16.22 71.3 5 270Change in number of animals1 3.95 9.35 237 −40 71BCS (thin-fat: scale 1–9) 4.75 0.66 13.8 2.18 7.50Change in fat percentage (%)2 −0.20 0.26 −125.6 −1.53 1.33Calving interval (d) 388 27.1 7.0 316 605Number of inseminations 1.33 0.25 19.0 1.00 3.50Peak calving date (d)3 232 78 22.4 −108 434Distribution of calving dates 0.41 0.18 44.9 0.00 1.00
1In both years the difference between 1998 and 1999 is used.2The difference in fat percentage on the test day closest to 77 DIM and the test day closest to 14 DIM.3−108 means d 257 of the year before, 434 means d 69 of the next year.
Journal of Dairy Science Vol. 86, No. 11, 2003
the results of the described model. No base adjustmentsin the index were made, i.e., average breeding valueswere not adjusted based on the average of the wholecurrent population. Secondly, the economic weight wasreadjusted to real economic weights in a few environ-ments. The correlated response of selection in a differ-ent environment is:
CRY = rXY × (σY/σX) × RX (Falconer and Mackay, 1996),
where CR is the correlated response in environment Y,rXY is the genetic correlation between environment Xand Y, σX and σY are genetic standard deviations inenvironments X and Y, and RX is the response of selec-tion in environment X. The adjustment factor of theweights of the INET is then equal to rXY × (σY/σX). Ifno reranking occurs or adjustment is for scaling effectsonly, i.e., rXY = 1, this reduces to (σY/σX).
RESULTS
Environmental Parameters
Mean and range for the environmental parametersis given in Table 1 based on 151,696 heifers in 6780herds. Herds differed considerably for the EP, for exam-ple, average protein ranged from 0.46 kg of protein perday to 1.21 kg of protein per day, average age at calvingfrom 672 to 1028 d and herd size from 5 to 270 numbersof heifers calving. Correlations among all EP rangedfrom −0.43 to 0.45 but were generally weak. Strongestcorrelations were found for pairs of EP that were calcu-lated from the same traits, such as EP defined on pro-duction traits and defined on the number of freshenedheifers in a herd. As peak date of calving is one of thenewly defined EP and had a considerable effect, the

CALUS AND VEERKAMP3760
Figure 1. Distribution of the numbers of animals with a peakdate of calving in a certain month for both 1998 (�) and 1999 (�).
number of animals with peak date of calving in a certainmonth is shown for both years (Figure 1). This illus-trates that most herds have their heifers calving inthe autumn, although this is less clear for 1999 thanfor 1998.
Significant reaction norms were found in 50 out of70 combinations of traits and EP. The highest estimableand significant order of the polynomial is given for eachcombination of traits and EP in Table 2. Milk, fat, andprotein yield each had significant reaction norms incombination with 12 EP. These three traits generallyshowed the same order of significant polynomials for agiven EP. Fat and protein percentage had significantreaction norms in combination with 6 and 8 EP.
Environmental Sensitivity
The EP for the environments at 25, 50, and 75% ofthe data based on the increasing environmental scale
Table 2. The number of the highest estimable and significant (P < 0.05) polynomial order1 of the combinationof the environmental parameter in the row and the trait in the column.
Traits
Environmental parameter Milk Fat Protein Fat % Protein %
Average protein 2 2 2 2 2Fat/protein 2 2 3 2 0SCS 2 2 2 0 1Persistency 2 2 2 0 0Relative peak milk yield 1 2 1 0 2Age at calving 1 1 1 1 2Number of animals 2 1 2 1 2Change number of animals 2 2 2 0 0BCS 2 2 2 1 1Change in fat percentage 0 0 0 0 1Calving interval 2 1 1 1 0Number of inseminations 1 2 1 0 0Peak calving date 3 2 1 1 0Distribution of calving dates 0 0 0 0 1
1A zero means that the first order polynomial is not significant.
Journal of Dairy Science Vol. 86, No. 11, 2003
were used to calculate sire variances and heritabilitiesfor these environments for milk, fat, and protein yield.The results for the sire variances calculated for 305 dare shown in Table 3. The heritabilities were compara-ble across environments for all combinations of traitsand EP.
Environmental parameters were ranked on decreas-ing absolute change in sire variances between 25 and75% on the scale of the EP, indicating decreasing GxEfor milk, fat, and protein yield (Table 4). For the traitprotein yield, average protein, BCS, calving interval,age at calving and persistency were the most importantEP (Figure 2). Age at calving and calving intervalshowed the same pattern of sire variance, which de-creased by a third across the environmental scale. Thesire variance showed the most curvilinear relationshipwith average protein. For average protein and BCS, thesire variances doubled across the environmental scale.For the EP average BCS, the sire variances for milk,fat, and protein yield are shown in Figure 3. The envi-ronmental scale in Figure 3 resembles the interval ofthe mean EP ± two standard deviations. The sire vari-ances are following a similar pattern across the environ-mental scale.
The genetic correlation between a trait in the envi-ronment at 25% and the same trait at 75% of the dataon the environmental scale were calculated for themodel with the highest significant order for the givencombination of trait and EP. The combination of thetrait protein and the EP fat over protein ratio gavea genetic correlation of 0.96 (SE = 0.009). All othercorrelations were 0.99 or higher (SE ranging from 0.000to 0.004). The multitrait model (results not shown) gavecomparable results to those of the random regressionmodel.

ENVIRONMENTAL SENSITIVITY OF MILK PRODUCTION 3761
Table 3. Sire variances in kg2 per 305 d at 25, 50, and 75% on the scale of the environmental parameters,for all combinations of environmental parameters and the traits milk, fat, and protein yield that showed asignificant environmental sensitivity.
Milk Fat Protein
Environmental parameter 25% 50% 75% 25% 50% 75% 25% 50% 75%
Average protein 116,598 131,872 142,291 169.9 189.8 203.8 92.4 107.8 119.5Fat/protein 118,942 118,923 118,039 168.7 170.5 171.8 96.9 95.9 94.3SCS 116,095 114,979 117,118 165.9 169.0 175.8 91.9 91.6 95.1Persistency 114,532 118,291 122,291 164.4 169.8 175.5 91.7 94.9 99.0Relative peak milk yield 118,439 117,388 116,625 172.9 172.6 170.9 94.2 94.3 95.2Age at calving 123,295 118,942 114,049 177.0 171.5 165.5 103.1 97.1 90.2Number of animals 117,202 116,905 116,942 165.6 166.8 169.0 93.3 93.4 93.8Change number of animals 119,379 117,063 114,644 166.6 167.8 169.8 96.1 93.8 91.7BCS 109,639 120,505 127,984 154.3 174.8 189.2 85.4 97.3 106.1Calving interval 124,533 115,965 109,100 176.7 170.7 164.2 102.7 96.3 89.4Number of inseminations 115,072 116,653 119,537 166.7 168.6 172.3 92.0 93.8 97.0Peak calving date 112,881 118,264 120,046 154.7 164.6 172.1 89.5 94.0 96.2
Economic Index
The overall economic value for milk, fat, and proteinyield, called INET, was calculated on the scale of the EPaverage BCS for the 10 sires with the highest number ofdaughters in the data (Figure 4). These bulls are notrepresentative for all bulls in the population, but theyrepresent the breeding bulls that are widely used bydairy farmers. The INET increases with increasing av-erage BCS, and little reranking happened. The sirewith the highest change of INET shows an INET of 65Euros for herds, with an average BCS of 3.5 and anINET of 120 Euros for herds with an average BCS of 6.0.
Based on the scaling effects of milk, fat, and proteinyield across environments, the economic weights in theINET formula were adjusted. The results for the EPaverage BCS are shown in Table 5. The change of theeconomic weights with the change of the EP clearlyillustrates the effect of scaling.
Table 4. Environmental parameters ranked per trait for decreasingabsolute change of the sire variances between 25 and 75% on theenvironmental scale.
Traits
Environmental parameter Milk Fat Protein
Average protein 1 2 1Fat/protein 11 11 10SCS 10 7 9Persistency 5 6 5Relative peak milk yield 9 12 11Age at calving 4 5 4Number of animals 12 9 12Change number of animals 7 10 8BCS 2 1 2Calving interval 3 4 3Number of inseminations 8 8 7Peak calving date 6 3 6
Journal of Dairy Science Vol. 86, No. 11, 2003
DISCUSSION
Environmental Parameters
Herds were required to have at least four records forcalving interval and at least five records for all otherEP in order to be selected. This criterion led to a sub-stantial loss of data. However, it ensured that smallherds with very few informative animals were not takeninto account. The data from such herds might be biasedby the small numbers and from the fact that their ge-netic composition is more likely to be nonrandom. Theedited data still contained herds that differed consider-ably for EP, indicating that data editing did not discardcertain types of herds, apart from small ones.
Figure 2. Sire variance of protein yield in kg2 for average protein(protein) (●), BCS (�), calving interval (▲), age at calving (�), andpersistency (�) given the deviation of the mean environmental param-eter in standard deviations.

CALUS AND VEERKAMP3762
Figure 3. Sire variances for 305 d milk/1000 (●), fat (�), andprotein yield (▲) as a function of the average BCS per herd-year.
Twelve EP gave significant reaction norms for milk,fat, and protein yield. Results for six of these parame-ters for milk yield were reported in literature. Signifi-cant ES for the EP herd size, relative peak milk yield,persistency, and age at first calving were found (Fikseet al., 2003), but no significant reaction norms for theEP fat over protein ratio and calving interval werefound in that study. Average protein and BCS showedthe highest ES based on our definition. Average proteinis proven to be a useful EP before (Calus et al., 2002;Kolmodin et al., 2002). These results indicate that ad-justing for heterogeneous variances in the genetic eval-uation model might be possible by using EP.
The situation in which the EP is calculated based onthe evaluated trait needs some attention. The fact thatEP are calculated as phenotypic averages within a herdimplies that the breeding values are partly based on
Figure 4. The Dutch total economic value for milk, fat, and proteinyield (INET) in Euros of the 10 sires with the highest number ofdaughters in the data, as function of the average BCS per herd-year.
Journal of Dairy Science Vol. 86, No. 11, 2003
Table 5. Economic values (in Euros) for 305-d milk, fat, and proteinyield in the INET formula, for different values of the environmentalparameter average BCS.
BCS Milk Fat Protein
3.5 −0.068 0.82 4.904.0 −0.074 0.90 5.364.5 −0.078 0.97 5.795.0 −0.082 1.03 6.195.5 −0.084 1.07 6.496.0 −0.087 1.10 6.74
the breeding values of sires of the cows producing in aherd. Kolmodin et al. (2002) suggested that this maynot be a problem, but no extensive evidence was given.In the case of random use of sires across environments,this will probably not be a problem, as the averagebreeding value will be zero, but the precise implicationof including the evaluated trait in the calculation of theEP is not clear yet.
It is tempting to suggest that significant scaling ef-fects shown for some of the EP, might be a result of theassociation with yield, because generally an increasinglevel of production also leads to increasing variance.In this study, both BCS and calving interval showedchanging sire variances with increasing values of theEP (Table 3), and BCS and calving interval had correla-tions of 0.19 and −0.01 with average protein. However,herds with an average BCS of four and herds with anaverage BCS of six, both had an average 305-d proteinproduction of 250 kg, indicating that only limited effectcan be expected from the low correlation between pro-tein yield and BCS. Still, it illustrates the problem ofinterpreting EP, and the need to consider multiple EPsimultaneously.
Body condition score gave considerable scaling ef-fects. Body condition score reflects cumulated energybalance (Chilliard et al., 1991). It was reported (Cromie,1999) that defining environments based on the amountof concentrate fed causes scaling effects that are compa-rable to scaling effects if environments are defined onaverage protein. These results support the suggestionof others (Calus et al., 2002; Kolmodin et al., 2002) thatfeed intake and feed supply are important parametersin relation to environmental sensitivity of genetic meritfor milk yield.
Environmental Sensitivity
Environmental sensitivity was defined by Falconer(1990) as the difference between phenotypic values ofa genotype or a population in two environments, dividedby the difference of the means of all individuals in bothenvironments. In our study, ES is defined at a popula-

ENVIRONMENTAL SENSITIVITY OF MILK PRODUCTION 3763
tion level as the variance in reaction norms of gen-otypes.
Genetic correlations of a trait across environmentswere high, indicating that reranking hardly occurredacross environments, as was expected from literature(Calus et al., 2002; Kolmodin et al., 2002; Fikse et al.,2003). However, sire variances showed considerablescaling effects for a number of the EP. At the sametime, heritabilities were comparable across environ-ments, indicating that scaling effects for environmentaland sire variances were comparable. Heterogeneousheritabilities for comparable models were reported, butin these studies the heterogeneity of residual varianceswas not taken into account (Calus et al., 2002; Kolmodinet al., 2002). If heterogeneity of sire variances is accom-modated in the model, but heterogeneity of residualvariance is not, the presence of scaling effects is likelyto cause heterogeneity of heritabilities.
Herds with high protein, high persistency, young ageat calving, high BCS, short calving intervals, and calv-ing peak in the fall or winter appeared to have thehighest genetic variance for milk, fat, and protein yield.This means that herds that have one or more of thesecharacteristics are more likely to benefit more from theuse of bulls with high genetic merit and the use ofexpensive high genetic merit bulls is more easily justi-fied in those herds. At the same time, selection of ani-mals on those herds will be more effective when thereis an insufficient correction for heterogeneous variancesin the breeding value estimation.
Economic Index
The economic value of a trait was affected if the traitshowed large scaling effects. If scaling effects are differ-ent among traits, the relative importance of these traitsin an economic index can change (Namkoong, 1985).The economic index might give different selection re-sponses depending on herd environment, and thereforereranking across environments might occur. This mightreduce the total benefit of selection based on this eco-nomic index. In this study, the economic values of thetraits in the index were only adjusted for scaling effects.Genetic correlations among environments of the ad-justed economic values (Table 5) ranged from 0.93 to0.99. Taking these into account would cause greaterdifferences across environments. As shown here, re-ranking based on INET will be small, for a number ofreasons. First, the scaling effects of milk, fat, and pro-tein yield are comparable across environments. Second,the genetic correlations among these three traits arehigh and therefore the economic index is relatively in-sensitive for changes in economic values (Veerkamp etal., 1995a). However, if other traits are included in the
Journal of Dairy Science Vol. 86, No. 11, 2003
economic index, with scaling effects that are indepen-dent from those of production traits, the scaling effectscould cause considerable reranking based on the eco-nomic index (Namkoong, 1985). This clearly indicatesthat scaling effects might be of importance in animalbreeding programs.
CONCLUSIONS
Herds with high protein, high persistency, young ageat calving, high BCS, short calving intervals, and calv-ing peak in the fall or winter, have higher variancesfor the yield traits and are therefore expected to benefitmore from the use of bulls with high genetic merit andselection of animals based on those herds will be moreeffective. Scaling effects for milk, fat, and protein yieldwere considerable, but comparable, indicating that nolarge differences of environmental sensitivities amongthese traits were found on a population level. Therefore,reranking based on economic index was limited. Theabsence of reranking based on a single trait does notnecessarily mean that GxE is not important and scalingeffects can easily be accounted for by adjusting the data.As more reproduction and health traits are included intotal merit indices, further research is needed to explorethe ES of these traits.
ACKNOWLEDGMENTS
This study was financially supported by the DutchMinistry of Agriculture, Nature Management and Fish-eries. The NRS is acknowledged for providing the data.The authors thank Johan van Arendonk, Piter Bijmaand Jack Windig for their suggestions and commentson the manuscripts.
REFERENCES
Calus, M. P. L., A. F. Groen, and G. de Jong. 2002. Genotype ×environment interaction for protein yield in Dutch dairy cattleas quantified by different models. J. Dairy Sci. 85:3115–3123.
Chilliard, Y., M. Cisse, R. Lefaivre, and B. Remond. 1991. Body-composition of dairy-cows according to lactation stage, somato-tropin treatment, and concentrate supplementation. J. Dairy Sci.74:3103–3116.
Cromie, A. R. 1999. Genotype by environment interaction for milkproduction traits in Holstein Friesian dairy cattle in Ireland.Ph.D. Thesis, Queens University of Belfast, Belfast, Ireland.
Crump, R. E., N. R. Wray, R. Thompson, and G. Simm. 1997. As-signing pedigree beef performance records to contemporarygroups taking account of within-herd calving patterns. Anim. Sci.65:193–198.
De Vries, M. J., and R. F. Veerkamp. 2000. Energy balance of dairycattle in relation to milk production variables and fertility. J.Dairy Sci. 83:62–69.
Falconer, D. S. 1990. Selection in different environments—effects onenvironmental sensitivity (reaction norm) and on mean perfor-mance. Genet. Res. 56:57–70.
Falconer, D. S., and T. F. C. Mackay. 1996. Introduction to Quantita-tive Genetics. 4th ed. Longman Group, Essex, UK.

CALUS AND VEERKAMP3764
Fikse, W. F., R. Rekaya, and K. A. Weigel. Assessment of environmen-tal descriptors for studying genotype by environment interaction.Livest. Prod. Sci. 82:223–231.
Gilmour, A. R., B. R. Cullis, S. J. Welham, and R. Thompson. 2002.ASREML Reference Manual. New South Wales Agriculture, Or-ange Agricultural Institute, Orange, NSW, Australia.
Kirkpatrick, M., D. Lofsvold, and M. Bulmer. 1990. Analysis of theinheritance, selection and evolution of growth trajectories. Genet-ics 124:979–993.
Kolmodin, R., E. Strandberg, P. Madsen, J. Jensen, and H. Jorjani.2002. Genotype by environment interaction in Nordic dairy cattlestudied using reaction norms. Acta Agric. Scand. Sect. A Anim.Sci. 52:11–24.
Lynch, M. and B. Walsh. 1998. Genetics and Analysis of QuantitativeTraits. Sinauer, Sunderland, MA.
Meuwissen, T. H. E., G. De Jong, and B. Engel. 1996. Joint estimationof breeding values and heterogeneous variances of large datafiles. J. Dairy Sci. 79:310–316.
Journal of Dairy Science Vol. 86, No. 11, 2003
Namkoong, G. 1985. The influence of composite traits on genotypeby environment relations. Theor. Appl. Genet. 70:315–317.
Van der Werf, J. H. J., M. E. Goddard, and K. Meyer. 1998. Theuse of covariance functions and random regressions for geneticevaluation of milk production based on test day records. J. DairySci. 81:3300–3308.
Veerkamp, R. F., and M. E. Goddard. 1998. Covariance functionsacross herd production levels for test day records on milk, fat,and protein yields. J. Dairy Sci. 81:1690–1701.
Veerkamp, R. F., W. G. Hill, A. W. Stott, S. Brotherstone, and G.Simm. 1995a. Selection for longevity and yield in dairy-cows usingtransmitting abilities for type and yield. Anim. Sci. 61:189–197.
Veerkamp, R. F., G. Simm, and J. D. Oldham. 1995b. Genotype byenvironment interactions: experience from Langhill. Pages 59–66 in Breeding and Feeding the High Genetic Merit Dairy Cow.Br. Soc. Anim. Sci. Occas. Publ. 19.
Zwald, N. R., K. A. Weigel, W. F. Fikse, and R. Rekaya. 2001. Charac-terization of dairy production systems in countries that partici-pate in the International Bull Evaluation Service. J. Dairy Sci.84:2530–2534.