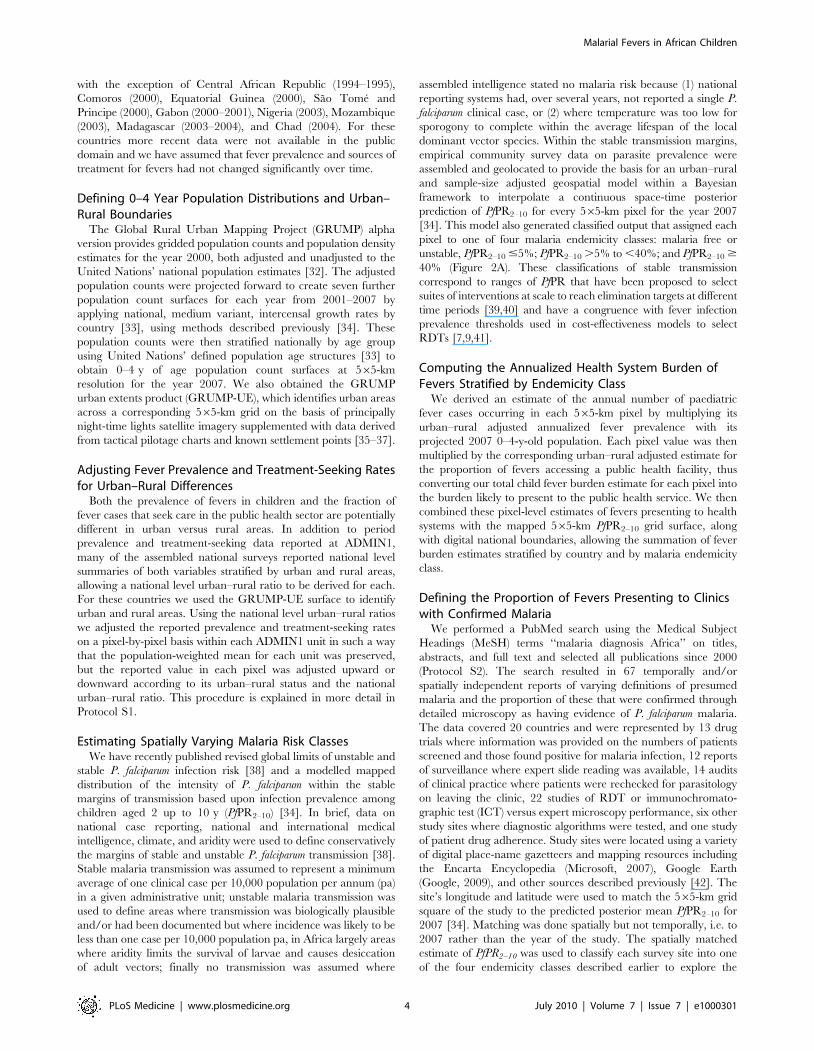
Estimating the Number of Paediatric Fevers Associated with Malaria Infection Presenting to Africa's...
12
Estimating the Number of Paediatric Fevers Associated with Malaria Infection Presenting to Africa’s Public Health Sector in 2007 Peter W. Gething 1 *, Viola C. Kirui 2 , Victor A. Alegana 2 , Emelda A. Okiro 2,3 , Abdisalan M. Noor 2,3 , Robert W. Snow 2,3 1 Spatial Ecology and Epidemiology Group, Department of Zoology, University of Oxford, Oxford, United Kingdom, 2 Malaria Public Health and Epidemiology Group, Centre for Geographic Medicine, KEMRI–University of Oxford–Wellcome Trust Collaborative Programme, Nairobi, Kenya, 3 Centre for Tropical Medicine, Nuffield Department of Clinical Medicine, University of Oxford, Oxford, United Kingdom Abstract Background: As international efforts to increase the coverage of artemisinin-based combination therapy in public health sectors gather pace, concerns have been raised regarding their continued indiscriminate presumptive use for treating all childhood fevers. The availability of rapid-diagnostic tests to support practical and reliable parasitological diagnosis provides an opportunity to improve the rational treatment of febrile children across Africa. However, the cost effectiveness of diagnosis-based treatment polices will depend on the presumed numbers of fevers harbouring infection. Here we compute the number of fevers likely to present to public health facilities in Africa and the estimated number of these fevers likely to be infected with Plasmodium falciparum malaria parasites. Methods and Findings: We assembled first administrative-unit level data on paediatric fever prevalence, treatment-seeking rates, and child populations. These data were combined in a geographical information system model that also incorporated an adjustment procedure for urban versus rural areas to produce spatially distributed estimates of fever burden amongst African children and the subset likely to present to public sector clinics. A second data assembly was used to estimate plausible ranges for the proportion of paediatric fevers seen at clinics positive for P. falciparum in different endemicity settings. We estimated that, of the 656 million fevers in African 0–4 y olds in 2007, 182 million (28%) were likely to have sought treatment in a public sector clinic of which 78 million (43%) were likely to have been infected with P. falciparum (range 60–103 million). Conclusions: Spatial estimates of childhood fevers and care-seeking rates can be combined with a relational risk model of infection prevalence in the community to estimate the degree of parasitemia in those fevers reaching public health facilities. This quantification provides an important baseline comparison of malarial and nonmalarial fevers in different endemicity settings that can contribute to ongoing scientific and policy debates about optimum clinical and financial strategies for the introduction of new diagnostics. These models are made publicly available with the publication of this paper. Please see later in the article for the Editors’ Summary. Citation: Gething PW, Kirui VC, Alegana VA, Okiro EA, Noor AM, et al. (2010) Estimating the Number of Paediatric Fevers Associated with Malaria Infection Presenting to Africa’s Public Health Sector in 2007. PLoS Med 7(7): e1000301. doi:10.1371/journal.pmed.1000301 Academic Editor: Christopher J. M. Whitty, London School of Hygiene and Tropical Medicine, United Kingdom Received December 8, 2009; Accepted May 26, 2010; Published July 6, 2010 Copyright: ß 2010 Gething et al. This is an open-access article distributed under the terms of the Creative Commons Attribution License, which permits unrestricted use, distribution, and reproduction in any medium, provided the original author and source are credited. Funding: PWG is supported by the Wellcome Trust Senior Research Fellowship held by Dr Simon Hay at the University of Oxford, UK (#079091). EAO is supported by the Wellcome Trust as a Research Training Fellow (#086166). AMN is supported by the Wellcome Trust as a Research Training Fellow (#081829). RWS is supported by the Wellcome Trust as Principal Research Fellow (#079080). This work forms part of the output of the Malaria Atlas Project (MAP, http:// www.map.ox.ac.uk), principally funded by the Wellcome Trust, UK. RWS and AMN also acknowledge support from the Kenya Medical Research Institute. The funders had no role in study design, data collection and analysis, decision to publish, or preparation of the manuscript. Competing Interests: RWS chaired Novartis’s National Malaria Control Programme Best Practice Workshops for several years in Africa for which he was paid an honorium. The need for defining drug commodity requirements by countries stems from these workshops. RWS thanks Novartis and the national programme participants of these workshops. Novartis has not, however, influenced the design of the data assembly, analysis, or interpretation of the results presented in this paper. Abbreviations: ACT, artemisinin-based combination therapy; ADMIN1, first-level administrative unit; GRUMP, Global Rural Urban Mapping Project; IQR, interquartile range; MIS, Malaria Indicator Survey; PfPR 2–10 , P. falciparum parasite rate in 2 y up to 10 y olds; RDT, rapid diagnostic test * E-mail: [email protected] PLoS Medicine | www.plosmedicine.org 1 July 2010 | Volume 7 | Issue 7 | e1000301
-
Upload
independent -
Category
Documents
-
view
0 -
download
0
Transcript of Estimating the Number of Paediatric Fevers Associated with Malaria Infection Presenting to Africa's...

Estimating the Number of Paediatric Fevers Associatedwith Malaria Infection Presenting to Africa’s PublicHealth Sector in 2007Peter W. Gething1*, Viola C. Kirui2, Victor A. Alegana2, Emelda A. Okiro2,3, Abdisalan M. Noor2,3,
Robert W. Snow2,3
1 Spatial Ecology and Epidemiology Group, Department of Zoology, University of Oxford, Oxford, United Kingdom, 2 Malaria Public Health and Epidemiology Group,
Centre for Geographic Medicine, KEMRI–University of Oxford–Wellcome Trust Collaborative Programme, Nairobi, Kenya, 3 Centre for Tropical Medicine, Nuffield
Department of Clinical Medicine, University of Oxford, Oxford, United Kingdom
Abstract
Background: As international efforts to increase the coverage of artemisinin-based combination therapy in public healthsectors gather pace, concerns have been raised regarding their continued indiscriminate presumptive use for treating allchildhood fevers. The availability of rapid-diagnostic tests to support practical and reliable parasitological diagnosisprovides an opportunity to improve the rational treatment of febrile children across Africa. However, the cost effectivenessof diagnosis-based treatment polices will depend on the presumed numbers of fevers harbouring infection. Here wecompute the number of fevers likely to present to public health facilities in Africa and the estimated number of these feverslikely to be infected with Plasmodium falciparum malaria parasites.
Methods and Findings: We assembled first administrative-unit level data on paediatric fever prevalence, treatment-seekingrates, and child populations. These data were combined in a geographical information system model that also incorporatedan adjustment procedure for urban versus rural areas to produce spatially distributed estimates of fever burden amongstAfrican children and the subset likely to present to public sector clinics. A second data assembly was used to estimateplausible ranges for the proportion of paediatric fevers seen at clinics positive for P. falciparum in different endemicitysettings. We estimated that, of the 656 million fevers in African 0–4 y olds in 2007, 182 million (28%) were likely to havesought treatment in a public sector clinic of which 78 million (43%) were likely to have been infected with P. falciparum(range 60–103 million).
Conclusions: Spatial estimates of childhood fevers and care-seeking rates can be combined with a relational risk model ofinfection prevalence in the community to estimate the degree of parasitemia in those fevers reaching public health facilities.This quantification provides an important baseline comparison of malarial and nonmalarial fevers in different endemicitysettings that can contribute to ongoing scientific and policy debates about optimum clinical and financial strategies for theintroduction of new diagnostics. These models are made publicly available with the publication of this paper.
Please see later in the article for the Editors’ Summary.
Citation: Gething PW, Kirui VC, Alegana VA, Okiro EA, Noor AM, et al. (2010) Estimating the Number of Paediatric Fevers Associated with Malaria InfectionPresenting to Africa’s Public Health Sector in 2007. PLoS Med 7(7): e1000301. doi:10.1371/journal.pmed.1000301
Academic Editor: Christopher J. M. Whitty, London School of Hygiene and Tropical Medicine, United Kingdom
Received December 8, 2009; Accepted May 26, 2010; Published July 6, 2010
Copyright: � 2010 Gething et al. This is an open-access article distributed under the terms of the Creative Commons Attribution License, which permitsunrestricted use, distribution, and reproduction in any medium, provided the original author and source are credited.
Funding: PWG is supported by the Wellcome Trust Senior Research Fellowship held by Dr Simon Hay at the University of Oxford, UK (#079091). EAO issupported by the Wellcome Trust as a Research Training Fellow (#086166). AMN is supported by the Wellcome Trust as a Research Training Fellow (#081829).RWS is supported by the Wellcome Trust as Principal Research Fellow (#079080). This work forms part of the output of the Malaria Atlas Project (MAP, http://www.map.ox.ac.uk), principally funded by the Wellcome Trust, UK. RWS and AMN also acknowledge support from the Kenya Medical Research Institute. Thefunders had no role in study design, data collection and analysis, decision to publish, or preparation of the manuscript.
Competing Interests: RWS chaired Novartis’s National Malaria Control Programme Best Practice Workshops for several years in Africa for which he was paid anhonorium. The need for defining drug commodity requirements by countries stems from these workshops. RWS thanks Novartis and the national programmeparticipants of these workshops. Novartis has not, however, influenced the design of the data assembly, analysis, or interpretation of the results presented in thispaper.
Abbreviations: ACT, artemisinin-based combination therapy; ADMIN1, first-level administrative unit; GRUMP, Global Rural Urban Mapping Project; IQR,interquartile range; MIS, Malaria Indicator Survey; PfPR2–10, P. falciparum parasite rate in 2 y up to 10 y olds; RDT, rapid diagnostic test
* E-mail: [email protected]
PLoS Medicine | www.plosmedicine.org 1 July 2010 | Volume 7 | Issue 7 | e1000301

Introduction
Between 2003 and 2009 all African countries at risk of P.
falciparum switched to artemisinin-based combination therapy
(ACT) as first-line therapy for uncomplicated malaria in their
public health sectors [1]. Access to these essential drugs remains
poor, however, with the World Health Organization reporting
that only one-sixth of fever cases in children under 5 y of age was
treated with an ACT in 2008 (in ref. [2], see Table 3.8).
Paradoxically, the prevailing doctrine to treat all fevers as malaria,
promoted during the era of widely available mono-therapies and
limited diagnostic facilities, has lead to the systematic overdiag-
nosis of malaria in many parts of Africa [3–6]. This status quo
leads to the inappropriate distribution and prescription of limited
ACT stocks and jeopardizes the appropriate case management of
nonmalarial fevers [7–9]. The single largest policy change likely to
impact upon the quality of case management for fevers, and on
future ACT requirements, is the implementation of improved
parasitological diagnosis to support appropriate prescription
practices in all age groups [10,11]. Some argue that the expanded
use of rapid diagnostic tests (RDTs) by prescribers at the point of
care will significantly change diagnosis and treatment of febrile
patients [10,12–15], increase the geographic reach of parasite
diagnostic services, and replace the lack of prescriber confidence in
poor routine microscopy [3,16–21]. Whilst there is broad
agreement that a long-term goal should be the laboratory or
RDT-based confirmation of all suspected malaria cases prior to
treatment with an antimalarial, considerable debate continues
surrounding the implications of such a transition under current
conditions [10,22–24].
Identifying optimum strategies for the phased introduction of
new diagnostic policies requires reliable information on a range of
spatially distributed public health metrics. Of particular importance
is an understanding of the volume of fever cases currently
presenting to health systems and the extent to which these fevers
are associated with P. falciparum parasitemia. Routine approaches to
estimating such metrics in government-supported clinics rely
mainly on data from imperfect health management information
systems [25–27]. Such data are fundamentally limited in many
African settings and characterized by sporadic and often inaccurate
reporting [27,28]. An alternative approach is to spatially triangu-
late more robust facility- and community-based survey data to
establish plausible rates of fever in the population, the proportion
expected to attend clinics, and the proportion likely to have
malaria, thus providing estimates that are entirely independent of
imperfect health system data [29,30]. In an earlier morbidity
modelling exercise that preceded the universal change in ACT
policy, data on reported fevers from national sample surveys were
used to estimate treatment burden for fevers across Africa [30].
Data were reconciled at national levels for population estimates for
the year 2000 against crude simulations of stable malaria risk on the
basis of theoretical climate suitability for transmission. It is now
possible to assemble more contemporary data on fever prevalence,
reconciled at higher spatial resolutions and matched to better
models of malaria transmission risk. Here we use this approach to
estimate and compare two fundamental metrics: the total number
of paediatric fever cases seeking treatment in the public sector, and
the number of those cases likely to have malaria.
Methods
Model OverviewWe used a simple pathway framework to derive the annualized
population of febrile children in Africa presenting to public health
facilities, and the proportion likely to have malaria: (1) we defined
the 14-d period prevalence of reported fevers among children aged
0–4 y by subnational administrative units, applying an urban–
rural adjustment factor and transforming to an annualized burden
using population projections for the year 2007; (2) we defined for
each administrative unit the proportion of fevers that seek care
from a public health facility, adjusting for urban–rural differences;
(3) the annualized fever burdens presenting to public health
facilities were structured according to four malaria transmission
risk strata; and finally, (4) we estimated the proportion of febrile
children presenting to clinics that had malaria infections according
to the different malaria transmission classifications. These steps are
discussed in detail below and summarized schematically in
Figure 1.
Assembling Data on Fever Prevalence and TreatmentSeeking among Children Aged 0–4 Years
We identified report and raw data from various national sample
surveys where the history of fever in the preceding 14 d was
reported from interviews with mothers and caretakers of resident
children aged 0–4 y. These data form part of monitoring and
evaluation surveys undertaken approximately every 3–5 y across
Africa as part of national Demographic and Health Surveys (DHS;
http://www.measuredhs.com/), Multiple Indicator Cluster Sur-
veys (MICS; http://www.unicef.org/statistics/index_24302.htlm),
or more recently national Malaria Indicator Surveys (MIS; http://
www.rollbackmalaria.org/mechanisms/merg), and are presented
in full in Table S1. The Monitoring and Evaluation Reference
Group of the Roll Back Malaria (RBM) initiative has promoted the
use of these data to serially track progress against several key RBM
targets including insecticide-treated net coverage, coverage of
intermittent presumptive treatment in pregnancy, and access to
effective antimalarial treatment within 48 h of the onset of
symptoms in young children [31]. The denominators used in the
RBM treatment indicators are all children reported to have had a
fever in the last 14 d. The multistage sampling design from first-
level administrative levels (e.g. province, state, or governorate) to
national census defined ‘‘enumeration clusters’’ is common to all
these surveys, and sample sizes are calculated on an ability to
provide precision in health and population indicators at the first-
level administrative unit (hereafter ADMIN1). We have recon-
structed information reported at ADMIN1 levels on the numbers
of children aged less than 5 y investigated, the number reported as
having had a fever in the 14 d preceding the survey, and the
number using a public health facility to treat the fever. 2-wk period
fever prevalence and treatment-seeking rates were derived directly
from these data. Period prevalence values were then annualized by
multiplying by 26. This simple approach assumed that most
surveys were undertaken at a time representative of fever
incidence across an average 12 mo, and also that most fevers
began and ended during the 2-wk survey period. These annualized
prevalence data were rasterised using ArcView 3.2 (ESRI Inc.)
into a 565-km resolution surface in which each pixel contained
the values reported at ADMIN1 level.
We have selected the most recent national sample survey for
each country that allowed the most complete definition of fever
period prevalence and the proportion of fevers seeking treatment
from public sector services (Table S1). For four countries no
information was available on fever prevalence (Eritrea, Botswana,
South Africa, and Cape Verde). The surveys undertaken in the
Comoros (2000), Equatorial Guinea (2000), Sao Tome and
Principe (2000), Sierra Leone (2005), Sudan (North and South,
2005), Mauritania (2007), and Togo (2006) did not document the
sources of treatment sought for children reported as having a fever
Malarial Fevers in African Children
PLoS Medicine | www.plosmedicine.org 2 July 2010 | Volume 7 | Issue 7 | e1000301

in the last 14 d, so the treatment-seeking data for reported acute
respiratory tract infections were used as a surrogate. The surveys
in Malawi in 2006 and Senegal in 2008–2009 did not report
treatment sources for fevers so we have assumed a similar pattern
to the fever treatment-seeking patterns described in the DHS
survey in 2000 for Malawi and the 2006 MIS for Senegal. In some
countries more recent data on fever prevalence have been
collected as part of national sample surveys but information is
not currently available in the public domain (Namibia, MIS 2009;
Mozambique, MIS 2007; Liberia, MIS 2007; Ethiopia, MIS 2007;
Rwanda, DHS 2007–2008) and earlier surveys have been used.
Nevertheless the majority of the data were assembled after 2004
Figure 1. Schematic overview of mapping procedures and methods. Blue rods describe input data; yellow boxes denote operations in ageographical information system; orange rods denote adjusted data; green rods indicate output data, with dashed lines denoting intermediateoutput and solid lines final outputs. U5, children aged under 5 y old.doi:10.1371/journal.pmed.1000301.g001
Malarial Fevers in African Children
PLoS Medicine | www.plosmedicine.org 3 July 2010 | Volume 7 | Issue 7 | e1000301
with the exception of Central African Republic (1994–1995),
Comoros (2000), Equatorial Guinea (2000), Sao Tome and
Principe (2000), Gabon (2000–2001), Nigeria (2003), Mozambique
(2003), Madagascar (2003–2004), and Chad (2004). For these
countries more recent data were not available in the public
domain and we have assumed that fever prevalence and sources of
treatment for fevers had not changed significantly over time.
Defining 0–4 Year Population Distributions and Urban–Rural Boundaries
The Global Rural Urban Mapping Project (GRUMP) alpha
version provides gridded population counts and population density
estimates for the year 2000, both adjusted and unadjusted to the
United Nations’ national population estimates [32]. The adjusted
population counts were projected forward to create seven further
population count surfaces for each year from 2001–2007 by
applying national, medium variant, intercensal growth rates by
country [33], using methods described previously [34]. These
population counts were then stratified nationally by age group
using United Nations’ defined population age structures [33] to
obtain 0–4 y of age population count surfaces at 565-km
resolution for the year 2007. We also obtained the GRUMP
urban extents product (GRUMP-UE), which identifies urban areas
across a corresponding 565-km grid on the basis of principally
night-time lights satellite imagery supplemented with data derived
from tactical pilotage charts and known settlement points [35–37].
Adjusting Fever Prevalence and Treatment-Seeking Ratesfor Urban–Rural Differences
Both the prevalence of fevers in children and the fraction of
fever cases that seek care in the public health sector are potentially
different in urban versus rural areas. In addition to period
prevalence and treatment-seeking data reported at ADMIN1,
many of the assembled national surveys reported national level
summaries of both variables stratified by urban and rural areas,
allowing a national level urban–rural ratio to be derived for each.
For these countries we used the GRUMP-UE surface to identify
urban and rural areas. Using the national level urban–rural ratios
we adjusted the reported prevalence and treatment-seeking rates
on a pixel-by-pixel basis within each ADMIN1 unit in such a way
that the population-weighted mean for each unit was preserved,
but the reported value in each pixel was adjusted upward or
downward according to its urban–rural status and the national
urban–rural ratio. This procedure is explained in more detail in
Protocol S1.
Estimating Spatially Varying Malaria Risk ClassesWe have recently published revised global limits of unstable and
stable P. falciparum infection risk [38] and a modelled mapped
distribution of the intensity of P. falciparum within the stable
margins of transmission based upon infection prevalence among
children aged 2 up to 10 y (PfPR2–10) [34]. In brief, data on
national case reporting, national and international medical
intelligence, climate, and aridity were used to define conservatively
the margins of stable and unstable P. falciparum transmission [38].
Stable malaria transmission was assumed to represent a minimum
average of one clinical case per 10,000 population per annum (pa)
in a given administrative unit; unstable malaria transmission was
used to define areas where transmission was biologically plausible
and/or had been documented but where incidence was likely to be
less than one case per 10,000 population pa, in Africa largely areas
where aridity limits the survival of larvae and causes desiccation
of adult vectors; finally no transmission was assumed where
assembled intelligence stated no malaria risk because (1) national
reporting systems had, over several years, not reported a single P.
falciparum clinical case, or (2) where temperature was too low for
sporogony to complete within the average lifespan of the local
dominant vector species. Within the stable transmission margins,
empirical community survey data on parasite prevalence were
assembled and geolocated to provide the basis for an urban–rural
and sample-size adjusted geospatial model within a Bayesian
framework to interpolate a continuous space-time posterior
prediction of PfPR2–10 for every 565-km pixel for the year 2007
[34]. This model also generated classified output that assigned each
pixel to one of four malaria endemicity classes: malaria free or
unstable, PfPR2–10 #5%; PfPR2–10 .5% to ,40%; and PfPR2–10 $
40% (Figure 2A). These classifications of stable transmission
correspond to ranges of PfPR that have been proposed to select
suites of interventions at scale to reach elimination targets at different
time periods [39,40] and have a congruence with fever infection
prevalence thresholds used in cost-effectiveness models to select
RDTs [7,9,41].
Computing the Annualized Health System Burden ofFevers Stratified by Endemicity Class
We derived an estimate of the annual number of paediatric
fever cases occurring in each 565-km pixel by multiplying its
urban–rural adjusted annualized fever prevalence with its
projected 2007 0–4-y-old population. Each pixel value was then
multiplied by the corresponding urban–rural adjusted estimate for
the proportion of fevers accessing a public health facility, thus
converting our total child fever burden estimate for each pixel into
the burden likely to present to the public health service. We then
combined these pixel-level estimates of fevers presenting to health
systems with the mapped 565-km PfPR2–10 grid surface, along
with digital national boundaries, allowing the summation of fever
burden estimates stratified by country and by malaria endemicity
class.
Defining the Proportion of Fevers Presenting to Clinicswith Confirmed Malaria
We performed a PubMed search using the Medical Subject
Headings (MeSH) terms ‘‘malaria diagnosis Africa’’ on titles,
abstracts, and full text and selected all publications since 2000
(Protocol S2). The search resulted in 67 temporally and/or
spatially independent reports of varying definitions of presumed
malaria and the proportion of these that were confirmed through
detailed microscopy as having evidence of P. falciparum malaria.
The data covered 20 countries and were represented by 13 drug
trials where information was provided on the numbers of patients
screened and those found positive for malaria infection, 12 reports
of surveillance where expert slide reading was available, 14 audits
of clinical practice where patients were rechecked for parasitology
on leaving the clinic, 22 studies of RDT or immunochromato-
graphic test (ICT) versus expert microscopy performance, six other
study sites where diagnostic algorithms were tested, and one study
of patient drug adherence. Study sites were located using a variety
of digital place-name gazetteers and mapping resources including
the Encarta Encyclopedia (Microsoft, 2007), Google Earth
(Google, 2009), and other sources described previously [42]. The
site’s longitude and latitude were used to match the 565-km grid
square of the study to the predicted posterior mean PfPR2–10 for
2007 [34]. Matching was done spatially but not temporally, i.e. to
2007 rather than the year of the study. The spatially matched
estimate of PfPR2–10 was used to classify each survey site into one
of the four endemicity classes described earlier to explore the
Malarial Fevers in African Children
PLoS Medicine | www.plosmedicine.org 4 July 2010 | Volume 7 | Issue 7 | e1000301

Figure 2. Transmission intensity, fevers, and care seeking for fever across Africa. (A) Predicted transmission intensity across Africa.Transmission is classified into areas of risk free, unstable, and stable transmission on the basis of country-reported case data and the limiting effectson transmission of aridity and low temperatures [38]. The latter class is further divided into low, medium, and high transmission settings from amodel-based geostatistical prediction of P. falciparum prevalence in the epidemiologically informative 2-y up to 10-y age range, PfPR2–10 [34]. (B) 14-dperiod prevalence of reported fevers among children aged 0–4 y derived from national sample survey data (yellow, no risk; grey, no data). (C)Proportion of paediatric fevers using a public health facility at some stage of the illness to treat the fever (yellow, no risk; grey, no data). Footnote: Thereference ADMIN1 digital boundaries for Africa were obtained through a combination of data from the United Nations Geographic InformationWorking Group, Second Administrative Level Boundary project (UNGIWG-SALB [56]) and the Food & Agriculture Organization - Global AdministrativeUnits Layers (FAO-GAUL [57]). These boundary units matched reported information on fever prevalence for 31 of 42 national survey reportsassembled. For Angola, Burundi, Central African Republic, Chad, Congo, Gabon, Guinea Bissau, Mauritania, and Nigeria nonstandard ADMIN1 unitswere reported by the national sample surveys and these were digitized using ArcGIS 9.3 (ESRI, Inc.) to replace existing ADMIN1 boundaries and thuscreate a single fever spatial reporting surface, similar to recent approaches to assemble mosquito net use from national survey data [58].doi:10.1371/journal.pmed.1000301.g002
Malarial Fevers in African Children
PLoS Medicine | www.plosmedicine.org 5 July 2010 | Volume 7 | Issue 7 | e1000301

relationship between underlying endemicity and the likelihood
that paediatric fevers attending clinics were positive for P.
falciparum. All data, their inclusion criteria, and age ranges are
shown in Protocol S2.
Results
Period Prevalence of FeverBetween 103 and 10,080 interviews with mothers or caretakers
were undertaken in each of 336 ADMIN1 units to investigate fever
period prevalence among children aged 0–4 y providing informa-
tion on 281,426 children. A total of 70,666 fevers were identified
across the 42 countries and 14-d period prevalence of fever ranged
from 0.7% in Kidal, Mali to 53.4% in West Equatoria in Southern
Sudan (Figure 2B). Fever prevalence was less than 5% in only eight
ADMIN1 units, including three in Zimbabwe, two in Northern
Sudan, and one each in Mali, The Gambia, and Sao Tome and
Principe. The median fever period prevalence across the entire
ADMIN1 range was 23.8% (interquartile range [IQR] 15.2%–
30.6%). All assembled data on fever prevalence are presented
nationally in Table S1. Overall there was no discernible
relationship between the intensity of transmission and the
proportion of children reported as having a fever in the last
2 wk (unpublished results). Nationally reported ratios for urban
versus rural fever prevalence are presented in Protocol S1 and
ranged from 0.55 in Uganda to 1.29 in Sao Tome and Principe,
with a median ratio of 0.87.
Transforming the period prevalence of fever to an annualized
estimate among the resident projected populations of children, we
estimate that there were 655.6 million reported fevers in 2007
among the 42 countries included in this analysis (i.e., excluding
Eritrea, South Africa, Botswana, and Cape Verde). Eleven
ADMIN1 units were estimated to account for more than 10
million fevers each: six in Nigeria, three in Ethiopia, and two in
Democratic Republic of Congo (DRC). These 11 areas of Africa
alone contributed 32% of the entire estimated African paediatric
fever burden in 2007.
Treatment Seeking for Childhood FeversTwo ADMIN1 units reported none of the febrile children
accessing care in the formal public health sector: Kidal in Mali,
where only two fevers were reported, and none among the 112
fevers reported in North West Somalia, consistent with the prolific
private medicine sector in this area [43] and the fact that the
public sector in Somalia has largely been destroyed during the civil
conflict. Other countries with a low (,10%) public health facility
use for fevers included Cote D’Ivoire, Ethiopia, and Chad. The
highest ($50%) use of public health services for fever treatment
was reported for Mozambique, Northern Sudan, Liberia, Djibouti,
Southern Sudan, Namibia, Tanzania, and Zambia. Use of public
services exceeding 75% was reported in some areas of Sudan,
Tanzania, and Zambia. All assembled data on treatment seeking
for fever are presented nationally in Table S1. The median public
health service use for fever treatment was 32.5% (IQR 22.7%–
45.2%) and the diversity across the continent is shown in
Figure 2C. Nationally reported urban–rural ratios in the use of
public health services are presented in Protocol S1 and ranged
from 0.45 in Burkina Faso to 5.05 in Chad, with a median ratio of
1.19.
Proportion of Paediatric Fevers at Clinics Associated withP. falciparum Infection
The 67 independent estimates of the proportion of febrile
children attending clinics found to be positive with expert
microscopy covered a wide range of transmission conditions
predicted by the 565-km modelled map surface (sites spanned
PfPR2–10 0%–68%). No sites were available in areas classified as
risk-free, and we assumed that no fevers at clinics in these areas
would be infected with P. falciparum. Three study sites were located
in the unstable malaria transmission category, 11 sites in areas
where stable transmission is #5% PfPR2–10, 32 sites in areas where
transmission ranged from .5% to ,40% PfPR2–10, and 21 sites in
the highest stable transmission category ($40% PfPR2–10). The
median proportions of fevers infected were similar between the
endemicity classes of unstable and #5% PfPR2–10 (see Protocol
S2), and these 14 study sites have been combined in Figure 3 to
examine broad differences in fever infection between locations of
differing endemicity. Under the lowest transmission intensity
classification the median proportion of infected fevers was 3.3%
(IQR 0.5%–12%). Among children presenting to clinics in the
medium transmission intensity class the median proportion
harbouring infection was 41.5% (IQR 29%–57%). Among fevers
presenting to clinics located in the highest transmission intensity
areas the median infection rate was 59.0% (IQR 47%–75%).
Despite overlapping ranges of fever infection risks among the
medium and high transmission classes, the endemicity classifica-
tion provides a legitimacy to the intuitive prior expectation that
areas of higher parasite transmission are likely to see more children
at clinics with peripheral infections. It is important to note,
however, that in a given proportion of parasitemic fever cases, the
fever will not be caused by the malaria infection. We make no
attempt here to attribute causation or to quantify this malaria
attributable fraction, but note that this proportion will tend to
decrease systematically with rising endemicity. Importantly,
however, for diagnostic-based treatment policies all infected fevers
are likely to be treated as malaria.
Figure 3. Risks of febrile children being infected whenpresenting to clinics within three epidemiological strata ofunstable/#5% PfPR2–10, .5% to ,40% PfPR2–10, and $40%PfPR2–10. The box indicates the IQR (25% and 75%); the thick line withinthe box represents the median; the whiskers represent the 2.5% and97.5% centiles; and outliers are plotted as circles outside this range.doi:10.1371/journal.pmed.1000301.g003
Malarial Fevers in African Children
PLoS Medicine | www.plosmedicine.org 6 July 2010 | Volume 7 | Issue 7 | e1000301

Burden of Fevers Associated with Malaria in Public HealthFacilities
Applying the urban–rural adjusted ADMIN1-specific treat-
ment-seeking estimates to the projected annualized burdens, we
estimate that of the 655.5 million fever events affecting children in
Africa in 2007, approximately 182.4 million will have presented at
public health facilities, of which 78.3 million were likely to have
been positive for P. falciparum. As part of a sensitivity analysis
(described in full in Protocol S3), the number of infected fevers
presenting at public health facilities was recalculated under more
extreme scenarios where the observed 0.25 and 0.75 quantile
infection rate was used for each endemicity class rather than the
median value. This resulted in a plausible range of 59.8–103.4
million fevers at clinics likely to be positive for P. falciparum,
reflecting our uncertainty in the infection rate in different settings.
Correspondingly, we estimate that 104.1 (79.0–122.6) million
paediatric fevers attending public clinics in 2007 were not
accompanied by a malaria infection.
Malarial and Nonmalarial Fevers by Country andEndemicity Setting
Health system decisions on malaria diagnostic and case
management practices are likely to be made primarily at the
national level and would ideally be informed by within-country
variations in endemicity. Table 1 presents summary estimates for
each country of the total number of paediatric fevers attending
public health facilities in 2007, and the number of those fevers
predicted to be associated with P. falciparum infection. Across
Africa, we estimate in areas of zero, unstable/low (PfPR2–10 #5%),
moderate (PfPR2–10 .5% to ,40%), and high (PfPR2–10 $40%)
risk, that 13.5 million, 22.4 million, 50.7 million, and 95.8 million
paediatric fevers, respectively, will have sought care from a public
health facility of which zero, 0.7 million (range 0.1–2.7 million),
21.0 million (range 14.7–28.9 million), and 56.5 million (range
45.0–71.8 million), respectively, would have been accompanied by
P. falciparum infection.
An additional exercise was undertaken to assess the sensitivity of
these results to reverting to a simpler analysis that made no
adjustments for potential urban–rural differences in fever
prevalence and treatment-seeking behaviour (presented in full in
Protocol S3). The overall effect of the adjustment was modest, with
the mean effect size at national level less than 1%, although this
varied considerably between countries as a function of their
observed urban–rural differentials and endemicity environments.
Discussion
We have used an assembly of spatially distributed data on
African children, fevers, and treatment-seeking behaviour, along
with comparisons of malaria infection prevalence amongst those
fevers reaching clinic in different endemicity settings to estimate
that 656 million fevers occurred in African 0–4 y olds in 2007. 182
million (28%) of these febrile events were likely to have resulted in
a visit to a public sector clinic of which 78 million (43%) were likely
to have been infected with P. falciparum (range 60–103 million).
As the scale-up of ACT provision to front-line health facilities in
sub-Saharan Africa continues, and optimum strategies for
improving routine diagnostic practices are sought, the establish-
ment of reliable baseline estimates of key public health metrics
becomes increasingly important. We have used national sample
survey data on fever period prevalence as the entry point to define
children seeking treatment in public health facilities managed by
national governments who have the responsibility for providing
effective case management via appropriate diagnostic strategies
and adequate drug and commodity provision. These survey data
have been collected from 42 African countries across time periods
spanning the escalation of ACT policy change on the continent.
We have modelled spatially the expected subnational fever contact
rate with public health services and apportioned these fevers into
those with and without a malaria infection according to varied
malaria transmission intensity conditions.
The results presented here provide a means to quantify the
anticipated drug and commodity requirements under different
diagnostic policy scenarios. For example, if a policy of presumptive
treatment of all fevers had been universally adhered to in 2007,
182 million ACT treatments would have been required to treat
children under 5 y presenting to front-line health facilities across
Africa, but 104 million (57%) of these may have been prescribed to
children without evidence of infection, highlighting the potential
for policies supporting diagnosis to substantially reduce overpre-
scription to febrile children. A utopian scenario in which every
prescriber adheres to the results of a diagnostic test is, however,
unlikely to be achieved universally. The current and theoretical
future adherence to recommended diagnostic policies, the
availability of both drugs and diagnostic kits, the attitude of
prescribers to test results, the expectations of patients, and
temporal changes to underlying endemicity and treatment-seeking
behaviours must all be considered if the full implications of
different policy scenarios are to be evaluated. Nevertheless, the
starting point for any such evaluation is a set of baseline metrics
that quantify the magnitude of the current treatment burden for
fever in Africa and the spatially varying contribution of malaria to
this burden.
A particularly important inference from the results presented in
this study is that any new policy on diagnostics is likely to be most
effective if geographic heterogeneity in infection risk and
parasitemia in fevers is considered. As expected, we found the
largest differences between malarial and nonmalarial fever
burdens in countries where the dominant transmission intensity
is unstable or low and fever incidence and use of public services
are high. The proportion of nonmalarial fevers exceeded 80% in
the public health sectors of Kenya, Namibia, Sudan North,
Mauritania, Ethiopia, Comoros, Djibouti, Swaziland, and Zim-
babwe (Table 1), all of which experience largely low endemicity
(PfPR2–10 ,5%). It should also be noted, however, that of the five
countries with the largest number of nonmalarial fevers, two
(Nigeria and DRC) are of predominantly high transmission
intensity, together contributing 25.1 million (24%) of the total
number of nonmalarial fevers.
Methodological and Data LimitationsWe have used a relatively straightforward approach to generate
broad estimates of the number of fever events in African children
in 2007, the total seeking care at public health facilities, and the
number of those likely to be infected with P. falciparum. Various
limitations arise from the retrospective assembly of diverse data
collected for differing purposes, at different times, and with
differing levels of precision.
We have used fevers in young children over the last 14 d
reported by their mothers or caretakers as the entry point to
estimating treatment needs. The use of the term ‘‘fever’’ can be
synonymous with a general state of poor health in some
communities rather than a biologically equivalent and clinically
relevant increase in body temperature [44]. Despite these
limitations fever is often the prompt to seek treatment [45,46],
and most clinical diagnoses and algorithms use fever reported by
mother’s as the prompt to treat for malaria [5]. The incidence of
perceived fever is therefore more important than the precise
Malarial Fevers in African Children
PLoS Medicine | www.plosmedicine.org 7 July 2010 | Volume 7 | Issue 7 | e1000301

Table 1. Estimated total and P. falciparum positive paediatric fevers attending public health facilities in Africa in 2007.
Countrya
All U5 FeversAttending PHFs U5 Fevers Attending PHFs with P. falciparum Infection
All Areas (% ofAttending Fevers)
Where Pfpr2–10 ,40% (% of P.falciparum Positives)
Where Pfpr2–10 $40% (% of P.falciparum Positives)
Angola 6,176 3,299 (53.4) 286 (8.7) 3,013 (91.3)
Benin 1,934 1,116 (57.7) 52 (4.7) 1,064 (95.3)
Burkina Faso 1,499 884 (59.0) 1 (0.1) 883 (99.9)
Burundi 1,407 401 (28.5) 301 (75.2) 99 (24.8)
Cameroon 1,971 1,061 (53.8) 157 (14.8) 905 (85.2)
CAR 933 541 (58.0) 21 (3.8) 521 (96.2)
Chad 1,827 660 (36.1) 631 (95.6) 29 (4.4)
Comoros 39 1 (3.1) 1 (100.0) 0 (0)
Congo 690 407 (59.0) 0 (0) 407 (100.0)
Cote D’Ivoire 2,132 1,247 (58.5) 0 (0) 1,247 (100.0)
Djibouti 131 4 (3.0) 4 (100.0) 0 (0)
DRC 20,969 11,335 (54.1) 471 (4.2) 10,864 (95.8)
Eq. Guinea 95 54 (56.3) 4 (8.2) 49 (91.8)
Ethiopia 6,939 578 (8.3) 578 (100.0) 0 (0)
Gabon 208 117 (55.9) 14 (12.4) 102 (87.6)
Gambia 154 63 (40.9) 63 (100.0) 0 (0)
Ghana 3,847 2,169 (56.4) 110 (5.1) 2,058 (94.9)
Guinea 3,123 1,645 (52.7) 460 (27.9) 1,186 (72.1)
Guinea Bissau 113 46 (40.4) 46 (100.0) 0 (0)
Kenya 11,821 1,724 (14.6) 1,502 (87.1) 222 (12.9)
Liberia 1,257 735 (58.5) 0 (0) 735 (100.0)
Madagascar 3,629 1,623 (44.7) 775 (47.8) 847 (52.2)
Malawi 1,668 857 (51.4) 295 (34.4) 563 (65.6)
Mali 2,507 1,334 (53.2) 119 (8.9) 1,214 (91.1)
Mauritania 85 12 (14.1) 11 (92.2) 1 (7.8)
Mozambique 10,360 5,202 (50.2) 1,056 (20.3) 4,145 (79.7)
Namibia 423 51 (12.0) 51 (100.0) 0 (0)
Niger 4,480 1,923 (42.9) 1,321 (68.7) 602 (31.3)
Nigeria 35,781 20,345 (56.9) 1,540 (7.6) 18,805 (92.4)
Rwanda 2,170 593 (27.3) 579 (97.6) 14 (2.4)
Senegal 4,165 1,269 (30.5) 1,269 (100.0) 0 (0)
Sierra Leone 2,164 1,233 (57.0) 0 (0) 1,233 (100.0)
Somalia 87 21 (23.5) 19 (93.2) 1 (6.8)
ST & P 15 6 (40.2) 6 (100.0) 0 (0)
Sudan 12,563 1,786 (14.2) 1,742 (97.5) 45 (2.5)
Swaziland 371 26 (7.0) 26 (100.0) 0 (0)
Tanzania 15,140 5,952 (39.3) 3,496 (58.7) 2,456 (41.3)
Togo 525 310 (59.0) 0 (0) 310 (100.0)
Uganda 13,002 5,899 (45.4) 3,156 (53.5) 2,743 (46.5)
Zambia 5,049 1,746 (34.6) 1,612 (92.4) 133 (7.6)
Zimbabwe 985 34 (3.4) 34 (100.0) 0 (0)
Total 182,433 78,306 (42.9) 21,810 (27.9) 56,496 (72.1)
The latter estimates are also shown stratified by areas of low or moderate (PfPR2–10 ,40%) and high (PfPR2–10 $40%) endemicity. All totals are given in ’000s.aFour African countries are excluded because of unavailable data: Eritrea, South Africa, Botswana, and Cape Verde.Abbreviations: CAR, Central African Republic; DRC, Democratic Republic of Congo; PHF, public health facility; ST & P, Sao Tome and Principe; U5, children under 5 y old.doi:10.1371/journal.pmed.1000301.t001
Malarial Fevers in African Children
PLoS Medicine | www.plosmedicine.org 8 July 2010 | Volume 7 | Issue 7 | e1000301

incidence of clinical malaria when examining the demand for
services and commodities but recognizes that not all reports of
‘‘fever’’ are biologically or clinically equivalent fevers [44] and not
all fevers are malaria [47,48].
We assumed that 14-d period prevalence for self-reported fever
from national surveys was representative of prevalence across the
year. This assumption may not be valid where the causes of fever
are strongly seasonal although the temporal correspondence
between climatic seasons, malaria, and fevers is complex and
spatially heterogeneous across Africa [49–52]. Further, the simple
multiplication of a 14-d reported incidence to obtain an annual
rate can introduce possible bias. If a large proportion of fevers are
of relatively long duration, then this approach will tend to
overestimate the annualized rate because many episodes in a
given 2-wk reporting period actually overlap with preceding or
proceeding periods and are therefore effectively double counted.
Conversely, however, children experiencing more than one febrile
episode during the 2-wk survey period will be recorded as a single
fever case, thus leading to an underestimate of total episodes. In
the absence of systematically collected and reliable data on child
fever durations and frequencies, it is not possible to evaluate these
effects more formally.
The assembled national survey data on both fever prevalence
and treatment-seeking rates are also limited by their spatial and
temporal resolution. We have obtained the most recent available
survey from every country and all but seven of the 43 included
were collected within 4 y of the target study date of 2007.
However, it is well known that malaria prevalence has declined in
certain locations in recent years (for example [53–55]), and more
widespread temporal changes in either fever rates or treatment-
seeking behaviours cannot be ruled out where survey data are less
recent. Attempting to enumerate any such transitions is beyond
the scope of the current study, but we note this fact as an
important potential caveat to our 2007 baseline enumeration.
From a geographical perspective, national survey data such as
those used in this study can generally be considered representative
at the ADMIN1 level, but represent a mean value for each
administrative region and therefore mask within-region spatial
heterogeneity. Inevitably, therefore, the mean value underesti-
mates the true local values in high areas and overestimates them in
low areas. In many regions, systematic differences between urban
and rural areas are a major component of this within-region
variation, and the procedure implemented in this study to adjust
for these urban–rural differentials is likely to mitigate some of the
spatial imprecision associated with ADMIN1 data, as is the use of
per-pixel delineations of underlying endemicity. Notwithstanding
these adjustments, we have chosen to treat the national survey
data as fixed, disregarding the effects of sampling error. This
decision was driven in part by the difficulty in enumerating
sampling errors derived from multistage cluster sampling designs
and the unavailability in some cases of required input parameters.
More importantly, however, the contribution of this source of
uncertainty on the national and continental-level results that form
the primary outputs of this study was considered likely to be
minimal in comparison to the much larger uncertainty ranges that
we present in association with our enumeration of infection rates
in presenting fevers in different endemicity strata. In a similar way,
we have chosen to treat the underlying modelled PfPR2–10
endemicity surface as fixed. Whilst uncertainty in predicted
prevalence is large in some regions, it is only transitions between,
rather than within, each of the three defined endemicity strata that
would have had a bearing on the results we present here and such
an effect is likely to be minimal except around the margins of each
risk strata. Again, out focus has been on quantifying the much
larger uncertainty associated with the infection rates in fevers at
health facilities.
We have used a simple approach to incorporate the variation
observed in our assembly of 67 endemicity-stratified studies on
infections rates in fevers at clinics. These ranges are based on small
sample sizes and precision in our estimates will inevitably increase
as additional suitable studies become available. However, we
applied lower and upper IQR values universally across Africa and
this is likely to yield conservative estimates of our precision
since the odds are small that infection rates at all locations display
values at the extremes of the observed statistical distributions
simultaneously.
We constrain this study to an analysis of fevers in children aged
under 5 y. Replicating our approach across all age ranges would
require either equivalent continent-wide subnational data on all-
age fever prevalence and treatment-seeking behaviour, or reliable
biological or empirical models that define age-dependent relation-
ships allowing inference of these variables across the entire age
spectrum using our observed results in children. To our knowledge
neither are available, which precludes quantitative analysis outside
the 0–4-y age range.
Model Availability and Future RefinementThe geographical information system modelling procedure
defined in this study has been packaged as a script (available as
Java, Python, or Visual Basic) that can be downloaded freely from
the Malaria Atlas Project website (http://www.map.ox.ac.uk/
publications). This portable tool has been provided to promote
replication of our methods and to facilitate updated analyses as
new input data become available. Several future refinements to
our model architecture could be envisaged. In particular, as
additional data are collected the relationship between transmission
intensity and the proportion of fevers attributable to malaria
infection in public health facilities can be defined more precisely,
potentially modelling a continuous relationship in a Bayesian
framework, allowing the inherent uncertainty to be quantified and
combined with other uncertainty sources such as those associated
with the underlying modelled prevalence.
ConclusionsFollowing the introduction of new, effective combination
medicines for the treatment of malaria, and ongoing efforts to
increase their coverage and availability in public health sectors,
concerns have been raised regarding the continued indiscriminate
use of antimalarials for all fevers across Africa. We estimate that
57% of the 182 million children presenting with a fever to
government supported clinics in Africa do not have a malaria
infection, and in some countries that proportion is greater than
90%, highlighting the potential benefits of robust diagnosis to
appropriate case management and drug stocking levels. Spatial
estimates of fever burdens and the use of health facilities can be
combined with relational infection risk models to estimate the
degree of parasitemia in fevers presenting to public health
facilities. This quantification provides an important baseline
comparison of malarial and nonmalarial fevers in different
endemicity settings that acts as an alternative to inadequate
routine data collection systems and can contribute to ongoing
debates about optimum clinical and financial strategies for the
introduction of new diagnostics. What these models can never
replace is high quality information from public sector services in
the form of reliable and complete health information on drug use
and patient burdens and whether these patients have peripheral
infections. Unfortunately, inadequacies in national health man-
agement information systems across Africa [28] are in part a cause
Malarial Fevers in African Children
PLoS Medicine | www.plosmedicine.org 9 July 2010 | Volume 7 | Issue 7 | e1000301

of the present imperfections in essential commodity demand and
burden estimation.
Supporting Information
Protocol S1 Implementing urban-rural adjustments to AD-
MIN1-reported fever prevalence and treatment-seeking rates.
Found at: doi:10.1371/journal.pmed.1000301.s001 (0.21 MB
DOC)
Protocol S2 Systematic literature review on the proportion of
febrile children presenting to public health systems that are P.
falciparum positive.
Found at: doi:10.1371/journal.pmed.1000301.s002 (0.15 MB
DOC)
Protocol S3 Assessing the effect of model configurations on
estimated total and P. falciparum-positive paediatric fevers attending
public health facilities in Africa in 2007.
Found at: doi:10.1371/journal.pmed.1000301.s003 (0.12 MB
DOC)
Table S1 Data assembled to define period prevalence of fever
among children 0–4 y at subnational levels from 42 African
national sample surveys.
Found at: doi:10.1371/journal.pmed.1000301.s004 (0.08 MB
DOC)
Acknowledgments
We thank Dejan Zurovac, Gerardo Priotto, Steffen Borrmann, Urlike
Fillinger, Elizabeth Juma, and MSF Spain for their generosity and help in
providing raw data for further analysis of parameter estimation for models
in this paper. We are also grateful to Lydiah Mwangi who managed the
search for full publications from varied sources following the PubMed
search. We thank Simon Hay, Peter Olumese, and Catherine Goodman
for their comments on this manuscript and Anja Bibby for proofing.
Author Contributions
ICMJE criteria for authorship read and met: PWG VCK VAA EAO AMN
RWS. Agree with the manuscript’s results and conclusions: PWG VCK
VAA EAO AMN RWS. Designed the experiments/the study: PWG RWS.
Analyzed the data: PWG VAA AMN RWS. Collected data/did
experiments for the study: PWG VAA EAO AMN RWS. Wrote the first
draft of the paper: PWG RWS. Contributed to the writing of the paper:
PWG VCK VAA AMN RWS.
References
1. World Health Organization (2009) Global Malaria Programme, WHO ACTpolicy update. Geneva: World Health Organization, Available: http://apps.
who.int/malaria/amdp/amdp_afro.htm. Accessed 13 November 2009.
2. World Health Organization (2009) World malaria report 2009. Geneva: WorldHealth Organization.
3. Font F, Gonzalez MA, Nathan R, Kimario J, Lwilla F, et al. (2001) Diagnosticaccuracy and case management of clinical malaria in the primary health
services of a rural area in south-eastern Tanzania. Trop Med Int Health 6:
423–428.
4. Kallander K, Nsungwa-Sabiiti J, Peterson S (2004) Symptom overlap for malaria
and pneumonia-policy implications for home management strategies. Acta Trop
90: 211–214.
5. Chandramohan D, Jaffar S, Greenwood B (2002) Use of clinical algorithms for
diagnosing malaria. Trop Med Int Health 7: 45–52.
6. Chandler CIR, Jones C, Boniface G, Juma K, Reyburn H, et al. (2008)Guidelines and mindlines: why do clinical staff over-diagnose malaria in
Tanzania? A qualitative study. Malaria J 7: 53.
7. Lubell Y, Hopkins H, Whitty CJM, Staedke SG, Mills A (2008) An interactive
model for the assessment of the economic costs and benefits of different rapid
diagnostic tests for malaria. Malaria J 7: 21.
8. Zurovac D, Larson BA, Skarbinski J, Slutsker L, Snow RW, et al. (2008)
Modeling the financial and clinical implications of malaria rapid diagnostic tests
in the case-management of older children and adults in Kenya. Am J Trop MedHyg 78: 884–891.
9. Shillcutt S, Morel C, Goodman C, Coleman P, Bell D, et al. (2008) Cost-effectiveness of malaria diagnostic methods in sub-Saharan Africa in an era of
combination therapy. B World Health Organ 86: 101–110.
10. D’Acremont V, Lengeler C, Mshinda H, Mtasiwa D, Tanner M, et al. (2009)Time to move from presumptive malaria treatment to laboratory-confirmed
diagnosis and treatment in African children with fever. PLoS Med 6: e252.
doi:10.1371/journal.pmed.0050252.
11. World Health Organization (2010) Guidelines for the treatment of malaria. 2nd
edition. Geneva: World Health Organization.
12. Amexo M, Tolhurst R, Barnish G, Bates I (2004) Malaria misdiagnosis: effects
on the poor and vulnerable. Lancet 364: 1896–1898.
13. Drakeley C, Reyburn H (2009) Out with the old, in with the new: the utility ofrapid diagnostic tests for malaria diagnosis in Africa. T Roy Soc Trop Med 103:
333–337.
14. Nosten F, Ashley E (2004) The detection and treatment of Plasmodium falciparum:time for change. J Postgrad Med 50: 35–39.
15. Rafael ME, Taylor T, Magill A, Lim Y, Girosi F, et al. (2006) Reducing theburden of childhood malaria in Africa: the role of improved diagnostics. Nature
444 (Suppl 1): 48.
16. Barat LM (2006) Four malaria success stories: how malaria burden wassuccessfully reduced in Brazil, Eritrea, India, and Vietnam. Am J Trop Med Hyg
74: 12–16.
17. Ishengoma DRS, Rwegoshora RT, Mdira KY, Kamugisha ML, Anga EO, et al.(2009) Health laboratories in the Tanga region of Tanzania: the quality of
diagnostic services for malaria and other communicable diseases. Ann Trop Med
Parasit 103: 441–453.
18. Malik EM, Eltahir HG, Ahmed ES (2005) Clinical and laboratory aspects of
malaria among children with fever in a low transmission area of Sudan. East
Mediterr Health J 11: 753–761.
19. McMorrow ML, Masanja MI, Abdulla SMK, Kahigwa E, Kachur SP (2008)
Challenges in routine implementation and quality control of rapid diagnostic
tests for malaria-Rufiji district, Tanzania. Am J Trop Med Hyg 79: 385–390.
20. Ngasala B, Mubi M, Warsame M, Petzold MG, Massele AY, et al. (2008) Impact
of training in clinical and microscopy diagnosis of childhood malaria on
antimalarial drug prescription and health outcome at primary health care level
in Tanzania: A randomized controlled trial. Malaria J 7: 199.
21. Polage CR, Bedu-Addo G, Owusu-Ofori A, Frimpong E, Lloyd W, et al. (2006)
Laboratory use in Ghana: physician perception and practice. Am J Trop Med
Hyg 75: 526–531.
22. English M, Reyburn H, Goodman C, Snow RW (2009) Abandoning
presumptive antimalarial treatment for febrile children aged less than five
years-a case of running before we can walk? PLoS Med 6: e1000015.
doi:10.1371/journal.pmed.1000015.
23. Olliaro P (2009) Management of fever and malaria - policy and practice. Trop
Med Int Health 14: 488–490.
24. Gosling RD, Drakeley CJ, Mwita A, Chandramohan D (2008) Presumptive
treatment of fever cases as malaria: help or hindrance for malaria control?
Malaria J 7: 132.
25. Kindermans JM, Vandenbergh D, Vreeke E, Olliaro P, D’Altilia JP (2007)
Estimating antimalarial drugs consumption in Africa before the switch to
artemisinin-based combination therapies (ACTs). Malaria J 6: 91.
26. Gething PW, Noor AM, Okiro EA, Mutheu JJ, Alegana VA, et al. (2008)
Defining medicine and commodity needs for the management of uncomplicated
and severe malaria in kenya’s formal sector using novel space-time geostatistical
methods. Submitted to the U.S. Agency for International Development by the
Strengthening Pharmaceutical Systems Program. Arlington (Virginia): Manage-
ment Sciences for Health, Available: http://pdf.usaid.gov/pdf_docs/
PNADN995.pdf. Accessed 27 November 2009.
27. Gething PW, Noor AM, Gikandi PW, Hay SI, Nixon MS, et al. (2008)
Developing geostatistical space-time models to predict outpatient treatment
burdens from incomplete national data. Geogr Anal 40: 167–188.
28. Gething PW, Noor AM, Gikandi PW, Ogara EAA, Hay SI, et al. (2006)
Improving imperfect data from health management information systems in
Africa using space-time geostatistics. PLoS Med 3: e271. doi:10.1371/
journal.pmed.0030271.
29. Kiszewski A, Johns B, Schapira A, Delacollette C, Crowell V, et al. (2007)
Estimated global resources needed to attain international malaria control goals.
Bull World Health Organ 85: 623–30.
30. Snow RW, Eckert E, Teklehaimanot A (2003) Estimating the needs for
artesunate-based combination therapy for malaria case-management in Africa.
Trends Parasitol 19: 363–369.
31. Roll Back Malaria Monitoring and Evaluation Reference Group (RBM-MERG)
(2009) Guidelines for core population-based indicators. MEASURE evaluation:
Calverton (Maryland). Available:http://www.rollbackmalaria.org/partnership/
wg/wg_monitoring/docs/GuidelinesForCorePopulationFINAL9-20_Malaria.
pdf. Accessed 24 November 2009.
Malarial Fevers in African Children
PLoS Medicine | www.plosmedicine.org 10 July 2010 | Volume 7 | Issue 7 | e1000301

32. Center for International Earth Science Information Network (CIESIN)
CUIFPRIITWBCIdATC (2007) Global Rural Urban Mapping Project(GRUMP) alpha: Gridded Population of the World, version 2, with urban
reallocation (GPW-UR). Available: http://sedac.ciesin.columbia.edu/gpw.
Accessed 13 November 2009.33. U.N.P.D. (2006) World population prospects: the 2006 revision population
database. http://esa.un.org/unpp/ New York: United Nations PopulationDivision (U.N.D.P).
34. Hay SI, Guerra CA, Gething PW, Patil AP, Tatem AJ, et al. (2009) A world
malaria map: Plasmodium falciparum endemicity in 2007. PLoS Med 6: e1000048.doi:10.1371/journal.pmed.1000048.
35. Balk DL, Deichmann U, Yetman G, Pozzi F, Hay SI, et al. (2006) Determiningglobal population distribution: methods, applications and data. Adv Parasitol 62:
119–156.36. Elvidge CD, Baugh KE, Dietz JB, Bland T, Sutton PC, et al. (1999) Radiance
calibration of DMSP-OLS low-light imaging data of human settlements. Remote
Sens Environ 68: 77–88.37. Elvidge CD, Hobson VR, Nelson IL, Safran JM, Tuttle BT, et al. (2003)
Overview of DMSP OLS and scope of applications. In: Mesev V, ed. Remotelysensed cities. London: Taylor and Francis. pp 281–299.
38. Guerra CA, Gikandi PW, Tatem AJ, Noor AM, Smith DL, et al. (2008) The
limits and intensity of Plasmodium falciparum transmission: implications for malariacontrol and elimination worldwide. PLoS Med 5: e38. doi:10.1371/journal.
pmed.0050038.39. Hay SI, Smith DL, Snow RW (2008) Measuring malaria endemicity from
intense to interrupted transmission. Lancet Infect Dis 8: 369–378.40. Smith DL, Hay SI (2009) Endemicity response timelines for Plasmodium falciparum
elimination. Malaria J 8: 87.
41. Lubell Y, Reyburn H, Mbakilwa H, Mwangi R, Chonya S, et al. (2008) Theimpact of response to the results of diagnostic tests for malaria: cost-benefit
analysis. Brit Med J 336: 202–205.42. Guerra CA, Hay SI, Lucioparedes LS, Gikandi PW, Tatem AJ, et al. (2007)
Assembling a global database of malaria parasite prevalence for the Malaria
Atlas Project. Malaria J 6: 17.43. Noor AM, Rage IA, Moonen B, Snow RW (2009) Health service providers in
Somalia: their readiness to provide malaria case-management. Malaria J 8: 100.44. Einterz EM, Bates ME (1997) Fever in Africa: do patients know when they are
hot? Lancet 350: 781.
45. McCombie SC (1996) Treatment seeking for malaria: a review of recent
research. Soc Sci Med 43: 933–945.46. Molyneux CS, Mung’Ala-Odera V, Harpham T, Snow RW (1999) Maternal
responses to childhood fevers: a comparison of rural and urban residents in
coastal Kenya. Trop Med Int Health 4: 836–845.47. Smith T, Schellenberg JA, Hayes R (1994) Attributable fraction estimates and
case definitions for malaria in endemic areas. Stat Med 13: 2345–2358.48. Smith T, Hurt N, Teuscher T, Tanner M (1995) Is fever a good sign for clinical
malaria in surveys of endemic communities. Am J Trop Med Hyg 52: 306–310.
49. Akenji TN, Ntonifor NN, Kimbi HK, Abongwa EL, Ching JK, et al. (2005) Theepidemiology of malaria in Bolifamba, a rural community on the eastern slopes
of Mount Cameroon: seasonal variation in the parasitological indices oftransmission. Ann Trop Med Parasit 99: 221–227.
50. Dicko A, Mantel C, Kouriba B, Sagara I, Thera MA, et al. (2005) Season, feverprevalence and pyrogenic threshold for malaria disease definition in an endemic
area of Mali. Trop Med Int Health 10: 550–556.
51. Boisier P, Jambou R, Raharimalala L, Roux J (2002) Relationship betweenparasite density and fever risk in a community exposed to a low level of malaria
transmission in Madagascar highlands. Am J Trop Med Hyg 67: 137–140.52. Bouvier P, Rougemont A, Breslow N, Doumbo O, Delley V, et al. (1997)
Seasonality and Malaria in a west African village: does high parasite density
predict fever Incidence? Am J Epidemiol 145: 850–857.53. Bhattarai A, Ali AS, Kachur SP, Martensson A, Abbas AK, et al. (2007) Impact
of artemisinin-based combination therapy and insecticide-treated nets onmalaria burden in Zanzibar. PLoS Med 4: e309. doi:10.1371/journal.
pmed.0040309.54. Kleinschmidt I, Torrez M, Schwabe C, Benavente L, Seocharan I, et al. (2007)
Factors influencing the effectiveness of malaria control in Bioko Island,
equatorial Guinea. Am J Trop Med Hyg 76: 1027–1032.55. Teklehaimanot HD, Teklehaimanot A, Kiszewski A, Rampao HS, Sachs JD
(2009) Malaria in Sao Tome and Principe: on the brink of elimination after threeyears of effective antimalarial measures. Am J Trop Med Hyg 80: 133–140.
56. UNGIWG-SALB (2009) Available: http://www.who.int/whosis/database/gis/
salb/salb_PO.htm. Accessed 17 August 2009.57. FAO-GAUL (2009) Available: http://www.fao.org/geonetwork/srv/cn/
metadata.show?id = 12691. Accessed 30 August 2009.58. Noor AM, Mutheu JJ, Tatem AJ, Hay SI, Snow RW (2009) Insecticide-treated
net coverage in Africa: mapping progress in 2000–07. Lancet 373: 58–67.
Malarial Fevers in African Children
PLoS Medicine | www.plosmedicine.org 11 July 2010 | Volume 7 | Issue 7 | e1000301

Editors’ Summary
Background. Malaria —an infectious parasitic diseasetransmitted to people through the bite of an infectedmosquito —kills about one million people (mainly childrenliving in sub-Saharan Africa) every year. Although severalparasites cause malaria, Plasmodium falciparum isresponsible for most of these deaths. For the past 50 years,the main treatments for P. falciparum malaria have beenchloroquine and sulfadoxine/pyrimethamine. Unfortunately,parasitic resistance to these ‘‘monotherapies’’ is nowwidespread and there has been a global upsurge in theillness and deaths caused by P. falciparum. To combat thisincrease, the World Health Organization recommendsartemisinin combination therapy (ACT) for P. falciparummalaria in all regions with drug-resistant malaria. In ACT,artemisinin derivatives (new, fast-acting antimalarial drugs)are used in combination with another antimalarial to reducethe chances of P. falciparum becoming resistant to eitherdrug.
Why Was This Study Done? All African countries at risk ofP. falciparum have now adopted ACT as first-line therapy formalaria in their public clinics. However, experts areconcerned that ACT is often given to children who don’tactually have malaria because, in many parts of Africa, healthcare workers assume that all childhood fevers are malaria.This practice, which became established when diagnosticfacilities for malaria were very limited, increases the chancesof P. falciparum becoming resistant to ACT, wastes limiteddrug stocks, and means that many ill children are treatedinappropriately. Recently, however, rapid diagnostic tests formalaria have been developed and there have been calls toexpand their use to improve the rational treatment of Africanchildren with fever. Before such an expansion is initiated, it isimportant to know how many African children develop fevereach year, how many of these ill children attend publicclinics, and what proportion of them is likely to have malaria.Unfortunately, this type of information is incompletely orunreliably collected in many parts of Africa. In this study,therefore, the researchers use a mathematical model toestimate the number of childhood fevers associated withmalaria infection that presented to Africa’s public clinics in2007 from survey data.
What Did the Researchers Do and Find? The researchersused survey data on the prevalence (the proportion of apopulation with a specific disease) of childhood fever and ontreatment-seeking behavior and data on child populations tomap the distribution of fever among African children and thelikelihood of these children attending public clinics fortreatment. They then used a recent map of the distribution
of P. falciparum infection risk to estimate what proportion ofchildren with fever who attended clinics were likely to havehad malaria in different parts of Africa. In 2007, theresearchers estimate, 656 million cases of fever occurred in0–4-year-old African children, 182 million were likely to havesought treatment in a public clinic, and 78 million (just underhalf of the cases that attended a clinic with fever) were likelyto have been infected with P. falciparum. Importantly, therewere marked geographical differences in the likelihood ofchildren with fever presenting at public clinics being infectedwith P. falciparum. So, for example, whereas nearly 60% ofthe children attending public clinics with fever in BurkinoFaso were likely to have had malaria, only 15% of similarchildren in Kenya were likely to have had this disease.
What Do These Findings Mean? As with all mathematicalmodels, the accuracy of these findings depends on theassumptions included in the model and on the data fed intoit. Nevertheless, these findings provide a map of theprevalence of malarial and nonmalarial childhood feversacross sub-Saharan Africa and an indication of how many ofthe children with fever reaching public clinics are likely tohave malaria and would therefore benefit from ACT. Thefinding that in some countries more than 80% of childrenattending public clinics with fever probably don’t havemalaria highlights the potential benefits of introducing rapiddiagnostic testing for malaria. Furthermore, these findingscan now be used to quantify the resources needed for andthe potential clinical benefits of different policies for theintroduction of rapid diagnostic testing for malaria acrossAfrica.
Additional Information. Please access these Web sites viathe online version of this summary at http://dx.doi.org/10.1371/journal.pmed.1000301.
N Information is available from the World Health Organiza-tion on malaria (in several languages) and on rapiddiagnostic tests for malaria
N The US Centers for Disease Control and Prevention provideinformation on malaria (in English and Spanish)
N MedlinePlus provides links to additional information onmalaria (in English and Spanish)
N Information on the global mapping of malaria is availableat the Malaria Atlas Project
N Information is available from the Roll Back MalariaPartnership on the global control of malaria (in Englishand French) and on artemisinin combination therapy
Malarial Fevers in African Children
PLoS Medicine | www.plosmedicine.org 12 July 2010 | Volume 7 | Issue 7 | e1000301