
Essentials of Marketing Research, 2005 - Rawal Institute of ...
616
. TONY PROCTOR ESSENTIALS OF MARKETING RESEARCH FOURTH EDITION
-
Upload
khangminh22 -
Category
Documents
-
view
0 -
download
0
Transcript of Essentials of Marketing Research, 2005 - Rawal Institute of ...

.
TONY PROCTOR
Looking for a concise introduction to Market Research? Look no further.
Tony Proctor’s Essentials of Marketing Research, 4e offers a streamlined,traditional introduction to all the major concepts of the field. He alsodiscusses new developments, particularly in the areas of qualitative data analysis and marketing decision-support systems.
Ideal for undergraduates studying marketing research for the first time, MBA students, and anyone who seeks a basic understanding of the topic,Essentials of Marketing Research, 4e, strikes an excellent balance betweendifferent topics.
NEW TO THIS EDITION!• New case studies• Coverage of Internet databases and the use of the Internet• Increased references to journal articles
To access additional Learning Resources, including an Instructor’s Manualand Power Point Slides, visit www.pearsoned.co.uk/proctor_emr.
Tony Proctor, MA, MPhil, Phd, DipM, has had many years experience in the marketing research industry and is Professor in Marketing at the Chester Business School. He has also authored several books and articleson marketing and management creativity.
ESSENTIALS OF MARKETING RESEARCH
www.pearson-books.com
“The simplicity of Proctor’s book differentiates it from other offerings in themarketplace. Many of my overseas students really find it an easy book to accessand its straightforward approach is the key here.” Nigel Culkin, The Business School, University of Hertfordshire
“There are many books on Marketing Research, but they rarely cover qualitativedata analysis so well. This is one of the key reasons why I chose Proctor as anessential text. I could not manage without this chapter.”Dr. Jane Hemsley-Brown, School of Management, University of Surrey
ESSENTIALS OF MARKETING RESEARCH
TON
Y PR
OCTO
R
FOURTH EDITION
TONY PROCTOR
FOURTH EDITION
ESSENTIA
LS OF M
AR
KETIN
GR
ESEAR
CH
FOURTHEDITION
an imprint of
CO
VER P
HO
TOG
RA
PH
: GA
ND
EE VASA
N/G
ETTY IMA
GES
0273694944_COVER 6/16/05 10:49 AM Page 1

.
Essentials of Marketing Research
..
EOM_A01.qxd 6/23/05 10:34 AM Page i

.
We work with leading authors to develop the strongest educational materials in business, finance and marketing, bringing cutting-edge thinking and best learning practice to a global market.
Under a range of well-known imprints, including Financial Times Prentice Hall, we craft high quality print and electronic publications which help readers to understand and apply their content, whether studying or at work.
To find out more about the complete range of our publishing, please visit us on the World Wide Web at: www.pearsoned.co.uk
..
EOM_A01.qxd 6/23/05 10:34 AM Page ii

.
..
ESSENTIALS OF MARKETING RESEARCH
FOURTH EDITION
TONY PROCTOR PhDProfessor in Marketing,
Chester Business School
EOM_A01.qxd 6/23/05 10:35 AM Page iii

.
Pearson Education LimitedEdinburgh GateHarlowEssex CM20 2JEEngland
and Associated Companies throughout the world
Visit us on the World Wide Web at:www.pearsoned.co.uk
First published 1997Second edition 2000Third edition 2003Fourth edition published 2005
© Pearson Professional Limited 1997© Pearson Education Limited 2000, 2005
The rights of Tony Proctor to be identified as author of this work has been assertedby him in accordance with the Copyright, Designs and Patents Act 1988.
All rights reserved. No part of this publication may be reproduced, stored in aretrieval system, or transmitted in any form or by any means, electronic, mechanical, photocopying, recording or otherwise, without either the prior written permission of the publisher or a licence permitting restricted copying in the United Kingdom issued by the Copyright Licensing Agency Ltd, 90 Tottenham Court Road, London W1T 4LP.
All trademarks used herein are the property of their respective owners. The use of any trademark in this text does not vest in the author or publisher any trademark ownership rights in such trademarks, nor does the use of such trademarks imply any affiliation with or endorsement of this book by such owners.
ISBN 0 273 69494 4
British Library Cataloguing-in-Publication DataA catalogue record for this book is available from the British Library
Library of Congress Cataloging-in-Publication DataA catalog record for this book can be obtained from the Library of Congress
10 9 8 7 6 5 4 3 2 110 09 08 07 06 05
Typeset in 10/12.5pt Palatino by 35Printed by Ashford Colour Press Ltd., Gosport
The publisher’s policy is to use paper manufactured from sustainable forests.
..
EOM_A01.qxd 6/23/05 10:35 AM Page iv

.
..
Brief contents
1 Nature of marketing research 1
2 Planning the research project 42
3 Secondary data 68
4 Sampling 103
5 Surveys 136
6 Measurement and scaling 164
7 Questionnaires 188
8 Qualitative research 219
9 Observation and experiment 247
10 Quantitative data analysis 278
11 Qualitative data analysis 322
12 Evaluation, reports and presentation 348
13 Applied marketing research 383
14 Marketing research settings: business-to-business, services and internal marketing 430
15 Global marketing research 455
16 Marketing decision-support system 481
EOM_A01.qxd 6/23/05 10:35 AM Page v

.
..
Supporting resourcesVisit www.pearsoned.co.uk/proctor_emr to find valuable online resources
For instructors• Complete, downloadable Instructor’s Manual• PowerPoint slides that can be downloaded and used as OHTs
For more information please contact your local Pearson Education salesrepresentative or visit www.pearsoned.co.uk/proctor_emr
EOM_A01.qxd 6/23/05 10:35 AM Page vi

.
Full contents
List of case studies xivPreface xviiAcknowledgements xxi
1 Nature of marketing research 1Introduction 3Marketing research: a definition 3Philosophy of science 4Marketing research and decision making 7Divisions of marketing research 9Categories of applied marketing research 13Marketing information systems 14Types of data 16Marketing research as part of marketing strategy 18Deciding who should do the research 18Assistance from outside research organisations 19Evaluating proposals 22Ethical considerations in marketing research 22Researchers’ obligations to clients 25Changing role of marketing research 27Using the Internet for marketing research 29Need for more creativity in research 29Non-response as an issue in marketing research effectiveness 30Summary 31Questions 31Case study 1.1 Lampelichter AG, Essen 32Case study 1.2 Spirit of Magellan Enterprises 34Case study 1.3 Rosine and Vera 35Case study 1.4 The English Bear Company 37Case study 1.5 21st-century market research 38References and notes 40Further reading 41
..
EOM_A01.qxd 6/23/05 10:35 AM Page vii

.
..
viii Full contents
2 Planning the research project 42Introduction 44Marketing problems 44Deciding whether to undertake a research study 47Uncertainty in decisions 48Research plan 50The proposal 55Use of PERT in planning research 56Summary 60Questions 61Case study 2.1 New Shoe Company 61Case study 2.2 Cheri-Rose 62Case study 2.3 Why researchers are so jittery 63Case study 2.4 Tracking the railways 65References and notes 66Further reading 67
3 Secondary data 68 Introduction 70Types of secondary data 70Searching for external data 72How secondary data can be used 78Other general sources 80International sources 82Non-official sources of data 85Professional organisations and libraries 88Using secondary data in exploratory research 90Online marketing research 93Marketing research tools 94Summary 94Questions 94Case study 3.1 Montres d’Occasion 95Case study 3.2 The Web 95Case study 3.3 Salaries 96Case study 3.4 PowerUp Electricity plc 99References and notes 101Further reading 101
4 Sampling 103Introduction 105Census and samples 105Sampling 106Sampling frame 110Sampling methods 111Sampling in practice 122
..
EOM_A01.qxd 6/23/05 10:35 AM Page viii

.
Full contents
Sample size 127Summary 129Questions 130Case study 4.1 Research Consultants 130Case study 4.2 Jerome’s department store 131Case study 4.3 McBain’s fast food restaurant 131Case study 4.4 Student research projects 132References and notes 134Further reading 134
5 Surveys 136 Introduction 138Postal surveys 139Personal interviews 143Telephone surveys 145Self-administered surveys 148Panels 148Syndicated research services 151Omnibus studies 153Interactive research 154Summary 154Questions 155Case study 5.1 Central Training College (1) 155Case study 5.2 Consumer Products 156Case study 5.3 Liptonjuice (1) 157Case study 5.4 Opinion polling faces new scrutiny 159Case study 5.5 Volvo Car UK 160References and notes 161Further reading 162
6 Measurement and scaling 164Introduction 166Measurement 166Scale types 169Attitude measurement 172Self-reporting methods 175Methods for rating attributes 180Summary 182Questions 183Case study 6.1 Summit Motors (1) 183Case study 6.2 Barney’s Café 184Case study 6.3 Liptonjuice (2) 184Case study 6.4 Chinese imports 185References and notes 186Further reading 186
ix
..
EOM_A01.qxd 6/23/05 10:35 AM Page ix

.
..
x Full contents
7 Questionnaires 188Introduction 190Questionnaire structure 190Stages in questionnaire development 192Questionnaire design and construction 193Introducing a questionnaire 206Reliability and validity in questionnaire design 208Summary 209Questions 210Case study 7.1 Central Training College (2) 211Case study 7.2 The Rholand Watch Company 212Case study 7.3 Researching the sports market 214Case study 7.4 Attitudes of cat owners to cat food 215References and notes 218Further reading 218
8 Qualitative research 219 Introduction 221Limitations of qualitative research 222Focus groups 223Other group research methods 227Practicalities of focus group sessions 229Industrial focus groups 234Other qualitative research methods 234Summary 237Questions 238Case study 8.1 Avon Cosmetics 238Case study 8.2 IBM 239Case study 8.3 Muller 240Case study 8.4 Brand valuation 240Case study 8.5 Hi-fi systems 242References and notes 245Further reading 245
9 Observation and experiment 247 Introduction 249Observation 249Experiments 254Experimental designs 258Statistical designs 263Test marketing: an introduction 267Consumer-tracking studies 270Summary 271Questions 271Case study 9.1 Soap-sud 272
..
EOM_A01.qxd 6/23/05 10:35 AM Page x

.
Full contents
Case study 9.2 Cheung’s chips 273Case study 9.3 The Safe ‘T’ fireproof letterbox 273Case study 9.4 Thompson Toys 274References and notes 276Further reading 276
10 Quantitative data analysis 278 Introduction 280Interpretation 280Analysis 281Tabulation 282Statistical analysis 284Significance of differences between numbers 287Chi-square analysis 290Use of similarities between numbers to show cause and effect 293Analysis of variance 294Measuring relationships 296Summary 313Questions 314Case study 10.1 La Gaieté Parisienne 317Case study 10.2 Summit Motors (2) 317Case study 10.3 Mr Hungry’s Burger Bar 318References and notes 320Further reading 321
11 Qualitative data analysis 322Introduction 324Qualitative analysis 324Operational aspects of qualitative research 325Data displays 331Matrices 332Networks 334Summary 338Questions 338Case study 11.1 Cyclist survey 338Case study 11.2 Uses of aluminium foil 343Case study 11.3 Renault Clio 345References and notes 346Further reading 346
12 Evaluation, reports and presentation 348 Introduction 350Evaluation of research 350Written report 351Sections of a report 354Oral research report 355
xi
..
EOM_A01.qxd 6/23/05 10:35 AM Page xi

.
..
xii Full contents
Visual aids and their use 356Summary 363Questions 363Case study 12.1 The St Honoré de Mazarin Restaurant, Paris 364Case study 12.2 Central Training College (3) 365Case study 12.3 Sunrise Hotels 367Case study 12.4 Wallaby Tours 379References and notes 381Further reading 381
13 Applied marketing research 383Introduction 385Product research 385Getting ideas for new products 385Product delivery 392Naming the product 394Packaging the product 395Market segmentation research 397Cartographying geographic segmentation 400Competition research 402Promotion research 405Measuring advertising effectiveness 406Selling research 411Pricing research 412Distribution research 413Summary 417Questions 417Case study 13.1 Tourism in Bukhara 418Case study 13.2 South Africa 419Case study 13.3 Music in marketing communications 422Case study 13.4 Bronco Jeans 424Case study 13.5 British divided into four types 425Case study 13.6 Skoda cars 425References and notes 427Further reading 428
14 Marketing research settings: business-to-business, services and internal marketing 430 Introduction 432Business-to-business marketing research 432Research into services 439Research for internal marketing 444Summary 446Questions 447Case study 14.1 Management in the public sector 447
..
EOM_A01.qxd 6/23/05 10:35 AM Page xii

.
Full contents
Case study 14.2 Orchestras aim to pass the baton 448Case study 14.3 Decline of frills 449Case study 14.4 Jasmine Hotel, Dubai 450Case study 14.5 Banking in Portugal 451References and notes 453Further reading 453
15 Global marketing research 455Introduction 457Global marketing research 457Desk research 467Principal methods of organising research 470Marketing research in developing countries 471Summary 471Questions 471Case study 15.1 Michel Herbelin 472Case study 15.2 China 473Case study 15.3 The future lies abroad 475Case study 15.4 European laundry statistics 476Case study 15.5 Delhi delights 478References and notes 479Further reading 480
16 Marketing decision-support system 481 Introduction 483Marketing information systems 483Decision-support mechanisms 490Forecasting demand 491Applications for mathematical models in the marketing decision-support system 499Expert systems and decision support 512Summary 519Questions 519Case study 16.1 Demand for agricultural tractors 520Case study 16.2 Kenbrock 521Case study 16.3 Restaurant strategies 521Case study 16.4 Brand switching 522Case study 16.5 Simon Theodolou, hairstylist 523References and notes 525Further reading 526
Further case studies 528Glossary 553Bibliography 559Index 577
xiii
..
EOM_A01.qxd 6/23/05 10:35 AM Page xiii

.
..
List of case studies
1.1 Lampelichter AG, Essen 321.2 Spirit of Magellan Enterprises 341.3 Rosine and Vera 351.4 The English Bear Company 371.5 21st-century market research 382.1 New Shoe Company 612.2 Cheri-Rose 622.3 Why researchers are so jittery 632.4 Tracking the railways 653.1 Montres d’Occasion 953.2 The Web 953.3 Salaries 963.4 PowerUp Electricity plc 994.1 Research consultants 1304.2 Jerome’s department store 1314.3 McBain’s fast food restaurant 1314.4 Student research projects 1325.1 Central Training College (1) 1555.2 Consumer Products 1565.3 Liptonjuice (1) 1575.4 Opinion polling faces new scrutiny 1595.5 Volvo Car UK 1606.1 Summit Motors (1) 1836.2 Barney’s Café 1846.3 Liptonjuice (2) 1846.4 Chinese imports 1857.1 Central Training College (2) 2117.2 The Rholand Watch Company 2127.3 Researching the sports market 2147.4 Attitudes of cat owners to cat food 2158.1 Avon Cosmetics 2388.2 IBM 2398.3 Muller 2408.4 Brand valuation 240
EOM_A01.qxd 6/23/05 10:35 AM Page xiv

.
List of case studies
8.5 Hi-fi systems 2429.1 Soap-sud 2729.2 Cheung’s chips 2739.3 The Safe ‘T’ fireproof letterbox 2739.4 Thompson Toys 274
10.1 La Gaieté Parisienne 31710.2 Summit Motors (2) 31710.3 Mr Hungry’s Burger Bar 31811.1 Cyclist survey 33811.2 Uses of aluminium foil 34311.3 Renault Clio 34512.1 The St Honoré de Mazarin Restaurant, Paris 36412.2 Central Training College (3) 36512.3 Sunrise Hotels 36712.4 Wallaby Tours 37913.1 Tourism in Bukhara 41813.2 South Africa 41913.3 Music in marketing communications 42213.4 Bronco Jeans 42413.5 British divided into four types 42513.6 Skoda cars 42514.1 Management in the public sector 44714.2 Orchestras aim to pass the baton 44814.3 Decline of frills 44914.4 Jasmine Hotel, Dubai 45014.5 Banking in Portugal 45115.1 Michel Herbelin 47215.2 China 47315.3 The future lies abroad 47515.4 European laundry statistics 47615.5 Delhi delights 47816.1 Demand for agricultural tractors 52016.2 Kenbrock 52116.3 Restaurant strategies 52116.4 Brand switching 52216.5 Simon Theodolou, hairstylist 523
Further case studies
1 Noteworthy response 5292 Moving images 5303 Going below the surface 5324 One strike and you’re down 534
xv
..
EOM_A01.qxd 6/23/05 10:35 AM Page xv

.
xvi List of case studies
5 Desmond sizes up shopping 5366 Is fizzing up its look enough? 5387 They might just as well be men . . . 5408 Now interacting with lots of new partners 5429 Lake Lucerne Navigation Company (SGV) 544
10 Gondolas for Liverpool 551
..
EOM_A01.qxd 6/23/05 10:35 AM Page xvi

.
Preface
‘Marketing research’ has often been called ‘market research’, and there has beenmuch confusion about what these terms actually mean. Indeed, some writershave been so worried about the terminology that they have called their books‘research for marketing decisions’ to overcome the problems. The term marketingresearch, of which market research is but one element, encompasses the full rangeof research and evaluation activities undertaken by marketing professionals toguide them in decision making, and it is marketing research that I address in thisbook.
There have been vast changes in marketing research, largely as a result of thedevelopment of information technology. Marketing research is, to some extent, aquantitative subject and although many of the techniques have been around formany years, using them was hindered by the lack of powerful and readily avail-able computational aids. It is sobering to remember that in the mid-1960s theslide rule was the main calculating tool, mainframe computers were in theirinfancy and the mechanical Burroughs’ comptometers had only just given way tomore sophisticated electronic ones. Now the problem is not so much lack of com-puting power as the need to acquire the skills necessary to select from and use themany sophisticated analytical methods that are available.
SCOPE AND COVERAGE
This book looks at the traditional approach to marketing research and the tradi-tional tools of analysis. It also discusses new developments – particularly in theareas of qualitative data analysis and marketing decisions support systems. I have tried to make the book into a teaching/study book designed primarily for undergraduates but of interest to MBA and other postgraduate or post-experience students wanting to get some idea of the subject matter. In writingsuch a book, getting the balance right between different topics and the depth atwhich each is covered is constrained by the length of the book. Because it isdesigned as a teaching book, I have devoted much of the available space to casestudies, illustrations and questions.
The various chapters address different topics in marketing research:
.. ..
EOM_A01.qxd 6/23/05 10:35 AM Page xvii

.
..
xviii Preface
• Chapter 1 looks at the nature of, and the need for, marketing research. Anoverview is given of the process of marketing research and the chapter con-cludes by looking at the role of agencies and at ethical issues.
• Chapter 2 pays attention to planning the research project and in particular tothe use of PERT analysis to guide the management of the project.
• Chapter 3 examines the uses and limitations of secondary data, indicatingwhen secondary data may be useful in research and giving details of usefulinternal and external sources of data.
• Chapter 4 examines the process of sampling. Attention is given to all aspects ofsampling, including the sampling frame, sampling unit selection, samplingmethod, the sample size and the sampling plan.
• Methods and applications of surveys are dealt with in Chapter 5. Sources oferror, methods of data collection, dealing with non-response, panel/syndicatedmarketing research and omnibus surveys are among the topics discussed.
• Chapter 6 covers measurement, scales and attitude measurement. The processof measurement is discussed along with levels and variations in measurement.The chapter also looks at the nature of attitudes and their measurement.
• Chapter 7 looks at questionnaire construction and development. Particularattention is given to question content, question phrasing, kinds of responseformat, question sequence, question layout, pretesting and revising. Validity,reliability and sensitivity are also considered.
• Qualitative research methods are outlined in Chapter 8. Focus group discus-sions, individual depth interviews and projective techniques are considered.
• Chapter 9 looks first at observation as a research method and then at experi-mentation. Details of many different experimental designs are given. Thechapter also looks at test marketing, both in the marketplace and under simu-lated conditions.
• Chapter 10 examines data interpretation and the various tools of quantitativedata analysis. A wide range of statistical methods is examined. It is presup-posed that the reader is familiar with statistics at an introductory level.
• Chapter 11 presents an aspect of marketing research that is not usually dis-cussed in a textbook of this kind. Qualitative data analysis is an importantdimension of marketing research. The chapter looks at a variety of tools andmethods that can assist in the analysis of qualitative data.
• Chapter 12 discusses reports and their presentation. Emphasis is placed on theuse of information technology to help prepare and present good reports.
• Chapter 13 looks at a variety of examples of applied marketing research,including product research, segmentation research, competition research andpromotion research.
..
EOM_A01.qxd 6/23/05 10:35 AM Page xviii

.
Preface
• Business-to-business marketing research, services research and research forinternal marketing are the subject matter of Chapter 14.
• Global marketing research is the subject matter of Chapter 15.
• Chapter 16 discusses marketing decision support systems. Among the mostinteresting developments here are applications of neural network software asexpert systems.
NEW TO THIS EDITION
This edition recognises that the Internet is becoming more and more important asa source for information. Chapter 3 provides more information on how theInternet can provide more information and how it can be used advantageously inthe course of research. In particular, the focus of attention is directed towards theavailability of Internet databases which can provide very relevant information formarketers.
In addition, all chapters have been re-examined, revised and updated asappropriate. The list of references in the book has also been extended consider-ably and the questions at the end of each chapter have been modified andreduced in number. New cases studies have replaced some of the older cases.These include case studies 1.2 Spirit of Magellan Enterprises, 2.2 Cheri, 11.3Renault Clio, 13.1 Tourism in Bukhara, among others.
ADDED BENEFITS
In addition the book also features:
• further case studies to promote thought on how marketing research as anentity can be applied in practice
• a glossary to reinforce key terms
• a full bibliography offering additional references.
LEARNING RESOURCES
Visit www.pearsoned.co.uk/proctor_emr to access an Instructor’s Manual andPowerPoint slides.
xix
..
EOM_A01.qxd 6/23/05 10:35 AM Page xix

.
xx Preface
AUTHOR’S ACKNOWLEDGEMENTS
My thanks are due to Jim Blythe for the case studies that he has contributed.In addition, I extend thanks to Lucy, Carol and Zoë for their contributions. Thefollowing reviewers provided useful feedback for this edition:
Nigel Culkin, University of HertfordshireJouan de Kervenoael, Lancaster UniversityRod Harradwe, Teeside Business SchoolKathy Mouat, Napier UniversityJane Hemsley-Brown, University of SurreyRichard West, University of Westminster
I would also like to thank the editorial team at Pearson for making this4th edition a reality. Thanks to Thomas Sigel, Senior Acquisitions Editor; PeterHooper, Editorial Assistant; Anita Atkinson, Senior Desk Editor; Helen Baxter,Copy Editor.
Tony ProctorSpring 2005
..
EOM_A01.qxd 6/23/05 10:35 AM Page xx
.
Acknowledgements
We are grateful to the following for permission to reproduce copyright material:
Figures 2.3, 2.4, 2.5, 2.6 and 16.8 featuring Microsoft’s Windows ™ browser bar,screen shots reprinted by permission from Microsoft Corporation; Table 4.1 from‘The “Marketing Research Services Classification’ of Social Class,’ in NationalReadership Survey, JINCARS 1981, National Readership Surveys Ltd; unnumberedtable on pp. 118–19 from http://www.caci.co.uk/acorn/acornmap.asp, 22 April2005, © 2005 CACI Limited, Acorn is a registered trade mark of CACI Limited;Figure 11.3 a screen shot from NUD*IST, Version 6, Work Interactions Project,NUD*IST is developed by QSR Pty Ltd; Figure 16.2 a screen shot from SNAP soft-ware, Mercator Research Group Ltd; Table 16.13 from Kotler, Philip, MarketingManagement, 11th edition, © 2003, p. 499, reprinted by permission of PearsonEducation, Inc., Upper Saddle River, NJ.
The American Marketing Association for a definition of ‘Marketing Research’;Editions Rebondir for extracts adapted from ‘Small business ideas and studyingthe local market’ published in Rebondir no. 12 1996; The Market Research Societyfor the following extracts; ‘How a spoonful of research helps the medicine godown’ by Tracey Sanderson April 1996, ‘With growing demands for data, willpurity prove only theoretical?’ by Peter Mouncey May 1996, ‘Quality will markthe route to deeper client relationships’ by Bryan Bates March 1996, Extractsadapted from Research Plus ‘Homelink’ September 1993, ‘Get a helping of thesugar-free chips game’ by Sue White September 1993, ‘The launch went fine –then the devil’s in the dealing’ by Andrew Scott April 1996, ‘In Europe’s complexmarket, check the price is right’ by A.J. Bowditch April 1996, ‘The cascade theorythat shows practical gains’ by Peter Gorle October 1995, ‘Now business researchis every agency’s research’ by D. Jamieson October 1995, ‘The world shrinks,maybe, but there’s still the need to travel’ by M. Goodyear May 1996, ‘Why wewon’t keep taking pills’ by A. Branthwaite and J. Bruggemann April 1996, ‘Nowthat India’s got GATT, a massive market beckons’ by Sue Bunn April 1996, and‘The markets are emerging – and research is hard on their heels’ by MiaBartonova January 1996; Marketing Week for extracts adapted from MarketingWeek ‘Research needs more creativity’ by Clare Nutall 29th April 1996, ‘Workingon site’ 26th April 1996, ‘Commercial TV audiences rise’ by Paul McCann 26th April 1996, ‘The data game’ by David Reed 3rd May 1996, ‘PepsiCo needsnew strategy for iced tea’ by Jon Rees 16th April 1996, and ‘Poster watch’ 26th April
.. ..
EOM_A01.qxd 6/23/05 10:35 AM Page xxi

.
..
xxii Acknowledgements
1996; Rene Spindler for an extract adapted from her MSc dissertation, OdenseUniversity 1991; Zoe Cooper for an extract adapted from her MBA dissertation,Keele University; Carol Fry for extracts adapted from her MBA dissertation,Keele University; Marketing for extracts adapted from ‘Research propels innova-tion’, and ‘Avon ads praise the real woman’ by Ruth Nicholas published inMarketing 27th January 1994, and ‘Eastern Promise is worth all the pain of redtape’ by Bob Tyrell published in Marketing 3rd February 1994; Business Oppor-tunity World for an extract adapted from ‘Safety letterbox’ published in BusinessOpportunity World May 1996; Lucy Double for an extract adapted from her MBAdissertation, Keele University 1991; Marketing News for an extract adapted from ‘Delphi technique can work for new product development’ by GianniBolongaro published in Marketing News 3rd January 1994; MapInfo Limited forextracts from their website www.mapinfo.co.uk/products/spftware.cfm andcompany literature; South Africa Tourism Board for an extract adapted fromSouth Africa: a World in One Country, 1996; International Wrist Watch for an extractadapted from ‘The French Connection’ published in International Wrist Watch1995, Issue 31; Rushuang Xiong for an extract adapted from an MBA disserta-tion, Keele University 1994; Mercator Research Group Limited for ‘SNAP’;Emerald Group Publishing Limited for an extract adapted from ‘Forecasting: the key to managerial decision-making’ by D. Waddell and A.S. Sohal publishedin Management Decision, 32(1) 1994 © MCB University Press Limited; and TheLake Lucerne Navigation Company, Switzerland, 2005, for information in ‘LakeLucerne Navigation Company (SGV)’.
We are grateful to the Financial Times Limited for permission to reprint the fol-lowing material:
‘Potential benefits of market research’, from Marketing wake-up, © FinancialTimes, 3 June 1997; Golden nuggets on a long and winding road, © FinancialTimes, 3 December 1997; Data loss, © Financial Times, 23 January 1997; Opinionpolling faces new scrutiny, © Financial Times, 21 March 1997; Baby boomers get the message, © Financial Times, 26 May 1997; Shoppers under the microscope, © Financial Times, 5 December 1997; Caught in the neighbours’ tangled web, ©Financial Times, 15 August 1997; Public puts faith in brand names, © FinancialTimes, 13 October 1997; Soft drinks switch to PET leaves industry struggling, ©Financial Times, 22 October 1997; ‘Newspapers are a source of information aboutcompetitiors’, from ‘Nike’ part of the Lex column, © Financial Times, 20 December1997; ‘Electronic revolution in the retailing world’, from Pressures in the market-place, © Financial Times, 3 September 1997; British divided into four types, ©Financial Times, 5 September 1997; Deceptive appearance, © Financial Times, 3 February 1997; Orchestras aim to pass the baton, © Financial Times, 26 May 1997;The decline of frills, © Financial Times, 28 April 1997; Noteworthy response, ©Financial Times, 26 October 2004; Moving images, © Financial Times, 19 October2004; Going below the surface, © Financial Times, 28 September 2004; Desmondsizes up shopping, © Financial Times, 19 October 2004; Is fizzing up its look
..
EOM_A01.qxd 6/23/05 10:35 AM Page xxii

.
Acknowledgements
enough?, © Financial Times, 26 October 2004; Now interacting with lots of newpartners, © Financial Times, 12 October 2004.
We are grateful to the following for permission to use copyright material:
Why researchers are so jittery from The Financial Times Limited, 3 March 1997, © Winston Fletcher; The future lies abroad from The Financial Times Limited, 30 June 1997, © Sir Martin Sorrell; One strike and you’re down from The FinancialTimes Limited, 5 October 2004, © Richard Gillis; They might as well be men . . .from The Financial Times Limited, 5 October 2004, © Jasmine Montgomery.
In some instances we have been unable to trace the owners of copyright material, and we would appreciate any information that would enable us to do so.
xxiii
..
EOM_A01.qxd 6/23/05 10:35 AM Page xxiii

.
..
EOM_A01.qxd 6/23/05 10:35 AM Page xxiv

.
1Last A Head on Spread
Nature of marketing research
Objectives
After reading this chapter, you should be able to:
• define marketing research, understand the philosophy of science andunderstand how marketing research relates to marketing decision makingand planning
• appreciate the major divisions of marketing research and how it is part ofmarketing strategy
• recognise the role played by marketing research agencies and the kind ofservices they provide
• understand the ethical issues involved in marketing research
• understand how the Internet can be used in marketing research
• appreciate the need for creativity in marketing research
• appreciate problems created by non-response in marketing research.
Keywords
agencies ontologyconclusive research performance researchcreativity preliminary researchcustomer research primary researchepistemology quantitative researchethics research proposalin-house research risk reductionmarket research secondary research
1
EOM_C01.qxd 6/23/05 10:35 AM Page 1

.
2 Chapter 1 • Nature of marketing research
Plan of Chapter 1
EOM_C01.qxd 6/23/05 10:35 AM Page 2

.
Marketing research: a definition 3
INTRODUCTION
Marketing research aims to take some of the risk out of marketing decisions byproviding information that can form part or the entire basis of decision making. Itis applicable to all aspects of marketing-mix decisions and should be an integralpart of the process of formulating marketing strategy. Marketing research canhelp in a variety of studies and makes use of both primary and secondary datasources. It can be conducted either in-house by a firm’s own staff or by outsidemarketing research companies that specialise in marketing research activities.Outside research companies, or agencies, offer a wide range of services, rangingfrom off-the-peg studies to tailor-made studies to meet the needs of individualclients. As is the case with many other services involving obtaining informationfrom firms and members of the public, ethical considerations are an importantissue. In a rapidly changing environment, the need to come up with new ideas isalso extremely important and priority needs to be given to introducing creativityinto marketing research.
MARKETING RESEARCH: A DEFINITION
Peter Chisnall (1992)1 points out that although the term ‘market research’ is nowlargely used as a synonym for ‘marketing research’ there was originally a distinctdifference between the scope of the activities they covered. Some confusion hasbeen caused by the term ‘market research’ being rather freely used to describe thefull range of activities properly covered by marketing research. Chisnall (1992)notes, however, that market or marketing research is essentially about the dis-ciplined collection and evaluation of specific data in order to help suppliers tounderstand their customer needs better. Moreover, since decision making neces-sarily involves some element of risk, the collection and evaluation of such datashould be used to reduce and control, to some degree, the parameters of risk sur-rounding particular marketing proposals.
MARKETING RESEARCH AS DEFINED BY THE AMERICANMARKETING ASSOCIATION
Marketing research is the function that links the consumer, customer and public tothe marketer through information – information used to identify and define marketingopportunities and problems; generate, refine, and evaluate marketing actions; monitormarketing performance; and improve understanding of marketing as a process.Marketing research specifies the information required to address these issues; designsthe method for collecting information; manages and implements the data-collectionprocess; analyses the results; and communicates the findings and their implications.
Source: AMA2
EOM_C01.qxd 6/23/05 10:35 AM Page 3

.
4 Chapter 1 • Nature of marketing research
Any definition of marketing research has to take account of the changing roleof research in modern marketing. Marketing research connects the consumer, thecustomer and the public to the marketer through the medium of information.This information is used to distinguish and define marketing opportunities andthreats or problems. It is also used to create, improve and assess marketingactions and to monitor marketing performance. It also helps to improve under-standing of marketing as a process. Marketing research identifies the informationrequired to address these issues. It comprises methods for collecting data, ana-lysis of data collected and their interpretation and communication of the findingsand their implications. It takes account of experience, the present situation andthe likely future so that marketing executives can make sound decisions.
This definition of marketing research underlines the role of research in allphases of marketing, assisting and guiding the marketing efforts of the organisa-tion (see Figure 1.1). Marketing research involves more than studies of specificproblems or specific situations, for it prevents problems arising in the first place.There is a need for marketing research to be at the centre of decision making.3, 4 Itis a fact-finding and forecasting function that is used by all phases of marketingand even by other functional aspects of an organisation.
PHILOSOPHY OF SCIENCE
All academic research is said to be grounded in a philosophical perspective.Easterby-Smith et al.5 provide a useful summary as to why a philosophical per-spective on any research study is important. For example, it can help to clarifyresearch design in terms of its overall configuration, what kind of evidence isgathered and from where, and how this can be interpreted to provide answers tothe question(s) asked. It can help recognise those designs that are likely to workand those that will not, and highlight limitations of particular approaches. It canhelp the researcher identify research designs that may be outside his/her pastexperiences.
There continues however to be a great deal of debate among academicresearchers around the most appropriate philosophical position from whichmethods of research should be derived. In this instance, the competing schools ofthought are often described as positivist and phenomenological. These schools ofthought are perhaps best viewed as extremes on a continuum. Each school has itsown set of assumptions and a range of methodological implications associatedwith its position. However, there is a danger of oversimplification if this distinc-tion is taken too literally. It is important to recognise that rarely does any piece ofresearch work fit neatly into a particular school of thought. Rather a piece ofresearch tends to subscribe to a particular school of thought.
The researcher’s methodological, epistemological and ontological premises canbe termed a paradigm or interpretive framework that encompasses a set of beliefsthat guide the research action. This comprises:
EOM_C01.qxd 6/23/05 10:35 AM Page 4

.
Philosophy of science 5
FIGURE 1.1 Role of marketing research
EOM_C01.qxd 6/23/05 10:35 AM Page 5

.
6 Chapter 1 • Nature of marketing research
• Methodology: focuses on how we gain knowledge about the world.
• Epistemology: asks: How do we know the world? What is the relationshipbetween the inquirer and the known? (It is concerned with how things can bemade known to the researcher.)
• Ontology: ontology raises basic questions about the nature of reality. (It is con-cerned with assumptions about the kind of things there are in the world.)
Research methodologies will differ according to both their ontological and epi-stemological assumptions, although generally there are two types of researchmethodology:
• positivist
• phenomenological.
Positivism
Positivism is a more dominant approach in natural science and is concerned withcausal explanation such as patterns and regularities in events. As such, this is animportant methodology in the social sciences and particularly in businessresearch. Within a positivist methodology, the ontological assumptions view thesocial world as an external environment, where definite structures affect peoplein similar ways, and where people understand and react to these structures in similar ways. The epistemological assumptions in this approach are that theresearcher is independent of what is being researched and their role is to observeand measure social structures. A positivist approach is therefore deductive innature; for example, taking a theory from literature and researching it to confirmor refute the proposition.
Phenomenology
Phenomenology is the main alternative to the positivist approach in socialresearch and is an interpretive methodology. The ontological assumption here isthat people are not passive in simply responding to structures but instead reality isitself socially constructed. The epistemological assumption is that the researcherinteracts with the subjects of the research and that their role is to understandpeople’s interpretation of events rather than the events themselves. The focuswith this approach is to discover meaning rather than measurement. A pheno-menological approach is therefore inductive in nature, as the investigation willguide the construction of a theory.
To understand fully the traditions of each school of thought, and its theoreticalbasis, is a significant field of study in its own right and is beyond the scope of this
EOM_C01.qxd 6/23/05 10:35 AM Page 6

.
Marketing research and decision making
book. (To gain a fuller appreciation of the theoretical foundations of each schoolof thought see: Allison et al;6 Bekesi;7 and Embree.8)
It is important that the research study and its findings are fully accepted by itstarget audience, if it is to have any actionable value. A positivist approach willhelp to overcome some of these reservations given that its approach is widelyadopted in this environment as a means of research. Allison et al. argue that positivism and phenomenology are in fact complementary rather than incom-patible and that there are many similarities between the two schools of thought.Hannabuss,9 citing the work of Gummesson,10 provides a useful summary of thedifferences between a positivistic and hermeneutic approach. The positivisticapproach stresses rules by which we can explore and explain phenomena objec-tively, defining valid knowledge and inquiry in scientific terms. It focuses ondescription and explanation. There exist clear distinctions between facts andvalues, rationality and logic, statistical techniques and detachment, and explicittheories and hypotheses.
Academics agree that there is no one research method that is the most appro-priate for all research problems. Each research study has its own distinctiveness,assumptions, bias and degrees of usefulness. It is generally argued that the choiceof research design imposes intellectual and practical constraints on a researcher interms of reliability, validity and generalisability.11
MARKETING RESEARCH AND DECISION MAKING
There are elements of uncertainty and risk attached to all business decisions andrisk reduction is the main difficulty involved in the choices that are made.Common sense suggests that the availability of good information reduces therisk. After all, having perfect information all the time would make the job of exer-cising choice much easier since there would be no risk in making marketingdecisions. Correct answers to such questions as how much to spend on advertisingand what message should be contained in the advertising would always be known.
The first step in the decision-making process is the identification of neededinformation. Incorrect specification of requirements will provide only uselessinformation, so it is necessary to ensure that the specification is correct. Poor ormisleading information not only costs time and money but also generates confu-sion, chaos and badly informed decisions. One must determine what informationis needed to make a particular decision. Next, consideration has to be given towhether the information can be obtained within a reasonable time and at a rea-sonable cost, and whether one can afford to spend both the time and the moneyto obtain it.
Information used in the right way can be a powerful aid to marketing. Acompetitive advantage can be achieved with the help of accurate, relevantinformation since it helps marketers make better decisions. Inaccurate, irrelevantinformation is both misleading and dangerous in the extreme.
7
EOM_C01.qxd 6/23/05 10:35 AM Page 7

.
8 Chapter 1 • Nature of marketing research
POTENTIAL BENEFITS OF MARKET RESEARCH
Plastics chemist Graham West thought marketing was an expensive exercise inwoolly thinking.
He is the managing director of Belgrade Insulations, a plastics and vacuum-forming company based in Wellingborough. In 1991 a Department of Trade andIndustry official called to talk about the department’s Marketing Initiative to helpsmaller businesses write a marketing plan. As a result of changes partly inspiredby the programme, West says: ‘I realised I had been lacking direction for years. Wehad been simply unable to look for markets where we could apply the company’sskills.’ A recent study by the Marketing Council and Warwick Business Schoollooked at companies, including Belgrade Insulations, that had taken part in the DTIscheme. It found that some simple marketing tasks had fostered significant salesgrowth.
John Stubbs, chief executive of the Marketing Council, thinks the findings shouldencourage personal business advisers at Business Links, the government-led sup-port service, to think hard about how to help sharpen marketing skills.
West had been running his own company for 20 years without a thought of mar-keting. In 1991 the building industry, to which he supplied a variety of productsincluding lids for cold water tanks, ‘stopped dead’. Worse, Belgrade Insulations was dependent for at least 60% of its sales – and ‘far more’ of its profits – on asingle customer. The company had a healthy balance sheet, with no borrowing, butturnover seemed to have plateaued at about £3m – producing pre-tax profits ofabout £230,000.
West hired a sales development manager. But he already had a sales executive.‘All I had done was put another man in the field with a scattergun approach. We hadto look outside the building industry, but we did not know where.’
So West was receptive when he heard about the DTI scheme. A marketing con-sultant was allocated to him and spent part of two or three weeks producing areport. The government paid half the consultant’s fee. ‘He was very sharp. He couldsee our problems and didn’t talk down to us. But he probably went too far. Therewas such an enormous list of things to do.’ More pertinently, the report assumedmarketing knowledge. ‘It didn’t quite get us off the ground.’
Shortly after, attracted by cheap training, he took part in the Investors in Peoplescheme, one of whose consultants had a marketing background. Building on theDTI report, West says: ‘We sat down and identified the company’s strengths andweaknesses and what we could bring to the table that our competitors could not –which was actually very little.’
The car components industry looked relatively promising – and, unlike the build-ing trade, was still ticking over, in spite of the recession. A telephone survey wasconducted, and West followed up every inquiry, however small – ‘odds and ends,orders no one else wanted’.
At the same time, West decided that he needed to bolster research and develop-ment capabilities and hired a pattern maker who could concentrate on developingprototypes from the new customers’ requests. Some sizeable orders materialised.
FT
EOM_C01.qxd 6/23/05 10:35 AM Page 8

.
Divisions of marketing research
‘I have to say we lost money on the majority, but we had gone up a very steep learningcurve. The ideas were tumbling out.’ Now the company could produce a prototypein a week or less – rather than the month or two it had previously taken.
Eighteen months ago West brought in a full-time marketing man with a brief tohunt out growth industries where the company’s skills – including its sharperresearch and development capabilities – could be used. In addition to car com-ponents, Belgrade Insulations is now selling to the leisure industry, to heating andventilation companies and to the general engineering sector. It has recentlyfocused on waste disposal as another growth area where it is working with customers to fashion new products. ‘We can charge whatever is the going rate, weare not beholden to one customer.’ The company to which West was once selling60% of his goods now accounts for less than 25% of sales, and he hopes that willreduce further as expansion continues elsewhere.
In the year to August 1996 pre-tax profits rose to about £500,000 on sales of£4.8m and he is aiming for sales of £7m by 1999. Belgrade Insulation’s financialstrength, its R&D skills and, as West puts it, the ‘team effort’ have played a crucialrole in its development. But it was some simple marketing, he reckons, that reallyawoke the business.
Source: Campbell12 (reprinted with permission)
DIVISIONS OF MARKETING RESEARCH
Marketing research has developed a number of broad divisions covering therange of problems and decisions with which executives have to deal. These areindicated in Figure 1.2.
Customer or market research
Customer or market research can produce quantitative facts about particularmarkets and market segments, for example, the size of the market in terms of both unit sales and value. When these data are collected over time, it allowsone to identify trends and helps to predict future sales. It can also provide information on where customers are located, their spending patterns, their earn-ings and their creditworthiness. It can also explain why customers prefer onebrand to another and what price they are willing to pay. Market research can alsoprovide information about market share of all the firms operating in a market ormarket segment.
9
EOM_C01.qxd 6/23/05 10:35 AM Page 9

.
10 Chapter 1 • Nature of marketing research
FIGURE 1.2 Divisions of marketing research
CUSTOMER MARKET RESEARCH PROVIDES INFORMATION ON:
• market and market segment sizes
• trends in the market that can be used for forecasting
• brand shares
• customer characteristics and motivations
• competitors’ brands shares
EOM_C01.qxd 6/23/05 10:35 AM Page 10

.
Divisions of marketing research
Advertising and promotion research
Advertising research measures the success of advertising campaigns in relation-ship to their objectives. It also helps users of advertising in selecting the mostappropriate promotional media and methods that are likely to produce the mosteffective results. Advertising research can provide information on which mediumis most likely to reach the target audience for specific campaigns. It also providesinformation about what messages are most likely to appeal to the target audience.Research also helps in the process of evaluating in advance the likely impact of acampaign by testing out advertisements on a limited scale. Through tracking studiesthe effectiveness of a campaign can be monitored at all stages of its implementation.
PROMOTIONAL RESEARCH PROVIDES INFORMATION ON:
• the most suitable method of promotion
• the most suitable copy and campaign material
• the most suitable media to use
• the effectiveness of the communications in achieving objectives
Product research
Product research helps to find additional uses for existing and potential productsor services. It also helps, in the case of new product ideas, to test out the productconcept with potential users and purchasers before the expensive process ofproduct development. If a product concept is found to be sound and is thendeveloped, product research can test the product out on potential users before thelaunch. This latter information can be used to remove any apparent design faultsin a product. Product research helps to provide an effective assessment of thestrengths and weaknesses of a product or service in comparison with compet-itors’ products or services. Research also provides information on the appropriatepackaging of a product, helping to design it in such a way as to promote theimage of the product (or service).
PRODUCT RESEARCH PROVIDES INFORMATION ON:
• opportunities for new product development
• product design requirements
• comparative performance vis-à-vis competitors’ offerings
• packaging
11
EOM_C01.qxd 6/23/05 10:35 AM Page 11

.
12 Chapter 1 • Nature of marketing research
Distribution research
Research helps to find the best channels of distribution for a product and helps inthe selection of distribution channel members. With regard to physical distribu-tion, research indicates the best sites for warehouse and retail locations.
DISTRIBUTION RESEARCH PROVIDES INFORMATION ON:
• suitable distribution methods
• appropriateness of channel members
• best location for warehouses and retail outlets
Sales research
Sales research helps to assess and measure the effectiveness of different methodsor techniques of selling. It helps to ensure that sales patches are roughly equival-ent in size so that sales staff are not unfairly discriminated against when it comesto setting sales targets. Sales research provides information on the suitability ofremuneration methods and levels for motivating the salesforce. Research is alsoconcerned with sales training and can provide extensive feedback on the qualityof sales presentations made by sales staff.
SALES RESEARCH PROVIDES INFORMATION ON:
• effectiveness of sales methods and techniques
• establishing sales territories
• the adequacy of remuneration methods
• sales training requirements
Marketing environment research
This division of marketing research examines the political, economic, social andtechnological influences that may impact on a firm’s marketing operations.
In the case of the political aspect of the environment, changes in governmentcan affect trading conditions and these need to be anticipated on a worldwidebasis. Clearly, the economic climate within which a business operates exerts aneffect. These effects may be temporary or more permanent. Attention has to be
EOM_C01.qxd 6/23/05 10:35 AM Page 12

.
Categories of applied marketing research 13
given to such influences when planning, and research helps to assess the impactof political and economic factors.
Social influences can also have a substantial impact on some businesses.Population explosions or declines directly influence the demand for certaingoods. Research provides information on which factors are relevant and howthey impinge on the organisation’s activities.
Technological influences can have a sudden and dramatic impact on the fortunesof a business. A sudden technological breakthrough can make currently success-ful products and processes obsolete in a very short space of time. Research canmonitor technological progress and provide advance notice of new developments.
MARKET ENVIRONMENT RESEARCH PROVIDES INFORMATION ON:
• political influences
• economic influences
• social influences
• technological influences
CATEGORIES OF APPLIED MARKETING RESEARCH
Preliminary research
Preliminary research is often necessary before a final statement and definition ofa problem can be agreed on. For example, someone may come up with the ideafor a new service. Preliminary research may concern such matters as: whether themarket for such a service is regional or national; who would use the service; andwhat substitute services people use. Answers to these kinds of question can helpto define the nature and scope of more complete research.
A review of earlier research may be helpful. It is possible, for example, that thesuggestion put forward as an idea for a new service has been previouslyresearched. There may even be already published sources of information that canprovide pertinent information. Government publications might mention the ser-vice, for example, or some trade publication may have mentioned it and evenconsidered its use.
Conclusive research
Conjectures or hypotheses are developed in the preliminary search and in thecourse of defining the marketing problem. Conclusive research is carried out
EOM_C01.qxd 6/23/05 10:35 AM Page 13

.
14 Chapter 1 • Nature of marketing research
to produce evidence to support these hypotheses. In conducting conclusiveresearch, a thorough search of already published data is made. Fieldwork mayalso be conducted.
Performance research
Performance research is concerned with assessing how well recommended mar-keting actions are being carried out and what benefits in terms of the objectivesset are being realised. Performance research monitors the effectiveness of market-ing management. It questions the definition of the problem that has directed thework to date. It makes one review whether a new study is desirable because certain questions remain unsatisfactorily resolved.
Marketing research provides information for marketing decision making andproblem solving and it may thus be regarded as part of the marketing informa-tion system. In the last chapter in the book, we look in detail at the marketinginformation system. However, because of its relationship to marketing researchwe introduce the subject in this chapter.
SMALL BUSINESS IDEAS AND STUDYING THE LOCAL MARKET
When you have got some idea of the national market for your idea and someinsights into the most suitable openings that relate to the activities in which you areinterested, the next step is to study possibilities in the local market.
You need to immerse yourself in the environment. Start by making a tour of thestreets in the town and the town’s commercial centres. Note the neighbouringkinds of business, particularly those that offer similar or complementary kinds ofproducts or services to those you want to offer. Take note of the kind of clientelethey attract.
This study will give you a better understanding of the neighbourhood. You canthen find out from your local Chamber of Commerce how long certain kinds of busi-nesses on particular streets have been there – a good indicator of your ownparticular chances of long-term survival. You may also find out what kind of busi-nesses have been unsuccessful either in general or in particular areas and, moreto the point, why this has been the case.
Source: Rebondir13
MARKETING INFORMATION SYSTEMS
Marketing information systems have been around for a long time – conceptuallythere is nothing particularly new about them. The original ones were paper-basedsystems in which summarised information was stored in large banks of filing
EOM_C01.qxd 6/23/05 10:35 AM Page 14

.
Marketing information systems
cabinets. In comparison with current notions of information systems, the earlypaper-based systems were relatively inefficient. With the advent of computers,particularly desktop computers, the opportunity developed for marketing infor-mation systems to become more sophisticated and efficient.
A marketing information system is a way of systematically gathering andgiving helpful marketing information to the right people on a continuous basisand at the right time. Since information needs, sources and costs alter with time, areview of any information system is desirable from time to time. Such a reviewshould specify individual people’s information requirements, at what times infor-mation is required and where it can be found.
Marketing managers use many different types of information and there aremany ways of putting together a marketing information system. The requiredinformation can be classified in a number of different ways. One way of classify-ing the information is:
• internal information
• external information
• position information
• decision information
• forecast information.
Internal information is made up of sales reports, sales analyses and cost ana-lyses related to sales. Most of the raw data already exist within the organisationand need to be processed or analysed so that they become helpful information.An information system facilitates this process.
External information refers to the size and structure of the market (or potentialmarket) and to trends, opportunities and threats in the environment. It also includesinformation on competitors and customers, both existing and potential. Employees,customers and distributors contribute this form of marketing information.
Position information is created by combining internal and external infor-mation. For example, one might combine the enterprise’s sales and the overallsales of the enterprise and its competitors in the market to calculate market share.In a similar fashion, internal strengths and weaknesses can be compared to thoseof competitors to find competitive advantage and unique selling points, and toascertain whether any competitive advantage is sustainable.
Decision information results from various analyses which can involve math-ematical and statistical treatment of data.
Forecast information can be based on either subjective opinions, ascertained bysurvey, or on statistical analysis of trends.
Some of this information can be obtained cheaply, while other forms take timeto gather and analyse. There is a tradeoff between the value of information and itscost – in terms of both time and money. Executives must know which informationaffects which decisions and which information is essential.
15
EOM_C01.qxd 6/23/05 10:35 AM Page 15

.
16 Chapter 1 • Nature of marketing research
TYPES OF DATA
Research can be categorised into primary and secondary and into qualitative andquantitative. Primary research is usually carried out for the specific use of aclient company or even by the company itself. Secondary research makes use ofresearch already carried out by someone else for some other purpose.
Quantitative research produces numbers and figures – such as numbers andpercentages of consumers who are aware of particular products or services.Qualitative research, contrariwise, provides data on why people buy – whatmotivates them to buy – or their impressions of products, services or advertise-ments. Both forms of research produce information on markets, competitors,distributors and customers. For example, reports provide information on mar-kets, their size, structure, key producers and distributors, their market share,trends and prices. They also provide information on behaviour, attitudes andintentions.
In the case of consumer goods, retail audits measure market sales, week byweek or day by day, competitor’s sales, market shares, prices, special offers andstock levels. Customer surveys use structured questionnaires to assess, amongother things, customer attitudes, levels of awareness, intentions to purchase andactual purchases. Qualitative research techniques, such as focus groups and in-depth interviews, obtain data on customers’ opinions, motivations, percep-tions and reactions to marketing-mix variables and changes in the variables – forexample, price changes. Customer reactions to the marketing-mix variables canbe observed and assessed by simulated test markets and real test markets.Consumer panels provide information on customer lifestyles, media habits andconsumption patterns.
In the case of industrial or business goods, many of the same kinds of data aresought after, as in the case of consumer research. Research methods vary slightlybut there are many commonalities between the two.
Types of data that can be collected
When looking at consumer markets, it can be observed that various factorsinfluence the way people purchase goods and services. These factors can beclassified as cultural factors, personal characteristics and psychological variables.For example, people tend to belong to certain social groupings and are influencedby the motivations and values of the group to which they belong. Social status,family and friends all influence people’s buying decisions. Culture influenceswhat people do and what they buy. Personal factors include age, income, job,lifestyle, personality and self-concept. Changes in any of these factors may exertan influence on purchasing behaviour. Income and lifestyle, for instance, affectboth the buying process and the eventual choice of goods people make. Finally,psychological factors influence individual buying behaviour and how people
EOM_C01.qxd 6/23/05 10:35 AM Page 16

.
Types of data 17
respond to promotional methods. Psychological factors include perception, motivation, attitudes and learning.
MEASURING CUSTOMER LOYALTY
Measuring customer loyalty is not only a means of identifying a target audience formarketing programmes, but it also facilitates assessing the performance of imple-mented advertising and promotion strategies. In order to measure customerloyalty, information is required on, for example, the frequency of purchase, thevalue of purchase and its contribution to total revenue. In assessing the impact of amarketing campaign, the difference in these factors has to be weighed against thecost of their implementation.
This information is already available to a retailer through its EPOS scanning terminal. More specific customer information can also be obtained by issuing shoppers with a card and PIN number. Purchase information can then be recordedeach time customers pay at the checkout. This kind of information is quantitative innature and not qualitative. It will show the trend in consumer behaviour, but itcannot explain it. Explanations can only be obtained through consumer surveys andinterviews.
Source: Samways and Whittcome14
PSYCHOLOGICAL FACTORS INFLUENCE INDIVIDUALS’RESPONSES
• People perceive advertisements in a particular way.
• People see only a few of the hundreds of advertisements they encounter eachday.
• People only remember some of the advertisements.
• People hold particular attitudes and learn new ones.
• People learn about new products and new benefits.
Marketers need to become familiar with people’s perceptions, values, atti-tudes, beliefs, the way they learn and their needs and wants. Through using thisinformation, marketers can influence customers’ buying behaviour. Marketersmust also know how social, personal and psychological factors can influence customers’ buying behaviour so that they can use this information to good effectin the marketing of products and services.
EOM_C01.qxd 6/23/05 10:35 AM Page 17

.
18 Chapter 1 • Nature of marketing research
MARKETING RESEARCH AS PART OF MARKETING STRATEGY
Marketing strategy involves implementing well-thought-out plans. The plansthemselves should involve a sequence of soundly informed and executed steps.Much of the information used as a basis for the planning can be provided by mar-keting research. Here is a simplified list of the steps involved in planning:
1 Establish company goals and assess how the firm has departed from thesegoals in the past.
2 Decide on products or services that best contribute to the likely attainment ofthese goals.
3 Establish the minimum market share required for specific products or servicesto produce a satisfactory profit and return on investment.
4 Determine a pricing strategy that will best lead to the required profit andreturn on investment.
5 Forecast sales demand over the planning horizon.
6 Decide on the best distribution channels to produce continuous satisfactorysales and profits.
7 Decide on the best promotional strategy to produce the desired sales andprofits.
8 Anticipate problems that may arise as these decisions are implemented and setout contingency plans to meet any of the anticipated problems.
Marketing research has a role to perform in all the key decisions that affect thedirection an organisation takes.
DECIDING WHO SHOULD DO THE RESEARCH
A firm’s own research staff alone may undertake research, it may be given to anoutside agency to perform or some combination of these two options may bechosen. Where both an outside agency and internal personnel undertake researchon the same problem, consultation between the outside agency and internal per-sonnel is essential. Handing over a complex study completely to an outside firmcan be fraught with problems. Having said that, however, allowing internal per-sonnel to have too much of an input may prevent new and useful insightsemerging. The research proposal should identify who should do what.
Where company personnel are used in the research, even though a competentagency has been hired, there are several advantages to be gained. Using peoplefrom departments that will be affected by the study will help ‘sell’ the results.
EOM_C01.qxd 6/23/05 10:35 AM Page 18

.
Assistance from outside research organisations
Using company personnel can also direct and redirect the progress of the studyinto the most useful and profitable areas. Using people from departments otherthan marketing will educate them about the ways and benefits of marketingresearch.
ASSISTANCE FROM OUTSIDE RESEARCH ORGANISATIONS
In recent years, there has been a trend towards using outside suppliers. This has probably occurred because of the more complex and sophisticated researchtechniques that have recently been developed and the fact that people in organ-isations do not usually have the necessary skills for these techniques. Com-puterisation has produced ways of finding and analysing information that couldnot have been dreamed of only a few years ago. While computers have beenadopted almost universally, their use for marketing research has developed as aspecialised field of knowledge and few firms have developed this expertise forthemselves. Companies are also reducing their middle and top management staff.For financial reasons, many companies believe that an outside research firm canperform market research better and more cheaply than the companies’ own per-sonnel. Because of the wealth of information now available to clients on acontinuing basis from agencies that specialise in gathering, analysing and report-ing information, it is too costly and time-consuming for any single company toattempt to collect such information itself. The use of outside firms is desirablewhen confidentiality is of paramount importance. This is important where know-ing the company and its products has an effect on the responses given by subjectsparticipating in the research.
Research sources
Outside research firms specialise in one or more forms of research assistance andrelatively few firms can offer all methods with equal expertise. The specialisedresearch assistance that can be given is as follows:
• mail surveys
• personal interview studies
• telephone studies
• panels
• omnibus studies
• sampling
• focus groups.
19
EOM_C01.qxd 6/23/05 10:35 AM Page 19

.
20 Chapter 1 • Nature of marketing research
Specialisation in overall marketing measurements might include the following:
• test marketing
• scanner test marketing
• controlled test marketing
• simulated test marketing.
There are also research firms that specialise in the problems of market segmentation,customer/prospect databases, advertising media studies and audience studies.
Types of research available
A number of types of marketing research are offered by specialist agencies:
• Custom-designed studies: designed to meet the specific needs of the buyer.
• Syndicated studies: ongoing surveys conducted continuously or periodically,using the same basic data that are reported separately to multiple clients. Thereports can be adjusted to meet client needs.
• Standardised studies: based on a method of doing things (usually a uniquemethod) such as copy testing, simulated test marketing or setting up a con-sumer panel or an omnibus study. Special equipment or facilities may be aninbuilt part of the service.
Outside agencies, offering research, may be categorised according to their typeand location.
Local firms offering special types of assistance
These firms may specialise in interviewing, mall intercepts, telephone research etc.They may take on special local assignments for large, nationwide research com-panies. Such firms often offer facilities for focus and other types of research groupsand may handle research other than their specialities.
National research firms
Agencies of this kind may be able to do almost all forms of marketing research.The companies often offer consulting in marketing and even general manage-ment. They also may offer computer-based information for use in databases,marketing strategy decisions and the like.
Consultants in various specialities
These firms may consult and advise about packaging, advertising and personnelproblems. They also may offer to do some research relating to their specialities.
EOM_C01.qxd 6/23/05 10:35 AM Page 20

.
Assistance from outside research organisations 21
These firms may have a major field of interest, such as engineering or electronics.The research offered by consultants can include necessary outside studies, bothmarketing and technical.
Selecting an outside research firm
In the case of selecting an ongoing research service, the buyer must think notonly of the dependability of the research method offered, but also about whetherthe research firm is likely to stay in business. For services with standardised pro-cedures, the crucial element is whether the concept of the procedure selected canproduce the information deemed necessary. Quality of work is important but theprobability is that a research firm would not still be in business if the quality of itswork were poor.
In selecting an outside agency, account should be taken of the degree to whichan in-depth knowledge of the employing company and its field is required andthe agency’s skill in the type of study to be undertaken. An outside agency oftenneeds some weeks of training or instruction about the company and its marketingproblems before it can understand what the client requires.
STEPS IN CHOOSING A RESEARCH FIRM
1 Check sources for finding names of research companies.
2 Compile a list of firms and decide on two or three that appear to be the mostpromising.
3 Contact the research firm in writing, giving as full a description as possible ofthe problem.
4 Arrange an interview with the research firm, preferably in its office.
5 Find out more about the research supplier and about its previous clients.
6 Explore how the research firm prefers to work with clients.
7 Ask for a written proposal.
8 Come to a clear understanding that further discussions may change the pro-posal in some ways.
9 Agree about who will be the prime contacts between client and researcher.
10 Make it clear to a firm submitting a proposal that proposals from other firmsare also being considered when this is the case.
EOM_C01.qxd 6/23/05 10:35 AM Page 21

.
22 Chapter 1 • Nature of marketing research
EVALUATING PROPOSALS
In evaluating proposals one should consider the factors shown in the box.
FACTORS TO CONSIDER WHEN EVALUATING PROPOSALS
1 Whether the proposal shows an understanding of the problem and its marketingimplications.
2 The nature of the organisation undertaking the research and the skills theresearchers possess.
3 Whether the total price is reasonable and acceptable. Whether there are largeprice differences among different proposals and, if so, whether they signal dif-ferent assumptions by different firms.
4 Whether the proposal contains a procedure for changes if they are required andwhether this procedure is acceptable to the client.
ETHICAL CONSIDERATIONS IN MARKETING RESEARCH
Coinciding with the rise of consumerism and equal rights legislation, people havebecome more assertive of their rights, especially in the marketplace. An increasedconcern for privacy, a reluctance to be used as guinea pigs for new products andan increased reluctance to accept research claims for new products in advertise-ments characterise the new outlook of many consumers.
In applying the term ‘ethics’ to marketing research, it is assumed that ethicsinvolves the assessment of an action in terms of that action being morally right orwrong. Each society possesses standards to which it expects its members toadhere. Sometimes, these standards are quite precise and there is little disputeabout their meaning. At other times, however, the standards are quite generaland can be interpreted in different ways. The area of greatest concern is market-ing researchers’ treatment of participants. The abuses that arise in this area tendto fall into three broad categories: invasion of privacy, deceptive practices andimpositions (see Figure 1.3).
Invasion of privacy
Invasion of privacy is not an issue that is unique to marketing research. It alsooccurs in many other aspects of business and has heightened people’s sensitivity
EOM_C01.qxd 6/23/05 10:35 AM Page 22

.
Ethical considerations in marketing research
to the privacy issue. However, actually defining when a person’s privacy isinvaded may be difficult. For example, is observing the actions of a shopper in asupermarket an invasion of his privacy? Is questioning a person about herincome, product use or future purchase plans an invasion of privacy?
Up to the present, it has been felt that observing a person’s public actions (e.g.shopping in a supermarket) does not infringe on privacy. It is also maintainedthat information willingly provided by respondents in a survey does not consti-tute an invasion of privacy, since the person’s participation implies consent.However, questions are currently being raised about whether many respondentsin surveys appreciate when they are in situations where they must provide infor-mation (as is the case in government census studies) and when they are insituations where they have a real choice of whether to provide information. Sincethere is no widely acceptable definition of privacy, the invasion of privacy issue isof considerable concern for marketing researchers.
Deceptive practices
It is a deceptive practice when a researcher misrepresents the purpose of theresearch, its sponsorship, its promises of anonymity, the amount of time requiredto participate in the research or inducement for participating in it. Perhaps themost notorious deception is obtaining a sales pitch under the guise of marketingresearch.
An operational definition of deception in marketing research may be difficultto make with absolute precision. A code of ethics should clarify what actionsmight be considered acceptable practice.
23
FIGURE 1.3 Ethical considerations in marketing research
EOM_C01.qxd 6/23/05 10:35 AM Page 23

.
24 Chapter 1 • Nature of marketing research
A CODE OF ETHICS – IS THERE A BREACH OF ETHICS INVOLVED?
• A potential telephone respondent is told that the questioning will only take a fewminutes, when it takes 20 minutes.
• Return envelopes in an ‘anonymous’ mail survey are coded so that respondentsand non-respondents can readily be identified in order to save money whensending out second requests.
Impositions on respondents
Here we are looking at actions by researchers that show a lack of concern for theparticipants. Under this heading are such actions as contacting respondents atinconvenient times, wasting participants’ time because of inappropriate researchand poorly prepared interviews.
ETHICAL CONSIDERATIONS IN TASTE TESTING WITH DRUGS
The Market Research Society makes no reference to the testing of medicines in itsCode of Conduct. Butterworth’s Law of Food and Drugs details the requirements forclinical trials of the efficacy of products, but does not provide any definition ofrequirements for the testing of other aspects of pharmaceutical products such asflavour acceptability. Indeed, there are no real guidelines for taste testing pharma-ceuticals. The responsibility for designing safe consumer research resides with theagency doing the work. Moreover, providing an agency takes sufficient steps toensure the safety of the research protocol, responsibility for the safety of the actualproduct and product ingredients lies with the manufacturer.
Increasingly, over-the-counter medicines are becoming more important to pharmaceutical firms. Manufacturers can increase sales and market share byimproving the appeal of their products to consumers. There is an increase inresearch activities into the reformulation of products to achieve better taste characteristics and subsequent testing with consumers to investigate preference or prove claims made about taste. Nevertheless, this type of research producesethical concerns since many of the products tested contain active drugs. However,the issues involved in showing that one product is preferred to another in terms oftaste are completely different from clinical trial issues.
Reading Scientific Services Ltd (RSSL) is a multidisciplinary scientific con-sultancy providing research and analytical services to the food, drink, consumergoods, chemical and healthcare industries. It has expertise in both routine andinvestigative pharmaceutical analysis including sensory evaluation and consumerresearch. When conducting consumer research on pharmaceutical products thedose each respondent receives has to be limited. In practice this means controlling
EOM_C01.qxd 6/23/05 10:35 AM Page 24

.
Researchers’ obligations to clients 25
the amount and number of products tasted. Pre-screening of product prototypes isessential in order to ensure the selection of the best samples to research with con-sumers. Sensory evaluation, making use of trained panels, is an efficient way ofpre-screening. Panellists are selected for their taste sensitivity and are trained to describe and measure flavour and mouthfeel characteristics. Results of the sensory evaluation are used to make sure that only prototypes that seem to havethe required range of flavour and mouthfeel characteristics are taken forward to the stage of consumer research. Moreover, because sensory evaluation gives anobjective and precise description of the flavour and mouthfeel characteristics of each product, the task of consumer research is simplified to preference judge-ments and opinions about key product characteristics. At the same time the doseadministered can be kept to a minimum.
Nonetheless, consumers must give their ‘informed consent’ to take part in suchresearch and interviewers must explicitly inform respondents of any restrictions orexclusions. Respondents must also read and sign a consent form which states therestrictions and tells consumers of the nature of the research. If appropriate, a GPsupervises the tasting sessions.
Source: Sanderson15
Ethics is also involved in the type of marketing research carried out and/orwhether it is carried out in an ethically correct manner. When the researchinvolves the testing of products that might have potentially dangerous sideeffects on consumers, considerable care has to be taken to ensure that proceduresadopted are ethically acceptable and that they are not open to criticism.
RESEARCHERS’ OBLIGATIONS TO CLIENTS
As well as ethical obligations to respondents, researchers also have obligations totheir clients. Among the obligations are:
• Methods used and results obtained must be accurately represented. Researchers mustuse effective research procedures in obtaining and analysing data. There is alsoan obligation to tell clients when they make ill-advised research requests. Theresearcher must also inform the client of any critical weakness or limitation incollected data, especially those that could lead to major errors if the informa-tion is acted on without reservation.
• Client’s identity and information obtained must be held in confidence. Any actual orprospective client approaching or using a research firm has the right to expectthat what is revealed to that firm as part of this relationship is confidential.
EOM_C01.qxd 6/23/05 10:35 AM Page 25

.
26 Chapter 1 • Nature of marketing research
• Research should not be undertaken for competition if such research will jeopardise theconfidential nature of the client–researcher relationship.
ICC/ESOMAR Code
This is a professional code of practice for market researchers, published by theEuropean Society for Opinion and Marketing Research. It is based on the follow-ing eight principles:
1 Personal data have to be processed fairly and lawfully.
2 Personal data have to be obtained only for lawful purposes and should not beprocessed in any manner that is incompatible with such purposes.
3 Personal data have to be adequate, relevant and not excessive in relationship tothe purpose for which they are being used.
4 Personal data have to be accurate and up to date where this is appropriate.
5 Personal data should not be kept on file any longer than is necessary for thepurpose for which they were acquired.
6 Personal data have to be processed in accordance with the requirements of theData Protection Act (see following section).
7 Appropriate technical and organisational measures have to be in place to pre-vent unauthorised or unlawful processing of personal data and to protect themagainst accidental loss, destruction or damage.
8 Personal data should not be transferred anywhere outside the EuropeanEconomic Area unless there are preventative measures in place to ensure therights and freedoms of data subjects in relation to the processing of personaldata.
Data Protection Act
In 1999 the Data Protection Act 1998 was extended. The definition of data nowincludes all manual and electronic records – including video recordings andgroup discussions. Under the new provisions there is now specific reference tosensitive personal data: information carried regarding racial or ethnic origin;political opinions; religious or other similar beliefs; physical or mental health; sexlife; and criminal convictions or proceedings. Conditions are laid down underwhich sensitive personal data may be lawfully processed. The 1984 Act set out asystem of registration for all users of personal data covered by the Act: datauser’s name and address; description of personal data held; purpose for which
EOM_C01.qxd 6/23/05 10:35 AM Page 26

.
Changing role of marketing research 27
the data are held; description of sources from which the data are derived; descrip-tion of people to whom the data may be disclosed; names of places outside theUK to where the data may be sent; and an address for the receipt of requests fromdata subjects who wish to have access to the data. The 1998 Act introduced a newsystem of notification. It should be noted that it is against the law to hold or useany data in a way that is inconsistent with the registered entry. Registered entriesare valid for specific periods and changes have to be recorded officially.
The Act is concerned with individuals, not corporate bodies, and does not referto the processing of data by manual means. (Useful guides to the Data ProtectionAct are available from the Data Protection Registrar, Springfield House, WaterLane, Wilmslow, Cheshire SK9 5AX.)
TRENDS IN MARKETING RESEARCH
• A movement away from probability sampling towards quota sampling, along witha fall in sample sizes.
• Because of cost and time pressures, less use of the integrated survey model ofqualitative, pilot and full survey in projects.
• More qualitative research as a ‘stand-alone’ method in a wider number ofapplications.
• Growing use of databases for sampling.
Source: Mouncey16
CHANGING ROLE OF MARKETING RESEARCH
Organisations are dynamic entities existing within a continuous state of flux andtrying to adapt to the requirements of rapidly changing environments. This verymuch applies to marketing research organisations whether they are in-housedepartments or agencies. The last 25 years have witnessed vast changes in theway in which information is handled in organisations of all types and sizes.Alongside this revolution in information management the role of marketingresearch has undergone substantial change. The change is not complete and it isimpossible to say that the role of marketing research is now a fixed, static entity:its role is certain to change further in the future.
Adapting to the changing conditions of the business environment means deal-ing with new problems and decisions that may not previously have arisen. Thisaccentuates the need for creativity in marketing research to enable new ways ofresearching new problem situations.
EOM_C01.qxd 6/23/05 10:35 AM Page 27

.
28 Chapter 1 • Nature of marketing research
CHANGING ROLE OF MARKET RESEARCH
In the years ahead, successful research suppliers will need to develop close co-operation with their research clients. It is likely that much of the day-to-day workformerly carried out by in-house market research departments will be outsourcedto specialist research agencies. This will entail agencies having to have a muchbetter understanding of their clients’ problems and the manner in which researchsurvey data can contribute towards the solution of such problems. Researchers arenot primarily data gatherers, although data gathering is essential and the workmust be properly organised and controlled. The specialist skill of researchers,however, is being able to spot how research can help resolve a problem and help afirm make better decisions. It is the skill and creativity that is part of knowing howto get worthwhile information, how to help clients understand what data are tellingthem and what decisions they should consider making as a result.
Substantial changes have occurred in the market research business over thepast decade. In particular there has been considerable change in the way researchis bought and sold and the manner in which research is conducted. During the1980s there was a slimming down in the size of market research departments andresearch suppliers often found themselves dealing with brand and marketing man-agement, rather than in-house market research managers. For a long time,research suppliers had bemoaned the fact that they seldom dealt directly withexecutives who used research data they supplied. The change in circumstancesmeant that researchers had to deal directly with brand and marketing managersand help them make the best use of research.
Unfortunately, things have not worked out as well as might have been anti-cipated. There have been practical difficulties, such as research needs not beinganticipated early enough within research users’ companies. Research suppliershave also had to acknowledge that brand and marketing managers make use ofinformation of which market research data are only a part. Executives are notresearch specialists and do not have the same depth of interest in the researchprocess. In practice, market research data are now bought more as a componentinput to a company’s overall activity rather than to meet specific client needs for aparticular project.
Data-collection methods are likely to change in the future, with an increasinguse of computer assisted techniques, email and the Internet as a means of com-municating with customers, retailers and consumers. The trend of the last tenyears, in which many market research departments have been abolished or com-bined with marketing departments, is also likely to be reversed. The unique skillsof the specialist market researcher will come to be better understood and appreci-ated. It is unlikely that large in-house market research departments will developagain, but the establishment of small, high-level specialist teams of researcherswithin medium-sized and major companies is likely. Such teams will have a specialist role to play in the development of research briefs that will enable informa-tion to be made available as and when it is required. They will also contributesignificantly to the way information is used within a marketing organisation.
Source: Bates17
EOM_C01.qxd 6/23/05 10:35 AM Page 28

.
Need for more creativity in research
USING THE INTERNET FOR MARKETING RESEARCH
The Internet has remarkable potential as a tool for marketing research. It enablesprimary marketing research to become much less expensive to conduct than byusing traditional media. Such research can, however, only really be exploratory.In using the Internet for collecting data and information, the scope of the sampling frame is restricted to those members of the Internet community whoagree to respond. It has to be borne in mind that the demographics of users of theInternet are different from the general population. Results from Internet market-ing research should not usually be generalised to the entire population. However,as more and more households gain access to the Internet this is a problem thatmay resolve itself in due course.
Web page self-completion forms facilitate the assessing of attitudes, wants and values of an organisation’s customers. For example, a firm might use a self-completion form to learn about its customers’ demographics and product prefer-ences. The firm might employ such data as a basis for segmenting its market.
The Internet might be used during product/service development. A companycan quickly assess globally customers’ thoughts about product changes or newproducts before any research and development investments are made. In thesame way, firms can gain much information through monitoring discussiongroups made up of members of the firm’s customer base. Executives can use thisinformation to learn not only of the perceived strengths and weaknesses of theirown products or services, but also of those of their competitors.
NEED FOR MORE CREATIVITY IN RESEARCH
We live in a world that is undergoing continuous and rapid change. Situations areregularly encountered that have not previously arisen. Technology, competition,changes in social values, new expectations of customers, economic upheaval andall the other kinds of changes that can occur in the business environment producenew problems for management. Solutions to such problems often require insightthat traditional, well-used problem-solving techniques are unable to provide.Under such circumstances, the need for creative problem solving assumes agreater importance than ever before. Developments in world markets, shorterproduction cycles, the need to find new ways to resource the exploitation ofopportunities and the scarcity and cost of basic resources are just a few of the newchallenges for the modern-day executive. In order to respond to such challengesthere is a need to think creatively.
Research findings have provided support for the argument that there is a directlink between creative thinking and organisational efficiency and effectiveness.18
In particular, creativity helps to improve the value of solutions to persistentorganisational problems. It has also been found that creativity helps to encourageprofitable innovations, rekindles employee motivation and improves personal
29
EOM_C01.qxd 6/23/05 10:35 AM Page 29

.
30 Chapter 1 • Nature of marketing research
skills and team performance. All these can contribute towards a continuous flowof ideas for new products and services and, by improving work processes, providethe platform on which an organisation can develop its competitive advantage.
There are few aspects of organisational activity where the need for creativ-ity does not make itself felt. While the need for new ideas often predominatesproblem tasks, old ideas, too, need to be re-examined. After all, creativity is theprocess of revealing, selecting, swapping around and combining our store offacts, ideas and skills. Rickards19 has described creativity as an ‘escape frommental stuckness’, an operational definition that is very much in keeping with itsrole in decision making and problem solving.
CREATIVE RESEARCH
One of the key reasons for the lack of genuine innovation in the 1990s is thatresearchers keep asking the same questions and using the same processes, withthe result that predictable responses are obtained from consumers. Since there arenowadays so many ‘expert’ consumers, a new creative focus is required to encour-age new kinds of consumer responses to be made. It is necessary to injectcreativity into research, making use of both environmental stimuli and people, for itis these elements that make creative research more effective. It is essential, how-ever, that researchers should be familiar with and confident in the use of creativitytechniques.
A step in the right direction is to introduce a high level of interaction into con-sumer workshops in order to interpret the sensory experiences of the consumer. Itis often the case that what consumers say and actually do conflict with one another.Knowing this and observing it may help us to intuitively read between the lines andmake research more efficient and meaningful.
Source: Nuttall20
The need for creativity in research is no less than in any other area of market-ing or management. If research is to provide useful information for helpingorganisations to gain a competitive advantage, it needs to be imaginative andcapable of bringing forth equally new ideas, insights and viewpoints fromrespondents.
NON-RESPONSE AS AN ISSUE IN MARKETING RESEARCHEFFECTIVENESS
In a society where people are becoming more and more cynical towards marketingresearch, non-response is becoming an issue that is relevant to the effectiveness
EOM_C01.qxd 6/23/05 10:35 AM Page 30

.
Questions 31
of marketing research. Answers to questions posed in surveys, for example, may differ considerably between those who respond and those who do not. In busy shopping malls, those who spend time helping the researcher fill in questionnaires may have very different ideas and concerns to those who walkrapidly by and refuse to cooperate. Moreover, in the case of business-to-businessresearch, the non-respondent may be an organisation of major significance whose exclusion results in the research having little meaning. While train-ing of interviewers, extra incentives and even patience can sometimes over-come potential non-response, pressure of time, apathy, scepticism and greater feelings of rights to privacy all contribute to the potential problems posed by non-response.
SUMMARY
This chapter has explored how marketing research can take some of the risk outof marketing decision making by providing information that can contribute tosound marketing decision making. This may be achieved in all elements of themarketing mix and, through involvement in problem formulation and solutionfinding, marketing research becomes an integral part of the process of formulat-ing marketing strategy. Marketing research can perform a variety of studies andmakes use of both primary and secondary data sources. It can be applied eitherin-house or by marketing research companies that specialise in this form of con-sultancy. The latter offer a wide range of services from off-the-peg studies totailor-made studies to meet the needs of individual clients. Like many other ser-vices involving the generation of confidential information and reports, ethicalconsiderations are an important issue and need to be fully explored. New ways ofasking questions pose challenges for marketing researchers and the introductionof creativity into marketing research is paramount.
QUESTIONS
1 Discuss how marketing research helps reduce the risk in marketing decisionmaking.
2 Design a marketing information system for an SME marketing a soft drink.How would you incorporate marketing research data into such a system?
3 Discuss how marketing research is part of marketing strategy.
4 Why is there a need for more creativity in marketing research?
EOM_C01.qxd 6/23/05 10:35 AM Page 31

.
32 Chapter 1 • Nature of marketing research
CASE STUDY 1.1: LAMPELICHTER AG, ESSEN
All manufacturers of lamps are frantically trying to maintain and protect theirshare in a shrinking market. Each manufacturer has a large number of productionfacilities across Europe and the profitability of the companies is determined by production loading. In this industry, economies of scale play a major role and the overcapacity of the manufacturers ensuing from the shrinking market has brought about aggressive price competition. This has been reflected in lowerunit selling prices and reduced margins and has put further emphasis on achievingeconomies of scale. Currently, lamp manufacturing is not a profitable industry.Companies are fighting for market share and high exit barriers prevent with-drawal. However, whenever the upturn occurs, those firms that survive the reces-sion will be in a good position to take advantage of future growth and new markets.
Recently, Philips has entered the Polish market both to access the emerging ex-Comecon markets and to obtain a lower cost base to aid its price competitive-ness in established European markets. Similarly, GE has invested heavily inHungary and Osram has expanded its distribution into the former East Germanyand purchased the North American operations of GTE, which has retrenched itsbusiness activities to the core of telecommunications. The acquisition of GTE’sshare of the North American market was critical to Osram to prevent it beingmarginalised as a European producer. The North America move countered GE’sexpansion into Europe. GE has also acquired controlling interests in manufactur-ing sites in Italy, Japan and China. Philips and Osram are also investing in jointventures in China and the Far East.
As manufacturers have moved into areas of lower cost production, the unitselling price of the manufacturers since 1993 has fallen in real terms – a trend thatis expected to continue. However, while the unit production cost of the producthas fallen, the distribution and sales cost associated with it have risen.
Lampelichter employs around 100 personnel and was established in 1970. Asone of the leading independent suppliers of replacement lamps to independentelectrical retailers in Germany, the firm undertakes marketing and distributionbut has no manufacturing capacity. It has a single warehousing and office facilityin Essen and uses carriers to deliver its consignments to customers. In 1993, 65%of its annual sales were under its own label brand. In 1995 the firm was lookingtowards a sales revenue target of DM30m. In 1994 the firm’s sales revenues weremade up as follows:
• light bulbs 74%
• plugs, sockets and other accessories 10%
• security, task lighting, etc. 12%
• torches, batteries, etc. 4%.
EOM_C01.qxd 6/23/05 10:35 AM Page 32

.
Case study 1.1
In Europe generally, the independent electrical retailers have chosen to reducestockholding, thereby holding stock back at their suppliers. This has produced anincrease in the number of orders placed but a reduction in the average ordervalue. Unless suppliers can break the trend of falling selling prices coupled withrising sales and distribution costs, the long-term net margin position of the sup-pliers in the independent market will continue to worsen. The lamp supplyindustry is especially seasonal – November’s turnover is approximately twicethat of June. The period September to March is critical to the success of the organ-isation, but the resources available to allow it to take advantage of the season arecarried throughout the year. This makes it a high fixed cost organisation thatactually budgets to lose money in the spring and summer periods.
Lampelichter differs from the majority of its competitors. It markets its pro-ducts on a national basis rather than the more usual local or regional basisadopted by the competition. Competition comprises manufacturers (competingdirectly for major accounts), national electrical wholesalers, local electrical wholesalers, special lamp distributors, appliance and accessory distributors.Within the company’s organisational structure there are board representatives for sales, marketing, finance and operations. Approximately 60% of companymanpower is directly related to the sales/sales support roles. The remaining 40%is taken up in staffing the following departments: data processing, accounts andfinance, quality assurance, warehousing and transport.
The sales budget in 1995 split the total revenue targets as shown in Table 1.1.Lampelichter considers that it has committed and talented management
and employees, a good reputation in the trade, excellent goodwill and signifi-cant customer loyalty. It also has a substantial field salesforce, its own brandedproduct range, consistent attractive barcoded own-brand packaging and excellent supplier relationships with all major lamp suppliers. The firm is a fin-ancially strong private company with limited borrowings. It has high stockinventory coupled with an extensive product range. Furthermore, it has expertisein fragile products. The firm has a market-led culture (with the object of being customer led).
33
Distribution channel 1995 1994target target
Independent electrical retailer 60% 65%Commercial user 32% 25%Onward distributor 8% 10%
TABLE 1.1 Lampelichter sales budget, 1995
EOM_C01.qxd 6/23/05 10:35 AM Page 33

.
34 Chapter 1 • Nature of marketing research
Lampelichter’s historic customer base is in decline and the firm is reluctant to accept added-value products. Within the company, there is a lack of internal performance standards. Profitability is declining and there is under-utilisation of assets. Compared with competition the firm is a relatively high-fixed-cost operation. Moreover, delivery performance is poorer than that of competitors.Under-manning of the salesforce is causing ineffective sales management. Thesalesforce is also an ageing one in terms of selling skills and professionalism andexhibits an absence of any customer segmentation and associated objectives andstrategies. The company has a weak planning structure and skills base and a poortraining culture.
There is a range of possible opportunities in the marketplace. These include:range extension into complementary non-lamp products; supply chain integra-tion; and new markets. However, the firm faces: increased competition fromlower cost distributors; increased competition from manufacturers on direct con-tracts with large users; increased seasonality of the core business; falling real costsof lamps; centralisation of supplier power with fewer own-brands suppliers; andfewer independent retailers.
Following discussion between the top management of the company and aEuropean management consultancy organisation, the consultancy firm recom-mended that Lampelichter should commission marketing research to explore thevarious avenues open to it.
Question
What kind of marketing research information do you think Lampelichter should try to obtain?
CASE STUDY 1.2: SPIRIT OF MAGELLANENTERPRISES
Spirit of Magellan Enterprises in Winchester, England, is well known for provid-ing its customers with out of the ordinary guided holidays abroad. The companyprides itself on its ability to retain customers year after year and its ability to offerthem something different and interesting every year. With the help of keen con-tacts abroad, the firm produces competitive offerings for the would-be holidaytraveller. Recently, South America and Russia have been among the destinationsthat have attracted some holidaymakers and in response to this, the firm hasdeveloped a number of tours.
Spirit of Magellan Enterprises produces an annual detailed and well-illustratedbrochure, which it sends in the post to all previous customers. It also makes thecontent of its brochure available through its website to all enquirers. The websiteis regularly updated with new destinations and tours as they become available.
EOM_C01.qxd 6/23/05 10:35 AM Page 34

.
Case study 1.3 35
Tours can last from 8 days to 21 days, although the majority are no longer than 14 days. Here is an example of one itinerary on offer:
Ukrainian experienceDay 1 Early morning flight from London Gatwick to Kiev. On arrival,
transfer to the MV Marshal OrenschenkoDay 2 Morning sightseeing tour of Kiev. Afternoon at leisureDay 3 Sail along the River DnieperDay 4 Arrive in Zaporizhya and enjoy a tour of the cityDay 5 Cruise to Odessa. Free time to see the sights. Optional opera or ballet
performance in the eveningDay 6 Sail across the Black Sea to Sevastapol. Free time in the late afternoon
and evening for sightseeingDay 7 Day excursion to the Crimean resort of Yalta, visiting the Livadia
Palace, the former summer residence of the Romanovs. Rest of the day at leisure
Day 8 A tour of Sevastopol in the morning. Afternoon at leisureDay 9 Cruise to Kherson. Sightseeing at leisureDay 10 Arrive late afternoon for sightseeing in DnipropetrovskDay 11 Cruise back to KievDay 12 Arrive Kiev early morning. Return flight to London Gatwick
Question
How might marketing research aid such a company in both choice of tours and theitinerary that goes along with such tours?
CASE STUDY 1.3: ROSINE AND VERA
France retains its international reputation as a centre for the avant garde. Parishas always been a magnet for experimental writers, artists and musicians. Parishas also been the home of haute couture. Original haute couture garments, as opposed to imitation ones and adaptations, are original one-off creationsdesigned by the 23 couture houses listed with the Féderation Française de laCouture. Very high prices put haute couture beyond the reach of most pockets yet it still remains the lifeblood and focus of the French fashion industry. Most couture houses are on or near the rue de Faubourg-St-Honoré. Housesinclude Chanel, Christian Lacroix, Guy Laroche, Nina Ricci, Yves St Laurent andChristian Dior to name just a few. Comme des Garçons produces avant gardequirky clothes for both men and women. In the nearby rue Jean-JacquesRousseau, the eccentric but celebrated designer Jean-Paul Gaultier has a shop atLes Halles shopping centre, as does Agnès B, whose clothes combine the verylatest chic with comfort. In the same centre there are also inexpensive outlets
EOM_C01.qxd 6/23/05 10:35 AM Page 35

.
36 Chapter 1 • Nature of marketing research
selling copies of new designs. The rue de Rosiers in the Marais is full of newdesigners.
Rosine graduated with a first class honours degree in fashion and businessmanagement in Manchester, England, in 1994. From the very beginning she waskeen to run her own business. While on the degree course she had becomefriendly with a woman the same age as herself, Vera, who, in addition to work-ing from home and producing cheap garments mainly for children, had recentlyacquired space in a small production unit in the Ancoats district of the city. Verawas technically proficient while Rosine had flair and imagination as well as agood training in how to work in business. From 1991–95 Rosine and Vera built upa small business using various contacts they had made in the trade and occa-sional breakthroughs with boutiques in downtown areas throughout the UK.
The real breakthrough into London, however, came in 1999 when Vera andRosine designs were worn by a leading UK female rock band, The Witches, on Topof the Pops. Almost overnight their £60,000 turnover business increased tenfoldand they were hard pressed to find workers who could produce the garments inthe quantities required to satisfy the demand. Apart from relocating their busi-ness premises to London, Rosine and Vera registered their partnership as alimited company taking on the name Pique Dame, which until then had been thebrand name or label of their creations.
By the year 2004, the image of Pique Dame had changed slightly, although theemphasis was very much on the avante garde. The firm now supplied manyexport markets with some 30% of output going to US markets. New labels hadbeen introduced and among these Narcissus and Femme Fatale had provedhighly successful. Narcissus appealed to the 15–20 year olds wanting to accentu-ate their youthfulness with an accent on dark colours and ragged appearance. Incontrast, Femme Fatale had been aimed in the main at the 30–40-year-old marketwhere the emphasis was on sophistication and the creation of an alluring air ofmystery, excitement and even danger.
Two big challenges now faced Rosine and Vera. The first was how to markettheir designs to women in the over-20-under-30-year age range and what theyshould do for the large untapped market of the over-40s. Indeed, they even wondered whether they should restrict their portfolio of offerings to the under-40s. Rosine felt that the 20–30-year-old woman had characteristics that set herapart from other groups of women. She saw such women as being uncertain ofwhat they really wanted, easily influenced by peer and social pressures and inneed of constant reassurance. As Rosine put it: ‘Women in their 20s are full ofhope and expectations but they are unsure of what they really want so it isdifficult for anyone to meet such women’s expectations.’ Moreover, she thoughtthat many women in this age group were experimenters wanting to try out newideas on almost a daily basis. It was difficult to create a fashion in a market wherefads abounded.
In the autumn of 2004 the firm acquired retail premises on the rue de Rosiers inthe Marais district of Paris. The decision had now to be made about how to posi-tion the firm in people’s minds in world markets and how to set about promotingthis image.
EOM_C01.qxd 6/23/05 10:35 AM Page 36

.
Case study 1.4 37
QuestionWhat role might marketing research play in helping the firm to promote its image?
CASE STUDY 1.4: THE ENGLISH BEAR COMPANY
The English Bear Company was founded in 1991 by Alise Crossick, 29, and her husband Jonty, 28. They now have ten shops in cities including Bath, Cam-bridge and London and have recently opened in Tokyo. Their annual turnover is£4m.
Jonty: ‘Alise and I met at Cambridge in 1988 when we were both impecuniousstudents. We knew we wanted to be in business on our own and that whateverwe did, we would have to start with nothing. Designing and selling T-shirts wasthe obvious choice because it didn’t need any capital, only an understanding sup-plier. The bear idea grew out of that. Our most popular T-shirt featured a bearwhich Alise had drawn, yet she’d never actually made one when we decided tolaunch the bear company.
‘Being a typical Antipodean, she just got on with it: advertised for bear-makers, and then sat down with a bear manual. Most of the applicants patientlywatched her demonstrate, and then showed her how it could be done 100%better.
‘We always wanted to create a company that would communicate somethingfrom the heart, something magical. I think the bears do that because they expressfun and cuddles. We make them out of distressed mohair which makes them lookold and loved. Our customers don’t want something pristine, they’re looking forcharacter.
‘We initially made mistakes in identifying our customers. Our first outlet was akiosk in Whiteley’s which we thought was perfect as it gave us a start in London.The rent was so cheap that we didn’t bother to carry out market research. Itwasn’t until we opened in Cambridge that we realised the tourist trade was muchmore lucrative.
‘Our sites are now picked with greater care. It’s about 50% strategic choice,30% gut feeling and 20% scientific data.’
Alise: ‘It was never just about selling bears, our vision was the whole conceptof people wearing bear clothes, eating bear marmalade and drinking bear tea.
‘When people love bears, they personify them and become absorbed in thelifestyle. We get young businessmen coming into our shops who look like theywant to quickly buy a bear and run out again. The next minute they’re captivatedand umming and ahhing over which face they like the best. Occasionally we getpeople bringing old bears in for repairs, like the chap who rushed in with some-thing his dog had half-eaten.
‘There’s not enough people in retail trying to help their customers, it’s all take,take, take. We put our hearts into the business and believe passionately in theproducts. If you put enough energy and care into something it should work.
EOM_C01.qxd 6/23/05 10:35 AM Page 37

.
38 Chapter 1 • Nature of marketing research
‘We’re not in business to suffer so we only work with people we like. Bearsbring out the best in people because they cross gender and race and representunconditional love. If we weren’t working together I wouldn’t find it so worth-while. We generate so much love between us that it makes it wonderful foreveryone around.’
Source: Lafferty21
Questions
1 Discuss how the English Bear Company may have used marketing researchbeneficially.
2 How might marketing research still prove a useful tool to the company?
CASE STUDY 1.5: 21ST-CENTURY MARKETRESEARCH
Market research is coming out of the closet. Direct marketing firms have emergedto service the new phenomenon of relationship marketing – lifestyle databasesunderpinning the mailings of the firms to provide a direct interface betweenresearch and practice.
Direct marketing company databases hold a mass of fine detail on customers’purchasing habits. Advances in computer technology have given firms the abilityto combine databases to give a fuller picture of customer purchasing habits with-out ever having to approach a respondent with a questionnaire – the informationis directly available. Researchers no longer need to reassure respondents aboutanonymity, either; instead they offer rewards to consumers in exchange for givingpersonal information to the researchers.
Data mining is the new catchword for market researchers. Using what used tobe considered as secondary sources of information, the researchers analyse directmarketing company records to build up an in-depth picture of the lifestyles ofmillions of consumers. New ways of segmenting markets based on lifestyles andattitudes are being discovered and ways of translating market research intomarket action are working more quickly and effectively. Because of the speed ofanalysing such research, market researchers are able to offer high-quality tailoredresearch packages to small firms which previously could not have afforded pro-fessional market research.
Another area in which market research is being revolutionised is through theInternet. On one Web-based project, 160 out of 400 respondents replied to anemail survey within three hours – formerly, this many responses would havetaken days to obtain or even weeks using normal postal services. An additionaladvantage is that such surveys cost around one-third the price of telephone
EOM_C01.qxd 6/23/05 10:35 AM Page 38

.
Case study 1.5
surveys. Currently most of this research is being conducted in the United States,where more people are connected to the Net than is the case in Europe, but even-tually Web-based research is expected to outperform all other methods ofconducting surveys.
The relatively new activity of category management (CM) has also thrown upnew challenges for market researchers. The Institute of Grocery Distributiondefines CM as: ‘The strategic management of product groups through trade part-nerships which aim to maximise sales and profits by satisfying consumer needs.’In practice, what this means is that manufacturers and retailers need to cooperatein managing certain product categories, rather than concentrating solely onbrands. For example, Van den Bergh Foods (manufacturers of margarine andother fats) saw a need to establish retailer-specific market research programmesto develop an understanding of consumers’ motivations to buy margarine. Theresearch programme involved 1200 interviews conducted as customers left thestores, 1300 interviews at the margarine display fixtures in the stores, 200 depthinterviews, 76 accompanied shopping trips and 36 hours of video observation.The research was carried out in seven major retail chains. Marked differencesbetween the different retailers were found, so Van den Bergh was able to con-clude that marketing, merchandising and even pricing might need to be variedbetween retailers to take account of differences in consumer motivation betweenstore chains.
Ultimately, it seems that such research would be more efficiently carried out ifthe retailers themselves participated in the costs and shared the benefits – thiswould, of course, require agreements between the retailers to share information.Such agreements do not present a problem if an independent market researchcompany, of course, carries out the work but the result for the market researchersis that they may find themselves forced into a tight brief that allows little roomfor creativity.
Increasingly, the business community is becoming more information oriented.In a constantly changing world, the need for up-to-date and accurate informationis more important than ever before, and market researchers are using (and seek-ing) new tools for collecting and analysing that information.
(Case contributed by Jim Blythe)
Questions
1 What might be the limitations of using Web-based research in the UK?
2 What are the advantages and disadvantages of research for category managementpurposes?
3 How might the disadvantages of category management research be reduced?
4 What ethical problems might arise from the combination of direct mail databasesto generate detailed information about consumers?
5 How might creative approaches to Web research increase response rates?
39
EOM_C01.qxd 6/23/05 10:35 AM Page 39

.
40 Chapter 1 • Nature of marketing research
REFERENCES AND NOTES
1 Chisnall, P (1992) Marketing Research (4th edn), Maidenhead: McGraw-Hill, 5–6.
2 AMA (1987) New marketing research definition approved, Marketing News, 21,January.
3 Cowan, D (1994) Good information, Journal of the Market Research Society, 36(2),105–14.
4 Freeling, A (1994) Marketing is in a crisis – can marketing research help? Journal of theMarket Research Society, 36, 97–104.
5 Easterby-Smith, M, Thorpe, R and Lowe, A (1991) Management Research: Anintroduction, London: Sage, 21.
6 Allison, B, O’Sullivan, T, Owen, A, Rice, J, Rothwell, A and Saunders, C (1996)Research Skills for Students: Transferable and learning skills, London: Kogan Page.
7 Bekesi, J (1997) Gruppe Phänomenologie. Society for the Advancement of the CriticalDevelopment of Phenomenology and its Impulses, http://gph.freezope.org.
8 Embree, L (1997) What is phenomenology? Center for Advanced Research inPhenomenology, http://www.phenomenologycenter.org/phenom.htm.
9 Hannabuss, S (1995) Approaches to research, Aslib Proceedings, 47(1), 3.
10 Gummesson, E (1990) Qualitative Methods in Management Research, London: Sage.
11 Cresswell, J W (1994) Research Design: Qualitative and quantitative approaches, London:Sage.
12 Campbell, S (1997) Marketing wake-up, Financial Times, 3 June.
13 Rebondir (1996) 12, 35.
14 Samways, A and Whittcome, K (1994) UK brand strategies, a Financial Timesmanagement report, 60.
15 Sanderson, T (1996) How a spoonful of research helps the medicine go down, ResearchPlus, April, 6–8.
16 Mouncey, P (1996) With growing demands for data, will purity prove only theoretical?Research Plus, May, 9.
17 Bates, B (1996) Quality will mark the route to deeper client relationships, ResearchPlus, March, 9, 14.
18 Raudsepp, T (1987) Establishing a creative climate, Training and Development Journal,April, 50–53.
19 Rickards, T (1988) Creativity and Innovation: A transatlantic perspective, Manchester:Manchester Business School (Creativity and Innovation Yearbook).
EOM_C01.qxd 6/23/05 10:35 AM Page 40

.
Further reading 41
20 Nuttall, C (1996) Research needs more creativity, Marketing Week, 29 April, 32.
21 Lafferty, F (1997) The English Bear Company, Financial Times, 28 April.
FURTHER READING
Aschenbaum, A A (1993) The future challenge to market research, Marketing Research: A magazine of management and application, 5(2), 12–18.
Bogda, P and Meyers, G C (1991) Grab a partner for more effective research, MarketingNews, 7 January, 2ff.
Brown, S (1996) Art or science? Fifty years of marketing debate, Journal of MarketingManagement, 12(4), 243–67.
Jackson, P (1994) Buying Market Research, London: Kogan Page.Piercy, N and Evans, M (1993) Managing Marketing Information, London: Croom Helm.Weinman, C (1991) It’s not an ‘art’, but marketing research can be creative, Marketing
News, 25(8), 9, 24.West, C (1995) Marketing research, in Baker, M J (ed.) Companion Encyclopaedia of
Marketing, London: Routledge.
EOM_C01.qxd 6/23/05 10:35 AM Page 41

.
Objectives
After reading this chapter, you should be able to:
• understand how marketing research helps in allaying uncertainty
• appreciate the cost and value of marketing research
• appreciate the need to plan, schedule and control a marketing researchproject, probably with the aid of computer-based PERT in this process.
Keywords
PERT research proposalproblem definition research scheduleresearch control uncertaintyresearch limitations value of researchresearch plan
Planning the research project2
EOM_C02.qxd 6/23/05 10:37 AM Page 42

.
Planning the research project 43
Plan of Chapter 2
EOM_C02.qxd 6/23/05 10:37 AM Page 43

.
44 Chapter 2 • Planning the research project
INTRODUCTION
Marketing research plays an important role in helping to solve problems and improve decision making by producing information that helps to allayuncertainty. Marketing research, however, costs money and while the benefits ofgood information are self-evident, research must be cost-effective if it is to be employed. Sometimes, it may not be worthwhile to undertake marketingresearch, while under other circumstances it will be highly beneficial to do so.Like all project work, marketing research can be quite complex and requires con-siderable planning, scheduling and control. Not only is this important from theviewpoint of coordinating a project but it also ensures that research informationis produced within a prespecified period of time and that costs are kept undercontrol. The use of computer-based PERT network methods not only helps toplan, schedule and control a project but can also indicate how further savings incost and time may be effected as and when the need arises.
MARKETING PROBLEMS
Marketing problems arise in business all the time. Some are vitally importantproblems and concern sales, profits and the general welfare of the business.Before any research is undertaken, a well-planned statement of the problem hasto be thought through. Since different executives may have different perspectivesof the problem, and hence different views about its precise nature, there is a needto consult everyone concerned before the problem is finally fully specified. Eachindividual must contribute their thoughts to the problem definition before avalid, useful study of the problem can be properly undertaken.
Continuous monitoring for problemsSome marketing problems require extensive study because they seem likely touncover the possibility of producing profitable marketing opportunities or, con-versely, sizeable losses. Some will require immediate attention while others maybe less urgent.
A PROBLEM THAT REQUIRES A THOROUGH STUDY
A firm produces a wide range of food products for the consumer market. It believesthat its jellies are of a superior quality and taste, but sales are below what the firmmight have expected. The fault may lie with the price or the packaging, but the firmdoes not really have any precise ideas. It is even wondering whether it should drop outof the jellies market entirely. If this last action is seriously contemplated, the firmneeds to know how this would affect its other product lines and, in particular, whateffect this would have on distributors’ readiness to stock the firm’s other products.
EOM_C02.qxd 6/23/05 10:37 AM Page 44

.
Marketing problems 45
A systematic approach to problem definition can help to direct marketingresearch staff in their efforts to obtain relevant information. It is also informativeto all those people in the organisation who will be affected by the findings andrecommendations.
MANY PARTIES MAY BE INVOLVED IN HELPING TO DEFINE AMARKETING PROBLEM AND IT HAS TO BE APPROACHED IN ASYSTEMATIC MANNER
A firm manufactures high-quality crystal glassware and wants to expand andbecome more profitable. It is considering manufacturing and distributing a line oflower-quality, lower-price products. It is unsure, however, whether it has the man-ufacturing and marketing experience to make such a venture successful.
In defining such a problem we have to adopt a systematic approach. The firststep is to find out what the firm needs to know. Certainly, the firm needs a completeknowledge of the market. What competitive lines are being sold? Are competitors’lines profitable? Is there room for another line? How strong are brand names? Howstrong would the firm’s brand name be in this lower-price line? Should the firmeven use its brand name for this product? Can current distribution channels handlethe new line? How strong are lines coming in from other countries?
The definition of the marketing problem must cover these questions togetherwith additional questions posed by other involved parties.
Problem definition must take into account the situation of the company and itsability to take sound action. Poorly thought-out marketing decisions can causemajor problems, sometimes with disastrous consequences. Many things can gowrong and many opportunities can be missed. The marketers in the firm need toanticipate and prevent as many of these as possible and in each case the firstaction should be a precise definition of the problem.
SWISS WATCH INDUSTRY – MISSING AN OPPORTUNITY THROUGHINCORRECT PERCEPTION OF THE PROBLEM
The Swiss watch industry chose to ignore the application of a new technology eventhough it had created the technology in the first place. Although the Swiss watchindustry invented the quartz movement it did not initially make use of the inventionbecause it felt that this invention would have strong negative effects on its existingproduct markets.1 The Swiss argued that anyone else could make the quartz move-ment, whereas only the Swiss themselves had the skills to make the clockworkcomponents required for automatic and mechanical movements.
With the benefit of hindsight we can appreciate that the Swiss were right in their thinking but wrong in their strategy. Watchmakers in Japan and Hong Kong
s
EOM_C02.qxd 6/23/05 10:37 AM Page 45

.
46 Chapter 2 • Planning the research project
immediately adopted the quartz movement and, in one year, the sales of Swisswatches dropped by some 25%.
Swiss watch manufacturers became entrapped because the executives in thefirms did not really understand the nature of the market. They did not appreciate orunderstand customer wants and needs. The Swiss Swatch company rescued theSwiss watch industry by providing a bulk outlet for quartz movements so that pricescould be brought down. The firm also recognised that telling the time was nolonger the most important thing in a watch. The Swatch was not selling ‘an indica-tor of the time’ as much as fun and costume jewellery.
From the very beginning of awareness and consideration of a marketing prob-lem, research should be an integral part of the problem-solving approach.
EXAMPLE OF A MARKETING DECISION – A NEW PRODUCT FOR AMANUFACTURER
Marketing research can find information that helps to answer the following questions:
• Does an obvious need for the product exist?
• Has the company sufficient financial resources to design, manufacture and pushthe product through the early sales growth years?
• What will be the best design to adopt?
• What will be the best price level(s) for the market or market segments?
• How should the firm choose between volume, price and profit?
• What will be the probable market life for the product?
• What level of quality will be required?
• Who are the competitors, who is about to enter the market and how strong areactual and potential competitors?
• What will be required in the way of promotion? What will it cost?
• How will this new product affect current lines?
Problem definition: goal-oriented approach
Rickards2 suggests a useful way in which to approach problem definition is thetechnique known as goal orientation. Essentially, the method employs identifyingneeds, obstacles and constraints in the search for an adequate definition of theproblem. The procedure, along with an illustration, is given in Table 2.1.
(See also Proctor3 for an extensive coverage of problem-definition techniques.)
EOM_C02.qxd 6/23/05 10:37 AM Page 46

.
Deciding whether to undertake a research study
Steps in solving problems
It is usually possible to solve problems in more than one way. For example, a newrange of furniture may be produced for sale in the domestic market, the domesticmarket and Europe or for worldwide distribution. A decision has to be taken as towhich of these options is the best strategy to adopt. The decision here reflects thenature of the problem and, in such a problem statement, there are three possibleoptions.
The problem statement illustrates the important point that the various optionsneed to be identified and set out. Information then has to be obtained that is perti-nent to each of the identified courses of action so that an objective evaluation canthen be made about the course of action to follow. There may be some disagree-ment about the nature of the options and it is therefore of paramount importancethat these disagreements are resolved as soon as possible. Before the final defini-tion of the marketing problem, those involved in the decision must also agree onthe nature and quality of the information needed to make a sound decision.
DECIDING WHETHER TO UNDERTAKE A RESEARCH STUDY
Whether marketing research makes organisations more profitable is open to ques-tion for there are other factors to consider. Profits are associated not just with
47
TABLE 2.1 Problem definition: goal orientation
• Problem: sales/profits of main productare stagnating
• Need: increased sales and profits
• Obstacles: competition intense soincrease in market share unlikely; marketsaturated; home market in recession
• Constraints: lack of funds for internalnew product development
• Problem redefinition: possible avenues toexplore: new markets, market segments,diversification, licensing, joint ventures,integrative strategies
• Write down description of problem. Then ask:
• What do we need to accomplish (needs)?
• What are the obstacles?
• What constraints must we accept in order to solve the problem?
• Redefine the problem, bearing the above in mind.
EOM_C02.qxd 6/23/05 10:37 AM Page 47

.
48 Chapter 2 • Planning the research project
increased revenues but also result from controlling or even cutting costs – toname but two sources! Many of these factors may have nothing to do with mar-keting research. However, in theory decision making based on good informationshould be better than decision making made on the basis of no information orpoor information. Of course, in practice, this may not hold true. Even informationthat is thought to be good may not necessarily be useful. People’s attitudes andopinions do not always match with their actions so that information collected cansometimes be misleading. For example, people may say that they will buy a newcar in the next year and that they will buy a specific model. Many factors can thenintervene in the meanwhile that will mean that the intended actions are not fol-lowed through.
The above, however, is a negative picture and it is argued that in manyinstances, hopefully the majority, marketing research will lead to better informa-tion that will, in turn, lead to better decisions. The better decisions may, in turn,lead to increased revenues or lower costs and hence to more profits. For example,group discussions may indicate the need for additional features that can be builtinto a product. The additional features will enhance the product’s competitiveadvantage in the marketplace which, in turn, will enhance its sales. The addi-tional cost of including the features may involve a price increase to the customerbut the overall effect is an increase in profits associated with the product.
It is arguably better to make decisions based on objective data than purely sub-jective feelings – and better still to use both in decision making. Better researchand better management judgment, for example, might have prevented the dis-aster when the Sinclair C5 car was introduced in the UK some years ago.4 Similarcomments also apply in the case of the Swiss watch industry and its failure toexploit the opportunities presented by the quartz movement.
UNCERTAINTY IN DECISIONS
Marketing decisions are made under conditions of uncertainty. We can never besure whether a new product will be successful or whether an advertising cam-paign will be effective in terms of meeting its objectives. In fact, in marketingthere is very little of which we can be certain.
MARKETING RESEARCH HELPS TO DISPEL UNCERTAINTY
A producer of gourmet foods encounters uncertainty when contemplating a newproduct containing large percentages of saturated fat and cholesterol. How strongis consumer awareness of these dangers to health? Are people likely to becomerapidly more health conscious? Marketing research would be very advisable for thisnew product.
EOM_C02.qxd 6/23/05 10:37 AM Page 48

.
Uncertainty in decisions
Probable payoff of each option
Attention to the probable payoff of each new product, service or other optionshould be considered. The greatest potential payoff, other things being equal, isthe determining factor in exercising choice. We should attempt to estimate theprobable payoff of each option before we specify the necessity of researchingmaterial that is relevant to that option. Past product successes or failures can giveclues about what might happen.
The cost of getting information should be weighed against possible sales and profits that may result from implementing a proposed course of action.Hence, the nature and amount of marketing research to be undertaken must be strictly controlled by cost and profit considerations. In many cases the cost of research is small compared with the possible benefits to be derived fromadopting a course of action. The profits associated with the introduction of newproducts can run into many millions of pounds whereas the cost of marketingresearch may be measured in thousands of pounds. However, there may beinstances where marketing research is relatively costly in relation to expectedbenefits. In such cases, decision trees like the one in Figure 2.1, including theoptions of ‘with’ or ‘without’ research, can be set up to estimate the value ofundertaking research.
Sometimes, for competition reasons, it may be considered undesirable toundertake research since this may provide advance warning to the competition of what the firm is intending to do. While not undertaking research is a riskystrategy, it is possible that signalling one’s possible intentions to competitors maybe even riskier.
Figure 2.1 shows the use of a decision tree to evaluate whether it is worthwhileundertaking research. We can see at a glance (see pp. 504–05) that the expectedpayoff from using research is £30,000 whereas if research is not used the payoff is
49
FIGURE 2.1 Value of marketing research
EOM_C02.qxd 6/23/05 10:37 AM Page 49

.
50 Chapter 2 • Planning the research project
only £20,000. This Bayesian approach to evaluating the possible value of informa-tion assumes that the same kind of decision will be made many times and that itis possible to attach subjective probabilities to the various outcomes.
Costs of getting information
Using the maximum or minimum payoff projections, management should decide how much it could spend on research. There also has to be an estimate of the time that can be spent on adequate research. Marketing management is always keen to move ahead since a new product or a new service is excit-ing, especially when the future of the product appears bright. New lines and new markets stimulate the imagination. Taking time for adequate marketingresearch is difficult in such circumstances, but it is necessary. Failure to provideadequate time can lead to inadequate research, poor decisions – and regret andrecriminations.
RESEARCH PLAN
Some preliminary steps are required before the preparation of a research plan(see Figure 2.2). If these steps are not followed, the research study may be unsatis-factory or even useless. Early discussion with those who need and will use thefindings of a study usually produces better research. It can help to determine thecost/benefit of research or even whether the study is needed at all. Attention canbe placed on what the organisation can afford to spend on marketing research inthe light of the potential usefulness of the findings.
A plan is a blueprint for the design, execution and monitoring of a study. Whileit is a preliminary document and can be changed, it spells out the company’sproblem and needs. A plan has to be set out in detail and be shown to all thoseinvolved in the decision and the research.
The proposal is a statement of the plan comprising a discussion of the need forthe study and what it will produce. The research proposal is often used to gainthe approval and commitment to the plan of those involved in the project.
It is important to ensure that all possible interested parties are involved at allstages of preparing the research plan. Even if everyone has been involved in earlyconsultations, it is a good idea to keep them informed while the plan and the proposal evolve. Although this is time-consuming, it prevents key personnelexpressing surprise later at the way the study is going and showing strong opposi-tion to it.
Researchers should not begin work until there is such a clear statement of whythe project should be done and its benefit. It is often useful to hypothesise thefindings likely to result from the study.5 An indication of what these differentfindings may mean to the sponsors of the research may be productive. Such a
EOM_C02.qxd 6/23/05 10:37 AM Page 50

.
Research plan 51
FIGURE 2.2 Stages of a marketing research project
EOM_C02.qxd 6/23/05 10:37 AM Page 51

.
52 Chapter 2 • Planning the research project
statement signals to everyone involved that they must start thinking about thepossible actions needed because of possible findings.
Acquiring the required information
Secondary data – that is, research data that have been collected as the result ofprevious research exercises – are readily available and usually relatively cheap topurchase. In many cases, time spent in searching for information in secondarysources saves a great amount of time and money that might otherwise be spenton field research. Outside research firms can often find sources of secondaryinformation that are unknown to a firm’s marketing department and ‘internalresearchers’. Primary research in the field is taking an increasingly smaller por-tion of the amount of money spent on research. Computers can put marketingpeople in touch with amounts and kinds of information that could not even becontemplated ten years ago.
The research plan must specify exactly how the study is to be done – postalquestionnaire, personal interview, focus groups or other method – and justifywhy the method has been chosen. A study may require the use of several types ofresearch method. Focus groups, for example, are often followed by quantitativestudies. The plan should indicate why the indicated approach is necessary. Itshould also state that the specified methods might have to be altered as the studyprogresses to meet changing needs.
Questions requiring answers
Anyone who reads and approves the plan and proposal should be informed ofthe questions to be asked and encouraged to comment on them. It can be helpfulto the researchers to receive comments on the questions that have been preparedsince it is often impossible to predict how respondents will interpret questions.Questions must be phrased so that they appeal to the respondents and encouragecompletion.
The proposal should provide a justification for the questions that are to beasked. It is a good idea to provide alternative questions for consideration by thosewho review the proposal. The latter may see difficulties that were not perceivedby those who initially formulated the questions. Moreover, if it is possible to pre-sent the questions in an interesting or unusual way it should be given favourableconsideration.
Planning in advance for analysis of research data
How one analyses research data depends on how the research data were collectedand the type of data they are. The method used for analysing data obtained from
EOM_C02.qxd 6/23/05 10:37 AM Page 52

.
Research plan 53
experiments and observational studies will be different to that involved inanalysing survey data. The preparation of questionnaires requires careful consid-eration about how the data will be analysed and this has to be taken into accountwhen setting out the format of questions.
Limitations
Any study will have limitations in terms of the applicability of its findings. Theproposal should indicate research limitations by explaining what the proposedstudy can do and what it cannot. Such an explanation may prevent undeservedcriticism at a later date and prevent any feeling of disappointment with the use-fulness of the research.
Time schedule
The time schedule for research must be clearly established from the outset.Timing should be a part of the proposal and discussed at meetings concerning theproposal. If management wants to move more quickly, it must adopt a differentresearch method.
The research schedule must be agreeable to all parties and, once established,the schedule must be followed as closely as possible. Some departments in thefirm will be waiting for and depending on the findings of the research and adelayed study can be costly. Delays can prevent these departments from goingahead on other projects that may be even more important to the firm. Everyonehas to realise that some schedules may have to be changed. New and unexpectedfindings may have to be pursued, perhaps producing a change in research tech-nique. A proposal should allow for such possibilities, even though the import-ance of staying with the original schedule is recognised.
ITEMS FOR INCLUSION IN A RESEARCH PROJECT MARKET PLAN
Research reasons and objectives
• Establish motivation for research project.
• Establish purpose of research project.
• Determine budget for research project.
• Define research problem.
• Find and review previous research on research topic.
• Determine current opinion.
• Determine previous recommendations.
• Determine research questions.
s
EOM_C02.qxd 6/23/05 10:37 AM Page 53

.
54 Chapter 2 • Planning the research project
Method/analysis for research
• Select data collection method.
• Select analysis method.
• Select supplier/field service.
• Choose facility location(s).
• Prepare focus group materials.
• Supervise recruiting.
• Supervise/conduct sessions.
• Review sessions.
Data analysis and interpretation
• Choose appropriate analysis.
• Run analysis.
• Interpret results.
• Choose report format.
• Highlight findings.
Report: write up research method and management
• Present overview.
• Review literature.
• Design and execute.
• Describe population; sampling frame; sampling method/size.
• Detail collection method.
• Report completion rate.
• Explain data processing.
Report: write up analysis and interpretation
• Present data.
• Present data manipulations.
• Present interpretations.
• Summary/conclusion.
• Review significant findings.
• State major discovery.
• Report study limitations.
EOM_C02.qxd 6/23/05 10:37 AM Page 54

.
The proposal 55
• Prepare tables.
• Prepare illustrative graphs.
• List references.
• Write abstract.
• Edit report.
• Revise report.
• Print report.
Research project: presentation to management
• Highlight findings.
• Prepare slides/overheads.
• Rehearse presentation.
• Present report.
THE PROPOSAL
The producers of the proposal and plan should take into account how thefindings and recommendations should be presented and to whom. These detailsimpinge on how collected information is subsequently organised and best pre-sented as charts, tables, slides or in other ways. A study that will be presentedsolely to top management may require important differences in method of pre-sentation and details. Some thought has to be given to the types of personalitythat will examine the proposal. This means assessing the extent to which the pro-posal will have to ‘prove itself’ to certain management members and what will be needed to convince them to accept the proposal.
RESEARCH PROPOSAL
1 Clear statement of the marketing problem or problems to be investigated.
2 Contributory factors and constraints related to the problem.
3 Definition of the product/service to be investigated.
4 Definition of the survey population to be sampled.
5 Major areas of measurement – consumption, beliefs about products, expecta-tions, attitudes, motivations, classifications of buyers etc.
6 Methodology to be adopted (types of data, method of sampling, researchinstruments etc.).
s
EOM_C02.qxd 6/23/05 10:37 AM Page 55

.
56 Chapter 2 • Planning the research project
7 Expected degree of accuracy of research findings.
8 Cost and time involved in conducting the research.
9 Conditions applying to research.
10 Previous experience of researchers.
USE OF PERT IN PLANNING RESEARCH
A marketing research plan is a form of project and as such may be thought of as acombination of interrelated activities that have to be carried out in a certain orderso that the entire task is completed. There is a logical sequence to the interrelatedactivities in the sense that some of them cannot start until others are completed.Projects and planning activities have become extremely complex and require sys-tematic and effective management techniques to help optimise the efficiency ofexecuting such activities. Efficiency amounts to bringing about the greatest reduc-tion in the time to complete the scheduled activities while taking into account theeconomic feasibility of using available resources.
A network analysis tool such as PERT (project evaluation and review tech-nique) can assist planning, scheduling and research control. This tool provideshelp to monitor and organise resources in order to enable a project or activity tobe completed on time and within budget limits. Projects and planning activitiesare complex entities that often have extensive duration times, involve many dif-ferent and interrelated costs, and comprise work of a distinctive, unique, non-repetitive nature. It is customary to model projects and planning activities as networks to capture the nature of the interrelationships and the sequencing oftheir various component parts.
PERT is a three-part technique:
1 Planning: incorporates an in-depth analysis of the project or planning task andthe construction of the network to describe it.
2 Scheduling: involves the analysis of the project or exercise to determine comple-tion time, critical activities and the start and finish times for each activity.
3 Controlling: includes using the network and the schedule to keep track ofprogress and making any revisions necessary to keep the project or exercise onschedule and within budget.
The planning stage involves three parts:
1 identifying and sequencing all activities
2 drawing the network to represent the exercise
3 estimating activity times and costs.
EOM_C02.qxd 6/23/05 10:37 AM Page 56

.
Use of PERT in planning research
Once the network has been constructed and the expected times decided itbecomes possible both to determine the minimum completion time for the exer-cise and to schedule each activity. This stage is handled well by a computerprogram.
At some stage in the project, it may be thought desirable to shorten the comple-tion time. This can usually be achieved by allocating additional resources tocritical activities. A minimum duration for the project or exercise will exist andfurther expenditure will not be able to reduce completion time below this mini-mum. It also has to be realised that the efficient allocation of resources requiresfurther analysis of the project or exercise, examining time/cost tradeoffs in orderto obtain the greatest time reduction per amount of money expended.
Computers have made a significant impact on the process of project manage-ment and planning, and specialised software packages – more specifically,packages that run on desktop computers – have been developed. In applying thePERT technique, the networks produced are often large and require many revisions for replanning and updating. Making such revisions by hand can betime-consuming, confusing and costly. The process is much accelerated by theuse of appropriate computer software, making changes and comparisons mucheasier. There are many relevant software packages available, some specificallydesigned for use with the desktop computer. A useful guide to have when select-ing a package is that provided by Smith and Gupta.6
An example of a sophisticated project management computer software pack-age is Time Line for Windows.7 It possesses convenient graphing tools that makeit easy to build and revise schedules and to assign and coordinate resources,dependencies and due dates across multiple projects and planning exercises.Multiple views also allow us to see many aspects of a complex model simultane-ously. There are six types of view permissible:
• the overview
• the Gantt view
• the PERT view
• the time-scaled PERT view
• the resource view
• the cross-tabulation view.
The package also includes Guide Line software that enables the user to gener-ate project and planning schedules just by answering a series of questions. TheGuide Maker add-on enables the user to create custom guides for any businesssituation. Guide Line is based on the idea that most projects and planning exer-cises have been done before. Once the user has specified project or planningexercise requirements, it produces task lists, resource allocations and time esti-mates for the project or exercise.
57
EOM_C02.qxd 6/23/05 10:37 AM Page 57

.
58 Chapter 2 • Planning the research project
Information about projects is stored in a database and it is taking various viewsof the database, coupled with appropriate graphical representations, that enablesdetailed and informative analysis to take place. (See Figures 2.3–2.6.)
Figure 2.3 shows the standard cross-tabulation view of a marketing researchplan. Two views or windows on the data are being displayed simultaneously.Moreover, the two views are synchronised to examine the same set of records.The two windows can be expanded or contracted to show more or fewer fieldsand further records can be viewed by panning down through the records to onesthat are not currently displayed on the screen. The cross-tabulation view or win-dows allow the user to examine the tasks that have to be completed in theirlogical sequence and to see how the costs will arise over time and affect cash-flowrequirements.
Figure 2.4 shows the standard resource view of the data along with availabilityand cost of each person involved in the exercise.
Figure 2.5 shows the standard Gantt view of the data. Here again two windowson the database are simultaneously displayed. The right-hand window showsgraphically how elements of the plan take up time slots. The left-hand windowidentifies both the nature of the task involved and the nature of the humanresource requirement to carry out the task. Once again, the user displays more orfewer fields in each window and pans through the data to examine as yet undis-played records.
FIGURE 2.3 Standard cross-tabulation
Source: Screenshot reprinted by permission from Microsoft Corporation
EOM_C02.qxd 6/23/05 10:37 AM Page 58

.
Use of PERT in planning research 59
FIGURE 2.4 Standard resource
FIGURE 2.5 Standard Gantt view of data
Source: Screenshot reprinted by permission from Microsoft Corporation
Source: Screenshot reprinted by permission from Microsoft Corporation
EOM_C02.qxd 6/23/05 10:37 AM Page 59

.
60 Chapter 2 • Planning the research project
FIGURE 2.6 Standard time-scaled PERT graphical view of data
Figure 2.6 shows the standard time-scaled PERT graphical view of the data forthe marketing plan. As above, different parts of the data can be viewed in thisgraphical manner by panning vertically or horizontally.
SUMMARY
In this chapter it has been argued that marketing research performs a key role inhelping to solve marketing problems and improve decisions. It achieves this byproducing information that helps to allay uncertainty. The cost and value of mar-keting research, however, must be taken into account when deciding how muchtime and effort to expend on this activity. While the benefits of good informationspeak for themselves, the research has to be cost-effective if it is to be used at all.Where the costs outweigh the benefits it is not desirable to undertake research.Marketing research projects are complex entities and require considerable plan-ning, scheduling and control. This helps to coordinate a project and ensures thatresearch information is produced within the specified period and cost specifica-tions. Computer-based PERT network methods help to plan, schedule and controla project and facilitate savings in the cost and time required to complete the project.
Source: Screenshot reprinted by permission from Microsoft Corporation
EOM_C02.qxd 6/23/05 10:37 AM Page 60

.
Case study 2.1 61
QUESTIONS
1 Small firms may think undertaking marketing research is too expensive andnot worth their while. How might you persuade them otherwise? Under whatcircumstances might there be some truth in their viewpoint?
2 Construct a research proposal that has as its purpose identifying new productand market opportunities for a small computer software developmentcompany currently employing 30 staff and achieving an annual sales turnoverof £8 million.
3 Discuss the basic methods of collecting marketing research information andoutline the circumstances under which each of the identified methods mightmost appropriately be used.
4 Why is it important to indicate at the research planning stage how one is goingto analyse the data?
5 What is meant by the limitations of a study? Why are they important?
CASE STUDY 2.1: NEW SHOE COMPANY
The New Shoe Company, based in the English Midlands, is experiencing a fall inprofits. The company measures profits in terms of the annual pre-tax return oncapital employed earned by the company.
The sales director says that falling profitability is a reflection of the currentslump in the market. Total demand in the marketplace is much less than it was 12 months ago and the company has struggled to maintain its market share at the previous level as competition has intensified. Competition from Europeanmanufacturers has been sharpened by changes in EU trading regulations andSpanish manufacturers, in particular, have taken advantage of their lower coststructure to make inroads into the British market. At the same time, the New ShoeCompany has failed to take full advantage of opportunities in Europe. It has notfully developed its market niching strategy where it can gain a competitiveadvantage. The sales director blames the firm’s lack of competitiveness on thepoor performance of the R&D team and the inability of the manufacturingdepartments to control costs.
The technical director claims that the firm’s products are competitive with anythat are produced worldwide. Indeed, in her view, the firm’s products are by farthe best available at the price offered. She points to the lack of marketing effortexpended by the firm in the past year, pointing to the necessity to keep the firm’sname before the public at all times, especially when competition is increasing in
EOM_C02.qxd 6/23/05 10:37 AM Page 61

.
62 Chapter 2 • Planning the research project
strength. At the same time she recognises that marketing effort requires financingand that this was not adequately provided during the period in question.
The production director points out that the company has been able to lower itsmanufacturing costs substantially through the introduction of new technologyinto the manufacturing process. However, he points out the accounting practicesadopted by the firm distort the true picture. Profitability, in his view, has improved,although this is not truly reflected in the company’s management accounts.
The finance director feels that the drop in profitability is attributable to recentacquisitions the firm has made. Ventures into retailing have not been as profitableas had first been supposed. This might to some extent have been reflective of badtiming on behalf of the company, given the current recession, in making suchacquisitions.
The managing director points out that there clearly is a problem and that per-haps one should pay particular attention to what competitors are doing and howthe firm is responding from a marketing viewpoint.
Questions
1 Given the limited information in this case, what do you think could be the realproblem or problems in this example?
2 Depending on the real nature of the problem identified, how might marketingresearch help in this case?
CASE STUDY 2.2: CHERI-ROSE
The editor of Cheri-Rose, a women’s fashion magazine, has approached you aboutundertaking some research on behalf of the magazine. The magazine has notbeen successful in attracting handbag manufacturers as advertisers. On the occa-sions when it has approached the manufacturers it has been told that ladies’outfitters are a rapidly declining segment of the handbag market and since Cheri-Rose appeals primarily to women who buy from those particular outlets thehandbag manufacturers argue that the magazine is not a good vehicle for theiradvertising.
The editor thinks that a survey of women’s outfitters will show that thesekinds of outlet are not, in fact, declining in terms of their importance as outlets forwomen’s accessories – including handbags.
Question
Draft a suitable research proposal for a study that will produce information that ispertinent to the editor’s problem.
EOM_C02.qxd 6/23/05 10:37 AM Page 62

.
Case study 2.3 63
CASE STUDY 2.3: WHY RESEARCHERS ARE SO JITTERY
With a general election looming, Britain’s market research wizards are on tenter-hooks. The latest issue of the UK’s Market Research Society magazine is titled1997: Year of Decision for MR, and the lead article starts by asking whether 1997will be a year of ‘further embarrassment’. The second article is titled: ‘Laying theghost of the nightmare of ’92’, a reference to the way UK opinion polls were all atsea with their predictions of the 1992 UK election result.
Having celebrated their society’s 50th birthday last year with much braggadocio,researchers now have a hangover. This being election year, the opinion polls areon trial again, and if researchers get things wrong – which hardly seems possible,but then it did not seem possible last time – their credibility will be in smithereens.
Inevitably, the entire market research business will be seen as guilty by associ-ation and market research is now pretty big business. With £7bn in turnover andsteady, compound growth of 8–10% a year, the UK research business has doneextremely well of late. Moreover, the Association of Market Survey Organisations(Amso) forecasts growth of 15–20% this year.
Research is a nice little export earner, too. As with other marketing activities,Britain is a world leader. According to Amso, about 20% of UK market researchturnover comes from international surveys and international work is growingfaster than domestic.
Today there are few manufacturing companies, media houses, governmentdepartments, public bodies, academic institutions or even retailers in Britain thatdo not integrate research into their decision-making processes. For many years,retailers were market research Cinderellas. They believed they could learn fromtheir store traffic everything they wanted to know. As a result, they felt they didnot need to ask any questions. But retailers now account for some 5% of totalresearch expenditure and their share is growing steadily.
However, not everything is rosy. Although other market researchers strive todistance themselves from the political pollsters, they know they share their prob-lems, and many of those problems are fundamental. On one hand, some membersof the public manifestly enjoy taking part in research surveys and focus groups.The paid interviewers know who they are and return to them repeatedly. Thisleads to bogus results.
On the other hand, more people are becoming refuseniks. In Britain the indus-try now conducts well over 15 million interviews per year and 100 millionquestionnaires are mailed out by database companies. Although there are no pub-lished figures, most experienced researchers will confirm that refusal rates arerising steadily.
Even in flagship studies like the National Readership Survey, response ratesare now just over 60% after eight or more calls on respondents. (When the surveystarted in 1954 they reached 85% after six calls.) So 40% of the NRS universe is
EOM_C02.qxd 6/23/05 10:37 AM Page 63

.
64 Chapter 2 • Planning the research project
nowadays uncanvassed. Political polls suffer similarly high non-response rates,which was one of the reasons for the 1992 debacle.
More worryingly, a welter of evidence shows that a growing proportion of thepublic is now playing games with market researchers. They understand theprocesses (which are hardly rocket science) and consciously manipulate theirresponses. Like voters in by-elections, they deliberately send messages to compan-ies and political parties, using the researchers as conduits. It takes only a smallpercentage of such respondents to invalidate results. None too soon, the researchindustry has started to investigate these problems. Several of the key papers atlast month’s Amso annual conference addressed the increasingly uncertain rela-tionship between market researchers and their raw material – the public.
It is by no means clear what, if anything, can be done, and that is why so muchhangs on the election pollsters’ accuracy this time round. Polls capture the head-lines. Polls have also captured politicians. Nobody pays more attention tosurveys than politicians. Contrary to conventional wisdom, market research is afar more potent influence in modern politics than advertising. Politicians read,mark, learn and inwardly digest the voters’ views on everything from abortion totraffic crossings. And the pollsters revel in their influence.
Behind the Oval Office, the new sell-and-tell potboiler by President Bill Clinton’sformer chief electoral strategist, Dick Morris, shows Clinton messily awash withmarket research findings in the run-up to last year’s election. Indeed, Clintonoften felt himself drowning in them.
The pollsters tried to control his every waking moment. They told him tobecome a father figure with a powerful red tie and dictated how he should spendhis holidays. ‘Can I golf?’ the president asked the pollsters, his tone dripping sarcasm. ‘Maybe if I wear a baseball cap?’ He was told: ‘No, sir, go rafting.’
In compensation, market research has given political leaders, both in westernand ex-communist democracies, new power over their parties. In Britain, formerprime minister Margaret Thatcher was able to march on with confidence duringthe Falklands War because she tracked public opinion throughout. Neil Kinnock,the former Labour leader, was able to defeat Militant extremists because he knewthat the vast majority of the electorate, and the vast majority of Labour voters,supported him. The ability of the present Labour leader, Tony Blair, to rideroughshod over Labour’s historic articles of faith has, again, been built on firmlyresearched foundations. When zealous and partisan supporters claim ‘the party’llnever buy that,’ the leader, research data in hip pocket, can nowadays ignorethem with insouciance.
All this emphasises the present symbiosis between market research and pol-itics. It will last as long as the politicians continue to have faith in the researchers’wizardry. The politicians influence a great deal of business, both directly, via gov-ernment departments, and indirectly, via publicity and the media.
So the researchers wait – and worry – for 1992 was not their only cock-up.They also bombed in 1970. And in the 13 elections between 1945 and 1987, some40% of pollsters’ forecasts were inaccurate by more than plus or minus 2% – asmall margin, but usually sufficient to swing the result, which is all that matters.
EOM_C02.qxd 6/23/05 10:37 AM Page 64

.
Case study 2.4 65
Most of the time the researchers’ findings cannot be verified. They cannot beproved right or wrong. Except at elections. That is why market researchers arenow so jumpy. Their outlook is far from bleak, but it is distinctly unsettled.
Source: Fletcher8 (reprinted with permission)
Question
If most of the time the researchers’ findings cannot be verified, how does this affectthe true value of market research?
CASE STUDY 2.4: TRACKING THE RAILWAYS
Since the British railway system was privatised in 1996, the new rail companieshave been plagued with problems. Poor rolling stock, delayed trains, disaffectedpassengers, and poor coordination between the different companies regardingtimetabling and through ticketing have all contributed to the feeling of malaisethat plagues the industry.
Some of the directors of the companies have been less than sympathetictowards their customers – one director went so far as to suggest that the 40,000complaints a year his company was getting were being written during people’sworking time and that he was considering writing to their bosses about it.Another director said that the non-functioning toilets on his trains were ‘a detail’that would have to wait. The same director raised fares by 5%, justifying this onthe grounds that he was acting within the terms of his operating contract – appar-ently ignoring the moral obligation he has to his customers. The reason for theseattitudes could be that the rail companies have only been given a seven-year franchise – a period of time hardly conducive to making major long-term invest-ments in capital goods such as rolling stock and locomotives. The temptation totake a short-term view is clearly a strong one.
Equally problematically, each company seems to be trying to establish its ownbrand, and even competing with other companies, at a time when the industryneeds to present a united front in order to stave off competition from road transport.
One of the problems facing the train operating companies – or TOCs – is thatbranding may not be very effective when approaching customers who prefer tobe called passengers and only want to get from A to B in the most efficient waypossible. Design company Wolff Olins found that the most popular layout for theHeathrow Express was the most practical one rather than the most luxurious, andVirgin Trains reports that the poor image of its rail services has damaged the pre-viously invulnerable Virgin brand.
Some commentators believe that the TOCs need to segment their market moreclearly and respond better to customer needs. ‘People must be very careful to
EOM_C02.qxd 6/23/05 10:37 AM Page 65

.
66 Chapter 2 • Planning the research project
distinguish superficial marketing from true marketing,’ says Fiona McAnena ofthe Added Value Company. Both Great North Eastern Railway and Great WesternTrains have modelled themselves on British Airways; market research showedthat people wanted a more personal approach and GNER has taken thesefindings on board to the extent of asking staff to seek out opportunities to add apersonal touch.
Market research has not always worked for the railways, however. When theGatwick Express was being redesigned, customers were asked how the servicecould be improved. They were unable to come up with anything beyond theobvious, whereas the researchers were hoping that they would be able to suggestradical changes to the service. The researchers responded by setting up a panel (athink tank) of advertisers, researchers and psychologists in the hope that theywould be able to second-guess the consumers. So far the results of this panel havenot been divulged.
In the longer term, the TOCs will need to work out the problem of short-termism. This will probably require a change of heart on the part of government,allowing longer franchises to be granted – the Catch-22 is that the government isunlikely to do so until standards improve. In the meantime, the TOCs and thepassengers (or customers) will need to make the best of a difficult situation.
Questions
1 Why might the Gatwick Express research have failed?
2 How would you plan a research programme to identify the needs of the differentmarket segments for rail transport?
3 What are the problems inherent in running a research programme for the railways?
4 Given the negative attitudes of some rail bosses towards their customers, whatmight be the problems of presenting the findings of the research?
5 How might market research help in effecting a reconciliation between the TOCsand their passengers?
REFERENCES AND NOTES
1 De Bono, E (1992) in Peters, T, Liberation Management, London: Macmillan, 635.
2 Rickards, T (1974) Problem Solving through Creative Analysis, Aldershot: Gower.
3 Proctor, T (1999) Creative Problem Solving for Managers, London: Routledge.
4 Marks, A P (1990) The Sinclair 5 – why did it fail? Management Decision, 28(4), 9–14.
5 Kerlinger, F (1973) Foundations of Behavioral Research, New York: Holt, Rinehart &Winston, Chapter 2.
EOM_C02.qxd 6/23/05 10:37 AM Page 66

.
Further reading 67
6 Smith, L A and Gupta, S (1985) Project management software in P & IM, P & IMReview and APICS News, June, 66–68.
7 Time Line 6 for Windows, Symantec Corporation, 10201 Torre Avenue, Cupertino,CA 95014, USA.
8 Fletcher, W (1997) Why researchers are so jittery, Financial Times, 3 March.
FURTHER READING
Andreasen, A (1983) Cost-conscious marketing research, Harvard Business Review, 61, 4.Butler, P (1994) Marketing problems: from analysis to decision, Marketing Intelligence and
Planning, 12(2), 4–13.Chapman, R G (1989) Problem definition in marketing research studies, Journal of Services
Marketing, 3(3), 51–59.Markland, R E (1983) Topics in Management Science, New York: Wiley.McCullough, D (1999) Why marketing research is a waste of money (and what you can do
about it), Marcom Today, November.Robson, C (2002) Real World Research (2nd edn), Oxford: Blackwell.Taha, H A (1992) Operations Research: An introduction (5th edn), New York: Macmillan,
Chapter 13.Zemke, R (1978) How market research techniques can pay off for trainers, Training, 15(12).
EOM_C02.qxd 6/23/05 10:37 AM Page 67

.
Objectives
After reading this chapter, you should be able to:
• appreciate the various sources of secondary data
• understand how to start systematically to collect these data.
Keywords
abstracts indexesbibliographies internal dataCD-ROM librariesdatabase onlineexternal data secondary datagovernment statistics
Secondary data3
EOM_C03.qxd 6/23/05 10:38 AM Page 68

.
Secondary data 69
Plan of Chapter 3
EOM_C03.qxd 6/23/05 10:38 AM Page 69

.
70 Chapter 3 • Secondary data
INTRODUCTION
In this chapter, we review the various sources of secondary data. Informationhelps an organisation to solve its marketing problems and to make marketingdecisions. A distinction between information and data has to be made. Data com-prise unorganised news, facts and figures about any kind of topic you couldpossibly name. Information, by comparison, is quite different from data. It is abody of facts that is organised around a specific topic or subject. It comprises factsorganised and presented to help solve a problem or develop a plan.
When we read about something that has happened, for example, new productsthat have been launched, we have been looking at secondary data. Actually beinginvolved in launching a new product and noting our experience in this connec-tion amounts to generating and collecting primary data. When doing research wenever collect primary data if someone else has already collected the material,since it is a waste of time and effort. We should always start, therefore, by exam-ining secondary sources of information.
TYPES OF SECONDARY DATA
There is a large amount of secondary data available to the marketing researcher.While only a very small proportion of existing secondary data may be useful inany one project, marketing researchers should know where to obtain relevantdata and should be familiar with procedures to reduce the amount of timerequired to search for data. A starting point is to separate secondary data intoeither internal or external sources.
Internal data
Internal secondary data are produced by an organisation in its day-to-day opera-tions. Data on sales, advertising expenditures, inventory records, salespersons’reports, distribution costs and prices are just some examples of the type of inter-nal data that are produced.
In many instances, internal data are gathered in a relatively unorganisedmanner and people in the organisation may have little knowledge of what dataare actually available. The growth of marketing information systems alongsidethe trend towards the computerisation of all records in a business has done andcan do much to simplify the organisation and accessibility of internal data.
External data
External data are data that come from a wide variety of sources outside an organisation. So numerous are the various forms of external data that in order to
EOM_C03.qxd 6/23/05 10:38 AM Page 70

.
Types of secondary data
use them effectively a researcher needs to be skilled in the use of indexes,abstracts and directories to locate relevant material. Without the use of these aids much time and effort is invariably wasted and much relevant informa-tion may be overlooked. (See Figure 3.1 for the interlinkage of these two types of data.)
71
FIGURE 3.1 Secondary sources of information
EOM_C03.qxd 6/23/05 10:38 AM Page 71

.
72 Chapter 3 • Secondary data
SEARCHING FOR EXTERNAL DATA
The complexity of the search operation will very much depend on the type ofdata that is sought. Where specific data are sought, the search may be quitenarrow and of short duration. The researcher may often be unaware of specificinformation sources so it is important to undertake the search in an organisedand systematic manner.
In the course of searching for information, the use of indexes, abstracts, direc-tories and other available guides is helpful. You need to appreciate the differencebetween an abstract and an index. Whereas an abstract presents the basic con-tents of a publication in a few lines, an index presents only the minimum of dataabout the publication: author, publisher, date of publication and so on. Today col-lections of abstracts may be searched for electronically on CD-ROM disks or theInternet and saved to a floppy disk or hard disk file. Since the stored informationis in ASCII format, these files may subsequently be read into word processors ordatabases for further analysis or exploration.
The starting point in reviewing secondary data is to make sure that you havecorrectly identified the topic on which you need information. This first involveslisting all the possible categories or headings under which the topic might be dis-cussed by other researchers or authors. It is a good idea to make the topics fairlywide ranging in the first instance so that important aspects are not overlooked.Once these headings have been established, attention can then be turned to aidsthat will point you in the right direction.
First, you should ascertain whether a bibliography on the subject alreadyexists. A publication called Bibliographies Index: A cumulative bibliography of biblio-graphies, published by the HH Wilson Company, New York, is a useful startingpoint. This publication lists various books, periodicals and other publications thatare relevant to topics that have been identified. The British National Bibliographyhas been published since 1950 and is generally available for consultation in publiclibraries. There are cumulative volumes and it is advisable to use the indexwhich will list terms or topics you may not have considered. Most academiclibraries have a wide range of bibliographies and indexes that cover major fieldsof study. If the subject is unique a bibliography may not exist. In this case, youwill need to construct a bibliography for yourself.
ABSTRACT AVAILABLE ON CD-ROM – PERMITTING ELECTRONICSEARCHES OF THOUSANDS OF ABSTRACTS
Access No: 01075313 ProQuest ABI/INFORM (R) ResearchTitle: Breaking awayAuthors: Selwyn, PadiJournal: Successful Meetings [SMM] ISSN: 0148–4052
Vol: 44 Iss: 9 Date: Aug 1995 pp: 79–83
EOM_C03.qxd 6/23/05 10:38 AM Page 72

.
Searching for external data 73
Reprint: Contact UMI for article reprint (order no. 9753.02)Restrictions may apply
Subjects: Business community; Meetings; Planning; Creativity; SuccessGeo Places: USCodes: 9190 (United States); 2310 (Planning); 2200 (Managerial skills)Abstract: A 1993 Porter/Novelli survey of 100 Fortune 500 executives revealed
that creativity is the most important element for business success.Six tips to help meetings planners to enhance their own and others’creativity are offered: 1. Open your mind. 2. Diversify. 3. Clear yourmind for each day. 4. Stop looking for the right answer. 5. Discoveryour creative rhythm. 6. Health makes wealth.
Specific sources of information include books, periodicals, newspapers, gov-ernment information, directories, and statistics and information stored for usewith a computer. Many different aids can help you find information that is mostappropriate to your needs. However, remember that the availability and compre-hensiveness of these aids varies from country to country. For example, whilethere is a vast amount of aids available in the USA for such purposes their relev-ance to the needs of researchers in, say, Europe is not always guaranteed.
Aids for books
Every library keeps a card catalogue file on what it contains and this should usu-ally be the starting point for most library research. Most catalogue systemspresent information on books in at least two ways: an author–title section forthose looking for works of a particular author, and a subject section for thoselooking for information on a specific subject. Where books are not held by alibrary, interlibrary loan facilities usually exist. Many UK libraries possess facilit-ies to enable researchers to examine a database on a CD-ROM. Boston Spa detailsthe 500,000 books in the British Library’s national interlibrary loan collection.Another database, Bookbank, also provides details of books published in Britain.Books in Print (UK and USA) enables researchers to identify all books that havebeen published and that are currently in print. Equivalent systems operate inmost other countries. The interlibrary loan facility may operate on a reciprocalbasis between a number of regional and/or local libraries. Alternatively, theBritish Library at Boston Spa in Yorkshire operates a service for books and period-ical articles. Researchers may find it useful to visit the British Library Centre atBoston Spa but it should be noted that advanced notice of a visit is appreciated.
Aids for periodicals
The large number of periodicals and their variety of articles mean that theresearcher has to rely on indexes in searching for appropriate data. Most of theseindexes are to be found in the reference areas of libraries.
EOM_C03.qxd 6/23/05 10:38 AM Page 73

.
74 Chapter 3 • Secondary data
Ulrich’s International Periodicals Directory (New York: Bowker) is a good placeto start because it lists subject specialisms and publication details of journals thatare currently available. In the case of specifically British journals, Current BritishJournals: A subject guide to periodicals is helpful. Other indexing services list all thematerial published in specified periodicals and are produced on a regular basiswith annual accumulations. They are arranged by subject matter and author butdo not give detailed information on the contents of the article.
Abstracting services provide the same information as indexes and also a sum-mary or abstract of the article that provides enough detail for the researcher toknow if it is relevant. A rapidly increasing number of indexes and abstracts arenow available as databases on CD-ROM disks. These include:
• ABI-Inform: business and management
• Bookbank: British books in print
• PSYCLIT: psychological abstracts
• UK Official Publications: parliamentary, non-parliamentary and non-TSO publications
• indexes and abstracts are also becoming available on the Internet.
Aid for newspapers and other sources of information
For some researchers the material sought will be contained in newspapers,national census reports or other statistical databases. Most universities, for example, have access to a retrieval system for the national census.
National Online Management Information System (NOMIS) is a computerisedemployment information system developed at Durham University on behalf of the Department of Employment. It has been in national use since 1982 and permits access to official statistics on employment, vacancies and population,together with facilities to compare and analyse data on a wide range of areasfrom local to national levels. The information is available at a wide range of geographical levels and some data analysis facilities, such as graphs and percent-ages, are available within the system itself. Among the data that NOMIS canprovide are:
• census of population data to ward level
• census of employment total since 1971 – specifically employment by industrialclassification for local travel-to-work areas
• annual population projections
• National Health Service migration datasets.
EOM_C03.qxd 6/23/05 10:38 AM Page 74

.
Searching for external data 75
Such data are available for many scales of study, including the following:
• wards
• travel-to-work areas
• local authority districts
• parliamentary constituencies
• regions.
When searching for UK government statistics, researchers should start withthe free Government Statistics, a Brief Guide to Sources or the Guide to OfficialStatistics, which can be bought from The Stationery Office (formerly HMSO).
THE UK MARKET FOR FITTED BATHROOMS: THE USE OFSECONDARY DATA AND ITS LIMITATIONS
At first the idea was to concentrate on the market for fitted bathrooms, but as thismarket in the UK is still in its infancy the market structure is very fragmented, soit is difficult to obtain information about this segment. Because of this problem theresearch concentrated on the British market for baths and sanitaryware. The objec-tives of the research were to provide the reader with a general understanding of:
• market structure
• distribution system
• buyer behaviour of private customers.
Using the Aslib directory, a list of eight libraries that could be of help was drawnup. Four of these were in London: London Business School, Overseas TradeLibrary, London Commercial Library and British Library – the science and businessdepartment. Two libraries were in Manchester: Manchester Business School and the Central Library commercial section. One library was in Birmingham –Birmingham Central Library – and the other was the British Library in Boston Spa.
Being based in the north of England, I started in the local area and visited thetwo libraries in Manchester and the one in Birmingham. The result was quite goodin terms of identifying the available material as there were several good publica-tions about available market reports, newspaper articles and magazines. Thesearch words used during this part of the desk research were:
• bath(s)
• showers
• sanitaryware
• en-suite bathroom
• bathroom
s
EOM_C03.qxd 6/23/05 10:38 AM Page 75

.
76 Chapter 3 • Secondary data
• ceramics
• toilet
• WC
The initial desk research was followed by a three-day stay in London. The material obtained in London comprised market analyses made by professionalcompanies and articles from magazines. On average the reports were one to twoyears old. All the reports more or less followed the same structure:
1 introduction
2 market size
3 demand composition: the customers
4 distribution: concentrating on the merchants
5 manufacturers
6 prospects and recent developments.
The information in reports was to a large extent a replication of the same factsand figures. This at least suggested that the data were reliable. However, the majorproblem was that none of the reports looked into the distribution system in depthnor did they describe the consumer buying behaviour in a systematic way.
Source: Spindler1
Aids for locating market research reports and othermarketing information
There are many thousands of reports available and they can be located throughseveral sources, for example, Market Search,2 Reports Index3 and Findex.4
Information on organisations providing marketing information and online datacan be found in The UK Marketing Source Book5 and The Source Book.6 Databasesource books include: On-Line Business Source Book,7 On-Line Business andCompany Databases8 and Directory of On-Line Databases.9
GOLDEN NUGGETS ON A LONG AND WINDING ROAD
Getting lost on the information superhighway? Online business information ser-vices can provide the shortcuts to show business users where they need to go.
The Internet is a goldmine of information, but searching for that elusive nuggetoften yields nothing but frustration.
FT
EOM_C03.qxd 6/23/05 10:38 AM Page 76

.
Searching for external data 77
Online business information services provide better and quicker ways of findinginformation on the Internet – albeit at a price. And through the Internet, these com-panies can reach a global market of information seekers and offer new products.
Business information has been available online for many years. Initially, accesswas only via proprietary terminals and private networks, on Reuters and Lexis-Nexis, for example. But the growth of the personal computer has led most servicesto move to PC-based access with a Windows-based interface design to makesearching for information easier.
Many information services use agency distributors, including big online net-works such as CompuServe, to extend their reach around the globe. But in theInternet age, these traditional delivery channels are costly and old-fashioned. Soproviders of business information are adapting their proprietary services to allowaccess from the Web.
‘The Internet allows us to serve our existing market with new products,’ saysGerard Buckley, marketing director with Dun & Bradstreet, a leading US businessinformation provider. The company opened its global information database to theInternet in July.
Web surfers can search free of charge the D&B GlobalSeek database, which hasdetails on more than 45 million companies in 200 countries. They also can buy asynopsis of the business operations of a particular company. The report is pur-chased by credit card directly from the Web for $5 (£2.95). D&B’s existing contractsubscribers can also buy reports on the Web using the password they use to accessthe traditional proprietary service.
FT Information, the business information division of Pearson, publisher of theFinancial Times, recently announced a new Internet-based product: FT Discovery forthe Web. It provides users with news alerts and international business informationincluding news, company information and market intelligence. The product isdesigned to appeal to smaller businesses and is thus offered at a fixed price – £99 amonth for each user – and can be accessed using a standard Web browser andInternet connection.
Dialog, which claims to be the world’s oldest and largest online informationservice, celebrated its 25th anniversary this year by launching an Internet-basedservice. Called Dialog Web, the service is accessed via a standard Web browserusing the same command language adopted for the proprietary Dialog service.Dialog comprises more than 470 databases from a broad range of disciplines,including business news, patents and trademarks, science and technology, as wellas consumer news. It is the flagship product of Dialog Corporation, formed lastmonth from the merger of MAID, a fast-growing UK information provider, andKnight-Ridder Information, the online division of US newspaper publisher Knight-Ridder and previous owner of Dialog.
KRI’s information empire comprises more than 900 databases, 9 terabytes ofdata and 160,000 customers. The smaller MAID has 4700 corporate subscribers – asingle subscription may, however, cover hundreds of users. Its core product isProfound, which offers around 100 million pages of information from more than5000 content publishers, including market research reports, business news, com-pany statistics, brokerage research and stock market prices. Profound uses MAID’sproprietary InfoSort data-indexing technology that allows fast, accurate searching
s
EOM_C03.qxd 6/23/05 10:38 AM Page 77

.
78 Chapter 3 • Secondary data
across all the databases. The service was launched in 1995, initially just as a dial-up service. But in mid-1996, MAID added access via the Internet.
At the end of 1996 an intranet version of Profound was launched that can becustom designed for an organisation at a fixed price and offers the security advan-tage of an intranet. The intranet (a private network) system also uses the InfoSorttechnology to allow each company to define its information needs and index infor-mation in predetermined categories. This facility aims to overcome the informationoverload problem common to online information services and ensure that onlyinformation relevant to the company is provided on its intranet. British Telecomplans to use the intranet version of Profound to offer large business customers acomplete managed intranet service, including customised information.
Financial analysts were surprised when loss-making MAID, whose 1996 saleswere just £21m, announced in August its plan to buy the much larger KRI, with revenues last year of almost $290m. KRI’s parent Knight-Ridder justified the saleby saying it wanted to focus resources on expanding its newspaper empire.
Online information services have proved a thorn in the side of many mediagroups because of their heavy upfront development costs. The Internet creates fur-ther uncertainty in the online market, and the big consumer-oriented services,such as CompuServe, have lost subscribers because of the Internet’s growth.
Analysts say business-oriented online services are not as vulnerable because oftheir sophisticated search engines and high-value data. However, much of thebread-and-butter information they offer, such as company results, and magazineand newspaper articles, can often be found for free on the Web. This is, however,assuming users have the patience to search for it. The rapid rise of the Web browseras a standard, easy-to-use interface has left online service providers wonderingwhether they should continue to sink money into developing and supporting pro-prietary software.
CompuServe, for example, announced in October it would make many of itsdatabases and technical forums available to Web surfers on a pay-as-you-go basis,as well as continuing with its traditional proprietary service. Gerard Buckley, of Dun& Bradstreet, believes proprietary services still have the edge because of the effortthat has gone into optimising the software used to acess the service. But theirlonger term future looks less certain.
‘There will always be people who will need value-added (proprietary) software,but increasingly we are moving to the Internet,’ he says.
Source: Nairn10 (reprinted with permission)
HOW SECONDARY DATA CAN BE USED
Secondary data can be useful in one or more of three ways in marketing research:in exploratory work, as a news source or in marketing decisions. When secondarydata are used as part of an exploratory study, they are often associated with long-range considerations of a firm, such as whether to think seriously about
EOM_C03.qxd 6/23/05 10:38 AM Page 78

.
How secondary data can be used
developing a completely new product or service. A manufacturer of leathergoods, for example, might want to consider the feasibility of establishing a chainof leatherware shops. The first step in the research process would involve a greatdeal of secondary research.
There is one secondary source – the census – that is both so extensive andintensive that it cuts across all three categories. There are also some other generalsources that can apply to one or more of the three categories.
The census
The census is the largest single source of secondary data. The range and amountof information available from the census is too great to describe in depth here.The material covers both population and business. First, we consider how censusdata may help the marketing researcher, and then we list the major types of information available in the census.
How census data may help the marketing researcher
• Studying the growth trends of production data over a period of years can helpa manufacturer to identify new product lines or additions to a product line.
• Census data may help in determining business location. Studying demo-graphic data for an area before deciding to open a retailer outlet in thatparticular area is a case in point. Furthermore, a firm may establish sales ter-ritories for its sales staff based on census of population data.
All countries will have censuses of one type or another. Here we choose illus-trations from the UK.
Census of population
Conducted every ten years, the census of population provides details on thenature of the population. It covers demographics such as sex, age, ethnicity,family size, marital status, occupation, income and education.
Economic censuses
Economic censuses include the census of production and the census of distribution.The census of production, taken every five years, provides data on shipments
(in both units and money terms) of thousands of manufactured products. Shownby Standard Industry Classification (SIC) numbers and descriptions, these datacan pinpoint exactly where particular items are produced.
The census of distribution provides basic information on the structure of retailareas of distribution. Since 1976 it has been superseded by annual sampleenquiries.
79
EOM_C03.qxd 6/23/05 10:38 AM Page 79

.
80 Chapter 3 • Secondary data
OTHER GENERAL SOURCES
Other sources of secondary data include national and local government (Table 3.1) and chambers of commerce. For business and professional markets,another possibility is trade, business or professional associations.
In the UK, a very useful government publication, published by TSO, is theGuide to Official Statistics: this covers all official and significant non-officialsources of statistics, both regular and occasional, published during the last tenyears. It attempts to give the user a broad indication of whether the statisticsrequired have been compiled and, if so, whether they have been published. Itdoes not contain statistics but it does indicate where to find them.
Abstract of Regional Statistics
Agricultural Statistics: England and Wales(annually)
Annual Abstract of Statistics
Annual Estimates of the Population of England and Wales and of Local Authority Areas(annually)
Bill of Entry Service
Business Monitor
Department of Employment Gazette (monthly)
Digest of Energy Statistics (annually)
TABLE 3.1 Useful UK government sources of information
Economic and social regional statistics for UK
Data on housing, manufactured goods, population, etc.
Customs and Excise data
Information on different UK industries – provides performanceindicators and trends against which one can compare one’sown performance. Helps to determine size of market
EOM_C03.qxd 6/23/05 10:38 AM Page 80

.
Other general sources 81
Digest of Health Statistics for England and Wales (annually)
Economic Trends
Family Expenditure Survey Reports (annually)
Financial Statistics (monthly)
Food Survey
General Household Survey
Highway Statistics (annually)
Housing and Construction Statistics (quarterly)
Key Data
Monthly Bulletin of Construction Statistics
Monthly Digest of Statistics
National Income and Expenditure Blue Book(annually)
Overseas trade statistics of the UK (monthly)
Passenger Transport in Great Britain (annually)
Social Trends
Monthly review of the economic situation
Trends in expenditure on consumer products – indicateschanges in patterns of expenditure
UK monetary and financial statistics
Trends in expenditure on food
A continuous sample survey providing a picture of changingsocial conditions in many aspects of everyday life
Overview of statistics produced by government, at a modest cost
Data on housing, manufactured goods, population, etc.
Annual collection of social statistics – population, households,education, health, housing, environment, leisure, etc. Useful forindicating changes in expenditure
EOM_C03.qxd 6/23/05 10:38 AM Page 81

.
82 Chapter 3 • Secondary data
DATA LOSS
Next week, Social Trends, the annual snapshot of life in the UK, will be published,significant parts of its data drawn from the General Household Survey. The editiondue in two years’ time will not be as good, for the Office of National Statistics hasjust announced that this year’s GHS, a survey of more than 10,000 households ayear, is to be suspended. It is a suspension, furthermore, that sounds worryinglylike a death knell. The survey will be resumed the following year, its users havebeen told, ‘if this is appropriate’.
This is a short-sighted and damaging decision. The GHS is a prime source ofcontinuous survey data since 1971. Its value lies in an unbroken series embracingincome, housing, family composition, health, employment status, education, dis-ability, use of social services, informal care and much else. It provides a windowinto the growing world of self-employment, the effects of widening inequality and thegrowth and impact of lone parenthood, while providing measures of social integra-tion and exclusion. It is used in government, in academia and in market research.
Over the past five years it has been the most used of the wealth of datasets heldin the Economic and Social Research Council’s archive. While other surveys dupli-cate some of the GHS’s coverage, none provides its ability to combine such disparateelements of British life over time in measures that can inform public policy.
Its suspension, to save £500,000, follows a cut in ONS’s £100m budget. It goes onhold while a rapid and wide-ranging review is held of future social survey needs.Such a review, to avoid unneeded duplication and ensure value for money, is sensible.
It is not sensible for the ONS to have to act first and consider afterwards. At atime when reform of welfare policies is centre stage, it cannot be right to suspend thesurvey that can inform those policies and measure their outcomes. The ONS shouldbe given the chance to think again, even if that means a temporary budget reprieve.
Source: Financial Times11 (reprinted with permission)
Regional statistics
The Office for National Statistics also publishes a useful booklet entitled GovernmentStatistics: A brief guide to sources. This publication lists the government ministriesand departments responsible for gathering specific economic and social data, suchas annual statistics in retail trades, classified list of manufacturing businesses.
INTERNATIONAL SOURCES
International data can be obtained from the International Chamber of Commerce,14/15 Belgrave Square, London SW1X 8PS, United Kingdom.
The Organisation for Economic Cooperation and Development provides data,information and charts about member countries and reports are available online.
FT
EOM_C03.qxd 6/23/05 10:38 AM Page 82

.
International sources
European Sources
The European Commission offers online material and free publications. The latterare obtainable from the Publications Centre. The Information Centre for membersof the European Information Network offers a helpline and specialist publica-tions and provides a forum for discussion through regular meetings.
The Eurostat Catalogue12 appears annually and comprises monographs, collec-tions, CD-ROMs and computer output products published by Eurostat. Thecatalogue provides a summary of each available publication or statistical docu-ment. Where statistics in printed form are also available as computer outputproducts on magnetic tape, disks or online, this is also indicated. The organisa-tions disseminating the information are also given. The useful sources ofinformation listed are shown in Table 3.2.
83
Atlas GIS for Windows and DOS, Eurostat Edition
Basic Statistics of the Community
Europe in Figures
European Official Statistics: A guide to databases
European Official Statistics: Sources of information
TABLE 3.2 European statistical sources
Displays socioeconomic data on city, region and country of Europe onmaps. Displaying data on maps pinpoints patterns and relationshipsbetween data elements. REGIO statistics include population, births,deaths, employment, gross value added and GDP as well as NUTSboundaries covering three levels of the EU regions
Gives all the main statistics on the EU and provides comparisons of anumber of European countries. Covers general statistics, economy andfinance, population and social conditions, forestry and fisheries, externaltrade, services and transport and the environment
The publication presents figures on the most important aspects of the EU.It uses diagrams, tables, maps, illustrations and text to summarise theprocess of European integration, its achievements and the important factsabout the Union today. It is essential for understanding current and futuredevelopments in Europe
Almost 100 publicly accessible databases within the field of officialstatistics are listed. The information contained in these databases coversvirtually all economic and social sectors
Lists the addresses of about 250 bodies: statistical offices of internationaland supranational organisations; national statistics institutes; regionalstatistics institutes; and national ministries and central banks thatpublish information s
EOM_C03.qxd 6/23/05 10:38 AM Page 83

.
84 Chapter 3 • Secondary data
Eurostat data are stored in different databases, for example New Cronos,COMEXT, REGIO, GISCO, EUROFARM, IOT and EUROCRON. Data are offeredon magnetic tapes, on diskettes, on paper and, in some cases, online:
• New Cronos contains around 55 million statistical data covering every sector of the economy. The data may be monthly, quarterly, half-yearly or yearlydepending on the statistical field covered.
• COMEXT exists on CD-ROM and contains statistics on trade between the mem-ber states of the Union and their trade with some 300 non-member countries.
Eurostat-CD
Eurostat Yearbook
Eurostat – Your Partner for European Statistics: A guide to the Statistical Office of the European Communities
Facts through Figures
Portrait of the Islands
Portrait of the Regions
Regions: Statistical Yearbook
Reports on ACP Countries
Contains economic and social statistics, regional data, external tradedata at product level and the nomenclatures used to classify thedifferent data
The contents are organised into five chapters: the people; the land andenvironment; the national economy; trade and industry; and the Union
The guide shows where to obtain statistical information about the EU –the sort of facts that are needed to be really well informed about the EU
Illustrates the life of people in Europe under five headings: theenvironment; men and women; education and employment; theeconomy; and day-to-day life
This provides information on all inhabited islands of the EU
Some 200 regions, comprising the entire territory of the EU, feature inthis publication in the form of maps and illustrations in colour, generaland harmonised statistical tables, commentaries and analyses onterritory, strengths and weaknesses of a region, changes in population,employment and unemployment and structure of the economy
Gives the latest statistics relating to economic and social factors in theregions of the EU
Various: e.g. Bulgaria, Hungary, Poland
TABLE 3.2 European statistical sources (continued)
EOM_C03.qxd 6/23/05 10:38 AM Page 84

.
85Non-official sources of data
• REGIO contains socioeconomic information on the various regions of theEuropean Union. These are classified in line with a specific system callednomenclature of territorial units for statistics (NUTS). The subjects covered byREGIO are demography, economic accounts, unemployment, labour forcesample survey, industry, agriculture and transport. The entire database ofapproximately 100 tables is available on magnetic tape, diskette or printout.
• GISCO is the Geographic Information System of the Commission of theEuropean Communities. Geographical data files provide a digital backcloth tomany types of cartographic applications and spatial analyses. Eurostat holdsseveral completely integrated subsets of data.
• EUROFARM is a database containing the results, in tabular form, of the Unionsurveys on the structure of agricultural holdings.
• IOT contains the input–output tables of Eurostat that appear every five years.
• EUROCRON contains the latest data for the main macroeconomic indicators in the major statistical sectors.
Further information on the databases is available from the European Commis-sion, rue de la Loi 200, B-1049 Brussels, Belgium, or at 2 rue Mercier, L-2985Luxembourg.
NON-OFFICIAL SOURCES OF DATA
There are also many non-government sources of data published by a variety of bodies: trade associations, banks, academic institutions, the trade and pro-fessional press, newspapers, and surveys produced by commercial researchorganisations. Some of these are shown in Table 3.3.
ADMAP (monthly)
BLA Group: Market Assessment(bi-monthly)
TABLE 3.3 Useful sources of information provided by commercial organisations
Covers all advertising media with regular analysesof advertising expenditures by product categoriesand media
Home, office and leisure sectors in the UK
s
EOM_C03.qxd 6/23/05 10:38 AM Page 85

.
86 Chapter 3 • Secondary data
British Rate and Data (BRAD)
Euromonitor: Market Research Europe (bi-monthly)
Euromonitor: Market ResearchGreat Britain (monthly)
Financial Times: Business Information Service
Keynotes Reports
Kompass Directory
Kompass On-line
Marketing in Europe (monthly)
Market Research Society Yearbook
Media Expenditure Analysis (MEAL)
Mintel Market Intelligence Reports(monthly)
Retail Business (monthly)
Retail Intelligence (Mintel) (quarterly)
Detailed information on newspapers, magazines,television and other advertising media
Studies of specific markets
Studies of specific markets
Business intelligence service: national andinternational commerce and industry data. Brandshares, advertising expenditure, production, importsand exports
Consumer and industrial market sizes and trends
Provides information on firms in different industriesand also geographically. Available for the UK, Europeand elsewhere. Useful for identifying competitors
Provides company names and addresses forthousands of firms throughout Europe, along withother pertinent information about the companies
Specific aspects of markets
Mainly useful for providing comprehensive lists oforganisations providing market research services inBritain
Advertising expenditure across media types
Reports on consumer products
Specific aspects of markets
Special studies of various market sectors
TABLE 3.3 Useful sources of information provided by commercial organisations (continued )
EOM_C03.qxd 6/23/05 10:38 AM Page 86

.
87Non-official sources of data
An interesting new partnership has formed between the Office for NationalStatistics (ONS) and Taylor Nelson Sofres. These two bodies are the largest gatherers and analysers of data in the UK in their respective sectors – public and private. The ONS’s mission is to improve decision making in business byproviding quality statistics. Taylor Nelson Sofres, as the UK’s largest marketresearch firm, has set the standard for market data analysis for more than 20 years.These two organisations have joined forces to produce UK Markets, published byTaylor Nelson Sofres from data provided by the ONS. The data relate to 4800 pro-ducts taken from 28,500 statistical returns made by the ONS under the Products ofthe European Community (PRODCOM) inquiry. The returns provide 90% cover-age of UK manufacturers’ sales – the remaining 10% is estimated. The aggregatedUK product sales totals are passed to Taylor Nelson Sofres, which processes thedata further, adding derived tables, analysis, commentary and charts.
UK MARKETS: A JOINT VENTURE BETWEEN THE OFFICE FORNATIONAL STATISTICS AND TAYLOR NELSON SOFRES
UK Markets is a series of 91 annual and 34 quarterly reports on UK manufacturers’sales, export/import and net supply. Data are provided for every manufacturingsector of the UK on:
• total manufacturers’ sales for each of 4800 products
• export/import totals in terms of both value and volume, inside and outside theEU
• the value of net supply to the UK market
• import and export ratios, inside and outside the EU
• average values of the product for each category
• trend data for up to the last five periods, both as actual figures and indices
• analysis and interpretation, with user-friendly commentaries, charts andgraphs.
The data and analyses in each report enable a firm to:
• compare its own performance with that of the total market
• assess market share in every category
• compare unit sales with the industry and market norms
• monitor trends and more accurately forecast the future
• measure share of exports
• measure share of the UK market held by imports.
UK Markets is available in three formats: hard copy, CD-ROM and Intelligent fax.
EOM_C03.qxd 6/23/05 10:38 AM Page 87

.
88 Chapter 3 • Secondary data
PROFESSIONAL ORGANISATIONS AND LIBRARIES
Various professional organisations and libraries are also useful sources of data.Professional organisations that are particularly useful in the UK include:
• Association of Market Survey Organisations
• Institute of Management
• Market Research Society
• Confederation of British Industry
• Chartered Institute of Marketing
• Institute of Practitioners in Advertising
• Advertising Association.
Main libraries in major UK cities, such as Manchester, have substantial com-mercial libraries attached and these provide large quantities of relevant data. Thefollowing specialist libraries are also of interest.
British Library
There is an extensive collection of international market research reports. Thelibrary has trade directories, exhibition catalogues, trade journals and other tradeliterature, including stockbroker reports. There are also CD-ROMs availableincluding the Financial Times, F & S Index, Quest Economics, European BusinessASAP, and FAME. Other publications available include Market Research Locator(index of published market research).
British Library-Lloyds TSB Business Line
British Library-Lloyds TSB Business Line is an enquiry service that is partiallyfunded through sponsorship from Lloyds TSB. The information provided may beused to gain new clients, find new suppliers, or contribute to either the businessplan or marketing strategy. The service provides the following information:
• company information – contact details, names of key personnel and share-holders, turnover figure
• market information – market size, names of major players
• product information – suppliers of particular products or services, name of thecompany that manufactures a product with a specific trade name.
EOM_C03.qxd 6/23/05 10:38 AM Page 88

.
89Professional organisations and libraries
Other library and library-type sources include:
• City Business Library, Brewers Hall Gardens, London EC2 City Business Libraryhas an extensive range of business information, trade directories, journals andmarket survey reports. It also has a collection of company annual reports, com-pany financial summary reports, UK economic reports and CD-ROMs.
• Datamonitor, http://www.datamonitor.com/ This includes reports on internationalbusiness and consumer markets. There are also databases, built up with overten years of historical data from many countries. Data are collected throughindustry panel research and through consumer research.
• Department of Trade and Industry, Export Market Intelligence Centre (EMIC),Ashdown House, 123 Victoria Street, London Information available includes UKand foreign statistics on trade, production, prices, employment, population,etc. Foreign trade and telephone directories, overseas market surveys, develop-ment plans and overseas mail order catalogues are also available.
• Euromonitor, http://www.euromonitor.com/ Euromonitor concentrates on globalconsumer goods and services sectors. This site enables viewing of the contentslistings for market reports. There is coverage of more than 300 markets (con-sumer, industrial and service sectors) and countries worldwide. The sourceconcentrates on global market intelligence, tracking international trends inboth consumer and industrial markets.
• Libraries attached to London, Manchester and Warwick Business Schools For example,the London Business School Library, at 25 Taunton Place, London NW1, hasmany market research reports along with electronic databases, thousands ofbooks, serial titles and international/historic company annual reports.
• National Statistics Library (NSILS), 1 Drummond Gate, Pimlico, London SW1 2QQThis is the Office for National Statistics and provides access and assistance toanyone who requires official statistics for research. The library maintains a col-lection of international statistical data published by major organisations suchas the UN, Eurostat and individual national statistical institutions.
• Science Reference Library, Chancery Lane, London WC2
• Statistics and Market Intelligence Library, 1 Victoria Street, London SW1
• Trade Partners UK Information Centre, Export Market Information Centre (EMIC)/Trade Partners UK, Kingsgate House, 66–74 Victoria Street, London SW1E 6SWHere there is an extensive electronic collection of statistical, marketing and con-tact information. This includes:
– electronic resources: a large range of statistical, contact, marketing and aid-funded project information available on CD-ROMs and via Internetterminals
– CD-ROM databases: information on CDs falls into three main categories:statistical, contact and marketing information.
EOM_C03.qxd 6/23/05 10:38 AM Page 89

.
90 Chapter 3 • Secondary data
Academic researchers also publish research findings on various aspects of themarketing process, often within specific industry sectors, at an even lower cost.
Government departments collect, analyse and publish a vast array of facts,figures, surveys and reports. Newspapers, trade journals and trade associationsregularly publish surveys and market reports for as little as the cover price. Theburden of scanning the press, wandering through libraries and searching amongmountains of journals can be reduced with database search facilities. Both CD-ROM databases and online databases can search newspapers, magazines andjournals for keywords. Some databases cover books, research reports and dis-sertations. Other online services, such as the Internet, are a great source of mar-keting intelligence. However, much of the information required by marketingresearchers is only available from commercial providers that charge for access, forexample, Infoplus13 and Dialog.14
Secondary sources are cheaper and faster, whether the researcher needs a com-plete market report or just a key fact, figure or name. However, the accuracy andreliability of the secondary source must also be considered.
USING SECONDARY DATA IN EXPLORATORY RESEARCH
Exploratory research provides a broad understanding of an industry, a service oran area in which a firm wants to expand its limited knowledge. Three steps areinvolved:
1 spelling out information needs
2 looking for promising leads by title or apparent content
3 getting hold of promising published material.
One often has to choose between print format and computer format whenchoosing how to capture the data. Although readily available print sources areusually inexpensive, checking out print sources takes considerable time. Use ofonline sources, by comparison, is much quicker and can often provide informa-tion that is more pertinent. However, it costs money to obtain data in this wayand the novice or even the person with computer experience is likely to needsome expert assistance.
Spelling out information needs
Marketing research begins with a statement of the problem. A statement of themarketing problem indicates the nature of the marketing decisions to be made. In turn, this leads to a statement of the kind of information that is required to
EOM_C03.qxd 6/23/05 10:38 AM Page 90

.
Using secondary data in exploratory research 91
reach these decisions. The nature of the information requirement always has to be specified. Failure to do this will make the search for secondary informationunfocused and indefinite.
Looking for promising leads
Libraries are the best source for printed material. Libraries include the publiclibrary, the college or university library and the specialist library. The publiclibrary is often a good starting point. Even in a small town, the public library mayhave commercial directories and other sources of data. Even better is the college,university or business school library, if there is one readily available – in thelarger ones, online searches may be possible. In major cities, there is probably anexcellent commercial library. The commercial library in a large city usually hasnot only good materials, but good general facilities as well.
An investigator will also want to see if there is a specialist library nearby.Typically found in industrial and commercial areas, these are usually privatelymaintained (by a business or an association) and carry considerable depth ofmaterial within some specialised topic, such as advertising or direct-mail selling.A good public library may give information on specialist libraries that may beprepared to make their services available.
When visiting a library you should arrive armed with a complete knowledgeof the business problem. When talking with the library staff about the problem, it will soon become clear whether they know how to help. If the person at thedesk cannot help, they will generally refer you to someone else. Your enquirymay also indicate that there are specialists in other library systems that can be of help.
Obtaining promising material
The economy
In order to have an understanding of the economic climate, since all marketingeffort operates within this framework, the marketer or marketing researcher musthave a continuing and current understanding of the state of the economy. Severalnewspapers and periodicals can be used for this purpose – for example, theFinancial Times and the Economist. Libraries retain numbers of the major publica-tions and these can be easily accessed.
Particular fields of business
Keeping up to date with knowledge about a particular field of business makes it anecessity to read trade papers covering the field on a regular basis. These also can
EOM_C03.qxd 6/23/05 10:38 AM Page 91

.
92 Chapter 3 • Secondary data
be helpful in getting a general feel of a particular business or industry field thatthe firm is considering entering.
Consumer geographics, demographics and psychographics
The term geographics, in terms of consumers, means where people live. The worddemographics concerns the statistics of an area’s population, such as number of households along with their composition, income, sex, age, education andoccupation. Combining geographics and demographics has coined the word geodemographics, which is simply a demographic description of those withinspecific geographic areas. The data are sometimes presented as descriptions oflocalities; in other cases the marketer predefines the characteristics of what areconsidered their best customers or prospects and obtains a list of where suchpeople live.
Psychologists use the term psychographics to mean the personality character-istics of an individual. Now that its usage has been adapted to marketingresearch, its meaning has been expanded. It is used to describe people not only interms of their personality characteristics, but also in terms of their interests andlifestyles as a reflection of these characteristics.
Lifestyle databases and geodemographic information
Data on sales and purchases underpin many databases and this is usually over-laid with a considerable amount of profile data. This is known as biographics – thefusion of profile and data on sales and purchases. As a result of associatingpeople’s names, addresses, purchasing behaviour and lifestyles and placing it alltogether on a single record we can obtain an idea of someone’s lifestyle. We canalso create data fusion by linking such data with a geographic informationsystem database. Linking purchasing behaviour data with lifestyle, geodemo-graphics and panel data helps to produce patterns of purchasing in variousregions.
Information sources for statistics
The census and private sources provide statistics about consumers. Since thecensus provides details about where and who consumers are – specific geogra-phy by characteristics such as age, sex, ethnicity, size and nature of the livingunit, type of dwelling and rental or value of dwelling unit – it has many immedi-ate marketing applications. A firm can use local data to tailor neighbourhoodpromotions. A bank can make use of local data to obtain a demographic picture ofthe neighbourhoods surrounding its various locations. With this information,it can single out neighbourhoods most closely matching its profiles of typical purchasers of personal loans, mutual funds and other banking services. It caneffectively target its advertising and direct mail efforts.
EOM_C03.qxd 6/23/05 10:38 AM Page 92

.
Using secondary data in exploratory research 93
Information about business and industry
General categorisation of business and industry using the SIC
Grouping by kind of business is just as important for business and industry as demographics is for consumers. One of the best and most commonly usedmethods of classifying business and industry by type is the Standard IndustrialClassification (SIC), which lists all types of business and assigns classificationnumbers to each.
The categorisation of the SIC is formulated so that no industry is missed. Onlywith knowledge of the SIC number is it possible to search most sources for material relevant to the particular marketing problem. A full explanation of howto use the SIC classification is provided in Chaper 14.
Directories
The Yellow Pages of the telephone directory is a good source of company names bytype of business. In the UK, even local public libraries usually have most of theYellow Pages for the entire country. A limitation of the use of the Yellow Pagesshould, however, be borne in mind. There is no quality control of the companieslisted: a listed firm might be a one-man operation handled on a part-time basis.Many other business directories may also be found on library shelves in the refer-ence section. For example, the Kompass Directories provide useful information onbusinesses and their products.
Databases
Searching databases is a good way to seek out published information. Online vendors of bibliographic databases include BRS (BRS Information Technologies),Dialog (Dialog Information Services, Inc.), NEXIS (Mead Data Central, Inc.) andDow Jones/Text-Search Services. These services give access to computer-readabledatabases. Dialog is the distributor of more than 350 databases. A typical data-base may have one million or more records, each consisting of an abstract of apublished article containing one or two paragraphs that give the major points ofthe article along with bibliographic information.
ONLINE MARKETING RESEARCH
Widespread use of the Internet has given rise to the online Internet marketingresearch firm and a shift in focus towards measurement and analysis of e-commerce Internet business activity. Research firms now offer e-business ana-lysis in addition to traditional quantitative and qualitative research methods.
EOM_C03.qxd 6/23/05 10:38 AM Page 93

.
94 Chapter 3 • Secondary data
MARKETING RESEARCH TOOLS
The BRMB International offers the target group index (TGI). People are recruitedto fill in an extensive questionnaire concerning their reading and shopping habitsand their lifestyles. This allows media companies to use TGI data to produce asnapshot of the person who buys a particular magazine or newspaper and targetpromotions and advertising accordingly. CACI International has developed e-types – the first classification of online consumers and their behavioural habits.The e-types classification provides information such as how long consumers stayon one site, how frequently they purchase, what products they are buying, etc.Use of the Internet for research purposes greatly reduces data collection costs andit tends to be quicker. Virtual focus groups are employed to conduct marketingresearch using the Internet.
SUMMARY
The chapter has considered the various sources of secondary data and suggestedsystematic ways of searching for appropriate data or information relevant to amarketing problem. Attention has been drawn to both government and commer-cial sources of data and to libraries, bibliographies, indexes and abstracts asimportant aids in the search for information process. Detailed information hasbeen presented about many secondary information sources.
QUESTIONS
1 What role do secondary as opposed to primary data play in the marketingresearch process? Discuss.
2 Indicate some of the main UK and European government published statisticsand reports and outline how they might be useful to marketers.
3 How might generalist or specialist UK libraries be useful to marketresearchers? Indicate some of the establishments and the relevant informationthey might contain.
4 Academic institutions undertake research and produce publications in avariety of fields. To what extent might the information that is produced beuseful to marketing management?
5 How might online marketing databases and online marketing research assistin the process of marketing decision making?
EOM_C03.qxd 6/23/05 10:38 AM Page 94

.
95Case study 3.2
CASE STUDY 3.1: MONTRES D’OCCASION
The jewellery quarter in Birmingham is one of the last surviving British examplesof the transition from an essentially domestic to an industrialised economy. Threecenturies of industrial innovation, growth and decay can be traced in its streetsand buildings. It typifies the essential character of entrepreneurial activity inVictorian Birmingham and it throws out a challenge to any ability to plan for thefuture. Working in precious metal in Birmingham dates from at least the 14th cen-tury, but the industry did not attain national importance until the second half ofthe 18th century.
Charles is contemplating taking up the lease on workshop/retail premises inthe jewellery quarter of Birmingham at Hockley. He wants to refurbish and repairsecond-hand wristwatches under the French name for second-hand watches,‘Montres d’Occasion’. Birmingham is the UK’s second largest city with over onemillion inhabitants and its jewellery quarter has a national and some say eveninternational reputation for the breadth and variety of jewellery goods and ser-vices it can offer.
In the jewellery quarter many businesses are engaged in buying, selling andrepairing jewellery items, including watches. Charles’ interest in the idea stemsfrom his own experience as an amateur horologist and the skills he developed atcollege in working with gold and silver. He has been an avid collector of wrist-watches for the past 20 years and has a comprehensive collection of more than500 wristwatches of different kinds. These range from modern-day quartzSwatches to First World War officers’ wristwatches. He plans to offer many ofthese watches for sale as part of his opening stock. Naturally, there are three orfour favourite ones that he plans to keep for himself.
Charles visited Hockley to get some idea of the kind of place he would beworking in if he did decide to go ahead with the venture. Now he wants to obtainmore detailed information that will help him make a sensible decision.
Question
What difficulties might Charles encounter in doing this?
CASE STUDY 3.2: THE WEB
You first need an understanding of what the Internet is and what it is not. Youhave to be conversant with the concept of networking – building relationshipsaround common interests. The World Wide Web is the part of the Internet that is likely to be of particular interest to marketers, because it brings together sound, vision, text and direct communication with individuals: in other words,
EOM_C03.qxd 6/23/05 10:38 AM Page 95

.
96 Chapter 3 • Secondary data
multimedia. At least 100,000 companies around the world launched websitesduring 1995–96.
Firms can design and run a website themselves. The big investors include com-panies with international brands, such as drinks manufacturers, which recognisethat the Web is a cost-effective global communication tool. Another website is theYell International directory site for Yellow Pages. Other companies include RankXerox, whose site has already generated sales worth nearly £200,000. Rank Xeroxmarkets colour laser printers and multifunctional faxes – which means it needs totarget early adopters. Research showed the firm that these are exactly the sort ofpeople who are likely to be using the Internet. The Glaxo Wellcome site invitesyou to choose from the following options:
• Science: browse a selection of information relevant to those involved in phar-macology, or find out about scientific research at Glaxo Wellcome.
• Healthcare: take a look at this collection of informative reports relating to dis-ease and disease management issues.
• News: keep yourself up to date with our latest developments.
Perhaps one of the faults with many sites is that they try to be all things to allpeople. Many website launches promote the fact that a company’s information isbeing presented to 20 or 30 million people worldwide, as if it were some kind ofglobal television broadcast. However, the Web is different to TV and press com-munication. It is ‘narrowcasting’ in the sense that the audience is self-selecting:the audience chooses to visit the site and, once in, the user chooses what informa-tion they want to look at.
Running a site is time-consuming if it is to be done properly and it is impera-tive to keep information up to date. Virgin Atlantic fell foul of a US court forfailing to update its fare information.
Source: Working on site15
Question
Discuss the possibility of using a website to provide secondary marketing information.What kind of difficulties are there in doing this?
CASE STUDY 3.3: SALARIES
In 1996 the James Market Research Organisation was trying to put together a listof published figures relating to people’s earnings. It was looking for informationfor the occupations shown in Table 3.4.
EOM_C03.qxd 6/23/05 10:38 AM Page 96

.
97Case study 3.3
ArmyPrivateColonel
Prison servicePrison officerPrincipal officer
PoliceConstableSuperintendent
HealthNurseGeneral practitionerDentistConsultant
EducationTeachers(primary/secondary)Head teacher (secondary)University lecturerProfessor
Council workersRoad sweeperOffice cleanerFiling clerkSenior officerChief executive
RetailSales assistantStorekeeper
TransportTyre/exhaust fitterCar mechanicAirline stewardessAirline captain
MediaReporter (national)National TV reporter
TABLE 3.4 Lining up occupations with earnings
s
EOM_C03.qxd 6/23/05 10:38 AM Page 97

.
98 Chapter 3 • Secondary data
AdvertisingProduct managerMarketing managerMarketing director
Civil serviceGraduate civil servantPermanent Secretary
Fire serviceFirefighterSenior divisional officer
ConstructionLabourerCarpenter/joinerCivil engineerArchitect
Food and restaurantsBarmanChef
Football playersPremier LeagueThird Division
ComputingProgrammerComputing manager
AccountancyAccountantChief accountant
LawyersSolicitorCriminal QCHigh Court judge
PoliticiansDMember of ParliamentPrime Minister
TABLE 3.4 Lining up occupations with earnings (continued)
EOM_C03.qxd 6/23/05 10:38 AM Page 98

.
99Case study 3.4
MiscellaneousHairdresserReceptionistPostmanSocial workerLibrarian
Questions
1 Indicate likely data sources for each one of the figures.
2 What will the figures in each case actually represent?
3 In each case, do you think that the figures will represent a true picture of actualearnings? Why or why not?
CASE STUDY 3.4: POWERUP ELECTRICITY PLC
The deregulation of the UK electricity supply industry in 1988 allowed new sup-pliers to enter the energy market and compete with the traditional (although nowprivatised) electricity supply companies. PowerUp Electricity plc is a subsidiaryof a French utility company and was formed specifically to take advantage of thenew competitive environment.
For the French company, the UK was an unknown territory. Having seen someof the mistakes made by French utility companies during the privatisation ofwater supplies in Britain, the parent company’s management were nervous aboutmaking the same errors, so they decided to carry out a major market researchexercise in order to ascertain the likely acceptability of PowerUp plc. The com-pany’s target market was home owners with family incomes in excess of £25,000a year; an analysis of the French utility company’s own records showed that thesehouseholds (or at least, their French equivalents) had the lowest rate of default oncredit, were relatively large consumers of electricity and were usually promptpayers. PowerUp needed to identify these customers, establish ways of reachingthem and (more importantly) find out what would attract them to switch electri-city suppliers.
In the first instance, the firm’s researchers set out to find out how many suchhouseholds exist within the UK. This proved straightforward enough; govern-ment statistics supplied the answer, at 2.2 million households. This was morethan enough to make entering the market worthwhile; PowerUp could go to thenext stage.
EOM_C03.qxd 6/23/05 10:38 AM Page 99

.
100 Chapter 3 • Secondary data
ACORN statistics were bought in to find out where the households werelocated, but then the work of surveying the households began. The researchersdecided to opt for a quota sample, using the ACORN classifications to establishthe quotas. This meant that considerable travel was involved, but since thesurvey was intended to establish parameters for a national company, this wasonly to be expected – PowerUp certainly did not want to skimp on research thatmight save the company millions in the long term.
Unfortunately, although the ACORN data were extremely reliable for judgingthe type of housing and the lifestyles of the inhabitants, they did not prove a suc-cessful predictor of income. For this the firm needed another source of data,which it was able to buy in from a specialist mailing list supplier. By combiningdetails from the mailing list with those supplied by ACORN, PowerUp’sresearchers were able to generate a more refined mailing list of customers withinthe target market and use this to run a questionnaire-based survey to determinetheir needs.
Furthermore, some doubt was expressed at board level as to whether thefigures for France could be applied to the UK – the directors were not naiveenough to believe that credit ratings in the UK could be calculated in exactly thesame way as they were in France or that UK consumers would have the sameconsumption profiles as their French equivalents, even if other details such asincome and home ownership were similar. Apart from any other considerations,the rate of home ownership in the UK is much higher than that in France, whichwould alone be enough to distort the comparisons.
Overall, the directors felt that the research as conducted so far was inconclu-sive to say the least, and downright inaccurate to say the worst. Their feeling wasthat the UK should be considered as a completely separate market, with its ownrules and parameters; very little could be carried over from experience of theFrench market, and indeed it might be dangerous to attempt to do so.
(Case contributed by Jim Blythe)
Questions
1 How might PowerUp have used secondary sources to check the comparability ofthe French target market with the British target market?
2 What other sources of secondary data might PowerUp have used to find out aboutits target market?
3 What information needs did the secondary research reveal?
4 What sources are available for PowerUp to find out how to promote the product tothe target market?
5 Why did PowerUp need to use primary research at all?
EOM_C03.qxd 6/23/05 10:38 AM Page 100

.
101Further reading
REFERENCES AND NOTES
1 Spindler, R (1991) unpublished MSc dissertation, Odense University.
2 Market Search, Arlington Publications, 25 New Bond Street, London W1Y 9HD.
3 Reports Index, Business Surveys Ltd, Osmington Drive, Broadmayne, Dorset DT2 8ED.
4 Findex, available through Euromonitor, 87 Turnmill Street, London EC1 5QU.
5 UK Marketing Source Book, NTC Publications, Farm Road, Henley-on-Thames,Oxfordshire RG9 1EJ.
6 The Source Book, Keynote Publications, 72 Oldfield Road, Hampton, MiddlesexTW12 2HQ.
7 On-Line Business Source Book, Headland Press, Henry Smith’s Terrace, Headland,Cleveland TS24 0PD.
8 On-Line Business and Company Databases, ASLIB, 20 Old Street, London EC1V 9AP.
9 Directory of On-Line Databases, Gale Research International, PO Box 699, North Way,Andover, Hampshire SP10 5YE.
10 Nairn, G (1997) Golden nuggets on a long and winding road, Financial Times, 3 December.
11 Financial Times, 23 January 1997.
12 Eurostat Catalogue: Publications and Electronic Services, Office for the OfficialPublications of the European Communities, L-2985 Luxembourg.
13 Infoplus, PO Box 12, Sunbury-on-Thames, Middlesex TW16 7UD.
14 Dialog, Plaza Suite, 114 Jermyn Street, London SW1Y 6HJ.
15 Working on site (1996) Marketing Week, 26 April, 51ff.
FURTHER READING
Abdel-Ghany, M and Sharpe, D L (1997) Consumption patterns among the young-old andold-old, Journal of Consumer Affairs, 31(1), Summer, 90–112.
Abraham, M and Lodish, L (1990) Getting the most out of advertising and promotion,Harvard Business Review, 68(3), 50–63.
Baker, K (1989) Using geodemographics in market research, Journal of the Market ResearchSociety, 31, 37–44.
Blattberg, R and Deighton, J (1991) Interactive marketing: exploiting the age ofaddressability, Sloan Management Review, 33(1), 5–14.
EOM_C03.qxd 6/23/05 10:38 AM Page 101

.
102 Chapter 3 • Secondary data
Blattberg, R and Hoch, S (1990) Database models and managerial intuition: 50% model + 50% manager, Management Science, 36(8), 887–99.
Crouch, S (1985) Marketing Research for Managers, London: Pan.Government Statistics: A brief guide to sources, London: Office for National Statistics.Jackson, P (1994) Desk Research, London: Kogan Page.Larson, E (1992) Watching Americans watch TV, The Atlantic Monthly, March.Levitas, R and Guy, W (eds) (1996) Interpreting Official Statistics, London: Routledge.Mayer, M (1990) Scanning the future, Forbes, 15 October.Marketing Pocket Book, published annually by The Advertising Association in conjunction
with NTC Publications, Farm Road, Henley-on-Thames, Oxfordshire RG9 1EJ. See alsothe Lifestyle Pocket Book, the Media Pocket Book and the Regional Marketing Pocket Book.
EOM_C03.qxd 6/23/05 10:38 AM Page 102

.
103Last A Head on Spread
Sampling
Objectives
After reading this chapter, you should be able to:
• appreciate the key elements involved in devising a sampling plan
• understand the important features of both probability and non-probabilitysamples
• understand the major types and primary practical uses of both probability andnon-probability sampling
• understand the primary approaches for determining sample size
• appreciate the nature of the sources of sampling and non-sampling error andhow to minimise them.
Keywords
ACORN populationcall-backs probability samplecensus quota samplecluster sample random sampleconvenience sample response errorframe samplejudgement sample social classificationnon-probability sample stratified samplenon-response error universe
4
EOM_C04.qxd 6/23/05 10:39 AM Page 103

.
104 Chapter 4 • Sampling
Plan of Chapter 4
EOM_C04.qxd 6/23/05 10:39 AM Page 104

.
Census and samples
INTRODUCTION
Once the researcher has decided how primary data are to be collected, the nexttask is to obtain a sample of respondents that is representative of the target popu-lation of interest. This chapter discusses the major sampling techniques and howthey are used in marketing research. The techniques can be divided into probabil-ity and non-probability methods. In probability sampling each element of thepopulation has a known non-zero chance of being selected. In such cases it is possible to compute sampling variation and project the results to the entire popu-lation. In the case of non-probability sampling, the chance of selection of aparticular population element is known and, strictly speaking, results cannot beprojected to the entire population. Although sampling can be technically rigorous,the need to be so does depend on the particular application.
This chapter discusses the key elements involved in devising a sampling planand explores the importance of properly defining the target population of inter-est. It illustrates the important features of both probability and non-probabilitysamples and describes the major types and primary practical uses of both probability and non-probability sampling. The chapter outlines the primaryapproaches to determining sample size, defines the concept of sampling and non-sampling error and explains the nature of the factors contributing response andnon-response errors. Finally, it suggests how response rates can be improvedand discusses ways of remedying non-response errors.
CENSUS AND SAMPLES
When we want to uncover information about the attitudes, ideas, beliefs andhabits of a population, one way is to ask every member of it to participate in ourstudy. Such an approach is called taking a census.
A census
A census is a count of people, houses, business firms or other items of inter-est taken at a particular time. Governments of different countries often take censuses of population and production every ten years. A census of the popula-tion, for example, tries to count everyone in the country at a specific time. Aquestionnaire is sent to every household asking how many persons are livingthere at the designated time and asking for information about gender, age andother details.
Census data are used for market research and changes in the data are indis-pensable in forecasting trends in demand for goods and services. Almost everycountry now conducts a census of some kind, usually at intervals of five or ten
105
EOM_C04.qxd 6/23/05 10:39 AM Page 105

.
106 Chapter 4 • Sampling
years. The information obtained ranges from basic data on the size, ages and locations of a country’s population to information on migration, family com-position, income and standard of living. Censuses can vary in their accuracy;questions have to be skilfully framed to obtain objective answers or at least tominimise the degree of inaccuracy.
SAMPLING
• Marketing research of a whole population is impractical.
• Sampling allows us to obtain valid data on a representative section of a popula-tion from which we can draw valid conclusions about the whole population.
• Random and quota sampling methods are usually applied in marketing research.
SAMPLING
Some so-called census information is in fact obtained by sampling. Computer-assisted statistical procedures make it possible to obtain useful information aboutmany characteristics of the population by questioning only a selected sample ofpersons. Samples cost only a fraction of what it would cost to interrogate everyone.
To sample something is to examine a small portion of it, usually for the pur-pose of judging the nature or quality of the whole. In statistics, a collection ofelements that have one or more specified characteristics is called a population. Asample, then, is some portion of a population. Because many populations of inter-est are too large to work with directly, techniques of statistical sampling havebeen devised to obtain samples taken from larger populations.
Unless a sample is chosen by a random mechanism, however, the results thatare obtained from a study are likely to be biased in some direction. It is for thisreason that methods of random sampling have been devised. A random samplecan be chosen, for example, by throwing dice. Most commonly, however, when alist of names exists from which a sample can be chosen, the actual technique is touse random numbers generated by a computer. The list is numbered, and thecomputer provides a string of numbers from this list in such a way that variousbatches of entries in the list have an equal chance of being drawn.
Suppose that a market survey is being taken. A sample group is chosen fromthe population in the above manner, and the individuals who make up thesample are then interviewed. For example, an individual may be asked aboutwashing powder brand choice. The arithmetic mean of the total answers pro-vided by the individuals yields the proportion preferring one brand or the other. Any statistical population asked this question will also have an averageresponse to it. The responses of the individuals in the population vary about this
EOM_C04.qxd 6/23/05 10:39 AM Page 106

.
Sampling 107
average response. The variability of the response is described by a quantity calledthe population variance. The arithmetic mean varies from one sample to the next,but it varies about the average response. In addition, the bigger the sample rela-tive to the population size, the more accurate is the estimate determined by sampling.
Some situations permit the population to be split into a few very homogenousgroups or strata. The sample may then consist of a random sample taken withineach stratum. Such a sample is called a stratified random sample.
Thus far we have assumed that a list, or sampling frame, is available. This isnot true, however, in all cases. For example, no list exists of the pony populationof Dartmoor. Thus the important topic of estimating the size of some populationsmust be handled differently. Areas are usually chosen at random.
THE BASIC NOTION OF A RANDOM SAMPLE
If the population is (1,2,3), there are three possible two-member samples:
(1,2), (2,3), and (1,3).
Each of them has a one in three chance of being drawn. This is called random sampling.
Key elements in devising a sampling plan
Surveys attempt to find things out about a population. For marketing researchpurposes populations may consist of people or firms. A population for a surveycomprises all the persons or companies to which you would like to direct ques-tions. It would be highly advantageous to contact all members of a populationand ask them to answer all the questions we want to put. If this could be done wecould produce very accurate results. However, only seldom is it possible to con-tact or gain a response from all the members of a population. The exception is inthe case of industrial market research where it may be possible to contact all thefirms that make up a particular population because the population may be verysmall (see Figure 4.1).
Usually, large populations are encountered in marketing research and it isimpractical or too expensive to contact all the members. In such cases we have totake a sample from the population – but we must ensure that the sample wechoose represents the population as a whole.
There are three decisions to be taken in drawing up a sampling plan:
• Who is to be surveyed? This defines the target population. Once this has beendone the next step is to develop a sampling frame: that is a way of givingeveryone in the target population a known chance of inclusion in the sample.
EOM_C04.qxd 6/23/05 10:39 AM Page 107

.
108 Chapter 4 • Sampling
• How many people/companies should be surveyed? Large samples give better resultsthan smaller ones. However, samples of less than 1% of a population can oftenprovide good, reliable information provided that the sampling procedure iscreditable.
• How should the respondents be chosen? Probability samples allow the calculationof confidence limits for sampling error. Thus in taking probability samples we can attach probabilities to any point estimates that are made. Cost and time often make it impractical to collect data through probability samples.Researchers often use non-probability samples – particularly quota samples.Strictly speaking, sampling errors cannot be measured in such cases.
FIGURE 4.1 Steps in developing a sample
EOM_C04.qxd 6/23/05 10:39 AM Page 108

.
Sampling 109
SAMPLING PLAN
• Who is to be surveyed?
• How many people/companies should be surveyed?
• How should respondents be chosen?
Definition of the population
The population is the total group to be studied, the target population (sometimesreferred to as the universe). It is the grand total of what is being measured:people, stores, homes or whatever. But since most samples in marketing researchare of people, homes or stores, the term population, as we use it here, typicallyrefers to one of these. If the purpose of the study has been well defined, the popu-lation is also well delineated. This is crucial if the study is to be significant andpractical for the guidance of marketing management.
Importance of properly defining target population
A sample should reflect the characteristics of the population of interest to thestudy – that is, the target population. It is essential to define the target populationprecisely since failure to do so is likely to lead to the ineffective solving of aresearch problem.
A population needs to be defined in terms of elements, units and time. Thepopulation for a new TV quiz programme, for example, may be defined as:
• males or females
• aged between eight and eighty
• who have watched an existing quiz TV programme in the past 30 days in theirown homes.
POPULATION FOR A NEW TV QUIZ PROGRAMME
Elements: males or females, aged between eight and eighty, who have watched an existing quiz programme in the past 30 days
Units: householdTime: January 1997
EOM_C04.qxd 6/23/05 10:39 AM Page 109

.
110 Chapter 4 • Sampling
The elements that constitute the population are referred to as sampling units.In the new TV quiz programme example, households are designated as the sampling units. It is easier to select households, the place where the programmesare watched, than to interview everyone who qualifies as a member of the popu-lation. In some situations, population elements and the sampling unit will be thesame, while in others they will be different.
It is up to the marketing researchers to provide explicit instructions to the fieldworkers about the qualifications of the target population. This is achieved withthe help of a list of screening questions that can be used to qualify respondents.Screening questions specifically define who should be included in the sample and who should be excluded. Most marketing research surveys exclude certainindividuals for a variety of reasons. For example, in the case of a TV sports programme, if a member of a household works for a TV company, then they areexcluded. This is usually the first question asked and the interview is terminatedat this point if this is the case. These individuals may be excluded for security rea-sons since they may work for competitors and the researchers would not wantthem to find out what the study is about.
SAMPLING FRAME
Obtaining a sample involves selecting some elements from the target population.In order to do this, it is assumed that it is possible to identify the target popula-tion of interest. A sampling frame is simply a list that identifies the targetpopulation. It can be a list of names and telephone numbers, as in telephone sur-veys, an area map of housing or a list of addresses purchased from a mailing-listsupplier. It could also be a database. The frame defines the sampling unit, the unitused in the design of the sample. The frame, and therefore the sampling unit,may take the form of households, students, retail stores of a particular definedtype (nature and size, for instance), businesses or transactions.
Although lists or other geographic breakdowns can be found, the list rarelymatches the target population exactly. For instance, a list of residents of a givendistrict naturally does not include new arrivals or households living in dwellingsbuilt since the list was compiled. Lists are rarely up to date and often containduplication, such as households with more than one telephone number or indi-viduals whose names appear on two or more lists.1
No sampling frame is perfect. For example, the listing in a telephone bookomits unlisted numbers and is outdated on the day of publication because ofmoves in and out of the area it covers (for implications, see McKenzie).2 Goodresearch planning requires knowledge of the shortcomings of the sampling framein order to make adjustments in the sampling design. The sampling frame or listthat is used defines what may be termed the operational or working population.The difference between the operational population and the target population isusually referred to as the sampling gap. This gap appears in most marketing
EOM_C04.qxd 6/23/05 10:39 AM Page 110

.
Sampling methods 111
research studies and efforts should be applied to try to minimise the gap since itspresence increases the potential for misleading results. This can sometimes bedone by combining two or more lists, taking care to remove one set of the namesthat appear on both lists.
SAMPLING FRAME OPTIMISATION
• Target population − Operational population = Sample gap
• Combine lists to minimise sample gap
Sometimes no sampling frame is available. As a rather extreme example, sup-pose that for some reason it is desirable to conduct a study of those who areoverweight. No such list exists. But it is possible to use screening as a method oflocating such people. A general frame of individuals can be used, and filter ques-tions (with standards of overweight set up in advance) can be used, asking age,height and weight to determine those who qualify.
One frame that might be used is the telephone directory. The typical approachis to randomly select a number from the alphabetical list – say 578343 – and thento add a predetermined number, say +3, to this. The number actually used in theframe then becomes 578346. The logic seems reasonable – but the list shouldinclude unlisted as well as listed numbers.
Another possibility for a frame is the mailing list. Depending on the needs forthe particular study, it is possible to obtain, on the consumer side, lists as variedas camera club members, computer owners, home owners (by value of home),prime investors (by nature of interest) and magazine subscribers (for many maga-zines). On the business and professional side, we can find lists of small-townbusinesspeople, personnel executives, retailers and plumbers.
An obvious sampling frame is the self-accumulated list: a list already in thehands of the marketing firm. It may include the names and addresses of thosewho have made purchases, have had deliveries made, used credit cards or regis-tered at trade shows.
SAMPLING METHODS
There are two major types of sampling methods: probability sampling and non-probability sampling (see Figure 4.2).
Probability samples comprise samples in which the elements being includedhave a known chance of being selected. A probability sample enables samplingerror to be estimated. This, in simple terms, is the difference between the samplevalue and the true value of the population being surveyed. A sampling error can
EOM_C04.qxd 6/23/05 10:39 AM Page 111

.
112 Chapter 4 • Sampling
be stated in mathematical terms: usually plus or minus a certain percentage. Alarger sample usually implies a smaller sampling error.
Non-probability samples are ones in which participants are selected in a purpose-ful way. The selection may require certain percentages of the sample to be womenor men, housewives under 30 or a similar criterion. This type of selection is aneffort to reach a cross-section of the elements being sampled. However, becausethe sample is not rigorously chosen it is statistically impossible to state a truesampling error.
Today, most samples chosen for applied research are non-probability samples.If carefully done – with quotas, for example, of persons to be studied – thefindings are usually valid. A true probability sample, because of the stringent
FIGURE 4.2 Types of sampling
EOM_C04.qxd 6/23/05 10:39 AM Page 112

.
Sampling methods
requirements, is likely to be far too expensive and too time-consuming for mostuses. The sampling method chosen for any particular study, therefore, must beexplained carefully, with the reasons for its acceptability and likelihood of sup-plying accurate data.
The research plan may not require that the whole country be sampled. Costand time factors may lead to the decision to cover only part of a country. Pastexperience for the products or services being studied may indicate that theselected areas are representative of the nation with respect to what is being studied. However, the more specific the description of those to be studied, thelarger the sample must be.
The major problem with the quota method of sampling is that the interviewersare allowed discretion in choosing the individual respondents within the quotacategories. This discretion introduces a possible source of bias, because the result-ing sample can largely omit some types of people, such as those who are difficultto contact.
A much better approach is the probability method of sampling, in whichspecific respondents are chosen by random selection methods. The result of thismethod is that no type of individual is systematically omitted from the sampleand the likely amount of error in the resulting data can be calculated.
Statistical laws have established that no matter how large the population beingstudied (from a small city to a whole country), the size of the sample is the mainfactor that determines the expected range of error in a probability sample. Mostcurrent polls use samples ranging in size from 1000 to 2000 individuals. Manypolling organisations have adopted probability methods in selecting their sam-ples, but the less reputable polls still use quota methods or even non-scientifichaphazard methods of sample selection – and the quality of their findings suffersaccordingly.
Forms of probability sampling
There are five forms of probability sampling:
1 simple random
2 random walk
3 stratified random
4 cluster
5 systematic.
The following are illustrative of the kind of sampling approach that might betaken (and see Figure 4.3).
113
EOM_C04.qxd 6/23/05 10:39 AM Page 113

.
114 Chapter 4 • Sampling
Simple random sampling
In this case all members of the population have a known and equal chance ofbeing included in the sample. For example, the names of every firm in a givenpopulation could be written on slips of paper and the slips deposited in a box.The box could then be shaken so that all the slips of paper become thoroughlymixed up. A blindfolded person drawing successive slips of paper from the boxwould be taking a random sample of the population.
Simple random sampling works well when we are dealing with relativelysmall populations. For large-scale consumer populations, however, the method is not appropriate since it is difficult to obtain a list of all the people in a givenpopulation!
Random walk sampling
This form of sampling is used extensively in market research as a cheap approxi-mation to true random sampling. The sample involves conducting random walksin small areas. These areas are usually wards within constituencies. First, arandom sample of constituencies is drawn from a list of constituencies and thenwithin each of the randomly selected constituencies a random selection of wardsis chosen. Next, selected random starting points within these areas (wards) arechosen and interviewers are given fixed routes to follow and instructions to obey.The instructions specify the interval of households to contact (for example, everyseventh house) and the action to take at each street junction (turn alternativelyleft or right). Special instructions are given about blocks of flats and what to dowhen non-residential buildings are encountered. Although the resulting sampleis not truly random it is usually treated as if it were.
FIGURE 4.3 Types of probability sample
EOM_C04.qxd 6/23/05 10:39 AM Page 114

.
Sampling methods
Stratified random sampling
This approach is more suitable for sampling large consumer populations. Itentails dividing the population into mutually exclusive groups and drawingrandom samples from each group. For example, the population might be dividedinto six groups, A, B, C1, C2, D and E, reflecting the social background of thepeople involved (see Table 4.1). Random samples are then drawn from eachgroup. Again, however, there still remains the problem of obtaining suitable lists of people who make up the population and the various groups within it.Stratified sampling may be used in industrial marketing research where it is possible to identify a population of firms. A stratified sample is usually adoptedto make sure that minority groups are adequately represented.
The ABCDE classification conceived by Market Research Services Ltd has beenthe system most frequently used as a method of social classification for market-ing purposes. Its failure to capture the complexity of class differences has led tonew systems such as SAGACITY and ACORN.
Cluster sampling
In this case the universe and the frame are defined and classified into homo-geneous segments. Random samples are then chosen from each segment. The method offers a sharpening of sampling, virtually guaranteeing that the useof these cells of units – done in two dimensions or more – will provide a cross-section of each.
Cluster sampling is a suitable approach to sampling large consumer popu-lations. Here the population is divided into mutually exclusive groups and the researcher draws a sample of the groups to interview. This time we are not
115
TABLE 4.1 Market Research Services classification of social class
Grade % of Status Head of household’s occupationpopulation
A 3 Upper middle class Higher managerial, administrative or professional
B 13 Middle class Intermediate managerial, administrative or professional
C1 23 Lower middle class Supervisory or clerical junior managerial, administrative or professional
C2 32 Skilled working class Skilled manual workersD 19 Working class Semi- and unskilled manual workersE 10 Those at lowest level State pensioners or widows; casual or
of subsistence lowest grade workers
Source: JICNARS3
EOM_C04.qxd 6/23/05 10:39 AM Page 115

.
116 Chapter 4 • Sampling
interested in a person’s social class but in where they live or some other charac-teristic. Assuming that residence is the key factor and that the objective is tointerview household heads, then the first step is to divide up the locality understudy into individual areas of housing. A random or stratified sample of the areasidentified is then taken and interviews are held with every household headwithin each sampled area.
This is a ‘single-stage’ cluster sample since only a sample of the blocks orareas of housing is taken. A ‘two-stage’ cluster sample might involve undertakingthe same number of interviews but making sure that a large number of blocks arecovered but that only a sample of households in each block is interviewed. Forexample, if an area comprises three high-rise tower blocks of flats, we might randomly select one of the three blocks and interview all household heads withinthat block.
Systematic sampling
In the systematic sampling method, the sampling units are chosen from thesampling frame at a uniform interval at a specified rate. For example, we mightuse the residential telephone directory. Perhaps the book has 400 pages in it, withan average, after a check of perhaps ten widely dispersed pages, of 400 listingsper page, for an estimated total of 160,000 listings (400 × 400). The particularstudy requires a list of 2000 for sampling purposes. (For simplicity at this point,we forget the number of completions required.) This means that every 80th listing(160,000/2000) should be drawn.
So that the method is a true probability method, where every sampling unithas an equal chance of coming into the sample, there also must be a random start-ing point. So if we are using every 80th listing, we must select a random startingnumber of between 1 and 79.
Forms of non-probability sampling
There are three forms of non-probability sampling (see Figure 4.4):
1 quota
2 convenience
3 judgement.
Quota sampling
In the case of quota sampling, the researcher starts with the knowledge of howthe universe is divided by strata. The investigators are instructed simply to fill thecells, so that the sample obtained is indeed representative in terms of the cells.The procedures used in quota sampling make the choice of respondents the
EOM_C04.qxd 6/23/05 10:39 AM Page 116

.
Sampling methods
responsibility of the interviewers. Unfortunately, this can lead to substantial biasthat cannot be objectively measured. Wide use of quota sampling has been madein marketing research since it is relatively cost-effective compared with othermethods. However, with the development of random sampling techniques,researchers have become more critical of the drawbacks of this method. Properlyapplied the method can be successful because it is possible to introduce repre-sentativeness by stratifying the quota sample by objective and known populationcharacteristics such as age, sex, family status and socioeconomic group. Quotasamples may be accurately constructed using classifications such as ACORN.This is because such classifications are based on objective distributions of statist-ical variations in demographic, housing and occupational factors.
The first step is to estimate the sizes of the various subclasses or strata in thepopulation. This is usually done through reference to some outside source, forexample, census of population data. The relevant strata to the study have to bespecified. For instance, a person’s age may be something that a researcher thinksis relevant to a particular study. As a consequence, age will have to be taken intoaccount when drawing up the sample. For example, if it is found that in the population 25% of people are aged between 25 and 30, then the aim should be tomake sure that 25% of the people in the sample fit into this age band. There aresimilar requirements for other age bands reflecting the proportions with whichthey appear in the population under study. Other factors as well as age mightalso be considered.
117
FIGURE 4.4 Types of non-probability sample
EOM_C04.qxd 6/23/05 10:39 AM Page 117

.
118 Chapter 4 • Sampling
SELECTED ACORN TYPES AND GROUPS
Category Group Type
Wealthy Achievers
UrbanProsperity
ComfortablyOff
Wealthy Executives
Affluent Greys
FlourishingFamilies
ProsperousProfessionals
EducatedUrbanites
Aspiring Singles
Starting Out
SecureFamilies
SettledSuburbia
PrudentPensioners
01 – Affluent mature professionals, large houses02 – Affluent working families with mortgages03 – Villages with wealthy commuters04 – Well-off managers, larger houses
05 – Older affluent professionals06 – Farming communities07 – Old people, detached houses08 – Mature couples, smaller detached houses
09 – Larger families, prosperous suburbs10 – Well-off working families with mortgages11 – Well-off managers, detached houses12 – Large families and houses in rural areas
13 – Well-off professionals, larger houses and converted flats
14 – Older professionals in detached houses and apartments
15 – Affluent urban professionals, flats16 – Prosperous young professionals, flats17 – Young educated workers, flats18 – Multi-ethnic young, converted flats19 – Suburban privately renting professionals
20 – Student flats and cosmopolitan sharers21 – Singles and sharers, multi-ethnic areas22 – Low-income singles, small rented flats23 – Student terraces
24 – Young couples, flats and terraces25 – White-collar singles/sharers, terraces
26 – Younger white-collar couples with mortgages27 – Middle-income, home-owning areas28 – Working families with mortgages29 – Mature families in suburban semis30 – Established home-owning workers31 – Home-owning Asian family areas
32 – Retired home owners33 – Middle-income, older couples34 – Lower-income people, semis
35 – Elderly singles, purpose-built flats36 – Older people, flats
EOM_C04.qxd 6/23/05 10:39 AM Page 118

.
Sampling methods 119
Convenience sampling
In convenience sampling, there is no sample design. It is similar to an interviewerquestioning people as they meet them on the street or in shopping precincts. Choiceof the respondent is left entirely to the interviewer. Some methods, such as this, alsoallow potential respondents to decide for themselves whether or not to respond.
The researcher takes the most accessible population members from which toobtain information. This happens, for example, when a firm producing a proto-type new domestic appliance gets some of its employees to test out the product intheir own homes. Such a sample provides useful information to the researcher aslong as the sample seems to be reasonably representative of the population beingstudied. However, asking a convenience sample of students about their readinghabits might not be appropriate if you are interested in the reading habits of thepopulation as a whole – i.e. all ages and occupations.
Category Group Type
ModerateMeans
HardPressed
Source: CACI4
AsianCommunities
Post IndustrialFamilies
Blue CollarRoots
StrugglingFamilies
BurdenedSingles
High RiseHardship
Inner CityAdversity
37 – Crowded Asian terraces38 – Low-income Asian families
39 – Skilled older family terraces40 – Young family workers
41 – Skilled workers, semis and terraces42 – Home owning, terraces43 – Older rented terraces
44 – Low-income larger families, semis45 – Older people, low income, small semis46 – Low income, routine jobs, unemployment47 – Low-rise terraced estates of poorly-off workers48 – Low incomes, high unemployment, single parents49 – Large families, many children, poorly educated
50 – Council flats, single elderly people51 – Council terraces, unemployment, many singles52 – Council flats, single parents, unemployment
53 – Old people in high-rise flats54 – Singles and single parents, high-rise estates
55 – Multi-ethnic purpose-built estates56 – Multi-ethnic, crowded flats
EOM_C04.qxd 6/23/05 10:39 AM Page 119

.
120 Chapter 4 • Sampling
Judgement sampling
This type of sampling relies on sound judgement or expertise. It depends onselecting elements that are believed to be typical or representative of the popula-tion in such a way that errors of judgement in the selection will cancel each otherout. Judgement samples tend to be used more often in industrial market researchthan in consumer market research. In industrial market research a firm may get50% of its business from ten large purchasers and the remaining 50% from 300smaller firms. A judgement sample might therefore comprise five of the largepurchasers (50%) and 150 of the remainder (50%). Judgement would be exercisedto ensure that the firms chosen in the sample represented the subgrouping.
Sampling and non-sampling error
The quality of the data in a particular survey is a function of what is termed thetotal survey error. Total survey error reflects the difference between the overallpopulation’s true mean value of the characteristic of interest and its meanobserved value obtained from the particular sample of respondents. What is ofinterest is what causes the information obtained from a sample of respondents todiffer from that of the entire population. Total survey error is composed ofrandom sampling error and non-sampling error.
Random sampling error occurs because the selected sample is not a perfect repre-sentation of the overall population. It represents how accurately the chosensample’s true mean value reflects that of the population. Random sampling errorcan be controlled by employing an appropriate statistical design and by increas-ing the sample size.
Non-sampling error represents the extent to which the mean observed value (onthe characteristic of interest) for the respondents of a particular sample disagreeswith the mean true value for the particular sample of respondents. The size of thenon-sampling error depends on two factors: non-response errors and responseerrors. Non-response errors occur because not all those included in the sampledo, in fact, respond. Moreover, the mean true value of those who do not respondmay be different from the entire sample’s true mean value. Response error, byway of contrast, occurs when respondents give inaccurate answers.
Non-response errors
Very few studies ever achieve a 100% response success rate. The problem of non-response error occurs because those who agree to participate in the study are insome respects different from those who decline to participate. Usually, the higher the response rate the lower the probability of non-response error effects.Nevertheless, response rates are not always a good indicator of non-responseerror. First, response rates do not reflect whether the respondents are good repre-sentatives of the target sample. Second, an increase in response does not always
EOM_C04.qxd 6/23/05 10:39 AM Page 120

.
Sampling methods 121
lead to a reduction in the non-response error. Third, the notion of response rate isambiguous since the number of eligible respondents used in the calculation ofresponse rates frequently differs across studies. Unfortunately, the extent of thedifference between respondents and non-respondents can seldom be directlydetermined (see Hahlo5 for a discussion of non-response errors).
NON-RESPONSE ERRORS
• Low response rates: those not responding differ in some way from those who do
• Unrepresentative sample
RESPONSE ERRORS
• Wanting to give an answer that pleases the researcher
• Faulty memory, fatigue or nature of the questions
• Lack of knowledge/familiarity with subject matter
• Wanting to give socially acceptable answers
• Interviewer influence
Response errors
People may give an inaccurate response either intentionally or unintentionallysimply because they are being interviewed. For example, respondents may delib-erately not report their duly considered answer because they want to help orplease the researcher. This is often encountered in new product tests. In anotherinstance, even though the respondent intends to respond accurately, responseerror arises because of faulty memory, fatigue, question format or even questioncontent. It also arises when people have little or no experience with the surveytopic, for example, asking a low-income respondent about comparatively expen-sive goods.
Interviewers can influence respondents’ answers, incorrectly record respond-ents’ answers and even falsify respondents’ answers. People may also be influ-enced by their attitude to the organisation conducting the study. Last, the wish togive socially acceptable answers to sensitive or potentially embarrassing ques-tions can also lead to response errors.
A variety of factors can cause errors in survey results. The onus is on theresearcher to:
• determine whether respondents have enough information about the topic on which to base their opinions
EOM_C04.qxd 6/23/05 10:39 AM Page 121

.
122 Chapter 4 • Sampling
• word and/or pose the questions carefully
• avoid biases in wording that suggest a socially desirable answer or leadrespondents to agree with one side of an issue
• pretest questions in pilot studies to ensure their clarity and impartiality
• train interviewers to avoid influencing respondents’ answers.
SAMPLING IN PRACTICE
So far we have examined some of the methods of applying sampling in a study.We now consider the choice of a sampling method.
Required precision is a factor in influencing the choice of sampling method.Getting a clear-cut answer about the most likely effect of a proposed price reduction on market share demands a sampling design where precision of resultscan be measured – some kind of probability sample. However, an exploratorystudy that is trying to obtain some rough idea about which price-reductionmethod is most promising for further development and testing can use a non-probability sample. It would not be cost-effective to spend additional money on a more precise sample. The availability of an appropriate samplingframe is another factor. Drawing a sample without a frame can be difficult and expensive.
Some factors specific to the study may dictate the form of data collection to beused, such as personal interviews in shopping precincts, postal questionnaire ortelephone study. If the study requires the placement of a product with people forin-home trial, the telephone and postal methods (except in combination withother methods) are not feasible. These methods also cannot be used for testingtelevision advertisements. However, if the study intends to measure the numberof people reached by a particular radio or television advertisement, the telephoneprocedure, with its easy access and low unit cost, may be the right method. Onthe other hand , if the study is aimed at measuring the readership of a publica-tion, then a meeting between interviewer and respondent is essential to show andgo through the publication. Finally, the cost of collecting the information has tomatch with the value of the study to the sponsor.
Sampling small populations
The sampling methods just mentioned are standard procedures to adopt whensampling populations that occur reasonably often. Sometimes, however, the popu-lation sought is not that easy to find. Special sampling methods may be requiredin these cases. A good illustration is to be found by a researcher who is interestedin ascertaining attitudes and other information about prescription drug brands
EOM_C04.qxd 6/23/05 10:39 AM Page 122

.
Sampling in practice 123
used by only a very small number of patients. There are likely to be few of themand, without special sampling methods, it will be too difficult and expensive tostudy them.
There are six techniques that can be applied in such a case:
1 direct screening
2 two-phase screening
3 stratification
4 multiframe sampling
5 selection of high-yield clusters
6 multiplicity sampling (also known as ‘snowballing’).
There is also a seventh approach that could involve using data from an existingdatabase.
Direct screening
Here, people are approached, on the telephone or in a shopping precinct, to ascer-tain whether they meet the requirements for being part of the sample and, if so,they are subsequently questioned. The method has the drawback that if the inci-dence is too low it will mean a lot of non-productive interview time, progress willbe slow and costs will be high.
Two-phase screening
In this case, one survey is followed by a second among those who qualify. Thefirst contact defines the qualifiers. The second produces the responses soughtfrom those who qualify.
THREE APPROACHES TO TWO-WAY SCREENING
Cluster sampling
Where users of barbecues are to be questioned, clusters of neighbourhoods wherebarbecues are likely to be common can be identified. Either by telephone interview-ing (using clusters by postal code, perhaps) or by personal interviewing withinclusters, those having barbecues can be located efficiently.
Omnibus study
A continuing study, it is done either personally or by telephone. It makes it possibleto ask a screening question and have the research firm follow up with those who
s
EOM_C04.qxd 6/23/05 10:39 AM Page 123

.
124 Chapter 4 • Sampling
qualify. It is an inexpensive way to accumulate lists of those who qualify. However,there are limitations. If the study requires follow-ups, in-home placement of aproduct, exposure of a television commercial, or the like, the research firm may notbe able to do this at reasonable cost, if at all.
Panels
The panel typically is a national list of families that have agreed to participate inmail and telephone studies, and the sponsoring research firm tries to make surethat the total panel represents national and regional demographics. The screeningand follow-up can be over the telephone or by post.
Stratification
Stratification entails sorting out those with specific demographic characteristicsfrom selected small geographic areas where there seem to be concentrations ofspecific groups of people with certain characteristics. Using census data it may bepossible to do this for postal code areas.
Multiframe sampling
A list of the desired rare population is seldom complete or even available. So theanswer, both in terms of costs and a good sample, is to work with two frames.
High-yield clusters
This is almost trial and error. It is useful in residential telephone surveys wherethe costs of an initial qualifying call are inexpensive. Let us say that a random-digit dialling system is intended to produce a sample of residences only. Such asystem is almost certain to produce non-residence numbers as well. To minimisethe proportion of non-residence numbers, clusters of perhaps 100 numbers are setup. Within each cluster, a ten-digit number is randomly chosen.
Multiplicity sampling (snowballing)
Members of the rare population are located by screening within each individuallydesignated enumeration unit. A respondent who qualifies for the sample is askedto provide the names of others who also presumably qualify. A network of con-tacts is produced which might include all households containing parents or theirchildren. Each network of households then becomes the sampling unit, fromwhich information about the other members of the network can be obtained.
A major drawback to this method is that there is no way of checking to be surethat the sample is representative of the population of interest.
EOM_C04.qxd 6/23/05 10:39 AM Page 124

.
Sampling in practice
Conducting sampling
Here, we consider the problems associated with obtaining the right respondent,gaining the respondent’s cooperation, the completion rate and handling the prob-lems of people being too busy to cooperate and not answering (in telephonesurveys).
Obtaining the right respondent
We should firmly establish in the minds of researchers the qualifications for beinga respondent in a study. If a telephone survey requires a specific person in ahousehold, the questioning procedure should establish the position of the personanswering the call and not allow the interviewer to assume that any voice on the phone belongs to the desired person. If a heavy user of instant puddings is required, the questions and questioning procedures must be objective and thorough. The interpretation of the term ‘heavy’ is not something that should beleft to either interviewer or respondent. There should be strict guidelines aboutclassifying respondents into heavy, medium or light users, for example, so thatthis objective definition can be used in deciding who qualifies for questioning.
In a shopping precinct study where interviewers stop shoppers to questionthem, investigators can be given instructions about the ratio of men and womento interview. However, there can be special problems in shopping precinct inter-views. The Monday shopper is likely to be different from the Saturday shopperand the morning shopper is different from the afternoon or evening shopper. Theinterviewing should be scheduled to represent all the varying categories.
When carrying out consumer telephone surveys, it is essential to make use of arecording form to ensure that the prescribed steps are properly carried out. Thisensures that the consumer telephone sample is carried out as planned. The samekind of attention is required with a sample of business respondents. In a tele-phone survey where executives are the target sample, it is often difficult to getpast the secretary or the assistant to the executive. A personal visit to the officeoften presents the same problem. Making a telephone call or sending a letterahead of time, to see if a specific time can be set for that telephone call or personalvisit, can help to resolve the problem. The nature of the questioning can be out-lined. This not only gives the secretary a chance to clear it with the boss, but givesthe executive time to obtain materials and documents ready for the interview.However, advance notice may also cause problems. It is often difficult for thepotential respondent to arrange time ahead. Moreover, the advance call may pro-vide the person with the means of postponing or refusing the interview outright.
Respondent cooperation
A large proportion of the public often refuses to participate in market surveys.Non-participation rises with interview length and varies with subject matter. Thispresents the possibility of a serious sampling problem.
125
EOM_C04.qxd 6/23/05 10:39 AM Page 125

.
126 Chapter 4 • Sampling
Completion rate
The completion rate is the proportion of those in the potential sample who actu-ally participate in the research. The sampling is ineffective if too few candidatesend up being questioned or observed. We would expect at least 50 to 60% of thosedesignated as potential respondents to participate. The problem is that non-respondents are often different in some way from those who participate. The wayin which this problem is tackled depends on how both the first contact with theperson and the follow-up contacts are made.
In consumer telephone surveys, the timing of the call may be a critical factor. Ifthe study involves working mothers, the hours of dinner preparation and servingshould be avoided in order to gain cooperation. Evenings and weekends providea better opportunity to secure interviews where the male household head is to bequestioned. However, evening calls to retired people may be unproductive sincesome senior citizens retire early and will not be pleased if prevented from doingso or if awakened from their sleep.
Achieving a 50% response rate on the first call is good going. Call-backs are anecessity, as are specific plans and record keeping to ensure that the call-backplan is properly carried through. Where a postal survey is involved, recordsshould be kept for each individual showing the original date of posting. After aset number of days without a response, a second letter or even a telephone call ismade. In the case of telephone and personal interview studies, you need to havesome idea about why there is a non-response. It may be that there is no one athome (or no answer to the telephone), or the qualified respondent is not avail-able. In the former case, the call-back is made on a random basis, following apredetermined plan that may schedule the follow-up attempt at a time whensomeone is there. It may be a different day, a different hour. If the non-response isbecause the qualified person is not available, there should be a procedure inwhich the individual who is at home can suggest a good time to make the call.
When a person is busy or there is no answer
One of the major reasons for no answers is the increasing proportion of coupleswho both work, and the proportion is greater among high-income groups and intowns. At evenings and weekends young couples may form a dining-out or ashopping team. Weather is also a consideration: in the good weather during thesummer months, people spend less time in the house and more outdoors, whilein the cold season, the reverse is true. Call-backs are the solution but they have tobe planned systematically.
In the case of telephone studies, interviews should be conducted only between9 a.m. and 9 p.m. Interviewers should be thoroughly trained, and an emphasisshould be put on making the interviewing experience pleasant and appealing tothe respondent so that further cooperation is encouraged. The respondent shouldbe told the topic at the start of the questioning and the questionnaire should bekept to a reasonable length.
EOM_C04.qxd 6/23/05 10:39 AM Page 126

.
Sample size
SAMPLE SIZE
Primary approaches for determining sample size
Marketing researchers use at least four different methods of determining samplesize. Sample size determination can be based on:
1 intuition
2 statistical precision
3 cost limitations
4 industry standards.
Intuition
This is the most unsatisfactory method of determining sample size. It usesinformed intuition as the basis for determining how many units to sample. Themethod of determining sample size is completely arbitrary and does not considerthe likely precision of the survey results or the cost of obtaining them.
Statistical precision
The size of a sample affects the quality of the research data and it is not simply aquestion of applying some arbitrary percentage to a specific population. Thesample size that needs to be taken should reflect the basic characteristics of thepopulation, the type of information required and the costs entailed. The largerthe sample size, the greater its precision or reliability, but practical constraints of time, staff and other costs intervene.
When computing the size of a sample, the size of the non-response factorshould be borne in mind. If, for example, a final sample of 3500 is planned andthe non-response is estimated at 30% then it would be advisable to increase theoriginal factor to 5000. Such a correction will help to obtain the number ofresponses required but it will not correct the bias that arises from non-responseerrors – the fact that those who do not respond may have significantly differentopinions from those who do respond.
The error of a sample varies inversely with the square root of the sample size.A sample of 9000 is more accurate than a sample of 1000. After a certain samplesize has been reached, additional large increases in size do not significantlyimprove the statistical precision of a given sample. Costs, however, certainly doincrease with larger samples.
The precision of the survey is a function of the sample size (although seeChisnall6). Precision is related to the square of the number in the sample. That is,the accuracy of results increases proportionately to the square of the sample size.If the sample size is doubled, let us say from 500 to 1000, accuracy rises only to
127
EOM_C04.qxd 6/23/05 10:39 AM Page 127

.
128 Chapter 4 • Sampling
the square root of the doubled sample size (2), or a bit less than half (1.4). Whiletechnically the rationale applies only to probability sampling, it is usually used asa guide in planning the size of non-probability samples as well. By sampling pre-cision we do not mean how accurate the results are, for accuracy depends on toomany factors: how good the questions are, whether or not the interviewer (ifthere is one) affects the results, etc. What is referred to here is the degree to whichdata on a simultaneously replicated study parallel those of another study or howsimilar the results of two simultaneous studies are.
Sampling error Sampling error is the difference between a survey result and itsparameter (a known statistic of the universe) – that is, the difference between thetrue value of a parameter of a population and that estimated from a sample. Theerror occurs because the value has been calculated from a sample rather thanfrom the whole parent population.
Confidence interval The confidence interval is an interval within which aparameter of a parent population is calculated (on the basis of sample data) tohave a stated probability of lying. Generally, the researcher settles for a 95% prob-ability – meaning that there are 95 or more chances in 100 that the reported figurefalls within the range of a stated numerical value from the parameter.
For simplicity and because it answers almost all needs, our discussion here islimited to a discussion of percentages. But another measure of the confidenceinterval might be in terms of means. The confidence interval can be calculatedonly when the study has used probability sampling to obtain the results.
Overall precision required Once the overall precision (range of the confidenceinterval) has been defined for the particular study, it is possible to make some ten-tative decisions on sample size. We say tentative only because there are still otheraspects to be considered. In principle this approach can be used only with prob-ability sampling, since there is no way of knowing whether a non-probabilitysample produces a sample similar to one based on selection probabilities.Practically, however, it is often used as a guide in determining the sample size ofnon-probability samples. As the sample size is quadrupled the confidence inter-val is cut in two. The confidence interval decreases as the expected percentage ofresults moves away from 50% (either plus or minus). This has some practicalimplications. First, increasing the required accuracy places a heavy premium onthe price of the survey because of the effect it has on sample size requirements.Second, if the expected result cannot be predicted, 50% is the correct percentageto use. That is where the greatest error margin is experienced. So if results cannotbe predicted in advance, sample size planning should be on the conservativeside: in this case, the larger, more expensive side.
Cost limitationsThis method determines sample size on the basis of the budget allocated to theproject. It first involves subtracting from the available budget all non-sampling-
EOM_C04.qxd 6/23/05 10:39 AM Page 128

.
Summary 129
related costs (for example, the fixed cost of designing the survey, questionnairepreparation, data analysis and report generation) and second dividing thisamount by the estimated cost per sampling unit to arrive at the desired samplesize. The approach is unsatisfactory because it emphasises cost to the exclusion ofall other factors, especially precision.
Industry standards
These refer to those rules of thumb, developed from experience, that havebecome standard industry guidelines for determining how large a sample todraw. Conventional guidelines on sample size vary with the type of market-ing research study as well as with the number of cells included in the study. Theconventional approach to determining sample size is frequently used in non-probability designs, especially in quota samples. In quota samples, for example,the minimum number of respondents per cell is usually 50. A cell of 1000–1500 isusually considered as a reasonable sample for a national (probability) marketstudy. Also, 200–300 per cell is the convention for a typical concept or producttest.
Other factors
Deciding on sample size is not simply a statistical matter. The actual decision is ajudgement call by marketing management or top management, depending on theimportance of the particular problem. In any case, the decision will not be basedon such points as sampling size: it will centre on costs versus value.
SUMMARY
This chapter has introduced the idea of sampling, contrasting it with a census.The key elements involved in devising a sampling plan have been discussed andthe importance of properly defining the target population of interest has beenemphasised. Illustrations of the important features of both probability and non-probability samples have been given and the major types and primary practicaluses of both probability and non-probability sampling have been outlined. Theprimary approaches for determining sample size have been discussed and theconcept of sampling and non-sampling error has been considered. The nature ofthe factors contributing to response and non-response errors has been describedand suggestions made as to how response rates can be improved and non-response errors minimised. Particular attention has been given to samplingmethods that are most appropriate for small populations. Attention has also been paid to the management of the sampling process and the determination ofsample size.
EOM_C04.qxd 6/23/05 10:39 AM Page 129

.
130 Chapter 4 • Sampling
QUESTIONS
1 What are the major arguments for undertaking research using sample data?
2 What are the key elements involved in developing a sample plan?
3 Why is no sampling frame perfect? What can you do to compensate for this?
4 Differentiate between probability and non-probability sampling.
5 Indicate the main sources of sampling and non-sampling errors in surveyresearch.
6 What are the essential components of ensuring that the sampling process iswell managed?
CASE STUDY 4.1: RESEARCH CONSULTANTS
Research Consultants has been commissioned to determine the following: Whydo people select one estate agent over another? Do customers know or care if anestate agent is a member of a particular institute or professional body? And whatadditional services would customers like to receive from estate agents?
Research Consultants underbid four other research firms to obtain the contractand in fact their bid was some 50% of the next lowest bid. The main reason thatResearch Consultants was able to do this was because of the sampling methodo-logy it selected. In its proposal the company said that university students wouldbe used to gather the survey data. The company said that it would randomlyselect 20 universities from across the UK and contact the head of the business ormanagement department at each college. The head would be asked to submit alist of ten students who would be interested in earning some extra money andthen a senior consultant in the company would contact the students individually.The company’s aim was to identify five students at each institute who would ulti-mately complete ten interviews each. When the students were contacted by thesenior consultant they were told that they would be given £5 for each completedinterview. The only requirement about who would be interviewed was that itmust be someone who had had some experience of dealing with an estate agentin the previous 12 months. In fact, the consultant said that probably the easiestthing to do was for students to visit local pubs during the lunch hour and go fromtable to table asking for people who might be interested in being interviewed.
Questions1 How would you describe this method of sampling?
2 What problems do you see arising from this approach?
3 Suggest a much better sampling method.
EOM_C04.qxd 6/23/05 10:39 AM Page 130
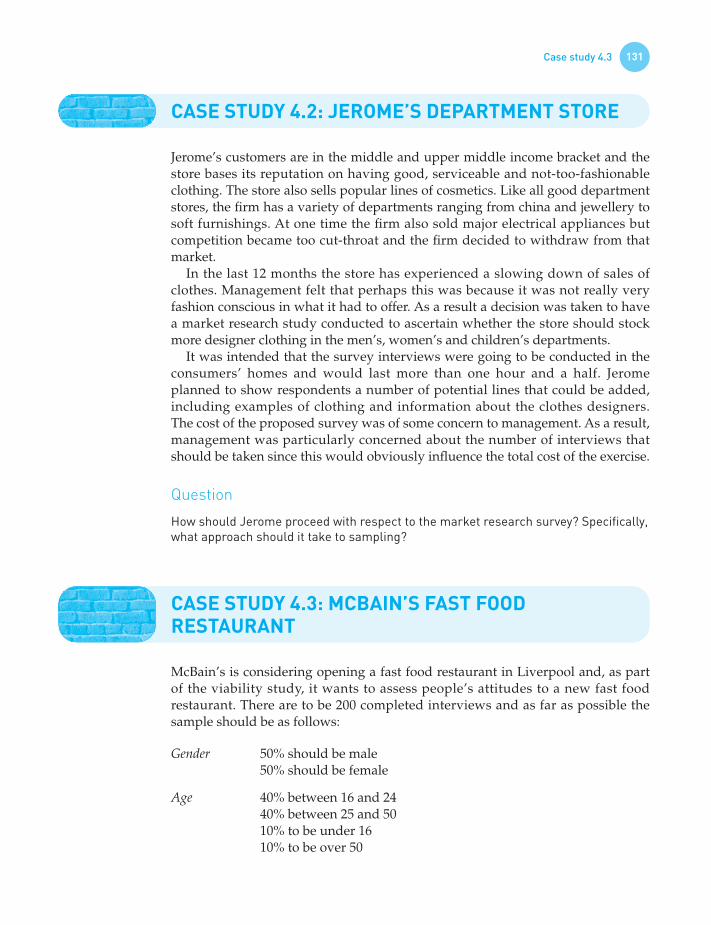
.
Case study 4.3 131
CASE STUDY 4.2: JEROME’S DEPARTMENT STORE
Jerome’s customers are in the middle and upper middle income bracket and thestore bases its reputation on having good, serviceable and not-too-fashionableclothing. The store also sells popular lines of cosmetics. Like all good departmentstores, the firm has a variety of departments ranging from china and jewellery tosoft furnishings. At one time the firm also sold major electrical appliances butcompetition became too cut-throat and the firm decided to withdraw from thatmarket.
In the last 12 months the store has experienced a slowing down of sales ofclothes. Management felt that perhaps this was because it was not really veryfashion conscious in what it had to offer. As a result a decision was taken to havea market research study conducted to ascertain whether the store should stockmore designer clothing in the men’s, women’s and children’s departments.
It was intended that the survey interviews were going to be conducted in theconsumers’ homes and would last more than one hour and a half. Jeromeplanned to show respondents a number of potential lines that could be added,including examples of clothing and information about the clothes designers. The cost of the proposed survey was of some concern to management. As a result,management was particularly concerned about the number of interviews thatshould be taken since this would obviously influence the total cost of the exercise.
Question
How should Jerome proceed with respect to the market research survey? Specifically,what approach should it take to sampling?
CASE STUDY 4.3: MCBAIN’S FAST FOODRESTAURANT
McBain’s is considering opening a fast food restaurant in Liverpool and, as partof the viability study, it wants to assess people’s attitudes to a new fast foodrestaurant. There are to be 200 completed interviews and as far as possible thesample should be as follows:
Gender 50% should be male50% should be female
Age 40% between 16 and 2440% between 25 and 5010% to be under 1610% to be over 50
EOM_C04.qxd 6/23/05 10:39 AM Page 131

.
132 Chapter 4 • Sampling
Occupation 20% to be students80% to be non-students
The interviews are to be conducted at the St Johns shopping precinct.
Question
Indicate how such a quota sample might be achieved.
CASE STUDY 4.4: STUDENT RESEARCH PROJECTS
A marketing lecturer set his students the task of thinking up an idea for a newproduct, then researching the market for it. The students were allowed to use anyresearch methods that seemed appropriate, but all were expected to carry out sec-ondary research before designing their primary research programmes. Most ofthe groups of students found that thinking up the product idea was fun, but theresearch was more like hard work – that said, they did appreciate the opportunityto put some of their own ideas to work.
Altogether, there were 42 ideas for new products; some of these were not tech-nically feasible, or would be unlikely to be profitable, but some of the ideasseemed viable. In any case, the assignment was about research, not about thetechnical design of products, so the feasibility or otherwise of the products wasirrelevant.
The students carried out the necessary secondary research, then designed theirown primary research programmes. Most used questionnaire-based surveys, afew used focus groups, and a small number used depth interviews, observation,experimentation or other techniques.
The students were left to their own devices somewhat; the idea was to allowthem to learn from their mistakes and find out for themselves what the pitfalls ofmarket research are. In most cases, students managed to produce fairly goodresults, but quite obviously some of them had serious difficulties.
The questionnaire surveys turned out to be the ones that caused the mostdifficulty; apart from the problems of designing the questionnaire, many of thestudents had made basic sampling errors. Here are some examples, taken fromthe students’ written-up assignments:
• ‘We conducted a random sample of shoppers by stopping people in the HighStreet on Saturday morning.’ (new type of shopping basket)
• ‘In order to find out the views of young people, we asked for volunteers andinterviewed 23 students from the university.’ (radio station)
• ‘We surveyed 10 women and 10 men. The women were 20% more likely to likethe product than were the men, and people over 60 were 10% more likely to
EOM_C04.qxd 6/23/05 10:39 AM Page 132

.
Case study 4.4 133
like the product. Overall, 40% of the respondents liked the product.’ (garden-ing tool)
• ‘Telephone interviews with 100 respondents revealed that 32% of those inter-viewed would buy the roof sealer. Unfortunately, a further eight people whowere interviewed later turned out to be grown-up children of the householdrather than the home owner.’ (emergency roof-sealing tarpaulin)
• ‘The main problem we had with the interviews was that most people were toobusy to stop and talk to us. Eventually, we managed to complete 70 useablequestionnaires, however.’ (banking services)
• ‘Having obtained the permission of the crèche to conduct our research, wegave the questionnaire to the mothers when they arrived to collect their children. The following day we collected the questionnaires; unfortunatelyonly about half were returned. However, these were enough to enable us todraw some conclusions.’
The focus groups were rather better, but even here some problems becameapparent:
• ‘Our group consisted of six boys and two girls, aged between 18 and 20. Weshowed them the model of the product and asked them to comment on it; atfirst they seemed to find it difficult to say much, but after some prompting theybegan to discuss it more freely.’ (car vacuum cleaner)
• ‘When we showed them the product most of them seemed puzzled. We had sixhousewives in the group, all of them from a coffee-morning group of friends.’(safety device for lawnmowers)
• ‘Our group often strayed from the subject. We had a representative sampleconsisting of three teenagers (one male, two female), two middle-aged people,and three old-age pensioners.’ (carpet cleaning device)
Although the students were able (in most cases) to work out what had gonewrong, they did not always know what to do to put matters right. This meantthat the lecturer needed to spend considerable time with them to correct miscon-ceptions and to help them understand the issues raised by the research; despitethat, all those concerned, both lecturer and students, felt that the exercise hadbeen a useful introduction to market research.
(Case contributed by Jim Blythe)
Questions
1 In each of the above cases, say what you think is wrong with the sampling.
2 For each of the above cases, say what you think the students should have doneinstead of what they actually did.
EOM_C04.qxd 6/23/05 10:39 AM Page 133

.
134 Chapter 4 • Sampling
3 For each of the above cases, say what additional research you could do to correctthe sampling errors or minimise their effect.
4 How can sampling errors such as these be avoided in future?
5 Is it possible to obtain a perfect sample?
REFERENCES AND NOTES
1 Semon, T T (1994) A good sample of accounts may not always be a good sample of yourcustomers, Marketing News, 28(9), 8–11.
2 McKenzie, J (1988) Study of characteristics of ex-directory telephone owners, MarketResearch Newsletter, December.
3 JICNARS (1981) National Readership Survey, London: JICNARS.
4 CACI (2005) http://www.caci.co.uk/acorn/acornmap.asp, 22 April.
5 Hahlo, G (1992) Examining the validity of re-interviewing respondents for quantitativesurveys, Journal of the Market Research Society, 34, 99–118.
6 Chisnall, P M (2001) Marketing Research (6th edn), Maidenhead: McGraw-Hill, 89–90.
FURTHER READING
Adcock, C J (1997) Sample size determination – a review, Statistician, 46(2), 261–83.Bailar, B A (1997) Does sampling work? Business Economics, 32(1), January, 47–53.Bolton, R N (1994) Covering the market, Marketing Research: A magazine of management and
application, 6(3), 30–35.Butcher B (1994) Sampling methods – an overview and review, Survey Methods Centre
Newsletter, 15, 4–8.Cowan, C D (1991) Using multiple sample frames to improve survey coverage, quality
and costs, Marketing Research: A magazine of management and application, 3(4), 66–69.Dent, T (1992) How to design for a more reliable customer sample, Business Marketing,
17(2), 73–76.Dutka, S and Frankel, L R (1988) Techniques for the Cost-efficient Sampling of Small or Rare
Populations, New York: Audits & Surveys.Hague, P N (1985) The Industrial Market Research Handbook (2nd edn), London: Kogan Page.Hoinville, G, Jowell, R and Assoc. (eds) (1978) Survey Research Practice, Oxford:
Heinemann, Chapter 4.Kress, G (1988) Marketing Research (3rd edn), Upper Saddle River, NJ: Prentice-Hall,
Chapters 8–9.
EOM_C04.qxd 6/23/05 10:39 AM Page 134

.
Further reading
Marsh, C and Scarborough, C (1990) Testing nine hypotheses about quota sampling,Journal of the Market Research Society, 32, October, 485–506.
Rowland, M L and Forthofer, R N (1993) Adjusting for non-response bias in a healthexamination survey, Public Health Reports, 108(3), May–June, 380–86.
Semon, T T (1994) Save a few bucks on sample size, risk millions in opportunity loss,Marketing News, 28(1), 19.
Watson, M A (1992) Researching minorities, Journal of the Market Research Society, 34(4), 337–44.
135
EOM_C04.qxd 6/23/05 10:39 AM Page 135

.
Objectives
After reading this chapter, you should be able to:
• appreciate the various approaches to collecting primary data throughsurveys: postal surveys, personal interviews, telephone surveys, completelyself-administered surveys, panels and omnibus studies
• understand the criteria used for selecting the data-collection method bestsuited to the specific marketing research problem on hand
• understand that, when using surveys to help answer a marketing problem,relevance, accuracy, timeliness and cost must be taken into account
• appreciate the merits of different survey methods.
Keywords
bias panelsinteractive research questionnaireinterviews syndicated researchomnibus surveys telephone surveysopinions
Surveys5
EOM_C05.qxd 6/23/05 10:39 AM Page 136

.
Surveys 137
Plan of Chapter 5
EOM_C05.qxd 6/23/05 10:39 AM Page 137

.
138 Chapter 5 • Surveys
INTRODUCTION
In this chapter we explore some of the various methods of collecting primarydata through surveys: postal surveys, personal interviews, telephone surveys,completely self-administered surveys, panels and omnibus studies. The import-ance of, and criteria for, selecting the data-collection method best suited to thespecific marketing research problem is considered. When using surveys to helpanswer a marketing problem, relevance, accuracy, timeliness and cost must betaken into account. The chapter discusses the merits of different survey methods.Each method has its advantages and limitations (see Figures 5.1 and 5.2).
FIGURE 5.1 Survey methods
EOM_C05.qxd 6/23/05 10:39 AM Page 138

.
Postal surveys
POSTAL SURVEYS
In the case of postal surveys a questionnaire is sent to a potential respondent andthe person writes in the replies and posts it back.
Advantages and limitations
Low cost per response
The costs of a postal survey are low. However, it is assumed that the user is anexpert in postal surveys and understands how to get a high rate of return. On thisassumption, the costs per return are low compared with most other survey methods. It is the going-in cost that is high; once the basic costs have been paid,
139
FIGURE 5.2 What surveys can do
EOM_C05.qxd 6/23/05 10:39 AM Page 139

.
140 Chapter 5 • Surveys
the additional cost per unit is minimal. Once envelopes and paper costs are paid,although postage costs rise proportionately with numbers, printing costs riseonly minimally.
No interviewer bias or cost
Since no interviewers are used in postal surveys, interviewer bias is absent in theresponses. Moreover, the lack of interviewers means that one of the largest costelements in the interviewer survey is eliminated.
Questionnaire scope
It is possible to request information about, and get answers to, a breadth of topics.The lack of a face-to-face situation removes any reticence to reveal personal habitsand feelings. Women freely respond to subjects such as personal hygiene and theuse of birth control methods and devices. Men, under the guise of anonymity,provide details of their investments, net worth and income.
Questionnaire length
Provided the subject matter interests the respondent, the person responding willspend considerable time filling in the questionnaire. This means that there is anopportunity to ask a reasonably long sequence of questions.
Respondent interaction
There is no interruption of what the respondent may be doing in order to respondto the series of questions and the person can reply whenever it is convenient to doso. There is an opportunity for a considered response, since the respondent isunder no pressure to make an immediate reply. The postal survey makes it easyto present exhibits, such as advertisements and product models.
Sampling problems
Unlike many other survey methods, the sampling frame is either a good list or anot-so-good list. As a result, the adequacy of the postal survey is dependent onthe quality of the postal list. In reality, few sampling frames for postal surveys –telephone books, city directories, industrial directories or purchased postal lists –are complete or current.
Response problems
The response rate is low, unless the researcher/marketer knows how to get goodresponses to a postal study. A problem with a low response rate is that those who respond are not necessarily similar to those who do not. The results, there-fore, may be misleading. Experience often indicates that people who reply to
EOM_C05.qxd 6/23/05 10:39 AM Page 140

.
Postal surveys 141
a survey are those who are most interested or those with extreme feelings oropinions about the survey’s subject matter. It is essential to compare the reactionsof those who respond immediately and those who respond only on follow-up.Moreover, it can be dangerous to depend on the findings of a postal survey.
ADVANTAGES AND LIMITATIONS OF POSTAL SURVEYS
Advantages
• low cost
• no interviewer bias
• questionnaire length
Limitations
• questionnaire scope
• respondent interaction
• sampling problems
• response rate problems
• lack of control over respondents
• wrong respondents – wrong information
Another response problem concerns the market definition for the particularproduct or service. Partial illiteracy is a feature of many populations in the west.It is also greater among households with lower incomes. If the product or serviceis one whose market extends into the lower income levels, people simply cannotor will not respond, leading to a non-measurement of that segment of the market.
Lack of control over respondent
Since the recipient of a postal questionnaire can see and examine all the questionsbefore answering any, there is no control over the sequence in which the ques-tions are exposed. This lack of control limits the scope of questions in the postalquestionnaire. For instance, we cannot ask for unaided recall of advertising slogans for household goods and then ask about the names of household goodsrecalled showing a list. Such a list would help people connect household goods’names with advertising messages.
Wrong respondents, wrong information
Another limitation of the postal survey is that the questionnaire may be answeredby someone other than the addressee. For the executive or professional, it might
EOM_C05.qxd 6/23/05 10:39 AM Page 141

.
142 Chapter 5 • Surveys
be the secretary. For a specific member of a household, it might be someone else in that household. These self-substitutions can rarely be detected. The postal questionnaire recipient may also consult others before responding to thequestionnaire.
When postal surveys are appropriate
The postal survey is also used to get information from people who are difficult tointerview in person: those insulated from personal contact by a ‘gatekeeper’(doorman, security guard, receptionist, secretary), including groups such as man-agement, professionals (lawyers, physicians) and those living in exclusive quarters.
The postal survey may be able to handle difficult questionnaire content. If the topic concerns delicate or personal topics – such as birth control, sexual behaviour or personal finances – the postal questionnaire may be the best way ofeliciting desired information.
In the case of an industrial survey, a question about sales or purchases of a par-ticular item will almost certainly require the checking of records, if an accurateresponse is to be obtained. The postal questionnaire, once again, may serve such a purpose well, but the rate of response will probably fall if records must be consulted.
Making postal surveys more efficient
Notifying people in advance increases the rate of return in a survey and shouldbe communicated to recipients a few days ahead of the postal questionnaire. Thesimplest approach is to make use of a personally addressed advance postcard,which alerts the recipient that a questionnaire will soon be on its way. There is atendency to ignore post sent to ‘the occupant’ or job title in a place of business, soefforts should be made to personalise the approach. Where a long questionnaireis to be used, advance notice by telephone may be worthwhile.
The cover letter must motivate the recipient to complete and return the ques-tionnaire. It must look interesting and important and seem short so that therecipient need spend little time in finding out the message. The purpose of thestudy should be described briefly and the benefits to the recipient should be high-lighted. Sometimes the recipient can be offered a small token of appreciation forparticipation and this is generally included in the posted materials. It is import-ant to retain the impression of quality, so a good-quality return envelope shouldbe used.
Follow-ups are intended to increase the proportion of respondents, therebyensuring a more representative survey. However, the researcher should ensurethat enthusiastic respondents do not reply twice. Most often this can be handledby keying, a method of identifying those who respond to the first posting, andapproaching only the non-respondents in the follow-up procedure.
EOM_C05.qxd 6/23/05 10:39 AM Page 142

.
Personal interviews 143
PERSONAL INTERVIEWS
In personal interviews, respondent and interviewer speak face to face. At onetime it was a very popular way of conducting surveys, particularly in-home inter-views for consumer products. Today, the in-home personal interview is no longera popular research method. It is expensive and generates a low response rateunless a great deal of time is spent in making call-backs. Fewer people are athome when interviewers are most likely to want to call.
Personal interviews now are largely conducted in shopping precincts.Shopping precincts are now a way of life in metropolitan areas, as is personalinterviewing in these locations. Personal interviews are also conducted at busi-ness and professional locations.
Interviewer influence
The interviewer is the chief factor in the value of the obtained data. The accuracyof the data obtained is influenced by the manner in which the questions are put tothe respondents and the skill with which follow-up and probing questions arehandled. The interviewer must act in a neutral way to avoid exerting a bias on thereplies.
ADVANTAGES AND LIMITATIONS OF PERSONAL INTERVIEWS IN SHOPPING MALLS
Advantages
• low cost
• little of the investigator’s time is wasted
• procedures are standardised and specific
• monitoring of the interviewers
• possible to use illustrative materials during the course of the interview
Limitations
• time pressure – people in a hurry can be difficult to question
• interviewer may be tempted to seek out those shoppers who do not appear to bein such a hurry
• per-interview cost is the highest of any survey method
• refusal rate is high, running anywhere from 5% to 30%
EOM_C05.qxd 6/23/05 10:39 AM Page 143

.
144 Chapter 5 • Surveys
A good interviewer should be able to establish rapport with others. They alsoneed to be trained and training should cover the role and nature of marketingresearch, what surveys are and how they are conducted, and the role and import-ance of the interviewer. Training for a specific study is also necessary. An exampleof training for a specific study is given in the following box.
TRAINING FOR A SPECIFIC STUDY
Interviewing instructions are provided with regard to:
• introduction to the particular study
• interviewer timing requirements (dates and hours of work assignments)
• general purpose of the study
• the process of interviewing
• selection of prospective respondents
• specific procedures for the initial contact and for securing cooperation
Interviewing in shopping precincts
The process is easy and fast and it can be set up and carried out in a hurry. Theapproach makes it easy to spread the geographic distribution of respondentswithout having to take steps such as paying for interviewer travel. Comparedwith most other methods, the approach is generally low cost. Little of the invest-igator’s time is wasted, procedures are standardised and specific, and there ismonitoring of the interviewees. All these augur well for efficiency. Whatever theform of personal interview, one major advantage of interview surveys is that it is possible to use illustrative materials, such as advertisements or illustrations ofthe product, during the course of the interview.
Interviews in shopping precincts are not based on a probability sample.Usually it is a quota sample and the interviewer is given instructions about the proportions they are expected to get by demographics (such as gender andage). There are problems with sampling with personal interviews in shoppingprecincts. On weekdays there may be greater proportions of the elderly andteenagers and if, in the case of a shopping centre, it has a number of entrances,those shoppers coming in from the parking lot will typically be of a higherincome level than those entering from the bus stop entrance. The strategic placement of interviewers to cover key thoroughfares is therefore criticallyimportant.
Many shopping precinct interviews have to be conducted quickly. Shoppingprecinct shoppers are there to shop and to get back to their homes or offices. They
EOM_C05.qxd 6/23/05 10:39 AM Page 144

.
Telephone surveys
can be difficult people to question. They don’t have time and it is not the rightpoint in their activities to interrupt them. So even when the interviewer gets theirattention, they are under pressure to speed up the questioning – which does notmake for high-quality interviewing. There is also the problem that the inter-viewer may be tempted to seek out those shoppers who do not appear to be insuch a hurry – they may be the ones who are shopping at leisure and are not in ahurry to get anywhere.
Central location tests
These involve personal interviews in which respondents are first contacted andpersonal details taken by phone. Interested respondents are then invited to attendat a central location in their district at specified times to participate in research.People are scheduled in groups or ‘waves’ to enable multiple interviews to takeplace simultaneously. These tests are used to establish acceptance or reaction tonew products or to identify taste preferences in foods. Usually, one offers the par-ticipant a gift or payment as recompense for their help.
Cost of personal interviews
The per-interview cost of personal interviewing is the highest of any surveymethod. A considerable amount of non-productive time has to be paid for. Therefusal rate is high, running anywhere from 5% to 30%. Moreover, more non-productive time is spent returning for recall interviews where in-home or busi-ness interviews are sought. Indeed, if the potential respondent is in a business orprofession, the time spent on the interview is often excessive. If an appointmenthas not been arranged in advance, many hours may be spent in a waiting roomhoping for a session.
TELEPHONE SURVEYS
If the study is one requiring a broad geographic sample, national or regional, thetelephone survey may be ideal. Telephone surveys can also be used as anefficient follow-up method in connection with another basic method of data col-lection. Telephone surveys involve a team of interviewers working from a centrallocation, with workstations provided along with outgoing telephone lines foreach.
Today, almost all telephone interviewing is computer controlled. The inter-viewer works with a computer. In a consumer survey, when the interviewer gets an answer to a call, they check to make sure that it is a household and then
145
EOM_C05.qxd 6/23/05 10:39 AM Page 145

.
146 Chapter 5 • Surveys
ask to speak to the desired respondent. Then the interviewer uses the computer.Each question is shown on the monitor in sequence and the interviewer reads thequestion exactly as it appears on screen. Since most questions designed for tele-phone surveys are short-answer questions, where the respondent’s replies arelimited to a choice of possibilities, these are also shown on the screen. All theresponses go immediately into the computer for later analysis.
Telephone interviews have many advantages. There is a compulsion to answerthe telephone, regardless of what a person happens to be doing at the time: theringing sound compels action. Some 95% of households have telephones and thebusiness telephone coverage is practically 100%. In the telephone method,efficient call-backs are the rule; they are made at times when the desired respond-ent is more likely to be at home. A very high response rate is not unusual in thecase of telephone interviewing. As no travel time is needed for the interviewer tomake contact with the respondent, it is wasteful neither of interview time norcostly travel expenses. As a result, the amount of time needed for the study andinterviewing costs are reduced.
ADVANTAGES AND LIMITATIONS OF TELEPHONE INTERVIEWS
Advantages
• compulsion to answer the telephone
• efficient call-backs
• high response rate
• no travel
• question modification possible
Limitations
• list of telephone numbers outdated
• demanding nature of the telephone ring may announce an unwanted sales pitch
• limit to the length of the typical telephone interview
• no way to provide visual aids
With a computerised interviewing program, it is generally possible to modifythe questions during the survey process. Sometimes, the order in which a list ofpossible answers is given to respondents can affect their response. The first itemon the list usually gets more responses than it should and the last position on thelist may also bias replies (order bias). The first and last positions are the mostlikely to be affected. Computerised interviewing can be programmed to providefor equal average position, eliminating any such bias.
EOM_C05.qxd 6/23/05 10:39 AM Page 146

.
Telephone surveys 147
TELEPOST: AN ADJUNCT TO PERSONAL INTERVIEWS
The aim of the research was to gather information that would ultimately help todefine an effective marketing strategy for the sponsoring firm’s market offeringsupplied as either a product or service, or as some combination of both. Theresearch studied both the actions and reactions to the market offering as well asthe degree of sophistication, in sales and marketing, of the companies interviewed.
The first stage of the research process was conducted using personal interviews,primarily because of their high degree of flexibility. The method used is termed as aguided or focused interview that, while allowing the respondent to talk freelyaround each topic, successfully covers the topics of crucial context in a more orless systematic way. The number of respondents was small and only partially repre-sentative of the population of interest. However, it was especially effective withbusy business executives and was ideal for this research as the respondents werechosen as experienced and authoritative executives from the field of sales andmarketing in industrial and business-to-business marketing. Thirty names andaddresses were located. Of the companies chosen, some were named by the spon-soring firm as ones that they wanted to interview. Others were located in Key BritishEnterprises – British Business Rankings (Dun & Bradstreet International).
The Telepost combination technique was the method used for the second stageof the research. This method is very effective in obtaining a high-quality response incomplex markets. A sample frame was developed that was supportive of the per-sonal interviews and that widened the sample base. The information gathered fromthe personal interviews allowed the sponsoring firm to produce revised documenta-tion on the market offering. This second document was used and sent out as thematerial for the Telepost survey. A questionnaire, to be administered by telephone,was prepared to cover what had been established in the personal interviews, as thekey dimensions. Letters were then sent to named respondents within the sampleframe, informing them that they would be contacted by telephone and providingdetails of the nature of the interview and requesting that they read the revised documentation before the interview.
The telephone interviews therefore provided a quantification, extension andverification of the findings of the personal interviews.
Source: Cooper1
Despite all its strong points, telephone interviewing does have limitations.Unless special steps are taken, the list of telephone numbers used in a survey willbe outdated on the day of publication, with omissions of new listings and inclu-sion of outdated ones. Although the demanding nature of the telephone ring is anadvantage it can all too often signal an unwanted sales pitch and the owner maynot answer the call. There is also a limit to the length of the typical telephoneinterview and usually it cannot run for more than about 15 minutes. Moreover,there is no way to provide visual aids, such as advertisements or other displaymaterials.
EOM_C05.qxd 6/23/05 10:39 AM Page 147

.
148 Chapter 5 • Surveys
SELF-ADMINISTERED SURVEYS
These kinds of study are often conducted by service firms such as restaurants,motels or hotels, and occasionally by health and financial institutions or evenretail stores. In these cases questionnaires are left in convenient places for thepotential respondent to pick up, fill in and return either in a convenient depositoryor by a prepaid return envelope.
Disk by mail
This is a comparatively new approach in which a computer disk with a self-administered questionnaire programmed on it is mailed to respondents.Respondents answer the questions on screen and return the completed disk.Often, a screening phone call is required to ensure that the respondent has thenecessary equipment to use the disk.
PANELS
Panels are continuing groups that respond to questioning from time to time. A panel can be made up of persons, households or business firms. A panel mayexist, for questioning purposes, for as little as a week or as long as a year or more. The panel may be set up by telephone, postal or personal interview. Someresearch firms offer the use of their ongoing panels to provide syndicated informa-tion available to all subscribers, while other research companies make theirpanels available for custom use. The user can specify the demographics or evenrequire specific category or brand users.
Syndicated panel services measure such things as buying volume by brandand television viewing and use consumer diaries or electronic devices to obtainthe desired data. The consumer diary is a form on which the consumer recordstheir purchases or some other form of behaviour. An electronic device attached tothe television set may monitor television tuning. With retail store panels, the data-collection method may be through the use of either scanners or physical audits.
CABLE TV HAS THE MOST VIEWERS
According to the first Cable Audience Measurement Survey, published this week, themain cable-exclusive channels reach over half of all people. Moreover, researchshows that more TV is watched in cable homes than non-cable households. In total,cable and satellite channels achieve a combined average weekly reach of 93.6% ofall cable home individuals.
EOM_C05.qxd 6/23/05 10:39 AM Page 148

.
Panels 149
End of End of first month second month
Total panel members (6000) (6000)Total exposed to early advertising (600) (600)Purchases by total sample 9.6% 10.8%Purchases by those exposed to early advertising 15% 18%Purchases by those not exposed to early advertising 9% 10%
(Measured in first wave)
Target audiences are relatively well satisfied with cable-exclusive channelsaccording to research findings. The Box achieves a higher viewing share than MTVamong 10–15 year olds: 1.8% compared with 1.5% for MTV and 0.8% for VH-1.
The survey also shows that cable householders make extensive use of techno-logy: 34% have a games console and 29% have a computer compared with thenational average of 24%, according to TGI.
The findings are based on diary research commissioned by the Cable ResearchGroup. Research was conducted in January among 997 adults and 315 children byresearch company RSMB.
Source: McCann2
Major types of panel
The major ongoing panels are divided into panels used for syndicated offeringsand those used for custom studies. The panel method has some great advantages,several of which are unique.
Longitudinal analysisA custom panel or a syndicated panel enables us to monitor the reactions orbehaviour of the same person, household or business respondent over a period oftime. The panel approach makes it possible to get a continuing series of reportsfrom the same people.
Where one-off studies are used, the researcher may encounter people who arenot consistent users of the brand in question. Researchers might then questionthem about their inconsistent patterns of purchase. However, the panel methodgives an opportunity to ask the question at the time the purchase behaviour haschanged and to obtain a current and immediate reply rather than one that isdependent on memory.
PURCHASE OF A BRAND BY EXPOSURE TO EARLY ADVERTISING
s
EOM_C05.qxd 6/23/05 10:39 AM Page 149

.
150 Chapter 5 • Surveys
Suppose you wanted to ascertain the impact of advertising on purchases. Theintroduction of a new product in the market might use an advertising blitz concen-trated in the first month. On two successive one-shot surveys, done at the end ofthe first month and again a month later, questions about advertising recall andbrand purchase could be asked, with results showing that brand advertising recallfor the test product dropped from 10% to 5% in the two sweeps, while brand purchases went from 9.6% to 10.8%.
People would be unlikely to recall whether they were exposed to the blitz advertising, even though they could recall brand purchase within the week. Thepanel results among 6000 customers are shown in the table. The data show clearlythat blitz advertising had a continued impact.
Panels cost less than a comparable series of parallel but separate samples.There is only a one-time basic sampling cost, be it households or stores, and con-tinuing cooperation may also be high. The sample is the most serious limitationof the panel. With consumer panels, annual loss of members can be substantial.Some panel members soon lose interest and others are sometimes so self-conscious about their participation that their behaviour is affected.
NIELSEN HOMESCAN GROCERY CONSUMER PANEL
Typical of the kind of data provided by this panel are the following. The reports pro-duced refer to the research purchaser’s specific products.
For the information purchaser’s particular brand, up-to-date data are providedon such things as total households buying the brand, penetration, brand volume,market share, percentage of the volume on offer, average price, purchase occa-sions per buyer, market volume per buyer. A demographic analysis is provided forall buyers broken down by social class, household size, age of housewife andregion. For example, the report might identify the percentage of a firm’s plasticproducts sold to different sizes of households.
A trend report is also produced showing consumer expenditure on specific pro-duct items, such as the firm’s plastic bags and plastic bags in total. It might alsoshow sales trends through different types of outlet, for example, ASDA, Boots,Gateway, etc.
Custom study panel
The postal panel can be specific for two types of small segments of the popula-tion: one is demographic and the other is behavioural. The research firm mayalready have information in its files identifying such households of people. If thisis not the case, most research firms offering custom panel use provide postal
EOM_C05.qxd 6/23/05 10:39 AM Page 150

.
Syndicated research services
screening. Alternatively, most of these firms will make a fast telephone survey tolocate those who qualify.
A postal panel does have some definite drawbacks. It is usually self-administered, so the questionnaire is filled in by the respondent without super-vision and can clearly be seen in its entirety before any questions are answered.Where careful sequencing through the questioning steps is required to obtain reliable information, the postal panel, like the postal questionnaire, can producemisleading findings. Moreover, as is the case with all postal questionnaires, it isunlikely that a person’s response to an open-ended question will be very deep.No opportunity exists for an interviewer to probe to get a full and meaningfulreply. An inherent disadvantage of the custom panel is the time it takes forresults. It is at least as slow as the outgoing and returning post. Another dis-advantage is that the typical custom panel has no way of showing its memberstelevision commercials and so has no way of getting reactions to these.
SYNDICATED RESEARCH SERVICES
Most syndicated research services are owned by the research companies that run them and, in the main, are continuous panels. The main problem for peoplewanting to make use of these services lies in identifying which services are avail-able and who provides them. The Market Research Society Yearbook contains a listof providers of these services. In effect, syndicated research services are off-the-peg research studies.
Syndicated service firms collect and distribute information for many differentusers. The firms specialise in making available secondary information and otherservices at a lower price than it would cost a user of the information if the userhad to conduct the study itself. An example of a syndicated service firm is ACNielsen. Syndicated research firms can provide excellent information. For exam-ple, a producer of consumer package goods – inexpensive items that are branded,packaged and sold via self-service in grocery stores, mass-merchandise outletsand other retail stores – may subscribe to Nielsen’s retail research services in order to get a variety of information about its brands and their comparativecompetitive performance with other brands. The manufacturer receives muchvaluable information, including:
• industry volume
• sales trends
• sales by package size
• competitors’ sales
• local or regional sales
151
EOM_C05.qxd 6/23/05 10:39 AM Page 151

.
152 Chapter 5 • Surveys
• inventory figures
• market share information
• distribution and out-of-stock figures.
The costs of conducting the research are shared among the entire client base.
LIFESTYLE MARKETING
Many brands are sponsoring questions on surveys about the use of competingbrands. Companies such as Procter & Gamble, Imperial Tobacco, Guinness andPremier Beverages have all taken the exclusive rights for a year on answers byconsumers about their branded products. Information on specific buying behaviourremains the strongest element of lifestyle data.
There is currently very little interest in attitudinal questions. Clients are lookingfor specific information on potential buyers or buyers of competitors’ products.There is less interest in attitudinal data than four or five years ago. This view isexpressed at CMT, which runs the National Shoppers’ Survey and markets alifestyle database called Behaviour Bank. The managing director of the firm saysthat it tends not to get too involved in attitudinal questions over and above what theyalready ask, such as reasons for purchase. Questions that are very important con-cern whether the consumer buys on price, promotion or brand name or whetherthe consumer simply rotates products. The power of the grocery multiples andelectrical goods chains has helped to stimulate the market for lifestyle data andmanufacturers need to be able to understand what share of customers they haveand what is stimulating purchase.
Geodemographic profile providers have been motivated to respond to the recentupsurge in interest in lifestyle data. CACI indicates that its base is in census dataand that this is still very much needed, for example in retail planning. The advan-tage geodemographics still has over lifestyle is that it is based on data on everyindividual in the country whereas the closest that lifestyle can get is data for house-holds from the MIC database, formed by pooling CMT and NDL’s surveys. CACI,however, is among a number of suppliers that have developed and launched sys-tems that draw on both sets of data. CensusLifestyle combines CACI’s ACORNgeodemographics with lifestyle data licensed from ICD. This enables bias to betaken out of lifestyle data. One new product to flow from this fusion of data isPayCheck, which enables marketers to predict the likely income for every postcode,something that has always been difficult to achieve in the UK.
In an effort to expand use of targeting and profiling beyond direct marketing andstore planning, some suppliers are now combining market research products withlifestyle and census information. Taylor Nielsen AGB, for instance, is marketing‘SmartBase’ that bridges the gap between market research and database market-ing. By licensing data on 13 million households from MIC and linking it to the AGBSuperPanel, SmartBase combines both breadth and depth of information. MIC hasinformation on 60% of households and has a match to 7000 of the households on
EOM_C05.qxd 6/23/05 10:39 AM Page 152

.
Omnibus studies 153
the SuperPanel. A similarly complex process has been used by Equifax Europe tobuild its Dimensions database, which incorporates census, lifestyle and marketresearch from MORI and other data sources.
Source: Reed3
OMNIBUS STUDIES
An omnibus study (or survey) is an ongoing study through which a buyer canask a limited number of questions at a very reasonable cost, because the generaloverhead costs of fielding the study are shared by a number of clients. Omnibusstudies are often scheduled on a weekly, monthly or quarterly basis. Some areconducted through personal interviews but most omnibus services collect data bytelephone interviews, so it is impossible to show display materials such as adver-tisements or products.
Omnibus studies assist in finding small segments of the population and thecosts of locating a sufficient number of such respondents are low. If the incidenceis too low to produce a sufficient number in one survey, the questions are retainedin subsequent ones at a modest cost. Most omnibus services offer follow-upprobes of those giving specific replies. These probes are usually conducted on afollow-up basis rather than at the time of original questioning (unless there areonly a few questions) so as not to delay completion of fieldwork for the standardservice.
Omnibus research is a hybrid between off-the-peg research, where data havealready been collected and the researcher simply purchases whatever is available,and primary research, where the researcher collects data first hand. The termdescribes regular research surveys undertaken with a certain frequency anddefinite method, which use a set number of respondents and sampling points.
Omnibus research is particularly suitable for fairly robust data – for example,the usage and purchase of products – but it is less useful for attitudinal and opin-ion studies. Typical omnibus surveys might last for 40 minutes or more andduring that time the respondent might be asked about six or more entirely differ-ent topics. The superficiality of some questions can prevent respondents fromgaining the amount of concentration necessary to pursue any particular topic indepth. The Market Research Society Newsletter provides a list of organisations offer-ing omnibus services.
Most consumer omnibus surveys reach at least 1000 adults per wave. This pro-vides a substantial sample size for most purposes of analysis. It is also possible toincrease the sample size by running questions over several waves of the omnibus.In the case of the more specialist omnibus survey, the sample size is much smaller(often around 100–200 respondents per wave) and they tend to be conducted lessfrequently.
EOM_C05.qxd 6/23/05 10:39 AM Page 153

.
154 Chapter 5 • Surveys
Omnibus surveys employ one of three sampling designs. The most commonapproach uses a random location – with quotas set for age and working statuswithin gender – although there are surveys utilising pre-selected and quota sam-pling. The standard output of most omnibuses is computer tables, although manysuppliers provide data in various formats.
INTERACTIVE RESEARCH
In interactive research the participant interacts, via a computer connection, toquestions or other stimuli presented on a screen or by some other means. Theprocess may provide a response by means of a keyboard, a computer mouse or atouch-sensitive screen.
There is no interviewer with most interactive research systems and this helpsto remove potential problems associated with such matters as the cost of inter-viewers, the need for supervision and potential biasing influence. There is no riskof the influence of inflection or accent, nor is there any limitation on delicate sub-ject matter, often present with an interviewer.
As responses are automatically entered into the system, there is no need for theexpensive process of the individual coding of each answer and all interactive sys-tems ask the questions in the same form and order. Most interactive researchsystems provide questionnaire skip patterns, so that subsidiary questions arealways asked when they should be asked and skipped when they should not beasked. As with all computer-based systems, these interactive methods providerapid reporting of results. The responses are barely in the system before the sum-mary tables are produced.
Interactive methods have their limitations. Only a reasonably straightforwardseries of questions can be asked; a complicated questionnaire cannot be handledthrough this medium. Moreover, since the method is almost a self-administeredexercise, no opportunity exists for asking open-ended questions.
SUMMARY
This chapter has explored some of the various methods of collecting primary datathrough surveys: postal surveys, personal interviews, telephone surveys, com-pletely self-administered surveys, panels and omnibus studies. The importanceof, and criteria for, selecting the data-collection method best suited to the specificmarketing research problem have been considered. When using surveys to helpanswer a marketing problem, relevance, accuracy, timeliness and cost have to betaken into account. The chapter has discussed the merits of different surveymethods, since each method has its own advantages and limitations. Attention
EOM_C05.qxd 6/23/05 10:39 AM Page 154

.
Case study 5.1 155
has also been given to the use of panels, syndicated research services, omnibusstudies and interactive research.
QUESTIONS
1 What are the main ways of conducting surveys? Discuss their appropriatenessfor different kinds of research problems and explain their advantages anddisadvantages.
2 What is a consumer panel? Indicate the main types of consumer panel andtheir purpose.
3 How do syndicated research services differ from other kinds of marketingresearch services? What kinds of information do they collect?
4 What are omnibus studies? Explain their usefulness in practice.
5 Indicate what is meant by interactive research. What are its advantages andlimitations?
CASE STUDY 5.1: CENTRAL TRAINING COLLEGE (1)
The Central Training College is the headquarters of a training group that is partof a consultation, recruitment and training company. One of the recruiting divi-sions of the company carries out the recruitment of permanent and temporarysales, construction, finance and management personnel, as well as office per-sonnel. The Central Training College offers a wide range of general office coursesas well as more specialised courses such as languages, business administrationand desktop publishing. The consultation, recruitment and training company hasbeen developing its activities in training and recruitment through organic andacquisitional growth. It has been proposed to move into the London market intime to take advantage of any improvements in industry growth. The most cost-effective method is thought to be to develop the property in central Londonalready owned by the firm – the Central Training College – rather than pay fornew premises.
At the moment, graduates of the college are left to find their own employmentcontacts or they are referred to a suitable employment agency. No financial gain isreceived by the college from this arrangement. If there were a recruitment agencythat was part of the same company operating in the college, all students would bereferred to it rather than to rival firms’ recruitment agencies. This would increasethe potential turnover per student. (Turnover refers to the money receivedthrough tuition and placement fees.)
EOM_C05.qxd 6/23/05 10:39 AM Page 155

.
156 Chapter 5 • Surveys
A consultant was called in to advise on the viability of opening a recruitmentagency in central London. On the basis of initial discussions the consultant pro-duced the following research proposal.
Research proposal
Summary of brief
1 To determine the viability of opening a recruitment agency in central London.
2 To determine if the Central Training College would be a good location.
3 To find out if the name Central Recruitment would be acceptable.
Proposed research objectives
1 Investigate current and future demand for recruitment agencies.
2 Investigate actual intentions to use the service.
3 Discover if the name of the recruitment agency is an important factor in thepurchase decision.
4 Investigate student and business attitudes to the provision of such a service.
5 Obtain demographic details of both students and businesses interested in theservice.
Proposed research design
Conduct two surveys, one of the students at the college and the other of theemployers. Students to be interviewed face to face and the employers to be con-tacted through the post.
Source: Fry4
Question
Evaluate the research proposal.
CASE STUDY 5.2: CONSUMER PRODUCTS
Phil Rice, marketing manager of Consumer Products, wants to gather as muchinformation as he can about purchasers of aluminium wrapping foil and plasticwrapping bags. This covers both his own firm’s products and those of competitors.
EOM_C05.qxd 6/23/05 10:39 AM Page 156

.
Case study 5.3 157
Competitive products include retailers’ own brands and this makes up a substan-tial proportion of sales in the market.
Phil would like to have information on such things as the total householdsbuying his firm’s brand, the penetration of the market, the brand volume, themarket share, the average price, the purchase occasions per buyer and the marketvolume per buyer, all by different demographic characteristics of consumers – i.e.broken down by social class, household size, age of housewife and region. Forexample, he would like to know such things as the percentage of the firm’s wrap-ping foil sold to different sizes of households. He also needs to have a good ideaof trends, including, for instance, consumer expenditure on specific product itemssuch as the firm’s aluminium foil sales by region. Information on sales throughdifferent types of retail outlets is also desirable.
In addition to such things as usage rates, purchase patterns and their relation-ship to consumer characteristics, he also wants to know what customers thinkabout the various brands already on the market.
Question
What might be the best way for Phil Rice to obtain such data? Explain your answer.
CASE STUDY 5.3: LIPTONJUICE (1)
In March 1994 Britvic felt that all its research indicated that it was onto anotherwinning brand in the iced tea drink, Liptonjuice, a joint venture betweenUnilever, the maker, PepsiCo, and its part-owned distributor, Britvic. It wasexpected that the product would achieve a sales volume of £20m in its first yearand the producers mistakenly saw the British tradition of tea drinking as anadvantage. Liptonjuice, it was believed, would play on the public’s love of tea incombination with an increasing preference for more varied soft drinks. Despiteinitial optimism, the brand’s future is now in serious jeopardy since PepsiCo andBritvic have said they will no longer distribute the brand. Unilever now has to go it alone or find a new partner. It was first launched in March 1994 and sub-sequently relaunched after radical changes to give a cleaner, more refreshingtaste, better suited to British palates. But all this has been to no purpose.
PepsiCo might consider introducing its own iced tea as part of its Radical Fruitrange. The range – minus an iced tea – is already available in Spain. The feeling asfar as the UK market is concerned is that the British take a singular view of tea: it is something to be drunk hot, at any time of the day. Moreover, it was felt that even a multimillion pound advertising campaign that had been used to back Liptonjuice had failed to persuade the British to change their minds (seeFigure 5.3).
However, tea drinkers in other European countries take their tea without milkand, as in the case of the USA, at specific times of the day. For Europeans and
EOM_C05.qxd 6/23/05 10:39 AM Page 157

.
158 Chapter 5 • Surveys
Americans the idea of drinking cold tea, without milk, as just another drink is farmore acceptable, since the associations with hot, milky tea are not as strong. It hasalso been easier to position the product as a sports drink in Europe and to sell itthrough sports clubs.
In 1995, iced tea was the fastest growing soft drink in Italy.Coca-Cola has its own iced tea in the USA and Europe, where it is called
Nestea. Liptonjuice was launched in Spain in 1994, a year after Nestea’s Spanishdebut but sales have been disappointing, as in the UK. PepsiCo’s Radical Fruitrange has, however, been a success in Spain.
Source: Rees5
Questions
1 Britvic’s original enthusiasm based on research seems to have been misguided.Discuss the kinds of thing that might have gone wrong.
2 Do you think that survey research might have a role to play in guiding any of thecompanies still interested in marketing iced tea to European countries, includingthe UK? Explain your answer.
FIGURE 5.3 Iced tea consumption in Europe, 1995
EOM_C05.qxd 6/23/05 10:39 AM Page 158

.
Case study 5.4 159
CASE STUDY 5.4: OPINION POLLING FACES NEW SCRUTINY
‘The general election will determine which techniques will be used for opinionpolling in future, although the diversity of current practices may make it moredifficult for the polling industry as a whole to win credibility,’ Mr John Curtice, areader in politics at Strathclyde University, said yesterday.
He said that because pollsters had changed their methodologies in differentways after getting the 1992 election wrong, this election would be a test of whichof the various methods now in use was most accurate.
The polling industry was as diverse in its methodologies as it had ever been, incontrast to the last election, when there was a broad consensus about how pollingshould be conducted, Mr Curtice said.
He told the Market Research Society conference in Birmingham that the elec-tion would provide an opportunity to assess the relative merits of telephone andface-to-face polling and of sampling on a random basis or by setting certainquotas for the types of people to be questioned.
A study following the debacle of 1992 said the surveys did not identify hiddenTories and that the controls in quota sampling were not enough to counter thepossibility that people questioned in a quota poll were more likely to be Labourthan the population in general.
The polls’ failure in 1992 to reflect the Tory victory has allowed the Conser-vative party to cast doubt on the credibility of the overwhelming Labour lead,which most have shown for many months.
Among changes brought in since 1992, NOP and Mori have altered how theyweight the quotas they set, by making more use of government surveys, such asthe Labour Force Survey.
ICM and Gallup have both switched to using a form of random samplingrather than quota sampling and to telephone polling instead of face-to-face inter-views. Pollsters have also adjusted how they weight figures depending on howpeople say they voted in the last election.
Source: Smith6 (reprinted with permission)
Question
Discuss the problems associated with quota sampling in surveys. How might suchproblems be solved?
FT
EOM_C05.qxd 6/23/05 10:39 AM Page 159

.
160 Chapter 5 • Surveys
CASE STUDY 5.5: VOLVO CAR UK
Volvo Car UK is the British marketing arm of the Volvo company, the Swedishmanufacturer of high-quality, reliable cars. Volvo cars have a reputation for beingsolid, extremely safe, reliable, long-lasting and comfortable; they also hold theirvalue well. For many drivers (and fleet operators) this makes Volvo the idealprestige company car.
In terms of its long-term corporate strategy, Volvo aims to become ‘the mostdesired and successful speciality car brand and the most customer-focused organ-isation in the world, achieving exemplary standards and support which willmatch or exceed customer expectations’. The problem for Volvo lies in decidingwho is the customer – is it the extensive dealer network, which sells the cars, is itthe corporations and fleet operators, which specify Volvo as company cars, or is itthe world’s motorists, who ultimately buy the cars?
Volvo believes that one of its major markets in the UK is the corporate customer; 70% of sales of Volvos in the UK are to corporations. Ultimately, thesesales are to corporate employees who would like to choose Volvo as their com-pany car. To meet the needs of these customers, Volvo runs two programmes;first, the Corporate Account Relationship Experience (CARE), which is aimed atcorporate customers and fleet operators, and, second, the One Customer OneRelationship (Oncore) programme, which is a dealer programme designed to satisfythe drivers of the cars. CARE is aimed at encouraging corporate customers andfleet operators to specify Volvo, but once the cars are sold and the drivers takepossession of them, the Oncore programme takes over. Oncore is concerned withthe relationship between the dealers (some of which are directly owned by Volvo,but most of which are independent businesses) and the drivers.
Volvo deals directly with the largest corporate customers, but dealers areinvolved both before and after sales with all the organisations that run fleets of Volvos. Some dealerships have in-house corporate specialists who have the expertise to understand the needs of fleet operators; typically, these dealer-ships are located in large cities where there are plenty of potential corporatecustomers.
Market research has shown that drivers of company Volvos are involved in sixrelationships that Volvo has input into. These relationships are as follows:
1 Volvo and its corporate customers
2 Corporate customers and their employees
3 Corporate customers and Volvo dealers
4 Volvo and Volvo drivers
5 Volvo and its dealers
6 Volvo dealers and Volvo drivers.
EOM_C05.qxd 6/23/05 10:39 AM Page 160

.
References and notes 161
The Oncore and CARE programmes help to ensure consistency across theserelationships. Oncore is about the drivers, CARE is about the corporations, but ineach case the approach must remain consistent because of the close relationshipbetween the corporations and the drivers (who are employed by the corpora-tions). Currently Volvo still lags behind Mercedes and BMW in terms of numbersof cars sold to corporate clients, but the firm hopes to improve on this over thenext few years.
From Volvo’s viewpoint, the drivers are of crucial importance even thoughthey do not always make the decision to specify Volvo. The reason for this is thatthe drivers will have some influence on the decisions (if they do not like the carsor are dissatisfied with Volvo’s dealer service they might discourage their firmsfrom specifying Volvo next time). Also, the drivers have families and friends whowill see the cars and ride in them and each satisfied driver becomes an ambas-sador for Volvo.
In the longer term, Volvo seeks to refine both its corporate programme and itsdriver care programme to provide maximum repeat business. To do this success-fully, the company must take account of its input into each of the six relationshipsidentified earlier, and must maintain a clear message and service to its corporatecustomers and their employees.
(Case contributed by Jim Blythe)
Questions
1 How might Volvo find out why some customers prefer Mercedes or BMW?
2 What types of market research might help Volvo to refine the Oncore programme?
3 What types of market research would help Volvo to refine the CARE programme?
4 How could Volvo find out how to improve each of the six relationships identifiedearlier?
5 How might Volvo find out how effective the drivers are at acting as ambassadors forthe cars?
REFERENCES AND NOTES
1 Cooper, Z (1991) Unpublished MBA dissertation, Department of Management, KeeleUniversity, September.
2 McCann, P (1996) Commercial TV audiences rise . . . , Marketing Week, 26 April, 15.
3 Reed, D (1996) The data game, Marketing Week, 3 May, 47–51.
4 Fry, C (1991) Unpublished MBA dissertation, Department of Management, KeeleUniversity, September.
EOM_C05.qxd 6/23/05 10:39 AM Page 161

.
162 Chapter 5 • Surveys
5 Rees, J (1996) PepsiCo needs new strategy for iced tea, Marketing Week, 16 April, 23.
6 Smith, A (1992) Opinion polling faces new scrutiny, Financial Times, 21 March.
FURTHER READING
Bachman, D, Elfrink, J and Vazzana, G (1996) Tracking the progress of email versus snail-mail, Marketing Research, 8, 31–35.
Collins, M (1997) Interviewer variability: a review of the problem, Journal of the MarketResearch Society, 39, 67–84.
Comley, P (2000) Pop-up surveys: what works, what doesn’t work and what will workin the future, ESOMAR Net Effects Internet Conference, Dublin, April,http://www.virtualsurveys.com/papers/popup-paper.htm
Craig, C S and Douglas, S P (2001) Conducting international marketing research in thetwenty-first century, International Marketing Review, 18(1), 80–90.
Davis, G (1997) Are Internet surveys ready for prime time? Marketing News, 7 April, 5.Deming, W E (1950) On errors in surveys, American Sociological Review, 9(4).Dillman, D A (1991) The design and administration of mail surveys, Annual Review of
Sociology, 17, 225–49.Dillman, D A and Tortora, R (1998) Principles for constructing respondent-friendly web
surveys and their influence on the response, American Statistical Association Meeting,Dallas.
Gubrium, J F and Holstein, J A (2003) Postmodern Interviewing, London: Sage.Kehoe, C, Pitkow, J and Rogers, J (1998) GVU’s ninth WWW user survey report, July,
http://www.gvu.gatech.edu/user_surveys/survey–1998-04/Kent, R and Lee, M (1999) Using the Internet for market research: a study of private
trading on the Internet, Journal of the Market Research Society, 41(4), 377–85.Mehta, R and Sivadas, E (1995) Comparing response rates and response context in mail vs
electronic mail surveys, Journal of Marketing Research Society, 37(4), 429–39.Meuter, M L, Ostrom, A L, Roundtree, R I and Bitner, M J (2000) Self-service technologies:
understanding customer satisfaction with technology-based service encounters, Journalof Marketing, 64, July, 50–64.
Oppermann, M (1995) E-mail survey – potentials and pitfalls, Market Research, 7(3), 29–33.Ranchhod, A and Zhou, E (2001) Comparing respondents of email and mail surveys:
understanding the implications of technology, Marketing Intelligence and Planning, 19(4),254–62.
Ray, N, Griggs, K and Tabor, S (2001) Web-based survey research workshop, WDSI, April,http://telecomm.boisestate.edu/research/
Riche, M F (1990) A bigger role for telephone interviews, American Demographics,September, 17.
Rothenberg, R (1989) The trouble with mail interviewing, New York Times, 16 August.Runham, M (1999) Presentation at the IIR Internet Research Conference, December.
EOM_C05.qxd 6/23/05 10:39 AM Page 162

.
Further reading
Schaefer, R and Dillman, D A (1998) Development of a standard email methodology:results of an experiment, Public Opinion Quarterly, 62(3), 378–97.
Schuldt, B A and Totten, J W (1999) Email surveys: what we’ve learned thus far, Quirk’sMarketing Research Review, July, www.quirks.com
Sheehan, K B and McMillan, S J (1999) Response variation in e-mail surveys: anexploration, Journal of Advertising Research, 39(4), 45–54.
Stanton, J M (1998) An empirical assessment of data collection using the Internet, Personnel Psychology, 51(3), 709–26.
Taylor, H (2000) Does Internet research work? Comparing online survey results withtelephone survey, International Journal of Market Research, 42(1), 51–63.
163
EOM_C05.qxd 6/23/05 10:39 AM Page 163

.
Objectives
After reading this chapter, you should be able to:
• appreciate the basic concepts of measurement and scaling
• distinguish between the various types of measurement scale
• describe and illustrate the comparative types of measurement scale
• distinguish and illustrate the non-comparative types of measurement scale
• appreciate the difference between single-item versus multiple-item scales.
Keywords
attitude scale projective techniquescomparative scale Q-sortgraphic scale ratingsinterval scale ratio scaleLikert scale scalingmeasurement semantic differentialnominal scale staple scalenon-comparative scale Thurstone differentialordinal scale
Measurement and scaling6
EOM_C06.qxd 6/23/05 10:40 AM Page 164

.
Measurement and scaling 165
Plan of Chapter 6
EOM_C06.qxd 6/23/05 10:40 AM Page 165

.
166 Chapter 6 • Measurement and scaling
INTRODUCTION
In this chapter the basic concepts of measurement and scaling are introducedand defined, distinguishing between the various types of measurement scale. Thechapter goes on to describe and illustrate the comparative types of measurementscale, distinguishing and illustrating non-comparative types of measurementscale. Finally, single-item versus multiple-item scales are discussed.
Measurement is the process by which scores or numbers are assigned to theattributes of people or objects. How this is done is strongly influenced by the sort of information that is being sought. For example, if precise information oncigarette consumption is being sought, it is better to ask people to say how manycigarettes they smoke in a day. By contrast, when trying to collect information onthe perceptions of cigarette smokers, it is better to ask people to classify them-selves as heavy or light smokers. The two methods produce quite different kindsof measurement.
There are many different kinds of measurement-scaling technique. These scaling techniques often have different properties. It is necessary to understandthe correct way to employ a technique because how a characteristic or trait ismeasured has implications for the interpretation and analysis of the data col-lected from using the technique.
First we look at some basic concepts of measurement and scaling and then distinguish between comparative and non-comparative scales. We then illus-trate how these different scales are used and finally we compare single-item and multiple-item scales.
MEASUREMENT
Numbers given as answers to questions help in the analysis and interpretation of information that is collected by research. When taking measurements there are rules for assigning numbers to objects to represent the quantities of attri-butes. The rules apply to the procedure used to assign numbers that reflect theamount of an attribute possessed by an object, a person, etc. Attention must bepaid to the objectives of the study, the precise definition of the characteristic to be measured and the correspondence between the measurement rule and thecharacteristic.
Concepts, constructs and definitions
A concept or construct refers to characteristics that we wish to measure and adefinition of the precise meaning of the concept or construct. Many of the con-structs measured in typical marketing research studies are directly observable
EOM_C06.qxd 6/23/05 10:40 AM Page 166

.
Measurement
and many are not. The concepts of sales and market share can be directly linkedto observable events. In contrast, the concepts of attitude, product perception orother customer satisfaction factors are measured indirectly.
Depending on the characteristics being measured, the numbers assigned havedifferent properties that affect the kind of statements that can be made about theamount of a characteristic possessed by one individual relative to another. Thescales used in these different types of measurement are termed nominal, ordinal,interval and ratio (see Figure 6.1).
Nominal scales allow us to place an object in one and only one of a set of mutually exclusive classes with no implied ordering. For example, a car’s regis-tration plate is an example of nominally scaled data. The numbers assigned haveno other specific properties other than to identify the car assigned that number.Nominal-scaled variables include examples such as gender, religious denomina-tion and political affiliation. The numbers assigned do not actually reflect theamount of the attribute possessed by the object under scrutiny. Because nominaldata do not possess order, distance or origin, only a limited number of statisticsare allowable. It is not meaningful, in this case, to compute the mean because ithas no significance. However, a nominal variable can be counted: it would, forexample, be legitimate to say that 50% of a sample is female. The correct measureof central tendency is the mode, the value that occurs most frequently.
167
FIGURE 6.1 Four types of data
EOM_C06.qxd 6/23/05 10:40 AM Page 167

.
168 Chapter 6 • Measurement and scaling
NOMINAL-SCALED DATA
Given three ratings 1, 2 and 3, we cannot say that the distance between 1 and 2 isthe same as between 2 and 3, nor can we say that the magnitude of 2 is pro-portional to both 1 and 3. There is no implied ordered sequence. The numbersassigned have no other specific properties than to identify the object.
Ordinal scales involve ranking. This means we can say that an object has moreor less or the same amount of an attribute as some other object. There is animplied ordered sequence so that the option listed first is less or greater than theobject listed second and subsequently. No property of distance between the num-bers is implied, nor do the numbers reflect the magnitude of a characteristicpossessed by an object.
ORDINAL-SCALED DATA
Given three ratings 1, 2 and 3, we cannot say that the distance between 1 and 2 isthe same as between 2 and 3, nor can we say that the magnitude of 2 is propor-tional to both 1 and 3. There is, however, an implied ordered sequence so the optionlisted first is less or greater than the object listed second and subsequently.
An interval scale reflects how much more one object has of an attribute thananother object. It is possible to tell how far apart two or more objects are withrespect to the attribute. Interval data have order and distance properties and themost frequent type of measure of central tendency is the arithmetic mean. Thestandard deviation is also used to measure dispersion about the mean. Almostthe whole range of statistical analysis can be applied to interval measurementscales but interval data do not allow comparisons of the absolute magnitude ofthe measurements to be made across objects. We cannot say that an objectassigned the number 6 has twice as much of the characteristic being measured asthe object assigned the number 3. While interval data possess the characteristic of order and distance, there is no absolute origin (zero point). Interval scales are often used in commercial marketing research studies, especially when aresearcher collects attitudinal and overall brand rating information.
INTERVAL-SCALED DATA
Given three ratings 1, 2 and 3, we can say that the distance between 1 and 2 is thesame as between 2 and 3 but we cannot say that the magnitude of 2 is proportionalto both 1 and 3. There is an implied ordered sequence so the option listed first isless or greater than the object listed second and subsequently.
EOM_C06.qxd 6/23/05 10:40 AM Page 168

.
Scale types 169
Ratio scales possess the same kind of properties as interval-scaled data but also possess an absolute or natural origin. Thus, we can say in this case that thenumber 6 has twice the characteristic being measured as the object assigned thenumber 3 on a ratio scale. Ratio data are commonly associated with directlyobservable physical events or entities. Measures of market share, sales, income,etc. possess characteristics that lend themselves to ratio scaling. Ratio scales haveall the properties of the other measurement scales, since they possess the charac-teristics of order, distance and unique origin (zero point).
RATIO-SCALED DATA
Given three ratings 1, 2 and 3, we can say that the distance between 1 and 2 is thesame as between 2 and 3, and we can say that the magnitude of 2 is proportional toboth 1 and 3. There is an implied ordered sequence so the option listed first is lessor greater than the object listed second and subsequently.
SCALE TYPES
There are two broad classes of measurement scale: comparative and non-comparative scales (see Figure 6.2).
With comparative scaling the respondent is asked to compare one set of objectsagainst another. For example, a respondent might be required to compare onebrand of butter against the other brands that they consider when making a pur-chase in a supermarket. Results have to be interpreted in relative terms and haveordinal or rank order properties. The scores obtained indicate that one brand ispreferred to another, but not by how much. In the case of this type of scale, rela-tively small differences among the objectives being compared can be detected.
In non-comparative scaling respondents are required to evaluate each objectindependently of other objects being investigated. Non-comparative scaling isoften referred to as monadic scaling.
Comparative scales
This type of scaling ensures that all respondents approach the rating task from thesame known reference point. There are several variations in the technique used.
Paired comparisons
The respondent is presented with two objects at a time and is required to indicatea preference for one of the two according to some stated criterion. The methodyields ordinal scaled data, for example, brand A is better than brand B, or, brand
EOM_C06.qxd 6/23/05 10:40 AM Page 169

.
170 Chapter 6 • Measurement and scaling
A is cleaner than brand B and so on. It is often applied in cases where the objectsare physical products. One important point about data obtained through pairedcomparisons is that the ordinal data can be readily converted into interval-scaleddata.
Rank order scale
In this case, respondents are presented with several objects simultaneously andrequired to order or rank them.
Constant sum scale
Respondents are asked to allocate a number of points – say, for instance, 100points – among objects according to some criterion, for example, preference orimportance. They are instructed to allocate the points such that if they like brandA twice as much as brand B, they should assign brand A twice as many points.
FIGURE 6.2 Types of scale
EOM_C06.qxd 6/23/05 10:40 AM Page 170

.
Scale types 171
Line marking/continuous rating comparative scale
This is often used to obtain similarity judgements. Usually, respondents are pre-sented with object pairs and asked to judge their similarity by marking a five-inchline anchored by the phrases ‘Exactly the same’ and ‘Completely different’.
EXAMPLE
Rolex and Longines
Please indicate how similar you believe these two brands of watch to be by placingan X on the line below at the point that approximates your judgement.
Exactly Completely the same different
Q-sort scale
This scale employs a rank order procedure in which objects are sorted into pilesbased on similarity with respect to some criterion. Respondents are presentedwith a set of objects (brands, concepts, words or phrases) and are told to sortthem into piles, according to some criterion. For instance, a respondent might be given a set of brands and asked to sort them according to which are the mostsimilar to the person’s ideal brand.
Once the respondent has completed the Q-sort, each item is assigned a rankorder. The data are ordinal in nature and can be analysed with statistical proced-ures that are suitable for these types of data.
Non-comparative scales
The respondent is not instructed to compare the object of interest either againstanother object or some specified criteria. In rating an object, the respondentassigns the rating based on whatever criteria are appropriate for that individual.In assigning a rating, each respondent must use some criteria of their own: it isnot provided by the researcher.
Line marking/continuous rating scale
A line marking or continuous rating scale can be used in a non-comparativeformat. In this case the respondent is required to assign a rating by placing amark at the appropriate position on a line, usually five inches long, that bestdescribes the subject under study. No standard for comparison is given. Theresulting scores are usually analysed as interval data.
EOM_C06.qxd 6/23/05 10:40 AM Page 171

.
172 Chapter 6 • Measurement and scaling
Itemised rating scale
Here the respondent is provided with a scale that has numbers and/or a briefdescription associated with each category. They are asked to select one of the cat-egories, ordered in terms of scale position, that best describes the object understudy. The scale can take on various formats reflecting the number of categoriesused, the nature and degree of verbal description, the number of favourable andunfavourable categories and the presence of the neutral position. This kind ofscale can have any number of response categories. However, the controllingfactor concerns the respondent’s ability to discriminate among categories.
Various types of verbal description and numeric format can be employed andthe former do help to ensure that respondents are operating from the same base.However, the presence of verbal descriptions will influence the responsesobtained. Pictures and other types of graphics may also be used.
If an equal number of favourable and unfavourable classes are used, a scale isbalanced; otherwise the scale is unbalanced. You might want to use an unbal-anced scale when the distribution of responses is likely to be skewed. Morecategories might be used in the direction of the skewness. Unbalanced scales areoften used when asking socially threatening questions or in cases where most ofthe respondents are likely to have positive (or, conversely, negative) opinionsabout a subject.
When a balanced rating scale is used, there is a choice between using an evenor an odd number of scale items. In the case of an odd number of scale items, themiddle scale position is usually designated as a neutral point.
Itemised rating scales are often used to measure purchase intentions. Purchaseintention scales represent an attempt to measure a respondent’s interest in abrand or product.
Multiple-item scale
A multiple-item scale consists of a number of statements to which the respondentmust react. For example, a respondent might be asked to indicate how favourableor unfavourable each statement is. An overall score is then determined by com-bining the reactions to each.
ATTITUDE MEASUREMENT
Attitudes are assumed to be a precursor of behaviour and are considered toexpress a person’s beliefs and, in some sense, to influence the person’s ultimatebehaviour. Most commercial market research studies contain questions as ameans of attitude measurement.
People have different notions about what constitutes an attitude but it ofteninvolves feelings, emotions and likes or dislikes. Attitudes reflect a person’s
EOM_C06.qxd 6/23/05 10:40 AM Page 172

.
Attitude measurement
evaluation of an object based on their beliefs about that object. To some degree,attitudes influence how the person will respond when they encounter the object.An attitude might therefore be looked on as a learned predisposition to respondin a consistently favourable or unfavourable manner to a given object.1 Such adescription assumes that attitudes are learned, that they are a forerunner tobehaviour and that they are stable.
There are several types of scaling technique that can be used to measure attitudes. Here we discuss and illustrate some of them.
Projective techniques
The basic premise of projective techniques is that the best way to obtain the truefeelings and attitudes of people is to enable them to indirectly present data aboutthemselves by speaking through others.
Projective techniques such as sentence, story and picture completion are takenfrom the domain of abnormal psychology. They were devised in the belief thatpeople have various psychological blockages that prevent them from verbalisingtheir true feelings. The assumption is that normal people, too, experience block-ages and that the method is also valuable in these circumstances.
In the case of picture completion or cartoon techniques the respondents areshown a picture of one or more people in a situation related to the subject understudy. They are then told to describe what is occurring or to answer a questionasked by one or other of the cartoon characters. The characters are usually drawnto be as neutral as possible (no smiles or frowns). Picture frustration (putting oneof the cartoon figures in a frustrating position) and thematic apperception tests(depicting more general situations than the frustration method) are the most gen-erally used methods (see Figure 6.3).
Word association and sentence completion
In the case of word association a respondent is given a series of single words and then asked to match each with one of their own. The goal is to elicit quick,unrestrained answers. For example:
Carnation: perfume
Flower seller: anniversary
Sentence completion follows the same kind of pattern:
The kind of flower I prefer is _______________________
Men who buy flowers are __________________________
173
EOM_C06.qxd 6/23/05 10:40 AM Page 173

.
174 Chapter 6 • Measurement and scaling
Story completion, role playing and reactions to lists
Story completion is a longer version of sentence completion in which participantsare presented with partial scenarios and asked to complete the story. For example:
It was a dark day and the headlamps of the cars moved like will-o’-the-wispsin the murky twilight. Candice stepped almost unconsciously into a limousinethat stood, door ajar, at the kerb . . .
Role playing
Participants are asked to assume the role of another person and to behave in a manner in which they feel that person would act. For example, to identifypeople’s attitudes towards a particular brand a small group of respondents isasked to provide the conversation they feel would occur in a similar-sized groupof consumers discussing their feelings about the brand.
Lists
Lists of various products or activities are shown to participants and they areasked to describe the type of person who would have used such a list. Their
FIGURE 6.3 Thematic apperception
EOM_C06.qxd 6/23/05 10:40 AM Page 174

.
Self-reporting methods 175
answers will shed light on their feelings about the items on the list and what typeof people such items appeal to.
LISTS
What kind of shoppers are A and B? Examine the two shopping lists and suggestcharacteristics for each of the shoppers.
Shopper A Shopper B
1 tin baked beans (Heinz) 2 kilos new potatoes2 large cartons of semi-skimmed milk 1 packet of baby corn6 apples – Coxes 1 box of tea bags (large)2 packets white sugar 2 cartons of milk (large)1 jar of Nescafé 1 tub of margarine2 tins of sardines 1 bottle of aerated water4 cans of Lager (Skol) 1 packet of Special K cereal1 tub of chocolate ice-cream (large) 1 tin of tuna chunks1 packet of PG Tips tea bags (large) 4 yoghurts – organic (fruit)2 loaves (white – from bakery dept) 6 eggs (medium)2 packets of pork sausages
A variation on this method is to have two identical shopping lists, except forone item. The lists are shown to different samples of respondent – i.e. no oneperson sees both the lists. This helps to spot what people associate with the itemthat is different on the two lists.
SELF-REPORTING METHODS
Semantic differential scale
The semantic differential scale technique was originated by Osgood, Suci andTannenbaum.2 The originators of the technique discovered that the perceivedmeaning of a variety of words and concepts could be decomposed in terms ofthree components: potency, activity and evaluation. In marketing research, thesemantic differential is often used to measure attitudes towards the imagery sur-rounding products and services. In general, only the evaluative (e.g. good/bad)component is measured.
The scale consists of a number of bipolar adjectival phrases and statements thatcould be used to describe the objectives being evaluated. In the original work of Osgood et al., only single-word bipolar adjectives, not phrases, were used.However, common practice in marketing research applications is to use adjectival
EOM_C06.qxd 6/23/05 10:40 AM Page 175

.
176 Chapter 6 • Measurement and scaling
phrases as well. An example is shown in Figure 6.4. Each bipolar adjective ratingscale consists of seven categories, with neither numerical labels nor categorydescriptions other than for the anchor categories. To remove any position bias,favourable and unfavourable adjectival phrases are randomly distributed to theleft-hand and right-hand anchor positions. The respondent is asked to mark oneof the seven categories that best describes their views about the object along thecontinuum implied by the bipolar object pair. An overall attitude score is com-puted by summing the responses on each adjective pair. Before computing theoverall score, the response categories must be coded. Usually the categories areassigned values from 1 to 7, where 1 is assigned to the unfavourable adjectivalphrase and 7 is assigned to the favourable adjectival phrase. Thus, before assign-ing codes and summing, the researcher must be careful to reverse the individualscale items where necessary so that each attitude continuum ranges fromunfavourable to favourable or vice versa.
Ratings on each of the bipolar adjective pairs are often used to provide aprofile or image of the objects being investigated. This is achieved by plotting the mean ratings on each of the bipolar adjective pairs for each of the objects.Figure 6.5 shows an example of such profiling. In order to facilitate interpretationof the profile, all the favourable adjectival phrases are positioned on the sameside. From this kind of plot, it is possible to obtain an overall impression ofpeople’s perceptions of the object.
In Figure 6.5, a comparison is made between two restaurants. Not only doesthe scale permit such comparisons to be taken in at a glance but it also allows usto see fairly readily where more in-depth research is required. The decor of ‘ourrestaurant’, for example, is perceived to be at or about the neutral point. Furtherresearch is needed to uncover how it might be improved to the taste of its clientele.
FIGURE 6.4 Semantic differential
EOM_C06.qxd 6/23/05 10:40 AM Page 176

.
Self-reporting methods 177
FIGURE 6.5 Semantic differential profile
Staple scale
The staple scale technique differs from the semantic differential because it usesjust one term and asks the respondent to describe how well that term describesthe subject. Circling +5 means that the respondent agrees very strongly that theterm is an appropriate description, while circling −4 indicates the reverse. Thescores for each respondent can be summed and compared with the total scores ofother respondents.
STAPLE SCALE
Our restaurant
+5 +5+4 +4+3 +3+2 +2+1 +1Awkward Helpful−1 −1−2 −2−3 −3−4 −4−5 −5
s
EOM_C06.qxd 6/23/05 10:40 AM Page 177

.
178 Chapter 6 • Measurement and scaling
Select a plus number for words that you think describe the restaurant accurately. The more accurate you think the description is, the larger should be theplus number selected. Conversely, select a minus number for words that do notdescribe the restaurant. The less accurate you believe the description to be, thelarger should be the minus number you select.
Likert scale
A Likert scale measures attitudes and comprise statements with which therespondent has to agree or disagree.
LIKERT SCALE
‘Persil washes whiter than white’
Strongly Stronglydisagree Disagree Don’t know Agree agree−2 −1 0 +1 +2
In the Likert3 method, a series of statements is provided and interviewees arerequired to rate each statement on the basis of the strength of their personal feel-ing towards it. The numbers assigned to the responses are numerical valuesassociated with each possible answer. When analysing the results, the signs ofthese numbers are reversed when a statement is unfavourable.
Thurstone differential
When using the Thurstone differential method, interviewees are asked to selectthose statements with which they agree from a list of between 20 and 25 state-ments. The statements are derived from an original list of 100 to 200 statementsthat are evaluated by a panel of 15 to 20 judges. Each judge is asked to place thosestatements in 11 nearly equal piles. These piles represent the judgements of thepanel members as to which statements are more favourable and which are leastfavourable about the subject. The sixth or middle pile is the neutral position.
Mean scores for each of the original 100 to 200 statements are determined onthe basis of the piles in which they were placed by the judges. The 20 to 25 state-ments with the smallest dispersion are chosen to be included in the survey. Fromthis latter list the interviewee is asked to check only those with which they agree,enabling a mean score for each interviewee to be obtained. This score quantifiesthe attitude of each interviewee towards the subject under study. Many peopleargue that the scale is an ordinal rather than interval scale.
EOM_C06.qxd 6/23/05 10:40 AM Page 178

.
Self-reporting methods 179
Some general comments relating to these techniques
When administering these techniques, respondents are provided with a numberof choices – words, statements, numbers – and required to select the one thatmost closely describes their attitude towards the subject. When applying thesetechniques, the researcher must decide how many choices to include as well astheir wording.
There is disagreement on the ideal number of choices that should be offered torespondents. Four to eight choices appears to be preferred, with five the numberused most often. There is also a lack of consensus on whether there should be aneven or odd number of choices. An even number of choices compels the respondentto declare a position, whereas an odd number usually provides a middle positionfor situations where the respondent cannot identify their feelings. The drawbackto offering a neutral position is that this choice attracts many respondents who donot have strong feelings on the issue and hence it does not allow the researcher todistinguish between answers.
There is a related issue which is relevant to the point about the ‘odd versuseven’ number of questions: this concerns the provision of a category headed‘don’t know’. There are many situations in which respondents do not have anopinion or are not sufficiently informed on a topic to have an opinion about it. Aneutral position and a ‘don’t know’ choice are not the same thing. Where both canoccur, provision has to be made to record both.
Attention should also be given to the wording of choices. There should usuallybe an equal number of favourable or unfavourable statements. Responses caneasily be biased if the majority of choices are either favourable or unfavourable.
The 20 to 25 statements used in the scale must all deal with the same subject. Ifattitudes towards a variety of subjects are sought – firm’s products, personnel,etc. – a separate list of statements would be required for each subject.
THURSTONE DIFFERENTIAL
Suppose attitudes towards a restaurant are being assessed using a Thurstonescale. An interviewee indicates three statements with which they agree:
Statement Value assigned by judges
1 The restaurant has a friendly atmosphere 3.015 The restaurant offers a good choice of menus 1.521 Always rely on the quality of the food 2.7Average 2.4
EOM_C06.qxd 6/23/05 10:40 AM Page 179

.
180 Chapter 6 • Measurement and scaling
An unbalanced set of categories might be preferred, however, when there is priorevidence that, in general, attitudes held are at extreme positions. For example, ifall viewpoints are likely to be positive, then more precision may be obtained byoffering the categories:
1 outstanding
2 well above average
3 above average
4 average
5 below average.
METHODS FOR RATING ATTRIBUTES
Thus far we have examined techniques that allow respondents to express theirfeelings on the extent to which an item or topic possesses certain attributes.However, in trying to obtain an overall score for the subject matter underscrutiny, we have assumed equal weighting for all the attributes or statements. Itis necessary, however, to measure how important each attribute or statement isfor the overall attitude being measured.
Rating scales enable respondents to disclose the intensity of their feelingsabout certain attributes or about the subject itself.
Graphic scales
Use of a graphic scale involves the respondent indicating the intensity of theirfeelings towards some attribute or object by placing a mark at some point along acontinuum that includes all possible ratings.
GRAPHIC SCALE
Please indicate how important each attribute is to you in your selection of a restau-rant. Place an X on each line at the position that best reflects your feelings.
Attribute Not important Very importantLow prices ______________________________________Courteous service ______________________________________Varied menu ______________________________________Convenient location ______________________________________
EOM_C06.qxd 6/23/05 10:40 AM Page 180

.
Methods for rating attributes 181
Itemised approach
Here, a list is prepared of the object’s attributes and the respondents are asked toidentify how important each item is to them in their final attitude towards theobject.
ITEMISED APPROACH
Very Fairly Somewhat NotAttribute important important important importantPrice ___ ___ _X__ ___Durability _X__ ___ ___ ___Appearance ___ ___ ___ _X__
Comparative weights
Here the respondent is forced to rate the attributes on the basis of their perceivedrelative importance.
COMPARATIVE WEIGHTS
The respondent is asked to divide 100 points among five attributes to denote therelative importance of each attribute.
Rank order
In this case the respondent is asked to arrange a number of objects accordingto some criterion. This produces strictly ordinal scaling, since no data are pre-sented about the relative difference between any of these objects. The procedureis easy for the respondent to perform if the comparison is limited to six or sevenobjects.
Multiple-item scales are often used in attitude measurement.
Price 22Weight 16Durability 12Material 21Looks 29Total 100
EOM_C06.qxd 6/23/05 10:40 AM Page 181

.
182 Chapter 6 • Measurement and scaling
FIGURE 6.6 Example of symbols representing ratings
RANK ORDER
Please rank the following restaurants according to the friendliness of their person-nel. Place the number 1 beside the restaurant that you feel has the most friendlypersonnel, 2 by the restaurant with the next most friendly personnel, and so onuntil all restaurants have been rated.
___ Rembrandt___ Silver Moon___ Hole in the Wall___ Barny’s Place___ Il Seraglio
Rating with symbols
In cases where there may be language or literacy difficulties, an alternative tousing words in scales is to use symbols instead. The example in Figure 6.6 illus-trates this.
SUMMARY
This chapter has defined and discussed the basic concepts of measurement andscaling, distinguishing among the various types of measurement scale. A descrip-tion and illustration of comparative types of measurement scale have been given,as have descriptions and illustrations of non-comparative types of measurementscale. Single-item versus multiple-item scales have been compared and discussed.Various attitude measurement scales have also been examined.
EOM_C06.qxd 6/23/05 10:40 AM Page 182

.
Case study 6.1 183
QUESTIONS
1 What do you understand by the term measurement in marketing research?
2 Differentiate between concepts, constructs and definitions.
3 Differentiate between nominal, ordinal, interval and ratio-scaled data andindicate when each might appropriately be used in marketing research.
4 Describe the two main types of scaling.
5 Differentiate between paired comparisons, rank-order scales, constant sumscales, continuous rating, comparative scale or line marking and Q-sort.
CASE STUDY 6.1: SUMMIT MOTORS (1)
Summit Motors’ records indicate that less than 40% of its new car buyers remainloyal service customers after the first free service. The dealer is keen to increasethe percentage to at least 50%. A number of different attributes have beenidentified as affecting the patronage of a service facility and the dealer wants toconduct a small survey among new car purchasers who have bought cars duringthe past two years to assess customer views.
The attributes affecting patronage are considered to be whether or not:
• the job is done first time
• complaints are dealt with speedily
• warranty work is attended to promptly
• the dealer can do any job required
• service is available when required
• the service is friendly and courteous
• a car is ready when promised
• only necessary work on a car is performed
• service prices are low
• the car is cleaned up after service
• the service facility is convenient for home
• the service facility is convenient for work
• courtesy cars are available
• maintenance reminders are posted.
EOM_C06.qxd 6/23/05 10:40 AM Page 183

.
184 Chapter 6 • Measurement and scaling
Question
Construct a scale that would be helpful to the dealer and that could be the focal pointof the survey.
CASE STUDY 6.2: BARNY’S CAFÉ
Barny’s Café is just off the promenade at Eastbourne. It is tucked away down aside street and although it does not enjoy the prominence of many of the cafés inthe town, there are a good number of passers-by during the season and manystop for a drink or even a meal. Out of season, however, the café suffers from theusual, perhaps to be expected, seasonal drop in sales. However, Barny hasnoticed that, unlike many of his competitors, he does not have any regular cus-tomers who help to offset the seasonal drop in sales. In the summer, when thetown is crowded, it is difficult to get a seat in a café and virtually all the cafés arefull to overflowing around lunchtime and in the afternoon. Virtually anyone whocan offer a seat and a rest for half an hour can get customers.
Barny sees his problem as one of establishing a customer base – in other words:how to get regular customers and keep them. As far as he can see there does notappear to be anything especially different about the ‘more successful’ cafés towhat he has to offer. One thought that has crossed his mind is the idea of con-ducting a small survey to find out people’s attitudes towards his café and, ifpossible, their attitudes to other cafés in the town.
Question
Draw up a suitable attitude measurement scale that could help Barny have a betteridea of how he might tackle this problem.
CASE STUDY 6.3: LIPTONJUICE (2)
Before making any further decisions, imagine that PepsiCo had decided to under-take an extensive survey of people’s attitudes to iced tea in the United States, theUnited Kingdom, Spain, France, Germany and Italy.
Question
Suggest how PepsiCo might go about measuring people’s attitudes to Liptonjuice.
EOM_C06.qxd 6/23/05 10:40 AM Page 184

.
Case study 6.4 185
CASE STUDY 6.4: CHINESE IMPORTS
East-West Connections Ltd specialises in the import of novelties and small house-hold products from the Far East, notably from Korea and mainland China. Thecompany’s Chinese agents have for some time been suggesting that the firm’srange could be extended to include Chinese white goods – washing machines,refrigerators, freezers and so forth – since these were now being produced to highstandards and in substantial quantities within the People’s Republic. Followingin the footsteps of Changhong, the largest TV manufacturer in China (nowexporting to the USA), the agents believe that the Western world is ready forChinese consumer durables.
The directors of East-West are somewhat less enthusiastic. Although they arewell aware that firms such as Wuxi Little Swan (washing machine makers) andQingdao Haier or Guangdon Kelon (refrigerator manufacturers) are seekingopportunities outside China, they feel that the British public still thinks ofChinese goods as being in the ‘cheap and nasty’ category. For the firm to makethe considerable leap from dealing in cheap fans and ceramic ornaments to deal-ing in consumer durables would require some fairly solid evidence; the capitalcost alone could bankrupt the firm if the idea went wrong. Contrariwise, beingfirst to introduce the products into Britain could have very substantial advan-tages in terms of long-term viability of the firm. After all, there is a limit to howmany substandard vases can be sold, and in the long run the firm would need toseek new opportunities.
The obvious answer to the problem was to conduct some research among UKconsumers to see what their perception of Chinese goods is. The consultantsbrought in to do the research decided to begin by using a Q-sort to assess percep-tions of Chinese goods against perceptions of 23 other nationalities, includingEuropean, American and Far Eastern countries. The perceptions of the countries’goods were assessed across the following criteria: reliability, design quality, dura-bility, price, availability and prestige value. The Q-sort revealed that Chinesegoods ranked higher than some countries on price and availability and evenranked higher on design than did a few countries, but in almost all cases Chinaranked low on durability and reliability.
The country that appeared to be closest to China in terms of public perceptionof the goods was Korea. Since Korean engineering has become more acceptablein the West over the past 10 to 15 years (with the advent of Korean cars such as Daewoo and Kia), the researchers decided to concentrate further efforts oninvestigating the relationship between perceptions of China and perceptions ofKorea. For this, the researchers decided to use a multidimensional scalingapproach so that they could see how great the differences were between Chinaand Korea on the attributes identified.
China was perceived as having a very large advantage on price, a small dis-advantage on design, a small disadvantage on prestige and big disadvantages on
EOM_C06.qxd 6/23/05 10:40 AM Page 185

.
186 Chapter 6 • Measurement and scaling
reliability, durability and availability. For Chinese goods to be successful in theUK, therefore, East-West Connections would need to change the perception ofunreliability. In fact, quality testing showed that the Chinese goods were no moreunreliable than Korean goods, but the Koreans had the advantage of being able toride on the back of Japan’s reputation for high-quality goods. The Chinese mightnot have a similar advantage – but without a doubt they were going to be in themarket within the next ten years or so.
The directors of East-West Connections were unsure whether the firm wouldbe able to make the substantial changes in public perceptions that appeared necessary; on the other hand, the prospect of being first to market in a potentiallyhuge growth area was very tempting indeed.
(Case contributed by Jim Blythe)
Questions
1 Why might the research team not have used multidimensional scaling across allthe comparison countries instead of a Q-sort?
2 What does multidimensional scaling tell us that a Q-sort does not?
3 Draw up a semantic differential scale for assessing attitudes to Chinese goods.
4 What other techniques might have been appropriate to the study?
5 What are the limitations of Q-sort and multidimensional scaling?
REFERENCES AND NOTES
1 Fishbein, M and Azjen, I (1975) Belief, Attitude, Intention and Behavior, Reading, MA:Addison-Wesley, 6.
2 Osgood, C, Suci G and Tannenbaum, P (1987) The Measurement of Meaning, Urbana, IL:University of Illinois Press.
3 Likert, R (1932) A technique for the measurement of attitudes, Archives of Psychology, 140.
FURTHER READING
Churchill, G A (1979) A paradigm for developing better measures of marketing constructs,Journal of Marketing Research, 16, February, 64–73.
Foddy, W (1994) Constructing Questions for Interviews and Questionnaires, Cambridge:Cambridge University Press.
EOM_C06.qxd 6/23/05 10:40 AM Page 186

.
Further reading
Gofton, K (1997) If it moves measure it, Marketing, 4 September, 17.Green, P A, Tull, D S and Albaum, G (1988) Research for Marketing Decisions, Upper Saddle
River, NJ: Prentice-Hall.Ohanian, R (1990) Construction and validation of a scale to measure celebrity endorsers’
perceived expertise, trustworthiness and attractiveness, Journal of Advertising, 19(3),39–52.
Oppenheim, A N (1968, 1969, 1984) Questionnaire Design and Attitude Measurement, Oxford:Heinemann.
187
EOM_C06.qxd 6/23/05 10:40 AM Page 187

.
Objectives
After reading this chapter, you should be able to:
• understand the principles involved in designing and constructingquestionnaires
• understand the principles involved in testing and debugging questionnaires.
Keywords
closed-ended questions questionnairedichotomous questions reliabilitylayout response formatmultiple-choice questions scalesopen-ended questions semantic differentialphrasing sequencepretesting surveyprojective techniques validity
Questionnaires7
EOM_C07.qxd 6/23/05 10:40 AM Page 188

.
Questionnaires 189
Plan of Chapter 7
EOM_C07.qxd 6/23/05 10:40 AM Page 189

.
190 Chapter 7 • Questionnaires
INTRODUCTION
In this chapter we look at the design and construction of questionnaires. Ques-tionnaires are used in a variety of contexts in marketing research. They can beemployed during the conducting of a survey, including mail surveys, telephoneinterviews, formal structured personal interviews and self-administered studies.Irrespective of the context in which survey research is conducted, the ways inwhich the questionnaire is constructed are very broadly similar. However, ques-tionnaires must be developed carefully, tested and debugged before they areadministered.
A questionnaire is a data-collection instrument. It formally sets out the way inwhich the research questions of interest should be asked. Even simple questionsneed proper wording and organisation to produce accurate information. Con-sideration needs to be given to how questions should be worded, in the light ofthe objectives of the research, and the target group of respondents who are to bequestioned. Attention also needs to be given to the organisation of the question-naire and to its pretesting. The procedures recommended in this chapter apply tomail, telephone, personal and computer-assisted telephone interviews.
There are definite guidelines for preparing a questionnaire. First, there are limi-tations to what a questionnaire can measure. People can accurately report themake or brand of a fashion item they have bought for some time after the actualpurchase. If it is a frozen-food item, their memory span will be considerablyshorter. If it is a commodity-type product such as salt or sugar, where the brandsare almost indistinguishable, it will probably have been completely forgotten.Depending on the subject, there may be recall of something that respondentsthink they have seen when actually they have not.
QUESTIONNAIRE STRUCTURE
The three major parts of the questionnaire are the introduction, the body of thequestionnaire and its basic data.
Introduction
To be successful, the introduction to the questionnaire must achieve two things:
1 It must be persuasive.
2 Usually it must qualify the respondent as someone who belongs in the sample.
The starting point of the questionnaire is self-identification. In a one-to-oneinterview, the investigator has to explain who they are and name the firm doing
EOM_C07.qxd 6/23/05 10:40 AM Page 190

.
Questionnaire structure 191
the study. The introduction states the topic of the study. If it is a one-to-one sur-vey, the person may have to be qualified to ensure that they really belong in thesample. Possibly only users of a particular type of product or service are wanted.
Body or content
The body or content consists of questions that cover information needed to solvethe marketing problem. The range of topics covers facts, knowledge, opinionsand attitudes, motives and possible future behaviour. Factual questions includesuch things as ownership, shopping/buying behaviour and media exposure aswell as knowledge possessed by respondents. Questions also attempt to measureopinions and attitudes – feelings about products, firms and advertising. There isalso the measurement of motives, still more difficult and uncertain in dependabil-ity of results. Finally, there is possible future behaviour. Questioning in this lastarea must bear in mind that results are an expression of attitude and not an accur-ate prediction of behaviour. People are often willing to describe their plans, butthese may often not be carried out.
DESIGNING THE QUESTIONNAIRE
First, the problem to be tackled by the survey has to be defined. This will enable you to decide what questions to ask. It is always tempting to cover too much in aquestionnaire. However, too long a questionnaire can be demoralising for bothinterviewer and respondent. A questionnaire should only be as long as is absolutelyessential for its purpose. Moreover, the aim of the questionnaire should always beborne firmly in mind when constructing it and each question should make contribu-tions to the research objectives.
The information obtained as a result of administering the questionnaire willdepend on the respondent’s ability and willingness to respond. The aim should beonly to ask opinions if the interviewer is reasonably sure that the respondentunderstands what is involved and is able to give meaningful answers. The inter-viewer should also aim to ask questions only from those who are able to answerthem accurately. It should always be borne in mind that a willingness to respond isnot a guarantee of the accuracy of the answers.
Basic data
The last section of the questionnaire is mainly information about the householdand the individual. It almost always includes demographics about the household,aspects such as family size, nature and income. Typically, it also covers demo-graphics about the respondent and it may include questions about lifestyle andpsychographics.
EOM_C07.qxd 6/23/05 10:40 AM Page 191

.
192 Chapter 7 • Questionnaires
This section of the questionnaire has three purposes. First, where there areknown and dependable statistics about the population from which the samplehas been selected, such data provide a rough check on the representativeness ofthe sampling. Second, through analysis of subgroups, it provides a method foridentifying differences of key results in response by subgroups such as genderand age. Third, there is identification material such as the respondent’s name,address and telephone number.
Impact of survey method on questionnaire design
Whether survey data are collected through personal interview, telephone, mail or self-administration, they will have an impact on questionnaire design. In ashopping centre interview, for example, there are time limitations that are notencountered in other situations. In the case of a self-administered questionnairethe questions have to be explicit and short. In the case of a telephone interview arich verbal description of a concept may be necessary to ensure that the respon-dent understands what is being discussed.
STAGES IN QUESTIONNAIRE DEVELOPMENT
The stages involved in the design of a questionnaire and how they fit in with thegeneral research process are outlined in the following box. This provides anoverview of what should have been done prior to the development of the question-naire. It also examines what is involved in questionnaire development and testing.
STAGES IN THE DEVELOPMENT OF A QUESTIONNAIRE
1 Identification and specification of the research problem/research objectives.
2 Selection of the population to be studied.
3 Choice of data collection: face to face, telephone, mail, computer approach.
4 Ordering of the topics to be addressed.
5 Establishing the required cross-tabulations.
6 Deciding how the topics will be covered – direct/indirect questions, open-endedquestions, closed-ended questions – and how they will be precoded.
7 Questionnaire layout and the design of any supporting material, such as showcards.
8 Pretesting of the questionnaire to obtain feedback on the ordering of questions,responses to questions, instructions to interviewers, efficiency of layout and toassess the time taken by the interviewers and the cost of interviews.
EOM_C07.qxd 6/23/05 10:40 AM Page 192

.
Questionnaire design and construction
QUESTIONNAIRE DESIGN AND CONSTRUCTION
On reaching this stage in conducting a research study it is expected that theresearch problem has already been expressed in terms of an appropriate set of research questions. These questions have now to be put in a suitable format for the respondents to answer and then arranged into a questionnaire in a valid,logical fashion that will produce meaningful answers. Considerable thoughtneeds to go into the process of constructing a questionnaire: it is not as simple as might appear at first sight. Indeed, the process involves going through the following sequence of steps (see also Figure 7.1):
1 preliminary considerations
2 question content
3 question phrasing
4 types of response format
5 question sequence
6 question layout
7 pretest, revision and final version of the questionnaire.
Preliminary considerations
Attention must be paid to the kind of information that is required, the nature ofthe respondents who are to be surveyed and the method by which the survey isto be conducted. The three considerations are interdependent. For instance, in order toanswer questions in a meaningful way, a respondent must have access to relevantinformation and it must be appropriate for the person concerned to make aresponse. By way of illustrating the last point, asking the male partner in a house-hold about shopping habits is not appropriate if the female partner does all theshopping.
The questionnaire must address all the data requirements that are specified inthe research objectives and attention must be given to ensuring that this is done.It is also important to take account of how the questionnaire is to be tabulatedafter collection of the data. Each topic should be taken in turn and it should bedecided which groups in the survey population warrant individual attentionwhen it comes to discussing this topic.
Question content
When looking at the content of questions, you should ask:
1 Is the question necessary? If the answer provided by a question does not contri-bute to satisfying the research objectives, the question itself should be omitted.
193
EOM_C07.qxd 6/23/05 10:40 AM Page 193

.
194 Chapter 7 • Questionnaires
FIGURE 7.1 Questionnaire design and construction
EOM_C07.qxd 6/23/05 10:40 AM Page 194

.
Questionnaire design and construction
2 Does the respondent understand the question? The language of the questionshould be at the level of the respondent being interviewed.
3 Will the question suffice to elicit the required data? Questions may be badlyphrased or too ambiguous to produce specific information, for example, ‘Whendo you shop?’ Asking the same question, but with the words in a differentorder, may also produce different answers. For example, asking whether it isright to ‘drink and drive’ may elicit a different answer to asking whether it isright to ‘drive and drink’.
You should also avoid questions that pose more than one question, forexample, ‘When and where do you shop?’
4 Does the respondent have the necessary information to answer the question? The abil-ity of a respondent to provide a meaningful answer will reflect:• The extent to which the respondent is informed. Some respondents may not wish
to disclose ignorance and may try to bluff their way through certain ques-tions. In constructing and asking questions it is therefore important toensure that there is no suggestion that the respondent should know theanswer.
• How good the respondent’s memory is. People forget and need something to jogtheir memories. It is better to ask people if they recognise something ratherthan to ask them to recall it.
• How articulate the respondent is. People vary considerably in this respect.Where open-ended questions are being asked it is inevitable that somepeople will be better than others at getting over the point they wish to make.Closed-ended questions, where an individual has to indicate an option froma prespecified list help to alleviate this particular problem.
5 Is the respondent willing or able to answer the questions? Non-response or distortedanswers are sometimes made by respondents. Embarrassment or loss of faceare strong motivators that influence how a person responds to questions. Waysof alleviating this problem include:• removing or redrafting questions that are likely to create these kinds of
problem• reassuring respondents of the importance of the questions and the confiden-
tiality of the data provided; anonymity of the responses can help.
Question phrasing
Clarity and simplicity
The style of language used should be appropriate for the target popula-tion. You should not appear to be condescending, nor should you assume that respondents are as well informed on the subject as the person who asks the questions.
195
EOM_C07.qxd 6/23/05 10:40 AM Page 195

.
196 Chapter 7 • Questionnaires
CLARITY AND SIMPLICITY
Don’t ask respondents what viscosity of oil they put in their cars. Ask them whatgrade they use.
Length of questions
Keep the sentences short and to the point.
Ambiguity and vagueness
Ambiguity and vagueness in question wording must be avoided at all costs. If themeaning of a question is unclear, you cannot expect the respondent to provide aclear, unambiguous answer. Avoid confusing words – words that are spelt thesame but can have different meanings or words that sound the same but are speltdifferently.
AMBIGUITY AND VAGUENESS
The word light can mean both light in weight and light in colour. Using the word onits own can be confusing.
Biased words and leading or loaded questions
Biased words have emotional connotations such that the respondent mayrespond to the word rather than to the question in which it is contained: ‘bosses’and ‘interference’ are two such words. Such words should be avoided. Leadingquestions are those that either suggest the way in which the respondent shouldanswer or strongly suggest what the questioner’s position on the subject is. Thesetoo should be avoided.
LEADING QUESTIONS
Avoid leading questions such as: ‘Most people believe that advertising puts up theprice of goods in the shop. Do you?’
Negative questions
Questions with a negative formulation, with which respondents are asked toagree or disagree, can be confusing. Confusion leads to the respondent guessing
EOM_C07.qxd 6/23/05 10:40 AM Page 196

.
Questionnaire design and construction 197
and thence to measurement error. Questions phrased in a negative fashion shouldbe avoided.
NEGATIVE QUESTIONS
Questions with the format: ‘You don’t think . . . do you?’ are not only confusing butalso leading.
Questions asking for estimates or generalisations
These should be avoided since they are a potential source of error.
ESTIMATES AND GENERALISATIONS
Do not ask people how much they usually spend on their green groceries on aver-age every week. This can be accurately ascertained by keeping consumer diaries.
Hypothetical questions
The words ‘would’ or ‘could’ should be avoided in questions since they encour-age the respondent to guess and speculate.
HYPOTHETICAL QUESTIONS
Do not ask people if they would purchase something if it were available.
Implicit assumptions
When phrasing questions, do not do so in a manner that assumes that all respon-dents are well informed and in possession of all the facts. Questions that make animplicit assumption of a respondent’s background knowledge will not producevalid, accurate results. Different respondents will make different assumptions, sothe questions will not generate useful responses. Indeed, it is advisable, whereverappropriate, to state the essential assumptions on which the question is dependent.
IMPLICIT ASSUMPTIONS
‘Would you prefer a holiday in Spain to a holiday in Greece?’ is a difficult question toanswer unless you know the various assumptions relating to the two holidayvenues, for example, that the cost of the holidays is similar.
EOM_C07.qxd 6/23/05 10:40 AM Page 197

.
198 Chapter 7 • Questionnaires
Response choices should not overlap
This applies to closed-ended questions where a number of answers are providedfrom which the respondent has to select the most appropriate (see box).
OVERLAPPING RESPONSES
If the categories of response given are in ranges such as:
1 0–5
2 5–10
3 10 or more
then there is clearly overlap between category 1 and category 2, and between cate-gory 2 and category 3. Redrafting the categories of response as:
1 less than 5
2 5 to under 10
3 10 or more
removes the problem.
Double-barrelled questions should be avoided
These are questions where two opinions are joined together in the one question.
DOUBLE-BARRELLED QUESTIONS
‘Do you think the service provided in the hotel is friendly and efficient?’There are really two questions in one here. Is the service friendly? Is the service
efficient? Two questions are warranted to avoid confusion in recording andanalysing answers.
Reliability and validity of questions
Reliability reflects whether asking the same question of the same person on a subsequent occasion will elicit the same response. Validity reflects whether youare ascertaining through a question what you think you are ascertaining. Both are influenced by the respondent’s ability to answer a question accurately. If a respondent is not informed on a topic or exhibits poor memory recall relating to
EOM_C07.qxd 6/23/05 10:40 AM Page 198

.
Questionnaire design and construction 199
the topic, the accuracy of responses will be impeded. Under such circumstancesthe reliability and validity of the question is in doubt.
QUESTIONNAIRE WORDING
Care has to be taken with how questions are phrased since careful question designcan substantially reduce the bias arising from confusion or lack of understanding. Itwill also help to minimise response bias which is a function of the respondent’sperceptions and predispositions. Questions should be simple, intelligible and clear.The tradeoff between the desire to secure a maximum amount of information froma respondent and the need to keep the interview clear has a major bearing onquestionnaire design in respect of its length, complexity, layout and wording.
Types of response format
Questions can be open ended, where the respondent may answer in their ownway, or closed ended, where all possible answers are prespecified. Open-endedquestions can reveal more information and are often worthwhile duringexploratory work when you want to discover what people think. Closed-endedquestions, however, are easier to interpret and tabulate.
There is evidence that respondents react differently to the two types of ques-tion. When the same question is put to matched samples of respondents,responses vary with the approach used.1
Closed-ended questions
In a closed-ended question, the question is followed by a structured response.All possible answers are given with the question. Such questions are easy to use,reduce interviewer bias, reduce the bias exhibited by respondents in answeringquestions and facilitate coding and tabulation.
Dichotomous question A dichotomous question suggests two answers: usuallyyes and no. These types of question are excellent where a fact is to be determinedand where the views of the respondents are likely to be clear-cut.
DICHOTOMOUS QUESTION
Did you buy your hi-fi on credit terms?
Yes No
EOM_C07.qxd 6/23/05 10:40 AM Page 199

.
200 Chapter 7 • Questionnaires
Multiple-choice question A multiple-choice question offers the respondent alist of answers from which to select the one that is closest to their view. Thisformat reduces any bias that can be introduced by the respondent’s ability toarticulate. It also simplifies the coding of responses. Three or more answers areoffered and the respondent usually has to select one of them.
MULTIPLE-CHOICE QUESTION
Which one of the following cities have you visited most often?
London Paris New York Lisbon
Munich Ankara Beijing Dublin
In this same category are scales. There is a variety of scales (see Chapter 6):
• Likert scale: measures attitudes
• semantic differential: also assesses people’s attitudes
• rating scale
• staple scale.
Open-ended questions
Open-ended questions do not suggest an answer and allow people to write what-ever they wish. The main purpose of this type of question is to obtain therespondent’s own verbalisation of, comprehension of and reaction to stimuli suchas advertisements, packages, products and concepts.
Unstructured questions This type of question allows the respondent to reply inwhatever format they prefer:
UNSTRUCTURED QUESTION
‘What do you think about Fry’s Turkish Delight?’
Projective techniques Projective techniques include word association, sen-tence completion, story completion and picture completion, all of which arediscussed in Chapters 6 and 8.
EOM_C07.qxd 6/23/05 10:40 AM Page 200

.
Questionnaire design and construction 201
Question sequence
The sequencing of questions is important. The earlier questions should attempt tocreate interest in the respondent. The questions should also follow a logical order.Questions about age, salary, etc. should be left until last, except where use isbeing made of a quota sampling, in which case it is necessary to establish thisinformation at the outset of the interview.
To enhance preparedness to participate in a study, questionnaires shouldappear logical and carefully thought out. The typical flow in market research sur-veys involves a progression from evaluative to diagnostic questioning, or viceversa, and then on to classification questions (see the following box).
EXAMPLE OF MOVING FROM EVALUATIVE THROUGH DIAGNOSTICTO CLASSIFICATION QUESTIONS
Questionnaire concerns consumer opinions of a new product concept.
Evaluative:
• purchase interest or intent
Diagnostic:
• reasoning behind the level of purchase intent or interest
• considered uniqueness of the concept
• considered credibility of the concept
• perceived importance of the main benefit
• anticipated frequency/quantity of purchase/usage
• ratings of the concept with respect to different product benefits
Classification:
• age of respondent
• family size of respondent
• educational attainment of respondent
• occupation of respondent
• income group of respondent
Initial questions should be used to engage interest, to reassure and to give aforetaste of what is to follow. Potentially embarrassing questions should be leftuntil later in the questionnaire. Questions that suggest answers to subsequentquestions should be avoided. Overall, the questions should move from the generalto the specific and there should be a logical flow from question to question and
EOM_C07.qxd 6/23/05 10:40 AM Page 201

.
202 Chapter 7 • Questionnaires
FIGURE 7.2 Flowchart for Sunday shopping questionnaire
EOM_C07.qxd 6/23/05 10:40 AM Page 202

.
Questionnaire design and construction 203
from topic to topic. All questions relating to a particular topic should be askedbefore moving on to another topic, thus making it easy for the respondent tofollow and develop a line of thought.
Flowcharts can help to highlight groups of questions that are relevant to somerespondents and not to others. They aid in the sequencing and routeing of questionsas well as in providing instructions to the interviewer (see Figures 7.2 and 7.3).
FIGURE 7.3 Flow of questionnaire resulting from Figure 7.2
EOM_C07.qxd 6/23/05 10:40 AM Page 203

.
204 Chapter 7 • Questionnaires
Funnelling and inverted funnelling are also important features of sequencing,although the approach is only really suitable for personal and telephone inter-views. A funnel sequence is adopted when the respondent is assumed to possesssome ideas about a topic. It refers to the procedure of asking the most generalquestions about the topic first, followed by successively more specific andrestricted questions. Such an approach minimises the possibility that early ques-tions will bias responses to later questions. It is a useful approach when theinterviewer needs to ascertain the nature of the respondent’s frame of reference.
EXAMPLE OF FUNNELLING
Questionnaire relates to assessing customer impressions of a new airline service.
1 What is your overall reaction to the new service we are operating fromManchester to Istanbul?
2 Do you find anything about the new service to your distaste?
3 Do you find the kind of in-flight entertainment to your taste?
Inverted funnelling moves from the specific to the general. Since this approachmakes respondents consider certain specific points in reaching their evaluations,it is useful in those instances where the interviewer wishes to ensure that allrespondents base their evaluations on similar factors. This approach works bestwhere respondents are questioned about topics about which they have strongfeelings.
Questionnaire layout
Questionnaires should be easy to use and encourage the user either to answerquestions posed by an interviewer or to self-complete. A questionnaire that isbadly presented or printed is likely to cause non-response or measurement error.Design considerations include:
• using good-quality paper
• keeping the body of the questionnaire as trim as possible
• using spacing to break up text and improve its presentation
• using different typefaces to assist reading
• adding colour to promote interest
• using routeing and/or branching instructions to guide a respondent
• making it easy for respondents to answer the questions.
EOM_C07.qxd 6/23/05 10:40 AM Page 204

.
Questionnaire design and construction
Pretesting and revising a questionnaire
When they are first drafted, questionnaires often contain questions that areambivalent, cumbersome and vague. Instructions may also be confusing: thequestionnaire may be too long and questions that should have been includedmay have been omitted. The pretest is a means of discovering the faults in a ques-tionnaire before it is administered. To pretest a questionnaire, a small subsampleof the intended respondent group is selected: perhaps a dozen or so people. Agood range of respondents is needed. The pretest can be run as a debriefing ses-sion or by using the protocol method.
Debriefing method
Here the questionnaire is presented to respondents in exactly the same manner asit would in a real study. After completing the questionnaire, respondents areasked about their thought processes while they were completing it and whetherthere were any problems with such items as routeing and branching instructions,understanding questions, and so on.
Protocol method
This involves respondents thinking aloud as the interview proceeds or as they fillin the questionnaire (protocol analysis).
In examining the findings of a pretest, particular attention should be given toensuring that:
• The meaning of the questions is clear.
• The questions are easy to answer.
• The questions flow logically from one to another.
• The routeing/branching instructions are clear.
• The questionnaire is not too long.
• The questionnaire engages and retains the respondent’s interest.
There are at least five considerations to be taken into account when conductinga pretest of the questionnaire:
1 All aspects of the questionnaire should be included, most specifically:• layout• question sequence• word meaning• question difficulty• branching instructions.
2 The pretest should be administered and conducted in an environment and con-text that is identical to the one to be used in the final survey.
205
EOM_C07.qxd 6/23/05 10:40 AM Page 205

.
206 Chapter 7 • Questionnaires
3 The majority of the pretest interviews should be undertaken by regular staffinterviewers. This should include experienced and relatively new interviewers.
4 Respondents in the pretest should resemble and be representative of the targetpopulation. This means that they should be familiar with the topic and possesssimilar characteristics, attitudes and opinions to those in the target population.
5 The size of the sample used for pretesting will depend on the variation of thetarget population. The more heterogeneous the target population, the largerthe pretest sample required. And the more complex the questionnaire is, thelarger the pretest sample should be.
Computer-assisted questionnaires
Computer-assisted programs can handle long and complicated questionnaires ofpractically any length and can also accommodate very large samples. They canalso be personalised or seem to act in an intelligent manner. In the latter respect,answers from previous questions can be inserted automatically into the text oflater questions. For instance, a questionnaire about computers may ask aboutwhether the respondent has used any particular makes recently and ask him orher to name the makes. A later portion of the questionnaire may probe into eachsuch computer experience and the program can be structured so that the name ofeach computer tried is inserted automatically into the questionnaire at the rightpoint. Another useful feature is that the replies to an open-ended question areavailable to an interviewer for later access, if required. Any interview temporarilyterminated at the respondent’s request, for instance a telephone interview, can berescheduled for completion at a later time.
INTRODUCING A QUESTIONNAIRE
Any questionnaire must be properly introduced to the respondent, whatevermethod of data collection is employed. Interviewers must introduce themselvesto the respondent, indicating the purpose of the study and must establish theircredentials. This is also true of postal questionnaires, where either the introduc-tory part of the questionnaire must do this or else an accompanying letter mustexplain its purpose and benefits.
EXERCISE
Critique the questionnaire in Figure 7.4 relating to cycling in Mudchester andsuggest how it might be improved. You should pay attention to the various pointsabout questionnaire design and construction that have already been mentioned.
EOM_C07.qxd 6/23/05 10:40 AM Page 206

.
Introducing a questionnaire 207
FIGURE 7.4 Mudchester cycle questionnaire
EOM_C07.qxd 6/23/05 10:40 AM Page 207

.
208 Chapter 7 • Questionnaires
RELIABILITY AND VALIDITY IN QUESTIONNAIRE DESIGN
Reliability refers to the consistency in reaching the same results when the mea-surement is made over and over again. Validity refers to the degree to which thequestion measures what it is supposed to be measuring. While a valid measure isalways reliable, a reliable measure is not necessarily a valid one. While pretesting,revision and further testing a questionnaire may increase its reliability, it will not necessarily increase its validity. One way to ensure that an instrument reallydoes measure what it is supposed to measure is to compare the results with a‘yardstick’ – an external measurement.
KEY POINTS ON QUESTIONNAIRE DESIGN, CONSTRUCTION AND PRETESTING
Preliminary considerations:
• information required
• nature of target respondents
• type of data-collection method required to survey the respondents
Questions:
• reason for asking each and every question
• clarity and conciseness in expression
• exclusivity of response choices
• use of natural, familiar language
• exclusion of bias in phraseology
• avoidance of double-barrelled questions
• alternatives to be stated explicitly
• reliability and validity of questions
Questionnaire construction:
• when to use open-ended as opposed to closed-ended questions
• determination of the appropriate number of response categories and theirdescription in the case of closed-ended questions
• ensuring movement through the questionnaire from evaluative to diagnostic toclassification type questions
EOM_C07.qxd 6/23/05 10:40 AM Page 208

.
Summary 209
Pretesting questionnaire
• ensuring all aspects of the questionnaire are tested
• pretesting in an environment and context identical to that which will be used inthe final survey
• establishing a debriefing procedure
An assessment of the validity of factual answers usually requires the researcherto consult other sources of information, secondary data or census reports.Nevertheless, while a measure may have excellent validity in the descriptivesense at the time it was taken, it may possess poor validity in terms of its abilityto accurately predict an outcome. In the time between the measurement and theactual event, many factors may have had an impact.
SUMMARY
Questionnaire design is a craft. Many factors have to be taken into account whenassembling a questionnaire. These include such things as the overall researchobjectives, the kinds of data analysis that are to be employed, the amount ofmoney that can be spent on the research project and the time in which theresearch has to be completed. There are no hard and fast rules about designing aquestionnaire but there is a set of guidelines that can be followed to help over-come the risk of poor questionnaire design.
In this chapter we have examined issues in questionnaire design and construc-tion. The major activities involved in questionnaire design are:
1 preliminary considerations
2 question content
3 question phrasing
4 types of response format
5 question sequence
6 question layout
7 pretest, revision and final version of the questionnaire.
EOM_C07.qxd 6/23/05 10:40 AM Page 209

.
210 Chapter 7 • Questionnaires
The discussion emphasised general guidelines and suggested basic principlesinvolved in asking questions. For questionnaire construction, attention wasfocused on response formats, logical flow and layout considerations. In dis-cussing the pretesting of questionnaires, emphasis was placed on what itemsshould be pretested, the manner in which the pretest should be conducted, whoshould be the respondents in the pretest and how large a sample is required forthe pretest. Finally, attention was paid to establishing the reliability and validityof questionnaires.
QUESTIONS
1 In what contexts are questionnaires used in marketing research?
2 Explain the initial considerations that have to be taken into account beforeembarking on the construction of a questionnaire.
3 Select from the following list of open-ended questions those that would bebetter posed as closed-ended questions. Rewrite the ones you choose to makeclosed ended.
• Exactly how much is the journey going to cost?• What are your favourite kinds of holiday?• Where have you been in previous years for your holiday?• How satisfied are you with your travel agent?• Which day of the week do you prefer to travel?
4 Describe the two approaches to pretesting and revising a questionnaire. Whatare the five considerations that should be taken into account when undertaking apretest?
5 Distinguish between reliability and validity in questionnaire design.
6 Here is a poorly worded set of questions attempting to establish howcustomers rate and perceive the products and services of a supermarket. Thequestions have to be answered by someone who has only a few minutes tospare while waiting at the till. Determine what the questions should be tryingto elicit, cut down the number of questions asked and see if you can design ashorter questionnaire that will elicit the kind of information being sought.
Hand the completed questionnaire to the cashier as you leave.Q1 What is your name?
Q2 How old are you?
Q3 Do you come here often?
Q4 What don’t you like?
EOM_C07.qxd 6/23/05 10:40 AM Page 210

.
Case study 7.1 211
Q5 How much do you have to spend?
Q6 Would you come on Friday nights after 6 o’clock if you thought we wereopen?
Q7 Have you a car?
Q8 What do you think about the quality of our service?
Q9 Where do you go for your holidays?
Q10 Can you park your car all right?
Q11 Are the trolleys the right size?
Q12 Do you bring your children with you?
Q13 Have you any complaints?
Q14 Do you like our green products?
Q15 Do you not think that we should not close every other Sunday?
Q16 What is your sex?
Q17 How often do you come here?
Q18 Do you think this is a clean shop?
Q19 Do you think we should diversify?
Q20 What promotional offers would you like to see?
CASE STUDY 7.1: CENTRAL TRAINING COLLEGE (2)
In Case study 5.1, a consultant was called in to advise on the viability of openinga recruitment agency in central London. On the basis of initial discussions theconsultant produced the following research proposal.
Research proposal
Summary of brief
1 To determine the viability of opening a recruitment agency in central London.
2 To determine if the Central Training College would be a good location.
3 To find out if the name Central Recruitment would be acceptable.
Proposed research objectives
1 Investigate current and future demand for recruitment agencies.
2 Investigate actual intentions to use the service.
EOM_C07.qxd 6/23/05 10:40 AM Page 211

.
212 Chapter 7 • Questionnaires
3 Discover if the name of the recruitment agency is an important factor in thepurchase decision.
4 Investigate student and business attitudes to the provision of such a service.
5 Obtain demographic details of both students and businesses interested in theservice.
Proposed research design
Conduct two surveys, one of the students at the college and the other of theemployers. Students to be interviewed face to face and the employers will be con-tacted by post.
Source: Fry2
Question
Produce a flowchart and questionnaires that could be used in this research.
CASE STUDY 7.2: THE RHOLAND WATCH COMPANY
Roland believes there is a growing and substantial market for mechanical andautomatic wristwatches for both ladies and gentlemen. For the past five years hehas produced and marketed watches with quartz movements under the label‘Rholand’ using the Greek letter ρ as his trademark.
There is a large and growing market for second-hand mechanical and auto-matic watches and there is a growing number of ‘houses’ producing andmarketing new models. Most of the major manufacturers now have a token item in their product line – at least as far as the men’s wristwatch market is con-cerned. The new market for mechanical and automatic watches is made up asfollows:
Segment 1
Watches usually priced at more than £2500 that do not contain expensive jew-ellery adornments such as diamonds. This tends to be a specialist market for theconnoisseur. Long-established, well-known companies offering watches to thismarket include Jaeger, Blancpain, Breguet, Patek Philippe, Audemars Piguet,Girard Perregaux and Vacheron Constantin. A number of small, less well-knownhouses also produce for this market segment. They include Alan Silberstein,Daniel Roth and Frank Muller.
EOM_C07.qxd 6/23/05 10:40 AM Page 212

.
Case study 7.2
Segment 2
Watches priced between £1000 and £2500. This represents a fairly substantialmarket and is dominated by Rolex. Other competitors in this price segmentinclude Bretling, which differentiates itself from Rolex by offering mechanicaland automatic sports watches. Omega has a range of mechanical and automaticwatches in this segment. A relative newcomer to the market, Chronoswiss, offersa range of connoisseur watches to this segment.
Segment 3
Watches priced between £500 and £1000. This represents a popular price rangeand there are many firms making offerings to this segment, including Eterna,Maurice Lacroix, Oris and Baume & Mercer. Many of the well-known ‘mass-production’ houses also have at least one offering to this segment. Included in the latter category are Longines and Ebel.
Segment 4
In this segment are found mechanical and automatic watches priced at between£150 and £500. Manufacturers such as Oris, Maurice Lacroix and Michel Herbelinhave a presence here.
Segment 5
This segment comprises watches priced between £75 and £150. It has the interestof several small houses, including Claude Helier and Le Cheminant.
Segment 6
This is the cheapest section of the market where watches are priced at less than£75. At the top end of the segment are mechanical and automatic fashion modelsproduced by Swatch along with utility models produced by Seiko. At the ultracheap end of the market are models by Limit and Sekonda.
Only a few houses manufacture their own mechanical and automatic movements.The majority buy the movements from the Swiss Eta manufacturing company.
Roland would like to start producing and selling mechanical and automaticwatches and has decided to survey his dealers and concessionaires for their opinions.
QuestionProduce a flowchart and questionnaire that Roland could send to dealers and otherintermediaries to help him decide what to do.
213
EOM_C07.qxd 6/23/05 10:40 AM Page 213

.
214 Chapter 7 • Questionnaires
CASE STUDY 7.3: RESEARCHING THE SPORTSMARKET
Westbourne Research Consultants is a small market research consultancy basedin the west of England. Recently it was approached by the local authority’s Leisure and Amenities Department to solve a market research problem.
Leisure and Amenities had decided to conduct a survey of its own to find outthe sports in which local people participated most frequently. It had conductedthe research outside local sports centres and had come up with some surprisingresults; for one thing, it appeared that far more local people claimed to participatein sports than could be accounted for by the usage figures obtained from thesports centres themselves. Second, the researchers had the impression thatrespondents had had real difficulty answering some of the questions. These arethe questions that proved problematical:
Q4: Why do you play your favourite sport?
Q8: How can sporting facilities be improved in the area?
Q12: What is your opinion of the Leisure and Amenities Department and why?
Q23: Who do you think should have the most say in deciding which new facil-ities can be developed?
In fact, the study seemed to be so flawed (and was proving so difficult toanalyse) that the Leisure and Amenities Department wanted Westbourne to run anew research project altogether.
Westbourne’s research manager asked Leisure and Amenities’ managementthe following questions:
1 What are you hoping to gain from this research?
2 What management decisions will be based on the research?
3 Who are the people whose opinions you wish to canvass?
The managers of the Leisure and Amenities Department explained that theresearch aim was to improve their knowledge of the needs of the local populationin terms of sports provision; they would be basing investment decisions on theresults, particularly in the area of sports centre design and playing field provi-sion; and they expected that a representative sample of the local population,including children and the elderly, should be included. In particular, Leisure andAmenities was interested in those people who rarely (or never) took part in sport,since there was a possibility that their needs were not being met at all by the pre-sent provisions.
EOM_C07.qxd 6/23/05 10:40 AM Page 214

.
Case study 7.4 215
Westbourne Research immediately identified a sampling problem: the originalLeisure and Amenities survey had been conducted close to the sports centres andtherefore the sample had contained a very high proportion of people who wereeither entering or leaving the centres. This sampling bias accounted for the veryhigh proportion of people who participated in sport regularly, since clearly peoplewho were entering or leaving the sports centre would be likely to participate in sport.
Leisure and Amenities had not pretested its questionnaire, which possiblyaccounted for some of the problems, but Westbourne immediately saw a need toredesign the questionnaire somewhat and rerun it. Unfortunately, Leisure andAmenities indicated that it had only very limited funds remaining; having spentconsiderable staff time on its own questionnaire, the management found it finan-cially embarrassing (and embarrassing from a career viewpoint) to admit that theoriginal study had gone wrong, and asked Westbourne if it could make any use atall of the data already collected.
Overall, Westbourne agreed that the original questionnaire was not entirelyuseless; apart from the questions already identified, the remainder of the ques-tionnaire seemed to have been reasonably well designed and the researchers hadno reason to doubt its worth. They agreed to seek ways to use the information insome way, in order to save costs.
(Case contributed by Jim Blythe)
Questions
1 What should Westbourne do to minimise the sampling bias?
2 How might Westbourne be able to comply with Leisure and Amenities’ request touse some of the existing data?
3 What was wrong with the questions that could not be analysed?
4 What are the problems associated with designing a questionnaire to be completedby such a broad range of respondents?
5 What preparatory work should Westbourne do before redesigning the questionnaire?
CASE STUDY 7.4: ATTITUDES OF CAT OWNERS TO CAT FOOD
The following cover letter and questionnaire was made available for self-completionat numerous pet shops throughout the UK. The purpose of the survey was:
1 To identify cat owners’ knowledge about the ingredients of cat foods and theircats’ dietary requirements.
2 To discover what factors are most important in their choice of cat foods.
EOM_C07.qxd 6/23/05 10:40 AM Page 215

.
216 Chapter 7 • Questionnaires
Rapid ResearchChester
Dear Cat Owner
This questionnaire is part of a research project on cat foods being conducted to (a) find out more about the feeding procedures followed by cat owners and (b) determine the attitude of cat owners towards existing cat food products. Yourcooperation and participation in this study will enable cat food manufacturers tobetter meet your cat’s food requirements. Your name is not required in this studysince we are only interested in aggregate replies. Please complete the questionnaireat leisure and place it in the box provided at the checkout next time you visit theshop. Your immediate cooperation in this study will be greatly appreciated.
Sincerely,
Mark TwainEnclosure
1. Precisely how many cats are there in your household? _______
2. Indicate each cat’s breed and estimated value; then indicate the description that most closely describes the cat.
Description of catBreed Estimated value Show cat Just a pet Other
[1] _________________________________________________________________[2] _________________________________________________________________[3] _________________________________________________________________[4] _________________________________________________________________
3. Indicate the percentage of each type of cat food and frequency with which you feed each type of food to your cat.
Never Seldom Frequently Usually Always0% 1–30% 30–70% 70–90% 90–100%
Table scraps ________________________________________________________Canned ________________________________________________________Dr ________________________________________________________
4. Indicate the brands of cat food you presently use [e.g. Tucker’s treats, Paws].
5. What is the major health benefit to your cat from each of the following ingredients? [Indicate ‘don’t know’ if applicable.]
Vitamins [i] Benefit_______ [ii] [ ] Value unknownMinerals [i] Benefit_______ [ii] [ ] Value unknownFats [i] Benefit_______ [ii] [ ] Value unknownProteins [i] Benefit_______ [ii] [ ] Value unknownCarbohydrates [i] Benefit_______ [ii] [ ] Value unknown
EOM_C07.qxd 6/23/05 10:40 AM Page 216

.
Case study 7.4
6. Which ingredients do you feel are the most important requirements in your cat’s diet?
[ ] Carbohydrates [ ] Vitamins [ ] Minerals [ ] Proteins [ ] Fats [ ] Don’t know
7. If you buy canned cat food, indicate how important each of the following factors is in your purchase.
No Some Veryinfluence influence Important important
Price _____________________________________________
Content [% of meat, etc.] _____________________________________________
Brand name [e.g. Paws] _____________________________________________
Who makes it [e.g. Smith]_____________________________________________
Nutritional value of the cat food _____________________________________________
8. What type of meat do you think is generally used in most canned cat food?
_____ The same as we eat.
_____ Meat that has not been passed for human consumption.
_____ Inedible by-products [e.g. intestines, bones, etc.]
_____ Don’t know
_____ Other
9. Do you think canned cat foods satisfy the dietary requirements of your cat?
[ ] Yes [ ] No [ ] Don’t know
10. Do you think some breeds of cat require special cat food?
[ ] Yes [ ] No [ ] Don’t know
11. Do you supplement your cat’s diet with vitamin drops or pills?
[ ] Yes [ ] No [ ] Don’t know
12. Who usually purchases your cat food?
_____ Husband
_____ Wife
_____ Children
13. How do you think canned cat food can be improved?
Question
What are the strengths and weaknesses of this questionnaire and cover letter?
217
EOM_C07.qxd 6/23/05 10:40 AM Page 217

.
218 Chapter 7 • Questionnaires
REFERENCES AND NOTES
1 Morton-Williams, J and Sykes, W (1984) The use of interaction coding, Journal of theMarket Research Society, 26(2), April.
2 Fry, C (1991) Unpublished MBA dissertation, Department of Management, KeeleUniversity, September.
FURTHER READING
Bolton, R (1991) An exploratory investigation of questionnaire pretesting with verbalprotocol analysis, Advances in Consumer Research, 18, 558–65.
Booth-Kewley, S, Edwards, J E and Rosenfeld, P (1992) Impression management, socialdesirability and computer administration of attitude questionnaires: does the computermake a difference? Journal of Applied Psychology, 77(4), 562–66.
Churchill, G (1995) Marketing Research: Methodological foundations (6th edn), Fort Worth, TX:Dryden.
Foddy, W (1994) Constructing Questions for Interviews and Questionnaires, Cambridge:Cambridge University Press.
Hague, P (1987) Good and bad in questionnaire design, Industrial Marketing Digest, 12(3),161–70.
Hague, P (1993) Questionnaire Design, London: Kogan Page.Holtgraves, T, Eck, J and Lasky, B (1997) Face management, question wording and social
desirability, Journal of Applied Social Psychology, 27(18), 1650–71.Kalton, G and Schuman, H (1982) The effect of the question on survey responses: a review,
Journal of the Royal Statistical Society, 145(1), 42–73.Locander, W, Sudman, S and Bradburn, N M (1976) An investigation of interview method,
threat and response distortion, Journal of American Statistical Association, 71, 269–75.Morton-Williams, J (1978) Questionnaire design, in Worcester, R and Downham, J (eds)
Consumer Market Research Handbook, Wokingham: Van Nostrand Reinhold.Oppenheim, A N (1968, 1984) Questionnaire Design and Attitude Measurement, London:
Heinemann.Payne, S L (1951) The Art of Asking Questions, Princeton, NJ: Princeton University Press.Tull, D S and Hawkins, D I (1990) Marketing Research: Measurement and method, New York:
Macmillan.Vinten, G (1997) The threat in the question, Credit Control 18(1), 25–31.Wilkinson, S (1998) Focus group methodology: a review, International Journal of Social
Research Methodology, 1(3), 181–203.
EOM_C07.qxd 6/23/05 10:40 AM Page 218

.
219Last A Head on Spread
Qualitative research
Objectives
After reading this chapter, you should be able to:
• understand the nature and uses of focus groups
• understand the possible misuse of focus groups
• appreciate the techniques used in moderating group discussions
• understand the difference between focus groups used for consumer productresearch and those used for industrial research.
Keywords
cartoon test industrial focus groupsclinical moderatordepth interview projective techniquesexperiencing teleconferencingexploratory videoconferencingfocus groups word associationguide
8
EOM_C08.qxd 6/23/05 10:41 AM Page 219

.
220 Chapter 8 • Qualitative research
Plan of Chapter 8
EOM_C08.qxd 6/23/05 10:41 AM Page 220

.
Introduction
INTRODUCTION
This chapter examines the nature and uses of focus groups, showing how thismethod of data collection can obtain information that is largely unavailablethrough other types of marketing research. Advice is offered about the possiblemisuse of focus groups, details of the techniques used in moderating group dis-cussions are given and the distinction is made between focus groups used forconsumer product research and those used for industrial research. Attention isalso drawn to a variety of other qualitative research techniques, notably thoserelying on projective methods.
Qualitative research is a widely used term for research that does not subjectresearch findings to quantification or quantitative analysis. Qualitative researchexamines the attitudes, feelings and motivations of product users. The contrastbetween qualitative research and quantitative research is shown in Table 8.1.
221
Comparison dimension
Type of questions
Sample size
Information per respondent
Administration
Type of analysis
Hardware required
Ease of replication
Researcher training necessary
Type of research
TABLE 8.1 Contrast between qualitative and quantitative research
Qualitative research
Probing
Small
Much
Requires interviewer with special skills
Subjective, interpretive
Tape recorders, projection devices,video, pictures, discussion guides
Difficult
Psychology, sociology, socialpsychology, consumer behaviour,marketing, marketing research
Exploratory
Quantitative research
Non-probing
Large
Varies
Fewer special skills required
Statistical
Easy
Statistics, decision models,decision-support systems,computer programming,marketing, marketing research
Descriptive or causal
EOM_C08.qxd 6/23/05 10:41 AM Page 221

.
222 Chapter 8 • Qualitative research
Qualitative research is characterised by small samples and this has alwaysbeen the focus of criticism. Executives are reluctant to base important strategydecisions on small-sample research because it relies so much on the subjectivityand interpretation of the researcher. Executives show a preference for a largesample with computer analysis and a summary table of results.
Despite the apparent preferences of executives, qualitative research has grownin popularity, for three reasons. First, it is usually much cheaper than quantitativeresearch. Second, it produces a good mechanism for coming to an understandingof customer attitudes and motivations. Third, it can improve the efficiency ofquantitative research.
Qualitative and quantitative research are often combined into a single study orseries of studies. The patterns displayed in quantitative research can be enrichedwith the addition of qualitative information. Qualitative research combines withquantitative measures by providing a thorough understanding of the customer.The techniques of qualitative research involve open-ended questioning and thedata are rich and often very revealing.
LIMITATIONS OF QUALITATIVE RESEARCH
Qualitative research does not pick out small differences quite as well as large-scale quantitative research. Nevertheless, qualitative research can detect minorproblems that are not apparent in a quantitative study. Another limitation is thatqualitative studies do not provide samples that are representative of the targetpopulation of the research. In terms of the sort of data produced, small samplesize and free-flowing discussion can lead qualitative research projects alongmany different avenues of thought. Influential or dominant characters within adiscussion group can also lead the group off on tangential discussions or bias the‘group view’. There is also the problem of the discussion leader’s competence.The usefulness of qualitative research depends very much on the skills of theresearcher.
BABY BOOMERS GET THE MESSAGE
Thirty years ago they were listening to the Beatles and enjoying the sixties aftergrowing up in post-war austerity. Now, 45 to 55 year olds in the ‘baby boomer’ gen-eration are looking at their circumstances and worrying about growing old in anincreasingly insecure society.
That general conclusion comes from a study based on qualitative research intothe attitudes of this group across 16 markets, including the USA, Japan, Australia,the UK and several countries in continental Europe. It carries strong marketingmessages for those seeking to address this group, whose spending power outstrips
FT
EOM_C08.qxd 6/23/05 10:41 AM Page 222

.
Focus groups 223
its numbers. In the UK, for example, it makes up 14% of the population but accountsfor almost one-quarter of household expenditure. In France, the ‘boomers’ accountfor 20% of spending on goods and services, while in the USA the figure is 17%.
Jane Gwilliam, author of the report, says there is a striking similarity not only in thecares and concerns expressed by the boomers across all the countries where theywere questioned but also about the most effective ways to communicate with them.
The prime media for reaching the boomers are television and newspapers. Theyspend a substantial amount of leisure time at home and although they regard radioas more reliable than TV, the lack of ‘grown-up commercial’ stations makes it lessrelevant for advertising.
Most still take at least one newspaper a day, and are more inclined to pay atten-tion to press advertisements than to inserts and flyers. While flyers and ‘junk mail’are likely to go straight in the bin, the group seems to have a more positive attitudetowards catalogues.
The study concludes that neither cinema nor sponsorship is particularly effec-tive in marketing to boomers. That is partly because they spend so much time athome, but also because they fear their concerns will be ridiculed by the young.
Boomers’ attitudes towards brands, as expressed in the study, are in sharp con-trast to younger people’s views. Gwilliam says that while young people value thebrand name itself, and may buy the product without thinking about other brands,for boomers brand names are only as valuable as the goods and services they repre-sent and are likely to have been chosen after other brands have been considered.
The research found that boomers do not like being patronised by advertising.According to Gwilliam, the boomers grew up with television and saw advertisingevolve to become more sophisticated. They are therefore more discriminating andmore alert to subtly patronising overtones than young people.
‘I sometimes wonder whether a 30-year-old account manager really has anunderstanding of what boomers have gone through.’
Source: Smith1 (reprinted with permission)
FOCUS GROUPS
A focus group comprises eight to twelve persons who are led by a moderator in an in-depth discussion on a particular topic or concept. The aim of focus groupresearch is to learn and understand what people have to say about a topic andunderstand their arguments. The moderator has to get people to talk about atopic at length and in detail. The purpose is to discover how they feel about a product, concept, idea or organisation and how it forms part of their lives. Themoderator wants to discover the amount of emotional involvement people pos-sess with the topic under discussion.
Most marketing research companies use the focus group technique in con-sumer marketing research. It is often fairly easy to bring together a knowledge-able group of people who can discuss the topic of interest. However, the method
EOM_C08.qxd 6/23/05 10:41 AM Page 223

.
224 Chapter 8 • Qualitative research
FIGURE 8.1 Types of focus group
is used much less among industrial goods companies: understandably, since thetask of getting together executives covering such diverse areas as engineering,sales management or financial management is both costly and time-consuming.
The participants in the group have some common characteristics that relate tothe topic discussed in the group. A focus group permits free discussion about aproblem or topic and, guided by the moderator, participants’ minds can rangefreely. Interaction with each other can produce ideas and suggestions that exhibitsynergy.
A moderator has to keep a discussion alive and guide it towards a conclusionon which all participants can agree. Effective guiding, not leading, is what a goodmoderator must do. Discussion must be kept to a topic of interest to the sponsor.The sponsoring firm is paying for the exercise and expects relevant results. The
EOM_C08.qxd 6/23/05 10:41 AM Page 224

.
Focus groups 225
moderator must move the group away from irrelevant discussion that is not help-ful to the sponsor – and still leave the group free to air valuable new ideas.
Types of focus group
Exploratory groups
Focus groups are often used at the exploratory phase of marketing research tohelp to define the problem precisely (see Figure 8.1). For example, focus groupsmay be employed to identify the questions to be included in a survey. They mayalso be used to help generate hypotheses for testing. The various types of focusgroups and their applications are summarised in Table 8.2.
Clinical focus groups
Clinical focus groups are used because a person’s true motivations and feelingsare subconscious. We cannot take at face value what many customers have to sayand the research needs to probe beneath the level of consciousness. It is assumed
Characteristics Exploratory Clinical Experiencing
Experience a real consumer No No Yes
Obtaining a high level of interaction among the group members is essential No Yes Yes
When a homogeneous group of people is required No No Yes
Moderator’s interviewing technique is critical No Yes No
Moderator must have scientific credentials Yes Yes No
Observation by management is appropriate No No Yes
Verbatim quotes should be emphasised in the reports No No Yes
TABLE 8.2 Types of focus group and their characteristics
EOM_C08.qxd 6/23/05 10:41 AM Page 225

.
226 Chapter 8 • Qualitative research
that a person’s real motives can be uncovered using clinical judgement. The focusgroup provides data for clinical judgement and the moderator has to be highlyskilled to persuade participants to reveal their inner thoughts and feelings.
SOME APPLICATIONS FOR FOCUS GROUPS
New product ideas
Focus groups can give the client firm ideas for new products. A gap in the marketmay be identified and further research can then seek to identify the true size of thepotential gap in the market. If several focus groups should come up with the sameidea it may well be worth serious consideration, even though it may have been considered before and rejected. It may be possible to adjust costs, for example, sothat profitability is more positive.
Focus groups can indicate the likelihood of success with a new product. It wouldbe possible, for example, to test the concept of a new product for the currentmarket. You would seek answers to questions such as:
• What would be its advantages?
• Would people accept the drawbacks of the product?
• How does the idea compare with other products?
• What is the reaction of the group to various product features?
• What does the group think about the product’s performance capabilities?
Problems with decreasing sales
When sales have declined rapidly on certain products, focus groups can helpuncover the reasons. The products, for example, might seem to be doing the jobthey were intended to do, but other problems might become apparent. Minor in-adequacies in product design or packaging can cause customers to switch to com-petitors’ products. A focus group can be given several competitors’ products toexamine (without identification) and their positive and negative comments aboutthe products can then be noted.
Price
In a time of inflation or recession, a producer may be looking for ways to cut costsand lower prices. Unnecessary product features may need to be eliminated. Focusgroups can be used to identify these unnecessary features.
Customer attitudes
Focus groups can uncover consumer attitudes towards the sponsoring firm suffici-ently to warrant further research that can lead to beneficial and remedial action.
EOM_C08.qxd 6/23/05 10:41 AM Page 226

.
Other group research methods
Experiencing focus groups
An experiencing focus group allows the researcher to experience a real customer.It gives the researcher an opportunity to experience the emotional framework inwhich the product is being used. Effectively, the researcher can ascertain all thesatisfactions, disatisfactions, rewards and frustrations experienced by the actualcustomer when the product is used.
Employing focus groups
Focus groups provide data about problems through the mechanism of groupdynamics. By talking among themselves and with a moderator, a relatively smallgroup of interested people can produce more valuable thoughts and ideas than ifeach participant were interviewed separately. Nothing is quite the same as whatcan happen when a group interested in a topic or a product sit around a table forone to two hours discussing how they feel about it. In terms of bringing out sug-gestions, an experienced moderator can produce a degree of interaction andcooperation that produce unanticipated ideas.
Focus groups are unique: they can explore customary ways of doing things orcustomary beliefs and possible reactions to something new. They can try to deter-mine why such conditions and reactions exist and what can be done to changethem. Focus groups can highlight attitudes, prejudices, changing ways of usingproducts and changing ways of viewing pricing and distribution.
OTHER GROUP RESEARCH METHODS
While the typical focus group still involves around seven to thirteen participants,a moderator, an agenda for discussion, a room equipped with a one-way mirrorin which sponsors may listen and watch, suitable electronic equipment andchalkboards, there have recently been new ideas and new techniques. Forexample, Option Technologies Inc. offers a system incorporating the following.
A group of people, often a focus group, generates a list of items relevant to the topic under discussion. The list is entered into a computer and the systemgenerates a systematic set of questions about the list that is projected onto a large-screen monitor. This provides a visual stimulus for group members to register their opinions. Participants vote on individual, handheld keypadslinked to the computer, which organises the votes into graphics that are fed back to the group by a projection system. Participants orally interpret the mean-ing of their opinions as projected on the monitor. Group discussion clarifies theissues under research and leads to a systematic and organised basis for furtherresearch.2
227
EOM_C08.qxd 6/23/05 10:41 AM Page 227

.
228 Chapter 8 • Qualitative research
Teleconferencing
Respondents are invited to participate in a group telephone discussion on aspecific day, at a specific time. At that time they are contacted at their office orhome anywhere in the country over a telephone conference system (hence, tele-conferencing). The moderator guides the discussion using techniques designedto create maximum interaction between the participants. The sponsor can giveinputs to the moderator’s assistant without being heard by the participants. Thesession lasts for about an hour and a half and provides about as much informa-tion as a two-hour face-to-face session.
Videoconferencing
In different locations, usually different parts of the country, groups gatheredaround tables are asked to sample new or improved products. Video cameras andmicrophones are installed at the locations (hence, videoconferencing). Executivesat remote locations are able to watch and hear the groups and can speak to themoderator, sharpening up the direction the group discussion is taking.
All these systems have their strengths and weaknesses. Using the telephoneobviously allows hard-to-reach experts to be involved in the research, since theydo not have to leave their homes or offices. Each participant can hear all theothers and each has a chance to contribute without being identified. The sponsorcan listen in on the actual session or later via a tape recording. However, face-to-face groups offer the opportunity for more personal contact – and perhaps thegroup dynamic works better when all the participants are seated around the tableand can see each other. Facial reactions and visible muscular reactions often tellus what the participant is thinking more clearly than words, and other partici-pants can and do react to these signs.
MARKETING RESEARCH AND INNOVATION
There is a danger in relying too heavily on research during the creative process.Hugh Seymour-Davies, a director of Innovation and Development, a new productdevelopment company that commissions much marketing research, argues thatnovel ideas do not come from market research. In his view the consumer can onlygive a retrospective response about what they use and how it influences theirbuying decisions. The point is echoed in a slightly different way by John Boult, adirector of industrial design company Product First. He argues that researchcannot design a new product, but it can act as a catalyst and indicate the directionthe innovation should take.
Innovation and Development use two different research techniques to deal withnew product innovations. Market researchers are commissioned through Innovation
EOM_C08.qxd 6/23/05 10:41 AM Page 228

.
Practicalities of focus group sessions 229
and Development’s clients to run consumer discussion groups. During these ses-sions participants may be ‘fooled’ into thinking a product idea already exists by beingpresented with fake newspaper clippings describing it. In this way the researchersdiscover what consumers like and dislike about the idea.
Discussion groups are also used to prompt representative consumers to fantas-ise about new products. A skilled discussion leader is required in these situationsas eliciting such responses from research consumer groups is an art. It is very easyfor such discussion groups to fizzle with embarrassment and awkwardness ratherthan sizzle with ideas. With an experienced group leader and a productive session,the respondents give the product development specialists clues about possible newproduct developments.
However, one of the biggest problems in using discussion group feedback isinterpreting exactly what consumers mean. When Innovation and Development was working on new product development for Cadbury’s chocolate cream liqueur, it included a hint of hazelnut flavouring to give the drink a unique flavour. When the researchers verbally suggested that the liqueur should have this slight flavouring, consumers reacted negatively as they were not used to the idea ofmixing the two flavours. However, when taste tests were conducted, without reveal-ing what the extra flavours were, consumers loved the chocolate liqueur laced withhazelnut.
Source: Marketing3
PRACTICALITIES OF FOCUS GROUP SESSIONS
Seven to twelve participants is ideal. With fewer than seven, there is not enoughinterplay to provide worthwhile information. It is difficult to work with largergroups, for under such circumstances one or two people tend to dominate theconversation and the discussion is difficult to control.
The group of participants should have enough knowledge of and experiencewith the type of problem to produce meaningful ideas and reactions.
The participants must feel they are taking part in something that is both worth-while and interesting, that they are contributing to the solution of the sponsor’sproblem. Payments to the respondents are perfectly in order and necessary to geta good representative group together.
The moderator
The role of the moderator in a focus session is to get the best and most innovativeideas about the focal problem from the group. The moderator must bring the ses-sion to a close with suggestions that will be of value to the sponsor in guidingfurther research or further thinking.
EOM_C08.qxd 6/23/05 10:41 AM Page 229

.
230 Chapter 8 • Qualitative research
SUGGESTED CHARACTERISTICS OF A MODERATOR
• Be acceptable to the group as a person with whom they can work easily.
• Have a quick mind capable of noting new ideas that come from the group andpressing for further discussion, even though it may mean leaving the fixedagenda.
• Have a good memory for names. Group dynamics will flourish if each participantcan feel the importance of what they are saying and thinking. This is reinforcedwhen participants are known by their names.
• Have the prestige and ability to control a group if it wanders, bringing it back tothe topic under discussion without appearing to dominate unduly. The moderatormust also be able to recognise the importance of new ideas that were notexpected but appear significant.
• Be as neutral as possible.
The moderator should be selected with the particular problem in mind.Selecting a moderator who has no interest in or knowledge of the subject wouldbe pointless: they might easily miss some good ideas that arise unexpectedlyfrom the group.
Preparation
Groups should be carefully screened to get the best people for the problem underdiscussion. The moderator and the sponsor should manage the choice of parti-cipants in the group. The most valuable thoughts and ideas arise when a group is fairly homogeneous. Usually, more than three groups discussing the sameproblem will add very little, although if there are known or suspected regionaldifferences, for example, more than three may be necessary. It may often be advis-able to form the different groups by age and sex.
DISCUSSION GUIDE FOR ACCEPTABILITY OF A NEW PRODUCTCONCEPT
1 Warm up
• Explain focus groups.
• No correct opinions – only opinions.
EOM_C08.qxd 6/23/05 10:41 AM Page 230

.
Practicalities of focus group sessions 231
• Need to hear from everyone.
• Associates are watching from behind the mirror. They are very interested in thegroup’s opinions.
• Audiotapes – so notes are not necessary.
• One person to talk at a time. No side discussions or some important commentswill be missed.
• No questions to the moderator. What they know is unimportant.
• Participants not to worry if they don’t know much about the topic. If there are different views in the group that is also important to know.
• No one will contact participants after the session.
• Any questions?
2 What comes to mind when this product concept is mentioned?
• Likes and dislikes?
• Problems?
• Changes you would like to see?
• How do you feel about current brands available?
• What are your likes and dislikes about them?
• How would you change them?
• Do you use more than one brand? What alternatives do you use? Why did youchoose those particular brands?
• What factors are important in determining the brands you do use?
3 Present a description of the new product concept. Ask how the group feels about it
• How many of you would consider using this product?
• Why do you say that?
• What do you like or dislike about it?
• Do you see any distinct advantages in this product over the brands you are cur-rently using?
• How would you expect this product to be priced?
• Use of product, frequency of purchase, etc. need to be explored next: expand onthis example.
4 Give them the opportunity for final questions and comments
5 Thank them for their cooperation
EOM_C08.qxd 6/23/05 10:41 AM Page 231

.
232 Chapter 8 • Qualitative research
Preparation of the moderator’s guide should be a joint effort of the sponsor, the agency (if one is involved) and the moderator. It should contain open, non-leading questions designed to stimulate thinking and discussion. Such ques-tions might not be used verbally at all; rather, they may serve as a reminder to the moderator of matters the sponsor wants to be covered.
The moderator’s guide should consider the types of participant in the group –their knowledge and experience. It should not show bias or reflect alreadyformed opinions and should be developed with the counsel of those people whowill have to implement the findings of the research study. All interested partiesare responsible for making sure that everything pertinent is included in theguide, which should also contain suggestions on the timing of the session.
The client firm should ensure that the moderator understands the problem andthe importance of the findings of each session. The moderator should be guidedin preparation for the various directions in which the discussion may go. Thisdoes not mean that the moderator should prejudge how the discussion should orshould not go. The moderator must know enough about the industry and theproblem to recognise the unexpected and valuable points that may be aired.
Most professional research firms that offer focus group sessions will have aroom dedicated for the purpose. The room will include one-way mirrors so thatthe client may watch and listen without being seen. It will contain chalkboards, adecent sized table, appropriate television and projection equipment and pads andpencils for taking notes.
Conducting the session and reporting the findings
A useful aid to the moderator is the provision of name cards. Initially, thereshould be a brief discussion of the ground rules for the session. The moderatortells the group about its purpose, stating that the sponsoring firm looks forwardto the group’s discussion on this topic as an aid in deciding a crucial matter. Theuse of a one-way mirror should be explained to the participants. There may be abrief account of who the sponsoring firm is, what it does and why problems suchas these make so much difference. Some mention should also be made of how theresults of the session will be used. The participants then usually introduce them-selves with a few brief remarks.
The moderator’s guide should be used to steer participants into discussion ofthe areas the sponsor wants covered. It should not be necessary for the moderatorto spend time merely asking questions and receiving answers. Participantsshould be encouraged to voice their thoughts without prodding. A well-chosenmoderator will be experienced enough to draw out the quiet ones and to quietthe talkative. At the end of the discussion, the moderator should summarise thegroup’s suggestions, ideas and attitudes.
It can be difficult to record informal interviews. Should the interviewerrecord everything that the respondents say, record only those remarks that
EOM_C08.qxd 6/23/05 10:41 AM Page 232

.
Practicalities of focus group sessions
are considered relevant or should the respondents’ answers be paraphrased? The last two procedures introduce the danger of interviewer bias, so in mostcases the verbatim report is probably the best solution.
Tape recording is particularly useful in informal interviews as long as none ofthe respondents objects. The use of tape recorders permits the recording of every-thing that respondents say, thus enabling the interviewer to concentrate on theinterview. On average it may take two to three times as long to transcribe tapes asit does to record the conversation. Thus an hour-long interview may take two tothree hours to transcribe. In transcribing the tapes, everything that the inter-viewer and the respondents say has to be written down. However, when writingup transcriptions, views, attitudes and factual answers may be put into a logicalorder for the ease of the reader.
The debriefing and wrap-up should be carried out immediately after the ses-sion. Strong points can be emphasised and errors noted while they are fresh ineveryone’s minds. Debriefing and wrap-up can also come after the conclusion ofa number of sessions on the same research problem. Here the emphasis will be onthose ideas and attitudes that were common to all groups. There may be a writtenor video screen report, which should emphasise all the important attitudes andissues expressed by one or more of the groups. The report should also recom-mend further necessary research.
Formal written reports can take on one of several formats according to theclient’s needs, the researcher’s style and what was formally agreed on in theresearch proposal. At one extreme, the investigator can prepare a brief impres-sionistic summary of the main findings, relying mainly on memory. This type ofreport is often used with experiencing groups, where the main objective is for theclients to experience real customers. The client can retain the tape recordings ofthe sessions and listen to the groups several times to become immersed in whatthe customers are saying. At the other extreme, the researcher listens to the tapes,copying down salient quotations and fitting the participants’ thoughts into amore general scheme derived from the research objectives and the researcher’straining.
A method lying between the two extremes and, indeed, the most commonmethod, is often called the cut-and-paste technique. It lacks the in-depth psycho-logical analysis of the clinical report, but still requires considerable skill andinsight on the part of the researcher. The first step is to have the group sessionstranscribed. Next, the researcher reviews the transcripts, looking for commonthreads or trends in response patterns. Similar patterns are then cut out andmatched between the groups. The researcher then produces folders containingrelevant material by subject matter.
The last step is to write the actual report: the introduction describing the pur-pose of the research, the major questions the researcher sought to answer, thenature and characteristics of the group members and how they were recruited.This is followed by a two- or three-page summary of findings and recommenda-tions. The report concludes with the main body of findings.
233
EOM_C08.qxd 6/23/05 10:41 AM Page 233

.
234 Chapter 8 • Qualitative research
INDUSTRIAL FOCUS GROUPS
Focus groups that deal with industrial research problems are much like thosecovering consumer products, but with several important differences. First, themoderator must be knowledgeable in the field being discussed. Most moderatorsknow about fast-moving consumer goods or shopping in supermarkets, but notall of them know enough about machine tools to conduct a discussion with agroup of technicians and engineers. The screening of possible moderators inindustrial areas must be even more thorough than for those in consumer productareas.
Preparing the moderator and the moderator’s guide about the industrial prob-lem must also be very thorough. It may be advisable to have an in-housemoderator lead the discussion, or at least to have one in the room to help themoderator with difficult technical points. The participants in industrial focusgroups must also be carefully chosen to make sure that each can speak about theproblem. Time considerations are important: a group of people will becomeimpatient if a session runs over time or becomes too wordy and repetitive.
OTHER QUALITATIVE RESEARCH METHODS
Depth interview
Historically, the term ‘depth interview’ has meant a relatively unstructured one-to-one interview. The interviewer is thoroughly trained in the skill of probingand eliciting detailed answers to each question. Sometimes psychologists areused in depth interviews. They use clinical non-directional techniques to uncoverhidden motivations.
SOME ADVANTAGES OF DEPTH INTERVIEWS RELATIVE TO FOCUS GROUPS
1 Group pressure is eliminated so that each respondent reveals more honest feelings.
2 The personal one-to-one situation gives the respondent the feeling of being thefocus of attention, whose personal thoughts and feelings are important and genuinely wanted.
3 The respondent attains a heightened state of awareness in a personal interviewbecause they are in constant rapport with the interviewer and there are no groupmembers to hide behind.
EOM_C08.qxd 6/23/05 10:41 AM Page 234

.
Other qualitative research methods 235
4 The extra time devoted to individual respondents encourages the revelation ofnew information.
5 Respondents can be probed at length to reveal the feelings and motivations thatunderlie their statements.
6 Without the restrictions of cultivating a group process, new directions of ques-tioning can be improvised more easily. Individual interviews allow greaterflexibility in exploring casual remarks and tangential issues, which may providecritical insights into the main issue.
7 The closeness of the one-to-one relationship allows the interviewer to becomemore sensitive to non-verbal feedback.
The direction of the depth interview is guided by the interviewee’s response.As the interview progresses, the interviewer thoroughly probes each answer anduses the replies as a basis for further questioning.
The success of any depth interview depends entirely on the interviewer. Asecond factor that determines the success of depth research is correct interpreta-tion. The unstructured nature of the interview and the clinical nature of theanalysis increases its complexity.
Projective techniques
Projective techniques are sometimes incorporated in depth interviews. The origins of projective techniques lie in the field of clinical psychology. In essence,the objective of any projective test is to delve below the surface responses in orderto obtain true feelings, meanings or motivations. The rationale behind projectivetests comes from knowledge that people are often reluctant to, or cannot, revealtheir deepest feelings. In other instances they are unaware of those feelingsbecause of psychological defence mechanisms.
Projective tests are techniques for penetrating a person’s defence mechanismsand allowing their true feelings and attitudes to emerge. A subject is usually pre-sented with an unstructured, nebulous situation and asked to respond. Becausethe situation is ill-defined and has no true meaning, the respondent must usetheir own frame of reference to answer the question. In theory, the respondentprojects their feelings into the unstructured stimulus. Because the subjects are not talking directly about themselves, defence mechanisms are purportedlybypassed. The interviewee is talking about something else or someone else, yetrevealing their own inner feelings in the process.
The most commonly applied projective tests used in marketing research areword association tests, sentence and story completion, cartoon tests, third-person techniques and analogies.
EOM_C08.qxd 6/23/05 10:41 AM Page 235

.
236 Chapter 8 • Qualitative research
Word association tests
Word association tests are used to select brand names, advertising campaignthemes and slogans (see Chapter 6 for an explanation of the test).
Sentence and story completion
These can be used in conjunction with word association tests. The respondent isfurnished with an incomplete story or group of sentences and asked to completethem (see Chapter 6 for more information).
Cartoon tests
Cartoon tests create a highly projective mechanism by means of cartoon figures orstrips, similar to those in comic books. They can be used to measure the strengthof an attitude towards a particular product or brand (see Chapter 6 – thematicapperception test – for more information).
Third-person techniques
Perhaps the easiest projective techniques to apply, other than word association,are third-person techniques. Rather than asking someone directly what theythink, it is couched as ‘your neighbour’ or ‘some people’ or some other third party.Rather than asking a housewife why she does not typically provide a nutrition-ally balanced breakfast, a researcher would ask, ‘Why don’t many housewivesprovide their families with nutritionally balanced breakfasts?’ The third-persontechnique is often used to avoid issues that might be embarrassing or evoke hostility if answered directly by a respondent.
Analogies
The use of analogies helps us to reveal people’s inner feelings. For example, aperson may buy a car to suit their personality. Through the purchase, the personis able to express their personality and thereby benefit. The use of the ‘personalanalogy’ technique can sometimes enable researchers to uncover the relationshipbetween people’s personalities and potential purchase objects, such as a car.
We all have emotions and feelings. The personal analogy mechanism harnessesthe use of our emotions and feelings in order to obtain insights into how peopleperceive decisions or problems. The idea is to identify ourselves with a non-human object that is the subject of the problem. We have to transfer our ownfeelings into the entity, imagine how it might feel and act in the problem situation.
For example, we might be asked to imagine what it would feel like to be a newBMW. Answers might be:
EOM_C08.qxd 6/23/05 10:41 AM Page 236

.
Summary 237
• ‘I feel powerful.’
• ‘I feel extremely fit and raring to go.’
• ‘I feel ready for my new executive owner.’
Based on such an analysis it might then be possible to develop advertisingthemes to aim at specific customer groups. Through such a technique, we canrelease ourselves from looking at a problem in terms of its previously analysedelements.4
Electronic interviewing
Electronic interviewing is a method that can be used for both one-to-one inter-views and focus groups, and offers practical advantages. In the first place it is notconstrained by geographical locations or time zones and, second, electronic inter-viewing requires no additional transcription. Not only does this save money butit can also eliminate errors introduced through transcription. Third, electronicinterviewing diminishes the problem of interviewer effect. It can also reduceproblems caused by dominant or shy participants, particularly in electronic focusgroups.
The skills required to conduct online discussions are different skills for boththe interviewer and the subject since lack of verbal communication can be a prob-lem. Often tacit information that would be conveyed in a conventional interviewsituation will be lost in electronic conversations. Non-verbal communication andactive listening are essential elements of effective interviewing. No doubt, as tech-nology progresses and videocam equipment becomes commonplace, even somenon-verbal communication will be transportable.
SUMMARY
This chapter has examined the nature and uses of focus groups, showing howthis method of data collection can obtain information that is largely unavailablethrough other types of marketing research. Advice has been offered about thepossible misuse of focus groups and detail of the techniques used in moderatinggroup discussions has been described. The distinction between focus groups usedfor consumer product research and those used for industrial research has beenmade. Attention has also been drawn to a variety of other qualitative researchtechniques, notably those relying on projective methods. Finally, considerationhas been given to a new way of collecting qualitative data through the medium ofelectronic interviews.
EOM_C08.qxd 6/23/05 10:41 AM Page 237

.
238 Chapter 8 • Qualitative research
QUESTIONS
1 What are focus groups? What is their purpose? Outline the different types offocus group. Discuss the kind of problems where focus groups may be able toprovide useful insights.
2 What is the moderator’s guide? What does it contain and how is it used?
3 Indicate the important points that should be made when briefing a moderator.
4 What are the important points to bear in mind about industrial focus groups?
5 What are depth interviews and what is their purpose? What advantages andlimitations do they have when compared with focus groups?
6 Explain the nature of projective techniques.
CASE STUDY 8.1: AVON COSMETICS
Some important questions about consumers that need to be answered in the cosmetics industry include:
• Do women buy cosmetics to cover up or to enhance what nature has provided?
• Do women have different wants and needs as far as cosmetics are concerned?
• What kind of advertising gimmicks are likely to be most effective?
• Is there an element of fantasy in buying and using cosmetics?
Glamour appeal in the advertising of cosmetics products to women usuallyfeatures the faces of attractive celebrities or good-looking young women.Nevertheless, the advertising agency handling Avon’s account maintains this isnot what women want to see. Avon’s group marketing communications managerbelieves that ‘real beauty’ comes from the inside and the company is intent onreflecting this in its advertising strategy.
In an attempt to modernise its image, Avon is developing two importantthemes in its advertising. First, it wants to show that the products it has to offerare for ‘real women’ and, second, it wants to show that it appreciates the natureof female friendship. After all, many of Avon’s 160,000 representatives make mostof their sales to friends.
Avon’s target audience is essentially women over 25 and under 50, positionedin the mid-market. Its main competitors are Boots and Body Shop. Avon’s
EOM_C08.qxd 6/23/05 10:41 AM Page 238

.
Case study 8.2 239
approach is novel: it challenges the traditionally accepted notions of women’sattractiveness. The managing partner of the agency handling the account wasquoted as saying that the advertisements spurned the way in which imagery wasassociated with cosmetic products and, in particular, ‘the preying on women’sfeelings of inadequacy’. He argued that cosmetics were not about hiding in-adequacies but rather about making the best of what women have.
In an attempt to bring female friendship and ‘real women’ into the advertising,one advertisement presents two friends talking about a new romance, along withthe ‘great for kissing’ lipstick with moisturiser. In another advertisement an upsetyoung mother, seeing her child off to school for the first time, is featured. In thelatter advertisement a friend offers her a tear-proof mascara. Friendship and ‘real-ness’ are also emphasised in press advertisements, where genuine friends arefeatured talking about each other. The actresses used in sequences have theappearance of ‘real women’.
Source: Nicholas5
Question
What kind of qualitative research do you think might have been used in this instance?
CASE STUDY 8.2: IBM
‘Butterfly was great technology, but very expensive to implement,’ according to aDell spokesman.
IBM’s extensively praised Butterfly expandable notebook keyboard designseems ready to die shortly after emerging from its chrysalis and IBM have noplans to replace it. The product was considered an important advance in portablePC design when it appeared in IBM’s Think Pad 701C in March 1995 since itoffered a reasonable sized keyboard in a sub-A4 system. However, its high priceis thought to have reduced anticipated sales and the appearance of larger screensthan the 701C’s 10.4″ display have allowed notebook manufacturers to producevery slim A4 or slightly larger designs which allow more room for keyboardspace.
Source: PC Direct6
Question
Is marketing research really of any value to a firm such as IBM when it comes todesigning new PCs?
EOM_C08.qxd 6/23/05 10:41 AM Page 239

.
240 Chapter 8 • Qualitative research
CASE STUDY 8.3: MULLER
Muller, a successful German yoghurt brand, established a UK operation in 1987,launching its two brands Muller Fruit Corner and Muller Crunch Corner into theUK market the following year. By 1990 the brand had captured more than 10% ofthe UK yoghurt market, becoming market leader ahead of the previously domin-ant Ski brand from Eden Vale. In 1993 the brand was the clear market leader witha share of 23%. Sales increased from around £75m in the UK in 1992, to over£100m in 1993.
An important tenet of Muller’s success was its adoption of a marketingapproach contrary to the style used by existing yoghurt brands in the UK. While many other yoghurt brands emphasised health issues such as low fat, live bacteria and real fruit, Muller brought new momentum to the market with a product that was high in calories and sold as an indulgence product. In 1993 Joanna Lumley was used in the £5m ‘pure and sinful’ campaign that wasseen by industry commentators as a welcome break from the ‘squeaky clean’yoghurt marketing campaigns of the past. Muller also sponsors Aston Villa football club.
The rest of the market soon followed Muller’s lead: there have been recentlaunches of ‘twin-pot’ yoghurt by own-label suppliers and other brands, as wellas an increase in yoghurts marketed as indulgence treats rather than as a meansof abstaining from calories.
Source: Samways and Whittcome7
Question
What kind of marketing research might have led Muller to adopt a strategy that wascontrary to the style used by existing yoghurt brands in the UK?
CASE STUDY 8.4: BRAND VALUATION
The brand acts as a focus for all marketing activities; consumers identify withbrands and have a mental image of what the brand means not only in terms of itsutilitarian values, but also in terms of intangible values such as prestige, value formoney or self-image. For example, research shows that in blind taste tests mostpeople prefer Pepsi Cola to Coca-Cola, but when they are able to see the can orbottle (and hence identify the brand) most people prefer the Coke.
For many years, managers have recognised that such brands have a value thatis independent of the physical product and most firms have tried (for internalaccounting purposes) to place a value on the ‘goodwill’ generated by the brand
EOM_C08.qxd 6/23/05 10:41 AM Page 240

.
Case study 8.4
itself. Unfortunately, the accounting methods used have varied from one firm toanother, which has led to problems when a firm wishes to sell a brand or whenthe company is being valued for tax purposes or for shareholders’ reports.
During 1999 a new accounting standard was introduced in the UK for the valu-ation of brands. For many years, standards have existed for the valuation of suchintangibles as goodwill and patents, but until now no agreed method has been inplace for measuring the value of a brand.
For many companies, this is a major breakthrough in asset valuation; it hasbeen estimated that brands and intellectual property make up 96% of the totalvalue of the Coca-Cola Corporation, 95% of the value of Microsoft, and even forheavy industrial corporations such as BP the figure may be as much as 74%.
Shell Oil realises the importance of the brands. Simon Saville, global brandmanager for Shell International, says: ‘For some years Shell has tracked the healthof its brand through market research surveys in key countries. We are extendingthis to include a tracking of brand value on an annual basis. In order to estimatethe Shell brand value, we must first understand how that value is derived: whycustomers buy our products and services, what they prefer about Shell, and howimportant this is to them in their purchase decisions.’
Brand value is an important part of franchising and licensing negotiations, and most firms recognise that they are managing an asset which has value.Investment in promoting the brand will increase its value, and having anaccounting standard for valuing brands means that marketing managers arebetter able to argue their case for more investment in the brand, even with themost traditional of finance managers.
For finance managers, the main purpose of brand valuation is to establish amore accurate balance sheet; brands as assets can be included and the financemanagers know that other firms are using the same valuation methods. From amarketing management viewpoint, the main purpose of brand valuation is to seethe trend over time, rather than to establish an absolute valuation figure. Thisallows the manager to control what is happening to the brand, perhaps byincreasing investment in it or (if the brand’s value is low) reducing investment. Inthe absence of agreed methods for valuing, firms have been operating with adegree of uncertainty, according to many managers.
On the other hand, Alex Batchelor (brand valuation director of consultantsInterbrand Newell & Sorrell) says: ‘Brand valuation is very much like businessvaluation with a couple of tweaks. Sure, there are judgements in it but there arejudgements in everything. The accounting profession has done a wool-pulling actwhere people think it’s a perfect science when it is not.’
The new accounting standard draws a distinction between intangible assetsthat have a limited life (for example most patents) and those that have anindefinite life (which would be true of many brands). The standard defines lim-ited life as being less than 20 years. In practice, market research has a major roleto play in the valuation of brands, because the consumer’s view of the brand willdetermine not only whether the brand will be purchased during the next fewyears, but whether the brand is robust enough to survive in the very long term.
241
EOM_C08.qxd 6/23/05 10:41 AM Page 241

.
242 Chapter 8 • Qualitative research
Whichever methods marketers use to determine the brand value, it seems thatthe new accounting standard will not only add more rigour to the estimates, butwill also help to focus the minds of managers more keenly on brand managementissues.
(Case contributed by Jim Blythe)
Questions
1 How might qualitative research be used to value brands?
2 What methods could be used to determine the most effective routes for investing inbrands?
3 What differences in research approach would be needed to meet the differingneeds of brand managers and finance managers?
4 How might the robustness of a brand be measured?
5 How might the objectiveness and accuracy of qualitative research into brandvaluation be ensured?
CASE STUDY 8.5: HI-FI SYSTEMS
Marketers often seem to be inordinately fond of the word ‘new’. Newnessappears to be a desirable feature of products, yet the word is difficult to define –is it about freshness or about novelty? Does it refer to something that the particu-lar manufacturer has not made before, does it refer to something that has beenbrought in from another industry or does it refer to something that the consumerhas never seen before? These questions have crucial importance to high-techindustries such as consumer electronics and photography.
Hi-fi purchase involves a substantial investment on the part of the customer.Apart from the obvious monetary cost of buying a top-of-the-range system(which is counted in thousands of pounds rather than hundreds) hi-fi buffs (oraudiophiles) are often highly involved in the product purchase. This means thattheir choice of hi-fi system reflects on them as individuals; they naturally want tobe seen with the latest, most technically advanced system as well as have asystem that sounds good and lasts.
It appears that the audiophiles’ perception of ‘newness’ of the equipment is afactor and research was conducted by a UK university to find out how consumersjudge newness in hi-fi equipment. Several focus groups were invited to examinethree hi-fi systems and comment on which was the most innovative and why. Thegroups were allowed to examine the equipment, play CDs on it and (of course)discuss what they thought about the equipment. The focus groups were recordedon video tape and full transcripts of everything that was said were made; a
EOM_C08.qxd 6/23/05 10:41 AM Page 242

.
Case study 8.5
separate analysis was carried out on the movement and body language of thefocus group members and the ways they used the equipment.
The following is a brief extract from the transcripts of one of the focus groups(note that this group was composed entirely of males aged 20 to 25):
Which is the most innovative?Hard to tell unless, you know, unless you study the brochures.You’d go for the looks.But it isn’t only looks is it?But it’s innovative design, but like you said earlier, that’s been around. You’ve
seen that for absolutely years.Saying that, that’s a new colour, whether it’ll take off . . .The thing is we’re not going to find out which is the most innovative unless we
read the manuals.But then I don’t understand the jargon they use anyway.But this one’s got this tape thing. I like the tape-to-tape thing.This one’s innovative with the size; they’re making them even smaller than
that nowadays.Compared to this one, yeah.But then you could add to it.Well, I think I can solve the problem.This one’s more innovative because of the size and because it’s more compact
and that. They’re making them even smaller than that nowadays.I’m not too sure about these small buttons.I don’t like the small buttons.The thing is you can’t have a small system with really big buttons.But this has gone too far the other way; with these they’re almost pin size.But with a remote control you just sort of sit there and press that.But half the time I don’t understand the remote control either.I reckon this one’s more innovative, then.Yeah, but are you going on looks alone?Yeah, it is swaying me a bit but no. Like the fact that it’s more compact and
everything, you’re going into smaller things now, all your microchips andeverything.
That’s all we can say really because we don’t know about the sound and that.But if I went into a shop and they, um . . .That one’s more fuddy-duddy, this one’s more modern and probably people
see that as being more innovative.There’s a record player option on it.If you go into a shop and they have stacks of stuff there you’d just like listen, I
wouldn’t know, I wouldn’t have a clue which would be the best sound forme really. And the ones that sounded best to me might not be the ones thathave the bass and everything on.
I don’t like it not being adjustable.I’d go for this one, I’d go for the adjustable one.
243
EOM_C08.qxd 6/23/05 10:41 AM Page 243

.
244 Chapter 8 • Qualitative research
This one looks like the one I’ve got, five, six or seven years old.That’s quite an old one, isn’t it.Whereas this, this one uses computer interfacing which is quite different.That’s right, yes.So this one must be more innovative, if it’s using digital impulses.Yeah, very right.Why, what’s the point?Is it just to cut down . . .Yeah, that is more innovative.There are design functions that I like. I like the drawer, I think that’s brill, but
some of the gimmicks to me are useless, like this search and find a tapething. I wouldn’t use that at all.
It’s got a lot of plusses. A lot of it’s gimmicks, you’ve got your sliding outdrawer thing which is nice, you’ve got your buttons which I tend to like, thebig ones and your laser display.
Which is the most innovative?The Denon definitely.It’s the looks.Which do you think is the most innovative?Why is it the most innovative?It’s the colour, its image, these sort of little touch controls . . .This is new.I agree with what you’re saying.These little touch controls.Is it really functional, your tape coming out like that? It’s quicker just to push a
button.This drawer sliding out and that . . .It must be a real bummer if your tape gets chewed, I mean how do you manage
with head cleaning and that? You sort of take it along to the bloke and saystick your head-cleaning tape in?
I would have thought that came out easily.This is practical and in a way it hides all its innovations, whereas that one
shouts at you this is new, this is Gary Glitter music!This one doesn’t appear to have anything, your stop, your play, your forward.
It’s programmable, it repeats your scan, it’s all standard, maybe it’s allinside, whereas that one shouts out what it’s got but it doesn’t particularlyexplain why.
There’s a thing on – what’s that programme called where they test all the cars? Top Gear – saying a sports car could be like a cappuccino, looks greatbut doesn’t taste so good, but that sort of tastes good but doesn’t look sogood.
At the end of the day I’d still stick with that.But this one’s more innovative, just on presentation.
(Case contributed by Jim Blythe)
EOM_C08.qxd 6/23/05 10:41 AM Page 244

.
Further reading 245
Questions
1 Using the data in the case study, extract the key issues in judging innovativeness.
2 Build a causal model for the judgement of innovativeness.
3 What other information would be helpful in analysing these data?
4 What other analysis could be undertaken?
5 How might the data be reordered to make analysis easier?
6 What computer software would be available for analysing this type of data?
REFERENCES AND NOTES
1 Smith, A (1997) Baby boomers get the message, Financial Times, 26 May.
2 Wheatley, K and Flexmer, W A (1987) Option Technologies, Inc., Marketing News, 27 February, 23.
3 Research propels innovation (1994) Marketing, 27 January, 33–35.
4 Proctor, T (1992) Essential Marketing, London: Collins Educational.
5 Nicholas, R (1994) Avon ads praise the real woman, Marketing, 27 January, 6.
6 IBM’s Butterfly gets crushed on the wheel (1996) PC Direct, May, 57.
7 Samways, A and Whittcome, K (1994) UK brand strategies, Financial Times ManagementReport.
FURTHER READING
Berg, B L (1998) Qualitative Methods for the Social Sciences, Boston, MA: Allyn & Bacon.Berman-Brown, R B and Coverley, R (1999) Succession planning in family businesses:
a study from East Anglia, UK, Journal of Small Business Management, January, 93–97.Carson, D, Gilmore, A, Perry, C and Gronhaug, G (2001) Qualitative Marketing Research,
London: Sage.Catterall, M and Maclaren, P (1997) Focus group data and qualitative analysis programs:
coding the moving picture as well as the snapshots, Sociological Research Online, 2(1),1–11.
Collins, L F (1991) Everything is true, but in a different sense: a new perspective onqualitative research, Journal of the Market Research Society, 33, 31–38.
Colwell, J (1990) Qualitative market research: a conceptual analysis and review ofpractitioner criteria, Journal of the Market Research Society, 32.
EOM_C08.qxd 6/23/05 10:41 AM Page 245

.
246 Chapter 8 • Qualitative research
Denzin, N K (1989) The Research Act: A theoretical introduction of sociological methods(3rd edn), Englewood Cliffs, NJ: Prentice-Hall.
Farnham, A (1998) Focus groups fail to reach pin-sharp results, Sunday Telegraph, 4 October, 27.
Fontana, A and Frey, J H (1994) Interviewing: the art of science, in Denzin, N K andFreeling, A (1994) Marketing is in a crisis – can marketing research help? Journal of theMarket Research Society, 36, 97–104.
Gabriel, C (1990) The validity of qualitative market research, Journal of the Market ResearchSociety, 32, 507–20.
Gibb, A (1997) Focus groups, Social Research Update, 19, Winter, Department of Sociology,University of Surrey, http://www.soc.surrey.ac.uk/sru/sru19.html
Gibb, A (1998) Academic research and the growth of ignorance, Plenary Paper, 21st ISBANational Small Firms Conference, Durham University, November.
Goss, J D (1996) Introduction to focus groups, Area, 28(6), 14–115.Hess, J M (1968) Group interviewing, in Ring, R L (ed.) New Science of Planning,
Chicago: American Marketing Association, http://www.socresonline.org.uk/socresonline/2/1/6.html.
Hutt, R W (1979) The focus group interview: a technique for counselling small businessclients, Journal of Small Business Management, 17(1), 15–20.
Kaden, R J (1977) Incomplete use keeps focus groups from producing optimum results,Marketing News, 11(4).
Kaushik, M and Sen, A (1990) Semiotics and qualitative research, Journal of the MarketResearch Society, 32, 227–43.
Kitzinger, J (1994) Focus groups: method or madness? in Boulton, M (ed.) Challenge andInnovation: Methodological advances in social research on HN/ALDS, London: Taylor &Francis.
Kitzinger, J (1995) Introducing focus groups, British Medical Journal, 311, 299–302.Krueger, R A (1997) Moderating focus groups, Focus Group Kit 4, London: Sage.Krueger, R A (1997) Analyzing and reporting focus group results, Focus Group Kit 6,
London: Sage.Lincoln, Y S (ed.) Handbook of Qualitative Research, Thousand Oaks, CA: Sage.Mathews, A (1997) Academic xenophobia and the analysis of focus group data, Journal of
Targeting, Measurement and Analysis for Marketing, 6(2), 160–71.Morgan, D L (1998) The focus group guidebook, Focus Group Kit 1, London: Sage.Strauss, A and Corbin, J (1990) Basics of Qualitative Research, London: Sage.Sykes, W (1990) Validity and reliability in qualitative marketing research: a review of the
literature, Journal of the Market Research Society, 33, 3–12.Teleconference Network (1990) The Market Navigator, Orangeburg, NY: Teleconference
Network.Yin, K R (1994) Case Study Research – design and methods, Newbury Park, CA: Sage.
EOM_C08.qxd 6/23/05 10:41 AM Page 246

.
247Last A Head on Spread
Observation and experiment
Objectives
After reading this chapter, you should be able to:
• understand the role played by observational techniques in marketingresearch
• appreciate how experimentation can be applied in marketing
• understand the function and limitation of different experimental designs
• understand the different kinds of approaches that can be taken to testmarketing.
Keywords
basic designs pupilometerconsumer-tracking studies randomised designcontrolled test marketing regression effectsexperimental design scanningfactorial design simulated test marketingLatin square design statistical designsmaturation test marketingmortality validitypsychogalvanator
9
EOM_C09.qxd 6/23/05 10:42 AM Page 247

.
248 Chapter 9 • Observation and experiment
Plan of Chapter 9
EOM_C09.qxd 6/23/05 10:42 AM Page 248

.
Observation 249
INTRODUCTION
This chapter examines a variety of observational methods including those usingmechanical means and scanning. It then looks at experimentation as a researchmethod. Different types of experimental design are examined, together with avariety of approaches to test marketing.
OBSERVATION
One drawback of the survey method is that much of the information obtained isbased on interviewees’ statements describing what they have done or expect todo in the future. With respect to past actions, the interviewees can make mistakesin trying to recall what has happened, particularly when some time has elapsedsince the event. The same kind of problem also applies to their intended actions,since these may also differ markedly from what actually happens. This is acommon occurrence when people are asked about their purchase intentions forsuch items as cars, homes or major appliances. Many intended purchases neveractually take place for a variety of reasons. The observation method does notsuffer from these shortcomings since it records events as they actually happen.
Observation involves the personal or mechanical monitoring of selected activ-ities. It records actions as they occur and thus there is no lack of accuracy causedby a respondent’s faulty recollection of their past actions or inadequate estimateof future ones.
SHOPPERS UNDER THE MICROSCOPE
The scene is a US convenience store: ‘cappuccino devotees’ stride confidentlytowards the coffee dispenser, while ‘clandestine consumers’ consider a range ofsnacks after choosing their main purchase and ‘explicit treaters’ wander in searchof something to satisfy a vague desire before selecting the familiar comfort of achocolate bar.
Clearly, researchers wanting to understand more about consumer habits wouldlearn little about these shoppers merely by analysing how often people visited thestore. But by using a technique called observational research – watching how dif-ferent types of people use goods and services – a fuller picture can be obtained.
By watching what happened in the convenience store, E-Lab, a Chicago-basedresearch consultancy, was able to advise PepsiCo, the international food and softdrinks group, on where and how to position its products in order to get higher sales.
Observing how people behave in different surroundings or how they handlepieces of equipment is valuable in helping a company meet a specified aim, such asentering a new market, and in developing products to meet future needs that con-sumers have not yet recognised.
s
FT
EOM_C09.qxd 6/23/05 10:42 AM Page 249

.
250 Chapter 9 • Observation and experiment
Observational research ranges from the distant to the intimate. For some proj-ects, studying footage of people browsing in a shopping mall or negotiating theirway through an airport can be appropriate. For others, researchers spend time withsubjects as they use the product at home or work.
‘It’s a matter of trying to get under the skin of real people,’ says Tim Brown,European director of Ideo, a product development company. For example, watchinga travel agent set up a conference call by arranging a speaker phone for eachperson and putting the handsets together demonstrated how she equated onephone with one person – an insight Ideo used in its advice on phone software toAT&T, the US telecoms operator. Finding the right people to watch is critical fortechniques that involve observation of a few individuals or households. In contrastto conventional market research, where consumers are chosen because they fitsquarely in the middle of particular categories, consumers picked for shadowingare intended, as Mr Brown says, to ‘hit the edges’.
This might involve selecting people who are ‘early adapters’ to new technology, andthose most resistant to it; or people using the product in an unusual environment.
In the UK the process can still be informal, while in the USA selection is itself abusiness. ‘We use an outside agency – which mainly handles focus groups – toscreen and recruit participants,’ says Liz Sanders, head of research at Fitch, thedesign consultancy, in Ohio. One factor driving the growth of observational researchis technology. Advances in photography and video recording make it easier to obtainand analyse the observations, increasing the research’s value. A second factor,technology, is itself an area where consumers may not be well placed to articulateneeds that could be met by a new generation of computers, telephones or othermachines.
Fitch used observational research when it was advising Compaq, the computercompany, on the design of the Presario personal computer. ‘By working with con-sumers in their homes, we came to the realisation that a computer should be morefriendly for home use,’ says John Fillingham, director of policy research at Fitch inthe UK. ‘For example, the Presario’s features include a compact disk rack and agreat pair of speakers – it looks more like a consumer product.’
He adds, however, that while observation shows researchers what people do, itdoes not tell them why. ‘A combination of observation and what consumers sayabout what they do gives you an ability to cross-check.’
Dorothy Leonard, writing in the current issue of the Harvard Business Review,identifies five types of information available from observation. Apart from needsthat consumers have not yet articulated, they are: the triggers that prompt peopleto use a product or service; how the product relates to the consumer’s environ-ment; how consumers customise the product (and so how manufacturers can makethose modifications for them); and the intangible qualities consumers value in theproduct.
Some consultants believe observational techniques can contribute even in thearea of brand identity, provided the observations are evaluated properly. This goeswell beyond whether packaging is convenient to open or whether a software pro-gram is easy to use.
‘Every kind of behaviour has a particular framework and theory,’ says RickRobinson of E-Lab. ‘It’s a matter of finding the meaningful pattern.’ Steelcase, the
EOM_C09.qxd 6/23/05 10:42 AM Page 250

.
Observation 251
US office furniture company, wanted to shift from being rooted in manufacturingexcellence to being based on understanding work processes. Observational researchhelped it develop the new identity, and design its showrooms to encourage cus-tomers to buy on the basis of that understanding.
Observing how people behave is valuable in helping a company meet a specifiedaim.
Source: Smith1 (reprinted with permission)
Conditions required for effective observation
Three conditions usually exist if the observation method is to be effectively carried out:
1 The event must be observable: attitudes, motives and other mental activitiesare difficult to record with the observation method.
2 The event must occur frequently or be predictable.
3 The event must be completed over a short period of time.
One way in which we can ensure that all three of these conditions are met is toset up an experiment in which all the conditions can be controlled and manipu-lated. The laboratory environment is often the best setting for observationalstudies.
Observation is used in shopping studies, especially in stores, when the cus-tomer is looking at the shelves and deciding what to buy. It is used to find outhow things are done in practice.2
TYPES OF OBSERVATION PROCEDURE
• normal versus controlled conditions
• structured versus unstructured observation
• use of mechanical devices to aid observation
• measuring response latency – indicator of certainty of preference
Types of observation procedure
Activities really need to be observed under normal conditions. However, as someactivities are not easily observed under normal conditions it is often necessary for
EOM_C09.qxd 6/23/05 10:42 AM Page 251

.
252 Chapter 9 • Observation and experiment
the observation to take place in a controlled environment – for example, invitingpeople into a specially equipped room in order to observe the manner in whichthey use a product.
When people are aware they are being observed it is argued that they behavein different ways to how they would under normal circumstances where they arenot being observed. In some cases this awareness will have little effect on theiractions. However, there are many situations in which people change their activ-ities if they know they are being watched. Salespeople in a clothing store may beespecially polite to customers if they know their performance is being monitored.
There is also the choice between a structured and an unstructured observation.In a structured situation, the observers are told how and what to observe. Usuallya checklist is given to them to record what happens. Structured methods are usedwhere a hypothesis is tested. In an unstructured observation, which is mostuseful in research of an exploratory nature, the observer is given much latitudewith respect to what to note.
A variety of mechanical devices are used to observe people’s actions orresponses. For example, a psychogalvanator measures a person’s emotional reactions to various stimuli by measuring changes in their perspiration rate. It is used to assess people’s reactions to different advertisements. The pupilometermeasures changes in the size of a person’s pupils as they are looking at an adver-tisement, package or product design. A change in pupil size reflects the person’sinterest in the object. Eye cameras can monitor a person’s eye movements whilereading, identifying the parts the reader perceived first, the parts dwelt on andthe amount of copy actually read.
One fairly simple observation method is called response latency. It measuresthe amount of time a respondent takes to answer a question. Quick answers indi-cate certainty of preference. This observation technique is especially useful in telephone interviews, since latency can be measured with voice-stimulatedstopwatches.
Electronic scanning
Electronic scanning is an observation method that is rapidly developing in popu-larity. Scanners were intended to improve productivity in retail shops, but theyhave also become valuable tools for researchers. Many retail stores will even sellresearch firms the data obtained from their own scanning records. There are,however, some limitations in scanner data. For example, not all sales data pro-vided by the scanners are accurate. Three conditions must exist for real accuracy:each item must be precoded correctly by the manufacturer; the code must be cor-rectly entered into the retailer’s system; and every item must be scanned at thecheckout counter.
Scanners are universal in large supermarkets and provide the store and its cen-tral office with an immediate record of sales by product (units and value). Datafrom scanners at checkout counters can be used to assess the impact that a pricecut, coupon blitz or store display has on sales and profits. A scanner analysis
EOM_C09.qxd 6/23/05 10:42 AM Page 252

.
Observation
system allows managers to determine almost instantly how well a promotion isworking and what effect price changes, amount of inventory and arrangement onshelves will have on sales. Scanner data can be lined with demographics of areasto guide consumers on what to buy. Foods on supermarket shelves can be tiedmore closely to the demographics of the particular area. Thus inventory can bematched to local needs and turnover rate can be increased.
Auditing is a method of measuring the amount of movement of merchandise,by category and brand, through a retail outlet. It requires someone to check theamount of goods on hand (both on shelf and in store) at the start of a sales period,the addition to stock during the period (from checking receipts for goods deliv-ered to the store) and the amount of goods on hand again at the end of the salesperiod.
Observation of the in-store environment
Observations include:
• distribution (and out of stock)
• shelf price
• shelf facings (reported in number and share)
• shelf location
• display activity
• presence of point-of-purchase material.
Results, depending on user needs, can be shown by category, brand andtypes/sizes. These are reported by total, by individual markets and by majorchains. Breaks by sales regions and other special analyses can be provided onorder.
Mystery shoppers
Retailers send out employees to shop at competitors’ stores. The purpose is toobserve fixture layouts, merchandise displays, store traffic and special promo-tions. Some organisations even send out especially trained staff to pose ascustomers. In the latter case the interest is in the quality of the customer service.A mystery shopper not only observes a shopping environment but also observeshow employees react and behave based on the shopper’s actions. It could involve visiting a bank and reporting that one had left at home (many miles away) one’s wallet and cheque book and requesting emergency cash. Some large retailorganisations employ many part-time mystery shoppers.
253
EOM_C09.qxd 6/23/05 10:42 AM Page 253

.
254 Chapter 9 • Observation and experiment
Observation of individuals
There are many applications of personal observation techniques. Hand counterswere employed for many years in making counts of pedestrians in and aroundshopping centres. Personal observation is used in most surveys: the interviewer,for example, records observations about gender, age and apparent socioeconomicstatus. Another personal observation method which has become fashionable is called the ‘anthropological’ approach.3 It is almost totally subjective andamounts to an almost live-in approach within a few households or shoppingplaces. It is used to arrive at generalisations about living styles relevant to thespecific product.
PERSONAL OBSERVATION AT WORK
A well-known car producer ‘discreetly’ observed car shoppers as they inspectedcars in showrooms. Observations included how shoppers were dressed, whetherthey appeared confident or timid, whether they kicked the tyres and what questionsthey asked.
Evaluation of the observation approach
Observation within both households and stores typically requires the setting upof a panel, making it subject to the sampling difficulties and maintaining partici-pation. Another problem is the quality of the data obtained. There may be seriousquestions about the quality and completeness of store scanner data. Large itemsmay not readily scan and may be incompletely or inaccurately entered by hand;some brands with multiple forms are similarly labelled; and so on.
EXPERIMENTS
In experiments, the researcher manipulates selected independent variablesand measures the effect of these manipulations on the dependent variables. In the survey and observation methods, the information is usually obtainedunder normal or near normal conditions and the researcher intervenes only to gather data, not to alter the environment. Causality means that a relation-ship exists between two or more events. The first event can be seen as a cause of the second if the occurrence of the first increases the likelihood of the occur-rence of the second. The objective is to provide evidence that suggests a highprobability of one event leading to another. It does not have to be demonstratedconclusively.
EOM_C09.qxd 6/23/05 10:42 AM Page 254

.
Experiments
Three types of evidence are used to demonstrate the existence of a causalrelationship:
1 Concomitant variation, which reflects the extent to which a cause (x) and effect(y) occur together or vary together in some predictable way.
2 Time order of occurrence of the causal factor (x), which must either precede or takeplace simultaneously with the effect (y). This is a logical requirement for acausal relationship, but there are situations where things become confusingbecause the two factors seem to affect one another.
3 Absence of other causal factors, which is the most difficult type of evidence todemonstrate. It states that no other factors could have caused a similar changein the dependent variable (y). This demands extensive testing to eliminate allother possible explanations for the change in x. It accounts for the importanceof selecting an appropriate experimental design.
As well as these three types of evidence, if a causal relationship is to be usefulto management the relationship should be operative in a variety of environments.It should also be a relationship that is stable enough to make future actions byexecutives worthwhile.
Components of experiments
Experiments should have three components (Figure 9.1):
1 The variable being acted on – variously called the test unit, dependent variableor subject.
2 The change being imposed – the treatment or independent variable.
3 The results related to the change – the effect, outcome or observation.
255
FIGURE 9.1 Three components of experiments
EOM_C09.qxd 6/23/05 10:42 AM Page 255

.
256 Chapter 9 • Observation and experiment
Validity of experiments
Experiments should possess both internal and external validity. Internal validityrefers to whether the experiment treatment is solely accountable for the changesoccurring or whether some extraneous factors were also at work. If there wereoutside factors as well, then internal validity is affected by the ability to measuretheir impact. External validity is to do with whether the findings can be appliedto the real-world situation. Experiments can be conducted either in the field orunder controlled laboratory conditions. In the former case the establishment ofinternal validity can be quite difficult. Laboratory experiments, by contrast, maylack external validity because of their controlled environment.
EXTERNAL VALIDITY
It is customary for tests or experiments involving new products to be carried outunder laboratory conditions. Unfortunately, because in actual usage the operatingconditions for the products may be very different to those in the laboratory, theexternal validity of such tests and experiments is difficult to assess.
Internal validity
Two considerations affect an experiment’s internal validity:
1 the influence the treatment had on the actual outcome
2 the influence of extraneous factors.
Extraneous factors can take a number of forms (see Figure 9.2).
History and maturation The changes associated with the passage of time aredescribed as history and maturation. The influence of history is typified bychanges in current events external to the experiment but that still may haveaffected its outcomes. The impact of history becomes greater as the length of theexperiments increases. Maturation is primarily concerned with changes occurringwithin the individual subjects.
Repeated testing This applies in experiments where the same people are testeda number of times. As they become familiar with the testing procedure, their per-formances may change solely because of this familiarity.
Impact of the researchers themselves The researchers themselves may causesome of the change. Their very presence may influence the actions of the subjectsbeing observed.
EOM_C09.qxd 6/23/05 10:42 AM Page 256

.
Experiments
Mortality of participants One problem with experiments carried out over a longperiod is mortality, meaning that, for one reason or another, some of the originalparticipants ‘drop out’. The problem is often encountered with consumer panels.There is no way of knowing whether the test units lost would have respondedsimilarly to the treatment as those units that remained.
Selection errors The test units may be chosen in a manner that biases theresults. They may not be representative of the desired population or the treat-ments are assigned to them in such a way that they influence the outcome.
Regression effects Regression effects occur when test units are chosen on thebasis of their extreme score or performance on some earlier test. The outliers,especially those with very low performance, tend to move to a more averageposition over time.
All these factors represent causes for error in the experiments. Many of them can be controlled if the appropriate experimental design is used. Experi-ments should be designed primarily to control those extraneous factors mostlikely to seriously influence the outcome and not try to eliminate all sources of error.
257
FIGURE 9.2 Extraneous factors influencing validity
EOM_C09.qxd 6/23/05 10:42 AM Page 257

.
258 Chapter 9 • Observation and experiment
EXPERIMENTAL DESIGNS
These are blueprints for the experiments. They define both the pattern for apply-ing the treatment to the test units and how to measure the treatment’s impact.Experimental designs fall into two broad categories:
1 basic (informal) designs
2 statistical (formal) designs.
The main difference between the two is that basic designs concentrate on meas-uring only the impact of the treatment, whereas statistical designs also measurethe impact of other factors in addition to the treatment.
There are a number of basic designs that attempt to measure the effect of thetreatment (Figure 9.3). The methods differ in terms of the approaches theyemploy to isolate the treatment’s impact. Some of the more popular designs arenow described (see Cochran and Cox4 for more designs).
FIGURE 9.3 Types of experimental design
EOM_C09.qxd 6/23/05 10:42 AM Page 258

.
Experimental designs 259
The following symbols are used to help in presenting these designs:
X = the period in which the treatment is appliedO = the observation periods before and/or after the treatment; subscripts
are used to identify the time of each observationEG = the experimental group: the subjects receiving the treatmentOG = control group: the subjects matched up with the experimental group,
but not receiving the treatment
After only
This is used by researchers who are not overly concerned about the strength oftheir findings or internal/external validity. Symbolically the design appears as:
X O
A single group of subjects is exposed to a treatment, and the subjects’responses are recorded once. The subjects are usually selected in a subjective(non-random) manner.
AFTER-ONLY DESIGN
Special pence-off coupons for a shampoo are hand-distributed to women in a shop-ping mall. The number of these coupons turned in is recorded and a judgement ismade of the success of the coupon promotion.
With this form of design, no data exist that can be used to assess the influenceof extraneous factors during the period. There is also no evidence about the sub-ject’s behaviour before the treatment. The design is simple to use, but its resultsare not very enlightening. There is no indication, for example, of how the treat-ment may have changed customer behaviour.
After only with control
This experimental design is the one most commonly used by marketingresearchers. It is intended to eliminate the influence of pretesting, so no measure-ments are taken between either of the groups:
EG: X O1O2
A firm wanted to test the success of free gifts as a method of stimulating sales forits detergent product. It posted free sampler packages of its detergent to randomly
EOM_C09.qxd 6/23/05 10:42 AM Page 259

.
260 Chapter 9 • Observation and experiment
selected homes in a neighbourhood. A month later it sent coupons offering 25pence off the purchase of a large package of its detergent to the same group ofhomes. These coupons were also sent to a control group randomly selected froma comparable neighbourhood but which had not received the free sample. Thecoupons were coded to enable a count to be made of the number of couponsredeemed by each group. The experimental group redeemed 121 coupons and thecontrol group redeemed 76 coupons. The difference (45 coupons) was felt to bethe result of the sampler:
Effect of treatment = O1 − O245 = 121 − 76
While this design neutralises the impact of pretest, it does not allow any meas-urement or analysis to be made of the total change that occurred, a situationhandled well in the before-after with control design.
Before after without control
This involves measuring the test unit before and after treatment:
O1 X O2
An example here would be the collecting of sales data for a period of timebefore the application of, say, a special sales promotion. Let us say that averagesales were £450 per day. During the next two weeks a special sales promotion wasoffered and average daily sales rose to £510 per day:
O1 = £450O2 = £510
O2 − O1 = effect of the treatment£510 − £450 = £60 per day
It appears that the inclusion of the special sales promotion had a positiveeffect: daily sales increased by £60. This assumes that any changes in the unitssold were caused solely by the introduction of the special promotional offer.Realistically, at least part of the difference could have been caused by extraneousfactors such as the unavailability of the main competitor’s product during thetwo weeks in question.
Before after with control
A control group is selected and observed over the entire testing period. This con-trol group is comparable in makeup to the group that will receive the treatment.The major assumption in the design is that both groups are affected in a similarmanner by extraneous factors. For this assumption to be correct, the subjectsmust be randomly selected and the treatments randomly assigned.
EOM_C09.qxd 6/23/05 10:42 AM Page 260

.
Experimental designs
The statement of the design is:
EG: O1 X O2OG: O3 O4
Effect of treatment = (O2 − O1) − (O4 − O3)
A regional bookstore chain wants to determine the effect of new displayshelves on the sale of children’s books. The shelving is temporarily installed inthree of its stores (test stores) and sales are compared with those in three compar-able stores in which the old shelving is retained. The following sales occurred inthe two sets of stores:
O1 = 290 books O2 = 350 booksO3 = 285 books O4 = 320 books
Effect of treatment = (350 − 290) − (320 − 285)= 60 − 35= 25 books
The assumption is that the sales increase in the control stores (35 books) wascaused by some extraneous factors. Thus, if this impact is to be subtracted fromthe change in sales in the test stores (60 books) the resulting value of 25 books canbe viewed as the direct impact of the treatment (the new shelving).
Ex-post facto design
This is a variation on the after-only design. The difference between the two is thatin ex-post facto design, neither the experimental nor the control group is chosenuntil after the treatment is actually applied. This design attempts to createequivalent experimental and control groups but identifies each only after theyhave been exposed to the experiment.
A group of people who read a certain issue of a particular magazine are con-tacted. Those who said they read a certain advertisement in the issue are theexperimental group; those who did not read the advertisement are the controlgroup. Both are asked about some attribute of different types of the product fea-tured in the advertisement and the difference in the two groups’ ratings of theproducts determines the advertisement’s success. The advantage of this designover the after-only study with control design is that the experimental variablewill have exerted its influence in a natural setting, enabling the researcher tostudy a group that, by choice, was exposed to the treatment, rather than havingbeen selected to receive the treatment.
Four-group six study design
This design, also called the Soloman four-group design, is the most sophisticatedbasic design. It is intended to isolate the effects of various internal validity measures
261
EOM_C09.qxd 6/23/05 10:42 AM Page 261

.
262 Chapter 9 • Observation and experiment
as well as the impact of pretesting. Two experimental and two control groups arerandomly selected. The following diagram shows how the design operates:
EG1: O1 X O2OG1: O3 O4EG2: X O5OG2: O6
Treatment effect = [O5 − 1/2(O1 − O3)] − [O6 − 1/2(O1 − O3)]
Although it is considered the ideal basic design, it is not very often used byresearchers because of its expense and the time it requires.
Time series design
This design uses a series of pre- and post-measurements to determine the impactof the experiment. It attempts to measure the impact over a longer period of timethan other basic methods.
The time series design appears as follows:
O1 O2 O3 O4 X O5 O6 O7 O8
It assumes that the researcher will have continual access to the same test units.Consumer panels are prime examples of the application of this type of experi-mental design. Figure 9.4 shows some possible outcomes from experiments usinga time series design.
FIGURE 9.4 Time series analysis
EOM_C09.qxd 6/23/05 10:42 AM Page 262

.
Statistical designs 263
Outcome 1: a short-lived positive effect.
Outcome 2: a long-term positive effect – market share increased.
Outcome 3: a positive effect – it halted a decline in sales.
Outcome 4: seems to have no effect – fluctuation continues in the same manner.
Outcome 5: seems to have no effect – growth continues in the same pattern.
Because measurements are made over a longer period of time, such extraneousfactors as testing, maturation and regression tend to be neutralised. However,there is always the danger that some other event may have occurred at the sametime the experiment took place and this external event could be the real cause ofany changes in the observation. The problem of mortality – drop out – alsoincreases as the length of the time series increases.
STATISTICAL DESIGNS
Statistical designs provide a framework for statistically testing the impact notonly of the treatment but also of other factors. In the case of statistical designs theresearcher randomly assigns treatments to randomly chosen test units and thetreatments are then systematically applied. The statistical analysis tool often usedwith these designs is analysis of variance. This can help to determine whetherone factor (the treatment) significantly affects another factor or whether theobserved changes are caused by some other factors or even by chance.
Completely randomised design
In this section we examine statistical designs that are often used with experi-ments. The design is described, together with the kind of information it canprovide.
Treatments are assigned to test units on a random basis and an analysis is thenperformed to determine whether the treatments caused a significant difference inthe test units. The design can only really measure one type of variance – thatoccurring between treatments, known as the ‘treatment effect’.
EXAMPLE
A motorist DIY chain is selling antifreeze in all of its outlets, but it doesn’t know themost effective price to charge (see Table 9.1). It tests three different prices per can– £3.89, £4.85, and £5.89 – and records the sales from each. It randomly assignsthese prices to nine experimental stores, three using each price.
s
EOM_C09.qxd 6/23/05 10:42 AM Page 263

.
264 Chapter 9 • Observation and experiment
Week Price £3.89 Price £4.85 Price £5.89
1 19 9 152 16 13 203 22 20 94 24 18 12Total 81 60 56
TABLE 9.1 Antifreeze sales through motorist DIY outlets
The analysis would examine the average amount of the product sold at eachprice. It could disclose whether the difference in sales at the lower price was asignificant one or whether it was caused by chance.
It fails, however, to take into consideration the influence of such extraneous factors as weather, size of store or competitors’ prices. This design assumes thatthe extraneous variables have had an equal impact on all the test units, which isalso a shortcoming of the basic design. Such an assumption might be acceptable ina laboratory experiment where the researcher controls most of the conditions, butit is an unjustified assumption to make for experiments conducted in a real-worldenvironment. This design is not widely used for field experiments.
Randomised block designThis type of design is used when the researcher is interested in isolating a majorsource of variation in addition to the treatment’s influence. In the example justgiven, where three different prices were tested, no allowance was made for thedifferent sizes of the stores, a potentially important influence on the actual salesobtained. The randomised block facilitates the isolation of one extraneous factorfrom the total experimental error, providing a precise picture of the treatment’sactual impact (see Table 9.2). This additional variable has to be identified andmeasured at the time of the experiment.
Store size £’000 Price £3.89 Price £4.85 Price £5.89
1 100 + 135 100 602 50–100 34 26 153 20–50 17 12 74 < 20 5 2 1TToottaall 119911 114400 8833
TABLE 9.2 Antifreeze sales in supermarkets at various prices
EOM_C09.qxd 6/23/05 10:42 AM Page 264

.
Statistical designs
Here we see how the antifreeze example has been expanded to permit the illus-tration of a randomised block design. In this case the desire is to control theimpact of store size on sales.
Latin square design
This design enables the researcher to isolate the impact of two major extraneoussources as well as measuring the impact of the treatment. It is a complex designand can cost time and money. The additional efficiency it provides must beweighed against the extra costs and the greater expertise needed by the user. Itassumes there is no interaction between the factors being measured.
Again expanding on the antifreeze example, this shows how the Latin squaredesign can be used to control for the impact of store size and the type of storeselling the antifreeze (Table 9.3).
In using the Latin square design the number of extraneous variables to be con-trolled must equal the number of treatments. Thus, in our example, three levels ofstore size are needed and three different types of store will be involved. The rowsand columns of the resulting matrix contain the extraneous variables. The treat-ment (different prices) is assigned so that each price level occurs only once ineach row and column.
Latin square designs are particularly useful in experiments where it is import-ant to establish controls for the effect of store size, the type of store or the timeperiod. The main limitations of the design are:
• It requires equal numbers of rows, columns and treatment levels. This can poseproblems when four or five treatments are involved.
• Regardless of the number of treatments, it can still only control two extraneousvariables.
• It assumes that the extraneous variables do not interact with one another or even with the treatment: a questionable assumption in many marketingexperiments.
265
Size of outlet (weekly sales)Type of store << £5000 £5000–£10,000 >> £10,000
Supermarket Price 2 Price 3 Price 1Convenience store Price 1 Price 2 Price 3Drugstore Price 3 Price 1 Price 2
TABLE 9.3 Latin square design
EOM_C09.qxd 6/23/05 10:42 AM Page 265

.
266 Chapter 9 • Observation and experiment
Latin square design in a supermarket grocery
The experiment reported in Table 9.4 makes use of a 3 × 3 design. The rows represent three different stores and the columns represent three time periods.Three replications of the 3 × 3 design were included in the experiment, each com-prising a different set of three stores. The treatments consisted of three colourranges of bananas: treatment A – ‘highly coloured green’, 75–100% good greencolour; B – ‘partly green’, 50–75% good green colour; and C – ‘yellow colour’,50–100% good yellow colour. The performance of treatment A (for example, aver-age sales across the nine As) can be thought of as a weighted average, where theweights given to each store and day of the week are equal. Treatment B’s per-formance is based on the same set of weights for stores and days of the week thatwere used to compute the performance of treatment A. This is also true for theweights used to compute the average performance of treatment C.
The results of the experiment indicate that customers most prefer the highlycoloured green bananas and least prefer those in the partly green category.
Factorial design
In the previous designs the assumption was that there were one or two majorsources of variation and that the researcher wanted to separate them from the
TABLE 9.4 Latin square design in a supermarket grocery
Experiment period20/6–3/7 4/7–17/7 18/7–31/7Treatment Sales Treatment Sales Treatment Sales
First replicationStore 1 A 765 B 488 C 410Store 2 B 330 C 307 A 258Store 3 C 813 A 579 B 301
Second replicationStore 1 A 724 C 411 B 308Store 2 B 366 A 478 C 271Store 3 C 633 B 366 A 588
Third replicationStore 1 A 562 B 381 C 322Store 2 B 308 C 478 A 412Store 3 C 166 A 233 B 65
EOM_C09.qxd 6/23/05 10:42 AM Page 266

.
Test marketing: an introduction
total variance. There was no allowance or even assumption that some factorsmight interact with one another. Indeed, researchers are often interested in thesimultaneous effects of two or more independent variables. In the antifreezeexample, the researcher might want to see if outlets serving higher-income clientele have greater success with the higher prices than those outlets servinglower-income clientele. A factorial design measures the influence of interactingvariables on a dependent variable. In our antifreeze example, improved sales areassociated with both the income of an outlet’s clientele and any change in theoutlet display used. Factorial designs enable researchers to measure the separateeffects of each variable as it works alone. The actual design used can be a ran-domised block or Latin square, but a more complicated form of variance analysisis applied to the results.
Limitations of experiments
Experiments are often limited to assessing short-term response, whereas long-term response is often more relevant to a problem. Moreover, the long-termresponse to a particular treatment is often quite different to that of the short-termresponse. As an example, much advertising is well known to be effective over aperiod of time that is often difficult, if not impossible, to gauge effectively. Thusto measure its effect over a short period of time may be suspect. Also, the longeran experiment is run, the greater is the opportunity for something to occur thatwill invalidate it – Murphy’s Law of ‘if anything can go wrong it will go wrong’ isalmost certain to apply. Moreover, an experiment often cannot be made suffi-ciently realistic to be useful.
TEST MARKETING: AN INTRODUCTION
Test marketing is about trying something out before making a big commitmentto it. It gives the firm producing and marketing the product or service some ideaof what is likely to happen should it decide to go ahead with a broader expansionon a regional or national basis. Test marketing aims to provide estimates of salesvolume and market share for a new product, a product extension or a new mar-keting device, such as a modified advertising campaign, varying media mixes ora change in advertising expenditure.
Conceptually it is very much like holding an experiment. The idea is literally toconduct a test or an experiment to arrive at a sales prediction. This may be doneby trying things out in a series of balanced markets under normal conditions andthis is the format of the traditional test market. In controlled test marketing, theresearch firm forces the distribution of the brand, making sure it is stocked in allselected stores and that stocks are maintained. At another level altogether there issimulated test marketing – virtually a laboratory situation, in which real storesare seldom used.
267
EOM_C09.qxd 6/23/05 10:42 AM Page 267

.
268 Chapter 9 • Observation and experiment
Traditional approach to test marketing
Traditional test marketing is marketing under ‘normal’ conditions and the com-pany’s own salesforce gets retailers to stock the product, give it good shelfposition and provide in-store promotion and cooperative advertising. The salesstaff also make sure that the shelves remain stocked.
HOMELINK
A new process, Homelink, enables accurate and effective targeting to be achievedin a few hours. The process makes use of a database of over 10,000 adults and isone of the most comprehensive, nationally representative research samples avail-able. It makes use of demographic variables and explores the way in which peoplelive, the products they use and the beliefs they hold.
Thousands of new products are launched every year but many of these initiativesfail to come to fruition. Arguably, by fully researching a target audience in the firstplace, much waste can be avoided. After all, ensuring that products or servicesmatch with customer wants, needs and expectations is a critical element in thenew product introduction process. Discussions with potential users of a new prod-uct, service or sales campaign is an essential part of getting projects of this type offthe ground.
Unfortunately, launchers of new ventures often perceive the research process tobe over-complex. They often feel that the more targeted the respondents are, theharder they are to locate and the more complex the process of finding meaningfuland manageable market data becomes. With Homelink this type of thinking can beshown to be completely out of date.
In order to ensure that the fullest picture can be drawn from their new marketresearch facility, the designers of Homelink have included a wide range of productand service categories. These include such things as baby products, householdequipment, pet food, skincare products, home leisure/entertainment equipment,types of food and much more. This enables people who use specific products and services or who lead particular lifestyles to be identified quickly and cost-effectively. Establishing a baseline from which all aspects of research can be com-pared is the fundamental question to be answered before the research can beginand Homelink enables this to be done very effectively. Moreover, the frameworkand database enable information to be gathered from the same respondents over along period of time which in turn means that sample variability can be reduced.Homelink facilitates the researching of products with both large and small marketshares in a cost-effective manner.
Homelink can be used for:
• product or advertisement concept testing
• evaluating market potential for new or revitalised products or services
EOM_C09.qxd 6/23/05 10:42 AM Page 268

.
Test marketing: an introduction 269
• testing new or reformulated products to discover how the current users of thoseproducts or users of competing brands rate a new or reformulated product
• discovering how products are used in the home environment
• uncovering customer attitudes towards a particular company and its products.
In the case of Homelink, no one remains in the database for more than twoyears, no one tests more than six concepts or products over the course of a yearand no one ever tests more than two products from the same product category.
Source: Research Plus5
Traditional test marketing rests on the premise that if a few reasonably typicalcommunities throughout the country are selected, and the product or marketingmethod is tried there, results will pretty well predict what will happen whenthere is a roll-out on a regional or national basis. Moreover, if a simultaneousseries of parallel markets is set up, it will be possible to predict which of two ormore product variations, copy approaches or the like will work better. One of thegreatest problems is the selection of test areas. The idea is to select test marketsnot too different from the country as a whole.
Matching local markets with national data on sales may not assure comparabil-ity. Change may creep in even without the introduction of any known marketingvariables. Matching test cities with one another on the basis of causal variablessuch as regular price, national advertising, couponing, displays and in-storeflyers might help matters.
Other important factors include demographics: per capita income, racial com-position, etc. The business nature of the community must also be considered. Thearea should roughly parallel the business composition nationally, by type of busi-ness and, usually, medium-sized cities are selected. The advertising media shouldbe representative. The media should be self-contained: they should not havemuch coverage beyond the test market.
The duration of a traditional market test depends on the nature of the productand the consumers’ buying habits. The rule of thumb for packaged goods is anaverage of three purchases (trial and two repeats). If the product is one with aslow but continuing purchase pattern, the test period has to be long. Competitivepressure also affects the length of the test. A strong competitor means that themarketer must stay in there longer to find out whether it is possible to makeinroads into the market.
Competitive action is one of the great risks and uncertainties of the traditionaltest market. Once a major competitor recognises what is happening, it may decideto make an effort to kill the test by spending heavy marketing funds on advertis-ing and coupons to distort the test results.
EOM_C09.qxd 6/23/05 10:42 AM Page 269

.
270 Chapter 9 • Observation and experiment
Controlled test marketingThis is a test where sales are measured within a controlled store environment.The length and frequency of the checks are set to parallel the real-life elements ofexpected product movement, the repurchase cycle of the category and purchaseseasonality. The research firm conducting the controlled market test obtains dis-tribution of the product in a representative sample of stores within each marketselected for the test. It handles ‘sell in’ and guarantees that this will be 100%. Itstocks the product in the stores, handling both warehousing and distribution. Theresearch firm maintains retail inventory levels, handles pricing, shelf conditionsand the building and placement of displays.
The approach has several advantages over traditional test marketing. Costs arefar lower and the forced test needs only about six months – the whole process isaccelerated. The method also makes it more difficult for competitors to recognisewhat is going on, so there is less chance that a competitor can exert a distortion effect.
Simulated test marketingSimulated test marketing is really test marketing in a laboratory setting. It appliesonly to a situation where the product and its packaging, pricing, and advertisingand promotion have been developed in finished form. Although there are vari-ations in practice, consumers are usually invited into a central location facility,such as a research centre in a shopping mall. They are given information – usu-ally in the form of advertising – about the test product, then invited to shop fromstocked shelves, which include the test product, with provided funds. Followingthe first purchase, or lack of it, the consumer is later interviewed to determinerepeat buying and frequency of purchase of the test product. Then a computermodel of customer behaviour provides an estimate of sales volume for the newproduct or line extension.
CONSUMER-TRACKING STUDIES
Associated with traditional test marketing, consumer-tracking studies (market-tracking studies) are diagnostic aids. These studies track what is, or is not,happening as a result of the marketing campaign. They do this by continuingcontact with consumers, doing ‘waves’ of studies, as they are sometimes called, tomeasure such things as:
• brand awareness
• recall of advertising
• purchase behaviour
• product satisfaction
• intent to repurchase.
EOM_C09.qxd 6/23/05 10:42 AM Page 270

.
Questions 271
Questions about the recall of advertising probe for ‘unaided advertising recall’.Typically, the person is first asked about what brands of a product or ser-vice they are aware of. The first two brands named are considered by marketersas an indication of probable purchase. Purchase and repurchase behaviour areparticularly significant. Overall audit figures report only total sales and marketshares. Such reports do not show repurchase behaviour.
Consumer-tracking studies take one of two forms: the one-off study or thepanel. Both are carried out in waves, but the one-shot study is conducted with aseparate, but comparable, sample of respondents each time. The panel study isconducted with the identical group of people on each wave. Both approachesoften make use of the telephone interview method.
Tracking studies must meet rigorous requirements if they are to be useful.Large shifts are rare in tracking studies, so they must be able to measure smalldifferences. Thus the sample design has to include a large and random samplewith rigorous controls in execution.
SUMMARY
This chapter has examined a variety of observational methods including thoseusing mechanical means and scanning. It has also looked at experimentation as aresearch method. Different types of experimental design have been examined,together with a discussion of their limitations, as well as a variety of approachesto test marketing.
QUESTIONS
1 Indicate the different types of observation procedure that may be used. Giveexamples of when each might be appropriate.
2 What is meant by scanning? What use can be made of information gathered inthis way?
3 What are the essential features of an experiment?
4 Distinguish between the different types of experimental design, includingstatistical designs, indicating the limitations of each one.
5 What is test marketing? What factors should be taken into account whensetting up a traditional test market?
6 What are consumer-tracking studies? What is their purpose?
EOM_C09.qxd 6/23/05 10:42 AM Page 271

.
272 Chapter 9 • Observation and experiment
CASE STUDY 9.1: SOAP-SUD
Soap-sud is a washing powder brand name for a product marketed throughoutthe UK. It is produced by one of the two leading multinational soap powder com-panies. Soap-sud has been around in slightly different forms for many years andhas stood the test of time. Periodically, new ingredients have been added to thepowder to produce new benefits for the customer, versions have been introducedthat have made it more suitable for automatic washing machines and variouspackaging designs have been used to keep the image of the product in vogue.
The first non-soap detergents were introduced in 1950 with Tide. This was fol-lowed by Surf in 1951 and Daz in 1953. They all promised greater cleanliness andwhiteness. But at that time Persil had been proclaiming the importance of white-ness for ten years with its famous slogan ‘Persil washes whiter’. In 1956 Persiloffered perfume for the first time and other changes followed. A scum-disposalagent was added that gave better performance in hard water, a solid suspensionagent to prevent dirt being redeposited and more fluorescers to brighten thewash. Persil was the first brand to be advertised on TV in 1956. In the 1960s thegrowth of washing-machine sales began to accelerate and in 1964 Persil wasreformulated to perform even better with machines. At the end of the decadeAriel exploded onto the market and captured brand leadership but within a yearPersil had regained the position. There have been many changes in the marketsince 1970 but perhaps none so radical as those of the 1950s and 1960s.
Maintaining market share is an important objective for the brand manager incharge of Soap-sud and in a highly competitive industry this is a difficult thing todo. There is also a problem: the company that owns the brand also has two othersoap powder brands competing alongside Soap-sud in the marketplace. BillCarruthers, the brand manager of Soap-sud, is now contemplating a number ofchanges to the product to give it additional leverage in the market. The changesare as follows:
• The introduction of a special new ‘green whitener’ ingredient. Tests show thatthis makes the product even more effective in washing clothes ‘whiter thanwhite’ and is also environmentally friendly.
• A new television advertising campaign telling users of washing powders of thechanges to Soap-sud.
• A brand new package design to promote the idea that the new Soap-sud reallyis a new product in every way.
Bill is looking for ways of testing out his ideas before making a definite com-mitment to them.
Question
What advice would you give Bill?
EOM_C09.qxd 6/23/05 10:42 AM Page 272

.
Case study 9.3 273
CASE STUDY 9.2: CHEUNG’S CHIPS
Mr Cheung offers a wide range of Chinese food, fried traditional British cuisine,such as fish and chips, and some Italian dishes. Every time he has introduced anew line in the past he has taken a random sample of his customers and askedthem whether or not they would be interested in the new line he proposes. Ifmore than 70% of those asked have said they would be interested, he has intro-duced the new line. Table 9.5 shows his notes on the last five new products heintroduced.
Line Percentage interested Weekly average sales turnover (£)
1 Fish and chips 98% 21562 Puddings 95% 3453 Steak pies 94% 2134 Spaghetti 70% 1355 Lasagne 71% 123
TABLE 9.5 Cheung’s random sampling technique
Mr Cheung wants to set up a method by which he can judge whether it isworthwhile to introduce new lines. He feels that the current method is not verysatisfactory and that he may be missing some good opportunities. He also feelsthat despite the number of people who say they would be interested in buying thenew lines, in many instances only a few of them actually do.
Someone has suggested that a good research approach would be to use theresponse latency technique. This measures the amount of time a respondent takesto answer a question and quick answers indicate certainty of preference. Thetechnique is especially useful in telephone interviews since latency can be meas-ured by recording all calls and measuring the time to respond post facto.
Question
What advice would you offer Mr Cheung?
CASE STUDY 9.3: THE SAFE ‘T’ FIREPROOFLETTERBOX
Barry invented the Safe ‘T’ out of necessity when an aggrieved tenant pouredpetrol through his letterbox and set fire to it. Being in the locksmith business, hesoon realised there was nothing on the market to protect him against further
EOM_C09.qxd 6/23/05 10:42 AM Page 273

.
274 Chapter 9 • Observation and experiment
attacks. He began to sketch out the sort of thing he wanted and the Safe ‘T’ letter-box began to emerge. The letterbox is able to deal with fireworks, lightednewspaper and almost anything of that nature. If someone pours petrol in, itcomes out at the bottom straight onto the culprit’s feet. Barry feels that his inven-tion has potential since there are some 80,000 reported arson attacks every year inEngland and Wales alone.
Source: Business Opportunities World6
Question
Assuming that Barry can find a financial backer to produce and market the invention,how might the idea be tested out among potential customers?
CASE STUDY 9.4: THOMPSON TOYS
Thompson Toys manufactures a range of simple toys for pre-school-age children.The toys are robust, colourful and fun to play with, but also take account ofsound educational principles – in toy industry parlance, they have high playvalue. The company has proved successful, exporting toys throughout Europeand Australia, and acquiring in the process a reputation for quality and durabilitywhich has stood them in good stead.
Harry Thompson, the founder of the firm, read in the trade press about theFisher-Price company’s crèche in Chicago. At one time, Fisher-Price ran a freecrèche at its headquarters where pre-school children were given the company’stoys to play with; observers, behind two-way mirrors, observed how the childrenplayed with the toys and which toys were most popular. This had proved invalu-able for Fisher-Price when developing and marketing new products.
After reading the article, Harry Thompson decided to set up a similar crèche ofhis own. The crèche would be free for the children of the company’s staff, soHarry let his personnel manager work out the details of setting up the project.Initially the crèche had seven children in it, of ages ranging from one year old tofour and a half. The crèche was staffed by a fully trained nursery nurse; twoobservers were hired, and a room fitted out for the purpose. The main differencebetween Thompson’s crèche and the Fisher-Price one was that Thompson usedclosed-circuit TV to monitor the children rather than two-way mirrors. This notonly turned out to be cheaper, but also allowed the observers to record the chil-dren’s behaviour for later analysis. A further spin-off of CCTV was that it allowedthe observers to take breaks or spend time preparing their reports.
The observers either directly observed or recorded all the children’s activitiesthroughout the day, in particular observing their approach to playing with thetoys.
EOM_C09.qxd 6/23/05 10:42 AM Page 274

.
Case study 9.4
Although the costs of running the crèche were high, Thompson thought itworthwhile in terms of new product development; several potentially damagingdesign problems in toys turned up, and some toys which had seemed promisingon the drawing board turned out to be duds with the children. This alone savedthe company a fortune in launch costs. The crèche took almost six months tosettle down, however, and the researchers detected a number of problems withthe set-up.
First, there was a conflict of interest between the nursery nurse’s professionaltraining and the needs of the observers. She needed to exercise a degree of controlover the children’s play, both for educational and nurturing reasons, and also forhousekeeping reasons – for example, stopping play when it was time for the chil-dren’s lunch. The observers, on the other hand, wanted the children to play asfreely as possible with the toys. They wanted to observe whether the childrenspontaneously shared toys with each other, at what point the children becamebored with the toys and what happened if another child tried to take a toy away.Also, the nursery nurse was not comfortable about the children playing with pro-totypes, because she was concerned about the chances of injury from toys thathad not yet undergone full safety testing.
Second, the children belonged to the Thompson staff. This meant that most ofthem were already familiar with the majority of Thompson toys, since staff wereallowed to buy toys for their children at very substantial discounts. The observersfelt that this might bias the results.
Third, the observers were obtaining so much data from the observations andvideo tapes that it became impossible to analyse all of them. Choosing whichareas should be analysed thoroughly was becoming a nightmare and theobservers were reluctant to perform superficial analysis on such rich data.
Finally, the researchers were not confident that good results could be obtainedfrom such a small sample of children.
Despite these difficulties, Harry Thompson still wanted to proceed with thecrèche; already, some very useful feedback had been generated and he had highhopes for the future running of the crèche once the initial teething troubles hadbeen overcome. The benefits were already outweighing the difficulties – but allconcerned with the project knew that even better results could be obtained.
(Case contributed by Jim Blythe)
Questions
11 How might Thompson Toys resolve the conflicts between the nursery nurse and theresearchers?
22 What type of observation would be appropriate in these circumstances?
33 What could be done to overcome the researchers’ concerns about sample size?
44 What types of experiment could be substituted for the observation methods usedby Thompson?
275
EOM_C09.qxd 6/23/05 10:42 AM Page 275

.
276 Chapter 9 • Observation and experiment
55 What other factors might affect the validity of the research done at the crèche?
66 How would you design an experiment for Thompson Toys, using the crèchechildren as experimental subjects?
REFERENCES AND NOTES
1 Smith, A (1997) Shoppers under the microscope, Financial Times, 5 December.
2 Hague, P and Jackson, P (1996) Market Research, London: Kogan Page.
3 Collins, L F (1991) Everything is true, but in a different sense: a new perspective onqualitative research, Journal of the Market Research Society, 33, 31–38.
4 Cochran, W G and Cox, G M (1957) Experimental Designs (2nd edn), New York: Wiley.
5 Homelink (1993) Research Plus, September, 8–9.
6 Safety letterbox (1996) Business Opportunities World, May, 64–65.
FURTHER READING
Adler, P and Adler, P (1994) Observational techniques, in Denzin, N K and Lincoln, Y S,Handbook of Qualitative Research, Thousand Oaks, CA: Sage.
Cuba, F (1985) Fourteen things that make or break tracking studies, Journal of AdvertisingResearch, 25(1), 21–23.
Eskin, G (1988) Setting a Forward Agenda for Test Market Modeling, New York: AdvertisingResearch Foundation, 14–15.
Gibson, R (1992) The fine art of stocking a supermarket’s shelves, Wall Street Journal, 15 October.
Gibson, R (1993) Broad grocery price cuts may not pay, Wall Street Journal, 7 May.Grove, S J and Fisk, R P (1992) Observational data collection methods for service
marketing: an overview, Journal of the Academy of Marketing Science, 20(3), 217–24.Kandathil, J (1985) The advantages of electronic test markets: an advertiser view based on
experience, Journal of Advertising Research, 25(6), 11–12.Langbourne, R (1993) How to reach children in stores: marketing tactics grounded in
observational research, Journal of Advertising Research, 33, November/December, 67–72.Malhotra, R (1988) Some Issues and Perspectives on Use of Simulated Test Markets, New York:
Advertising Research Foundation, 57.Moult, W M (1988) The Role of Simulated Test Markets and Test Markets, New York:
Advertising Research Foundation, 140.Robson, C (1993) Real World Research, Oxford: Blackwell.
EOM_C09.qxd 6/23/05 10:42 AM Page 276

.
Further reading
Rosenfeld, J (1985) Speeding up test marketing, Marketing Communications, June.Russo, J (1988) Simulated test markets in the real world, Pre-Test Market Research,
New York: Advertising Research Foundation, 118–19.Rydholm, J (1997) Right on cue: mystery shopping makes sure salespeople sing
praises of Yamaha digital pianos, Quirk’s Marketing Review, Article 234, January.Seaton, A V (1997) Unobtrusive observational measures as a qualitative extension of
visitor surveys at festivals and events: mass observation revisited, Journal of TravelResearch, 35(4), Spring, 25–30.
Test markets: winners and losers (1983) Advertising Week, 3 October.
277
EOM_C09.qxd 6/23/05 10:42 AM Page 277

.
Objectives
After reading this chapter, you should be able to:
• understand how to identify meaningful patterns in research data
• understand how to convert into tables data collected with researchinstruments
• understand how to code questions
• understand how to analyse data with statistical methods
• appreciate how the computer can be used to transform and facilitate theinterpretation of research data.
Keywords
analysis mediananalysis of variance modeaverages multidimensional scalingchi-square multiple regressioncluster analysis non-parametriccoding proportionconjoint analysis regressioncorrelation standard deviationediting tabulationfactor analysis t testhypothesis varianceinterpretation Z testmean
Quantitative data analysis10
EOM_C10.qxd 6/23/05 10:44 AM Page 278

.
Quantitative data analysis 279
Plan of Chapter 10
EOM_C10.qxd 6/23/05 10:44 AM Page 279

.
280 Chapter 10 • Quantitative data analysis
INTRODUCTION
In this chapter we examine how research results are analysed to establish mean-ingful patterns. The steps involved in converting completed research instrumentsinto tables are examined, together with the coding of answers to questions andthe statistical treatment of survey data. Finally, we consider the role of the com-puter in transforming and facilitating the interpretation of research data.
INTERPRETATION
Interpretation and analysis are closely related. If one or the other is not carriedout properly, the success of a study cannot be assured. Consider the cases thatfollow. In the first, improper interpretation is the problem and, in the second,improper analysis is the problem.
IMPROPER INTERPRETATION
A producer of a branded fast-moving consumer product, which also markets anown-label or private brand version to a large supermarket chain, noted the follow-ing sales returns from the supermarket.
The figures show that sales of its own brand have been declining steadily for thepast two years while those of the private brand have been steadily increasing. Thefirm concludes that its own brand sales have been dropping because consumersare switching to the private branded label. The company decided to stop supplyingits own product to the supermarket.
In fact, what was happening was that another supplier to the supermarket wasmaking huge gains in terms of market share by running very substantial promotions.The decline in sales of the company’s brand was due largely to promotional effortsof the other company. The mistake the company made here was the failure to relatethe data it had obtained to other pertinent data – i.e. the activities of its competitor.
Company brand sales Private brand sales
1995 1st quarter 151,234 74,3402nd quarter 146,530 81,1883rd quarter 139,312 83,2484th quarter 131,931 91,430
1996 1st quarter 125,245 101,1212nd quarter 119,236 110,2343rd quarter 111,125 113,1224th quarter 102,197 122,008
EOM_C10.qxd 6/23/05 10:44 AM Page 280

.
Analysis 281
IMPROPER ANALYSIS
A firm is trying to determine which of three advertisements is most likely toincrease sales of its product. It tests out the three advertisements by running eachat different times in newspapers in different areas.
The sales indicated that advertisement 1 was the most successful. The logicalresult of the research would be to use the advertisement to promote national sales.However, had an analysis of variance been carried out, it would have indicated thatthe three advertisements did not in fact differ significantly in terms of their impacton sales. Advertisement 1’s apparent success was really due to abnormally highdemand in area B. Advertisement 1 was not significantly more successful in theother areas.
In order to ensure that procedures for analysing the collection of data are giventhe proper attention, a formal data-analysis plan should be developed in the earlystages of the project. Such a plan should identify:
1 major variables to be studied
2 methods used to measure the variables
3 analysis procedures that will be used to give meaning to the collected data.
ANALYSIS
The two major approaches employed in summarising the results of marketingresearch are tabulation and statistical analysis. Tabulation involves laying outdata into easy-to-understand summary tables. Tables are the basic way of
Advertisement Total sales associated with the advertisement
1 39,005 units2 31,452 units3 29,438 units
Advertisment A B C D Total
1 7072 16098 8122 7713 39,0052 7512 7481 7859 8600 31,4523 7120 7219 9087 6012 29,438
EOM_C10.qxd 6/23/05 10:44 AM Page 281

.
282 Chapter 10 • Quantitative data analysis
presenting summary data. Tabulation is the preparation of tables showing the frequency distribution of particular events. Patterns in the data can often be spotted from a cursory examination of data, although when tables themselves are summarised in the form of graphs the patterns are often even more readilydiscernible. Statistical analysis is undertaken to identify patterns that are not aseasy to see in the data. This is often the case when very large amounts of dataneed analysis.
TABULATION
Three steps are involved in converting completed questionnaires to tables: editing,coding and counting. The procedures involved are called data processing andshould be planned at the time of the study design. There are at least three goodreasons.
First, the researcher has to think ahead about specific potential results. If this isdone, it means that plans for specific tables are made as part of the basic studyplan. Second, the data-collection method should be designed to provide efficientdata processing. This mainly involves the precoding of questionnaires or otherresearch instruments. Precoding is the assignment of codes to various possibleresponses identified on the research instrument. Whenever possible and reason-able, alternative responses should be identified and listed in advance. Third, ifdata processing is planned out well, table production is an inexpensive operation.
Editing
Editing is the inspection of data forms to make a modification or correction ofresponses. This may seem as if the researcher is making sure that results come outas hoped, but this is not the case. The function of editing is to make the best senseout of what is in hand. One intent is to eliminate or minimise errors in the rawdata. There are two basic sources of error: interviewer error and respondent error.Interviewers, for example, may check the wrong response category or not ask theproper flow-through questions. Interviewers can also be poor at recordinganswers to open-ended questions. Respondents may be inconsistent in theirreplies: at one point they may indicate they do not drink, yet later talk confidentlyin the manner of people who regularly drink. Editing gets rid of the inconsisten-cies and improves the quality of the raw data.
Editing process
Editing can be done manually or by computer, depending on the method of datacollection. In manual editing, there can be as many as three stages involved: theinterviewer, the field editor and the central research office. The computer-editing
EOM_C10.qxd 6/23/05 10:44 AM Page 282

.
Tabulation
process starts at the point of data collection. If the respondent or the interviewerenters an inconsistent response, the error must be corrected by the respondentbefore the next question appears on the screen. The computer is programmed torecognise the acceptable patterns for sequential questions, what to look for incontingent questions and inconsistent replies and how to handle no replies. Ifdefinitive action for particular corrections can be identified, the computer alsoissues instructions accordingly.
Coding
Usually in coding a number is assigned to represent each reply to a question on aquestionnaire or some other research instrument. Coding translates the answersor responses into a more readily countable form. However, without considerablecare about the coding of inputs, the tables that are produced as a result of analysismay be misleading. Three types of coding are required to handle the three basickinds of data collected in surveys: names codes, quantitative codes and qualita-tive codes.
Name codes
Name codes apply to such things as brands or makes of goods, or even to firms.The names in the list are almost always known in advance. Where a product is being researched, it is simple enough to prelist the brand names that willaccount for the majority of replies and the same applies to a prelisting of retailersor manufacturers.
Quantitative codes
Quantitative codes are used with questions that request replies in terms of num-bers. Categories should be mutually exclusive. For example, too often thequestion about household income shows categories such as:
£20,000–£25,000£25,000–£30,000
There is no single place to list a £25,000 income.Both precoding and postcoding can be applied to quantitative questions.
Precoding involves a closed-ended list and postcoding has categories that can beset up only after the answers are in hand. Here are examples of the closed-endedtype of quantitative question:
• How many times have you driven your car in the past seven days, not includ-ing today?
• What size shirt do you wear?
• Do you own your own house? How long have you owned it?
283
EOM_C10.qxd 6/23/05 10:44 AM Page 283

.
284 Chapter 10 • Quantitative data analysis
In each case, answer categories can be set up in advance and the range of answersis known in advance.
In the case of open-ended quantitative questions, even though there may be arough idea of the range of answers, the likely distribution of answers cannot beknown in advance. Setting up categories in advance may produce data thatdestroy the chances to analyse it or, even worse, that actually distort results.Consider the following:
• Where are you intending to go for your holidays?
• Where were you educated?
• What is your favourite TV programme?
Computers take over much of the work in establishing quantitative categories.Each specific response can be entered into the system and totalled for eachspecific category. These preliminary runs give the researcher or marketer theinformation needed to set up the quantitative categories that meet all require-ments. Appropriate class intervals can be set up and the computer instructed toenter this information for each questionnaire.
Qualitative codes
Qualitative questions usually produce descriptions, explanations and reasons.The question is open ended and answers can range widely. Setting up codes for qualitative answers calls for much thought in terms of what the particu-lar question is intended to contribute by way of information for the specific study.
STATISTICAL ANALYSIS
Numbers resulting from a piece of research seldom provide much meaning by themselves. Using percentages can facilitate our understanding. A figure of300 pairs of shoes means little, if anything, completely on its own. However, if we ask ‘What is the 300 pairs of shoes a part of?’, it begins to assume some meaning if we are told that out of 1000 sales of shoes over the past month, 30%have been bought within the last three days. It means even more if we know thatthis 30% is responding to a special promotional offer that was introduced threedays ago.
There are pitfalls in the use of percentages, however. Just because they are aneasy-to-understand form of quantifying data does not make them the universalsolution to all problems. Percentages from different groups of people should notbe averaged unless they are weighted.
EOM_C10.qxd 6/23/05 10:44 AM Page 284

.
Statistical analysis 285
18–29 30–49 18–49 No. % No. % No. %
Total interviews 200 100.0 250 100.0 450 100.0Car owners 44 22.0 87 34.8 131 29.1
Number and percentage of car owners among two age groups
AVERAGING PERCENTAGES SHOULD ALWAYS INVOLVE WEIGHTING
The percentage of car owners for three age groups is shown below. We want todetermine the percentage of car owners in the first two groups to arrive at a figureshowing usage among those aged 18 to 49. Averaging the two percentages gives afigure of 28.4%.
However, if a third column is added to show the total for the combined 18–49group, as shown below, when the two age groups are combined in terms of theirreal weights in the study, the resultant correct car-ownership figure for the 18–49group turns out to be 29.1%. While the difference from the average percentage maynot appear all that great, the two figures might be of rather different marketingsignificance in terms of the particular problem. And the difference between anaveraged percentage and a weighted one might be far greater.
Averages
Averages or measures of central tendency come in three forms: the mode, themean and the median.
ModeThe mode represents the point in an array showing the greatest response level. Itis not an average used often in marketing research, but it takes on considerableimportance when looking at ordinal data.
18–29 30–49 50 and over
Total interviews 100.0% 100.0% 100.0%Car owners 22.0% 34.8% 65.4%
Average of 18–49 28.4%
Percentage of car owners among three age groups
EOM_C10.qxd 6/23/05 10:44 AM Page 285

.
286 Chapter 10 • Quantitative data analysis
Mean
The mean is a commonly used average in marketing research and is readilyunderstood as the sum total of values divided by the number of cases. However,it has one shortcoming: it is affected by a few large or small numbers (skewing),since it is based on all the values in the array. In terms of a product usage-ratestudy, for instance, the presence of a small number of heavy users in the studycould produce mean usage results not truly representative of the typical user inthe sample. The mean usage rate is too large to be descriptive of the user.
Median
The median is the value of the middle case in an ordered series. There are as many cases on the higher side as on the lower side. The measure offers theadvantage of being unaffected by extreme cases at one end or the other. Thisagain is a useful measure when examining ordinal data.
USING AVERAGES – MEASURES OF CENTRAL TENDENCY
The mean, median and mode should first be calculated. If the mean and median areabout the same, the mean should be used since the former is the most generallyunderstood. However, if the mean and median are greatly different, the medianshould probably be used, as it is likely to be a better measure.
Note that it is possible to have more than one modal value in a distribution.
In marketing research we should use the mean or the median or both. Depend-ing on the nature of the numerical distribution, these may or may not coincide.Taken together they provide a good indication of the average.
Measures of dispersion
The most common methods used to describe the dispersion of data are the range,variance and standard deviation. Small values for these measures indicate thatthe data are compact.
9 7 6 4 38 7 6 4 28 6 6 3 27 6 5 3 17 6 5 3 1
Mean 5 Median 6 Mode 6
Number of people living in 25 surveyed households
EOM_C10.qxd 6/23/05 10:44 AM Page 286

.
Significance of differences between numbers
Range
This is the interval from the lowest to the highest value in an array of data. In thenumber of people living in the sampled households example, the range is 9 − 1 = 8.
Variance
This is an index that indicates the extent to which the values are dispersed. Wereevery observation in a dataset the same value, the variance would be zero.Variance increases as values differ significantly from the mean. The formula usedto calculate variance is:
S2 = ∑n
i=1(Xi − X )2/(n − 1)
where Xi is the individual value in an array, X is the mean of the array and n isthe number of values in an array.
Standard deviation
This is the square root of the variance and is represented by the symbol S.
SIGNIFICANCE OF DIFFERENCES BETWEEN NUMBERS
Hypotheses
The first step in tests of significance is to make a claim which one then has to find evidence against. This statement is called the null hypothesis. The test isintended to determine the strength of the evidence against the null hypothesis.Customarily, the null hypothesis is a statement of no difference or no effect. Theterm null hypothesis is abbreviated as H0 and is usually stated in terms of somepopulation parameter or parameters. For example, suppose that p1 is the propor-tion of the whole population of British males who would have been illness free in1999 had they ridden a bicycle to work each day and let p2 stand for the illness-free proportion had they gone to work in their cars instead. The null hypothesis is:
H0 : p1 = p2
because this states that riding a bicycle to work has the same effectiveness as travelling by car. The name given to the statement we hope or suspect is trueinstead of H0 is called the alternative hypothesis, abbreviated by H1. The alter-native hypothesis in this case is that riding a bicycle to work is more effectivethan travelling by car. In terms of the population parameters this is:
H1 : p1 > p2
287
EOM_C10.qxd 6/23/05 10:44 AM Page 287

.
288 Chapter 10 • Quantitative data analysis
A test of significance assesses the strength of the evidence against the nullhypothesis in terms of probability. If the observed outcome is unlikely under thesupposition that the null hypothesis is true, but is more probable if the alter-native hypothesis is true, that outcome is evidence against H0 in favour of H1. The less probable the outcome is, the stronger is the evidence that H0 is false.
There are many tests of significance appropriate for different types of hypo-thesis and for different data-collection designs – as well as levels of significance.Some of these are examined later. An outline of what such a test of significanceshould include is shown in the box.
STEPS IN A TEST OF SIGNIFICANCE
1 Select the null hypothesis H0 and the alternative hypothesis H1. The test isdesigned to assess the strength of the evidence against the null hypothesis. H1 isa statement of the alternative we will accept if the evidence enables us to reject H0.
2 Select the level of significance. This states how much evidence against H0 we willaccept as sufficient.
3 Select the test statistic on which the test will be based. This is a statistic thatassesses how well the data conform to H0.
4 Find the probability value that the test statistic would weigh against H0 at leastas strongly as it does for these data, were H0, in fact, true. If the probability valueis less than or equal to the significance level then the test was statisticallysignificant at that level.
Measuring differences
Whenever sample data are being used, we have to compensate for samplingerror. Z and t tests are methods used to assess the differences among data whilestill taking into account the influence that sampling error may have played. Themethods are employable when measurement scales are at least interval, observa-tions are independent, only one or two groups are involved, differences betweentwo means are involved and, in the case of the t test, where observations aredrawn from a normally distributed population.
Provided that these criteria are met, we need to decide which of the two tests isthe more appropriate. A Z test is used if the sample size is larger than 30. A t testis appropriate when the sample size is less than 30. If the population variance isnot known, then the sample variance is assumed to equate to it and is usedinstead. The t test is usually employed in marketing research.
Z testOne- and two-tailed tests The tabular value of Z at any level of significancedepends on whether a one- or a two-tailed test is involved. Where we are lookingfor equality between two sets of data, H0 : µ1 = µ2, a two-tailed test is appropriate.
EOM_C10.qxd 6/23/05 10:44 AM Page 288

.
Significance of differences between numbers
Where we are looking at a situation that involves evaluating whether some-thing is greater than something else, a one-tailed test is appropriate. The samealso applies to situations where we are evaluating whether something is less thansomething else.
Dealing with proportions If proportions are involved rather than discrete num-bers, a different formula is needed – although in other respects the procedure isthe same.
The formula used is:
Z = (p − P)/σp
where p = sample proportionP = population proportionQ = 1 − Pσp = √(P.Q/n) where n is the sample size
t test
The procedures for using the t test are similar to those for using the Z test.However, there are different formulae that are applicable in different situations(see Kress1). For example:
t =
s = standard deviation of the samplex = sample meanµ = population meann = sample size
When the population data do exist, but the other group is represented by afairly small sample, this formula should be employed.
Tests with non-metric data
There are several tests that can be used, depending on the nature of the data andthe comparisons made. These include:
• Mann-Whitney U test: this is used when comparing two groups, but the basisfor comparison is data in ordinal form.
• Wilcoxon or signed rank test: this is appropriate for situations where two matching(non-independent) samples are being compared using ordinal (non-parametric)data.
• Kruskal-Wallis test: this is used when more than two independent samples areinvolved and the data are ordinal.
• Friedman two-way analysis of data: this is used when three or more related samplesare involved and the data are ordinal.
(x − µ)/s√(n − 1)
289
EOM_C10.qxd 6/23/05 10:44 AM Page 289

.
290 Chapter 10 • Quantitative data analysis
We have to decide whether the difference between two or more numbers, orsets of numbers, is probably significant, and whether two numbers are causallyrelated.
Difference between numbers in a single array
Suppose that in a survey of 1500, results showed that 64% chose brand X, 24%chose brand Y and the remainder made no choice. Are these real differences?Assuming that this was a probability sample, the answer is yes: the samplingerror for 64% is some 2.5% and for 24% it is some 2.2%.
CHI-SQUARE ANALYSIS
Difference between numbers in a series of arrays
In this case a comparison is made between the answers given by people with dif-ferent sets of characteristics to a particular question. Characteristics of the peopleinclude demographics, such as geography, household size, the presence of chil-dren, income, sex and age. These are cross-tabulated against such things asawareness or the use of a product category, brand and purchase intent.
EXAMPLE
Question: Are you aware of brand X washing machines? Table 10.1 shows theresults.
Simple inspection of the data would seem to suggest there is a differencebetween men and women in terms of awareness level. However, we really want toknow if the difference observable in cross-tabulating the data is statisticallysignificant: in other words, what the probability is that observed differences couldhave occurred by chance. In this particular instance we can use the chi-square test
Yes No Total
Men 50 200 250Women 150 300 450Total 200 500 700
TABLE 10.1 Awareness results
EOM_C10.qxd 6/23/05 10:44 AM Page 290

.
Chi-square analysis 291
In the example, using a 2 × 2 table, it is usually preferable to use Fisher’s exacttest or include Yates’ correction where there are a small number of cases. In thelatter case the formula is modified to:
χ2 = ∑n
i=1( |Oi − Ei | − 0.5)2/Ei
Where the sample size is so small that the expected value is less than 5, then chi-square should not be used.
Chi-square is a statistical tool used to evaluate the statistical significance of differences between sets of data. Basically, it compares one or more frequency distributions of data to indicate whether there is a real difference. It compares anactual set of data against a theoretical one to show what would be expected bychance alone.
to see if this is the case (we should, however, consult standard statistical texts toappreciate the suitability of this test and to understand its theoretical underpinning).
The chi-square statistic is calculated by the formula:
χ2 = ∑n
i=1
(Oi − Ei)2/Ei
where Oi = the observed value and Ei = the theoretically expected value, assuming inthis case that there is no difference between the occupational backgrounds ofrespondents (see Table 10.2).
We hypothesise that there is no relationship. However, χ2 at 2 degrees of freedomat the 5% level = 3.84 and because 13.5 > 3.84 the difference noted in the sample isstatistically significant. We must reject the null hypothesis and conclude that thedifference in levels of awareness in men and women did not occur by chance.
Yes No Total
Men (O = observed) 50 200 250(250 × 200)/700 (250 × 500)/700
(E = expected) = 71 = 179Women (O = observed) 150 300 450
(450 × 200)/700 (450 × 500)/700(E = expected) = 129 = 321Total 200 500 700
Note: Expected values are rounded off to the nearest whole number.
χ2 = (50 − 71)2/71 + (200 − 179)2/179 + (150 − 129)2/129 + (300 − 321)2/321= 13.5 with degrees of freedom (r − 1)(k − 1) = 1
where r = number of rows, k = number of columns
TABLE 10.2 Breakdown of brand awareness
EOM_C10.qxd 6/23/05 10:44 AM Page 291

.
292 Chapter 10 • Quantitative data analysis
EXAMPLE
Chi-square
A market researcher has completed a study of soft drinks. The following tableshows the brand purchased most often, broken down by male versus female. Theresearcher wants to know if there is a relationship between the gender of the pur-chaser and the brand purchased.
Drink Male Female
Coke 66 52Pepsi 67 487-Up 35 38Dr Pepper 34 21Sprite 32 41Lilt 33 31Blackjack 18 25Tango 34 24
Male Female Total
1 66 52 11862.84 55.16
2 67 48 11561.24 53.76
3 35 38 7338.88 34.12
4 34 21 5529.29 25.71
5 32 41 7338.88 34.12
6 33 31 6434.08 29.92
7 18 25 4322.90 20.10
8 34 24 5830.89 27.11
Total 319 280 599
Chi-square ‘male’ ‘female’
Expected counts are printed below observed counts:
EOM_C10.qxd 6/23/05 10:44 AM Page 292

.
Use of similarities between numbers to show cause and effect 293
χ2 = −0.159 + 0.181 + 0.541 + 0.616 + 0.387 + 0.440 + 0.757 + 0.863 + 1.216+ 1.386 + 0.034 + 0.039 + 1.048 + 1.194 + 0.314 + 0.357
χ2 = 9.533 df = 7
The tabular value of χ2 at 0.05 level of significance and (8 − 1)(2 − 1) = 7 degreesof freedom is 14.07. The calculated value (9.533) is lower than the tabular value(14.07). There would not seem to be a significant relationship between gender ofthe purchaser and the brand purchased.
USE OF SIMILARITIES BETWEEN NUMBERS TO SHOW CAUSE AND EFFECT
Another application of numbers in marketing research is in the analysis andunderstanding of the similarities between variables. Many surveys try to measurethe sales impact of advertising or other marketing efforts. One often-used pro-cedure compares the proportion of purchasers among two groups: those whoremember seeing or hearing the advertising and those who do not.
Table 10.3 displays these data, this time ignoring the gender of the respondents.It also shows brand awareness of the washing machine by those who recall thebrand’s advertising and those who do not. An obvious but incorrect conclusionfrom the table is that advertising accounted for the 15% difference in the awarenesslevel. However, the results merely show only that there is a correlation betweenadvertising awareness and brand awareness. The correlation may be becausepeople become aware of the brand by other means and then notice its advertising.
Interpreting the meaning of cross-tabulations amounts to more than simplytaking the figures at face value. There has to be some underlying logical explana-tion behind the inferences that are drawn from the numbers alone. In this case, there is some evidence to support the argument presented. In the case of higher-priced items, psychologists have found that people pay attention toadvertisements after purchase to help reinforce their purchase choice (allayingpost-purchase cognitive dissonance).
Those remembering Those not rememberingadvertising advertising
Total group 100% 100%Aware of brand 20% 5%Not aware of brand 80% 95%
TABLE 10.3 Brand awareness and advertising recall
EOM_C10.qxd 6/23/05 10:44 AM Page 293

.
294 Chapter 10 • Quantitative data analysis
Measuring relationships by cross-tabulation
For data provided by marketing research to be useful in making marketing deci-sions, it is most important that the cross-tabulation that might help to makemarketing decisions are identified. For example, differences by age groups, oreven concentration on a single age segment, could imply completely differentapproaches for each target market.
ANALYSIS OF VARIANCE
Analysis of variance is a method used extensively in evaluating the results of experiments. The general question involves determining the influence of atreatment on a dependent variable. The argument is that the total variance thatexists among the data can be apportioned to specific factors by means of formalmathematical techniques. The amount of variance attributable to each factor isindicative of the factor’s influence on the dependent variable.
EXAMPLE
As part of a new advertising campaign, a firm plans a full-page advertisement ineither a news magazine or a sports magazine. The problem is to decide which magazine has the lowest ratio of full-page advertisements to the number of pagesin the magazine (see Table 10.4).
Year News magazine Sports magazine
1989 0.79 0.600.80 0.460.54 0.380.72 0.42
1991 0.49 0.390.85 0.560.50 0.570.67 0.46
1993 0.36 0.370.65 0.640.47 0.520.68 0.41
Note: The advertisement ratio is calculated by dividing the number of full-page ads by the number of pages in the issue.
TABLE 10.4 Ratio of full-page advertisements to number of pages
EOM_C10.qxd 6/23/05 10:44 AM Page 294

.
Analysis of variance 295
It is also important to establish whether there has been a recent change in thisratio. (See Tables 10.5 and 10.6 for analysis of variance.)
Three hypotheses are to be tested:
H0: there is no interaction between year and magazineH1: there is an interaction between year and magazineH0: there is no difference in the average ad ratios for different yearsH1: there is a difference in the average ad ratios for different yearsH0: there is no difference in the average ad ratio when using different magazinesH1: there is a difference in the average ad ratio when using different magazines.
We reject the hypothesis when the probability is ≤ = 0.05 (decision rule).
Source DF SS MS F P
Year 2 0.02386 0.01193 0.73 0.494Magazine 1 0.12615 0.12615 7.76 0.012Year*Magazine 2 0.03753 0.01876 1.15 0.338Error 18 0.29265 0.01626Total 23 0.48018
Produced with the student edition of Minitab.DF = degrees of freedom; SS = sum of squares; MS = mean square; F = statistic; P = probability.
TABLE 10.5 Analysis of variance for advertisement ratio
Test Effect F ratio P-value Decision
1 Year*Magazine 1.15 0.338 Do not reject H0: do not conclude there is significant interaction between year and magazine
2 Year 0.73 0.494 Do not reject H0: the mean ad ratios are probably the same for the three years
3 Magazine 7.76 0.012 Reject H0: the mean ad ratios are not the same for the two magazines
For further details of analysis of variance, see McKenzie et al.2
TABLE 10.6 Analysis of variance
EOM_C10.qxd 6/23/05 10:44 AM Page 295

.
296 Chapter 10 • Quantitative data analysis
MEASURING RELATIONSHIPS
Regression and correlation both measure the relationship between a dependentvariable and one or more independent variables, but each shows this relationshipin a different manner. Regression analysis identifies the nature of the relation-ship using an equation, whereas correlation analysis describes the strength ofrelationships between variables by means of an index.
Correlation analysis
A coefficient of determination r2 is computed and indicates the proportion ofchange in the dependent variable that is associated with changes in the independ-ent variable. For instance, an r2 of 0.49 means that 49% of the variation in thedependent variable is associated with changes in the independent variable. Thesquare root of the coefficient of determination is the correlation coefficient r and isan index of association between the two variables.
A strong correlation does not establish causality. There are two major cate-gories of correlation analysis: bivariate and multivariate. Bivariate analysismeasures the relationship between two variables whereas multivariate analysismeasures the relationship among three or more variables.
Bivariate analysis
EXAMPLE
The first thing we might do before calculating r or r2 is to produce a scatterplot ofthe relationship between the two variables. This is shown in Figure 10.1.
From the scatterplot we can see that there is some association between the twosets of data, although it may not be very strong. Were there to be a strong degree ofassociation between the two variables, the graph might have appeared as shown inFigure 10.2. (Table 10.7 shows our data in tabular form.)
Notice that where there is a high degree of association, the points lie along astraight line.
The indices association r and r2 are calculated according to the formula:
r = n(∑YX ) − (∑Y )2 / (n∑X − (∑X )2)(n∑Y2 − (∑Y )2)
r2 is obtained from r.In this example correlation of price and alcohol r = 0.241.The significance of r can be tested using the t test:
t = r (n − 2)/(1 − r2)
t = 0.241 (14 − 2) / (1 − 0.058) = 0.241 × (12/0.942) = 0.86
tabular t = 2.179 at 0.05 level of significance, 12 degrees of freedom.
EOM_C10.qxd 6/23/05 10:44 AM Page 296

.
Measuring relationships 297
FIGURE 10.1 Price versus alcohol content per glass – low degree of association
s
Brand Price (£) Alcohol content (%)
1 1.1 4.2
2 1.1 4.2
3 0.9 4.0
4 0.9 3.0
5 1.2 8.5
6 0.9 8.4
7 0.9 4.0
8 0.7 4.0
9 1.1 8.5
10 1.1 8.5
11 0.9 7.5
12 0.9 7.5
13 0.7 7.6
14 1.0 6.0
TABLE 10.7 Fourteen brands of cider, their price per glass and alcohol content per glass
Since the computed value is less than the tabular value, the computed value of rindicates no evidence of any association.
EOM_C10.qxd 6/23/05 10:44 AM Page 297

.
298 Chapter 10 • Quantitative data analysis
Rank order correlation
Where we have ordinal data, it is appropriate to use the Spearman Rank correla-tion method. The formula is:
r = 1 − 6∑D2/n(n2 − 1)
where D is the absolute difference between rankings and n is the number ofobservations.
Regression analysis
The first step in regression analysis is to plot the relationships between thedependent and the independent variables on a graph: this is referred to as thescatterplot (as shown in Figures 10.3 to 10.6). This will give some idea of the gen-eral kinds of relationship that exist between the data. Once it has been establishedthat a linear relationship exists, it is appropriate to derive values for the equationfor fitting a straight line to two variables: Y = a + b(X). Regression analysis fits aline through the data points that minimises the sum of the squared deviations. Inorder to position the line, two values have to be determined: a, the intercept, andb, the regression coefficient.
Suppose we have the following data about houses for sale:
• price• area in square feet covered by building• acres of garden• number of rooms• number of bathrooms/toilets.
FIGURE 10.2 Price versus alcohol content per glass – high degree of association
EOM_C10.qxd 6/23/05 10:44 AM Page 298

.
Measuring relationships
Which of the various factors in Table 10.8 that describe the house are mostclosely associated with the price?
Overall, we see that there appears to be some degree of positive associationbetween each one of the variables and the price. The clustering of data pointsalong a straight line (indicating the goodness of fit) is perhaps best exhibitedbetween area and price, although acres and price also appear to be well associ-ated. We calculate the regression equation for the relationship between oneindependent variable and one dependent variable by means of the followingequation:
Y = a + b(X)
299
FIGURE 10.3 Scatterplot – price versus area
FIGURE 10.4 Scatterplot – price versus acres
EOM_C10.qxd 6/23/05 10:44 AM Page 299

.
300 Chapter 10 • Quantitative data analysis
where b is the amount of change that takes place in Y for each unit of change in X.
b =
a is the intercept or the value of Y when X is zero. It is the point where the regres-sion line crosses the Y axis.
∑XY − [(∑X)(∑Y)/n]∑X2 − [(∑X2)/n]
FIGURE 10.5 Scatterplot – price versus rooms
FIGURE 10.6 Scatterplot – price versus bathrooms
EOM_C10.qxd 6/23/05 10:44 AM Page 300

.
Measuring relationships 301
Price Area Acres Rooms Baths
£168,500 2990 0.70 9 2
£122,000 1560 0.24 8 2
£136,000 1990 0.65 9 2
£129,000 1320 0.68 7 1
£136,000 1990 0.70 8 2
£154,000 1980 0.45 8 2
£129,000 2300 0.34 7 2
£118,000 1150 0.32 8 1
£144,000 1400 2.00 7 3
£143,000 1700 0.60 8 2
£120,000 1230 0.50 6 1
£155,000 1990 1.00 7 2
£90,000 1550 0.40 7 1
£154,000 2700 0.60 9 3
£125,000 1400 0.55 7 1
£145,000 1850 0.38 7 2
£146,500 1750 0.72 8 2
£118,000 1000 0.40 8 1
£210,000 2950 1.20 9 3
£138,000 1900 0.57 8 1
TABLE 10.8 Houses for sale
EXAMPLE
Using Minitab 8.0 for Windows and SPSSPC, the following bivariate regressions areobtained on these data (note that figures may show the effects of rounding off):
where Coef = regression coefficientStdev = standard deviationt = t-ratio (statistic)p = probability of occurrences = standard error of the estimateFit Stdev = fit standard deviationSt resid = standard residual
s
EOM_C10.qxd 6/23/05 10:44 AM Page 301

.
302 Chapter 10 • Quantitative data analysis
1 The regression equation is:
Price = 79312 + 32.6 areaPredictor Coef Stdev t-ratio pConstant 79312 12691 6.25 0.000Area 32.555 6.627 4.91 0.000
s = 16231 R-sq = 57.3% R-sq(adj) = 54.9%
Analysis of variance
Source DF SS MS F pRegression 1 6356522504 6356522504 24.13 0.000Error 18 4741927496 263440416Total 19 11098450000
Unusual observations
Obs Area Price Fit Stdev Fit Residual St Resid13 1550 90000 129772 4091 −39772 −2.53R19 2950 210000 175349 8233 34651 2.48R
R denotes an observation with a large standard residual.
2 The regression equation is:
Price = 119815 + 29593 acresPredictor Coef Stdev t-ratio pConstant 119815 9623 12.45 0.000Acres 29593 12767 2.32 0.032
s = 21791 R-sq = 23.0% R-sq(adj) = 18.7%
Analysis of variance
Source DF SS MS F pRegression 1 2551202835 2551202835 5.37 0.032Error 18 8547247165 474847065Total 19 11098450000
Unusual observations
Obs Acres Price Fit Stdev Fit Residual St Resid9 2.00 144000 179000 17911 −35000 −2.82RX
19 1.20 210000 155326 8547 54674 2.73RR denotes an observation with a large standard residual.X denotes an observation whose X value gives it large influence.
EOM_C10.qxd 6/23/05 10:44 AM Page 302

.
Measuring relationships 303
3 The regression equation is:
Price = 22518 + 15036 roomsPredictor Coef Stdev t-ratio pConstant 22518 44284 0.51 0.617Rooms 15036 5682 2.65 0.016
s = 21068 R-sq = 28.0% R-sq(adj) = 24.0%
Analysis of variance
Source DF SS MS F pRegression 1 3108768182 3108768182 7.00 0.016Error 18 7989681818 443871212Total 19 11098450000
Unusual observations
Obs Rooms Price Fit Stdev Fit Residual St Resid19 9.00 210000 157845 8523 52155 2.71R
R denotes an observation with a large standard residual.
4 The regression equation is:
Price = 94793 + 24587 bathsPredictor Coef Stdev t-ratio pConstant 94793 11123 8.52 0.000Baths 24587 5782 4.25 0.000
s = 17539 R-sq = 50.1% R-sq(adj) = 47.3%
Analysis of variance
Source DF SS MS F pRegression 1 5561569565 5561569565 18.08 0.000Error 18 5536880435 307604469Total 19 11098450000
Unusual observations
Obs Baths Price Fit Stdev Fit Residual St Resid19 3.00 210000 168554 7970 41446 2.65R
R denotes an observation with a large standard residual.As predicted by the scattergraph the best relationship is that between area and
price.Knowledge of an independent variable, coupled with the appropriate equation,
enables an estimate to be made of the dependent variable. Thus knowing the areacovered by a house can be used to estimate its likely price.
EOM_C10.qxd 6/23/05 10:44 AM Page 303

.
304 Chapter 10 • Quantitative data analysis
Multivariate analysis
In the preceding sections, simple regression and correlation have been used todetermine the association between two variables. However, it is not usual for oneindependent variable to play such a major part in explaining the dependent vari-able. Where an r2 value between two variables is less than 0.8 it is necessary tosearch for additional independent variables, which can increase the variationexplained by the regression or correlation models.
Multiple regression analysis is usually the preferred way of introducing morethan one independent variable into the study. The multiple regression model isan expansion of the simple regression model:
Y = a + b1X1 + b2X2 + . . . + bnXn
The number of independent variables used in each model depends on howmany are needed to estimate adequately the value of the dependent variable.Most equations usually have fewer than ten independent variables.
A multiple regression model for the house data just examined follows.Stepwise regression of price on four predictors (rooms, baths, acres and area),
with N = 20:
Step 1 2Constant 79,312 69,085Area 32.6 30.1t-ratio 4.91 5.24Acres 22,800t-ratio 2.77S 16,231 13,859R-SQ 57.27 70.58
We see that only areas and acres are kept in the regression equation. Thesetwo independent variables account for more than 70% of the variance in thedependent variable. Since no other independent variables have been includedand the total variance accounted for does not come near to 80%, we can only con-clude that there must be other factors that are relevant to the house price thanthose reported here.
For further information on multivariate analysis, see McKenzie et al.2 and Hairet al.3
Cluster analysis
Cluster analysis is the name given to a group of multivariate techniques thatidentify similar entities from the characteristics possessed by the entities. Objectsor variables are identified or classified so that each object is very similar to theothers in the cluster with respect to some criteria. The technique examines simi-larities between observations of entities based on profiles of their scores on anumber of measured characteristics. Applications include:
EOM_C10.qxd 6/23/05 10:44 AM Page 304

.
Measuring relationships 305
• determining the number and composition of market segments
• facilitating the selection of test markets
• identifying groups of people with common purchasing interests in segmenta-tion studies; this helps to identify target markets and provides information forestablishing product positioning and developing promotional themes.
EXAMPLE
Various measures of the standard of living in European countries at the end of the1980s are shown in Table 10.9 and Figure 10.7. On the basis of these measures,countries are clustered according to similarities in the standard of living. The dataare standardised and hierarchical clustering using group average linkage is used toobtain clusters.
From the dendrogram a number of clusters are seen, for example: ‘Denmark,Sweden and Switzerland’, ‘France, Netherlands and Norway’, and ‘Belgium andSpain’. Subsequent clustering obviously depends on what indicators of the standardof living are taken – a different set of indicators could produce different clustering.Another point is that through standardisation of the data in this example, equalweighting to each of the measures is given. It might be desirable to give moreweighting to some measures than to others.
For further information on cluster analysis, see Hair et al.3 and Green et al.4
Private Per ’000 Per ’000 Per ’000 per capita population live births ownership
Consumption Doctors Infant deaths TV Cars Phones
Austria 7,434 2.1 8.3 323 370 525Belgium 8,486 3.3 8.6 301 349 478Denmark 7,705 2.7 7.5 386 321 864France 8,733 2.6 7.5 332 394 608Germany 8,120 3.0 7.5 379 457 650Ireland 5,079 1.5 7.5 216 210 265Italy 8,577 1.3 8.9 255 408 488Netherlands 8,133 2.4 6.8 327 348 639Norway 8,224 2.5 8.3 348 388 622Spain 6,443 3.7 7.8 322 263 396Sweden 8,090 3.1 5.8 393 400 890Switzerland 10,181 2.9 7.3 411 419 856UK 9,154 1.4 8.4 534 318 524
TABLE 10.9 Measures of living standards in Europe
s
EOM_C10.qxd 6/23/05 10:44 AM Page 305

.
306 Chapter 10 • Quantitative data analysis
Factor analysis
This is a generic name given to a class of multivariate statistical methods thatundertake data reduction and summarisation. The method analyses the inter-relationships among a large number of variables and explains these variables interms of their common underlying dimensions (factors). For example, a surveyquestionnaire may consist of 100 questions, but because not all the questions are thesame, they do not all measure the basic underlying dimensions to the same extent.Factor analysis enables us to identify the separate dimensions being measuredby the survey and obtain a factor loading for each variable on each factor.
Factor analysis may be used to discover a set of dimensions that underlie orunderpin a set of variables (Figure 10.8).
Applications for factor analysis include:
• uncovering the factors that influence advertising readership
• ascertaining which personal characteristics are associated with preferring onebrand of product to another
• uncovering the important dimensions of product/service quality
• uncovering the factors that need to be taken into account in making decisionsabout such things as product design and promotion.
FIGURE 10.7Dendrogram showing measures of standard of living in Europe (produced withthe aid of S-Plus for Windows)5
EOM_C10.qxd 6/23/05 10:44 AM Page 306

.
Measuring relationships
The example in Table 10.10 shows a factor analysis of the standard of livingdata just examined. Factor 2 represents the health dimension and Factor 1 thespending power dimension.
For further information on factor analysis, see Hair et al.3 and Green et al.4
Conjoint analysis
Conjoint analysis is a method of portraying consumers’ decisions realistically as atradeoff among multiattribute products or services. Conjoint analysis helps us tounderstand how people develop preferences for products or services. It is basedon the simple notion that consumers evaluate the utility or value of something bycombining the separate amounts of utility provided by each attribute.
It is closely related to traditional experimentation. In situations where peopleare involved we often need to conduct experiments with factors we can control.For example, should a chocolate bar be slightly sweet to the taste or very sweet?Should it be promoted as a Slimmers’ product or not? What price should be askedfor the product?
In conjoint analysis the use of experimental design in the analysis of consumerdecisions has two objectives. First, the experiments may try to assess how the
307
FIGURE 10.8 Scatterplot of standard of living analysis
EOM_C10.qxd 6/23/05 10:44 AM Page 307

.
308 Chapter 10 • Quantitative data analysis
sweetness of the chocolate bar contributes to the willingness of the consumer tobuy it. It may also seek to assess how much a change in the willingness to buy canbe accounted for by differences between levels of sweetness. Second, the experi-ments may seek to establish a valid model of consumer judgements that is usefulin predicting the consumer acceptance of any combination of attributes, eventhose not originally evaluated by the consumer.
Conjoint analysis has been used in the pharmaceutical industry for productpositioning close to launch where the product attributes were not changeable.However, it is now used earlier in product development to help define clinicalend-points, and with input into go/no-go decisions.6
TABLE 10.10 Importance of factors in standard of living analysis
Factor 1 Factor 2 Factor 3
SS loadings 1.644996 1.3791295 1.2124108Proportion variation 0.274166 0.2298549 0.2020685Cumulative variation 0.274166 0.5040209 0.7060894
The degrees of freedom for the model is 0.
Uniquenesses
Consumption Doctors Infant mortality TV Cars Phones
0.08042417 0.7765078 0.3057129 0.3231836 0.1644488 0.1131866
Loadings
Factor 1 Factor 2 Factor 3
Consumption 0.755 0.588Doctors 0.108 0.460Infant mortality −0.825TV 0.176 0.120 0.795Cars 0.891 0.161 0.126Phones 0.481 0.665 0.461
Obtained with the aid of S-Plus for Windows5 using principal axis method.
EOM_C10.qxd 6/23/05 10:44 AM Page 308

.
Measuring relationships 309
EXAMPLE
In a furniture polish concept-testing experiment, each respondent has been told about the properties of eight dummy cans of polish to rank choices in order of preference for purchase. The responses for two respondents are shown in Table 10.11.
Size Properties Brand Respondent 1 Respondent 2
Small A Alpha 1 1A Beta 2 2B Alpha 5 6B Beta 6 5
Large A Alpha 3 4A Beta 4 3B Alpha 7 7B Beta 8 8
TABLE 10.11 Concept-testing experiment: responses
For simplicity, in applying the technique we will assume an additive model isappropriate and that the overall preference for a combination of attributes is represented as:
Preference sib = PWs + PWi + PWb
where the overall preference for a combination of size, properties and brand(Preference sib) is the sum of PWs, PWi, and PWb, the estimated part-worths forthe levels of size, properties and brands, respectively.
In order to calculate the coefficients, we have to specify the composition rulesand if the additive rule strictly holds, a simple difference from the mean (ANOVA)should apply. The average rank of the eight combinations is 4.5 and we calculatethe impact of each factor. For example, the average ranks for the two levels of sizeare:
Small = (1 + 2 + 5 + 6)/4 = 3.5Large = (3 + 4 + 7 + 8)/4 = 5.5
Figures for properties and brand are similarly calculated. Then, for respondent 1the average ranks and deviations for each factor from the overall average rank (4.5)are as shown in Table 10.12.
Higher rank and a more preferred stimulus are usually given a smaller numberso the next step is to reverse all the signs so that the positive part-worths now indi-cate higher preference. Coefficients are then calculated using the following method:
s
EOM_C10.qxd 6/23/05 10:44 AM Page 309

.
310 Chapter 10 • Quantitative data analysis
• Square the deviations and find their sum (in this case the total is 10.5).
• Multiply each squared deviation by a standardising value calculated as thenumber of levels divided by the sum of the squared deviations, in this case(6/10.5) or 0.571.
• Take the square root of the standardised squared deviation to get the actualcoefficient.
By way of illustration, for the first level of property (A), the deviation of 2 (reversing the sign!) is squared and then multiplied by 0.571 to obtain 2.284. To cal-culate the coefficent for this level, we then take the square root of 2.284 to obtaina coefficient of 1.511. This process yields the coefficients for each level, as shown inTable 10.13.
The part-worth estimates are in a common scale, so the relative importance ofeach factor can be computed directly. The importance of a factor is represented bythe range of its levels. The ranges are then standardised by dividing each range by the sum of the ranges. For example, for respondent 1, the ranges are 1.512 and.756. The relative importance for size, properties and brand are calculated as1.512/5.294, 3.022/5.294, and .756/5.294 or 29%, 57% and 14% respectively.
We can follow the same procedures for the second respondent and calculate theaverage ranks, deviations and coefficients for each level (Table 10.14).
To examine the ability of the model to predict the actual choices of the respon-dents, we predict performance order by summing the coefficients for the different
Factor level Average rank Deviation
Small 3.5 −1Large 5.5 +1A 2.5 −2B 6.5 +2Alpha 4.0 −.5Beta 5.0 +.5
TABLE 10.12 Average ranks and deviations for respondent 1
TABLE 10.13 Coefficients for each level
Size Property Brand
Small Large A B Alpha Beta.756 −.756 1.51 −1.51 .378 −.378
EOM_C10.qxd 6/23/05 10:44 AM Page 310

.
Measuring relationships 311
TABLE 10.14 Average ranks, deviations and coefficients for respondent 2
Factor level Average rank Deviation Coefficent
Small 3.5 −1 .77Large 5.5 +1 −.77A 2.5 −2 1.55B 6.5 +2 −1.55Alpha 4.0 −.5 0.0Beta 5.0 +.5 0.0
TABLE 10.15 Respondent 1: calculations
Product description Predicted valueSize Properties Brand Part-worth total Predicted rank
Small A Alpha.756 + 1.51 + .378 = 2.644 1
Small A Beta.756 + 1.51 + −.378 = 1.888 2
Small B Alpha.756 + −1.51 + .378 = −.376 5
Small B Beta.756 + −1.51 + −.378 = −1.132 6
Large A Alpha−.756 + 1.51 + .378 = 1.132 3
Large A Beta−.756 + 1.51 + −.378 = .376 4
Large B Alpha−.756 + −1.51 + .378 = −1.888 7
Large B Beta−.756 + −1.51 + −.378 = −2.644 8
combinations of factor levels and rank ordering the resulting scores. The calcula-tions for respondent 1 are shown in Table 10.15.
The predicted preference order can be compared to the respondent’s actualpreference order for a measure of predictive accuracy. The predictive preferenceorders for both respondents are shown in Table 10.16.
In the case of respondent 2, since the weights of zero were calculated for thebrand name the compositional rule is unable to predict a difference betweenbrands within the ingredient and can size combinations. Brand name may be a
s
EOM_C10.qxd 6/23/05 10:44 AM Page 311

.
312 Chapter 10 • Quantitative data analysis
TABLE 10.16 Predictive preference orders: both respondents
Original rank Predicted rank order
Respondent 1 Respondent 2
1 1 1.52 2 1.53 3 3.54 4 3.55 5 5.56 6 5.57 7 7.58 8 7.5
random choice, given size and properties. Moreover, when two or more stimulihave equal total-worth predictions, the rank orders are averaged.
The example illustrated assumes an additive model only as the base for thecompositional rule. Original rankings assumed that no interaction effect occurs: forexample, the respondent prefers Alpha and normally prefers property A over B. Ifinteraction is thought to have a serious effect, steps have to be taken in the analysisto allow for this.
Multidimensional scaling and perceptual mapping
It is easier to understand the relationships between facts, events or objects if wecan visualise these relationships spatially. There are a number of techniques thatgo under the heading of multidimensional scaling and perceptual mapping tech-niques which enable us to do exactly that. They allow us to visualise how usersperceive products and services in relationship to one another. There are a varietyof perceptual-mapping programs and techniques designed to work with the dif-ferent kinds of data that have been collected.
EXAMPLE
This example uses Multiscale II.7 In this case, brands of watch were taken in pairsand respondents were asked to judge how dissimilar the brands were vis-à-viseach other.
EOM_C10.qxd 6/23/05 10:44 AM Page 312

.
Summary 313
FIGURE 10.9 Configuration plot for dimension 2 (vertical axis) against dimension 1
Judgement-similarity measures between products or brands can be used tocreate geometric representations in multidimensional spaces called perceptualmaps. The brands or products are represented by points in the space, while thedimensions represent the attributes used by the customers in making the similarityjudgements. Brands located close to each other are judged to be similar on theattributes and thus form a defined market. In Figure 10.9, information about thecompetitive sets is obtained by the examination of clusters of points. Products A, Fand L (Rolex, Jaeger and Ebel) cluster together, but are separate, for example,from M and P (Tag and Breitling), which form another cluster.
Comparing products at the extreme points of both dimensions gives some ideaof the name to give to each of the two axes. On the horizontal axis Jaeger at oneextreme contrasts with Fossil at the other – perhaps reflecting the status symbol,high-price dimension – while on the vertical axis, Accurist and Roamer contrastwith Swatch and Fossil, reflecting the conservatism, or lack of it, of the brands.
SUMMARY
This chapter has examined how research results can be analysed and interpretedto establish meaningful patterns. The steps involved in converting completedresearch instruments into tables has been examined, together with the coding of
EOM_C10.qxd 6/23/05 10:44 AM Page 313

.
314 Chapter 10 • Quantitative data analysis
answers to questions and the statistical treatment of survey data. Attention hasbeen given to the role of the computer in transforming and facilitating the inter-pretation of research data. Specific topics covered include the cross-tabulation ofdata, correlation and regression. Multivariate analysis of variance has also beencovered, together with other multivariate techniques such as multiple regressionanalysis, cluster analysis, factor analysis, conjoint analysis and multidimensionalscaling.
QUESTIONS
1 What is meant by data interpretation? Discuss the kinds of pitfall that wehave to watch for when interpreting data.
2 Explain data tabulation and editing and coding.
3 Calculate the percentage of house owners across all age groups for the wholesample, using data from Table 10.17.
4 Calculate the mean, the median and the mode in the case given in Table 10.18.
Which average best describes the data?
TABLE 10.17 Number and percentage of house owners among three age groups
Total 18–29 (number) 30–49 (number) 50+ (number)
Total interviews 150 230 140% house owners 36 65 29
TABLE 10.18 Cars per household
Number of cars per household in 25 surveyed households
2 2 4 1 11 2 0 1 20 1 0 1 23 3 0 1 12 1 2 2 1
EOM_C10.qxd 6/23/05 10:44 AM Page 314

.
Questions
5 What is the range in the data in Question 4?
6 What is the standard deviation and variance of the data in Question 4?
7 In a survey of 281 consumers, the question asked was: Are you aware ofbrand X? The tally of responses are shown separately for both men andwomen in Table 10.19.
Is there a difference between men and women in terms of their respectivelevels of awareness of brand X?
8 What are analysis of variance techniques? What do they attempt to measure?In the context of what kinds of problem might they be useful?
9 Data for 14 brands of cider and their price and alcohol content per glass areshown in Table 10.20.
315
TABLE 10.19 Awareness of brand X
Yes No
Men 55 85Women 65 76
TABLE 10.20 Cider brands, price and alcohol content per glass
Brand Price (£) Alcohol content (%)
1 1.71 3.3
2 1.62 3.2
3 1.94 3.1
4 1.81 3.6
5 1.65 4.3
6 1.67 2.2
7 1.56 3.6
8 1.54 1.8
9 1.76 1.7
10 1.88 2.4
11 1.91 2.1
12 1.93 3.2
13 1.72 3.3
14 1.88 3.1
EOM_C10.qxd 6/23/05 10:44 AM Page 315

.
316 Chapter 10 • Quantitative data analysis
TABLE 10.21 Houses for sale in another part of the country
Price Area Acres Rooms Baths
£128,500 1220 1.50 6 2£142,000 1670 0.74 7 2£146,000 1330 0.25 6 2£159,000 1560 1.38 8 1£186,000 1430 0.40 7 1£174,000 1730 1.95 6 2£119,000 2210 1.34 8 2£198,000 1780 0.52 9 1£134,000 1290 2.30 6 2£153,000 1340 0.70 7 1£170,000 1810 1.20 8 1£185,000 1740 1.90 6 2
£91,000 1330 1.76 6 1£154,000 2700 0.60 9 3£125,000 1400 0.55 7 1£145,000 1850 0.38 7 2£146,500 1750 0.72 8 2£118,000 1000 0.40 8 1£210,000 2950 1.20 9 3£138,000 1900 0.57 8 1
For the data:(a) Produce a scattergraph to show the relationship between the two
variables.(b) Calculate the Pearson correlation coefficient to measure the relationship
between the two variables.(c) Calculate the bivariate regression equations (i) using alcohol content as
the independent variable and (ii) using the price of cider as theindependent variable.
(d) Interpret and comment on the analysis you have undertaken.
10 Table 10.21 is a dataset similar to that in Table 10.8, which refers to a differentarea of the country. Use multiple regression analysis to analyse the dataset.
11 Indicate the possible applications, in marketing research, for:(a) cluster analysis(b) factor analysis(c) conjoint analysis(d) multidimensional scaling.
EOM_C10.qxd 6/23/05 10:44 AM Page 316

.
Case study 10.2 317
CASE STUDY 10.1: LA GAIETÉ PARISIENNE
La Gaieté Parisienne owns four boutiques in and around Paris. Recently it under-took a survey of 1000 customers which, among other things, attempted toascertain whether there was any association between age and the boutique patro-nised by respondents. A random sample of 250 customers was taken at eachboutique between 12 May and 30 May.
If there were any associations between age and boutique patronage, theremight be an argument for changing the mix of items offered for sale at each of theboutiques. Table 10.22 shows the boutiques and the age profile of the respondentsinterviewed at each boutique.
Question
What advice would you offer?
CASE STUDY 10.2: SUMMIT MOTORS (2)
Summit Motors’ records indicate that less than 40% of its new car buyers remainloyal service customers after the first free service and the dealer is keen toincrease the percentage to at least 50%. Some 14 different attributes have beenidentified as affecting the patronage of a service facility and a small survey hasbeen conducted among new car purchasers who have bought cars during thepast two years. Respondents were asked two questions about each of theidentified attributes:
1 How important is the attribute?
2 How well did Summit Motors perform in terms of this attribute?
TABLE 10.22 Boutiques and age profiles
Boutique Under 18 18–24 25–34 35–44 45 and over
Montparnasse 57 71 61 38 23St Lazare 48 82 86 20 14La Fayette 51 66 65 40 28Madeleine 44 47 54 56 49
EOM_C10.qxd 6/23/05 10:44 AM Page 317

.
318 Chapter 10 • Quantitative data analysis
TABLE 10.23 Summit Motors: mean importance and performance ratings
No. Attribute Mean importance Mean performance rating rating
1 Job done first time 3.79 2.682 Complaints dealt with speedily 3.61 2.783 Warranty work attended to promptly 3.57 3.114 Can do any job required 3.59 2.965 Service available when required 3.42 3.026 Friendly/courteous service 3.36 3.287 Car ready when promised 3.33 3.008 Only necessary work performed 3.42 3.069 Low service prices 3.26 1.95
10 Clean-up after service done 3.22 2.9711 Convenient for home 2.46 2.2112 Convenient for work 2.39 2.4713 Courtesy cars available 2.32 2.3314 Maintenance reminders posted 1.99 3.38
Note: A five-point rating scale was used in both cases. In terms of importance, the scale ran from extremelyimportant (5) to not important (0). In the case of performance, the scale ran from excellent (5) to poor (0).
Mean importance and performance ratings from some 311 of 682 contactedprevious buyers are shown in Table 10.23.
Questions
1 Plot the 28 attribute scores on a two-dimensional graph, the axes being (a) importance of attributes and (b) Summit’s performance on the attributes.
2 How might Summit interpret this graphical representation of the data?
CASE STUDY 10.3: MR HUNGRY’S BURGER BAR
Mr Hungry’s Burger Bar is a national chain of hamburger restaurants withbranches in all major cities of the UK and most large towns. The burger bars typi-cally attract three main categories of customer: teenagers looking for a cheap,filling lunch while cruising shopping malls, parents who take young children tothe restaurants for a treat or birthday celebration and office workers and otherslooking for a quick lunch stop during the day or a pre-cinema snack in the evening.
EOM_C10.qxd 6/23/05 10:44 AM Page 318

.
Case study 10.3 319
):<< ): |: (: (:>>
Promptness of service from staff 3891 3202 1576 1789 2074
Quality of food 4007 2956 1809 1687 2073
Cleanliness of restaurant 3568 2508 1457 1708 3291
Value for money 4578 3672 1067 1431 1784
Facilities for children 3457 3278 2890 1459 1448
Range of choice on menu 3279 2845 2078 1897 2433
Convenient location 2450 1891 1546 2581 4064
In an attempt to gauge customer attitudes to the restaurant, each customer isasked to complete a form, which uses a five-point Likert scale to assess responsesacross a range of issues. The form is shown below.
At Mr Hungry’s we are always looking for ways to improve our service to you, the customer. Tohelp us do this, we would be grateful if you could take a few moments to fill out this form.
Return of the forms tended to be low (less than 10% from most restaurants) butgiven the very large numbers of customers involved, the firm’s customer servicesdepartment found that it was overwhelmed with forms, with 12,532 useableresponses coming in during the first month. A raw tabulation of the formsshowed the following pattern.
):<< ): |: (: (:>>
Promptness of service from staff
Quality of food
Cleanliness of restaurant
Value for money
Facilities for children
Range of choice on menu
Convenient location
Thank you for your help. We look forward to seeing you again soon at Mr Hungry’s!
These figures caused some consternation; on the face of it, it seemed that onmost measures the restaurants were not doing well. The trend was for customersto be very dissatisfied or dissatisfied with each element of the restaurant, withonly the convenience of location coming out well.
EOM_C10.qxd 6/23/05 10:44 AM Page 319

.
320 Chapter 10 • Quantitative data analysis
Another problem was that the forms could not be segmented; the analystswere unable to tell which sub-category of the firm’s target customers had filled ineach form. Since the restaurants remained busy, and indeed business seemed tobe increasing rather than decreasing, senior management felt that the researchmust be flawed in some ways. After all, the customers were perfectly capable ofvoting with their feet by going to any one of half a dozen other hamburger outlets;if the restaurants were obviously all right, and the research said the restaurantswere all wrong, then the research had to be at fault. The directors of Mr Hungry’stold the researchers to look again at the research design and report back.
(Case contributed by Jim Blythe)
Questions1 Plot the figures in the form on a graph, using a separate plot for each attribute.
What can you deduce from the shape of the lines?
2 How might the respondents be divided so that the researchers could determinewhether responses regarding one attribute of the restaurants relate to responsesregarding another attribute?
3 Which of the attributes show significant correlations with each other? What mightbe the reasons for these correlations?
4 What are the sources of bias in data of these types?
5 How might the firm improve the form in order to obtain better quality data?
6 How might you check whether the variation shown in the data is statisticallysignificant?
REFERENCES AND NOTES
1 Kress, G (1988) Marketing Research (3rd edn), Upper Saddle River, NJ: Prentice-Hall,260–61.
2 McKenzie, J, Schaefer, R L and Farber, E (1995) The Student Edition of Minitab forWindows, Reading, MA: Addison-Wesley, Chapter 9.
3 Hair, J F, Anderson, R E, Tatham, R L and Black, W C (1992) Multivariate Data Analysis,New York: Macmillan.
4 Green, P E, Tull, D S and Albaum, G (1988) Research for Marketing Decisions, UpperSaddle River, NJ: Prentice-Hall.
5 S-Plus for Windows, Statistical Sciences, Inc., 1700 Westlake Av N Suite 500, Seattle, WA98109.
6 Winters, P (1996) Of mergers, managers, money, mailsters . . . and patients too, Research Plus, April.
7 Multiscale II, Ramsay, J O, Psychology Department, McGill University.
EOM_C10.qxd 6/23/05 10:44 AM Page 320

.
Further reading 321
FURTHER READING
Burdick, R K (1983) Statement of hypothesis in the analysis of variance, Journal ofMarketing Research, August, 320–24.
Cattin, P and Wittink, D (1982) Commercial use of conjoint analysis: a survey, Journal ofMarketing, 46, 44–53.
Chakrapani, C (2004) Statistics in Market Research, London: Arnold.Curwin, J and Slater, R (1991) Quantitative Methods for Business Decisions (3rd edn),
London: Chapman & Hall.Deal, K (1997) Determining success factors for financial products: a comparative analysis
of CART, logit and factor/discrimant analysis, Service Industries Journal, 17(3), July, 489–506.Dolan, C V (1994) Factor analysis of variables with 2, 3, 5 and 7 response categories: a
comparison of categorical variable estimaters using simulated data, British Journal ofMathematical and Statistical Pyschology, 47, 309–26.
Everitt, B S, Landau, S and Leese, M (2000) Cluster Analysis (4th edn), London: Arnold.Freeman, P (1991) Using computers to extend analysis and reduce data, Journal of the
Market Research Society, 33(2), 127–36.Hair, J, Anderson, R, Tatham, R and Black, W (1995) Multivariate Data Analysis with
Readings (4th edn), New York: Macmillan.Huberty, C J (1994) Applied Discriminant Analysis, New York: Wiley Interscience.Huff, D (1991) How to Lie with Statistics, Harmondsworth: Penguin.Kaciak, E and Louviere, J (1990) Multiple correspondence analysis of multiple choice
experiment data, Journal of Marketing Research, 27, 455–65.Lenell, W and Bissoneau, R (1996) Using causal comparative and correlational designs
in conducting market research, Journal of Professional Services Marketing, 13(2), 59–69.Myers, J H (1996) Segmentation and Positioning for Strategic Marketing Decisions, Chicago:
AMA.Rogers, K (1996) Correspondence analysis: the big picture, Quirk’s Marketing Research
Review, Article 2, April.Sawyer, A and Peter, J P (1983) The significance of statistical significance tests in marketing
research, Journal of Marketing Research, May, 20, 125.Serious Data Analysis Software (1989), Chicago, IL: SPSS.Strutton, D and Pelton, L (1994) A multiple correspondence analysis of telephone contact
rates, Mid-Atlantic Journal of Business, 30(1), 27–39.Zeisel, H (1985) Say it with Figures, New York: Harper & Row.
EOM_C10.qxd 6/23/05 10:44 AM Page 321

.
Objectives
After reading this chapter, you should be able to:
• understand the general overall approach to qualitative analysis
• appreciate the types of computer program that may be used to help in theprocess of categorisation and other aspects of qualitative research
• understand how to improve data display
• convey meaning in the analysis through the use of matrices, networks anddiagrams.
Keywords
categories KWICcausal models matricescognitive maps networksconcordance taxonomyindex text segmentskeyword in context transcribing data
Qualitative data analysis11
EOM_C11.qxd 6/23/05 10:52 AM Page 322

.
Qualitative data analysis 323
Plan of Chapter 11
EOM_C11.qxd 6/23/05 10:52 AM Page 323

.
324 Chapter 11 • Qualitative data analysis
INTRODUCTION
In this chapter we look at how qualitative data might be analysed. Traditionally,the approach has been to transcribe notes or recordings of meetings and to makean analysis based on visual inspection of the data, quoting what people have saidas evidence to support a point of view. The approach has appeared to lack therigour of quantitative analysis. Recently, however, more analytical methods havebeen introduced and brought to bear on this form of research and an introductionto these methods is presented here.
The chapter first considers the general overall approach to qualitative analysis,a key aspect of which involves transcribing data, either what has been said orotherwise recorded, and then undertaking a detailed analysis of the transcribedwritten text. This involves searching for keywords and phrases and categorisingsections of text. Methods for doing this are reported in the chapter, together withtypes of computer program that may be used to help. In quantitative research,tables and graphs are used to display data and convey meaning in the analysis. In qualitative analysis the same effect may be achieved with matrices and networks. The chapter provides some examples of these tools. In the case of net-works, attention is also specifically given to the construction of causal diagramswhich can do much to help the interpretation of findings.
QUALITATIVE ANALYSIS
Qualitative analysis is a term for the analysis of data that are not numeric. Theconcept, however, means different things to researchers, depending on the type ofapproach they take. Not only the nature of the data varies (responses to open-ended questions, narrative field notes, interview transcripts, personal diaries,public documents, etc.) but even if two researchers were to analyse the same text,their strategies and outcomes are likely to be quite different, each justified in thelight of their epistemological and research frameworks. It is necessary, therefore,to take into account the variations in the processes that researchers employ whenthey set about analysing qualitative data. Moreover, qualitative research tends tolay considerable emphasis on situational and often structural contexts, in contrastto quantitative research, which is often multivariate but weak on context.Qualitative research tends to be weak on cross-comparisons.1
Despite many practical variations, the stages in qualitative research follow thelines indicated in Figure 11.1. This may include initial background reading ofrelated documents and formal or informal discussions, followed by focus groupor depth interviews, or even open-ended survey questionnaires. Taken together,this constitutes the data-collection stage. The next step involves the subject matterof this chapter: an analysis of transcripts from interviews, discussions and othersources. In the analysis, the data have first to be reduced into a manageable formand from the more manageable form abstractions from the data, usually referred
EOM_C11.qxd 6/23/05 10:52 AM Page 324

.
Operational aspects of qualitative research
to as events, are then categorised. This can then lead to the synthesis of ideas andtestable propositions.
OPERATIONAL ASPECTS OF QUALITATIVE RESEARCH
First, we consider the major operations required in qualitative research. The fol-lowing list is not exhaustive and there may be other operations.
325
FIGURE 11.1 Stages of qualitative research
EOM_C11.qxd 6/23/05 10:52 AM Page 325

.
326 Chapter 11 • Qualitative data analysis
Locating individual words and phrases
Suppose we want to locate individual words and phrases for the purpose ofcross-tabulation. For example, we might want to establish whether men are morelikely to say they use a product for a particular purpose more than women do. Inorder to establish this, a survey is conducted. If in the first instance we do nothave any ideas of the responses people are going to make, the question will havebeen phrased as an open-ended one. However, after the survey results are madeavailable, it might be quite apparent from cursory inspection that many of theresponses do in fact contain a common idea or phrase. It is necessary therefore to code the answers that have been given so that they can be cross-tabulated with other data that have been gathered, such as gender, age, incomes, etc. ofrespondents.
Where the researcher simply wants to search for words and phrases, word-processing packages or databases may be all that is needed.
Creating alphabetic wordlists, counting frequency of word occurrence
This may be used in connection with responses to open-ended questions, toobtain frequency counts. However, it may be much more useful in the context ofanalysing focus group interview data or even depth interviews. In order to obtainan initial idea about where the emphasis of discussions has been, it is often usefulto compare the frequencies of the occurrence of words and phrases used in dis-cussion and to examine the context in which they have been used.
Several computer programs can help in this particular task, for example,Longman Concordance. Such programs produce an alphabetic list with frequencycounts.
Creating indices (attaching source information to eachoccurrence) and keyword in context concordance
Where it is important to compare what has been said in one context with whathas been said in another context, we could merely compare the frequency of theoccurrence of relevant words (content analysis). However, some researchers mayprefer to look at a list of locations of each word or phrase. Such a list would besimilar to an index in the back of a book, but it would provide information onseveral levels: document name, chapter number, page and perhaps even para-graph number. In this way, not only can the words be compared across texts, buttheir locations can be found and the context can be taken into consideration.Techniques that are helpful here involve the researcher creating what is com-monly called a keyword in context (KWIC) concordance. The word is listed andeach occurrence is surrounded by a specific range of content.
EOM_C11.qxd 6/23/05 10:52 AM Page 326

.
Operational aspects of qualitative research
Constructing keyword in context is the sole purpose of the KWIC text index. Itis a simple, cheap program that makes a list of words in a file or any chunk of itand sorts it alphabetically with reference information. The function is also per-formed by the Longman Concordance program, an illustration of which is givenin Figure 11.2. The keyword that was searched in this case was ‘aluminium foil’and a proportion of the 127 abstractions is shown.
Attaching keywords to text segments
In speech or written text, an idea may be verbalised in many ways, without everusing the keyword that precisely defines it (such as talking about our various car-servicing experiences without ever using the word ‘garage’, or ‘dealer’ or thephrase ‘car-servicing experience’). If the researcher wants to examine a text fortopics it is necessary to break the text down into segments that represent topicunits and attach to each the appropriate keyword. All the segments that deal withthe same topic can then be brought together or assembled by a keyword andinterpreted. This again is something that can well be applied in analysing thetranscriptions of focus group discussions.
This kind of data manipulation is only possible if the data do not consist ofcontinuous text, but are structured chunks of information that are put into fields:
327
FIGURE 11.2 Output of Longman Concordance program, searching on ‘aluminium foil’
EOM_C11.qxd 6/23/05 10:52 AM Page 327

.
328 Chapter 11 • Qualitative data analysis
then one or more keywords are attached that in some way signify the content ofany particular field. A search can then be done using the keyword and all fieldsthat have the appropriate content are reproduced. All database systems providethis facility.
Attaching codes (categorisation symbols) to text segments
The difference between keywords and codes is that keywords are one-word sum-maries of the content of a text segment, while codes are abbreviations of categorynames. Categories may be thought of as the conceptual equivalent of file folders,each labelled with the name of one aspect of the research project or one topicfound in the data. This serves to organise data pieces. These categories mayemerge during the analysis, or they may be developed beforehand, or partiallyboth. Keywords are complete normal English words, and there can be as many inthe study as there are different topics contained in the text. Codes are abbrevi-ations or other made-up fragments.
QUALPRO2 is the most basic of the qualitative analysis programs. It invites theuser to segment and code, then performs searches for the indicated segments andassembles them. An added refinement of the ETHNOGRAPH is that it allows theresearcher to search for co-occurring codes and prints out the segments that werecoded with both. The ETHNOGRAPH also permits selective searches. In this casethe program does not, as usual, search for a particular code or code combinationthrough all data files, but will automatically select only those that satisfy a certaincondition.
Connecting codes (categories)
Many researchers want to go beyond mere classification and explore whether ornot the subject under analysis possesses a discernible structure, or whether or notlinkages exist between or among particular categories. The purpose is to developpropositional statements or to relate concepts in order to discover the underlyingprinciples – often referred to as the generation of hypotheses. Analysing focusgroup discussion data in this way can produce questions or hypotheses thatmight then be answered or tested by large-scale survey work and quantitativeanalysis.
None of these programs really facilitates ‘theory building’. The procedure thattheory-building qualitative analysis programs employ is somewhat different tothose mentioned previously. Although a code is attached to a particular segmentof text, the code ‘characterises’ the file in which it is present. Codes are thereforethought of as more like ‘values’ of a variable. For example, if the category or concept is ‘relationship with peers’ the corresponding codes could be ‘com-petitive’, ‘cooperative’, etc. Any given file will have one of these embedded, perhaps attached to several segments, all of which represent evidence of the
EOM_C11.qxd 6/23/05 10:52 AM Page 328

.
Operational aspects of qualitative research
‘competitiveness’ in the peer relationship, for example. It could also be thatamong the remaining categories there is one that is concerned with work beha-viour. The programs might be used to find that files characterised by competitiverelationships with peers are more often than not also characterised by aggressivework behaviour. This might then form the basis of a more formal hypothesis.QSR NUD*IST3 is a program that facilitates this form of analysis (Figure 11.3).The latest versions of the product are N6 and Nvivo.
NUD*IST stands for non-numerical unstructured data indexing searching andtheorising. It is a computer package designed to help users handle non-numericaland unstructured data in qualitative analysis. NUD*IST does this by supportingthe processes of indexing, searching and theorising.
NUD*IST handles data such as:
• text – for example, reports or minutes, transcripts of unstructured conversa-tional interviews, evidence transcripts, literary documents, personnel records,fieldnotes, newspaper clippings and abstracts
• non-textual records – for example, photographs, tape recordings, films, maps,plans.
Catterall and Maclaren,4 in an article examining the use of computers in research,suggest that programs such as NUD*IST take out some of the tedium of exploring
329
FIGURE 11.3 QSR NUD*IST program
Source: QSR NUD*IST3 (NUD*IST is developed by QSR International Pty Ltd)
EOM_C11.qxd 6/23/05 10:52 AM Page 329

.
330 Chapter 11 • Qualitative data analysis
qualitative data and therefore help the researcher in this task. However, they alsopoint out that it is important that the program chosen is appropriate to the task inhand and that it remains a tool to assist the researcher and does not become thedriving force of the research. They point out that programs such as NUD*IST aresophisticated tools for the researcher, but the intellectual task of conceptualisingdata remains the researcher’s and will reflect their competence and the quality ofthe data they have collected.
The same authors point out that such programs encourage the researcher tobuild detailed and complex coding structures that can be an advantage whenexploring complex phenomena. However, they warn that the researcher can get‘bogged down’ in its complexities. They warn that such procedure can decontex-tualise data and make procedure mechanistic. They suggest that there is alwaysan advantage in returning to the original data to gain further insights.
The computer program QSR NUD*IST allows the researcher to build up a com-plex categorisation system to classify the data under analysis. The documentsystem numbers each line of text for you and brings up the text as a window thatallows you to explore it and read each interview thoroughly. Using the indexingsystem, which allows you to tag and code lines of text with an appropriate termand then store this code in an index tree, you can go through each text indexinglines and assigning line numbers to categories that are created as you go along.These categories are changeable and can be revised over time. As new insights aregained, so you are able to create new codes as the data are explored and a betterfeel for them is experienced. Another advantage is that it is possible to code onepiece of text with several codes. Examples of different categories can oftenbe more than one line long, which means that small sections of text can beassigned a number of different codes if they illustrate several different categories.Thus, NUD*IST allows you to multiple code sections of text and, at the sametime, to store each code separately in its own category.
USING COMPUTER SOFTWARE IN QUALITATIVE STUDIES
• Making notes in the field.
• Writing up or transcribing fieldnotes or interview proceedings.
• Editing: correcting, extending or revising fieldnotes.
• Coding: attaching a keyword or tags to segments of text to permit later retrieval.
• Storage: keeping text in an organised database.
• Search and retrieval: locating relevant segments of text and making them avail-able for inspection.
• Data ‘linking’: connecting relevant data segments with each other, forming cate-gories, clusters or networks of information.
EOM_C11.qxd 6/23/05 10:52 AM Page 330

.
Data displays 331
• Memoing: writing reflective commentaries on some aspect of the data, as abasis for deeper analysis.
• Content analysis: counting frequencies, sequences of locations of words andphrases.
• Data display: placing selected or reduced data in condensed, organised format,such as a matrix or network for inspection.
• Conclusion drawing and verification: helping the analyst to interpret displayeddata and to test or confirm findings.
• Theory building: developing systematic, conceptually coherent explanations offindings; testing hypotheses.
• Graphic mapping: creating diagrams that depict findings or theories.
• Preparing interim and final reports.
Once the first version of categories is completed, you can go back over all thecategories, making reports of them using the indexing system in NUD*IST andrevising your initial findings. You can then explore the categories created, to tryto gain a better understanding of the phenomena they represent and also to workat better conceptual labels to describe them. This can be accomplished by meansof the index system in NUD*IST and a separate report of each category can beproduced. The reports can contain all the examples of the categories you havetagged in each transcript and, by exploring these reports, you can refine yourthinking about the category and shift, add and delete coding as you feel appro-priate. This may be important in places where you have coded things wrongly orwhere a new category has subsequently been created that better describes anexample that had previously been assigned to another category. You can alsomove the position of the categories within the tree structure to represent whatfeels more appropriate. As a result, the tree may be simplified as the individualcategories become more distinctive.
DATA DISPLAYS
In the context of qualitative analysis, a display is a visual format that presentsinformation systematically so that the user can draw valid conclusions and takethe required action. In the case of qualitative research the typical mode of displayhas been extended, unreduced text that the analyst scans through, attachingcodes and then extracting code segments and drawing conclusions. The analystthen writes a second form of extended text: a case study report.
Unreduced text by itself is a weak, cumbersome form of display. It makesanalysis difficult because data are dispersed over many pages and they are not
EOM_C11.qxd 6/23/05 10:52 AM Page 331

.
332 Chapter 11 • Qualitative data analysis
easy to see as a whole. They are sequential rather than simultaneous, making itdifficult to look at two or three variables at once. They are also poorly orderedand can become bulky and monotonously overloading. Making careful compar-isons between several extended texts can also be difficult.
Valid analysis requires displays that are focused enough to allow a viewing ofa full dataset in the same location and are arranged systematically to answer theresearch questions at hand. In this sense a full dataset means the condensed, dis-tilled data drawn from a full range of people, events and processes that have beensystematically studied. The chances of drawing and verifying valid conclusionsare much greater than for extended text: the display is arranged coherently topermit careful comparisons to detect differences in patterns and themes and tospot the trends.
Generating formats to display qualitative data is relatively easy. Formats canbe as various as the imagination of the analyst permits. They fall into two majortypes: matrices, with defined rows and columns, and networks, with a series ofnodes with links between them. The data entries can take on different forms: a short block of text, quotes, phrases, ratings, abbreviations, symbolic figures,labelled lines and so on. The display format and the nature and shape of theentries will depend on what the researcher is trying to understand.
MATRICES
A matrix is effectively the crossing of two lists, set up as rows and columns. Avariety of different formats may be of interest to qualitative researchers. The following are illustrative of the kinds of approach that can be taken.
Time-ordered event matrix
Time periods may be defined conceptually and adjusted according to actual hap-penings. The events may be sorted according to where the event took place or insome other way (Table 11.1).
The display is helpful for understanding the flow, location and connection ofevents. It can also be easily compared with similar matrices in other studies. Withan analysis and commentary attached, it can also provide a good outline of theprocess of change that may have taken place.
Conceptually clustered matrix
Many studies are designed to answer a string of research questions – and thestring often becomes very lengthy. As a consequence, the performance of a separ-ate analysis and case report section for each research question is likely to lead to
EOM_C11.qxd 6/23/05 10:52 AM Page 332

.
Matrices
confusion for both the analyst and the reader. The solution is to cluster severalresearch questions so that the meaning can be more easily generated.
A conceptually clustered matrix has its rows and columns arranged so as tobring together items that belong to one another. For example, we may be inter-ested to know whether a relationship exists between people’s motives and theirattitudes towards purchasing a product. The best way to find out is to cluster theresponses to these questions. A format is needed that displays all the relevantresponses of all the key informants on one sheet, permits an initial comparisonbetween responses and between informants, lets us see how the data can beanalysed further, for multicase studies, lends itself readily to cross-case analysisand will not have to be redone and, for multicase studies, provides some prelim-inary standardisation. Such a display is shown in Table 11.2.
333
Place Time period
Morning Afternoon Evening
Work Setting up computer program to analyse results
Home Analysis of Checking all final survey results documentation and
overheads
TABLE 11.1 Time-ordered event matrix
Informants Motives Attitude to purchasing/stocking brand
ConsumersC1 Price Very positiveC2 Price Fairly positiveC3 Availability Neutral
RetailersR1 Price margin NeutralR2 Consumer advertising NeutralR3 Price margin Fairly positive
TABLE 11.2 Research questions
EOM_C11.qxd 6/23/05 10:52 AM Page 333

.
334 Chapter 11 • Qualitative data analysis
The display matrix possesses on one sheet a format that includes all respon-dents and all responses to the two research questions. It should be noted thatcomparisons have been set up between different kinds of informants (customersand retailers). Some preliminary scaling or sorting of responses may be required:types of motive or valence of attitude.
NETWORKS
A network is a collection of nodes or points connected by lines. They can be veryuseful when it is necessary to focus on more than a few variables at a time. Someexamples of the use of networks of different kinds are shown here.
Tree taxonomy
To avoid the implication that concepts are always properly sorted into rows andcolumns, the tree diagram in Figure 11.4 illustrates how they can also be dis-played in a network form. This taxonomy shows how a respondent might classifymotorcars when they are asked the question: ‘What kinds of car are there?’ As therespondent continues in the interview, they might next be asked: ‘What kinds ofcar do you call luxury sport?’ or ‘What kinds of car do you call cross-country?’and so on.
Componential analysis may be used as a way to help clarify categories, mak-ing it clear why a particular label is assigned to a particular object. We ask for
FIGURE 11.4 Taxonomy of cars
EOM_C11.qxd 6/23/05 10:52 AM Page 334

.
Networks
distinctive features of the sort of objects being taxonomised and aim to find thesmallest group of features that discriminates them clearly, as shown in Table 11.3.
Cognitive maps
It is useful to have displays that show us the complexities of the person. People’sminds are not always organised hierarchically, as we just saw in the taxonomies.They can be well represented in non-hierarchical network form: a collection ofnodes attached by links. Cognitive maps display the person’s representations ofconcepts about a particular domain, showing the relationships among them.
For example, the cognitive map in Figure 11.5 shows that the respondentthinks a wristwatch needs to be fashionable and how this need to be fashionableis reflected in such things as a good-quality leather strap, having sports featuresand having a case made from gold or stainless steel.
Building causal models
When we are analysing data we might observe that there are associationsbetween elements in the data. The interest is usually to see whether the associ-ations can be integrated into a meaningful explanatory model. To do this it is necessary to apply some heuristics.
The first heuristic involves ordering the model temporally. The questions to beanswered then become:
• Which variables or events of those found relevant occur first in time?
• Which occur along the way during implementation?
• Which might be seen as early and late outcomes?
335
Expensive Practical High performance
Lamborghini + +Ferrari + +Jaguar + +Ford +Vauxhall +Land Rover +MG sports +Mazda sports +
QSR NUD*IST is good at helping to generate taxonomies.
TABLE 11.3 Smallest group of discriminating features
EOM_C11.qxd 6/23/05 10:52 AM Page 335

.
336 Chapter 11 • Qualitative data analysis
The second heuristic involves considering which variables might reasonablybe expected to have a direct impact on other variables, both preceding them intime and having a plausible direct connection. This rule means that we need tothink of the mechanisms that could be involved.
The third rule is to check case informants’ explanations. What causal linkagesdo they claim are present? We need to examine our transcripts and fieldnotesvery carefully.
FIGURE 11.5 Requirements of a wristwatch
EOM_C11.qxd 6/23/05 10:52 AM Page 336

.
Networks 337
The fourth rule is to consider what available research and theories have to sayabout causal connections.
Using these rules, we have to play with the data for a while. It can help if weput variables or events on cards and move them around into various configura-tions, looking at the connections that seem sensible. Graphics packages such asInspiration5 can also be helpful. Another special program that can help developcausal models is COPE (cognitive policy evaluation).6 While primarily designedto produce cognitive maps, it enables us to map in two dimensions explanationsand consequences of events through a graphic user interface. Since it also has thefacility to trace paths throughout the complex network structures that can be con-structed, it can also help to establish cause–effect relationships and hence buildcausal models.
EXAMPLE
Marketing researchers undertaking focus group discussions with groups ofpatients suffering from a specific disease might discover that in severe cases ofloss of appetite, patients are treated in different ways by the GP, depending onwhether or not the GP feels they can treat the particular symptom. Where the GPfeels confident, a proprietary brand of medicine is prescribed as treatment. Wherethe GP is unsure, referral is made to the consultant at the hospital, who prescribesa non-proprietary brand. The whole process is captured in Figure 11.6.
FIGURE 11.6 Causal diagram
EOM_C11.qxd 6/23/05 10:52 AM Page 337

.
338 Chapter 11 • Qualitative data analysis
SUMMARY
In this chapter, we have examined the general overall approach to qualitativeanalysis, a key aspect of which involves transcribing what has been said or other-wise recorded and then undertaking a detailed analysis of the transcribed text.This involves searching for keywords and phrases and categorising sections oftext. Methods for doing this have been reported in the chapter, together withtypes of computer program that may be used to help in this process. In quantita-tive research, tables and graphs are used to display data and convey meaning inthe analysis. In qualitative analysis the same effect may be achieved with the useof matrices and networks. The chapter has given some examples of these tools. Inthe case of networks, attention has also specifically been given to the constructionof causal diagrams that can do much to help in the interpretation of findings.
QUESTIONS
1 What do you understand by qualitative analysis? How is it different fromquantitative analysis?
2 What are the steps involved in the general process of qualitative research?
3 Indicate some of the operational aspects of qualitative research. What purpose do they serve?
4 Discuss the role that computer programs can play in qualitative research. How can they specifically help with some of the operational aspects?
5 What are data displays?
6 What are the two kinds of data display that can be used in qualitativeresearch? How do they compare with data displays that can be used inquantitative research?
7 To what purposes might cognitive maps be put in qualitative research?
8 What are causal diagrams? What use are they in the context of qualitativeresearch?
CASE STUDY 11.1: CYCLIST SURVEY
A survey was conducted to ascertain cyclists’ views on provisions for them in the town. Cyclists were asked what beneficial improvements were needed. Theresponses to the survey, together with the sex and age of the respondents, can beseen in Table 11.4.
EOM_C11.qxd 6/23/05 10:52 AM Page 338

.
Case study 11.1 339
Sex Age Comments
Male 25–34 Improve visibility at A52 junction with Wellington Road
Female 17–24 More space by the library
Male 17–24 More cycle lanes
Male 25–34 More cycle lanes
Male 17–24 More cycle lanes. No motor vehicles on roads in the city centre atcertain times
Male 25–34 Why do cycles have to give way to cars on the A52 roundabout when,with no cycle lane, they would have priority!?
Female 25–34 More cycle lanes, particularly in the one-way streets
Male 25–34 Enforcement of town/village traffic speed restrictions
Female 25–34 Very good cycle parking in main streets
Female 17–24 More safe areas for locking bikes – maybe more cycle signs
Male 35–44 More cycle parking racks
Female 25–34 Cycle lanes in and around town and more of them
Male 25–34 Introduce more cycle lanes alongside busy roads and majorroundabouts
Male 35–44 More cycle lanes to surrounding towns/villages
Female 35–44 Punishment for those motorists who think the cycle lanes are anextension to the car parks
Female 17–24 Education for drivers. Roads/paths for cycles
Female 25–34 More cycle lanes especially in one-way areas. Control parkingoutside shops
Female 17–24 More cycle paths
Male 17–24 It would help cyclists if the council were to resurface some of theroads
Female 35–44 More cycle lanes
Male 35–44 Road safety by creating cycle route and traffic lights for cyclists
Female 25–34 Cycle paths for as many streets as possible, in as wide an area aspossible
Female 25–34 Cycle priority lanes in main areas and roundabouts
Male 17–24 Better edges to roads, as they are too rough and bumpy
Female 25–34 Resurfacing the whole length of the canal lane
Female 35–44 Increase cycle lanes especially around roundabouts where there aretwo queues of traffic and little or no room for cyclists. I would like tosee improved cycle security facilities at the railway station
Male 25–34 Pay and return lock-up facilitiesFemale 17–24 Cycle bars (sketch here) or thin streetposts (for parking hours etc.)
where I can lock my front wheel and frame to the post, neither ofwhich is common in town. Maintain the edges of roads better andavoid putting drains and other obstructions too far out in the road
Male 35–44 More public awareness of bikers’ needs
TABLE 11.4 Cyclist survey: results
s
EOM_C11.qxd 6/23/05 10:52 AM Page 339

.
340 Chapter 11 • Qualitative data analysis
Sex Age Comments
Male 35–44 More cycle lanesFemale 17–24 In city centre with more facilities to lock a cycle to a fixed object.
The speed ramps in Sheldon Road and Park Avenue are extremelyuncomfortable for cyclists
Male 25–34 Something more safe round the one-way systemMale 35–44 Try and make car drivers more aware of us cyclistsFemale 35–44 Cycle lanesMale 17–24 More cycle lanesMale 17–24 Cycle lanes are excellent; could these routes be extended?Female 17–24 Proper cycle racks outside Army & Navy so that you can lock your
bike to something solid. On the A529 we need the cycle path litbecause at night the place is a deathtrap. If you fell off your bike andbroke a leg no one would find you till morning
Female 17–24 More cycle lanes at major roundabouts. College Lane desperatelyneeds a cycle lane and road surface improvements
Male 17–24 Perhaps more parking facilities in town centreMale 35–44 One-way systems and cycle lanes are unsafe. To cycle in and out of
work on the centre of the one-way system is not helped by the cyclelane. Junctions are also dangerous for cyclists
Female 35–44 More cycle pathwaysFemale 25–34 Add a cycle lane to all main roads and sort out the junction at
Southern Road/Westwood AvenueFemale 17–24 Better facilities for leaving bikesMale 25–34 Pedestrian and cycle crossing or bridge over A52 roundaboutFemale 35–44 East Street or North Street cycle rack requiredMale 35–44 A52 roundabout: design encourages motorists to not signal on
leaving roundabout, into North Street/Dale Road and LavernumRoad
Female 35–44 Worst place to leave cycles is at railway station. More cycle lanesFemale 17–24 At the moment it is only a matter of time before there is a fatal
accidentFemale 35–44 Making sure that vehicles don’t keep parking in the cycle lanesFemale 17–24 Cycle-parking facilities that are under coverMale 35–44 Proper cycle lanes. Get rid of the current system at the Fire Brigade
roundabout. Cyclists on the roundabout should be given priority overcars leaving the road, as at any other junction
Female 17–24 More cycle lanes. Promoting more cycle safetyFemale 25–34 Somehow, improved safety at roundaboutsMale 25–34 I don’t think cycling is a problem in the town. London is differentMale 35–44 Cycle lanes on all main roads. Cycle priority on all roads in city
especially A52 roundabout
TABLE 11.4 Cyclist survey: results (continued)
EOM_C11.qxd 6/23/05 10:52 AM Page 340

.
Case study 11.1 341
Sex Age Comments
Female 25–34 More bike racks and cycle lanes and, to ease congestion and traffic,develop park and ride schemes for motorists
Female 17–24 More cycle lanes, increase other road users’ awareness that bikeshave a right to be on the road too
Female 17–24 More cycle lanes please
Male 35–44 New traffic calming humps should have had level gaps in them sothat cyclists could ride through them and not up and over
Male 25–34 More secure facilities at station and other places. Better cycleways,particularly in the dangerous one-way systems. Also traffic lightsneeded at the junction of Redmayne Drive and Haughton Street
Female 25–34 More cycle lanes
Male 35–44 I think there could be more cycle parks in the four main streets ofthe town
Female 17–24 Make more cycle paths, as we have in Germany
Female 25–34 Cycle lanes on all major roundabouts and one-way systems
Male 35–44 Cycle lanes beside main roads and greater number of road signs.‘Think Bike’
Male 25–34 More cycle racks
Male 35–44 Improve canal towpath cycling. Generally providing better crossingof inner ring road
Male 25–34 More cycle lanes
Female 17–24 In parking facilities, something needed to actually chain bike to
Female 35–44 More cycle lanes and the holes in the roads filled in more often
Male 25–34 Council is lazy and needs to sort town out before it falls apart
Female 17–24 You need cycling lines. Cars do not give enough consideration tocyclists
Male 17–24 More cycle paths in town
Female 25–34 More cycle paths through town
Female 35–44 Cycling around roundabouts needs improvement
Female 17–24 Many more cycle lanes needed for safety
Female 35–44 Various parts of the roadside have potholes or cracks that makecycling both uncomfortable and unsafe
Female 17–24 Supervised parking (preferably sheltered) area near train station
Female 25–34 Make car drivers more aware of cyclists
Female 35–44 Add kerbs to outer cycle lane to prevent drivers encroaching intocycle lanes
Male 17–24 Make car drivers more aware of cyclists on the road
Female 17–24 Everything OK
Female 25–34 More cycle parking facilities in town
Male 25–34 Very pleased with cycle route. More of the same would be welcomeas, although I have never had an accident, the near misses arecountless! s
EOM_C11.qxd 6/23/05 10:52 AM Page 341

.
342 Chapter 11 • Qualitative data analysis
Sex Age Comments
Male 35–44 Prohibition of motor vehicles in and within the town centre
Male 35–44 More cycle lanes especially across the bypass
Male 35–44 More cycle lanes to ring the city and filter lanes for left turns.Additional signs to make motorists aware of cyclists
Female 35–44 A much safer system at A52 roundabout. More cycle lanes on busyroads, which don’t suddenly peter out
Female 35–44 Lights or bridge over A52 at roundabout. Cycle lanes on all roads
Female 25–34 Additional cycle space throughout town centre. More cycle routes toand from town areas
Male 17–24 Better cycle lanes and more cycle lanes
Male 17–24 More cycle paths, especially by the main roundabouts
Female 25–34 At the roundabout A52 – experience problems with vehicles as theyfail to indicate when turning off or too close to kerb – roundaboutmaking it very dangerous! Trouble with trucks/lorries andpedestrians in town centre
Female 17–24 Cycle lanes are hopeless on roundabouts as no vehicles indicatewhere they are going
Female 17–24 A lot more spaces in other parts of town
Male 35–44 Allow cyclists to ride through the pedestrianised parts of town
Male 25–34 Do something about A52 roundabout
Male 35–44 I know it’s impossible, but all car drivers should be made to cycleregularly and vice versa
Male 25–34 It would be really useful to be able to cycle though town
Female 25–34 Town centre is particularly poorly served for cycle parking. In otherplaces an increase in spaces would be advantageous to combatovercrowding
Female 25–34 Improvement in road surfaces, especially near the edge ofcarriageway. Improve vehicle driver awareness to cycles
Male 17–24 More cycle lanesMale 35–44 I have had four near misses from cars pulling across cycle lane
on A52Male 25–34 Perhaps consider a network of cycle lanes or tracks linking up
surrounding villages with town centreFemale 35–44 Improve the edges of the roadsMale 17–24 Provide courses for people to know how to ride safely – as most do
not knowMale 35–44 Give cycle priority all the way round the roundabout and do away
with the dangerous cycle laneMale 35–44 Educate car drivers to signal their intentionsFemale 35–44 Right of way for cyclists at A52 ring road. Also more cycle lanes in
other areas
TABLE 11.4 Cyclist survey: results (continued)
EOM_C11.qxd 6/23/05 10:52 AM Page 342

.
Case study 11.2 343
Sex Age Comments
Male 25–34 Perhaps a cycle lane on the one-way system
Male 25–34 Cycle lanes exclusively for cyclists, especially on busy main roads
Male 35–44 More cycle lanes
Female 25–34 Improve cycle tracks around town
Male 35–44 The two most hazardous spots to cycle in are at the metropolitanroundabout where cyclists give way to motorists and take a chanceto cross
Female 35–44 More cycle lanes around fire station
Male 35–44 Maybe there could be a system of padlocking and paying to lock yourbike
Male 35–44 Lockable parking outside library
Female 17–24 Raise driver awareness of cyclists and their problems. More andimproved cycle ways away from traffic
Female 25–34 Extend cycle lanes and improve awareness of motorists – they don’tindicate at roundabouts
Male 35–44 More cycle tracks on country roads especially main roads
Male 17–24 Cycle lanes on one-way system roundabouts
Male 35–44 Cycle lane on all roads around town
Male 35–44 City and district generally desperately need more properly designedcycle lanes
Question
Analyse the responses in the best way you can.
CASE STUDY 11.2: USES OF ALUMINIUM FOIL
Respondents were asked to generate as many ideas as they could for uses of aluminium foil. One of the respondents produced the following list of ideas.
1 Covering roast chicken
2 Wrapping potatoes for baking
3 Covering food for storage in a refrigerator
4 Folding it to make a cup to drink out of
5 Using it as a plate
EOM_C11.qxd 6/23/05 10:52 AM Page 343

.
344 Chapter 11 • Qualitative data analysis
6 Smoothing it out to make a mirror
7 Reflecting sunlight to attract help/send messages
8 Reflecting a heat source for cooking
9 Lining the wall behind a radiator to reflect heat into a room
10 Wrapping up a flower stem for a buttonhole
11 Making Christmas decorations
12 Making milk bottle tops
13 Stringing small pieces together to make a baby’s rattle
14 Making a dish to hold glue
15 Making a dish to hold paint
16 Using under a sleeping bag to stop the cold getting through
17 Wrapping food to cook on a campfire
18 Keeping food fresh without refrigeration
19 Hanging as temporary curtains
20 Sticking on a collage
21 Using to make ‘water’ for the Brownie Guide pool at Brownie camp
22 Making children’s jewellery
23 Wrapping matches to keep them dry
24 Keeping food warm
25 Keeping food cold
26 Screwing it up to make a makeshift ball
27 Making a toy for cats to play with. Foil makes a light but indestructible cat toy
28 Cutting it up into squares to make stepping stones
29 Cutting out fish shapes and having a race to waft them along the hall
30 Cutting a strip to make a bookmark
31 Lining a grill pan to make it easy to clean after use
32 Wrapping up 25th wedding anniversary gifts
33 Wrapping sandwiches for a packed lunch
34 Lining cake-storage tins
Question
Construct a cognitive map showing the respondent’s ideas about the possible uses ofaluminium foil.
EOM_C11.qxd 6/23/05 10:52 AM Page 344

.
Case study 11.3 345
CASE STUDY 11.3: RENAULT CLIO
A researcher was interested to see if there were differences in how males andfemales interpreted or perceived an advertisement in a magazine for men. Theadvertisement featured an image of the Renault Clio being driven by a large cat-like creature. Two group discussions were held – one with a group of young menand the other with a group of young women. Both group discussion sessionswere taped and the researcher made the following notes on playing back the tape:
The females see the Renault Clio as a male’s car that seems to be largely as aresult of using the metaphor of the cat. They are being guided that cats are men. . . big cats and speed. The men seem to be divided on it . . . they start by inter-preting it by using pronouns such as ‘I’ and ‘we’ and ‘whatever’ but then theyget guided off this and one of them says that it’s a female’s car and so theychange. They are not sure. The female group has used the word ‘round’ indescribing the car at one point so perhaps this shows they are moving towardsa female interpretation. With the women, however, they think it is a male’s caron balance . . . ‘men are like animals, men are like wild animals’, ‘yes, it isgoing fast’ . . . semantic link to speed. ‘Like a lad’, ‘you see them in films don’tyou, cruising’. They try to fit everything about the car into the narrative thatthe car is for males . . . Things like used for cruising, etc. The researcher askswhether they think it is a female car . . . and they say, ‘well it’s got a prettybackground to it.’ They construct a narrative that this is a male car . . . ‘speed’.When they look at potential customer they decide it is a man. Their narrativegoes off in this direction . . . they are going to be cool and fast . . . they aregoing to be a cheetah . . . it is about power . . . all the links here are masculine . .. and then it is about sex . . . Men say that they are wild in bed and stuff . . .‘like to “grrrrr” and get our paws on it’. They are linking it in a masculine way. . . they are not identifying it with themselves. ‘The car is female (for thewomen group) is it?’ asks the researcher . . . ‘No it’s a male car’ is the answerfrom some females in the group . . . so there is some confusion. The cheetah isseen as a male. Then they say that the car will attract ‘you a female’. It is stylish(i.e. male) because of the way the cheetah is sitting. But the males also pick upon ‘stylish’ too . . . indicating they think it is a male car . . . ‘one hand on thecar’, ‘relaxed, cruising’. Males see a link between ‘cruising’ and ‘getting yourpaws on it’; ‘cool’ and ‘fast’ denote it is a male car.
Males give different interpretations . . . i.e. cheetah is humour, ‘stupid’. Theyalso identify with the cheetah. See themselves in the role. Cheetah has genderdifferences. Remember the advertisement was aimed at men in the magazine.Would it have a different effect if shown in a female magazine? Females didn’tknow it was in a male magazine. The males are more informed than thefemales. City slicker . . . You can go almost anywhere in it. Merging of machin-ery and grass – semantic links with the countryside through the metaphor of the cheetah. Identify with the cheetah. Using their knowledge to read the
EOM_C11.qxd 6/23/05 10:52 AM Page 345

.
346 Chapter 11 • Qualitative data analysis
picture. ‘Hairdresser’s car’ . . . there is diversity of opinion about the car. Theydo identify themselves with the cheetah . . . they see themselves in that role.Cheetah has gender differences . . . The car is seen as a woman by the men . . .shows what he thinks a car should look like. When they are constructing thenarrative they are drawing on cultural knowledge that they have. Interest andknowledge affect how they construct the narrative . . . males and females con-structed the narrative differently . . . Males provide more detail on the car thanthe females.
Questions
1 Analyse the researcher’s notes making use of a cognitive map and data displaytables.
2 What differences do you note in terms of male and femaleinterpretations/perceptions of the advertisement?
REFERENCES AND NOTES
1 Strauss, A S (1993) Qualitative Analysis for Social Scientists, Cambridge: CambridgeUniversity Press, 2.
2 QUALPRO and ETHNOGRAPH, Qualitative Research Management, 73425 HilltopRoad, Desert Hot Springs, CA.
3 QSR NUD*IST, Qualitative Solutions & Research Pty Ltd, Box 171, La Trobe UniversityPost Office, Victoria, Australia 3083.
4 Catterall, M and Maclaren, P (1995) Using a computer to code qualitative data, inProceedings of 1995 Annual Conference of the Marketing Education Group ‘Making MarketingWork’, Bradford University, July.
5 Inspiration, Inspiration Software, Inc., 2920 SW Dolph Court, Suite 3, Portland, Oregon97219.
6 COPE, Advertising leaflet/working demo, Department of Management Science,University of Strathclyde.
FURTHER READING
Bryman, A and Burgess, R G (1994) Reflections on qualitative data analysis, in Bryman, Aand Burgess, R G (eds), Analysing Qualitative Data, London: Routledge, 216–26.
Coffey, A, Holbrook, B and Atkinson, P (1996) Qualitative data analysis:technologies and representations, Sociological Research Online, 2,http://www.socresonline.org.uk/socresonline/1/1/4.html
EOM_C11.qxd 6/23/05 10:52 AM Page 346

.
Further reading 347
Dembhowski, S and Hanmer-Lloyd, S (1995) Computer applications – a new road toqualitative analysis? European Journal of Marketing, 29(11), 50–62.
Denzin, N and Lincoln, Y (1993) Handbook of Qualitative Research, Newbury Park; CA: Sage.Fielding, R and Lee, R (eds) (1991) Using Computers in Qualitative Analysis, Berkeley; CA:
Sage.Griggs, S (1987) Analysing qualitative data, Journal of the Market Research Society, 32,
507–20.Miles, M B and Huberman, A M (1994) Qualitative Data Analysis, London: Sage.Richards, T and Richards, L (1991) The NUD*IST qualitative data analysis system,
Qualitative Sociology, 14.Silverman, D (1993) Interpreting Qualitative Data, London: Sage.Spiggle, S (1994) Analysis and interpretation of qualitative data in consumer research,
Journal of Consumer Research, 21(3), 491–503.Stern, B B (ed.) (1998) Representing Consumers: Voices, views, visions, London: Routledge.Strauss, A S (1993) Qualitative Analysis for Social Scientists, Cambridge: Cambridge
University Press, 2.Weitzman, E and Miles, M (1995) Computer Programs for Qualitative Data Analysis,
Thousand Oaks, CA: Sage.Whipple, Thomas W (1994) Mapping focus group data, Marketing Research, 6(1), 16–21.
EOM_C11.qxd 6/23/05 10:52 AM Page 347

.
Objectives
After reading this chapter, you should be able to:
• understand the importance of the presentation to the success of a research study
• appreciate the preparation of different aspects of the presentation
• understand how to use some of the visual and electronic aids that areavailable to the presenter.
Keywords
executive summary proposalfindings reportoral report report bodyoutline visual aidspresentation
Evaluation, reports and presentation12
EOM_C12.qxd 6/23/05 10:52 AM Page 348

.
Evaluation, reports and presentation 349
Plan of Chapter 12
EOM_C12.qxd 6/23/05 10:52 AM Page 349

.
350 Chapter 12 • Evaluation, reports and presentation
INTRODUCTION
This chapter looks at various ways in which one might evaluate research and spe-cial consideration is given to evaluating research in non-financial terms. Thechapter also emphasises how important the presentation is to the success of aresearch study. It looks at the preparation of the different aspects of the presenta-tion and concludes with a discussion of some of the visual and electronic aidsthat are available to the presenter.
EVALUATION OF RESEARCH
Marketing research needs to be evaluated post-facto in order to ascertain its use-fulness/cost-effectiveness and draw lessons from the experience that may proveuseful when considering further research. In order to do this, the research objec-tives must be clearly specified in measurable or ascertainable terms so that thedegree to which they have been achieved, exceeded or underachieved can beidentified. It may not always be possible to link financial expectations in terms ofexpected savings or increased profits to the financial cost of carrying out research.In measuring advertising effectiveness, for example, the objective may be tomeasure increase in product awareness.
There are several ways of evaluating research in non-financial terms. Lincolnand Guba1 suggest four criteria for evaluating qualitative research – credibility,transferability, dependability and confirmability. Credibility demonstrates that theresearch was carried out in a manner such that the subject of the research was cor-rectly identified and described. It can be improved by persistent observation toobtain a greater depth of understanding, by triangulation, by using differentsources and collection methods of data and by peer debriefing of colleagues on acontinuous basis. This is clearly pertinent to all marketing research studies.Transferability is concerned about whether the findings can be applied to anothersituation that is sufficiently similar to permit generalisation – useful when gener-ating research that may form part of omnibus studies or provide secondary datafor other studies. Dependability should show that the research processes are sys-tematic, rigorous and well documented. This is an essential foundation on whichall marketing research should be based. It permits subsequent users of theresearch to ascertain how well the research was conducted. Confirmability shouldbe used as a criterion where the study has described the research process fullyand it is possible to assess whether the findings flow from the data. Again thisshould be a requirement of a marketing research study. Yet another approach toevaluation involves obtaining respondent validity for the analysis. This involvesdiscussing findings from the analysis with those who have participated in thestudy to obtain their reactions and opinions.
EOM_C12.qxd 6/23/05 10:52 AM Page 350

.
Written report
WRITTEN REPORT
The basic requirement is for a report and presentation that can be believed andtrusted by everyone who will be affected by the research (Figure 12.1). The solu-tion to a particular research problem should produce greater efficiency, lowercosts and more benefits for the organisation. The presenter of the research resultshas to convince the audience that the research findings can be acted on for theirown benefit. A written report needs to be put together so that interest and beliefdevelop throughout its reading and the recommended action appears as a naturaloutcome.
It may be beneficial to delete less important questions in order to emphasisethe basic problem. Constant attention to the basic problem and its recommenda-tions will make the study and its presentation more usable and interesting in theminds of the listeners and/or the readers of the final presentation. Presenters
351
FIGURE 12.1 Characteristics of a good marketing research report
EOM_C12.qxd 6/23/05 10:52 AM Page 351

.
352 Chapter 12 • Evaluation, reports and presentation
have the best chance of success if they have planned their research well and meetthe expectations of their listeners.
A good knowledge and understanding of the audience are essential for goodreporting. The presenter of a report should know in advance who will receivecopies of the written report or who will be at an oral presentation. The reportshould address itself directly to these people and their needs.
Anticipating objections from people with known mindsets may alter how areport is written – or even how the research is done.
Research studies sometimes tend to deviate from the original problem and proposal. It is often the case that interesting information is uncovered which isperipheral to the study. However, the study should be directed towards the solu-tion of the stated problem and, if research has uncovered another problem thatneeds looking at, this should be suggested as the basis of another study.
The written or oral report must address itself precisely to questions such as:
• Do these recommendations still appear sound?
• Will they affect the needs of the company in the way that was first intended?
• Will the whole study now make sense in the light of conditions when the studywas begun?
CONTENTS OF A MARKETING RESEARCH REPORT
Title page
1 Title
2 Client (optional)
3 Research company (optional)
4 Date
Table of contents
1 Section titles and subheadings with page numbers
2 Table of tables: titles and pages
3 Table of figures: titles and pages
4 Appendices: titles and pages
Management or executive summary
1 Statement of objectives
2 Statement of major findings
EOM_C12.qxd 6/23/05 10:52 AM Page 352

.
Written report 353
3 Statement of conclusions and recommendations
4 Other pertinent information such as limitations of the research or backgroundinformation
Introduction
1 Background to the research undertaken
2 People involved in the research, their positions and roles
3 Acknowledgements
Analysis and findings
1 Analytical approach adopted
2 Tables and figures
3 Explanatory text
Conclusions and recommendations
Research methodology
1 Type of study
2 Purpose of study
3 Definition of population of interest
4 Sampling design and method
5 Data-collection method adopted and justification for method
6 Questionnaire or other data-collection instruments – description and explanation
Limitations
1 Sample size
2 Sample selection
3 Error
Appendices
1 Questionnaire
2 Technical
3 Other
EOM_C12.qxd 6/23/05 10:52 AM Page 353

.
354 Chapter 12 • Evaluation, reports and presentation
SECTIONS OF A REPORT
Executive summary
This is placed at the beginning of the report and allows executives to quickly andeasily grasp what has been learned and what is being recommended. Sometimesthe digest is bound separately for executives who will not want to read all thedetails. Experienced presenters often make use of this technique of the separateexecutive summary.
This executive summary will include:
• action implications backed up by key findings
• discussion of findings for interested middle management
• a short appendix with a few details of procedures, a sample of appropriatematerials, a few detailed tabulations, and statistics.
Outline
The outline should be as complete as possible, since it will greatly facilitate thewriting of the final report. All sources of information should be named anddetails that might seem so obvious that they need not be put on paper should beentered.
Findings
Key findings should stand out, perhaps highlighted by a table, a chart or someother visual aid. The key findings may even form the basis of a separate execut-ive report. Key action recommendations largely stem from the key findingsnoted.
Details of the procedures followed should be included. These details shouldinclude such facts about the study as the research instruments used, samplingmethods and the response rate for questionnaires. The procedures should berecorded in enough detail to protect the validity both of the recommenda-tions and of the procedures. This may at some time enable a further study to be made replicating the same procedures so that a comparison can be made with the first study. Once the report has been written up, it can be turned into an oral or a video presentation, or may even become the basis for a small-groupseminar.
EOM_C12.qxd 6/23/05 10:52 AM Page 354

.
Oral research report
Body of the report
The report body might include the following:
• a statement of the problem, perhaps slightly modified to allow for changes ininstructions and changes caused by early findings in the research
• a brief account of how the research was conducted
• a detailed presentation of the findings, but only what is necessary for backingup the recommendations
• a list of the major recommendations
• a statement of the implications of the findings and recommendations forspecific departments of the sponsoring company.
Objectivity in report writing is of paramount importance. It is a good idea tolist the shortcomings of a study since most studies do in fact have them. Style ofwriting is most important. A research report needs to be sharp, clear and vivid.Simple words are usually best and jargon should be avoided.
ORAL RESEARCH REPORT
Only rarely will top executives be interested in the minute details of the recommendations. Later they will want to know almost everything that willaffect their firm if action is to be taken on the recommendations. At this point therecipients of the report will usually want just the highlights of both findings andrecommendations.
Physical facilities
The room must be ready with proper lighting, air-conditioning and a soundsystem that enables everyone to hear. All possibly distracting noises from outsidesources must have been eliminated.
Advance preparation of presentation
The presentation must have been well prepared and all possible interruptionsconsidered. Perhaps several people should participate in the presentation, torelieve the possible boredom of one voice and face.
355
EOM_C12.qxd 6/23/05 10:52 AM Page 355

.
356 Chapter 12 • Evaluation, reports and presentation
Advance announcement of length of presentation
Stating how long the presentation will be is a good strategy.
VISUAL AIDS AND THEIR USE
Use of visual aids such as chalkboards, flipboards and overhead transparenciesshould be made. Too many visuals, however, can become distracting and evenboring. They should be used solely to clarify or reinforce a point. It is a mistake tobelieve that pictures are always better than words. Visual aids should only beused if they serve a real and necessary purpose.
Figure 12.2 illustrates an overhead transparency that can be prepared with aproduct such as Microsoft PowerPoint. It shows how a graphic presentation canbe combined with key points expressed in words.
There is a wide range of graphical illustrations that can be used. The followinggives some examples.
FIGURE 12.2 Text and map in an overhead transparency
EOM_C12.qxd 6/23/05 10:52 AM Page 356

.
Visual aids and their use
Chernov faces
This is a useful way of displaying attitudes to various objects and is more or lessself-explanatory. The expression on the faces reflects the attitudes towards theobject (Figure 12.3).
Conventional bar charts
A bar chart is a graph of a frequency distribution (Figure 12.4).
357
FIGURE 12.3 Chernov faces of attitude towards various brands of cereal
FIGURE 12.4 Conventional bar chart
EOM_C12.qxd 6/23/05 10:52 AM Page 357

.
358 Chapter 12 • Evaluation, reports and presentation
Contour mapsWhere demographic, attitudinal or other data can be shown to vary geographi-cally by region, area or district, and data points are clustered together into fairlyhomogeneous groupings, contour maps can be used effectively to illustrate howthe data are distributed (Figure 12.5).
FIGURE 12.5 Contour map
Many statistical, charting and spreadsheet computer packages now have quitesophisticated graphing features and these should be explored to find methods ofportraying data in an effective way.
DiagramsPresentations can be considerably enhanced with the use of simple, easy-to-understand diagrams. For example, in researching the way in which computersoftware is marketed, the diagram in Figure 12.6 was constructed to show thevarious end-users and the channels of distribution that could be used to reachthem.
In a similar way, diagrams may be used to show how different groups of cus-tomers differ in their purchase wants and needs. The diagram in Figure 12.7identifies three types of purchaser of bathroom furnishings, together with import-ant, differentiating aspects of their buying behaviour.
EOM_C12.qxd 6/23/05 10:52 AM Page 358

.
Visual aids and their use
Sophisticated computer presentation packages now enable combined displaysto be produced. These can be used either as a page for incorporation in a report oras an overhead transparency master. The example in Figure 12.8 captures theoriginal spreadsheet data for expenditure on rent and housing, together withexpenditure on food and drink, along with the scattergraph showing the relation-ship between the two. It also shows the distribution of both variables acrossEurope on a map as well as graphic pictures emphasising the products.
359
FIGURE 12.6 Use of diagrams in presentation
EOM_C12.qxd 6/23/05 10:52 AM Page 359

.
360 Chapter 12 • Evaluation, reports and presentation
FIGURE 12.7 Three types of purchaser of bathroom furnishings
Picture maps
Picture maps are another way of helping to display information in a readilymeaningful way (Figure 12.9).
INSPIRATION2
Inspiration is a visual idea development tool for developing ideas and plans. It fullyintegrates an easy-to-use diagram creator and a powerful outliner. We can use thediagram creator to generate ideas, plan and produce diagrams and the outline viewto organise writing. Inspiration’s integration of these facilities through different‘views’ gives two different perspectives of the same information: a graphic view and
EOM_C12.qxd 6/23/05 10:52 AM Page 360

.
Visual aids and their use 361
FIGURE 12.8 Multiple items on one page or overhead
a text view. It provides a single tool for idea development and planning and is usefulfor developing and communicating ideas.
Inspiration makes it easy and fast to create mind maps, cluster diagrams andidea maps as part of your brainstorming and planning process. These are all visualthinking techniques used for generating ideas and clarifying thinking. Visual mapshelp stimulate thinking and add clarity. They also simplify the process of movingthoughts into words that communicate your ideas. When writing a report,Inspiration saves time because its powerful outliner helps to revise, edit and formatwork quickly.
Often a picture is the best way to express a concept since it presents its essenceinstantly. It adds insight by showing the flow of ideas, their relationships and theirdependencies. Visual diagrams are a powerful way to communicate an idea or con-cept, explain a process or procedure, or sell your message.
EOM_C12.qxd 6/23/05 10:52 AM Page 361

.
362 Chapter 12 • Evaluation, reports and presentation
FIGURE 12.9 Picture map
FIGURE 12.10 Diagram view of Inspiration
EOM_C12.qxd 6/23/05 10:52 AM Page 362

.
Questions 363
FIGURE 12.11 Outline view from Inspiration
Figures 12.10 and 12.11 illustrate Inspiration in use. The diagram in Figure 12.10 shows the various areas that the report is covering. Each of the boxescan be expanded in the outliner view (Figure 12.11).
SUMMARY
This chapter has examined the importance of the presentation to the success of aresearch study. It looked at the preparation of the different aspects of the pre-sentation and concluded with a discussion of some of the visual and electronicaids that are available to the presenter.
QUESTIONS
1 When preparing a research report, where should you begin? Why?
2 List the various sections that go into making a marketing research report andbriefly state what each section includes.
3 How should the oral report differ from the written report?
4 Indicate the types of visual aid that might be used in making an oralpresentation.
EOM_C12.qxd 6/23/05 10:52 AM Page 363

.
364 Chapter 12 • Evaluation, reports and presentation
Guest Country Age Varied Friendly Value for Quick Pleasantof abode cuisine service money service surroundings
1 France <25 2 4 2 2 22 England 65+ 3 3 2 3 23 Germany 25–34 4 4 2 4 24 Italy 45–54 3 3 2 2 25 France 25–34 4 4 1 3 16 Germany 35–44 2 4 2 3 27 Italy 65+ 3 4 3 3 28 France 35–44 4 4 2 2 19 France 45–54 3 2 1 1 2
10 Italy 35–44 3 3 2 2 211 England 25–34 4 1 1 3 312 Germany 45–54 3 3 2 4 213 England 55–64 2 2 1 3 214 England <25 3 2 2 2 215 Italy <25 4 3 3 1 316 France 55–64 3 4 2 2 217 England 45–54 2 3 2 3 318 Italy 25–34 3 2 2 2 319 Germany 55–64 4 2 1 1 220 England 35–44 2 3 2 3 221 France 65+ 4 4 3 2 122 Germany 65+ 3 3 2 3 123 Germany <25 2 2 3 3 224 Italy 55–64 1 4 2 3 2
TABLE 12.1 Responses to questionnaire
CASE STUDY 12.1: THE ST HONORÉ DE MAZARINRESTAURANT, PARIS
A summary of responses to a short questionnaire completed by 24 visitors to therestaurant is shown in Table 12.1. The numbers show the rating given by respon-dents on a five-point scale (1 is high) on five evaluation criteria.
Question
Draw up a report based on the summaries shown in the table, paying particularattention to the graphical means of summarising the data.
EOM_C12.qxd 6/23/05 10:52 AM Page 364

.
Case study 12.2 365
CASE STUDY 12.2: CENTRAL TRAINING COLLEGE (3)
Two surveys were conducted to find answers to the research questions indicatedin the Central Training College (1) case (see Case study 5.1). The first survey wasamong students and the second was among potential business users. The aim ofthe research was to establish the viability of setting up a recruitment agencyunder the aegis of the Central Training College that would be of mutual benefit tostudents and potential employers. In the first of the surveys, students at theCentral College were asked for their opinions, while in the second instance poten-tial employers were asked for their reactions.
The student survey sought answers to a comprehensive list of questions. These were incorporated in a well-designed questionnaire that offered possibleanswers from which the students might select answers or they could suggestanswers of their own. Of students at the 60 colleges contacted, 48.3% returned acompleted questionnaire.
The students, 41.4% of them, said that they had used an employment agencybefore. When asked whether they were satisfied with the service they had beenoffered, 50% said that they were. Students with experience of using agencies par-ticularly liked a helpful, friendly consultant and career advice. The first factorwas mentioned by 50% of students and 16.7% mentioned the second factor. One-third of the students who answered the question complained about agencies’poor communication with students. Consultants would agree to contact a studentby a particular time but they would fail to do so and students’ costs were there-fore increased. Twenty-five per cent of students mentioned the frequency of beingsent for an unsuitable position as another source of complaint. Another dislikementioned by 16.7% of students was being referred to different consultants oneach visit. Often, students would have to explain their interests and experience repeatedly to different consultants. Comments written on questionnaires sug-gested that students felt they were treated very impersonally. Lack of informationon pay and holidays supplied by the agencies, the absence of training schemesoffered by the agencies to broaden students’ skill base and the apparent lack ofeffort to find the student employment were also cited as shortcomings. However,37.9% of respondents indicated that they definitely intended using an employ-ment agency in the future and a further 51% said that they would probably do so.
Six people thought that a reputation for being helpful and efficient was themost important consideration when choosing an agency. Five mentioned theneed for the chosen agency to have good contacts. Overall reputation, a spe-cialised service for foreign and arts world contacts and a relatively cheap servicewere each mentioned by four of the respondents. Four thought a personal service,a well-established name and an agency with many branches was important.
Just over half of the students (51.7%) had no idea which agency they intendedengaging. Of those who did have some idea, 22.7% stated that they intended to
EOM_C12.qxd 6/23/05 10:52 AM Page 365

.
366 Chapter 12 • Evaluation, reports and presentation
use Kelly, 27.2% said they intended to use Alfred Marks or City Secretaries. Drakeand Angela Mortimer each accounted for 9.1% of choices. Also mentioned wereAbacus, Angela Pike, Elizabeth Hunt and Pathfinders. Those who indicated thatthey were not going to use an agency gave high charges as one of the main reasons.
When asked if they thought it was a good idea for a recruitment agency to beopened in the college, 89.6% said that it was. The most frequent reason given forthe idea being perceived as a good one was the belief that the service would bespecifically designed for the students of the college. It was thought that an agencyin the college might have more flexible consulting times. This flexibility wouldenable the students to meet consultants on a more frequent and regular basis thanwould be the case with an agency situated several miles away. Of all the respon-dents, 37.9% said they would definitely use an agency based in the college and48.3% said they would probably use it. Of the respondents, 10.3% usually livedoutside the UK and, of the remainder, 80.8% were resident in London. The major-ity of respondents (96.5%) were female. There were no respondents over 50 yearsof age and 34.5% were under 20 years of age. When it came to employment,51.7% of the students classed themselves as unemployed, 31% were full-time students and 6.9% were self-employed; 34.5% of the respondents with work experience had obtained it in areas where a college agency might find jobs. One-fifth had bookkeeping and accounting experience, two-fifths had experience assecretaries, clerks and receptionists. Just over one-fifth had worked as nannies,waitresses and shop assistants, while 17.2% had teaching experience. A further17.2% had sales, design or consultant experience, while 10.3% of students had no work experience at all. Most respondents were interested in secretarial work:just over 25% were interested in it. Business administration, receptionist and linguistic work were the next popular choices, each accounting for 13.7% of indi-cated preference; 3.9% were interested in desktop publishing and bookkeeping.Accounting and spreadsheet analysis were popular with 1.9% of respondents;19.6% were not interested in office work at all.
As in the case of the student survey, a well-constructed questionnaire was puttogether for the survey of firms. This time the survey was by post. Only 30 out of100 questionnaires were returned. Of those that were returned, 30.3% were notcompleted but were accompanied by a letter stating that the company did notand would not use employment agencies.
Just over half of the respondents said they had never used a recruitmentagency in the past. When used, the most frequently sought employees were secre-taries (frequency 15), accounting staff (12), receptionists (4), bookkeepers (3) andbusiness administrators (2). Of jobs offered to the agencies, 37.5% were perman-ent. The most frequent future need was predicted to be for secretaries – 45.4% of respondents indicated this. However, 45.55% of the respondents said theywould be using an agency to hire secretaries and accounting staff in the future.Employers said they would not be using agencies to hire desktop publishers,spreadsheet analysts and linguists; 70% said they would not be using agencies torecruit receptionists.
EOM_C12.qxd 6/23/05 10:52 AM Page 366
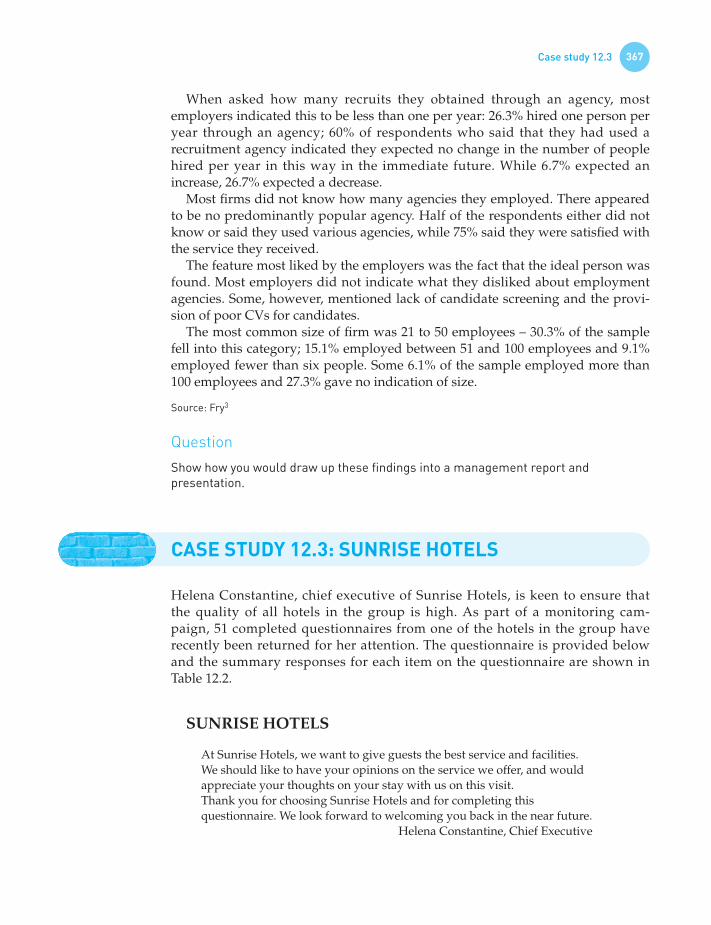
.
Case study 12.3 367
When asked how many recruits they obtained through an agency, mostemployers indicated this to be less than one per year: 26.3% hired one person peryear through an agency; 60% of respondents who said that they had used arecruitment agency indicated they expected no change in the number of peoplehired per year in this way in the immediate future. While 6.7% expected anincrease, 26.7% expected a decrease.
Most firms did not know how many agencies they employed. There appearedto be no predominantly popular agency. Half of the respondents either did notknow or said they used various agencies, while 75% said they were satisfied withthe service they received.
The feature most liked by the employers was the fact that the ideal person wasfound. Most employers did not indicate what they disliked about employmentagencies. Some, however, mentioned lack of candidate screening and the provi-sion of poor CVs for candidates.
The most common size of firm was 21 to 50 employees – 30.3% of the samplefell into this category; 15.1% employed between 51 and 100 employees and 9.1%employed fewer than six people. Some 6.1% of the sample employed more than100 employees and 27.3% gave no indication of size.
Source: Fry3
Question
Show how you would draw up these findings into a management report andpresentation.
CASE STUDY 12.3: SUNRISE HOTELS
Helena Constantine, chief executive of Sunrise Hotels, is keen to ensure that the quality of all hotels in the group is high. As part of a monitoring cam-paign, 51 completed questionnaires from one of the hotels in the group haverecently been returned for her attention. The questionnaire is provided below and the summary responses for each item on the questionnaire are shown inTable 12.2.
SUNRISE HOTELS
At Sunrise Hotels, we want to give guests the best service and facilities.We should like to have your opinions on the service we offer, and would appreciate your thoughts on your stay with us on this visit.Thank you for choosing Sunrise Hotels and for completing this questionnaire. We look forward to welcoming you back in the near future.
Helena Constantine, Chief Executive
EOM_C12.qxd 6/23/05 10:52 AM Page 367

.
368 Chapter 12 • Evaluation, reports and presentation
Your name ____________________________________________________
Your address ________________________________________________________________________________________________________ ____________________________________________________
From / / To / /
Room number ________
Your age Under 25 25–34 35–44 45–5455–64 Over 65
Your sex Male Female
What was the primary Business trip to localitypurpose of your visit? Overnight stop en route
Visiting area, sightseeingWeekend break Other
Our general service and facilities
How well did we match with your expectations? Excellent Good Fair Poor
On reservation
Accuracy of information provided 1 2 3 4
Your welcome
On arrival at reception 1 2 3 4
In reception
Speed of check-in 1 2 3 4
In the bedroom
Cleanliness of room 1 2 3 4
Overall comfort of room 1 2 3 4
General maintenance 1 2 3 4
In the telephone service
Staff telephone manner 1 2 3 4
Speed of response 1 2 3 4
Have you any specific comments you would like to make? If so, please writethem in the box below.
EOM_C12.qxd 6/23/05 10:52 AM Page 368

.
Case study 12.3
Our staff
How would you rate our staff in terms of: Excellent Good Fair PoorCourteousness 1 2 3 4Efficiency 1 2 3 4Reliability 1 2 3 4Anticipating your requirements 1 2 3 4Attending to your requirements 1 2 3 4Ability to deal with problems 1 2 3 4Please mention any member of staff who made your stay especially enjoyable.
Our dining and bar service
How would you rate our service?In the restaurant Excellent Good Fair PoorAnticipating your requirements 1 2 3 4Range of food and beverages 1 2 3 4Quality of food and beverages 1 2 3 4Quality of service 1 2 3 4Ambiance/decor 1 2 3 4Please write any further comments you may have in the box below.
In the lounge or bar Excellent Good Fair PoorAnticipating your requirements 1 2 3 4Quality of service 1 2 3 4Quality of food and beverages 1 2 3 4Ambiance/decor 1 2 3 4Please write any further comments you may have in the box below.
What do you consider is the hotel’s best feature?
What do you think is the hotel’s poorest feature?
What is your opinion of the hotel in terms of Excellent Goodprice? Fair Poor
Thank you for taking the time to complete this questionnaire
369
EOM_C12.qxd 6/23/05 10:52 AM Page 369

.
370 Chapter 12 • Evaluation, reports and presentation
TABLE 12.2 Sunrise Hotels: questionnaire responses
Name From To Room Age Sex Purpose
Sam Jones 8/3/96 12/3/96 69 25–34 M Business trip to locality
Janet Mills 5/2/96 7/2/96 123 Over 65 F Weekend break
Ernest Crabbe 4/2/96 7/2/96 109 Over 65 M Weekend break
John Plant 17/2/96 18/2/96 15 45–54 M Overnight stop en route
William Brown 22/1/96 23/1/96 16 45–54 M Overnight stop en route
Rose Thorne 29/1/96 30/1/96 27 45–54 F Weekend break
Sam Singleton 9/3/96 10/3/96 6 Under 25 M Weekend break
John Bright 8/4/96 9/4/96 6 55–64 M Overnight stop en route
Jim Thickett 24/4/96 27/4/96 11 55–64 M Not answered
Jolly Forsyte 7/5/96 9/5/96 2 55–64 M Business trip to locality
Juniper Green 10/11/96 15/11/96 1 Over 65 F Weekend break
Penelope Snow 7/7/96 21/7/96 123 35–44 F Visiting area sightseeing
Wallace Arnold 5/3/96 8/3/96 10 35–44 M Weekend break
William Little 9/9/96 24/9/96 29 45–54 M Not answered
Claire Charles 12/7/96 17/7/96 140 Over 65 F Visiting area sightseeing
Cecilia Cardwell 5/4/96 6/4/96 17 45–54 F Overnight stop en route
Kurt Waldheimer 25/7/96 30/7/96 21 35–44 M Visiting area sightseeing
Françoise Angouleme 23/8/96 29/8/96 78 25–34 F Visiting area sightseeing
Peter Pratt 29/4/96 30/4/96 46 45–54 M Weekend break
René de la Vallière 5/3/96 6/3/96 45 35–44 M Overnight stop en route
Valerie Carmichael 21/4/96 23/4/96 97 35–44 F Weekend break
Thomas Thomas 6/6/96 8/6/96 9 35–44 M Weekend break
Margaret Lemming 21/8/96 24/8/96 1 25–34 F Weekend break
Duncan Reddish 5/2/96 7/2/96 199 35–44 M Weekend break
Robert Thompson-Smithers 20/2/96 22/2/96 5 Over 65 M Other
Arnold Ellis 19/9/96 20/9/96 101 55–64 M Not answered
Warwick St John-Stevenson 3/4/96 6/4/96 200 45–54 M Other
Hermione Page 29/1/96 30/1/96 56 25–34 F Overnight stop en route
Teddie Taylor 21/6/96 28/6/96 17 45–54 M Weekend break
Ursula Canning 21/12/96 22/12/96 27 Under 25 F Overnight stop en route
Lionel Clarkson 21/7/96 25/7/96 45 45–54 M Business trip to locality
Tania Smith 23/1/96 30/1/96 2 Under 25 F Weekend break
Stella Homer 3/2/96 5/2/96 5 25–34 F Weekend break
Ronald Leask 2/9/96 5/9/96 4 55–64 M Visiting area sightseeing
François Morrell 2/4/96 5/4/96 2 45–54 M Weekend break
Audrey Chapman-Harris-Johnson 9/2/96 11/2/96 20 55–64 F Weekend break
Robin Rutherford 5/3/96 14/3/96 69 25–34 M Weekend break
EOM_C12.qxd 6/23/05 10:52 AM Page 370

.
Case study 12.3 371
Reservation Welcome Check-in Cleanliness Comfort Maintenance Manner Response
Good Fair Fair Good Good Fair Fair Fair
Good Fair Fair Good Fair Good Good Fair
Good Good Fair Good Good Good Good Good
Good Good Fair Poor Fair Good Good Poor
Good Good Fair Good Good Fair Fair Fair
Good Good Good Fair Fair Fair Good Good
Good Good Excellent Fair Good Fair Fair Excellent
Excellent Fair Good Good Good Good Good Good
Excellent Good Good Good Excellent Good Excellent Good
Excellent Good Excellent Good Fair Good Good Fair
Excellent Excellent Excellent Good Fair Good Fair Excellent
Fair Good Poor Good Good Good Poor Poor
Excellent Fair Fair Good Fair Fair Good Fair
Fair Good Good Fair Good Fair Fair Good
Good Good Good Good Excellent Good Good Excellent
Poor Fair Good Fair Poor Fair Fair Good
Good Good Good Fair Good Excellent Fair Fair
Good Good Good Good Good Good Excellent Good
Good Good Good Good Good Excellent Good Good
Excellent Excellent Good Good Excellent Excellent Good Good
Good Fair Fair Good Good Excellent Good Fair
Good Good Fair Good Excellent Fair Good Good
Good Excellent Excellent Good Excellent Good Good Fair
Fair Good Good Fair Fair Fair Good Fair
Fair Good Excellent Good Good Fair Good Good
Excellent Good Good Good Excellent Good Excellent Good
Poor Excellent Good Fair Good Fair Fair Good
Poor Poor Poor Fair Poor Fair Fair Poor
Good Fair Fair Good Fair Good Good Fair
Fair Good Poor Good Poor Good Poor Fair
Fair Good Poor Fair Good Fair Fair Fair
Good Good Fair Fair Good Good Good Fair
Good Good Poor Good Fair Good Good Good
Good Excellent Fair Good Excellent Fair Good Good
Excellent Poor Excellent Fair Fair Poor Good Excellent
Fair Good Poor Poor Fair Fair Good Good
Good Excellent Fair Excellent Excellent Good Fair Good s
EOM_C12.qxd 6/23/05 10:52 AM Page 371

.
372 Chapter 12 • Evaluation, reports and presentation
Name From To Room Age Sex Purpose
Emily Jackson 23/4/96 26/4/96 180 35–44 F Business trip to locality
Constance Tucker 5/9/96 10/9/96 13 45–54 F Weekend break
Sandy Sturgeon 4/1/96 11/1/96 73 25–34 F Weekend break
Morgan Jones 1/4/96 15/4/96 100 55–64 M Weekend break
David Roberts 24/3/96 26/3/96 1 55–64 M Visiting area sightseeing
Frederick Cornwallis 24/3/96 26/3/96 4 35–44 M Not answered
Candice Olsen 24/3/96 25/3/96 16 35–44 F Overnight stop en route
Owen Tudor-Williams 24/3/96 26/3/96 34 35–44 M Weekend break
Janice King 24/3/96 26/3/96 131 35–44 F Weekend break
James Kerr-Jones 24/3/96 26/3/96 77 55–64 M Not answered
Philip Hardborne 24/3/96 26/3/96 79 35–44 M Business trip to locality
Rita Davies 22/3/96 23/3/96 79 25–34 M Overnight stop en route
Walter Pidgeon 8/3/96 12/3/96 88 35–44 M Visiting area sightseeing
Guests’ comment Courteousness Efficiency
Need better chairs in the bedroom Good Good
Chairs in the bedroom uncomfortable; tap drips Good Good– needs new washer
Receptionist too slow Excellent Good
Receptionist needs training Good Good
Telephone service is poor Excellent Good
Chairs are very uncomfortable Excellent Excellent
Cobwebs in bedroom; leaking tap in bedroom Excellent Good
Excellent Good
Genial and comfortable Excellent Excellent
Chairs in bedroom uncomfortable Fair Good
Very poor-quality chairs – very uncomfortable Good Fair
Fair Fair
Room rather dark and chairs very uncomfortable Good Fair
Wash basin cracked; cobwebs in room and dust Good Fairunder bed
Excellent Excellent
Chairs were less comfortable than church pews Poor Fairand the decor was awful
Cleanliness is poor by German standards Good Good
Excellent Good
Name
Sam Jones
Janet Mills
Ernest Crabbe
John Plant
William Brown
Rose Thorne
Sam Singleton
John Bright
Jim Thickett
Jolly Forsyte
Juniper Green
Penelope Snow
Wallace Arnold
William Little
Claire Charles
Cecilia Cardwell
Kurt Waldheimer
Françoise Angouleme
TABLE 12.2 Sunrise Hotels: questionnaire responses (continued )
EOM_C12.qxd 6/23/05 10:52 AM Page 372

.
Case study 12.3 373
Reservation Welcome Check-in Cleanliness Comfort Maintenance Manner Response
Excellent Good Excellent Good Excellent Good Fair Fair
Fair Good Poor Poor Good Excellent Fair Fair
Good Good Excellent Excellent Good Good Good Excellent
Poor Poor Excellent Good Good Fair Poor Fair
Good Good Good Excellent Fair Fair Fair Good
Good Good Fair Excellent Good Fair Fair Good
Good Excellent Good Excellent Fair Good Fair Good
Good Excellent Good Excellent Excellent Excellent Excellent Good
Good Excellent Good Excellent Fair Excellent Excellent Good
Good Good Good Excellent Excellent Fair Excellent Good
Good Fair Good Excellent Good Fair Excellent Good
Good Fair Good Good Good Fair Excellent Good
Good Good Fair Good Fair Good Fair Fair
Reliability Anticipate need Attend need Resolve problems Special remarks
Good Fair Good Good Bill the barman
Good Fair Good Fair Bill the barman: brilliantly funny
Good Good Fair Fair Sue the chambermaid
Fair Poor Fair Fair Bill the barman
Good Good Excellent Good
Excellent Good Good Good
Excellent Good Not answered Fair Bill the barman
Good Good Fair Good
Good Excellent Excellent Excellent Bill the barman
Excellent Good Excellent Good Freda the chambermaid
Fair Good Fair Good
Poor Poor Poor Fair
Good Fair Fair Good
Excellent Good Fair Good
Good Good Good Excellent
Poor Fair Poor Poor I wish I could
Good Good Good Good
Excellent Good Excellent Excellent s
EOM_C12.qxd 6/23/05 10:52 AM Page 373

.
374 Chapter 12 • Evaluation, reports and presentation
Guests’ comment Courteousness Efficiency
Good Excellent
Excellent Good
More staff needed, I think Good Good
Tap dripping all night Good Good
Excellent Good
Lack of insulation – draughts Fair Fair
Decor poor Good Good
Excellent Good
Poor Good
Service is very poor and decor is outrageous. Poor PoorBedroom chairs are hard
Good Good
Very uncomfortable bedroom chairs Good Poor
Good Good
Excellent Good
Good Good
Excellent Good
Plumbing very noisy: kept me awake all night Excellent Excellent
Not answered Good
Excellent Good
Excellent Excellent
Room was very dusty Fair Good
Excellent Excellent
I couldn’t get the blinds in my room to work Not answered Good
Good Good
Not answered Good
Excellent Good
Excellent Good
Good Good
Excellent Good
Excellent Good
Excellent Good
Need better chairs in the bedroom Good Fair
Name
Peter Pratt
René de la Vallière
Valerie Carmichael
Thomas Thomas
Margaret Lemming
Duncan Reddish
Robert Thompson-Smithers
Arnold Ellis
Warwick St John-Stevenson
Hermione Page
Teddie Taylor
Ursula Canning
Lionel Clarkson
Tania Smith
Stella Homer
Ronald Leask
François Morrell
Audrey Chapman-Harris-Johnson
Robin Rutherford
Emily Jackson
Constance Tucker
Sandy Sturgeon
Morgan Jones
David Roberts
Frederick Cornwallis
Candice Olsen
Owen Tudor-Williams
Janice King
James Kerr-Jones
Philip Hardborne
Rita Davies
Walter Pidgeon
TABLE 12.2 Sunrise Hotels: questionnaire responses (continued )
EOM_C12.qxd 6/23/05 10:52 AM Page 374

.
Case study 12.3 375
Reliability Anticipate need Attend need Resolve problems Special remarks
Excellent Excellent Good Good
Good Good Excellent Excellent
Good Fair Fair Good
Good Fair Good Fair Bill the barman
Good Excellent Good Good
Fair Fair Fair Poor
Good Fair Fair Poor Couldn’t get dripping tap in my room fixed
Good Excellent Good Good
Poor Fair Fair Poor Bill the barman
Poor Fair Poor Poor
Good Fair Good Good
Good Poor Good Not answered Staff are poor at giving help when needed
Good Poor Good Not answered Bill the barman
Good Excellent Good Good Bill the barman
Good Fair Good Good
Fair Excellent Good Good Bill the barman
Good Good Good Excellent
Good Fair Fair Fair Bill the barman
Fair Good Good Excellent Bill the barman
Excellent Good Good Excellent
Good Poor Poor Fair No room service provided
Good Good Excellent Excellent
Fair Fair Fair Poor No one was able to find the cat in my room
Excellent Good Excellent Good
Fair Good Excellent Good Bill the barman – knew him in the army
Excellent Good Excellent Good Bill the barman
Excellent Excellent Excellent Good Bill the barman – knew him in the navy
Excellent Good Excellent Good
Excellent Excellent Excellent Good
Excellent Good Excellent Good Bill the barman – knew him in the airforce
Excellent Good Good Good
Excellent Fair Good Good Bill the barman s
EOM_C12.qxd 6/23/05 10:52 AM Page 375

.
376 Chapter 12 • Evaluation, reports and presentation
TAB
LE12
.2Su
nris
e H
otel
s: q
uest
ionn
aire
res
pons
es (c
ontin
ued
)
Ant
icip
atio
n of
R
ange
of
Qua
lity
of
Qua
lity
of
Res
taur
ant
Spec
ial r
emar
ksA
ntic
ipat
ing
Bar
ser
vice
Qua
lity
ofB
ar d
ecor
requ
irem
ents
food
food
serv
ice
deco
rin
the
bar
bar
food
Goo
dG
ood
Fair
Goo
dG
ood
Fair
Goo
dEx
celle
ntG
ood
Goo
dG
ood
Fair
Goo
dFa
irG
ood
Goo
dG
ood
Exce
llent
Goo
dG
ood
Goo
dFa
irFa
irG
ood
Goo
dG
ood
Exce
llent
Goo
dFa
irP
oor
Fair
Fair
Fair
Poo
rFa
irFa
ir
Goo
dG
ood
Goo
dEx
celle
ntG
ood
Fair
Goo
dG
ood
Fair
Exce
llent
Exce
llent
Goo
dG
ood
Goo
dFa
irFa
irFa
irP
oor
Goo
dEx
celle
ntG
ood
Not
Fa
irG
ood
Fair
Exce
llent
Exce
llent
answ
ered
Goo
dG
ood
Goo
dFa
irG
ood
Exce
llent
Fair
Exce
llent
Goo
d
Exce
llent
Goo
dEx
celle
ntEx
celle
ntEx
celle
ntG
ood
Exce
llent
Goo
dEx
celle
nt
Goo
dEx
celle
ntG
ood
Exce
llent
Goo
dG
ood
Goo
dEx
celle
ntG
ood
Fair
Fair
Goo
dFa
irG
ood
Goo
dFa
irG
ood
Exce
llent
Fair
Poo
rP
oor
Poo
rFa
irFa
irFa
irFa
irP
oor
Fair
Goo
dFa
irFa
irG
ood
Goo
dG
ood
Exce
llent
Goo
d
Fair
Exce
llent
Goo
dFa
irG
ood
Fair
Exce
llent
Goo
dEx
celle
nt
Exce
llent
Goo
dG
ood
Goo
dEx
celle
ntG
ood
Goo
dEx
celle
ntFa
ir
Fair
Poo
rFa
irP
oor
Poo
rI w
ish
I cou
ldFa
irP
oor
Poo
rFa
ir
Goo
dG
ood
Goo
dG
ood
Goo
dEx
celle
ntG
ood
Goo
dG
ood
Goo
dEx
celle
ntG
ood
Exce
llent
Exce
llent
Goo
dEx
celle
ntEx
celle
ntEx
celle
nt
Exce
llent
Exce
llent
Exce
llent
Goo
dG
ood
Goo
dEx
celle
ntEx
celle
ntG
ood
Goo
dG
ood
Goo
dEx
celle
ntEx
celle
ntG
ood
Exce
llent
Exce
llent
Exce
llent
Goo
dG
ood
Fair
Fair
Goo
dG
ood
Fair
Goo
dFa
ir
Goo
dG
ood
Fair
Goo
dFa
irEx
celle
ntG
ood
Goo
dFa
ir
Goo
dG
ood
Exce
llent
Goo
dG
ood
Goo
dFa
irEx
celle
ntG
ood
Fair
Fair
Fair
Fair
Poo
rFa
irG
ood
Fair
Fair
Goo
dG
ood
Fair
Fair
Poo
rC
ould
n’t g
et th
e G
ood
Exce
llent
Exce
llent
Fair
drip
ping
tap
in m
y ro
om fi
xed
Nam
e
Sam
Jon
es
Jane
t Mill
s
Erne
st C
rabb
e
John
Pla
nt
Will
iam
Bro
wn
Ros
e Th
orne
Sam
Sin
glet
on
John
Bri
ght
Jim
Thi
cket
t
Jolly
For
syte
Juni
per
Gre
en
Pen
elop
e Sn
ow
Wal
lace
Arn
old
Will
iam
Litt
le
Cla
ire
Cha
rles
Cec
ilia
Car
dwel
l
Kur
t Wal
dhei
mer
Fran
çois
e A
ngou
lem
e
Pet
er P
ratt
Ren
é de
la V
alliè
re
Vale
rie
Car
mic
hael
Thom
as T
hom
as
Mar
gare
t Lem
min
g
Dun
can
Red
dish
Rob
ert T
hom
pson
-Sm
ither
s
EOM_C12.qxd 6/23/05 10:52 AM Page 376

.
Case study 12.3 377
sG
ood
Goo
dEx
celle
ntG
ood
Goo
dG
ood
Exce
llent
Exce
llent
Fair
Goo
dP
oor
Fair
Fair
Poo
rG
ood
Fair
Fair
Goo
d
Poo
rP
oor
Fair
Poo
rP
oor
Fair
Poo
rP
oor
Poo
r
Goo
dG
ood
Fair
Goo
dG
ood
Goo
dFa
irG
ood
Fair
Poo
rG
ood
Poo
rG
ood
Not
St
aff a
re p
oor
at
Fair
Goo
dFa
irFa
iran
swer
edre
nder
ing
help
w
hen
need
ed
Goo
dG
ood
Poo
rG
ood
Not
P
oor
Goo
dFa
irG
ood
answ
ered
Goo
dG
ood
Exce
llent
Goo
dG
ood
Goo
dG
ood
Exce
llent
Exce
llent
Goo
dG
ood
Fair
Goo
dG
ood
Fair
Goo
dG
ood
Fair
Goo
dFa
irEx
celle
ntG
ood
Goo
dG
ood
Exce
llent
Exce
llent
Goo
d
Exce
llent
Goo
dG
ood
Goo
dEx
celle
ntG
ood
Goo
dFa
irG
ood
Goo
dG
ood
Fair
Fair
Fair
Fair
Goo
dFa
irFa
ir
Goo
dFa
irG
ood
Goo
dEx
celle
ntEx
celle
ntG
ood
Goo
dG
ood
Exce
llent
Exce
llent
Goo
dG
ood
Exce
llent
Exce
llent
Goo
dEx
celle
ntG
ood
Goo
dG
ood
Poo
rP
oor
Fair
No
room
ser
vice
Goo
dG
ood
Fair
Fair
prov
ided
Exce
llent
Goo
dG
ood
Exce
llent
Exce
llent
Goo
dEx
celle
ntEx
celle
ntG
ood
Goo
dFa
irFa
irFa
irP
oor
No
one
was
abl
e Fa
irG
ood
Goo
dFa
irto
find
the
cat i
n m
y ro
om
Goo
dEx
celle
ntG
ood
Exce
llent
Goo
dG
ood
Exce
llent
Exce
llent
Goo
d
Goo
dFa
irG
ood
Exce
llent
Goo
dG
ood
Exce
llent
Goo
dG
ood
Goo
dEx
celle
ntG
ood
Exce
llent
Goo
dG
ood
Exce
llent
Exce
llent
Goo
d
Goo
dEx
celle
ntEx
celle
ntEx
celle
ntG
ood
Goo
dEx
celle
ntEx
celle
ntEx
celle
nt
Goo
dEx
celle
ntG
ood
Exce
llent
Goo
dG
ood
Exce
llent
Exce
llent
Exce
llent
Goo
dEx
celle
ntEx
celle
ntEx
celle
ntG
ood
Goo
dEx
celle
ntEx
celle
ntFa
ir
Goo
dEx
celle
ntG
ood
Exce
llent
Goo
dG
ood
Exce
llent
Goo
dFa
ir
Goo
dEx
celle
ntG
ood
Goo
dG
ood
Goo
dEx
celle
ntG
ood
Goo
d
Fair
Exce
llent
Fair
Goo
dG
ood
Goo
dG
ood
Exce
llent
Goo
d
Arn
old
Ellis
War
wic
k St
Joh
n-St
even
son
Her
mio
ne P
age
Tedd
ie T
aylo
r
Urs
ula
Can
ning
Lion
el C
lark
son
Tani
a Sm
ith
Stel
la H
omer
Ron
ald
Leas
k
Fran
çois
Mor
rell
Aud
rey
Cha
pman
-H
arri
s-Jo
hnso
n
Rob
in R
uthe
rfor
d
Emily
Jac
kson
Con
stan
ce T
ucke
r
Sand
y St
urge
on
Mor
gan
Jone
s
Dav
id R
ober
ts
Fred
eric
k C
ornw
allis
Can
dice
Ols
en
Ow
en T
udor
-Will
iam
s
Jani
ce K
ing
Jam
es K
err-
Jone
s
Phi
lip H
ardb
orne
Rita
Dav
ies
Wal
ter
Pid
geon
EOM_C12.qxd 6/23/05 10:52 AM Page 377

.
378 Chapter 12 • Evaluation, reports and presentation
Bar comment Like most Like least Value
Good
Bill needs some good assistants to help Goodhim with the workload
Poor Bill is overburdened with work – but Cheerful staff Decor Fairhe is always cheerful
Food poor Good
Mediocrity Good
Price Restaurant Excellent
More waiters required in bar Price Slightly seedy Excellent
Decoration rather gaudy Price Homeliness Good
Price Drabness Fair
Price Lack of good- Fairquality decor
More waiters required Conveniently Rather basic Fairsituated comforts
FairPoor range of food GoodMore staff required Price Decor Good
FairI don’t drink None Everything Fair
FairPrice and Decor Goodfriendliness
GoodGood
Friendliness GoodPrice Delays in service Excellent
Decorations need to be improved Friendliness Decor GoodDecor poor Price Poor appearance Poor
Price Decor Good
Friendliness Decor GoodPoor decor Price Decor Good
I decided not to eat in the restaurant at all Has not got one Everything GoodPrice Good
GoodNeeds a games room Price Doesn’t cater Good
for vegetarian snooker players
Name
Sam Jones
Janet Mills
Ernest Crabbe
John Plant
William Brown
Rose Thorne
Sam Singleton
John Bright
Jim Thickett
Jolly Forsyte
Juniper Green
Penelope SnowWallace ArnoldWilliam LittleClaire CharlesCecilia CardwellKurt WaldheimerFrançoise Angouleme
Peter PrattRené de la VallièreValerie CarmichaelThomas ThomasMargaret LemmingDuncan ReddishRobert Thompson-SmithersArnold EllisWarwick St John-StevensonHermione PageTeddie TaylorUrsula CanningLionel Clarkson
TABLE 12.2 Sunrise Hotels: questionnaire responses (continued )
EOM_C12.qxd 6/23/05 10:52 AM Page 378

.
Case study 12.4 379
Name
Tania Smith
Stella Homer
Ronald Leask
François Morrell
Audrey Chapman-Harris-Johnson
Robin Rutherford
Emily Jackson
Constance Tucker
Sandy Sturgeon
Morgan Jones
David Roberts
Frederick Cornwallis
Candice Olsen
Owen Tudor-Williams
Janice King
James Kerr-Jones
Philip Hardborne
Rita Davies
Walter Pidgeon
Bar comment Like most Like least Value
Good
Fair
Poor
Decor not very tasteful Price Good
Fair
Excellent
Good
Decor awful Price No room service Poor
Price Good
It is easy to find There was a cat Fairin the dark in my room
Excellent
Bill the barman Price Excellent
Excellent
Easy to find Good
Easy to find Price Good
Price Hard to find Good
Bill the barman Good
Decor rather gaudy Price Gaudy decor Good
Easy to find Decor Good
Question
Produce a report on the findings of this sample survey.
CASE STUDY 12.4: WALLABY TOURS
Wallaby Tours operates a tourist bus link between Adelaide and Melbourne.Instead of taking the inland road, which is the most direct route (taking around24 hours), the company takes three days to travel along the Great OceanHighway, stopping off at places of interest on the way – although the cost is con-siderably higher than the commercial bus route, the passengers see a part ofAustralia that they would miss if the bus followed the ‘boring’ route. Each buscarries a maximum of 18 passengers with their luggage; lunch is provided eachday, but passengers make their own arrangements for evening meals at the vari-ous towns the bus visits. The buses rarely run fully booked, but the service isprofitable.
EOM_C12.qxd 6/23/05 10:52 AM Page 379

.
380 Chapter 12 • Evaluation, reports and presentation
Country of origin, age, Pleasant driver Route taken Accommodation Quality of lunch Comfort of busand gender of passenger
Bus 1: Ad. to Mel.UK: 27: M 2 1 3 2 3Aus: 42: F 1 2 4 4 4Italian: 23: M 4 2 4 4 2Italian: 23: F 3 3 3 4 2Swiss: 32: F 3 1 1 2 3UK: 51: F 2 2 4 1 4Aus: 26: F 2 1 2 4 2Aus: 28: M 2 1 2 4 2UK: 24: M 1 1 1 1 1Singapore: 22: M 4 1 2 3 2Singapore: 22: M 5 2 1 2 3Singapore: 21: F 3 1 2 1 4UK: 48: F 2 2 4 3 4
Bus 2: Ad. to Mel.Aus: 31: F 2 2 4 2 1Aus: 36: M 1 3 2 2 2Aus: 24: M 1 2 3 2 2Aus: 24: M 2 3 2 1 3Aus: 23: M 2 2 1 2 2Aus: 24: M 3 2 2 3 1Irish: 28: F 2 1 3 2 2Irish: 29: F 1 2 3 2 1UK: 37: M 2 1 3 3 2UK: 34: F 2 1 4 4 2Aus: 26: F 1 1 4 3 3Dutch: 29: F 1 2 5 3 3
Bus 3: Mel. to Ad.Singapore: 25: M 3 2 3 4 1Singapore: 25: F 3 1 3 4 2UK: 32: M 1 2 3 2 1UK: 31: F 1 2 3 2 1Aus: 26: M 3 1 2 3 2Aus: 24: M 2 2 2 3 2Irish: 32: M 1 1 2 2 2Irish: 37: M 2 1 2 1 2
Bus 4: Mel. to Ad.Dutch: 43: M 2 1 4 3 3Dutch: 37: F 1 1 4 3 2Aus: 47: M 1 1 2 2 2Aus: 42: F 2 2 4 3 3UK: 24: M 1 1 3 2 2UK: 24: M 2 2 2 1 2
TABLE 12.3 Wallaby Tours: questionnaire responses
EOM_C12.qxd 6/23/05 10:52 AM Page 380

.
Further reading 381
Recently the firm conducted a survey among four groups of passengers – twogroups travelling from Adelaide to Melbourne and two travelling the other way.The directors of the company are hoping to use this information to refine theservice offered; one of the directors believes that the company should be offeringa different service to people of different age groups, since he believes that olderpeople are less prepared to ‘rough it’ than are the younger ones. The other direc-tor is more concerned about gender issues, believing that women have differentneeds and expectations than men.
The passengers were asked to complete a Likert scale, with 1 as the highestrating and 5 as the lowest. Table 12.3 shows the responses obtained from the passengers.
Ultimately, the directors will be looking to collect feedback from all the passen-gers on all the buses; this initial survey is intended to show up major gaps in theservices, and also to offer ideas for designing future research studies.
(Case contributed by Jim Blythe)
Questions
1 Prepare a report based on the figures in the table.
2 What conclusions can you draw from analysis of the data?
3 What recommendations can you make for Wallaby Tours?
4 How should the report be written in order to meet the needs of the Wallaby Toursdirectors?
5 What are the key findings of the research?
REFERENCES AND NOTES
1 Lincoln, Y S and Guba, E C (1985) Naturalistic Inquiry, Beverly Hills, CA: Sage.
2 Inspiration, Inspiration Software Inc., 2920 SW Dolph Court, Suite 3, Portland, Oregon97219.
3 Fry, C (1991) Unpublished MBA Dissertation, Department of Management, KeeleUniversity, September.
FURTHER READING
Boland, A (1996) Got report-o-phobia? Follow these simple steps to get those ideas on topaper, Chemical Engineering, 103(3), March, 131–32.
EOM_C12.qxd 6/23/05 10:52 AM Page 381

.
382 Chapter 12 • Evaluation, reports and presentation
Britt, S H (1971) The writing of readable research reports, Journal of Marketing Research,May, 265.
Carnes, W T (1980) Effective Meetings for Busy People, New York: McGraw-Hill.Dwyer, J (1993) The Business Communication Handbook (3rd edn), Erskineville, NSW:
Star Printery.Eagleson, R D (1990) Writing in Plain English, Canberra, ACT: AGPS.Eunson, B (1994) Writing & Presenting Reports, Milton, Queensland: Wiley.Fletcher, W (1984) Meetings, Meetings, New York: Morrow.Hague, P and Roberts, C (1994) Presentation and Report Writing, London: Kogan Page.Haynes, M E (1988) Effective Meeting Skills, Los Altos, CA: Crisp Publications.Hibbins, G M (1990) Stands to Reason (4th edn), South Melbourne, Victoria: Macmillan.Hinkin, S (1995) Charting your course to effective information graphics, Presentations,
9(11), November.Hrisak, D M (1997) Key presentation principles, Chartered Accountants Journal of New
Zealand, 76(3), April, 24.Kauder, N B (1996) Pictures worth a thousand words, American Demographics (Tools
supplement), November, 64–68.Keys, T (1996) Report writing, Internal Auditor, 53(4), August.Mohn, N C (1989) How to present marketing research results effectively, Marketing &
Research Today, 17(2), 115–18.Nutting, J and White, G (1992) The Business of Communication (2nd edn), Roseville,
CA: McGraw-Hill.Rawlins, K (1993) Presentation and Communication Skills: A handbook for practitioners,
London: Emap Healthcare Ltd.Snell, F (1979) How to Win the Meeting, New York: Hawthorn Books.Sussmans, J (1991) How to Write Effective Reports, Aldershot: Gower.Thomsett, M C (1989) The Little Black Book of Business Meetings, New York: American
Management Association.
EOM_C12.qxd 6/23/05 10:52 AM Page 382

.
A Head 383
Objectives
After reading this chapter, you should be able to:
• understand how marketing research may be applied to specific areas ofmarketing.
Keywords
advertising effectiveness market segmentationanthropological studies memoryattention monadic testingblind testing motivational researchbranded testing new productscartographying packagingconsumer product testing paired comparisonDelphi technique persuasabilityevaluation product deliverygeographic information system product testingideas for new products sociological studies
Applied marketing research13
EOM_C13.qxd 6/23/05 10:53 AM Page 383

.
384 Chapter 13 • Applied marketing research
Plan of Chapter 13
EOM_C13.qxd 6/23/05 10:53 AM Page 384

.
Getting ideas for new products 385
INTRODUCTION
This chapter looks at some applied areas of marketing research: product research,segmentation research, promotion research, distribution research and pricingresearch. These applications of marketing research are substantive enough towarrant specific consideration in their own right. In the case of product research,attention is given to product generation and testing, consumer product testingand packaging research. In the case of segmentation research, attention is givento researching ways of segmenting the market. Attention is given to competitionresearch in which understanding the market strategies of competitors is seen as afocal point. The identification of competitors and sources of information aboutcompetitors are also seen as key issues. Next, in promotion research, attention isfocused on the ways of assessing its effectiveness. This is followed by a discus-sion of various approaches to pricing research. Finally, aspects of distributionresearch are considered.
PRODUCT RESEARCH
Most new products fail, so the use of research in developing and evaluating pro-ducts is important since it reduces the risk of failure. Product research covers several different kinds of research. The aim of product research is to provide com-pany management with information about the likely acceptance of a newproduct, a modified product or an existing product. Product research has threeroles to play in this aspect of marketing (Figure 13.1):
1 getting ideas for new products
2 evaluating new product ideas
3 consumer product testing.
GETTING IDEAS FOR NEW PRODUCTS
Consumers can provide ideas for product improvements and even occasionallyidentify a new product opportunity in the marketplace. Focus group researchmay be used to generate product ideas, as it reflects the nature of unsatisfied con-sumer wants. Through focus group discussion, shortcomings of existing productscan be identified as well as desirable new product features (see Chapter 8).
Concept testing means getting reactions to a new product idea or concept andcan help eliminate bad ideas. One form of the concept test describes the conceptentirely through words. There is a statement about what the product is and does,perhaps listing its major characteristics. Another form is visual, with an illustration
EOM_C13.qxd 6/23/05 10:53 AM Page 385

.
386 Chapter 13 • Applied marketing research
FIGURE 13.1 Scope of product research
(drawing or photograph) presented along with the description. It can even takethe form of a draft advertisement, which combines the description and illustra-tion, usually in the form of a print advertisement. A third form of the concept testuses a mock-up of the product. This is something that passes for a prototype, butis really only a dummy product that helps get across the idea of the product.
In the typical concept test, the concept is stated or shown to the consumer andthe person is asked about their interest in purchase. It is conducted with arandom group of potential consumers and the typical starting sample size is 600.Each respondent is recruited and interviewed at home, then offered the productin a personal call-back interview and for ‘real money’. Further sales waves aremade by telephone calls and the product is delivered to the homes of purchasers.Sales to the consumer on several occasions over a time period provide an obser-vation of how much the consumer really wants to buy.
MADAME TUSSAUD’S
Each additional waxwork figure, or new theme area that is put into the exhibition, isinitially a new product – something the public has not seen before. Ideas for newproducts originate from several sources. The ideas, which will be for a new figure
EOM_C13.qxd 6/23/05 10:53 AM Page 386

.
Getting ideas for new products 387
or theme, come principally from a committee consisting of company executives,totalling about eight people, who meet regularly for brainstorming sessions. Thecommittee also canvasses the opinions of other members of staff and takes intoaccount what the marketing department has discovered through its research. The research team conducts a popularity poll, each year, to find out who are thefavourite/least favourite figures and who people would most like to see in the exhibition. These surveys help to overcome the fact that the committee itself is not representative of the people who visit Madame Tussaud’s.
The list of possible new figures has to be narrowed down or screened in order tofind and drop poor ideas as soon as possible. For Madame Tussaud’s it is not somuch having to drop poor ideas, as to eliminate the ones that are not practical: forexample, the availability of a person, what they look like and what length of life theyare likely to have in the exhibition. The question is not so much a monetary one, asone of opportunity cost.
The remaining ideas for figures have to be honed into concepts, because it isthese, not the idea, that the consumer will eventually buy. The product concept iswhat the new product will be and do to satisfy the customers. For Madame Tussaud’sconcept development consists of deciding where to put the figure, in what pose, inwhat clothes and whether it will be a ‘character’ portrayal or not.
Source: Double1
Hall tests are used mostly in the context of developing new products. Theyapply to consumer products and involve displaying and testing products on largenumbers of possible purchasers. Often the tests take place in or close to shoppingcentres or precincts and are located in a hall or other suitable area. People areinvited to visit the place where the tests are being held and to try the products forthemselves and to register their comments and reactions to the products.
Consumer product testing measures what people think of a new or existingproduct only after the actual trial of the developed product. The testing does notalways predict successful products or failures in the marketplace, for a productmay fail because of factors other than the characteristics of the product itself.Even a good product may fail because it lacks the funds to meet the competitionor because a competitor has built up so strong a reputation that no amount ofspending on advertising and other forms of promotion can make any impressionon it. Indeed, a poor or marginal product, as long as it has even a low level ofacceptance, may perform acceptably in the marketplace as a result of massivespending on promotional efforts.
The nature of the testing varies according to the product. For a food or drinkitem, the test may be as simple as a one-time taste test, perhaps conducted at ashopping precinct. For a detergent, a longer term in-home test is required and thebrand may be given to people at a shopping centre with a request that they try itat home over an extended time period. In this case, participants in the study aresubsequently contacted by telephone to answer questions about the product. Youneed to decide whether the products in the test are presented on a blind basis (no
EOM_C13.qxd 6/23/05 10:53 AM Page 387

.
388 Chapter 13 • Applied marketing research
brand identification) or on a branded basis. Another is whether only a singleproduct is presented to the tester for rating (the monadic test), or whether a pairof products is presented (paired comparison).
SUGAR-FREE RIBENA: SMITHKLINEBEECHAM
SmithKlineBeecham does a lot of product testing, partly because of the diversenature of the firm’s brands (health, oral care and health drinks) and partly becauseof the constraints it imposes on methods. The way the company tests LucozadeSports products reflects the fact that they are specially formulated to taste appro-priate for sports activities. The firm tries to test the products in situ, interviewingsports players in leisure centres directly after taking part in a sport (that is, beforethey can get to a cafeteria or a bar).
The firm is particularly innovative in brand development and extension and a lotof the product research involves concept product testing. A recent example was aconcept product test for the firm’s new sugar-free Ribena concentrate before itslaunch. The main aim of the research was to evaluate two formulation options forthe concept and to determine which was the better to develop further or evenlaunch. Because the new product would have to live up to the expectations gener-ated by the Ribena name and the quality of other Ribena products, the firm decidedto include standard and light formulations in the test for comparison with thesugar-free products. There was some concern about where the volume of sugarfree was going to come from and whether the other Ribena concentrate productswould be cannibalised.
After discussing these issues with the research agency (RSGB), a recommenda-tion was used to include a technique that would give an indication of the possiblevolume effects of the launch on the firm’s other products. RSGB recommended aconstant-sum preference exercise, otherwise known as the ‘Chip Game’. The ChipGame asks respondents to score different brands and products (and only thosewithin their present or past repertoire) on the basis of which they would prefer. Inthis case they were asked to allocate marks out of nine between different pairs ofproducts in their repertoire, one pair at a time. The scoring is such that if a respon-dent prefers brand A to brand B by quite an extent, they might give brand A six andbrand B three marks; and if brand A to brand C by a very large extent, brand Amight be awarded eight marks and brand C one mark. In this way a total score isbuilt up for each brand within the market, enabling preference shares and there-fore volume share estimates to be calculated for each brand, as shown in the table.
Brand A Brand B Brand C Total
Brand A / 6 8 14Brand B 3 / 5 8Brand C 1 4 / 5
EOM_C13.qxd 6/23/05 10:53 AM Page 388

.
Getting ideas for new products 389
The exercise can be undertaken twice, once on the current market situation (thatis, before the introduction of sugar-free Ribena) and once after the introduction ofthe new concept, enabling the effects of the launch of sugar-free Ribena on themarket and on other brands within the market to be assessed.
The research answered not only the basic objective of product evaluation butalso many of the other concerns and issues surrounding the project. The finalstructure of the test was:
Concept stage
1 Basic background information.
2 Chip Game: current situation.
3 Evaluation of sugar-free concept.
4 Sugar-free Chip Game.
Product stage
1 Round Robin product test: four formulations, with each respondent testing twoof these.
2 Ranking of sugar-free concept against standard and light concepts.
The research indicated that the concept of the new sugar-free Ribena would bewell received and that one of the formulations would be a slightly better option forthe launch. It also gave a clear indication of the likely effects on volume share for the other Ribena concentrates, for the brand as a whole and for other brandswithin the market.
Source: White2
Blind versus branded testing
There is almost always a need for blind testing, since this really determines howthe product, and only the product, is perceived by the tester. It provides basicguidance, when questions about reactions to specific attributes are also asked, asto how the firm can improve its product to make it more acceptable. Brandedtesting also has an important role. The results of such a test provide informationabout how people react to the product and the brand image. Identified brandstypically score higher than blind products, unless the brand is relativelyunknown or has a poor image.
Monadic versus paired comparison testing
Monadic testing is the presentation of only one test product at a time, obtaining arating on that product alone or perhaps against the regular brand used by the
EOM_C13.qxd 6/23/05 10:53 AM Page 389

.
390 Chapter 13 • Applied marketing research
consumer. Paired comparison testing means the presentation of two products tobe tried, one against the other, and comparative preferences are usually required.In either case, the ratings are not only for overall liking or preference, but usuallyalso cover many attributes or qualities of the product(s).
In conducting the tests, various precautions have to be taken, especially in thecase of the paired comparison test. Experience suggests that, all else being equal,the product tried first has a preferred position and may, just because of itssequential position, receive too high a proportion of preferred ratings. The moresimilar the two products are, the more likely this is to happen. So each productbeing tested has to be given first position with half of the sample of respondents.
The monadic test reflects the way the real world operates. Consumers rarelymake side-by-side choices, although sometimes they do so in a buying situation,particularly with consumer durables. However, experience has shown that thesame monadic test may give sharply differing results, probably because thosereplying have no anchor point on which to base responses. The paired comparisontest provides sharper results, because two definite things are being compared.Under some circumstances, however, these results too are not always consistent.Moreover, paired comparison tests are unsuitable for predicting what willhappen in the marketplace.
CAUGHT IN THE NEIGHBOURS’ TANGLED WEB
Now that everyone in Cyber Street can use a modem and a mouse, it’s apparentlytime to move on to higher things. Microsoft, the software company, has hooked up30 houses on our north London backwater to the Internet, providing computers,phone lines and plenty of software to let us wander where we will, in an attempt tofind out what consumers are going to want from the online revolution.
After just four months of being a market research testbed, everyone is copingwith emails, bulletin boards and the Internet.
To refresh the process, the street was invited to a convivial evening’s networkingat an Islington eaterie to meet our ‘Microsoft buddies’ – the people who keep intouch with individuals and are available for questions – and to be shown what thecompany was up to in developing its own output. In common with other big com-panies, Microsoft hopes that in future people will not just sign up for companiesthat give them an email address and Internet access.
The people passing round the porc au pixil and Chateau Byte were talking ani-matedly in TV-speak about ‘shows’ – a word telly people use about everything fromNews at Ten to Sunday Night at the London Palladium. The ‘shows’ are the extra pro-duct the big computer companies want us to buy: similar to television, it is organisedin ‘channels’ including a news and weather service and magazine programmes oneverything from cinema, fashion and health to comics.
Over the tables, the street became introspective and the idea seemed to developthat no self-respecting virtual community was complete without its own website.
People thought it might be good to be able to call up pictures of their neighboursand even of their neighbours’ pets – it’s nice to know whose moggie you’re chasing
FT
EOM_C13.qxd 6/23/05 10:53 AM Page 390

.
Getting ideas for new products 391
from the back garden. We would trade information on the best restaurants,plumbers, interior decorators and chiropractors. To set it all up, the street’s veryfirst online ‘chat’ was organised, using the ‘chat room’ that has lain neglectedalongside the street’s private bulletin board since the start of the project.
A chat room is a sort of online conference call. Instead of speaking and listening,you type in what you want to say in one section of the screen. The names of thosetaking part are displayed in another panel and the main bit of the screen showseveryone else’s writings as they send them. As a means of communication, it rankssomewhere above hiccuping in Morse code. By the time you type your response toone suggestion, five other remarks have been made and your offering comes upbehind one of those. So your ‘I agree’ response to some completely sensible pro-posal appears on everyone’s screens just after some misguided soul has tippedTottenham for the league.
To make matters worse, the cyber experts have their own language, such as <g>,which is apparently like a slap on the back, but whether this is to approve, say hello,sympathise or dislodge a fishbone from the throat isn’t specified. They also likeconstructing little faces, by typing :-) or :-( to express approval or disapprovalrespectively. It works really well if you tilt your head through 90°.
The street cantered through its first chat without too much misunderstanding,although this was mainly because there were only seven or eight people online atany one time.
The suggested bits of the website range from the practical – information onshops, restaurants, cinemas and recycling centres – to the avowedly self-indulgent:there was a call for a philosophy column, which isn’t a feature of too many otherwebsites.
Only the residents of Cyber Street would have access to the site, although thereis apparently a plan to develop an Islington website for general use – the councilalready has a site about its services, but there was a feeling that something a bitracier would be more helpful.
Not that this is a great time to be creating virtual experiences: the street seemsto have gone on holiday en masse, possibly to the same part of Tuscany – this ismiddle-class Islington, after all – and the bulletin board has gone quiet. However,when everyone returns with their cases of duty-free Chianti, there’s renewedenthusiasm for organising a street party, one of the first things suggested on thebulletin board way back in April. There has been a marked increase in contact inthe street in recent months – it was never noted for neighbourly contact – but thegrand street party is taking a bit of building up to. If it does happen, the online com-munity will become a lot closer to being a real one.
Source: Lynch3 (reprinted with permission)
One-time sensory test
This form of product test is relatively simple. For example, a flavour test, used todetermine which of a product’s two flavours is preferred, may require only onecentral location test, such as in a shopping precinct. In such a high-density traffic
EOM_C13.qxd 6/23/05 10:53 AM Page 391

.
392 Chapter 13 • Applied marketing research
location, people can easily be intercepted. Once intercepted interviewers makesure that the respondents are qualified (such as being heavy users of the productcategory), then they can ask the respondents to sample the product and obtaintheir reactions to it. Either the monadic or paired comparison presentation of theproduct(s) can be applied.
PRODUCT DELIVERY
In the discussion that follows, the term ‘product’ should be construed to meanboth product and service. To understand the ways in which marketing researchcan be helpful in product delivery, it is necessary first to talk about symbolismand imagery, for that is what product delivery is all about: the building of an auraaround a particular product.
A symbol is something that stands for or represents something else and it helpscreate an image. Imagery reflects the way we perceive things, how we screenthings to arrive at an interpretation of reality. If a brand is perceived as being poorquality, it is difficult for the supplier of that brand to change people’s evaluation.Imagery or perception take on great importance in marketing. The name of theproduct or service, the package and the personalising of product delivery all con-tribute to imagery. It requires considerable understanding and skill about how touse research to develop and measure the impact of these three areas of productdelivery. It is unwise to ask people directly how they like a particular logo orbrand name: they will probably give a socially acceptable reply rather than onethey really feel.
THE DELPHI TECHNIQUE AND NEW PRODUCT DEVELOPMENT
When a comparison is made between research projects on new products carriedout in 1968 and 1980 (Booz, Allen and Hamilton 1983, ESOMAR seminar) with onescarried out in 1993 (EFO Group, Marketing News, 21 June 1993), the percentage offailures still remains extremely high. The Achilles heel in the development processof new products is that consumer needs are measured in a static, not dynamic, way.This means that importance is attached to the analysis of the present without givingadequate consideration to the fact that competitive advantages are achieved by satisfying needs that are still embryonic and whose full benefits have yet to come.Consumers are required to judge new products relative to their current needs,which are usually quite well met by existing products. As a result, new productstend to develop from a priority analysis of the present. Products are derived fromthe analysis of habits rather than from the study of evolving needs. By changing theperspective and the focus of the analysis from current to future needs, a competi-tive advantage could be achieved by meeting these emerging needs rather than
EOM_C13.qxd 6/23/05 10:53 AM Page 392

.
Product delivery 393
through a better satisfaction of existing needs. This would gain commitment fromtrendsetters and arouse the interest of the trend followers.
A method that recognises the so-called market weak signals indicating a currentchange so that the concept of the new product to be developed can then be basedon such signals is the Delphi technique4. It was introduced into Italy in the early1970s and used for a large number of significant research projects carried out forconsumer goods and services. One example of its use was to develop a food pro-duct with a long shelf life that did not need cooking or warming up. The researchtook the following steps:
1 Analysing the Delphi results, mapping out the various evolving consumptionopportunities (and their relevant motives) pertaining to the company’s businessidea. Although food habits are among the slowest to change, the impact causedby the change in working hours and kinds of jobs (less industry and more ser-vices), the population’s ageing and a greater attention to health-oriented foodare causing changes that will not take many years (five to seven) to occur.
2 Defining the possible alternatives of product concepts, in line with the changesexpected in the near future.
3 Identifying the weak signals coming from current behaviours by analysing exist-ing research projects on food habits. Sociodemographic research showed that afew behavioural patterns, for which the Delphi technique expected a wide spreadduring a span of ten years, were already spreading among population classeswith less traditional lifestyles.
4 Confirming weak signals and identification of products. Five product lines werefound that shared a few basic elements such as recipes, ingredients, and servicelevel with the new line concept. Sales trends among the five products showedthey had small markets, but trends were favourable.
5 Defining the contents of the concept to convert it into a briefing for R&D. Elementswere separated into these categories: basic ingredients to use; their qualitativefeatures; importance of organoleptic elements (smell, colour, taste); importanceof aesthetic aspects; physical elements of packaging; packaging size; productservice level; and emotional elements – naturalness, lightness, taste, health.
Priorities were assigned to the elements because some of them caused tech-nical or economic problems that were not in line with the product budget.
6 Identifying the positioning, which would influence both the recipe and the adver-tising. Delphi research provided help in determining which food style would bedominant in the years to come and identifying the value system it was based onso that a particular nutritional area could be chosen.
The next steps were the usual ones: elaboration of the recipes, prototypes at experimental cooking level, and the product concept test, which showed anextremely high level of consensus on the concept with respect to the results of similar research projects.
Source: Bolongaro5
EOM_C13.qxd 6/23/05 10:53 AM Page 393

.
394 Chapter 13 • Applied marketing research
NAMING THE PRODUCT
There are three stages in naming the product:
1 defining the need
2 developing possible names
3 testing those names.
Definition of the need means that the purpose of the name must be stated interms of the overall marketing goals and its expected contribution in such termsas imagery or perception of the firm’s own name or that of its product or service.
The basic method of developing possible names is brainstorming. Once poten-tial names have been generated, an image or perception test may be the way todetermine the best one.
In developing possible names, the first step is to construct a dictionary ofverbal terms and symbol fragments (visible and appropriate elements of existingnames in the category). These terms are assembled into a word-making patternthat expresses the product category and messages. These may be natural words(apricot) or coined words (NatWest). Each promising name is further modified toemphasise impact, aesthetics, memorability, uniqueness, vocabulary fit, internalor external reference and shelf appeal. The final step is a focus group discussionamong the target market group at which the group is exposed to the names andcompetitive names. They discuss how well each name describes the product andthe kind of images each name puts forward.
The symbol associated with the product is also an important ingredient.
PUBLIC PUTS FAITH IN BRAND NAMES
Britain has become a nation that puts more trust in brand names than in traditionalinstitutions, according to a report published today by the Henley Centre, the fore-casting organisation.
Research carried out for the report, ‘Planning for Social Change 1997’, foundthat four in five people would trust food manufacturers such as Heinz and Kelloggsto be honest and fair.
The comparable figures for the police and the judiciary were three in five and twoin five. Only a quarter felt they could trust their local council. When people wereasked whether they would trust a multinational company to be honest and fair, only13% gave a positive response.
However, high street retailers also scored highly, with 83% trusting Marks &Spencer, 74% J Sainsbury and 71% Tesco.
Paul Edwards, chairman of the Henley Centre, said the trust in brand namesmatched other findings in the research. These showed that people felt both ‘in and
FT
EOM_C13.qxd 6/23/05 10:53 AM Page 394

.
Packaging the product 395
out of control of their lives’, he said. While people felt powerful as consumers, theyfelt they were not in control in their roles as employees or as members of society.
This perception was associated with the transfer of risk from the state andemployers to individuals, leaving people to take responsibility for increasingly com-plex issues such as financial planning.
Mr Edwards said consumers now trusted certain brands so much that theywould welcome their extension into new areas in order to help them to cope withincreasing demands on their time.
The research suggests that as retailers moved to develop home shopping ser-vices, or even to provide services such as household cleaning, they would find aready market.
The Henley Centre concludes that: ‘Brand management is becoming synony-mous with “trust management”, demanding strategic attention at the top of theorganisation.’
The findings will fuel the debate within the marketing industry about the role of a company’s marketing department, and about what type of external adviser –advertising agency or management consultant – should take the lead in givingadvice about a company’s brand.
Source: Smith6 (reprinted with permission)
PACKAGING THE PRODUCT
Packaging, particularly for fast-moving consumer goods, has three functions.First, through visibility and appeal, it helps to focus attention on the shelf.Second, it builds an image for the product. Third, it is for the convenience of stor-age and use by the consumer.
Good packaging can help the chances of the success of the product in the mar-ketplace. In the case of fast-moving consumer goods, package design is importantand so specialised that most larger companies use a package designer. Thedesigning of the package must start with a good idea of the imagery desired, theimportance of shelf visibility and consumer requirements for storage and use.Marketing research should have preceded this design step.
Packaging development
Discussion with consumers through focus groups in the early stages of packagedevelopment is useful. The process is similar to that adopted in consumer pro-duct research. Drawings or mock-ups of various packages can be shown and discussion in group interviews will produce important points, many of which may not have been previously considered by the firm.
EOM_C13.qxd 6/23/05 10:53 AM Page 395

.
396 Chapter 13 • Applied marketing research
SOFT DRINKS SWITCH TO PET LEAVES INDUSTRY STRUGGLING
Aluminium is under attack in its biggest packaging sector – the drinks industry. Put50 cents into any of the vending machines at the World of Coca-Cola in Atlanta –housing ‘the world’s largest collection of Coca-Cola memorabilia’ – and the softdrink is delivered in a plastic bottle. A year ago the Coke would have been in an aluminium can. The switch from cans to PET (polyethylene terephthalate) for softdrinks in the USA has been so swift and bruising that the aluminium industry is stillstruggling to come to terms with it.
Aluminium’s lightness and flexibility combined with strength, its foldability, goodbarrier characteristics, non-reactivity in contact with liquids, fats and oils, as wellas its abundance and recyclability, all make it a formidable packaging material.Innovative design and effective marketing have enabled it to take share in virtuallyevery type of packaging, in spite of its relatively high price, and growth is continuingin many areas.
Cans represent one of aluminium’s most important markets, accounting for 20%of global demand. Cans in the USA alone account for 10% of worldwide sales of themetal. Now this market is under threat, not only from PET in the soft drinks busi-ness, but also because glass bottles are back in favour as beer containers.
In the USA the development of microbreweries and the perception that ‘pre-mium’ beer should be served in glass bottles is having a noticeable impact. Glass’sshare of the beer package market in the States moved up from 35.8% in 1994 to38.6% last year while cans slipped from 64.2% to 61.4%.
‘Our market research shows that people think glass is classy and that beertastes better in glass,’ says Norman Nieder, group director, packaging technologygroup at Ansheuser-Busch, the brewing giant. ‘A can is a can. It is always thesame.’
Robert Budway, president of the US Can Manufacturers’ Institute acknowledgedthe advances glass is making in the beer business but insists that the main threatto the aluminium can is posed by PET bottles in the ‘single-serve’ soft drinksmarket, primarily in vending. ‘In the US this is a market of 15bn to 18bn units and80% of all new vending business is going to PET,’ he warns.
In 1991 aluminium cans accounted for 55% of US soft drinks packages while PETbottles had 34%. Last year the two were neck and neck at 50% and 47% respec-tively. While the industry had some time to adjust to the PET threat in NorthAmerica, it has been startled by the way the aluminium can’s progress in Europehas suddenly stalled.
Until 1995 demand for aluminium cans in Europe was growing at 9% a year butsince then it has levelled off, not only because of the growth in PET bottles but alsobecause the steel industry, not wanting to see the beverage can market go thesame way in the USA – where aluminium had nearly 100% of the market – hadfought back spiritedly. Nick Mason, research manager of the aluminium group atthe CRU International consultancy, says: ‘Until very recently we thought there wasscope for the can to penetrate the European beverage packaging mix a little fur-ther, even though we recognise the looming threat of PET. But we estimate that,after three years of steady gains, the share of the packaged beer and soft drinksmarket taken by cans fell very slightly in 1996 to just more than 15%.’
FT
EOM_C13.qxd 6/23/05 10:53 AM Page 396

.
Market segmentation research 397
He points out that it is rare for a product to remain at the top for more thanten years and that in the USA and Europe, ‘we appear to be at, or close to, the finalsaturation phase in the life cycle of the can, although I do not believe that pre-cipitate decline is inevitable.’
Another worry for aluminium producers is that the drinks companies, havingquickly transferred the PET technology to Europe from the States, might do thesame in emerging markets, such as those in Latin America, on which the alu-minium industry is heavily relying for future growth in the can business. In softdrinks, for example, two US companies dominate the global business, Coca-Cola,with 47%, and Pepsi with 22.3%. ‘One lesson from Europe is that there is a risk,across a whole range of developments in packaging, of a leap to PET,’ says Mr Mason. ‘Packaging has become a crucial element of brand identity. Over a rela-tively short period, container and material combinations that offer proprietarydistinctiveness have acquired tremendous competitive advantages. ‘So far the pacehas been set by PET bottles.’
Nevertheless, the can remains an excellent container offering, for example, a30% cost advantage over glass bottles at the filling stage and, at present, competi-tiveness with PET in the ‘single-serve’ container filled in high volumes.
Mr Mason suggests that a ‘two-tier market’ might emerge, consisting of a highthroughput segment in which system economics still dominate – and in which cansretain many advantages – while the other would be the premium part of themarket, ‘in which the package, as much as the contents, may determine the valueof the product to the brand manager’. Ansheuser-Busch’s Mr Nieder implies thatbrewers are still attempting to find a way to win customers by using cans.
‘Cans are much more profitable to us than glass bottles,’ he points out. Hisgroup is experimenting with embossed cans, cans with labels using ten colours,cans with photographs on them, cans that change colour to show whether they arecold or warm, cans with ‘touch-off’ tops instead of ring pulls and shaped cans.
However, the plastic producers are now developing bottles made of polyethylenenaphthalate (PEN) capable of holding beer, so the plastic threat to the aluminiumindustry could become even more serious.
Source: Gooding7 (reprinted with permission)
MARKET SEGMENTATION RESEARCH
A segment is a unique group of customers – or potential customers – who sharesome common characteristics that make them different from other groups.Different segments may have different needs: they may require different versionsof the same product; they may pay different prices; they may buy in differentplaces; they may be reached by different media.
In consumer markets, customers and prospective customers can be groupedtogether, or ‘segmented’, by: attitude and lifestyle; age, gender or stage in the family life cycle; job types, level of income; and many other relevant variables.
EOM_C13.qxd 6/23/05 10:53 AM Page 397

.
398 Chapter 13 • Applied marketing research
In industrial markets, customers and prospective customers are usually groupedtogether and slotted into a particular segment depending on customer type, cus-tomer size, customer culture and customer location. Customers and prospectivecustomers can be further segmented according to whether they are heavy or lightusers of a particular product or service and whether they are loyal to a particularcompetitor.
Segmenting and selecting the optimum market segments is called target market-ing. This is a vital marketing skill. Target marketing requires an ability to:
• find the key characteristic(s) that break a market into relevant ‘actionable’ segments
• identify and quantify which customers fall into which segments
• target the segments most likely to give the best results.
Identifying what each segment wants, what it can afford, whether it is loyal toa particular competitor and how it might respond to an offer is vital information.Careful market segmentation and accurate targeting keeps a firm close to themarket. It reduces waste, finds the best customers and helps to keep them satisfied.
We can segment consumer markets using many different variables, including:
• geographic
• demographic
• geodemographic
• psychographic
• behaviour patterns.
Geographic segments mean location, which can include: streets, towns, cities,regions, countries, continents and trading blocs like the European Union andNAFTA.
Demographics, or social statistics include age, sex, family, life cycle, job type/socioeconomic and group income level.
Geodemographics mix geographic and demographic data to create categories ofhouse types and locations, for example, people who live in detached houses inexclusive suburbs.
Psychographics attempt to segment according to the psychological profiles ofpeople in terms of their lifestyles, attitudes and personalities, for example, activego-getters.
Behavioural segments address behaviour patterns which include usage (e.g.heavy or light users), and uses: the way a product or service is used – in otherwords, the benefit enjoyed.
A market can be segmented by the benefits enjoyed: different segments buy thesame product for different reasons. Some people use toothpaste for healthy teeth,others to prevent bad breath. Some people buy it for both reasons.
EOM_C13.qxd 6/23/05 10:53 AM Page 398

.
Market segmentation research 399
More than one variable can be used when segmenting markets and, indeed, themore variables the better since they help to focus on a tighter target market.Tighter targeting means less waste, more relevant offers to appropriate customersand higher customer satisfaction.
Industrial, organisational or business-to-business markets can also be brokeninto segments and the most appropriate ones selected as target markets. Differentvariables are used for these types of markets: customer type; size; location; andhow they operate in the corporate culture. Customer type categorises the type ofproduct or service that the customer organisation produces. In the UK, industrytype is defined by the Standard Industrial Classification (SIC) code. The size ofthe customer in terms of sales, number of staff and usage may determine whetheror not it is worth targeting. Size of customer is also influenced by whether theyare heavy or light users of a particular product or service, and whether they areloyal to a particular competitor.
Basic forms of segmentation
There are three segmentation bases: consumer, business and industrial and geographics.
Consumer segmentation
Consumer segmentation falls into two groups: syndicated and proprietary.Syndicated services use both primary and secondary sources. The informationmay be pure demographics, an implied mix of psychographics from demo-graphics or pure psychographics. Demographics are vital statistics: age, sex, marital status, ethnicity, family size and composition, nature of housing, occupa-tion, education and other statistical characteristics covered by the census.Psychographics are the psychological attributes that constitute a person’s lifestyleand have much to do with the person’s self-image and how he or she wants to beperceived. Purely psychographic studies are generally used only in proprietaryservices, for the sole use of the firm doing the study, because any such study hasto be tailored for specific needs and uses. The syndicated sources basically usedemographic statistics and embellish them in psychographic terms.
Business segmentation
Business segmentation is the description of areas or customers in terms of variouskinds of statistics, such as nature or size of the business. Business segmentation isnot as well developed as consumer segmentation. Firms can readily pinpointbusiness customers and potential customers and then promote directly to them.Moreover, there are few standard sources for such business and economic seg-mentation information. Some sources provide data on the general businessenvironment and outlook for a particular community and others give more detailabout specific kinds of business. On a simple basis, business customers may besegmented by SIC code or by classifications within the Yellow Pages.
EOM_C13.qxd 6/23/05 10:53 AM Page 399

.
400 Chapter 13 • Applied marketing research
Geographics
Many people have difficulty arriving at conclusions by inspecting large tables. Itis far easier to look at a coded or coloured map to get rapid and lasting impres-sions. Where tables show data by area, one can easily use mapping and computertechnology has facilitated this. Depending on the data source, maps can be dis-played in varying colours or shading patterns with almost unlimited possibilities,according to category, such as proportion of potential or actual customers, percapita spending in a particular product or service group or sales achievementversus potential. Most mapping sources can produce maps on paper, trans-parency film, slides or colour transparency overlays.
CARTOGRAPHYING GEOGRAPHIC SEGMENTATION
Computer technology has enabled the ready production of maps that display seg-mentation data effectively, a process known as cartographying. Depending on thedata source, the maps can be displayed in varying colours or shading patternswith almost unlimited possibilities, according to category, such as proportion ofpotential or actual customers, per capita spending in a particular product or servicegroup, or sales achievement versus potential. An illustration of how such mapsappear with the aid of a spreadsheet package such as Lotus 1–2–3 release 5 isshown in Figure 13.2. Most mapping sources can produce maps on paper, trans-parency film or slides, and colour transparency overlays are almost always apossibility.
GEOGRAPHIC INFORMATION SYSTEMS
A geographic information system (GIS) makes use of graphical map displays on towhich various kinds of data, such as business locations or demographic informa-tion, can be superimposed. This enables the user to visualise the spatial relation-ships between the data. A good GIS can be linked to information databases and canmake spatial calculations on the data within the maps. This form of analysis helpsusers to make business decisions about such matters as where to locate a newoutlet, by matching customer profiles and population density to actual geographicalphysical locations.
MapInfo is a leading provider of such systems, and the most recent version of itsflagship product, MapInfo Professional (v7.8), has the advantage of being com-patible with Microsoft Windows XP and Oracle 10g, both functionally and security-wise. At the same time, the product remains compatible with previous versions ofsoftware, such as Oracle 9i, Oracle Locator and Oracle 8.17 as well as Microsoft SQL Server 2000 and IBM Informix 9.4. Aside from database systems, MapInfo
EOM_C13.qxd 6/23/05 10:53 AM Page 400

.
Cartographying geographic segmentation 401
FIGURE 13.2 Map drawn with the aid of Lotus 1–2–3 showing population figures, 1990
Professional can also access and use information in a variety of commonly useddata formats. Supported formats include Microsoft Excel, Microsoft Access, DBFfiles, delimited ASCII text files, various commonly used drawing data formats(including data from CAD packages and other mapping systems) and data from Webservers.
s
EOM_C13.qxd 6/23/05 10:53 AM Page 401

.
402 Chapter 13 • Applied marketing research
The product is able to assess the spatial relationship between points of originand various other locations listed in a table. For example, one can identify a list ofsales prospects and the software will automatically find the nearest service centrefrom a table that lists the location of all available service centres. There is also anextremely useful spider graph feature. If, for example, a supplier company wantedto see how its customers are distributed among its various branches, the spidergraph dialog can be used to establish the spatial criteria.
MapInfo Pro enables the user to perform sophisticated and detailed data analy-sis to increase revenue, lower costs, boost efficiency and improve service withlocation-based intelligence. Its creators maintain it can:
• create highly detailed maps to enhance presentations and aid in decision making
• reveal patterns and trends in data that may otherwise be impossible to see
• perform sophisticated and extensive data analysis
• enable users to understand customer and marketplace demographics
• facilitate the management of geographically based assets, such as stores,people and property
• enable the planning of logistics and preparations for emergency response.
A very useful feature of the system is the Synchronized Map Window view that enables the user to view the same area with multiple map windows open. As the user zooms or pans within a single map view, all other windows can be synchronised to zoom/pan simultaneously in the same fashion. In this way, mapviews showing different features (e.g. different thematic maps) of the same area ofinterest can continue to be studied alongside the principal view of the map cur-rently being used.
Source: MapInfo8
COMPETITION RESEARCH
Identifying competitors
The first step is to identify the competition. This may seem a simple question formost firms to answer. For example, at first sight a book publisher’s main com-petitors might appear to be other book publishers. This is, of course, correct.However, product substitution has also to be considered. This involves lookingmore broadly at the types of business in which the firm operates. If this is doneone can identify many producers of goods and services that people use forleisure, education and other informational needs. Many of these products could
EOM_C13.qxd 6/23/05 10:53 AM Page 402

.
Competition research 403
be potential competition for the publisher. Many of these products could be usedinstead of the publisher’s books – i.e. they can be substituted.
Sources of information about competitors
Decision making can be improved by an adequate supply of relevant informa-tion and a knowledge of good sources of information is an important first step. Asuitable starting point is to examine what competitors say about themselves andwhat others say about them. Sources of information fall into four categories:
• public
• trade
• government
• investors.
Public sources
Advertising, promotional materials and press releases are prime sources of information on what competitors have to say about themselves. Articles andnewspaper reports provide a good source of information on what others have tosay about them. Nonetheless, one does have to be wary of the informationgleaned since it may be biased or even distorted.
Trade and professional sources
Courses, seminars, technical papers and manuals prepared by competitors cangive detailed insights into their activities. However, it can take a considerableamount of time to distil and analyse this information. Distributors, the tradepress and even customers can be good sources of information about what othershave to say about competitors.
Government sources
In the UK, companies have to lodge their annual reports at Companies House inLondon and the contents of these reports provide insights into the operations ofcompetitors. In addition, lawsuits, government ministries and national plans areuseful sources of information.
Investors
Annual meetings, annual reports and prospectuses are primary sources of whatcompetitors have to say about themselves. Credit reports and industry studiesprovide an outsider’s viewpoint.
EOM_C13.qxd 6/23/05 10:53 AM Page 403

.
404 Chapter 13 • Applied marketing research
NEWSPAPERS ARE A SOURCE OF INFORMATION ABOUTCOMPETITORS
Nike
Is Nike no longer cool? Its shares certainly are not. The sportswear group, a stock-market star for much of the 1990s, has underperformed the S&P 500 by over 70%this year. Even Reebok, its smaller and more fragile rival, has not done quite as badly.The two companies have blamed their recent profit warnings on Asia, and with somejustification since the Far East has been an important source of growth in recent years.
More significant, however, are the sudden problems in the USA, which stillaccounts for over half of sales at both. Some slowing was inevitable. Nike’s torridgrowth, based on winning market share and ramping up prices in a fundamentallystatic athletic footwear market, was always going to plateau. But few investorsexpected footwear sales and orders to start declining, as they did last quarter. Thatprobably reflects resistance to this spring’s sharp price increases. Many of Nike’sshoes sell for well over $100 a pair, while competitors such as Converse andAdidas have launched ranges at $80 to $100. But the real worry would be if Nikewas ever to lose its touch with the notoriously fickle teenagers who set the trendsin the sportswear market.
Nike will bounce back. It has a strong balance sheet, a great brand and isbranching out into new market segments like golf and soccer. But with no big newproduct launches until early 1999, and plenty of unwanted stock to unload untilthen, its comeback will take time.
Source: Financial Times9 (reprinted with permission)
Understanding competitors’ marketing strategies
Understanding competition is central to making marketing plans and strategy. Afirm has to be regularly comparing its products, prices, channels of distributionand promotional methods with those of its competitors in order to ensure that itis not at a disadvantage. In so doing it can also identify areas where it can gain acompetitive advantage.
In order to establish a sustainable competitive advantage in the marketplace itis necessary to know and understand the strategies adopted by competitors. Thisis more than noting in which markets/segments the competition is operating and their respective market shares and financial performance. In addition, it isimportant to consider how competition will develop in the future and thus toascertain the focus of the strategies that competitors are pursuing.
Firms need to monitor competition continually. The main need is for informa-tion regarding:
• sales
• market share
FT
EOM_C13.qxd 6/23/05 10:53 AM Page 404

.
Promotion research 405
• profit margin
• return on investment
• cash flow
• new investment.
In addition, knowledge of competitors’ financial performances is useful.Such information enables firms to gain comprehensive impressions of their
rivals that may be useful in predicting short-term strategies to be adopted by competitors. A knowledge of competitors’ specific objectives would be verywelcome since these would give clues as to future strategies that competitors are likely to pursue. This kind of information may be difficult to obtain but maybe inferred from present or past activities.
PROMOTION RESEARCH
Much of promotional research is aimed at the development of advertisingappeals. The type of research this requires may be classified as psychological (ormotivational), sociological (focus groups) and anthropological (observation).
Psychological (motivational) studies
Motivational research usually employ psychological approaches within theframework of individual interviews. This involves talking with people in depthabout what a product may mean to them: products may often evoke strong emo-tional feelings. Thus it is often possible to discover what a product symbolises.
Sociological (focus group) studies
In Chapter 8 we examined the use of focus group technique. Sociological studiesmay lead to ideas that a single person would be unlikely to generate.
Anthropological studies
Anthropological studies may observe a small number of people in order tounderstand how a product fits into their lives and what retains their interest in aparticular brand. The method has also been used as an in-depth tool to obtainbetter understanding of consumers. It can provide a way of getting past the levelof responses to questions by observing what people actually do, instead of merelylistening to what they say.
EOM_C13.qxd 6/23/05 10:53 AM Page 405

.
406 Chapter 13 • Applied marketing research
EFFECTIVENESS OF POSTER ADVERTISING
Some 300 people aged between 18 and 55 were shown ten current posters andasked whether they remembered seeing them before. They were also asked to indi-cate how much they liked each poster by giving a mark out of ten. More than 80%recognised at least one poster, ranging from 61% for Esso Price-watch to 9% forthe National Lottery ‘National Heritage’ advertisement. Four posters – Esso,Peugeot 406, Silk Cut ‘German’ and Foster’s Lager ‘Ambre Solaire’ – were recog-nised by one-third of respondents.
Men were twice as likely as women to have noticed one poster before – but this may have been caused by the rather masculine nature of the products. Malerecall was particularly high for the Royal’s ‘Batman’ advertisement and for theLittlewoods FA Cup advertisement for which men make up 70% of the recognisers.Of Channel 4’s NBA poster and the Silk Cut and Orange campaigns, the under 25sare similarly important.
The Esso and Royal Insurance poster advertisements tied for top position in thesurvey, with Esso taking first place among the females and over 35s.
Poster Liking marks Ranking Recognition Rankout of 10 % saying
Royal Insurance 5.4 1 20 8Esso 5.3 2 61 1Peugeot 4.9 3 47 2Silk Cut 4.9 3 47 2Toyota 4.7 5 22 7Foster’s 4.7 5 35 4Littlewoods 4.5 7 27 5Channel 4 NBA 4.5 7 25 6National Lottery 3.8 9 9 10Orange 2.8 10 19 9
Source: Poster watch10
MEASURING ADVERTISING EFFECTIVENESS
Measurement of advertising effectiveness is one of the most difficult aspects ofmarketing research. Many factors influence sales besides advertising. The otherfactors include all the elements of the marketing mix, together with the availabil-ity of the product and the effect of competition. It is perhaps only when peopleplace orders in response to advertisements, however, that we can be reasonablysure about its effectiveness in terms of producing sales.
Advertising must, however, provide information and it must persuade.Various available copy-testing research services are essentially built around these
EOM_C13.qxd 6/23/05 10:53 AM Page 406

.
Measuring advertising effectiveness
two premises. Most leading agencies provide services to measure awareness-creation ability, information retention and persuasability of advertisements.Another service provides guidance on how the particular advertisement might bemodified to be more effective.
Advertising content research tests an advertisement’s ability to project thedesired message to the target audience. The design and layout of an advertisementare tested together with the basic theme: the copy platform. Different kinds ofcommunication appeal are tested out in this kind of research. Measurements canbe taken at two stages: pre-publication and post-publication. At the pretestingphase, emphasis is placed on ideas and methods of publication; at post-testing,the emphasis is on measuring how effectively communication concepts werereceived by the intended audience.
The pretesting of advertisements can involve the following:
• Direct rating, where a consumer panel is shown different advertisements andasked to rate them on each advertisement’s attention-getting power, whether itencourages the recipient of the message to listen, watch or read further, theclarity of the message, the effectiveness of the appeal and whether it suggestsfollow-through action.
• Portfolio tests, where the participant is presented with a collection of advertise-ments and asked to recall their content. Recalling an advertisement reflects itsability to be understood and remembered.
• Laboratory tests, which are used to measure the consumers’ physical reactionsto advertisements. Pupil-dilation tests, changes in heartbeat, etc., reflect anadvertisement’s ability to attract attention.
Post-testing is mainly concerned with the recognition and recall of advertise-ments. Recognition is measured by showing participants an advertisement andasking if they recognise it. Recall can be measured using either unaided or aidedrecall tests. In unaided recall tests, participants are asked to remember whatadvertisements they have seen recently, sometimes for a specific product cate-gory. In aided recall tests, participants are shown a series of advertisements,including the one you are interested in, and asked which ones they have seenrecently and what impact they had.
Advertising campaigns have a number of objectives and advertisers want toknow how effective they have been in reaching these objectives. Changing aware-ness, knowledge and preference about a brand may be the objectives for acampaign. The use of models such as the Lavidge and Steiner11 hierarchy ofeffects model may enable researchers to specify the kind of advertising researchthat is appropriate. Researchers may try to assess how successful an advertisingcampaign has been in terms of, say, creating awareness of a product or givingpeople information about a product or service that will move them further up theladder of purchase intent. Similar measures may be taken for creating a liking,
407
EOM_C13.qxd 6/23/05 10:53 AM Page 407

.
408 Chapter 13 • Applied marketing research
developing a preference, bringing about conviction and, where relevant, actualpurchase.
Current thinking about advertising effectiveness suggests that four elementsare generally regarded as extremely important:
1 Awareness. A variety of studies of assessing awareness point to its importance.Studies by the Dutch organisation NIPO12 through its brand-monitor system,demonstrate a high correlation between brand loyal buying behaviour scoresand aggregate brand awareness. They also found a high correlation with brandawareness and the numbers of people who claim that their next purchase of adurable will be a given brand.
2 The customer liking an advertisement or finding it appealing. The AdvertisingResearch Foundation’s Copy Research Validation Study suggested that the ‘like-ability of a commercial was the single best predictor of sales effectiveness’. Theuse of a likeability scale claims to predict sales winners 97% of the time.13
Factors such as ingenuity, meaningfulness, energy and warmth were found tounderpin likeability. The relative importance of each one of these factorsappears to vary across products.
3 Interest. Finding an advertisement really interesting is suggested as being evenmore important than liking the advertisement.14
4 Enjoyment. The extent to which an advertisement is enjoyed has been found tobe a better pretest measure than short-term recall.15
These advertising-effectiveness predictors are often used today by marketresearch companies, usually under the direction of the advertising agency. Thepredictors are linked to the customer’s emotional thoughts.
Advertising media research
Research here tries to eliminate waste in advertising by systematically examiningthe media available for promoting products and services.
Press research
This mainly takes the form of readership surveys, for example, the NationalReadership Survey, which is based on a stratified random sample of 28,500 adultinterviews over a continuous period of 12 months. Businesses making use of thissurvey obtain breakdowns by demographic characteristics, regional distribution,television viewing, cinema attendance, commercial radio listening and specialinterests. Average issue readership is provided for each publication, together witha regional analysis. The National Readership Survey is administered by the JointIndustry Committee for National Readership Surveys (JICNARS).
EOM_C13.qxd 6/23/05 10:53 AM Page 408

.
Measuring advertising effectiveness 409
Television advertising research
The Joint Industry Committee for Television Advertising Research ( JICTAR)appoints a research organisation to provide a research service based on a televi-sion panel of UK households. The service releases information on the size ofaudiences at different times of the day and week by projecting the viewing pat-terns of the sample panel. A measure is also taken of the audience appreciation ofTV programmes.
Radio research
A Joint Industry Committee for Radio Audience Research ( JICRAR) follows thepattern set by JICNAR and JICTAR. The JICRAR survey is based on seven-daydiaries distributed among random samples of people aged 15 or more living inprivate households within a radio station’s designated area. The diaries areplaced and collected by the interviewers.
Cinema audience research
This is covered mainly by the National Readership Survey administered by JICNARS.
Poster research
The Joint Industry Committee for Poster Advertising Research (JICPAR) commis-sions a research organisation to estimate both pedestrian and vehicular audiencesfor all posters. Information is also provided on types of area, shops and commer-cial characteristics so that posters can be strategically sited.
Television audience measurement
Measuring methods used are diaries, set meters and people meters. A mediaresearch diary involves participants keeping records of their television viewing ina structured form. It is usually kept for a week and covers, by day of the weekand time of day, station and programme identification. Diaries are on a house-hold basis, with a diary for each household set. Every person 12 years of age orover, or an adult surrogate, is asked to fill in the diary. Viewing of younger chil-dren is also recorded.
The set meter is an electronic device attached to the individual television set inthe home. It automatically records the time, whether the set is on or off, and thechannel to which it is tuned – all reported on a minute-by-minute basis. The dataare recorded in a home storage unit and are transferred to the research firm’s cen-tral computer the next day, through telephone lines. Since the participating homeneeds an expensive installation, this is operated with a relatively small panel ofhouses.
EOM_C13.qxd 6/23/05 10:53 AM Page 409

.
410 Chapter 13 • Applied marketing research
The people meter is a special form of the set meter. In this case, each familymember pushes buttons on a keypad to indicate viewing and these data are auto-matically recorded simultaneously with set usage.
Each of the three methods presumes to measure total audience size. Thestraight set meter measures only whether the set is on or off. Figures showingtotal audience size and size by nature of household demographics are producedbut specific viewers and their demographics cannot be identified. Such measure-ments are not specific enough to permit an advertiser to pinpoint its desiredindividual market. Diaries and people meters provide demographic definitionsfor individual audiences. People meters have added a method of measuring thedemographics of the audience to a particular show.
Magazine audience measurement
The method usually used to measure the audience involves taking the personthrough the book and asking aided recognition questions. The researcher has adeck of cards, each containing the logo of one of the magazines being covered.The deck is handed to the respondent, who is asked to sort the cards into twopiles, placing in one pile those he or she might have read or looked into in thepast six months and, in the other pile, those the person is sure that he or she hasnot read or looked into. For each magazine that the respondent ‘might have reador looked into,’ a stripped issue (containing up to nine articles) is shown. Theissue is sufficiently dated to permit time for the magazine to accumulate its totalaudience. The person is shown each of the articles and then asked whether the particular issue was seen. Then follow other queries such as where the pub-lication was seen and the overall rating the respondent would give. Reports generated show, for each magazine, summaries of audience accumulation andreach, net unduplicated audiences for combinations of magazines, total and in-home audiences by demographics and psychographics, and qualitative meas-ures of readership.
Newspaper audience measurements
Newspaper measurements usually call for two interviews with each respondent,separated by a short time interval, and employ the ‘yesterday reading’ method.For daily newspapers, respondents are first asked what newspapers they haveread or looked into during the past six months. Then, excluding the day of theinterview, they are asked when they last looked into an issue of the particularpaper and the amount read (but only the replies of those reading yesterday arecounted). The same general procedure is followed for Sunday newspapers, withnecessary changes. Qualitative questions about place of reading and how thepaper was obtained may also be asked.
EOM_C13.qxd 6/23/05 10:53 AM Page 410

.
Selling research 411
SELLING RESEARCH
Research into selling is examined by Moutinho and Evans16 and there are variousmodels reported in the literature that discuss, among other things, how to allo-cate territories to representatives (see, for example, Lilien et al.17). The illustrationin the following box, however, shows research in action in terms of the morequalitative dimensions of selling.
GETTING FEEDBACK ON SELLING
Pharmaceutical firms depend primarily on the salesforce as the means of commu-nication with both existing and potential customers. In order to provide informationof the effectiveness of representative detailing, ‘follow-up research’ has developed.The research aims to contact those healthcare professionals who have been visitedby the representatives and to question them about their recall of the interview.Research interviews with professionals are usually conducted over the telephoneand last 10 to 20 minutes each.
The analysis of the results is usually presented in a series of quantitative meas-ures of various parameters used to assess the effectiveness of the detail. Theparameters might include:
• recall of the detail taking place
• recall of the key communication objectives
• reaction to the information provided
• impact on usage.
A wide spread of interviews is obtained by limiting the number of interviews con-ducted for each representative in the fieldforce. For an average fieldforce of 50 to 60representatives, a sample of two interviews per representative is a reasonabletarget. This works well for larger samples and where most of the questions can beprecoded. Much more, however, can be learned from a detailed follow-up survey,particularly when interviews are tape recorded. Verbatim transcripts of interviewsshow the depth and richness of the answers.
Although the results of a detailed follow-up survey are useful in their own right,they are made much more useful when comparisons are made with other detailedfollow-up surveys conducted for the same company and with surveys conducted bycompetitors. Standard norms of performance may be developed for both levels ofrecall of a product, the number of key communication points that are recalled andthe impact on usage. Through the use of these comparisons, an effective measureof the success of the detail can be obtained.
Source: Scott18
EOM_C13.qxd 6/23/05 10:53 AM Page 411

.
412 Chapter 13 • Applied marketing research
PRICING RESEARCH
Research into pricing explores pricing approaches both for new products beforethey are launched and any proposed changes once they have been launched.There are two general approaches to pricing research. The first19 involves pre-senting different prices for a product to respondents who are then questionedabout whether or not they would buy. A ‘buy-response’ curve of different pricesassociated with positive purchase intentions is then constructed. Anotherapproach involves people being shown different sets of brand in the same pro-duct category, at different prices. They, too, are then asked which ones theywould buy. This latter approach enables competitors’ brands to be taken intoaccount by respondents.
Statistical analysis of data is useful for helping to sort out the effects of priceversus that of other variables on quantities sold. The main technique used isregression analysis. Data obtained from consumer panels can be analysed withregression analysis to assess the impact of price changes.
Another commonly applied approach is to make use of survey data. Aquestion might be included in a survey such as ‘By how much would your sales increase (or decrease) if prices were increased (decreased) to . . . ?’ Such aquestion would be aimed at distributors but similar questions can be put to consumers. But obtaining response curves in this way can be subject to error.Distributors may readily exhibit bias and consumers are usually unable to givereliable answers to questions about how price affects their brand purchase andpreferences.
Yet another approach is to make use of laboratory experiments and simulatedtest markets. This usually involves having a simulated store where prices arealtered experimentally and their effects on purchase levels assessed. This is a rela-tively inexpensive way of estimating the demand for a product at different prices,but getting a sense of reality into the simulation can be difficult and the simula-tion may not represent the real world at all well.
The standard test market also offers an approach to pricing research.
PRICING PHARMACEUTICALS IN EUROPE
Despite the fact that controllers of drug budgets can exert an influence over whatphysicians prescribe, the latter have to believe that a product has a ‘perceivedvalue’ that is commensurate with its price if they are to prescribe it. Some coun-tries are now following the example set by France in requiring firms to examine thevolume projections for a new product and using it as a basis for price setting. Thedanger in this is underlined by the sales history of the antidepressant Prozac. Assales in France exceeded forecast, Lilly was forced into reducing its price.Eventually the price in France was cheaper than that in the UK and other countriesand led to parallel importation despite an initial pan-European approach to pricing.
EOM_C13.qxd 6/23/05 10:53 AM Page 412

.
Distribution research 413
Marketing research is needed to determine the price/volume ratio required tofocus as much if not more on the patient’s willingness to pay as the physician’s will-ingness to prescribe. In the future, investigations using consumer pricing researchtechniques, such as the Gabor and Grainger method, will probably become moreand more popular. Such studies will also benefit from the ‘perceived value pricing’approach developed since 1989 at Martin Hamblin Research. In this latter connec-tion, the adoption in the last two years of choice-based conjoint techniques enablesthe researcher to examine a variety of scenarios that might affect the market in thefuture: for example, what happens if important competitors reduce their prices.Choice-based conjoint is a valuable procedure for exploring the potential actionthat prescribers and buyers would take, given a change in market circumstances.Bowditch and Fitall20 describe how Janssen used the method when examining anumber of alternative line extensions for one of its leading products, enabling thefirm to develop a forecasting model. The model not only established the impact onthe product and the competitors from the alternatives tested, but also helped toestablish the projected profit and loss for each one.
Source: Bowditch21
DISTRIBUTION RESEARCH
A variety of research can be conducted to cover distribution. The relevance of such research often reflects whether the sponsors are engaged in business-to-business or consumer marketing. There are many commonalities in terms of requirements. Possibly the main difference reflects the fact that research isrequired at the retail level – the consumer interface – in the case of consumer-goods marketing.
Research can also be divided or categorised according to whether it is in con-nection with physical distribution decisions or with channel selection andmanagement. In the case of physical distribution there are obvious overlaps withthe broader subject area of operations management and operations research tech-niques that help to optimise the management process. For example, inventorymanagement may be regarded as part of the distribution system (or part of theproduction system) depending on whether it is at the factory or at a distributionwarehousing facility. The topic of inventory optimisation is well covered in theoperational research management literature. Warehouse location and layout for optimal efficiency are also discussed extensively in the operational researchliterature, as are models to facilitate the optimal transportation of goods policies(see, for example, Taha22) although Moutinho and Evans16 do discuss warehouselocation research and retail outlet location research. Lilien et al.17 provide a goodoverview of the kind of models and information requirements useful in bothphysical distribution and channel strategy decisions.
EOM_C13.qxd 6/23/05 10:53 AM Page 413

.
414 Chapter 13 • Applied marketing research
In consumer marketing, Crimp23 discusses retail audits in general and the useof syndicated trade research in the assessment of performance compared withthat of competitors through the retail audit. Retail marketing perhaps offers moreopportunities for the traditional market researcher through the medium of shop-ping surveys. These tend to be restricted to retailing generally and to servicemarketing where there is a mixing of customers – hotels, restaurants and the like.In these studies, a fieldworker poses as a customer and makes mental notes onaspects of customer service. The shopper may note those aspects of service thatwere or were not present or they may note the quality or rating of service. Someof the aspects typically covered are:
• product or service quality
• facility quality
• personnel courtesy
• personnel efficiency
• personnel service
• personnel promotion of selected brands, items, features, benefits
• items stocked, offered, on display
• prices.
Such studies are usually handled by an outside specialist firm.
ELECTRONIC REVOLUTION IN THE RETAILING WORLD
More sophisticated sales strategies and strong interest in electronic commerce arefueling a boom in IT use among retailers.
The retail sector is a battleground where the effective deployment of informationtechnology can make the difference between victory and defeat and where recentadvances in information systems and the prospects for electronic commerce arebringing about the most rapid changes in retailing for decades.
Meanwhile, in an attempt to differentiate their services and retain customer loy-alty, retailers are using IT systems to personalise their offerings and switch fromdemand-led to customer-focused strategies.
‘Consumers have become incredibly demanding,’ says Deloitte & ToucheConsulting. ‘They have high expectations for ever-improving quality, better infor-mation, better service at lower real prices – and they are getting it. They are able toenforce these demands because of the information explosion and the increasingcompetitive alternatives available to them today.’ Retailers, already under tremen-dous pressure on margins, are trying to reduce labour costs, improve customerretention and finetune pricing and inventory. To achieve this, they are deploying awide range of IT systems ranging from demand forecasting and logistics software,to self-scanners, electronic labelling systems and huge data warehouses.
FT
EOM_C13.qxd 6/23/05 10:53 AM Page 414

.
Distribution research 415
‘There is already a sustained pressure in the retail supply chain to reduce costand this trend is set to continue,’ says IBM, one of the leading suppliers to the retailsector. ‘Overall, the strategic trend by the retailer is to move from “product led” to“market led” by improving knowledge of the consumer and consequently increas-ing margins by more effectively positioning products.’
Demand-chain management software, such as Industri-Matematik’s SystemESS, is based on the principle that customer ‘pull’ through the demand chain hasprimacy over the desire of manufacturers to ‘push’ products through the supplychain. It is increasingly seen as a key to delivering business benefits such asimproved customer service, better financial performance and differentiated products.
According to a recent Harvard Business Review study, most retailers estimate thecost of carrying inventory for a year is equivalent to at least a quarter of what theypaid for the product. Therefore a two-week inventory reduction represents a costsaving of nearly 1% of sales and a significant boost to profits.
IT systems also help retailers monitor ‘customer traffic’ using infrared or video-tracking systems to follow shoppers’ movements, identify ‘cold spots’ in the storeand help to ensure adequate staffing levels in service-critical areas.
Meanwhile, loyalty cards – increasingly likely to be smartcards – are being usedto boost what analysts call ‘frequency of shop’, especially in the food retailingsector.
Other back-office systems sort out ‘customer activity’ by hoping to classify shop-pers by ‘type of purchase’ and promoting goods that will appeal to them while inthat frame of mind by product positioning or related discount offers.
‘Overall, there are two big vectors in retailing,’ says Julian David, marketingdirector for IBM Europe’s distribution industry business unit. ‘Digitisation, in all itsforms, and personalisation.’ In spite of reduced market growth expectations, com-panies in Europe’s retail and distribution industries plan to increase their IT invest-ments by up to 10% this year, according to a survey sponsored by IBM. In largecompanies, IT spending is being driven by the challenges of improving overall infra-structure, cost competitiveness and customer service, with investments focusedmainly on supply chain management, targeted marketing and globalisation.
For example, Benetton, the fashion retailer, signed a worldwide agreement withIBM in July, which will eventually link point-of-sale terminals in 7000 shops andfive continents. ‘Operational management of the business will be simplified and itwill be possible to distribute IT services from our central data processing system tothe point of sale,’ says Bruno Zuccaro, Benetton’s computer systems director.
Existing IT investments are also being used differently. When electronic point-of-sale (EPOS) systems were introduced over a decade ago, they were mostly used forstock control and inventory management. Now, however, retailers are using the datathey collect in different ways – to identify trends and target individual consumers.
‘IT in retailing is moving from being an operational tool, primarily aimed atimproving inventory control and front-end technologies, to become an enterprise-wide mechanism for increasing efficiency throughout the supply chain,’ says AndyCummins, retail marketing manager for Siemens Nixdorf in the UK.
‘With the merchandise pipeline geared for rapid response, the priority of manyretailers is to identify customer requirements and shopping habits using the mostrecent relational database systems and data mining techniques,’ he says.
s
EOM_C13.qxd 6/23/05 10:53 AM Page 415

.
416 Chapter 13 • Applied marketing research
Retail-based data warehouses manage the records of individual transactionsfrom a variety of processing systems and information sources such as electroniccash registers, inventory systems, weather records and customer demographics.They then enable users such as store managers to query the database. ‘Retail isdetail,’ says Tony Fano, senior vice-president of NCR’s Atlanta-based retail group.
NCR, a leading data warehouse provider, says retailers typically begin asking thedata warehouse about the company, then about individual stores, followed byinquiries about individual items and prices. They then demand historic data so theycan examine trends by season or region. Such information allows retailers to domarket-basket analysis, looking at each customer’s entire transaction history todesign loyalty programmes, determine display space, and judge the effectivenessof promotions. Wal-Mart, which claims to operate the world’s largest commercialdata warehouse, uses the vast amounts of information stored there to guide its business. It is expanding the warehouse, based on the NCR Teradata system, from7.5 terabytes to more than 24 terabytes – the equivalent of 6bn pages of text.
‘Our business strategy depends on detailed data at every level,’ says Randy Mott,senior vice-president in charge of information systems at Wal-Mart. ‘Every cost,every item is carefully analysed, enabling better merchandising decisions to bemade on a daily basis.’
Among the UK-based stores, Safeway has already deployed its ‘Shop and Go’self-scanning service to more than 130 stores and plans to roll it out in another 35 stores by the end of 1997.
Self-scanning systems have been on trial for more than ten years but with mixedresults. Analysts believe it is only now as customers become familiar with high-tech systems that the concept seems to have taken off. It has been much the samewith multimedia kiosk systems that first appeared in the early 1980s using cum-bersome 12-inch video disks.
Numerous schemes have been tested since then and most have failed, but inter-active media now seems to be gaining more popular acceptance. Kiosks are seenby many analysts as simply one of a range of channels to market which retailerswill deploy in the future. Clearly, the Internet, and the World Wide Web in particu-lar, represents another important and rapidly emerging channel.
Although many early entrants in the home shopping arena, such as TimeWarner’s Dream Shop, IBM’s World Avenue, comprising 20 retail ‘shops’, and e-ShopPlaza have been slow to take off or have failed, many specialist Internet-basedstores are flourishing and most market research firms predict a bright future forelectronic commerce. Nevertheless, forecasts for business-to-consumer electroniccommerce vary wildly from a conservative $6.6bn in 2000 from Forrester Researchto around $200bn from IDC and Input. Despite this, a Cap Gemini sponsored surveyof European retailers published in March suggested the greatest uptake of elec-tronic shopping by retailers will come not in the longer term, but over the next two years.
According to the Cap Gemini survey, most retailers outside traditional mail orderexpect 13% of their sales to be via home shopping within two years, rising to 26% inten years, yet despite these bullish forecasts, almost 60% said this would not affecttheir existing store operations. In other words, most retailers hope to run theirphysical outlets and electronic channels profitably side by side.
EOM_C13.qxd 6/23/05 10:53 AM Page 416

.
Questions 417
Internet shopping in particular is forecast to increase its share of total sales dramatically with 70% of retailers expecting to be receiving customer orders via theWeb within two years.
‘Over the next decade, Internet shopping will steadily build for traditional store-based retailers to 14% of total sales, and just over half of home shopping sales,’says the Cap Gemini report. ‘Television shopping – via both dedicated and inter-active channels – is also expected to enjoy major growth after the next two years.’
Source: Taylor24 (reprinted with permission)
SUMMARY
This chapter has examined several applied areas of marketing research: productresearch, segmentation research, competition research, promotion research, pric-ing research and distribution research. In the case of product research, attentionhas been paid to product generation and testing, consumer product testing andpackaging research. In the case of segmentation research, attention has beengiven to researching ways of segmenting the market. In promotion research,attention has been focused on the ways of assessing its suitability and effective-ness, and various approaches to pricing research were examined. Finally,attention was paid to some aspects of distribution research.
QUESTIONS
1 Explain how marketing research can be used in product generating andtesting.
2 What is product delivery? What is the relevance of marketing research to thistopic?
3 Discuss the role of the Delphi technique in product research.
4 What is market segmentation research? What actually takes place?
5 Discuss the problems involved in identifying competitors and indicate howfirms might obtain information about competitors’ strategies and intendedstrategies.
6 Indicate the different marketing research methods that have been successfullyapplied in researching the elements of the marketing mix.
EOM_C13.qxd 6/23/05 10:53 AM Page 417

.
418 Chapter 13 • Applied marketing research
CASE STUDY 13.1: TOURISM IN BUKHARA
Central Asia conjures up all kinds of mystic and romantic images for Europeansand others who have no experience of it. Whether it is reading about the expedi-tions of Marco Polo or listening to the music of Mussorgsky, the image seemsquite distinct from that of other parts of the world. Names of places such asSamarkand and Bukhara add to this illusion, bringing into the imaginationimages of cities glittering with golden palaces and jewel-bedecked rulers.
Some people think that the future of Bukhara in Central Asia lies very much in its past. In the days when the Silk Road was the main highway to the Orient it was crowded with businessmen, merchants, camels and camel drivers.Warehouses full of silk, brocade, cotton, carpets, gold and silverwork were dottedalong its route. Today, however, Bukhara still has spectacular buildings in fan-tastic shape, fitting epitaphs to its illustrious past.
The Lyab-I-Khauz pool is entertaining. It is surrounded by plane trees and is aplace where locals and foreigners alike can go to eat shashlyk or drink plov or tea.On the east side of the pool is the Nadir Divanbegi madrasa, built around 1620.Above its main entrance are fantastic mosaics including the sun with a Mongolface, two strange birds and a goat. Such mosaics are not completely contrary to allMuslim teaching, only to Sunni teaching. On the west side of the pool is whatwas once a khanaga, a hostel for wandering dervishes. Today, however, it is anexhibition hall. On the north side of the pool is the Kukeldash madrasa, the largestin Bukhara, with over 150 cells, or rooms, and an enormous courtyard inside.In Bukhara there are different bazaars. One such bazaar is the Tag-I-TelpagFurushon where it is possible to purchase quality astrakhan hats and gold-embroidered skullcaps.
In Samani Park one finds the spring of Jacob (or Job, according to some) whichis considered by some to possess miraculous powers of healing. Then there is theArk or Fortress or original Walled City, which contained royal apartments, recep-tion rooms, stables, mosques, a treasury, police department, prison and homes foraround 3000 people. It was destroyed time and time again in the 10th, 11th, 13thand 20th centuries.
Bukhara used to be one of the world’s most famous religious and tradingcities. Some regard it now as simply an overnight stop for package tourists ontheir way to and from China.
Question
Assume a tourism promotion agency is to be set up in Bukhara. Suggest a researchproposal that could be implemented in order to establish how the concepts of marketsegmentation, targeting and positioning and the marketing mix might be profitablyapplied to re-establish Bukhara as a tourist destination rather than merely anovernight stop in the minds of tourists.
EOM_C13.qxd 6/23/05 10:53 AM Page 418

.
Case study 13.2 419
CASE STUDY 13.2: SOUTH AFRICA
The Sotho word, Gauteng, translates into English as ‘place of gold’. It is the newname given to the Pretoria–Witwatersrand–Vaal triangle, one of the largest indus-trial regions in the southern hemisphere. In 1886, on a patch of windswept veld,an unemployed miner came across a stone containing traces of gold. From thisevent came the discovery of the world’s richest natural treasurehouse. Speculators,prospectors, fortune seekers and adventurers arrived in the area from all over theworld and, in a comparatively short space of time, the pastoral landscape wascompletely transformed. First, shanty towns sprang up as goldrush fever grippedthe area. Then these shanty towns rapidly changed into modern concrete cities.Johannesburg became known as the ‘gold capital of the world’ and the entirecountry became the centre of an economic boom. The revenues generated by goldin the world’s export markets enabled the country to develop its impressiveindustrial, commercial and financial strength.
South Africa is home to an extraordinary variety of ethnic groups, cultures,creeds and languages. The background to this human diversity extends overthousands of years to the original inhabitants – the Stone Age hunter–gatherersknown as the Bushmen. Black migrants arrived from the north to take their placeand they, in turn, were followed by European and Indian immigrants. Gauteng isa dynamic, cosmopolitan kaleidoscope representing most of these different cul-tural components.
Johannesburg is nouveau riche territory: a modern, cosmopolitan metropolispacked with vitality and verve. In quiet, leafy suburbs, baronial mansions inmanicured gardens lined with limousines testify to the fact that the city, at the topof the supertax bracket, is a very affluent society. In the central business district,the astute make daily fortunes on the stock exchange. Skyscrapers tower overchic boutiques, aromatic Indian bazaars and African muti (medicine) shops wheretraditional healers dispense advice and herbal remedies.
Some 50 kilometres north of Johannesburg, Pretoria is well known for itscolourful gardens, shrubs and trees. The city developed more slowly thanJohannesburg but now boasts high-tech shopping centres, museums, art galleriesand multiculinary restaurants. The city has four universities and several scien-tific institutes, including the Council for Scientific and Industrial Research andthe Onderstepoort Veterinary Research Institute, both of which are famousworldwide.
Soweto (South Western Township) is a huge sprawling township, estimated tobe inhabited by more than two million people. Homes range from affluent man-sions to makeshift shacks. Soweto residents belong to nine ethnic groups, amongwhom Zulus and Xhosas predominate. The township has the BaragwanathHospital, which is reputed to be the largest hospital in the southern hemisphere.Here high-quality training and medical standards are provided. The hospitalattracts patients not only from the rest of South Africa but also from countries asfar north as Nigeria. Despite this, it is estimated that between 80% and 85% of
EOM_C13.qxd 6/23/05 10:53 AM Page 419

.
420 Chapter 13 • Applied marketing research
Soweto residents consult traditional healers. Commercial activities in Soweto areexpanding rapidly. New supermarkets, retail chains, banks and shopping com-plexes are constantly being developed.
In the north of the country lies the Northern Province. The Venda, who inhabitthe eastern part of the Soutpansberg, are thought to be descended from chiefswho travelled south from Central Africa towards the end of the 17th century.They are an intensely superstitious people who place great store on rites and rituals. For example, in the python dance, barebreasted teenage girls perform aslow, rhythmic dance to the throb of tribal drums. The drum is central to tradi-tional Venda religious belief.
Scattered throughout the Northern Province are to be found the North Sothopeople who live in small settlements with family homesteads clustered aroundtheir cattle kraal. The most famous member of this tribe was the legendary RainQueen, Modjadji, who was believed by many to be immortal. Small numbers ofthe Tsonga people also inhabit the Northern Province. In rural areas they pursuea leisurely pace, spending time on arts and crafts. Unlike other tribal people, theTsonga are also keen fishermen. Pietersburg is the commercial and cultural hub ofthe region, featuring impressive art exhibitions and elegant historical buildings. Italso possesses wide streets, jacaranda and coral trees, colourful parks andsparkling fountains. In the vicinity, the countryside is the setting for some of themost prosperous cattle ranches in South Africa.
Mpumalanga (the former Eastern Transvaal) is steeped in the history of pioneers, hunters and fortune seekers and goldrush towns abound. Barbertonand Pilgrim’s Rest are among the most famous. The Middleveld region is inhabited by the Ndebele people who are renowned for their strikingly attractivedress, characterised by vivid colours, metal rings and beaded hoops. They are also notable for the exceptional quality of their beadwork and the strong geometric designs on the walls of their homes. The capital of the region isNelspruit and revenues from the extensive fruit growing that has taken place inthe region have played a vital role in its development. The town shows the signsof the opulence generated by the natural wealth of the region produced by thefruit growers.
KwaZulu-Natal is the main home of South Africa’s Indian population.Languages, especially among the older generation, include Tamil, Telegu, Hindi,Gujarati and Urdu. The strictly regulated patriarchal, extended family is not asevident today as at one time and Indian languages tend to be heard less often.Younger people tend to speak English as a first language and lead an increasinglywesternised life. Members of the Indian community are found throughout theupper echelons of commerce, industry and the professions. Durban has goodshopping centres where you can buy anything from photographic equipment tocouturier clothes and rare antiques. Fleamarkets and craft trails attract leisurelybrowsers, while discount stores offer quality merchandise at bargain-basementprices. Within a stone’s throw of the city centre, oriental bazaars, fragrant withspice and incense, offer silks, saris, unusual jewellery and ornaments. Theatresand concert halls present avant garde and ethnic programmes.
EOM_C13.qxd 6/23/05 10:53 AM Page 420

.
Case study 13.2 421
Although most of the South Sotho (Basotho) people live in the kingdom ofLesotho, a self-contained mountain kingdom in the middle of South Africa, manyof them live in Qwaqwa and in other parts of the Free State. Marriage customsamong traditional South Sotho people involve the exchange of lobola, wherebythe bridegroom gives a specified number of cattle to the bride’s parents. Marriagebetween relatives is allowed for the simple reason that this keeps wealth withinthe family. Old tribal traditions still continue in the mountains where the peopleare fairly isolated. Farmers till the fields with hand-held ox-drawn ploughs.Bloemfontein originated at a spring which at various times was a source of waterfor Bushman hunters, Sotho farmers, Voortrekkers and enormous herds of game.For many years it remained a tranquil agricultural settlement, but it has recentlydeveloped into a prosperous commercial and industrial city – the capital of theFree State and the judicial capital of South Africa. With its stately old buildingsdominated by skyscrapers, the city has many facets, ranging from sophisticatedup-market shopping centres, restaurants and theatres to vestiges of the graciousVictorian ambience that once prevailed. Surprisingly, for a city that was formerlythe capital of a Boer republic, Bloemfontein has many British features – legacies ofthe Anglo-Boer War when the town was occupied by British forces. In the northof the Free State is the attractive garden-city of Welkom, which lies at the centre ofthe Freestate goldfields. It has good shopping malls and restaurants, an airportand a thriving theatre. Winburg, steeped in Voortrekker history, is the oldest townand first capital of the former Republic of the Orange Free State. The VoortrekkerMonument symbolises five major trekker groups.
In the early days of European settlement in South Africa, groups of Malayswere brought to the Cape by the Dutch East India Company. Among the manytalents the Malays brought with them were exceptional cooking skills and thishas exerted considerable influence over the cuisine of the Western Cape. Over thepast 340 years, their lifestyle has become a unique blend of East and West – butmuch of the mystique remains, as Malay culture is firmly rooted in Islam.Although Malays are found throughout the Western Cape, the area on the lowerslopes of Signal Hill, known as the Bo-Kaap, is the place most closely identifiedwith Malay culture. With its majestic Table Mountain backdrop, Cape Town isone of the most magnificent cities in the world. Between high-rise office blocks,Edwardian and Victorian buildings have been meticulously preserved and manyoutstanding examples of Cape Dutch architecture are to be found. Narrow cob-blestone streets and the strongly Islamic ambience of the Bo-Kaap enhance thecosmopolitan sense of the city. Cape Town’s shopping provision includes elegantmalls, antique shops, craft markets and fleamarkets. Specialist boutiques offer anenticing array of unusual items that are not readily obtainable elsewhere.Gourmets and lovers of fine wines have a treat in store.
The Xhosa are a diversity of Eastern Cape tribes of Nguni origin who movedsouth across the Kei river from KwaZulu-Natal before the 17th century. While theXhosa are increasingly moving into towns and adopting the white man’s life-style, those who remain on the land cling to their old tribal systems and timelesstraditions. Each rural family lives in a group of huts known as a kraal with a
EOM_C13.qxd 6/23/05 10:53 AM Page 421

.
422 Chapter 13 • Applied marketing research
cattle byre and a small garden. In every kraal a man lives with his wife and chil-dren, together with his married sons and their wives and children. Cattle, sheepand goats play an important role in their social life and its rituals. A man countshis wealth in cattle: his daughters are valuable assets, for their bride price is paidin cattle.
Kimberley is in the Northern Cape and its diamond mines were largelyresponsible for financing the Witwatersrand goldfields. Today, Kimberley is amodern city with broad, tree-lined streets, attractive parks and gardens, comfort-able hotels and busy shopping centres.
Source: South Africa Tourism Board25
Question
Discuss the kinds of problem that would be encountered in segmentation research inSouth African markets.
CASE STUDY 13.3: MUSIC IN MARKETINGCOMMUNICATIONS
Postmodernism in music originated in the 1980s when up-and-coming composerssuch as Adams and Corigliano turned to the past for styles, quotations and otherpoints of departure. In terms of compositional philosophy and musical effect,however, there is often little to differentiate their work from that of Stravinsky orShostakovich in the 1930s. Some essentially modernist composers in the 1930sand 1960s, for example Kagel and Ligeti, have looked with scepticism andhumour on the past. It is the idea of looking with scepticism or humour on thepast that seems relevant to modern-day marketing communications. Many televi-sion advertisements employ popular music tunes to sell cars, jeans, beer andother types of consumer good. For instance, in the USA, if you want to createmagic in 2002, it should take the form of a Mercedes-Benz car according to theadvertisements of the car company. The message is reinforced by the musicalaccompaniment of strains of the pop group Lovin’ Spoonful’s 1966 hit. While it isnot clear why this particular combination was featured in the advertisement, twoexplanations are plausible. It could be that it is targeted at people in their 50s whowill have emotionally bonded with the hit at a young age or it may merely be theindulgence of a middle-aged Mercedes executive (or advertising executive) whoremembers the tune fondly and assumes that the target audience will respond ina similar manner. Again in the USA, Wrangler sells jeans to Credence ClearwaterRevival’s ‘Fortunate Son’. Other examples include Electric Light Orchestra (ELO),the heavy-string rock band of the early 1970s, which has been revived to sellVolkswagen Beetles. ELO’s ‘Mr Blue Sky’, which was about sunny days andbabies joining the human race, now celebrates the rebirth of the classic VW car in
EOM_C13.qxd 6/23/05 10:53 AM Page 422

.
Case study 13.3 423
the 21st century. In addition there is the Gap, which sells sweaters to the tune ofO’Jay’s classic, ‘Love Train’.
Music is an effective means for triggering mood and communicating non-verbally. In marketing, music has been employed in advertising contexts toinfluence listeners’ emotions, judgements and behaviours. Where messages aregenerally secondary to the information that a listener or viewer seeks, as is thecase in television and radio advertising, music can be used to attract and holdattention or induce a positive mood towards the advertised product or service. Inan advertising context, music can operate as a form of non-verbal communica-tion, conveying information in a different way to written and spoken material.However, although music may influence audiences’ perceptions, memory andpersuasion, so far knowledge of exactly when, how, and why music operates as itdoes seems rather limited.
Classical as well as popular music seems to be a fruitful medium for creatingthe ambience necessary to reinforce promotional messages. Adrian North andDavid Hargreaves, for example, have found that classical music prompted thepurchase of more expensive wine in an off-licence, compared with when the top40 was played. Classical music is finding its way into the promotion and advertis-ing of global products. Levi’s advertisements have come to be regarded as anindicator of cultural change. Ever since Nick Kamen removed his shirt and pantsin a launderette in 1985 to the sound of Marvin Gaye’s ‘I Heard it Through theGrapevine’, the Levi’s advertisement has been a quasi-cultural icon, encapsulat-ing the perceptions and aspirations of older teenagers whose attention theadvertiser wants to capture. The launderette advertisement was successful notonly for Levi but also because it put soul music back on the map. In addition, itput ‘Grapevine’ to number one in the pop charts. Jonathan Glazer, who devisedaward-winning surf horses for Guinness and ‘Last Orders’ for Stella Artois adver-tisements, has experimented with a musical illustration from the classicalrepertoire in Levi’s recent ‘freedom to move ad’. However, the soundtrack for thisadvertisement is the Sarabande from the Suite in D minor for solo harpsichordby Handel. Classics traditionally evoke nostalgia (brown bread), safety (motoroil), comfort (club class) and perfumes of every kind. Traditionally, the ‘mood-generating music’ for young people is pop and rock. One could argue thatclassical music turned the story in the advertisement into a piece of theatre.Apparently, during the research and development of the Levi advertisement,musicologists were called in and many scores were sampled, from Vivaldi toBartok, before the Sarabande was considered.
We might conjecture that using music in marketing communication advertise-ments may assist messages and images to achieve specific marketing commun-ications objectives – for example by developing the mood associated with anadvertisement. While there is no evidence of effectiveness measurement or howsuch effectiveness may be defined within the context of marketing communica-tion effectiveness, research does seem to indicate that music can influence atten-tion and the perceived positioning of products and brands and can lend meaningto otherwise unimportant marketing messages. One explanation for this might be the belief that music fills an important need in people’s lives. It constitutes
EOM_C13.qxd 6/23/05 10:53 AM Page 423

.
424 Chapter 13 • Applied marketing research
consumption for pleasure that is vital to human experience. Music with meaningthat represents important social and cultural aspects of a target market can beused as a means of strengthening a message. The greater the relevance of themusic to the target market, the better may be the expected results. Measuring theeffectiveness of music in marketing communications is clearly an important issueand one that merits attention that it has not to date received. A framework forinterpreting and analysing music is a prerequisite. It has been argued that: ‘Musicthat is custom written for a commercial frequently makes little or no sense whenheard by itself, away from the context of words and pictures.’
Question
How might one conduct conduct research into the effectiveness of classical and popmusic in the context of TV advertising?
CASE STUDY 13.4: BRONCO JEANS
Bronco Jeans distributes its denims direct to retailers. The firm produces and markets a single line of jeans under the brand name Bronco and sells them toretailers at a list price of £8 per pair. Total fixed costs amount to £1000 per weekand variable unit costs are £2.00. Various discounts are given to retailers for bulkpurchases and the early settlement of debts. Retailers put a 100% mark-up on thelist price + VAT. Demand has been quite strong at the retail level and Bronco hasbeen able to sell 1000 pairs of jeans per week. It wants to expand production andat the same time it feels that because it can sell all it produces, it may be pricingitself too low. Most of its competitors’ jeans are retailing for around £20 a pair,including VAT at 17.5%.
In an effort to get some hard data to help it reach a decision, the firm has askedthe 250 retail outlets it supplies to estimate the impact on demand that variouschanges in the list price might have. The answers are summarised in Table 13.1.
Price change (%) Change in demand mean (%) Standard deviation (%)
−10 +5 2.1−5 +2 1.0+5 0 0.0
+10 −5 1.1+15 −10 1.5+20 −25 2.5
TABLE 13.1 Bronco Jeans: impact on demand of price changes
EOM_C13.qxd 6/23/05 10:53 AM Page 424

.
Case study 13.6 425
Question
On looking at the results of the survey, the firm feels that it should increase its pricesby 20%. Do you think this would be a good idea? Explain your reasons.
CASE STUDY 13.5: BRITISH DIVIDED INTO FOUR TYPES
A third of Britons are unhappy with their lot, struggling with life in the mod-ern age, according to market research released yesterday. The group – dubbedresistors – makes up 36% of the population. They are offset by embracers, the 1990s’successors to the 1980s’ yuppies who see new technology as a style statement.Embracers are physically and socially active but decidedly selfish. Only one-thirdof this group, who make up 27% of the population, believe it is their responsibil-ity to help people worse off than themselves. In the middle are the pragmatists –the ‘ordinary’ men and women who adopt new technology when they believe itoffers them proven benefits and are more concerned with the community than acomputer – and the traditionalists, the smallest group, at 15%. Generally theoldest, generally well off, they are ‘a happy self-confident bunch’, according toMichael Svennevig, the project’s research director.
The classifications come from futura.com, a research project run by LeedsUniversity in partnership with the Independent Television Commission andOgilvy & Mather and sponsored by a string of big companies including Unilever,IBM, Guinness and Ford as well as the Department of Trade and the CentralOffice of Information.
Source: Timmins26 (reprinted with permission)
Question
Discuss how the classifications given in this case study might be used insegmentation research studies.
CASE STUDY 13.6: SKODA CARS
Skoda is, by one measure, the third oldest car manufacturer in the world. It is thebiggest Czech industrial company and is far and away the biggest employer inthe country – some 30% of the Czech workforce are either employed directly bySkoda or owe their jobs to the firm, working for suppliers or firms servicing the
FT
EOM_C13.qxd 6/23/05 10:53 AM Page 425

.
426 Chapter 13 • Applied marketing research
company. During the 1930s the company’s cars were regarded as prestige auto-mobiles; they were the BMWs of their day and the Skoda company was theflagship of the then-buoyant Czech economy. Czechoslovakia was then the fifthrichest country in the world in terms of per-capita wealth and thus had a strongdomestic market; unfortunately, the Second World War and the advent of com-munism changed all that.
During the ensuing 40 years of communist rule in Czechoslovakia the com-pany suffered badly from a lack of innovation, from a lowering of qualitystandards and a poor image elsewhere in the world. The cars acquired a reputa-tion for being unreliable, uncomfortable and hard to resell – in the UK, ‘Skodajokes’ became fashionable, with the car as the butt of the humour. The cars couldonly be sold by being the cheapest available and even then sales were somewhatdisappointing.
In 1989 communism collapsed in eastern Europe and in 1991 Volkswagenacquired Skoda and set about changing the firm’s products and image. Researchshowed that the Skoda image was one of unreliability and poor quality; since thiswas the very opposite of VW’s image the company began by stressing the linkwith VW at every opportunity. Skoda’s advertising campaign used the slogan,‘We’ve changed our cars – can you change your mind?’ The target audiences forthis campaign were not only the potential buyers for the cars, but also the publicat large; the company hoped to stem the flood of Skoda jokes and make Skodapurchase a matter for congratulation rather than ridicule. The next move in thecampaign to reinvent Skoda was to invest heavily in the factory, introducingbetter quality control and modern manufacturing equipment. Skoda’s designteam were moved from the dingy corner of the factory they had occupied in com-munist days into new offices where they were given the facilities to redesign the cars.
Skoda’s UK managing director, Dermot Kelly, said, ‘We did image analysis beforeand after the marketing campaign to assess our progress. While VW is a strongtrigger, it doesn’t create a strong brand image but it takes away a negative one.’
Currently, the brand is multifaced across Europe; Alfred Rieck, the Dutchmanwho was appointed as marketing manager of Skoda, aims to create a single brandimage across the continent. This will be achieved on the back of the SkodaOctavia, the company’s flagship vehicle, which has been well received by motor-ing writers and the general public alike.
The company’s greatest accolade might be the influential JD Power Survey, anAmerican research programme that surveys customer satisfaction. The surveycanvasses customers’ opinions of their cars and the dealerships two years afterpurchase, and is regarded as highly influential on consumers’ decision making.In 1994 Skoda was rated 21st in the survey; in 1995 in came 13th, in 1996 7th, in1997 it came 6th and finally, in 1998, Skoda was rated first in total overall satisfaction.
So far, Skoda’s policies appear to be paying off; in 1994, 170,000 cars were built.This had risen to 357,000 by 1997 and 422,000 by 1999. European demand hasbeen so high the company has been forced to cut deliveries to Asia and the Skodafactory at Mlada Boleslav in Bohemia works 24 hours a day, six days a week, tosatisfy demand. Having moved from its 1991 position of having to pay potential
EOM_C13.qxd 6/23/05 10:53 AM Page 426

.
References and notes 427
customers £10 to induce them to take a test drive, Skoda is now in a position ofbeing unable to meet world demand for the cars. From being the butt of every-one’s humour in the 1970s and 1980s, Skoda has again become a force to bereckoned with in the world’s automobile markets.
(Case contributed by Jim Blythe)
Questions
1 What role has market research played in the success of Skoda?
2 How might Skoda research a new market, such as China?
3 What techniques might be used to monitor the image of the cars?
4 Although the JD Power Survey has been very positive about Skoda, what are thepotential problems with relying on a survey of this kind?
5 What are the market research implications of trying to develop a pan-Europeanimage for the cars?
REFERENCES AND NOTES
1 Double, L (1991) Unpublished MBA dissertation, Department of Management, KeeleUniversity, September.
2 White, S (1993) Get a helping of the sugar-free chips game, Research Plus, September, 3.
3 Lynch, T (1997) Caught in the neighbours’ tangled web, Financial Times, 15 August.
4 For details of the Delphi technique, see: Goldfisher, K (1992) Modified Delphi: Aconcept for product forecasting, Journal of Business Forecasting, Winter 1992–93;Lindstone, H and Turoff, M (eds) (1975) The Delphi Method, Reading, MA: Addison-Wesley – one of the best and most detailed discussions of the Delphi method;McCarthy, K (1992) Comment on the ‘Analytic Delphi Method’, International Journal of Production Economics, May; Mitchell, V-W (1992) Using Delphi to forecast newtechnology industries, Marketing Intelligence and Planning, 10 (2) – contains a broadreview of the literature on Delphi and many references to the method and to paststudies.
5 Bolongaro, G (1994) Delphi technique can work for new product development,Marketing News, 3 January, 11.
6 Smith, A (1997) Public puts faith in brand names, Financial Times, 13 October.
7 Gooding, K (1997) Soft drinks switch to PET leaves industry struggling, FinancialTimes, 22 October.
8 www.mapinfo.co.uk/products/software.cfm and company literature, MapInfo,Centennial Court, Easthampstead Road, Bracknell, Berks RG12 1YQ. Tel: 01344 482888.
EOM_C13.qxd 6/23/05 10:53 AM Page 427

.
428 Chapter 13 • Applied marketing research
9 Nike (part of the Lex column) Financial Times (1997) 20 December.
10 Poster watch (1996) Marketing Week, 26 April, 58.
11 Lavidge, R J and Steiner, G A (1961) A model for predictive measurements ofadvertising effectiveness, Journal of Marketing, 25, October, 59–62.
12 Stapel, J (1990) Monitoring advertising performance, ADMAP, July/August.
13 Biel, A (1989) Love the advertisement, buy the product? ADMAP, October.
14 Stapel, H (1991) Like the advertisement but does it interest me? ADMAP, April.
15 Brown, G (1991) Modelling advertising awareness, ADMAP, April.
16 Moutinho, L and Evans, M (1992) Applied Marketing Research, Harlow: Addison-Wesley.
17 Lilien, G L, Kotler, P and Moorthy, K S (1992) Marketing Models, Upper Saddle River,NJ: Prentice-Hall, Chapter 9.
18 Scott, A (1996) The launch went fine – then the devil’s in the detailing, Research Plus,April, 14.
19 Gabor, A and Grainger, C (1966) Price as an indicator of quality, Economics, 33, 43–70.
20 Bowditch, A J and Fitall, S (1995) Through the looking glass: primary research inmulticountry forecasting, Proceedings of the EphMRA/ESOMAR PharmaceuticalMarketing Research Conference, Geneva, Amsterdam: ESOMAR, 141–63.
21 Bowditch, A J (1996) In Europe’s complex market, check the price is right, ResearchPlus, April, 12–13.
22 Taha, H A (1992) Operations Research: An introduction (5th edn), New York: Macmillan.
23 Crimp, M (1990) The Marketing Research Process (3rd edn), Hemel Hempstead:Prentice-Hall.
24 Taylor, P (1997) Pressures in the marketplace, Financial Times, 3 September.
25 South Africa: A world in one country (1996) South Africa Tourism Board.
26 Timmins, N (1997) British divided into four types, Financial Times, 5 September.
FURTHER READING
Brown, S and Turley, D (eds) (1997) Consumer Research: Postcards from the edge, London:Routledge.
Brown, G, Copeland, T and Millward, M (1973) Monadic testing of new products – an oldproblem and some partial solutions, Journal of the Market Research Society, (15)2, April,112–31.
EOM_C13.qxd 6/23/05 10:53 AM Page 428

.
Further reading
Coffey, A and Atkinson, P (1996) Making Sense of Qualitative Data, Thousand Oaks, CA: Sage.Cooper, L and Nakanishi, M (1988) Market Share Analysis: Evaluating competitive marketing
effectiveness, Boston, MA: Kluwer Academic Press.Cox, W E (1979) Industrial Marketing Research, New York: Wiley.Day, E and Stafford, M R (1997) Age-related cues in retail services advertising: their effects
on younger consumers, Journal of Retailing, 73(2), 211–33.Douglas, S P and Craig, C S (1983) International Marketing Research, Upper Saddle River,
NJ: Prentice-Hall.Geo-Visual Solutions for Today’s Business (1990) Mt Olive, NJ: Intelligent Charting.Gordon, W and Corr, D (1990) The space between words: the application of a new model
of communication to quantitative brand image measurement, Journal of the MarketResearch Society, 32(3), 409–35.00
Green, P E and Krieger, A M (1989) Recent contributions to optimal product positioningand buyer segmentation, European Journal of Operational Research, 41, 127–41.
Green, P E and Krieger, A M (1992) An application of a product positioning model topharmaceutical products, Marketing Science, 11(2), Spring, 117–32.
Grover, R and Srinivasan, V (1987) A simultaneous approach to market segmentation andmarket structuring, Journal of Marketing Research, 24, May, 139–53.
Gummesson, E (2000) Qualitative Methods in Management Research, Thousand Oaks, CA:Sage.
Hammond, K, Ehrenberg, A S C and Goodhart, G J (1996) Market segmentation forcompetitive brands, European Journal of Marketing, 30, 39–49.
Kamakura, W and Russell, G J (1989) A probabilistic choice model for marketsegmentation, Journal of Marketing Research, 26, November, 379–90.
Lewis, P H (1989) When maps are tied to databases, New York Times, 28 May, 10.Lucas, D B (1983) Advertising research and measurement, in Marketing Manager’s
Handbook, Chicago, IL: Dartnell, Chapter 6.Malhotra, N K (1995) Marketing Research: An application orientation, Upper Saddle River
NJ: Prentice-Hall.Marks, A P (1990) The Sinclair C5 – why did it fail? Management Decision, 28(4), 9–14.Mitchell, V (1995) Using astrology in market segmentation, Management Decision, 33(1),
48–57.Moskowitz, H R (1985) New Directions for Product Testing and Sensory Analysis of Foods,
Westport, CT: Food & Nutrition Press, 171ff.Moutinho, L and Evans, M (1992) Applied Marketing Research, Harlow: Addison-Wesley.New products (1990) The Number News, June, 8.Newton, S (1993) From hearses to horses: launching the Volvo 850, Journal of the Market
Research Society, 33, 153–62.Proctor, S, Papasolomou-Doukakis, I and Proctor, T (2001) What are TV advertisements really
trying to tell us? A postmodern perspective, Journal of Consumer Behaviour, 1(3), 246–55.Studies of Media and Markets (1989) New York: Simmons Market Research Bureau.Uncles, M D, Hammond, K A, Ehrenberg, A S C and Davies, R E (1994) A replication study
of two brand-loyalty measures, European Journal of Operational Research, 76, 375–84.Workman, J P (1993), Marketing’s limited role in new product development in one
computer system firm, Journal of Marketing Research, 30, November, 405–21.
429
EOM_C13.qxd 6/23/05 10:53 AM Page 429

.
430 Chapter 14 • Marketing research settings: business-to-business, services and internal marketing
Marketing research settings:business-to-business, services and internal marketing
Objectives
After reading this chapter, you should be able to:
• understand the differences and similarities between consumer marketingresearch and business-to-business marketing research
• appreciate how marketing research can be applied to the marketing ofservices
• understand the concept of internal marketing and the role that can be playedby marketing research within such a context.
Keywords
business-to-business markets service satisfactioninternal marketing SERVQUALservice delivery shopping surveysservice quality SIC
14
EOM_C14.qxd 6/23/05 10:53 AM Page 430

.
Marketing research settings: business-to-business, services and internal marketing 431
Plan of Chapter 14
EOM_C14.qxd 6/23/05 10:53 AM Page 431

.
432 Chapter 14 • Marketing research settings: business-to-business, services and internal marketing
INTRODUCTION
This chapter looks at business-to-business marketing research, services researchand internal marketing research.
In the case of business-to-business marketing research, the differences and thesimilarities with consumer marketing research are explored. Business-to-businessmarketing research has changed considerably in recent years and employs manyof the approaches that were at one time the domain of consumer research. Thechanging nature of business-to-business marketing research is explored further.
The chapter explores the role of marketing research in service marketing, look-ing specifically at shopping surveys, customised, full-scale studies of servicesatisfaction to provide measurement of customer reactions to the service delivery,and SERVQUAL, designed to assess service quality.
The last section looks at the role of marketing research in internal marketing.Market research can be adopted to gain feedback for management about workingconditions, company policy in general and workers’ own understanding aboutwhat comprises quality for the customer. The relationship between organisa-tional subunits and also their relationship to top management is also important.This can be assessed by a variation of the SERVQUAL instrument just mentioned.
BUSINESS-TO-BUSINESS MARKETING RESEARCH
Business-to-business marketing research is very similar in many ways to con-sumer marketing research. Both forms of marketing research use primary andsecondary sources, qualitative and quantitative techniques, and internal andexternal sources of data. Both forms of research use telephone interviews or face-to-face interviews, but organisational marketing research does not use streetsurveys, door-to-door interviews or hall tests. However, there are some major dif-ferences between consumer and business-to-business markets. For example,when developing the marketing mix, different strategies are needed for business-to-business customers than for final customers – a difference that significantlyaffects research activities.
Business-to-business market
Business-to-business markets are composed of those organisations and agenciesthat purchase goods and services either to aid in the production of other goodsand services or for resale purposes. This includes manufacturing firms, govern-ment agencies, public utilities and educational institutions as well as inter-mediaries such as retailers and wholesalers. Consumer markets, by contrast, comprise individuals, families or households who purchase goods and servicesfor their own final consumption.
EOM_C14.qxd 6/23/05 10:53 AM Page 432

.
Business-to-business marketing research
The demand for business goods is derived from the demand for final consumergoods. If the domestic car market has a bad year the car components industrywill also suffer because its sales are closely tied to the demand for cars. Because ofthis relationship, the demand for business-to-business goods can be very volatileand business-to-business marketing research has therefore to be concerned withgeneral business and economic conditions, levels of inventory and the prices ofraw materials.
It is quite common in business-to-business markets to have a small number ofcustomers account for the vast majority of a firm’s sales. Often 80% of the busi-ness comes from 20% of the customers. Such a relationship influences the type ofsampling procedures used in business-to-business markets since a great deal canbe learned from surveying only a few large customers.
When trying to determine which factors influence purchase decisions, the business-to-business researcher’s task is made more difficult by the fact that morethan one person is often involved in making such decisions. It is not possiblefrom one interview in a company to ascertain key buying influences.
Quality of service, availability of supplies and consistent quality of materialsare critical factors in the purchase decisions made in the business-to-businessmarket. Businesses-to-business buyers are usually more knowledgeable abouttheir own needs and are swayed less by promotional appeals than are consumers.
Many business-to-business products are engineered or designed specificallyfor a customer. In these situations the supplier must identify the specific needs of the customer but it also means that there is less need for research of mass markets.
When conducting consumer research, the persons to be surveyed or observedcan usually be identified and contacted fairly easily. In business-to-business mar-kets not only are the appropriate respondents hard to identify because of multiplebuyers but once identified these people may be difficult to reach directly: manyare senior managers and are shielded from would-be interviewers by assistantsand secretaries. Senior managers also tend to be less accessible since they travelfrequently and possess little uncommitted time. The fact that they are being con-tacted for their business knowledge usually prevents making such contacts in theevening hours or during weekends.
Most manufacturers of consumer products, especially those in high-techproducts, adopt the marketing concept: that is, they attempt to build their pro-duct marketing offerings around identified customer needs. The concept, how-ever, is not as prevalent among business-to-business firms primarily because their research activities are strongly influenced by technically oriented people who appear to place more emphasis on distinctive features and technological breakthroughs.
Consumer product firms can purchase information from Nielsen that willafford them a monthly review of how their products, as well as their competitors’products, are doing in terms of unit sales and market share. No similar type ofinformation exists for business-to-business products from either syndicated firmsor the firm’s own research staff. There appears to be less interest in continuous
433
EOM_C14.qxd 6/23/05 10:53 AM Page 433

.
434 Chapter 14 • Marketing research settings: business-to-business, services and internal marketing
monitoring of the sales of business-to-business products. This may be due tocharacteristic sales patterns – infrequent sales – but it could also be due to a dif-ference in outlook of the executives of business-to-business organisations.
Because the costs of developing and producing prototypes of some business-to-business products are quite high, test marketing is not usually an importantresearch tool within business-to-business markets. Some firms also do not like tohave proposed products on display in test situations where competitors canobserve their operation and usage.
Overview of research
Business-to-business marketing research tends to emphasise the use of internalstaff and internal records as a major source of research information. Market intelligence is also a more significant aspect of the marketing information systemthan in consumer goods marketing. The explanation for this perhaps lies in thefact that business-to-business activity involves being more directly in touch withthe market than is usual in the case of consumer goods marketing, where thenature of the distribution system creates a physical separation between the manu-facturer and consumers. Close contact with the market makes it advantageous for a business-to-business marketing organisation to maintain a marketing intelli-gence system that makes use of feedback from the salesforce as a mechanism forreporting customer views.
Desk research has more significance in business-to-business marketing than inconsumer marketing. Government publications, trade information, publishedsources and so on contribute an important part of the data input for marketingplanning and decisions. Where the consumer researcher is interested in thecensus of population, for example, the business-to-business researcher is morelikely to be interested in the census of production. As far as syndicated andomnibus research services are concerned these are unlikely to be available in anybut the largest and most sophisticated markets.
Business-to-business marketing researchers are more likely to make use ofpostal research and telephone research in conducting quantitative surveys.Telephone research has traditionally been an important technique for business-to-business marketing researchers and its major advantage over personal interviewing in this case is that a geographically dispersed sample can be moreeconomically contacted and produce better response rates than postal research.
Depth interviews figure predominantly in qualitative research in business-to-business marketing research. It is difficult to get a small group of businessexecutives in the same room at the same time for the purpose of a research groupdiscussion. Nevertheless, group discussions are used and can be useful, but theyare the exception rather than the rule. Expert informants in particular fields arevaluable for their information, and their participation in depth interviews at theexploratory stage of research study is of particular significance in business-to-business marketing research.
EOM_C14.qxd 6/23/05 10:53 AM Page 434

.
Business-to-business marketing research 435
In business-to-business marketing, business directories or even internal customerlists or business mailing lists are often used as sampling frames. Stratification as asophistication of random sampling and to some extent quota sampling methodsare used. In this case the allocation of sample segments might be based on appropriate criteria such as the Standard Industrial Classification (SIC) or size oforganisation in terms of sales turnover.
One sampling problem, however, concerns who is actually to be asked thequestions. The business-to-business marketing researcher has to know whichindividual in the firm should be asked the questions or to whom a postal or tele-phone enquiry should be addressed in order to ensure the best chance of gettingvalid and reliable information.
Types of research undertaken
There is, in fact, a great deal of similarity between the types of research under-taken by consumer product firms and business-to-business product firms. Thefollowing similarities and differences should be noted:
1 Consumer product firms are much more involved with all types of researchrelated to advertising.
2 Both groups are heavily involved with economic and sales forecasting.
3 Both groups are heavily involved with most aspects of product research – butbusiness-to-business product firms are less concerned with packaging.
4 Both groups are heavily involved with sales and market analysis.
BALL BEARINGS
A well known ball-bearing firm established its early reputation on an innovativeself-aligning ball bearing. The tolerance provided by the bearing permitted rollingbearings to be employed where inaccuracies in the manufacture and assemblymethods then used were too destructive for conventional deep-groove bearings.
By the 1980s it was thought that the product might be approaching the end of its life cycle. The market was researched at some length across a wide range ofapplications using two levels of research team members chosen for their specificknowledge of the specific target sectors. Results indicated that while few firmswould admit that their own manufacturing processes were inaccurate or that theirassembly was hit and miss, many still were glad of the flexibility that the bearingsdesign permitted. Indeed the concept had proved so valuable that a whole new generation of compact aligning bearings has been developed.
Source: Gorle1
EOM_C14.qxd 6/23/05 10:53 AM Page 435

.
436 Chapter 14 • Marketing research settings: business-to-business, services and internal marketing
Differences in research applications
The market for most business-to-business products is composed largely of othermanufacturers or middlemen. Information on these firms is usually containedunder Standard Industrial Classification (SIC) headings and includes such informa-tion as total shipments, number of employees and size of payroll. In order to putSIC data to good use, the researcher needs to understand the numbering processof the system.
In this classification system all places of business are classified into one of thefollowing sections, covering the entire range of economic activity:
A Agriculture, hunting and forestryB FishingC Mining and quarryingD ManufacturingE Electricity, gas and water supplyF ConstructionG Wholesale and retail trade; repair of motor vehicles, motorcycles and per-
sonal and household goodsH Hotels and restaurantsI Transport, storage and communicationJ Financial intermediationJ Real estate, renting and business activitiesL Public administration and defence; compulsory social securityM EducationN Health and social workO Other community, social and personal service activitiesP Private households with employed personsQ Extra-territorial organisations and bodies
The principal sections are divided into several major groups, such as printingand publishing or chemicals and allied products, with each major group havingassigned to it a two-letter SIC code. Further classification is achieved by sub-dividing the major groups and adding numbers to the SIC code (see Figure 14.1).By using the SIC system business-to-business markets can be divided into rela-tively small, medium or large market segments.
Most firms belong to one or more trade associations and the publications ofthese associations are a major source of statistics about a particular industry. Thepublications also cover a variety of topics relevant to their member firms.
Many business-to-business firms serve unique markets and for this reasonappropriate secondary data may be difficult to obtain. Firms often make use ofthe services of indexing services, such as Chemical Abstracts or Engineering Index,to obtain information on unique topics or groups of customers. These agenciessearch many data sources, such as journals and association publications, to locatearticles of possible value to their clients.
EOM_C14.qxd 6/23/05 10:53 AM Page 436

.
Business-to-business marketing research 437
Of the methods that may be used to obtain primary data, the survey method ismost important for business-to-business researchers. The complexity of the buyingprocess in most business-to-business markets usually precludes the use of eitherobservations or experiments. Personal interviews are favoured on account of thesmall size and geographical compactness of respondents, the uniqueness of informa-tion sought, the frequent need for demonstrations in interviews and the greateramounts of information that can usually be obtained within the time constraints.
Extensive use of probability sampling is not made among business-to-businessmarketing researchers because most markets are fairly small and can be com-pletely surveyed or the surveys concentrate on the bigger customers in themarket. Many business-to-business researchers ignore sampling altogether: theyprefer to obtain information through a series of interviews until satisfied that theyhave obtained an accurate picture of the market. When sampling is used it tendsto be judgement sampling.
Since less emphasis is placed on sampling there is less use of sophisticatedmethods when analysing data. Attitudes merely reflect such conditions as fewerfirms in the market, less emphasis on probability sampling, and an emphasis onqualitative data. (See Table 14.1 for a comparison of business-to-business and con-sumer marketing research.)
CHANGES IN BUSINESS RESEARCH
Business-to-business market research emerged from the protective cloak of con-sumer market research in the 1960s as being a more appropriate approach to theresearch needs primarily of business-to-business goods manufacturers. The tech-niques required for business-to-business markets were very different from thoserequired to measure the brand share of fast-moving consumer goods.
s
FIGURE 14.1 Some example SIC classifications
EOM_C14.qxd 6/23/05 10:53 AM Page 437

.
438 Chapter 14 • Marketing research settings: business-to-business, services and internal marketing
Population
Respondent accessibility
Respondent cooperation
Sample size
Respondent definitions
Interviewers
Research costs
TABLE 14.1 Differences between business-to-business and consumer marketing research
Consumer
Large – usually unlimited
Fairly easy. Can interview at home, in the street, on the telephone or usingmail technique
Has become more and more difficult.Millions still never interviewed
Can usually be drawn as large asdeemed necessary since thepopulation is so large
Usually fairly simple. Users of a brand,demographic characteristics, etc. Theultimate purchaser is also a user formost consumer products and services
Easily trained. They are familiar with the area under investigation for mostcategories
Key factors are sample size andincidence of usage categories (low incidence categories)
Business to business
Small
Difficult. Available usually only during workinghours at place of work. Usually has otherpriorities
A major concern. Danger of being over-researched
Usually much smaller than consumer sample but the statistical confidence is equal due to therelationship of the sample to the total population
Can be difficult. The user and the purchasingdecision maker in most cases are not the same
Difficult to find good executive interviewers. A working knowledge of the subject beingresearched is absolutely essential
Lower incidence levels and difficulties in locatingthe right respondent are key factors
The rigid separation between business-to-business and consumer research –further enhanced by the Business-to-Business Market Research Associationremaining a separate entity from the Market Research Society – continued throughthe 1970s and early 1980s, when the emergence of the business services sectorprompted a fundamental re-examination of which approaches were most relevantto this dynamic sector. By the 1990s the needs of the business-to-business andbusiness services community had moved substantially away from a need to quantifymarket size and structure to a preoccupation with retaining and satisfying customers.This environment has encouraged a return to a more consumer research-orientedapproach. IMRA is no more and the interests of business-to-business marketresearch are now handled by the Business-to-Business Group, a special interestgroup within the Market Research Society.
EOM_C14.qxd 6/23/05 10:53 AM Page 438

.
Research into services 439
Many attempts have been made to quantify the market for business and business-to-business market research. Few are made with much conviction, given the break-ing down of boundaries between business and consumer research from an agencyperspective and the grey areas of what actually constitutes consumer as opposedto business-to-business research. Some of the most exciting data-capture develop-ments emanate from the business-to-business sector. This is well demonstrated bythe development of audiotext as a data-capture tool, the use of predictive diallers incustomer satisfaction surveys and cheque-book-sized computers as self-comple-tion tools – all developed and pioneered by leading UK business-to-businessagencies. In the field of sampling, data capture and processing – and especially inthe larger surveys – consumer research approaches are being used increasinglyand are improving efficiency and accuracy for the research customers.
Source: Jamieson2
RESEARCH INTO SERVICES
There are many different kinds of service and they demand the full spectrum ofresearch activities. In this section we will consider some of the rather specifickinds of research that are only applicable to services.
Shopping surveys
Shopping surveys are related to retailing and to service marketing where there isa mingling of customers (hotels, motels, restaurants and the like). In a shoppingsurvey, a field worker poses as a customer and, following a list of predefinedsteps, makes mental notes. The shopper may simply note what aspects of deliv-ery were or were not delivered. In addition, he or she may note the quality orrating of delivery. Major users of such surveys may be retailers such as fast foodoutlets and hotels. Here are some of the aspects typically covered (both for theorganisation and its major competitors):
• product or service quality
• facility quality in various aspects
• personnel courtesy
• personnel efficiency
• personnel service
• personnel promotion of selected brands, items, features, benefits
• items stocked, offered, on display
• prices.
EOM_C14.qxd 6/23/05 10:53 AM Page 439

.
440 Chapter 14 • Marketing research settings: business-to-business, services and internal marketing
Such studies are generally handled by an outside specialist firm. There arethree reasons. First, impartiality: the outside firm has no pre-formed dispositions.Second, skill: it can assist in determining what has to be checked and how tocheck it. Third, there is much less chance of the shopper being detected by theemployees, since it is most unlikely that any employee would know the individual.
Customised, full-scale studies of service satisfaction
Some marketing research firms are offering customised, full-scale studies to pro-vide measurement of customer reactions to the delivery of service. This is a continuing service aimed at firms that have continuing and ‘formal’ service satisfaction systems (i.e. where consumer reactions funnel into a single centrallocation). It is used to conduct a day-after telephone interview with the customerto measure reaction while the experience is still fresh in the customer’s mind.Because of the day-after telephone feature, the service has particular value to utility, financial and healthcare organisations.
Other customer/client reaction research studies
Studies of customer/client reaction are often used by small-scale retailers or service firms as well as by the larger firms. They are typically do-it-yourselfresearch projects.
DECEPTIVE APPEARANCE
There always seems to be at least one moving walkway out of order at London’sHeathrow Airport. When I asked Sir John Egan, chief executive of BAA, the owner ofHeathrow, why this should be, he said it was because so many people used them.But help was at hand, he said. BAA was empowering its engineers to fix the walk-ways as they broke down. The night I arrived to catch a flight, the engineers hadapparently used their new empowerment to go to the pub. Not only was there adysfunctional walkway, there was also something unpleasant smeared on theground outside the airport’s third terminal. The check-in area was strewn with litter,while the gents’ toilets were flooded and the hand towels needed replacing. Thelines of passengers waiting to have their hand luggage X-rayed were long becauseonly a few security machines were in use. The carpet in the security area was dirty.
A short distance away, however, on the other side of the machines, we could seea glittering world of plenty. Swatch and Burberry signs twinkled at us fromHeathrow’s shops, like a glimpse of cold war West Berlin from the wrong side of theWall. I am not the only one to have noticed the contrast between the public areasand the shops at the world’s busiest international airport. Sir Terence Conran, theretailer and restaurateur, wrote in The Independent newspaper last year of a visit to
FT
EOM_C14.qxd 6/23/05 10:53 AM Page 440

.
Research into services 441
Heathrow’s Terminal One: ‘All is glossy and new, clean and tidy in the shoppingareas; in the walkways and the departure lounge, however, it’s an altogether differ-ent story. They are fitted with stained, worn-out carpet held together with oddlengths of black tape, patched plastic tiles, odd wires hanging all over the place,broken chairs with their stuffing hanging out, cigarette burns on table tops, rubbishon the floors. The check-in desks are falling to pieces. Even a third world countrywould feel disgraced by the squalor and shabbiness.’ Before boarding my flight fromTerminal Three, I filled in a complaints card and posted it in one of the boxes BAAhas put up around the airport. That was over two months ago. I have heard nothing.
Des Wilson, the veteran radical activist who now heads BAA’s public relationseffort, agreed it was unacceptable that I had had no response. But he stronglycontested my view that Heathrow was in danger of becoming a slum. Heathrow’s56m passengers did not feel that way, he said. He sent me to see Stan Maiden,BAA’s research director. Before meeting Maiden at Heathrow, I wandered aroundthe terminals. Two moving walkways were out of order, although the empoweredengineers were hacking away at one of them. Terminal One’s public areas werebright and clean; Terminal Two, largely because it is the oldest, was dark andgloomy; and Terminal Three still looked shabby. Did my complaints, I askedMaiden, really make me one in 56m – or two in 56m, counting Sir Terence? Notquite, he said. Heathrow attracts its share of complaints and tries to act on them. BAA is investing £1m ($1.6m) a day at Heathrow, and its managers’ pay ispartly tied to what passengers say about the airport. To find out what they think,BAA did a lot of market research, Maiden said. If its activities in this area were astand-alone operation, BAA would be one of the top 20 market research companiesin the UK.
BAA’s most basic customer feedback comes from the complaint and commentcards at the airport. Heathrow receives about 7000 complaints a year. The airport’spolicy, which broke down in my case, is to reply to all of them. Heathrow alsoreceives compliments on the cards, but people were more likely to complain, saidMaiden, ‘as in any other field’. He uses the cards to identify clusters of complaints,such as a shortage of luggage trolleys or long lines in the security area. The cardsare an unsatisfactory form of feedback, however, because they rely on passengerstaking the trouble to fill them in. In addition to reading the cards, BAA interviews26,000 Heathrow customers a year in a range of languages. They are asked to rateeverything from flight announcements to public telephones on a scale of one to five,where five is excellent and one is very poor.
He showed me some recent results, which had the airport receiving a score offour in many areas and over 3.5 in almost all. One of the few areas scoring below3.5 was passengers’ perception of the distances they had to walk in the airport.Smokers gave smoking facilities in one part of the airport a mark of only 3.4, butnon-smokers judged the same arrangement a 3.7. And Heathrow would rather satisfy the non-smokers? ‘Well, there are more of them,’ Maiden said. A fairly creditable performance, if BAA’s methodology is sound. Maiden insisted it was.Brussels and Vienna airports have asked BAA to implement its survey methodsthere. The group also carries out market research on specific areas, such aswhether customers prefer lifts or escalators. Which do they prefer? ‘It ratherdepends on their age,’ Maiden said. BAA also asks passengers to compare Heathrow
s
EOM_C14.qxd 6/23/05 10:53 AM Page 441

.
442 Chapter 14 • Marketing research settings: business-to-business, services and internal marketing
with other airports. This gives Heathrow an opportunity to compare itself with com-petitors such as Amsterdam’s Schiphol and Singapore’s Changi.
On issues such as availability of trolleys and flight information, Heathrow issomewhere in the middle, below Schiphol and Changi, but above both Paris air-ports and New York’s JFK. Heathrow’s cleanliness is rated average, as is seatavailability in departure lounges. Heathrow’s catering, shops and the attitudeof security staff all receive high international ratings. The least critical Heathrowcustomers are elderly American and British passengers who travel infrequently.And the most critical? ‘Regular British business travellers,’ Maiden said throughclenched teeth. ‘People like you.’
Source: Skapinker3 (reprinted with permission)
SERVQUAL
In 1985 Parasuraman et al.4 published their now classic article, which led to a revolution in the way that service quality is monitored. The results of theirexploratory research included a statement of ten service quality determinants.These represent the basic dimensions that a consumer uses to evaluate a service.In order to improve ‘true quality’ in a service organisation, the first step is to identify the quality determinants that are most important or relevant to thecompany’s target market5 and then assess their own and their competitors’ per-formance. This early work formed the basis for the development of SERVQUAL6
with the ten determinants mapped onto five underlying factors: tangibles, empathy, responsiveness, reliability and assurance.
There are claims that SERVQUAL can be used or adapted to measure servicequality in a variety of service settings. However, one should note that there aresome who hold reservations about this.7
Service positioning
A service organisation is interested in how its image is positioned in the minds ofcustomers and the trade vis-à-vis competition. It wants to know what kinds ofpeople prefer to be its customers and how they compare with non-customers interms of service perceptions and preferences, benefits sought, lifestyle and demo-graphics. It also wants to know what is happening to its positioning from a moreor less dynamic standpoint. For instance, it wants to know from which compet-itors it is gaining customers and to which competitors it is losing them. Servicepositioning is of major interest to management and it is here that perceptual maps of how customers see various providers as being similar or different areuseful. The maps can help to show what combination of attributes customersprefer in their choice of service.
EOM_C14.qxd 6/23/05 10:53 AM Page 442

.
Research into services 443
IN-HOUSE MARKETING RESEARCH IN FIRMS’ DISTRICT BANKS
Consumer behaviour research in banks and the financial sector is becoming afocus of interest. Here we will look at some of the more informal and day-to-daymarketing research that can be done in-house in banks and other similar types ofservice organisation that serve a local community.
The most common decisions that bank executives have to make related to cus-tomers are simple but at the same time may become complex due to the lack ofinformation to enable the decisions to be made with real confidence. For example,decisions such as:
• Will this advertising convey the information the bank wants the potential cus-tomers to have?
• Will the advertising be credible to the potential customers?
• Will an advertising message motivate customers of other banks to visit it?
• How will customers react to a new product?
• Will the interest rates promoted in a particular promotion motivate customers toincrease their deposits?
• Why is a branch not attracting enough customers?
• Where are the bank’s customers?
• How can the bank best give customers access to services?
• What image should be projected into the customer’s mind when positioning thebank as a lender?
The answer to such questions may be obtained through in-house marketingresearch and information gathered every time the organisation thinks it has doubtsabout its customers. There are several ways to do this.
The customer’s map
It is useful to know where customers live and work. A roadmap of the area servedshould be covered in transparent foil and mounted on card. The foil is attached tothe top of the map with office adhesive tape. Up to four overlay foils can be used onthe same map to view four kinds of information simultaneously. For example: cus-tomers, competitors, transportation and housing.
On the first overlay of the map you mark with an ink marker, let’s say red incolour, a point at the addresses of a sample of customers. The best way to do thissampling is to mark the opening account card in any place in the file and from thereon count a set of cards and extract the next. The count quota is established by divid-ing the total number of customers by the size of the sample. For example, if abranch has 1500 customer cards and you want to make a map with 100 customers,then you will have to extract the residential address of every 15th customer. Thisproduces clusters of points where customers live. This can be repeated with work-ing address. You take the next foil and start the same process with a blue marker.Then you might use another overlay to mark the competitor’s and your branches,
s
EOM_C14.qxd 6/23/05 10:53 AM Page 443

.
444 Chapter 14 • Marketing research settings: business-to-business, services and internal marketing
let’s say with a green marker. Finally, you may want to know where the bus stopsare. We take the last foil and mark them in black.
Now, if you place the branch and transportation overlays together on the map,you can find opportunities to open branches and place automated teller machines(ATMs) near bus stops. Now if you place the branch foil with the working addressfoil, you can see how vulnerable your customers can be if they are far from you andnear to the competitor’s branches.
If you place the residential and working address overlays on the map, then youcan see areas where customers are not being served, blockades of natural andman-made obstacles (bridges, rivers, highways, etc.) that make the customersjourney in a roundabout way in order to reach the branch. If you have also theapproximate population of districts, an overlay with this information on top of theoverlay foils will indicate the areas where the bank is not present and a high popu-lation density exists. This system works very well for malls, commercial centres,department stores and shops in general.
RESEARCH FOR INTERNAL MARKETING
Internal marketing is based on the idea that every individual in an organisation,particularly a service organisation, should recognise that they have customers toserve. In addition, it implements the philosophy that all internal customers mustbe convinced about the quality of the service being provided and be content intheir work.
Relationship between internal and external service quality
The link between internal service quality and external service quality and hencecustomer satisfaction, customer loyalty and the profitability of the organisationhas been proposed by Heskett et al.8 They propose that high-quality internalservices lead to increased employee satisfaction, which in turn leads to increasedservice value, leading to increased external customer satisfaction. This is sup-ported by Brooks and Smith,9 Brooks10,11 and Davis.12 Magidson and Polcha13 alsodiscuss the problem of the inferior quality of many internally produced productsand services having a direct relationship with the ability of companies to adjust tochanging customer needs and meet competitive challenges. Equally, Azzolini andShillaber14 propose that quality service to internal customers converts to qualityservice to external customers. Furthermore, Hart15 discusses how internal serviceis related to external service. In his paper he proposes that internal service guarantees ultimately benefit the (external) customer and the bottom line.
Internal marketing will allow the company to improve the quality of the services and products produced internally and so improve both internal andexternal customer satisfaction. This assumes that the quality of the internalexchange can be measured.
EOM_C14.qxd 6/23/05 10:53 AM Page 444

.
Research for internal marketing 445
Role of marketing research
Market research traditionally involves identifying the needs and wants of customers in a systematic manner and monitors the impact of marketing activities on them. The same process can be adopted with employees. Personnel
FIGURE 14.2 Internal customer questionnaire
EOM_C14.qxd 6/23/05 10:53 AM Page 445

.
446 Chapter 14 • Marketing research settings: business-to-business, services and internal marketing
can be given the opportunity to give feedback to management about workingconditions, company policy in general and workers’ own understanding about what comprises quality for the customer. The information might be obtained byusing questionnaires or focus groups or in-depth interviews with employees.Although surveys of employees need careful handling, they not only provideemployees with a measure of satisfaction but can identify early breakdowns incommunication.
The relationship between organisational subunits and their relationship to topmanagement are also important since the quality of support they receive fromeach other impinges on the overall quality of service that is eventually given tothe customer. This can be assessed by a variation of the SERVQUAL instrumentmentioned earlier, which is constructed to measure the quality of support organ-isational subunits provide to each other (see Figure 14.2 on p. 445).
In service organisations, those involved in dealing with customers are in aunique position to identify trends and business opportunities. Marketing researchor an ‘internal marketing’ information system can be used to good effect in helpingto collect such information and provide it to senior/top management for action.
SUMMARY
The chapter has examined business-to-business marketing research and internalmarketing research. In the case of business-to-business marketing research thedifferences and the similarities with consumer marketing research have beenexplored. Business-to-business marketing research has changed considerably inrecent years and employs many of the approaches that were at one time thedomain of consumer research.
Service marketing research includes shopping surveys. In a shopping survey, afield worker poses as a customer and, following a list of predefined steps, makesmental notes. Major users of such surveys are retailers and hotels. Such studiesare generally handled by an outside specialist firm. It also makes use of cus-tomised, full-scale studies of service satisfaction to provide measurement ofcustomer reactions to the delivery of service. Other customer/client reactionstudies are often used by small-scale retailers or service firms as well as by thelarger firms.
Parasuraman et al. published their now classic article which led to a revolu-tion in the way that service quality is dealt with. In that paper the results of theirexploratory research were presented, including a statement of ten service qualitydeterminants that appeared to be relative. In order to improve ‘true quality’ in aservice organisation the first step is to identify the quality determinants mostimportant or relevant to the company’s target market and then assess their ownand their competitors’ performance. This early work formed the basis for thedevelopment of SERVQUAL.
EOM_C14.qxd 6/23/05 10:53 AM Page 446

.
Case study 14.1 447
Internal marketing is based on the idea that every individual in an organisa-tion, particularly a service organisation, should recognise that they have customersto serve. There is a positive link between internal service quality and externalservice quality and hence customer satisfaction, customer loyalty and the pro-fitability of the organisation. Market research can be adopted for use withemployees. Personnel can be given the opportunity to give feedback to manage-ment about working conditions, company policy in general and workers’ ownunderstanding about what comprises quality for the customer. The relationshipbetween organisational subunits and their relationship to top management arealso important. This can be assessed by a variation of the SERVQUAL instrument.
QUESTIONS
1 What is business-to-business marketing research? How does it differ fromconsumer marketing research?
2 Discuss how shopping studies can help decision making in a large retailingorganisation.
3 Consider how SERVQUAL might be used in an organisation of your ownchoice.
4 Discuss the role of marketing research within the context of internal marketing.
5 Examine how marketing research that looks at internal marketing mightinterface with that which looks at external customers.
6 How can an intranet help manage knowledge?
CASE STUDY 14.1: MANAGEMENT IN THE PUBLIC SECTOR
In recent years one city council has been the object of considerable change.Moreover, following the changes that have occurred, there has been a feeling thatwhat has been left behind results in a disgruntled set of employees whose angerand resentment needs to be assuaged. On being appointed to their posts as execu-tive directors of the city council, the new senior management was faced with theirfirst priority, and that was to find ways of reducing the then currently high levelof council tax burden. Staffing levels were an obvious target for savings andbecame the focus of immediate attention. A thorough analysis of the situationindicated that there appeared to be far too many levels of management – espe-cially at the middle management level. In some cases, the number of levels of
EOM_C14.qxd 6/23/05 10:53 AM Page 447

.
448 Chapter 14 • Marketing research settings: business-to-business, services and internal marketing
management between the chief executive and the ground-floor workers was as many as eight. The executive directors therefore decided to embark on a voluntary redundancy scheme, which had the intention of encouraging middlemanagers to take early retirement and/or generous redundancy payments on theunderstanding that they would not be replaced.
While these initiatives were in train the city council decided to commission astudy to identify the quality of the communication processes with employees.The senior management of the organisation had felt that there was room forimprovement both in terms of communication and management style, but wasunsure as to what this should involve. The actions it had taken were a response tothese feelings.
Question
Draw up a research proposal for the city council that will specifically address thequestion of identifying the quality of the communication processes with employees.
CASE STUDY 14.2: ORCHESTRAS AIM TO PASS THE BATON
The lights dim in the concert hall of the Colorado Symphony Orchestra and theaudience falls silent. Conductor Martin Alsop raises his baton to direct a piece bycomposer Scott Bradley and over the performance stage a camera image is pro-jected. Tom and Jerry, the famous duo, scamper across the screen.
What are Tom and Jerry doing at a classical music performance? The sym-phony orchestra hopes they – and other marketing innovations – will bring inlarger and younger audiences.
Symphony orchestra concerts are not the only US entertainment form facing anincreasingly grey-haired clientele.
But the demographics of symphonic attendance are striking. A study of con-certgoers released last year by the National Endowment for the Arts foundaudiences declining for every age group under 50. According to the St PaulChamber Orchestra, only 6% of its audience is under 35.
An ageing audience eventually means more empty seats. Eight symphonyorchestras have closed in the USA in the last ten years. Last year alone, theorchestras of San Diego and Sacramento shut down.
What’s needed, say observers, is a complete overhaul of marketing strategy.Eugene Carr, president of Culture Finder, a Net information service about thearts, says he realised just how little symphony orchestras have changed when theNew York Philharmonic recently presented a concert nearly identical to a per-formance a century ago.
FT
EOM_C14.qxd 6/23/05 10:53 AM Page 448

.
Case study 14.3 449
Previously foreign concepts such as ‘building a brand image’, ‘measuring cus-tomer satisfaction’ and ‘creating name recognition’ are finding their way intoclassical music parlance.
The Oregon Symphony, for instance, has conducted market research to find outwhat appeals to its viewers. ‘Our theory is, the music’s not the problem, it’s howit’s presented,’ says Don Roth, director of the orchestra. To attract a youngerclientele, the Oregon Symphony has introduced concerts under a new ‘brand’name, Nerve Endings. ‘We did it this way because it lets people know that theseconcerts will be different from your standard fare,’ says Maureen O’Connor, incharge of marketing for the orchestra. Under the auspices of the new brand, theOregon Symphony is venturing on to new ground. A February concert featured acorpse in the lobby, cordoned off with police tape. The corpse was a dummy ofMozart, a display designed to create a mood for that night’s Mozart programme.
Another Nerve Endings performance featured a flamenco-inspired classicalmusic programme, complete with dancers, videos of flamenco singers, and dis-counts to flamenco parties at local night clubs.
Source: Griffith16 (reprinted with permission)
QuestionSuggest a programme of marketing research that could be useful in helping anorchestra develop a good marketing strategy.
CASE STUDY 14.3: DECLINE OF FRILLS
Companies are spending more money on business travel but their employees aregaining little of the benefit as they continue to cut the costs of each trip,Scheherazade Daneshkhu writes.
Euromonitor, the London-based market research group, says that costs arebeing reduced through shorter trips. Business travellers are also holding backfrom spending a night in their destination to save on hotel bills. The main reasonfor the increase in corporate business travel spending is because of the rise inflight costs, according to Euromonitor.
Some companies are continuing to cut the number of trips their employeestake as well as trading down the class of air travel. Carlson Wagonlit, the businesstravel agent, says that 35% of UK companies questioned for its survey in Januarysaid that they had changed their policy to allow for a lower class of travel.
The number of companies willing to pay for long-haul business-class travelhas been in general decline over the past three years, according to CarlsonWagonlit. There has been a corresponding rise in economy fares. Most of those itquestioned said they were prepared to travel on less expensive no-frills flights onshort-haul routes, but wanted greater comfort on longer flights.
FT
EOM_C14.qxd 6/23/05 10:53 AM Page 449

.
450 Chapter 14 • Marketing research settings: business-to-business, services and internal marketing
The latter wish appears not to be granted. The number of those flying in busi-ness or first class on long-haul flights dropped compared to last year, whileeconomy-class travel has increased.
But there is some room for optimism. More than two-thirds of the travellersquestioned said they expected to make more business trips over the next 12months – a 36% increase from last year.
Source: Daneshkhu17 (reprinted with permission)
Question
How might marketing research help the travel business to unravel some of itsproblems that are as yet unresolved?
CASE STUDY 14.4: JASMINE HOTEL, DUBAI
Jasmine Hotel is located in the Deira district of Dubai in the United ArabEmirates. It is about ten minutes’ drive from the airport and within a short walkof the shops. The Gold Souk is a short taxi drive away and the hotel is withinwalking distance of most of the city on the Deira side of the creek. A compliment-ary shuttle service operates between the hotel and the public Al Mamzar BeachPark where full beach club and water sports are available for a small fee.
Within the hotel itself there is a good choice of bars and restaurants and there isalso a coffee shop. Leisure facilities include a small roof-top swimming pool, afitness room, sauna and spa. The central atrium is light and spacious and is thefocal point of this very recently built hotel.
Dubai enjoys a very hot and dry climate, being subtropical and close to thedesert. Temperatures for most of the year exceed 100°F during the daytime andare more than 80°F after sunset. It is not unknown for daytime temperatures tosoar to 120°F in July and August. Acclimatisation can take visitors to Dubai a littlewhile to achieve. While locals brave the daytime sun, all-year-round visitors frommore temperate climates can find the climate unbearable during the day duringJuly and August.
The accommodation comprises some 250 rooms that are spacious and well fur-nished with bath and shower, air-conditioning, telephone and television andmini-bar. The hotel has three restaurants: Indian, Thai and Chinese. All are wellappointed in traditional style. Guests pay separately for all meals and use of themini-bar. A typical room costs between 30 and 50 pounds sterling per night,depending on the time of year. The breakfast buffet costs around 12 pounds ster-ling. Canned soft drinks from the mini-bar cost around 3 pounds sterling a canwhile beer is around 4 pounds sterling a can. In the neighbourhood there are
EOM_C14.qxd 6/23/05 10:53 AM Page 450

.
Case study 14.5 451
many good-quality restaurants offering meals at low prices and soft drinks can bebought locally from stores for as little as 10 pence per can.
The hotel employs a large number of staff. These range from several reception-ists and doormen to house boys, chambermaids, waiters and cooks. The hotel iskeen to improve the level of service it offers to customers and at the same time isalso anxious to ensure that it has a fully motivated staff to meet the needs andwants of the wide variety of guests that it entertains. Guests come from all overthe world and the hotel also hires out its conference suite on the top floor to bothlocal and foreign clients.
Question
Design a marketing research system that will help the hotel maintain the level ofservice quality that it is hoping to achieve. Account should be taken of both the hotel’sinternal and external customers in designing the system.
CASE STUDY 14.5: BANKING IN PORTUGAL
Northern Portugal is the cradle of the nation’s entrepreneurial spirit. Business-people in the region consider themselves to be the real wheeler-dealers of thePortuguese economy, running mainly small to medium-size businesses, andhaving a certain air of contempt for their counterparts in Lisbon and furthersouth. According to the northern Portuguese, Lisbonites are mere employees ofmultinationals who spend their time on politics and parties while the real dealsare done in the north.
Of course, in common with most other capital cities, Lisbon is where the powerand money gravitates; like the multinationals, banks have a strong presencethere. However, the Portuguese have a saying that banks are born in Oporto anddie in Lisbon, where deal-making skills become blunted and attention to detailbecomes lax. For this reason, Banco Portugues de Investimento (BPI) keeps itsheadquarters in Oporto.
BPI is an exclusive merchant bank set up in 1981 by Artur Santos Silva; SenhorSilva has, in the meantime, set up or acquired a string of subsidiary banksbetween Oporto and Lisbon. Two of these, Banco de Fomento e Exterior andBanco Fonsecas & Burnay, have head offices in Lisbon, while a third, BancoBorges & Irmao, remains in Oporto. Borges & Irmao is focused towards northernPortugal, which is where the bulk of its branches are, and Fonsecas & Burnayfocuses in the south.
Both subsidiary networks have been briefed to develop consumer lendingniches such as credit cards and car purchase loans, segments where BPI claims ithas developed key products. The business in the north has the added bonus of using its retail activities to scout for corporate finance – so many of its retail
EOM_C14.qxd 6/23/05 10:53 AM Page 451

.
452 Chapter 14 • Marketing research settings: business-to-business, services and internal marketing
customers are businesspeople running small and medium enterprises. Typically,the banking groups in Portugal divide their markets into three main segments:small and medium enterprises, universal banking, and large corporations. BPIbelieves that the delivery of tailor-made services to specific segments is the key tosuccess in domestic banking.
Banking executives are painfully aware that there is a lot of work to be done inrestructuring the industries of northern Portugal – they talk in terms of identify-ing products and standardising them, of joint marketing projects, and of poolingcompanies together for research and testing of projects. Aiding management buy-outs and merger and acquisition deals are seen as ways of ensuring continuity inbusinesses, and are looking towards cross-border transactions with companies innorthern Spain as a way of consolidating businesses.
So far, progress has been slow; the northern business culture is not receptive toinvolving banks in their activities. The family businesses in the north tend to bemistrustful of banks, are suspicious of marketing ideas and usually employ onegraduate to look after the banks – there is a widespread belief that the less thecompany has to do with the bank, the stronger is the business. Successful firmsare perceived as those who neither give nor receive credit, who deal in cash only,and who keep their business dealings close to their chests. There is, fortunately, agrowing realisation that these practices might work well for small firms, but willnot be effective if the firm is to grow beyond a small family concern. ‘Small familycompanies tend to have opaque accounts which makes risk evaluation very com-plex; they are also, by definition, very individualistic,’ is how one Oporto bankinganalyst expressed it.
In the near future, the banks are expecting some medium to large firms toemerge in northern Portugal as the merger process accelerates. Better able to com-pete on a world stage, these firms will probably be engaged in the traditionalindustries of textiles and leather, but will be better managed and better financedthan the present companies. If this is the case, the banks expect to be sharing intheir success, and in the growth of northern Portugal as a player on the worldbusiness stage.
(Case contributed by Jim Blythe)
Questions
1 What kind of secondary sources might be useful to the banks in identifyingbusiness customers?
2 How might banks decide which retail customers are also potential corporate clients?
3 What would be the main difficulties in researching the corporate market innorthern Portugal?
4 How might the banks research the market for retail customers?
5 What secondary sources might be useful for the banks in identifying customerswithin their chosen niche markets of credit cards and car loans?
EOM_C14.qxd 6/23/05 10:53 AM Page 452

.
Further reading 453
REFERENCES AND NOTES
1 Gorle, P (1995) The cascade theory that shows practical gains, Research Plus, October, 11.
2 Jamieson, D (1995) Now business research is every agency’s research, Research Plus,October, 4–5.
3 Skapinker, M (1997) Deceptive appearance, Financial Times, 3 February.
4 Parasuraman, A, Berry, L L and Zeithaml, V (1985) A conceptual model of servicequality and the implications for future research, Journal of Marketing, 49, 41–51.
5 Berry, L L, Zeithaml, V A and Parasuraman, A (1985) Quality counts in services, too,Business Horizons, May–June, 44– 52.
6 Zeithaml, V, Parasuraman, A and Berry, L (1990) Delivering Quality Service, New York:Free Press.
7 Buttle, F (1996) Relationship Marketing, London: Paul Chapman, 59–60.
8 Heskett, J L, Jones, T O, Loveman, G W, Sasser, W E and Schlesinger, L A (1994)Putting the service profit chain to work, Harvard Business Review, March–April, 164–74.
9 Brooks, R F and Smith J V (1993) Service from within, TQM Journal, October, 41–45.
10 Brooks, R F (1993) Internal service quality – a manufacturing perspective, Proceedingsof the Marketing Education Group, Loughborough, 93–94.
11 Brooks, R F (1995) Internal service quality – a theoretical development, Proceedings ofthe Marketing Education Group, Bradford, 80–90.
12 Davis, T R V (1992) Satisfying internal customers: the link to external customersatisfaction, Planning Review, 20(1), 34–37.
13 Magidson, D and Polcha, A E (1992) Creating market economies within organisations,a conference on internal markets, Planning Review, January–February, 37–40.
14 Azzolini, M and Shillaber, J (1993) Internal service quality: winning from the insideout, Quality Progress, November, 75–78.
15 Hart, C W L (1995) The power of internal guarantees, Harvard Business Review,January–February, 64–73.
16 Griffiths, V (1997) Orchestras aim to pass the baton, Financial Times, 26 May.
17 Daneshkhu, S (1997) The decline of frills, Financial Times, 28 April.
FURTHER READING
Anderson, E W (1993) Firm, industry and national indices of customer satisfaction:implications for services, in Swartz, T and Brown, S W (eds), Advances in ServicesMarketing Management: Research and practice, Vol. 2, Greenwich, CT: JAI Press, 87–108.
EOM_C14.qxd 6/23/05 10:53 AM Page 453

.
454 Chapter 14 • Marketing research settings: business-to-business, services and internal marketing
Anderson, E W, Fornell, C and Rust, R T (1997) Customer satisfaction, productivity, andprofitability: differences between goods and services, Marketing Science, 16(2), 129–45.
Andreasson, T W (1994) Satisfaction, loyalty and reputation as indicators of customerorientation in the public sector, International Journal of Public Sector Management, 7(2),16–34.
Donnelly, M, Wisniewski, M, Dalrymple, J F and Curry, A (1995) Measuring service qualityin local government: the SERVQUAL approach, International Journal of Public SectorManagement, 8(7), 15–20.
Eklof, J A, Hackl, P and Westlund, A (1999) On measuring interactions between customersatisfaction and financial results, Total Quality Management, 10(4–5), 514–22.
Flanagan, T A and Fredericks, J O (1993) Improving company performance throughcustomer satisfaction measurement and management, National Productivity Review,Spring, 239–58.
Gronroos, C (1990) Service Management and Marketing: Managing the moments of truth inservice competition, Lexington, MA: Lexington Books.
Gulledge, L G (1991) Satisfying the internal customer, Bank Marketing, 23, 46–48.Gummesson, E (1993) Quality management in service organizations: an interpretation of
the service quality phenomenon and a synthesis of international research, Karlstad,Sweden: International Service Quality Association.
Hague, P (1985) The Industrial Market Research Handbook (2nd edn), London: Kogan Page.Hallowell, R (1996) The relationship of customer satisfaction, customer loyalty and
profitability: an empirical study, International Journal of Service Industry Management,7(4), 27–42.
Jobber, D and O’Reilly, D (1996) Industrial mail surveys: techniques for inducing response,Marketing Intelligence and Planning, 14(1), 29–34.
Piercy, N (1996) The effects of customer satisfaction measurement: the internal marketversus the external market, Marketing Intelligence and Planning, 14(4), April, 9.
Piercy, N and Morgan, N (1995) Customer satisfaction measurement and management: a processual analysis, Journal of Marketing Management, 11, 817–34.
Schneider, K C and Johnson, J C (1995) Stimulating response to market surveys of businessprofessionals, Industrial Marketing Management, 24, 265–76.
Sirkin, A F (1995) Maximizing customer satisfaction, MLS: Marketing Library Services, 9(4),June, 3–4.
Smith, A M (1995) Quality aspects of service marketing, Marketing Intelligence and Planning,8(6), 25–32.
Sutherland, K (ed.) (1994) Researching Business Markets, London: Kogan Page.Swindley, D (1992) Retail buying in the United Kingdom, The Service Industries Journal, 12,
533–44.White, D and Abels, Eileen, G (1995) Measuring service quality in special libraries: lessons
from service marketing, Special Libraries, 86, Winter, 36–45.Zeithaml, V A, Berry, L L and Parasuraman, A (1996) The behavioral consequences of
service quality, Journal of Marketing, 60, April, 31–46.
EOM_C14.qxd 6/23/05 10:53 AM Page 454

.
Objectives
After reading this chapter, you should be able to:
• appreciate how marketing research is organised and conducted in global markets
• understand how it may differ from research in the home market.
Keywords
concentration functional equivalenceconceptual equivalence instrument equivalenceculture instrument translationdesk research international segmentationdeveloping markets market selectiondiversification target marketethnic influences
Global marketing research15
EOM_C15.qxd 6/23/05 10:54 AM Page 455

.
456 Chapter 15 • Global marketing research
Plan of Chapter 15
EOM_C15.qxd 6/23/05 10:54 AM Page 456

.
Global marketing research 457
INTRODUCTION
This chapter looks at how marketing research is organised and conducted inglobal markets. Segmentation and targeting are considered along with the selec-tion of markets. Attention is given to methodological considerations whenoperating in an international context. Desk research is an important source ofinformation and attention is given in the chapter to identifying fruitful sources ofinformation. How marketing research is organised is also covered in the chapter.We then go on to look at the additional difficulties involved in undertaking mar-keting research in developing countries where the situation is also worsened by alack of requisite research skills and a poor appreciation of the value of marketingresearch. Often, few indigenous organisations possess marketing research depart-ments and comparatively few commercial marketing research services exist.
GLOBAL MARKETING RESEARCH
Most firms involved in international marketing activities at least know the desti-nation of their goods. Clearly, this means that such firms really need to under-stand the foreign marketplace in the same way as they understand the domesticmarketplace. It would seem sensible that before undertaking international mar-keting, firms should undertake analysis of what marketing opportunities exist. Avariety of factors should then be taken into account when screening potentialinternational marketing opportunities to enable a sensible decision to be takenabout which, if any, of the opportunities should be pursued.
A company engaged in international marketing needs to know foreign gov-ernment policies about importing the range and type of products it produces,together with information on tariffs and quotas. Because of the complexity ofinternational marketing, knowledge of legal and financial regulations is essential.The marketing and commercial infrastructures of countries differ considerablyand it is imperative to understand how these vary from country to country.
As far as consumer behaviour is concerned we can not assume that whatapplies in the home market will also be applicable in different foreign markets.Life cycle patterns, bases of motivation, cultural values and lifestyles may be verydifferent from what we are used to and require an entirely different marketingapproach. Many blunders have been made by firms that have failed to study localcustoms carefully. In some countries, it is considered unacceptable and evenoffensive to portray physical contact between the sexes in promotional material.In Thailand, for example, a firm was trying to introduce a mouthwash but wasunaware that the foregoing comments were applicable in that country andshowed, in its advertisements, a young couple holding hands. This causedoffence but by changing the advertisement so that two women were portrayedholding hands the commercials were then considered to be acceptable.1
EOM_C15.qxd 6/23/05 10:54 AM Page 457

.
458 Chapter 15 • Global marketing research
Marketing communication channels must be studied in order to identify howinformation relating to products and services can be brought effectively to theconsumer’s attention. Common barriers include those posed by literacy and lan-guage and these have to be overcome.
One key factor, however, is the capacity of the market to pay for the goods andservices supplied. This is influenced by such things as personal disposableincome and government restrictions on the expenditure of foreign currencyreserves. In the case of larger items and business-to-business projects, loan terms,interest and capital requirements are also important factors.
International marketing research
Most marketing research work is usually carried out by local researchers but theentire process is directed and coordinated by headquarters staff. Headquartersstaff also have to put considerable effort into ‘country market screening’ – lookingat the relative size of each potential market, the size of its purchasing power andits concentration, and the likely rate of future growth. In addition, an assessmentof the competitive forces at work in each potential market has to be made.
RISE OF INTERNATIONAL RESEARCH
Consumer marketing has penetrated to most cities in most countries in the worldand, along with marketing and advertising, market research is commonplace.Recently, Mary Goodyear sat in a small house in a black township in Cape Townwith a group of young men whose prospects seemed limited to casual labour and,possibly, crime. One of the young men chided Mary for showing the group a dulladvertisement. ‘Surely you must remember AIDA,’ he said. ‘Attention InterestDesire Action – well I don’t see much of interest and desire in that advert.’
Source: Goodyear2
TRANSITIONARY MARKETS
Millionaires on the French Riviera are to be expected but it may be surprising toknow that there are over 500,000 dollar millionaires in the People’s Republic ofChina and that there is also an emerging middle class in China (those with annualincomes in excess of $15,000 equivalent) that numbers more than 35 millionpeople.
The common view is that China’s growing consumer market is tied to its urbanpopulation, which represents about 20% to 25% of the nation’s 1.2 billion people.
EOM_C15.qxd 6/23/05 10:54 AM Page 458

.
Global marketing research 459
With annual disposable income of about US$465 a head (and much more in pur-chasing power), urban dwellers reportedly earn about 2.5 times as much as theirrural cousins. However, this picture not only undercounts city dwellers but alsomisses a huge adjunct to the main consumer market: an increasingly affluent suburban economy that has sprouted on the fringes of the cities but is oftenclassified as part of the rural economy. Suburbanites and better off peasants makeup some 384 million people and they enjoy average per capita incomes of US$450,almost as much as urbanites. Urban and suburban groups taken together make upsome two-thirds of China’s population and account for 80% of its gross domesticproduct. Their purchasing power helps to explain why real retail sales on the main-land continue to grow at 10% per annum despite the nation’s recent austeritymeasures.
Indeed, while European retail sales languish in the doldrums many Asian retailmarkets are experiencing annual sales growths of more than 10%. Of course, thestage in development of the market may vary considerably from country to country,even within a particular region of the world. Malaysia in 1994 was a buoyant retaileconomy, but some of its neighbours such as Thailand, Cambodia, Vietnam andLaos did not share the same fortune.
It is possible to characterise the stage of economic development in a country andrelate it to levels and types of marketing activity. The following typology is sug-gested by the Henley Centre:
• The first stage is where the formal cash economy is hardly developed and mostconsumption is of unbranded commodities.
• At the second stage incomes are in the range $2000 to $3000 per annum; brandsconsciousness develops and consumption patterns are influenced by a desire toemulate.
• At the third stage consumption is characterised by the demands of an indi-vidualistic middle class and people seek to express their individuality. The massmarkets that are typical of the second stage are supplemented and even replacedby market niches.
• Stage four sees gender, class, family or caste-based stereotypes disintegrate asindividuals act and buy in a way that is alien to the norms of the group to whichthey have been traditionally affiliated.
• Stage five sees individuals buying brands for occasions. Often more differencesexist between the same individual on two different occasions than between twodifferent individuals on the same occasion.
Many of the developing markets of Asia appear to be somewhere betweenstages one and two. However, notable exceptions are Hong Kong and Singapore,where living standards are above those of Ireland and Portugal. Malaysia andIndonesia are developing rapidly and other Pacific Rim countries are likely todevelop swiftly as political stability takes root.
Source: Tyrrell3 and Korents4
EOM_C15.qxd 6/23/05 10:54 AM Page 459

.
460 Chapter 15 • Global marketing research
International segmentation
Market segmentation amounts to dividing markets into groups of consumerswith similar buying needs and who are likely to respond, as a group, to specificmarketing mixes.
International segmentation helps firms to market their products globally inthe most effective ways. It is important to note that all segments should be meas-urable, accessible and of reasonable size. The international marketing strategistseeks to consolidate numerous small segments across a number of countries intoa slice of the global market that is worth serving.
Target market selection
The process involves narrowing down potential country markets to a feasiblenumber of countries and to target market segments within them. It is argued thatinstead of trying to appeal to everyone, firms best make use of their resources byidentifying potential markets for entry and expanding selectively over time tothose that are considered attractive. The four stages of screening are:
• preliminary screening
• estimation of market potential
• estimation of sales potential
• identification of segments.
Preliminary screening relies on secondary data and in particular indicators of overall buying power in country markets are useful. Estimation of marketpotential is often undertaken with the aid of secondary data-based analyticaltechniques that focus on or utilise demand patterns, income elasticity measuresetc.
Estimating sales potential involves assessing the market share likely to beachieved. Information on competition, degree of relative product advantage andaccess to retail outlets must figure predominantly in these assessments.
Selecting markets
It is often the case that opportunities in foreign markets present themselves towould-be exporters/international marketing firms from time to time. In such acase, one has to evaluate each case on its merits. It may also be, however, that afirm is actively searching for such opportunities and in either case it should bearin mind the points that follow.
EOM_C15.qxd 6/23/05 10:54 AM Page 460

.
Global marketing research 461
The kind of information that needs to be obtained before market selectionoccurs should answer questions about the following points:
• approximate size of the market production/imports/exports/consumption
• products that are currently available (how well they satisfy tastes, habits etc.)
• leading competitors, their market shares, promotion methods, services andfacilities offered
• channels and costs of distribution
• legal requirements, standards etc.
• tariffs, quotas, import licences – contact the British Overseas Trade Board(BOTB), part of the DTI, for details
• ease of transportation (speed/frequency/costs)
• political/economic stability of the market (BOTB Hints to Exporters booklets area good source)
• growth trends in the market.
Concentration versus diversification as a strategy
A firm’s major alternatives are concentration on a small number of markets or toachieve growth by diversification in a large number of markets in the early stagesof international market expansion. The choice of expansion strategy is influencedby market-related, mix-related factors.
NATIONAL ATTITUDES TO ANTIBIOTICS
People were consulted about their beliefs about infections and their problems intaking antibiotics in a large survey of attitudes. The study, conducted in Belgium,France, Italy, Spain, Turkey and the UK, involved some 3610 people. Respondentshad taken an antibiotic, or given one to their child, for a respiratory tract infection(RTI), such as colds, sore throats, catarrh, ’flu and earaches in the previous 12 months. Two hundred respondents were drawn from each country in each ofthree groups: working adults, elderly adults over 55 years and mothers of childrenunder 12 years.
More than 50% of those interviewed thought that antibiotics should be pre-scribed for any respiratory tract infection with the exception of a simple cold. Thepercentage in France, Spain and Turkey was higher than that in Belgium, Italy andthe UK. These differences in expectations were related to patients’ perceptions of antibiotics (in particular their fears about their effects) and the extent of theirknowledge about antibiotics.
s
EOM_C15.qxd 6/23/05 10:54 AM Page 461

.
462 Chapter 15 • Global marketing research
Cultural attitudes underlie individual behaviour and practices in taking coursesof antibiotics. Medical opinion strongly advises that a whole course should be usedto prevent the development of resistant bacteria and recurrent infection. However,in Spain there was a widespread belief that part of a course could be saved andused for a subsequent illness. Indeed, the proportion of patients who claimed not to have taken the whole of the antibiotic course showed distinct variations acrosscountries. Compliance was high in Belgium, France and the UK, but was lower in Italyand Spain. The main reason for stopping taking the antibiotic before the end of thecourse was completed was ‘feeling better’. In Italy and Spain it had become the normto stop taking the medicine once you felt better. Differences in the rates of compli-ance across countries reflect social norms and attitudes and this has profoundimplications for community health. The research uncovered a natural rhythm inantibiotic taking related to the patient’s intrinsic timetable for visiting the doctor,getting antibiotics, then feeling well and consequently stopping the medication.
Ideas about improving antibiotics reflected concern, first, about fewer side-effects (52%) and then improved efficacy (35%) and speed of action (34%). Interestin shorter courses (32%) and fewer daily doses (28%) was also expressed. Interestin reducing the duration of treatment and number of doses was greatest in the UKand Spain but in Italy most were concerned with side-effects.
Nowadays people expect effectiveness and quick results from modern tech-nology. Producers of consumer products, by corresponding closer to patients’lifestyles and the expressed desire for shorter courses of treatment, would not onlymeet patients’ wishes but would also achieve significant medical benefits throughimproved compliance.
Source: Branthwaite and Bruggemann5
Marketing research
Many factors add to the complexity and diversity of conducting marketingresearch in international markets. They include the following.
Understanding the culture
A thorough understanding of the culture is necessary if the researcher is to obtain satisfactory response rates. Quite apart from the problems associated withhigh rates of illiteracy, in some cultures a woman will not consent to an interviewby a stranger, let alone a man. In other cultures men will be reluctant to discusstopics such as personal hygiene or preferences in clothing because they feel thatthis would be beneath their dignity – and they will definitely not address theseissues in the presence of a female interviewer. In addition, it is difficult forrespondents to answer questions concerning goods and services that have neverbeen available or are not commonly used in the community, or whose use is notwell understood.
EOM_C15.qxd 6/23/05 10:54 AM Page 462

.
Global marketing research 463
Lack of secondary data
The usually large amounts of secondary data that characterise countries such asthe USA are in most cases not available in every other country. This is particularlythe case in developing or transitional countries. Even if data are available, theywill be of variable quality. For instance, population censuses in some countriesare frequently made by people who are not professionals and data on income andsales from tax returns can be totally inaccurate in countries where such informa-tion is often undeclared or under-reported.
Cost of collecting primary data
One soon discovers, when trying to collect data in international markets, that thecost of collecting it can be considerably higher without a network of establishedmarketing firms. Many countries lack companies that are experienced in collect-ing information, which means that a sponsoring firm will have to invest in thedevelopment of sampling frames and other materials and in the training of inter-viewers and other necessary personnel.
RESEARCH CAN BE RAINED OFF FOR THE DAY IN INDIA
One of the first things that strikes one about a country such as India is its diversity.It has a population of 900 million people across 26 states, with 16 official languagesand over 1600 minor languages and dialects and numerous different religions.
At a general methodological level, there are a number of considerations whenconducting marketing research in India. Clearly with such a population and massiveregional differences, selecting an appropriate sample of the population in terms of both size and survey centres is a considerable feat to achieve. In addition, withthe large number of different languages there is considerable opportunity for mis-understandings or misinterpretations to arise and qualitative research requiresexecutive teams who can speak all of the local languages that may be required.
With respect to data collection methods, postal research in India is a non-starteruntil the postal system within the country is improved significantly. In addition,because of cultural traditions the telephone is rarely used for lengthy discussions.This being the case, a relatively cheap labour force usually makes face-to-faceinterviewing the most appropriate method to employ.
There are also other logistical factors to be taken into account. For example,when it rains in India it pours and because research is conducted through personalinterviews it makes it impossible to carry on working. Religious festivals also pre-sent obstacles that one would not encounter in the West. There are so many of themand the level of devotion practised is so high that scheduling fieldwork requiressignificant juggling skills.
Source: Bunn6
EOM_C15.qxd 6/23/05 10:54 AM Page 463

.
464 Chapter 15 • Global marketing research
MARKETING RESEARCH IN CENTRAL AND EASTERN EUROPE
Within only five years the countries in central and eastern Europe have moved fromstate-led command economies to consumer-led demand economies. During thistime Western products and services have been actively marketed to the local popu-lation. Consumers have had to get used to the new economic situation and itsmarketing tools: advertising, promotions and branding. The majority have learnedto differentiate not only between local and Western brands but also among Westernbrands. Value for money, an almost unknown concept in 1992, is now part of theeveryday vocabulary. Moreover, local brands are increasing in popularity andincreasing in quality.
Research existed in the region before the collapse of Communism and mostcountries have a tradition of government-sponsored research. At the end of the1980s the value of commercial survey research commissioned by Western com-panies in the region was probably less than US$100,000 but by 1995 it had risen tomore than US$30 million. In the more developed countries some 65% of the com-missions are from locally based companies, primarily multinationals. In the lessdeveloped areas about 60% of the commissioning companies are based outside thecountry in which research is undertaken. In the Czech Republic, Hungary, Polandand Russia there are some ten to twenty companies offering full-service qualitativeand quantitative research. In addition, there are many others that claim to providesome elements of the marketing research service. There are at least three to fivefull-service marketing research agencies in each country in the region. In theCzech Republic, Hungary, Poland and Russia major marketing research suppliersare forming associations and considering quality-standard systems for field work.Most major companies are investing in their future by training staff in westernEurope and America. In most countries there is at least one viewing facility forqualitative research, one monthly omnibus service, one consumer or specialistpanel and one CATI facility. Moreover, several companies in the region are testingor piloting CAPI methods of data collection.
Source: Bartonova7
Methodological considerations
A number of methodological considerations affect the construction of question-naires and other research instruments to be used in international research studies.The problems arise from two sources:
1 the complex cultural differences in the meaning of products and activities
2 the lack of standardised data collection instruments to measure marketing-related variables.
EOM_C15.qxd 6/23/05 10:54 AM Page 464

.
Global marketing research 465
Functional equivalence
The extent to which the same product is used for the same or a similar function intwo or more countries is called functional equivalence. However, possessionstend to be used for different functions in different societies. In India, for example,the accumulation of jewellery represents less an interest in the display of socialstatus than in security and accumulation of wealth. Refrigerators, used to storefood in some countries, are used primarily for chilling water and soft drinks in some other countries.8 When General Mills entered the UK breakfast cerealmarket, a box featured a freckled, red-haired, crew-cut kid saying ‘Gee kids, it’s great.’ What General Mills failed to recognise was that the British family is not as child oriented and permissive as the American family to which it was accustomed, and that British parent–child relationships tend to be moreauthoritarian; consequently, the package had no appeal to the British housewife.9
A similar blunder was made by Binoca when it launched a talcum powderadvertisement in India. The advertisement showed an attractive, seeminglynaked, woman dousing herself with talcum powder. The caption, covering strategic portions of her body, read: ‘Don’t go wild – just enough is all you needof Binoca talc.’ The highly conservative Indian public found the advertisementdistasteful and developed strong negative associations with the brand name.9 Toask proper questions requires that the researchers understand the functionalequivalence, or lack of it, of the activities being investigated.
Conceptual equivalence
The extent to which the same concept (e.g. family) has the same meaning in twoor more countries is known as conceptual equivalence. However, concepts canhave totally different meanings in different cultural environments. This requiresthe careful choice of words used to convey the meaning of what the researcher isattempting to explore. The word ‘family’, for example, means something differentin the USA, where it typically refers to only parents and children, than it does inmany other cultures, where it can extend to grandparents, aunts, uncles and otherrelatives.
Ethnic influences
Researchers need to understand how the cultural values of a society will affect theapproach to the research issue of interest. It may be possible to research problemsin one culture but not in another because of cultural taboos, different levels ofabstraction and other ethnic influences. For example, researching attitudes andbehaviour concerning personal hygiene products may simply not be possible insome cultures where the norm clearly proscribes public discussion of such issues.
EOM_C15.qxd 6/23/05 10:54 AM Page 465

.
466 Chapter 15 • Global marketing research
Instrument equivalence
It may not be possible to use the same measuring instrument in every culture, aconcept known as instrument equivalence. For this reason the researcher maychoose to use what are called ‘emic’ instruments. An emic instrument is one thatis constructed specifically for investigating an attitude in a specific culture.Closed-ended questions, for example, may not work well in one culture, butbecause of cultural differences may work well in another. Certain categories mayhave to be omitted while others may have to be added. Open-ended questionsmay also pose some problems, especially in countries where the level of literacyis low and where interviewer bias is significant. Other methods of interviewing,such as focus groups and consumer panels, may face problems because of strongsocial acquiescence tendencies that are the cultural norm in some countries.
In some instances the researcher may construct ‘etic’ instruments, ones that aretranscultural in application, relating to the behavioural analysis of attitudes con-sidered in isolation. This would permit direct comparison of the same variable acrosscultures. Attempts at developing etic instruments have employed non-verbalinstruments such as picture completion, TAT instruments and semantic differentials.8
Instrument translation
It may seem obvious to suggest that a survey developed in one country be carefully translated into the language of the country where it is going to beadministered and assessed (a process known as instrument translation). How-ever, mistakes can happen even in the case of literal equivalence: one classicexample is a US airline’s advertisement of its Boeing 747 ‘rendezvous lounge’ thattranslated into Portuguese as the ‘prostitution chamber’.9
Special translation methods have been applied in international research projects:
• Direct translation: the survey undergoes a single translation from one languageinto another by a bilingual translator. This method, however, exposes theinstrument to all the problems just mentioned.
• Back translation: this is a variation of direct translation that requires the trans-lated survey to be translated back into the original language by anotherbilingual translator. This lets the translator correct any meaning problemsbetween the original and retranslated instruments. Note that back translationrequires that equivalent terms for words or phrases exist in the other language,which may not always be the case.
• Decentring: a hybrid of back translation, this method involves a successive iteration process: translation and retranslation of an instrument, each time by a different translator. The back-translated versions in the original language arecompared sequentially. If discrepancies occur, the original is modified and theprocess is repeated until both show the same or similar wordings. Generallyeach iteration should show more convergence.
EOM_C15.qxd 6/23/05 10:54 AM Page 466

.
Desk research
Sampling and fielding the survey
In many countries telephone directories, census tract and block data, and detailedsocioeconomic characteristics of the target population will not be available or will be outdated. This adversely affects the ability to draw non-probability aswell as probability samples and to conduct personal interviews of any variety.For example, lacking age distributions for the target population, it is difficult for a marketing researcher to set representative age quotas. Moreover, in certaincultures, convenience samples are doomed to failure. In Saudi Arabia, for example,because of the seclusion of women, shopping mall interviews produce all-malesamples.
Inadequate mailing lists and rudimentary postal and telephone services can make marketing research in some countries extremely difficult. In manycountries only a small percentage of the population possesses telephones and an alarmingly large percentage of telephone lines may be out of service at anyone time. Mail surveys suffer from similar problems. Delivery delays of weeksare common, and in certain countries, expected response rates are lowered con-siderably because the questionnaire can be mailed back only at the post office.
The obstacles in conducting international marketing research studies can be formidable. Understanding the cultural environment in which the research is taking place is a necessary condition for success. The researcher must alsoavoid the tendency to blindly apply conventional research techniques and practices. Designing and implementing international research projects can be done effectively. It just takes effort and sensitivity to asking questions in amanner that increases the likelihood that respondents will provide the desiredinformation.
DESK RESEARCH
Desk research is particularly important in export research. This type of researchshould be fully explored before considering field research. A great deal of deskresearch can be conducted in the UK where extremely valuable information isfreely available from government and other sources. The British Overseas TradeBoard is concerned with giving directions for the development of British exportactivities and establishing priorities in these areas.
The export marketing information service of the Department of Trade andIndustry (1–19 Victoria Street, London SW1H 0ET) has the following resourcesavailable:
• Foreign statistical publications: produced by both national statistical offices andinternational organisations, covering a range of topics including trade, produc-tion, prices, employment, population and other economic data. The centre canalso undertake some searching of selected trade statistics online.
467
EOM_C15.qxd 6/23/05 10:54 AM Page 467

.
468 Chapter 15 • Global marketing research
• Foreign trade directories: including telephone directories for most countries andspecialised directories covering particular sectors of industry.
• National development plans: issued by many countries and most are available forloan to exporters.
• British overseas trade information system: a database for exporters which containsinformation on products and markets, overseas contacts, export opportunitiesand promotional events. This includes:1 The product data store – a computerised microfilm database of product and
industry information on overseas markets. Sources include unique marketreports researched by British embassy staff. Coverage varies from country tocountry but falls within three broad areas of interest: market size, structureand share.
2 The Overseas Contacts Service that provides details of potential agents, dis-tributors, importers, retailers and others supplied by British embassies.
Export intelligence service
This service sends export-related information to interested subscribing com-panies, trade associations and other similar organisations. Its main objective is to secure export orders for British companies by bringing individual exportopportunities to their attention. It also supplies market information such aschanges in tariff rates and import regulations. Each subscriber is profiled toreceive only those notices that are relevant to the organisation – by commodity,overseas market and type of notice.
Other UK government services
There are a number of journals and booklets that provide a wealth of informationuseful to exporters. These are summarised in Table 15.1.
There are many other sources of data, including:
• National Economic Development Office
• Central Office of Information
• foreign embassies
• British Export Houses Association
• British Standards Institution
• Institute of Export
• London World Trade Centre
• Market Research Society.
EOM_C15.qxd 6/23/05 10:54 AM Page 468

.
Desk research 469
Professional advice on export marketing research is obtainable from organisa-tions such as:
• European Association for Business-to-Business Marketing Research
• Market Research Society
• Business-to-Business Marketing Research Association.
Source
British Business
CBI overseas reports
Economic Surveys (HMSO/TSO)
Euromonitor
European Union Information Office (8 Storey’s Gate, London SW1P 3AT)
Export and Import Statistics(Statistical Office)
Hints to Exporters (Department of Trade and Industry)
OECD: Foreign Trade Statistics Bulletin
Overseas Trade Bulletin (CBI)
TABLE 15.1 UK government services
Content
Markets, tariff changes, importregulations, overseas trade missions.Special market surveys, details of tradefairs and exhibitions. Covers world markets
Detailed appraisals of local economicconditions
Booklets that cover all export markets,giving a rapid overview of trading customs,travel facilities, etc.
EOM_C15.qxd 6/23/05 10:54 AM Page 469

.
470 Chapter 15 • Global marketing research
PRINCIPAL METHODS OF ORGANISING RESEARCH
Research for export marketing can be undertaken in a variety of ways, and a briefoutline of the principal methods follows.
Use of own staff or importing agents
The first objection to this methodology is lack of objectivity; sales staff are usuallyincapable of giving an unbiased opinion about the likely success of their product.
The second objection is that agents may have other interests that prevent themfrom giving an objective assessment of the market.
Research is a specialist’s job that requires particular training and expertise andyet, however, this method may be the only feasible way of researching in somemarkets.
Using research agencies in overseas markets
Selection of these may be difficult and risky and where several markets areinvolved, multiple agencies may have to be used to cover the whole export pro-gramme. One big advantage is that national research organisations shouldpossess intimate knowledge of their own home market.
Using a UK-based marketing research organisation plusthe services of a locally based research firm
This method is rather cumbersome and offers few advantage over the previousmethod. It could, however, be useful where manufacturers have no trainedresearch staff (as is often the case in smaller companies).
Using the services of a consortium of research agencies
This method is superficially attractive, but member firms can vary considerablyin the quality of those services. Closely related to this method is that of an inter-national research organisation linked with advertising agencies over principalmarkets. This is generally effective.
Several of the larger marketing research companies – e.g. Gallup, BMRB via itsassociated company MRBI, IFT, and Research Services Ltd – are active in multi-country research.
EOM_C15.qxd 6/23/05 10:54 AM Page 470

.
Questions 471
MARKETING RESEARCH IN DEVELOPING COUNTRIES
There are additional difficulties involved in undertaking marketing research indeveloping countries. The rapid rate of change occurring in such countries createsproblems in maintaining adequate databases. Moreover, as countries develop,there is an increased requirement for both secondary sources of data and primarydata-collection research skills. The situation is also worsened by a lack of requisiteresearch skills and a poor appreciation of the value of marketing research.
Often, few indigenous organisations possess marketing research depart-ments and comparatively few commercial marketing research services exist.Government departments make inadequate use of marketing research and areunlikely to be really useful sources of information in this respect. Until adequatedocumentary detail and data agglomeration infrastructures are set up in suchcountries, the situation cannot improve.
The overall process of marketing research still applies and with modification totake account of cultural, economic and other environmental considerations,research can produce useful results. Secondary sources are a prime source of data and are used extensively despite their limitations. Field research can be hazardous and there is a propensity to rely on certain methods and techniques in order to obviate sampling and non-sampling errors.
SUMMARY
Emphasis has been placed on how marketing research is organised and con-ducted in global markets. Desk research is an important source of informationand attention has been given in the chapter to identifying fruitful sources of information. There are additional difficulties involved in undertaking market-ing research in developing countries and the situation is also worsened by a lackof requisite research skills and a poor appreciation of the value of marketingresearch. Often, few indigenous organisations possess marketing research depart-ments and comparatively few commercial marketing research services exist.
QUESTIONS
1 How is the majority of international marketing research conducted?
2 Explain international segmentation research.
3 What is involved in selecting target markets in international markets?
4 Compare and contrast concentration and diversification as strategies.
EOM_C15.qxd 6/23/05 10:54 AM Page 471

.
472 Chapter 15 • Global marketing research
5 What are the main factors to take into account when undertaking internationalmarketing research?
6 Indicate the main sources of desk research material made available by the UKgovernment and the use to which it may be put.
7 What are the principal methods of organising international marketingresearch?
8 Examine the problems of undertaking marketing research in developingcountries.
CASE STUDY 15.1: MICHEL HERBELIN
At the end of the Second World War, a young self-taught watchmaker namedMichel Herbelin opened a workshop in Charquemont in the Jura Mountains justacross the border from Switzerland. He chose Charquemont principally becausehis main suppliers were close at hand. Only 15 km away as the crow flies was LaChaux-de-Fonds, centre of Swiss watchmaking for a couple of hundred years andhome to some of its most prestigious brands.
To start with he assembled ‘private-label’ watches for other companies, con-centrating particularly on the precision of his manufacture. Very soon, MichelHerbelin gained a reputation for not only the reliability and quality of his pro-ducts but also for their aesthetic appeal. He longed to have his own brand, however, and in 1968 he launched his first collection under the name MichelHerbelin. These watches were extremely well received and during the course ofthe 1970s under the direction of his elder son Jean-Claude the brand began toacquire an international reputation. Today it has a presence in 80 countriesthroughout the five continents and more than 60% of the factory output goesabroad. The majority of sales are to the Middle East and Far East although thebrand is well known in Europe. But it is in France that its main success lies. InFrance it is the leading independent watchmaker and has a 12% share of theunder £1000 retail price bracket. Moreover, in each of the past two years it hasachieved a 25% increase in sales turnover.
Michel Herbelin retired from active participation in the business in 1993 andthe firm is now in the hands of his two sons, Jean-Claude and Pierre-Michel. Itemploys 80 workers who produce around 120,000 pieces annually of which 90%use quartz movements. The accent has always been on reliability and to this endthe firm utilises ETA movements for 80% of its production. The majority are thepopular Flatline movements with the Valjoux 7750 automatic chronograph move-ments in the more complicated models. Quartz movements from FranceEbauches, France’s largest supplier, are used in certain ladies’ models such as thefashionable Chic collection.
EOM_C15.qxd 6/23/05 10:54 AM Page 472

.
Case study 15.2 473
The aesthetic appeal of the whole range is the responsibility of a design teamunder the personal direction of the managing director, Jean-Claude. With a carefuleye on fashion trends the team creates two collections a year – rather like theircouturier contemporaries in Paris – and works to a distinctive house style notable forits emphasis on softness of line and harmony of dimension enhanced by subtlerefinement of detail. The 350 exclusive models of the collection fall into three mainranges. The classic range features traditional styles with simple uncluttered lines.The jewellery range consists of original and elegant designs. The sports range has astrong nautical flavour of ships’ wheels and ropes and sea-blue dials and straps.
Jean-Claude’s concern for quality ensures that every watch is individuallyfinished by craftsmen and has to undergo 50 quality control procedures during itsjourney through the factory. Considerable attention is given to protection againstmoisture penetration, seals being fitted to the crystal, case back and even bezel.Water resistance to 30 metres is standard and verified individually by the routinecompression tank immersion and droplet test. Gold plating is another operationwhere the accent on quality is paramount. Nineteen microns of anti-corrosionalloy are laid over the base metal, followed by five microns of 18ct gold platingwhich in turn is covered by a one micron layer of 23.7 gold for finish and resist-ance. The rhodium plating process is equally meticulous.
Michel Herbelin originally entered the UK market in the 1970s but failure tomeet the targeted growth led the parent company to withdraw around 1990. Itwas relaunched under its present sales director, Peter Gauntlett, in 1993, sincewhen it has achieved considerable acceptance by the trade, with some 80 stockistscovering the country. Peter Gauntlett indicated that the company had found thata number of go-ahead independent jewellers look on Michel Herbelin as a splendid platform to help them launch their business onwards and upwards. The brand received an encouraging reception at a recent International JewelleryFair at Earl’s Court. Quite a few new accounts were opened and a number ofrepeat orders were taken.
Source: Edwards10
Question
What kind of marketing research do you think would be beneficial to a company suchas Michel Herbelin in its attempt to get a strong foothold in the UK market?
CASE STUDY 15.2: CHINA
Before the outbreak of the Second World War, Shanghai was referred to as the‘Paris of the Orient’ but after the Communist revolution of 1949 its significancediminished. Today, however, there is talk of it surpassing even Hong Kong in thenot too distant future as a capital of enterprise. In the first four months of 1993
EOM_C15.qxd 6/23/05 10:54 AM Page 473

.
474 Chapter 15 • Global marketing research
business-to-business output surged by more than 20%. American firms such asAT&T, Dupont, Merrill Lynch, Hilton and Sheraton have made their way toShanghai, joining Volkswagen, Hitachi, Pilkington and many others.
It is on the east side of the city in the Pudong New Area that the business-to-business activity is most in evidence. During the past three years more than 1000foreign firms have located there and investments have approached nearly $5bn.The Chinese government has chosen Shanghai to become the trade and bank-ing centre not only of Asia but of the whole world by 2010, or at least to surpassHong Kong as a financial giant. Commercial advertising in Shanghai is gaining in importance. In 1992 advertising appearing on city buses alone sold for morethan 10 million yuan. There are some 16 million hoardings on Shanghai’s publictransport buses every workday.
In Shanghai today, chic young Chinese promenade on the Bund, the waterfrontwhere European, US and Japanese colonial powers built one of the first commercialenclaves in China. Along Nanjing Road a million people pass every day. Therethe shops are full of foreign luxury items. New businesses in Shanghai are beingestablished at the rate of five an hour. But this growth in the business-to-businessand commercial sector has created cost of living rises of around 20% a year.Moreover, the bill for a couple of drinks in a luxury hotel can amount to more thanhalf a month’s income for a Chinese peasant.
Chinese women, like their Western counterparts, take a great deal of interest in their appearance and cosmetics are much valued. However, cultural factorshave a very strong impact on their tastes, beliefs and attitudes. For example, in1988 an exhibition in a northern city produced information that revealed that acosmetic was required that would both moisturise the face and whiten it. To meetthis requirement, a new product ‘Xiafei Gold Brand Special Whitening Honey’was developed and introduced to the market, breaking the sales record with 20 million items sold in four years.
‘Xiafei’ and ‘Olice’ feature among the most well-known brands of cosmetics inChina. Both products were introduced to the market by Cao Jianhua, who has justintroduced yet another new product, ‘Chaotian’. Xiafei’s success is attributable to its middle price position and suitability for a wide range of people. Olice wasformulated by adapting a product and adding a biological ingredient known asSOD, which was supposed to protect middle-aged women from signs of age. Withthe name ‘Blue Noble’, the packaging was given the image of elegance in order tosatisfy the customers’ desire for fashion and modernity and the product was animmediate success. ‘Chaotian Beauty Treasure’ was introduced in 1993 into the topten department stores in Shanghai and this too has been an immediate success.
The brand names, supportive of the positioning strategy adopted, were con-sidered very important to their success. The names sound bright and modern inChinese – ‘Xiafei’ means ‘the brightening of a colourful morning glow’ and namessuch as ‘Whitening Honey’, ‘Blue Noble’ and ‘Beauty Treasure’ give the impressionof safety, nutrition and grace associated with expected levels of product quality.
Source: Xiong11
EOM_C15.qxd 6/23/05 10:54 AM Page 474

.
Case study 15.3 475
Question
Discuss the kind of marketing research that might well be undertaken with regard tofast-moving consumer and fashion goods in China.
CASE STUDY 15.3: THE FUTURE LIES ABROAD
Over the past year, WPP has started up market research businesses in China,Indonesia and South Korea. We have set up a joint venture in healthcare market-ing services in Japan. Earlier this month we bought the largest sales promotionand direct marketing agency in Taiwan.
These initiatives are a sign of our commitment to the so-called ‘emerging markets’, more aptly named ‘fast-growing markets’.
Asia Pacific, Latin America, central and eastern Europe, Africa and the MiddleEast accounted for about one-fifth of WPP’s business last year. This year they willaccount for almost a quarter, and in five years’ time, I would be disappointed ifthe proportion were not at least one-third.
It seems to me that consumer-driven businesses in the West are preoccupiedwith the development, or lack of it, of our own markets and so miss out onopportunities elsewhere.
Unilever is a rare exception among multinationals in setting the objective thathalf of its business comes from Asia Pacific, Latin America, Africa and the MiddleEast within five years, instead of the one-third currently generated.
It also seems to me that most major multinational businesses are not pursuingglobal strategies in the way they would have us believe. The average US-basedmultinational still derives only 20% of its sales from outside the USA. Coca-Colais the exception not the rule, with 80% of its business outside the USA.
Yet over the next ten years worldwide geographical expansion must be astrategic priority. Many consumer goods and services companies promise growthof 5, 10 or 15% in earnings per share or a similar measure. When the world’s population is growing at less than 2% a year on average, this means finding newinternational opportunities.
As we have seen in the case of Vietnam, with a market of around 75m people,and with South Africa and its market of around 40m people, unprecedented foreigninvestment flows in as soon as political conditions allow. The same will be truefor Burma’s 45m people market and Cuba’s 11m people. As a result of greatereconomic stability, more welcoming governments and harder working people,Asia Pacific still retains the lead in terms of interest among multinationals. LatinAmerica is a close second. Within Asia Pacific, only China remains an enigma,with significant revenue growth but limited profitability.
Western businesses should not assume that these markets are simply awaitingtheir arrival.
EOM_C15.qxd 6/23/05 10:54 AM Page 475

.
476 Chapter 15 • Global marketing research
Besides the dominant Japanese financial institutions, some of the leadingKorean chaebols – conglomerates such as Samsung, Hyundai, LG and Daewoo –have grown as big as or bigger than IBM in a shorter time.
President Foods, one of the world’s biggest food companies, based in Taiwan,and San Miguel, the Philippines-based brewing company, are both capable ofdeveloping global brands.
Latin America is also witnessing the development of significant global forces.In the media and communications sector, for example, the Azcarraga family, theMarinho family and John Malone of TCI have all collaborated with RupertMurdoch on pan-regional projects or companies.
Against this background, if we in Western companies don’t develop our businesses, products and services in the new, faster growing markets, we willultimately suffer competitively as the growing forces invade our own backyards.
The author is chief executive of WPP Group.
Source: Sorrell12 (reprinted with permission)
Question
Discuss the kind of marketing research that might be undertaken in the variousmarkets mentioned in this case study. What kind of problems do you thinkresearchers will encounter in each case?
CASE STUDY 15.4: EUROPEAN LAUNDRYSTATISTICS
Detergents are big business, and the world market is dominated by a few verylarge companies. America’s Procter & Gamble and Britain’s Unilever are amongthe biggest. Economies of scale (notably in the construction costs of the hugedrying towers used to convert liquid detergents into powders) mean that it isdifficult for small firms to enter the powdered detergent market.
It may be a commonly held view that detergents differ very little from one toanother, but the fact that differences in washday habits between countries areoften very marked means that detergent manufacturers need to take account ofthese differences if they are to be successful in capturing their share of the globalmarket.
Research conducted on behalf of American detergent manufacturers showedthat European clothes-washing practices not only differ from American practices,but also differ between European countries. Procter & Gamble’s Walter Linglehad said as early as 1955: ‘Washing habits vary widely from country to country.We must tailor products to meet consumer demands in each nation. We cannotsimply sell products with US formulas. They won’t work – they won’t be accepted.’
EOM_C15.qxd 6/23/05 10:54 AM Page 476

.
Case study 15.4 477
The main differences revealed by the research were as follows:
1 European washing machines are normally front loading, with a horizontallyrotating drum. The typical US washing machine is top loading, with a centralagitator.
2 European machines have a smaller water capacity, usually around 3–5 gallonsrather than the 12–14 gallons used by American machines.
3 European machines have a 90- to 120-minute wash cycle, whereas USmachines cycle in about 20–30 minutes.
4 Water temperatures are much higher in Europe, with ‘boil washes’ using waterhotter than 60°C being commonplace. In some countries, the washing machinesdo not heat the water, so the powders need to work at lower temperatures andin still other countries hand-washing is common.
5 Americans use more synthetic fabrics than Europeans do and also tend towash their clothes more often.
6 Although many Europeans do not own a washing machine, those who do tendto use more detergent than Americans use, so that the total detergent con-sumption in Europe is some 30% above US levels.
The problem for the detergent companies has several aspects. First, the front-loading machines made liquid detergents harder to use. Second, the muchslower washing cycle of European machines meant that the washing powders orliquids needed to remain stable in the water for longer. Third, the higher washingtemperature meant a different formulation for the product – or a programme ofre-educating the consumers to wash at lower temperatures. Fourth, Europeanclothing purchase trends would need to be monitored carefully to see whetherthere would be an increase in the wearing of synthetics.
Fifth, and in a more positive vein, the European market is clearly an attractiveone for US detergent manufacturers since consumption levels are high. The manu-facturers were interested in the possibilities of opening up a market for liquiddetergents; liquids are much easier to manufacture and the companies wereafraid that if they did not establish strong brands in the market fairly quickly,small manufacturers would be able to enter the market and establish a presence.This would create competition in an industry that had previously had very littlecompetitive pressure, due to the high capital costs of establishing plants to manu-facture powder detergents. In the meantime, the difficulty of using liquids inEuropean machines was working to the advantage of the major manufacturers.
Although many Americans tend to regard Europe as being one place (in thesame way as many Europeans ignore cultural differences between Americanstates), the more sophisticated marketers within the detergent companies realisedquickly that separate strategies would need to be worked out for each country andeven for regions within each country. This meant that several separate researchprogrammes would need to be carried out, both nationally and regionally. In
EOM_C15.qxd 6/23/05 10:54 AM Page 477

.
478 Chapter 15 • Global marketing research
some cases cultural similarities cross borders; for example, Bavarians often havemore in common with Austrians than they do with their fellow countrymen innorthern Germany.
Striking a balance between finding economies of scale in manufacture and theneed to differentiate the product would prove difficult, but the detergent manu-facturers did not see these difficulties as being insuperable. What they needed todo was to identify segments within the European market as a whole, ignoringborders, and develop products that would meet the needs of consumers withinthose segments.
(Case contributed by Jim Blythe)
Questions
1 What are the main difficulties in designing a research programme for the European detergent market?
2 How would you research the acceptability of low-temperature detergents?
3 What problems might arise when collecting secondary data within Europe?
4 The European market can be segmented by methods other than nationality; inother words, segments exist that cut across national borders. How might you goabout identifying thes000e segments?
5 What methods might be available for monitoring pan-European fashion-buyingtrends?
CASE STUDY 15.5: DELHI DELIGHTS
In Delhi there are many colourful markets that carry a vast and exciting range of handicrafts to attract the money of visitors and tourists in particular. There are also the ‘state emporia’, run by the government, that have goods at fixed and reasonable prices, and for the well off there are shopping arcades at largerhotels that often have quite exclusive boutiques. However, it is the street stallsand bazaars that reflect the colour of local life and where the bargaining for goodstakes place. The shopping experience in Delhi offers a variety of outlets, goodsand markets. Shops, bazaars, smart boutiques and department stores offer a variety of goods and produce ranging from food and handicrafts to designerclothes and electronic items. At market locations, stalls sell newspapers, magazines, music cassettes and best-selling books. There are also a large numberof book and music shops and some stock a wide variety of books by internationalpublishing houses.
Opening hours for shopping are usually from 10.00 a.m. to 7.30 p.m., althoughthe smaller markets keep longer hours and the government-run emporia close an
EOM_C15.qxd 6/23/05 10:54 AM Page 478

.
References and notes 479
hour earlier. Shopping centres in the New Delhi area are closed on Sundays but insome other areas the closing days are Monday or Tuesday. Different parts of thecity have their own weekly holiday, too.
The larger stores accept international credit cards such as VISA, AmericanExpress and Diners and usually display signs prominently within the shop.Bargaining is commonplace when shopping in India and, at the smaller markets,prices are quoted by stallholders on the expectation that customers will haggle.Local shoppers may indulge in long and often acrimonious discussions withshopkeepers about price and quality. The trend, however, seems to be that moreretail outlets are labelling their wares with clearly indicated prices.
Questions
1 Indicate the kind of research in consumer behaviour that you feel would bebeneficial to an organisation interested in marketing each of the following products:(a) tables and chairs(b) cookers, refrigerators and washing machines(c) cars(d) package tours of Europe and America(e) wristwatches(f) textbooks(g) mobile phones.
2 Indicate how you would research the growth in the use of credit cards and thepricing of retail goods in general.
3 How would you research the prime mechanisms used by retailers in the bazaarsand the markets to market their goods?
REFERENCES AND NOTES
1 Ricks, D A, Fu, Y C and Arpan, S (1974) International Business Blunders, Columbus,OH: Grid.
2 Goodyear, M (1996) The world shrinks, maybe, but there’s still the need to travel,Research Plus, May, 12.
3 Tyrrell, B (1994) Eastern promise is worth all the pain of red tape, Marketing, 3 February, 5.
4 Korents, G (1996) China’s other consumers, Business Week, 13 May, 11.
5 Branthwaite, A and Bruggemann, J (1996) Why we won’t keep taking pills, ResearchPlus, April, 8–9.
6 Bunn, S (1996) Now that India’s got GATT, a massive market beckons, Research Plus,April, 10–11.
EOM_C15.qxd 6/23/05 10:54 AM Page 479

.
480 Chapter 15 • Global marketing research
7 Bartonova, M (1996) The markets are emerging – and research is hard on their heels,Research Plus, January, 4–5.
8 Choudry, Y A (1986) Pitfalls of international marketing research: are you speakingFrench like a Spanish cow? ABER, 17(4), Winter, 18–28.
9 Ricks, D A, Fu, Y C and Arpan, S (1974) International Business Blunders, Columbus,OH: Grid.
10 Edwards, F (1995) The French connection, International Wrist Watch, 31, 46–48.
11 Xiong, R (1994) Unpublished MBA dissertation, Department of Management, KeeleUniversity, September.
12 Sorrell, M (1997) The future lies abroad, Financial Times, 30 June.
FURTHER READING
Brock, S E (1989) Marketing research in Asia: problems, opportunities and lessons,Marketing Research, September, 47.
Cateora, P R (1993) International Marketing (8th edn), Homewood, IL: Irwin, Chapter 11.Craig, C S and Douglas, S P (2001) Conducting international marketing research in the
twenty-first century, International Marketing Review, 18(1), 80–90.Douglas, S P and Craig, C S (1983) International Marketing Research, Upper Saddle River,
NJ: Prentice-Hall.Greenbaum, T L (1996) Understanding focus group research abroad, Marketing News,
30(12), June, 3.Hart, S J, Webb, J R and Jones, M V (1996) Export marketing research and the effect of
export experience in industrial SMEs, International Marketing Review, 11(6), 4–23.Johansson, J K and Nonaka, J (1987) Market research the Japanese way, Harvard Business
Review, May–June, 16–22.Keillor, B, Owens, D and Pettijohn, C (2001) A cross-cultural/cross-national study of
influencing factors and socially desirable response bias, International Journal of MarketResearch, 43(1), 63–84.
Kinsey, J (1988) Marketing in Developing Countries, London: Macmillan, Chapter 4.Malhotra, N K, Agarwal, J and Peterson, M (1996) Cross-cultural marketing research:
methodological issues and guidelines, International Marketing Review, 13(5), 7–43.Mattson, J (1990) Measuring inherent product values, European Journal of Marketing, 24(9),
25–39.McKie, A (1996), International research in a relative world, Journal of the Market Research
Society, 38(1), 7–12.Munson, J and McIntery, S (1979) Developing practical procedures for measurement of
personal values in cross-cultural marketing, Journal of Marketing Research, 16.Pawle, J (1999), Mining the international consumer, Journal of the Market Research Society,
41(1), 19–32.
EOM_C15.qxd 6/23/05 10:54 AM Page 480

.
481Last A Head on Spread
Marketing decision-support system
Objectives
After reading this chapter, you should be able to:
• appreciate the nature of marketing decision-support mechanisms
• appreciate, in particular, the use of traditional managementscience/operational research tools in marketing.
Keywords
assignment model marketing intelligencedecision-support mechanism mathematical models decision trees Markov analysiselectronic data interchange (EDI) moving averageexpert systems network modelsexponential smoothing new productforecasting queuing theory modelsgame theory simulationinventory models statistical demand analysislinear programming time series analysismarket demand transportation model
16
EOM_C16.qxd 6/23/05 10:55 AM Page 481

.
482 Chapter 16 • Marketing decision-support system
Plan of Chapter 16
EOM_C16.qxd 6/23/05 10:55 AM Page 482

.
Marketing information systems 483
INTRODUCTION
This chapter presents the main components of a marketing information system. Itcovers both objective and subjective approaches to market measurement andforecasting and the use of traditional management science/operational researchtools in marketing decisions.
First, we take a systematic look at the overall concept of a marketing informa-tion system and then explore its various components in more detail. Attention isdirected to methods of market measurement and forecasting and then to examin-ing the range of management science and operational research techniques thatcan be used to help improve our marketing decisions. Finally, we look at the pos-sible uses for expert systems as part of the decision-support mechanism.
MARKETING INFORMATION SYSTEMS
Marketing information systems exist to help marketing management make gooddecisions. When the marketing environment is undergoing rapid change, initia-tive in decision making is necessary. An efficient marketing information systemrecords the relevant changes taking place in the marketplace and prevents man-agement suffering from an overload of redundant information.
A marketing information system supports marketing decisions by facilitatinginterlinkage and integration between functional departments of the business.Customer perceptions of new products, for example, may be collected by thesalesforce and disseminated to product development groups by way of thesystem. The marketing information system enhances the organisation’s ability torespond to a dynamic business environment. For example, as a result of informa-tion provided through a link with retail scanners, price changes can be immediatelyinitiated in response to the actions of competitors. A well-designed informationsystem enables the efficient handling, organisation and storage of data and leadsto improvements in customer service through increased responsiveness to cus-tomer needs (see Figure 16.1).
A marketing information system might comprise the following subsystems:1
• An internal reporting system containing data on such things as sales, invent-ories, cash flows and accounts receivable, all of which can be used to measurecurrent activity and performance.
• A marketing intelligence system that collects everyday information aboutdevelopments in the external environment and, in particular, problems andopportunities.
• A marketing research system that gathers, evaluates and reports informationon a specific environmental situation facing a company and provides sufficientinformation to minimise guesswork.
EOM_C16.qxd 6/23/05 10:55 AM Page 483

.
484 Chapter 16 • Marketing decision-support system
• An analytical marketing system that is able to undertake the complex analysisof business problems.
The analytical marketing system consists of a set of statistical tools and mathematical models. We have already looked at the statistical tools in earlierchapters. The mathematical models help executives to generate better marketingdecisions. These tools and models comprise the decision-support mechanisms.
Information on competitors’ activities and on customers’ wants and needs canbe obtained from salespersons’ reports. These can be entered into the informationsystem in electronic form and this calls for the design of electronic forms whichcan easily be completed by sales staff. Sales reports tend to be filled in at home atweekends or in hotel bedrooms during the working week. A portable laptop com-puter directly connected by a modem to the firm’s mainframe computer providesan attractive solution to the problem. The communication link is also two way.Information that the company has on the information system can be fed to salesstaff in the field. This includes information that is both internal and external tothe firm. While internal data are collected as a matter of course as business pro-ceeds, data on the environment and competitive activity can often be bought
FIGURE 16.1 Marketing information system
EOM_C16.qxd 6/23/05 10:55 AM Page 484

.
Marketing information systems
from consultants and marketing research agencies, which is often already in anelectronic form (see Chapter 3 on secondary data).
It is better to store data in a disaggregated form in the database. This allowsanyone to manipulate and analyse the data to suit their own particular purposes.Any summary statistical analyses can be kept in a separate file within the data-base. Having a computer-based information system means that information inthe form of reports can quickly be made available to management.
SNAP is a useful computer program, which incorporates questionnaire design,storage of data based on surveys using the questionnaire and data analysis(Figure 16.2). The features of the program are shown in the box overleaf.
485
FIGURE 16.2 How SNAP works
Source: SNAP software, Mercator Research Group Ltd
EOM_C16.qxd 6/23/05 10:55 AM Page 485

.
486 Chapter 16 • Marketing decision-support system
Users and uses of marketing information systems
Sales management is one of the prime users of the marketing information system.The information system can help with the effective allocation of tasks to the sales-force. It also facilitates the assessment of the performance of sales. Sales staff, too,benefit from being able to access the system easily and to get support and infor-mation about such things as:
• quantity of the product on hand
• prices and price discounts
• status information on invoices, time of delivery and back orders
• delivery dates
• complete product specifications.
SNAP
SNAP Professional is an integrated survey design and analysis software programproviding on-screen questionnaire design, data entry, analysis and presentation ofresults in the form of tables and charts. It operates in Windows 95, NT, 2000, MEand XP environments.
Questionnaire Design Choice of WYSIWYG on-screen questionnaire design or alter-native survey variable definition.
Single or multiple column page layout.
Predefined question styles which are customisable and re-usable.
Choice of Single, Multiple, Date, Literal and Quantity responses.
Up to 250 answer choices per question.
No limit to the number of questions per survey.
Variety of question numbering schemes.
Question renumbering feature.
Questionnaire data view shows completed respondent questionnaires.
Questionnaire analysis view shows counts or percentage survey results.
Bitmap backgrounds can be shown behind questions and notes.
Each code of a question has an optional ‘GoTo Q . . .’ routing tag.
Questionnaire editing includes a spell-checker.
Style Templates that enable a complete questionnaire style to be saved or loaded.
Links seamlessly with optional Internet and Scanning modules.
Use predefined questions from SNAP surveyPaks.
Use other questions from your own surveys.
Data Entry Up to 100,000 respondents per survey.
EOM_C16.qxd 6/23/05 10:55 AM Page 486

.
Marketing information systems 487
Four modes of data entry – Questionnaire, Interview, Prompted and Fast.
Customisable data verification in all modes.
Automatic routing following logic set up through questions.
Configuration of non-response strategy.
Changes may be made to questions even after data entry has begun.
Filtering to select cases for browsing and/or printing reports.
Search and replace feature for data cleaning. Import and export data to/from otherSNAP surveys, spreadsheets, databases and other survey software.
Data entry spell-checker.General Analysis features (applies to both Tabular and Graphical Analysis).Analyses based on respondents or responses, with or without missing and ‘notasked’ results.Unlimited level of filters to tabulate subsets of data.Weighting capabilities enable weighting by other questions, factors or to targets.Question responses may be dynamically split, combined and regrouped to con-struct multi-way analyses. Specification of derived variables to group quantity, dateand literal response variables or to combine categories from any number of othersingle and multiple response variables.Batch operation to generate large volume reporting in a ‘macro’ style.Tables and charts can be saved for future quick reference.Optional Internet module generates tables for publication on the WWW.Tabular Analysis Choice of cross-tabulations, frequency tables, grid tables andholecounts.
Predefined table presentation styles which are customisable and re-usable.
Selection of row, column, total per cents, index and expected values, suppresszeros and order rows.
Calculation of score statistics (mean, standard error and confidence) on cross-tabulations and grid tables.
Descriptive statistics: count, sum, mean, mode, median, minimum, maximum,range, standard deviation, variance, standard error, skewness and kurtosis.
Additional statistics on cross-tabulations: Chi square, Cramers V, Phi coefficient,Contingency coefficient. Tables of means, with optional T-test significance results.
Graphical Analysis Choice of 2D and 3D bar, pie, line, area, step, scatter, radar, hi-lo and donut charts. Predefined chart presentation styles which are customisableand re-usable.
Optional inclusion of titles, footnotes, bar and sector labels, values and percent-ages, coloured backgrounds. Creation of pictograph bar charts using BMP andWMF image files.
Perspective rotation and modification of light source location and intensity on 3D charts.
Source: Mercator Systems2
EOM_C16.qxd 6/23/05 10:55 AM Page 487

.
488 Chapter 16 • Marketing decision-support system
FIGURE 16.3 Sources of internal data
Useful sources of internal data
The information system can help to produce sales forecasts and marketing bud-gets that form the basis of sales strategies and quotas. The sales forecasts facilitatethe planning and control of manufacturing, distribution, advertising and promo-tion activities (see Figures 16.3–16.5).
EOM_C16.qxd 6/23/05 10:55 AM Page 488

.
Marketing information systems 489
FIGURE 16.4 Marketing information system reports
FIGURE 16.5 Sources of external data
ELECTRONIC DATA INTERCHANGE
Electronic data interchange (EDI) improves the process of distribution for bothproducers and retailers. With the aid of technology a constant communication linkis forged between manufacturers and retailers, making the process of supply much
s
EOM_C16.qxd 6/23/05 10:55 AM Page 489

.
490 Chapter 16 • Marketing decision-support system
more efficient and cost-effective. It means that instead of going through the tire-some and time-consuming process of assessing demand, making an order andwaiting for it to be processed, retailers can allow sales information provided byEPOS to be instantly transmitted to suppliers through EDI. This gives the supplierthe opportunity to respond immediately to demand, despatching stock as and whenrequired by the retailer.
EDI confers several potential improvements on the process of distribution:
• EDI enables a supplier to use ‘real-time’ processing as opposed to batch pro-cessing. As a result, an order can be despatched when the need is identified,rather than at a regular processing point (usually, the end of the day).
• The system can improve customer service, since goods will be in stock whencustomers require them.
• EDI reduces operating expenses, since orders are handled more efficiently andmore rapidly as there are fewer repetitions involved. Once data is input at thepoint of sale (via EPOS), there is no need for a re-entry at the supplier end andthis reduces costs.
• Where a process is a long one, there is more chance of error. In the case of EDI,there is the need for only one point of data entry and the risk of error is substan-tially reduced.
EDI can help manufacturers gain a competitive advantage in the market. First, itenables them to gain access to valuable information held by retailers about con-sumer tastes and behaviour. This in turn helps manufacturers regain some contactwith the ultimate consumer – contact that has been lost as a result of growingretailer power. Second, manufacturers are able to use their technical resources asan incentive to attract retailers to stock their brand.
Source: Samways and Whittcome3
DECISION-SUPPORT MECHANISMS
Marketing decision-support mechanisms are a collection of tools and techniques,with supporting software and hardware. With it, an organisation gathers andinterprets relevant information from business and the environment and turns it into a basis for marketing action. A marketing decision-support system is acomputer-based system that helps decision makers deal with problems throughdirect interaction with databases and software. A decision-support system’s com-puter software allows managers to combine and restructure databases, diagnoserelationships, discover patterns, estimate variables, and otherwise analyse thevarious databases.
Companies can use decision-support systems to provide customer relation-ship management (CRM). A CRM system might bring together many pieces of information about customers, sales, marketing effectiveness, responsivenessand market trends and describe customer relationships well enough to enable
EOM_C16.qxd 6/23/05 10:55 AM Page 490

.
Forecasting demand
management, salespeople and people providing customer service to know whatother products a customer has purchased, and so forth.
Organisations can create their own databases relating to customers and theirwants, needs, orders supplied etc. with the aid of off-the-shelf software packages.This kind of customer information will be obtained from the orders placed andenquiries made. Technological developments now allow the combination of cook-ies or user log-ins and server logging software to enable tracking and recordingof a customer’s progress through a website, thereby showing interests that wouldotherwise have gone unnoticed.
Data warehousing involves a centrally stored source of data that have beenextracted from various organisational databases and standardised and integratedfor use throughout an organisation. They contain a wide variety of data that presenta coherent picture of business conditions at a single point in time. Data mining isa class of database applications that look for hidden patterns in a group of data.
The remainder of this chapter examines the various decision-support mechan-isms that can be used. The main areas covered are:
1 forecasting tools
2 mathematical models
3 expert systems
4 customer databases.
FORECASTING DEMAND
Forecasting amounts to estimating some future event that is outside the control ofthe organisation and that provides a basis for managerial planning. The estimatesproduced often form the basis of production planning, salesforce planning, set-ting advertising appropriations, estimating cash flow and assessing the need forinnovation. Marketing plans are only useful if the size of current and future mar-kets is carefully measured and estimated. Such information is a useful startingpoint from which to determine how resources should be allocated among mar-kets and products or services.
Defining market demand
Market demand can be measured at several different levels:
• product levels: product item sales, product form sales, product line sales, com-pany sales, industry sales, national sales
• space levels: sales to individual customers, sales by territory, area, country orworld sales
• time levels: short-, medium-, long-range sales.
491
EOM_C16.qxd 6/23/05 10:55 AM Page 491

.
492 Chapter 16 • Marketing decision-support system
There are many different ways of describing a market. The current number ofusers of a product or service and the sales volume they generate constitutes the‘penetrated market’. Secondary data sources may provide information on this orit may be necessary to establish this figure by sample survey. This measure doesnot take account of those people who have an interest in buying the product orservice, but who currently do not buy the product. The latter are important, sincein looking at future demand they provide a measure of the ‘potential market’. Afurther stipulation is that customers must be able to afford the product or service.In assessing the ‘potential market’ this too must be established and will lead to aredefinition of the market size. The ability to use a product or service affects thesize of the market. If it is not possible to use a product, this will obviously restrictthe market size and taking this into account will define the ‘available market’.Finally, a firm has only a limited amount of resources at its disposal, so it choosesonly certain market segments where it feels it has the capacity to compete effec-tively and where the market size is sufficiently attractive. This becomes the‘served’ or the ‘target market’.
Predicting future demand
The following considerations should be borne in mind when choosing the mostappropriate forecasting technique:
• Time horizon: the technique must be suitable for use over the period of timerequired.
• Technical sophistication: the people doing the forecasting must be comfortablewith the technique used and must have the knowledge to understand its useand limitations.
• Cost: greater accuracy in forecasting may only be possible at extra cost; wehave to assess whether the extra cost of accuracy is worthwhile.
• The data that can be used: the extensiveness, currency, accuracy and representa-tiveness of the availability must be assessed before choosing a technique.
Firms can adopt a variety of approaches to sales forecasting but the basicapproach is to:
1 Make an environmental forecast about inflation, employment, interest rates,consumer spending and saving, business investment.
2 Make a forecast of sales and profits to be earned by the industry, using the datain 1 together with other information that links industry figures to environ-mental trends.
3 Make a company sales forecast, using the data in 2 and assuming a givenmarket share.
EOM_C16.qxd 6/23/05 10:55 AM Page 492

.
Forecasting demand
Often, however, firms may not know the industry sales level. In such cases,sales forecasts are made at the company level at stage 2 and stage 3 is not used.
When forecasting the sales for established products, two approaches are pos-sible, both of which have a number of variants. First, there are methods that relyon asking people questions and, second, there are methods that involve the statist-ical or mathematical analysis of historical data.
Asking people questions
Surveys of buyers’ intentions
Some market research organisations, and even businesses themselves, conductperiodic surveys of buying intentions. Using the results produced by regularsample surveys, predictions of the likely demand for various items or activitiescan then be made. This method can be applied effectively by producers of manybusiness products and services, particularly industrial plant, machinery and supplies.
Composite of salesforce opinion
The sales team makes contact with the distributors and/or customers in the mar-ketplace and is well positioned to provide estimates on potential sales demand.When making use of estimates produced by the salesforce, account needs to betaken of any bias that may exist. The salesforce may be biased either in the direc-tion of pessimism or of optimism. We also have to remember that the salesforcemay not really appreciate the larger economic factors that may influence sales.However, providing we can identify the sources of bias and compensate for themin interpreting predictions, it is possible to make use of these estimates.
Expert opinion
Expert opinion is another method of forecasting. Experts may include dealers,distributors, suppliers, marketing consultants and even trade associations. A keyfactor that influences patterns of sales in a country is the state of the economy.Various economic experts can provide their opinions and each government pro-duces its own economic forecast.
Analysing past data
Firms tend to base their forecasts on what they have achieved in the past. Thisapproach to forecasting offers few opportunities for mistakes except where thereare large variations in sales from one year to the next. There are two basic methodsof forecasting, each of which has a number of versions, and these are outlined below.
493
EOM_C16.qxd 6/23/05 10:55 AM Page 493

.
494 Chapter 16 • Marketing decision-support system
Time-dependent methods
Classical time series analysis
The first sets of methods are those based on time series analysis, which assumesthat sales simply vary as a function of time. The time effects are divided into:
• cycle – fluctuations every few years, for example, the effect of trade cycles asvarious major economies in the world are hit by booms and slumps
• trend – a general upward, downward or static (no trend) pattern, for example,the upward trend of sales of video recorders during the growth phase of thelife cycle
• seasonal – systematic variations at certain times of the year, for example, addi-tional sales of swimsuits in the summer months
• erratic – unpredictable or random variations, for example, demand interruptedby an industry-wide strike.
Erratic variation is taken into account when making forecasts, but we do notattempt to predict it exactly. We merely express it as the error we attach to thesales forecast. This method is most suitable for forecasting the sales of productswhere the unexplained variation is small.
The trend component results from developments in a population, the forma-tion of capital and developments in technology. It is evidenced by a generalupward or downward shift in the pattern of sales. If there is no such pattern,there is assumed to be no trend.
The cycle depicts the wavelike flow of sales over a number of years and is mostuseful when examining data for use in intermediate range forecasts (3–7 years).Traditionally, the cycle represents swings in economic activity.
The seasonal component refers to recurrent sales patterns that may exist withinthe period of a single year. This will reflect things such as weather factors, holi-days and seasonal buying habits.
Erratic variation comprises such things as strikes, fashions and other unfore-seen circumstances. These factors are unpredictable and need to be removed frompast data in order to inspect the other three elements. Time series analysis con-sists of decomposing the original sales data into their trend, cyclical, seasonal anderratic components. The series is then recombined to produce a sales forecast.
EXAMPLE
Imagine that Table 16.1 represents quarterly data on shipments of a particularcommodity.
More than one way to forecast time series data such as these exist. One methodis to use dummy variables and multiple regression analysis. Multiple regression is
EOM_C16.qxd 6/23/05 10:55 AM Page 494

.
Forecasting demand 495
Period Year Sales (tonnes)
1 1993 4362 2913 3574 5295 1994 3866 3047 3338 4719 1995 383
10 33611 36512 539
TABLE 16.1 Quarterly data on commodity shipments
a statistical tool that can be applied to past data to discover the most important factors influencing sales and their relative influence. The dummy variables in thisparticular case represent the factors influencing sales. The approach consists ofcreating a variable for each of the four quarters and the following equation is thenestimated by multiple linear regression analysis (see Table 16.2):
Sales = B0 + B1 Time + B2 Winter + B3 Spring + B4 Summer
Time Sales Winter Spring Summer Autumn
1 436 1 0 0 02 291 0 1 0 03 357 0 0 1 04 529 0 0 0 15 386 1 0 0 06 304 0 1 0 07 333 0 0 1 08 471 0 0 0 19 383 1 0 0 0
10 336 0 1 0 011 365 0 0 1 012 539 0 0 0 1
TABLE 16.2 Multiple linear regression analysis
s
EOM_C16.qxd 6/23/05 10:55 AM Page 495

.
496 Chapter 16 • Marketing decision-support system
One of the dummy variables has to be left out so that the regression can besolved by computer: in this case ‘Autumn’ is omitted. The values obtained are:
B0 = 510.5 B1 = 0.3125 B2 = −110.396 B3 = −202.042 B4 = −161.021
Substituting values into the equation for subsequent periods enables a forecastof sales to be made. For example:
Period 13 forecast sales = 510.5 + 0.3125 × 13 − 110.396 × 1 = 404
Moving average
Moving average is one of the simplest methods. Trend, seasonal or cyclical pat-terns are not usually included in it, although in the more advanced methods it ispossible to do so.
The average demand is the arithmetic mean of demand from a number (N) ofpast periods:
At = [D1 + D2 + . . . + Dt−(N+1)]/N
The forecast demand for period t + 1 is a projection of the past averagedemand. The number of periods included in the average can be increased to givemore importance to past demand (referred to as damping). In order to finetune thesensitivity of the moving average to certain periods, a weighting factor Wt can beapplied to those periods:
Ft+1 = At = W1D1 + W2D2 + . . . + WNDt−(N+1)
where W1 + W2 + . . . + WN = 1
Exponential smoothing
Many businesses produce many hundreds or thousands of products. Notableexamples are the firms operating in the pharmaceutical industry. For such firms, asimple forecasting technique is required which requires the minimum of data. Inits simplest form exponential smoothing requires only three pieces of information:
1 the period’s actual sales Qt
2 the current period’s smoothed sales qt
3 a smoothing parameter a, a value between 0 and 1.
The sales forecast for the next period is given by the formula:
qt+1 + 1 = aQt + (1 − a)qt
Forecasts of this kind are handled by computer. Using an iterative procedure(trial and error), the computer program can regularly determine that value of ‘a’which gives the most satisfactory results in making forecasts. The value is the onethat gives the best fit to past sales. Once the system has been set up, all we have to
EOM_C16.qxd 6/23/05 10:55 AM Page 496

.
Forecasting demand
do is to add new sales figures to the database as and when they occur. There are anumber of more sophisticated variants on this approach, such as double expon-ential smoothing and exponential smoothing incorporating seasonal and trendcomponents.
Statistical demand analysis
So far, the statistical or mathematical approaches we have considered treat thefactors that seem to influence sales as regularly reoccurring phenomena. Thedifficulty with this approach is that some patterns do not reappear at regularintervals. For example, while there are economic booms and slumps from time totime, their patterns are not so precise as to enable accurate forecasts to be made.
Statistical demand analysis attempts to identify the source of all influences ondemand so that more accurate forecasts can be made. The basic statistical methodto take account of such factors is multiple regression analysis. Experience indi-cates that the factors most commonly considered are price, income, population,and marketing promotion.
The first stage in a regression analysis is to build a causal model in which wetry to explain sales in terms of a number of independent variables. For example,we might conjecture that industry sales of umbrellas are related to their relativeprice (P), personal disposable income (I), relative advertising expenditure (A) andthe absolute level of rainfall (R). We would express this relationship in the form ofan equation:
S = a0 + b0P + b1I + b2A + b3R
We need to estimate the parameters for a0, b1 to b3 and apply them toquantifications of P, I, A and R for the period of the forecast.
In principle, demand equations of this variety are acquired by fitting the bestequations to historical or cross-sectional data. The coefficients of the equation areestimated according to what is called the ‘least squares criterion’, according towhich the best equation is the one that minimises a measure of the error betweenthe actual and the predicted observations. The better the fit, the more useful willbe the equation for forecasting purposes.
Although this is a popular technique, it needs to be used with care. There mustalways be an adequate number of observations: in making annual forecasts,10–15 years of data are not unreasonable where there are four independent vari-ables. Independent variables can sometimes turn out to influence each other andthus are not independent at all. For example, relative price and relative advertis-ing expenditure may well influence each other, since advertising costs can bereflected in the selling price. There are also other pitfalls to be watched for.
Forecasting sales of new products
To forecast sales of a new product we need some initial sales figures with whichto work. Given that early sales data are available, it is usually possible, by usingone or other of a variety of mathematical models or ‘curve-fitting routines’ to
497
EOM_C16.qxd 6/23/05 10:55 AM Page 497

.
498 Chapter 16 • Marketing decision-support system
make some prediction for sales over a specified time period. Alternatively, it maybe possible to look at sales histories of similar new products and make predic-tions by analogy. There are many examples of these models (see, for instance,Kotler and Lilien4).
EXAMPLE
The epidemic model of initial sales is a useful tool to have to hand when trying to makea sales prediction for certain kinds of new products. The model developed by Bass,5
which he specifically tested out on a range of consumer-durable goods, is illustrative:
pt = p + q/M(Yt)
where pt = probability of purchase given that no previous purchase was madeYt = total number who have tried the productM = total number of potential buyers (saturation level)q = parameter reflecting the rate of diffusion of the modelp = initial probability of first-time purchase
The model can be estimated by running a regression of current versus past sales(Table 16.3):
Salest = c0 + c1Yt + c2Yt2
Analysis of the sales in Table 16.3 gives the forecasting model:
Salest = 2.06 + 1.016Yt − 0.00464Y2t
Forecasting sales of new products in retail outlets
Large retail chains often add new lines to their stock. Most of these retailers havebenchmarks against which to judge whether a product is likely to be successful ornot. A common practice is to offer the product for sale for a limited period in one
Year Salest ’000 Yt ’000 Y t2 ’000
1 1 0 02 2 1 13 4 3 94 10 7 495 20 17 2896 36 37 1,3697 48 73 5,3298 58 121 14,641
TABLE 16.3 Current versus past sales
EOM_C16.qxd 6/23/05 10:55 AM Page 498

.
Applications for mathematical models in the marketing decision-support system 499
of its shops. If the product fails to achieve level of sales within the specifiedperiod, it is withdrawn and is not put on sale in other outlets.
APPLICATIONS FOR MATHEMATICAL MODELS IN THEMARKETING DECISION-SUPPORT SYSTEM
Mathematical models are those referred to in the operations research literature.The main models are:
1 Linear programming
2 Transportation model
3 Assignment model
4 Network model
5 Decision tree
6 Inventory model
7 Queuing theory model
8 Markov analysis
9 Simulation
10 Game theory
The various models or techniques have been applied in a wide variety of settings and can help to find solutions to problems in many different areas ofmarketing. In the following sections, examples are shown (usually omitting cal-culations) of how these techniques may be applied to marketing problems.
Linear programming
Linear programming helps to determine how to minimise costs or maximiseprofits (or minimise/maximise some other factors) subject to a set of constraints.
EXAMPLE
A marketing executive has a budget of £5000 and wants to maximise the ‘reach’ ofmagazine advertisements. The reach of magazine 1 is 8000 potential customersand that of magazine 2 is 5000 potential customers. The number of potential cus-tomers with incomes of less than £10,000 per annum is 1000 and 400, respectively,
s
EOM_C16.qxd 6/23/05 10:55 AM Page 499

.
500 Chapter 16 • Marketing decision-support system
per column inch advertising seen in each magazine. The cost of an advertisementin magazine 1 is £600 per column inch and £1000 per column inch in the case of 2.The manager would like to reach at most 4500 potential customers whose incomesare less than £10,000 per annum. How many column inches should be bought ineach of the magazines in order to maximise profits?
This problem is expressed as follows:
Objective: maximise Z = 8000 X1 + 5000 X2subject to X1,X2 ≥ 0 (negative amounts not allowed)and £600 X1 + £1000 X2 ≤ £5000 (budget constraint)and 1000 X1 + 400 X2 ≤ 4500 (reach constraint)
Applying linear programming gives the answer:
3.29 column inches in magazine 13.03 column inches in magazine 2and the number of readers reached is 41,470.
Transportation model
The transportation model may be considered a special case of the linear pro-gramming model. A special algorithm is developed to solve such problems.Essentially, the idea is to allocate the flow of objects to sources and destinations insuch a way as to minimise costs or maximise profits (or some other measure relat-ing to minimisation/maximisation).
EXAMPLE
A company ships goods from three factories to three distribution outlets. Thesupply capacities of the factories, the demand requirements of the three outletsand the shipping costs (£/tonne) are shown in Table 16.4.
To distribution outlet
From factory 1 2 3 Supply (tonnes)1 12 14 7 1602 13 6 18 403 7 4 5 90Demand (tonnes) 140 50 100 290
TABLE 16.4 Transportation model
EOM_C16.qxd 6/23/05 10:55 AM Page 500

.
Applications for mathematical models in the marketing decision-support system 501
1 2 3 Total
Supply plant 1 60.00 0.00 100.00 160.002 0.00 40.00 0.00 40.003 80.00 10.00 0.00 90.00
Demand 140.00 50.00 100.00 290.00
The solution value = £2260 (cost minimised).
TABLE 16.5 Transportation model: solution
How should supply be equated with demand in order to minimise costs?The solution suggested is shown in Table 16.5.
Assignment model
The assignment model helps to find the minimum or maximum payoff associ-ated with matching one set of items to a second set. The items may be people,projects, jobs, contracts or territories. For example, we might be concerned withassigning people to jobs, assigning various contracts to people making bids orassigning sales people to territories. An assignment problem is one where onlyone from a set of items is assigned to only one from a set of other items.
EXAMPLE
This problem involves getting a marketing research project completed in the short-est possible time. A marketing research department has received a request to carryout a study of the market for eight different products. The department managerasks individual members of the department to estimate how long (in days) it wouldtake each of them to complete each of the projects (one for each product). The esti-mates shown in Table 16.6 were provided.
Entries marked ‘M’ signify that the person would not have the skills or experi-ence to carry out that particular study.
s
EOM_C16.qxd 6/23/05 10:55 AM Page 501

.
502 Chapter 16 • Marketing decision-support system
Product1 2 3 4 5 6 7 8
John 4 3 4 3 6 3 M 7Paul 5 4 3 2 5 4 6 7Bill 3 M 5 4 4 5 7 6Sam 4 6 6 3 3 2 8 6Helen 2 7 7 M 5 3 5 7Mary 4 4 3 6 4 6 6 8Winifred 5 5 4 5 M 5 5 8Alice 4 5 5 4 4 M 3 7Arthur 3 4 M 3 5 3 7 6Mark 6 3 4 4 6 2 7 4
TABLE 16.6 Assignment model
Product study Name Time
1 Helen 22 John 33 Mary 34 Paul 25 Sam 36 Mark 27 Alice 38 Bill 6
TABLE 16.7 Assignment: solution 1
The objective is to accomplish the task in the shortest possible time. In this case,the firm wants to have only one individual per project since experience indicatesthat this is usually the quickest way to get things done. In the past the firm has con-ducted this exercise by assigning tasks according to the shortest available timeindicated in each person’s product-study column, provided they have not alreadybeen previously allocated to one of the other tasks. Thus the assignment made,based on such an heuristic, might be as shown in Table 16.7.
This would give a completion time of 24 days. Using the assignment model andminimising the amount of time, the solution indicates that the tasks can in fact becompleted in 23 days with a different assignment of personnel (Table 16.8).
EOM_C16.qxd 6/23/05 10:55 AM Page 502

.
Applications for mathematical models in the marketing decision-support system 503
Network modelThere are a variety of different network models, including critical path and PERTmodels. Here we consider a simple type of network.
EXAMPLE
A particular market research study includes ten activities, which have durationsand precedences as shown in Table 16.9.
Activity Duration (days) Immediately preceding activities
A 1B 4 AC 5 AD 6 AE 2 BF 1 BG 7 EH 4 FI 3 G, HJ 5 G, H, C and DK 6 DL 2 I, J and K
Note: Activities D, G and H must be completed before the commencement of J.
TABLE 16.9 Network model
Product study Name Time
1 Helen 22 John 33 Mary 34 Paul 25 Sam 36 Arthur 37 Alice 38 Mark 4
= 23 days
TABLE 16.8 Assignment: solution 2
s
EOM_C16.qxd 6/23/05 10:55 AM Page 503

.
504 Chapter 16 • Marketing decision-support system
FIGURE 16.6 Network model
The objective is to determine the minimum time that the project would take tocomplete. This is calculated to be:
A B E G I L 1 + 4 + 2 + 7 + 3 + 2 = 19 days
The minimum time of 19 is on the critical path. In order to shorten the time tocomplete the entire project, an element on this route or path has to be shortened. Itwould be no use shortening C, D or K, for instance (see Figure 16.6).
Decision tree
Decision trees evaluate the expected payoff of different alternatives. The follow-ing example is a simple one and much more complex ones can be built. Theexpected payoff of the various alternatives are calculated and evaluated.
EXAMPLE
A marketing manager is deciding among a number of alternatives:
1 Launch a new product that has a 0.3 probability of a £5m profit if it is successfuland a 0.7 probability of losing £1m if it is unsuccessful.
EOM_C16.qxd 6/23/05 10:55 AM Page 504

.
Applications for mathematical models in the marketing decision-support system 505
2 Cut prices temporarily and stimulate market share. This would generate anadditional £0.7m.
3 Do nothing for the present, so that there would be neither a gain nor a loss.
Which of these alternatives should be chosen?The expected values of the three alternatives are:
1 (0.7 × −1.0) + (0.3 × 5.0) = £0.8m
2 £0.7m
3 £0
Alternative 1 is the best (see Figure 16.7).
Inventory model
Inventory models are employed to assess the best level of stocks to maintain, thefrequency with which to place orders and the quantities to buy. These modelsprovide information on how to minimise the total cost of the inventory system.The total inventory cost is the sum of total ordering costs and shortage costs.Ordering costs refer to the costs connected with placing orders and receiving
FIGURE 16.7 Alternative 1
EOM_C16.qxd 6/23/05 10:55 AM Page 505

.
506 Chapter 16 • Marketing decision-support system
inventory – salaries in purchasing and accounting departments, wages in thereceiving area. Carrying costs are those associated with storage, such as ware-house rent and fuel costs. Shortages are the costs associated with a lost sale andloss of customer goodwill.
Inventory models can be quite complex and take into account a variety of dif-ferent factors such as quantity discounts, backorders and economic lot sizes. Thebest-known and the simplest model is the economic order quantity (EOQ) model,the purpose of which is to determine the optimum order quantity. The modelassumes a demand pattern that is deterministic and at a constant rate, the instan-taneous replenishment of inventory, constant inventory costs and no shortages.The algorithm used is:
where Q* = optimum order quantityD = annual demand in unitsCh = holding cost per unit per yearCo = ordering cost per order
Unfortunately, the basic EOQ model may be unsuitable for many real-worldsituations where the basic assumptions of the model do not apply. Furtherrefinements to the model can enable these difficulties to be overcome.
Queuing theory model
Queues arise because facilities cannot meet the demand for the service the facili-ties have been set up to provide. The purpose of applying queuing theory modelsor techniques is usually to facilitate the identification of an adequate but not too liberal service facility. If the service provision is too generous, the service facility will often be idle and incur unnecessary costs, such as idle employees. On the other hand, where excessive waiting time exists because the facility is inadequate, customer dissatisfaction can occur and a loss of important goodwillensues. The aim of these techniques is to establish the economic equilibriumbetween the cost of the service and the cost associated with the possible loss ofgoodwill.
Solutions to queuing problems may be determined by common formulae.However, the situations in which they occur are complex and it is often preferableto use simulation methods (see later) to obtain a solution.
Markov analysis
Markov analysis has mainly been restricted to brand-switching behaviour andthe impact it has had on market share.
Q h* /= 2 0DC C
EOM_C16.qxd 6/23/05 10:55 AM Page 506

.
Applications for mathematical models in the marketing decision-support system
EXAMPLE
Research data show the following probabilities that a person will buy a particularbrand of soap, given that they purchased a specific brand on the previous occasion(Table 16.10).
The current market shares of the brands is as follows:
Amy’s 20%
Bebe’s 30%
Celia’s 50%
The task is to estimate the long-run market share positions, given that thebrand-switching probabilities remain constant. This can be done in several ways.One way is to multiply out the matrices thus:
A.5 .5 .4D A.2D A0.45D1 B.2 .4 .3E · B.3E = B0.31E
C.3 .1 .3F C.5F C0.24FA.5 .5 .4D A0.45D A0.476D
2 B.2 .4 .3E · B0.31E = B0.286EC.3 .1 .3F C0.24F C0.238FA.5 .5 .4D A0.476D A0.476D
3 B.2 .4 .3E · B0.286E = B0.281EC.3 .1 .3F C0.238F C0.243FA.5 .5 .4D A0.476D A0.476D
4 B.2 .4 .3E · B0.281E = B0.28 EC.3 .1 .3F C0.243F C0.244FA.5 .5 .4D A0.476D A0.476D
5 B.2 .4 .3E · B0.28 E = B0.28 EC.3 .1 .3F C0.244F C0.244F
507
Transition matrix Next purchase
Last purchase Amy’s brand Bebe’s brand Celia’s brand
Amy’s brand 0.5 0.2 0.3Bebe’s brand 0.5 0.4 0.1Celia’s brand 0.4 0.3 0.3
TABLE 16.10 Markov analysis
s
EOM_C16.qxd 6/23/05 10:55 AM Page 507

.
508 Chapter 16 • Marketing decision-support system
The solution is:
Amy’s = 0.476
Bebe’s = 0.28
Celia’s = 0.244
The main limitation of the model is the assumption of a stationery transitionmatrix.
Simulation
The idea behind simulation is to find a satisfactory or close-to-best solution to aproblem by using a mathematical model of the problem situation and testing itout by varying the various parameters to the model. Simulation does not employan optimisation algorithm but simply portrays the performance of a particularsystem, given a set of input parameters. Simulation is usually employed whenthe problem under study is too complex to be treated by optimisation techniques.A problem may be judged to be too complex when either it cannot be expressedmathematically or the formulation is too involved for economic or practical purposes.
Simulation has been widely used by practitioners because of the degree of real-ism that can be included in simulation models and the ease with which suchmodels can be explained to non-technical decision makers.6 In comparison withanalytic techniques, such as queuing theory, simulation models do not require thestringent assumptions necessary for tractable solutions. The logic and mathemat-ical relationships are usually more easily understood.
Since simulation models the expected behaviour of a system, the model has to bebuilt from the perspective of the executive who is studying the system. The execu-tive can then experiment with different factors and different scenarios to decidewhich gives the most satisfactory results. The executive can then experiment witha model rather than interfere with a system in order to understand its behaviour.
The technique of simulation consists of taking random samples from the prob-ability distribution that represents the real-world system under study. Manyreal-world phenomena are ‘normally’ distributed and so in many cases probabil-ity estimates using the normal curve can be employed. In the case of queues,however, other kinds of distributions may be more appropriate – such as a uni-form or a random distribution – and we first need to establish how the events aredistributed in reality. The inputs to the model consist of the observed values andthe probabilities associated with each event.
Recent software developments for desktop and laptop computers have made itpossible for simulations to be developed with comparative ease. An excellentsoftware package is MicroSaint.7 Illustrations of its use can be found in Proctor.8, 9
EOM_C16.qxd 6/23/05 10:55 AM Page 508

.
Applications for mathematical models in the marketing decision-support system
An excellent simulation package is available from Decision Support Laborat-ory10 and an illustration of its use is given in Figure 16.8. Here, sales demand for aproduct is being simulated over a period of time. Decision Support Laboratory isa visual spreadsheet. It provides an easier and faster way to build, edit andexplain a spreadsheet model. The basic building block of traditional spreadsheetsis a cell. The basic building block of DS Lab is an element. With DS Lab, youdefine your model in the same way you would think through a problem, usingsymbols for elements such as inputs, variables, constants, series and tables todefine the data with which you work.
DS Lab shows graphically the logic of the model by letting the user representand manipulate the data with symbols connected by arrows. The symbols (ele-ments) display the data one step at a time, while leaving all the data accessible inan instant with the click of a mouse. The arrows display the relationships betweenthe elements. DS Lab easily manages hundreds of elements over thousands ofsteps. Time is the parameter most commonly defined for these steps, so DS Labprovides a built-in calendar to define days, weeks, months or years. Steps may bedefined as something other than time, such as geography or product type, bysimply creating a list of items. The software will then automatically generate thevalues for each step of the user-defined parameters.
509
FIGURE 16.8 Simulation model
Source: Screenshot reprinted by permission of Microsoft Corporation
EOM_C16.qxd 6/23/05 10:55 AM Page 509

.
510 Chapter 16 • Marketing decision-support system
Game theory
Game theory has been found to be useful when considering marketing strategyproblems. It helps to determine the best strategy that competing firms can adopt.Games can be constructed for any number of ‘players’ and the simplest of theseto understand is the two-person game.
EXAMPLE
In the model presented here (Table 16.11) there are two players, A and B. Each hasthree strategies available and it is assumed that full information about the outcomeof each possible pair of strategies is available. The two players decide their strat-egies simultaneously and it is a one-shot game.
The usual way of showing this form of the game is indicated in Table 16.12. Thetable records the payoffs to A and to B for each possible combination of strategies.For example, the cell containing the payoff 6,4 denotes a payoff of 6 to A and 4 to B.
A B C D E F G H I J K
123 Payoff Tables4 To A To B Row5 B1 B2 B3 B1 B2 B3 Max.6 A1 6 7 2 4 5 3 57 A2 4 2 6 5 4 7 78 A3 6 4 2 4 9 3 99 Col.
10 Max. 6 7 611 1 = code
number1213 B1 B2 B3 B1 B2 B314 A1 1 1 0 A1 0 1 015 A2 0 0 1 A2 0 0 116 A3 1 0 0 A3 0 1 01718 B1 B2 B319 A1 – NE – NE – Nash20 A2 – – NE equilibrium21 A3 – – – strategies
TABLE 16.11 Game theory
EOM_C16.qxd 6/23/05 10:55 AM Page 510

.
Applications for mathematical models in the marketing decision-support system 511
Strategies B1 B2 B3
A1 6,4 7,5 2,3A2 4,5 2,5 6,7A3 6,4 4,4 2,3
TABLE 16.12 Payoff matrix A, B
Examination of the payoff table shows, by trial and error, that there are twostrategy pairs (A1,B2) and (A2,B3) that satisfy the Nash equilibrium condition thateach player’s strategy is a best response to the other’s. In order to model this gameon a spreadsheet, it is necessary to use the data from the payoff matrix to constructtwo separate payoff tables for A and B, as shown in the main table. Note that thecodes used in the following explanation apply to the software used to produce thisexample – other packages may employ different coding systems.
First, the payoff data for A have to be entered into cells C6 to E8. Next, the payoffdata for B have to be inserted into cells I6 to K8. To find A’s best response to each ofB’s strategies, the column maximums for A’s payoff table have to be found. Enter@MAX(C6 . . . C8) in cell C10.
This formula should then be copied from C10 to cells D10 and E10. The columnmaximum signifies the payoff to A when it chooses its best response to B’s strategycorresponding to that column. To find B’s best response to each of A’s strategies,the row maximums for B’s payoff table have to be found. Enter @MAX(I6 . . . K6) incell M6 and then copy the formula to M7 and M8.
The next step is to find out which, if any, pairs of strategies correspond to both acolumn maximum for A’s payoff table and a row maximum for B’s payoff table. Thisis accomplished by first identifying which cells in the payoff tables contain thecolumn and row maximums, respectively, and putting the number 1 in these cells.This identifying code (1) is put in cell G11.
We next create a new set of payoff matrices in rows 14 to 16. In cell C14, enter@IF(C6=C$10,$G11,$A$11).
This will cause the number 1 (from cell G11) to appear in C14 if C6 equals thecolumn maximum in C10 and 0, from cell A11, if it is not. This formula can now becopied from C14 to C15 and C16 as the row 10 is anchored with the $. In this exam-ple the code 1 appears in C16 as strategy A3 is A’s best response if B plays B1.
To code A’s best response to B2 and B3, copy from the three cells C14 . . . C16 to the column sections commencing D14 and E14. To code B’s best response to each of A’s strategies it is necessary to indicate which cells in B’s payoff matrix correspond to the row maximums in cells M6 to M8. In cell I14, enter@IF(I6=$M6,$G$11,$A$11).
Copy the formula from I14 to J14 and K14, then copy the three cells I14 . . . K14to the row sections commencing I15 and I16.
Nash equilibrium conditions are satisfied when each player receives the maxi-mum payoff possible, taking into account the other player’s strategy. This means that
s
EOM_C16.qxd 6/23/05 10:55 AM Page 511

.
512 Chapter 16 • Marketing decision-support system
there will be a 1 in both the coded payoff matrices for this strategy combination.Nash equilibrium pairs in the final matrix can be coded NE in a single matrix ofstrategy combinations by adding the two matrices already coded and finding cellswhose value is 2, i.e. where the strategy combination is both a column maximumfor A and a row maximum for B. In cell C1, enter @IF(+C14+I14>$G$11,$H$19,$I$19).
This last entry displays the code NE from cell H19 when the value in C19 isgreater than the value 1 in cell G11, i.e. when it equals 2. The dash in I19 is dis-played when C19 has the value less than 2. Copy this formula from C19 to the restof the cells in the matrix C19 . . . C21.
Using the basic principles developed, more complex games can be constructed.Such games might contain payoff tables with larger numbers of rows and columns(see, for example, Rosser 199511). It would also be possible to consider other formsof payoff. For example, the objective may be to minimise the maximum gain of theother player. In such a case a 3,4 strategy would be preferable from A’s viewpoint toa 7,8 strategy. Alternatively, minimising the relative gain might be the object, inwhich case a 7,8 strategy would be preferred to a 2,4 strategy. While the construc-tion of the payoff tables and principles of calculation would be similar in all thesecases, the rules to be applied would be different.
EXPERT SYSTEMS AND DECISION SUPPORT
An expert system provides expertise to help problem solving. It can represent thebest thinking of the top experts in the field that can lead to solutions to problemsthat are imaginative, accurate and efficient. An expert system has predictive mod-elling power and can act as an information-processing model of problem solvingin marketing, providing the desired answers for a given problem-solving situ-ation and demonstrating how they would change for new situations.
Expert systems are most appropriately used in the following circumstances:
1 Where the key relationships are logical rather than arithmetical. Generatingnew ideas is more appropriate for an expert system. Advising on action to betaken in specific situations is another example.
2 Where the problem is semi-structured rather than structured. For structuredproblems, a traditional algorithm approach will do; for unstructured problemsthere may not be sufficient knowledge in the knowledge base to provide satis-factory results.
3 Where the knowledge in the domain is incomplete. Expert systems are mostapplicable in the domains of incomplete knowledge.
4 Where problem solving in the domain requires a direct interface between themanager and the computer system. Situations of decision urgency and onlinedecision support are most appropriate for expert system use.
EOM_C16.qxd 6/23/05 10:55 AM Page 512

.
Expert systems and decision support
The three major components of an expert system are:
• a user interface
• a knowledge base
• an inference engine.
The knowledge base includes the definitions of the objects and variables in thesystem, including data, assumptions, production rules (if–then statements),heuristics and models. The inference engine manipulates the elements in theknowledge base and combines it with information from the user to solve a par-ticular problem.
Expert systems can be used for a variety of purposes. These include:
• Interpretation: inferring situation descriptions from sensor data. This is usefulin observational market research studies.
• Prediction: inferring the likely consequences of given situations. This is usefulin forecasting.
• Planning: designing actions. Campaign planning or even marketing planning isan area of application.
• Diagnosis and monitoring: inferring system malfunctions from observables. Thisis useful in the context of marketing control, monitoring performance againsttargets or budgets set.
• Debugging: prescribing remedies for malfunctions. Recommending contin-gency action when plans are not achieved.
• Design: configuring objects under constraints. Product design is an area whereexpert systems can be applied.
• Repair: putting contingency plans into action.
Given the wide array of applications for expert systems in marketing, it is notappropriate to discuss or illustrate expert systems in the generic sense. However,there are different commercial packages available that suit specific purposes. Agood example is that provided by project-management systems software thatincorporates an applications generator capable of facilitating the production of amarketing plan.
In marketing, expert systems have been used to examine single source data for trends, to filter marketing data for quality problems, to develop forecast-ing models, to set sales quotas, to qualify sales prospects and to train sales personnel.12, 13
McCann14 has described several expert systems that have been useful to con-sumer packaged goods brand managers.
513
EOM_C16.qxd 6/23/05 10:55 AM Page 513

.
514 Chapter 16 • Marketing decision-support system
Neural networks
Whereas expert systems parody experts’ thinking processes, neural networks are computer applications that mimic the human brain. One important aspect of neural networks is their ability to learn from their past activities in the sense that records of the system’s past performance can influence processing in order to improve future performance. Theoretically, such systems could be self-improving.
The growth of interest in neural networks comes about as a result of the factthat they emulate not only the brain’s reasoning but also its learning capabilities.Although neural network applications in marketing are currently sparse,researchers have documented several interesting applications. Kestylyn15 hasstudied how neural networks can be used to identify the best sales prospects for atelemarketing operation to call from a list of customers who have not been activerecently. Westland16 has presented systems that save busy executives time byidentifying and organising environmental and internal information for them.Proctor17 has also suggested a potential application of neural networks in evalu-ating new product opportunities.
BREAKTHROUGHS IN BUSINESS INTELLIGENCE
Neural networks and data-mining software can now mimic human thought whenprocessing vast amounts of sales data, thus allowing large companies to save mil-lions of dollars, enter new markets, retain customers, track fraud and generallybecome more competitive.
Neural networks and artificial intelligence were among the hot issues in thefast-moving information technology industry in the early 1980s. But when theyfailed to deliver the instant wins that venture capitalists and others were seeking,neural computing and AI fell out of fashion and out of the high-tech spotlight.
Even Japan’s much vaunted Fifth Generation computer project, which was begunin 1982 and was to use parallel processing and AI techniques to develop next-generation ‘intelligent’ machines, faded from sight.
But in spite of these early setbacks, neural computing, parallel processing andAI techniques have all made substantial advances in recent years aided, in part, bythe dramatic advances in microprocessor power.
Although many researchers and high-tech start-ups now shun the AI tag, theseadvances coupled with more realistic expectations, have ensured that neural com-puting and AI have not been forgotten. Indeed, many of the technologies pioneeredby AI researchers at the Massachusetts Institute of Technology and other laborat-ories on both sides of the Atlantic have begun to be incorporated into mainstreambusiness applications.
Unlike conventional computing techniques, neural computing is modelled on the biological processes of the human brain and has many human-like qualities.
EOM_C16.qxd 6/23/05 10:55 AM Page 514

.
Expert systems and decision support 515
For example, neural computers can learn from experience and do not need to beprogrammed with fixed rules or equations. They can analyse vast quantities ofcomplex data and identify patterns from which predictions can be made.
They also tend to be more robust than their conventional counterparts. Theyhave the ability to cope well with incomplete or ‘fuzzy’ data and can deal with previ-ously unspecified or new situations. As such, they are ideally suited to real-worldapplications and can provide the solution to a host of currently impossible or com-mercially impractical problems.
In addition, the time needed to develop a neural application is often less thanwith a conventional program because there are no algorithms or rules to define.The scope and accuracy of the finished application are also often improved sincethe neural computer can be exposed to many more examples than can be assimi-lated by a single human ‘expert’. International Business Machines has, forexample, integrated neural network and artificial intelligence technology into soft-ware applications, such as data-mining packages.
Mr Evangelous Simoudis, a scientist at IBM’s Almanden Research Center, sayssuch techniques enable business users to sift through vast quantities of raw data inorder to spot hidden trends or anomalies that might otherwise be missed. IBM’sbusiness intelligence and data-mining software can mimic human thought whenprocessing information, called the ‘verification model’, or go beyond human logic todiscover correlations between seemingly disparate data, called the ‘discoverymodel’.
The verification model confirms or refutes the hypothesis of a savvy businessperson while the discovery model reveals patterns that human logic might not see.The classic example was the unexpected connection between beer and nappies dis-covered during a data-mining experiment on a US supermarket database. Thestudy revealed that the people purchasing nappies on a Friday also tended to buybeer.
Before neural networks and artificial intelligence were used in business intelli-gence applications, companies lacked the ability to leverage the information theywere collecting in data warehouses. They were unable to connect consumer-buyingpatterns, customise promotions to target a range of customers with different needsor identify potentially fraudulent insurance claims based on past behaviour.
At best, information analysis was done manually, perhaps as much as 90% ofanalysts’ time was spent gathering information, leaving only 10% of the time todigest and analyse the data. With IBM’s business intelligence technology, however,customers are now able to save millions of dollars, enter new markets, retain cus-tomers, track fraud and generally be more competitive.
Among IBM’s customers, Merrill Lynch developed a Trusted Global Advisor (TGA)network that gives up-to-the-minute information on customer portfolios andinvestments. With access to information in real time, brokers can help customersmake better decisions about their financial futures.
Cadbury’s saw its market share of the chocolate market slip from 33% to 28%,but an IBM business intelligence solution helped the company focus attention onthose product lines that appealed to customers and Cadbury’s market share is nowback up to 30%.
s
EOM_C16.qxd 6/23/05 10:55 AM Page 515

.
516 Chapter 16 • Marketing decision-support system
The Safeway supermarket chain in the UK is improving customer service bytracking product purchases – a system created by IBM in only a few weeks.Preferred customers receive marketing information that appeals directly to theirindividual needs and tastes.
Southern California Edison uses IBM database technology to identify unantici-pated opportunities that saved millions of dollars for the United States’ secondlargest utility. One application that looked at credit collection and overdue accountshelped recover more than $8m. The company says its overall return on investmentfor its databases is 600%.
Neural computing and AI techniques also lie behind many of the sophisticatedsearch engines and intelligent agents found on the Internet and corporateintranets. As Mr Mike Lynch, founder and managing director of Autonomy, theCambridge-based intelligent agent pioneer, notes: ‘In business today, the ability toaccess the right information at the right time is absolutely critical. The problem isthat technologies which promise this ability, namely the Internet and corporateintranets, are flawed in their delivery. Rather than giving users the tools to assimi-late the right information into useful knowledge, they are overloading them with too much irrelevant dross.’ Autonomy’s latest products include server productsdesigned to deliver personalised information to Internet and intranet users in adynamic fashion. They use the dynamic reasoning engine technology developed byCambridge Neurodynamics, a recognised world leader in the application of neuralnetwork and pattern-recognition technologies.
AI and neural-computing techniques are used in ‘case-based reasoning’ toolssuch as those developed by California-based Inference for intelligent problem solv-ing in help desk, customer support and other computer-telephony integrationpackages.
Other AI and neural computing-based systems are used for credit scoring and tohelp pinpoint and prevent fraud in areas as diverse as equity trading and cellulartelephone networks.
Meanwhile, Neural Technologies, a Hampshire-based start-up has launched asoftware package called Prospect Explorer. The product, developed in conjunctionwith Australia’s Straits Resources group, is a geological exploration tool with thecapacity to analyse a range of different types of raw exploration data and automat-ically detect and prioritise anomalies. ‘Neural computing and other forms of intelligent technology are providing leading edge solutions to complex businessproblems’, says Mr Nick Ryman-Tubb, chief executive of Neural Technologies.‘From manufacturing, banking and finance, defence, telecommunications, pharma-ceuticals to the holiday industry, we have already applied neural computing to awide variety of commercial and industrial applications – particularly those whichhave, until now, been either impossible or commercially impractical for conven-tional computing to address,’ says Ryman-Tubb.
Nevertheless, even neural computing enthusiasts concede that neural networkswill not replace conventional computers. ‘Neural computing should not be viewedas a competitor to conventional computing, but rather as a complementary tech-nique,’ notes Neural Technologies.
The most successful neural computing applications to date have been those thatoperate in conjunction with other computing techniques. For example, using a
EOM_C16.qxd 6/23/05 10:55 AM Page 516

.
Expert systems and decision support 517
neural network to perform a first pass over a set of incoming data, then passing theresults over to a conventional system for subsequent processing.
However, with the growing emphasis on autonomy, intelligence and an increasedamount of information required by businesses, traditional computer processingtechnology can only cope through faster hardware with more complex, bespokesoftware. With this approach, the question is: how long is it going to take to writethis software, how many different versions for each variation and once written, howsafe is it from bugs? As Neural Technologies notes in its white paper: ‘The problem,growing towards the millennium, is that engineers no longer have the luxury indevelopment to calculate all the algorithms or identify all the rules in these com-plex systems. In fact, most of these systems are so chaotic that doing so would befutile and prone to failure.
‘Neural computers, with their ability to learn from examples, rather than need-ing to be explicitly programmed, offer a means of making such tasks tractable to amachine.’
Source: Taylor18
Other marketing applications
Neuroshell is an expert system shell that can operate in binary or analogue mode. The binary mode enables us to set up an expert system that uses essen-tially categorical data. Kotler1 provides an illustration of how a firm mightrespond to a competitor cutting its price. The conditions and correspondingactions can be set into a decision table (Table 16.13).
The top half of the table shows the various conditions that can occur – theactions that can be undertaken by competitors (inputs). A ‘Y’ indicates the pre-sence of the condition, whereas an ‘N’ or a blank space indicates the condition’sabsence. In the bottom half of the table the reactions (outputs) to the conditionsare shown as a 1 in the appropriate column.
The seven cases can then be entered into Neuroshell in its binary mode of opera-tion and the pattern of inputs and outputs learned. After learning has takenplace, if we then enter into the program the nature of the competitor’s action, theprogram will respond with the appropriate output – what action should be taken(the lower half of the table).
The ability of neural network shells to work with binary data opens up allkinds of applications for routine strategic decision making.
Further information on neural nets
Eberhart and Dobbins19 present a comprehensive text on neural network devel-opments and include ‘C’ source code for several types of neural networking
EOM_C16.qxd 6/23/05 10:55 AM Page 517

.
518 Chapter 16 • Marketing decision-support system
models. This includes the feed-forward backward propagation model discussedin their article. More material is available from Roy Dobbins on request.McClelland and Rumelhart20 have also produced a useful handbook that includessource code and diskettes. The work includes material on the backward propaga-tion model and provides tutorial assistance. The major limitation on applicationsusing PC-based neural networking software just now is that imposed by thehardware. The complexities of some types of pattern make it difficult for softwareto learn the pattern within a reasonable timespan. Ward Systems21 has tried toovercome this problem with respect to Neuroshell by offering a piece of hardwarethat accelerates the process. However, it may only be that when parallel program-ming becomes available on the PC will a step have been taken in the direction ofsolving this particular limitation.
Statistical tools and decision support
See Chapter 10.
Reaction to competitor cutting price 1 2 3 4 5 6 7
Competitor cuts price N Y Y Y Y Y YCompetitor’s price stable YPrice cut likely to have a significant
effect on sales N N Y Y Y YCut is likely to be permanent N Y N Y Y YPrice has been cut by more than 4% Y N NPrice cut between 2.1% and 4.0% N Y NPrice cut less than 2% N N Y
Drop price to competitor’s price 1Offer self-liquidating premium to
steal limelight from competitor 1Run temporary cents off to dilute
effect of price cut 1Hold our prices at present level:
continue to watch competitor’s price 1 1 1 1
Source: Kotler, Philip, Marketing Management, 11th edition © 2003, p. 499. Reprinted by permission ofPearson Education, Inc., Upper Saddle River, NJ1
TABLE 16.13 Decision table showing reaction to a competitor’s price cut
EOM_C16.qxd 6/23/05 10:55 AM Page 518

.
Questions 519
SUMMARY
Marketing information systems exist to help marketing managers get to gripswith the volumes of data with which they are constantly bombarded. The mar-keting information system provides management with a variety of reports to helpits decision making.
Marketing planning requires the size of current and potential markets to becarefully measured and estimated. There are several approaches to forecasting.Some methods rely on asking people questions, while others involve the statist-ical analysis of historical data.
An indication and examples of how management science/operational researchtechniques and tools can be applied to marketing problems is given. Methodsconsidered include linear programming, transportation models, assignmentmodels, network models, decision trees, inventory models, queuing theorymodels, Markov analysis, simulation and game theory.
A growing area of interest and importance in the area of decision-support sys-tems are expert systems. There are many opportunities for the implementation ofexpert systems in marketing.
QUESTIONS
1 How does a marketing information system differ from marketing research?What are marketing decision-support mechanisms? How do they relate to themarketing information system?
2 When forecasting future demand for products or services, what should be thenature of the basic approach?
3 Indicate the kinds of marketing problem to which the following might beusefully applied:• linear programming• transportation models• assignment models• network models• decision trees• inventory models• queuing theory• Markov analysis• simulation• game theory.
EOM_C16.qxd 6/23/05 10:55 AM Page 519

.
520 Chapter 16 • Marketing decision-support system
Average Number AV hp Farms Tractor AV price Sales of Average Average A&B A&B Yearfarm size of farms tractors income population of tractors tractor big tractor share share(acres) sold index tractors (units) horse horse small big
(units) power (all power (all tractor tractorproducers) producers) sales sales
232 7256 51.2 100 10,425 100 1114 48.0 58.3 12.3 11.5 77233 7103 51.4 101.5 10,200 100 1108 48.2 59.1 12.5 11.6 78235 7002 51.7 101.6 10,000 101.5 1196 48.5 60.2 12.8 11.7 79238 6874 52.4 98.3 9987 101.6 1024 48.8 61.2 13.2 11.8 80240 6687 52.8 96.2 9915 101.8 1056 49.2 62.3 13.4 11.3 81246 6502 53.1 95.3 9824 102.1 995 49.4 62.7 13.5 11.8 82253 6411 54.8 97.2 9810 102.7 1087 49.3 62.8 12.9 12.0 83258 6301 56.7 96.3 9786 103.5 1056 49.6 63.4 13.2 12.5 84260 6218 57.5 95.1 9752 104.5 1034 50.1 64.2 13.4 12.8 85263 6154 58.3 96.5 9664 106.8 1025 50.7 65.3 13.4 12.0 86268 6058 59.5 97.2 9615 105.6 1048 51.6 66.8 13.6 12.4 87270 5947 60.5 100.5 9611 105.7 1189 52.3 68.1 13.8 11.8 88272 5821 61.2 101.2 9588 105.7 1205 54.6 69.0 13.8 12.1 89275 5714 61.8 102.4 9615 106.4 1314 55.0 69.5 13.9 12.4 90278 5621 62.4 103.5 9623 108.6 1412 55.1 70.0 13.7 12.5 91281 5545 62.7 102.0 9625 110.5 1248 55.3 71.2 14.1 12.4 92284 5432 63.1 100.5 9634 111.5 1232 55.6 72.1 14.0 12.4 93287 5308 63.8 96.2 9651 112.4 1145 56.1 72.5 13.8 11.8 94290 5126 64.5 98.5 9667 112.4 1045 56.8 72.8 14.0 12.1 95
TABLE 16.14 Demand for agricultural tractors
4 Suggest potential applications for expert systems in marketing management.
5 What type of questions could a manager expect to answer using thecompany’s marketing decision-support system? What makes a decision-support system successful?
CASE STUDY 16.1: DEMAND FOR AGRICULTURALTRACTORS
Examine Table 16.14 closely, then answer the question that follows.
Question
Prepare forecasts of sales of all tractor sizes for the next five years.
Hint: Use the regression feature in Lotus 1–2–3, Aseasyas or some other spreadsheetto help with your calculations.
EOM_C16.qxd 6/23/05 10:55 AM Page 520

.
Case study 16.3 521
CASE STUDY 16.2: KENBROCK
Kenbrock Timber Finishes Pty Ltd manufactures a range of Cabot’s timber treat-ments. The firm thinks of itself as being one of the smaller national Australianbrands, and claims 25% of the total national paint market in Australia. Being inthe wood-finishing business, the company reckons its main rivals market paint,wallpaper and other decorative material. It counts on four major competitors,among whom are Dulux and Bristol, both of whom sell Kenbrock’s products intheir own stores and are important Kenbrock customers. Besides distributingnationally throughout all the states, Kenbrock obtains export orders, mainly fromThailand, which account for roughly 3% to 4% of its total sales volume. In pur-suance of its strategy of full market penetration, the company manufactures morethan 250 individual products with different features, colours and sizes.
In the past, the company experienced difficulties with its approach to forecast-ing. Even though the company possessed such a large product range that wasdistributed nationally, it continued to use a simple, naive 12-month moving aver-age on each product to forecast and schedule production requirements. However,from the analysis of past sales data, a seasonal pattern corresponded closely tothe weather conditions observed in each state.
As a result of using a simple moving average method, the company’s forecast-ing system failed to incorporate the seasonal pattern into its forecasting process,which produced misleading forecast results. It was taken for granted that therolling average was valid, but in the real world some product ranges variedbetween 25% and 30% either side of the average with the seasonal variations. Asthe problem existed it led to a combination of increased inventory cost (caused bya build-up of stock) and failure to meet customer demand at peak times. Such asituation impeded the company’s market competitiveness.
Source: Waddell and Sohal22
Question
Suggest how the firm might have resolved its forecasting difficulties.
CASE STUDY 16.3: RESTAURANT STRATEGIES
Two restaurants, A and B, are positioned at either end of a village and competewith one another for business. Each can adopt one of three strategies with respectto the evening menu and each restaurant has full information about the outcomeof each possible pair of strategies available. Both restaurants decide their strategyfor the evening meal simultaneously and can only change the strategy for the
EOM_C16.qxd 6/23/05 10:55 AM Page 521

.
522 Chapter 16 • Marketing decision-support system
b1 b2 b3
a1 2,1 3,2 6,1a2 4,2 4,2 5,3a3 4,4 3,4 1,3
TABLE 16.15 Payoff matrix A,B (evening meal sales turnover £’00)
Next purchaseLast purchase A B C
A .6 .1 .3B .6 .2 .2C .4 .3 .3
TABLE 16.16 Brand-switching probabilities
next evening meal – it is a one-shot game. Table 16.15 records the payoffs torestaurant A and restaurant B for each possible combination of strategies.
Question
Which strategy leads to each restaurant receiving the maximum possible payoff,taking into account the other restaurant’s strategy?
CASE STUDY 16.4: BRAND SWITCHING
Studies indicate the following probabilities that a person will buy a particularbrand of jam, given that they purchased a specific brand on the previous occa-sion, as shown in Table 16.16.
Question
Given that the current market shares of the brands are:
A 40%B 30%C 30%
estimate the long-run market share position.
EOM_C16.qxd 6/23/05 10:55 AM Page 522

.
Case study 16.5 523
CASE STUDY 16.5: SIMON THEODOLOU,HAIRSTYLIST
Simon Theodolou runs two large hairdressing salons in the Midlands. Each salonoperates as a separate limited company, with Simon owning half the shares ineach one and the salon manager owning the other half. Services such as materialspurchase and laundry are provided centrally and economies of scale help ensurethat the salons remain highly profitable. The salons’ reputation in terms of thequality of the hairdressing is one of the best in Britain, with stylists being regu-larly entered in competitions, and Simon also operates a training school for hisown staff and for hairdressers from other salons.
As a regular routine, each salon collects daily data on the number of clientsseen (including a breakdown of the services bought), the daily takings and thetakings for each stylist. These figures are aggregated weekly and monthly andcomparisons are made with previous months and years. Comparisons are alsomade between the salons, so Simon and his co-directors can assess whether theindividual salons are improving or worsening and whether they are doing betteror worse in comparison with each other.
In the short term, the directors are planning to open a third salon inWolverhampton; in the longer term, the intention is to expand throughout theMidlands, or even nationally. Each director is well aware that expansion of thegroup will strengthen the individual salons, not only because of the economies ofscale in central services, but also because of the greater impact on public percep-tions that membership of a large chain would imply. The problem for Simon is that he finds it hard to predict whether a new salon will be a success or not;experience has shown that it takes about a year for business to build up to its permanent level.
Simon also finds it hard to benchmark performances; in other words, he doesn’t know whether his salons could be doing even better overall than they are, because he only makes comparisons one with another. Aware that his presentsystems, although better than most hairdressing salons’, are still somewhat naive,he decided to call in a firm of consultants, Midlands Marketing, to re-analyse his figures and come up with some new recommendations. The aggregatedfigures for the previous 12 months for each salon are shown in Table 16.17.
Simon asked Midlands Marketing to come up with ideas for improving hissystems and also to forecast what his businesses will be doing over the next year.He also wants to know how he can predict the performance of the proposed newsalon in Wolverhampton and other salons in the future.
(Case contributed by Jim Blythe)
EOM_C16.qxd 6/23/05 10:55 AM Page 523

.
524 Chapter 16 • Marketing decision-support system
TABLE 16.17 Simon Theodolou’s two salons: aggregated figures for previous 12 months
Birmingham (12 stylists)
Month Perms Cut & Highlights Tinting No. of Av. clients Takings Takings b/dry clients per stylist (£) per stylist
(£)
Oct 75 1002 98 384 1559 130 42,393 3533
Nov 110 1235 97 342 1784 146 49,552 4129
Dec 125 1104 98 374 1701 142 51,730 4311
Jan 62 804 73 205 1144 143 32,432 4054
Feb 77 843 76 227 1223 153 34,966 4371
Mar 84 837 74 229 1224 153 37,430 4679
Apr 79 997 87 260 1423 142.3 40,555 4055
May 93 1055 78 273 1499 149.9 44,970 4497
Jun 104 973 84 285 1446 144.6 46,272 4627
Jul 73 904 78 240 1295 144 34,317 3813
Aug 83 944 72 248 1347 150 36,908 4100
Sept 97 904 70 243 1314 146 39,157 4351
Coventry (8 stylists)
Month Perms Cut & Highlights Tinting No. of Av. clients Takings Takings b/dry clients per stylist (£) per stylist
(£)
Oct 60 798 75 210 1143 143 32,678 4085
Nov 79 837 78 210 1204 151 34,820 4353
Dec 114 970 92 246 1422 178 45,504 5688
Jan 42 605 54 207 908 114 22,700 2838
Feb 62 698 54 193 1007 126 27,586 3448
Mar 73 620 56 208 957 119 28,953 3619
Apr 82 980 75 241 1378 172 37,895 4737
May 93 995 72 235 1395 174 37,386 4673
Jun 82 825 71 198 1176 147 31,125 3891
Jul 75 807 64 208 1154 144 33,408 4176
Aug 73 798 61 183 1115 139 29,938 3742
Sept 48 809 67 210 1134 142 30,448 3806
EOM_C16.qxd 6/23/05 10:55 AM Page 524

.
References and notes 525
Questions
1 Using the figures given in the case study, predict the takings for the next 12 monthsfor each salon.
2 What seasonal trends can be discovered within the data given?
3 If Simon were to open his new salon next March and employ six stylists to begin with,what would be a reasonable expectation for the salon’s turnover in the second year?
4 What other information could Simon collect in order to make the predictions moreaccurate?
5 What differences are apparent between the two salons in terms of the businessdone?
REFERENCES AND NOTES
1 Kotler, P (2003) Marketing Management (11th edn), Upper Saddle River, NJ: Prentice-Hall, 499.
2 SNAP software, Mercator Systems, 5 Mead Court, Bristol B35 3UW. Tel: 44(0) 1454280800; Fax: 44(0) 1454 281216; http://www.mercator.co.uk
3 Samways, A and Whittcome, K (1994) UK brand strategies, Financial TimesManagement Report, 108.
4 Kotler, P and Lilien, G (1983) Marketing Decision Making: A model-building approach,New York: Harper & Row.
5 Bass, F (1969) A new product growth model for consumer durables, ManagementScience, 15 January, 215–27.
6 Hoover, S V and Perry, R F (1989) Simulation: A problem-solving approach, New York:Addison-Wesley.
7 MicroSaint: Rapid Data Ltd, Crescent House, Crescent Road, Worthing, West SussexBN11 5RW (computer software).
8 Proctor, R A (1994) Queues and the power of simulation in helping with businessdecisions and problems, Management Decision, 32(1), 50–55.
9 Proctor, R A (1994) Simulation in management services, Management Services, 38(1),January, 18–23.
10 Decision Support Laboratory, The Visual Spreadsheet, DS Group, Inc., 474 North Street,Greenwich CT 06830–3449, Version 2.0.
11 Rosser, M (1995) Modelling game theory with spreadsheets, Cheer, 9(2), 15–18.
12 Schmitz, J D, Armstrong, G D and Little, J D C (1990) Cover story: automated newsfindings in marketing, Marketing Interfaces, 20(6), November/December, 29–38.
EOM_C16.qxd 6/23/05 10:55 AM Page 525

.
526 Chapter 16 • Marketing decision-support system
13 Steinberg, M and Planck, R E (1990) Implementing expert systems into business-to-business marketing practice, Journal of Business and Industrial Marketing, 5(2), 15–26.
14 McCann, J M (1986) The Marketing Workbench, Homewood, IL: Dow-Jones Irwin.
15 Kestylyn, J (1992) Application watch, AI Expert, January, 63–64.
16 Westland, J C (1992) Self-organising executive information networks, Decision SupportSystems, 8, 41–53.
17 Proctor, R A (1992) Marketing decision support systems: a role for neural networking,Marketing Intelligence and Planning, 10(1), 21–26.
18 Taylor, P (1997) Breakthroughs in business intelligence, Financial Times, 7 May.
19 Eberhart, R C and Dobbins, R W (1990) Neural Network PC Tools, London: AcademicPress.
20 McClelland, J L and Rumelhart, D E (1988) Explorations in Parallel DistributedProcessing: A handbook of models, programs and exercises, Cambridge, MA: MIT Press.
21 Ward Systems (1989) Neuroshell: Neural Network Shell Program, Ward Systems Inc., 228 W Patrick Street, Frederick, MD 21701.
22 Waddell, D and Sohal, A S (1994) Forecasting: the key to managerial decision making,Management Decision, 32(1), 46.
FURTHER READING
Ashill, N and Jobber, D (1999) The impact of environmental uncertainty perceptions,decision-maker characteristics and work environment characteristics on the perceived usefulness of marketing information systems (MkIS): a conceptualframework, Journal of Marketing Management, 15(6), 519–40.
Attaran, M (1992) Management Science Information Systems, New York: Wiley.Chakrapani, C (2004) Statistics in Market Research, London: Arnold.Cohen, M A, Jehoshua, E and Teck, H H (1997) An anatomy of a decision support system
for developing and launching line extensions, Journal of Marketing Research, 34,February, 117–29.
Goff, M (1997) Mapping out markets, Provider, 23(10), October, 79–80.Graver, M S (2002) Using data mining for customer satisfaction research, Marketing
Research, 14(1), 8–12.Hoover, S V and Perry, R F (1989) Simulation: A problem-solving approach, New York:
Addison-Wesley.Huberty, C J (1994) Applied Discriminant Analysis, New York: Wiley Interscience.Jones, J W and McLeod, R (1986) The structure of executive information systems: an
exploratory analysis, Decision Science, 17, 220–49.
EOM_C16.qxd 6/23/05 10:55 AM Page 526

.
Further reading
Kotler, P A (1966) A design for the firm’s marketing nerve centre, Business Horizons, Fall,63–74.
Li, E (1997) Perceived importance of information system success factors: a meta analysis ofgroup differences, Information and Management, 32, 15–28.
McConagle, J J and Vella, C M (1990) Outsmarting the Competition, Naperville, IL:Sourcebooks.
Marshall, K P (1996) Marketing Information Systems, Danvers, MA: Boyd & Fraser.Morris, S (1990) Using Personal Computers in Marketing, Oxford: NCC Blackwell.Orme, B and Huber, J (2000) Improving the value of conjoint simulations, Marketing
Research, 12, Winter, 12–21.Ratner, B (2003) Statistical Modeling and Analysis for Database Marketing, Boca Raton, FL:
Chapman & Hall/CRC.Watson, H J and Blackstone, J H (1989) Computer Simulation, New York: Wiley.Yava, U (1996) Demand forecasting in a service setting, Journal of International Marketing
and Marketing Research, 21(1), February, 3–11.
527
EOM_C16.qxd 6/23/05 10:55 AM Page 527

.
Noteworthy response 529
Moving images 530
Going below the surface 532
One strike and you’re down 534
Desmond sizes up shopping 536
Is fizzing up its look enough? 538
They might just as well be men . . . 540
Now interacting with lots of new partners 542
Lake Lucerne Navigation Company (SGV) 544
Gondalas for Liverpool 551
Further case studies
EOM_D01.qxd 6/23/05 10:36 AM Page 528

.
Further case studies
CASE STUDY 1
Noteworthy response
Whenever former Virgin Records managing director Jon Webster has a bad hang-over he will lie down and put on a recording of jazz pianist Keith Jarrett’slegendary Cologne concert, writes Steve Hemsley.
During a long music industry career this has been Webster’s personally pre-scribed morning-after cure. It exemplifies the power of music to influence theway we feel and act.
Few things stimulate a response as directly as music. It reflects or shapes ourmood at the time of listening and our taste for a long time afterwards. The genreswe follow when we are young can also make up part of our identity, by connect-ing us to a particular social group or moment.
Webster runs a music industry consultancy these days. But during his time atVirgin during the 1980s and 1990s he worked with many acts, such as Genesisand Peter Gabriel, whose music had a poignant effect on their fans. ‘Brands mustnever underestimate the impact music has on people’s lives,’ he says.
Marketers wanting to use music to influence consumer behaviour enter thisemotional minefield. Get it right and you can join the advertising hall of fame:Hamlet Cigars (Bach), Levi 501s (1960s soul), Coca-Cola (the New Seekers). Get itwrong and you can end up with Missy Elliott, Madonna and the Gap or theRolling Stones and Microsoft – combinations that are criticised by the act’s fansand end up generating negative, or at least distracting, coverage for the brand.
Whether it is choosing music for a television commercial or a sonic back-ground for customers – British Airways plays birdsong in some terminals to relaxtravellers – marketers must pay attention to sounds associated with their brands.This is now a question as much for areas such as events sponsorship, productplacement and brand extensions as traditional above-the-line advertising.
Music psychology is a growth area. Researchers at the University of Leicesterclaim that restaurant diners spend about 10% more on food and drink if music isplayed in the background while they are eating (classical works best, then pop;there are no data for thrash garage).
John Sloboda, a professor at Keele University, says playing German, French orItalian music in the drinks aisles of supermarkets has increased sales of eachnation’s wines.
‘Music is sensory and, as such, is a strong mnemonic. Get it right and musiccan trigger the right consumer reactions in terms of conjuring up very visualbrand images. It is this kind of emotional connection that creates brands ratherthan just selling products,’ says Natasha Kizzie, head of entertainment at EuroRSCG KLP, the marketing agency.
The Jungle Jim consultancy was launched last week to deal with this area. It wasset up by Ben Pincus, founder of sponsorship agency The Works London, MikeKettles, the creator of events such as Tennents in the Park and the V Festivals,music industry lawyer Dave Perez and producer and promoter Jim King.
529
FT
EOM_D01.qxd 6/23/05 10:36 AM Page 529

.
530 Further case studies
The consultancy has conducted an online study of 525 14–25 year olds to findtheir top influences: music, movies, sport, where they grew up or none of these.Eighty-two per cent of respondents said music was one of the top three influenceson their lives. Thirty-one per cent said it was more important than any other factor.
How do brands, looking to exploit this appeal, identify the right music part-ners? As part of its research, Jungle Jim investigated which particular brandsattracted which music fans. From a list of 50 lifestyle brands selected by theagency, followers of acts such as Coldplay and Keane rated products from thelikes of Vans and Doc Martens as credible. Fans of Justin Timberlake and BritneySpears favoured Levi’s and Top Shop. Dance enthusiasts chose Red Bull andSmirnoff. R&B devotees desired clothing from Rocawear, Puma and Lacoste.
Pincus says: ‘The challenge for marketers is to navigate their way throughwhat can be a complicated path. You must understand how young people relateto particular music and know who to talk to in the music industry to get dealsdone. Very few brands have got this area right and this is due in part to the musicbusiness’s approach to brands as cash cows and its failure to understand whatbrands can do for the industry in return.’
Music consultancy Frukt also has a seven-step programme called Music BrandAffinity which uses ongoing customer feedback and research to assess the typesof music influencing a brand’s consumers at a particular time.
‘The personal nature of music and the varying tastes people have mean it is aseasy to alienate an existing or potential consumer as it is to create a relationship,’warns Frukt’s creative director Jack Horner.
Trying to understand how music affects a consumer’s attitudes and feelings isclearly enough to give any marketer a headache. The stress remedy, of course,could turn out to be a dose of Keith Jarrett.
Source: Steve Hemsley (2004) Financial Times, 26 October. Reprinted with permission.
Question
Discuss how marketing research might be used to try to understand how musicaffects a consumer’s attitudes and feelings.
CASE STUDY 2
Moving images
From tomorrow, Japanese commuters will be able to put away their news-papers and music players and tune in to the world’s first commercial multimediabroadcasting service for customers on the move. The service, called Mobaho!, will broadcast seven video channels and 30 music and audio channels from satel-lite, allowing consumers to watch live video broadcasts on a train, bus or boat. Itwill charge customers a mix of subscription bundles and à la carte payments.
FT
EOM_D01.qxd 6/23/05 10:36 AM Page 530

.
Further case studies
This is no ordinary start-up. Mobaho! has been launched by the MobileBroadcasting Corporation (MBCO), which is backed by 85 investors, includingsome of the giants of the country’s consumer electronics and telecommunica-tions sectors – Sharp, Toshiba, Tokyo FM Broadcasting and Nippon TelevisionNetwork. The Mobaho! service covers all of Japan bar a few outlying islands –although as the signal will not be accessible under tunnels, commuters on Japan’sextensive underground system will be unable to use the service.
Hardware for the service is already in the market. Toshiba offers a portable AVdevice with built-in satellite antenna and LCD screen to receive the channels andnext month Sharp launches its version. The handsets retail for just under £400.Sharp’s device can also be used as an MP3 player, electronic photo album andelectronic book reader.
Other countries will be watching the Japanese launch closely as they trial theirown television-on-the-move services. In the UK, Nokia, O2, NTL and Sony aretesting a service from next spring.
But the Japanese platform is the first to go live on such a scale. Its target is tosign up 1.5m customers in three years. One unknown is the level of demand forsuch offerings and how well Mobaho!’s choice of payment models and content(which does not include any advertising at launch) goes down in Japan. Thecountry already has a sophisticated mobile services market thanks to the launchof 3G, the success of NTT DoCoMo’s i-mode interactive service and some 77mmobile phone users.
Mobaho! will offer a bundle of six video channels covering news, sport, enter-tainment, business, children and music, while a seventh channel, a premiumoffering, will cover live sports events. The music and audio channels includenews, special genre channels (such as jazz and 1980s music), content from US stations, English-language news and English conversation lessons. About 350,000music tracks will be on the air each month on a 24-hour basis.
There will also be 60 data services offering news, business and cultural information, beamed direct to the portable devices. If the service signs up 1m cus-tomers, it believes that it would be realistic to tailor advertising to its customers.
After an initial registration fee of Y2500 (£13), consumers can opt for a packagethat includes audio, video and data services (excluding the premium channel) atY2080 per month, or opt for audio-only services for Y1380 per month. Opting forvideo and data services alone costs the same amount. The premium sports chan-nel is an extra Y1260 per month.
Owners of the new portable AV devices will also be able to use them as homevideo players. A number of TV sets in Japan can record programmes on tomemory cards, and viewers will be able to slip a memory card into their portableAV device and watch the recorded programme.
Worldwide sales of portable video products such as personal DVD playershave generally been disappointing. ‘I have to admit that I was initially scepticalabout whether anyone would want to watch video when they’re out of the home,but I’ve changed my mind,’ says Ashley Norris, publisher of Tech-Digest, a con-sumer electronics information website. ‘Video downloading on a mobile phone is
531
EOM_D01.qxd 6/23/05 10:36 AM Page 531

.
532 Further case studies
a growing activity and you can imagine times when you’d like to watch, say, alive football match when you’re on a train.’
But even if there turns out to be a viable market for video on the move, thebroadcasters will not able to colonise it. Competition from mobile phone com-panies looking to increase their revenues and their customer base is likely to bestrong.
Japanese consumers can already buy mobile phones with built-in analogue TVtuners. Further, the Japanese digital terrestrial television service has allocatedpart of the spectrum for mobile television services to mobile phones and otherportable devices. Public broadcaster NHK will next year begin mobile TV broad-casts, and Sanyo and NTT DoCoMo have both shown prototype mobile phonehandsets with built-in digital tuners at trade shows in Japan.
NTT DoCoMo’s handset includes a docking station with a 20GB hard drivethat can store up to 80 hours of television programmes.
Mobaho! will not be available for mobile phones, because receiving video services from satellite requires a lot of battery power and today’s mobiles wouldsoon run out of juice. However, a new generation of mobile phones that canreceive video broadcasts via satellite are under development and are expected tohit the market within the next two years.
If watching video on the move proves as popular as listening to music, expectbroadcasters, advertisers and sponsors to pile into this sector.
Source: George Cole (2004) Financial Times, 19 October. Reprinted with permission.
Question
Indicate the kind of marketing research that you think might be undertaken beforedeciding to launch this product into a particular international market.
CASE STUDY 3
Going below the surface
Unilever brand Dove’s use of six generously proportioned ‘real women’ to pro-mote its skin-firming preparations must qualify as one of the most talked-aboutmarketing decisions taken this summer. It was also one of the most successful:since the campaign broke, sales of the firming lotion have gone up 700% in theUK, 300% in Germany and 220% in the Netherlands.
Yet so entrenched is the industry’s attachment to the cult of perfection that theidea got off the ground only after Dove’s agency, Ogilvy Mather, brought in SusieOrbach, the psychotherapist known for her work on eating disorders, to talkabout the benefits of celebrating female forms of all shapes and sizes.
Co-opting academics and clinicians into advertising research is fast becoming atrend, although it raises some ethical questions. Although clinicians use general
FT
EOM_D01.qxd 6/23/05 10:36 AM Page 532

.
Further case studies
insights gleaned over the years – rather than confidential individual patient ex-periences – into groups, some concerns arise about whether such ‘white-coat’findings should be used at all for commercial campaigns. The most immediatequery from marketers, however, is likely to be ‘Does it work?’
Agencies that have used these techniques include Miles Calcraft BriginshawDuffy and Abbot Mead Vickers BBDO, which brought in psychologists to workfor COI Communications and the Departments of Health and Transport.
The Inland Revenue’s advertising to promote self-assessment featuring AdamHart-Davis is an example of a campaign with a psychological foundation. On the advice of expert respondents, MCBD eschewed the hectoring style of theRevenue’s earlier campaign and opted instead for an empathetic approach.Among the successes claimed for the campaign are an eightfold increase in elec-tronic submissions and the highest number of forms completed on time sinceself-assessment began in 1997.
Psychologists and academics from related disciplines such as anthropology arealso increasingly in demand with ad agencies looking for deeper explanations ofthe roles that brands perform in people’s lives.
‘There’s a recognition that we need to ask other questions to avoid being suckedinto our own brand mythologies,’ says Anthony Tasgal, founder of brand andcommunications consultancy POV. But it is not just the desire to get back to firstprinciples that is driving brand owners. It has become increasingly common formarketers to question whether consumers can be relied on to express what they feel.‘Often we don’t have much self-knowledge; it takes someone else to tell us what’sgoing on,’ says Sanjay Nazerali, managing director of brand consultancy The Depot.
To illustrate the point, Nazerali cites work he did for Cacharel which aimed toestablish how the company’s Anaïs Anaïs brand could be made more relevant to young fragrance wearers. Instead of focus groups, Nazerali interviewed eightclinicians specialising in teen psychology. What the discussions highlighted was that, in a far cry from girl power, teens have a deep-seated, though rarelyacknowledged, desire to express their vulnerabilities.
Out of this was born the brand idea of having the confidence to admit yourfeelings – a theme duly adopted by Cacharel in an integrated global campaignfeaturing a young woman blowing kisses which turned into petals, under thebanner: ‘One day, tenderness will move the world.’
Nazerali also undertook a project for United Biscuits, which shed light on theemotional devices that women use to reduce their sense of being separated fromtheir children during the working day.
But what do others in the industry make of such methods? Marco Rimini,director of strategy at J Walter Thompson, believes that talking to psychologistshas more to offer than the current fashion of conducting mini-ethnographic stud-ies: ‘Half an hour with someone who spends their life talking to teenagers in aprofound way will take you further than an evening hanging out with the crowd.’
However, Tasgal thinks there is a danger of trusting implicitly in ‘white-coatauthority’, and Jane Cunningham, planning director at O&M, says that psycholo-gists simply contribute a framework for understanding at a deeper level what
533
EOM_D01.qxd 6/23/05 10:36 AM Page 533

.
534 Further case studies
consumers have been talking about all along. ‘It can help to verify something youthink you’ve spotted and extend your thinking.’
Paying practising psychologists to take part in brand-related research is alsonot without its critics. While some argue that their input could actually benefitvulnerable groups, others suspect that the whole business is a flagrant attempt toget practitioners from the under-rewarded caring professions to sell what theyknow about human susceptibilities to brands searching for profits.
Says Nazerali: ‘Advertising has always played to people’s fears or desires.Talking to psychologists doesn’t change the ethical debate. It’s just a more intelli-gent way of working out what’s going on in people’s minds.’
Source: Alicia Clegg (2004) Financial Times, 28 September. Reprinted with permission.
Question
How can psychologists and academics from related disciplines such as anthropologyassist ad agencies looking for deeper explanations of the roles that brands perform inpeople’s lives?
CASE STUDY 4
One strike and you’re down
‘Companies forget that staff have the power to wreck the brand.’ This warningcomes from Martin Langford, a corporate reputation specialist at PR firmKissman Langford. But brand owners that probably don’t need reminding of thisinclude British Airways, Royal Mail and Jaguar, because of the high profile thatstaff industrial action, or threats of industrial action, has assumed at all three inrecent months.
Management at large organisations do not embark on widespread and riskycompany restructurings unless they believe their businesses are in straitenedfinancial circumstances. And the potential long-term damage to company brandingthat can be done if staff and managers clash publicly over plans will almost alwaystake a back seat to other priorities, such as getting the business back into profit.
Nevertheless, brands are a key part of the intangible assets that are playing anincreasingly important role on company balance sheets. This means that it can bea serious issue for any business if its brands emerge as tainted in the long term bystrikes and other industrial conflicts. If this is the risk, how can corporations orother branded organisations reduce this danger?
Many people believe that mud sticks and it was certainly noticeable that presscoverage of the recent talks between unions and management at the now Ford-owned Land Rover plant at Solihull referred to conflicts at the plant as far back asthe 1970s and 1980s, when it was part of British Leyland.
EOM_D01.qxd 6/23/05 10:36 AM Page 534

.
Further case studies
Mike Seymour, international director of crisis and issues management forEdelman, describes this trend as the parenthesis factor. ‘The negative shadow ofprevious industrial relations conflicts hang over the current management, whichhas an undermining effect on the brand,’ he says.
Conversely, he points out, the rate of change among senior levels of manage-ment is conveniently – and unfairly – forgotten: ‘Consumers and the media forgetthat it is in some cases a different management team which is dealing with theissues today than when the previous problems arose.’ This is compounded by theintermittent nature of industrial conflicts and their accompanying media attention.
However, others argue that it is rare for individual incidents to have asignificant long-term effect on the fortunes of a company. For this to happen theymust be compounded by a flawed strategy.
Risk management company Lippincott Mercer looked at Fortune 1000 com-panies that had lost at least 25% of their market capitalisation in four weeks orless during the mid- to late-1990s. It found that 58% of those declines were fromstrategic errors, many of which had affected the brand value.
Langford estimates that about one-third of his clients’ problems are caused bythe behaviour of their staff, with industrial action and disaffected workers beingthe most common examples.
John Williamson, board director of brand consultants Wolff Olins, says: ‘Poorindustrial relations do not come about in isolation. They reflect on the business asa whole and the way in which it is being managed. British Airways managementthinks the brand is something that is done by the marketing communicationsdepartment, which makes for very poor brand strategy.’
There is a particularly acute danger here for service companies. In service businesses, the impression of the brand given to the customer is often dictated bythe behaviour of staff at the bottom of the organisation hierarchy. And, in themaelstrom of media activity that goes with major industrial action, the seniormanagement can develop the habit of briefing journalists before their own staff.This has a direct impact on the quality of the service.
Seymour describes this chain of events as a form of self-fulfilling prophesy.‘The people dealing with the public at large service organisations are those waydown the management chain, who know least about what is going on,’ he says.‘Often these people are getting their information from, and having their opinionsshaped by, what they see and hear in the media. This leads to a drop-off in ser-vice, which is, of course, the last thing that is needed at such a critical time.’
It follows that the protection of the brand’s long-term reputation is also not justa marketing issue. ‘People are the primary marketing channel for any serviceorganisation and they should be the first audience for any form of communica-tion,’ says Dan Bobby of brand consultancy Dave. ‘The best companies start withthose staff who are dealing with the public and work back from there.
‘The worst thing that can happen is for people to see change management con-sultants wandering around the workplace without having been briefed as towhat needs to be changed,’ he says. ‘Taken out of context, change means insecu-rity and job losses.’
535
EOM_D01.qxd 6/23/05 10:36 AM Page 535

.
536 Further case studies
‘Brands represent the value of the organisation’s relationship with its customer.It’s the one thing a competitor cannot copy,’ says Brenda Banks of insurers Aon,which works with clients on the issue of brand risk. Companies are not able toinsure against declines in brand value, but often compound the problem by notmanaging the risk to their most valuable asset. ‘Reputation risk only comes hometo roost when things go wrong.’
Source: Richard Gillis (2004) Financial Times, 5 October. Reprinted with permission.
Question
How can marketing research inform those people engaged in internal marketingwithin an organisation on how best to perform their jobs?
CASE STUDY 5
Desmond sizes up shopping
Fancy buying your knickers from a company owned by Richard Desmond? Well,half-owned. Avid readers of the Daily Express – and watchers of the newspaperproprietor’s Fantasy Channel – will get their chance to do just that from tomor-row, when Desmond launches the Express Shopping Channel.
The joint venture between Northern Shell, his privately owned company, andN Brown Group, the mail order shopping group, will go live on Sky and NTL onChannel 637.
The Express channel will cater to fashion ‘for real women’, offering lingerie forladies up to size 48 and bras from B to HH – a cup size so large, one exec joked,that you could ‘take three people across the river in it’.
It will also serve up a series of ‘lifestyle shows’ to highlight its fashion, cook-ing, DIY and gardening-related offering.
For Desmond, who agreed to invest ‘a couple of million quid’ to set up thejoint venture following a meeting with Lord Alliance, non-executive chairman ofN Brown, the combination of Northern Shell’s television experience and market-ing reach and N Brown’s catalogue business represents ‘a perfect marriage’.
‘I got on with [Lord Alliance], he was telling me about his mail order business,and I’ve wanted to go into shopping for a few years now,’ Desmond says.
Executives involved in the creation of the joint venture say the division ofresponsibility between the companies has been clearly defined: Northern Shellwill provide the joint venture with television expertise, the capacity of its studiosand marketing initiatives through its newspapers and N Brown will provide‘back-end’ services – the products being sold, the warehouses and call centres.
‘I think we’re bloody good at front end,’ Desmond says.
FT
EOM_D01.qxd 6/23/05 10:36 AM Page 536

.
Further case studies
The channel’s shows, including six hours of live broadcasting, will be pro-duced in newly refurbished studios at Northern Shell Tower, in London’sDocklands area – the same building where some of Desmond’s steamier pro-grammes are edited.
But can the brand that sells Posh and Becks features and stories about womenwho earn so much ‘they can’t get a man’ really sell frying pans and ladies shoes(which will be offered with up to triple-E-width fittings)?
Desmond, who made headlines earlier this year when he launched a foul-mouthed outburst against executives at the Telegraph group at a board meetingof their West Ferry joint venture, says the Express brand is ‘the most reassuring,trustworthy brand’ in middle England.
The decision to launch a branded shopping channel represents a new experi-ment in the expansion of the Express brand name in a market that can be toughfor new entrants.
Chris Haslum, a Northern Shell executive who has been named managingdirector of the shopping channel, says today’s home shopping channels havebeen carried by the trailblazing work done by QVC, the first home-shopping net-work and market leader.
According to industry folklore, customers watched an average of 50 hours ofprogramming before they started ordering from QVC at the time of its launchnearly two decades ago.
Haslum says it is ‘difficult’ to avoid adopting a similar model to the QVC one,although he says that the Express channel will offer customers ‘more humour,more fun, and more interaction’.
Desmond takes a more direct approach in criticising the market leader, which isowned by Liberty Media, the investment vehicle of US media mogul John Malone.
‘I don’t think QVC do it very well, to be honest. When you see our channel, theproducts we’ve got [are] more relevant and the presentation is better,’ he says.
QVC’s customers – and the 6.5m viewers who tune in every month – may notagree with Desmond’s view. The company’s UK arm reported pre-tax profits of£16m on turnover of £226m in 2003.
Dermot Boyd, finance director at QVC UK, says the Express channel’s launchis a positive sign for the sector, adding that the group’s ability to cross-promote inthe Express group’s newspapers and magazines would be an advantage thatmost start-ups lack.
The Express channel is counting, in part, on the experience of Alan White, chiefexecutive of N Brown. As group finance director of Littlewoods in the late 1990s,White shut down Shop!, a television shopping channel the company had set upas a joint venture with Granada.
‘I always felt it was an important part of the business. It got to the stage it wasdoing £40m of turnover. However, it had an expensive infrastructure and therewere high costs involved in bringing customers to the channel,’ White says.
The N Brown executive says the joint venture expects to break even in twoyears – in contrast to a flippant remark by Desmond, that he expects to make aprofit from the moment the channel airs.
537
EOM_D01.qxd 6/23/05 10:36 AM Page 537

.
538 Further case studies
However, Desmond then adds, more seriously: ‘It took me seven years on OK![the celebrity monthly mag] to make money, it took five years on the FantasyChannel, but we’ve always found a way through. We’re winners.’
Perhaps unsurprisingly, White concedes that his initial response was a cautiousone: ‘Having seen where things can go wrong, I think it is probably fair to say Ihad some degree of scepticism.’ One of his biggest concerns was whether or notthe group would be able to create a channel with a low enough cost base to breakeven in a reasonable amount of time.
Boyd at QVC agrees with the strategy: ‘It is a good idea to have the disciplinenot to invest huge amounts of money and try to get break-even early.’
White says his confidence in the Express channel is based on two key differ-ences from the Littlewoods venture: Express Shopping Channel will have aclearer view on which products work well than Shop! did, and it will benefit fromthe growth in multichannel viewers. ‘We are focusing on customers from middleage and beyond and being a specialist in terms of fittings,’ he says.
The extensive range of the group’s product offering, including clothes forwomen sized 12 to 32 and men with 66-inch chests, will be the Express channel’smost competitive advantage over the high street.
In the meantime, people hoping to catch a glimpse of Desmond onscreenshould not hold their breath. The newspaper owner says he has no plans to be aguest on the channel.
Source: Stephanie Kirchgaessner (2004) Financial Times, 19 October. Reprinted with permission.
Question
‘The decision to launch a branded shopping channel represents a new experiment in the expansion of the Express brand name in a market that can be tough for newentrants.’ Suggest what marketing research might have been undertaken prior tomaking the decision to go ahead with such a venture.
CASE STUDY 6
Is fizzing up its look enough?
Laurent-Perrier, number three in terms of worldwide sales of champagne, hasbeen getting its house in order. Having bought back Diageo’s shareholding, listedon the Paris Stock Exchange in 1999 and finalised its purchase of ChateauMalakoff, a smaller champagne house, earlier this year, Yves Dumont, chairmanof L-P’s management board, feels he can draw breath.
Which makes this a good time to review L-P’s image, particularly among thepublic. Says Dumont: ‘We have been very sales oriented but less focused on theconsumer.’ In the UK, where alcohol is increasingly bought from supermarkets,that direct connection with the customer is ever more relevant.
FT
EOM_D01.qxd 6/23/05 10:36 AM Page 538

.
Further case studies
L-P wanted a new look for its promotional material, corporate literatureincluding annual reports and press ads. It brought in Paris brand consultancy MAssociates, who turned to photographer Jean-Baptiste Huynh. He shot a series ofblack-and-white images, each intended to express a different variant – a tulip forL-P Brut Non-Vintage, a seashell for Ultra Brut and so on.
The labelling on the bottles has not changed, but from next year the imageswill appear on material from print ads and point of sale to gift boxes, accom-panied by a new brand colour – an earthy hue that L-P calls terre de champagne.
The move at L-P, which is majority owned by the Nonancourt family, is a stepaway from much of the imagery associated with the sector. But then, champagnebrands are hardly enthusiastic image updaters. As a glance along any off-licenceshelf will prove, champagne is stuck in the design Dark Ages. It’s all swirls,crests, gold embossing and italics. The only label that leaps out is Veuve Clicquot– and that’s only because it’s bright orange or yellow, rather than a pallid cream.Compared with the wine sector, champagne is in a time warp. ‘Champagnehouses are incredibly conservative – very few brands in this sector stand out,’says John Blackburn of Blackburns, the drinks packaging design specialist.
The champagne companies seem unfazed by this, as sales are going up.Between 1998 and 2002, the UK market value rose by 32% and went up by a fur-ther 10% in 2003 to £850m, according to Mintel. Lack of differentiation means thatthe whole sector exudes brand values that work for all of the members: exclusive,traditional and refined.
Differentiation is instead done through sponsorship, and here the brands arehyperactive. Everyone wants to ‘own’ an event or a sport, thereby getting the rightpeople to drink their brand in the right environment. So Moët Chandon, majorsponsor of London Fashion Week, ‘owns fashion’, according to David Cunningham,marketing director of Moët Hennessy; Veuve Clicquot, also in the Moët Hennessyportfolio, is the champagne of the ‘season’, associated with ladies-in-big-hatssporting events. Mumm, on the other hand, is active in the sailing world and itsFormula One sponsorship is estimated by Mintel at more than £10m.
So what does this leave L-P to get its teeth into? Dumont says it is focusing onnature and, more recently, design. Hence its regular sponsorship of a garden atthe Chelsea Flower Show, and its Eureka design award at this year’s LondonDesign Festival.
Unsurprisingly, the vast proportion of champagne houses’ marketing spend ison sponsorship rather than advertising or design. L-P doesn’t advertise on TV, sosponsorship and event marketing currently account for 90% of its total marketingspend.
L-P hopes that its refocus will help move it from a distant fourth in the UKcloser to Veuve Clicquot at number three. The market here is dominated by MoëtChandon, which accounted for 28% of the total market value last year, accordingto Mintel. Lanson, in second place, accounted for 18%, giving the two top brandstogether nearly 50% of the market value.
Despite the big volume increases, however, these conservative brands need towatch their backs. The funkier and increasingly credible sparkling wine brigade
539
EOM_D01.qxd 6/23/05 10:36 AM Page 539

.
540 Further case studies
has the potential to threaten their position, with the UK market growing 27%since 1999, to an estimated value of £1.25bn in 2004.
So new audiences need to be cultivated. Moët Hennessy is doing research withunnamed agencies into who these potential new consumers are. ‘Champagne hasa lot to learn in targeting new consumers,’ says Cunningham, who joined Moëttwo months ago from Diageo. As this might well mean going for consumers who are less impressed by provenance and heritage and happily slurp cava orprosecco, targeting them will be a challenge.
To do so, Blackburn says, the champagne houses need to do more than tinkerat the edges: ‘The big threat is the sparkling wines, and tarting up gift boxes togive shelf appeal is not the answer.’
Source: Clare Dowdy (2004) Financial Times, 26 October. Reprinted with permission.
Question
Discuss what marketing research might mean to a firm such as this.
CASE STUDY 7
They might just as well be men . . .
Are women who work in marketing making things better for female consumers?Research by FutureBrand suggests not. As part of interviews into women’sviews on advertising, we talked to 150 women from five, broadly drawn groups.These were: women over size 16; over-50s; lesbians; professional workingwomen; and, separately, women working in advertising, branding, communica-tions or design.
The group that felt most alienated from conventional marketing was lesbians,although the size 16+s felt almost as disconnected. It’s noteworthy that the lattergroup, which constitutes around half of all UK women, should feel almost as neg-ative as a group that comprises an estimated 5%.
By contrast, the audience that felt most adequately represented was the mar-keters. Some 67% of this group felt that ads were aimed at women like them,compared to an average among the four other groups of 49%. It is startling that,while one in 10 lesbians and women size 16+, and one in 12 professional workingwomen thought that none of the ads they saw was targeted at them, not a singlewoman in marketing we interviewed felt that way.
Only 29% of marketing women believe the industry is misogynistic, but 64% ofthem feel it is their responsibility to change attitudes. Is it not curious that asfemale marketers we are willing to help change things, even if we don’t reallythink there’s a problem in the first place? So, in what ways are marketers failingto connect with female audiences?
EOM_D01.qxd 6/23/05 10:36 AM Page 540

.
Further case studies
Overall, women professionals felt represented in ads. But when they wereasked to name brands that spoke to them as business women, they could not doso. They felt less able than their male counterparts to compartmentalise theirlives. Men, they said, were much more able to disengage from the home whenthey were in the office and could view the weekend as pure leisure time. By con-trast, professional women talked about the reality of ordering groceries onlinewhile talking to a client on the phone or using weekends to catch up on house-hold chores.
To these professional women, it felt as if business-to-business brands weremarketing to the whole man in his office environment, but only to part of awoman in the same setting. As one woman put it: ‘I am all four characters of Sexand the City rolled into one, plus a bit of Dawn French, Carol Vorderman, MoMowlam and Anita Roddick.’ B2B brands are not marketing to that woman in allher facets.
For lesbians, there was the perennial issue of being part of a minority. Bydefinition, mainstream marketing almost never deals with feelings of exclusion.Most branding is about conformity, in a world where sexuality is almost alwaysheterosexuality and on-screen families are of a highly conventional variety.
For women over 50, the disconnect between advertising and the reality of theirlives is improving. Brands such as Saga have targeted this group, and ourresearch showed the approach was resonating well. (As an aside, only 4% of thewomen marketers we interviewed described themselves as aged over 40 – areflection, perhaps, of a wider ageism in the industry)
For women over size 16 the disconnect is clear. More than half of size 16+women took the view that fashion brands and their use of super-thin modelsundermined women’s self-confidence. This issue was highlighted by all groupsbar the female marketers, where only 35% agreed. And whereas 36% of size 16+women said fashion brands contributed to anorexia, only 11% of the marketersthought so.
Drill down and there appears to be another discrepancy of view. Some 93% ofwomen in marketing feel shops cater for women their size. This is not surprisinggiven that 76% of women in marketing describe themselves as a size 12 or less,and not one described herself as over size 16. Remember, 47% of UK women are asize 16 or more. And the discrepancy between women in the marketing fields andour other groups came through in their brand preferences, too.
Overall, there were only two brands that all women asked associated withenhanced self-esteem: The Body Shop and Dove.
As women in marketing, we are not only out of touch but we are too aware ofthe tactics of marketers to think like consumers. Even if women in marketing sawthe need for change – which they do not – and even if they were willing to helpbring it about – which they generally are – it could be argued that they would stillnot be able to change on the basis of personal experience alone.
For once, women’s intuition won’t work. We need to approach marketing towomen as we might approach marketing to men: by admitting that we don’tunderstand them, aren’t very much like them, want to get inside their heads and
541
EOM_D01.qxd 6/23/05 10:36 AM Page 541

.
542 Further case studies
need to connect with them better. Brands should see this as a major opportunity.The playing field is wide open for brands to capture women’s hearts by promot-ing – rather than plundering – their self-esteem.
Source: Jasmine Montgomery (2004) Financial Times, 5 October. Reprinted with permission.
Question
Imagine you are a buyer working for a large department store that sells ranges ofwomen’s clothes. What use could you make of the information contained in thisstudy? How might you pass on such information to sales staff in the store so that theyare better equipped to deal with customers?
CASE STUDY 8
Now interacting with lots of new partners
It would be unfair to describe Nivea consumers as diet-obsessed, chain-smokingsingle women with little success with men. Yet many of the consumers which thepersonal care brand wants to target do seem to have a fascination with the strug-gles experienced by Helen Fielding’s character Bridget Jones.
In fact, more than 6m women in the UK within Nivea’s core demographic arepredicted to watch the movie Bridget Jones: The Edge of Reason when it opens inUK cinemas on 12 November. This is why Nivea is placing the film at the centreof a new integrated marketing campaign which starts this week.
Nivea’s marketing manager, Samantha Wright, is one of a growing number ofmarketers demanding her media planners think differently and work moreclosely with above- and below-the-line agencies to engage consumers and bring abrand story to life.
The term ‘media neutrality’ has been bandied around for a while within mar-keting circles, but for many marketers it is becoming reality. To hit the target thesedays, brands need a thorough understanding of how and where their consumersare likely to interact with them. The traditional media planning ideal of shoutingthe loudest to reach the greatest number of people is no longer enough.
And planners need to do more than simply demonstrate that they can allocatefunds to different media without overloading the audience or busting the budget.Today, the role is much more about building a media schedule around a con-sumer’s interests and tastes, making the brand more relevant.
‘Clever media planning is a way for marketers to extend their thinking.Today’s planners must be able to take a conventional media schedule and thenask the right questions so different ideas can be bolted on,’ says Alison Hoad,planning partner at Campbell Doyle Dye and a convenor of judges for this year’sIPA Effectiveness Awards.
FT
EOM_D01.qxd 6/23/05 10:36 AM Page 542

.
Further case studies
Carat Media is project managing the Nivea campaign, but Wright briefed allher agencies at the same time, including the creative teams at TBWA and FCBLondon, making sure that everyone had bought into the integrated concept. RedBaron Media, a creative partnership agency, helped Nivea’s owner, Beiersdorf, to signup the brand as one of Universal Studios’ official marketing partners for the movie.
Initially, Nivea wanted product placement in the film, but research revealed itsconsumers would not see this as a credible link for the brand. Instead, consumerswill see promotions and traditional advertising linked to the movie through vari-ous touch points, including at retail outlets, on the Web and via mobile-basedpromotions to complement the glossy magazines and outdoor ads.
Carat’s communications planner, Ciaran Challis, accepts media planners mustbe multifaceted these days. ‘Planners must look at the bigger picture and under-stand the value of other disciplines, such as PR, and know how to use them. It isessential to develop media opportunities around the interests of the targetmarket. If consumers like going to the movies, then that is where we need to talkto them,’ he says.
Media fragmentation is adding to the pressure on media planners to thinksmarter. Take the music and dance phenomenon created by Bartle Bogle Hegartyfor Lever Fabergé’s toiletries brand Lynx Pulse. As well as booking traditionalmedia, the plan involved releasing the single ‘Make Luv’ by Room 5 featuringOliver Cheatham, which topped the singles chart for four weeks selling 325,000copies. The campaign included an interactive element with a website and screen-saver, while events such as Pulse parties were held in clubs.
Planning agency Naked was established on the belief that brand owners mustmove away from the old media planning model and that planners need to under-stand how to build excitement around a brand by focusing on a consumer’spreferences. Naked helped boost awareness of directory inquiries brand 118 118by getting its runners to interact with the public and through guerrilla tactics.
‘We are at the beginning of a restructuring of the communications industry.Media is increasingly being seen as a place to showcase your creative messageand demonstrate how your brand interacts with consumers. It is no longer justabout having a single grandstanding piece of creative work or a factory produc-ing TV commercials,’ says Naked partner Will Collin.
Indeed, advertising agencies that have traditionally insisted on beingguardians of the brands they represent are accepting that they must work moreclosely with other marketing services companies. They realise that it is as impor-tant to reach consumers when they are shopping or in the pub, as when they arewatching Coronation Street.
The British Heart Foundation’s fatty cigarette campaign has been one of themost memorable of the year. The activity is being managed by advertising agencyEuro RSCG London, which wanted to ensure that the image of how a person’sarteries clog up and ooze with fat every time they smoke is in their mind whenthey are having a cigarette. As well as booking outdoor and television space theBHF worked with different agencies to produce beer mats for pubs and to createa micro website carrying advice on how to give up.
543
EOM_D01.qxd 6/23/05 10:36 AM Page 543

.
544 Further case studies
During the first burst of activity in January, the BHF helpline received almost13,000 calls and the website attracted more than 250,000 visitors. It is estimatedthat around half that number will go on to give up the habit.
BHF launched the second phase of its campaign last week, with new elementssuch as text and email support, interactive TV and a Tetris-style computer game,Fatris, which can be played on a mobile phone or the BHF website.
Says Malcolm White, executive planning director at Euro RSCG: ‘This is anexample of where the client is providing the integrated glue for all the marketingagencies to stick together. Clients are becoming reluctant to buy all their mediaservices from one group and are preferring to purchase the best facilities from dif-ferent places, so that they can be the force that ensures that everyone workstogether in a way that brings the most benefit to the brand.’
Source: Steve Hemsley (2004) Financial Times, 12 October. Reprinted with permission.
Question‘To hit the target these days, brands need a thorough understanding of how and wheretheir consumers are likely to interact with them.’ How can marketing research helpfirms to get to grips with this problem?
CASE STUDY 9
Lake Lucerne Navigation Company (SGV)
The Lake Lucerne Navigation Company (SGV) is Switzerland’s largest steam andmotor ship operator. Its fleet of five nostalgic paddle steamers and 15 elegantmotor ships transports 2.3 million passengers a year. The ships have been carry-ing both tourists and local people over beautiful Lake Lucerne since 1835. Thelake offers a varied landscape ranging from the fertile shores of the lowlands andthe steep slopes of the Alpine foothills to the vertical rock faces of the toweringAlps surrounding Lake Uri.
It is 170 years since businessman Friedrich Knörr, from Alsace, realised hisdream and founded a ‘limited company for the purpose of the establishment of asteam ship on Lake Lucerne’. This limited company is now known as the LakeLucerne Navigation Company (SGV) and has become the largest shipping com-pany in Switzerland. However, this beautiful lake in Central Switzerland stillretains something from those pioneering days. Out of a total fleet of 20 ships, fiveare genuine paddle steamers from the early years of the last century.
A versatile company
The core business of the Lake Lucerne Navigation Company is timetable and spe-cial cruises. In addition it runs restaurants and arranges entertainment, as well as
EOM_D01.qxd 6/23/05 10:36 AM Page 544

.
Further case studies
running its own shipyard where it builds its own ships and boats for otherpeople. In addition to all this, working with Auto AG Schwyz (AAGS) the SGVruns the Riviera bus service between Küssnacht am Rigi and Schwyz. In Lucerne,Brunnen and Flüelen, Navirag, a subsidiary, runs three bistros and a newspaperstand. Add in the Weggis Travel Centre, which specialises in the sale of freightcruises, and it is clear that the SGV is also an innovative company in the outgoingsector.
Catering services on the boats are run by a leasing company, SchiffsgastronomieAG.
A modern employer
The Lake Lucerne Navigation Company is an important and popular employer incentral Switzerland. After the SBB (Federal Swiss Railways) it is one of the mostimportant transport companies in the heart of Switzerland and possesses thelargest shipyard in the country. The company employs 160 people a year, on aver-age, as well as 13 apprentices. The typical SGV employee is multitalented andvery flexible. In summer employees work on the boats, be it as controller-sailor orcaptain, while in winter the majority of staff work in the company’s shipyard intheir other professional capacity, such as electrician, welder or carpenter.
Imposing figures
Even the company’s figures are impressive. Every year, 2.3 million passengerstravel 380,000 km in 20 boats. In other words, the Lake Lucerne NavigationCompany transports the population of Paris nine times around the world! Thefleet has a capacity for 13,000 passengers and 3,200 restaurant seats.
Without taking Schiffsgastronomie AG into account, the Lake LucerneNavigation Company has an income of 26 million francs, 20 million of whichcome from cruises. The main markets are Switzerland and Germany, plus themore distant markets of Asia and America. A rough calculation shows that 70% ofpassengers are Swiss and 30% are foreign tourists.
Beautiful landscape and attractive range of services
The Lucerne/Lake Lucerne region is one of Switzerland’s tourist centres. A rideon a ship, over a beautiful lake, is an unforgettable highlight. With its 35 boatlandings spread along the shores of the lake, the Lake Lucerne NavigationCompany is able to offer passengers from near and far an unbeatable range ofcruises. These can be combined with a trip into the mountains or a walk along thelakeshore, or can simply be a pleasant round trip on a ship; the Lake LucerneNavigation Company has something for everyone, all year round.
545
EOM_D01.qxd 6/23/05 10:36 AM Page 545

.
546 Further case studies
Special cruises
The Lake Lucerne Navigation Company also offers special cruises and runs theseas professionally as ever. With its 600 special cruises a year, the company hasacquired a lot of know-how in this area. Be it a wedding, a company jubilee, abanquet or a business meeting, the SGV, with its 20 boats in various sizes and its3,200 restaurant seats, is well-equipped for any situation.
The Lake Lucerne Navigation Company and its partners offer an infinite rangeof attractive services. The following gives a brief – but incomplete – overview. Ifyou require more detailed information, or wish to make a reservation, the com-pany would be happy to be of service at any time.
Timetable cruises
Departures are scheduled approximately every hour on these main routes:
• Lucerne – Weggis – Vitznau – Beckenried – Gersau – Brunnen – Rütli – Flüelen
• Lucerne – Kehrsiten (– Bürgenstock) – Stansstad – Alpnachstad
Visitors are offered an attractive choice of cruises lasting between one and sixhours. Between spring and autumn the Lake Lucerne Navigation Company oper-ates five nostalgic paddle steamers in addition to its numerous motor ships. InLucerne, Brunnen, Flüelen and Alpnachstad, the lake is connected to the Swissand European railways and fully integrated in their system of schedules andfares. Around the lake you will find ideal parking for cars and coaches.
On-board gastronomy
On all main routes, the company offers refined service for breakfast, lunch,coffee/cakes and dinner. In addition, working with Schiffsgastronomie AG, thecompany offers a wide range of speciality cuisine
• breakfast cruise (Zmorge-Schiff)
• brunch cruise with childcare on board
• year-round lunch cruise
• lunch cruise with departure from Brunnen
• SUSHIP – the sushi ship
• Indian buffet
• cruise with Chinese fondue.
EOM_D01.qxd 6/23/05 10:36 AM Page 546

.
Further case studies
Evening cruises
For that unforgettable moment on Lake Lucerne, the largest navigation companyin Switzerland also has a wide range of thematic round trips on offer for theevening:
• sunset dinner cruise
• evening cruises with music and gastronomy
• Irish cruise
• night boat (Swiss folklore).
Family-friendly Lake Lucerne cruises
With the Junior Card, children aged from 6 to 16 can travel free when accom-panied by one parent. Thanks to the new Grandchild Card, even grandparentscan introduce their grandchildren to the beautiful region of Lake Lucerne and thefascinating world of ship cruises. The SGV strives to be family-friendly – which iswhy it also offers junior menus and issues the travel brochure Walking Trails forBaby Carriages.
Lucerne Concert Hall accessible by boat
The new Lucerne Concert Hall (KKL) was inaugurated in 1998. Some of the SGVlanding stages by the main railway station are located directly under architectJean Nouvel’s spectacular projecting roof. The proximity of the landing stage tothe KKL offers a range of attractive combinations (side programmes, exhibitions,various events, transfers etc.).
Cast off and find time for hiking, walking and biking
Twenty ships bring excursionists and people who want to relax into the naturearena of Lake Lucerne, year-round, rain or shine. Many guests seek that specialpositive feeling attained through physical activity and enjoying a ride. The SGVoffers those guests a wide range of possibilities:
• Hiking and strolling: detailed description of routes for the Swiss Path and 15other lakeside paths are available, free.
• Guided hiking tours, baby-stroller and wheelchair friendly hiking paths:suggested routes for all generations available in two free brochures.
• Bike and lake: delightful panoramic routes for bikers and inline skaters.Children’s bikes are transported free of charge.
547
EOM_D01.qxd 6/23/05 10:36 AM Page 547

.
548 Further case studies
• Walking and Nordic walking: wide lakeside paths for athletic walking, anideal sport for your health, with or without special Nordic walking sticks. Andto freshen up there are numerous swimming opportunities in the clean lakeon public or natural beaches.
The Swiss Path
Fourteen years ago, the scenic Swiss Path walking trail was opened. The SwissPath is a joint cantonal effort in commemoration of Switzerland’s 700th anniver-sary (1291 to 1991). It starts at Rütli Meadow, birthplace of the Confederation, andends in Brunnen. Each canton designed one segment of the trail (there are 5mm of trail for each citizen). The sponsoring cantons are making sure that their giftwill retain its value by financing and ensuring its continuity. The trail is accessiblevia nine ship landings, three railway stations, a funicular railway and four buslines.
Combination lake and mountain trips
All mountain cable and rail systems can be reached quickly and conveniently byour ships:
• Rigi cogwheel railway: Lucerne – Vitznau, approx. 60 minutes
• Pilatus cogwheel railway: Lucerne – Alpnachstad, approx. 80 minutes
• Klewenalp aerial cable car: Lucerne – Beckenried, approx. 90 minutes
• Seelisberg funicular: Lucerne – Treib, approx. 110 minutes
• Bürgenstock funicular: Lucerne – Kehrsiten, approx. 40 minutes
• Stanserhorn and Titlis lifts: Lucerne – Stansstad, approx. 60 minutes
• Seebodenalp aerial cable car: Lucerne – Küssnacht am Rigi, approx. 60 minutes.
Ideal combination options for round trips and walks. Bargain package ratesincluding ship fare, lift fare and snack are available for trips to Bürgenstock/Felsenweg, Seebodenalp, Rigi and Klewenalp.
Lake Uri
The beautiful, historic and unique cultural region of Lake Uri is well worth avisit. Good public transport connections and adequate parking are available nearBrunnen and Flüelen landing stages.
EOM_D01.qxd 6/23/05 10:36 AM Page 548

.
Further case studies
Top price–performance ratio
• Villas and castles cruise: particularly good-value round trips in the Bay ofLucerne and in Lake Küssnacht. Pleasant cruises along the shoreline, pastvillas and castles.
• Group discount: groups of ten or more people receive attractive reducedprices on all boats.
• Price reductions: the following are recognised by the SGV: Half-fare Card,Annual General Season Ticket (GA) and Swiss Travel Cards, Swiss Boat Pass,Swiss Family Boat Pass and the Tell Pass of Central Switzerland.
• Children: children under 5 and children aged between 6 and 16 with a JuniorCard or a Grandchild Card travel free.
• Day cards: both summer and winter, the SGV offers day cards at attractiveprices and gives you total freedom of movement on Lake Lucerne.
• Winter Fun GA: the super-value winter general season ticket.
William Tell Express: the only alpine express by boat and train
The William Tell Express is a top tourist attraction connecting two of the most fas-cinating Swiss regions – Central Switzerland and Ticino. On board the paddlesteamer, your journey takes you over Lake Lucerne, from Lucerne to Flüelen,where you transfer to a train on the world-famous Gotthardt Railway and ridepast steep gorges, over innumerable bridges and through sinuous tunnels, toLugano or Locarno. Now there are two new connections per day from CentralSwitzerland to Tessin, and vice versa. Taking approximately five hours, theWilliam Tell Express can easily be incorporated in many travel programmes, forexample in combination with the Bernina or Glacier Express.
Lake Lucerne is in season all year round!
During the winter months, the SGV daily offers six lake cruises leaving Lucernefor Hertenstein, Weggis, Vitznau (Rigi), Beckenried (Klewenalp), Gersau, Treib(Seelisberg), Brunnen and Rütli. On Sundays and public holidays additional landing stages on Lake Uri will also be in operation. The following offers areespecially attractive:
• lunch cruise
• fondue cruise
549
EOM_D01.qxd 6/23/05 10:36 AM Page 549

.
550 Further case studies
FIG
UR
EC
S9.1
Lake
Luc
erne
Nav
igat
ion
Com
pany
map
EOM_D01.qxd 6/23/05 10:36 AM Page 550

.
Further case studies 551
• Chinese fondue cruise
• gateau boat
• Sunday breakfast boat
• brunch boat.
Lakeview for all: www.lakelucerne.ch
The Lake Lucerne Navigation Company’s up-to-date website will enthrall youwith its many ideas. The live-cam on landing stage 3 in Lucerne delivers live pic-tures of main landing stages 1 and 2 every 30 seconds, thus boats on cruise andthe schedules can be followed on screen. Current weather and temperature fore-casts for Lucerne and Flüelen also come in very handy.
Source: Lake Lucerne Navigation Company, Switzerland (2005).
QuestionThe marketing manager is keen to find out visitor attitudes and opinions about whatthe company presently provides. Outline a number of research studies that mightprovide the company with useful information in this respect.
CASE STUDY 10
Gondolas for Liverpool
Liverpool is a big city but like most cities its centre is relatively small. The onlyproblem with Liverpool is that the centre is on two sites: the old centre aroundLime Street, the James Centre and the City (as far as the Town Hall) and the newcentre on the waterfront around the Pier Head and the Albert Dock. For the newcentre there have been several recent proposals for expansion, including a vastshopping complex and a new site for Everton football stadium. In addition, thenew centre has an industrial complex and residential up-beat apartments built inwhat were once the old dockland buildings.
Liverpool has an underground railway system that traverses the River Merseybut there are only four underground stations on the Liverpool side of the Mersey– James Street, Moorfields, Lime Street and Central. The last two are in the heartof the old shopping area. During the 19th century Liverpool was among the fore-most cities in Britain in terms of innovation of travel around the city. The city’snetwork of tramcars rivalled that of modern-day San Francisco while its over-head railway, which ran the length of the docklands, rivalled that of modern-dayNew York. Sadly, both of these systems of transportation are no more. Buses andtaxis ply their trade where once these transport systems ruled supreme.
EOM_D01.qxd 6/23/05 10:36 AM Page 551

.
552 Further case studies
Recently, on a visit to Switzerland, Liverpool City Councillor Dan Smithencountered the gondola transportation system in operation at the foot of MountPilatus near Krienz next to Lucerne. The red gondolas are an impressive sight asthey continually ply their way from the terminus station at Krienz, through anintermediate dropping off point, to the higher station some 4500 feet above sealevel (an ascent of some 3500 feet) two-thirds of the way up Mount Pilatus. Thejourney covers several miles and takes around half an hour to complete. Dan wasnot able to count the number of gondolas on the continuous belt system but hereckoned it to be several hundred. Each gondola could carry four people so thatthe whole system must have been able to carry at least 1000 people at any onetime. A gondola is a bit like a four-seater bubble car that is suspended from acable that runs in a continuous loop-over circuit and is supported from pylons.The gondolas at Krienz can be up to 100 feet above the ground, although moreoften the distance is 20 to 30 feet.
Dan felt that perhaps a gondola transportation system might be the answer towhat Liverpool really needed. Such a system would be highly innovative in theUK and be an attraction that would outperform the new tram systems in eitherSheffield or Manchester. He felt an obvious first route would be from Lime Streetto the Pier Head with maybe an intermediate station in the city close to the TownHall. The system might also be extended to other parts of the city in due course,e.g. Anfield and the Liverpool football ground, the Liverpool University and JohnMoores University campuses.
Dan mulled these ideas over and decided that perhaps some sort of feasibilitystudy would be required. At the next meeting of the City Council he put forwardhis ideas and suggested that perhaps a feasibility study would be worthwhile.His colleagues were quite interested in the idea but pointed out that they couldnot really waste ratepayers’ money on a ‘pie in the sky’ scheme. Dan said hethought it might be worthwhile to find out ratepayers’ attitudes to such a schemein the first place. If these were positive, he argued, then his idea would have somesupport and it would be worthwhile taking the scheme on to the next stagewhere one might assess its costs and benefits.
Questions
1 Is Dan right in suggesting one should assess customer attitudes to such a schemeprior to undertaking a cost–benefit analysis? Explain.
2 Draw up a research proposal indicating how you would set about measuringratepayers’ attitudes as Dan suggests.
3 In making a decision about this project, what information is required? What rolewould marketing research play in providing the relevant information – i.e. whatfurther information is required?
EOM_D01.qxd 6/23/05 10:36 AM Page 552

.
553Last A Head on Spread
Glossary
aided questions Questions that provide clues to help respondents recall moreaccurately.
aided recall Respondents are asked if they remember an advertisement for a particular brand.
alternative hypothesis A competing hypothesis to the null.
analysis of variance A method of testing hypotheses of no differences amongmeans for more than two independent samples.
attitude A learned predisposition to act in a consistent manner with respect to agiven object.
audit A formal examination of the movement of goods at the retail level or in andout of stock in warehouses.
balanced scale Scale employing an equal number of favourable andunfavourable categories.
blind testing Tests where the brand name of the product under test is not disclosed.
branded testing Test where the name of a product is made known.
causality The effect of one variable creating change in another.
census A complete enumeration of the pre-specified group.
chi-square test statistic Measures the goodness of fit between the numbersobserved in the sample and the numbers that should have been evident in asample were the null hypothesis true.
cluster sampling Design where one first selects a sample of clusters and nextdecides on which sampling unit to include.
coding Involves the assignment of an alphanumeric symbol or a numerical valueto represent a specific response to a question. It also includes the column positionthat the designated code occupies on a data record.
comparative scaling Sometimes called non-metric scaling, it requires the respon-dent to compare a set of stimulus objects directly against one another.
EOM_D02.qxd 6/23/05 10:36 AM Page 553

.
554 Glosary
concept Something intended to satisfy customers’ wants and needs.
concept evaluation test A test for screening new product ideas or alternative endbenefits for products.
concept tests Data on purchase intentions, attribute ratings and likes/dislikeswith respect to ideas for new products or repositioning of existing ones.
construct validity Assessment of whether the variables measured in a study adequately represent the intended theoretical constructs.
content validity Assessment of whether scale items adequately reflect the entirespectrum of the construct under examination.
continuous rating scale Involves the respondent indicating a rating by placing amark at an appropriate position on a line.
continuous tracking A study whereby the measurements are taken during theentire length of the campaign.
copy recall The number (percentage) of respondents who can recall the copy inan advertisement being tested.
copy testing Advertising effectiveness research.
cross-sectional surveys Data obtained by survey from a number of differentrespondents at a single point in time.
debriefing Respondents’ explanation of answers to questions, interpretation ofmeanings and nature of problems encountered during the conduct of a study.
dependent variable The response measure which is being studied in a researchexercise.
depth interview A one-to-one interview in which feelings and opinions are dis-cussed. Usually intended to uncover motivations, prejudices and attitudes.
diary panels Households that agree to give information regularly for anextended period of time. Respondents record events as they occur, e.g. purchases.
double-barrelled questions Requests for information that simultaneously try toelicit answers to two questions.
electronic scanner services Services that record information on purchases madewith the aid of electronic optical checkout devices.
emic instrument An instrument that investigates a cultural construct.
ethnography Systematic recording of human cultures.
etic instrument An instrument to make comparisons of the same variable acrossdifferent cultures.
experimental design The particular approach adopted in an experiment to mini-mise the effect of different sources of error.
EOM_D02.qxd 6/23/05 10:36 AM Page 554

.
Glossary
exploratory analysis No prior assumptions are made and the data themselvesallow for the findings that are obtained.
extended-use product test In-home tests where a product is tried out for anextended period of time.
external validity The extent to which research findings can be generalised to andacross populations of interest in different situations and at different times.
filter questions Questions posed to determine the route to be followed through a questionnaire.
follow-up Means of contacting respondents from time to time after an initial contact.
funnel sequence In an interview or questionnaire, the process of asking ques-tions of a general nature followed by questions of a more precise and pointednature that refer to the topic being explored.
hypothesis An assumption a researcher is making about a characteristic of, or arelationship in, a population of interest.
independent variable A factor that has influence on the values adopted by thedependent variable in a phenomenon being explored.
inverted funnel sequence Moving from the specific to the general when explor-ing a topic in a questionnaire or interview.
itemised questions (closed ended) Questionnaire format in which the respon-dent is allowed a number of predetermined descriptions and requested to selectthe one he or she prefers.
judgemental data Data reflecting perceptions or preferences.
judgemental sampling A sample selected for study because it is considered to berepresentative of the population of interest or because it fits with the require-ments of the research study.
laboratory experiment Experimentation under artificially created conditions inwhich the experimenter has direct control over most of the factors that influencethe outcome of the experiment.
latent theoretical construct A construct that is not directly observable.
loaded questions Questions that suggest what the answer might be or expressthe researcher’s own position on the matter.
longitudinal design A research design in which time is an important variable.
longitudinal surveys A survey in which respondents are questioned at differentpoints in time.
555
EOM_D02.qxd 6/23/05 10:36 AM Page 555

.
556 Glosary
market testing Test designed to assess the impact of a change in a marketing mixelement.
market tracking studies Provide performance benchmarks by examining per-formance of competitors.
maturation The changes that take place in the dependent variable under study inresearch with the passage of time and that are unrelated to the influence of theindependent variable.
monadic product tests Product tests undertaken without comparison to otherproducts as benchmarks.
mortality Drop out or loss of respondents in the course of a longitudinal researchproject.
multicollinearity The correlations that exist among independent variables,which make it difficult to assess the true impact of individual independent vari-ables on the dependent variable.
multiple-item formats Attitude scaling measures requiring the subject torespond to several items (usually statements) of belief, feeling and intention.
non-comparative scaling (monadic scaling) A scaling method in which therespondent is asked to evaluate each object on a scale independently of the otherobjects being evaluated.
non-probability samples A sample where there is no way of assessing what theprobability is of selecting any particular element or unit into the sample.
non-response error Error that is introduced because not all the respondentsincluded in a sample do, in fact, respond. It reflects the possibility that theresponses of non-respondents may well be different to those of people who actu-ally respond and hence the results produced are not representative of the wholepopulation of interest.
null hypothesis The hypothesis being tested.
open-ended questions Questions that allow respondents freedom to expresstheir answers in whatever format they choose.
optical scanning Direct machine reading of numerical values or alphanumericcodes and transcription into electronic storage devices.
order bias A condition whereby responses to stimuli (questions, pictures, objectsetc.) is influenced by the order in which they are shown.
paired comparison scale A scale that presents the respondents with objects twoat a time requesting the respondent to select one or other of them according tosome criterion.
EOM_D02.qxd 6/23/05 10:36 AM Page 556

.
Glossary
positioning A means of determining how to set the marketing-mix elements so asto maximise the appeal of a particular product in the minds of a specific targetpopulation.
protocol analysis A procedure in which the subject in the research verbalises hisor her thoughts while answering questions.
qualitative research Methods of research, usually involving small samples, thatattempt to elicit descriptive information about the thoughts and feeling ofrespondents on a topic of interest to the research.
quantitative research methods An approach usually involving large samplesthat are designed to generate data that can be projected onto the whole population.
random sampling error Error produced because the selected sample is not a perfect representation of the overall population.
recall A measure of the number of people who can remember having seen anadvertisement.
recognition A measure of whether respondents can recognise the name of a par-ticular brand.
reliability The extent to which measures are free from random error and giveconsistent results.
response error Error occurring as a result of inaccurate or wrongly recordedanswers.
response rates The percentage of people who respond positively to requests toparticipate in the research.
sampling frame List of members of the population of interest who are eligiblefor inclusion in a sample.
sampling unit Elements that make up a population.
spurious association Inappropriate assumption that a causal relationship existsbetween observed events.
structured interview Method of interviewing where the questions are entirelypredetermined.
syndicated research services Suppliers of market research data which are col-lected on a regular basis through standardised procedures. The data are sold toindividual clients.
target population The set of people, products or objects that possesses the infor-mation of interest to the researcher.
tracking System that permits the assessment of key sales components of cus-tomer awareness and trial and repeat purchases.
557
EOM_D02.qxd 6/23/05 10:36 AM Page 557

.
558 Glosary
treatment Refers to manipulation of the independent variable – especially inexperiments.
Type I error A situation where the null hypothesis is true but it is rejected on thebasis of the sample data.
Type II error A situation where the null hypothesis is not rejected when, in fact,the alternative hypothesis is true.
unaided questions Questions that do not provide any clues as to the answer.
unbalanced scale A scale that uses an unequal number of unfavourable orfavourable scale categories.
unstructured interview An interview wherein questions are not entirely pre-determined and the interviewer can probe for details and underlying thoughts.
validity The extent to which instruments measure that which they are intendedto measure or research findings reflect reality as we might know it.
verification Procedures aimed at ensuring the accurate transcription of researchdata.
EOM_D02.qxd 6/23/05 10:36 AM Page 558

.
559Last A Head on Spread
Bibliography
Abdel-Ghany, M and Sharpe, D L (1997) Consumption patterns among theyoung-old and old-old, Journal of Consumer Affairs, 31(1), Summer, 90–112.
Abraham, M and Lodish, L (1990) Getting the most out of advertising and promo-tion, Harvard Business Review, 68, 3.
Achrol, R S and Stern, L W (1988) Environmental determinants of decisionmaking uncertainty in marketing channels, Journal of Marketing Research, 25,36–50.
Adcock, C J (1997) Sample size determination – a review, Statistician, 46(2), 261–83.Adler, P and Adler, P (1994) Observational techniques, in Denzin, N K and
Lincoln, Y S (eds), Handbook of Qualitative Research, Thousand Oaks, CA: Sage.Advertising Association (published annually) Marketing Pocket Book, The
Advertising Association in conjunction with NTC Publications, Farm Road,Henley-on-Thames, Oxfordshire RG9 1EJ. Also the Lifestyle Pocket Book, theMedia Pocket Book and the Regional Marketing Pocket Book.
Albaum, G (1987) Do source and anonymity affect mail survey results? Journal ofthe Academy of Marketing Science, 15, 74–81.
Albaum, G and Strandskow, J (1989) Participation in a mail survey of interna-tional marketers: effects of pre-contact and detailed project explanation, Journalof Global Marketing, 2(4), 7–23.
Albrecht, T L, Johnson, G M and Walther, J B (1993) Understanding communica-tion processes in focus groups, in Morgan, D L (ed.), Successful Focus Groups:Advancing the state of the art, Newbury Park, CA: Sage.
Allison, B, O’Sullivan, T, Owen, A, Rice, J, Rothwell, A and Saunders, C (1996)Research Skills for Students: Transferable and learning skills, London: Kogan Page.
AMA (1987) New marketing research definition approved, Marketing News, 21,6–8.
Anderson, E W (1993) Firm, industry and national indices of customer satisfac-tion: implications for services, in Swartz, T and Brown, S W (eds), Advances inServices Marketing Management: Research and practice vol. 2, Greenwich, CT: JAIPress.
Anderson, E W, Fornell, C and Rust, R T (1997) Customer satisfaction, productiv-ity, and profitability: differences between goods and services, Marketing Science,16(2), 129–45.
Anderson, P F (1983) Marketing, scientific progress, and scientific method, Journalof Marketing, 47(4), 18–31.
EOM_D03.qxd 6/23/05 10:36 AM Page 559

.
560 Bibliography
Andreasen, A (1983) Cost-conscious marketing research, Harvard Business Review,61, 4.
Andreasson, T W (1994) Satisfaction, loyalty and reputation as indicators of per-sonal values in cross-cultural marketing, Journal of Marketing Research, 7(2).
Arnett, R (1990) Mail panel research in the 1990s, Applied Marketing Research,30(2), 8–10.
Aschenbaum, A A (1993) The future challenge to market research, MarketingResearch: A magazine of management and application, 5(2), 12–18.
Ashill, N and Jobber, D (1999) The impact of environmental uncertainty percep-tions, decision-maker characteristics and work environment characteristics onthe perceived usefulness of marketing information systems (MkIS): a concep-tual framework, Journal of Marketing Management, 15(6), 519–40.
Attaran, M (1992) Management Science Information System, New York: Wiley.Azzolini, M and Shillaber, J (1993) Internal service quality: winning from the
inside out, Quality Progress, November, 75–78.Bachmann, D P (1987) Cover letter appeals and sponsorship effects on mail
survey response rates, Journal of Marketing Education, 9, 45–51.Bachman, D P, Elfrink, J and Vazzana, G (1996) Tracking the progress of email
versus snail-mail, Marketing Research, 8, 31–35.Bailar, B A (1997) Does sampling work? Business Economics, 32(1), January, 47–53.Baker, K (1989) Using geodemographics in market research, Journal of the Market
Research Society, 31, 37–44.Barrie, C (1996) Second rescue for spluttering Reliant, Guardian, 6 April, 2.Bartonova, M (1996) The markets are emerging – and research is hard on their
heels, Research Plus, January, 4–5.Bass, F (1969) A new product growth model for consumer durables, Management
Science, 15, January, 215–27.Bates, B (1996) Quality will mark the route to deeper client relationships, Research
Plus, March, 9, 14.Bekesi, J (1997) Gruppe Phänomenologie. Society for the Advancement of the
Critical Development of Phenomenology and its Impulses, http://gpn.freezope.org
Berg, B L (1998) Qualitative Methods for the Social Sciences, Boston, MA: Allyn & Bacon.Berry, L L, Zeithaml, V A and Parasuraman, A (1985) Quality counts in services,
too, Business Horizons, May–June, 44–52.Berry, L L, Zeithaml, V A and Parasuraman, A (1989) Five imperatives for improv-
ing service quality, Sloan Management Review, 31–32, 89–91.Bhaduri, M, de Souza, M and Sweeney, T (1993) International qualitative
research: a critical review of different approaches, Marketing and Research Today,21(3), 171–78.
Biel, A (1989) Love the advertisement, buy the product? ADMAP, October.Blattberg, R and Deighton, J (1991) Interactive marketing: exploiting the age of
addressability, Sloan Management Review, 33, 1.Blattberg, R and Hoch, S (1990) Database models and managerial intuition: 50%
model + 50% manager, Management Science, 36(8), 887–99.
EOM_D03.qxd 6/23/05 10:36 AM Page 560

.
Bibliography
Blum, G and Law, K (1984) Making focus groups even more effective, AgriMarketing, March, 24ff.
Bogda, P and Meyers, G C (1991) Grab a partner for more effective research,Marketing News, 7 January, 2ff.
Boland, A (1996) Got report-o-phobia? Follow these simple steps to get thoseideas on to paper, Chemical Engineering, 103(3), March, 131–32.
Bolongaro, G (1994) Delphi technique can work for new product development,Marketing News, 3 January, 11.
Bolton, R N (1991) An exploratory investigation of questionnaire pretesting withverbal protocol analysis, Advances in Consumer Research, 18, 558–65.
Bolton, R N (1994) Covering the market, Marketing Research: A magazine of manage-ment and application, 6(3), 30–35.
Booth-Kewley, S, Edwards, J E and Rosenfeld, P (1992) Impression management,social desirability and computer administration of attitude questionnaires:does the computer make a difference? Journal of Applied Psychology, 77(4),562–66.
Bowditch, A J (1996) In Europe’s complex market, check the price is right,Research Plus, April, 12–13.
Bowditch, A J and Fitall, S (1995) Through the looking glass: primary research inmulticountry forecasting, Proceedings of the EphMRA/ESOMAR PharmaceuticalMarketing Research Conference, Geneva, Amsterdam: ESOMAR, 141–63.
Branthwaite, A and Bruggemann, J (1996) Why we won’t keep taking pills,Research Plus, April.
Britt, S H (1971) The writing of readable research reports, Journal of MarketingResearch, May, 265.
Brock, S E (1989) Marketing research in Asia: problems, opportunities and les-sons, Marketing Research, September, 47.
Brooks, R F (1993) Internal service quality – a manufacturing perspective,Proceedings of the Marketing Education Group, Loughborough, 93–94.
Brooks, R F (1995) Internal service quality – a theoretical development,Proceedings of the Marketing Education Group, Bradford, 80–90.
Brooks, R F and Smith, J V (1993) Service from within, TQM Journal, October,41–45.
Brown, G (1991) Big stable brands and advertisements’ effects, ADMAP, May.Brown, G (1991) Modelling advertising awareness, ADMAP, April.Brown, G, Copeland, T and Millward, M (1973) Monadic testing of new products
– an old problem and some partial solutions, Journal of the Market ResearchSociety, 15(2), 112–31.
Brown, S (1996) Art or science? Fifty years of marketing debate, Journal ofMarketing Management, 12(4), 243–67.
Brown, S and Turley, D (eds) (1997) Consumer Research: Postcards from the edge,London: Routledge.
Bryman, A and Burgess, R G (1994) Reflections on qualitative data analysis, inBryman, A and Burgess, R G (eds), Analysing Qualitative Data, London:Routledge.
561
EOM_D03.qxd 6/23/05 10:36 AM Page 561

.
562 Bibliography
Bunn, S (1996) Now that India’s got GATT, a massive market beckons, ResearchPlus, April, 10–11.
Burdick, R K (1983) Statement of hypotheses in the analysis of variance, Journal ofMarketing Research, August, 320–24.
Burns, T (1997) Saffron revivalists turn to genetic engineering, Financial Times, 15 January.
Butcher, B (1994) Sampling methods – an overview and review, Survey MethodsCentre Newsletter, 15, 4–8.
Butler, P (1994) Marketing problems: from analysis to decision, MarketingIntelligence and Planning, 2(2), 4–13.
Buttle, F (1996) Relationship Marketing, London: Paul Chapman.Byers, P Y and Wilcox, J R (1991) Focus groups: a qualitative opportunity for
researchers, Journal of Business Communication, 28(1), 63–78.CACI (1989) Market Analysis, London: CACI.Cahill, D (1998) When to use qualitative marketing research: how about at the
midpoint? Marketing News, 32(1), 5 January, 15, 17.Campbell, S (1997) Management: marketing wake-up, Financial Times, 3 June.Carnes, W T (1980) Effective Meetings for Busy People, New York: McGraw-Hill.Carson, D, Gilmore, A, Perry, C and Gronhaug, G (2001) Qualitative Marketing
Research, London: Sage.Cateora, P R (1993) International Marketing (8th edn), Homewood, IL: Irwin.Catterall, M and Maclaren, P (1995) Using a computer to code qualitative data, in
Proceedings of 1995 Annual Conference of the Marketing Education Group ‘MakingMarketing Work’, Bradford University, July.
Catterall, M and Maclaren, P (1997) Focus group data and qualitative analysisprograms: coding the moving picture as well as the snapshots, SociologicalResearch Online, 2(1), 1–11.
Cattin, P and Wittink, D (1982) Commercial use of conjoint analysis: a survey,Journal of Marketing, 46, 44–53.
Chakrapani, C (2004) Statistics in Market Research, London: Arnold.Chapman, R G (1989) Problem definition in marketing research studies, Journal of
Services Marketing, 3(3), 51–59.Chisnall, P M (1992) Marketing Research (4th edn), Maidenhead: McGraw-Hill.Choudry, Y A (1986) Pitfalls of international marketing research: are you speaking
French like a Spanish cow? ABER, 17(4), Winter, 18–28.Churchill, G A (1979) A paradigm for developing better measures of marketing
constructs, Journal of Marketing Research, 16, February, 64–73.Churchill, G A (1995) Marketing Research: Methodological foundations (6th edn), Fort
Worth, TX: Dryden.Churchill, V B (1988) How good is mail panel research? Address before Advertising
Research Foundation Conference.Churchill, V B (1988) Learning to live with continuing household panels,
Telenation Reports, Summer, 1–2.Clark, L G (1986) Focus groups are a phone call away, Marketing News, 3 January.Cochran, W G and Cox, G M (1957) Experimental Designs (2nd edn), New York:
Wiley.
EOM_D03.qxd 6/23/05 10:36 AM Page 562

.
Bibliography
Coffey, A and Atkinson, P (1996) Making Sense of Qualitative Data, Thousand Oaks,CA: Sage.
Coffey A, Holbrook, B and Atkinson, P (1996) Qualitative data analysis: technologies and representations, Sociological Research Online, 2, http://www.socresonline.org.uk/socresonline/1/1/4.html
Cohen, M A, Jehoshua, E and Teck, H H (1997) An anatomy of a decision supportsystem for developing and launching line extensions, Journal of MarketingResearch, 34, February, 117–29.
Collins, L F (1991) Everything is true, but in a different sense: a new perspectiveon qualitative research, Journal of the Market Research Society, 33, 31–38.
Collins, M (1997) Interviewer variability: a review of the problem, Journal of theMarket Research Society, 39, 67–84.
Colwell, J (1990) Qualitative market research: a conceptual analysis and review ofpractitioner criteria, Journal of the Market Research Society, 32.
Comley, P (2000) Pop-up surveys: what works, what doesn’t work and what willwork in the future. ESOMAR Net Effects Internet Conference, Dublin, April,http://www.virtualsurveys.com/papers/popup-paper.htm
Cooper, L and Nakanishi, M (1988) Market Share Analysis: Evaluating competitivemarketing effectiveness, Boston, MA: Kluwer Academic.
Cowan, C D (1991) Using multiple sample frames to improve survey coverage,quality and costs, Marketing Research: A magazine of management and applications,3(4), 66–69.
Cowan, D (1994) Good information, Journal of the Market Research Society, 36(2),105–14.
Cox, W E (1979) Industrial Marketing Research, New York: Wiley.Craig, C S and Douglas, S P (2001) Conducting international marketing research
in the twenty-first century, International Marketing Review, 18(1), 80–90.Cresswell, J W (1994) Research Design: Qualitative and quantitative approaches,
London: Sage.Crimp, M (1990) The Marketing Research Process (3rd edn), Hemel Hempstead:
Prentice-Hall.Crouch, S (1985) Marketing Research for Managers, London: Pan.Cuba, F (1985) Fourteen things that make or break tracking studies, Journal of
Advertising Research, 25(1), 21–23.Curwin, J and Slater, R (1991) Quantitative Methods for Business Decisions (3rd edn),
London: Chapman & Hall.Daneshkhu, S (1997) The decline and fall of frills, Financial Times, 28 April.Davis, G (1997) Are Internet surveys ready for prime time? Marketing News,
7 April, 5.Davis, T R V (1992) Satisfying internal customers: the link to external customer
satisfaction, Planning Review, 20(1), 34–37.Day, E (1998) Know consumers through qualitative research, Marketing News,
32(1), 5 January, 14.Day, E and Stafford, M R (1997) Age-related cues in retail services advertising:
their effects on younger consumers, Journal of Retailing, 73(2), 211–33.De Bono, E (1992) in Peter, T, Liberation Management, New York: Macmillan.
563
EOM_D03.qxd 6/23/05 10:36 AM Page 563

.
564 Bibliography
Deal, K (1997) Determining success factors for financial products: a comparativeanalysis of CART, Logit and factor/discriminant analysis, Service IndustriesJournal, 17(3), July, 489–506.
Dembhowski, S and Hanmer-Lloyd, S (1995) Computer applications – a new roadto qualitative analysis? European Journal of Marketing, 29(11), 50–62.
Deming, W E (1950) On errors in surveys, American Sociological Review, 9(4).Dent, T (1992) How to design for a more reliable customer sample, Business
Marketing, 17(2), 73–76.Denzin, N and Lincoln, Y (1993) Handbook of Qualitative Research, Newbury Park,
CA: Sage.Dillman, D A (1978) Mail and Telephone Surveys: The total design method, New York:
Wiley Interscience.Dillman, D A (1991) The design and administration of mail surveys, Annual
Review of Sociology, 17, 225–49.Dillman, D A and Tortora, R (1998) Principles for constructing respondent-
friendly web surveys and their influence on the response, American StatisticalAssociation Meeting, Dallas.
Dillman, D A, Singer, E, Clark, J R and Treat, J B (1996) Effects of benefits appealsand variations in statements of confidentiality on completion rates for censusquestionnaires, Public Opinion Quarterly, 60(3).
Dolan, C V (1994) Factor analysis of variables with 2, 3, 5 and 7 response cate-gories: a comparison of categorical variable estimators using simulated data,British Journal of Mathematical and Statistical Psychology, 47, 309–26.
Donnelly, M, Wisniewski, M, Dalrymple, J F and Curry, A (1995) Measuring ser-vice quality in local government: the SERVQUAL approach, International Journalof Public Sector Management, 8(7), 15–20.
Douglas, S P and Craig, C S (1983) International Marketing Research, Upper SaddleRiver, NJ: Prentice-Hall.
Dutka, S and Frankel, L R (1988) Techniques for the Cost-Efficient Sampling of Smallor Rare Populations, New York: Audits and Surveys.
Dwyer, J (1993) The Business Communication Handbook (3rd edn), Erskineville,NSW: Star Printery.
Eagleson, R D (1990) Writing in Plain English, Canberra, ACT: AGPS.Eames, A (1997) When time means money, Financial Times, 24 May.Easterby-Smith, M, Thorpe, R and Lowe, A (1991) Management Research: An intro-
duction, London: Sage.Eberhart, R C and Dobbins, R W (1990) Neural Network PC Tools, London:
Academic Press.Edwards, F (1995) The French connection, International Wrist Watch, 31, 46–48.EFO Group (1993) Marketing News, 21 June.Eklof, J A, Hackl, P and Westlund, A (1999) On measuring interactions between
customer satisfaction and financial results, Total Quality Management, 10(4–5),514–22.
Embree, L (1997) What is phenomenology? Center For Advanced Research inPhenomenology, http://www.phenomenologycenter.org/phenom.htm
EOM_D03.qxd 6/23/05 10:36 AM Page 564

.
Bibliography
Eskin, G (1988) Setting a Forward Agenda for Test Market Modeling, New York:Advertising Research Foundation.
Eunson, B (1994) Writing and Presenting Reports, Milton, Queensland: Wiley.Everitt, B S, Landau, S and Leese, M (2000) Cluster Analysis (4th edn), London:
Arnold.Farnham, A (1998) Focus groups fail to reach pin-sharp results, Sunday Telegraph,
4 October, 27.Fazey, I H (1997) Watching paint fly, Financial Times, 25 September.Fielding, R and Lee, R (eds) (1991) Using Computers in Qualitative Analysis,
Berkeley, CA: Sage.Fishbein, M and Azjen, I (1975) Belief, Attitude, Intention and Behavior, Reading,
MA: Addison-Wesley.Flanagan, T A and Fredericks, J O (1993) Improving company performance
through customer satisfaction measurement and management, NationalProductivity Review, Spring, 239–58.
Fletcher, K (1995) Jump on the omnibus, Marketing, 15 June, 25–28.Fletcher, W (1984) Meetings, Meetings, New York: Morrow.Fletcher, W (1997) Why researchers are so jittery, Financial Times, 3 March.Foddy, W (1994) Constructing Questions for Interviews and Questionnaires,
Cambridge: Cambridge University Press.Fontana, A and Frey, J H (1994) Interviewing: the art of science, in Denzin, N K
and Freeling, A (1994), Marketing is in a crisis – can marketing research help?Journal of the Market Research Society, 36, 97–104.
Freeman, P (1991) Using computers to extend analysis and reduce data, Journal ofthe Market Research Society, 33(2), 127–36.
Gabor, A and Grainger, C (1966) Price as an indicator of quality, Economics, 33, 43–70.
Gabriel, C (1990) The validity of qualitative marketing research, Journal of theMarket Research Society, 32, October, 507–19.
Geo-Visual Solutions for Today’s Business (1990) Mt Olive, NJ: Intelligent Charting.Gibb, A (1997) Focus groups, Social Research Update, 19, Winter, Department of
Sociology, University of Surrey, http://www.soc.surrey.ac.uk/sru/sru19.htmlGibson, R (1992) The fine art of stocking a supermarket’s shelves, Wall Street
Journal, 15 October.Gibson, R (1993) Broad grocery price cuts may not pay, Wall Street Journal, 7 May.Goff, M (1997) Mapping out markets, Provider, 23(10), October, 79–80.Gofton, K (1997) If it moves measure it, Marketing, 4 September, 17.Gold, L N (1996) Do it yourself interviewing, Marketing Research: A magazine of
management and applications, 8(2), Summer, 40–41.Goldfisher, K (1992) Modified Delphi: A concept for product forecasting, Journal of
Business Forecasting, Winter 1992–93.Gooding, K (1997) Soft drinks switch to PET leaves industry struggling, Financial
Times, 22 October.Goodyear, M (1996) The world shrinks, maybe, but there’s still the need to travel,
Research Plus, May, 12.
565
EOM_D03.qxd 6/23/05 10:36 AM Page 565

.
566 Bibliography
Gordon, W and Corr, D (1990) The space between words: the application of a newmodel of communication to quantitative brand image measurement, Journal ofthe Market Research Society, 32(3), 409–35.
Gorle, P (1995) The cascade theory that shows practical gains, Research Plus,October, 11.
Goss, J D (1996) Introduction to focus groups, Area, 28(6), 14–115.Government Statistics: A brief guide to sources, London: Office for National Statistics.Graver, M S (2002) Using data mining for customer satisfaction research,
Marketing Research, 14(1), 8–12.Green, P A, Tull, D S and Albaum, G (1988) Research for Marketing Decisions, Upper
Saddle River, NJ: Prentice-Hall.Green, P E and Krieger, A M (1989) Recent contributions to optimal product posi-
tioning and buyer segmentation, European Journal of Operational Research, 41,127–41.
Green, P E and Krieger, A M (1992) An application of a product positioning modelto pharmaceutical products, Marketing Science, 11(2), 117–32.
Greenbaum, T L (1984) Keys to improving the effectiveness of focus groupresearch, Marketing Review, June–July, 23.
Greenbaum, T L (1988) The Practical Handbook and Guide to Focus Group Research,Lexington, MA: Heath.
Greenbaum, T L (1996) Understanding focus group research abroad, MarketingNews, 30(12), 3 June.
Griffiths, J (1997) World tyre industry may face shake out, Financial Times, 14 May.Griffiths, V (1997) Orchestras aim to pass the baton, Financial Times, 20 May.Griggs, S (1987) Analysing qualitative data, Journal of the Market Research Society,
32, 507–20.Gronroos, C (1990) Service Management and Marketing: Managing the moments of
truth in service competition, Lexington, MA: Lexington Books.Grove, S J and Fisk, R P (1992) Observational data collection methods for service
marketing: an overview, Journal of the Academy of Marketing Science, 20(3), 217–24.Grover, R and Srinivasan, V (1987) A simultaneous approach to market segmenta-
tion and market structuring, Journal of Marketing Research, 24, 139–53.Gubrium, J F and Holstein, J A (2003) Postmodern Interviewing, London: Sage.Gulledge, L G (1991) Satisfying the internal customer, Bank Marketing, 23, 46–48.Gummesson, E (1990) Qualitative Methods in Management Research, London: Sage.Gummesson, E (1993) Quality management in service organizations: an inter-
pretation of the service quality phenomenon and a synthesis of internationalresearch, International Service Quality Association, Karlstad, Sweden.
Gummesson, E (2000) Qualitative Methods in Management Research, ThousandOaks, CA: Sage.
Hague, P (1985) The Industrial Market Research Handbook (2nd edn), London:Kogan Page.
Hague, P (1987) Good and bad in questionnaire design, Industrial MarketingDigest, 12(3), 161–70.
Hague, P (1993) Questionnaire Design, London: Kogan Page.
EOM_D03.qxd 6/23/05 10:36 AM Page 566

.
Bibliography
Hague, P and Jackson, P (1996) Market Research, London: Kogan Page.Hague, P and Roberts, C (1994) Presentation and Report Writing, London: Kogan
Page.Hahlo, G (1992) Examining the validity of re-interviewing respondents for
quantitative surveys, Journal of the Market Research Society, 34, 99–118.Hair, J F, Anderson, R E, Tatham, R L and Black, W C (1992) Multivariate Data
Analysis, New York: Macmillan.Hair, J F, Anderson, R E, Tatham, R L and Black, W C (1995) Multivariate Data
Analysis with Readings (4th edn), New York: Macmillan.Hallowell, R (1996) The relationship of customer satisfaction, customer loyalty
and profitability: an empirical study, International Journal of Service IndustryManagement, 7(4), 27–42.
Hammond, K, Ehrenberg, A S C and Goodhart, G J (1996) Market segmentationfor competitive brands, European Journal of Marketing, 30, 39–49.
Hammond, M (1986) Creative focus groups: uses and misuses, Marketing andMedia Decisions, July, 154–55.
Hannabuss, S (1995) Approaches to research, Aslib Proceedings, 47, January, 3–11.Harding, J (1997) China’s future dragons, Financial Times, 14 August.Hart, C W L (1995) The power of internal guarantee, Harvard Business Review,
January–February, 64–73.Hart, S J, Webb, J R and Jones, M V (1994) Export marketing research and the
effect of export experience in industrial SMEs, International Marketing Review,11(6), 4–23.
Haynes, M E (1988) Effective Meeting Skills, Los Altos, CA: Crisp.Heskett, J L, Jones, T O, Loveman, G W, Sasser, W E and Schlesinger, L A (1994)
Putting the service profit chain to work, Harvard Business Review, March–April,164–74.
Hess, J M (1968) Group interviewing, in Ring, R L (ed.) New Science of Planning,Chicago: American Marketing Association,http://www.socresonline.org.uk/socresonline/2/1/6.html
Hibbins, G M (1990) Stands to Reason (4th edn), South Melbourne, Victoria:Macmillan.
Hill, A, Roberts, H, Ewings, P and Gunnell, D (1997) Nonresponse bias in alifestyle survey, Journal of Public Health Medicine, 19(2), June, 203–7.
Hinkin, S (1995) Charting your course to effective information graphics,Presentations, 9(11), November.
Hirschman, E C (1986) Humanistic inquiry in marketing research: philosophy,method and criteria, Journal of Marketing Research, 23, 237–49.
Hoinville, G, Jowell, R and Associates (eds) (1978) Survey Research Practice,London: Heinemann.
Holtgraves, T, Eck, J and Lasky, B (1997) Face management, question wordingand social desirability, Journal of Applied Social Psychology, 27(18), 1650–71.
Homelink (1993) Research Plus, September, 8–9.Hoover, S V and Perry, R F (1989) Simulation: A problem-solving approach, New
York: Addison-Wesley.
567
EOM_D03.qxd 6/23/05 10:36 AM Page 567

.
568 Bibliography
Hrisak, D M (1997) Key presentation principles, Chartered Accountants Journal ofNew Zealand, 76(3), April, 24.
Huberty, C J (1994) Applied Discriminant Analysis, New York: Wiley Interscience.Huff, D (1991) How to Lie with Statistics, Harmondsworth: Penguin.Hutt, R W (1979) The focus group interview: a technique for counselling small
business clients, Journal of Small Business Management, 17(1), 15–20.Hutton, R (1994) Best of the bunch, Scottish Business Insider, March, 662–63.IBM’s Butterfly gets crushed on the wheel (1996) PC Direct, May, 57.Jack, A (1997) Canal satellite disappoints, Financial Times, 12 September.Jackson, P (1994) Buying Market Research, London: Kogan Page.Jackson, P (1994) Desk Research, London: Kogan Page.Jamieson, D (1995) Now business research is every agency’s research, Research
Plus, October.Jick, T D (1979) Mixing qualitative and quantitative methods: triangulation in
action, Administrative Science Quarterly, 24, 602–11.JICNARS (1981) National Readership Survey, London: JICNARS.Jobber, D and O’Reilly, D (1996) Industrial mail surveys: techniques for inducing
response, Marketing Intelligence and Planning, 14(1), 29–34.Johansson, J K and Nonaka, J (1987) Market research the Japanese way, Harvard
Business Review, May–June, 16–22.Jones, J W and McLeod, R (1986) The structure of executive information systems:
an exploratory analysis, Decision Science, 17, 220–49.Kaciak, E and Louviere, J (1990) Multiple correspondence analysis of multiple
choice experiment data, Journal of Marketing Research, 27, 455–65.Kalton, G and Schuman, H (1982) The effect of the question on survey responses:
a review, Journal of the Royal Statistical Society, 145, Part 1, 42–73.Kamakura, W A and Russell, G J (1989) A probabilistic choice model for market
segmentation, Journal of Marketing Research, 26, 379–90.Kamakura, W A and Wedel, M (1997) Statistical data fusion for cross-tabulation,
Journal of Marketing Research, 34(4), November, 485–98.Kandathil, J (1985) The advantages of electronic test markets: an advertiser view
based on experience, Journal of Advertising Research, 25(6), 11–12.Kauder, N B (1996) Pictures worth a thousand words, American Demographics
(Tools supplement), November, 64–68.Kaushik, M and Sen, A (1990) Semiotics and qualitative research, Journal of the
Market Research Society, 32, 227–43.Keillor, B, Owens, D and Pettijohn, C (2001) A cross-cultural/cross-national study
of influencing factors and socially desirable response bias, International Journalof Market Research, 43(1), 63–84.
Kent, R and Lee, M (1999) Using the Internet for market research: a study of pri-vate trading on the Internet, Journal of the Market Research Society, 41(4), 377–85.
Kerlinger, F (1973) Foundations of Behavioral Research, New York: Holt, Rinehart &Winston.
Kestylyn, J (1992) Application watch, AI Expert, January, 63–64.Keys, T (1996) Report writing, Internal Auditor, 53(4), August.
EOM_D03.qxd 6/23/05 10:36 AM Page 568

.
Bibliography
Kinsey, J (1988) Marketing in Developing Countries, London: Macmillan.Kitzinger, J (1995) Introducing focus groups, British Medical Journal, 311, 299–302.Korents, G (1996) China’s other consumers, Business Week, 13 May, 11.Kotler, P (1966) A design for the firm’s marketing nerve centre, Business Horizons,
Fall, 63–74.Kotler, P (1988) Marketing Management: Planning, analysis and control (6th edn),
Upper Saddle River, NJ: Prentice-Hall.Kotler, P and Lilien, G (1983) Marketing Decision Making: A model-building approach,
New York: Harper & Row.Kress, G (1988) Marketing Research (3rd edn), Upper Saddle River, NJ: Prentice-
Hall.Krueger, R A (1997) Analyzing and Reporting Focus Group Results: Focus group kit 6,
London: Sage.Krueger, R A (1997) Moderating Focus Groups: Focus group kit 4, London: Sage.Lafferty, F (1997) Management: the English Bear Company – partners, Financial
Times, 28 April.Langbourne, R (1993) How to reach children in stores: marketing tactics
grounded in observational research, Journal of Advertising Research, 33,November/December, 67–72.
Larson, E (1992) Watching Americans watch TV, The Atlantic Monthly, March.Lautenschlager, G and Flaherty, V L (1990) Computer administration of ques-
tions: more desirable or more social desirability? Journal of Applied Psychology,75, 310–14.
Lavidge, R J and Steiner, G A (1961) A model for predictive measurements ofadvertising effectiveness, Journal of Marketing, 25, October, 59–62.
Lenell, W and Bissoneau, R (1996) Using causal comparative and correlationaldesigns in conducting market research, Journal of Professional Services Marketing,13(2), 59–69.
Levitas, R and Guy, W (eds) (1996) Interpreting Official Statistics, London:Routledge.
Lewis, D B (1983) Advertising research and measurement, in Marketing Manager’sHandbook, Chicago, IL: Dartnell.
Lewis, P H (1989) When maps are tied to data bases, New York Times, 28, May, F10.Li, E (1997) Perceived importance of information system success factors: a meta
analysis of group differences, Information and Management, 32, 15–28.Likert, R (1932) A technique for the measurements of attitudes, Archives of
Psychology, 140.Lilien, G L, Kotler, P and Moorthy, K S (1992) Marketing Models, Upper Saddle
River, NJ: Prentice-Hall.Lincoln, Y S and Guba, E G (1985) Naturalistic Inquiry, Beverly Hills, CA: Sage.Lindstone, H and Turoff, M (eds) (1975) The Delphi Method, Reading, MA:
Addison-Wesley.Locander, W, Sudman, S and Bradburn, N M (1976) An investigation of interview
method, threat and response distortion, Journal of the American StatisticalAssociation, 71, 269–75.
569
EOM_D03.qxd 6/23/05 10:36 AM Page 569

.
570 Bibliography
Lynch, T (1997) Caught in the neighbours’ tangled web, Financial Times, 15 August.Macht, J (1999) The new market research, Inc, 20(10), 86–94.Magidson, D and Polcha, A E (1992) Creating market economies within organisa-
tions, a conference on internal markets, Planning Review, January–February,37–40.
Malhotra, N K (1995) Marketing Research: An application orientation, Upper SaddleRiver, NJ: Prentice-Hall.
Malhotra, N K, Agarwal, J and Peterson, M (1996) Cross-cultural marketingresearch: methodological issues and guidelines, International Marketing Review,13(5), 7–43.
Malhotra, R (1988) Some Issues and Perspectives on Use of Simulated Test Markets,New York: Advertising Research Foundation.
Marek, D (1998) We all need to address declining respondent co-operation,http://www.mra-net.org.
Markland, R E (1983) Topics in Management Science, New York: Wiley.Marks, A P (1990) The Sinclair 5 – why did it fail? Management Decision, 28(4), 9–14.Marsh, C and Scarborough, C (1990) Testing nine hypotheses about quota sam-
pling, Journal of the Market Research Society, 32, October, 485–506.Marsh, P (1997) The growing business: same aims, different strategies, Financial
Times, 23 December.Marshall, K P (1996) Marketing Information Systems, Danvers, MA: Boyd & Fraser.Mathews, A (1997) Academic xenophobia and the analysis of focus group data,
Journal of Targeting, Measurement and Analysis for Marketing, 6(2), 160–71.Mattson, J (1990) Measuring inherent product values, European Journal of
Marketing, 24(9), 25–39.Mayer, M (1990) Scanning the future, Forbes, 15 October.Mazzella, G F (1997) Show and tell focus groups reveal core boomer values,
Marketing News, 3(12), H8.McCann, J M (1986) The Marketing Workbench, Homewood, IL: Dow-Jones Irwin.McCann, P (1996) Commercial TV audiences rise . . . , Marketing Week, 26 April, 15.McCarthy, K (1992) Comment on the ‘Analytic Delphi Method’, International
Journal of Production Economics, May.McClelland, J L and Rumelhart, D E (1988) Explorations in Parallel Distributed Pro-
cessing: A handbook of models, programs and exercises, Cambridge, MA: MIT Press.McConagle, J J and Vella, C M (1990) Outsmarting the Competition, Naperville, IL:
Sourcebooks.McCullough, D (1999) Why marketing research is a waste of money (and what
you can do about it), Marcom Today, November.McDaniel, C and Gates, R (2002) Marketing Research: The impact of the internet (5th
edn), Cincinnati, OH: South-Western.McDonald, W (1993) Focus groups research dynamics, Journal of the Academy of
Marketing Science, 21(2), 161–68.McKenzie, J (1988) Study of characteristics of ex-directory telephone owners,
Market Research Newsletter, December.McKenzie J, Schaefer, R L and Farber, E (1995) The Student Edition of Minitab for
Windows, Reading, MA: Addison-Wesley.
EOM_D03.qxd 6/23/05 10:36 AM Page 570

.
Bibliography
McKie, A (1996) International research in a relative world, Journal of the MarketResearch Society, 38(1), 7–12.
Mehta, R and Sivadas, E (1995) Comparing response rates and response contextin mail vs electronic mail surveys, Journal of Marketing Research Society, 37(4),429–39.
Miles, M B and Huberman, A M (1994) Qualitative Data Analysis, London: Sage.Mitchell, V (1995) Using astrology in market segmentation, Management Decision,
33(1), 48–57.Mitchell, V-W (1992) Using Delphi to forecast new technology industries,
Marketing Intelligence and Planning, 10(2).Mohanty, R P and Deshmukh, S G (1997) Evolution of a decision support system
for human resource planning in a petroleum company, International Journal ofProduction Economics, 51(3), September, 251–61.
Mohn, N C (1989) How to present marketing research results effectively,Marketing & Research Today, 17(2), 115–18.
Morgan, D L (1998) The Focus Group Guidebook: Focus group kit 1, London: Sage.Morris, S (1990) Using Personal Computers in Marketing, Oxford: NCC Blackwell.Morton-Williams, J (1978) Questionnaire design, in Worcester, R and Downham, J
(eds), Consumer Market Research Handbook, Wokingham: Van NostrandReinhold.
Morton-Williams, J and Sykes, W (1984) The use of interaction coding, Journal ofthe Market Research Society, 26(2), April.
Moskowitz, H R (1985) New Directions for Product Testing and Sensory Analysis ofFoods, Westport, CT: Food and Nutrition Press.
Moult, W M (1988) The Role of Simulated Test Markets and Test Markets, New York:Advertising Research Foundation.
Mouncey, P (1996) With growing demands for data, will purity prove only theoretical? Research Plus, May, 9.
Moutinho, L and Evans, M (1992) Applied Marketing Research, Harlow: Addison-Wesley.
Munson, J and McIntery, S (1979) Developing practical procedures for measure-ment of personal values in cross-cultural marketing, Journal of MarketingResearch, 16.
Murray, P J (1997) Using virtual focus groups in qualitative research, QualitativeHealth Research, 7(4), 542–49.
Myers, J H (1996) Segmentation and Positioning for Strategic Marketing Decisions,Chicago: AMA.
Nairn, G (1997) Golden nuggets on a long and winding road, Financial Times, 3 December.
Newton, S (1993) From hearses to horses: launching the Volvo 850, Journal of theMarket Research Society, 33, 153–62.
Nicholas, R (1994) Avon ads praise the real woman, Marketing, 27 January, 6.Number News (1990) New products, June, 8.Nuttall, C (1996) Research needs more creativity, Marketing Week, 29 April, 32.Nutting, J and White, G (1992) The Business of Communication (2nd edn), Roseville,
CA: McGraw-Hill.
571
EOM_D03.qxd 6/23/05 10:36 AM Page 571

.
572 Bibliography
Ohanian, R (1990) Construction and validation of a scale to measure celebrityendorsers’ perceived expertise, trustworthiness and attractiveness, Journal ofAdvertising, 19(3), 39–52.
Oppenheim, A N (1984) Question Design and Attitude Measurement, London:Heinemann.
Oppermann, M (1995) E-mail survey – potentials and pitfalls, Market Research,7(3), 29–33.
Orme, B and Huber, J (2000) Improving the value of conjoint simulations,Marketing Research, 12, Winter, 12–21.
Osgood, C, Suci, G and Tannenbaum, P (1987) The Measurement of Meaning,Urbana, IL: University of Illinois Press.
Parasuraman, A, Berry, L L and Zeithaml, V (1985) A conceptual model of servicequality and the implications for future research, Journal of Marketing, 49, 41–51.
Parker, L (1992) Collecting data the e-mail way, Training and Development, 52–54.Pawle, J (1999) Mining the international consumer, Journal of the Market Research
Society, 41(1), 19–32.Payne, S L (1951) The Art of Asking Questions, Princeton, NJ: Princeton University
Press.Pereira, R E (1999) Factors influencing consumer perceptions of web-based deci-
sion support systems, Logistics Information Management, 12(1/2), 157–81.Perrott, N (1995) Research that becomes part of a company’s strategy, Research
Plus, October, 6ff.Perry C, Reige, A and Brown, L (1999) Realism’s role among scientific paradigms
in marketing research, Irish Marketing Review, 12(2), 16–23.Peter, P J and Olson, C (1989) The relativist/constructionist perspective on
scientific knowledge and consumer research, in Hirschman, E (ed.), InterpretiveConsumer Research, Provo, UT: ACR.
Piercy, N (1996) The effects of customer satisfaction measurement: the internalmarket versus the external market, Marketing Intelligence and Planning, 14(4), 9.
Piercy, N and Evans, M (1993) Managing Marketing Information, London: CroomHelm.
Piercy, N and Morgan, N (1995) Customer satisfaction measurement and manage-ment: a processual analysis, Journal of Marketing Management, 11, 817–34.
Poster watch (1996) Marketing Week, 26 April, 58.Proctor, R A (1992) Marketing decision support systems: a role for neural net-
working, Marketing Intelligence and Planning, 10(1), 21–26.Proctor, R A (1994) Queues and the power of simulation in helping with business
decisions and problems, Management Decision, 32(1), 50–55.Proctor, R A (1994) Simulation in management services, Management Services,
38(1), January, 18–23.Proctor, S, Papasolomou-Doukakis, I and Proctor, T (2001) What are TV advertise-
ments really trying to tell us? A postmodern perspective, Journal of ConsumerBehaviour, 1(3), 246–55.
Proctor, T (1992) Essential Marketing, London: Collins Educational.Proctor, T (1999) Creative Problem Solving for Managers, London: Routledge.
EOM_D03.qxd 6/23/05 10:36 AM Page 572

.
Bibliography
Ranchhod, A and Zhou, E (2001) Comparing respondents of email and mail sur-veys: understanding the implications of technology, Marketing Intelligence andPlanning, 19(4), 254–62.
Ratner, B (2003) Statistical Modeling and Analysis for Database Marketing, Londonand Boca Raton, FL: Chapman & Hall/CRC.
Raudsepp, T (1987) Establishing a creative climate, Training and DevelopmentJournal, April, 50–53.
Rawlins, K (1993) Presentation and Communication Skills: A handbook for practition-ers, London: Emap Healthcare Ltd.
Rebondir (1996) Un restaurant de gambas ouvrir un commerce, 12, 35.Reed, D (1996) The data game, Marketing Week, 3 May, 47–51.Rees, J (1996) PepsiCo needs new strategy for iced tea, Marketing Week, 16 April, 23.Research propels innovation (1994) Marketing, 27 January, 33–35.Richards, T and Richards, L (1991) The NUD*IST qualitative data analysis system,
Qualitative Sociology, 14.Riche, M F (1990) A bigger role for telephone interviews, American Demographics,
September, 17.Rickards, T (1974) Problem Solving through Creative Analysis, Aldershot: Gower.Rickards, T (1988) Creativity and innovation: a transatlantic perspective,
Creativity and Innovation Yearbook, Manchester: Manchester Business School.Ricks, D A, Fu, Y C and Arpan, S (1974) International Business Blunders, Columbus,
OH: Grid.Robson, C (1993) Real World Research, Oxford: Blackwell.Robson, S (1991) Ethics: informed consent or misinformed compliance? Journal of
the Market Research Society, 33, 19–28.Rogers, K (1996) Correspondence analysis: the big picture, Quirk’s Marketing
Research Review, Article 2, April.Rosenfeld, J (1985) Speeding up test marketing, Marketing Communications, June.Rosser, M (1995) Modelling game theory with spreadsheets, Cheer, 9(2), 15–18.Rothenberg, R (1989) The trouble with mail interviewing, New York Times, 16 August.Rowland, M L and Forthofer, R N (1993) Adjusting for non-response bias in a
health examination survey, Public Health Reports, 108(3), May–June, 380–86.Russo, J (1988) Simulated test markets in the real world, Pre-Test Market Research,
New York: Advertising Research Foundation, 118–19.Rydholm, J (1997) Right on cue: mystery shopping makes sure salespeople sing
praises of Yamaha digital pianos, Quirk’s Marketing Review, Article 234, January.Safety letterbox (1996) Business Opportunities World, May, 64–65.Samways, A and Whittcome, K (1994) UK brand strategies, Financial Times
Management Report.Sanderson, T (1996) How a spoonful of research helps the medicine go down,
Research Plus, April, 6–8.Sawyer, A and Peter, J P (1983) The significance of statistical significance tests in
marketing research, Journal of Marketing Research, 20, May, 125.Schindler, R M (1992) The real lesson of New Coke: the value of focus groups for
predicting the effects of social influence, Marketing Research: A magazine of man-agement and applications, December, 22–27.
573
EOM_D03.qxd 6/23/05 10:36 AM Page 573

.
574 Bibliography
Schmitz, J D, Armstrong, G D and Little, J D C (1990) Cover story: automatednews findings, Marketing Interfaces, 20(6), 29–38.
Schneider, K C and Johnson, J C (1995) Stimulating response to market surveys ofbusiness professionals, Industrial Marketing Management, 24, 265–76.
Schuldt, B A and Totten, J W (1999) Email surveys: what we’ve learned thus far,Quirk’s Marketing Research Review, July, www.quirks.com.
Scott, A (1996) The launch went fine – then the devil’s in the detailing, ResearchPlus, April, 14.
Seaton, A V (1997) Unobtrusive observational measures as a qualitative extensionof visitor surveys at festivals and events: mass observation revisited, Journal ofTravel Research, 35(4), Spring, 25–30.
Semon, T T (1994) A good sample of accounts may not always be a good sampleof your customers, Marketing News, 28(9), 8–11.
Semon, T T (1994) Save a few bucks on sample size, risk millions in opportunityloss, Marketing News, 28(1), 19.
Shait, D I (1994) Report writing, HR Focus, 71(2), 20.Shea, C Z and LeBourveau, C (2000) Jumping the hurdles of marketing research,
Marketing Research, 12(3), 22–30.Sheehan, K B and McMillan, S J (1999) Response variation in e-mail surveys: an
exploration, Journal of Advertising Research, 39(4), 45–54.Silverman, D (1993) Interpreting Qualitative Data, London: Sage.Singer, E, Von Thurn, D R and Miller, E R (1995) Confidentiality assurances and
response. A quantitative review of the experimental literature, Public OpinionQuarterly, 59(1), 67–77.
Sirkin, A F (1995) Maximizing customer satisfaction, MLS: Marketing LibraryServices, 9(4), 3–4.
Skapinker, M (1997) Deceptive appearance, Financial Times, 3 February.Smith, A (1995) Quality aspects of service marketing, Marketing Intelligence and
Planning, 8(6), 25–32.Smith, A (1997) Baby boomers get the message, Financial Times, 26 May.Smith, A (1997) Opinion polling faces new scrutiny, Financial Times, 21 March.Smith, A (1997) Public puts faith in brand names, Financial Times, 13 October.Smith, A (1997) Shoppers under the microscope, Financial Times, 5 December.Smith, L A and Gupta, S (1985) Project management software in P & IM, P & IM
Review and APICS News, June, 66–68.Snell, F (1979) How to Win the Meeting, New York: Hawthorn.Soroczynski, P (1999) Technical Communication Handbook, Darwin, NT: NTU Press.Sorrell, M (1997) The future lies abroad, Financial Times, 30 June.South Africa: a world in one country (1996) South Africa Tourism Board.Spiggle, S (1994) Analysis and interpretation of qualitative data in consumer
research, Journal of Consumer Research, 21, December, 491–503.Stanton, J M (1998) An empirical assessment of data collection using the Internet,
Personnel Psychology, 51(3), 709–26.Stapel, H (1991) Like the advertisement but does it interest me? ADMAP, April.Stapel, J (1990) Monitoring advertising performance, ADMAP, July/August.
EOM_D03.qxd 6/23/05 10:36 AM Page 574

.
Bibliography
Steinberg, M and Planck, R E (1990) Implementing expert systems into business-to-business marketing practice, Journal of Business and Industrial Marketing, 5(2),15–26.
Stern, B B (ed.) (1998) Representing Consumers: Voices, views, visions, London:Routledge.
Strauss, A S (1993) Qualitative Analysis for Social Scientists, Cambridge: CambridgeUniversity Press.
Strauss, A S and Corbin, J (1990) Basics of Qualitative Research, London: Sage.Strutton, D and Pelton, L (1994) A multiple correspondence analysis of telephone
contact rates, Mid-Atlantic Journal of Business, 30(1), 27–39.Studies of Media and Markets (1989) New York: Simmons Market Research Bureau.Sussmans, J (1991) How to Write Effective Reports, Aldershot: Gower.Sutherland, K (ed.) (1994) Researching Business Markets, London: Kogan Page.Swindley, D (1992) Retail buying in the United Kingdom, The Service Industries
Journal, 12, 533–44.Sykes, W (1990) Validity and reliability in qualitative marketing research: a
review of the literature, Journal of the Market Research Society, 33, 3–12.Sylvester, S (1993) Don’t ask consumers to supply your answers, Research Plus,
November, 8.Synodinos, N E and Brennan, J E (1988) Computer interactive interviewing in
survey research, Psychology and Marketing, 5, Summer, 115–38.Taha, H A (1992) Operations Research: An introduction (5th edn), New York:
Macmillan.Taylor, H (2000) Does Internet research work? Comparing online survey results
with telephone survey, International Journal of Market Research, 42(1), 51–63.Taylor, P (1997) Breakthroughs in business intelligence, Financial Times, 7 May.Taylor, P (1997) Electronic revolution in the retailing world, Financial Times,
3 September.Teleconference Network (1990) Orangeburg, NY: The Market Navigator.Test markets: winners and losers (1983) Advertising Week, 3 October.Thomsett, C (1989) The Little Black Book of Business Meetings, New York: American
Management Association.Tillet, L S (2000) A 24-hour focus group – sites dig into search queries to learn con-
sumer preferences, Internet Week, 808, 10 April, 170.Timmins, N (1997) British divided into four types, Financial Times, 5 September.Tse, C B, Tse, K C, Yin, C H, Ting, C B, Yi, K W, Yee, K P and Hong, W C (1995)
Comparing two methods of sending out questionnaires: e-mail vs mail, Journalof the Market Research Society, 37(4).
Tull, D S and Hawkins, D I (1990) Marketing Research: Measurement and method,New York: Macmillan.
Tyrrell, B (1994) Eastern promise is worth all the pain of red tape, Marketing, 3 February, 5.
Uncles, M D, Hammond, K A, Ehrenberg, A S C and Davies, R E (1994) A replica-tion study of two brand-loyalty measures, European Journal of OperationalResearch, 76, 375–84.
575
EOM_D03.qxd 6/23/05 10:36 AM Page 575

.
576 Bibliography
Vinten, G (1997) The threat in the question, Credit Control, 18(1), 25–31.Waddell, D and Sohal, A S (1994) Forecasting: the key to managerial decision
making, Management Decision, 32(1), 46.Warner, S L (1965) Randomised response: a survey technique for eliminating
evasive answer bias, Journal of the American Statistical Association, 60, 63–69.Watson, H J and Blackstone, J H (1989) Computer Simulation, New York: Wiley.Watson, M A (1992) Researching minorities, Journal of the Market Research Society,
34(4), 337–44.Weible, R and Wallace, J (1998) Cyber research: the impact of the Internet on data
collection, Market Research, 10(3), 19–27.Weinman, C (1991) It’s not an ‘art’, but marketing research can be creative,
Marketing News, 25(8), 9–24.Weitzman, E and Miles, M (1995) Computer Programs for Qualitative Data Analysis,
Thousand Oaks, CA: Sage.West, C (1995) Marketing research, in Baker, M J (ed.) Companion Encyclopaedia of
Marketing, London: Routledge.Westland, J C (1992) Self-organising executive information networks, Decision
Support Systems, 8, 41–53.Wheatley, K and Flexmer, W A (1987) Option Technologies, Inc., Marketing News,
27 February, 23.Whipple, T W (1994) Mapping focus group data, Marketing Research, 6(1), 16–21.White, D M and Abels, E G (1995) Measuring service quality in special libraries:
lessons from service marketing, Special Libraries, 86, Winter, 36–45.White, S (1993) Get a helping of the sugar-free chips game, Research Plus,
September, 3.Wilkinson, S (1998) Focus group methodology: a review, International Journal of
Social Research Methodology, 1(3), 181–203.Winters, P (1996) Of mergers, managers, money, mailsters . . . and patients too,
Research Plus, April.Workman, J P (1993) Marketing’s limited role in new product development in one
computer system firm, Journal of Marketing Research, 30, November, 405–21.Yava, U (1996) Demand forecasting in a service setting, Journal of International
Marketing and Marketing Research, 21(1), February, 3–11.Yin, K R (1994) Case Study Research – Design and Methods, Newbury Park CA: Sage.Zeisel, H (1985) Say It with Figures, New York: Harper & Row.Zeithaml, V A, Berry, L L and Parasuraman, A (1993) The nature and determin-
ants of customer expectations of a service, Journal of the Academy of MarketingScience, 21(1), 1–12.
Zeithaml, V A, Berry, L L and Parasuraman, A (1996) The behavioral con-sequences of service quality, Journal of Marketing, 60, April, 31–46.
Zeithaml, V A, Parasuraman, A and Berry, L L (1990) Delivering Quality Service,New York: Free Press.
Zemke, R (1978) How market research techniques can pay off for trainers,Training, 15(12).
EOM_D03.qxd 6/23/05 10:36 AM Page 576

.
Annual Abstract of Statistics 80anthropological studies 254, 405antibiotics (attitudes) 461–2applied market research
advertising effectiveness 405–6categories 13–14competition research 402–5distribution research 413–16geographic information systems
400–2market segmentation 397–400naming the product 394–5packaging 395–7pricing research 411–13product delivery 392–3product research 11, 385–92promotion research 405–6selling research 410–11
artificial intelligence 514–17Aslib directory 75assignment model 501–3Association of Market Survey Organisation
(Amso) 63–4attitudes 122, 152, 153, 461–2, 553
measurement 172–5, 178–9, 200, 318attribute rating (methods) 180–2audit 16, 148, 253, 413, 553averages 285–6Avon (case study) 238–9Azzolini, M. 444
BAA 440–1baby boomers 222–3back translation 466backward propagation model 518balanced scale 172, 553ball-bearings firm 435
577Last A Head on Spread
Index
Numbers in bold indicate glossary entries.
ABCDE classification 115ABI-Inform 74Abstract of Regional Statistics 80abstracts 71, 72–3, 80, 437ACORN 100, 115, 117, 152ADMAP 85Advertising Association 88advertising research 11, 422–4
cinema 409effectiveness research 406–10impact (panels) 149–50magazine 410media research 408–9newspaper 410poster 409press 408, 410radio 409recall 141, 150, 271, 407, 557television 408
Advertising Research Association 408after-only design (experiments) 259–60agencies 3, 18–21, 27, 28, 470agricultural tractors (case study) 520AIDA 458aided questions 141, 553aided recall 141, 407, 553Allison, B. 7alternative hypothesis 287, 553aluminium cans (packaging) 396–7aluminium foil (case study) 343–4American Marketing Association 3analogies 236–7, 498analysis 484–5
quantitative data 278–321research data 52–5
analysis of variance 263, 267, 294–5, 301–3,309, 553
EOM_D04.qxd 6/23/05 10:37 AM Page 577

.
578 Index
banks/banking 442–3, 451–2banking in Portugal (case study) 451–2
bar charts 354, 357Barny’s Café (case study) 184Bartonova, M. 464basic designs (experiments) 258–9Batchelor, A. 241Bates, B. 28before-after design (experiments) 260–1behavioural patterns 398Bekesi, J. 7Belgrade Insulations 8–9bias 154, 196, 199, 203, 257, 493
interviewer 140, 143, 146, 199, 232, 466bibliographies 72biographics 92bipolar adjective rating scale 175–6bivariate analysis 296–7BLA Group: Market Assessment 85Blair, Tony 64blind testing 389, 553Blythe, J. 39, 133, 161, 186, 215, 242, 244, 275,
381, 426, 452, 478, 523Bolongaro, G. 393Bookbank 73, 74books (search) 73Books in Print 73Booz, Allen and Hamilton 392BOTB 461, 467Boult, J. 228Bowditch, A.J. 413BRAD 86brand 9, 10, 150
advertising 149–50awareness 290–1, 407case study 534–6names 45, 152, 394–5switching 506, 522valuation (case study) 240–2
branded testing 389, 553Branthwaite, A. 462BRBM International 94British Library 88British Library Centre (Boston Spa) 73British Library-Lloyds TSB Business Line
88–90British National Bibliography 72Britons classified (case study) 425Bronco Jeans (case study) 424
Brooks, R.F. 444Brown, T. 250Bruggemann, J. 462Buckley, G. 77, 78Budway, R. 396Bukhara tourism (case study) 418Bunn, S. 463business
information about 92–3intelligence 86, 514–17segmentation 399
business-to-business marketing research432–8
Business Monitor 80business travel (case study) 449buyers/buying (demand forecast) 493
cable television 148–9CACI International 94, 118, 152Cadbury 229call-backs 126, 143, 146, 386Campbell, K. 8–9card catalogue (in library) 73cartographying (segmentation) 400–2cartoon tests 173, 236case study report 331cat food (case study) 215–17catalogue system (in library) 73categories/categorisation 328–31category management 39Catterall, M. 329causal models 335–7, 497causality 254–5, 296, 553CD-ROMs 83, 85, 88
abstracts on 72, 73–4census data 74, 79, 92, 105–6, 117, 152, 553Central and Eastern Europe 464central location tests 145Central Training College (case studies) 155–6,
211–12, 365–7chambers of commerce 14champagne (case study) 539–40Cheri-Rose (case study) 62Chernov faces 357Cheung’s chips (case study) 273chi-square analysis 290–3, 553China (case studies) 185–6, 473–5Chisnall, P.M. 3, 127cinema audience research 409
EOM_D04.qxd 6/23/05 10:37 AM Page 578

.
Index 579
clients 25–7, 440–1clinical focus groups 225–6Clinton, Bill 64closed-ended questions 195, 199–200, 326,
555cluster analysis 304–5cluster sample 115–16, 123, 553Cochran, W.G. 258codes 328–31coding 200, 282, 283–4, 553cognitive dissonance, post-purchase 293cognitive maps 335Colorado Symphony Orchestra (case study)
448–9COMEXT 84Companies House 403comparative scaling 169–71, 181, 553competition research 402–5competitive advantage 15, 30, 392, 404competitors 45, 50, 151, 269, 402–5componential analysis 334–5CompuServe 77–8computer-assisted questionnaires 206computer-editing process 282–3computers 19, 29, 38–9, 57, 106, 145–6, 284
information systems 485–7qualitative studies 328–31, 338
concentration strategy 461–2concept 328, 554concept evaluation test 388, 554concept tests 309–11, 385–6, 388, 554conceptual equivalence 465conceptually clustered matrix 332–4conclusive research 13–14concordance 326–7confidence interval 128confirmability criteria 350conjectures 13conjoint analysis 307–12, 413connecting codes (categories) 328–31Conran, Sir Terence 440constant sum scales 170Constantine, Helena 367construct validity 166–9, 554consultants 20–1consumer-tracking studies 270–1consumer goods 15, 234, 280, 390, 395, 434,
439, 498consumer panel 19, 124, 148–51, 257, 412
Consumer Products (case study) 156–7consumers 30, 91–2
behaviour 17, 152, 270, 490diaries 148, 410observational research 249–54
content analysis 326, 330content validity 198–9, 206–7, 554contingency plans 18, 513continuous rating scale 171, 554continuous tracking 270, 554contour maps 358controlled test-marketing 267, 270convenience sampling 116, 119Cooper, Z. 147COPE 337copy recall 407, 554Copy Research Validation Study 408copy testing 20, 406, 554corporate culture 399correlation analysis 296cosmetics industry (case study) 532–4costs
data collection 139–40, 145, 463of information 49, 50, 122limitation (sample size) 128–9
Cox, G.M. 258creativity 3, 29–30credibility criteria 350Crimp, M. 413critical path model 503cross-sectional surveys 554cross-tabulation 57, 58, 290–1, 293, 294, 326culture/cultural difference 17, 462–7Cummins, A. 415Current British Journals 74Curtice, J. 159custom-designed studies 20custom study panel 149, 150–1customer/client reaction 440–1customer loyalty 17customer relationship management (CRM)
490customer research 9–10customer satisfaction 439, 444customer surveys 16–17customised studies 439–41Cyber Street 390–1cyclical patterns (demand) 494cyclist survey (case study) 338–43
EOM_D04.qxd 6/23/05 10:37 AM Page 579

.
580 Index
Daneshkhu, S. 449data
collection 28, 138, 145, 463displays 331–2external 70–8, 489internal 70, 483, 488–90loss 82mining 39past (for future demand) 493primary 3, 16, 70, 437, 463secondary see secondary datasources (marketing information) 488–90types 16–17warehouses 415–16
data analysis 52–5see also qualitative data analysis;
quantitative data analysisdata mining 491Data Protection Act 26–7data warehousing 491databases 73–4, 77, 83, 84, 88, 93
lifestyle 38–9, 92David, J. 415Davis, T.R.V. 444debriefing 233, 350, 554decentring (instrument translation) 466deceptive practices 23decision making 3, 4, 7–9, 29, 48–50decision-support mechanisms 484, 490–1decision information 15Decision Support Laboratory 509decision support system see marketing
decision support systemdecision tree 49–50, 504–5degrees of freedom 291Deloitte & Touche Consulting 414Delphi technique 392–3demand 491–9, 520demographics 79, 91–2, 144, 191, 398, 399, 409dendogram 305–6dependability criteria 350dependent variable 254, 255, 267, 296, 298,
299, 304, 554depth interview 234–5, 326, 434, 554desk research 434, 467–9Desmond, Richard (case study) 536–8detergent market (case study) 476–8developing countries 459, 471diagrams 358–9
Dialog 77, 90, 93diary panels 148, 409–10, 554dichotomous questions 199direct marketing 38–9direct screening 123direct translation 466directories 71, 72, 93discussion groups 227, 229dispersion (measures) 286–7distribution
channels 18, 45, 404, 413process (use of EDI) 489–90research 12, 18, 79, 413–16
diversification strategy 461–2Dobbins, R.W. 518Double, L. 387double-barrelled questions 198, 554drug industry 24–5DTI 8, 467
email 38, 390East-West Connections (case study) 185–6Easterby-Smith, M. 4Eberhart, R.C. 517economic censuses 79economic influences 13Economic Order Quantity model 506Economic and Social Research Council 82Economic Trends 81Economist 91economy/economic climate 91editing 282–3Edwards, F. 473Edwards, P. 394–5EFO Group 392Egan, Sir John 440elections (case studies) 63–5, 159electricity supply (case study) 99–101electronic data interchange (EDI) 489–90electronic interviewing 237electronic scanning 17, 252–3, 554Embree, L. 7emic instrument 466, 554employment information 74, 80, 82English Bear Company (case study) 37–8epidemic model 498epistemology 4, 6EPOS 17, 415, 490erratic variation (demand) 494
EOM_D04.qxd 6/23/05 10:37 AM Page 580

.
Index 581
errorsrole of editing 283sampling 108, 111–13, 120–22, 128, 288
ESOMAR 26, 392ethics 3, 22–5ethnic influences 465ETHNOGRAPH 328ethnography 554etic instrument 466, 554Eurocron 84Eurofarm 84Euromonitor 86, 89European statistics 83–5Eurostat 83–5evaluation 22, 350
new product ideas 385, 389PERT 44, 56–60, 503
Evans, M. 410, 413executive summary 354experiencing focus groups 227experimental design 258–63, 307, 554experiments 254–63
after-only designs 259–60before-after designs 260–1completely randomised design 263components 255consumer-tracking studies 270–1designs 259–63, 307, 554ex-post facto design 261extraneous design 260–1factorial design 266–7four-group six-study design 261–2Latin square design 265–6limitations 267randomised block design 264–5statistical designs 263–7test marketing 267–70time series design 262–3validity of 256–7see also observation
expert opinion (demand forecasting) 493expert systems 512–18exploratory analysis 90–3, 122, 555exploratory groups 225, 227exponential smoothing 496–7export intelligence service 468export marketing 467, 469Express Shopping Channel (case study) 536–8extended-use product test 387, 555
external data 70–8, 489external information 15external service quality 444external validity 256, 555eye cameras 252
factor analysis 306–7factorial design 266–7facts 139, 191Family Expenditure Survey 81Fano, T. 415fast-moving consumer goods 234, 280, 395,
439Fillingham, J. 250filter questions 110, 111, 555Financial Times 77, 82, 86, 91, 404Findex 76findings, key (report) 354Fisher’s exact test 291Fitall, S. 413fitted bathrooms market (data) 75–6Fletcher, W. 65flowchart, questionnaire 201–3focus groups 52, 234, 327–8, 385, 394, 395
applications 226moderator 225–6, 229–30, 234nature/uses of 222–3practicalities 229–30types of 225–7
follow ups 141, 143, 145, 153, 555forecasting 15, 491–9foreign trade directories 468Friedman two-way analysis 289Fry, C. 156, 212, 367functional equivalence 465funnelling 204, 555future demand (prediction) 492–3
Gabor, A. 412Gallup 159game theory 510–12Gantt view 57, 58, 59General Household Survey 81, 82generalisation 7, 350geodemographic information 91–2, 152geographic information systems 85, 92,
400–2geographics 91–2, 398, 400Gisco 85
EOM_D04.qxd 6/23/05 10:37 AM Page 581

.
582 Index
global marketing research 455–80concentration strategy 461–2conceptual equivalence 465desk research 467–9developing countries 471diversification strategy 461–2ethnic influences 465functional equivalence 465instrument translation 466instrumental equivalence 466international marketing research 458–9international segmentation 460knowledge of foreign markets 457–8methods 464, 470sampling 467target market selection 460UK government services 468–9
Global Positioning System (GPS) 402goal-oriented approach 46, 47gondola transport (case study) 553–4Gooding, K. 397Goodyear, M. 458Gorle, P. 435government
information sources 80–2, 403services (UK) 468–9statistics (UK) 75, 80–1, 82, 85–7
Grainger, C. 412graphic scale 180Green, P.E. 307Griffith, V. 449group research methods 227–9
see also focus groupsGuba, E.C. 350guide, moderator’s 230–2Guide Line/Guide Maker 57Guide to Official Statistics 75, 80Gummesson, E. 7Gupta, S. 57Gwilliam, J. 223
Hahlo, G. 121Hair, J.F. 304, 307hall tests 387, 432Hannabuss, S. 7Hart, C.W.L. 444haute couture (case study) 35–7Heathrow 440–1Heskett, J.L. 444
hi-fi systems (case study) 242–4hierarchy of effects model 407high-yield clusters 123Homelink 268–9hypothesis/hypothesis testing 13–14, 225,
252, 287–8, 328, 555hypothetical questions 197
IBM 239, 414–15, 515–16ICC/ESOMAR Code 26ICM 159imagery 392, 395implicit assumptions 197improper analysis/interpretation 280–1in-house research 3, 18–19, 28, 29–30in-store environment 253independent variable 254, 267, 296, 298, 299,
304, 497, 555index/indexing services 71, 72–3, 326–7, 437index tree 330–1India 463industrial focus groups 234industry 92–3, 115, 129, 142, 399inference engine (expert system) 513Infoplus 90information 4
acquisition of 52about business/industry 92–3about competitors 402–5costs 49–50, 122external/internal 15needs (exploratory research) 90services 76–8sources 74–6, 80–7, 92see also data; marketing information
systeminformed consent 25innovation 29–30, 228–9Inspiration 337, 360–3Institute of Grocery Distribution 39instrument translation 466instrumental equivalence 466interactive research 154internal customer questionnaire 445internal data 70, 483, 488internal information 15internal marketing research 444–6internal validity 256, 261international marketing research 458–9
EOM_D04.qxd 6/23/05 10:37 AM Page 582

.
Index 583
International Periodicals Directory 74international segmentation 460Internet 29, 38–9, 74, 76–8, 94, 96, 390–1, 416interpretation 139, 280–1interval scale 168, 170interviewer 144, 282
bias 140, 143, 146, 199, 466interviewing 122–4
depth interview 234–5, 326, 434, 554electronic 237focus groups 232–3personal interviews 143–5telephone surveys 145–7
intranet 77invasion of privacy 22–3inventory management 413inventory model 505–6inverted funnelling 203, 555investors 403IOT 85itemised approach 181itemised questions (closed-ended) 195,
199–200, 326, 555itemised rating scale 172
James Market Research Organisation (casestudy) 97–9
Jasmine Hotel (case study) 450Jerome’s Department Store (case study) 131JICNARS 408JICPAR 409JICRAR 409JICTAR 408judgement data 313, 555judgement sampling 116, 120, 555
Kelly, Dermot 426Kenbrock (case study) 521Kestylyn, J. 514Key British Enterprises 147Key Data 81keyword in context (KWIC) 326–7keywords 326–7, 328Keynotes Reports 86Kinnock, Neil 64Knight-Ridder Information 77knowledge base (expert system) 513Kompass 86, 93Korents, G. 459
Kotler, P. 498, 517Kruskal-Wallis test 287KWIC concordance 326–7
La Gaieté Parisienne (case study) 317laboratory experiment 251, 256, 412, 555Labour Force Survey 159Lafferty, F. 38Lake Lucerne Navigation Company (SGV)
(case study) 544–53Lampelichter AG (case study) 32–4latent theoretical construct 555Latin square design 265–6Lavidge, R.J. 407layout (questionnaire) 203–4leading questions 196least squares criterion 497Leonard, D. 250libraries 72, 75, 88–90, 93lifestyle databases 38–9, 92lifestyle marketing 152, 191Likert scale 178, 200, 319, 381Lilien, G.L. 410, 413, 498Lincoln, Y.S. 350line marking scale 171linear programming 499–500Liptonjuice (case studies) 157–8, 184lists 174–5Liverpool, gondola transport in (case study)
551–2living standards 305–6loaded questions 196, 555longitudinal analysis 149–50, 555Longman Concordance 326, 327Lotus 1–2–3 400Lynch, M. 516
McAnena, F. 66McBain’s fast food (case study) 130McCann, J.M. 513McCann, P. 149McClelland, J.L. 518McKenzie, J. 110, 295, 304Maclaran, P. 329Madame Tussaud’s 385–6magazine audience measurement 410Magidson, D. 444Maiden, Stan 441Mann-Whitney U test 289
EOM_D04.qxd 6/23/05 10:37 AM Page 583

.
584 Index
manufacturers 38–9MapInfo 400–2market
definitions 3–4demand 491–9, 520
market research 3–4, 9–10reports 76–8tools 94
Market Research Services 115Market Research Society 24, 63, 86, 151, 153,
159, 437Market Search 76market segmentation research 397–400market selection (global) 460market testing 267–70, 556market tracking studies 270–1, 556Marketing Council 8marketing decision support system 481–527
decision-support mechanisms 490–1electronic data interchange 489–90expert systems 512–18exponential smoothing 496–7forecasting demand 491–9marketing information systems 483–90mathematical models 499–512moving average 496sources of data 488–90statistical demand analysis 497uses/users 486
marketing environment research 12–13marketing information system 14–15, 50–6,
70, 76–8, 434, 444, 483–90marketing intelligence 86, 483marketing problems 44–7marketing research
agencies 3, 18–21, 26–7, 470applied see main entrybenefits 8–9creativity in 29–30decision-making and 7–9definition 3–4divisions of 9–13ethical considerations 22–5global see global marketing researchas marketing strategy 18–21obligations to clients 25–7online 93plan 42–67proposals 22, 50–2, 55–6, 352
recent developments 38–9reports 76–8role 5, 6, 26–7, 444–6sources 19–20system 483–4trends 27types available 20–1who should do it 18–19women in 540–2
Markov analysis 506–8Mason, N. 396–7mathematical model 498, 499–512matrices 332–4, 510–12, 522maturation (experiments) 256, 556MEAL 86mean 286measurement 164–87
of attitudes 172–5, 178–9comparative scales 169–71comparative weights 181concept 166–9constant sum scales 170construct 166–9continuous rating 171definitions 166–9differences 288–90graphic scales 180interval scale 168itemised approach 181itemised rating scale 172Likert scale 178line marking 171lists 174–5multiple-item scales 172nominal scales 167–8non-comparative scales 171–2ordinal scales 168paired comparisons 169–70projective techniques 173Q-sort scale 171rank order 181–2rank order scales 170rating attributes (methods) 180–2ratio scale 169relationships 290–1, 296–313role playing 174scale types 169–72self-reporting methods 175–80semantic differential scale 175–7
EOM_D04.qxd 6/23/05 10:37 AM Page 584

.
Index 585
measurement (continued)sentence completion 173, 174–5staple scale 177–8story completion 174–5symbols, rating with 182techniques (choices) 179–80Thurstone differential 178–9word association 173
media planners (case study) 542–4media research 408–9median 286memory see recallMercator Systems 487methodologies 4–6Michel Herbelin (case study) 472–3MicroSAINT 508Microsoft Powerpoint 356Minitab 295, 301Mintel 86mode 285moderator 224–5, 229–30, 230–2, 234monadic scaling 169, 171–2monadic testing 388, 389–91, 556monitoring, continuous (problems) 44–7Monthly Digest of Statistics 81Montres d’Occasion (case study) 95MORI 153, 159mortality (respondents) 257, 263, 556motivational research 405Mott, R. 416Mouncey, P. 27Moutinho, L. 410, 413moving average 496Mr Hungry’s Burger Bar (case study) 318–20Mudchester Cycle Questionnaire 206–7Muller (case study) 240multicollinearity 497, 556multidimensional scaling 312–13multiframe sampling 123multiple choice questions 200multiple item scales 172, 181, 556multiple regression analysis 304, 494–5, 497multiplicity sampling (snowballing) 123Multiscale II 312multivariate analysis 304, 306music (case study) 529–30music marketing communications (case
study) 422–4mystery shoppers 253
Nairn, G. 78name codes 283Nash equilibrium 511–12national development plans 468National Readership Survey 63–4, 409national research firms 20National Shoppers’ Survey 152negative questions 196–7networks 56, 332, 334–7, 503–4, 514–17neural networks 514–17, 517New Cronos 84new products 201, 385–92, 497–8New Shoe Company (case study) 61–2newspapers 74, 410Nicholas, R. 239Nieder, N. 396, 397Nielsen, A.C. 151Nielsen Homescan 150Nike 404NIPO 408nominal data/scales 167–8NOMIS 74non-comparative scales 169, 171–2, 556non-metric tests 289–90
see also comparative scalingnon-official sources of data 85–7non-parametric tests 289non-probability samples 105, 108, 112–13,
116–18, 122, 128, 556non-response 31–2, 126, 195
errors 105, 121, 127, 556non-sampling error 120NOP 159NUD*IST 329–31, 335null hypothesis 287, 556NUTS system 85Nuttall, C. 30
observations 247–77conditions for effective 251–3electronic scanning 252–3personal (of individuals) 254procedures (types) 251–3
Office of National Statistics 82, 87omnibus studies 20, 123, 153–4, 350one-tailed tests 288–9one-time sensory test 387, 391–2online services 76–8, 86, 89ontology 6
EOM_D04.qxd 6/23/05 10:37 AM Page 585

.
586 Index
open-ended questions 151, 195, 200, 556operational population 110opinion polls 63–5, 159opinions 139, 153, 191, 493optical scanning 252–3, 556oral research report 352, 354–5order bias 146, 556ordinal scales/data 167–8, 169, 181, 285Osgood, C. 175outline (of reports) 354outside research organisations 3, 18–21, 28,
470overhead transparency 356Overseas Contacts Service 468
packaging research 395–7paired comparisons 169–70, 388, 389–91, 556panels 20, 124, 148–51, 257, 412Parasuraman, A. 442, 446payoff 49–50, 511–12, 522perceived value pricing 412–13perceptual mapping 312–13performance research 14periodicals 73–4personal characteristics 17, 92personal interviews 122, 123, 143–5, 147personal observation 254PERT 44, 56–60, 503phenomenology 5, 6–7philosophical perspective 4–7phrasing (of questions) 195–9picture completion technique 173picture maps 360–3planning research 42–67Polcha, A.E. 444political influences 13political polls 63–5, 159population, sampling 106–10, 122–4population variance 107Portuguese banking (case study) 451–2position information 15positioning 442, 557positivism 4, 6postal panels 151postal surveys 122, 139–42poster research 406, 409PowerUp Electricity (case study) 99–101precoding (of questionnaires) 282preliminary research 13
presentation 351–3visual aids 356–63
press research 408pricing research 412–13primary data 3, 16, 70, 437, 463primary research 3, 16privacy, invasion of 22–3probability sampling 27, 105, 108, 111–12,
113–16, 122, 127, 128, 144problem definition 45, 46problem solving 29, 44–7, 512–13Proctor, R.A. 46, 508, 514PRODCOM inquiry 87Product First 228product research 11, 385–92
blind testing 389branded testing 389Delphi technique 392–3hall tests 387, 432monadic testing 389–91naming the product 394–5new products 385–92one-time sensory test 391–2packaging development 395–7paired comparison testing 389–91product delivery 392–3scope of 390
professional organisations 88profit/profitability 47–8project evaluation 44, 56–60, 503–4projective techniques 173, 200, 235–7promotion research 11, 405–6proposal research 18, 22, 50–2, 55–6, 352protocol analysis 205–6, 557psychogalvanator 252psychographics 92, 191, 398, 399, 410psychological factors/variables 17psychological studies 405PSYCLIT 74public sector management (case study) 447–8pupilometer 252
Q-sort (scale) 171, 185QSR NUD*IST 329–31, 335qualitative codes 284qualitative data analysis 322–47
causal models 335–7codes 328–31cognitive maps 335
EOM_D04.qxd 6/23/05 10:37 AM Page 586

.
Index 587
qualitative data analysis (continued)conceptually clustered matrix 332–4concordance 326–7COPE 337data displays 331–2ETHNOGRAPH 328indices (creation) 326–7keyword in context 326–7locating individual words/phrases 326matrices 332–4networks 334–7operational aspects 325–31QUALPRO 328QSR NUD*IST 329–31, 335stages 324–5time-ordered event matrix 332tree taxonomy 334–5wordlists/counts 326
qualitative research 16, 27, 219–46, 557clinical focus groups 225–6conducting sessions 232depth interview 234–5electronic interviewing 237experiencing focus groups 227exploratory groups 225evaluation criteria 350focus groups 221, 223–7industrial focus groups 234interview 232–3limitations 222–3moderator 223, 229–30, 230–2operational aspects 325–31practicalities of sessions 229–30preparation 230–2projective techniques 235–7teleconferencing 228video-conferencing 228
QUALPRO 328quantitative codes 283–4quantitative data analysis 278–321
analysis of variance 294–5averages 285–6bivariate analysis 296–7chi-square analysis 290–3cluster analysis 304–5coding 283–4conjoint analysis 307–12correlation analysis 296cross-tabulation 290–1, 293, 294
difference between numbers 287–90dispersion (measures) 286–7editing 282–3factor analysis 306–7hypothesis testing 287–8interpretation 280–1mean 286median 286Minitab 295, 301mode 285multidimensional scaling 312–13multivariate analysis 304name codes 283non-metric tests 289–90one-tailed/two-tailed tests 288–9perceptual mapping 312–13proportions 289range 287rank order correlation 298regression analysis 298–303relationships (measurement) 296–313similarities between numbers 293–4standard deviation 287statistical analysis 284–7t test 287tabulation 282–4variance 287
quantitative research 16, 52, 221–2, 557questionnaire 188–218
ambiguity/vagueness 196basic data 191–2body of 191closed-ended questions 199–200computer-assisted 206content 191content of questions 193–5debriefing method 205design 190–206development (stages) 192dichotomous questions 199double-barrelled questions 198estimates/generalisations 197funnelling 203hypothetical questions 197impact of survey method 192implicit assumptions 197introduction of 206–7introduction 190–2language style/wording 195–6, 199
EOM_D04.qxd 6/23/05 10:37 AM Page 587

.
588 Index
questionnaire (continued)layout 204–5leading questions 196length 140, 192length of questions 196loaded questions 196multiple choice questions 200negative questions 196–7open-ended questions 200postal surveys 139preliminary considerations 193pretesting 205–6projective techniques 200protocol method 205–6question content 193–5question phrasing 195–9reliability 198–9, 208–9response choices 198response format 199–200revising 205–6scope 140sequence of questions 201–3structure 190–2unstructured questions 200validity 198–9, 208–9
queuing theory model 506quota sampling 27, 108, 112–13, 116–17, 129,
144, 435
radio research 409railway system (case study) 65–6random sampling 107, 114–15, 435
error 120, 557randomised design 263–5range 287rank order 170, 181–2, 298rating 169, 171–2, 176
methods 180–2ratio scale 169Reading Scientific Services 24–5Rebondir 14recall 141, 145, 150, 195, 198, 271, 407, 557recognition, brand 150, 293, 394–5, 557Reed, D. 153Regio 85regional statistics 82regression analysis 298–303, 412, 497regression effect (experiments) 257relationship marketing 38
relationships (measurement) 290–1, 296–313reliability 7, 127, 557
of questions 198–9, 208–9Renault Clio (case study) 345–6repeated testing 256reports (presentation) 348–82
advance preparation 355bar charts 357body of 355Chernov faces 357contour maps 358diagrams 358–9evaluation of research 350executive summary 354findings 354language/style 355length 356oral report 355–6outline 354picture maps 360–3sections of 354–5visual aids 356–63written report 351–3
Reports Index 76research
evaluation of 350planning 42–67proposal 18–19, 22, 50–2, 55–6, 352schedule 53, 56
Research Consultants (case study) 130researchers 25, 256
agencies 3, 18–21, 27, 28, 470in-house 3, 18–19, 27–8
resource view (of data) 57, 58respondents 24–5, 125, 140, 141–2, 283, 350response errors 105, 121, 557response format (questions) 199–200response latency 252response rates 126, 140–1, 146, 557restaurant strategies (case study) 521–2retail audits 16, 413–14retail sector 39, 79, 86, 414–16, 498–9Ribena 388–9Rickards, T. 30, 46Rieck, Alfred 426risk reduction 3, 7Robinson, R. 250Roland Watch (case study) 212–13role playing 174
EOM_D04.qxd 6/23/05 10:37 AM Page 588

.
Index 589
Rosser, M. 512Rumelhart, D.E. 518Ryman-Tubb, N. 516
Safe ‘T’ letterbox (case study) 273–4SAGACITY 115St Honoré de Mazarin Restaurant, Paris (case
study) 364salaries (secondary data) 96–9salesforce (predicting demand) 493sales research 12sampling 103–33, 140
business-to-business 435, 437census and samples 105–6cluster 115–16, 123completion rate 126conducting 123–5convenience 119cost limitations 128–9direct screening 122errors 108, 111–13, 120–21, 128, 288frame 29, 107, 110–11, 121, 463, 557gap 110–11global marketing research 467industry standards 129judgement 120methods 111–20non-probability 112–13, 116–18, 121, 126, 127plan 107–8population 107–8in practice 120–5probability 27, 111–12, 113–16quota 27, 116–17, 435random 107, 112–13, 435size (determinants) 127–9small populations 122–4snowballing 121, 123stratification 115, 122–3, 435systematic 116unit 110, 116, 124, 127, 129, 557
Samways, A. 17, 240, 490Sanders, L. 250Sanderson, T. 25Saville, S. 241scaling 164–87, 200scanning, electronic 17, 252–3, 554scattergraph 359scatterplot 296, 298–300, 307screening, two-phase 110, 121, 123, 458, 460
seasonal demand 494secondary data 3, 16, 52, 68–102, 437
books 73census 79directories 93European statistics 83–5exploratory research 90–3external data 70–8Financial Times 77information services 76–8libraries 88–90limitations 75–6market research reports 76–8newspapers 74non-official sources 85–7periodicals 73–4professional organisations 88regional statistics 82SIC classification 79, 93, 399, 435types of 70–1UK government sources 80–2uses 75–6, 78–9
segmentation research 397–400, 460selection errors (experiments) 257self-administered surveys 148, 192self-reporting methods 175–80self-scanning systems 414, 416selling research 410–11semantic differential 175–7, 200, 466sentence completion 173, 236service quality 433, 442, 444, 446service satisfaction 440, 444services research 439–43SERVQUAL 432, 442, 445, 446Seymour-Davies, H. 228Shillaber, J. 444shopping precincts 31, 125, 143, 144–5, 387,
391shopping surveys 439SIC 79, 93, 399, 435, 436signed rank test 289significance (tests) 287–8Simon Theodolou (case study) 523–5Simoudis, E. 515simple random sample 114simulation 20, 267, 270, 508–9Sinclair C5 48Skapinker, M. 442Skoda (case study) 425–6
EOM_D04.qxd 6/23/05 10:37 AM Page 589

.
590 Index
Smith, A. 159, 223, 251, 395Smith, J.V. 444Smith, L.A. 57Smith Kline Beecham 388–9SNAP 485, 486–7snowballing (multiplicity sampling) 121, 124Soap-sud (case study) 272–3social classification 115, 117social influences 13Social Trends 81, 82sociological studies 405Sohal, A.S. 521Soloman four-group design 261–2Sorrell, M. 476South Africa (case study) 419–22Spearman rank correlation method 298Spindler, R. 76Spirit of Magellan Enterprises (case study)
34–5sports market (case study) 214–15SPSSPC 301spurious association 296, 557standard deviation 287standardised studies 20staple scale 177–8statistical analysis 281–2, 284–313statistical demand analysis 497statistical designs (experiments) 120, 257,
263–7statistics 74–87, 92, 106–7, 467Steiner, G.A. 407story completion 174–5, 236stratification 107, 115, 124, 435structured interview 232–3, 557Stubbs, J. 8student research projects (case study) 132–3Suci, G. 175Summit Motors (case studies) 183–4, 317–18Sunday shopping questionnaire 202Sunrise Hotels (case study) 367–79surveys 16–17, 28, 107–8, 136–63, 192, 412
interactive research 154omnibus studies 153–4panels 148–51personal interviews 143–5postal 139–42self-administered 148syndicated research services 151–3telephone 145–7
Svennevig, M. 425Swatch 45–6Swiss watch industry 45–6, 48symbolism/symbols 182, 392syndicated studies 20, 151–3, 399, 413–14,
557systematic sampling 116
t test 287tabulation 199, 282–4Taha, H.A. 413Tannenbaum, P. 175target market 398–400, 460, 492target population 105, 107–9, 206, 557TAT instruments 466taxonomy 334–5Taylor, P. 416, 517Taylor Nelson 87, 152technological influences 13teleconferencing 228telephone surveys 122, 124, 125, 145–7Telepost 147television advertising research 408test marketing 20, 267–70, 412, 435text segments 327–8Thatcher, Margaret 64thematic apperception test 173, 236theory building 328, 329third-person techniques 236Thompson Toys (case study) 274–6Thurstone differential 178–9time-dependent approach 494–9time-ordered event matrix 332time-scaled PERT 57, 60Time Line for Windows 57Timmins, N. 425total survey error 120tracking 270–1, 557trade associations 436, 493train operating companies (TOCs) 65–6transferability criteria 350transitionary markets 458–9transportation model 500–1treatment effect 263, 265, 558tree taxonomy 334–5trends 29–30, 150, 494triangulation 350two-phase screening 110, 123, 458, 460two-tailed tests 288–9
EOM_D04.qxd 6/23/05 10:37 AM Page 590

.
Index 591
Type I error 558Type II error 558Tyrrell, B. 459
UK Markets 87unaided questions 141, 271, 407, 558unbalanced scale 172, 558uncertainty 7, 48–50Unilever (case study) 532–4universe (sampling population) 109, 128unstructured interview 234, 235, 329, 558unstructured observation 252unstructured question 200user interface (expert system) 513
validity 7, 331–2, 558of experiments 256–7of questions 198–9, 208–9
variance 287verification 147, 330, 332, 515, 558video (case study) 530–2videoconferencing 228Virgin Records (case study) 529–30visual aids 356–63Volvo (case study) 160–1
Waddell, D. 521Wallaby Tours (case study) 379–81Warwick Business School 8Web 29, 38–9, 76–8, 95–6, 390–1, 416West, Graham 8–9Westbourne Research (case study) 214–15Westland, J.C. 514White, S. 389Whittcome, K. 17, 240, 490Wilcoxon test 289Wilson, Des 440–1women in marketing 540–2word association 173, 236wordlists/counts 326working population 110WPP Group (case study) 475–6written report 351–3
Xiong, R. 474
Yates’ Correction 291Yellow Pages 93, 96
Z test 288, 289Zuccaro, B. 415
EOM_D04.qxd 6/23/05 10:37 AM Page 591