ESR Cayman Limited - :: HKEX :: HKEXnews ::
1060
ESR Cayman Limited Stock Code: 1821 (Incorporated in the Cayman Islands with limited liability) Joint Sponsors Joint Global Coordinators and Joint Bookrunners Joint Bookrunners GLOBAL OFFERING (in alphabetical order)
-
Upload
khangminh22 -
Category
Documents
-
view
1 -
download
0
Transcript of ESR Cayman Limited - :: HKEX :: HKEXnews ::

ESR Cayman Limited
ESR C
ayman Lim
ited
ESR Cayman Limited
Stock Code: 1821
(Incorporated in the Cayman Islands with limited liability)
Joint Sponsors
Joint Global Coordinators and Joint Bookrunners
Joint Bookrunners
GLOBAL OFFERING
(in alphabetical order)

IMPORTANT
If you are in any doubt about any of the contents of this Prospectus, you should seek independent professionaladvice.
ESR Cayman Limited(Incorporated in the Cayman Islands with limited liability)
GLOBAL OFFERINGNumber of Offer Shares under the Global Offering : 653,680,000 Offer Shares (comprising 280,140,000 New
Shares and 373,540,000 Sale Shares, and subject to theOffer Size Adjustment Option and the Over-allotmentOption)
Number of Hong Kong Public Offer Shares : 34,700,000 New Shares (subject to reallocation and theOffer Size Adjustment Option)
Number of International Placing Shares : 618,980,000 Offer Shares (comprising 245,440,000 NewShares and 373,540,000 Sale Shares, and subject toreallocation, the Offer Size Adjustment Option and theOver-allotment Option)
Maximum Offer Price:(subject to a Downward Offer Price Adjustment)
: HK$17.40 per Offer Share, plus brokerage of 1%, SFCtransaction levy of 0.0027% and Stock Exchange tradingfee of 0.005% (payable in full on application in HongKong dollars and subject to refund) (If the Offer Price isset at 10% below the bottom end of the indicative OfferPrice range after making a Downward Offer PriceAdjustment, the Offer Price will be HK$14.58 per OfferShare)
Nominal value: : US$0.001 per ShareStock code: : 1821
Joint Sponsors
Joint Global Coordinators and Joint Bookrunners
Joint Bookrunners(in alphabetical order)
Hong Kong Exchanges and Clearing Limited, The Stock Exchange of Hong Kong Limited and Hong Kong Securities Clearing Company Limited take noresponsibility for the contents of this Prospectus, make no representation as to its accuracy or completeness and expressly disclaim any liability whatsoever forany loss howsoever arising from or in reliance upon the whole or any part of the contents of this Prospectus.
A copy of this Prospectus, having attached thereto the documents specified in the section headed “Documents Delivered to the Registrar of Companies inHong Kong and Available for Inspection” in Appendix IX to this Prospectus, has been registered by the Registrar of Companies in Hong Kong as required bySection 342C of the Companies (Winding Up and Miscellaneous Provisions) Ordinance (Cap.32). The Securities and Futures Commission and the Registrar ofCompanies in Hong Kong take no responsibility for the contents of this Prospectus or any other documents referred to above.
The Offer Price is expected to be determined by agreement between the Joint Global Coordinators (for themselves and on behalf of the Underwriters) andour Company (for ourselves and on behalf of the Selling Shareholders) on or around Friday, October 25, 2019 and, in any event, on or before Thursday,October 31, 2019. The Offer Price will not be more than HK$17.40 per Offer Share and is expected to be not less than HK$16.20 per Offer Share (subject to aDownward Offer Price Adjustment), unless otherwise announced.
If, for any reason, our Company (for ourselves and on behalf of the Selling Shareholders) and the Joint Global Coordinators (for themselves and on behalfof the Underwriters) are unable to reach agreement on the Offer Price on or before Thursday, October 31, 2019, the Global Offering will not proceed and willlapse.
The Joint Global Coordinators (for themselves and on behalf of the Underwriters) may, where considered appropriate, and with the consent of ourCompany, reduce the number of Offer Shares and/or the indicative Offer Price range stated in this Prospectus which is HK$16.20 to HK$17.40 at any time on orprior to the morning of the last day for lodging applications under the Hong Kong Public Offering. In such case, notices of the reduction in the number of OfferShares and/or the indicative Offer Price range will be published in the South China Morning Post (in English) and the Hong Kong Economic Times (in Chinese)as soon as practicable following the decision to make such reduction, and in any event not later than the morning of the last day for lodging applications under theHong Kong Public Offering. Such notices will also be available on the website of the Stock Exchange at www.hkexnews.hk and on the website of our Companyat www.esr.com. Further details are set forth in the sections headed “Structure of the Global Offering” and “How to Apply for Hong Kong Public Offer Shares”in this Prospectus.
Prior to making an investment decision, prospective investors should consider carefully all of the information set out in this Prospectus, including the riskfactors set out in the section headed “Risk Factors” in this Prospectus.
The obligations of the Hong Kong Underwriters under the Hong Kong Underwriting Agreement are subject to termination by the Joint GlobalCoordinators (for themselves and on behalf of the Underwriters) if certain grounds arise prior to 8:00 a.m. on the Listing Date. Such grounds are set out in thesection headed “Underwriting” in this Prospectus. It is important that you refer to that section for further details.
The Offer Shares have not been and will not be registered under the U.S. Securities Act or any state securities laws in the United States and may not beoffered, sold, pledged or transferred within the United States, except that Offer Shares may be offered, sold or delivered within the United States to QIBs inreliance on Rule 144A under the U.S. Securities Act or other exemption(s) from registration under the U.S. Securities Act or outside the United States in relianceon Regulation S under the U.S. Securities Act.
October 22, 2019

EXPECTED TIMETABLE(1)
If there is any change in the following expected timetable of the Global Offering, we will issue anannouncement in Hong Kong to be published on the websites of the Stock Exchange at www.hkexnews.hk andour Company at www.esr.com.
Hong Kong Public Offering commences and WHITE and YELLOWApplication Forms available from . . . . . . . . . . . . . . . . . . . . . . . . . . . . . . .
9:00 a.m. on Tuesday,October 22, 2019
Latest time for completing electronic applications under the White FormeIPO service through the designated website at www.eipo.com.hk(2) . . . .
11:30 a.m. on Friday, October 25,2019
Application lists open(3) . . . . . . . . . . . . . . . . . . . . . . . . . . . . . . . . . . . . . . . . . . 11:45 a.m. on Friday, October 25,2019
Latest time for (a) lodging WHITE and YELLOW Application Forms,(b) completing payment for White Form eIPO applications by effectinginternet banking transfer(s) or PPS payment transfer(s) and (c) givingelectronic application instructions to HKSCC . . . . . . . . . . . . . . . . . . . .
12:00 noon on Friday,October 25, 2019
Application lists close(3) . . . . . . . . . . . . . . . . . . . . . . . . . . . . . . . . . . . . . . . . . 12:00 noon on Friday,October 25, 2019
Expected Price Determination Date . . . . . . . . . . . . . . . . . . . . . . . . . . . . . . . . Friday, October 25, 2019
(1) Where applicable, announcement of the Offer Price being set belowthe bottom end of the indicative Offer Price range after making aDownward Offer Price Adjustment (see the section headed “Structureof the Global Offering—Pricing and Allocation”) on the website of theStock Exchange at www.hkexnews.hk and the Company’s website atwww.esr.com on or before . . . . . . . . . . . . . . . . . . . . . . . . . . . . . . . . . . . Thursday, October 31, 2019
(2) Announcement of the Offer Price, the level of indications of interest inthe International Placing, the level of applications in the Hong KongPublic Offering and the basis of allocations of the Hong Kong PublicOffer Shares to be published in the South China Morning Post (inEnglish) and the Hong Kong Economic Times (in Chinese) on orbefore . . . . . . . . . . . . . . . . . . . . . . . . . . . . . . . . . . . . . . . . . . . . . . . . . . . . Thursday, October 31, 2019
(3) Results of allocations in the Hong Kong Public Offering to beavailable through a variety of channels as described in the sectionheaded “How to Apply for Hong Kong Public Offer Shares—Publication of Results” in this Prospectus from . . . . . . . . . . . . . . . . . . . Thursday, October 31, 2019
(4) Announcement containing (2) and (3) above to be published on thewebsites of the Company and the Stock Exchange at www.esr.comand www.hkexnews.hk from . . . . . . . . . . . . . . . . . . . . . . . . . . . . . . . . . Thursday, October 31, 2019
Results of allocations for the Hong Kong Public Offering will be availableat www.iporesults.com.hk (alternatively: Englishhttps://www.eipo.com.hk/en/Allotment; Chinesehttps://www.eipo.com.hk/zh-hk/Allotment) with a “search by ID”function from . . . . . . . . . . . . . . . . . . . . . . . . . . . . . . . . . . . . . . . . . . . . . . . . Thursday, October 31, 2019
Dispatch of Share certificates and White Form e-Refund paymentinstructions/refund checks on or before(4) . . . . . . . . . . . . . . . . . . . . . . . . . . Thursday, October 31, 2019
Dealings in the Shares on the Stock Exchange expected to commence on . . Friday, November 1, 2019
Notes:(1) All dates and times refer to Hong Kong dates and times.(2) You will not be permitted to submit your application under the White Form eIPO service through the designated website at
www.eipo.com.hk after 11:30 a.m. on the last day for submitting applications. If you have already submitted your application andobtained a payment reference number from the designated website prior to 11:30 a.m., you will be permitted to continue the applicationprocess (by completing payment of the application monies) until 12:00 noon on the last day for submitting applications, when theapplication lists close.
i

EXPECTED TIMETABLE(1)
(3) If there is/are a “black” rainstorm warning signal, a tropical cyclone warning signal number 8 or above and/or Extreme Conditions inforce in Hong Kong at any time between 9:00 a.m. and 12:00 noon on Friday, October 25, 2019, the application lists will not open andclose on that day. See the section headed “How to Apply for Hong Kong Public Offer Shares” in this Prospectus.
(4) The Share certificates will only become valid at 8:00 a.m. on the Listing Date, which is expected to be Friday, November 1, 2019,provided that the Global Offering has become unconditional in all respects at or before that time. Investors who trade Shares on the basisof publicly available allocation details or prior to the receipt of the Share certificates or prior to the Share certificates becoming valid doso entirely at their own risk.
For details of the structure of the Global Offering, including its conditions, and the proceduresfor applications for Hong Kong Public Offer Shares, see the sections headed “Structure of the GlobalOffering” and “How to Apply for Hong Kong Public Offer Shares” in this Prospectus, respectively.
If the Global Offering does not become unconditional or is terminated in accordance with itsterms, the Global Offering will not proceed. In such a case, the Company will make an announcementas soon as practicable thereafter.
ii

CONTENTS
IMPORTANT NOTICE TO PROSPECTIVE INVESTORS
This Prospectus is issued by us solely in connection with the Hong Kong Public Offering andthe Hong Kong Public Offer Shares and does not constitute an offer to sell or a solicitation of anoffer to buy any security other than the Hong Kong Public Offer Shares offered by this Prospectuspursuant to the Hong Kong Public Offering. This Prospectus may not be used for the purpose of, anddoes not constitute, an offer or invitation in any other jurisdiction or in any other circumstances. Noaction has been taken to permit a public offering of the Offer Shares in any jurisdiction other thanHong Kong and no action has been taken to permit the distribution of this Prospectus in anyjurisdiction other than Hong Kong. The distribution of this Prospectus and the offering of the OfferShares in other jurisdictions are subject to restrictions and may not be made except as permittedunder the applicable securities laws of such jurisdictions pursuant to registration with orauthorization by the relevant securities regulatory authorities or an exemption therefrom.
You should rely only on the information contained in this Prospectus and the ApplicationForms to make your investment decision. We have not authorized anyone to provide you withinformation that is different from what is contained in this Prospectus. Any information orrepresentation not made in this Prospectus must not be relied on by you as having been authorizedby us or any of the Relevant Persons.
Page
EXPECTED TIMETABLE . . . . . . . . . . . . . . . . . . . . . . . . . . . . . . . . . . . . . . . . . . . . . . . . . . . . . . . . . . . . i
CONTENTS . . . . . . . . . . . . . . . . . . . . . . . . . . . . . . . . . . . . . . . . . . . . . . . . . . . . . . . . . . . . . . . . . . . . . . . . iii
SUMMARY . . . . . . . . . . . . . . . . . . . . . . . . . . . . . . . . . . . . . . . . . . . . . . . . . . . . . . . . . . . . . . . . . . . . . . . . . 1
DEFINITIONS . . . . . . . . . . . . . . . . . . . . . . . . . . . . . . . . . . . . . . . . . . . . . . . . . . . . . . . . . . . . . . . . . . . . . . 24
FORWARD-LOOKING STATEMENTS . . . . . . . . . . . . . . . . . . . . . . . . . . . . . . . . . . . . . . . . . . . . . . . . . . 43
RISK FACTORS . . . . . . . . . . . . . . . . . . . . . . . . . . . . . . . . . . . . . . . . . . . . . . . . . . . . . . . . . . . . . . . . . . . . . 44
WAIVERS AND CONSENT FROM STRICT COMPLIANCE WITH THE LISTING RULES ANDEXEMPTIONS FROM COMPANIES (WINDING UP AND MISCELLANEOUS PROVISIONS)ORDINANCE . . . . . . . . . . . . . . . . . . . . . . . . . . . . . . . . . . . . . . . . . . . . . . . . . . . . . . . . . . . . . . . . . . . . . 114
INFORMATION ABOUT THIS PROSPECTUS AND THE GLOBAL OFFERING . . . . . . . . . . . . . . . . 126
DIRECTORS AND PARTIES INVOLVED IN THE GLOBAL OFFERING . . . . . . . . . . . . . . . . . . . . . . 131
CORPORATE INFORMATION . . . . . . . . . . . . . . . . . . . . . . . . . . . . . . . . . . . . . . . . . . . . . . . . . . . . . . . . . 137
HISTORY, DEVELOPMENT AND CORPORATE STRUCTURE . . . . . . . . . . . . . . . . . . . . . . . . . . . . . 139
BUSINESS . . . . . . . . . . . . . . . . . . . . . . . . . . . . . . . . . . . . . . . . . . . . . . . . . . . . . . . . . . . . . . . . . . . . . . . . . 165
RELATIONSHIP WITH WARBURG PINCUS X . . . . . . . . . . . . . . . . . . . . . . . . . . . . . . . . . . . . . . . . . . 222
DIRECTORS AND SENIOR MANAGEMENT . . . . . . . . . . . . . . . . . . . . . . . . . . . . . . . . . . . . . . . . . . . . 224
SHARE CAPITAL . . . . . . . . . . . . . . . . . . . . . . . . . . . . . . . . . . . . . . . . . . . . . . . . . . . . . . . . . . . . . . . . . . . 235
SUBSTANTIAL SHAREHOLDERS . . . . . . . . . . . . . . . . . . . . . . . . . . . . . . . . . . . . . . . . . . . . . . . . . . . . . 238
FINANCIAL INFORMATION . . . . . . . . . . . . . . . . . . . . . . . . . . . . . . . . . . . . . . . . . . . . . . . . . . . . . . . . . . 240
FUTURE PLANS AND USE OF PROCEEDS . . . . . . . . . . . . . . . . . . . . . . . . . . . . . . . . . . . . . . . . . . . . . 329
iii

CONTENTS
Page
CORNERSTONE INVESTOR . . . . . . . . . . . . . . . . . . . . . . . . . . . . . . . . . . . . . . . . . . . . . . . . . . . . . . . . . . 331
UNDERWRITING . . . . . . . . . . . . . . . . . . . . . . . . . . . . . . . . . . . . . . . . . . . . . . . . . . . . . . . . . . . . . . . . . . . 334
STRUCTURE OF THE GLOBAL OFFERING . . . . . . . . . . . . . . . . . . . . . . . . . . . . . . . . . . . . . . . . . . . . . 348
HOW TO APPLY FOR HONG KONG PUBLIC OFFER SHARES . . . . . . . . . . . . . . . . . . . . . . . . . . . . . 360
APPENDIX I ACCOUNTANTS’ REPORT . . . . . . . . . . . . . . . . . . . . . . . . . . . . . . . . . . . . . . . . . . . . I-1
APPENDIX II-A AUDITED FINANCIAL STATEMENTS ON PROPERTYLINK FOR THE THREEYEARS ENDED 30 JUNE 2018 . . . . . . . . . . . . . . . . . . . . . . . . . . . . . . . . . . . . . . . . . . II-A-1
APPENDIX II-B AUDITED FINANCIAL STATEMENTS ON PROPERTYLINK FOR THEPERIOD FROM 1 JULY 2018 TO 20 MARCH 2019 . . . . . . . . . . . . . . . . . . . . . . . . . II-B-1
APPENDIX III UNAUDITED PRO FORMA FINANCIAL INFORMATION . . . . . . . . . . . . . . . . . . III-1
APPENDIX IV INDUSTRY OVERVIEW . . . . . . . . . . . . . . . . . . . . . . . . . . . . . . . . . . . . . . . . . . . . . . IV-1
APPENDIX V REGULATORY OVERVIEW . . . . . . . . . . . . . . . . . . . . . . . . . . . . . . . . . . . . . . . . . . . V-1
APPENDIX VI PROPERTY VALUATION . . . . . . . . . . . . . . . . . . . . . . . . . . . . . . . . . . . . . . . . . . . . . VI-1
APPENDIX VII SUMMARY OF THE CONSTITUTION OF OUR COMPANY AND CAYMANCOMPANIES LAW . . . . . . . . . . . . . . . . . . . . . . . . . . . . . . . . . . . . . . . . . . . . . . . . . . . VII-1
APPENDIX VIII STATUTORY AND GENERAL INFORMATION . . . . . . . . . . . . . . . . . . . . . . . . . . . VIII-1
APPENDIX IX DOCUMENTS DELIVERED TO THE REGISTRAR OF COMPANIES INHONG KONG AND AVAILABLE FOR INSPECTION . . . . . . . . . . . . . . . . . . . . . . IX-1
iv

SUMMARY
This summary aims to give you an overview of the information contained in this Prospectus.As it is a summary, it does not contain all of the information that may be important to you. Youshould read the whole Prospectus before you decide whether to invest in the Offer Shares. There arerisks associated with any investment. Some of the particular risks in investing in the Offer Shares areset out in the section headed “Risk Factors” in this Prospectus. You should read that sectioncarefully in full before you decide whether to invest in the Offer Shares.
OUR MISSION
We aim to build modern logistics infrastructure for 21st century commerce across APAC. Weendeavor to offer tenants modern, state-of-the-art logistics facilities and solutions, and provideinvestors with exposure to a dynamic sector in the fast-growing APAC region.
OVERVIEW
We are the largest APAC focused logistics real estate platform by GFA and by value of thePortfolio Assets and have the largest development pipeline in aggregate across the major APACmarkets as measured by GFA from July 1, 2019 to December 31, 2020, according to the JLL Report.We develop and manage modern logistics facilities that cater to e-commerce companies, 3PLproviders, bricks-and-mortar retailers, manufacturers, cold-chain logistics providers and others inAPAC as logistics infrastructure continues to evolve for the modern economy. We focus solely onAPAC, which comprised over 3.6 billion people (around 50% of the global population) and overUS$28.6 trillion of GDP (over 33% of the global GDP) in 2018, according to the JLL Report. Wecurrently operate in the PRC, Japan, South Korea, Singapore, Australia and India markets thatrepresent close to 90% of GDP in APAC in 2018, according to the JLL Report. We have grownsignificantly during the Track Record Period. Our revenue grew by 58.5% from US$96.7 million in2016 to US$153.3 million in 2017, and further grew by 65.8% to US$254.1 million in 2018. Ourrevenue grew by 66.3% from US$93.7 million for the six months ended June 30, 2018 to US$155.8million for the six months ended June 30, 2019. Our management fee income, a key component of ourrevenue, grew significantly from US$46.5 million in 2016 to US$94.3 million in 2017, and further toUS$135.6 million in 2018, driven by robust growth in our Fund AUM. Our management fee incomegrew from US$59.0 million for the six months ended June 30, 2018 to US$61.8 million for the sixmonths ended June 30, 2019. Our net profit grew by 91.6% from US$104.8 million in 2016 toUS$200.8 million in 2017, and further grew by 6.0% to US$212.9 million in 2018. Our net profit grewby 32.0% from US$63.7 million for the six months ended June 30, 2018 to US$84.1 million for the sixmonths ended June 30, 2019. During the Track Record Period, the majority of our profit was derivedfrom fair value gains on investment properties and share of profits and losses of joint ventures andassociates, which together amounted to US$142.9 million, US$232.2 million, US$237.8 million,US$61.0 million and US$121.9 million in 2016, 2017 and 2018 and for the six months ended June 30,2018 and 2019, respectively.
We hold a portfolio of logistics properties on our balance sheet and manage a broad range offunds and investment vehicles that invest in logistics properties at various stages of the property lifecycle across APAC. As of June 30, 2019, we managed 30 private third-party pooled investmentvehicles, with over US$6.3 billion in total equity commitments, and two REITs listed on the SGX-STwith aggregate appraised carrying value of approximately US$2.9 billion. As of June 30, 2019, ourAUM was approximately US$20.2 billion (of which US$2.7 billion was on our balance sheet) and
1

SUMMARY
comprised approximately 8.5 million sq.m of GFA of completed properties, approximately 4.4 millionsq.m of GFA of properties under construction (which we expect to be completed over the next two tofive years and the size of which is expected to be more than half of the GFA of our current completedproperties) and approximately 2.4 million sq.m of GFA to be built on land held for future development,adding up to over 15.3 million sq.m of GFA in total. GFA on land held for future development refers tototal estimated GFA upon completion based on the Company’s construction plans. See the sectionheaded “Business—Property Operations—Classification of the Portfolio Assets” in this Prospectus forfurther details.
We develop logistics real estate primarily in Tier 1 and 1.5 cities in APAC, targeting strategiclocations near key logistics hubs, major seaports, airports, transportation hubs and industrial zones inthe PRC, Japan, South Korea, Singapore, Australia and India, which are the markets we believe willdrive future growth across APAC. The majority of the tenants in the Portfolio Assets service domesticconsumption in APAC. According to the JLL Report, APAC’s substantial middle class populationcoupled with rapid economic growth and rising income levels are expected to support risingconsumption levels in the region. Private consumption in China, Japan, South Korea, Singapore,Australia and India is forecasted to grow at a CAGR of 8.1% between 2019 and 2023, approximatelytwo times the anticipated 4.0% growth in the US during the same period. As of June 30, 2019,e-commerce and 3PL tenants made up approximately 48.5% of the tenant base of the Portfolio Assetsby leased area. In 2016, 2017 and 2018 and for the six months ended June 30, 2019, rental revenuesfrom e-commerce and 3PL tenants in our balance sheet properties amounted to 82.6%, 76.7%, 63.5%and 41.0% of our total rental revenues, respectively. The decrease in the proportion of rental revenuesfrom e-commerce and 3PL tenants in the six months ended June 30, 2019 was due to our acquisition ofPropertylink, the property portfolio of which had a higher percentage of traditional logistics andindustrial tenants, as well as the disposal of certain balance sheet properties to NCI Core Fund, themajority of which were occupied by e-commerce tenants.
With our APAC-focused business model, we grew significantly during the Track Record Periodthrough organic growth and strategic merger and acquisition (“M&A”), increasing our AUM fromUS$7.4 billion as of December 31, 2016, to US$12.0 billion as of December 31, 2017, toapproximately US$16.0 billion as of December 31, 2018 and further to US$20.2 billion as of June 30,2019. We have also attracted investments from three out of the top six real estate capital providersglobally based on IP&E Real Assets’ top 100 ranking of the world’s largest real estate investors in2018. We were ranked #29 in the world in PERE’s “Fab 50”, the flagship ranking of the private realestate world’s top managers (by total annual fundraising amount) in 2018. Our total consolidatedbalance sheet assets, which include our investment properties, investments in joint ventures, andfinancial assets at fair value, grew by 45.4% from US$2,101.5 million as of December 31, 2016 toUS$3,054.9 million as of December 31, 2017, and further grew by 45.1% to US$4,431.6 million as ofDecember 31, 2018 and 34.2% to US$5,946.0 million as of June 30, 2019.
2

SUMMARY
Below is a summary of the Portfolio Assets we directly owned as of June 30, 2019:
CountryNumber ofproperties(1)
GFA ofcompleted
properties(2)(3)
GFA ofproperties
underconstruction(3)
GFA on landheld forfuture
development(3)
(sqm in thousands)
The PRC . . . . . . . . . . . . . . . . . . . . . . . . . . . . . . . . . . . . . 27 1,105.4 842.4 657.4Greater Shanghai . . . . . . . . . . . . . . . . . . . . . . . . . . . 8 516.1 403.3 245.6Greater Beijing . . . . . . . . . . . . . . . . . . . . . . . . . . . . . 5 253.7 — 147.8Greater Guangzhou . . . . . . . . . . . . . . . . . . . . . . . . . . 6 238.6 — 107.9Others . . . . . . . . . . . . . . . . . . . . . . . . . . . . . . . . . . . . 8 96.9 439.1 156.2
Japan . . . . . . . . . . . . . . . . . . . . . . . . . . . . . . . . . . . . . . . . 4 — 575.0 300.0Tokyo . . . . . . . . . . . . . . . . . . . . . . . . . . . . . . . . . . . . 4 — 575.0 300.0
Australia . . . . . . . . . . . . . . . . . . . . . . . . . . . . . . . . . . . . . 41(4) 481.7 35.9 —(4)
New South Wales . . . . . . . . . . . . . . . . . . . . . . . . . . . 15 158.6 18.4 —Queensland . . . . . . . . . . . . . . . . . . . . . . . . . . . . . . . . 10 80.5 — —Victoria . . . . . . . . . . . . . . . . . . . . . . . . . . . . . . . . . . . 13 214.9 17.5 —Western Australia . . . . . . . . . . . . . . . . . . . . . . . . . . . 3 27.6 — —
India . . . . . . . . . . . . . . . . . . . . . . . . . . . . . . . . . . . . . . . . . 3 — 116.5 229.9Mumbai . . . . . . . . . . . . . . . . . . . . . . . . . . . . . . . . . . . 2 — 116.5 199.3Kolkata . . . . . . . . . . . . . . . . . . . . . . . . . . . . . . . . . . . 1 — — 30.7
Total . . . . . . . . . . . . . . . . . . . . . . . . . . . . . . . . . . . . . . . . . 75 1,587.1 1,569.7 1,187.3
Notes:(1) Includes completed properties, properties under construction and GFA on land held for future development.(2) Includes both stabilized and pre-stabilized completed properties. “Stabilized properties” refer to completed properties: (i) for which
construction or acquisition had been completed for more than 12 months; or (ii) reached an occupancy rate of 93% or higher. “Pre-stabilized properties” refer to completed properties: (i) for which construction or acquisition had been completed for less than 12 months;or (ii) with an occupancy rate of less than 93%.
(3) For the definitions of “completed properties,” “properties under construction,” and “GFA on land held for future development,” see thesection headed “Business—Property Operations—Classification of the Portfolio Assets” in this Prospectus.
(4) We also own four parcels of land in Australia to be developed in the future, and are currently in the process of formulating theconstruction plans and as such have not included the number of properties or the GFA figures to be built on such land.
As of June 30, 2019, the portion of the Portfolio Assets that we held on our balance sheet wasvalued at US$2.7 billion.
3
SUMMARY
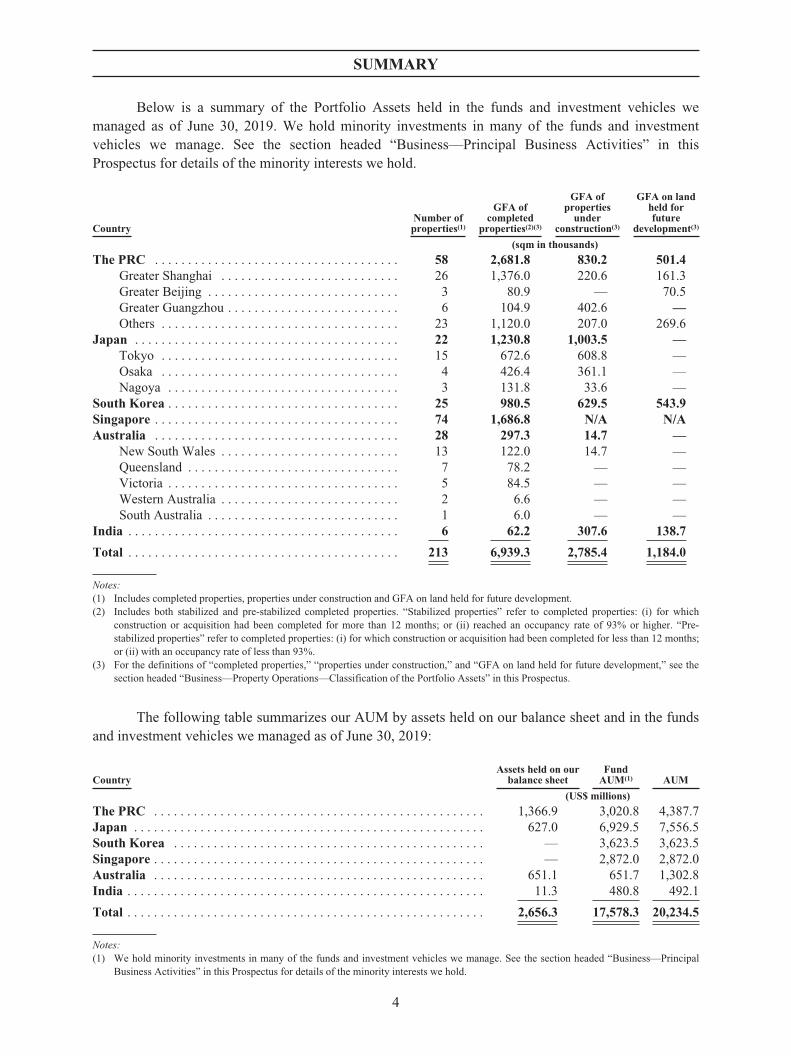
Below is a summary of the Portfolio Assets held in the funds and investment vehicles wemanaged as of June 30, 2019. We hold minority investments in many of the funds and investmentvehicles we manage. See the section headed “Business—Principal Business Activities” in thisProspectus for details of the minority interests we hold.
CountryNumber ofproperties(1)
GFA ofcompleted
properties(2)(3)
GFA ofproperties
underconstruction(3)
GFA on landheld forfuture
development(3)
(sqm in thousands)
The PRC . . . . . . . . . . . . . . . . . . . . . . . . . . . . . . . . . . . . . 58 2,681.8 830.2 501.4Greater Shanghai . . . . . . . . . . . . . . . . . . . . . . . . . . . 26 1,376.0 220.6 161.3Greater Beijing . . . . . . . . . . . . . . . . . . . . . . . . . . . . . 3 80.9 — 70.5Greater Guangzhou . . . . . . . . . . . . . . . . . . . . . . . . . . 6 104.9 402.6 —Others . . . . . . . . . . . . . . . . . . . . . . . . . . . . . . . . . . . . 23 1,120.0 207.0 269.6
Japan . . . . . . . . . . . . . . . . . . . . . . . . . . . . . . . . . . . . . . . . 22 1,230.8 1,003.5 —Tokyo . . . . . . . . . . . . . . . . . . . . . . . . . . . . . . . . . . . . 15 672.6 608.8 —Osaka . . . . . . . . . . . . . . . . . . . . . . . . . . . . . . . . . . . . 4 426.4 361.1 —Nagoya . . . . . . . . . . . . . . . . . . . . . . . . . . . . . . . . . . . 3 131.8 33.6 —
South Korea . . . . . . . . . . . . . . . . . . . . . . . . . . . . . . . . . . . 25 980.5 629.5 543.9Singapore . . . . . . . . . . . . . . . . . . . . . . . . . . . . . . . . . . . . . 74 1,686.8 N/A N/AAustralia . . . . . . . . . . . . . . . . . . . . . . . . . . . . . . . . . . . . . 28 297.3 14.7 —
New South Wales . . . . . . . . . . . . . . . . . . . . . . . . . . . 13 122.0 14.7 —Queensland . . . . . . . . . . . . . . . . . . . . . . . . . . . . . . . . 7 78.2 — —Victoria . . . . . . . . . . . . . . . . . . . . . . . . . . . . . . . . . . . 5 84.5 — —Western Australia . . . . . . . . . . . . . . . . . . . . . . . . . . . 2 6.6 — —South Australia . . . . . . . . . . . . . . . . . . . . . . . . . . . . . 1 6.0 — —
India . . . . . . . . . . . . . . . . . . . . . . . . . . . . . . . . . . . . . . . . . 6 62.2 307.6 138.7
Total . . . . . . . . . . . . . . . . . . . . . . . . . . . . . . . . . . . . . . . . . 213 6,939.3 2,785.4 1,184.0
Notes:(1) Includes completed properties, properties under construction and GFA on land held for future development.(2) Includes both stabilized and pre-stabilized completed properties. “Stabilized properties” refer to completed properties: (i) for which
construction or acquisition had been completed for more than 12 months; or (ii) reached an occupancy rate of 93% or higher. “Pre-stabilized properties” refer to completed properties: (i) for which construction or acquisition had been completed for less than 12 months;or (ii) with an occupancy rate of less than 93%.
(3) For the definitions of “completed properties,” “properties under construction,” and “GFA on land held for future development,” see thesection headed “Business—Property Operations—Classification of the Portfolio Assets” in this Prospectus.
The following table summarizes our AUM by assets held on our balance sheet and in the fundsand investment vehicles we managed as of June 30, 2019:
CountryAssets held on our
balance sheetFundAUM(1) AUM
(US$ millions)
The PRC . . . . . . . . . . . . . . . . . . . . . . . . . . . . . . . . . . . . . . . . . . . . . . . . . . 1,366.9 3,020.8 4,387.7Japan . . . . . . . . . . . . . . . . . . . . . . . . . . . . . . . . . . . . . . . . . . . . . . . . . . . . . 627.0 6,929.5 7,556.5South Korea . . . . . . . . . . . . . . . . . . . . . . . . . . . . . . . . . . . . . . . . . . . . . . . — 3,623.5 3,623.5Singapore . . . . . . . . . . . . . . . . . . . . . . . . . . . . . . . . . . . . . . . . . . . . . . . . . . — 2,872.0 2,872.0Australia . . . . . . . . . . . . . . . . . . . . . . . . . . . . . . . . . . . . . . . . . . . . . . . . . . 651.1 651.7 1,302.8India . . . . . . . . . . . . . . . . . . . . . . . . . . . . . . . . . . . . . . . . . . . . . . . . . . . . . . 11.3 480.8 492.1
Total . . . . . . . . . . . . . . . . . . . . . . . . . . . . . . . . . . . . . . . . . . . . . . . . . . . . . . 2,656.3 17,578.3 20,234.5
Notes:(1) We hold minority investments in many of the funds and investment vehicles we manage. See the section headed “Business—Principal
Business Activities” in this Prospectus for details of the minority interests we hold.
4
SUMMARY
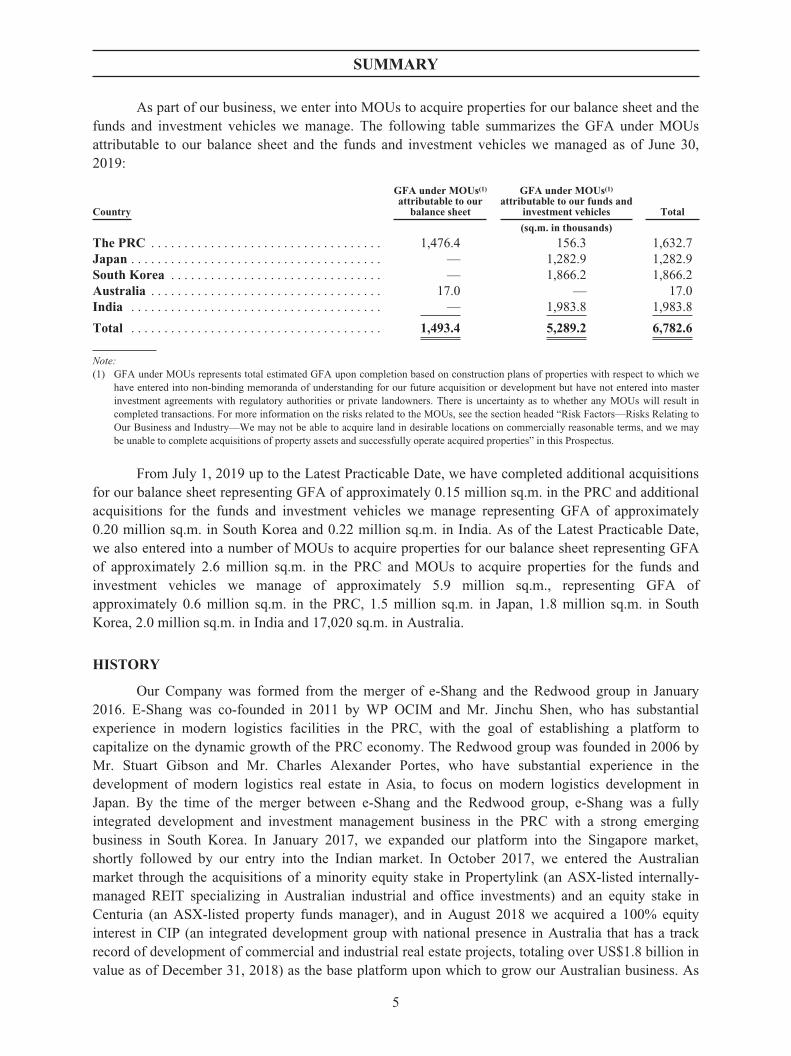
As part of our business, we enter into MOUs to acquire properties for our balance sheet and thefunds and investment vehicles we manage. The following table summarizes the GFA under MOUsattributable to our balance sheet and the funds and investment vehicles we managed as of June 30,2019:
Country
GFA under MOUs(1)attributable to our
balance sheet
GFA under MOUs(1)attributable to our funds and
investment vehicles Total
(sq.m. in thousands)
The PRC . . . . . . . . . . . . . . . . . . . . . . . . . . . . . . . . . . . 1,476.4 156.3 1,632.7Japan . . . . . . . . . . . . . . . . . . . . . . . . . . . . . . . . . . . . . . — 1,282.9 1,282.9South Korea . . . . . . . . . . . . . . . . . . . . . . . . . . . . . . . . — 1,866.2 1,866.2Australia . . . . . . . . . . . . . . . . . . . . . . . . . . . . . . . . . . . 17.0 — 17.0India . . . . . . . . . . . . . . . . . . . . . . . . . . . . . . . . . . . . . . — 1,983.8 1,983.8
Total . . . . . . . . . . . . . . . . . . . . . . . . . . . . . . . . . . . . . . 1,493.4 5,289.2 6,782.6
Note:(1) GFA under MOUs represents total estimated GFA upon completion based on construction plans of properties with respect to which we
have entered into non-binding memoranda of understanding for our future acquisition or development but have not entered into masterinvestment agreements with regulatory authorities or private landowners. There is uncertainty as to whether any MOUs will result incompleted transactions. For more information on the risks related to the MOUs, see the section headed “Risk Factors—Risks Relating toOur Business and Industry—We may not be able to acquire land in desirable locations on commercially reasonable terms, and we maybe unable to complete acquisitions of property assets and successfully operate acquired properties” in this Prospectus.
From July 1, 2019 up to the Latest Practicable Date, we have completed additional acquisitionsfor our balance sheet representing GFA of approximately 0.15 million sq.m. in the PRC and additionalacquisitions for the funds and investment vehicles we manage representing GFA of approximately0.20 million sq.m. in South Korea and 0.22 million sq.m. in India. As of the Latest Practicable Date,we also entered into a number of MOUs to acquire properties for our balance sheet representing GFAof approximately 2.6 million sq.m. in the PRC and MOUs to acquire properties for the funds andinvestment vehicles we manage of approximately 5.9 million sq.m., representing GFA ofapproximately 0.6 million sq.m. in the PRC, 1.5 million sq.m. in Japan, 1.8 million sq.m. in SouthKorea, 2.0 million sq.m. in India and 17,020 sq.m. in Australia.
HISTORY
Our Company was formed from the merger of e-Shang and the Redwood group in January2016. E-Shang was co-founded in 2011 by WP OCIM and Mr. Jinchu Shen, who has substantialexperience in modern logistics facilities in the PRC, with the goal of establishing a platform tocapitalize on the dynamic growth of the PRC economy. The Redwood group was founded in 2006 byMr. Stuart Gibson and Mr. Charles Alexander Portes, who have substantial experience in thedevelopment of modern logistics real estate in Asia, to focus on modern logistics development inJapan. By the time of the merger between e-Shang and the Redwood group, e-Shang was a fullyintegrated development and investment management business in the PRC with a strong emergingbusiness in South Korea. In January 2017, we expanded our platform into the Singapore market,shortly followed by our entry into the Indian market. In October 2017, we entered the Australianmarket through the acquisitions of a minority equity stake in Propertylink (an ASX-listed internally-managed REIT specializing in Australian industrial and office investments) and an equity stake inCenturia (an ASX-listed property funds manager), and in August 2018 we acquired a 100% equityinterest in CIP (an integrated development group with national presence in Australia that has a trackrecord of development of commercial and industrial real estate projects, totaling over US$1.8 billion invalue as of December 31, 2018) as the base platform upon which to grow our Australian business. As
5

SUMMARY
of June 30, 2019, we owned a 14.8% stake in Centuria. In April 2019, we completed our acquisition ofPropertylink. See the section headed “Business—The Propertylink Acquisition” in this Prospectus forfurther information.
OUR BUSINESS MODEL
Development Cycle
Capital Recycling
12 – 24 Months
Land Sourcing
� Comprehensive marketresearch
� Deep local knowledge
� State-of-the-art design� Modern specifications� BTS capability
� Strict cost & qualitycontrol
� Standardized tenderingprocess
� Go-to provider fore-commerce & 3PL
� Active pre-leasing� Strong tenant network
� Professional management� Dedicated team
Integrated Platform
Development Cycle
Capital Recycling
� Core/Core plus funds� Public REIT
� Development funds� Balance sheet
Design Construction Leasing Ongoing AssetManagementStabilization
Greenfield/BrownfieldDevelopment Vehicles
Exit/Transfer toAcquisition
Vehicles
We use in-house capabilities to source, design, construct, lease and manage the PortfolioAssets. We have expertise throughout the development cycle and actively source ground-up(greenfield) and re-development (brownfield) opportunities across APAC. We design and constructmodern logistics properties that meet the evolving needs of tenants and lease these properties toe-commerce companies, 3PL providers, bricks-and-mortar retailers, manufacturers, cold-chain logisticsproviders and others, as they continue to expand their logistics infrastructure in APAC. Ourdevelopment team works closely with our local and regional leasing and operations teams, enhancingour ability to deliver and rapidly lease-up modern logistics facilities.
We scale our business by deploying both our own capital and that of pooled funds andinvestment vehicles, which span the spectrum of both risk and liquidity. We develop logisticsproperties through our own balance sheet and the development funds and investment vehicles that wemanage, which leverage our development capabilities. We utilize a capital recycling strategy when wedispose of stabilized assets to the core/core-plus funds and investment vehicles we manage, andpotentially to REITs, in order to realize development profits which can then be used for future projects.During the Track Record Period, we disposed of a total of 12 completed properties in the PRC with anaggregate value of approximately US$572.4 million from our balance sheet, and a total of sixcompleted properties with an aggregate value of approximately US$959.0 million from a developmentfund that we manage, in both cases, to certain of the core funds that we manage where we maintain aninterest in the assets through our fund interests and continue to collect recurring fees. In June 2019, weeffected the transfer of 50% of the interest in a logistics property in Japan at a purchase price ofJPY4,395.0 million (approximately US$40.5 million), which was held jointly by two of ourdevelopment funds, to a new private REIT in Japan which we recently established. Going forward weintend to continue effecting disposals of properties when appropriate to funds and investment vehicleswe manage, such as certain properties held by Propertylink. Pursuant to our capital recycling strategy,
6

SUMMARY
we determine the types of assets to dispose from our balance sheet, and the timing of such disposals,based on our evaluation of a number of factors, including (i) the amount of rental revenue and capitalappreciation an asset would generate if kept on our balance sheet, (ii) potential investments into whichwe could redeploy capital upon disposal of an existing asset, (iii) the fees that we could generate froman asset if it were held in a fund or investment vehicle we manage, and (iv) the investment mandates ofour funds and investment vehicles. We generally consider the disposal of a property once it has beencompleted, and we prioritize the disposal of our balance sheet properties to the funds and investmentvehicles we manage in order to manage assets for the long term where our fund mandates permit. Weretain the option to dispose of assets to third-parties if we deem it appropriate to do so. The synergiesbetween our development and core/core-plus funds and investment vehicles give us the opportunity tomanage the underlying assets throughout their useful lives and build recurring revenue streams. Wecan acquire, develop and own assets that fit our capital partners’ risk-reward profiles and still captureopportunities using our own balance sheet which may not fall within the investment criteria of thefunds and investment vehicles we manage. The flexibility of this dual approach helps us avoid a timeconsuming search for a co-investor on each individual project and provides future capital partners withvisibility over the assets on our balance sheet that might form a fund or investment vehicle.
We also use our balance sheet to grow our business through the acquisition of private andpublic platforms in prospective growth markets. For example, in January 2017, we expanded into theSingapore market and obtained control of the ESR-REIT Manager. In April 2019, we completed ouracquisition of Propertylink in Australia. See the section headed “Business—The PropertylinkAcquisition” in this Prospectus for further information. In June 2019, we completed the SabanaManager Acquisition in Singapore. As we continue to expand the business, we have and will continueto utilize our business model to acquire local expertise and assemble business teams in each of ourmarkets of operation. See the section headed “Business—Principal Business Activities—Development” in this Prospectus for further details.
Our Company is organized into business units based on our products and services and has threereportable operating segments as follows:
Š Development. We earn development profit through the development, construction and saleof completed properties on our balance sheet. Our development profit includesconstruction income (as a result of the consolidation of CIP since August 2018), fair valuegains on investment properties under construction and gains on disposal of subsidiaries.We also derive pro rata earnings and pro rata value appreciation through the developmentactivities of the development funds and investment vehicles we manage in proportion toour co-investments in those funds and investment vehicles.
Š Fund management. We earn fee income from managing the underlying assets on behalf ofour capital partners via the funds and investment vehicles we manage. Our fees includebase management fees, asset management fees, acquisition fees, development fees andleasing fees. We also participate in a disproportionate share of profits (a “promote”) uponexceeding a pre-determined target IRR and after our capital partners have received theirtargeted capital returns.
Š Investment. Our investment segment is divided into three main categories: (i) completedproperties that we hold on our balance sheet, from which we derive rental income andappreciation in value; (ii) our co-investments in the funds and investment vehicles and thepublic REIT we manage, from which we derive dividend income, pro rata earnings and/orpro rata value appreciation; and (iii) other investments.
7

SUMMARY
Since March 2019, we consolidated the results of operations of Propertylink in our investmentand fund management segments. For further information, see the section headed “FinancialInformation—Segmentation” in this Prospectus.
As of June 30, 2019, we owned or managed: (i) completed GFA of 8.5 million sq.m; (ii) GFAunder construction of 4.4 million sq.m; and (iii) GFA on land held for future development ofapproximately 2.4 million sq.m. As of June 30, 2019, 71.5% of the Portfolio Assets in terms of GFAwere held by the funds and investment vehicles that we manage, with the rest held on our balancesheet.
COMPETITIVE STRENGTHS
We believe that the following competitive strengths contribute to our success and differentiateus from our competitors:
Š we are the largest APAC focused logistics real estate platform;
Š we have an integrated development platform with strong project sourcing and executioncapabilities, complemented by our efficient capital recycling strategy;
Š our fund management platform provides us with high margin and stable fee income largelyindependent of property values;
Š our platform is supported by a network of high-quality tenants and capital partners withwhom we have strong and long-standing relationships;
Š we have a proven ability to grow organically and to execute opportunistic M&Atransactions to expand our capabilities, broaden the scope of the Portfolio Assets, andsupport our growth in the logistics real estate industry; and
Š we are led by a strong management team and backed by reputable shareholders.
For a detailed discussion of these competitive strengths, see the section headed “Business—Competitive Strengths and Strategies—Competitive Strengths” in this Prospectus.
OUR GROWTH STRATEGIES
Our goal is to expand on our position as a leading logistics real estate and fund managementplatform in APAC. We intend to pursue the following growth strategies to achieve this goal:
Š continue to execute our integrated strategy and capitalize on the significant marketopportunities across APAC;
Š leverage our scale and geographic presence to expand into new growth markets to deepenour regional connectivity;
Š expand our fund management platform across geographies, strategies and liquidity profilesand attract new capital partners while bringing existing capital partners across markets;and
Š strategically explore and expand into adjacent businesses and investment products withinAsia.
For a detailed discussion of these strategies, see the section headed “Business—CompetitiveStrengths and Strategies—Strategies” in this Prospectus.
8

SUMMARY
CUSTOMERS
Tenants
The Portfolio Assets are leased to a broad range of large and mid-sized, multinational anddomestic tenants that require logistics and distribution facilities, including e-commerce companies,3PL providers, bricks-and-mortar retailers, manufacturers, cold-chain logistics providers and others.3PL providers serve end-users in a large variety of industries, including e-commerce, electronics, fast-moving consumer goods, retail and fast food chains, general logistics services, auto and parts,pharmaceuticals, and medical instruments and machinery. We seek to be a regional partner for ourtenants, with a goal to be the single point of contact to design and build a multi-market distributionnetwork for tenants throughout the PRC, Japan, South Korea, Singapore, Australia and India.
In 2016, 2017 and 2018 and for the six months ended June 30, 2019, rental revenue generatedfrom the single largest tenant of our balance sheet properties accounted for approximately 19.7%,12.6%, 9.3% and 9.8%, respectively, of our total revenue. For the same periods, rental revenueattributable to the five largest tenants of our balance sheet properties accounted for approximately40.7%, 25.8%, 17.4% and 13.8%, respectively, of our total revenue. Our five largest tenants for eachyear during the Track Record Period are independent third parties. In 2016 and 2017, three of our fivelargest tenants were e-commerce companies and two were bricks-and-mortar retailers. In 2018, two ofour five largest tenants were e-commerce companies, two were manufacturers and one was a bricks-and-mortar retailer. For the six months ended June 30, 2019, one of our five largest tenants was an e-commerce company, one was a bricks-and-mortar retailer and three were manufacturers.
We expect the percentage of revenue attributable to our five largest tenants to decrease in thefuture as we increase the proportion of the Portfolio Assets held in the funds and investment vehicleswe manage.
Funds and Investment Vehicles
We manage 30 funds and investment vehicles and generate revenue from the management ofthose funds and investment vehicles. In 2016, 2017 and 2018 and for the six months ended June 30,2019, revenue generated from the single largest fund we managed on the basis of management feeincome accounted for approximately 10.9%, 12.2%, 12.0% and 8.8%, respectively, of our totalrevenue. For the same periods, revenue attributable to the five largest funds and investment vehicleswe managed, all of which were development funds and investment vehicles, accounted forapproximately 34.0%, 31.5%, 27.9% and 23.8%, respectively, of our total revenue.
SUPPLIERS
Our suppliers primarily consist of construction companies, property management companies,interior designers and commercial real estate brokers. In 2016, 2017 and 2018 and for the six monthsended June 30, 2019, transaction amounts with our single largest supplier accounted for approximately16.7%, 20.3%, 10.8% and 11.3%, respectively, of our total purchase amount incurred in the period. Forthe same periods, transaction amounts with our five largest suppliers in aggregate accounted forapproximately 35.5%, 38.1%, 20.0% and 19.0%, respectively, of our total purchase amount incurred inthe period. These suppliers are mostly construction contractors. As we select contractors on a projectbasis, we do not rely on any single contractor despite the relatively high contribution of our largest orfive largest contractors/suppliers to our cost incurred in a given period. Our five largest suppliers areindependent third parties.
9
SUMMARY
COMPETITION
We face competition from other large international and domestic developers, owners andoperators of other logistics facilities and fund managers and, within any specific individual market,also from smaller and local players. We compete with other providers for locations and sites for futurelogistics facilities as well as tenants. For a discussion of the key players in the industry and regions inwhich we operate, see the JLL Report included in Appendix IV of this Prospectus.
RISK FACTORS
Our business and the Global Offering involve certain risks as set out in “Risk Factors” in thisProspectus. You should read that section in its entirety carefully before you decide to invest in ourShares. Some of the major risks we face include:
Š our business is concentrated in APAC and may be affected by regional and globaleconomic and political developments;
Š the success of our business depends on our ability to service the rising demand of thee-commerce and 3PL sectors in APAC and the sustainability of this rising demand inAPAC;
Š we operate a multinational business in APAC with a relatively short operating history andare subject to complex operational risks which may be difficult to address;
Š our business is intensely competitive;
Š the returns from investments in the Portfolio Assets could be adversely affected byfluctuations in the income generated from, and the value of, the Portfolio Assets and otherfactors, including the concentration of the Portfolio Assets in the logistics real estatesector;
Š our profitability may be affected by revaluation of the properties held on our balancesheet, as well as the properties held by the funds and investment vehicles that we manage;
Š we may not be able to secure capital resources, either through equity or debt financing, oncommercially reasonable terms, or at all;
Š we depend on our senior management team and certain key senior personnel as well asskilled employees;
Š we may face difficulties in realizing the benefits of any acquisitions and successfullyintegrating acquired businesses, including Propertylink; and
Š we may not be successful in executing our business strategy, including the expansion intonew geographical locations and adjacent businesses.
PROPERTY VALUATION
All of our completed investment properties and investment properties under construction wererevalued on December 31, 2016, 2017 and 2018 and June 30, 2019 (save as disclosed below) based onvaluations performed by independent professionally qualified valuers and industry specialists ininvestment property valuation, including Beijing Colliers International Real Estate Valuation Co., Ltd.,CBRE Valuation Pty Limited, Jones Lang LaSalle Advisory Services Pty Ltd and Cushman &Wakefield K.K., at fair value. In determining fair value of the Portfolio Assets, a combination of
10
SUMMARY
approaches and methods were used, including the Direct Comparison Method and Discounted CashFlow Method. A combination of valuation approaches and methods are used because suitable valuationmethods for properties may vary depending on the nature of the property and available information.For example, for a development project in very early stages where future cash flows are less certain, acomparative approach to valuation may be more reliable. On the other hand, during more mature stagesof development where projected cash flows can be determined more accurately, a discounted cash flowmethod may be more suitable. Certain investment properties recently acquired were revalued as ofJune 30, 2019 with reference to (i) their purchase price or (ii) the independent valuation performed atthe time of the acquisition. For further details on each of the valuation methods, see the section headed“Financial Information—Analysis of Selected Consolidated Statements of Financial Position Items—Investment Properties” in this Prospectus. See Note 20 to the Accountant’s Report in Appendix I tothis Prospectus for details of the key inputs used in the valuation techniques. In connection with theListing, we engaged property valuers to value our directly held investment properties in the PRC,Japan and Australia as of September 30, 2019 pursuant to the relevant requirements under the ListingRules. The text of their respective letters, summaries of valuation and the valuation certificates are setforth in Appendix VI to this Prospectus.
SUMMARY HISTORICAL FINANCIAL INFORMATION
The following is a summary of our consolidated financial information for the periods and as ofthe dates indicated. We have derived the summary from our consolidated financial information setforth in the Accountants’ Report in Appendix I to this Prospectus. The below summary should be readtogether with the consolidated financial information in Appendix I to this Prospectus, including theaccompanying notes and the information set forth in the section headed “Financial Information” in thisProspectus. Our consolidated financial information has been prepared in accordance with IFRS.
Summary Consolidated Statements of Profit or Loss and Other Comprehensive Income
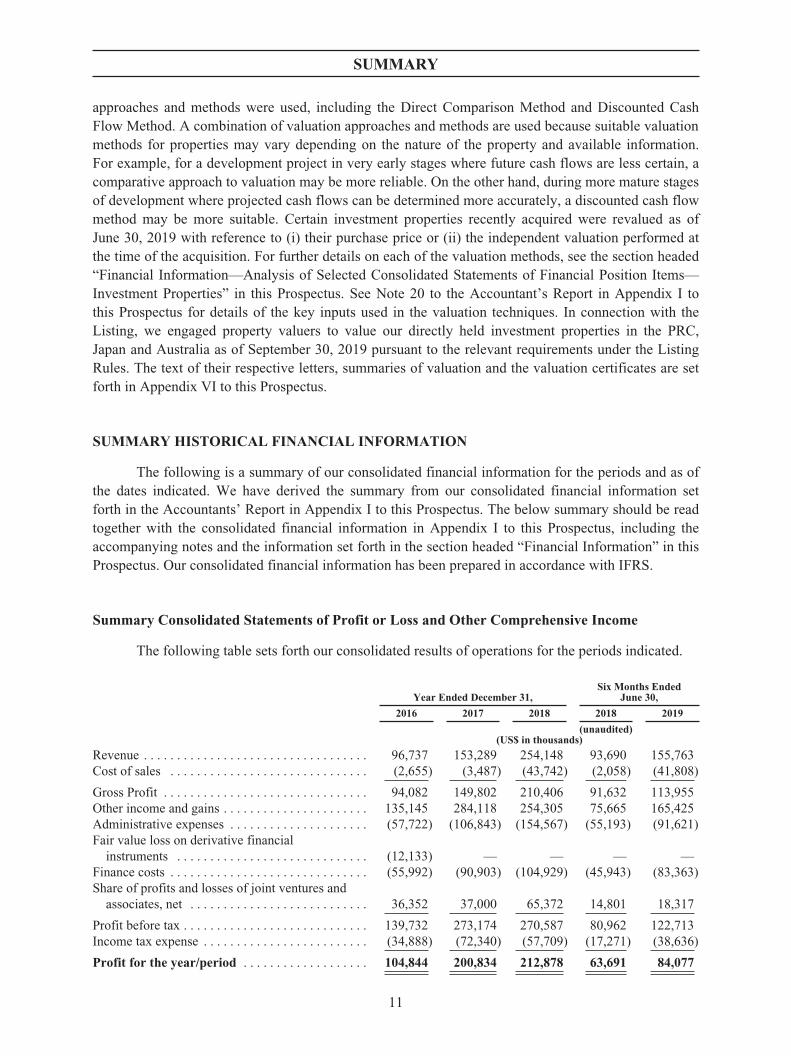
The following table sets forth our consolidated results of operations for the periods indicated.
Year Ended December 31,Six Months Ended
June 30,
2016 2017 2018 2018 2019
(unaudited)(US$ in thousands)
Revenue . . . . . . . . . . . . . . . . . . . . . . . . . . . . . . . . . . 96,737 153,289 254,148 93,690 155,763Cost of sales . . . . . . . . . . . . . . . . . . . . . . . . . . . . . . (2,655) (3,487) (43,742) (2,058) (41,808)
Gross Profit . . . . . . . . . . . . . . . . . . . . . . . . . . . . . . . 94,082 149,802 210,406 91,632 113,955Other income and gains . . . . . . . . . . . . . . . . . . . . . . 135,145 284,118 254,305 75,665 165,425Administrative expenses . . . . . . . . . . . . . . . . . . . . . (57,722) (106,843) (154,567) (55,193) (91,621)Fair value loss on derivative financial
instruments . . . . . . . . . . . . . . . . . . . . . . . . . . . . . (12,133) — — — —Finance costs . . . . . . . . . . . . . . . . . . . . . . . . . . . . . . (55,992) (90,903) (104,929) (45,943) (83,363)Share of profits and losses of joint ventures and
associates, net . . . . . . . . . . . . . . . . . . . . . . . . . . . 36,352 37,000 65,372 14,801 18,317
Profit before tax . . . . . . . . . . . . . . . . . . . . . . . . . . . . 139,732 273,174 270,587 80,962 122,713Income tax expense . . . . . . . . . . . . . . . . . . . . . . . . . (34,888) (72,340) (57,709) (17,271) (38,636)
Profit for the year/period . . . . . . . . . . . . . . . . . . . 104,844 200,834 212,878 63,691 84,077
11
SUMMARY
Year Ended December 31,Six Months Ended
June 30,
2016 2017 2018 2018 2019
(unaudited)(US$ in thousands)
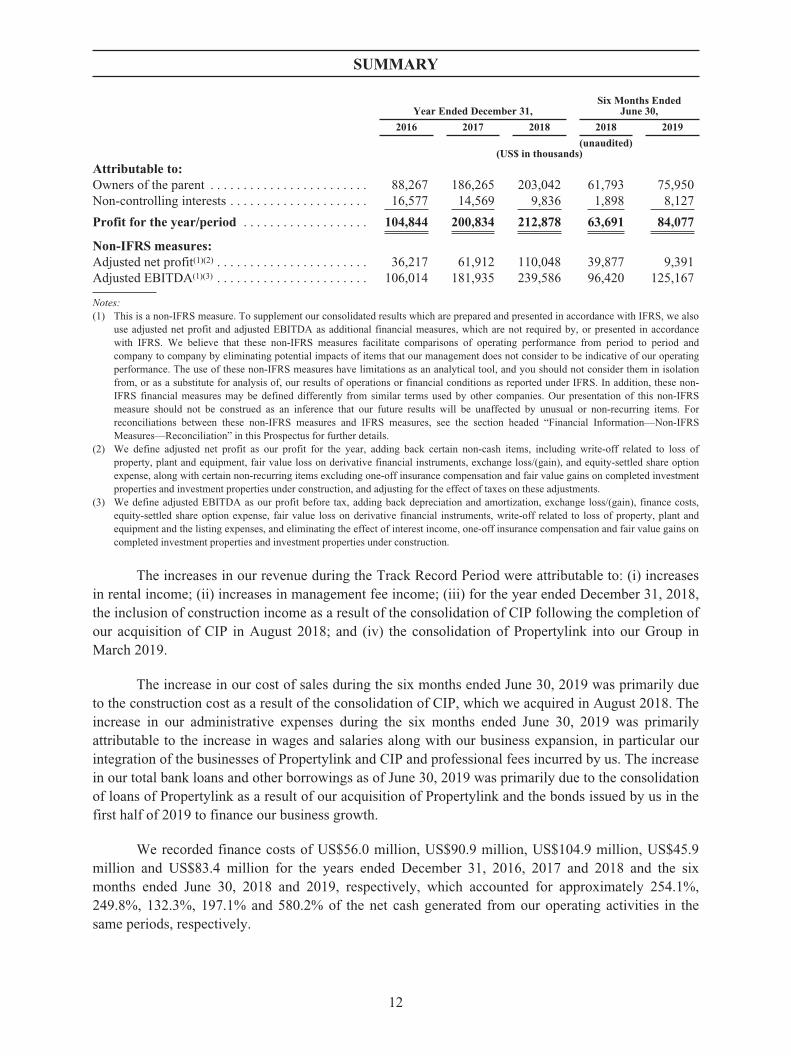
Attributable to:Owners of the parent . . . . . . . . . . . . . . . . . . . . . . . . 88,267 186,265 203,042 61,793 75,950Non-controlling interests . . . . . . . . . . . . . . . . . . . . . 16,577 14,569 9,836 1,898 8,127
Profit for the year/period . . . . . . . . . . . . . . . . . . . 104,844 200,834 212,878 63,691 84,077
Non-IFRS measures:Adjusted net profit(1)(2) . . . . . . . . . . . . . . . . . . . . . . . 36,217 61,912 110,048 39,877 9,391Adjusted EBITDA(1)(3) . . . . . . . . . . . . . . . . . . . . . . . 106,014 181,935 239,586 96,420 125,167
Notes:(1) This is a non-IFRS measure. To supplement our consolidated results which are prepared and presented in accordance with IFRS, we also
use adjusted net profit and adjusted EBITDA as additional financial measures, which are not required by, or presented in accordancewith IFRS. We believe that these non-IFRS measures facilitate comparisons of operating performance from period to period andcompany to company by eliminating potential impacts of items that our management does not consider to be indicative of our operatingperformance. The use of these non-IFRS measures have limitations as an analytical tool, and you should not consider them in isolationfrom, or as a substitute for analysis of, our results of operations or financial conditions as reported under IFRS. In addition, these non-IFRS financial measures may be defined differently from similar terms used by other companies. Our presentation of this non-IFRSmeasure should not be construed as an inference that our future results will be unaffected by unusual or non-recurring items. Forreconciliations between these non-IFRS measures and IFRS measures, see the section headed “Financial Information—Non-IFRSMeasures—Reconciliation” in this Prospectus for further details.
(2) We define adjusted net profit as our profit for the year, adding back certain non-cash items, including write-off related to loss ofproperty, plant and equipment, fair value loss on derivative financial instruments, exchange loss/(gain), and equity-settled share optionexpense, along with certain non-recurring items excluding one-off insurance compensation and fair value gains on completed investmentproperties and investment properties under construction, and adjusting for the effect of taxes on these adjustments.
(3) We define adjusted EBITDA as our profit before tax, adding back depreciation and amortization, exchange loss/(gain), finance costs,equity-settled share option expense, fair value loss on derivative financial instruments, write-off related to loss of property, plant andequipment and the listing expenses, and eliminating the effect of interest income, one-off insurance compensation and fair value gains oncompleted investment properties and investment properties under construction.
The increases in our revenue during the Track Record Period were attributable to: (i) increasesin rental income; (ii) increases in management fee income; (iii) for the year ended December 31, 2018,the inclusion of construction income as a result of the consolidation of CIP following the completion ofour acquisition of CIP in August 2018; and (iv) the consolidation of Propertylink into our Group inMarch 2019.
The increase in our cost of sales during the six months ended June 30, 2019 was primarily dueto the construction cost as a result of the consolidation of CIP, which we acquired in August 2018. Theincrease in our administrative expenses during the six months ended June 30, 2019 was primarilyattributable to the increase in wages and salaries along with our business expansion, in particular ourintegration of the businesses of Propertylink and CIP and professional fees incurred by us. The increasein our total bank loans and other borrowings as of June 30, 2019 was primarily due to the consolidationof loans of Propertylink as a result of our acquisition of Propertylink and the bonds issued by us in thefirst half of 2019 to finance our business growth.
We recorded finance costs of US$56.0 million, US$90.9 million, US$104.9 million, US$45.9million and US$83.4 million for the years ended December 31, 2016, 2017 and 2018 and the sixmonths ended June 30, 2018 and 2019, respectively, which accounted for approximately 254.1%,249.8%, 132.3%, 197.1% and 580.2% of the net cash generated from our operating activities in thesame periods, respectively.
12

SUMMARY
Reconciliation for Non-IFRS Measures
The following tables set forth the reconciliations of our non-IFRS financial measures for theperiods indicated to the nearest measures prepared in accordance with IFRS:
Year Ended December 31,
Six MonthsEndedJune 30,
2016 2017 2018 2018 2019
(US$ in thousands)
Profit for the year/period . . . . . . . . . . . . . . . . . . . . . . . . . 104,844 200,834 212,878 63,691 84,077Add:Write-off related to loss of property, plant and
equipment(1) . . . . . . . . . . . . . . . . . . . . . . . . . . . . . . . . . . . — — 9,632 — —Fair value loss on derivative financial instruments(2) . . . . . 12,133 — — — —Exchange loss/(gain)(3) . . . . . . . . . . . . . . . . . . . . . . . . . . . . (916) (4,431) 869 41 1,761Equity-settled share option expense(4) . . . . . . . . . . . . . . . . 75 11,923 23,157 11,961 9,885Tax effects of adjustments . . . . . . . . . . . . . . . . . . . . . . . . . . 26,640 48,804 44,317 10,341 17,229Less:One-off insurance compensation . . . . . . . . . . . . . . . . . . . . . — — (8,338) — —Fair value gains on completed investment properties(5) . . . (100,799) (95,179) (109,688) (37,396) (26,800)Fair value gains on investment properties under
construction(6) . . . . . . . . . . . . . . . . . . . . . . . . . . . . . . . . . (5,760) (100,039) (62,779) (8,761) (76,761)
Adjusted net profit . . . . . . . . . . . . . . . . . . . . . . . . . . . . . . . 36,217 61,912 110,048 39,877 9,391
Notes:(1) Represents a write-off of property, plant and equipment due to the damage of certain solar assets in Japan by a typhoon in September
2018.(2) Represents an one-off fair value loss on derivative financial instruments related to warrant instruments in connection with certain loan
facilities entered into in December 2013 and August 2015. Upon the repayment of the relevant loans in November 2016, no additionalfair value gain or loss related to these warrant instruments is recognized in 2017 and subsequent years.
(3) Represents the exchange loss/(gain) related to foreign currency translation impacts. Foreign currency translations are volatile in natureand depend primarily on movements in the global exchange rates and the macroeconomic environment, both of which are beyond ourcontrol. We do not consider exchange loss/(gain) directly related to our ability to generate revenue from our daily operations, andtherefore this line item has been adjusted to facilitate comparison of our operating performance across periods.
(4) Represents share-based compensation expenses incurred in connection with our pre-IPO share option schemes. We do not consider suchamounts indicative of our profit from operations post-completion of our Listing, and therefore we believe that adjusting for share-basedcompensation expenses incurred in connection with our pre-IPO share option schemes in the past periods will facilitate the comparisonof our operating performance across periods.
(5) Represents the fair value gains on completed investment properties that the Company holds on its balance sheet. The completedinvestment properties are subject to periodic revaluation by independent property valuers.
(6) Represents the development-profit related appreciation of the Company’s under-construction balance-sheet properties. They areprimarily affected by the construction progress of these projects (and to a lesser extent by factors such as rental growth and capitalizationrates) which in turn, determines the development-related appreciation that we are able to generate on these projects.
13

SUMMARY
Year Ended December 31,
Six MonthsEndedJune 30,
2016 2017 2018 2018 2019
(US$ in thousands)
Profit before tax . . . . . . . . . . . . . . . . . . . . . . . . . . . . . . . . 139,732 273,174 270,587 80,962 122,713Add:Depreciation and amortization . . . . . . . . . . . . . . . . . . . . . . 6,059 8,061 10,226 4,655 7,296Exchange loss/(gain)(1) . . . . . . . . . . . . . . . . . . . . . . . . . . . . (916) (4,431) 869 41 1,761Finance costs . . . . . . . . . . . . . . . . . . . . . . . . . . . . . . . . . . . . 55,992 90,903 104,929 45,943 83,363Equity-settled share option expense(2) . . . . . . . . . . . . . . . . 75 11,923 23,157 11,961 9,885Fair value loss on derivative financial instruments(3) . . . . . 12,133 — — — —Write-off related to loss of property, plant and
equipment(4) . . . . . . . . . . . . . . . . . . . . . . . . . . . . . . . . . . . — — 9,632 — —Listing Expenses(5) . . . . . . . . . . . . . . . . . . . . . . . . . . . . . . . — — 2,521 — 5,478Less:Interest income . . . . . . . . . . . . . . . . . . . . . . . . . . . . . . . . . . (502) (2,477) (1,530) (985) (1,768)One-off insurance compensation . . . . . . . . . . . . . . . . . . . . — — (8,338) — —Fair value gains on completed investment properties(6) . . . (100,799) (95,179) (109,688) (37,396) (26,800)Fair value gains on investment properties under
construction(7) . . . . . . . . . . . . . . . . . . . . . . . . . . . . . . . . . (5,760) (100,039) (62,779) (8,761) (76,761)
Adjusted EBITDA . . . . . . . . . . . . . . . . . . . . . . . . . . . . . . . 106,014 181,935 239,586 96,420 125,167
Notes:(1) Represents the exchange loss/(gain) related to foreign currency translation impacts. Foreign currency translations are volatile in nature
and depend primarily on movements in the global exchange rates and the macroeconomic environment, both of which are beyond ourcontrol. We do not consider exchange loss/(gain) directly related to our ability to generate revenue from our daily operations, andtherefore this line item has been adjusted to facilitate comparison of our operating performance across periods.
(2) Represents share-based compensation expenses incurred in connection with our pre-IPO share option schemes. We do not consider suchamounts indicative of our profit from operations post-completion of our Listing, and therefore we believe that adjusting for share-basedcompensation expenses incurred in connection with our pre-IPO share option schemes in the past periods will facilitate the comparisonof our operating performance across periods.
(3) Represents an one-off fair value loss on derivative financial instruments related to warrant instruments in connection with certain loanfacilities entered into in December 2013 and August 2015. Upon the repayment of the relevant loans in November 2016, no additionalfair value gain or loss related to these warrant instruments is recognized in 2017 and subsequent years.
(4) Represents a write-off of property, plant and equipment due to the damage of certain solar assets in Japan by a typhoon in September2018.
(5) Represents the listing expenses in connection with the proposed Global Offering.(6) Represents the fair value gains on completed investment properties that the Company holds on its balance sheet. The completed
investment properties are subject to periodic revaluation by independent property valuers.(7) Represents the development-profit related appreciation of the Company’s under-construction balance-sheet properties. They are
primarily affected by the construction progress of these projects (and to a lesser extent by factors such as rental growth and capitalizationrates) which in turn, determines the development-related appreciation that we are able to generate on these projects.
14

SUMMARY
Summary Operating Segment Information
The table below sets forth the line items that comprise the segment results for each of our threereportable operating segments, which are reported and prepared based on our consolidated statement ofprofit or loss and other comprehensive income, together with a reconciliation, for the periods indicated.See the section headed “Financial Information—Segmentation” in this Prospectus for moreinformation about the line items comprising the segments.
Year Ended December 31,Six Months Ended
June 30,
2016 2017 2018 2018 2019
(unaudited)(US$ in thousands)
Development SegmentSegment revenue . . . . . . . . . . . . . . . . . . . . . . . . . . . . — — 40,665 — 37,661Fair value gains on investment properties under
construction . . . . . . . . . . . . . . . . . . . . . . . . . . . . . . 5,760 100,039 62,779 8,761 76,761Changes in fair value of financial assets and
liabilities at fair value through profit or loss . . . . . 23,792 8,497 31,741 16,014 22,107Share of profits and losses of joint ventures and
associates . . . . . . . . . . . . . . . . . . . . . . . . . . . . . . . . 27,151 26,505 35,200 12,059 726Gain on disposal of subsidiaries . . . . . . . . . . . . . . . . 32 38,311 2,662 — 16,495Allocable operating expenses . . . . . . . . . . . . . . . . . . (6,548) (11,793) (57,544) (4,626) (51,305)
Development segment result . . . . . . . . . . . . . . . . . . . 50,187 161,559 115,503 32,208 102,445
Fund Management SegmentSegment revenue . . . . . . . . . . . . . . . . . . . . . . . . . . . . 46,464 94,268 135,579 59,033 61,784Share of profits and losses of joint ventures and
associates . . . . . . . . . . . . . . . . . . . . . . . . . . . . . . . . — — — — 557Allocable operating expenses . . . . . . . . . . . . . . . . . . (7,291) (14,897) (25,978) (11,803) (12,467)
Fund management segment result . . . . . . . . . . . . . . . 39,173 79,371 109,601 47,230 49,874
Investment SegmentSegment revenue . . . . . . . . . . . . . . . . . . . . . . . . . . . . 50,273 59,021 77,904 34,657 56,318Fair value gains on completed investment
properties . . . . . . . . . . . . . . . . . . . . . . . . . . . . . . . . 100,799 95,179 109,688 37,396 26,800Changes in fair value of financial assets and
liabilities at fair value through profit or loss . . . . . 2,936 24,242 13,196 2,355 711Share of profits and losses of joint ventures and
associates . . . . . . . . . . . . . . . . . . . . . . . . . . . . . . . . 9,201 10,495 30,172 2,742 17,034Dividend income . . . . . . . . . . . . . . . . . . . . . . . . . . . . — 10,679 25,519 9,771 11,848Allocable operating expenses . . . . . . . . . . . . . . . . . . (13,833) (16,683) (22,887) (8,047) (13,387)
Investment segment result . . . . . . . . . . . . . . . . . . . . . 149,376 182,933 233,592 78,874 99,324
Total segment result . . . . . . . . . . . . . . . . . . . . . . . . 238,736 423,863 458,696 158,312 251,643
Reconciliation:Depreciation and amortization . . . . . . . . . . . . . . . . . (6,059) (8,061) (10,226) (4,655) (7,296)Exchange gain/(losses) . . . . . . . . . . . . . . . . . . . . . . . 916 4,431 (869) (41) (1,761)Interest income . . . . . . . . . . . . . . . . . . . . . . . . . . . . . 502 2,477 1,530 985 1,768Other unallocated gains . . . . . . . . . . . . . . . . . . . . . . . 408 234 7,190 653 379Corporate and other unallocated expenses(1) . . . . . . . (26,571) (46,973) (57,648) (16,388) (28,772)Finance costs . . . . . . . . . . . . . . . . . . . . . . . . . . . . . . . (55,992) (90,903) (104,929) (45,943) (83,363)Equity-settled share option expense . . . . . . . . . . . . . (75) (11,923) (23,157) (11,961) (9,885)Fair value loss on derivative financial instrument . . (12,133) — — — —Gain on deemed partial disposal of a joint
venture . . . . . . . . . . . . . . . . . . . . . . . . . . . . . . . . . . — 29 — — —
Profit before tax from continuing operations . . . . 139,732 273,174 270,587 80,962 122,713
15

SUMMARY
Note:(1) Corporate and other unallocated expenses relate primarily to head office and corporate expenses that are not directly attributable to
operations of the reportable segments, and thus cannot be allocated to any of the reportable operating segments. They primarilycomprised professional services fees related to our financing and M&A activities, operating costs such as lease expenses andmaintenance costs which are not directly related to any business segment, and other miscellaneous expenses like bank service fees,meeting and office expenses, travel and welfare expenses and entertainment fees, which are not directly related to any of the operatingsegments. The increase in corporate and other unallocated expenses from US$26.6 million in 2016 to US$47.0 million in 2017, andfurther to US$57.7 million in 2018, and from US$16.4 million for the six months ended June 30, 2018 to US$28.8 million for the sixmonths ended June 30, 2019 was primarily led by increases in professional services fees, leasing expenses and other expenses. Weconsistently monitor the results of our operating segments excluding these unallocated expenses for the purpose of making decisionsabout resource allocation and performance assessment.
Fluctuations in fair value gains on completed investment properties and fair value gains oninvestment properties under construction could significantly affect our performance. See the sectionsheaded “Financial Information—Principal Components of Our Consolidated Statement of Profit orLoss—Other Income and Gains—Fair Value Gains on Completed Investment Properties and FairValue Gains on Investment Properties Under Construction,” “Financial Information—Segmentation—Investment Segment” and “Financial Information—Segmentation—Development Segment” in thisProspectus for further information.
Summary Consolidated Statements of Financial Position
As of December 31,As of
June 30,
2016 2017 2018 2019
(US$ in thousands)
Non-current assets . . . . . . . . . . . . . . . . . . . . . . . . . . . . . . . . . . . . 1,584,442 2,386,490 3,562,491 4,684,441Current assets . . . . . . . . . . . . . . . . . . . . . . . . . . . . . . . . . . . . . . . 517,100 668,378 869,109 1,261,563Current liabilities . . . . . . . . . . . . . . . . . . . . . . . . . . . . . . . . . . . . . 109,538 162,362 855,373 1,087,274Net current assets . . . . . . . . . . . . . . . . . . . . . . . . . . . . . . . . . . . . 407,562 506,016 13,736 174,289Non-current liabilities . . . . . . . . . . . . . . . . . . . . . . . . . . . . . . . . . 1,141,700 1,185,866 1,258,305 2,419,836Net assets . . . . . . . . . . . . . . . . . . . . . . . . . . . . . . . . . . . . . . . . . . . 850,304 1,706,640 2,317,922 2,438,894Total Equity . . . . . . . . . . . . . . . . . . . . . . . . . . . . . . . . . . . . . . . . . 850,304 1,706,640 2,317,922 2,438,894
Summary Consolidated Statements of Cash Flows
Year Ended December 31,Six Months Ended
June 30,
2016 2017 2018 2018 2019
(unaudited)(US$ in thousands)
Net cash generated from operating activities . . . . . 22,039 36,396 79,340 23,306 14,367Net cash used in investing activities . . . . . . . . . . . . (264,271) (472,801) (786,778) (463,706) (583,970)Net cash generated from financing activities . . . . . 522,081 526,691 688,677 445,394 1,008,912Net increase/(decrease) in cash and cash
equivalents . . . . . . . . . . . . . . . . . . . . . . . . . . . . . 279,849 90,286 (18,761) 4,994 439,309Cash and cash equivalents at beginning of year . . . 144,319 411,765 526,988 526,988 502,056Effect of foreign exchange rate changes, net . . . . . (12,403) 24,937 (6,171) 372 2,254Cash and cash equivalents at end of
year/period . . . . . . . . . . . . . . . . . . . . . . . . . . . . . 411,765 526,988 502,056 532,354 943,619
16

SUMMARY
Major Financial Ratios
The following table sets forth the major financial ratios as of, or for, the periods indicated.
As of or For the Year Ended December 31,As of or For the Six
Months Ended June 30,
2016 2017 2018 2019
Return on average equity(1) . . . . . . . . . . . . . . . . . . . . 16.7% 15.7% 10.6% N/ACurrent ratio(2) . . . . . . . . . . . . . . . . . . . . . . . . . . . . . . 472.1% 411.7% 101.6% 116.0%Net gearing ratio(3) . . . . . . . . . . . . . . . . . . . . . . . . . . 16.6% 7.6% 19.8% 30.2%
Notes:(1) Return on average equity is calculated using net profit divided by the average of total equity at the beginning and at the end of the year.(2) Current ratio is calculated by dividing current assets by current liabilities at the end of each year or period.(3) Net gearing ratio is calculated by dividing net debt, defined as total bank loans and other borrowings less cash and bank balances, by
total assets at the end of each year or period.
THE PROPERTYLINK ACQUISITION
In April 2019, we completed our acquisition of 100% of the securities of Propertylink.Propertylink is an internally-managed REIT previously listed on the ASX, specializing in Australianindustrial and office investments. Propertylink also co-invests in funds with institutional investors fromNorth America, Europe, the Middle East, Asia and Australia. As of March 20, 2019, being the date onwhich Propertylink was consolidated into our Group, Propertylink managed 58 industrial and officeproperties, including assets managed under its co-invested funds as well as assets held under itswholly-owned industrial portfolio. Following our acquisition, Propertylink was delisted from the ASXon April 26, 2019. The three entities that comprised Propertylink were de-stapled on May 30, 2019.For further information on our acquisition of Propertylink, see the sections headed “History,Development and Corporate Structure—Propertylink Acquisition” and “Business—The PropertylinkAcquisition” in this Prospectus.
Propertylink had revenue of approximately AUD21.7 million, AUD137.0 million andAUD175.1 million (approximately US$119.1 million) for the years ended June 30, 2016, 2017 and2018, respectively, and approximately AUD108.3 million (approximately US$73.7 million) for theperiod from July 1, 2018 to March 20, 2019. As of June 30, 2016, 2017, 2018 and March 20, 2019, ithad total assets of approximately AUD59.9 million, AUD802.3 million, AUD942.6 million(approximately US$641.3 million) and AUD1,133.1 million (approximately US$771.0 million),respectively. Following our acquisition of Propertylink, our rental income, management fees,administrative expenses and finance costs for the six months ended June 30, 2019 increased due to theconsolidation of Propertylink into our Group in March 2019. The consolidation of Propertylink intoour Group also contributed to the increase in our total assets as of June 30, 2019. In addition, our totalbank loans and other borrowings as of June 30, 2019 increased as a result of our consolidation of theloans and other borrowings of Propertylink. For more information about the impact of the acquisitionof Propertylink on our financial performance and position, see “Financial Information–Comparison ofResults of Operations–Six Months Ended June 30, 2019 Compared to Six Months Ended June 30,2018” and “Financial Information–Analysis of Selected Consolidated Statements of Financial PositionItems” in this Prospectus. We have included pre-acquisition financial information of Propertylink inAppendices II-A and II-B to this Prospectus. For further information about the historical financialresults of Propertylink, see the section headed “Financial Information—Financial Information ofPropertylink.”
17

SUMMARY
As of March 20, 2019, the majority of the assets managed by Propertylink were fully developedas Propertylink was not heavily engaged in development. Following the completion of the PropertylinkAcquisition and pursuant to our capital recycling strategy, we plan to own and manage certain of theseassets within our Group and to transfer certain of these assets into new funds and investment vehiclesmanaged by us. For more information, see the paragraph headed “—Recent Developments—MaterialDevelopments—New Australia Fund” in this section.
As of June 30, 2019, Propertylink contributed US$1.2 billion to our AUM, consisting ofUS$591.1 million and US$651.7 million to our balance sheet and Fund AUM, respectively. For moreinformation on the risks related to our acquisition of Propertylink, see the section headed “RiskFactors—Risks Relating to Our Business and Industry—We may not realize the expected benefits ofour acquisition of Propertylink” in this Prospectus.
RECENT DEVELOPMENTS
New Australia Fund
In line with our capital recycling strategy, in August 2019 we entered into an umbrellaagreement with managed vehicles of China Merchant Capital Fund (“CMC Fund”) in connection withthe establishment of a new joint venture in Australia (the “New Australia Fund”), the formation ofwhich is subject to certain conditions precedent, including obtaining relevant regulatory approvals andconfirmations and external financing. It is proposed that CMC Fund will hold an 80% interest in theNew Australia Fund and we will hold the remaining 20% interest, and our initial total capitalcommitment is expected to be approximately AUD35 million (approximately US$23.8 million). Weexpect ESR Australia to manage the New Australia Fund, which is proposed to acquire warehouse andlogistics facilities located in various locations on the east coast of Australia, in particular Sydney andMelbourne. Pursuant to the umbrella agreement, the New Australia Fund has been established in orderto hold 11 of Propertylink’s wholly-owned properties following a group restructuring which isexpected to be completed by the end of 2019, subject to obtaining the relevant regulatory approvals.
Kawajima Acquisition
In August 2019, we acquired a logistics property in Kawajima, near Tokyo, Japan for apurchase price of JPY8.74 billion (approximately US$80.5 million) from one of our developmentfunds to facilitate the ultimate transfer of the property to a new Japan fund which will serve as avehicle for the acquisitions of typically smaller and/or longer-established assets in Japan which are notpart of the mandate of the Japan Core Fund. The establishment of this vehicle will provide another toolfor us to aggregate logistics assets in Japan either from transfers from the development funds wemanage that meet the investment criteria, or acquisitions from third-party sellers.
India Partnership
In July 2019, we entered into a strategic alliance with Future Group through Future MarketNetworks Ltd (stock codes: NSE: FMNL, BSE:533296) to develop logistics infrastructure assets inIndia. We expect to collaborate with this partner to jointly develop two state-of-the-art industrial andwarehousing parks in the cities of Nagpur and Jhajjar to service the northern and central regions inIndia. The relevant land costs and the total estimated development costs are expected to beapproximately US$42 million. We hope to set new standards for the warehousing and industrial realestate sector through this collaboration, which we believe will benefit from the burgeoning e-
18

SUMMARY
commerce growth in these regions in India. The two sites have a total area of approximately 305,000sq.m. and planned GFA of approximately 122,000 sq.m. We commenced development on these twosites in September 2019. We, as the majority partner, are expected to hold approximately 51% interestin this partnership at the development stage and to acquire the remaining interest in this partnershipfollowing the completion of the development by the end of September 2020.
Material Developments
After due and careful consideration, our Directors confirm that, up to the date of thisProspectus, there has been no material adverse change in our financial and trading position orprospects since June 30, 2019, the end of the Track Record Period, save as disclosed above, and noevent has occurred since June 30, 2019 which would materially affect the information shown in theAccountants’ Report set forth in Appendix I to this Prospectus.
PRE-IPO INVESTMENTS
We have received eight rounds of investment since our establishment. We granted warrants toGoldman Sachs Investments Holdings (Asia) Limited (“Goldman Sachs”) entitling Goldman Sachs tocertain shares at a nominal value as part and parcel of, and in consideration of the performance byGoldman Sachs of its obligations under a facility agreement. Other details of our Pre-IPO Investmentsare as follows.
Date of initialshare
subscriptionagreement
Name ofShareholder(s)
Date of lastpayment of
consideration
Total number ofshares under theshare subscription
agreement(s)Cost per share
paid(1)Total funds raisedby the Company
Discount tothe OfferPrice(2)
Valuationof our
Companyas of thedate of
initial sharesubscriptionagreement(3)
1. January 9,2014(4)
GoldmanSachsInvestmentsHoldings(Asia)Limited
January 19, 2018(4) 54,684,608 Class B2Shares
US$0.0013 perClass B2Share(4)
US$70,000(4) 99.99% n/a(4)
2. May 26, 2014 APG-Stichting
May 27, 2014 316,567,534 Class B3Shares
US$0.5054 perClass B3 Share
US$160,000,000 76.4% US$0.79billion
3. December 23,2016
ChineseInstitutionalInvestors(5)
January 4, 2017 245,359,810 Class CPreference Shares
US$1.2227 perClass CPreferenceShare
US$300,000,000 42.9% US$2.89billion
4. July 31, 2017 SK(6) August 3, 2017 261,930,955 Class B6Shares
US$1.2726 perClass B6 Share
US$333,333,333 40.5% US$3.40billion
5. November 29,2017
StepStone November 28, 2017 70,721,358 Class B7Shares
US$1.2726 perClass B7 Share
US$90,000,000 40.5% US$3.49billion
6. November 29,2017
GeneralElectricPension Trust
November 29, 2017 39,289,643 Class B3Shares
US$1.2726 perClass B3 Share
US$50,000,000 40.5% US$3.54billion
7. April 24,2018
JingdongLogisticsGroupCorporation
May 10, 2018 240,578,861 Class B8Shares
US$1.5169 perClass B8 Share
US$306,160,659(7) 29.1% US$4.58billion
8. May 28, 2018 MontsoreauInvestmentLimited
June 15, 2018 26,363,847 Class B9Shares
US$1.5172 perClass B9 Share
US$40,000,000 29.1% US$4.63billion
Notes:(1) Not adjusted to reflect subsequent share splits and other capital reorganizations, as applicable.(2) The discount to the Offer Price is calculated on the assumption that the Offer Price is HK$16.80 per Share, being the mid-point of the
indicative Offer Price range of HK$16.20 to HK$17.40.(3) This refers to the post-money valuation of our Company, being the sum of the pre-money valuation and the amount of new equity.
19

SUMMARY
(4) We granted warrants to Goldman Sachs entitling Goldman Sachs to certain shares at nominal value as part and parcel of, and inconsideration of the performance by Goldman Sachs of its obligations under a facility agreement dated December 4, 2013 (as amendedand restated on August 19, 2015) which has been fully repaid. Such warrants were granted pursuant to the warrant instruments datedJanuary 9, 2014 (as amended and restated on August 27, 2015) and August 27, 2015, respectively. Such warrants were exercised in fullon January 19, 2018 for the subscription of a total of 54,684,608 Class B2 Shares. For further details, see the section headed “History,Development and Corporate Structure—Major Shareholding Changes of our Company” in this Prospectus. Since the warrants weregranted pursuant to the warrant instruments as part and parcel of, and in consideration of the performance by Goldman Sachs of itsobligations under the facility agreement, the consideration of the warrants was not determined with reference to the valuation of ourCompany, but the nominal value of our Shares instead.
(5) For further details of the Chinese Institutional Investors, please refer to the section headed “History, Development and CorporateStructure—Information about the Principal Pre-IPO Investors—Chinese Institutional Investors” on page 155 to page 156 of thisProspectus.
(6) On September 14, 2018 and September 21, 2018, SK entered into sale and purchase agreements to purchase 18,633,334 Class B4 Sharesand 55,975,003 Class B3 Shares from Redwood Consulting and APG-Stichting, respectively. See the section headed “History,Development and Corporate Structure—Major Shareholding Changes of our Company” in this Prospectus for further details.
(7) Part of the consideration was satisfied by contributions and/or commitments made by Jingdong Logistics Group Corporation understrategic business cooperation arrangements with our Company.
SUBSTANTIAL SHAREHOLDERS
So far as our Directors are aware, immediately following the completion of the Global Offering(assuming the Offer Size Adjustment Option and the Over-allotment Option are not exercised), WPOCIM will hold 24.1% (if Luckfield Global Limited is a Selling Shareholder) or 23.6% (if LuckfieldGlobal Limited is not a Selling Shareholder) of the total issued Shares.
DIVIDENDS
We are a holding company incorporated under the laws of the Cayman Islands. Subject to theCayman Companies Law and our Articles of Association, the Directors may from time to time declaredividends (including interim dividends) and other distributions on Shares in issue and authorizepayment of the same out of the funds lawfully available therefor, including out of profits and from ourshare premium account, at their discretion; we, by ordinary resolution, may declare dividends, but nodividend shall exceed the amount recommended by the Directors; and the payment of any dividend orother distribution in specie shall be subject to the Directors’ approval and Shareholders’ approval byordinary resolution.
We paid a distribution of US$4.1 million, US$8.2 million and US$4.1 million to holders ofsubordinated perpetual capital securities, which primarily comprised institutional, accredited and otherspecified investors (as defined in the Listing Manual of the Singapore Exchange Securities TradingLimited), in 2017 and 2018 and for the six months ended June 30, 2019, respectively. We did notdeclare or distribute any dividend to our Shareholders during the Track Record Period. We currentlyintend to retain most, if not all, of our available funds to operate and expand our business. Followingthe completion of the Global Offering, we have no immediate plan to pay any dividends to ourShareholders. However, the Board will review our dividend policy from time to time in light of thefollowing factors in determining whether dividends are to be declared and paid: our result ofoperations, our cash flows, our financial condition, our Shareholders’ interests, our capitalrequirements, the payment by our subsidiaries of cash dividends to us, general business conditions andstrategies, the economic climate and other factors the Board may deem relevant. Our future dividendpayments to our Shareholders will also depend upon the availability of dividends received from oursubsidiaries and the statutory fund reserve requirements in the jurisdiction of our subsidiaries. Forexample, PRC laws require that dividends be paid out of the net profit calculated according to PRCaccounting principles. PRC laws also require PRC enterprises to set aside part of their net profit asstatutory reserves before they make a distribution. These statutory reserves are not available for
20

SUMMARY
distribution as cash dividends. The payment of dividends may also be limited by legal restrictions andby financing agreements that are existing and that we may enter into in the future. There can be noassurance that dividends of any amount will be declared or distributed in any year.
GLOBAL OFFERING
This Prospectus is published in connection with the Hong Kong Public Offering as part of theGlobal Offering. The Global Offering comprises:
(i) the Hong Kong Public Offering of 34,700,000 Offer Shares (subject to reallocation and theOffer Size Adjustment Option) in Hong Kong, as described in the section headed“Structure of the Global Offering—The Hong Kong Public Offering” in this Prospectus;and
(ii) the International Offering of initially 618,980,000 Offer Shares (subject to reallocation, theOffer Size Adjustment Option and the Over-allotment Option): (a) in the United States toQIBs in reliance on Rule 144A or another available exemption; and (b) outside the UnitedStates in reliance on Regulation S (including to professional and institutional investors inHong Kong).
The Offer Shares will represent approximately 21.5% of the issued share capital of ourCompany immediately following completion of the Global Offering (assuming the Offer SizeAdjustment Option and the Over-allotment Option are not exercised). If the Offer Size AdjustmentOption and the Over-allotment Option are exercised in full, the Offer Shares will representapproximately 28.5% of the issued share capital of our Company immediately following completion ofthe Global Offering. As no new Shares will be issued under the Offer Size Adjustment Option and theOver-allotment Option (as all Offer Shares being offered under the Offer Size Adjustment Option andthe Over-allotment Option will be existing Shares), there will be no dilution effect on investors’potential shareholding, nor will any additional proceeds be raised by the Company.
LISTING EXPENSES
Our listing expenses in connection with the Global Offering consist primarily of underwritingcommission, incentive fees and professional fees, and are estimated to be approximately US$36.7million (assuming that the Global Offering is conducted at the mid-point of the Offer Price range).During the Track Record Period, we incurred listing expenses of US$10.1 million, of which US$8.0million was charged to our consolidated statements of comprehensive income during the Track RecordPeriod, while the remaining amount of US$2.1 million was included in prepayments and will besubsequently charged to equity upon completion of the Global Offering. We estimate that underwritingcommission, incentive fees and other listing expenses of approximately US$26.6 million will beincurred after June 30, 2019, of which approximately US$12.2 million will be charged to theconsolidated statements of comprehensive income and US$14.4 million will be charged to equity uponcompletion of the Global Offering. The listing expenses above are the best estimate as of the LatestPracticable Date and for reference only and the actual amount may differ from this estimate. Thelisting expenses above will not adversely affect our results of operations for the year endedDecember 31, 2019.
21

SUMMARY
OFFERING STATISTICS
All statistics in the following table are based on the assumption that the Global Offering hasbeen completed and 280,140,000 New Shares are issued pursuant to the Global Offering.
Based on an Offer Priceof HK$14.58 per Offer
Share, after aDownward Offer PriceAdjustment of 10%
Based on an Offer Priceof HK$16.20 per Offer
Share
Based on an Offer Priceof HK$17.40 per Offer
Share
Market capitalization of our Shares(1) . . . . . . HK$44,252,975,109 HK$49,187,150,192 HK$52,842,093,652Unaudited pro forma adjusted consolidated
net tangible asset per Share(2) . . . . . . . . . . HK$ 6.62 HK$ 6.76 HK$ 6.87
Notes:(1) The calculation of market capitalization is based on 3,036,243,839, 3,036,901,934 or 3,035,183,478 Shares expected to be in issue based
on an Offer Price of HK$16.20, HK$17.40 or HK$14.58, being the final Offer Price under the Downward Offer Price Adjustment, perShare, respectively, immediately upon completion of the Global Offering, further information of which is set out in the section headed“History, Development and Corporate Structure—Capitalization of the Company” in this Prospectus. For these purposes it is assumedthat the Listing Date is Friday, November 1, 2019.
(2) The unaudited pro forma adjusted consolidated net tangible asset per Share upon the completion of the Global Offering is calculated aftermaking the adjustments referred to in “Appendix III—Unaudited Pro Forma Financial Information” in this Prospectus.
USE OF PROCEEDS
Assuming an Offer Price of HK$16.80 per Offer Share (being the mid-point of the stated rangeof the Offer Price of between HK$16.20 and HK$17.40 per Offer Share) and regardless of whether theOffer Size Adjustment Option and the Over-allotment Option are exercised, we estimate that we willreceive net proceeds of approximately HK$4,418.8 million (approximately US$563.3 million) from theGlobal Offering after deducting the underwriting commissions and other estimated expenses inconnection with the Global Offering. We intend to use the net proceeds from the Global Offering forthe following purposes and in the amounts set out below, subject to changes in light of our evolvingbusiness needs and changing market conditions:
Š approximately 71.7%, or HK$3,168.2 million (approximately US$403.9 million), for therepayment of the Hana Notes that were issued in November 2016 and redemption of theClass C Preference Shares that were issued in December 2016 and that have not beenconverted into ordinary shares. See the sections headed “Financial Information—Indebtedness—Bank Loans and Other Borrowings” and “—Redeemable ConvertiblePreference Shares” in this Prospectus for further details; and
Š approximately 28.3%, or HK$1,250.6 million (approximately US$159.4 million), for thedevelopment of logistics properties on our own balance sheet and making co-investmentsin the funds and investment vehicles we manage.
To the extent that our actual net proceeds from the Global Offering is higher or lower than ourestimate above, we will increase or decrease our allocation of the net proceeds for the purposes set outabove after the repayment of the Hana Notes and the redemption of the Class C Preference Shares thatare not converted. If we make a Downward Offer Price Adjustment to set the final Offer Price ofHK$14.58 per Offer Share, the net proceeds we will receive from the Global Offering will beapproximately HK$3,809.4 million (approximately US$485.6 million).
SELLING SHAREHOLDERS
We estimate the net proceeds to the Selling Shareholders from the sale of Sale Shares pursuantto the Global Offering, assuming the Offer Size Adjustment Option and Over-allotment Option are not
22

SUMMARY
exercised, to be approximately HK$6,149.5 million (approximately US$784.0 million) (assuming anOffer Price of HK$16.80 per Offer Share, being the mid-point of the indicative Offer Price range andno Downward Offer Price Adjustment is made), after deducting the underwriting commission andestimated related expenses payable by the Selling Shareholders. We will not receive net proceeds fromthe sale of Sale Shares pursuant to the Global Offering, whether or not the Offer Size AdjustmentOption or the Over-allotment Option is exercised.
23

DEFINITIONS
In this Prospectus, unless the context otherwise requires, the following expressions have thefollowing meanings.
“2016 Merger” the merger between e-Shang, Redwood and RedwoodAsian Investments Ltd., pursuant to the Merger Agreementin January 2016
“3PL” third-party logistics
“AUD” or “Australian dollars” Australian dollars, the lawful currency of Australia
“APAC” Asia-Pacific region
“APG-AM” APG Asset Management N.V., an asset management firmincorporated in the Netherlands and the manager of APG-Stichting, which is one of the Pre-IPO Investors
“APG Group” a conglomerate based in the Netherlands, which providesmanagement consulting, asset management, pensionadministration, communication and employer services forpension funds in its group’s pension market
“APG-Stichting” Stichting Depositary APG Strategic Real Estate Pool asdepositary of APG Strategic Real Estate Pool, a foundationfounded in the Netherlands and a Pre-IPO Investor
“Application Form(s)” WHITE application form(s), YELLOW applicationform(s) and GREEN applications form(s) or, where thecontext so requires, any of them that are used in connectionwith the Hong Kong Public Offering
“Articles” or “Articles ofAssociation”
the articles of association of the Company adopted onOctober 12, 2019, which will become effective upon theListing Date, as amended from time to time, a summary ofwhich is set out in Appendix VII to this Prospectus
“associate(s)” has the meaning ascribed to it under the Listing Rules
“ASX” or “Australian StockExchange”
ASX Limited and the financial market operated by itnamed Australian Securities Exchange
“Audit Committee” the audit committee of the Board
“AUM” the sum of (i) the fair value of the properties directly heldon our balance sheet and (ii) Fund AUM.
“Bidder’s Statement” the bidder’s statement we (through our subsidiary, ESRAustralia) served on November 19, 2018 on Propertylink inrelation to the Propertylink Offer, which contained theterms of the Propertylink Offer
24

DEFINITIONS
“Blackwood Group” Blackwood Trust, Blackwood Investment Pte. Ltd., SabanaInvestment Partners Pte. Ltd., Sabana PropertyManagement Pte. Ltd. and Sabana Real Estate InvestmentManagement Pte. Ltd.
“Board” or “Board of Directors” our board of Directors
“BTS” build-to-suit
“Business Day” or “business day” a day on which banks in Hong Kong are generally open fornormal banking business and which is not a Saturday,Sunday or public holiday in Hong Kong
“BVI” the British Virgin Islands
“CAGR” compound annual growth rate
“Cayman Companies Law” or“Companies Law”
the Companies Law (as revised) of the Cayman Islands, asamended, supplemented or otherwise modified from time totime
“CCASS” the Central Clearing and Settlement System established andoperated by HKSCC
“CCASS Clearing Participant” a person admitted to participate in CCASS as a directclearing participant or general clearing participant
“CCASS Custodian Participant” a person admitted to participate in CCASS as a custodianparticipant
“CCASS Investor Participant” a person admitted to participate in CCASS as an investorparticipant who may be an individual, joint individuals or acorporation
“CCASS Participant” a CCASS Clearing Participant, a CCASS CustodianParticipant or a CCASS Investor Participant
“Centuria” the Centuria Capital Group, consisting of two stapledentities listed on the Australian Stock Exchange (StockCode: CNI) namely, Centuria Capital Limited and CenturiaCapital Fund and their respective subsidiaries, in which ourGroup acquired a 14.9% equity stake in October 2017
“China Everbright” China Everbright Securities International StructuredFinance Company Limited, a limited liability companyincorporated in Hong Kong on April 11, 2016 and aPre-IPO Investor
“Chinese Institutional Investors” Bohai Investment Holding Limited, Mercury BetaInvestment Limited, Emerald Ewood (Cayman) Limited,
25

DEFINITIONS
China Everbright, Luckfield Global Limited, CMBCInternational Holdings Limited, SF Project (Cayman)Limited
“CIP” CIP Constructions (Australia) Pty Ltd (formerly known asCommercial & Industrial Property Pty Ltd), a commercialcompany established in Australia on June 12, 2003 and anindirect subsidiary of our Company following theacquisition in August 2018
“Class A Shares” the Class A ordinary shares, with a par value of US$0.001each, in the share capital of our Company
“Class B Shares” prior to the capital reorganization on May 26, 2014, meansthe Class B ordinary shares of par value of US$0.001 eachand after that date, means each of the Class B1 Shares,Class B2 Shares, Class B3 Shares, Class B4 Shares,Class B5 Shares, Class B6 Shares, Class B7 Shares,Class B8 Shares and each of the Class B9 Shares, as andwhen each class was created through further capitalreorganizations in the share capital of our Company
“Class B1 Shares” the Class B1 ordinary shares, with a par value of US$0.001each, in the share capital of our Company
“Class B2 Shares” the Class B2 ordinary shares, with a par value of US$0.001each, in the share capital of our Company
“Class B3 Shares” the Class B3 ordinary shares, with a par value of US$0.001each, in the share capital of our Company
“Class B4 Shares” the Class B4 ordinary shares, with a par value of US$0.001each, in the share capital of our Company
“Class B5 Shares” the Class B5 ordinary shares, with a par value of US$0.001each, in the share capital of our Company
“Class B6 Shares” the Class B6 ordinary shares, with a par value of US$0.001each, in the share capital of our Company
“Class B7 Shares” the Class B7 ordinary shares, with a par value of US$0.001each, in the share capital of our Company
“Class B8 Shares” the Class B8 ordinary shares, with a par value of US$0.001each, in the share capital of our Company
“Class B9 Shares” the Class B9 ordinary shares, with a par value of US$0.001each, in the share capital of our Company
26

DEFINITIONS
“Class C Preference Shares” the Class C preference shares, with a par value ofUS$0.001 each, in the share capital of our Company,referred to as the Redeemable Convertible PreferenceShares in the Accountants’ Report included in Appendix Ito this Prospectus
“Class C Shares” the Class C ordinary shares, with a par value of US$0.001each, in the share capital of our Company
“CNLP” China Logistics Property Holdings Co., Ltd., a companyincorporated in the Cayman Islands on November 12, 2013,whose shares are listed on the Hong Kong Stock Exchange(Stock Code: 1589) in which our Group holds an equityinterest of approximately 13.7% as of the Latest PracticableDate
“Companies Ordinance” or“Hong Kong CompaniesOrdinance”
the Companies Ordinance (Chapter 622 of the Laws ofHong Kong), as amended or supplemented from time totime
“Companies (Winding Up andMiscellaneous Provisions)Ordinance”
Companies (Winding Up and Miscellaneous Provisions)Ordinance (Chapter 32 of the Laws of Hong Kong), asamended or supplemented from time to time
“Company” or “our Company” ESR Cayman Limited (formerly known as e-ShangCayman Limited, Asia Logistics Limited and e-ShangRedwood Limited), an exempted company incorporated inthe Cayman Islands with limited liability on June 14, 2011
“connected person” has the meaning ascribed to it in the Listing Rules
“CPPIB” Canada Pension Plan Investment Board, a Canadian Crowncorporation established under the 1997 Canada PensionPlan Investment Board Act and an investor in fundsmanaged by our Group
“CSRC” China Securities Regulatory Commission of the PRC
“Director(s)” the director(s) of our Company
“Downward Offer Price Adjustment” an adjustment that has the effect of setting the final OfferPrice up to 10% below the bottom end of the indicativeOffer Price range
“e-Shang” e-Shang Cayman Limited, an exempted companyincorporated with limited liability under the laws of theCayman Islands on June 14, 2011 and the pre-merger entityof our Company prior to the 2016 Merger
27

DEFINITIONS
“E-Shang Star” E-Shang Star Cayman Limited, an exempted companyincorporated with limited liability under the laws of theCayman Islands on April 16, 2014 and a joint venture ofour Company
“EIT Law” the Enterprises Income Tax Law of the PRC (《中華人民共和國企業所得稅法》), which was promulgated by theStanding Committee of the NPC on March 16, 2007 andlast amended on December 29, 2018, and the Regulation onthe Implementation of the Enterprise Income Tax Law ofthe PRC (《中華人民共和國企業所得稅法實施條例》)which was promulgated by the State Council onDecember 6, 2007 and with effect from January 1, 2008
“EIT rate” enterprise income tax rate
“Elite Bond” Elite Bond Limited, a company incorporated in BVI onMay 4, 2011 and an initial shareholder of e-Shang thatexited as shareholder in August 2017, and owned by anaffiliate of an ex-director of our Company
“ESOP Shareholders” Laurels and WP OCIM
“ESR Australia” ESR Real Estate (Australia) Pty Ltd, a company limited byshares incorporated in Australia on April 24, 2018 and anindirect subsidiary of our Company
“ESR Japan” ESR LTD, a joint stock corporation (kabushiki kaisha)incorporated in Japan on May 8, 2006 and an indirectwholly-owned subsidiary of our Company
“ESR-REIT” a REIT formerly known as Cambridge Industrial Trust,established in March 2006 and listed on the SingaporeStock Exchange (Stock Code: J91U) since July 2006, inwhich we hold approximately 8.78% of the units as of theLatest Practicable Date
“ESR-REIT Manager” ESR Funds Management (S) Limited, formerly known asCambridge Industrial Trust Management Limited, acompany incorporated in Singapore on September 14,2005, an indirect non-wholly owned subsidiary of ourCompany and the manager of ESR-REIT
“EUR” the lawful currency of the member states of the EuropeanUnion
“Existing Articles” the amended and restated memorandum and articles ofassociation of our Company adopted by special resolutionof the Shareholders passed on September 16, 2019
28

DEFINITIONS
“External Acquisition Facility” an AUD230 million (approximately US$156.5 million)share acquisition bridging facility under which externaldebt was provided to us, in connection with our acquisitionof Propertylink, which has been refinanced with debt that issecured by the underlying assets of Propertylink
“Extreme Conditions” extreme conditions caused by a super typhoon asannounced by the Government of Hong Kong
“FIEs” foreign invested enterprises
“Fund AUM” the sum of: (i) the fair value of the properties held in theprivate funds and investment vehicles we manage; (ii) thetotal uncalled capital commitments in the private funds andinvestment vehicles we manage; (iii) the additional debtthat is estimated to be incurred with reference to the targetleverage ratio of the relevant private funds and investmentvehicles we manage when all capital is called and invested;and (iv) the appraised carrying value of ESR-REIT.
“GDP” gross domestic product
“GFA” gross floor area
“Global Offering” the Hong Kong Public Offering and the InternationalPlacing
“Goodman Group” Goodman Group, consisting of three stapled entities listedon the Australian Stock Exchange (Stock Code: GMG),namely, Goodman Logistics (HK) Limited, GoodmanLimited and Goodman Industrial Trust, and their respectivesubsidiaries
“GP” general partner
“GREEN application form(s)” the application form(s) to be completed by the WhiteForm eIPO Service Provider, Computershare Hong KongInvestor Services Limited
“Group”, “our Group”, “the Group”,“we” or “us”
our Company and our subsidiaries, or where the context sorequires, in respect of the period before our Companybecame the holding company of our present subsidiaries,the subsidiaries as if they were the subsidiaries of ourCompany at the time
“GST” goods and services tax
“Hana Notes” US$300 million notes due 2019 issued by our Company toHana Private Real Estate Investment Trust No. 16 andHana Private Real Estate Investment Trust No. 17
29

DEFINITIONS
“HK$” or “Hong Kong dollars” or“HK dollars” or “cents”
Hong Kong dollars and cents respectively, the lawfulcurrency of Hong Kong
“HKSCC” Hong Kong Securities Clearing Company Limited, awholly-owned subsidiary of Hong Kong Exchanges andClearing Limited
“HKSCC Nominees” HKSCC Nominees Limited, a wholly-owned subsidiary ofHKSCC
“Hong Kong” or “HK” the Hong Kong Special Administrative Region of the PRC
“Hong Kong Public Offer Shares” the 34,700,000 New Shares initially offered by ourCompany for subscription pursuant to the Hong KongPublic Offering together with, where relevant, anyadditional Shares which may be offered pursuant to theexercise of the Offer Size Adjustment Option (subject toreallocation as described in the section headed “Structureof the Global Offering” in this Prospectus)
“Hong Kong Public Offering” the offer of the Hong Kong Public Offer Shares forsubscription by the public in Hong Kong at the Offer Priceon the terms and conditions described in this Prospectusand the Application Forms
“Hong Kong Share Registrar” Computershare Hong Kong Investor Services Limited
“Hong Kong Stock Exchange,”“Stock Exchange” or “HKSE”
The Stock Exchange of Hong Kong Limited
“Hong Kong Underwriters” the underwriters of the Hong Kong Public Offering listed inthe section headed “Underwriting—Hong KongUnderwriters” in this Prospectus
“Hong Kong UnderwritingAgreement”
the underwriting agreement dated October 21, 2019 relatingto the Hong Kong Public Offering and entered into amongour Company, the Joint Sponsors, the Joint GlobalCoordinators and the Hong Kong Underwriters as furtherdescribed in the section headed “Underwriting” in thisProspectus
“IFRS” International Financial Reporting Standards, amendmentsand interpretations issued by the International AccountingStandards Board
“independent third party(ies)” any party(ies) who is/are not connected (within themeaning of the Listing Rules) with our Company so far asthe Directors are aware after having made reasonableenquiries
30

DEFINITIONS
“India” the Republic of India
“Indirect Transfer” an indirect transfer by a non-resident enterprise of theequity interests of a mainland Chinese resident enterpriseby disposition of the equity interests of an overseasnon-public holding company, as defined in SAT Circular698 in the PRC
“Infinitysub Group” Infinitysub Pte. Ltd. (formerly known as Nabinvest OxleySingapore Pte. Ltd.), ESR Investment Management Pte.Ltd. (formerly known as Cambridge Real Estate InvestmentManagement Pte. Ltd.), ESR Funds Management (S)Limited (formerly known as Cambridge Industrial TrustManagement Limited) and ESR Property Management (S)Pte. Ltd. (formerly known as Cambridge IndustrialProperty Management Pte. Ltd.)
“Internal Equity Commitment” existing cash and cash equivalents sources within ourGroup including pursuant to an equity commitment letterfor up to AUD352 million (approximately US$239.5million), in connection with our acquisition of Propertylink
“International Placing Shares” the 618,980,000 Offer Shares (comprising 245,440,000New Shares and 373,540,000 Sale Shares), initially beingoffered in the International Placing together with, whererelevant, any additional Shares which may be sold pursuantto the exercise of the Offer Size Adjustment Option and theOver-allotment Option (subject to reallocation as describedin the section headed “Structure of the Global Offering” inthis Prospectus)
“International Placing” the offer and sale of the International Placing Shares by ourCompany and the Selling Shareholders through theInternational Underwriters at the Offer Price in offshoretransactions outside the United States in accordance withRegulation S under the U.S. Securities Act and within theUnited States to QIBs under the U.S. Securities Act or anyother available exemption from registration under the U.S.Securities Act, as further described in the section headed“Structure of the Global Offering” in this Prospectus
“International Underwriters” the international underwriters for the International Placing,that are expected to enter into the InternationalUnderwriting Agreement to underwrite the InternationalPlacing
“International Underwriting Agreement” the underwriting agreement expected to be entered into onor around Friday, October 25, 2019 by, among others, our
31

DEFINITIONS
Company, the Joint Global Coordinators (for themselvesand on behalf of the International Underwriters) and theSelling Shareholders in respect of the International Placing,as further described in the section headed “Underwriting”in this Prospectus
“IPO Implementation Deed” the IPO implementation deed dated October 18, 2019entered into between, inter alia, each existing Shareholder,Mr. Jinchu Shen and our Company in respect of certainshareholder arrangements for the purpose of the Listing, asfurther described in the section headed “History,Development and Corporate Structure—IPOImplementation Arrangements” in this Prospectus
“IRR” internal rate of return
“JLL” Jones Lang LaSalle Limited, an industry consultant
“JLL Report” the market research report prepared by JLL
“Joint Bookrunners” Morgan Stanley Asia Limited (in relation to theHong Kong Public Offering), Morgan Stanley & Co.International plc (in relation to the International Placing),Deutsche Bank AG, Hong Kong Branch, CCB InternationalCapital Limited, China International Capital CorporationHong Kong Securities Limited, Citigroup Global MarketsAsia Limited (in relation to the Hong Kong PublicOffering), Citigroup Global Markets Limited (in relation tothe International Placing), CLSA Limited, Crédit AgricoleCorporate and Investment Bank, Hong Kong Branch (inrelation to the Hong Kong Public Offering), CréditAgricole Corporate and Investment Bank (in relation to theInternational Placing), Credit Suisse (Hong Kong) Limited,DBS Asia Capital Limited, Goldman Sachs (Asia) L.L.C.,Mirae Asset Securities (HK) Limited and UOB Kay Hian(Hong Kong) Limited
“Joint Global Coordinators” Morgan Stanley Asia Limited, Deutsche Bank AG,Hong Kong Branch, Citigroup Global Markets AsiaLimited, Credit Suisse (Hong Kong) Limited and GoldmanSachs (Asia) L.L.C.
“Joint Sponsors” Deutsche Securities Asia Limited and CLSA CapitalMarkets Limited
“JPY” or “Japanese Yen” Japanese yen, the lawful currency of Japan
“KM ESOP” the employee stock incentive scheme adopted by theCompany on November 24, 2017 as amended from time totime, the principal terms of which are set out in the sectionheaded “Statutory and General Information—D. KM
32

DEFINITIONS
ESOP, Tier 1 ESOP and Post-IPO Share Option Scheme—1. KM ESOP” in Appendix VIII to this Prospectus
“LAT” land appreciation tax in the PRC
“Latest Practicable Date” October 13, 2019, being the latest practicable date prior tothe printing of this Prospectus for the purpose ofascertaining certain information contained in thisProspectus
“Laurels” Laurels Capital Investments Limited, a business companyincorporated with limited liability under the laws of theBVI on May 4, 2011 and an original investor of ourCompany, which is owned by The Shen Trust, whose solebeneficiary is an associate of Mr. Jinchu Shen, one of ourexecutive Directors
“Listing” the listing of our Shares on the Main Board of the StockExchange
“Listing Committee” the Listing Committee of the Stock Exchange
“Listing Date” the date, expected to be on or about Friday, November 1,2019 on which dealings in the Shares first commence onthe Stock Exchange
“Listing Rules” the Rules Governing the Listing of Securities on The StockExchange of Hong Kong Limited (as amended,supplemented or otherwise modified from time to time)
“modern logistics facilities” logistics facilities typically characterized by large floorplates, high ceilings, wide column spacing, spacious andmodern loading docks as well as enhanced safety systemsand other value-added features
“Main Board” the stock market (excluding the option market) operated bythe Stock Exchange which is independent from andoperated in parallel with the Growth Enterprise Market ofthe Stock Exchange
“Major Subsidiary(ies)” 35 entities that we consider our major subsidiariesprimarily responsible for the results of our Group duringthe Track Record Period as further described in the sectionheaded “History, Development and Corporate Structure—Our Major Subsidiaries” in this Prospectus
“Measures” Special Administrative Measures (Negative List) forForeign Investment Access (Edition 2019) (《外商投資准入特別管理措施(負面清單)(2019年版)》) promulgated byMOFCOM and the NDRC on June 30, 2019 effective as ofJuly 30, 2019
33

DEFINITIONS
“Memorandum” or “Memorandum ofAssociation”
the memorandum of association of our Company (asamended from time to time), adopted on October 12, 2019,which will become effective upon the Listing Date, asummary of which is set out in Appendix VII to thisProspectus
“Merger Agreement” a merger and subscription agreement dated November 3,2015 and entered into between, amongst others, ourCompany and Redwood Investor, as amended by anamendment agreement dated December 27, 2015
“MOFCOM” the Ministry of Commerce of the PRC
“MOU” Memorandum of Understanding
“NDRC” the National Development and Reform Commission of thePRC
“New Share(s)” the Shares to be offered by our Company for subscription atthe Offer Price pursuant to the Global Offering
“Nomination Committee” the nomination committee of the Board
“NPC” National People’s Congress of the PRC
“Offer Price” the final offer price per Offer Share in Hong Kong dollars(exclusive of brokerage of 1%, SFC transaction levy of0.0027% and Stock Exchange trading fee of 0.005%) of notmore than HK$17.40 and expected to be not less thanHK$16.20, at which the Hong Kong Public Offer Sharesare to be subscribed for and to be determined in the mannerfurther described in the section headed “Structure of theGlobal Offering—Pricing and Allocation” in thisProspectus and subject to any Downward Offer PriceAdjustment
“Offer Share(s)” the Hong Kong Public Offer Shares and the InternationalPlacing Shares together with, where relevant, anyadditional Shares to be offered pursuant to the exercise ofthe Offer Size Adjustment Option and Over-allotmentOption
“Offer Size Adjustment Option” the option granted by the Offer Size Adjustment OptionGrantors to the Hong Kong Underwriters under the OfferSize Adjustment Option Deed, exercisable by the JointGlobal Coordinators on behalf of the Hong KongUnderwriters on or before the Price Determination Date,pursuant to which the Offer Size Adjustment OptionGrantors may be required to sell up to an aggregate of
34

DEFINITIONS
98,052,000 additional Shares, at the Offer Price, to coveradditional market demand, if any, as described in thesection headed “Structure of the Global Offering” in thisprospectus
“Offer Size Adjustment OptionDeed”
the offer size adjustment option deed dated October 21,2019 relating to the Offer Size Adjustment Option andentered into among the Offer Size Adjustment OptionGrantors, the Joint Global Coordinators and the Hong KongUnderwriters
“Offer Size Adjustment OptionGrantors”
WP OCIM, Goldman Sachs Investments Holdings (Asia)Limited, General Electric Pension Trust and MontsoreauInvestment Limited
“Over-allotment Option” pursuant to the International Underwriting Agreement, theoptions to be granted by the Over-allotment OptionGrantors to the International Underwriters, exercisable bythe Joint Global Coordinators (on behalf of theInternational Underwriters), pursuant to which may berequired to sell an aggregate of up to 15% of the totalnumber of Offer Shares available under the GlobalOffering, including the Shares offered pursuant to theexercise of the Offer Size Adjustment Option, if any, at theOffer Price, which will be equal to 98,052,000 Sale Shares,assuming the Offer Size Adjustment Option is notexercised, or 112,759,800 Sale Shares, assuming the OfferSize Adjustment Option is fully exercised at the OfferPrice, to cover over-allocation, if any, in the InternationalPlacing. For further details, please refer to the sectionheaded “Structure of the Global Offering” in thisProspectus
“Over-allotment Option Grantors” WP OCIM, Goldman Sachs Investments Holdings (Asia)Limited, General Electric Pension Trust and MontsoreauInvestment Limited
“PML” probable maximum loss
“Portfolio Assets” assets our Group owns directly and those owned by thefunds and investment vehicles we manage
“Post-IPO Share Option Scheme” the post-IPO share option scheme adopted by the Companyon October 12, 2019, the principal terms of which are setout in the section headed “Statutory and GeneralInformation—D. KM ESOP, Tier 1 ESOP and Post-IPOShare Option Scheme—3. Post-IPO Share Option Scheme”in Appendix VIII to this Prospectus
35

DEFINITIONS
“PRC” or “China” the People’s Republic of China, but for the purposes of thisProspectus only (unless otherwise indicated) excludingHong Kong, the Macao Special Administrative Region ofthe PRC and Taiwan
“PRC Government” or “State” the central government of the PRC, including allgovernmental subdivisions (including provincial, municipaland other regional or local government entities) and itsorgans or, as the context requires, any of them
“PRC Legal Advisor” Global Law Office, legal counsel as to PRC law to ourCompany
“Pre-IPO Investments” the investments made by the Pre-IPO Investors, theprincipal terms of which are summarized in the sectionheaded “History, Development and Corporate Structure—Pre-IPO Investments” in this Prospectus
“Pre-IPO Investor(s)” APG-Stichting, the Chinese Institutional Investors, SK,General Electric Pension Trust, StepStone, Goldman SachsInvestments Holdings (Asia) Limited, Jingdong LogisticsGroup Corporation and Montsoreau Investment Limited
“Pre-IPO Shareholders’ Agreement” the amended and restated shareholders’ agreement datedJune 15, 2018, as further amended by amendment lettersdated September 21, 2018, August 14, 2019 and September16, 2019, respectively, entered into between Laurels, WPOCIM, Redwood Investor, Kurmasana Holdings, LLC,Redwood Consulting, the Pre-IPO Investors and ourCompany
“Price Determination Date” the date, expected to be on or around Friday, October 25,2019, on which the Offer Price is determined, or such latertime as the Joint Global Coordinators (for themselves andon behalf of the Hong Kong Underwriters) and ourCompany (for ourselves and on behalf of the SellingShareholders) may agree, but in any event no later thanThursday, October 31, 2019
“Propertylink” one of our platforms in Australia, consisting of threeentities which were stapled and listed on the AustralianSecurities Exchange (Stock Code: PLG) namely, ESRAsset Management (Holdings) Limited (formerly known asPropertylink (Holdings) Limited), Propertylink Trust(“PT”) and Propertylink Australian Industrial Partnership(“PAIP”) and their respective subsidiaries, which wasconsolidated into our Group as our subsidiary on March 20,2019, further information on which is set out in the section
36

DEFINITIONS
headed “Business—The Propertylink Acquisition” in thisProspectus
“Prospectus” this prospectus being issued in connection with theHong Kong Public Offering
“QIBs” qualified institutional buyers within the meaning ofRule 144A
“Redwood” ESR Singapore Pte. Ltd. (formerly known as RedwoodGroup Asia Pte. Ltd.), a limited liability companyincorporated in Singapore on November 27, 2007 and adirect wholly-owned subsidiary of our Company
“Redwood Consulting” Redwood Consulting (Cayman) Limited, an exemptedcompany incorporated with limited liability under the lawsof the Cayman Islands incorporated on September 18, 2015and which is owned as to 50.0% and 50.0% by Mr. StuartGibson and Mr. Charles Alexander Portes, respectively,two of our executive Directors
“Redwood Entities” Redwood Consulting and Redwood Investor
“Redwood Investor” Redwood Investment Company, Ltd., an exemptedcompany incorporated with limited liability under the lawsof the Cayman Islands and a shareholder of our Companyfollowing the 2016 Merger. Redwood Investor is ultimatelycontrolled as to 50.0% and 50.0% by Mr. Stuart Gibson andMr. Charles Alexander Portes, respectively
“Regulation S” Regulation S under the U.S. Securities Act
“REIT” real estate investment trust
“relevant interest” has the meaning given in the Australian Corporations Act2001 (Cth) and used in connection with our acquisition ofPropertylink
“Relevant Persons” the Joint Sponsors, the Joint Global Coordinators, the JointBookrunners, the Underwriters, the Selling Shareholders,any of their or the Company’s respective directors, officers,agents, or representatives or advisers or any other personinvolved in the Global Offering
“Remuneration Committee” the remuneration committee of the Board
“RMB” or “Renminbi” the lawful currency of the PRC
“Repurchase Mandate” the general mandate to repurchase Shares given to ourDirectors by our Shareholders as referred to in the section
37

DEFINITIONS
headed “Statutory and General Information—A. FurtherInformation about our Group—3. Written Resolutions ofour Shareholders passed on June 4, 2019 and October 12,2019” in Appendix VIII to this Prospectus
“Rule 144A” Rule 144A under the U.S. Securities Act
“Sabana Manager” Sabana Real Estate Investment Management Pte. Ltd., acompany incorporated in Singapore on March 15, 2010 andan indirect non-wholly-owned subsidiary of our Company
“Sabana Manager Acquisition” the acquisition of 51% interest in Sabana InvestmentPartners Pte. Ltd., the 100% shareholder of SabanaManager by our subsidiary, InfinitySub Pte. Ltd.
“Sabana REIT” Sabana Shariah Compliant Industrial REIT, which is listedon the Singapore Stock Exchange (Stock Code: M1GU)
“Sabana REIT Investment” the acquisition of 104,390,903 units (representingapproximately 9.9% of the then issued units of SabanaREIT) by our subsidiary, e-Shang Infinity Cayman Limited
“Sale Shares” 373,540,000 Shares to be offered for sale by the SellingShareholders at the Offer Price under the Global Offering(before any exercise of the Offer Size Adjustment Optionand the Over-allotment Option), up to 98,052,000additional Shares pursuant to any exercise of the Offer SizeAdjustment Option and up to 98,052,000 additional Shares(if the Offer Size Adjustment Option is not exercised) or112,759,800 additional Shares (if the Offer SizeAdjustment Option is exercised in full) pursuant to anyexercise of the Over-allotment Option
“SAFE” the State Administration of Foreign Exchange of the PRC
“SAT” the State Administration of Taxation of the PRC
“Selling Shareholders” WP OCIM, Goldman Sachs Investments Holdings (Asia)Limited, APG-Stichting, General Electric Pension Trust,Emerald Ewood (Cayman) Limited, MontsoreauInvestment Limited, Jingdong Logistics Group Corporationand Luckfield Global Limited (if it sells Shares in theInternational Placing)
“SFC” the Securities and Futures Commission of Hong Kong
“SFO” or “Securities and FuturesOrdinance”
the Securities and Futures Ordinance (Chapter 571 of theLaws of Hong Kong), as amended or supplemented fromtime to time
38
DEFINITIONS
“SGD” or “Singapore dollars” Singapore dollar(s), the lawful currency of Singapore
“SGX-ST” or “Singapore StockExchange”
Singapore Exchange Securities Trading Limited
“Shanghai e-Shang Warehousing” Shanghai e-Shang Warehousing Services Co., Ltd. (上海益商倉儲服務有限公司), a WFOE established in the PRC onJuly 8, 2011 and an indirect wholly-owned subsidiary ofour Company
“Shareholder(s)” holder(s) of our Shares
“Shares” ordinary share(s) with a nominal value of US$0.001 each inthe capital of our Company
“Share Redesignation” subject to the Global Offering becoming unconditional, thereclassification and re-designation of all the authorizedissued and unissued Class A Shares, Class B Shares andClass C Shares into Shares
“Share Option DisclosureRequirements”
the requirements set out under Rule 17.02(1)(b) of, andparagraph 27 of Appendix 1A to, the Listing Rules, andparagraph 10(d) of Part I of the Third Schedule to theCompanies (Winding Up and Miscellaneous Provisions)Ordinance
“SK” SK Holdings Co., Ltd., a company incorporated in SouthKorea on April 13, 1991 and a Pre-IPO Investor
“Singapore” the Republic of Singapore
“South Korea” the Republic of Korea
“sq.m.” square meters
“StepStone” StepStone A Opportunities Fund, L.P. (an exempted limitedliability partnership registered in the Cayman Islands),StepStone Rivas Private Equity Fund, L.P. (an exemptedlimited liability partnership registered in the CaymanIslands), StepStone H Opportunities Fund, L.P. (anexempted limited liability partnership registered in theCayman Islands), StepStone AMP Opportunities Fund, L.P.(a limited partnership with designated series formed in theState of Delaware in the U.S.) and StepStone FSSOpportunities Fund, L.P. (a limited partnership withdesignated series formed in the State of Delaware in theU.S.), each being a Pre-IPO Investor
“Stabilizing Manager” Morgan Stanley Asia Limited
39
DEFINITIONS
“Stock Borrowing Agreement” the stock borrowing agreement to be entered into betweenthe Over-allotment Option Grantors and the StabilizingManager (or its affiliate) on or around the PriceDetermination Date
“subsidiary” or “subsidiaries” has the meaning ascribed to it under the CompaniesOrdinance
“substantial shareholder” has the meaning ascribed to it in the Listing Rules
“Takeovers Code” the Hong Kong Code on Takeovers and Mergers
“Tianjin Mingcheng” Tianjin Mingcheng Warehousing Company Limited (天津明誠倉儲有限公司), a company incorporated in the PRC onOctober 28, 2013, which was transferred by our Group toNCI Core Fund on March 20, 2019
“Tier 1 ESOP” the pre-IPO employee stock incentive scheme adopted by theCompany on November 3, 2015 as amended from time totime, the principal terms of which are set out in the sectionheaded “Statutory and General Information—D. KM ESOP,Tier 1 ESOP and Post-IPO Share Option Scheme—2. Tier 1ESOP” in Appendix VIII to this Prospectus
“Tier 1.5 cities” China’s Tier 1.5 cities as top second tier cities that haveseparated themselves from other tier 2 cities to sit justbelow the level of Tier 1 cities, based on an analysis of arange of economic, business and property indicators.Examples are Tianjin and Wuhan.
“Track Record Period” the three financial years ended December 31, 2016, 2017and 2018 and the six months ended June 30, 2019
“U.S. Securities Act” the U.S. Securities Act of 1933, as amended andsupplemented or otherwise modified from time to time, andthe rules and regulations promulgated thereunder
“Underwriters” the Hong Kong Underwriters and the InternationalUnderwriters
“Underwriting Agreements” the Hong Kong Underwriting Agreement and theInternational Underwriting Agreement
“United States” or “U.S.” the United States of America, its territories, its possessionsand all areas subject to its jurisdiction
“US$”, “USD” or “U.S. dollars” United States dollars, the lawful currency for the time beingof the United States
“VITM” Viva Industrial Trust Management Pte. Ltd., a companyincorporated in Singapore on February 21, 2012 and themanager of VIT and which was acquired by the ESR-REITManager as part of the VIT Merger on October 22, 2018
40

DEFINITIONS
“VIM” Viva Investment Management Pte. Ltd., a companyincorporated in Singapore on June 22, 2011 and theshareholder of VITM
“VIT” or “Viva Industrial Trust” Viva Industrial Trust, a stapled-group comprising a REITand a business trust, both established in 2013 and listed onthe Singapore Stock Exchange (Stock Code: T8B) untilOctober 2018 and was merged with ESR-REIT pursuant tothe VIT Merger
“VIT Merger” the acquisition by ESR-REIT of all the issued and paid-upstapled securities of VIT held by the stapled securityholders of VIT by way of a trust scheme of arrangement ata consideration of SGD936.7 million (approximatelyUS$683.0 million) in October 2018
“Warburg Pincus X” Warburg Pincus Private Equity X, L.P., a Delaware limitedpartnership, and a substantial shareholder of our Company
“WFOE” wholly foreign owned enterprises established in the PRC
“White Form eIPO” the application for Hong Kong Public Offer Shares to beissued in the applicant’s own name by submittingapplications online through the designated website ofWhite Form eIPO at www.eipo.com.hk
“White Form eIPO ServiceProvider”
Computershare Hong Kong Investor Services Limited
“Withdrawal Mechanism” a mechanism which requires the Company, among otherthings, to (a) issue a supplemental prospectus as a result ofmaterial changes in the information (such as the offer price)in this Prospectus, (b) extend the offer period and to allowpotential investors, if they so desire, to confirm theirapplications using an opt-in approach, for examplerequiring investors to positively confirm their applicationsfor Shares despite the change
“WP OCIM” WP OCIM One LLC, a limited liability company organizedunder the laws of the State of Delaware of the United Statesof America on January 31, 2011, a substantial shareholderof our Company and controlled by Warburg Pincus X
“Wuhan Mingju” Wuhan Mingju Supply Chain Development CompanyLimited (武漢明聚供應鏈發展有限公司), a companyincorporated in the PRC on December 10, 2013 and was anindirect wholly-owned subsidiary of our Company until itwas disposed of to one of our funds on April 18, 2019
41
DEFINITIONS
“Wuhan Minglong” Wuhan Minglong Warehousing Company Limited (武漢明隆倉儲有限公司), a company incorporated in the PRC onApril 18, 2013 and an indirect wholly-owned subsidiary ofour Company
“%” per cent.
Unless otherwise stated, any reference in this Prospectus to the share capital of the Company orthe shareholding of a Shareholder immediately prior to completion of the Global Offering is calculatedassuming that all of the pre IPO reorganization steps which are contemplated to take effect prior to theGlobal Offering have been effected as described in the section headed “History, Development andCorporate Structure—IPO Implementation Arrangements” in this Prospectus and assuming that: (i) theOffer Price is determined to be HK$16.80, the mid-point of the Offer Price range; and (ii) the ListingDate is Friday, November 1, 2019.
Unless otherwise stated, any reference in this Prospectus to the share capital of the Company orthe shareholding of a Shareholder after Completion of the Global Offering is calculated assuming thatall of the pre IPO reorganization steps which are contemplated to take effect prior to the GlobalOffering have been effected as described in the section headed “History, Development and CorporateStructure—IPO Implementation Arrangements” in this Prospectus and assuming that: (i) the Offer SizeAdjustment Option has not been exercised; (ii) the Over-allotment Option has not been exercised;(iii) the Offer Price is determined to be HK$16.80, the mid-point of the Offer Price range; (iv) theListing Date is Friday, November 1, 2019; and (v) Luckfield Global Limited is one of the SellingShareholders.
For more details on changes to our shareholding, please see the section headed “History,Development and Corporate Structure—IPO Implementation Arrangements” in this Prospectus.
42

FORWARD-LOOKING STATEMENTS
This Prospectus includes forward-looking statements. All statements other than statements ofhistorical facts contained in this Prospectus, including, without limitation, those regarding our futurefinancial position, our strategies, plans, objectives, goals, targets and future developments in themarkets where we operate or are seeking to operate, and any statements preceded by, followed by orthat include the words “believe”, “expect”, “estimate”, “predict”, “aim”, “intend”, “will”, “may”,“plan”, “consider”, “anticipate”, “seek”, “should”, “could”, “would”, “continue”, or similarexpressions or the negative thereof, are forward-looking statements. These forward-looking statementsinvolve known and unknown risks, uncertainties and other factors, some of which are beyond ourcontrol, which may cause our actual results, performance, achievements or industry results, to bematerially different from any future results, performance or achievements expressed or implied by theforward-looking statements. These forward-looking statements are based on numerous assumptionsregarding our present and future business strategies and the environment in which we will operate inthe future. Additionally, the estimated development costs that are included under the section headed“Business” reflect our good faith estimates of such costs, and actual development costs may differfrom such estimates. Important factors that could cause our actual performance or achievements todiffer materially from those in the forward-looking statements include, among other things, thefollowing:
Š our business and prospects;
Š future developments, trends and conditions in the logistics real estate industry and marketsin which we operate;
Š our strategies, plans, and objectives;
Š general economic conditions;
Š changes to regulatory and operating conditions in the industry and markets in which weoperate;
Š our dividend policy;
Š the amount and nature of, and potential for, future development of our business;
Š capital market(s) developments;
Š the actions and developments of our capital partners, suppliers, customers andcompetitors; and
Š certain statements in the section headed “Financial Information” in this Prospectus withrespect to trends in prices, volumes, operations, margins, overall market trends, riskmanagement and exchange rates.
Additional factors that could cause actual performance or achievements to differ materiallyinclude, but are not limited to, those discussed in the section headed “Risk Factors” and elsewhere inthis Prospectus. We caution you not to place undue reliance on these forward-looking statements,which reflect our views only as of the date of this Prospectus. We undertake no obligation to update orrevise any forward-looking statements, whether as a result of new information, future events orotherwise. In light of these risks, uncertainties and assumptions, the forward-looking events discussedin this Prospectus might not occur. All forward-looking statements contained in this Prospectus arequalified by reference to the cautionary statements set out in this section.
In this Prospectus, statements of, or references to, our intentions or those of any Directors aremade as of the date of this Prospectus. Any of these intentions may change in light of futuredevelopments.
43

RISK FACTORS
You should carefully consider all of the information in this Prospectus, including thefollowing risk factors, before making any investment decision in relation to the Offer Shares. Ourbusiness, financial condition, results of operations, performance and/or prospects could bematerially and adversely affected by any of these risks. The market price of the Offer Shares couldfall significantly due to any of these risks, and you may lose all or part of your investment. The risksand uncertainties described below are not the only risks and uncertainties we face. In addition to therisks described below, there may be other risks and uncertainties not currently known to us or thatwe currently deem to be immaterial which may in the future become material risks. The risksdiscussed below may also include forward-looking statements and our actual results may differsubstantially from those discussed in these forward-looking statements. Sub-headings are forconvenience only and risk factors that appear under a particular sub-heading may also apply to oneor more other sub-headings.
We believe that there are certain risks involved in our operations, many of which are beyondour control. These risks can be categorized into: (i) risks relating to our business and industry; (ii) risksrelating to the presentation of the financial information in this Prospectus; and (iii) risks relating to theGlobal Offering. Additional risks and uncertainties presently not known to us or not expressed orimplied below, or that we currently deem immaterial, could also harm our business, financialcondition, results of operations, performance and/or prospects. You should consider our business andprospects in light of the challenges we face, including the ones discussed in this section.
RISKS RELATING TO OUR BUSINESS AND INDUSTRY
Our business is concentrated in APAC and may be affected by regional and global economic andpolitical developments.
The economies in APAC may be adversely impacted by actual or expected decreases in thegrowth of the global economy, consumption and investment. Regional and global economic factorsmay adversely affect the economic growth in countries in which we do business, including thecountries where we operate. In particular, the PRC economy has experienced slowing investments inrecent period and may face additional pressures from the Sino-U.S. trade conflicts. The escalation inSino-U.S. trade tensions and the uncertainty of a resolution of trade conflicts may further dampen theeconomic activities in China and APAC. As our business is focused on APAC and serves a largenumber of e-commerce and 3PL companies in the region, the slowing business activities in e-commerce and 3PL sectors may cause a decrease in the market demand for modern logistics facilitiesin the region, and as a result, our business, financial position and results of operations may bematerially and adversely affected. There can be no assurance that a recession or slower economicgrowth globally or in APAC will not result in reduced demand for modern logistics properties, adecrease in the confidence of our tenants, capital partners and shareholders, or lower property prices incountries in which we do business. Moreover, the performance of the Portfolio Assets depends, in part,on the volumes of trade flowing through APAC, including the countries where we operate. Factorssuch as more favorable regulatory, taxation and tariff regimes, cheaper terminal costs, costcompetitiveness of competing ports and the growth of the e-commerce and 3PL sectors may diverttrade away from the region. Furthermore, our business also faces risks from the political climate in thecountries in which we operate. For example, South Korea and India have experienced and maycontinue to experience political instability. Such political instability could have an adverse impact onthe economic and social conditions of those countries, resulting in a material adverse effect on ourbusiness, financial condition, results of operations, performance and prospects in those countries.
44

RISK FACTORS
As of June 30, 2019, 77.9% of the Portfolio Assets in terms of GFA were located in the PRC,Japan and South Korea. Our results of operations, financial conditions, business and future growthdepend, to a large extent, on the operational and financial performance of the Portfolio Assets in thesemarkets, and the general economic conditions of APAC. Over the past decade, inflation, currency andinterest rate fluctuations, and other factors have adversely affected many countries in APAC. Anyfurther severe economic decline in APAC could adversely affect our results of operations and futuregrowth. In addition to being affected by global, regional and local economic conditions, propertyvalues in the PRC, Japan and South Korea have in the past been affected by the supply and demand ofcomparable properties, rental yield fluctuations, political developments, governmental regulations andtaxation, which may have a material adverse effect on our results of operations, financial conditions,business performance and prospects.
We may expand our business into other countries in APAC in connection with our businessstrategy, resulting in changes to our risk profile as it encompasses the risks in each of the countries orbusinesses which we expand into. Our results of operations, financial conditions, business performanceand prospects may be materially and adversely affected by risks in these countries, including, but notlimited to, risks relating to adverse economic conditions, political instability, and property marketdevelopments and dynamics.
The success of our business depends on our ability to service the rising demand of thee-commerce and 3PL sectors in APAC and the sustainability of this rising demand in APAC.
We lease a significant portion of our logistics properties to large e-commerce and 3PL tenantswho require modern logistics facilities in APAC. The growth of the e-commerce and 3PL sectors in thecountries where we operate has led to a significant increase in demand for modern logistics real estateand boosted the local logistics property markets. However, this trend also presents inherent risks andchallenges. For example, e-commerce and 3PL tenants usually prefer large-scale, state-of-the-artlogistics facilities which require significant upfront capital investments, and such tenants can beaggressive on rental rates and other contract terms. Further, these tenants generally seek facilities in orclose to major metropolitan areas where land parcels suitable for the development of modern logisticsproperties are becoming increasingly costly due to scarcity. If we are unable to successfully identifyand address these challenges, we may fail to service the rising demand of the e-commerce and 3PLsectors, which may have a material adverse effect on our business performance and prospects, resultsof operations, and financial condition.
In addition, there can be no assurance as to the sustainability of this rising demand in APAC.The e-commerce sector evolves rapidly with technological advancement, changes in user preferences,product and service innovation, and new industry standards and practices, any of which could renderthe existing products, services, technologies and/or systems obsolete and reduce the demand forlogistics facilities by e-commerce tenants. The demand from the e-commerce sector may also beimpacted by changes in supply chain management, for example, the shift in building fulfilmentcapabilities in-house by some e-commerce platforms in the PRC. The development of the 3PL sector inAPAC has been primarily driven by rising domestic consumption as a result of the rise of modernretailing operations, as well as increases in income levels, changing consumption patterns, the adoptionof new technologies and advancement in supply chain management. Any negative trend in thee-commerce and 3PL sectors in the countries where we operate may materially and adversely affectour business, financial condition, results of operations, performance and prospects.
45

RISK FACTORS
We operate a multinational business in APAC with a relatively short operating history and aresubject to complex operational risks which may be difficult to address.
Our Company was incorporated in 2011. We expanded organically and through acquisitions.After the 2016 Merger, we expanded into Singapore, Australia and India, and now operate in sixcountries in APAC, including the PRC, Japan, South Korea, Singapore, Australia and India, and weactively evaluate opportunities in other countries into which we may expand. Consequently, we facerisks and challenges associated with operating a multinational business with a relatively short operatinghistory. These risks and challenges include, without limitation:
Š unpredictability as to whether we can maintain the same or similar growth and profitabilityas we have achieved in the Track Record Period;
Š difficulty in successfully operating the Portfolio Assets located across our six currentoperating countries, as well as any countries we may expand into;
Š difficulty in integrating any businesses and assets we have acquired or we may acquire;
Š conflicts in allocating our senior management’s time and our resources among the projectsand countries where we operate and as between the assets held on our balance sheet andthrough the funds and investment vehicles we manage;
Š difficulty in building, implementing and maintaining standardized operational andinformation technology systems, and internal controls;
Š difficulty in staffing, managing and maintaining a high caliber employee base;
Š managing communication and integration problems arising from cultural differences andgeographic dispersion;
Š potentially lengthy decision-making processes resulting from multiple layers of regionaland local management;
Š difficulty in tailoring and implementing our business strategies to local markets, andmonitoring the status of business expansion in local markets;
Š difficulty in striking a balance between central oversight and control and delegation ofauthority to local offices;
Š multiple competitive pressures from a diverse competitive environment at the local level;
Š difficulty in maintaining standards of construction and leasing consistent with our qualitystandards;
Š difficulty in attracting and maintaining well-resourced capital partners in our variousmarkets;
Š exposure to the risk of harm to our reputation which could develop rapidly across themarkets where we operate; and
Š compliance with a wide variety of laws and regulations.
Further, our limited track record, in particular in Australia and India, may subject us toadditional operational risks, such as attracting and retaining capable management and expertise, a lackof communication channels with local government and greater unfamiliarity with local commercialpractices. As we continue to expand our operations in multiple jurisdictions, we may continue to facethese risks and may have difficulty managing and administering a geographically dispersed business in
46

RISK FACTORS
APAC. We are also subject to risks relating to the lack of transparency of some of the real estatemarkets in which we operate. Market information such as rents, vacancies and lease expiration dates atother logistics properties not operated by us may not be available to us, as such information may not bedisclosed publicly and we have limited resources to access such information. We may also need toexpend additional funds to, among other things, successfully operate businesses in multiple countries,integrate business teams, improve cost efficiency, achieve expected synergies and capture growthopportunities in various markets. Our success in growing our business will depend, in part, on ourability to anticipate and effectively manage these and other risks related to international operations.Any failure by us to effectively manage the challenges associated with the international operationscould materially adversely affect our results of operations, financial conditions, business performanceand prospects.
Our business is intensely competitive.
Our fund management business faces significant competition from other private funds,specialist investment funds, hedge fund sponsors, financial institutions, corporate buyers and otherparties. In particular, our fund management business faces competition in the pursuit of capital partnersand in seeking profitable investment opportunities, while ESR-REIT and new REITs that we maymanage or invest in in the future face competition primarily in acquiring additional properties. Inraising capital for the funds and investment vehicles we manage, we compete primarily on quality ofportfolio assets; investment performance; alignment of our interests to our capital partners’ interests;categories of products provided and scope of services; quality of services provided to and relationshipswith capital partners; level of fees and expenses charged for services; brand recognition; andtransaction execution skills. For acquisitions and investment opportunities, we compete primarily onprice; speed of execution; access to market information about suitable investment opportunities;payment terms; and access to capital, among other factors. For example, REITs generally requireunitholders’ approval to raise funds before completion of any acquisitions, and therefore may requirelonger completion periods as compared to private funds and corporate buyers.
Our logistics real estate business, which primarily comprises our operations in development andinvestment segments, faces competition from both global large-scale logistics facilities providers andsmaller-scale local players, primarily on our ability to acquire quality land and retain a quality anddiverse tenant base. Competition may also come from tenants such as large e-commerce players, whichmay choose to build up in-house warehousing capability or enter into new markets ahead of us.
A number of factors serve to increase our competitive risks:
Š some competitors are larger than us in terms of assets and revenue, and may have greatercapital resources, possess better quality assets, offer more comprehensive lines of productsand services, have stronger relationships with potential vendors and tenants, and haveconsiderably greater financial, technical and marketing resources than are available to us;
Š some competitors may have stronger land sourcing and execution capabilities, lowerdevelopment costs and higher development margins;
Š some competitors may have higher risk tolerances, different risk assessments or lowerreturn thresholds, which could allow them to consider a wider variety of investments andto bid more aggressively than us for investments that we want to make;
47

RISK FACTORS
Š corporate investors may be able to achieve synergistic cost savings with regard toinvestments in logistics properties that may provide them with a competitive advantage inbidding for such investments; and
Š the entry of new players in our markets.
In addition, if competitors sell assets similar to those that we intend to divest, we may not beable to dispose of our assets on favorable terms, or at all. Furthermore, if our competitors sell similarassets at lower prices than comparable assets held or managed by us, it may have an adverse impact onthe market value of these assets. Likewise, the existence of pricing competition for lettable propertiesmay have a material adverse impact on our ability to secure tenants for the Portfolio Assets atsatisfactory rental rates and on a timely basis. There is no assurance that we will be able to continuecompeting effectively in our industry. If we fail to compete effectively, it could have a material adverseeffect on our business, financial condition, results of operations, performance and prospects.
The returns from investments in the Portfolio Assets could be adversely affected by fluctuationsin the income generated from, and the value of, the Portfolio Assets and other factors, includingthe concentration of the Portfolio Assets in the logistics real estate sector.
Returns from investments in the Portfolio Assets depend largely upon the amount of incomegenerated from the Portfolio Assets as well as changes in the fair market value of the Portfolio Assets.Income generated from, and/or the fair market value of, the Portfolio Assets may be adversely affectedby a number of factors, including, without limitation:
Š the asset classes and quality of the Portfolio Assets;
Š overall economic conditions in regions where we operate, such as growth or contraction inGDP, consumer confidence or sentiment, employment trends, the level of inflation,foreign exchange rates, interest rates and the credit environment;
Š local real estate market conditions, such as the level of demand for, and supply of,logistics properties;
Š competitiveness of logistics properties supplied by other players with lower costs, superiorlocations, and better management skills and services;
Š changes in legal and regulatory frameworks and government guidance eliminatingfavorable policies of or imposing restrictions on real estate or logistics real estatedevelopments, leasings and maintenance, such as changes in environmental, tax, planning,tenancy or zoning laws or government guidelines;
Š reduced demand from tenants arising from factors including, but not limited to, theperception of tenants of the utility and convenience of the relevant Portfolio Asset, andchanges in building and system technologies, supply chain management, or local orregional infrastructure;
Š our ability to procure adequate management, maintenance or insurance;
Š the skills, management knowhow and professionalism of our management team and itsability to respond to changing market conditions;
Š our ability to negotiate rent on favorable terms and collect rent on a timely basis;
Š poor economic conditions resulting in tenants defaulting on leases or increases in vacancyrates;
48

RISK FACTORS
Š title defects affecting the Portfolio Assets which could affect the ability of the relevanttenants to operate out of such properties; and
Š external factors including major world events, such as war and terrorist attacks, andnatural disasters, such as floods and earthquakes.
In addition, other factors may adversely affect the values of the Portfolio Assets withoutnecessarily affecting their revenues and operating income, including potential environmental or otherlegal liabilities and unforeseen capital expenditures. As the funds and investment vehicles we managegenerally have limited operating history, and some have not yet realized returns for our capital partnersby selling fund assets, it is difficult to evaluate our investment performance and prospects. If we areunsuccessful in addressing any of the above-mentioned the risks or challenges associated with thePortfolio Assets, our business, prospects, financial condition and results of operations may bematerially and adversely affected.
Further, the funds and investment vehicles we manage and the logistics properties we own areconcentrated in the logistics real estate sector, and we intend to remain focused on the logistics realestate sector, which may entail certain industry-related concentration risks. During periods of difficultmarket conditions or slowdowns in this sector, the rental income generated by the Portfolio Assets and/or the capital value of such properties may decline, which may further reduce return from investmentof the Portfolio Assets.
Our business could be adversely affected by a fall in occupancy rates, an inability to pre-leaseproperties under development or lease completed properties on economically favorable terms, afailure to maintain our business relationships with our major tenants, or default by our tenants.
A significant portion of our revenue comprises: (i) rental income from the logistics propertieswe own; and (ii) income from our fund management business, which, to certain extent, is impacted bythe rental income of the logistics properties owned by the funds and investment vehicles we manage.As a result, our performance largely depends on our ability to pre-lease properties under development,to lease completed properties or to lease developed properties as the lease terms expire, oneconomically favorable terms. Our lease agreements typically require quarterly or monthly fixed raterent payments, and some of our agreements also require rent prepayments prior to completion of theproperty. Our leases are generally up for renewal every three to five years and the rents charged uponrenewals of leases are typically adjusted based upon then prevailing market rates. Accordingly, it ispossible to have a concentration of lease renewals or rent adjustments in a given year, and a slowdownin the rental market in a given year could adversely affect our rental income in that year. If a significantnumber of expiring or terminated leases are unable to be either promptly renewed (including leasesended pursuant to tenant lease break options), if we are not able to promptly re-let the area covered bysuch leases, if the rental rates upon renewal or re-letting are significantly lower than the current rates orif higher lease incentives are required in order to attract or retain tenants, our results of operations andcash flows would be adversely affected. If the pre-leased Portfolio Assets are not completed on time,the tenants of these pre-leased Portfolio Assets may be entitled to compensation for late delivery ormay be able to terminate their lease agreements with us and claim damages. Therefore, if we areunable to lease the completed Portfolio Assets, or pre-lease the Portfolio Assets under construction, orcomplete the pre-leased Portfolio Assets on time, our business, financial condition, results ofoperations, performance and prospects would also be adversely affected.
49

RISK FACTORS
In addition, the Portfolio Assets have several major tenants. For example, for our directly-owned properties, we generate a significant portion of our rental revenue from our five largest tenants.In 2016, 2017 and 2018 and for the six months ended June 30, 2019, rental revenue from the fivelargest tenants of our balance sheet properties accounted for approximately 40.7%, 25.8%, 17.4% and13.8%, respectively, of our total revenue. If one or more of those major tenants terminates or elects notto renew all or a significant portion of its or their leases and we are unable to promptly re-let the areacovered by such leases on terms (including rental levels) as favorable as those currently or thenexisting, our results of operations and cash flows would be adversely affected. Alternatively, we maybe forced to re-let the area covered by such leases to less creditworthy tenants which would expose usto a higher risk of tenant default in the future, which could materially adversely affect our results ofoperations and cash flows.
Further, tenants of the Portfolio Assets may at any time experience a downturn in their businessthat may weaken their financial conditions. Changes to local, regional and global economic conditionsor other internal or external factors may cause tenants of the Portfolio Assets to downsize or close theiroperations. As a result, tenants may relocate, fail to make rental payments when due, require arestructure of their lease terms, sub-lease the relevant properties to third parties in breach of the headlease term, declare bankruptcy or enter into liquidation, any of which may reduce cash flow from theirleases. In particular, the loss of a significant number of our tenants or major tenants of the PortfolioAssets may significantly reduce, both directly and indirectly, our future cash flows, rental income andfee income. In the event of default by a significant number of tenants or a default by any of the majortenants on all or a significant portion of their leases, we would suffer decreased rents and possiblyincur substantial costs in enforcing our rights as a landlord, which could have a material adverse effecton our business, results of operations and cash flows. Moreover, as many of the major tenants of thePortfolio Assets operate in correlated sectors such as e-commerce and 3PL, these tenants may beaffected by the same macro-economic factors within a region. The financial conditions of certain majortenants in one sector may also affect the tenants operating in another sector. As a result, thedeterioration in the performance of the Portfolio Assets due to the major tenants’ weakened financialconditions could have a material adverse effect on our business, results of operations and cash flows.
We may not be able to acquire land in desirable locations on commercially reasonable terms, andwe may be unable to complete acquisitions of property assets and successfully operate acquiredproperties.
The sustainable growth and success of our business significantly depend on our ability tocontinue acquiring land in desirable locations at commercially reasonable prices that are suitable forlogistics properties. Our ability to acquire land depends on a variety of factors, some of which arebeyond our control, such as overall economic conditions, the availability of land parcels offered byland owners or local governments, our effectiveness in identifying and acquiring land parcels suitablefor development or redevelopment, competition for such land parcels, which may be contentious andeven involve legal proceedings, and the time needed to obtain relevant government approvals.Furthermore, the rapid development of certain cities in which we conduct business in recent decadeshas resulted in a limited supply of undeveloped land in desirable locations and at reasonableacquisition costs. Land parcels located in convenient locations or connected by quality roads, highwaysand railroad access may command a premium price, which may exceed our budget. If we are unable toacquire suitable land parcels for future development or redevelopment in a timely manner or at termsthat generate reasonable economic returns to us, our business, financial condition, results of operations,performance and prospects may be materially and adversely affected.
50

RISK FACTORS
Further, we intend to continue to pursue acquisitions of property assets in the markets weoperate as opportunities arise. Such acquisitions involve a number of risks inherent in assessing thevalues, strengths, weaknesses and profitability of the property assets. While our policy is to undertakeappropriate due diligence in order to assess these risks, unexpected problems and latent liabilities suchas the presence of hazardous substances, such as asbestos, or other environmental liabilities, may occurwhich could limit our ability to complete such acquisitions or successfully operate an asset onceacquired. See “—Due diligence on acquisitions and investments, either by us or by the funds andinvestment vehicles we manage, may not reveal all relevant facts in connection with an acquisition oran investment, or identify all material defects or other deficiencies.”
Acquisition activities of property assets also include the following risks:
Š the acquired properties may not achieve anticipated rental rates or occupancy levels, ormay not be suitable for redevelopment;
Š assumptions or judgments with respect to financial returns (including the occupancy ratesand rents of a completed property) of acquired properties may prove inaccurate;
Š we may incur unintended or unanticipated capital expenditures in connection withacquisitions or the vendors of our acquired properties may breach their obligations to us;
Š we may abandon acquisition opportunities in respect of which we have incurred costs toexplore. In the normal course of business we enter into a number of non-binding MOUsfor land for our future acquisition or development but for which we have not entered intomaster investment agreements with regulatory authorities or private landowners. As of theLatest Practicable Date, we entered into a number of MOUs to acquire properties for ourbalance sheet representing GFA of approximately 2.6 million sq.m. in the PRC and MOUsto acquire properties for the funds and investment vehicles we manage representing GFAof approximately 5.9 million sq.m. across the PRC, Japan, South Korea, India andAustralia. We cannot assure you that all of these MOUs will result in completedtransactions;
Š we may experience difficulty in obtaining the requisite licenses, permits, authorization orapprovals from regulatory authorities, resulting in increases in development costs or delaysin project construction;
Š we may not be able to fully utilize land or property assets located in desirable locationsdue to restrictions on use or development; and
Š in relation to our interests in properties held through joint venture arrangements, necessaryjoint venture partner approvals in connection with operations or expansions, if applicable,may not be granted in a timely manner, or at all.
Any or all of the foregoing factors may affect our business, results of operations, financialcondition and future cash flows.
Our profitability may be affected by revaluation of the properties held on our balance sheet, aswell as the properties held by the funds and investment vehicles that we manage.
We measure our balance sheet properties initially at cost. Subsequent to initial recognition, weare required to reassess the fair value of the properties held on our balance sheet at every reporting datefor which we issue financial statements. The valuations will be based on market prices or alternative
51

RISK FACTORS
valuation methods, such as discounted cash flow analysis based on estimated future cash flows. Inaccordance with IFRS, we recognize changes to the fair value of the properties held on our balancesheet as a gain or loss (as applicable) in our consolidated statement of profit or loss in the period inwhich they arise. The fair value gains on the properties held on our balance sheet in 2016, 2017 and2018 and for the six months ended June 30, 2018 and 2019 were US$106.6 million, US$195.2 million,US$172.5 million, US$46.2 million and US$103.6 million, respectively, representing 110.2%, 127.4%,67.9%, 49.3% and 66.5% of our revenue for the respective periods. The profits attributable to ourequity holders may include gains and losses that arise from revaluation of the properties held on ourbalance sheet, which may be volatile. However, fair value gains on the properties held on our balancesheet would not change our cash position as long as these properties are held by us, and thus would notincrease our liquidity in spite of the increased profit. On the other hand, fair value losses on theproperties held on our balance sheet would have a negative effect on our results of operations, eventhough such losses would not change our cash position. The amount of revaluation adjustments havebeen, and may continue to be, significantly affected by the prevailing property market conditions andmay be subject to market fluctuations. There is no assurance that the fair value of the properties heldon our balance sheet will not decrease in the future. Any such decrease in the fair value of theproperties held on our balance sheet will reduce our profits, which in turn may have a material adverseeffect on our business, financial condition, results of operations, performance and prospects. Inaddition, we cannot assure you that we will be able to recognize comparable fair value gains on theproperties held on our balance sheet in the future and we may also recognize fair value losses, whichwould impact our results of operations for future periods.
Furthermore, properties held by the funds and investment vehicles we manage are also subjectto revaluation according to accounting standards that apply to them. The amount of revaluationadjustments have been, and may continue to be, significantly affected by the factors set forth in theparagraph above. We cannot assure you that we will be able to continue to recognize fair value gainson the properties held by the funds and investment vehicles we manage, which benefit our minorityinterests in the funds and investment vehicles we manage and our results of operations. From time totime, the funds and investment vehicles we manage may even experience fair value loss, which wouldimpact our results of operations for future periods.
Failure of our joint ventures to perform as anticipated could have a material adverse effect onour business, results of operations, financial condition and future cash flows.
We have significant investments in joint ventures from which we receive a share of profits. Ourinvestment in joint ventures amounted to US$526.1 million as of June 30, 2019 and our share of profitsand losses of joint ventures and associates was US$18.3 million for the six months ended June 30,2019. We may be exposed to special risks in the decision-making processes of our joint ventures ascertain corporate actions of our joint ventures require approval of all joint venture partners whilst ourjoint venture partners may have economic or business interests or goals that are inconsistent with oursand may take actions contrary to ours. As a result, we are generally not in a position to exercise soledecision-making authority with respect to these joint ventures, including with respect to dividendpolicies. If any of our joint ventures fail to perform as anticipated, or if for any reason, including theneed to retain cash for operations, any of our joint ventures are unable to declare any dividends, even ifthe share of profits of these joint ventures are consolidated into our accounts under equity accountingmethod, we may not receive cash payments for our share of profits on a timely basis, or at all, whichcould have a material adverse effect on our business, results of operations, financial condition andfuture cash flows. In addition, there is liquidity risk associated with our investments in our joint
52

RISK FACTORS
ventures. A disposal of our interests in our joint ventures is subject to certain pre-emptive rights on thepart of the other joint venture partners or certain other restrictions. As a result, a disposal of ourinterests in our joint ventures may require a longer time to complete, if at all, than a disposal of ourinvestments in publicly-listed companies or of our wholly-owned subsidiaries or assets. For moreinformation, see the section headed “Financial Information—Analysis of Selected ConsolidatedStatements of Financial Position Items—Investment in Joint Ventures” in this Prospectus.
Valuation methodologies for our financial assets at fair value through profit or loss and ourfinancial assets at fair value through comprehensive income may involve subjective judgmentsand/or may be subject to market volatility, which may result in changes in the fair values of thesefinancial assets.
As of June 30, 2019, our financial assets at fair value through profit or loss comprise unquotedequity investments estimated based on our share of the net asset value of the funds and investmentvehicles we manage. Our financial assets at fair value through profit or loss increased by US$221.5million from approximately US$140.6 million as of December 31, 2016 to approximately US$362.1million as of December 31, 2017, decreased by US$26.3 million from approximately US$362.1 millionas of December 31, 2017 to approximately US$335.8 million as of December 31, 2018 and thenincreased by US$169.1 million to approximately US$504.9 million as of June 30, 2019. We use ourjudgment to select a variety of methods and make various assumptions and estimates. Changes in theseassumptions and estimates could materially affect the respective fair value of these financial assets.Further, the valuation methodologies for the net asset value of the funds and investment vehicles takeinto consideration a range of factors including but not limited to the price at which an asset wasacquired, local property market conditions, values of comparable assets in the same market, andcurrent and projected operating performance, which involve a significant degree of managementjudgment and use of unobservable inputs, and may result in material adjustment to the carryingamounts of certain assets held by the funds and investment vehicles we manage. For more details, seeNote 49 “Fair Value Hierarchy of Financial Instruments” to “Appendix I—Accountants’ Report” tothis Prospectus. As there is significant uncertainty in the valuation of, or in the stability of the value of,the net asset value of the funds and investment vehicles we manage, the fair value measurement of ourfinancial assets at fair value through profit or loss as reflected in our share of the net asset value ofthese funds and investment vehicles are also subject to significant uncertainties and risks, which mayresult in volatility in our financial condition and results of operations.
In addition, as of June 30, 2019, our financial assets at fair value through other comprehensiveincome comprise listed equity investments in public companies listed on the SGX, ASX and theHKSE, of which the fair values are estimated based on their quoted prices on an active market.Although these are publicly traded companies, the prices of their securities may fluctuate significantly,which contribute to the uncertainties in valuation. Historically we did not record any financial assets atfair value through other comprehensive income in 2016 and 2017. However, due to our adoption ofIFRS 9, effective from January 1, 2018, we recorded financial assets at fair value through othercomprehensive income of approximately US$484.2 million as of December 31, 2018 as a result ofreclassification of certain items (which were previously classified as available-for-sale investments andfinancial assets at fair value through profit or loss) as equity instruments designated at fair valuethrough other comprehensive income. We recorded financial assets at fair value through othercomprehensive income of approximately US$469.0 million as of June 30, 2019. For more details, seethe paragraph headed “Financial Information—Analysis of Selected Consolidated Statements ofFinancial Position Items—Financial Assets at Fair Value through Other Comprehensive Income” in
53

RISK FACTORS
this Prospectus. Any change in the securities prices and market conditions could lead to the volatility inthe fair values of our financial assets at fair value through other comprehensive income, which couldfurther impact our financial condition and results of operation and may also impact our ability todispose of these financial instruments at favorable prices.
Fluctuations in our gains on disposal of subsidiaries, which may vary from period to period,could have a material adverse effect on our business, results of operations, financial conditionand future cash flows.
Gains on disposal of subsidiaries represents our gains from the sale of our equity interests insubsidiaries holding our investment properties. While we intend to continue disposing of our propertiesin implementing our capital recycling strategy, fluctuations in the timing of these transactions subjectsus to a risk that our income fluctuates from period to period. In the years ended December 31, 2016,2017 and 2018, we recorded gains on disposal of subsidiaries of US$32,000, US$38.3 million andUS$2.7 million, respectively. In the six months ended June 30, 2018, we did not dispose of anysubsidiary and for the six months ended June 30, 2019, we recorded gains on disposal of subsidiariesof US$16.5 million. Any fluctuations in our gains on disposal of subsidiaries could have a materialadverse effect on our business, results of operations, financial condition and future cash flows. Formore information, see the section headed “Financial Information—Principal Components of ourConsolidated Statement of Profit or Loss—Gain on Disposal of Subsidiaries” and Note 37 to theAccountants’ Report set forth in Appendix I to this Prospectus.
We may not be able to secure capital resources, either through equity or debt financing, oncommercially reasonable terms, or at all.
Our business, in particular the funds and investment vehicles we manage, requires substantialcapital investment. We have in the past financed our business and operations through internal cashflows, private equity fundraising, public bond offerings and commercial bank loans, among otherthings. We may, in the future, require additional financing to fund our capital expenditures to supportthe future growth of our business and/or to refinance our existing debt obligations. The funds andinvestment vehicles we manage may also require additional financing to fund or refinance theirexisting projects and complete profitable acquisitions. The funds and investment vehicles we managealso rely on additional financing in connection with capital called from our capital partners in order tomaintain target leverage ratios in our funds and investment vehicles.
Our ability to arrange external financing and manage the cost of such financing is dependent onnumerous factors, including general economic and capital markets conditions, interest rates, creditavailability from banks or other lenders, investor confidence in us, our own financial conditions, thesuccess of our business, provisions of relevant tax and securities laws, policies regarding regulation andcontrol of the logistics real estate markets where we operate, and political and economic conditions inthese markets. In addition, changes in the global financial markets have, in recent years, affected theavailability of financing and led to an increase in the cost of financing. We may consequently find itdifficult in the future to access the financial markets, which could in turn make it more difficult orexpensive to obtain funding. There can be no assurance that additional financing, either on a short-termor a long-term basis, will be made available or, if available, that such financing will be obtained on termsfavorable to us or the funds and investment vehicles we manage. If we fail to obtain adequate financingto fund our operations or the existing projects and proposed acquisitions of the funds and investmentvehicles we manage, our business, financial condition, results of operations, performance and prospectsmay be materially and adversely affected.
54

RISK FACTORS
Further, as our AUM is calculated taking into account the additional debt that will be incurredwith reference to the target leverage ratio of the relevant funds and investment vehicles we manage whenall capital is called and invested, if the funds and investment vehicles we manage are not able to achievethe target leverage ratios, our AUM may be materially and adversely affected. In addition, the inability torefinance our indebtedness or the indebtedness of the projects of the funds and investment vehicles wemanage at maturity, or meet our payment or redemption obligations or the payment or redemptionobligations of the funds and investment vehicles we manage, upon the occurrence of certain events suchas change of control, could adversely affect our cash flows, results of operations, financial conditions andreputation. In such circumstances, we may require additional equity financing, and the funds andinvestment vehicles we manage may require additional capital investment, which would be dependent onthe appetite and financial capacity of our shareholders and our capital partners. For further details of theequity financing risks relating to the funds and investment vehicles we manage, see “—Our capitalpartners in the funds and investment vehicles we manage with commitment-based structures may notsatisfy their contractual obligation to fund capital calls when requested by us, which could adverselyaffect the operations and performance of the funds and investment vehicles we manage” and “—We maynot be able to sustain our business relationships with existing capital partners and may fail to formrelationships with new capital partners, either of which may adversely affect our financial condition andresults of operations.” If we are unable to raise equity or debt financing or the funds and investmentvehicles we manage are not able to secure additional capital investment from capital partners, ourbusiness, financial condition, results of operations, performance and prospects will be materially andadversely affected.
In addition, our restricted cash, which is reserved for specific purposes, may be unavailable forgeneral corporate purposes. Further, we may be subject to foreign exchange controls that may adverselyaffect the ability to repatriate the income or proceeds of sale arising from the Portfolio Assets. See “—Weare subject to restrictions on the repatriation of funds in the PRC, South Korea and India” in this section.Accordingly, our ability to successfully execute our business strategy and maintain our operationsdepends on our ability to continue to maintain sufficient liquidity, cash and available credit under ourcredit facilities. If we do not maintain sufficient liquidity, our ability to meet our payment obligations tocreditors or to borrow additional funds may become impaired, and our business, financial condition andour results of operations may be materially and adversely affected.
Covenants in our credit agreements limit the flexibility of our operations and breaches of thesecovenants could adversely affect our financial condition.
The terms of our various credit arrangements require compliance with a number of bothrestrictive and financial covenants, including, among others, negative pledges, interest coverage ratios,leverage covenants, limitations on the incurrence of indebtedness, restrictions on the distributions toshareholders and requirements to provide notice or obtain consent for certain significant corporateevents. These covenants could limit the flexibility of our operations. For example, some of oursubsidiaries are subject to covenants that restrict them from distributing dividends, restructuring,transferring material assets, liquidating or changing their shareholding or management structure. Inaddition, borrowings under certain loan agreements between our subsidiaries and banks or otherfinancial institutions are not allowed to be used for purposes other than the development of the projectsspecified in the agreements. Moreover, some of the loan agreements that we have entered into containfinancial covenants that require us and/or our subsidiaries to maintain specified financial ratios. See thesection headed “Financial Information—Indebtedness” in this Prospectus. Breaches of these covenantscould result in defaults under the instruments governing the applicable indebtedness and the
55

RISK FACTORS
acceleration of repayment of such indebtedness. Certain of our credit agreements also contain cross-default or cross-acceleration provisions that would permit the lenders thereunder to acceleraterepayments of indebtedness in the event of a default or acceleration of repayment of other materialindebtedness. Any breaches of such covenants could have a material adverse effect on our business,financial condition, results of operations, performance and prospects.
Dependence on leverage for investments made by us and by the funds and investment vehicles wemanage could expose us to interest rate risks and adversely affect us.
We use leverage on investments made by us and by the funds and investment vehicles wemanage. Our ability to achieve attractive yields and rates of return on our balance sheet investmentsand the investments of the funds and investment vehicles we manage may depend on our continuedability to access sufficient sources of debt financing at attractive or acceptable rates. Due to the use ofleverage, indebtedness may constitute a majority of the asset value of certain Portfolio Assets, and mayconstitute a majority of the asset value of future properties that we acquire. An increase in either thegeneral levels of interest rates or in the risk spread demanded by sources of financing would make itmore expensive to finance those investments.
Leveraged investments are inherently more sensitive to declines in revenue, increases inexpenses and interest rates and adverse economic, market and industry developments. The incurrenceof a significant amount of indebtedness by us or the funds and investment vehicles we manage could,among other things:
Š give rise to an obligation to make mandatory prepayments of debt using excess cash flows,which might limit our ability or the ability of the funds and investment vehicles wemanage to make unplanned but necessary capital expenditures or to take advantage ofgrowth opportunities;
Š limit our ability or the ability of the funds and investment vehicles we manage to adjust tochanging market conditions, thereby placing us or the funds and investment vehicles wemanage at a competitive disadvantage;
Š limit our ability or the ability of the funds and investment vehicles we manage to engage instrategic acquisitions that might be necessary to further expand our business or generatefurther growth; and
Š limit our ability or the ability of the funds and investment vehicles we manage to obtainadditional financing or increase the cost of obtaining such financing, including for capitalexpenditures, working capital or general corporate purposes.
Our profitability may be affected by our finance costs.
We fund our business operations, including our balance sheet investments, through internallygenerated funds and external financing, including private equity fundraising, public bond offerings andcommercial bank loans, among other things. For details, see the section headed “FinancialInformation—Indebtedness” in this Prospectus. As a result of our financings, we record significantfinance costs. In 2016, 2017 and 2018 and for the six months ended June 30, 2018 and 2019, weincurred finance costs of US$56.0 million, US$90.9 million, US$104.9 million, US$45.9 million andUS$83.4 million, respectively, which were more than the net cash generated from our operatingactivities of approximately US$22.0 million, US$36.4 million, US$79.3 million, US$23.3 million andUS$14.4 million, respectively.
56

RISK FACTORS
Some of our outstanding borrowings are subject to floating rates. As commercial banks in thePRC link the interest rates on their bank loans to benchmark lending rates published by the People’sBank of China, any increase in the benchmark lending rates will increase the interests expenses andfinance costs related to our developments. To the extent the governments in the countries where weoperate slow the development of the real estate sector by increasing lending rates to the sector, our costof financing may be adversely affected. As such, any increase in interest rates offered to us maysignificantly impact our results of operations. Additionally, a general increase in the demand for loansin the countries where we operate may increase applicable interest rates, resulting in additional interestcosts for us. If we are not able to negotiate lower financing costs, our net profit and results ofoperations may be materially and adversely affected by our total financing costs and interest expenses.
Our capital partners in the funds and investment vehicles we manage with commitment-basedstructures may not satisfy their contractual obligation to fund capital calls when requested by us,which could adversely affect the operations and performance of the funds and investmentvehicles we manage.
The funds and investment vehicles we manage rely heavily on capital investment from ourcapital partners. Our capital partners make capital commitments to the funds and investment vehicleswe manage during the respective commitment periods as prescribed in the organizational agreementsfor the funds and investment vehicles we manage, and we, as the general partner or the investmentmanager, on behalf of such funds and investment vehicles, are entitled to call capital from those capitalpartners at any time during such periods. We depend on capital partners fulfilling their commitmentswhen called to fund, investments and otherwise fulfill their obligations when due. To date, we have nothad any capital partners fail to honor capital calls to any meaningful extent. A capital partner that doesnot fund a capital call will be subject to several possible penalties, including having a significantamount of its existing investment in that fund or investment vehicle forfeited, losing its right to appointdirectors or committee members of that fund or investment vehicle, or risking its shares being called bynon-defaulting shareholders at a discounted price. However, the impact of these penalties can belimited. For example, the investment forfeiture may be less meaningful if a capital partner has little orno prior capital investment and the forfeiture occurs early in the life of the fund or investment vehicle.Capital partners may in the future also negotiate for fewer or reduced penalties in the organizationalagreements of the fund or investment vehicle, thereby reducing the enforceability of a capital call. Inaddition, we have a certain level of concentration of major capital partners, which increases our riskexposure if any of the major capital partners were to default. If our capital partners were to fail tosatisfy a significant amount of capital calls for any particular fund or investment vehicle, the operationand performance of such fund and investment vehicle could be materially and adversely affected and/or an intended investment may not be able to be made, which could further have a material adverseeffect on our management fee income, business, financial condition, results of operations, performanceand prospects.
We may not be able to sustain our business relationships with existing capital partners and mayfail to form relationships with new capital partners, either of which may adversely affect ourfinancial condition and results of operations.
Our business depends on our ability to maintain relationships with our existing capital partnersand form relationships with new capital partners. Under certain of the development funds andinvestment vehicles we manage, our capital partners have the right to initiate the sale of certain assetswhen they are stabilized. While we have a right of first offer to acquire such assets, we may not have
57
RISK FACTORS
the capital on our balance sheet or in the core/core-plus funds and investment vehicles we manage todo so, which could have an adverse effect on our AUM and non-transaction based management feeincome, and further affect our business, financial condition and results of operations. Our developmentfunds and investment vehicles cease to have the right to call capital from our capital partners for newprojects that have not been identified and approved by the expiration of the commitment period. Also,our capital partners may choose not to continue to invest with us, either in new development or core/core-plus funds and investment vehicles we seek to set up, upon the winding down of the developmentfunds and investment vehicles in which they have originally invested. In addition, we may fail to formrelationships with new capital partners and, as a result, fail to diversify capital sources other than fromour current capital partners. While we have not experienced any forced sale of assets under our fundsand investment vehicles or any material redemption by our capital partners with respect to theirinvestments during the Track Record Period and up to the Latest Practicable Date, if any of theforegoing occurs, our business, financial condition, results of operations, performance and prospectsmay be materially and adversely affected.
We possess certain management rights under investment management agreements as part of ourfund management business. The organizational agreements of the funds and investment vehicles wemanage may contain provisions such as capital partner exit provisions or allow capital partners toresolve to remove us as the investment manager. Similarly, certain of our partnership agreementscontain provisions allowing capital partners to resolve to remove us as the general partner. Each of thefunds and investment vehicles we manage has provisions concerning the replacement of the investmentmanager and general partner in certain circumstances. Our material default or underperformance withrespect to the funds and investment vehicles we manage may give rise to risks that the investmentmanager mandates can be canceled or otherwise changed, and that we may have to indemnify the fundsand investment vehicles we manage for certain losses incurred, subject to certain conditions. Inaddition, certain of our investment management agreements include a cross-termination provision that,if we cease to be the investment manager or general partner of certain funds, the investmentmanagement agreements of other investment vehicles which co-invest alongside such funds may beautomatically terminated. While we have not experienced any of the forgoing events during the TrackRecord Period and up to the Latest Practicable Date, if any of the foregoing were to occur, ourbusiness, financial condition, results of operations, performance and prospects may be materially andadversely affected.
Our capital partners may demand better commercial terms or lower fees under certaincircumstances.
We earn fee income and promotes from managing funds and investment vehicles, as well as theassets under the funds and investment vehicles on behalf of our capital partners. Our fees include basemanagement fees, asset management fees, acquisition fees, development fees and leasing fees. We alsoparticipate in a disproportionate share of profits through promote upon exceeding a pre-determinedtarget IRR and after our capital partners have received their targeted capital returns. In 2016, 2017 and2018 and for the six months ended June 30, 2018 and 2019, our management fee income amounted toUS$46.5 million, US$94.3 million, US$135.6 million, US$59.0 million and US$61.8 million,respectively, accounting for approximately 48.0%, 61.5%, 53.4%, 63.0% and 39.7%, respectively, ofour total revenue. Our management fees are negotiated on a case by case basis under the organizationalagreements of the funds and investment vehicles we manage, which generally have a term of more thanseven years. Because base management fees are a percentage of either committed capital or portfoliovalue at the outset of a fund’s commitment period and subsequently a percentage of invested capital
58

RISK FACTORS
after the expiration of a fund’s commitment period, the level of base management fees we earndepends almost exclusively on the percentage we are able to negotiate with our capital partners, whichgenerally ranges from 1% to 2%.
Our capital partners may demand better commercial terms or lower fees under certaincircumstances, such as decreases in the prevailing market rates of management fees, increases in thesupply of competing services at more favorable terms, poor performance of investment funds andvehicles, or deteriorating economic conditions. Under such circumstances, fundraising conditions forthe funds and investment vehicles we manage are likely to be challenging and pressures by capitalpartners for lower fees, different fee sharing arrangements or fee concessions may increase. If we areunable to agree to terms, which may be less favorable to us, we may lose capital support from ourcapital partners. In addition, certain arrangements with our capital partners contain highly customizedterms: for example, certain capital partners may be entitled to discounts to management feeschargeable or one-off rebates in the event of a budget overrun, and limited sharing of management feesif certain capital partners successfully introduce qualified new capital partners to the funds orinvestment vehicles managed by us. As a result of the foregoing, we may not be able to collect the fullamount of management fees that we would otherwise be entitled to, which would affect ourmanagement fee income, financial condition, results of operations and performance.
As part of our business, we encounter conflicts of interest, and a failure to identify, address andresolve such conflicts of interest could adversely affect our business.
We develop logistics property assets owned directly by us and owned by the developmentfunds and investment vehicles we manage. We also provide investment and asset management servicesto the funds and investment vehicles we manage. From time to time as part of our business model, weacquire and sell logistics property assets both for our own balance sheet and for the development fundsand investment vehicles we manage. We have in the past and expect in the future to encounter conflictsof interest including, but not limited to, the following situations:
Š our fiduciary and contractual obligations to our capital partners in the funds andinvestment vehicles we manage may preclude us from pursuing investment opportunitiesfor our own balance sheet;
Š conflicts may arise among the funds and investment vehicles we manage as to which fundor investment vehicle is allocated a certain investment opportunity;
Š conflicts may arise in allocating time, services, expenses, personnel and financial or otherresources: (i) between the investment activities of the funds and investment vehicles wemanage, on the one hand, and of our balance sheet, on the other hand; or (ii) among theinvestment activities of the funds and investment vehicles we manage;
Š conflicts may arise in our capital recycling strategy, through which the funds andinvestment vehicles we manage may seek to effect a purchase or sale of an asset from or toone or more of the other funds or investment vehicles we manage (such as the sale of anasset from a development fund to a core fund), or we may seek to effect a purchase or saleof an asset on our balance sheet from or to a fund or investment vehicle we manage.Because we undertake various roles simultaneously in such transactions (such as theowner and seller of the asset as well as the investment manager of the fund or investmentvehicle which purchases the asset, or the investment manager of the fund or investmentvehicle which sells the asset and the investment manager of the fund or investment vehicle
59

RISK FACTORS
that purchases the asset), and there is no open market bid to substantiate the purchase priceof the relevant asset, there may be a conflict between our interests and the interests of ourcapital partners, as well as a conflict between the interests of capital partners of differentfunds; and
Š conflicts may arise with respect to our rights to receive fees or other compensation inconnection with specific transactions. For example, we earn acquisition fees (whichtypically range from 0.5% to 1.75% of the cost of properties) for the sale of properties heldby our development funds to the core/core-plus funds or investment vehicles we manage.As we negotiate on both sides with respect to such sale, conflicts may arise as we try tomaximize the acquisition fees we earn and represent the interests of different capitalpartners simultaneously.
In addition to the organizational agreements of the funds and investment vehicles we manage,we have a conflicts of interest policy in place to help us identify, address and resolve such conflicts,including to help us determine the allocation of investment opportunities between us and the funds andinvestment vehicles we manage, and among the funds and investment vehicles we manage. For moreinformation on these procedures, see the section headed “Business—Fund Management—FundInvestment Process” in this Prospectus. However, it is difficult to identify, address and resolve all suchpotential, perceived or actual conflicts of interest. Our procedures may fail to identify all conflicts orfail to effectively resolve conflicts and/or the perception of conflicts. We may not be able to resolve allconflicts in a way suitable to us or to our capital partners. If we fail to identify, address and resolveconflicts, our business and our reputation may be damaged. The willingness of capital partners to enterinto agreements with us or invest in the funds or investment vehicles we manage may be adverselyaffected if we fail, or appear to fail, to deal appropriately with conflicts of interest or fulfill ourfiduciary and contractual obligations. Conflicts of interest not properly addressed and/or resolved couldgive rise to claims by and liabilities to capital partners, litigation or enforcement actions. As a result,we may be obligated to bear legal, settlement and other costs. If we are unable to effectively manageconflicts of interest, we may not be able to carry on with our capital recycling strategy, and ourbusiness, financial condition, results of operations, performance and prospects could be materiallyadversely affected.
The organizational agreements of the funds and investment vehicles we manage includeprovisions that constrain our ability to take certain actions without the approval of our capitalpartners, including with respect to investment opportunities.
We have partnered with respect to, or acquired interests in, funds and investment vehicles wemanage to acquire logistics property assets. Cooperation and agreement among us and our capitalpartners on the acquisition of logistics property assets is critical for the operation and financial viabilityof the funds and investment vehicles we manage. Certain actions or decisions of the funds andinvestment vehicles we manage may require approval of all shareholders or partners, and the relevantshareholders agreements, partnership agreements or platform framework agreements with our capitalpartners include provisions that constrain our ability to take certain actions, including the incurrence ofcapital expenditures exceeding certain amounts, sale of assets exceeding certain values and incurrenceof indebtedness exceeding certain limits. These arrangements may involve certain risks associated withthe possibility that our capital partners may:
Š have economic or business interests or goals that are inconsistent with each other or ourown and act in a manner that does not serve our interests or goals;
60

RISK FACTORS
Š take actions contrary to the instructions or requests of us or contrary to our policies orobjectives with respect to our investments;
Š vote on business, financial or management decisions with which we do not agree;
Š be unwilling to fulfill their obligations or unable due to financial or other difficulties; or
Š have disputes with us as to the scope of their and our responsibilities and obligations, andwith regard to the performance of their or our obligations.
In particular, our capital partners may disagree as to whether to invest in investmentopportunities we have identified due to their different perception of the risk-return profile of the assetsand they may exercise veto rights pursuant to the relevant shareholders agreements, partnershipagreements or platform framework agreements. As we typically do not hold a majority interest in mostof the funds and investment vehicles we manage, we may not be able to proceed with certaininvestment opportunities and our ability to efficiently deploy resources to take advantage of newinvestment opportunities in a timely and efficient manner may be restricted. Further, we may not beable to effectively implement our capital recycling strategy if the sale of assets from our own balancesheet assets to funds or investment vehicles we manage or sales between the funds and investmentvehicles we manage are vetoed by our capital partners.
If we were to have a significant disagreement with our capital partners, such disagreement mayhave a material adverse effect on our reputation and the success of the funds and investment vehicleswe manage. In addition, a disposal of our interests in a fund or investment vehicle is subject to certainpreemptive rights on the part of the other capital partners or certain other contractual restrictions. As aresult, a disposal of our interests in a fund or investment vehicle may require a longer time to complete,if at all, than a disposal of a wholly-owned asset. If any of the foregoing occurs, our business, financialcondition, results of operations, performance and prospects will be materially and adversely affected.
Our business and the funds and investment vehicles we manage require significant upfrontinvestment, and we and the funds and investment vehicles we manage may experience lower thanexpected returns on such investment.
Our business involves developing logistics properties on our balance sheet and through thefunds and investment vehicles we manage. Developing logistics properties requires significant upfrontinvestment. In 2016, 2017 and 2018 and for the six months ended June 30, 2018 and 2019, we incurredcapital expenditures to develop the logistics properties on our balance sheet of US$235.7 million,US$328.9 million, US$646.4 million, US$423.3 million and US$962.7 million, respectively. Inaddition, we have made equity capital investments to the funds and investment vehicles we manage.We also hold investment interests in ESR-REIT. We and the funds and investment vehicles we managemay experience lower returns on our investments, including on our equity capital investments, due to anumber of reasons, many of which are beyond our control, including the overall economic conditionsin the markets in which we operate, increase in interest rates or construction costs, delays in obtaininggovernmental permits and authorizations, default by counterparties with respect to the obligation toreturn cash deposits for land transactions in the event they are terminated, competition from otheravailable logistics facilities and new entrants into the logistics real estate market, fluctuation of rentalrates and variable operating costs and any downward cycle of the industries in which our existing andprospective tenants operate. If we fail to identify, attract and retain tenants for the Portfolio Assets, wewill not be able to generate any operating cash flow from these properties to recover the significantupfront investment in our business and/or in the funds and investment vehicles we manage, which
61

RISK FACTORS
could have a material adverse effect on our business, financial condition, results of operations,performance and prospects. We also have investments in companies we do not manage, includingCenturia in Australia, CNLP in Hong Kong and others. There is no assurance that these investmentsmay experience expected or higher than expected returns.
We may not be able to complete the development or redevelopment of the Portfolio Assetsaccording to our budget, on time, or at all.
Depending on the market and property type, it typically takes us approximately 12 to 24 monthsto develop, from land acquisition to stabilization, the Portfolio Assets. As a result, our cash flows andresults of operations may be significantly affected by our property development or redevelopmentschedules and any changes to those schedules may affect our development or redevelopment budgets.The schedules and the budgets of our property developments or redevelopments depend on a numberof factors, including regulatory approvals, project financing, and performance of third-partycontractors. In particular, if we fail to obtain or maintain various approvals, licenses and permits thatare required for the development or redevelopment of Portfolio Assets, we may be subject to fines,suspension of construction work, and/or other liabilities arising from such non-compliance, whichcould delay our construction schedule, incur significant expenses and divert substantial managementtime to rectify these incidents. Other specific factors that could adversely affect our propertydevelopment or redevelopment schedules and budget include, but are not limited to:
Š changes in market conditions, economic downturns, and decreases in business andconsumer sentiment in general;
Š shortage of capital;
Š changes in relevant regulations and government policies, including environmental andzoning laws;
Š relocation of existing tenants and/or demolition of existing constructions;
Š shortages of materials, equipment, contractors and skilled labor;
Š labor disputes of third-party subcontractors;
Š construction accidents;
Š construction failures caused by unforeseen engineering, design, quality, environmental, orgeological problems;
Š breach of contractual obligations or unsatisfactory performance by third-party contractors;
Š unforeseen costs or delays resulting from errors in judgment on the selection andacquisition criteria for potential sites; and
Š natural catastrophes and adverse weather conditions.
Construction delays, or failure to complete the construction of a logistics property according toits planned specifications, schedule and budget may harm our reputation and lead to loss of, or delay inrecognizing, revenue and lower returns on our capital investment. In addition, cost overruns mayentitle some of our capital partners to claim waivers from paying base management fees chargeable inrespect of capital commitments invested in projects which exceed the original approved budgets ofsuch projects. As a result, we may not be able to collect the full amount of base management fees thatwe are originally entitled to, which may adversely affect our management fee income. We cannot
62

RISK FACTORS
assure you that we will not experience any significant delays or cost overruns in completing logisticsproperties in the future, which could have a material adverse effect on our business, financialcondition, results of operations, performance and prospects.
Our Portfolio Assets rely on the transportation infrastructure and connectivity of thesurrounding areas.
Infrastructure support, particularly public roads, highways and railroad access, is critical to thefunctioning of the Portfolio Assets and future development of logistics properties on our balance sheetor under the funds and investment vehicles we manage. There can be no assurance that certaingovernment development plans will be executed in a timely manner, or at all. This may depend on thelevel of investment by the relevant government in the infrastructure support, which historically hasvaried in the countries in which we operate. If the transportation infrastructure surrounding thePortfolio Assets is not established in time, or at all, or adequately maintained, we may not be able toattract tenants for the Portfolio Assets or may even lose tenants, which may have a material adverseeffect on the valuation of the Portfolio Assets. In particular, e-commerce and 3PL tenants attachsignificant importance to infrastructure support of surrounding areas, such as roads or expresswaysadjacent to urban areas. Failure to lease out the Portfolio Assets due to poor infrastructure support willmaterially and adversely affect our business, and we might not achieve the expected return on ourinvestment. Furthermore, as the urban areas in the markets where we operate continue to develop,existing transportation infrastructure and traffic conditions surrounding the Portfolio Assets maydeteriorate, or become unattractive in light of other or new transportation links, which in turn mayrender the location of the Portfolio Assets undesirable from our tenants’ perspective and lead to earlytermination or non-renewal of their leases or renegotiation of rentals. In addition, a lack ofinfrastructure support in the countries into which we aim to expand could negatively impact our abilityto do so. Any such occurrence may have a material adverse effect on the valuation of the PortfolioAssests as well as our business, financial condition, results of operations, performance and prospects.
We depend on our senior management team and certain key senior personnel as well as skilledemployees.
Our success largely depends upon the continued service and performance of our seniormanagement, key personnel as well as skilled employees. In particular, our senior management hasbeen crucial to the development of our business, culture and growth strategies. If we lose the servicesof any member of our senior management, we may not be able to locate suitable or qualifiedreplacements, and may incur additional expenses to recruit replacements, which could severely disruptour business and impede our growth. Although we generally have non-compete arrangements in placefor our senior management, if any member of our senior management joins a competitor or forms acompeting business, we may lose know-how and business relationships with tenants, capital partnersand key third parties such as principal banks and contractors. Further, pursuant to certain agreementsexecuted in connection with certain of the funds and investment vehicles we manage, certain seniormanagement and local management are identified as “key persons” under key person clauses. If any ofthem ceases to devote substantially all of their business time to activities directly or indirectlybenefitting the projects held by these fund or investment vehicles during the specified commitmentperiod, our capital partners may have the option to terminate these agreements. The departure of thesekey management personnel may therefore impact our business both from the loss of their servicesgenerally, as well as the continuation of these funds and investment vehicles. Such “key person”clauses may also restrict what the relevant individuals could do in the broader context of our business.
63

RISK FACTORS
Certain funds and investment vehicles we manage are subject to change of control clauses that aretriggered when certain key persons cease to hold a specified amount of ownership or voting rights inthe relevant vehicles. If any of the foregoing were to occur, our business, financial condition, results ofoperations, performance and prospects may be materially and adversely affected.
We have experienced significant growth in recent years and as a consequence require morepersonnel with specific skill-sets as we continue to expand our operations. In particular, as we expandinto new markets, we may require the expertise of individuals with relevant knowledge of the localmarket as well as an understanding of our international business. However, competition for talent isintense, especially for those who have the relevant skill-sets and experience in the industry. We cannotassure you that key personnel and skilled employees will always choose to stay with us. The loss ofany of these key personnel or skilled employees, or the inability to attract and retain talent, could havea material adverse effect on our business, financial condition, results of operations, performance andprospects.
Due diligence on acquisitions and investments, either by us or by the funds and investmentvehicles we manage, may not reveal all relevant facts in connection with an acquisition or aninvestment, or identify all material defects or other deficiencies.
Before making acquisitions and investments, either by us or by the funds and investmentvehicles we manage, we generally conduct due diligence that we deem reasonable and appropriatebased on the facts and circumstances applicable to each acquisition or investment. When conductingdue diligence and making an assessment regarding an acquisition or an investment, we rely on theresources available to us, including information provided by the target of the acquisition or investmentor seller of a property and, in some circumstances, third-party investigations. As part of the duediligence process, we may be required to evaluate important and complex business, financial, tax,accounting, environmental and legal issues. Third party property appraisers, market consultants, legaladvisors, accountants and financial advisors may be involved in the due diligence process in varyingdegrees depending on the type of acquisition or investment. However, due diligence information ormaterials prepared by these third parties or the due diligence investigation that we will carry out withrespect to any acquisition or investment opportunity may not reveal or highlight all relevant facts thatmay be necessary or helpful in evaluating such acquisition or investment opportunity. Public searchesmay not be available in certain jurisdictions and, even if they are available, such searches may havelimited details or may not be up-to-date. In addition, even if our due diligence uncovers certain issueswith respect to the acquisition, such as ongoing litigation affecting the target, we may decide toproceed with the acquisition due to strategic reasons. This could result in, among other things,management time and expenditure to resolve the outstanding issues. Finally, our acquisitions orinvestments, or the investments we make on behalf of the funds and investment vehicles we managemay not perform as expected.
In addition, although we believe that reasonable due diligence investigations with respect to thePortfolio Assets have been conducted prior to acquisition by us or by the funds and investmentvehicles we manage, there is no assurance that the Portfolio Assets will not have defects or deficienciesrequiring repair or maintenance (including design, construction or other latent property or equipmentdefects or asbestos contamination) which may require additional capital expenditures, special repair ormaintenance expenses. Further, the experts’ due diligence reports that we rely upon as part of our duediligence process may be subject to inaccuracies and deficiencies. This may be because certainbuilding defects and deficiencies are difficult or impossible to ascertain due to limitations inherent in
64

RISK FACTORS
the scope of the inspections, the technologies or techniques used, data forgery by engineering firms andother factors. As such, it is practically impossible or difficult to detect defects or deficiencies inproperties through a due diligence process and there is no guarantee that the Portfolio Assets bear nodefects in relation to the installation piles or other equipment used for construction. Such undisclosedand undetected defects or deficiencies, if any, may require significant capital expenditures or triggerrepair and maintenance obligations to our tenants and involve significant and unpredictable patternsand levels of expenditure or reduction in rental income during the repair process which may have amaterial adverse effect on our business, financial condition, results of operations, performance andprospects.
We may face difficulties in realizing the benefits of any acquisitions and successfully integratingacquired businesses.
Some of our historical acquisitions have been transformative to our business. See the sectionsheaded “Business—Competitive Strengths and Strategies—Competitive Strengths—We have a provenability to grow organically and to execute opportunistic M&A transactions to expand our capabilities,broaden the scope of the Portfolio Assets, and support our growth in the logistics real estate industry”and “History, Development and Corporate Structure—Major Acquisitions and Mergers” in thisProspectus. We may in the future continue to evaluate potential acquisition opportunities and pursueacquisitions of major businesses.
Prior to completing any acquisitions, we identify expected synergies, cost savings and growthopportunities. However, due to legal, regulatory and business limitations, we may not have access toall necessary information and, as a result, will face the operational and financial risks inherent in suchacquisitions. The integration process, particularly in connection with a transformative acquisition, maybe complex, costly and time-consuming. The potential difficulties of integrating the operations of anacquired business and realizing our expectations for an acquisition, including the benefits that may berealized, include, among other things:
Š failure to implement the business plan for the combined business;
Š delays or difficulties in completing the integration of acquired companies or assets,including unanticipated issues in integrating logistics, information, communications andother systems;
Š higher than expected costs, lower than expected cost savings and/or a need to allocateresources to manage unexpected operating difficulties;
Š unanticipated changes in the combined business due to potential divestitures or otherrequirements imposed by antitrust regulators;
Š failure to maintain the continuity or assimilation of operations or employees;
Š retaining key tenants, suppliers and employees;
Š retaining and obtaining required regulatory approvals, licenses and permits;
Š diversion of the attention and resources of management;
Š assumption of liabilities not identified in due diligence;
Š difficulties in establishing and maintaining effective internal controls;
65

RISK FACTORS
Š potential litigations from existing shareholders for any deficiencies in due diligenceprocess and overpriced considerations; and
Š other unanticipated issues, expenses and liabilities.
Any such acquisition, or the failure to complete any future intended acquisition, may have amaterial adverse impact on our business, financial condition, results of operations, performance andprospects. For example, to ensure the smooth integration of our business and an acquired business andto create synergies for each other, a certain degree of optimization and integration will be required withrespect to tenant resources management, marketing, technical research and development, financialaccounting and human resources management of us and the acquired business. However, it is uncertainwhether such integration can be successfully implemented, if at all. If the relevant risks of suchintegration are not properly managed or the expected benefits of an acquisition fail to materialize, thepost-acquisition business may risk losing key employees, senior management team and/or tenantrelationships, which may have a material and adverse effect on our business, financial condition,results of operations, performance and prospects.
In August 2018, we acquired CIP, a property development group that provides constructionservices in Australia. In addition to the risks and uncertainties generally associated with ouracquisitions, some of which are identified in the preceding paragraphs, our acquisition of CIP presentsrisks and uncertainties which are unique to that transaction, including the possibility that we may facedifficulties in integrating CIP’s construction operations and realizing the expected benefits from theacquisition as we have not historically engaged in the construction business. Furthermore, because therevenue model for CIP’s construction business is different from our existing model, we expect theoperating results of CIP to have a significant impact on our revenue mix and cost of sales goingforward. Historically, CIP had a lower gross margin than we had, and this will have an adverse impacton our gross margin going forward. We cannot assure you that CIP will perform consistently with ourexpectations or that we will be able to successfully execute our business strategy with respect to CIP.Our failure to address these risks or other problems encountered in connection with our acquisition ofCIP may have a material and adverse effect on our business, financial condition, results of operations,performance and prospects.
We completed the Sabana Manager Acquisition in June 2019, and we may face difficulties inintegrating Sabana Manager’s business into our operations and realizing the expected benefits from theacquisition, which may have a material adverse effect on our business, financial condition, results ofoperations, performance and prospects. See the section headed the section headed “History,Development and Corporate Structure—Major Acquisitions and Mergers—Sabana ManagerAcquisition and Sabana REIT Investment” in this Prospectus for further information.
For more information on the risks related to our acquisition of Propertylink, see the paragraphheaded “—We may not realize the expected benefits of our acquisition of Propertylink” in this section.
We may not realize the expected benefits of our acquisition of Propertylink.
We intend to employ Propertylink as part of our strategy to build up and strengthen ourAustralian platform. See the section headed “Summary—Recent Developments—MaterialDevelopments—New Australia Fund” in this Prospectus. We are committed to long term investment inlogistics real estate in the Australian market. Our acquisition of Propertylink, like our acquisition ofCIP, is part of our focus on value creation which involves expanding our Australian operations and
66

RISK FACTORS
identifying accretive acquisition targets, both as an owner of property and a fund, asset and propertymanager.
Our valuation of Propertylink, and the consideration offered under the Propertylink Offer (asdefined in the section headed “History, Development and Corporate Structure—Major Acquisitionsand Mergers—Propertylink Acquisition” in this Prospectus) of AUD1.20 per Propertylink security(which includes the ability for Propertylink securityholders to receive an interim distribution ofAUD0.036 per Propertylink security), was determined based on, among other things, our estimation oftheir value, the publicly listed price of Propertylink securities and the negotiation processes with thePropertylink board. However, our valuation may not be entirely accurate, due to various factors such asour lack of full access to all the financial materials of Propertylink prior to the acquisition, and thepossibility that the assumptions we made in our evaluation prior to the acquisition do not align withPropertylink’s actual performance in the future.
If the anticipated benefits of our acquisition of Propertylink are not realized or if we are unableto address the risks related to its business, its business, financial condition, results of operations,performance and prospects may suffer and our investment in Propertylink may be at risk.
Those risks specifically associated with Propertylink and its business include the following:
Š Capital losses: Propertylink has carried forward net capital losses which are available to beutilized against net capital gains in future income tax years. Given that we have acquired100% of Propertylink securities, Propertylink may fail the continuity of ownership test,which means that Propertylink may not be able to utilize its carried forward net capitallosses unless it satisfies the same business test during the relevant period;
Š MIT status: Given that we have acquired 100% of Propertylink securities, a consequenceof the ownership structure of the three entities that comprise Propertylink is that they maycease to satisfy the requirements to be a ‘Managed Investment Trust’ (“MIT”) in respectof future income tax years. Consequently, distributions made by Propertylink Trust (“PT”)and Propertylink Australian Industrial Partnership (“PAIP”) in relation to those futureyears would be subject to non-resident withholding tax which may be higher than the MITwithholding tax rate. This may have an adverse effect on the tax treatment of PT and PAIPand their distributions going forward;
Š Change of control provisions: Our acquisition of Propertylink, and the delisting ofPropertylink, has triggered change of control and similar provisions under certain externalfund co-ownership agreements, financing arrangements and property leases to whichPropertylink and external funds are party to. As of the Latest Practicable Date, we hadrefinanced the loans of Propertylink and had not received any notification from anycounterparty requesting to terminate the relevant agreements or exercise other rights inrespect of the change of control of Propertylink. However, we cannot assure you that therelevant counterparties will not opt to exercise their rights relying on change of controlprovisions in the future. If counterparties to the relevant agreements exercise terminationor other rights in respect of the change of control of Propertylink, Propertylink’s financialperformance and the value of Propertylink securities could be materially adverselyaffected; and
Š Termination for convenience: There is a risk that existing material agreements may beterminated, lost or impaired, or renewed on less favorable terms. Some of Propertylink’s
67

RISK FACTORS
material agreements can be terminated without cause (for example the managementagreements for the Propertylink Australian Industrial Partnership II can be terminatedwithout cause by a 75% majority of unitholders) or on short notice periods (depending onthe termination event or circumstances).
Certain facts and statistics derived from Propertylink’s public disclosure may not be reliable.
We have derived certain facts, statistics and business and financial information relating toPropertylink, including pre-acquisition financial information of Propertylink set forth in“Appendix II-A—Audited Financial Statements on Propertylink for the three years ended June 30,2018” in this Prospectus, from information disclosed by Propertylink in its various public disclosures.While we have taken responsible care in the reproduction of such information, it has not been preparedor independently verified by us, the Joint Sponsors, the Joint Bookrunners, the Joint Lead Managers orany of our or their respective affiliates or advisors and, therefore, we cannot assure you as to theaccuracy and reliability of such facts, statistics and information. We cannot assure you that theinformation derived from Propertylink’s public disclosures was stated or compiled on the same basis,or with the same degree of accuracy, as similar statistics presented elsewhere in this Prospectus. In allcases, you should consider carefully how much weight or importance you should attach to or place onsuch facts and statistics.
We may not be successful in executing our business strategy, including the expansion into newgeographical locations and adjacent businesses.
Our business model involves developing, operating and managing logistics properties, eitherowned directly by us or by the funds and investment vehicles we manage, in APAC and managingsuch funds and investment vehicles. As we expand into new geographic locations, we may faceuncertainties and challenges due to our unfamiliarity with local regulatory practices and tenants’preferences and behavior, the reliability of local contractors and suppliers, business practices andbusiness environments and municipal-planning policies. These uncertainties, in particular in Australiaand India given our relatively short track record in these two countries, affect our developmentschedule and therefore our ability to meet stated goals. In addition, whether we can successfullyexpand into these new locations depends on many factors which are beyond our control, includingwhether we can find suitable sites at reasonable costs in urban areas, whether we can establish andmaintain cooperative relationships with local governments, and whether we can raise capital for thefunds and investment vehicles in the new locations. Further, expanding our business into new locationsmay entail competition with logistics property providers who have better-established local presence orbetter relationships with local governments or greater access to local labor, expertise and knowledgethan we do. See “—Our business is intensely competitive.”
In addition, we intend to establish a pan-APAC fund to provide investors with single productexposure to the logistics real estate market in APAC. We may not be successful in executing thisstrategy or attracting the capital needed to seed such a fund, and such strategy may impact our businessin ways we cannot presently forecast.
Further, we intend to leverage our ecosystem of shareholders, capital partners, local teams andtenants to penetrate adjacent businesses that benefit from the synergies of our platform, such as realestate properties to be used for data centers, suburban IT offices and business parks. As we may facenew challenges in these adjacent businesses, we may fail to recognize or properly assess risks or take
68
RISK FACTORS
full advantage of opportunities, or otherwise fail to adequately leverage our resources and pastexperience. For example, we may have difficulties in accurately predicting market demand or industrystandards for our data centers, suburban IT offices and business parks, which may render suchbusinesses incompatible with our existing business or cause delays due to budget overrun andunanticipated local issues such as labor and supplies. Any such failures may have a material adverseeffect on our business, financial condition, results of operations, performance and prospects.
Our capital recycling strategy may result in changes in our balance sheet and our incomestatement in the future.
We use our balance sheet and development funds to acquire land and develop logistics facilitiesand then transfer mature, income-yielding assets to the core/core-plus vehicles and listed fundplatforms we manage. As a result, we realize fair value gains on completed investment properties, fairvalue gains on investment properties under construction, gains on disposal of properties, and earnmanagement fee income. The disposed assets are also off our balance sheet upon the completion ofsuch transfers. As we continue to recycle our capital and transfer assets on our balance sheet to coreand core-plus funds and REITs we manage, we expect that our balance sheet and income statementwill continue to change from time to time. Further, successful execution of our capital recyclingstrategy is subject to various factors including the variety of avenues of development available to us,risk and liquidity profiles in our fund management business and geographies where we operate, whichmay ultimately affect our results of operations. Our historical financials may not be indicative of ourfuture financial performance and our operating results may change.
Goodwill impairment may negatively affect our reported results of operations.
During the Track Record Period, we recorded goodwill in connection with our businesscombinations and acquisitions, and did not record any impairment of such goodwill during the sameperiod. If the businesses we acquired cannot generate the financial results as we expect, it could resultin the use of substantial amounts of cash, the occurrence of significant goodwill impairment charges,amortization expenses for other intangible assets and exposure to potential unknown liabilities.
Goodwill is initially measured at cost, and tested for impairment annually or more frequently ifevents or changes in circumstances indicate that the carrying value may be impaired. Performing thegoodwill impairment test requires us to make an estimate of the expected future cash flows from thecash-generating units and also to choose a suitable discount rate in order to calculate the present valueof those cash flows. There are inherent uncertainties related to these factors and to our judgment inapplying these factors to the assessment of goodwill recoverability. We could be required to evaluatethe recoverability of goodwill prior to the annual assessment if there are any impairment indicatorswhich could potentially be caused by our failure to successfully integrate the operations of the acquiredbusinesses with other operations. Impairment charges could substantially affect our reported results ofoperations in the periods of such charges. In addition, impairment charges would negatively impact ourfinancial ratios and could limit our ability to obtain financing in the future.
The limited liquidity of the Portfolio Assets could restrict our ability to respond to adversechanges in the property markets.
We have been engaged in a capital recycling strategy since 2017 where we dispose of logisticsfacility assets we have developed on our balance sheet or in development funds or investment vehicles
69

RISK FACTORS
we manage to the core/core-plus funds or investment vehicles we manage. We may also in the futuredispose of such assets to development funds that we manage. Our ability to complete the divestmentsof select property assets into the funds and investment vehicles we manage or to third parties may beadversely affected by competition from other sellers, issues with planning, changes in the desirabilityof the locations of the assets, current market conditions (including capitalization rates and theunderlying property fundamentals applicable to our balance sheet properties) and the availability offinancing for interested purchasers.
In particular, as the Portfolio Assets have limited liquidity, our ability to sell them in a timelymanner or at all, including as an exit strategy of the development funds we manage or in response tochanging economic, financial and investment conditions, may be limited. The real estate market isaffected by many factors beyond our control, such as general economic conditions, availability offinancing, interest rates, and supply and demand of properties. We cannot predict whether we will beable to sell any of the Portfolio Assets for the price or on the terms desired or set by us, or whether theprice or other terms offered by a prospective purchaser would be acceptable to us. We also cannotpredict the length of time needed to find a purchaser or to close a sale in respect of an investmentproperty or other assets. In addition, we may be required to expend funds to maintain properties,correct defects, or make improvements before an investment property or certain other asset can be sold.There is no assurance that we will have funds available for these purposes. Any prolonged repair ormaintenance process due to a shortage of funds may impede our ability to respond to adverse changesin the performance of the Portfolio Assets, which may have material adverse effect on our business,financial condition, results of operations, performance and prospects.
In addition, we also hold investment interests in ESR-REIT and other investments primarily inlisted companies, including our investments in Sabana REIT and AIMS AMP Capital Industrial REITin Singapore, Centuria in Australia and CNLP in Hong Kong. The liquidity of these listed equityinvestments is subject to market conditions, which could impact our ability to dispose of theseinvestments, and we may not be able to dispose of our listed equity investments at favorable prices.
If we are unable to dispose of assets on our balance sheet or held by the development funds wemanage or our listed equity investments on favorable terms or at all, we will not be able to execute ourstrategy, which could adversely affect our business, financial condition, results of operation,performance and prospects. Further, our capital recycling strategy may result in changes in our balancesheet and our income statement and may affect our profitability in the future. See “—Our capitalrecycling strategy may result in changes in our balance sheet and our income statement in the future”in this section.
Our business is subject to significant regulation and supervision by regulatory authorities incertain jurisdictions, and compliance failures and changes in regulation could adversely affect us.
Our fund management business is subject to significant regulation and supervision in thejurisdictions where we operate, and we incur compliance costs accordingly. We manage a number offunds and investment vehicles in multiple jurisdictions and hold various licenses or rely on validlicense exemptions or registrations in some jurisdictions, including the PRC, Japan, South Korea,Singapore and Australia, pursuant to local requirements. In particular, in the PRC, it typically takeslonger to complete fund management registration before setting up a new fund vehicle, which maydelay our implementation of our core and core-plus strategy in the PRC. In addition, the licenseexemptions that we rely on can be complex and may in certain circumstances depend on compliance
70

RISK FACTORS
by third parties whom we do not control. If for any reason these exemptions were to becomeunavailable to us, we could become subject to additional restrictive and costly registrationrequirements, regulatory action or third-party claims. Our fund management agreements specificallyprovide that, among other things, our fund management services may be terminated in the event thatwe cease to be licensed, or exempted from the licensing requirements, under relevant local regulations,to provide such services. If our licenses are suspended or revoked by relevant regulatory authorities asa result of any non-compliance with relevant regulatory requirements or if there is any change in thelicensing/exemption regimes in the jurisdictions where we provide fund management services and ifwe fail to fulfill such licensing requirements, the agreements we enter into in connection with the fundsand investment vehicles we manage may be terminated by our capital partners, and we may also berequired to suspend relevant businesses and be subject to monetary penalties imposed by relevantregulatory authorities, which may have a material adverse effect on our business, financial condition,results of operations, performance and prospects. We may also be materially affected if new or revisedlegislation or regulations are enacted, or if there are changes in the interpretation or enforcement ofexisting rules and regulations that apply to us. Such events could increase our costs of doing business,require us to restructure the way in which we carry on our business, or render us unable to continue allor part of our business, which in turn could have a material adverse effect on our business, financialcondition, results of operations, performance and prospects. See “Regulatory Overview” in AppendixV to this Prospectus.
In addition, our property development business is subject to various laws and regulations of thecountries where we operate. Our activities on the Portfolio Assets are limited by planning laws andregulations, the terms of the relevant government land leases, and other regulations enacted by theauthorities in these markets. Developing properties, refurbishing, re-developing and operatingproperties require government permits, some of which may take longer to obtain than others. ThePortfolio Assets are subject to routine inspections by the authorities in these markets with regard tovarious safety and environmental issues. Changes in laws and regulations or the implementationthereof may require us to obtain additional approvals and licenses from the relevant authorities for theconduct of our operations in these markets. In such event, we may incur additional expenses to complywith such requirements, which may affect our business and results of operations. Furthermore, theremay also be delays on the part of the administrative authorities in reviewing our applications andgranting approvals, and there can be no assurance that such approvals or licenses will be granted to uspromptly, or at all. If we experience delays in obtaining, or are unable to obtain, such requiredapprovals or licenses, the investment, development and leasing of the Portfolio Assets could besubstantially disrupted, which may have a material adverse impact on our business, financial condition,results of operations, performance and prospects. The occurrence of any of the foregoing may have amaterial adverse effect on our financial condition, results of operations and cash flow.
Potential liability for environmental issues relating to the Portfolio Assets and regulationsrelating to climate change could result in substantial costs.
As an owner, lessor, developer and manager of logistics properties in multiple jurisdictions, weare subject to extensive regulation under environmental laws. These laws vary by jurisdiction and aresubject to change. Current and future environmental laws and regulations in relation to climate changecould impose significant costs or liabilities on us.
Some of the Portfolio Assets are located in industrial areas. The nature of the past uses of theseproperties, as well as the past and current uses of surrounding properties, gives rise to increased risk of
71

RISK FACTORS
contamination. Environmental legislation in certain jurisdictions imposes strict and retrospectiveliability for cleaning up contaminated land, watercourses or groundwater on the person causing orknowingly permitting the contamination in circumstances where such contamination is causing, orwhere there is significant possibility of it causing, significant harm to people or the environment. Insome jurisdictions, the owner or occupier of contaminated land could become liable as a “knowingpermitter” if it became aware of pollution capable of causing significant harm to people or theenvironment, had the necessary degree of control over operations on the land to prevent such harm andfailed to take certain actions to prevent it. This legislation places liability for clean-up costs on theowner or occupier of contaminated land where no person can be found who has caused or knowinglypermitted the presence of the substances which have led to the pollution. Thus, if land we own iscontaminated, then, where the person who caused or knowingly permitted such contamination to occurcannot be found, or if, directly or indirectly, a third party is injured or otherwise suffers a loss as aresult of the presence of toxic substances on the Portfolio Assets, we might be liable for the costs ofcleaning up such contamination. In Australia, generally there is no strict requirement for regulators topursue the person who causes the pollution in the first instance, and the owner or occupier ofcontaminated land may not be liable for clean-up costs regardless of whether or not the person whocauses the pollution can be located. Further, certain environmental regulations, among other things,impose liability on present and former property owners and operators for costs and damages related tosoil and water contaminations from hazardous or toxic substances whether or not the owner or operatorknew of, or was responsible for, the presence or release of such hazardous or toxic substances. Forexample, under the Soil Contamination Countermeasures Act of Japan, a current owner of real propertymay be held strictly liable for the removal or remediation of hazardous or toxic substances, such aslead, arsenic and trichloroethylene, on or under the surface of such property, whether or not the currentowner knew of or was responsible for the presence of such hazardous or toxic substances. We or thefunds and investment vehicles we manage may also be held liable under other laws for the use ofasbestos and polychlorinated biphenyls, or PCBs, at any of the Portfolio Assets in Japan.
In addition, the presence of hazardous or toxic substances on of any of the Portfolio Assets mayadversely affect our ability to sell such properties or to borrow using such properties as collateral andthe value of such Portfolio Assets may decrease, and may cause us to incur penalties and clean-upcosts. We may also become liable if, directly or indirectly, a third party is injured or otherwise suffers aloss as a result of the presence of toxic substances on the Portfolio Assets, and in such a case it isunclear whether we can be indemnified by those who are actually responsible. In such event,unanticipated clean-up costs that we may incur, the adverse effect on the ability to sell properties, thelikely adverse impact on our tenants affected by such substance, and the risk of prosecution bygovernmental authorities may materially adversely affect our business, financial condition, results ofoperations, performance and prospects.
Climate change regulations in APAC could increase our capital and operating expenses.
Under laws or regulations of certain countries where we operate, owners of certain real estateproperties may face obligations to report on, or limit their emissions of, greenhouse gases. Forexample, in Japan, although some of our tenants are subject to relevant climate change regulations, theportfolio companies holding the Portfolio Assets, in their capacity as the owners of these properties,are also subject to these climate change regulations and may be held liable for greenhouse gasemissions in the event of violation of these climate change regulations. Any such measures may forceus to rebuild or repair the Portfolio Assets in order to reduce emissions or obtain emissions credits.Moreover, since some of our tenants’ businesses rely heavily on trucking, if regulations regarding the
72

RISK FACTORS
emission of nitrogen oxides and particulates become stricter, our tenants could incur increasedcompliance costs and demand for logistics facilities could decline. We or any of our tenants may alsoface new requirements mandating a substantial reduction or regulation in greenhouse gas emissionsand implementation of further measures under the Kyoto Protocol and Bali Road Map, which couldhave far-reaching and significant impacts on us and our tenants. Any such future laws and regulationscould result in increased compliance costs or additional operating restrictions, and could have amaterial adverse effect on us or the demand for logistics facilities. Any of the foregoing could have amaterial adverse effect on our business, financial condition, results of operations, performance andprospects.
We may be involved in disputes or legal and other proceedings in connection with the PortfolioAssets or arising from our operations from time to time, which could result in significantliabilities and reputational harm and could materially and adversely affect our results ofoperations, financial condition and liquidity.
We have been, and in the future may be, involved, from time to time, in disputes relating to ourcommercial arrangements and operations, environmental, health and safety, labor and employment, orother harms, including claims resulting from the actions of individuals or entities outside of ourcontrol. These disputes may lead to legal or other proceedings, and may cause us to incur additionalcosts or delays in our operations. In addition, we may have disagreements with regulatory bodies in thecourse of our operations, which may subject us to administrative proceedings and unfavorable orders,directives or decrees that may result in financial losses, and/or delay the construction or completion ofthe Portfolio Assets. Adverse outcomes in any litigation or other proceedings could have a materialadverse effect on our business, results of operations, financial condition or prospects.
In particular, we are exposed to risk of litigation by capital partners of the funds and investmentvehicles we manage, if our management thereof is alleged to constitute fraud, negligence, willfuldefault, for breach of applicable laws or regulations, breach of the trust deed or other constitutivedocuments or breach of any agreements we may have entered into with our capital partners. Capitalpartners could sue us to attempt to recover amounts lost by the funds or investment vehicles wemanage due to our alleged misconduct, up to the entire amount of the loss. Further, we may be subjectto litigation arising from investor dissatisfaction with the performance of the funds or investmentvehicles we manage. We are also exposed to risks of litigation or investigation relating to transactionswhere potential conflicts of interest were not properly addressed. See “—As part of our business, weencounter conflicts of interest, and a failure to identify, address and resolve such conflicts of interestcould adversely affect our business.” In such actions, we may be obligated to bear legal, settlement andother costs, which may be in excess of available insurance coverage. If we are required to bear all or aportion of the costs arising out of litigation or investigations as a result of inadequate insuranceproceeds or failure to obtain indemnification from the funds or investment vehicles we manage, ourresults of operations, financial condition and liquidity could be materially and adversely affected.
Our tax planning may not be effective.
We have minority investments in many of the funds and investment vehicles we manage, andretain relatively larger investment interests in certain other investment vehicles that we manage. Someof the investments by us or the funds and investment vehicles we manage are in entities that arestructured to achieve tax transparency. In particular, in Australia, a condition of transparency is that theinvestments held by a fund are passive in nature, and primarily focused on the derivation of rentalincome.
73

RISK FACTORS
Certain jurisdictions, including Australia, have adopted legislation that limits the taxdeductibility of certain interest expense incurred by companies domiciled/operated in thosejurisdictions. For example, there are limits on the tax deductibility of interest paid by heavily gearedAustralian funds on loans from non-Australian lenders. These measures will most likely adverselyaffect the Portfolio Assets in Australia in which the funds and investment vehicles we manage haveinvestments, and limit the benefits of additional investments in those jurisdictions. In addition, certainjurisdictions such as South Korea and Australia have sought to tax the investment gains derived bynon-resident investors, including private real estate funds, from the disposition of the equity incompanies operating in those countries. In some cases this is the result of new legislation or changes inthe interpretation of existing legislation and in other cases tax authorities have challenged investmentstructures that benefit from tax treaties between countries. In the event that our tax planning forourselves or for the funds or investment vehicles we manage ceases to be effective, whether as a resultof a loss or revocation of a tax ruling by a competent tax authority, or a change in (or in theinterpretation of) applicable tax laws or otherwise, we may be subject to additional tax assessment,penalties and/or interests thereon, which could reduce the return on our investments and increase ouroperating costs and expenses, and in turn could have a material adverse impact on our business,financial condition, results of operations, performance and prospects.
We may face corruption, bribery, money-laundering and other internal control risks, and wemay not be able to successfully implement, monitor or comply with internal controls, policies andprocedures.
We operate in six jurisdictions, some of which may be considered high-risk from an anti-bribery and anti-corruption perspective, and strict compliance with anti-bribery and anti-corruptionlaws may conflict with local customs and practices. We cannot assure you that our internal controls,policies and procedures are adequate or will protect us from improper conduct by our officers,directors, employees, representatives, third-party intermediaries, tenants, business partners or agents.In the event that we believe or have reason to believe that any such party has or may have violatedsuch laws, we may investigate (or have outside counsel investigate) the relevant facts andcircumstances. Detecting, investigating and resolving actual or alleged violations can be expensive andrequire a significant diversion of time, resources and attention from senior management. In addition,actual or alleged violations could damage our reputation and ability to do business. Any of theforegoing could materially adversely affect our business, financial condition, results of operations,performance and prospects.
We are required to comply with applicable anti-money laundering and anti-terrorism laws andother regulations in the jurisdictions where we operate. The anti-money laundering laws andregulations in the markets we operate require us to establish sound internal control policies andprocedures with respect to anti-money laundering monitoring and reporting activities. Policies andprocedures we have adopted may not completely eliminate instances where our operations may be usedby other parties to engage in money laundering and other illegal or improper activities. We may not beable to fully detect money laundering and other illegal or improper activities in our business operationson a timely basis or at all, which could subject us to liabilities and penalties. If we fail to comply withapplicable laws and regulations, we could be exposed to claims for damages, civil or criminal financialpenalties, reputational harm, incarceration of our employees, restrictions on our operations and otherliabilities, which could materially and adversely affect our business, financial condition, results ofoperations, performance and prospects.
74

RISK FACTORS
Certain of the agreements governing the funds and investment vehicles we manage also containprovisions that may result in the termination of our appointment as investment manager or assetmanager, as the case may be, if we, or any of our delegates, directors or employees commit fraud,willful default or misconduct or gross negligence in connection with the performance of obligationsunder the relevant agreement and such action is not cured within a specified timeframe.
In addition, we face other internal control risks of loss resulting from, among other factors,inadequate or flawed processes or systems, theft, and fraud. Operational risk of this kind can occur inmany forms including, among others, errors, business interruptions, inappropriate behavior of, ormisconduct by, our employees or those contracted to perform services for us, and third parties that donot perform in accordance with their contractual agreements. These events could result in financiallosses or other damage to us. Furthermore, we rely on internal and external information technologysystems to manage our operations and we are exposed to the risk of loss resulting from breaches in thesecurity, or other failures, of these systems. See “—Any failure, inadequacy and security breach in ourcomputer systems and servers may adversely affect our business.” Any of the foregoing couldmaterially and adversely affect our business, financial condition, results of operations, performanceand prospects.
As we are expanding rapidly with a relatively short track record, there is a lack of and need forincreased standardization of systems, including IT and backup systems, and processes, includinginternal communication and delegation of authority. We historically have not had a holistic riskmanagement framework and have not conducted any internal audits or investigations to monitorcompliance with our policies, including those with respect to corruption, bribery, anti-moneylaundering and other internal control risks. Recent internal control reviews conducted by our internalcontrol consultant have identified areas of internal control weaknesses, which has led us to adoptenhanced internal control procedures, including implementing operational procedures for cash andtreasury management and insurance management and establishing a register which properly documentsthe usage of checks. See the sections headed “Business—Risk Management and Internal Control” and“Business—Compliance and Legal Proceedings” in this Prospectus. Though we will monitor ourinternal control compliance status on a regular basis going forward, there may be potential legacyproblems and a lack of familiarity with our enhanced internal control procedures. We cannot assureyou that there are no historic or new areas of internal control weaknesses which may materially andadversely affect our business, financial condition, results of operations, performance and prospects inthe future.
The valuation of the Portfolio Assets contains assumptions that may not materialize or mayprove inaccurate and the value of the Portfolio Assets may not reflect the timely value of suchassets.
Real estate assets are inherently difficult to value. Valuations are subject to judgments andestimates and are made on the basis of assumptions that may not necessarily materialize. Additionally,the inspection and other work undertaken in connection with a valuation exercise of the PortfolioAssets may not identify all material defects, breaches of contracts, laws and regulations, and otherdeficiencies and factors that could affect the valuation. There can be no assurance that our investmentin our directly held properties or the property investment made by the funds and investment vehicleswe manage will be realized at the valuations or property values recorded or reflected in our financialstatements or in this Prospectus. We apply fair value accounting for all of the Portfolio Assets.Independent valuation is carried out on the Portfolio Assets, typically not less than once every year.
75

RISK FACTORS
We assess the valuation of the Portfolio Assets to ensure that the carrying amount of each of thePortfolio Assets reflects the market conditions at the relevant financial reporting date. The value of thePortfolio Assets may fluctuate from time to time due to market and other conditions. There is noassurance that the Portfolio Assets will retain the price at which they may be valued or that ourinvestment or the investment made by the funds and investment vehicles we manage in such propertieswill be realized at the valuation or property values we have recorded or reflected in our financialstatements, and the price at which we may sell or lease any part or the whole of the properties may belower than the valuation for those properties. Adjustments to the fair value of the Portfolio Assetscould have an adverse effect on our net asset value and profitability. It may also affect our ability toobtain more borrowings, or result in us having to reduce debt, if the financial covenants in ourfinancing and other agreements require us to maintain a certain level of debt relative to gross assetvalue, and such covenants are triggered as a result of adjustments to the fair value of the PortfolioAssets.
In addition to valuations of the Portfolio Assets, we also undertake due diligence on potentialacquisitions in order to assess the risks associated with such acquisitions. However, such due diligenceprocedures may not reveal all risks or defects associated with a Portfolio Asset. See “—Due diligenceon acquisitions and investments, either by us or by the funds and investment vehicles we manage, maynot reveal all relevant facts that may be relevant in connection with an acquisition or an investment, oridentify all material defects or other deficiencies.”
The expert appraisals and reports upon which we rely for the acquisitions and operations ofPortfolio Assets are subject to significant uncertainties and assumptions.
We may obtain appraisals as well as engineering, environmental and seismic reports inconnection with project assessment and site selection for new logistics facilities. However, thesereports cannot give a precise assessment of the past, present or future value or engineering,environmental or seismic conditions of the relevant logistics facilities. Furthermore, the appraisers andother experts use a variety of different review methodologies or different sets of assumptions, whichcould affect the results of such appraisals, reports and the conclusions that the appraisers, other expertsand we can draw from them. Thus, different experts reviewing the same logistics facility could reachsignificantly different conclusions.
Engineering, environmental and seismic reports we have obtained for the Portfolio Assets maynot reveal all material risks or liabilities and may not be an accurate reflection of such risks, becausesuch risks are often hidden or difficult to evaluate. If we were to discover any significant, unidentifiedengineering, environmental or seismic liabilities, the value of the affected logistics facility could fall,we may be required to incur additional costs and discharge of the liability could be time consuming.For example, in accordance with customary practice in Japan, we disclose certain information relatingto a logistics facility’s PML to our capital partners of the relevant funds and investment vehicles wemanage based on reports we receive from third parties. PML percentages are based on complicated,highly speculative building engineering reports that include many subjective factors and are based onnumerous assumptions. We are not an expert in assessing earthquake risk, and cannot independentlyverify the PML percentages provided to us, and the uncertainties inherent in such reports limit thevalue of them to us.
76
RISK FACTORS
The Portfolio Assets or parts thereof may be acquired compulsorily by governments of thecountries in which we operate.
Governments of the countries where we operate have the power to compulsorily acquire anyland in the respective countries for the public interest pursuant to the provisions of applicablelegislation. For example, for properties located in Singapore, the Singapore government has the powerto acquire any land in Singapore for any public purpose and for any residential, commercial orindustrial purposes. Moreover, the Indian government under the provisions of the Right to FairCompensation and Transparency in Land Acquisition, Rehabilitation and Resettlement Act, 2013 hasthe right to compulsorily acquire any land if such acquisition is for a “public purpose”, after providingcompensation to the owner. The likelihood of such acquisitions may increase as central and stategovernments seek to acquire land for the development of infrastructure projects such as roads,railways, airports and townships. The amount of compensation to be awarded for compulsoryacquisition of property in the countries where we operate is assessed pursuant to the relevant laws andregulations. If any of the Portfolio Assets in the countries where we operate is acquired compulsorilyby the relevant government, and we or the funds or investment vehicles we manage are not able to wina favorable judgment after appealing to the courts in the relevant jurisdiction for reconsidering thevalidity of such compulsory acquisition, the level of compensation paid to us or the funds orinvestment vehicles we manage pursuant to this calculation method may be less than the acquisitionprice which we or the funds or investment vehicles we manage paid for such properties.
A large proportion of our existing shareholders comprise institutional investors and privateequity investors who may not act in the best interest of our other Shareholders.
We are currently a private company incorporated with limited liability in the Cayman Islandsand, prior to the Global Offering, a large proportion of our shares are held by institutional investors andprivate equity investors including WP OCIM, APG-Stichting and the Chinese Institutional Investors. Inparticular, immediately following the completion of the Global Offering (assuming the Offer SizeAdjustment Option and the Over-allotment Option are not exercised), WP OCIM, will hold 24.1% (ifLuckfield Global Limited is a Selling Shareholder) or 23.6% (if Luckfield Global Limited is not aSelling Shareholder) of the issued share capital of our Company. For more information relating to WPOCIM, its controlling entities and their shareholdings in our Company, see the sections headed“Substantial Shareholders” and “Relationship with Warburg Pincus X” in this Prospectus. The natureof such investments by these shareholders and other of our investors may mean that, should a suitableopportunity arise which allows them to meet their investment objectives in relation to their investmentin us, they may divest, subject to certain lock-up periods beginning on the date on which trading in ourShares commences on the Stock Exchange, some or all of their shares to other parties including, butnot limited to, other existing shareholders, which may potentially trigger change of control and similarprovisions under certain business contracts and financing arrangements to which we and oursubsidiaries are party. If counterparties to the relevant agreements exercise termination or other rightsin respect of the change of control of our Company, our business, financial condition and results ofoperations could be materially adversely affected. For details of our existing institutional investors andprivate equity investors, see the section headed “History, Development and Corporate Structure—Pre-IPO Investments” in this Prospectus. In addition, our existing shareholders who are institutionalinvestors and private equity investors may from time to time exert, or attempt to exert, influence overour business to achieve their own economic objectives, or other objectives which may otherwise not bein the best interest of our other shareholders.
Further, we may, in the future, seek to raise additional equity capital funding from new orexisting institutional and/or private equity investors or shareholders or from financial or other
77

RISK FACTORS
investors, which could result in a change in the composition of our shareholders and/or result in adilution to existing shareholders, and which may be material. There can be no assurance that newinvestors who become our shareholders as a result of the equity capital fundraising will act in the bestinterest of our other shareholders, nor can we guarantee that existing shareholders acquiring moreholdings of our company may continue to act in the best interest of all shareholders.
The costs of the Post-IPO Share Option Scheme may adversely affect our results of operationsand any exercise of the options granted thereunder may result in a dilution of our Shareholders’shareholdings and the exercise of options granted under the KM ESOP may adversely affect ourresults of operations.
For the years ended December 31, 2016, 2017 and 2018 and for the six months ended June 30,2018 and 2019, we recognized equity-settled share option expenses of approximately US$75,000 (frompre-2016 grants), US$11.9 million, US$23.2 million, US$12.0 million and US$9.9 million,respectively, in connection with the awards granted under our pre-IPO share option schemes. Fordetails of our pre-IPO share option schemes, see the section headed “Statutory and GeneralInformation—D. KM ESOP, Tier 1 ESOP and Post-IPO Share Option Scheme” in Appendix VIII tothis Prospectus. Further, for the purpose of providing incentives to eligible participants to contribute tous and enabling us to recruit high caliber employees and to attract or retain human resources that arevaluable to us, we adopted the Post-IPO Share Option Scheme on October 12, 2019. See the sectionheaded “Statutory and General Information—D. KM ESOP, Tier 1 ESOP and Post-IPO Share OptionScheme” in Appendix VIII to this Prospectus. We expect to incur less share-based compensationexpenses under our pre-IPO share option schemes after the completion of the Global Offering, as therewill not be new grants under those schemes. We expect share-based compensation expenses after thecompletion of the Global Offering to be largely driven by new grants under the Post-IPO Share OptionScheme. However, under our KM ESOP, in specified circumstances, in lieu of the participant payingthe exercise price to exercise an option, the participant may elect to receive a net cash settlement equalto the value of the shares in respect of which the option is being exercised less the exercise priceotherwise payable for those shares. This may result in a reduction in our cash flows and workingcapital and may adversely affect our liquidity and business operations. Additionally, the issue ofShares on any exercise of the Post-IPO share options in the future would result in a reduction in thepercentage ownership of our shareholders and may result in a dilution in the earnings per Share and netasset value per Share, as a result of the increase in the number of Shares outstanding after suchissuance.
We are subject to risks relating to foreign currency exchange rate fluctuations.
Because of the geographic diversity of our business, we receive income and incur expenses in avariety of currencies, including the Chinese Renminbi, Japanese Yen, Korean won, Singapore dollar,Australian dollar, Indian rupees, and U.S. dollar. It is not possible to predict the effect of futureexchange rate fluctuations on our assets, liabilities, income, cost of sales and margins. In addition,some of the currencies used by us may not be readily convertible or exchangeable or may be subject toexchange controls. Furthermore, while we receive income and incur expenses in a variety ofcurrencies, we report our financial results in U.S. dollars. Therefore, fluctuations in currency exchangerates could materially affect our reported financial results. The foreign exchange gains or losses werecorded in various line items in our profit and loss statements result from the settlement of foreigncurrency translations, which are translated into the functional currency of U.S. dollars using prevailingforeign exchange rates at the dates of the relevant transactions or valuation where items are re-
78
RISK FACTORS
measured, and from the translation at the year-end foreign exchange rates of the monetary assets andliabilities denominated in foreign currencies. For example, during the Track Record Period, revenuesfrom our rental income decreased slightly in 2016 partially due to foreign exchange translation fromChinese Renminbi to U.S. dollars. Such foreign exchange gains or losses differ from exchangedifferences on translation of foreign operations in other comprehensive income, which are calculatedbased on certain subsidiaries’ financial statements for which non-U.S. dollar functional currencies aretranslated into the functional currency of U.S. dollars. In 2016, 2017 and 2018 and for the six monthsended June 30, 2018 and 2019, exchange differences on translation of foreign operations amounted toapproximately US$(38.4) million, US$46.3 million, US$(57.8) million, US$(4.9) million and US$(1.1)million, respectively. See the section headed “Financial Information—Principal Components of OurConsolidated Statement of Profit or Loss” in this Prospectus. Any future fluctuations in currencyexchange rates could materially adversely affect our business, financial condition and results ofoperations.
We may suffer substantial losses in the event of a natural or man-made disaster, such as anearthquake, typhoon or other casualty event in the countries where we operate, which may notbe covered by insurance.
Natural disasters, severe weather conditions, catastrophe or other events, all of which arebeyond our control, may adversely affect the economy and infrastructure of the countries where weoperate and/or result in severe personal injury, property damage and environmental damage, whichmay curtail our business operations and materially adversely affect our prospects, financial conditionand results of operations. Some cities where we operate are under the threat of typhoon, flood,earthquake, severe storm, sandstorm, snowstorm, fire and drought. See “—Our Japanese operationsand real estate may be disrupted due to earthquakes, typhoons or other natural disasters.” If any of thePortfolio Assets are damaged by severe weather or any other disaster, accident, catastrophe or otherevent, our operations may be significantly interrupted and our business and financial condition may beadversely affected. The continuance of any of these events could increase the costs associated with ouroperations and reduce our ability to operate our businesses at their intended capacities, therebyreducing revenues and profitability.
In addition, although we maintain insurance coverage on all of the Portfolio Assets inaccordance with what we believe to be industry standards, insurance policies generally do not covercertain types of losses such as war, civil disorder and acts of terrorism and/or our business interruptionrisks under certain circumstances and the claim amounts under insurance policies are subject to limits,which may not cover the total amount of any loss or liability incurred. In addition, we do not insure forevery risk, such as earthquake risks. For example, while all of our buildings in Japan are designed andbuilt to the highest seismic amelioration standards and are compliant with the relevant statutoryseismic design codes, we do not insure earthquake risks, which is not uncommon in Japan forcompanies operating in our industry, as such insurance is generally unavailable to cover all of ourassets in Japan. An earthquake could severely damage or otherwise adversely offset our logisticsfacilities and if our tenants were to suffer significant uninsured losses due to earthquake damage to oneor more of our facilities, it could reduce their demand for our facilities and therefore have a materialadverse effect on our business, financial condition, results of operations, performance and prospects.Such accidents may expose us to liability or other claims by our tenants and other third parties.Although we believe that we have adequate insurance arrangements in place to cover sucheventualities, it is possible that our estimates may not be accurate and that accidents or incidents couldoccur which are not covered by these arrangements. Any substantial losses arising from the occurrence
79

RISK FACTORS
of any such accidents or incidents that are not covered by insurance could adversely affect our businessand results of operations.
We are subject to restrictions on the repatriation of funds in the PRC, South Korea and India.
We may be subject to foreign exchange controls that may adversely affect the ability torepatriate the income or proceeds of sale arising from the Portfolio Assets. For example, the PRCGovernment imposes controls on the convertibility of Renminbi into foreign currencies and theremittance of currency out of the PRC. See “—Restrictions on the remittance of Renminbi into and outof the PRC and governmental control of currency conversion may limit our ability to pay dividendsand other obligations, and affect the value of your investment.” Additionally, under foreign exchangeregulations currently in force in India, transfer of shares between non-residents and residents are notfreely permitted (subject to certain exceptions and subject to compliance with the valuation andreporting requirements specified by the Reserve Bank of India). Additionally, conversion of Indianrupee proceeds from a sale of shares in India into foreign currency and repatriation of that foreigncurrency from India requires a no-objection or a tax clearance certificate from the Indian income taxauthorities. Repatriation of income, capital and the proceeds of sale may require the consent of, anddepending upon the provisions of the Double Taxation Avoidance Agreement of India with the countryof residence of the investor, may be subject to taxation by, the relevant governments in the PRC, SouthKorea and India, and may also be subject to stipulations relating to lock-in periods prescribed under theapplicable laws in India. In particular, disposition of the Portfolio Assets may incur potential tax costssuch as capital gain tax regardless of a direct or indirect sale and local taxes with respect to dispositionof real estate or stocks in real estate rich companies as well as trigger relevant local tax reporting orfiling requirements in certain of the jurisdictions where we operate. Delays in, or a refusal to grant, anysuch approval, a revocation or variation of consents previously granted, or the imposition of additionaltaxes or new restrictions, may adversely affect our business, financial condition, results of operations,performance and prospects.
Any limitation on the ability of our subsidiaries to make dividend payments to us could have amaterial adverse effect on our ability to conduct our business or our financial condition.
We are a holding company, and we receive dividends and other distributions on equity that maybe paid by our subsidiaries in the countries where we operate, for our cash and financing requirements,including the funds necessary to pay dividends and other cash distributions to the holders of ourordinary shares and service any debt we may incur. If our subsidiaries incorporated in these countriesincur debt on their own behalf, the instruments governing the debt may restrict their ability to paydividends or make other distributions to us. In addition, even if our subsidiaries are allowed to paydividends or make other distributions to us, tax regimes in some of the countries where we operategenerally require our subsidiaries to withhold a certain percentage of the dividend or after-tax profit tofund certain statutory reserves. Although a bilateral income tax treaty may be applied to reduce suchwithholding tax, such treaty benefit may not be available as its applicability depends on the income taxtreaty framework of the payor country and whether a tax payor is qualified to claim benefit under therelevant tax treaty.
For instance, under the PRC laws and regulations, WFOE may pay dividends only out of theirretained earnings as determined in accordance with the Chinese accounting standards and regulations.In addition, a wholly foreign-owned enterprise is required to set aside at least 10% of its after-taxprofits each year, after making up previous years’ accumulated losses, if any, to fund certain statutory
80

RISK FACTORS
reserve funds, until the aggregate amount of such a fund reaches 50% of its registered capital. Subjectto approval by shareholders of the wholly foreign-owned enterprise, it may allocate a portion of itsafter-tax profits based on the Chinese accounting standards to staff welfare and bonus funds. Thesereserve funds and staff welfare and bonus funds are not distributable as cash dividends.
In South Korea, cash dividends can only be paid out of distributable profit, as defined in theKorean Commercial Code (“KCC”). The dividends must be approved at the annual general meeting ofshareholders. The KCC also requires that a legal reserve of 10% of the amount of the dividend be setaside, unless the legal reserve has been accumulated to not less than half of the stated capital.
Under Australian laws and regulations, Australian companies may only pay dividends where acompany has sufficient net assets, the dividend is fair and reasonable to a company’s shareholders as awhole and the dividend does not materially prejudice a company’s ability to pay its credits. Thedirectors must also be satisfied that the company has sufficient profits and must ensure any additionalrequirements imposed by a company’s constitution are met. In relation to trusts (which are another typeof Australian entity), distributions must be made in accordance with the relevant trust deeds whichwere entered into before we acquired our Australia business and may impose a variety of conditionsthat must be complied with before a distribution is made, some of which may be beyond our control.
Under current Indian tax laws, a company is liable to pay a dividend distribution tax asapplicable from time to time on the total amount distributed as dividend. Any changes in the rate ofdividend distribution tax or other applicable taxes may adversely affect our subsidiaries’ ability to paydividends or make other distributions to us.
Any limitation on the ability of our wholly-owned subsidiaries incorporated in the jurisdictionswhere we have operations and into which we may expand to pay dividends or make other distributionsto us could materially and adversely limit our ability to grow, make investments or acquisitions thatcould be beneficial to our business, pay dividends, or otherwise fund and conduct our business.
We are subject to risks related to our use of independent service providers for the provision ofessential services, including construction and property management services in particular.
We engage contractors and independent third-party service providers in connection with ourbusiness, including construction contractors, property managers, property valuers, and real estateagents. We outsource the structural design and construction of development projects to third-partycontractors which are overseen by our development management team. We engage third-party serviceproviders to provide professional property management services and conduct property maintenancework on our logistics properties, including regular cleaning, repairing and security for our logisticsfacilities, under the supervision of our property manager. We engage third-party valuers to performindependent valuations of the Portfolio Assets. We also occasionally engage third-party real estateagents to procure tenants. There can be no assurance that our contractors or independent serviceproviders will always perform to contractual specifications or on schedule, or that such contractors orproviders will continue their contractual relationships with us under commercially reasonable terms, ifat all, and we may be unable to source adequate replacement services in a timely or cost-efficientmanner. Properties that we develop with the help of third-party contractors may prove to have defectsfor which we are not able to hold the contractor responsible and we would be required to spendadditional time and expense on implementing remedial measures. For example, one of the propertieson our balance sheet was discovered to have sinking floors. As we were the ultimate decision maker in
81

RISK FACTORS
choosing the approach to backfilling and enhancing the floors from several options available to us, itwould be difficult for us to hold the third-party contractor liable for the defect, and therefore we wouldneed to take corrective measures at our own expense.
There is also a risk that our major contractors and service providers may experience financial orother difficulties, which may affect their ability to discharge their obligations, thus delaying thecompletion of their work which may result in additional costs for us or the funds or investmentvehicles we manage. Any of these factors could have a material adverse effect on our business,financial condition, results of operations, performance and prospects.
Any failure, inadequacy and security breach in our computer systems and servers may adverselyaffect our business.
Our operations depend on our ability to process a large number of transactions on a daily basisacross our network of offices, most of which are connected through computer systems and servers toour centralized data centers. Our financial, accounting or other data processing systems may fail tooperate adequately or become disabled as a result of events that are beyond our control, including adisruption of electrical or communications services. Our ability to operate and remain competitive willdepend, in part, on its ability to maintain and upgrade our information technology systems on a timelyand cost-effective basis. The information available to, and received by, our management through ourexisting systems may not be timely and sufficient to manage risks or to plan for and respond tochanges in market conditions and other developments in our operations. We continue to assess theadequacy of our computer systems and implement improvements to our platform. For example, we arein the process of implementing the SAP enterprise software platforms in Australia and India. We mayexperience difficulties in upgrading, developing and expanding our systems quickly enough toaccommodate changing times.
Our operations also rely on the secure processing, storage and transmission of confidential andother information in our computer systems and networks. Although we have employed significantresources to develop our security measures against breaches, our cybersecurity measures may notdetect or prevent all attempts to compromise our systems. Our computer systems, servers and software,including software licensed from vendors and networks, may be vulnerable to unauthorized access,computer viruses or other malicious code and other events that could compromise data integrity andsecurity and result in identity theft, including tenant data, employee data and proprietary business data,for which we could potentially be liable. Any failure to effectively maintain, improve or upgrade ourmanagement information systems in a timely manner could adversely affect our competitiveness,financial position and results of operations. Moreover, if any of these systems do not operate properly,are disabled, or if there are other shortcomings or failures in our internal processes or systems, it couldaffect our operations or result in financial loss, disruption of our businesses, regulatory intervention ordamage to our reputation. In addition, our ability to conduct business may be adversely impacted by adisruption in the infrastructure that supports our business, which could have a material adverse effecton our business, financial condition, results of operation, performance and prospects.
We may fail to effectively manage confidential information received from our tenants and capitalpartners, which could harm our reputation, our relationships with tenants or capital partnersand our business.
In the normal course of business, we obtain confidential information from our tenants inconnection with the leases they enter into, and from our capital partners in connection with their
82
RISK FACTORS
investments in the funds and investment vehicles we manage. Our efforts to protect this informationmay be unsuccessful due to employee errors or malfeasance, technical malfunctions, the actions ofthird parties (such as hacking and other cyber attacks) or other factors. Failure to protect theconfidential information of our tenants or capital partners could expose us to liability, harm ourreputation and deter current and potential tenants and capital partners from doing business with us,which could have a material adverse effect on our business, financial condition, results of operation,performance and prospects.
We may not be able to prevent the unauthorized use of our intellectual property and may besubject to intellectual property infringement or misappropriation claims, which could harm ourbusiness and competitive position.
We regard our trademarks, domain names and similar intellectual property as critical to oursuccess, and we rely on a combination of intellectual property laws and contractual arrangements,including confidentiality and non-compete agreements with our employees and others, to protect ourproprietary rights. Despite these measures, any of our intellectual property rights could be challenged,invalidated, circumvented or misappropriated, or such intellectual property may not be sufficient toprovide us with competitive advantages. In addition, there can be no assurance that our trademarkapplications will be approved, that any issued trademarks will adequately protect our intellectualproperty, or that such trademarks will not be challenged by third parties or found by a judicial authorityto be invalid or unenforceable.
In addition, we cannot be certain that our operations or any aspects of our business do not orwill not infringe upon or otherwise violate trademarks, copyrights or other intellectual property rightsheld by third parties. We may be subject to legal proceedings and claims relating to the intellectualproperty rights of others. If we are found to have violated the intellectual property rights of others, wemay be subject to liability for our infringement activities or may be prohibited from using suchintellectual property, and we may incur licensing fees or be forced to develop alternatives of our own.Defending against these claims and proceedings is costly and time consuming and may divertmanagement’s time and other resources from our business and operations, and the outcome of many ofthese claims and proceedings cannot be predicted. If a judgment, a fine or a settlement involving apayment of a material sum of money were to occur, or injunctive relief were issued against us, it mayresult in significant monetary liabilities and may materially disrupt our business and operations byrestricting or prohibiting our use of the intellectual property in question, and our business, financialposition and results of operations could be materially and adversely affected.
We are subject to extensive occupational health and safety regulations, which could imposesignificant costs or liabilities on us.
The owners of the Portfolio Assets, whether it be us with respect to our directly held propertiesor the portfolio companies with respect to the properties that are held by the funds and investmentvehicles we manage, have obligations under the various occupational health and safety regulations inthe PRC, Japan, Australia and India. While appropriate risk management procedures, training andintroduction programs (for employees, construction workers and third party contractors) are in place atall of the Portfolio Assets, any failure in health and safety performance may result in penalties fornon-compliance with relevant regulatory requirements, and a failure that results in a significant healthand safety incident is likely to be costly in terms of potential liabilities incurred as a result. Such afailure could generate significant negative publicity and have a corresponding impact on our
83

RISK FACTORS
reputation, our relationships with relevant regulatory agencies or governmental authorities, and ourability to attract tenants and employees, which in turn could have a material adverse effect on ourbusiness, financial condition, results of operations, performance and prospects. Even if we are incompliance with applicable occupational health and safety regulations, any significant health andsafety incident, such as bodily injury or death, may still lead to negative publicity and trigger scrutinyfrom regulatory agencies or authorities.
If more stringent labor laws or other industry standards in APAC become applicable to us, ourbusiness, financial condition, results of operations, performance and prospects may be adverselyaffected.
APAC generally has stringent labor legislation that protects the interests of workers, includinglegislation that sets forth detailed procedures for dispute resolution and employee removal andlegislation that imposes financial obligations on employers upon retrenchment. In addition, we may besubject to certain industry standards regarding our employees. Our employees may in the future formunions. If these labor laws or industry standards become more stringent or are more strictly enforced,or if our employees unionize, it may become difficult for us to maintain flexible human resourcepolicies, discharge employees or downsize, any of which could have a material adverse effect onbusiness, financial condition, results of operations, performance and prospects. See “—Failure to fullycomply with labor dispatch regulations in the PRC may expose us to potential penalties.”
Further, the introduction of legislation imposing new restrictions on working hours orconditions of workers in general or in the logistics real estate industry and fund management industrycould have an adverse effect on our business, financial condition, results of operations, performanceand prospects.
The occurrence of a contagious disease or any other serious public health concerns around theworld, and particularly in APAC, could affect our business, financial condition, results ofoperations, performance and prospects.
Some cities where we operate have previously been subject to, or may be under the threat of,Severe Acute Respiratory Syndrome, H5N1 avian flu, H1N1 human swine flu, Middle East respiratorysyndrome coronavirus (MERS-CoV) and the Zika virus. In 2003, there was an outbreak of SARS inHong Kong, the PRC and other Asian countries. The SARS outbreak in 2003 had a significant adverseimpact on the economies of many of the affected countries. There have also been sporadic outbreaks ofthe H5N1 virus or “Avian Influenza A” among birds, in particular poultry, as well as some isolatedcases of transmission of the virus to humans. In 2009 and 2010, there have also been outbreaks amonghumans of the H1N1 human swine flu, also known globally as influenza A (H1N1).
There can be no assurance that there will not be another significant outbreak of a highlycontagious disease in the future in the markets where we operate or that may affect us. Nor can therebe any assurance that any precautionary measures taken against infectious diseases will be effective. Ifsuch an outbreak were to occur, together with any resulting restrictions on travel and/or imposition ofquarantines, it could have a negative impact on the economy and business activities in areas where weoperate, which could in turn have a material adverse impact on our business, financial condition,results of operations, performance and prospects.
84

RISK FACTORS
Terrorist attacks, civil unrest, hostilities, and other acts of violence or war, and adverse politicaldevelopments may affect our business, financial condition, results of operations, performanceand prospects.
Terrorist activities have contributed to the substantial and continuing economic volatility andsocial unrest in APAC. Any developments stemming from these events or other similar events couldcause further volatility. Any significant military response by relevant governments or any furtherterrorist activities could also materially and adversely affect international financial markets and theeconomies of the countries where we operate and may adversely affect our operations, revenues andprofitability. Local civil disturbances witnessed in certain countries, such as India, and any future civilunrest and any other adverse social, economic or political events could have an adverse effect on ourbusiness. The consequences of any of these terrorist attacks or armed conflicts are unpredictable, andwe may not be able to foresee events that could have a material adverse effect on our business,financial condition, results of operations, performance and prospects.
Risks Relating to Our Business in the PRC
We may face penalties for the non-registration of our lease agreements with tenants and the leaseagreements for the properties we lease in the PRC.
Pursuant to Urban Real Estate Law, lease agreements are required to be filed for registrationand record with the relevant real estate administration authorities. The registration of lease agreementsrequires cooperation of the tenants and lessors, including the provision of various original documentsto the relevant local authority by the tenants and lessors. As of the Latest Practicable Date, 34.6% ofour lease agreements with tenants in the PRC by GFA, which covers GFA of approximately0.36 million sq.m., and 2.6% of the lease agreements for the properties we lease in the PRC by numberof lease agreements had been registered and filed with the relevant land and real estate administrationbureaus. We were not able to complete the remaining lease registration processes as the relevanttenants or lessors did not cooperate and provide us with the necessary documentation required underthe relevant PRC legislation and/or by the relevant local authorities, such as: (i) the original or certifiedcopy of land use right certificate (for our lessors); (ii) the original or certified property title certificate(for our lessors); (iii) the original or certified copy of business licenses (for our tenants or lessors); and(iv) the original or certified copy of personal identification of the legal representatives (for our tenantsor lessors) to register the lease agreements with the local government authorities.
While we have been trying to register these lease agreements throughout the Track RecordPeriod, our tenants or lessors were not willing to cooperate primarily because the non-registration doesnot affect the validity of the lease agreements and due to the inconvenience caused by providing thevarious original documents. Furthermore, cooperating in the lease registration process was not acontractual obligation of our tenants under their lease agreements in the past. For more details, see thesection headed “Business—Compliance and Legal Proceedings” in this Prospectus. Non-registrationdoes not affect our rights or entitlements to lease out the facilities to tenants, or the validity or thebinding effect of the lease agreements over contracting parties. However, pursuant to the provisions ofthe Urban Real Estate Law, the lease agreements are required to be registered and recorded with therelevant local real estate administration authorities. Pursuant to the requirements of the PRCAdministrative Measures of Commodity Property Leases (商品房屋租賃管理辦法) and relevant localrules, we may be subject to requests by the local authorities to complete the registration formalitiesand/or penalties for the non-registration of property lease agreements imposed by the local authorities.As some PRC local governments have not issued or implemented specific penalty rules for the
85

RISK FACTORS
non-registration of lease agreements, our PRC Legal Advisor conducted an estimate based on thepenalty rules that have been published by relevant PRC local governments and has advised us that, asof the Latest Practicable Date, we may be subject to an estimated maximum penalty of approximatelyRMB0.48 million (approximately US$0.07 million) in aggregate for the non-registration of these leaseagreements, which our Directors believe will not have any material adverse impact on our businessoperations or financial performance if imposed on us by the relevant authorities.
As of the Latest Practicable Date, we had neither received a request from any governmentauthority in the PRC to complete the registration formalities nor been penalized for the non-registrationof our lease agreements. We intend to register lease agreements to the extent practicable. Nevertheless,there can be no assurance that we will not be subject to such penalties and/or requests for undertakingthe registration formalities in the future, any of which could increase our costs.
The PRC Government may require us to forfeit our land use rights or penalize us if we were tofail to comply with the development commencement deadline as specified in our land grantcontracts and our land parcels were to be deemed idle lands by the PRC Government.
We may fail to comply with the terms of land grant contracts with the PRC Government due toa delay in commencing our developments or as a result of factors outside of our control. As a result ofthe non-compliance, if the land in question is deemed “idle” in accordance with the applicable laws,the PRC local governments may impose on us an “idle” land fee or require forfeiture of the land. See“Regulatory Overview—A. PRC Laws and Regulations—4. Development of Warehousing Projects—(i) Commencement of Warehousing Development Projects” in Appendix V to this Prospectus.
As of the Latest Practicable Date, we had one land parcel of approximately 102,300 sq.m. ofland area that was deemed idle land by the relevant PRC local government. Based on a confirmationletter issued by relevant competent PRC local government authority on June 16, 2017, the relevantPRC local government authority has confirmed that this particular land parcel was deemed as idle land.Pursuant to the investment agreement and land grant contract in connection with this particular landparcel, the PRC local government had the contractual obligation to deliver this land parcel to us withthe necessary preparatory work completed by March 1, 2014. Such preparatory work included groundleveling and access to power supply, water supply and road transportation. However, the PRC localgovernment was unable to deliver this land parcel with such preparatory work completed before theagreed deadline and as a result, we were unable to commence construction on this land parcel withinthe deadline for commencement of development as specified in the relevant land grant contract,resulting in the land parcel being deemed as idle land. As advised by our PRC Legal Adviser, as it wasdue to government actions that such land parcel was deemed as idle land, it is unlikely that the relevantPRC local government will forfeit our land use right thereof or impose an “idle land” fee or otherpenalties on us. Regardless of the foregoing, we cannot assure you that we will be able to comply withthe PRC regulations and rules relating to idle land going forward. As a result, if the relevant PRC localgovernments were to require us to forfeit the relevant land or impose an “idle land” fee or otherpenalties on us, we may suffer financial loss, including our investments in the land, any land premiumspaid and development costs incurred, we may lose our ability to bid for adjacent land, and the existingtenants on such properties may initiate complaints or claims on us if they have to relocate as a result ofpotential forfeiture of the relevant land parcels by relevant PRC local governments. Because eachparcel of land is unique, we may not be able to procure similar parcels of land. Any of these resultscould materially and adversely affect our business, financial condition, results of operations,performance and prospects.
86

RISK FACTORS
If we were to fail to commence or complete construction within a certain time period or developproperty projects according to the investment criteria set forth in the land grant contracts and/orinvestment agreements, the PRC Government may hold us liable for breach of contract.
We may fail to comply with the terms of land grant contracts and/or investment agreementswith the PRC Government due to a delay in commencing or completing our developments or as aresult of factors out of our control. As a result of such non-compliance, the PRC local governmentsmay hold us liable for breach of contract or terminate the relevant land grant contracts and/orinvestment agreements where the construction did not timely commence or complete pursuant to theagreed timeline.
Failure to commence or complete construction within a certain time period pursuant to termsof land grant contracts.
As of the Latest Practicable Date, the aggregate land area of the land parcels held by our PRCsubsidiaries and joint ventures that did not comply with the deadlines for commencement orcompletion of development as specified in the relevant land grant contracts was approximately1.07 million sq.m. Such delay in commencement or completion of development was mainly due to thedelay in completing relevant government administrative procedures or documentary work. As of theLatest Practicable Date, we obtained written or verbal confirmations from the relevant PRC localgovernment authorities that they will not seek liquidated damages from our respective PRCsubsidiaries and joint ventures, or paid liquidated damages thereunder and entered into supplementalagreements with the relevant PRC local government authorities for our land parcels of 0.97 millionsq.m of land area in aggregate on which we did not commence and/or complete construction within acertain time period as specified in the relevant land grant contracts. As advised by our PRC LegalAdvisor, the relevant PRC local government authorities that provided the aforesaid written or verbalconfirmations, as applicable, are competent government authorities in the PRC that are able to issuesuch confirmations. Details of the two remaining land parcels with a total land area of 0.10 millionsq.m. are set out below:
(i) according to the relevant land grant contract in connection with the first remaining landparcel of 0.07 million sq.m., construction was to be commenced on September 4, 2019. Asof the Latest Practicable Date, we had not commenced construction on this land parcel dueto the prolonged process of preparing the application files in connection with thecommencement of construction in order to appropriately address the comments receivedfrom relevant government authorities. Based on our PRC Legal Adviser’s interview withthe Emerging Industry Demonstration Zone Branch of Land and Resource Bureau ofLangfang City (the “Emerging Industry Branch”) in October 2019, the EmergingIndustry Branch confirmed that (i) from September 4 to September 30, 2019, it would notseek liquidated damages from our relevant PRC subsidiary that did not comply with thedeadline for commencement of development; and (ii) from October 1, 2019 onwards, itwould not seek liquidated damages from such PRC subsidiary if we had not commenceconstruction provided that (a) we maintain effective communications with the EmergingIndustry Branch with respect to the progress of this matter; and (b) we will be able tosubmit documentations in a form satisfactory to the Emerging Industry Branch evidencingthat the delay in commencement of development is due to genuine practical difficulties
87
RISK FACTORS
arising from the preparation of the application documents and complete all the requisiteprocedures and formalities in order to commence construction. If we fail to provide validand satisfactory documentary evidence, we shall be liable for breach of the associated landgrant contract and be required to pay liquidated damages in an amount of RMB39,000(approximately US$5,503.2) per each day of delay. We expect to commence constructionwork on this remaining parcel of land before the end of the year; and
(ii) on September 25, 2019, we acquired a 0.03 million sq.m. land parcel from an independentthird party. According to the relevant land grant contract, construction was to becommenced on March 18, 2019. As of the Latest Practicable Date, we had not commencedconstruction on this land parcel as (i) the seller of this land parcel did not commenceconstruction before it transferred this land to us, and (ii) since September 25, 2019, thedate of the completion of our acquisition of this land parcel, we have been preparingapplication files in connection with the commencement of construction with the aim tocommence construction before the end of this year. Based on our PRC Legal Adviser’sinterview with the Anci District Branch of Land and Resource Bureau of Langfang City(the “Anci District Branch”) in October 2019, the Anci District Branch confirmed that (i)it will issue a written notification after our relevant PRC subsidiary obtains the requisitepermit and start looking into the matter of delay in the commencement of developmentafter we have commenced construction on this land parcel; and (ii) we will have the rightto explain the reasons for such delay to the Anci District Branch, and in the event that therelevant PRC government authority ultimately determines that we are at fault for the delay,we shall be required to pay liquidated damages in an amount of RMB25,400(approximately US$3,584.1) per each day of delay. Pursuant to the share purchaseagreement entered into between the seller and us, in the event that the relevant PRCgovernment authority holds our relevant PRC subsidiary liable for breach of the land grantcontract and seeks liquidated damages from our relevant PRC subsidiary, we have theright to seek indemnification from the seller in the amount of RMB3.4 million(approximately US$0.5 million), subject to certain adjustments.
As advised by our PRC Legal Advisor, the Emerging Industry Branch and the Anci DistrictBranch are competent government authorities in the PRC that are able to opine on the relevant mattersas disclosed above. As of the Latest Practicable Date, we had not been requested by any PRCgovernment authority to pay liquidated damages for not complying with the deadline forcommencement of construction as stipulated in the relevant land grant contracts as disclosed above.
Failure to commence or complete construction within a certain time period pursuant to termsof investment agreements and failure to abide by any other terms of investment agreements.
As of the Latest Practicable Date, one of our PRC subsidiaries, holding land parcels ofapproximately 266,037 sq.m of aggregate land area, did not strictly follow the development scheduleas specified in their investment agreements. As advised by our PRC Legal Advisor, if the relevantgovernment authority holds us liable for not strictly following the development schedule specified inthe investment agreement entered into by this subsidiary, the PRC local government authority mayseek maximum liquidated damages of RMB1.7 million (approximately US$0.2 million). Additionally,failure by us to abide by any terms in the investment agreements may result in the cancellation ofcertain government subsidies granted to us, if any, under the relevant investment agreement.
88
RISK FACTORS
Although the possibility of the relevant government authorities holding us liable for breach ofcontract or terminating the relevant land grant contracts and/or investment agreements is remote, if therelevant government authorities were to hold us liable for breach of contract or terminate the relevantland grant contracts and/or investment agreements, we may suffer financial loss, including ourinvestments in the land, any land premiums paid and development costs incurred, we may lose ourability to bid for adjacent land, and the existing tenants on such properties may initiate complaints orclaims on us if they have to relocate as a result of potential forfeiture of the relevant land parcels byrelevant government authorities. Because each parcel of land is unique, we may not be able to procuresimilar parcels of land. Any of these results could materially and adversely affect our business,financial condition, results of operations, performance and prospects.
In addition, pursuant to some of our land grant contracts and/or investment agreements withPRC local governments, we are required to develop property projects according to investment criteriaset forth in the land grant contracts and/or investment agreements, including those relating to the totalinvestment amount, the average investment amount per sq.m., the total investment amount of fixedassets and the tax payable per sq.m of the built-up areas. We cannot assure you that each of ourprojects under development will fulfill the investment criteria as specified in the relevant land grantcontract and/or investment agreement. As advised by our PRC Legal Adviser, if we fail to develop aproperty project according to the investment criteria set forth in the land grant contract and/orinvestment agreement, the relevant PRC local government authorities may seek liquidated damagesfrom us and/or reduce the land area in the land use right granted to us proportionately. As of the LatestPracticable Date, we had not been requested by any PRC local government to pay liquidated damagesfor not fulfilling the investment criteria set forth in any land grant contract and/or investmentagreement.
The actual or intended usage of some land or properties held by our PRC subsidiaries or by ourjoint ventures may not be in full compliance with legal zoning or usage requirements.
Certain land held by our PRC subsidiaries or our joint ventures for developing modern logisticsfacilities are zoned for “industrial or other usage” rather than for logistics use, and certain propertiesowned by our PRC subsidiaries or our joint ventures are used for logistics and warehousing purposesinstead of their intended use on the relevant property or land certificates. Such intended developmentor actual use may be found by the PRC local governments to be incompatible with zoning or otherlegal designations and therefore penalties may be imposed on the relevant subsidiary or joint venture,such as administrative actions taken by relevant government departments to prevent continuingnon-conforming use, including issuing warnings or rectification orders, imposing fines or forfeiture ofland without compensation. As of the Latest Practicable Date, the aggregate land area of the landparcels held by our PRC subsidiaries and joint ventures that did not strictly comply with legal zoningor usage requirements was approximately 0.22 million sq.m. As of the Latest Practicable Date, we hadobtained confirmations from the relevant PRC local government authorities that they will not imposepenalties on our respective PRC subsidiaries and joint ventures for all the land parcels that did notstrictly comply with legal zoning or usage requirements. As advised by our PRC Legal Advisor, therelevant PRC local government authorities that provided the aforesaid confirmations are competentgovernment authorities in the PRC that are able to issue such confirmations. If the relevant governmentauthorities were to impose penalties on us or require us to suspend ongoing use of the land until furthernotice or forfeit the relevant land being used, we may suffer financial loss, including our investments inthe land, any land premiums paid and development costs incurred, our ability to bid for adjacent landcould be lost, and the existing tenants on such properties may initiate complaints or claims against us if
89

RISK FACTORS
they have to relocate as a result of rectification orders or potential forfeiture of land parcels by therelevant government authorties. Because each parcel of land is unique, we may not be able to procuresimilar parcels of land. The occurrence of any of the foregoing could have an adverse effect on ourbusiness, financial condition, results of operations, performance and prospects.
We may fail to obtain, or experience material delays in obtaining, requisite governmentapprovals, licenses and permits for our properties under construction.
To construct a logistics facility, our relevant PRC subsidiaries and joint ventures must obtainpermits, licenses, certificates and other approvals from the relevant administrative authorities at variousstages of land acquisition and construction, including land use rights certificates, construction landplanning permits, construction works planning permits, construction works commencement permitsand filing forms of completion inspection. In particular, before commencement of construction workfor our logistics properties, we are required to obtain the project approval, construction works planningpermit and construction works commencement permit, among other approvals, licenses and permits.Most of these licenses are subject to examination or verification by governmental authorities and arevalid only for a fixed period of time, subject to renewal and accreditation. Obtaining such approvalsmay require substantial expense, and any non-compliance may expose us to liability. In the event ofnon-compliance, we may have to incur significant expense and divert substantial management time torectify the incidents. During the Track Record Period, we have complied with all relevant PRC lawsand regulations in all material respects in relation to obtaining requisite approvals, licenses and permitsfrom the relevant regulatory authorities for our properties under construction in the PRC, except that,we were not able to obtain the land use right certificate, construction land planning permit,construction works planning permit and construction works commencement permit for the constructionwork carried out in Jiangsu Province with a land area of approximately 40,130 sq.m. (the “SuzhouProject”) before we commenced construction. As advised by our PRC Legal Advisor, in connectionwith this incident, the relevant project company (in which we hold 55% equity interest) may be subjectto an estimated maximum penalty of approximately RMB1.3 million (approximately US$0.2 million).Although our PRC Legal Adviser has interviewed officials from the Management Committee of FenhuHigh-tech Industrial Development Zone of Jiangsu Province (formerly Jiangsu Wujiang FenhuEconomic Development Zone) (the “Management Committee”) in connection with this incident andobtained verbal confirmation from such officials that the Management Committee will not imposepenalties on our relevant PRC subsidiary that commenced construction before obtaining the requisitecertificate and permits, there can be no assurance that the relevant government authority will always, ifever, exercise its discretion in our favor. As advised by our PRC Legal Advisor, according to theNotice to establish the Management Committee of Jiangsu Wujiang Fenhu Economic DevelopmentZone promulgated by the Wujiang municipal government on October 16, 2006, the ManagementCommittee is a competent authority for planning, construction and management of Jiangsu WujiangFenhu Economic Development Zone under the lead of Wujiang municipal government and to give theaforesaid verbal confirmation. As of the Latest Practicable Date, we have obtained the land use rightcertificate, construction land planning permit, construction works planning permit and constructionworks commencement permit for the Suzhou Project.
In the future, if we were to fail to obtain, or experience material delays in obtaining, therequisite governmental approvals, licenses and permits for our properties under construction, we maybe subject to fines, suspension of construction work or the suspension of operations of the logisticsproperties that do not have all the requisite licenses and permits, which could materially and adverselyaffect our investment in our PRC subsidiaries and joint ventures and the schedule of development and
90

RISK FACTORS
commencement of our leasing operations could be substantially disrupted, resulting in a materialadverse effect on our business, financial condition, results of operations, performance and prospects.See “Regulatory Overview” in Appendix V to this Prospectus for further details on the requisiteapprovals, licenses and permits for our logistics property projects. We may also experience adversepublicity arising from non-compliance with government regulations, which would negatively impactour reputation.
In the future, we may not be able to obtain all the land use rights certificates and buildingownership certificates for our logistics properties under construction.
Although our PRC subsidiaries had obtained the land use rights certificates, building ownershipcertificates and/or real property ownership certificates for all of our completed properties in operationpursuant to relevant PRC laws and regulations, we cannot assure you that we will be able to obtain:(i) the land use rights certificates or real property ownership certificates (with respect to the registrationof land use rights) for our properties under construction; or (ii) the building ownership certificates orreal property ownership certificates (with respect to the registration of land use rights as well asbuilding ownership) for such properties after the completion of the construction work. If we are notable to obtain land use rights certificates or real property ownership certificates (with respect to theregistration of land use rights) before the commencement of construction work and/or buildingownership certificates or real property ownership certificates (with respect to the registration of landuse rights as well as building ownership) after the completion of construction work for the relevantproperties under construction: (i) the users of the relevant properties may claim against us for lossesthey suffer; (ii) we may be required to vacate the relevant properties which, to the extent that any of therelevant properties are leased to our tenants, may also affect our ability to continue to perform ourobligations under the lease agreements; and/or (iii) we may be prohibited from transferring the land userights or building ownership rights of such properties or set mortgages on such properties. In addition,if the failure to obtain such certificates is due to violation of any other law or regulation, the competentPRC government authority may impose liabilities on our relevant PRC subsidiaries and joint venturespursuant to the applicable law or regulation. Any such consequences could have an adverse effect onour business, financial condition, results of operations, performance and prospects.
Land use right in the PRC is not perpetual, and the PRC Government may redesignate the usageof land that has been granted to us.
In the PRC, land use rights are granted by the government with a limited term. Under PRClaws, the maximum term of land use rights is 70 years for residential use, 50 years for industrial,warehousing or mixed use and 40 years for commercial use. A substantial portion of the land use rightsfor our directly held properties, including our completed properties, properties under construction andGFA on land held for future development, are for industrial or warehousing use and will expirebetween 2053 and 2069. It remains uncertain as to what will happen when such land use rights expire.To the extent we are required to make substantial payment to renew these land use rights, our financialcondition may be materially and adversely affected. In addition, if we are unable to renew these landuse rights, we may need to obtain alternative locations, which in turn may materially and adverselyaffect our business, financial condition, results of operations, performance and prospects.
In addition, we are subject to the Urban and Rural Planning Law of the PRC (Revised in 2015)(城鄉規劃法) promulgated by the Standing Committee of the NPC on April 24, 2015, pursuant towhich relevant local governments may, from time to time, redesignate the usage of certain land for
91

RISK FACTORS
local planning and development purposes. When a government re-zones land that has been granted tous, we may be required to revise our original design and development plans that were approved before,or such parcel of land may be swapped for another parcel, thereby affecting the development timelineand costs of the entire project. There can be no assurance that relevant local governments will notchange the zoning of certain land that we have already acquired, which could have a material adverseeffect on our business, financial condition, results of operations, performance and prospects.
The establishment and operation of funds and investment vehicles in the PRC are subject totightened legal restrictions and prolonged regulatory approval procedures, which may adverselyaffect our fund management business in the PRC.
In the PRC, pursuant to Law of Security and Investment Fund of the PRC (中華人民共和國證券投資基金法) promulgated by the Standing Committee of the NPC on October 28, 2003 and latestupdated on April 24, 2015, a manager of a private fund shall undergo registration formalities with theAsset Management Association of China (the “AMAC”). Such manager of fund shall be theresponsible entity for the filing of fund or investment vehicle with the AMAC. However, it typicallytakes a long time for a manager of a private fund to complete the registration and filing with theAMAC due to the highly regulated nature of the fund management industry. The AMAC has releasedseries of regulations on the registration of a manager of a private fund and filing of the formation of afund. Pursuant to the Notice on Registration of Manager of Private Investment Fund (私募基金管理人登記須知) promulgated by the AMAC in December 2017 and updated in December 2018, to applyfor and complete the registration with the AMAC, the manager of a private fund shall meet certainrequirements, including but not limited to: (i) it being duly incorporated and validly existing; (ii) ithaving in its registered business scope “fund management”, “investment management”, “assetmanagement”, “equity interest investment”, “venture capital investment” or other description of similarnature; (iii) its principal business being professional and clear; (iv) it having established certainrequisite systems, as relevant to its actual business, including, without limitation, risk managementsystems, disclosure systems, internal control systems, and sound accounting systems; and (v) it havingobtained a certificate of security practice of senior management of a manager of private fund. Pursuantto the Measures on Registration of Manager of Private Investment Fund and Filing of Fund (TrialImplementation) (私募投資基金管理人登記和基金備案辦法(試行)) promulgated by the AMAC onJanuary 17, 2014: (i) with respect to the registration of a manager of fund, the manager of fund shallsubmit required documents online through the electronic application system of the AMAC. TheAMAC will review the submitted materials and request clarification if such materials are incomplete orfailing to meet requirements. The AMAC is entitled to take the following actions to review suchmaterials: interview the senior management of the manager of fund, on-site inspection, andconsultation with the China Security Regulatory Commission and its agencies or relevant professionalassociations. If the materials submitted by the manager of the fund are full and complete, the AMACwill, within 20 working days after receipt of such full and complete materials, complete the registrationformalities by publishing the information of the manager on its website; and (ii) with respect to thefiling of a fund, within 20 working days after completion of fundraising, the manager of fund shallsubmit required documents online through the electronic application system of the AMAC, and theAMAC will review the materials submitted online and request clarification if such materials areincomplete or fail to meet requirements. If the materials submitted by the manager of the fund arecomplete and meet the requirements, the AMAC will, within 20 working days after receipt of full andcomplete materials, complete the filing formalities by publishing the of information of the private fundon its website. We are in the process of setting up our third PRC core fund. In light of the lengthyapplication procedures as described above, if we were to fail to obtain the approvals, licenses, permits
92
RISK FACTORS
or qualifications required for establishing the proposed PRC core fund from relevant regulators in thePRC due to any tightened legal restrictions or prolonged regulatory approval procedures or otherwise,our implementation of our core and core-plus strategy in the PRC may be delayed.
In addition, additional regulatory approvals, licenses, permits or qualifications for fundmanagement business may be required by relevant regulators in the PRC in the future, and some of ourcurrent approvals, licenses, permits or qualifications are subject to periodic renewal. The failure toobtain or maintain our required approvals, licenses, permits or qualifications could adversely affect ourbusiness, financial condition and results of operations. Furthermore, the relevant regulatoryrequirements in the fund management industry are evolving and subject to change or differentinterpretations by relevant government authorities, all of which are out of our control. As a result, wecannot assure you that in the future we will be deemed compliant with applicable regulatoryrequirements relating to the fund management industry in the PRC at all times. Material incidents ofnon-compliance with fund management regulatory requirements in the PRC may subject us tosanctions, fines, penalties, disqualification for our existing fund management business in the PRC ornon-renewal of our qualifications upon expiry, or other administrative penalties, regulatory actions andself-disciplinary actions by the PRC regulatory authorities, which may harm our reputation andmaterially adversely affect our business, financial condition, results of operations, performance andprospects.
We may fail to contribute to the registered capital of our PRC subsidiaries or experiencematerial delays in contributing to the registered capital of our PRC subsidiaries.
Following the recent amendments to the Company Law of the PRC, which came into force onMarch 1, 2014, FIEs are no longer subject to any major statutory restrictions in terms of capitalcontribution, except for companies in certain industries which are subject to special requirements inrespect of paid-in capital. For FIEs established before March 1, 2014, the shareholders are entitled toamend the constitutional documents (e.g., joint venture contracts and articles of association) if suchconstitutional documents set forth any time schedule in connection with capital contribution. Incontrast, for FIEs in specially-regulated industries, the failure to contribute capital pursuant to legalrequirements may still subject us to governmental penalties.
Some of our PRC subsidiaries were established before March 1, 2014. Such companies mayamend their joint venture contracts and/or articles of association in respect of the schedule for capitalcontribution if needed, and file such amendment to the competent subordinates of MOFCOM.
Currently, there is no clear PRC law or regulation on governmental penalties in connection withfailure of making capital contribution pursuant to joint venture contracts and/or articles of associationfor companies outside the specially-regulated industries, except that pursuant to Article 199 of theCompany Law of the PRC (公司法), promulgated by the Standing Committee of the NPC and effectiveas of October 26, 2018, if a promoter or shareholder of a company fails to contribute money ornon-monetary assets as registered capital or fails to contribute such on time, the relevant companyregistration authority has the power to request rectification. It is possible that new PRC laws orregulations may be promulgated in the future imposing more stringent requirements and liabilities,which could have a material adverse effect on our business, financial condition, results of operations,performance and prospects.
93

RISK FACTORS
The legal system in the PRC embodies uncertainties which could limit the legal protectionsavailable to us.
The legal system in the PRC is a civil law system based on written statutes. Unlike commonlaw systems, it is a system in which decided legal cases have little precedential value. The legal systemin the PRC evolves rapidly, and the interpretations of many laws, regulations and rules may containinconsistencies. Our subsidiaries incorporated in the PRC are subject to laws and regulationsapplicable to foreign investment in the PRC in general, as well as specific laws and regulationsapplicable to FIEs. However, these laws, regulations and legal requirements are constantly changingand their interpretation and enforcement involve uncertainties. These uncertainties could limit the legalprotections available to us. In addition, we cannot predict the effect of future developments in themainland Chinese legal system, particularly with regard to logistics real estate industries, including thepromulgation of new laws, changes to existing laws or the interpretation or enforcement thereof, or thepreemption of local regulations by national laws. Such unpredictability towards our contractual,property (including intellectual property) and procedural rights could adversely affect our business inthe PRC and impede our ability to continue our operations in the PRC. Furthermore, any litigation inthe PRC may be protracted and result in substantial costs and diversion of resources and managementattention.
We may be classified as a “resident enterprise in mainland China” for mainland Chineseenterprise income tax purposes, which could result in unfavorable tax consequences to us andour shareholders and have a material adverse effect on our results of operations and the value ofyour investment.
Under the EIT Law, which became effective on January 1, 2008, an enterprise establishedoutside mainland China whose “de facto management body” is located in mainland China isconsidered a “resident enterprise in mainland China” and will generally be subject to the uniform 25%EIT rate, on its global income. Under the implementation rules of the EIT Law, “de facto managementbody” is defined as the organization body that effectively exercises management and control over suchaspects as the business operations, personnel, accounting and properties of the enterprise.
On April 22, 2009, the SAT released the Notice Regarding the Determination of Chinese-Controlled Offshore Incorporated Enterprises as People’s Republic of China Tax Resident Enterpriseson the Basis of De Facto Management Bodies (關於境外註冊中資控股企業依據實際管理機構標準認定為居民企業有關問題的通知) (“SAT Circular 82”) that sets out the standards and procedures fordetermining whether the “de facto management body” of an enterprise registered outside of mainlandChina and controlled by mainland Chinese enterprises or mainland Chinese enterprise groups is locatedwithin mainland China. Further to SAT Circular 82, on July 27, 2011, the SAT issued theAdministrative Measures for Enterprise Income Tax of Chinese-Controlled Offshore IncorporatedResident Enterprises (Trial) (境外註冊中資控股居民企業所得稅管理辦法(試行)) (“SAT Bulletin 45”),to provide more guidance on the implementation of SAT Circular 82; the bulletin became effective onSeptember 1, 2011 and revised on April 27, 2015. SAT Bulletin 45 clarified certain issues in the areasof resident status determination, post-determination administration and competent tax authorities’procedures.
Under SAT Circular 82, a foreign enterprise controlled by a mainland Chinese enterprise ormainland Chinese enterprise group is considered a mainland Chinese resident enterprise if all of thefollowing apply: (i) the senior management and core management departments in charge of daily
94

RISK FACTORS
operations are located mainly within mainland China; (ii) financial and human resources decisions aresubject to determination or approval by persons or bodies in mainland China; (iii) major assets,accounting books, company seals and minutes and files of board and shareholders’ meetings arelocated or kept within mainland China; and (iv) at least half of the enterprise’s directors with votingrights or senior management reside within mainland China.
Although SAT Circular 82 and SAT Bulletin 45 explicitly provide that the above standardsapply to enterprises which are registered outside of mainland China and controlled by mainlandChinese enterprises or mainland Chinese enterprise groups, Circular 82 may reflect SAT’s criteria fordetermining the tax residence of foreign enterprises in general. If mainland Chinese tax authoritiesdetermine that we were treated as a resident enterprise in mainland China for mainland Chineseenterprise income tax purposes, the 25% mainland Chinese enterprise income tax on our global taxableincome could materially and adversely affect our ability to satisfy any cash requirements we may have.
Laws and regulations in mainland China establish more complex procedures for someacquisitions of Chinese companies by foreign investors, which could make it more difficult for usto pursue growth through acquisitions in mainland China.
A number of mainland Chinese laws and regulations, including the M&A Rules, theAntimonopoly Law (反壟斷法) promulgated by the Standing Committee of the NPC in August 2007,and the Rules of Ministry of Commerce on Implementation of Security Review System of Mergers andAcquisitions of Domestic Enterprises by Foreign Investors (商務部實施外國投資者併購境內企業安全審查制度的規定) promulgated by MOFCOM in August 2011 (the Security Review Rules), haveestablished procedures and requirements that are expected to make merger and acquisition activities inmainland China by foreign investors more time-consuming and complex. These include requirementsin some instances that the approval from MOFCOM be obtained in circumstances where overseascompanies established or controlled by enterprises or residents in mainland China acquire affiliateddomestic companies. Mainland Chinese laws and regulations also require certain merger andacquisition transactions to be subject to merger control review or security review.
We have grown and may continue to grow our business by acquiring complementarybusinesses. Complying with the requirements of the above-mentioned regulations and other relevantrules to complete such transactions could be time-consuming, and any required approval processes,including obtaining approval from the MOFCOM or its local counterparts may delay or inhibit ourability to complete such transactions. It is unclear whether our business would be deemed to be in anindustry that raises “national defense and security” or “national security” concerns. However, theMOFCOM or other government agencies may publish explanations in the future determining that ourbusiness is in an industry subject to the security review, in which case our future acquisitions inmainland China, including those by way of entering into contractual control arrangements with targetentities, may be closely scrutinized or prohibited. Our ability to expand our business or maintain orexpand our market share through future acquisitions would as such be materially and adverselyaffected.
The heightened scrutiny over acquisition transactions by tax authorities in mainland China mayhave a negative impact on our business operations, our acquisition or restructuring strategy orthe value of your investment in us.
Pursuant to the Notice of State Administration for Taxation on Strengthening Administration ofEnterprise Income Tax for Share Transfers by Non-Resident Enterprises (國家稅務總局關於加強非居
95
RISK FACTORS
民企業股權轉讓所得企業所得稅管理的通知) (“SAT Circular 698”) issued by the SAT in December2009 with retroactive effect from January 1, 2008, where a non-resident enterprise transfers the equityinterests of a mainland Chinese resident enterprise indirectly by disposition of the equity interests of anoverseas non-public holding company or, an Indirect Transfer, and such overseas holding company islocated in a tax jurisdiction that: (i) has an effective tax rate of less than 12.5%; or (ii) does not imposeincome tax on foreign income of its residents, the non-resident enterprise, being the transferor, mustreport to the competent tax authority of the mainland Chinese resident enterprise this Indirect Transfer.Using a “substance over form” principle, the mainland Chinese tax authority may disregard theexistence of the overseas holding company if it lacks a reasonable commercial purpose and wasestablished for the purpose of reducing, avoiding or deferring mainland Chinese tax.
On March 28, 2011, the SAT released the SAT Public Notice on Certain Issues ofAdministration of Enterprise Income Tax of Non-Resident Enterprises (2011) No. 24 (國家稅務總局關於非居民企業所得稅管理若干問題的公告) (“SAT Public Notice 24”), which became effective onApril 1, 2011, to clarify several issues related to SAT Circular 698. According to SAT Public Notice24, the term “effective tax” refers to the effective tax on the gain derived from disposition of the equityinterests of an overseas holding company; and the term “does not impose income tax” refers to thecases where the gain derived from disposition of the equity interests of an overseas holding company isnot subject to income tax in the jurisdiction where the overseas holding company is a resident.
On February 3, 2015, the SAT issued the Announcement of the SAT on Several Issuesconcerning the Enterprise Income Tax on Income from the Indirect Transfer of Assets byNon-Resident Enterprises (國家稅務總局關於非居民企業間接轉讓財產企業所得稅若干問題的公告)(“SAT Circular 7”), which abolished certain provisions in SAT Circular 698, as well as certain otherrules providing clarification on SAT Circular 698. SAT Circular 7 provided comprehensive guidelinesrelating to, and also heightened the mainland Chinese tax authorities’ scrutiny over, indirect transfersby a non-resident enterprise of mainland Chinese taxable assets. Under SAT Circular 7, the taxauthorities in mainland China are entitled to reclassify the nature of an indirect transfer of mainlandChinese taxable assets, when a non-resident enterprise transfers mainland Chinese taxable assetsindirectly by disposing of equity interests in an overseas holding company directly or indirectlyholding such mainland Chinese taxable assets, by disregarding the existence of such overseas holdingcompany and considering the transaction to be a direct transfer of mainland Chinese enterprise incometaxes and without any other reasonable commercial purpose. However, SAT Circular 7 contains certainexemptions, including: (i) where a non-resident enterprise derives income from the indirect transfer ofmainland Chinese taxable assets by acquiring and selling shares of an overseas listed company whichholds such mainland Chinese taxable assets on a public market; and (ii) where there is an indirecttransfer of mainland Chinese taxable assets, but if the non-resident enterprise had directly held anddisposed of such mainland Chinese taxable assets, the income from the transfer would have beenexempted from enterprise income tax in mainland China under an applicable tax treaty or arrangement.
On October 17, 2017, the SAT issued the Circular on the Source of Deduction of Income Taxfor Non-resident Enterprises (國家稅務總局關於非居民企業所得稅源泉扣繳有關問題的公告) (“SATCircular 37”), which became effective on December 1, 2017 and abolished SAT Circular 698 as wellas certain provisions in SAT Circular 7. Pursuant to SAT Circular 37, where the party responsible todeduct such income tax did not or was unable to make such deduction, the non-resident enterprisereceiving such income should declare and pay the taxes that should have been deducted to the relevanttax authority. The taxable gain is calculated as the income from such transfer net of the net book valueof equity interest.
96
RISK FACTORS
We have conducted and may conduct acquisitions involving changes in corporate structures,and historically our shares were transferred by certain then shareholders to our current shareholders.We cannot assure you that the mainland Chinese tax authorities will not, at their discretion, adjust anycapital gains or impose tax return filing obligations on us or require us to provide assistance for theinvestigation of mainland Chinese tax authorities with respect thereto. Any mainland Chinese taximposed on a transfer of our Shares or any adjustment of such gains would cause us to incur additionalcosts and may have a negative impact on the value of your investment in us.
We may be subject to LAT in connection with an equity transaction which in substance may betreated as an asset transaction.
In the PRC, we acquire land-use rights directly from the local governments. Our propertytransfer activities are subject to LAT with respect to the appreciated value of the land. LAT applies toboth domestic and foreign investors in the sale of properties on which developments are completed inthe PRC, and is levied at progressive rates ranging from 30% to 60% of the appreciation of land valueafter deducting allowed costs and expenses. In addition, our subsidiaries may be subject to LAT whenselling properties that are still under construction and the rate of LAT so levied is calculated based onrates and formula local tax authorities implement. As a result, our results are susceptible to anysignificant increase in LAT expenses, which depends on the level of appreciation in land value as wellas the amount of deductible costs and expenses, such as land premium and applicable propertydevelopment costs. Furthermore, if we sell properties by way of equity transfer, the applicable taxauthority may deem such equity transfer subject to LAT as the underlying assets of such equity areland use rights and property thereon. During the Track Record Period, we have not been required tomake any payments for LAT. However, we cannot assure you that the relevant tax authorities willagree to the basis on which we have calculated our LAT for provision purposes, or that such provisionswill be sufficient to cover all LAT obligations that tax authorities may ultimately impose on us,especially with regard to any equity transfer which involves land as the underlying asset and which insubstance may be treated as an asset transaction. Our financial condition and results of operations maybe materially adversely affected if our LAT as calculated by the relevant tax authorities aresubstantially higher than our provisions.
The PRC Government’s pilot plan to replace the business tax with a value added tax (“VAT”)may require us to pay more taxes, which could have a material adverse effect on our financialcondition and results of operations.
Pursuant to the People’s Republic of China Provisional Regulations on Business Tax (中華人民共和國營業稅暫行條例) promulgated by the State Council on December 13, 1993, taxpayers providingtaxable services falling under the category of service industry in mainland China are required to paybusiness tax at a normal tax rate of 5% of their revenues. On November 16, 2011, the Ministry ofFinance and the SAT promulgated the Pilot Plan for Imposition of Value-Added Tax to ReplaceBusiness Tax (營業稅改徵增值稅試點方案). Pursuant to this plan and relevant notices, from January 1,2012, a VAT was imposed to replace the business tax in the transport and shipping industry and someof the modern service industries in certain pilot regions. Under the pilot plan, a VAT rate of 6% appliesto some modern service industries. On March 23, 2016, the Notice of the Ministry of Finance and theState Administration of Taxation on Implementing the Pilot Program of Replacing Business Tax withValue-Added Tax in an All-round Manner (關於全面推開營業稅改徵增值稅試點的通知) was issued,pursuant to which the pilot plan for the replacement of business tax with VAT was expanded to allregions and industries as of May 1, 2016. Our subsidiaries incorporated in the PRC that are granted
97

RISK FACTORS
VAT general taxpayer status may be subject to a VAT rate of 6% for sale of service, or a VAT rate of10% for sale and/or leasing of real estate. This may have an adverse effect on our financial conditionand results of operations.
The PRC regulations on loans and direct investment by offshore holding companies to mainlandChinese entities may delay or prevent us from using the proceeds of the Global Offering to makeloans or additional capital contributions to our subsidiaries incorporated in the PRC, whichcould materially and adversely affect their liquidity and our ability to fund and expand ourbusiness.
We may transfer funds to our subsidiaries incorporated in the PRC or finance them by means ofshareholders’ loans or capital contributions after completion of the Global Offering. Any loans to oursubsidiaries incorporated in the PRC, which are FIEs, cannot exceed statutory limits, and shall beregistered with the SAFE or its local counterparts.
On March 30, 2015, the SAFE promulgated the Circular on Reforming the AdministrationMeasures on Conversion of Foreign Exchange Registered Capital of Foreign-invested Enterprises (國家外匯管理局關於改革外商投資企業外匯資本金結匯管理方式的通知) (“Circular 19”), which willreplace Circular 142 from June 1, 2015. Circular 19, however, allows FIEs with investment as the mainbusiness in the PRC to use their registered capital settled in Renminbi converted from foreigncurrencies to make equity investments, but the registered capital of a foreign invested company settledin Renminbi converted from foreign currencies remains not allowed to be used for investment in thesecurity markets, offering entrustment loans or purchases of any investment properties, unlessotherwise regulated by other laws and regulations. Circular 19 may limit our ability to utilize the netproceeds from the Global Offering if we are to inject such net proceeds to our subsidiaries incorporatedin the PRC which are FIEs to increase their registered capital.
We may be subject to penalties if our resident shareholders or beneficial owners in mainlandChina fail to comply with relevant mainland Chinese foreign exchange regulations.
The SAFE issued the Notice on Relevant Issues Relating to Domestic Residents’ Investmentand Financing and Round-Trip Investment through Special Purpose Vehicles (關於境內居民通過特殊目的公司境外投融資及返程投資外匯管理有關問題的通知) (“Circular 37”), effective on July 4, 2014,which replaced the previous Notice on Relevant Issues Concerning Foreign Exchange Administrationfor the People’s Republic of China Residents Engaging in Financing and Roundtrip Investments viaOverseas Special Purpose Vehicles (關於境內居民通過境外特殊目的公司融資及返程投資外匯管理有關問題的通知) (Circular 75). Circular 37 requires mainland Chinese residents, including mainlandChinese individuals and institutions, to register with the SAFE or its local branches in connection withtheir direct establishment or indirect control of an offshore special purpose vehicle, for the purpose ofoverseas investment and financing, with such mainland Chinese residents’ legally owned assets orequity interests in domestic enterprises or offshore assets or interests. In addition, such residents inmainland China must update their foreign exchange registrations with the SAFE or its local brancheswhen the offshore special purpose vehicle undergoes material events relating to any change of basicinformation (including change of such mainland Chinese individual shareholder, name and operationterm), increases or decreases in investment amount, share transfers or exchanges, or mergers ordivisions.
If any shareholder holding interest in an offshore special purpose vehicle, who is a mainlandChinese resident as determined by Circular 37, fails to make the required foreign exchange registration
98

RISK FACTORS
with a local SAFE branch, the mainland Chinese subsidiaries of that offshore special purpose vehiclemay be prohibited from distributing their profits and dividends to their offshore parent company orfrom carrying out other subsequent cross-border foreign exchange activities, and the offshore specialpurpose vehicle may be restricted in its ability to contribute additional capital to its mainland Chinesesubsidiaries. Moreover, failure to comply with the SAFE registration described above could result inliability under mainland Chinese laws for evasion of applicable foreign exchange restrictions.
We may not be fully informed of the identities of all our shareholders or beneficial owners whoare mainland Chinese residents, and therefore, we may not be able to identify all our shareholders orbeneficial owners who are mainland Chinese residents in order to ensure their compliance withCircular 37 or other related rules. In addition, we cannot provide any assurance that all of ourshareholders and beneficial owners who are residents in mainland China will comply with our requestto make, obtain or update any applicable registrations or comply with other requirements required bythe Circular 37 or other related rules in a timely manner. Even if our shareholders and beneficialowners who are residents in mainland China comply with such request, we cannot provide anyassurance that they will successfully obtain or update any registration required by Circular 37 or otherrelated rules in a timely manner due to many factors, including those beyond our and their control. Ifany of our shareholders who are residents in mainland China as determined by Circular 37 fail to makethe required foreign exchange registration with local SAFE branches, our mainland Chinesesubsidiaries may be prohibited from distributing their profits and dividends to us or from carrying outother subsequent cross-border foreign exchange activities, and we may be restricted in our ability tocontribute additional capital to our subsidiaries in mainland China, which may adversely affect ourbusiness.
Restrictions on the remittance of Renminbi into and out of the PRC and governmental control ofcurrency conversion may limit our ability to pay dividends and other obligations, and affect thevalue of your investment.
The PRC Government imposes controls on the convertibility of Renminbi into foreigncurrencies and the remittance of currency out of the PRC. We generate a considerable portion of ourrevenue in Renminbi, and may need to convert a portion of our cash and cash equivalents fromRenminbi into other currencies in the future to meet our foreign currency obligations, such as paymentsof dividends declared in respect of our Shares. Shortages in the availability of foreign currency mayrestrict the ability of our subsidiaries incorporated in the PRC to remit sufficient foreign currency topay dividends or other payments to us, or otherwise satisfy their foreign currency-denominatedobligations.
Under existing PRC foreign exchange regulations, payments of current account items,including profit distributions, interest payments and trade and service-related foreign exchangetransactions, can be made in foreign currencies without prior SAFE approval by complying withcertain procedural requirements. However, approval from or registration with competent governmentauthorities is required where Renminbi is to be converted into foreign currency and remitted out of thePRC to pay capital expenses such as the repayment of loans denominated in foreign currencies. ThePRC Government may at its discretion restrict access to foreign currencies for current accounttransactions in the future. If the foreign exchange control system in the PRC prevents us fromobtaining sufficient foreign currencies to satisfy our foreign currency demands, we may not be able topay dividends in foreign currencies to our Shareholders. Further, there is no assurance that new
99

RISK FACTORS
regulations will not be promulgated in the future that would have the effect of further restricting theremittance of Renminbi into or out of the PRC.
Failure to fully comply with labor dispatch regulations in the PRC may expose us to potentialpenalties.
Pursuant to the Labor Contract Law and its amendments, dispatched labor is intended to be asupplementary form of employment and the primary form of employment by enterprises andorganizations that hire employees should be direct employment. Further, it is stated in the InterimProvisions on Labor Dispatch (勞務派遣暫行規定) (the “Interim Provisions”) that became effective onMarch 1, 2014 that the number of dispatched workers an employer uses may not exceed 10% of itstotal labor force and the employer has a two-year transition period starting from March 1, 2014 tocomply with such requirement. See section headed “Regulatory Overview—PRC Laws andRegulations—Labor Protection” in Appendix V to this Prospectus. During the Track Record Period,we relied on dispatched workers to perform certain property management services in the PRC. As ofthe Latest Practicable Date, we had a total of 11 dispatched workers in nine subsidiaries in the PRC.We have been trying to reduce the number of dispatched workers and to bring the percentages ofdispatched workers in our PRC subsidiaries below the 10% limit. As advised by our PRC LegalAdvisor, pursuant to relevant PRC laws and regulations, in aggregate, as of the Latest Practicable Date,we may be subject to a maximum penalty of approximately RMB0.11 million (approximately US$0.02million) for not fully complying with labor dispatch regulations. As of the Latest Practicable Date, wehad not been ordered by relevant government authorities to make rectification with respect to thecompliance with Interim Provisions. However, we cannot assure you that we can successfully reducethe percentages of dispatched workers of all of our PRC subsidiaries to below 10% and that PRCgovernmental authorities will not impose penalties on the relevant subsidiaries, which could have amaterial adverse effect on our financial condition and results of operations.
Risks Relating to Our Business in Japan
Our Japanese operations and real estate may be disrupted due to earthquakes, typhoons or othernatural disasters.
Japan is susceptible to earthquakes and typhoons, and has experienced several largeearthquakes that have caused extensive property damage. For example, Japan has historicallyexperienced numerous large earthquakes that have resulted in extensive property damage, such as theGreat East Japan Earthquake of March 2011, which resulted in a tsunami and leakage of radioactivematerial at the Fukushima nuclear power plants, and a series of earthquakes that occurred on or afterApril 14, 2016 centering on Kumamoto prefecture, which caused major manufacturers’ plants andfacilities in the region to suspend production. More recently, Japan has experienced significantearthquakes in Osaka in June 2018 and in Hokkaido in September 2018 which caused extensiveproperty damage in surrounding areas and electricity outage in the case of Hokkaido. Japan is alsoprone to typhoons, such as a typhoon that hit across Japan in September 2018 which caused KansaiInternational Airport to be out of operation for several days. The typhoon has also has caused damagesto our logistics properties in Osaka. Any events resulting from a similar earthquake, such asaftershocks, tsunamis, electric outages or radiation leakages, or floods or storm surges caused bytyphoons could have a catastrophic effect on our facilities in Japan and our ability to operate suchfacilities, the businesses of our tenants in Japan, especially where those facilities are located onreclaimed lands that are vulnerable to earthquake, tidal surges or rising sea waters, or the Japanese
100

RISK FACTORS
economy in general and the global supply chain. In turn, this could have a material adverse effect onour business, financial condition, results of operations, performance and prospects. Furthermore, wemight also be liable for losses claimed from our tenants that were incurred due to our damagedproperties. These potential liabilities could also have a material adverse effect on our results ofoperations.
The Japanese real property registration system may not accurately reflect the ownership of thereal property-related title or right.
Japan has a system of registering the ownership of real property (which includes land andbuildings) as well as certain other real property-related rights, such as security rights over real propertyand easements, pursuant to which an unregistered owner of real property or an unregistered holder ofcertain other rights cannot assert its title or such rights against a third-party in principle. However, thereal property register does not necessarily reflect the true owner of the real property-related title orright. In practice, parties who plan to enter into a real property transaction usually rely upon theregister, as it is generally the best indication of the true owner of the real property-related title or right.However, a party has no recourse to anyone but the seller if, relying on the register, it purchases theproperty or a related right from a seller and the information contained in the register turns out to beincorrect. The purchaser may claim for damages against the seller pursuant to statutory warranties orcontractual warranties, but, in general, cannot acquire the ownership of, or title to, the real propertyfrom the real owner. Imperfect title to one or more of our facilities in Japan could have a materialadverse effect on our business, financial condition, results of operations, performance and prospects.
We may be exposed to risks associated with dividend deduction requirements for TMKs inJapan.
In Japan, we invest in logistics properties in Japan through TMKs (Tokutei Mokuteki Kaisya).For a TMK to avail itself of the dividend distribution deduction tax treatment, the TMK must meetcertain initial requirements when it is established and must continue to meet certain annualrequirements in accordance with the Special Taxation Measures Law of Japan. One of these annualrequirements is that a TMK should distribute more than 90% of its distributable profits for each fiscalyear (the “TMK Distribution Requirement”). The TMK Distribution Requirement is based on theamount of audited pre-tax profits of the TMK in Japan. While we will work closely with theprofessional advisers to the TMKs we invest in to minimize any tax costs due to the differencesbetween tax and accounting treatments, there can be no assurance that such tax costs can be entirelyeliminated. Accordingly, the TMKs we invest in may bear excessive tax costs, in which case the TMKswe invest in may not have sufficient cash to distribute dividends and hence may fail to satisfy the TMKDistribution Requirement. In the event that the TMKs we invest in are unable to meet the TMKDistribution Requirement, we will not be able to deduct the dividend distributions of the TMKs weinvest in from our taxable income of the TMKs we invest in as deductible expenses. Instead, the TMKwould have to make dividend distributions after its taxable income has been subject to Japanesecorporate income tax at the regular rate. This will reduce the amount of distributions to us, and couldhave a material adverse effect on our business, financial condition, results of operations, performanceand prospects.
101

RISK FACTORS
Some of the Portfolio Assets are currently held or may be held in the form of a property or trustbeneficiary co-ownership interest, and rights relating to such properties may be affected by theintentions of other owners.
We, or the funds and investment vehicles we manage, own or may acquire interests in someproperties in the form of a property co-ownership interest (kyōyū-mochibun) with third parties in thefuture in Japan. Management of co-owned properties is conducted by a majority of the co-owners,weighted according to ownership proportion, unless otherwise agreed among the co-owners. Thus, ifwe, or the funds and investment vehicles we manage, do not own a majority interest in a property, ourpolicies concerning management and operation of the property may not be executed. Furthermore,since co-owners can in some instances use the entire co-owned property, depending on the proportionof the ownership, our ownership or use of the property may be prevented if a co-owner possesses andexercises such right. Under Japanese law, a co-owner of a property has the right to sell its interest inthe property without the consent of other co-owners, unless there is an agreement between theco-owners that requires such consent or grants a right of first refusal. In general, a co-owner has theright to demand that such property be partitioned. Although special provisions may be included tocontractually prohibit the exercise of such right of partition, such provisions are only valid for a periodof five years. If a co-owner of one of the Portfolio Assets becomes subject to bankruptcy proceedings,corporate reorganization or civil rehabilitation proceedings, the trustees in the proceedings of suchco-owner may have the right to demand that such property be partitioned. Although the otherco-owners of the property may, if so agreed, have a right of first refusal to purchase the ownershipinterests of the defaulting or selling co-owner, we or the funds and investment vehicles we managemay not be able to exercise such rights on favorable terms. In addition, a sale of the propertyco-ownership interest held by us or the funds and investment vehicles we manage under suchcircumstances may result in liquidation proceeds that are less than the fair value of such property orinterests being sold, which may have an adverse effect on our business, financial condition, results ofoperations, performance and prospects.
A co-owner of a property may mortgage its interest in the property. However, such mortgagebecomes applicable to the entire property when the co-owned property is partitioned. Accordingly,each of the co-owners in such case would be subject to such mortgage in proportion to its ownershipinterest. There is a risk that the interest held by us or the funds and investment vehicles we manage in aproperty that was formerly owned through a property co-ownership interest and owned by us or thefunds and investment vehicles we manage independently following a partition may be subject to amortgage that was placed on it by another co-owner. We, or the funds and investment vehicles wemanage, may also bear the credit risk of a co-owner in case, for example, there is a contractualarrangement under which the rent is paid from a lessee to the co-owner, which in return pays a portionof such rent to us, or the funds and investment vehicles we manage.
In addition, when the properties in Japan are owned or acquired as trust beneficiary interests inproperties in the form of co-ownership (jun-kyōyū-mochibun) with other trust beneficiaries, restrictionssimilar to those associated with property co-ownership interests are applicable. For example, a holderof a trust beneficiary co-ownership interest may choose to dispose of such interest to a third party if itreceives consent from the trustee, thus allowing for the possibility of having a co-owner that we wouldprefer not to have. In addition, unless there is an agreement among the holders of the trust beneficiaryco-ownership interests, there is a possibility that an owner may not be able to have its opinionsreflected in the instructions provided to the trustee pursuant to the trust agreement or that a holder oftrust beneficiary co-ownership interests may be liable for the full amount of liabilities to the trustee
102

RISK FACTORS
unpaid by other holders. Any such risks may have a material adverse effect on our business, financialcondition, results of operations, performance and prospects.
The ownership rights in some of the Portfolio Assets may be declared invalid or limited.
The Portfolio Assets in Japan are either directly held by a TMK structure under which the titleto the property is registered in the name of TMKs, or held in a trust structure under which the title tothe property is or will be registered in the name of the trustee. However, such registration of title doesnot guarantee absolute ownership under Japanese law. For example, if the former owner of a PortfolioAsset subsequently becomes subject to bankruptcy, corporate reorganization or civil rehabilitationproceedings, we or the funds and investment vehicles we manage could face a claim for avoidance orfraudulent conveyance. If, for example, we or the funds and investment vehicles we manage acquired aPortfolio Asset while the seller or former owner was insolvent, or if as a result of the sale of a PortfolioAsset to us or the funds and investment vehicles we manage, the seller becomes insolvent, we or thefunds and investment vehicles we manage may be required to return that Portfolio Asset or beneficiaryinterest in that Portfolio Asset to the seller or former owner without full refund of the purchase price,or we or the funds and investment vehicles we manage may have to pay a significant amount of moneyto settle such claims. Further, if the former owner of a Portfolio Asset was or becomes unable to pay itsdebt at the time of the acquisition of that Portfolio Asset by us or the funds and investment vehicles wemanage, the acquisition may be voided by the creditors of the former owner. We or the funds andinvestment vehicles we manage may also lose the beneficiary interest in a trust property if the seller ora former owner is found to have originally entrusted the property with a trustee to avoid having theproperty foreclosed by creditors. Although we or the funds and investment vehicles we manage do notbelieve that any of the Portfolio Assets are currently subject to significant risks of this type, these riskscannot be completely eliminated. As a result, future changes in the conditions of any owners or formerowners of the Portfolio Assets could jeopardize the ownership interests held by us or the funds andinvestment vehicles we manage in the Portfolio Assets.
As title insurance is not customary in Japan, our ability to obtain protection from propertyownership risks is limited. Moreover, because the rights and obligations attached to some of thePortfolio Assets are complicated, in part because of the manner in which we or the funds andinvestment vehicles we manage acquire and hold these properties, our ownership rights or theownership rights of the funds and investment vehicles we manage in these properties may be declaredinvalid, or the rights held by third parties may limit our rights or the rights of the funds and investmentvehicles we manage in these properties. For example, for tax reasons, when we purchase a property wemay seek to delay the date on which we apply for transfer of property rights to be transferred to us onthe public real estate register. Although we will seek to take steps such as pre-registering the propertyrights in order to ensure priority in the real estate register, during this period of delay we may not beable to assert our ownership in the event that the seller becomes insolvent. Any of these circumstancescould have a material adverse effect on our business, financial condition, results of operations,performance and prospects.
We or the funds and investment vehicles we manage may lose the rights in a Portfolio Asset or aproperty we or the funds and investment vehicles we manage intend to acquire if the purchase ofthe property is recharacterized as a secured financing.
Depending on the underlying facts and circumstances surrounding the purchase of a property, ifa purchase cannot be construed as a “true sale” under Japanese law, it may be recharacterized as a
103

RISK FACTORS
secured financing. In such case, the relevant property would be deemed to be an asset of the seller, andwe or the funds and investment vehicles we manage would lose the ownership interest in the property.We or the funds and investment vehicles we manage would instead hold only a security interest in theproperty. Recharacterization could occur when the seller becomes insolvent by way of bankruptcy,corporate reorganization or civil rehabilitation proceedings. Under Japanese law, whether a purchasemay be recharacterized as a secured financing is determined through a consideration of various factors,including, without limitation, the intention of the seller and purchaser, whether the seller recorded thepurchased property on its balance sheet, whether the seller transferred the economic risk to thepurchaser, and whether the seller and purchaser contracted a buy-back arrangement permitting theseller to reacquire the property. Although we have no reason to believe that the acquisition of any ofthe Portfolio Assets would be recharacterized as a secured financing, there is no guarantee that anysuch acquisition will not be recharacterized as a secured financing following a legal or regulatoryproceeding.
Risks Relating to Our Business in South Korea
Escalations in tensions between South Korea and North Korea could have an adverse effect on usand the market value of the Shares.
Relations between South Korea and North Korea have been tense throughout South Korea’smodern history. The level of tension between the two Koreas has fluctuated and may increase abruptlyas a result of current and future events. In particular, there continues to be uncertainty regarding thelong-term stability of North Korea’s political leadership since the succession of Kim Jong-un to powerfollowing the death of his father in December 2011, which has raised concerns with respect to thepolitical and economic future of the region. In recent years, there have been heightened securityconcerns stemming from North Korea’s nuclear weapons and long-range missile programs andincreased uncertainty regarding North Korea’s actions and possible responses from the internationalcommunity. North Korea’s economy also faces severe challenges, including severe inflation and foodshortages, which may further aggravate social and political tensions within North Korea.
In addition, reunification of South Korea and North Korea could occur in the future, whichwould entail significant economic commitment and expenditure by South Korea that may outweighany resulting economic benefits of reunification. On April 27, 2018 and May 26, 2018, Moon Jae-in,President of the South Korea and North Korea’s Kim Jong-un attended summits held in theDemilitarized Zone of the Korean peninsula. On June 12, 2018, the president of the United StatesDonald J. Trump and Kim Jong-un held a meeting in Singapore. The two leaders signed the “JointStatement of President Donald J. Trump of the United States of America and Chairman Kim Jong Unof the Democratic People’s Republic of Korea” at the Singapore Summit, which contains statementsthat they will work together towards building a peace regime on, and denuclearization of, the KoreanPeninsula. Furthermore, the two leaders of South and North Korea held the Inter-Korean SummitMeeting in Pyeongyang from September 18 to 20, 2018, and adopted the Pyeongyang Joint Declarationof September 2018, which contains the principle of independence and self-determination of the Koreannation, and agreed to consistently and continuously develop inter-Korean relations for nationalreconciliation and cooperation, firm peace and co-prosperity, and to make efforts to realize throughpolicy measures the aspiration and hope of all Koreans that the current developments in inter-Koreanrelations will lead to reunification. In addition, the two leaders of United States of America and NorthKorea held summit meetings from February 26, 2019 to February 28, 2019 and on June 30, 2019.There can be no assurance that the level of tensions on the Korean peninsula will not escalate in the
104

RISK FACTORS
future. Any further increase in tensions, which may occur, for example, if North Korea experiences aleadership crisis, high-level contacts between South Korea and North Korea break down or militaryhostilities occur, could have a material adverse effect on our operations.
While real property registration in South Korea creates a strong presumptive evidence of validownership, it may not be conclusive in exceptional circumstances.
The South Korean title registration for real estate (i.e., the land and the buildings on it) will beeffective upon registration in the relevant registry of real estate managed by the court office which hasjurisdiction over such real estate. Therefore, the registration as an owner on the relevant real estateregistry will provide a strong presumption for the valid title of the owner.
The existence of a registration legally presumes that there exists a corresponding substantiveright as well as a corresponding relationship between the former owner and the current owner asrecorded within the registry. The current owner may defend his/her ownership, which is presumptivelyvalid against the former owner as well as any third party who challenges his or her registeredownership. The party who challenges title holds the burden of proof, i.e., the challenging party mustprove non-existence of rights or grounds of nullity of such registration of previous transactions, whilethe current owner only needs to prove the existence of its registration. The courts have in some casesreversed the presumption, such as: (i) registration with the name of the dead or non-existing person;(ii) when it is proved that the registered person is not the same as the actual purchaser of the real estate;or (iii) when it is obvious that there is an impediment in the registration procedure. In addition to thisstrong presumption, the South Korean Civil Code provides for a certain prescription period whereby apurchaser may be protected if certain requirements are duly satisfied. Under the South Korean CivilCode, if a person who has been registered as an owner of the property has occupied the propertypeacefully, publicly, in good faith and without any fault for ten years with an intention to own suchproperty, he/she will acquire the title to such property.
The level of risk associated with the ownership of real estate can thus be assessed to a certainextent based on the review of the current entry of the registry and the chain of preceding acquisitions.Sellers of all the South Korean properties (other than cases where the seller was designated as adeveloper of a logistics complex development project pursuant to the relevant law, in which case suchdesignee has legal authority to acquire title to the land through expropriation with respect to the parcelsthat cannot be obtained through mutual agreements with former owner of the parcel) must match withthe entry of the registry at the time of signing and closing of the relevant transactions. Although we arenot currently aware of any challenges that have been brought against the title to the Portfolio Assets inSouth Korea, we cannot assure you that the title to the Portfolio Assets in South Korea will not bechallenged in the future or any challenging parties will not succeed in proving the non-existence ofrights or grounds of nullity of such registration of previous transactions with respect to theseproperties. If any of the foregoing were to occur, our business, financial condition, results ofoperations, performance and prospects may be adversely affected.
Risks Relating to Our Business in Singapore
ESR-REIT’s borrowing limit may be exceeded if there is a downward revaluation of properties,which may have an adverse effect on our business, financial condition and results of operations.
ESR-REIT is subject to the aggregate leverage limit of 45% as defined in the Property FundsAppendix of Singapore. As of June 30, 2019, ESR-REIT’s aggregate leverage is approximately 39.0%.
105
RISK FACTORS
ESR-REIT may, from time to time, require further debt financing to achieve its investment strategy. Asubstantial decline in the value of its portfolio may affect ESR-REIT’s ability to make furtherborrowings due to the aggregate leverage limit under the Property Funds Appendix of Singapore. IfESR-REIT were to be leveraged close to the leverage limit, it may not be able to:
Š fund future acquisitions of properties or its capital expenditure requirements, including anyrefurbishments, renovation and improvements, asset enhancement initiatives and otherdevelopment works, on its properties;
Š fund working capital requirements which may further constrain its operational flexibility;or
Š experience cash flow shortage which may have an adverse impact on its ability to satisfyits debt obligations.
If any of the foregoing were to occur, the business, financial condition and results of operationsof ESR-REIT could be materially and adversely affected, which may result in a reduction in themanagement fee income of the ESR-REIT Manager. As a result, our business, financial condition andresults of operations may be adversely affected.
We are not involved in the day-to-day operations of the ESR-REIT Manager or the SabanaManager, and we cannot assure you that the ESR-REIT Manager or the Sabana Manager willsuccessfully implement its investment and development strategy.
The ESR-REIT Manager and the Sabana Manager, the respective managers of ESR-REIT andSabana REIT, employ strategies that include expanding the industrial property portfolios of therespective REITs in Singapore and expanding the portfolios to include industrial properties in overseasmarkets. Although we are a controlling shareholder of the ESR-REIT Manager and the SabanaManager, we are not involved in, and do not control, the day-to-day business operations of either theESR-REIT Manager or the Sabana Manager. We cannot assure you that the ESR-REIT Manager or theSabana Manager will be able to expand the portfolios of the respective REITs they manage, or at anyspecified rate or to any specified size. The ESR-REIT Manager or the Sabana Manager may not be ableto make investments or acquisitions on behalf of the respective REITs they manage on favorable termsin a desired time frame.
In addition, the ESR-REIT Manager or the Sabana Manager may from time to time initiateasset enhancement and/or development works on some of the properties held by the respective REITsthey manage at the request of existing or pre-committed tenants or to attract new tenants. We cannotassure you that such plans for asset enhancement and/or development works will materialize, or in theevent that they do materialize and are completed, that they will be able to achieve their desired results.The proposed asset enhancement initiatives are also subject to the respective REITs obtaining theapprovals of the relevant authorities.
Furthermore, the ESR-REIT Manager or the Sabana Manager may not be able to carry out theproposed asset enhancement initiatives within a desired timeframe, and any benefit or return whichmay arise from such asset enhancement initiatives may be reduced or lost. Despite the significant coststhat may have been incurred by ESR-REIT or Sabana REIT, as applicable, in the course of such assetenhancement and/or development works, such properties may still be unable to attract new tenants orretain existing tenants and pre-committed tenants may default on their pre-commitment obligations.This may adversely affect the financial condition of ESR-REIT or Sabana REIT, as applicable, and thereputation of the ESR-REIT Manager or the Sabana Manager and our Company.
106

RISK FACTORS
Risks Relating to Our Business in Australia
If more stringent laws are introduced regarding the acquisition of real estate in Australia byforeign entities, our ability to acquire additional real estate may be adversely affected.
Under Australia’s current foreign investment framework, the Australian government requirescertain proposed investments in real estate to be notified to and approved by a Foreign InvestmentReview Board. The notification requirements vary depending on a number of factors including thenature and value of the property. Under this framework, we and our Australian subsidiaries areclassified as “foreign government investors” and are required to obtain approval for each acquisitionwe propose to make of Australian land (including through a company or trust) regardless of the valueof the investment. To date, we have obtained the necessary approvals for all investments and activitiesin Australia. However, there is a risk that approvals may not be successfully obtained or may only beobtained subject to conditions not acceptable to us in the future. Further, if changes are introduced bythe Australian government which amend the existing foreign investment framework, our ability toacquire and the cost of acquiring additional real estate in Australia may be adversely affected, whichmay have a material adverse effect on our business, financial condition, results of operations,performance and prospects.
Foreign purchasers of land in Australia are, depending on the jurisdiction in which the land islocated, required to pay an additional surcharge on top of the standard land transfer dutypayable by Australian purchasers.
Subject to the relevant requirements of the state or territory in which a land is located, foreignpurchasers of the land in Australia are required to pay an additional surcharge on top of the standardland transfer duty payable by Australian purchasers. The surcharge rate differs across the Australianstates and territories and is regularly subject to legislative review. This surcharge is applicable on asimilar basis to foreign purchasers of local companies where duty is payable under the landholderprovisions. To the extent the surcharge rates increase or the categories of land which are subject to thesurcharge change, this will have an impact on the amount of capital required to acquire land inAustralia, which may have a material adverse effect on our business, financial condition, results ofoperations, performance and prospects.
The application of retail leasing legislation in Australia may restrict our ability to enforce ourstandard lease covenants against tenants.
There is legislation specific to retail leases in each of the Australian states and territories. Thelegislation differs slightly between each of the Australian jurisdictions but has the general effect ofproviding tenants under retail leases with additional protections which they would not otherwise haveif the lease was not a retail lease and which cannot be contracted out of. What constitutes a “retaillease” differs across the Australian jurisdictions and has been the subject of recent judicialconsideration in connection with industrial/warehouse property. The application of retail leasinglegislation may restrict our ability to enforce our standard lease covenants against tenants, which mayhave a material adverse effect on our business, financial condition, results of operations, performanceand prospects.
107

RISK FACTORS
Tightening lending restrictions by major Australian banks may reduce our access to fundsrequired for further acquisitions.
The major Australian banks have recently tightened their lending requirements and this isexpected to continue in the near future following the recent measures introduced by banks in responseto the findings of the Banking Royal Commission of Australia in relation to misconduct in the banking,superannuation and financial services industry. An inability to access debt on favorable terms willimpact our ability to both refinance existing properties and acquire new properties in Australia, whichmay have a material adverse effect on our business, financial condition, results of operations,performance and prospects.
Risks Relating to Our Business in India
Political instability or a change in economic liberalization and deregulation policies couldseriously harm business and economic conditions in India, generally, and our expansion intoIndia, in particular.
Our expansion into the India market could be significantly influenced by economic policiesadopted by the government of India. The government of India has in recent years sought to implementeconomic reforms and the current government of India has implemented policies and undertakeninitiatives that continue the economic liberalization policies pursued by previous governments. Therecan be no assurance that liberalization policies will continue in the future. The rate of economicliberalization could change, and specific laws and policies affecting foreign investment, currencyexchange rates and other matters affecting investment in India could change as well.
The government of India has traditionally exercised, and continues to exercise, influence overmany aspects of the economy. A change in the government of India’s economic liberalization andderegulation policies could disrupt business and economic conditions in India generally, andspecifically our expansion into the India market. This could have a material adverse effect on ourbusiness, strategy and prospects.
Changing laws, rules and regulations and legal uncertainties in India, including adverseapplication of corporate and tax laws, may adversely affect our business and financialperformance.
The regulatory and policy environment in India is evolving and subject to change. Suchchanges in applicable law and policy in India, including the instances described below, may adverselyaffect our business, financial condition, results of operations, performance and prospects in India, tothe extent that we are not able to suitably respond to and comply with such changes.
For instance, the government of India implemented a comprehensive national GST regime thatcombines taxes and levies by the central and state governments into a unified rate structure fromJuly 1, 2017, which we believe will result in fundamental changes to India’s third-party logisticsindustry. However, given its recent introduction, there is no established practice regarding theimplementation of, and compliance with, GST. The implementation of the new GST regime hasincreased the operational and compliance burden for Indian companies and has also led to variousuncertainties. Any future increases and amendments to the GST regime may further affect the overalltax efficiency of companies operating in India and may result in significant additional taxes becomingpayable. Our business and financial performance could be adversely affected by any unexpected or
108

RISK FACTORS
onerous requirements or regulations resulting from the introduction of GST or any changes in laws orinterpretation of existing laws, or the promulgation of new laws, rules and regulations relating to GST,as it is implemented. Further, as GST is implemented, there can be no assurance that we will not berequired to comply with additional procedures and/or obtain additional approvals and licenses from thegovernment and other regulatory bodies or that they will not impose onerous requirements andconditions on our operations. Any such changes and the related uncertainties with respect to theimplementation of GST may have a material adverse effect on our business, financial condition andresults of operations.
Further, the Finance Act 2018 instituted a number of amendments to the existing direct andindirect tax regime which includes the withdrawal of long term capital gains exemptions on equityshares, long term capital gains applicability in the hands of foreign institutional investors andapplicability of dividend distribution tax for certain transactions with shareholders, among others.
In addition, in November 2016, the government of India demonetized certain high-valuedenominations of currency. Trading and retail businesses in India were impacted for a limited period oftime on account of such demonetization. Such businesses have subsequently needed to introduceadditional point of sale instruments to improve their collection process. Furthermore, the General AntiAvoidance Rules came into effect on April 1, 2017. The effect of the application of these provisions toour business in India is at present uncertain.
Hostilities, terrorist attacks, civil unrest and other acts of violence could adversely affect ourbusiness in India.
Terrorist attacks and other acts of violence or war may adversely affect the Indian propertymarket. In addition, any deterioration in international relations, especially between India and itsneighboring countries, may result in investor concern regarding regional stability. In addition, India haswitnessed local civil disturbances in recent years and it is possible that future civil unrest as well asother adverse social, economic or political events in India could have an adverse effect on ourbusiness. Such incidents could also create a greater perception that investment in Indian companiesinvolves a higher degree of risk and could have an adverse effect on our business, results of operationsand financial condition.
A certain portion of the land on which our construction projects are or will be located in Indiamay require certain approvals and permits in order for us to use such land for developing ourprojects. In the event we are unable to obtain such approvals and permits, our business, resultsof operations, cash flows and financial condition could be adversely affected.
Some of our construction projects in India are located, or will be located, on agricultural land,or land owned by private parties. The land title transfer process is dependent on the type of land onwhich the projects are, or will be, located, and the policies of the relevant state governments in theplaces in which such land is located. In the case of land acquired from private parties which isagricultural land, the transfer of such land from agriculturalists to non-agriculturalists such as us andthe use of such land for nonagricultural purposes may require an order from the relevant state land orrevenue authority allowing such transfer and use. There can be no assurance that the relevant approvalswill be received, or that lease deeds will be executed in a timely manner, such that the operation of ourconstruction projects will be unaffected. In the event we are unable to obtain such approvals andpermits, our business, results of operations, cash flows and financial condition could be adverselyaffected.
109

RISK FACTORS
We may not be able to identify or correct defects or irregularities in title to the properties whichwe own, lease or intend to acquire in connection with the development of our constructionprojects as land title in India can be uncertain.
There is no central title registry for real property in India and the documentation of land recordsin India has not been fully digitized. Property records in India are generally maintained at the state anddistrict level and in local languages, and are updated manually through physical records. Therefore, incertain cases property records may not be available online for inspection, may be illegible, untraceable,and incomplete, may not have been updated, may be inaccurate in certain respects, or may have beenkept in poor condition, which may impede title investigations or our ability to rely on such propertyrecords. Title to land in India is often fragmented, and in many cases, land may have multiple owners.Title may also suffer from irregularities, such as non-execution or non-registration of conveyancedeeds and inadequate stamping, and may be subjected to encumbrances that we are unaware of and thatmay not be apparent on the face of the relevant documentation. Any defects in, or irregularities of, titlemay result in a loss of development or operating rights over the land, which may prejudice the successof our construction projects and require us to write off substantial expenditure in respect of ourconstruction projects in India. Improperly executed, unregistered or insufficiently stamped conveyanceinstruments in a property’s chain of title, unregistered encumbrances in favor of third parties, rights ofadverse possessors, ownership claims of family members of prior owners or third parties, or otherdefects that a purchaser may not be aware of can affect title to a property. As a result, potentialdisputes or claims over title to the land on which our projects are located or will be constructed mayarise. However, an adverse decision from a court or the absence of an agreement with such third partiesmay result in additional costs and delays in the construction and operating phases of our projectssituated on such land. Also, such disputes, whether resolved in our favor or not, may divertmanagement’s attention, harm our reputation or otherwise disrupt our business. Our rights to theproperties used for our construction projects may be challenged by property owners and other thirdparties for various other reasons as well. Any such challenge, if successful, could impair thedevelopment or operations of our projects on such properties. All of this may adversely affect ourbusiness, results of operations and cash flows in the future.
RISKS RELATING TO THE GLOBAL OFFERING
There has been no prior public market for our Shares and the liquidity and market price of ourShares may be volatile.
Prior to completion of the Global Offering, there has been no public market for our Shares.There can be no guarantee that an active trading market for our Shares will develop or be sustainedafter completion of the Global Offering. The Offer Price is the result of negotiations between ourCompany and the Joint Global Coordinators (for themselves and on behalf of the Underwriters), whichmay not be indicative of the price at which our Shares will be traded following completion of theGlobal Offering. The market price of our Shares may drop below the Offer Price at any time aftercompletion of the Global Offering.
The trading price of our Shares may be volatile, which could result in substantial losses to you.
The trading price of our Shares may be volatile and could fluctuate widely in response tofactors beyond our control, including general economic, political and stock market conditions of thesecurities markets in Hong Kong, the PRC, the United States and elsewhere in the world. In particular,the performance and fluctuation of the market prices of other companies with business operations
110

RISK FACTORS
located mainly in the PRC that have listed their securities in Hong Kong may affect the volatility in theprice of and trading volumes for our Shares. A number of PRC-based companies have listed theirsecurities, and some are in the process of preparing for listing their securities, in Hong Kong. Some ofthese companies have experienced significant volatility, including significant price declines after theirinitial public offerings. The trading performances of the securities of these companies at the time of orafter their offerings may affect the overall investor sentiment towards PRC-based companies listed inHong Kong and consequently may impact the trading performance of our Shares. These broad marketand industry factors may significantly affect the market price and volatility of our Shares, regardless ofour actual operating performance.
Possible setting of the Offer Price after making a Downward Offer Price Adjustment.
We have the flexibility to make a Downward Offer Price Adjustment to set the final Offer Priceat up to 10% below the bottom end of the indicative Offer Price range per Offer Share. It is thereforepossible that the final Offer Price will be set at HK$14.58 per Offer Share upon the making of a fullDownward Offer Price Adjustment. In such a situation, the Global Offering will proceed and theWithdrawal Mechanism will not apply. If the final Offer Price is set at HK$14.58 per Offer Share, thenet proceeds we will receive from the Global Offering will be reduced to HK$3,809.4 million(approximately US$485.6 million) and such reduced proceeds will be used as described in “FuturePlans and Use of Proceeds—Use of Proceeds”.
You will incur immediate and substantial dilution and may experience further dilution in thefuture.
As the Offer Price of our Shares is higher than the net tangible book value per Share of ourShares immediately prior to the Global Offering, purchasers of our Shares in the Global Offering willexperience an immediate dilution. If we issue additional Shares in the future, purchasers of our Sharesin the Global Offering may experience further dilution in their shareholding percentage. See theparagraph headed “—The costs of the Post-IPO Share Option Scheme may adversely affect our resultsof operations and any exercise of the options granted thereunder may result in a dilution of ourshareholders’ shareholdings and the exercise of options granted under the KM ESOP may adverselyaffect our results of operations” in this section.
The actual or perceived sale or availability for sale of substantial amounts of our Shares,especially by our Directors, executive officers or our shareholders, could adversely affect the marketprice of our Shares.
Future sales of a substantial number of our Shares, especially by our Directors, executiveofficers and our shareholders, or the perception or anticipation of such sales, could negatively impactthe market price of our Shares in Hong Kong and our ability to raise equity capital in the future at atime and price that we deem appropriate. While we currently are not aware of any intention of suchpersons to dispose of significant amounts of their Shares, we cannot assure you that they will notdispose of any Shares they may own now or in the future.
You may be subject to mainland Chinese income tax on dividends from us or on any gainrealized on the transfer of our Shares.
Under the EIT Law and its implementation rules, subject to any applicable tax treaty or similararrangement between mainland China and your jurisdiction of residence that provides for a different
111

RISK FACTORS
income tax arrangement, mainland Chinese withholding tax at the rate of 10% is normally applicable todividends from mainland Chinese sources payable to investors that are resident enterprises outside ofmainland Chinese, which do not have an establishment or place of business in mainland China, orwhich have such establishment or place of business if the relevant income is not effectively connectedwith the establishment or place of business. Any gain realized on the transfer of shares by suchinvestors is subject to 10% (or a lower rate) mainland Chinese income tax if such gain is regarded asincome derived from sources within mainland China unless a treaty or similar arrangement otherwiseprovides. Under the Individual Income Tax Law of the People’s Republic of China (《中華人民共和國個人所得稅法》) and its implementation rules, dividends from sources within mainland China paid toforeign individual investors who are not residents in mainland China are generally subject to amainland Chinese withholding tax at a rate of 20% and gains from mainland Chinese sources realizedby such investors on the transfer of shares are generally subject to 20% mainland Chinese income tax,in each case, subject to any reduction or exemption set forth in applicable tax treaties and mainlandChinese laws.
Although a significant amount of our business operations are in mainland China, it is unclearwhether dividends we pay with respect to our Shares, or the gain realized from the transfer of ourShares, would be treated as income derived from sources within mainland China and as a result besubject to mainland Chinese income tax if we are considered a mainland Chinese resident enterprise. Ifmainland Chinese income tax is imposed on gains realized through the transfer of our Shares or ondividends paid to our non-resident investors, the value of your investment in our Shares may bematerially and adversely affected. Furthermore, our Shareholders whose jurisdictions of residence havetax treaties or arrangements with mainland China may not qualify for benefits under such tax treaties orarrangements.
Certain data and information in this Prospectus were obtained from third-party sources andwere not independently verified by us.
This Prospectus, in particular the JLL Report included in Appendix IV to this Prospectus,contains certain data and information that have been derived from third-party reports, eithercommissioned by us or publicly accessible, and other publicly available sources. Statistical data inthese sources of information also include projections based on a number of assumptions. The countrieswhere we operate property markets may not grow at the rate projected by such statistical data, or at all.The failure of our industry to grow at the projected rate may have a material adverse effect on ourbusiness. In addition, the complex and changing nature of the broad macroeconomic factors discussedin this Prospectus may result in significant uncertainties for any projections or estimates relating to thegrowth prospects or future condition of our market. Furthermore, if any one or more of the assumptionsunderlying the market data is later found to be incorrect, actual results may differ from the projectionsbased on these assumptions.
We have not independently verified the data and information contained in such third-partypublications and reports. Data and information contained in such third-party publications and reportsmay be collected using third-party methodologies, which may differ from the data collection methodsused by us. In addition, these industry publications and reports generally indicate that the informationcontained therein was believed to be reliable, but do not guarantee the accuracy and completeness ofsuch information. You should therefore not place undue reliance on such information.
112

RISK FACTORS
You should read this entire Prospectus carefully and should not rely on any informationcontained in press articles, forecasts, reports or other media regarding us and the GlobalOffering.
We strongly caution you not to rely on any information contained in press articles, forecasts,reports or other media regarding us and the Global Offering. There has been, prior to the publication ofthis Prospectus, and there may be, subsequent to the date of this Prospectus but prior to the completionof the Global Offering, research reports, press and media coverage regarding us and the GlobalOffering, which contained, among other things, certain financial information, projections, valuationsand other forward-looking information about us and the Global Offering. We have not authorized thedisclosure of any such information in the research reports, press or media and do not acceptresponsibility for the accuracy or completeness of such research reports, press articles or other mediacoverage. We make no representations as to the appropriateness, accuracy, completeness or reliabilityof any of the projections, valuations or other forward-looking information about us. To the extent suchstatements are inconsistent with, or conflict with, the information contained in this Prospectus, wedisclaim responsibility for them. Accordingly, prospective investors are cautioned to make theirinvestment decisions on the basis of the information contained in this Prospectus only and should notrely on any other information.
113

WAIVERS AND CONSENT FROM STRICT COMPLIANCE WITH THE LISTINGRULES AND EXEMPTIONS FROM COMPANIES (WINDING UP AND
MISCELLANEOUS PROVISIONS) ORDINANCE
In preparation for the Listing, our Company has applied for the following waivers and consentfrom strict compliance with the relevant provisions of the Listing Rules and exemptions from theCompanies (Winding Up and Miscellaneous Provisions) Ordinance:
WAIVER IN RELATION TO MANAGEMENT PRESENCE IN HONG KONG
Rule 8.12 of the Listing Rules requires that, except as otherwise permitted by the StockExchange at its discretion, our Company has a sufficient management presence in Hong Kong. Thisnormally means that at least two of our Company’s executive Directors must be ordinarily resident inHong Kong. Since most of our Company’s core business operations are based, managed and conductedoutside of Hong Kong, our Company does not have, and in the foreseeable future will not have, asufficient management presence in Hong Kong for the purpose of satisfying the requirement underRule 8.12 of the Listing Rules.
Accordingly, our Company has applied to the Stock Exchange for, and has been granted, awaiver from strict compliance with Rule 8.12 of the Listing Rules on the condition that the followingarrangements be made to maintain regular and effective communication between the Stock Exchangeand our Company:
(a) Our Company has appointed Mr. Jinchu Shen (沈晉初) and Mr. Richard Kin-sing Lee (李建成) as its authorized representatives (the “Authorized Representatives”), who will actas our Company’s principal channel of communication between our Company and theStock Exchange. Each of the Authorized Representatives has the means to contact allmembers of the Board (including the executive Directors, non-executive Directors and theindependent non-executive Directors) and the senior management of our Companypromptly at all times as and when the Stock Exchange wishes to contact them for anymatter. Our Company will also inform the Stock Exchange promptly in respect of anychange in the Authorized Representatives.
(b) To enhance the communication between the Stock Exchange, the AuthorizedRepresentatives and the Directors, our Company has implemented a policy that eachDirector has to provide his or her respective office phone numbers, mobile phonenumbers, fax numbers and email addresses (if applicable) to the AuthorizedRepresentatives and the Stock Exchange and in the event that any Director expects totravel or otherwise be out of office, he or she will provide the phone number of the placeof his or her accommodation to the Authorized Representatives.
(c) Both Authorized Representatives have to provide their office phone numbers, mobilephone numbers, fax numbers and email addresses (if applicable) to the Stock Exchange.
(d) In addition, each Director who is not an ordinarily resident in Hong Kong has confirmedthat he or she possesses or can apply for valid travel documents to visit Hong Kong forbusiness purpose and would be able to come to Hong Kong and meet with the relevantmembers of the Stock Exchange upon reasonable notice.
(e) In accordance with Rule 3A.19 of the Listing Rules, our Company has appointed OctalCapital Limited as its compliance adviser (the “Compliance Adviser”) for the periodcommencing on the date of Listing and ending on the date on which the Companycomplies with Rule 13.46 of the Listing Rules in respect of its financial results for the first
114

WAIVERS AND CONSENT FROM STRICT COMPLIANCE WITH THE LISTINGRULES AND EXEMPTIONS FROM COMPANIES (WINDING UP AND
MISCELLANEOUS PROVISIONS) ORDINANCE
full financial year commencing after the date of Listing. The Compliance Adviser will actas the Company’s additional channel of communication with the Stock Exchange and theCompliance Adviser shall have access at all times to the Authorized Representatives, theDirectors and other officers of our Company to ensure that he or she is in a position toprovide prompt responses to any queries or requests from the Stock Exchange in respect ofour Company.
(f) Our Company will retain a Hong Kong legal adviser to advise on the on-going compliancerequirements, any amendment or supplement to and other issues arising under the ListingRules and other applicable laws and regulations in Hong Kong after the Listing.
(g) The Compliance Adviser will also advise our Company on the on-going compliancerequirements and other issues arising under the Listing Rules and other applicable lawsand regulations in Hong Kong after the Listing.
WAIVER IN RELATION TO THE DISCLOSURE REQUIREMENTS WITH RESPECT TOCHANGES IN SHARE CAPITAL
We have applied for, and the Stock Exchange has granted, a waiver from strict compliance withthe requirements of paragraph 26 of Part A of Appendix 1 to the Listing Rules in respect of disclosingthe particulars of any alterations in the capital of any member of the Group within the two yearsimmediately preceding the issue of this Prospectus.
As of the end of the Track Record Period, our Group is made up of over 450 subsidiaries,across more than 10 different jurisdictions, of which our Company and 30 Major Subsidiariescontributed to approximately 92% to our Group’s revenue for the six months ended June 30, 2019 andheld approximately 79% of our Group’s total assets as of June 30, 2019. For further details, please seesection headed “History, Development and Corporate Structure—Our Major Subsidiaries” in thisProspectus. Hence, the remaining subsidiaries in our Group are therefore insignificant to the overallresults of our Group. It would be unduly burdensome on our Company if we are required to complystrictly with the requirements of paragraph 26 of Part A of Appendix 1 to the Listing Rules as ourCompany would have to incur additional costs and devote additional resources in compiling andverifying the relevant information for such disclosure, which would not be material or meaningful toinvestors.
Particulars of the changes in the share capital of our Company and the Major Subsidiaries aredisclosed in the section headed “Statutory and General Information—A. Further Information about ourGroup—2. Changes in the Share Capital of our Company” and “Statutory and General Information—A. Further Information about our Group—4. Changes in the Share Capital of our Major Subsidiaries”in Appendix VIII to this Prospectus. Further, all major shareholding changes of our Company havebeen disclosed in the section headed “History, Development and Corporate Structure” in thisProspectus.
WAIVER AND EXEMPTION IN RELATION TO THE KM ESOP
Under Rule 17.02(1)(b) of, and paragraph 27 of Appendix 1A to, the Listing Rules, andparagraph 10(d) of Part I of the Third Schedule to the Companies (Winding Up and Miscellaneous
115

WAIVERS AND CONSENT FROM STRICT COMPLIANCE WITH THE LISTINGRULES AND EXEMPTIONS FROM COMPANIES (WINDING UP AND
MISCELLANEOUS PROVISIONS) ORDINANCE
Provisions) Ordinance, our Company is required to include in this Prospectus, among other things,details of the number, description, and amount of any shares in or debentures of our Company whichany person has, or is entitled to be given, an option to subscribe for, together with certain particulars ofeach option, namely the period during which it is exercisable, the price to be paid for shares ordebentures subscribed for under it, the consideration (if any) given or to be given for it or for the rightto it, the names and addresses of the persons to whom it was given, and their potential dilution effecton the shareholding upon listing as well as the impact on the earnings per Share arising from theexercise of such outstanding options.
As of the Latest Practicable Date, our Company had outstanding options granted under the KMESOP to 163 grantees, including employees, and a director of certain subsidiaries who is also amember of the senior management of our Group, to subscribe for an aggregate of 63,558,343 Shares,representing 2.09% of the total number of Shares in issue immediately after completion of the GlobalOffering, assuming that (a) the Offer Size Adjustment Option has not been exercised; (b) theincentivization arrangements related to Laurels and Mr. Jinchu Shen are settled entirely with thetransfer of Shares; (c) the Offer Price is determined to be HK$16.80, being the mid-point of the OfferPrice range; and (d) the Listing Date is November 1, 2019, on the terms of the KM ESOP, details ofwhich are set out in the section headed “Statutory and General Information—D. KM ESOP, Tier 1ESOP and Post-IPO Share Option Scheme—1. KM ESOP” in Appendix VIII to this Prospectus.
Our Company has applied to the Stock Exchange and the SFC for: (a) a waiver from strictcompliance with the applicable Share Option Disclosure Requirements; and (b) a certificate ofexemption under section 342A of the Companies (Winding Up and Miscellaneous Provisions)Ordinance exempting our Company from strict compliance with the applicable Share OptionDisclosure Requirements, respectively, on the ground that strict compliance with the Share OptionDisclosure Requirements would be unduly burdensome for our Company for the following reasons:
(a) As of the Latest Practicable Date, among all 163 grantees, one of them is a member ofsenior management and a connected person of our Company, but is not a Director. Theremaining 162 grantees are or were employees of the Group, and are not Directors,members of senior management or connected persons of the Company. Strict compliancewith the applicable Share Option Disclosure Requirements to disclose the names,addresses and entitlements on an individual basis in this Prospectus will require asubstantial volume of additional disclosure in this Prospectus which would be costly andunduly burdensome for our Company in light of a significant increase in cost and time forcompiling the information and preparing the disclosure in this Prospectus; and
(b) We have highlighted some of the key concerns with loss of key personnel under thesection headed “Risk Factor—We depend on our senior management team and certain keysenior personnel as well as skilled employees” in this Prospectus, key amongst which isthe fact that pursuant to certain agreements executed in connection with certain of the fundand investment vehicles we manage, certain senior management and local management areidentified as “key persons” under key person clauses (and who are amongst the group ofgrantees who hold options with underlying shares of one million or more). If any of suchkey persons ceases to devote substantially all of their business time to activities directly orindirectly benefitting the projects held by these funds or investment vehicles during thespecified commitment period, our capital partners will have the option to terminate these
116

WAIVERS AND CONSENT FROM STRICT COMPLIANCE WITH THE LISTINGRULES AND EXEMPTIONS FROM COMPANIES (WINDING UP AND
MISCELLANEOUS PROVISIONS) ORDINANCE
agreements. Such key persons clauses are standard in the funds industry in which weoperate, and other fund managers would also face the same challenges in case ofdepartures of key persons. Therefore, the loss of even one such key employee would causesignificant concerns from a business perspective not only from the loss of the services ofsuch key persons but also in relation to the continuation of these funds and investmentvehicles if capital partners exercise their right to terminate their investment arrangementsin our funds or investment vehicles, or leverage on the departure of any key person torenegotiate the terms of their investments. The disclosure of details of option holdings ofkey employees may facilitate poaching of key employees by competitors and potentiallylead to their departures. Given the characteristic of our business, their departures may havea material and adverse impact on business, financial condition, results of operations,performance and prospects of the Group.
All material information has been disclosed in this Prospectus for investors’ information,including (i) details of the holdings of our Directors, senior management and connected persons, (ii)the aggregate dilutive effect of the options, and (iii) further information provided to show how theoptions are being held by grantees within certain bands. Therefore, the granting of the waiver fromstrict compliance with the applicable Share Option Disclosure Requirements, would not prejudice theinterests of the investing public in any manner. More specifically:
(a) Material information relating to the options under the KM ESOP have been disclosed inthis Prospectus as set out above, including the total number of Shares subject to the KMESOP, the exercise price per Share, the potential dilution effect on shareholding, andimpact on the earnings per Share upon the full exercise of the options granted under theKM ESOP. We have included detailed disclosure based on different bands of grantees,together with full details of those who (i) are the director, senior management or connectpersons of the Company and (ii) have been granted options to subscribe for 3,000,000Shares or more, to provide further information in terms of how such options are spreadbetween holders; and
(b) The full list of grantees with details stated individually will be made available for publicinspection in Hong Kong as set out in this Prospectus. Therefore, such information wouldstill be available to any investor who considered this material to its assessment of theCompany.
The Stock Exchange has granted to us a waiver under the Listing Rules on the condition that:
(a) full details of the options under the KM ESOP granted to each of our Directors, membersof the senior management and connected persons of our Company, and other grantees whohave been granted options to subscribe for 3,000,000 Shares or more have been disclosedin the section headed “Statutory and General Information—D. KM ESOP, Tier 1 ESOPand Post-IPO Share Option Scheme—1. KM ESOP” in Appendix VIII to this Prospectus,on an individual basis, as required under the applicable Share Option DisclosureRequirements;
(b) for the remaining grantees (being the other grantees who are not Directors, members of thesenior management or connected persons of our Company or other grantees who have notbeen granted options to subscribe for 3,000,000 Shares or more), disclosure have been
117
WAIVERS AND CONSENT FROM STRICT COMPLIANCE WITH THE LISTINGRULES AND EXEMPTIONS FROM COMPANIES (WINDING UP AND
MISCELLANEOUS PROVISIONS) ORDINANCE
made, on an aggregate basis, of (1) the aggregate number of grantees and their number ofShares underlying the options under the KM ESOP; (2) their consideration (if any) paidfor the grant of the options under the KM ESOP; (3) their exercise period; and (4) thevarious exercise prices for the options granted under the KM ESOP, in the followingbands: (i) grantees who have been granted options to subscribe for 1,000,000 Shares orless; and (ii) grantees who have been granted options to subscribe for 1,000,001 to3,000,000 Shares;
(c) the aggregate number of Shares underlying the options under the KM ESOP and thepercentage of our Company’s total issued share capital represented by such number ofShares as of the Latest Practicable Date are disclosed in this Prospectus;
(d) the dilution effect and impact on earnings per Share upon full exercise of the options underthe KM ESOP are disclosed in the section headed “Statutory and General Information—D. KM ESOP, Tier 1 ESOP and Post-IPO Share Option Scheme—1. KM ESOP” inAppendix VIII to this Prospectus;
(e) a summary of the major terms of the KM ESOP is disclosed in the section headed“Statutory and General Information—D. KM ESOP, Tier 1 ESOP and Post-IPO ShareOption Scheme—1. KM ESOP” in Appendix VIII to this Prospectus;
(f) a full list of all the grantees (including those persons whose details have already beendisclosed in this Prospectus) under the KM ESOP, containing all the particulars asrequired under the applicable Share Option Disclosure Requirements, will be madeavailable for public inspection as detailed in the section headed “Documents Delivered tothe Registrar of Companies in Hong Kong and Available for Inspection” in Appendix IXto this Prospectus;
(g) the certificate of exemption under the Companies (Winding Up and MiscellaneousProvisions) Ordinance exempting the Company from strict compliance with the applicableShare Option Disclosure Requirements has been granted by the SFC; and
(h) the particulars of the waiver are disclosed in this Prospectus.
The SFC has granted to our Company the certificate of exemption under section 342A of theCompanies (Winding Up and Miscellaneous Provisions) Ordinance exempting our Company fromstrict compliance with paragraph 10(d) of Part I of the Third Schedule to the Companies (Winding Upand Miscellaneous Provisions) Ordinance, on the conditions that:
(a) full details of the options under the KM ESOP granted to each of our Directors, membersof the senior management and connected persons of our Company, and other grantees whohave been granted options to subscribe for 3,000,000 Shares or more have been disclosedin the section headed “Statutory and General Information—D. KM ESOP, Tier 1 ESOPand Post-IPO Share Option Scheme—1. KM ESOP” in Appendix VIII to this Prospectus,on an individual basis, as required under the applicable Share Option DisclosureRequirements;
(b) for the remaining grantees (being the other grantees who are not Directors, members of thesenior management or connected persons of our Company or other grantees who have notbeen granted options to subscribe for 3,000,000 Shares or more), disclosure have been
118

WAIVERS AND CONSENT FROM STRICT COMPLIANCE WITH THE LISTINGRULES AND EXEMPTIONS FROM COMPANIES (WINDING UP AND
MISCELLANEOUS PROVISIONS) ORDINANCE
made, on an aggregate basis, of (1) the aggregate number of grantees and their number ofShares underlying the options under the KM ESOP; (2) their consideration (if any) paidfor the grant of the options under the KM ESOP; (3) their exercise period; and (4) thevarious exercise prices for the options granted under the KM ESOP, in the followingbands: (i) grantees who have been granted options to subscribe for 1,000,000 Shares orless; and (ii) grantees who have been granted options to subscribe for 1,000,001 to3,000,000 Shares;
(c) a full list of all the grantees (including those persons whose details have already beendisclosed in this Prospectus) under the KM ESOP, containing all the particulars asrequired under the applicable Share Option Disclosure Requirements, will be madeavailable for public inspection as detailed in the section headed “Documents Delivered tothe Registrar of Companies in Hong Kong and Available for Inspection” in Appendix IXto this Prospectus; and
(d) the particulars of the exemption are disclosed in this Prospectus, and this Prospectus willbe issued on or before October 22, 2019.
Please refer to the section headed “Statutory and General Information—D. KM ESOP, Tier 1ESOP and Post-IPO Share Option Scheme—1. KM ESOP” in Appendix VIII to this Prospectus forfurther details of the KM ESOP.
WAIVER IN RELATION TO DISCLOSURE OF PRE-ACQUISITION FINANCIALINFORMATION
Rule 4.05A of the Listing Rules requires that where a new listing applicant acquires anymaterial subsidiary or business during the trading record period and such an acquisition if made by alisted issuer would have been classified at the date of application as a major transaction or a verysubstantial transaction, it must disclose pre-acquisition financial information on that materialsubsidiary or business from the commencement of the trading record period (or if the materialsubsidiary or business commenced its business after the commencement of the trading record period,then from the date of the commencing of its business) to the date of acquisition. Pre-acquisitionfinancial information on the material subsidiary or business must normally be drawn up in conformitywith accounting policies adopted by the new applicant and be disclosed in the form of a note to theaccountants’ report or in a separate accountants’ report.
Propertylink was, until its recent delisting in April 2019, listed in the form of a REIT on theAustralian Stock Exchange (Stock Code: PLG), specializing in Australian industrial and officeinvestments. Propertylink also co-invests in funds with institutional investors from North America,Europe, the Middle East, Asia and Australia. In October 2017, we acquired approximately 19.9% ofthe issued stapled securities of Propertylink and became its single largest securityholder. We furtheracquired the remaining securities in 2019 and the acquisition of 100% of the securities of Propertylinkwas completed in April 2019. As of March 20, 2019, being the date on which Propertylink wasconsolidated into our Group, Propertylink managed a total of 58 industrial and office properties,including assets managed under its co-invested external funds as well as assets held under its wholly-owned industrial portfolio. For further details, please refer to the section headed “Business – ThePropertylink Acquisition” in this Prospectus.
119

WAIVERS AND CONSENT FROM STRICT COMPLIANCE WITH THE LISTINGRULES AND EXEMPTIONS FROM COMPANIES (WINDING UP AND
MISCELLANEOUS PROVISIONS) ORDINANCE
We have applied to the Stock Exchange for, and the Stock Exchange has granted us, a waiverfrom strict compliance with Rule 4.05A of the Listing Rules in relation to the disclosure ofpre-acquisition financial information of Propertylink on the following grounds:
(a) In order to enable potential investors to make an informed assessment of our Company(including the Propertylink acquisition), this Prospectus has included the followinginformation:
(i) Appendix II-A to this Prospectus sets out (i) the audited financial statements ofPropertylink for the financial years ended June 30, 2017 and 2018 audited by KPMG;(ii) the audited financial statements of Propertylink (Holdings) Limited (currentlyknown as ESR Asset Management (Holdings) Limited) (“PHL”) and PropertylinkTrust (“PT”) for the year ended June 30, 2016 audited by Bentleys BrisbanePartnership; and (iii) the audited financial statements of Propertylink AustralianIndustrial Partnership (“PAIP”) for the six months ended June 30, 2016 audited byKPMG (collectively, the “Propertylink 3Y Financial Information”). ThePropertylink 3Y Financial Information were prepared in accordance with theAustralian Accounting Standards and which comply with IFRS.
Three entities, namely PHL, PT and PAIP, together with their respective subsidiaries,were stapled to form Propertylink during the completion of its initial public offeringon August 15, 2016 and listing on the ASX. Prior to the completion of the initialpublic offering of Propertylink, PAIP was an independent legal entity of which theunits were not stapled to the units in PT and the shares in PHL. As part ofPropertylink’s listing process, PAIP published its audited accounts for the six monthsended June 30, 2016 on the ASX pursuant to the ASX’s requirements. We havetherefore included the standalone (i) audited financial statements of PHL and PT forthe year ended June 30, 2016 and (ii) audited financial statements of PAIP for the sixmonths ended June 30, 2016 in Appendix II-A to the Prospectus as well to providemore information to potential investors.
A line-by-line reconciliation of Propertylink’s financials in relation to the differencesbetween Australian Accounting Standards and IFRS has not been included in thisProspectus as the Propertylink 3Y Financial Information was prepared in accordancewith the Australian Accounting Standards which already comply with IFRS.
In addition, a line-by-line reconciliation of Propertylink’s financials in relation to thedifferences between the accounting policies adopted by Propertylink and ourCompany has not been included in this Prospectus because this would require ourCompany and its reporting accountants to undertake a considerable amount of work,which is onerous and burdensome in terms of the amount of time, resources and costsinvolved as further explained in paragraph 4.1.3 below. We consider that theomission of such information would not prevent our Company from providing itspotential investors with an informed assessment of the activities, assets, liabilities,financial position, management and prospects of Propertylink.
(ii) Appendix II-B to this Prospectus sets out the audited interim consolidated financialstatements of Propertylink for the period from July 1, 2018 to March 20, 2019, being
120

WAIVERS AND CONSENT FROM STRICT COMPLIANCE WITH THE LISTINGRULES AND EXEMPTIONS FROM COMPANIES (WINDING UP AND
MISCELLANEOUS PROVISIONS) ORDINANCE
the date on which the financial information of Propertylink was consolidated into theaccounts of our Group. To ensure consistency with the Propertylink 3Y FinancialInformation, such interim consolidated financial statement was prepared inaccordance with the Australian Accounting Standards, and which also complies withIFRS, and audited by Ernst & Young, Australia, which has been appointed as theauditor of Propertylink, which became a subsidiary of our Company following thecompletion of the acquisition; and
(iii) Appendix I to this Prospectus sets out the audited financial information on our Groupfor the three years ended December 31, 2016, 2017 and 2018 and the six monthsended June 30, 2019, which has included the financial information of Propertylinkwhich was consolidated to the accounts of our Group on and after March 20, 2019,prepared under IFRS and audited by Ernst & Young, the reporting accountants andindependent auditor of our Company.
(b) As Propertylink was listed on the ASX, in accordance with the rules and requirements ofthe ASX, Propertylink has published its financial information for the three years endedJune 30, 2018 prepared in accordance with the Australian Accounting Standards andwhich also complies with IFRS, including its annual audited accounts, on a regular basissince it was listed on the ASX which will enable investors to assess its activities andfinancial position.
(c) Strict compliance with the requirements of Rule 4.05A of the Listing Rules would requirean accountants’ report on the financial information of Propertylink to be prepared inrespect of the (a) financial years ended December 31, 2016, 2017 and 2018; and (b) theperiod from January 1, 2019 to March 20, 2019 and such financial information ofPropertylink would need to be prepared in conformity with the accounting policiesadopted by our Company under IFRS. In order to prepare such financial information incompliance with the requirements of the Listing Rules, our Company and our reportingaccountant would need to undertake the following work: (i) in order to presentPropertylink’s financial statements, with relevant notes, on the basis of the accountingpolicies adopted by our Company, would require, for example, our Company to conductproperty valuations as of the end of relevant periods, conduct actuarial valuations onvarious pension and other post-retirement benefit plans as of the end of relevant periods,and re-compute income tax provisions and related tax adjustments; (ii) even afterPropertylink’s financial statements had been prepared for the pre-acquisition period on thebasis of the accounting policies adopted by our Company under IFRS, the reportingaccountant would need to re-conduct the audit procedures in relation to these financialstatements; and (iii) to align the financial years of Propertylink, which ended on June 30,with that of our Company, which ends on December 31. These would require ourCompany and our reporting accountants to undertake a considerable amount of work,which impose onerous and burdensome obligations in terms of time, resources and costs,and would be of limited informational value to investors.
Prior to the acquisition of 100% of the Propertylink securities, our Company and ourauditors have not been provided with access to Propertylink and its auditors which wouldbe required in order for our Company’s auditors to prepare the accountants’ report on
121

WAIVERS AND CONSENT FROM STRICT COMPLIANCE WITH THE LISTINGRULES AND EXEMPTIONS FROM COMPANIES (WINDING UP AND
MISCELLANEOUS PROVISIONS) ORDINANCE
Propertylink for inclusion in this Prospectus. Propertylink was independently managed andoperated as a separate ASX-listed entity. Considering that this Prospectus will includealternative financial statements (i.e. the Propertylink 3Y Financial Information and theaudited financial statements of Propertylink for the period from July 1, 2018 to March 20,2019) that are broadly commensurate in all material respects with the disclosure in theaudited financial statements that would otherwise have been provided under strictcompliance with Rule 4.05A of the Listing Rules, which will afford the investors with allmaterial information necessary to assess the financial performance of Propertylinkthroughout the periods presented, we believe that strict compliance with Rule 4.05A of theListing Rules will impose onerous and undue burdensome obligations on our Companyand our reporting accountants.
(d) In addition to the financial information on Propertylink referred to in paragraph (a) above,we have disclosed the following additional information on Propertylink in this Prospectusin order to enable potential investors to understand Propertylink in greater detail as well asthe impact of the Propertylink Offer on our Group: (a) a brief summary of the backgroundof the Propertylink Offer, including our Company’s reasons for the Propertylink Offer andthe basis upon which the consideration was determined; (b) a brief description ofPropertylink’s principal businesses; (c) the benefits which are expected to accrue to ourCompany as a result of the Propertylink Offer and confirmation that our Directors believethat the terms of the Propertylink Offer are fair and reasonable and in the interests of theshareholders of the Company as a whole; (d) other information required for a majortransaction under Chapter 14 of the Listing Rules; and (e) a discussion and analysis of thefinancial information of Propertylink for the two years ended June 30, 2017 and 2018 andthe period from July 1, 2018 to March 20, 2019.
WAIVER IN RESPECT OF PUBLIC FLOAT REQUIREMENTS
Rule 8.08(3) of the Listing Rules provides that not more than 50% of the securities in publichands at the time of listing can be beneficially owned by the three largest public shareholders, savewhere: (a) the securities to be listed are options, warrants or similar rights to subscribe or purchaseshares; (b) such securities are offered to existing holders of a listed issuer’s shares by way of bonusissue; and (c) in the 5 years preceding the date of the announcement on the proposed bonus issue, thereare no circumstances to indicate that the shares of the issuer may be concentrated in the hands of a fewshareholders.
We are proposing to offer 653,680,000 Offer Shares (comprising 280,140,000 New Shares and373,540,000 Sale Shares) under the Global Offering, representing approximately 21.53% of ourenlarged issued share capital immediately after the completion of the Global Offering (assuming theOver-allotment Option and the Offer Size Adjustment Option are not exercised). Upon completion ofthe Global Offering (assuming the Over-allotment Option and the Offer Size Adjustment Option arenot exercised and the Offer Price is determined to be HK$16.20 per Offer Share, being the low-end ofthe indicative Offer Price range stated in this Prospectus), approximately 42.18% of our enlargedissued share capital will be held in public hands, which is a larger public float than usual listingapplicants on the Stock Exchange. On this basis, the aggregate shareholding of the three largest publicShareholders should not exceed 21.09%, being 50% of the Shares to be held in public hands.
122
WAIVERS AND CONSENT FROM STRICT COMPLIANCE WITH THE LISTINGRULES AND EXEMPTIONS FROM COMPANIES (WINDING UP AND
MISCELLANEOUS PROVISIONS) ORDINANCE
Based on the level of demand indicated by a cornerstone investor and the proposed size of theGlobal Offering, the aggregate shareholding of the three largest public Shareholders (includingOMERS Administration Corporation) will be approximately 23.60% of our enlarged issued sharecapital immediately after completion of the Global Offering, representing approximately 55.96% of theShares to be held in public hands immediately after the completion of the Global Offering (assumingthe Over-allotment Option and the Offer Size Adjustment Option are not exercised), comprising:
(a) OMERS Administration Corporation, holding approximately 9.00% of our enlarged issuedshare capital;
(b) Jingdong Logistics Group Corporation (“JD Group”), an existing Shareholder, holdingapproximately 7.65% of our enlarged issued share capital; and
(c) APG-Stichting, an existing Shareholder, holding approximately 6.95% of our enlargedissued share capital.
Rule 8.08 of the Listing Rules aims to ensure an open market in the securities to be listed on theStock Exchange. In light of the size of the Global Offering, as well as the number and thecorresponding board lots and market capitalization of Shares in public hands (excluding theshareholding of the three largest public Shareholders and other Shares subject to lock-up undertakings),there will be sufficient Shares (in terms of board lots) for broad distribution to the public in Hong Kongas well as professional and institutional investors in and outside Hong Kong. This would ensure adiverse investor base in the Shares, and will further contribute to an active and liquid aftermarket in thetrading of the Shares, subject to market conditions and other external factors.
The following table sets out, (i) the total number of Shares held by public Shareholders; (ii) thenumber of Shares held by public Shareholders other than the three largest public Shareholders; (iii) thenumber of Shares held by public Shareholders other than (A) those held by the three largest publicShareholders and (B) those which are the subject of lock-up undertakings:
Shares in public hands(1)
Shares in public hands(excluding the three
largest publicShareholders)
Shares in public handsnot subject to any
lock-up(2)(3)
Number of Shares and number of board lotsof 200 Shares each . . . . . . . . . . . . . . . . . . .
1,280,658,152 Shares(6,403,290 board
lots)
564,036,394 Shares(2,820,181 board
lots)
396,775,321 Shares(1,983,876 board
lots)HK$ value of the Shares (based on
HK$16.20 per Shares, being the low-endof the indicative Offer Price range) . . . . . . HK$20,746,662,062 HK$9,137,389,582 HK$6,427,760,200
Percentage of total issued Sharesimmediately following completion of theGlobal Offering . . . . . . . . . . . . . . . . . . . . . 42.18% 18.58% 13.07%
Notes:(1) Number of Shares in public hands at the time of Listing=(i) 653,680,000 initial Offer Shares under the Global Offering +
(ii) 626,978,152 Shares held by the existing Shareholders which count towards the public float.(2) All of the Shares held by each of the existing Shareholders, save for 16,357,321 Shares held by Luckfield Global Limited, will be subject
to a 6-month lock-up period upon Listing due to their respective undertakings to, among others, the Company and the Joint GlobalCoordinators. For further details, please refer to the sections headed “Underwriting – Lock-up Arrangements—Undertaking by theSelling Shareholders pursuant to the International Underwriting Agreement” and “Underwriting—Lock-up Arrangements—Undertakingby non-Selling Shareholders pursuant to the Lock-up Deeds” in the Prospectus. Hence, 610,620,831 Shares held by the existingShareholders will not be included in “Shares in public hands not subject to any lock-up”.
(3) Taking into consideration note (2) above, the number of Shares in public hands not subject to any lock-up at the time ofListing=(i) 653,680,000 initial Offer Shares under the Global Offering—(ii) the 273,262,000 Shares held by OMERS AdministrationCorporation + 16,357,321 Shares held by Luckfield Global Limited, being the only existing Shareholder whose Shares are not subject toany lock-up.
123
WAIVERS AND CONSENT FROM STRICT COMPLIANCE WITH THE LISTINGRULES AND EXEMPTIONS FROM COMPANIES (WINDING UP AND
MISCELLANEOUS PROVISIONS) ORDINANCE
Based on the above, we have applied to the Stock Exchange for, and the Stock Exchange hasgranted us, a waiver from strict compliance with Rule 8.08(3) of the Listing Rules to allow the threelargest public Shareholders to hold no more than 55.96% of the Shares to be held in public handsimmediately after the completion of the Global Offering (assuming the Over-allotment Option and theOffer Size Adjustment Option are not exercised). The grant of the waiver would reduce the total Sharesin public hands (excluding the three largest public shareholders) from 21.09% of the enlarged issuedshare capital immediately after the completion of the Global Offering (assuming the Over-allotmentOption and the Offer Size Adjustment Option are not exercised) to 18.58%.
Please also refer to the sections headed “History, Development and Corporate Structure—Pre-IPO Investments—Information about the principal Pre-IPO Investors” and “Cornerstone Investors” forfurther information regarding our three largest public shareholders.
We will disclose in the allotment results announcement: (i) the total number of Shares held bythe three largest public Shareholders and the corresponding percentage of our enlarged issued sharecapital at the time of Listing; and (ii) the total number of Shares held by public Shareholders which arenot subject to any lock up undertaking and the corresponding percentage of our enlarged issued sharecapital at the time of Listing.
WAIVER IN RESPECT OF CLAWBACK MECHANISM
Paragraph 4.2 of Practice Note 18 of the Listing Rules requires a clawback mechanism to beput in place, which would have the effect of increasing the number of Offer Shares under the HongKong Public Offering to a certain percentage of the total number of Offer Shares offered under theGlobal Offering if certain prescribed total demand levels are reached. We have applied to the StockExchange for, and the Stock Exchange has granted to us, a waiver from strict compliance withparagraph 4.2 of Practice Note 18 of the Listing Rules such that, in the event of over-subscription, thealternative clawback mechanism on the following basis shall be applied, following the closing of theapplication lists.
(a) If the number of Offer Shares validly applied for under the Hong Kong Public Offeringrepresents 10 times or more but less than 45 times of the total number of Offer Sharesinitially available for subscription under the Hong Kong Public Offering, then OfferShares will be reallocated to the Hong Kong Public Offering from the InternationalPlacing so that the total number of Offer Shares available under the Hong Kong PublicOffering will be 51,700,000 Offer Shares, representing 7.9% of the total number of OfferShares initially available under the Global Offering (before any exercise of the Offer SizeAdjustment Option and the Over-allotment Option);
(b) If the number of Offer Shares validly applied for under the Hong Kong Public Offeringrepresents 45 times or more but less than 95 times of the total number of Offer Sharesinitially available for subscription under the Hong Kong Public Offering, then OfferShares will be reallocated to the Hong Kong Public Offering from the InternationalPlacing so that the total number of Offer Shares available under the Hong Kong PublicOffering will be 68,700,000 Offer Shares, representing 10.5% of the total number of OfferShares initially available under the Global Offering (before any exercise of the Offer SizeAdjustment Option and the Over-allotment Option); and
124

WAIVERS AND CONSENT FROM STRICT COMPLIANCE WITH THE LISTINGRULES AND EXEMPTIONS FROM COMPANIES (WINDING UP AND
MISCELLANEOUS PROVISIONS) ORDINANCE
(c) If the number of Offer Shares validly applied for under the Hong Kong Public Offeringrepresents 95 times or more of the total number of Offer Shares initially available forsubscription under the Hong Kong Public Offering, then Offer Shares will be reallocatedto the Hong Kong Public Offering from the International Placing so that the total numberof Offer Shares available under the Hong Kong Public Offering will be 137,300,000 OfferShares, representing 21.0% of the total number of Offer Shares initially available underthe Global Offering (before any exercise of the Offer Size Adjustment Option and theOver-allotment Option).
In each case, the additional Offer Shares reallocated to the Hong Kong Public Offering will beallocated between pool A and pool B and the number of Offer Shares allocated to the InternationalPlacing will be corresponding reduced in a manner as the Joint Global Coordinators deem appropriate.
For further details, please see the section headed “Structure of the Global Offering—The HongKong Public Offering—Reallocation.”
125
INFORMATION ABOUT THIS PROSPECTUS AND THE GLOBAL OFFERING
DIRECTORS’ RESPONSIBILITY FOR THE CONTENTS OF THIS PROSPECTUS
This Prospectus includes particulars given in compliance with the Companies (Winding Up andMiscellaneous Provisions) Ordinance, the Securities and Futures (Stock Market Listing) Rules(Chapter 571V of the Laws of Hong Kong) (as amended) and the Listing Rules for the purpose ofgiving information to the public with regards to our Group. Our Directors collectively and individuallyaccept full responsibility for the accuracy of the information contained in this Prospectus. OurDirectors, having made all reasonable enquiries, confirm that to the best of their knowledge and belief,the information contained in this Prospectus is accurate and complete in all material respects and notmisleading or deceptive, and there are no other matters the omission of which would make anystatement in this Prospectus misleading.
INFORMATION ON THE GLOBAL OFFERING, STRUCTURE AND CONDITIONS OF THEGLOBAL OFFERING AND PROCEDURES FOR APPLICATION FOR HONG KONGPUBLIC OFFER SHARES
The Hong Kong Public Offer Shares are offered solely on the basis of the informationcontained, representations made, and on and subject to the terms and conditions set out, in thisProspectus and the Application Forms. No person is authorized to give any information in connectionwith the Global Offering or to make any representation not contained in this Prospectus and theApplication Forms, and any information or representation not contained in this Prospectus and theApplication Forms must not be relied upon as having been authorized by our Company or any of theRelevant Persons.
Neither the delivery of this Prospectus nor any offering, sale or delivery made in connectionwith the Offer Shares should, under any circumstances, constitute a representation that there has beenno change or development reasonably likely to involve a change in our affairs since the date of thisProspectus or imply that the information contained in this Prospectus is correct as of any datesubsequent to the date of this Prospectus.
Details of the structure of the Global Offering, including its conditions, are set out in the sectionheaded “Structure of the Global Offering” in this Prospectus, and the procedures for applying for theHong Kong Public Offer Shares are set out in the section headed “How to Apply for Hong Kong PublicOffer Shares” in this Prospectus and in the Application Forms.
UNDERWRITING
This Prospectus is published solely in connection with the Hong Kong Public Offering, whichforms part of the Global Offering. For applicants under the Hong Kong Public Offering, thisProspectus and the Application Forms set out the terms and conditions of the Hong Kong PublicOffering.
The Listing is sponsored by the Joint Sponsors. The Hong Kong Public Offering is fullyunderwritten by the Hong Kong Underwriters under the terms of the Hong Kong UnderwritingAgreement and is subject to us (on behalf of ourselves and the Selling Shareholders) and the JointGlobal Coordinators (for themselves and on behalf of the Underwriters) agreeing on the Offer Price.An International Underwriting Agreement relating to the International Placing is expected to beentered into on or around Friday, October 25, 2019, subject to the Offer Price being agreed.
126

INFORMATION ABOUT THIS PROSPECTUS AND THE GLOBAL OFFERING
If, for any reason, our Company (for ourselves and on behalf the Selling Shareholders) and theJoint Global Coordinators (for themselves and on behalf of the Underwriters) are unable to reach anagreement on the Offer Price on or before Thursday, October 31, 2019 the Global Offering will notproceed and will lapse. For full information about the Underwriters and the underwriting arrangements,please see the section headed “Underwriting” in this Prospectus.
OFFER SIZE ADJUSTMENT OPTION
In connection with the Global Offering, the Offer Size Adjustment Option Grantors havegranted the Offer Size Adjustment Option to the Hong Kong Underwriters, pursuant to which the HongKong Underwriters will have the right, exercisable by the Joint Global Coordinators on behalf of theHong Kong Underwriters, on or before the Price Determination Date, to require the Offer SizeAdjustment Option Grantors to sell up to an aggregate of 98,052,000 additional Shares at the OfferPrice to cover additional market demand, if any.
Further details with respect to the Offer Size Adjustment Option are set forth in the sectionheaded “Structure of the Global Offering—Offer Size Adjustment Option” in this prospectus.
DOWNWARD OFFER PRICE ADJUSTMENT
We have reserved the right to make a Downward Offer Price Adjustment to provide flexibilityin pricing the Offer Shares. The ability to make a Downward Offer Price Adjustment does not affectour obligation to issue a supplemental prospectus and to offer investors a right to withdraw theirapplications if there is a material change in circumstances not disclosed in this Prospectus.
If it is intended that the final Offer Price is set at more than 10% below the bottom end of theindicative Offer Price range, the Withdrawal Mechanism will be applied if the Global Offering is toproceed.
RESTRICTIONS ON OFFER OF THE OFFER SHARES AND SALE OF SHARES
Each person acquiring the Hong Kong Public Offer Shares under the Hong Kong PublicOffering will be required to, or be deemed by his acquisition of the Offer Shares to, confirm that he isaware of the restrictions on offers of the Offer Shares described in this Prospectus and the ApplicationForms.
No action has been taken to permit a public offering of the Offer Shares in any jurisdictionother than in Hong Kong, or the distribution of this Prospectus and/or Application Forms in anyjurisdiction other than Hong Kong. Accordingly, this Prospectus and/or Application Forms may not beused for the purpose of, and does not constitute, an offer or invitation in any jurisdiction or in anycircumstances in which such an offer or invitation is not authorized or to any person to whom it isunlawful to make such an offer or invitation. The distribution of this Prospectus and the offering of theOffer Shares in other jurisdictions are subject to restrictions and may not be made except as permittedunder the applicable securities laws of such jurisdictions pursuant to registration with or authorizationby the relevant securities regulatory authorities or an exemption therefrom.
SELLING SHAREHOLDERS
As of the Latest Practicable Date, Luckfield Global Limited is still obtaining certain approvalsto sell Shares pursuant to the International Placing, hence subject to such approvals being obtained,
127

INFORMATION ABOUT THIS PROSPECTUS AND THE GLOBAL OFFERING
Luckfield Global Limited may or may not sell Shares pursuant to the International Placing. Suchdecision will be made prior to the time when the International Underwriting Agreement is proposed tobe entered into on or about the Price Determination Date. If Luckfield Global Limited is not a SellingShareholder, the Over-allotment Option Grantors will, on a pro-rata basis, sell additional Sale Sharesequal to the number of Shares which Luckfield Global Limited would have sold in the Global Offeringto ensure that the total number of Sale Shares in the Global Offering remains the same. For furtherdetails of the effect on the shareholding structure of our Company, please refer to the section headed“History, Development and Corporate Structure—Capitalization of the Company” in this Prospectus.For further details of the Selling Shareholders, please refer to the section headed “Statutory andGeneral Information—10. Particulars of the Selling Shareholders, the Over-allotment Option Grantorsand the Offer Size Adjustment Option Grantors” in this Prospectus.
We estimate the net proceeds to the Selling Shareholders from the sale of Sale Shares pursuantto the Global Offering, assuming the Offer Size Adjustment Option and the Over-allotment Option arenot exercised, to be approximately HK$6,149.5 million (approximately US$784.0 million) (assumingan Offer Price of HK$16.80 per Offer Share, being the mid-point of the indicative Offer Price range),after deducting the underwriting commission and estimated related expenses payable by the SellingShareholders. We will not receive net proceeds from the sale of Sale Shares pursuant to the GlobalOffering, whether or not the Over-allotment Option is exercised.
APPLICATION FOR LISTING ON THE STOCK EXCHANGE
We have applied to the Listing Committee for the granting of the listing of, and permission todeal in, the Shares in issue and to be issued pursuant to the Global Offering, the exercise of the Over-allotment Option and the Shares which may be issued under the KM ESOP, Tier 1 ESOP and ShareOption Scheme.
Save as disclosed in this Prospectus, no part of our Company’s share or loan capital is listed onor dealt in on any other stock exchange and no such listing or permission to list is being or proposed tobe sought in the near future.
COMMENCEMENT OF DEALINGS IN THE SHARES
Dealings in the Shares on the Stock Exchange are expected to commence at 9:00 am on Friday,November 1, 2019. The Shares will be traded in board lots of 200 Shares each. The stock code of theShares will be 1821.
ADMISSION OF THE SHARES INTO CCASS
Subject to the granting of the listing of, and permission to deal in, the Shares on the StockExchange and our compliance with the stock admission requirements of HKSCC, our Shares will beaccepted as eligible securities by HKSCC for deposit, clearance and settlement in CCASS with effectfrom the Listing Date or any other date HKSCC chooses. Settlement of transactions between ExchangeParticipants (as defined in the Listing Rules) is required to take place in CCASS on the secondBusiness Day after any trading day. All activities under CCASS are subject to the General Rules ofCCASS and CCASS Operational Procedures in effect from time to time. Investors should seek theadvice of their stockbroker or other professional advisors for details of the settlement arrangements assuch arrangements may affect their rights and interests.
All necessary arrangements have been made enabling the Shares to be admitted into CCASS.
128

INFORMATION ABOUT THIS PROSPECTUS AND THE GLOBAL OFFERING
REGISTER OF MEMBERS AND STAMP DUTY
Our Company’s principal register of members will be maintained by our principal registrar,Walkers Corporate Limited, in the Cayman Islands and our Company’s Hong Kong register ofmembers will be maintained by our Hong Kong Share Registrar, Computershare Hong Kong InvestorServices Limited, in Hong Kong.
All Offer Shares issued pursuant to applications made in the Hong Kong Public Offering andthe International Placing will be registered on the Hong Kong branch register of members of ourCompany in Hong Kong. Dealings in the Shares will be subject to Hong Kong stamp duty.
PROFESSIONAL TAX ADVICE RECOMMENDED
Potential investors in the Global Offering are recommended to consult their professionaladvisors if they are in any doubt as to the taxation implications of subscribing for, purchasing, holdingor disposal of, and dealing in, our Shares (or exercising rights attached to them). None of us or any ofthe Relevant Persons accepts responsibility for any tax effects on, or liabilities of, any person resultingfrom the subscription, purchase, holding or disposal of, dealing in, or the exercise of any rights inrelation to, our Shares.
OVER-ALLOTMENT AND STABILIZATION
Details of the arrangement relating to the Over-allotment Option and stabilization are set outunder the section headed “Underwriting” in this Prospectus.
EXCHANGE RATE CONVERSION
Solely for convenience purposes, this Prospectus includes translations among certain amountsdenominated in Australian dollars, European euros, Hong Kong dollars, Japanese Yen, Korean won,Renminbi, Singapore dollars and U.S. dollars. No representation is made that the amounts denominatedin one currency could actually be converted into the amounts denominated in another currency at therates indicated, or at all.
Unless otherwise indicated, the translations of certain Australian dollars, European euros, HongKong dollars, Japanese Yen, Korean won, Renminbi, Singapore dollars into U.S. dollars were made atthe rates of AUD1.4697, EUR0.9059, HK$7.8441, JPY108.5200, KRW1,195.6100, RMB7.0868,SGD1.3714 to US$1.00, respectively, each being the noon buying rate as set forth in the H.10statistical release of the United States Federal Reserve Board on October 11, 2019. Any discrepanciesin any table between totals and sums of amounts listed therein are due to rounding.
LANGUAGE
If there is any inconsistency between this Prospectus and the Chinese translation of thisProspectus, this Prospectus shall prevail. Translated English names of Chinese, Japanese and Koreanlaws and regulations, governmental authorities, departments, entities, enterprises (including certain ofour subsidiaries), institutions, natural persons, facilities, certificates, titles and the like included in thisProspectus and for which no official English translation exists are unofficial translations foridentification purposes only. In the event of any inconsistency, the Chinese, Japanese and Koreannames (as appropriate) will prevail.
129

INFORMATION ABOUT THIS PROSPECTUS AND THE GLOBAL OFFERING
ROUNDING
Unless otherwise stated, all the numerical figures are rounded to one decimal place.
Any discrepancies between totals and sums of amounts listed in any table or chart are due torounding.
130

DIRECTORS AND PARTIES INVOLVED IN THE GLOBAL OFFERING
DIRECTORS
Name Address Nationality
Executive Directors
Mr. Jinchu Shen (沈晉初) Room B, 62/F., Block 1,Harbourfront Landmark, No. 11Wan Hoi Street, Hung Hom, HongKong
Chinese
Mr. Stuart Gibson Domus Minamiazabu #502,3-10-1, Minamiazabu, Minato-ku,Tokyo, Japan
British
Mr. Charles Alexander Portes 17 Cove Drive, #04-24 MarinaCollection, Singapore 098329
American
Non-executive Directors
Mr. Jeffrey David Perlman(Chairman)
7 Ardmore Park, #12-01, ArdmoreResidence, Singapore 259954
American
Mr. Joseph Raymond Gagnon 793 NC Hwy 62EPleasant GardenNorth Carolina27313USA
American
Mr. Zhenhui Wang (王振輝 ) No. 107, Building 9, Hua Qing JiaYuan, Haidian District, Beijing,PRC
Chinese
Mr. Ho Jeong Lee 213-dong 1103-ho, 46, Wi city4-ro, Ilsandong-gu Goyang-si,Gyeonggi-do, South Korea
South Korean
Independent non-executive Directors
Mr. Brett Harold Krause Room 601, No. 4, 777 BiyunRoad, Shanghai, PRC
American
The Right Honourable Sir HugoGeorge William Swire, KCMG,MP
Base, 31 Walpole Street, London,SW3 4QS, United Kingdom
British
Mr. Simon James McDonald #66-11, 2 Marina Boulevard,The Sail @ Marina Bay,Singapore 018987
Australian
Ms. Jingsheng Liu (劉京生) A1701, Wensha Building, No. 1Guanghua Xi Li, ChaoyangDistrict, Beijing, PRC
Chinese
Mr. Robin Tom Holdsworth Flat B, 9/F,Arbuthnot House,10-12 Arbuthnot Road,Hong Kong
British
For more information on our Directors, please refer to the section headed “Directors and SeniorManagement” in this Prospectus.
131
DIRECTORS AND PARTIES INVOLVED IN THE GLOBAL OFFERING
PARTIES INVOLVED IN THE GLOBAL OFFERING
Joint Sponsors Deutsche Securities Asia Limited52/F, International Commerce Centre1 Austin Road West, KowloonHong Kong
CLSA Capital Markets Limited18/F, One Pacific Place88 QueenswayHong Kong
Joint Global Coordinators Morgan Stanley Asia Limited46/F, International Commerce Centre1 Austin Road WestKowloonHong Kong
Deutsche Bank AG, Hong Kong Branch52/F, International Commerce Centre1 Austin Road West, KowloonHong Kong
Citigroup Global Markets Asia Limited50th Floor, Champion Tower3 Garden Road, CentralHong Kong
Credit Suisse (Hong Kong) LimitedLevel 88, International Commerce Centre1 Austin Road West, KowloonHong Kong
Goldman Sachs (Asia) L.L.C.68/F, Cheung Kong Center2 Queen’s Road CentralHong Kong
Joint Bookrunners Morgan Stanley Asia Limited(in relation to the Hong Kong Public Offering)46/F, International Commerce Centre1 Austin Road WestKowloonHong Kong
Morgan Stanley & Co. International plc(in relation to the International Placing)25 Cabot Square, Canary WharfLondon E14 4QAUnited Kingdom
132

DIRECTORS AND PARTIES INVOLVED IN THE GLOBAL OFFERING
Deutsche Bank AG, Hong Kong Branch52/F, International Commerce Centre1 Austin Road West, KowloonHong Kong
CCB International Capital Limited12/F, CCB Tower3 Connaught Road CentralCentral, Hong Kong
China International Capital CorporationHong Kong Securities Limited29/F One International Finance Centre1 Harbour View StreetCentralHong Kong
Citigroup Global Markets Asia Limited(in relation to the Hong Kong Public Offering)50th Floor, Champion Tower3 Garden Road, CentralHong Kong
Citigroup Global Markets Limited(in relation to the International Placing)33 Canada SquareCanary WharfLondonE14 5LBUnited Kingdom
CLSA Limited18/F, One Pacific Place88 QueenswayHong Kong
Crédit Agricole Corporate and Investment Bank,Hong Kong branch(in relation to the Hong Kong Public Offering)27/F, Two Pacific Place88 Queensway, Admiralty, Hong Kong
Crédit Agricole Corporate and Investment Bank(in relation to the International Placing)27/F, Two Pacific Place88 Queensway, Admiralty, Hong Kong
Credit Suisse (Hong Kong) LimitedLevel 88, International Commerce Centre1 Austin Road West, KowloonHong Kong
133

DIRECTORS AND PARTIES INVOLVED IN THE GLOBAL OFFERING
DBS Asia Capital Limited73/F, The Center99 Queen’s Road CentralCentralHong Kong
Goldman Sachs (Asia) L.L.C.68/F, Cheung Kong Center2 Queen’s Road CentralHong Kong
Mirae Asset Securities (HK) LimitedUnits 8501, 8507-08Level 85, International Commerce Centre1 Austin Road West, KowloonHong Kong
UOB Kay Hian (Hong Kong) Limited15/F, China Building29 Queen’s Road Central, Hong Kong
Legal Advisors to Our Company As to Hong Kong and U.S. law:Latham & Watkins LLP18th Floor, One Exchange Square8 Connaught Place, CentralHong Kong
As to PRC law:Global Law Office15/F Tower 1, China Central PlaceNo. 81 Jianguo Road, Chaoyang DistrictBeijing 100025, PRC
As to Japanese law:Nagashima Ohno & TsunematsuJP Tower, 7-2 Marunouchi 2-chome,Chiyoda-ku, Tokyo 100-7036Japan
As to South Korean law:Shin & Kim23F, D-Tower (D2)17 Jongno 3-gil, Jongno-guSeoul 03155, Korea
As to Singapore law:White & Case Pte. Ltd.8 Marina View # 2701Asia Square Tower 1Singapore 018960
134

DIRECTORS AND PARTIES INVOLVED IN THE GLOBAL OFFERING
As to Australian law:Corrs Chambers WestgarthLevel 17, 8 Chifley8-12 Chifley SquareSydney NSW 2000Australia
As to Indian law:Kanga & CoReadymoney Mansion43, Veer Nariman Road, FortMumbai-400 001India
As to Cayman Islands and BVI law:Walkers (Hong Kong)15/F, Alexandra House18 Chater Road, CentralHong Kong
Legal Advisors to the JointSponsors and the Underwriters
As to Hong Kong and U.S. law:Freshfields Bruckhaus Deringer55th Floor, One Island EastTaikoo Place, Quarry BayHong Kong
As to PRC law:Commerce & Finance Law OfficesJing An Kerry Center Tower 1, 10th floor1515 West Nanjing RoadShanghai, China
Reporting Accountants andIndependent Auditor
Ernst & Young22/F CITIC Tower1 Tim Mei Avenue, CentralHong Kong
Property Valuers Beijing Colliers International Real Estate ValuationCo., Ltd.Suite 501, Tower W3Oriental PlazaNo. 1 East Chang’an AvenueDongcheng DistrictBeijing, China, 100738
Cushman & Wakefield K.K.Sanno Park Tower 13F 2-11-1 Nagatacho2-11-1 NagatachoChiyoda-ku, Tokyo, 100-6113Japan
135

DIRECTORS AND PARTIES INVOLVED IN THE GLOBAL OFFERING
CBRE Limited3/F, 4/F & 12/F 1204-06 (Reception)Three Exchange Square8 Connaught PlaceCentral, Hong Kong
Jones Lang LaSalle Corporate Appraisal and AdvisoryLimited7th Floor, One Taikoo Place979 King’s Road, Quarry BayHong Kong
Industry Consultant Jones Lang LaSalle Limited7/F, One Taikoo Place979 King’s Road, Quarry BayHong Kong
Receiving Bank Standard Chartered Bank (Hong Kong) Limited15th Floor, Standard Chartered Tower388 Kwun Tong RoadKwun Tong, KowloonHong Kong
Compliance Advisor Octal Capital LimitedRoom 801-805 Nan Fung Tower88 Connaught Road CentralHong Kong
136

CORPORATE INFORMATION
Registered office c/o Walkers Corporate LimitedCayman Corporate Centre27 Hospital Road, George TownGrand Cayman, KY1-9008Cayman Islands
Headquarters and principalplace of business in Hong Kong
2406-07 Man Yee Building68 Des Voeux Road, CentralHong Kong
Company’s website www.esr.com(The contents on this website do not form part of thisProspectus)
Company Secretary Mr. Richard Kin-sing Lee (李建成) (Hong Kong solicitor)2406-07, Man Yee Building68 Des Voeux Road CentralHong Kong
Authorized Representatives Mr. Jinchu Shen (沈晉初)Room B, 62/F., Block 1Harbourfront LandmarkNo. 11 Wan Hoi Street, Hung HomHong Kong
Mr. Richard Kin-sing Lee (李建成)2406-07, Man Yee Building68 Des Voeux Road CentralHong Kong
Audit Committee Mr. Simon James McDonald (Chairman)Mr. Joseph Raymond GagnonMr. Brett Harold KrauseMr. Ho Jeong LeeMr. Robin Tom Holdsworth
Nomination Committee The Right Honorable Sir Hugo George William Swire,KCMG, MP (Chairman)Mr. Brett Harold KrauseMs. Liu Jingsheng (劉京生)
Remuneration Committee Mr. Brett Harold Krause (Chairman)Mr. Jeffrey David PerlmanMr. Simon James McDonald
Principal share registrar andtransfer office
Walkers Corporate Limited27 Hospital Road, George TownGrand Cayman, KY1-9008Cayman Islands
137

CORPORATE INFORMATION
Hong Kong Share Registrar Computershare Hong Kong Investor Services LimitedShops 1712-1716, 17th FloorHopewell Centre183 Queen’s Road East, Wan ChaiHong Kong
Principal bankers Australia and New Zealand Banking Group LimitedLevel 3, 100 Queen Street,Melbourne VIC 3000Australia
Bank of China, Singapore Branch4 Battery Road, Bank of China BuildingSingapore
BNP Paribas, Australia Branch60 Castlereagh StreetSydney, NSW 2000Australia
Crédit Agricole Corporate and Investment Bank, HongKong branch27/F, Two Pacific Place88 Queensway, Admiralty, Hong Kong
Credit Suisse AGOne Raffles Link, #05-02Singapore 039393
Deutsche Bank AG Singapore BranchOne Raffles Quay#16-00 South TowerSingapore 048583
National Australia Bank LimitedLevel 22, 255 George StreetSydney, NSW 2000Australia
Standard Chartered BankMarina Bay Financial Centre (Tower 1)8 Marina BoulevardLevel 23Singapore 018981
SRCB Shanghai2/F, Building B, No. 70Second East Zhongshan RoadShanghai, China
United Overseas Bank Limited80 Raffles Place#29-03 UOB Plaza 1Singapore 049624
138

HISTORY, DEVELOPMENT AND CORPORATE STRUCTURE
OVERVIEW
Our Group’s history dates back to our major predecessors, namely e-Shang and the Redwoodgroup.
In 2011, e-Shang was co-founded by WP OCIM and Mr. Jinchu Shen, our co-CEO andexecutive Director. Mr. Shen has substantial experience in modern logistics in the PRC, and prior tothe founding of e-Shang he was a senior vice president of Prologis China, and advised Prologis Chinaon their initial entry into the PRC when he was at DTZ. E-Shang grew to become a fully integrateddevelopment and investment management business from 2011 to 2016, and was one of the topdevelopers, owners and operators of modern logistics facilities in the PRC, with a strong emergingbusiness in South Korea led by Korean logistics industry leaders, Mr. Thomas Nam and Mr. JihunKang.
The Redwood group was founded in 2006 by Mr. Charles Alexander Portes and Mr. StuartGibson, both of whom are our executive Directors and have substantial experience in developingmodern warehouses in Asia. The Redwood group was a specialized logistics real estate firm withestablished knowledge and experience that included in-house development, leasing and assetmanagement services (with a primary focus on the identification and execution of logisticswarehousing), and warehousing and transportation real estate solutions for some of the largestend-users and 3PL providers operating in APAC and the rest of the world.
In January 2016, e-Shang and the Redwood group completed an all stock merger to form ourCompany, which effectively: (a) increased our scale by expanding our development pipelines in thePRC, Japan and South Korea; (b) enhanced our business relationships with leading multinationalcorporate tenants who carry out business in APAC; (c) deepened our relationships with awell-diversified, blue-chip institutional capital partner base, including, but not limited to, APG Group,PGGM (a co-operative Dutch pension fund service provider), CPPIB, Morgan Stanley AIP andGoldman Sachs Investments Holdings (Asia) Limited (“Goldman Sachs”); and (d) brought together acombined management team of leaders and industry innovators from around the world. Sincecompletion of the 2016 Merger, we have undergone a few major mergers and acquisitions, includingthe Prax Capital acquisition in late 2016, and further expanded our business in recent years to increaseour presence throughout APAC, including Singapore through the acquisition of a majority stake inESR-REIT Manager and the entire issued share capital of ESR Property Management (S) Pte. Ltd. inearly 2017, Australia through the investments in Propertylink and Centuria in late 2017 and theacquisition of CIP in 2018, and India since 2017, with our industry leader country heads in eachjurisdiction spearheading such efforts, including Mr. Adrian Chui in Singapore, Mr. Philip Pearce inAustralia and Mr. Abhijit Malkani and Mr. Jaikumar Mirpuri in India.
KEY MILESTONES
The following is a summary of our key milestones and achievements in the businessdevelopment of our Group:
Year Event
2006 Mr. Charles Alexander Portes and Mr. Stuart Gibson founded the Redwood group to invest inmodern logistics facilities in Asia and with fund management and capital raising operations basedin Singapore.
2011 WP OCIM co-founded e-Shang with Mr. Jinchu Shen.
139

HISTORY, DEVELOPMENT AND CORPORATE STRUCTURE
Year Event
2012 The Redwood group formed its first PRC logistics development fund, Redwood China LogisticsFund Limited Partnership.
2013 The Redwood group formed its first Japan logistics development fund, Redwood Japan LogisticsFund Limited Partnership.
2014 E-Shang formed E-Shang Star, a PRC logistics development fund.
E-Shang expanded into South Korea.
2015 E-Shang formed Sunwood Star, a Korea logistics development fund.
2016 In January, e-Shang and the Redwood group merged, forming our Group.
We launched our first post-merger logistics development fund in Japan, Redwood Japan LogisticsFund II Limited Partnership.
2017 We established our first PRC core fund, China Invesco Core Fund, focusing on investing inmature income-yielding logistics properties in the PRC.
We expanded into the Singapore market and obtained control of the ESR-REIT Manager andsubsequently became the second largest unitholder of ESR-REIT.
We expanded into the Indian market and established an experienced local management team.
We expanded into Australia by becoming the largest securityholder of Centuria (an ASX-listedproperty funds manager). We also made an equity investment in Propertylink (a real estate groupspecializing in Australian industrial and office investments, listed on ASX) and became its singlelargest securityholder.
2018 We made a strategic investment in CNLP, the third largest logistics real estate player in the PRC,which is listed on the Hong Kong Stock Exchange.
We established our first South Korea core fund, which invests in mature income-yielding logisticsproperties in South Korea.
In August, we acquired the entire equity interest in CIP, a leading property development group inAustralia.
In October, ESR-REIT merged with VIT, which was the first merger of REITs listed on theSingapore Stock Exchange.
We established our first Japan core logistics fund, which invests in mature income-yieldinglogistics properties in Japan, under which we subsequently formed a new core joint venture inDecember 2018 with AXA Investment Managers-Real Assets and a major sovereign wealth fundfor acquisitions of core stabilized logistics assets in Japan.
We partnered with NCI and established NCI Core Fund, which invests in mature income-yieldinglogistics properties in the PRC.
We established our first logistics and industrial fund in India with a global real estate investorbased in Germany.
2019 In April, we acquired 100% of the securities of Propertylink, and Propertylink was subsequentlydelisted from the ASX.
In May, we established our Japan Logistics Fund III, which will focus on the development oflarge-scale, modern logistics facilities in the largest metropolitan areas of Japan.
In August, we increased our holdings in the equity interest of Sabana Manager to approximately96.0%.
140

HISTORY, DEVELOPMENT AND CORPORATE STRUCTURE
Year Event
In August, we have entered into an umbrella agreement to establish our new fund in Australia,which will focus on the acquisition of warehouse and logistics facilities located in variouslocations on the east coast of Australia.
We completed the disposal of seven balance sheet properties to NCI Core Fund.
MAJOR ACQUISITIONS AND MERGERS
e-Shang Redwood Merger
In November 2015, our Company, Redwood Investor (and its shareholders) and the thenShareholders of our Company entered into the Merger Agreement, under which our Company and theRedwood Investor agreed to merge the entire issued share capital of: (a) Redwood with e-ShangGalaxy Singapore Pte. Ltd; and (b) Redwood Asian Investments Limited with e-Shang Galaxy CaymanLtd. Pursuant to the Merger Agreement, our Company agreed to allot the Redwood Investor389,933,535 Class B4 Shares, which was determined based on arm’s length negotiation among theparties and the respective value of Redwood’s and e-Shang’s underlying businesses. Completion tookplace on January 20, 2016. The 2016 Merger enabled us to benefit from the complementary anddifferentiated geographic footprints of e-Shang and the Redwood group, resulting in enhancedoperational capabilities and business relationships to cater to the needs of leading e-commerce players,modern bricks-and-mortar retailers and 3PL providers in the PRC, Japan and South Korea.
The pre-2016 Merger financial information of Redwood and Redwood Asian Investments Ltd.for the period from January 1, 2016 to January 20, 2016 as required under Rule 4.05A of the ListingRule is set out in the section headed “IV. Supplementary Pre-Acquisition Financial Information ofRedwood Asian Investments, Ltd. and ESR Singapore Pte. Ltd. Business” in Appendix I to thisProspectus.
Prax Capital Acquisition
In May 2016 (as amended in September 2016), we entered into a share purchase agreementwith Prax Capital China Logistics Holding Limited, Prax Capital China Real Estate Fund III, L.P., PraxCapital China Real Estate Fund III GP, LTD., all being independent third parties, and others toindirectly acquire 100% equity interests in Wuhan Minglong, Wuhan Mingju, Tianjin Mingcheng andTaicang Mingzhan Logistics Company Limited at an aggregate purchase price of RMB588.8 millionwhich was determined with reference to the fair market value of the properties held by such companiesand the net assets of such companies and settled by our self-generated funds and bank financing. Theacquisition of Wuhan Minglong was completed on September 22, 2016, and the rest of the acquisitionswere completed on October 20, 2016.
ESR-REIT / VIT Merger
In January 2017, our Group acquired 80.0% of ESR-REIT Manager and 100% of ESR PropertyManagement (S) Pte. Ltd. from Nabinvest Capital Partners Pty Limited and CREIM Limited, bothindependent third parties, as well as 12.0% of the units in ESR-REIT from a number of independentthird parties, becoming the second largest unitholder of ESR-REIT, for an aggregate consideration ofapproximately SGD150 million, which was determined based on, among other things, the corporatevalue of ESR-REIT and settled by our self-generated funds and bank financing. ESR-REIT Managerserves as the manager of the ESR-REIT while ESR Property Management (S) Pte. Ltd. providesproperty management services to the REIT.
141
HISTORY, DEVELOPMENT AND CORPORATE STRUCTURE
In May 2018, ESR-REIT entered into an agreement with VIT, pursuant to which ESR-REITagreed to acquire all the issued and paid-up stapled securities of VIT held by the stapled securityholders of VIT by way of a trust scheme of arrangement at a consideration of SGD936.7 million(approximately US$683.0 million), which was determined based on, among other things, the corporatevalue of VIT company’s underlying business and settled by our self-generated funds and bankfinancing. The merger became effective on October 15, 2018. As part of the VIT Merger, ESR-REITManager acquired all of the issued shares of the Viva Industrial Trust Management Pte. Ltd., themanager of VIT, from VIM, an independent third party, for an aggregate consideration ofSGD62.0 million (approximately US$45.2 million), which was determined based on, among otherthings, its underlying business’ corporate value and settled by our self-generated funds and bankfinancing. Concurrently, Shanghai Summit Pte. Ltd. (“SSPL”), being a company incorporated inSingapore and an indirect shareholder of VIM, subscribed for a 25.0% stake in ESR-REIT Manager.As of the Latest Practicable Date, ESR-REIT Manager is held by our Group as to 67.3%, SSPL as to25.0% and Mitsui as to 7.7%.
Propertylink Acquisition
In October 2017, we acquired approximately 19.9% of the issued stapled securities ofPropertylink and became the single largest Propertylink securityholder. On November 12, 2018, we(through our subsidiary, ESR Australia) entered into a bid implementation agreement with Propertylinkto acquire all of the securities of Propertylink owned by third parties by way of an off-market takeoveroffer (the “Propertylink Offer”). Propertylink is an ASX-listed internally-managed REIT, specializingin Australian industrial and office investments. Propertylink also co-invests in funds with institutionalinvestors from North America, Europe, the Middle East, Asia and Australia. On November 19, 2018,we (through our subsidiary, ESR Australia) served on Propertylink the Bidder’s Statement in relationto the Propertylink Offer, which contains the terms of the Propertylink Offer. Propertylink became ournon-wholly-owned subsidiary on March 20, 2019, and we completed our acquisition of 100% ofPropertylink on April 24, 2019. Propertylink was delisted from the ASX on April 26, 2019. The threeentities that comprise Propertylink were de-stapled on May 30, 2019.
Our valuation of Propertylink, and the consideration offered under the Propertylink Offer ofAUD1.20 per Propertylink security (which included the proposed interim distribution to Propertylinksecurityholders of AUD0.036 per Propertylink security), was determined based on, among other things,our estimation of their value, the publicly listed price of Propertylink securities and the negotiationprocesses with the Propertylink board. The consideration paid by us under the Propertylink Offer andany associated transaction costs were funded by us through a combination of (a) external debt providedto us under a AUD230 million (approximately US$156.5 million) share acquisition bridging facility,which has since been refinanced with debt that is secured by the underlying assets of Propertylink; and(b) existing cash and cash equivalents sources within our Group including pursuant to an equitycommitment letter for up to AUD352 million (approximately US$239.5 million). Please refer to thesection headed “Business—The Propertylink Acquisition” in this Prospectus for further information.
We have included additional financial information in relation to Propertylink in AppendicesII-A and II-B to this Prospectus. For further details, please refer to the section headed “Waivers andConsent from Strict Compliance with the Listing Rules and Exemptions from Companies (Winding Upand Miscellaneous Provisions) Ordinance—Waiver in relation to disclosure of pre-acquisition financialinformation” in this Prospectus.
142

HISTORY, DEVELOPMENT AND CORPORATE STRUCTURE
CIP Acquisition
In August 2018, our Group acquired the equity interest in CIP from four independent thirdparty sellers following a competitive auction process at a consideration of AUD40.1 million(approximately US$27.3 million), which was determined with reference to the enterprise value of theCIP with adjustments for its dividend, debt and other negotiated deal specific items. Part of theconsideration was settled by way of issuing shares in ESR Australia Holding Company Pte. Ltd.amounting to AUD4.0 million (approximately US$2.7 million) to two of the sellers, while theremainder was settled in cash. The Group also paid additional amounts to the sellers to acquireoutstanding shareholder loans and funded certain other amounts on behalf of the sellers in connectionwith the acquisition. We plan to have CIP to act as the seed platform to launch the Group’s business inAustralia. CIP is an integrated development group with a national presence in Australia and hasdeveloped more than 1.5 million sq.m. of commercial and industrial real estate projects, with acombined value of over US$1.8 billion. CIP has a large portfolio of developments in the pipelineacross Australia’s eastern seaboard with a fully developed and GFA at completion of over 600,000sq.m.
Sabana Manager Acquisition and Sabana REIT Investment
Sabana Manager is a company incorporated in Singapore and is the fund manager of SabanaREIT. Sabana REIT has a diversified property portfolio valued at SGD872.2 million (approximatelyUS$636.0 million) as of June 30, 2019, comprising 18 properties strategically located acrossSingapore. Sabana REIT primarily invests in income-producing real estate for industrial purposes andreal estate-related assets. Its portfolio comprises quality industrial buildings in four property segments:high-tech industrial park, warehouse and logistics, chemical warehouse and logistics as well as generalindustrial. Immediately prior to the Sabana Manager Acquisition and Sabana REIT Investment, weheld an indirect 42.8% interest in Sabana Manager and a direct and indirect 12.97% interest in SabanaREIT.
On May 22, 2019, we (through our subsidiary InfinitySub Pte. Ltd.) entered into a sale andpurchase agreement with Vibrant Group Limited, an independent third party, in relation to the purchaseof 51% of the issued share capital of Sabana Investment Partners Pte. Ltd., the 100% shareholder ofSabana Manager, at a consideration of SGD20.5 million (approximately US$14.9 million), which wasdetermined with reference to the trading multiples of comparable companies and acquisition multiplesof comparable precedent transactions. Such consideration was settled by our self-generated funds andbank financing. The Sabana Manager Acquisition was completed on June 28, 2019. Concurrently, we(through our subsidiary e-Shang Infinity Cayman Limited) also entered into separate sale and purchaseagreements with independent third parties to purchase 104,390,903 units (representing approximately9.9% of the then total issued units) in Sabana REIT for approximately SGD50.1 million(approximately US$36.5 million). Such consideration was settled by our self-generated funds and bankfinancing. The final tranche of the Sabana REIT Investment was completed on July 9, 2019. Uponcompletion of the Sabana Manager Acquisition and the Sabana REIT Investment, we holdapproximately 93.8% equity interest in Sabana Manager and approximately 21.2% of the total issuedunits in Sabana REIT. Given that (a) the relevant sale and purchase agreements in relation to theSabana Manager Acquisition and Sabana REIT Investment were entered into during the Track RecordPeriod; and (b) the Sabana Manager Acquisition and Sabana REIT Investment, in aggregate, do notconstitute a major transaction under the Listing Rules, pre-acquisition financial information in relationto Sabana Manager and Sabana REIT is not required to be disclosed in this Prospectus under Rule4.05A of the Listing Rules.
143
HISTORY, DEVELOPMENT AND CORPORATE STRUCTURE
On August 30, 2019, we (through our subsidiary InfinitySub Pte. Ltd.) entered into a sale andpurchase agreement with Ms. Ng Shin Ein, an independent third party, to purchase approximately 2.2%indirect interest in Sabana Investment Partners Pte. Ltd. at a consideration of approximately SGD1.6million (approximately US$1.2 million), which was settled by our self-generated funds and bankfinancing and was completed on the same day. In addition, we (through our subsidiary InfinitySub Pte.Ltd.) will be entering into a sale and purchase agreement with Atrium Asia Capital Partners Pte. Ltd.,an independent third party, to further purchase 4% of the issued share capital of Sabana InvestmentPartners Pte. Ltd. at a consideration of SGD1.4 million (approximately US$1.0 million), which isexpected to be settled by our units in Sabana REIT and be completed by end of 2019. Theconsiderations in relation to the above acquisitions were determined with reference to the tradingmultiples of comparable companies and acquisition multiples of comparable precedent transactions.Upon completion of the abovementioned acquisitions, we will hold the entire equity interest in SabanaManager and it will become our indirect wholly-owned subsidiary.
OUR MAJOR SUBSIDIARIES
As of the end of the Track Record Period, our Group comprised over 450 companies. Due tothe project-specific nature of our business, we have established individual project companies for theholding, development and operation of different projects. We have also established companies whichperform various functions for our funds management business.
144

HISTORY, DEVELOPMENT AND CORPORATE STRUCTURE
The
principa
lbu
sine
ssac
tivities
andda
teof
establishm
entan
dco
mmen
cemen
tof
busine
ssof
each
mem
berof
ourGroup
that
mad
eamaterial
contribu
tion
toou
rresu
ltsof
operations
during
theTrack
Rec
ordPeriodaresh
ownbe
low:
Nam
eof
entity
Place
ofinco
rpor
ation
Issu
edsh
are
capital/r
egistere
dca
pital/inv
estm
ent
amou
ntPrinc
ipal
busine
ssac
tivities
Dateof
establishm
entan
dco
mmen
cemen
tof
busine
ss
e-Sha
ng(pre-m
erge
r)..
....
....
....
....
....
....
...
Cay
man
Island
sUS$2
,924
,465
.293
Ultim
ateParen
tCom
pany
June
14,2
011
CIP
....
....
....
....
....
....
....
....
....
....
....
Aus
tralia
AUD30
,258
,518
.93
Inve
stmen
tHolding
Com
pany
June
12,2
003
Jian
gsuFrien
dW
areh
ousing
Co.,L
td.
( 江蘇富萊德倉儲有限公司
)..
....
....
....
....
....
..PRC
RM
B37
1,32
0,07
7Project
Com
pany
Aug
ust1
4,20
03ESR-R
EIT
Man
ager
....
....
....
....
....
....
....
..Singa
pore
SGD64
,714
,500
Man
agem
entC
ompa
nyof
the
ESR
REIT
Sep
tembe
r14
,200
5
ESR
Prope
rtyM
anag
emen
t(S)Pte.L
td.
....
....
....
..Singa
pore
SGD25
0,00
0Prope
rtyM
anag
emen
tCom
pany
oftheESR
REIT
Nov
embe
r4,
2005
ESR
LTD
....
....
....
....
....
....
....
....
....
...
Japa
nJP
Y46
6,97
0,00
0M
anag
emen
tCom
pany
May
8,20
06Red
woo
d..
....
....
....
....
....
....
....
....
....
.Singa
pore
US$1
Man
agem
entC
ompa
nyNov
embe
r27
,200
7Sha
ngha
iYurun
Mea
tFoo
dCo.,L
td( 上海雨潤肉食品有限公司
)..
....
....
....
....
....
..PRC
RM
B65
0,00
0,00
0(5)
Project
Com
pany
June
3,20
10Lan
gfan
gW
eidu
Internationa
lLog
istics
Co.,L
td(廊坊唯度國際物流有限公司
)..
....
....
....
....
....
PRC
US$2
4,00
0,00
0Project
Com
pany
March
15,2
011
Sha
ngha
ie-S
hang
Wareh
ousing
Service
sCo.,L
td.
( 上海益商倉儲服務有限公司
)..
....
....
....
....
....
PRC
RM
B10
9,09
0,90
9M
anag
emen
tCom
pany
July
8,20
11Don
ggua
nHon
gsha
ngW
areh
ousing
Service
Co.,L
td(東莞鴻商倉儲服務有限公司
)..
....
....
....
....
....
PRC
US$6
3,00
0,00
0Project
Com
pany
June
24,2
013
Don
ggua
nHuish
ange-co
mmerce
Service
Co.,L
td( 東莞匯商電子商務服務有限公司
)..
....
....
....
....
PRC
US$2
0,00
0,00
0Project
Com
pany
Dec
embe
r21
,201
1Xinbin(S
hang
hai)Corpo
rate
Man
agem
entS
ervice
sCo.,
Ltd
(新賓(上海)企業管理服務有限公司
)(1)
....
....
..PRC
US$1
5,00
0,00
0Project
Com
pany
Feb
ruary22
,201
2Sum
mit(B
VI)
Lim
ited
....
....
....
....
....
....
....
BVI
US$1
Inve
stmen
tHolding
Com
pany
Feb
ruary24
,201
2Gua
ngzh
ouM
ingy
ueW
areh
ousing
Co.,L
td.
( 廣州市銘粵倉儲有限公司
)..
....
....
....
....
....
..PRC
RM
B76
,000
,000
Project
Com
pany
Dec
embe
r6,
2012
Red
woo
dAsian
Inve
stmen
ts,L
td..
....
....
....
....
..Cay
man
Island
sUS$1
00Inve
stmen
tHolding
Com
pany
Aug
ust5
,201
3Tianjin
Fan
binW
areh
ousing
Service
Co.,L
td(天津凡濱倉儲服務有限公司
)..
....
....
....
....
....
PRC
US$2
9,20
0,00
0Project
Com
pany
Aug
ust2
2,20
13Tianjin
Mingc
heng
Wareh
ousing
Co.,L
td.
( 天津明誠倉儲有限公司
)(2)
....
....
....
....
....
...
PRC
US$1
2,00
0,00
0Project
Com
pany
Octob
er28
,201
3
145
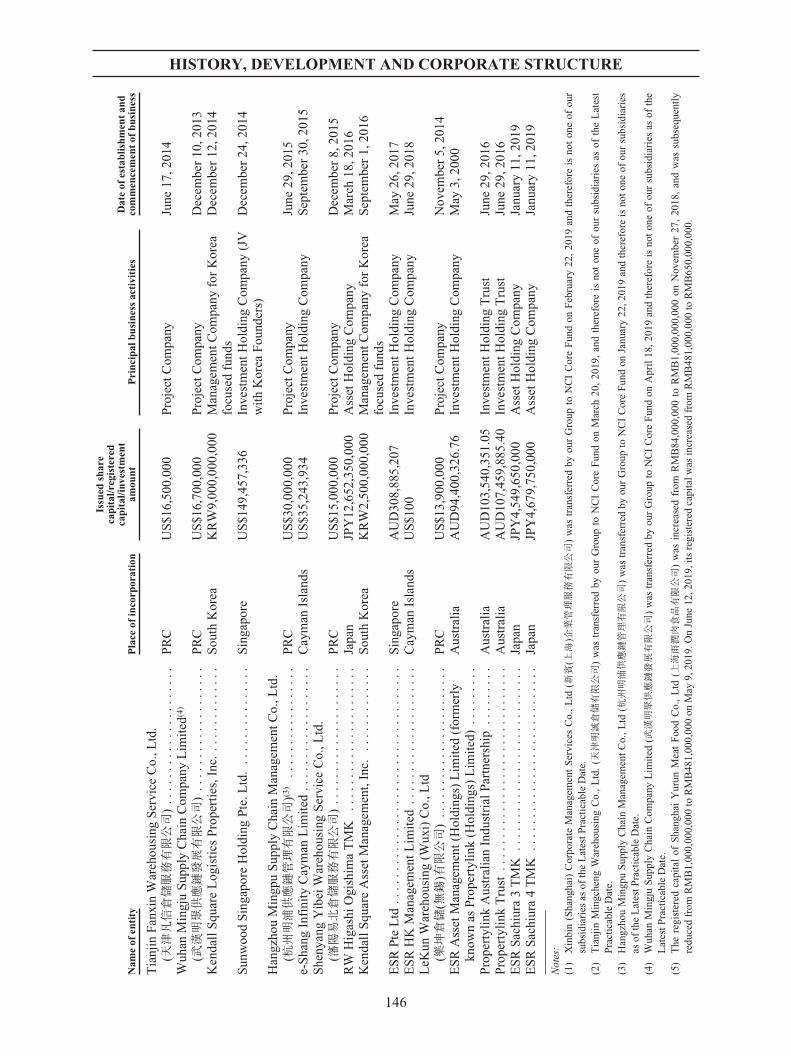
HISTORY, DEVELOPMENT AND CORPORATE STRUCTURE
Nam
eof
entity
Place
ofinco
rpor
ation
Issu
edsh
are
capital/r
egistere
dca
pital/inv
estm
ent
amou
ntPrinc
ipal
busine
ssac
tivities
Dateof
establishm
entan
dco
mmen
cemen
tof
busine
ss
Tianjin
Fan
xinW
areh
ousing
Service
Co.,L
td.
( 天津凡信倉儲服務有限公司
)..
....
....
....
....
...
PRC
US$1
6,50
0,00
0Project
Com
pany
June
17,2
014
Wuh
anM
ingjuSup
plyCha
inCom
pany
Lim
ited
(4)
(武漢明聚供應鏈發展有限公司
)..
....
....
....
....
.PRC
US$1
6,70
0,00
0Project
Com
pany
Dec
embe
r10
,201
3Ken
dallSqu
areLog
istics
Prope
rties,
Inc.
....
....
....
.Sou
thKorea
KRW
9,00
0,00
0,00
0M
anag
emen
tCom
pany
forKorea
focu
sedfund
sDec
embe
r12
,201
4
Sun
woo
dSinga
pore
Holding
Pte.L
td...
....
....
....
.Singa
pore
US$1
49,457
,336
Inve
stmen
tHolding
Com
pany
(JV
withKorea
Fou
nders)
Dec
embe
r24
,201
4
Han
gzho
uM
ingp
uSup
plyCha
inM
anag
emen
tCo.,L
td.
( 杭州明浦供應鏈管理有限公司
)(3)
....
....
....
....
.PRC
US$3
0,00
0,00
0Project
Com
pany
June
29,2
015
e-Sha
ngInfinity
Cay
man
Lim
ited
....
....
....
....
...
Cay
man
Island
sUS$3
5,24
3,93
4Inve
stmen
tHolding
Com
pany
Sep
tembe
r30
,201
5She
nyan
gYibei
Wareh
ousing
Service
Co.,L
td.
( 瀋陽易北倉儲服務有限公司
)..
....
....
....
....
...
PRC
US$1
5,00
0,00
0Project
Com
pany
Dec
embe
r8,
2015
RW
Higashi
Ogish
imaTM
K..
....
....
....
....
....
Japa
nJP
Y12
,652
,350
,000
Asset
Holding
Com
pany
March
18,2
016
Ken
dallSqu
areAsset
Man
agem
ent,Inc.
....
....
....
.Sou
thKorea
KRW
2,50
0,00
0,00
0M
anag
emen
tCom
pany
forKorea
focu
sedfund
sSep
tembe
r1,
2016
ESR
Pte
Ltd
....
....
....
....
....
....
....
....
....
Singa
pore
AUD30
8,88
5,20
7Inve
stmen
tHolding
Com
pany
May
26,2
017
ESR
HK
Man
agem
entL
imited
....
....
....
....
....
.Cay
man
Island
sUS$1
00Inve
stmen
tHolding
Com
pany
June
29,2
018
LeK
unW
areh
ousing
(Wux
i)Co.,L
td( 樂坤倉儲
(無錫
)有限公司
)..
....
....
....
....
....
.PRC
US$1
3,90
0,00
0Project
Com
pany
Nov
embe
r5,
2014
ESR
Asset
Man
agem
ent(Holding
s)Lim
ited
(formerly
know
nas
Prope
rtylink(H
olding
s)Lim
ited
)..
....
...
Aus
tralia
AUD94
,400
,326
.76
Inve
stmen
tHolding
Com
pany
May
3,20
00
Prope
rtylinkAus
tralianIndu
strial
Partnersh
ip..
....
...
Aus
tralia
AUD10
3,54
0,35
1.05
Inve
stmen
tHolding
Trust
June
29,2
016
Prope
rtylinkTrust
....
....
....
....
....
....
....
...
Aus
tralia
AUD10
7,45
9,88
5.40
Inve
stmen
tHolding
Trust
June
29,2
016
ESR
Sac
hiura3TM
K..
....
....
....
....
....
....
..Japa
nJP
Y4,54
9,65
0,00
0Asset
Holding
Com
pany
Janu
ary11
,201
9ESR
Sac
hiura4TM
K..
....
....
....
....
....
....
..Japa
nJP
Y4,67
9,75
0,00
0Asset
Holding
Com
pany
Janu
ary11
,201
9
Not
es:
(1)
Xinbin(S
hang
hai)
Corpo
rate
Man
agem
entService
sCo.,Ltd
(新賓
(上海
)企業管理服務有限公司
)was
tran
sferredby
ourGroup
toNCICoreFun
don
Feb
ruary22
,20
19an
dthereforeis
noton
eof
our
subs
idiaries
asof
theLatestP
racticab
leDate.
(2)
Tianjin
Mingc
heng
Wareh
ousing
Co.,Ltd.(天津明誠倉儲有限公司
)was
tran
sferredby
ourGroup
toNCICoreFun
don
March
20,20
19,an
dthereforeis
noton
eof
oursu
bsidiaries
asof
theLatest
Practicab
leDate.
(3)
Han
gzho
uM
ingp
uSup
plyCha
inM
anag
emen
tCo.,L
td(杭州明浦供應鏈管理有限公司
)was
tran
sferredby
ourGroup
toNCICoreFun
don
Janu
ary22
,201
9an
dthereforeis
noton
eof
oursu
bsidiaries
asof
theLatestP
racticab
leDate.
(4)
Wuh
anM
ingjuSup
plyCha
inCom
pany
Lim
ited
( 武漢明聚供應鏈發展有限公司
)was
tran
sferredby
ourGroup
toNCICoreFun
don
April18
,201
9an
dthereforeis
noton
eof
oursu
bsidiaries
asof
the
LatestP
racticab
leDate.
(5)
The
registered
capitalof
Sha
ngha
iYurun
Mea
tFoo
dCo.,Ltd
(上海雨潤肉食品有限公司
)was
increa
sedfrom
RM
B84
,000
,000
toRM
B1,00
0,00
0,00
0on
Nov
embe
r27
,20
18,an
dwas
subs
eque
ntly
redu
cedfrom
RM
B1,00
0,00
0,00
0to
RM
B48
1,00
0,00
0on
May
9,20
19.O
nJu
ne12
,201
9,itsregistered
capitalw
asincrea
sedfrom
RM
B48
1,00
0,00
0to
RM
B65
0,00
0,00
0.
146

HISTORY, DEVELOPMENT AND CORPORATE STRUCTURE
MAJOR SHAREHOLDING CHANGES OF OUR COMPANY
Our Company was incorporated as an exempted company with limited liability in the CaymanIslands on June 14, 2011 with an authorized share capital of US$50,000 divided into 50,000,000ordinary shares with a par value of US$0.001 each.
Following our establishment, we effected a series of capital reorganizations on June 30, 2011,following which the authorized share capital was increased to US$216,000 and the ordinary shares inour authorized share capital were re-classified and re-designated into 118,800,000 Class A Shares and97,200,000 Class B Shares. Further details of our Company’s changes in the share capital can be foundin the section headed “Statutory and General Information—A. Further information about ourGroup—2. Changes in the share capital of our Company” in Appendix VIII to this Prospectus.
As of July 4, 2011, our Company was held by three founding shareholders which were Laurelsas to 275 Class A Shares (representing 27.5% interest in our Company), Elite Bond as to 275 Class AShares (representing 27.5% interest in our Company) and WP OCIM as to 450 Class B Shares(representing 45.0% interest in our Company).
On May 26, 2014, our Company received an investment from APG-Stichting. Upon completionof this investment, our authorized capital was increased to US$2,050,000 divided in to 600,000,000Class A Shares, 1,000,000,000 Class B1 Shares, 50,000,000 Class B2 Shares and 400,000,000Class B3 Shares, which were held by Laurels as to 190,063,207 Class A Shares (representing 12.1%interest in our Company), Elite Bond as to 190,063,207 Class A Shares (representing 12.1% interest inour Company), WP OCIM as to 876,250,989 Class B1 Shares (representing 55.7% interest in ourCompany) and APG-Stichting as to 316,567,534 Class B3 Shares (representing 20.1% interest in ourCompany).
At the beginning of the Track Record Period, we had an authorized capital of US$2,650,000divided in to 600,000,000 Class A Shares, 1,000,000,000 Class B1 Shares, 100,000,000 Class B2Shares, 400,000,000 Class B3 Shares, 500,000,000 Class B4 Shares and 50,000,000 Class B5 Shares,which were held by Laurels as to 190,063,207 Class A Shares (representing 12.1% interest in ourCompany), Elite Bond as to 190,063,207 Class A Shares (representing 12.1% interest in ourCompany), WP OCIM as to 876,250,989 Class B1 Shares which (representing 55.7% interest in ourCompany) and APG-Stichting as to 316,567,534 Class B3 Shares (representing 20.1% interest in ourCompany).
On January 20, 2016, we allotted and issued 389,933,535 Class B4 Shares to the RedwoodInvestor, as part of the 2016 Merger. For further information see the paragraph headed “—MajorAcquisitions and Mergers—e-Shang Redwood Merger” in this section above.
We have conducted eight rounds of pre-IPO financing resulting in an aggregate issuance of355,857,177 Class B3 Shares, 261,930,955 Class B6 Shares, 70,721,358 Class B7 Shares, 240,578,861Class B8 Shares, 26,363,847 Class B9 Shares and 245,359,810 Class C Preference Shares, furtherdetails of which are set out in the paragraph below headed “—Pre-IPO Investments” in this section.
On January 10, 2017, a portion of the Shares held by Luckfield Global Limited, one of ourPre-IPO Investors, being 9,814,392 Class C Preference Shares, were redeemed by our Company for atotal amount of US$11,439,200 (determined in accordance with the terms of the Class C PreferenceShares).
147
HISTORY, DEVELOPMENT AND CORPORATE STRUCTURE
On August 18, 2017, Elite Bond transferred its entire remaining holding of 190,063,207Class A Shares to WP OCIM, together with its entitlement under the Tier 1 ESOP, for a totalconsideration of US$186,671,734 (determined with reference to the Company’s fair market value atthe time of transfer and duly paid in cash upon completion) pursuant to a share purchase agreementdated July 20, 2017.
On January 19, 2018, Goldman Sachs exercised all its warrants granted pursuant to warrantinstruments dated January 9, 2014 (as amended and restated on August 27, 2015) and August 27, 2015,respectively, which were granted in Goldman Sachs’ favor in consideration of the performance of itsobligations under a facility agreement dated December 4, 2013 (as amended and restated on August 19,2015) resulting in an issuance of 54,684,608 Class B2 Shares. The loan facility under such facilityagreement was fully repaid.
In September 2018, Redwood Consulting exercised a portion of its options under the Tier 1ESOP, pursuant to exercise option letters dated September 7, 2018 and September 14, 2018,respectively, and nominated that 13,838,797 Class B4 Shares and 18,633,334 Class B4 Shares beallotted to WP OCIM and SK, respectively, pursuant to sale and purchase agreements datedSeptember 7, 2018 and September 14, 2018, respectively. The consideration paid to our Company wasUS$18,959,152 and US$25,527,668 by WP OCIM and SK, respectively, and was determined withreference to the exercise price of US$0.46 per Share as set out in the Tier 1 ESOP and duly settled incash on September 10, 2018 and September 20, 2018 by WP OCIM and SK, respectively.
On September 21, 2018, APG-Stichting transferred 41,257,634 and 55,975,003 Class B3Shares to WP OCIM and SK, respectively, in return for US$56,522,959 and US$76,685,754 from WPOCIM and SK, respectively, determined with reference to the Company’s fair market value at the timeof transfer, and duly settled in cash on the date of the transfers.
Pursuant to the terms of the Pre-IPO Shareholders’ Agreement, (a) each of CMBC InternationalHoldings Limited, SF Project (Cayman) Limited and Mercury Beta Investment Limited has elected toredeem all of its Class C Preference Shares on September 18, 2019; (b) Luckfield Global Limited has(i) elected to convert 32,714,642 Class C Preference Shares to Class C Shares on September 18, 2019;and (ii) agreed to extend the date for conversion or redemption of the remaining 16,357,320 Class CPreference Shares from September 18, 2019 to March 18, 2020; and (c) each of Bohai InvestmentHolding Limited and Emerald Ewood (Cayman) Limited has agreed to extend the date for conversionor redemption of its Class C Preference Shares to March 18, 2020.
Since our Company’s incorporation and subsequent to each of the Pre-IPO financing rounds,we effected further changes to our authorized share capital, further information on which is set out inthe section headed “Statutory and General Information—A. Further information about our Group—2.Changes in the share capital of our Company” in Appendix VIII to this Prospectus.
Pursuant to the terms of the Pre-IPO Shareholders’ Agreement, subject to the Global Offeringbecoming unconditional, all the issued Class C Preference Shares may either be converted to Class CShares or redeemed upon the Global Offering becoming unconditional (“Share Conversion”). Afterthis change is effected, the Company will have no Class C Preference Shares in issue. The holders ofthe Class C Preference Shares have each exercised their redemption right, except (a) Emerald Ewood(Cayman) Limited, which has elected to redeem 50% of its shareholding and convert the remaining50% of its shareholding to Class C Shares; and (b) Luckfield Global Limited, which has elected toredeem 16,357,320 Class C Preference Share and convert 32,714,642 Class C Preference Shares toClass C Shares (both in accordance with the Pre-IPO Shareholders’ Agreement).
148

HISTORY, DEVELOPMENT AND CORPORATE STRUCTURE
Pursuant to the terms of the IPO Implementation Deed, subject to the Global Offeringbecoming unconditional, all the issued, unissued and authorized Class A Shares, Class B Shares andClass C Shares will be reclassified and re-designated as ordinary Shares immediately following theShare Conversion. Immediately after these changes are effected, the authorized share capital of theCompany shall be US$4,400,000 divided into 4,400,000,000 Shares of US$0.001 par value each, andthe issued share capital shall be 2,756,749,189 Shares of US$0.001 par value each. For further detailsof the IPO Implementation Deed, please refer to the paragraph headed “—IPO ImplementationArrangements” in this section of the Prospectus.
EMPLOYEE SHARE OPTION PLANS
KM ESOP
The KM ESOP was adopted by our Board on November 24, 2017. As of the Latest PracticableDate, the current number of options granted to 163 grantees of the KM ESOP, allow for the aggregatesubscription of 63,558,343 Shares, representing approximately 2.09% of the share capital of ourCompany immediately following the completion of the Global Offering, assuming that the Offer SizeAdjustment Option has not been exercised. No additional options will be granted under the KM ESOP.For further information, a summary of the principal terms of the KM ESOP is set out in the sectionheaded “Statutory and General Information—D. KM ESOP, Tier 1 ESOP and Post-IPO Share OptionScheme—1. KM ESOP” in Appendix VIII to this Prospectus.
ESOP Shareholders have entered into arrangements with our Company under which the ESOPShareholders agreed to transfer an aggregate of up to 15,246,949 Class A and/or Class B1 Shares toour Company, or make cash payments, upon exercise of certain options over shares in our Company(the “ESOP Options”) by the relevant participants under the KM ESOP. Pursuant to the IPOImplementation Deed, these arrangements will be terminated on the date of Listing in consideration ofan adjustment to the number of Shares that Laurels is issued upon exercise of certain vested andunexercised options under the Tier 1 ESOP, certain cash payments from our Company to Laurels andWP OCIM and cancellation of certain vested and unexercised options under the Tier 1 ESOP held byWP OCIM (the “ESOP Unwind”). Our Company will, after Listing, make cash payments to the ESOPShareholders based on the then market value of the Shares if any ESOP Options expire or lapse on orafter the Listing Date. For further details of the IPO Implementation Deed, please see the paragraphheaded “—IPO Implementation Arrangements” in this section below.
Tier 1 ESOP
The Tier 1 ESOP was adopted by our Board pursuant to a shareholders’ agreement datedNovember 3, 2015. As of the Latest Practicable Date, each of WP OCIM and Laurels hold unexercisedoptions to subscribe for a total of 15,800,325 Shares each and Redwood Consulting holds unexercisedoptions to subscribe for a total of 35,995,945 Shares, representing in aggregate approximately 2.23% ofthe share capital of our Company immediately following the completion of the Global Offering,assuming that the Offer Size Adjustment Option has not been exercised. Under the terms of the IPOImplementation Deed, the Company and the holders of the Tier 1 ESOP have agreed: (i) not to exerciseany vested options under the Tier 1 ESOP until the Listing Date; and (ii) to exercise or cancel all thevested and unexercised options under the Tier 1 ESOP on the Listing Date on a cashless basis based onthe Offer Price, such that the option holders will not be required to make payment of the strike price ofthe options being exercised save for the nominal value of such Shares (the “Strike Amount”) andinstead, the number of Shares to be issued on such exercise will be reduced by an amount whose value
149

HISTORY, DEVELOPMENT AND CORPORATE STRUCTURE
would equal the Strike Amount (the “Tier 1 Exercise”). For further information, a summary of theprincipal terms of the Tier 1 ESOP is set out in the section headed “Statutory and GeneralInformation—D. KM ESOP, Tier 1 ESOP and Post-IPO Share Option Scheme—2. Tier 1 ESOP” inAppendix VIII to this Prospectus.
As a result of the Tier 1 Exercise and taking into account agreements related to the ESOPUnwind and the Incentivization Unwind, Laurels and Redwood Consulting will be issued 3,450,861Shares and 15,001,945 Shares, respectively, on the Listing Date, assuming the Offer Price isdetermined to be HK$16.80, the mid-point of the Offer Price range and the Listing Date is determinedto be Friday, November 1, 2019.
CAPITALIZATION OF THE COMPANY
The following table sets out the shareholding structure on the date of this Prospectusimmediately prior to completion of the Global Offering and upon completion of the Global Offering:
(a) (b) (c) (d) (e) (f) (g) (h)
Shareholders(1)
Aggregate totalnumber of shares ofpar value US$0.001each as of the dateof this Prospectus(2)
Aggregateownership
percentage as ofthe date of thisProspectus(2)
Aggregatetotal numberof shares ofpar value
US$0.001 eachas of
immediatelyprior to the
GlobalOffering
Aggregateownershippercentage
as ofimmediatelyprior to the
GlobalOffering
Aggregate totalnumber of Shares
each uponcompletion of theGlobal Offering(assuming theOver-allotmentOption and the
Offer SizeAdjustment
Option are notexercised)
Aggregateownership
percentage uponcompletion of theGlobal Offering(assuming theOver-allotmentOption and the
Offer SizeAdjustment
Option are notexercised)
Aggregate ownershippercentage uponcompletion of theGlobal Offering(assuming full
exercise of the Over-allotment Option but
the Offer SizeAdjustment Optionis not exercised)
Aggregateownership
percentage uponcompletion of theGlobal Offering(assuming fullexercise of theOver-allotmentOption and the
Offer SizeAdjustmentOption)
Laurels . . . . . . . . . . 190,063,207 6.76% 281,858,789(3), (4)10.23% 281,858,789 9.28% 9.28% 9.28%WP OCIM(7) . . . . . . 1,121,410,627 39.89% 1,033,065,906(3), (4)37.48% 732,592,930 24.13% 21.21% 17.85%Goldman
Sachs(8) . . . . . . . . 54,684,608 1.94% 54,684,608 1.98% 40,153,449 1.32% 1.18% 1.02%APG-Stichting . . . . 219,334,897 7.80% 219,334,897 7.96% 211,057,897 6.95% 6.95% 6.95%General Electric
PensionTrust(9) . . . . . . . . 39,289,643 1.40% 39,289,643 1.43% 28,849,337 0.95% 0.85% 0.73%
RedwoodEntities . . . . . . . . 389,933,535 13.87% 404,935,480(4) 14.69% 404,935,480 13.34% 13.34% 13.34%
SK . . . . . . . . . . . . . 336,539,292 11.97% 336,539,292 12.21% 336,539,292 11.08% 11.08% 11.08%StepStone . . . . . . . . 70,721,358 2.52% 70,721,358 2.57% 70,721,358 2.33% 2.33% 2.33%Bohai Investment
HoldingLimited . . . . . . . 40,893,302(5) 1.45% —(6) — — — — —
Emerald Ewood(Cayman)Limited . . . . . . . 32,714,641(5) 1.16% 16,357,320(5) 0.59% 8,178,660 0.27% 0.27% 0.27%
Luckfield GlobalLimited . . . . . . . 49,071,962(5) 1.75% 32,714,642(6) 1.19% 16,357,321 0.54% 0.54% 0.54%
CMBCInternationalHoldingsLimited . . . . . . . —(5) — — — — — — —
SF Project(Cayman)Limited . . . . . . . —(5) — — — — — — —
Mercury BetaInvestmentLimited . . . . . . . —(5) — — — — — — —
Jingdong LogisticsGroupCorporation . . . . 240,578,861 8.56% 240,578,861 8.73% 232,301,861 7.65% 7.65% 7.65%
MontsoreauInvestmentLimited(10) . . . . . 26,363,847 0.94% 26,363,847 0.96% 19,358,269 0.64% 0.57% 0.49%
PublicShareholders . . . — 0.00% — 0.00% 653,680,000 21.53% 24.76% 28.47%
TOTAL 2,811,599,780 100.00% 2,756,444,643 100.00% 3,036,584,643 100.00% 100.00% 100.00%
150
HISTORY, DEVELOPMENT AND CORPORATE STRUCTURE
Notes:(1) For further information on our Shareholders, please refer to the paragraph headed “—Information about the Principal Pre-IPO
Investors” in this section below.(2) As at the date of this Prospectus, the share capital of the Company is divided into 12 different classes of Shares, namely the Class A
Shares, the Class B1 Shares, the Class B2 Shares, the Class B3 Shares, the Class B4 Shares, the Class B5 Shares, the Class B6 Shares,the Class B7 Shares, the Class B8 Shares, the Class B9 Shares, the Class C Shares and the Class C Preference Shares. Each class ofShare has the same rights, with the exception of Class B5 Shares, which have no voting rights, no pre-emption rights or any other rightsconferred in the Existing Articles (unless determined by special resolution) and of which there are none currently in issue, and theClass C Preference Shares, which rank ahead of all the other Shares and have additional rights including the conversion of the Class CPreference Shares to Class C Shares. Pursuant to the terms of the IPO Implementation Deed, each of the shares in issue will bereclassified and re-designated into one Share, conditional upon and subject to the completion of the Global Offering.
(3) As a result of the unwind of arrangements entered into to incentivize Mr. Jinchu Shen, being (i) promote arrangements which have beenin place since WP OCIM co-founded e-Shang and (ii) certain share participation arrangements and taking into account agreementsrelated to the ESOP Unwind and the Tier 1 Exercise, WP OCIM will transfer 85,445,178 Shares to Laurels, on the Listing Date,assuming the Offer Price is determined to be HK$16.80, the mid-point of the Offer Price range and the Listing Date is determined to beFriday, November 1, 2019. For further details please refer to the paragraph headed “—IPO Implementation Arrangements” below inthis section.
(4) As a result of the Tier 1 Exercise and taking into account agreements related to the ESOP Unwind and the Incentivization Unwind,Laurels and Redwood Consulting will be issued 3,450,861 Shares and 15,001,945 Shares, respectively, on the Listing Date, assumingthe Offer Price is determined to be HK$16.80, the mid-point of the Offer Price range and the Listing Date is determined to be Friday,November 1, 2019. For further details of the Tier 1 Exercise, please refer to the paragraph headed “—Employee share option plans—Tier 1 ESOP” above in this section.
(5) Pursuant to the terms of the Pre-IPO Shareholders’ Agreement, (a) each of CMBC International Holdings Limited, SF Project(Cayman) Limited and Mercury Beta Investment Limited has elected to redeem all of its Class C Preference Shares on September 18,2019; (b) Luckfield Global Limited has (i) elected to convert 32,714,642 Class C Preference Shares to Class C Shares on September 18,2019; and (ii) agreed to extend the date for conversion or redemption of the remaining 16,357,320 Class C Preference Shares fromSeptember 18, 2019 to March 18, 2020; and (c) each of Bohai Investment Holding Limited and Emerald Ewood (Cayman) Limited hasagreed to extend the date for conversion or redemption of its Class C Preference Shares to March 18, 2020.
(6) Pursuant to the terms of the Pre-IPO Shareholders’ Agreement, these Shareholders, being the holders of the Class C Preference Shares,have each exercised their redemption right, except (a) Emerald Ewood (Cayman) Limited, which has elected to redeem 50% of itsshareholding and convert the remaining 50% of its shareholding to Class C Shares; and (b) Luckfield Global Limited, which has electedto redeem 16,357,320 Class C Preference Shares and convert 32,714,642 Class C Preference Shares to Class C Shares. For furtherdetails, please refer to the paragraph headed “—Major shareholding changes of our Company” above in this section.
(7) If Luckfield Global Limited is not a Selling Shareholder, the respective numbers of Shares or ownership percentages for each ofcolumns (e) to (h) in the table above will be 717,808,954 Shares, 23.64%, 20.72% and 17.36%, respectively.
(8) If Luckfield Global Limited is not a Selling Shareholder, the respective numbers of Shares or ownership percentages for each ofcolumns (e) to (h) in the table above will be 39,438,482 Shares, 1.30%, 1.16% and 1.00%, respectively.
(9) If Luckfield Global Limited is not a Selling Shareholder, the respective numbers of Shares or ownership percentages for each ofcolumns (e) to (h) in the table above will be 28,335,649 Shares, 0.93%, 0.83% and 0.72%, respectively.
(10) If Luckfield Global Limited is not a Selling Shareholder, the respective numbers of Shares or ownership percentages for each ofcolumns (e) to (h) in the table above will be 19,013,579 Shares, 0.63%, 0.56% and 0.48%, respectively.
151

HISTORY, DEVELOPMENT AND CORPORATE STRUCTURE
PRE-IPO INVESTMENTS
Background of the Pre-IPO Investors
We have received eight rounds of investment since our establishment. We granted warrants toGoldman Sachs entitling Goldman Sachs to certain shares at a nominal value as part and parcel of, andin consideration of the performance by Goldman Sachs of its obligations under a facility agreement.Other details of our Pre-IPO Investments are as follows.
Date of initialshare
subscriptionagreement
Name ofShareholder(s)
Date of lastpayment of
consideration
Total number ofshares under theshare subscription
agreement(s)Cost per share
paid(1)Total funds raisedby the Company
Discount tothe OfferPrice(2)
Valuationof our
Companyas of thedate of
initial sharesubscriptionagreement(3)
1. January 9, 2014(4) Goldman Sachs January 19, 2018(4) 54,684,608 Class B2Shares
US$0.0013 perClass B2 Share(4)
US$70,000(4) 99.99% n/a(4)
2. May 26, 2014 APG-Stichting May 27, 2014 316,567,534 Class B3Shares
US$0.5054 perClass B3 Share
US$160,000,000 76.4% US$0.79billion
3. December 23,2016
ChineseInstitutionalInvestors(5)
January 4, 2017 245,359,810 Class CPreference Shares
US$1.2227 perClass CPreference Share
US$300,000,000 42.9% US$2.89billion
4. July 31, 2017 SK(6) August 3, 2017 261,930,955 Class B6Shares
US$1.2726 perClass B6 Share
US$333,333,333 40.5% US$3.40billion
5. November 29,2017
StepStone November 28, 2017 70,721,358 Class B7Shares
US$1.2726 perClass B7 Share
US$90,000,000 40.5% US$3.49billion
6. November 29,2017
General ElectricPension Trust
November 29, 2017 39,289,643 Class B3Shares
US$1.2726 perClass B3 Share
US$50,000,000 40.5% US$3.54billion
7. April 24, 2018 JingdongLogistics GroupCorporation
May 10, 2018 240,578,861 Class B8Shares
US$1.5169 perClass B8 Share
US$306,160,659(7) 29.1% US$4.58billion
8. May 28, 2018 MontsoreauInvestmentLimited
June 15, 2018 26,363,847 Class B9Shares
US$1.5172 perClass B9 Share
US$40,000,000 29.1% US$4.63billion
Notes:(1) Not adjusted to reflect subsequent share splits and other capital reorganizations, as applicable.(2) The discount to the Offer Price is calculated on the assumption that the Offer Price is HK$16.80 per Share, being the mid-point of the
indicative Offer Price range of HK$16.20 to HK$17.40.(3) This refers to the post-money valuation of our Company, being the sum of the pre-money valuation and the amount of new equity.(4) We granted warrants to Goldman Sachs entitling Goldman Sachs to certain shares at nominal value as part and parcel of, and in
consideration of the performance by Goldman Sachs of its obligations under a facility agreement dated December 4, 2013 (as amendedand restated on August 19, 2015) which has been fully repaid. Such warrants were granted pursuant to the warrant instruments datedJanuary 9, 2014 (as amended and restated on August 27, 2015) and August 27, 2015, respectively. Such warrants were exercised in fullon January 19, 2018 for the subscription of a total of 54,684,608 Class B2 Shares. For further details, see the paragraph headed “—MajorShareholding Changes of our Company” in this section above. Since the warrants were granted pursuant to the warrant instruments aspart and parcel of, and in consideration of the performance by Goldman Sachs of its obligations under the facility agreement, theconsideration of the warrants was not determined with reference to the valuation of our Company, but the nominal value of our Sharesinstead.
(5) For further details of the Chinese Institutional Investors, please refer to the paragraph headed “—Information about the Principal Pre-IPOInvestors—Chinese Institutional Investors” in this section below.
(6) On September 14, 2018 and September 21, 2018, SK entered into sale and purchase agreements to purchase 18,633,334 Class B4 Sharesand 55,975,003 Class B3 Shares from Redwood Consulting and APG-Stichting, respectively. See paragraph headed “—MajorShareholding Changes of our Company” in this section above for further details.
(7) Part of the consideration was satisfied by contributions and/or commitments made by Jingdong Logistics Group Corporation understrategic business cooperation arrangements with our Company.
152
HISTORY, DEVELOPMENT AND CORPORATE STRUCTURE
Principal terms of the Pre-IPO InvestmentsUse of proceeds from the Pre-IPOInvestments
We utilized all of the proceeds from the Pre-IPO Investments forthe development and operation of our business.
Strategic benefits the Pre-IPOInvestors brought to our Company
At the time of the Pre-IPO Investments, our Directors were of theview that our Company would benefit from the additional capitalprovided by the Pre-IPO Investors’ investments in our Companyand their knowledge and experience.
Basis of determination ofconsideration paid
The consideration for the Pre-IPO Investments was determinedbased on arm’s length negotiations between our Company andthe Pre-IPO Investors after taking into consideration the timing ofthe investments and the status of our business and operatingentities.
Dividends For so long as the Class C Preference Shares remain in issue, theholders of Class C Preference Shares are entitled to a fixed,cumulative, preferential and cash dividend.
Conversion and Redemption Upon the occurrence of certain events, such as a proposed initialpublic offering or liquidation of our Company and certaindefaults under or amendments to the financing documents of ourCompany but in no event later than September 18, 2019 (whichhas been further extended to March 18, 2020 by each ofLuckfield Global Limited, Bohai Investment Holding Limitedand Emerald Ewood (Cayman) Limited), the holders of Class CPreference Shares will have the right to convert their Class CPreference Shares into Class C Shares on a 1:1 basis or have theirClass C Preference Shares redeemed by our Company at a price(which when combined with any previous distributions on theClass C Preference Shares) would result in such holders ofClass C Preference Shares receiving an aggregate internal rate ofreturn as agreed in the Pre-IPO Shareholders’ Agreement on thesubscription price of such Class C Preference shares at therelevant date calculated in USD after deduction of certain taxes.
Number of Class C Shares to beissued assuming all holders ofClass C Preference Shares (as atthe date when the Class CPreference Shares were allotted)elect to have their Class CPreference Shares converted
245,359,810(note)
Direct shareholding in ourCompany by the holders of ClassC Preference Shares assuming allholders of Class C PreferenceShares (as at the date when theClass C Preference Shares wereallotted) elect to have their Class CPreference Shares converted andbased on the share capital of ourCompany immediately prior to thecompletion of the Global Offering
Approximately 8.9%
Note:As of the Latest Practicable Date, 89,965,263 Class C Preference Shares were in issue as (i) 32,714,642 Class C Preference Shares have beenconverted to Class C Shares, and (ii) 122,679,905 Class C Preference Shares have been redeemed. Those outstanding Class C PreferenceShares will either be redeemed or converted. For further details, please refer to the paragraph “—Capitalization of the Company” above andthe section headed “Share Capital” in this Prospectus.
153

HISTORY, DEVELOPMENT AND CORPORATE STRUCTURE
Special rights of the Pre-IPO Investors
All of our Pre-IPO Investors are currently bound by the terms of the Pre-IPO Shareholders’Agreement and the Company is bound by the Existing Articles, which will be replaced by our Articleseffective upon Completion of the Global Offering. Under the Pre-IPO Shareholders’ Agreement,certain of the Pre-IPO Investors were granted certain special rights in relation to our Companydependent, in some cases, on their percentage ownership in our Company. This included, amongothers, customary rights of first refusal to participate in future funding rounds, information rights,board nomination right and veto rights. The Pre-IPO Shareholders’ Agreement and such special rightswill terminate subject to and effective upon completion of the Global Offering in accordance with theterms of the IPO Implementation Deed.
Public Float
Upon the completion of the Global Offering (assuming the Offer Size Adjustment Option andthe Over-allotment Option are not exercised), the Shares held by certain of our shareholders who are asubstantial shareholder (in the case of WP OCIM) or are indirectly controlled by our core connectedpersons, will not be counted towards the public float. Details of these Shareholders and theircontrollers are set out below:
Š WP OCIM will hold approximately 24.1% (if Luckfield Global Limited is a SellingShareholder) or 23.6% (if Luckfield Global Limited is not a Selling Shareholder) of thetotal issued Shares;
Š Redwood Entities, ultimately owned by two of our executive Directors, Mr. CharlesAlexander Portes and Mr. Stuart Gibson, will hold approximately 13.3% of the total issuedShares;
Š Laurels, will hold approximately 9.3% of the total issued Shares. Laurels is wholly ownedby The Shen Trust, the sole beneficiary of which is an associate of our executive Director,Mr. Jinchu Shen; and
Š SK will hold approximately 11.1% of the total issued Shares.
Save as provided above, upon completion of the Global Offering (assuming the Offer SizeAdjustment Option and the Over-allotment Option are not exercised), the remaining Pre-IPO Investorswill collectively hold 626,978,152 Shares, or approximately 20.6% of the issued share capital of theCompany.
Save as disclosed above, no other Pre-IPO Investor is a substantial shareholder or a coreconnected person of our Company, as defined in the Listing Rules. Therefore, the Shares held by theremaining Pre-IPO Investors will count towards the public float.
Information about the principal Pre-IPO Investors
Set out below is a description of the Pre-IPO Investors that are sophisticated investors, beingprivate equity funds and investment companies, and that have made meaningful investments in ourCompany (each holding between 0.94% to 11.97% of the total issued and outstanding shares as of thedate of this Prospectus, further information of which is set out in the paragraph headed“—Capitalization of the Company” above in this section).
154

HISTORY, DEVELOPMENT AND CORPORATE STRUCTURE
APG-Stichting
APG-Stichting is a Dutch foundation (stichting) acting in its capacity as depository of APGStrategic Real Estate Pool, which is formed for the purpose of collective investments by itsparticipants, all being Dutch pension funds. As a “pool”, APG Strategic Real Estate Pool is establishedas a fund for joint account (fonds voor gemene rekening) under Dutch laws. It is not a legal entity but acontractual arrangement between APG-Stichting as its depositary, APG-AM as its manager, and itsparticipants which invest in it through subscribing an interest in it.
APG-AM is wholly-owned by APG Groep N.V., which itself is owned by StichtingPensioenfonds ABP, as to approximately 92.16% and Stichting Bedrijfstakpensioenfonds voor deBouwnijverheid as to approximately 7.84%.
As at October 1, 2019, Stichting Pensioenfonds ABP has an approximately 96.8% interest inAPG Strategic Real Estate Pool, and the remaining approximately 3.2% interest in APG Strategic RealEstate Pool is held by other Dutch pension fund participants. As of the date of this Prospectus, APG-Stichting holds approximately 7.80% of the total issued and outstanding shares.
Chinese Institutional Investors
CMBC International Holdings Limited is a limited liability company incorporated in HongKong. CMBC International Holdings Limited is ultimately controlled by China Minsheng BankingCorp. Ltd., a commercial bank listed on the Hong Kong Stock Exchange (Stock Code: 1988) and onthe Shanghai Stock Exchange (Stock Code: 600016). CMBC International Holdings Limited elected toredeem all of its 31,078,909 Class C Preference Shares on September 18, 2019 pursuant to the terms ofthe Pre-IPO Shareholders’ Agreement, and therefore it holds no issued or outstanding shares as of thedate of this Prospectus.
Mercury Beta Investment Limited is a business company incorporated under the laws of BVIlimited by shares. Mercury Beta Investment Limited is ultimately controlled by China Huarong AssetManagement Co., Ltd., a company listed on the Hong Kong Stock Exchange (Stock Code: 2799).Mercury Beta Investment Limited elected to redeem all of its 40,893,302 Class C Preference Shares onSeptember 18, 2019 pursuant to the terms of the Pre-IPO Shareholders’ Agreement, and therefore itholds no issued or outstanding shares as of the date of this Prospectus.
Bohai Investment Holding Limited is a business company incorporated under the laws of BVI.Bohai Investment Holding Limited is ultimately controlled by China Huarong Asset Management Co.,Ltd., a company listed on the Hong Kong Stock Exchange (Stock Code: 2799). As of the date of thisProspectus, Bohai Investment Holding Limited holds approximately 1.45% of the total issued andoutstanding shares.
SF Project (Cayman) Limited is an exempted limited liability company incorporated in theCayman Islands. SF Project (Cayman) Limited is ultimately controlled by GF Securities Co., Ltd., acompany listed on the Hong Kong Stock Exchange (Stock Code: 1776) and on the Shenzhen StockExchange (Stock Code: 000776). SF Project (Cayman) Limited elected to redeem all of its 40,893,302Class C Preference Shares on September 18, 2019 pursuant to the terms of the Pre-IPO Shareholders’Agreement, and therefore it holds no issued or outstanding shares as of the date of this Prospectus.
Emerald Ewood (Cayman) Limited is a limited liability company incorporated in the CaymanIslands. Emerald Ewood (Cayman) Limited is ultimately owned by Shanghai Pudong Development
155

HISTORY, DEVELOPMENT AND CORPORATE STRUCTURE
Bank Co. Ltd, a joint-stock commercial bank on the Shanghai Stock Exchange (Stock Code: 600000).As of the date of this Prospectus, Emerald Ewood (Cayman) Limited holds approximately 1.16% of thetotal issued and outstanding shares.
China Everbright is a limited liability company incorporated in Hong Kong. China Everbrightis ultimately controlled by Everbright Securities Company Limited, a company listed on the HongKong Stock Exchange (Stock Code: 6178) and on the Shanghai Stock Exchange (Stock Code:601788). On August 16, 2019, China Everbright transferred 32,714,641 Class C Preference Shares at aconsideration of US$44,746,624 to Luckfield Global Limited, a company incorporated under the lawsof the BVI which engages in the business of investment holding and a subsidiary of China EverbrightLimited, a company listed on the Hong Kong Stock Exchange (Stock Code: 0165). Luckfield GlobalLimited redeemed 9,814,392 Class C Preference Shares on January 10, 2017 and has elected to convert32,714,642 Class C Preference Shares to Class C Shares on September 18, 2019 pursuant to the termsof the Pre-IPO Shareholders’ Agreement. As of the date of this Prospectus, China Everbright holds noissued or outstanding shares while Luckfield Global Limited holds approximately 1.75% of the totalissued and outstanding shares.
SK
SK is a company incorporated in South Korea. SK is a public listed company, whose shares arelisted on the Korea Stock Exchange (Stock Code: KRX 034730). SK and its subsidiaries are engagedin the business of energy, telecommunications and semi-conductors. As of the date of this Prospectus,SK holds approximately 11.97% of the total issued and outstanding shares.
StepStone
StepStone A Opportunities Fund, L.P., an exempted limited liability partnership registered inthe Cayman Islands and whose general partner is StepStone A (GP), LLC, StepStone Rivas PrivateEquity Fund, L.P., an exempted limited liability partnership registered in the Cayman Islands andwhose general partner is StepStone Rivas (GP), LLC, StepStone H Opportunities Fund, L.P., anexempted limited liability partnership registered in the Cayman Islands and whose general partner isStepStone H (GP), LLC, StepStone AMP Opportunities Fund, L.P. a limited partnership withdesignated series formed in the State of Delaware in the U.S. and whose general partner is StepStoneAMP (GP), LLC, and StepStone FSS Opportunities Fund, L.P., a limited partnership with designatedseries formed in the State of Delaware in the U.S. and whose general partner is StepStone FSS (GP),LLC, and are each ultimately advised by StepStone Group L.P.. As of the date of this Prospectus,StepStone collectively hold approximately 2.52% of the total issued and outstanding shares.
General Electric Pension Trust
General Electric Pension Trust is a New York common law trust which is acting by and throughits investment manager SSGA Funds Management, Inc. SSGA Funds Management, Inc. is an indirectwholly owned subsidiary of State Street Corporation, a company listed on the New York StockExchange (Stock Code: STT), whose principal business is providing financial services globally. As ofthe date of this Prospectus, General Electric Pension Trust holds approximately 1.40% of the totalissued and outstanding shares.
Goldman Sachs
Goldman Sachs is a company incorporated in Mauritius. Goldman Sachs is a wholly ownedsubsidiary of Asia Investing Holdings Pte. Ltd. and ultimately controlled by The Goldman Sachs
156

HISTORY, DEVELOPMENT AND CORPORATE STRUCTURE
Group Inc. As of the date of this Prospectus, Goldman Sachs holds approximately 1.94% of the totalissued and outstanding shares.
Jingdong Logistics Group Corporation
Jingdong Logistics Group Corporation is an exempted company incorporated under the laws ofthe Cayman Islands. Jingdong Logistics Group Corporation is an indirect wholly-owned subsidiary ofJD.com, Inc., JD.com is China’s leading technology driven e-commerce company and retailinfrastructure service provider. As of the date of this Prospectus, Jingdong Logistics GroupCorporation holds approximately 8.56% of the total issued and outstanding shares.
Montsoreau Investment Limited
Montsoreau Investment Limited is an investment company incorporated under the laws of BVI.Montsoreau Investment Limited is wholly owned by CSOBOR Fund, a private equity investment fundof CLSA that capitalizes on Belt and Road investment opportunities in the consumer products andservices, technology, media, telecommunication and infrastructure industries. CLSA is theinternational platform of CITIC Securities Company Limited, a leading brokerage and investment bankin the PRC listed on the Hong Kong Stock Exchange (Stock Code: 6030) and on the Shanghai StockExchange (Stock Code: 600030). As of the date of this Prospectus, Montsoreau Investment Limitedholds approximately 0.94% of the total issued and outstanding shares.
COMPLIANCE WITH INTERIM GUIDANCE AND GUIDANCE LETTERS
The Joint Sponsors confirm that the Pre-IPO Investments are in compliance with GuidanceLetter HKEX-GL29-12 issued by the Stock Exchange in January 2012 and updated in March 2017,Guidance Letter HKEX-G43-12 issued by the Stock Exchange in October 2012 and updated in July2013 and March 2017 and Guidance Letter HKEX-44-12 issued by the Stock Exchange in October2012 and updated in March 2017.
IPO IMPLEMENTATION ARRANGEMENTS
In preparation for the Global Offering, the Shareholders, Mr. Jinchu Shen and our Companyhave entered into the IPO Implementation Deed which provides, among other things that:
Š upon the Global Offering becoming unconditional the Share Conversion and the ShareRedesignation (as described in further detail under the paragraph headed “—MajorShareholding Changes of our Company” in this section) shall be implemented, the Pre-IPO Shareholders’ Agreement shall be terminated and the memorandum and articles ofassociation of our Company shall be amended and restated;
Š commit all Selling Shareholders to the number of Shares they will sell in the GlobalOffering;
Š commit all existing Shareholders who are not Selling Shareholders to enter into lock-upagreements on market standard terms in respect of their Shares;
Š upon the Global Offering becoming unconditional the ESOP Unwind (as described infurther detail under the paragraph headed “—Employee Share Option Plans— KM ESOP”in this section) shall be implemented; and
157

HISTORY, DEVELOPMENT AND CORPORATE STRUCTURE
Š upon the Global Offering becoming unconditional the Tier 1 Exercise (as described infurther detail under the paragraph headed “—Employee Share Option Plans— KM ESOP”in this section) shall be implemented.
In addition, Laurels, WP OCIM and Mr. Jinchu Shen have entered into separate arrangementswhich implement the unwind of certain arrangements being (i) promote arrangements which have beenin place since WP OCIM co-founded e-Shang and (ii) certain share participation arrangements, througha cash payment from WP OCIM to Laurels and a transfer of Shares from WP OCIM to Laurels as setout below. Under these arrangements, WP OCIM agreed to transfer Class A Shares, Class B1 Shares,options over shares and/or make cash payments to Laurels upon, among other events, an initial publicoffering of the Company, in an amount to be determined based on the market price of the shares.Assuming that the Offer Price is determined to be HK$16.80, the mid-point of the Offer Price rangeand the Listing Date is determined to be Friday, November 1, 2019, on the Listing Date and taking intoaccount agreements related to the ESOP Unwind and the Tier 1 Exercise, WP OCIM will transfer85,445,178 Shares to Laurels (the “Incentivization Unwind”).
158

HISTORY, DEVELOPMENT AND CORPORATE STRUCTURE
CORPORATE
STRUCTURE
ASOFTHE
DATE
OFTHIS
PROSP
ECTUS
The
follow
ingch
arts
etsou
tasimplifiedco
rporatean
dsh
areh
olding
structureof
ourGroup
asof
theda
teof
this
Prosp
ectus.
ESR
Pte
. Ltd
(Sin
gapo
re)
95.5
%(1
)
CIP
(Aus
tral
ia)
100%
100%
100%
100%
95.0
9%(4
)
ESR
Pro
perty
Man
agem
ent
(S) P
te. L
td.
(Sin
gapo
re)
ESR
Fun
dsM
anag
emen
t(S
) Lim
ited
(Sin
gapo
re)
67.3
%(3
)
e-Sh
ang
Infin
ityC
aym
anLi
mite
d(C
aym
an Is
land
s)
100%
ESR
Sing
apor
ePt
e. L
td(S
inga
pore
)
ESR
LTD
(Jap
an)
Ken
dall
Squa
re A
sset
Man
agem
ent,
Inc.
(Kor
ea)
Sum
mit
(BV
I)Li
mite
d(B
VI)
Ken
dall
Squa
reLo
gist
ics
Prop
ertie
s, In
c.(K
orea
)
Red
woo
dA
sian
Inve
stm
ents
,Lt
d(C
aym
an Is
land
s)
Sunw
ood
Sing
apor
eH
oldi
ngPt
e. L
td.
(Sin
gapo
re)
Don
ggua
nH
uish
ang
E-co
mm
erce
Serv
ices
Co.
, Ltd
.(P
RC)
Don
ggua
nH
ongs
hang
War
ehou
sing
Serv
ices
Co.
,Lt
d. (P
RC)
Lang
fang
Wei
duIn
tern
atio
nal
Logi
stic
sC
o., L
td.
(PRC
)
Shan
ghai
e-Sh
ang
War
ehou
sing
Serv
ices
Co.
, Ltd
.(P
RC)
Shan
ghai
Yur
unM
eat F
ood
Co.
,Lt
d. (P
RC)
58.5
%(5
)(9
)
Gua
ngzh
ouM
ingy
ueW
areh
ousin
g C
o.Lt
d. (P
RC)
100%
100%
100%
100%
100%
74%
10%
100%
100%
70%
(6)
RW
Hig
ashi
Ogi
shim
aTM
K(J
apan
)
100% ES
RSa
chiu
ra 3
TMK
(Jap
an)
100% ES
RSa
chiu
ra 4
TMK
(Jap
an)
96.5
%(2
)
Prop
erty
link
Aus
tralia
nIn
dust
rial
Partn
ersh
ip(A
ustr
alia
)
96.5
%(8
)(10
)
Prop
erty
link
Trus
t(A
ustr
alia
)
96.5
%(8
)(11
)(8
)
ESR
Ass
etM
anag
emen
t(H
oldi
ngs)
Lim
ited
(Aus
tral
ia)
96.5
%
APG
-Stic
htin
g
58%
42%
Kur
mas
ana
Hol
ding
s, LL
C
Red
woo
d In
vest
or (C
aym
an) L
td
50%
50%
Mr.
Stua
rtG
ibso
n
Mr.
Cha
rles
Ale
xand
erPo
rtes
WP
OC
IM
ESR
Cay
man
Lim
ited
SK H
oldi
ngs
Co.
, Ltd
.
Laur
els
Jing
dong
Logi
stic
s Gro
upC
orpo
ratio
n
Step
Ston
eLu
ckfie
ld G
loba
lLi
mite
dG
ener
al E
lect
ricPe
nsio
n Tr
ust
Boha
iIn
vestm
ent
Hol
ding
Lim
ited
Emer
ald
Ewoo
d(C
aym
an)
Lim
ited
Mon
tsor
eau
Inve
stm
ent
Lim
ited
Gol
dman
Sac
hsIn
vest
men
tsH
oldi
ng(A
sia)
Lim
ited
13.8
7%39
.89%
7.80
%6.
76%
11.9
7%8.
56%
2.52
%1.
45%
1.16
%1.
75%
0.94
%1.
40%
1.94
%
Red
woo
dIn
vest
or
100%
100% Ji
angs
uFr
iend
War
ehou
sing
Co.
, Ltd
.(P
RC)
Tian
jinFa
nbin
War
ehou
sing
Serv
ices
Co.
,Lt
d. (P
RC)
100%
100%
90%
(7)
Shen
yang
Yib
eiW
areh
ousi
ngSe
rvic
e C
o.,
Ltd.
(PRC
)
Tian
jinFa
nxin
War
ehou
sing
Serv
ice
Co.
,Lt
d. (P
RC)
ESR
HK
Man
agem
ent
Lim
ited
(Cay
man
Isla
nds)
100%
LeK
unW
areh
ousi
ng(W
uxi)
Co.
, Ltd
(PRC
)
100%
159

HISTORY, DEVELOPMENT AND CORPORATE STRUCTURE
Not
es: Direc
towne
rship
Indirect
owne
rship
*The
abov
eco
rporatestructurech
artisprep
ared
ontheassu
mptionthat
the(a)Luc
kfield
Globa
lLim
ited
haspa
rtiallyco
nverteditsClass
CPreferenc
eSha
resinto
Class
CSha
reson
Sep
tembe
r18
,201
9;an
d(b)Class
CPreferenc
eSha
resof
each
ofCM
BC
Internationa
lHolding
sLim
ited
,SFProject
(Cay
man
)Lim
ited
andM
ercu
ryBetaInve
stmen
tLim
ited
have
been
fullyrede
emed
onSep
tembe
r18
,20
19.
(1)
The
remaining
4.5%
equity
interest
inESR
Pte.L
tdis
held
byRos
ewoo
d(C
ayman
)Holding
s,theultimatebe
neficial
owne
rof
which
isadirector
ofce
rtainsu
bsidiaries
ofou
rGroup
.(2)
CIP
iswho
llyow
nedby
ESR
Dev
elop
men
ts(A
ustralia)Pty
Ltd,which
inturn
iswho
llyow
nedby
ESR
Aus
tralia,which
inturn
ishe
ldas
toap
prox
imately99
.99%
equity
interest
byESR
Aus
tralia
Holding
Com
pany
Pte.Ltd
andas
toap
prox
imately0.01
%eq
uity
interest
byM
r.PhilipPearce,
adirector
ofESR
Pte.Ltd.(one
ofou
rM
ajor
Sub
sidiaries)
andothe
rsu
bsidiaries
inou
rGroup
.ESR
Aus
tralia
Holding
Com
pany
Pte.Ltd
ishe
ldas
to96
.5%
equity
interest
byESR
Pte
Ltd,an
othe
rM
ajor
Sub
sidiary.
The
remaining
3.5%
equity
interest
inESR
Aus
tralia
Holding
Com
pany
Pte.L
tdis
held
bySku
nshPty
Ltd,as
trus
teefortheM
cKen
naInve
stmen
tTrust,as
to2.6%
andM
axmon
tPty
Ltd,as
trus
teefortheLyn
ch-G
rant
Inve
stmen
tTrust,as
to0.9%
,theultimatebe
neficial
owne
rof
each
oftheseen
tities
areeither
curren
torform
erdirectorsof
certainsu
bsidiaries
ofou
rGroup
.(3)
The
remaining
32.7%
equity
interest
inESR
Fun
dsM
anag
emen
t(S
)Lim
ited
ishe
ldby
Mitsu
i&
CoLtd,an
inde
pend
entthirdpa
rtyto
ourGroup
,as
to7.7%
,save
foritsinterest
inESR
Fun
dsM
anag
emen
t(S)Lim
ited
andSSPLas
to25
.0%.
(4)
The
remaining
4.9%
equity
interest
inSun
woo
dSinga
pore
Holding
Pte.L
td.ishe
ldby
Mr.Tho
mas
Nam
asto
2.9%
,CEO
ofESR
Korea
,and
byM
r.Jihu
nKan
gas
to2.0%
,CIO
ofESR
Korea.
(5)
Gua
ngzh
ouM
ingy
ueW
areh
ousing
Co.,L
td( 廣州市銘粵倉儲有限公司
)is
held
asto
90.0%
equity
interest
byM
ingy
ueLog
istics
Pte
Ltd,a
nindirect
subs
idiary
ofou
rCom
pany
,which
inturn
ishe
ldas
to65
.0%
equity
interest
byRed
woo
dPho
enix
China
Inve
stmen
tFun
dPte
Ltd,an
indirect
subs
idiary
ofou
rCom
pany
.The
remaining
10.0%
equity
interest
inGua
ngzh
ouM
ingy
ueW
areh
ousing
Co.,
Ltd
( 廣州市銘粵倉儲有限公司
)is
held
bySha
ngha
ie-Sha
ngW
areh
ousing
Service
sCo.
Ltd.,aM
ajor
Sub
sidiary.
The
remaining
35.0%
equity
interest
inM
ingy
ueLog
istics
Pte
Ltd
ishe
ldby
RCLF
Gua
ngzh
ou1Pte.Ltd.,which
iswho
llyow
nedby
Red
woo
dChina
Log
istics
Fun
dLim
ited
Partnersh
ip,w
hich
isman
aged
byou
rGroup
.Red
woo
dPho
enix
China
Inve
stmen
tFun
dPte
Ltd
iswho
lly
owne
dby
Red
woo
dAsian
Inve
stmen
ts,L
td,a
Major
Sub
sidiary.
(6)
RW
Higashi
Ogish
imaTM
Kis
owne
das
to50
.01%
econ
omic
interest
byRW
Higashi
Ogish
imaGK,an
indirect
subs
idiary
ofou
rCom
pany
who
llyow
ned
byHGS
Japa
nPte.Ltd.,an
indirect
subs
idiary
ofou
rCom
pany
who
llyow
nedby
RW
Higashi
Pte.Ltd.,an
indirect
subs
idiary
ofou
rCom
pany
(“Higas
hiPte”).The
remaining
49.99%
econ
omic
interest
equity
interest
inRW
Higashi
Ogish
imaTM
Kis
held
byRW
Higashi
SPE
1Pte.Ltd,an
indirect
subs
idiary
ofou
rCom
pany
who
llyow
nedby
Higashi
Pte.Higashi
Pte
isow
nedas
to70
.0%
equity
interest
byRed
woo
dInve
stor
(Higashi)Ltd,awho
llyow
nedsu
bsidiary
ofRed
woo
dAsian
Inve
stmen
tsLtd,aM
ajor
Sub
sidiary.
The
remaining
30.0%
equity
interest
inHigashi
Pte
ishe
ldby
Red
woo
dJapa
nLog
istics
Fun
dII
Lim
ited
Partnersh
ip,a
Japa
nde
velopm
entfun
dwhich
isman
aged
byou
rGroup
.(7)
Tianjin
Fan
xin
Wareh
ousing
Service
Co.,Ltd.( 天津凡信倉儲服務有限公司
)is
who
lly
owne
dby
ABM
Cap
ital
Lim
ited
(inc
orpo
ratedun
derthelawsof
Hon
gKon
g),an
indirect
subs
idiary
ofou
rCom
pany
,which
inturn
iswho
llyow
nedby
ABM
Cap
ital
Lim
ited
(inc
orpo
ratedun
derthelawsof
theBVI)
(“ABM
BVI”),an
indirect
subs
idiary
ofou
rCom
pany
,which
inturn
ishe
ldas
to90
.0%
equity
interest
byDelte
Offsh
oreHolding
s(B
VI)
Lim
ited
,awho
llyow
nedsu
bsidiary
ofou
rCom
pany
.The
remaining
10.0%
equity
interest
inABM
BVIis
held
byAmbition
MindHolding
sLim
ited
,an
inde
pend
entthird
partyto
ourGroup
,sav
eforitsinterest
inABM
BVI.
(8)
The
acqu
isitionof
Prope
rtylinkwas
completed
onApril24
,20
19.Prope
rtylinkis
who
lly-ow
nedby
ESR
Aus
tralia,which
inturn
ishe
ldas
toap
prox
imately99
.99%
equity
interest
byESR
Aus
tralia
Holding
Com
pany
Pte
Ltd
andas
toap
prox
imately0.01
%eq
uity
interest
byM
r.PhilipPea
rce,
adirector
ofESR
Pte.Ltd.(one
ofou
rM
ajor
Sub
sidiaries)
andothe
rsu
bsidiaries
inou
rGroup
.ESR
Aus
tralia
Holding
Com
pany
Pte
Ltd
ishe
ldas
to96
.5%
equity
interest
byESR
Pte
Ltd,an
othe
rM
ajor
Sub
sidiary.
The
remaining
3.5%
equity
interest
inESR
Aus
tralia
Holding
Com
pany
Pte.Ltd
ishe
ldby
Sku
nshPty
Ltd,as
trus
teefortheM
cKen
naInve
stmen
tTrust,as
to2.6%
andM
axmon
tPty
Ltd,as
trus
teefortheLyn
ch-G
rant
Inve
stmen
tTrust,as
to0.9%
,theultimatebe
neficial
owne
rof
each
oftheseen
tities
isadirector
ofce
rtainsu
bsidiaries
ofou
rGroup
.(9)
The
remaining
26%
equity
interest
inSha
ngha
iYurun
Mea
tFoo
dCo.,L
tdis
held
byJiax
ingYisha
ngEqu
ityInve
stmen
tPartnersh
ip(L
imited
Partnersh
ip),which
isco
ntrolled
byafund
man
aged
byus
.(10)
PAIP
iswho
lly-ow
nedby
ESR
ALFQld
Trust,w
hich
inturn
iswho
llyow
nedby
ESR
Que
enslan
dHoldTrust,w
hich
inturn
iswho
llyow
nedby
ESR
Aus
tralia
Log
istics
Fun
d,which
inturn
iswho
lly
owne
dby
ESR
Co-Inve
stTrust,w
hich
inturn
iswho
llyow
nedby
ESRT
No2,
which
inturn
iswho
llyow
nedby
ESRT,w
hich
inturn
ishe
ldas
toap
prox
imately99
.99%
equity
interest
byESR
Hold
Trust
andas
toap
prox
imately0.01
%eq
uity
interest
byM
r.PhilipPea
rce,
adirector
ofESR
Pte.L
td(one
ofou
rM
ajor
Sub
sidiaries)
andothe
rsu
bsidiaries
inou
rGroup
.ESR
HoldTrust
ishe
ldas
to99
.90%
equity
interest
byESR
Aus
tralia
Holding
Trust,w
hich
inturn
iswho
lly-ow
nedby
ESR
Aus
tralia
Holding
Com
pany
Pte
Ltd,which
inturn
ishe
ldas
to96
.5%
equity
interest
byESR
Pte
Ltd,
anothe
rM
ajor
Sub
sidiary.
The
remaining
3.5%
equity
interest
inESR
Aus
tralia
Holding
Com
pany
Pte.Ltd
ishe
ldby
Sku
nshPty
Ltd,as
trus
teefortheM
cKen
naInve
stmen
tTrust,as
to2.6%
and
Max
mon
tPty
Ltd,as
trus
teefortheLyn
ch-G
rant
Inve
stmen
tTrust,as
to0.9%
,theultimatebe
neficial
owne
rof
each
oftheseen
tities
isadirector
ofcertainsu
bsidiaries
ofou
rGroup
.The
remaining
approx
imately0.1%
equity
interest
inESR
HoldTrust
ishe
ldby
ESR
Aus
tralia
Holding
Com
pany
Pte.L
tddirectly.
(11)
PTis
who
llyow
nedby
ESR
Co-Inve
stTrust,w
hich
inturn
iswho
llyow
nedby
ESRTNo2,
which
inturn
iswho
llyow
nedby
ESRT,w
hich
inturn
ishe
ldas
toap
prox
imately99
.99%
equity
interest
byESR
HoldTrust
andas
toap
prox
imately0.01
%eq
uity
interest
byM
r.PhilipPea
rce,
adirector
ofESR
Pte.L
td(one
ofou
rM
ajor
Sub
sidiaries)
andothe
rsu
bsidiaries
inou
rGroup
.ESR
HoldTrust
ishe
ldas
toap
prox
imately99
.90%
equity
interest
byESR
Aus
tralia
Holding
Trust,w
hich
inturn
iswho
lly-ow
nedby
ESR
Aus
tralia
Holding
Com
pany
Pte
Ltd,w
hich
inturn
ishe
ldas
to96
.5%
equity
interest
byESR
Pte
Ltd,an
othe
rM
ajor
Sub
sidiary.
The
remaining
3.5%
equity
interest
inESR
Aus
tralia
Holding
Com
pany
Pte.L
tdis
held
bySku
nshPty
Ltd,a
strus
teefortheM
cKen
naInve
stmen
tTrust,as
to2.6%
andM
axmon
tPty
Ltd,as
trus
teefortheLyn
ch-G
rant
Inve
stmen
tTrust,as
to0.9%
,theultimatebe
neficial
owne
rof
each
oftheseen
tities
isadirector
ofce
rtainsu
bsidiaries
ofou
rGroup
.The
remaining
approx
imately0.1%
equity
interest
inESR
HoldTrust
ishe
ldby
ESR
Aus
tralia
Holding
Com
pany
Pte.L
tddirectly.
160

HISTORY, DEVELOPMENT AND CORPORATE STRUCTURE
CORPORATE
STRUCTURE
IMM
EDIA
TELY
PRIO
RTO
THE
GLOBAL
OFFERIN
G
The
follow
ingch
artsets
outasimplifiedco
rporatean
dsh
areh
olding
structureof
ourGroup
immed
iately
before
completionof
theGloba
lOffering.
Not
es: Direc
towne
rship
Indirect
owne
rship
(1)
Includ
esSha
reshe
ldby
Red
woo
dCon
sulting.
(2)
The
remaining
4.5%
equity
interest
inESR
Pte.L
tdis
held
byRos
ewoo
d(C
ayman
)Holding
s,theultimatebe
neficial
owne
rof
which
isadirector
ofce
rtainsu
bsidiaries
ofou
rGroup
.
161

HISTORY, DEVELOPMENT AND CORPORATE STRUCTURE
(3)
CIP
iswho
llyow
nedby
ESR
Dev
elop
men
ts(A
ustralia)Pty
Ltd,which
inturn
iswho
llyow
nedby
ESR
Aus
tralia,which
inturn
ishe
ldas
toap
prox
imately99
.99%
equity
interest
byESR
Aus
tralia
Holding
Com
pany
Pte.Ltd,an
das
toap
prox
imately0.01
%eq
uity
interest
byM
r.PhilipPea
rce,
adirector
ofESR
Pte.Ltd.(one
ofou
rM
ajor
Sub
sidiaries)
andothe
rsu
bsidiaries
inou
rGroup
.ESR
Aus
tralia
Holding
Com
pany
Pte.Ltd
ishe
ldas
to96
.5%
equity
interest
byESR
Pte
Ltd,an
othe
rM
ajor
Sub
sidiary.
The
remaining
3.5%
equity
interest
inESR
Aus
tralia
Holding
Com
pany
Pte.L
tdis
held
bySku
nshPty
Ltd,as
trus
teefortheM
cKen
naInve
stmen
tTrust,as
to2.6%
andM
axmon
tPty
Ltd,as
trus
teefortheLyn
ch-G
rant
Inve
stmen
tTrust,as
to0.9%
,theultimatebe
neficial
owne
rof
each
oftheseen
tities
areeither
curren
torform
erdirectorsof
certainsu
bsidiaries
ofou
rGroup
.(4)
The
remaining
32.7%
equity
interest
inESR
Fun
dsM
anag
emen
t(S
)Lim
ited
ishe
ldby
Mitsu
i&
CoLtd,an
inde
pend
entthirdpa
rtyto
ourGroup
,as
to7.7%
,save
foritsinterest
inESR
Fun
dsM
anag
emen
t(S)Lim
ited
andSSPLas
to25
.0%.
(5)
The
remaining
4.9%
equity
interest
inSun
woo
dSinga
pore
Holding
Pte.L
td.ishe
ldby
Mr.Tho
mas
Nam
asto
2.9%
,CEO
ofESR
Korea
,and
byM
r.Jihu
nKan
gas
to2.0%
,CIO
ofESR
Korea
.(6)
Gua
ngzh
ouM
ingy
ueW
areh
ousing
Co.,L
td( 廣州市銘粵倉儲有限公司
)is
held
asto
90.0%
equity
interest
byM
ingy
ueLog
istics
Pte
Ltd,a
nindirect
subs
idiary
ofou
rCom
pany
,which
inturn
ishe
ldas
to65
.0%
equity
interest
byRed
woo
dPho
enix
China
Inve
stmen
tFun
dPte
Ltd,an
indirect
subs
idiary
ofou
rCom
pany
.The
remaining
10.0%
equity
interest
inGua
ngzh
ouM
ingy
ueW
areh
ousing
Co.,
Ltd
( 廣州市銘粵倉儲有限公司
)is
held
bySha
ngha
ie-Sha
ngW
areh
ousing
Service
sCo.
Ltd.,aM
ajor
Sub
sidiary.
The
remaining
35.0%
equity
interest
inM
ingy
ueLog
istics
Pte
Ltd
ishe
ldby
RCLF
Gua
ngzh
ou1Pte.Ltd.,which
iswho
llyow
nedby
Red
woo
dChina
Log
istics
Fun
dLim
ited
Partnersh
ip,which
isman
aged
byou
rGroup
.Red
woo
dPho
enix
China
Inve
stmen
tFun
dPte
Ltd
iswho
lly
owne
dby
Red
woo
dAsian
Inve
stmen
ts,L
td,a
Major
Sub
sidiary.
(7)
RW
Higashi
Ogish
imaTM
Kis
owne
das
to50
.01%
econ
omic
interest
byRW
Higashi
Ogish
imaGK,an
indirect
subs
idiary
ofou
rCom
pany
who
llyow
ned
byHGS
Japa
nPte.Ltd.,an
indirect
subs
idiary
ofou
rCom
pany
who
llyow
nedby
RW
Higashi
Pte.Ltd.,an
indirect
subs
idiary
ofou
rCom
pany
(“Higas
hiPte”).The
remaining
49.99%
econ
omic
interest
equity
interest
inRW
Higashi
Ogish
imaTM
Kis
held
byRW
Higashi
SPE
1Pte.Ltd,an
indirect
subs
idiary
ofou
rCom
pany
who
llyow
nedby
Higashi
Pte.Higashi
Pte
isow
nedas
to70
.0%
equity
interest
byRed
woo
dInve
stor
(Higashi)Ltd,awho
llyow
nedsu
bsidiary
ofRed
woo
dAsian
Inve
stmen
tsLtd,aM
ajor
Sub
sidiary.
The
remaining
30.0%
equity
interest
inHigashi
Pte
ishe
ldby
Red
woo
dJapa
nLog
istics
Fun
dII
Lim
ited
Partnersh
ip,a
Japa
nde
velopm
entfun
dwhich
isman
aged
byou
rGroup
.(8)
Tianjin
Fan
xin
Wareh
ousing
Service
Co.,Ltd.( 天津凡信倉儲服務有限公司
)is
who
lly
owne
dby
ABM
Cap
ital
Lim
ited
(inc
orpo
ratedun
derthelawsof
Hon
gKon
g),an
indirect
subs
idiary
ofou
rCom
pany
,which
inturn
iswho
llyow
nedby
ABM
Cap
ital
Lim
ited
(inc
orpo
ratedun
derthelawsof
theBVI)
(“ABM
BVI”),an
indirect
subs
idiary
ofou
rCom
pany
,which
inturn
ishe
ldas
to90
.0%
equity
interest
byDelte
Offsh
oreHolding
s(B
VI)
Lim
ited
,awho
llyow
nedsu
bsidiary
ofou
rCom
pany
.The
remaining
10.0%
equity
interest
inABM
BVIis
held
byAmbition
MindHolding
sLim
ited
,an
inde
pend
entthird
partyto
ourGroup
,sav
eforitsinterest
inABM
BVI.
(9)
The
acqu
isitionof
Prope
rtylinkwas
completed
onApril24
,20
19.Prope
rtylinkis
who
lly-ow
nedby
ESR
Aus
tralia,which
inturn
ishe
ldas
toap
prox
imately99
.99%
equity
interest
byESR
Aus
tralia
Holding
Com
pany
Pte
Ltd
andas
toap
prox
imately0.01
%eq
uity
interest
byM
r.PhilipPea
rce,
adirector
ofESR
Pte.Ltd.(one
ofou
rM
ajor
Sub
sidiaries)
andothe
rsu
bsidiaries
inou
rGroup
.ESR
Aus
tralia
Holding
Com
pany
Pte
Ltd
ishe
ldas
to96
.5%
equity
interest
byESR
Pte
Ltd,an
othe
rM
ajor
Sub
sidiary.
The
remaining
3.5%
equity
interest
inESR
Aus
tralia
Holding
Com
pany
Pte.Ltd
ishe
ldby
Sku
nshPty
Ltd,as
trus
teefortheM
cKen
naInve
stmen
tTrust,as
to2.6%
andM
axmon
tPty
Ltd,as
trus
teefortheLyn
ch-G
rant
Inve
stmen
tTrust,as
to0.9%
,theultimatebe
neficial
owne
rof
each
oftheseen
tities
isadirector
ofce
rtainsu
bsidiaries
ofou
rGroup
.(10)
The
remaining
26%
equity
interest
inSha
ngha
iYurun
Mea
tFoo
dCo.,L
tdis
held
byJiax
ingYisha
ngEqu
ityInve
stmen
tPartnersh
ip(L
imited
Partnersh
ip),which
isco
ntrolled
byafund
man
aged
byus
.(11)
PAIP
iswho
lly-ow
nedby
ESR
ALFQld
Trust,w
hich
inturn
iswho
llyow
nedby
ESR
Que
enslan
dHoldTrust,w
hich
inturn
iswho
llyow
nedby
ESR
Aus
tralia
Log
istics
Fun
d,which
inturn
iswho
lly
owne
dby
ESR
Co-Inve
stTrust,w
hich
inturn
iswho
llyow
nedby
ESRT
No2,
which
inturn
iswho
llyow
nedby
ESRT,w
hich
inturn
ishe
ldas
toap
prox
imately99
.99%
equity
interest
byESR
Hold
Trust
andas
toap
prox
imately0.01
%eq
uity
interest
byM
r.PhilipPea
rce,
adirector
ofESR
Pte.L
td(one
ofou
rM
ajor
Sub
sidiaries)
andothe
rsu
bsidiaries
inou
rGroup
.ESR
HoldTrust
ishe
ldas
to99
.90%
equity
interest
byESR
Aus
tralia
Holding
Trust,w
hich
inturn
iswho
lly-ow
nedby
ESR
Aus
tralia
Holding
Com
pany
Pte
Ltd,which
inturn
ishe
ldas
to96
.5%
equity
interest
byESR
Pte
Ltd,
anothe
rM
ajor
Sub
sidiary.
The
remaining
3.5%
equity
interest
inESR
Aus
tralia
Holding
Com
pany
Pte.Ltd
ishe
ldby
Sku
nshPty
Ltd,as
trus
teefortheM
cKen
naInve
stmen
tTrust,as
to2.6%
and
Max
mon
tPty
Ltd,as
trus
teefortheLyn
ch-G
rant
Inve
stmen
tTrust,as
to0.9%
,theultimatebe
neficial
owne
rof
each
oftheseen
tities
isadirector
ofcertainsu
bsidiaries
ofou
rGroup
.The
remaining
approx
imately0.1%
equity
interest
inESR
HoldTrust
ishe
ldby
ESR
Aus
tralia
Holding
Com
pany
Pte.L
tddirectly.
(12)
PTis
who
llyow
nedby
ESR
Co-Inve
stTrust,w
hich
inturn
iswho
llyow
nedby
ESRTNo2,
which
inturn
iswho
llyow
nedby
ESRT,w
hich
inturn
ishe
ldas
toap
prox
imately99
.99%
equity
interest
byESR
HoldTrust
andas
toap
prox
imately0.01
%eq
uity
interest
byM
r.PhilipPea
rce,
adirector
ofESR
Pte.L
td(one
ofou
rM
ajor
Sub
sidiaries)
andothe
rsu
bsidiaries
inou
rGroup
.ESR
HoldTrust
ishe
ldas
toap
prox
imately99
.90%
equity
interest
byESR
Aus
tralia
Holding
Trust,w
hich
inturn
iswho
lly-ow
nedby
ESR
Aus
tralia
Holding
Com
pany
Pte
Ltd,w
hich
inturn
ishe
ldas
to96
.5%
equity
interest
byESR
Pte
Ltd,an
othe
rM
ajor
Sub
sidiary.
The
remaining
3.5%
equity
interest
inESR
Aus
tralia
Holding
Com
pany
Pte.L
tdis
held
bySku
nshPty
Ltd,a
strus
teefortheM
cKen
naInve
stmen
tTrust,as
to2.6%
andM
axmon
tPty
Ltd,as
trus
teefortheLyn
ch-G
rant
Inve
stmen
tTrust,as
to0.9%
,theultimatebe
neficial
owne
rof
each
oftheseen
tities
isadirector
ofce
rtainsu
bsidiaries
ofou
rGroup
.The
remaining
approx
imately0.1%
equity
interest
inESR
HoldTrust
ishe
ldby
ESR
Aus
tralia
Holding
Com
pany
Pte.L
tddirectly.
162

HISTORY, DEVELOPMENT AND CORPORATE STRUCTURE
CORPORATE
STRUCTURE
IMM
EDIA
TELY
FOLLOW
ING
THE
GLOBAL
OFFERIN
G
The
follow
ingch
artsets
outasimplifiedco
rporatean
dsh
areh
olding
structureof
ourGroup
immed
iately
follow
ingtheco
mpletionof
the
Globa
lOffering(assum
ingtheOve
r-allotm
entOptionan
dtheOffer
SizeAdjus
tmen
tOptionareno
tex
ercisedan
dif
Luc
kfield
Globa
lLim
ited
isa
Selling
Sha
reho
lder).
ESR
Cay
man
Lim
ited
ESR
Pte
. Ltd
(Sin
gapo
re)
95.5
%(2
)10
0%10
0%
100%
100%
95.0
9%(5
)
ESR
Pro
perty
Man
agem
ent
(S) P
te. L
td.
(Sin
gapo
re)
ESR
Fun
dsM
anag
emen
t(S
) Lim
ited
(Sin
gapo
re)
67.3
%(4
)
e-Sh
ang
Infin
ityC
aym
anLi
mite
d(C
aym
an Is
land
s)
100%
ESR
Sing
apor
ePt
e. L
td(S
inga
pore
)
ESR
LTD
(Jap
an)
Ken
dall
Squa
re A
sset
Man
agem
ent,
Inc.
(Kor
ea)
Sum
mit
(BV
I)Li
mite
d(B
VI)
Ken
dall
Squa
reLo
gist
ics
Prop
ertie
s, In
c.(K
orea
)
Red
woo
dA
sian
Inve
stm
ents
,Lt
d(C
aym
an Is
land
s)
Sunw
ood
Sing
apor
eH
oldi
ngPt
e. L
td.
(Sin
gapo
re)
Don
ggua
nH
uish
ang
E-co
mm
erce
Serv
ices
Co.
, Ltd
.(P
RC)
Don
ggua
nH
ongs
hang
War
ehou
sing
Serv
ices
Co.
,Lt
d. (P
RC)
Lang
fang
Wei
duIn
tern
atio
nal
Logi
stic
sC
o., L
td.
(PRC
)
Shan
ghai
e-Sh
ang
War
ehou
sing
Serv
ices
Co.
, Ltd
.(P
RC)
Shan
ghai
Yur
unM
eat F
ood
Co.
,Lt
d. (P
RC)
58.5
%(6
)(1
0)
Gua
ngzh
ouM
ingy
ueW
areh
ousi
ng C
o.Lt
d. (P
RC)
100%
100%
100%
100%
100%
74%
10%
100%
100%
70%
(7)
RW
Hig
ashi
Ogi
shim
aTM
K(J
apan
)
APG
-Stic
htin
g*
58%
42%Kur
mas
ana
Hol
ding
s, LL
C
Red
woo
d In
vest
or (C
aym
an) L
td
100%
50%
50%
Mr.
Stua
rtG
ibso
n
Mr.
Cha
rles
Ale
xand
erPo
rtes
WP
OC
IMSK
Hol
ding
sC
o., L
td.
Laur
els
Jing
dong
Logi
stic
s Gro
upC
orpo
ratio
n*St
epSt
one*
Emer
ald
Ewoo
d(C
aym
an)
Lim
ited*
13.34%
24.13%
6.95
%11
.08%
9.28
%7.65
%2.33
%0.27
%
Gen
eral
Ele
ctric
Pens
ion
Trus
t*
0.95
%
Red
woo
dIn
vest
or (1
)Pu
blic
*
21.53%
Gol
dman
Sac
hsIn
vest
men
tsH
oldi
ng(A
sia)
Lim
ited*
1.32
%
Mon
tsor
eau
Inve
stm
ent
Lim
ited*
0.64
%
100% Ji
angs
uFr
iend
War
ehou
sing
Co.
, Ltd
.(P
RC)
Tian
jinFa
nbin
War
ehou
sing
Serv
ices
Co.
,Lt
d. (P
RC)
100%
100%
90%
Shen
yang
Yib
eiW
areh
ousi
ngSe
rvic
e C
o.,
Ltd.
(PRC
)
Tian
jinFa
nxin
War
ehou
sing
Serv
ice
Co.
,Lt
d. (P
RC)
(8)
ESR
HK
Man
agem
ent
Lim
ited
(Cay
man
Isla
nds)
100%
96.5
% CIP
(Aus
tral
ia)
(3)
96.5
%(9
)
ESR
Ass
etM
anag
emen
t(H
oldi
ngs)
Lim
ited
(Aus
tral
ia)
LeK
unW
areh
ousi
ng (W
uxi)
Co.
, Ltd
(PRC
)
100%
100% ES
RSa
chiu
ra 3
TMK
(Jap
an)
100% ES
RSa
chiu
ra 4
TMK
(Jap
an)
Prop
erty
link
Aus
tralia
nIn
dust
rial
Partn
ersh
ip(A
ustr
alia
)
96.5
%(9
)(11
)96
.5%
(9)(
12)
Prop
erty
link
Trus
t(A
ustr
alia
)
Luck
field
Glo
bal L
imite
d*
0.54
%
Not
es: Direc
towne
rship
Indirect
owne
rship
*Sha
reho
ldersthat
willb
eco
untedtowards
thepu
blic
floa
tupo
ntheco
mpletionof
theGloba
lOffering(assum
ingtheOve
r-allotm
entO
ptionis
note
xercised
)(1)
Includ
esSha
reshe
ldby
Red
woo
dCon
sulting.
163
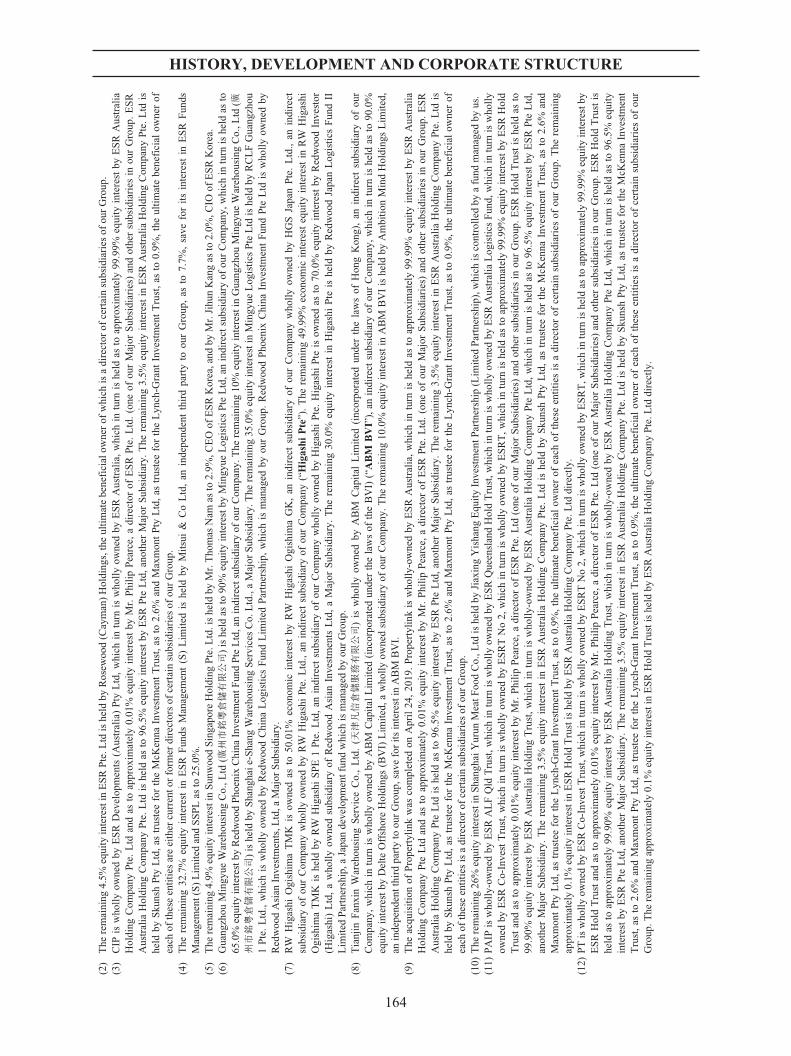
HISTORY, DEVELOPMENT AND CORPORATE STRUCTURE
(2)
The
remaining
4.5%
equity
interest
inESR
Pte.L
tdis
held
byRos
ewoo
d(C
ayman
)Holding
s,theultimatebe
neficial
owne
rof
which
isadirector
ofce
rtainsu
bsidiaries
ofou
rGroup
.(3)
CIP
iswho
llyow
nedby
ESR
Dev
elop
men
ts(A
ustralia)Pty
Ltd,which
inturn
iswho
llyow
nedby
ESR
Aus
tralia,which
inturn
ishe
ldas
toap
prox
imately99
.99%
equity
interest
byESR
Aus
tralia
Holding
Com
pany
Pte.Ltd
andas
toap
prox
imately0.01
%eq
uity
interest
byM
r.PhilipPea
rce,
adirector
ofESR
Pte.Ltd.(one
ofou
rM
ajor
Sub
sidiaries)
andothe
rsu
bsidiaries
inou
rGroup
.ESR
Aus
tralia
Holding
Com
pany
Pte.Ltd
ishe
ldas
to96
.5%
equity
interest
byESR
Pte
Ltd,an
othe
rM
ajor
Sub
sidiary.
The
remaining
3.5%
equity
interest
inESR
Aus
tralia
Holding
Com
pany
Pte.L
tdis
held
bySku
nshPty
Ltd,as
trus
teefortheM
cKen
naInve
stmen
tTrust,as
to2.6%
andM
axmon
tPty
Ltd,as
trus
teefortheLyn
ch-G
rant
Inve
stmen
tTrust,as
to0.9%
,theultimatebe
neficial
owne
rof
each
oftheseen
tities
areeither
curren
torform
erdirectorsof
certainsu
bsidiaries
ofou
rGroup
.(4)
The
remaining
32.7%
equity
interest
inESR
Fun
dsM
anag
emen
t(S
)Lim
ited
ishe
ldby
Mitsu
i&
CoLtd,an
inde
pend
entthirdpa
rtyto
ourGroup
,as
to7.7%
,save
foritsinterest
inESR
Fun
dsM
anag
emen
t(S)Lim
ited
andSSPLas
to25
.0%.
(5)
The
remaining
4.9%
equity
interest
inSun
woo
dSinga
pore
Holding
Pte.L
td.ishe
ldby
Mr.Tho
mas
Nam
asto
2.9%
,CEO
ofESR
Korea
,and
byM
r.Jihu
nKan
gas
to2.0%
,CIO
ofESR
Korea
.(6)
Gua
ngzh
ouM
ingy
ueW
areh
ousing
Co.,L
td( 廣州市銘粵倉儲有限公司
)is
held
asto
90%
equity
interest
byM
ingy
ueLog
istics
Pte
Ltd,a
nindirect
subs
idiary
ofou
rCom
pany
,which
inturn
ishe
ldas
to65
.0%
equity
interest
byRed
woo
dPho
enix
China
Inve
stmen
tFun
dPte
Ltd,a
nindirect
subs
idiary
ofou
rCom
pany
.The
remaining
10%
equity
interest
inGua
ngzh
ouM
ingy
ueW
areh
ousing
Co.,L
td( 廣
州市銘粵倉儲有限公司
)is
held
bySha
ngha
ie-S
hang
Wareh
ousing
Service
sCo.
Ltd.,aM
ajor
Sub
sidiary.
The
remaining
35.0%
equity
interest
inM
ingy
ueLog
istics
Pte
Ltd
ishe
ldby
RCLFGua
ngzh
ou1Pte.Ltd.,which
iswho
llyow
nedby
Red
woo
dChina
Log
istics
Fun
dLim
ited
Partnersh
ip,which
isman
aged
byou
rGroup
.Red
woo
dPho
enix
China
Inve
stmen
tFun
dPte
Ltd
iswho
llyow
nedby
Red
woo
dAsian
Inve
stmen
ts,L
td,a
Major
Sub
sidiary.
(7)
RW
Higashi
Ogish
imaTM
Kis
owne
das
to50
.01%
econ
omic
interest
byRW
Higashi
Ogish
imaGK,an
indirect
subs
idiary
ofou
rCom
pany
who
llyow
ned
byHGS
Japa
nPte.Ltd.,an
indirect
subs
idiary
ofou
rCom
pany
who
llyow
nedby
RW
Higashi
Pte.Ltd.,an
indirect
subs
idiary
ofou
rCom
pany
(“Higas
hiPte”).The
remaining
49.99%
econ
omic
interest
equity
interest
inRW
Higashi
Ogish
imaTM
Kis
held
byRW
Higashi
SPE
1Pte.Ltd,an
indirect
subs
idiary
ofou
rCom
pany
who
llyow
nedby
Higashi
Pte.Higashi
Pte
isow
nedas
to70
.0%
equity
interest
byRed
woo
dInve
stor
(Higashi)Ltd,awho
llyow
nedsu
bsidiary
ofRed
woo
dAsian
Inve
stmen
tsLtd,aM
ajor
Sub
sidiary.
The
remaining
30.0%
equity
interest
inHigashi
Pte
ishe
ldby
Red
woo
dJapa
nLog
istics
Fun
dII
Lim
ited
Partnersh
ip,a
Japa
nde
velopm
entfun
dwhich
isman
aged
byou
rGroup
.(8)
Tianjin
Fan
xin
Wareh
ousing
Service
Co.,Ltd.( 天津凡信倉儲服務有限公司
)is
who
lly
owne
dby
ABM
Cap
ital
Lim
ited
(inc
orpo
ratedun
derthelawsof
Hon
gKon
g),an
indirect
subs
idiary
ofou
rCom
pany
,which
inturn
iswho
llyow
nedby
ABM
Cap
ital
Lim
ited
(inc
orpo
ratedun
derthelawsof
theBVI)
(“ABM
BVI”),an
indirect
subs
idiary
ofou
rCom
pany
,which
inturn
ishe
ldas
to90
.0%
equity
interest
byDelte
Offsh
oreHolding
s(B
VI)
Lim
ited
,awho
llyow
nedsu
bsidiary
ofou
rCom
pany
.The
remaining
10.0%
equity
interest
inABM
BVIis
held
byAmbition
MindHolding
sLim
ited
,an
inde
pend
entthird
partyto
ourGroup
,sav
eforitsinterest
inABM
BVI.
(9)
The
acqu
isitionof
Prope
rtylinkwas
completed
onApril24
,20
19.Prope
rtylinkis
who
lly-ow
nedby
ESR
Aus
tralia,which
inturn
ishe
ldas
toap
prox
imately99
.99%
equity
interest
byESR
Aus
tralia
Holding
Com
pany
Pte
Ltd
andas
toap
prox
imately0.01
%eq
uity
interest
byM
r.PhilipPea
rce,
adirector
ofESR
Pte.Ltd.(one
ofou
rM
ajor
Sub
sidiaries)
andothe
rsu
bsidiaries
inou
rGroup
.ESR
Aus
tralia
Holding
Com
pany
Pte
Ltd
ishe
ldas
to96
.5%
equity
interest
byESR
Pte
Ltd,an
othe
rM
ajor
Sub
sidiary.
The
remaining
3.5%
equity
interest
inESR
Aus
tralia
Holding
Com
pany
Pte.Ltd
ishe
ldby
Sku
nshPty
Ltd,as
trus
teefortheM
cKen
naInve
stmen
tTrust,as
to2.6%
andM
axmon
tPty
Ltd,as
trus
teefortheLyn
ch-G
rant
Inve
stmen
tTrust,as
to0.9%
,theultimatebe
neficial
owne
rof
each
oftheseen
tities
isadirector
ofce
rtainsu
bsidiaries
ofou
rGroup
.(10)
The
remaining
26%
equity
interest
inSha
ngha
iYurun
Mea
tFoo
dCo.,L
tdis
held
byJiax
ingYisha
ngEqu
ityInve
stmen
tPartnersh
ip(L
imited
Partnersh
ip),which
isco
ntrolled
byafund
man
aged
byus
.(11)
PAIP
iswho
lly-ow
nedby
ESR
ALFQld
Trust,w
hich
inturn
iswho
llyow
nedby
ESR
Que
enslan
dHoldTrust,w
hich
inturn
iswho
llyow
nedby
ESR
Aus
tralia
Log
istics
Fun
d,which
inturn
iswho
lly
owne
dby
ESR
Co-Inve
stTrust,w
hich
inturn
iswho
llyow
nedby
ESRT
No2,
which
inturn
iswho
llyow
nedby
ESRT,w
hich
inturn
ishe
ldas
toap
prox
imately99
.99%
equity
interest
byESR
Hold
Trust
andas
toap
prox
imately0.01
%eq
uity
interest
byM
r.PhilipPea
rce,
adirector
ofESR
Pte.L
td(one
ofou
rM
ajor
Sub
sidiaries)
andothe
rsu
bsidiaries
inou
rGroup
.ESR
HoldTrust
ishe
ldas
to99
.90%
equity
interest
byESR
Aus
tralia
Holding
Trust,w
hich
inturn
iswho
lly-ow
nedby
ESR
Aus
tralia
Holding
Com
pany
Pte
Ltd,which
inturn
ishe
ldas
to96
.5%
equity
interest
byESR
Pte
Ltd,
anothe
rM
ajor
Sub
sidiary.
The
remaining
3.5%
equity
interest
inESR
Aus
tralia
Holding
Com
pany
Pte.Ltd
ishe
ldby
Sku
nshPty
Ltd,as
trus
teefortheM
cKen
naInve
stmen
tTrust,as
to2.6%
and
Max
mon
tPty
Ltd,as
trus
teefortheLyn
ch-G
rant
Inve
stmen
tTrust,as
to0.9%
,theultimatebe
neficial
owne
rof
each
oftheseen
tities
isadirector
ofcertainsu
bsidiaries
ofou
rGroup
.The
remaining
approx
imately0.1%
equity
interest
inESR
HoldTrust
ishe
ldby
ESR
Aus
tralia
Holding
Com
pany
Pte.L
tddirectly.
(12)
PTis
who
llyow
nedby
ESR
Co-Inve
stTrust,w
hich
inturn
iswho
llyow
nedby
ESRTNo2,
which
inturn
iswho
llyow
nedby
ESRT,w
hich
inturn
ishe
ldas
toap
prox
imately99
.99%
equity
interest
byESR
HoldTrust
andas
toap
prox
imately0.01
%eq
uity
interest
byM
r.PhilipPea
rce,
adirector
ofESR
Pte.L
td(one
ofou
rM
ajor
Sub
sidiaries)
andothe
rsu
bsidiaries
inou
rGroup
.ESR
HoldTrust
ishe
ldas
toap
prox
imately99
.90%
equity
interest
byESR
Aus
tralia
Holding
Trust,w
hich
inturn
iswho
lly-ow
nedby
ESR
Aus
tralia
Holding
Com
pany
Pte
Ltd,w
hich
inturn
ishe
ldas
to96
.5%
equity
interest
byESR
Pte
Ltd,an
othe
rM
ajor
Sub
sidiary.
The
remaining
3.5%
equity
interest
inESR
Aus
tralia
Holding
Com
pany
Pte.L
tdis
held
bySku
nshPty
Ltd,a
strus
teefortheM
cKen
naInve
stmen
tTrust,as
to2.6%
andM
axmon
tPty
Ltd,as
trus
teefortheLyn
ch-G
rant
Inve
stmen
tTrust,as
to0.9%
,theultimatebe
neficial
owne
rof
each
oftheseen
tities
isadirector
ofce
rtainsu
bsidiaries
ofou
rGroup
.The
remaining
approx
imately0.1%
equity
interest
inESR
HoldTrust
ishe
ldby
ESR
Aus
tralia
Holding
Com
pany
Pte.L
tddirectly.
164

BUSINESS
OUR MISSION
We aim to build modern logistics infrastructure for 21st century commerce across APAC. Weendeavor to offer tenants modern, state-of-the-art logistics facilities and solutions, and provideinvestors with exposure to a dynamic sector in the fast-growing APAC region.
OVERVIEW
We are the largest APAC focused logistics real estate platform by GFA and by value of thePortfolio Assets and have the largest development pipeline in aggregate across the major APACmarkets as measured by GFA from July 1, 2019 to December 31, 2020, according to the JLL Report.We develop and manage modern logistics facilities that cater to e-commerce companies, 3PLproviders, bricks-and-mortar retailers, manufacturers, cold-chain logistics providers and others inAPAC as logistics infrastructure continues to evolve for the modern economy. We focus solely onAPAC, which comprised over 3.6 billion people (around 50% of the global population) and overUS$28.6 trillion of GDP (over 33% of the global GDP) in 2018, according to the JLL Report. Wecurrently operate in the PRC, Japan, South Korea, Singapore, Australia and India markets thatrepresent close to 90% of GDP in APAC in 2018, according to the JLL Report.
We hold a portfolio of logistics properties on our balance sheet and manage a broad range offunds and investment vehicles that invest in logistics properties at various stages of the property lifecycle across APAC. As of June 30, 2019, we managed 30 private third-party pooled investmentvehicles, with over US$6.3 billion in total equity commitments, and two REITs listed on the SGX-STwith aggregate appraised carrying value of approximately US$2.9 billion. As of June 30, 2019, ourAUM was approximately US$20.2 billion (of which US$2.7 billion was on our balance sheet) andcomprised approximately 8.5 million sq.m of GFA of completed properties, approximately 4.4 millionsq.m of GFA of properties under construction (which we expect to be completed over the next two tofive years and the size of which is expected to be more than half of the GFA of our current completedproperties) and approximately 2.4 million sq.m of GFA to be built on land held for future development,adding up to over 15.3 million sq.m of GFA in total. GFA on land held for future development refers tototal estimated GFA upon completion based on the Company’s construction plans. See the paragraphheaded “—Property Operations—Classification of the Portfolio Assets” in this section of theProspectus for further details.
We develop logistics real estate primarily in Tier 1 and 1.5 cities in APAC, targeting strategiclocations near key logistics hubs, major seaports, airports, transportation hubs and industrial zones inthe PRC, Japan, South Korea, Singapore, Australia and India, which are the markets we believe willdrive future growth across APAC. The majority of the tenants in the Portfolio Assets service domesticconsumption in APAC. According to the JLL Report, APAC’s substantial middle class populationcoupled with rapid economic growth and rising income levels are expected to support risingconsumption levels in the region. Private consumption in China, Japan, South Korea, Singapore,Australia and India is forecasted to grow at a CAGR of 8.1% between 2019 and 2023, approximatelytwo times the anticipated 4.0% growth in the US during the same period. As of June 30, 2019,e-commerce and 3PL tenants made up approximately 48.5% of the tenant base of the Portfolio Assetsby leased area. In 2016, 2017 and 2018 and for the six months ended June 30, 2019, rental revenuesfrom e-commerce and 3PL tenants in our balance sheet properties amounted to 82.6%, 76.7%, 63.5%and 41.0% of our total rental revenues, respectively. The decrease in the proportion of rental revenuesfrom e-commerce and 3PL tenants in 2017 was due to the disposal of several properties to China
165

BUSINESS
Invesco Core Fund from our balance sheet, the majority of which we had leased to e-commercetenants, and in 2018 was due to rental income from an existing manufacturing tenant in the RWHigashi-Ogishima DC property, which we plan to redevelop into a modern logistics facility. Thedecrease in the proportion of rental revenues from e-commerce and 3PL tenants in the six monthsended June 30, 2019 was due to our acquisition of Propertylink, the property portfolio of which had ahigher percentage of traditional logistics and industrial tenants, as well as the disposal of certainbalance sheet properties to NCI Core Fund, the majority of which were occupied by e-commercetenants.
Our Company was formed from the merger of e-Shang and the Redwood group in January2016. E-Shang was co-founded in 2011 by WP OCIM and Mr. Jinchu Shen, who has substantialexperience in modern logistics facilities in the PRC, with the goal of establishing a platform tocapitalize on the dynamic growth of the PRC economy. The Redwood group was founded in 2006 byMr. Stuart Gibson and Mr. Charles Alexander Portes, who have substantial experience in thedevelopment of modern logistics real estate in Asia, to focus on modern logistics development inJapan. By the time of the merger between e-Shang and the Redwood group, e-Shang was a fullyintegrated development and investment management business in the PRC with a strong emergingbusiness in South Korea. In January 2017, we expanded our platform into the Singapore market,shortly followed by our entry into the Indian market. In October 2017, we entered the Australianmarket through the acquisitions of a minority equity stake in Propertylink (an ASX-listed internally-managed REIT, specializing in Australian industrial and office investments) and an equity stake inCenturia (an ASX-listed property funds manager), and in August 2018 we acquired a 100% equityinterest in CIP (an integrated development group with national presence in Australia that has a trackrecord of development of commercial and industrial real estate projects totaling over US$1.8 billion invalue as of December 31, 2018) as the base platform upon which to grow our Australian business. Asof June 30, 2019, we owned a 14.8% stake in Centuria. To facilitate both acquisitions we entered intoshare swap transactions that have now been closed out. In April 2019, we completed our acquisition ofPropertylink. See the paragraph headed “—The Propertylink Acquisition” in this section below forfurther information.
With our APAC-focused business model, we grew significantly during the Track Record Periodthrough organic growth and strategic M&A, increasing our AUM from US$7.4 billion as ofDecember 31, 2016 to US$12.0 billion as of December 31, 2017, to approximately US$16.0 billion asof December 31, 2018 and further to US$20.2 billion as of June 30, 2019. We have also attractedinvestments from three out of the top six real estate capital providers globally based on IP&E RealAssets’ top 100 ranking of the world’s largest real estate investors in 2018. We were ranked #29 in theworld in PERE’s “Fab 50”, the flagship ranking of the private real estate world’s top managers (bytotal annual fundraising amount) in 2018. Our revenue grew by 58.5% from US$96.7 million in 2016to US$153.3 million in 2017, and further grew by 65.8% to US$254.1 million in 2018. Our revenuegrew by 66.3% from US$93.7 million for the six months ended June 30, 2018 to US$155.8 million forthe six months ended June 30, 2019. Our net profit grew by 91.6% from US$104.8 million in 2016 toUS$200.8 million in 2017, and further grew by 6.0% to US$212.9 million in 2018. Our net profit grewby 32.0% from US$63.7 million for the six months ended June 30, 2018 to US$84.1 million for the sixmonths ended June 30, 2019. Our total consolidated balance sheet assets, which include our investmentproperties, investments in joint ventures, and financial assets at fair value, grew by 45.4% fromUS$2,101.5 million as of December 31, 2016 to US$3,054.9 million as of December 31, 2017, andfurther grew by 45.1% to US$4,431.6 million as of December 31, 2018 and 34.2% to US$5,946.0million as of June 30, 2019.
166

BUSINESS
Below is a summary of the Portfolio Assets we directly owned as of June 30, 2019:
CountryNumber ofproperties(1)
GFA ofcompleted
properties(2)(3)
GFA ofproperties
underconstruction(3)
GFA on landheld forfuture
development(3)
(sqm in thousands)
The PRC . . . . . . . . . . . . . . . . . . . . . . . . . . . . . . . . . . . . . 27 1,105.4 842.4 657.4Greater Shanghai . . . . . . . . . . . . . . . . . . . . . . . . . . . 8 516.1 403.3 245.6Greater Beijing . . . . . . . . . . . . . . . . . . . . . . . . . . . . . 5 253.7 — 147.8Greater Guangzhou . . . . . . . . . . . . . . . . . . . . . . . . . . 6 238.6 — 107.9Others . . . . . . . . . . . . . . . . . . . . . . . . . . . . . . . . . . . . 8 96.9 439.1 156.2
Japan . . . . . . . . . . . . . . . . . . . . . . . . . . . . . . . . . . . . . . . . 4 — 575.0 300.0Tokyo . . . . . . . . . . . . . . . . . . . . . . . . . . . . . . . . . . . . 4 — 575.0 300.0
Australia . . . . . . . . . . . . . . . . . . . . . . . . . . . . . . . . . . . . . 41(4) 481.7 35.9 —(4)
New South Wales . . . . . . . . . . . . . . . . . . . . . . . . . . . 15 158.6 18.4 —Queensland . . . . . . . . . . . . . . . . . . . . . . . . . . . . . . . . 10 80.5 — —Victoria . . . . . . . . . . . . . . . . . . . . . . . . . . . . . . . . . . . 13 214.9 17.5 —Western Australia . . . . . . . . . . . . . . . . . . . . . . . . . . . 3 27.6 — —
India . . . . . . . . . . . . . . . . . . . . . . . . . . . . . . . . . . . . . . . . . 3 — 116.5 229.9Mumbai . . . . . . . . . . . . . . . . . . . . . . . . . . . . . . . . . . . 2 — 116.5 199.3Kolkata . . . . . . . . . . . . . . . . . . . . . . . . . . . . . . . . . . . 1 — — 30.7
Total . . . . . . . . . . . . . . . . . . . . . . . . . . . . . . . . . . . . . . . . . 75 1,587.1 1,569.7 1,187.3
Notes:(1) Includes completed properties, properties under construction and GFA on land held for future development.(2) Includes both stabilized and pre-stabilized completed properties. “Stabilized properties” refer to completed properties: (i) for which
construction or acquisition had been completed for more than 12 months; or (ii) reached an occupancy rate of 93% or higher. “Pre-stabilized properties” refer to completed properties: (i) for which construction or acquisition had been completed for less than 12 months;or (ii) with an occupancy rate of less than 93%.
(3) For the definitions of “completed properties,” “properties under construction,” and “GFA on land held for future development,” see thesection headed “—Property Operations—Classification of the Portfolio Assets” in this Prospectus.
(4) We also own four parcels of land in Australia to be developed in the future, and are currently in the process of formulating theconstruction plans and as such have not included the number of properties or the GFA figures to be built on such land.
As of June 30, 2019, the portion of the Portfolio Assets that we held on our balance sheet wasvalued at US$2.7 billion.
167

BUSINESS
Below is a summary of the Portfolio Assets held in the funds and investment vehicles wemanaged as of June 30, 2019. We hold minority investments in many of the funds and investmentvehicles we manage. See the section headed “Business—Principal Business Activities” in thisProspectus for details of the minority interests we hold:
CountryNumber ofproperties(1)
GFA ofcompleted
properties(2)(3)
GFA ofproperties
underconstruction(3)
GFA on landheld forfuture
development(3)
(sqm in thousands)
The PRC . . . . . . . . . . . . . . . . . . . . . . . . . . . . . . . . . . . . . 58 2,681.8 830.2 501.4Greater Shanghai . . . . . . . . . . . . . . . . . . . . . . . . . . . 26 1,376.0 220.6 161.3Greater Beijing . . . . . . . . . . . . . . . . . . . . . . . . . . . . . 3 80.9 — 70.5Greater Guangzhou . . . . . . . . . . . . . . . . . . . . . . . . . . 6 104.9 402.6 —Others . . . . . . . . . . . . . . . . . . . . . . . . . . . . . . . . . . . . 23 1,120.0 207.0 269.6
Japan . . . . . . . . . . . . . . . . . . . . . . . . . . . . . . . . . . . . . . . . 22 1,230.8 1,003.5 —Tokyo . . . . . . . . . . . . . . . . . . . . . . . . . . . . . . . . . . . . 15 672.6 608.8 —Osaka . . . . . . . . . . . . . . . . . . . . . . . . . . . . . . . . . . . . 4 426.4 361.1 —Nagoya . . . . . . . . . . . . . . . . . . . . . . . . . . . . . . . . . . . 3 131.8 33.6 —
South Korea . . . . . . . . . . . . . . . . . . . . . . . . . . . . . . . . . . . 25 980.5 629.5 543.9Singapore . . . . . . . . . . . . . . . . . . . . . . . . . . . . . . . . . . . . . 74 1,686.8 N/A N/AAustralia . . . . . . . . . . . . . . . . . . . . . . . . . . . . . . . . . . . . . 28 297.3 14.7 —
New South Wales . . . . . . . . . . . . . . . . . . . . . . . . . . . 13 122.0 14.7 —Queensland . . . . . . . . . . . . . . . . . . . . . . . . . . . . . . . . 7 78.2 — —Victoria . . . . . . . . . . . . . . . . . . . . . . . . . . . . . . . . . . . 5 84.5 — —Western Australia . . . . . . . . . . . . . . . . . . . . . . . . . . . 2 6.6 — —South Australia . . . . . . . . . . . . . . . . . . . . . . . . . . . . . 1 6.0 — —
India . . . . . . . . . . . . . . . . . . . . . . . . . . . . . . . . . . . . . . . . . 6 62.2 307.6 138.7
Total . . . . . . . . . . . . . . . . . . . . . . . . . . . . . . . . . . . . . . . . . 213 6,939.3 2,785.4 1,184.0
Notes:(1) Includes completed properties, properties under construction and GFA on land held for future development.(2) Includes both stabilized and pre-stabilized completed properties. “Stabilized properties” refer to completed properties: (i) for which
construction or acquisition had been completed for more than 12 months; or (ii) reached an occupancy rate of 93% or higher. “Pre-stabilized properties” refer to completed properties: (i) for which construction or acquisition had been completed for less than 12 months;or (ii) with an occupancy rate of less than 93%.
(3) For the definitions of “completed properties,” “properties under construction,” and “GFA on land held for future development,” see thesection headed “Business—Property Operations—Classification of the Portfolio Assets” in this Prospectus.
The following table summarizes our AUM by assets held on our balance sheet and in the fundsand investment vehicles we managed as of June 30, 2019:
CountryAssets held on our
balance sheetFundAUM(1) AUM
(US$ millions)
The PRC . . . . . . . . . . . . . . . . . . . . . . . . . . . . . . . . . . . . . . . . . . . . . . . . . . 1,366.9 3,020.8 4,387.7Japan . . . . . . . . . . . . . . . . . . . . . . . . . . . . . . . . . . . . . . . . . . . . . . . . . . . . . 627.0 6,929.5 7,556.5South Korea . . . . . . . . . . . . . . . . . . . . . . . . . . . . . . . . . . . . . . . . . . . . . . . — 3,623.5 3,623.5Singapore . . . . . . . . . . . . . . . . . . . . . . . . . . . . . . . . . . . . . . . . . . . . . . . . . . — 2,872.0 2,872.0Australia . . . . . . . . . . . . . . . . . . . . . . . . . . . . . . . . . . . . . . . . . . . . . . . . . . 651.1 651.7 1,302.8India . . . . . . . . . . . . . . . . . . . . . . . . . . . . . . . . . . . . . . . . . . . . . . . . . . . . . . 11.3 480.8 492.1
Total . . . . . . . . . . . . . . . . . . . . . . . . . . . . . . . . . . . . . . . . . . . . . . . . . . . . . . 2,656.3 17,578.3 20,234.5
Note:(1) We hold minority investments in many of the funds and investment vehicles we manage. See the paragraph headed “—Principal
Business Activities” in this section of the Prospectus for details of the minority interests we hold.
168
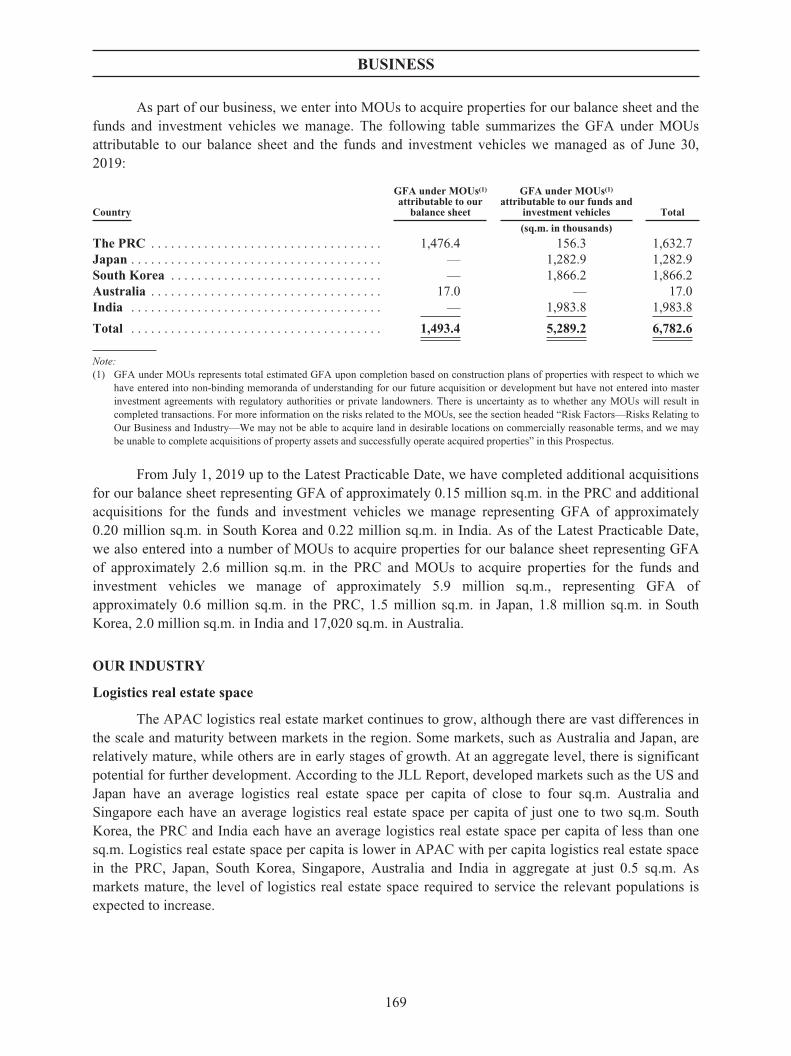
BUSINESS
As part of our business, we enter into MOUs to acquire properties for our balance sheet and thefunds and investment vehicles we manage. The following table summarizes the GFA under MOUsattributable to our balance sheet and the funds and investment vehicles we managed as of June 30,2019:
Country
GFA under MOUs(1)attributable to our
balance sheet
GFA under MOUs(1)attributable to our funds and
investment vehicles Total
(sq.m. in thousands)
The PRC . . . . . . . . . . . . . . . . . . . . . . . . . . . . . . . . . . . 1,476.4 156.3 1,632.7Japan . . . . . . . . . . . . . . . . . . . . . . . . . . . . . . . . . . . . . . — 1,282.9 1,282.9South Korea . . . . . . . . . . . . . . . . . . . . . . . . . . . . . . . . — 1,866.2 1,866.2Australia . . . . . . . . . . . . . . . . . . . . . . . . . . . . . . . . . . . 17.0 — 17.0India . . . . . . . . . . . . . . . . . . . . . . . . . . . . . . . . . . . . . . — 1,983.8 1,983.8
Total . . . . . . . . . . . . . . . . . . . . . . . . . . . . . . . . . . . . . . 1,493.4 5,289.2 6,782.6
Note:(1) GFA under MOUs represents total estimated GFA upon completion based on construction plans of properties with respect to which we
have entered into non-binding memoranda of understanding for our future acquisition or development but have not entered into masterinvestment agreements with regulatory authorities or private landowners. There is uncertainty as to whether any MOUs will result incompleted transactions. For more information on the risks related to the MOUs, see the section headed “Risk Factors—Risks Relating toOur Business and Industry—We may not be able to acquire land in desirable locations on commercially reasonable terms, and we maybe unable to complete acquisitions of property assets and successfully operate acquired properties” in this Prospectus.
From July 1, 2019 up to the Latest Practicable Date, we have completed additional acquisitionsfor our balance sheet representing GFA of approximately 0.15 million sq.m. in the PRC and additionalacquisitions for the funds and investment vehicles we manage representing GFA of approximately0.20 million sq.m. in South Korea and 0.22 million sq.m. in India. As of the Latest Practicable Date,we also entered into a number of MOUs to acquire properties for our balance sheet representing GFAof approximately 2.6 million sq.m. in the PRC and MOUs to acquire properties for the funds andinvestment vehicles we manage of approximately 5.9 million sq.m., representing GFA ofapproximately 0.6 million sq.m. in the PRC, 1.5 million sq.m. in Japan, 1.8 million sq.m. in SouthKorea, 2.0 million sq.m. in India and 17,020 sq.m. in Australia.
OUR INDUSTRY
Logistics real estate space
The APAC logistics real estate market continues to grow, although there are vast differences inthe scale and maturity between markets in the region. Some markets, such as Australia and Japan, arerelatively mature, while others are in early stages of growth. At an aggregate level, there is significantpotential for further development. According to the JLL Report, developed markets such as the US andJapan have an average logistics real estate space per capita of close to four sq.m. Australia andSingapore each have an average logistics real estate space per capita of just one to two sq.m. SouthKorea, the PRC and India each have an average logistics real estate space per capita of less than onesq.m. Logistics real estate space per capita is lower in APAC with per capita logistics real estate spacein the PRC, Japan, South Korea, Singapore, Australia and India in aggregate at just 0.5 sq.m. Asmarkets mature, the level of logistics real estate space required to service the relevant populations isexpected to increase.
169

BUSINESS
Estimated total logistics real estate space per capita(1)
0.0
0.7
0.7
0.8
1.6
1.9
3.8
4.0
0.0 0.5 1.0 1.5 2.0 2.5 3.0 3.5 4.0 4.5
India
China
South Korea
Germany
Australia
Singapore
USA
Japan
sqm
Figures refer to total stock (sqm) per capita
Source: JLL estimates based on a combination of information from public sources, company reports, site visits, and industry contacts, Oxford
Economics, as of April 1, 2019 (except China, Japan, South Korea and India as of December 31, 2018).Note:(1) Based on total logistics stock. An accurate breakdown of modern and non-modern real estate is not available in each market. Includes
existing warehouse and distribution buildings of all grades; owner- and tenant-occupied, and available for lease and/or sale. Differentcountries use different methodologies and definitions to capture total stock. As such total stock and stock per capita between countriesmay not be directly comparable.
Modern logistics real estate space
Modern logistics real estate space is characterized by, among other things, large floor plates,high ceilings, wide column spacing, spacious and modern loading docks as well as enhanced safetysystems and other value-added features. Modern logistics real estate space in APAC as a proportion oftotal space is relatively low compared to the US. This may provide scope for greater development,particularly against the backdrop of increasing demand from the 3PL industry and e-commerceplatforms. Supply chain modernization is adding to the global demand for new logistics facilities.Tenants are upgrading from outdated, often small and owner-occupied facilities to newer facilities inpremium locations.
Estimated modern logistics real estate space as a proportion of total logistics real estate space(1)(2)
15.7
34.6
40.2
502.8
955
India
South Korea
Australia
Japan
China
Million, sqm
% in circles refers to modern stock (red bar) as proportion of total stock
7%
5%
75%
28%
38%
0 100 200 300 400 500 600 700 800 900 1000
Source: JLL estimates based on a combination of information from public sources, company reports, site visits, and industry contacts, as ofJune 30, 2019 (except for India, Japan and South Korea which are as of October 1, 2018).
170
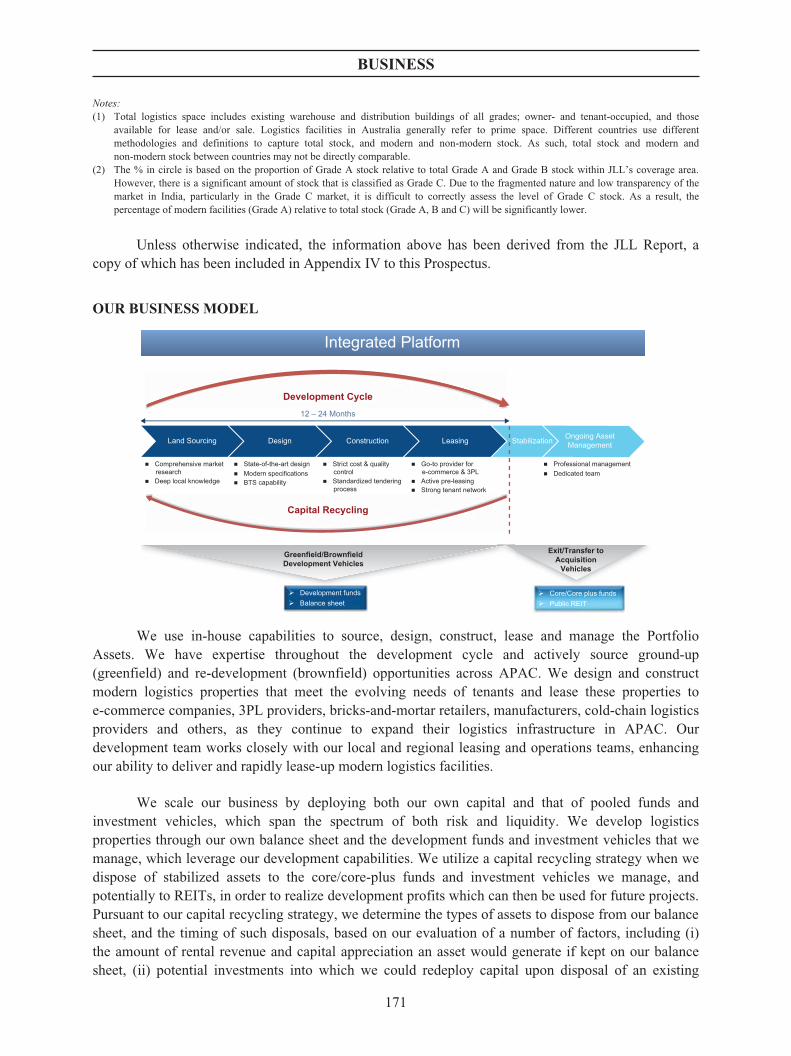
BUSINESS
Notes:(1) Total logistics space includes existing warehouse and distribution buildings of all grades; owner- and tenant-occupied, and those
available for lease and/or sale. Logistics facilities in Australia generally refer to prime space. Different countries use differentmethodologies and definitions to capture total stock, and modern and non-modern stock. As such, total stock and modern andnon-modern stock between countries may not be directly comparable.
(2) The % in circle is based on the proportion of Grade A stock relative to total Grade A and Grade B stock within JLL’s coverage area.However, there is a significant amount of stock that is classified as Grade C. Due to the fragmented nature and low transparency of themarket in India, particularly in the Grade C market, it is difficult to correctly assess the level of Grade C stock. As a result, thepercentage of modern facilities (Grade A) relative to total stock (Grade A, B and C) will be significantly lower.
Unless otherwise indicated, the information above has been derived from the JLL Report, acopy of which has been included in Appendix IV to this Prospectus.
OUR BUSINESS MODEL
Development Cycle
Capital Recycling
12 – 24 Months
Land Sourcing
� Comprehensive marketresearch
� Deep local knowledge
� State-of-the-art design� Modern specifications� BTS capability
� Strict cost & qualitycontrol
� Standardized tenderingprocess
� Go-to provider fore-commerce & 3PL
� Active pre-leasing� Strong tenant network
� Professional management� Dedicated team
Integrated Platform
Development Cycle
Capital Recycling
� Core/Core plus funds� Public REIT
� Development funds� Balance sheet
Design Construction Leasing Ongoing AssetManagementStabilization
Greenfield/BrownfieldDevelopment Vehicles
Exit/Transfer toAcquisition
Vehicles
We use in-house capabilities to source, design, construct, lease and manage the PortfolioAssets. We have expertise throughout the development cycle and actively source ground-up(greenfield) and re-development (brownfield) opportunities across APAC. We design and constructmodern logistics properties that meet the evolving needs of tenants and lease these properties toe-commerce companies, 3PL providers, bricks-and-mortar retailers, manufacturers, cold-chain logisticsproviders and others, as they continue to expand their logistics infrastructure in APAC. Ourdevelopment team works closely with our local and regional leasing and operations teams, enhancingour ability to deliver and rapidly lease-up modern logistics facilities.
We scale our business by deploying both our own capital and that of pooled funds andinvestment vehicles, which span the spectrum of both risk and liquidity. We develop logisticsproperties through our own balance sheet and the development funds and investment vehicles that wemanage, which leverage our development capabilities. We utilize a capital recycling strategy when wedispose of stabilized assets to the core/core-plus funds and investment vehicles we manage, andpotentially to REITs, in order to realize development profits which can then be used for future projects.Pursuant to our capital recycling strategy, we determine the types of assets to dispose from our balancesheet, and the timing of such disposals, based on our evaluation of a number of factors, including (i)the amount of rental revenue and capital appreciation an asset would generate if kept on our balancesheet, (ii) potential investments into which we could redeploy capital upon disposal of an existing
171

BUSINESS
asset, (iii) the fees that we could generate from an asset if it were held in a fund or investment vehiclewe manage, and (iv) the investment mandates of our funds and investment vehicles. We generallyconsider the disposal of a property once it has been completed, and we prioritize the disposal of ourbalance sheet properties to the funds and investment vehicles we manage in order to manage assets forthe long term where our fund mandates permit. We retain the option to dispose of assets to third-partiesif we deem it appropriate to do so. The synergies between our development and core/core-plus fundsand investment vehicles give us the opportunity to manage the underlying assets throughout theiruseful lives and build recurring revenue streams. We can acquire, develop and own assets that fit ourcapital partners’ risk-reward profiles and still capture opportunities using our own balance sheet whichmay not fall within the investment criteria of the funds and investment vehicles we manage. Theflexibility of this dual approach helps us avoid a time consuming search for a co-investor on eachindividual project and provides future capital partners with visibility over the assets on our balancesheet that might form a fund or investment vehicle.
We also use our balance sheet to grow our business through the acquisition of private andpublic platforms in prospective growth markets. For example, in January 2017, we expanded into theSingapore market and obtained control of the ESR-REIT Manager. In April 2019, we completed ouracquisition of Propertylink in Australia. See the paragraph headed “—The Propertylink Acquisition” inthis section of the Prospectus for further information. In June 2019, we completed the Sabana ManagerAcquisition in Singapore. As we continue to expand the business, we have and will continue to utilizeour business model to acquire local expertise and assemble business teams in each of our markets ofoperation. See the paragraph headed “—Principal Business Activities—Development” in this sectionof the Prospectus for further details.
Our Company is organized into business units based on our products and services and has threereportable operating segments as follows:
Š Development. We earn development profit through the development, construction and saleof completed properties on our balance sheet. Our development profit includesconstruction income (as a result of the consolidation of CIP since August 2018), fair valuegains on investment properties under construction and gains on disposal of subsidiaries.We also derive pro rata earnings and pro rata value appreciation through the developmentactivities of the development funds and investment vehicles we manage in proportion toour co-investments in those funds and investment vehicles.
Š Fund management. We earn fee income from managing the underlying assets on behalf ofour capital partners via the funds and investment vehicles we manage. Our fees includebase management fees, asset management fees, acquisition fees, development fees andleasing fees. We also participate in a disproportionate share of profits through promoteupon exceeding a pre-determined target IRR and after our capital partners have receivedtheir targeted capital returns.
Š Investment. Our investment segment is divided into three main categories: (i) completedproperties that we hold on our balance sheet, from which we derive rental income andappreciation in value; (ii) our co-investments in the funds and investment vehicles and thepublic REIT we manage, from which we derive dividend income, pro rata earnings and/orpro rata value appreciation; and (iii) other investments. In the years ended December 31,2016, 2017 and 2018 and for the six months ended June 30, 2019, our average rental yield(rental income as a proportion of property book cost) for properties held on our balancesheet was 11.5%, 11.1%, 11.3% and 12.5%, respectively.
172

BUSINESS
COMPETITIVE STRENGTHS AND STRATEGIES
Competitive Strengths
We are the largest APAC focused logistics real estate platform
We are the largest APAC focused logistics real estate platform by GFA and by the value of thePortfolio Assets and have the largest development pipeline in aggregate across APAC as measured byGFA from July 1, 2019 to December 31, 2020, according to the JLL Report.
Our network of strategically-located modern logistics facilities in APAC combined with ourlogistics real estate fund management platform offers us a number of strategic benefits:
Š Dynamic growth. According to the JLL Report, the six economies in APAC where weoperate account for close to 90% of the nominal GDP of APAC in 2018. According to theJLL Report, the revenue of APAC’s e-commerce logistics market expanded by 22.9% in2018 and is expected to grow at a CAGR of 15.1% from 2018 to 2023. We believe that ourAPAC focus differentiates us from certain global logistics real estate players for whomAsia is a small part of their portfolio or who concentrate on more limited geographies inAPAC, and positions us to capitalize on this dynamic growth with strong on-the-groundexecution and tenant sourcing capabilities, as evidenced by our 272% growth in AUMduring the Track Record Period.
Š Economies of scale. Our scale and presence across six economies in APAC gives usadvantages of scale and regional tenant relationships over those local players that onlyoperate in one country. This scale is complemented by the strength of our balance sheetand the size of our fund management platform which together enable us to be nimble inacquiring land and to start construction promptly without having to source third partyfinancing for each project. Further, our scale offers us cost efficiencies in terms ofnegotiating construction contracts and facility management contracts and optimizingpersonnel resources.
Š Network effect. Having the largest portfolio of modern logistics facilities in APACprovides our tenants with regional solutions as their business grows. For example, JD.comleased approximately 1,025,817 sq.m from us across 16 locations as of June 30, 2019. Weare JD.com’s largest external landlord in the Yangtze River Delta area and one of its majorlandlords across APAC. Further, our broad and diverse logistics real estate fundmanagement platform also provides investors a single interface to access investmentopportunities across APAC. For example, APG Group is a capital partner in our funds inthe PRC, South Korea and Japan and remains open to exploring investments in othermarkets in APAC with us. Our broad network of modern logistics facilities and investmentvehicles underpins our value proposition to tenants and capital partners.
Below are highlights of our strong market position in each of our markets of operation.According to the JLL Report:
Š The PRC. Our portfolio of logistics properties is the second largest in Greater Shanghai,Greater Beijing and Greater Guangzhou as measured by GFA and development pipelinefrom July 1, 2019 to December 31, 2020.
Š Japan. We have the largest development pipeline by GFA from July 1, 2019 toDecember 31, 2020 in the Greater Tokyo and Greater Osaka regions.
173

BUSINESS
Š South Korea. We are the largest owner of logistics stock by GFA and have the largestdevelopment pipeline from January 1, 2019 to December 31, 2020 in the SeoulMetropolitan Area.
Š Singapore. We are the third largest industrial REIT in Singapore in terms of number ofassets.
We have an integrated development platform with strong project sourcing and executioncapabilities, complemented by our efficient capital recycling strategy
We have a high-performing development platform with an end-to-end integrated suite oftechnical capabilities and services to meet tenants’ growing demand in key APAC markets.Throughout the development cycle, we have expertise to source ground-up (greenfield) andre-development (brownfield) opportunities across APAC to design, construct and lease modernlogistics properties. One of our key strengths for prospective tenants and capital partners is our abilityto execute logistics development projects at a consistently efficient and high quality level, deliveringmodern facilities characterized by large floor plates, high ceilings, wide column spacing, spacious andmodern loading docks as well as enhanced safety systems and other value-added features. We conductfeasibility studies, master planning, project design, project cost analysis and project management foreach of our logistics properties so as to cater to individual tenants’ needs. The quality of our logisticsfacilities has been recognized, for example, through the award of LEED Gold certification for two ofour logistics facilities, located in Kunshan and Wuxi in the Greater Shanghai area.
Depending on the market and property type, it typically takes us approximately 12 to 24 monthsto develop, from land acquisition to stabilization, the Portfolio Assets, which is in line with industrystandards. We believe our development capabilities and ability to offer tailored services such ascustomized site selection, land acquisition and design helps us attract high quality and long-term tenants.For example, we delivered to Amazon the Kunshan Friend I facility, a customized project in the greaterShanghai area, PRC, with construction completed within 11 months. In another case, we provided highly-specified logistics facilities for a leading German automobile manufacturer in Guangzhou, PRC, withconstruction completed in 13 months.
Our high-performing development platform complements our efficient capital recyclingstrategy, in which we dispose of assets that we own directly or are owned by the development funds wemanage to the core/core-plus funds and investment vehicles we manage, and potentially to REITs. Inthe first half of 2019, we completed the disposal of seven properties with an aggregate gross assetvalue of approximately US$276.7 million from our balance sheet to NCI Core Fund, in respect ofwhich we realized gains of US$16.5 million. In December 2018, we effected the disposal of a total ofsix completed modern logistics facilities from Redwood Japan Logistics Fund Limited Partnership toour Japan Core Fund with an aggregate value of approximately US$959.0 million. In August 2017, wedisposed of a total of five properties from our balance sheet with an aggregate value of approximatelyUS$295.7 million to China Invesco Core Fund, which realized gains for us of US$38.3 million. We didnot dispose of any properties in 2016. We also have the flexibility to dispose of assets to other core/core-plus funds that we may form and/or manage in the future and to third parties. This provides anexit strategy for our development platform and realizes gains for us and for our development fundcapital partners.
Through our August 2018 acquisition of CIP and April 2019 acquisition of Propertylink, wehave further expanded our capabilities into the Australian market, where we can now leverage the
174

BUSINESS
development capabilities of CIP and pursue capital recycling opportunities with Propertylink’s fundmanagement platform in furtherance of our integrated business model.
Our fund management platform provides us with high margin and stable fee income largelyindependent of property values
We have an integrated fund management platform that facilitates AUM growth and generatesmultiple sources of income (including base management fees, development fees, asset managementfees, land acquisition fees and leasing fees) and additionally allows us to participate in adisproportionate share of equity gains through a promote upon exceeding certain target IRR and afterour capital partners have received their targeted capital returns. Because we manage multiple fundswith varying investment mandates, we can dispose of assets from our development funds to our core/core-plus funds as they mature, and continue to generate fees from such assets.
We manage development funds and core/core-plus funds in PRC, Japan, South Korea and Indiaand a public REIT in Singapore. We believe the depth and breadth of our fund management platformattracts sophisticated capital partners who want to access multiple investment opportunities acrossAPAC through a single interface. We have grown our Fund AUM from US$6.5 billion as ofDecember 31, 2016 to US$17.6 billion as of June 30, 2019. Our fund management revenue hasincreased from US$46.5 million in 2016 to US$94.3 million in 2017, and further to US$135.6 millionin 2018, and from US$59.0 million for the six months ended June 30, 2018 to US$61.8 million for thesix months ended June 30, 2019. We have maintained high margins with respect to our fundmanagement segment during the Track Record Period.
Our fund management platform was designed to provide us with long-term operational controlof the logistics real estate assets and sustainable fees across the full asset life-cycle, without necessarilyholding such assets on our balance sheet, which supports our ability to remain resilient throughoutchanging business cycles and fluctuations in asset value.
Our platform is supported by a network of high-quality tenants and capital partners with whom wehave strong and long-standing relationships
We lease the logistics facilities owned directly by us or by the funds that we manage to a broadrange of large and mid-sized, multinational and domestic tenants, including e-commerce companies,3PL providers, bricks-and-mortar retailers, manufacturers, cold-chain logistics providers and others.These tenants are in a large variety of industries, including electronics, fast-moving consumer goods,retail, food and beverage, general logistics services, auto and parts, pharmaceuticals, medicalinstruments and machinery. The majority of the tenants in the Portfolio Assets service domesticconsumption in APAC.
We believe our proven ability to deliver tenant-driven solutions within short developmenttimelines is attractive to potential tenants. Together with our broad network across APAC, thiscapability has made us a key partner for high-quality tenants that operate in sectors well positioned tobenefit from economic trends in APAC, in particular, e-commerce companies and 3PL providers. Forexample, with respect to the Portfolio Assets in the PRC, e-commerce companies constitute asignificant portion of our tenants, with approximately 1.6 million sq.m., or 45.0% of our leased area,occupied by leading e-commerce tenants such as Cainiao (a member of Alibaba Group), JD.com andAmazon, as of June 30, 2019. In Japan, we are a leading landlord for 3PL providers who account for
175

BUSINESS
approximately 0.4 million sq.m., or 49.5% of our leased area. In APAC overall, e-commerce and 3PLtenants made up approximately 48.5% of the tenant base of the Portfolio Assets by leased area, as ofJune 30, 2019. In 2016, 2017 and 2018 and for the six months ended June 30, 2019, rental revenuesfrom e-commerce and 3PL tenants in our balance sheet properties amounted to 82.6%, 76.7%, 63.5%and 41.0%, respectively, of our total rental revenues. The decrease in the proportion of rental revenuesfrom e-commerce and 3PL tenants in 2017 was due to the disposal of several properties to ChinaInvesco Core Fund from our balance sheet, the majority of which we had leased to e-commercetenants, and in 2018 was due to rental income from an existing manufacturing tenant in the RWHigashi-Ogishima DC property, which we plan to redevelop into a modern logistics facility. Thedecrease in the proportion of rental revenues from e-commerce and 3PL tenants in the six monthsended June 30, 2019 was due to our acquisition of Propertylink, the property portfolio of which had ahigher percentage of traditional logistics and industrial tenants, as well as the disposal of certainbalance sheet properties to NCI Core Fund, the majority of which were occupied by e-commercetenants.
As APAC supply chain decisions are generally made locally within the region, our ability toconnect with the decision makers and know their requirements have allowed us to establish regionalsupply chain solutions for our tenants. For example, 16 of our existing tenants lease multiple locationsfrom us across APAC. Our value proposition to our tenants has resulted in an occupancy rate ofapproximately 92% for stabilized properties in the Portfolio Assets as of June 30, 2019. Further, ournetwork of high quality tenants underpins our ability to lease any vacancies.
We have a diversified global institutional investor base whom we believe are attracted by ourability to deliver strong ongoing returns and long-term value creation. Many of our capital partners,such as APG Group, CPPIB, Ping An and Allianz Real Estate, are long-term investors with capitalcommitments in more than one of our investment vehicles, and some of them invest in our funds inmore than one jurisdiction. For example, investment vehicles managed by the APG Group firstinvested with us in the PRC in 2014 and subsequently in South Korea in 2015 and in Japan in 2019.Also, CPPIB first invested with us in our development fund in South Korea in 2015 and then investedwith us in our core fund in South Korea in 2018. The size and scale of our capital partners combinedwith their long-term approach, and our multinational platform provide us with access to capital acrossAPAC. This network positions us to take advantage of growth opportunities in our existing markets atvarious stages of the investment cycle, and provides flexibility to our capital partners to deploy theircapital across different geographies and risk profiles via different types of funds and investmentvehicles.
We believe our regional presence increases the strength of our relationships with our tenantsand capital partners, creating a virtuous cycle. Our capital partners utilize an increasing amount ofcapital to facilitate the expansion of our logistics real estate infrastructure; the expansion of ourregional footprint attracts existing and potential tenants seeking regional solution-providers, which inturn attracts more investor interest and partnership opportunity.
We have a proven ability to grow organically and to execute opportunistic M&A transactions toexpand our capabilities, broaden the scope of the Portfolio Assets, and support our growth in thelogistics real estate industry
Our organic growth capabilities are evidenced by our expansion into new markets, includingSouth Korea in 2014 and India in 2017. In South Korea, we have partnered with strong local leadership
176
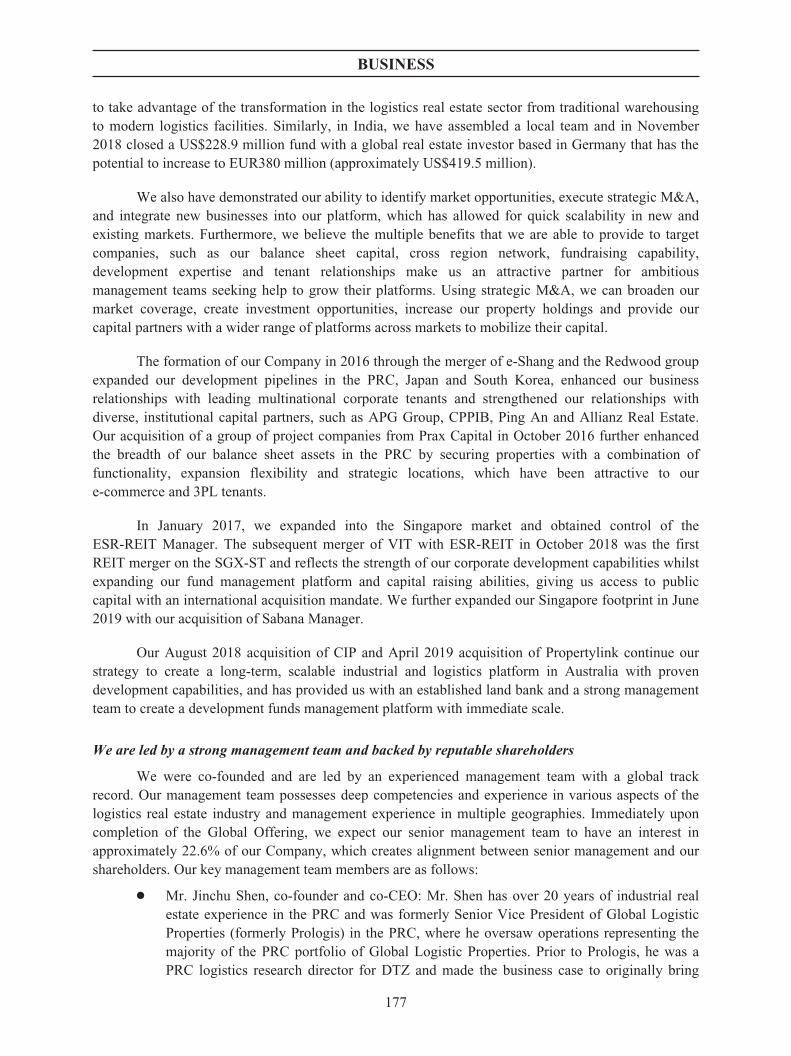
BUSINESS
to take advantage of the transformation in the logistics real estate sector from traditional warehousingto modern logistics facilities. Similarly, in India, we have assembled a local team and in November2018 closed a US$228.9 million fund with a global real estate investor based in Germany that has thepotential to increase to EUR380 million (approximately US$419.5 million).
We also have demonstrated our ability to identify market opportunities, execute strategic M&A,and integrate new businesses into our platform, which has allowed for quick scalability in new andexisting markets. Furthermore, we believe the multiple benefits that we are able to provide to targetcompanies, such as our balance sheet capital, cross region network, fundraising capability,development expertise and tenant relationships make us an attractive partner for ambitiousmanagement teams seeking help to grow their platforms. Using strategic M&A, we can broaden ourmarket coverage, create investment opportunities, increase our property holdings and provide ourcapital partners with a wider range of platforms across markets to mobilize their capital.
The formation of our Company in 2016 through the merger of e-Shang and the Redwood groupexpanded our development pipelines in the PRC, Japan and South Korea, enhanced our businessrelationships with leading multinational corporate tenants and strengthened our relationships withdiverse, institutional capital partners, such as APG Group, CPPIB, Ping An and Allianz Real Estate.Our acquisition of a group of project companies from Prax Capital in October 2016 further enhancedthe breadth of our balance sheet assets in the PRC by securing properties with a combination offunctionality, expansion flexibility and strategic locations, which have been attractive to oure-commerce and 3PL tenants.
In January 2017, we expanded into the Singapore market and obtained control of theESR-REIT Manager. The subsequent merger of VIT with ESR-REIT in October 2018 was the firstREIT merger on the SGX-ST and reflects the strength of our corporate development capabilities whilstexpanding our fund management platform and capital raising abilities, giving us access to publiccapital with an international acquisition mandate. We further expanded our Singapore footprint in June2019 with our acquisition of Sabana Manager.
Our August 2018 acquisition of CIP and April 2019 acquisition of Propertylink continue ourstrategy to create a long-term, scalable industrial and logistics platform in Australia with provendevelopment capabilities, and has provided us with an established land bank and a strong managementteam to create a development funds management platform with immediate scale.
We are led by a strong management team and backed by reputable shareholders
We were co-founded and are led by an experienced management team with a global trackrecord. Our management team possesses deep competencies and experience in various aspects of thelogistics real estate industry and management experience in multiple geographies. Immediately uponcompletion of the Global Offering, we expect our senior management team to have an interest inapproximately 22.6% of our Company, which creates alignment between senior management and ourshareholders. Our key management team members are as follows:
Š Mr. Jinchu Shen, co-founder and co-CEO: Mr. Shen has over 20 years of industrial realestate experience in the PRC and was formerly Senior Vice President of Global LogisticProperties (formerly Prologis) in the PRC, where he oversaw operations representing themajority of the PRC portfolio of Global Logistic Properties. Prior to Prologis, he was aPRC logistics research director for DTZ and made the business case to originally bring
177

BUSINESS
Prologis into the PRC and, as a result, was instrumental in the development of the modernlogistics real estate industry in the PRC.
Š Mr. Stuart Gibson, co-founder and co-CEO: Mr. Gibson has over 24 years of real estateinvestment experience in APAC and was formerly President of Prologis Japan as well asco-founder and co-CEO of AMB BlackPine, Japan, and was instrumental in thedevelopment of the modern logistics real estate industry in Japan.
Š Mr. Charles Alexander Portes, co-founder and President: Mr. Portes has over 23 years ofreal estate investment experience, including over 19 years of industrial real estateexperience in APAC, and was formerly Head of Acquisitions in Japan and Capital Officerfor Asia with Prologis Japan as well as Co-Founder and co-CEO of AMB BlackPine,Japan.
Š Mr. Wee Peng Cho, CFO: Mr. Cho has over 25 years of international financial experienceand was formerly CFO of SATS and Hyflux (both listed on the SGX-ST), and worked forThe Dow Chemical Company in various treasury roles in Dow’s US headquarters andSingapore offices.
In addition to our strong management team, we are supported by key shareholders, includingco-founder WP OCIM, an affiliate of Warburg Pincus LLC. Warburg Pincus LLC was founded in 1966and is one of the largest private equity sponsors in the PRC and Southeast Asia region. Othershareholders, such as JD.com and SK, have provided us with the ability to leverage our shareholders’capabilities in originating logistics solutions, access to capital and access to strategic land holdings andtenant relationships.
Strategies
Our goal is to expand on our position as a leading logistics real estate and fund managementplatform in APAC. We intend to pursue the following growth strategies to achieve this goal:
Continue to execute our integrated strategy and capitalize on the significant market opportunitiesacross APAC
We intend to leverage our position as the largest APAC focused logistics real estate platform byGFA and value of the Portfolio Assets to further extend our market leadership positions through ourhigh performing integrated business model as follows:
Š Further develop our markets and build logistics infrastructure for the modern economy.We intend to continue developing modern logistics facilities targeting metropolitanpopulations and centers of consumption that will form part of the backbone of 21st centurycommerce across APAC. Below are highlights of our development strategies in our keymarkets in APAC:
Š The PRC. Acquire additional land in strategic locations, form new partnerships andjoint ventures to scale up our business in developed and high growth areas. We willalso seek strategic investment opportunities in local logistics real estate players orpotential strategic assets.
Š Japan. Leverage the continued growth of 3PL providers, e-commerce companies,internet and mail order services and develop new logistics facilities in locations thatenhances our portfolio and complement our tenants’ business and expansion plans.
178

BUSINESS
Š South Korea. Expand our existing presence in the greater Seoul and Busan marketsby pursuing both development and core/core-plus opportunities, further enhancingour position as the largest logistics facilities supplier in the Seoul Metropolitan Area.
Š Singapore. Grow ESR-REIT through platform and asset acquisitions and pursuedevelopment and redevelopment opportunities.
Š Australia. Create a long-term, scalable logistics platform in Australia with provendevelopment capabilities. We intend to leverage CIP’s land bank and strongmanagement team to seed a development fund with scale. This is complemented byour strategic investments in Propertylink and Centuria. Following the completion ofthe Propertylink Acquisition and pursuant to our capital recycling strategy, we plan toown and manage certain of Propertylink’s existing assets within our Group and totransfer certain of the assets into new funds and investment vehicles managed by us.For more information, see the section headed “Summary—Recent Developments—Material Developments—New Australia Fund” in this Prospectus.
Š India. Create one of the leading Indian logistics real estate platforms with a focus ondeveloping larger-style modern logistics parks that typically measure approximately20,000 sq.m of space, initially targeting the major cities of Mumbai, Pune, Delhi,Chennai and Bangalore.
Š Continue to build on our network of high quality tenants. Our current APAC marketleadership and ability to grow is supported by our network of high quality tenants. Ourtenants come back to us due to our ability to deliver high quality state-of-the-art logisticsfacilities across their operating network on efficient development timelines and budgets.We intend to continue building modern logistics facilities in strategic locations that meetthe evolving expansion needs of our tenants, especially those that make supply chaindecisions across APAC (such as JD.com and Cainiao, a member of Alibaba Group).
Š Continue to leverage on our integrated fund platform. Using our robust deal sourcing anddevelopment capabilities and our capital pool, we intend to provide our capital partnerswith access to deal opportunities across APAC to actively participate in the growth of theAPAC economy and e-commerce market penetration. By bringing our capital partnersacross APAC, we will be able to provide the capital for developments and platformacquisitions in new markets in APAC. We intend to launch new core/core-plus USD andRMB denominated funds to grow our capital available for new projects.
Leverage our scale and geographic presence to expand into new growth markets to deepen ourregional connectivity
We will continue to actively evaluate opportunities in new markets through potentialpartnerships and selective acquisitions in high growth markets (such as Indonesia, Thailand andVietnam), leveraging on our strong management expertise and diverse network of existing tenantrelationships. We intend to deepen our regional connectivity by offering a single solution for regionaltenants as supply chain efficiency becomes increasingly critical. For example, JD.com, Carrefour andAmazon are tenants in more than one of our markets of operation. Our tenants can benefit from ourability to offer logistics solutions in multiple cities in multiple markets.
We are focused on building and deepening long-term tenant relationships and deliveringsolutions that meet our tenants’ business needs, helping them to improve their supply chain efficiency
179

BUSINESS
and fulfill their strategic expansion goals. We intend to promote the broad product and geographicofferings of our logistics facilities portfolio to attract existing and prospective tenants with a view toexpanding our footprint in the region.
Expand our fund management platform across geographies, strategies and liquidity profiles andattract new capital partners while bringing existing capital partners across markets
We intend to expand our fund management platform to support our growth plans, takingadvantage of our global institutional investor base and capital recycling model, which efficientlyallocates capital across our balance sheet and the funds and investment vehicles we manage. Forexample, in 2017, we signed agreements to dispose of certain directly held properties with anaggregate disposal asset value of approximately US$295.7 million to China Invesco Core Fund. In thefirst half of 2019, we completed the disposal of seven properties with an aggregate gross asset value ofapproximately US$276.7 million from our balance sheet to NCI Core Fund. We intend to continue toinject select completed properties into our core/core-plus funds to return capital and spur near-termexpansion into higher-growth acquisition and development opportunities while retaining managementcontrol, fee revenue and pro-rata earnings share from completed properties.
For our listed fund platform, we will continue to pursue acquisition opportunities that provideattractive and stable cash flows and yields together with growth potential. We also intend to leverageour extensive network to selectively expand our existing REIT vehicle or set up new REITs tocapitalize on significant opportunities that exist in other real estate markets in Asia. For example, werecently established a new private REIT in Japan that will focus on typically smaller and/or longer-established assets in Japan which are not part of the mandate of the Japan Core Fund. We believe thatthis will enable us to more aggressively tap capital inflows into the Asia real estate sector to grow ourportfolio management fee income, and at the same time, create value for our capital partners andshareholders.
We will continue to leverage the network effect produced by our scale and geographic presenceto attract capital partners across APAC. Our scale across the region permits us to be able to raisecapital for an APAC-focused strategy, allowing investors to gain pan-APAC exposure throughinvesting in multiple funds. Additionally, we also intend to establish a pan-APAC fund in the future toprovide investors with a single product to get exposure to logistics real estate across the region, asmany investors are seeking regional investment allocations and have neither the risk tolerance nor theexpertise to make country specific allocations.
Finally, we intend to deepen our capital partner relationships and also establish long-termrelationships with selected small- and medium-sized investors as well as to establish new funds thatwill allow us to have wider discretion, better economics and further diversification of our investorbase.
Strategically explore and expand into adjacent businesses and investment products within Asia
We intend to leverage our ecosystem of shareholders, capital partners, local teams and tenantsto penetrate adjacent businesses that benefit from the synergies of our platform, such as real estateproperties to be used for data centers, suburban IT offices and business parks. We also intend to utilizeour platform to capitalize on the high percentage of user-owned real estate to structure sale-leasebacks,where we acquire existing logistics facilities and lease them back to the original owners to satisfy their
180
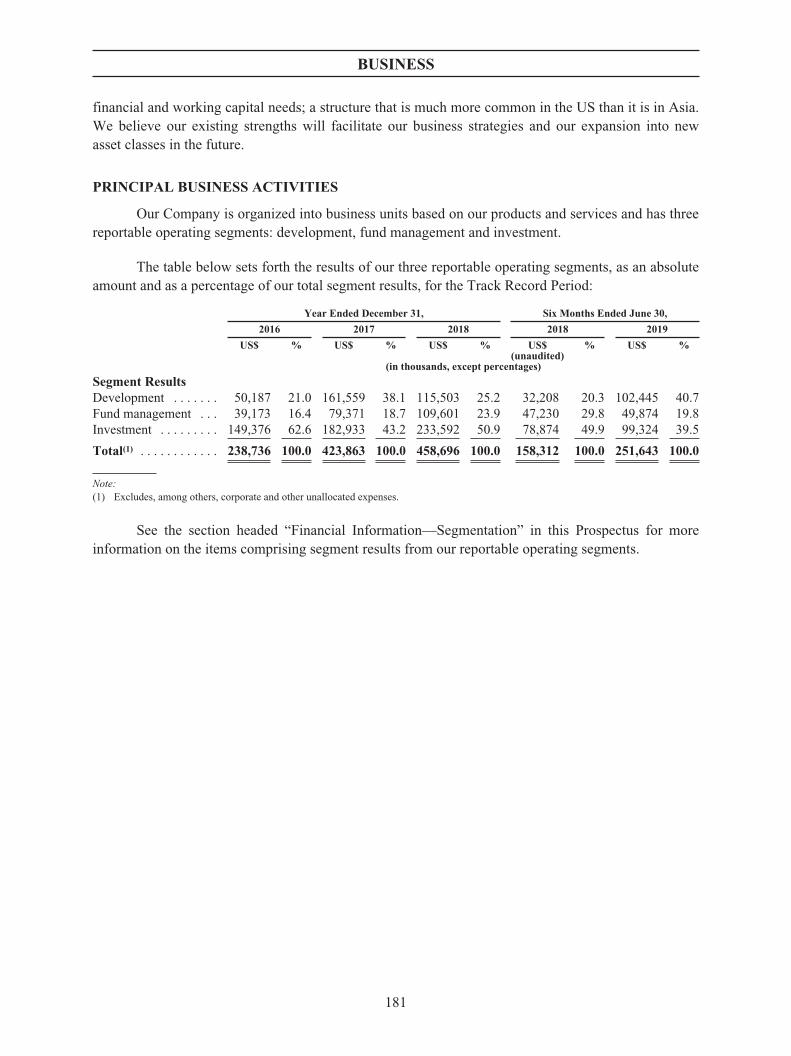
BUSINESS
financial and working capital needs; a structure that is much more common in the US than it is in Asia.We believe our existing strengths will facilitate our business strategies and our expansion into newasset classes in the future.
PRINCIPAL BUSINESS ACTIVITIES
Our Company is organized into business units based on our products and services and has threereportable operating segments: development, fund management and investment.
The table below sets forth the results of our three reportable operating segments, as an absoluteamount and as a percentage of our total segment results, for the Track Record Period:
Year Ended December 31, Six Months Ended June 30,
2016 2017 2018 2018 2019
US$ % US$ % US$ % US$ % US$ %(unaudited)
(in thousands, except percentages)
Segment ResultsDevelopment . . . . . . . 50,187 21.0 161,559 38.1 115,503 25.2 32,208 20.3 102,445 40.7Fund management . . . 39,173 16.4 79,371 18.7 109,601 23.9 47,230 29.8 49,874 19.8Investment . . . . . . . . . 149,376 62.6 182,933 43.2 233,592 50.9 78,874 49.9 99,324 39.5
Total(1) . . . . . . . . . . . . 238,736 100.0 423,863 100.0 458,696 100.0 158,312 100.0 251,643 100.0
Note:(1) Excludes, among others, corporate and other unallocated expenses.
See the section headed “Financial Information—Segmentation” in this Prospectus for moreinformation on the items comprising segment results from our reportable operating segments.
181

BUSINESS
As depicted below, as of June 30, 2019, the geographic reach of the Portfolio Assets allows usto meet our tenants’ business and expansion needs in multiple locations in APAC and also gives ourcapital partners multiple jurisdictions in which to invest.
China
Japan
India
Singapore
Australia
SouthKorea
Kolkata, (3)
Pune, (3)Mumbai, (2)
Tokyo, (19)Nagoya, (3)
Osaka, (4)
Busan, (3)
Seoul, (21)
Singapore, (56)
Dalian, (3)
Shenyang, (1)
Beijing, (1)
Tianjin, (3)Langfang, (4)
Jilin, (1)
Suzhou, (3)Kunshan, (12)
Quanzhou, (1)
Guangzhou, (5)Dongguan, (5)
Jinan, (1)
Foshan, (1)
Chengdu, (3)
Changsha, (3)
Wuhan, (6)
Taicang, (2) Hangzhou, (5)
Shanghai, (9)
Ningbo, (2)
Pinghu, (2)
Wuxi, (4)Chongqing, (1)
ChungCheongnamdo(Central), (1)
Qingyuan, (1)
Fenhu, (2)Wenzhou, (1)
Fuzhou, (1)
Gedian, (2)
Chennai, (1)
New South Wales, (28)
Queensland, (17)
Victoria, (18)
Western Australia, (5)
South Australia, (1)
Note:( ) Number in bracket is the number of properties we own or manage.
As of June 30, 2019, we owned or managed: (i) completed GFA of 8.5 million sq.m; (ii) GFAunder construction of 4.4 million sq.m; and (iii) GFA on land held for future development ofapproximately 2.4 million sq.m. As of the Latest Practicable Date, we also entered into a number ofMOUs to acquire properties for our balance sheet representing GFA of approximately 2.6 million sq.m.in the PRC and MOUs to acquire properties for the funds and investments vehicles we managerepresenting GFA of approximately 5.9 million sq.m. across the PRC, Japan, South Korea, India andAustralia. As of June 30, 2019, 71.5% of the Portfolio Assets in terms of GFA were held by the fundsand investment vehicles that we manage, with the rest held on our balance sheet.
Development
We develop logistics properties on our balance sheet and through the funds and investmentvehicles we manage. We have established efficient, high-quality and scalable greenfield and
182

BUSINESS
brownfield logistics facilities development capabilities in each country where we operate with ourextensive in-house expertise from selection and acquisition of sites to the design, construction andleasing of modern logistics facilities. These facilities are characterized by large floor plates, highceilings, wide column spacing, spacious and modern loading docks as well as enhanced safety systemsand other value-added features. We conduct feasibility studies, master planning, project design, projectcost analysis and project management for each of our logistics properties. We contract with andsupervise third-party construction companies to construct the logistics facilities. In Australia, followingour acquisition of CIP, we have acquired in-house construction capabilities.
We earn development profit through the development, construction and sale of completedproperties from our balance sheet. We also derive pro rata earnings and pro rata value appreciationthrough the development activities of the development funds and investment vehicles we manage inproportion to our co-investments in those funds and investment vehicles. Our business model allows usto transfer properties under development to our funds and investment vehicles, from which we derivefund management fees, including development fees and acquisition fees. Additionally, our ability todevelop certain properties on our balance sheet gives us the ability to seed funds with fully developedand stabilized properties from our balance sheet, which not only facilitates fundraising but also helpsus to realize development gains when we dispose of such properties.
Our development activities are led, in addition to our co-founders Mr. Jinchu Shen, Mr. StuartGibson and Mr. Charles Alexander Portes, by local teams that we have established in each country inwhich we operate. Mr. Adrian Chui, CEO and executive director of ESR-REIT, has over 18 years ofexperience in real estate developers, REITs, banking and capital markets in Singapore and ASEAN.Mr. Thomas Nam, CEO of ESR Korea and former head of Prologis in South Korea, and Mr. JihunKang, CIO of ESR Korea, are both considered logistics real estate industry leaders in South Korea. Mr.Abhijit Malkani, a director of ESR India, has over 18 years of experience in commercial and industrialreal estate operations in North America, Europe, the Middle East and Asia, including 11 years ofexperience in logistic and industrial real estate in India, and was recently the Head of BusinessDevelopment for IndoSpace (currently one of the largest logistics real estate platforms in India). Mr.Jaikumar Mirpuri, one of the country heads of ESR India, has over 15 years of experience in real estateinvestment and fund management in Asia and North America. Mr. Philip Pearce, CEO of ESRAustralia, has over 20 years of experience in real estate in APAC and was formerly Managing Directorfor Greater China for the Goodman Group from 2013 to 2016 where he was responsible for theestablishment of the Goodman Group’s business in China.
In August 2018, we acquired CIP for approximately AUD40.1 million (approximately US$27.3million) to launch our business in Australia. CIP is an integrated development group with a nationalpresence in Australia and has developed more than 1.6 million sq.m of commercial and industrial realestate projects, with a combined value of over US$1.9 billion as of June 30, 2019. CIP has adevelopment pipeline of 578,801 sq.m across Australia’s eastern seaboard in connection withconstruction projects for third parties. We intend to leverage CIP’s construction capabilities to developlogistics properties for our own balance sheet and the funds and investment vehicles we manage.
In each country where we operate, we endeavor to acquire strategic locations to build logisticsfacilities. We also purchase existing logistics facilities, generally with a view towards refurbishing,expanding, modernizing or replacing them.
183

BUSINESS
The modern logistics properties that we develop generally offer the following key features:
Š Optimal space utilization. Large floor plates, high ceilings and wide column spacing.
Š High operating efficiency. Spacious loading and parking areas equipped with modernloading docks.
Š Storage safety. Security and surveillance features, proper ventilation and basicfire-fighting features such as sprinkler systems.
Š Flexibility to provide customized features. Office space, air-conditioning and refrigeration/freezing.
The following pictures illustrate certain of our logistics properties:
Jiangsu Friend—III (China) (directly owned by us) is a multi-story ramped distribution center located in Jiangsu Provence. Completed in2017, this facility is four stories tall and has a GFA of 206,418 sq.m.
184

BUSINESS
Nanko—I (Japan) (owned by a fund managed by us) is a double-ramped multi-story distribution center strategically located at the port ofOsaka. Completed in 2016, this facility is four stories tall and has a GFA of 125,813 sq.m.
Bucheon (Korea) (owned by a fund managed by us) is a prime infill ramped multi-story distribution center located in Bucheon, Gyeonggi.Completed in 2018, this facility has a GFA of 304,916 sq.m.
185

BUSINESS
The table below summarizes the GFA and number of properties for development completionsduring the Track Record Period:
As of December 31, As of June 30,
2016 2017 2018 2019
(sq.m inthousands)
Numberof
properties(sq.m in
thousands)
Numberof
properties(sq.m in
thousands)
Numberof
properties(sq.m in
thousands)
Numberof
propertiesDevelopment completion of on-balance
sheet propertiesThe PRC . . . . . . . . . . . . . . . . . . . . . . 40.4 1 206.4 1 88.2 2 22.5 1Australia . . . . . . . . . . . . . . . . . . . . . . — — — — 9.2 1 10.9 2Total . . . . . . . . . . . . . . . . . . . . . . . . . 40.4 1 206.4 1 97.4 3 33.4 3
Development completion of propertiesheld by funds and investmentvehicles we manage
The PRC . . . . . . . . . . . . . . . . . . . . . . 97.6 1 661.4 7 257.6 5 272.0 4Japan . . . . . . . . . . . . . . . . . . . . . . . . . 239.7 4 269.8 4 382.1 3 205.2 1South Korea . . . . . . . . . . . . . . . . . . . — — 205.4 1 449.5 5 199.7 1India . . . . . . . . . . . . . . . . . . . . . . . . . — — — — 9.9 1 — —Total . . . . . . . . . . . . . . . . . . . . . . . . . 337.3 5 1,136.6 12 1,099.2 14 676.9 6
186

BUSINESS
The
follow
ingtablesets
forthde
tailsof
thede
velopm
entp
rope
rtieshe
ldon
ourba
lanc
esh
eetb
yge
ograph
iclocation
asof
theda
tesindicated:
Sept
embe
r30
,201
9Ju
ne30
,201
9
Pro
perty
Loc
ation
Status
Exp
ectedye
arof
completion
Lan
dar
eaGFA
Total
Valua
tion
(4)
Lan
dar
eaGFA
Total
estimated
deve
lopm
entco
st(5)Dev
elop
men
tco
stincu
rred
Intere
sthe
ldby
our
Com
pany
(sqm
)(U
S$in
millions
)(sqm
)(U
S$in
millions
)
The
PRC
....
....
....
..1,80
4,85
91,71
0,56
645
4.9
1,56
8,57
81,49
9,80
273
6.4
282.6
Wuh
anM
inglon
g..
....
..W
uhan
Lan
dN/A
(3)
102,28
261
,534
9.4
102,28
261
,534
100%
Cho
ngqing
Yon
gxiang
....
Cho
ngqing
Und
erCon
struction
2019
266,03
714
8,11
568
.826
6,03
714
8,11
510
0%(6)
Sha
ngha
iYurun
....
....
.Sha
ngha
iUnd
erCon
struction
2020
260,02
634
2,78
715
5.6
260,02
634
2,78
774
%Cha
ngsh
aYizhu
—II
....
.Cha
ngsh
aUnd
erCon
struction
2020
67,896
67,366
27.6
67,896
67,366
100%
Fen
huQua
nshe
ng..
....
..Zhe
jian
gUnd
erCon
struction
2019
39,840
24,722
9.6
39,840
24,722
55%
JilinDaling..
....
....
...Jilin
Und
erCon
struction
2019
147,75
094
,403
58.0
147,75
094
,403
100%
Qingy
uanAnq
ing..
....
..Qingy
uan
Lan
d20
2017
5,99
310
7,88
219
.017
5,99
310
7,88
290
%(7)
Sha
ngha
iYisi..
....
....
.Lan
gfan
gLan
d20
2153
,334
65,736
9.7
53,334
65,736
100%
Pingh
uDus
hang
ang
....
..Zhe
jian
gLan
d20
2110
0,00
024
5,57
115
.910
0,00
024
5,57
110
0%W
enzh
ouRuian
....
....
.Zhe
jian
gUnd
erCon
struction
2020
86,667
129,17
320
.686
,667
129,17
310
0%Jian
gnan
Chu
anting
....
..Sha
ngha
iUnd
erCon
struction
2020
33,333
35,815
20.2
33,333
35,815
100%
Lan
gfan
gHen
gjia
....
....
Lan
gfan
gLan
d20
2166
,638
82,064
12.4
66,638
82,064
100%
FujianPingfu
....
....
...Fujian
Lan
d20
2016
8,78
294
,634
10.3
168,78
294
,634
100%
(8)
Wuh
anDen
so(1)..
....
...W
uhan
Lan
d20
2061
,911
38,464
3.1
N/A
N/A
100%
Jiax
ingHaining
(1)..
....
..Jiax
ing
Lan
d20
2185
,371
103,00
64.7
N/A
N/A
100%
Gua
ngdo
ngJiey
ang(
1)..
...Jiey
ang
Lan
d20
2188
,999
69,294
9.9
N/A
N/A
100%
Japa
n..
....
....
....
...
293,27
387
5,12
374
8.6
293,27
387
5,12
31,39
0.2
503.1
RW
Higashi-O
gish
imaDC
PH1(
2)..
....
....
....
.Tok
yoUnd
erCon
struction
2022
77,723
310,67
023
9.9
77,723
310,67
070
%RW
Higashi-O
gish
imaDC
PH2(
2)..
....
....
....
.Tok
yoUnd
erCon
struction
2024
66,116
264,45
318
3.2
66,116
264,45
370
%ESR
Sac
hiura2A
DC
....
.Tok
yoLan
dN/A
149,43
430
0,00
015
9.0
149,43
430
0,00
010
0%ESR
Sac
hiura2B
DC
....
.Tok
yoLan
dN/A
166.5
100%
Aus
tralia
....
....
....
..18
4,83
035
,870
48.4
184,83
035
,870
60.8
5.9
Lan
eCov
e..
....
....
...New
Sou
thW
ales
Lan
dN/A
N/A
N/A
6.0
N/A
N/A
92%
Bring
elly
Bus
inessPark
(CFC
Group
andSteel
Force
)..
....
....
....
.New
Sou
thW
ales
Und
erCon
struction
2019
44,397
18,363
14.0
44,397
18,363
92%
Berrinb
a..
....
....
....
.Que
enslan
dLan
dN/A
41,781
N/A
5.2
41,781
N/A
92%
Yatala..
....
....
....
...Que
enslan
dLan
dN/A
26,116
N/A
3.9
26,116
N/A
92%
Willawon
g..
....
....
...Que
enslan
dLan
dN/A
61,426
N/A
10.3
61,426
N/A
92%
Welling
tonRd
....
....
..Victoria
Und
erCon
struction
2020
11,110
17,507
9.1
11,110
17,507
46%
India..
....
....
....
....
607,37
434
6,41
115
.160
7,37
434
6,41
113
0.5
11.3
Mum
bai2
....
....
....
..M
umba
iUnd
erCon
struction
2021
183,71
611
6,49
91.2
183,71
611
6,49
910
0%Kolka
ta..
....
....
....
..Kolka
taLan
d20
2147
,708
30,658
1.4
47,708
30,658
82%
Palav
a..
....
....
....
...M
umba
iLan
d20
2237
5,95
019
9,25
312
.537
5,95
019
9,25
359
%
Not
es:
(1)
Weac
quired
theseprop
erties
post
June
30,2
019.
(2)
Weplan
todisp
oseof
RW
Higashi-O
gish
imaDC
toane
wde
velopm
entfun
dan
dtherea
fter
commen
cerede
velopm
ento
ftheprop
erty
intw
oph
ases,s
tartingin
theseco
ndqu
arterof
2020
.
187
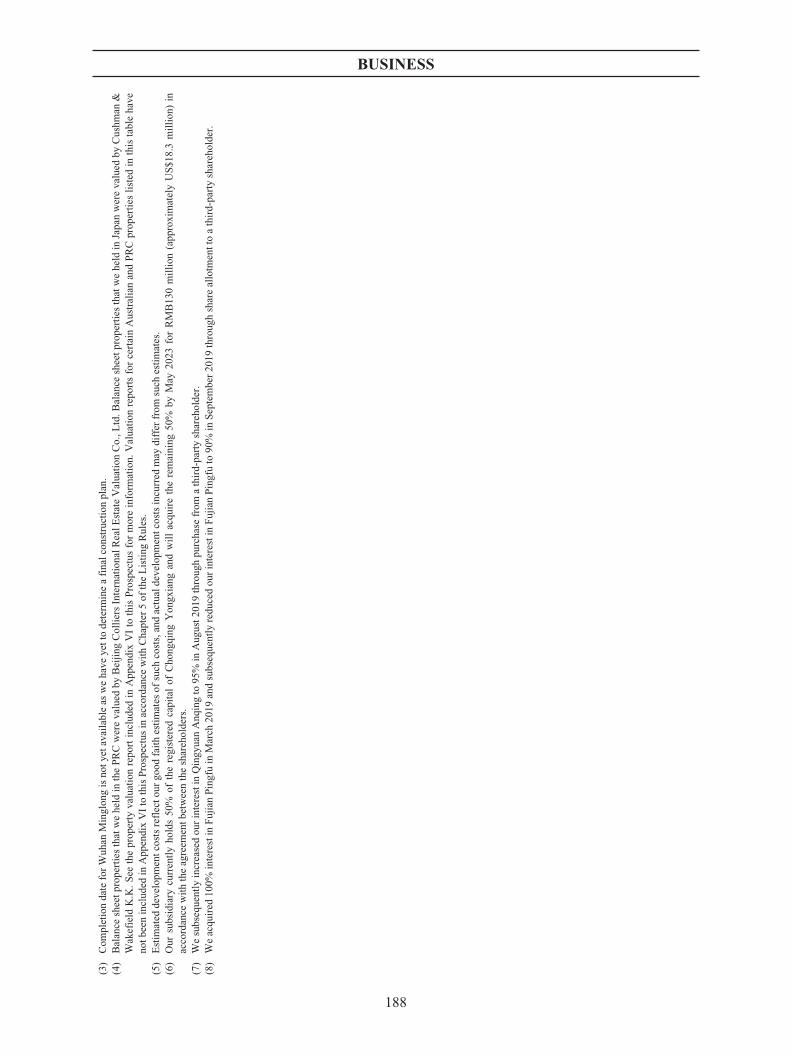
BUSINESS
(3)
Com
pletionda
teforW
uhan
Minglon
gis
noty
etav
ailableas
weha
veye
ttode
term
ineafina
lcon
structionplan
.(4)
Balan
cesh
eetp
rope
rtiesthat
wehe
ldin
thePRC
wereva
lued
byBeijing
ColliersInternationa
lRea
lEstateValua
tion
Co.,L
td.B
alan
cesh
eetp
rope
rtiesthat
wehe
ldin
Japa
nwereva
lued
byCus
hman
&W
akefield
K.K
.See
theprop
erty
valuationrepo
rtinclud
edin
App
endixVIto
this
Prosp
ectusformoreinform
ation.
Valua
tion
repo
rtsforce
rtainAus
tralianan
dPRC
prop
erties
listed
inthis
tableha
veno
tbee
ninclud
edin
App
endixVIto
this
Prosp
ectusin
acco
rdan
cewithCha
pter
5of
theListing
Rules.
(5)
Estim
ated
deve
lopm
entc
osts
reflec
tour
good
faithestimates
ofsu
chco
sts,an
dac
tual
deve
lopm
entc
osts
incu
rred
may
differ
from
such
estimates.
(6)
Our
subs
idiary
curren
tlyho
lds50
%of
theregistered
capitalof
Cho
ngqing
Yon
gxiang
andwillac
quiretheremaining
50%
byM
ay20
23forRM
B13
0million
(app
roximatelyUS$1
8.3million
)in
acco
rdan
cewiththeag
reem
entb
etwee
nthesh
areh
olde
rs.
(7)
Wesu
bseq
uently
increa
sedou
rinterest
inQingy
uanAnq
ingto
95%
inAug
ust2
019throug
hpu
rcha
sefrom
athird-pa
rtysh
areh
olde
r.(8)
Weac
quired
100%
interest
inFujianPingfuin
March
2019
andsu
bseq
uently
redu
cedou
rinterest
inFujianPingfuto
90%
inSep
tembe
r20
19throug
hsh
areallotm
enttoathird-pa
rtysh
areh
olde
r.
188

BUSINESS
The RW Higashi-Ogishima DC property generated an income of JPY811.7 million(approximately US$7.5 million) for the six months ended June 30, 2019. We intend to dispose of theproperty to a new development fund. Thereafter, we plan to redevelop the property starting in thesecond quarter of 2020 in two phases in order to minimize the impact of the development process onincome generated from the property.
The following table sets forth details of the development properties held by our joint venturesand other funds and investment vehicles we managed as of June 30, 2019:
Number ofproperties Total GFA
Interest held byour Company(1)
(sq.m inthousands)
Joint venturese-Shang Star Cayman Limited (PRC) . . . . . . . . . . . . . . . . . . . . . . . . . . . 9 782.0 25.6%—Properties under construction . . . . . . . . . . . . . . . . . . . . . . . . . . . . . . . 4 344.2—GFA on land held for future development . . . . . . . . . . . . . . . . . . . . . 5 437.9
Sunwood Star Pte. Ltd (South Korea) . . . . . . . . . . . . . . . . . . . . . . . . . . . 11 1,173.3 20.0%—Properties under construction . . . . . . . . . . . . . . . . . . . . . . . . . . . . . . . 7 629.5—GFA on land held for future development . . . . . . . . . . . . . . . . . . . . . 4 543.9
ESR India Logistics Fund Pte. Ltd. (India) . . . . . . . . . . . . . . . . . . . . . . . 4 446.3 100.0%(2)
—Properties under construction . . . . . . . . . . . . . . . . . . . . . . . . . . . . . . . 3 307.6—GFA on land held for future development . . . . . . . . . . . . . . . . . . . . . 1 138.7
Other funds and investment vehiclesThe PRC . . . . . . . . . . . . . . . . . . . . . . . . . . . . . . . . . . . . . . . . . . . . . . . . . 5 549.5 2.3%Japan . . . . . . . . . . . . . . . . . . . . . . . . . . . . . . . . . . . . . . . . . . . . . . . . . . . . 8 1,003.5 9.6%Australia . . . . . . . . . . . . . . . . . . . . . . . . . . . . . . . . . . . . . . . . . . . . . . . . . 1 14.7 15.0%
Note:(1) For other funds and investment vehicles, the percentage interest held by our Company is calculated on a weighted average basis by
reference to the GFA of the properties held under the applicable funds and investment vehicles.(2) We are in the process of issuing 50% of the shares in the India Fund to our joint venture partner.
Certain key projects in Japan and Korea held in the development funds include (i) theconstruction of a modern logistics facility with a GFA of over 360,000 sq.m. and total estimateddevelopment cost of over US$700 million in Amagasaki, Hyogo prefecture of Japan, expected to becompleted in March 2020, (ii) construction of a modern logistics facility in the Gimpo area targetingthe Infill West market of the Greater Seoul region, with a total GFA of over 137,000 sq.m. and totalestimated development cost of over US$230 million, expected to be completed in the first quarter of2020, (iii) construction of a modern logistics facility in the City of Anseong targeting the SuburbanEast market of the Greater Seoul region, with a total GFA of over 150,000 sq.m. and total estimateddevelopment cost of over US$160 million, expected to be completed in the second quarter of 2020, and(iv) construction of a multi-building modern logistics complex in the City of Gwangju targeting theInfill East market of the Greater Seoul region, with a total GFA of over 180,000 sq.m. and totalestimated development cost of over US$280 million, expected to be completed in 2021.
189

BUSINESS
CIP
The table below summarizes the top five construction projects of CIP by revenue recognized inthe six months ended June 30, 2019.
Project LocationContractamount
Revenuerecognized
(US$ in thousands)
My Chemist W/house-Civil Works . . . . . . . . . . . . . . . . . . . . . . . . . . . . . New South Wales 18,739 2,967Mitre10-Gilmore Rd Dev Profit . . . . . . . . . . . . . . . . . . . . . . . . . . . . . . . Queensland 15,129 5,525VFS, Drystone Development . . . . . . . . . . . . . . . . . . . . . . . . . . . . . . . . . Victoria 10,525 8,047Bringelly Est & Infrst Works . . . . . . . . . . . . . . . . . . . . . . . . . . . . . . . . . New South Wales 9,651 4,027Goodman Fielder, Darra Dev . . . . . . . . . . . . . . . . . . . . . . . . . . . . . . . . . Queensland 4,929 2,355
In the fiscal year ended June 30, 2019, CIP completed 4 construction projects and recognizedUS$37.7 million in revenue. Since our acquisition of CIP and up to the end of the Track Record Period,CIP contributed US$40.7 million to our revenue for the year ended December 31, 2018 and US$37.7million to our revenue for the six months ended June 30, 2019, from projects representing totalcontracted amounts of US$216.1 million. As of the Latest Practicable Date, CIP has a total of 16 projectseither committed or ongoing, 6 of which are estimated to be completed in 2019. As part of our broaderbusiness strategy, we intend to leverage CIP’s construction capabilities to build logistics facilities in-house for our own balance sheet and the funds and investment vehicles we manage in the future.
Development Process
We have established extensive standards and procedures in connection with the entiredevelopment process which are mainly monitored by a sub-committee of our Board, includingprocedures related to initial project assessment and site selection, land acquisition, project planning anddesign, project construction, and project monitoring and quality control. Although we typically utilizeour in-house capabilities throughout the entire development process, we also engage third partyconsultants to assist our in-house teams in the project assessment, site selection, construction andproperty management process and occasionally in the leasing process. We also follow extensivestandards in connection with our redevelopment projects, including procedures related to initial projectassessment, property acquisition, project planning and design, project construction, and projectmonitoring and quality control.
Project Assessment and Site Selection
We assess several factors when conducting research in a target market, including the following:
Š macro-economic indicators, local industry structure, demographics, purchasing power andconsumption pattern, maturity of local logistics facilities market and competitivelandscape;
Š state of development in the region, supporting infrastructure, distance to city centers,transportation connectivity, local government policy and track record; and
Š geographical characteristics and price of the target land to be acquired.
We also conduct feasibility studies on potential projects for development by evaluating keyindicators such as:
Š development potential of the project, potential tenants and expected rent and leasingtimeline;
190

BUSINESS
Š cost of development;
Š source and costs of financing; and
Š potential investment return.
We regularly hire third-party consultants to assist our in-house teams in the project assessmentand site selection process to perform, among other things, environmental due diligence, engineeringdue diligence, land surveys and market research.
Land Acquisition
Set forth below are the major procedures we carry out during the land acquisition stage:
Š our local teams actively communicate with the local government or the private landownerwith regard to the land acquisition process and undertake site visits and carefully reviewindicative terms of the investment agreements in connection with the propertydevelopment project;
Š a subcommittee of our board reviews and approves the acquisition plan and principalterms of the investment agreement; and
Š we acquire land in both primary and secondary transactions and participate in publictenders, auctions and listing-for-sale processes to acquire the land, as applicable.
Substantially all of our logistics properties in Japan, South Korea and Australia are held onfreehold land. Substantially all of our logistics properties in India are under long term lease agreementswith the Indian government that convey land use rights and the right to derive profit from the use of theproperty. Substantially all of our logistics properties in the PRC are held under long-term land userights granted by the PRC Government that convey the right to derive profit from, and dispose of, theproperty and the land use rights. All of our logistics properties in Singapore are held on land leasedfrom Singapore government agencies for varying tenures.
Project Planning and Design
We have established a comprehensive project design process that aims to satisfy therequirements of modern logistics facilities. We have also established specific design guidelines forlogistics facilities that suit the different climates across APAC, with logistics facilities tailored for coldchain logistics services and multi-floor logistics facilities designs. We believe this standardized projectdesign approach enhances the scalability of our business model as well as our ability to control thequality and costs of our logistics facilities.
Project Construction
We hire third-party contractors to undertake the construction of properties, and we manage theconstruction through our local construction management department, with the exception of ourbusiness in Australia since our acquisition of CIP in August 2018 which has in-house constructioncapabilities. Our construction management department reviews the key parameters for our projectconstruction process, sets the evaluation criteria and sets out the main responsibilities of each projectcompany. Our construction management department establishes the scope of centralized procurementand supply, delivery standards, construction standards and quality control specifications. Ourconstruction management department oversees the day-to-day construction process carried out by ourcontractors.
191
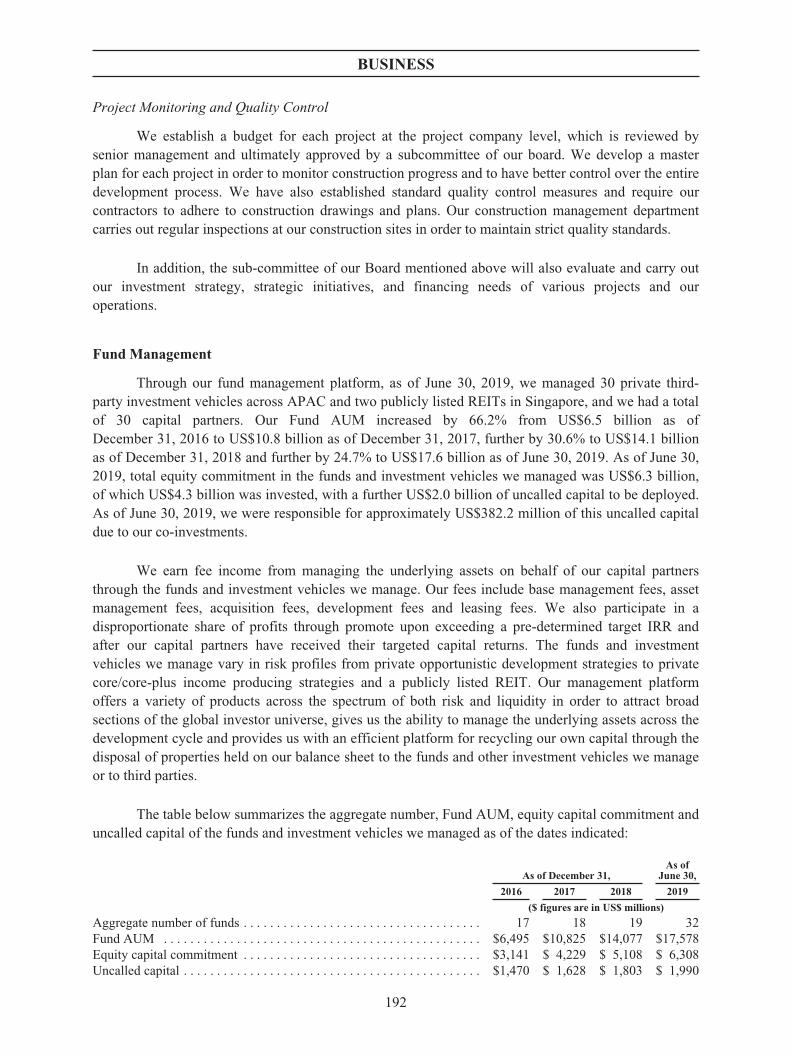
BUSINESS
Project Monitoring and Quality Control
We establish a budget for each project at the project company level, which is reviewed bysenior management and ultimately approved by a subcommittee of our board. We develop a masterplan for each project in order to monitor construction progress and to have better control over the entiredevelopment process. We have also established standard quality control measures and require ourcontractors to adhere to construction drawings and plans. Our construction management departmentcarries out regular inspections at our construction sites in order to maintain strict quality standards.
In addition, the sub-committee of our Board mentioned above will also evaluate and carry outour investment strategy, strategic initiatives, and financing needs of various projects and ouroperations.
Fund Management
Through our fund management platform, as of June 30, 2019, we managed 30 private third-party investment vehicles across APAC and two publicly listed REITs in Singapore, and we had a totalof 30 capital partners. Our Fund AUM increased by 66.2% from US$6.5 billion as ofDecember 31, 2016 to US$10.8 billion as of December 31, 2017, further by 30.6% to US$14.1 billionas of December 31, 2018 and further by 24.7% to US$17.6 billion as of June 30, 2019. As of June 30,2019, total equity commitment in the funds and investment vehicles we managed was US$6.3 billion,of which US$4.3 billion was invested, with a further US$2.0 billion of uncalled capital to be deployed.As of June 30, 2019, we were responsible for approximately US$382.2 million of this uncalled capitaldue to our co-investments.
We earn fee income from managing the underlying assets on behalf of our capital partnersthrough the funds and investment vehicles we manage. Our fees include base management fees, assetmanagement fees, acquisition fees, development fees and leasing fees. We also participate in adisproportionate share of profits through promote upon exceeding a pre-determined target IRR andafter our capital partners have received their targeted capital returns. The funds and investmentvehicles we manage vary in risk profiles from private opportunistic development strategies to privatecore/core-plus income producing strategies and a publicly listed REIT. Our management platformoffers a variety of products across the spectrum of both risk and liquidity in order to attract broadsections of the global investor universe, gives us the ability to manage the underlying assets across thedevelopment cycle and provides us with an efficient platform for recycling our own capital through thedisposal of properties held on our balance sheet to the funds and other investment vehicles we manageor to third parties.
The table below summarizes the aggregate number, Fund AUM, equity capital commitment anduncalled capital of the funds and investment vehicles we managed as of the dates indicated:
As of December 31,As of
June 30,
2016 2017 2018 2019
($ figures are in US$ millions)
Aggregate number of funds . . . . . . . . . . . . . . . . . . . . . . . . . . . . . . . . . . . . 17 18 19 32Fund AUM . . . . . . . . . . . . . . . . . . . . . . . . . . . . . . . . . . . . . . . . . . . . . . . . $6,495 $10,825 $14,077 $17,578Equity capital commitment . . . . . . . . . . . . . . . . . . . . . . . . . . . . . . . . . . . . $3,141 $ 4,229 $ 5,108 $ 6,308Uncalled capital . . . . . . . . . . . . . . . . . . . . . . . . . . . . . . . . . . . . . . . . . . . . . $1,470 $ 1,628 $ 1,803 $ 1,990
192

BUSINESS
Overview of Funds and Investment Vehicles
We categorize the funds and investment vehicles we manage into: (i) development funds; and(ii) core/core-plus funds and REITs.
Š Our development funds are private real estate funds that invest in opportunistic andstrategic investments such as greenfield or brownfield developments and which may entailhigher risks but offer the potential for greater returns.
Š Our core/core-plus funds and REITs include private real estate funds and two REITs.These funds typically have a lower risk profile than our development funds and focus onincreasing yields and returns through the acquisition of properties with stable incomes thatare yield-accretive and which offer potential for growth through asset enhancement and/oran active leasing strategy. Our core-plus funds may also invest in value-add opportunities,such as redevelopments of existing structures, that have higher income growth potentialbut still have lower risk profiles than ground-up developments.
193

BUSINESS
The
tablebe
low
summarizes
thefund
san
dinve
stmen
tveh
iclesweman
aged
asof
June
30,2
019:
Inve
stmen
tve
hicleby
geog
raph
icfocu
sIn
ception
date
Com
mitmen
tpe
riod
(1)
Cap
ital
commitmen
ts(2)Unc
alled
capital
Fun
dAUM
(3)
GFA
Categ
ory
Intere
sthe
ldby
our
Com
pany
Inve
stmen
tfocu
s
(US$
inmillions
)(U
S$in
millions
)(U
S$in
millions
)(tho
usan
dsq
.m)
%The
PRC:
e-Sha
ngStarCay
man
Lim
ited
*..
....
...
5/20
143ye
ars(
4)86
3.3
181.3
1,73
4.7
2,08
7.8
Dev
elop
men
t25
.6Dev
elop
andinve
stin
mod
ernlogisticsfacilities
inthe
PRC
Red
woo
dChina
Log
istics
Fun
dLim
ited
Partnersh
ip..
....
....
....
....
....
.7/20
123ye
ars
440.0
1.5
685.4
1,22
9.1
Dev
elop
men
t2.3
Dev
elop
andinve
stin
adive
rsifiedpo
rtfolioof
distribu
tion
andlogisticsfacilities
inmainlan
dChina
focu
sing
onke
ypo
rtsan
dinfrastruc
ture
hubs
inTier1
and1.5cities
China
Inve
scoCoreFun
d*..
....
....
...
10/201
7N/A
190.0
—32
5.7
370.9
Core
16.3
Man
agean
dinve
stin
lower-risk,
long
-term
yielding
mod
ernlogisticsfacilities
inthePRC
NCICoreFun
d..
....
....
....
....
....
1/20
19N/A
163.7
—27
4.9
325.4
Core
10.0
Man
agean
dinve
stin
long
-term
yielding
mod
ern
logisticsfacilities
inthePRC
Japa
n:Red
woo
dJapa
nLog
istics
Fun
dII
Lim
ited
Partnersh
ip..
....
....
....
....
....
.3/20
163ye
ars
581.0
108.2
1,26
9.7
777.0
Dev
elop
men
t0.0(
7)Dev
elop
andinve
stin
real
estate
used
prim
arilyfor
indu
strial,w
areh
ousing
andlogisticspu
rpos
esloca
ted
inthereco
gnized
indu
strial
subm
arke
tsof
Greater
Tok
yo(w
ithafocu
son
theTok
yoBay
area
),Greater
Osaka
andNag
oya
Japa
nCoreFun
d*..
....
....
....
....
..12
/201
8N/A
392.2
—1,01
1.6
420.6
Core
17.0
Man
agean
dinve
stin
long
-term
yielding
mod
ern
logisticsfacilities
inJapa
nRJL
FIII..
....
....
....
....
....
....
..6/20
194ye
ars
698.6
643.3
1,70
7.6
196.6
Dev
elop
men
t20
.0Inve
stin
thede
velopm
ento
flarge-scale,
state-of-the
-art
logisticsfacilities
inthelargestm
etropo
litanarea
sof
Japa
n
Other
inve
stmen
tveh
icles(
5)(6)..
....
....
.Various
Various
953.5
254.8
2,94
0.7
840.1
Dev
elop
men
tVarious
Dev
elop
andinve
stin
selected
deve
lopm
entrea
lestate
used
prim
arilyforindu
strial,w
areh
ousing
andlogistics
purpos
esloca
tedin
thereco
gnized
indu
strial
subm
arke
tsof
Greater
Tok
yo(w
ithafocu
son
the
Tok
yoBay
area
),Greater
Osaka
andNag
oya
Sout
hKor
ea:
Sun
woo
dStarPte.L
td*
....
....
....
...
11/201
53ye
ars(
4)1,00
034
5.4
2,41
7.8
1,77
3.7
Dev
elop
men
t20
.0Dev
elop
andinve
stin
mod
ernlogisticsfacilities
loca
ted
intheSeo
ulan
dBus
anM
etropo
litanAreas
withthe
potentialtoco
nsider
othe
rregion
son
aca
se-by-ca
seba
sis
Sou
thKorea
CoreFun
d*..
....
....
....
7/20
18N/A
500
296.1
1,17
4.1
353.8
Core/Core-plus
10.0
Dev
elop
andinve
stin
mod
ernlogisticswareh
ousesin
Sou
thKorea
tocrea
tea“b
est-in-class”logistics
prop
erties
portfolio,
withfocu
son
theSeo
ulan
dBus
anM
etropo
litanAreas
withthepo
tentialtoco
nsider
othe
rregion
son
aca
se-by-ca
seba
sis
TELog
is(8)
....
....
....
....
....
....
.N/A
N/A
N/A
N/A
31.6
26.3
N/A
0.0
N/A
Sing
apor
e:ESR-R
EIT
....
....
....
....
....
....
..20
06N/A
N/A
N/A
2,22
7.8
1,31
0.0
REIT
8.9
Inve
stin
inco
me-prod
ucingreal
estate
andreal
estate
relatedassets
inSinga
pore
used
prim
arilyforindu
strial,
wareh
ousing
andlogisticspu
rpos
es.
Sab
anaREIT
....
....
....
....
....
....
2010
N/A
N/A
N/A
644.2
380.0
REIT
21.4
Inve
stin
inco
me-prod
ucingreal
estate
forindu
strial
purpos
esan
dreal
estate-related
assets
194

BUSINESS
Inve
stmen
tve
hicleby
geog
raph
icfocu
sIn
ception
date
Com
mitmen
tpe
riod
(1)
Cap
ital
commitmen
ts(2)Unc
alled
capital
Fun
dAUM
(3)
GFA
Categ
ory
Intere
sthe
ldby
our
Com
pany
Inve
stmen
tfocu
s
(US$
inmillions
)(U
S$in
millions
)(U
S$in
millions
)(tho
usan
dsq
.m)
%Aus
tralia:
PEP
....
....
....
....
....
....
....
...
8/20
167ye
ars
32.1
—62
.847
.2Core-plus
25.0
Inve
stin
adive
rsifiedpo
rtfolioof
Aus
tralian
assets
adop
ting
ava
luead
dstrategy
throug
hac
tive
assetm
anag
emen
t50
Ann
PEP..
....
....
....
....
....
...
5/20
177ye
ars
61.9
—11
4.3
25.5
Core-plus
25.0
Inve
stin
asing
leAus
tralianCBD
office
asset
adop
ting
ava
luead
dstrategy
throug
hac
tive
asset
man
agem
ent
PAIP
II..
....
....
....
....
....
....
..9/20
156ye
ars
99.2
—22
6.1
194.9
Core-plus
17.1
Inve
stin
Aus
tralianlogisticsassets
withafocu
son
active
assetm
anag
emen
tthrou
ghlease
rene
walsan
dtargeted
capitale
xpen
diture
toen
hanc
einco
me
PCII
....
....
....
....
....
....
....
...
11/201
55ye
ars
9.8
—22
.89.6
Core
7.5
Inve
stin
ane
wlong
WALEco
relogisticsassetin
Aus
tralia
POPIII
....
....
....
....
....
....
....
2/20
194ye
ars
41.6
—88
.020
.0Core-plus
11.2
Inve
stin
apo
rtfolioof
Syd
neyM
etro
office
assets
withafocu
son
active
assetm
anag
emen
tthroug
htargeted
capitale
xpen
diture
andleasing
PACT
....
....
....
....
....
....
....
.12
/201
75ye
ars
54.0
—13
7.7
14.7
Core-plus
15.0
Inve
stin
asing
leNorth
Syd
neyoffice
asset,
deploy
ingasu
bstantialrep
ositioning
andleasing
strategy
India:
IndiaFun
d*..
....
....
....
....
....
...
11/201
84ye
ars
228.0
159.3
480.8
508.5
Dev
elop
men
t10
0(9)
Inve
stin
inve
stmen
t-grad
elogistics,distribu
tion
andligh
tind
ustrialp
rope
rtiesin
major
econ
omic
centersin
India
Total
ofallfun
ds..
....
....
....
....
..6,30
8.4
1,98
9.9
17,578
.310
,911
.9
Not
es:
*Indica
testhat
theinve
stmen
tve
hicleis
setup
asajointve
nture.
Eac
hof
ourothe
rinve
stmen
tve
hicles,w
iththeex
ceptionof
oursepa
rate
acco
unts
andESR-R
EIT
,are
setup
aslimited
partne
rships
inwhich
weho
ldbo
thGPan
dLPinterests.
(1)
Com
mitmen
tpe
riod
gene
rallyrefers
tothepe
riod
oftimeafteraclos
ingdu
ring
which
capitalca
nbe
called
from
inve
storsto
fund
new
inve
stmen
ts,which
may
beex
tend
edup
onag
reem
entby
the
man
ager
andinve
storsfrom
timeto
time.
The
core/core-plus
fund
sweman
agedo
notha
vefixe
dco
mmitmen
tpe
riod
sas
capitalis
typica
llyfullyinve
sted
attheou
tset
ofou
rco
re/core-plus
fund
san
dinve
stmen
tveh
icles.
How
ever,the
inve
storsun
dertheco
re/core-plus
fund
san
dinve
stmen
tveh
iclesweman
agemay
beob
liga
tedto
mak
efollow
-oninve
stmen
tsfrom
timeto
timeifrequ
ired
tosu
pport
existing
inve
stmen
ts.
(2)
The
commitmen
trepresen
tstheag
greg
ateca
pitalco
mmitmen
tsto
thefund
orinve
stmen
tve
hicle,
asap
plicab
le,includ
ingca
pitalco
mmitmen
tsby
third-pa
rtyinve
storsan
dthege
neralpa
rtne
ror
inve
stmen
tman
ager.F
oreign
curren
cyco
mmitmen
tsha
vebe
enco
nvertedinto
U.S.d
ollars
basedon
:(i)theforeignex
chan
gerate
attheda
teof
purcha
seforea
chinve
stmen
t;an
d(ii)theex
chan
gerate
that
prev
ailedon
June
30,2
019,
intheca
seof
unca
lled
commitmen
ts.
(3)
The
target
leve
rage
ratioof
thefund
san
dinve
stmen
tveh
iclesweman
agetypica
llyrang
esbe
twee
n50
%to
65%,d
epen
ding
onthemarke
toftheun
derlying
prop
erties
andthefund
type
.(4)
From
Nov
embe
r20
17.
(5)
Weman
age14
othe
rinve
stmen
tveh
icleswhich
gene
rallyha
vefewer
(typ
ically
oneto
three)
inve
stors.
(6)
Weha
veeffected
thetran
sfer
of50
%of
theinterest
inalogisticsprop
erty
inJapa
n,which
was
held
jointlyby
twoof
ourde
velopm
entfun
ds,toaprivateREIT
that
wecu
rren
tlywho
lly-ow
n.(7)
Weho
ldminorityinterestsin
certainothe
rfund
san
dinve
stmen
tveh
icleswhich
co-inv
esta
long
side
Red
woo
dJapa
nLog
istics
Fun
dII
Lim
ited
Partnersh
ip,w
hich
resu
ltsin
useffectivelyow
ning
variou
sminorityinterestsin
theun
derlying
prop
erties.
(8)
TELog
isis
asing
leprop
erty
forwhich
weac
tasan
assetm
anag
erforathirdpa
rty.
The
prop
erty
man
agem
entfee
sthat
weea
rnfrom
this
prop
erty
arebo
oked
asman
agem
entfee
inco
me.
(9)
Wearein
theproc
essof
issu
ing50
%of
thesh
ares
intheIndiaFun
dto
ourjointv
enture
partne
r.
195

BUSINESS
Fund Structures
Private Real Estate Funds
Investors in our private real estate funds typically commit capital upon their subscription forinterests in the fund, which is then drawn down periodically as investment opportunities arise, typicallyover a commitment period of three to four years in the case of our development funds and investmentvehicles, which may be extended upon agreement by the manager and investors from time to time.After the commitment period, profits are returned to investors as investments are realized through thesale of such investments to our other funds and investment vehicles or to third parties, generally overthree to five years. Our core/core-plus funds and investment vehicles do not have fixed commitmentperiods as capital is typically fully invested at the outset of our core/core-plus funds and investmentvehicles. However, the investors under the core/core-plus funds and investment vehicles we managemay be obligated to make follow-on investments from time to time if required to support existinginvestments.
As the manager of the private real estate funds, we are responsible for the management of thefunds’ investment portfolio. We actively source real estate deals through our network and manage theinvestment process. We aim to add value through active management of the assets owned by the funds.We also seek opportunities to divest a fund’s investments upon stabilization of the underlying assets inorder to maximize IRR.
We invest a portion of our own capital in funds that we set up in order to align our interestswith investors. In the case of funds we set up as limited partnerships, we typically invest through anaffiliate of the GP. In the case of funds we set up as corporate vehicles such as joint ventures, wetypically invest as a shareholder. We determine the level of our own capital commitments based on avariety of factors, including estimates regarding our liquidity over the relevant time period, theamounts of capital that may be needed for other funds and our general working capital requirements.
As of June 30, 2019, we managed a total of 30 private real estate funds and investmentvehicles, 20 of which were development funds and 10 of which were core/core-plus funds. The totalequity commitment in these private real estate funds and investment vehicles amounts toUS$6.3 billion. As of June 30, 2019, a total of US$4.3 billion had been called from these private realestate funds, representing 68.0% of the total equity commitment. As of June 30, 2019, our private realestate funds had a total AUM of US$14.7 billion. We are the developer, asset and investment managerand retain a stake up to 50.0% in each private real estate fund.
Public Real Estate Funds—ESR-REIT and Sabana REIT
ESR-REIT is a Singapore-based REIT, principally investing directly or indirectly in income-producing real estate and real estate related assets in Singapore used primarily for industrial,warehousing and logistics purposes. ESR-REIT was listed on the SGX-ST on July 25, 2006. Throughthe successful acquisition of the ESR-REIT Manager in 2017, through which we manage ESR-REIT,we have broadened our APAC presence with an established REIT management team in Singapore. Thetransaction has also created an attractive capital recycling vehicle for us, as we now have the ability toinject stabilized assets from the funds and other investment vehicles we manage into ESR-REIT,subject to the relevant listing rules of SGX-ST, and as a result realize development gains on ourbalance sheet.
196

BUSINESS
As of June 30, 2019, ESR-REIT had a diversified portfolio of 56 properties located acrossSingapore consisting of business parks, high specification industrial properties, logistics facilities andlight industrial facilities. ESR-REIT’s portfolio has aggregate appraised carrying value ofapproximately SGD3.0 billion (approximately US$2.2 billion), a total GFA of approximately14.0 million square feet (approximately 1.3 million sq.m) as of June 30, 2019. As of June 30, 2019, wehad an interest of approximately 9.0% in ESR-REIT as a result of our ownership of 299,415,239 unitsin ESR-REIT and manage all of its assets as ESR-REIT’s property and asset manager.
The key objectives of the ESR-REIT Manager are to deliver secure and stable distributions tounitholders and to achieve long-term growth in net asset value per unit in order to provide unitholderswith a competitive rate of return for their investment.
The ESR-REIT Manager’s strategies to achieve these objectives include:
Š proactively managing ESR-REIT’s property portfolio to maximize returns;
Š selectively acquiring properties that meet its investment criteria and enhance unitholders’value;
Š divesting non-core properties; and
Š adopting prudent capital and risk management strategies.
In May 2018, ESR-REIT entered into an agreement with VIT, pursuant to which ESR-REITagreed to acquire all the issued and paid-up stapled securities of VIT held by the stapledsecurityholders of VIT by way of a trust scheme of arrangement for a consideration ofSGD936.7 million (approximately US$683.0 million). VIT is a Singapore-focused business park andindustrial property stapled group. The principal investment strategy of VIT is investing in a diversifiedportfolio of income-producing real estate predominantly for business parks and other industrialpurposes in Singapore and elsewhere in APAC. The VIT Merger took effect on October 15, 2018.Following the completion of the VIT Merger, we continue to manage the assets of the enlarged ESR-REIT as its property and asset manager.
Upon the completion of the Sabana Manager Acquisition and the Sabana REIT Investment, weindirectly held approximately 93.8% equity interest in Sabana Manager and approximately 21.2% ofthe total issued units in Sabana REIT. Sabana Manager is a company incorporated in Singapore and isthe fund manager of Sabana REIT. Sabana REIT has a diversified property portfolio valued atSGD872.2 million (approximately US$636.0 million) as of June 30, 2019, comprising 18 propertiesstrategically located across Singapore. Sabana REIT primarily invests in income-producing real estateused for industrial purposes and real estate-related assets. Its portfolio comprises quality industrialbuildings in four main industrial property segments: high-tech industrial park, warehouse and logistics,chemical warehouse and logistics as well as general industrial. For further details, please refer to thesection headed “History, Development and Corporate Structure—Major Acquisitions and Mergers—Sabana Manager Acquisition and Sabana REIT Investment” in this Prospectus.
Fund Management Fees
We receive management fees in exchange for our management services. These managementfees are paid either by the funds and investment vehicles or the project companies held by these fundsand investment vehicles, using the capital contributed from the investors and/or the sale proceeds from
197

BUSINESS
the investments. Our management fees include base management fees, asset management fees anddevelopment fees, which are recognized over time, and acquisition fees and leasing fees, which arerecognized at a point in time when such transactions occur. We also participate in a disproportionateshare of profits through a promote upon exceeding a pre-determined target IRR and after our capitalpartners have received their targeted capital returns. We earn more fees as we source new developmentopportunities, develop and dispose of assets from our balance sheet and from our development fundsand investment vehicles, and expand our fund management platform. Below is summary of the variousfees we receive from the funds and investment vehicles we manage, which may be subject to certainfee rebates and discounts pursuant to side agreements with certain of our capital partners. For example,some side agreements include discounts to management fees chargeable or one-off rebates in the eventof a budget overrun, as well as limited sharing of management fees if certain capital partners introducenew capital partners to the funds or investment vehicles managed by us.
Base Management Fees
We earn recurring base management fees from providing investment management services tothe funds and investment vehicles we manage. Base management fees for our private real estate fundsgenerally range from 1% to 2% per annum of committed or invested capital during the fund’scommitment period and are generally 1% to 2% per annum of invested capital after the expiration ofthe fund’s commitment period with subsequent reductions in fee percentages over time as investmentsare sold. Therefore, the percentage level of base management fees we earn depends almost exclusivelyon the percentage we are able to negotiate with our capital partners.
Asset Management Fees
We earn recurring asset management fees from providing asset management services in respectof the underlying assets held by the funds and investment vehicles we manage. Asset management feesfor our private real estate funds are typically around 1% per annum of invested capital or 0.5% perannum of gross asset value of the properties owned by the relevant funds.
Development Fees
We earn project development fees for each property we develop to completion in ourdevelopment funds. Development fees typically range from 4% to 5% of the total cost of theconstruction and development of the properties, excluding land costs and financing costs.
Acquisition Fees
We earn acquisition fees per transaction from the acquisition of land and properties.Acquisition fees typically range from 1% to 1.75% of the cost of land for land acquisitions and 0.5% to1.75% of the cost of properties for property acquisitions.
Leasing Fees
We earn leasing fees on a transactional basis on new leases or renewal of leases on theproperties held in the funds and investment vehicles we manage. Leasing fees typically range from 1 to2.5 months of average rental, depending on lease term.
198

BUSINESS
Promote
In addition to the profits allocable to us in proportion to our share of ownership in the funds andinvestment vehicles we manage, as the general partner to the funds managed by us and structured aslimited partnerships and as the investment manager to the investment vehicles managed by us andstructured as joint ventures, we are typically entitled to a promote, which allocates to us adisproportionate share of profits, upon exceeding a pre-determined target IRR for our investors. Thepromote is typically structured as a distribution waterfall such that we would share 10% to 37.5% ofthe net profits realized by the investors depending on the IRR achieved, subject to an initialperformance hurdle which requires that investors receive an IRR of 8% to 12% in most of our funds. In2018, the first year we began to recognize promote income, we recognized US$8.5 million in promoteincome. For the six months ended June 30, 2019, we recognized US$1.7 million in promote income.
Management of Funds and Investment Vehicles
As of June 30, 2019, we had more than 30 employees dedicated to our fund managementbusiness. The funds and investment vehicles we manage have different structures depending on theprofile of our capital partners, the investment restrictions of our funds and investment vehicles, thenature of the project (i.e. target return, equity funding requirements, costs, timing, diversification etc.),exit alternatives and tax considerations.
The funds and investment vehicles are structured as limited partnerships or corporate vehiclessuch that each capital partner’s liability is limited to their own capital commitment. The relationshipbetween our affiliate (acting as GP) and the capital partners (each a limited partner) to our funds andinvestment vehicles is governed by a limited partnership agreement, which sets out the key investmentterms (e.g. target IRR, investment restrictions, minimum capital commitments, commitment period,partnership term etc.), together with the rights, duties and liabilities of the partners. We also typicallyenter into a series of agreements with each of the funds and investment vehicles we manage for theprovision of fund management services. These agreements typically include an investmentmanagement agreement, as asset management agreement and a project or development managementagreement, as applicable. The property investments under each fund and investment vehicle are heldand managed under separate project companies that hold the actual property rights.
The GP has overall responsibility for the management, operation and administration of the fundor investment vehicle, as applicable (and for supervising and directing the investment manager andappraising its recommendations). The key responsibilities of the GP include:
Š approving funding requests upon decisions to invest by the investment manager;
Š maintaining the books and records;
Š making distributions to the limited partners;
Š entering into any agreements or other arrangements on behalf of the fund or investmentvehicle, as applicable; and
Š opening and maintaining bank accounts and effecting necessary payments on behalf of thefund or investment vehicle, as applicable.
199

BUSINESS
As permitted by law, the GP delegates day-to-day operations of the fund or investment vehicle,as applicable, and its portfolio to an affiliate pursuant to an investment management agreement. Thekey responsibilities of the investment manager include:
Š selecting, acquiring, developing and monitoring of projects;
Š preparing project budgets, business plans and valuation reports;
Š managing the cash and cash flows of the fund or investment vehicle, as applicable;
Š advising on the terms, timing and contractual agreements to dispose of projects;
Š negotiating and managing all debt financing relating to projects;
Š procuring and maintaining insurance for directors and officers and assets; and
Š obtaining recommendations on matters that fall outside of the investment restrictions toour funds and investment vehicles.
The GP and investment manager are also directed by an independent advisory committee,comprising representatives from the limited partners of the applicable fund or investment vehiclewhose capital commitments exceed a fixed monetary threshold. The advisory committees act by amajority of members and meet as required (in person or via teleconference). The advisory committeestypically have authority to, amongst other matters, consider and approve:
Š entry into any agreement or arrangement that involves an actual or potential conflictinvolving the GP, the investment manager and their respective affiliates;
Š any amendment to the investment restrictions of the fund or investment vehicle, asapplicable;
Š any investment that does not comply with the investment restrictions of the fund orinvestment vehicle, as applicable;
Š disposal of any project other than in accordance with the limited partnership agreement;
Š any borrowings or incurrence of indebtedness on behalf of the fund or investment vehicle,as applicable, or its project companies, which would result in the agreed loan-to-valueratio not being met;
Š any action to create any pledge, charge, lien, mortgage, or other security interest over anyasset of the fund or investment vehicle, as applicable;
Š any change in the dividend policy of the fund or investment vehicle, as applicable;
Š any settlement of legal proceedings involving the fund or investment vehicle, asapplicable, that exceeds a fixed monetary threshold; and
Š any project budget or business plan or amendment thereof which results in a materialchange to any item of expense or revenue (i.e. exceeding 10%).
Aside from the specific matters identified in the limited partnership agreement, these advisorycommittees do not: (i) participate in the management of the business or assets of our funds orinvestment vehicles; (ii) have any authority or power to take any action on behalf of the funds orinvestment vehicles; or (iii) have any right to appoint a representative to the board of any projectcompany. However, the GP will cast votes consistent with the advisory committee’s direction at thefund or investment vehicle level when voting on the board of any project company.
200

BUSINESS
The project company also engages a separate ESR affiliate as the asset manager and projectmanager to provide ‘local’ level services relating to assets in which the fund or investment vehicle, asapplicable, has invested. The key responsibilities of the asset manager and project manager include:
Š land and acquisition sourcing and providing due diligence for the investment manager forconsideration;
Š project financing, origination and structuring;
Š asset management (e.g. leasing arrangements with third party tenants); and
Š development management (e.g. procurement and appointing contractors).
Marketing of Funds
Our capital partner relationships are fundamental to our business. We aim to consistently actwith professionalism and integrity toward our capital partners. We have developed a following amongmany globally significant institutional investors. For example, investment vehicles managed by theAPG Group have invested with us in both China and Korea. Also, CPPIB first invested with us in ourdevelopment fund in South Korea in 2015 and then invested with us in our core fund in South Korea in2018. We believe investors follow us due to our investment record, our reputation for integrity and thetransparency of our fee structures. We continue to develop deep relationships with our capital partners.
We rely on our management and private capital team to generate referrals from existing orformer capital partners. We occasionally engage third-party placement agents for sales and marketingwith respect to our funds and investment vehicles, but the majority of our capital is generated throughinternal channels with institutional investors. A principal source of new transactions has been repeatbusiness from prior capital partners and their referral of new leads. We also have several capitalpartners who have further increased their initial capital commitments with existing funds andinvestment vehicles in “re-up” arrangements. To best match the most appropriate capital partners foreach of the funds and investment vehicles we manage, we target institutional investors that haveinvestment objectives in line with those of the particular fund or investment vehicle for which we seeknew investors, which is determined on a case-by-case basis depending on several factors, including,but not limited to, (i) the risk profile, return profile and/or income profile of the fund or investmentvehicle, (ii) the geographic focus, (iii) the types of assets targeted, (iv) the amount of investmentdiscretion retained by our Company, and (v) the capital commitments required.
Fund Investment Process
We believe we have established a rigorous investment process and a comprehensive duediligence approach across the funds and investment vehicles we manage as well as comprehensivecontrols to manage conflicts of interest. Each fund has its own investment criteria, policies, objectivesand procedures which generally specify investment requirements, limitations and approval processes,such as the type of real estate asset, sector and geographic focus, leverage limitations and investmentstrategies, which we believe serves to limit conflicts that could otherwise arise in identifying andallocating investment opportunities. For example, typical investment criteria for our funds andinvestment vehicles can include, but are not limited to: (i) limitations on investments to specificmetropolitan areas, (ii) requirements to invest in modern logistics development projects in the case of adevelopment fund or investment vehicle, or stabilized income-producing properties in the case of acore/core-plus fund or investment vehicle, (iii) minimum occupancy rates for the acquisition of
201

BUSINESS
existing assets, (iv) minimum GFA, (v) limitations on investment size or concentration, and (vi) targetreturns, including income yield and IRR, which are typically higher for the development funds andinvestment vehicles we manage and lower for the core/core-plus funds and investment vehicles wemanage. Target IRR for the development funds and investment vehicles we manage range from 13% to17%, while target IRR for the core/core-plus funds and investment vehicles we manage range from 9%to 13%. We have generally been able to meet or exceed our target returns during the Track RecordPeriod.
Our investment process for our funds and investment vehicles will also be subject to review byour internal audit department which reports to our Audit Committee directly. Our management teamand internal audit department work together to monitor the effectiveness of processes and risk controlmeasures. In addition to the terms of the organizational agreements of the funds and investmentvehicles we manage, which set forth procedures to resolve conflicts of interest among the Companyand the funds and investment vehicles we manage, we have also adopted a conflicts of interest policythat sets forth general principles that supplement the applicable organizational agreements.
The origination of our investments largely comes from opportunities identified by our extensivenetwork comprising our local business teams in the PRC, Japan, South Korea, Singapore, Australia andIndia, as well as through our relationships with developers, tenants, capital partners, bankers, assetowners and real estate consultants.
Management of Investment Opportunities
For any investment opportunity that we identify, our regional CEO in the relevant country andthe respective management team will allocate such investment opportunity based upon the fit with theinvestment criteria of our funds and investment vehicles. Once an opportunity is submitted to therelevant fund manager, it will be evaluated by the relevant investment committee and such committeewill decide whether to accept or reject such opportunity. For any investment opportunities that do notfit the investment objectives and criteria for any of our funds or investment vehicles, or that are notaccepted by the investor advisory committee of any of the funds or investment vehicles we manage, wewill make the decision of whether to invest in such opportunity solely on our own balance sheetpursuant to our group strategy in each of the countries where we operate. The final decision is made bya committee designated by our Board of Directors including certain executive Directors and seniormanagement members. In practice, we generally do not have overlapping fund mandates with similarstrategies or investment criteria in order to minimize conflicts over deal allocation. Nevertheless, wetake great care to ensure that investment opportunities are allocated fairly and equitably among thefunds and investment vehicles we manage in accordance with our contractual and fiduciary obligationsto them. Our conflicts of interest policy sets forth general investment allocation principles thatsupplement the organizational agreements of the funds and investment vehicles we manage, whichcover issues arising from parallel vehicles, predecessor and successor funds, co-investments andstrategic investors, and investments away from existing funds.
While our funds generally do not have overlapping mandates, prior to closing on an investmentfor which more than one fund or investment vehicle is eligible to participate, a committee designatedby the Board of Directors will, in consultation with the investment managers, provide a memorandumto the investment managers that explains the rationale for the final investment allocation. Thecommittee will also address the investment objectives of the funds or investment vehicles in question,the capital commitments available for investment by each fund or investment vehicle in question, any
202

BUSINESS
individual allocation rights granted to specific investors and the basis for the allocation recommendedto the investment managers. After review, the investment managers will determine whether to applythe allocation suggested by the committee or if any adjustments should be made. Any such departureswill be further determined by a committee designated by the Board of Directors.
Management of Conflicts of Interest
Because we provide asset management and development services to all the funds andinvestment vehicles we manage and acquire and sell assets as part of our business model, conflicts ofinterest arise from time to time. In general, the organizational agreements for each of the funds andinvestment vehicles we manage contain pre-agreed procedures for managing or obtaining investorconsent for conflicts of interests. In order to manage such conflicts, each of the funds and investmentvehicles that we manage have either investment committees or investor advisory committees or both,made up of representatives appointed by us and by capital partners in such relevant funds andinvestment vehicles. Such investment committees or investor advisory committees have approvalrights on certain pre-agreed reserved matters and conflicts of interest matters on the terms set out in theapplicable organizational agreements. When there is a transaction or any other issue where ourCompany has any actual or potential conflict of interest, our representatives recuse themselves fromthe vote.
Our Board of Directors has adopted a conflicts of interest policy and has designated a sub-committee that helps to manage conflicts of interest within the Company. Pursuant to our conflicts ofinterest policy, when an investment manager determines there is a conflict of interest, such managermust: (i) comply with the relevant provisions of the applicable organization agreements, together withall applicable laws and regulations; (ii) bring to the attention of the sub-committee of the matteridentified giving rise to such conflict of interest; (iii) either avoid the transaction giving rise to suchconflict of interest or refer such matter to the advisory board/committee or board of directors of therelevant fund or investment vehicle and obtain the necessary approval; and (iv) confirm withconcurrent approval of the sub-committee that any such conflicts of interest have been resolved.
From time to time and in accordance with our overall business strategy, we may undertake asale or transfer of certain assets from our own balance sheet to a fund or investment vehicle wemanage, or from one fund or investment vehicle to another fund or investment vehicle, where we act asan adviser on both sides. In such a situation, in addition to the procedures described above and subjectto the terms of all applicable organizational agreements, our conflicts of interest policy sets forthadditional measures, including independent third-party valuations, limited partner consent and recusalof Company representatives, in order to manage any potential conflicts of interest that may arise inthese transactions. In appropriate circumstances, the sub-committee may establish information barriersand additional conflict clearance procedures to ensure the proper management of conflicts of interestand that clients’ interests are preserved at all times. The relevant fund or investment vehicles may alsobe represented by separate external legal counsel.
Investment
Our investment segment is divided into three main categories: (i) completed properties that wehold on our balance sheet, from which we derive total return, including rental income and appreciationin value; (ii) our co-investments in the funds and investment vehicles and the REIT we manage, fromwhich we derive dividend income, pro rata earnings and/or pro rata value appreciation; and (iii) other
203

BUSINESS
investments, including our minority equity stakes in other companies, such as our 13.7% stake inCNLP as of June 30, 2019, a major logistics infrastructure and service provider in the PRC which had150 logistics facilities in operation in 32 logistics parks with a total GFA of 4.6 million sq.m in 16provinces or centrally administered municipalities across the PRC as of December 31, 2018.
We use our strong balance sheet to acquire and own assets that have attractive risk-rewardprofiles and capture opportunities which may not fit the current investment criteria of our funds, andwhich may be used to seed future funds that we may establish. We are able to develop propertieswithout the need to source equity for every individual project and can warehouse properties on ourbalance sheet if needed. This provides attractive visibility to prospective capital partners and is animportant advantage of our platform, which facilitates faster fundraising and enables us to realizedevelopment profits. Additionally, our investments in properties through our co-investments in thefunds and investment vehicles we manage allow us to align our interests with those of our capitalpartners.
Balance Sheet Properties
The following table summarizes the completed investment properties held on our balance sheetby geographic location as of the dates indicated. Completed investment properties held on our balancesheet accounted for 10.4% of the Portfolio Assets by GFA as of June 30, 2019.
Location
Yearcompleted
oracquired
September 30, 2019 June 30, 2019
Property GFA Valuation(1) GFAOccupancy
rate WALE(2)
Interestheld by theCompany
(sq.m)(US$
in millions) (sq.m)
The PRCJiangsu Friend—I . . . . . . . . . Jiangsu 2011 135,081 130.8 135,081 99% 3.4 100%Jiangsu Friend—II . . . . . . . . Jiangsu 2013 85,508 83.0 85,508 100% 4.3 100%Langfang Weidu . . . . . . . . . . Hebei 2013 71,687 65.0 71,687 100% 2.5 100%Dongguan Machong . . . . . . . Guangdong 2014 85,066 84.7 85,066 100% 1.9 100%Dongguan Hongmei . . . . . . . Guangdong 2014 62,343 53.5 62,343 100% 5.6 100%Tianjin Fanbin . . . . . . . . . . . . Tianjin 2014 106,616 90.3 106,616 100% 1.7 100%Guangzhou Mingyue—I . . . . Guangdong 2014 37,094 58.7 37,094 100% 5.4 58.5%(3)
Dongguan Hongmei—Mingfeng . . . . . . . . . . . . . . Guangdong 2016 40,383 34.1 40,383 100% 3.9 100%
Jiangsu Friend—III . . . . . . . . Jiangsu 2017 206,418 167.4 206,418 100% 3.6 100%Guangzhou Mingyue—II . . . Guangdong 2018 13,735 22.5 13,735 100% 5.4 58.5%(3)
Tianjin Fanxin . . . . . . . . . . . . Tianjin 2018 75,427 65.5 75,427 100% 1.8 90%Shenyang Yibei . . . . . . . . . . . Shenyang 2018 74,442 45.2 74,442 50% 1.5 100%Wuxi Lekun . . . . . . . . . . . . . Wuxi 2019 89,116 69.1 89,116 100% 5.5 100%Changsha Yizhu—I . . . . . . . . Changsha 2019 22,475 17.6 22,475 62% 4.8 100%Shanghai WGQ . . . . . . . . . . . Shanghai 2019 14,265 15.7 N/A(4) N/A(4) N/A(4) 100%(4)
JapanKawajima . . . . . . . . . . . . . . . Tokyo 2017 39,762 82.0 N/A(4) N/A(4) N/A(4) 100%(4)
AustraliaWetherill Park 1 . . . . . . . . . . New South
Wales 2015 18,060 24.8 18,060 100% 4.7 92.2%Laverton North . . . . . . . . . . . Victoria 2015 25,639 10.9 25,639 100% 3.3 92.2%Northmead . . . . . . . . . . . . . . New South
Wales 2014 5,660 9.7 5,660 87% 3.7 92.2%Campbellfield . . . . . . . . . . . . Victoria 2014 16,620 16.7 16,620 100% 5.5 92.2%Macquarie Park . . . . . . . . . . . New South
Wales 2014 12,597 65.2 12,597 99.7% 2.5 92.2%Wacol 1 . . . . . . . . . . . . . . . . . Queensland 2014 13,636 16.6 13,636 100% 2.0 92.2%Wetherill Park 2 . . . . . . . . . . New South
Wales 2014 11,854 16.5 11,854 100% 1.7 92.2%
204

BUSINESS
Location
Yearcompleted
oracquired
September 30, 2019 June 30, 2019
Property GFA Valuation(1) GFAOccupancy
rate WALE(2)
Interestheld by theCompany
(sq.m)(US$
in millions) (sq.m)
Frenchs Forest 1 . . . . . . . . . . . . New SouthWales 2015 8,410 22.5 8,410 100% 3.5 92.2%
Wangara . . . . . . . . . . . . . . . . . . WesternAustralia 2015 5,415 4.9 5,415 100% 0.6 92.2%
Wacol 2 . . . . . . . . . . . . . . . . . . . Queensland 2014 12,246 15.6 12,246 100% 4.5 92.2%Lane Cove . . . . . . . . . . . . . . . . . New South
Wales 2017 9,751 35.1 9,751 88.6% 3.1 92.2%Mt Waverley . . . . . . . . . . . . . . . Victoria 2014 8,916 14.2 8,916 77% 1.6 92.2%Dingley . . . . . . . . . . . . . . . . . . . Victoria 2014 17,431 12.8 17,431 0% N/A 92.2%Smeaton Grange . . . . . . . . . . . . New South
Wales 2014 7,689 8.3 7,689 100% 2.8 92.2%Frenchs Forest 2 . . . . . . . . . . . . New South
Wales 2015 4,035 7.8 4,035 87% 2.4 92.2%Sunshine West . . . . . . . . . . . . . . Victoria 2013 10,467 8.1 10,467 100% 3.0 92.2%Kingston . . . . . . . . . . . . . . . . . . Queensland 2014 6,096 5.7 6,096 100% 4.1 92.2%Welshpool . . . . . . . . . . . . . . . . . Western
Australia 2007 6,925 5.2 6,925 100% 2.1 92.2%Villawood . . . . . . . . . . . . . . . . . New South
Wales 2015 19,645 18.4 19,645 96% 1.1 92.2%Chullora . . . . . . . . . . . . . . . . . . New South
Wales 2014 6,428 10.4 6,428 100% 3.1 92.2%Minto . . . . . . . . . . . . . . . . . . . . . New South
Wales 2014 21,557 26.9 21,557 94% 2.3 92.2%Derrimut . . . . . . . . . . . . . . . . . . Victoria 2014 8,321 6.5 8,321 100% 2.4 92.2%Archerfield . . . . . . . . . . . . . . . . Queensland 2014 24,368 22.2 24,368 100% 3.7 92.2%Braeside . . . . . . . . . . . . . . . . . . Victoria 2014 7,598 8.1 7,598 100% 4.9 92.2%Clayton 1 . . . . . . . . . . . . . . . . . . Victoria 2015 18,194 18.2 18,194 100% 13.2 92.2%Clayton 2 . . . . . . . . . . . . . . . . . . Victoria 2015 10,468 11.0 10,468 100% 13.2 92.2%Mt Kuring-Gai . . . . . . . . . . . . . New South
Wales 2015 32,954 42.8 32,954 94.9% 2.8 92.2%Canning Vale . . . . . . . . . . . . . . Western
Australia 2015 15,251 11.5 15,251 100.0% 1.9 92.2%Epping . . . . . . . . . . . . . . . . . . . . Victoria 2014 10,590 10.0 10,590 100.0% 2.0 92.2%Richlands . . . . . . . . . . . . . . . . . Queensland 2014 9,818 10.3 9,818 89.2% 1.4 92.2%Melbourne Markets . . . . . . . . . . Victoria 2015 74,968 78.8 74,968 100.0% 3.3 92.2%Tonka St . . . . . . . . . . . . . . . . . . Queensland 2018 9,175 22.3 9,175 100.0% 9.1 92.2%Sherbrooke Rd . . . . . . . . . . . . . Queensland 2019 5,203 9.6 5,203 100.0% 6.9 92.2%Perry Rd . . . . . . . . . . . . . . . . . . Victoria 2019 5,701 23.3 5,701 100.0% 11.8 92.2%
Notes:(1) The valuations of our investment properties are determined through independent valuations by third-party property valuers. See the
property valuation report included in Appendix VI to this prospectus for more information. Valuation reports for certain Australiaproperties listed in this table have not been included in Appendix VI to this Prospectus in accordance with Chapter 5 of the Listing Rules.
(2) “WALE” means weighted average lease expiry and represents the average remaining lease term to expiry (or remaining lease term tofirst lease break) by rental income (excluding outgoing recoveries for net leases), excluding vacancies, as adjusted to reflect theCompany’s pro rata share of any properties not wholly-owned.
(3) We subsequently increased our interest in Guangzhou Mingyue—I and II to 68.5% in August 2019.(4) We acquired the Shanghai WGQ and Kawajima properties in August 2019.
In 2016, 2017 and 2018 and for the six months ended June 30, 2019, our top five balance sheetproperties by rental revenue generated aggregate rental revenues of US$36.3 million, US$38.4 million,US$43.7 million and US$28.2 million, respectively, representing 72.2%, 66.4%, 58.8% and 51.3%,respectively, of total rental revenues generated from our balance sheet properties, and representingaggregate rental yields, calculated by dividing net operating income by the cost of the properties, of
205

BUSINESS
10.2%, 10.3%, 10.6% and 10.9%, respectively. Net operating income is calculated by subtractingrental cost (including taxes) and administrative expenses (excluding depreciation and amortization)from rental revenue.
Fund Properties
The following table summarizes the completed properties held by our joint ventures and theother funds and investment vehicles we managed and the interest we held as of June 30, 2019. Thecompleted properties held by our joint ventures and the other funds and investment vehicles wemanage accounted for 45.5% of the Portfolio Assets by GFA as of June 30, 2019.
Number ofproperties Total GFA
Interest heldby the
Company(1)
(sq.m inthousands)
Joint venturese-Shang Star Cayman Limited (PRC) . . . . . . . . . . . . . . . . . . . . . . . . . . . . . . . 19 1,305.8 25.6%Sunwood Star Pte. Ltd (South Korea) . . . . . . . . . . . . . . . . . . . . . . . . . . . . . . . 4 600.4 20.0%
Other funds and investment vehiclesThe PRC . . . . . . . . . . . . . . . . . . . . . . . . . . . . . . . . . . . . . . . . . . . . . . . . . . . . . . 25 1,376.0 8.1%Japan . . . . . . . . . . . . . . . . . . . . . . . . . . . . . . . . . . . . . . . . . . . . . . . . . . . . . . . . . 14 1,230.8 9.6%South Korea . . . . . . . . . . . . . . . . . . . . . . . . . . . . . . . . . . . . . . . . . . . . . . . . . . . 10 380.1 10.0%Australia . . . . . . . . . . . . . . . . . . . . . . . . . . . . . . . . . . . . . . . . . . . . . . . . . . . . . . 27 297.3 18.3%India . . . . . . . . . . . . . . . . . . . . . . . . . . . . . . . . . . . . . . . . . . . . . . . . . . . . . . . . . 2 62.2 74.8%(2)
Note:(1) For other funds and investment vehicles, the percentage interest held by our Company in the completed properties is calculated on a
weighted average basis by reference to the GFA of the properties held under the applicable funds and investment vehicles.(2) We are in the process of issuing 50% of the shares in the India Fund to our joint venture partner.
In addition, we also hold investment interests in ESR-REIT and other investments primarily inlisted companies, including our investments in Sabana REIT and AIMS AMP Capital Industrial REITin Singapore, Centuria in Australia, CNLP in Hong Kong and others. As of June 30, 2019, these listedequity investments were classified under financial assets at fair value through other comprehensiveincome, which amounted to US$469.0 million. See the section headed “Financial Information—Analysis of Selected Consolidated Statements of Financial Position Items” in this Prospectus for moreinformation.
PROPERTY OPERATIONS
Classification of the Portfolio Assets
We classify the Portfolio Assets into the following categories based on their respectivedevelopment stages:
Š Completed properties, means both stabilized properties and pre-stabilized properties.
Š Stabilized properties, are completed properties: (i) for which construction oracquisition had been completed for more than 12 months; or (ii) reached anoccupancy rate of 93% or higher.
Š Pre-stabilized properties, are completed properties: (i) for which construction oracquisition had been completed for less than 12 months; or (ii) with an occupancyrate of less than 93%.
206

BUSINESS
Š Properties under construction consist of three sub-categories of properties: (i) propertiesfor which we have commenced development; (ii) a light manufacturing facility comprisingseveral buildings for which we are currently evaluating the feasibility of conversion into abusiness park or research and development center; and (iii) a light industrial and logisticsfacility which will be upgraded into a standard modern logistics facility.
Š GFA on land held for future development, representing total estimated GFA uponcompletion based on the Company’s construction plans of properties with respect to whichwe have either received the land-use rights certificates or have entered into land grantcontracts with regulatory authorities or private landowners, but have not yet commencedconstruction work.
For the PRC properties which we directly hold, a property valuation report has been preparedby Beijing Colliers International Real Estate Valuation Co., Ltd. For the two Japanese properties whichwe directly hold, RW Higashi-Ogishima DC PH1 and RW Higashi-Ogishima DC PH2, two propertyvaluation reports have been prepared by Cushman & Wakefield K.K. For the Australian propertieswhich we directly hold, a property valuation report has been prepared by CBRE Limited. Ourclassification of properties is based on how we view our business, while the classification of propertiesin the property valuation report in Appendix VI to this Prospectus and the Accountants’ Report inAppendix I to this Prospectus have been prepared pursuant to the requirements of the relevantprofessions. The table below sets forth our classification of properties in this Prospectus and thecorresponding classification of properties in the property valuation report and the Accountants’ Report:
This Prospectus Property Valuation Report Accountants’ Report
• Completed properties • Completed • Completed investmentproperties
• Properties under construction • Construction in progress • Investment propertiesunder construction
• GFA on land held for futuredevelopment
• Vacant land • Investment propertiesunder construction
In determining planned dates and estimated GFA information, we rely on certain assumptions,including that: (i) there will be no material change with respect to the general economic conditions inthe PRC, Japan, South Korea, Singapore, Australia and India, the performance of the PRC, Japan,South Korea, Singapore, Australia and India property markets or demand for our properties,particularly in the regions where we plan to develop these properties; (ii) there will be no materialchange in the regulatory regime governing the real estate market in each of the markets which couldadversely affect our ability to develop such properties; (iii) there will be no significant delay orobstacle in obtaining necessary licenses and approvals to develop such properties, or any such licensesand approvals obtained are not subject to any material changes or amendments; (iv) we will be able tofinance the project development through a combination of our working capital, external borrowingsand other debt and equity financing on a timely basis; (v) we will be able to obtain the land-use rightswith respect to the land identified for our land held for future development as expected without anysignificant delay or difficulty; (vi) we will be able to carry out the development plan as set out in themaster investment agreement without any material delay or significant changes or amendments to thedevelopment plan with respect to land held for future development for which we have not entered intoland grant contracts with regulatory authorities or private landowners; (vii) services provided by thirdparty contractors, including our construction contractors, will meet our quality standards and
207

BUSINESS
requirements; (viii) there will be no material increase in the costs and expenses relating to theconstruction and development of the properties, including costs of construction materials and labor;and (ix) we will not be involved in any material legal or other proceedings that could significantlyaffect our project development process.
Based on the above assumptions, estimated GFA information in this Prospectus is derived onthe following bases:
Š Total GFA information:
Š if the construction of a property is completed and a completion inspection filing hasbeen made, the total GFA information in respect of such completed property refers tothe total GFA information set forth in its completion certificate;
Š if the completion inspection filing has not been made, the total GFA information withrespect of such project is estimated based on: (i) the total GFA information set forthin the construction work commencement permit; (ii) the total GFA information setforth in the construction work planning permit if the construction workcommencement permit is not yet available; (iii) our current development plans ifneither of the above documents is otherwise available; or (iv) the total GFAinformation if any is indicated in the master investment agreement we entered intowith regulatory authorities or private landowners; and
Š with respect to GFA on land held for future development for the total GFAinformation is based on the expected buildable GFA of the properties to be developedon such land.
Property Operations
As of June 30, 2019, our property management team, along with third party property managersthat we hired in connection with our Japan operations, provided services to over 586 tenants in the 269properties comprising the Portfolio Assets.
We assign certain of our logistics properties to one of our property operations managers whosupervises the services performed by professional third-party property management vendors that weengage for property maintenance work on our logistics properties, including regular cleaning, repairingand security. Our property operations manager is also in charge of managing facilities and leases,collecting and responding to feedback from our tenants, and conducting operations, procurement andcontracts management, as well as monitoring energy efficiency initiatives and budgeting.
Our internal policy requires us to attempt to resolve all inquiries from our tenants promptlyupon receipt. The relevant property operation manager is required to record details of any inquiry fromour tenants, to provide an estimated processing time to the tenants, and to timely report the inquiry torelevant responsible departments. Our property operations manager is required to commenceinvestigation into the inquiry immediately and propose a solution within one business day. If the issueis material, our facility management staff will visit the facility to communicate with the relevanttenants directly. If the inquiry is within the scope of our lease or if we are responsible for therectification, our facility management staff are also responsible for monitoring the entire responseprocess and following up with such tenants to ensure the inquiry is fully addressed.
208
BUSINESS
LEASING AND MARKETING
We engage in leasing and marketing activities for properties on our balance sheet and held bythe funds and investment vehicles we manage. We commence our leasing and marketing efforts oncethe construction work begins. It typically takes us up to three months in the PRC, three to six months inSouth Korea and up to twelve months in Japan to substantially lease-up a new logistics property afterits completion of construction. We also often execute lease agreements with tenants for customizedfacilities prior to their completion. We engage in various marketing initiatives in order to attract newtenants and expand our market recognition. We supplement the efforts and relations of our in-housebusiness development and leasing teams with reputable external professional brokers to source land,properties and tenants in each country where we operate. We pay a portion of the leasing fees we earnfrom our fund management activities to third-party leasing agents that procure leases for certain of theproperties held in the funds and investment vehicles we manage. We develop and strengthenrelationships with large national and international firms with significant logistics operations to presentour logistics facilities, and undertake dedicated media campaigns to enhance and promote our logisticsfacilities. Furthermore, we collaborate with other professional institutions, such as property brokeragefirms, to prepare marketing studies and develop our marketing and property leasing plans.
We also engage in traditional “banner” advertising targeted at existing and prospective tenants,and market our logistics facilities through marketing brochures, social media and our website. Weendeavor to increase our brand exposure through event-specific media coverage and media briefings,such as signing ceremonies related to the establishment of strategic relationships. On occasion, we joinwith brokers to organize “open house” events at some of our logistics facilities.
As part of our marketing and leasing strategy, we also periodically sponsor and participate inevents in local regions in the PRC, Japan, South Korea, Singapore, Australia and India where wedevelop and operate our logistics properties, such as trade seminars and exhibitions, in order toenhance our brand name and promote our logistics facilities. By raising our profile among variousindustry participants at these events, such as domestic and international trade and industry associations,chambers of commerce, manufacturers and trading companies, we believe that we can enhance ourbrand recognition, display the strengths and advantages of our logistics properties and attract additionaldomestic and international tenants.
We determine the rent for our logistics facilities based a number of factors, including our targetinvestment return rate for the project, the location of the project, demand for the project, tenantrelationships, the GFA covered by the lease, duration of the lease and the prevailing market rate forcomparable logistics facilities. We also employ lease incentives in order to attract potential tenants,particularly in Japan.
CUSTOMERS
Tenants
The Portfolio Assets are leased to a broad range of large and mid-sized, multinational anddomestic tenants that require logistics and distribution facilities, including e-commerce companies,3PL providers, bricks-and-mortar retailers, manufacturers, cold-chain logistics providers and others.3PL providers serve end-users in a large variety of industries, including e-commerce, electronics, fast-moving consumer goods, retail and fast food chains, general logistics services, auto and parts,pharmaceuticals, and medical instruments and machinery. Our leases are generally up for renewal
209

BUSINESS
every three to five years and the rents charged upon renewals of these leases are typically adjustedbased upon then prevailing market rates. Our lease agreements give standard termination rights to thetenant or landlord, as applicable, under certain situations, including, but not limited to: (i) damage tothe property caused by a force majeure event that renders the premises unusable, (ii) events of defaultby the tenant, including, but not limited to, failure to take the premises, failure to pay rent andunauthorized sub-lease, (iii) circumstances that affect the legal capacity of the tenant, and (iv) materialevents of default by the landlord, including, but not limited to, failure to deliver the premises or failureto maintain the premises in good condition. Our lease agreements typically require quarterly ormonthly fixed rate rent payments, and some of our agreements also require rent prepayments prior tocompletion of the property. We seek to be a regional partner for our tenants, with a goal to be thesingle point of contact to design and build a multi-market distribution network for tenants throughoutthe PRC, Japan, South Korea, Singapore, Australia and India.
In 2016, 2017 and 2018 and for the six months ended June 30, 2019, rental revenue generatedfrom the single largest tenant of our balance sheet properties accounted for approximately 19.7%,12.6%, 9.3% and 9.8%, respectively, of our total revenue. For the same periods, rental revenueattributable to the five largest tenants of our balance sheet properties accounted for approximately40.7%, 25.8%, 17.4% and 13.8%, respectively, of our total revenue. Our five largest tenants for eachyear during the Track Record Period are independent third parties. In 2016 and 2017, three of our fivelargest tenants were e-commerce companies and two were bricks-and-mortar retailers. In 2018, two ofour five largest tenants were e-commerce companies, two were manufacturers and one was a bricks-and-mortar retailer. For the six months ended June 30, 2019, one of our five largest tenants was an e-commerce company, one was a bricks-and-mortar retailer and three were manufacturers.
We expect the proportion of the Portfolio Assets held in the funds and investment vehicles wemanage to increase in the future, resulting in a decrease in the percentage of revenue attributable to ourfive largest tenants.
Funds and Investment Vehicles
We manage 30 funds and investment vehicles and generate revenue from the management ofthose funds and investment vehicles. In 2016, 2017 and 2018 and for the six months ended June 30,2019, revenue generated from the single largest fund we managed on the basis of management feeincome accounted for approximately 10.9%, 12.2%, 12.0% and 8.8%, respectively, of our totalrevenue. For the same periods, revenue attributable to the five largest funds and investment vehicleswe managed, all of which were development funds and investment vehicles, accounted forapproximately 34.0%, 31.5%, 27.9% and 23.8%, respectively, of our total revenue.
SUPPLIERS
Our suppliers primarily consist of construction companies, property management companies,interior designers and commercial real estate brokers. In 2016, 2017 and 2018 and for the six monthsended June 30, 2019, transaction amounts with our single largest supplier accounted for approximately16.7%, 20.3%, 10.8% and 11.3%, respectively, of our total purchase amount incurred in the period. Forthe same periods, transaction amounts with our five largest suppliers in aggregate accounted forapproximately 35.5%, 38.1%, 20.0% and 19.0%, respectively, of our total purchase amount incurred inthe period. These suppliers are mostly construction contractors. We typically pay our constructioncontractors according to a schedule as set forth in the relevant construction agreements, some of which
210

BUSINESS
require monthly or bi-monthly payments until completion of the project, and others which call for alump sum payment upon completion of the project. As we select contractors on a project basis, we donot rely on any single contractor despite the relatively high contribution of our largest or five largestcontractors/suppliers to our cost incurred in a given period. Our five largest suppliers are independentthird parties.
COMPETITION
We face competition from other large international and domestic developers, owners andoperators of other logistics facilities and fund managers and, within any specific individual market,also from smaller and local players. We compete with other providers for locations and sites for futurelogistics facilities as well as tenants.
We believe that, in choosing a provider of logistics facilities, our tenants focus primarily on thesize of a provider’s network, background and reputation of the provider, the locations and constructionquality of its properties, and the property services provided. We believe that the size of our networkand our focus on customer service, and on assisting our tenants in establishing and maintaining theirlogistics networks, allow us to compete favorably with our competitors. For additional details about thecompetitive environment we operate in, see the JLL Report included in Appendix IV to thisProspectus.
Our fund management business faces competition from other private funds, specialistinvestment funds, hedge fund sponsors, financial institutions, corporate buyers and other parties forcapital partners and investment opportunities. We mainly compete with these competitors in acquiringinvestments for the funds and investment vehicles we manage and in the pursuit of capital partners toinvest. In particular, our private fund management business faces competition in the pursuit of capitalpartners as well as in seeking profitable investment opportunities. Our REIT management businessfaces competition primarily in acquiring additional properties for ESR-REIT and for new REITs thatwe may manage or invest in in the future. In raising capital for the funds and investment vehicles wemanage, we compete with our competitors primarily on the basis of the following factors: investmentperformance, investor perception of our drive, focus and alignment of interest; quality of serviceprovided to and relationship with capital partners; access to capital; level of fees and expenses chargedfor services; brand recognition; transaction execution skills; range of products and services andinnovation. For acquisitions and investment opportunities, we compete with our competitors primarilyon price, access to market information about suitable investment opportunities and payment terms,among other factors.
RISK MANAGEMENT AND INTERNAL CONTROL
We recognize that risk management is critical to our business. Our key operational risks includechanges in general market conditions and the regulatory environment of the PRC, Japan, South Korea,Singapore, Australia and India property markets, availability of suitable sites for logistics properties atcommercially reasonable prices, the local economic environment and the urbanization process,expansion risks relating to entering into new geographic regions and business areas, our ability tocomplete our construction properties to the required quality standards and within our target timelines,the availability of financing to support our growth, competition from other logistics facilities providersand our ability to promote and lease out our logistics facilities. In addition, we face market risks suchas interest rate risk, foreign currency risk, credit risk and liquidity risk that arise in the normal course of
211

BUSINESS
our business. See the section headed “Financial Information—Quantitative and Qualitative DisclosuresAbout Market Risk” for more information.
We have implemented the following structures and measures to control and manage our risks.
Š Our Board of Directors is responsible and has general powers over the management andconduct of our business, and is in charge of our overall risk control. Any significantbusiness decisions involving material risks, such as decisions to expand into newgeographic regions or to incur significant corporate finance transactions, are reviewed,analyzed and approved at the board level to ensure a thorough examination of theassociated risks at our highest corporate governance body.
Š We have implemented control measures to manage operational risks. We control majorconstruction risks by engaging qualified construction contractors with strict contractualrequirements while maintaining daily quality control supervision. We also engagereputable financial, accounting and legal professionals to assist us in conductingsignificant corporate transactions, such as material investments for capital expenditure,incurrence of indebtedness or other financing activities. We have engaged an independentinternal control consultant to review our internal control measures and makerecommendations.
Š We enforce strict control and accountability policies and manuals at an individualemployee level and conduct ongoing on-site training. We also closely monitor the qualityand safety measures adopted on our construction sites with the construction contractors tolower the risks of damage to our property and liabilities that may be attributable to us. Ourinsurance coverage is in line with the customary practice in the PRC, Japan, South Korea,Singapore, Australia and India real estate industries.
Š Our policies and manuals are updated regularly based on our operational needs. We seekto maintain a corporate culture with a high level of responsibility, integrity and reliabilityto manage our operational and market risks.
Š We have in-house personnel that review our internal control measures on a continuingbasis.
For more details regarding risk management of our fund management business, see theparagraph headed “—Principal Business Activities—Fund Management—Fund Investment Process” inthis section of the Prospectus.
INSURANCE
We maintain insurance policies covering both our assets and employees, with policyspecifications and insured limits that are commercially reasonable and appropriate for a Company ofour size, for our assets and for activities in the logistics business. We believe this is in line withindustry practice in the logistics industries where we operate. Our insurance policies are arranged withreputable insurers and cover risks such as fire, flood, lightning, explosion, strike, riot, civil disorder,accidental or malicious damage, natural disasters, theft, and business interruption. We also insure forpotential public liability claims made by third parties in respect of bodily injury and third-partyproperty damage arising out of properties and other assets owned by us. We further maintain liabilityinsurance policies for our Directors and officers as well as professional indemnity insurance for ourbusinesses. See the section headed “Risk Factors—We may suffer substantial losses in the event of a
212

BUSINESS
natural or man-made disaster, such as an earthquake, typhoon or other casualty event in the countrieswhere we operate, which may not be covered by insurance” in this Prospectus.
TITLES, LICENSES, PERMITS AND APPROVALS
Our PRC Legal Advisor has advised that, during the Track Record Period and up to the LatestPracticable Date, we had obtained all the requisite licenses, permits and approvals from the relevantgovernment authorities that are material for our business operations in the PRC.
During the Track Record period and up to the Latest Practicable Date, we have obtained allmaterial requisite licenses, permits and approvals for our business operations in the other marketswhere we operate.
The following table sets forth details of our material licenses and permits:
License/Permit Holder Issuing Authority Issuance Date Expiry Date
Real Estate BrokerageLicense
ESR LTD Governor of Tokyo April 21, 2017 April 20, 2022
Investment Advisoryand AgencyRegistration
ESR LTD Financial ServicesAgency of Japan
May 27, 2008 No expiry date
Type II FinancialInstruments BusinessRegistration
ESR LTD Financial ServicesAgency of Japan
May 27, 2008 No expiry date
Capital MarketsServices License toconduct Real EstateInvestment TrustManagement
ESR FundsManagement(S) Limited (f.k.a.Cambridge IndustrialTrust ManagementLimited)
Monetary Authorityof Singapore
November 8,2016
No expiry date
Registration of PrivateEquity InvestmentFund Manager
Shanghai YizongEquity InvestmentFund ManagementCo., Ltd.
Asset ManagementAssociation of China
November 21,2017
No expiry date
License for real estatedevelopment business
Kendall SquareLogistics Properties,Inc.
Ministry of Land,Infrastructure andTransport(South Korea)
November 7,2017
No expiry date
License forProfessional PrivatePlacement CollectiveInvestment Business
Kendall Square AssetManagement, Inc.
Financial ServicesCommission(South Korea)
December 23,2016
No expiry date
License for ForeignExchange Business
Kendall Square AssetManagement, Inc.
Ministry of Economyand Finance(South Korea)
May 24, 2017 No expiry date
213

BUSINESS
License/Permit Holder Issuing Authority Issuance Date Expiry Date
Australian FinancialsServices License—Retail
ESR RIM (Australia)Ltd
Australian Securities& InvestmentCommission
July 3, 2019 No expiry date
Australian FinancialsServices License—Wholesale
ESR WIM(Australia) Pty Ltd
Australian Securities& InvestmentCommission
July 3, 2019 No expiry date
Real Estate License—NSW
ESR AssetManagement(Australia) PtyLimited
New South WalesFair Trading
May 5, 2015 May 4, 2020
Real Estate License—Victoria
ESR AssetManagement(Australia) PtyLimited
Victorian LicensingAuthority
May 6, 2015 May 5, 2020
Building—Unlimited CIP Constructions(VIC) Pty Ltd
Victorian BuildingAuthority (VBA)
July 1, 2018 April 19, 2023
Builder CIP Constructions(NSW) Pty Ltd
NSW GovernmentFair Trading
February 1,2017
February 8,2020
Builder Open—Restricted
CIP Constructions(QLD) Pty Ltd
Queensland Buildingand ConstructionCommission (QBCC)
September 29,2018
September 29,2021
Registered BuildingContractor (Company)
CIP Constructions(WA) Pty Ltd
BuildingCommission—Government ofWestern AustraliaDepartment ofCommerce
November 1,2017
November 1,2020
Building WorkContractor
CIP Constructions(SA) Pty Ltd
Consumer andBusiness Services—Government of SouthAustralia
November 18,2014
November 30,2020
Certificate ofApproval as anApproved InvestmentManager
ESR QFLP GPHoldings Limited
Financial ServicesCommission of BVI
July 31, 2019 No expiry date
Certificate ofRegistration—ForeignPortfolio Investor
ESR India InvestorPTE LTD
Securities andExchange Board ofIndia
February 26,2018
No expiry date
INTELLECTUAL PROPERTY RIGHTS
We currently have 32 registered trademarks in total, including the ESR logo “ ”, which we useon many of our logistics properties and are in the process of adding to additional properties in order tounify our branding. We currently use our ESR logo “ ” in the PRC, Hong Kong, Japan, South Korea
214

BUSINESS
and Singapore, as well as “易商”, “益商” and their respective accompanying designs in the PRC. Wehave also registered our logo in Australia and India and intend to display our logo on Portfolio Assetsin Australia and India in the future. For further information on these intellectual property rights, see thesection headed “Statutory and General Information—Intellectual Property Rights of our Group” inAppendix VIII to this Prospectus for further details.
As of the Latest Practicable Date, we are not aware of any infringement: (i) by us of anyintellectual property rights owned by third parties; or (ii) by any third parties of any intellectualproperty rights owned by us.
INFORMATION TECHNOLOGY
We rely on our information technology to support our business operations. We utilize enterprisesoftware platforms including SAP and Salesforce to aggregate and analyze data regarding ourbuildings, our financials, and our clients. We also assess the need to implement and supplement humanresources and management systems as the business grows. We believe that our information technologyplatform improves our operational efficiency and provides high quality internal governance controls.We continue to assess the adequacy of our computer systems and implement improvements to ourplatform. For example, we are in the process of implementing the SAP enterprise software platforms atour Australia and India operations, which we expect to be implemented in 2019.
EMPLOYEES
As of June 30, 2019, we had 595 employees in seven locations. The following tablessummarize the number of employees we have by geographical location and function as of June 30,2019:
Employees by Geographical Location
As ofJune 30,2019
The PRC . . . . . . . . . . . . . . . . . . . . . . . . . . . . . . . . . . . . . . . . . . . . . . . . . . . . . . . . . . . . . . . . . . . . . . . . . . . 167Japan . . . . . . . . . . . . . . . . . . . . . . . . . . . . . . . . . . . . . . . . . . . . . . . . . . . . . . . . . . . . . . . . . . . . . . . . . . . . . . 58South Korea . . . . . . . . . . . . . . . . . . . . . . . . . . . . . . . . . . . . . . . . . . . . . . . . . . . . . . . . . . . . . . . . . . . . . . . . . 43Singapore . . . . . . . . . . . . . . . . . . . . . . . . . . . . . . . . . . . . . . . . . . . . . . . . . . . . . . . . . . . . . . . . . . . . . . . . . . 101Hong Kong . . . . . . . . . . . . . . . . . . . . . . . . . . . . . . . . . . . . . . . . . . . . . . . . . . . . . . . . . . . . . . . . . . . . . . . . . 27Australia . . . . . . . . . . . . . . . . . . . . . . . . . . . . . . . . . . . . . . . . . . . . . . . . . . . . . . . . . . . . . . . . . . . . . . . . . . . 151India . . . . . . . . . . . . . . . . . . . . . . . . . . . . . . . . . . . . . . . . . . . . . . . . . . . . . . . . . . . . . . . . . . . . . . . . . . . . . . 48
Total . . . . . . . . . . . . . . . . . . . . . . . . . . . . . . . . . . . . . . . . . . . . . . . . . . . . . . . . . . . . . . . . . . . . . . . . . . . . . . 595
215

BUSINESS
Employees by Function
As ofJune 30,2019
Investment/Divestment . . . . . . . . . . . . . . . . . . . . . . . . . . . . . . . . . . . . . . . . . . . . . . . . . . . . . . . . . . . . . . . . 51Project Development Management . . . . . . . . . . . . . . . . . . . . . . . . . . . . . . . . . . . . . . . . . . . . . . . . . . . . . . . 173Leasing/Marketing . . . . . . . . . . . . . . . . . . . . . . . . . . . . . . . . . . . . . . . . . . . . . . . . . . . . . . . . . . . . . . . . . . . . 42Asset/Property Management . . . . . . . . . . . . . . . . . . . . . . . . . . . . . . . . . . . . . . . . . . . . . . . . . . . . . . . . . . . . 126Finance/Accounting . . . . . . . . . . . . . . . . . . . . . . . . . . . . . . . . . . . . . . . . . . . . . . . . . . . . . . . . . . . . . . . . . . . 99General Management/Administration . . . . . . . . . . . . . . . . . . . . . . . . . . . . . . . . . . . . . . . . . . . . . . . . . . . . . 104
Total . . . . . . . . . . . . . . . . . . . . . . . . . . . . . . . . . . . . . . . . . . . . . . . . . . . . . . . . . . . . . . . . . . . . . . . . . . . . . . 595
We actively recruit skilled and qualified personnel, including university and advanced degreegraduates and employees with relevant working experience. The remuneration package of ouremployees includes salary, bonuses and other cash elements. In general, we determine employeesalaries based on each employee’s qualifications, experience, position and seniority. We have designedan annual review system to assess the performance of our employees, which forms the basis of ourdeterminations on salary raises, bonuses and promotion. We are subject to social insurancecontribution plans organized by relevant local governments. We believe that the salaries and benefitsthat our employees receive are competitive with market standards in each country where we conductbusiness.
Except for certain employees within our construction business, none of our employees is amember of a labor union. We have not experienced any strikes or disruptions to our operations due tolabor disputes. We believe that our relationships with our employees are good.
We have compliance training programs that aim to support and encourage members of ourmanagement team to continue improving their management skills, including online training. We alsoprovide our management training and development opportunities relevant to their professions in areasof technical knowledge, professional qualification and soft skills to improve their skills and developtheir careers. We provide orientation for newly hired employees as well as continuing training forexisting employees. In addition to compliance training, we provide on-the-job training on a regularbasis on various topics, which is designed to improve the skills of our employees.
ENVIRONMENTAL AND SAFETY MATTERS
Our operations are subject to regulatory requirements and potential liabilities arising underapplicable environmental, health or safety-related laws and regulations in each of the countries inwhich we operate. We pursue a sustainable approach to the environment, as well as properconsideration of our social and economic responsibilities to the wider community. Optimizing thesustainability potential in new developments through green design initiatives positions a property wellto minimize its environmental impact and provides long-term benefits for tenants and value to ourcapital partners. We believe we have established appropriate risk management procedures, training andinduction programs (for employees and third-party contractors) at all of our assets.
Environmental regulations, among other things, impose liability on present and former propertyowners and operators for costs and damages related to soil and water contaminations from hazardousor toxic substances. Such laws often impose liability whether or not the owner or operator knew of, orwas responsible for, the presence or release of such hazardous or toxic substances. We are particularly
216

BUSINESS
mindful of the potential liabilities associated with these regulations. Additionally, the presence ofhazardous or toxic substances on our properties may adversely affect our ability to sell such propertiesor to borrow using such properties as collateral, and may cause us to incur penalties and cleanup costs.All of our development properties are constructed in accordance with the relevant local environmentalregulations.
Save for CIP, with respect to our development projects, we do not directly undertake theconstruction work for our properties, and the responsibility for ensuring the health and safety ofconstruction workers on our properties typically rests with the contractors we engage. With ouracquisition of CIP in August 2018, we have added in-house construction to our business activities thatare subject to the applicable environmental, health or safety-related laws and regulations in Australia.In our capacity as owner of our directly held properties, we have obligations under the variousoccupational health and safety regulations in the PRC, Japan, Australia and India.
We believe that we are in compliance in all material respects with applicable environmental,health and safety regulations in the PRC, Japan, South Korea, Singapore, Australia and India. Duringthe Track Record Period and as of the Latest Practicable Date, none of us or any of our subsidiarieswas involved in any material environmental, health or safety-related incident. We are currently notaware of any material environmental, health or safety-related proceedings or investigations to whichwe might become a party.
COMPLIANCE AND LEGAL PROCEEDINGS
During the Track Record Period and as of the Latest Practicable Date: (i) we did not commitany material non-compliance of the laws or regulations applicable to the Group, and we did notexperience any systemic non-compliance incidents, which taken as a whole, in our opinion, were likelyto have a material and adverse effect on our business, financial condition or results of operations; and(ii) none of us or any of our subsidiaries was a party to, or was aware of any threat of, any legal,arbitral or administrative proceeding, which, in our opinion, was likely to have a material and adverseeffect on our business, financial condition or results of operations. We may from time to time become aparty to various legal, arbitral or administrative proceedings arising in the ordinary course of ourbusiness.
Set forth below is a summary of our certain of our non-compliance matters during the TrackRecord Period and up to the Latest Practicable Date, as well as rectification actions and preventivemeasures that we have taken in respect of such matters:
Non-compliance Matter
As of the Latest Practicable Date, 34.6% of our lease agreements with tenants in the PRC byGFA, which covers GFA of approximately 0.36 million sq.m., and 2.6% of the lease agreements forthe properties we lease in the PRC by number of lease agreements had been registered and filed withthe relevant land and real estate administration bureaus.
Reasons for the Non-compliance
The registration of the leases requires cooperation of the tenants or lessors, including theprovision of various original documents to the local authority by the tenants or lessors. We were not
217

BUSINESS
able to complete the remaining lease registration processes as the relevant tenants or lessors did notcooperate and provide us with the necessary documentation required under the relevant PRClegislation and/or by the relevant local authorities, such as: (i) the original or certified copy of land useright certificate (for our lessors); (ii) the original or certified property title certificate (for our lessors);(iii) the original or certified copy of business licenses (for our tenants or lessors); and (iv) the originalor certified copy of personal identification of the legal representatives (for our tenants or lessors) toregister the leases with the local government authorities. While we have been trying to register theseleases throughout the Track Record Period, our tenants were not willing to cooperate primarily becausethe non-registration does not affect the validity of the leases and due to the inconvenience caused byproviding the various original documents. Furthermore, cooperating in the lease registration processwas not part of the contractual obligation of our tenants under our lease agreements in the past.
Legal Consequences and Potential Maximum Penalties
As advised by our PRC Legal Adviser, failure to complete the registration and filing of leaseagreements does not affect our rights or entitlements to lease out the facilities to tenants, or the validityof the lease agreements or the binding effect of the lease agreements over contracting parties.However, pursuant to the provisions of the Urban Real Estate Law, the lease agreements shall be filedfor registration and recorded with the relevant local real estate administration authorities. According tothe Administrative Measures for Commodity House Leasing (商品房屋租賃管理辦法) and relevantlocal rules, we may be subject to requests by the local authorities to complete the registrationformalities and/or penalties for the non-registration of property lease agreements imposed by the localauthorities. As some PRC local governments have not issued or implemented specific penalty rules forthe non-registration of lease agreements, our PRC Legal Advisor conducted an estimate based on thepenalty rules that have been published by relevant PRC local governments and has advised us that as ofthe Latest Practicable Date, we may be subject to an estimated maximum penalty of approximatelyRMB0.48 million (approximately US$0.07 million) in aggregate for the non-registration of these leaseagreements, which our Directors believe will not have any material adverse impact on our businessoperations or financial performance if imposed on us by the relevant authorities. See the section headed“Risk Factors—Risks Relating to Our Business in the PRC—We may face penalties for thenon-registration of our lease agreements with tenants and the lease agreements for the properties welease in the PRC” in this Prospectus for further details.
Remedies and Rectification Measures Taken to Prevent Future Breach and Ensure On-goingCompliance
While we have no control over the cooperation efforts of tenants or lessors, we endeavor tocomplete the lease registration in a proper manner. We are in the process of registering the remaininglease and will take all reasonable and practical steps to ensure that it is registered. In particular, westarted to undertake the following enhanced internal control measures to ensure cooperation by ourtenants or lessors in November 2018, including the following:
Š we have established a team to work on the lease registration by proactivelycommunicating with the tenants and lessors in order to obtain their cooperation and collectthe application documents for the relevant lease registration;
Š each team member was designated to specific projects that they will be responsible for;
Š our legal team runs periodic review of the status of lease registration;
218

BUSINESS
Š we have also revised our lease templates to include the cooperation of tenants for leaseregistration as a contractual obligation for our tenants. We will insist on the inclusion ofsuch terms during negotiation. To the extent any tenants breach this obligation, we areentitled to take necessary legal actions to enforce this contractual obligation; and
Š we will request the inclusion of such term with our lessors upon renewal of existing leasesor signing of future leases to ensure our lessors are also contractually obligated tocooperate with us in the lease registration process.
In the opinion of our PRC Legal Advisor, none of the above administrative penalties andregulatory measures will become a material legal obstacle to our Global Offering. Considering thenature, scale, reasons and potential impact of the non-compliance incidents disclosed in this section inthis Prospectus, our Directors take the view that none of the non-compliance incidents had a materialadverse effect on our business, financial condition or results of operations during the Track RecordPeriod.
We have engaged an independent internal control consultant to review our internal controlmeasures and make recommendations. Among other things, our internal control consultant reviewedour license application procedures. Based on the recommendations of our internal control consultant,we have implemented enhanced procedures, including proper documentation and more efficientinternal approval process for license applications, updates and renewals. In addition, our Directorsbelieve that we have established adequate internal control measures to ensure that we will be able toobtain and maintain all the material government filings, approval and permits required for our businessoperation. Such measures include the following:
Š we will have an audit committee comprising independent non-executive Directors tosupervise our internal control systems and an investment committee to supervise ourinvestment process and the investment process of the funds and investment vehicles wemanage;
Š our legal and compliance department will continue to oversee our legal and regulatorycompliance related matters, including closely monitoring any updates to applicable lawsand regulations;
Š our legal, financial and operational departments continually review the implementation ofour internal policies and measures to ensure our policies and implementation are effectiveand sufficient for the prevention of any potential non-compliance, and will organizeinternal trainings if any potential non-compliance or implementation shortfall is identified;
Š we will retain external legal advisor(s) to advise on compliance matters when necessary;
Š our audit department will conduct internal annual audits of our business lines based on therequirements of relevant rules and regulations so as to ensure that all activities are beingcarried out in accordance with our compliance policy and procedures; and
Š we have in-house personnel that review our internal control measures on a continuingbasis.
For more details regarding our internal control process, see the paragraph headed “—RiskManagement and Internal Control” in this section of the Prospectus.
The Joint Sponsors concur with the Directors’ view that none of the non-compliance incidentshad a material adverse effect on our business, financial condition or results of operations during the
219

BUSINESS
Track Record Period, having considered the implementation of the enhanced internal policies andmeasures by us. However, we cannot predict the outcome of any pending or future examination,investigation or litigation, we cannot assure you that any pending legal and regulatory matters will nothave a material adverse effect on our reputation, business, financial condition or results of operationsand we cannot assure you that any future litigation or regulatory proceeding will not have a materialadverse effect on our reputation, business, financial condition or operating results.
CONNECTED TRANSACTIONS
We currently do not expect to have any transactions with connected persons of the Groupimmediately following the Listing. We will comply with the applicable reporting, announcement,annual review and/or independent shareholders’ approval requirements in accordance with the ListingRules if we enter into any connected transactions after the Listing.
THE PROPERTYLINK ACQUISITION
Propertylink is an internally-managed REIT previously listed on the ASX, specializing inAustralian industrial and office investments. Propertylink also co-invests in funds with financialinstitutions from North America, Europe, the Middle East, Asia and Australia. As of March 20, 2019,being the date on which Propertylink was consolidated as a subsidiary into our Group, Propertylinkmanaged 58 industrial and office properties, including assets managed under its co-invested funds aswell as assets held under its wholly-owned industrial portfolio. Previously, in October 2017, weacquired approximately 19.9% of Propertylink and became its single largest securityholder. Wesubsequently completed our acquisition of 100% of the securities of Propertylink in April 2019.Propertylink was delisted from the ASX on April 26, 2019. The three entities that comprisedPropertylink were de-stapled on May 30, 2019. For further information on our acquisition ofPropertylink, see the sections headed “History, Development and Corporate Structure—PropertylinkAcquisition.” Propertylink had revenue of approximately AUD21.7 million, AUD137.0 million andAUD175.1 million (approximately US$119.1 million) for the years ended June 30, 2016, 2017 and2018, respectively, and approximately AUD108.3 million (approximately US$73.7 million) for theperiod from July 1, 2018 to March 20, 2019. As of June 30, 2016, 2017, 2018 and March 20, 2019, ithad total assets of approximately AUD59.9 million, AUD802.3 million, AUD942.6 million(approximately US$641.3 million) and AUD1,133.1 million (approximately US$771.0 million),respectively. We have included pre-acquisition financial information of Propertylink in AppendicesII-A and II-B to this Prospectus. For further information about the historical financial results ofPropertylink, see the section headed “Financial Information—Financial Information of Propertylink.”
The consideration paid by us to acquire Propertylink and any associated transaction costs werefunded by us through a combination of:
Š external debt provided to us under the External Acquisition Facility (a AUD230 million(approximately US$156.5 million) share acquisition bridging facility); and
Š existing cash and cash equivalents sources within our Group including pursuant to theInternal Equity Commitment (an equity commitment letter for up to AUD352 million(approximately US$239.5 million)).
The External Acquisition Facility was used as a bridging facility and has now been refinancedwith debt that is secured by the underlying assets of Propertylink.
220

BUSINESS
We are committed to a long term investment in logistics real estate in the Australian market.Our acquisition of Propertylink, like our acquisition of CIP, is part of our focus on value creationwhich involves expanding our Australian operations and identifying accretive acquisition targets, bothas a property developer and a fund, asset and property manager. As of March 20, 2019, the majority ofthe assets managed by Propertylink were fully developed as Propertylink was not heavily engaged indevelopment. In line with our capital recycling strategy, we plan to own and manage certain of theseassets within our Group and to transfer certain of these assets into new funds and investment vehiclesmanaged by us. For more information, see the section headed “Summary—Recent Developments—New Australia Fund” in this Prospectus.
For more information on the risks related to our acquisition of Propertylink, see the sectionheaded “Risk Factors—Risks Relating to Our Business and Industry—We may not realize the expectedbenefits of our acquisition of Propertylink” in this Prospectus.
221

RELATIONSHIP WITH WARBURG PINCUS X
OVERVIEW
Immediately following the completion of the Global Offering (assuming the Over-allotmentOption and the Offer Size Adjustment Option are not exercised), WP OCIM will be entitled to exercisevoting rights of approximately 24.1% (if Luckfield Global Limited is a Selling Shareholder) or 23.6%(if Luckfield Global Limited is not a Selling Shareholder) of the issued share capital and will remain asubstantial Shareholder. WP OCIM is indirectly owned as to 96.9% by Warburg Pincus X. For moreinformation relating to WP OCIM, Warburg Pincus X and their shareholdings in our Company, pleasesee the section headed “Substantial Shareholders” in this Prospectus.
INDEPENDENCE FROM WARBURG PINCUS X
In the opinion of our Directors, our Group is capable of carrying on our business independentlyof, and does not place undue reliance on, WP OCIM and its associates, on account of the followingfactors:
Management Independence
Our Board consists of twelve Directors, of whom three are executive Directors, four arenon-executive Directors and five are independent non-executive Directors. Our management andoperational decisions are made by our executive Directors and senior management, all of whom haveserved our Group during the Track Record Period and have substantial experience in the industry inwhich we are engaged. Please see the section headed “Directors and Senior Management” in thisProspectus for further details. Except for two of our non-executive Directors, Mr. Jeffrey DavidPerlman and Mr. Joseph Raymond Gagnon, who are employed by affiliates of WP OCIM, none of theDirectors or senior management team hold any board or executive position in, or are employed by WPOCIM or any of its affiliates.
Our Directors consider that our Board and senior management will function independently ofWP OCIM and its associates because:
(a) each Director is aware of his/her fiduciary duties as a Director which require, among otherthings, that he/she acts for the benefits of and in the best interest of our Company andshould avoid any conflict between his/her duties as a Director and his/her other actual orpotential interests and duties;
(b) the five independent non-executive Directors have extensive experience in different areasand have been appointed in accordance with the requirements under the Listing Rules toensure that the decision of the Board are made only after due consideration of independentand impartial opinions;
(c) the Board acts collectively by majority decisions in accordance with the Articles ofAssociation and applicable laws, and no single Director is able to make any decisionsunless authorized by the Board; and
(d) the Articles of Association (which will be effective on the Listing Date) require a Directorto declare his/her interest in any contract or arrangement in which he/she has an interestand he/she is not entitled to vote on (nor be counted in the quorum in relation to) anyresolution of the Board approving any contract or arrangement or any other proposal inwhich he/she or any of his/her close associates has a material interest, except in certainprescribed circumstances, details of which are set out in the section headed “Summary of
222

RELATIONSHIP WITH WARBURG PINCUS X
the Constitution of our Company and Cayman Companies Law” in Appendix VII to thisProspectus. The provisions of the Articles of Association ensure that matters involving aconflict of interest which may arise from time to time will be managed in line withaccepted corporate governance practice with a view to ensuring that decisions are takenhaving regard to the best interests of the Company and the Shareholders (including theindependent Shareholders) taken as a whole.
Based on the factors above, our Directors are satisfied that they are able to perform their rolesin our Company independently and manage the business of our Group together with our seniormanagement independently from WP OCIM and its associates after the Listing.
Financial Independence
We have our own accounting and finance department, internal control, accounting and financialmanagement and reporting system and treasury systems independent from those of WP OCIM, and weare able to make financial decisions and operate independently from WP OCIM from a financialperspective.
In addition, our Group does not rely on WP OCIM and/or its associates for provision offinancial assistance. As of the Latest Practicable Date, save for certain security support provided byWP OCIM in relation to the Hana Notes which will be released prior to completion of the GlobalOffering, and save and except for the management incentivization arrangements (details of which havebeen set out in the section headed “History, Development and Corporate Structure” in this Prospectus)which will be settled on the Listing Date, we had no outstanding loans, current account balances,financial assistance or financing in any other form from WP OCIM or its associates, and had notprovided any outstanding securities, loans or any other form of financial assistance to WP OCIM or itsassociates.
Our Directors therefore believe that we have maintained and are able to maintain financialindependence from WP OCIM and its associates.
Operational Independence
We have our own organizational structure and departments with specific responsibilities andauthority independent from WP OCIM and its associates. We have full rights and ability to formulateand to implement decisions regarding our business operations, administration and human resources.Our Group holds or enjoys the benefit of all relevant licenses necessary to carry out our business, andhas sufficient capital, employees and resources to operate our business independently. We have alsodeveloped and maintain a comprehensive set of internal control procedures for promoting efficientbusiness operations. As such, our Directors believe that we have maintained and are able to maintainoperational independence from WP OCIM or its associates.
223

DIRECTORS AND SENIOR MANAGEMENT
BOARD OF DIRECTORS
Our Board consists of 12 Directors, comprising of three executive Directors, four non-executiveDirectors and five independent non-executive Directors:
Name Age Position
Date ofJoining ourGroup(1)
Date ofAppointmentas Director Key Responsibilities
Executive Directors
Mr. Jinchu Shen(沈晉初)
46 ExecutiveDirector,Co-founder andco-CEO
June 30, 2011 June 30, 2011 Responsible for themanagement and conduct of ourbusiness, overall risk controland daily business operation.
Mr. Stuart Gibson 55 ExecutiveDirector,Co-founder andco-CEO
July 1, 2006 January 20, 2016 Responsible for themanagement and conduct of ourbusiness, overall risk controland daily business operation.
Mr. CharlesAlexander Portes
50 ExecutiveDirector,Co-founder andpresident
July 1, 2006 January 20, 2016 Responsible for themanagement and conduct of ourbusiness, overall risk controland daily business operation.
Non-executive Directors
Mr. Jeffrey DavidPerlman
36 Chairman andNon-executiveDirector
June 14, 2011 June 14, 2011 Responsible for the formulationof strategic directions and forthe high level oversight of themanagement and operation ofour Group.
Mr. JosephRaymond Gagnon
41 Non-executiveDirector
June 30, 2011 June 30, 2011 Responsible for the formulationof strategic directions and forthe high level oversight of themanagement and operation ofour Group.
Mr. Zhenhui Wang(王振輝 )
44 Non-executiveDirector
May 10, 2018 May 10, 2018 Responsible for the formulationof strategic directions and forthe high level oversight of themanagement and operation ofour Group.
Mr. Ho Jeong Lee 52 Non-executiveDirector
August 3, 2017 August 3, 2017 Responsible for the formulationof strategic directions and forthe high level oversight of themanagement and operation ofour Group.
Independent non-executive Directors
Mr. Brett HaroldKrause
51 Independentnon-executiveDirector
May 20, 2019(2) May 20, 2019(2) Responsible for addressingconflicts and giving strategicadvice and guidance on thebusiness and operations of ourGroup.
The RightHonourable SirHugo GeorgeWilliam Swire,KCMG, MP
59 Independentnon-executiveDirector
May 20, 2019(2) May 20, 2019(2) Responsible for addressingconflicts and giving strategicadvice and guidance on thebusiness and operations of ourGroup.
224

DIRECTORS AND SENIOR MANAGEMENT
Name Age Position
Date ofJoining ourGroup(1)
Date ofAppointmentas Director Key Responsibilities
Mr. Simon JamesMcDonald
57 Independentnon-executiveDirector
May 20, 2019(2) May 20, 2019(2) Responsible for addressingconflicts and giving strategicadvice and guidance on thebusiness and operations of ourGroup.
Ms. Jingsheng Liu(劉京生)
67 Independentnon-executiveDirector
May 20, 2019(2) May 20, 2019(2) Responsible for addressingconflicts and giving strategicadvice and guidance on thebusiness and operations of ourGroup.
Mr. Robin TomHoldsworth
50 Independentnon-executiveDirector
October 14,2019(2)
October 14,2019(2)
Responsible for addressingconflicts and giving strategicadvice and guidance on thebusiness and operations of ourGroup.
Notes:(1) Date stated is in respect to our Company or applicable predecessor entity.(2) The appointment is effective on the date of this Prospectus.
Executive Directors
Mr. Jinchu SHEN (沈晉初 )
Mr. Jinchu Shen, also known as Jeffrey, aged 46, is a co-founder of e-Shang and has been theco-CEO of our Group since June 2011. He was appointed as a director of e-Shang on June 30, 2011and following the 2016 Merger, was appointed as a Director and is responsible for overseeing ESR’soverall operations and business development, leading regional growth strategies, and expanding ESR’sasset and fund management platforms. Mr. Shen was re-designated as an executive Director onFebruary 22, 2019.
Mr. Shen has over 20 years of industrial real estate experience in China. Prior to co-foundingour Group in June 2011, Mr. Shen held a variety of roles, including Senior Vice President, at GLPInvestment Management (China) Co., Ltd. (全球物流資產公司(中國)) (formerly known as PrologisChina) from January 2004 to September 2010, overseeing the Eastern China area. Mr. Shen was thedeputy director in DTZ Debenham Tie Leung International Property Advisers from June 2001 toDecember 2003 and prior to this, he was the assistant general manager of marketing at ShanghaiWaigaoqiao Free Trade Zone Xin Development Co., Ltd from July 1995 to November 2000. Mr. Shenwas also a director of ESR-REIT Manager, the fund manager of ESR-REIT, from January 2017 toJanuary 2019.
Mr. Shen graduated from the Shanghai Jiaotong University in the PRC in July 1995, where heobtained a bachelor’s degree in technical economics. In July 2001, he obtained a master’s degree inbusiness administration from Donghua University in the PRC.
Mr. Stuart GIBSON
Mr. Stuart Gibson, aged 55, is a co-founder of our Group, and was the co-founder and CEO ofthe Redwood group from July 2006 until the 2016 Merger, and he has been the co-CEO of our
225

DIRECTORS AND SENIOR MANAGEMENT
Company since January 2016. He was appointed as a Director on January 20, 2016 and is responsiblefor overseeing ESR’s overall operations and business development. Mr. Gibson was re-designated asan executive Director on February 22, 2019.
Mr. Gibson has over 24 years of real estate development and investment experience in Asia,which includes 15 years spent in the Japanese industrial real estate sector. Mr. Gibson joined PrologisB.V. (formerly known as LogiStar B.V.) in 1998 as the development associate, and was subsequentlyseconded from Prologis B.V. to Prologis Japan as a vice president from 2000 and was later promotedto the country head of Prologis Japan. He is the former co-founder and co-CEO of AMB BlackPinefrom 2003 to 2006, which was subsequently incorporated into Prologis. He was also the Chairman ofAMB Property Corporation Japan Advisory Committee from July 2006 to December 2007.
Mr. Charles Alexander PORTES
Mr. Charles Alexander Portes, also known as Charles de Portes, aged 50, is a co-founder of ourGroup and was the co-founder and President of the Redwood group from July 2006 until the 2016Merger, and he has been the President of our Group since January 2016. He was appointed as aDirector on January 20, 2016 and is responsible for overseeing ESR’s overall private equity capitalraising and operations and business development. Mr. Portes was re-designated as an executiveDirector on February 22, 2019.
Mr. Portes has over 23 years of real estate investment experience, including 19 years in theindustrial sector in Asia. Mr. Portes was the co-founder and co-CEO of AMB BlackPine from 2003 to2006, which was subsequently incorporated into Prologis and was a Member of the AMB PropertyJapan Advisory Committee from June 2006 to August 2008. Mr. Portes was the Head of Acquisitionsand Capital for Europe and Asia for Prologis Japan from 1998 to 2003 and he worked in real estate,principally in investments, at Goldman Sachs from 1996 to 1998.
Mr. Portes graduated from The John Hopkins University in the United States in May 1991,where he obtained a bachelor’s degree in Economics. In July 1996, he further obtained a master’sdegree in business administration from INSEAD, France.
Non-executive Directors
Mr. Jeffrey David PERLMAN
Mr. Jeffrey David Perlman, aged 36, was appointed as a Director on June 14, 2011 and wasre-designated as a non-executive Director on February 22, 2019. He was appointed as our chairman onMay 20, 2019.
Mr. Perlman joined Warburg Pincus LLC in 2006, and has been serving as Managing Directorand Head of Southeast Asia since May 2016, leading Warburg Pincus’ investments in Southeast Asiain addition to focusing on real estate investments across the greater Asia-Pacific region. Prior to joiningWarburg Pincus, he worked in the Real Estate Investment Banking Group at Credit Suisse from July2005 to August 2006. Mr. Perlman is a director and member of the executive committee and thenomination and remuneration committee of ESR-REIT Manager, the manager of ESR-REIT, a realestate investment trust listed on the Singapore Exchange Securities Trading Limited (Stock Code:J91U), since January 2017. Mr. Perlman was also a director of Vincom Retail Joint Stock Company, acompany listed on the Ho Chi Minh City Stock Exchange in Vietnam (Stock Code: VRE), from July2013 to September 2017, and was re-appointed and has been serving as a director since February 2018.
226
DIRECTORS AND SENIOR MANAGEMENT
Mr. Perlman graduated from University of Michigan in the United States in April 2005, wherehe obtained a bachelor’s degree in business administration from its Ross School of Business.
Mr. Joseph Raymond GAGNON
Mr. Joseph Raymond Gagnon, aged 41, was appointed as a Director on June 30, 2011 and wasre-designated as a non-executive Director on February 22, 2019.
Mr. Gagnon joined Warburg Pincus LLC in September 2005 as a Managing Director, focusingon the firm’s real estate investment business in China and Southeast Asia. Mr. Gagnon has served as anon-executive director of Red Star Macalline Group Corporation Ltd., a company listed on the MainBoard of the Stock Exchange (Stock Code: 1528), since December 2009 and as director of VingroupJoint Stock Company, a company listed on the Ho Chi Minh City Stock Exchange, in Vietnam (StockCode: VIC) since 2013. In addition, he served as a director for Vincom Retail Joint Stock Company, acompany listed on the Ho Chi Minh City Stock Exchange, in Vietnam (Stock Code: VRE), from July2013 until September 2017.
Mr. Gagnon graduated from Wake Forest University in the United States in August 2000,where he obtained a bachelor’s degree of science in mathematical economics.
Mr. Zhenhui WANG (王振輝)
Mr. Zhenhui Wang, aged 44, was appointed as a Director on May 10, 2018 and wasre-designated as a non-executive Director on February 22, 2019.
Mr. Wang has been the CEO of JD Logistics since April 2017 and is in charge of its logisticsoperations and services to businesses across a wide range of industries. Prior to this role, he joinedJD.com in April 2010 as general manager of its North China region. He has also held leadership rolesat JD.com in its Warehousing and Logistics Department from August 2013 to July 2014, and served asPresident of JD Smart from July 2014 to May 2016.
Mr. Wang graduated from the University of Science and Technology Beijing, in the PRC, inJuly 1998 where he obtained a Bachelor of Engineering degree and obtained an EMBA degree fromChina Europe International Business School in November 2016.
Mr. Ho Jeong LEE
Mr. Ho Jeong Lee, aged 52, was appointed as a Director on August 3, 2017 and wasre-designated as a non-executive Director on February 22, 2019. He is also a member of the AuditCommittee.
Mr. Lee has been an executive of SK since January 2017 to date. In addition to this, Mr. Leehas worked for various SK group companies, including various roles at SK Innovation Co., Ltd, suchas Business Development Manager and Marketing Information Manager, from April 1991 toNovember 2018, various roles at SK Networks, such as Vice President in the Strategy & PlanningDivision, between June 1999 and December 2016, as well as President at SK Pinx from January 2015to December 2015.
Mr. Lee graduated from Inha University in South Korea in February 1991, where he obtained aBachelor of Science in Engineering degree. In August 2008, he further obtained a master’s degree from
227

DIRECTORS AND SENIOR MANAGEMENT
the Korea University in South Korea, in business administration from the Korea University BusinessSchool.
Independent non-executive Directors
Mr. Brett Harold KRAUSE
Mr. Brett Harold Krause, aged 51, is an independent non-executive Director and also thechairman of the Remuneration Committee, a member of the Audit Committee and a member of theNomination Committee. He was appointed as an independent non-executive Director on May 20, 2019,effective on the date of this Prospectus.
Mr. Krause has extensive experience in the banking industry in Asia and in corporatemanagement. In March 2018, Mr. Krause became the Chief Strategy Officer at FunPlus. FunPlusengages in digital interactive entertainment with major offices in San Francisco and Beijing. Prior toFunPlus, Mr. Krause was the Managing Partner at PurpleSky Capital LLC, a China-based angelventure capital firm specializing in funding start-ups in high-tech sectors, from July 2016 to February2018. Mr. Krause was the President of JPMorgan Chase Bank (China) Co. Ltd. from January 2014 toJuly 2016 and prior to this, he held various senior roles in Citigroup, including CitiService Head ofCitibank NA, Taipei in Taiwan from January 1999 to May 2000, e-Business Head of Citibank NA,Tokyo, in Japan, from May 2000 to January 2002, Director and Cash Management Head of CitigroupGlobal Transaction Services of Citibank NA, Shanghai in Shanghai, PRC, from January 2002 toJanuary 2005, Managing Director and Head of Global Transaction Services of Citibank China Co., Ltd.in Shanghai, PRC, from February 2005 to June 2008, and Citi Country Officer, Vietnam of CitibankNA in Vietnam from July 2008 to December 2013. Mr. Krause has also been an independent boarddirector for both East West Bank (China) Limited since November 2017 and Vincom Retail JointStock Company, a company listed on the Ho Chi Minh City Stock Exchange in Vietnam (Stock Code:VRE), since September 2017.
Mr. Krause graduated from Georgetown University in the United States in May 1991, where heobtained a Bachelor of Science degree in foreign service. In May 1996, he further obtained a master’sdegree in business administration from Columbia Business School of Columbia University in theUnited States.
The Right Honourable, Sir Hugo George William SWIRE, KCMG, MP
Sir Hugo George William Swire KCMG, MP, aged 59, is an independent non-executiveDirector and also the chairman of the Nomination Committee. He was appointed as an independentnon-executive Director on May 20, 2019, effective on the date of this Prospectus.
Since 2016, Sir Hugo has been the Deputy Chairman of Commonwealth Enterprise andInvestment Council and the Chairman of Conservative Middle East Council, as well as the Member ofParliament for East Devon in the United Kingdom since 2001. He has held several ministerial roles inthe United Kingdom, including Minister of State for Northern Ireland between 2010 and 2012, as wellas Minister of State for the Foreign and Commonwealth Office between 2012 and 2016. Sir Hugo wassworn to the Privy Council of the United Kingdom in 2011, and was awarded a knighthood in theUnited Kingdom in August 2016.
Sir Hugo has been the chairman of The British Honey Company Ltd, a company that produceslocal honey products and infused spirits containing honey and local fruit products in the United
228

DIRECTORS AND SENIOR MANAGEMENT
Kingdom, since March 2018 and prior to this, he also served as an independent non-executive directoron the board of Photo-Me International plc, a company listed on the London Stock Exchange in theUnited Kingdom (Stock Code: PHTM) that operates, sells and services a range of instant serviceequipment, from 2005 to 2010 as an independent non-executive director, including as thenon-executive chairman from 2008 to 2010. Sir Hugo was a non-executive director of SymphonyEnvironmental Technologies Plc, a company whose shares are listed on the London Stock Exchange(Stock Code: SYM) from October 2008 to May 2010. He worked as a deputy director at Sotheby’s inLondon from 1992 to 1996 and as a director from 1996 to 2003, prior to which he was the Head of theNational Gallery Trust Office in London from 1988 to 1992.
Sir Hugo attended University of St. Andrews in Scotland, the United Kingdom, where he wasstudying towards a master’s degree in fine arts and medieval history from 1978 to 1979, and attendedRoyal Military Academy at Sandhurst in the United Kingdom. From 1980 to 1983, Sir Hugo wascommissioned as an officer in the 1st Battalion Grenadier Guards.
Mr. Simon James MCDONALD
Mr. Simon James McDonald, aged 57, is an independent non-executive Director and also thechairman of the Audit Committee and a member of the Remuneration Committee. He was appointed asan independent non-executive Director on May 20, 2019, effective on the date of this Prospectus.
Mr. McDonald has extensive experience in real estate and management in APAC and was thehead of asset management at Asia Pacific Land from February 2015 to May 2019, and was responsiblefor the day-to-day oversight of Asia Pacific Land’s asset management activities. Prior to this, Mr.McDonald held various roles at GE Capital Real Estate, in Sydney in Australia and Tokyo in Japan,from August 1997 to September 2013, including Managing Director Asia Pacific (Portfolio Strategy),Managing Director Asia Pacific (Asset Management), Managing Director Asia Pacific (RiskManagement), Joint Managing Director for Australia and New Zealand, and Director (RiskManagement).
Mr. McDonald graduated from The Australian National University in Australia in May 1987,where he obtained a bachelor’s degree in economics. In May 1991, he further obtained a master ofbusiness from the University of Technology in Sydney, Australia. Mr. McDonald is a member of CPAAustralia since April 1987, and subsequently became a fellow member since May 2014. He has alsobeen a fellow of the Financial Services Institute of Australia since June 2005. In addition, Mr.McDonald is a member and a Graduate of the Australian Institute of Company Directors since August2013 and May 2014, respectively.
Ms. Jingsheng LIU (劉京生)
Ms. Jingsheng Liu, aged 67, is an independent non-executive Director and also a member of theNomination Committee. She was appointed as an independent non-executive Director on May 20,2019, effective on the date of this Prospectus.
Ms. Liu has extensive experience in the capital markets in the PRC. She joined ChinaInternational Capital Corporation Limited (“CICC”) in 1996 and is currently the advisory director atCICC. Prior to this, she held various roles within the CICC group, including the chairwoman ofInvestment Banking Business Committee of CICC, chairwoman and CEO of China International
229

DIRECTORS AND SENIOR MANAGEMENT
Capital Corporation (Singapore) Pte. Limited, and the Head of the Strategic Research Department ofCICC. Prior to joining CICC, Ms. Liu worked at the Department of State Planning and RegionalEconomy of State Planning Commission (國土規劃和地區經濟司) (currently known as the NationalDevelopment and Reform Commission (國家發展和改革委員會)) in the PRC.
Ms. Liu graduated from Renmin University of China, in Beijing, PRC in October 1983, whereshe obtained a bachelor’s degree in economics. In November 1992, she further obtained a master’sdegree in rural development management from Khon Kaen University in Thailand.
Mr. Robin Tom Holdsworth
Mr. Robin Tom Holdsworth, aged 50, is an independent non-executive and also a member ofthe Audit Committee. He was appointed as an independent non-executive Director on October 14,2019, effective on the date of this Prospectus.
Mr. Holdsworth has over 20 years of experience in private equity fund management andproperty consultancy. He is currently the Founder and Managing Director of RTH Advisors Limited.From August 2006 to December 2017, Mr. Holdsworth was the Senior Partner and Co-FoundingPartner at LimeTree Capital Advisors Ltd. Prior to this, he held various roles at Jones Lang LaSalle,including (a) its President Director and Country Head in Indonesia from July 2001 to June 2006; (b) itsHead of Corporate services in Indonesia from October 1999 to June 2001; and (c) the AssociateDirector and subsequently its Country Head in Ho Chi Minh City, Vietnam from July 1997 toSeptember 1999. From July 1995 to June 1997, Mr. Holdsworth served as the Hanoi Representativeand subsequently the Country Head of Brooke Hillier Parker in Hanoi, Vietnam.
Mr. Holdsworth graduated from the University of Exeter in the United Kingdom in July 1991,where he obtained a bachelor’s degree in economic and social history.
SENIOR MANAGEMENT
Members of the senior management of our Group include the following:
Senior Management
Name Age Position
Date ofJoiningour
Group(1) Responsibility
Mr. Jinchu Shen(沈晉初) . . . . . . . . . . 46 Executive Director,
Co-founder and co-CEOJuly 30,2011
Responsible for the management andconduct of our business, overall riskcontrol and daily business operation.
Mr. Stuart Gibson . . . . 55 Executive Director,Co-founder and co-CEO
July 1,2006
Responsible for the management andconduct of our business, overall riskcontrol and daily business operation.
Mr. Charles AlexanderPortes . . . . . . . . . . . 50 Executive Director,
Co-founder and presidentJuly 1,2006
Responsible for the management andconduct of our business, overall riskcontrol and daily business operation.
230

DIRECTORS AND SENIOR MANAGEMENT
Name Age PositionDate of Joiningour Group(1) Responsibility
Mr. Wee Peng Cho(鄒偉平) . . . . . . . . . . 50 Group Chief Financial
OfficerDecember 19,2016
Responsible for all aspects of theGroup’s financial management,including finance (accounting, tax,budgeting & forecasting),financing (debt and equity), riskmanagement and investor relations.
Note:(1) Date stated is in respect to our Company or applicable predecessor entity.
Mr. Wee Peng CHO (鄒偉平)
Mr. Wee Peng Cho, aged 50, has been serving as the Chief Financial Officer of our Groupsince December 2016, and is responsible for all aspects of the Group’s financial management,including finance (accounting, tax, budgeting & forecasting), financing (debt and equity), and investorrelations.
Mr. Cho has over 25 years of experience in finance in international and regional companies inAsia. Mr. Cho was the CFO at SATS Ltd. (Stock Code: S58) and Hyflux Ltd. (Stock Code: 600), bothlisted on the Singapore Exchange, from July 2013 to November 2016 and from January 2011 to May2013, respectively. Mr. Cho joined Hyflux Ltd in early 2007 as Senior VP Group Treasurer andInvestment Director and was promoted to Group EVP and Chief Investment Officer in December2008. He held various treasury roles with Dow Chemical in the USA and Asia Pacific, includingFinance Risk Manager (Asia Pacific) and Corporate Finance Manager, from May 1998 to February2007.
Mr. Cho graduated from the Nanyang Technological University in Singapore in April 1993,where he obtained the bachelor’s degree in accountancy. He further obtained a master’s degree inapplied finance from the National University of Singapore in Singapore in August 2001. He has been aChartered Financial Analyst since September 2001.
Save as disclosed above, none of our Directors and senior management has been a director ofany public company the securities of which are listed on any securities market in Hong Kong oroverseas in the three years immediately preceding the date of this Prospectus.
None of our Directors and senior management is related to other Directors and seniormanagement.
Save as disclosed, to the best of the knowledge, information and belief of our Directors, havingmade all reasonable enquiries, there was no other matter with respect to the appointment of ourDirectors that need to be brought to the attention of our Shareholders and there was no informationrelating to our Directors that is required to be disclosed pursuant to Rule 13.51(2)(h) to (v) of theListing Rules as of the Latest Practicable Date.
As of the Latest Practicable Date, save for the interests in the Shares of Mr. Jinchu Shen,Mr. Charles Alexander Portes and Mr. Stuart Gibson, which are disclosed in the section headed“Statutory and General Information—C. Further information about our Directors and SubstantialShareholders—1. Disclosure of interests” in Appendix VIII to this Prospectus, none of our Directorsheld any interest in the Shares within the meaning of Part XV of the SFO.
231

DIRECTORS AND SENIOR MANAGEMENT
COMPANY SECRETARY
Richard Kin-sing Lee (李建成), aged 42, joined our Group in September 2018 and wasappointed as the company secretary of our Company on February 22, 2019. Mr. Lee has been asolicitor of the High Court of Hong Kong since 2006 and the Supreme Court of England & Wales since2008. Mr. Lee has over 14 years private practice and in-house legal counsel experience. Mr. Lee wasthe senior legal counsel of the strategic investment department at Imperial Pacific InternationalHoldings Ltd, a company listed on the Hong Kong Stock Exchange (Stock Code: 1076), fromNovember 2017 to September 2018. Prior to this, Mr. Lee was counsel at Sidley Austin from March2016 to October 2017, a senior associate at Jun He Law Offices in Hong Kong from April 2015 toFebruary 2016, a senior associate and an associate at DLA Piper Hong Kong from May 2012 to March2015 and October 2007 to May 2012, respectively, and a solicitor at Jun He Law Offices in HongKong in association with X. J. Wang & Co. from October 2006 to October 2007.
Mr. Lee graduated from the University of Hong Kong in December 1999, where he obtained abachelor’s degree in cognitive science. In August 2002, he further obtained a bachelor’s degree in lawfrom the University of London (External) in the United Kingdom, before obtaining a postgraduatecertificate in law from the University of Hong Kong in June 2003. In November 2004, he obtained amaster’s degree in law, specializing in banking and finance laws, from the University College Londonin the United Kingdom.
BOARD COMMITTEES
Our Company has established the Audit Committee, the Remuneration Committee and theNomination Committee in compliance with the Corporate Governance Code. These committeesoperate in accordance with their respective terms of reference established by our Board.
Audit Committee
We have established the Audit Committee with written terms of reference in compliance withthe Corporate Governance Code as set out in Appendix 14 to the Listing Rules. The primary duties ofthe Audit Committee are to review and supervise our financial reporting process and the internalcontrol system of our Group, manage risk, perform internal audit, provide advice and comments to ourBoard and perform other duties and responsibilities as may be assigned by our Board.
The Audit Committee consists of five members, namely Mr. Simon James McDonald, Mr.Joseph Raymond Gagnon, Mr. Brett Harold Krause, Mr. Ho Jeong Lee and Mr. Robin TomHoldsworth. The chairman of the Audit Committee is Mr. Simon James McDonald, who is anindependent non-executive Director with the appropriate accounting and related financial managementexpertise.
Nomination Committee
We have established the Nomination Committee with written terms of reference in compliancewith the Corporate Governance Code as set out in Appendix 14 to the Listing Rules. The primaryduties of the Nomination Committee are to review the structure, size and composition of our Board ona regular basis and make recommendations to our Board regarding any proposed changes to thecomposition of our Board; identify, select and make recommendations to our Board on the selection ofindividuals nominated for directorship, and ensure the diversity of our Board members; assess the
232

DIRECTORS AND SENIOR MANAGEMENT
independence of our independent non-executive Directors and make recommendations to our Board onrelevant matters relating to the appointment, reappointment and removal of our Directors andsuccession planning for our Directors.
The Nomination Committee consists of three members, namely The Right Honorable Sir HugoGeorge William Swire, KCMG, MP, Mr. Brett Harold Krause and Ms. Liu Jingsheng (劉京生). Thechairman of the Nomination Committee is The Right Honorable Sir Hugo George William Swire,KCMG, MP.
Remuneration Committee
We have established the Remuneration Committee with written terms of reference incompliance with the Corporate Governance Code as set out in Appendix 14 of the Listing Rules. Theprimary duties of the Remuneration Committee are to establish, review and provide advice to ourBoard on the structure of remuneration of our Directors and senior management and on theestablishment of a formal and transparent procedure for developing policies concerning remuneration,determine the terms of the specific remuneration package of each executive Director and seniormanagement and review and approve performance-based remuneration by reference to corporate goalsand objectives resolved by our Directors from time to time.
The Remuneration Committee consists of three members, namely Mr. Brett Harold Krause,Mr. Jeffrey David Perlman and Mr. Simon James McDonald. The chairman of the RemunerationCommittee is Mr. Brett Harold Krause.
REMUNERATION OF DIRECTORS AND SENIOR MANAGEMENT
The remuneration of our Directors and senior management are paid in the form of salaries,allowances, employee benefits, discretionary bonuses, fees and retirement benefits.
For the three years ended December 31, 2016, 2017 and 2018 and the six months endedJune 30, 2019, the aggregate amounts of remuneration costs (including remuneration, salaries, equity-settled share options, allowances, contributions to pension schemes, discretionary bonuses and otherbenefits) incurred by our Company with respect to our Directors and entities related to them wereapproximately US$4.5 million, US$14.3 million, US$12.2 million and US$7.1 million, respectively.
Under the arrangements currently in force, it is estimated that the aggregate amounts ofremuneration costs (including remuneration, salaries, equity-settled share options, allowances,contributions to pension schemes, discretionary bonuses and other benefits) incurred by our Companywith respect to our Directors and entities related to them for the year ending December 31, 2019 willbe approximately US$13.5 million.
For the year ended December 31, 2016, four of the five highest paid individuals were formerand current Directors. For the two years ended December 31, 2017 and 2018, three of the five highestpaid individuals were Directors. The aggregate amounts of remuneration, salaries, equity-settled shareoptions, allowances, contributions to pension schemes, discretionary bonuses and other benefitsincurred by our Company with respect to the highest paid individual and entities related to same in theyear ended December 31, 2016 was approximately US$0.9 million, and with respect to the tworemaining highest paid individuals and entities related to same in the two years ended December 31,2017 and 2018 was approximately US$1.5 million and US$3.3 million, respectively.
233

DIRECTORS AND SENIOR MANAGEMENT
Saved as disclosed in “Accountants’ Report—Directors’ and chief executive’s remuneration” inAppendix I to this Prospectus, for the three years ended December 31, 2016, 2017 and 2018, no feewas paid by the Company to the Directors or the five highest paid employees in connection with theirretirement or as compensation for loss of office, or as an inducement to join or upon joining ourCompany, or for services provided by such persons in connection with the promotion or establishmentof the Company. In addition, there have been no arrangements under which a Director waived oragreed to waive any remuneration during the relevant periods. For further details, see the sectionheaded “Accountants’ Report—Directors’ and chief executive’s remuneration” in Appendix I to thisProspectus.
COMPLIANCE ADVISOR
We have engaged Octal Capital Limited as our compliance advisor under Rule 3A.19 of theListing Rules. The key terms of the engagement are as follows:
(a) the term will be from the Listing Date to the date when our Company complies with Rule13.46 of the Listing Rules in respect of the financial results of the first full financial yearafter the Listing Date is issued, or the termination date of the agreement, whichever isearlier;
(b) the compliance advisor will provide guidance and advice as to the on-going compliance,requirements and other issues arising out of the Listing Rules and other applicable laws,rules, codes, and guidelines;
(c) the compliance advisor will, as soon as practicable, inform us of any amendment orsupplement to the Listing Rules announced by the Stock Exchange, and of new applicablelaws, rules, codes and guidelines or amendments to the same; and
(d) the compliance advisor will be one of the communication channels between us and theStock Exchange.
CORPORATE GOVERNANCE CODE
We aim to achieve high standards of corporate governance which are crucial to ourdevelopment and safeguarding the interests of our Shareholders. To accomplish this, we will complywith the Corporate Governance Code set out in Appendix 14 to the Listing Rules and the associatedListing Rules after the Listing.
234

SHARE CAPITAL
AUTHORIZED AND ISSUED SHARE CAPITAL
The following is a description of the authorized and issued share capital of our Company as ofthe Latest Practicable Date and to be issued as fully paid or credited as fully paid immediatelyfollowing the completion of the Global Offering:
As of the Latest Practicable Date
US$
Authorized share capital:600,000,000 Class A Shares of US$0.001 each . . . . . . . . . . . . . . . . . . . . . . . . . . . . . . . . . . . . . . . . $ 600,0001,000,000,000 Class B1 Shares of US$0.001 each . . . . . . . . . . . . . . . . . . . . . . . . . . . . . . . . . . . . . $ 1,000,000100,000,000 Class B2 Shares of US$0.001 each . . . . . . . . . . . . . . . . . . . . . . . . . . . . . . . . . . . . . . . $ 100,000400,000,000 Class B3 Shares of US$0.001 each . . . . . . . . . . . . . . . . . . . . . . . . . . . . . . . . . . . . . . . $ 400,000500,000,000 Class B4 Shares of US$0.001 each . . . . . . . . . . . . . . . . . . . . . . . . . . . . . . . . . . . . . . . $ 500,000100,000,000 Class B5 Shares of US$0.001 each . . . . . . . . . . . . . . . . . . . . . . . . . . . . . . . . . . . . . . . $ 100,000300,000,000 Class B6 Shares of US$0.001 each . . . . . . . . . . . . . . . . . . . . . . . . . . . . . . . . . . . . . . . $ 300,000200,000,000 Class B7 Shares of US$0.001 each . . . . . . . . . . . . . . . . . . . . . . . . . . . . . . . . . . . . . . . $ 200,000300,000,000 Class B8 Shares of US$0.001 each . . . . . . . . . . . . . . . . . . . . . . . . . . . . . . . . . . . . . . . $ 300,000300,000,000 Class B9 Shares of US$0.001 each . . . . . . . . . . . . . . . . . . . . . . . . . . . . . . . . . . . . . . . $ 300,000300,000,000 Class C Shares of US$0.001 each . . . . . . . . . . . . . . . . . . . . . . . . . . . . . . . . . . . . . . . . $ 300,000300,000,000 Class C Preference Shares of US$0.001 each . . . . . . . . . . . . . . . . . . . . . . . . . . . . . . . $ 300,000Total . . . . . . . . . . . . . . . . . . . . . . . . . . . . . . . . . . . . . . . . . . . . . . . . . . . . . . . . . . . . . . . . . . . . . . . . . $ 4,400,000
Issued share capital:380,126,414 Class A Shares of US$0.001 each . . . . . . . . . . . . . . . . . . . . . . . . . . . . . . . . . . . . . . . . $ 380,126.41876,250,989 Class B1 Shares of US$0.001 each . . . . . . . . . . . . . . . . . . . . . . . . . . . . . . . . . . . . . . . $ 876,250.9954,684,608 Class B2 Shares of US$0.001 each . . . . . . . . . . . . . . . . . . . . . . . . . . . . . . . . . . . . . . . . $ 54,684.61355,857,177 Class B3 Shares of US$0.001 each . . . . . . . . . . . . . . . . . . . . . . . . . . . . . . . . . . . . . . . $ 355,857.18422,405,666 Class B4 Shares of US$0.001 each . . . . . . . . . . . . . . . . . . . . . . . . . . . . . . . . . . . . . . . $ 422,405.670 Class B5 Shares of US$0.001 each . . . . . . . . . . . . . . . . . . . . . . . . . . . . . . . . . . . . . . . . . . . . . . . . $ 0261,930,955 Class B6 Shares of US$0.001 each . . . . . . . . . . . . . . . . . . . . . . . . . . . . . . . . . . . . . . . $ 261,930.9570,721,358 Class B7 Shares of US$0.001 each . . . . . . . . . . . . . . . . . . . . . . . . . . . . . . . . . . . . . . . . $ 70,721.36240,578,861 Class B8 Shares of US$0.001 each . . . . . . . . . . . . . . . . . . . . . . . . . . . . . . . . . . . . . . . $ 240,578.8626,363,847 Class B9 Shares of US$0.001 each . . . . . . . . . . . . . . . . . . . . . . . . . . . . . . . . . . . . . . . . $ 26,363.8532,714,642 Class C Shares of US$0.001 each . . . . . . . . . . . . . . . . . . . . . . . . . . . . . . . . . . . . . . . . . $ 32,714.6489,965,263 Class C Preference Shares of US$0.001 each . . . . . . . . . . . . . . . . . . . . . . . . . . . . . . . . $ 89,965.26Total . . . . . . . . . . . . . . . . . . . . . . . . . . . . . . . . . . . . . . . . . . . . . . . . . . . . . . . . . . . . . . . . . . . . . . . . . $2,811,599.78
Immediately Before and After Completion of the Global Offering, regardless of whether the Over-allotment Option and the OfferSize Adjustment Option are exercised
US$
Authorized share capital:8,000,000,000 Shares of US$0.001 each . . . . . . . . . . . . . . . . . . . . . . . . . . . . . . . . . . . . . . . . . . . . . 8,000,000
Issued share capital immediately before completion of the Global Offering:2,756,444,643(1) Shares of US$0.001 each . . . . . . . . . . . . . . . . . . . . . . . . . . . . . . . . . . . . . . . . . . . . 2,756,444.64
Shares to be issued as part of the Global Offering:280,140,000 Shares of US$0.001 each . . . . . . . . . . . . . . . . . . . . . . . . . . . . . . . . . . . . . . . . . . . . . . . 280,140.00
Total number of issued Shares on completion of the Global Offering3,036,584,643 Shares of US$0.001 each . . . . . . . . . . . . . . . . . . . . . . . . . . . . . . . . . . . . . . . . . . . . . 3,036,584.64
Note:(1) The number of issued shares of the Company as of the Latest Practicable Date is 2,811,599,780. Changes will occur to the number of
issued shares of the Company between the Latest Practicable Date and immediately before completion of the Global Offering as furtherdescribed in “History, Development and Corporate Structure—Capitalization of the Company” in this Prospectus.
235

SHARE CAPITAL
Upon the effectiveness of the Share Redesignation, the issued share capital of our Companyshall consist of the Shares (being ordinary shares of our Company with a nominal value of US$0.001each).
ASSUMPTIONS
The table above assumes that the Global Offering becomes unconditional and is completed inaccordance with the relevant terms and conditions of, and that the Shares are issued pursuant to, theGlobal Offering. The above does not take into account any Shares which may be issued or repurchasedby our Company pursuant to the general mandates granted to our Directors to issue or repurchaseShares as described below.
RANKING
The Offer Shares are ordinary shares in the share capital of our Company and rank equally withall Shares currently in issue or to be issued and, in particular, will rank in full for all dividends or otherdistributions declared, made or paid on the Shares in respect of a record date which falls after the dateof this Prospectus.
KM ESOP, TIER 1 ESOP AND POST-IPO SHARE OPTION SCHEME
We have adopted the KM ESOP and Tier 1 ESOP, and conditionally adopted the Post-IPOShare Option Scheme. The principal terms of the KM ESOP, Tier 1 ESOP and Post-IPO Share OptionScheme are summarized in the section headed “Statutory and General Information—D. KM ESOP,Tier 1 ESOP and Post-IPO Share Option Scheme” in Appendix VIII to this Prospectus.
GENERAL MANDATE TO ISSUE SHARES
Subject to the Global Offering becoming unconditional, our Directors have been granted ageneral mandate to allot, issue and deal with Shares in the share capital of our Company with a totalnumber of issued Shares of not more than the sum of:
(a) 20% of the total number of Shares in issue immediately following completion of theGlobal Offering; and
(b) the total number of Shares repurchased by our Company (if any) under the generalmandate to repurchase Shares referred to below.
Our Directors may, in addition to the Shares which they are authorized to issue under thisgeneral mandate, allot, issue or deal with Shares under a rights issue, scrip dividend scheme or similararrangement.
This general mandate will remain in effect until the earliest of:
(a) the conclusion of our Company’s next annual general meeting; or
(b) the expiry of the period within which our Company is required by any applicable laws orour Articles to hold the next annual general meeting; or
(c) when varied, revoked or renewed by an ordinary resolution of our Shareholders in ageneral meeting.
236

SHARE CAPITAL
Further information on this general mandate is set out in the section headed “Statutory andGeneral Information—A. Further Information about our Group—3. Written Resolutions of ourShareholders passed on June 4, 2019 and October 12, 2019” in Appendix VIII to this Prospectus.
GENERAL MANDATE TO REPURCHASE SHARES
Subject to the Global Offering becoming unconditional, our Directors have been granted ageneral mandate to exercise all of the powers of our Company to repurchase Shares of a total numberof not more than 10% of the total number of Shares in issue immediately following the completion ofthe Global Offering.
This mandate only relates to repurchases made on the Stock Exchange or any other stockexchange on which the Shares are listed (and which is recognized by the SFC and the Stock Exchangefor this purpose), and which are made in accordance with all applicable laws and/or requirements ofthe Listing Rules. A summary of the relevant Listing Rules is set out in the section headed “Statutoryand General Information—A. Further Information about our Group—5. Repurchase by our Companyof our own Securities” in Appendix VIII to this Prospectus.
This general mandate to repurchase Shares will remain in effect until the earliest of:
(a) the conclusion of our Company’s next annual general meeting; or
(b) the expiration of the period within which our Company is required by any applicable lawsor our Articles to hold the next annual general meeting; or
(c) when varied, revoked or renewed by an ordinary resolution of our Shareholders in ageneral meeting.
Further information on this general mandate is set out in the section headed “Statutory andGeneral Information—A. Further Information about our Group—3. Written Resolutions of ourShareholders passed on June 4, 2019 and October 12, 2019” in Appendix VIII to this Prospectus.
CIRCUMSTANCES UNDER WHICH GENERAL MEETINGS AND CLASS MEETINGS AREREQUIRED
Please see the section headed “Summary of the Constitution of our Company and CaymanCompanies Law” in Appendix VII to this Prospectus which sets out the circumstances under whichgeneral meetings and class meetings are required.
237

SUBSTANTIAL SHAREHOLDERS
So far as our Directors are aware, immediately following the completion of the Global Offering(assuming the Over-allotment Option and the Offer Size Adjustment Option are not exercised), thefollowing persons will have an interest or a short position in the Shares or the underlying Shares of ourCompany which will be required to be disclosed to our Company and the Stock Exchange pursuant tothe provisions of Division 2 and 3 of Part XV of the SFO, or will be, directly or indirectly, interested in10.0% or more of the nominal value of any class of share capital carrying rights to vote in allcircumstances at our general meetings:
Shares held as of theLatest Practicable Date
Upon completion of theGlobal Offering (assumingthe Over-allotment Option
and the Offer SizeAdjustment Option are not
exercised)
Upon completion of theGlobal Offering
(assuming full exercise of theOver-allotment Option butthe Offer Size AdjustmentOption is not exercised)
Upon completion of theGlobal Offering (assumingfull exercise of the Over-allotment Option and theOffer Size Adjustment
Option)
Name of shareholdersNature ofinterest
Number ofshares held
Approximate% of
shareholdingNumber ofShares held
Approximate% of
shareholdingNumber ofShares held
Approximate% of
shareholdingNumber ofShares held
Approximate% of
shareholding
WP OCIM (if LuckfieldGlobal Limited is a SellingShareholder)(1) . . . . . . . . . .
Beneficialinterest
1,121,410,627 39.89% 732,592,930 24.13% 643,972,161 21.21% 542,058,277 17.85%
WP OCIM(1) (if LuckfieldGlobal Limited is not aSelling Shareholder) . . . . .
Beneficialinterest
1,121,410,627 39.89% 717,808,954 23.64% 629,188,185 20.72% 527,274,301 17.36%
Mr. Charles AlexanderPortes(2) . . . . . . . . . . . . . . .
Interest inacontrolledcorporation
389,933,535 13.87% 421,835,167(6) 13.89% 421,835,167(6) 13.89% 421,835,167(6) 13.89%
Mr. Stuart Gibson(2) . . . . . . . . Interest inacontrolledcorporation
389,933,535 13.87% 421,835,167(6) 13.89% 421,835,167(6) 13.89% 421,835,167(6) 13.89%
Redwood Entities(2) . . . . . . . . Beneficialinterest
389,933,535 13.87% 421,835,167(6) 13.89% 421,835,167(6) 13.89% 421,835,167(6) 13.89%
APG-Stichting(3) . . . . . . . . . . . Beneficialinterest
219,334,897 7.80% 211,057,897 6.95% 211,057,897 6.95% 211,057,897 6.95%
Laurels(4) . . . . . . . . . . . . . . . . Beneficialinterest
190,063,207 6.76% 285,758,717(7) 9.41% 285,758,717(7) 9.41% 285,758,717(7) 9.41%
SK . . . . . . . . . . . . . . . . . . . . . Beneficialinterest
336,539,292 11.97% 336,539,292 11.08% 336,539,292 11.08% 336,539,292 11.08%
Jingdong Logistics GroupCorporation(5) . . . . . . . . . .
Beneficialinterest
240,578,861 8.56% 232,301,861 7.65% 232,301,861 7.65% 232,301,861 7.65%
Notes:(1) WP OCIM is a wholly-owned subsidiary of WP X Investment VI Ltd. (“WP X VI”). WP X VI is 96.9% owned by Warburg Pincus X,
the general partner of which is Warburg Pincus X, L.P. (“WP X LP”). The general partner of WP X LP is Warburg Pincus X GP L.P.,the general partner of which is WPP GP LLC (“WPP GP”). The managing member of WPP GP is Warburg Pincus Partners, L.P.(“WPP”). The general partner of WPP is Warburg Pincus Partners GP LLC, the managing member of which is Warburg Pincus & Co.Accordingly, each of WP X VI, Warburg Pincus X, WP X LP, WPP GP, WPP, Warburg Pincus Partners GP LLC and Warburg Pincus &Co. are deemed to be interested in the Shares held by WP OCIM.
(2) Redwood Investor is owned as to 42.0% and 58.0% by Kurmasana Holdings, LLC and Redwood Investor (Cayman) Ltd, respectively, ofwhich Kurmasana Holdings, LLC is wholly-owned by Redwood Investor (Cayman) Ltd and the voting rights of Redwood Investor(Cayman) Ltd. are controlled as to 50% and 50% by Mr. Charles Alexander Portes and Mr. Stuart Gibson, respectively. Hence, each ofMr. Charles Alexander Portes, Mr. Stuart Gibson, Redwood Investor (Cayman) Ltd and Kurmasana Holdings, LLC are deemed to beinterested in the Shares held by Redwood Investor. Redwood Consulting is owned as to 50.0% and 50.0% by Mr. Charles AlexanderPortes and Mr. Stuart Gibson, respectively. Hence each of Mr. Charles Alexander Portes and Mr. Stuart Gibson are deemed to beinterested in Shares held by Redwood Consulting.
(3) APG-AM is the investment manager of APG-Stichting, which is the holder of the relevant Shares. APG-AM is wholly-owned by APGGroep N.V., which is 92.16% owned by Stichting Pensioenfonds ABP, which is an investor in APG Strategic Real Estate Pool. Each ofStichting Pensioenfonds ABP, APG-AM and APG Groep N.V., are therefore deemed to be interested in the Shares held by APG-Stichting.
(4) Laurels is wholly owned by The Shen Trust. The settlor of The Shen Trust is Rosy Fortune Limited, the sole shareholder of which isMr. Jinchu Shen. The trustee of The Shen Trust is Equity Trustee Limited. Rosy Fortune Limited has a deemed interest under the SFO inthe Shares held by The Shen Trust in its capacity as settlor of The Shen Trust, Mr. Jinchu Shen has a deemed interest under the SFO inthe Shares held by The Shen Trust solely in his capacity as the sole shareholder of the settlor of The Shen Trust and Equity TrusteeLimited has a deemed interest under the SFO in the Shares held by The Shen Trust in its capacity as trustee of The Shen Trust.
(5) Jingdong Logistics Group Corporation is a wholly owned subsidiary of JD.com, Inc., a Cayman Islands company with its Americandepository shares listed on the Nasdaq Global Select Market. Max Smart Limited, a BVI company beneficially owned by Mr. Richard
238

SUBSTANTIAL SHAREHOLDERS
Qiangdong Liu through a trust, owned 15.2% of the total outstanding ordinary shares and 72.9% of the total outstanding voting power ofJD.com, Inc. as of February 28, 2019. Therefore, each of JD.com, Inc., Max Smart Limited and Mr. Richard Qiangdong Liu is deemed tohave beneficial ownership over the Shares held by Jingdong Logistics Group Corporation.
(6) This also includes its interest in 16,899,687 Shares underlying the options pursuant to the Tier 1 ESOP.(7) This also includes its interest in 3,899,928 Shares underlying the options pursuant to the Tier 1 ESOP.
For information on the other shareholders in the table above, please see the section headed“History, Development and Corporate Structure—Pre-IPO Investments” in this Prospectus.
Save as disclosed above, our Directors are not aware of any person who will, immediatelyfollowing the completion of the Global Offering (assuming the Over-allotment Option and the OfferSize Adjustment Option are not exercised), have an interest or a short position in the Shares orunderlying Shares which will be required to be disclosed to our Company and the Stock Exchangeunder the provisions of Division 2 and 3 of Part XV of the SFO or will be, directly or indirectly,interested in 10% or more of the nominal value of any class of share capital carrying rights to vote inall circumstances at our general meetings.
239

FINANCIAL INFORMATION
In the following section we discuss our historical financial results for the years endedDecember 31, 2016, 2017 and 2018 and the six months ended June 30, 2018 and 2019. You shouldread the following discussion and analysis together with our audited consolidated financialstatements as of and for the years ended December 31, 2016, 2017 and 2018 and the six monthsended June 30, 2019 and the accompanying notes included in the Accountants’ Report set out inAppendix I to this Prospectus. Our consolidated financial statements have been prepared inaccordance with IFRS.
This discussion and analysis contains forward-looking statements that reflect our currentviews with respect to future events and our financial performance and involves risks anduncertainties. These statements are based on our assumptions and analysis in light of our experienceand perception of historical trends, current conditions and expected future developments, as well asother factors we believe are appropriate under the circumstances. However, whether actualoutcomes and developments will meet our expectations and predictions depends on a number of risksand uncertainties. Our actual results may differ materially from those anticipated in these forward-looking statements as a result of any number of factors. In evaluating our business, you shouldcarefully consider the information provided in this Prospectus, including the sections headed “RiskFactors” and “Business” in this Prospectus.
OVERVIEW
We are the largest APAC focused logistics real estate platform by GFA and by value of thePortfolio Assets and have the largest development pipeline in aggregate across the major APACmarkets as measured by GFA from July 1, 2019 to December 31, 2020, according to the JLL Report.We develop and manage modern logistics facilities that cater to e-commerce companies, 3PLproviders, bricks-and-mortar retailers, manufacturers, cold-chain logistics providers and others inAPAC as logistics infrastructure continues to evolve for the modern economy. We focus solely onAPAC, which comprised over 3.6 billion people (around 50% of the global population) and overUS$28.6 trillion of GDP (over 33% of the global GDP) in 2018, according to the JLL Report. Wecurrently operate in the PRC, Japan, South Korea, Singapore, Australia and India markets thatrepresent close to 90% of GDP in APAC in 2018, according to the JLL Report.
We hold a portfolio of logistics properties on our balance sheet and manage a broad range offunds and investment vehicles that invest in logistics properties at various stages of the property lifecycle across APAC. As of June 30, 2019, we managed 30 private third-party pooled investmentvehicles, with over US$6.3 billion in total equity commitments, and two REITs listed on the SGX-STwith aggregate appraised carrying value of approximately US$2.9 billion. As of June 30, 2019, ourAUM was approximately US$20.2 billion (of which US$2.7 billion was on our balance sheet) andcomprised approximately 8.5 million sq.m of GFA of completed properties, approximately 4.4 millionsq.m of GFA of properties under construction (which we expect to be completed over the next two tofive years and the size of which is expected to be more than half of the GFA of our current completedproperties) and approximately 2.4 million sq.m of GFA to be built on land held for future development,adding up to over 15.3 million sq.m of GFA in total.
We develop logistics real estate primarily in Tier 1 and 1.5 cities in APAC, targeting strategiclocations near key logistics hubs, major seaports, airports, transportation hubs and industrial zones inthe PRC, Japan, South Korea, Singapore, Australia and India, which are the markets we believe will
240

FINANCIAL INFORMATION
drive future growth across APAC. The majority of the tenants in the Portfolio Assets service domesticconsumption in APAC. According to the JLL Report, APAC’s substantial middle class populationcoupled with rapid economic growth and rising income levels are expected to support risingconsumption levels in the region. Private consumption in China, Japan, South Korea, Singapore,Australia and India is forecasted to grow at a CAGR of 8.1% between 2019 and 2023, approximatelytwo times the anticipated 4.0% growth in the US during the same period. As of June 30, 2019,e-commerce and 3PL tenants made up approximately 48.5% of the tenant base of the Portfolio Assetsby leased area. In 2016, 2017 and 2018 and for the six months ended June 30, 2019, rental revenuesfrom e-commerce and 3PL tenants in our balance sheet properties amounted to 82.6%, 76.7%, 63.5%and 41.0% of our total rental revenues, respectively. The decrease in the proportion of rental revenuesfrom e-commerce and 3PL tenants in 2017 was due to the disposal of several properties to ChinaInvesco Core Fund from our balance sheet, the majority of which we had leased to e-commercetenants, and in 2018 was due to rental income from an existing manufacturing tenant in the RWHigashi-Ogishima DC property, which we plan to redevelop into a modern logistics facility. Thedecrease in the proportion of rental revenues from e-commerce and 3PL tenants in the six monthsended June 30, 2019 was due to our acquisition of Propertylink, the property portfolio of which had ahigher percentage of traditional logistics and industrial tenants, as well as the disposal of certainbalance sheet properties to NCI Core Fund, the majority of which were occupied by e-commercetenants.
With our APAC-focused business model, we grew significantly during the Track Record Periodthrough organic growth and strategic M&A, increasing our AUM from US$7.4 billion as ofDecember 31, 2016, to US$12.0 billion as of December 31, 2017, to approximately US$16.0 billion asof December 31, 2018 and further to US$20.2 billion as of June 30, 2019. We have also attractedinvestments from three out of the top six real estate capital providers globally based on IP&E RealAssets’ top 100 ranking of the world’s largest real estate investors in 2018. We were ranked #29 in theworld in PERE’s “Fab 50”, the flagship ranking of the private real estate world’s top managers (bytotal annual fundraising amount) in 2018. Our revenue grew by 58.5% from US$96.7 million in 2016to US$153.3 million in 2017, and further grew by 65.8% to US$254.1 million in 2018. Our revenuegrew by 66.3% from US$93.7 million for the six months ended June 30, 2018 to US$155.8 million forthe six months ended June 30, 2019. Our net profit grew by 91.6% from US$104.8 million in 2016 toUS$200.8 million in 2017, and further grew by 6.0% to US$212.9 million in 2018. Our net profit grewby 32.0% from US$63.7 million for the six months ended June 30, 2018 to US$84.1 million for the sixmonths ended June 30, 2019. Our total consolidated balance sheet assets grew, which include ourinvestment properties, investments in joint ventures, and financial assets at fair value, by 45.4% fromUS$2,101.5 million as of December 31, 2016 to US$3,054.9 million as of December 31, 2017, andfurther grew by 45.1% to US$4,431.6 million as of December 31, 2018 and 34.2% to US$5,946.0million as of June 30, 2019.
FACTORS AFFECTING OUR RESULTS OF OPERATIONS
Our results of operations have been, and we expect them to continue to be, primarily affectedby the following factors:
Š supply and demand for modern logistics facilities in APAC;
Š our ability to source, design, construct, lease and manage the Portfolio Assets;
Š our ability to manage our integrated business model and grow multiple sources of income;
241

FINANCIAL INFORMATION
Š our ability to continue attracting and maintaining our relationships with capital partnersand growing our AUM;
Š rental prices, occupancy rates, leasing cycles and fair value change of the Portfolio Assets;
Š our expansion through organic growth and strategic acquisitions; and
Š our access to capital and cost of financing.
Supply and Demand for Modern Logistics Facilities in APAC
Our business growth and results of operations have benefited from the growth of the consumereconomy in APAC. The rise of the new economy in the region has led to increasing demand formodern logistics facilities from e-commerce companies, 3PL providers, bricks-and-mortar retailers,manufacturers, cold-chain logistics providers and others that require larger and more sophisticatedlogistics networks. Shortages in the supply of modern logistics facilities along with increased demandand the growth of the e-commerce and 3PL industries have been the important drivers of our growth.As of June 30, 2019, e-commerce and 3PL tenants made up approximately 48.5% of the tenant base ofthe Portfolio Assets by leased area. We believe that both macroeconomic factors such as economicgrowth, urbanization and domestic consumer spending, as well as industry-specific factors such as theimbalance of supply and demand for modern logistics facilities and growth in the e-commerce and 3PLmarkets have had, and will continue to have, an impact on the supply and demand for modern logisticsfacilities and therefore will continue to drive our business. Any changes in these factors could have animpact on the demand for our logistics facilities, which may ultimately affect our results of operations.
Our Ability to Source, Design, Construct, Lease and Manage the Portfolio Assets
A key driver of our results of operations is our ability to source, design, construct, lease andmanage the Portfolio Assets. Our business revolves around our strategic decision making with respectto how we source and execute development opportunities and we generate income throughout thedevelopment cycle. Our profitability is affected in part by the length of our development cycles and ourability to originate high-quality logistics projects at reasonable costs that will be attractive toprospective tenants and capital partners. Our development costs, including construction costs,marketing expenses, and other expenses, and our ability to secure land at reasonable cost, also affectour profitability. Our cash flows and results of operations are affected by any changes to our propertydevelopment schedules which may also affect our development budgets. Accordingly, our businessdepends on our ability to manage the development cycles of the properties held on our balance sheet orby the development funds or investment vehicles we manage to shorten the cash conversion cycle andattain quicker and more attractive returns by disposing of stabilized properties into the core/core-plusfunds we manage, and potentially to REITs, on a timely basis, which allows us to redeploy capital intonew development projects and grow our portfolio and AUM, which have direct effects on our level ofdevelopment income as well as fee income.
Our Ability to Manage our Integrated Business Model and Grow Multiple Sources of Income
Our business is affected by our ability to manage our integrated business model whichcombines our abilities to develop, lease and operate with our ability to fund the Portfolio Assets. Westrategically use our own capital on our balance sheet and that of the funds and investment vehicles wemanage to scale our business quickly and generate income throughout the development process. Wedevelop logistics properties through our own balance sheet and the development funds that we manage,
242

FINANCIAL INFORMATION
which leverage our development capabilities, and utilize our capital recycling strategy to dispose of thestabilized assets to the core/core-plus funds we manage, and potentially to REITs. As a result, werealize fair value gains on completed investment properties, fair value gains on investment propertiesunder construction and gains on disposal of properties. The disposed assets are also off our balancesheet upon the completion of such transfers. As we continue to recycle our capital and transfer assetson our balance sheet to core and core-plus funds and REITs we manage, we expect that our balancesheet and income statement will continue to change from time to time. For the funds and investmentvehicles we manage, we determine the level of our co-investments in order to effectively leverage thirdparty capital in expanding our business. Furthermore, we operate in multiple geographies acrossAPAC. The variety of avenues of development available to us, risk and liquidity profiles in our fundmanagement business and geographies presents challenges in managing our integrated business model,which may ultimately affect our results of operations.
Our business is affected by our ability to grow our multiple sources of income. The timing ofour income may fall unevenly across periods and may cause fluctuations in the amount of our incomefrom period to period. For the properties that we develop on our balance sheet, we earn developmentprofits through the development and sale of investment properties to the core/core-plus funds wemanage, and potentially to REITs. These development profits vary across periods depending on severalfactors including development time and subsequent sale of assets and are transaction-specific. Forexample, in the first half of 2019, we completed the disposal of seven properties with an aggregategross asset value of approximately US$276.7 million from our balance sheet to NCI Core Fund, inrespect of which we realized gains of US$16.5 million in the first half of 2019. In August 2017, wedisposed of a total of five properties from our balance sheet with an aggregate value of approximatelyUS$295.7 million to China Invesco Core Fund, which realized gains for us of US$38.3 million. Wealso capture the appreciation in value of logistics properties held on our balance sheet and earn rentalincome. Management fee income from our fund management segment includes base management fees,asset management fees, acquisition fees, development fees and leasing fees. Certain fees, such as basemanagement fees, asset management fees and development fees, are recognized over time, and otherfees, such as acquisition fees and leasing fees, are recognized at a point in time. We are also able toparticipate in a disproportionate share of profits through promote once we exceed a pre-determinedtarget IRR and after our capital partners have received their targeted capital returns. Accordingly, wedo not receive promote consistently from period to period. Because we manage multiple funds withvarying investment mandates, we can also generate fees such as promote and acquisition fees from thetransfer of logistics assets from one fund to another fund we manage. For more information, see thesection headed “Business—Principal Business Activities—Fund Management—Fund ManagementFees” in this Prospectus. In addition, we derive pro rata earnings and pro rata value appreciationthrough our co-investments in the funds and investment vehicles we manage.
As a result of our acquisition of CIP in Australia in August 2018, we also began generatingconstruction income through CIP, which provides construction services to its customers. Followingcompletion of the acquisition, we include construction costs in connection with the propertydevelopment activities of CIP in our cost of sales. We expect the operating results of CIP to have asignificant impact on our revenue mix and cost of sales because we did not record construction incomeand construction costs prior to the acquisition of CIP. Historically, CIP had a lower gross margin thanwe had, and this will have an impact on our gross margin going forward.
243

FINANCIAL INFORMATION
Our Ability to Continue Attracting and Maintaining our Relationships with Capital Partnersand Growing our AUM
We believe that we have developed strong relationships with many blue-chip capital partnerswho provide the capital needed to maintain and grow our fund management business and our AUMand to take advantage of growth opportunities in key APAC markets at various stages of thedevelopment cycle. Our business is affected by our ability to maintain business relationships with ourexisting capital partners, and attract new capital partners to our platform. Our capital partners areattracted by the performance of the funds and investment vehicles we manage and the investmentopportunities we are able to offer. Many of our existing capital partners invest in more than one of ourinvestment vehicles, and some of them have followed us into different countries. For example,investment vehicles managed by the APG Group first invested with us in the PRC in 2014 andsubsequently in South Korea in 2015. Also, CPPIB first invested with us in our development fund inSouth Korea in 2015 and then invested with us in our core fund in South Korea in 2018. Our ability toprovide attractive and stable cash flows and yields along with potential growth opportunities to ourcapital partners will affect our fund management income and results of operations. Our attractivenessto capital partners is also driven in part by the extent to which they continue to view the logistics realestate industry generally, and our projects specifically, as an attractive vehicle for rental income andvalue appreciation. We seek to develop deeper relationships with new and existing capital partners.However, we operate in a competitive fundraising environment. Our ability to attract and raise fundsfrom new and existing capital partners may materially affect our results of operations.
Rental Prices, Occupancy Rates and Leasing Cycles and Fair Value Change of the PortfolioAssets
Rental Prices. Rental prices affect the returns generated from the Portfolio Assets, andtherefore affect our results of operations. With respect to the logistics properties held on our balancesheet, rental prices affect our rental income, appreciation in value and development profits. Throughour co-investments in the funds and investment vehicles we manage, rental prices affect our dividendincome, pro rata earnings and/or pro rata value appreciation, and also indirectly affect the fees wegenerate as rental prices affect the rental income generated by, as well as the valuation of, logisticsproperties held by the funds and investment vehicle we manage. We determine the rent for thePortfolio Assets, both for new tenants and existing tenants upon the expiry of prior rental agreements,based on a number of factors, including our target investment return rate for the logistics facility, thelocation of the logistics facility, market demand for the logistics facility, tenant relationships, the GFAcovered by the lease, duration of the lease and the prevailing market rate for comparable logisticsfacilities.
Occupancy Rates and Leasing Cycles. Our revenue may vary from period to period dependingon occupancy rates and the time it takes to lease the Portfolio Assets. Higher occupancy rates andshorter lease-up periods are favorable to our revenue. Occupancy rates depend on a number of factors,including the overall attractiveness of our logistics facilities, local supply and demand of comparableproperties, our tenant mix, rental prices at competing properties, general economic conditions, abilityto pre-lease rental space, the amount of capital that our tenants invest in our logistics facilities, whichincentivizes longer tenancies, and the ability to minimize the intervals between lease expiries (orterminations) and entry into new leases.
Fair Value Change of the Portfolio Assets. Changes in the fair value of the Portfolio Assetshave had a significant effect on our results of operations during the Track Record Period. The fair
244

FINANCIAL INFORMATION
value of the Portfolio Assets is primarily affected by macroeconomic conditions in the relevantcountry, rental rate growth and capitalization rate movements, the supply of and demand forcomparable properties, the rate of overall economic growth, interest rates, inflation and political andeconomic developments in the areas where the investment properties are located. Investment propertiesthat are under construction are further affected by construction costs and development schedules. Weexpect continued impact of fair value change on the Portfolio Assets as a result of market fluctuations,and that this will have a significant impact on our results of operations.
Our Expansion Through Organic Growth and Strategic Acquisitions
Our results of operations have been and will be affected by our expansion through organicgrowth as well as strategic acquisitions, some of which have been accounted for as businesscombinations. See the paragraph headed “—Business Combinations” in this section of the Prospectusfor more details. To execute our growth strategy, we have pursued an APAC-focused expansion planby leveraging our scale and geographic presence in APAC. Our Company was formed from theJanuary 2016 merger of e-Shang and the Redwood group, two of Asia’s leading logistics platforms,with combined presence in the PRC, Japan and South Korea. In January 2017, we expanded into theSingapore market through our acquisition of ESR-REIT Manager, shortly followed by our entry intothe Indian market. In October 2018, we acquired a 100% interest in VITM at a consideration ofSGD62.0 million (approximately US$45.2 million) as part of the VIT Merger. In October 2017, weentered the Australian market via the acquisition of a 19.9% stake in Propertylink and a 14.8% stake inCenturia, and in August 2018 we acquired an 100% equity interest in CIP as the base platform uponwhich to grow our Australian business. In April 2019, we completed the acquisition of Propertylink.See the sections headed “Business—Overview,” “Business—The Propertylink Acquisition” and“Financial Information—Financial Information of Propertylink” in this Prospectus and the pre-acquisition financial information of Propertylink set out in Appendices II-A and II-B to thisProspectus. In June 2019, we completed the Sabana Manager Acquisition and held approximately93.8% equity interest in Sabana Manager post-acquisition.
We have grown our asset portfolio through both organic development and single asset andportfolio acquisitions. During the Track Record Period, we grew our Portfolio Assets from 7.3 millionsq.m of GFA, operating in three markets as of December 31, 2016, to over 15.1 million sq.m of GFA,operating in six markets as of June 30, 2019. From strategic M&A, such as the 2016 Merger, ouracquisition of the ESR-REIT Manager in 2017 and the subsequent merger between ESR-REIT and VITin 2018, our acquisition of CIP in 2018, and our acquisitions of Propertylink and Sabana Manager in2019, we have and in the future expect to broaden our market coverage, create investmentopportunities, increase our properties owned and managed and provide our capital partners with awider range of platforms across markets to mobilize their capital.
Our Access to Capital and Cost of Financing
Our business and AUM are affected by our ability to access capital and the cost of the financingwe obtain for ourselves and for the funds and investment vehicles we manage. We fund our businessoperations, including our balance sheet investments, through internally generated funds and externalfinancing, including private equity fundraising, public bond offerings and commercial bank loans,among other things. As of December 31, 2016, 2017 and 2018 and June 30, 2019, we had bank loansand other borrowings of US$835.3 million, US$833.4 million, US$1,460.5 million and US$2,803.7million, respectively. Our net gearing ratio (excluding redeemable convertible preference shares),
245

FINANCIAL INFORMATION
which is calculated by dividing our net debt by total assets, was 16.6% as of December 31, 2016, 7.6%as of December 31, 2017, 19.8% as of December 31, 2018 and 30.2% as of June 30, 2019. Some of ouroutstanding borrowings are subject to floating rates. As commercial banks in the PRC link the interestrates on their bank loans to benchmark lending rates published by the People’s Bank of China, anyincrease in the benchmark lending rates will increase the interest costs related to our developments. Aswe expanded in scale and improved our balance sheet, the effective interest rates of our bank loans andother borrowings also generally decreased during the Track Record Period. For details, see theparagraph headed “—Indebtedness” in this section of the Prospectus. We incurred finance costs ofUS$56.0 million, US$90.9 million, US$104.9 million, US$45.9 million and US$83.4 million in 2016,2017 and 2018 and for the six months ended June 30, 2018 and 2019, respectively.
We have historically financed our expansion through various other instruments includingpreference shares, fixed rate notes and perpetual capital securities. In November 2016, we issuedUS$300 million of the Hana Notes with a fixed rate of 6.3% to Hana Private Real Estate InvestmentTrust No. 16 and Hana Private Real Estate Investment Trust No. 17, which will mature in November2019. In December 2016, we issued 245,359,810 Class C Preference Shares at an aggregateconsideration of US$300 million which carry a coupon rate of 4.5% per annum. In January 2017, weredeemed 9,814,392 Class C Preference Shares for US$11.4 million. We plan to redeem both theClass C Preference Shares that are not converted and the Hana Notes upon the completion of theGlobal Offering using part of the proceeds of the Global Offering. In June 2017, we issuedUS$100 million of subordinated perpetual capital securities. In February 2019, we issued SGD150million (approximately US$109.4 million) of three year 6.75% fixed rate notes due February 2022 (the“6.75% Notes”) under our US$2.0 billion Multicurrency Debt Issuance Programme. We subsequentlyissued three further tranches within the same series, two in March 2019 and one in May 2019,amounting to an aggregate of SGD200 million (approximately US$145.8 million). The aggregate totalamount of 6.75% Notes issued to date is SGD350 million (approximately US$255.2 million). In April2019, we issued US$250 million of 7.875% fixed rate notes due April 2022 (the “7.875% Notes”)under our US$2.0 billion Multicurrency Debt Issuance Programme. In July 2019, we subsequentlyissued a further tranche under the same series amounting to an aggregate of US$175 million, whichwas consolidated with the April 2019 issuance to form a single series of US$425 million 7.875%Notes. Our ability to access capital may affect our ability to generate revenue and other income andgains. Our ability to negotiate lower financing costs may affect our total financing costs and interestexpenses, which may in turn affect our net profit.
BASIS OF PRESENTATION
Our historical financial information has been prepared in accordance with IFRS, whichcomprise all standards and interpretations approved by the International Accounting Standards Board(IASB).
We have adopted IFRS 9 Financial Instruments, effective for the accounting period beginningon January 1, 2018. We have not restated financial information from January 1, 2016 to December 31,2017 for financial instruments in the scope of IFRS 9. The financial information from January 1, 2016to December 31, 2017 is reported under IAS 39 Financial Instruments: Recognition and Measurementand is not comparable to the information presented for 2018. The impact of the classification,measurement and impairment requirements are summarized in Note 2.2 to the Accountants’ Report setforth in Appendix I to this Prospectus. Since January 1, 2018, the adoption of IFRS 9 has had nosignificant impact on our financial position and performance as compared to that of IAS 39.
246
FINANCIAL INFORMATION
IFRS 15 Revenue from Contracts with Customers, amendments to IFRS 15 Clarifications toIFRS 15 Revenue from Contracts with Customers, and IFRS 16 Leases, together with the relevanttransitional provisions, have been adopted by us in the preparation of our historical financialinformation throughout the Track Record Period. The adoption of IFRS 15 had no significant impacton our financial position and performance during the Track Record Period as compared to that of IAS18.
By applying IFRS 16, there were increases in both total assets and liabilities of our Group whencompared to the total assets and liabilities under IAS 17, and other than this, there was no significantimpact on our financial position and performance during the Track Record Period. As of December 31,2016, 2017, 2018 and June 30, 2019, we recognized right-of-use asset of US$4.2 million, US$7.5million, US$9.1 million and US$13.0 million, respectively, and recognized lease liabilities of US$4.2million, US$8.0 million, US$9.7 million and US$24.4 million, respectively. Due to the increase of thecurrent portion of the lease liabilities, there were decreases in current ratio when compared to thatunder IAS 17, and other than this, there was no significant impact on other financial ratios during theTrack Record Period.
Our historical financial information has been prepared under the historical cost convention,except for investment properties, available-for-sale investments, financial assets at fair value throughother comprehensive income and financial assets and liabilities at fair value through profit or loss,which have been measured at fair value.
Our consolidated financial statements include the financial statements of our Company and oursubsidiaries for the Track Record Period.
BUSINESS COMBINATIONS
During the Track Record Period, we have grown and expanded our business organically as wellas by acquiring other businesses, some of which have been accounted for as business combinations asdescribed below. See the paragraph headed “—Critical Accounting Policies and Estimates—Businesscombinations and goodwill” in this section of the Prospectus for a description of the accountingtreatment of our business combinations.
Merger with Redwood
In November 2015, our Company, Redwood Investor (and its shareholders) and the thenShareholders of our Company entered into the Merger Agreement, under which our Company and theRedwood Investor agreed to merge the entire issued share capital of: (a) Redwood with e-ShangGalaxy Singapore Pte. Ltd; and (b) Redwood Asian Investments Limited with e-Shang Galaxy CaymanLtd. Pursuant to the Merger Agreement, our Company agreed to allot the Redwood Investor389,933,535 Class B4 Shares. The acquisition was completed in January 2016. The transaction wasaccounted for as a business combination. We elected to measure the non-controlling interest in theRedwood group at the proportionate share of our interest in the acquiree’s identifiable net assets. Seethe paragraph headed “—Analysis of Selected Consolidated Statements of Financial Position Items—Goodwill and Other Intangible Assets” in this section of the Prospectus for a discussion of therecognition of goodwill. Since the merger, the Redwood business contributed US$24.5 million to ourrevenue and US$40.5 million to our consolidated profit for the eleven months ended December 31,2016.
247

FINANCIAL INFORMATION
Acquisition of Infinitysub Group
In January 2017, we acquired an 100% equity interest in Nabinvest Oxley Singapore Pte. Ltd.,which owned an 100% interest in Cambridge Real Estate Investment Management Pte. Ltd., an 80%indirect interest in Cambridge Industrial Trust Management Limited (the trust manager of CambridgeIndustrial Trust (“CIT”)), and an 100% indirect interest in Cambridge Industrial Property ManagementPte. Ltd. (the property manager of CIT) for US$43.9 million. Infinitysub Group serves as theESR-REIT Manager. The acquisition of Infinitysub Group was accounted for as a businesscombination as the Infinitysub Group were fully operating companies as of the acquisition dates andproviding private equity fund management services. We elected to measure the non-controlling interestin the Infinitysub Group at the proportionate share of our interest in the acquiree’s identifiable netassets. See the paragraph headed “—Analysis of Selected Consolidated Statements of FinancialPosition Items—Goodwill and Other Intangible Assets” in this section of the Prospectus for adiscussion of the recognition of goodwill. Since the acquisition, Infinitysub Group contributedUS$10.6 million to our revenue and US$3.7 million to our consolidated profit for the eleven monthsended December 31, 2017.
Acquisition of CIP
In August 2018, we, through our subsidiary, ESR Developments (Australia) Pty Ltd, completedthe acquisition of an 100% equity interest in CIP, which owns several subsidiaries and joint ventures(collectively, the “CIP Group”), at a consideration of AUD40.1 million (approximatelyUS$27.3 million). CIP is an integrated property development group with a national presence inAustralia. The acquisition of CIP was accounted for as a business combination by our management asthe CIP Group was fully operating companies as of the acquisition date and providing constructionservices. See the paragraph headed “—Analysis of Selected Consolidated Statements of FinancialPosition Items—Goodwill and Other Intangible Assets” in this section of the Prospectus for adiscussion of the recognition of goodwill. Since the acquisition, the business of the CIP Groupcontributed US$40.7 million to our revenue and US$1.0 million loss to our consolidated profit for thefour months ended December 31, 2018.
Acquisition of VITM
In October 2018, we completed the acquisition of an 100% interest in VITM, an assetmanagement company providing trust management services in Singapore, for a consideration ofSGD62.0 million (approximately US$45.2 million) as part of the VIT Merger. The acquisition ofVITM was accounted for as a business combination by our management as VITM was a fullyoperational company as of the acquisition date and its principal activity is management services inSingapore. See the paragraph headed “—Analysis of Selected Consolidated Statements of FinancialPosition Items—Goodwill and Other Intangible Assets” in this section of the Prospectus for adiscussion of the recognition of goodwill. Since the acquisition, VITM contributed nil to our revenueand US$0.05 million profit to our consolidated profit for the two months ended December 31, 2018.
Acquisition of Propertylink
In March 2019, we consolidated Propertylink as a subsidiary of our Group, and completed theacquisition of Propertylink in April 2019. The acquisition of Propertylink was identified as a businesscombination by the management. Propertylink is a fully operational company as at the acquisition dateand its principal activity is management services in Australia. See the paragraph headed “—Analysis of
248
FINANCIAL INFORMATION
Selected Consolidated Statements of Financial Position Items—Goodwill and Other Intangible Assets”in this section of the Prospectus for a discussion of the recognition of goodwill. Since March 2019,Propertylink contributed US$15.5 million to our revenue and US$4.6 million to our consolidated profitfor the period ended June 30, 2019.
Acquisition of Sabana Manager
In June 2019, we completed the acquisition of an additional 51% interest in Sabana Manager.We previously held 42.8% interest in Sabana Manager and accounted for it as an investment inassociates. Upon acquisition of the additional interest, Sabana Manager became our subsidiary. TheSabana Manager Acquisition was identified as a business combination by the management. SabanaManager is a fully operational company as at the acquisition date and its principal activity ismanagement services in Singapore. See the paragraph headed “—Analysis of Selected ConsolidatedStatements of Financial Position Items—Goodwill and Other Intangible Assets” in this section of theProspectus for a discussion of the recognition of goodwill. Since the acquisition, Sabana Managercontributed nil to our revenue and our consolidated profit for the period ended June 30, 2019.
CRITICAL ACCOUNTING POLICIES AND ESTIMATES
Critical accounting policies are those accounting policies that reflect significant judgments andwhich may result in materially different results under different assumptions and conditions.
Some of our accounting policies require us to apply estimates and assumptions as well ascomplex judgments related to accounting items. The estimates and assumptions we use and thejudgments we make in applying our accounting policies have a significant impact on our financialposition and operating results. Our management continually evaluates such estimates, assumptions andjudgments based on historical experience and other factors, including expectations of future events thatare believed to be reasonable under the circumstances, on an ongoing basis, and recognize anyrevisions to these accounting estimates in the financial period, in which the estimates are revised and inany future periods affected. There has not been any material deviation from our management’sestimates or assumptions and actual results, and we have not made any material changes to theseestimates or assumptions during the Track Record Period.
See Notes 2 and 3 to the Accountants’ Report set forth in Appendix I to this Prospectus fordetails of our significant accounting policies, estimates, assumptions and judgments, which areimportant for understanding our financial position and results of operations. The most significant ofthese critical accounting policies are set forth below.
Investment Properties
Investment properties comprise completed properties and properties under construction held toearn rentals or for capital appreciation or both. An investment property is measured initially at costincluding transaction costs.
Subsequent to initial recognition, investment property is stated at fair value. Any gain or lossarising from the change in the fair values is included in profit or loss in the year in which they arise.
Investment property is derecognized when it has been disposed of or permanently withdrawnfrom use and no future economic benefit is expected from its disposal. Any gain or loss on the
249

FINANCIAL INFORMATION
retirement or disposal of investment property is recognized in the statement of profit or loss in the yearof retirement or disposal.
A transfer is made to an investment property when, and only when, there is a change in the use,evidenced by the end of owner occupation or commencement of an operating lease.
To determine the fair value of investment properties, in the absence of current prices in anactive market for similar properties, we consider information from a variety of sources, including:
(1) current prices in an active market for properties of a different nature, condition or locationor subject to different lease or other contracts, adjusted to reflect those differences;
(2) recent prices of similar properties on less active markets, with adjustments to reflect anychanges in economic conditions since the dates of the transactions that occurred at thoseprices; and
(3) discounted cash flow projections based on reliable estimates of future cash flows,supported by the terms of any existing lease and other contracts and (when possible) byexternal evidence such as current market rents for similar properties in the same locationand condition, and using discount rates that reflect current market assessments of theuncertainty in the amount and timing of the cash flows.
We engage third-party valuers to perform independent valuations of our completed investmentproperties and investment properties under construction.
The fair value of our investment properties as of December 31, 2016, 2017 and 2018 andJune 30, 2019 was approximately US$942.9 million, US$1,189.2 million, US$1,885.5 million andUS$2,656.5 million, respectively. For further details, including the key assumptions used for fair valuemeasurement, see Note 20 to the Accountants’ Report set forth in Appendix I to this Prospectus.
Business Combination and Goodwill
When we acquire a business, we assess the financial assets and liabilities assumed forappropriate classification and designation in accordance with the contractual terms, economiccircumstances and pertinent conditions as of the acquisition date. This includes the separation ofembedded derivatives in host contracts of the acquiree.
Goodwill is initially measured at cost, being the excess of the aggregate of the considerationtransferred, the amount recognized for non-controlling interests and any fair value of our previouslyheld equity interests in the acquiree over the identifiable net assets acquired and liabilities assumed. Ifthe sum of this consideration and other items is lower than the fair value of the net assets acquired, thedifference is, after reassessment, recognized in profit or loss as a gain on bargain purchase. After initialrecognition, goodwill is measured at cost less any accumulated impairment losses. The carryingamount of goodwill as of December 31, 2016, 2017 and 2018 and June 30, 2019 was US$210.5million, US$226.2 million, US$ 285.4 million and US$340.2 million, respectively.
Impairment testing of goodwill
We determine whether goodwill is impaired at least on an annual basis. This requires anestimation of the value in use of the cash-generating units to which the goodwill is allocated.
250

FINANCIAL INFORMATION
Estimating the value in use requires us to make an estimate of the expected future cash flows from thecash-generating units and also to choose a suitable discount rate in order to calculate the present valueof those cash flows. Assumptions were used in the calculation of the value in use of ourcash-generating units for the Track Record Period. Set out below are the key assumptions based onwhich our management builds its cash flow projections to undertake impairment testing of goodwill:
Š Budgeted gross fee income—The basis used to determine the value assigned to thebudgeted gross fee income is the average fee income achieved in the year immediatelybefore the budget year, increased for expected market development.
Š Discount rates—The discount rates used are before tax and reflect specific risks relating tothe relevant units.
Key parameters applied in the cash flow projections are as follows:
Discount rates
As of December 31,As of
June 30,
2016 2017 2018 2019
Redwood assets management business . . . . . . . . . . . . . . . . . . . . . . . . . . . . . . . 17% 17% 17% 16.7%Infinitysub asset management business . . . . . . . . . . . . . . . . . . . . . . . . . . . . . . 15% 15% 15% 10.5%CIP business . . . . . . . . . . . . . . . . . . . . . . . . . . . . . . . . . . . . . . . . . . . . . . . . . . . 9% 9% 9% N/AVITM business . . . . . . . . . . . . . . . . . . . . . . . . . . . . . . . . . . . . . . . . . . . . . . . . . 11.1% 11.1% 11.1% N/AESR Australia asset management business . . . . . . . . . . . . . . . . . . . . . . . . . . . . N/A N/A N/A 10%
Terminal growth rates
As of December 31,As of
June 30,
2016 2017 2018 2019
Redwood assets management business . . . . . . . . . . . . . . . . . . . . . . . . . . . . . . . 3% 3% 3% 3%Infinitysub asset management business . . . . . . . . . . . . . . . . . . . . . . . . . . . . . . 3% 3% 3% 2.5%CIP business . . . . . . . . . . . . . . . . . . . . . . . . . . . . . . . . . . . . . . . . . . . . . . . . . . . 0.35% 0.35% 0.35% N/AVITM business . . . . . . . . . . . . . . . . . . . . . . . . . . . . . . . . . . . . . . . . . . . . . . . . . 1.2% 1.2% 1.2% N/AESR Australia asset management business . . . . . . . . . . . . . . . . . . . . . . . . . . . . N/A N/A N/A 2.5%
In October 2018, we, through the ESR-REIT Manager, acquired all of the issued shares ofVITM, the manager of VIT. In 2019, we completed the consolidation of Infinitysub asset managementbusiness and VITM asset management business pursuant to the VIT Merger in October 2018.Consequently, as of June 30, 2019, the original Infinitysub asset management business cash-generatingunit and VITM business cash-generating unit had been consolidated as a single cash-generating unit,namely Infinitysub asset management business.
Following our acquisition of Propertylink, Propertylink became our subsidiary in March 2019,and as a result, CIP business and Propertylink now share the same management and are consolidated asa single cash-generating unit, namely ESR Australia asset management business. The cash flowprojections are derived based on financial budgets after taking into effect the consolidated cash-generating units.
251

FINANCIAL INFORMATION
Based on the results of the goodwill impairment testing, the recoverable amounts of each of ourcash-generating units which exceeded its carrying amounts as of the dates indicated are as follows:
As at December 31,
2016 2017 2018
USD’000 USD’000 USD’000
Redwood assets management business . . . . . . . . . . . . . . . . . . . . . . . . . . . . . . . . . . . 72,136 101,269 53,386Infinitysub asset management business . . . . . . . . . . . . . . . . . . . . . . . . . . . . . . . . . . . N/A 26,406 14,326CIP business . . . . . . . . . . . . . . . . . . . . . . . . . . . . . . . . . . . . . . . . . . . . . . . . . . . . . . . . N/A N/A 6,068VITM business . . . . . . . . . . . . . . . . . . . . . . . . . . . . . . . . . . . . . . . . . . . . . . . . . . . . . . N/A N/A 14,067
72,136 127,675 87,847
As at June 30,
2019
USD’000
Redwood assets management business . . . . . . . . . . . . . . . . . . . . . . . . . . . . . . . . . . . . . . . . . . . . . . . . 20,168Infinitysub asset management business . . . . . . . . . . . . . . . . . . . . . . . . . . . . . . . . . . . . . . . . . . . . . . . . 42,784ESR Australia asset management business . . . . . . . . . . . . . . . . . . . . . . . . . . . . . . . . . . . . . . . . . . . . . 51,684
114,536
An impairment exists when the carrying value of an asset or a cash-generating unit exceeds itsrecoverable amount. We have included some headroom so that certain changes in the assumptionswould not likely cause the carrying amount of our cash generating units to exceed their recoverableamounts.
Sensitivity to changes in assumptions
By applying a certain basis point increase in the discount rate and decrease in the terminalgrowth rate as follows, it would result in the recoverable amount of each of our cash-generating unitsbeing approximately equal to its carrying amount.
Increase in the discount rate
As at December 31,
2016 2017 2018
Basis point Basis point Basis point
Redwood assets management business . . . . . . . . . . . . . . . . . . . . . . . . . . . . . . . 1,150 1,210 310Infinitysub asset management business . . . . . . . . . . . . . . . . . . . . . . . . . . . . . . . N/A 1,450 1,130CIP business . . . . . . . . . . . . . . . . . . . . . . . . . . . . . . . . . . . . . . . . . . . . . . . . . . . . N/A N/A 1,780VITM business . . . . . . . . . . . . . . . . . . . . . . . . . . . . . . . . . . . . . . . . . . . . . . . . . . N/A N/A 2,110
Increase in the discount rate
As at June 30,
2019
Basis point
Redwood assets management business . . . . . . . . . . . . . . . . . . . . . . . . . . . . . . . . . . . . . . 120Infinitysub asset management business . . . . . . . . . . . . . . . . . . . . . . . . . . . . . . . . . . . . . . 360ESR Australia asset management business . . . . . . . . . . . . . . . . . . . . . . . . . . . . . . . . . . . 400
252

FINANCIAL INFORMATION
Decrease in theterminal growth rate
As at December 31,
2016 2017 2018
Basispoint
Basispoint
Basispoint
Redwood assets management business . . . . . . . . . . . . . . . . . . . . . . . . . . . . . . . . . . . . . . . . . 910 1,140 600Infinitysub asset management business . . . . . . . . . . . . . . . . . . . . . . . . . . . . . . . . . . . . . . . . . N/A 4,510 2,750CIP business . . . . . . . . . . . . . . . . . . . . . . . . . . . . . . . . . . . . . . . . . . . . . . . . . . . . . . . . . . . . . . N/A N/A 835VITM business . . . . . . . . . . . . . . . . . . . . . . . . . . . . . . . . . . . . . . . . . . . . . . . . . . . . . . . . . . . . N/A N/A 2,120
Decrease in the terminal growth rate
As at June 30,
2019
Basis point
Redwood assets management business . . . . . . . . . . . . . . . . . . . . . . . . . . . . . . . . . 190Infinitysub asset management business . . . . . . . . . . . . . . . . . . . . . . . . . . . . . . . . 520ESR Australia asset management business cash- generating unit . . . . . . . . . . . . 670
Any reasonably possible change in the key assumptions on which the recoverable amount isbased would not cause the carrying amount of the cash-generating unit to exceed its recoverableamount.
For further details of impairment testing of goodwill and sensitivity to changes in assumptions,see Note 21 to the Accountants’ Report set forth in Appendix I to this Prospectus.
Revenue Recognition
Revenue from contracts with customers is recognized when control of the goods or services aretransferred to the customer at an amount that reflects the consideration to which we expect to beentitled in exchange for those goods or services. We have concluded that we are acting as a principal inall of our revenue arrangements because we typically control the goods or services before transferringthem to the customer. The specific recognition criteria described below must also be met beforerevenue is recognized.
Rental Income
Rental income arising from operating leases on investment properties is accounted for on astraight-line basis over the lease terms and is included in revenue.
Management Fee Income
Management fee income comprises: (i) base management fees, asset management fees anddevelopment management fees, which are recognized over time; and (ii) leasing fee income,acquisition fee income and promote, which are recognized at a point in time. Base management feesare derived from the management of the funds and investment vehicles we manage and are determinedbased on the total capital commitment or net equity invested as the case may be for these funds. Assetmanagement fees are derived from the management of warehousing projects and are determined basedon the fair value of properties. Development fees are earned on a straight line basis in accordance withthe relevant project construction cost across the entire construction period. Leasing fees relate to feesearned in consideration of the investment manager carrying out leasing services for the funds andinvestment vehicles we manage. Acquisition fees relate to fees earned in relation to the acquisition of
253

FINANCIAL INFORMATION
properties by the funds and investment vehicles we manage. Acquisition fees are determined based onthe value of the properties acquired and recognized when the services have been rendered. Promote isearned when the performance targets are met.
Solar Energy Income
Solar energy income is recognized based on direct measurements of the value to the customerof the services transferred to date according to contracts with customers. Revenue are recognized basedon price specified in the contracts and output delivered to customers.
Construction Income
Construction income is recognized in accordance with the percentage of completion methodmeasured by reference to the proportion of costs incurred to date to the estimated total cost of therelevant contract. The stage of completion is measured by reference to the completion of specificmilestones in the construction process. On completion of each milestone, the recoverable costsincurred during the period plus the related fee earned corresponding to the particular milestone isrecognized as revenue.
Dividend Income
Dividend income is recognized when the company’s right to receive payment is established.
PRINCIPAL COMPONENTS OF OUR CONSOLIDATED STATEMENT OF PROFIT ORLOSS
Revenue
During the Track Record Period, we generated revenue primarily from the leasing of ourdirectly held logistics facilities and the provision of fund management services to the funds and otherinvestment vehicles we manage. Rental income from directly held investment properties is accountedfor on a straight-line basis over the lease term. Management fee income includes fees and other incomewe receive from the management of funds and other investment vehicles, such as base managementfees, asset management fees, acquisition fees, development fees, leasing fees and promote.
Following the acquisition of our property development company CIP in Australia in August2018, we recognized construction income in accordance with the percentage of completion methodmeasured by reference to the completion of specific milestones in the construction process.
We also recognize income from the sales of solar energy from solar panels installed on some ofour facilities in Japan. Solar energy income is recognized based on direct measurements of the value tothe customer of the services transferred to date according to contracts with the customer. This isbecause the customers simultaneously receive and consume the benefits provided by the Group.
254

FINANCIAL INFORMATION
The table below sets forth the revenue breakdown, both in absolute amounts and as percentagesof our total revenue, for the periods indicated.
Year Ended December 31, Six Months Ended June 30,
2016 2017 2018 2018 2019
US$ % US$ % US$ % US$ % US$ %(unaudited)
(in thousands, except percentages)
Rental income . . . . 50,273 52.0 57,844 37.7 74,311 29.2 32,678 34.9 54,954 35.3Management fee
income . . . . . . . 46,464 48.0 94,268 61.5 135,579 53.4 59,033 63.0 61,784 39.7Construction
income(1) . . . . . . — — — — 40,665 16.0 — — 37,661 24.2Solar energy
income . . . . . . . — — 1,177 0.8 3,593 1.4 1,979 2.1 1,364 0.8
Total . . . . . . . . . . . 96,737 100.0 153,289 100.0 254,148 100.0 93,690 100.0 155,763 100.0
Note:(1) As a result of our acquisition of CIP in August 2018, we consolidated CIP, which provides construction services to its customers, and
recognized construction income of US$40.7 million and US$37.7 million in 2018 and the six months ended June 30, 2019, respectively.
Certain management fees, such as base management fees, asset management fees anddevelopment fees, are recognized over time, and other management fees, such as acquisition fees,leasing fees and promote, are recognized at a point in time. The management fees recognized over timeconsist of fees paid on a one-off or periodic basis in relation to our performance obligations that maybe satisfied over a period of time. The management fees recognized at a point in time consist of feesearned from providing transaction-based services. As our management fee income increased during theTrack Record Period, both types of management fees also increased, primarily as a result of the growthin AUM in the funds and investment vehicles managed by us and an increase in transactional activities.The table below sets forth the management fee income breakdown for the periods indicated:
Year Ended December 31,Six Months Ended
June 30,
2016 2017 2018 2018 2019
(unaudited)(US$ in thousands)
Management fee income . . . . . . . . . . . . . . . . . . . . . . . . . . . . . . 46,464 94,268 135,579 59,033 61,784Over time . . . . . . . . . . . . . . . . . . . . . . . . . . . . . . . . . . . . . . 35,313 78,457 90,306 29,168 47,822Point in time . . . . . . . . . . . . . . . . . . . . . . . . . . . . . . . . . . . 11,151 15,811 45,273 29,865 13,962
255
FINANCIAL INFORMATION
The table below sets forth the revenue based on the location of the assets which generated suchrevenue, both in absolute amounts and as percentages of our total revenue, for the periods indicated.During the Track Record Period, we have expanded our operations from three to six countries. ThePRC, Japan, South Korea and Singapore were the major markets for our revenue generation, and wedid not generate revenue from India during the Track Record Period as we only set up the India Fundin November 2018 and started our operation in India shortly after that. Australia became a majormarket for us after our August 2018 acquisition of CIP and April 2019 acquisition of Propertylink. Inthe near future, the PRC, Japan, South Korea and Australia will be our major markets for revenuegeneration.
Year Ended December 31, Six Months Ended June 30,
2016 2017 2018 2018 2019
US$ % US$ % US$ % US$ % US$ %(unaudited)
(in thousands, except percentages)
PRC . . . . . . . . . . . 62,026 64.1 73,303 47.8 89,008 35.0 44,835 47.9 44,897 28.8Japan . . . . . . . . . . . 24,453 25.3 50,441 32.9 64,325 25.3 24,830 26.5 31,740 20.4South Korea . . . . . 10,258 10.6 18,934 12.4 37,861 14.9 18,031 19.2 15,581 10.0Singapore . . . . . . . — — 10,611 6.9 21,701 8.6 5,994 6.4 8,614 5.5Australia . . . . . . . . — — — — 41,253 16.2 — — 53,915 34.6India . . . . . . . . . . . — — — — — — — — 1,016 0.7
Total . . . . . . . . . . . 96,737 100.0 153,289 100.0 254,148 100.0 93,690 100.0 155,763 100.0
Cost of Sales
Our cost of sales consists of property management fees we paid to third-party on-site propertymanagement companies, construction costs and others, which include utility costs, on-site maintenancecosts and property insurance costs. We include construction costs in connection with the propertydevelopment activities of CIP following the completion of the acquisition of CIP. We expectconstruction costs to account for a significant portion of our cost of sales going forward.
The table below sets forth our cost of sales breakdown, both in absolute amounts and aspercentages of our total revenue, for the periods indicated.
Year Ended December 31, Six Months Ended June 30,
2016 2017 2018 2018 2019
US$ % US$ % US$ % US$ % US$ %(unaudited)
(in thousands, except percentages)
Property management fees . . . 1,916 2.0 2,027 1.3 2,292 0.9 1,021 1.1 3,630 2.3Construction costs(1) . . . . . . . . — — — — 39,645 15.6 — — 36,978 23.7Others . . . . . . . . . . . . . . . . . . . 739 0.8 1,460 1.0 1,805 0.7 1,037 1.1 1,200 0.8
Total . . . . . . . . . . . . . . . . . . . . 2,655 2.7 3,487 2.3 43,742 17.2 2,058 2.2 41,808 26.8
Note:(1) As a result of our acquisition of CIP in August 2018, we consolidated CIP, which provides construction services to its customers, and
recorded construction costs of US$39.6 million and US$37 million in 2018 and the six months ended June 30, 2019, respectively.
Other Income and Gains
Our other income and gains consist primarily of fair value gains on completed investmentproperties, fair value gains on investment properties under construction, changes in fair value offinancial assets and liabilities at fair value through profit or loss, gain on disposal of subsidiaries, gain
256
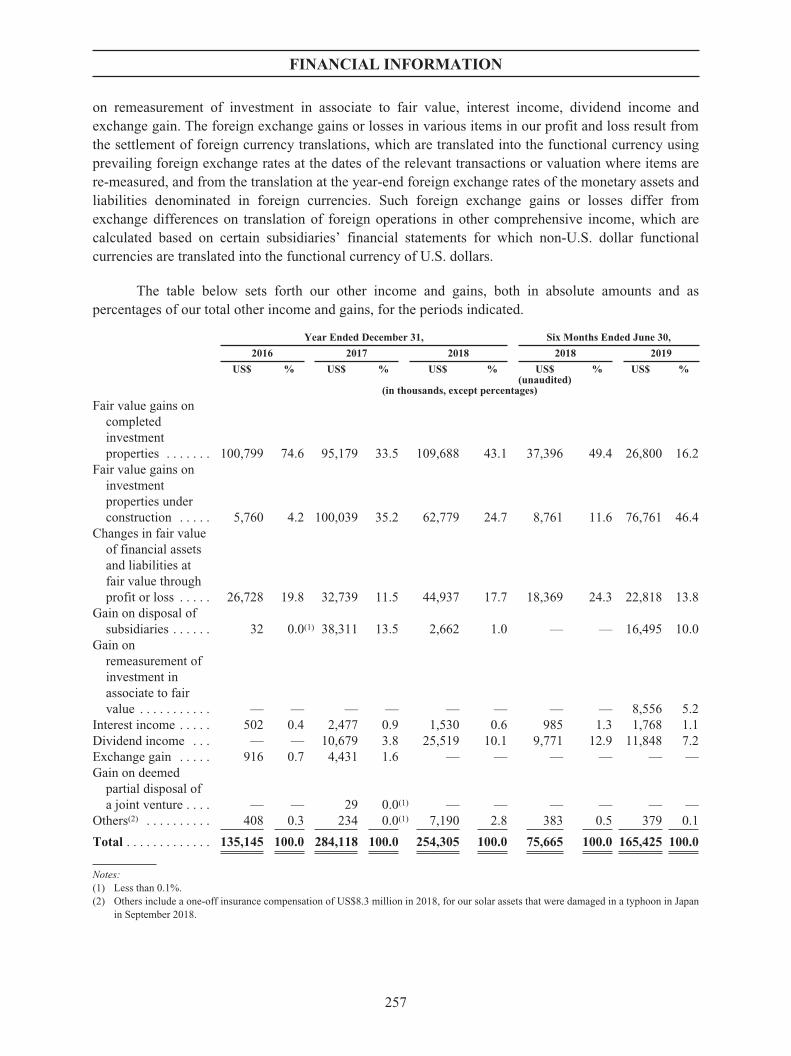
FINANCIAL INFORMATION
on remeasurement of investment in associate to fair value, interest income, dividend income andexchange gain. The foreign exchange gains or losses in various items in our profit and loss result fromthe settlement of foreign currency translations, which are translated into the functional currency usingprevailing foreign exchange rates at the dates of the relevant transactions or valuation where items arere-measured, and from the translation at the year-end foreign exchange rates of the monetary assets andliabilities denominated in foreign currencies. Such foreign exchange gains or losses differ fromexchange differences on translation of foreign operations in other comprehensive income, which arecalculated based on certain subsidiaries’ financial statements for which non-U.S. dollar functionalcurrencies are translated into the functional currency of U.S. dollars.
The table below sets forth our other income and gains, both in absolute amounts and aspercentages of our total other income and gains, for the periods indicated.
Year Ended December 31, Six Months Ended June 30,
2016 2017 2018 2018 2019
US$ % US$ % US$ % US$ % US$ %(unaudited)
(in thousands, except percentages)
Fair value gains oncompletedinvestmentproperties . . . . . . . 100,799 74.6 95,179 33.5 109,688 43.1 37,396 49.4 26,800 16.2
Fair value gains oninvestmentproperties underconstruction . . . . . 5,760 4.2 100,039 35.2 62,779 24.7 8,761 11.6 76,761 46.4
Changes in fair valueof financial assetsand liabilities atfair value throughprofit or loss . . . . . 26,728 19.8 32,739 11.5 44,937 17.7 18,369 24.3 22,818 13.8
Gain on disposal ofsubsidiaries . . . . . . 32 0.0(1) 38,311 13.5 2,662 1.0 — — 16,495 10.0
Gain onremeasurement ofinvestment inassociate to fairvalue . . . . . . . . . . . — — — — — — — — 8,556 5.2
Interest income . . . . . 502 0.4 2,477 0.9 1,530 0.6 985 1.3 1,768 1.1Dividend income . . . — — 10,679 3.8 25,519 10.1 9,771 12.9 11,848 7.2Exchange gain . . . . . 916 0.7 4,431 1.6 — — — — — —Gain on deemed
partial disposal ofa joint venture . . . . — — 29 0.0(1) — — — — — —
Others(2) . . . . . . . . . . 408 0.3 234 0.0(1) 7,190 2.8 383 0.5 379 0.1
Total . . . . . . . . . . . . . 135,145 100.0 284,118 100.0 254,305 100.0 75,665 100.0 165,425 100.0
Notes:(1) Less than 0.1%.(2) Others include a one-off insurance compensation of US$8.3 million in 2018, for our solar assets that were damaged in a typhoon in Japan
in September 2018.
257

FINANCIAL INFORMATION
Fair Value Gains on Completed Investment Properties and Fair Value Gains on InvestmentProperties Under Construction
Our directly held logistics facilities are accounted for as investment properties and are recordedas non-current assets on our consolidated balance sheets at fair value as of each balance sheet date asdetermined by independent valuers. Gains or losses arising from changes in the fair value of ourcompleted investment properties are accounted for as gains or losses in our consolidated statements ofprofit or loss, which may have a substantial effect on our profits. The valuation of property involvesthe exercise of professional judgment and requires the use of certain bases and assumptions. The fairvalue of our investment properties may have been higher or lower if a different basis or set ofassumptions is used. In addition, upward revaluation adjustments reflect unrealized capital gains on ourinvestment properties as of the relevant balance sheet dates and do not generate any cash inflow for ouroperations.
The fair value gain or loss of each of our completed investment properties is primarily affectedby rental rate growth and capitalization rate movements, the supply of and demand for comparableproperties, the rate of overall economic growth, interest rates, inflation and political and economicdevelopments in the areas where the investment properties are located. The fair value gain or loss ofeach of our investment properties under construction is affected by the above as well as byconstruction costs and the development schedule of our logistics properties.
See “Risk Factors—Risks Relating to Our Business and Industry—Our profitability may beaffected by revaluation of the properties held on our balance sheet, as well as the properties held by thefunds and investment vehicles that we manage.”
Changes in Fair Value of Financial Assets and Liabilities at Fair Value Through Profit or Loss
Changes in fair value of financial assets and liabilities at fair value through profit or losscomprise changes in fair value of unquoted equity interests (relating to our equity interests in the fundsand investment vehicles we manage) at fair value and listed equity investments at market value. Gainsor losses arising from changes in the fair value of these investments are accounted for as gains orlosses in our consolidated statements of profit or loss, which may have a substantial effect on ourprofits.
The fair value of unquoted equity investments is estimated based on our share of the net assetvalue of the funds and investment vehicles we manage. The funds and investment vehicles we managewere designated at fair value through profit or loss upon initial recognition on the basis that they aremanaged and have their performance evaluated on a fair value basis, in accordance with our riskmanagement and investment strategies. Fair value determination on the assets managed by these fundsand investment vehicles are generally determined by an independent valuer for each of the period end.
Investments in listed equity investments recorded in 2017 represent our investment in theESR-REIT, which is quoted on the SGX. The market values of these listed equity investments werebased on their quoted prices on the stock market as of the period end. Our investment in the ESR-REITis no longer recorded under financial assets at fair value through profit or loss as this item has beenre-classified as equity instruments designated at fair value through other comprehensive income due toour adoption of IFRS 9 since January 1, 2018.
258

FINANCIAL INFORMATION
Gain on Disposal of Subsidiaries
Gain on disposal of subsidiaries represents our gain from sale of our equity interest in oursubsidiaries holding investment properties to the core/core-plus funds and investment vehicles wemanage or third parties. In August 2017, we disposed of approximately US$295.7 million in logisticsproperty assets which were held on our balance sheet to China Invesco Core Fund, pursuant to whichwe recorded gains of US$38.3 million. In November 2018, we disposed of a 50% interest in oursubsidiary, ESR India Logistics Fund Pte Ltd., to a global real estate investor based in Germany, whichallowed us to record a gain of US$2.7 million. In the first half of 2019, we completed the disposal ofseven properties with an aggregate gross asset value of approximately US$276.7 million from ourbalance sheet to NCI Core Fund, which realized gains for us of US$16.5 million in the first half of2019. We expect to continue recording this income source as we continue implementing our capitalrecycling strategy by disposing of income-yielding investment properties on our balance sheet to thefunds and investment vehicles we manage, or other third parties.
Dividend Income
Dividend income represents dividends received primarily from our equity investments inpublicly listed securities and our investments in the funds and investment vehicles we manage.
Administrative Expenses
The components of our administrative expenses include headcount-related employee wages,salaries and benefit expenses, professional fees, including legal and due diligence fees, valuation feesand auditing fees, associated with our M&A transactions as well as fundraising and financingactivities, depreciation and amortization. We also record property taxes under administrative expenses.
259

FINANCIAL INFORMATION
The table below sets forth the breakdown of our administrative expenses, both in absoluteamounts and as percentages of our total revenue, for the periods indicated.
Year Ended December 31, Six Months Ended June 30,
2016 2017 2018 2018 2019
US$ % US$ % US$ % US$ % US$ %(unaudited)
(in thousands, except percentages)
Wages, salaries andrelated costs . . . . . . 26,180 27.1 39,355 25.7 56,302 22.2 19,476 20.8 33,884 21.8
Equity-settled shareoption expense . . . . 75 0.0(1) 11,923 7.8 23,157 9.1 11,961 12.8 9,885 6.3
Professional servicefee . . . . . . . . . . . . . 11,381 11.8 21,660 14.1 21,584 8.5 8,462 9.0 19,910 12.8
Depreciation ofproperty, plant andequipment . . . . . . . 648 0.7 1,242 0.8 1,812 0.7 824 0.9 2,063 1.3
Amortization of otherintangibles andright-of-useassets . . . . . . . . . . . 5,411 5.6 6,819 4.4 8,414 3.3 3,831 4.1 5,233 3.4
Other tax expenses . . 4,114 4.3 6,137 4.0 8,884 3.5 3,576 3.8 4,608 3.0Loss on disposal of
items of property,plant andequipment . . . . . . . 74 0.0(1) 81 0.1 9,697 3.8 148 0.2 316 0.2
Other finance cost . . . 904 0.9 6,605 4.3 3,311 1.3 — 0.0(1) 1,010 0.6Lease expenses . . . . . 640 0.7 1,183 0.8 1,689 0.7 828 0.9 1,909 1.2Others(2) . . . . . . . . . . . 8,295 8.6 11,838 7.7 19,717 7.8 6,087 6.5 12,803 8.2
Total . . . . . . . . . . . . . 57,722 59.7 106,843 69.7 154,567 60.8 55,193 58.9 91,621 58.8
Notes:(1) Less than 0.1%.(2) Others include mainly exchange losses, traveling and entertainment costs.
Equity-settled Share Option Expense
In November 2015 and November 2017, the Board approved the Tier 1 ESOP and the KMESOP, respectively, for the purpose of providing incentives and rewards to eligible participants whohave contributed to the success of our operations. Eligible participants of the Tier 1 ESOP are ourshareholders including WP OCIM, Laurels and Redwood Consulting. For details of the eligibleparticipants of the Tier 1 ESOP, see “Statutory and General Information—D. KM ESOP, Tier 1 ESOPand Post-IPO Share Option Scheme—2. Tier 1 ESOP” in Appendix VIII to this Prospectus. Eligibleparticipants of the KM ESOP include our Directors and employees. Equity-settled share optionexpense constitutes a portion of salaries and benefits, which is reflected in our administrative expenses.The fair value of the share options granted in the years ended December 31, 2016, 2017 and 2018 andfor the six months ended June 30, 2018 and 2019 was nil, US$31.3 million, US$36.5 million, US$35.8million and US$2.6 million, respectively. The fair value of equity-settled share options granted duringthe year was estimated as of the date of grant using a binomial model, taking into account the termsand conditions upon which the options were granted. We recognized equity-settled share optionexpenses of approximately US$75,000 (from pre-2016 grants), US$11.9 million, US$23.2 million,US$12.0 million and US$9.9 million for the years ended December 31, 2016, 2017 and 2018 and thesix months ended June 30, 2018 and 2019, respectively. We expect to incur less share-based
260

FINANCIAL INFORMATION
compensation expenses under our pre-IPO share option schemes after the completion of the GlobalOffering, as there will not be any new grants under those schemes. We expect share-basedcompensation expenses after the completion of the Global Offering will be largely driven by newgrants under the Post IPO Share Option Scheme.
Fair Value Loss on Derivative Financial Instruments
In 2016, we had a fair value loss on derivative financial instruments of US$12.1 millionresulting from warrant instruments outstanding at the time. The warrant instruments were issued inconnection with certain loan facility agreements entered into in December 2013 and August 2015.Upon issuance in December 2015, the warrant instruments were accounted for as financial liabilitydesignated at fair value through profit or loss. Upon the repayment of the relevant loans in November2016, the derivative component of the warrant instruments, which was an obligation to deliver anumber of equity instruments, was determined and became fixed, and the derivative component of theinstruments was reclassified from financial liability to equity in 2016, and thus there will be noadditional fair value gain or loss related to these warrant instruments in 2017 and subsequent years.
Finance Costs
Our finance costs consist primarily of interest expense on bank loans, interest expense on otherborrowings, and interest on redeemable convertible preference shares.
The table below sets forth our finance costs for the periods indicated.
Year Ended December 31, Six Months Ended June 30,
2016 2017 2018 2018 2019
(unaudited)(US$ in thousands)
Interest expense on the bank loans . . . 24,491 35,666 39,603 12,926 34,843Interest expense on other
borrowings(1) . . . . . . . . . . . . . . . . . . 37,707 18,339 21,718 10,334 12,231Interest expense on bonds . . . . . . . . . . — — — — 11,102Interest expense on lease liabilities . . . 97 291 428 192 701Interest on redeemable convertible
preference shares(2) . . . . . . . . . . . . . — 41,327 45,610 23,318 26,101
62,295 95,623 107,359 46,770 84,978Less: interest capitalized . . . . . . . . . . . (6,303) (4,720) (2,430) (827) (1,615)
Total . . . . . . . . . . . . . . . . . . . . . . . . . . 55,992 90,903 104,929 45,943 83,363
Notes:(1) Includes non-recurring interest expense of US$18.3 million, US$20.8 million, US$10.4 million and US$10.4 million in 2017 and 2018
and for the six months ended June 30, 2018 and 2019, respectively, on the Hana Notes which we intend to redeem upon the completionof the Global Offering. We do not expect to incur any additional finance costs with respect to the Hana Notes following the completionof the Global Offering.
(2) In 2016, 2017 and 2018 and for the six months ended June 30, 2018 and 2019, interest on redeemable convertible preference sharesincluded dividends associated with the Class C Preference Shares amounting to nil, US$13.0 million, US$13.0 million, US$6.5 millionand US$6.5 million, respectively, and costs associated with the equity element of the Class C Preference Shares amounting to nil,US$28.4 million, US$32.7 million, US$16.8 million and US$19.6 million, respectively. We intend to redeem our Class C PreferenceShares that are not converted upon the Global Offering becoming unconditional using part of the proceeds from the Global Offering.
Over the Track Record Period, the absolute amount of our finance costs increased, primarilydue to the increases in our bank borrowings to support our business growth and net currency exchangegains in connection with the proceeds from the issuance of redeemable convertible preference shares in
261

FINANCIAL INFORMATION
2017. Interest on bank borrowings continued to grow during the Track Record Period, primarily due tothe increases in our bank borrowings to support our business growth. See the paragraph headed“—Indebtedness” in this section of the Prospectus for further details of our bank borrowings.
In December 2016, we issued 245,359,810 Class C Preference Shares, which carry a couponrate of 4.5% per annum, for an aggregate consideration of US$300.0 million. In January 2017, weredeemed 9,814,392 Class C Preference Shares for US$11.4 million. In 2017 and 2018 and the sixmonths ended June 30, 2018 and 2019, interest on Class C Preference Shares was US$41.3 million,US$45.6 million, US$23.3 million and US$26.1 million, respectively, including both the dividendsassociated with the Class C Preference Shares and the costs associated with the equity element of theClass C Preference Shares. In November 2016, we issued US$300 million of the Hana Notes whichwill mature in 2019. In 2017 and 2018 and the six months ended June 30, 2018 and 2019, we incurredinterest expense in connection with the Hana Notes in the amount of US$18.3 million,US$20.8 million, US$10.4 million and US$10.4 million, respectively. We plan to redeem the HanaNotes and the Class C Preference Shares that are not converted upon the completion of the GlobalOffering using part of the proceeds from the Global Offering.
Share of Profits and Losses of Joint Ventures and Associates, Net
Our share of profits and losses of joint ventures and associates, net, represents primarily ourshare of profits of joint ventures, E-Shang Star and Sunwood Star Pte. Ltd. (“Sunwood Star”), less ourshare of losses, if any, of the joint ventures. E-Shang Star is focused on development projects in thePRC while Sunwood Star is focused on development projects in South Korea. Prior to the completionof the Sabana Manager Acquisition in June 2019, our share of profits and losses of joint ventures andassociates, net, also included our share of profits of an associate, Sabana Manager, the equity interestof which was held by us as to 45% as of December 31, 2018, less our share of losses, if any, of suchassociate.
Income Tax Expense
Our income tax expense consists of current tax and deferred tax components. ESR CaymanLimited was incorporated in the Cayman Islands as an exempted company with limited liability and isexempted from Cayman Islands income tax. During the Track Record Period, our subsidiaries wereincorporated in the Cayman Islands, BVI, Hong Kong, the PRC, Japan, South Korea, Singapore,Australia, India and others. See the paragraph headed “—Taxation” in this section of the Prospectus fordetails. During the Track Record Period, our deferred tax assets resulted primarily from lossesavailable for offsetting against future taxable profits, employee benefits payable and accrued expenses.Our deferred tax liability resulted primarily from fair value adjustments on investment properties andfinancial assets at fair value through profit or loss and acquisition of subsidiaries.
Year Ended December 31, Six Months Ended June 30,
2016 2017 2018 2018 2019
(unaudited)(US$ in thousands)
Current tax . . . . . . . . . . . . . . . . . . . . . . 643 20,131 13,871 6,173 17,577Deferred tax . . . . . . . . . . . . . . . . . . . . . 34,245 52,209 43,838 11,098 21,059
Total . . . . . . . . . . . . . . . . . . . . . . . . . . 34,888 72,340 57,709 17,271 38,636
The table below sets forth a reconciliation of the tax expense applicable to profit before taxusing the applicable rates for the regions in which our Company and our subsidiaries are domiciled to
262

FINANCIAL INFORMATION
the aggregate tax expense, and the consequential effective tax rates are as set forth below, for theperiods indicated.
Year Ended December 31, Six Months Ended June 30,
2016 2017 2018 2018 2019
(unaudited)(US$ in thousands)
Profit before tax . . . . . . . . . . . . . . . . . . 139,732 273,174 270,587 80,962 122,713Tax at the statutory tax rate . . . . . . . . . 35,108 72,917 62,058 17,556 23,865Profits attributable to joint ventures . . (1,571) (1,640) (7,641) (1,046) (2,190)Income not subject to tax . . . . . . . . . . — (267) — — —Non-deductible expenses . . . . . . . . . . . 1,351 1,528 3,292 761 1,358Unrecognized deductible temporary
differences . . . . . . . . . . . . . . . . . . . . — (198) — — 134Effect of withholding tax . . . . . . . . . . . — — — — 15,469
Tax charge . . . . . . . . . . . . . . . . . . . . . 34,888 72,340 57,709 17,271 38,636
In 2016, 2017 and 2018 and for the six months ended June 30, 2018 and 2019, our effective taxrates, calculated by dividing our income tax expense by our profit before income tax, were 25.0%,26.5%, 21.3%, 21.3% and 31.5%, respectively.
TAXATION
Our Company was incorporated in the Cayman Islands as an exempted company with limitedliability under the Cayman Companies Law and is exempted from the payment of income tax in theCayman Islands. Additionally, dividend payments made by us are not subject to withholding tax in theCayman Islands. During the Track Record Period, we did not declare any dividend payments and didnot incur any withholding tax in the Cayman Islands.
Our subsidiaries incorporated in BVI are not subject to any income tax. Additionally, dividendpayments made by us are not subject to withholding tax in BVI. During the Track Record Period, wedid not declare any dividend payments and did not incur any withholding tax in BVI.
We are subject to Hong Kong profits tax at a rate of 16.5% on the estimated assessable profitsarising in Hong Kong in 2016, 2017 and 2018. There is no withholding tax on the dividends distributedfrom our Hong Kong subsidiaries. During the Track Record Period, we did not declare any dividendpayments and did not incur any withholding tax in Hong Kong.
According to the EIT Law, the income tax rates for both domestic and foreign investmententerprises in the PRC are unified at 25% in 2016, 2017 and 2018. Pursuant to the EIT Law, a 10%withholding tax is levied on dividends declared to foreign investors from foreign investmententerprises established in the PRC. The requirement is effective from January 1, 2008 and applies toearnings after December 31, 2007. A lower withholding tax rate may be applied if there is a tax treatybetween the PRC and the jurisdiction of the foreign investors. We are, therefore, liable to withholdingtaxes on dividends distributed by our subsidiaries, joint ventures and associates established in the PRCin respect of earnings generated from January 1, 2008 onwards. Our subsidiaries incorporated in PRCare subject to a EIT rate of 25% under the EIT Law during the Track Record Period.
Our subsidiaries incorporated in Japan are subject to Japanese income tax at the rate of 30.86%in 2016, 2017 and 2018. Dividend payments made by our subsidiaries in Japan are subject to
263

FINANCIAL INFORMATION
withholding tax of 5% for foreign investors, and 20.42% for domestic investors. During the TrackRecord Period, we declared a dividend of US$2.75 million in total in September 2018, which was paidin December 2018. The withholding tax incurred with respect to this dividend payment in Japan wasUS$349.6 thousand.
Our subsidiary incorporated in South Korea is subject to South Korean corporate income tax atthe rate of 24.2%, 24.2% and 27.5% in 2016, 2017 and 2018, respectively. Dividend payments madeby our subsidiaries in South Korea are subject to withholding tax of 15% in South Korea. During theTrack Record Period, we did not declare any dividend payments and did not incur any withholding taxin South Korea.
Our subsidiary incorporated in Singapore is subject to Singapore income tax at the rate of 17%during the Track Record Period on the profits, including those arising from sources outside Singaporeand received in Singapore. Additionally, dividend payments made by our subsidiary in Singapore arenot subject to withholding tax in Singapore. During the Track Record Period, we did not declare anydividend payments and did not incur any withholding tax in Singapore.
Our subsidiary incorporated in Australia is subject to Australian corporate income tax at therate of 30% in 2016, 2017 and 2018. Dividend payments made by our subsidiaries in Australia aresubject to withholding tax of 30% in Australia. During the Track Record Period, we did not declareany dividend payments and did not incur any withholding tax in Australia.
Our subsidiary incorporated in India is subject to Indian income tax at the rate of 30% in 2016,2017 and 2018. Dividend payments made by our subsidiaries in India are subject to withholding tax of15% in India. During the Track Record Period, we did not declare any dividend payments and did notincur any withholding tax in India.
NON-IFRS MEASURES
To supplement our consolidated results which are prepared and presented in accordance withIFRS, we also use adjusted net profit and adjusted EBITDA as additional financial measures, which arenot required by, or presented in accordance with IFRS. We believe that these non-IFRS measuresfacilitate comparisons of operating performance from period to period and company to company byeliminating potential impacts of items that our management does not consider to be indicative of ouroperating performance. The use of these non-IFRS measures have limitations as an analytical tool, andyou should not consider them in isolation from, or as a substitute for analysis of, our results ofoperations or financial conditions as reported under IFRS. In addition, these non-IFRS financialmeasures may be defined differently from similar terms used by other companies.
Adjusted Net Profit
We define adjusted net profit as our profit for the year, adding back certain non-cash items,including write-off related to loss of property, plant and equipment, fair value loss on derivativefinancial instruments, exchange loss/(gain), and equity-settled share option expense, along with certainnon-recurring items excluding one-off insurance compensation and fair value gains on completedinvestment properties and investment properties under construction, and adjusting for the effect oftaxes on these adjustments. The use of adjusted net profit has material limitations as an analytical tool,as it does not include all items that impact our profit for the year attribute to the owners of ourCompany. Our presentation of this non-IFRS measure should not be construed as an inference that ourfuture results will be unaffected by unusual or non-recurring items.
264

FINANCIAL INFORMATION
Our adjusted net profit increased from US$36.2 million in 2016 to US$61.9 million in 2017,primarily due to the growth in our revenue, including rental income and management fee income,higher gain on disposal of subsidiaries, partially offset by the growth in administrative expenses, andfinance costs, in connection with the expansion of our business. Our adjusted net profit increased fromUS$61.9 million in 2017 to US$110.0 million in 2018, primarily due to the continued growth in ourrevenue, including rental income and management fee income, the inclusion of construction income asa result of the consolidation of CIP following the completion of our acquisition of CIP in August 2018,and higher dividend income, partially offset by the increases in our cost of sales, including constructioncosts attributable to CIP, which we acquired in August 2018, lower gain on disposal of subsidiaries andhigher administrative expenses in connection with the expansion of our business. Our adjusted netprofit decreased from US$39.9 million for the six months ended June 30, 2018 to US$9.4 million forthe six months ended June 30, 2019 primarily due to (i) the deduction of a significantly higher fairvalue gain on investment properties under construction driven by the fair value gains on investmentproperties under construction from the RW Higashi-Ogishima DC property after it was reclassified toan investment property under construction in the second half of 2018 due to our plan to redevelop itinto a modern logistics facility and the increased construction activities associated with the RWHigashi-Ogishima DC property in the first half of 2019 and (ii) the increases in our cost of sales inconnection with our revenue growth and business expansion, including construction costs attributableto CIP, which we acquired in August 2018, partially offset by (iii) higher tax effects of adjustmentitems.
Adjusted EBITDA
We define adjusted EBITDA as our profit before tax, adding back depreciation andamortization, exchange loss/(gain), finance costs, equity-settled share option expense, fair value losson derivative financial instruments, write-off related to loss of property, plant and equipment and thelisting expenses, and eliminating the effect of interest income, one-off insurance compensation and fairvalue gains on completed investment properties and investment properties under construction. The useof adjusted EBITDA has certain limitations because it does not reflect all items of income andexpenses that affect our operations. Items excluded from adjusted EBITDA are significant componentsin understanding and assessing our operating and financial performance. Each of these items shouldalso be considered in the overall evaluation of our results. Additionally, adjusted EBITDA does notconsider changes in working capital, capital expenditures and other investing expenditures and shouldnot be considered as a measure of our liquidity. The term adjusted EBITDA is not defined under IFRS,and adjusted EBITDA is not a measure of profit and total comprehensive income or liquidity presentedin accordance with IFRS.
Our adjusted EBITDA significantly increased from US$106.0 million in 2016 toUS$181.9 million in 2017, primarily due to the growth in our revenue as discussed above and highergain on disposal of subsidiaries, partially offset by the growth in administrative expenses we incurredin connection with the expansion of our business. Our adjusted EBITDA increased fromUS$181.9 million in 2017 to US$239.6 million in 2018, primarily due the growth in our revenue asdiscussed above, partially offset by the increases in our cost of sales, including construction costsattributable to CIP, which we acquired in August 2018, lower gain on disposal of subsidiaries andhigher administrative expenses as a result of the growth of the scale of our operations. Our adjustedEBITDA increased from US$96.4 million for the six months ended June 30, 2018 to US$125.2 millionfor the six months ended June 30, 2019 primarily due to the growth in our revenue as discussed above,including our acquisition of Propertylink in March 2019, and the adding back of higher finance costs
265

FINANCIAL INFORMATION
due to an increase in interest expenses on bank loans and other borrowings attributable to theconsolidation of Propertylink into our Group in March 2019 and new bank loans and bonds to supportour business growth and acquisitions, partially offset by the deduction of significantly higher fair valuegains on investment properties under construction, increases in costs of sales, including constructioncosts of sales attributable to CIP, which we acquired in August 2018, and higher administrativeexpenses as a result of the growth of the scale of our operations.
Reconciliation
The following tables set forth the reconciliations of our non-IFRS financial measures for theperiods indicated to the nearest measures prepared in accordance with IFRS:
Year Ended December 31,
Six MonthsEndedJune 30,
2016 2017 2018 2018 2019
(US$ in thousands)
Profit for the year/period . . . . . . . . . . . . . . . . . . . . . . . . . 104,844 200,834 212,878 63,691 84,077Add:Write-off related to loss of property, plant and
equipment(1) . . . . . . . . . . . . . . . . . . . . . . . . . . . . . . . . . . . — — 9,632 — —Fair value loss on derivative financial instruments(2) . . . . . 12,133 — — — —Exchange loss/(gain)(3) . . . . . . . . . . . . . . . . . . . . . . . . . . . . (916) (4,431) 869 41 1,761Equity-settled share option expense(4) . . . . . . . . . . . . . . . . . 75 11,923 23,157 11,961 9,885Tax effects of adjustments . . . . . . . . . . . . . . . . . . . . . . . . . . 26,640 48,804 44,317 10,341 17,229Less:One-off insurance compensation . . . . . . . . . . . . . . . . . . . . . — — (8,338) — —Fair value gains on completed investment properties(5) . . . (100,799) (95,179) (109,688) (37,396) (26,800)Fair value gains on investment properties under
construction(6) . . . . . . . . . . . . . . . . . . . . . . . . . . . . . . . . . (5,760) (100,039) (62,779) (8,761) (76,761)
Adjusted net profit . . . . . . . . . . . . . . . . . . . . . . . . . . . . . . . 36,217 61,912 110,048 39,877 9,391
Notes:(1) Represents a write-off of property, plant and equipment due to the damage of certain solar assets in Japan by a typhoon in September
2018.(2) Represents an one-off fair value loss on derivative financial instruments related to warrant instruments in connection with certain loan
facilities entered into in December 2013 and August 2015. Upon the repayment of the relevant loans in November 2016, no additionalfair value gain or loss related to these warrant instruments is recognized in 2017 and subsequent years.
(3) Represents the exchange loss/(gain) related to foreign currency translation impacts. Foreign currency translations are volatile in natureand depend primarily on movements in the global exchange rates and the macroeconomic environment, both of which are beyond ourcontrol. We do not consider exchange loss/(gain) directly related to our ability to generate revenue from our daily operations, andtherefore this line item has been adjusted to facilitate comparison of our operating performance across periods.
(4) Represents share-based compensation expenses incurred in connection with our pre-IPO share option schemes. We do not consider suchamounts indicative of our profit from operations post-completion of our Listing, and therefore we believe that adjusting for share-basedcompensation expenses incurred in connection with our pre-IPO share option schemes in the past periods will facilitate the comparisonof our operating performance across periods.
(5) Represents the fair value gains on completed investment properties that the Company holds on its balance sheet. The completedinvestment properties are subject to periodic revaluation by independent property valuers.
(6) Represents the development-profit related appreciation of the Company’s under-construction balance-sheet properties. They areprimarily affected by the construction progress of these projects (and to a lesser extent by factors such as rental growth and capitalizationrates) which in turn, determines the development-related appreciation that we are able to generate on these projects.
266
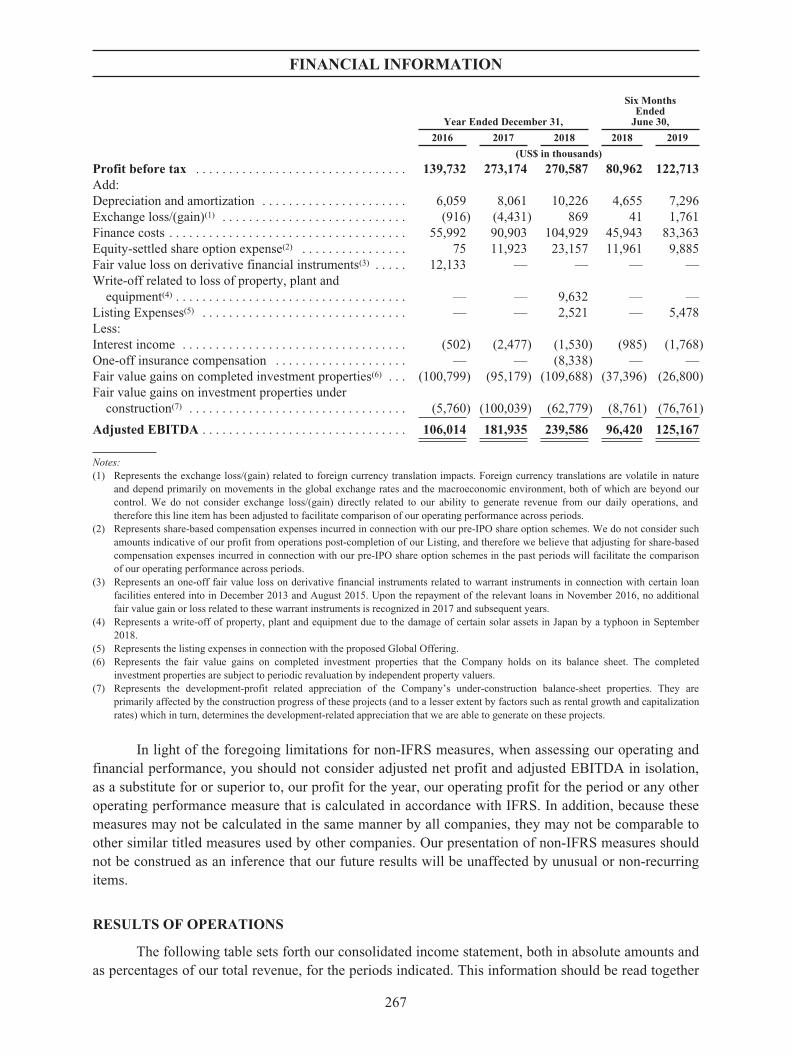
FINANCIAL INFORMATION
Year Ended December 31,
Six MonthsEndedJune 30,
2016 2017 2018 2018 2019
(US$ in thousands)
Profit before tax . . . . . . . . . . . . . . . . . . . . . . . . . . . . . . . . 139,732 273,174 270,587 80,962 122,713Add:Depreciation and amortization . . . . . . . . . . . . . . . . . . . . . . 6,059 8,061 10,226 4,655 7,296Exchange loss/(gain)(1) . . . . . . . . . . . . . . . . . . . . . . . . . . . . (916) (4,431) 869 41 1,761Finance costs . . . . . . . . . . . . . . . . . . . . . . . . . . . . . . . . . . . . 55,992 90,903 104,929 45,943 83,363Equity-settled share option expense(2) . . . . . . . . . . . . . . . . 75 11,923 23,157 11,961 9,885Fair value loss on derivative financial instruments(3) . . . . . 12,133 — — — —Write-off related to loss of property, plant and
equipment(4) . . . . . . . . . . . . . . . . . . . . . . . . . . . . . . . . . . . — — 9,632 — —Listing Expenses(5) . . . . . . . . . . . . . . . . . . . . . . . . . . . . . . . — — 2,521 — 5,478Less:Interest income . . . . . . . . . . . . . . . . . . . . . . . . . . . . . . . . . . (502) (2,477) (1,530) (985) (1,768)One-off insurance compensation . . . . . . . . . . . . . . . . . . . . — — (8,338) — —Fair value gains on completed investment properties(6) . . . (100,799) (95,179) (109,688) (37,396) (26,800)Fair value gains on investment properties under
construction(7) . . . . . . . . . . . . . . . . . . . . . . . . . . . . . . . . . (5,760) (100,039) (62,779) (8,761) (76,761)
Adjusted EBITDA . . . . . . . . . . . . . . . . . . . . . . . . . . . . . . . 106,014 181,935 239,586 96,420 125,167
Notes:(1) Represents the exchange loss/(gain) related to foreign currency translation impacts. Foreign currency translations are volatile in nature
and depend primarily on movements in the global exchange rates and the macroeconomic environment, both of which are beyond ourcontrol. We do not consider exchange loss/(gain) directly related to our ability to generate revenue from our daily operations, andtherefore this line item has been adjusted to facilitate comparison of our operating performance across periods.
(2) Represents share-based compensation expenses incurred in connection with our pre-IPO share option schemes. We do not consider suchamounts indicative of our profit from operations post-completion of our Listing, and therefore we believe that adjusting for share-basedcompensation expenses incurred in connection with our pre-IPO share option schemes in the past periods will facilitate the comparisonof our operating performance across periods.
(3) Represents an one-off fair value loss on derivative financial instruments related to warrant instruments in connection with certain loanfacilities entered into in December 2013 and August 2015. Upon the repayment of the relevant loans in November 2016, no additionalfair value gain or loss related to these warrant instruments is recognized in 2017 and subsequent years.
(4) Represents a write-off of property, plant and equipment due to the damage of certain solar assets in Japan by a typhoon in September2018.
(5) Represents the listing expenses in connection with the proposed Global Offering.(6) Represents the fair value gains on completed investment properties that the Company holds on its balance sheet. The completed
investment properties are subject to periodic revaluation by independent property valuers.(7) Represents the development-profit related appreciation of the Company’s under-construction balance-sheet properties. They are
primarily affected by the construction progress of these projects (and to a lesser extent by factors such as rental growth and capitalizationrates) which in turn, determines the development-related appreciation that we are able to generate on these projects.
In light of the foregoing limitations for non-IFRS measures, when assessing our operating andfinancial performance, you should not consider adjusted net profit and adjusted EBITDA in isolation,as a substitute for or superior to, our profit for the year, our operating profit for the period or any otheroperating performance measure that is calculated in accordance with IFRS. In addition, because thesemeasures may not be calculated in the same manner by all companies, they may not be comparable toother similar titled measures used by other companies. Our presentation of non-IFRS measures shouldnot be construed as an inference that our future results will be unaffected by unusual or non-recurringitems.
RESULTS OF OPERATIONS
The following table sets forth our consolidated income statement, both in absolute amounts andas percentages of our total revenue, for the periods indicated. This information should be read together
267

FINANCIAL INFORMATION
with our consolidated financial statements and related notes included elsewhere in this Prospectus. Theoperating results in any period are not necessarily indicative of the results that may be expected for anyfuture period.
Year Ended December 31, Six Months Ended June 30,
2016 2017 2018 2018 2019
US$ % US$ % US$ % US$ % US$ %(unaudited)
(in thousands, except percentages)
Revenue . . . . . . . . . . . . . . . . 96,737 100.0 153,289 100.0 254,148 100.0 93,690 100.0 155,763 100.0Cost of sales . . . . . . . . . . . . . (2,655) (2.7) (3,487) (2.3) (43,742) (17.2) (2,058) (2.2) (41,808) (26.8)
Gross Profit . . . . . . . . . . . . . 94,082 97.3 149,802 97.7 210,406 82.8 91,632 97.8 113,955 73.2Other income and gains . . . . 135,145 139.7 284,118 185.2 254,305 100.1 75,665 80.7 165,425 106.2Administrative expenses . . . (57,722) (59.7) (106,843) (69.7) (154,567) (60.8) (55,193) (58.9) (91,621) (58.8)Fair value loss on derivative
financial instruments . . . . (12,133) (12.6) — — — — — — — —Finance costs . . . . . . . . . . . . (55,992) (57.9) (90,903) (59.3) (104,929) (41.3) (45,943) (49.0) (83,363) (53.5)Share of profits and losses of
joint ventures andassociates, net . . . . . . . . . 36,352 37.6 37,000 24.1 65,372 25.7 14,801 15.8 18,317 11.7
Profit before tax . . . . . . . . . . 139,732 144.4 273,174 178.2 270,587 106.5 80,962 86.4 122,713 78.8Income tax expense . . . . . . . (34,888) (36.1) (72,340) (47.2) (57,709) (22.7) (17,271) (18.4) (38,636) (24.8)
Profit for the year . . . . . . . 104,844 108.3 200,834 131.0 212,878 83.8 63,691 68.0 84,077 54.0
Attributable to:Owners of the parent . . . . . . 88,267 91.2 186,265 121.5 203,042 79.9 61,793 66.0 75,950 48.8Non-controlling interests . . . 16,577 17.1 14,569 9.5 9,836 3.9 1,898 2.0 8,127 5.2
Profit for theyear/period . . . . . . . . . . . 104,844 108.3 200,834 131.0 212,878 83.8 63,691 68.0 84,077 54.0
COMPARISON OF RESULTS OF OPERATIONS
Six Months Ended June 30, 2019 Compared to Six Months Ended June 30, 2018
Revenue
Our revenues increased by US$62.1 million, or 66.3%, from US$93.7 million for the sixmonths ended June 30, 2018 to US$155.8 million for the six months ended June 30, 2019. Thisincrease was primarily attributable to: (i) an increase in rental income primarily driven by theconsolidation of Propertylink into our Group in March 2019; (ii) an increase in management feeincome; and (iii) the inclusion of construction income as a result of the consolidation of CIP followingthe completion of our acquisition of CIP in August 2018.
Š Our rental income increased from US$32.7 million for the six months ended June 30, 2018to US$55.0 million for the six months ended June 30, 2019. The growth in rental incomewas primarily attributable to the following:
Š The growth in rental income from our investment properties was primarily driven bythe consolidation of Propertylink into our Group in March 2019 which contributedrental income of US$13.1 million, the completion of more properties underdevelopment and more property acquisitions. The number of investment propertiesgenerating rental income increased from 13 as of June 30, 2018, to 19 as of June 30,2019. In the six months ended June 30, 2019, we had six properties that commenced
268

FINANCIAL INFORMATION
operations or were acquired after June 30, 2018 and generated rental income duringthis period, including RW Higashi-Ogishima DC Property, Wuxi Lekun and TianjinFanxin. In addition, the completion of Shenyang Yibei in the second half of 2018 alsocontributed to the increase in rental income in the six months ended June 30, 2019.
Š This growth in rental income was partially offset by the disposal of certain of oursubsidiaries which held seven balance sheet properties to NCI Core Fund.
Š Our management fee income increased from US$59.0 million for the six months endedJune 30, 2018 to US$61.8 million for the six months ended June 30, 2019 primarily due tothe following:
Š An increase in base management fees and asset management fees was driven by thegrowth in our Fund AUM from US$11.4 billion for the six months ended June 30,2018 to US$17.6 billion for the six months ended June 30, 2019. This growth wasdriven by the following factors: (i) an increase in the amount of invested capital inexisting funds, in light of additional funding requirements; (ii) the establishment ofnew funds such as the South Korea Core Fund, the India Fund, the Japan Core Fundand RJLF III; and (iii) the consolidation of Propertylink in March 2019. Basemanagement fee and asset management fee growth was strong across our keymarkets, with our Japan, South Korea and PRC funds recording strong growth due to,among other things, the acquisitions of new projects in Japan, South Korea and thePRC.
Š Other management fee income streams such as acquisition fees increased. Theincrease in acquisition fees was primarily driven by the acquisition fee recognized inconnection with the acquisition of new projects by South Korea Core Fund and JapanCore Fund. We recognized promote for the six months ended June 30, 2019 inconnection with the disposal of Redwood Japan Logistic Fund Limited Partnership inJapan.
Š The above increases were offset by (i) a decrease in development fees due to thecompletion of various properties under construction, in particular a major project inJapan in January 2019; and (ii) a decrease in leasing fees as we leased out majorproperties, in particular, in South Korea, in the first half of 2018 and we had no majorprojects completed for new leases in the first half of 2019.
Š We consolidated CIP, which provides construction services to its customers, andrecognized construction income of US$37.7 million for the six months ended June 30,2019 following the completion of our acquisition of CIP in August 2018.
Cost of Sales
Our cost of sales increased significantly by US$39.7 million from US$2.1 million for the sixmonths ended June 30, 2018 to US$41.8 million for the six months ended June 30, 2019. The increasewas primarily attributable to the construction cost attributable to CIP, which we acquired in August2018. Cost of sales accounted for 2.2% and 26.8% of our revenue for the six months ended June 30,2018 and 2019, respectively.
269

FINANCIAL INFORMATION
Gross Profit
Our gross profit increased by US$22.4 million, or 24.4%, from US$91.6 million for the sixmonths ended June 30, 2018 to US$114.0 million for the six months ended June 30, 2019. We had agross profit margin of 97.8% for the six months ended June 30, 2018 and 73.2% for the six monthsended June 30, 2019. Gross profit margin for our construction business was 1.8% for the six monthsended June 30, 2019, reflecting our acquisition of CIP, which operates a construction business having adifferent margin profile, in August 2018.
Other Income and Gains
Our other income and gains increased by US$89.8 million, or 118.6%, from US$75.7 millionfor the six months ended June 30, 2018 to US$165.4 million for the six months ended June 30, 2019primarily due to the following:
Š Fair value gains on investment properties under construction increased from US$8.8million for the six months ended June 30, 2018 to US$76.8 million for the six monthsended June 30, 2019. This increase was primarily driven by the fair value gains oninvestment properties under construction from the RW Higashi-Ogishima DC propertyafter it was reclassified to an investment property under construction in the second half of2018 due to our plan to redevelop it into a modern logistics facility and the increasedconstruction activities in the first half of 2019. In terms of individual properties, Sachiuraproperties and the RW Higashi-Ogishima DC property contributed to the highest fair valuegains on investment properties under construction in the six months ended June 30, 2019.
Š Changes in fair value of financial assets and liabilities at fair value through profit or lossincreased from US$18.4 million for the six months ended June 30, 2018 to US$22.8million for the six months ended June 30, 2019. This was primarily driven by an improvedfinancial performance from the funds and investment vehicles accounted through the fairvalue method, as well as the increased net asset values of the associated project companiesin which we made co-investments. Most of the gains were recorded from properties inJapan.
Š We recorded no gain on disposal of subsidiaries in the six months ended June 30, 2018,and recorded US$16.5 million gain on disposal of subsidiaries in the six months endedJune 30, 2019. The gain in the six months ended June 30, 2019 was primarily due to thedisposal of seven balance sheet properties to NCI Core Fund.
Š Dividend income increased from US$9.8 million for the six months ended June 30, 2018to US$11.8 million for the six months ended June 30, 2019. This was primarily due todividends received from our equity investments in publicly listed securities for the sixmonths ended June 30, 2019.
The above were partially offset by the following:
Š Fair value gains on completed investment properties decreased from US$37.4 million forthe six months ended June 30, 2018 to US$26.8 million for the six months ended June 30,2019. This was primarily due to the reclassification of RW Higashi-Ogishima DC propertyfrom a completed investment property to an investment property under construction in thesecond half of 2018 due to redevelopment and the disposal of seven properties to NCICore Fund in the first half of 2019.
270

FINANCIAL INFORMATION
Administrative Expenses
Our administrative expenses increased by US$36.4 million, or 66.0%, from US$55.2 millionfor the six months ended June 30, 2018 to US$91.6 million for the six months ended June 30, 2019.The increase was primarily due to: (i) the increase in wages and salaries attributable to the growth ofour business, with the number of full-time employees increasing from 336 as of June 30, 2018 to 595as of June 30, 2019 as a result of our integration of the businesses of Propertylink and CIP; and (ii) theincurrence of professional fees including legal and due diligence fees, valuation fees and auditing fees,associated with our fundraising and financing activities, the increase in our property projects as well asM&A activities which we pursued during this period. The increase was partially offset by the decreaseof equity-settled share option expense of approximately US$9.9 million for the six months endedJune 30, 2019 from US$12.0 million for the six months ended June 30, 2018, attributable to our grantof share options to eligible participants.
Our administrative expenses accounted for 58.9% and 58.8% of our revenue for the six monthsended June 30, 2018 and 2019, respectively.
Finance Costs
Our finance costs increased by US$37.4 million, or 81.4%, from US$45.9 million for the sixmonths ended June 30, 2018 to US$83.4 million for the six months ended June 30, 2019. The increasewas primarily due to an increase in interest expenses on bank loans and other borrowings ofUS$23.8 million attributable to the consolidation of Propertylink into our Group in March 2019 and anincrease in new bank loans and bonds to support our business growth and acquisitions. Our financecosts accounted for 49.0% and 53.5% of our revenue for the six months ended June 30, 2018 and 2019,respectively.
Share of Profits and Losses of Joint Ventures and Associates, Net
We recorded share of profits of joint ventures, net, of US$18.3 million for the six months endedJune 30, 2019, compared to US$14.8 million for the six months ended June 30, 2018. This increasewas primarily driven by the increase in fair value gains on investment properties held by Sunwood Starand the joint ventures in Australia post our acquisition of Propertylink.
Income Tax Expense
We had income tax expense of US$17.3 million for the six months ended June 30, 2018,comprising current tax of US$6.2 million and deferred tax of US$11.1 million. We had income taxexpense of US$38.6 million for the six months ended June 30, 2019, comprising current tax ofUS$17.6 million and deferred tax of US$21.1 million. The increase in current tax in the six monthsended June 30, 2019 was primarily due to higher profits generated. The increase in deferred tax in thesix months ended June 30, 2019 was due to higher fair value gain on our investment properties asdiscussed above. Our effective tax rate, calculated by dividing our income tax expense by our profitbefore income tax, was 21.3% for the six months ended June 30, 2018 to 31.5% for the six monthsended June 30, 2019 primarily due to the tax liability incurred as a result of the disposal of sevenproperties to NCI Core Fund.
Net Profit
As a result of the foregoing, our net profit was US$84.1 million for the six months endedJune 30, 2019, compared to US$63.7 million for the six months ended June 30, 2018. We had a net
271
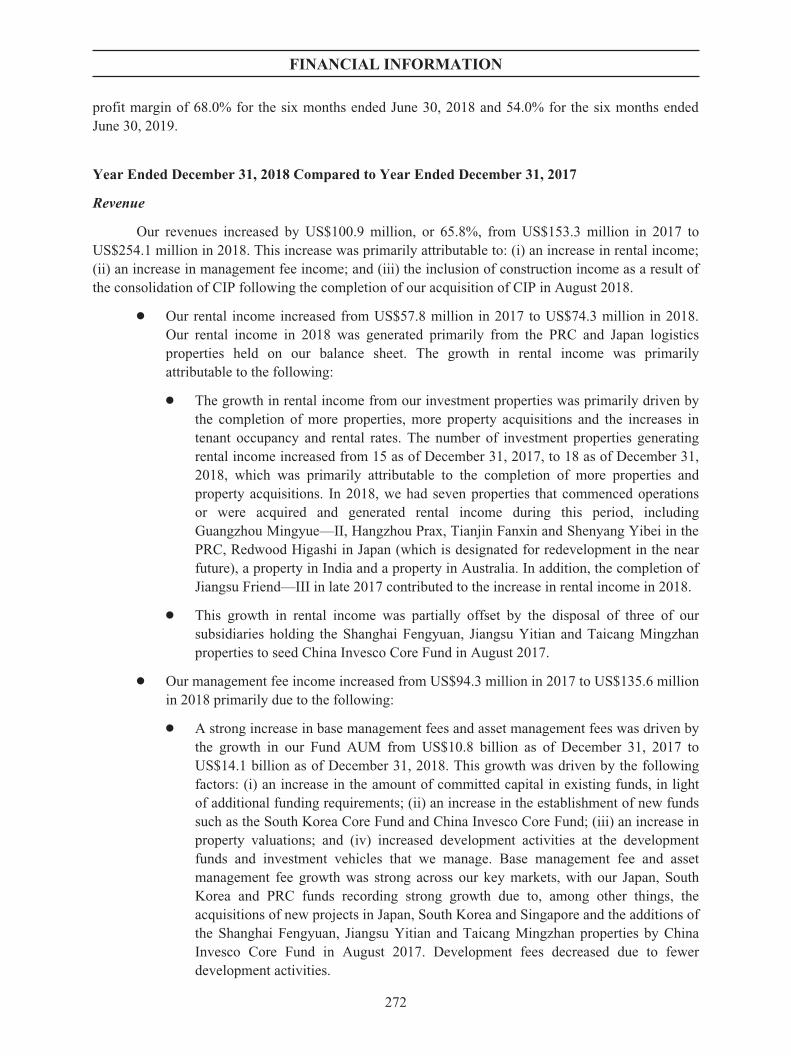
FINANCIAL INFORMATION
profit margin of 68.0% for the six months ended June 30, 2018 and 54.0% for the six months endedJune 30, 2019.
Year Ended December 31, 2018 Compared to Year Ended December 31, 2017
Revenue
Our revenues increased by US$100.9 million, or 65.8%, from US$153.3 million in 2017 toUS$254.1 million in 2018. This increase was primarily attributable to: (i) an increase in rental income;(ii) an increase in management fee income; and (iii) the inclusion of construction income as a result ofthe consolidation of CIP following the completion of our acquisition of CIP in August 2018.
Š Our rental income increased from US$57.8 million in 2017 to US$74.3 million in 2018.Our rental income in 2018 was generated primarily from the PRC and Japan logisticsproperties held on our balance sheet. The growth in rental income was primarilyattributable to the following:
Š The growth in rental income from our investment properties was primarily driven bythe completion of more properties, more property acquisitions and the increases intenant occupancy and rental rates. The number of investment properties generatingrental income increased from 15 as of December 31, 2017, to 18 as of December 31,2018, which was primarily attributable to the completion of more properties andproperty acquisitions. In 2018, we had seven properties that commenced operationsor were acquired and generated rental income during this period, includingGuangzhou Mingyue—II, Hangzhou Prax, Tianjin Fanxin and Shenyang Yibei in thePRC, Redwood Higashi in Japan (which is designated for redevelopment in the nearfuture), a property in India and a property in Australia. In addition, the completion ofJiangsu Friend—III in late 2017 contributed to the increase in rental income in 2018.
Š This growth in rental income was partially offset by the disposal of three of oursubsidiaries holding the Shanghai Fengyuan, Jiangsu Yitian and Taicang Mingzhanproperties to seed China Invesco Core Fund in August 2017.
Š Our management fee income increased from US$94.3 million in 2017 to US$135.6 millionin 2018 primarily due to the following:
Š A strong increase in base management fees and asset management fees was driven bythe growth in our Fund AUM from US$10.8 billion as of December 31, 2017 toUS$14.1 billion as of December 31, 2018. This growth was driven by the followingfactors: (i) an increase in the amount of committed capital in existing funds, in lightof additional funding requirements; (ii) an increase in the establishment of new fundssuch as the South Korea Core Fund and China Invesco Core Fund; (iii) an increase inproperty valuations; and (iv) increased development activities at the developmentfunds and investment vehicles that we manage. Base management fee and assetmanagement fee growth was strong across our key markets, with our Japan, SouthKorea and PRC funds recording strong growth due to, among other things, theacquisitions of new projects in Japan, South Korea and Singapore and the additions ofthe Shanghai Fengyuan, Jiangsu Yitian and Taicang Mingzhan properties by ChinaInvesco Core Fund in August 2017. Development fees decreased due to fewerdevelopment activities.
272

FINANCIAL INFORMATION
Š Other management fee income streams such as acquisition and leasing feessignificantly increased. The increase in acquisition fees was primarily driven by theacquisition fee recognized in connection with the VIT Merger and the acquisition ofnew projects by South Korea Core Fund, partially offset by lower acquisition fees inJapan attributable to a decrease in projects under construction. The growth in leasingfees was driven by an increase in completions of development properties at our fundsand was primarily led by the growth in our Japan, South Korea and PRC funds. Werecognized promote in 2018 in connection with the disposal of Redwood JapanLogistic Fund Limited Partnership and another investment vehicle in Japan.
Š We consolidated CIP, which provides construction services to its customers, andrecognized construction income of US$40.7 million in 2018 following the completion ofour acquisition of CIP in August 2018.
Cost of Sales
Our cost of sales increased by US$40.3 million, or 1,154.4%, from US$3.5 million in 2017 toUS$43.7 million in 2018. The increase was primarily attributable to the construction cost attributableto CIP, which we acquired in August 2018. Cost of sales accounted for 2.3% and 17.2% of our revenuein 2017 and 2018, respectively.
Gross Profit
Our gross profit increased by US$60.6 million, or 40.5%, from US$149.8 million in 2017 toUS$210.4 million in 2018. We had a gross profit margin of 97.7% in 2017 and 82.8% in 2018. Grossprofit margin for our construction business was 2.5% in 2018, reflecting our acquisition of CIP, whichoperates a construction business having a different margin profile, in August 2018.
Other Income and Gains
Our other income and gains decreased by US$29.8 million, or 10.5%, from US$284.1 millionin 2017 to US$254.3 million in 2018 primarily due to the following:
Š Fair value gains on investment properties under construction decreased fromUS$100.0 million in 2017 to US$62.8 million in 2018. This decrease was primarily drivenby the completion of Jiangsu Friend—III in 2017 and the decreased valuation gainsrealized from our investment properties under construction in 2018 attributable to theslower construction progress in 2018.
Š Gain on disposal of subsidiaries decreased from US$38.3 million in 2017 toUS$2.7 million in 2018. The gain in 2017 was primarily due to the disposal of threesubsidiaries holding the Shanghai Fengyuan, Jiangsu Yitian and Taicang Mingzhanproperties to China Invesco Core Fund as part of our capital recycling strategy in 2017.The gain in 2018 was primarily due to the disposal of a 50% interest in our subsidiary,ESR India Logistics Fund Pte. Ltd., to a global real estate investor based in Germany.
The above was partially offset by the following:
Š Fair value gains on completed investment properties increased from US$95.2 million in2017 to US$109.7 million in 2018. This was primarily due to the increase in the valuationsof the existing investment properties driven by higher rental rate growth and compression
273

FINANCIAL INFORMATION
in the capitalization rates, as well as an increase in the number of completed investmentproperties, including Redwood Higashi in Japan (which is designated for redevelopment inthe near future), in 2018. In terms of individual properties, the highest gains were in thePRC driven by Jiangsu Friend—I, Jiangsu Friend—III, Tianjin Fanbin and LangfangWeidu.
Š Changes in fair value of financial assets and liabilities at fair value through profit or lossincreased from US$32.7 million in 2017 to US$44.9 million in 2018. This was primarilydriven by an improved financial performance from the funds and investment vehiclesaccounted through the fair value method, as well as the increased net asset values of theassociated project companies in which we made co-investments. Most of the gains wererecorded from properties in Japan.
Š Dividend income increased from US$10.7 million in 2017 to US$25.5 million in 2018.This was primarily due to our increase in investments in CNLP, Propertylink and ESR-REIT and dividends received from our equity investments in publicly listed securities.
Š We had an one-off insurance compensation of US$8.3 million in 2018 for our solar assetsthat were damaged in a typhoon in Japan in September 2018.
Administrative Expenses
Our administrative expenses increased by US$47.7 million, or 44.7%, from US$106.8 millionin 2017 to US$154.6 million in 2018. The increase was primarily due to: (i) the increase in wages andsalaries attributable to the growth of our business, with the number of full-time employees increasingfrom 303 as of December 31, 2017 to 506 as of December 31, 2018; (ii) the incurrence of professionalfees including legal and due diligence fees, valuation fees and auditing fees, associated with ouracquisition of CIP in 2018 and our fundraising and financing activities, the increase in our propertyprojects as well as M&A activities which we pursued during this period; (iii) the loss on disposal ofitems of property, plant and equipment of US$9.7 million due to the damage of certain solar assets inJapan by a typhoon in September 2018; and (iv) the incurrence of equity-settled share option expenseof approximately US$23.2 million in 2018, as compared to US$11.9 million in 2017, attributable toour grant of share options to eligible participants.
Our administrative expenses accounted for 69.7% and 60.8% of our revenue in 2017 and 2018,respectively.
Finance Costs
Our finance costs increased by US$14.0 million, or 15.4%, from US$90.9 million in 2017 toUS$104.9 million in 2018. The increase was primarily due to an increase in interest on redeemableconvertible preference shares of US$4.3 million and an increase in interest expenses on bank loans andother borrowings of US$7.3 million attributable to an increase in new bank loans to support ourbusiness growth. Our finance costs accounted for 59.3% and 41.3% of our revenue 2017 and 2018,respectively.
Share of Profits and Losses of Joint Ventures and Associates, Net
We recorded share of profits of joint ventures, net, of US$65.4 million in 2018, compared toUS$37.0 million in 2017. This increase was primarily driven by the increase in fair value gains on
274

FINANCIAL INFORMATION
investment properties under construction held by Sunwood Star such as the Bucheon and Goyangprojects.
Income Tax Expense
We had income tax expense of US$72.3 million in 2017, comprising current tax ofUS$20.1 million and deferred tax of US$52.2 million. We had income tax expense of US$57.7 millionin 2018, comprising current tax of US$13.9 million and deferred tax of US$43.8 million. The decreasein current tax in 2018 was primarily due to higher current tax in 2017 attributable to the income fromthe disposal of Jiangsu Yitian and Shanghai Fengyuan in 2017. The decrease in deferred tax in 2018was due to decreases in fair value gains from our investment properties and the increase of deferred taxassets which generated losses available for offsetting against future taxable profits. Our effective taxrate, calculated by dividing our income tax expense by our profit before income tax, was 26.5% in2017 and 21.3% in 2018 because the effective tax rate of the Redwood group decreased from 13% in2017 to 7% in 2018 which led to a decrease in our effective tax rate and we generated more incomefrom entities located in countries with lower corporate tax rates, such as ESR-REIT and Sunwood Starin Singapore and E-Shang Star in the Cayman Islands.
Net Profit
As a result of the foregoing, our net profit was US$212.9 million in 2018, compared toUS$200.8 million in 2017. We had a net profit margin of 83.8% in 2018, compared to 131.0% in 2017.
Year Ended December 31, 2017 Compared to Year Ended December 31, 2016
Revenue
Our revenues increased by US$56.6 million, or 58.5%, from US$96.7 million in 2016 toUS$153.3 million in 2017. This increase was primarily attributable to increases in rental income andmanagement fee income. We also generated US$1.2 million of other income in 2017, primarily fromthe sale of solar energy.
Š Our rental income increased from US$50.3 million in 2016 to US$57.8 million in 2017.The growth in rental income was primarily driven by the following:
Š All of our rental income during this period was generated from the PRC logisticsproperties held on our balance sheet. The growth in rental income from our logisticsproperties was primarily driven by the completion of more properties and increases intenant occupancy and rental rates. The number of investment properties generatingrental income increased from 13 as of December 31, 2016 to 15 as of December 31,2017. We had a new property, Shanghai Yita, generating rental income in 2017. Inaddition, Taicang Mingzhan, Wuhan Dongxihu and Tianjin Wuqing continued tocontribute rental income in 2017 since the completion of acquisition in the secondhalf of 2016.
Š The growth in rental income was partially offset by the disposal of three of oursubsidiaries holding the Shanghai Fengyuan, Jiangsu Yitian and Taicang Mingzhanproperties to seed China Invesco Core Fund in August 2017.
275

FINANCIAL INFORMATION
Š Our management fee income increased from US$46.5 million in 2016 to US$94.3 millionin 2017 primarily due to the following:
Š A strong increase in base management fees and asset management fees was driven bythe growth in our Fund AUM from US$6.5 billion as of December 31, 2016 toUS$10.8 billion as of December 31, 2017. This growth was driven by the followingfactors: (i) increased development activities at the development funds and investmentvehicles that we manage; (ii) an increase in the amount of committed capital in theexisting funds to cater to funding requirements; and (iii) an increase in propertyvaluations. Base management fee and asset management fee growth was strongacross all our key markets, with our Japan, South Korea and PRC funds recordingstrong growth, along with contribution from the acquisition of the ESR-REITManager in February 2017. Development fees increased, which was primarily drivenby stronger development pipelines in the various development funds that we manage.The growth was strong across our markets, with the development funds focused onkey markets of the PRC, Japan and South Korea showing strong growth.
Š Other management fee income streams such as acquisition and leasing fees grew at asteady pace. The increase in acquisition fees was primarily on account of theacquisition fees received by the ESR-REIT Manager. The growth in leasing fees wasdriven by an increase in completion of development properties at our funds and wasprimarily led by the growth in Redwood Japan, Sunwood Star and the ESR-REIT.
Cost of Sales
Our cost of sales increased by US$0.8 million, or 31.3%, from US$2.7 million in 2016 toUS$3.5 million in 2017. The increase was primarily attributable to an increase in on-site maintenancecosts, property management fees, utilities and other expenses due to the increase in the scale ourlogistics facilities in operation. Cost of sales accounted for 2.7% and 2.3% of our revenue in 2016 and2017, respectively.
Gross Profit
Our gross profit increased by US$55.7 million, or 59.2%, from US$94.1 million in 2016 toUS$149.8 million in 2017. We had a gross profit margin of 97.3% in 2016 and 97.7% in 2017.
Other Income and Gains
Our other income and gains increased by US$149.0 million, or 110.2%, from US$135.1 millionin 2016 to US$284.1 million in 2017 primarily due to the following:
Š Fair value gains on investment properties under construction increased fromUS$5.8 million in 2016 to US$100.0 million in 2017. This was primarily driven by astrong development pipeline on our balance sheet due to an increase in valuation gainsrealized from our investment properties under construction due to the developmentprogress in 2017 as compared to valuation gains realized from our investment propertiesunder construction in 2016. For example, we had completed more logistics properties onour balance sheet in 2017 as compared to 2016. In terms of individual properties, thecompletion of Jiangsu Friend—III and the construction of Hangzhou Prax and ShenyangYibei facilities contributed to the highest fair value gains on investment properties underconstruction in 2017.
276

FINANCIAL INFORMATION
Š Changes in fair value of financial assets and liabilities at fair value through profit and lossincreased from US$26.7 million in 2016 to US$32.7 million in 2017. This was primarilydriven by an improved financial performance from the funds and investment vehiclesaccounted through the fair value method, as well as associated project companies in whichwe made co-investments. Most of the gains were recorded from Redwood Higashi,Redwood Fujiidera, RW Nankonaka, and Phoenix.
Š We had a substantial increase on gain on disposal of subsidiaries of US$38.3 million in2017. This was driven by the disposal of three subsidiaries holding the ShanghaiFengyuan, Jiangsu Yitian and Taicang Mingzhan properties to China Invesco Core Fundas part of our capital recycling strategy.
Š We recorded dividend income of US$10.7 million, primarily driven by our investment inpublicly-listed REIT units in Singapore and Australia.
Š The above was partially offset by the slight decrease in fair value gains on completedinvestment properties, which decreased from US$100.8 million in 2016 toUS$95.2 million in 2017. This was primarily due to the disposals of Shanghai Fengyuan,Jiangsu Yitian and Taicang Mingzhan projects into China Invesco Core Fund, partiallyoffset by an increase in the valuations of investment properties completed in 2017 and theexisting completed investment properties in that year driven by higher rental rate growthand compression in the capitalization rates, as well as an increase in the number ofcompleted investment properties.
Our other income and gains accounted for 139.7% and 185.3% of our revenue in 2016 and2017, respectively.
Administrative Expenses
Our administrative expenses increased by US$49.1 million, or 85.1%, from US$57.7 million in2016 to US$106.8 million in 2017. The increase was primarily due to: (i) the increase in wages andsalaries attributable to the growth of our business, with the number of full-time employees increasingfrom 219 as of December 31, 2016 to 303 as of December 31, 2017; (ii) the incurrence of professionalfees including legal and due diligence fees, valuation fees and auditing fees, associated with ourfundraising and financing activities, the increase in our property projects as well as M&A activitieswhich we pursued during this period; and (iii) the incurrence of equity-settled share option expense ofapproximately US$11.9 million in 2017 compared to US$75,000 in 2016 attributable to our grant ofshare options to eligible participants. Our administrative expenses accounted for 59.7% and 69.7% ofour revenue in 2016 and 2017, respectively.
Fair Value Loss on Derivative Financial Instruments
Our fair value loss on derivative financial instruments was nil in 2017, compared toUS$12.1 million in 2016 due to the accounting treatment of the warrant instruments issued inDecember 2015 which were converted into equity in 2016.
Finance Costs
Our finance costs increased by US$34.9 million, or 62.3%, from US$56.0 million in 2016 toUS$90.9 million in 2017. The increase was primarily due to an increase in interest expense from an
277

FINANCIAL INFORMATION
increase in bank loans to support our business growth, increase in interest expense on other borrowingsincluding the interest expense of US$18.3 million on the Hana Notes, which will be redeemed upon thecompletion of the Global Offering and the interest expense of US$41.3 million on the Class CPreference Shares, which will also be redeemed or converted upon the Global Offering becomingunconditional.
Share of Profits and Losses of Joint Ventures and Associates, Net
We recorded share of profits of joint ventures and associate, net, of US$37.0 million in 2017,compared to US$36.4 million in 2016. The increase was primarily due to an increase in fair value gainson completed investment properties at the two joint ventures.
Income Tax Expense
We recorded income tax expense of US$34.9 million in 2016, comprising current tax ofUS$0.6 million and deferred tax of US$34.2 million. We had income tax expense of US$72.3 millionin 2017, comprising current tax of US$20.1 million and deferred tax of US$52.2 million. The increasein current tax was primarily due to the increase in our taxable income, and the increase in deferred taxwas due to increases in fair value gains on investment properties under construction and increases inchanges in fair value of financial assets and liabilities at fair value through profit or loss and othertemporary differences arising between the tax bases of assets and liabilities and their carrying amountsat the end of respective periods. Our effective tax rate, calculated by dividing our income tax expenseby our profit before income tax, was 25.0% in 2016 and 26.5% in 2017.
Net Profit
As a result of the foregoing, our net profit was US$200.8 million in 2017, compared toUS$104.8 million in 2016. We had a net profit margin of 131.0% in 2017, compared to 108.4% in2016.
SEGMENTATION
Our management arrange and report our financials based on three reportable operatingsegments: development, fund management and investment segments. Our management monitors theresults of our operations separately for the purpose of making decisions about resource allocation andperformance assessment. Segment performance is evaluated based on reportable segment profit/loss,which is a measure of adjusted profit/loss before tax from continuing operations. See Note 4 to theAccountants’ Report set forth in Appendix I to this Prospectus.
Š Development. We earn development profit through the development, construction and saleof completed properties from our balance sheet. We also derive pro rata earnings and prorata value appreciation through the development activities of the development funds andinvestment vehicles we manage in proportion to our co-investments in those funds andinvestment vehicles. As a result of our acquisition of CIP in August 2018, we also begangenerating construction income through CIP in Australia, which provides constructionservices to its customers.
Š Fund management. We earn fee income from managing the underlying assets on behalfof our capital partners via the funds and investment vehicles we manage. Our fees includebase management fees, asset management fees, acquisition fees, development fees and
278

FINANCIAL INFORMATION
leasing fees. We also participate in a disproportionate share of profits through promoteupon exceeding a pre-determined target IRR and after our capital partners have receivedtheir targeted capital returns.
Š Investment. Our investment segment is divided into three main categories: (i) completedproperties that we hold on our balance sheet, from which we derive total return, includingrental income and appreciation in value; (ii) our co-investments in the funds andinvestment vehicles and the REIT we manage, from which we derive dividend income, prorata earnings and/or pro rata value appreciation; and (iii) other investments.
The table below sets forth the line items that comprise the segment results for each of our threereportable operating segments, which are reported and prepared based on our consolidated statement ofprofit or loss and other comprehensive income, together with a reconciliation, for the periods indicated.
Year Ended December 31, Six Months Ended June 30,
2016 2017 2018 2018 2019
(unaudited)(US$ in thousands)
Development SegmentSegment revenue . . . . . . . . . . . . . . . . . — — 40,665 — 37,661Fair value gains on investment
properties under construction . . . . . 5,760 100,039 62,779 8,761 76,761Changes in fair value of financial
assets and liabilities at fair valuethrough profit or loss . . . . . . . . . . . . 23,792 8,497 31,741 16,014 22,107
Share of profits and losses of jointventures and associates . . . . . . . . . . 27,151 26,505 35,200 12,059 726
Gain on disposal of subsidiaries . . . . . 32 38,311 2,662 — 16,495Allocable operating expenses . . . . . . . (6,548) (11,793) (57,544) (4,626) (51,305)
Development segment result . . . . . . . . 50,187 161,559 115,503 32,208 102,445
Fund Management SegmentSegment revenue . . . . . . . . . . . . . . . . . 46,464 94,268 135,579 59,033 61,784Share of profits and losses of joint
ventures and associates . . . . . . . . . . — — — — 557Allocable operating expenses . . . . . . . (7,291) (14,897) (25,978) (11,803) (12,467)
Fund management segment result . . . . 39,173 79,371 109,601 47,230 49,874
Investment SegmentSegment revenue . . . . . . . . . . . . . . . . . 50,273 59,021 77,904 34,657 56,318Fair value gains on completed
investment properties . . . . . . . . . . . 100,799 95,179 109,688 37,396 26,800Changes in fair value of financial
assets and liabilities at fair valuethrough profit or loss . . . . . . . . . . . . 2,936 24,242 13,196 2,355 711
Share of profits and losses of jointventures and associates . . . . . . . . . . 9,201 10,495 30,172 2,742 17,034
Dividend income . . . . . . . . . . . . . . . . . — 10,679 25,519 9,771 11,848Allocable operating expenses . . . . . . . (13,833) (16,683) (22,887) (8,047) (13,387)
Investment segment result . . . . . . . . . . 149,376 182,933 233,592 78,874 99,324
Total segment result . . . . . . . . . . . . . 238,736 423,863 458,696 158,312 251,643
279

FINANCIAL INFORMATION
Year Ended December 31, Six Months Ended June 30,
2016 2017 2018 2018 2019
(unaudited)(US$ in thousands)
Reconciliation:Depreciation and amortization . . . . . . (6,059) (8,061) (10,226) (4,655) (7,296)Exchange gain/(losses) . . . . . . . . . . . . 916 4,431 (869) (41) (1,761)Interest income . . . . . . . . . . . . . . . . . . 502 2,477 1,530 985 1,768Other unallocated gains . . . . . . . . . . . . 408 234 7,190 653 379Corporate and other unallocated
expenses(1) . . . . . . . . . . . . . . . . . . . . (26,571) (46,973) (57,648) (16,388) (28,772)Finance costs . . . . . . . . . . . . . . . . . . . . (55,992) (90,903) (104,929) (45,943) (83,363)Equity-settled share option expense . . (75) (11,923) (23,157) (11,961) (9,885)Fair value loss on derivative financial
instrument . . . . . . . . . . . . . . . . . . . . (12,133) — — — —Gain on deemed partial disposal of a
joint venture . . . . . . . . . . . . . . . . . . . — 29 — — —
Profit before tax from continuingoperations . . . . . . . . . . . . . . . . . . . . 139,732 273,174 270,587 80,962 122,713
Note:(1) Corporate and other unallocated expenses relate primarily to head office and corporate expenses that are not directly attributable to
operations of the reportable segments, and thus cannot be allocated to any of the reportable operating segments. They primarilycomprised professional services fees related to our financing and M&A activities, operating costs such as lease expenses andmaintenance costs which are not directly related to any business segment, and other miscellaneous expenses like bank service fees,meeting and office expenses, travel and welfare expenses and entertainment fees, which are not directly related to any of the operatingsegments. The increase in corporate and other unallocated expenses from US$26.6 million in 2016 to US$47.0 million in 2017, andfurther to US$57.7 million in 2018, and from US$16.4 million for the six months ended June 30, 2018 to US$28.8 million for thesix months ended June 30, 2019 was primarily led by increases in professional services fees, leasing expenses and other expenses. Weconsistently monitor the results of our operating segments excluding these unallocated expenses for the purpose of making decisionsabout resource allocation and performance assessment.
We separate the fair value gains on our balance sheet investment properties into fair value gainson completed properties and fair value gains on properties under construction. We have followed thismethodology due to the distinct nature of the key drivers behind these gains.
The fair value gains on the completed properties are primarily affected by the rental growth andcapitalization rates used when the properties are valued, both of which are influenced by broaderparameters around macroeconomic conditions as well as supply and demand trends in our business, theextent of control which we have over these factors are relatively lower and as a result this line item ismore dependent on the economic conditions in which our properties operate.
The fair value gains on properties under construction are primarily affected by the constructionprogress that we are able to make on these projects (and to a relatively lesser extent on macroeconomicparameters like rental growth and capitalization rates), which in turn determines the development-related appreciation that we are able to generate on these projects. We actively manage and control ourconstruction pipeline. Accordingly, we present fair value gains on our properties in two line items toclearly distinguish the impact from movements in macroeconomic parameters and the impact from theCompany’s ability to execute on its development projects. We consistently monitor the results of ouroperating segments by distinguishing between the above two categories of gains in order to makedecisions about resource allocation and to evaluate our performance.
280

FINANCIAL INFORMATION
Please see below a description of the line items comprising the segments.
Development Segment
Segment revenue . . . . . . . . . . . . . . . . . . . . . . Revenue represents construction income following theacquisition of CIP in Australia in August 2018. CIP is primarily acontractor developing properties for other third party clients, andany revenues derived from this segment is recorded in thedevelopment segment.
Fair value gains on investment properties . . Represents the fair value gains on investment properties underconstruction that we hold on our balance sheet. This is recordedin the development segment as it relates to properties underconstruction which are not yet complete and are being developedby us. This is calculated as the difference between the fair marketvalue and book value of the property. The primary source of therevaluation gain on properties under construction comes from thevaluation gain that accrues to us when it completes andtransitions into a rent-generating property.
Changes in fair value of financial assets atfair value through profit or loss . . . . . . . . The fair value changes primarily denote changes in the net asset
value based on our stake in the funds and investment vehicleswhich are accounted for as financial assets at fair value throughprofit or loss method. The key drivers of this component for theunlisted entities are (i) rental income at the properties held atthese funds, and (ii) fair value gains at the properties held at thesefunds (both completed and under construction), less (iii)management fee related expenses incurred by these funds.Changes in fair value of financial assets at fair value throughprofit or loss are allocated between the development andinvestment segments based on the GFA split of completedinvestment property and investment properties under constructionheld by the funds and investment vehicles we manage, with theportion related to investment properties under constructionallocated to the development segment and the portion related tocompleted investment properties allocated to the investmentsegment.
Share of profits and losses of jointventures . . . . . . . . . . . . . . . . . . . . . . . . . . . The share of profits and losses of joint ventures represents the
profit and losses (pro-rata for the stake held by us) of those fundsand investment vehicles which are accounted for through theequity accounting method. This line item is primarily driven bythe two funds: E-Shang Star and Sunwood Star. The key driversof this component are (i) rental income at the properties held atthese funds, and (ii) fair value gains at the properties held at thesefunds (both completed and under construction), less (iii)management fee related expenses incurred by these funds. Shareof profits and losses of joint ventures is allocated, with respect toeach joint venture, between the development and investmentsegments based on the ratio of the GFA of properties held in eachsuch joint venture that are completed within the calendar year tothe GFA of properties held in each such joint venture that arecompleted prior to the calendar year, allocating the proportionalshare of results attributable to properties completed within thecalendar year to the development segment and the remainder tothe investment segment.
281

FINANCIAL INFORMATION
Gain on disposal of subsidiaries . . . . . . . . . . This represents the gain from disposal of the subsidiaries (whichwere our balance sheet properties) to core funds/other thirdparties as part of the capital recycling plans in order for us torealize the development gains.
Allocable operating expenses . . . . . . . . . . . . Allocated operating expenses for each business segmentcomprise directly incurred cost of sales and/or operatingexpenses for each segment and allocated staff costs. Staff costsare allocated, with respect to each relevant subsidiary, equallybetween: (i) the management segment; and (ii) the investmentand development segments for which the staff costs are furtherallocated based on the GFA split of completed investmentproperty and investment properties under construction, with theportion related to investment properties under constructionallocated to the development segment and the portion related tocompleted investment properties allocated to the investmentsegment.
Fund Management Segment
Segment revenue . . . . . . . . . . . . . . . . . . . . . . This represents the fee income from managing the underlyingassets on behalf of the capital partners through the funds andinvestment vehicles we manage.
Allocable operating expenses . . . . . . . . . . . . Please refer to the explanation under development segmentabove.
Investment Segment
Segment revenue . . . . . . . . . . . . . . . . . . . . . . Represents rental income from the completed properties that wehold on our balance sheet.
Fair value gains on investment properties . . Represents the fair value gains on completed investmentproperties that we hold on our balance sheet. The completedinvestment properties are subject to periodic revaluation byindependent property valuers in order to determine the fair value,which is the difference between the fair value post revaluationand the current book value of the property is what is recognizedin the profit and loss statements as revaluation gain.
Changes in fair value of financial assets atfair value through profit or loss . . . . . . . . Please refer to the explanation under the development segment
above.
Share of profits and losses of jointventures . . . . . . . . . . . . . . . . . . . . . . . . . . . Please refer to the explanation under the development segment
above.
Dividend income . . . . . . . . . . . . . . . . . . . . . . Represents the dividend income from the co-investments in thefunds and investment vehicles and the REIT that we manage andour equity investments in publicly listed securities.
Allocable operating expenses . . . . . . . . . . . . Please refer to the explanation under the development segmentabove.
282

FINANCIAL INFORMATION
Development Segment
Six Months Ended June 30, 2019 Compared to Six Months Ended June 30, 2018
Our development segment result increased by US$70.2 million from US$32.2 million for thesix months ended June 30, 2018 to US$102.4 million for the six months ended June 30, 2019. Thisincrease was primarily attributable to the following:
Š Fair value gains on investment properties under construction increased from US$8.8million for the six months ended June 30, 2018 to US$76.8 million for the six monthsended June 30, 2019. This increase was primarily driven by the fair value gains oninvestment properties under construction from the RW Higashi-Ogishima DC propertyafter it was reclassified to an investment property under construction in the second half of2018 due to our plan to redevelop it into a modern logistics facility and the increasedconstruction activities in the first half of 2019. In terms of individual properties, Sachiuraproperties and the RW Higashi-Ogishima DC property contributed to the highest fair valuegains on investment properties under construction in the six months ended June 30, 2019.
Š Changes in fair value of financial assets and liabilities at fair value through profit or lossincreased from US$16.0 million for the six months ended June 30, 2018 to US$22.1million for the six months ended June 30, 2019. This was primarily driven by an improvedfinancial performance from the funds and investment vehicles accounted through the fairvalue method, as well as the increased net asset values of the associated project companiesin which we made co-investments. Most of the gains were recorded from properties inJapan.
Š We recorded no gain on disposal of subsidiaries in the six months ended June 30, 2018,and recorded US$16.5 million gain on disposal of subsidiaries in the six months endedJune 30, 2019. The gain in the six months ended June 30, 2019 was primarily due to thedisposal of seven balance sheet properties to NCI Core Fund.
The above increase in development segment was partially offset by the following:
Š Share of profits and losses of joint ventures and associates decreased from US$12.1million for the six months ended June 30, 2018 to US$0.7 million for the six months endedJune 30, 2019. This decrease was primarily driven by the decrease in fair value gains oninvestment properties under construction held by Sunwood Star.
Š Allocable operating expenses increased from US$4.6 million for the six months endedJune 30, 2018 to US$51.3 million for the six months ended June 30, 2019. This wasprimarily driven by the consolidation of the construction costs attributable to CIP, whichwe acquired in August 2018 and higher administrative expenses allocated to this segmentas a result of higher GFA in our investment properties under construction.
Year Ended December 31, 2018 Compared to Year Ended December 31, 2017
Our development segment result decreased by US$46.1 million from US$161.6 million in 2017to US$115.5 million in 2018. This decrease was primarily attributable to the following:
Š Fair value gains on investment properties under construction decreased fromUS$100.0 million in 2017 to US$62.8 million in 2018. This decrease was primarily driven
283

FINANCIAL INFORMATION
by the completion of Jiangsu Friend—III in 2017 and the decreased valuation gainsrealized from our investment properties under construction in 2018 attributable to theslower construction progress in 2018.
Š Gain on disposal of subsidiaries decreased from US$38.3 million in 2017 toUS$2.7 million in 2018. The gain in 2017 was primarily due to the disposal of threesubsidiaries holding the Shanghai Fengyuan, Jiangsu Yitian and Taicang Mingzhanproperties to China Invesco Core Fund as part of our capital recycling strategy in 2017.The gain in 2018 was primarily due to the disposal of a 50% interest in our subsidiary,ESR India Logistics Fund Pte Ltd., to a global real estate investor based in Germany.
Š Allocable operating expenses increased from US$11.8 million in 2017 to US$57.5 millionin 2018. This was primarily driven by the consolidation of the construction costsattributable to CIP, which we acquired in August 2018 and higher administrative expensesallocated to this segment as a result of higher GFA in our investment properties underconstruction.
The above were partially offset by the following:
Š Changes in fair value of financial assets and liabilities at fair value through profit or lossincreased from US$8.5 million in 2017 to US$31.7 million in 2018. This was primarilydriven by an improved financial performance from the funds and investment vehiclesaccounted through the fair value method, as well as the increased net asset values of theassociated project companies in which we made co-investments. Most of the gains wererecorded from properties in Japan.
Š Share of profits and losses of joint ventures and associates increased from US$26.5 millionin 2017 to US$35.2 million in 2018. This increase was primarily driven by the increase infair value gains on investment properties under construction held by Sunwood Star such asthe Bucheon and Goyang projects.
Š We consolidated CIP, which provides construction services to its customers, andrecognized construction income of US$40.7 million in 2018 following the completion ofour acquisition of CIP in August 2018.
Year Ended December 31, 2017 Compared to Year Ended December 31, 2016
Our development segment result increased by US$111.4 million from US$50.2 million in 2016to US$161.6 million in 2017. This increase was primarily attributable to the following:
Š Fair value gains on investment properties under construction increased fromUS$5.8 million in 2016 to US$100.0 million in 2017. This was primarily driven by astrong development pipeline on our balance sheet due to an increase in valuation gainsrealized from our investment properties under construction due to the developmentprogress in 2017 as compared to valuation gains realized from our investment propertiesunder construction in 2016. For example, we had completed more logistics properties onour balance sheet in 2017 as compared to 2016. In terms of individual properties, thecompletion of Jiangsu Friend—III and the construction of Hangzhou Prax and ShenyangYibei facilities contributed to the highest fair value gains on properties in the developmentsegment in 2017.
Š Gain on disposal of subsidiaries increased from US$32,000 to US$38.3 million in 2017.This was driven by the disposal of three subsidiaries holding the Shanghai Fengyuan,
284

FINANCIAL INFORMATION
Jiangsu Yitian and Taicang Mingzhan properties to China Invesco Core Fund as part ofour capital recycling plans.
The above gains were partially offset by the following:
Š Changes in fair value of financial assets and liabilities at fair value through profit or lossdecreased from US$23.8 million in 2016 to US$8.5 million in 2017. This was primarilydriven by the decline in the value of investment properties under construction at the fundsaccounted for through this method which in turn, was led by completions of severalinvestment properties at these funds (the gains on which were allocated to the investmentsegment).
Š Share of profits and losses of joint ventures and associates slightly decreased fromUS$27.2 million in 2016 to US$26.5 million in 2017. This was primarily driven by foreignexchange translation impacts as well as completions of several investment properties atthese funds (the gains on which were allocated to the investment segment).
Š Allocable operating expenses increased from US$6.5 million in 2016 to US$11.8 millionin 2017. This was primarily driven by higher administrative expenses allocated to thissegment as a result of higher GFA in our investment properties under construction.
Fund Management Segment
Six Months Ended June 30, 2019 Compared to Six Months Ended June 30, 2018
Our fund management segment result increased by US$2.6 million from US$47.2 million forthe six months ended June 30, 2018 to US$49.9 million for the six months ended June 30, 2019. Thisincrease was primarily attributable to the increase in fund management revenues from US$59.0 millionfor the six months ended June 30, 2018 to US$61.8 million for the six months ended June 30, 2019which in turn was driven by the following:
Š An increase in base management fees and asset management fees was driven by thegrowth in our Fund AUM from US$11.4 billion for the six months ended June 30, 2018to US$17.6 billion for the six months ended June 30, 2019. This growth was driven bythe following factors: (i) an increase in the amount of invested capital in existing funds,in light of additional funding requirements; (ii) the establishment of new funds such asthe South Korea Core Fund, the India Fund, the Japan Core Fund and RJLF III; and (iii)the consolidation of Propertylink in March 2019. Base management fee and assetmanagement fee growth was strong across our key markets, with our Japan, SouthKorea and PRC funds recording strong growth due to, among other things, theacquisitions of new projects in Japan, South Korea and the PRC.
Š Other management fee income streams such as acquisition fees increased. The increase inacquisition fees was primarily driven by the acquisition fee recognized in connection withthe acquisition of new projects by South Korea Core Fund and Japan Core Fund. Werecognized promote in the six months ended June 30, 2019 in connection with the disposalof Redwood Japan Logistic Fund Limited Partnership in Japan. The above increases wereoffset by (i) a decrease in development fees due to the completion of various propertiesunder construction, in particular a major project in Japan in January 2019; and (ii) adecrease in leasing fees as we leased out major properties, in particular, in South Korea, inthe first half of 2018 and we had no major projects completed for new leases in the firsthalf of 2019.
285

FINANCIAL INFORMATION
The growth in our fund management segment result was partially offset by the growth inallocable operating expenses from US$11.8 million for the six months ended June 30, 2018 to US$12.5million for the six months ended June 30, 2019, primarily due to an increase in administrative expensesassociated with this segment attributable to an increased allocation of staff resources to the segment inconnection with the increased staffing for fund raising and fund management teams for the newlyestablished funds such as South Korea Core Fund and India Fund, the formation of new funds such asNCI Core Fund, the Japan Core Fund and RJLF III and an anticipation of further expansion of our fundmanagement business, and was broadly in line with the higher revenue growth for the year.
Year Ended December 31, 2018 Compared to Year Ended December 31, 2017
Our fund management segment result increased by US$30.2 million from US$79.4 million in2017 to US$109.6 million in 2018. This increase was primarily attributable to the increase in fundmanagement revenues from US$94.3 million in 2017 to US$135.6 million in 2018 which in turn wasdriven by the following:
Š A strong increase in base management fees and asset management fees was driven by thegrowth in our Fund AUM from US$10.8 billion as of December 31, 2017 toUS$14.1 billion as of December 31, 2018. The growth was driven by the followingfactors: (i) an increase in the amount of committed capital in existing funds, in light ofadditional funding requirements; (ii) an increase in the establishment of new funds such asthe South Korea Core Fund and China Invesco Core Fund; (iii) an increase in propertyvaluations; and (iv) increased development activities at the development funds andinvestment vehicles that we manage. Base management fee and asset management feegrowth was strong across our key markets, with our Japan, South Korea and PRC fundsrecording strong growth due to, among other things, the acquisitions of new projects inJapan, South Korea and Singapore and the additions of the Shanghai Fengyuan, JiangsuYitian and Taicang Mingzhan properties by China Invesco Core Fund in August 2017.Development fees decreased due to fewer development activities.
Š Other management fee income streams such as acquisition and leasing fees significantlyincreased. The increase in acquisition fees was primarily driven by the acquisition feerecognized in connection with the VIT Merger and the acquisition of new projects bySouth Korea Core Fund, partially offset by lower acquisition fees in Japan attributable to adecrease in projects under construction. The growth in leasing fees was driven by anincrease in completions of development properties at our funds and was primarily led bythe growth in our Japan, South Korea and PRC funds. We recognized promote in 2018 inconnection with the disposal of Redwood Japan Logistic Fund Limited Partnership andanother investment vehicle in Japan.
The growth in our fund management segment result was partially offset by the growth inallocable operating expenses from US$14.9 million in 2017 to US$26.0 million in 2018, primarily dueto an increase in administrative expenses associated with this segment attributable to an increasedallocation of staff resources to the segment in connection with the increased staffing for fund raisingand fund management teams for the newly established funds such as South Korea Core Fund, theformation of new funds such as NCI Core Fund and the India Fund and an anticipation of furtherexpansion of our fund management business, and was broadly in line with the higher revenue growthfor the year.
286

FINANCIAL INFORMATION
Year Ended December 31, 2017 Compared to Year Ended December 31, 2016
Our fund management segment result increased by US$40.2 million from US$39.2 million in2016 to US$79.4 million in 2017. This increase was primarily attributable to the increase in fundmanagement revenue from US$46.5 million in 2016 to US$94.3 million in 2017 which in turn wasdriven by the following:
Š A strong increase in base management fees and asset management fees was driven by thegrowth in our Fund AUM from US$6.5 billion as of December 31, 2016 toUS$10.8 billion as of December 31, 2017. The growth was driven by the followingfactors: (i) increased development activities at the development funds that we manage;(ii) an increase in the amount of committed capital in the existing funds to cater to fundingrequirements; and (iii) an increase in property valuations. Base management fee and assetmanagement fee growth was strong across all our key markets, with our Japan, SouthKorea and PRC funds recording strong growth, along with contribution from theacquisition of the ESR-REIT Manager in February 2017. Development fees increased,which was primarily driven by stronger development pipelines in the various developmentfunds that we manage. The growth was strong across our markets, with the developmentfunds focused on key markets of the PRC, Japan and South Korea showing strong growth.
Š Other management fee income streams such as acquisition and leasing fees grew at asteady pace. The increase in acquisition fees was primarily on account of the acquisitionfees received by the ESR-REIT Manager. The growth in leasing fees was driven by anincrease in completion of development properties at our funds and was primarily led bythe growth in Redwood Japan, Sunwood Star and the ESR-REIT.
The growth in our fund management segment result was partially offset by growth in allocableoperating expenses from US$7.3 million in 2016 to US$14.9 million in 2017. This was primarily dueto an increase in administrative expenses associated with this segment and was broadly in line with thehigher revenue growth for the year.
Investment Segment
Six Months Ended June 30, 2019 Compared to Six Months Ended June 30, 2018
Our investment segment result increased by US$20.5 million from US$78.9 million for the sixmonths ended June 30, 2018 to US$99.3 million for the six months ended June 30, 2019. This increasewas primarily attributable to the following factors:
Š Our rental income increased from US$32.7 million for the six months ended June 30, 2018to US$55.0 million for the six months ended June 30, 2019. The growth in rental incomewas primarily attributable to the following:
Š The growth in rental income from our investment properties was primarily driven bythe consolidation of Propertylink into our Group in March 2019 which contributedrental income of US$13.1 million, the completion of more properties underdevelopment and more property acquisitions. The number of investment propertiesgenerating rental income increased from 13 as of June 30, 2018 to 19 as of June 30,2019. In the six months ended June 30, 2019, we had six properties that commencedoperations or were acquired after June 30, 2018 and generated rental income duringthis period, including RW Higashi-Ogishima DC Property, Wuxi Lekun and Tianjin
287

FINANCIAL INFORMATION
Fanxin. In addition, the completion of Shenyang Yibei in the second half of 2018 alsocontributed to the increase in rental income in the six months ended June 30, 2019.
Š This growth in rental income was partially offset by the disposal of certain of oursubsidiaries which held seven balance sheet properties to NCI Core Fund.
Š Share of profits and losses of joint ventures and associates increased from US$2.7 millionfor the six months ended June 30, 2018 to US$17.0 million for the six months endedJune 30, 2019. This was primarily driven by the increase in fair value gains on completedinvestment properties held by Sunwood Star and the joint ventures in Australia post ouracquisition of Propertylink.
Š Dividend income increased from US$9.8 million for the six months ended June 30, 2018to US$11.8 million for the six months ended June 30, 2019. This was primarily due todividends received from our equity investments in publicly listed securities for the sixmonths ended June 30, 2019.
The above increase in investment segment result was partially offset by the following:
Š Fair value gains on completed investment properties decreased from US$37.4 million forthe six months ended June 30, 2018 to US$26.8 million for the six months ended June 30,2019. This was primarily due to the reclassification of RW Higashi-Ogishima DC propertyfrom a completed investment property to an investment property under construction in thesecond half of 2018 due to redevelopment and the disposal of seven properties to NCICore Fund in the first half of 2019.
Š Allocable operating expenses increased from US$8.0 million for the six months endedJune 30, 2018 to US$13.4 million for the six months ended June 30, 2019, which was inturn primarily driven by higher administrative expenses allocation and higher cost of salesrelated to rental income generation.
Year Ended December 31, 2018 Compared to Year Ended December 31, 2017
Our investment segment result increased by US$50.7 million from US$182.9 million in 2017 toUS$233.6 million in 2018. This increase was primarily attributable to the following factors:
Š Our rental income increased from US$57.8 million in 2017 to US$74.3 million in 2018.Our rental income in 2018 was generated primarily from the PRC and Japan logisticsproperties held on our balance sheet. The growth in rental income was primarilyattributable to the following:
Š The growth in rental income from our investment properties was primarily driven bythe completion of more properties, more property acquisitions and the increases intenant occupancy and rental rates. The number of investment properties generatingrental income increased from 15 as of December 31, 2017 to 18 as of December 31,2018, which was primarily attributable to the completion of more properties andproperty acquisitions. In 2018, we had seven properties that commenced operationsor were acquired and generated rental income during this period, includingGuangzhou Mingyue—II, Hangzhou Prax, Tianjin Fanxin and Shenyang Yibei in thePRC, Redwood Higashi in Japan (which is designated for redevelopment in the nearfuture), a property in India and a property in Australia. In addition, the completion ofJiangsu Friend—III in late 2017 contributed to the increase in rental income in 2018.
288

FINANCIAL INFORMATION
Š This growth in rental income was partially offset by the disposal of three of oursubsidiaries holding the Shanghai Fengyuan, Jiangsu Yitian and Taicang Mingzhanproperties to seed China Invesco Core Fund in August 2017.
Š Fair value gains on completed investment properties increased from US$95.2 million in2017 to US$109.7 million in 2018. This was primarily due to the increase in the valuationsof the existing investment properties driven by higher rental rate growth and compressionin the capitalization rates, as well as an increase in the number of completed investmentproperties, including Redwood Higashi in Japan (which is designated for redevelopment inthe near future), in 2018. In terms of individual properties, the highest gains were in thePRC driven by Jiangsu Friend—I, Jiangsu Friend—III, Tianjin Fanbin and LangfangWeidu.
Š Share of profits and losses of joint ventures and associates increased from US$10.5 millionin 2017 to US$30.2 million in 2018. This was primarily driven by an increase in fair valuegains on completed investment properties held by Sunwood Star.
Š Dividend income increased from US$10.7 million in 2017 to US$25.5 million in 2018.This was primarily due to our increase in investments in CNLP, Propertylink and ESR-REIT and dividends received from our equity investments in publicly listed securities.
The above increase in investment segment result was partially offset by the following:
Š Changes in fair value of financial assets and liabilities at fair value through profit or lossdecreased from US$24.2 million in 2017 to US$13.2 million in 2018. This was primarilyattributable to Redwood Higashi which was classified as a financial asset at fair valuethrough profit or loss before our acquisition of the additional interest in RW Higashi Pte.Ltd. in June 2018 and reclassified as an investment property upon the completion of suchacquisition. For the purposes of segment reporting, Redwood Higashi was regarded by ourmanagement as a completed property in 2017 and as a property under construction in2018, and therefore in 2017 the fair value change of Redwood Higashi was recorded ininvestment segment and in 2018 the fair value change of Redwood Higashi was recordedin development segment. The aforesaid reclassification of Redwood Higashi in segmentreporting caused an increase in changes in fair value of financial assets and liabilities atfair value through profit or loss in development segment but a decrease in investmentsegment.
Š Allocable operating expenses increased from US$16.7 million in 2017 to US$22.9 millionin 2018, which was in turn primarily driven by higher administrative expenses allocationand higher cost of sales related to rental income generation.
Year Ended December 31, 2017 Compared to Year Ended December 31, 2016
Our investment segment result increased by US$33.6 million from US$149.4 million in 2016 toUS$182.9 million in 2017. This was primarily attributable to the following factors:
Š Our rental income increased from US$50.3 million in 2016 to US$57.8 million in 2017.All of our rental income during this period was generated from the PRC logisticsproperties held on our balance sheet. The growth in rental income from our logisticsproperties was primarily driven by the completion of more properties and increases intenant occupancy and rental rates. The number of investment properties generating rental
289

FINANCIAL INFORMATION
income increased from 13 as of December 31, 2016 to 15 as of December 31, 2017. Wehad a new property, Shanghai Yita, generating rental income in 2017. In addition, TaicangMingzhan, Wuhan Dongxihu and Tianjin Wuqing continued to contribute rental income in2017 since the completion of acquisition in the second half of 2016. The growth in rentalincome was partially offset by the disposal of three of our subsidiaries holding theShanghai Fengyuan, Jiangsu Yitian and Taicang Mingzhan properties to seed ChinaInvesco Core Fund in August 2017.
Š Changes in fair value of financial assets and liabilities at fair value through profit or lossincreased from US$2.9 million in 2016 to US$24.2 million in 2017. This was primarilydriven by our share of an increase in fair value gains of completed investment properties atthe funds managed by us and establishment of core funds like China Invesco Core Fundwhich is focused on investing solely in completed investment properties.
Š Share of profits and losses of joint ventures and associates increased from US$9.2 millionin 2016 to US$10.5 million in 2017. This was primarily driven by an increase in fair valuegains of completed investment properties at the two joint ventures accounted through theequity method (E-Shang Star and Sunwood Star).
Š We had dividend income of US$10.7 million in 2017, primarily driven by our investmentin publicly-listed REIT units in Singapore and Australia.
The above increase in our investment segment result was partially offset by the following:
Š Fair value gains on completed investment properties decreased from US$100.8 million in2016 to US$95.2 million in 2017. This was primarily driven by the disposals of ShanghaiFengyuan, Jiangsu Yitian and Taicang Mingzhan projects into China Invesco Core Fund,partially offset by an increase in the valuations of investment properties completed in 2017and the existing completed investment properties in that year driven by higher rental rategrowth and compression in the capitalization rates, as well as the increase in the number ofcompleted investment properties.
Š Allocable operating expenses increased from US$13.8 million in 2016 to US$16.7 millionin 2017, which was in turn primarily driven by higher administrative expenses allocationand higher cost of sales related to rental income generation.
290
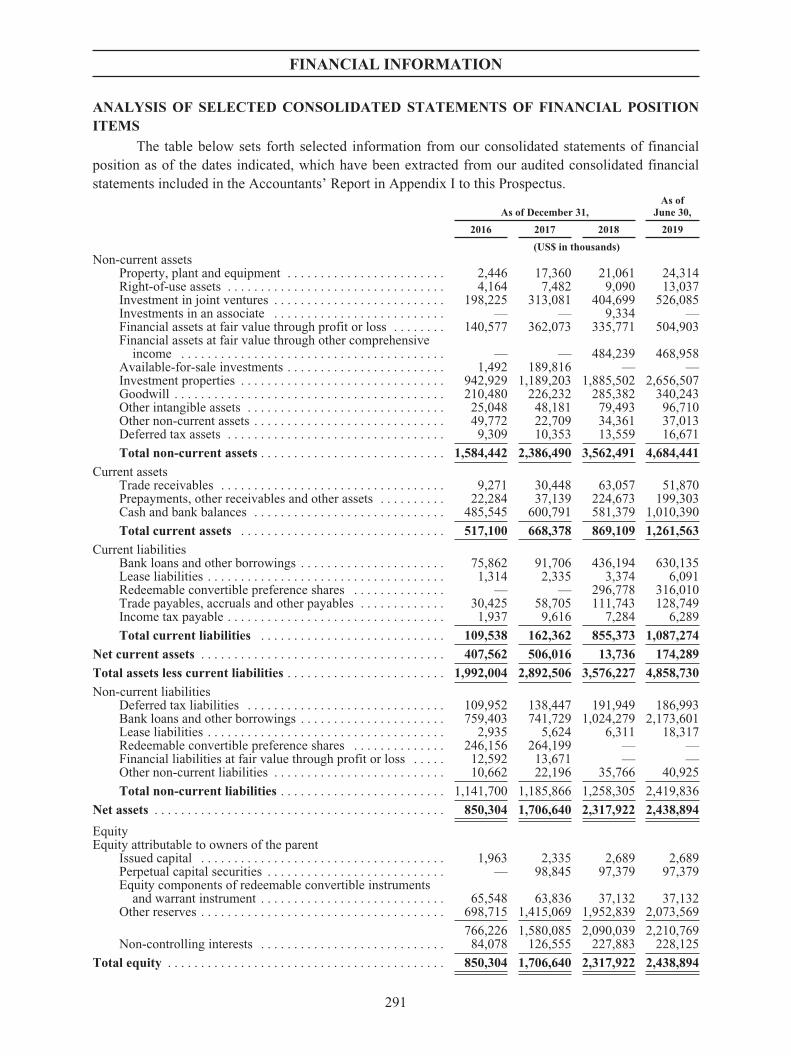
FINANCIAL INFORMATION
ANALYSIS OF SELECTED CONSOLIDATED STATEMENTS OF FINANCIAL POSITIONITEMS
The table below sets forth selected information from our consolidated statements of financialposition as of the dates indicated, which have been extracted from our audited consolidated financialstatements included in the Accountants’ Report in Appendix I to this Prospectus.
As of December 31,As of
June 30,
2016 2017 2018 2019
(US$ in thousands)Non-current assets
Property, plant and equipment . . . . . . . . . . . . . . . . . . . . . . . . 2,446 17,360 21,061 24,314Right-of-use assets . . . . . . . . . . . . . . . . . . . . . . . . . . . . . . . . . 4,164 7,482 9,090 13,037Investment in joint ventures . . . . . . . . . . . . . . . . . . . . . . . . . . 198,225 313,081 404,699 526,085Investments in an associate . . . . . . . . . . . . . . . . . . . . . . . . . . — — 9,334 —Financial assets at fair value through profit or loss . . . . . . . . 140,577 362,073 335,771 504,903Financial assets at fair value through other comprehensive
income . . . . . . . . . . . . . . . . . . . . . . . . . . . . . . . . . . . . . . . . — — 484,239 468,958Available-for-sale investments . . . . . . . . . . . . . . . . . . . . . . . . 1,492 189,816 — —Investment properties . . . . . . . . . . . . . . . . . . . . . . . . . . . . . . . 942,929 1,189,203 1,885,502 2,656,507Goodwill . . . . . . . . . . . . . . . . . . . . . . . . . . . . . . . . . . . . . . . . . 210,480 226,232 285,382 340,243Other intangible assets . . . . . . . . . . . . . . . . . . . . . . . . . . . . . . 25,048 48,181 79,493 96,710Other non-current assets . . . . . . . . . . . . . . . . . . . . . . . . . . . . . 49,772 22,709 34,361 37,013Deferred tax assets . . . . . . . . . . . . . . . . . . . . . . . . . . . . . . . . . 9,309 10,353 13,559 16,671
Total non-current assets . . . . . . . . . . . . . . . . . . . . . . . . . . . . 1,584,442 2,386,490 3,562,491 4,684,441
Current assetsTrade receivables . . . . . . . . . . . . . . . . . . . . . . . . . . . . . . . . . . 9,271 30,448 63,057 51,870Prepayments, other receivables and other assets . . . . . . . . . . 22,284 37,139 224,673 199,303Cash and bank balances . . . . . . . . . . . . . . . . . . . . . . . . . . . . . 485,545 600,791 581,379 1,010,390
Total current assets . . . . . . . . . . . . . . . . . . . . . . . . . . . . . . . 517,100 668,378 869,109 1,261,563
Current liabilitiesBank loans and other borrowings . . . . . . . . . . . . . . . . . . . . . . 75,862 91,706 436,194 630,135Lease liabilities . . . . . . . . . . . . . . . . . . . . . . . . . . . . . . . . . . . . 1,314 2,335 3,374 6,091Redeemable convertible preference shares . . . . . . . . . . . . . . — — 296,778 316,010Trade payables, accruals and other payables . . . . . . . . . . . . . 30,425 58,705 111,743 128,749Income tax payable . . . . . . . . . . . . . . . . . . . . . . . . . . . . . . . . . 1,937 9,616 7,284 6,289
Total current liabilities . . . . . . . . . . . . . . . . . . . . . . . . . . . . 109,538 162,362 855,373 1,087,274
Net current assets . . . . . . . . . . . . . . . . . . . . . . . . . . . . . . . . . . . . . 407,562 506,016 13,736 174,289
Total assets less current liabilities . . . . . . . . . . . . . . . . . . . . . . . . 1,992,004 2,892,506 3,576,227 4,858,730
Non-current liabilitiesDeferred tax liabilities . . . . . . . . . . . . . . . . . . . . . . . . . . . . . . 109,952 138,447 191,949 186,993Bank loans and other borrowings . . . . . . . . . . . . . . . . . . . . . . 759,403 741,729 1,024,279 2,173,601Lease liabilities . . . . . . . . . . . . . . . . . . . . . . . . . . . . . . . . . . . . 2,935 5,624 6,311 18,317Redeemable convertible preference shares . . . . . . . . . . . . . . 246,156 264,199 — —Financial liabilities at fair value through profit or loss . . . . . 12,592 13,671 — —Other non-current liabilities . . . . . . . . . . . . . . . . . . . . . . . . . . 10,662 22,196 35,766 40,925
Total non-current liabilities . . . . . . . . . . . . . . . . . . . . . . . . . 1,141,700 1,185,866 1,258,305 2,419,836
Net assets . . . . . . . . . . . . . . . . . . . . . . . . . . . . . . . . . . . . . . . . . . . . 850,304 1,706,640 2,317,922 2,438,894
EquityEquity attributable to owners of the parent
Issued capital . . . . . . . . . . . . . . . . . . . . . . . . . . . . . . . . . . . . . 1,963 2,335 2,689 2,689Perpetual capital securities . . . . . . . . . . . . . . . . . . . . . . . . . . . — 98,845 97,379 97,379Equity components of redeemable convertible instruments
and warrant instrument . . . . . . . . . . . . . . . . . . . . . . . . . . . . 65,548 63,836 37,132 37,132Other reserves . . . . . . . . . . . . . . . . . . . . . . . . . . . . . . . . . . . . . 698,715 1,415,069 1,952,839 2,073,569
766,226 1,580,085 2,090,039 2,210,769Non-controlling interests . . . . . . . . . . . . . . . . . . . . . . . . . . . . 84,078 126,555 227,883 228,125
Total equity . . . . . . . . . . . . . . . . . . . . . . . . . . . . . . . . . . . . . . . . . . 850,304 1,706,640 2,317,922 2,438,894
291

FINANCIAL INFORMATION
Investment Properties
Investment properties comprise completed properties and properties under construction held toearn rentals or for capital appreciation or both. An investment property is measured initially at costincluding transaction costs. Transaction costs include transfer taxes, professional fees for legal servicesand initial leasing commissions to bring the property to the condition necessary for it to be capable ofoperating. The carrying amount also includes the cost of replacing part of an existing investmentproperty at the time that cost is incurred if the recognition criteria are met. Subsequent to initialrecognition, investment property is stated at fair value. Any gain or loss arising from change in the fairvalues are included in profit or loss in the year in which they arise.
All of our completed investment properties and investment properties under construction wererevalued on December 31, 2016, 2017 and 2018 and June 30, 2019 (save as discussed below) based onvaluations performed by independent professionally qualified valuers and industry specialists ininvestment property valuation, including Beijing Colliers International Real Estate Valuation Co., Ltd.,CBRE Valuation Pty Limited, Jones Lang LaSalle Advisory Services Pty Ltd and Cushman &Wakefield K.K., at fair value. In determining fair value of the Portfolio Assets, a combination ofapproaches and methods were used, including the Direct Comparison Method and Discounted CashFlow Method. The Direct Comparison Method is applied based on the market prices of comparableproperties. Comparable properties with similar sizes, characters and locations were analyzed, andweighted against all respective advantages and disadvantages to arrive at the fair value of the property.The Discounted Cash Flow Method measures the value of a property by the present worth of the neteconomic benefit to be received over the life of the asset. Certain investment properties recentlyacquired were revalued as of June 30, 2019 with reference to (i) their purchase price or (ii) theindependent valuation performed at the time of the acquisition.
We lease out our completed investment properties under operating lease arrangements. Leasesrun for a period of one to ten years with an option to renew the leases after the expiry dates at whichtime all terms will be renegotiated.
292

FINANCIAL INFORMATION
The table below sets forth a breakdown of the changes in fair value of our investment propertiesas of the dates indicated.
CompletedInvestmentProperties
InvestmentPropertiesUnder
Construction Total
(US$ in thousands)
As of January 1, 2016 . . . . . . . . . . . . . . . . . . . . . . . . . . . . . . . . . . . . . . . . . . 648,246 30,076 678,322Additions . . . . . . . . . . . . . . . . . . . . . . . . . . . . . . . . . . . . . . . . . . . . . . . . . . . . — 72,725 72,725Acquisition of subsidiaries . . . . . . . . . . . . . . . . . . . . . . . . . . . . . . . . . . . . . . 122,454 9,633 132,087Changes in fair value of investment properties . . . . . . . . . . . . . . . . . . . . . . . 100,799 5,760 106,559Transfer from investment properties under construction to completed
investment properties . . . . . . . . . . . . . . . . . . . . . . . . . . . . . . . . . . . . . . . . 25,168 (25,168) —Exchange realignment . . . . . . . . . . . . . . . . . . . . . . . . . . . . . . . . . . . . . . . . . . (44,656) (2,108) (46,764)
As of December 31, 2016 and January 1, 2017 . . . . . . . . . . . . . . . . . . . . . 852,011 90,918 942,929
Additions . . . . . . . . . . . . . . . . . . . . . . . . . . . . . . . . . . . . . . . . . . . . . . . . . . . . 25,984 122,652 148,636Acquisition of subsidiaries . . . . . . . . . . . . . . . . . . . . . . . . . . . . . . . . . . . . . . 64,029 72,763 136,792Changes in fair value of investment properties . . . . . . . . . . . . . . . . . . . . . . . 95,179 100,039 195,218Transfer from investment properties under construction to completed
investment properties . . . . . . . . . . . . . . . . . . . . . . . . . . . . . . . . . . . . . . . . 215,635 (215,635) —Disposal of subsidiaries . . . . . . . . . . . . . . . . . . . . . . . . . . . . . . . . . . . . . . . . . (295,690) — (295,690)Exchange realignment . . . . . . . . . . . . . . . . . . . . . . . . . . . . . . . . . . . . . . . . . . 53,534 7,784 61,318
As of December 31, 2017 and January 1, 2018 . . . . . . . . . . . . . . . . . . . . . 1,010,682 178,521 1,189,203
Additions . . . . . . . . . . . . . . . . . . . . . . . . . . . . . . . . . . . . . . . . . . . . . . . . . . . . 4,287 94,897 99,184Acquisition of subsidiaries . . . . . . . . . . . . . . . . . . . . . . . . . . . . . . . . . . . . . . 467,959 25,699 493,658Changes in fair value of investment properties . . . . . . . . . . . . . . . . . . . . . . . 109,688 62,779 172,467Transfer from investment properties under construction to completed
investment properties . . . . . . . . . . . . . . . . . . . . . . . . . . . . . . . . . . . . . . . . 45,801 (45,801) —Disposal of subsidiaries . . . . . . . . . . . . . . . . . . . . . . . . . . . . . . . . . . . . . . . . . (514) — (514)Exchange realignment . . . . . . . . . . . . . . . . . . . . . . . . . . . . . . . . . . . . . . . . . . (54,844) (13,652) (68,496)
As of December 31, 2018 and January 1, 2019 . . . . . . . . . . . . . . . . . . . . . 1,583,059 302,443 1,885,502
Additions . . . . . . . . . . . . . . . . . . . . . . . . . . . . . . . . . . . . . . . . . . . . . . . . . . . . 17,624 247,265 264,889Acquisition of subsidiaries . . . . . . . . . . . . . . . . . . . . . . . . . . . . . . . . . . . . . . 672,022 — 672,022Changes in fair value of investment properties . . . . . . . . . . . . . . . . . . . . . . . 26,800 76,761 103,561Transfer from investment properties under construction to completed
investment properties . . . . . . . . . . . . . . . . . . . . . . . . . . . . . . . . . . . . . . . . 29,242 (29,242) —Transfer from completed investment properties to investment properties
under construction for redevelopment . . . . . . . . . . . . . . . . . . . . . . . . . . . . (392,285) 392,285 —Disposal of subsidiaries . . . . . . . . . . . . . . . . . . . . . . . . . . . . . . . . . . . . . . . . . (276,711) — (276,711)Exchange realignment . . . . . . . . . . . . . . . . . . . . . . . . . . . . . . . . . . . . . . . . . . (9,745) 16,989 7,244
As of June 30, 2019 . . . . . . . . . . . . . . . . . . . . . . . . . . . . . . . . . . . . . . . . . . . 1,650,006 1,006,501 2,656,507
The fair value of our investment properties increased by 39.0% from US$678.3 million as ofJanuary 1, 2016 to US$942.9 million as of December 31, 2016, primarily due to cumulative increasesin: (i) a newly added completed investment property, Dongguan Hongmei-Mingfeng; (ii) theacquisition of four subsidiaries, which held Wuhan Minglong, Wuhan Mingju, Tianjin Mingcheng andTaicang Mingzhan, from Prax Capital; (iii) the changes in fair value of completed investmentproperties, including Shanghai Fengyuan, Tianjin Fanbin, Jiangsu Friend—I, Kushan Yitian—I, andDongguan Machong; and (iv) the changes in fair value of investment properties under construction,including Jiangsu Friend—III.
293

FINANCIAL INFORMATION
Our investment properties further increased by 26.1% to US$1,189.2 million as ofDecember 31, 2017, primarily due to the cumulative increases from: (i) a newly added completedinvestment property, Shanghai Yita; (ii) a newly acquired parcel of land, Shanghai Yurun; (iii) thechanges in fair value of completed investment properties, including Dongguan Machong, JiangsuFriend—II and Tianjin Fanbin; and (iv) the changes in fair value of investment properties underconstruction, including Jiangsu Friend—III, offset by a disposal of subsidiaries, namely ShanghaiFengyuan, Jiangsu Yitian and Taicang Mingzhan to the China Invesco Fund.
Our investment properties further increased by 58.6% to US$1,885.5 million as ofDecember 31, 2018, primarily due to cumulative increases in: (i) newly added completed investmentproperties, including Redwood Higashi in Japan (which is designated for redevelopment in the nearfuture) and certain properties in the PRC such as Jiangsu Friend—III; (ii) newly added investmentproperties under construction such as Jilin Yiling; (iii) the changes in fair value of completedinvestment properties primarily driven by Jiangsu Friend—I, Jiangsu Friend—III, Tianjin Fanbin andLangfang Weidu in the PRC; and (iv) the changes in fair value of investment properties underconstruction in line with their development progress such as Shenyang Yibei.
Our investment properties further increased by 40.9% to US$2,656.5 million as of June 30,2019, primarily due to: (i) our acquisitions of Propertylink; (ii) newly added completed investmentproperties, including Wuxi Lekun; (iii) newly added investment properties under construction, such asthe Sachiura project, Langfang Hengjia and Fujian Pingfu; (iv) changes in fair value of completedinvestment properties primarily driven by increases in fair value of the Langfang Weidu and JiangsuFriend properties in the PRC; and (v) changes in fair value of investment properties under constructionduring the development process.
Investments in Joint Ventures
Our investments in joint ventures mainly relates to our share of net assets of joint ventures,goodwill on retaining interests in joint ventures and receivables from joint ventures. As of the datesindicated, our joint ventures included E-Shang Star and Sunwood Star.
As of December 31,As of
June 30,
2016 2017 2018 2019
(US$ in thousands)
Share of net assets . . . . . . . . . . . . . . . . . . . . . . . . . . . . . . . . . . . . . . . . . . 198,223 283,855 404,697 526,083Goodwill on retaining interests in joint ventures . . . . . . . . . . . . . . . . . . 2 2 2 2Receivables from joint ventures(1) . . . . . . . . . . . . . . . . . . . . . . . . . . . . . . — 29,224 — —
Total . . . . . . . . . . . . . . . . . . . . . . . . . . . . . . . . . . . . . . . . . . . . . . . . . . . . 198,225 313,081 404,699 526,085
Note:(1) Receivables from joint ventures are unsecured, interest free and repayable on demand. The repayment of these receivables are neither
planned nor likely to occur in the foreseeable future and are considered as part of our net investments in the joint ventures.
Our investment in joint ventures increased to US$313.1 million as of December 31, 2017, ascompared to US$198.2 million as of December 31, 2016, primarily due to the contribution to jointventures in the form of cash of US$60.4 million and share of profits of joint ventures and associate ofUS$37.0 million during the year. The further increase in our investment in joint ventures to US$404.7million as of December 31, 2018, as compared to US$313.1 million as of December 31, 2017, wasprimarily due to our contribution to joint ventures in the form of cash of US$31.2 million and share of
294

FINANCIAL INFORMATION
profits of joint ventures and associate of US$65.4 million in 2018. The further increase in ourinvestment in joint ventures to US$$526.1 million as of June 30, 2019, as compared to US$404.7million as of December 31, 2018, was primarily due to our contribution to joint ventures in the form ofcash of US$42.1 million and share of profits of joint ventures and associate of US$18.3 million as ofJune 30, 2019. During the Track Record Period, our interest in E-Shang Star was diluted from 30.00%to 25.62% in late 2017, whereas our interest in Sunwood Star has remained 20.0% since the mergerwith Redwood.
Financial Assets at Fair Value through Profit or Loss
Our financial assets at fair value through profit or loss comprise unquoted equity interests, atfair value and listed equity investments, at market value. The table below sets forth the breakdown ofour financial assets at fair value through profit or loss as of the dates indicated.
As of December 31,As of
June 30,
2016 2017 2018 2019
(US$ in thousands)
Unquoted equity interests, at fair value . . . . . . . . . . . . . . . . . . . . . . . . . . 140,577 292,982 335,771 504,903Listed equity investments, at market value . . . . . . . . . . . . . . . . . . . . . . . — 69,091 — —
Total . . . . . . . . . . . . . . . . . . . . . . . . . . . . . . . . . . . . . . . . . . . . . . . . . . . . 140,577 362,073 335,771 504,903
The fair values of unquoted equity investments are estimated based on our share of the net assetvalue of the investment funds and associates. In accordance with the exemption in IAS 28 Investmentsin Associates, we do not account for our investments in associates and joint ventures using the equitymethod as we act as investment fund managers. Instead, we have elected to measure our investments inassociates and joint ventures at fair value through profit or loss in accordance with IAS 39 or IFRS 9.This exemption is related to the fact that fair value measurement provides more useful information forusers of the financial statements than the application of the equity method. This is an exemption fromthe requirement to measure interests in associates using the equity method, rather than an exception tothe scope of IAS 28 for the accounting for associates and joint ventures.
Investments in listed equity investments represent our investment in ESR-REIT, which isquoted on SGX. The fair value of listed equity investments is based on their quoted prices as of theyear end in an active market.
Our financial assets at fair value through profit or loss increased to US$362.1 million as ofDecember 31, 2017, as compared to US$140.6 million as of December 31, 2016, primarily due to:(i) the increase in the net asset value of the funds and investment vehicles and the associated projectcompanies in which we made co-investments; and (ii) our investment in ESR-REIT in 2017. Thedecrease to US$335.8 million as of December 31, 2018, as compared to US$362.1 million as ofDecember 31, 2017, was primarily attributable to reclassification of our investment in ESR-REIT(which was previously classified as financial assets at fair value through profit or loss) as equityinstruments designated at fair value through other comprehensive income due to our adoption of IFRS9, effective from January 1, 2018. The decrease was partially offset by the increase in the fair value ofRedwood Japan Logistics Fund I Limited Partnership and Redwood Japan Logistics Fund II LimitedPartnership attributable to the gain of the properties invested by Redwood Japan Logistics Fund ILimited Partnership and Redwood Japan Logistics Fund II Limited Partnership. The increase toUS$504.9 million as of June 30, 2019, as compared to US$335.8 million as of December 31, 2018,
295

FINANCIAL INFORMATION
was primarily attributable to the increase in the net asset value of the funds and investment vehicles inwhich we made co-investments and the associated project companies in which we madeco-investments.
Our management is responsible for determining the policies and procedures for the fair valuemeasurement of financial instruments. At each reporting date, our management analyzes themovements in the values of financial instruments and reviews the major inputs applied in the valuation.The valuation is reviewed and approved by our chief financial officer. The valuation process andresults are discussed with the Board of Directors for annual financial reporting.
The fair values of unlisted financial assets at fair value through profit or loss have beenestimated based on our share of the net asset fair value of the investment fund which comprise of thefair value of the underlying investment properties and book value of funds’ working capital whichsimilar to fair value in the view of the Directors. The fair value of these underlying investmentproperties were revalued on each year end based on valuation performed by independent professionallyqualified valuers who are industry specialist in investment property valuation. The valuation requiresthe Directors to make estimates about the expected future cash flows. In determining fair value, acombination of approaches and methods were used to measure the fair value of the underlyinginvestment properties in these investment funds, including the Direct Comparison Method andDiscounted Cash Flow Method. The Direct Comparison Method is applied based on the market pricesof comparable properties. Comparable properties with similar sizes, characters and locations wereanalyzed, and weighted against all respective advantages and disadvantages to arrive at the fair valueof the property. The Discounted Cash Flow Method measures the value of a property by the presentworth of the net economic benefit to be received over the life of the asset.
In relation to the valuation of the financial assets recognized at fair value through profit or loss,our Directors, based on the professional advice received, adopted the following procedures: (i) engagedindependent professionally qualified valuers, provided necessary financial and non-financialinformation so as to enable the valuers to perform valuation procedures and discussed with the valuerson relevant assumptions; (ii) considered relevant information such as the price at which an asset wasacquired, local property market conditions, values of comparable assets in the same market and currentand projected operating performance, which require management assessments and estimates; and(iii) reviewed the valuation working papers and results prepared by the valuers. Based on the aboveprocedures, our Directors are of the view that the valuation analysis performed by the valuers on thefinancial assets recognized at fair value through profit or loss is fair and reasonable, and that theestimated fair values are the most appropriate values as of December 31, 2016, 2017 and 2018 andJune 30, 2019, respectively.
Details of the fair value measurement of financial assets recognized at fair value through profitor loss, particularly the fair value hierarchy, the valuation techniques and key inputs, includingsignificant unobservable inputs, the relationship of unobservable inputs to fair value and reconciliationof level 3 measurements in connection with the underlying investment properties are disclosed in Note49 to the Accountant’s Report in Appendix I to this Prospectus issued by the Reporting Accountants inaccordance with Hong Kong Standard on Investment Circular Reporting Engagement 200“Accountants’ Report on Historical Financial Information in Investment Circulars” issued by the HongKong Institute of Certified Public Accountants. The Reporting Accountants’ opinion on the HistoricalFinancial Information of the Group for the Track Record Period as a whole is set out on page I-2 of theAccountants’ Report set forth in Appendix I to this Prospectus.
296

FINANCIAL INFORMATION
In relation to the valuation analysis performed by valuers on the financial assets recognized atfair value through profit or loss, the Joint Sponsors have conducted relevant due diligence work,including but not limited to, (i) review of relevant notes in the Accountants’ Report set forth inAppendix I to this Prospectus and relevant documents provided by valuers; and (ii) discussed with theCompany and the Reporting Accountants about the key basis and assumptions for the valuation offinancial assets recognized at fair value through profit or loss. Having considered the work done by theDirectors and Reporting Accountants and the relevant due diligence done as stated above, nothing hascome to the Joint Sponsors’ attention that would cause the Joint Sponsors to question the valuationanalysis performed by the valuers on the financial assets recognized at fair value through profit or loss.
Available-for-Sale Investments
Our available-for-sale investments comprise unquoted equity interests, at fair value, unquotedequity investments, at cost, and investments in listed securities. The table below sets forth thebreakdown of our available-for-sale investments as of the dates indicated.
As of December 31,As of
June 30,
2016 2017 2018 2019
(US$ in thousands)
Unquoted equity interests, at fair value . . . . . . . . . . . . . . . . . . . . . . . . . . . . . . . 1,131 — — —Unquoted equity investments, at cost . . . . . . . . . . . . . . . . . . . . . . . . . . . . . . . . 361 8,327 — —Listed equity investments, at market value . . . . . . . . . . . . . . . . . . . . . . . . . . . . — 181,489 — —
Total . . . . . . . . . . . . . . . . . . . . . . . . . . . . . . . . . . . . . . . . . . . . . . . . . . . . . . . . . 1,492 189,816 — —
As of December 31, 2016, our unquoted equity investments, at fair value, comprised unquotedequity interests in Redwood Japan Logistics Fund Limited Partnership and Redwood Japan LogisticsFund II Limited Partnership in 2016. The unlisted equity investments were carried at fair value andwas estimated based on our share of the net asset value of the investment funds. Our unquoted equityinvestments, at cost, related to an unquoted equity investment in the property manager of VivaIndustrial Trust. This equity investment was carried at cost less accumulated impairment lossesbecause the fair value could not be reliably determined. The variability in the range of reasonable fairvalue estimates was significant and the probabilities of the various estimates within the range ofreasonable inputs were not sufficiently reliable to determine a fair value.
As of December 31, 2017, our listed equity investments, at market value, related to quotedequity investments on active markets, which include, among others, our investments in Viva IndustrialTrust and Sabana REIT listed on the SGX, Propertylink and Centuria listed on the ASX and CNLPlisted on the HKSE.
The increase in available-for-sale investments from December 31, 2016 to December 31, 2017was primarily due to the increase in our investments in listed securities.
Since January 1, 2018, our unquoted equity investments in the property manager of VivaIndustrial Trust and all of our publicly listed equity investments (which were previously classified asthe available-for-sale investments) have been re-classified to financial assets at fair value throughcomprehensive income due to our adoption of IFRS 9.
297

FINANCIAL INFORMATION
Financial Assets at Fair Value through Other Comprehensive Income
Our financial assets at fair value through other comprehensive income comprise listed equityinvestments at market value. The recording of our financial assets at fair value through othercomprehensive income in 2018 was as a result of reclassification of our unquoted equity investments inthe property manager of Viva Industrial Trust and all of our publicly listed equity investments (whichwere previously classified as available-for-sale investments) and our investment in ESR-REIT (whichwas previously classified as financial assets at fair value through profit or loss) as equity instrumentsdesignated at fair value through other comprehensive income due to our adoption of IFRS 9, effectivefrom January 1, 2018.
The table below sets forth our financial assets at fair value through other comprehensiveincome as of the dates indicated.
As of December 31,As of
June 30,
2016 2017 2018 2019
(US$ in thousands)
Listed equity investments, at market value . . . . . . . . . . . . . . . . . . . . . . . . — — 484,239 468,958
Listed equity investments, at market value, represent our investments in public companieslisted on the SGX, ASX and the HKSE, which are quoted in an active market. The market values of thelisted equity investments are based on their quoted prices as of December 31, 2018 and June 30, 2019in active markets.
Goodwill and Other Intangible Assets
Our goodwill mainly relates to business combinations and acquisitions. We recorded goodwillof US$210.5 million, US$226.2 million, US$285.4 million and US$340.2 million as of December 31,2016, 2017 and 2018 and June 30, 2019, respectively. The goodwill of US$210.5 million as ofDecember 31, 2016 and US$226.2 million as of December 31, 2017 was primarily due to the 2016Merger and our acquisition of the ESR-REIT Manager in January 2017. The increase to US$285.4million as of December 31, 2018, as compared to US$226.2 million as of December 31, 2017, was dueto our acquisition of CIP and VITM. The increase to US$340.2 million as of June 30, 2019 wasattributable to our acquisitions of Propertylink and Sabana Manager.
Our other intangible assets mainly relate to software and management contracts in 2016 inconnection with the merger with Redwood; software, management contracts and trust managementrights with indefinite useful life in 2017 in connection with the acquisition of the ESR-REIT Manager;and software, management contracts, trust management rights with indefinite useful life and customercontracts in 2018 in connection with the acquisition of CIP and VITM. We recorded other intangibleassets of US$25.0 million, US$48.2 million, US$79.5 million and US$96.7 million as of December 31,2016, 2017 and 2018 and June 30, 2019, respectively.
298

FINANCIAL INFORMATION
Trade Receivables
Our trade receivables primarily comprise rental income receivables, management fees due fromour joint ventures, management fees due from funds managed by us and other income receivables. Thetable below sets forth a breakdown of our trade receivables as of the dates indicated.
As of December 31,As of
June 30,
2016 2017 2018 2019
(US$ in thousands)
Rental income receivables . . . . . . . . . . . . . . . . . . . . . . . . . . . . . . . . . . . . . . 6,757 5,636 4,889 4,527Management fees due from our joint ventures . . . . . . . . . . . . . . . . . . . . . . . 1,821 8,004 16,058 12,798Management fees due from funds managed by us . . . . . . . . . . . . . . . . . . . . 693 16,649 34,309 28,317Construction income receivables . . . . . . . . . . . . . . . . . . . . . . . . . . . . . . . . . — — 7,481 5,221Other income receivables . . . . . . . . . . . . . . . . . . . . . . . . . . . . . . . . . . . . . . . — 159 320 1,007
Total . . . . . . . . . . . . . . . . . . . . . . . . . . . . . . . . . . . . . . . . . . . . . . . . . . . . . . . 9,271 30,448 63,057 51,870
Our trade receivables increased by 228.4% from US$9.3 million as of December 31, 2016 toUS$30.4 million as of December 31, 2017, primarily due to the increases in: (i) management fees duefrom funds managed by us attributable to the expansion of and the significant growth in our fundmanagement business; and (ii) management fees due from our joint ventures, partially offset by adecrease in rental income receivables as of December 31, 2017 due to the timing of the billings. Ourtrade receivables further increased to US$63.1 million as of December 31, 2018, primarily due to theincreases in: (i) management fees due from our joint ventures attributable to increases in the number ofproperties held by our joint ventures and development activities at our joint ventures; and(ii) management fees due from funds managed by us attributable to the expansion of and the significantgrowth in our fund management business. As of December 31, 2018, we had construction incomereceivables of US$7.5 million due to our acquisition of CIP in August 2018. Our trade receivablesdecreased to US$51.9 million as of June 30, 2019, primarily due to decreases in management fees duefrom joint ventures and funds managed by us attributable to lower promote fee accrued as of June 30,2019, compared to December 31, 2018.
The following table sets out the aging analysis of our trade receivables as of the dates indicated:
As of December 31,As of
June 30,
2016 2017 2018 2019
(US$ in thousands)
Within 90 days . . . . . . . . . . . . . . . . . . . . . . . . . . . . . . . . . . . . . . . . . . . . . . . . . 5,757 28,337 36,292 39,83891 to 180 days . . . . . . . . . . . . . . . . . . . . . . . . . . . . . . . . . . . . . . . . . . . . . . . . . . 3,514 2,111 23,015 3,699Over 180 days . . . . . . . . . . . . . . . . . . . . . . . . . . . . . . . . . . . . . . . . . . . . . . . . . . — — 3,750 8,333
Total . . . . . . . . . . . . . . . . . . . . . . . . . . . . . . . . . . . . . . . . . . . . . . . . . . . . . . . . . 9,271 30,448 63,057 51,870
As of December 31, 2016 and 2017, the aging of our trade receivables is within six months. In2018, we granted a 180-day credit term to the joint venture managed by Kendall Square LogisticsProperties Inc., which receivables were settled. As of June 30, 2019, the receivables due over 180 dayswere primarily due to receivables from a tenant pursuant to a one-off arrangement which we expect tobe settled by the end of the year. All receivables that were neither past due nor impaired relate mainlyto receivables from tenants, for whom there was no recent history of default. Our management, basedon IAS 39’s incurred loss approach, is of the opinion that no provision for trade receivables wasnecessary as of December 31, 2016, 2017 and 2018 and June 30, 2019 as there has not been asignificant credit risk.
299

FINANCIAL INFORMATION
From January 1, 2018, we have applied the simplified approach to providing impairment forexpected credit losses prescribed by IFRS 9, which permits the use of the lifetime expected lossprovision for all trade receivables. To measure the expected credit losses, trade receivables have beengrouped based on shared credit risk characteristics and the days past due. The expected credit lossbelow also incorporates forward-looking information. The impairments as of December 31, 2018 andJune 30, 2019 were determined as follows:
December 31,2018
Current
June 30,2019
Current
Expected credit loss rate . . . . . . . . . . . . . . . . . . . . . . . . . . . . . . . . . . . . . . . . . . . . . . . . . . . . <0.001% <0.001%Gross carrying amount (US$ in thousands) . . . . . . . . . . . . . . . . . . . . . . . . . . . . . . . . . . . . . 63,057 51,870Impairment (US$ in thousands) . . . . . . . . . . . . . . . . . . . . . . . . . . . . . . . . . . . . . . . . . . . . . . — —
As a result, no impairment provision was made as of December 31, 2018 and June 30, 2019.
We typically do not extend credit to our customers for their payment of rents and managementfees. We seek to maintain strict control over our outstanding receivables to minimize credit risk.Overdue balances are reviewed regularly by senior management. In view of the aforementioned andthe fact that our trade receivables relate to various diverse customers, there is no significantconcentration of credit risk. We do not hold any collateral or other credit enhancements over our tradereceivable balances. The balances of trade receivables are non-interest-bearing. As of August 31, 2019,US$26.3 million, or 50.7% of our trade receivables as of June 30, 2019, was settled.
Prepayments, Other Receivables and Other Assets
Our prepayments, other receivables and other assets mainly relate to deposits for acquisitions,due from other related parties, prepayment on behalf of funds, insurance compensation receivable anddeductible value added tax. The table below sets forth a breakdown of our prepayments, otherreceivables and other assets as of the dates indicated.
As of December 31,As of
June 30,
2016 2017 2018 2019
(US$ in thousands)
Deposits for acquisition . . . . . . . . . . . . . . . . . . . . . . . . . . . . . . . . . . . . . . . . 12,618 6,456 19,917 11,655Due from related parties . . . . . . . . . . . . . . . . . . . . . . . . . . . . . . . . . . . . . . . 5,426 7,507 15,911 18,767(1)
Receivable from funds . . . . . . . . . . . . . . . . . . . . . . . . . . . . . . . . . . . . . . . . — — 99,212 80,186Prepayment on behalf of funds . . . . . . . . . . . . . . . . . . . . . . . . . . . . . . . . . . — 8,563 46,938 26,835Prepayments to suppliers . . . . . . . . . . . . . . . . . . . . . . . . . . . . . . . . . . . . . . . 1,372 1,278 4,355 7,246Dividend receivable . . . . . . . . . . . . . . . . . . . . . . . . . . . . . . . . . . . . . . . . . . . — 4,813 4,362 4,402Contract assets . . . . . . . . . . . . . . . . . . . . . . . . . . . . . . . . . . . . . . . . . . . . . . . — — 5,048 3,824Deductible value added tax . . . . . . . . . . . . . . . . . . . . . . . . . . . . . . . . . . . . . — 4,917 4,849 12,250Insurance compensation receivable . . . . . . . . . . . . . . . . . . . . . . . . . . . . . . . — — 8,617 8,830Other receivable . . . . . . . . . . . . . . . . . . . . . . . . . . . . . . . . . . . . . . . . . . . . . 2,868 3,605 15,464 25,308
Total . . . . . . . . . . . . . . . . . . . . . . . . . . . . . . . . . . . . . . . . . . . . . . . . . . . . . . 22,284 37,139 224,673 199,303
Note:(1) Approximately US$14.3 million of the balance due from related parties are trade in nature and approximately US$4.5 million are non-
trade in nature. The portion which is non-trade in nature relates to two interest-free and unsecured loans provided by our Group to twocompanies held by three Directors for the purposes of incentivizing these Directors to contribute to us and enabling us to retain high-caliber human resources that are valuable to us. For further details, see Note 42 to the Accountants’ Report set forth in Appendix I to thisProspectus.
300

FINANCIAL INFORMATION
Our prepayments, other receivables and other assets increased by 66.7% from US$22.3 millionas of December 31, 2016 to US$37.1 million as of December 31, 2017, primarily due to:(i) prepayments on behalf of funds and investment vehicles we managed in order to seed assets for thefunds and investment vehicles we managed; (ii) increase of amounts due from related partiesattributable to the costs incurred by us on behalf of Redwood in order to secure land; and(iii) dividends receivable from our equity investments in publicly listed securities and deductible valueadded tax in 2017. Our prepayments, other receivables and other assets increased by 505.3% fromUS$37.1 million as of December 31, 2017 to US$224.7 million as of December 31, 2018, primarilydue to: (i) a receivable from funds in 2018 in connection with the disposal of Redwood Japan LogisticsFund Limited Partnership and another investment vehicle in Japan; (ii) an increase in prepayments onbehalf of funds in connection with the construction payment paid on behalf of India Fund; (iii) therecording of the deposits for acquisition of a project in the PRC; and (iv) an increase in due fromrelated parties attributable to the receivables in connection with joint ventures associated with CIPwhich we acquired in August 2018. We had insurance compensation receivable of US$8.6 million asof December 31, 2018 as we were in the process of obtaining the insurance compensation for our solarassets that were damaged in a typhoon in Japan in September 2018. Our prepayments, otherreceivables and other assets decreased by 11.3% from US$224.7 million as of December 31, 2018 toUS$199.3 million as of June 30, 2019, primarily due to: (i) a decrease in prepayments on behalf offunds in connection with the injection of capital in India Fund; (ii) a decrease in receivable from fundsin connection with the settlement of an outstanding receivable in January 2019; and (iii) a decrease indeposits for acquisition primarily due to the completion of Wuxi Lekun project; which were partiallyoffset by (iv) an increase in deductible value added tax and other receivable.
Trade Payables, Accruals and Other Payables
Our trade payables, accruals and other payables mainly relate to payables for purchase ofproperty, plant and equipment and investment properties and accruals. The table below sets forth abreakdown of trade payables, accruals and other payables as of the dates indicated.
As of December 31,As of
June 30,
2016 2017 2018 2019
(US$ in thousands)
Accruals . . . . . . . . . . . . . . . . . . . . . . . . . . . . . . . . . . . . . . . . . . . . . . . . . . . 8,738 18,117 37,168 23,637Trade payables . . . . . . . . . . . . . . . . . . . . . . . . . . . . . . . . . . . . . . . . . . . . . . — — 5,207 4,562Payables for purchase of property, plant and equipment and investment
properties . . . . . . . . . . . . . . . . . . . . . . . . . . . . . . . . . . . . . . . . . . . . . . . . 9,940 22,269 15,833 27,600Staff payroll and welfare payables . . . . . . . . . . . . . . . . . . . . . . . . . . . . . . 3,551 6,325 15,375 15,710Other tax payable . . . . . . . . . . . . . . . . . . . . . . . . . . . . . . . . . . . . . . . . . . . 2,776 3,928 3,044 4,976Deferred rents . . . . . . . . . . . . . . . . . . . . . . . . . . . . . . . . . . . . . . . . . . . . . . 2,128 1,383 1,222 1,752Interest payable . . . . . . . . . . . . . . . . . . . . . . . . . . . . . . . . . . . . . . . . . . . . . 998 3,624 7,817 23,282Due to related parties . . . . . . . . . . . . . . . . . . . . . . . . . . . . . . . . . . . . . . . . . 972 731 2,633 3,438(1)
Due to other shareholder of fund . . . . . . . . . . . . . . . . . . . . . . . . . . . . . . . . — 1,378 — —Payable to a fund . . . . . . . . . . . . . . . . . . . . . . . . . . . . . . . . . . . . . . . . . . . . — — 16,789 2,010Others . . . . . . . . . . . . . . . . . . . . . . . . . . . . . . . . . . . . . . . . . . . . . . . . . . . . 1,322 950 6,655 21,782
Total . . . . . . . . . . . . . . . . . . . . . . . . . . . . . . . . . . . . . . . . . . . . . . . . . . . . . 30,425 58,705 111,743 128,749
Note:(1) Approximately US$3.1 million of the balance due to related parties are trade in nature and approximately US$0.34 million are non-trade
in nature. The portion which is non-trade in nature relates to loans granted by certain of our shareholders to us which will be waived priorto the Proposed Listing.
301

FINANCIAL INFORMATION
Our trade payables, accruals and other payables increased by 92.9% from US$30.4 million asof December 31, 2016 to US$58.7 million as of December 31, 2017, primarily due to: (i) an increase inour accruals primarily attributable to professional fees and other administrative and maintenance feesincurred by our management companies; and (ii) an increase in payables for purchase of property, plantand equipment and investment properties, accruals and interest payables primarily attributable toincrease in construction costs incurred in connection with the development of various projects as aresult of our business expansion. Our trade payables, accruals and other payables increased by 90.3%from US$58.7 million as of December 31, 2017 to US$111.7 million as of December 31, 2018,primarily due to: (i) an increase in our accruals primarily attributable to the consolidation of theongoing construction payables of CIP, which we acquired in August 2018; (ii) the recording of tradepayables from construction materials purchased by CIP; (iii) an increase in staff payroll and welfarepayables which was in line with the increase in expenses as a result of the acquisition of CIP in August2018 and the accrued bonus; (iv) an increase in interest payables attributable to new loans obtained forthe financing of our investments and operations; (v) a payable to a fund in 2018, representing thebalance to Redwood Japan Logistic Fund Limited Partnership which was recorded as financial assets atfair value through profit or loss before the disposal; and (vi) an increase in other payables attributableto our acquisition of VITM in October 2018. The increase was partially offset by a decrease inpayables for purchase of property, plant and equipment and investment properties. Our trade payables,accruals and other payables increased by 15.2% from US$111.7 million as of December 31, 2018 toUS$128.7 million as of June 30, 2019, primarily due to: (i) an increase in interest payables attributableto the additional bonds which we issued in the first half of 2019; and (ii) an increase in payables forpurchase of property, plant and equipment and investment properties in connection with the acquisitionof land in the PRC and land for the Sachiura project in Japan; partially offset by (iii) a decrease inaccruals due to the completion of several construction projects of CIP; and (iv) settlement of payablesto a fund in early 2019. As of August 31, 2019, US$1.5 million, or 32.9% of our trade payables as ofJune 30, 2019 was settled.
The following table sets out the aging analysis of our trade payables as of the dates indicated:
As of December 31,As of
June 30,
2016 2017 2018 2019
(US$ in thousands)
Within 30 days . . . . . . . . . . . . . . . . . . . . . . . . . . . . . . . . . . . . . . . . . . . . — — 4,283 1,58430 to 60 days . . . . . . . . . . . . . . . . . . . . . . . . . . . . . . . . . . . . . . . . . . . . . . — — 881 2,978Over 60 days . . . . . . . . . . . . . . . . . . . . . . . . . . . . . . . . . . . . . . . . . . . . . . — — 43 —
Total . . . . . . . . . . . . . . . . . . . . . . . . . . . . . . . . . . . . . . . . . . . . . . . . . . . . — — 5,207 4,562
Subordinated Perpetual Capital Securities
In June 2017, we issued subordinated perpetual capital securities with an aggregate principalamount of US$100 million. The distribution rate is 8.25% per annum, with the first distribution ratereset in June 2020 and subsequent resets occurring every three years thereafter. Distributions arepayable semi-annually in arrears. Subject to the relevant terms and conditions of the subordinatedperpetual capital securities, we may elect to defer making distributions on the subordinated perpetualcapital securities and there are no limit as to the number of times a distribution can be deferred. Thesubordinated perpetual capital securities may be redeemed at our option at principal amount in June2020 or upon the occurrence of certain redemption events specified in the conditions of the issuance. Ifthe subordinated perpetual capital securities are not redeemed by the first distribution rate reset date,
302

FINANCIAL INFORMATION
the distribution rate will be subject to a step up margin of 5.00% per annum. The subordinatedperpetual capital securities are classified as equity instruments and recorded in equity in ourconsolidated statement of financial position.
LIQUIDITY AND CAPITAL RESOURCES
Our principal sources of liquidity have been proceeds from cash flows from operating activitiesand financing activities. For the years ended December 31, 2016, 2017 and 2018 and for the six monthsended June 30, 2018 and 2019, our cash and cash equivalents were US$411.8 million,US$527.0 million, US$502.1 million, US$532.4 million and US$943.6 million, respectively. Our cashand cash equivalents primarily consist of cash on hand and at banks earning interest at floating ratesbased on daily bank deposit rates. As of June 30, 2019, our cash and cash equivalents weredenominated in U.S. dollars, Renminbi, Hong Kong dollars, Japanese Yen, Korean won, Singaporedollars, Australian dollars and Indian rupees.
The following table sets forth a selected summary of our statement of cash flows for the periodsindicated.
Year Ended December 31,Six Months Ended
June 30,
2016 2017 2018 2018 2019
(unaudited)(US$ in thousands)
Net cash generated from operating activities . . . . . 22,039 36,396 79,340 23,306 14,367Net cash used in investing activities . . . . . . . . . . . . (264,271) (472,801) (786,778) (463,706) (583,970)Net cash generated from financing activities . . . . . 522,081 526,691 688,677 445,394 1,008,912Net increase/(decrease) in cash and cash
equivalents . . . . . . . . . . . . . . . . . . . . . . . . . . . . . 279,849 90,286 (18,761) 4,994 439,309Cash and cash equivalents at beginning of year . . . 144,319 411,765 526,988 526,988 502,056Effect of foreign exchange rate changes, net . . . . . (12,403) 24,937 (6,171) 372 2,254Cash and cash equivalents at end of
year/period . . . . . . . . . . . . . . . . . . . . . . . . . . . . . 411,765 526,988 502,056 532,354 943,619
Operating Activities
Net cash generated from operating activities for the six months ended June 30, 2019 amountedto US$14.4 million, which was primarily attributable to the profit before tax of US$122.7 millionadjusted for non-cash items including finance costs of US$83.4 million, equity-settled share optionexpense of US$9.9 million, fair value gains on investment properties under construction of US$76.8million, fair value gains on completed investment properties of US$26.8 million, fair value gains onfinancial assets at fair value through profit or loss of US$22.8 million, share of profits and losses ofjoint ventures and associates of US$18.3 million, and offset by the effect of the movements of workingcapital and other cash items such as the amount of income tax paid. Our movements in working capitalreflected a decrease in trade receivables of US$11.2 million due to lower management fee receivablesas discussed above, a decrease in trade payables, accruals and other payables of US$13.6 million andan increase in prepayments, other receivables and other assets of US$4.9 million that were related toour operating activities and the payment of income tax of US$18.6 million.
Net cash generated from operating activities in 2018 amounted to US$79.3 million, which wasprimarily attributable to the profit before tax of US$270.6 million adjusted for non-cash items includingfinance costs of US$104.9 million, loss on disposal of items of property, plant and equipment of
303

FINANCIAL INFORMATION
US$9.7 million, equity-settled share option expense of US$23.2 million, fair value gains on completedinvestment properties of US$109.7 million, share of profits and losses of joint ventures and associates ofUS$65.4 million, fair value gains on investment properties under construction of US$62.8 million, fairvalue gains on financial assets at fair value through profit or loss of US$44.9 million and offset by theeffect of the movements of working capital and other cash items such as the amount of income tax paid.Our movements in working capital reflected an increase in trade payables, accruals and other payables ofUS$27.7 million, partially offset by an increase in trade receivables of US$21.0 million due to the growthin our business operations, particularly our funds management business, and an increase in prepayments,other receivables and other assets of US$17.2 million that were related to our operating activities and thepayment of income tax of US$16.2 million.
Net cash generated from operating activities in 2017 amounted to US$36.4 million, which wasprimarily attributable to the profit before tax of US$273.2 million adjusted for non-cash itemsincluding finance costs of US$90.9 million, equity-settled share option expense of US$11.9 million,fair value gains on completed investment properties of US$95.2 million, fair value gains on investmentproperties under construction of US$100.0 million, gains on disposal of subsidiaries ofUS$38.3 million, share of profits and losses of joint ventures and associates of US$37.0 million, andfair value gains on financial assets at fair value through profit or loss of US$32.7 million, and offset bythe effect of the movements of working capital and other cash items such as the amount of income taxpaid. Our movements in working capital reflected an increase in trade receivables of US$22.4 millionand an increase in prepayments, other receivables and other assets of US$25.7 million as due to ourbusiness expansion, partially offset by an increase in trade payables, accruals and other payables ofUS$29.2 million that were related to our operating activities and the payment of income tax ofUS$12.5 million.
Net cash generated from operating activities in 2016 amounted to US$22.0 million, which wasprimarily attributable to the profit before tax of US$139.7 million adjusted for non-cash itemsincluding finance costs of US$56.0 million, fair value loss on derivative financial instruments ofUS$12.1 million, fair value gains on completed investment properties of US$100.8 million, share ofprofits and losses of joint ventures and associates of US$36.4 million, fair value gains on financialassets at fair value through profit or loss of US$26.7 million and fair value gains on investmentproperties under construction of US$5.8 million, and offset by the effect of the movements of workingcapital and other cash items such as the amount of income tax paid. Our movements in working capitalreflected an increase in trade receivables of US$2.3 million and an increase in prepayments, otherreceivables and other assets of US$6.4 million which are in line with our business growth, and adecrease in trade payables, accruals and other payables of US$13.1 million.
Investing Activities
Net cash used in investing activities for the six months ended June 30, 2019 amounted toUS$584.0 million, which was primarily attributable to acquisition of subsidiaries includingPropertylink of US$445.0 million, additions to investment properties of US$242.8 million, purchase offinancial assets of fair value through profit and loss of US$129.0 million, capital injection in jointventures of US$42.1 million and purchase of financial assets at fair value through other comprehensiveincome of US$37.3 million, partially offset by proceeds of US$119.4 million from disposal of certainof our subsidiaries which held seven properties to NCI Core Fund.
Net cash used in investing activities in 2018 amounted to US$786.8 million, which wasprimarily attributable to purchase of financial assets at fair value through other comprehensive income
304

FINANCIAL INFORMATION
of US$243.7 million, acquisition of subsidiaries holding investment properties in the PRC, CIP, VITM,Redwood Higashi in Japan and Blackwood Group of US$166.0 million, purchase of financial assets offair value through profit and loss of US$154.5 million, additions to investment properties ofUS$107.0 million, prepayment of financial assets at fair value through profit or loss ofUS$42.8 million, capital injection in joint ventures of US$31.2 million and purchases of property, plantand equipment of US$13.2 million.
Net cash used in investing activities in 2017 amounted to US$472.8 million, which wasprimarily attributable to purchase of an available-for-sale investment of US$193.8 million, additions toinvestment properties of US$134.9 million, acquisition of subsidiaries of US$133.2 million, purchaseof financial assets at fair value through profit or loss of US$87.7 million, capital injections in our jointventures, E-Shang Star and Sunwood Star, of US$60.4 million and purchase of property, plant andequipment of US$16.0 million, partially offset by proceeds from the disposal of subsidiaries ofUS$150.5 million to seed China Invesco Core Fund.
Net cash used in investing activities in 2016 amounted to US$264.3 million, which wasprimarily attributable to capital injections in our joint ventures, E-Shang Star and Sunwood Star, ofUS$80.5 million, additions to investment properties of US$68.4 million, purchase of financial assets atfair value through profit or loss of US$51.2 million, acquisition of subsidiaries from Prax Capital ofUS$40.3 million, and prepayments of financial assets at fair value through profit or loss ofUS$30.3 million, partially offset by proceeds of US$12.7 million from disposal of subsidiaries held onour balance sheet under our South Korea development platform to Sunwood Star.
Financing Activities
Net cash generated from financing activities for the six months ended June 30, 2019 amountedto US$1,008.9 million, which was primarily attributable to proceeds from bank loans and otherborrowings of US$1,606.6 million for financing our acquisitions and balance sheet projects and forfinancing our business operations, partially offset by repayment of bank loans and other borrowings ofUS$546.0 million and interest of bank loans and other borrowings paid of US$42.7 million.
Net cash generated from financing activities in 2018 amounted to US$688.7 million, which wasprimarily attributable to proceeds from bank loans and other borrowings of US$584.8 million forfinancing our balance sheet projects and for financing our business operations and proceeds from theissue of shares of US$361.1 million, partially offset by repayment of bank loans and other borrowingsof US$195.5 million, and interest of bank loans and other borrowings paid of US$54.6 million.
Net cash generated from financing activities in 2017 amounted to US$526.7 million, which wasprimarily attributable to proceeds from the issue of shares of US$473.3 million, proceeds from bankloans and other borrowings of US$330.1 million for financing our balance sheet projects and forfinancing our business operations and the issue of subordinated perpetual capital securities ofUS$98.8 million, partially offset by repayments of bank loans and other borrowings ofUS$294.6 million and interest of bank loans and other borrowings paid of US$46.7 million.
Net cash generated from financing activities in 2016 amounted to US$522.1 million, which wasprimarily attributable to proceeds from bank loans and other borrowings of US$682.4 million,including proceeds from the issuance of the Hana Notes, for financing our balance sheet projects andfor financing our business operations, proceeds from the issue of redeemable convertible preference
305

FINANCIAL INFORMATION
shares of US$285.0 million, partially offset by repayments of bank loans and other borrowings ofUS$344.9 million, increase in pledged bank deposits for bank loans of US$58.3 million and interest ofbank loans and other borrowings paid of US$55.8 million.
CONTRACTUAL OBLIGATIONS AND COMMITMENTS
Operating Lease Commitments
We are the lessee in respect of a number of properties for our office use and in respect of landheld under operating leases. The leases typically run for an initial period of one to ten years, with anoption to renew such leases when all the terms are renegotiated. As of June 30, 2019, we had totalfuture minimum lease receivable under non-cancellable operating leases of US$443.4 million. Thetable below summarizes our non-cancellable operating lease receivables as of the dates indicated.
As at December 31As at
June 30
2016 2017 2018 2019
USD’000 USD’000 USD’000 USD’000
Within one year . . . . . . . . . . . . . . . . . . . . . . . . . . . . . . . . . . . . . . . . . . . . 59,170 62,076 82,472 114,411In the second to fifth years, inclusive . . . . . . . . . . . . . . . . . . . . . . . . . . . 145,518 179,698 207,834 271,675After five years . . . . . . . . . . . . . . . . . . . . . . . . . . . . . . . . . . . . . . . . . . . . 17,807 40,520 18,667 57,341
222,495 282,294 308,973 443,427
Capital Commitments
Our capital commitments during the Track Record Period were primarily relating to purchaseof property, plant and equipment. The table below sets forth the breakdown of our capitalcommitments as of the dates indicated.
As of December 31,As of
June 30,
2016 2017 2018 2019
(US$ in thousands)
Contracted, but not provided for investment properties . . . . . . . . . . . . . 70,743 57,648 306,725 326,872Contracted, but not provided for plant and machinery . . . . . . . . . . . . . . — — — 11,143Authorized, but not contracted for investment properties . . . . . . . . . . . . — — — 49,933Undrawn capital calls to real estate investment funds . . . . . . . . . . . . . . 213,670 48,503 50,581 392,786
Total . . . . . . . . . . . . . . . . . . . . . . . . . . . . . . . . . . . . . . . . . . . . . . . . . . . . 284,413 106,151 357,306 780,734
We, as the general partner or the investment manager, are entitled to call capital from capitalpartners at any time during the respective commitment periods as prescribed in the governingdocuments of the funds and investment vehicles we manage, and we depend on capital partnersfulfilling their commitments when called to fund, investments and otherwise fulfill their obligationswhen due. As of December 31, 2016, 2017 and 2018 and June 30, 2019, the total amount of ouroutstanding capital commitments was US$284.4 million, US$106.2 million, US$357.3 million andUS$780.7 million, respectively. We had higher capital commitments as of December 31, 2016 than wedid as of December 31, 2017 because we raised capital for a number of new funds and investmentvehicles established in 2016, the capital of which was not completely drawn in 2016. Our capitalcommitments in 2017 decreased as commitments to the funds and investment vehicles we managewere drawn down. We had higher capital commitments as of December 31, 2018 than we did in 2017because we had capital commitments for several new development projects. We had higher capital
306

FINANCIAL INFORMATION
commitments as of June 30, 2019 primarily because we had higher capital commitment for investmentproperties in Australia which were not contracted yet and an increase in undrawn capital call fromfunds and investment vehicles in which we made co-investments.
Other than the contractual obligations set forth above and disclosure set forth elsewhere in thisProspectus, we do not have any other long-term debt obligations, operating lease commitments, capitalcommitments or other long-term liabilities.
CAPITAL EXPENDITURES
Our capital expenditures consist of additions to property, plant and equipment, investmentproperties and intangible assets including assets from the acquisitions of subsidiaries. Our historicalcapital expenditures were primarily funded by our cash and cash equivalents, cash flows from ouroperating activities and financing activities, including bank borrowings and debt offerings.
Our capital expenditures amounted to US$235.7 million in 2016, US$328.9 million in 2017,US$646.4 million in 2018 and US$962.7 million for the six months ended June 30, 2019. Our capitalexpenditures increased from 2016 to 2017, primarily due to significant increases in our additions toinvestment properties and intangible assets due to our increasing investment and acquisition activitiesin the PRC and Japan, and the increase in our purchases of property, plant and equipment due to anincrease in our office expansion and IT infrastructure costs. Our capital expenditures increased from2017 to 2018, primarily due to significant increases in our additions to investment properties andintangible assets due to our increasing investment and acquisition activities in the PRC, acquisition ofadditional interest in RW Higashi Pte. Ltd. and the increase in our purchases of property, plant andequipment due to an increase in our office expansion and IT infrastructure costs. Our capitalexpenditures increased from December 31, 2018 to June 30, 2019, primarily due to the development ofthe Sachiura properties on our balance sheet, our acquisition of Propertylink and the increase in ourpurchases of property, plant and equipment due to an increase in our office expansion and ITinfrastructure costs.
We currently expect to incur capital expenditures in connection with the existing investmentproperties on our balance sheet for the years ending December 31, 2019 and 2020 as follows.
Year Ending December 31, 2019 Year Ending December 31, 2020
(US$ millions)
Planned capital expenditures . . . . . . . . . . . . . . . . . . . 1,226.5 424.7
Pursuant to our business expansion plan, it is currently estimated that the total capitalexpenditure in connection with the existing investment properties on our balance sheet to be incurredin 2019 and 2020, without taking into account the investment properties to be acquired or built on ourbalance sheet in the future, amounts to US$1,226.5 million and US$424.7 million, respectively, whichare primarily for the acquisition of land, development of our logistics facilities and other relatedpurposes in our ordinary course of business. We plan to fund these capital expenditures with: (i) ourexisting cash and cash equivalents; (ii) cash flow generated from our operating activities; (iii) proceedsfrom the Global Offering; and (iv) other sources of external financings, including equity or equity-linked securities. We will continue to make capital expenditures to support the growth of ourbusiness. See the sections headed “Business—Competitive Strengths and Strategies—Strategies” and“Future Plans and Use of Proceeds” in this Prospectus for further details about our planned capitalexpenditure in connection with investment properties on our balance sheet. Such estimate represents
307

FINANCIAL INFORMATION
the total capital expenditure that we expect to incur in connection with investment properties on ourbalance sheet in the periods indicated above based on our existing business plans. We may adjust ourbusiness plans from time to time and the estimated total capital expenditure in connection withinvestment properties on our balance sheet may also change.
WORKING CAPITAL
We recorded net current assets of US$407.6 million, US$506.0 million, US$13.7 million,US$174.3 million and US$289.5 million, respectively, as of December 31, 2016, 2017, 2018, June 30,2019 and August 31, 2019. The table below sets forth a breakdown of our current assets and currentliabilities as of the dates indicated:
As of December 31,As of
June 30,As of
August 31,
2016 2017 2018 2019 2019
(US$ in thousands)
Current assetsTrade receivables . . . . . . . . . . . . . . . . . . . . . . . . . . . . . . . 9,271 30,448 63,057 51,870 60,154Prepayments, other receivables and other assets . . . . . . . 22,284 37,139 224,673 199,303 125,884Cash and bank balances(1) . . . . . . . . . . . . . . . . . . . . . . . . . 485,545 600,791 581,379 1,010,390 1,155,496
Total current assets . . . . . . . . . . . . . . . . . . . . . . . . . . . . 517,100 668,378 869,109 1,261,563 1,341,534
Current liabilities:Bank loans and other borrowings(2) . . . . . . . . . . . . . . . . . 75,862 91,706 436,194 630,135(3) 589,536Lease liabilities . . . . . . . . . . . . . . . . . . . . . . . . . . . . . . . . . 1,314 2,335 3,374 6,091 5,907Redeemable convertible preference shares . . . . . . . . . . . — — 296,778 316,010 324,539Trade payables, accruals and other payables . . . . . . . . . . 30,425 58,705 111,743 128,749 125,474Income tax payable . . . . . . . . . . . . . . . . . . . . . . . . . . . . . . 1,937 9,616 7,284 6,289 6,537
Total current liabilities . . . . . . . . . . . . . . . . . . . . . . . . . 109,538 162,362 855,373 1,087,274 1,051,993
Net current assets . . . . . . . . . . . . . . . . . . . . . . . . . . . . . . 407,562 506,016 13,736 174,289 289,541
Notes:(1) Included pledged bank deposits.(2) Current portion due within the next one year.(3) Included the bank loans of Propertylink which we acquired and the External Acquisition Facility we obtained for the purposes of
acquiring Propertylink which have now been refinanced. For further details, see the section headed “Business—The PropertylinkAcquisition.”
We recorded an increase of US$98.4 million in net current assets from US$407.6 million as ofDecember 31, 2016 to US$506.0 million as of December 31, 2017, primarily due to: (i) an increase incash and bank balances, including pledged bank deposits, primarily attributable to proceeds from theissue of new shares, net cash generated from our operating activities and issue of subordinatedperpetual capital securities; (ii) an increase in trade receivables, primarily driven by the increases inmanagement fees due from funds managed by us attributable to the growth in our fund managementbusiness; and (iii) an increase in prepayments, other receivables and other assets, partially offset by:(i) an increase in trade payables, accruals and other payables driven by an increase in our accrualsprimarily attributable to professional fees and other administrative and maintenance fees incurred byour management companies and an increase in payables for purchase of property, plant and equipmentand investment properties, accruals and interest payables primarily attributable to increase inconstruction costs incurred in connection with the development of projects; and (ii) an increase in bankloans and other borrowings for financing our balance sheet projects and our business operations.
308

FINANCIAL INFORMATION
We recorded a decrease of US$492.3 million in net current assets from US$506.0 million as ofDecember 31, 2017 to US$13.7 million as of December 31, 2018, primarily due to: (i) an increase inthe current liabilities due to the reclassification of the Class C Preference Shares to current liabilities;(ii) an increase in bank loans and other borrowings for financing our balance sheet projects and ourbusiness operations; (iii) an increase in trade payables, accruals and other payables due toconsolidation of payables of CIP and (iv) a decrease in cash and bank balances, including pledged bankdeposits, primarily attributable to the increased net cash used in investing activities, partially offset bythe increased net cash generated from operating activities and financing activities. The decrease in netcurrent assets was partially offset by (i) an increase in prepayments, other receivables and other assetsdriven by the recording of the deposits for acquisition of land in India to seed the India Fund and theacquisition of properties for our balance sheet and an increase in due from related parties attributable tothe receivables in connection with joint ventures associated with CIP, which we acquired in August2018; and (ii) an increase in trade receivables due to growth in our fund management business.
We recorded an increase of US$160.6 million in net current assets from US$13.7 million as ofDecember 31, 2018 to US$174.3 million as of June 30, 2019, primarily due to an increase in cash andbank balances, primarily attributable to proceeds from the issue of new bonds and loans, partiallyoffset by an increase in current liabilities primarily attributable to the short term revolving loan facilityof US$150 million and an increase in lease liabilities due to our acquisition of Propertylink.
We recorded an increase of US$115.2 million from net current assets of US$174.3 million as ofJune 30, 2019 to net current assets of US$289.5 million as of August 31, 2019, primarily due toproceeds from additional bonds issued in July 2019.
Taking into account the financial resources available to us, including our internally generatedfunds, our existing facilities, the proposed facilities supported by letters of intent issued by banks, theestimated net proceeds from the Global Offering (after a possible Downward Offer Price Adjustmentsetting the final Offer Price up to 10% below the bottom end of the indicative Offer Price range) andother funds raised from the capital markets from time to time, our Directors, after due and carefulconsideration, confirmed that we have sufficient working capital to meet our anticipated cash needs,including our working capital and capital expenditure requirements, for at least the next 12 monthsfrom the date of this Prospectus. After due consideration and discussion with our management andbased on the above, the Joint Sponsors have no reason to believe that we cannot meet the workingcapital requirements for the 12-month period from the date of this Prospectus.
Our future cash requirements will depend on many factors, including our operating cash flows,capital expenditures on our logistics properties and their development and changing businessconditions and future developments, including any investments or acquisitions we may decide topursue. We may require additional cash due to changing business conditions or other futuredevelopments. If our existing cash is insufficient to meet our requirements, we may seek funding fromthe capital markets or borrow from lending institutions. See the section headed “Risk Factors—RisksRelating to Our Business and Industry—Our business and the funds and investment vehicles wemanage require significant upfront investment, and we and the funds and investment vehicles wemanage may experience lower than expected returns on such investment” in this Prospectus.
Our Directors confirm that we did not have any material default in payment of trade andnon-trade payables, bank borrowings and other debt financing obligations and/or breaches of financecovenants during the Track Record Period and up to the Latest Practicable Date.
309

FINANCIAL INFORMATION
INDEBTEDNESS
Bank Loans and Other Borrowings
As of December 31, 2016, 2017 and 2018, June 30, 2019 and August 31, 2019, our total bankloans and other borrowings amounted to US$835.3 million, US$833.4 million, US$1,460.5 million,US$2,803.7 million and US$3,042.5 million, respectively. The amounts of bank loans and otherborrowings were primarily used as underlying funds to support our projects. The decrease of 0.2%from US$835.3 million as of December 31, 2016 to US$833.4 million as of December 31, 2017 wasprimarily due to our repayment of certain loans. The increase of 75.2% from US$833.4 million as ofDecember 31, 2017 to US$1,460.5 million as of December 31, 2018 was primarily due to the increasein financing needs resulting from the expansion of our business. The increase of 92.0% fromUS$1,460.5 million as of December 31, 2018 to US$2,803.7 million as of June 30, 2019 was primarilydue to the consolidation of the loans and other borrowings of Propertylink on our balance sheet as aresult of our acquisition of Propertylink and the bonds issued in the first half of 2019 to finance ourbusiness growth. We have refinanced such loans as change of control provisions under such loans weretriggered by our acquisition of Propertylink. The increase in bank loans and other borrowings was alsoattributable to the External Acquisition Facility in connection with our acquisition of Propertylink,which has now been refinanced with debt that is secured by the underlying assets of Propertylink. Theincrease of 8.5% from US$2,803.7 million as of June 30, 2019 to US$3,042.5 million as of August 31,2019 as primarily due to issuance of additional bonds in July 2019. Our bank loans and otherborrowings during the Track Record Period were denominated in U.S. dollars, Renminbi, JapaneseYen, Australian dollars and Singapore dollars.
In November 2016, we issued US$300 million of the Hana Notes with a fixed rate of 6.3% toHana Private Real Estate Investment Trust No. 16 and Hana Private Real Estate Investment TrustNo. 17. The Hana Notes will mature in November 2019. Certain of our existing shareholders providedcertain security support in connection with Hana Notes which will be released prior to completion ofthe Global Offering. We plan to redeem the Hana Notes upon the completion of the Global Offeringusing part of the proceeds of the Global Offering.
In February 2019, we issued SGD150 million (approximately US$109.4 million) of 6.75%Notes due February 2022 under our US$2.0 billion Multicurrency Debt Issuance Programme. Wesubsequently issued three further tranches within the same series, two in March 2019 and one in May2019, amounting to an aggregate of SGD200 million (approximately US$145.8 million). The aggregatetotal amount of 6.75% Notes issued to date is SGD350 million (approximately US$255.2 million).Proceeds from the 6.75% Notes will be used to refinance certain existing borrowings and to financepotential acquisition and investment opportunities we may pursue in the future, as well as to satisfy ourworking capital requirements and for general corporate purposes. The 6.75% Notes are redeemable byour Company for taxation reasons and will remain as subordinated and unsecured obligations of ourCompany for as long as the Hana Notes remain outstanding. From and including the date on which theHana Notes have been redeemed in full or are otherwise no longer outstanding, the 6.75% Notes willconstitute unsubordinated and unsecured obligations of our Company.
In April 2019, we issued US$250 million of 7.875% Notes due April 2022 under our US$2.0billion Multicurrency Debt Issuance Programme. In July 2019, we subsequently issued a furthertranche under the same series amounting to an aggregate of US$175 million, which was consolidatedwith the April 2019 issuance to form a single series of US$425 million 7.875% Notes. Proceeds fromthe 7.875% Notes will be used to refinance certain existing borrowings and to finance potential
310

FINANCIAL INFORMATION
acquisition and investment opportunities we may pursue in the future, as well as to satisfy our workingcapital requirements and for general corporate purposes. The 7.875% Notes are redeemable by ourCompany for taxation reasons and will remain as subordinated and unsecured obligations of ourCompany for as long as the Hana Notes remain outstanding. From and including the date on which theHana Notes have been redeemed in full or are otherwise no longer outstanding, the 7.875% Notes willconstitute unsubordinated and unsecured obligations of our Company.
In May 2019, we entered into a new facility agreement under which we borrowed the fullamount of a US$100 million three year term loan facility to fund our working capital requirements andfor general corporate purposes, and we also entered into a new revolving loan facility agreement underwhich we borrowed US$150 million for general corporate purposes.
In July 2019, we entered into a new facility agreement under which we can borrow up toSGD150 million (approximately US$109.4 million) for the purposes of refinancing indebtedness undercertain existing loan facilities and financing the Sabana Manager Acquisition and the Sabana REITInvestment.
The table below sets forth our current and non-current total bank loans and other borrowingsrepayable by maturity as of the dates indicated.
As of December 31,As of
June 30,As of
August 31,
2016 2017 2018 2019 2019
(US$ in thousands)
Within one year . . . . . . . . . . . . . . . . . . . . . . . . . . . . . . . 75,862 91,706 436,194 630,135 589,536Over one year . . . . . . . . . . . . . . . . . . . . . . . . . . . . . . . . 759,403 741,729 1,024,279 2,173,601 2,452,958
Total . . . . . . . . . . . . . . . . . . . . . . . . . . . . . . . . . . . . . . . 835,265 833,435 1,460,473 2,803,736 3,042,494
Our outstanding bank loans and other borrowings are secured as described below. As ofJune 30, 2019, certain of our completed investment properties and investment properties underconstruction with a fair value of US$2,099.8 million, property, plant and equipment with a carryamount of US$19.7 million, pledged bank deposits amounting to US$44.7 million, listed equityinterests at market value with a fair value of US$167.7 million and equity interests of our Companyand certain subsidiaries were pledged to secure bank loans and other borrowings granted to us. Thetable below sets forth our outstanding bank loans and other borrowings as of the dates indicated.
As of December 31,As of
June 30,As of
August 31,
2016 2017 2018 2019 2019
(US$ in thousands)
Current bank loans and other borrowings:Current bank loans—secured . . . . . . . . . . . . . . . . 75,862 91,706 138,953 179,080 134,913Current bank loans—unsecured . . . . . . . . . . . . . . — — — 151,772 154,869Other borrowing—secured(1) . . . . . . . . . . . . . . . . . — — 297,241 299,283 299,754
Total current bank loans and other borrowings: 75,862 91,706 436,194 630,135 589,536
Non-current bank loans and other borrowings:Non-current bank loans—secured . . . . . . . . . . . . . 479,692 443,646 1,005,259 1,501,352 1,610,962Non-current bank loans—unsecured . . . . . . . . . . . — — — 99,056 99,111
311

FINANCIAL INFORMATION
As of December 31,As of
June 30,As of
August 31,
2016 2017 2018 2019 2019
(US$ in thousands)
Other borrowing—secured . . . . . . . . . . . . . . . . . . 279,711(1) 298,083(1) 19,020 19,026 18,648Other borrowing—unsecured . . . . . . . . . . . . . . . . — — — 51,866 52,527Bond—unsecured . . . . . . . . . . . . . . . . . . . . . . . . . — — — 502,301 671,710
Total non-current bank loans and otherborrowings: 759,403 741,729 1,024,279 2,173,601 2,452,958
Total . . . . . . . . . . . . . . . . . . . . . . . . . . . . . . . . . . . . . . . 835,265 833,435 1,460,473 2,803,736 3,042,494
Note:(1) This includes US$300 million of the Hana Notes. As of December 31, 2018, the Hana Notes were reclassified to current liabilities.
During the Track Record Period and up to August 31, 2019, our bank loans and otherborrowings bore fixed and floating interest rates. The table below sets forth the effective interest ratesfor our outstanding bank loans and other borrowings as of the dates indicated.
As of December 31, As of June 30, As of August 31,
2016 2017 2018 2019 2019
(Effective Interest Rate in %)
Current bank loans and otherborrowings:
Current bank loans—secured . . . 2.4-5.32 2.4-6.5 0.5952-6.875 0.5952-6.175 0.5684-5.88Current bank
loans—unsecured . . . . . . . . . . — — — 3.6 3.6Other borrowing—secured . . . . . — — 7.6 7.6 7.6
Non-current bank loans and otherborrowings:
Non-current bank loans—secured . . . . . . . . . . . . . . . . . . 2.4-6.5 1.875-6.875 0.5952-6.875 0.5952-6.7658 0.5684-6.7658
Non-current bank loans—unsecured . . . . . . . . . . . . . . . . — — — 5.44 5.27
Other borrowing—secured . . . . . 7.6 7.6 6.0 9 9Other borrowing—unsecured . . . — — — 10-12 10-12Bond—unsecured . . . . . . . . . . . . — — — 6.75-7.875 6.75-7.875
As of August 31, 2019, we had approximately US$85.4 million in unutilized banking facilitiesand nil proposed facilities supported by letters of intent from the underlying banks.
We are subject to certain restrictive covenants under our bank loan arrangements and otherborrowing arrangements. These restrictive covenants include, among other things, negative pledges,interest coverage ratios, leverage covenants, limitations on the incurrence of indebtedness, restrictionson the distributions to shareholders and requirements to provide notice or obtain consent for certainsignificant corporate events. For example, some of our subsidiaries are subject to covenants thatrestrict them from distributing dividends, restructuring, transferring material assets, liquidating orchanging their shareholding or management structure. In addition, borrowings under certain loanagreements between our subsidiaries and banks or other financial institutions are not allowed to beused for purposes other than the development of the projects specified in the agreements. The HanaNotes also contain notice and repayment provisions that require the repayment of the Hana Notes inconnection with an IPO. Moreover, some of the loan agreements that we have entered into contain
312

FINANCIAL INFORMATION
financial covenants that require us and/or our subsidiaries to maintain specified financial ratios. Someof our loan agreements contain cross-default provisions where one technical default on one of ourobligations under other agreements will trigger a technical default under such agreements. During theTrack Record Period and up to the Latest Practicable Date, our Directors confirmed that they are notaware of any breach of any of the covenants contained in our bank loan arrangements and otherborrowing arrangements, of any event of default nor are they aware of any restrictions that will limitour ability to drawdown on our unutilized facilities.
We anticipate that we shall seek to obtain further financing to fund our working capital andcapital expenditures with bank borrowings and other funds raised from domestic and internationalcapital markets.
Lease Liabilities
As our Group adopted IFRS 16, we recognized total lease liabilities of US$4.2 million, US$8.0million, US$9.7 million and US$24.4 million as of December 31, 2016, 2017 and 2018 and June 30,2019, respectively. The increase from US$9.7 million to US$24.4 million was primarily attributable toour acquisition of Propertylink. See Note 28 to the Accountants’ Report in Appendix I to thisProspectus.
Redeemable Convertible Preference Shares
On December 30, 2016, we issued 245,359,810 Class C Preference Shares to a group ofindependent third parties for an aggregate consideration of US$300.0 million. On January 4, 2017, weredeemed 9,814,392 Class C Preference Shares for US$11.4 million. The Class C Preference Shareshave a par value of US$0.001 per share and carry a coupon rate of 4.5% per annum.
The Class C Preference Shares have been split into liability and equity components. As ofDecember 31, 2016, 2017 and 2018 and June 30, 2019, the outstanding Class C Preference Sharesamounted to US$285.0 million, US$301.3 million, US$333.9 million and US$353.1 million,respectively. US$246.2 million and US$264.2 million of the outstanding Class C Preference Shareswere recorded as our non-current liabilities as of December 31, 2016 and 2017, respectively, US$296.8million and US$316.0 million of the outstanding Class C Preference Shares was reclassified to andrecorded as our current liabilities as of December 31, 2018 and June 30, 2019 and US$38.8 million,US$37.1 million, US$37.1 million and US$37.1 million of the outstanding Class C Preference Shareswere recorded as our equity as of December 31, 2016, 2017 and 2018 and June 30, 2019.
Out of 235,545,418 Class C Preference Shares, we expect (i) 112,865,513 Class C PreferenceShares will be redeemed on September 18, 2019; (ii) 49,071,962 Class C Preference Shares will beconverted to Class C Shares upon completion of the Global Offering; and (iii) 73,607,943 Class CPreference Shares will be redeemed upon completion of the Global Offering. We shall redeem theClass C Preference Shares that are not converted upon the completion of the Global Offering using partof the proceeds of the Global Offering.
NO OTHER OUTSTANDING INDEBTEDNESS
Save as disclosed in this “—Indebtedness” above, we did not have outstanding indebtedness orany loan capital issued and outstanding or agreed to be issued, bank overdrafts, loans or similarindebtedness, liabilities under acceptances (other than normal trade bills), acceptance credits,
313

FINANCIAL INFORMATION
debentures, mortgages, charges, finance leases or hire purchase commitments, guarantees or othercontingent liabilities or any covenant in connection therewith as of August 31, 2019, being the latestdate for our indebtedness statement.
MAJOR FINANCIAL RATIOS
The following table sets forth the major financial ratios as of, or for, the periods indicated.
As of or For the Year EndedDecember 31,
As of or For theSix Months
Ended June 30,
2016 2017 2018 2019
Return on average equity(1) . . . . . . . . . . . . . . . . . . . . . . . . . . . . . . . . 16.7% 15.7% 10.6% N/ACurrent ratio(2) . . . . . . . . . . . . . . . . . . . . . . . . . . . . . . . . . . . . . . . . . . 472.1% 411.7% 101.6% 116.0%Net gearing ratio(3) . . . . . . . . . . . . . . . . . . . . . . . . . . . . . . . . . . . . . . 16.6% 7.6% 19.8% 30.2%
Notes:(1) Return on average equity is calculated using net profit divided by the average of total equity at the beginning and at the end of the year.(2) Current ratio is calculated by dividing current assets by current liabilities at the end of each year or period.(3) Net gearing ratio is calculated by dividing net debt, defined as total bank loans and other borrowings less cash and bank balances, by
total assets at the end of each year or period.
Return on Average Equity
Our return on average equity slightly decreased from 16.7% in 2016 to 15.7% in 2017, as aresult of the increased total equity balance primarily resulting from the US$473.3 million issue of newshares and the US$98.8 million issue of subordinated perpetual capital securities, while partially offsetby the increase in the net profit from US$104.8 million in 2016 to US$200.8 million in 2017.
Our return on average equity decreased from 15.7% in 2017 to 10.6% in 2018, as a result of theincreased total equity balance primarily resulting from the equity investment from Jingdong LogisticsGroup Corporation and Montsoreau Investment Limited, while partially offset by the increase in thenet profit from US$200.8 million in 2017 to US$212.9 million in 2018.
Current Ratio
Our current ratio decreased from 472.1% as of December 31, 2016 to 411.7% as ofDecember 31, 2017, as a result of the increased current liabilities resulting from the increased currentportion of bank loans and other borrowings, trade and other payables and income tax payable, whilepartially offset by the increased current assets resulting from the increased cash and bank balances,trade receivables and prepayments, other receivables and other assets.
Our current ratio decreased from 411.7% as of December 31, 2017 to 101.6% as ofDecember 31, 2018, as a result of the increased current liabilities primarily due to the current portionof redeemable convertible preference shares, an increase in bank loans and other borrowings, anincrease in trade payables, accruals and other payables and a decreased cash and bank balances, whilepartially offset by an increase in trade receivables and an increase in prepayments, other receivablesand other assets.
Our current ratio increased from 101.6% as of December 31, 2018 to 116.0% as of June 30,2019, as a result of the decreased income tax payable and the increased current assets resulting fromthe increased cash and bank balances, trade receivables and prepayments, other receivables and other
314

FINANCIAL INFORMATION
assets, while partially offset by increased current liabilities resulting from the increased current portionof bank loans, other borrowings, trade and other payables and the current portion of redeemableconvertible preference shares.
Net Gearing Ratio
Our net gearing ratio decreased from 16.6% as of December 31, 2016 to 7.6% as ofDecember 31, 2017, due to the increased total equity balance primarily resulting from theUS$473.3 million issue of new shares and the US$98.8 million issue of subordinated perpetual capitalsecurities and the increased cash and bank balances. Our banks loans and other borrowings as ofDecember 31, 2017 did not change materially as compared to that as of December 31, 2016.
Our net gearing ratio increased from 7.6% as of December 31, 2017 to 19.8% as ofDecember 31, 2018, primarily due to the increased bank loans and other borrowings and decreasedcash and bank balances, while partially offset by the increased total equity balance primarily resultingfrom the US$361.1 million issue of new shares.
Our net gearing ratio increased from 19.8% as of December 31, 2018 to 30.2% as of June 30,2019, primarily due to additional bonds and loans to finance the growth of our business as discussedabove.
OFF-BALANCE SHEET ARRANGEMENTS
Derivative Financial Instruments
In December 2013 and August 2015, we entered into facility agreements with a third partyinvestor to obtain loans of US$120.0 million and US$100.0 million, respectively. In connection withsuch loans, we issued warrant instruments to such third party investor at a total consideration ofUS$70,000 with a call option in respect of our 54,684,608 ordinary shares. Upon issuance and as ofDecember 31, 2015, the warrant instruments were accounted for as financial liabilities measured at fairvalue through profit or loss. The derivative financial assets arising from the draw-down commitmentsat a determined interest rate had been recognized in our consolidated statement of profit or loss uponour application of the remaining drawdown in March 2016. In November 2016, we fully repaid theloan. Our Directors are of the view that the derivative component of the instruments, that previouslyinvolved an obligation to deliver a variable number of equity instruments, can be determined andbecome fixed. From the date of such change in circumstances, the derivative component of theinstruments was reclassified from financial liability to equity in 2016. In January 2018, the third partyinvestor exercised the written call option in respect of our 54,684,608 ordinary shares. As a result, thewarrant instruments no longer constitute off-balance sheet arrangements.
Except as disclosed in this Prospectus, during the Track Record Period, we did not enter into,nor do we expect to enter into, any off-balance sheet arrangements, nor did we enter into any financialguarantees or other commitments to guarantee the payment obligations of third parties. In addition, wedid not enter into any derivative contracts that were indexed to our equity interests and classified asowners’ equity. We did not have any retained or contingent interest in assets transferred to anunconsolidated entity that served as credit, liquidity or market risk support to such entity. We did nothave any variable interest in any unconsolidated entity that provided financing, liquidity, market risk orcredit support to us or that engaged in leasing or hedging services with us.
315

FINANCIAL INFORMATION
CONTINGENT LIABILITIES
As of August 31, 2019, we did not have significant contingent liabilities.
RELATED PARTY TRANSACTIONS
Parties are considered to be related if one party has the ability, directly or indirectly, control theother party or exercise significant influence over the other party in making financial and operationdecisions. Parties are also considered to be related if they are subject to common control. Members ofour key management and their close family member are also considered as related parties. For adiscussion of related party transactions, see Note 42 to the Accountants’ Report set forth in Appendix Ito this Prospectus. Our Directors believe that the related party transactions were carried out on anarm’s length basis and will not distort our results during the Track Period or make such results notreflective of our future performance.
QUANTITATIVE AND QUALITATIVE DISCLOSURES ABOUT MARKET RISK
Our principal financial instruments comprise bank borrowings, trade and other payables, otherborrowings, cash and bank balances, trade receivables, financial assets included in prepayments, otherreceivables and other assets, financial assets at fair value through profit or loss, financial assets at fairvalue through other comprehensive income, available-for-sale investments, and financial assetsincluded in other non-current assets. The main purpose of these financial instruments is to raise financefor our operations. We have various financial assets such as trade receivables, cash and short-termdeposits, which arose directly from our operations. The main risks faced by us are interest rate risk,foreign currency risk, credit risk and liquidity risk. We do not hold or issue derivative financialinstruments either for hedging or for trading purposes. Our Directors reviews and agrees policies formanaging each of the risks which are summarized below:
Interest Rate Risk
Our exposure to the risk of changes in interest rates relates primarily to our interest-bearingbank loans and other borrowings. We do not use derivative financial instruments to manage our interestrate risk.
The following table demonstrates the sensitivity to reasonably possible changes in interestrates, with all other variables held constant, of our profit before tax (mainly the impact on floating rateborrowings). Our equity is not affected, other than the consequential effect on the accumulated lossesof the changes in profit before tax as disclosed below.
Increase/(Decrease) inBasis Points
(Decrease)/Increase inProfit Before Tax(US$ in thousands)
For the year ended/as of December 31, 2016 . . . . . . . . . . . . . . . . . . . . . 100/(100) (4,421)/4,421For the year ended/as of December 31, 2017 . . . . . . . . . . . . . . . . . . . . . 100/(100) (5,352)/5,352For the year ended/as of December 31, 2018 . . . . . . . . . . . . . . . . . . . . . 100/(100) (4,548)/4,548For the six months ended/as of June 30, 2019 . . . . . . . . . . . . . . . . . . . . 100/(100) (5,771)/5,771
Foreign Currency Risk
During the years ended December 31, 2016, 2017 and 2018 and for the six months endedJune 30, 2018 and 2019, we had monetary assets and liabilities, which were denominated in foreign
316

FINANCIAL INFORMATION
currencies, and were exposed to foreign exchange risk arising from various currency exposures.Foreign exchange risk arises from future commercial transactions, recognized assets and liabilities,which are denominated in a currency that is not the functional currency of the relevant entities. Wehave not hedged our foreign exchange rate risk. In addition, our conversion of Renminbi into foreigncurrencies is subject to the rules and regulations of the foreign exchange control promulgated by thePRC Government.
The following table details our sensitivity to a 1% increase and decrease in the relevant foreigncurrencies against the functional currency. The sensitivity analysis includes only outstanding foreigncurrency denominated monetary items and adjusts their translation at the end of the reporting periodfor a 1% change in foreign currency rates.
For the Year Ended December 31,
For the SixMonths Ended
June 30,
2016 2017 2018 2019
(US$ in thousands)
Increase/(decrease) in profit before tax:if US$ weakens against RMB . . . . . . . . . . . . . . . . . . . . . (3,418) 965 997 (1,771)if US$ strengthens against RMB . . . . . . . . . . . . . . . . . . . 3,418 (965) (997) 1,771
if US$ weakens against JPY . . . . . . . . . . . . . . . . . . . . . . 126 1,544 (2,008) (2,629)if US$ strengthens against JPY . . . . . . . . . . . . . . . . . . . . (126) (1,544) 2,008 2,629
if USD weakens against SGD . . . . . . . . . . . . . . . . . . . . . — — — (2,426)if USD strengthens against SGD . . . . . . . . . . . . . . . . . . . — — — 2,426
if USD weakens against AUD . . . . . . . . . . . . . . . . . . . . . — — — 6,461if USD strengthens against AUD . . . . . . . . . . . . . . . . . . — — — (6,461)
Credit Risk
Prior to our adoption of IFRS 9 on January 1, 2019, we traded only with recognized andcreditworthy third parties. It was our policy that all customers who wished to trade on credit termswere subject to credit verification procedures. Credit risk arose from cash and bank balances, tradereceivables and other receivables, the balances of which represented the maximum credit risk exposureto us.
After our adoption of IFRS 9 on January 1, 2019, we have assessed and have found noconcentration of credit risk from third party debtors. The carrying amounts of restricted cash, cash andcash equivalents, financial assets included in prepayments, other receivables and other assets in theconsolidated statements of financial position represent our maximum exposure to credit risk in relationto our financial assets. We deposited all cash and bank balances in high-credit-quality financialinstitutions without significant credit risk.
We have established a policy to perform an assessment on December 31, 2018, of whetherfinancial instruments’ credit risk has increased significantly since initial recognition, by consideringother receivables in two stages, such that in stage 1, when other receivables are first recognized, werecord an allowance based on 12 months’ expected credit loss; and stage 2, when other receivableshave shown a significant increase in credit risk since origination, we record an allowance for thelifetime expected credit loss. Our management also regularly reviews the recoverability of thesereceivables and follow up the dispute or amount overdue, if any. Our management is of the opinionthat the risk of default by counterparties is low. We consider the probability of default upon initial
317
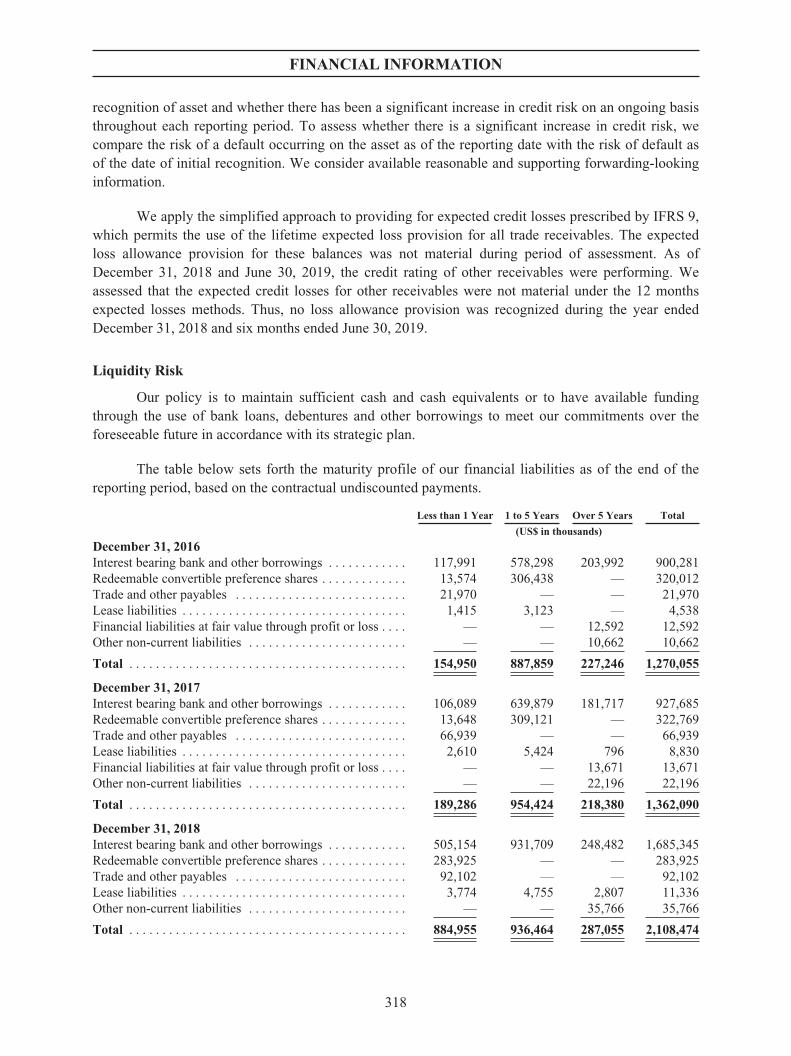
FINANCIAL INFORMATION
recognition of asset and whether there has been a significant increase in credit risk on an ongoing basisthroughout each reporting period. To assess whether there is a significant increase in credit risk, wecompare the risk of a default occurring on the asset as of the reporting date with the risk of default asof the date of initial recognition. We consider available reasonable and supporting forwarding-lookinginformation.
We apply the simplified approach to providing for expected credit losses prescribed by IFRS 9,which permits the use of the lifetime expected loss provision for all trade receivables. The expectedloss allowance provision for these balances was not material during period of assessment. As ofDecember 31, 2018 and June 30, 2019, the credit rating of other receivables were performing. Weassessed that the expected credit losses for other receivables were not material under the 12 monthsexpected losses methods. Thus, no loss allowance provision was recognized during the year endedDecember 31, 2018 and six months ended June 30, 2019.
Liquidity Risk
Our policy is to maintain sufficient cash and cash equivalents or to have available fundingthrough the use of bank loans, debentures and other borrowings to meet our commitments over theforeseeable future in accordance with its strategic plan.
The table below sets forth the maturity profile of our financial liabilities as of the end of thereporting period, based on the contractual undiscounted payments.
Less than 1 Year 1 to 5 Years Over 5 Years Total
(US$ in thousands)
December 31, 2016Interest bearing bank and other borrowings . . . . . . . . . . . . 117,991 578,298 203,992 900,281Redeemable convertible preference shares . . . . . . . . . . . . . 13,574 306,438 — 320,012Trade and other payables . . . . . . . . . . . . . . . . . . . . . . . . . . 21,970 — — 21,970Lease liabilities . . . . . . . . . . . . . . . . . . . . . . . . . . . . . . . . . . 1,415 3,123 — 4,538Financial liabilities at fair value through profit or loss . . . . — — 12,592 12,592Other non-current liabilities . . . . . . . . . . . . . . . . . . . . . . . . — — 10,662 10,662
Total . . . . . . . . . . . . . . . . . . . . . . . . . . . . . . . . . . . . . . . . . . 154,950 887,859 227,246 1,270,055
December 31, 2017Interest bearing bank and other borrowings . . . . . . . . . . . . 106,089 639,879 181,717 927,685Redeemable convertible preference shares . . . . . . . . . . . . . 13,648 309,121 — 322,769Trade and other payables . . . . . . . . . . . . . . . . . . . . . . . . . . 66,939 — — 66,939Lease liabilities . . . . . . . . . . . . . . . . . . . . . . . . . . . . . . . . . . 2,610 5,424 796 8,830Financial liabilities at fair value through profit or loss . . . . — — 13,671 13,671Other non-current liabilities . . . . . . . . . . . . . . . . . . . . . . . . — — 22,196 22,196
Total . . . . . . . . . . . . . . . . . . . . . . . . . . . . . . . . . . . . . . . . . . 189,286 954,424 218,380 1,362,090
December 31, 2018Interest bearing bank and other borrowings . . . . . . . . . . . . 505,154 931,709 248,482 1,685,345Redeemable convertible preference shares . . . . . . . . . . . . . 283,925 — — 283,925Trade and other payables . . . . . . . . . . . . . . . . . . . . . . . . . . 92,102 — — 92,102Lease liabilities . . . . . . . . . . . . . . . . . . . . . . . . . . . . . . . . . . 3,774 4,755 2,807 11,336Other non-current liabilities . . . . . . . . . . . . . . . . . . . . . . . . — — 35,766 35,766
Total . . . . . . . . . . . . . . . . . . . . . . . . . . . . . . . . . . . . . . . . . . 884,955 936,464 287,055 2,108,474
318

FINANCIAL INFORMATION
Less than 1 Year 1 to 5 Years Over 5 Years Total
(US$ in thousands)
June 30, 2019Interest bearing bank and other borrowings . . . . . . . . . . . . 756,789 2,231,129 185,688 3,173,606Redeemable convertible preference shares . . . . . . . . . . . . . 316,010 — — 316,010Trade and other payables . . . . . . . . . . . . . . . . . . . . . . . . . . 106,311 — — 106,311Lease liabilities . . . . . . . . . . . . . . . . . . . . . . . . . . . . . . . . . . 5,806 15,108 71,187 92,101Other non-current liabilities . . . . . . . . . . . . . . . . . . . . . . . . — — 40,925 40,925
Total . . . . . . . . . . . . . . . . . . . . . . . . . . . . . . . . . . . . . . . . . . 1,184,916 2,246,237 297,800 3,728,953
Equity price risk
Equity price risk is the risk that the fair values of equity securities decrease as a result ofchanges in the levels of equity indices and the value of individual securities. We are exposed to equityprice risk arising from individual equity investments classified as financial assets at fair value throughprofit or loss, financial assets at fair value through comprehensive income and available-for-saleinvestments as of December 31, 2016, 2017 and 2018 and June 30, 2019. Our listed investments arelisted on the Hong Kong Stock Exchange, the Stock Exchange of Singapore and Australian StockExchange and are valued at quoted market prices at the end of each 2016, 2017 and 2018 and as ofJune 30, 2019.
DIVIDENDS
We are a holding company incorporated under the laws of the Cayman Islands. Subject to theCayman Companies Law and our Articles of Association, the Directors may from time to time declaredividends (including interim dividends) and other distributions on Shares in issue and authorizepayment of the same out of the funds lawfully available therefor, including out of profits and from ourshare premium account, at their discretion; we, by ordinary resolution, may declare dividends, but nodividend shall exceed the amount recommended by the Directors; and the payment of any dividend orother distribution in specie shall be subject to the Directors’ approval and Shareholders’ approval byordinary resolution.
We paid a distribution of US$4.1 million, US$8.2 million and US$4.1 million to holders ofsubordinated perpetual capital securities in 2017 and 2018 and for the six months ended June 30, 2019,respectively. We did not declare or distribute any dividend to our Shareholders during the TrackRecord Period. We currently intend to retain most, if not all, of our available funds to operate andexpand our business. Following the completion of the Global Offering, we have no immediate plan topay any dividends to our Shareholders. However, the Board will review our dividend policy from timeto time in light of the following factors in determining whether dividends are to be declared and paid:our result of operations, our cash flows, our financial condition, our Shareholders’ interests, our capitalrequirements, the payment by our subsidiaries of cash dividends to us, general business conditions andstrategies, the economic climate and other factors the Board may deem relevant. Our future dividendpayments to our Shareholders will also depend upon the availability of dividends received from oursubsidiaries and the statutory fund reserve requirements in the jurisdiction of our subsidiaries. Forexample, PRC laws require that dividends be paid out of the net profit calculated according to PRCaccounting principles. PRC laws also require PRC enterprises to set aside part of their net profit asstatutory reserves before they make a distribution. These statutory reserves are not available fordistribution as cash dividends. The payment of dividends may also be limited by legal restrictions andby financing agreements that are existing and that we may enter into in the future. There can be noassurance that dividends of any amount will be declared or distributed in any year.
319

FINANCIAL INFORMATION
DISTRIBUTABLE RESERVES
As of December 31, 2016, 2017 and 2018 and for the six months ended June 30, 2019, ourCompany had reserves available for distribution to our members of US$495.0 million, US$871.3million, US$1,217.4 million and US$1,139.3 million, respectively. The Companies Law provides thatthe share premium account of a company incorporated in the Cayman Islands, such as our Company,may be applied in such manner as it may from time to time determine, subject to the provisions, if any,of its memorandum and articles of association, provided that no distribution or dividend may be paid toits members out of the share premium account unless, immediately following the date on which thedistribution or dividend is proposed to be paid, such company shall be able to pay its debts as they falldue in the ordinary course of business.
PROPERTY VALUATION
Beijing Colliers International Real Estate Valuation Co., Ltd., Cushman & Wakefield K.K. andJones Lang LaSalle Corporate Appraisal and Advisory Limited, and CBRE Limited have valuedinvestment properties we hold directly in the PRC, Japan and Australia at RMB10,189.0 million(approximately US$1,458.0 million), JPY89,320.4 million (approximately US$830.7 million) andAUD326.8 million (approximately US$221.9 million), respectively, as of September 30, 2019. Thetext of their respective letters, summaries of valuation and the valuation certificates are set forth inAppendix VI to this Prospectus.
The statement below shows the reconciliation of aggregate amounts of certain properties asreflected in our audited consolidated financial statements as of June 30, 2019 as set forth in“Accountants’ Report” in Appendix I to this Prospectus with the valuation of these properties as ofSeptember 30, 2019 as set forth in the section headed “Property Valuation” in Appendix VI to thisProspectus.
Investment Properties inthe PRC
Investment Properties inJapan
Investment Properties inAustralia
(RMB inmillions)
(US$ inmillions)
(JPY inmillions)
(US$ inmillions)
(AUD inmillions)
(US$ inmillions)
Fair value as of June 30, 2019 (audited) . . . 9,167.0 1,333.1 67,710.4 630.4 316.9 222.8Additions . . . . . . . . . . . . . . . . . . . . . . . . . . . . 639.4 91.5 9,744.0 90.6 — —Net gains from fair value adjustments . . . . . . 382.6 54.8 11,866.0 111.4 9.9 6.7Exchange realignment . . . . . . . . . . . . . . . . . . — (21.4) — (1.7) — (7.6)
Fair value as of September 30, 2019 setforth in the valuation reports . . . . . . . . . 10,189.0 1,458.0 89,320.4 830.7 326.8 221.9
LISTING EXPENSES
Our listing expenses in connection with the Global Offering consist primarily of underwritingcommission, incentive fees and professional fees, and are estimated to be approximately US$36.7million (assuming that the Global Offering is conducted at the mid-point of the Offer Price range).During the Track Record Period, we incurred listing expenses of US$10.1 million, of which US$8.0million was charged to our consolidated statements of comprehensive income during the Track RecordPeriod, while the remaining amount of US$2.1 million was included in prepayments and will besubsequently charged to equity upon completion of the Global Offering. We estimate that underwritingcommission, incentive fees and other listing expenses of approximately US$26.6 million will beincurred after June 30, 2019, of which approximately US$12.2 million will be charged to the
320

FINANCIAL INFORMATION
consolidated statements of comprehensive income and US$14.4 million will be charged to equity uponcompletion of the Global Offering.
NO MATERIAL ADVERSE CHANGE
After due and careful consideration, our Directors confirm that, up to the date of the Prospectus,there has been no material adverse change in our financial and trading position or prospects sinceJune 30, 2019, save as disclosed in the section headed “Summary—Recent Developments” in thisProspectus, and there has been no event since June 30, 2019 which would materially affect theinformation shown in the Accountants’ Report, the text of which is set out in Appendix I to thisProspectus.
UNAUDITED PRO FORMA STATEMENT OF ADJUSTED CONSOLIDATED NETTANGIBLE ASSETS OF THE GROUP
The following unaudited pro forma statement of adjusted consolidated net tangible assets of ourGroup prepared in accordance with Rule 4.29 of the Listing Rules is to illustrate the effect of theGlobal Offering on our consolidated net tangible assets attributable to the shareholders as of June 30,2019 as if the Global Offering had taken place on that date.
The unaudited pro forma adjusted consolidated net tangible assets has been prepared forillustrative purposes only and, because of its hypothetical nature, it may not give a true picture of ourconsolidated net tangible assets had the Global Offering been completed as of June 30, 2019 or at anyfuture dates.
Unadjusted AuditedConsolidated NetTangible Assets of
our GroupAttributable to the
Owners of theCompany as ofJune 30, 2019(1)
Estimated NetProceeds from theGlobal Offering(2)
Estimated ImpactRelated to theConversion of
Class CPreferenceShares
ImmediatelyPrior to the
Completion ofthe GlobalOffering(3)
Unaudited ProForma AdjustedConsolidated NetTangible Assets of
our GroupAttributable to
the Owners of theCompany
Unaudited ProForma AdjustedConsolidated Net
Tangible Assets PerShare(4)(5)
(US$ in thousands)(US$ in
thousands)(US$ in
thousands)(US$ in
thousands) (US$) (HK$)
Based on an OfferPrice of HK$14.58per Offer Share,after DownwardOffer PriceAdjustment of10% . . . . . . . . . . . . . 2,001,941 493,633 65,835 2,561,409 0.84 6.62
Based on an OfferPrice of HK$16.20per Share . . . . . . . . . 2,001,941 550,327 65,835 2,618,103 0.86 6.76
Based on an OfferPrice of HK$17.40per Share . . . . . . . . . 2,001,941 592,323 65,835 2,660,099 0.88 6.87
Notes:(1) The unadjusted audited consolidated net tangible assets of our Group attributable to the owners of the Company as of June 30, 2019 is
extracted from the Accountants’ Report set out in Appendix I to this Prospectus, which is based on the audited consolidated net assets ofour Group attributable to the owners of the Company as of June 30, 2019 of approximately US$2,438.9 million with an adjustment forthe intangible assets of US$96.7 million and goodwill of US$340.2 million as of June 30, 2019.
321

FINANCIAL INFORMATION
(2) The estimated net proceeds to be received by the Company from the Global Offering are based on the indicative Offer Price ofHK$16.20 and HK$17.40 per Share, and also based on an Offer Price of HK$14.58 per Offer Share after making a Downward OfferPrice Adjustment of 10%, after deduction of the underwriting fees and other related expenses payable by the Company (excluding listingexpenses of approximately US$8.0 million, which have been accounted for in the consolidated statement of comprehensive income priorto June 30, 2019) and assuming that all of the steps contained in the IPO Implementation Deed which are contemplated to take effectprior to the Global Offering have been effected as described in the section headed “History, Development and Corporate Structure—IPOImplementation Arrangements” in this Prospectus and assuming solely for the purposes of calculating the number of Shares in issue, thatthe Listing Date is Friday, November 1, 2019. The calculation of net proceeds mentioned in the section headed “Future Plans and Use ofProceeds” in this Prospectus represents the estimated gross proceeds less all listing expenses (including such amounts already incurred in2018 and 2019).
(3) Immediately prior to the completion of the Global Offering, 49,071,962 of the Class C Preference Shares will be converted into Class CShares, after which the carrying amounts of the US$65.8 million recorded as a liability of the Company will be transferred to theCompany’s equity. Accordingly, for the purpose of the unaudited pro forma financial information, the unaudited pro forma adjusted nettangible assets attributable to the owners of the Company will be increased by US$65.8 million, being the carrying amounts of suchClass C Preference Shares as of June 30, 2019.
(4) The unaudited pro forma adjusted net tangible assets per Share is arrived at after the adjustments referred to in the preceding paragraphsand on the basis that 3,036,243,839 Shares, 3,036,901,934 Shares and 3,035,183,478 Shares were in issue (including 280,140,000 NewShares) based on an Offer Price of HK$16.20 per Share, HK$17.40 per Share or HK$14.58 per Share, being the final Offer Price underthe Downward Offer Price Adjustment, respectively, and assuming that all of the steps contained in the IPO Implementation Deed whichare contemplated to take effect pursuant to such agreement have been effected as described in the section headed “History, Developmentand Corporate Structure—IPO Implementation Arrangements” in this Prospectus and assuming solely for the purposes of calculating thenumber of Shares in issue, that the Listing Date is Friday, November 1, 2019.
(5) Save as aforesaid, no adjustment has been made to the unaudited pro forma adjusted net tangible assets to reflect any trading results orother transactions of our Group entered into subsequently to June 30, 2019.
DISCLOSURE UNDER THE LISTING RULES
Our Directors confirmed that, except as otherwise disclosed in this Prospectus, as of the LatestPracticable Date, there has been no circumstance which, had we been required to comply with Rules13.13 to 13.19 in Chapter 13 of the Listing Rules, would give rise to a disclosure requirement underRules 13.13 to 13.19 of the Listing Rules.
FINANCIAL INFORMATION OF PROPERTYLINK
The Propertylink Acquisition
Propertylink became our non-wholly-owned subsidiary on March 20, 2019, prior to thecompletion of our acquisition of 100% of the securities of Propertylink in April 2019, which fallswithin the Track Record Period. Based on the historical financial information of Propertylink, suchacquisition has triggered the disclosure thresholds under Rule 4.05A of the Listing Rules. Therefore,we have included the pre-acquisition financial information of Propertylink for the fiscal years endedJune 30, 2016, 2017 and 2018, which are publically available on the ASX, and for the period fromJuly 1, 2018 to March 20, 2019, being the date on which Propertylink was consolidated into our Group,accompanied by the unaudited comparative consolidated statement of profit or loss and othercomprehensive income for the period from July 1, 2017 to March 31, 2018. See Appendices II-A andII-B to this Prospectus. We have also included in this sub-section a discussion and analysis of thefinancial information of Propertylink, subject to the following paragraphs:
(i) Three entities, Propertylink (Holdings) Limited (“PHL”), Propertylink Trust (“PT”) andPropertylink Australian Industrial Partnership (“PAIP”), together with their respectivesubsidiaries, were stapled to form Propertylink during the completion of its initial publicoffering on August 15, 2016 and listing on the ASX. Prior to the completion of the initialpublic offering of Propertylink in August 2016, PT and PHL were unlisted stapledsecurities, and PAIP was an unrelated legal entity of which the units were not stapled tothe units in PT and the shares in PHL. PAIP paid management fees to PHL during the yearended June 30, 2016 but PAIP was not consolidated into the unlisted stapled group of PHL
322

FINANCIAL INFORMATION
and PT for that year. Until December 31, 2015, PAIP was a private investment fund with aDecember 31 financial year end and was not required to lodge any accounts with anAustralian regulatory authority. As part of Propertylink’s listing process, PAIP publishedits audited accounts for the six months ended June 30, 2016 on the ASX pursuant to theASX’s requirements. Therefore, no consolidated financial statements were published forthe enlarged group of Propertylink comprising PHL, PT and PAIP for the year endedJune 30, 2016, and only separate audited financial statements for (i) PHL and PT for theyear ended June 30, 2016 and (ii) PAIP for the six months ended June 30, 2016 wereavailable;
(ii) The financial statements of Propertylink for the year ended June 30, 2017 include profitsgenerated by the unlisted stapled PHL and PT from July 1, 2016 to August 15, 2016, andprofits generated by the listed stapled group of Propertylink from August 16, 2016 toJune 30, 2017. The profits of the unlisted PHL and PT up to August 15, 2016 includedmanagement fees paid by PAIP prior to completion of Propertylink’s initial public offeringin August 2016. The financial statements of Propertylink for the year ended June 30, 2017include comparative figures for the year ended June 30, 2016. However, the financialstatements of Propertylink for the year ended June 30, 2017 comprised the financial resultsof PHL, PT and PAIP whereas the comparative financial information for the year endedJune 30, 2016 only included the financial results of PHL and PT. As such, the comparativeinformation between these two years is not directly comparable and does not provide abasis for meaningful comparison. Therefore, we have not included any commentarycomparing the financial information of Propertylink between these two years; and
(iii) The financial statements of Propertylink for the year ended June 30, 2018 includecomparative figures for the year ended June 30, 2017. As explained above, suchcomparative figures for the year ended June 30, 2017 only reflect the contribution of PAIPfor 10.5 months.
For more details of Propertylink’s pre-acquisition financial information, see the financialstatements of PAIP for the period from January 1, 2016 to June 30, 2016, the financial statements ofPHL and PT for the year ended June 30, 2016, the financial statements of Propertylink for the yearsended June 30, 2017 and 2018, the financial statements of Propertylink for the period from July 1,2018 to March 20, 2019 and the unaudited consolidated statement of profit or loss and othercomprehensive income for the period from July 1, 2017 to March 31, 2018 set out in Appendices II-Aand II-B to this Prospectus.
The inclusion of this sub-section and the pre-acquisition financial information of Propertylink isto provide potential investors with a high level discussion of the results of operations of Propertylinkfor the stated periods only. Potential investors are cautioned not to unduly rely on the informationcontained in this sub-section and the pre-acquisition financial information of Propertylink, as we didnot control or direct the business or management of Propertylink during those periods. We cannotassure you that we will maintain the same or similar growth and profitability of Propertylink as it hadachieved prior to its consolidation with our Group in March 2019. Furthermore, the pre-acquisitionfinancial information of Propertylink does not represent our Group’s consolidated results during thoseperiods or indicate our Group’s future performance.
323
FINANCIAL INFORMATION
Events after Balance Sheet Date
De-stapling of PHL, PT and PAIP and Internal Restructuring
The following events occurred or may occur after March 20, 2019, being the latest balancesheet date of Propertylink’s financial statements for the period from July 1, 2018 to March 20, 2019.
Following our acquisition, Propertylink was removed from the official list of the ASX onApril 26, 2019. The three entities that comprised Propertylink were de-stapled on May 30, 2019.
Following our acquisition, we have caused Propertylink to undergo a series of restructurings inorder to integrate our Australian platform, streamline our group structure and prepare us for potentialrecycling of assets of Propertylink to new funds and investment vehicles managed by us, which isconsistent with our overall strategy. As a result, PHL has become a subsidiary of our Australianmanagement company, and PT and PAIP have become subsidiaries of the respective Australianinvestment entities within our Group. We have refinanced secured loans of PAIP in order to align withour Group’s strategy for financing our Australian operations.
As of March 20, 2019, being the date on which Propertylink was consolidated into our Group,Propertylink managed 58 industrial and office properties, including assets managed under its co-invested external funds as well as assets held under its wholly-owned industrial portfolio. The majorityof these assets were fully developed as Propertylink was not heavily engaged in development. In linewith our capital recycling strategy, we are planning various options including owning and managingcertain assets within our Group, as well as transferring certain assets into new funds and investmentvehicles managed by us. Currently, we cannot assure you that we will be able to complete suchtransfers in the near future.
Description of Major Components of the Consolidated Statement of Profit or Loss and OtherComprehensive Income of Propertylink
Revenue
Revenue includes property revenue, management fee revenue and share of net profit of jointventures generated by Propertylink.
Property revenue
Property revenue includes rental income, outgoings recovery income, straight-lining leaseincentives and make good recovery. Rental income arising from operating leases on investmentproperty is accounted for on a straight-line basis over the lease terms and is included in revenue in theconsolidated statement of profit or loss. Initial direct costs incurred in negotiating and arranging anoperating lease are capitalized, then recognized as an expense over the lease term on the same basis asthe lease income.
Management fee revenue
Management fee revenue includes performance fees, acquisition fees, investment managementfees, property management fees and other property services fees, which are recognized as follows:
(i) performance fees are generally only entitled to be charged on the sale of all assets of afund, so such fees are only recognized when all assets of a particular fund have been soldand Propertylink is entitled to charge fees;
324
FINANCIAL INFORMATION
(ii) acquisition and other transaction related fees are recognized when the service has beenprovided and Propertylink is entitled to charge fees; and
(iii) investment and property management services are provided on a monthly basis andrevenue is recognized each month.
Share of net profit of joint ventures
Propertylink’s share of net profit of joint ventures represents primarily the share of profits of itsmaterial joint ventures, which are controlled jointly with external investors, less its share of losses, ifany, of these joint ventures, adjusted where necessary to reflect any differences in accounting policiesbetween Propertylink and the investees. These joint ventures were formed in Australia and theirprincipal activity is property investment in Australia. See Note 11(b) to each of Propertylink’s financialstatements for the years ended June 30, 2017 and June 30, 2018 set out in Appendices II-A and II-B tothis Prospectus.
Other income
Other income primarily includes net fair value gain on investment property.
Net fair value gain on investment property
Investment property comprises completed property and property under construction or re-development (including integral plant and equipment) that are held to earn rentals and for capitalappreciation.
Investment property is measured initially at cost, including transaction costs. The carryingamount also includes capital expenditure on investment property and components relating to leaseincentives and assets relating to fixed increases in operating lease rentals in future periods.
Subsequent to initial recognition, investment property is stated at fair value, which reflectsmarket conditions at the reporting date. Gains or losses arising from changes in the fair values ofinvestment properties are included in profit or loss in the period in which they arise.
Expenses
The expenses of Propertylink consist primarily of property expenses, employment andmanagement costs, finance costs, occupancy costs, travel expenses, legal and consultancy fees,depreciation and amortization expenses, and administration and other expenses.
Period-to-Period Comparison of Results of Operations of Propertylink
Period from July 1, 2018 to March 20, 2019 Compared to Period from July 1, 2017 to March 31,2018
During the period from July 1, 2018 to March 20, 2019, Propertylink engaged in corporateactivities which initially involved launching a bid to acquire Centuria, the initial phase of whichresulted in the acquisition of approximately 17.7% of the entity. We then launched our own bid toacquire Propertylink, which was ultimately successful. The costs associated with these corporateactivities were AUD16.8 million (approximately US$11.4 million). Propertylink’s total comprehensive
325

FINANCIAL INFORMATION
income decreased by 37.1% from AUD92.9 million (approximately US$63.2 million) for the periodended March 31, 2018 to AUD58.4 million (approximately US$39.8 million) for the period endedMarch 20, 2019.
Revenue
Property revenue
Property revenue decreased by 1.5% from AUD47.6 million (approximately US$32.4 million)for the period ended March 31, 2018 to AUD46.9 million (approximately US$31.9 million) for theperiod ended March 20, 2019. While the periods are closely comparable, the period ended March 20,2019 spanned 263 days, or 4.0% lower than the period ended March 31, 2018, a period of 274 days.
Management fee revenue
Management fee revenue decreased by 61.3% from AUD29.3 million (approximately US$19.9million) for the period ended March 31, 2018 to AUD11.3 million (approximately US$7.7 million) forthe period ended March 20, 2019, primarily due to a decrease in performance fees (which aretransactional in nature) from AUD22.3 million (approximately US$15.2 million) for the period endedMarch 31, 2018 to AUD3.7 million (approximately US$2.5 million) for the period ended March 20,2019.
Share of net profit of joint ventures
Share of net profit of joint ventures of Propertylink decreased marginally by 1.0% fromAUD15.9 million (approximately US$10.9 million) for the period ended March 31, 2018 to AUD15.8million (approximately US$10.8 million) for the period ended March 20, 2019.
Other income
Net fair value gain on investment property
Net fair value gain on investment property decreased by 6.1% from AUD28.4 million(approximately US$19.3 million) for the period ended March 31, 2018 to AUD26.7 million(approximately US$18.1 million) for the period ended March 20, 2019 due to minor fluctuations inproperty valuations.
Listed entity distributions
The period ended March 20, 2019 recorded AUD5.9 million (approximately US$4.0 million) indistributions received or accrued from the investment in Centuria.
Expenses
Expenses increased by 54.6% from AUD34.4 million (approximately US$23.4 million) for theperiod ended March 31, 2018 to AUD53.3 million (approximately US$36.2 million) for the periodended March 20, 2019. This increase was largely attributable to (i) the incurrence of AUD16.8(approximately US$11.4 million) million in one-off corporate activity costs and (ii) increased financecosts of AUD7.0 million (approximately US$4.7 million). The above increase was partly offset by (i) adecrease in property expenses (largely due to the change in accounting treatment of leased assets in theperiod ended March 20, 2019) and (ii) the reduction in employment costs of AUD1.4 million(approximately US$1.0 million) due to reduced bonus payments.
326

FINANCIAL INFORMATION
Profit before income tax
As a result of the foregoing, profit before income tax decreased by 36.8% from AUD87.1million (approximately US$59.3 million) for the period ended March 31, 2018 to AUD55.0 million(approximately US$37.4 million) for the period ended March 20, 2019.
Year Ended June 30, 2018 Compared to Year Ended June 30, 2017
Significant events in the year ended June 30, 2018 include the sale of 320 Pitt Street whichresulted in a significant performance fee, increased co-investments, and the acquisition of 18-20 OrionRoad, Lane Cove (the “Lane Cove Property”). Propertylink’s total comprehensive income increasedby 63.8% from AUD87.2 million for the year ended June 30, 2017 to AUD142.8 million(approximately US$97.2 million) for the year ended June 30, 2018.
Revenue
Property revenue
Property revenue increased by 13.5% from AUD57.4 million for the year ended June 30, 2017to AUD65.1 million (approximately US$44.3 million) for the year ended June 30, 2018, primarilydriven by (i) an increase in rental income in 2018 due to the acquisition the Lane Cove Property andthe increases in tenant occupancy and rental rates; and (ii) the recording of full-year rental income forthe year ended June 30, 2018 as compared to the recording of rental income for a period of 10.5months for the year ended June 30, 2017.
Management fee revenue
Management fee revenue decreased by 15.3% from AUD37.2 million for the year endedJune 30, 2017 to AUD31.5 million (approximately US$21.4 million) for the year ended June 30, 2018,primarily due to (i) a decrease in performance fees, which are transactional in nature, from AUD25.2million for the year ended June 30, 2017 to AUD22.3 million (approximately US$15.2 million) for theyear ended June 30, 2018; and (ii) a decrease in property acquisition fees from AUD2.7 million for theyear ended June 30, 2017 to AUD0.7 million (approximately US$0.5 million) for the year endedJune 30, 2018 driven by fewer property acquisitions in the external funds managed by Propertylink.
Share of net profit of joint ventures
Share of net profit of joint ventures of Propertylink increased by 132.0% from AUD8.5 millionfor the year ended June 30, 2017 to AUD19.8 million (approximately US$13.5 million) for the yearended June 30, 2018, partly due to increased co-investments and partly to higher share of valuationuplifts.
Other income
Net fair value gain on investment property
Net fair value gain on investment property increased by 108.0% from AUD27.8 million for theyear ended June 30, 2017 to AUD57.9 million (approximately US$39.4 million) for the year endedJune 30, 2018, due to the increase in the valuations of the existing investment properties driven bycapital expenditure on property improvements, increased occupancy rates, higher rental rate growthand compression in capitalization rates.
327

FINANCIAL INFORMATION
Expenses
Expenses decreased by 19.9% from AUD57.8 million for the year ended June 30, 2017, whichwas mainly attributable to the incurrence of one-off expenses of AUD16.9 million in connection withPropertylink’s initial public offering in August 2016, to AUD46.3 million (approximately US$31.5million) for the year ended June 30, 2018. The above decrease was offset by (i) an increase in propertyexpenses for the year ended June 30, 2018 primarily attributable to the recording of full-year propertyexpenses for the year ended June 30, 2018 as compared to the recording of 10.5-month propertyexpenses for the year ended June 30, 2017 and (ii) the incurrence of employment costs of AUD1.5million (approximately US$1.0 million) for outperformance bonuses under Propertylink’s short termincentive plan.
Profit before income tax
As a result of the foregoing, profit before income tax increased by 62.6% from AUD79.2million for the year ended June 30, 2017 to AUD128.7 million (approximately US$87.6 million) forthe year ended June 30, 2018.
328

FUTURE PLANS AND USE OF PROCEEDS
FUTURE PLANS
See the section headed “Business—Competitive Strengths and Strategies—Strategies” in thisProspectus for a detailed description of our future plans.
USE OF PROCEEDS
Assuming an Offer Price of HK$16.80 per Offer Share (being the mid-point of the stated rangeof the Offer Price of between HK$16.20 and HK$17.40 per Offer Share) and regardless of whether theOffer Size Adjustment Option and Over-allotment Option are exercised, we estimate that we willreceive net proceeds of approximately HK$4,418.8 million (approximately US$563.3 million) from theGlobal Offering after deducting the underwriting commissions and other estimated expenses inconnection with the Global Offering. We intend to use the net proceeds from the Global Offering forthe following purposes and in the amounts set out below, subject to changes in light of our evolvingbusiness needs and changing market conditions:
Š approximately 71.7%, or HK$3,168.2 million (approximately US$403.9 million), for therepayment of the Hana Notes that were issued in November 2016 and redemption of theClass C Preference Shares that were issued in December 2016 and that have not beenconverted into ordinary shares. Of this amount, HK$2,353.2 million (approximatelyUS$300.0 million) will be used for the repayment of the Hana Notes, and HK$815.0million (approximately US$103.9 million) will be used for the redemption of the Class CPreference Shares. See the sections headed “Financial Information—Indebtedness—BankLoans and Other Borrowings” and “—Redeemable Convertible Preference Shares” in thisProspectus for further details; and
Š approximately 28.3%, or HK$1,250.6 million (approximately US$159.4 million), for thedevelopment of logistics properties on our own balance sheet and making co-investmentsin the funds and investment vehicles we manage.
After deducting the underwriting fees, commissions and estimated expenses payable by us inrelation to the Global Offering, we estimate that we will receive net proceeds of approximatelyHK$4,583.5 million (approximately US$584.3 million) from the Global Offering, assuming the OfferPrice is determined to be HK$17.40 per Offer Share, being the high-end of the indicative Offer Pricerange stated in this Prospectus and approximately HK$4,254.1 million (approximately US$542.3million), assuming the Offer Price is determined to be HK$16.20 per Offer Share, being the low-end ofthe indicative Offer Price range stated in this Prospectus. If we make a Downward Offer PriceAdjustment to set the final Offer Price of HK$14.58 per Offer Share, the net proceeds we will receivefrom the Global Offering will be approximately HK$3,809.4 million (approximately US$485.6million).
To the extent that our actual net proceeds from the Global Offering is higher or lower than ourestimate above, we will increase or decrease our allocation of the net proceeds for the purposes set outabove after the repayment of the Hana Notes and the redemption of the Class C Preference Shares thatare not converted.
To the extent that the net proceeds of the Global Offering we receive are not immediately usedfor the purposes above, we may allocate part or all of the proceeds to short-term interest-bearing
329

FUTURE PLANS AND USE OF PROCEEDS
deposits or money-market instruments with licensed banks or authorized financial institutions in HongKong.
We will issue announcements, where required, if there is any material change in the use ofproceeds mentioned above.
Selling Shareholder Proceeds
We will not receive any proceeds from the sale of the Sale Shares (including the proceeds ofany Sale Shares sold pursuant to the exercise of the Offer Size Adjustment Option or the exercise ofthe Over-allotment Option).
Assuming the Offer Price of HK$16.80 per Offer Share, being the midpoint of the indicativeOffer Price range, and after deducting the underwriting fees and commissions payable by the SellingShareholders in relation to the Global Offering, we estimate that the Selling Shareholders will receivenet proceeds of approximately HK$6,149.5 million (approximately US$784.0 million) assuming noexercise of the Offer Size Adjustment Option or the Over-allotment Option; HK$7,763.7 millionapproximately US$989.7 million) assuming no exercise of the Offer Size Adjustment Option and theOver-allotment Option is exercised in full; HK$7,763.7 million (approximately US$989.7 million)assuming the Offer Size Adjustment Option is exercised in full and the Over-allotment Option is notexercised; HK$9,620.0 million (approximately US$1,226.4 million) assuming the Offer SizeAdjustment Option and Over-allotment Option are both exercised in full. If we make a DownwardOffer Price Adjustment to set the Final Offer Price of HK$14.58 per Offer Share, we estimate that theSelling Shareholders will receive net proceeds of HK$5,336.9 million (approximately US$680.4million) assuming the Over-allotment Option is not exercised and HK$6,737.8 million (approximatelyUS$859.0 million) assuming the Over-allotment Option is exercised in full.
330

CORNERSTONE INVESTOR
THE CORNERSTONE PLACING
We entered into a cornerstone investment agreement with OMERS Administration Corporation(“OMERS”) as cornerstone investor (the “Cornerstone Investor”), pursuant to which the CornerstoneInvestor has agreed to subscribe for, at the Offer Price, such number of Offer Shares which uponcompletion of the Global Offering will represent nine (9) per cent of our share capital (regardless ofwhether the Offer Size Adjustment Option and/or the Over-allotment Option are exercised), roundeddown to the nearest whole board lot (the “Cornerstone Placing”).
Founded in 1962, OMERS is one of Canada’s largest defined benefit pension plans, with morethan C$97 billion in net assets as at December 31, 2018. A jointly-sponsored pension plan, withapproximately 1,000 participating employers, OMERS invests and administers pensions on behalf ofalmost half a million active and retired members. OMERS members include union and non-unionemployees of municipalities, school boards, transit systems, electrical utilities, emergency services andchildren’s aid societies across Ontario. Contributions are funded equally by members and employers.OMERS has employees in Toronto, London, New York, Amsterdam, Luxembourg, Singapore, Sydneyand other major cities across North America and Europe, originating and managing a diversifiedportfolio of high-quality investments in public markets, private equity, infrastructure and real estate.
The Cornerstone Placing is part of OMERS strategy to continue investing in a growing regionthat offers opportunities across the asset classes where it is active. Our Company hopes that theinvestment of the Cornerstone Investor will be the start of a larger collaboration with OMERS and itsaffiliates. Our Company believes that the commitment of the Cornerstone Investor to the CornerstonePlacing will demonstrate to potential investors confidence in our business and prospects from leadinginternational investors.
The subscription amount for the Cornerstone Placing, regardless of whether the Offer SizeAdjustment Option and/or the Over-allotment Option are exercised or not, are as follows:
Assuming an OfferPrice of HKD14.58
per Offer Share, beingthe minimum OfferPrice after exercisingthe Downward OfferPrice Adjustment
Assuming an OfferPrice of HKD16.20
per Offer Share, beingthe low-end of theOffer Price Range
Assuming an OfferPrice of HKD16.80
per Offer Share, beingthe mid-point of theOffer Price Range
Assuming an OfferPrice of HKD17.40
per Offer Share, beingthe high-end of theOffer Price Range
Subscription amount . . . . . HK$3,984,606,108 HK$4,427,340,120 HK$4,591,315,680 HK$4,755,291,240
The Cornerstone Placing will form part of the International Placing and the CornerstoneInvestor will not subscribe for any Offer Shares under the Global Offering (other than and pursuant tothe cornerstone investment agreement). The Offer Shares to be subscribed for by the CornerstoneInvestor will rank pari passu in all respects with the other fully paid Shares in issue upon completion ofthe Global Offering and will be counted towards the public float of the Company. Immediatelyfollowing the completion of the Global Offering, the Cornerstone Investor will not have any boardrepresentation in the Company, nor will it become a substantial shareholder of the Company (asdefined under the Listing Rules). The Cornerstone Investor is a corporation without share capital,established under legislation of the Province of Ontario, Canada, and does not have any shareholders.The Cornerstone Investor confirmed that it has obtained all necessary approvals to invest in ourCompany, and it expects to fund the consideration for the Cornerstone Placing with its internalresources.
331
CORNERSTONE INVESTOR
The Offer Shares to be subscribed for by the Cornerstone Investor will not be affected by anyreallocation of the Offer Shares between the International Placing and the Hong Kong Public Offeringin the event of over-subscription under the Hong Kong Public Offering as described in the sectionheaded “Structure of the Global Offering—The Hong Kong Public Offering” in this Prospectus.Pursuant to the terms of the cornerstone investment agreement, the Cornerstone Investor will not beable to defer settlement in payment and there will not be delayed delivery of Offer Shares subscribedby the Cornerstone Investor under the Cornerstone Placing.
To the best knowledge of our Company, the Cornerstone Investor is an independent third partyand independent of our connected persons and their respective close associates. In addition, ourCompany confirms that (i) there are no side agreements or arrangements between our Group and theCornerstone Investor entered into between our Group and the Cornerstone Investor for the purpose ofthe Cornerstone Placing; (ii) it became acquainted with the Cornerstone Investor through introductionby an Underwriter in the Global Offering; (iii) the Cornerstone Investor is not accustomed to takeinstructions from our Company, our Directors, chief executive of our Company, substantialShareholders or existing Shareholders or any of its subsidiaries or their respective close associates; (iv)the subscription of Offer Shares by the Cornerstone Investor is not financed by our Company, ourDirectors, chief executive, substantial Shareholders, or existing Shareholders or any of its subsidiariesor their respective close associates.
CONDITIONS PRECEDENT
The subscription by the Cornerstone Investor is subject to, among other things, the followingconditions precedent:
(i) the underwriting agreements for the Hong Kong Public Offering and the InternationalPlacing being entered into and having become effective and unconditional (in accordancewith their respective original terms or as subsequently waived or varied by agreement ofthe parties thereto) by no later than the time and date as specified in these underwritingagreements, and neither of the aforesaid underwriting agreements having been terminated;
(ii) the Offer Price having been agreed upon between our Company (for itself and on behalf ofthe Selling Shareholders) and the Joint Global Coordinators (for themselves and on behalfof the underwriters of the Global Offering);
(iii) the Listing Committee of the Stock Exchange having granted the approval for the listingof, and permission to deal in, the Shares (including the Shares to be subscribed by theCornerstone Investor as well as other applicable waivers and approvals) and suchapproval, permission or waiver having not been revoked prior to the commencement ofdealings in the Shares on the Stock Exchange;
(iv) no laws shall have been enacted or promulgated by any governmental authority whichprohibits the consummation of the transactions contemplated in the Global Offering or inthe cornerstone investment agreement and there shall be no orders or injunctions from acourt of competent jurisdiction in effect precluding or prohibiting consummation of suchtransactions; and
(v) the representations, warranties, undertakings, confirmations and acknowledgements of theCornerstone Investor under the cornerstone investment agreement are accurate and true inall material respects and not misleading and that there is no material breach of thecornerstone investment agreement on the part of the Cornerstone Investor.
332

CORNERSTONE INVESTOR
RESTRICTIONS ON DISPOSALS BY THE CORNERSTONE INVESTOR
The Cornerstone Investor has agreed, covenanted with and undertaken to the Company and theJoint Sponsors that, the Cornerstone Investor will not, at any time during the period of six months fromthe Listing Date (the “Lock-up Period”), directly or indirectly, (a) dispose of, in any way, any Sharesto be subscribed by the Cornerstone Investor pursuant to the cornerstone investment agreement (the“Relevant Shares”) or any interest in any company or entity holding any Relevant Shares, includingany securities convertible into or exchangeable or exercisable for or that represent the right to receiveany of the foregoing securities; (b) agree or contract to, or publicly announce any intention to enter intoa transaction with a third party for disposal of the Relevant Shares; (c) allow itself to undergo a changeof control (as defined in the Takeovers Code) at the level of its ultimate beneficial owner; or (d) enterinto any transactions directly or indirectly with the same economic effect as any aforesaid transaction.
333

UNDERWRITING
HONG KONG UNDERWRITERS
Morgan Stanley Asia LimitedDeutsche Bank AG, Hong Kong BranchCCB International Capital LimitedChina International Capital Corporation Hong Kong Securities LimitedCitigroup Global Markets Asia LimitedCLSA LimitedCrédit Agricole Corporate and Investment Bank, Hong Kong BranchCredit Suisse (Hong Kong) LimitedDBS Asia Capital LimitedGoldman Sachs (Asia) L.L.C.Mirae Asset Securities (HK) LimitedUOB Kay Hian (Hong Kong) Limited
UNDERWRITING
This Prospectus is published solely in connection with the Hong Kong Public Offering. TheHong Kong Public Offering is fully underwritten by the Hong Kong Underwriters on a conditionalbasis. The International Placing is expected to be fully underwritten by the International Underwriters.If, for any reason, the Offer Price is not agreed between the Joint Global Coordinators (on behalf of theUnderwriters) and the Company (for itself and on behalf of the Selling Shareholders), the GlobalOffering will not proceed and will lapse.
The Global Offering comprises the Hong Kong Public Offering of initially 34,700,000 HongKong Public Offer Shares and the International Placing of initially 618,980,000 International PlacingShares, subject, in each case, to reallocation on the basis as described in the section headed “Structureof the Global Offering” in this Prospectus, the Offer Size Adjustment Option and the Over-allotmentOption (in the case of the International Placing).
UNDERWRITING ARRANGEMENTS AND EXPENSES
Hong Kong Public Offering
Hong Kong Underwriting Agreement
The Hong Kong Underwriting Agreement was entered into on October 21, 2019. Pursuant tothe Hong Kong Underwriting Agreement and subject to the Offer Size Adjustment Option, theCompany is offering the Hong Kong Public Offer Shares for subscription on the terms and conditionsset out in this Prospectus, the Application Forms and the Hong Kong Underwriting Agreement at theOffer Price.
Subject to: (a) the Listing Committee granting approval for the listing of, and permission todeal in, the Shares in issue and to be issued pursuant to the Global Offering on the Main Board of theStock Exchange and such approval not having been withdrawn and; (b) certain other conditions set outin the Hong Kong Underwriting Agreement, the Hong Kong Underwriters have agreed severally butnot jointly to procure subscribers for, or themselves to subscribe for, their respective applicableproportions of the Hong Kong Public Offer Shares being offered which are not taken up under theHong Kong Public Offering on the terms and conditions set out in this Prospectus, the ApplicationForms and the Hong Kong Underwriting Agreement.
334

UNDERWRITING
As part of the Global Offering, the Offer Size Adjustment Option Grantors have granted theOffer Size Adjustment Option to the Hong Kong Underwriters under the Offer Size Adjustment Deed,exercisable by the Joint Global Coordinators (on behalf of the Hong Kong Underwriters) on or beforethe Price Determination Date, pursuant to which, the Offer Size Adjustment Option Grantors may berequired to sell any number of Shares up to an aggregate of 98,052,000 Shares under the GlobalOffering, at the Offer Price, to cover additional market demand, if any. The additional Offer Shares, ifany, will be allocated so as to maintain the proportionality between the Hong Kong Public Offeringand the International Placing following the application of the clawback arrangement described in“—The Hong Kong Public Offering—Reallocation” below and the Joint Global Coordinators shallallocate additional new Shares to be offered by the Company pursuant to the International Placing tothe Hong Kong Public Offering in order maintain such proportionality and the Offer Size AdjustmentOption Shares shall be allocated to the International Placing.
The Hong Kong Underwriting Agreement is conditional on, among other things, theInternational Underwriting Agreement having been executed and becoming unconditional and nothaving been terminated in accordance with its terms.
Grounds for Termination
If any of the events set out below occur at any time prior to 8:00 a.m. on the Listing Date, theJoint Global Coordinators (for themselves and on behalf of the Hong Kong Underwriters) in their solediscretion may, by giving notice to the Company, terminate the Hong Kong Underwriting Agreementwith immediate effect:
(a) there develops, occurs, exists or comes into force:
(i) any event, or series of events, in the nature of force majeure (including, withoutlimitation, any acts of government, declaration of a national or internationalemergency or war, calamity, crisis, epidemic, pandemic, large scale outbreaks ofdiseases, economic sanctions (other than those publicly proposed or threatened onor prior to the date hereof), strikes, labor disputes, lock-outs, fire, explosion,flooding, earthquake, civil commotion, riots, public disorder, acts of war, outbreakor escalation of hostilities, acts of God or acts of terrorism (whether or notresponsibility has been claimed)) in or affecting Australia, the Cayman Islands,Hong Kong, India, Japan, Singapore, South Korea, the PRC, the United States, theUnited Kingdom or the European Union (or any member thereof) (collectively, the“Relevant Jurisdictions”);
(ii) any change or development involving a prospective change, or any event orcircumstances or series of events likely to result in any change or developmentinvolving a prospective change, in any local, national, regional or internationalfinancial, economic, political, military, industrial, legal, fiscal, regulatory, currency,credit or market matters or conditions, equity securities or exchange control or anymonetary or trading settlement system or other financial markets (including,without limitation, conditions in the stock and bond markets, money and foreignexchange markets and credit markets), in or affecting any of the RelevantJurisdictions;
(iii) any moratorium, suspension or restriction (including, without limitation, anyimposition of or requirement for any minimum or maximum price limit or price
335

UNDERWRITING
range) in or on trading in securities generally on the Stock Exchange, the New YorkStock Exchange, the NASDAQ Global Market, the London Stock Exchange or theShanghai Stock Exchange;
(iv) any general moratorium on commercial banking activities in Hong Kong (imposedby the Financial Secretary or the Hong Kong Monetary Authority or othercompetent authority), New York (imposed at the U.S. Federal or New York Statelevel or by any other competent authority) or any of the other Relevant Jurisdictions(declared by the relevant authorities) or any disruption in commercial banking orforeign exchange trading or securities settlement or clearance services, proceduresor matters in or affecting any of the Relevant Jurisdictions;
(v) any new law or regulation or any change or development involving a prospectivechange in existing laws or regulations or any change or development involving aprospective change in the interpretation or application thereof by any court or anyadministrative, governmental or regulatory commission, board, body, authority oragency, or any stock exchange, self-regulatory organization or other non-governmental regulatory authority, or any court, tribunal or arbitrator, in each casewhether national, central, federal, provincial, state, regional, municipal, local,domestic, foreign or supranational in or affecting any of the Relevant Jurisdictions;
(vi) an order or petition for the winding up or liquidation of any member of the Groupor any composition or arrangement made by any member of the Group with itscreditors or a scheme of arrangement entered into by any member of the Group orany resolution for the winding-up of any member of the Group or the appointmentof a provisional liquidator, receiver or manager over all or part of the assets orundertaking of any member of the Group or anything analogous thereto occurring inrespect of any member of the Group;
(vii) any litigation, dispute, legal action or claim or regulatory or administrativeinvestigation or action being threatened or instigated against any member of theGroup;
(viii) any contravention by the Company or any member of the Group of any applicablelaws and regulations including the Listing Rules;
(ix) any non-compliance of this prospectus (or any other documents used in connectionwith the contemplated subscription and sale of the Offer Shares) or any aspect ofthe Global Offering with the Listing Rules or any other applicable laws andregulations;
(x) there is an event, act or omission which gives or is likely to give rise to any liabilityof the Company or any of the Selling Shareholders pursuant to the indemnitiesgiven by any of them under the Hong Kong Underwriting Agreement or theInternational Underwriting Agreement, as applicable;
(xi) there is a breach of, or any event or circumstance rendering untrue, incorrect,incomplete or misleading in any respect, any of the warranties given by theCompany or any of the Selling Shareholders in the Hong Kong UnderwritingAgreement or the International Underwriting Agreement, as applicable;
(xii) any Director or member of senior management of the Company is being chargedwith an indictable offense or is prohibited by operation of law or otherwise
336

UNDERWRITING
disqualified from taking part in the management of a company or there is thecommencement by any governmental, political or regulatory body of anyinvestigation or other action against any Director in his or her capacity as such orany member of the Group or an announcement by any governmental, political orregulatory body that it intends to commence any such investigation or take any suchaction; or
(xiii) there is any order or petition for the winding-up of any member of the Group or anycomposition or arrangement made by any member of the Group with its creditors ora scheme of arrangement entered into by any member of the Group or anyresolution for the winding-up of any member of the Group or the appointment of aprovisional liquidator, receiver or manager over all or part of the material assets orundertaking of any member of the Group or anything analogous thereto occurring inrespect of any member of the Group,
which, individually or in the aggregate, in the sole opinion of the Joint GlobalCoordinators (for themselves and on behalf of the Hong Kong Underwriters):
(1) results or will or may result in a material adverse change, or any developmentinvolving a prospective material adverse change, in or affecting the condition(financial or otherwise), business, operations, general affairs, management,earnings, prospects, assets and liabilities, financial position, shareholders’ equity orresults of operations of the Group, taken as a whole;
(2) has or will have or may have a material adverse effect on the success ormarketability of the Global Offering or the level of applications or the distributionof the Offer Shares under the Hong Kong Public Offering or the level of interestunder the International Placing;
(3) makes or will make or is likely to make it inadvisable, inexpedient, impracticable orincapable for the Hong Kong Public Offering and/or the International Placing toproceed or to market the Global Offering or the delivery or distribution of the OfferShares on the terms and in the manner contemplated by the Offering Documents (asdefined below); or
(4) has or will or may have the effect of making any material part of the Hong KongUnderwriting Agreement (including underwriting) incapable of performance inaccordance with its terms or preventing the processing of applications and/orpayments pursuant to the Global Offering or pursuant to the underwriting thereof;or
(b) there has come to the notice of the Joint Global Coordinators that:
(i) any statement contained in this prospectus, the Application Forms, the formalnotice in connection with the Hong Kong Public Offering and/or any notices,announcements, advertisements, communications or other documents (includingany announcement, circular, document or other communication pursuant to theHong Kong Underwriting Agreement) issued or used by or on behalf of theCompany in connection with the Hong Kong Public Offering (including anysupplement or amendment thereto (the “Offering Documents”) but excludinginformation relating to the Underwriters) was, when it was issued, or has become,untrue, incorrect, inaccurate, incomplete in any material respects or misleading or
337

UNDERWRITING
deceptive, or that any estimate, forecast, expression of opinion, intention orexpectation contained in any of such documents is not fair and honest and based onreasonable grounds or reasonable assumptions when taken as a whole;
(ii) any matter has arisen or has been discovered which would, had it arisen or beendiscovered immediately before the date of this prospectus, constitute a materialomission from, or misstatement in, any of the Offering Documents;
(iii) there is a material breach of any of the obligations imposed upon the Company orany of the Selling Shareholders under the Hong Kong Underwriting Agreement orthe International Underwriting Agreement, as applicable;
(iv) there is any material adverse change or development or likely to be any prospectivematerial adverse change or development in the assets, liabilities, general affairs,business, management, prospects, shareholders’ equity, profits, losses, earnings,results of operations, performance, position or condition, financial or otherwise, ofthe Group as a whole;
(v) the approval of the Listing Committee of the listing of, and permission to deal in,the Shares in issue and to be issued pursuant to the Global Offering, the KM ESOP,Tier 1 ESOP and Post-IPO Share Option Scheme, other than subject to customaryconditions, is not granted on or before the date of the Listing, or if granted, theapproval is subsequently withdrawn, canceled, qualified (other than by customaryconditions), revoked or withheld;
(vi) any person (other than any of the Joint Sponsors) has withdrawn its consent to theissue of this prospectus with the inclusion of its reports, letters and/or legal opinions(as the case may be) and references to its name included in the form and context inwhich it respectively appears;
(vii) the Company withdraws this prospectus (and/or any other documents issued or usedin connection with the Global Offering) or the Global Offering; or
(viii) there is a prohibition on the Company for whatever reason from offering, allotting,issuing or selling any of the Offer Shares pursuant to the terms of the GlobalOffering.
LOCK-UP ARRANGEMENTS
Undertakings by the Company and the WP Entities to the Stock Exchange pursuant to the ListingRules
(A) Undertakings by the Company
Pursuant to Rule 10.08 of the Listing Rules, the Company has undertaken to the StockExchange that it will not exercise its power to issue any further Shares, or securities convertible intoShares (whether or not of a class already listed) or enter into any agreement to such an issue within sixmonths from the Listing Date (whether or not such issue of Shares or securities will be completedwithin six months from the Listing Date), except: (a) pursuant to the Global Offering; or (b) under anyof the circumstances provided under Rule 10.08 of the Listing Rules.
338

UNDERWRITING
(B) Undertakings by WP Entities
Pursuant to Rule 10.07(1) of the Listing Rules, (i) WP OCIM has irrevocably andunconditionally undertaken to the Stock Exchange that it shall not (and shall procure the relevantregistered holder(s) shall not), and (ii) Warburg Pincus X, L.P and WP X Investment VI Ltd. (togetherthe “WP Parents”, and collectively with WP OCIM, “WP Entities”) each has severally irrevocablyand unconditionally undertaken to the Stock Exchange to procure that WP OCIM or such otherrelevant registered holder(s) or Shares shall not, except pursuant to the Global Offering and the Over-allotment Option, in the period commencing on the date by reference to which disclosure of theholding of Shares is made in this prospectus and ending on the date which is six (6) months from theListing Date, dispose of, nor enter into any agreement to dispose of or otherwise create any options,rights, interests or encumbrances in respect of, any of the Shares or securities of the Company inrespect of which it is shown by this prospectus to be the beneficial owner(s).
Notwithstanding the undertaking above, pursuant to Note (3) to Rule 10.07(2) of the ListingRules, WP OCIM is permitted to pledge or charge its Shares or securities of the Company beneficiallyowned by it in favor of an authorized institution (as defined in the Banking Ordinance (Chapter 155 ofthe Laws of Hong Kong)) (the “Secured Party”) for a bona fide commercial loan pursuant to Note (2)to Rule 10.07(2) of the Listing Rules (a “Permitted Encumbrance”) and the Secured Party mayenforce the Permitted Encumbrance subject to the following undertakings. Each of WP OCIM and theWP Parents hereby further severally, irrevocably and unconditionally undertake to the Stock Exchangethat within the period commencing on the date by reference to which disclosure of their holding ofShares is made in this prospectus and ending on the date which is six (6) months from the Listing Date,it shall:
(a) if WP OCIM grants a Permitted Encumbrance, immediately inform the Company inwriting of such pledge or charge together with the number of securities so pledged orcharged; and
(b) when it receives indications, either verbal or written, from the Secured Party that any ofsecurities of the Company that are pledged or charged by WP OCIM will be disposed of,immediately inform the Company in writing of such indications.
As of the date of this prospectus, WP OCIM has obtained a bona fide commercial loan from anauthorized institution (as defined in the Banking Ordinance (Chapter 155 of the Laws of HongKong)). Upon completion of the Listing, WP OCIM will grant security to such authorized institutionover the Shares held by WP OCIM which are not sold pursuant to the Global Offering.
Undertakings by the Company pursuant to the Hong Kong Underwriting Agreement
The Company has undertaken to the Joint Global Coordinators, the Joint Sponsors, the HongKong Underwriters and each of them not to (save for the issue, offer or sale of the Offer Shares by theCompany pursuant to the Global Offering), without the prior written consent of the Joint GlobalCoordinators (for themselves and on behalf of the Hong Kong Underwriters) and unless in compliancewith the Listing Rules, at any time during the period commencing on the date of the Hong KongUnderwriting Agreement and ending on the date falling six months after the Listing Date (the “FirstSix-Month Period”):
(i) offer, allot, issue, sell, accept subscription for, contract to allot, issue or sell, contract oragree to allot, issue or sell, assign, grant or sell any option, warrant, right or contract to
339

UNDERWRITING
purchase, purchase any option or contract to sell, grant or agree to grant any option, rightor warrant to purchase or subscribe for, or otherwise transfer or dispose of, or agree totransfer or dispose of, either directly or indirectly, conditionally or unconditionally, orrepurchase, any legal or beneficial interest in any Shares or other equity securities of theCompany, or any interests in any of the foregoing (including, but not limited to, anysecurities that are convertible into or exercisable or exchangeable for, or that represent theright to receive, or any warrants or other rights to purchase, any Shares or other equitysecurities of the Company); or
(ii) enter into any swap or other arrangement that transfers to another, in whole or in part, anyof the economic consequences of subscription or ownership (legal or beneficial) of anyShares or other equity securities of the Company, or any interest therein (including,without limitation, any securities of which are convertible into or exchangeable orexercisable for, or represent the right to receive, or any warrants or other rights topurchase, any Shares or other equity securities of the Company); or
(iii) enter into any transaction with the same economic effect as any transaction described inparagraphs (i) or (ii) above; or
(iv) offer to or contract to or agree to announce, or publicly disclose that the Company will ormay enter into any such transaction described in paragraphs (i), (ii) or (iii) above,
in each case, whether any such transaction described in paragraphs (i), (ii) or (iii) above is to be settledby delivery of the Shares or other equity securities of the Company, in cash or otherwise (whether ornot the issue of such Shares or other equity securities of the Company will be completed within theFirst Six-Month Period), provided that the foregoing restrictions shall not apply to the granting ofoptions and issue of Shares by the Company pursuant to the Global Offering, the KM ESOP, Tier 1ESOP and Post-IPO Share Option Scheme.
Undertakings by the Selling Shareholders pursuant to the International Underwriting Agreement
Each of the Selling Shareholders (save for Luckfield Global Limited if it is one of the SellingShareholders) has undertaken to the Company, the Joint Global Coordinators, the Joint Sponsors andthe Hong Kong Underwriters that, without the prior written consent of the Company and the JointGlobal Coordinators (for themselves and on behalf of the International Underwriters) and unless incompliance with the Listing Rules:
(a) during the First Six-Month Period, it will not, and will procure that the relevant registeredholder(s) will not:
(i) offer, pledge, charge, sell, contract or agree to sell, mortgage, charge, pledge,hypothecate, lend, grant or sell any option, warrant, contract or right to purchase,grant, or purchase any option, warrant, contract or right to sell, grant or agree togrant any option, right or warrant to purchase or subscribe for, lend or otherwisetransfer or dispose of or create an encumbrance over, either directly or indirectly,conditionally or unconditionally, any Shares or other equity securities of theCompany or any interest in any of the foregoing (including, but not limited to, anysecurities that are convertible into or exchangeable or exercisable for, or thatrepresent the right to receive, or any warrants or other rights to purchase, anyShares or other equity securities of the Company) beneficially owned by it as of theListing Date (the “Locked-up Securities”); or
340

UNDERWRITING
(ii) enter into any swap or other arrangement that transfers to another, in whole or inpart, any of the economic consequences of ownership of, any Locked-up Securities;or
(iii) enter into any transaction with the same economic effect as any transactiondescribed in paragraphs (i) or (ii) above; or
(iv) offer to or contract to or agree to or publicly disclose that it will or may enter intoany transaction described in paragraphs (i), (ii) or (iii) above,
in each case, whether any such transaction described in (i), (ii) or (iii) above is to besettled by delivery of such Shares or other equity securities of the Company, in cash orotherwise (whether or not the settlement or delivery of such Shares or other equitysecurities will be completed within the First Six-Month Period), except for:
(i) any lending of Shares pursuant to the Stock Borrowing Agreement;
(ii) any sale of Shares pursuant to the Global Offering including pursuant to the OfferSize Adjustment Option and the Over-allotment Option);
(iii) transfers as may be required by applicable law or regulation or by any competentauthority;
(iv) transfers to any affiliate of a Selling Shareholder, provided that such affiliatetransferee enters into a lock-up undertaking with the Company and theUnderwriters on substantially the same terms;
(v) where the Joint Global Coordinators have given prior written consent to release thelock-up undertaking for one Selling Shareholder, transfers up to the sameproportion of Shares as has been released in respect of shares of the other SellingShareholders;
(vi) transfers of all Shares held by a Selling Shareholder to a strategic purchaser,provided that such transferee enters into a lock-up undertaking with theUnderwriters on substantially the same terms;
(vii) acceptance of a general or public tender offer for the Shares of the Company madein accordance with the relevant public takeover rules, the provision of anirrevocable undertaking to accept such an offer, a sale to an offeror (or potentialofferor) which is named in a public announcement of a firm intention to make anoffer (or possible intention to make such an offer) or a sale of shares to an offeror(or potential offeror) during an offer period (as defined by the relevant publictakeover rules);
(viii) transfer of the Shares of the Company pursuant to any scheme of compromise orarrangement providing for the acquisition, by any person or group of persons actingin concert, of 50.0% or more of the equity share capital of the Company, or anydisposal of shares in connection with a scheme of reconstruction under lawsapplicable to the Company;
(ix) transfers made pursuant to an offer by the Company to repurchase its own shares, aslong as this is executed on a pro-rata basis;
(x) disposal of shares to raise monies to meet any claim under the InternationalUnderwriting Agreement, or any expenses or other liabilities (including tax)incurred or suffered in meeting or defending any such claim or arising inconsequence of any such disposal;
341

UNDERWRITING
(xi) mortgage, charge or pledge granted over any Shares of the Company by a SellingShareholder to a third party as collateral for any financing or a transfer of suchshares on enforcement of security; and
(xii) and any agreement, undertaking or commitment to do any of the actions set out in(i) to (xi); and
(b) at any time during the First Six-Month Period, it will:
(i) if and when it or the relevant registered holder(s) pledges or charges any Shares orother equity securities of the Company beneficially owned by it, immediatelyinform the Company and the Joint Global Coordinators in writing of such pledge orcharge together with the number of Shares or other equity securities of theCompany so pledged or charged; and
(ii) if and when it or the relevant registered holder(s) receives indications, either verbalor written, from any pledgee or chargee that any of the pledged or charged Sharesor other equity securities of the Company will be disposed of, immediately informthe Company and the Joint Global Coordinators in writing of such indications.
The Company has undertaken to the Joint Global Coordinators, the Joint Sponsors and theInternational Underwriters that upon receiving such information in writing from any of the SellingShareholders, it will, as soon as practicable and if required pursuant to the Listing Rules, notify theStock Exchange and make a public disclosure in relation to such information by way of anannouncement.
Undertakings by non-Selling Shareholders pursuant to the Lock-up Deeds
Each of certain existing Shareholders (save for Luckfield Global Limited if it is not one of theSelling Shareholders) that are not selling shares in the Global Offering, being Laurels, RedwoodEntities, SK and StepStone (each, a “Locked-up Non-Selling Shareholder”), has undertaken to theCompany and each of the Joint Global Coordinators (for themselves and on behalf of each of theInternational Underwriters and the Hong Kong Underwriters) that:
(a) during the First Six-Month Period, it will not, and will procure that no company controlledby the Locked-up Non-Selling Shareholder (by majority interest or board control) or anynominee or trustee holding in trust for the Locked-up Non-Selling Shareholder will:
(i) offer, pledge, charge, sell, contract or agree to sell, mortgage, charge, hypothecate,lend, grant or sell any option, warrant, contract or right to purchase, grant, orpurchase any option, warrant, contract or right to sell, grant or agree to grant anyoption, right or warrant to purchase or subscribe for, lend or otherwise transfer ordispose of or create an encumbrance over (each a “transfer”), either directly orindirectly, conditionally or unconditionally, any Shares or other equity securities ofthe Company or any interest in any of the foregoing (including, but not limited to,any securities that are convertible into or exchangeable or exercisable for, or thatrepresent the right to receive, or any warrants or other rights to purchase, any Sharesor other equity securities of the Company) beneficially owned by the Locked-up Non-Selling Shareholder as of the Listing Date (the “Locked-up Non-SellingShareholder Shares”);
342

UNDERWRITING
(ii) enter into any swap or other arrangement that transfers to another, in whole or in part,any of the economic consequences of ownership of, any Locked-up Non-SellingShareholder Shares;
(iii) enter into any transaction with the same economic effect as any transaction describedin (i) or (ii) above; or
(iv) offer to or contract to or agree to or publicly disclose that such Locked-up Non-Selling Shareholder will or may enter into any transaction described in (i), (ii) or (iii)above,
in each case, whether any such transaction described in (i), (ii) or (iii) above is to besettled by delivery of such Shares or other equity securities of the Company, in cash orotherwise (whether or not the settlement or delivery of such Shares or other equitysecurities will be completed within the First Six-Month Period), except for:
(i) transfers as may be required by applicable law or regulation or by any competentauthority;
(ii) transfers with the prior written consent of the Joint Global Coordinators;
(iii) transfers to any affiliate of the Locked-up Non-Selling Shareholder, provided thatsuch affiliate transferee enters into a lock-up undertaking with the Company and theJoint Global Coordinators on substantially the same terms as set forth in the lock-updeed;
(iv) transfers to a strategic purchaser, provided it is in respect of all Locked-up Non-Selling Shareholder Shares and that such transferee enters into a lock-up undertakingwith the Joint Global Coordinators on substantially the same terms as set forth in thelock-up deed;
(v) transfers as part of the acceptance of a general or public tender offer for the Shares ofthe Company made in accordance with the relevant public takeover rules, theprovision of an irrevocable undertaking to accept such an offer, a sale to an offeror(or potential offeror) which is named in a public announcement of a firm intention tomake an offer (or possible intention to make such an offer) or a sale of shares to anofferor (or potential offeror) during an offer period (as defined by the relevant publictakeover rules);
(vi) transfers pursuant to any scheme of compromise or arrangement providing for theacquisition, by any person or group of persons acting in concert, of 50.0% or more ofthe equity share capital of the Company, or any disposal of Shares in connection witha scheme of reconstruction under laws applicable to the Company;
(vii) transfers pursuant to an offer by the Company to repurchase its own Shares, as longas this is executed on a pro-rata basis;
(viii)transfers pursuant to any security interest granted over such Locked-up Non-SellingShareholder Shares by the Locked-up Non-Selling Shareholder to a third party ascollateral for any financing or a transfer of such Locked-up Non-Selling ShareholderShares on enforcement of security; or
(ix) entering into, giving or making any agreement, undertaking or commitment to do anyof the actions set out in (a) to (h) above; and
343

UNDERWRITING
(b) at any time during the First Six-Month period, it will:
(i) if and when it pledges or charges any Locked-up Non-Selling Shareholder Shares orother equity securities of the Company beneficially owned by it, to immediatelyinform the Company and the Joint Global Coordinators of such pledge or chargetogether with the number of Shares so pledged or charged; and
(ii) if and when it receives indications, either verbal or written, from the pledgee orchargee of any Shares that any of the pledged or charged Shares will be disposed of,to immediately inform the Company and the Joint Global Coordinators of suchindications.
Hong Kong Underwriters’ Interests in the Company
Save for their respective obligations under the Hong Kong Underwriting Agreement and, ifapplicable, the Stock Borrowing Agreement, as of the Latest Practicable Date, none of the Hong KongUnderwriters was interested, legally or beneficially, directly or indirectly, in any Shares or anysecurities of any member of the Group or had any right or option (whether legally enforceable or not)to subscribe for or purchase, or to nominate persons to subscribe for or purchase, any Shares or anysecurities of any member of the Group.
Following the completion of the Global Offering, the Hong Kong Underwriters and theiraffiliated companies may hold a certain portion of the Shares as a result of fulfilling their respectiveobligations under the Hong Kong Underwriting Agreement and/or the International UnderwritingAgreement.
International Placing
International Underwriting Agreement
In connection with the International Placing, the Company and the Selling Shareholders expectto enter into the International Underwriting Agreement with the International Underwriters on the PriceDetermination Date. Under the International Underwriting Agreement and subject to the Offer SizeAdjustment Option and the Over-allotment Option, the International Underwriters would, subject tocertain conditions set out therein, agree severally but not jointly to procure subscribers for, orthemselves to subscribe for, their respective applicable proportions of the International Placing Sharesinitially being offered pursuant to the International Placing. It is expected that the InternationalUnderwriting Agreement may be terminated on similar grounds to the Hong Kong UnderwritingAgreement. Potential investors should note that in the event that the International UnderwritingAgreement is not entered into or terminated, the Global Offering will not proceed. See the sectionheaded “Structure of the Global Offering—The International Placing” in this Prospectus.
Over-allotment Option
The Over-allotment Option Grantors have granted the Over-allotment Option to theInternational Underwriters, exercisable by the Joint Global Coordinators (on behalf of the InternationalUnderwriters), pursuant to which the Over-allotment Option Grantors may be required to sell anaggregate of up to 15% of the total number of Offer Shares available under the Global Offering,including the Shares offered pursuant to the exercise of the Offer Size Adjustment Option, if any, at theOffer Price to cover over-allocations in the International Placing, if any, and such number of Shares
344

UNDERWRITING
will be equal to 98,052,000 Offer Shares, assuming the Offer Size Adjustment Option is not exercised,or 112,759,800 Offer Shares, assuming the Offer Size Adjustment Option is fully exercised. See thesection headed “Structure of the Global Offering—Over-allotment Option” in this Prospectus forfurther details.
Commissions and Expenses
The Underwriters will receive a base fee of 1.25% of the aggregate Offer Price of all the OfferShares (including any Offer Shares to be sold pursuant to the exercise of the Offer Size AdjustmentOption and the exercise of the Over-allotment Option but excluding any Offer Shares to be sold toinvestors introduced by the Selling Shareholders or the Company), out of which they will pay any sub-underwriting commissions and other fees.
The Joint Global Coordinators will receive an incentive fee of 0.75% of the aggregate OfferPrice of all the Offer Shares (including any Offer Shares to be sold pursuant to the exercise of the OfferSize Adjustment Option and the Over-allotment Option but excluding any Offer Shares to be sold toinvestors introduced by the Selling Shareholders or the Company). The Joint Global Coordinators mayalso receive an additional discretionary fee of up to 0.5% of the aggregate Offer Price of all the OfferShares (including any Offer Shares to be issued and/or sold pursuant to the exercise of the Offer SizeAdjustment Option and the Over-allotment Option but excluding any Offer Shares to be sold toinvestors introduced by the Selling Shareholders or the Company).
For any unsubscribed Hong Kong Public Offer Shares reallocated to the International Placing,the underwriting commission will not be paid to the Hong Kong Underwriters but will instead be paid,at the rate applicable to the International Placing, to the relevant International Underwriters.
The aggregate base fee and incentive fee payable by the Company and the Selling Shareholdersto the Underwriters in relation to the Global Offering (assuming an Offer Price of HK$16.80 per OfferShare (which is the mid-point of the Offer Price range) and the full exercise of the Offer SizeAdjustment Option and the Over-allotment Option) will be approximately HK$286.5 million.
The aggregate base and incentive fees together with the Stock Exchange listing fees, the SFCtransaction levy and the Stock Exchange trading fee, legal and other professional fees and printing andall other expenses relating to the Global Offering are estimated to be approximately HK$484.7 million(assuming an Offer Price of HK$16.80 per Offer Share (which is the mid-point of the Offer Pricerange) and the full exercise of the Offer Size Adjustment Option and the Over-allotment Option) andwill be paid by the Company, save for such base and incentive fees and expenses relating to the sale ofthe Sale Shares by the Selling Shareholders which will be borne by the Selling Shareholders.
Indemnity
The Company has agreed to indemnify the Hong Kong Underwriters for certain losses whichthey may suffer or incur, including losses arising from their performance of their obligations under theHong Kong Underwriting Agreement and any breach by them of the Hong Kong UnderwritingAgreement.
ACTIVITIES BY SYNDICATE MEMBERS
The underwriters of the Hong Kong Public Offering and the International Placing (together, the“Syndicate Members”) and their affiliates may each individually undertake a variety of activities (asfurther described below) which do not form part of the underwriting or stabilizing process.
345

UNDERWRITING
The Syndicate Members and their affiliates are diversified financial institutions withrelationships in countries around the world. These entities engage in a wide range of commercial andinvestment banking, loan financing, brokerage, funds management, trading, hedging, investing andother activities for their own account and for the account of others. In the ordinary course of theirvarious business activities, the Syndicate Members and their respective affiliates may purchase, sell orhold a broad array of investments and actively trade securities, derivatives, loans, commodities,currencies, credit default swaps and other financial instruments for their own account and for theaccounts of their customers. Such investment and trading activities may involve or relate to assets,securities, co-investments and/or instruments of or with the Company or members of the Group and/orpersons and entities with relationships with the Company and may also include swaps and otherfinancial instruments entered into for hedging purposes in connection with the Group’s loans and otherdebt.
In relation to the Shares, the activities of the Syndicate Members and their affiliates couldinclude acting as agent for buyers and sellers of the Shares, entering into transactions with those buyersand sellers in a principal capacity, including as a lender to initial purchasers of the Shares (whichfinancing may be secured by the Shares) in the Global Offering, proprietary trading in the Shares, andentering into over the counter or listed derivative transactions or listed or unlisted securitiestransactions (including issuing securities such as derivative warrants listed on a stock exchange) whichhave as their underlying assets, assets including the Shares. Such transactions may be carried out asbilateral agreements or trades with selected counterparties. Those activities may require hedgingactivity by those entities involving, directly or indirectly, the buying and selling of the Shares, whichmay have a negative impact on the trading price of the Shares. All such activities could occur in HongKong and elsewhere in the world and may result in the Syndicate Members and their affiliates holdinglong and/or short positions in the Shares, in baskets of securities or indices including the Shares, inunits of funds that may purchase the Shares, or in derivatives related to any of the foregoing.
In relation to issues by Syndicate Members or their affiliates of any listed securities having theShares as their underlying securities, whether on the Stock Exchange or on any other stock exchange,the rules of the stock exchange may require the issuer of those securities (or one of its affiliates oragents) to act as a market maker or liquidity provider in the security, and this will also result in hedgingactivity in the Shares in most cases.
All such activities may occur both during and after the end of the stabilizing period described in“Structure of the Global Offering”. Such activities may affect the market price or value of the Shares,the liquidity or trading volume in the Shares and the volatility of the price of the Shares, and the extentto which this occurs from day to day cannot be estimated.
It should be noted that when engaging in any of these activities, the Syndicate Members will besubject to certain restrictions, including the following:
(a) the Syndicate Members (other than the Stabilizing Manager or any person acting for it)must not, in connection with the distribution of the Offer Shares, effect any transactions(including issuing or entering into any option or other derivative transactions relating tothe Offer Shares), whether in the open market or otherwise, with a view to stabilizing ormaintaining the market price of any of the Offer Shares at levels other than those whichmight otherwise prevail in the open market; and
346

UNDERWRITING
(b) the Syndicate Members must comply with all applicable laws and regulations, includingthe market misconduct provisions of the SFO, including the provisions prohibiting insiderdealing, false trading, price rigging and stock market manipulation.
Certain of the Syndicate Members or their respective affiliates have provided from time to time,and expect to provide in the future, investment banking, loan financing and other services to theCompany and each of its affiliates for which such Syndicate Members or their respective affiliateshave received or will receive customary fees and commissions. Certain of the Syndicate Members ortheir respective affiliates may also be involved in joint venture arrangements or other co-investmentswith members of the Group.
In addition, the Syndicate Members or their respective affiliates may provide financing toinvestors to finance their subscriptions of Offer Shares in the Global Offering.
347

STRUCTURE OF THE GLOBAL OFFERING
THE GLOBAL OFFERING
This Prospectus is published in connection with the Hong Kong Public Offering as part of theGlobal Offering. Morgan Stanley Asia Limited, Deutsche Bank AG, Hong Kong Branch, CitigroupGlobal Markets Asia Limited, Credit Suisse (Hong Kong) Limited and Goldman Sachs (Asia) L.L.C.are the Joint Global Coordinators of the Global Offering.
The listing of the Shares on the Stock Exchange is sponsored by the Joint Sponsors. The JointSponsors have made an application on behalf of the Company to the Listing Committee of the StockExchange for the listing of, and permission to deal in, the Shares in issue and to be issued as mentionedin this Prospectus.
653,680,000 Offer Shares will initially be made available under the Global Offeringcomprising:
(a) the Hong Kong Public Offering of initially 34,700,000 New Shares (subject to reallocationand the Offer Size Adjustment Option) in Hong Kong as described in “—The Hong KongPublic Offering” below; and
(b) the International Placing of initially 245,440,000 New Shares and 373,540,000 Sale Shares(subject to reallocation, the Offer Size Adjustment Option and the Over-allotment Option)(i) in the United States solely to QIBs in reliance on Rule 144A or another exemptionfrom, or in a transaction not subject to, the registration requirements of the U.S. SecuritiesAct and (ii) outside the United States (including to professional and institutional investorswithin Hong Kong) in offshore transactions in reliance on Regulation S, as described in“—The International Placing” below.
Up to 98,052,000 additional Offer Shares may be offered pursuant to the exercise of the OfferSize Adjustment Option referred to in “—Offer Size Adjustment Option” below. Furthermore, up to anadditional 112,759,800 Offer Shares (assuming the Offer Size Adjustment Option is exercised in full)may be offered pursuant to the exercise of the Over-allotment Option referred to in “—Over-allotmentOption” below.
Investors may either:
(i) apply for Hong Kong Public Offer Shares under the Hong Kong Public Offering; or
(ii) apply for or indicate an interest for International Placing Shares under the InternationalPlacing,
but may not do both.
The Offer Shares will represent approximately 21.5% of the total Shares in issue immediatelyfollowing the completion of the Global Offering, assuming the Offer Size Adjustment Option and theOver-allotment Option are not exercised. If the Offer Size Adjustment Option and the Over-allotmentOption are exercised in full, the Offer Shares will represent approximately 28.5% of the total Shares inissue immediately following the completion of the Global Offering.
References in this Prospectus to applications, Application Forms, application monies or theprocedure for applications relate solely to the Hong Kong Public Offering.
348

STRUCTURE OF THE GLOBAL OFFERING
THE HONG KONG PUBLIC OFFERING
Number of Offer Shares initially offered
The Company is initially offering 34,700,000 New Shares for subscription by the public inHong Kong at the Offer Price, representing approximately 5.3% of the total number of Offer Sharesinitially available under the Global Offering. The number of Offer Shares initially offered under theHong Kong Public Offering, subject to any reallocation of Offer Shares between the InternationalPlacing and the Hong Kong Public Offering and the Offer Size Adjustment Option, will representapproximately 1.0% of the total Shares in issue immediately following the completion of the GlobalOffering.
The Hong Kong Public Offering is open to members of the public in Hong Kong as well as toinstitutional and professional investors. Professional investors generally include brokers, dealers,companies (including fund managers) whose ordinary business involves dealing in shares and othersecurities and corporate entities that regularly invest in shares and other securities.
Completion of the Hong Kong Public Offering is subject to the conditions set out in“—Conditions of the Global Offering” below.
Allocation
Allocation of Offer Shares to investors under the Hong Kong Public Offering will be basedsolely on the level of valid applications received under the Hong Kong Public Offering. The basis ofallocation may vary, depending on the number of Hong Kong Public Offer Shares validly applied forby applicants. Such allocation could, where appropriate, consist of balloting, which could mean thatsome applicants may receive a higher allocation than others who have applied for the same number ofHong Kong Public Offer Shares, and those applicants who are not successful in the ballot may notreceive any Hong Kong Public Offer Shares.
For allocation purposes only, the total number of Hong Kong Public Offer Shares availableunder the Hong Kong Public Offering (after taking into account any reallocation referred to below)will be divided equally (to the nearest board lot) into two pools: pool A and pool B. The Hong KongPublic Offer Shares in pool A will be allocated on an equitable basis to applicants who have applied forHong Kong Public Offer Shares with an aggregate price of HK$5 million (excluding the brokerage, theSFC transaction levy and the Stock Exchange trading fee payable) or less. The Hong Kong PublicOffer Shares in pool B will be allocated on an equitable basis to applicants who have applied forHong Kong Public Offer Shares with an aggregate price of more than HK$5 million (excluding thebrokerage, the SFC transaction levy and the Stock Exchange trading fee payable) and up to the totalvalue in pool B.
Investors should be aware that applications in pool A and applications in pool B may receivedifferent allocation ratios. If any Hong Kong Public Offer Shares in one (but not both) of the pools areunsubscribed, such unsubscribed Hong Kong Public Offer Shares will be transferred to the other poolto satisfy demand in that other pool and be allocated accordingly. For the purpose of the immediatelypreceding paragraph only, the “price” for Hong Kong Public Offer Shares means the price payable onapplication therefor (without regard to the Offer Price as finally determined). Applicants can onlyreceive an allocation of Hong Kong Public Offer Shares from either pool A or pool B and not fromboth pools. Multiple or suspected multiple applications under the Hong Kong Public Offering and anyapplication for more than 17,350,000 Hong Kong Public Offer Shares is liable to be rejected.
349

STRUCTURE OF THE GLOBAL OFFERING
Reallocation
The allocation of the Offer Shares between the Hong Kong Public Offering and theInternational Placing is subject to reallocation. Paragraph 4.2 of Practice Note 18 of the Listing Rulesrequires a clawback mechanism to be put in place which would have the effect of increasing thenumber of Offer Shares under the Hong Kong Public Offering to a certain percentage of the totalnumber of Offer Shares offered under the Global Offering if certain prescribed total demand levels arereached. We have applied to the Stock Exchange for, and the Stock Exchange has granted to us, awaiver from strict compliance with paragraph 4.2 of Practice Note 18 of the Listing Rules such that, inthe event of over-subscription, the alternative clawback mechanism shall be applied.
If the number of Offer Shares validly applied for under the Hong Kong Public Offeringrepresents (a) 10 times or more but less than 45 times, (b) 45 times or more but less than 95 times and(c) 95 times or more of the total number of Offer Shares initially available for subscription under theHong Kong Public Offering, then Offer Shares will be reallocated to the Hong Kong Public Offeringfrom the International Placing. As a result of such reallocation, the total number of Offer Sharesavailable under the Hong Kong Public Offering will be increased to 51,700,000 Offer Shares (in thecase of (a)), 68,700,000 Offer Shares (in the case of (b)) and 137,300,000 Offer Shares (in the case of(c)), representing approximately 7.9%, 10.5% and 21.0% of the total number of Offer Shares initiallyavailable under the Global Offering, respectively (before any exercise of the Offer Size AdjustmentOption or the Over-allotment Option) (the “Modified PN18 Clawback”). In each case, the additionalOffer Shares reallocated to the Hong Kong Public Offering will be allocated between pool A and poolB and the number of Offer Shares allocated to the International Placing will be corresponding reducedin a manner as the Joint Global Coordinators deem appropriate.
In addition, the Joint Global Coordinators may reallocate Offer Shares from the InternationalPlacing to the Hong Kong Public Offering to satisfy valid applications under the Hong Kong PublicOffering.
In accordance with Guidance Letter HKEX-GL91-18 issued by the Stock Exchange, if: (a) theInternational Placing is undersubscribed and the Hong Kong Public Offering is fully subscribed oroversubscribed; or (b) the International Placing is fully subscribed or oversubscribed and theHong Kong Public Offering is oversubscribed by less than 15 times of the total number of Offer Sharesinitially available under the Hong Kong Public Offering, then the Joint Global Coordinators may onlyreallocate Offer Shares from the International Placing to the Hong Kong Public Offering other thanpursuant to Practice Note 18 of the Listing Rules on the following conditions in accordance withGuidance Letter HKEX-GL91-18 (the “Allocation Cap”):
(i) the maximum total number of Offer Shares that may be reallocated from the InternationalPlacing to the Hong Kong Public Offering shall not be more than double the number ofHong Kong Public Offer Shares initially available under the Hong Kong Public Offering(i.e. 69,400,000 Offer Shares); and
(ii) the final Offer Price shall be fixed at the bottom of the indicative Offer Price range statedin this Prospectus or the downward adjusted final Offer Price if a Downward Offer PriceAdjustment is made in accordance with Guidance Letter HKEX-GL90-18 issued by theStock Exchange.
350

STRUCTURE OF THE GLOBAL OFFERING
If the Hong Kong Public Offering is not fully subscribed, the Joint Global Coordinators mayreallocate all or any unsubscribed Hong Kong Public Offer Shares to the International Placing, in suchproportions as the Joint Global Coordinators deem appropriate. The Allocation Cap is not triggered.
The Offer Shares to be offered in the Hong Kong Public Offering and the Offer Shares to beoffered in the International Placing may, in certain circumstances, be reallocated between theseofferings at the discretion of the Joint Global Coordinators, subject to the Modified PN18 Clawbackand the Allocation Cap (as applicable).
Details of any reallocation of the Offer Shares between the Hong Kong Public Offering and theInternational Placing will be disclosed in the results announcement which is expected to be publishedon Thursday, October 31, 2019.
Applications
Each applicant under the Hong Kong Public Offering will be required to give an undertakingand confirmation in the application submitted by him that he and any person(s) for whose benefit he ismaking the application has not applied for or taken up, or indicated an interest for, and will not applyfor or take up, or indicate an interest for, any International Placing Shares under the InternationalPlacing. Such applicant’s application is liable to be rejected if such undertaking and/or confirmation is/are breached and/or untrue (as the case may be) or if he has been or will be placed or allocatedInternational Placing Shares under the International Placing.
Applicants under the Hong Kong Public Offering are required to pay, on application, themaximum Offer Price of HK$17.40 per Offer Share in addition to the brokerage, the SFC transactionlevy and the Stock Exchange trading fee payable on each Offer Share, amounting to a total ofHK$3,515.06 for one board lot of 200 Shares. If the Offer Price, as finally determined in the mannerdescribed in the paragraph headed “—Pricing and Allocation” in this section below, is less than themaximum Offer Price of HK$17.40 per Offer Share, appropriate refund payments (including thebrokerage, the SFC transaction levy and the Stock Exchange trading fee attributable to the surplusapplication monies) will be made to successful applicants, without interest. Further details are set outin the section headed “How to Apply for Hong Kong Public Offer Shares” in this Prospectus.
THE INTERNATIONAL PLACING
Number of Offer Shares initially offered
The International Placing will consist of an offering of initially 618,980,000 Shares, comprising245,440,000 New Shares being offered by the Company and 373,540,000 Sale Shares being offered bythe Selling Shareholders and representing approximately 94.7% of the total number of Offer Sharesinitially available under the Global Offering (subject to reallocation, the Offer Size Adjustment Optionand the Over-allotment Option). The number of Offer Shares initially offered under the InternationalPlacing, subject to any reallocation of Offer Shares between the International Placing and the HongKong Public Offering, will represent approximately 20.4% of the total Shares in issue immediatelyfollowing the completion of the Global Offering.
Allocation
The International Placing will include selective marketing of Offer Shares to QIBs in theUnited States as well as institutional and professional investors and other investors anticipated to have
351

STRUCTURE OF THE GLOBAL OFFERING
a sizeable demand for such Offer Shares in Hong Kong and other jurisdictions outside the UnitedStates in reliance on Regulation S. Professional investors generally include brokers, dealers, companies(including fund managers) whose ordinary business involves dealing in shares and other securities andcorporate entities that regularly invest in shares and other securities. Allocation of Offer Sharespursuant to the International Placing will be effected in accordance with the “book-building” processdescribed in the paragraph headed “—Pricing and Allocation” in this section below and based on anumber of factors, including the level and timing of demand, the total size of the relevant investor’sinvested assets or equity assets in the relevant sector and whether or not it is expected that the relevantinvestor is likely to buy further Shares and/or hold or sell its Shares after the Listing. Such allocation isintended to result in a distribution of the Shares on a basis which would lead to the establishment of asolid professional and institutional shareholder base to the benefit of the Group and the Shareholders asa whole.
The Joint Global Coordinators (on behalf of the Underwriters) may require any investor whohas been offered Offer Shares under the International Placing and who has made an application underthe Hong Kong Public Offering to provide sufficient information to the Joint Global Coordinators so asto allow it to identify the relevant applications under the Hong Kong Public Offering and to ensure thatthey are excluded from any allocation of Offer Shares under the Hong Kong Public Offering.
Reallocation
The total number of Offer Shares to be issued or sold pursuant to the International Placing maychange as a result of the clawback arrangement described in the paragraph headed “—The Hong KongPublic Offering—Reallocation” in this section above, the exercise of the Offer Size Adjustment Optionand/or the Over-allotment Option in whole or in part and/or any reallocation of unsubscribed OfferShares originally included in the Hong Kong Public Offering.
OFFER SIZE ADJUSTMENT OPTION
In connection with the Global Offering, the Offer Size Adjustment Option Grantors havegranted the Offer Size Adjustment Option to the Hong Kong Underwriters under the Offer SizeAdjustment Option Deed. The Offer Size Adjustment Option provides flexibility to increase thenumber of Offer Shares available for purchase under the Global Offering to cover additional marketdemand, if any. The Offer Size Adjustment Option is exercisable by the Joint Global Coordinators onbehalf of the Hong Kong Underwriters on or before the Price Determination Date, and will lapseimmediately thereafter.
Under the Offer Size Adjustment Option, the Offer Size Adjustment Option Grantors may berequired to sell any number of Shares up to an aggregate of 98,052,000 additional Offer Shares at theOffer Price. These additional Offer Shares, if any, will be allocated so as to maintain theproportionality between the Hong Kong Public Offering and the International Placing following theapplication of the clawback arrangement described in “—Reallocation” in this section and the JointGlobal Coordinators shall allocate additional new Shares to be offered by the Company pursuant to theInternational Placing to the Hong Kong Public Offering in order maintain such proportionality and theOffer Size Adjustment Option Shares shall be allocated to the International Placing. The Offer SizeAdjustment Option will not be used for price stabilization purposes and will not be subject to theprovisions of the Securities and Futures (Price Stabilization) Rules (Chapter 571W of the Laws ofHong Kong). The Offer Size Adjustment Option will be in addition to the Over-Allotment Option. As
352

STRUCTURE OF THE GLOBAL OFFERING
no new Shares will be issued under the Offer Size Adjustment Option and the Over-allotment Option(as all Offer Shares being offered under the Offer Size Adjustment Option and the Over-allotmentOption will be existing Shares), there will be no dilution effect on investors’ potential shareholding,nor will any additional proceeds be raised by the Company.
The Company will disclose in its allotment results announcement if and to what extent theOffer Size Adjustment Option has been exercised, or will confirm that if the Offer Size AdjustmentOption has not been exercised by the Price Determination Date, it will lapse and cannot be exercised atany future date.
DOWNWARD OFFER PRICE ADJUSTMENT
We have reserved the right to make a Downward Offer Price Adjustment to provide flexibilityin pricing the Offer Shares. The ability to make a Downward Offer Price Adjustment does not affectour obligation to issue a supplemental prospectus and to offer investors a right to withdraw theirapplications if there is a material change in circumstances not disclosed in this Prospectus.
If it is intended that the final Offer Price is set at more than 10% below the bottom end of theindicative Offer Price range, the Withdrawal Mechanism will be applied if the Global Offering is toproceed.
OVER-ALLOTMENT OPTION
In connection with the Global Offering, the Over-allotment Option Grantors are expected togrant the Over-allotment Option to the International Underwriters, exercisable by the Joint GlobalCoordinators (on behalf of the International Underwriters).
Pursuant to the Over-allotment Option, the International Underwriters will have the right,exercisable by the Joint Global Coordinators (on behalf of the International Underwriters) at any timefrom the Listing Date until 30 days after the last day for lodging applications under the Hong KongPublic Offering, to require the Over-allotment Option Grantors to sell up to an aggregate of112,759,800 Sale Shares (assuming the Offer Size Adjustment Option is fully exercised), representingnot more than 15% of the total number of Offer Shares initially available under the Global Offering, atthe Offer Price under the International Placing to cover over-allocations in the International Placing, ifany.
If the Over-allotment Option is exercised in full, the additional Offer Shares to be sold pursuantthereto will represent approximately 3.2% of the total Shares in issue immediately following thecompletion of the Global Offering (assuming the Offer Size Adjustment Option is not exercised). If theOver-allotment Option is exercised, an announcement will be made.
STABILIZATION
Stabilization is a practice used by underwriters in some markets to facilitate the distribution ofsecurities. To stabilize, the underwriters may bid for, or purchase, the securities in the secondarymarket during a specified period of time, to retard and, if possible, prevent a decline in the initialpublic market price of the securities below the offer price. Such transactions may be effected in alljurisdictions where it is permissible to do so, in each case in compliance with all applicable laws andregulatory requirements, including those of Hong Kong. In Hong Kong, the price at which stabilizationis effected is not permitted to exceed the offer price.
353

STRUCTURE OF THE GLOBAL OFFERING
In connection with the Global Offering, the Stabilizing Manager (or any person acting for it),on behalf of the Underwriters, may over-allocate or effect transactions with a view to stabilizing orsupporting the market price of the Shares at a level higher than that which might otherwise prevail for alimited period after the Listing Date. However, there is no obligation on the Stabilizing Manager (orany person acting for it) to conduct any such stabilizing action. Such stabilizing action, if taken:(a) will be conducted at the absolute discretion of the Stabilizing Manager (or any person acting for it)and in what the Stabilizing Manager reasonably regards as the best interest of the Company; (b) maybe discontinued at any time; and (c) is required to be brought to an end within 30 days of the last dayfor lodging applications under the Hong Kong Public Offering. The Underwriting Agreements providethat the net profits, if any, resulting from stabilizing actions shall be shared between the SyndicateMembers, the Company and the Selling Shareholders.
Stabilization action permitted in Hong Kong pursuant to the Securities and Futures (PriceStabilizing) Rules of the SFO includes: (a) over-allocating for the purpose of preventing or minimizingany reduction in the market price of the Shares, (b) selling or agreeing to sell the Shares so as toestablish a short position in them for the purpose of preventing or minimizing any reduction in themarket price of the Shares, (c) purchasing, or agreeing to purchase, the Shares pursuant to the Over-allotment Option in order to close out any position established under paragraph (a) or (b) above,(d) purchasing, or agreeing to purchase, any of the Shares for the sole purpose of preventing orminimizing any reduction in the market price of the Shares, (e) selling or agreeing to sell any Shares inorder to liquidate any position established as a result of those purchases and (f) offering or attemptingto do anything as described in paragraph (b), (c), (d) or (e) above.
Specifically, prospective applicants for and investors in the Offer Shares should note that:
(a) the Stabilizing Manager (or any person acting for it) may, in connection with thestabilizing action, maintain a long position in the Shares;
(b) there is no certainty as to the extent to which and the time or period for which theStabilizing Manager (or any person acting for it) will maintain such a long position;
(c) liquidation of any such long position by the Stabilizing Manager (or any person acting forit) and selling in the open market may have an adverse impact on the market price of theShares;
(d) no stabilizing action can be taken to support the price of the Shares for longer than thestabilization period, which will begin on the Listing Date, and is expected to expire onSunday, November 24, 2019, being the 30th day after the last day for lodging applicationsunder the Hong Kong Public Offering. After this date, when no further stabilizing actionmay be taken, demand for the Shares, and therefore the price of the Shares, could fall;
(e) the price of the Shares cannot be assured to stay at or above the Offer Price by the takingof any stabilizing action; and
(f) stabilizing bids or transactions effected in the course of the stabilizing action may be madeat any price at or below the Offer Price and can, therefore, be done at a price below theprice paid by applicants for, or investors in, the Offer Shares.
The Company will ensure or procure that an announcement in compliance with the Securitiesand Futures (Price Stabilizing) Rules of the SFO will be made within seven days of the expiration ofthe stabilization period.
354

STRUCTURE OF THE GLOBAL OFFERING
Over-Allocation
Following any over-allocation of Shares in connection with the Global Offering, the StabilizingManager (or any person acting for it) may cover such over-allocations by, among other methods,exercising the Over-allotment Option in full or in part, by using Shares purchased by the StabilizingManager (or any person acting for it) in the secondary market at prices that do not exceed the OfferPrice or through the Stock Borrowing Agreement as detailed below or a combination of these means.
STOCK BORROWING AGREEMENT
In order to facilitate the settlement of over-allocations, if any, in connection with the GlobalOffering, the Stabilizing Manager (or its affiliate or any person acting for it) may choose to borrow upto 112,759,800 Shares (being the maximum number of Shares which may be sold pursuant to theexercise of the Over-allotment Option, assuming the Offer Size Adjustment Option is exercised in full)from the Over-allotment Option Grantors, pursuant to the Stock Borrowing Agreement, which isexpected to be entered into between the Stabilizing Manager (or its affiliate or any person acting for it)and the Over-allotment Option Grantors on or about the Price Determination Date.
If the Stock Borrowing Agreement with the Over-allotment Option Grantors is entered into, theborrowing of Shares will only be effected by the Stabilizing Manager (or its affiliate or any personacting for it) for the settlement of over-allocations in the International Placing and such borrowingarrangement is not subject to the restrictions of Rule 10.07(1)(a) of the Listing Rules, provided that therequirements set out in Rule 10.07(3) of the Listing Rules, being that the Stock Borrowing Agreementwill be for the sole purpose of covering any short position prior to the exercise of the Over-allotmentOption in connection with the International Placing, are complied with.
The same number of Shares so borrowed must be returned to the Over-allotment OptionGrantors or its nominees, as the case may be, on or before the third business day following the earlierof: (a) the last day for exercising the Over-allotment Option; and (b) the day on which the Over-allotment Option is exercised in full.
The Shares borrowing arrangement described above will be effected in compliance with allapplicable laws, rules and regulatory requirements. No payment will be made to the Over-allotmentOption Grantors by the Stabilizing Manager (or its affiliate or any person acting for it) in relation tosuch Shares borrowing arrangement.
OFFER SIZE
The allocation and the total number of Offer Shares under the Global Offering will bedetermined in the following manner:
Š The allocation of Offer Shares between the International Placing and the Hong KongPublic Offering will be subject to a reallocation adjustment depending on the number ofOffer Shares validly applied for under the Hong Kong Public Offering. See “—The HongKong Public Offering—Reallocation” above for details.
Š If the Offer Size Adjustment Option is exercised in full, the additional Offer Shares madeavailable as a result, representing approximately 15% of the number of Offer Sharesinitially being offered under the Global Offering, will be allocated so as to maintain theproportionality between the Hong Kong Public Offering and the International Placing on a
355

STRUCTURE OF THE GLOBAL OFFERING
post-clawback basis. The Offer Size Adjustment Option will lapse if it is not exercised bythe Price Determination Date. See “—Offer Size Adjustment Option” above for details.
Š The number of Offer Shares to be made available under the International Placing may befurther increased if the Over-allotment Option is exercised. The maximum number ofadditional International Placing Shares to be offered pursuant to the exercise of the Over-allotment Option will represent approximately 15% of the number of Offer Shares beingoffered under the Global Offering (including the shares offered pursuant to the exercise ofthe Offer Size Adjustment Option, if any). See “—Over-allotment Option” above fordetails.
The table below sets out a summary of the total number of Hong Kong Public Offer Shares andInternational Placing Shares being offered in the Global Offering under different scenarios, dependingon (a) whether a reallocation pursuant to the clawback arrangement described in “—The Hong KongPublic Offering—Reallocation” above occurs and (b) whether either of the Offer Size AdjustmentOption and the Over-allotment Option is exercised at all or exercised in full, or both are exercised infull.
No clawback reallocation7.9% clawbackreallocation
10.5% clawbackreallocation
21.0% clawbackreallocation
Total number of OfferShares before theexercise of the OfferSize AdjustmentOption and the Over-allotment Option
34,700,000 HongKong Public OfferShares
51,700,000 HongKong Public OfferShares
68,700,000 HongKong Public OfferShares
137,300,000 HongKong Public OfferShares
618,980,000International PlacingShares
601,980,000InternationalPlacing Shares
584,980,000InternationalPlacing Shares
516,380,000InternationalPlacing Shares
Total number of OfferShares following theexercise in full of theOffer Size AdjustmentOption only (the Over-allotment Option is notexercised)
39,850,000 HongKong Public OfferShares
59,390,000 HongKong Public OfferShares
78,940,000 HongKong Public OfferShares
157,870,000 HongKong Public OfferShares
711,882,000International PlacingShares
692,342,000InternationalPlacing Shares
672,792,000InternationalPlacing Shares
593,862,000InternationalPlacing Shares
Total number of OfferShares following theexercise in full of theOver-allotment Optiononly (the Offer SizeAdjustment Option isnot exercised)
34,700,000 HongKong Public OfferShares
51,700,000 HongKong Public OfferShares
68,700,000 HongKong Public OfferShares
137,300,000 HongKong Public OfferShares
717,032,000International PlacingShares
700,032,000InternationalPlacing Shares
683,032,000InternationalPlacing Shares
614,432,000InternationalPlacing Shares
Total number of OfferShares following thefull exercise of theOffer Size AdjustmentOption and the Over-allotment Option
39,850,000 HongKong Public OfferShares
59,390,000 HongKong Public OfferShares
78,940,000 HongKong Public OfferShares
157,870,000 HongKong Public OfferShares
824,641,800International PlacingShares
805,101,800InternationalPlacing Shares
785,551,800InternationalPlacing Shares
706,621,800InternationalPlacing Shares
356
STRUCTURE OF THE GLOBAL OFFERING
PRICING AND ALLOCATION
Pricing for the Offer Shares for the purpose of the various offerings under the Global Offeringwill be fixed on the Price Determination Date, which is expected to be on or about Friday, October 25,2019 and, in any event, no later than Thursday, October 31, 2019, by agreement between the JointGlobal Coordinators (on behalf of the Underwriters), the Company (for itself and on behalf of theSelling Shareholders), and the number of Offer Shares to be allocated under the various offerings willbe determined shortly thereafter.
The Offer Price will not be more than HK$17.40 per Offer Share and is expected to be not lessthan HK$16.20 per Offer Share (subject to a Downward Offer Price Adjustment), unless otherwiseannounced, as further explained below. Applicants under the Hong Kong Public Offering must pay, onapplication, the maximum Offer Price of HK$17.40 per Offer Share plus brokerage of 1.0%, SFCtransaction levy of 0.0027% and Stock Exchange trading fee of 0.005%, amounting to a total ofHK$3,515.06 for one board lot of 200 Shares. Prospective investors should be aware that the OfferPrice to be determined on the Price Determination Date may be, but is not expected to be, lowerthan the minimum Offer Price stated in this Prospectus (subject to a Downward Offer PriceAdjustment).
The International Underwriters will be soliciting from prospective investors indications ofinterest in acquiring Offer Shares in the International Placing. Prospective professional andinstitutional investors will be required to specify the number of Offer Shares under the InternationalPlacing they would be prepared to acquire either at different prices or at a particular price. Thisprocess, known as “book-building”, is expected to continue up to, and to cease on or about, the last dayfor lodging applications under the Hong Kong Public Offering.
The Joint Global Coordinators (on behalf of the Underwriters) may, where consideredappropriate, based on the level of interest expressed by prospective investors during the book-buildingprocess, and with the consent of the Company, determine the final Offer Price to be no more than 10%below the bottom end of the indicative Offer Price range, at any time on or prior to the PriceDetermination Date.
In such situation, the Company will, as soon as practicable following the decision to set thefinal Offer Price below the bottom end of the indicative Offer Price range, publish on the website ofthe Stock Exchange (www.hkexnews.hk) and the Company’s website (www.esr.com) anannouncement of the final Offer Price after making a Downward Offer Price Adjustment. Suchannouncement will be issued before and separate from the announcement of the results of allocationsexpected to be announced on Thursday, October 31, 2019. The Offer Price announced followingmaking of a Downward Offer Price Adjustment shall be the final Offer Price and shall not besubsequently changed. In the absence of an announcement that a Downward Offer Price Adjustmenthas been made, the final Offer Price will not be outside the indicative Offer Price range as disclosed inthis Prospectus unless the Withdrawal Mechanism is utilized. If the number of Offer Shares and/or theOffer Price range is so reduced beyond 10%, all applicants who have already submitted an applicationwill need to confirm their applications in accordance with the procedures set out in the supplementalprospectus and all unconfirmed applications will not be valid.
The Joint Global Coordinators (on behalf of the Underwriters) may, where they deemappropriate, based on the level of interest expressed by prospective investors during the book-buildingprocess in respect of the International Placing, and with the consent of the Company, reduce the
357

STRUCTURE OF THE GLOBAL OFFERING
number of Offer Shares offered and/or the Offer Price range below that stated in this Prospectus at anytime on or prior to the morning of the last day for lodging applications under the Hong Kong PublicOffering. In such a case, the Company will, as soon as practicable following the decision to make suchreduction, and in any event not later than the morning of the last day for lodging applications under theHong Kong Public Offering, cause to be published in the South China Morning Post (in English) andthe Hong Kong Economic Times (in Chinese) and on the websites of the Company and the StockExchange at www.esr.com and www.hkexnews.hk, respectively, notices of the reduction. Upon theissue of such a notice, the revised number of Offer Shares and/or the Offer Price range will be final andconclusive and the Offer Price, if agreed upon by the Joint Global Coordinators (on behalf of theUnderwriters) and the Company (for itself and on behalf of the Selling Shareholders), will be fixedwithin such revised Offer Price range.
Before submitting applications for the Hong Kong Public Offer Shares, applicants should haveregard to the possibility that any announcement of a reduction in the number of Offer Shares and/or theOffer Price range may not be made until the last day for lodging applications under the Hong KongPublic Offering. Such notice will also include confirmation or revision, as appropriate, of the workingcapital statement and the Global Offering statistics as currently set out in this Prospectus, and any otherfinancial information which may change as a result of any such reduction. In the absence of any suchnotice so published, the number of Offer Shares will not be reduced and/or the Offer Price, if agreedupon by the Joint Global Coordinators (on behalf of the Underwriters) and the Company (for itself andon behalf of the Selling Shareholders), will under no circumstances be set outside the Offer Price rangeas stated in this Prospectus.
Irrespective of whether a Downward Offer Price Adjustment is made, the final Offer Price, thelevel of indications of interest in the International Placing, the level of applications in the Hong KongPublic Offering, the basis of allocations of the Hong Kong Public Offer Shares, the results ofallocations in the Hong Kong Public Offering and if and to what extent the Offer Size AdjustmentOption has been exercised are expected to be made available through a variety of channels in themanner described in “How to Apply for Hong Kong Public Offer Shares—D. Publication of Results”.
UNDERWRITING
The Hong Kong Public Offering is fully underwritten by the Hong Kong Underwriters underthe terms and conditions of the Hong Kong Underwriting Agreement and is subject to, among otherthings, the Joint Global Coordinators (on behalf of the Underwriters) and the Company (for itself andon behalf of the Selling Shareholders) agreeing on the Offer Price.
The Company expects to enter into the International Underwriting Agreement relating to theInternational Placing on the Price Determination Date.
These underwriting arrangements, including the Underwriting Agreements, are summarized in“Underwriting”.
CONDITIONS OF THE GLOBAL OFFERING
Acceptance of all applications for Offer Shares will be conditional on:
(a) the Listing Committee granting approval for the listing of, and permission to deal in, theShares in issue and to be issued pursuant to the Global Offering on the Main Board of the
358
STRUCTURE OF THE GLOBAL OFFERING
Stock Exchange and such approval not subsequently having been withdrawn or revokedprior to the Listing Date;
(b) the Offer Price having been agreed between the Joint Global Coordinators (on behalf ofthe Underwriters) and the Company (for itself and on behalf of the Selling Shareholders);
(c) the execution and delivery of the International Underwriting Agreement on or about thePrice Determination Date; and
(d) the obligations of the Hong Kong Underwriters under the Hong Kong UnderwritingAgreement and the obligations of the International Underwriters under the InternationalUnderwriting Agreement becoming and remaining unconditional and not having beenterminated in accordance with the terms of the respective agreements,
in each case on or before the dates and times specified in the respective Underwriting Agreements(unless and to the extent such conditions are validly waived on or before such dates and times) and, inany event, not later than the date which is 30 days after the date of this Prospectus.
If, for any reason, the Offer Price is not agreed between the Joint Global Coordinators (onbehalf of the Underwriters) and the Company (for itself and on behalf of the Selling Shareholders) onor before Thursday, October 31, 2019, the Global Offering will not proceed and will lapse.
The consummation of each of the Hong Kong Public Offering and the International Placing isconditional upon, among other things, the other offering becoming unconditional and not having beenterminated in accordance with its terms.
If the above conditions are not fulfilled or waived prior to the dates and times specified, theGlobal Offering will lapse and the Stock Exchange will be notified immediately. Notice of the lapse ofthe Hong Kong Public Offering will be published by the Company in the South China Morning Post(in English) and the Hong Kong Economic Times (in Chinese) and on the websites of the Companyand the Stock Exchange at www.esr.com and www.hkexnews.hk, respectively, on the next dayfollowing such lapse. In such a situation, all application monies will be returned, without interest, onthe terms set out in in the section headed “How to Apply for Hong Kong Public Offer Shares—F. Refund of Application Monies” in this Prospectus. In the meantime, all application monies will beheld in separate bank account(s) with the receiving bank or other bank(s) in Hong Kong licensed underthe Banking Ordinance (Chapter 155 of the Laws of Hong Kong).
Share certificates for the Offer Shares will only become valid at 8:00 a.m. on Friday,November 1, 2019, provided that the Global Offering has become unconditional in all respects at orbefore that time.
DEALINGS IN THE SHARES
Assuming that the Hong Kong Public Offering becomes unconditional at or before 8:00 a.m. inHong Kong on Friday, November 1, 2019, it is expected that dealings in the Shares on the StockExchange will commence at 9:00 a.m. on Friday, November 1, 2019.
The Shares will be traded in board lots of 200 Shares each and the stock code of the Shares willbe 1821.
359

HOW TO APPLY FOR HONG KONG PUBLIC OFFER SHARES
A. APPLICATIONS FOR HONG KONG PUBLIC OFFER SHARES
1. How to Apply
If you apply for Hong Kong Public Offer Shares, then you may not apply for or indicate aninterest for International Placing Shares.
To apply for Hong Kong Public Offer Shares, you may:
Š use a WHITE or YELLOW Application Form;
Š apply online through the White Form eIPO service at www.eipo.com.hk; or
Š electronically cause HKSCC Nominees to apply on your behalf.
None of you or your joint applicant(s) may make more than one application, except where youare a nominee and provide the required information in your application.
The Company, the Joint Global Coordinators, the White Form eIPO Service Provider andtheir respective agents may reject or accept any application, in full or in part, for any reason at theirdiscretion.
2. Who Can Apply
You can apply for Hong Kong Public Offer Shares on a WHITE or YELLOW ApplicationForm if you or any person(s) for whose benefit you are applying:
Š are 18 years of age or older;
Š have a Hong Kong address;
Š are outside the United States (within the meaning of Regulation S) or are a persondescribed in paragraph (h)(3) of Rule 902 of Regulation S; and
Š are not a legal or natural person of the PRC (except qualified domestic institutionalinvestors).
If you apply for Hong Kong Public Offer Shares online through the White Form eIPO service,in addition to the above you must also:
Š have a valid Hong Kong identity card number; and
Š provide a valid e-mail address and a contact telephone number.
If you are a firm, the application must be in the individual members’ names. If you are a bodycorporate, the Application Form must be signed by a duly authorized officer, who must state hisrepresentative capacity, and stamped with your corporation’s chop.
If an application is made by a person under a power of attorney, the Company and the JointGlobal Coordinators, as the Company’s agent, may accept it at their discretion, and on any conditionsthey think fit, including requiring evidence of the attorney’s authority.
The number of joint applicants may not exceed four and they may not apply by means of theWhite Form eIPO service for the Hong Kong Public Offer Shares.
360

HOW TO APPLY FOR HONG KONG PUBLIC OFFER SHARES
Unless permitted by the Listing Rules, you cannot apply for any Hong Kong Public OfferShares if:
Š you are an existing beneficial owner of Shares and/or a substantial shareholder of any ofthe Company’s subsidiaries;
Š you are a director or chief executive of the Company and/or any of the Company’ssubsidiaries;
Š you are a close associate of any of the above persons;
Š you are a connected person of the Company or a person who will become a connectedperson of the Company immediately upon the completion of the Global Offering; or
Š you have been allocated or have applied for any International Placing Shares or otherwiseparticipate in the International Placing.
3. Applying for Hong Kong Public Offer Shares
Which Application Channel to Use
For Hong Kong Public Offer Shares to be issued in your own name, use a WHITE ApplicationForm or apply online through the White Form eIPO service at www.eipo.com.hk.
For Hong Kong Public Offer Shares to be issued in the name of HKSCC Nominees anddeposited directly into CCASS to be credited to your or a designated CCASS Participant’s stockaccount, use a YELLOW Application Form or electronically instruct HKSCC via CCASS to causeHKSCC Nominees to apply for you.
Where to Collect the Application Forms
You can collect a WHITE Application Form and a Prospectus during normal business hoursfrom 9:00 a.m. on Tuesday, October 22, 2019 until 12:00 noon on Friday, October 25, 2019 from:
(a) any of the following offices of the following Joint Global Coordinators:
Morgan Stanley Asia Limited46/F, International Commerce Centre
1 Austin Road West KowloonHong Kong
Deutsche Bank AG, Hong Kong Branch52/F, InternationalCommerce Centre
1 Austin Road West KowloonHong Kong
Credit Suisse (Hong Kong) LimitedLevel 88, International Commerce Centre
1 Austin Road West, KowloonHong Kong
Goldman Sachs (Asia) L.L.C.68/F, Cheung Kong Center2 Queen’s Road Central
Hong Kong
361

HOW TO APPLY FOR HONG KONG PUBLIC OFFER SHARES
(b) any of the following branches of the receiving bank for the Hong Kong Public Offering:
Standard Chartered Bank (Hong Kong) Limited
Branch Name Address
Hong Kong Island Des Voeux Road Branch Standard Chartered Bank Building,4-4A, Des Voeux Road Central,Central
Aberdeen Branch Shop 4A, G/F and Shop 1, 1/F,Aberdeen Centre Site 5, No.6-12Nam Ning Street, Aberdeen
Causeway Bay Branch G/F to 2/F, Yee Wah Mansion, 38-40A Yee Wo Street, CausewayBay
Quarry Bay Branch G/F, Westlands Gardens, 1027King’s Road, Quarry Bay
Kowloon Kwun Tong Branch G/F & 1/F One Pacific Centre, 414Kwun Tong Road, Kwun Tong
Mongkok Branch Shop B, G/F, 1/F & 2/F, 617-623Nathan Road, Mongkok
Mei Foo Branch Shop Nos.106 - 109, 1st Floor,Mei Foo Plaza, Mei Foo SunChuen
Yaumatei Branch G/F - 1/F, Ming Fong Bldg., 564Nathan Road, Yaumatei
New Territories Metroplaza Branch Shop 473B, Level 4, Metroplaza,223 Hing Fong Road, Kwai Fong,New Territories
Tsuen Wan Branch Shop C, G/F & 1/F, Jade Plaza,298 Sha Tsui Road, Tsuen Wan
Shatin Plaza Branch Shop No. 8, Shatin Plaza, 21-27Shatin Centre Street, Shatin
Tai Po Branch G/F Shop No. 2, 23-25 Kwong FukRoad, Tai Po Market, Tai Po
You can collect a YELLOW Application Form and a Prospectus during normal business hoursfrom 9:00 a.m. on Tuesday, October 22, 2019 until 12:00 noon on Friday, October 25, 2019 from:
Š the Depository Counter of HKSCC at 1/F, One & Two Exchange Square, 8 ConnaughtPlace, Central, Hong Kong; or
Š your stockbroker.
Time for Lodging Application Forms
Your completed WHITE or YELLOW Application Form, together with a check or a banker’scashier order attached and marked payable to “Horsford Nominees Limited—ESR Cayman Public
362

HOW TO APPLY FOR HONG KONG PUBLIC OFFER SHARES
Offer” for the payment, should be deposited in the special collection boxes provided at any of thebranches of the receiving bank listed above at the following times:
Tuesday, October 22, 2019 — 9:00 a.m. to 5:00 p.m.Wednesday, October 23, 2019 — 9:00 a.m. to 5:00 p.m.Thursday, October 24, 2019 — 9:00 a.m. to 5:00 p.m.Friday, October 25, 2019 — 9:00 a.m. to 12:00 noon
The application lists will be open from 11:45 a.m. to 12:00 noon on Friday, October 25, 2019,the last day for applications, or such later time as described in the paragraph headed “—C. Effect ofBad Weather on the Opening and Closing of the Application Lists” in this section below.
4. Terms and Conditions of an Application
Follow the detailed instructions in the WHITE or YELLOW Application Form carefully,otherwise your application may be rejected.
By submitting a WHITE or YELLOW Application Form or applying through the WhiteForm eIPO service, among other things, you:
(a) undertake to execute all relevant documents and instruct and authorize the Company and/or the Joint Global Coordinators (or its agents or nominees), as agents of the Company, toexecute any documents for you and to do on your behalf all things necessary to registerany Hong Kong Public Offer Shares allocated to you in your name or in the name ofHKSCC Nominees as required by the Articles of Association;
(b) agree to comply with the Memorandum and Articles of Association of the Company, theCompanies (Winding Up and Miscellaneous Provisions) Ordinance and CaymanCompanies Law;
(c) confirm that you have read the terms and conditions and application procedures set out inthis Prospectus and in the Application Form and agree to be bound by them;
(d) confirm that you have received and read this Prospectus and have relied only on theinformation and representations in this Prospectus in making your application and will notrely on any other information or representations, except those in any supplement to thisProspectus;
(e) confirm that you are aware of the restrictions on the Global Offering set out in thisProspectus;
(f) agree that none of the Company, the Joint Sponsors, the Joint Global Coordinators, theJoint Bookrunners, the Joint Lead Managers, the Underwriters, any of their or theCompany’s respective directors, officers, employees, agents or representatives and anyother parties involved in the Global Offering (the “Relevant Persons”) and the WhiteForm eIPO Service Provider is or will be liable for any information and representationsnot in this Prospectus (and any supplement to this Prospectus);
(g) undertake and confirm that you or the person(s) for whose benefit you have made theapplication have not applied for or taken up, or indicated an interest for, and will not applyfor or take up, or indicate an interest for, any International Placing Shares nor participatedin the International Placing;
363

HOW TO APPLY FOR HONG KONG PUBLIC OFFER SHARES
(h) agree to disclose to the Company, the Hong Kong Share Registrar, the receiving banks andthe Relevant Persons any personal data which any of them may require about you and theperson(s) for whose benefit you have made the application;
(i) if the laws of any place outside Hong Kong apply to your application, agree and warrantthat you have complied with all such laws and neither the Company nor the RelevantPersons will breach any laws outside Hong Kong as a result of the acceptance of youroffer to purchase, or any action arising from your rights and obligations under the termsand conditions in this Prospectus and the Application Form;
(j) agree that once your application has been accepted, you may not rescind it because of aninnocent misrepresentation;
(k) agree that your application will be governed by the laws of Hong Kong;
(l) represent, warrant and undertake that (i) you understand that the Hong Kong Public OfferShares have not been and will not be registered under the U.S. Securities Act and (ii) youand any person for whose benefit you are applying for the Hong Kong Public Offer Sharesare outside the United States (within the meaning of Regulation S) or are a persondescribed in paragraph (h)(3) of Rule 902 of Regulation S;
(m) warrant that the information you have provided is true and accurate;
(n) agree to accept the Hong Kong Public Offer Shares applied for or any lesser numberallocated to you under the application;
(o) authorize (i) the Company to place your name(s) or the name of HKSCC Nominees on theregister of members of the Company as the holder(s) of any Hong Kong Public OfferShares allocated to you and such other registers as required under the Memorandum andArticles of Association of the Company and (ii) the Company and/or its agents to send anyShare certificate(s) and/or any e-Refund payment instructions and/or any refund check(s)to you or the first-named applicant for joint applications by ordinary post at your own riskto the address stated on the application, unless you have fulfilled the criteria mentioned in“—Personal Collection” below to collect the Share certificate(s) and/or refund check(s) inperson;
(p) declare and represent that this is the only application made and the only applicationintended by you to be made to benefit you or the person for whose benefit you areapplying;
(q) understand that the Joint Global Coordinators may reallocate Offer Shares from theInternational Placing to the Hong Kong Public Offering to satisfy valid applications underthe Hong Kong Public Offering and in accordance with Guidance Letter HKEx-GL91-18issued by the Stock Exchange, if such reallocation is done other than pursuant to PracticeNote 18 of the Listing Rules, the maximum total number of Offer Shares that may bereallocated to the Hong Kong Public Offering following such reallocation shall be notmore than double the initial allocation to the Hong Kong Public Offering (i.e. 65,400,000Offer Shares). Further details of the reallocation are stated in the paragraph headed“Structure of the Global Offering” in this prospectus;
(r) understand that the Company, the Directors and the Joint Global Coordinators will rely onyour declarations and representations in deciding whether or not to allocate any of theHong Kong Public Offer Shares to you and that you may be prosecuted for making a falsedeclaration;
364

HOW TO APPLY FOR HONG KONG PUBLIC OFFER SHARES
(s) (if the application is made for your own benefit) warrant that no other application has beenor will be made for your benefit on a WHITE or YELLOW Application Form or bygiving electronic application instructions to HKSCC or through the White Form eIPOservice or by any one as your agent or by any other person; and
(t) (if you are making the application as an agent for the benefit of another person) warrantthat (i) no other application has been or will be made by you as agent for or for the benefitof that person or by that person or by any other person as agent for that person on aWHITE or YELLOW Application Form or by giving electronic applicationinstructions to HKSCC and (ii) you have due authority to sign the Application Form orgive electronic application instructions on behalf of that other person as its agent.
Additional Instructions for YELLOW Application Forms
You should refer to the YELLOW Application Form for details.
5. Applying Through the White Form eIPO Service
General
Individuals who meet the criteria in “—A. Applications for Hong Kong Public Offer Shares—2. Who Can Apply” above may apply through the White Form eIPO service for the Offer Shares to beallocated and registered in their own names through the designated website at www.eipo.com.hk.
Detailed instructions for application through the White Form eIPO service are set out on thedesignated website. If you do not follow the instructions, your application may be rejected and may notbe submitted to the Company. If you apply through the designated website, you authorize the WhiteForm eIPO Service Provider to apply on the terms and conditions in this Prospectus, as supplementedand amended by the terms and conditions of the White Form eIPO Service Provider.
Time for Submitting Applications under the White Form eIPO Service
You may submit your application through the White Form eIPO service through thedesignated website at www.eipo.com.hk (24 hours daily, except on the last day for applications) from9:00 a.m. on Tuesday, October 22, 2019 until 11:30 a.m. on Friday, October 25, 2019 and the latesttime for completing full payment of application monies in respect of such applications will be 12:00noon on Friday, October 25, 2019, the last day for applications, or such later time as described in theparagraph headed “—C. Effect of Bad Weather on the Opening and Closing of the Application Lists”in this section below.
No Multiple Applications
If you apply by means of the White Form eIPO service, once you complete payment in respectof any electronic application instruction given by you or for your benefit through the White FormeIPO service to make an application for Hong Kong Public Offer Shares, an actual application will bedeemed to have been made. For the avoidance of doubt, giving an electronic application instructionunder the White Form eIPO service more than once and obtaining different application referencenumbers without effecting full payment in respect of a particular reference number will not constitutean actual application.
365

HOW TO APPLY FOR HONG KONG PUBLIC OFFER SHARES
Only one application may be made for the benefit of any person. If you are suspected ofsubmitting more than one application through the White Form eIPO service or by any other means,all of your applications are liable to be rejected.
Section 40 of the Companies (Winding Up and Miscellaneous Provisions) Ordinance
For the avoidance of doubt, the Company and all other parties involved in the preparation ofthis Prospectus acknowledge that each applicant who gives or causes to give electronic applicationinstructions is a person who may be entitled to compensation under Section 40 of the Companies(Winding Up and Miscellaneous Provisions) Ordinance (as applied by Section 342E of the Companies(Winding Up and Miscellaneous Provisions) Ordinance).
Commitment to sustainability
The obvious advantage of White Form eIPO service is to save the use of paper via the self-serviced and electronic application process. Computershare Hong Kong Investor Services Limited,being the designated White Form eIPO Service Provider, will contribute HK$2 for each “ESR CaymanLimited” White Form eIPO application submitted via www.eipo.com.hk to support sustainability.
6. Applying By Giving Electronic Application Instructions to HKSCC via CCASS
General
CCASS Participants may give electronic application instructions to apply for the Hong KongPublic Offer Shares and to arrange payment of the money due on application and payment of refundsunder their participant agreements with HKSCC and the General Rules of CCASS and the CCASSOperational Procedures.
If you are a CCASS Investor Participant, you may give these electronic applicationinstructions through the CCASS Phone System by calling +852 2979 7888 or through the CCASSInternet System (https://ip.ccass.com) (using the procedures in HKSCC’ s “An Operating Guide forInvestor Participants” in effect from time to time).
HKSCC can also input electronic application instructions for you if you go to:
Hong Kong Securities Clearing Company LimitedCustomer Service Center 1/F,One & Two Exchange Square,8 Connaught Place, Central,
Hong Kong
and complete an input request form.
You can also collect a Prospectus from the above address.
If you are not a CCASS Investor Participant, you may instruct your broker or custodian whois a CCASS Clearing Participant or a CCASS Custodian Participant to give electronic applicationinstructions via CCASS terminals to apply for the Hong Kong Public Offer Shares on your behalf.
You will be deemed to have authorized HKSCC and/or HKSCC Nominees to transfer thedetails of your application to the Company, the Joint Global Coordinators and the Hong Kong ShareRegistrar.
366

HOW TO APPLY FOR HONG KONG PUBLIC OFFER SHARES
Giving Electronic Application Instructions to HKSCC via CCASS
Where you have given electronic application instructions to apply for the Hong Kong PublicOffer Shares and a WHITE Application Form is signed by HKSCC Nominees on your behalf:
(a) HKSCC Nominees will only be acting as a nominee for you and is not liable for anybreach of the terms and conditions of the WHITE Application Form or this Prospectus;and
(b) HKSCC Nominees will do the following things on your behalf:
Š agree that the Hong Kong Public Offer Shares to be allocated shall be registered inthe name of HKSCC Nominees and deposited directly into CCASS for the credit ofthe CCASS Participant’s stock account on your behalf or your CCASS InvestorParticipant’s stock account;
Š agree to accept the Hong Kong Public Offer Shares applied for or any lesser numberallocated;
Š undertake and confirm that you have not applied for or taken up, or indicated aninterest for, and will not apply for or take up, or indicate an interest for, anyInternational Placing Shares nor participated in the International Placing;
Š (if the electronic application instructions are given for your benefit) declare thatonly one set of electronic application instructions has been given for your benefit;
Š (if you are an agent for another person) declare that you have only given one set ofelectronic application instructions for the other person’s benefit and are dulyauthorized to give those instructions as its agent;
Š confirm that you understand that the Company, the Directors and the Joint GlobalCoordinators will rely on your declarations and representations in deciding whetheror not to allocate any of the Hong Kong Public Offer Shares to you and that you maybe prosecuted for making a false declaration;
Š authorize the Company to place HKSCC Nominees’ name on the register of membersof the Company as the holder of the Hong Kong Public Offer Shares allocated to youand such other registers as required under the Articles of Association, and dispatchShare certificate(s) and/or refund monies in accordance with the arrangementsseparately agreed between the Company and HKSCC;
Š confirm that you have read the terms and conditions and application procedures setout in this Prospectus and agree to be bound by them;
Š confirm that you have received and read a copy of this Prospectus and have reliedonly on the information and representations in this Prospectus in causing theapplication to be made and will not rely on any other information or representations,except those in any supplement to this Prospectus;
Š agree that neither the Company nor the Relevant Persons is or will be liable for anyinformation and representations not in this Prospectus (and any supplement to thisProspectus);
Š agree to disclose to the Company, the Hong Kong Share Registrar, the receiving bankand the Relevant Persons any personal data which they may require about you;
367

HOW TO APPLY FOR HONG KONG PUBLIC OFFER SHARES
Š agree (without prejudice to any other rights which you may have) that once HKSCCNominees’ application has been accepted, it cannot be rescinded for innocentmisrepresentation;
Š agree that any application made by HKSCC Nominees on your behalf is irrevocableon or before Thursday, November 21, 2019, such agreement to take effect as acollateral contract with the Company, and to become binding when you give theinstructions and such collateral contract to be in consideration of the Companyagreeing that it will not offer any Hong Kong Public Offer Shares to any person on orbefore Thursday, November 21, 2019, except by means of one of the proceduresreferred to in this Prospectus. However, HKSCC Nominees may revoke theapplication on or before Thursday, November 21, 2019 if a person responsible forthis Prospectus under Section 40 of the Companies (Winding Up and MiscellaneousProvisions) Ordinance (as applied by Section 342E of the Companies (Winding Upand Miscellaneous Provisions) Ordinance) gives a public notice under that section onor before the fifth day after the time of the opening of the application lists (excludingany day which is a Saturday, Sunday or public holiday in Hong Kong) whichexcludes or limits that person’s responsibility for this Prospectus;
Š agree that once HKSCC Nominees’ application is accepted, neither that applicationnor your electronic application instructions can be revoked, and that acceptance ofthat application will be evidenced by the announcement of the results of the HongKong Public Offering by the Company;
Š agree to the arrangements, undertakings and warranties under the participantagreement between you and HKSCC, read with the General Rules of CCASS and theCCASS Operational Procedures, for giving electronic application instructions toapply for Hong Kong Public Offer Shares;
Š agree with the Company, for itself and for the benefit of each Shareholder (and sothat the Company will be deemed by its acceptance in whole or in part of theapplication by HKSCC Nominees to have agreed, for the Company and on behalf ofeach Shareholder, with each CCASS Participant giving electronic applicationinstructions) to observe and comply with the Memorandum and Articles ofAssociation of the Company, the Companies (Winding Up and MiscellaneousProvisions) Ordinance and Cayman Companies Law; and
Š agree that your application, any acceptance of it and the resulting contract will begoverned by and construed in accordance with the laws of Hong Kong.
Effect of Giving Electronic Application Instructions to HKSCC via CCASS
By giving electronic application instructions to HKSCC or instructing your broker orcustodian who is a CCASS Clearing Participant or a CCASS Custodian Participant to give suchinstructions to HKSCC, you (and, if you are joint applicants, each of you jointly and severally) aredeemed to have done the following things. Neither HKSCC nor HKSCC Nominees will be liable to theCompany or any other person in respect of the things mentioned below:
Š instructed and authorized HKSCC to cause HKSCC Nominees (acting as nominee for therelevant CCASS Participants) to apply for the Hong Kong Public Offer Shares on yourbehalf;
368

HOW TO APPLY FOR HONG KONG PUBLIC OFFER SHARES
Š instructed and authorized HKSCC to arrange payment of the maximum Offer Price,brokerage, SFC transaction levy and Stock Exchange trading fee by debiting yourdesignated bank account and, in the case of a wholly or partially unsuccessful applicationand/or if the Offer Price is less than the maximum Offer Price initially paid on application,refund of the application monies (including brokerage, SFC transaction levy and StockExchange trading fee) by crediting your designated bank account; and
Š instructed and authorized HKSCC to cause HKSCC Nominees to do on your behalf all thethings stated in the WHITE Application Form and in this Prospectus.
Minimum Purchase Amount and Permitted Numbers
You may give or cause your broker or custodian who is a CCASS Clearing Participant or aCCASS Custodian Participant to give electronic application instructions for a minimum of 200 HongKong Public Offer Shares. Instructions for more than 200 Hong Kong Public Offer Shares must be inone of the numbers set out in the table in the Application Forms. No application for any other numberof Hong Kong Public Offer Shares will be considered and any such application is liable to be rejected.
Time for Inputting Electronic Application Instructions
CCASS Clearing/Custodian Participants can input electronic application instructions at thefollowing times on the following dates:(1)
Tuesday, October 22, 2019 — 9:00 a.m. to 8:30 p.m.Wednesday, October 23, 2019 — 8:00 a.m. to 8:30 p.m.Thursday, October 24, 2019 — 8:00 a.m. to 8:30 p.m.
Friday, October 25, 2019 — 8:00 a.m. to 12:00 noon
Note:(1) The times in this sub-section are subject to change as HKSCC may determine from time to time with prior notification to CCASS
Clearing/Custodian Participants and/or CCASS Investor Participants.
CCASS Investor Participants can input electronic application instructions from 9:00 a.m. onTuesday, October 22, 2019 until 12:00 noon on Friday, October 25, 2019 (24 hours daily, except onFriday, October 25, 2019, the last day for applications).
The latest time for inputting your electronic application instructions will be 12:00 noon onFriday, October 25, 2019, the last day for applications, or such later time as described in the paragraphheaded “—C. Effect of Bad Weather on the Opening and Closing of the Application Lists” in thissection below.
No Multiple Applications
If you are suspected of having made multiple applications or if more than one application ismade for your benefit, the number of Hong Kong Public Offer Shares applied for by HKSCCNominees will be automatically reduced by the number of Hong Kong Public Offer Shares for whichyou have given such instructions and/or for which such instructions have been given for your benefit.Any electronic application instructions to make an application for the Hong Kong Public OfferShares given by you or for your benefit to HKSCC will be deemed to be an actual application for thepurposes of considering whether multiple applications have been made.
369

HOW TO APPLY FOR HONG KONG PUBLIC OFFER SHARES
Section 40 of the Companies (Winding Up and Miscellaneous Provisions) Ordinance
For the avoidance of doubt, the Company and all other parties involved in the preparation ofthis Prospectus acknowledge that each CCASS Participant who gives or causes to give electronicapplication instructions is a person who may be entitled to compensation under Section 40 of theCompanies (Winding Up and Miscellaneous Provisions) Ordinance (as applied by Section 342E of theCompanies (Winding Up and Miscellaneous Provisions) Ordinance).
Personal Data
The section of the Application Form headed “Personal Data” applies to any personal data heldby the Company, the Hong Kong Share Registrar, the receiving bank and the Relevant Persons aboutyou in the same way as it applies to personal data about applicants other than HKSCC Nominees.
7. Warning for Electronic Applications
The application for Hong Kong Public Offer Shares by giving electronic applicationinstructions to HKSCC is only a facility provided to CCASS Participants. Similarly, the applicationfor Hong Kong Public Offer Shares through the White Form eIPO service is only a facility providedby the White Form eIPO Service Provider to public investors. Such facilities are subject to capacitylimitations and potential service interruptions and you are advised not to wait until the last day forapplications to make your electronic application. The Company, the Relevant Persons and the WhiteForm eIPO Service Provider take no responsibility for such applications and provide no assurance thatany CCASS Participant or person applying through the White Form eIPO service will be allocatedany Hong Kong Public Offer Shares.
To ensure that CCASS Investor Participants can give their electronic application instructions,they are advised not to wait until the last minute to input their instructions to the systems. In the eventthat CCASS Investor Participants have problems connecting to the CCASS Phone System or theCCASS Internet System for submission of their electronic application instructions, they shouldeither (a) submit a WHITE or YELLOW Application Form or (b) go to HKSCC’s Customer ServiceCenter to complete an input request form for electronic application instructions before 12:00 noon onFriday, October 25, 2019, the last day for applications, or such later time as described in the paragraphheaded “—C. Effect of Bad Weather on the Opening and Closing of the Application Lists” in thissection below.
8. How Many Applications Can You Make
Multiple applications for the Hong Kong Public Offer Shares are not allowed except bynominees. If you are a nominee, in the box on the Application Form marked “For nominees”, you mustinclude:
Š an account number; or
Š some other identification code;
for each beneficial owner or, in the case of joint beneficial owners, for each joint beneficial owner. Ifyou do not include this information, the application will be treated as being made for your benefit.
All of your applications will be rejected if more than one application on a WHITE orYELLOW Application Form or by giving electronic application instructions to HKSCC or through
370
HOW TO APPLY FOR HONG KONG PUBLIC OFFER SHARES
the White Form eIPO service is made for your benefit (including the part of the application made byHKSCC Nominees acting on electronic application instructions).
If an application is made by an unlisted company and:
Š the principal business of that company is dealing in securities; and
Š you exercise statutory control over that company,
then the application will be treated as being made for your benefit.
“Unlisted company” means a company with no equity securities listed on the Stock Exchange.
“Statutory control” means you:
Š control the composition of the board of directors of the company;
Š control more than half of the voting power of the company; or
Š hold more than half of the issued share capital of the company (not counting any part of itwhich carries no right to participate beyond a specified amount in a distribution of eitherprofits or capital).
B. HOW MUCH ARE THE HONG KONG PUBLIC OFFER SHARES
The maximum Offer Price is HK$17.40 per Offer Share. You must also pay brokerage of 1.0%,SFC transaction levy of 0.0027% and Stock Exchange trading fee of 0.005%. This means that for oneboard lot of 200 Hong Kong Public Offer Shares, you will pay HK$3,515.06.
You must pay the maximum Offer Price, together with brokerage, SFC transaction levy andStock Exchange trading fee, in full upon application for Hong Kong Public Offer Shares under theterms and conditions set out in the Application Forms.
The Application Forms have tables showing the exact amount payable for the numbers of OfferShares that may be applied for.
You may submit an application using a WHITE or YELLOW Application Form or throughthe White Form eIPO service in respect of a minimum of 200 Hong Kong Public Offer Shares. Eachapplication or electronic application instruction in respect of more than 200 Hong Kong Public OfferShares must be in one of the numbers set out in the table in the Application Form, or as otherwisespecified on the designated website at www.eipo.com.hk.
If your application is successful, brokerage will be paid to the Exchange Participants (asdefined in the Listing Rules), and the SFC transaction levy and the Stock Exchange trading fee will bepaid to the Stock Exchange (in the case of the SFC transaction levy, collected by the Stock Exchangeon behalf of the SFC).
For further details on the Offer Price, see the section headed “Structure of the GlobalOffering—Pricing and Allocation” in this Prospectus.
371

HOW TO APPLY FOR HONG KONG PUBLIC OFFER SHARES
C. EFFECT OF BAD WEATHER ON THE OPENING AND CLOSING OF THEAPPLICATION LISTS
The application lists will not open or close if there is/are:
Š a tropical cyclone warning signal number 8 or above;
Š a “black” rainstorm warning; and/or
Š Extreme Conditions
in force in Hong Kong at any time between 9:00 a.m. and 12:00 noon on Friday, October 25, 2019.Instead, they will open between 11:45 a.m. and 12:00 noon on the next business day which does nothave any of those warnings or Extreme Conditions in force in Hong Kong at any time between 9:00a.m. and 12:00 noon.
If the application lists do not open and close on Friday, October 25, 2019 or if there is/are atropical cyclone warning signal number 8 or above, a “black” rainstorm warning signal and/or ExtremeConditions in force in Hong Kong that may affect the dates mentioned in the section headed “ExpectedTimetable” in this Prospectus, an announcement will be made.
D. PUBLICATION OF RESULTS
The Company expects to announce the Offer Price, the level of indications of interest in theInternational Placing, the level of applications in the Hong Kong Public Offering and the basis ofallocations of the Hong Kong Public Offer Shares on Thursday, October 31, 2019 in the South ChinaMorning Post (in English) and the Hong Kong Economic Times (in Chinese) and on the websites ofthe Company at www.esr.com and the Stock Exchange at www.hkexnews.hk.
The results of allocations and the Hong Kong identity card/passport/Hong Kong businessregistration numbers of successful applicants under the Hong Kong Public Offering will be available atthe times and dates and in the manner set out below:
Š in the announcement to be posted on the websites of the Company and the Stock Exchangeat www.esr.com and www.hkexnews.hk, respectively, by no later than 9:00 a.m. onThursday, October 31, 2019;
Š from the designated results of allocations website at www.iporesults.com.hk(alternatively: English https://www.eipo.com.hk/en/Allotment; Chinese https://www.eipo.com.hk/zh-hk/Allotment) with a “search by ID function” on a 24 hour basisfrom 8:00 a.m. on Thursday, October 31, 2019 to 12:00 midnight on Wednesday,November 6, 2019;
Š from the allocation results telephone enquiry line by calling +852 2862 8669 between 9:00a.m. and 10:00 p.m. from Thursday, October 31, 2019 to Sunday, November 3, 2019; and
Š in the special allocation results booklets which will be available for inspection during theopening hours of the individual receiving bank branches and sub-branches referred toabove from Thursday, October 31, 2019 to Saturday, November 2, 2019.
If the Company accepts your offer to purchase (in whole or in part), which it may do byannouncing the basis of allocations and/or making available the results of allocations publicly, there
372

HOW TO APPLY FOR HONG KONG PUBLIC OFFER SHARES
will be a binding contract under which you will be required to purchase the Hong Kong Public OfferShares if the conditions of the Global Offering are satisfied and the Global Offering is not otherwiseterminated. Further details are set out in “Structure of the Global Offering”.
You will not be entitled to exercise any remedy of rescission for innocent misrepresentation atany time after acceptance of your application. This does not affect any other right you may have.
E. CIRCUMSTANCES IN WHICH YOU WILL NOT BE ALLOCATED HONG KONGPUBLIC OFFER SHARES
You should note the following situations in which the Hong Kong Public Offer Shares will notbe allocated to you:
(a) If your application is revoked:
By completing and submitting an Application Form or giving electronic applicationinstructions to HKSCC or through the White Form eIPO service, you agree that your application orthe application made by HKSCC Nominees on your behalf cannot be revoked on or before Thursday,November 21, 2019. This agreement will take effect as a collateral contract with the Company.
Your application or the application made by HKSCC Nominees on your behalf may only berevoked on or before Thursday, November 21, 2019 in the following circumstances:
(i) if a person responsible for this Prospectus under Section 40 of the Companies (WindingUp and Miscellaneous Provisions) Ordinance (as applied by Section 342E of theCompanies (Winding Up and Miscellaneous Provisions) Ordinance) gives a public noticeunder that section on or before the fifth day after the time of the opening of the applicationlists (excluding any day which is a Saturday, Sunday or public holiday in Hong Kong)which excludes or limits that person’s responsibility for this Prospectus; or
(ii) if any supplement to this Prospectus is issued, in which case applicants who have alreadysubmitted an application will be notified that they are required to confirm theirapplications. If applicants have been so notified but have not confirmed their applicationsin accordance with the procedure to be notified, all unconfirmed applications will bedeemed revoked.
If your application or the application made by HKSCC Nominees on your behalf has beenaccepted, it cannot be revoked. For this purpose, acceptance of applications which are not rejected willbe constituted by notification in the press of the results of allocation, and where such basis ofallocation is subject to certain conditions or provides for allocation by ballot, such acceptance will besubject to the satisfaction of such conditions or results of the ballot, respectively.
(b) If the Company or its agents exercise their discretion to reject your application:
The Company, the Joint Global Coordinators, the White Form eIPO Service Provider andtheir respective agents or nominees have full discretion to reject or accept any application, or to acceptonly part of any application, without giving any reasons.
373
HOW TO APPLY FOR HONG KONG PUBLIC OFFER SHARES
(c) If the allocation of Hong Kong Public Offer Shares is void:
The allocation of Hong Kong Public Offer Shares will be void if the Listing Committee doesnot grant permission to list the Shares either:
Š within three weeks from the closing date of the applications lists; or
Š within a longer period of up to six weeks if the Listing Committee notifies the Company ofthat longer period within three weeks of the closing date of the application lists.
(d) If:
Š you make multiple applications or are suspected of making multiple applications;
Š you or the person for whose benefit you apply for, have applied for or taken up, orindicated an interest for, or have been or will be placed or allocated (includingconditionally and/or provisionally) Hong Kong Public Offer Shares and InternationalPlacing Shares;
Š your payment is not made correctly or the check or banker’s cashier order paid by you isdishonored upon its first presentation;
Š your Application Form is not completed in accordance with the stated instructions;
Š your electronic application instructions through the White Form eIPO service are notcompleted in accordance with the instructions, terms and conditions on the designatedwebsite at www.eipo.com.hk;
Š you apply for more than 17,350,000 Hong Kong Public Offer Shares, being 50% of the34,700,000 Hong Kong Public Offer Shares initially available under the Hong KongPublic Offering;
Š the Company or the Joint Global Coordinators believe that by accepting your application,it would violate applicable securities or other laws, rules or regulations; or
Š the Underwriting Agreements do not become unconditional or are terminated.
F. REFUND OF APPLICATION MONIES
If an application is rejected, not accepted or accepted in part only, or if the Offer Price as finallydetermined is less than the maximum Offer Price per Offer Share (excluding brokerage, SFCtransaction levy and Stock Exchange trading fee payable thereon) paid on application, or if theconditions of the Global Offering as set out in the section headed “Structure of the Global Offering—Conditions of the Global Offering” in this Prospectus are not satisfied or if any application is revoked,the application monies, or the appropriate portion thereof, together with the related brokerage, SFCtransaction levy and Stock Exchange trading fee, will be refunded, without interest or the check orbanker’s cashier order will not be cleared.
Any refund of your application monies will be made on or before Thursday, October 31, 2019.
G. DISPATCH/COLLECTION OF SHARE CERTIFICATES/e-REFUND PAYMENTINSTRUCTIONS/REFUND CHECKS
You will receive one Share certificate for all Hong Kong Public Offer Shares allocated to youunder the Hong Kong Public Offering (except pursuant to applications made on YELLOW
374

HOW TO APPLY FOR HONG KONG PUBLIC OFFER SHARES
Application Forms or by electronic application instructions to HKSCC via CCASS where the Sharecertificates will be deposited into CCASS as described below).
No temporary document of title will be issued in respect of the Offer Shares. No receipt will beissued for sums paid on application.
If you apply by WHITE or YELLOW Application Form, subject to personal collection asmentioned below, the following will be sent to you (or, in the case of joint applicants, to the first-named applicant) by ordinary post, at your own risk, to the address specified on the Application Form:
(a) Share certificate(s) for all the Hong Kong Public Offer Shares allocated to you (forapplicants on YELLOW Application Forms, Share certificate(s) for the Hong KongPublic Offer Shares allocated to you will be deposited into CCASS as described below);and
(b) refund check(s) crossed “Account Payee Only” in favor of the applicant (or, in the case ofjoint applicants, the first-named applicant) for: (i) all or the surplus application monies forthe Hong Kong Public Offer Shares, wholly or partially unsuccessfully applied for; and/or(ii) the difference between the Offer Price and the maximum Offer Price paid onapplication in the event that the Offer Price is less than the maximum Offer Price paid onapplication (including brokerage of 1.0%, SFC transaction levy of 0.0027% and StockExchange trading fee of 0.005% but without interest).
Part of the Hong Kong identity card number/passport number provided by you or the first-named applicant (if you are joint applicants) may be printed on your refund check, if any. Your bankermay require verification of your Hong Kong identity card number/passport number before encashmentof your refund check. Inaccurate completion of your Hong Kong identity card number/passport numbermay invalidate or delay encashment of your refund check.
Subject to arrangement on dispatch/collection of Share certificates and refund checks asmentioned below, any refund checks and Share certificate(s) are expected to be posted on or beforeThursday, October 31, 2019. The right is reserved to retain any Share certificate(s) and any surplusapplication monies pending clearance of check(s) or banker’s cashier order(s).
Share certificates will only become valid at 8:00 a.m. on Friday, November 1, 2019, providedthat the Global Offering has become unconditional in all respects at or before that time. Investors whotrade Share on the basis of publicly available allocation details or prior to the receipt of the Sharecertificates or prior to the Share certificates becoming valid do so entirely at their own risk.
Personal Collection
(a) If you apply using a WHITE Application Form:
Š If you apply for 1,000,000 Hong Kong Public Offer Shares or more on a WHITEApplication Form and have provided all information required by your Application Form,you may collect your refund check(s) and/or Share certificate(s) (where applicable) fromthe Hong Kong Share Registrar, Computershare Hong Kong Investor Services Limited, atShops 1712-1716, 17th Floor, Hopewell Centre, 183 Queen’s Road East, Wanchai, HongKong from 9:00 a.m. to 1:00 p.m. on Thursday, October 31, 2019, or any other place ordate notified by the Company in the newspapers.
375

HOW TO APPLY FOR HONG KONG PUBLIC OFFER SHARES
Š If you are an individual who is eligible for personal collection, you must not authorize anyother person to collect for you. If you are a corporate applicant who is eligible for personalcollection, your authorized representative must provide a letter of authorization from yourcorporation stamped with your corporation’s chop. Both individuals and authorizedrepresentatives must produce, at the time of collection, evidence of identity acceptable tothe Hong Kong Share Registrar.
Š If you do not personally collect your refund check(s) and/or Share certificate(s) (whereapplicable) within the time specified for collection, they will be dispatched promptly toyou to the address specified in your Application Form by ordinary post and at your ownrisk.
Š If you apply for less than 1,000,000 Hong Kong Public Offer Shares on a WHITEApplication Form, your refund check(s) and/or Share certificate(s) (where applicable) willbe sent to the address specified in your Application Form on or before Thursday,October 31, 2019 by ordinary post and at your own risk.
(b) If you apply using a YELLOW Application Form:
Š If you apply for 1,000,000 Hong Kong Public Offer Shares or more and have provided allinformation required by your Application Form, please follow the same instructions asdescribed above for collecting refund check(s). If you have applied for less than 1,000,000Hong Kong Public Offer Shares, your refund check(s) will be sent to the address specifiedin the Application Form on or before Thursday, October 31, 2019 by ordinary post and atyour own risk.
Š If you apply by using a YELLOW Application Form and your application is wholly orpartially successful, your Share certificate(s) will be issued in the name of HKSCCNominees and deposited into CCASS for credit to your or your designated CCASSParticipant’s stock account as stated in your Application Form on Thursday, October 31,2019 or, in the event of a contingency, on any other date determined by HKSCC orHKSCC Nominees.
Š If you apply through a designated CCASS Participant (other than a CCASS InvestorParticipant), for Hong Kong Public Offer Shares credited to your designated CCASSParticipant’s stock account (other than a CCASS Investor Participant), you can check thenumber of Hong Kong Public Offer Shares allocated to you with that CCASS Participant.
Š If you apply as a CCASS Investor Participant, the Company expects to publish the resultsof CCASS Investor Participants’ applications together with the results of the Hong KongPublic Offering on Thursday, October 31, 2019 in the manner as described in “—Publication of Results” above. You should check the announcement published by theCompany and report any discrepancies to HKSCC before 5:00 p.m. on Thursday,October 31, 2019 or any other date as determined by HKSCC or HKSCC Nominees.Immediately after the credit of the Hong Kong Public Offer Shares to your stock account,you can check your new account balance via the CCASS Phone System and the CCASSInternet System. HKSCC will also make available to you an activity statement showingthe number of Hong Kong Public Offer Shares credited to your CCASS InvestorParticipant stock account.
376

HOW TO APPLY FOR HONG KONG PUBLIC OFFER SHARES
(c) If you apply through White Form eIPO service:
Š If you apply for 1,000,000 Hong Kong Public Offer Shares or more through the WhiteForm eIPO service and your application is wholly or partially successful, you may collectyour Share certificate(s) (where applicable) in person from the Hong Kong ShareRegistrar, Computershare Hong Kong Investor Services Limited, at Shops 1712-1716,17th Floor, Hopewell Centre, 183 Queen’s Road East, Wanchai, Hong Kong, from 9:00a.m. to 1:00 p.m. on Thursday, October 31, 2019, or any other place or date notified by theCompany in the newspapers as the date of dispatch or collection of Share certificates.
Š If you do not personally collect your Share certificate(s) within the time specified forcollection, they will be sent to the address specified in your application instructions byordinary post and at your own risk.
Š If you apply for less than 1,000,000 Hong Kong Public Offer Shares through the WhiteForm eIPO service, your Share certificate(s) (where applicable) will be sent to the addressspecified in your application instructions on or before Thursday, October 31, 2019 byordinary post and at your own risk.
Š If you apply and pay the application monies from a single bank account, any refundmonies will be dispatched to that bank account in the form of e-Refund paymentinstructions. If you apply and pay the application monies from multiple bank accounts, anyrefund monies will be dispatched to the address specified in your application instructionsin the form of refund check(s) by ordinary post and at your own risk.
(d) If you apply by giving electronic application instructions to HKSCC via CCASS:
Allocation of Hong Kong Public Offer Shares
Š For the purposes of allocating Hong Kong Public Offer Shares, HKSCC Nominees willnot be treated as an applicant. Instead, each CCASS Participant who gives electronicapplication instructions or each person for whose benefit instructions are given will betreated as an applicant.
Deposit of Share Certificates into CCASS and Refund of Application Monies
Š If your application is wholly or partially successful, your Share certificate(s) will be issuedin the name of HKSCC Nominees and deposited into CCASS for the credit of yourdesignated CCASS Participant’s stock account or your CCASS Investor Participant stockaccount on Thursday, October 31, 2019 or on any other date determined by HKSCC orHKSCC Nominees.
Š The Company expects to publish the application results of CCASS Participants (and wherethe CCASS Participant is a broker or custodian, the Company will include informationrelating to the relevant beneficial owner), your Hong Kong identity card /passport/Hong Kong business registration number or other identification code (Hong Kongbusiness registration number for corporations) and the basis of allocations of the HongKong Public Offer Shares in the manner as described in “—D. Publication of Results”above on Thursday, October 31, 2019. You should check the announcement published bythe Company and report any discrepancies to HKSCC before 5:00 p.m. on Thursday,October 31, 2019 or such other date as determined by HKSCC or HKSCC Nominees.
377

HOW TO APPLY FOR HONG KONG PUBLIC OFFER SHARES
Š If you have instructed your broker or custodian to give electronic applicationinstructions on your behalf, you can also check the number of Hong Kong Public OfferShares allocated to you and the amount of refund monies (if any) payable to you with thatbroker or custodian.
Š If you have applied as a CCASS Investor Participant, you can also check the number ofHong Kong Public Offer Shares allocated to you and the amount of refund monies (if any)payable to you via the CCASS Phone System and the CCASS Internet System (under theprocedures contained in HKSCC’s “An Operating Guide for Investor Participants” ineffect from time to time) on Thursday, October 31, 2019. Immediately following the creditof the Hong Kong Public Offer Shares to your stock account and the credit of the refundmonies to your bank account, HKSCC will also make available to you an activitystatement showing the number of Hong Kong Public Offer Shares credited to your CCASSInvestor Participant stock account and the amount of refund monies (if any) credited toyour designated bank account.
Š Refund of your application monies (if any) in respect of wholly and partially unsuccessfulapplications and/or difference between the Offer Price and the maximum Offer Price perOffer Share initially paid on application (including brokerage, SFC transaction levy andStock Exchange trading fee but without interest) will be credited to your designated bankaccount or the designated bank account of your broker or custodian on Thursday,October 31, 2019.
H. ADMISSION OF THE SHARES INTO CCASS
If the Stock Exchange grants the listing of, and permission to deal in, the Shares and theCompany complies with the stock admission requirements of HKSCC, the Shares will be accepted aseligible securities by HKSCC for deposit, clearance and settlement in CCASS with effect from the dateof commencement of dealings in the Shares on the Stock Exchange or any other date HKSCC chooses.Settlement of transactions between Exchange Participants (as defined in the Listing Rules) is requiredto take place in CCASS on the second business day after any trading day.
All activities under CCASS are subject to the General Rules of CCASS and CCASSOperational Procedures in effect from time to time.
Investors should seek the advice of their stockbroker or other professional adviser for details ofthe settlement arrangements as such arrangements may affect their rights and interests.
All necessary arrangements have been made to enable the Shares to be admitted into CCASS.
378
APPENDIX I ACCOUNTANTS’ REPORT
The following is the text of a report, prepared for inclusion in this prospectus, received fromthe independent reporting accountants of the Company, Ernst & Young, Certified PublicAccountants, Hong Kong.
22/F, CITIC Tower1 Tim Mei Avenue
Central, Hong Kong
October 22, 2019
The DirectorsESR Cayman Limited
Deutsche Securities Asia LimitedCLSA Capital Markets Limited
Dear Sirs,
We report on the Historical Financial Information of ESR Cayman Limited (the “Company”)and its subsidiaries (together, the “Group”) set out on pages I-4 to I-175, which comprises theconsolidated statements of profit or loss and other comprehensive income, statements of changes inequity and statements of cash flows of the Group for each of the years ended December 31, 2016,2017, and 2018, and the six months ended June 30, 2019 (the “Relevant Periods”), and theconsolidated statements of financial position of the Group and the statements of financial position ofthe Company as at December 31, 2016, 2017 and 2018 and June 30, 2019 and a summary of significantaccounting policies and other explanatory information (together, the “Historical FinancialInformation”). The Historical Financial Information set out on pages I-4 to I-175 forms an integral partof this report, which has been prepared for inclusion in the prospectus of the Company datedOctober 22, 2019 (the “Prospectus”) in connection with the initial listing of the shares of the Companyon the Main Board of The Stock Exchange of Hong Kong Limited (the “Stock Exchange”).
DIRECTORS’ RESPONSIBILITY FOR THE HISTORICAL FINANCIAL INFORMATION
The directors of the Company are responsible for the preparation of the Historical FinancialInformation that gives a true and fair view in accordance with the basis of preparation set out in note2.1 to the Historical Financial Information, and for such internal control as the directors determine isnecessary to enable the preparation of the Historical Financial Information that is free from materialmisstatement, whether due to fraud or error.
REPORTING ACCOUNTANTS’ RESPONSIBILITY
Our responsibility is to express an opinion on the Historical Financial Information and to reportour opinion to you. We conducted our work in accordance with Hong Kong Standard on InvestmentCircular Reporting Engagements 200 Accountants’ Reports on Historical Financial Information inInvestment Circulars issued by the Hong Kong Institute of Certified Public Accountants. This standard
I-1

APPENDIX I ACCOUNTANTS’ REPORT
REPORTING ACCOUNTANTS’ RESPONSIBILITY (continued)
requires that we comply with ethical standards and plan and perform our work to obtain reasonableassurance about whether the Historical Financial Information is free from material misstatement.
Our work involved performing procedures to obtain evidence about the amounts anddisclosures in the Historical Financial Information. The procedures selected depend on the reportingaccountants’ judgement, including the assessment of risks of material misstatement of the HistoricalFinancial Information, whether due to fraud or error. In making those risk assessments, the reportingaccountants consider internal control relevant to the entity’s preparation of the Historical FinancialInformation that gives a true and fair view in accordance with the basis of preparation set out in note2.1 to the Historical Financial Information, in order to design procedures that are appropriate in thecircumstances, but not for the purpose of expressing an opinion on the effectiveness of the entity’sinternal control. Our work also included evaluating the appropriateness of accounting policies used andthe reasonableness of accounting estimates made by the directors, as well as evaluating the overallpresentation of the Historical Financial Information.
We believe that the evidence we have obtained is sufficient and appropriate to provide a basisfor our opinion.
OPINION
In our opinion, the Historical Financial Information gives, for the purposes of the accountants’report, a true and fair view of the financial position of the Group and the Company as at December 31,2016, 2017 and 2018 and at June 30, 2019 and of the financial performance and cash flows of theGroup for each of the Relevant Periods in accordance with the basis of preparation set out in note 2.1to the Historical Financial Information.
REVIEW OF INTERIM COMPARATIVE FINANCIAL INFORMATION
We have reviewed the interim comparative financial information of the Group which comprisesthe consolidated statement of profit or loss and other comprehensive income, consolidated statement ofchanges in equity and consolidated statement of cash flows for the six months ended June 30, 2018 andother explanatory information (the “Interim Comparative Financial Information”). The directors of theCompany are responsible for the preparation of the Interim Comparative Financial Information inaccordance with the basis of preparation set out in note 2.1 to the Historical Financial Information. Ourresponsibility is to express a conclusion on the Interim Comparative Financial Information based onour review. We conducted our review in accordance with Hong Kong Standard on ReviewEngagements 2410 Review of Interim Financial Information Performed by the Independent Auditor ofthe Entity issued by the Hong Kong Institute of Certified Public Accountants. A review consists ofmaking inquiries, primarily of persons responsible for financial and accounting matters, and applyinganalytical and other review procedures. A review is substantially less in scope than an audit conductedin accordance with International Standards on Auditing and consequently does not enable us to obtainassurance that we would become aware of all significant matters that might be identified in an audit.Accordingly, we do not express an audit opinion. Based on our review, nothing has come to ourattention that causes us to believe that the Interim Comparative Financial Information, for the purposesof the accountants’ report, is not prepared, in all material respects, in accordance with the basis ofpreparation set out in note 2.1 to the Historical Financial Information.
I-2

APPENDIX I ACCOUNTANTS’ REPORT
REPORT ON MATTERS UNDER THE RULES GOVERNING THE LISTING OFSECURITIES ON THE STOCK EXCHANGE AND THE COMPANIES (WINDING UP ANDMISCELLANEOUS PROVISIONS) ORDINANCE
Adjustments
In preparing the Historical Financial Information, no adjustments to the Underlying FinancialStatements as defined on page I-4 have been made.
Dividends
We refer to note 11 to the Historical Financial Information which states that no dividends havebeen paid by the Company in respect of the Relevant Periods.
Yours faithfully,
Ernst & YoungCertified Public AccountantsHong Kong
I-3

APPENDIX I ACCOUNTANTS’ REPORT
I. HISTORICAL FINANCIAL INFORMATION
Preparation of Historical Financial Information
Set out below is the Historical Financial Information which forms an integral part of thisaccountants’ report.
The financial statements of the Group for the Relevant Periods, on which the HistoricalFinancial Information is based, were audited by Ernst & Young Hua Ming LLP in accordance withInternational Standards on Auditing issued by the International Auditing and Assurance StandardsBoard (the “IAASB”) (the “Underlying Financial Statements”).
The Historical Financial Information is presented in U.S. Dollar (“USD”) and all values arerounded to the nearest thousand (USD’000) except when otherwise indicated.
I-4

APPENDIX I ACCOUNTANTS’ REPORT
I. HISTORICAL FINANCIAL INFORMATION (continued)
CONSOLIDATED STATEMENTS OF PROFIT OR LOSS AND OTHER COMPREHENSIVEINCOME
Year ended December 31 Six months ended June 30
Notes 2016 2017 2018 2018 2019
USD’000 USD’000 USD’000 USD’000 USD’000(unaudited)
REVENUE . . . . . . . . . . . . . . . . . . . . . . . . . . . . . . . . . . . . . . . . . 5 96,737 153,289 254,148 93,690 155,763Cost of sales . . . . . . . . . . . . . . . . . . . . . . . . . . . . . . . . . . . . . . . . (2,655) (3,487) (43,742) (2,058) (41,808)
Gross profit . . . . . . . . . . . . . . . . . . . . . . . . . . . . . . . . . . . . . . . . . 94,082 149,802 210,406 91,632 113,955Other income and gains . . . . . . . . . . . . . . . . . . . . . . . . . . . . . . . 5 135,145 284,118 254,305 75,665 165,425Administrative expenses . . . . . . . . . . . . . . . . . . . . . . . . . . . . . . (57,722) (106,843) (154,567) (55,193) (91,621)Fair value loss on derivative financial instrument . . . . . . . . . . . (12,133) — — — —Finance costs . . . . . . . . . . . . . . . . . . . . . . . . . . . . . . . . . . . . . . . 7 (55,992) (90,903) (104,929) (45,943) (83,363)Share of profits and losses of joint ventures and associates,
net . . . . . . . . . . . . . . . . . . . . . . . . . . . . . . . . . . . . . . . . . . . . . . 36,352 37,000 65,372 14,801 18,317
Profit before tax . . . . . . . . . . . . . . . . . . . . . . . . . . . . . . . . . . . . 6 139,732 273,174 270,587 80,962 122,713Income tax expense . . . . . . . . . . . . . . . . . . . . . . . . . . . . . . . . . . 10 (34,888) (72,340) (57,709) (17,271) (38,636)
Profit for the year/period . . . . . . . . . . . . . . . . . . . . . . . . . . . . . 104,844 200,834 212,878 63,691 84,077
Attributable to:Owners of the parent . . . . . . . . . . . . . . . . . . . . . . . . . . . . . 88,267 186,265 203,042 61,793 75,950Non-controlling interests . . . . . . . . . . . . . . . . . . . . . . . . . . 16,577 14,569 9,836 1,898 8,127
104,844 200,834 212,878 63,691 84,077
EARNINGS PER SHARE ATTRIBUTABLE TOORDINARY EQUITY HOLDERS OF THE PARENT
BasicFor profit for the year/period . . . . . . . . . . . . . . . . . . . . . . . . . . . 12 0.05 0.09 0.08 0.03 0.03DilutedFor profit for the year/period . . . . . . . . . . . . . . . . . . . . . . . . . . . 12 0.04 0.09 0.08 0.02 0.03
Profit for the year/period . . . . . . . . . . . . . . . . . . . . . . . . . . . . . 104,844 200,834 212,878 63,691 84,077
OTHER COMPREHENSIVE INCOMEOther comprehensive income/(loss) that may be
reclassified to profit or loss in subsequent periods:Changes in fair value of available-for-sale investments . . . . . . 250 (10,388) — — —Exchange differences on translation of foreign operations . . . . (38,394) 46,312 (57,792) (4,901) (1,133)Share of other comprehensive income/(loss) of joint ventures
and associates . . . . . . . . . . . . . . . . . . . . . . . . . . . . . . . . . . . . . (11,098) 16,367 (13,465) (8,051) (10,719)
Net other comprehensive income/(loss) that may bereclassified to profit or loss in subsequent periods . . . . . . . . (49,242) 52,291 (71,257) (12,952) (11,852)
Other comprehensive income that will not be reclassified toprofit or loss in subsequent periods:
Changes in fair value of financial assets at fair value throughother comprehensive income . . . . . . . . . . . . . . . . . . . . . . . . . — — 8,544 9,239 31,632
Net other comprehensive income that will not be reclassifiedto profit or loss in subsequent periods . . . . . . . . . . . . . . . . . . — — 8,544 9,239 31,632
Other comprehensive (loss)/ income for the year/period,net of tax . . . . . . . . . . . . . . . . . . . . . . . . . . . . . . . . . . . . . . . . (49,242) 52,291 (62,713) (3,713) 19,780
Total comprehensive income for the year/period . . . . . . . . . 55,602 253,125 150,165 59,978 103,857
Attributable to: . . . . . . . . . . . . . . . . . . . . . . . . . . . . . . . . . . . . .Owners of the parent . . . . . . . . . . . . . . . . . . . . . . . . . . . . . 39,922 235,595 134,941 53,050 91,879Non-controlling interests . . . . . . . . . . . . . . . . . . . . . . . . . . 15,680 17,530 15,224 6,928 11,978
55,602 253,125 150,165 59,978 103,857
I-5

APPENDIX I ACCOUNTANTS’ REPORT
I. HISTORICAL FINANCIAL INFORMATION (continued)
CONSOLIDATED STATEMENTS OF FINANCIAL POSITION
As at December 31As at
June 30
Notes 2016 2017 2018 2019
USD’000 USD’000 USD’000 USD’000NON-CURRENT ASSETSProperty, plant and equipment . . . . . . . . . . . . . . . . . . . . . . 13 2,446 17,360 21,061 24,314Right-of-use assets . . . . . . . . . . . . . . . . . . . . . . . . . . . . . . . 14 4,164 7,482 9,090 13,037Investments in joint ventures . . . . . . . . . . . . . . . . . . . . . . . 15 198,225 313,081 404,699 526,085Investments in associates . . . . . . . . . . . . . . . . . . . . . . . . . . 16 — — 9,334 —Financial assets at fair value through profit or loss . . . . . . 17 140,577 362,073 335,771 504,903Financial assets at fair value through other
comprehensive income . . . . . . . . . . . . . . . . . . . . . . . . . 18 — — 484,239 468,958Available-for-sale investments . . . . . . . . . . . . . . . . . . . . . 19 1,492 189,816 — —Investment properties . . . . . . . . . . . . . . . . . . . . . . . . . . . . 20 942,929 1,189,203 1,885,502 2,656,507Goodwill . . . . . . . . . . . . . . . . . . . . . . . . . . . . . . . . . . . . . . 21 210,480 226,232 285,382 340,243Other intangible assets . . . . . . . . . . . . . . . . . . . . . . . . . . . . 22 25,048 48,181 79,493 96,710Other non-current assets . . . . . . . . . . . . . . . . . . . . . . . . . . 23 49,772 22,709 34,361 37,013Deferred tax assets . . . . . . . . . . . . . . . . . . . . . . . . . . . . . . . 30 9,309 10,353 13,559 16,671
Total non-current assets . . . . . . . . . . . . . . . . . . . . . . . . . . . 1,584,442 2,386,490 3,562,491 4,684,441
CURRENT ASSETSTrade receivables . . . . . . . . . . . . . . . . . . . . . . . . . . . . . . . . 24 9,271 30,448 63,057 51,870Prepayments, other receivables and other assets . . . . . . . . 25 22,284 37,139 224,673 199,303Cash and bank balances . . . . . . . . . . . . . . . . . . . . . . . . . . . 26 485,545 600,791 581,379 1,010,390
Total current assets . . . . . . . . . . . . . . . . . . . . . . . . . . . . . . 517,100 668,378 869,109 1,261,563
CURRENT LIABILITIESBank loans and other borrowings . . . . . . . . . . . . . . . . . . . 27 75,862 91,706 436,194 630,135Lease liabilities . . . . . . . . . . . . . . . . . . . . . . . . . . . . . . . . . 28 1,314 2,335 3,374 6,091Redeemable convertible preference shares . . . . . . . . . . . . 32 — — 296,778 316,010Trade payables, accruals and other payables . . . . . . . . . . . 29 30,425 58,705 111,743 128,749Income tax payable . . . . . . . . . . . . . . . . . . . . . . . . . . . . . . 1,937 9,616 7,284 6,289
Total current liabilities . . . . . . . . . . . . . . . . . . . . . . . . . . . 109,538 162,362 855,373 1,087,274
NET CURRENT ASSETS . . . . . . . . . . . . . . . . . . . . . . . 407,562 506,016 13,736 174,289
TOTAL ASSETS LESS CURRENT LIABILITIES . . 1,992,004 2,892,506 3,576,227 4,858,730
NON-CURRENT LIABILITIESDeferred tax liabilities . . . . . . . . . . . . . . . . . . . . . . . . . . . . 30 109,952 138,447 191,949 186,993Bank loans and other borrowings . . . . . . . . . . . . . . . . . . . 27 759,403 741,729 1,024,279 2,173,601Lease liabilities . . . . . . . . . . . . . . . . . . . . . . . . . . . . . . . . . 28 2,935 5,624 6,311 18,317Redeemable convertible preference shares . . . . . . . . . . . . 32 246,156 264,199 — —Financial liabilities at fair value through profit or loss . . . 33 12,592 13,671 — —Other non-current liabilities . . . . . . . . . . . . . . . . . . . . . . . 10,662 22,196 35,766 40,925
Total non-current liabilities . . . . . . . . . . . . . . . . . . . . . . . . 1,141,700 1,185,866 1,258,305 2,419,836
NET ASSETS . . . . . . . . . . . . . . . . . . . . . . . . . . . . . . . . . . 850,304 1,706,640 2,317,922 2,438,894
EQUITYEquity attributable to owners of the parentIssued capital . . . . . . . . . . . . . . . . . . . . . . . . . . . . . . . . . . . 43 1,963 2,335 2,689 2,689Perpetual capital securities . . . . . . . . . . . . . . . . . . . . . . . . 45 — 98,845 97,379 97,379Equity components of redeemable convertible
instruments and warrant instrument . . . . . . . . . . . . . . . 65,548 63,836 37,132 37,132Other reserves . . . . . . . . . . . . . . . . . . . . . . . . . . . . . . . . . . 46 698,715 1,415,069 1,952,839 2,073,569
766,226 1,580,085 2,090,039 2,210,769Non-controlling interests . . . . . . . . . . . . . . . . . . . . . . . . . . 34 84,078 126,555 227,883 228,125
Total equity . . . . . . . . . . . . . . . . . . . . . . . . . . . . . . . . . . . 850,304 1,706,640 2,317,922 2,438,894
I-6

I.HIS
TORIC
AL
FIN
ANCIA
LIN
FORM
ATIO
N(con
tinu
ed)
CONSO
LID
ATED
STATEM
ENTSOFCHANGESIN
EQUIT
Y
Attribu
tableto
owne
rsof
thepa
rent
Issu
edca
pital
Shar
epr
emium*
Statut
ory
reserv
e*M
erge
rreserv
e*
Shar
eop
tion
reserv
e*
Exc
hang
eFluctua
tion
reserv
e*
Ava
ilable
-for
-sale
inve
stmen
treva
luation
reserv
e*Retaine
dpr
ofits*
Equ
ity
compo
nent
ofre
deem
able
conv
ertible
instru
men
t
Equ
ity
compo
nent
ofwar
rant
instru
men
tTotal
Non
-con
trollin
gintere
sts
Total
equity
(note43
)(n
ote43
)(n
ote46
)(n
ote46
)(n
ote44
)(n
ote46
)USD
’000
USD
’000
USD
’000
USD
’000
USD
’000
USD
’000
USD
’000
USD
’000
USD
’000
USD
’000
USD
’000
USD
’000
USD
’000
Asat
Janu
ary1,
2016
....
....
....
....
....
.1,57
324
6,98
551
056
,358
347
(22,56
6)—
124,29
5—
—40
7,50
292
240
8,42
4Profitfor
theye
ar..
....
....
....
....
....
...
——
——
——
—88
,267
——
88,267
16,577
104,84
4Cha
ngein
fairva
lueof
available-for-sale
inve
stmen
ts,n
etof
tax
....
....
....
....
...
——
——
——
250
——
—25
0—
250
Exc
hang
edifferen
ceson
tran
slationof
foreign
operations
....
....
....
....
....
....
....
.—
——
——
(37,49
7)—
——
—(37,49
7)(897
)(38,39
4)Sha
reof
othe
rco
mpreh
ensive
loss
ofjoint
ventures
....
....
....
....
....
....
....
...
——
——
—(11,09
8)—
——
—(11,09
8)—
(11,09
8)
Total
compr
ehen
sive
inco
me/(los
s)forth
eye
ar..
....
....
....
....
....
....
....
....
——
——
—(48,59
5)25
088
,267
——
39,922
15,680
55,602
Issu
eof
shares
(note43
)..
....
....
....
....
..39
025
2,78
9—
——
——
——
—25
3,17
9—
253,17
9Equ
ity-settledsh
areop
tion
arrang
emen
ts..
....
.—
——
—75
——
——
—75
—75
Trans
ferred
from
retained
profits
....
....
....
.—
—18
9—
——
—(189
)—
——
——
Trans
ferred
from
fina
ncialliabilities
(note33
)..
.—
——
——
——
——
——
41,019
41,019
Trans
ferred
from
deriva
tive
fina
ncialins
trum
ents
(note31
)..
....
....
....
....
....
....
....
——
——
——
——
—26
,704
26,704
—26
,704
Issu
eof
rede
emab
leco
nvertiblepreferen
cesh
ares
(note32
)..
....
....
....
....
....
....
....
——
——
——
——
38,844
—38
,844
—38
,844
Acq
uisition
ofasu
bsidiary
(note35
)..
....
....
——
——
——
——
——
—26
,662
26,662
Dispo
salo
fsu
bsidiaries
(note37
)..
....
....
...
——
——
——
——
——
—(205
)(205
)
Asat
Dec
embe
r31
,201
6..
....
....
....
....
1,96
349
9,77
469
956
,358
422
(71,16
1)25
021
2,37
338
,844
26,704
766,22
684
,078
850,30
4
I-7
APPENDIX I ACCOUNTANTS’ REPORT

I.HIS
TORIC
AL
FIN
ANCIA
LIN
FORM
ATIO
N(con
tinu
ed)
CONSO
LID
ATED
STATEM
ENTSOFCHANGESIN
EQUIT
Y(con
tinu
ed)
Attribu
tableto
owne
rsof
thepa
rent
Issu
edca
pital
Shar
epr
emium*
Statut
ory
reserv
e*M
erge
rreserv
e*
Shar
eop
tion
reserv
e*
Exc
hang
eFluctua
tion
reserv
e*
Ava
ilable
-for
-sale
inve
stmen
treva
luation
reserv
e*Retaine
dpr
ofits*
Equ
ity
compo
nent
ofrede
emab
leco
nvertible
preferen
cesh
ares
Equ
ity
compo
nent
ofwar
rant
instru
men
t
Per
petu
alca
pital
instru
men
tTotal
Non
-con
trollin
gintere
sts
Total
equity
(note43
)(n
ote43
)(n
ote46
)(n
ote46
)(n
ote44
)(n
ote46
)USD
’000
USD
’000
USD
’000
USD
’000
USD
’000
USD
’000
USD
’000
USD
’000
USD
’000
USD
’000
USD
’000
USD
’000
USD
’000
USD
’000
Asat
Janu
ary1,
2017
....
....
.1,96
349
9,77
469
956
,358
422
(71,16
1)25
021
2,37
338
,844
26,704
—76
6,22
684
,078
850,30
4Profitfor
theye
ar..
....
....
...
——
——
——
—18
6,26
5—
——
186,26
514
,569
200,83
4Cha
ngein
fairva
lueof
available-for-sale
inve
stmen
ts,
neto
ftax
....
....
....
....
..—
——
——
—(10,38
8)—
——
—(10,38
8)—
(10,38
8)Exc
hang
edifferen
ceson
tran
slationof
foreign
operations
....
....
....
....
.—
——
——
43,351
——
——
—43
,351
2,96
146
,312
Sha
reof
othe
rco
mpreh
ensive
inco
meof
jointv
entures
....
..—
——
——
16,367
——
——
—16
,367
—16
,367
Total
compr
ehen
sive
inco
me/
(los
s)forth
eye
ar..
....
....
.—
——
——
59,718
(10,38
8)18
6,26
5—
——
235,59
517
,530
253,12
5Issu
eof
shares
(note43
)..
....
..37
247
2,96
1—
——
——
——
——
473,33
3—
473,33
3Equ
ity-settledsh
areop
tion
arrang
emen
ts(note44
)..
....
.—
——
—11
,923
——
——
——
11,923
—11
,923
Trans
ferred
from
retained
profits
....
....
....
....
....
——
43—
——
—(43)
——
——
——
Red
emptionof
therede
emab
leco
nvertiblepreferen
cesh
ares
(note32
)..
....
....
....
....
——
——
——
——
(1,712
)—
—(1,712
)—
(1,712
)Issu
eof
perpetua
lcap
ital
secu
rities
(note45
)..
....
....
....
....
——
——
——
——
——
98,845
98,845
—98
,845
Profita
ttribu
tableto
holdersof
perpetua
lcap
ital
secu
rities
(note
45)..
....
....
....
....
....
.—
——
——
——
(4,125
)—
—4,12
5—
——
Acq
uisition
ofsu
bsidiaries
(note35
)..
....
....
....
....
——
——
——
——
——
——
25,417
25,417
Distributionpa
idto
holdersof
perpetua
lcap
ital
secu
rities
(note
45)..
....
....
....
....
....
.—
——
——
——
——
—(4,125
)(4,125
)—
(4,125
)Dividen
ddistribu
tion
tono
n-co
ntrollinginterestsof
subs
idiaries
....
....
....
....
——
——
——
——
——
——
(470
)(470
)
Asat
Dec
embe
r31
,201
7..
....
.2,33
597
2,73
574
256
,358
12,345
(11,44
3)(10,13
8)39
4,47
037
,132
26,704
98,845
1,58
0,08
512
6,55
51,70
6,64
0
I-8
APPENDIX I ACCOUNTANTS’ REPORT

I.HIS
TORIC
AL
FIN
ANCIA
LIN
FORM
ATIO
N(con
tinu
ed)
CONSO
LID
ATED
STATEM
ENTSOFCHANGESIN
EQUIT
Y(con
tinu
ed)
Attribu
tableto
owne
rsof
thepa
rent
Issu
edca
pital
Shar
epr
emium*
Statut
ory
reserv
e*M
erge
rre
serv
e*
Shar
eop
tion
reserv
e*
Exc
hang
eFluctua
tion
reserv
e*
Ava
ilable
-for
-sale
inve
stmen
treva
luation
reserv
e*Retaine
dpr
ofits*
Inve
stmen
treserv
e(n
on-
recy
cling)*
Equ
ity
compo
nent
ofwar
rant
instru
men
t
Equ
ity
compo
nent
ofre
deem
able
conv
ertible
prefer
ence
shar
es
Per
petu
alca
pital
instru
men
tTotal
Non
-con
trollin
gintere
sts
Total
equity
(note43
)(n
ote43
)(n
ote46
)(n
ote46
)(n
ote44
)(n
ote46
)USD
’000
USD
’000
USD
’000
USD
’000
USD
’000
USD
’000
USD
’000
USD
’000
USD
’000
USD
’000
USD
’000
USD
’000
USD
’000
USD
’000
USD
’000
Asat
Janu
ary1,
2018
....
....
....
.2,33
597
2,73
574
256
,358
12,345
(11,44
3)(10,13
8)39
4,47
0—
26,704
37,132
98,845
1,58
0,08
512
6,55
51,70
6,64
0Im
pact
oninitial
applicationof
IFRS9
——
——
——
10,138
(701
)(9,437
)—
——
——
—
Adjus
tedba
lanc
esas
atJanu
ary1,
2018
2,33
597
2,73
574
256
,358
12,345
(11,44
3)—
393,76
9(9,437
)26
,704
37,132
98,845
1,58
0,08
512
6,55
51,70
6,64
0Profitfor
theye
ar..
...
——
——
——
—20
3,04
2—
——
—20
3,04
29,83
621
2,87
8Cha
ngein
fairva
lueof
fina
nciala
ssetsat
fair
valuethroug
hothe
rco
mpreh
ensive
inco
me
....
....
...
——
——
——
——
8,54
4—
——
8,54
4—
8,54
4Exc
hang
edifferen
ceson
tran
slationof
foreign
operations
....
....
.—
——
——
(63,18
0)—
——
——
—(63,18
0)5,38
8(57,79
2)Sha
reof
othe
rco
mpreh
ensive
loss
ofjointv
entures
....
——
——
—(13,46
5)—
——
——
—(13,46
5)—
(13,46
5)
Total
compr
ehen
sive
inco
me/(los
s)forth
eye
ar..
....
....
...
——
——
—(76,64
5)—
203,04
28,54
4—
——
134,94
115
,224
150,16
5Issu
eof
shares
(note43
)..
....
....
299
370,95
9—
—(10,16
1)—
——
——
——
361,09
7—
361,09
7Trans
ferred
from
retained
profit
....
..—
—19
3—
——
—(193
)—
——
——
——
Trans
ferof
equity
compo
nent
ofrede
emab
leco
nvertible
instrumen
t..
....
...
5526
,704
——
——
——
—(26,70
4)—
—55
—55
I-9
APPENDIX I ACCOUNTANTS’ REPORT

I.HIS
TORIC
AL
FIN
ANCIA
LIN
FORM
ATIO
N(con
tinu
ed)
CONSO
LID
ATED
STATEM
ENTSOFCHANGESIN
EQUIT
Y(con
tinu
ed)
Attribu
tableto
owne
rsof
thepa
rent
Issu
edca
pital
Shar
epr
emium*
Statut
ory
reserv
e*M
erge
rre
serv
e*
Shar
eop
tion
reserv
e*
Exc
hang
eFluctua
tion
reserv
e*
Ava
ilable
-for
-sale
inve
stmen
treva
luation
reserv
e*Retaine
dpr
ofits*
Inve
stmen
treserv
e(n
on-
recy
cling)*
Equ
ity
compo
nent
ofwar
rant
instru
men
t
Equ
ity
compo
nent
ofre
deem
able
conv
ertible
prefer
ence
shar
es
Per
petu
alca
pital
instru
men
tTotal
Non
-con
trollin
gintere
sts
Total
equity
(note43
)(n
ote43
)(n
ote46
)(n
ote46
)(n
ote44
)(n
ote46
)USD
’000
USD
’000
USD
’000
USD
’000
USD
’000
USD
’000
USD
’000
USD
’000
USD
’000
USD
’000
USD
’000
USD
’000
USD
’000
USD
’000
USD
’000
Rep
urch
aseof
perpetua
lca
pitals
ecurities
(note45
)..
....
....
——
——
——
——
——
—(1,466
)(1,466
)—
(1,466
)Profita
ttribu
tableto
holdersof
perpetua
lca
pitals
ecurities
(note45
)..
....
....
——
——
——
—(8,192
)—
——
8,19
2—
——
Distributionpa
idto
holdersof
perpetua
lca
pitals
ecurities
(note45
)..
....
....
——
——
——
——
——
—(8,192
)(8,192
)—
(8,192
)Acq
uisition
ofsu
bsidiaries
(note35
)..
....
....
——
——
——
——
——
——
—57
,442
57,442
Issu
ance
ofsh
ares
ofa
subs
idiary
(note35
)..
....
....
——
——
——
——
——
——
—15
,481
15,481
Con
tributionfrom
non-co
ntrolling
interest
....
....
...
——
——
——
—36
2—
——
—36
213
,793
14,155
Dividen
ddistribu
tion
tono
n-co
ntrolling
interestsof
subs
idiaries
....
....
——
——
——
——
——
——
—(612
)(612
)Equ
ity-settledsh
are
option
arrang
emen
t(note44
)..
....
....
——
——
23,157
——
——
——
—23
,157
—23
,157
Asat
Dec
embe
r31
,20
18..
....
....
...
2,68
91,37
0,39
893
556
,358
25,341
(88,08
8)—
588,78
8(893
)—
37,132
97,379
2,09
0,03
922
7,88
32,31
7,92
2
I-10
APPENDIX I ACCOUNTANTS’ REPORT

I.HIS
TORIC
AL
FIN
ANCIA
LIN
FORM
ATIO
N(con
tinu
ed)
CONSO
LID
ATED
STATEM
ENTSOFCHANGESIN
EQUIT
Y(con
tinu
ed)
Attribu
tableto
owne
rsof
thepa
rent
Issu
edca
pital
Shar
epr
emium*
Statut
ory
reserv
e*M
erge
rreserv
e*
Shar
eop
tion
reserv
e*
Exc
hang
eFluctua
tion
reserv
e*
Ava
ilable
-for
-sale
inve
stmen
treva
luation
reserv
e*Retaine
dpr
ofits*
Inve
stmen
treserv
e(n
on-
recy
cling)*
Equ
ity
compo
nent
ofwar
rant
instru
men
t
Equ
ity
compo
nent
ofre
deem
able
conv
ertible
prefer
ence
shar
es
Per
petu
alca
pital
instru
men
tTotal
Non
-con
trollin
gintere
sts
Total
equity
(note43
)(n
ote43
)(n
ote46
)(n
ote46
)(n
ote44
)(n
ote46
)USD
’000
USD
’000
USD
’000
USD
’000
USD
’000
USD
’000
USD
’000
USD
’000
USD
’000
USD
’000
USD
’000
USD
’000
USD
’000
USD
’000
USD
’000
Asat
Janu
ary1,
2018
....
.2,33
597
2,73
574
256
,358
12,345
(11,44
3)(10,13
8)39
4,47
0—
26,704
37,132
98,845
1,58
0,08
512
6,55
51,70
6,64
0Im
pact
oninitiala
pplica
tion
ofIF
RS9(una
udited
)..
..—
——
——
—10
,138
(701
)(9,437
)—
——
——
—
Adj
ustedba
lanc
esas
atJa
nuar
y1,
2018
....
....
2,33
597
2,73
574
256
,358
12,345
(11,44
3)—
393,76
9(9,437
)26
,704
37,132
98,845
1,58
0,08
512
6,55
51,70
6,64
0Profitfor
thepe
riod
(una
udited
)..
....
....
..—
——
——
——
61,793
——
——
61,793
1,89
863
,691
Cha
ngein
fairva
lueof
fina
nciala
ssetsat
fair
valuethroug
hothe
rco
mpreh
ensive
inco
me
(una
udited
)..
....
....
..—
——
——
——
—9,23
9—
——
9,23
9—
9,23
9Exc
hang
edifferen
ceson
tran
slationof
foreign
operations
(una
udited
)..
.—
——
——
(9,931
)—
——
——
—(9,931
)5,03
0(4,901
)Sha
reof
othe
rco
mpreh
ensive
loss
ofjointv
entures
(una
udited
)..
....
....
..—
——
——
(8,051
)—
——
——
—(8,051
)—
(8,051
)
Total
compr
ehen
sive
inco
me/(los
s)forth
epe
riod
....
....
....
....
——
——
—(17,98
2)—
61,793
9,23
9—
——
53,050
6,92
859
,978
Issu
eof
shares
(una
udited
)..
....
....
..26
734
5,89
4—
——
——
——
——
—34
6,16
1—
346,16
1Trans
ferred
from
retained
profit(una
udited
)..
....
.—
—73
——
——
(73)
——
——
——
—Trans
ferof
equity
compo
nent
ofrede
emab
leco
nvertible
instrumen
t(un
audited)
...
5526
,704
——
——
——
—(26,70
4)—
—55
—55
Rep
urch
aseof
perpetua
lca
pitals
ecurities
(una
udited
)..
....
....
..—
——
——
——
——
——
(1,466
)(1,466
)—
(1,466
)
I-11
APPENDIX I ACCOUNTANTS’ REPORT

I.HIS
TORIC
AL
FIN
ANCIA
LIN
FORM
ATIO
N(con
tinu
ed)
CONSO
LID
ATED
STATEM
ENTSOFCHANGESIN
EQUIT
Y(con
tinu
ed)
Attribu
tableto
owne
rsof
thepa
rent
Issu
edca
pital
Shar
epr
emium*
Statut
ory
reserv
e*M
erge
rreserv
e*
Shar
eop
tion
reserv
e*
Exc
hang
eFluctua
tion
reserv
e*
Ava
ilable
-for
-sale
inve
stmen
treva
luation
reserv
e*Retaine
dPro
fits*
Inve
stmen
treserv
e(n
on-
recy
cling)*
Equ
ity
compo
nent
ofwar
rant
instru
men
t
Equ
ity
compo
nent
ofre
deem
able
conv
ertible
prefer
ence
shar
es
Per
petu
alca
pital
instru
men
tTotal
Non
-con
trollin
gintere
sts
Total
equity
(note43
)(n
ote43
)(n
ote46
)(n
ote46
)(n
ote44
)(n
ote46
)USD
’000
USD
’000
USD
’000
USD
’000
USD
’000
USD
’000
USD
’000
USD
’000
USD
’000
USD
’000
USD
’000
USD
’000
USD
’000
USD
’000
USD
’000
Profita
ttribu
tableto
holders
ofpe
rpetua
lcap
ital
secu
rities
(una
udited
)..
..—
——
——
——
(4,202
)—
——
4,20
2—
——
Distributionpa
idto
holders
ofpe
rpetua
lcap
ital
secu
rities
(una
udited
)..
..—
——
——
——
——
——
(4,202
)(4,202
)—
(4,202
)Acq
uisition
ofasu
bsidiary
(una
udited
)..
....
....
..—
——
——
——
——
——
——
53,284
53,284
Con
tributionfrom
non-co
ntrollinginterest
(una
udited
)..
....
....
..—
——
——
——
——
——
——
154
154
Dividen
ddistribu
tion
tono
n-co
ntrollinginterestsof
subs
idiaries
(una
udited
)..
——
——
——
——
——
——
—(369
)(369
)Equ
ity-settledsh
areop
tion
arrang
emen
t(una
udited
)..
....
....
..—
——
—11
,961
——
——
——
—11
,961
—11
,961
Asat
June
30,2
018
(una
udited
)..
....
....
.2,65
71,34
5,33
381
556
,358
24,306
(29,42
5)—
451,28
7(198
)—
37,132
97,379
1,98
5,64
418
6,55
22,17
2,19
6
I-12
APPENDIX I ACCOUNTANTS’ REPORT

I.HIS
TORIC
AL
FIN
ANCIA
LIN
FORM
ATIO
N(con
tinu
ed)
CONSO
LID
ATED
STATEM
ENTSOFCHANGESIN
EQUIT
Y(con
tinu
ed)
Attribu
tableto
owne
rsof
thepa
rent
Issu
edca
pital
Shar
epr
emium*
Statut
ory
reserv
e*M
erge
rreserv
e*
Shar
eop
tion
reserv
e*
Exc
hang
eFluctua
tion
reserv
e*Retaine
dPro
fits*
Inve
stmen
treserv
e(n
on-
recy
cling)*
Equ
ity
compo
nent
ofre
deem
able
conv
ertible
prefer
ence
shar
es
Per
petu
alca
pital
instru
men
tTotal
Non
-con
trollin
gintere
sts
Total
equity
(note43
)(n
ote43
)(n
ote46
)(n
ote46
)(n
ote44
)(n
ote46
)USD
’000
USD
’000
USD
’000
USD
’000
USD
’000
USD
’000
USD
’000
USD
’000
USD
’000
USD
’000
USD
’000
USD
’000
USD
’000
Asat
Janu
ary1,
2019
....
....
....
....
...
2,68
91,37
0,39
893
556
,358
25,341
(88,08
8)58
8,78
8(893
)37
,132
97,379
2,09
0,03
922
7,88
32,31
7,92
2Profitfor
thepe
riod
....
....
....
....
....
..—
——
——
—75
,950
——
—75
,950
8,12
784
,077
Cha
ngein
fairva
lueof
fina
nciala
ssetsat
fair
valuethroug
hothe
rco
mpreh
ensive
inco
me
....
....
....
....
....
....
....
..—
——
——
——
30,684
——
30,684
948
31,632
Exc
hang
edifferen
ceson
tran
slationof
foreign
operations
....
....
....
....
....
....
....
——
——
—(4,036
)—
——
—(4,036
)2,90
3(1,133
)Sha
reof
othe
rco
mpreh
ensive
loss
ofjoint
ventures
....
....
....
....
....
....
....
.—
——
——
(10,71
9)—
——
—(10,71
9)—
(10,71
9)
Total
compr
ehen
sive
inco
me/(los
s)forth
epe
riod
....
....
....
....
....
....
....
..—
——
——
(14,75
5)75
,950
30,684
——
91,879
11,978
103,85
7Trans
ferred
from
retained
profit
....
....
....
——
145
——
—(145
)—
——
——
—Profita
ttribu
tableto
holdersof
perpetua
lca
pitals
ecurities(note45
)..
....
....
....
.—
——
——
—(4,125
)—
—4,12
5—
——
Distributionpa
idto
holdersof
perpetua
lcap
ital
secu
rities
(note45
)..
....
....
....
....
...
——
——
——
——
—(4,125
)(4,125
)—
(4,125
)Acq
uisition
ofsu
bsidiaries
(note35
)..
....
...
——
——
——
11,125
(11,12
5)—
——
798
798
Dispo
salo
fsu
bsidiaries
....
....
....
....
..—
—(724
)—
—4,90
1—
——
—4,17
7—
4,17
7Con
tributionfrom
non-co
ntrollinginterests
...
——
——
——
21,220
——
—21
,220
47,570
68,790
Acq
uisition
ofno
n-co
ntrollinginterests
....
..—
——
——
—(2,306
)—
——
(2,306
)(346
)(2,652
)Distributionto
non-co
ntrollinginterestsof
subs
idiaries
....
....
....
....
....
....
...
——
——
——
——
——
—(59,55
1)(59,55
1)Dividen
ddistribu
tion
tono
n-co
ntrolling
interestsof
subs
idiaries
....
....
....
....
.—
——
——
——
——
——
(207
)(207
)Equ
ity-settledsh
areop
tion
arrang
emen
t(note44
)..
....
....
....
....
....
....
...
——
——
9,88
5—
——
——
9,88
5—
9,88
5
Asat
June
30,2
019
....
....
....
....
....
.2,68
91,37
0,39
835
656
,358
35,226
(97,94
2)69
0,50
718
,666
37,132
97,379
2,21
0,76
922
8,12
52,43
8,89
4
Not
e:*
The
sereserveac
coun
tsco
mprisetheco
nsolidated
reserves
ofUSD69
8,71
5,00
0,USD1,41
5,06
9,00
0,USD1,95
2,83
9,00
0an
dUSD
2,07
3,56
9,00
0in
theco
nsolidated
statem
ents
offina
ncialp
ositionas
atDec
embe
r31
,201
6,20
17,2
018,
andJu
ne30
,201
9,resp
ective
ly.
I-13
APPENDIX I ACCOUNTANTS’ REPORT

APPENDIX I ACCOUNTANTS’ REPORT
I. HISTORICAL FINANCIAL INFORMATION (continued)
CONSOLIDATED STATEMENTS OF CASH FLOWS
Year ended December 31 Six months ended June 30
Notes 2016 2017 2018 2018 2019
USD’000 USD’000 USD’000 USD’000 USD’000(unaudited)
Cash flows from operating activitiesProfit before tax . . . . . . . . . . . . . . . . . . . . . . . . . . . . . . . . . . 139,732 273,174 270,587 80,962 122,713Adjustments for:—Depreciation of property, plant and equipment . . . . . . . . 6 648 1,242 1,812 824 2,063—Amortization of other intangible assets . . . . . . . . . . . . . . 6 3,799 4,204 5,089 2,168 3,034—Depreciation of right-of-use assets . . . . . . . . . . . . . . . . . . 6 1,612 2,615 3,325 1,663 2,199—Fair value gains on financial assets at fair value through
profit or loss . . . . . . . . . . . . . . . . . . . . . . . . . . . . . . . . . . . 5 (26,728) (32,739) (44,937) (18,369) (22,818)—Fair value gains on investment properties under
construction . . . . . . . . . . . . . . . . . . . . . . . . . . . . . . . . . . . . 5 (5,760) (100,039) (62,779) (8,761) (76,761)—Fair value gains on completed investment properties . . . . 5 (100,799) (95,179) (109,688) (37,396) (26,800)—Fair value loss on derivative financial instruments . . . . . . 12,133 — — — ——Loss on disposal of items of property, plant and
equipment . . . . . . . . . . . . . . . . . . . . . . . . . . . . . . . . . . . . . 6 74 81 9,697 148 316—Share of profits and losses of joint ventures and
associates, net . . . . . . . . . . . . . . . . . . . . . . . . . . . . . . . . . . (36,352) (37,000) (65,372) (14,801) (18,317)—Equity-settled share option expense . . . . . . . . . . . . . . . . . 6 75 11,923 23,157 11,961 9,885—Gain on remeasurement of investment in associate to fair
value . . . . . . . . . . . . . . . . . . . . . . . . . . . . . . . . . . . . . . . . . — — — — (8,556)—Gains on disposal of subsidiaries . . . . . . . . . . . . . . . . . . . 5 (32) (38,311) (2,662) — (16,495)—Gains on deemed partial disposal of a joint venture . . . . . 5 — (29) — — ——Finance costs . . . . . . . . . . . . . . . . . . . . . . . . . . . . . . . . . . . 7 55,992 90,903 104,929 45,943 83,363—Interest income . . . . . . . . . . . . . . . . . . . . . . . . . . . . . . . . . 5 (502) (2,477) (1,530) (985) (1,768)—Dividend income . . . . . . . . . . . . . . . . . . . . . . . . . . . . . . . . 5 — (10,679) (25,519) (9,771) (11,848)
43,892 67,689 106,109 53,586 40,210—(Increase)/decrease in trade receivables . . . . . . . . . . . . . . (2,262) (22,390) (21,012) (10,395) 11,197—(Increase)/decrease in prepayments, other receivables
and other assets . . . . . . . . . . . . . . . . . . . . . . . . . . . . . . . . . (6,419) (25,653) (17,238) (3,305) (4,861)—(Decrease)/increase in trade payables, accruals and other
payables . . . . . . . . . . . . . . . . . . . . . . . . . . . . . . . . . . . . . . . (13,084) 29,202 27,684 (6,876) (13,607)
Cash flows generated from operations . . . . . . . . . . . . . . . 22,127 48,848 95,543 33,010 32,939Income tax paid . . . . . . . . . . . . . . . . . . . . . . . . . . . . . . . . . . . (88) (12,452) (16,203) (9,704) (18,572)
Net cash flows generated from operating activities . . . . 22,039 36,396 79,340 23,306 14,367
I-14

APPENDIX I ACCOUNTANTS’ REPORT
I. HISTORICAL FINANCIAL INFORMATION (continued)
CONSOLIDATED STATEMENTS OF CASH FLOWS (continued)
Year ended December 31 Six months ended June 30
Notes 2016 2017 2018 2018 2019
USD’000 USD’000 USD’000 USD’000 USD’000(unaudited)
Cash flows used in investing activitiesPurchases of property, plant and equipment . . . . . . . . . . (1,561) (15,957) (13,229) (9,558) (5,440)Additions of other intangible assets . . . . . . . . . . . . . . . . (160) (603) (499) (124) (719)Additions of investment properties . . . . . . . . . . . . . . . . . (68,375) (134,929) (106,998) (85,919) (242,778)Prepayments for acquiring land use rights . . . . . . . . . . . (2,451) — (8,729) — (4,324)Increase in deposits for bidding of land use rights . . . . . (830) (4,898) (16,476) (7,271) (4,070)Purchase of financial assets at fair value through profit
or loss . . . . . . . . . . . . . . . . . . . . . . . . . . . . . . . . . . . . . (51,248) (87,651) (154,481) (134,561) (128,996)Prepayments for financial assets at fair value through
profit or loss . . . . . . . . . . . . . . . . . . . . . . . . . . . . . . . . (30,335) — (42,763) — —Dividend income from financial assets at fair value
through profits or loss . . . . . . . . . . . . . . . . . . . . . . . . . — 4,987 — — 1,376Distribution from financial assets at fair value through
profits or loss . . . . . . . . . . . . . . . . . . . . . . . . . . . . . . . . — — — — 83,547Purchase of financial assets at fair value through other
comprehensive income . . . . . . . . . . . . . . . . . . . . . . . . — — (243,745) (197,763) (37,289)Dividend income from financial assets at fair value
through other comprehensive income . . . . . . . . . . . . . — — 26,142 9,311 10,432Purchase of an available-for-sale investment . . . . . . . . . — (193,848) — — —Disposal of assets at fair value through other
comprehensive income . . . . . . . . . . . . . . . . . . . . . . . . — — — — 96,463Acquisition of subsidiaries . . . . . . . . . . . . . . . . . . . . . . . 35 (40,253) (133,249) (165,985) (30,763) (444,980)Disposal of subsidiaries . . . . . . . . . . . . . . . . . . . . . . . . . 37 12,744 150,500 (11,415) — 119,383Capital injection in joint ventures . . . . . . . . . . . . . . . . . . (80,470) (60,407) (31,160) (6,944) (42,083)Dividend income from associates . . . . . . . . . . . . . . . . . . — — — — 4,221Addition to investment in associates . . . . . . . . . . . . . . . . — — — — (126)Advances to related parties . . . . . . . . . . . . . . . . . . . . . . . (4,992) (594) (3,652) (1,099) (5,673)Repayments from related parties . . . . . . . . . . . . . . . . . . . 3,158 492 — — —Dividend income from available-for-sale
investments . . . . . . . . . . . . . . . . . . . . . . . . . . . . . . . . . — 879 — — —Release of non-pledged fixed time deposits . . . . . . . . . . — — — — 15,318Interest received . . . . . . . . . . . . . . . . . . . . . . . . . . . . . . . 502 2,477 1,530 985 1,768(Increase)/decrease in non-pledged fixed time deposits
with maturity period over three months . . . . . . . . . . . — — (15,318) — —
Net cash flows used in investing activities . . . . . . . . . . (264,271) (472,801) (786,778) (463,706) (583,970)
I-15

APPENDIX I ACCOUNTANTS’ REPORT
I. HISTORICAL FINANCIAL INFORMATION (continued)
CONSOLIDATED STATEMENTS OF CASH FLOWS (continued)
Year ended December 31 Six months ended June 30
Notes 2016 2017 2018 2018 2019
USD’000 USD’000 USD’000 USD’000 USD’000(unaudited)
Cash flows from financing activitiesProceeds from bank loans and other
borrowings . . . . . . . . . . . . . . . . . . . . . . . . . . . . . 40 682,395 330,098 584,812 183,513 1,606,607Repayments of bank loans and other
borrowings . . . . . . . . . . . . . . . . . . . . . . . . . . . . . 40 (344,887) (294,558) (195,500) (46,740) (545,976)Interest of bank loans and other borrowings paid . . 40 (55,772) (46,700) (54,615) (22,806) (42,711)Increase in restricted cash . . . . . . . . . . . . . . . . . . . 26 — — (19,294) — (2,766)Interest of redeemable convertible preference
shares paid . . . . . . . . . . . . . . . . . . . . . . . . . . . . . 32 — (13,596) (13,031) (6,919) (6,869)Acquisition of non-controlling interests . . . . . . . . — — — — (2,652)Capital contribution from non-controlling
shareholders . . . . . . . . . . . . . . . . . . . . . . . . . . . . — — 11,199 154 68,790Distribution paid to non-controlling interests . . . . — — — — (59,551)Distribution paid to holders of perpetual capital
securities . . . . . . . . . . . . . . . . . . . . . . . . . . . . . . 45 — (4,125) (8,192) (4,202) (4,125)Release of bank deposits pledged for bank
loans . . . . . . . . . . . . . . . . . . . . . . . . . . . . . . . . . . 26 21,994 12,958 29,092 — —Increase in pledged bank deposits for bank
loans . . . . . . . . . . . . . . . . . . . . . . . . . . . . . . . . . . 26 (58,255) (12,981) — — —Proceeds from issue of shares . . . . . . . . . . . . . . . . — 473,333 361,097 346,161 —Repurchase of perpetual capital securities . . . . . . . 45 — — (1,466) (1,466) —Proceeds from issue of redeemable convertible
preference shares . . . . . . . . . . . . . . . . . . . . . . . . 32 285,000 — — — —Redemption of redeemable convertible preference
share . . . . . . . . . . . . . . . . . . . . . . . . . . . . . . . . . . 32 — (11,400) — — —Issue of perpetual capital securities . . . . . . . . . . . . 45 — 98,845 — — —Proceeds from/(repayments to) related parties . . . (6,649) (2,167) (1,197) (254) 805Dividend paid to non-controlling shareholder of a
subsidiary . . . . . . . . . . . . . . . . . . . . . . . . . . . . . . (205) (470) (612) (369) (207)Principal portion of lease payments . . . . . . . . . . . . 40 (1,540) (2,546) (3,616) (1,678) (2,433)
Net cash generated from financing activities . . 522,081 526,691 688,677 445,394 1,008,912
Net increase/(decrease) in cash and cashequivalents . . . . . . . . . . . . . . . . . . . . . . . . . . . . 279,849 90,286 (18,761) 4,994 439,309
Cash and cash equivalents at beginning of year /period . . . . . . . . . . . . . . . . . . . . . . . . . . . . . . . . . 144,319 411,765 526,988 526,988 502,056
Effect of foreign exchange rate changes, net . . . . . (12,403) 24,937 (6,171) 372 2,254
Cash and cash equivalents at end of year/period . . . . . . . . . . . . . . . . . . . . . . . . . . . . . . . . 411,765 526,988 502,056 532,354 943,619
ANALYSIS OF BALANCES OF CASH ANDCASH EQUIVALENTS
Cash and bank balances . . . . . . . . . . . . . . . . . . . 26 485,545 600,791 581,379 606,157 1,010,390Non-pledged fixed time deposits with maturity
period over three months . . . . . . . . . . . . . . . . 26 — — (15,318) — —Restricted bank balances . . . . . . . . . . . . . . . . . . 26 — — (19,294) — (22,060)Pledged bank deposits . . . . . . . . . . . . . . . . . . . . 26 (73,780) (73,803) (44,711) (73,803) (44,711)
Cash and cash equivalents as stated in theconsolidated statements of cash flows . . . . . . 411,765 526,988 502,056 532,354 943,619
I-16

APPENDIX I ACCOUNTANTS’ REPORT
I. HISTORICAL FINANCIAL INFORMATION (continued)
STATEMENTS OF FINANCIAL POSITION
As at December 31 As at June 30
Notes 2016 2017 2018 2019
USD’000 USD’000 USD’000 USD’000
NON-CURRENT ASSETSProperty, plant and equipment . . . . . . . . . . . . . . . . . . . — — 358 361Available-for-sale investments . . . . . . . . . . . . . . . . . . . 19 — 543 — —Financial assets at fair value through other
comprehensive income . . . . . . . . . . . . . . . . . . . . . . . 18 — — 32,549 33,122Investments in subsidiaries . . . . . . . . . . . . . . . . . . . . . . 289,370 386,190 629,822 660,349Investments in joint ventures . . . . . . . . . . . . . . . . . . . . 15 143,618 173,318 220,180 237,014Other intangible assets . . . . . . . . . . . . . . . . . . . . . . . . . 22 — 227 432 337Other non-current assets . . . . . . . . . . . . . . . . . . . . . . . . — — — 2,734
Total non-current assets . . . . . . . . . . . . . . . . . . . . . . . . 432,988 560,278 883,341 933,917
CURRENT ASSETSPrepayments, other receivables and other assets . . . . . . 25 414,982 721,786 1,452,762 1,920,700Cash and bank balances . . . . . . . . . . . . . . . . . . . . . . . . . 26 318,976 414,315 230,546 447,459
Total current assets . . . . . . . . . . . . . . . . . . . . . . . . . . . . 733,958 1,136,101 1,683,308 2,368,159
CURRENT LIABILITIESBank loans and other borrowings . . . . . . . . . . . . . . . . . 27 42,450 42,450 339,691 492,913Redeemable convertible preference shares . . . . . . . . . . 32 — — 296,778 316,010Trade payables, accruals and other payables . . . . . . . . 29 48,109 41,484 55,987 78,117Income tax payable . . . . . . . . . . . . . . . . . . . . . . . . . . . . — 1,045 993 994
Total current liabilities . . . . . . . . . . . . . . . . . . . . . . . . . 90,559 84,979 693,449 888,034
NET CURRENT ASSETS . . . . . . . . . . . . . . . . . . . . . 643,399 1,051,122 989,859 1,480,125
TOTAL ASSETS LESS CURRENTLIABILITIES . . . . . . . . . . . . . . . . . . . . . . . . . . . . . 1,076,387 1,611,400 1,873,200 2,414,042
NON-CURRENT LIABILITIESBank loans and other borrowings . . . . . . . . . . . . . . . . . 27 275,920 298,083 — 601,357Redeemable convertible preference shares . . . . . . . . . . 32 246,156 264,199 — —Trade payables, accruals and other payables . . . . . . . . 29 — — 495,000 495,000
Total non-current liabilities . . . . . . . . . . . . . . . . . . . . . . 522,076 562,282 495,000 1,096,357
NET ASSETS . . . . . . . . . . . . . . . . . . . . . . . . . . . . . . . . 554,311 1,049,118 1,378,200 1,317,685
EQUITYIssued capital . . . . . . . . . . . . . . . . . . . . . . . . . . . . . . . . . 43 1,963 2,335 2,689 2,689Perpetual capital securities . . . . . . . . . . . . . . . . . . . . . . 45 — 98,845 97,379 97,379Equity components of redeemable convertible
instruments and warrant instrument . . . . . . . . . . . . . 65,548 63,836 37,132 37,132Other reserves . . . . . . . . . . . . . . . . . . . . . . . . . . . . . . . . 46 486,800 884,102 1,241,000 1,180,485
Total equity . . . . . . . . . . . . . . . . . . . . . . . . . . . . . . . . . 554,311 1,049,118 1,378,200 1,317,685
I-17

APPENDIX I ACCOUNTANTS’ REPORT
II. NOTES TO THE HISTORICAL FINANCIAL INFORMATION
1. CORPORATE INFORMATION
ESR Cayman Limited (formerly known as e-Shang Redwood Limited, e-shang CaymanLimited, the “Company”) was incorporated and registered as an exempted company with limitedliability in the Cayman Islands under the Cayman Companies Law on June 14, 2011. The address ofthe registered office is c/o Walkers Corporate Limited, 27 Hospital Road, George Town, GrandCayman KY1-9008, Cayman Islands.
The Company and its subsidiaries (together, the “Group”) are principally engaged inwarehousing investment property development, leasing, property management and construction in thePeople’s Republic of China (the “PRC”), and private equity fund investment and management in thePRC, Singapore, Australia, South Korea, Japan and India.
Information about subsidiaries
As at the end of June 30, 2019, the Company had direct and indirect interests in its subsidiaries,the particulars of which are set out below:
Name
Place and date ofincorporation/registration and
business
Issued ordinary/registered share
capital
Percentage ofequity attributableto the Company
Principal activitiesDirect Indirect
Shanghai e-Shang WarehousingService Co., Ltd.(i)
PRC/ MainlandChina July 8, 2011
RMB109,090,909
N/A 100% Investment andmanagement
Dongguan Huishang e-commerceService Co., Ltd. (i)
PRC/ MainlandChinaDecember 21, 2011
USD20,000,000
N/A 100% Warehousingbusiness
Langfang Weidu International LogisticCo., Ltd. (i)
PRC/ MainlandChinaMarch 15, 2011
USD24,000,000
N/A 100% Warehousingbusiness
Jiangsu Friend Warehousing Co.,Ltd. (i)
PRC/ MainlandChinaAugust 14, 2003
RMB371,320,077
N/A 100% Warehousingbusiness
Dongguan Hongshang WarehousingService Co., Ltd. (i)
PRC/ MainlandChinaJune 24, 2013
USD63,000,000
N/A 100% Warehousingbusiness
Tianjin Fanbin Warehousing ServiceCo., Ltd. (i)
PRC/ MainlandChinaAugust 22, 2013
USD29,200,000
N/A 100% Warehousingbusiness
Kendall Square Logistics Properties,Inc.(ii)
South KoreaDecember 16, 2014
KWR9,000,000,000
N/A 100% Investment andmanagement
Redwood Asian Investment, Ltd.(“RAIL”) (iii)
Cayman IslandsAugust 5, 2013
USD1
100% N/A Investment andmanagement
ESR Singapore Pte. Ltd. (formerlyknown as Redwood Group AsiaPTE. Ltd., “ESR Singapore”) (iii)
SingaporeNovember 27, 2007
USD1
100% N/A Investment andmanagement
ESR LTD (formerly known asRedwood Group Japan Ltd.) (iv)
JapanMay 8, 2006
JPY466,970,000
N/A 100% Investment andmanagement
I-18

APPENDIX I ACCOUNTANTS’ REPORT
II. NOTES TO THE HISTORICAL FINANCIAL INFORMATION (continued)
1. CORPORATE INFORMATION (continued)
Information about subsidiaries (continued)
Name
Place and date ofincorporation/registration and
business
Issued ordinary/registered share
capital
Percentage ofequity attributableto the Company
Principal activitiesDirect Indirect
Sunwood Singapore Holding Pte.Ltd. (iii)
SingaporeDecember 24, 2014
USD149,457,336
N/A 95% Investment andmanagement
ESR Pte. Ltd. (formerly known as ESRSingapore Sub Pte. Ltd.) (iii)
SingaporeMay 26, 2017
AUD308,885,207
95.5% N/A Investment andmanagement
E-Shang Infinity Cayman Ltd. (i) Cayman IslandsSeptember 30, 2015
USD35,243,934
N/A 100% Investment andmanagement
RW Higashi Ogishima TMK(“Higashi”) (iv)
JapanJanuary 26, 2016
JPY12,652,350,000
N/A 70% Warehousingbusiness
Guangzhou Mingyue WarehousingCo., Ltd. (i)
ChinaDecember 6, 2012
RMB76,000,000
N/A 58.5% Warehousingbusiness
ESR Funds Management (S) Limited SingaporeSeptember 14, 2005
SGD64,714,500
N/A 67.3% Investment andmanagement
ESR Property Management (S) Pte.Ltd.
SingaporeNovember 4, 2005
SGD250,000
N/A 100% Investment andmanagement
Shanghai Yurun Meat Food Co., Ltd. (i) PRC/ MainlandChinaJune 3, 2010
RMB650,000,000
N/A 74% Warehousingbusiness
Summit (BVI) Limited BVIFebruary 24, 2012
USD1
N/A 100% Investment andmanagement
Tianjin Fanxin Warehousing ServiceCo., Ltd. (i)
PRC/ MainlandChinaJune 17, 2014
USD16,500,000
N/A 90% Warehousingbusiness
Shenyang Yibei Warehousing ServiceCo., Ltd. (i)
PRC/ MainlandChinaDecember 8, 2015
USD15,000,000
N/A 100% Warehousingbusiness
Kendall Square Asset Management,Inc. (ii)
South KoreaSeptember 1, 2016
KRW2,500,000,000
N/A 100% Investment andmanagement
ESR HK Management Limited Cayman IslandsJune 29, 2018
USD100
100% N/A Investment andmanagement
Propertylink Trust AustraliaJune 29, 2016
AUD107,459,985
92.2% N/A Investment andmanagement
Propertylink Australian IndustrialPartnership
AustraliaJune 29, 2016
AUD103,540,351
92.2% N/A Investment andmanagement
ESR Asset Management (Holdings)Limited (formerly known asPropertyLink (Holdings) Limited)
AustraliaMay 3, 2000
AUD94,400,327
92.2% N/A Investment andmanagement
ESR Sachiura 3 TMK JapanJanuary 11, 2019
JPY4,549,650,000
N/A 100% Investment andmanagement
ESR Sachiura 4 TMK JapanJanuary 11, 2019
JYP4,679,750,000
N/A 100% Investment andmanagement
I-19

APPENDIX I ACCOUNTANTS’ REPORT
II. NOTES TO THE HISTORICAL FINANCIAL INFORMATION (continued)
1. CORPORATE INFORMATION (continued)
Information about subsidiaries (continued)
Name
Place and date ofincorporation/registration and
business
Issued ordinary/registered share
capital
Percentage ofequity attributableto the Company
Principal activitiesDirect Indirect
Lekun Warehousing (Wuxi) Co., Ltd. PRC/ MainlandChinaNovember 5, 2014
USD13,900,000
N/A 100% Warehousingbusiness
CIP Constructions (Australia) Pty Ltd(formerly known as Commercial &Industrial Property Pty Ltd)
AustraliaJune 12, 2003
AUD30,258,519
N/A 92.2% Construction
The above table lists the subsidiaries of the Company which, in the opinion of the directors,principally affected the results during the Relevant Periods or formed a substantial portion of the netassets of the Group. To give details of other subsidiaries would, in the opinion of the directors, result inparticulars of excessive length.
Notes:(i) The statutory financial statements of Shanghai e-Shang Warehousing Service Co., Ltd., Dongguan Huishang e-commerce Service Co.,
Ltd., Langfang Weidu International Logistic Co., Ltd., Jiangsu Friend Warehousing Co., Ltd., Dongguan Hongshang WarehousingService Co., Ltd., Tianjin Fanbin Warehousing Service Co., Ltd. and Shenyang Yibei Warehousing Service Co., Ltd. for the years endedDecember 31, 2016, 2017 and 2018, of Guangzhou Mingyue Warehousing Co., Ltd. and Shanghai Yurun Meat Food Co., Ltd for theyears ended December 31, 2017 and 2018 and of Tianjin Fanxin Warehousing Service Co., Ltd. for the years ended December 31, 2018prepared under PRC generally accepted accounting principles (PRC GAAP) and the statutory financial statements of E-Shang InfinityCayman Ltd. for the years ended December 31, 2016, 2017 and 2018 prepared under International Accounting Standards were audited byErnst & Young Hua Ming LLP.
(ii) The statutory financial statements of Kendall Square Logistics Properties, Inc. for the years ended December 31, 2016, 2017 and 2018and of Kendall Square Asset Management, Inc. for the period from September 1, 2016 to December 31, 2016 and the years endedDecember 31, 2017 and 2018 prepared under South Korea generally accepted accounting principles were audited by Ernst & Young HanYoung.
(iii) The statutory financial statements of ESR Pte. Ltd. for the period ended from May 26, 2017 to December 31, 2017, of SunwoodSingapore Holding Pte. Ltd. and ESR Singapore Pte. Ltd. for the years ended December 31, 2016, 2017 and 2018 prepared underSingapore generally accepted accounting principles and the statutory financial statements of Redwood Asian Investment, Ltd. for theyears ended December 31, 2016, 2017 and 2018 prepared under International Accounting Standards were audited by Ernst & YoungLLP.
(iv) The statutory financial statements of RW Higashi Ogishima TMK for the year ended December 31, 2016 and of ESR LTD. for the yearsended December 31, 2016, 2017 and 2018 prepared under Japan generally accepted accounting principles were audited by Ernst &Young ShinNihon LLC.
2.1 BASIS OF PREPARATION
The Historical Financial Information has been prepared in accordance with InternationalFinancial Reporting Standards (“IFRSs”), which comprise all standards and interpretations approvedby the International Accounting Standards Board (the “IASB”).
IFRS 9 Financial Instruments, have been effective for the accounting period commencing fromJanuary 1, 2018.
IFRS 15 Revenue from Contracts with Customers, amendments to IFRS 15 Clarifications toIFRS 15 Revenue from Contracts with Customers and IFRS 16 Leases together with the relevanttransitional provisions have been adopted by the Group in the preparation of the Historical FinancialInformation throughout the Relevant Period.
I-20

APPENDIX I ACCOUNTANTS’ REPORT
II. NOTES TO THE HISTORICAL FINANCIAL INFORMATION (continued)
2.1 BASIS OF PREPARATION (continued)
The Historical Financial Information has been prepared under the historical cost convention,except for investment properties, available-for-sale instruments, financial assets at fair value throughother comprehensive income and financial assets and liabilities at fair value through profit or loss,which have been measured at fair value.
Basis of consolidation
The consolidated financial statements comprise the financial statements of the Company and itssubsidiaries as at December 31, 2016, 2017, and 2018. A subsidiary is an entity (including a structuredentity), directly or indirectly, controlled by the Company. Control is achieved when the Group isexposed, or has rights, to variable returns from its involvement with the investee and has the ability toaffect those returns through its power over the investee. Specifically, the Group controls an investee if,and only if, the Group has:
‰ Power over the investee (i.e., existing rights that give it the current ability to direct therelevant activities of the investee)
‰ Exposure, or rights, to variable returns from its involvement with the investee
‰ The ability to use its power over the investee to affect its returns
Generally, there is a presumption that a majority of voting rights result in control. To supportthis presumption and when the Group has less than a majority of the voting or similar rights of aninvestee, the Group considers all relevant facts and circumstances in assessing whether it has powerover an investee, including:
‰ The contractual arrangement with the other vote holders of the investee
‰ Rights arising from other contractual arrangements
‰ The Group’s voting rights and potential voting rights
The Group re-assesses whether or not it controls an investee if facts and circumstances indicatethat there are changes to one or more of the three elements of control. Consolidation of a subsidiarybegins when the Group obtains control over the subsidiary and ceases when the Group loses control ofthe subsidiary. Assets, liabilities, income and expenses of a subsidiary acquired or disposed of duringthe year are included in the consolidated financial statements from the date the Group gains controluntil the date the Group ceases to control the subsidiary.
Profit or loss and each component of other comprehensive income (OCI) are attributed to theequity holders of the parent of the Group and to the non-controlling interests, even if this results in thenon-controlling interests having a deficit balance. When necessary, adjustments are made to thefinancial statements of subsidiaries to bring their accounting policies into line with the Group’saccounting policies. All intra-group assets and liabilities, equity, income, expenses and cash flowsrelating to transactions between members of the Group are eliminated in full on consolidation.
A change in the ownership interest of a subsidiary, without a loss of control, is accounted for asan equity transaction.
I-21

APPENDIX I ACCOUNTANTS’ REPORT
II. NOTES TO THE HISTORICAL FINANCIAL INFORMATION (continued)
2.1 BASIS OF PREPARATION (continued)
Basis of consolidation (continued)
If the Group loses control over a subsidiary, it derecognizes the related assets (includinggoodwill), liabilities, non-controlling interest and other components of equity while any resultant gainor loss is recognized in profit or loss. Any investment retained is recognized at fair value.
2.2 CHANGES IN ACCOUNTING POLICIES AND DISCLOSURES
Adoption of IFRS 9
The Group has adopted IFRS 9, effective for the period beginning on or after January 1, 2018.The Group has not restated financial information from January 1, 2016 to December 31, 2017 forfinancial instruments in the scope of IFRS 9. The financial information from January 1, 2016 toDecember 31, 2017 is reported under International Accounting Standard (“IAS”) 39 FinancialInstruments: Recognition and Measurement and is not comparable to the information presented for2018. The impacts relate to the classification and measurement and the impairment requirements andare summarized as follows:
(a) Classification and measurement
Under IFRS 9, debt instruments are subsequently measured at fair value through profit or loss,amortized cost, or fair value through other comprehensive income (“OCI”); equity instruments aresubsequently measured at fair value through profit or loss, or fair value through OCI. The classificationis based on two criteria: the Group’s business model for managing the assets; and whether theinstruments’ contractual cash flows represent solely payments of principal and interest on the principalamount outstanding.
The assessment of the Group’s business model was made as of the date of initial application,January 1, 2018, and then applied retrospectively to those financial assets that were not derecognizedbefore January 1, 2018. The assessment of whether contractual cash flows on debt instruments aresolely comprised of principal and interest was made based on the facts and circumstances as at theinitial recognition of the assets.
The classification and measurement requirements of IFRS 9 did not have a significant impacton the Group. The Group continued measuring at fair value all financial assets previously held at fairvalue under IAS 39. The following are the changes in the classification of the Group’s financial assets:
Trade and other receivables previously classified as receivables are held to collect contractualcash flows and give rise to cash flows representing solely payments of principal and interest. These arenow classified and measured as debt instruments at amortized cost.
Upon adoption of IFRS 9, the Group classified and measured all its publicly listed equityinvestments that were classified previously as available-for-sale (“AFS”) investments and financialassets at fair value through profit or loss, as equity instruments designated at fair value through OCI. Inaddition, an unquoted equity investments in a privately-held real estate company that was previouslyclassified as AFS Investment is classified and measured now as equity instruments designated at fair
I-22

APPENDIX I ACCOUNTANTS’ REPORT
II. NOTES TO THE HISTORICAL FINANCIAL INFORMATION (continued)
2.2 CHANGES IN ACCOUNTING POLICIES AND DISCLOSURES (continued)
Adoption of IFRS 9 (continued)
(a) Classification and measurement (continued)
value through OCI. The Group elected to classify irrevocably its equity investments under thiscategory as it intends to hold these investments for the foreseeable future. There were no impairmentlosses recognized in profit or loss for these investments in prior periods.
There are no changes in classification and measurement for the Group’s financial liabilities.
In summary, upon the adoption of IFRS 9, the Group had the following required or electedreclassifications as at January 1, 2018:
IFRS 9 measurement category
IAS 39 measurement category
Fair valuethroughprofit or
lossAmortized
cost
Fair valuethrough othercomprehensive
income
USD’000 USD’000 USD’000 USD’000
Financial assetsTrade receivables . . . . . . . . . . . . . . . . . . . . . . . . . . . . . . 30,448 — 30,448 —Available-for-sale investments:
— Unquoted equity investments . . . . . . . . . . . . . . 8,327 — — 8,327— Listed equity investments . . . . . . . . . . . . . . . . . 181,489 — — 181,489
Financial assets at fair value through profit or loss . . . . 362,073 292,982 — 69,091Pledged bank deposits . . . . . . . . . . . . . . . . . . . . . . . . . . . 73,803 — 73,803 —Cash and bank balances . . . . . . . . . . . . . . . . . . . . . . . . . 526,988 — 526,988 —Financial assets included in prepayments, other
receivables and other assets . . . . . . . . . . . . . . . . . . . . 29,405 — 29,405 —Other non-current assets . . . . . . . . . . . . . . . . . . . . . . . . . 9,778 — 9,778 —
292,982 670,422 258,907
Financial liabilitiesTrade and other payables . . . . . . . . . . . . . . . . . . . . . . . . 47,069 — 47,069 —Interest-bearing bank and other borrowings . . . . . . . . . . 833,435 — 833,435 —Other non-current liabilities . . . . . . . . . . . . . . . . . . . . . . 22,196 — 22,196 —Redeemable convertible preference shares . . . . . . . . . . . 264,199 — 264,199 —Financial liabilities designated at fair value through
profit or loss . . . . . . . . . . . . . . . . . . . . . . . . . . . . . . . . 13,671 13,671 — —
13,671 1,166,899 —
(b) Impairment
The adoption of IFRS 9 has fundamentally changed the Group’s accounting for impairmentlosses for financial assets by replacing IAS 39’s incurred loss approach with a forward-lookingexpected credit loss (ECL) approach. IFRS 9 requires the Group to recognize an allowance for ECLsfor all debt instruments not held at fair value through profit or loss and contract assets.
Upon the adoption of IFRS 9, no additional impairment was recognized on the Group’sfinancial assets.
I-23

APPENDIX I ACCOUNTANTS’ REPORT
II. NOTES TO THE HISTORICAL FINANCIAL INFORMATION (continued)
2.3 ISSUED BUT NOT YET EFFECTIVE IFRSs
The Group has not adopted the following standards that have been issued but not yet effective,in the Historical Financial Information:
Amendments to IFRS 10 and IAS 28 Sale or Contribution of Assets between an Investorand its Associate or Joint Venture3
IFRS 17 Insurance Contracts2
Amendments to IAS 1 and IAS 8 Definition of Material1
Amendments to IFRS 3 Definition of a Business4
1 Effective for annual periods beginning on or after January 1, 20202 Effective for annual periods beginning on or after January 1, 20213 No mandatory effective date yet determined but available for adoption4 Effective for business combinations for which the acquisition date is on or after January 1, 2020 and to asset acquisition that
occurs on or after the beginning of that period
The directors of the Company anticipate that the application of the new and revised IFRSs willhave no significant financial impact to the Group’s financial performance and financial positions.
2.4 SUMMARY OF SIGNIFICANT ACCOUNTING POLICIES
Investments in associates and joint ventures
An associate is an entity, in which the Group has a long term interest of generally not less than20% of the equity voting rights and over which it is in a position to exercise significant influence.Significant influence is the power to participate in the financial and operating policy decisions of theinvestee, but is not control or joint control over those policies.
A joint venture is a type of joint arrangement whereby the parties that have joint control of thearrangement have rights to the net assets of the joint venture. Joint control is the contractually agreedsharing of control of an arrangement, which exists only when decisions about the relevant activitiesrequire the unanimous consent of the parties sharing control.
The Group’s investments in associates and joint ventures are stated in the consolidatedstatement of financial position at the Group’s share of net assets under the equity method ofaccounting, less any impairment losses.
The Group’s share of the post-acquisition results and other comprehensive income of associatesand joint ventures is included in the consolidated statement of profit or loss and other comprehensiveincome respectively. In addition, when there has been a change recognized directly in the equity of theassociate or joint venture, the Group recognizes its share of any changes, when applicable, in theconsolidated statement of changes in equity. Unrealized gains and losses resulting from transactionsbetween the Group and its associates or joint ventures are eliminated to the extent of the Group’sinvestments in the associates or joint ventures, except where unrealized losses provide evidence of animpairment of the assets transferred. Goodwill arising from the acquisition of associates or jointventures is included as part of the Group’s investments in associates or joint ventures.
If an investment in an associate becomes an investment in a joint venture or vice versa, theretained interest is not remeasured. Instead, the investment continues to be accounted for under theequity method. In all other cases, upon loss of significant influence over the associate or joint control
I-24

APPENDIX I ACCOUNTANTS’ REPORT
II. NOTES TO THE HISTORICAL FINANCIAL INFORMATION (continued)
2.4 SUMMARY OF SIGNIFICANT ACCOUNTING POLICIES (continued)
Investments in associates and joint ventures (continued)
over the joint venture, the Group measures and recognizes any retained investment at its fair value.Any difference between the carrying amount of the associate or joint venture upon loss of significantinfluence or joint control and the fair value of the retained investment and proceeds from disposal isrecognized in profit or loss.
When an investment in an associate or a joint venture is classified as held for sale, it isaccounted for in accordance with IFRS 5 Non-current Assets Held for Sale and DiscontinuedOperations.
If the Group’s ownership interest in a joint venture is reduced, but investment continues to beclassified either as a joint venture, the Group reclassifies to profit or loss the proportion of the gain orloss that had previously been recognized in other comprehensive income relating to that reduction inownership interest if that gain or loss would be required to be reclassified to profit or loss on thedisposal of the related assets or liabilities.
Business combinations and goodwill
Business combinations are accounted for using the acquisition method. The considerationtransferred is measured at the acquisition date fair value which is the sum of the acquisition date fairvalues of assets transferred by the Group, liabilities assumed by the Group to the former owners of theacquiree and the equity interests issued by the Group in exchange for control of the acquiree. For eachbusiness combination, the Group elects whether to measure the non-controlling interests in theacquiree that are present ownership interests and entitle their holders to a proportionate share of netassets in the event of liquidation at fair value or at the proportionate share of the acquiree’s identifiablenet assets. All other components of non-controlling interests are measured at fair value. Acquisition-related costs are expensed as incurred.
When the Group acquires a business, it assesses the financial assets and liabilities assumed forappropriate classification and designation in accordance with the contractual terms, economiccircumstances and pertinent conditions as at the acquisition date. This includes the separation ofembedded derivatives in host contracts of the acquiree.
If the business combination is achieved in stages, the previously held equity interest isremeasured at its acquisition date fair value and any resulting gain or loss is recognized in profit orloss.
Any contingent consideration to be transferred by the acquirer is recognized at fair value at theacquisition date. Contingent consideration classified as an asset or liability is measured at fair valuewith changes in fair value recognized in profit or loss. Contingent consideration that is classified asequity is not remeasured and subsequent settlement is accounted for within equity.
Goodwill is initially measured at cost, being the excess of the aggregate of the considerationtransferred, the amount recognized for non-controlling interests and any fair value of the Group’spreviously held equity interests in the acquiree over the identifiable net assets acquired and liabilities
I-25

APPENDIX I ACCOUNTANTS’ REPORT
II. NOTES TO THE HISTORICAL FINANCIAL INFORMATION (continued)
2.4 SUMMARY OF SIGNIFICANT ACCOUNTING POLICIES (continued)
Business combinations and goodwill (continued)
assumed. If the sum of this consideration and other items is lower than the fair value of the net assetsacquired, the difference is, after reassessment, recognized in profit or loss as a gain on bargainpurchase.
After initial recognition, goodwill is measured at cost less any accumulated impairment losses.Goodwill is tested for impairment annually or more frequently if events or changes in circumstancesindicate that the carrying value may be impaired. The Group performs its annual impairment test ofgoodwill as at December 31. For the purpose of impairment testing, goodwill acquired in a businesscombination is, from the acquisition date, allocated to each of the Group’s cash-generating units, orgroups of cash-generating units, that are expected to benefit from the synergies of the combination,irrespective of whether other assets or liabilities of the Group are assigned to those units or groups ofunits.
Impairment is determined by assessing the recoverable amount of the cash-generating unit(group of cash-generating units) to which the goodwill relates. Where the recoverable amount of thecash-generating unit (group of cash-generating units) is less than the carrying amount, an impairmentloss is recognized. An impairment loss recognized for goodwill is not reversed in a subsequent period.
Where goodwill has been allocated to a cash-generating unit (or group of cash-generating units)and part of the operation within that unit is disposed of, the goodwill associated with the operationdisposed of is included in the carrying amount of the operation when determining the gain or loss onthe disposal. Goodwill disposed of in these circumstances is measured based on the relative value ofthe operation disposed of and the portion of the cash-generating unit retained.
Fair value measurement
The Group measures its investment properties, derivative financial instruments,available-for-sale investments at fair value, financial assets and liabilities at fair value through othercomprehensive income and financial assets and liabilities at fair value through profit or loss at the endof each of the Relevant Periods. Fair value is the price that would be received to sell an asset or paid totransfer a liability in an orderly transaction between market participants at the measurement date. Thefair value measurement is based on the presumption that the transaction to sell the asset or transfer theliability takes place either in the principal market for the asset or liability, or in the absence of aprincipal market, in the most advantageous market for the asset or liability. The principal or the mostadvantageous market must be accessible by the Group. The fair value of an asset or a liability ismeasured using the assumptions that market participants would use when pricing the asset or liability,assuming that market participants act in their economic best interest.
A fair value measurement of a non-financial asset takes into account a market participant’sability to generate economic benefits by using the asset in its highest and best use or by selling it toanother market participant that would use the asset in its highest and best use.
The Group uses valuation techniques that are appropriate in the circumstances and for whichsufficient data are available to measure fair value, maximizing the use of relevant observable inputsand minimizing the use of unobservable inputs.
I-26
APPENDIX I ACCOUNTANTS’ REPORT
II. NOTES TO THE HISTORICAL FINANCIAL INFORMATION (continued)
2.4 SUMMARY OF SIGNIFICANT ACCOUNTING POLICIES (continued)
Fair value measurement (continued)
All assets and liabilities for which fair value is measured or disclosed in the Historical FinancialInformation are categorized within the fair value hierarchy, described as follows, based on the lowestlevel input that is significant to the fair value measurement as a whole:
Š Level 1—Quoted (unadjusted) market prices in active markets for identical assets orliabilities
Š Level 2—Valuation techniques for which the lowest level input that is significant to thefair value measurement is directly or indirectly observable
Š Level 3—Valuation techniques for which the lowest level input that is significant to thefair value measurement is unobservable
For assets and liabilities that are recognized in the Historical Financial Information on arecurring basis, the Group determines whether transfers have occurred between levels in the hierarchyby re-assessing categorization (based on the lowest level input that is significant to the fair valuemeasurement as a whole) at the end of each of the Relevant Periods.
Impairment of non-financial assets
Where an indication of impairment exists, or when annual impairment testing for an asset isrequired (other than inventories, construction contract assets, financial assets, investment propertiesand non-current assets/a disposal group classified as held for sale), the asset’s recoverable amount isestimated. An asset’s recoverable amount is the higher of the asset’s or cash-generating unit’s value inuse and its fair value less costs of disposal, and is determined for an individual asset, unless the assetdoes not generate cash inflows that are largely independent of those from other assets or groups ofassets, in which case the recoverable amount is determined for the cash-generating unit to which theasset belongs.
An impairment loss is recognized only if the carrying amount of an asset exceeds itsrecoverable amount. In assessing value in use, the estimated future cash flows are discounted to theirpresent value using a pre-tax discount rate that reflects current market assessments of the time value ofmoney and the risks specific to the asset. An impairment loss is charged to profit or loss in the periodin which it arises in those expense categories consistent with the function of the impaired asset.
An assessment is made at the end of each Relevant Periods as to whether there is an indicationthat previously recognized impairment losses may no longer exist or may have decreased. If such anindication exists, the recoverable amount is estimated. A previously recognized impairment loss of anasset other than goodwill is reversed only if there has been a change in the estimates used to determinethe recoverable amount of that asset, but not to an amount higher than the carrying amount that wouldhave been determined (net of any depreciation) had no impairment loss been recognized for the asset inprior years. A reversal of such an impairment loss is credited to profit or loss in the period in which itarises.
I-27
APPENDIX I ACCOUNTANTS’ REPORT
II. NOTES TO THE HISTORICAL FINANCIAL INFORMATION (continued)
2.4 SUMMARY OF SIGNIFICANT ACCOUNTING POLICIES (continued)
Related parties
A party is considered to be related to the Group if:
(a) the party is a person or a close member of that person’s family and that person:
(i) has control or joint control over the Group;
(ii) has significant influence over the Group; or
(iii) is a member of the key management personnel of the Group or of a parent of theGroup;
or
(b) the party is an entity where any of the following conditions applies:
(i) the entity and the Group are members of the same group;
(ii) one entity is an associate or joint venture of the other entity (or of a parent,subsidiary or fellow subsidiary of the other entity);
(iii) the entity and the Group are joint ventures of the same third party;
(iv) one entity is a joint venture of a third entity and the other entity is an associate of thethird entity;
(v) the entity is a post-employment benefit plan for the benefit of employees of eitherthe Group or an entity related to the Group;
(vi) the entity is controlled or jointly controlled by a person identified in (a);
(vii) a person identified in (a)(i) has significant influence over the entity or is a memberof the key management personnel of the entity (or of a parent of the entity); and
(viii) the entity, or any member of a group of which it is a part, provides key managementpersonnel services to the Group or to the parent of the Group.
Property, plant and equipment and depreciation
Property, plant and equipment, other than construction in progress, are stated at cost lessaccumulated depreciation and any impairment losses. The cost of an item of property, plant andequipment comprises its purchase price and any directly attributable costs of bringing the asset to itsworking condition and location for its intended use.
Expenditure incurred after items of property, plant and equipment have been put into operation,such as repairs and maintenance, is normally charged to profit or loss in the period in which it isincurred. In situations where the recognition criteria are satisfied, the expenditure for a majorinspection is capitalized in the carrying amount of the asset as a replacement. Where significant partsof property, plant and equipment are required to be replaced at intervals, the Group recognizes suchparts as individual assets with specific useful lives and depreciates them accordingly.
I-28

APPENDIX I ACCOUNTANTS’ REPORT
II. NOTES TO THE HISTORICAL FINANCIAL INFORMATION (continued)
2.4 SUMMARY OF SIGNIFICANT ACCOUNTING POLICIES (continued)
Property, plant and equipment and depreciation (continued)
Depreciation is calculated on the straight-line basis to write off the cost of each item ofproperty, plant and equipment to its residual value over its estimated useful life. The principal annualrates used for this purpose are as follows:
Category Estimated useful life Estimated residual value
Motor vehicles . . . . . . . . . . . . . . . . . . . . . . . . . . . . . . . . . . . . . 4 years 10%Machineries . . . . . . . . . . . . . . . . . . . . . . . . . . . . . . . . . . . . . . . 20 years 0%Leasehold improvements . . . . . . . . . . . . . . . . . . . . . . . . . . . . . 5 years 0%Others . . . . . . . . . . . . . . . . . . . . . . . . . . . . . . . . . . . . . . . . . . . . 3~5 years 10%
Where parts of an item of property, plant and equipment have different useful lives, the cost ofthat item is allocated on a reasonable basis among the parts and each part is depreciated separately.Residual values, useful lives and the depreciation method are reviewed, and adjusted if appropriate, atleast at each financial year end.
An item of property, plant and equipment including any significant part initially recognized isderecognized upon disposal or when no future economic benefits are expected from its use or disposal.Any gain or loss on disposal or retirement recognized in profit or loss in the year the asset isderecognized is the difference between the net sales proceeds and the carrying amount of the relevantasset.
Construction in progress represents a building under construction, which is stated at cost lessany impairment losses, and is not depreciated. Cost comprises the direct costs of construction andcapitalized borrowing costs on related borrowed funds during the period of construction. Constructionin progress is reclassified to the appropriate category of property, plant and equipment when completedand ready for use.
Investment properties
Investment property comprises completed property and property under construction.
Investment properties comprise completed property and property under construction or re-development held to earn rentals or for capital appreciation or both. Investment property is measuredinitially at cost including transaction costs. Transaction costs include transfer taxes, professional feesfor legal services and initial leasing commissions to bring the property to the condition necessary for itto be capable of operating. The carrying amount also includes the cost of replacing part of an existinginvestment property at the time that cost is incurred if the recognition criteria are met.
Subsequent to initial recognition, investment property is stated at fair value. Gains or lossesarising from changes in the fair values are included in the statement of profit or loss in the year inwhich they arise.
Investment property is derecognized when it has been disposed of or permanently withdrawnfrom use and no future economic benefit is expected from its disposal. Any gains or losses on theretirement or disposal of investment property are recognized in profit or loss in the year of retirementor disposal.
I-29

APPENDIX I ACCOUNTANTS’ REPORT
II. NOTES TO THE HISTORICAL FINANCIAL INFORMATION (continued)
2.4 SUMMARY OF SIGNIFICANT ACCOUNTING POLICIES (continued)
Investment properties (continued)
Transfers are made to investment property when, and only when, there is a change in use,evidenced by the end of owner occupation or commencement of an operating lease.
Other intangible assets (other than goodwill)
Other intangible assets acquired separately are measured on initial recognition at cost. The costof other intangible assets acquired in a business combination is the fair value at the date of theacquisition. The useful lives of other intangible assets are assessed to be finite. Other intangible assetswith finite lives are subsequently amortized over the useful economic life and assessed for impairmentwhenever there is an indication that the other intangible asset may be impaired. The amortizationperiod and the amortization method for another intangible asset with a finite useful life are reviewed atleast at each financial year end.
Intangible assets with indefinite useful lives are tested for impairment annually eitherindividually or at the cash- generating unit level. Such intangible assets are not amortized. The usefullife of an intangible asset with an indefinite life is reviewed annually to determine whether theindefinite life assessment continues to be supportable. If not, the change in the useful life assessmentfrom indefinite to finite is accounted for on a prospective basis.
The principal estimated useful lives of other intangible assets are as follows:
Category Estimated useful life Estimated residual value
Software . . . . . . . . . . . . . . . . . . . . . . . . . . . . . . . . . . . . . . . 3 years 0%Management contracts (note (i)) . . . . . . . . . . . . . . . . . . . . 7 years 0%Trust management rights (note (ii)) . . . . . . . . . . . . . . . . . . indefinite useful lives 0%Customer contracts(note (iii)) . . . . . . . . . . . . . . . . . . . . . . 3 years 0%Others . . . . . . . . . . . . . . . . . . . . . . . . . . . . . . . . . . . . . . . . . indefinite useful lives 0%
Notes:(i) Management contracts have the amortization period of seven years based on the period covered by the management contracts.(ii) Trust management rights has an indefinite estimated useful life due to the fact that the related trusts in Singapore can exist
perpetually. The impairment testing is performed by the end of each year. The recoverable amount of the trust managementrights has been determined based on a value in use calculation using cash flow projections based on financial budgets coveringa five-year period approved by senior management. The discount rate applied to the cash flow projections of VITM,Infinitysub and Sabana Investment Partners Pte. Ltd. (the “SIP Group”) asset management are 11.1%, 15% and 10.1%-10.3%,respectively. The growth rate used to extrapolate the cash flow of VITM, Infinitysub and SIP asset management beyond thefive-year period are 1.2%, 3% and 1.0%, respectively. This growth rate is based on the average growth rate of the managementfee in which the business operates. Senior management believes that this growth rate is justified. These calculations use pre-taxcash flow projections based on financial budgets approved by management.
(iii) Customer contracts have the amortization period of three years based on the lifespan of the construction service period with thecustomers.
Leases
Group as a lessee
Right-of-use assets
The Group recognizes right-of-use assets at the commencement date of the lease (i.e., the datethe underlying asset is available for use). Right-of-use assets are measured at cost, less any
I-30
APPENDIX I ACCOUNTANTS’ REPORT
II. NOTES TO THE HISTORICAL FINANCIAL INFORMATION (continued)
2.4 SUMMARY OF SIGNIFICANT ACCOUNTING POLICIES (continued)
Leases (continued)
Group as a lessee (continued)
Right-of-use assets (continued)
accumulated depreciation and impairment losses, and adjusted for any remeasurement of leaseliabilities. The cost of right-of-use assets includes the amount of lease liabilities recognized, initialdirect costs incurred, and lease payments made at or before the commencement date less any leaseincentives received. Unless the Group is reasonably certain to obtain ownership of the leased asset atthe end of the lease term, the recognized right-of-use assets are depreciated on a straight-line basis overthe shorter of its estimated useful life and the lease term. Right-of-use assets are subject to impairment.
Lease liabilities
At the commencement date of the lease, the Group recognizes lease liabilities measured at thepresent value of lease payments to be made over the lease term. In calculating the present value oflease payments, the Group uses the incremental borrowing rate at the lease commencement date if theinterest rate implicit in the lease is not readily determinable. After the commencement date, the amountof lease liabilities is increased to reflect the accretion of interest and reduced for the lease paymentsmade. In addition, the carrying amount of lease liabilities is remeasured if there is a modification, achange in the lease term, a change in the in-substance fixed lease payments or a change in theassessment to purchase the underlying asset.
Group as a lessor
Leases in which the Group does not transfer substantially all the risks and benefits of ownershipof an asset are classified as operating leases. Initial direct costs incurred in negotiating an operatinglease are added to the carrying amount of the leased asset and recognized over the lease term on thesame basis as rental income.
Contingent rents are recognized as revenue in the period in which they are earned.
Financial instruments
Investments and other financial assets (under IFRS 9 applicable after January 1, 2018)
Initial recognition and measurement
Financial assets are classified, at initial recognition, as subsequently measured at amortizedcost, fair value through other comprehensive income (OCI), and fair value through profit or loss.
The classification of financial assets at initial recognition depends on the financial asset’scontractual cash flow characteristics and the Group’s business model for managing them. With theexception of trade receivables that do not contain a significant financing component or for which theGroup has applied the practical expedient, the Group initially measures a financial asset at its fair valueplus, in the case of a financial asset not at fair value through profit or loss, transaction costs. Tradereceivables that do not contain a significant financing component or for which the Group has appliedthe practical expedient are measured at the transaction price determined under IFRS 15.
I-31

APPENDIX I ACCOUNTANTS’ REPORT
II. NOTES TO THE HISTORICAL FINANCIAL INFORMATION (continued)
2.4 SUMMARY OF SIGNIFICANT ACCOUNTING POLICIES (continued)
Financial instruments (continued)
Investments and other financial assets (under IFRS 9 applicable after January 1,2018) (continued)
Initial recognition and measurement (continued)
In order for a financial asset to be classified and measured at amortized cost or fair valuethrough OCI, it needs to give rise to cash flows that are ‘solely payments of principal and interest(SPPI)’ on the principal amount outstanding. This assessment is referred to as the SPPI test and isperformed at an instrument level.
The Group’s business model for managing financial assets refers to how it manages itsfinancial assets in order to generate cash flows. The business model determines whether cash flowswill result from collecting contractual cash flows, selling the financial assets, or both.
Purchases or sales of financial assets that require delivery of assets within a time frameestablished by regulation or convention in the market place (regular way trades) are recognized on thetrade date, i.e., the date that the Group commits to purchase or sell the assets.
Subsequent measurement
Financial assets measured at amortized cost
The Group measures financial assets at amortized cost if both of the following conditions aremet:
‰ The financial asset is held within a business model with the objective to hold financialassets in order to collect contractual cash flows; and
‰ The contractual terms of the financial asset give rise on specified dates to cash flows thatare solely payments of principal and interest on the principal amount outstanding.
Financial assets at amortized cost are subsequently measured using the effective interest (EIR)method and are subject to impairment. Gains and losses are recognized in profit or loss when the assetis derecognized, modified or impaired.
The Group’s financial assets at amortized cost includes trade receivables, and financial assetsincluded in prepayments, other receivables and other assets.
Financial assets designated at fair value through OCI (equity investments)
Upon initial recognition, the Group can elect to classify irrevocably its equity investments asequity instruments designated at fair value through OCI when they meet the definition of equity underIAS 32 Financial Instruments: Presentation and are not held for trading. The classification isdetermined on an instrument-by-instrument basis.
Gains and losses on these financial assets are never recycled in profit or loss. Dividends arerecognized as other income in profit or loss when the right of payment has been established, it is
I-32

APPENDIX I ACCOUNTANTS’ REPORT
II. NOTES TO THE HISTORICAL FINANCIAL INFORMATION (continued)
2.4 SUMMARY OF SIGNIFICANT ACCOUNTING POLICIES (continued)
Financial instruments (continued)
Investments and other financial assets (under IFRS 9 applicable after January 1,2018) (continued)
Subsequent measurement (continued)
Financial assets designated at fair value through OCI (equity investments) (continued)
probable that the economic benefits associated with the dividend will flow to the Group and theamount of the dividend can be measured reliably, except when the Group benefits from such proceedsas a recovery of part of the cost of the financial asset, in which case, such gains are recorded in othercomprehensive income. Equity investments designated at fair value through other comprehensiveincome are not subject to impairment assessment.
The Group elected to classify irrevocably its equity investments under this category.
Financial assets measured at fair value through profit or loss (FVTPL)
Financial assets at fair value through profit or loss include financial assets held for trading,financial assets designated upon initial recognition at fair value through profit or loss, or financialassets mandatorily required to be measured at fair value. Financial assets are classified as held fortrading if they are acquired for the purpose of selling or repurchasing in the near term. Derivatives,including separated embedded derivatives, are also classified as held for trading unless they aredesignated as effective hedging instruments. Financial assets with cash flows that are not solelypayments of principal and interest are classified and measured at fair value through profit or loss,irrespective of the business model. Notwithstanding the criteria for debt instruments to be classified atamortized cost or at fair value through OCI, as described above, debt instruments may be designated atfair value through profit or loss on initial recognition if doing so eliminates, or significantly reduces, anaccounting mismatch.
Financial assets at fair value through profit or loss are carried in the consolidated statements offinancial position at fair value with net changes in fair value recognized in profit or loss.
This category includes equity investments which the Group had not irrevocably elected toclassify at fair value through other comprehensive income. Dividends on equity investments classifiedas financial assets at fair value profit or loss are also recognized as other income in profit or loss whenthe right of payment has been established, it is probable that the economic benefits associated with thedividend will flow to the Group and the amount of the dividend can be measured reliably.
Investments and other financial assets (policies under IAS 39 applicable before January 1,2018)
Initial recognition and measurement
Financial assets are classified, at initial recognition, as financial assets at fair value throughprofit or loss, loans and receivables and available-for-sale financial investments; as appropriate. Whenfinancial assets are recognized initially, they are measured at fair value plus transaction costs that areattributable to the acquisition of the financial assets, except in the case of financial assets recorded atfair value through profit or loss.
I-33

APPENDIX I ACCOUNTANTS’ REPORT
II. NOTES TO THE HISTORICAL FINANCIAL INFORMATION (continued)
2.4 SUMMARY OF SIGNIFICANT ACCOUNTING POLICIES (continued)
Financial instruments (continued)
Investments and other financial assets (policies under IAS 39 applicable before January 1,2018) (continued)
Initial recognition and measurement (continued)
All regular way purchases and sales of financial assets are recognized on the trade date, that is,the date that the Group commits to purchase or sell the asset. Regular way purchases or sales arepurchases or sales of financial assets that require delivery of assets within the period generallyestablished by regulation or convention in the marketplace.
Subsequent measurement
The subsequent measurement of financial assets depends on their classification as follows:
Financial assets at fair value through profit or loss
Financial assets at fair value through profit or loss include financial assets held for trading andfinancial assets designated upon initial recognition as at fair value through profit or loss. Financialassets are classified as held for trading if they are acquired for the purpose of sale in the near term.Derivatives, including separated embedded derivatives, are also classified as held for trading unlessthey are designated as effective hedging instruments as defined by IAS 39.
Financial assets at fair value through profit or loss are carried in the statement of financialposition at fair value with positive net changes in fair value presented as other income and gains andnegative net changes in fair value presented as finance costs in profit or loss. These net fair valuechanges do not include any dividends or interest earned on these financial assets, which are recognizedin accordance with the policies set out for “Interest income” and “Dividend income” below.
Financial assets designated upon initial recognition as at fair value through profit or loss aredesignated at the date of initial recognition and only if the criteria in IAS 39 are satisfied.
Derivatives embedded in host contracts are accounted for as separate derivatives and recordedat fair value if their economic characteristics and risks are not closely related to those of the hostcontracts and the host contracts are not held for trading or as at fair value through profit or loss. Theseembedded derivatives are measured at fair value with changes in fair value recognized in profit or loss.Reassessment only occurs if there is either a change in the terms of the contract that significantlymodifies the cash flows that would otherwise be required or a reclassification of a financial asset out ofthe fair value through profit or loss category.
Loans and receivables
Loans and receivables are non-derivative financial assets with fixed or determinable paymentsthat are not quoted in an active market. After initial measurement, such assets are subsequentlymeasured at amortized cost using the effective interest rate method less any allowance for impairment.Amortized cost is calculated by taking into account any discount or premium on acquisition and
I-34

APPENDIX I ACCOUNTANTS’ REPORT
II. NOTES TO THE HISTORICAL FINANCIAL INFORMATION (continued)
2.4 SUMMARY OF SIGNIFICANT ACCOUNTING POLICIES (continued)
Financial instruments (continued)
Investments and other financial assets (policies under IAS 39 applicable before January 1,2018) (continued)
Subsequent measurement (continued)
Loans and receivables (continued)
includes fees or costs that are an integral part of the effective interest rate. The effective interest rateamortization is included in other income and gains in profit or loss. The loss arising from impairment isrecognized in profit or loss in finance costs for loans and in other expenses for receivables.
Available-for-sale financial investments
Available-for-sale financial investments are non-derivative financial assets in listed andunlisted equity investments. Equity investments classified as available for sale are those which areneither classified as held for trading nor as at fair value through profit or loss. Debt securities in thiscategory are those which are intended to be held for an indefinite period of time and which may be soldin response to needs for liquidity or in response to changes in market conditions.
After initial recognition, available-for-sale financial investments are subsequently measured atfair value, with unrealized gains or losses recognized as other comprehensive income in theavailable-for-sale investment revaluation reserve until the investment is derecognized, at which timethe cumulative gain or loss is recognized in profit or loss in other income, or until the investment isdetermined to be impaired, when the cumulative gain or loss is reclassified from the available-for-saleinvestment revaluation reserve to profit or loss in other gains or losses. Interest and dividends earnedwhilst holding the available-for-sale financial investments are reported as interest income and dividendincome, respectively and are recognized in profit or loss as other income in accordance with thepolicies set out for “Interest income” and “Dividend income” below.
When the fair value of unlisted equity investments cannot be reliably measured because (a) thevariability in the range of reasonable fair value estimates is significant for that investment or (b) theprobabilities of the various estimates within the range cannot be reasonably assessed and used inestimating fair value, such investments are stated at cost less any impairment losses.
The Group evaluates whether the ability and intention to sell its available-for-sale financialassets in the near term are still appropriate. When, in rare circumstances, the Group is unable to tradethese financial assets due to inactive markets, the Group may elect to reclassify these financial assets ifmanagement has the ability and intention to hold the assets for the foreseeable future or until maturity.
For a financial asset reclassified from the available-for-sale category, the fair value carryingamount at the date of reclassification becomes its new amortized cost and any previous gain or loss onthat asset that has been recognized in equity is amortized to profit or loss over the remaining life of theinvestment using the effective interest rate. Any difference between the new amortized cost and thematurity amount is also amortized over the remaining life of the asset using the effective interest rate.If the asset is subsequently determined to be impaired, then the amount recorded in equity isreclassified to profit or loss.
I-35

APPENDIX I ACCOUNTANTS’ REPORT
II. NOTES TO THE HISTORICAL FINANCIAL INFORMATION (continued)
2.4 SUMMARY OF SIGNIFICANT ACCOUNTING POLICIES (continued)
Financial instruments (continued)
Derecognition of financial assets (policies under IFRS 9 applicable from January 1, 2018and policies under IAS 39 applicable before January 1, 2018)
A financial asset (or, where applicable, a part of a financial asset or part of a group of similarfinancial assets) is primarily derecognized (i.e., removed from the Group’s consolidated statement offinancial position) when:
• the rights to receive cash flows from the asset have expired; or
• the Group has transferred its rights to receive cash flows from the asset or has assumed anobligation to pay the received cash flows in full without material delay to a third partyunder a “pass-through” arrangement; and either (a) the Group has transferred substantiallyall the risks and rewards of the asset, or (b) the Group has neither transferred nor retainedsubstantially all the risks and rewards of the asset, but has transferred control of the asset.
When the Group has transferred its rights to receive cash flows from an asset or has enteredinto a pass-through arrangement, it evaluates if, and to what extent, it has retained the risk and rewardsof ownership of the asset. When it has neither transferred nor retained substantially all the risks andrewards of the asset nor transferred control of the asset, the Group continues to recognize thetransferred asset to the extent of the Group’s continuing involvement. In that case, the Group alsorecognizes an associated liability. The transferred asset and the associated liability are measured on abasis that reflects the rights and obligations that the Group has retained.
Continuing involvement that takes the form of a guarantee over the transferred asset ismeasured at the lower of the original carrying amount of the asset and the maximum amount ofconsideration that the Group could be required to repay.
Impairment of financial assets (policies under IFRS 9 applicable from January 1, 2018)
The Group has types of financial assets subject to IFRS 9’s new expected credit loss model:
• trade receivables; and
• other receivables.
The Group recognizes an allowance for expected credit losses (ECLs) for all debt instrumentsnot held at fair value through profit or loss. ECLs are based on the difference between the contractualcash flows due in accordance with the contract and all the cash flows that the Group expects to receive,discounted at an approximation of the original effective interest rate. The expected cash flows willinclude cash flows from the sale of collateral held or other credit enhancements that are integral to thecontractual terms.
General approach
ECLs are recognized in two stages. For credit exposures for which there has not been asignificant increase in credit risk since initial recognition, ECLs are provided for credit losses thatresult from default events that are possible within the next 12-months (a 12-month ECL). For those
I-36
APPENDIX I ACCOUNTANTS’ REPORT
II. NOTES TO THE HISTORICAL FINANCIAL INFORMATION (continued)
2.4 SUMMARY OF SIGNIFICANT ACCOUNTING POLICIES (continued)
Financial instruments (continued)
Impairment of financial assets (policies under IFRS 9 applicable from January 1,2018) (continued)
General approach (continued)
credit exposures for which there has been a significant increase in credit risk since initial recognition, aloss allowance is required for credit losses expected over the remaining life of the exposure,irrespective of the timing of the default (a lifetime ECL).
At each reporting date, the Group assesses whether the credit risk on a financial instrument hasincreased significantly since initial recognition. When making the assessment, the Group compares therisk of a default occurring on the financial instrument as at the reporting date with the risk of a defaultoccurring on the financial instrument as at the date of initial recognition and considers reasonable andsupportable information that is available without undue cost or effort, including historical and forward-looking information.
For debt investments at fair value through other comprehensive income, the Group applies thelow credit risk simplification. At each reporting date, the Group evaluates whether the debt investmentsare considered to have low credit risk using all reasonable and supportable information that is availablewithout undue cost or effort. In making that evaluation, the Group reassesses the external credit ratingsof the debt investments. In addition, the Group considers that there has been a significant increase incredit risk when contractual payments are more than 90 days past due.
The Group considers a financial asset in default when contractual payments are 150 days pastdue. However, in certain cases, the Group may also consider a financial asset to be in default wheninternal or external information indicates that the Group is unlikely to receive the outstandingcontractual amounts in full before taking into account any credit enhancements held by the Group. Afinancial asset is written off when there is no reasonable expectation of recovering the contractual cashflows.
Debt investments at fair value through other comprehensive income and financial assets atamortized cost are subject to impairment under the general approach and they are classified within thefollowing stages for measurement of ECLs except for trade receivables and contract assets which applythe simplified approach as detailed below.
Stage 1 — Financial instruments for which credit risk has not increased significantly sinceinitial recognition and for which the loss allowance is measured at an amount equal to 12-month ECLs
Stage 2 — Financial instruments for which credit risk has increased significantly since initialrecognition but that are not credit-impaired financial assets and for which the loss allowance ismeasured at an amount equal to lifetime ECLs
Stage 3 — Financial assets that are credit-impaired at the reporting date (but that are notpurchased or originated credit-impaired) and for which the loss allowance is measured at an amountequal to lifetime ECLs
I-37
APPENDIX I ACCOUNTANTS’ REPORT
II. NOTES TO THE HISTORICAL FINANCIAL INFORMATION (continued)
2.4 SUMMARY OF SIGNIFICANT ACCOUNTING POLICIES (continued)
Financial instruments (continued)
Impairment of financial assets (policies under IFRS 9 applicable from January 1,2018) (continued)
Simplified approach
For trade receivables and contract assets, the Group applies a simplified approach in calculatingECLs. Therefore, the Group does not track changes in credit risk, but instead recognizes a lossallowance based on lifetime ECLs at each reporting date. The Group has established a provision matrixthat is based on its historical credit loss experience, adjusted for forward-looking factors specific to thedebtors and the economic environment.
For trade receivables and contract assets that contain a significant financing component andlease receivables, the Group chooses as its accounting policy to adopt the simplified approach incalculating ECLs with policies as described above.
Impairment of financial assets (policies under IAS 39 applicable before January 1, 2018)
The Group assesses at the end of each Relevant Periods whether there is objective evidence thata financial asset or a group of financial assets is impaired. An impairment exists if one or more eventsthat occurred after the initial recognition of the asset have an impact on the estimated future cash flowsof the financial asset or the group of financial assets that can be reliably estimated. Evidence ofimpairment may include indications that a debtor or a group of debtors is experiencing significantfinancial difficulty, default or delinquency in interest or principal payments, the probability that theywill enter bankruptcy or other financial reorganization and observable data indicating that there is ameasurable decrease in the estimated future cash flows, such as changes in arrears or economicconditions that correlate with defaults.
Financial assets carried at amortized cost
For financial assets carried at amortized cost, the Group first assesses whether impairmentexists individually for financial assets that are individually significant, or collectively for financialassets that are not individually significant. If the Group determines that no objective evidence ofimpairment exists for an individually assessed financial asset, whether significant or not, it includes theasset in a group of financial assets with similar credit risk characteristics and collectively assesses themfor impairment. Assets that are individually assessed for impairment and for which an impairment lossis, or continues to be, recognized are not included in a collective assessment of impairment.
The amount of any impairment loss identified is measured as the difference between the asset’scarrying amount and the present value of estimated future cash flows (excluding future credit lossesthat have not yet been incurred). The present value of the estimated future cash flows is discounted atthe financial asset’s original effective interest rate (i.e., the effective interest rate computed at initialrecognition).
The carrying amount of the asset is reduced through the use of an allowance account and theloss is recognized in profit or loss. Interest income continues to be accrued on the reduced carrying
I-38

APPENDIX I ACCOUNTANTS’ REPORT
II. NOTES TO THE HISTORICAL FINANCIAL INFORMATION (continued)
2.4 SUMMARY OF SIGNIFICANT ACCOUNTING POLICIES (continued)
Financial instruments (continued)
Impairment of financial assets (policies under IAS 39 applicable before January 1,2018) (continued)
Financial assets carried at amortized cost (continued)
amount and is accrued using the rate of interest used to discount the future cash flows for the purposeof measuring the impairment loss. Loans and receivables together with any associated allowance arewritten off when there is no realistic prospect of future recovery and all collateral has been realized orhas been transferred to the Group.
If, in a subsequent period, the amount of the estimated impairment loss increases or decreasesbecause of an event occurring after the impairment was recognized, the previously recognizedimpairment loss is increased or reduced by adjusting the allowance account. If a write-off is laterrecovered, the recovery is credited to other expenses in profit or loss.
Available-for-sale financial investments
For available-for-sale financial investments, the Group assesses at the end of each RelevantPeriods whether there is objective evidence that an investment or a group of investments is impaired.
If an available-for-sale asset is impaired, an amount comprising the difference between its cost(net of any principal payment and amortization) and its current fair value, less any impairment losspreviously recognized in profit or loss, is removed from other comprehensive income and recognizedin profit or loss.
In the case of equity investments classified as available for sale, objective evidence wouldinclude a significant or prolonged decline in the fair value of an investment below its cost.“Significant” is evaluated against the original cost of the investment and “prolonged” against theperiod in which the fair value has been below its original cost. Where there is evidence of impairment,the cumulative loss—measured as the difference between the acquisition cost and the current fairvalue, less any impairment loss on that investment previously recognized in profit or loss—is removedfrom other comprehensive income and recognized profit or loss. Impairment losses on equityinstruments classified as available for sale are not reversed through profit or loss. Increases in their fairvalue after impairment are recognized directly in other comprehensive income.
The determination of what is “significant” or “prolonged” requires judgement. In making thisjudgement, the Group evaluates, among other factors, the duration or extent to which the fair value ofan investment is less than its cost.
Financial liabilities (policies under IFRS 9 applicable from January 1, 2018 and IAS 39applicable before January 1, 2018)
Initial recognition and measurement
Financial liabilities are classified, at initial recognition, as financial liabilities at fair valuethrough profit or loss, loans and borrowings, payables, as appropriate.
I-39

APPENDIX I ACCOUNTANTS’ REPORT
II. NOTES TO THE HISTORICAL FINANCIAL INFORMATION (continued)
2.4 SUMMARY OF SIGNIFICANT ACCOUNTING POLICIES (continued)
Financial instruments (continued)
Financial liabilities (policies under IFRS 9 applicable from January 1, 2018 and IAS 39applicable before January 1, 2018) (continued)
Initial recognition and measurement (continued)
All financial liabilities are recognized initially at fair value and, in the case of loans andborrowings and payables, net of directly attributable transaction costs.
The Group’s financial liabilities include trade and other payables, interest-bearing bank loanand other borrowings, financial liabilities at fair value through profit or loss, derivative financialinstruments and redeemable convertible preference shares.
Subsequent measurement
The subsequent measurement of financial liabilities depends on their classification as follows:
Loans and borrowings
After initial recognition, interest-bearing loans and borrowings are subsequently measured atamortized cost, using the effective interest rate method unless the effect of discounting would beimmaterial, in which case they are stated at cost. Gains and losses are recognized in profit or loss whenthe liabilities are derecognized as well as through the effective interest rate amortization process.
Amortized cost is calculated by taking into account any discount or premium on acquisition andfees or costs that are an integral part of the effective interest rate. The effective interest rateamortization is included in finance costs in profit or loss.
Derivative financial instruments
Warrant instruments are initially recognized as financial liability at fair value on the date onwhich the warrant instrument is issued and are subsequently remeasured at fair value. Any gains orlosses arising from changes in fair value of warrant instruments are taken directly in profit or loss.
Redeemable convertible instruments
The component of redeemable convertible instruments that exhibits characteristics of a liabilityis recognized as a liability in the consolidated statement of financial position, net of transaction costs.On issuance of redeemable convertible instruments, the fair value of the liability component isdetermined using a market rate for an equivalent non-convertible bond; and this amount is carried as along-term liability on the amortized cost basis until extinguished on conversion or redemption. Theremainder of the proceeds is allocated to the conversion option that is recognized and included inshareholders’ equity, net of transaction costs. The carrying amount of the conversion option is notremeasured in subsequent years. Transaction costs are apportioned between the liability and equitycomponents of the redeemable convertible preference shares based on the allocation of proceeds to theliability and equity components when the instruments are first recognized.
I-40

APPENDIX I ACCOUNTANTS’ REPORT
II. NOTES TO THE HISTORICAL FINANCIAL INFORMATION (continued)
2.4 SUMMARY OF SIGNIFICANT ACCOUNTING POLICIES (continued)
Financial instruments (continued)
Financial liabilities (policies under IFRS 9 applicable from January 1, 2018 and IAS 39applicable before January 1, 2018) (continued)
Subsequent measurement (continued)
Redeemable convertible instruments (continued)
If the conversion option of a redeemable convertible instruments exhibits characteristics of anembedded derivative, it is separated from its liability component. On initial recognition, the derivativecomponent of the instruments is measured at fair value and presented as part of derivative financialinstruments. Any excess of proceeds over the amount initially recognized as the derivative componentis recognized as the liability component. Transaction costs are apportioned between the liability andderivative components when the instruments are initially recognized. The portion of the transactioncosts relating to the liability component is recognized initially as part of the liability. The portionrelating to the derivative component is recognized immediately in profit or loss.
Preference shares
Preference share capital issued by certain subsidiaries of the Group is classified as equity if it isnon-redeemable, or redeemable only at the Group’s option, and any dividends are discretionary.Discretionary dividends thereon are recognized as distributions within equity upon approval by theGroup’s shareholders.
Preference share capital issued by certain subsidiaries of the Group is classified as a financialliability if it is redeemable on a specific date or at the option of the shareholders, or if dividendpayments are not discretionary, and non-discretionary dividends thereon that are estimated based onprofits or net assets of underlying issuers are recognized as fair value gains or losses in profit or loss.
Financial liabilities at fair value through profit or loss (policies under IAS 39 applicable beforeJanuary 1, 2018)
Financial liabilities at fair value through profit or loss include financial liabilities held for tradingand financial liabilities designated upon initial recognition as at fair value through profit or loss.
Financial liabilities are classified as held for trading if they are acquired for the purpose ofrepurchasing in the near term. This category includes derivative financial instruments entered into bythe Group that are not designated as hedging instruments in hedge relationships as defined by IAS 39.Separated embedded derivatives are also classified as held for trading unless they are designated aseffective hedging instruments. Gains or losses on liabilities held for trading are recognized in profit orloss. The net fair value gain or loss recognized in profit or loss does not include any interest charged onthese financial liabilities.
Financial liabilities designated upon initial recognition as at fair value through profit or loss aredesignated at the date of initial recognition and only if the criteria in IAS 39 are satisfied.
I-41

APPENDIX I ACCOUNTANTS’ REPORT
II. NOTES TO THE HISTORICAL FINANCIAL INFORMATION (continued)
2.4 SUMMARY OF SIGNIFICANT ACCOUNTING POLICIES (continued)
Financial instruments (continued)
Financial liabilities (policies under IFRS 9 applicable from January 1, 2018 and IAS 39applicable before January 1, 2018) (continued)
Subsequent measurement (continued)
Reclassification of financial liabilities
The nature and risk profile of a financial instrument may change as a result of a change incircumstances. From the date of such change in circumstances, the derivative component of theinstruments were reclassified from financial liability to equity (absent of any other terms requiring itscontinued classification as financial liability).
Derecognition of financial liabilities (policies under IFRS 9 applicable from January 1,2018 and policies under IAS 39 applicable before January 1, 2018)
A financial liability is derecognized when the obligation under the liability is discharged orcanceled, or expired.
When an existing financial liability is replaced by another from the same lender on substantiallydifferent terms, or the terms of an existing liability are substantially modified, such an exchange ormodification is treated as a derecognition of the original liability and a recognition of a new liability,and the difference between the respective carrying amounts is recognized in profit or loss.
Offsetting of financial instruments (policies under IFRS 9 applicable from January 1,2018 and policies under IAS 39 applicable before January 1, 2018)
Financial assets and financial liabilities are offset and the net amount is reported in thestatement of financial position if there is a currently enforceable legal right to offset the recognizedamounts and there is an intention to settle on a net basis, or to realize the assets and settle the liabilitiessimultaneously.
Cash and cash equivalents
For the purpose of the consolidated statements of cash flows, cash and cash equivalentscomprise cash on hand and demand deposits, and short term highly liquid investments that are readilyconvertible into known amounts of cash, are subject to an insignificant risk of changes in value, andhave a short maturity of generally within three months when acquired, less bank overdrafts which arerepayable on demand and form an integral part of the Group’s cash management.
Cash and bank balances
For the purpose of the statements of financial position, cash and bank balances comprise cashon hand and at banks, including term deposits, and restricted cash.
I-42

APPENDIX I ACCOUNTANTS’ REPORT
II. NOTES TO THE HISTORICAL FINANCIAL INFORMATION (continued)
2.4 SUMMARY OF SIGNIFICANT ACCOUNTING POLICIES (continued)
Provisions
A provision is recognized when a present obligation (legal or constructive) has arisen as a resultof a past event and it is probable that a future outflow of resources will be required to settle theobligation, provided that a reliable estimate can be made of the amount of the obligation.
When the effect of discounting is material, the amount recognized for a provision is the presentvalue at the end of the reporting period of the future expenditures expected to be required to settle theobligation. The increase in the discounted present value amount arising from the passage of time isincluded in finance costs in profit or loss.
The Group provides for warranties in relation to the sale of certain industrial products and theprovision of construction services for general repairs of defects occurring during the warranty period.Provisions for these assurance-type warranties granted by the Group are recognized based on salesvolume and past experience of the level of repairs and returns, discounted to their present values asappropriate.
Income tax
Income tax comprises current and deferred tax. Income tax relating to items recognized outsideprofit or loss is recognized outside profit or loss, either in other comprehensive income or directly inequity.
Current tax assets and liabilities are measured at the amount expected to be recovered from orpaid to the taxation authorities, based on tax rates (and tax laws) that have been enacted orsubstantively enacted by the end of the Relevant Periods, taking into consideration interpretations andpractices prevailing in the countries in which the Group operates.
Deferred tax is provided, using the liability method, on all temporary differences at the end ofthe Relevant Periods between the tax bases of assets and liabilities and their carrying amounts forfinancial reporting purposes.
Deferred tax liabilities are recognized for all taxable temporary differences, except:
• when the deferred tax liability arises from the initial recognition of goodwill or an asset orliability in a transaction that is not a business combination and, at the time of thetransaction, affects neither the accounting profit nor taxable profit or loss; and
• in respect of taxable temporary differences associated with investments in subsidiaries,associates and joint ventures, when the timing of the reversal of the temporary differencescan be controlled and it is probable that the temporary differences will not reverse in theforeseeable future.
I-43

APPENDIX I ACCOUNTANTS’ REPORT
II. NOTES TO THE HISTORICAL FINANCIAL INFORMATION (continued)
2.4 SUMMARY OF SIGNIFICANT ACCOUNTING POLICIES (continued)
Income tax (continued)
Deferred tax assets are recognized for all deductible temporary differences, the carryforward ofunused tax credits and any unused tax losses. Deferred tax assets are recognized to the extent that it isprobable that taxable profit will be available against which the deductible temporary differences, thecarryforward of unused tax credits and unused tax losses can be utilized, except:
• when the deferred tax asset relating to the deductible temporary differences arises from theinitial recognition of an asset or liability in a transaction that is not a business combinationand, at the time of the transaction, affects neither the accounting profit nor taxable profit orloss; and
• in respect of deductible temporary differences associated with investments in subsidiaries,associates and joint ventures, deferred tax assets are only recognized to the extent that it isprobable that the temporary differences will reverse in the foreseeable future and taxableprofit will be available against which the temporary differences can be utilized.
The carrying amount of deferred tax assets is reviewed at the end of each Relevant Periods andreduced to the extent that it is no longer probable that sufficient taxable profit will be available to allowall or part of the deferred tax asset to be utilized. Unrecognized deferred tax assets are reassessed at theend of each Relevant Periods and are recognized to the extent that it has become probable thatsufficient taxable profit will be available to allow all or part of the deferred tax asset to be recovered.
Deferred tax assets and liabilities are measured at the tax rates that are expected to apply to theperiod when the asset is realized or the liability is settled, based on tax rates (and tax laws) that havebeen enacted or substantively enacted by the end of each of the Relevant Periods.
Deferred tax assets and deferred tax liabilities are offset if and only if the Group has a legallyenforceable right to set off current tax assets and current tax liabilities and the deferred tax assets anddeferred tax liabilities relate to income taxes levied by the same taxation authority on either the sametaxable entity or different taxable entities which intend either to settle current tax liabilities and assetson a net basis, or to realize the assets and settle the liabilities simultaneously, in each future period inwhich significant amounts of deferred tax liabilities or assets are expected to be settled or recovered.
Government grants
Government grants are recognized at their fair value where there is reasonable assurance thatthe grant will be received and all attaching conditions will be complied with. When the grant relates toan expense item, it is recognized as income on a systematic basis over the periods that the costs, whichit is intended to compensate, are expensed.
Revenue from contracts with customers
Revenue from contracts with customers is recognized when control of the goods or services aretransferred to the customer at an amount that reflects the consideration to which the Group expects tobe entitled in exchange for those goods or services. The Group has concluded that it is acting as a
I-44

APPENDIX I ACCOUNTANTS’ REPORT
II. NOTES TO THE HISTORICAL FINANCIAL INFORMATION (continued)
2.4 SUMMARY OF SIGNIFICANT ACCOUNTING POLICIES (continued)
Revenue from contracts with customers (continued)
principal in all of its revenue arrangements because it typically controls the goods or services beforetransferring them to the customer. The specific recognition criteria described below must also be metbefore revenue is recognized.
Management fee income
Management fee income comprise of base management fees, asset management fees anddevelopment management fees which are recognized over time and leasing fee income, acquisition feeincome and promote fee which are recognized at point in time.
Base management fees are derived from the management of real estate investment funds orwarehousing projects. Base management fee derived from the management of real estate investmentfunds is determined based on the total capital commitment or net equity invested as the case may be forthese funds. Asset management fee derived from the management of warehousing projects isdetermined based on the fair value of properties.
Development management fee is earned on a straight-line basis in accordance with the relevantproject construction cost across the entire construction period.
Leasing fee income relates to fees earned in consideration of the investment manager carryingout the leasing services for the real estate investment funds.
Acquisition fee income relates to fees earned in relation to the acquisition of properties by realestate investment funds. The acquisition fee income is determined based on the value of the propertiesacquired and is recognized when the services have been rendered.
Promote fee income is earned when the performance targets are met.
Solar energy income
Solar energy income is recognized based on direct measurements of the value to the customerof the services transferred to date according to contracts with the customer. Revenue are recognizedbased on price specified in the contracts and output delivered to customers.
Construction income
Construction income is recognized in accordance with the percentage of completion methodmeasured by reference to the proportion of costs incurred to date to the estimated total cost of therelevant contract. The stage of completion is measured by reference to the completion of specificmilestones in the construction process. On completion of each milestone, the recoverable costsincurred during the period plus the related fee earned corresponding to the particular milestone isrecognized as revenue.
I-45
APPENDIX I ACCOUNTANTS’ REPORT
II. NOTES TO THE HISTORICAL FINANCIAL INFORMATION (continued)
2.4 SUMMARY OF SIGNIFICANT ACCOUNTING POLICIES (continued)
Revenue from other sources
Rental income
Rental income arising from operating leases on investment properties is accounted for on astraight-line basis over the lease terms and is included in revenue.
Interest income
Interest income is accounted for on an accrual basis using the effective interest method byapplying the rate that exactly discounts the estimated future cash receipts through the expected life ofthe financial instrument or a shorter period, when appropriate, to the net carrying amount of thefinancial asset.
Dividend income
Dividend income is recognized when the company’s right to receive payment is established.
Contract assets
A contract asset is the right to consideration in exchange for goods or services transferred to thecustomer. If the Group performs by transferring goods or services to a customer before the customerpays consideration or before payment is due, a contract asset is recognized for the earned considerationthat is conditional.
Contract liabilities
A contract liability is the obligation to transfer goods or services to a customer for which theGroup has received a consideration (or an amount of consideration that is due) from the customer. If acustomer pays the consideration before the Group transfers goods or services to the customer, acontract liability is recognized when the payment is made or the payment is due (whichever is earlier).Contract liabilities are recognized as revenue when the Group performs under the contract.
Share-based payment
The Company operates a share option scheme for the purpose of providing incentives andrewards to eligible participants who contribute to the success of the Group’s operations. Employees ofthe Group receive remuneration in the form of share-based payment, whereby employees renderservices as consideration for equity instruments (“equity-settled transactions”). The cost of equity-settled transactions with employees is measured by reference to the fair value at the date at which theyare granted. The fair value is determined by an external valuer using a binomial model.
The cost of equity-settled transactions is recognized, together with a corresponding increase inequity, over the period in which the performance and/or service conditions are fulfilled in employeebenefit expense. The cumulative expense recognized for equity-settled transactions at the end of eachRelevant Periods until the vesting date reflects the extent to which the vesting period has expired andthe Group’s best estimate of the number of equity instruments that will ultimately vest. The charge orcredit to profit or loss for a period represents the movement in the cumulative expense recognized as atthe beginning and end of that period.
I-46

APPENDIX I ACCOUNTANTS’ REPORT
II. NOTES TO THE HISTORICAL FINANCIAL INFORMATION (continued)
2.4 SUMMARY OF SIGNIFICANT ACCOUNTING POLICIES (continued)
Share-based payment (continued)
No expense is recognized for awards that do not ultimately vest, except for equity-settledtransactions where vesting is conditional upon a market or non-vesting condition, which are treated asvesting irrespective of whether or not the market or non-vesting condition is satisfied, provided that allother performance and/or service conditions are satisfied.
Where the terms of an equity-settled award are modified, as a minimum an expense isrecognized as if the terms had not been modified, if the original terms of the award are met. Inaddition, an expense is recognized for any modification that increases the total fair value of the share-based payments, or is otherwise beneficial to the employee as measured at the date of modification.
Where an equity-settled award is canceled, it is treated as if it had vested on the date ofcancelation, and any expense not yet recognized for the award is recognized immediately. Thisincludes any award where non-vesting conditions within the control of either the Group or theemployee are not met. However, if a new award is substituted for the canceled award, and isdesignated as a replacement award on the date that it is granted, the canceled and new awards aretreated as if they were a modification of the original award, as described in the previous paragraph.
The dilutive effect of outstanding option is reflected as additional share dilution in thecomputation of earnings per share.
Other employee benefits
The employees of the Group’s subsidiaries which operate in Mainland China are required toparticipate in a central pension scheme operated by the local municipal government. These subsidiariesare required to contribute certain percentage of their payroll costs to the central pension scheme. Thecontributions are charged to profit and loss as they become payable in accordance with the rules of thecentral pension scheme.
The employees of the Group’s subsidiaries which operate in Singapore are required toparticipate in a defined contribution plan. A defined contribution plan is a post-employment benefitplan under which an entity pays fixed contributions into a separate entity and will have no legal orconstructive obligation to pay further amounts. Obligations for contributions to defined contributionpension plans are recognized as an employee benefit expense in profit or loss in the periods duringwhich related services are rendered by the employees.
Borrowing costs
Borrowing costs directly attributable to the acquisition, construction or production of qualifyingassets, i.e., assets that necessarily take a substantial period of time to get ready for their intended use orsale, are capitalized as part of the cost of those assets. The capitalization of such borrowing costsceases when the assets are substantially ready for their intended use or sale. Investment income earnedon the temporary investment of specific borrowings pending their expenditure on qualifying assets isdeducted from the borrowing costs capitalized. All other borrowing costs are expensed in the period inwhich they are incurred. Borrowing costs consist of interest and other costs that an entity incurs inconnection with the borrowing of funds.
I-47

APPENDIX I ACCOUNTANTS’ REPORT
II. NOTES TO THE HISTORICAL FINANCIAL INFORMATION (continued)
2.4 SUMMARY OF SIGNIFICANT ACCOUNTING POLICIES (continued)
Borrowing costs (continued)
Where funds have been borrowed generally, and used for the purpose of obtaining qualifyingassets, a capitalization rate ranging between 3.48% and 6.3% has been applied to the expenditure onthe individual assets.
Dividends
Final dividends are recognized as a liability when they are approved by the shareholders in ageneral meeting. Proposed final dividends are disclosed in the notes to the Historical FinancialInformation.
Interim dividends are simultaneously proposed and declared, because the Company’smemorandum and articles of association grant the directors the authority to declare interim dividends.Consequently, interim dividends are recognized immediately as a liability when they are proposed anddeclared.
Foreign currencies
The Company’s functional currency is USD. Each entity in the Group determines its ownfunctional currency and items included in the financial statements of each entity are measured usingthat functional currency. Foreign currency transactions recorded by the entities in the Group areinitially recorded using their respective functional currency rates prevailing at the dates of thetransactions. Monetary assets and liabilities denominated in foreign currencies are translated at thefunctional currency rates of exchange ruling at the end of the Relevant Periods. Differences arising onsettlement or translation of monetary items are recognized in profit or loss.
Non-monetary items that are measured in terms of historical cost in a foreign currency aretranslated using the exchange rates at the dates of the initial transactions. Non-monetary itemsmeasured at fair value in a foreign currency are translated using the exchange rates at the date when thefair value was measured. The gain or loss arising on translation of a non-monetary item measured atfair value is treated in line with the recognition of the gain or loss on change in fair value of the item(i.e., translation differences on the item whose fair value gain or loss is recognized in othercomprehensive income or profit or loss are also recognized in other comprehensive income or profit orloss, respectively).
In determining the exchange rate on initial recognition of the related asset, expense or incomeon the derecognition of a non-monetary asset or non-monetary liability relating to an advanceconsideration, the date of initial transaction is the date on which the Group initially recognizes thenon-monetary asset or non-monetary liability arising from the advance consideration. If there aremultiple payments or receipts in advance, the Group determines the transaction date for each paymentor receipt of the advance consideration.
The functional currencies of certain overseas subsidiaries are currencies other than USD. As atthe end of the Relevant Periods, the assets and liabilities of these entities are translated into the
I-48

APPENDIX I ACCOUNTANTS’ REPORT
II. NOTES TO THE HISTORICAL FINANCIAL INFORMATION (continued)
2.4 SUMMARY OF SIGNIFICANT ACCOUNTING POLICIES (continued)
Foreign currencies (continued)
presentation currency of the Company at the exchange rates prevailing at the end of the RelevantPeriods and their statements of profit or loss are translated into USD at the weighted average exchangerates for the year.
The resulting exchange differences are recognized in other comprehensive income andaccumulated in the exchange fluctuation reserve. On disposal of a foreign operation, the component ofother comprehensive income relating to that particular foreign operation is recognized in profit or loss.
For the purpose of the consolidated statements of cash flows, the cash flows of overseassubsidiaries are translated into USD at the exchange rates ruling at the dates of the cash flows.Frequently recurring cash flows of overseas subsidiaries which arise throughout the year are translatedinto USD at the weighted average exchange rates for the year.
3. SIGNIFICANT ACCOUNTING JUDGEMENT AND ESTIMATES
The preparation of the Group’s Historical Financial Information requires management to makejudgments, estimates and assumptions that affect the reported amounts of revenues, expenses, assetsand liabilities, and their accompanying disclosures, and the disclosure of contingent liabilities.Uncertainty about these assumptions and estimates could result in outcomes that could require amaterial adjustment to the carrying amounts of the assets or liabilities affected in the future.
Judgement
In the process of applying the Group’s accounting policies, management has made thefollowing judgments, apart from those involving estimations, which have the most significant effect onthe amounts recognized in the Historical Financial Information:
Operating lease commitments—Group as lessor
The Group has entered into commercial property leases on its investment property portfolio.The Group has determined, based on an evaluation of the terms and conditions of the arrangements,that it retains all the significant risks and rewards of ownership of these properties which are leased outon operating leases.
Deferred tax liabilities for withholding tax
Pursuant to the PRC Corporate Income Tax Law, a 10% withholding tax is levied on dividendsdeclared to foreign investors from the foreign investment enterprises established in Mainland China (Alower withholding tax rate may be applied if there is a tax treaty between China and the jurisdiction ofthe foreign investors). As at the end of each of the Relevant Periods, no deferred tax has beenrecognized for withholding taxes that would be payable on the unremitted earnings that are subject towithholding taxes of the Group’s subsidiaries and joint ventures established in Mainland China. Nodeferred taxation has been provided for the distributable retained profits of approximatelyUSD4,904,000, USD1,747,000, USD3,766,000 and USD3,845,000 as at December 31, 2016, 2017,
I-49
APPENDIX I ACCOUNTANTS’ REPORT
II. NOTES TO THE HISTORICAL FINANCIAL INFORMATION (continued)
3. SIGNIFICANT ACCOUNTING JUDGEMENT AND ESTIMATES (continued)
Judgement (continued)
Deferred tax liabilities for withholding tax (continued)
2018 and at June 30, 2019, respectively which were derived from the PRC subsidiaries as the Group isable to control the timing of the reversal of the temporary differences and it is probable that thetemporary differences will not reverse in the foreseeable future.
Whether the presumption that investment properties stated at fair value are recovered throughsale or use in determining deferred tax
As of December 31, 2016, 2017, 2018 and June 30, 2019, deferred tax liabilities amounting toUSD97,882,000, USD123,231,000, USD164,768,000 and USD157,769,000 have been provided for therevaluation of investment properties. The Group determines that these deferred tax liabilities arerecognized based on the presumption that the investment properties stated at fair value are recoveredthrough use rather than sale. Further details are given in note 30.
Consolidation of structured entities
The management makes significant judgment on whether to control and consolidate structuredentities. The decision outcome impacts accounting methodologies in use and the financial andoperational results of the Group.
When assessing control, the Group considers: (1) the level of control of the investor over theinvestee; (2) variable returns gained through participation of relevant activities of the investee; and(3) the amount of return gained from using its power over the investee.
When assessing the level of control over the structured entities, the Group considers thefollowing four aspects:
(1) the degree of participation when establishing the structured entities;
(2) contractual arrangements;
(3) activities that take place only at special occasions or occurring events; and
(4) commitments made to the investee from the Group.
When assessing whether there is control over the structured entities, the Group also considerswhether the decisions it makes are as a principal or as an agent. Aspects of considerations normallyinclude the decision-making scope over the structured entities, substantive rights of third parties,reward of the Group, and the risk of undertaking variable returns from owning other benefits of thestructured entities.
I-50

APPENDIX I ACCOUNTANTS’ REPORT
II. NOTES TO THE HISTORICAL FINANCIAL INFORMATION (continued)
3. SIGNIFICANT ACCOUNTING JUDGEMENT AND ESTIMATES (continued)
Estimation uncertainty
The key assumptions concerning the future and other key sources of estimation uncertainty atthe end of the Relevant Periods, that have a significant risk of causing a material adjustment to thecarrying amounts of assets and liabilities within the next financial year, are described below.
Impairment of goodwill
The Group determines whether goodwill is impaired at least on an annual basis. This requiresan estimation of the value in use of the cash-generating units to which the goodwill is allocated.Estimating the value in use requires the Group to make an estimate of the expected future cash flowsfrom the cash-generating units and also to choose a suitable discount rate in order to calculate thepresent value of those cash flows. The carrying amount of goodwill at December 31, 2016, 2017 and2018 and June 30, 2019 were USD210,480,000, USD226,232,000, USD285,382,000 and USD340,243,000. Further details are given in note 21.
Impairment of trade receivables
Before January 1, 2018, the provision policy for impairment of receivables of the Group isbased on ongoing assessment of the recoverability and the aging analysis of the outstandingreceivables and on management’s judgement. A considerable amount of judgement is required inassessing the ultimate realization of those receivables, including the creditworthiness and the pastcollection history of each customer. If the financial conditions of the customers of the Group were todeteriorate, resulting in an impairment of their ability to make payments, additional allowances mightbe required.
From January 1, 2018, the impairment loss in respect of trade and other receivables of theGroup is based on the evaluation of collectability and aging analysis of trade and other receivables andon management’s judgement. A considerable amount of judgement is required in assessing the ultimaterealization of those receivables, including the current creditworthiness and the past collection history ofeach debtor. If the financial conditions of the debtors of the Group were to deteriorate, resulting in animpairment of their ability to make payments, additional allowances might be required.
The assessment of the correlation between historical observed default rates, forecast economicconditions and expected credit losses(“ECLs”) is a significant estimate. The amount of ECLs issensitive to changes in circumstances and of forecast economic conditions. The Group’s historicalcredit loss experience and forecast of economic conditions may also not be representative ofcustomer’s actual default in the future. The information about the ECLs on the Group’s tradereceivables and contract assets is disclosed in note 24 and note 25.
Fair value of investment properties
In the absence of current prices in an active market for similar properties, the Group considersinformation from a variety of sources, including:
(1) current prices in an active market for properties of a different nature, condition or locationor subject to different lease or other contracts, adjusted to reflect those differences;
I-51
APPENDIX I ACCOUNTANTS’ REPORT
II. NOTES TO THE HISTORICAL FINANCIAL INFORMATION (continued)
3. SIGNIFICANT ACCOUNTING JUDGEMENT AND ESTIMATES (continued)
Estimation uncertainty (continued)
Fair value of investment properties (continued)
(2) recent prices of similar properties on less active markets, with adjustments to reflect anychanges in economic conditions since the dates of the transactions that occurred at thoseprices; and
(3) discounted cash flow projections based on reliable estimates of future cash flows,supported by the terms of any existing lease and other contracts and (when possible) byexternal evidence such as current market rents for similar properties in the same locationand condition, and using discount rates that reflect current market assessments of theuncertainty in the amount and timing of the cash flows.
The carrying amount of investment properties at December 31, 2016, 2017 and 2018 andJune 30, 2019 was USD942,929,000, USD1,189,203,000, USD1,885,502,000 and USD2,656,507,000,respectively. Further details, including the key assumptions used for fair value measurement and asensitivity analysis, are given in note 20 to the Historical Financial Information.
Fair value of financial instruments
If the market for a financial instrument is not active, the Group estimates fair value by using avaluation technique. Valuation techniques include using recent prices in arm’s length markettransactions between knowledgeable and willing parties, if available, reference to the current fair valueof another instrument that is substantially the same, or discounted cash flow analyzes and optionpricing models. To the extent practicable, valuation technique makes the maximum use of marketinputs. However, where market inputs are not available, management needs to make estimates on suchunobservable market inputs.
Deferred tax assets
Deferred tax assets are recognized for all deductible temporary differences and unused taxlosses to the extent that it is probable that taxable profit will be available against which the losses canbe utilized. Significant management judgement is required to determine the amount of deferred taxassets that can be recognized, based upon the likely timing and level of future taxable profits togetherwith future tax planning strategies.
Impairment of non-financial assets (other than goodwill)
The Group assesses whether there are any indicators of impairment for all non-financial assetsat the end of each of the Relevant Periods. Other intangible assets with indefinite life are tested forimpairment annually and at other times when such an indicator exists. Other non-financial assets aretested for impairment when there are indicators that the carrying amounts may not be recoverable. Animpairment exists when the carrying value of an asset or a cash-generating unit exceeds its recoverableamount, which is the higher of its fair value less costs of disposal and its value in use. The calculationof the fair value less costs of disposal is based on available data from binding sales transactions in anarm’s length transaction of similar assets or observable market prices less incremental costs for
I-52

APPENDIX I ACCOUNTANTS’ REPORT
II. NOTES TO THE HISTORICAL FINANCIAL INFORMATION (continued)
3. SIGNIFICANT ACCOUNTING JUDGEMENT AND ESTIMATES (continued)
Estimation uncertainty (continued)
Impairment of non-financial assets (other than goodwill) (continued)
disposing of the asset. When value in use calculations are undertaken, management must estimate theexpected future cash flows from the asset or cash-generating unit and choose a suitable discount rate inorder to calculate the present value of those cash flows.
4. OPERATING SEGMENT INFORMATION
For fund management purposes, the Group is organized into business units based on theirproducts and services and has three reportable operating segments as follows:
(a) the investment segment is divided into three main categories: (i) properties that the Groupholds on balance sheet, from which the Group derives total return, including rental income andappreciation in value, (ii) co-investments funds and investment vehicles and the REIT the Groupmanages, from which the Group derives dividend income, pro rata earnings and/or pro rata valueappreciation, and (iii) other investments.
(b) the fund management segment earns profitable and recurring fee income for managingassets on behalf of the Group’s capital partners via funds and investment vehicles. The Group’s feesinclude base management fees, asset fund management fees, acquisition fees, development fees andleasing fees, as well as promote fees upon reaching or exceeding certain target IRR.
(c) the development segment earns development profit through the continued development,construction and sale of investment properties. the Group also derives pro rata earnings and pro ratavalue appreciation through co-investments in the funds and investment vehicles the Group manages.
Fund management monitors the results of the Group’s operating segments separately for thepurpose of making decisions about resources allocation and performance assessment. Segmentperformance is evaluated based on reportable segment profit/loss, which is a measure of adjustedprofit/loss before tax from continuing operations. The adjusted profit/loss before tax from continuingoperations is measured consistently with the Group’s profit before tax from continuing operationsexcept that interest income, finance costs, exchange gain, depreciation and amotisation, equity-settledshare option expense, gain on deemed partial disposal of a joint venture as well as head office andcorporate expenses are excluded from such measurement.
I-53

APPENDIX I ACCOUNTANTS’ REPORT
II. NOTES TO THE HISTORICAL FINANCIAL INFORMATION (continued)
4. OPERATING SEGMENT INFORMATION (continued)
Intersegment sales and transfers are transacted with reference to the selling prices used for salesmade to third parties at the then prevailing market prices.
Year ended December 31, 2016
InvestmentFund
management Development Total
USD’000 USD’000 USD’000 USD’000
Segment Revenue . . . . . . . . . . . . . . . . . . . . . . . . . . . . . 50,273 46,464 — 96,737—Intersegment sales . . . . . . . . . . . . . . . . . . . . . . . . . . . — 2,212 — 2,212
50,273 48,676 — 98,949Reconciliation:Elimination of intersegment sales . . . . . . . . . . . . . . . . . — (2,212) — (2,212)
Revenue from continuing operations . . . . . . . . . . . . . . . 50,273 46,464 — 96,737
Operating expenses . . . . . . . . . . . . . . . . . . . . . . . . . . . . (13,833) (7,291) (6,548) (27,672)Fair value gains on investment properties . . . . . . . . . . . 100,799 — 5,760 106,559Changes in fair value of financial assets and liabilities
at fair value through profit or loss . . . . . . . . . . . . . . . 2,936 — 23,792 26,728Share of profits and losses of joint ventures . . . . . . . . . 9,201 — 27,151 36,352Gain on disposal of subsidiaries . . . . . . . . . . . . . . . . . . . — — 32 32
Segment Result . . . . . . . . . . . . . . . . . . . . . . . . . . . . . . . 149,376 39,173 50,187 238,736
Reconciliation:Depreciation and amortization . . . . . . . . . . . . . . . . . . . . (6,059)Exchange gain . . . . . . . . . . . . . . . . . . . . . . . . . . . . . . . . 916Interest income . . . . . . . . . . . . . . . . . . . . . . . . . . . . . . . . 502Other unallocated gains . . . . . . . . . . . . . . . . . . . . . . . . . 408Corporate and other unallocated expenses . . . . . . . . . . . (26,571)Finance costs . . . . . . . . . . . . . . . . . . . . . . . . . . . . . . . . . (55,992)Equity-settled share option expense . . . . . . . . . . . . . . . . (75)Fair value loss on derivative financial instruments . . . . (12,133)
Profit before tax from continuing operations . . . . . . 139,732
Other segment information:Depreciation and amortization . . . . . . . . . . . . . . . . . . . . (6,059)Capital expenditure* . . . . . . . . . . . . . . . . . . . . . . . . . . . 235,662Investments in joint ventures . . . . . . . . . . . . . . . . . . . . . 198,225
I-54

APPENDIX I ACCOUNTANTS’ REPORT
II. NOTES TO THE HISTORICAL FINANCIAL INFORMATION (continued)
4. OPERATING SEGMENT INFORMATION (continued)Year ended December 31, 2017
InvestmentFund
management Development Total
USD’000 USD’000 USD’000 USD’000
Segment Revenue . . . . . . . . . . . . . . . . . . . . . . . . . . . . . 59,021 94,268 — 153,289—Intersegment sales . . . . . . . . . . . . . . . . . . . . . . . . . . . — 2,064 — 2,064
59,021 96,332 — 155,353Reconciliation:Elimination of intersegment sales . . . . . . . . . . . . . . . . . — (2,064) — (2,064)
Revenue from continuing operations . . . . . . . . . . . . . . . 59,021 94,268 — 153,289
Operating expenses . . . . . . . . . . . . . . . . . . . . . . . . . . . . (16,683) (14,897) (11,793) (43,373)Fair value gains on investment properties . . . . . . . . . . . 95,179 — 100,039 195,218Changes in fair value of financial assets and liabilities
at fair value through profit or loss . . . . . . . . . . . . . . . 24,242 — 8,497 32,739Share of profits and losses of joint ventures . . . . . . . . . 10,495 — 26,505 37,000Gain on disposal of subsidiaries . . . . . . . . . . . . . . . . . . . — — 38,311 38,311Dividend income . . . . . . . . . . . . . . . . . . . . . . . . . . . . . . 10,679 — — 10,679
Segment Result . . . . . . . . . . . . . . . . . . . . . . . . . . . . . . . 182,933 79,371 161,559 423,863
Reconciliation:Depreciation and amortization . . . . . . . . . . . . . . . . . . . . (8,061)Exchange gain . . . . . . . . . . . . . . . . . . . . . . . . . . . . . . . . 4,431Interest income . . . . . . . . . . . . . . . . . . . . . . . . . . . . . . . . 2,477Other unallocated gains . . . . . . . . . . . . . . . . . . . . . . . . . 234Corporate and other unallocated expenses . . . . . . . . . . . (46,973)Finance costs . . . . . . . . . . . . . . . . . . . . . . . . . . . . . . . . . (90,903)Equity-settled share option expense . . . . . . . . . . . . . . . . (11,923)Gain on deemed partial disposal of a joint venture . . . . 29
Profit before tax from continuing operations . . . . . . 273,174
Other segment information:Depreciation and amortization . . . . . . . . . . . . . . . . . . . . (8,061)Capital expenditure* . . . . . . . . . . . . . . . . . . . . . . . . . . . 328,892Investments in joint ventures . . . . . . . . . . . . . . . . . . . . . 313,081
I-55

APPENDIX I ACCOUNTANTS’ REPORT
II. NOTES TO THE HISTORICAL FINANCIAL INFORMATION (continued)
4. OPERATING SEGMENT INFORMATION (continued)Year ended December 31, 2018
InvestmentFund
management Development Total
USD’000 USD’000 USD’000 USD’000
Segment Revenue . . . . . . . . . . . . . . . . . . . . . . . . . . . . . . . . . . 77,904 135,579 40,665 254,148—Intersegment sales . . . . . . . . . . . . . . . . . . . . . . . . . . . . . . . . . — 895 — 895
77,904 136,474 40,665 255,043Reconciliation:Elimination of intersegment sales . . . . . . . . . . . . . . . . . . . . . . . — (895) — (895)
Revenue from continuing operations . . . . . . . . . . . . . . . . . . . . . 77,904 135,579 40,665 254,148
Operating expenses . . . . . . . . . . . . . . . . . . . . . . . . . . . . . . . . . . (22,887) (25,978) (57,544) (106,409)Fair value gains on investment properties . . . . . . . . . . . . . . . . . 109,688 — 62,779 172,467Changes in fair value of financial assets and liabilities at fair
value through profit or loss . . . . . . . . . . . . . . . . . . . . . . . . . . 13,196 — 31,741 44,937Share of profits and losses of joint venture and associate . . . . . 30,172 — 35,200 65,372Gain on disposal of subsidiaries . . . . . . . . . . . . . . . . . . . . . . . . . — — 2,662 2,662Dividend income . . . . . . . . . . . . . . . . . . . . . . . . . . . . . . . . . . . . 25,519 — — 25,519
Segment Result . . . . . . . . . . . . . . . . . . . . . . . . . . . . . . . . . . . . . 233,592 109,601 115,503 458,696
Reconciliation:Depreciation and amortization . . . . . . . . . . . . . . . . . . . . . . . . . . (10,226)Exchange loss . . . . . . . . . . . . . . . . . . . . . . . . . . . . . . . . . . . . . . . (869)Interest income . . . . . . . . . . . . . . . . . . . . . . . . . . . . . . . . . . . . . . 1,530Other unallocated gains . . . . . . . . . . . . . . . . . . . . . . . . . . . . . . . 7,190Corporate and other unallocated expenses . . . . . . . . . . . . . . . . . (57,648)Finance costs . . . . . . . . . . . . . . . . . . . . . . . . . . . . . . . . . . . . . . . (104,929)Equity-settled share option expense . . . . . . . . . . . . . . . . . . . . . . (23,157)
Profit before tax from continuing operations . . . . . . . . . . . . 270,587
Other segment information:Depreciation and amortization . . . . . . . . . . . . . . . . . . . . . . . . . . (10,226)Capital expenditure* . . . . . . . . . . . . . . . . . . . . . . . . . . . . . . . . . 646,396Investments in joint ventures . . . . . . . . . . . . . . . . . . . . . . . . . . . 404,699Investments in associates . . . . . . . . . . . . . . . . . . . . . . . . . . . . . . 9,334
I-56

APPENDIX I ACCOUNTANTS’ REPORT
II. NOTES TO THE HISTORICAL FINANCIAL INFORMATION (continued)
4. OPERATING SEGMENT INFORMATION (continued)Six months ended June 30, 2018 (unaudited)
InvestmentFund
management Development Total
USD’000 USD’000 USD’000 USD’000
Segment Revenue . . . . . . . . . . . . . . . . . . . . . . . . . . . . . 34,657 59,033 — 93,690—Intersegment sales . . . . . . . . . . . . . . . . . . . . . . . . . . . — 285 — 285
34,657 59,318 — 93,975Reconciliation:Elimination of intersegment sales . . . . . . . . . . . . . . . . . — (285) — (285)
Revenue from continuing operations . . . . . . . . . . . . . . . 34,657 59,033 — 93,690
Operating expenses . . . . . . . . . . . . . . . . . . . . . . . . . . . . (8,047) (11,803) (4,626) (24,476)Fair value gains on investment properties . . . . . . . . . . . 37,396 — 8,761 46,157Changes in fair value of financial assets and liabilities
at fair value through profit or loss . . . . . . . . . . . . . . . 2,355 — 16,014 18,369Share of profits and losses of joint venture and
associate . . . . . . . . . . . . . . . . . . . . . . . . . . . . . . . . . . . 2,742 — 12,059 14,801Dividend income . . . . . . . . . . . . . . . . . . . . . . . . . . . . . . 9,771 — — 9,771
Segment Result . . . . . . . . . . . . . . . . . . . . . . . . . . . . . . . 78,874 47,230 32,208 158,312
Reconciliation:Depreciation and amortization . . . . . . . . . . . . . . . . . . . . (4,655)Exchange loss . . . . . . . . . . . . . . . . . . . . . . . . . . . . . . . . . (41)Interest income . . . . . . . . . . . . . . . . . . . . . . . . . . . . . . . . 985Other unallocated gains . . . . . . . . . . . . . . . . . . . . . . . . . 653Corporate and other unallocated expenses . . . . . . . . . . . (16,388)Finance costs . . . . . . . . . . . . . . . . . . . . . . . . . . . . . . . . . (45,943)Equity-settled share option expense . . . . . . . . . . . . . . . . (11,961)
Profit before tax from continuing operations . . . . . . 80,962
Other segment information:Depreciation and amortization . . . . . . . . . . . . . . . . . . . . (4,655)Capital expenditure* . . . . . . . . . . . . . . . . . . . . . . . . . . . 423,259Investments in joint ventures . . . . . . . . . . . . . . . . . . . . . 336,077Investments in associates . . . . . . . . . . . . . . . . . . . . . . . . —
I-57
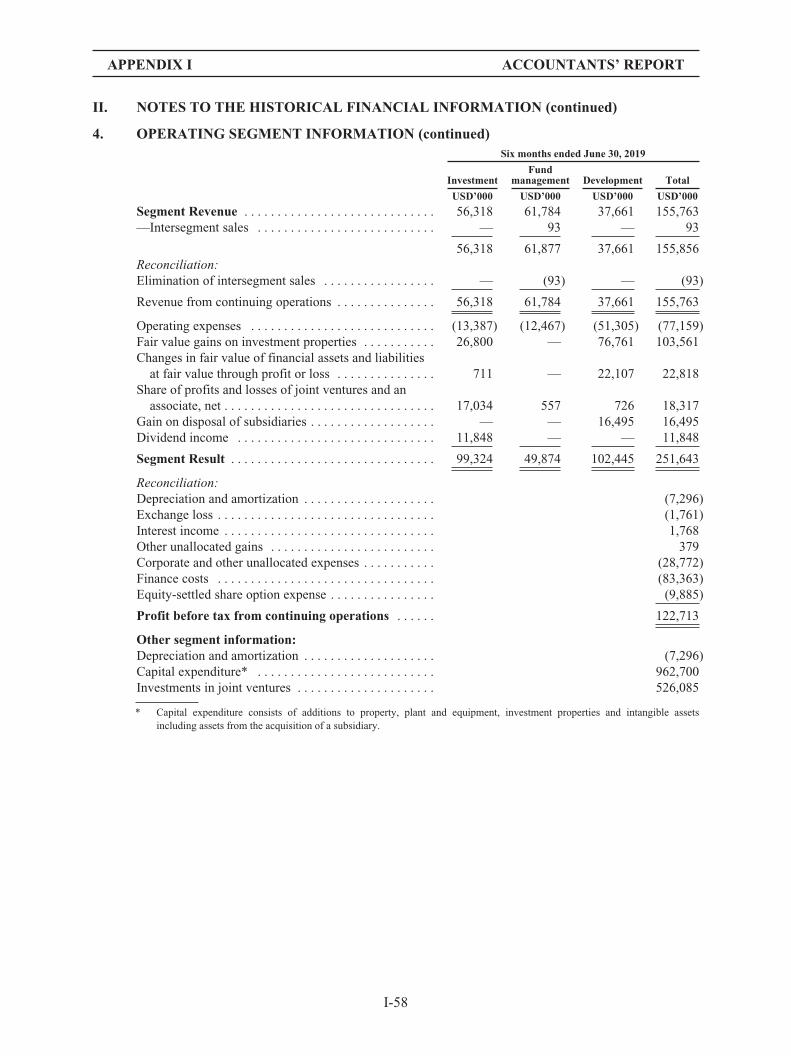
APPENDIX I ACCOUNTANTS’ REPORT
II. NOTES TO THE HISTORICAL FINANCIAL INFORMATION (continued)
4. OPERATING SEGMENT INFORMATION (continued)Six months ended June 30, 2019
InvestmentFund
management Development Total
USD’000 USD’000 USD’000 USD’000
Segment Revenue . . . . . . . . . . . . . . . . . . . . . . . . . . . . . 56,318 61,784 37,661 155,763—Intersegment sales . . . . . . . . . . . . . . . . . . . . . . . . . . . — 93 — 93
56,318 61,877 37,661 155,856Reconciliation:Elimination of intersegment sales . . . . . . . . . . . . . . . . . — (93) — (93)
Revenue from continuing operations . . . . . . . . . . . . . . . 56,318 61,784 37,661 155,763
Operating expenses . . . . . . . . . . . . . . . . . . . . . . . . . . . . (13,387) (12,467) (51,305) (77,159)Fair value gains on investment properties . . . . . . . . . . . 26,800 — 76,761 103,561Changes in fair value of financial assets and liabilities
at fair value through profit or loss . . . . . . . . . . . . . . . 711 — 22,107 22,818Share of profits and losses of joint ventures and an
associate, net . . . . . . . . . . . . . . . . . . . . . . . . . . . . . . . . 17,034 557 726 18,317Gain on disposal of subsidiaries . . . . . . . . . . . . . . . . . . . — — 16,495 16,495Dividend income . . . . . . . . . . . . . . . . . . . . . . . . . . . . . . 11,848 — — 11,848
Segment Result . . . . . . . . . . . . . . . . . . . . . . . . . . . . . . . 99,324 49,874 102,445 251,643
Reconciliation:Depreciation and amortization . . . . . . . . . . . . . . . . . . . . (7,296)Exchange loss . . . . . . . . . . . . . . . . . . . . . . . . . . . . . . . . . (1,761)Interest income . . . . . . . . . . . . . . . . . . . . . . . . . . . . . . . . 1,768Other unallocated gains . . . . . . . . . . . . . . . . . . . . . . . . . 379Corporate and other unallocated expenses . . . . . . . . . . . (28,772)Finance costs . . . . . . . . . . . . . . . . . . . . . . . . . . . . . . . . . (83,363)Equity-settled share option expense . . . . . . . . . . . . . . . . (9,885)
Profit before tax from continuing operations . . . . . . 122,713
Other segment information:Depreciation and amortization . . . . . . . . . . . . . . . . . . . . (7,296)Capital expenditure* . . . . . . . . . . . . . . . . . . . . . . . . . . . 962,700Investments in joint ventures . . . . . . . . . . . . . . . . . . . . . 526,085
* Capital expenditure consists of additions to property, plant and equipment, investment properties and intangible assetsincluding assets from the acquisition of a subsidiary.
I-58

APPENDIX I ACCOUNTANTS’ REPORT
II. NOTES TO THE HISTORICAL FINANCIAL INFORMATION (continued)
4. OPERATING SEGMENT INFORMATION (continued)
Geographical information
(a) Revenue from external customers
Year ended December 31 Six months ended June 30
2016 2017 2018 2018 2019
USD’000 USD’000 USD’000 USD’000 USD’000(unaudited)
Mainland China . . . . . . . . . . . . . . . . . . . . . . . 62,026 73,303 89,008 44,835 44,897Singapore . . . . . . . . . . . . . . . . . . . . . . . . . . . . — 10,611 21,701 5,994 8,614Japan . . . . . . . . . . . . . . . . . . . . . . . . . . . . . . . . 24,453 50,441 64,325 24,830 31,740India . . . . . . . . . . . . . . . . . . . . . . . . . . . . . . . . — — — — 1,016South Korea . . . . . . . . . . . . . . . . . . . . . . . . . . 10,258 18,934 37,861 18,031 15,581Australia . . . . . . . . . . . . . . . . . . . . . . . . . . . . . — — 41,253 — 53,915
96,737 153,289 254,148 93,690 155,763
The revenue information of continuing operations above is based on the locations of the assets.
(b) Non-current assets
As at December 31 As at June 30
2016 2017 2018 2019
USD’000 USD’000 USD’000 USD’000
Mainland China . . . . . . . . . . . . . . . . . . . . . . . . . . . . . . 1,137,544 1,407,428 1,701,925 1,640,662Singapore . . . . . . . . . . . . . . . . . . . . . . . . . . . . . . . . . . . 88 45,539 104,382 138,778Japan . . . . . . . . . . . . . . . . . . . . . . . . . . . . . . . . . . . . . . 238,359 256,940 645,027 868,027South Korea . . . . . . . . . . . . . . . . . . . . . . . . . . . . . . . . . 57,073 114,341 180,798 206,203India . . . . . . . . . . . . . . . . . . . . . . . . . . . . . . . . . . . . . . . — — — 10,379Australia . . . . . . . . . . . . . . . . . . . . . . . . . . . . . . . . . . . . — — 96,790 829,860
1,433,064 1,824,248 2,728,922 3,693,909
The non-current asset information of continuing operations above is based on the locations ofthe assets and excludes financial instruments and deferred tax assets.
Information about major customers
Since no revenue from sales to a single customer amounted to 10% or more of the Group’srevenue during the Relevant Periods, no major customer information is presented in accordance withIFRS 8 Operating Segments.
I-59

APPENDIX I ACCOUNTANTS’ REPORT
II. NOTES TO THE HISTORICAL FINANCIAL INFORMATION (continued)
5. REVENUE, OTHER INCOME AND GAINS
(a) Revenue
An analysis of revenue is as follows:
Year endedDecember 31
Six months endedJune 30
2016 2017 2018 2018 2019
USD’000 USD’000 USD’000 USD’000 USD’000(unaudited)
Rental income . . . . . . . . . . . . . . . . . . . . . . . . . . . . . 50,273 57,844 74,311 32,678 54,954Management fee income . . . . . . . . . . . . . . . . . . . . . 46,464 94,268 135,579 59,033 61,784Construction income . . . . . . . . . . . . . . . . . . . . . . . . — — 40,665 — 37,661Solar energy income . . . . . . . . . . . . . . . . . . . . . . . . — 1,177 3,593 1,979 1,364
Total . . . . . . . . . . . . . . . . . . . . . . . . . . . . . . . . . . . . 96,737 153,289 254,148 93,690 155,763
Timing of revenue recognition
Year endedDecember 31
Six months endedJune 30
2016 2017 2018 2018 2019
USD’000 USD’000 USD’000 USD’000 USD’000(unaudited)
Rental income . . . . . . . . . . . . . . . . . . . . . . . . . . . . . 50,273 57,844 74,311 32,678 54,954
Point in timeManagement fee income . . . . . . . . . . . . . . . . . . . . . 11,151 15,811 45,273 29,865 13,962
Over timeManagement fee income . . . . . . . . . . . . . . . . . . . . . 35,313 78,457 90,306 29,168 47,822Construction income . . . . . . . . . . . . . . . . . . . . . . . . — — 40,665 — 37,661Solar energy income . . . . . . . . . . . . . . . . . . . . . . . . — 1,177 3,593 1,979 1,364
96,737 153,289 254,148 93,690 155,763
Performance obligations
Information about the Group’s performance obligations is summarized below:
Construction services
The performance obligation is satisfied over time as services are rendered and payment isgenerally due within 30 days from the date of billing. A certain percentage of payment is retained bycustomers until the end of the retention period as the Group’s entitlement to the final payment isconditional on the satisfaction of the service quality by the customers over a certain period asstipulated in the contracts.
Management services
The performance obligation is satisfied over time as services are rendered and short-termadvances are normally required before rendering the services. Management service contracts are forperiods of one year or less, or are billed based on the time incurred.
I-60

APPENDIX I ACCOUNTANTS’ REPORT
II. NOTES TO THE HISTORICAL FINANCIAL INFORMATION (continued)
5. REVENUE, OTHER INCOME AND GAINS (continued)
(a) Revenue (continued)
Performance obligations (continued)
Solar energy sales
The performance obligation is satisfied upon delivery of the industrial products and payment isgenerally due within 30 to 90 days from delivery, except for new customers, where payment inadvance is normally required. Some contracts provide customers with a right of return and volumerebates which give rise to variable consideration subject to constraint.
The transaction prices allocated to the remaining performance obligations (unsatisfied orpartially unsatisfied) as at June 30, 2019 and December 31, 2018 are as follows:
December 31,2018
June 30,2019
USD’000 USD’000
Within one year . . . . . . . . . . . . . . . . . . . . . . . . . . . . . . . . . . . . . . . . . . . . . . . . . . . . . . . . . . 46,460 72,005More than one year . . . . . . . . . . . . . . . . . . . . . . . . . . . . . . . . . . . . . . . . . . . . . . . . . . . . . . . 2,100 30,208
48,560 102,213
The remaining performance obligations relate to construction services that are normally to besatisfied within one year, of which the amounts disclosed above do not include variable considerationwhich is constrained; and promote fee relate to management services which management has exercisedjudgment in applying constraint on the recognition of the promote fee income in 2018 and 2019.
There are no transaction prices allocated to the remaining performance obligations (unsatisfiedor partially unsatisfied) as at December 31, 2016 and 2017.
(b) Other income and gains
Year ended December 31Six months ended
June 30
2016 2017 2018 2018 2019
USD’000 USD’000 USD’000 USD’000 USD’000(unaudited)
Fair value gains on completed investmentproperties . . . . . . . . . . . . . . . . . . . . . . . . . . . . . . 100,799 95,179 109,688 37,396 26,800
Fair value gains on investment properties underconstruction . . . . . . . . . . . . . . . . . . . . . . . . . . . . 5,760 100,039 62,779 8,761 76,761
Changes in fair value of financial assets andliabilities at fair value through profit or loss . . . 26,728 32,739 44,937 18,369 22,818
Gain on disposal of subsidiaries . . . . . . . . . . . . . . . 32 38,311 2,662 — 16,495Gain on remeasurement of investment in associate
to fair value . . . . . . . . . . . . . . . . . . . . . . . . . . . . — — — — 8,556Interest income . . . . . . . . . . . . . . . . . . . . . . . . . . . . 502 2,477 1,530 985 1,768Dividend income . . . . . . . . . . . . . . . . . . . . . . . . . . — 10,679 25,519 9,771 11,848Exchange gain . . . . . . . . . . . . . . . . . . . . . . . . . . . . 916 4,431 — — —Gain on deemed partial disposal of a joint
venture . . . . . . . . . . . . . . . . . . . . . . . . . . . . . . . . — 29 — — —Others . . . . . . . . . . . . . . . . . . . . . . . . . . . . . . . . . . . 408 234 7,190 383 379
135,145 284,118 254,305 75,665 165,425
I-61

APPENDIX I ACCOUNTANTS’ REPORT
II. NOTES TO THE HISTORICAL FINANCIAL INFORMATION (continued)
6. PROFIT BEFORE TAX
The Group’s profit before tax is arrived at after charging/(crediting):
(a) Employee benefit expense
Year ended December 31 Six months ended June 30
2016 2017 2018 2018 2019
USD’000 USD’000 USD’000 USD’000 USD’000(unaudited)
Wages and salaries (including directors’ and chiefexecutive’s remuneration) . . . . . . . . . . . . . . . . . 25,333 37,512 52,412 17,457 31,353
Equity-settled share option expense (note 43) . . . . 75 11,923 23,157 11,961 9,885Pension scheme contributions . . . . . . . . . . . . . . . . 847 1,843 3,890 2,019 2,531
26,255 51,278 79,459 31,437 43,769
(b) Other items
Year ended December 31 Six months ended June 30
2016 2017 2018 2018 2019
USD’000 USD’000 USD’000 USD’000 USD’000(unaudited)
Other tax expenses . . . . . . . . . . . . . . . . . . . . . 4,114 6,137 8,884 3,576 4,608Professional service fee . . . . . . . . . . . . . . . . . . 11,381 21,660 21,584 8,462 19,910Auditor’s remuneration . . . . . . . . . . . . . . . . . . 582 479 858 141 442Exchange losses . . . . . . . . . . . . . . . . . . . . . . . — — 869 41 1,761Entertainment fee . . . . . . . . . . . . . . . . . . . . . . 1,026 1,507 2,052 755 1,017Depreciation of property, plant and
equipment . . . . . . . . . . . . . . . . . . . . . . . . . . 648 1,242 1,812 824 2,063Amortization of other intangible assets . . . . . 3,799 4,204 5,089 2,168 3,034Depreciation of right-of-use assets . . . . . . . . . 1,612 2,615 3,325 1,663 2,199Fair value gains on investment properties . . . (106,559) (195,218) (172,467) (46,157) (103,561)Construction cost* . . . . . . . . . . . . . . . . . . . . . . — — 39,645 — 36,978Loss on disposal of items of property, plant
and equipment . . . . . . . . . . . . . . . . . . . . . . . 74 81 9,697 148 316
* The construction cost for the years ended December 31, 2016, 2017, 2018 and six months ended June 30, 2018 and 2019 isincluded in “Cost of sales” in the consolidated statements of profit or loss and other comprehensive income.
7. FINANCE COSTS
Year ended December 31 Six months ended June 30
2016 2017 2018 2018 2019
USD’000 USD’000 USD’000 USD’000 USD’000(unaudited)
Interest expense on bank loans . . . . . . . . . . . . . . . 24,491 35,666 39,603 12,926 34,843Interest expense on other borrowings . . . . . . . . . . 37,707 18,339 21,718 10,334 12,231Interest expense on bonds . . . . . . . . . . . . . . . . . . . — — — — 11,102interest expense on lease liabilities . . . . . . . . . . . . 97 291 428 192 701Interest on redeemable convertible preference
shares (note (i)) . . . . . . . . . . . . . . . . . . . . . . . . . — 41,327 45,610 23,318 26,101
62,295 95,623 107,359 46,770 84,978Less: Interest capitalized . . . . . . . . . . . . . . . . . . . . (6,303) (4,720) (2,430) (827) (1,615)
55,992 90,903 104,929 45,943 83,363
I-62

APPENDIX I ACCOUNTANTS’ REPORT
II. NOTES TO THE HISTORICAL FINANCIAL INFORMATION (continued)
7. FINANCE COSTS (continued)
Note:(i) For the years ended December 31, 2016, 2017, 2018 and six months ended June 30, 2018 and 2019, interest on redeemable
convertible preference shares includes dividend on redeemable convertible preference shares amounting to nil,USD12,960,000, USD12,960,000, USD6,480,000, USD6,480,000 respectively, and costs associated with the equity element ofthe Class C Preference Shares amounting to nil, USD28,367,000, USD32,650,000, USD16,838,000, USD19,621,000respectively.
8. DIRECTORS’ AND CHIEF EXECUTIVE’S REMUNERATION
Directors’ and chief executive’s remuneration for the Relevant Periods was as follows:
Year ended December 31 Six months ended June 30
2016 2017 2018 2018 2019
USD’000 USD’000 USD’000 USD’000 USD’000(unaudited)
Consulting fee (note (i)) . . . . . . . . . . . . . . . . . . . . 3,481 3,495 3,846 1,923 1,931Salaries, allowances and benefits in kind . . . . . . . 986 758 765 367 364Equity-settled share option expense (note (ii)) . . . — 10,038 7,599 2,617 2,633Pension scheme contributions . . . . . . . . . . . . . . . . 41 38 38 18 10
4,508 14,329 12,248 4,925 4,938
Notes:(i) This represents the consulting fee paid by the Group to Redwood Consulting (Cayman) Limited (“Redwood Consulting”) and
other entities that are associated with the executive directors.(ii) These equity-settled share options are granted to Redwood Consulting and an entity associated with Jinchu Shen.
During the Relevant Periods, certain directors were granted share options, in respect of theirservices to the Group, under the share option scheme of the Company, further details of which are setout in note 44 to the Historical Financial Information. The fair value of such options, which has beenrecognized in profit or loss over the vesting period, was determined as at the date of grant and theamount included in the Historical Financial Information is included in the above directors’ and chiefexecutive’s remuneration disclosures.
(a) Independent non-executive directors
The Company did not have any independent non-executive directors at any time during theRelevant Periods. The Company has identified Mr. Brett Harold Krause, Mr. Robin Tom Holdsworth,The Right Honorable Sir Hugo George William Swire, KCMG, MP, Mr. Simon James McDonald andMs. Liu Jingsheng as independent non-executive directors of the Company as at the date of this report.
There were no emoluments payable to the independent non-executive directors during theRelevant Periods.
I-63
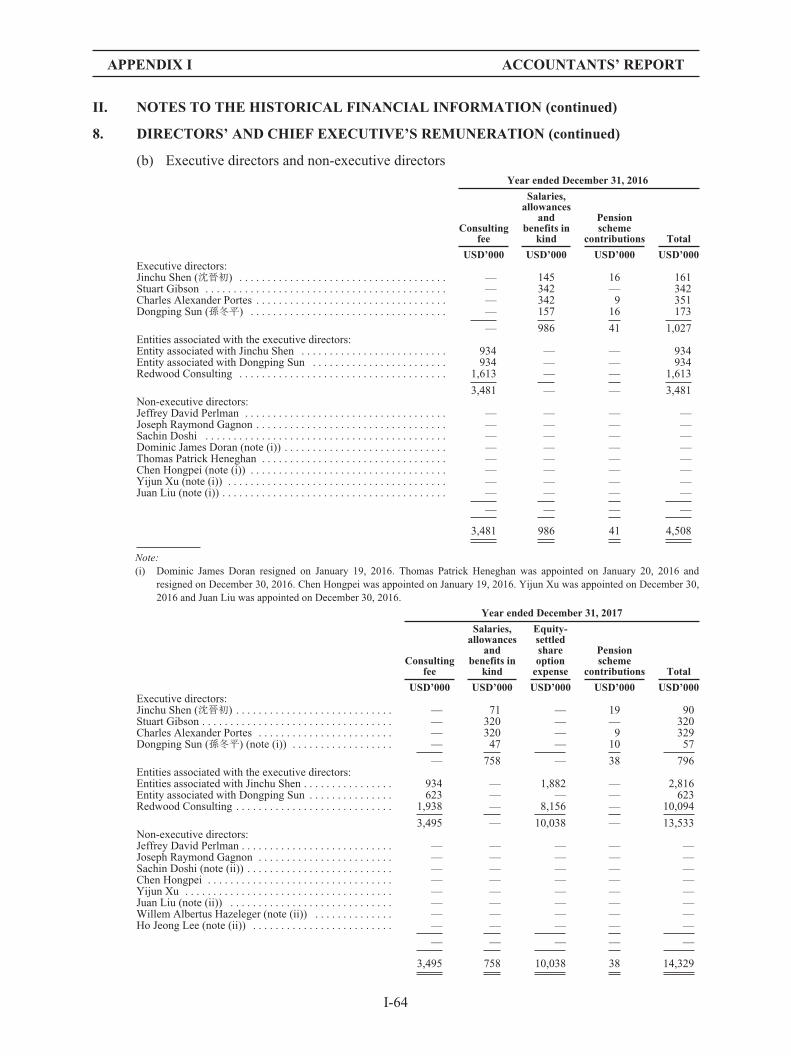
APPENDIX I ACCOUNTANTS’ REPORT
II. NOTES TO THE HISTORICAL FINANCIAL INFORMATION (continued)
8. DIRECTORS’ AND CHIEF EXECUTIVE’S REMUNERATION (continued)
(b) Executive directors and non-executive directorsYear ended December 31, 2016
Consultingfee
Salaries,allowances
andbenefits in
kind
Pensionscheme
contributions Total
USD’000 USD’000 USD’000 USD’000Executive directors:Jinchu Shen (沈晉初) . . . . . . . . . . . . . . . . . . . . . . . . . . . . . . . . . . . . . — 145 16 161Stuart Gibson . . . . . . . . . . . . . . . . . . . . . . . . . . . . . . . . . . . . . . . . . . . — 342 — 342Charles Alexander Portes . . . . . . . . . . . . . . . . . . . . . . . . . . . . . . . . . . — 342 9 351Dongping Sun (孫冬平) . . . . . . . . . . . . . . . . . . . . . . . . . . . . . . . . . . . — 157 16 173
— 986 41 1,027Entities associated with the executive directors:Entity associated with Jinchu Shen . . . . . . . . . . . . . . . . . . . . . . . . . . 934 — — 934Entity associated with Dongping Sun . . . . . . . . . . . . . . . . . . . . . . . . 934 — — 934Redwood Consulting . . . . . . . . . . . . . . . . . . . . . . . . . . . . . . . . . . . . . 1,613 — — 1,613
3,481 — — 3,481Non-executive directors:Jeffrey David Perlman . . . . . . . . . . . . . . . . . . . . . . . . . . . . . . . . . . . . — — — —Joseph Raymond Gagnon . . . . . . . . . . . . . . . . . . . . . . . . . . . . . . . . . . — — — —Sachin Doshi . . . . . . . . . . . . . . . . . . . . . . . . . . . . . . . . . . . . . . . . . . . — — — —Dominic James Doran (note (i)) . . . . . . . . . . . . . . . . . . . . . . . . . . . . . — — — —Thomas Patrick Heneghan . . . . . . . . . . . . . . . . . . . . . . . . . . . . . . . . . — — — —Chen Hongpei (note (i)) . . . . . . . . . . . . . . . . . . . . . . . . . . . . . . . . . . . — — — —Yijun Xu (note (i)) . . . . . . . . . . . . . . . . . . . . . . . . . . . . . . . . . . . . . . . — — — —Juan Liu (note (i)) . . . . . . . . . . . . . . . . . . . . . . . . . . . . . . . . . . . . . . . . — — — —
— — — —
3,481 986 41 4,508
Note:(i) Dominic James Doran resigned on January 19, 2016. Thomas Patrick Heneghan was appointed on January 20, 2016 and
resigned on December 30, 2016. Chen Hongpei was appointed on January 19, 2016. Yijun Xu was appointed on December 30,2016 and Juan Liu was appointed on December 30, 2016.
Year ended December 31, 2017
Consultingfee
Salaries,allowances
andbenefits in
kind
Equity-settledshareoptionexpense
Pensionscheme
contributions Total
USD’000 USD’000 USD’000 USD’000 USD’000Executive directors:Jinchu Shen (沈晉初) . . . . . . . . . . . . . . . . . . . . . . . . . . . . — 71 — 19 90Stuart Gibson . . . . . . . . . . . . . . . . . . . . . . . . . . . . . . . . . . — 320 — — 320Charles Alexander Portes . . . . . . . . . . . . . . . . . . . . . . . . — 320 — 9 329Dongping Sun (孫冬平) (note (i)) . . . . . . . . . . . . . . . . . . — 47 — 10 57
— 758 — 38 796Entities associated with the executive directors:Entities associated with Jinchu Shen . . . . . . . . . . . . . . . . 934 — 1,882 — 2,816Entity associated with Dongping Sun . . . . . . . . . . . . . . . 623 — — — 623Redwood Consulting . . . . . . . . . . . . . . . . . . . . . . . . . . . . 1,938 — 8,156 — 10,094
3,495 — 10,038 — 13,533Non-executive directors:Jeffrey David Perlman . . . . . . . . . . . . . . . . . . . . . . . . . . . — — — — —Joseph Raymond Gagnon . . . . . . . . . . . . . . . . . . . . . . . . — — — — —Sachin Doshi (note (ii)) . . . . . . . . . . . . . . . . . . . . . . . . . . — — — — —Chen Hongpei . . . . . . . . . . . . . . . . . . . . . . . . . . . . . . . . . — — — — —Yijun Xu . . . . . . . . . . . . . . . . . . . . . . . . . . . . . . . . . . . . . — — — — —Juan Liu (note (ii)) . . . . . . . . . . . . . . . . . . . . . . . . . . . . . — — — — —Willem Albertus Hazeleger (note (ii)) . . . . . . . . . . . . . . — — — — —Ho Jeong Lee (note (ii)) . . . . . . . . . . . . . . . . . . . . . . . . . — — — — —
— — — — —
3,495 758 10,038 38 14,329
I-64

APPENDIX I ACCOUNTANTS’ REPORT
II. NOTES TO THE HISTORICAL FINANCIAL INFORMATION (continued)
8. DIRECTORS’ AND CHIEF EXECUTIVE’S REMUNERATION (continued)
(b) Executive directors and non-executive directors (continued)
Notes:(i) Mr. Dongping Sun (孫冬平) resigned on August 18, 2017.
(ii) Sachin Doshi resigned on July 21, 2017. Juan Liu resigned on January 10, 2017. Ho Jeong Lee was appointed on August 3,2017 and Willem Albertus Hazeleger was appointed on July 21, 2017.
Year ended December 31, 2018
Consultingfee
Salaries,allowances
andbenefits in
kind
Equity-settledshareoptionexpense
Pensionscheme
contributions Total
USD’000 USD’000 USD’000 USD’000 USD’000
Executive directors:Jinchu Shen (沈晉初) . . . . . . . . . . . . . . . . . . . . . — 125 — 27 152Stuart Gibson . . . . . . . . . . . . . . . . . . . . . . . . . . . — 320 — — 320Charles Alexander Portes . . . . . . . . . . . . . . . . . — 320 — 11 331
— 765 — 38 803Entities associated with the executive directors:Entity associated with Jinchu Shen . . . . . . . . . . 1,426 — 1,425 — 2,851Redwood Consulting . . . . . . . . . . . . . . . . . . . . . 2,420 — 6,174 — 8,594
3,846 — 7,599 — 11,445Non-executive directors:Jeffrey David Perlman . . . . . . . . . . . . . . . . . . . . — — — — —Joseph Raymond Gagnon . . . . . . . . . . . . . . . . . — — — — —Zhenhui Wang (王振輝) (note (i)) . . . . . . . . . . . — — — — —Ho Jeong Lee . . . . . . . . . . . . . . . . . . . . . . . . . . . — — — — —Willem Albertus Hazeleger . . . . . . . . . . . . . . . . — — — — —Chen Hongpei . . . . . . . . . . . . . . . . . . . . . . . . . . — — — — —Yijun Xu . . . . . . . . . . . . . . . . . . . . . . . . . . . . . . — — — — —Graeme Torre (note (i)) . . . . . . . . . . . . . . . . . . . — — — — —
— — — — —
3,846 765 7,599 38 12,248
Note:(i) Zhenhui Wang was appointed on May 10, 2018 and Graeme Torre was appointed on July 11, 2018.
I-65
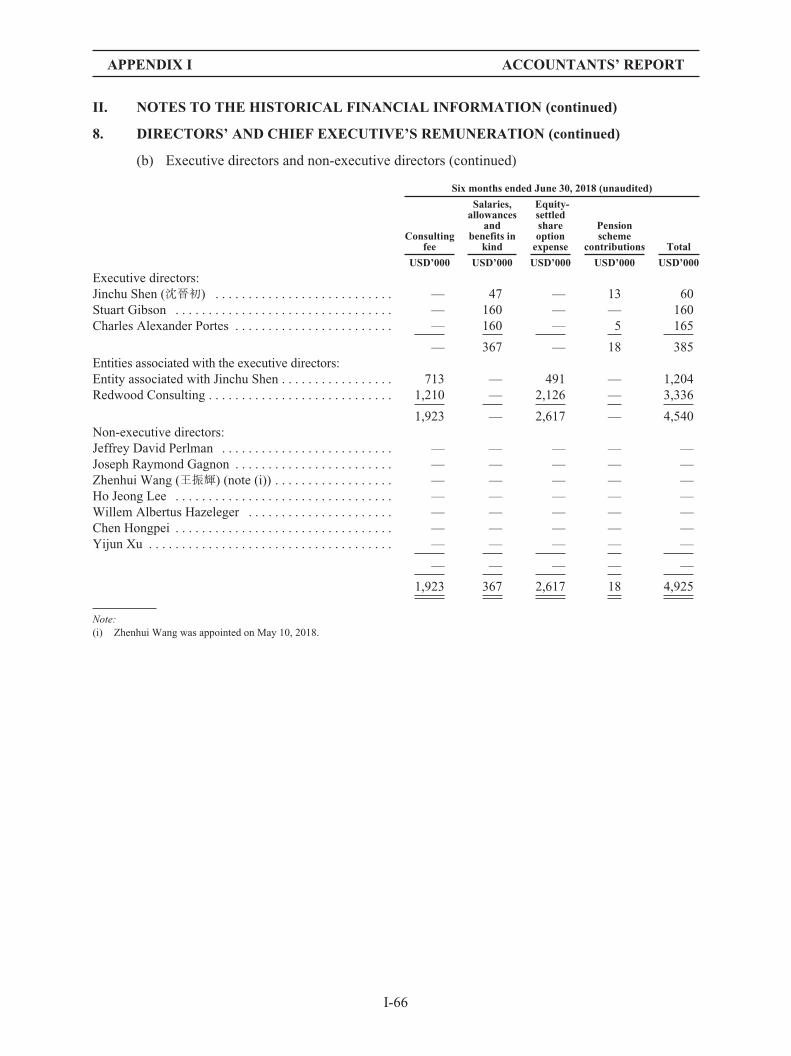
APPENDIX I ACCOUNTANTS’ REPORT
II. NOTES TO THE HISTORICAL FINANCIAL INFORMATION (continued)
8. DIRECTORS’ AND CHIEF EXECUTIVE’S REMUNERATION (continued)
(b) Executive directors and non-executive directors (continued)
Six months ended June 30, 2018 (unaudited)
Consultingfee
Salaries,allowances
andbenefits in
kind
Equity-settledshareoptionexpense
Pensionscheme
contributions Total
USD’000 USD’000 USD’000 USD’000 USD’000
Executive directors:Jinchu Shen (沈晉初) . . . . . . . . . . . . . . . . . . . . . . . . . . . — 47 — 13 60Stuart Gibson . . . . . . . . . . . . . . . . . . . . . . . . . . . . . . . . . — 160 — — 160Charles Alexander Portes . . . . . . . . . . . . . . . . . . . . . . . . — 160 — 5 165
— 367 — 18 385Entities associated with the executive directors:Entity associated with Jinchu Shen . . . . . . . . . . . . . . . . . 713 — 491 — 1,204Redwood Consulting . . . . . . . . . . . . . . . . . . . . . . . . . . . . 1,210 — 2,126 — 3,336
1,923 — 2,617 — 4,540Non-executive directors:Jeffrey David Perlman . . . . . . . . . . . . . . . . . . . . . . . . . . — — — — —Joseph Raymond Gagnon . . . . . . . . . . . . . . . . . . . . . . . . — — — — —Zhenhui Wang (王振輝) (note (i)) . . . . . . . . . . . . . . . . . . — — — — —Ho Jeong Lee . . . . . . . . . . . . . . . . . . . . . . . . . . . . . . . . . — — — — —Willem Albertus Hazeleger . . . . . . . . . . . . . . . . . . . . . . — — — — —Chen Hongpei . . . . . . . . . . . . . . . . . . . . . . . . . . . . . . . . . — — — — —Yijun Xu . . . . . . . . . . . . . . . . . . . . . . . . . . . . . . . . . . . . . — — — — —
— — — — —
1,923 367 2,617 18 4,925
Note:(i) Zhenhui Wang was appointed on May 10, 2018.
I-66

APPENDIX I ACCOUNTANTS’ REPORT
II. NOTES TO THE HISTORICAL FINANCIAL INFORMATION (continued)
8. DIRECTORS’ AND CHIEF EXECUTIVE’S REMUNERATION (continued)
(b) Executive directors and non-executive directors (continued)
Six months ended June 30, 2019
Consultingfee
Salaries,allowances
andbenefits in
kind
Equity-settledshareoptionexpense
Pensionscheme
contributions Total
USD’000 USD’000 USD’000 USD’000 USD’000
Executive directors:Jinchu Shen (沈晉初) . . . . . . . . . . . . . . . . . . . . . — 44 — 5 49Stuart Gibson . . . . . . . . . . . . . . . . . . . . . . . . . . . — 160 — — 160Charles Alexander Portes . . . . . . . . . . . . . . . . . — 160 — 5 165
— 364 — 10 374Entities associated with the executive directors:Entity associated with Jinchu Shen . . . . . . . . . . 721 — 494 — 1,215Redwood Consulting . . . . . . . . . . . . . . . . . . . . . 1,210 — 2,139 — 3,349
1,931 — 2,633 — 4,564Non-executive directors:Jeffrey David Perlman . . . . . . . . . . . . . . . . . . . . — — — — —Joseph Raymond Gagnon . . . . . . . . . . . . . . . . . — — — — —Zhenhui Wang (王振輝) . . . . . . . . . . . . . . . . . . . — — — — —Ho Jeong Lee . . . . . . . . . . . . . . . . . . . . . . . . . . . — — — — —Willem Albertus Hazeleger . . . . . . . . . . . . . . . . — — — — —Chen Hongpei . . . . . . . . . . . . . . . . . . . . . . . . . . — — — — —Yijun Xu . . . . . . . . . . . . . . . . . . . . . . . . . . . . . . — — — — —Graeme Torre . . . . . . . . . . . . . . . . . . . . . . . . . . . — — — — —
— — — — —
— — — — —
1,931 364 2,633 10 4,938
There was no arrangement under which a director waived or agreed to waive any remunerationduring the year.
9. FIVE HIGHEST PAID EMPLOYEES
Details of directors’ remuneration are set out in note 8. Details of the remuneration of theremaining 1, 2, and 2 highest paid employees who are neither a director nor chief executive of theCompany for the Relevant Periods and six months ended June 30, 2018 as follows:
Year ended December 31Six months ended
June 30
2016 2017 2018 2018 2019
USD’000 USD’000 USD’000 USD’000 USD’000(unaudited)
Salaries, allowances and benefits in kind . . . . . . . . . 852 1,501 1,601 589 842Equity-settled share option expense . . . . . . . . . . . . . — — 1,656 452 324Pension scheme contributions . . . . . . . . . . . . . . . . . . 14 13 13 5 —
866 1,514 3,270 1,046 1,166
I-67

APPENDIX I ACCOUNTANTS’ REPORT
II. NOTES TO THE HISTORICAL FINANCIAL INFORMATION (continued)
9. FIVE HIGHEST PAID EMPLOYEES (continued)
The numbers of non-director highest paid employees whose remuneration fell within thefollowing band are as follows:
Number of employees
Year ended December 31 Six months ended June 30
2016 2017 2018 2018 2019
(unaudited)
HK$ 2,500,001 to HK$3,000,000 . . . . . . . . . . . . . . . . . . — — — 1 —HK$ 4,500,001 to HK$5,000,000 . . . . . . . . . . . . . . . . . . — — — — 2HK$ 5,500,001 to HK$6,000,000 . . . . . . . . . . . . . . . . . . — 2 — 1 —HK$ 6,500,001 to HK$7,000,000 . . . . . . . . . . . . . . . . . . 1 — — — —HK$ 9,500,001 to HK$10,000,000 . . . . . . . . . . . . . . . . . — — 1 — —HK$ 15,500,001 to HK$16,000,000 . . . . . . . . . . . . . . . . — — 1 — —
1 2 2 2 2
During the Relevant Periods, share options were granted to a non-director and non-chiefexecutive highest paid employee in respect of his services to the Group, further details of which areincluded in the disclosures in note 44 to the Historical Financial Information. The fair value of suchoptions, which has been recognized in profit or loss over the vesting period, was determined as at thedate of grant and the amount included in the Historical Financial Information is included in the abovenon-director and non-chief executive highest paid employees’ remuneration disclosures.
10. INCOME TAX EXPENSE
Year ended December 31 Six months ended June 30
2016 2017 2018 2018 2019
USD’000 USD’000 USD’000 USD’000 USD’000(unaudited)
Current tax . . . . . . . . . . . . . . . . . . . . . . . . . . . . . . . 643 20,131 13,871 6,173 17,577Deferred tax (note 30) . . . . . . . . . . . . . . . . . . . . . . 34,245 52,209 43,838 11,098 21,059
34,888 72,340 57,709 17,271 38,636
The Company was incorporated in the Cayman Islands as an exempted company with limitedliability under the Cayman Islands Companies Law and is exempted from the payment of CaymanIslands income tax.
The subsidiaries incorporated in the BVI are not subject to income tax as these subsidiaries do nothave a place of business (other than a registered office only) nor conduct on any business in the BVI.
Hong Kong profits tax has been provided at the rate of 16.5% on the assessable profits arisingin Hong Kong during the Relevant Periods and the six months ended June 30, 2018.
The subsidiary incorporated in Singapore is subject to Singapore income tax at the rate of 17%on the profits including those arising from sources outside Singapore and received in Singapore duringthe Relevant Periods and the six months ended June 30, 2018.
The subsidiaries incorporated in South Korea are subject to Korean income tax at the rate of24% during the Relevant Periods and the six months ended June 30, 2018.
I-68

APPENDIX I ACCOUNTANTS’ REPORT
II. NOTES TO THE HISTORICAL FINANCIAL INFORMATION (continued)
10. INCOME TAX EXPENSE (continued)
The subsidiaries incorporated in Japan are subject to Japan income tax at the rate of 30.86%during the Relevant Periods and the six months ended June 30, 2018.
The subsidiaries incorporated in Australia are subject to Australian income tax at the rate of30% during the Relevant Periods and the six months ended June 30, 2018.
The subsidiaries incorporated in India are subject to Indian income tax at the rate of 30% duringthe Relevant Periods and the six months ended June 30, 2018.
According to the Corporate Income Tax (“CIT”) Law of the People’s Republic of China, theincome tax rates for both domestic and foreign investment enterprises in Mainland China were unifiedat 25% during the Relevant Periods and the six months ended June 30, 2018.
A reconciliation of the tax expense applicable to profit before tax using the applicable rate forthe region in which the Group and its subsidiaries are domiciled to the tax expense at the effective taxrates is as follows:
Year ended December 31 Six months ended June 30
2016 2017 2018 2018 2019
USD’000 USD’000 USD’000 USD’000 USD’000(unaudited)
Profit before tax . . . . . . . . . . . . . . . . . . . . . . . . . . 139,732 273,174 270,587 80,962 122,713
Tax at the statutory tax rate . . . . . . . . . . . . . . . . . 35,108 72,917 62,058 17,556 23,865Profits attributable to joint ventures . . . . . . . . . . (1,571) (1,640) (7,641) (1,046) (2,190)Income not subject to tax . . . . . . . . . . . . . . . . . . . — (267) — — —Non-deductible expenses . . . . . . . . . . . . . . . . . . . 1,351 1,528 3,292 761 1,358Unrecognized deductible temporary
differences . . . . . . . . . . . . . . . . . . . . . . . . . . . . — (198) — — 134Effect of withholding tax . . . . . . . . . . . . . . . . . . . — — — — 15,469
Tax charge . . . . . . . . . . . . . . . . . . . . . . . . . . . . . . 34,888 72,340 57,709 17,271 38,636
The share of tax attributable to joint ventures of USD1,571,000, USD1,640,000, USD7,641,000and USD2,190,000 as at December 31, 2016, 2017, 2018 and June 30, 2019 respectively, is included in“Share of profits and losses of joint ventures” in the consolidated statements of profit or loss and othercomprehensive income.
11. DIVIDENDS
No dividend has been paid or declared by the Company to its ordinary shareholders since itsdate of incorporation.
12. EARNINGS PER SHARE ATTRIBUTABLE TO ORDINARY EQUITY HOLDERS OFTHE PARENT
The calculation of the basic earnings per share amounts is based on the profit for theyear/period attributable to ordinary equity holders of the parent, and the weighted average number ofordinary shares in issue during each of the Relevant Periods and six months ended June 30, 2018.
I-69

APPENDIX I ACCOUNTANTS’ REPORT
II. NOTES TO THE HISTORICAL FINANCIAL INFORMATION (continued)
12. EARNINGS PER SHARE ATTRIBUTABLE TO ORDINARY EQUITY HOLDERS OFTHE PARENT (continued)
The calculation of the diluted earnings per share amounts is based on the profit for theyear/period attributable to ordinary equity holders of the parent, adjusted to reflect the interest on thepreference shares where applicable (see below). The weighted average number of ordinary shares usedin the calculation is the number of ordinary shares in issue during the Relevant Periods and six monthsended June 30, 2018, as used in the basic earnings per share calculation, and the weighted averagenumber of ordinary shares assumed to have been issued at no consideration on the deemed exercise orconversion of all dilutive potential ordinary shares into ordinary shares.
The calculations of basic and diluted earnings per share are based on:
Year endedDecember 31
Six months endedJune 30
2016 2017 2018 2018 2019
USD’000 USD’000 USD’000 USD’000 USD’000(unaudited)
Earnings:Profit attributable to ordinary equity holders of the
parent, used in the basic earnings per sharecalculation . . . . . . . . . . . . . . . . . . . . . . . . . . . . . . 88,267 186,265 203,042 61,793 75,950
Year endedDecember 31
Six months endedJune 30
2016 2017 2018 2018 2019
’000 ’000 ’000 ’000 ’000(unaudited)
Number of shares:Weighted average number of ordinary
shares in issue during the year/period,used in the basic earnings per sharecalculation . . . . . . . . . . . . . . . . . . . . . . . 1,947,958 2,081,185 2,566,494 2,455,805 2,688,920
Effect of dilution—weighted averagenumber of ordinary shares . . . . . . . . . . .
Derivative financial instruments . . . . . . . . 54,685 54,685 2,847 2,847 —Share options . . . . . . . . . . . . . . . . . . . . . . . 2,563 20,388 78,944 77,465 71,697
2,005,206 2,156,258 2,648,285 2,536,117 2,760,617
* Because the diluted earnings per share amount is increased when taking redeemableconvertible preference shares into account, the redeemable convertible preference shareshad an anti-dilutive effect on the basic earnings per share for the Relevant Periods and sixmonths ended June 30, 2018 and were ignored in the calculation of diluted earnings pershare.
I-70

APPENDIX I ACCOUNTANTS’ REPORT
II. NOTES TO THE HISTORICAL FINANCIAL INFORMATION (continued)
13. PROPERTY, PLANT AND EQUIPMENT
Group
Motorvehicles
Leaseholdimprovements Others TOTAL
USD’000 USD’000 USD’000 USD’000
December 31, 2016At December 31, 2015 and at January 1, 2016:Cost . . . . . . . . . . . . . . . . . . . . . . . . . . . . . . . . . . . . . . . . . . . . 317 581 686 1,584Accumulated depreciation . . . . . . . . . . . . . . . . . . . . . . . . . . . (37) (171) (272) (480)
Net carrying amount . . . . . . . . . . . . . . . . . . . . . . . . . . . . . . . 280 410 414 1,104
At January 1, 2016, net of accumulated depreciation . . . . . . 280 410 414 1,104Additions . . . . . . . . . . . . . . . . . . . . . . . . . . . . . . . . . . . . . . . . — 643 918 1,561Acquisition of subsidiaries (note 35) . . . . . . . . . . . . . . . . . . . — 332 116 448Disposals . . . . . . . . . . . . . . . . . . . . . . . . . . . . . . . . . . . . . . . . — — (74) (74)Depreciation provided during the year . . . . . . . . . . . . . . . . . (68) (387) (193) (648)Exchange realignment . . . . . . . . . . . . . . . . . . . . . . . . . . . . . . (15) (22) 92 55
At December 31, 2016, net of accumulated depreciation . . . 197 976 1,273 2,446
At December 31, 2016:Cost . . . . . . . . . . . . . . . . . . . . . . . . . . . . . . . . . . . . . . . . . . . . 298 1,429 1,931 3,658Accumulated depreciation . . . . . . . . . . . . . . . . . . . . . . . . . . . (101) (453) (658) (1,212)
Net carrying amount . . . . . . . . . . . . . . . . . . . . . . . . . . . . . . . 197 976 1,273 2,446
Motorvehicles Machineries
Leaseholdimprovements Others
Constructionin process TOTAL
USD’000 USD’000 USD’000 USD’000 USD’000 USD’000
December 31, 2017At December 31, 2016 and at
January 1, 2017:Cost . . . . . . . . . . . . . . . . . . . . . . . 298 — 1,429 1,931 — 3,658Accumulated depreciation . . . . . (101) — (453) (658) — (1,212)
Net carrying amount . . . . . . . . . . 197 — 976 1,273 — 2,446
At January 1, 2017, net ofaccumulated depreciation . . . . 197 — 976 1,273 — 2,446
Additions . . . . . . . . . . . . . . . . . . . — 6,736 8 795 8,418 15,957Acquisition of subsidiaries
(note 35) . . . . . . . . . . . . . . . . . — — 59 120 — 179Disposals . . . . . . . . . . . . . . . . . . . (79) — — (2) — (81)Disposal of subsidiaries
(note 37) . . . . . . . . . . . . . . . . . — — — (3) — (3)Depreciation provided during the
year . . . . . . . . . . . . . . . . . . . . . (54) (341) (346) (501) — (1,242)Exchange realignment . . . . . . . . . 8 — 11 85 — 104
At December 31, 2017, net ofaccumulated depreciation . . . . 72 6,395 708 1,767 8,418 17,360
At December 31, 2017:Cost . . . . . . . . . . . . . . . . . . . . . . . 235 6,736 1,585 2,992 8,418 19,966Accumulated depreciation . . . . . (163) (341) (877) (1,225) — (2,606)
Net carrying amount . . . . . . . . . . 72 6,395 708 1,767 8,418 17,360
I-71

APPENDIX I ACCOUNTANTS’ REPORT
II. NOTES TO THE HISTORICAL FINANCIAL INFORMATION (continued)
13. PROPERTY, PLANT AND EQUIPMENT (continued)
Group (continued)
Motorvehicles Machineries
Leaseholdimprovements Others
Constructionin process TOTAL
USD’000 USD’000 USD’000 USD’000 USD’000 USD’000
December 31, 2018At December 31, 2017 and at
January 1, 2018:Cost . . . . . . . . . . . . . . . . . . . . . . . 235 6,736 1,585 2,992 8,418 19,966Accumulated depreciation . . . . . (163) (341) (877) (1,225) — (2,606)
Net carrying amount . . . . . . . . . . 72 6,395 708 1,767 8,418 17,360
At January 1, 2018, net ofaccumulated depreciation . . . . 72 6,395 708 1,767 8,418 17,360
Additions . . . . . . . . . . . . . . . . . . . 29 — 293 628 12,279 13,229Acquisition of subsidiaries
(note 35) . . . . . . . . . . . . . . . . . 268 — 1,446 367 — 2,081Disposals . . . . . . . . . . . . . . . . . . . (13) (9,632) — (52) — (9,697)Depreciation provided during the
year . . . . . . . . . . . . . . . . . . . . . (57) (948) (293) (514) — (1,812)Transfer from construction in
progress . . . . . . . . . . . . . . . . . . — 20,697 — — (20,697) —Exchange realignment . . . . . . . . . (14) — (71) (15) — (100)
At December 31, 2018, net ofaccumulated depreciation . . . . 285 16,512 2,083 2,181 — 21,061
At December 31, 2018:Cost . . . . . . . . . . . . . . . . . . . . . . . 670 17,802 3,376 5,189 — 27,037Accumulated depreciation . . . . . (385) (1,290) (1,293) (3,008) — (5,976)
Net carrying amount . . . . . . . . . . 285 16,512 2,083 2,181 — 21,061
I-72

APPENDIX I ACCOUNTANTS’ REPORT
II. NOTES TO THE HISTORICAL FINANCIAL INFORMATION (continued)
13. PROPERTY, PLANT AND EQUIPMENT (continued)
Group (continued)
Motorvehicles Machineries
Leaseholdimprovements Others TOTAL
USD’000 USD’000 USD’000 USD’000 USD’000
June 30, 2019At December 31, 2018 and at January 1, 2019:Cost . . . . . . . . . . . . . . . . . . . . . . . . . . . . . . . . . . 670 17,802 3,376 5,189 27,037Accumulated depreciation . . . . . . . . . . . . . . . . (385) (1,290) (1,293) (3,008) (5,976)
Net carrying amount . . . . . . . . . . . . . . . . . . . . . 285 16,512 2,083 2,181 21,061
At January 1, 2019, net of accumulateddepreciation . . . . . . . . . . . . . . . . . . . . . . . . . . 285 16,512 2,083 2,181 21,061
Additions . . . . . . . . . . . . . . . . . . . . . . . . . . . . . . 3,956 314 1,170 5,440Acquisition of subsidiaries (note 35) . . . . . . . . — — 166 60 226Disposals . . . . . . . . . . . . . . . . . . . . . . . . . . . . . . — (238) (48) (30) (316)Disposal of subsidiaries (note 37) . . . . . . . . . . . — — — (2) (2)Depreciation provided during the period . . . . . (42) (544) (1,068) (409) (2,063)Exchange realignment . . . . . . . . . . . . . . . . . . . . (3) — (14) (15) (32)
At June 30, 2019, net of accumulateddepreciation . . . . . . . . . . . . . . . . . . . . . . . . . . 240 19,686 1,433 2,955 24,314
At June 30, 2019:Cost . . . . . . . . . . . . . . . . . . . . . . . . . . . . . . . . . . 663 21,520 4,118 6,800 33,101Accumulated depreciation . . . . . . . . . . . . . . . . (423) (1,834) (2,685) (3,845) (8,787)
Net carrying amount . . . . . . . . . . . . . . . . . . . . . 240 19,686 1,433 2,955 24,314
Certain of the Group’s property, plant and equipment with a carrying amount of nil,USD6,395,000, USD16,512,000 and USD19,686,000 as at December 31, 2016, 2017 and 2018 andJune 30, 2019 were pledged to secure bank loans and other borrowings granted to the Group asdisclosed in note 27.
Company
Others
USD’000
December 31, 2018At January 1, 2018, net of accumulated depreciation . . . . . . . . . . . . . . . . . . . . . . . . . . . . . . . . . . —Additions . . . . . . . . . . . . . . . . . . . . . . . . . . . . . . . . . . . . . . . . . . . . . . . . . . . . . . . . . . . . . . . . . . . . 364Depreciation provided during the period . . . . . . . . . . . . . . . . . . . . . . . . . . . . . . . . . . . . . . . . . . . . (6)
At December 31, 2018, net of accumulated depreciation . . . . . . . . . . . . . . . . . . . . . . . . . . . . . . . 358
At December 31, 2018:Cost . . . . . . . . . . . . . . . . . . . . . . . . . . . . . . . . . . . . . . . . . . . . . . . . . . . . . . . . . . . . . . . . . . . . . . . . 364Accumulated depreciation . . . . . . . . . . . . . . . . . . . . . . . . . . . . . . . . . . . . . . . . . . . . . . . . . . . . . . . (6)
Net carrying amount . . . . . . . . . . . . . . . . . . . . . . . . . . . . . . . . . . . . . . . . . . . . . . . . . . . . . . . . . . . 358
I-73
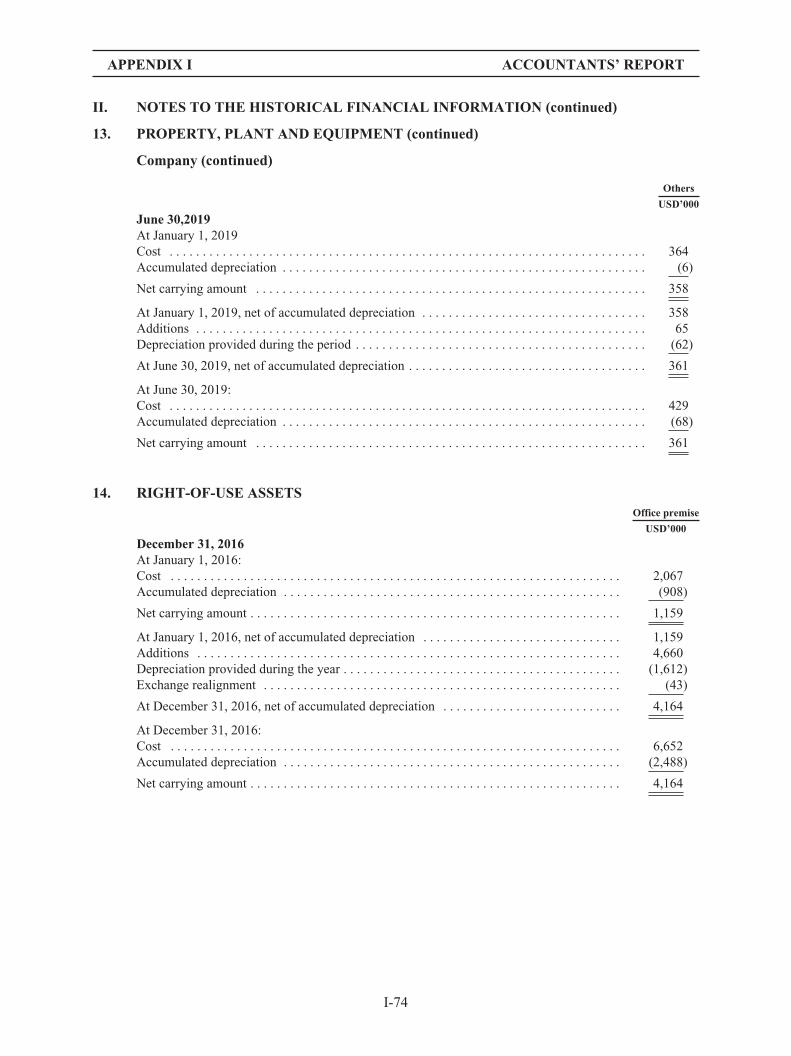
APPENDIX I ACCOUNTANTS’ REPORT
II. NOTES TO THE HISTORICAL FINANCIAL INFORMATION (continued)
13. PROPERTY, PLANT AND EQUIPMENT (continued)
Company (continued)
Others
USD’000
June 30,2019At January 1, 2019Cost . . . . . . . . . . . . . . . . . . . . . . . . . . . . . . . . . . . . . . . . . . . . . . . . . . . . . . . . . . . . . . . . . . . . . . . . 364Accumulated depreciation . . . . . . . . . . . . . . . . . . . . . . . . . . . . . . . . . . . . . . . . . . . . . . . . . . . . . . . (6)
Net carrying amount . . . . . . . . . . . . . . . . . . . . . . . . . . . . . . . . . . . . . . . . . . . . . . . . . . . . . . . . . . . 358
At January 1, 2019, net of accumulated depreciation . . . . . . . . . . . . . . . . . . . . . . . . . . . . . . . . . . 358Additions . . . . . . . . . . . . . . . . . . . . . . . . . . . . . . . . . . . . . . . . . . . . . . . . . . . . . . . . . . . . . . . . . . . . 65Depreciation provided during the period . . . . . . . . . . . . . . . . . . . . . . . . . . . . . . . . . . . . . . . . . . . . (62)
At June 30, 2019, net of accumulated depreciation . . . . . . . . . . . . . . . . . . . . . . . . . . . . . . . . . . . . 361
At June 30, 2019:Cost . . . . . . . . . . . . . . . . . . . . . . . . . . . . . . . . . . . . . . . . . . . . . . . . . . . . . . . . . . . . . . . . . . . . . . . . 429Accumulated depreciation . . . . . . . . . . . . . . . . . . . . . . . . . . . . . . . . . . . . . . . . . . . . . . . . . . . . . . . (68)
Net carrying amount . . . . . . . . . . . . . . . . . . . . . . . . . . . . . . . . . . . . . . . . . . . . . . . . . . . . . . . . . . . 361
14. RIGHT-OF-USE ASSETSOffice premise
USD’000
December 31, 2016At January 1, 2016:Cost . . . . . . . . . . . . . . . . . . . . . . . . . . . . . . . . . . . . . . . . . . . . . . . . . . . . . . . . . . . . . . . . . . . . 2,067Accumulated depreciation . . . . . . . . . . . . . . . . . . . . . . . . . . . . . . . . . . . . . . . . . . . . . . . . . . . (908)
Net carrying amount . . . . . . . . . . . . . . . . . . . . . . . . . . . . . . . . . . . . . . . . . . . . . . . . . . . . . . . . 1,159
At January 1, 2016, net of accumulated depreciation . . . . . . . . . . . . . . . . . . . . . . . . . . . . . . 1,159Additions . . . . . . . . . . . . . . . . . . . . . . . . . . . . . . . . . . . . . . . . . . . . . . . . . . . . . . . . . . . . . . . . 4,660Depreciation provided during the year . . . . . . . . . . . . . . . . . . . . . . . . . . . . . . . . . . . . . . . . . . (1,612)Exchange realignment . . . . . . . . . . . . . . . . . . . . . . . . . . . . . . . . . . . . . . . . . . . . . . . . . . . . . . (43)
At December 31, 2016, net of accumulated depreciation . . . . . . . . . . . . . . . . . . . . . . . . . . . 4,164
At December 31, 2016:Cost . . . . . . . . . . . . . . . . . . . . . . . . . . . . . . . . . . . . . . . . . . . . . . . . . . . . . . . . . . . . . . . . . . . . 6,652Accumulated depreciation . . . . . . . . . . . . . . . . . . . . . . . . . . . . . . . . . . . . . . . . . . . . . . . . . . . (2,488)
Net carrying amount . . . . . . . . . . . . . . . . . . . . . . . . . . . . . . . . . . . . . . . . . . . . . . . . . . . . . . . . 4,164
I-74

APPENDIX I ACCOUNTANTS’ REPORT
II. NOTES TO THE HISTORICAL FINANCIAL INFORMATION (continued)
14. RIGHT-OF-USE ASSETS (continued)Office premise Equipment Total
USD’000 USD’000 USD’000
December 31, 2017At December 31, 2016 and at January 1, 2017:Cost . . . . . . . . . . . . . . . . . . . . . . . . . . . . . . . . . . . . . . . . . . . . . . . . . . . 6,652 — 6,652Accumulated depreciation . . . . . . . . . . . . . . . . . . . . . . . . . . . . . . . . . (2,488) — (2,488)
Net carrying amount . . . . . . . . . . . . . . . . . . . . . . . . . . . . . . . . . . . . . . 4,164 — 4,164
At January 1, 2017, net of accumulated depreciation . . . . . . . . . . . . 4,164 — 4,164Additions . . . . . . . . . . . . . . . . . . . . . . . . . . . . . . . . . . . . . . . . . . . . . . 2,712 850 3,562Acquisition of subsidiaries (note 35) . . . . . . . . . . . . . . . . . . . . . . . . . 2,010 — 2,010Depreciation provided during the year . . . . . . . . . . . . . . . . . . . . . . . . (2,581) (34) (2,615)Exchange realignment . . . . . . . . . . . . . . . . . . . . . . . . . . . . . . . . . . . . 347 14 361
At December 31, 2017, net of accumulated depreciation . . . . . . . . . 6,652 830 7,482
At December 31, 2017:Cost . . . . . . . . . . . . . . . . . . . . . . . . . . . . . . . . . . . . . . . . . . . . . . . . . . . 9,776 865 10,641Accumulated depreciation . . . . . . . . . . . . . . . . . . . . . . . . . . . . . . . . . (3,124) (35) (3,159)
Net carrying amount . . . . . . . . . . . . . . . . . . . . . . . . . . . . . . . . . . . . . . 6,652 830 7,482
Office premise Equipment Total
USD’000 USD’000 USD’000
December 31, 2018At December 31, 2017 and at January 1, 2018:Cost . . . . . . . . . . . . . . . . . . . . . . . . . . . . . . . . . . . . . . . . . . . . . . . . . . . 9,776 865 10,641Accumulated depreciation . . . . . . . . . . . . . . . . . . . . . . . . . . . . . . . . . (3,124) (35) (3,159)
Net carrying amount . . . . . . . . . . . . . . . . . . . . . . . . . . . . . . . . . . . . . . 6,652 830 7,482
At January 1, 2018, net of accumulated depreciation . . . . . . . . . . . . 6,652 830 7,482Additions . . . . . . . . . . . . . . . . . . . . . . . . . . . . . . . . . . . . . . . . . . . . . . 1,357 2,202 3,559Acquisition of subsidiaries (note 35) . . . . . . . . . . . . . . . . . . . . . . . . . 1,553 — 1,553Depreciation provided during the year . . . . . . . . . . . . . . . . . . . . . . . . (3,199) (126) (3,325)Exchange realignment . . . . . . . . . . . . . . . . . . . . . . . . . . . . . . . . . . . . (202) 23 (179)
At December 31, 2018, net of accumulated depreciation . . . . . . . . . 6,161 2,929 9,090
At December 31, 2018:Cost . . . . . . . . . . . . . . . . . . . . . . . . . . . . . . . . . . . . . . . . . . . . . . . . . . . 12,406 3,091 15,497Accumulated depreciation . . . . . . . . . . . . . . . . . . . . . . . . . . . . . . . . . (6,245) (162) (6,407)
Net carrying amount . . . . . . . . . . . . . . . . . . . . . . . . . . . . . . . . . . . . . . 6,161 2,929 9,090
I-75

APPENDIX I ACCOUNTANTS’ REPORT
II. NOTES TO THE HISTORICAL FINANCIAL INFORMATION (continued)
14. RIGHT-OF-USE ASSETS (continued)Office premise Equipment Total
USD’000 USD’000 USD’000
June 30, 2019At December 31, 2018 and at January 1, 2019:Cost . . . . . . . . . . . . . . . . . . . . . . . . . . . . . . . . . . . . . . . . . . . . . . . . . . . 12,406 3,091 15,497Accumulated depreciation . . . . . . . . . . . . . . . . . . . . . . . . . . . . . . . . . (6,245) (162) (6,407)
Net carrying amount . . . . . . . . . . . . . . . . . . . . . . . . . . . . . . . . . . . . . . 6,161 2,929 9,090
At January 1, 2019, net of accumulated depreciation . . . . . . . . . . . . 6,161 2,929 9,090Additions . . . . . . . . . . . . . . . . . . . . . . . . . . . . . . . . . . . . . . . . . . . . . . 3,746 — 3,746Acquisition of subsidiaries (note 35) . . . . . . . . . . . . . . . . . . . . . . . . . 2,379 — 2,379Depreciation provided during the period . . . . . . . . . . . . . . . . . . . . . . (2,122) (77) (2,199)Exchange realignment . . . . . . . . . . . . . . . . . . . . . . . . . . . . . . . . . . . . (48) 69 21
At June 30, 2019, net of accumulated depreciation . . . . . . . . . . . . . . 10,116 2,921 13,037
At June 30, 2019:Cost . . . . . . . . . . . . . . . . . . . . . . . . . . . . . . . . . . . . . . . . . . . . . . . . . . . 17,259 3,166 20,425Accumulated depreciation . . . . . . . . . . . . . . . . . . . . . . . . . . . . . . . . . (7,143) (245) (7,388)
Net carrying amount . . . . . . . . . . . . . . . . . . . . . . . . . . . . . . . . . . . . . . 10,116 2,921 13,037
15. INVESTMENTS IN JOINT VENTURES
GroupAs at December 31 As at June 30
2016 2017 2018 2019
USD’000 USD’000 USD’000 USD’000
Share of net assets . . . . . . . . . . . . . . . . . . . . . . . . . . . . . . . . . 198,223 283,855 404,697 526,083Goodwill on retaining interests in joint ventures . . . . . . . . . 2 2 2 2
198,225 283,857 404,699 526,085Receivables from joint ventures . . . . . . . . . . . . . . . . . . . . . . — 29,224 — —
198,225 313,081 404,699 526,085
The receivables from the joint ventures are unsecured, interest-free and repayable on demand.In the opinion of the directors, the repayment of these receivables are neither planned nor likely tooccur in the foreseeable future and are considered as part of the Group’s net investments in the jointventures.
Particulars of the Group’s material joint ventures are as follows:
NameRegistered
share capital
Place ofRegistrationand business
Percentage of
Principalactivities
Ownershipinterest
Votingpower
Profitsharing
E-Shang Star CaymanLimited (“E-ShangStar”) . . . . . . . . . . . . . . . .
USD4,968,538 Cayman Islands 25.62% 33.33% 25.62% Investment holding
Sunwood Star Pte. Ltd.(“Sunwood Star”) . . . . . . . USD
654,557,110 Singapore 20.00% 33.33% 20.00% Investment holding
Note:Unanimous agreements with the two joint venture investors are required for E-Shang Star and Sunwood Star, respectively.
I-76

APPENDIX I ACCOUNTANTS’ REPORT
II. NOTES TO THE HISTORICAL FINANCIAL INFORMATION (continued)
15. INVESTMENTS IN JOINT VENTURES (continued)
Group (continued)
The following table illustrates the summarized financial information in respect of E-Shang Staradjusted for any differences in accounting policies and reconciled to the carrying amount in theHistorical Financial Information:
As at December 31 As at June 30
2016 2017 2018 2019
USD’000 USD’000 USD’000 USD’000
Cash and bank balances . . . . . . . . . . . . . . . . . . . . . . . . . 144,777 193,332 124,443 147,845Other current assets . . . . . . . . . . . . . . . . . . . . . . . . . . . . 25,250 116,565 38,637 38,954
Current assets . . . . . . . . . . . . . . . . . . . . . . . . . . . . . . . . 170,027 309,897 163,080 186,799
Non-current assets . . . . . . . . . . . . . . . . . . . . . . . . . . . . . 663,747 1,011,081 1,273,423 1,403,732
Financial liabilities, excluding trade and otherpayables . . . . . . . . . . . . . . . . . . . . . . . . . . . . . . . . . . . (10,891) (19,405) (3,369) (51,741)
Other current liabilities . . . . . . . . . . . . . . . . . . . . . . . . . (60,317) (253,088) (111,811) (64,958)
Current liabilities . . . . . . . . . . . . . . . . . . . . . . . . . . . . . . (71,208) (272,493) (115,180) (116,699)
Non-current financial liabilities, excluding trade andother payables . . . . . . . . . . . . . . . . . . . . . . . . . . . . . . (190,700) (257,175) (304,694) (348,264)
Other non-current liabilities . . . . . . . . . . . . . . . . . . . . . (93,139) (114,815) (157,230) (200,455)
Non-current liabilities . . . . . . . . . . . . . . . . . . . . . . . . . . (283,839) (371,990) (461,924) (548,719)
Net assets . . . . . . . . . . . . . . . . . . . . . . . . . . . . . . . . . . . 478,727 676,495 859,399 925,113
Proportion of the Group’s ownership . . . . . . . . . . . . . . 30.00% 25.62% 25.62% 25.62%Carrying amount of the investment . . . . . . . . . . . . . . . . 143,618 173,318 220,178 237,014
Revenue . . . . . . . . . . . . . . . . . . . . . . . . . . . . . . . . . . . . . 24,132 25,205 51,462 33,107Interest income . . . . . . . . . . . . . . . . . . . . . . . . . . . . . . . 850 434 1,649 195Depreciation and amortization . . . . . . . . . . . . . . . . . . . (2) (2) (15) (25)Interest expenses . . . . . . . . . . . . . . . . . . . . . . . . . . . . . . (7,802) (9,833) (17,601) (10,599)Tax . . . . . . . . . . . . . . . . . . . . . . . . . . . . . . . . . . . . . . . . (37,271) (32,098) (33,418) (10,470)Profit . . . . . . . . . . . . . . . . . . . . . . . . . . . . . . . . . . . . . . . 90,564 91,393 89,071 25,356Total comprehensive income for the year/period . . . . . 81,868 100,271 44,014 7,225
I-77

APPENDIX I ACCOUNTANTS’ REPORT
II. NOTES TO THE HISTORICAL FINANCIAL INFORMATION (continued)
15. INVESTMENTS IN JOINT VENTURES (continued)
Group (continued)
The following table illustrates the summarized financial information in respect of Sunwood Staradjusted for any differences in accounting policies and reconciled to the carrying amount in theHistorical Financial Information:
As at December 31 As at June 30
2016 2017 2018 2019
USD’000 USD’000 USD’000 USD’000
Cash and bank balances . . . . . . . . . . . . . . . . . . . . . . . . . . 22,256 35,780 12,963 15,296Other current assets . . . . . . . . . . . . . . . . . . . . . . . . . . . . . 5,184 48,138 95,067 144,323
Current assets . . . . . . . . . . . . . . . . . . . . . . . . . . . . . . . . . . 27,440 83,918 108,030 159,619
Non-current assets . . . . . . . . . . . . . . . . . . . . . . . . . . . . . . 306,216 729,557 1,225,541 1,307,617
Financial liabilities, excluding trade and otherpayables . . . . . . . . . . . . . . . . . . . . . . . . . . . . . . . . . . . . (45) (188) (684) (759)
Other current liabilities . . . . . . . . . . . . . . . . . . . . . . . . . . . (14,945) (47,143) (20,164) (14,234)
Current liabilities . . . . . . . . . . . . . . . . . . . . . . . . . . . . . . . (14,990) (47,331) (20,848) (14,993)
Non-current financial liabilities, excluding trade andother payables . . . . . . . . . . . . . . . . . . . . . . . . . . . . . . . . (45,641) (211,697) (335,506) (350,095)
Other non-current liabilities . . . . . . . . . . . . . . . . . . . . . . . — (1,762) (93,100) (89,874)
Non-current liabilities . . . . . . . . . . . . . . . . . . . . . . . . . . . (45,641) (213,459) (428,606) (439,969)
Net assets . . . . . . . . . . . . . . . . . . . . . . . . . . . . . . . . . . . . . 273,025 552,685 884,117 1,012,274
Proportion of the Group’s ownership . . . . . . . . . . . . . . . . 20.00% 20.00% 20.00% 20.00%Carrying amount of the investment . . . . . . . . . . . . . . . . . 54,605 110,537 176,823 202,454
Revenue . . . . . . . . . . . . . . . . . . . . . . . . . . . . . . . . . . . . . . — — — —Interest income . . . . . . . . . . . . . . . . . . . . . . . . . . . . . . . . . 14 27 (1) 38Interest expenses . . . . . . . . . . . . . . . . . . . . . . . . . . . . . . . (58) (1,145) (6,086) (5,870)Tax . . . . . . . . . . . . . . . . . . . . . . . . . . . . . . . . . . . . . . . . . . (1,080) (2,796) (46,157) (1,789)Profit . . . . . . . . . . . . . . . . . . . . . . . . . . . . . . . . . . . . . . . . . 45,915 50,042 225,629 52,931Total comprehensive income for the year/ period . . . . . . 43,513 57,531 204,205 45,327
The following table illustrates the aggregate financial information of the Group’s joint venturesthat are not individually material:
As at December 31 As at June 30
2016 2017 2018 2019
USD’000 USD’000 USD’000 USD’000
Aggregate carrying amount of the Group’s investments inthe joint ventures . . . . . . . . . . . . . . . . . . . . . . . . . . . . . . . . . — — 7,696 86,615
I-78

APPENDIX I ACCOUNTANTS’ REPORT
II. NOTES TO THE HISTORICAL FINANCIAL INFORMATION (continued)
16. INVESTMENT IN ASSOCIATES
As at December 31 As at June 30
2016 2017 2018 2019
USD’000 USD’000 USD’000 USD’000
Share of net assets . . . . . . . . . . . . . . . . . . . . . . . . . . . . . . . . . . — — 6,941 —Goodwill on acquisition . . . . . . . . . . . . . . . . . . . . . . . . . . . . . — — 2,393 —
— — 9,334 —
Particulars of the Group’s associates is as follows:
Name
Particulars ofissued
shares held
Place ofincorporation/registrationand business
Effectivepercentage ofownershipinterest
attributableto the Group
PrincipalActivities
Sabana Investment Partners Pte.Ltd. . . . . . . . . . . . . . . . . . . . . . . . . Ordinary shares Singapore 42.8 Investment holding
Note:On 28 June 2019, the Group has, through its wholly-owned subsidiary Infinitysub Pte. Ltd., completed the acquisition of 51%interest in Sabana Investment Partners Pte. Ltd. (“SIP”) from Vibrant Group Limited (Vibrant). The Group previously has 42.8%interest in SIP. After the acquisition, the Group accounts for its 93.8% interest in SIP as an investment in subsidiary (Note 35).
17. FINANCIAL ASSETS AT FAIR VALUE THROUGH PROFIT OR LOSS
As at December 31 As at June 30
2016 2017 2018 2019
USD’000 USD’000 USD’000 USD’000
Unquoted equity interests, at fair value(i) . . . . . . . . . . . . . . . 140,577 292,982 335,771 504,903Listed equity investments, at market value(ii) . . . . . . . . . . . . — 69,091 — —
140,577 362,073 335,771 504,903
Notes:(i) The fair value of these investments is estimated based on the Group’s share of the net asset value of the investment funds and
associates.
In accordance with the exemption in IAS 28 Investments in associates, the Group does not account for its investments inassociates and joint ventures using equity method if the Group acts as investment fund managers. Instead, the Group haselected to measure its investments in associates and joint ventures at fair value through profit or loss in accordance with IAS 39or IFRS 9. This exemption is related to the fact that fair value measurement provides more useful information for users of thefinancial statements than application of the equity method. This is an exemption from the requirement to measure interests inassociates using the equity method, rather than an exception to the scope of IAS 28 for the accounting for associates and a jointventure.
I-79
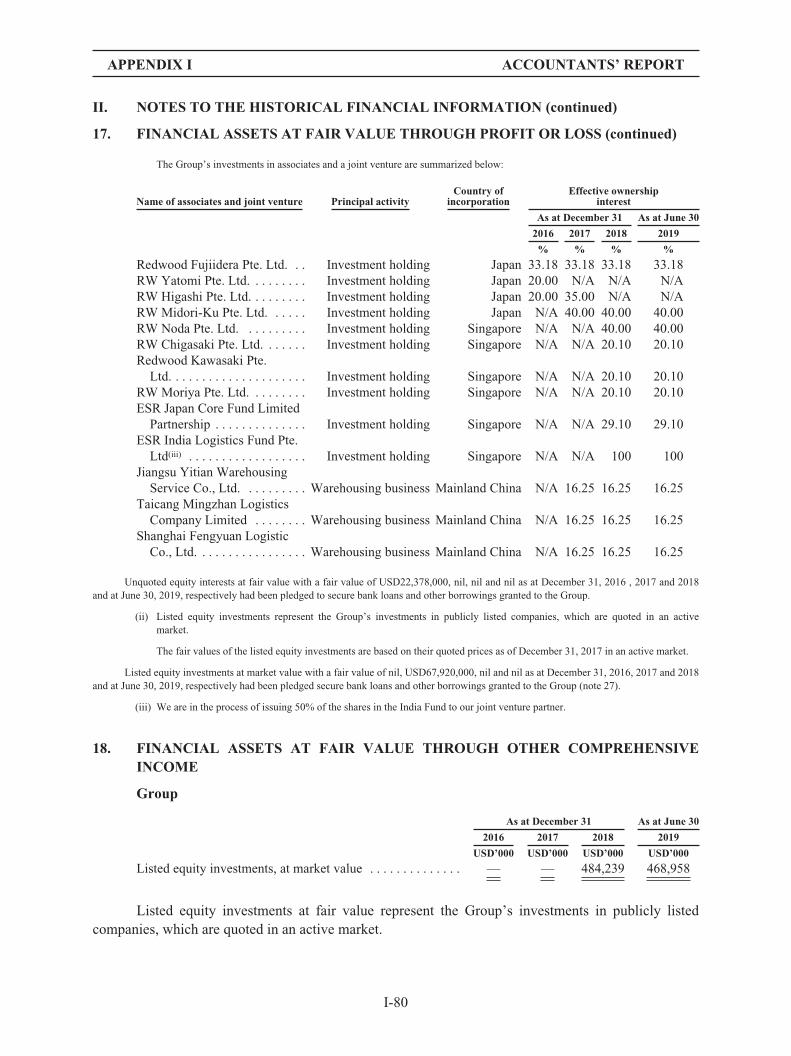
APPENDIX I ACCOUNTANTS’ REPORT
II. NOTES TO THE HISTORICAL FINANCIAL INFORMATION (continued)
17. FINANCIAL ASSETS AT FAIR VALUE THROUGH PROFIT OR LOSS (continued)
The Group’s investments in associates and a joint venture are summarized below:
Name of associates and joint venture Principal activityCountry of
incorporationEffective ownership
interest
As at December 31 As at June 30
2016 2017 2018 2019
% % % %
Redwood Fujiidera Pte. Ltd. . . Investment holding Japan 33.18 33.18 33.18 33.18RW Yatomi Pte. Ltd. . . . . . . . . Investment holding Japan 20.00 N/A N/A N/ARW Higashi Pte. Ltd. . . . . . . . . Investment holding Japan 20.00 35.00 N/A N/ARW Midori-Ku Pte. Ltd. . . . . . Investment holding Japan N/A 40.00 40.00 40.00RW Noda Pte. Ltd. . . . . . . . . . Investment holding Singapore N/A N/A 40.00 40.00RW Chigasaki Pte. Ltd. . . . . . . Investment holding Singapore N/A N/A 20.10 20.10Redwood Kawasaki Pte.
Ltd. . . . . . . . . . . . . . . . . . . . . Investment holding Singapore N/A N/A 20.10 20.10RW Moriya Pte. Ltd. . . . . . . . . Investment holding Singapore N/A N/A 20.10 20.10ESR Japan Core Fund Limited
Partnership . . . . . . . . . . . . . . Investment holding Singapore N/A N/A 29.10 29.10ESR India Logistics Fund Pte.
Ltd(iii) . . . . . . . . . . . . . . . . . . Investment holding Singapore N/A N/A 100 100Jiangsu Yitian Warehousing
Service Co., Ltd. . . . . . . . . . Warehousing business Mainland China N/A 16.25 16.25 16.25Taicang Mingzhan Logistics
Company Limited . . . . . . . . Warehousing business Mainland China N/A 16.25 16.25 16.25Shanghai Fengyuan Logistic
Co., Ltd. . . . . . . . . . . . . . . . . Warehousing business Mainland China N/A 16.25 16.25 16.25
Unquoted equity interests at fair value with a fair value of USD22,378,000, nil, nil and nil as at December 31, 2016 , 2017 and 2018and at June 30, 2019, respectively had been pledged to secure bank loans and other borrowings granted to the Group.
(ii) Listed equity investments represent the Group’s investments in publicly listed companies, which are quoted in an activemarket.
The fair values of the listed equity investments are based on their quoted prices as of December 31, 2017 in an active market.
Listed equity investments at market value with a fair value of nil, USD67,920,000, nil and nil as at December 31, 2016, 2017 and 2018and at June 30, 2019, respectively had been pledged secure bank loans and other borrowings granted to the Group (note 27).
(iii) We are in the process of issuing 50% of the shares in the India Fund to our joint venture partner.
18. FINANCIAL ASSETS AT FAIR VALUE THROUGH OTHER COMPREHENSIVEINCOME
Group
As at December 31 As at June 30
2016 2017 2018 2019
USD’000 USD’000 USD’000 USD’000
Listed equity investments, at market value . . . . . . . . . . . . . . — — 484,239 468,958
Listed equity investments at fair value represent the Group’s investments in publicly listedcompanies, which are quoted in an active market.
I-80

APPENDIX I ACCOUNTANTS’ REPORT
II. NOTES TO THE HISTORICAL FINANCIAL INFORMATION (continued)
18. FINANCIAL ASSETS AT FAIR VALUE THROUGH OTHER COMPREHENSIVEINCOME (continued)
Group (continued)
The gain in respect of the Group’s listed equity investments recognized in other comprehensiveincome amounted to nil, nil, USD8,544,000 and USD 31,632,000 during the years ended December 31,2016, 2017 and 2018 and the six months ended June 30, 2019.
The dividend income in respect of the Group’s listed equity investments recognized in othercomprehensive income amounted to nil, nil, USD21,390,000 and USD10,472,000 during the yearsended December 31, 2016, 2017 and 2018 and the six months ended June 30, 2019.
Listed equity investments represent the Group’s investments in publicly listed companies,which are quoted in an active market. The listed equity investments comprise:
Listed equity investments, at fairvalue
Ownership interest Fair Value
Stock Exchange As at December 31 As at June 30 As at June 30
2016 2017 2018 2019 2019
USD’000
Investment A . . . . . . . . . . . . Australia Stock Exchange Nil 20% 20% Nil —Investment B . . . . . . . . . . . . Australia Stock Exchange Nil 15% 15% 15% 69,786Investment C . . . . . . . . . . . . Hong Kong Exchanges and
Clearing Limited Nil Nil 13% 14% 162,262Investment D . . . . . . . . . . . . Singapore exchange
securities trading limited Nil 9% 13% 9% 116,104Investment E . . . . . . . . . . . . Singapore exchange
securities trading limited Nil Nil 5% 5% 39,096Investment F . . . . . . . . . . . . Singapore exchange
securities trading limited Nil 5% 9% 23% 81,710Investment G . . . . . . . . . . . . Singapore exchange
securities trading limited Nil 3% Nil Nil —
The above equity investments were irrevocably designated at fair value through othercomprehensive income as the Group considers these investments to be strategic in nature.
Listed equity investments at market value with a fair value of nil, nil, USD122,176,000 andUSD167,681,000 as at December 31, 2016, 2017 and 2018 and at June 30, 2019, respectively had beenpledged to secure bank loans and other borrowings granted to the Group (note 27).
Company
As at December 31 As at June 30
2016 2017 2018 2019
USD’000 USD’000 USD’000 USD’000
Listed equity investments, at market value . . . . . . . . . . . . . . . — — 32,549 33,122
Listed equity investments represent the Company’s investments in publicly listed companies,which are quoted in active markets.
The fair values of the listed equity investments are based on their quoted prices as ofDecember 31, 2018 and June 30, 2019 in active markets.
I-81

APPENDIX I ACCOUNTANTS’ REPORT
II. NOTES TO THE HISTORICAL FINANCIAL INFORMATION (continued)
19. AVAILABLE-FOR-SALE INVESTMENTS
Group
As at December 31 As at June 30
2016 2017 2018 2019
USD’000 USD’000 USD’000 USD’000
Unquoted equity interests, at fair value . . . . . . . . . . . . . . . . . 1,131 — — —Unquoted equity investments, at cost (i) . . . . . . . . . . . . . . . . 361 8,327 — —Listed equity investments, at market value (ii) . . . . . . . . . . . — 181,489 — —
1,492 189,816 — —
Notes:(i) Available-for-sale assets, carried at cost of the Group relate to unquoted equity investments in a privately-held real estate entity
in Singapore.
These equity investments are carried at cost less accumulated impairment losses because the fair value cannot be reliablydetermined. The variability in the range of reasonable fair value estimates is significant and the probabilities of the variousestimates within the range of reasonable inputs are not sufficiently reliable to determine a fair value.
(ii) Available-for-sale assets, at fair value of the Group relates the Group’s investments in publicly listed companies, which arequoted in active markets.
The gain/(loss) in respect of the Group’s listed equity investments recognized in other comprehensive income/(loss) amountedto USD250,000, USD(10,388,000), nil and nil during the years ended December 31, 2016, 2017 and 2018 and the six monthsended June 30, 2019.
Listed equity investments at market value with a fair value of nil, USD15,673,000, nil and nil as at December 31, 2016, 2017and 2018 and June 30, 2019, respectively had been pledged to secure bank loans and other borrowings granted to the Group.
Company
As at December 31 As at June 30
2016 2017 2018 2019
USD’000 USD’000 USD’000 USD’000
Listed equity investments, at market value . . . . . . . . . . . . . . . — 543 — —
I-82

APPENDIX I ACCOUNTANTS’ REPORT
II. NOTES TO THE HISTORICAL FINANCIAL INFORMATION (continued)
20. INVESTMENT PROPERTIES
CompletedInvestmentproperties
InvestmentProperties
underconstruction Total
USD’000 USD’000 USD’000At January 1, 2016 . . . . . . . . . . . . . . . . . . . . . . . . . . . . . . . . . . . . . . 648,246 30,076 678,322Additions . . . . . . . . . . . . . . . . . . . . . . . . . . . . . . . . . . . . . . . . . . . . . . — 72,725 72,725Acquisition of subsidiaries . . . . . . . . . . . . . . . . . . . . . . . . . . . . . . . . 122,454 9,633 132,087Changes in fair values of investment properties . . . . . . . . . . . . . . . . 100,799 5,760 106,559Transfer from investment properties under construction to
completed investment properties . . . . . . . . . . . . . . . . . . . . . . . . . 25,168 (25,168) —Exchange realignment . . . . . . . . . . . . . . . . . . . . . . . . . . . . . . . . . . . . (44,656) (2,108) (46,764)
At December 31, 2016 and January 1, 2017 . . . . . . . . . . . . . . . . . . . 852,011 90,918 942,929Additions . . . . . . . . . . . . . . . . . . . . . . . . . . . . . . . . . . . . . . . . . . . . . . 25,984 122,652 148,636Acquisition of subsidiaries . . . . . . . . . . . . . . . . . . . . . . . . . . . . . . . . 64,029 72,763 136,792Changes in fair value of investment properties . . . . . . . . . . . . . . . . . 95,179 100,039 195,218Transfer from investment properties under construction to
completed investment properties . . . . . . . . . . . . . . . . . . . . . . . . . 215,635 (215,635) —Disposal of subsidiaries (note 37) . . . . . . . . . . . . . . . . . . . . . . . . . . . (295,690) — (295,690)Exchange realignment . . . . . . . . . . . . . . . . . . . . . . . . . . . . . . . . . . . . 53,534 7,784 61,318
At December 31, 2017 and January 1, 2018 . . . . . . . . . . . . . . . . . . . 1,010,682 178,521 1,189,203Additions . . . . . . . . . . . . . . . . . . . . . . . . . . . . . . . . . . . . . . . . . . . . . . 4,287 94,897 99,184Acquisition of subsidiaries (note 35) . . . . . . . . . . . . . . . . . . . . . . . . 467,959 25,699 493,658Changes in fair values of investment properties . . . . . . . . . . . . . . . . 109,688 62,779 172,467Transfer from investment properties under construction to
completed investment properties . . . . . . . . . . . . . . . . . . . . . . . . . 45,801 (45,801) —Disposal of subsidiaries (note 37) . . . . . . . . . . . . . . . . . . . . . . . . . . . (514) — (514)Exchange realignment . . . . . . . . . . . . . . . . . . . . . . . . . . . . . . . . . . . . (54,844) (13,652) (68,496)
At December 31, 2018 and January 1, 2019 . . . . . . . . . . . . . . . . . . . 1,583,059 302,443 1,885,502Additions . . . . . . . . . . . . . . . . . . . . . . . . . . . . . . . . . . . . . . . . . . . . . . 17,624 247,265 264,889Acquisition of subsidiaries (note 35) . . . . . . . . . . . . . . . . . . . . . . . . 672,022 — 672,022Changes in fair values of investment properties . . . . . . . . . . . . . . . . 26,800 76,761 103,561Transfer from investment properties under construction to
completed investment properties . . . . . . . . . . . . . . . . . . . . . . . . . 29,242 (29,242) —Transfer from completed investment properties to investment
properties under construction for redevelopment . . . . . . . . . . . . . (392,285) 392,285 —Disposal of subsidiaries (note 37) . . . . . . . . . . . . . . . . . . . . . . . . . . . (276,711) — (276,711)Exchange realignment . . . . . . . . . . . . . . . . . . . . . . . . . . . . . . . . . . . . (9,745) 16,989 7,244
At June 30, 2019 . . . . . . . . . . . . . . . . . . . . . . . . . . . . . . . . . . . . . . . . 1,650,006 1,006,501 2,656,507
(a) All completed investment properties and investment properties under construction of theGroup were revalued at December 31, 2016, 2017 and 2018 and June 30, 2019 based onvaluation performed by independent professionally qualified valuers, Beijing ColliersInternational Real Estate Valuation Co., Ltd., CBRE Valuation Pty Limited, Jones LangLaSalle Advisory Services Pty Ltd and Cushman & Wakefield K.K. at fair value. They areindustry specialist in investment property valuation.
In determining fair value, a combination of approaches and methods were used, including the DirectComparison Method and Discounted Cash Flow Method. The Direct Comparison Method is applied basedon the market prices of comparable properties. Comparable properties with similar sizes, characters andlocations were analyzed, and weighted against all respective advantages and disadvantages to arrive at thefair value of the property. The Discounted Cash Flow Method measures the value of a property by thepresent worth of the net economic benefit to be received over the life of the asset.
I-83

APPENDIX I ACCOUNTANTS’ REPORT
II. NOTES TO THE HISTORICAL FINANCIAL INFORMATION (continued)
20. INVESTMENT PROPERTIES (continued)
(b) Completed investment properties leased out under operating leases
The Group leases out completed investment properties under operating lease arrangements. Allleases run for a period of one to ten years, with an option to renew the leases after the expiry dates, atwhich time all terms will be renegotiated. The Group’s total future minimum lease receivables undernon-cancellable operating leases generated from completed investment properties are as follows:
As at December 31 As at June 30
2016 2017 2018 2019
USD’000 USD’000 USD’000 USD’000
Within one year . . . . . . . . . . . . . . . . . . . . . . . . . . . . . . . . . . 59,170 62,076 82,472 114,411In the second to fifth years, inclusive . . . . . . . . . . . . . . . . . . 145,518 179,698 207,834 271,675After five years . . . . . . . . . . . . . . . . . . . . . . . . . . . . . . . . . . . 17,807 40,520 18,667 57,341
222,495 282,294 308,973 443,427
(c) Certain of the Group’s completed investment properties and investment properties underconstruction with a fair value of USD818,048,000, USD1,013,791,000,USD1,591,741,000 and USD2,099,845,000 as at December 31, 2016, 2017 and 2018 andat June 30, 2019 were pledged to secure bank loans and other borrowings granted to theGroup as disclosed in note 27.
(d) Fair value hierarchy
The following table illustrates the fair value measurement hierarchy of the Group’s investmentproperties:
As at December 31 As at June 30
2016 2017 2018 2019
USD’000 USD’000 USD’000 USD’000
Significant observable inputs(Level 2) . . . . . . . . . . . . . 34,193 136,206 20,202 44,790Significant unobservable inputs(Level 3) . . . . . . . . . . . 908,736 1,052,997 1,865,300 2,611,717
942,929 1,189,203 1,885,502 2,656,507
The movement in fair value measurements within Level 3 during the Relevant Periods are asfollows:
As at December 31 As at June 30
2016 2017 2018 2019
USD’000 USD’000 USD’000 USD’000
At January 1 . . . . . . . . . . . . . . . . . . . . . . . . . . . . . . . . . . 666,433 908,736 1,052,997 1,865,300Additions . . . . . . . . . . . . . . . . . . . . . . . . . . . . . . . . . . . . . 46,397 117,109 51,888 245,545Acquisition of subsidiaries . . . . . . . . . . . . . . . . . . . . . . . 122,454 67,147 493,658 672,022Changes in fair value of investment properties . . . . . . . 106,559 162,967 151,271 98,316Transfer from level 2 to level 3 . . . . . . . . . . . . . . . . . . . 11,889 34,193 176,952 —Disposal of subsidiaries . . . . . . . . . . . . . . . . . . . . . . . . . — (295,690) (514) (276,711)Exchange realignment . . . . . . . . . . . . . . . . . . . . . . . . . . (44,996) 58,535 (60,952) 7,245
908,736 1,052,997 1,865,300 2,611,717
I-84

APPENDIX I ACCOUNTANTS’ REPORT
II. NOTES TO THE HISTORICAL FINANCIAL INFORMATION (continued)
20. INVESTMENT PROPERTIES (continued)
(d) Fair value hierarchy (continued)
Below is a summary of the valuation techniques used and the key inputs to the valuation ofinvestment properties:
December 31, 2016
Warehouseproperties
Discounted cash flowmethod (term andreversionarymethod)
(1) Capitalization rate(2) Market unit rent
5.65-6.25%
RMB26.00-RMB35.00per square meter permonth
December 31, 2017
Warehouseproperties
Discounted cash flowmethod (term andreversionarymethod)
(1) Capitalization rate(2) Market unit rent
5.65-6.25%
RMB23.00-RMB47.00per square meter permonth
December 31, 2018
Warehouseproperties
Discounted cash flowmethod (term andreversionarymethod)
(1) Capitalization rate(2) Market unit rent
China Properties:
(1) 5.70-6.60%(2) RMB 24.00-RMB 59.00 per squaremeter per month
Japan Property:
(1) 4.20%(2) JPY1,152 persquare meter per month
June 30, 2019
Warehouseproperties
Discounted cash flowmethod (term andreversionarymethod)
(1) Capitalization rate(2) Market unit rent
China Properties:
(1) 5.75-6.50%(2) RMB 24.00-RMB 58.80 per squaremeter per month
Japan Property:
(1) 4.10%-4.20%(2) JPY 1,150- JPY2,269 per square meterper month
Australia Property:
(1) 5.75%-9.00%(2) AUS 4.38- AUS 29per square meter permonth
I-85

APPENDIX I ACCOUNTANTS’ REPORT
II. NOTES TO THE HISTORICAL FINANCIAL INFORMATION (continued)
20. INVESTMENT PROPERTIES (continued)
(d) Fair value hierarchy (continued)
Investment properties held by the Group were valued at level 2 and level 3 listed above; thevaluation techniques are Direct Comparison Approach and Discounted Cash Flow Method (term andreversion approach), and key inputs are:
(1) Term yield: the higher the term yield, the lower the fair value
(2) Reversionary yield: the higher the reversionary yield, the lower the fair value
(3) Market unit rent: the higher the market unit rent, the higher the fair value
(4) Capitalization rate: the higher the capitalization rate, the lower the fair value
21. GOODWILLUSD’000
Cost at January 1, 2016, net of accumulated impairment . . . . . . . . . . . . . . . . . . . . . . . . . . . . . . . —Acquisition of subsidiaries (note 35) . . . . . . . . . . . . . . . . . . . . . . . . . . . . . . . . . . . . . . . . . . . . . . 210,480
Cost and net carrying amount at 31 December 2016 . . . . . . . . . . . . . . . . . . . . . . . . . . . . . . . . . . 210,480
At December 31, 2016Cost . . . . . . . . . . . . . . . . . . . . . . . . . . . . . . . . . . . . . . . . . . . . . . . . . . . . . . . . . . . . . . . . . . . . 210,480Accumulated impairment . . . . . . . . . . . . . . . . . . . . . . . . . . . . . . . . . . . . . . . . . . . . . . . . . . . —
Net carrying amount . . . . . . . . . . . . . . . . . . . . . . . . . . . . . . . . . . . . . . . . . . . . . . . . . . . . . . . 210,480
Cost at January 1, 2017, net of accumulated impairment . . . . . . . . . . . . . . . . . . . . . . . . . . . . . . . 210,480Acquisition of subsidiaries (note 35) . . . . . . . . . . . . . . . . . . . . . . . . . . . . . . . . . . . . . . . . . . . . . . 15,752
Cost and net carrying amount at December 31, 2017 . . . . . . . . . . . . . . . . . . . . . . . . . . . . . . . . . . 226,232
At December 31, 2017Cost . . . . . . . . . . . . . . . . . . . . . . . . . . . . . . . . . . . . . . . . . . . . . . . . . . . . . . . . . . . . . . . . . . . . 226,232Accumulated impairment . . . . . . . . . . . . . . . . . . . . . . . . . . . . . . . . . . . . . . . . . . . . . . . . . . . —
Net carrying amount . . . . . . . . . . . . . . . . . . . . . . . . . . . . . . . . . . . . . . . . . . . . . . . . . . . . . . . 226,232
Cost at January 1, 2018, net of accumulated impairment . . . . . . . . . . . . . . . . . . . . . . . . . . . . . . . 226,232Acquisition of subsidiaries (note 35) . . . . . . . . . . . . . . . . . . . . . . . . . . . . . . . . . . . . . . . . . . . . . . 59,150
Cost and net carrying amount at December 31, 2018 . . . . . . . . . . . . . . . . . . . . . . . . . . . . . . . . . . 285,382
At December 31, 2018Cost . . . . . . . . . . . . . . . . . . . . . . . . . . . . . . . . . . . . . . . . . . . . . . . . . . . . . . . . . . . . . . . . . . . . 285,382Accumulated impairment . . . . . . . . . . . . . . . . . . . . . . . . . . . . . . . . . . . . . . . . . . . . . . . . . . . —
Net carrying amount . . . . . . . . . . . . . . . . . . . . . . . . . . . . . . . . . . . . . . . . . . . . . . . . . . . . . . . 285,382
Cost at January 1, 2019, net of accumulated impairment . . . . . . . . . . . . . . . . . . . . . . . . . . . . . . . 285,382Acquisition of subsidiaries (note 35) . . . . . . . . . . . . . . . . . . . . . . . . . . . . . . . . . . . . . . . . . . . . . . 54,861
Cost and net carrying amount at June 30, 2019 . . . . . . . . . . . . . . . . . . . . . . . . . . . . . . . . . . . . . . 340,243
At June 30, 2019Cost . . . . . . . . . . . . . . . . . . . . . . . . . . . . . . . . . . . . . . . . . . . . . . . . . . . . . . . . . . . . . . . . . . . . 340,243Accumulated impairment . . . . . . . . . . . . . . . . . . . . . . . . . . . . . . . . . . . . . . . . . . . . . . . . . . . —
Net carrying amount . . . . . . . . . . . . . . . . . . . . . . . . . . . . . . . . . . . . . . . . . . . . . . . . . . . . . . . 340,243
I-86

APPENDIX I ACCOUNTANTS’ REPORT
II. NOTES TO THE HISTORICAL FINANCIAL INFORMATION (continued)
21. GOODWILL (continued)
Impairment testing of goodwill
As of December 31, 2016, 2017 and 2018, goodwill acquired through business combinations isallocated to Redwood asset management business cash-generating unit, Infinitysub asset managementbusiness cash-generating unit, CIP business cash-generating unit and VITM business cash-generatingunit for impairment testing.
Redwood assets management business cash-generating unit
The recoverable amount of the Redwood asset management cash-generating unit has beendetermined based on a value in use calculation using cash flow projections based on financial budgetscovering a five-year period approved by senior management. The discount rate applied to the cash flowprojections is 17%. The growth rate used to extrapolate the cash flow of the Redwood assetmanagement beyond the five-year period is 3%. This growth rate is based on the average growth rateof the management fee in which the business operates. Senior management believes that this growthrate is justified. These calculations use pre-tax cash flow projections based on financial budgetsapproved by management.
Infinitysub asset management business cash-generating unit
The recoverable amount of Infinitysub asset management business cash-generating unit hasbeen determined based on a value in use calculation using cash flow projections based on financialbudgets covering a five-year period approved by senior management. The discount rate applied to thecash flow projections is 15%. The growth rate used to extrapolate the cash flow of the Infinitysub feebusiness cash-generating unit beyond the five-year period is 3%. This growth rate is based on theaverage growth rate of the management fee in which the business operates. Senior managementbelieves that this growth rate is justified. These calculations use pre-tax cash flow projections based onfinancial budgets approved by management.
CIP business cash-generating unit
The recoverable amount of CIP business cash-generating unit has been determined based on avalue in use calculation using cash flow projections based on financial budgets covering a five-yearperiod approved by senior management. The discount rate applied to the cash flow projections is 9%.The growth rate used to extrapolate the cash flow of the CIP fee business cash-generating unit beyondthe five-year period is 0.35%. This growth rate is based on the average growth rate of the managementfee in which the fee business operates. Senior management believes that this growth rate is justified,whilst a lower multiple for the residual business units is reasonable due to the increased risk profile ofeach business unit. These calculations use pre-tax cash flow projections based on financial budgetsapproved by management.
VITM business cash-generating unit
The recoverable amount of VITM business cash-generating unit has been determined based ona value in use calculation using cash flow projections based on financial budgets covering a five-yearperiod approved by senior management. The discount rate applied to the cash flow projections is
I-87
APPENDIX I ACCOUNTANTS’ REPORT
II. NOTES TO THE HISTORICAL FINANCIAL INFORMATION (continued)
21. GOODWILL (continued)
Impairment testing of goodwill (continued)
VITM business cash-generating unit (continued)
11.1%. The growth rate used to extrapolate the cash flow of the VITM fee business cash-generatingunit beyond the five-year period is 1.2%. This growth rate is based on the average growth rate of themanagement fee in which the fee business operates. Senior management believes that this growth rateis justified, whilst a lower multiple for the residual business units is reasonable due to the increasedrisk profile of each business unit. These calculations use pre-tax cash flow projections based onfinancial budgets approved by management.
In October 2018, the Group acquired all of the issued shares of Viva Industrial TrustManagement Pte Ltd (manager of VIT). In 2019, the Group completed the consolidation of Infinitysub(manager of ESR-REIT) asset management business and VITM asset management business pursuantto merger of ESR-REIT and VIT (“VIT Merger”) in October 2018. Consequently, as of June 30, 2019,the original Infinitysub asset management business cash-generating unit and VITM business cash-generating unit have been consolidated as a single cash-generating unit namely Infinitysub assetmanagement business.
Following to acquisition of PLG Group as subsidiary of the Group in March 2019, CIP businessand PLG Group are now sharing the same management and consolidated as a single cash-generatingunits namely ESR Australia asset management business. The cash flow projections is derived based onfinancial budgets after taking into effect the consolidated cash-generating units.
As of June 30, 2019, the Group’s goodwill impairment testing is allocated to Redwood assetsmanagement business cash-generating unit, Infinitysub asset management business cash-generatingunit, ESR Australia asset management business cash-generating unit and SIP asset managementbusiness.
Redwood assets management business cash-generating unit
The recoverable amount of the Redwood assets management business cash-generating unit hasbeen determined based on a value in use calculation using cash flow projections based on financialbudgets covering a five-year period approved by senior management. The discount rate applied to thecash flow projections is 16.7%. The growth rate used to extrapolate the cash flow of the Redwood assetmanagement beyond the five-year period is 3%. This growth rate is based on the average growth rateof the management fee in which the business operates. Senior management believes that this growthrate is justified. These calculations use pre-tax cash flow projections based on financial budgetsapproved by management.
Infinitysub asset management business cash-generating unit
The recoverable amount of Infinitysub asset management business cash-generating unit hasbeen determined based on a value in use calculation using cash flow projections based on financialbudgets covering a five-year period approved by senior management. The discount rate applied to thecash flow projections is 10.5%. The growth rate used to extrapolate the cash flow of the Infinitysub fee
I-88

APPENDIX I ACCOUNTANTS’ REPORT
II. NOTES TO THE HISTORICAL FINANCIAL INFORMATION (continued)
21. GOODWILL (continued)
Impairment testing of goodwill (continued)
Infinitysub asset management business cash-generating unit (continued)
business cash-generating unit beyond the five-year period is 2.5%. This growth rate is based on theaverage growth rate of the management fee in which the business operates. Senior managementbelieves that this growth rate is justified. These calculations use pre-tax cash flow projections based onfinancial budgets approved by management.
ESR Australia asset management business cash-generating unit
The recoverable amount of ESR Australia asset management business cash-generating unit hasbeen determined based on a value in use calculation using cash flow projections based on financialbudgets covering a five-year period approved by senior management. The discount rate applied to thecash flow projections is 10.0%. The growth rate used to extrapolate the cash flow of the ESR Australiaasset management business cash-generating unit beyond the five-year period is 2.5%. This growth rateis based on the average growth rate of the management fee in which the business operates. Seniormanagement believes that this growth rate is justified. These calculations use pre-tax cash flowprojections based on financial budgets approved by management.
SIP asset management business cash-generating unit
SIP’s acquisition was completed on June 28, 2019 and hence no goodwill impairmentassessment done as of June 30, 2019
The carrying amounts of goodwill allocated to each other cash-generating units of fee businessare as follows:
Redwood asset management business
As at December 31 As at June 30
2016 2017 2018 2019
USD’000 USD’000 USD’000 USD’000
Carrying amount of goodwill . . . . . . . . . . . . . . . . . . . . . . . . 210,480 210,480 210,480 210,480
CIP business
As at December 31 As at June 30
2016 2017 2018 2019
USD’000 USD’000 USD’000 USD’000
Carrying amount of goodwill . . . . . . . . . . . . . . . . . . . . . . . . N/A N/A 40,532 N/A
VITM business
As at December 31 As at June 30
2016 2017 2018 2019
USD’000 USD’000 USD’000 USD’000
Carrying amount of goodwill . . . . . . . . . . . . . . . . . . . . . . . . N/A N/A 18,618 N/A
I-89

APPENDIX I ACCOUNTANTS’ REPORT
II. NOTES TO THE HISTORICAL FINANCIAL INFORMATION (continued)
21. GOODWILL (continued)
Impairment testing of goodwill (continued)
SIP asset management business cash-generating unit (continued)Infinitysub asset management business
As at December 31As at
June 30
2016 2017 2018 2019
USD’000 USD’000 USD’000 USD’000
Carrying amount of goodwill . . . . . . . . . . . . . . . . . . . . . . . . . . . . N/A 15,752 15,752 34,370
ESR Australia asset management business
As at December 31 As at June 30
2016 2017 2018 2019
USD’000 USD’000 USD’000 USD’000
Carrying amount of goodwill . . . . . . . . . . . . . . . . . . . . . . . . N/A N/A N/A 81,823
SIP asset management business
As at December 31 As at June 30
2016 2017 2018 2019
USD’000 USD’000 USD’000 USD’000
Carrying amount of goodwill . . . . . . . . . . . . . . . . . . . . . . . . N/A N/A N/A 13,570
Total
As at December 31 As at June 30
2016 2017 2018 2019
USD’000 USD’000 USD’000 USD’000
Carrying amount of goodwill . . . . . . . . . . . . . . . . . . . . . . . . 210,480 226,232 285,382 340,243
Assumptions were used in the value in use calculation of the Group’s cash-generating unit forthe Relevant Periods. The following describes each key assumption on which management has basedits cash flow projections to undertake impairment testing of goodwill.
Budgeted gross fee income—The basis used to determine the value assigned to the budgetedgross fee income is the average fee income achieved in the year immediately before the budget year,increased for expected market development.
Discount rates—The discount rates used are before tax and reflect specific risks relating to therelevant units.
Based on the results of the goodwill impairment testing, the recoverable amount of each cash-generating units exceeded its carrying amount are as follows:
As at December 31
2016 2017 2018
USD’000 USD’000 USD’000
Redwood assets management business . . . . . . . . . . . . . . . . . . . . . . . . . . . . 72,136 101,269 53,386Infinitysub asset management business . . . . . . . . . . . . . . . . . . . . . . . . . . . . N/A 26,406 14,326CIP business . . . . . . . . . . . . . . . . . . . . . . . . . . . . . . . . . . . . . . . . . . . . . . . . . N/A N/A 6,068VITM business . . . . . . . . . . . . . . . . . . . . . . . . . . . . . . . . . . . . . . . . . . . . . . N/A N/A 14,067
72,136 127,675 87,847
I-90
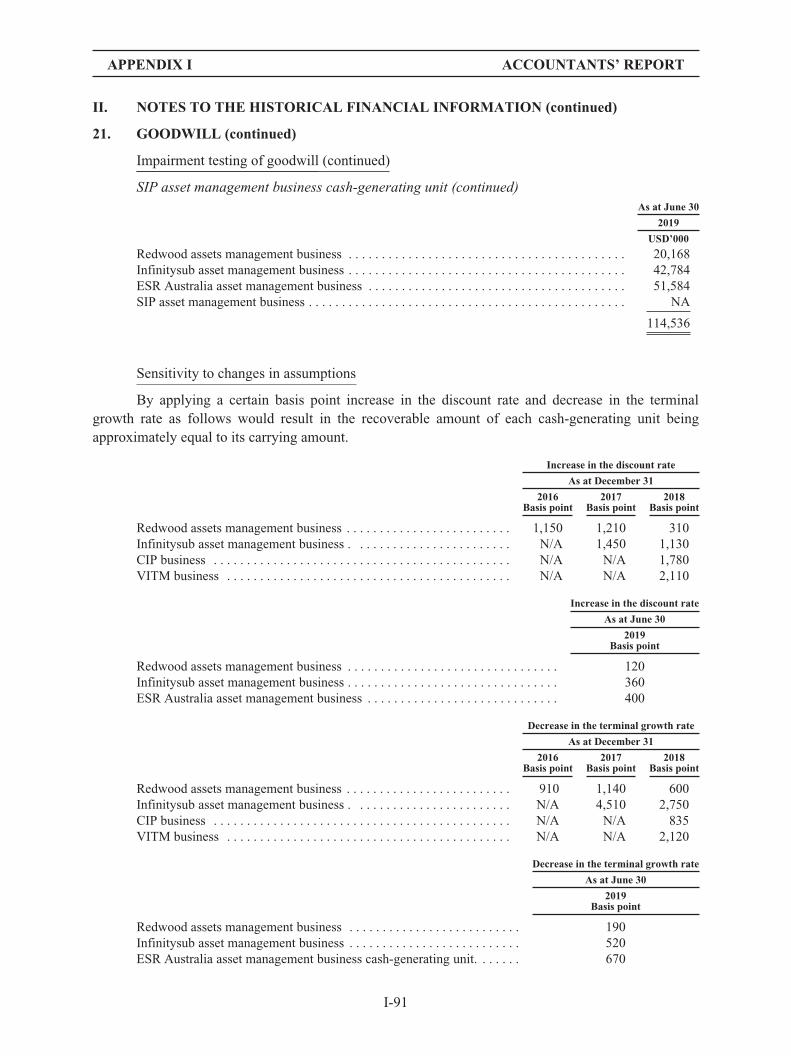
APPENDIX I ACCOUNTANTS’ REPORT
II. NOTES TO THE HISTORICAL FINANCIAL INFORMATION (continued)
21. GOODWILL (continued)
Impairment testing of goodwill (continued)
SIP asset management business cash-generating unit (continued)As at June 30
2019
USD’000
Redwood assets management business . . . . . . . . . . . . . . . . . . . . . . . . . . . . . . . . . . . . . . . . . . 20,168Infinitysub asset management business . . . . . . . . . . . . . . . . . . . . . . . . . . . . . . . . . . . . . . . . . . 42,784ESR Australia asset management business . . . . . . . . . . . . . . . . . . . . . . . . . . . . . . . . . . . . . . . 51,584SIP asset management business . . . . . . . . . . . . . . . . . . . . . . . . . . . . . . . . . . . . . . . . . . . . . . . . NA
114,536
Sensitivity to changes in assumptions
By applying a certain basis point increase in the discount rate and decrease in the terminalgrowth rate as follows would result in the recoverable amount of each cash-generating unit beingapproximately equal to its carrying amount.
Increase in the discount rate
As at December 31
2016Basis point
2017Basis point
2018Basis point
Redwood assets management business . . . . . . . . . . . . . . . . . . . . . . . . . 1,150 1,210 310Infinitysub asset management business . . . . . . . . . . . . . . . . . . . . . . . . N/A 1,450 1,130CIP business . . . . . . . . . . . . . . . . . . . . . . . . . . . . . . . . . . . . . . . . . . . . . N/A N/A 1,780VITM business . . . . . . . . . . . . . . . . . . . . . . . . . . . . . . . . . . . . . . . . . . . N/A N/A 2,110
Increase in the discount rate
As at June 30
2019Basis point
Redwood assets management business . . . . . . . . . . . . . . . . . . . . . . . . . . . . . . . . 120Infinitysub asset management business . . . . . . . . . . . . . . . . . . . . . . . . . . . . . . . . 360ESR Australia asset management business . . . . . . . . . . . . . . . . . . . . . . . . . . . . . 400
Decrease in the terminal growth rate
As at December 31
2016Basis point
2017Basis point
2018Basis point
Redwood assets management business . . . . . . . . . . . . . . . . . . . . . . . . . 910 1,140 600Infinitysub asset management business . . . . . . . . . . . . . . . . . . . . . . . . N/A 4,510 2,750CIP business . . . . . . . . . . . . . . . . . . . . . . . . . . . . . . . . . . . . . . . . . . . . . N/A N/A 835VITM business . . . . . . . . . . . . . . . . . . . . . . . . . . . . . . . . . . . . . . . . . . . N/A N/A 2,120
Decrease in the terminal growth rate
As at June 30
2019Basis point
Redwood assets management business . . . . . . . . . . . . . . . . . . . . . . . . . . 190Infinitysub asset management business . . . . . . . . . . . . . . . . . . . . . . . . . . 520ESR Australia asset management business cash-generating unit. . . . . . . 670
I-91

APPENDIX I ACCOUNTANTS’ REPORT
II. NOTES TO THE HISTORICAL FINANCIAL INFORMATION (continued)
21. GOODWILL (continued)
Sensitivity to changes in assumptions (continued)
Any reasonably possible change in the key assumptions on which the recoverable amount isbased would not cause the carrying amount of the cash-generating unit to exceed its recoverableamount.
22. OTHER INTANGIBLE ASSETS
Group
SoftwareManagementcontracts Total
USD’000 USD’000 USD’000
December 31, 2016Cost at January 1, 2016, net of accumulated amortization . . . . . . . . . . . 10 — 10Additions . . . . . . . . . . . . . . . . . . . . . . . . . . . . . . . . . . . . . . . . . . . . . . . . . 160 — 160Acquisition of subsidiaries (note 33) . . . . . . . . . . . . . . . . . . . . . . . . . . . . — 28,681 28,681Amortization provided during the year . . . . . . . . . . . . . . . . . . . . . . . . . . (43) (3,756) (3,799)Exchange realignment . . . . . . . . . . . . . . . . . . . . . . . . . . . . . . . . . . . . . . . (4) — (4)
At December 31, 2016 . . . . . . . . . . . . . . . . . . . . . . . . . . . . . . . . . . . . . . . 123 24,925 25,048
SoftwareManagementcontracts
Trustmanagementrights withindefiniteuseful life Total
USD’000 USD’000 USD’000 USD’000(note (i))
December 31, 2017Cost at January 1, 2017, net of accumulated
amortization . . . . . . . . . . . . . . . . . . . . . . . . . . . . . . . . . . 123 24,925 — 25,048Additions . . . . . . . . . . . . . . . . . . . . . . . . . . . . . . . . . . . . . . 603 — — 603Acquisition of subsidiaries (note 33) . . . . . . . . . . . . . . . . . — — 26,725 26,725Amortization provided during the year . . . . . . . . . . . . . . . (107) (4,097) — (4,204)Exchange realignment . . . . . . . . . . . . . . . . . . . . . . . . . . . . 9 — — 9
At December 31, 2017 . . . . . . . . . . . . . . . . . . . . . . . . . . . . 628 20,828 26,725 48,181
SoftwareManagementcontracts
Trustmanagementrights withindefiniteuseful life
Customercontracts Total
USD’000 USD’000 USD’000 USD’000 USD’000(note (ii))
December 31, 2018Cost at January 1, 2018, net of accumulated
amortization . . . . . . . . . . . . . . . . . . . . . . . . . 628 20,828 26,725 — 48,181Additions . . . . . . . . . . . . . . . . . . . . . . . . . . . . . 499 — — — 499Acquisition of subsidiaries (note 33) . . . . . . . . — — 31,670 6,075 37,745Disposal . . . . . . . . . . . . . . . . . . . . . . . . . . . . . . — — — (2,047) (2,047)Amortization provided during the year . . . . . . (266) (4,097) — (726) (5,089)Exchange realignment . . . . . . . . . . . . . . . . . . . (14) — 374 (156) 204
At December 31, 2018 . . . . . . . . . . . . . . . . . . . 847 16,731 58,769 3,146 79,493
I-92

APPENDIX I ACCOUNTANTS’ REPORT
II. NOTES TO THE HISTORICAL FINANCIAL INFORMATION (continued)
22. OTHER INTANGIBLE ASSETS (continued)
Group (continued)
SoftwareManagementcontracts
Trustmanagementrights withindefiniteuseful life
Customercontracts Others Total
USD’000 USD’000 USD’000 USD’000 USD’000 USD’000(note iii) (note iv)
June 30, 2019Cost at January 1, 2019, net of
accumulated amortization . . . . . . 847 16,731 58,769 3,146 — 79,493Additions . . . . . . . . . . . . . . . . . . . . . 36 — — — 683 719Acquisition of subsidiaries
(note 35) . . . . . . . . . . . . . . . . . . . . — 4,039 15,364 — — 19,403Amortization provided during the
period . . . . . . . . . . . . . . . . . . . . . . (206) (2,285) — (543) — (3,034)Exchange realignment . . . . . . . . . . . 8 — 228 (107) — 129
At June 30, 2019 . . . . . . . . . . . . . . . . 685 18,485 74,361 2,496 683 96,710
Company
Software
USD’000
December 31, 2017Cost at January 1, 2017, net of accumulated amortization . . . . . . . . . . . . . . . . . . . . . . . . . . . . . . —Additions . . . . . . . . . . . . . . . . . . . . . . . . . . . . . . . . . . . . . . . . . . . . . . . . . . . . . . . . . . . . . . . . . . . . 235Amortization provided during the year . . . . . . . . . . . . . . . . . . . . . . . . . . . . . . . . . . . . . . . . . . . . . (8)
At December 31, 2017 . . . . . . . . . . . . . . . . . . . . . . . . . . . . . . . . . . . . . . . . . . . . . . . . . . . . . . . . . . 227
Software
USD’000
December 31, 2018Cost at January 1, 2018, net of accumulated amortization . . . . . . . . . . . . . . . . . . . . . . . . . . . . . . 227Additions . . . . . . . . . . . . . . . . . . . . . . . . . . . . . . . . . . . . . . . . . . . . . . . . . . . . . . . . . . . . . . . . . . . . 312Amortization provided during the year . . . . . . . . . . . . . . . . . . . . . . . . . . . . . . . . . . . . . . . . . . . . . (107)
At December 31, 2018 . . . . . . . . . . . . . . . . . . . . . . . . . . . . . . . . . . . . . . . . . . . . . . . . . . . . . . . . . . 432
Software
USD’000
June 30, 2019Cost at January 1, 2019, net of accumulated amortization . . . . . . . . . . . . . . . . . . . . . . . . . . . . . . 432Amortization provided during the period . . . . . . . . . . . . . . . . . . . . . . . . . . . . . . . . . . . . . . . . . . . (95)
At June 30, 2019 . . . . . . . . . . . . . . . . . . . . . . . . . . . . . . . . . . . . . . . . . . . . . . . . . . . . . . . . . . . . . . 337
(i) In January 2017, the Group has acquired Infinitysub Pte. Ltd. (“Infinitysub”), an assetmanagement company providing trust management and property management service inSingapore. The trust management is expected to continuously contribute to the net cashinflow of the Group.
I-93

APPENDIX I ACCOUNTANTS’ REPORT
II. NOTES TO THE HISTORICAL FINANCIAL INFORMATION (continued)
22. OTHER INTANGIBLE ASSETS (continued)
Company (continued)
Impairment testing of other intangible assets—trust management rights
The Group’s trust management rights have indefinite useful lives and are allocated to theGroup’s Infinitysub Business, which is treated as a cash-generating unit for impairment testing. Furtherdetails of the impairment test of Infinitysub Business cash-generating unit are given in note 21.
(ii) In October 2018, the Group has acquired Viva Industrial Trust Management Pte.Ltd.(“VITM”), an asset management company providing trust management services inSingapore. The trust management services are expected to continuously contribute to thenet cash inflow of the Group.
Impairment testing of other intangible assets – trust management rights
The Group’s trust management rights have indefinite useful lives and are allocated to theGroup’s VITM Business, which is treated as a cash-generating unit for impairment testing. Furtherdetails of the impairment test of VITM Business cash-generating unit are given in note 21.
(iii) In June 2019, the Group has acquired Sabana Investment Partners Pte. Ltd. (“SIP”), anasset management company providing trust management services in Singapore. The trustmanagement services are expected to continuously contribute to the net cash inflow of theGroup.
Impairment testing of other intangible assets—trust management rights
The Group’s trust management rights have indefinite useful lives and are allocated to theGroup’s SIP Business, which is treated as a cash-generating unit for impairment testing. Further detailsof the impairment test of SIP Business cash-generating unit are given in note 21.
23. OTHER NON-CURRENT ASSETS
As at December 31 As at June 30
2016 2017 2018 2019
USD’000 USD’000 USD’000 USD’000
Prepayments for financial assets at fair value through profitand loss . . . . . . . . . . . . . . . . . . . . . . . . . . . . . . . . . . . . . . . . 35,995 5,660 — —
Prepayments for acquiring land use right . . . . . . . . . . . . . . . . 2,373 7,271 23,883 23,548Rental income receivables . . . . . . . . . . . . . . . . . . . . . . . . . . . 7,800 5,179 5,376 6,443Due from other related parties . . . . . . . . . . . . . . . . . . . . . . . . 1,920 2,061 1,975 3,724Rental deposits . . . . . . . . . . . . . . . . . . . . . . . . . . . . . . . . . . . . 877 994 1,468 1,645Others . . . . . . . . . . . . . . . . . . . . . . . . . . . . . . . . . . . . . . . . . . . 807 1,544 1,659 1,653
49,772 22,709 34,361 37,013
The balances due from other related parties are non-trade in nature and non-interest-bearing.
As at December 31, 2018 and June 30, 2019, other non-current assets of the Group consideredto be of low credit risk and thus the Group has assessed that the ECL for deposits is immaterial underthe 12 months expected credit losses method.
I-94
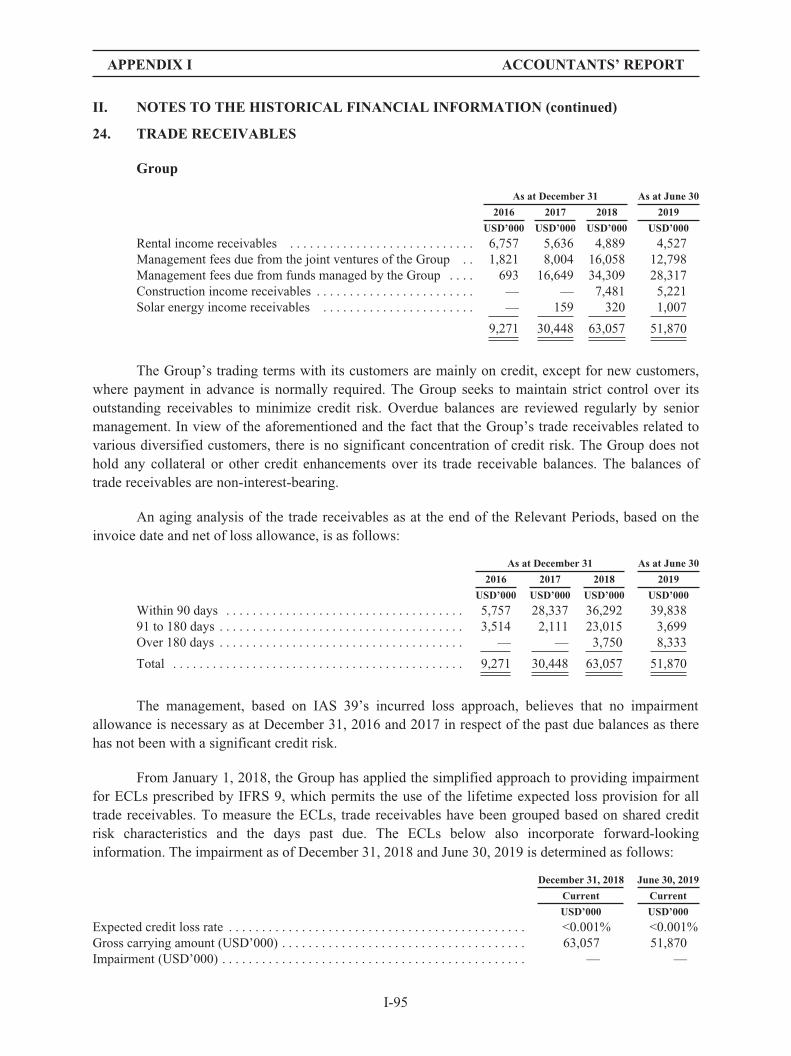
APPENDIX I ACCOUNTANTS’ REPORT
II. NOTES TO THE HISTORICAL FINANCIAL INFORMATION (continued)
24. TRADE RECEIVABLES
Group
As at December 31 As at June 30
2016 2017 2018 2019
USD’000 USD’000 USD’000 USD’000
Rental income receivables . . . . . . . . . . . . . . . . . . . . . . . . . . . . 6,757 5,636 4,889 4,527Management fees due from the joint ventures of the Group . . 1,821 8,004 16,058 12,798Management fees due from funds managed by the Group . . . . 693 16,649 34,309 28,317Construction income receivables . . . . . . . . . . . . . . . . . . . . . . . . — — 7,481 5,221Solar energy income receivables . . . . . . . . . . . . . . . . . . . . . . . — 159 320 1,007
9,271 30,448 63,057 51,870
The Group’s trading terms with its customers are mainly on credit, except for new customers,where payment in advance is normally required. The Group seeks to maintain strict control over itsoutstanding receivables to minimize credit risk. Overdue balances are reviewed regularly by seniormanagement. In view of the aforementioned and the fact that the Group’s trade receivables related tovarious diversified customers, there is no significant concentration of credit risk. The Group does nothold any collateral or other credit enhancements over its trade receivable balances. The balances oftrade receivables are non-interest-bearing.
An aging analysis of the trade receivables as at the end of the Relevant Periods, based on theinvoice date and net of loss allowance, is as follows:
As at December 31 As at June 30
2016 2017 2018 2019
USD’000 USD’000 USD’000 USD’000
Within 90 days . . . . . . . . . . . . . . . . . . . . . . . . . . . . . . . . . . . . 5,757 28,337 36,292 39,83891 to 180 days . . . . . . . . . . . . . . . . . . . . . . . . . . . . . . . . . . . . . 3,514 2,111 23,015 3,699Over 180 days . . . . . . . . . . . . . . . . . . . . . . . . . . . . . . . . . . . . . — — 3,750 8,333
Total . . . . . . . . . . . . . . . . . . . . . . . . . . . . . . . . . . . . . . . . . . . . 9,271 30,448 63,057 51,870
The management, based on IAS 39’s incurred loss approach, believes that no impairmentallowance is necessary as at December 31, 2016 and 2017 in respect of the past due balances as therehas not been with a significant credit risk.
From January 1, 2018, the Group has applied the simplified approach to providing impairmentfor ECLs prescribed by IFRS 9, which permits the use of the lifetime expected loss provision for alltrade receivables. To measure the ECLs, trade receivables have been grouped based on shared creditrisk characteristics and the days past due. The ECLs below also incorporate forward-lookinginformation. The impairment as of December 31, 2018 and June 30, 2019 is determined as follows:
December 31, 2018 June 30, 2019
Current Current
USD’000 USD’000
Expected credit loss rate . . . . . . . . . . . . . . . . . . . . . . . . . . . . . . . . . . . . . . . . . . . . . <0.001% <0.001%Gross carrying amount (USD’000) . . . . . . . . . . . . . . . . . . . . . . . . . . . . . . . . . . . . . 63,057 51,870Impairment (USD’000) . . . . . . . . . . . . . . . . . . . . . . . . . . . . . . . . . . . . . . . . . . . . . . — —
I-95

APPENDIX I ACCOUNTANTS’ REPORT
II. NOTES TO THE HISTORICAL FINANCIAL INFORMATION (continued)
25. PREPAYMENTS, OTHER RECEIVABLES AND OTHER ASSETS
Group
As at December 31 As at June 30
2016 2017 2018 2019
USD’000 USD’000 USD’000 USD’000
Deposits for acquisition . . . . . . . . . . . . . . . . . . . . . . . . . . . . . 12,618 6,456 19,917 11,655Due from related parties . . . . . . . . . . . . . . . . . . . . . . . . . . . . . 5,426 7,507 15,911 18,767Receivable from funds . . . . . . . . . . . . . . . . . . . . . . . . . . . . . . — — 99,212 80,186Prepayments on behalf of funds . . . . . . . . . . . . . . . . . . . . . . . — 8,563 46,938 26,835Prepayments to suppliers . . . . . . . . . . . . . . . . . . . . . . . . . . . . 1,372 1,278 4,355 7,246Dividend receivable . . . . . . . . . . . . . . . . . . . . . . . . . . . . . . . . — 4,813 4,362 4,402Contract assets . . . . . . . . . . . . . . . . . . . . . . . . . . . . . . . . . . . . — — 5,048 3,824Deductible value added tax . . . . . . . . . . . . . . . . . . . . . . . . . . — 4,917 4,849 12,250Insurance compensation receivable . . . . . . . . . . . . . . . . . . . . — — 8,617 8,830Other receivable . . . . . . . . . . . . . . . . . . . . . . . . . . . . . . . . . . . 2,868 3,605 15,464 25,308
22,284 37,139 224,673 199,303
CompanyAs at December 31 As at June 30
2016 2017 2018 2019
USD’000 USD’000 USD’000 USD’000
Loans and receivables(note(i)) . . . . . . . . . . . . . . . . . . . . . — — 174,000 174,000Due from related parties . . . . . . . . . . . . . . . . . . . . . . . . . . 1,560 75,881 123,170 143,604Due from subsidiaries . . . . . . . . . . . . . . . . . . . . . . . . . . . . 412,700 645,108 1,145,295 1,590,080Other receivables . . . . . . . . . . . . . . . . . . . . . . . . . . . . . . . . 722 797 10,297 13,016
414,982 721,786 1,452,762 1,920,700
Note(i) Pursuant to the loan agreements with a wholly-owned subsidiary of the Group, the Company provided loans to this subsidiary
with total amount of USD174,000,000 in 2018. The loans are unsecured, interest-free and payable on demand.
The amounts due from related parties are unsecured, interest-free and payable on demand.
Most of the above assets is neither past due nor impaired. The financial assets included in theabove balances related to receivables for which there was no recent history of default.
As at December 31, 2018 and June 30, 2019, other receivables of the Group considered to be oflow credit risk and thus the Group has assessed that the ECL for other receivables is immaterial underthe 12 months expected losses method.
I-96

APPENDIX I ACCOUNTANTS’ REPORT
II. NOTES TO THE HISTORICAL FINANCIAL INFORMATION (continued)
26. CASH AND BANK BALANCES
Group
As at December 31 As at June 30
2016 2017 2018 2019
USD’000 USD’000 USD’000 USD’000
Cash and bank balances . . . . . . . . . . . . . . . . . . . . . . . . . . . . 411,765 526,988 502,056 929,232Non-pledged fixed time deposits with maturity period
within three months . . . . . . . . . . . . . . . . . . . . . . . . . . . . . — — — 14,387Non-pledged fixed time deposits with maturity period over
three months . . . . . . . . . . . . . . . . . . . . . . . . . . . . . . . . . . . — — 15,318 —Restricted bank balances . . . . . . . . . . . . . . . . . . . . . . . . . . . — — 19,294 22,060Pledged bank deposits . . . . . . . . . . . . . . . . . . . . . . . . . . . . . 73,780 73,803 44,711 44,711
485,545 600,791 581,379 1,010,390
Company
As at December 31 As at June 30
2016 2017 2018 2019
USD’000 USD’000 USD’000 USD’000
Cash and bank balances . . . . . . . . . . . . . . . . . . . . . . . . . . . . 318,976 414,315 230,546 447,459
The Renminbi (“RMB”) is not freely convertible into other currencies, however, underMainland China’s Foreign Exchange Control Regulations and Administration of Settlement, Sale andPayment of Foreign Exchange Regulations, the Group is permitted to exchange RMB for othercurrencies through banks authorized to conduct foreign exchange business.
Cash at banks earns interest at floating rates based on daily bank deposit rates. The bankbalances and deposits are deposited with creditworthy banks with no recent history of default. Thecarrying amounts of the cash and bank balances approximate to their fair values.
As at December 31, 2018, the fixed deposit of USD15,318,000 had a maturity date of over 180days. The balance was principal-protected and carried the rates of return ranging from 2.0% to 3.7%per annum. As at June 30, 2019, the fixed deposit of USD14,387,000 had a maturity date of within 90days. The balance was principal-protected and carried the rates of return ranging from 2.0% to 3.7%per annum.
All pledged bank deposits at the end of each of the Relevant Periods were denominated inUSD. Pledged bank deposits earn interest at interest rates stipulated by the respective financialinstitutions. The pledged bank deposits represent the amounts pledged to secure bank loans and otherborrowings granted to the Group (note 27).
As at the end of each of the Relevant Periods, cash and bank balances and deposits of theGroup and the Company considered to be of low credit risk and thus the Group has assessed that theECL for cash and bank balances is immaterial under the 12 months expected credit losses method.
I-97

II.
NOTESTO
THE
HIS
TORIC
AL
FIN
ANCIA
LIN
FORM
ATIO
N(con
tinu
ed)
27.
BANK
LOANSAND
OTHER
BORROW
INGS
Gro
up
Asat
Dec
embe
r31
,Asat
June
30,
2016
2017
2018
2019
Effec
tive
intere
stra
te(%
)M
atur
ity
USD
’000
Effec
tive
intere
stra
te(%
)M
atur
ity
USD
’000
Effec
tive
intere
stra
te(%
)M
atur
ity
USD
’000
Effec
tive
intere
stra
te(%
)M
atur
ity
USD
’000
Cur
rent
Ban
kloan
s—secu
red
....
.2.4-5.32
2017
75,862
2.4-6.5
2018
91,706
0.59
52-6.875
2019
138,95
30.59
52-6.175
2019
-202
017
9,08
0Ban
kloan
s—un
secu
red
...
——
—3.6
2020
151,77
2Other borrow
ing—
secu
red..
..—
—7.6
2019
297,24
17.6
2019
299,28
3
75,862
91,706
436,19
463
0,13
5
Non
-cur
rent
Ban
kloan
s—secu
red
....
.2.4-6.520
18-202
947
9,69
21.87
5-6.87
520
19-202
944
3,64
60.59
52-6.875
2020
-203
51,00
5,25
90.59
52-6.765
820
20-203
51,50
1,35
2Ban
kloan
s—un
secu
red
...
——
—5.43
720
2299
,056
Other borrow
ing—
secu
red..
..7.6
2019
279,71
17.6
2019
298,08
36.020
20-202
319
,020
920
2319
,026
Other
borrow
ing—
unsecu
red..
....
....
..—
——
10-1220
20-202
451
,866
Bon
d—un
secu
red
....
...
——
—6.75
-7.875
2022
502,30
1
759,40
374
1,72
91,02
4,27
92,17
3,60
1
835,26
583
3,43
51,46
0,47
32,80
3,73
6
Ana
lyze
dinto:
Asat
Dec
embe
r31
Asat
June
30
2016
2017
2018
2019
USD
’000
USD
’000
USD
’000
USD
’000
Ban
kloan
san
dothe
rbo
rrow
ings
repa
yable
Withinon
eye
ar..
....
....
....
....
....
....
....
....
....
....
....
....
....
....
....
....
....
.75
,862
91,706
436,19
463
0,13
5Ove
ron
eye
ar..
....
....
....
....
....
....
....
....
....
....
....
....
....
....
....
....
....
..75
9,40
374
1,72
91,02
4,27
92,17
3,60
1
835,26
583
3,43
51,46
0,47
32,80
3,73
6
I-98
APPENDIX I ACCOUNTANTS’ REPORT

II.
NOTESTO
THE
HIS
TORIC
AL
FIN
ANCIA
LIN
FORM
ATIO
N(con
tinu
ed)
27.
BANK
LOANSAND
OTHER
BORROW
INGS(con
tinu
ed)
Com
pany
Asat
Dec
embe
r31
,Asat
June
30,
2016
2017
2018
2019
Effec
tive
intere
stra
te(%
)M
atur
ity
USD
’000
Effec
tive
intere
stra
te(%
)M
atur
ity
USD
’000
Effec
tive
intere
stra
te(%
)M
atur
ity
USD
’000
Effec
tive
intere
stra
te(%
)M
atur
ity
USD
’000
Cur
rent
Ban
kloan
s—secu
red
....
....
2.4
2017
42,450
3.2
2018
42,450
4.1
2019
42,450
3.6-4.1
2019
-202
042
,450
Ban
kloan
s—un
secu
red
....
..—
——
3.6
2020
151,77
2Other
borrow
ing—
secu
red
...
——
7.6
2019
297,24
17.6
2019
298,69
1
42,450
42,450
339,69
149
2,91
3
Non
-cur
rent
Ban
kloan
s—un
secu
red
....
..—
——
5.43
720
2299
,056
Other
borrow
ing—
secu
red
...
7.6
2019
275,92
07.6
2019
298,08
3—
——
——
—Bon
d—un
secu
red
....
....
..—
——
6.75
-7.875
2022
502,30
1
275,92
029
8,08
3—
601,35
7
318,37
034
0,53
333
9,69
11,09
4,27
0
Ana
lyze
dinto:
Asat
Dec
embe
r31
Asat
June
30
2016
2017
2018
2019
USD
’000
USD
’000
USD
’000
USD
’000
Ban
kloan
san
dothe
rbo
rrow
ings
repa
yable
Withinon
eye
ar..
....
....
....
....
....
....
....
....
....
....
....
....
....
....
....
....
....
..42
,450
42,450
339,69
149
2,91
3Ove
ron
eye
ar..
....
....
....
....
....
....
....
....
....
....
....
....
....
....
....
....
....
....
275,92
029
8,08
3—
601,35
7
318,37
034
0,53
333
9,69
11,09
4,27
0
Not
e:(a)
Asat
Dec
embe
r31
,20
16,20
17an
d20
18an
dJu
ne30
,20
19,ce
rtainof
theGroup
’sco
mpleted
inve
stmen
tprop
erties
andinve
stmen
tprop
erties
unde
rco
nstruc
tion
intotalfair
valueof
USD81
8,04
8,00
0,USD1,01
3,79
1,00
0,USD1,59
1,74
1,00
0an
dUSD2,09
9,84
5,00
0(note
20(c)),resp
ective
ly,prop
erty,plan
tan
deq
uipm
entwith
aca
rry
amou
ntof
nil,
USD6,39
5,00
0,USD16
,512
,000
andUSD19
,686
,000
(note13
),resp
ective
ly,pled
gedba
nkde
posits
withan
amou
ntof
USD73
,780
,000
,USD73
,803
,000
,USD44
,711
,000
andUSD44
,711
,000
(note26
),
I-99
APPENDIX I ACCOUNTANTS’ REPORT

II.
NOTESTO
THE
HIS
TORIC
AL
FIN
ANCIA
LIN
FORM
ATIO
N(con
tinu
ed)
27.
BANK
LOANSAND
OTHER
BORROW
INGS(con
tinu
ed)
Com
pany
(con
tinu
ed)
resp
ective
ly,listed
equity
interestsat
marke
tva
luewithafair
valueof
nil,USD67
,920
,000
(note17
),USD12
2,17
6,00
0(note18
)an
dUSD16
7,68
1,00
0(note18
),resp
ective
ly,an
deq
uity
interestsin
theCom
pany
andce
rtainsu
bsidiaries
werepled
gedto
secu
reba
nkloan
san
dothe
rbo
rrow
ings
gran
tedto
theGroup
.(b)
InFeb
ruary20
19,the
Group
issu
edSGD35
0,00
0,00
0of
fixe
drate
notesbe
aring6.75
%pe
ran
num
which
willbe
duein
Feb
ruary20
22,a
ndin
April20
19,the
Group
issu
edUSD25
0,00
0,00
0of
fixe
drate
notesbe
aring7.87
5%pe
ran
num
which
willb
edu
eApril20
22un
deritsUSD2.0billionM
ulticu
rren
cyDeb
tIssua
nceProgram
me.
28.
LEASE
LIA
BIL
ITIE
S
Asat
Dec
embe
r31
,Asat
June
30,
2016
2017
2018
2019
Effec
tive
intere
stra
te(%
)M
atur
ity
USD
’000
Effec
tive
intere
stra
te(%
)M
atur
ity
USD
’000
Effec
tive
intere
stra
te(%
)M
atur
ity
USD
’000
Effec
tive
intere
stra
te(%
)M
atur
ity
USD
’000
Current
leaselia
bilities..
....
....
....
....
..1-5.33
2017
1,31
41-13
.25
2018
2,33
51-13
.25
2019
3,37
41-16
2019
6,09
1Non
-current
leaselia
bilities
....
....
....
....
1-5.33
2020
-202
22,93
51-13
.2520
20-203
85,62
41-13
.2520
20-203
86,31
11-16
2020
-205
518
,317
4,24
97,95
99,68
524
,408
I-100
APPENDIX I ACCOUNTANTS’ REPORT

APPENDIX I ACCOUNTANTS’ REPORT
II. NOTES TO THE HISTORICAL FINANCIAL INFORMATION (continued)
29. TRADE PAYABLES, ACCRUALS AND OTHER PAYABLES
Group
As at December 31 As at June 30
2016 2017 2018 2019
USD’000 USD’000 USD’000 USD’000
Accruals . . . . . . . . . . . . . . . . . . . . . . . . . . . . . . . . . . . . . . . . . 8,738 18,117 37,168 23,637Trade payables (note(i)) . . . . . . . . . . . . . . . . . . . . . . . . . . . . . — — 5,207 4,562Payables for purchase of property, plant and equipment and
investment properties . . . . . . . . . . . . . . . . . . . . . . . . . . . . . 9,940 22,269 15,833 27,600Staff payroll and welfare payables . . . . . . . . . . . . . . . . . . . . . 3,551 6,325 15,375 15,710Other tax payable . . . . . . . . . . . . . . . . . . . . . . . . . . . . . . . . . . 2,776 3,928 3,044 4,976Rental income received in advance . . . . . . . . . . . . . . . . . . . . 2,128 1,383 1,222 1,752Interest payable . . . . . . . . . . . . . . . . . . . . . . . . . . . . . . . . . . . 998 3,624 7,817 23,282Due to related parties . . . . . . . . . . . . . . . . . . . . . . . . . . . . . . . 972 731 2,633 3,438Due to other shareholder of a fund . . . . . . . . . . . . . . . . . . . . . — 1,378 — —Payable to a fund . . . . . . . . . . . . . . . . . . . . . . . . . . . . . . . . . . — — 16,789 2,010Others . . . . . . . . . . . . . . . . . . . . . . . . . . . . . . . . . . . . . . . . . . . 1,322 950 6,655 21,782
30,425 58,705 111,743 128,749
Note:(i) An aging analysis of the trade payables as at the end of the Relevant Periods is as follows:
As at December 31 As at June 30
2016 2017 2018 2019
USD’000 USD’000 USD’000 USD’000Within 30 days . . . . . . . . . . . . . . . . . . . . . . . . . . . . . . . . . . . . . . . . . . . . . — — 4,283 1,58430 to 60 days . . . . . . . . . . . . . . . . . . . . . . . . . . . . . . . . . . . . . . . . . . . . . . — — 881 2,978Over 60 days . . . . . . . . . . . . . . . . . . . . . . . . . . . . . . . . . . . . . . . . . . . . . . — — 43 —
Total . . . . . . . . . . . . . . . . . . . . . . . . . . . . . . . . . . . . . . . . . . . . . . . . . . . . . — — 5,207 4,562
Company
Current As at December 31 As at June 30
2016 2017 2018 2019
USD’000 USD’000 USD’000 USD’000
Accruals . . . . . . . . . . . . . . . . . . . . . . . . . . . . . . . . . . . . . 1,985 2,753 5,199 15,494Interest payable . . . . . . . . . . . . . . . . . . . . . . . . . . . . . . . . 189 2,397 2,234 15,066Due to subsidiaries . . . . . . . . . . . . . . . . . . . . . . . . . . . . . — — 48,554 47,444Due to related parties . . . . . . . . . . . . . . . . . . . . . . . . . . . 45,935 36,334 — —Others . . . . . . . . . . . . . . . . . . . . . . . . . . . . . . . . . . . . . . . — — — 113
48,109 41,484 55,987 78,117
The amount due to related parties are non-trade in nature, unsecured, interest-free and payableon demand.
Non-Current As at December 31 As at June 30
2016 2017 2018 2019
USD’000 USD’000 USD’000 USD’000
Due to a subsidiary . . . . . . . . . . . . . . . . . . . . . . . . . . . . . — — 495,000 495,000
I-101

APPENDIX I ACCOUNTANTS’ REPORT
II. NOTES TO THE HISTORICAL FINANCIAL INFORMATION (continued)
29. TRADE PAYABLES, ACCRUALS AND OTHER PAYABLES (continued)
Company (continued)
Non-Current (continued)
The non-current amount due to a subsidiary are unsecured, with interest for a period of36 months at an interest rate of LIBOR plus 1.25 percent.
30. DEFERRED TAX
The movements in deferred tax assets during the Relevant Periods are as follows:
Year ended December 31 2016
Lossesavailable foroffsetting
against futuretaxableprofits
Employeebenefitpayable
Accruedexpense Others Total
USD’000 USD’000 USD’000 USD’000 USD’000
At January 1, 2016 . . . . . . . . . . . . . . . . . . . . . . . . . . . . . . . 5,779 492 — 87 6,358Deferred tax credited/(charged) to the profit or loss
during the year . . . . . . . . . . . . . . . . . . . . . . . . . . . . . . . . 755 (13) 300 60 1,102Acquisition of subsidiaries (note 35) . . . . . . . . . . . . . . . . . 2,290 — — — 2,290Exchange realignment . . . . . . . . . . . . . . . . . . . . . . . . . . . . (394) (31) (9) (7) (441)
Deferred tax assets at December 31, 2016 . . . . . . . . . . . 8,430 448 291 140 9,309
Year ended December 31 2017
Lossesavailable foroffsetting
against futuretaxableprofits
Employeebenefitpayable
Accruedexpense Others Total
USD’000 USD’000 USD’000 USD’000 USD’000
At January 1, 2017 . . . . . . . . . . . . . . . . . . . . . . . . . . . . . . . 8,430 448 291 140 9,309Deferred tax credited/(charged) to the profit or loss
during the year . . . . . . . . . . . . . . . . . . . . . . . . . . . . . . . . (338) 303 1,072 718 1,755Disposal of subsidiaries (note 37) . . . . . . . . . . . . . . . . . . . (1,305) — — (16) (1,321)Exchange realignment . . . . . . . . . . . . . . . . . . . . . . . . . . . . 492 37 51 30 610
Deferred tax assets at December 31, 2017 . . . . . . . . . . . 7,279 788 1,414 872 10,353
Year ended December 31 2018
Lossesavailable foroffsetting
against futuretaxableprofits
Employeebenefitpayable
Accruedexpense Others Total
USD’000 USD’000 USD’000 USD’000 USD’000
At January 1, 2018 . . . . . . . . . . . . . . . . . . . . . . . . . . . . . . . 7,279 788 1,414 872 10,353Deferred tax credited/(charged) to the profit or loss
during the year . . . . . . . . . . . . . . . . . . . . . . . . . . . . . . . . 4,226 (778) (677) 29 2,800Acquisition of subsidiaries (note 35) . . . . . . . . . . . . . . . . . 1,037 — — — 1,037Exchange realignment . . . . . . . . . . . . . . . . . . . . . . . . . . . . (530) (10) (46) (45) (631)
Deferred tax assets at December 31, 2018 . . . . . . . . . . . 12,012 — 691 856 13,559
I-102

APPENDIX I ACCOUNTANTS’ REPORT
II. NOTES TO THE HISTORICAL FINANCIAL INFORMATION (continued)
30. DEFERRED TAX (continued)
The movements in deferred tax assets during the Relevant Periods are as follows (continued):
Six months ended June 30 2019
Lossesavailable foroffsetting
against futuretaxableprofits
Employeebenefitpayable
Accruedexpense Others Total
USD’000 USD’000 USD’000 USD’000 USD’000
At January 1, 2019 . . . . . . . . . . . . . . . . . . . . . . . . . . . . . . . 12,012 — 691 856 13,559Acquisition of subsidiaries (note 35) . . . . . . . . . . . . . . . . . 4,731 31 56 38 4,856Deferred tax credited/(charged) to the profit or loss
during the period . . . . . . . . . . . . . . . . . . . . . . . . . . . . . . (479) 237 (241) 76 (407)Disposal of subsidiaries (note 37) . . . . . . . . . . . . . . . . . . . (1,010) — — (136) (1,146)Exchange realignment . . . . . . . . . . . . . . . . . . . . . . . . . . . . (197) (18) (3) 27 (191)
Deferred tax assets at June 30, 2019 . . . . . . . . . . . . . . . 15,057 250 503 861 16,671
The movements in deferred tax liabilities during the Relevant Periods are as follows:
Year ended December 31 2016
Fair valueadjustments ofinvestmentproperties
Gain on fairvalue changeof financialassets at fairvalue throughprofit or loss
Fair valueAdjustmentarising fromacquisition ofsubsidiaries
Unbilledrevenue Total
USD’000 USD’000 USD’000 USD’000 USD’000
At January 1, 2016 . . . . . . . . . . . . . . . . . . . . . . . . 69,949 — — 2,267 72,216Deferred tax charged/(credited) to the profit or
loss during the year . . . . . . . . . . . . . . . . . . . . . . 33,474 1,947 (484) 410 35,347Acquisition of subsidiaries (note 35) . . . . . . . . . . — — 8,604 — 8,604Exchange realignment . . . . . . . . . . . . . . . . . . . . . (5,541) (62) (455) (157) (6,215)
Deferred tax liabilities at December 31,2016 . . . . . . . . . . . . . . . . . . . . . . . . . . . . . . . . . 97,882 1,885 7,665 2,520 109,952
Year ended December 31 2017
Fair valueadjustments ofinvestmentproperties
Gain on fairvalue changeof financialassets at fairvalue throughprofit or loss
Fair valueAdjustmentarising fromacquisition ofsubsidiaries
Unbilledrevenue Total
USD’000 USD’000 USD’000 USD’000 USD’000
At January 1, 2017 . . . . . . . . . . . . . . . . . . . . . . . . 97,882 1,885 7,665 2,520 109,952Deferred tax charged/(credited) to the profit or
loss during the year . . . . . . . . . . . . . . . . . . . . . . 52,328 3,691 (1,417) (638) 53,964Acquisition of subsidiaries (note 35) . . . . . . . . . . — — 2,207 — 2,207Disposal of subsidiaries (note 37) . . . . . . . . . . . . (34,035) — — (897) (34,932)Exchange realignment . . . . . . . . . . . . . . . . . . . . . 7,056 78 — 122 7,256
Deferred tax liabilities at December 31,2017 . . . . . . . . . . . . . . . . . . . . . . . . . . . . . . . . . 123,231 5,654 8,455 1,107 138,447
I-103

APPENDIX I ACCOUNTANTS’ REPORT
II. NOTES TO THE HISTORICAL FINANCIAL INFORMATION (continued)
30. DEFERRED TAX (continued)
The movements in deferred tax liabilities during the Relevant Periods are as follows (continued):
Year ended December 31 2018
Fair valueadjustments ofinvestmentproperties
Gain on fairvalue changeof financialassets at fairvalue throughprofit or loss
Fair valueAdjustmentarising fromacquisition ofsubsidiaries
Unbilledrevenue Total
USD’000 USD’000 USD’000 USD’000 USD’000
At January 1, 2018 . . . . . . . . . . . . . . . . . . . . . . . . 123,231 5,654 8,455 1,107 138,447Deferred tax charged/(credited) to the profit or
loss during the year . . . . . . . . . . . . . . . . . . . . . . 49,530 227 (2,827) (292) 46,638Acquisition of subsidiaries (note 35) . . . . . . . . . . — — 15,734 — 15,734Exchange realignment . . . . . . . . . . . . . . . . . . . . . (7,993) (291) (541) (45) (8,870)
Deferred tax liabilities at December 31,2018 . . . . . . . . . . . . . . . . . . . . . . . . . . . . . . . . . 164,768 5,590 20,821 770 191,949
Six months ended June 30 2019
Fair valueadjustments ofinvestmentproperties
Gain on fairvalue changeof financialassets at fairvalue throughprofit or loss
Fair valueAdjustmentarising fromacquisition ofsubsidiaries
Unbilledrevenue Total
USD’000 USD’000 USD’000 USD’000 USD’000
At January 1, 2019 . . . . . . . . . . . . . . . . . . . . . . . . 164,768 5,590 20,821 770 191,949Credited/(charged) to the profit or loss . . . . . . . . 20,842 (268) (615) 693 20,652Acquisition of subsidiaries (note 35) . . . . . . . . . . — — 2,619 — 2,619Disposal of subsidiaries (note 37) . . . . . . . . . . . . (28,085) — — (430) (28,515)Exchange realignment . . . . . . . . . . . . . . . . . . . . . 244 — 50 (6) 288
Deferred tax liabilities at June 30, 2019 . . . . . . 157,769 5,322 22,875 1,027 186,993
In accordance with PRC laws and regulations, tax losses could be carried forward for five yearsto offset against future taxable profits. Deferred tax assets relating to unutilized tax losses arerecognized to the extent that it is probable that sufficient taxable profit will be available to allow suchdeferred tax assets to be utilized.
The Group had unused tax losses available for offsetting against future profits in respect ofcertain subsidiaries of USD6,547,378, USD15,961,631, USD13,626,000 and USD14,652,883 as atDecember 31, 2016, 2017, 2018 and June 30 2019, respectively, and the deferred tax assets have notbeen recognized.
No deferred tax assets have been recognized in respect of these losses due to theunpredictability of future available taxable profit of the subsidiaries to offset against the unused taxlosses. The available period of the unused tax losses will expire in one to five years for offsettingagainst future taxable profits.
Pursuant to the PRC Corporate Income Tax Law, a 10% withholding tax is levied on dividendsdeclared to foreign investors from the foreign investment enterprises established in Mainland China.The requirement becomes effective on January 1, 2008 and applies to earnings after December 31,
I-104

APPENDIX I ACCOUNTANTS’ REPORT
II. NOTES TO THE HISTORICAL FINANCIAL INFORMATION (continued)
30. DEFERRED TAX (continued)
2007. A lower withholding tax rate may be applied if there is a tax treaty between Mainland China andthe jurisdiction of the foreign investors. The Group is therefore liable to withholding taxes ondividends distributed by its subsidiaries, joint ventures and associates established in Mainland China inrespect of earnings generated from January 1, 2008.
At the end of each of the Relevant Period, no deferred tax has been recognized for withholdingtaxes that would be payable on the unremitted earnings that are subject to withholding taxes of theGroup’s subsidiaries established in Mainland China and Group’s investment in joint venture. In theopinion of the directors, it is not probable that these subsidiaries and investments in joint venture willdistribute such earnings in the foreseeable future.
The aggregate amounts of temporary differences associated with investments in subsidiaries inMainland China for which deferred tax liabilities have not been recognized totaled approximatelyUSD4,904,000, USD1,747,000, USD3,766,000 and USD3,845,000 at December 31, 2016, 2017, 2018and June 30, 2019.
31. DERIVATIVE FINANCIAL INSTRUMENTS
On December 4, 2013 and August 19, 2015, the Company entered into facility agreements witha third party, Financial Investor A, to obtain loans of USD120,000,000 (“Facility Agreements I”) andUSD100,000,000 (“Facility Agreements II”), respectively. In connection, with the above loans, theCompany issued warrant instruments to Financial Investor A for total consideration of USD70,000with a written call option in respect of the Company’s 54,684,608 ordinary shares. Upon issuance andas of December 31, 2015, the warrant instruments were accounted for as financial liabilities measuredat fair value through profit or loss. The derivative financial assets arising from the draw-downcommitments at determined interest rate had been recognized in the Group’s consolidated statement ofprofit or loss upon the application of remaining drawdown in March 2016.
On November 21, 2016, the Company fully repaid the loan under Facility Agreement I andFacility Agreement II. The directors are of the view that the derivative component of the instruments,that previously involved an obligation to deliver a variable number of equity instruments, can bedetermined and become fixed. From the date of such change in circumstances, the derivativecomponent of the instruments were reclassified from financial liability to equity during the year endedDecember 31, 2016.
On January 19, 2018, Financial Investor A exercised the written call option in respect of theCompany’s 54,684,608 ordinary shares.
32. REDEEMABLE CONVERTIBLE PREFERENCE SHARES
In December 2016, the Company issued 245,359,810 Redeemable Convertible PreferenceShares to a group of independent third parties for an aggregate consideration of USD300,000,000.
In January 2017, the Company redeemed 9,814,392 Redeemable Convertible Preference Sharesamounting to approximately USD11,400,000.
I-105

APPENDIX I ACCOUNTANTS’ REPORT
II. NOTES TO THE HISTORICAL FINANCIAL INFORMATION (continued)
32. REDEEMABLE CONVERTIBLE PREFERENCE SHARES (continued)
The Redeemable Convertible Preference Shares have a par value of USD0.001 per share, andcarried a coupon rate of 4.5% per annum. The holders are entitled to convert the RedeemableConvertible Preference Shares into the Company’s ordinary shares based on conversion ratio of 1:1under certain circumstances.
The preference shares have been split into the liability and equity components as follows:
Liabilitiescomponent
Equitycomponent Total
USD’000 USD’000 USD’000
At December 31, 2015 and January 1, 2016 . . . . . . . . . . . . . . . . . . . . . . — — —Preference shares issued during the year . . . . . . . . . . . . . . . . . . . . . . . . 261,156 38,844 300,000Direct issuing costs attributable to the liability component . . . . . . . . . . (15,000) — (15,000)
At January 1, 2017 . . . . . . . . . . . . . . . . . . . . . . . . . . . . . . . . . . . . . . . . . 246,156 38,844 285,000Redemption of redeemable convertible preference shares . . . . . . . . . . . (9,688) (1,712) (11,400)Interest accretion of the liabilities component . . . . . . . . . . . . . . . . . . . . 41,327 — 41,327Interest paid . . . . . . . . . . . . . . . . . . . . . . . . . . . . . . . . . . . . . . . . . . . . . . . (13,596) — (13,596)
At December 31, 2017 and January 1, 2018 . . . . . . . . . . . . . . . . . . . . . . 264,199 37,132 301,331Interest accretion of the liabilities component . . . . . . . . . . . . . . . . . . . . 45,610 — 45,610Interest paid . . . . . . . . . . . . . . . . . . . . . . . . . . . . . . . . . . . . . . . . . . . . . . . (13,031) — (13,031)
At December 31, 2018 and January 1, 2019 . . . . . . . . . . . . . . . . . . . . . . 296,778 37,132 333,910Interest accretion of the liabilities component . . . . . . . . . . . . . . . . . . . . 26,101 — 26,101Interest paid . . . . . . . . . . . . . . . . . . . . . . . . . . . . . . . . . . . . . . . . . . . . . . . (6,869) — (6,869)
At June 30, 2019 . . . . . . . . . . . . . . . . . . . . . . . . . . . . . . . . . . . . . . . . . . . 316,010 37,132 353,142
As at December 31 As at June 30
2016 2017 2018 2019
USD’000 USD’000 USD’000 USD’000
Liabilities component- Current portion . . . . . . . . . . . . . . . . . . . . . . . . . . . . . . . . . . — — 296,778 316,010- Non-current portion . . . . . . . . . . . . . . . . . . . . . . . . . . . . . . 246,156 264,199 — —
246,156 264,199 296,778 316,010
33. FINANCIAL LIABILITIES AT FAIR VALUE THROUGH PROFIT OR LOSSAs at December 31 As at June 30
2016 2017 2018 2019
USD’000 USD’000 USD’000 USD’000
Loan from a third party . . . . . . . . . . . . . . . . . . . . . . . . . . . . . . 12,592 13,671 — —
Pursuant to the loan agreement dated August 28, 2013 entered into by certain subsidiaries of theGroup and a third party Financial Investor B (“Loan Agreement”), and the security over sharesagreement dated August 28, 2013 entered into by a subsidiary of the Group and Financial Investor B(“Security Agreement”), the Group utilized the proceeds from the loan from Financial Investor B tosubscribe interest in Redwood Japan Logistics Fund LP (“RJLF”).
Under the Loan Agreement, all distribution proceeds from RJLF relating to the loan that havebeen invested into RJLF will be passed on to Financial Investor B. As such, the loan from Financial
I-106

APPENDIX I ACCOUNTANTS’ REPORT
II. NOTES TO THE HISTORICAL FINANCIAL INFORMATION (continued)
33. FINANCIAL LIABILITIES AT FAIR VALUE THROUGH PROFIT ORLOSS (continued)
Investor B was designated at fair value through profit or loss upon the initial recognition on the basisthat it is structured, managed and has its performance evaluated on a fair value basis, in accordancewith the Loan Agreement and the risk management and investment strategies of the Group.
The fair value of the loan from Financial Investor B is estimated based on the Group’s share ofthe net asset value of RJLF at the end of each of the Reporting Periods.
In 2018, the loan from Financial Investor B was disposed of to a third party for an amount ofUSD16,789,000.
34. SUBSIDIARIES WITH MATERIAL NON-CONTROLLING INTERESTS
Details of the Group’s subsidiaries that have material non-controlling interests are set outbelow:
As at December 31 As at June 30
2016 2017 2018 2019
USD’000 USD’000 USD’000 USD’000
Percentage of equity interests held by non-controllinginterests at the reporting date:
Preference shares issued by subsidiariesRedwood Fujiidera Investor Ltd.(i) . . . . . . . . . . . . . . . . . . . . . 86% 86% 86% 86%Redwood Asian Investments 2 Ltd.(ii) . . . . . . . . . . . . . . . . . . . 86% 86% 86% 86%Equity interest held by non-controlling interestsMingyue Logistics Pte Ltd.(iii) . . . . . . . . . . . . . . . . . . . . . . . . . N/A 35% 35% 35%Higashi(iv) . . . . . . . . . . . . . . . . . . . . . . . . . . . . . . . . . . . . . . . . N/A N/A 30% 30%Shanghai Yurun . . . . . . . . . . . . . . . . . . . . . . . . . . . . . . . . . . . N/A N/A N/A 26%
As at December 31 As at June 30
2016 2017 2018 2019
USD’000 USD’000 USD’000 USD’000
Profit/ (loss) for the year allocated to non-controllinginterest:
Preference shares issued by subsidiariesRedwood Fujiidera Investor Ltd.(i) . . . . . . . . . . . . . . . . . . . . . 4,619 5,384 2,966 19Redwood Asian Investments 2 Ltd.(ii) . . . . . . . . . . . . . . . . . . . 11,010 3,530 (1,209) (2,116)
15,629 8,914 1,757 (2,097)Equity interest held by non-controlling interestsMingyue Logistics Pte Ltd.(iii) . . . . . . . . . . . . . . . . . . . . . . . . . — 5,052 2,095 841Higashi(iv) . . . . . . . . . . . . . . . . . . . . . . . . . . . . . . . . . . . . . . . . — — 1,776 7,671Shanghai Yurun . . . . . . . . . . . . . . . . . . . . . . . . . . . . . . . . . . . — — — (61)
— 5,052 3,871 8,451
15,629 13,966 5,628 6,354
I-107

APPENDIX I ACCOUNTANTS’ REPORT
II. NOTES TO THE HISTORICAL FINANCIAL INFORMATION (continued)
34. SUBSIDIARIES WITH MATERIAL NON-CONTROLLING INTERESTS (continued)
As at December 31As at
June 30
2016 2017 2018 2019
USD’000 USD’000 USD’000 USD’000
Accumulated balances of non-controlling interests at thereporting date:
Preference shares issued by subsidiaries,Redwood Fujiidera Investor Ltd. (i) . . . . . . . . . . . . . . . . . . . . . . 44,005 54,704 58,979 887Redwood Asian Investments 2 Ltd. (ii) . . . . . . . . . . . . . . . . . . . . 35,421 41,991 45,114 44,047
79,426 96,695 104,093 44,934
Equity interest held by non-controlling interestsRPCIF (iii) . . . . . . . . . . . . . . . . . . . . . . . . . . . . . . . . . . . . . . . . . . — 26,812 27,464 28,308Higashi (iv) . . . . . . . . . . . . . . . . . . . . . . . . . . . . . . . . . . . . . . . . . . — — 55,066 64,184Shanghai Yurun . . . . . . . . . . . . . . . . . . . . . . . . . . . . . . . . . . . . . — — — 40,713
— 26,812 82,530 133,205
79,426 123,507 186,623 178,139
The following tables illustrate the summarized financial information of the above subsidiaries.The amounts disclosed are before any inter-company eliminations:
RedwoodFujiidera
Investor Ltd.Redwood Asian
Investments 2 Ltd.
USD’000 USD’000
2016Revenue . . . . . . . . . . . . . . . . . . . . . . . . . . . . . . . . . . . . . . . . . . . . . . . . . . . — —Total expense . . . . . . . . . . . . . . . . . . . . . . . . . . . . . . . . . . . . . . . . . . . . . . . (7,359) (2,466)Profit for the year . . . . . . . . . . . . . . . . . . . . . . . . . . . . . . . . . . . . . . . . . . . . 9,994 12,850Total comprehensive income for the year . . . . . . . . . . . . . . . . . . . . . . . . . 9,994 12,850
Current assets . . . . . . . . . . . . . . . . . . . . . . . . . . . . . . . . . . . . . . . . . . . . . . . 12,130 9,957Non-current assets . . . . . . . . . . . . . . . . . . . . . . . . . . . . . . . . . . . . . . . . . . . 41,583 35,564Current liabilities . . . . . . . . . . . . . . . . . . . . . . . . . . . . . . . . . . . . . . . . . . . . (526) (2,162)Non-current liabilities . . . . . . . . . . . . . . . . . . . . . . . . . . . . . . . . . . . . . . . . . — —
Net cash flow from/(used in) operating activities . . . . . . . . . . . . . . . . . . . 9,715 (198)Net cash flow from investing activities . . . . . . . . . . . . . . . . . . . . . . . . . . . 1,753 —Net cash flow used in financing activities . . . . . . . . . . . . . . . . . . . . . . . . . (8,814) (6,858)
Net increase/(decrease) in cash and cash equivalents . . . . . . . . . . . . . . . . 2,654 (7,056)
I-108
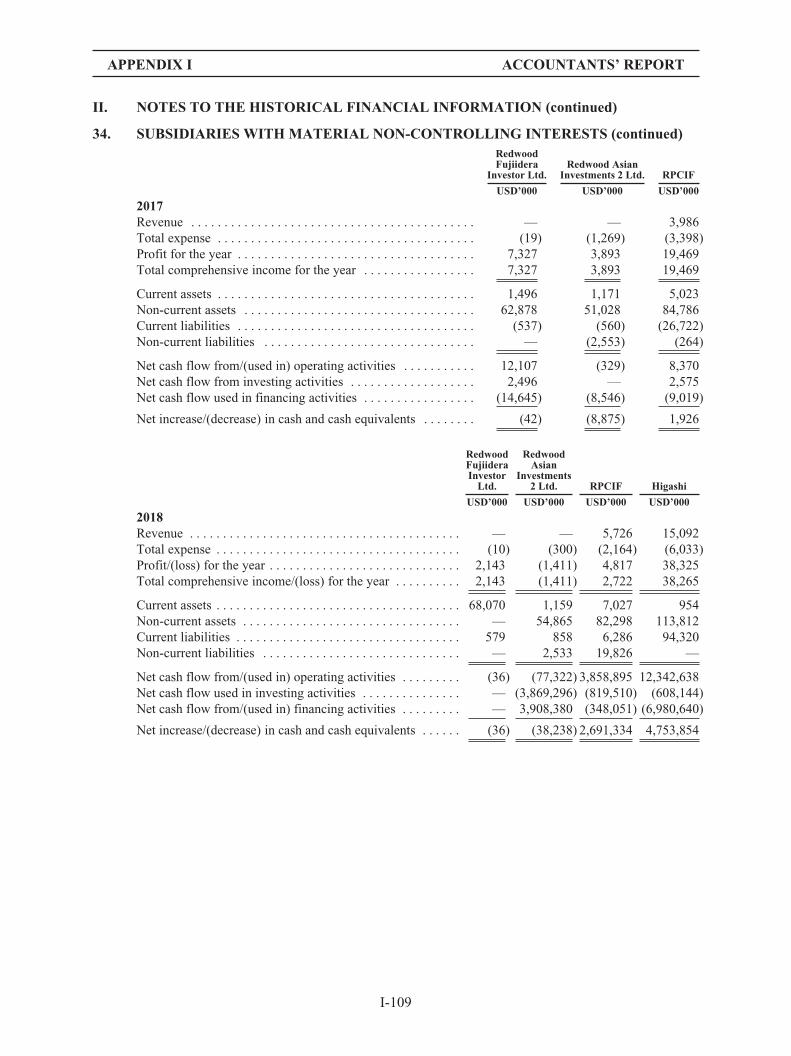
APPENDIX I ACCOUNTANTS’ REPORT
II. NOTES TO THE HISTORICAL FINANCIAL INFORMATION (continued)
34. SUBSIDIARIES WITH MATERIAL NON-CONTROLLING INTERESTS (continued)RedwoodFujiidera
Investor Ltd.Redwood Asian
Investments 2 Ltd. RPCIF
USD’000 USD’000 USD’000
2017Revenue . . . . . . . . . . . . . . . . . . . . . . . . . . . . . . . . . . . . . . . . . . . — — 3,986Total expense . . . . . . . . . . . . . . . . . . . . . . . . . . . . . . . . . . . . . . . (19) (1,269) (3,398)Profit for the year . . . . . . . . . . . . . . . . . . . . . . . . . . . . . . . . . . . . 7,327 3,893 19,469Total comprehensive income for the year . . . . . . . . . . . . . . . . . 7,327 3,893 19,469
Current assets . . . . . . . . . . . . . . . . . . . . . . . . . . . . . . . . . . . . . . . 1,496 1,171 5,023Non-current assets . . . . . . . . . . . . . . . . . . . . . . . . . . . . . . . . . . . 62,878 51,028 84,786Current liabilities . . . . . . . . . . . . . . . . . . . . . . . . . . . . . . . . . . . . (537) (560) (26,722)Non-current liabilities . . . . . . . . . . . . . . . . . . . . . . . . . . . . . . . . — (2,553) (264)
Net cash flow from/(used in) operating activities . . . . . . . . . . . 12,107 (329) 8,370Net cash flow from investing activities . . . . . . . . . . . . . . . . . . . 2,496 — 2,575Net cash flow used in financing activities . . . . . . . . . . . . . . . . . (14,645) (8,546) (9,019)
Net increase/(decrease) in cash and cash equivalents . . . . . . . . (42) (8,875) 1,926
RedwoodFujiideraInvestorLtd.
RedwoodAsian
Investments2 Ltd. RPCIF Higashi
USD’000 USD’000 USD’000 USD’000
2018Revenue . . . . . . . . . . . . . . . . . . . . . . . . . . . . . . . . . . . . . . . . . — — 5,726 15,092Total expense . . . . . . . . . . . . . . . . . . . . . . . . . . . . . . . . . . . . . (10) (300) (2,164) (6,033)Profit/(loss) for the year . . . . . . . . . . . . . . . . . . . . . . . . . . . . . 2,143 (1,411) 4,817 38,325Total comprehensive income/(loss) for the year . . . . . . . . . . 2,143 (1,411) 2,722 38,265
Current assets . . . . . . . . . . . . . . . . . . . . . . . . . . . . . . . . . . . . . 68,070 1,159 7,027 954Non-current assets . . . . . . . . . . . . . . . . . . . . . . . . . . . . . . . . . — 54,865 82,298 113,812Current liabilities . . . . . . . . . . . . . . . . . . . . . . . . . . . . . . . . . . 579 858 6,286 94,320Non-current liabilities . . . . . . . . . . . . . . . . . . . . . . . . . . . . . . — 2,533 19,826 —
Net cash flow from/(used in) operating activities . . . . . . . . . (36) (77,322) 3,858,895 12,342,638Net cash flow used in investing activities . . . . . . . . . . . . . . . — (3,869,296) (819,510) (608,144)Net cash flow from/(used in) financing activities . . . . . . . . . — 3,908,380 (348,051) (6,980,640)
Net increase/(decrease) in cash and cash equivalents . . . . . . (36) (38,238) 2,691,334 4,753,854
I-109

APPENDIX I ACCOUNTANTS’ REPORT
II. NOTES TO THE HISTORICAL FINANCIAL INFORMATION (continued)
34. SUBSIDIARIES WITH MATERIAL NON-CONTROLLING INTERESTS (continued)RedwoodFujiidera
Investor Ltd.(i)Redwood Asian
Investments 2 Ltd.(ii) RPCIF(iii) Higashi(iv)ShanghaiYurun
USD’000 USD’000 USD’000 USD’000 USD’000
June 30, 2019Revenue . . . . . . . . . . . . . . . . . . . . . . . . . . . . . — — 2,762 7,708 —Total expense . . . . . . . . . . . . . . . . . . . . . . . . 22 (2,468) (935) 17,796 312Profit/(loss) for the period . . . . . . . . . . . . . . . 22 (2,468) 1,827 25,504 (234)Total comprehensive income/(loss) for the
period . . . . . . . . . . . . . . . . . . . . . . . . . . . . 22 (2,468) 1,827 25,504 (234)
Current assets . . . . . . . . . . . . . . . . . . . . . . . . 127 1,171 8,160 25,818 53,775Non-current assets . . . . . . . . . . . . . . . . . . . . . 940 53,412 82,983 425,289 35,547Non-current liabilities . . . . . . . . . . . . . . . . . . (33) (957) (6,603) (11,867) (12,583)
Net cash flow from/(used in) operatingactivities . . . . . . . . . . . . . . . . . . . . . . . . . . (587) 490 637 5,307 (172)
Net cash flow from/(used in) investingactivities . . . . . . . . . . . . . . . . . . . . . . . . . . 682 — 1,253 — (12,377)
Net cash flow from/(used in) financingactivities . . . . . . . . . . . . . . . . . . . . . . . . . . — — (675) (4,364) 61,373
Net increase in cash and cash equivalents . . 95 490 1,215 943 48,824
Notes:(i) Pursuant to the subscription agreement dated December 18, 2014 entered into by certain subsidiaries of the Company,
including Redwood Asian Investment 1 Ltd. (“RAIL 1”), Redwood Fujiidera Investor Ltd., ESR Singapore (the “Manager”)and a third party Financial Investor C, (“Subscription Agreement”), RAIL 1 and Financial Investor C have agreed to providefunding to Redwood Fujiidera Investor Ltd. for the purpose of subscribing to interest in Redwood Fujiidera Pte. Ltd.
Prior to September 23, 2016, according to Articles of Association, there is an obligation to Redwood Fujiidera Investor Ltd. topay distributions to the preference share shareholders should distribution proceeds be received from Redwood Fujiidera Pte.Ltd. On September 23, 2016, Redwood Fujiidera Investor Ltd. made amendments to the Articles of Association and deleted theabove obligation. The preference shares meet the definition of equity afterwards. The carrying amount of the preference sharesare transferred into non-controlling interests from financial liabilities.
At December 31, 2016, 2017 and 2018 and June 30, 2019, Financial Investor C was a holder of 3,994,902,381, 4,243,902,381,4,243,902,381 and 4,243,902,381 preference shares issued by Redwood Fujiidera Investor Ltd., a Cayman Island incorporatedsubsidiary. Financial Investor C is entitled to participate pari passu with ordinary shareholders in dividends as well asdistribution upon return of capital on winding up. The dividend distribution is at the discretion of Redwood Fujiidera InvestorLtd. based on the terms of preference shares.
(ii) Pursuant to the subscription agreement dated March 5, 2015 entered into by RAIL, Financial Investor C, Redwood AsianInvestments 2 Ltd. and ESR Singapore (the “Manager”) (“Subscription Agreement”), RAIL and Financial Investor C haveagreed to provide funding to Redwood Asian Investments 2 Ltd. for the purpose of, indirectly through Redwood Nanko Pte.Ltd. and its subsidiaries, subscribing interest in RW Nankonaka TMK.
At December 31, 2016, 2017 and 2018, and June 30, 2019, Financial Investor C was a holder of 3,085,714,286, 3,085,714,286and 3,454,285,715 and 3,454,285,715 Preference A Shares issued by Redwood Asian Investments 2 Ltd., a Cayman Islandincorporated subsidiary, respectively. Financial Investor C is entitled to participate pari passu with ordinary shareholders individends as well as distribution upon return of capital on winding up. The dividend distribution is at the discretion ofRedwood Asian Investments 2 Ltd. based on the terms of preference shares.
(iii) Pursuant to the Sales and Purchase Agreement dated June 30, 2017 entered into with RAIL and Phoenix Global Real EstateSecondaries 2009 LP (“PGRE”), RPCIF became a 100% wholly owned subsidiary of RAIL and RAIL indirectly held 65% ofMingyue Logistic Pte. Ltd. which held 90% of Guangzhou Mingyue Warehousing Co., Ltd. The purchase considerationamounted to USD23,436,000.
(iv) Pursuant to the Sales and Purchase Agreement dated June 28, 2018 entered into with Redwood Investor (Higashi) Ltd. (“RWInvestor Higashi”), a wholly owned subsidiary of the Group, and Fupeng Investment Management Limited, RW InvestorHigashi acquired 35% shares of RW Higashi Pte. Ltd. (“Higashi Pte”). After the acquisition, RW Investor Higashi owned 70%shares of Higashi Pte, which became a subsidiary of the Group.
I-110

APPENDIX I ACCOUNTANTS’ REPORT
II. NOTES TO THE HISTORICAL FINANCIAL INFORMATION (continued)
35. BUSINESS COMBINATION
(a) In November 2015, the Company entered into Share Subscription and Merger Agreementwith Redwood Investment Company, Ltd. (“RIC”) and its controlling shareholders, toissue 389,933,535 ordinary shares of the Company to RIC in exchange for the 100%equity interests in ESR Singapore and RAIL (together, the “Redwood Business”). Theacquisition deal was consummated on January 20, 2016, which was evidenced by thecompletion of update of the Company’s register of members.
The Group has elected to measure the non-controlling interest in Redwood Business at theproportionate share of its interest in the acquiree’s identifiable net assets.
The fair values of the identifiable assets and liabilities of Redwood Business as at the date ofacquisition were as follows:
NotesFair value recognized on
acquisition
USD’000
Property, plant and equipment . . . . . . . . . . . . . . . . . . . . . . . . . . . . . . . . . . . 13 448Financial assets at fair value through profit and loss . . . . . . . . . . . . . . . . . . 53,255Available-for-sale investments . . . . . . . . . . . . . . . . . . . . . . . . . . . . . . . . . . . 1,195Other intangible assets . . . . . . . . . . . . . . . . . . . . . . . . . . . . . . . . . . . . . . . . . 22 28,681Other non-current assets . . . . . . . . . . . . . . . . . . . . . . . . . . . . . . . . . . . . . . . . 580Deferred tax assets . . . . . . . . . . . . . . . . . . . . . . . . . . . . . . . . . . . . . . . . . . . . 520Trade receivables . . . . . . . . . . . . . . . . . . . . . . . . . . . . . . . . . . . . . . . . . . . . . 1,278Prepayments, other receivables and other assets . . . . . . . . . . . . . . . . . . . . . 7,676Cash and bank balances . . . . . . . . . . . . . . . . . . . . . . . . . . . . . . . . . . . . . . . . 45,730Bank loans and other borrowings . . . . . . . . . . . . . . . . . . . . . . . . . . . . . . . . . (917)Trade payable, accruals and other payables . . . . . . . . . . . . . . . . . . . . . . . . . (17,662)Deferred tax liabilities . . . . . . . . . . . . . . . . . . . . . . . . . . . . . . . . . . . . . . . . . 30 (8,604)Financial liabilities at fair value through profit or loss . . . . . . . . . . . . . . . . (42,819)
Total identifiable net assets at fair value . . . . . . . . . . . . . . . . . . . . . . . . . . . 69,361
Non-controlling interests . . . . . . . . . . . . . . . . . . . . . . . . . . . . . . . . . . . . . . . (26,662)Goodwill on acquisition . . . . . . . . . . . . . . . . . . . . . . . . . . . . . . . . . . . . . . . . 21 210,480
Satisfied by issuance of ordinary shares . . . . . . . . . . . . . . . . . . . . . . . . . . . . 253,179
The fair values of the trade receivables and prepayments, other receivables and other assets asat the date of acquisition amounted to USD1,278,000 and USD7,676,000, respectively. The grosscontractual amounts of trade receivables and other receivables were USD1,278,000 andUSD7,676,000, respectively.
None of the goodwill recognized is expected to be deductible for income tax purposes.
An analysis of the cash flows in respect of the acquisition of a subsidiary is as follows:
USD’000
Cash and bank balances acquired . . . . . . . . . . . . . . . . . . . . . . . . . . . . . . . . . . . . . . . . . . . . . . . . . 45,730
Net inflow of cash and cash equivalents included in cash flows generated in investmentactivities . . . . . . . . . . . . . . . . . . . . . . . . . . . . . . . . . . . . . . . . . . . . . . . . . . . . . . . . . . . . . . . . . . . 45,730
I-111

APPENDIX I ACCOUNTANTS’ REPORT
II. NOTES TO THE HISTORICAL FINANCIAL INFORMATION (continued)
35. BUSINESS COMBINATION (continued)
Since the acquisition, Redwood Business contributed USD24,453,000 to the Group’s revenueand USD40,506,000 to the consolidated profit for the eleven months period ended 31 December, 2016.
Had the combination taken place at the beginning of the year, the revenue from continuingoperations of the Group and the profit of the Group for the year would have been USD97,277,000 andUSD104,772,000, respectively.
(b) On January 18, 2017, the Group has through its wholly-owned subsidiary, E-ShangInfinity Cayman Limited (“Infinity”), completed the acquisition of 100% interest inNabinvest Oxley Singapore Pte. Ltd.(“NIOS”), which owns 100% interest in CambridgeReal Estate Investment Management Pte. Ltd. (“CREIM”), 80% indirect interest inCambridge Industrial Trust Management Limited (“CITM”), the trust manager ofCambridge Industrial Trust (“CIT REIT”), and 100% indirect interest in CambridgeIndustrial Property Management Pte. Ltd. (“CIPM”), the property manager of CIT. (NIOS,CREIM, CITM and CIPM, together “Infinitysub Group”).
The acquisition of Infinitysub Group was identified as business combination by themanagement because Infinitysub Group are fully operating companies at the acquisition date andproviding private equity fund management services. The subsidiaries in Infinitysub Group havechanged their names as followings:
Company name Formerly known as
Infinitysub Pte. Ltd. (“Infinitysub”) Nabinvest Oxley Singapore Pte. Ltd. (“NIOS”)ESR Investment Management Pte. Ltd. (“ESR IMP”) Cambridge Real Estate Investment Management
Pte. Ltd. (“CREIM”)ESR Funds Management (S) Limited (“ESR FMS”) Cambridge Industrial Trust Management Limited
(“CITM”)ESR Property Management (S) Pte Ltd.(“ESR PMS”) Cambridge Industrial Property Management Pte.
Ltd. (“CIPM”)ESR-REIT Cambridge Industrial Trust (“CIT REIT”)
The Group has elected to measure the non-controlling interest in Infinitysub Group at theproportionate share of its interest in the acquiree’s identifiable net assets.
I-112

APPENDIX I ACCOUNTANTS’ REPORT
II. NOTES TO THE HISTORICAL FINANCIAL INFORMATION (continued)
35. BUSINESS COMBINATION (continued)
The fair values of the identifiable assets and liabilities of Infinitysub Group as at the date ofacquisition were as follows:
NotesFair value recognized
on acquisition
USD’000
Property, plant and equipment . . . . . . . . . . . . . . . . . . . . . . . . . . . . . . . . . . . . . 13 179Right-of-use assets . . . . . . . . . . . . . . . . . . . . . . . . . . . . . . . . . . . . . . . . . . . . . . 14 2,010Financial assets at fair value through profit or loss . . . . . . . . . . . . . . . . . . . . . 2,021Other current assets . . . . . . . . . . . . . . . . . . . . . . . . . . . . . . . . . . . . . . . . . . . . . . 850Prepayments, other receivables and other assets . . . . . . . . . . . . . . . . . . . . . . . 319Other intangible assets . . . . . . . . . . . . . . . . . . . . . . . . . . . . . . . . . . . . . . . . . . . 22 26,725Cash and bank balances . . . . . . . . . . . . . . . . . . . . . . . . . . . . . . . . . . . . . . . . . . 3,025Tax payables . . . . . . . . . . . . . . . . . . . . . . . . . . . . . . . . . . . . . . . . . . . . . . . . . . . (455)Trade payable, accruals and other payables . . . . . . . . . . . . . . . . . . . . . . . . . . . (783)Lease liabilities . . . . . . . . . . . . . . . . . . . . . . . . . . . . . . . . . . . . . . . . . . . . . . . . . (2,010)Deferred tax liabilities . . . . . . . . . . . . . . . . . . . . . . . . . . . . . . . . . . . . . . . . . . . (9)
Total identifiable net assets at fair value . . . . . . . . . . . . . . . . . . . . . . . . . . . . . 31,872Non-controlling interests . . . . . . . . . . . . . . . . . . . . . . . . . . . . . . . . . . . . . . . . . (3,677)Goodwill on acquisition . . . . . . . . . . . . . . . . . . . . . . . . . . . . . . . . . . . . . . . . . . 21 15,752
Satisfied by cash and bank balances . . . . . . . . . . . . . . . . . . . . . . . . . . . . . . . . . 43,947
The fair values of the prepayments, other receivables and other assets as at the date ofacquisition amounted to USD319,000. The gross contractual amounts of other receivables wereUSD319,000.
None of the goodwill recognized is expected to be deductible for income tax purposes.
An analysis of the cash flows in respect of the acquisition of a subsidiary is as follows:
USD’000
Cash consideration . . . . . . . . . . . . . . . . . . . . . . . . . . . . . . . . . . . . . . . . . . . . . . . . . . . . . . . . . . . . . (43,947)Cash and bank balances acquired . . . . . . . . . . . . . . . . . . . . . . . . . . . . . . . . . . . . . . . . . . . . . . . . . 3,025
Net outflow of cash and cash equivalents included in cash flows generated in investmentactivities . . . . . . . . . . . . . . . . . . . . . . . . . . . . . . . . . . . . . . . . . . . . . . . . . . . . . . . . . . . . . . . . . . . (40,922)
Since the acquisition, Infinitysub Group contributed USD10,611,230 to the Group’s revenueand USD3,726,023 to the consolidated profit for the eleven months period ended December 31, 2017.
Had the combination taken place at the beginning of the year, the revenue from continuingoperations of the Group and the profit of the Group for the year would have been USD153,633,975 andUSD201,227,805, respectively.
(c) On August 10, 2018, the Group has, through its wholly-owned subsidiary ESR Australia,completed the acquisition of 100% interest in Commercial & Industrial Property Pty Ltd(“CIP”), which owns several subsidiaries and joint ventures (the “CIP Group”).
The acquisition of CIP Group was identified as business combination by the management asCIP Group is fully operating companies as at the acquisition date and providing construction services.
I-113

APPENDIX I ACCOUNTANTS’ REPORT
II. NOTES TO THE HISTORICAL FINANCIAL INFORMATION (continued)
35. BUSINESS COMBINATION (continued)
The fair values of the identifiable assets and liabilities of CIP Group as at the date ofacquisition were as follows:
Notes
Fair valuerecognized
onacquisition
USD’000
Property, plant and equipment . . . . . . . . . . . . . . . . . . . . . . . . . . . . . . . . . . . . . . . . . . . . . 13 2,042Right-of-use assets . . . . . . . . . . . . . . . . . . . . . . . . . . . . . . . . . . . . . . . . . . . . . . . . . . . . . . 14 1,553Investments in joint ventures . . . . . . . . . . . . . . . . . . . . . . . . . . . . . . . . . . . . . . . . . . . . . . 9,010Investment properties . . . . . . . . . . . . . . . . . . . . . . . . . . . . . . . . . . . . . . . . . . . . . . . . . . . 20 43,225Other intangible assets . . . . . . . . . . . . . . . . . . . . . . . . . . . . . . . . . . . . . . . . . . . . . . . . . . . 22 6,075Other non-current assets . . . . . . . . . . . . . . . . . . . . . . . . . . . . . . . . . . . . . . . . . . . . . . . . . 14Deferred tax assets . . . . . . . . . . . . . . . . . . . . . . . . . . . . . . . . . . . . . . . . . . . . . . . . . . . . . . 30 1,037Trade receivables . . . . . . . . . . . . . . . . . . . . . . . . . . . . . . . . . . . . . . . . . . . . . . . . . . . . . . . 9,962Prepayments, other receivables and other assets . . . . . . . . . . . . . . . . . . . . . . . . . . . . . . . 26,678Cash and bank balances . . . . . . . . . . . . . . . . . . . . . . . . . . . . . . . . . . . . . . . . . . . . . . . . . . 3,647Bank loans and other borrowings . . . . . . . . . . . . . . . . . . . . . . . . . . . . . . . . . . . . . . . . . . (393)Trade payable, accruals and other payables . . . . . . . . . . . . . . . . . . . . . . . . . . . . . . . . . . (59,651)Lease liabilities . . . . . . . . . . . . . . . . . . . . . . . . . . . . . . . . . . . . . . . . . . . . . . . . . . . . . . . . (1,553)Other liabilities . . . . . . . . . . . . . . . . . . . . . . . . . . . . . . . . . . . . . . . . . . . . . . . . . . . . . . . . (240)
Total identifiable net assets at fair value . . . . . . . . . . . . . . . . . . . . . . . . . . . . . . . . . . . . . 41,406Goodwill on acquisition . . . . . . . . . . . . . . . . . . . . . . . . . . . . . . . . . . . . . . . . . . . . . . . . . 21 40,532
Satisfied by cash . . . . . . . . . . . . . . . . . . . . . . . . . . . . . . . . . . . . . . . . . . . . . . . . . . . . . . . 81,938
The fair values of the trade receivables and prepayments, deposits and other receivables as at thedate of acquisition amounted to USD9,962,000 and USD26,678,000, respectively. The gross contractualamounts of trade receivables and other receivables were USD9,962,000 and USD26,678,000, respectively.
None of the goodwill recognized is expected to be deductible for income tax purposes.
An analysis of the cash flows in respect of the acquisition of a subsidiary is as follows:
USD’000
Cash consideration . . . . . . . . . . . . . . . . . . . . . . . . . . . . . . . . . . . . . . . . . . . . . . . . . . . . . . . . . . . . . (81,938)Cash and bank balances acquired . . . . . . . . . . . . . . . . . . . . . . . . . . . . . . . . . . . . . . . . . . . . . . . . . 3,647
Net outflow of cash and cash equivalents included in cash flows generated in investmentactivities . . . . . . . . . . . . . . . . . . . . . . . . . . . . . . . . . . . . . . . . . . . . . . . . . . . . . . . . . . . . . . . . . . . (78,291)
Since the acquisition, CIP Group contributed USD40,665,000 to the Group’s revenue andUSD961,000 loss to the consolidated profit for the year ended December 31, 2018.
Had the combination taken place at the beginning of the year, the revenue from continuingoperations of the Group and the profit of the Group for the year would have been USD293,023,000 andUSD200,903,000, respectively.
(d) On October 21, 2018, the Group has, through its subsidiary ESR Funds Management(S)Limited (“ESR FM”), completed the acquisition of a 100% interest in Viva IndustrialTrust Management Pte. Ltd. (“VITM”).
I-114

APPENDIX I ACCOUNTANTS’ REPORT
II. NOTES TO THE HISTORICAL FINANCIAL INFORMATION (continued)
35. BUSINESS COMBINATION (continued)
The acquisition of VITM was identified as a business combination by the management. VITMis a fully operational company as at the acquisition date and its principal activity is managementservices in Singapore.
The fair values of the identifiable assets and liabilities of VITM as at the date of acquisitionwere as follows:
NotesFair value recognized
on acquisition
USD’000
Property, plant and equipment . . . . . . . . . . . . . . . . . . . . . . . . . . . . . . . . . . . . . 13 39Other intangible assets . . . . . . . . . . . . . . . . . . . . . . . . . . . . . . . . . . . . . . . . . . . 22 31,670Deferred tax liability . . . . . . . . . . . . . . . . . . . . . . . . . . . . . . . . . . . . . . . . . . . . . 30 (5,384)
Total identifiable net liabilities at fair value . . . . . . . . . . . . . . . . . . . . . . . . . . . 26,325Goodwill on acquisition . . . . . . . . . . . . . . . . . . . . . . . . . . . . . . . . . . . . . . . . . . 21 18,618
Satisfied by:Cash . . . . . . . . . . . . . . . . . . . . . . . . . . . . . . . . . . . . . . . . . . . . . . . . . . . . . . . . . . 14,723Financial assets at fair value through other comprehensive income . . . . . . . . 8,459Consideration payable (note(i)) . . . . . . . . . . . . . . . . . . . . . . . . . . . . . . . . . . . . 6,280Issuance of shares of a subsidiary . . . . . . . . . . . . . . . . . . . . . . . . . . . . . . . . . . . 15,481
44,943
Note:(i) As at December 31, 2018, USD6,280,000 of the consideration has not been paid to the former shareholder of VITM.
None of the goodwill recognized is expected to be deductible for income tax purposes.
An analysis of the cash flows in respect of the acquisition of a subsidiary is as follows:
USD’000
Cash consideration . . . . . . . . . . . . . . . . . . . . . . . . . . . . . . . . . . . . . . . . . . . . . . . . . . . . . . . . . . . . . (14,723)
Net outflow of cash and cash equivalents included in cash flows generated in investmentactivities . . . . . . . . . . . . . . . . . . . . . . . . . . . . . . . . . . . . . . . . . . . . . . . . . . . . . . . . . . . . . . . . . . . (14,723)
Since the acquisition, VITM contributed Nil to the Group’s revenue and USD48,000 profit tothe consolidated profit for the year ended December 31, 2018.
Had the combination taken place at the beginning of the year, the revenue from continuingoperations of the Group and the profit of the Group for the year would have been USD260,563,000 andUSD216,677,000, respectively.
(e) On March 20, 2019, the Group has, through its wholly-owned subsidiary ESR Real Estate(Australia) Pty Ltd., completed the acquisition of additional 80.1% interest in Propertylink(Holdings) Limited Group (the “PLG Group”). The Group previously held 19.9% interestin PLG Group and accounted as financial assets at fair value through other comprehensiveincome. Upon acquisition of additional 80.1% interest, PLG Group became a subsidiary ofthe Group.
I-115

APPENDIX I ACCOUNTANTS’ REPORT
II. NOTES TO THE HISTORICAL FINANCIAL INFORMATION (continued)
35. BUSINESS COMBINATION (continued)
The acquisition of PLG Group was identified as a business combination by the management.PLG is a fully operational company as at the acquisition date and its principal activity is managementservices in Australia.
The fair values of the identifiable assets and liabilities of PLG Group as at the date ofacquisition were as follows:
NotesFair value recognizedon acquisition date
USD’000
Property, plant and equipment . . . . . . . . . . . . . . . . . . . . . . . . . . . . . . . . . . . . . 212Right-of-use assets . . . . . . . . . . . . . . . . . . . . . . . . . . . . . . . . . . . . . . . . . . . . . . 2,095Other intangible assets . . . . . . . . . . . . . . . . . . . . . . . . . . . . . . . . . . . . . . . . . . . 4,039Investment properties . . . . . . . . . . . . . . . . . . . . . . . . . . . . . . . . . . . . . . . . . . . . 608,680Investments in joint ventures . . . . . . . . . . . . . . . . . . . . . . . . . . . . . . . . . . . . . . 72,262Deferred tax assets . . . . . . . . . . . . . . . . . . . . . . . . . . . . . . . . . . . . . . . . . . . . . . 4,852Financial assets at fair value through other comprehensive income . . . . . . . . 95,822Prepayments, other receivables and other assets . . . . . . . . . . . . . . . . . . . . . . . 8,127Cash and bank balances . . . . . . . . . . . . . . . . . . . . . . . . . . . . . . . . . . . . . . . . . . 4,012Trade payables, accruals and other payables . . . . . . . . . . . . . . . . . . . . . . . . . . (6,237)Bank loans and other borrowings . . . . . . . . . . . . . . . . . . . . . . . . . . . . . . . . . . . (325,368)Lease liabilities . . . . . . . . . . . . . . . . . . . . . . . . . . . . . . . . . . . . . . . . . . . . . . . . . (12,615)
Total identifiable net assets at fair value . . . . . . . . . . . . . . . . . . . . . . . . . . . . . 455,881Goodwill on acquisition . . . . . . . . . . . . . . . . . . . . . . . . . . . . . . . . . . . . . . . . . . 21 41,291
497,172
Satisfied by:Cash . . . . . . . . . . . . . . . . . . . . . . . . . . . . . . . . . . . . . . . . . . . . . . . . . . . . . . . . . . 398,285Financial asset at fair value through other comprehensive income . . . . . . . . . 98,887
497,172
None of the goodwill recognized is expected to be deductible for income tax purposes.
An analysis of the cash flows in respect of the acquisition of a subsidiary is as follows:
USD’000
Cash consideration . . . . . . . . . . . . . . . . . . . . . . . . . . . . . . . . . . . . . . . . . . . . . . . . . . . . . . . . . . . . (398,285)Cash and bank balances acquired . . . . . . . . . . . . . . . . . . . . . . . . . . . . . . . . . . . . . . . . . . . . . . . . 4,012
Net outflow of cash and cash equivalents included in cash flows generated in investmentactivities . . . . . . . . . . . . . . . . . . . . . . . . . . . . . . . . . . . . . . . . . . . . . . . . . . . . . . . . . . . . . . . . . . (394,273)
Since the acquisition, PLG Group contributed USD15,476,000 to the Group’s revenue andUSD4,640,000 profit to the consolidated profit for the period ended June 30, 2019.
Had the combination taken place at the beginning of the period, the revenue from continuingoperations of the Group and the profit of the Group for the year would have been USD170,102,000 andUSD87,481,000, respectively.
(f) On June 28, 2019, the Group has, through its wholly-owned subsidiary Infinitysub Pte.Ltd., completed the acquisition of additional 51% interest in Sabana Investment Partners
I-116
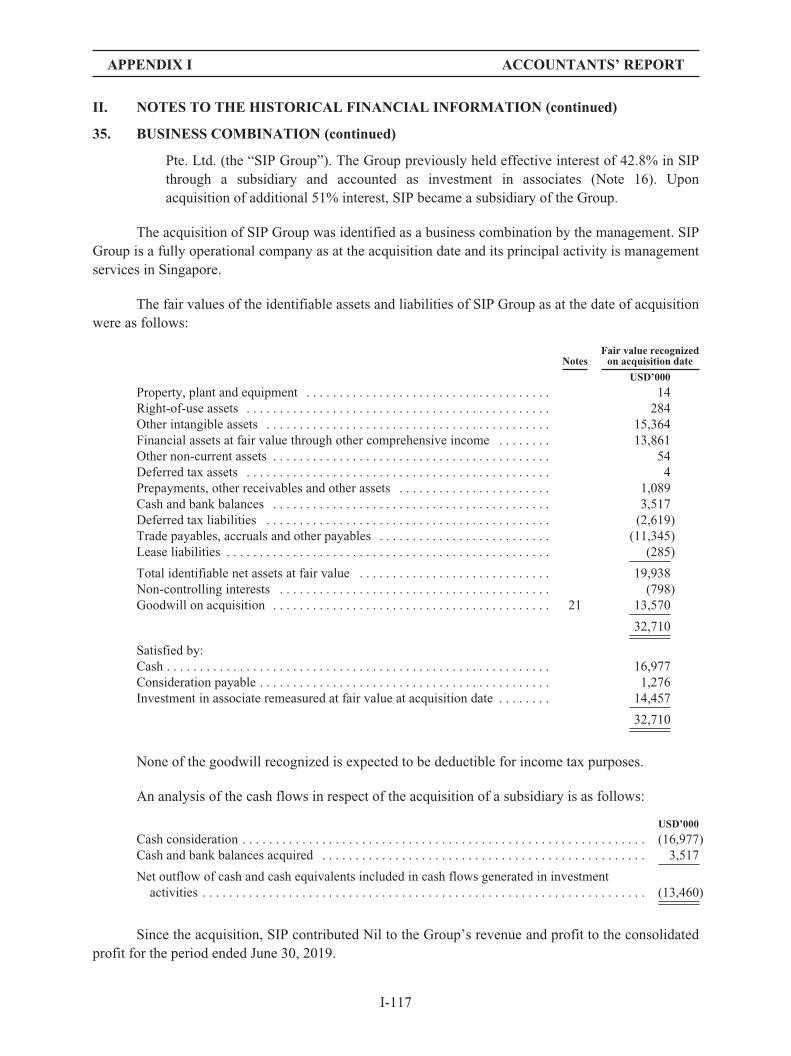
APPENDIX I ACCOUNTANTS’ REPORT
II. NOTES TO THE HISTORICAL FINANCIAL INFORMATION (continued)
35. BUSINESS COMBINATION (continued)
Pte. Ltd. (the “SIP Group”). The Group previously held effective interest of 42.8% in SIPthrough a subsidiary and accounted as investment in associates (Note 16). Uponacquisition of additional 51% interest, SIP became a subsidiary of the Group.
The acquisition of SIP Group was identified as a business combination by the management. SIPGroup is a fully operational company as at the acquisition date and its principal activity is managementservices in Singapore.
The fair values of the identifiable assets and liabilities of SIP Group as at the date of acquisitionwere as follows:
NotesFair value recognizedon acquisition date
USD’000
Property, plant and equipment . . . . . . . . . . . . . . . . . . . . . . . . . . . . . . . . . . . . . 14Right-of-use assets . . . . . . . . . . . . . . . . . . . . . . . . . . . . . . . . . . . . . . . . . . . . . . 284Other intangible assets . . . . . . . . . . . . . . . . . . . . . . . . . . . . . . . . . . . . . . . . . . . 15,364Financial assets at fair value through other comprehensive income . . . . . . . . 13,861Other non-current assets . . . . . . . . . . . . . . . . . . . . . . . . . . . . . . . . . . . . . . . . . . 54Deferred tax assets . . . . . . . . . . . . . . . . . . . . . . . . . . . . . . . . . . . . . . . . . . . . . . 4Prepayments, other receivables and other assets . . . . . . . . . . . . . . . . . . . . . . . 1,089Cash and bank balances . . . . . . . . . . . . . . . . . . . . . . . . . . . . . . . . . . . . . . . . . . 3,517Deferred tax liabilities . . . . . . . . . . . . . . . . . . . . . . . . . . . . . . . . . . . . . . . . . . . (2,619)Trade payables, accruals and other payables . . . . . . . . . . . . . . . . . . . . . . . . . . (11,345)Lease liabilities . . . . . . . . . . . . . . . . . . . . . . . . . . . . . . . . . . . . . . . . . . . . . . . . . (285)
Total identifiable net assets at fair value . . . . . . . . . . . . . . . . . . . . . . . . . . . . . 19,938Non-controlling interests . . . . . . . . . . . . . . . . . . . . . . . . . . . . . . . . . . . . . . . . . (798)Goodwill on acquisition . . . . . . . . . . . . . . . . . . . . . . . . . . . . . . . . . . . . . . . . . . 21 13,570
32,710
Satisfied by:Cash . . . . . . . . . . . . . . . . . . . . . . . . . . . . . . . . . . . . . . . . . . . . . . . . . . . . . . . . . . 16,977Consideration payable . . . . . . . . . . . . . . . . . . . . . . . . . . . . . . . . . . . . . . . . . . . . 1,276Investment in associate remeasured at fair value at acquisition date . . . . . . . . 14,457
32,710
None of the goodwill recognized is expected to be deductible for income tax purposes.
An analysis of the cash flows in respect of the acquisition of a subsidiary is as follows:
USD’000
Cash consideration . . . . . . . . . . . . . . . . . . . . . . . . . . . . . . . . . . . . . . . . . . . . . . . . . . . . . . . . . . . . . (16,977)Cash and bank balances acquired . . . . . . . . . . . . . . . . . . . . . . . . . . . . . . . . . . . . . . . . . . . . . . . . . 3,517
Net outflow of cash and cash equivalents included in cash flows generated in investmentactivities . . . . . . . . . . . . . . . . . . . . . . . . . . . . . . . . . . . . . . . . . . . . . . . . . . . . . . . . . . . . . . . . . . . (13,460)
Since the acquisition, SIP contributed Nil to the Group’s revenue and profit to the consolidatedprofit for the period ended June 30, 2019.
I-117

APPENDIX I ACCOUNTANTS’ REPORT
II. NOTES TO THE HISTORICAL FINANCIAL INFORMATION (continued)
35. BUSINESS COMBINATION (continued)
Had the combination taken place at the beginning of the period, the revenue from continuingoperations of the Group and the profit of the Group for the year would have been USD159,073,000 andUSD84,757,000, respectively.
(g) Acquisition of subsidiaries that are not business
Year ended December 31, 2016
The Company, through its wholly owned subsidiary, Savior Offshore Holdings (BVI) Limited,entered into share purchase agreement with independent third parties, Prax Capital China LogisticsHolding Limited, Prax Capital China Real Estate Fund III, L.P., Prax Capital China Real Estate FundIII GP, LTD., Terpanic S.A.R.L., S.P.F. and JP Great International INC., to acquire 100% equityinterests of Wuhan Minglong Warehousing Company Limited (“Wuhan Minglong”), Wuhan MingjuSupply Chain Development Company Limited (“Wuhan Mingju”), Tianjin Mingcheng WarehousingCompany Limited (“Tianjin Mingcheng”) and Taicang Mingzhan Logistics Company Limited(“Taicang Mingzhan”) for an aggregate purchase price of USD88,052,000 in cash. The acquisition ofWuhan Minglong was completed on September 22, 2016, and the rest acquisitions were completed onOctober 20, 2016.
On the acquisition date, there were no other material assets and liabilities carried by WuhanMinglong, Wuhan Mingju, Tianjin Mingcheng and Taicang Mingzhan other than cash and bankbalances and investment properties under construction. The transaction was accounted for as an assetacquisition.
WuhanMingju
TianjinMingcheng
TaicangMingzhan
WuhanMinglong
USD’000 USD’000 USD’000 USD’000
Net assets acquired:Cash and bank balances . . . . . . . . . . . . . . . . . . . . . . . . . . . . . . 768 390 — 911Trade receivables . . . . . . . . . . . . . . . . . . . . . . . . . . . . . . . . . . . — 527 — —Prepayments, other receivables and other assets . . . . . . . . . . . 39 51 — —Investment properties . . . . . . . . . . . . . . . . . . . . . . . . . . . . . . . 46,747 31,081 44,624 9,635Deferred tax assets . . . . . . . . . . . . . . . . . . . . . . . . . . . . . . . . . . 135 671 932 32Trade payables, accruals and other payables . . . . . . . . . . . . . . (1,274) (1,263) (6,989) 380Bank loans and other borrowings . . . . . . . . . . . . . . . . . . . . . . (8,088) (10,309) (20,948) —
Satisfied by cash . . . . . . . . . . . . . . . . . . . . . . . . . . . . . . . . . . . 38,327 21,148 17,619 10,958
An analysis of the cash flows in respect of the acquisition of subsidiary is as follows:
USD’000 USD’000 USD’000 USD’000
Cash consideration . . . . . . . . . . . . . . . . . . . . . . . . . . . . . . . . . . . . (38,327) (21,148) (17,619) (10,958)Cash and bank balances acquired . . . . . . . . . . . . . . . . . . . . . . . . . 768 390 — 911
Net outflow of cash and cash equivalents included in cash flowsgenerated in investment activities . . . . . . . . . . . . . . . . . . . . . . . (37,559) (20,758) (17,619) (10,047)
Year ended December 31, 2017
The Company, through its wholly owned subsidiary, RAIL, entered into share purchaseagreement with independent third parties, Phoenix Global Real Estate Secondaries 2009 LP, to acquire
I-118

APPENDIX I ACCOUNTANTS’ REPORT
II. NOTES TO THE HISTORICAL FINANCIAL INFORMATION (continued)
35. BUSINESS COMBINATION (continued)
Year ended December 31, 2017 (continued)
the 100% equity interests of Redwood Phoenix China Investment Fund Pte Ltd (“RPCIF”) for anaggregate purchase price of USD23,665,000 in cash. The acquisition of RPCIF was completed onAugust 15, 2017. RPCIF holds 65% interests of Mingyue Logistic Pte Ltd which hold 90% ofGuangzhou Mingyue Warehousing Co., Ltd.
On the acquisition date, there were no other material assets and liabilities carried by RPCIFother than cash and bank balances and investment properties. The transaction was accounted for as anasset acquisition.
The Company, through its wholly-owned subsidiary, Shanghai Dongjin Shiye Co., Ltd., enteredinto share purchase agreement with independent third party, Nanjing Yurun Food Co., Ltd, to acquire100% equity interests of Shanghai Yurun Meat Food Co., Ltd. (“Shanghai Yurun”) for an aggregatepurchase price of USD72,763,000 in cash. The acquisition of Shanghai Yurun was completed onSeptember 30, 2017. On the acquisition date, there were no other material assets and liabilities ownedby Shanghai Yurun other than cash and bank balances and investment properties under construction.The transaction was accounted for as an asset acquisition.
The Company, through its wholly-owned subsidiary, Impulse Singapore Holding Pte. Ltd.,entered into share purchase agreement with independent third party, Shanghai Anbixin Investment andConsulting Co. Ltd, to acquire 100% equity interests of Chongqing Yongxiang Market ManagementCo., Ltd. (“Chongqing Yongxiang”) for an aggregate purchase price of USD579,000 in cash. Theacquisition of Chongqing Yongxiang was completed on April 30, 2017.
On the acquisition date, there were no other material assets and liabilities owned by ChongqingYongxiang other than cash and bank balances and deposit for land acquisition. The transaction wasaccounted for as an asset acquisition.
RPCIFShanghaiYurun
ChongqingYongxiang
USD’000 USD’000 USD’000
Net assets acquired:Cash and bank balances . . . . . . . . . . . . . . . . . . . . . . . . . . . . . . . . . . . . . . . 4,676 — 4Trade receivables . . . . . . . . . . . . . . . . . . . . . . . . . . . . . . . . . . . . . . . . . . . . 1,711 — —Prepayments, other receivables and other assets . . . . . . . . . . . . . . . . . . . . 574 — 602Property, plant and Equipment . . . . . . . . . . . . . . . . . . . . . . . . . . . . . . . . . 5 — —Investment properties . . . . . . . . . . . . . . . . . . . . . . . . . . . . . . . . . . . . . . . . . 64,029 72,763 —Bank loans and other borrowings . . . . . . . . . . . . . . . . . . . . . . . . . . . . . . . (17,003) — —Trade payables, accruals and other payables . . . . . . . . . . . . . . . . . . . . . . . (6,389) — (27)Deferred tax liabilities . . . . . . . . . . . . . . . . . . . . . . . . . . . . . . . . . . . . . . . . (2,198) — —Non-controlling interests . . . . . . . . . . . . . . . . . . . . . . . . . . . . . . . . . . . . . . (21,740) — —
Satisfied by cash . . . . . . . . . . . . . . . . . . . . . . . . . . . . . . . . . . . . . . . . . . . . 23,665 72,763 579
I-119

APPENDIX I ACCOUNTANTS’ REPORT
II. NOTES TO THE HISTORICAL FINANCIAL INFORMATION (continued)
35. BUSINESS COMBINATION (continued)
Year ended December 31, 2017 (continued)
An analysis of the cash flows in respect of the acquisition of subsidiary is as follows:
RPCIFShanghaiYurun
ChongqingYongxiang
USD’000 USD’000 USD’000
Cash consideration . . . . . . . . . . . . . . . . . . . . . . . . . . . . . . . . . . . . . . . . . . . (23,665) (72,763) (579)Cash and bank balances acquired . . . . . . . . . . . . . . . . . . . . . . . . . . . . . . . 4,676 — 4
Net outflow of cash and cash equivalents included in cash flowsgenerated in investment activities . . . . . . . . . . . . . . . . . . . . . . . . . . . . . (18,989) (72,763) (575)
Year ended December 31, 2018
The Company, through its wholly owned subsidiary, Delte Offshore Holdings (BVI) Limited,entered into share purchase agreement with an independent third-party Ambition Mind HoldingsLimited, to acquire 90% equity interests of Tianjin Fanxin Warehousing Service Co., Ltd. (“TianjinFanxin”) for an aggregate purchase price of USD31,198,000 in cash. The acquisition of Tianjin Fanxinwas completed on August 2, 2018.
On the acquisition date, there were no other material assets and liabilities carried by TianjinFanxin other than cash and bank balances and investment properties. The transaction was accountedfor as an asset acquisition.
The Company, through its wholly owned subsidiary, Redwood Investor (Higashi) Ltd, enteredinto Sales and Purchase Agreement with Fupeng Investment Management Limited to acquire theoutstanding 35% equity interests of Higashi for an aggregate purchase price of USD52,485,000 incash. The acquisition of Higashi was completed on June 29, 2018. As a result of this purchase, RAIL’sinterest in Higashi was increased from 35% to 70%.
On the acquisition date, there were no other material assets and liabilities carried by Higashiother than cash and bank balances and investment properties. The transaction was accounted for as anasset acquisition.
On October 1, 2018, the Group has, through its subsidiary Shanghai Chukai EnterpriseManagement Consulting Co., Ltd., completed the acquisition of a 100% interest in Shanghai JiangnanShips and Boats Manufacturing Co., Ltd. (上海江南船艇製造有限公司) (“Jiangnan Chuanting”), for apurchase consideration of USD8,854,000.
On the acquisition date, there were no other material assets and liabilities carried by JiangnanChuanting other than other receivables and other payables balance, and investment properties. Thetransaction was accounted for as an asset acquisition.
On December 4, 2018, the Group has, through its subsidiary Infinitysub Pte. Ltd.(“Infinitysub”), completed the acquisition of a 90% interest in Blackwood Trust Pte. Ltd. (“BWT”),which owns a 100% direct interest in Blackwood Investment Pte. Ltd. (“BWI”), a 45% indirect interestin Sabana Investment Partners Pte. Ltd. (“SIP”), SIP owns a 100% indirect interest in Sabana Property
I-120

APPENDIX I ACCOUNTANTS’ REPORT
II. NOTES TO THE HISTORICAL FINANCIAL INFORMATION (continued)
35. BUSINESS COMBINATION (continued)
Year ended December 31, 2018 (continued)
Management Pte. Ltd. (“Sabana Property”) and a 100% indirect interest in Sabana Real EstateInvestment Management Pte. Ltd. (“Sabana IM”) (BWT, BWI, SIP, Sabana Property and Sabana IM,together “Blackwood Group”). The aggregate purchase consideration is USD8,465,000. On January 10,2019, the Group has, through its subsidiary Infinitysub, acquired additional 5% interest in BWT withpurchase consideration of USD2,652,000.
On the acquisition date, there were no other material assets and liabilities carried by BlackwoodGroup other than investment in associate. The transaction was accounted for as an asset acquisition.
NoteTianjinFanxin Higashi
JiangnanChuanting
BlackwoodGroup
USD’000 USD’000 USD’000 USD’000
Net assets acquired:Cash and bank balances . . . . . . . . . . . . . . . . . . . . . . . . 2,968 21,722 — —Trade receivables . . . . . . . . . . . . . . . . . . . . . . . . . . . . . 427 1,405 — —Prepayments, other receivables and other assets . . . . . 35 — 6,825 2Investment properties . . . . . . . . . . . . . . . . . . . . . . . . . 61,748 379,268 9,417 —Investment in an associate . . . . . . . . . . . . . . . . . . . . . . — — — 9,151Bank loans and other borrowings . . . . . . . . . . . . . . . . (29,045) (211,376) — —Trade payables, accruals and other payables . . . . . . . (1,296) (13,564) (7,388) (14)Deferred tax liabilities . . . . . . . . . . . . . . . . . . . . . . . . . 30 — (10,350) — —Non-controlling interests . . . . . . . . . . . . . . . . . . . . . . . (3,484) (53,284) — (674)
31,353 113,821 8,854 8,465
Satisfied by:Cash . . . . . . . . . . . . . . . . . . . . . . . . . . . . . . . . . . . . . . . 31,353 52,485 8,854 4,969Financial assets at fair value through profit or loss
(note(i)) . . . . . . . . . . . . . . . . . . . . . . . . . . . . . . . . . . — 61,336 — —Investment in a joint venture (note(ii)) . . . . . . . . . . . . — — — 3,496
31,353 113,821 8,854 8,465
An analysis of the cash flows in respect of the acquisition of subsidiary is as follows:
TianjinFanxin Higashi
JiangnanChuanting
BlackwoodGroup
USD’000 USD’000 USD’000 USD’000
Cash consideration . . . . . . . . . . . . . . . . . . . . . . . . . . . . . . . . . . (31,353) (52,485) (8,854) (4,969)Cash and bank balances acquired . . . . . . . . . . . . . . . . . . . . . . 2,968 21,722 — —
Net outflow of cash and cash equivalents included in cashflows generated in investment activities . . . . . . . . . . . . . . . (28,385) (30,763) (8,854) (4,969)
Note:i. The total consideration includes the 35% equity interest of Higashi held by the Group before the acquisition date.ii. On September 11, 2018, Infinitysub signed sale contracts with shareholders of Blackwood to acquire 30% of the shares in the
capital of Blackwood, for a purchase consideration of SGD4,720,000.
I-121

APPENDIX I ACCOUNTANTS’ REPORT
II. NOTES TO THE HISTORICAL FINANCIAL INFORMATION (continued)
35. BUSINESS COMBINATION (continued)
Six months ended June 30, 2019
The Company, through its wholly owned subsidiary, Zeta Offshore Holdings (BVI) Limited,entered into share purchase agreement with independent third-parties Barn Holding Pte. Limited andTCL Electronics Holdings Limited, to acquire 100% equity interests of Lekun Warehousing (Wuxi)Co., Ltd. (“Wuxi Lekun”) for an aggregate purchase price of USD38,591,000 in cash. The acquisitionof Wuxi Lekun was completed on March 14, 2019.
On the acquisition date, there were no other material assets and liabilities carried by WuxiLekun other than cash and bank balances, bank loans and other borrowings and investment properties.The transaction was accounted for as an asset acquisition.
Wuxi Lekun
USD’000
Net assets acquired:Cash and bank balances . . . . . . . . . . . . . . . . . . . . . . . . . . . . . . . . . . . . . . . . . . . . . . . . . . . . . . 1,344Trade receivables . . . . . . . . . . . . . . . . . . . . . . . . . . . . . . . . . . . . . . . . . . . . . . . . . . . . . . . . . . . 10Prepayments, other receivables and other assets . . . . . . . . . . . . . . . . . . . . . . . . . . . . . . . . . . . 70Investment properties . . . . . . . . . . . . . . . . . . . . . . . . . . . . . . . . . . . . . . . . . . . . . . . . . . . . . . . . 63,342Bank loans and other borrowings . . . . . . . . . . . . . . . . . . . . . . . . . . . . . . . . . . . . . . . . . . . . . . . (24,873)Trade payables, accruals and other payables . . . . . . . . . . . . . . . . . . . . . . . . . . . . . . . . . . . . . . (1,302)
Satisfied by cash . . . . . . . . . . . . . . . . . . . . . . . . . . . . . . . . . . . . . . . . . . . . . . . . . . . . . . . . . . . . 38,591
An analysis of the cash flows in respect of the acquisition of subsidiary is as follows:
Wuxi Lekun
USD’000
Cash consideration . . . . . . . . . . . . . . . . . . . . . . . . . . . . . . . . . . . . . . . . . . . . . . . . . . . . . . . . . . (38,591)Cash and bank balances acquired . . . . . . . . . . . . . . . . . . . . . . . . . . . . . . . . . . . . . . . . . . . . . . . 1,344
Net outflow of cash and cash equivalents included in cash flows generated in investmentactivities . . . . . . . . . . . . . . . . . . . . . . . . . . . . . . . . . . . . . . . . . . . . . . . . . . . . . . . . . . . . . . . . (37,247)
36. INTERESTS IN THE UNCONSOLIDATED STRUCTURED ENTITIES
As at December 31, 2016, 2017, 2018 and June 30, 2019, total of 24, 30, 24 and 25 assets arecurrently under management of ESR Singapore as its investment manager to manage the operations ofthose assets to earn fee income based on their capital contributed by investors, development costsincurred on real estate projects, or for the acquisition advisory service and brokerage service renderedby ESR Singapore. The assets have been designed so that voting and similar rights are not thedominant factor in deciding how the investing activities should be conducted and are financed throughthe issue of ownership interest instrument to investors. ESR Singapore did not provide any financialsupport and has no intention of providing financial or any other support.
As at December 31, 2016, 2017, 2018 and June 30, 2019, RAIL considers its equityinvestments in 12, 15, 20 and 24 investment funds to be interests in unconsolidated structured entities.The investment funds are designed so that the management rights are not the dominant factor indeciding who controls them.
I-122

APPENDIX I ACCOUNTANTS’ REPORT
II. NOTES TO THE HISTORICAL FINANCIAL INFORMATION (continued)
36. INTERESTS IN THE UNCONSOLIDATED STRUCTURED ENTITIES (continued)
The table below describes the type of structured entities that the Group does not consolidate butin which it holds an interest.
Type of structured entity Nature and purpose Interest held by the Group
Investment funds held throughRAIL
To generate investment returnsfrom the funds managed by arelated company
Investments in equity andpreference share issued by theinvestment funds
Investment funds held throughESR Singapore
To generate fees frommanaging contributed capitalon behalf of investors,managing project development,rendering acquisition advisoryservice or brokerage service.These vehicles are financedthrough the issue of ownershipinterest instruments toinvestors.
Investment management feesand development fees,acquisition fees and leasing fees
The Group earned a total gross fee income of USD24,459,000, USD21,060,000,USD44,621,000 and USD23,372,039 from the real estate funds for the years ended December 31,2016, 2017, 2018 and the period ended June 30, 2019, respectively. As at December 31, 2016, 2017,2018 and June 30, 2019, the Group’s maximum exposure to loss as a result of acting as the investmentmanager of the real estate funds was equivalent to the carrying amount of fee income receivable fromthem amounting to USD1,327,000, USD5,919,000, USD25,785,000 and USD14,691,000 and thecarrying amount of the investments amounting to USD141,708,000, USD244,255,000,USD275,160,000 and USD420,273,000, respectively.
I-123

APPENDIX I ACCOUNTANTS’ REPORT
II. NOTES TO THE HISTORICAL FINANCIAL INFORMATION (continued)
37. DISPOSAL OF SUBSIDIARIES
On January 26, 2016, the Group contributes 100% interests in a subsidiary Gachang HoldingPte. Ltd., which holds 100% interests of Gachang Logistics Park Private Inc., as investment inSunwood Star.
USD’000
Net assets disposed of:Cash and bank balances . . . . . . . . . . . . . . . . . . . . . . . . . . . . . . . . . . . . . . . . . . . . . . . . . . . . . . . . . 1,179Prepayments, trade and other receivables and other assets . . . . . . . . . . . . . . . . . . . . . . . . . . . . . . 28,900Other non-current assets . . . . . . . . . . . . . . . . . . . . . . . . . . . . . . . . . . . . . . . . . . . . . . . . . . . . . . . . 17,058Trade payables, accruals, other payables and income tax payable . . . . . . . . . . . . . . . . . . . . . . . . (718)Amount due to related parties . . . . . . . . . . . . . . . . . . . . . . . . . . . . . . . . . . . . . . . . . . . . . . . . . . . . (28,614)Non-controlling interests . . . . . . . . . . . . . . . . . . . . . . . . . . . . . . . . . . . . . . . . . . . . . . . . . . . . . . . . (205)
17,600Gain on disposal of subsidiaries . . . . . . . . . . . . . . . . . . . . . . . . . . . . . . . . . . . . . . . . . . . . . . . . . . 32
17,632
Satisfied by:Cash . . . . . . . . . . . . . . . . . . . . . . . . . . . . . . . . . . . . . . . . . . . . . . . . . . . . . . . . . . . . . . . . . . . . . . . . 13,923Investment in a joint venture . . . . . . . . . . . . . . . . . . . . . . . . . . . . . . . . . . . . . . . . . . . . . . . . . . . . . 3,709
17,632
An analysis of the net inflow of cash and cash equivalents in respect of the disposal ofsubsidiaries is as follows:
USD’000
Cash consideration . . . . . . . . . . . . . . . . . . . . . . . . . . . . . . . . . . . . . . . . . . . . . . . . . . . . . . . . . . . . . 13,923Cash and bank balances disposed of subsidiaries . . . . . . . . . . . . . . . . . . . . . . . . . . . . . . . . . . . . . (1,179)
Net inflow of cash and cash equivalents in respect of the disposal of subsidiaries . . . . . . . . . . . 12,744
I-124
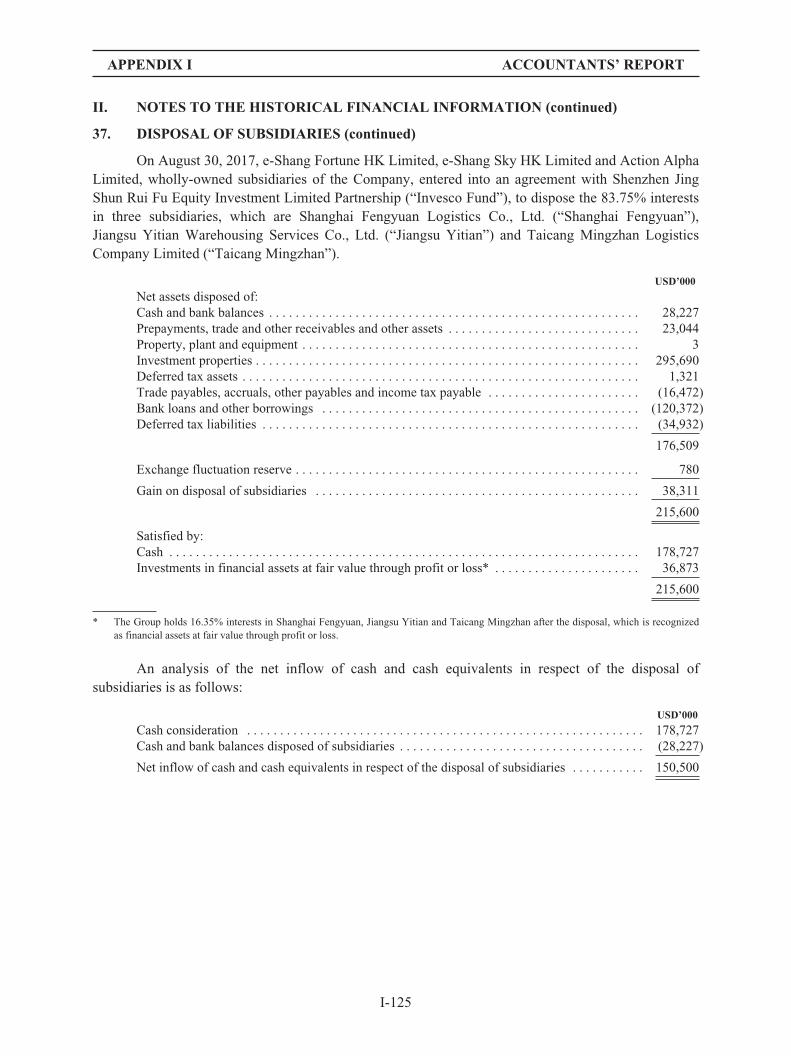
APPENDIX I ACCOUNTANTS’ REPORT
II. NOTES TO THE HISTORICAL FINANCIAL INFORMATION (continued)
37. DISPOSAL OF SUBSIDIARIES (continued)
On August 30, 2017, e-Shang Fortune HK Limited, e-Shang Sky HK Limited and Action AlphaLimited, wholly-owned subsidiaries of the Company, entered into an agreement with Shenzhen JingShun Rui Fu Equity Investment Limited Partnership (“Invesco Fund”), to dispose the 83.75% interestsin three subsidiaries, which are Shanghai Fengyuan Logistics Co., Ltd. (“Shanghai Fengyuan”),Jiangsu Yitian Warehousing Services Co., Ltd. (“Jiangsu Yitian”) and Taicang Mingzhan LogisticsCompany Limited (“Taicang Mingzhan”).
USD’000
Net assets disposed of:Cash and bank balances . . . . . . . . . . . . . . . . . . . . . . . . . . . . . . . . . . . . . . . . . . . . . . . . . . . . . . . . 28,227Prepayments, trade and other receivables and other assets . . . . . . . . . . . . . . . . . . . . . . . . . . . . . 23,044Property, plant and equipment . . . . . . . . . . . . . . . . . . . . . . . . . . . . . . . . . . . . . . . . . . . . . . . . . . . 3Investment properties . . . . . . . . . . . . . . . . . . . . . . . . . . . . . . . . . . . . . . . . . . . . . . . . . . . . . . . . . . 295,690Deferred tax assets . . . . . . . . . . . . . . . . . . . . . . . . . . . . . . . . . . . . . . . . . . . . . . . . . . . . . . . . . . . . 1,321Trade payables, accruals, other payables and income tax payable . . . . . . . . . . . . . . . . . . . . . . . (16,472)Bank loans and other borrowings . . . . . . . . . . . . . . . . . . . . . . . . . . . . . . . . . . . . . . . . . . . . . . . . (120,372)Deferred tax liabilities . . . . . . . . . . . . . . . . . . . . . . . . . . . . . . . . . . . . . . . . . . . . . . . . . . . . . . . . . (34,932)
176,509
Exchange fluctuation reserve . . . . . . . . . . . . . . . . . . . . . . . . . . . . . . . . . . . . . . . . . . . . . . . . . . . . 780
Gain on disposal of subsidiaries . . . . . . . . . . . . . . . . . . . . . . . . . . . . . . . . . . . . . . . . . . . . . . . . . 38,311
215,600
Satisfied by:Cash . . . . . . . . . . . . . . . . . . . . . . . . . . . . . . . . . . . . . . . . . . . . . . . . . . . . . . . . . . . . . . . . . . . . . . . 178,727Investments in financial assets at fair value through profit or loss* . . . . . . . . . . . . . . . . . . . . . . 36,873
215,600
* The Group holds 16.35% interests in Shanghai Fengyuan, Jiangsu Yitian and Taicang Mingzhan after the disposal, which is recognizedas financial assets at fair value through profit or loss.
An analysis of the net inflow of cash and cash equivalents in respect of the disposal ofsubsidiaries is as follows:
USD’000
Cash consideration . . . . . . . . . . . . . . . . . . . . . . . . . . . . . . . . . . . . . . . . . . . . . . . . . . . . . . . . . . . . 178,727Cash and bank balances disposed of subsidiaries . . . . . . . . . . . . . . . . . . . . . . . . . . . . . . . . . . . . . (28,227)
Net inflow of cash and cash equivalents in respect of the disposal of subsidiaries . . . . . . . . . . . 150,500
I-125

APPENDIX I ACCOUNTANTS’ REPORT
II. NOTES TO THE HISTORICAL FINANCIAL INFORMATION (continued)
37. DISPOSAL OF SUBSIDIARIES (continued)
On November 23, 2018, the Group entered into an agreement with a global real-estate investorbased in Germany to dispose of 50% interest in its subsidiary ESR India Logistics Fund Pte. Ltd.
USD’000
Net assets disposed of:Cash and bank balances . . . . . . . . . . . . . . . . . . . . . . . . . . . . . . . . . . . . . . . . . . . . . . . . . . . . . . . . . 11,415Prepayments, trade and other receivables and other assets . . . . . . . . . . . . . . . . . . . . . . . . . . . . . . 38,205Investment properties . . . . . . . . . . . . . . . . . . . . . . . . . . . . . . . . . . . . . . . . . . . . . . . . . . . . . . . . . . . 514Investment in joint ventures . . . . . . . . . . . . . . . . . . . . . . . . . . . . . . . . . . . . . . . . . . . . . . . . . . . . . 3,484Other non-current assets . . . . . . . . . . . . . . . . . . . . . . . . . . . . . . . . . . . . . . . . . . . . . . . . . . . . . . . . 8,593Trade payables, accruals, other payables and income tax payable . . . . . . . . . . . . . . . . . . . . . . . . (66,015)
(3,804)
Exchange fluctuation reserve . . . . . . . . . . . . . . . . . . . . . . . . . . . . . . . . . . . . . . . . . . . . . . . . . . . . . 1,142
Gain on disposal of subsidiaries . . . . . . . . . . . . . . . . . . . . . . . . . . . . . . . . . . . . . . . . . . . . . . . . . . 2,662
—
Satisfied by:Investments in financial assets at fair value through profit or loss* . . . . . . . . . . . . . . . . . . . . . . . —
* The Group will hold a 50.00% interest in ESR India Logistics Fund Pte. Ltd., after the disposal, which is recognized in financial assets atfair value through profit or loss.
I-126

APPENDIX I ACCOUNTANTS’ REPORT
II. NOTES TO THE HISTORICAL FINANCIAL INFORMATION (continued)
37. DISPOSAL OF SUBSIDIARIES (continued)
During the six months ended June 30, 2019, E-shang Action Wealth HK, Shanghai Dongjin,E-shang Jiadong Investment, E-shang Talent HK, E-shang Action Growth HK, E-shang Wealth HKand E-shang Action Rocks HK, wholly-owned subsidiaries of the Company, entered into an agreementwith Shanghai Yishang Logistics Equity Investment Partnership (“Xinhua Fund”), to dispose the99.99% interests in seven subsidiaries, which are Hangzhou Mingpu, Shanghai Yita, Shanghai Xinbin,Shanghai Moya, Tianjin Mingcheng, Shanghai Donghe and Wuhan Mingju (“Disposed subsidiaries”).
USD’000
Net assets disposed of:Cash and bank balances . . . . . . . . . . . . . . . . . . . . . . . . . . . . . . . . . . . . . . . . . . . . . . . . . . . . . . . . 20,851Prepayments, trade and other receivables and other assets . . . . . . . . . . . . . . . . . . . . . . . . . . . . . . 58,391Investment properties . . . . . . . . . . . . . . . . . . . . . . . . . . . . . . . . . . . . . . . . . . . . . . . . . . . . . . . . . . 276,711Property, plant and equipment . . . . . . . . . . . . . . . . . . . . . . . . . . . . . . . . . . . . . . . . . . . . . . . . . . . 2Deferred tax assets . . . . . . . . . . . . . . . . . . . . . . . . . . . . . . . . . . . . . . . . . . . . . . . . . . . . . . . . . . . . 1,146Other non-current assets . . . . . . . . . . . . . . . . . . . . . . . . . . . . . . . . . . . . . . . . . . . . . . . . . . . . . . . . 1,492Trade payables, accruals, other payables and income tax payable . . . . . . . . . . . . . . . . . . . . . . . . (48,481)Deferred tax liabilities . . . . . . . . . . . . . . . . . . . . . . . . . . . . . . . . . . . . . . . . . . . . . . . . . . . . . . . . . . (28,515)Bank loans and other borrowings . . . . . . . . . . . . . . . . . . . . . . . . . . . . . . . . . . . . . . . . . . . . . . . . . (84,315)Other non-current liabilities . . . . . . . . . . . . . . . . . . . . . . . . . . . . . . . . . . . . . . . . . . . . . . . . . . . . . (4,481)
192,801
Exchange fluctuation reserve . . . . . . . . . . . . . . . . . . . . . . . . . . . . . . . . . . . . . . . . . . . . . . . . . . . . 4,901
Gain on disposal of subsidiaries . . . . . . . . . . . . . . . . . . . . . . . . . . . . . . . . . . . . . . . . . . . . . . . . . . 16,495
214,197
Satisfied by:Cash . . . . . . . . . . . . . . . . . . . . . . . . . . . . . . . . . . . . . . . . . . . . . . . . . . . . . . . . . . . . . . . . . . . . . . . . 140,234Consideration receivable . . . . . . . . . . . . . . . . . . . . . . . . . . . . . . . . . . . . . . . . . . . . . . . . . . . . . . . . 73,941Investments in financial assets at fair value through profit or loss* . . . . . . . . . . . . . . . . . . . . . . . 22
214,197
* The Group hold 0.01% interests in the disposed subsidiaries after the disposal, which is recognized as financial assets at fair valuethrough profit or loss.
An analysis of the net inflow of cash and cash equivalents in respect of the disposal ofsubsidiaries is as follows:
USD’000
Cash consideration . . . . . . . . . . . . . . . . . . . . . . . . . . . . . . . . . . . . . . . . . . . . . . . . . . . . . . . . . . . . 140,234Cash and bank balances disposed of subsidiaries . . . . . . . . . . . . . . . . . . . . . . . . . . . . . . . . . . . . . (20,851)
Net inflow of cash and cash equivalents in respect of the disposal of subsidiaries . . . . . . . . . . . 119,383
38. CONTINGENT LIABILITIES
As at the end of each of the Relevant Periods, neither the Group nor the Company had anysignificant contingent liabilities.
I-127

APPENDIX I ACCOUNTANTS’ REPORT
II. NOTES TO THE HISTORICAL FINANCIAL INFORMATION (continued)
39. PLEDGE OF ASSETS
Details of the Group’s interest-bearing bank loans and other borrowings, which are secured bythe assets of the Group, are included in note 27 to the Historical Financial Information.
40. NOTES TO THE CONSOLIDATED STATEMENTS OF CASH FLOWS
(a) Major non-cash transactions
In January 2016, the Company entered into Share Subscription and Merger Agreement withRIC and its controlling shareholders, to issue 389,933,535 ordinary shares of the Company to RIC inexchange for the 100% equity interests in Redwood business.
(b) Changes in financial liabilities arising from financing activities
Bank andother loans
Liabilitiescomponent of the
redeemableconvertible
preference sharesInterestpayable
Otherpayable—due
to relatedparties
Leaseliabilities
USD’000 USD’000 USD’000 USD’000 USD’000
At January 1, 2016 . . . . . . . . . . . . . . . . . 501,523 — 914 8,024 1,052Changes from financing cash flows . . . . 337,508 246,156 (55,772) (6,649) (1,540)Interest expense . . . . . . . . . . . . . . . . . . . . — — 55,895 — 97Addition . . . . . . . . . . . . . . . . . . . . . . . . . . — — — — 4,660Acquisition of subsidiaries . . . . . . . . . . . 40,262 — — — —Foreign exchange movements . . . . . . . . . (44,028) — (39) (403) (20)
At December 31, 2016 . . . . . . . . . . . . . . 835,265 246,156 998 972 4,249
Bank andother loans
Liabilitiescomponent of the
redeemableconvertible
preference sharesInterestpayable
Otherpayable—due
to relatedparties
Leaseliabilities
USD’000 USD’000 USD’000 USD’000 USD’000
At January 1, 2017 . . . . . . . . . . . . . . . . . 835,265 246,156 998 972 4,249Changes from financing cash flows . . . . 35,540 (23,284) (46,700) (2,167) (2,546)Changes in investing cash flows—
additions to investment properties . . . — — (4,720) — —Acquisition of subsidiaries . . . . . . . . . . . 17,003 — — — 2,010Addition . . . . . . . . . . . . . . . . . . . . . . . . . . — — — — 3,562Foreign exchange movements . . . . . . . . . 65,999 — 41 68 393Interest expense . . . . . . . . . . . . . . . . . . . . — 41,327 49,285 — 291Capitalized interest expense . . . . . . . . . . — — 4,720 — —Repayment of non-current liabilities—
due to related parties . . . . . . . . . . . . . . — — — 1,858 —Disposal of subsidiaries . . . . . . . . . . . . . . (120,372) — — — —
At December 31, 2017 . . . . . . . . . . . . . . 833,435 264,199 3,624 731 7,959
I-128

APPENDIX I ACCOUNTANTS’ REPORT
II. NOTES TO THE HISTORICAL FINANCIAL INFORMATION (continued)
40. NOTES TO THE CONSOLIDATED STATEMENTS OF CASH FLOWS (continued)
(b) Changes in financial liabilities arising from financing activities (continued)
Bank andother loans
Liabilitiescomponent of the
redeemableconvertible
preference sharesInterestpayable
Otherpayable—due
to relatedparties
Leaseliabilities
USD’000 USD’000 USD’000 USD’000 USD’000
At January 1, 2018 . . . . . . . . . . . . . . . . . 833,435 264,199 3,624 731 7,959Changes from financing cash flows . . . . 389,312 (13,031) (54,615) 1,197 (3,616)Changes in investing cash flows—
additions to investment properties . . . — — (2,430) — —Foreign exchange movements . . . . . . . . (23,118) — (83) 705 (198)Interest expense . . . . . . . . . . . . . . . . . . . — 45,610 58,891 — 428Capitalized interest expense . . . . . . . . . . — — 2,430 —Addition . . . . . . . . . . . . . . . . . . . . . . . . . — — — — 3,559Acquisition of subsidiaries . . . . . . . . . . . 260,844 — — — 1,553
At December 31, 2018 . . . . . . . . . . . . . . 1,460,473 296,778 7,817 2,633 9,685
Bank andother loans
Liabilitiescomponent of the
redeemableconvertible
preference sharesInterestpayable
Otherpayable—due
to relatedparties
LeaseLiabilities
USD’000 USD’000 USD’000 USD’000 USD’000
At January 1, 2018 . . . . . . . . . . . . . . . . 833,435 264,199 3,624 731 7,959Changes from financing cash flows
(unaudited) . . . . . . . . . . . . . . . . . . . . 136,773 (6,919) (22,806) (254) (1,678)Changes in investing cash flows—
additions to investment properties(unaudited) . . . . . . . . . . . . . . . . . . . . — — (827) — —
Foreign exchange movements(unaudited) . . . . . . . . . . . . . . . . . . . . (5,028) (57) — — (79)
Interest expense (unaudited) . . . . . . . . . — 23,318 23,260 — 214Capitalized interest expense
(unaudited) . . . . . . . . . . . . . . . . . . . . — — 827 — 2,885Acquisition of subsidiaries
(unaudited) . . . . . . . . . . . . . . . . . . . . 211,376 — — — —
At June 30, 2018 (unaudited) . . . . . . . . 1,176,556 280,541 4,078 477 9,306
Bank andother loans
Liabilitiescomponent of the
redeemableconvertible
preference sharesInterestpayable
Otherpayable—due
to relatedparties
Leaseliabilities
USD’000 USD’000 USD’000 USD’000 USD’000
At January 1, 2019 . . . . . . . . . . . . . . . . . 1,460,473 296,778 7,817 2,633 9,685Changes from financing cash flows . . . . 1,060,631 (6,869) (42,711) 805 (2,433)Changes in investing cash flows—
additions to investment properties . . . — — (1,615) — —Foreign exchange movements . . . . . . . . 16,706 — — — (191)Interest expense . . . . . . . . . . . . . . . . . . . — 26,101 58,176 — 701Capitalized interest expense . . . . . . . . . . — — 1,615 — —Addition . . . . . . . . . . . . . . . . . . . . . . . . . — — — — 3,746Acquisition of subsidiaries . . . . . . . . . . . 350,241 — — — 12,900Disposal of subsidiaries . . . . . . . . . . . . . (84,315) — — — —
At June 30, 2019 . . . . . . . . . . . . . . . . . . . 2,803,736 316,010 23,282 3,438 24,408
I-129

APPENDIX I ACCOUNTANTS’ REPORT
II. NOTES TO THE HISTORICAL FINANCIAL INFORMATION (continued)
41. COMMITMENTS
(a) Operating lease commitments
As lessor
The Group leases out its completed investment properties under operating lease arrangementson terms ranging from one to ten years and with an option for renewal after the expiry dates, at whichtime all terms will be renegotiated.
At the end of each of the Relevant Periods, the Group had total future minimum leasereceivable under non-cancellable operating leases with its tenants falling due as stated in note 20.
(b) Capital commitments
As at December 31 As at June 30
2016 2017 2018 2019
USD’000 USD’000 USD’000 USD’000
Contracted, but not provided for investment properties . . . . 70,743 57,648 306,725 326,872Contracted, but not provided for plant and machinery . . . . . — — — 11,143Authorized, but not contracted for investment properties . . — — — 49,933Undrawn capital calls to real estate investment funds . . . . . 213,670 48,503 50,581 392,786
284,413 106,151 357,306 780,734
42. RELATED PARTY TRANSACTIONS
In addition to the transactions and balances detailed elsewhere in the Historical FinancialInformation, the Group had the following material transactions with related parties during the RelevantPeriods:
(a) Transactions with related parties:Year ended December 31 Six months ended June 30
2016 2017 2018 2018 2019
USD’000 USD’000 USD’000 USD’000 USD’000(unaudited)
Associates:-Management fees income (note(i)) . . . . . . . . . . . . . . 1,937 4,493 2,358 944 1,839-Advances to associates (note(ii)) . . . . . . . . . . . . . . . . — 335 — — —-Advances from associates (note(ii)) . . . . . . . . . . . . . — 92 — — —
Joint ventures:-Management fees income (note(i)) . . . . . . . . . . . . . . 17,006 25,522 30,256 18,232 10,786-(Repayments from) /advances to joint ventures
(note(ii)) . . . . . . . . . . . . . . . . . . . . . . . . . . . . . . . . . (3,158) 594 3,652 1,099 4,408-(Repayment to)/advances from joint ventures
(note(ii)) . . . . . . . . . . . . . . . . . . . . . . . . . . . . . . . . . (6,649) (2,167) (1,197) (254) 805Companies controlled by the directors:
-Advance to the directors (note(iii)) . . . . . . . . . . . . . . 4,500 — — — —-Construction costs (note(iv)) . . . . . . . . . . . . . . . . . . . 107 12,126 — — —
Director:-Advance to/ (repayment from) a related party
(note(v)) . . . . . . . . . . . . . . . . . . . . . . . . . . . . . . . . . 492 (492) — — —
I-130
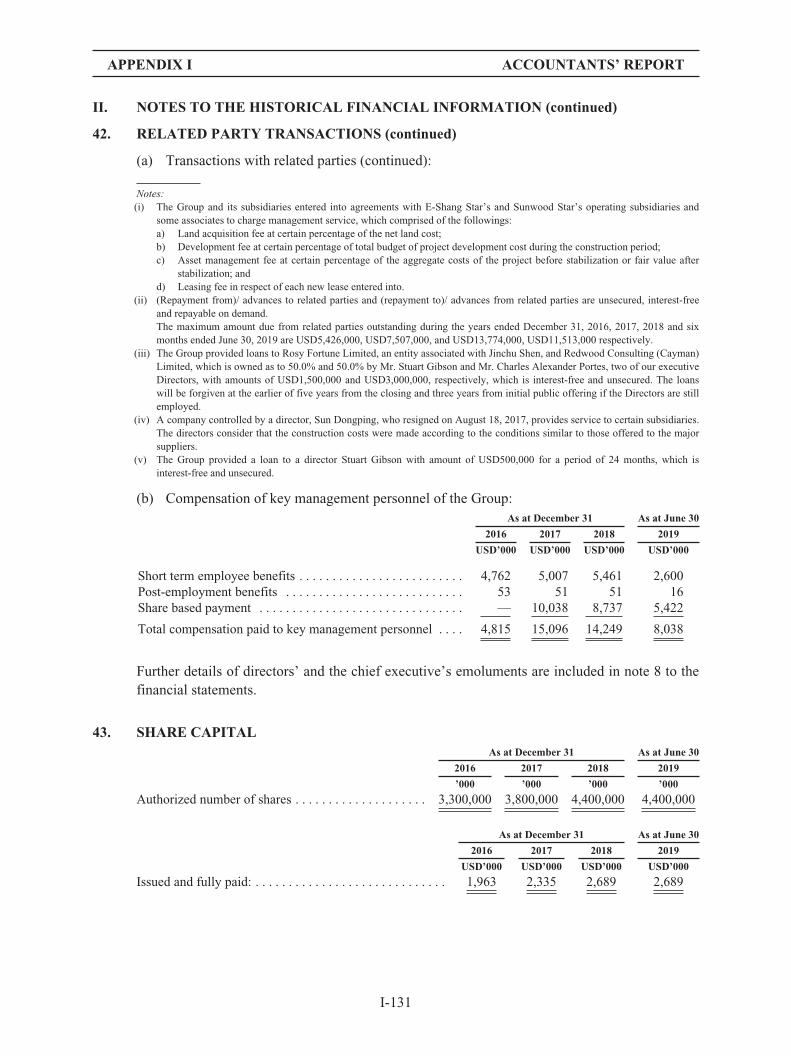
APPENDIX I ACCOUNTANTS’ REPORT
II. NOTES TO THE HISTORICAL FINANCIAL INFORMATION (continued)
42. RELATED PARTY TRANSACTIONS (continued)
(a) Transactions with related parties (continued):
Notes:(i) The Group and its subsidiaries entered into agreements with E-Shang Star’s and Sunwood Star’s operating subsidiaries and
some associates to charge management service, which comprised of the followings:a) Land acquisition fee at certain percentage of the net land cost;b) Development fee at certain percentage of total budget of project development cost during the construction period;c) Asset management fee at certain percentage of the aggregate costs of the project before stabilization or fair value after
stabilization; andd) Leasing fee in respect of each new lease entered into.
(ii) (Repayment from)/ advances to related parties and (repayment to)/ advances from related parties are unsecured, interest-freeand repayable on demand.The maximum amount due from related parties outstanding during the years ended December 31, 2016, 2017, 2018 and sixmonths ended June 30, 2019 are USD5,426,000, USD7,507,000, and USD13,774,000, USD11,513,000 respectively.
(iii) The Group provided loans to Rosy Fortune Limited, an entity associated with Jinchu Shen, and Redwood Consulting (Cayman)Limited, which is owned as to 50.0% and 50.0% by Mr. Stuart Gibson and Mr. Charles Alexander Portes, two of our executiveDirectors, with amounts of USD1,500,000 and USD3,000,000, respectively, which is interest-free and unsecured. The loanswill be forgiven at the earlier of five years from the closing and three years from initial public offering if the Directors are stillemployed.
(iv) A company controlled by a director, Sun Dongping, who resigned on August 18, 2017, provides service to certain subsidiaries.The directors consider that the construction costs were made according to the conditions similar to those offered to the majorsuppliers.
(v) The Group provided a loan to a director Stuart Gibson with amount of USD500,000 for a period of 24 months, which isinterest-free and unsecured.
(b) Compensation of key management personnel of the Group:As at December 31 As at June 30
2016 2017 2018 2019
USD’000 USD’000 USD’000 USD’000
Short term employee benefits . . . . . . . . . . . . . . . . . . . . . . . . . 4,762 5,007 5,461 2,600Post-employment benefits . . . . . . . . . . . . . . . . . . . . . . . . . . . 53 51 51 16Share based payment . . . . . . . . . . . . . . . . . . . . . . . . . . . . . . . — 10,038 8,737 5,422
Total compensation paid to key management personnel . . . . 4,815 15,096 14,249 8,038
Further details of directors’ and the chief executive’s emoluments are included in note 8 to thefinancial statements.
43. SHARE CAPITALAs at December 31 As at June 30
2016 2017 2018 2019
’000 ’000 ’000 ’000
Authorized number of shares . . . . . . . . . . . . . . . . . . . . 3,300,000 3,800,000 4,400,000 4,400,000
As at December 31 As at June 30
2016 2017 2018 2019
USD’000 USD’000 USD’000 USD’000
Issued and fully paid: . . . . . . . . . . . . . . . . . . . . . . . . . . . . . 1,963 2,335 2,689 2,689
I-131
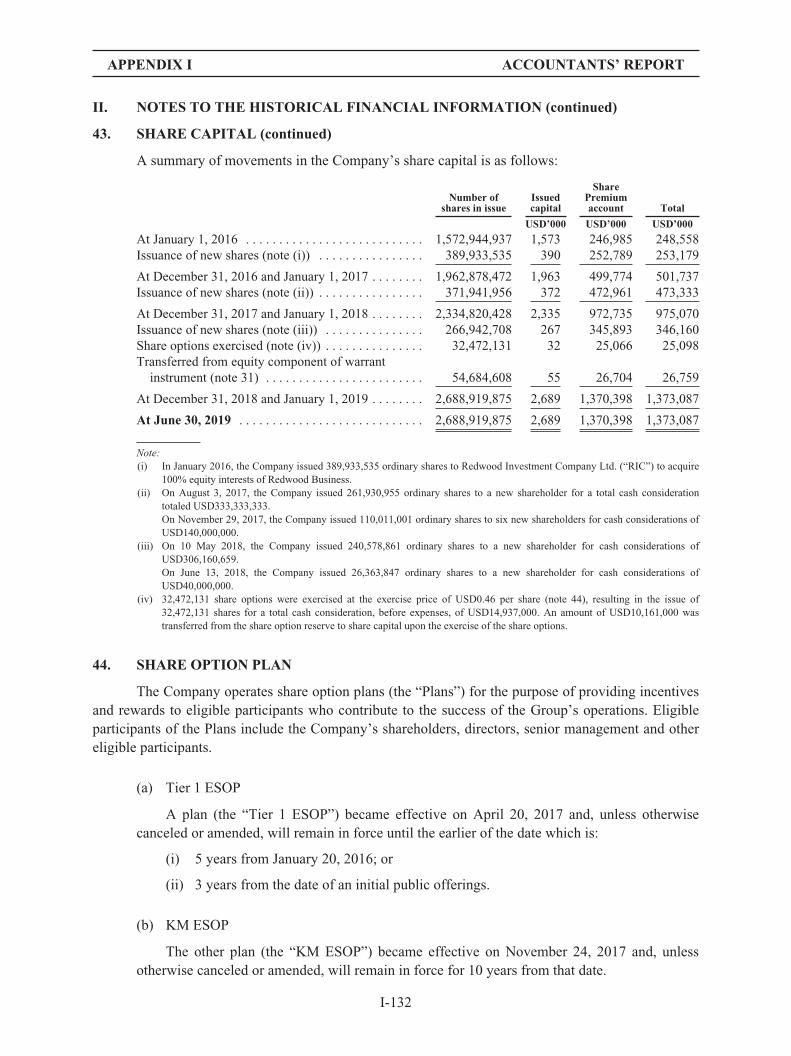
APPENDIX I ACCOUNTANTS’ REPORT
II. NOTES TO THE HISTORICAL FINANCIAL INFORMATION (continued)
43. SHARE CAPITAL (continued)
A summary of movements in the Company’s share capital is as follows:
Number ofshares in issue
Issuedcapital
SharePremiumaccount Total
USD’000 USD’000 USD’000
At January 1, 2016 . . . . . . . . . . . . . . . . . . . . . . . . . . . 1,572,944,937 1,573 246,985 248,558Issuance of new shares (note (i)) . . . . . . . . . . . . . . . . 389,933,535 390 252,789 253,179
At December 31, 2016 and January 1, 2017 . . . . . . . . 1,962,878,472 1,963 499,774 501,737Issuance of new shares (note (ii)) . . . . . . . . . . . . . . . . 371,941,956 372 472,961 473,333
At December 31, 2017 and January 1, 2018 . . . . . . . . 2,334,820,428 2,335 972,735 975,070Issuance of new shares (note (iii)) . . . . . . . . . . . . . . . 266,942,708 267 345,893 346,160Share options exercised (note (iv)) . . . . . . . . . . . . . . . 32,472,131 32 25,066 25,098Transferred from equity component of warrant
instrument (note 31) . . . . . . . . . . . . . . . . . . . . . . . . 54,684,608 55 26,704 26,759
At December 31, 2018 and January 1, 2019 . . . . . . . . 2,688,919,875 2,689 1,370,398 1,373,087
At June 30, 2019 . . . . . . . . . . . . . . . . . . . . . . . . . . . . 2,688,919,875 2,689 1,370,398 1,373,087
Note:(i) In January 2016, the Company issued 389,933,535 ordinary shares to Redwood Investment Company Ltd. (“RIC”) to acquire
100% equity interests of Redwood Business.(ii) On August 3, 2017, the Company issued 261,930,955 ordinary shares to a new shareholder for a total cash consideration
totaled USD333,333,333.On November 29, 2017, the Company issued 110,011,001 ordinary shares to six new shareholders for cash considerations ofUSD140,000,000.
(iii) On 10 May 2018, the Company issued 240,578,861 ordinary shares to a new shareholder for cash considerations ofUSD306,160,659.On June 13, 2018, the Company issued 26,363,847 ordinary shares to a new shareholder for cash considerations ofUSD40,000,000.
(iv) 32,472,131 share options were exercised at the exercise price of USD0.46 per share (note 44), resulting in the issue of32,472,131 shares for a total cash consideration, before expenses, of USD14,937,000. An amount of USD10,161,000 wastransferred from the share option reserve to share capital upon the exercise of the share options.
44. SHARE OPTION PLAN
The Company operates share option plans (the “Plans”) for the purpose of providing incentivesand rewards to eligible participants who contribute to the success of the Group’s operations. Eligibleparticipants of the Plans include the Company’s shareholders, directors, senior management and othereligible participants.
(a) Tier 1 ESOP
A plan (the “Tier 1 ESOP”) became effective on April 20, 2017 and, unless otherwisecanceled or amended, will remain in force until the earlier of the date which is:
(i) 5 years from January 20, 2016; or
(ii) 3 years from the date of an initial public offerings.
(b) KM ESOP
The other plan (the “KM ESOP”) became effective on November 24, 2017 and, unlessotherwise canceled or amended, will remain in force for 10 years from that date.
I-132
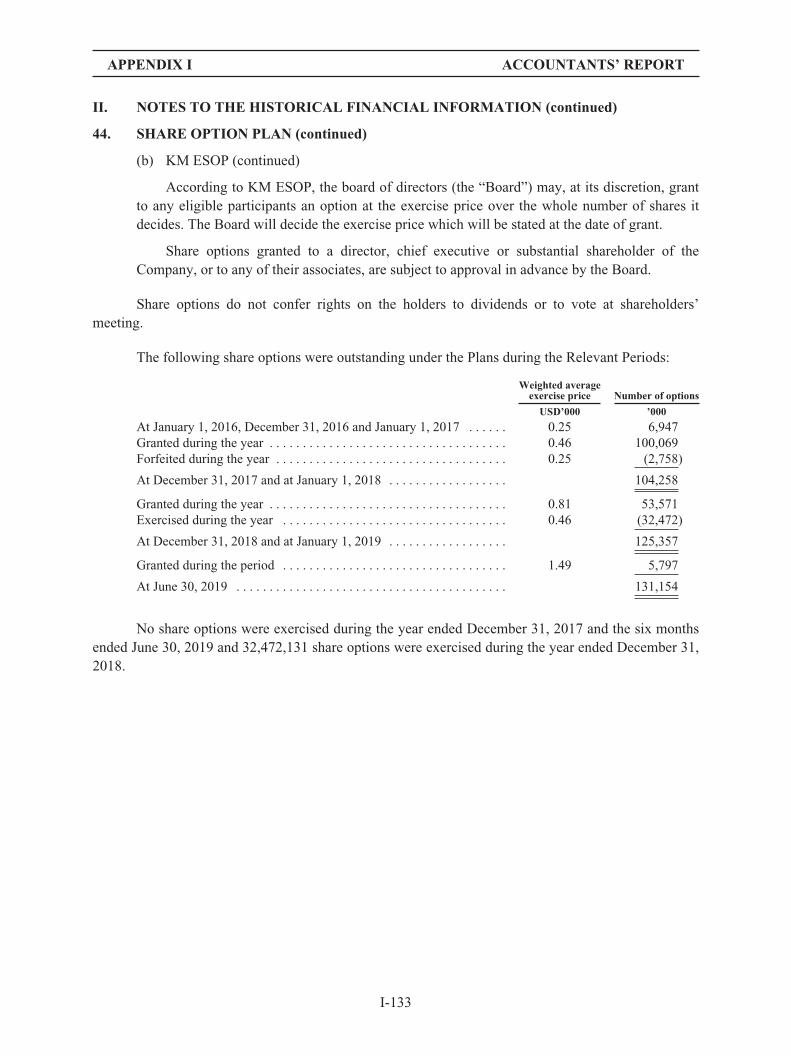
APPENDIX I ACCOUNTANTS’ REPORT
II. NOTES TO THE HISTORICAL FINANCIAL INFORMATION (continued)
44. SHARE OPTION PLAN (continued)
(b) KM ESOP (continued)
According to KM ESOP, the board of directors (the “Board”) may, at its discretion, grantto any eligible participants an option at the exercise price over the whole number of shares itdecides. The Board will decide the exercise price which will be stated at the date of grant.
Share options granted to a director, chief executive or substantial shareholder of theCompany, or to any of their associates, are subject to approval in advance by the Board.
Share options do not confer rights on the holders to dividends or to vote at shareholders’meeting.
The following share options were outstanding under the Plans during the Relevant Periods:
Weighted averageexercise price Number of options
USD’000 ’000
At January 1, 2016, December 31, 2016 and January 1, 2017 . . . . . . 0.25 6,947Granted during the year . . . . . . . . . . . . . . . . . . . . . . . . . . . . . . . . . . . . 0.46 100,069Forfeited during the year . . . . . . . . . . . . . . . . . . . . . . . . . . . . . . . . . . . 0.25 (2,758)
At December 31, 2017 and at January 1, 2018 . . . . . . . . . . . . . . . . . . 104,258
Granted during the year . . . . . . . . . . . . . . . . . . . . . . . . . . . . . . . . . . . . 0.81 53,571Exercised during the year . . . . . . . . . . . . . . . . . . . . . . . . . . . . . . . . . . 0.46 (32,472)
At December 31, 2018 and at January 1, 2019 . . . . . . . . . . . . . . . . . . 125,357
Granted during the period . . . . . . . . . . . . . . . . . . . . . . . . . . . . . . . . . . 1.49 5,797
At June 30, 2019 . . . . . . . . . . . . . . . . . . . . . . . . . . . . . . . . . . . . . . . . . 131,154
No share options were exercised during the year ended December 31, 2017 and the six monthsended June 30, 2019 and 32,472,131 share options were exercised during the year ended December 31,2018.
I-133

APPENDIX I ACCOUNTANTS’ REPORT
II. NOTES TO THE HISTORICAL FINANCIAL INFORMATION (continued)
44. SHARE OPTION PLAN (continued)
(b) KM ESOP (continued)
The exercise prices and exercise periods of the share options outstanding as at the end of eachof the Relevant Periods are as follows:
2016Number of options Exercise price Exercise period
‘000 USDPer share
6,947 0.2520 01-02-19 to 31-01-24
2017Number of options Exercise price Exercise period
‘000 USDPer share
4,189 0.2520 01-02-19 to 31-01-24100,069 0.4600 20-04-17 to 20-01-26
104,258
2018Number of options Exercise price Exercise period
‘000 USDPer share
4,189 0.2520 01-02-19 to 31-01-2467,597 0.4600 20-04-17 to 20-01-264,652 0.9445 01-01-23* to 31-12-27
15,247 0.4722 01-01-23* to 11-12-2732,799 0.9445 01-01-23* to 14-01-28
873 1.1453 16-08-23* to 15-08-28
125,357
2019Number of options Exercise price Exercise period
‘000 USDPer share
4,189 0.2520 01-02-19 to 31-01-2467,597 0.4600 20-04-17 to 20-01-264,652 0.9445 01-01-23* to 31-12-27
15,247 0.4722 01-01-23* to 22-02-2932,799 0.9445 01-01-23* to 19-05-29
873 1.1453 16-08-23* to 15-08-281,098 1.3655 26-02-24* to 25-02-293,710 1.5172 26-02-24* to 25-02-29989 1.5172 20-05-24* to 19-05-29
131,154
* Participants will have an unconditional right to exercise an option to the extent that it is vested after the earliest of thefollowings:
a) an IPO;
b) an Early Vesting Event;
c) 5 years of the date of grant.
If there is (i) a sale of all or substantially all of the shares in; or (ii) a disposal of all or substantially all of the business of the memberof the Group of which a participant is a director or by which the participant is employed, as appropriate, by way of trade sale or byway of sale to a third party (an “Early Vesting Event”), any options granted to the participant will vest in full on the occurrence ofthe Early Vesting Event.
I-134

APPENDIX I ACCOUNTANTS’ REPORT
II. NOTES TO THE HISTORICAL FINANCIAL INFORMATION (continued)
44. SHARE OPTION PLAN (continued)
(b) KM ESOP (continued)
The fair value of the share options granted in 2017 was approximately USD31,304,000(USD0.31 each), of which the Group recognized a share option expense of approximatelyUSD11,923,000, USD6,293,000 and USD3,127,000 during the year ended December 31, 2017, duringthe year ended December 31, 2018, and during the period ended June 30, 2019, respectively.
The fair value of the share options granted in 2018 was approximately USD36,456,000(USD0.68 each), of which the Group recognized a share option expense of approximatelyUSD16,864,000 and USD5,851,000 during the year ended December 31, 2018 and during the periodended June 30, 2019, respectively.
The fair value of the share options granted in 2019 was approximately USD2,640,000(USD0.46 each), of which the Group recognized a share option expense of approximately USD907,000during the period ended June 30, 2019.
The fair value of equity-settled share options granted during the Relevant Periods, wasestimated as at the date of grant using a binomial model, taking into account the terms and conditionsupon which the options were granted. The following table lists the inputs to the model used:
2017 2018 2019
Dividend yields (%) . . . . . . . . . . . . . . . . . . . . . . . . . . . . . . . . . . . . . . . . — — —Volatility . . . . . . . . . . . . . . . . . . . . . . . . . . . . . . . . . . . . . . . . . . . . . . . . . 33.68 32.70-34.41 20.09Risk-free interest rate (%) . . . . . . . . . . . . . . . . . . . . . . . . . . . . . . . . . . . 2.33 2.33-3.11 2.26-2.77Expected life of options (year) . . . . . . . . . . . . . . . . . . . . . . . . . . . . . . . . 8.8 8.8-10 10.00
The expected life of the options is based on the historical data over the past three years and isnot necessarily indicative of the exercise patterns that may occur.
No other feature of the options granted was incorporated into the measurement of fair value.
At December 31, 2016, the Company had 6,947,000 share options outstanding under the Plans.The exercise in full of the outstanding share options would, under the present capital structure of theCompany, result in the issue of 6,947,000 additional ordinary shares of the Company and additionalshare capital and share premium of USD1,715,000 (before issue expenses).
At December 31, 2017, the Company had 104,258,000 share options outstanding under thePlans. The exercise in full of the outstanding share options would, under the present capital structure ofthe Company, result in the issue of 104,258,000 additional ordinary shares of the Company andadditional share capital and share premium of USD47,087,000 (before issue expenses).
At the December 31, 2018, the Company had 125,357,000 share options outstanding under thePlans. The exercise in full of the outstanding share options would, under the present capital structure ofthe Company, result in the issue of 125,357,000 additional ordinary shares of the Company andadditional share capital and share premium of USD75,722,000 (before issue expenses).
I-135
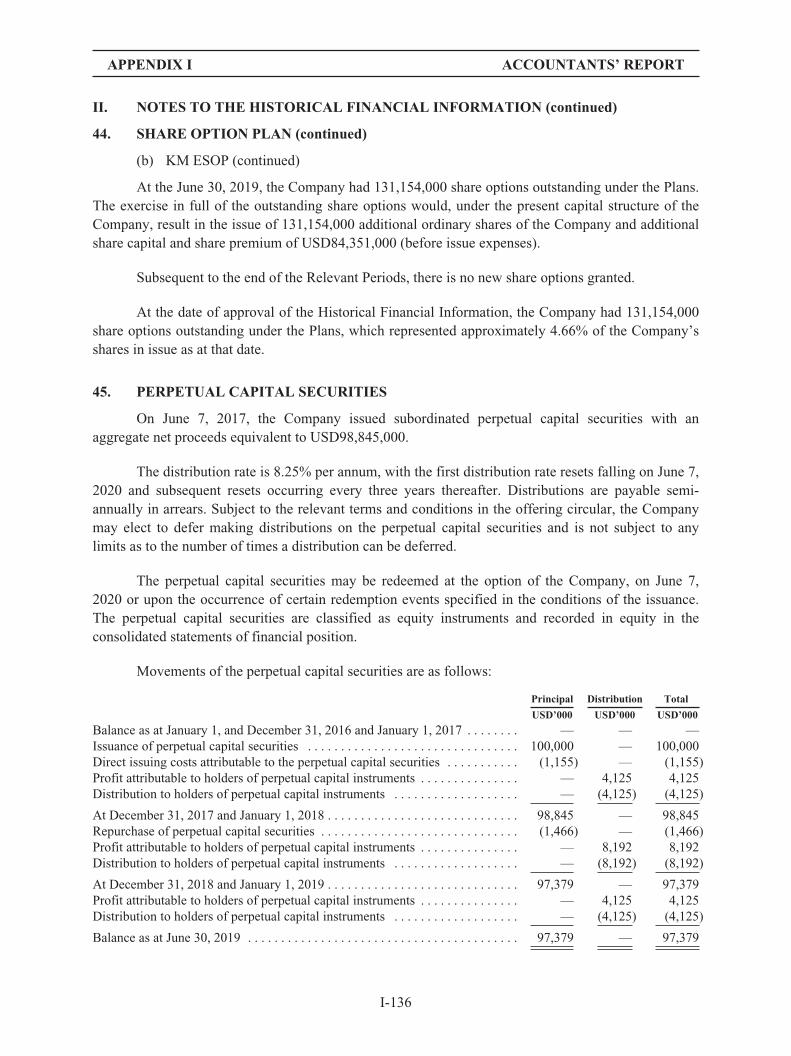
APPENDIX I ACCOUNTANTS’ REPORT
II. NOTES TO THE HISTORICAL FINANCIAL INFORMATION (continued)
44. SHARE OPTION PLAN (continued)
(b) KM ESOP (continued)
At the June 30, 2019, the Company had 131,154,000 share options outstanding under the Plans.The exercise in full of the outstanding share options would, under the present capital structure of theCompany, result in the issue of 131,154,000 additional ordinary shares of the Company and additionalshare capital and share premium of USD84,351,000 (before issue expenses).
Subsequent to the end of the Relevant Periods, there is no new share options granted.
At the date of approval of the Historical Financial Information, the Company had 131,154,000share options outstanding under the Plans, which represented approximately 4.66% of the Company’sshares in issue as at that date.
45. PERPETUAL CAPITAL SECURITIES
On June 7, 2017, the Company issued subordinated perpetual capital securities with anaggregate net proceeds equivalent to USD98,845,000.
The distribution rate is 8.25% per annum, with the first distribution rate resets falling on June 7,2020 and subsequent resets occurring every three years thereafter. Distributions are payable semi-annually in arrears. Subject to the relevant terms and conditions in the offering circular, the Companymay elect to defer making distributions on the perpetual capital securities and is not subject to anylimits as to the number of times a distribution can be deferred.
The perpetual capital securities may be redeemed at the option of the Company, on June 7,2020 or upon the occurrence of certain redemption events specified in the conditions of the issuance.The perpetual capital securities are classified as equity instruments and recorded in equity in theconsolidated statements of financial position.
Movements of the perpetual capital securities are as follows:
Principal Distribution Total
USD’000 USD’000 USD’000
Balance as at January 1, and December 31, 2016 and January 1, 2017 . . . . . . . . — — —Issuance of perpetual capital securities . . . . . . . . . . . . . . . . . . . . . . . . . . . . . . . . 100,000 — 100,000Direct issuing costs attributable to the perpetual capital securities . . . . . . . . . . . (1,155) — (1,155)Profit attributable to holders of perpetual capital instruments . . . . . . . . . . . . . . . — 4,125 4,125Distribution to holders of perpetual capital instruments . . . . . . . . . . . . . . . . . . . — (4,125) (4,125)
At December 31, 2017 and January 1, 2018 . . . . . . . . . . . . . . . . . . . . . . . . . . . . . 98,845 — 98,845Repurchase of perpetual capital securities . . . . . . . . . . . . . . . . . . . . . . . . . . . . . . (1,466) — (1,466)Profit attributable to holders of perpetual capital instruments . . . . . . . . . . . . . . . — 8,192 8,192Distribution to holders of perpetual capital instruments . . . . . . . . . . . . . . . . . . . — (8,192) (8,192)
At December 31, 2018 and January 1, 2019 . . . . . . . . . . . . . . . . . . . . . . . . . . . . . 97,379 — 97,379Profit attributable to holders of perpetual capital instruments . . . . . . . . . . . . . . . — 4,125 4,125Distribution to holders of perpetual capital instruments . . . . . . . . . . . . . . . . . . . — (4,125) (4,125)
Balance as at June 30, 2019 . . . . . . . . . . . . . . . . . . . . . . . . . . . . . . . . . . . . . . . . . 97,379 — 97,379
I-136

APPENDIX I ACCOUNTANTS’ REPORT
II. NOTES TO THE HISTORICAL FINANCIAL INFORMATION (continued)
46. RESERVES
(a) Group
The amount of the Group’s reserves and the movements therein are presented in theconsolidated statements of changes in equity of the Historical Financial Information.
(i) Statutory reserve
In accordance with the Company Law of the People’s Republic of China, the subsidiaries in thePRC are required to allocate 10% of the statutory after tax profits to the statutory reserve until thecumulative total of the reserve reaches 50% of the subsidiaries’ registered capital. Subject to approvalfrom the relevant PRC authorities, the statutory reserve may be used to offset any accumulated lossesor increase the registered capital of the subsidiaries. The statutory reserve is not available for dividenddistribution to shareholders of the PRC subsidiaries.
(ii) Merger reserve
The merger reserve of the Group represents the reserve arose pursuant to thereorganization of subsidiaries.
(iii) Exchange fluctuation reserve
The exchange fluctuation reserve represents exchange differences arising from thetranslation of the financial statements of foreign operations whose functional currencies aredifferent from the Group’s presentation currency.
I-137

II.
NOTESTO
THE
HIS
TORIC
AL
FIN
ANCIA
LIN
FORM
ATIO
N(con
tinu
ed)
46.
RESE
RVES(con
tinu
ed)
(b)
The
Com
pany
Shar
epr
emium
Shar
eop
tion
reserv
e
Exc
hang
efluc
tuation
reserv
e
Retaine
dpr
ofits/
(acc
umulated
losses)
Total
USD
’000
USD
’000
USD
’000
USD
’000
USD
’000
Asat
Janu
ary1,
2016
....
....
....
....
....
....
....
....
....
....
....
....
....
....
....
....
.24
6,98
534
742
21,145
268,51
9Los
sfortheye
ar..
....
....
....
....
....
....
....
....
....
....
....
....
....
....
....
....
....
——
—(25,88
7)(25,88
7)Other
compreh
ensive
inco
mefortheye
ar:
Sha
reof
othe
rco
mpreh
ensive
inco
meof
jointv
entures..
....
....
....
....
....
....
....
....
....
..—
—(8,696
)—
(8,696
)
Total
compr
ehen
sive
inco
meforth
eye
ar..
....
....
....
....
....
....
....
....
....
....
....
...
——
(8,696
)(25,88
7)(34,58
3)Issu
eof
shares
....
....
....
....
....
....
....
....
....
....
....
....
....
....
....
....
....
....
252,78
9—
——
252,78
9Equ
ity-settledsh
areop
tion
arrang
emen
ts..
....
....
....
....
....
....
....
....
....
....
....
....
.—
75—
—75
Asat
Dec
embe
r31
,201
6..
....
....
....
....
....
....
....
....
....
....
....
....
....
....
....
.49
9,77
442
2(8,654
)(4,742
)48
6,80
0
Shar
epr
emium
Shar
eop
tion
reserv
e
Exc
hang
efluc
tuation
reserv
eAcc
umulated
losses
Total
USD
’000
USD
’000
USD
’000
USD
’000
USD
’000
Asat
Janu
ary1,
2017
....
....
....
....
....
....
....
....
....
....
....
....
....
....
....
....
.49
9,77
442
2(8,654
)(4,742
)48
6,80
0Los
sfortheye
ar..
....
....
....
....
....
....
....
....
....
....
....
....
....
....
....
....
....
——
—(92,60
5)(92,60
5)Other
compreh
ensive
inco
mefortheye
ar:
Sha
reof
othe
rco
mpreh
ensive
inco
meof
jointv
entures..
....
....
....
....
....
....
....
....
....
..—
—9,14
8—
9,14
8
Total
compr
ehen
sive
inco
meforth
eye
ar..
....
....
....
....
....
....
....
....
....
....
....
...
——
9,14
8(92,60
5)(83,45
7)Issu
eof
shares
....
....
....
....
....
....
....
....
....
....
....
....
....
....
....
....
....
....
472,96
1—
——
472,96
1Equ
ity-settledsh
areop
tion
arrang
emen
ts..
....
....
....
....
....
....
....
....
....
....
....
....
.—
11,923
——
11,923
Profita
ttribu
tableto
holdersof
perpetua
lcap
ital
secu
rities
....
....
....
....
....
....
....
....
....
.—
——
(4,125
)(4,125
)
Asat
Dec
embe
r31
,201
7..
....
....
....
....
....
....
....
....
....
....
....
....
....
....
....
.97
2,73
512
,345
494
(101
,472
)88
4,10
2
I-138
APPENDIX I ACCOUNTANTS’ REPORT

II.
NOTESTO
THE
HIS
TORIC
AL
FIN
ANCIA
LIN
FORM
ATIO
N(con
tinu
ed)
46.
RESE
RVES(con
tinu
ed)
(b)
The
Com
pany
(con
tinu
ed)
Shar
epr
emium
Shar
eop
tion
reserv
e
Exc
hang
efluc
tuation
reserv
eAcc
umulated
losses
Inve
stmen
tre
serv
e(n
on-rec
yclin
g)Total
USD
’000
USD
’000
USD
’000
USD
’000
USD
’000
USD
’000
Asat
Janu
ary1,
2018
....
....
....
....
....
....
....
....
....
....
....
....
....
....
....
972,73
512
,345
494
(101
,472
)—
884,10
2Los
sfortheye
ar..
....
....
....
....
....
....
....
....
....
....
....
....
....
....
....
...
——
—(43,37
8)—
(43,37
8)Other
compreh
ensive
inco
mefortheye
ar:
Cha
ngein
fairva
lueof
fina
nciala
ssetsat
fairva
luethroug
hothe
rco
mpreh
ensive
inco
me..
....
.—
——
—6,60
76,60
7Sha
reof
othe
rco
mpreh
ensive
inco
meof
jointv
entures
....
....
....
....
....
....
....
....
..—
—(8,798
)—
—(8,798
)
Total
compr
ehen
sive
inco
meforth
eye
ar..
....
....
....
....
....
....
....
....
....
....
.—
—(8,798
)(43,37
8)6,60
7(45,56
9)Issu
eof
shares
....
....
....
....
....
....
....
....
....
....
....
....
....
....
....
....
..37
0,95
9(10,16
1)—
——
360,79
8Trans
ferred
from
fina
ncialliabilities
....
....
....
....
....
....
....
....
....
....
....
....
.26
,704
——
——
26,704
Profita
ttribu
tableto
holdersof
perpetua
lcap
ital
secu
rities
....
....
....
....
....
....
....
....
——
—(8,192
)—
(8,192
)Equ
ity-settledsh
areop
tion
arrang
emen
t..
....
....
....
....
....
....
....
....
....
....
....
—23
,157
——
—23
,157
Asat
Dec
embe
r31
,201
8..
....
....
....
....
....
....
....
....
....
....
....
....
....
...
1,37
0,39
825
,341
(8,304
)(153
,042
)6,60
71,24
1,00
0
Shar
epr
emium
Shar
eop
tion
reserv
e
Exc
hang
efluc
tuation
reserv
eAcc
umulated
losses
Inve
stmen
tre
serv
e(n
on-rec
yclin
g)Total
USD
’000
USD
’000
USD
’000
USD
’000
USD
’000
USD
’000
Asat
Janu
ary1,
2019
....
....
....
....
....
....
....
....
....
....
....
....
....
....
....
1,37
0,39
825
,341
(8,304
)(153
,042
)6,60
71,24
1,00
0Los
sforthepe
riod
....
....
....
....
....
....
....
....
....
....
....
....
....
....
....
...
——
—(73,91
5)—
(73,91
5)Other
compreh
ensive
inco
meforthepe
riod
:Cha
ngein
fairva
lueof
fina
nciala
ssetsat
fairva
luethroug
hothe
rco
mpreh
ensive
inco
me..
....
.—
——
—1,32
11,32
1Sha
reof
othe
rco
mpreh
ensive
inco
meof
jointv
entures
....
....
....
....
....
....
....
....
..—
—6,31
9—
—6,31
9
Total
compr
ehen
sive
inco
meforth
epe
riod
....
....
....
....
....
....
....
....
....
....
.—
—6,31
9(73,91
5)1,32
1(66,27
5)Profita
ttribu
tableto
holdersof
perpetua
lcap
ital
secu
rities
....
....
....
....
....
....
....
....
——
—(4,125
)—
(4,125
)Equ
ity-settledsh
areop
tion
arrang
emen
t..
....
....
....
....
....
....
....
....
....
....
....
—9,88
5—
——
9,88
5
Asat
June
30,2
019..
....
....
....
....
....
....
....
....
....
....
....
....
....
....
....
1,37
0,39
835
,226
(1,985
)(231
,082
)7,92
81,18
0,48
5
I-139
APPENDIX I ACCOUNTANTS’ REPORT

APPENDIX I ACCOUNTANTS’ REPORT
II. NOTES TO THE HISTORICAL FINANCIAL INFORMATION (continued)
47. FINANCIAL RISK MANAGEMENT OBJECTIVES AND POLICIES
The Group’s principal financial instruments comprise bank borrowings, trade and otherpayables, other borrowings, cash and bank balances, trade receivables, financial assets included inprepayments, other receivables and other assets, financial assets at fair value through profit or loss,financial assets at fair value through other comprehensive income, available-for-sale investments, andfinancial assets included in other non-current assets. The main purpose of these financial instruments isto raise finance for the Group’s operations. The Group has various financial assets such as tradereceivables, cash and short-term deposits, which arose directly from its operations. The main risksfaced by the Group are interest rate risk, foreign currency risk, credit risk and liquidity risk. The Groupdoes not hold or issue derivative financial instruments either for hedging or for trading purposes. Thedirectors reviews and agrees policies for managing each of the risks which are summarized below:
Interest rate risk
The Group’s exposure to the risk of changes in interest rates relates primarily to its interest-bearing bank loans and other borrowings. The Group does not use derivative financial instruments tomanage its interest rate risk. The interest rates and terms of repayments of the borrowings are disclosedin note 27.
The following table demonstrates the sensitivity to reasonably possible changes in interest rate,with all other variables held constant, of the Group’s profit before tax (mainly the impact on floatingrate borrowings). The Group’s equity is not affected, other than the consequential effect on theaccumulated losses of the changes in profit before tax as disclosed below.
Increase/(decrease) inBasis point
(Decrease)/increase inprofit before tax
USD’000 USD’000
Year ended December 31, 2016 . . . . . . . . . . . . . . . . . . . . . . . 100/(100) (4,421)/4,421Year ended December 31, 2017 . . . . . . . . . . . . . . . . . . . . . . . 100/(100) (5,352)/5,352Year ended December 31, 2018 . . . . . . . . . . . . . . . . . . . . . . . 100/(100) (4,548)/4,548Six months ended June 30, 2019 . . . . . . . . . . . . . . . . . . . . . . 100/(100) (5,771)/5,771
Foreign currency risk
During the Relevant Periods, the Group had monetary assets and liabilities, which weredenominated in foreign currencies, and were exposed to foreign exchange risk arising from variouscurrency exposures. Foreign exchange risk arises from future commercial transactions, recognizedassets and liabilities, which are denominated in a currency that is not the functional currency of therelevant entities.
I-140
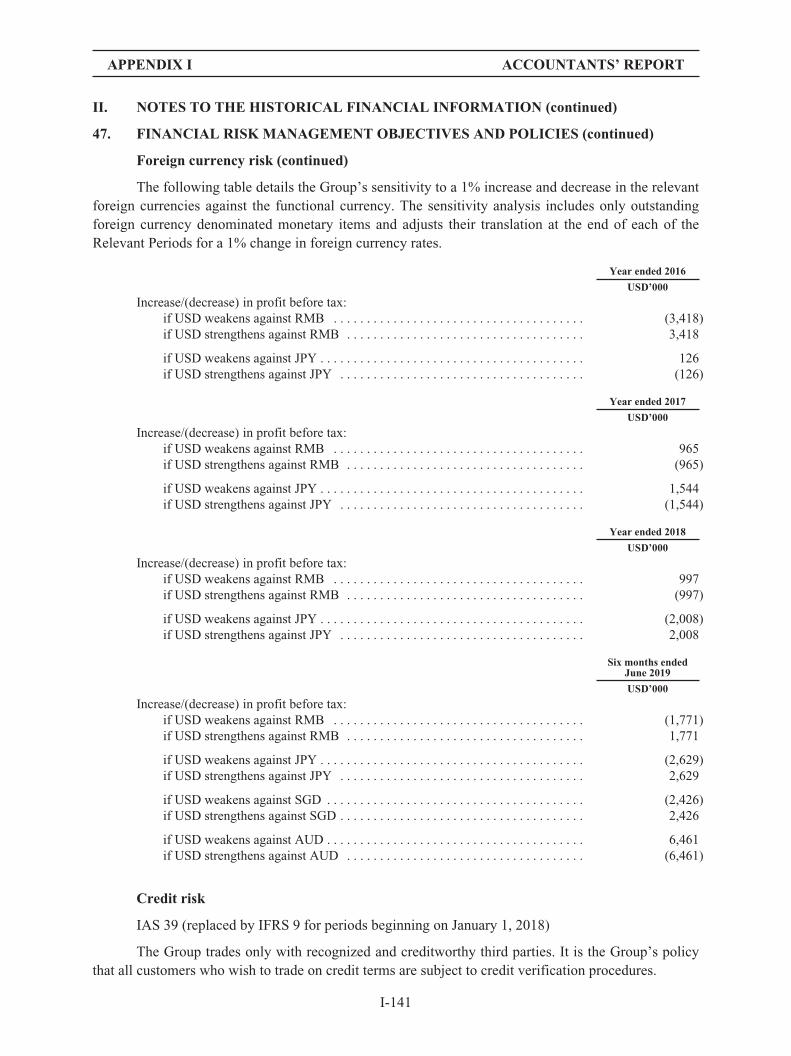
APPENDIX I ACCOUNTANTS’ REPORT
II. NOTES TO THE HISTORICAL FINANCIAL INFORMATION (continued)
47. FINANCIAL RISK MANAGEMENT OBJECTIVES AND POLICIES (continued)
Foreign currency risk (continued)
The following table details the Group’s sensitivity to a 1% increase and decrease in the relevantforeign currencies against the functional currency. The sensitivity analysis includes only outstandingforeign currency denominated monetary items and adjusts their translation at the end of each of theRelevant Periods for a 1% change in foreign currency rates.
Year ended 2016
USD’000
Increase/(decrease) in profit before tax:if USD weakens against RMB . . . . . . . . . . . . . . . . . . . . . . . . . . . . . . . . . . . . . . (3,418)if USD strengthens against RMB . . . . . . . . . . . . . . . . . . . . . . . . . . . . . . . . . . . . 3,418
if USD weakens against JPY . . . . . . . . . . . . . . . . . . . . . . . . . . . . . . . . . . . . . . . . 126if USD strengthens against JPY . . . . . . . . . . . . . . . . . . . . . . . . . . . . . . . . . . . . . (126)
Year ended 2017
USD’000
Increase/(decrease) in profit before tax:if USD weakens against RMB . . . . . . . . . . . . . . . . . . . . . . . . . . . . . . . . . . . . . . 965if USD strengthens against RMB . . . . . . . . . . . . . . . . . . . . . . . . . . . . . . . . . . . . (965)
if USD weakens against JPY . . . . . . . . . . . . . . . . . . . . . . . . . . . . . . . . . . . . . . . . 1,544if USD strengthens against JPY . . . . . . . . . . . . . . . . . . . . . . . . . . . . . . . . . . . . . (1,544)
Year ended 2018
USD’000
Increase/(decrease) in profit before tax:if USD weakens against RMB . . . . . . . . . . . . . . . . . . . . . . . . . . . . . . . . . . . . . . 997if USD strengthens against RMB . . . . . . . . . . . . . . . . . . . . . . . . . . . . . . . . . . . . (997)
if USD weakens against JPY . . . . . . . . . . . . . . . . . . . . . . . . . . . . . . . . . . . . . . . . (2,008)if USD strengthens against JPY . . . . . . . . . . . . . . . . . . . . . . . . . . . . . . . . . . . . . 2,008
Six months endedJune 2019
USD’000
Increase/(decrease) in profit before tax:if USD weakens against RMB . . . . . . . . . . . . . . . . . . . . . . . . . . . . . . . . . . . . . . (1,771)if USD strengthens against RMB . . . . . . . . . . . . . . . . . . . . . . . . . . . . . . . . . . . . 1,771
if USD weakens against JPY . . . . . . . . . . . . . . . . . . . . . . . . . . . . . . . . . . . . . . . . (2,629)if USD strengthens against JPY . . . . . . . . . . . . . . . . . . . . . . . . . . . . . . . . . . . . . 2,629
if USD weakens against SGD . . . . . . . . . . . . . . . . . . . . . . . . . . . . . . . . . . . . . . . (2,426)if USD strengthens against SGD . . . . . . . . . . . . . . . . . . . . . . . . . . . . . . . . . . . . . 2,426
if USD weakens against AUD . . . . . . . . . . . . . . . . . . . . . . . . . . . . . . . . . . . . . . . 6,461if USD strengthens against AUD . . . . . . . . . . . . . . . . . . . . . . . . . . . . . . . . . . . . (6,461)
Credit risk
IAS 39 (replaced by IFRS 9 for periods beginning on January 1, 2018)
The Group trades only with recognized and creditworthy third parties. It is the Group’s policythat all customers who wish to trade on credit terms are subject to credit verification procedures.
I-141

APPENDIX I ACCOUNTANTS’ REPORT
II. NOTES TO THE HISTORICAL FINANCIAL INFORMATION (continued) (continued)
47. FINANCIAL RISK MANAGEMENT OBJECTIVES AND POLICIES (continued)
Credit risk (continued)
IAS 39 (replaced by IFRS 9 for periods beginning on January 1, 2018) (continued)
Credit risk arises from cash and bank balances, trade receivables and other receivables, thebalances of which represent the maximum credit risk exposure of the Group.
Further quantitative data in respect of the Group’s exposure to credit risk arising from trade andother receivables are disclosed in notes 24 and 25.
IFRS 9 (for the periods beginning on or after January 1, 2018)
Credit risk is the risk of loss due to the inability or unwillingness of a counterparty to meets itscontractual obligation. The Group has no concentration of credit risk from third party debtors. Thecarrying amounts of restricted cash, cash and bank balances, financial assets included in prepayments,other receivables and other assets in the consolidated statements of financial position represent theGroup’s maximum exposure to credit risk in relation to its financial assets.
All cash and bank balances were deposited in high-credit-quality financial institutions withoutsignificant credit risk.
The Group has established a policy to perform an assessment at December 31, 2018, of whethera financial instrument’s credit risk has increased significantly since initial recognition, by consideringthe groups its other receivables into Stage 1 and Stage 2, as described below:
Stage 1-When other receivables are first recognized, the Group records an allowance based on12 months’ expected credit loss (ECL)
Stage 2-When other receivables have shown a significant increase in credit risk sinceorigination, the Group records an allowance for the lifetime ECLs
Management also regularly reviews the recoverability of these receivables and follow up thedispute or amount overdue, if any. The management is of the opinion that the risk of default bycounterparties is low.
The Group considers the probability of default upon initial recognition of asset and whetherthere has been a significant increase in credit risk on an ongoing basis throughout each reportingperiod. To assess whether there is a significant increase in credit risk, the Group compare the risk of adefault occurring on the asset as of the reporting date with the risk of default as of the date of initialrecognition. It considers available reasonable and supportive forwarding-looking information.
The Group applies the simplified approach to providing for expected credit losses prescribed byIFRS 9, which permits the use of the lifetime expected loss provision for all trade receivables. Theexpected loss allowance provision for these balances was not material during the Relevant Periods.
The Group has applied IFRS 9, effective for the periods beginning on or after January 1, 2018.As at December 31, 2018 and June 30, 2019, the credit rating of other receivables were performing.
I-142

APPENDIX I ACCOUNTANTS’ REPORT
II. NOTES TO THE HISTORICAL FINANCIAL INFORMATION (continued) (continued)
47. FINANCIAL RISK MANAGEMENT OBJECTIVES AND POLICIES (continued)
Credit risk (continued)
IAS 39 (replaced by IFRS 9 for periods beginning on January 1, 2018) (continued)
The Group assessed that the expected credit losses for these receivables are not material under the12 months expected losses methods. Thus no loss allowance provision was recognized during the yearended December 31, 2018 and the six months ended June 30, 2019.
Further quantitative data in respect of the Group’s exposure to credit risk arising from tradereceivables and other receivables are disclosed in note 24 and note 25.
Liquidity risk
The Group’s policy is to maintain sufficient cash and bank balances or to have availablefunding through the use of bank loans and other borrowings to meet its commitments over theforeseeable future in accordance with its strategic plan.
The maturity profile of the Group’s financial liabilities as at the end of each of the RelevantPeriods, based on the contractual undiscounted payments, is as follows:
GroupLess than1 year
1 to5 year
Over5 years Total
USD’000 USD’000 USD’000 USD’000
December 31, 2016Interest-bearing bank and other borrowings . . . . . . . . . . . . . . 117,991 578,298 203,992 900,281Redeemable convertible preference shares . . . . . . . . . . . . . . . 13,574 306,438 — 320,012Trade and other payables . . . . . . . . . . . . . . . . . . . . . . . . . . . . 21,970 — — 21,970Lease liabilities . . . . . . . . . . . . . . . . . . . . . . . . . . . . . . . . . . . . 1,415 3,123 — 4,538Financial liabilities at fair value through profit or loss . . . . . . — — 12,592 12,592Other non-current liabilities . . . . . . . . . . . . . . . . . . . . . . . . . . — — 10,662 10,662
154,950 887,859 227,246 1,270,055
Less than1 year
1 to5 year
Over5 years Total
USD’000 USD’000 USD’000 USD’000
December 31, 2017Interest-bearing bank and other borrowings . . . . . . . . . . . . . . 106,089 639,879 181,717 927,685Redeemable convertible preference shares . . . . . . . . . . . . . . . 13,648 309,121 — 322,769Trade and other payables . . . . . . . . . . . . . . . . . . . . . . . . . . . . 66,939 — — 66,939Lease liabilities . . . . . . . . . . . . . . . . . . . . . . . . . . . . . . . . . . . . 2,610 5,424 796 8,830Financial liabilities at fair value through profit or loss . . . . . . — — 13,671 13,671Other non-current liabilities . . . . . . . . . . . . . . . . . . . . . . . . . . — — 22,196 22,196
189,286 954,424 218,380 1,362,090
I-143
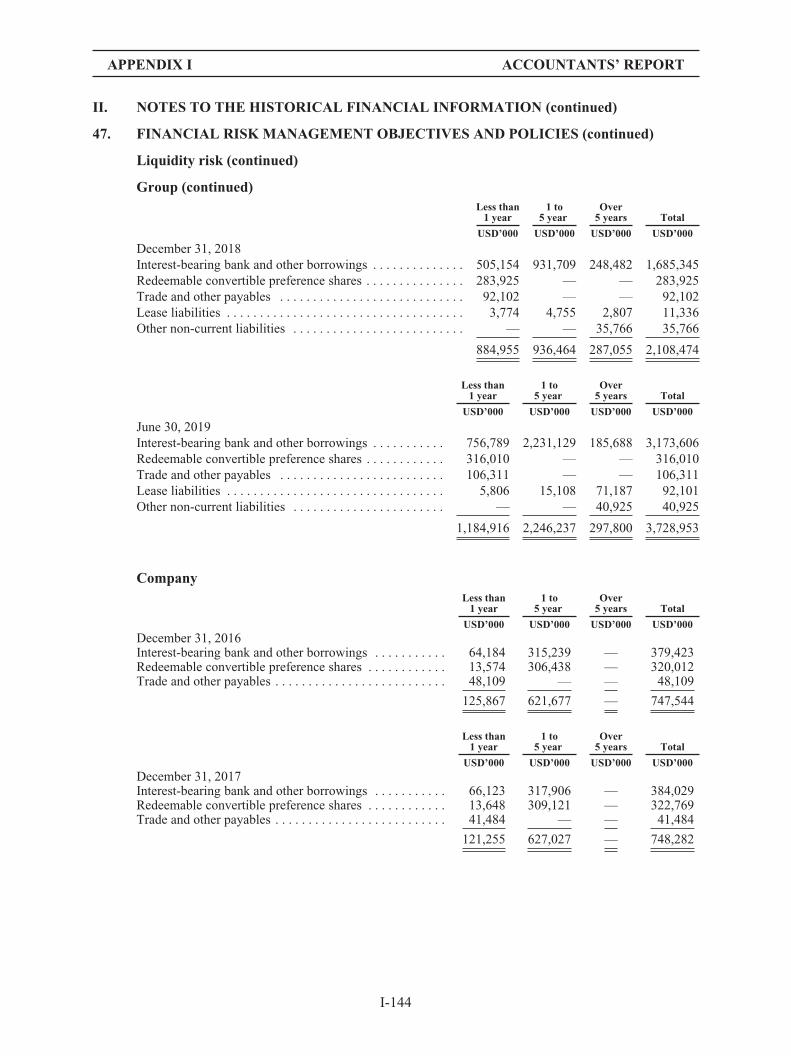
APPENDIX I ACCOUNTANTS’ REPORT
II. NOTES TO THE HISTORICAL FINANCIAL INFORMATION (continued)
47. FINANCIAL RISK MANAGEMENT OBJECTIVES AND POLICIES (continued)
Liquidity risk (continued)
Group (continued)Less than1 year
1 to5 year
Over5 years Total
USD’000 USD’000 USD’000 USD’000
December 31, 2018Interest-bearing bank and other borrowings . . . . . . . . . . . . . . 505,154 931,709 248,482 1,685,345Redeemable convertible preference shares . . . . . . . . . . . . . . . 283,925 — — 283,925Trade and other payables . . . . . . . . . . . . . . . . . . . . . . . . . . . . 92,102 — — 92,102Lease liabilities . . . . . . . . . . . . . . . . . . . . . . . . . . . . . . . . . . . . 3,774 4,755 2,807 11,336Other non-current liabilities . . . . . . . . . . . . . . . . . . . . . . . . . . — — 35,766 35,766
884,955 936,464 287,055 2,108,474
Less than1 year
1 to5 year
Over5 years Total
USD’000 USD’000 USD’000 USD’000
June 30, 2019Interest-bearing bank and other borrowings . . . . . . . . . . . 756,789 2,231,129 185,688 3,173,606Redeemable convertible preference shares . . . . . . . . . . . . 316,010 — — 316,010Trade and other payables . . . . . . . . . . . . . . . . . . . . . . . . . 106,311 — — 106,311Lease liabilities . . . . . . . . . . . . . . . . . . . . . . . . . . . . . . . . . 5,806 15,108 71,187 92,101Other non-current liabilities . . . . . . . . . . . . . . . . . . . . . . . — — 40,925 40,925
1,184,916 2,246,237 297,800 3,728,953
CompanyLess than1 year
1 to5 year
Over5 years Total
USD’000 USD’000 USD’000 USD’000December 31, 2016Interest-bearing bank and other borrowings . . . . . . . . . . . 64,184 315,239 — 379,423Redeemable convertible preference shares . . . . . . . . . . . . 13,574 306,438 — 320,012Trade and other payables . . . . . . . . . . . . . . . . . . . . . . . . . . 48,109 — — 48,109
125,867 621,677 — 747,544
Less than1 year
1 to5 year
Over5 years Total
USD’000 USD’000 USD’000 USD’000December 31, 2017Interest-bearing bank and other borrowings . . . . . . . . . . . 66,123 317,906 — 384,029Redeemable convertible preference shares . . . . . . . . . . . . 13,648 309,121 — 322,769Trade and other payables . . . . . . . . . . . . . . . . . . . . . . . . . . 41,484 — — 41,484
121,255 627,027 — 748,282
I-144

APPENDIX I ACCOUNTANTS’ REPORT
II. NOTES TO THE HISTORICAL FINANCIAL INFORMATION (continued)
47. FINANCIAL RISK MANAGEMENT OBJECTIVES AND POLICIES (continued)
Liquidity risk (continued)
Company (continued)Less than1 year
1 to5 year
Over5 years Total
USD’000 USD’000 USD’000 USD’000December 31, 2018Interest-bearing bank and other borrowings . . . . . . . . . . . 66,346 317,008 — 383,354Redeemable convertible preference shares . . . . . . . . . . . . 283,925 — — 283,925Trade and other payables . . . . . . . . . . . . . . . . . . . . . . . . . . 55,987 — — 55,987Other non-current liabilities . . . . . . . . . . . . . . . . . . . . . . . — — 516,523 516,523
406,258 317,008 516,523 1,239,789
Less than1 year
1 to5 year
Over5 years Total
USD’000 USD’000 USD’000 USD’000June 30, 2019Interest-bearing bank and other borrowings . . . . . . . . . . . 549,388 685,482 — 1,234,870Redeemable convertible preference shares . . . . . . . . . . . . 316,010 — — 316,010Trade and other payables . . . . . . . . . . . . . . . . . . . . . . . . . . 78,117 — — 78,117Other non-current liabilities . . . . . . . . . . . . . . . . . . . . . . . — 532,402 — 532,402
943,515 1,217,884 — 2,161,399
Equity price risk
Equity price risk is the risk that the fair values of equity securities decrease as a result ofchanges in the levels of equity indices and the value of individual securities. The Group is exposed toequity price risk arising from individual equity investments classified as financial assets at fair valuethrough profit or loss (note 17), financial assets at fair value through comprehensive income (note 18)and available-for-sale investments (note 19) as at December 31, 2017, 2018 and June 30, 2019. TheGroup’s listed investments are listed on Stock Exchange of Hong Kong, Singapore and AustralianStock Exchange and are valued at quoted market prices at the end of each of the Relevant Periods.
The market equity indices for the following stock exchanges, at the close of business of thenearest trading day in the year to the end of each of the Relevant Periods, and their respective highestand lowest points during the year were as follows:
December 312017
High/Low2017
December 312018
High/Low2018
June 30,2019
High/Low2019
Australia—AORDIndex . . . . . . . . . . . . 6,167 6,193/5,635 5,709 6,481/5,478 6,699 6,768/5,620
Singapore—STIIndex . . . . . . . . . . . . 3,403 3,469/2,870 3,069 3,642/2,956 3,322 3,415/3,002
Hong Kong—Hang Seng Index . . N/A N/A 25,846 33,484/24,541 28,543 30,222/24,897
Capital management
The primary objectives of the Group’s capital management are to safeguard the Group’s abilityto continue as a going concern and to maintain healthy capital ratios in order to support its businessand maximize shareholders’ value.
I-145

APPENDIX I ACCOUNTANTS’ REPORT
II. NOTES TO THE HISTORICAL FINANCIAL INFORMATION (continued)
47. FINANCIAL RISK MANAGEMENT OBJECTIVES AND POLICIES (continued)
Capital management (continued)
The Group manages its capital structure and makes adjustments to it in light of changes ineconomic conditions and the risk characteristics of the underlying assets. To maintain or adjust thecapital structure, the Group may adjust the dividend payment to shareholders, return capital toshareholders or issue new shares. The Group is not subject to any externally imposed capitalrequirements. No changes were made in the objectives, policies or processes for managing capitalduring the years ended December 31, 2016, 2017 and 2018 and the six months ended June 30, 2019.
The Group monitors capital using net gearing ratio, which is calculated by dividing net debt,defined as total bank loans and other borrowings less cash and bank balances, by total assets at the endof each year. The gearing ratios as at the end of the reporting periods were as follows:
December 31,2016
December 31,2017
December 31,2018
June 30,2019
USD’000 USD’000 USD’000 USD’000
Bank loans and other borrowingsCurrent . . . . . . . . . . . . . . . . . . . . . . . . . . . . . 75,862 91,706 436,194 630,135Non-current . . . . . . . . . . . . . . . . . . . . . . . . . . 759,403 741,729 1,024,279 2,173,601
Bank loans and other borrowings—Total . . . . . . . 835,265 833,435 1,460,473 2,803,736Less: Cash and bank balances . . . . . . . . . . . . . . . . (485,545) (600,791) (581,379) (1,010,390)
Debt . . . . . . . . . . . . . . . . . . . . . . . . . . . . . . . . . . . . 349,720 232,644 879,094 1,793,346Total assets . . . . . . . . . . . . . . . . . . . . . . . . . . . . . . 2,101,542 3,054,868 4,431,600 5,946,004Gearing ratio . . . . . . . . . . . . . . . . . . . . . . . . . . . . . 16.6% 7.6% 19.8% 30.2%
48. FINANCIAL INSTRUMENTS BY CATEGORY
The carrying amounts of each of the categories of financial instruments as at the end of each ofthe Relevant Periods are as follow:
December 31, 2016
Financialassets at fairvalue throughprofit or loss
Loans andreceivables
Available-for-salefinancial assets Total
USD’000 USD’000 USD’000 USD’000
Financial assetsFinancial assets at fair value through profit or
loss . . . . . . . . . . . . . . . . . . . . . . . . . . . . . . . . 140,577 — — 140,577Available-for-sale investments . . . . . . . . . . . . — — 1,492 1,492Trade receivables . . . . . . . . . . . . . . . . . . . . . . . — 9,271 — 9,271Other non-current assets . . . . . . . . . . . . . . . . . — 11,404 — 11,404Financial assets included in prepayments,
other receivables and other assets . . . . . . . . — 8,294 — 8,294Pledged bank deposits . . . . . . . . . . . . . . . . . . . — 73,780 — 73,780Cash and bank balances . . . . . . . . . . . . . . . . . . — 411,765 — 411,765
140,577 514,514 1,492 656,583
I-146

APPENDIX I ACCOUNTANTS’ REPORT
II. NOTES TO THE HISTORICAL FINANCIAL INFORMATION (continued)
48. FINANCIAL INSTRUMENTS BY CATEGORY (continued)
December 31, 2016 (continued)
Financialassets at fairvalue throughprofit or loss
Financialliabilities at
amortized cost Total
USD’000 USD’000 USD’000
Financial liabilitiesTrade and other payables . . . . . . . . . . . . . . . . . — 21,970 21,970Interest-bearing bank and other borrowings . . — 835,265 835,265Lease liabilities . . . . . . . . . . . . . . . . . . . . . . . . — 4,249 4,249Other non-current liabilities . . . . . . . . . . . . . . — 10,662 10,662Redeemable convertible preference shares . . . — 246,156 246,156Financial liabilities designated at fair value
through profit or loss . . . . . . . . . . . . . . . . . . 12,592 — 12,592
12,592 1,118,302 1,130,894
December 31, 2017
Financialassets at fairvalue throughprofit or loss
Loans andreceivables
Available-for-salefinancial assets Total
USD’000 USD’000 USD’000 USD’000
Financial assetsFinancial assets at fair value through profit or
loss . . . . . . . . . . . . . . . . . . . . . . . . . . . . . . . . 362,073 — — 362,073Available-for-sale investments . . . . . . . . . . . . — — 189,816 189,816Trade receivables . . . . . . . . . . . . . . . . . . . . . . . — 30,448 — 30,448Other non-current assets . . . . . . . . . . . . . . . . . — 9,778 — 9,778Financial assets included in prepayments,
other receivables and other assets . . . . . . . . — 29,405 — 29,405Pledged bank deposits . . . . . . . . . . . . . . . . . . . — 73,803 — 73,803Cash and bank balances . . . . . . . . . . . . . . . . . . — 526,988 — 526,988
362,073 670,422 189,816 1,222,311
Financialassets at fairvalue throughprofit or loss
Financialliabilities at
amortized cost Total
USD’000 USD’000 USD’000
Financial liabilitiesTrade and other payables . . . . . . . . . . . . . . . . . — 47,069 47,069Interest-bearing bank and other borrowings . . — 833,435 833,435Lease liabilities . . . . . . . . . . . . . . . . . . . . . . . . — 7,959 7,959Other non-current liabilities . . . . . . . . . . . . . . — 22,196 22,196Redeemable convertible preference shares . . . — 264,199 264,199Financial liabilities designated at fair value
through profit or loss . . . . . . . . . . . . . . . . . . 13,671 — 13,671
13,671 1,174,858 1,188,529
I-147

APPENDIX I ACCOUNTANTS’ REPORT
II. NOTES TO THE HISTORICAL FINANCIAL INFORMATION (continued)
48. FINANCIAL INSTRUMENTS BY CATEGORY (continued)
December 31, 2018
Financialassets at fairvalue throughprofit or loss
Loans andreceivables
Available-for-salefinancial assets Total
USD’000 USD’000 USD’000 USD’000
Financial assetsFinancial assets at fair value through profit or
loss . . . . . . . . . . . . . . . . . . . . . . . . . . . . . . . . 335,771 — — 335,771Financial assets at fair value through other
comprehensive income . . . . . . . . . . . . . . . . — — 484,239 484,239Trade receivables . . . . . . . . . . . . . . . . . . . . . . . — 63,057 — 63,057Other non-current assets . . . . . . . . . . . . . . . . . — 10,478 — 10,478Financial assets included in prepayments,
other receivables and other assets . . . . . . . . — 200,401 — 200,401Pledged bank deposits . . . . . . . . . . . . . . . . . . . — 44,711 — 44,711Restricted bank balances . . . . . . . . . . . . . . . . . — 19,294 — 19,294Non-pledged fixed time deposits with
maturity period over three months . . . . . . . — 15,318 — 15,318Cash and bank balances . . . . . . . . . . . . . . . . . . — 502,056 — 502,056
335,771 855,315 484,239 1,675,325
Financialassets at fairvalue throughprofit or loss
Financialliabilities at
amortized cost Total
USD’000 USD’000 USD’000
Financial liabilitiesTrade and other payables . . . . . . . . . . . . . . . . . — 92,102 92,102Interest-bearing bank and other borrowings . . — 1,460,473 1,460,473Lease liabilities . . . . . . . . . . . . . . . . . . . . . . . . — 9,685 9,685Other non-current liabilities . . . . . . . . . . . . . . — 35,766 35,766Redeemable convertible preference shares . . . — 296,778 296,778
— 1,894,804 1,894,804
I-148

APPENDIX I ACCOUNTANTS’ REPORT
II. NOTES TO THE HISTORICAL FINANCIAL INFORMATION (continued)
48. FINANCIAL INSTRUMENTS BY CATEGORY (continued)
June 30, 2019
Financialassets at fairvalue throughprofit or loss Amortized cost
Financialassets atfair value
through othercomprehensive
income Total
USD’000 USD’000 USD’000 USD’000
Financial assetsFinancial assets at fair value through profit or
loss . . . . . . . . . . . . . . . . . . . . . . . . . . . . . . . . . 504,903 — — 504,903Financial assets at fair value through other
comprehensive income . . . . . . . . . . . . . . . . . — — 468,958 468,958Trade receivables . . . . . . . . . . . . . . . . . . . . . . . . — 51,870 — 51,870Other non-current assets . . . . . . . . . . . . . . . . . . — 13,465 — 13,465Financial assets included in prepayments, other
receivables and other assets . . . . . . . . . . . . . . — 180,402 — 180,402Pledged bank deposits . . . . . . . . . . . . . . . . . . . . — 44,711 — 44,711Restricted bank balances . . . . . . . . . . . . . . . . . . — 22,060 — 22,060Cash and bank balances . . . . . . . . . . . . . . . . . . . — 929,232 — 929,232Non-pledged fixed time deposits with maturity
period within three months . . . . . . . . . . . . . . — 14,387 — 14,387
504,903 1,256,127 468,958 2,229,988
Financialassets at fairvalue throughprofit or loss
Financialliabilities at
amortized cost Total
USD’000 USD’000 USD’000
Financial liabilitiesTrade and other payables . . . . . . . . . . . . . . . . . . — 106,311 106,311Interest-bearing bank and other borrowings . . . — 2,803,736 2,803,736Lease liabilities . . . . . . . . . . . . . . . . . . . . . . . . . — 24,408 24,408Other non-current liabilities . . . . . . . . . . . . . . . . — 40,925 40,925Redeemable convertible preference shares . . . . — 316,010 316,010
— 3,291,390 3,291,390
49. FAIR VALUE HIERARCHY OF FINANCIAL INSTRUMENTS
Management has assessed that the fair values of cash and bank balances, amounts due fromrelated parties, trade receivables, financial assets included in prepayments, other receivables and otherassets, current interest-bearing bank and other borrowings, amounts due to related parties, tradepayables, financial liabilities included in other payables and accruals approximate to their carryingamounts largely due to the short-term maturities of these instruments.
The management is responsible for determining the policies and procedures for the fair valuemanagement of financial instruments. At each reporting date, the management analyzes the movementsin the values of financial instruments and determines the major inputs applied in the valuation. Thevaluation is reviewed and approved by the chief financial officer. The valuation process and results arediscussed with the board of directors for annual financial reporting.
I-149

APPENDIX I ACCOUNTANTS’ REPORT
II. NOTES TO THE HISTORICAL FINANCIAL INFORMATION (continued)
49. FAIR VALUE HIERARCHY OF FINANCIAL INSTRUMENTS (continued)
The fair values of the financial assets and liabilities are included at the amount at which theinstrument could be exchanged in a current transaction between willing parties, other than in a forcedor liquidation sale. The following methods and assumptions were used to estimate the fair values.
The fair values of the non-current interest-bearing bank and other borrowings have beencalculated by discounting the expected future cash flows using rates currently available for instrumentswith similar terms, credit risk and remaining maturities.
The fair values of listed equity investments are based on quoted market prices. The fair valuesof unlisted available-for-sale equity investments have been estimated based on the Group’s share of thenet asset fair value of the investment fund. The valuation requires the directors to make estimates aboutthe expected future cash flows including expected future dividends and proceeds on subsequentdisposal of the shares. The directors believe that the estimated fair values resulting from the valuationtechnique, which are recorded in the consolidated statement of financial position, and the relatedchanges in fair values, which are recorded in other comprehensive income, are reasonable, and thatthey were the most appropriate values at the end of the reporting periods.
The summary of significant unobservable inputs to the valuation of financial instrumentstogether with a quantitative sensitivity analysis as at the end of each of the Reporting Periods is asfollows.
Valuationtechnique
Significantunobservable
input Range Sensitivity of fair value to the input
Unlisted financial assetsat fair value throughprofit or loss
Net assetvalue
Net assetvalue
2019:USD503,855 toUSD599,831,1302018:USD143,841 toUSD63,969,0882017:USD147,000 toUSD62,878,0002016:USD582,000 toUSD41,583,000
1% increase (decrease)in net asset value would resultin increase (decrease) in fairvalue by 1%
Unquoted equityinterests, at fair valueincluded in available-for-sale
Net assetvalue
Net assetvalue
2019: nil2018: nil2017: nil2016:USD1,131,000
1% increase (decrease)in net asset value would resultin increase (decrease) in fairvalue by 1%
Unlisted financialliabilities at fair valuethrough profit or loss
Net assetvalue
Net assetvalue
2019: nil2018:USD8,374,000 toUSD8,544,0002017:USD13,671,0002016:USD12,592,000
1% increase (decrease)in net asset value would resultin increase (decrease) in fairvalue by 1%
I-150

APPENDIX I ACCOUNTANTS’ REPORT
II. NOTES TO THE HISTORICAL FINANCIAL INFORMATION (continued)
49. FAIR VALUE HIERARCHY OF FINANCIAL INSTRUMENTS (continued)
Financial assets at fair value through profit or loss within Level 3 stand for unquoted equityinterests. The unquoted equity interests are stated at their fair value at each reporting date, determinedby share of the net asset value of the investment funds and associates, which based on their underlyinginvestments properties and book value of working capital which is similar to fair value in the view ofthe directors.
Below is a summary of the valuation techniques used and the key inputs to the valuation ofunderlying investment properties of financial assets at fair value through profit or loss:
December 31, 2016
Warehouse properties Discounted cashflow method (termand reversionarymethod)
(1) Capitalization rate(2) Market unit rent
China Properties:(1) 6.60-7.10%(2) RMB 24.00-RMB 55.20 persquare meter permonth
Japan Properties:(1) 4.20-5.20%(2) JPY 855-JPY1,409 per squaremeter per month
December 31, 2017
Warehouse properties Discounted cashflow method (termand reversionarymethod)
(1) Capitalization rate(2) Market unit rent
China Properties:(1) 5.45-7.10%(2) RMB 23.10-RMB 57.00 persquare meter permonth
Japan Properties:(1) 4.10-5.00%(2) JPY 855-JPY1,455 per squaremeter per month
December 31, 2018
Warehouse properties Discounted cashflow method (termand reversionarymethod)
(1) Capitalization rate(2) Market unit rent
China Properties:(1) 6.15-7.10%(2) RMB 23.10-RMB 43.20 persquare meter permonth
Japan Properties:(1) 4.10-5.00%(2) JPY 973-JPY1,623 per squaremeter per month
I-151

APPENDIX I ACCOUNTANTS’ REPORT
II. NOTES TO THE HISTORICAL FINANCIAL INFORMATION (continued)
49. FAIR VALUE HIERARCHY OF FINANCIAL INSTRUMENTS (continued)
June 30, 2019
Warehouse properties Discounted cashflow method (termand reversionarymethod)
(1) Capitalization rate(2) Market unit rent
China Properties:(1) 5.75%-6.50%(2) RMB 24.00-RMB 58.80 persquare meter permonth
Japan Property:(1) 4.10%-4.20%(2) JPY 1,150-JPY2,269 per squaremeter per month
Australia Property:(1) 5.75%-9.00%(2) AUS 4.38-AUS 29 per squaremeter per month
Underlying investment properties were valued at level 3 listed above; the valuation techniquesare Discounted Cash Flow Method (term and reversion approach), and key inputs are:
(1) Term yield: the higher the term yield, the lower the fair value
(2) Reversionary yield: the higher the reversionary yield, the lower the fair value
(3) Market unit rent: the higher the market unit rent, the higher the fair value
(4) Capitalization rate: the higher the capitalization rate, the lower the fair value
I-152

APPENDIX I ACCOUNTANTS’ REPORT
II. NOTES TO THE HISTORICAL FINANCIAL INFORMATION (continued)
49. FAIR VALUE HIERARCHY OF FINANCIAL INSTRUMENTS (continued)
The following tables illustrate the fair value measurement hierarchy of the Group’s financialinstruments:
Group
Assets measured at fair value
Quoted pricesIn active market
(level 1)
Significantunobservable inputs
(level 3) Total
USD’000 USD’000 USD’000
As at December 31, 2016Financial assets at fair value through profit or loss . . . . . . — 140,577 140,577Available-for-sale investments . . . . . . . . . . . . . . . . . . . . . . — 1,131 1,131
— 141,708 141,708
As at December 31, 2017Financial assets at fair value through profit or loss . . . . . . 69,091 292,982 362,073Available-for-sale investments . . . . . . . . . . . . . . . . . . . . . . 181,489 — 181,489
250,580 292,982 543,562
As at December 31, 2018Financial assets at fair value through profit or loss . . . . . . — 335,771 335,771Financial assets at fair value through other comprehensive
income . . . . . . . . . . . . . . . . . . . . . . . . . . . . . . . . . . . . . . . 484,239 — 484,239
484,239 335,771 820,010
As at June 30, 2019Financial assets at fair value through profit or loss . . . . . . — 504,903 504,903Financial assets at fair value through other comprehensive
income . . . . . . . . . . . . . . . . . . . . . . . . . . . . . . . . . . . . . . . 468,958 — 468,958
468,958 504,903 973,861
The movement in fair value measurements within Level 3 during the year are as follows:
As at December 31 As at June 30
2016 2017 2018 2019
USD’000 USD’000 USD’000 USD’000
Financial assets at fair value through profit or loss—unlisted
At January 1, . . . . . . . . . . . . . . . . . . . . . . . . . . . . . . . . . . . . . — 140,577 292,982 335,771Total gain recognized in profit or loss included in other
income . . . . . . . . . . . . . . . . . . . . . . . . . . . . . . . . . . . . . . . 37,417 24,134 48,055 22,818Distribution . . . . . . . . . . . . . . . . . . . . . . . . . . . . . . . . . . . . . . — — — (1,218)Acquisition of subsidiaries . . . . . . . . . . . . . . . . . . . . . . . . . . 53,255 — — —Purchases . . . . . . . . . . . . . . . . . . . . . . . . . . . . . . . . . . . . . . . 51,248 117,986 160,141 143,252Disposal . . . . . . . . . . . . . . . . . . . . . . . . . . . . . . . . . . . . . . . . — — (164,072) —Exchange realignment . . . . . . . . . . . . . . . . . . . . . . . . . . . . . (1,343) 10,285 (1,335) 4,280
140,577 292,982 335,771 504,903
I-153

APPENDIX I ACCOUNTANTS’ REPORT
II. NOTES TO THE HISTORICAL FINANCIAL INFORMATION (continued)
49. FAIR VALUE HIERARCHY OF FINANCIAL INSTRUMENTS (continued)
Group (continued)
Assets measured at fair value (continued)
As at December 31 As at June 30
2016 2017 2018 2019
USD’000 USD’000 USD’000 USD’000
Available-for-sale investmentsAt January 1, . . . . . . . . . . . . . . . . . . . . . . . . . . . . . . . . . . . . . . — 1,131 — —Total gain recognized in other comprehensive income
included in available-for-sale investments changes in fairvalue . . . . . . . . . . . . . . . . . . . . . . . . . . . . . . . . . . . . . . . . . . . 114 37 — —
Acquisition of subsidiaries . . . . . . . . . . . . . . . . . . . . . . . . . . . . 1,017 — — —Disposal . . . . . . . . . . . . . . . . . . . . . . . . . . . . . . . . . . . . . . . . . . — (1,168) — —
1,131 — — —
As at December 31 As at June 30
2016 2017 2018 2019
USD’000 USD’000 USD’000 USD’000
Financial assets at fair value through othercomprehensive income
At January 1, . . . . . . . . . . . . . . . . . . . . . . . . . . . . . . . . . . . . . . — — — —Purchases . . . . . . . . . . . . . . . . . . . . . . . . . . . . . . . . . . . . . . . . . — — 132 —Transfer from Available-for-sale investment at cost . . . . . . . . — — 8,327 —Disposal . . . . . . . . . . . . . . . . . . . . . . . . . . . . . . . . . . . . . . . . . . — — (8,459) —
— — — —
Liabilities measured at fair valueSignificant
unobservableinputs(level 3)
USD’000
As at December 31, 2016Financial liabilities at fair value . . . . . . . . . . . . . . . . . . . . . . . . . . . . . . . . . . . . . . . . . . . . . . . 12,592
As at December 31, 2017Financial liabilities at fair value . . . . . . . . . . . . . . . . . . . . . . . . . . . . . . . . . . . . . . . . . . . . . . . 13,671
As at December 31, 2018Financial liabilities at fair value . . . . . . . . . . . . . . . . . . . . . . . . . . . . . . . . . . . . . . . . . . . . . . . —
As at June 30, 2019Financial liabilities at fair value . . . . . . . . . . . . . . . . . . . . . . . . . . . . . . . . . . . . . . . . . . . . . . . —
The movement in fair value measurements within Level 3 during the year are as follows:
As at December 31, As at June 30,
2016 2017 2018 2019
USD’000 USD’000 USD’000 USD’000
At January 1, . . . . . . . . . . . . . . . . . . . . . . . . . . . . . . . . . . . . . 11,056 12,592 13,671 —Total gain recognized in profit or loss . . . . . . . . . . . . . . . . . . 1,536 1,079 3,118 —Transfer to other payables . . . . . . . . . . . . . . . . . . . . . . . . . . . — — (16,789) —
12,592 13,671 — —
I-154

APPENDIX I ACCOUNTANTS’ REPORT
II. NOTES TO THE HISTORICAL FINANCIAL INFORMATION (continued)
49. FAIR VALUE HIERARCHY OF FINANCIAL INSTRUMENTS (continued)
Group (continued)
Liabilities measured at fair value (continued)
During the Relevant Periods, there were no transfers of fair values measurements into or out ofLevel 3 for financial liabilities.
Company
Assets measured at fair value
Quoted pricesIn active market
(level 1)
Significantunobservable
inputs(level 3) Total
USD’000 USD’000 USD’000
As at December 31, 2017Available-for-sale investments . . . . . . . . . . . . . . . . . . . . . . . . . . . 543 — 543
As at December 31, 2018Financial assets at fair value through other comprehensive
income . . . . . . . . . . . . . . . . . . . . . . . . . . . . . . . . . . . . . . . . . . . . 32,549 — 32,549
As at June 30, 2019Financial assets at fair value through other comprehensive
income . . . . . . . . . . . . . . . . . . . . . . . . . . . . . . . . . . . . . . . . . . . . 33,122 — 33,122
50. EVENTS AFTER THE RELEVANT PERIODS
In July 2019, the Company issued a further tranche of USD175 million, under its existingUSD250 million of three-year fixed rate notes bearing 7.875% per annum which due April 2022(“7.875% Notes”), pursuant to its US$2.0 billion Multicurrency Debt Issuance Programme. Theaggregate total amount of 7.875% Notes issued is USD425 million.
In July 2019, the Group entered a strategic alliance with Future Market Networks Ltd. todevelop logistics infrastructure assets in India with an investment of approximately US$42 million,which will be made to develop industrial and warehousing parks in India.
In August 2019, the Group, entered into an umbrella agreement with managed vehicles of apotential capital partner in connection with the establishment of a new joint venture in Australia (the“New Australia Fund”). Pursuant to the umbrella agreement, the Group will hold 20% interest in theNew Australia Fund and plan to transfer 11 investment properties in the balance sheet into the NewAustralia Fund.
In August 2019, the Group acquired a logistics property in Kawajima, Japan for a purchaseprice of JPY8.74 billion (approximately US$80.5 million) from one of the development funds managedby the Group.
III. SUBSEQUENT FINANCIAL STATEMENTS
No audited financial statements have been prepared by the Company, the Group, or any of thecompanies now comprising the Group in respect of any period subsequent to June 30, 2019.
I-155

APPENDIX I ACCOUNTANTS’ REPORT
IV. SUPPLEMENTARY PRE-ACQUISITION FINANCIAL INFORMATION OFREDWOOD ASIAN INVESTMENTS, LTD. AND ESR SINGAPORE PTE. LTD.BUSINESS
1. FINANCIAL INFORMATION OF REDWOOD ASIAN INVESTMENTS, LTD.
Pre-acquisition financial information of Redwood Asian Investments, Ltd. (“the company”) andits subsidiaries (the “Redwood Asian Group”) for the period from January 1, 2016 to January 20, 2016(the “Pre-acquisition Period”) has been prepared in accordance with the basis of preparation andaccounting policies as set out in Section IV, Note 2.1. This information is referred hereafter as“Financial Information of the Redwood Asian Investments, Ltd.”
CONSOLIDATED STATEMENTS OF PROFIT OR LOSS AND OTHER COMPREHENSIVEINCOME
Notes
Period fromJanuary 1, 2016 toJanuary 20, 2016
USD’000
Fair value gains on financial assets at fair value through profit and loss . . . . . . . 184Administrative expenses . . . . . . . . . . . . . . . . . . . . . . . . . . . . . . . . . . . . . . . . . . . . (442)
Loss before tax . . . . . . . . . . . . . . . . . . . . . . . . . . . . . . . . . . . . . . . . . . . . . . . . . . . 2.2 (258)Income tax expense . . . . . . . . . . . . . . . . . . . . . . . . . . . . . . . . . . . . . . . . . . . . . . . . 2.3 —
Loss for the period . . . . . . . . . . . . . . . . . . . . . . . . . . . . . . . . . . . . . . . . . . . . . . . (258)
Attributable to:Owners of the parent . . . . . . . . . . . . . . . . . . . . . . . . . . . . . . . . . . . . . . . . . . . (258)Non-controlling interests . . . . . . . . . . . . . . . . . . . . . . . . . . . . . . . . . . . . . . . . —
Loss for the period . . . . . . . . . . . . . . . . . . . . . . . . . . . . . . . . . . . . . . . . . . . . . . . (258)OTHER COMPREHENSIVE INCOMEChanges in fair value of available-for-sale investments . . . . . . . . . . . . . . . . . . . . (13)Exchange differences on translation of foreign operations . . . . . . . . . . . . . . . . . . 1,061
Other comprehensive income for the period . . . . . . . . . . . . . . . . . . . . . . . . . . . . . 1,048Total comprehensive income for the period . . . . . . . . . . . . . . . . . . . . . . . . . . . 790
Attributable to:Owners of the parent . . . . . . . . . . . . . . . . . . . . . . . . . . . . . . . . . . . . . . . . . . . 13Non-controlling interests . . . . . . . . . . . . . . . . . . . . . . . . . . . . . . . . . . . . . . . . 777
790
I-156

APPENDIX I ACCOUNTANTS’ REPORT
IV. SUPPLEMENTARY PRE-ACQUISITION FINANCIAL INFORMATION OFREDWOOD ASIAN INVESTMENTS, LTD. AND ESR SINGAPORE PTE. LTD.BUSINESS (continued)
1. FINANCIAL INFORMATION OF REDWOOD ASIAN INVESTMENTS,LTD. (continued)
CONSOLIDATED STATEMENTS OF FINANCIAL POSITION
Notes
As atJanuary 20,
2016
USD’000
NON-CURRENT ASSETSAvailable-for-sale investments . . . . . . . . . . . . . . . . . . . . . . . . . . . . . . . . . . . . . . . . . . . 2.4 1,017Financial assets at fair value through profit or loss . . . . . . . . . . . . . . . . . . . . . . . . . . . . 2.5 53,255
Total non-current assets . . . . . . . . . . . . . . . . . . . . . . . . . . . . . . . . . . . . . . . . . . . . . . . . . 54,272
CURRENT ASSETSPrepayments, deposits and other receivables . . . . . . . . . . . . . . . . . . . . . . . . . . . . . . . . 2.6 5,493Cash and bank balances . . . . . . . . . . . . . . . . . . . . . . . . . . . . . . . . . . . . . . . . . . . . . . . . . 2.7 42,589
Total current assets . . . . . . . . . . . . . . . . . . . . . . . . . . . . . . . . . . . . . . . . . . . . . . . . . . . . 48,082
CURRENT LIABILITIESTrade payables, accruals and other payables . . . . . . . . . . . . . . . . . . . . . . . . . . . . . . . . . 2.8 25,048
Total current liabilities . . . . . . . . . . . . . . . . . . . . . . . . . . . . . . . . . . . . . . . . . . . . . . . . . 25,048
NET CURRENT ASSETS . . . . . . . . . . . . . . . . . . . . . . . . . . . . . . . . . . . . . . . . . . . . . 23,034
TOTAL ASSETS LESS CURRENT LIABILITIES . . . . . . . . . . . . . . . . . . . . . . . . 77,306
NON-CURRENT LIABILITIESBank loans and other borrowings . . . . . . . . . . . . . . . . . . . . . . . . . . . . . . . . . . . . . . . . . 2.9 917Financial liabilities at fair value through profit or loss . . . . . . . . . . . . . . . . . . . . . . . . . 2.10 42,819
Total non-current liabilities . . . . . . . . . . . . . . . . . . . . . . . . . . . . . . . . . . . . . . . . . . . . . . 43,736
Net assets . . . . . . . . . . . . . . . . . . . . . . . . . . . . . . . . . . . . . . . . . . . . . . . . . . . . . . . . . . . 33,570
EQUITYEquity attributable to owner of the parentIssued capital . . . . . . . . . . . . . . . . . . . . . . . . . . . . . . . . . . . . . . . . . . . . . . . . . . . . . . . . . 2.14 1Other reserves . . . . . . . . . . . . . . . . . . . . . . . . . . . . . . . . . . . . . . . . . . . . . . . . . . . . . . . . 2.15 6,907
6,908Non-controlling interests . . . . . . . . . . . . . . . . . . . . . . . . . . . . . . . . . . . . . . . . . . . . . . . . 26,662
Total equity . . . . . . . . . . . . . . . . . . . . . . . . . . . . . . . . . . . . . . . . . . . . . . . . . . . . . . . . . 33,570
I-157

IV.
SUPPLEM
ENTARY
PRE-A
CQUIS
ITIO
NFIN
ANCIA
LIN
FORM
ATIO
NOF
REDW
OOD
ASI
AN
INVEST
MENTS,
LTD.AND
ESR
SINGAPORE
PTE.L
TD.B
USI
NESS
(con
tinu
ed)
1.FIN
ANCIA
LIN
FORM
ATIO
NOFREDW
OOD
ASI
AN
INVEST
MENTS,
LTD.(co
ntinue
d)
CONSO
LID
ATED
STATEM
ENTSOFCHANGESIN
EQUIT
Y
Periodfrom
Janu
ary1,
2016
toJanu
ary20
,201
6
Attribu
tableto
owne
rsof
thepa
rent
Issu
edca
pital
Exc
hang
efluc
tuation
reserv
eRetaine
dpr
ofits
Ava
ilable-
for-sa
leinve
stmen
tre
valuation
reserv
eTotal
Non
-co
ntro
lling
intere
sts
Total
equity
USD
’000
USD
’000
USD
’000
USD
’000
USD
’000
USD
’000
USD
’000
Asat
Janu
ary1,
2016
....
....
....
....
....
....
....
....
....
....
....
135
6,54
631
36,89
525
,885
32,780
Los
sforthepe
riod
....
....
....
....
....
....
....
....
....
....
....
...
——
(258
)—
(258
)—
(258
)Other
compreh
ensive
inco
meforthepe
riod
:..
....
....
....
....
....
....
.—
——
——
——
Exc
hang
edifferen
ceson
tran
slationof
foreignop
erations
....
....
....
....
—28
4—
—28
477
71,06
1Cha
ngein
fairva
lueof
available-for-sale
inve
stmen
ts..
....
....
....
....
.—
——
(13)
(13)
—(13)
Total
compr
ehen
sive
inco
meforth
epe
riod
....
....
....
....
....
....
..—
284
(258
)(13)
1377
779
0Asat
Janu
ary20
,201
6..
....
....
....
....
....
....
....
....
....
....
.1
319
6,28
830
06,90
826
,662
33,570
I-158
APPENDIX I ACCOUNTANTS’ REPORT

APPENDIX I ACCOUNTANTS’ REPORT
IV. SUPPLEMENTARY PRE-ACQUISITION FINANCIAL INFORMATION OFREDWOOD ASIAN INVESTMENTS, LTD. AND ESR SINGAPORE PTE. LTD.BUSINESS (continued)
1. FINANCIAL INFORMATION OF REDWOOD ASIAN INVESTMENTS,LTD. (continued)
CONSOLIDATED STATEMENTS OF CASH FLOWS
Period fromJanuary 1, 2016 toJanuary 20, 2016
USD’000
Cash flows from operating activitiesLoss before tax . . . . . . . . . . . . . . . . . . . . . . . . . . . . . . . . . . . . . . . . . . . . . . . . . . . . . . . . . (258)Adjustments for:Fair value gains on financial assets and liabilities at fair value through profit or loss . . . (184)
(442)Increase in prepayments, deposits and other receivables . . . . . . . . . . . . . . . . . . . . . . . . . (123)Increase in accruals and other payables . . . . . . . . . . . . . . . . . . . . . . . . . . . . . . . . . . . . . . 591
Cash flows generated from operations and net increase in cash and cashequivalents . . . . . . . . . . . . . . . . . . . . . . . . . . . . . . . . . . . . . . . . . . . . . . . . . . . . . . . . . . 26
Cash and cash equivalents at beginning of period . . . . . . . . . . . . . . . . . . . . . . . . . . . . . . 41,382Effect of foreign exchange rate changes, net . . . . . . . . . . . . . . . . . . . . . . . . . . . . . . . . . . 1,181
Cash and cash equivalents at end of period . . . . . . . . . . . . . . . . . . . . . . . . . . . . . . . . . 42,589
ANALYSIS OF BALANCES OF CASH AND CASH EQUIVALENTSCash and cash equivalents . . . . . . . . . . . . . . . . . . . . . . . . . . . . . . . . . . . . . . . . . . . . . . . 42,589
Cash and cash equivalents as stated in the consolidated statement of financialposition and consolidated statement of cash flows . . . . . . . . . . . . . . . . . . . . . . . . . . 42,589
I-159

APPENDIX I ACCOUNTANTS’ REPORT
IV. SUPPLEMENTARY PRE-ACQUISITION FINANCIAL INFORMATION OFREDWOOD ASIAN INVESTMENTS, LTD. AND ESR SINGAPORE PTE. LTD.BUSINESS (continued)
2. NOTES TO THE FINANCIAL INFORMATION OF REDWOOD ASIANINVESTMENTS, LTD.
2.1 PRINCIPAL ACCOUNTING POLICIES
The Financial Information of the Redwood Asian Investments, Ltd. has been prepared inaccordance with the accounting policies set out in Section II, note 2.4.
2.2 LOSS BEFORE TAX
The Redwood Asian Group loss before tax is arrived after changing:
Period fromJanuary 1, 2016 toJanuary 20, 2016
USD’000
Professional service fee . . . . . . . . . . . . . . . . . . . . . . . . . . . . . . . . . . . . . . . . . . . . . . . . . . 3Exchange losses . . . . . . . . . . . . . . . . . . . . . . . . . . . . . . . . . . . . . . . . . . . . . . . . . . . . . . . . 428
2.3 INCOME TAX EXPENSE
The Company is incorporated under the laws of the Cayman Islands is exempted from thepayment of Cayman Islands income tax.
2.4 AVAILABLE-FOR-SALE INVESTMENTS
As at January 20, 2016
USD’000
Unquoted equity interests, at fair value . . . . . . . . . . . . . . . . . . . . . . . . . . . . . . . . . . . 1,017
Available-for-sale assets, at fair value of the Redwood Asian Group relates the Redwood AsianGroup’s unquoted equity investments in a privately-held real estate entity in China and one preferenceshare in Japan.
2.5 FINANCIAL ASSETS AT FAIR VALUE THROUGH PROFIT OR LOSS
As at January 20, 2016
USD’000
Unquoted equity interests . . . . . . . . . . . . . . . . . . . . . . . . . . . . . . . . . . . . . . . . . . . . . . 53,255
The fair value of these investments is estimated based on the Redwood Asian Group’s share ofthe net asset value of the investment funds.
The investments were designated at fair value through profit or loss upon the initial recognitionon the basis that they are managed and have their performance evaluated on a fair value basis, inaccordance with risk management and investment strategies of the Redwood Asian Group.
I-160

APPENDIX I ACCOUNTANTS’ REPORT
IV. SUPPLEMENTARY PRE-ACQUISITION FINANCIAL INFORMATION OFREDWOOD ASIAN INVESTMENTS, LTD. AND ESR SINGAPORE PTE. LTD.BUSINESS (continued)
2. NOTES TO THE FINANCIAL INFORMATION OF REDWOOD ASIANINVESTMENTS, LTD. (continued)
2.6 PREPAYMENTS, DEPOSITS AND OTHER RECEIVABLES
As at January 20, 2016
USD’000
Due from other related parties . . . . . . . . . . . . . . . . . . . . . . . . . . . . . . . . . . . . . . . . . . 5,023Prepayments to suppliers . . . . . . . . . . . . . . . . . . . . . . . . . . . . . . . . . . . . . . . . . . . . . . 26Other receivables . . . . . . . . . . . . . . . . . . . . . . . . . . . . . . . . . . . . . . . . . . . . . . . . . . . . 444
5,493
Amount due from other related parties is interest-free, unsecured and repayable on demand.There is no allowance for doubtful debts arising from these outstanding balances. None of one aboveassets is either past due or impaired. The financial assets included in the above balance relate toreceivables for which there was no recent history of default.
2.7 CASH AND BANK BALANCES
As at January 20, 2016
USD’000
Cash and bank balances . . . . . . . . . . . . . . . . . . . . . . . . . . . . . . . . . . . . . . . . . . . . . . . 42,589
Cash at banks earns interest at floating rates based on daily bank deposit rates. The bankbalances and deposits are deposited with creditworthy banks with no recent history of default. Thecarrying amounts of the cash and bank balances approximate to their fair values.
2.8 TRADE PAYABLES, ACCRUALS AND OTHER PAYABLES
As at January 20, 2016
USD’000
Accruals . . . . . . . . . . . . . . . . . . . . . . . . . . . . . . . . . . . . . . . . . . . . . . . . . . . . . . . . . . . 208Due to other related parties . . . . . . . . . . . . . . . . . . . . . . . . . . . . . . . . . . . . . . . . . . . . . 24,584Others . . . . . . . . . . . . . . . . . . . . . . . . . . . . . . . . . . . . . . . . . . . . . . . . . . . . . . . . . . . . . 256
25,048
Amount due to other related parties is interest-free, unsecured and repayable on demand.
2.9 BANK LOANS AND OTHER BORROWINGS
As at January 20, 2016
USD’000
Preference shares issued by a subsidiary . . . . . . . . . . . . . . . . . . . . . . . . . . . . . . . . . . 917
At January 20, 2016, a third party Financial Investor B is a holder of 107,101,575 preferenceshares issued by a certain subsidiary of the Redwood Asian Group.
I-161

APPENDIX I ACCOUNTANTS’ REPORT
IV. SUPPLEMENTARY PRE-ACQUISITION FINANCIAL INFORMATION OFREDWOOD ASIAN INVESTMENTS, LTD. AND ESR SINGAPORE PTE. LTD.BUSINESS (continued)
2. NOTES TO THE FINANCIAL INFORMATION OF REDWOOD ASIANINVESTMENTS, LTD. (continued)
2.10 FINANCIAL LIABILITIES AT FAIR VALUE THROUGH PROFIT OR LOSS
As at January 20, 2016
USD’000
Loan from a third party (note a) . . . . . . . . . . . . . . . . . . . . . . . . . . . . . . . . . . . . . . . . . 11,388Preference shares issued by a subsidiary, Redwood Fujiidera Investor Ltd.
(note b) . . . . . . . . . . . . . . . . . . . . . . . . . . . . . . . . . . . . . . . . . . . . . . . . . . . . . . . . . . 31,431
42,819
Notes:
(a) Pursuant to the loan agreement dated August 28, 2013 entered into by certainsubsidiaries of the Redwood Asian Group and a third party Financial Investor B (“LoanAgreement”), and the security over shares agreement dated August 28, 2013 entered intoby a subsidiary of the Redwood Asian Group and Financial Investor B (“SecurityAgreement”), the Redwood Asian Group utilized the proceeds from the loan fromFinancial Investor B to subscribe interest in Redwood Japan Logistics Fund LP (“RJLF”).
Under the Loan Agreement, all distribution proceeds from RJLF relating to the loan thathave been invested into RJLF will be passed on to Financial Investor B. As such, the loanfrom Financial Investor B was designated at fair value through profit or loss upon theinitial recognition on the basis that it is structured, managed and has its performanceevaluated on a fair value basis, in accordance with the Loan Agreement and the riskmanagement and investment strategies of the Redwood Asian Group.
The fair value of the loan from Financial Investor B is estimated based on the RedwoodAsian Group’s share of the net asset value of RJLF as at January 20, 2016.
(b) Pursuant to the subscription agreement dated December 18, 2014 entered into bycertain subsidiaries of the Company, including Redwood Asian Investment 1 Ltd.(“RAIL 1”), Redwood Fujiidera Investor Ltd., and a related party ESR Singapore (the“Manager”) and a third party Financial Investor C, (“Subscription Agreement”), RAIL 1and Financial Investor C have agreed to provide funding to Redwood Fujiidera InvestorLtd. for the purpose of subscribing to interest in Redwood Fujiidera Pte. Ltd.
At January 20, 2016, Financial Investor C was a holder of 3,994,902,381 preference sharesissued by Redwood Fujiidera Investor Ltd., a Cayman Island incorporated subsidiary.
I-162

APPENDIX I ACCOUNTANTS’ REPORT
IV. SUPPLEMENTARY PRE-ACQUISITION FINANCIAL INFORMATION OFREDWOOD ASIAN INVESTMENTS, LTD. AND ESR SINGAPORE PTE. LTD.BUSINESS (continued)
2. NOTES TO THE FINANCIAL INFORMATION OF REDWOOD ASIANINVESTMENTS, LTD. (continued)
2.11 SUBSIDIARIES
Details of the subsidiaries as at January 20, 2016 are as follows:
Name of subsidiary Principal activity Country of incorporationEffective ownership
interest
%Redwood Japan Logistics Fund
Investments, Ltd.Investment holding Cayman Islands 100
Redwood Japan Logistics FundInvestments 1, Ltd.
Investment holding Cayman Islands 100
RCLF LP Ltd. Limited partner ofa real estate fund
Cayman Islands 100
Redwood Group China I RGC 1 Investment holding Cayman Islands 100Baraki 2 Investor Pte. Ltd. Investment holding Singapore 100Redwood Asian Investments 1 Ltd. Investment holding Cayman Islands 100Redwood Fujiidera Investor Ltd. Investment holding Cayman Islands 100Redwood Asian Investments 2 Ltd. Investment holding Cayman Islands 100Redwood Nanko Pte. Ltd. Investment holding Singapore 100Redwood Nanko SPE I Pte. Ltd. Investment holding Singapore 100NKA Japan Investment Pte. Ltd. Investment holding Singapore 100RW Nankonaka Godo Kaisha Investment holding Japan 100Redwood Sustainable Investments, Ltd. Investment holding Cayman Islands 100Redwood Australia Fund I Ltd. Investment holding Cayman Islands 100Redwood Australia Fund II Ltd. Investment holding Cayman Islands 100Redwood Australia Fund III Ltd. Investment holding Cayman Islands 100Redwood Australia Fund IV Ltd. Investment holding Cayman Islands 100Redwood Australia Fund V Ltd. Investment holding Cayman Islands 100Redwood Sustainable Investments 1, Ltd Investment holding Cayman Islands 100RW Renewables Sustainable Solar GK Investment holding Japan 100Redwood Investor GP Ltd Investment holding Cayman Islands 100RW Renewables ISH Investment holding Japan 100RW Renewables 2 ISH Investment holding Japan 100RW Renewables 3 ISH Investment holding Japan 100RW Renewables 4 ISH Investment holding Japan 100RW Renewables 5 ISH Investment holding Japan 100RW Renewables 6 ISH Investment holding Japan 100RW Renewables GK Investment holding Japan 100RW Renewables 4 GK Investment holding Japan 100RW Renewables 5 GK Investment holding Japan 100RW Renewables 6 GK Investment holding Japan 100
2.12 COMMITMENTS
Commitment to contributing capital to real estate investment funds are as follows:
As at January 20, 2016
USD’000
Undrawn capital calls . . . . . . . . . . . . . . . . . . . . . . . . . . . . . . . . . . . . . . . . . . . . . . . . . 49,027
I-163

APPENDIX I ACCOUNTANTS’ REPORT
IV. SUPPLEMENTARY PRE-ACQUISITION FINANCIAL INFORMATION OFREDWOOD ASIAN INVESTMENTS, LTD. AND ESR SINGAPORE PTE. LTD.BUSINESS (continued)
2. NOTES TO THE FINANCIAL INFORMATION OF REDWOOD ASIANINVESTMENTS, LTD. (continued)
2.13 RELATED PARTY TRANSACTIONS
For the purposes of these consolidated financial statements, parties are considered to be relatedto the Redwood Asian Group if the Redwood Asian Group has the ability, directly or indirectly, tocontrol the party or exercise significant influence over the party in making financial and operatingdecisions, or Vice versa, or where the Redwood Asian Group and the party are subject to commoncontrol or joint control. Related parties may be individuals or other entities.
Key management personnel
The directors are employees of a related corporation and no consideration is paid to that relatedcorporation for services rendered by the directors.
2.14 SHARE CAPITALAs at January 20, 2016
Number of Shares Share capital
USD
Ordinary shares at January 1, 2016 and January 20, 2016 . . . . . . . . . . . . . 1 1
The holders of ordinary shares are entitled to receive dividends as declared from time to timeand are entitled to one vote per share at meetings of the Company. All shares rank equally with regardto the Company’s residual assets.
Capital management
The primary objective of the Redwood Asian Group’s capital management is to ensure that itmaintains sound capital position in order to support its business and maximize shareholders’ value. TheRedwood Asian Group is also committed to maintain efficient mix of debt and equity in order toachieve optimal cost of capital, while taking into account the adequacy of access to cash flows.
The Redwood Asian Group manages its capital structure and makes alignment to it, in light ofchanges in economic conditions. To maintain or adjust the capital structure, the Redwood Asian Groupmay align the dividend payment to shareholder, return capital to shareholders or issue new shares.
There was no change to the Redwood Asian Group’s approach to capital management.
Neither the Company nor any of its subsidiaries are subject to externally imposed capitalrequirements.
2.15 RESERVES
Exchange fluctuation reserve
The exchange fluctuation reserve comprises all foreign currency differences arising from thetranslation of the financial statements of foreign operations.
I-164

APPENDIX I ACCOUNTANTS’ REPORT
IV. SUPPLEMENTARY PRE-ACQUISITION FINANCIAL INFORMATION OFREDWOOD ASIAN INVESTMENTS, LTD. AND ESR SINGAPORE PTE. LTD.BUSINESS (continued)
2. NOTES TO THE FINANCIAL INFORMATION OF REDWOOD ASIANINVESTMENTS, LTD. (continued)
2.15 RESERVES (continued)
Fair value reserve
The fair value reserve comprises the cumulative net change in the fair value ofavailable-for-sale financial assets until the assets are derecognized or impaired.
2.16 INVOLVEMENT WITH UNCONSOLIDATED STRUCTURED ENTITIES
The Redwood Asian Group considers its equity investments in 8 investment funds to beinterests in unconsolidated structured entities. The investment funds are designed so that themanagement rights are not the dominant factor in deciding who controls them.
The table below describes the type of structured entities that the Redwood Asian Group doesnot consolidate but in which it holds an interest.
Type of structured entity Nature and purposeInterest held by the
Company
Total netassets undermanagement
as atJanuary 20, 2016
USD’million
Investment funds To generateinvestment returnsfrom the fundsmanaged by a relatedcompany
Investment in equityand preference shareissued by theinvestment funds
816.2
The table below sets out an analysis of the carrying amount of interests held by the RedwoodAsian Group in the 8 unconsolidated investment funds. The maximum exposure to loss is the carryingamount of the investments.
As atJanuary 20, 2016
USD’000
Carrying amountInvestment funds . . . . . . . . . . . . . . . . . . . . . . . . . . . . . . . . . . . . . . . . . . . . . . . . . . . . . . . . . 54,273
3. FINANCIAL INFORMATION OF ESR SINGAPORE PTE. LTD.
Pre-acquisition financial information of ESR Singapore Pte. Ltd.(the “Company”) and itssubsidiaries (the “ESR Singapore Group”) for the period from January 1, 2016 to January 20, 2016 (the“Pre-acquisition Period”) has been prepared in accordance with the basis of preparation and accountingpolicies as set out in Section IV, Note 4.1. This information is referred hereafter as “FinancialInformation of the ESR Singapore Pte. Ltd.”
I-165
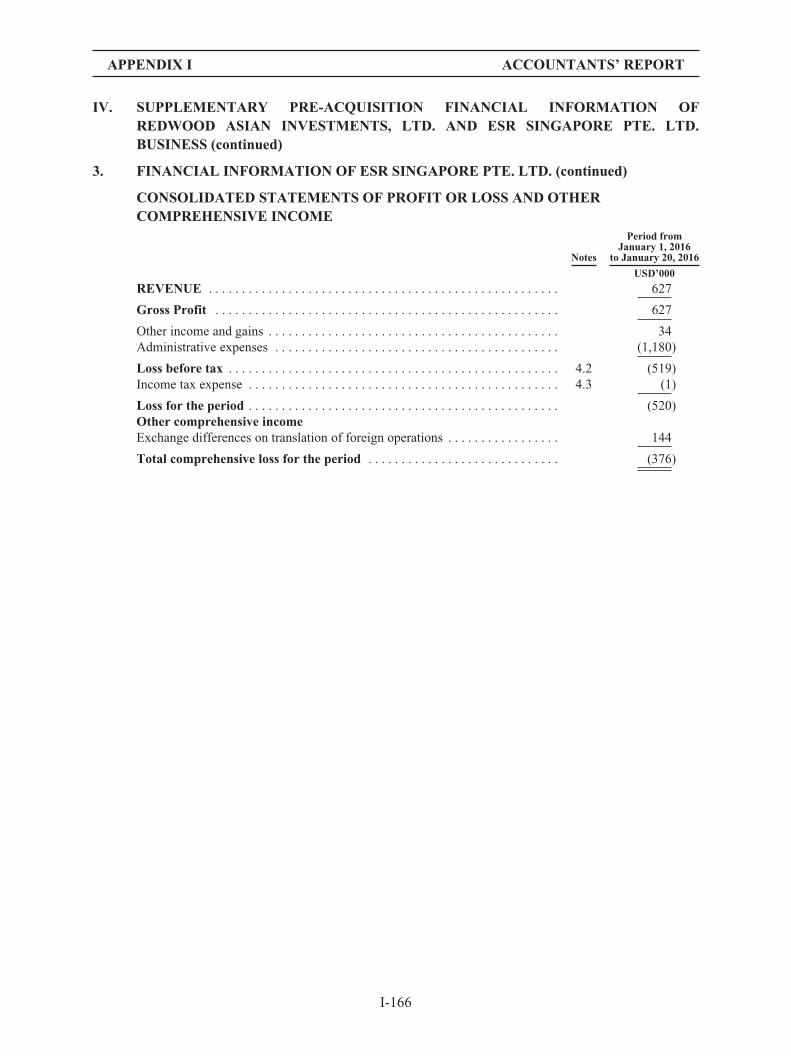
APPENDIX I ACCOUNTANTS’ REPORT
IV. SUPPLEMENTARY PRE-ACQUISITION FINANCIAL INFORMATION OFREDWOOD ASIAN INVESTMENTS, LTD. AND ESR SINGAPORE PTE. LTD.BUSINESS (continued)
3. FINANCIAL INFORMATION OF ESR SINGAPORE PTE. LTD. (continued)
CONSOLIDATED STATEMENTS OF PROFIT OR LOSS AND OTHERCOMPREHENSIVE INCOME
Notes
Period fromJanuary 1, 2016
to January 20, 2016
USD’000
REVENUE . . . . . . . . . . . . . . . . . . . . . . . . . . . . . . . . . . . . . . . . . . . . . . . . . . . . . 627
Gross Profit . . . . . . . . . . . . . . . . . . . . . . . . . . . . . . . . . . . . . . . . . . . . . . . . . . . . 627
Other income and gains . . . . . . . . . . . . . . . . . . . . . . . . . . . . . . . . . . . . . . . . . . . . 34Administrative expenses . . . . . . . . . . . . . . . . . . . . . . . . . . . . . . . . . . . . . . . . . . . (1,180)
Loss before tax . . . . . . . . . . . . . . . . . . . . . . . . . . . . . . . . . . . . . . . . . . . . . . . . . . 4.2 (519)Income tax expense . . . . . . . . . . . . . . . . . . . . . . . . . . . . . . . . . . . . . . . . . . . . . . . 4.3 (1)
Loss for the period . . . . . . . . . . . . . . . . . . . . . . . . . . . . . . . . . . . . . . . . . . . . . . . (520)Other comprehensive incomeExchange differences on translation of foreign operations . . . . . . . . . . . . . . . . . 144
Total comprehensive loss for the period . . . . . . . . . . . . . . . . . . . . . . . . . . . . . (376)
I-166

APPENDIX I ACCOUNTANTS’ REPORT
IV. SUPPLEMENTARY PRE-ACQUISITION FINANCIAL INFORMATION OFREDWOOD ASIAN INVESTMENTS, LTD. AND ESR SINGAPORE PTE. LTD.BUSINESS (continued)
3. FINANCIAL INFORMATION OF ESR SINGAPORE PTE. LTD. (continued)
CONSOLIDATED STATEMENTS OF FINANCIAL POSITION
Note
As atJanuary 20,
2016
USD’000
NON-CURRENT ASSETSProperty, plant and equipment . . . . . . . . . . . . . . . . . . . . . . . . . . . . . . . . . . . . . . . . . . . . 4.4 451Other non-current assets . . . . . . . . . . . . . . . . . . . . . . . . . . . . . . . . . . . . . . . . . . . . . . . . . 585Other intangible assets . . . . . . . . . . . . . . . . . . . . . . . . . . . . . . . . . . . . . . . . . . . . . . . . . . 1Available-for-sale investments . . . . . . . . . . . . . . . . . . . . . . . . . . . . . . . . . . . . . . . . . . . 4.5 179Deferred tax assets . . . . . . . . . . . . . . . . . . . . . . . . . . . . . . . . . . . . . . . . . . . . . . . . . . . . . 4.6 524
Total non-current assets . . . . . . . . . . . . . . . . . . . . . . . . . . . . . . . . . . . . . . . . . . . . . . . . . 1,740
CURRENT ASSETSTrade receivables . . . . . . . . . . . . . . . . . . . . . . . . . . . . . . . . . . . . . . . . . . . . . . . . . . . . . . 4.7 1,095Prepayments, deposits and other receivables . . . . . . . . . . . . . . . . . . . . . . . . . . . . . . . . . 4.8 4,354Cash and bank balances . . . . . . . . . . . . . . . . . . . . . . . . . . . . . . . . . . . . . . . . . . . . . . . . . 4.9 3,165
Total current assets . . . . . . . . . . . . . . . . . . . . . . . . . . . . . . . . . . . . . . . . . . . . . . . . . . . . . 8,614
CURRENT LIABILITIESTrade payables, accruals and other payables . . . . . . . . . . . . . . . . . . . . . . . . . . . . . . . . . 4.10 25,489Income tax payable . . . . . . . . . . . . . . . . . . . . . . . . . . . . . . . . . . . . . . . . . . . . . . . . . . . . 83
Total current liabilities . . . . . . . . . . . . . . . . . . . . . . . . . . . . . . . . . . . . . . . . . . . . . . . . . . 25,572
NET CURRENT LIABILITIES . . . . . . . . . . . . . . . . . . . . . . . . . . . . . . . . . . . . . . . . . (16,958)
TOTAL ASSETS LESS CURRENT LIABILITIES . . . . . . . . . . . . . . . . . . . . . . . . . (15,218)
NET LIABILITIES . . . . . . . . . . . . . . . . . . . . . . . . . . . . . . . . . . . . . . . . . . . . . . . . . . . (15,218)
EquityShare capital . . . . . . . . . . . . . . . . . . . . . . . . . . . . . . . . . . . . . . . . . . . . . . . . . . . . . . . . . . 4.14 10,301Reserves . . . . . . . . . . . . . . . . . . . . . . . . . . . . . . . . . . . . . . . . . . . . . . . . . . . . . . . . . . . . . 4.15 (25,519)
Total equity . . . . . . . . . . . . . . . . . . . . . . . . . . . . . . . . . . . . . . . . . . . . . . . . . . . . . . . . . . (15,218)
I-167

IV.
SUPPLEM
ENTARY
PRE-A
CQUIS
ITIO
NFIN
ANCIA
LIN
FORM
ATIO
NOF
REDW
OOD
ASI
AN
INVEST
MENTS,
LTD.AND
ESR
SINGAPORE
PTE.L
TD.B
USI
NESS
(con
tinu
ed)
3.FIN
ANCIA
LIN
FORM
ATIO
NOFESR
SINGAPORE
PTE.L
TD.(co
ntinue
d)
CONSO
LID
ATED
STATEM
ENTSOFCHANGESIN
EQUIT
Y
Perioden
dedfrom
Janu
ary1,
2016
toJanu
ary20
,201
6
Issu
edca
pital
Cap
ital
reserv
e
Exc
hang
efluc
tuation
reserv
eAcc
umulated
losses
Total
equity
USD
’000
USD
’000
USD
’000
USD
’000
USD
’000
Asat
Janu
ary1,
2016
....
....
....
....
....
....
....
....
....
....
....
....
....
....
....
135
6,54
66,89
532
,780
Los
sforthepe
riod
....
....
....
....
....
....
....
....
....
....
....
....
....
....
....
...
——
(258
)(258
)(258
)Other
compreh
ensive
inco
meforthepe
riod
....
....
....
....
....
....
....
....
....
....
....
——
——
—Exc
hang
edifferen
ceson
tran
slationof
foreignop
erations
....
....
....
....
....
....
....
....
.—
284
—28
41,06
1Total
compr
ehen
sive
inco
meforth
epe
riod
....
....
....
....
....
....
....
....
....
....
..—
284
(258
)(13)
790
Asat
Janu
ary20
,201
6..
....
....
....
....
....
....
....
....
....
....
....
....
....
....
.1
319
6,28
86,90
833
,570
I-168
APPENDIX I ACCOUNTANTS’ REPORT

APPENDIX I ACCOUNTANTS’ REPORT
IV. SUPPLEMENTARY PRE-ACQUISITION FINANCIAL INFORMATION OFREDWOOD ASIAN INVESTMENTS, LTD. AND ESR SINGAPORE PTE. LTD.BUSINESS (continued)
3. FINANCIAL INFORMATION OF ESR SINGAPORE PTE. LTD. (continued)
CONSOLIDATED STATEMENTS OF CASH FLOWS
Notes
Period fromJanuary 1, 2016 toJanuary 20, 2016
USD’000
Cash flows from operating activitiesLoss before tax . . . . . . . . . . . . . . . . . . . . . . . . . . . . . . . . . . . . . . . . . . . . . . . . . . . (519)Adjustments for:Depreciation of property, plant and equipment . . . . . . . . . . . . . . . . . . . . . . . . . . 4.2 5
(514)Increase in trade receivables . . . . . . . . . . . . . . . . . . . . . . . . . . . . . . . . . . . . . . . . . (390)Increase in prepayments, deposits and other receivables . . . . . . . . . . . . . . . . . . . (115)Increase in trade payables, accruals and other payables . . . . . . . . . . . . . . . . . . . . 1,395Cash flows generated from operations and net cash flows generated from
operating activities . . . . . . . . . . . . . . . . . . . . . . . . . . . . . . . . . . . . . . . . . . . . . 376
Cash flows used in investing activitiesPurchase for an available-for-sale investment . . . . . . . . . . . . . . . . . . . . . . . . . . . (7)Purchases of property, plant and equipment . . . . . . . . . . . . . . . . . . . . . . . . . . . . . 4.4 (64)
Net cash flows used in investing activities . . . . . . . . . . . . . . . . . . . . . . . . . . . . . (71)
Cash flows used in financing activitiesRepayments to related parties . . . . . . . . . . . . . . . . . . . . . . . . . . . . . . . . . . . . . . . . (131)
Net cash flows used in financing activities . . . . . . . . . . . . . . . . . . . . . . . . . . . . (131)
Net increase in cash and cash equivalents . . . . . . . . . . . . . . . . . . . . . . . . . . . . . 174
Cash and cash equivalents at beginning of period . . . . . . . . . . . . . . . . . . . . . . . . 2,474Effect of foreign exchange rate changes, net . . . . . . . . . . . . . . . . . . . . . . . . . . . . 151
Cash and cash equivalents at end of period . . . . . . . . . . . . . . . . . . . . . . . . . . . 2,799
ANALYSIS OF BALANCES OF CASH AND CASH EQUIVALENTSCash and cash equivalents as stated in the statement of financial
position . . . . . . . . . . . . . . . . . . . . . . . . . . . . . . . . . . . . . . . . . . . . . . . . . . . . . . . 4.9 3,165Pledged bank deposits . . . . . . . . . . . . . . . . . . . . . . . . . . . . . . . . . . . . . . . . . . . . . 4.9 (366)
Cash and cash equivalents as stated in the statement of cash flows . . . . . . . . 2,799
4. NOTES TO THE FINANCIAL INFORMATION OF ESR SINGAPORE PTE. LTD.
4.1 PRINCIPAL ACCOUNTING POLICIES
The Financial Information of the ESR Singapore Pte., Ltd. has been prepared in accordancewith the accounting policies set out in Section II, Note 2.4.
I-169

APPENDIX I ACCOUNTANTS’ REPORT
IV. SUPPLEMENTARY PRE-ACQUISITION FINANCIAL INFORMATION OFREDWOOD ASIAN INVESTMENTS, LTD. AND ESR SINGAPORE PTE. LTD.BUSINESS (continued)
4. NOTES TO THE FINANCIAL INFORMATION OF ESR SINGAPORE PTE.LTD. (continued)
4.2 LOSS BEFORE TAX
Period fromJanuary 1, 2016 toJanuary 20, 2016
USD’000
Wages and salaries (including directors’ and chief executives’ remuneration) . . . . . . . . 930Pension scheme contributions . . . . . . . . . . . . . . . . . . . . . . . . . . . . . . . . . . . . . . . . . . . . . . 44
974
Professional service fee . . . . . . . . . . . . . . . . . . . . . . . . . . . . . . . . . . . . . . . . . . . . . . . . . . 56Minimum lease payments under operating leases . . . . . . . . . . . . . . . . . . . . . . . . . . . . . . 33Depreciation of property, plant and equipment . . . . . . . . . . . . . . . . . . . . . . . . . . . . . . . . 5
4.3 INCOME TAX EXPENSE
Period fromJanuary 1, 2016 toJanuary 20, 2016
USD’000
Current tax . . . . . . . . . . . . . . . . . . . . . . . . . . . . . . . . . . . . . . . . . . . . . . . . . . . . . . . . . . . . (1)
(1)
A reconciliation of the tax expense is as follows:
Period fromJanuary 1, 2016 toJanuary 20, 2016
USD’000
Loss before tax . . . . . . . . . . . . . . . . . . . . . . . . . . . . . . . . . . . . . . . . . . . . . . . . . . . . . . . . . (519)Tax at the statutory tax rate . . . . . . . . . . . . . . . . . . . . . . . . . . . . . . . . . . . . . . . . . . . . . . . (88)Non-deductible expenses . . . . . . . . . . . . . . . . . . . . . . . . . . . . . . . . . . . . . . . . . . . . . . . . . 87
Tax charge . . . . . . . . . . . . . . . . . . . . . . . . . . . . . . . . . . . . . . . . . . . . . . . . . . . . . . . . . . . . . (1)
I-170

APPENDIX I ACCOUNTANTS’ REPORT
IV. SUPPLEMENTARY PRE-ACQUISITION FINANCIAL INFORMATION OFREDWOOD ASIAN INVESTMENTS, LTD. AND ESR SINGAPORE PTE. LTD.BUSINESS (continued)
4. NOTES TO THE FINANCIAL INFORMATION OF ESR SINGAPORE PTE.LTD. (continued)
4.4 PROPERTY, PLANT AND EQUIPMENT
Leaseholdimprovements
Computersand other ITequipment Total
January 20, 2016 USD’000 USD’000 USD’000
At December 31, 2015 and at January 1, 2016:Cost . . . . . . . . . . . . . . . . . . . . . . . . . . . . . . . . . . . . . . . . . . . . . . . . . . 119 535 654Accumulated depreciation . . . . . . . . . . . . . . . . . . . . . . . . . . . . . . . . (21) (247) (268)
Net carrying amount . . . . . . . . . . . . . . . . . . . . . . . . . . . . . . . . . . . . . 98 288 386
At January 1, 2016, net of accumulated depreciation . . . . . . . . . . . . 98 288 386Additions . . . . . . . . . . . . . . . . . . . . . . . . . . . . . . . . . . . . . . . . . . . . . . 62 2 64Depreciation provided during the period . . . . . . . . . . . . . . . . . . . . . — (5) (5)Exchange realignment . . . . . . . . . . . . . . . . . . . . . . . . . . . . . . . . . . . . 4 2 6
At January 20, 2016, net of accumulated depreciation . . . . . . . . . . . 164 287 451
At January 20, 2016:Cost . . . . . . . . . . . . . . . . . . . . . . . . . . . . . . . . . . . . . . . . . . . . . . . . . . 186 543 729Accumulated depreciation . . . . . . . . . . . . . . . . . . . . . . . . . . . . . . . . (22) (256) (278)
Net carrying amount . . . . . . . . . . . . . . . . . . . . . . . . . . . . . . . . . . . . . 164 287 451
4.5 AVAILABLE-FOR-SALE INVESTMENTSAs at January 20, 2016
USD’000
Available-for-sale financial asset, at cost . . . . . . . . . . . . . . . . . . . . . . . . . . . . . . . . . . 179
The available-for-sale financial assets of the Company relates to unquoted equity investment ina privately-held real estate company in Singapore.
The equity investment is carried at cost less accumulated impairment losses because the fairvalue cannot be reliably determined. The variability in the range of reasonable fair value estimates issignificant and the probabilities of the various estimates within the range of reasonable inputs are notsufficiently reliable to determine a fair value.
4.6 DEFERRED TAX ASSETS
Movement in deferred tax assets during the period are as follows:
Losses available foroffsetting against
future taxable profits
USD’000
At January 1, 2016 . . . . . . . . . . . . . . . . . . . . . . . . . . . . . . . . . . . . . . . . . . . . . . . . . . . . 528Exchange realignment . . . . . . . . . . . . . . . . . . . . . . . . . . . . . . . . . . . . . . . . . . . . . . . . . . (4)
Gross deferred tax assets at January 20, 2016 . . . . . . . . . . . . . . . . . . . . . . . . . . . . . 524
I-171

APPENDIX I ACCOUNTANTS’ REPORT
IV. SUPPLEMENTARY PRE-ACQUISITION FINANCIAL INFORMATION OFREDWOOD ASIAN INVESTMENTS, LTD. AND ESR SINGAPORE PTE. LTD.BUSINESS (continued)
4. NOTES TO THE FINANCIAL INFORMATION OF ESR SINGAPORE PTE.LTD. (continued)
4.7 TRADE RECEIVABLESAs at January 20, 2016
USD’000
Management fees due from funds managed by the Company . . . . . . . . . . . . . . . . . . 1,028Others . . . . . . . . . . . . . . . . . . . . . . . . . . . . . . . . . . . . . . . . . . . . . . . . . . . . . . . . . . . . . 67
1,095
The ESR Singapore Group’s trading terms with its customers are mainly on credit, except fornew customers, where payment in advance is normally required.
4.8 PREPAYMENTS, DEPOSITS AND OTHER RECEIVABLESAs at January 20, 2016
USD’000
Deposits for acquisition . . . . . . . . . . . . . . . . . . . . . . . . . . . . . . . . . . . . . . . . . . . . . . . 28Due from other related parties . . . . . . . . . . . . . . . . . . . . . . . . . . . . . . . . . . . . . . . . . . 2,945Prepayments on behalf of funds . . . . . . . . . . . . . . . . . . . . . . . . . . . . . . . . . . . . . . . . . 192Prepayments to suppliers . . . . . . . . . . . . . . . . . . . . . . . . . . . . . . . . . . . . . . . . . . . . . . 137Other receivables . . . . . . . . . . . . . . . . . . . . . . . . . . . . . . . . . . . . . . . . . . . . . . . . . . . . 1,052
4,354
Amount due from other related parties is unsecured, interest-free, and repayable on demand.None of one above assets is either past due or impaired. The financial assets included in the abovebalance relate to receivables for which there was no recent history of default.
4.9 CASH AND BANK BALANCESAs at January 20, 2016
USD’000
Cash and bank balances . . . . . . . . . . . . . . . . . . . . . . . . . . . . . . . . . . . . . . . . . . . . . . . 2,799Pledged bank deposits . . . . . . . . . . . . . . . . . . . . . . . . . . . . . . . . . . . . . . . . . . . . . . . . . 366
3,165
Pledged deposit represent bank balances of the Company pledged as security to obtaincorporate credit card facility.
Restricted cash represent bank balance of certain subsidiaries reserved for certain specificinvestment purposes only.
I-172

APPENDIX I ACCOUNTANTS’ REPORT
IV. SUPPLEMENTARY PRE-ACQUISITION FINANCIAL INFORMATION OFREDWOOD ASIAN INVESTMENTS, LTD. AND ESR SINGAPORE PTE. LTD.BUSINESS (continued)
4. NOTES TO THE FINANCIAL INFORMATION OF ESR SINGAPORE PTE.LTD. (continued)
4.10 TRADE PAYABLES, ACCRUALS AND OTHER PAYABLESAs at January 20, 2016
USD’000
Accruals . . . . . . . . . . . . . . . . . . . . . . . . . . . . . . . . . . . . . . . . . . . . . . . . . . . . . . . . . . . 4,851Trade payables . . . . . . . . . . . . . . . . . . . . . . . . . . . . . . . . . . . . . . . . . . . . . . . . . . . . . . 749Other tax payable . . . . . . . . . . . . . . . . . . . . . . . . . . . . . . . . . . . . . . . . . . . . . . . . . . . . 519Due to related parties . . . . . . . . . . . . . . . . . . . . . . . . . . . . . . . . . . . . . . . . . . . . . . . . . 18,204Others . . . . . . . . . . . . . . . . . . . . . . . . . . . . . . . . . . . . . . . . . . . . . . . . . . . . . . . . . . . . . 1,166
25,489
Amount due to related parties is unsecured, interest-free and repayable on demand.
4.11 SUBSIDIARIES
Details of the subsidiaries are as follows:
Name of subsidiaries Principal activitiesCountry of
incorporation
Effectiveownershipinterest
As at January 20,2016
%
Held by the CompanyRedwood Group Japan Ltd (“RWJ”) . . . . . . . . . . . . Real estate asset
managementJapan 100
Redwood Real Estate Development Ltd . . . . . . . . . . Real estate assetdevelopment
Japan 100
Redwood Advisors Private Limited . . . . . . . . . . . . . Real estate assetmanagement
India 100
Redwood China Holdings Limited . . . . . . . . . . . . . . Distribution andlogistics serviceproviders
Hong Kong 49.9
Redwood Japan Logistics Fund LP Pte. Ltd. . . . . . . Property fundmanagement
Singapore 100
Redwood Japan Logistics Fund GP Pte. Ltd. . . . . . . General partner forlimited partnership
Singapore 100
Redwood China Logistics Fund GP Pte. Ltd. . . . . . . General partner forlimited partnership
Singapore 100
Redwood Group China Holdings Pte. Ltd(“RGCH”) . . . . . . . . . . . . . . . . . . . . . . . . . . . . . . .
Investment holdings Singapore 100
Redwood Investment Consulting (Shanghai) Co.Ltd . . . . . . . . . . . . . . . . . . . . . . . . . . . . . . . . . . . . .
Real estate assetmanagement
China 100
I-173

APPENDIX I ACCOUNTANTS’ REPORT
IV. SUPPLEMENTARY PRE-ACQUISITION FINANCIAL INFORMATION OFREDWOOD ASIAN INVESTMENTS, LTD. AND ESR SINGAPORE PTE. LTD.BUSINESS (continued)
4. NOTES TO THE FINANCIAL INFORMATION OF ESR SINGAPORE PTE.LTD. (continued)
4.12 COMMITMENTS
Leases as lessee
Non-cancellable operating lease rentals are payable as follows:
As at January 20, 2016
USD’000
Within one year . . . . . . . . . . . . . . . . . . . . . . . . . . . . . . . . . . . . . . . . . . . . . . . . . . . . . . 686After one year but within five years . . . . . . . . . . . . . . . . . . . . . . . . . . . . . . . . . . . . . . 790
The ESR Singapore Group lease office premises under operating lease. The lease is for a periodof one to five year with option to renew the lease after that date.
There is no contingent rent recognized as an expense during the year.
4.13 RELATED PARTY TRANSACTION
During the period from January 1, 2016 to January 20, 2016, other than disclosed elsewhere inthe report, there were the following significant related party transactions:
Period fromJanuary 1, 2016 toJanuary 20, 2016
USD
Funds managed by the ESR Singapore GroupInvestment management fees . . . . . . . . . . . . . . . . . . . . . . . . . . . . . . . . . . . . . . . . . . . . . . 275Development fees . . . . . . . . . . . . . . . . . . . . . . . . . . . . . . . . . . . . . . . . . . . . . . . . . . . . . . . 341Asset management fee income . . . . . . . . . . . . . . . . . . . . . . . . . . . . . . . . . . . . . . . . . . . . . 11
4.14 SHARE CAPITAL
Number ofShares
Sharecapital
USD’000
Ordinary shares at January 1, 2016 and January 20, 2016 . . . . . . . . . . . . . . . . . . . 22,430,563 10,301
The holders of ordinary shares are entitled to receive dividends as declared from time to time,and are entitled to one vote per share at meetings of the ESR Singapore Group and the Company. Allshares rank equally with regard to the ESR Singapore Group’s residual assets.
All issued shares are fully paid, with no par value.
I-174

APPENDIX I ACCOUNTANTS’ REPORT
IV. SUPPLEMENTARY PRE-ACQUISITION FINANCIAL INFORMATION OFREDWOOD ASIAN INVESTMENTS, LTD. AND ESR SINGAPORE PTE. LTD.BUSINESS (continued)
4. NOTES TO THE FINANCIAL INFORMATION OF ESR SINGAPORE PTE.LTD. (continued)
4.15 RESERVES
Capital reserves
Capital reserve relates to non-trade amounts that were terminated or waived and werepreviously due to related corporations as financial support provided to the ESR Singapore Group. Asthe extinguishment of debts due to related corporations was considered as capital transaction with theowners of the ESR Singapore Group, the amounts were recorded as capital contributions by the ownersof the ESR Singapore Group.
Exchange fluctuation reserve
Exchange fluctuation reserve comprises all foreign currency differences arising from thetranslation of the financial statements of foreign operations.
4.16 INVOLVEMENT IN UNCONSOLIDATED STRUCTURED ENTITIES
The ESR Singapore Group has been appointed by 6 real estate funds as its Investment Manager tomanage the operations of those funds to earn fee income based on their capital contributed by investors,development costs incurred on real estate projects, or for the acquisition advisory service and brokerageservice rendered by the ESR Singapore Group. The funds have been designed so that voting and similarrights are not the dominant factor in deciding how the investing activities should be conducted and arefinanced through the issue of ownership interest instrument to investors. The ESR Singapore Group did notprovide any financial support and has no intention of providing financial or any other support.
The table below describes the type of structured entities that the ESR Singapore Group does notconsolidate but in which it holds an interest.
Type of structured entity Nature and purposeInterest held
by the ESR Singapore Group
Investment funds To generate fees frommanaging contributed capitalon behalf of investors,managing project development,rendering acquisition advisoryservice or brokerage service
Investment management feesand development fees,acquisition fees and leasing fees
These vehicles are financedthrough the issue of ownershipinterest instrument to investors.
The ESR Singapore Group earned a total gross fee income of USD627,000 from the real estatefunds for the period from January 1, 2016 to January 20, 2016. As at January 20, 2016, the ESR SingaporeGroup’s maximum exposure to loss as a result of acting as the investment manager of the real estate fundsis equivalent to the carrying amount of fee income receivable from them amounted to USD1,028,000.
I-175

APPENDIX II-A AUDITED FINANCIAL STATEMENTS ON PROPERTYLINK FOR THETHREE YEARS ENDED 30 JUNE 2018
The audited financial information of Propertylink contained in this Appendix II-A (the“Propertylink Financial Information”) is directly extracted from the financial reports previouslypublished by Propertylink as a company publicly listed on the Australian Stock Exchange. ThePropertylink Financial Information has been prepared in accordance with the AustralianAccounting Standards and which comply with the International Financial Reporting Standards(“IFRS”).
The Propertylink Financial Information and other related business and operating information ofPropertylink for the years ended 30 June 2016, 2017 and 2018 have been included in this Prospectus asfollows:
Periodcovered Entities involved Auditors Quick links Page Reference
1. For theyear ended30 June2016
a. Propertylink(Holdings) Limited(currently known asESR AssetManagement(Holdings) Limited)(“PHL”)
b. Propertylink Trust(“PT”)
Bentleys BrisbanePartnership
https://www.asx.com.au/asxpdf/20160929/pdf/
43bl65nyd70j6c.pdf
II-A-4 to II-A-48
2. For the sixmonthsended30 June2016
PropertylinkAustralian IndustrialPartnership(“PAIP”)
KPMG https://www.asx.com.au/asxpdf/20160929/pdf/
43bl5f10kcmgfv.pdf
II-A-49 to II-A-86
3. For theyear ended30 June2017
a. PHLb. PTc. PAIP
KPMG https://www.asx.com.au/asxpdf/20170830/pdf/
43lvzg2s1r7n6d.pdf
II-A-87 to II-A-142
4. For theyear ended30 June2018
a. PHLb. PTc. PAIP
KPMG https://www.asx.com.au/asxpdf/20180814/pdf/
43x9kcfpddqcpz.pdf
II-A-143 to II-A-197
Except for those expressly included herein, any other statement, data or information containedin these hyperlinks are not incorporated into this Prospectus. All figures stated in this Appendix II-Aare in AUD, unless expressly stated otherwise.
The Propertylink Financial Information is included in this Prospectus in connection with theCompany’s application for a waiver from strict compliance with Rule 4.05A of the Listing Rules, andthe Stock Exchange has granted us the waiver. For further details, please refer to the section headed“Waivers and Consent from Strict Compliance with the Listing Rules and Exemptions fromCompanies (Winding Up and Miscellaneous Provisions) Ordinance—Waiver in relation to disclosureof pre-acquisition financial information” in this Prospectus. None of our Company, the Joint Sponsors,the Joint Global Coordinators, the Joint Bookrunners, the Joint Lead Managers, the Underwriters or the
II-A-1

APPENDIX II-A AUDITED FINANCIAL STATEMENTS ON PROPERTYLINK FOR THETHREE YEARS ENDED 30 JUNE 2018
Reporting Accountant involved in the Global Offering or their respective affiliates, directors, officers,employees, advisers or agents was involved or have otherwise participated in the preparation of thePropertylink Financial Information or have performed any verification or inspection as to its accuracy,fairness and completeness.
The inclusion of the Propertylink Financial Information is for the Shareholders and potentialinvestors of our Company to evaluate the risks associated with our Company’s investment inPropertylink and the Global Offering only. Shareholders and potential investors of our Company are
II-A-2

APPENDIX II-A AUDITED FINANCIAL STATEMENTS ON PROPERTYLINK FOR THETHREE YEARS ENDED 30 JUNE 2018
cautioned not to unduly rely on the Propertylink Financial Information announced by Propertylink, asthey do not represent our Group’s consolidated results during the Track Record Period. Instead,Shareholders and potential investors of our Company should refer to our Group’s consolidated resultsextracted from the Accountants’ Report set out in Appendix I to this Prospectus, as well as the sectionheaded “Financial Information” in this Prospectus. Shareholders and potential investors of ourCompany should not place undue reliance on any financial information not prepared by our Company,including the Propertylink Financial Information.
A Chinese version of the Propertylink Financial Information has been prepared and included inthe Chinese version of this Prospectus by the Directors to be in compliance with the Companies(Winding Up and Miscellaneous Provisions) Ordinance and section 4 of the Companies (Exemption ofCompanies and Prospectuses from Compliance with Provisions) Notice (Chapter 32L of the Laws ofHong Kong). Neither Propertylink nor its independent auditors were involved in or has otherwiseparticipated in the process of translating the Propertylink Financial Information into Chinese.
II-A-3

APPENDIX II-A AUDITED FINANCIAL STATEMENTS ON PROPERTYLINK FOR THETHREE YEARS ENDED 30 JUNE 2018
THE AUDITED FINANCIAL STATEMENTS OF PROPERTYLINK (HOLDINGS) LIMITED(CURRENTLY KNOWN AS ESR ASSET MANAGEMENT (HOLDINGS) LIMITED) ANDPROPERTYLINK TRUST FOR THE YEAR ENDED JUNE 30, 2016
Consolidated Statement of Profit or Loss and Other Comprehensive IncomeFor the year ended 30 June 2016
2016 2015
Note $ $
IncomeShare of net profits of associates and joint ventures . . . . . . . . . . . . . . . . . . . . 12 9,352,256 2,014,147Fee income . . . . . . . . . . . . . . . . . . . . . . . . . . . . . . . . . . . . . . . . . . . . . . . . . . . . 3 10,757,353 8,324,412Other income . . . . . . . . . . . . . . . . . . . . . . . . . . . . . . . . . . . . . . . . . . . . . . . . . . 3 523,517 324,597Rental income . . . . . . . . . . . . . . . . . . . . . . . . . . . . . . . . . . . . . . . . . . . . . . . . . 505,169 137,114Net gain on investment property at fair value . . . . . . . . . . . . . . . . . . . . . . . . . 602,383 —
Total income . . . . . . . . . . . . . . . . . . . . . . . . . . . . . . . . . . . . . . . . . . . . . . . . . . 21,740,678 10,800,270
ExpensesEmployment and management costs . . . . . . . . . . . . . . . . . . . . . . . . . . . . . . . . (7,238,782) (4,641,958)Finance costs . . . . . . . . . . . . . . . . . . . . . . . . . . . . . . . . . . . . . . . . . . . . . . . . . . (1,435,507) (449,482)Occupancy costs . . . . . . . . . . . . . . . . . . . . . . . . . . . . . . . . . . . . . . . . . . . . . . . . (795,189) (153,364)Travel expenses . . . . . . . . . . . . . . . . . . . . . . . . . . . . . . . . . . . . . . . . . . . . . . . . (585,555) (406,343)Legal and consultancy fees . . . . . . . . . . . . . . . . . . . . . . . . . . . . . . . . . . . . . . . (1,524,078) (499,258)Directors fees . . . . . . . . . . . . . . . . . . . . . . . . . . . . . . . . . . . . . . . . . . . . . . . . . . 5 (394,400) (292,500)Auditors remuneration . . . . . . . . . . . . . . . . . . . . . . . . . . . . . . . . . . . . . . . . . . . 6 (152,444) (52,083)Property expenses . . . . . . . . . . . . . . . . . . . . . . . . . . . . . . . . . . . . . . . . . . . . . . (27,307) (31,760)Depreciation and amortisation expense . . . . . . . . . . . . . . . . . . . . . . . . . . . . . . (200,123) (131,774)Administration and other expenses . . . . . . . . . . . . . . . . . . . . . . . . . . . . . . . . . (776,039) (1,016,408)
Total expenses . . . . . . . . . . . . . . . . . . . . . . . . . . . . . . . . . . . . . . . . . . . . . . . . . (13,129,424) (7,674,930)
Profit before income tax . . . . . . . . . . . . . . . . . . . . . . . . . . . . . . . . . . . . . . . . 8,611,254 3,125,340Tax (expense)/income . . . . . . . . . . . . . . . . . . . . . . . . . . . . . . . . . . . . . . . . . . . 4(a) (280,947) (708,942)
Profit after income tax attributable to owners of the staplessecurities . . . . . . . . . . . . . . . . . . . . . . . . . . . . . . . . . . . . . . . . . . . . . . . . . . . 8,330,307 2,416,398
Other comprehensive income . . . . . . . . . . . . . . . . . . . . . . . . . . . . . . . . . . . . . — —
Total comprehensive income attributable to owners of the staplessecurities . . . . . . . . . . . . . . . . . . . . . . . . . . . . . . . . . . . . . . . . . . . . . . . . . . . 8,330,307 2,416,398
Basic earnings/(loss) per stapled security (cents) . . . . . . . . . . . . . . . . . . . . . . 7(a) 29.84 9.24Diluted earnings/(loss) per stapled security (cents) . . . . . . . . . . . . . . . . . . . . . 7(b) 25.32 7.76Dividends proposed per share (cents) . . . . . . . . . . . . . . . . . . . . . . . . . . . . . . . 8 — 2.00
The above consolidated statement of profit or loss and other comprehensive income should beread in conjunction with the accompanying notes.
II-A-4

APPENDIX II-A AUDITED FINANCIAL STATEMENTS ON PROPERTYLINK FOR THETHREE YEARS ENDED 30 JUNE 2018
THE AUDITED FINANCIAL STATEMENTS OF PROPERTYLINK (HOLDINGS) LIMITED(CURRENTLY KNOWN AS ESR ASSET MANAGEMENT (HOLDINGS) LIMITED) ANDPROPERTYLINK TRUST FOR THE YEAR ENDED JUNE 30, 2016
Consolidated Statement of Financial PositionAs at 30 June 2016
2016 2015
Note $ $
ASSETSCURRENT ASSETSCash and cash equivalents . . . . . . . . . . . . . . . . . . . . . . . . . . . . . . . . . . . . . . . . . . 9 3,958,675 2,347,705Trade and other receivables . . . . . . . . . . . . . . . . . . . . . . . . . . . . . . . . . . . . . . . . . 10 4,007,660 1,835,941Other assets . . . . . . . . . . . . . . . . . . . . . . . . . . . . . . . . . . . . . . . . . . . . . . . . . . . . . 11 162,401 109,334
TOTAL CURRENT ASSETS . . . . . . . . . . . . . . . . . . . . . . . . . . . . . . . . . . . . . . 8,128,736 4,292,980
NON-CURRENT ASSETSFinancial assets . . . . . . . . . . . . . . . . . . . . . . . . . . . . . . . . . . . . . . . . . . . . . . . . . . 13 39,413,597 24,311,215Investment properties . . . . . . . . . . . . . . . . . . . . . . . . . . . . . . . . . . . . . . . . . . . . . 16 6,470,871 5,856,547Property, plant and equipment . . . . . . . . . . . . . . . . . . . . . . . . . . . . . . . . . . . . . . . 15 561,920 199,426Deferred tax assets . . . . . . . . . . . . . . . . . . . . . . . . . . . . . . . . . . . . . . . . . . . . . . . . 20 786,804 183,883Intangible assets . . . . . . . . . . . . . . . . . . . . . . . . . . . . . . . . . . . . . . . . . . . . . . . . . . 17 4,565,574 4,586,553
Total non-current assets . . . . . . . . . . . . . . . . . . . . . . . . . . . . . . . . . . . . . . . . . . 51,798,766 35,137,624
TOTAL ASSETS . . . . . . . . . . . . . . . . . . . . . . . . . . . . . . . . . . . . . . . . . . . . . . . . 59,927,502 39,430,604
LIABILITIESCURRENT LIABILITIESTrade and other payables . . . . . . . . . . . . . . . . . . . . . . . . . . . . . . . . . . . . . . . . . . . 18 10,165,514 2,168,771Borrowings . . . . . . . . . . . . . . . . . . . . . . . . . . . . . . . . . . . . . . . . . . . . . . . . . . . . . 19 22,802,226 2,578,466Current tax liabilities . . . . . . . . . . . . . . . . . . . . . . . . . . . . . . . . . . . . . . . . . . . . . . 20 410,510 629,885Provisions . . . . . . . . . . . . . . . . . . . . . . . . . . . . . . . . . . . . . . . . . . . . . . . . . . . . . . 21 355,781 700,103
TOTAL CURRENT LIABILITIES . . . . . . . . . . . . . . . . . . . . . . . . . . . . . . . . . 33,734,031 6,077,225
NON-CURRENT LIABILITIESProvisions . . . . . . . . . . . . . . . . . . . . . . . . . . . . . . . . . . . . . . . . . . . . . . . . . . . . . . 21 198,099 23,960Borrowings . . . . . . . . . . . . . . . . . . . . . . . . . . . . . . . . . . . . . . . . . . . . . . . . . . . . . 19 — 8,450,871
TOTAL NON-CURRENT LIABILITIES . . . . . . . . . . . . . . . . . . . . . . . . . . . . 198,099 8,474,831
TOTAL LIABILITIES . . . . . . . . . . . . . . . . . . . . . . . . . . . . . . . . . . . . . . . . . . . 33,932,130 14,552,054
NET ASSETS . . . . . . . . . . . . . . . . . . . . . . . . . . . . . . . . . . . . . . . . . . . . . . . . . . . 25,995,372 24,878,550
EQUITYIssued capital . . . . . . . . . . . . . . . . . . . . . . . . . . . . . . . . . . . . . . . . . . . . . . . . . . . . 22 40,598,477 27,255,515Capital reserve . . . . . . . . . . . . . . . . . . . . . . . . . . . . . . . . . . . . . . . . . . . . . . . . . . . (20,556,446) —Retained earnings/(Accumulated losses) . . . . . . . . . . . . . . . . . . . . . . . . . . . . . . . 5,953,341 (2,376,965)
TOTAL EQUITY . . . . . . . . . . . . . . . . . . . . . . . . . . . . . . . . . . . . . . . . . . . . . . . 25,995,372 24,878,550
NAV per stapled security (cents) . . . . . . . . . . . . . . . . . . . . . . . . . . . . . . . . . . . 59.34 89.29
The above consolidated statement of financial position should be read in conjunction with theaccompanying notes.
II-A-5

APPENDIX II-A AUDITED FINANCIAL STATEMENTS ON PROPERTYLINK FOR THETHREE YEARS ENDED 30 JUNE 2018
THE AUDITED FINANCIAL STATEMENTS OF PROPERTYLINK (HOLDINGS) LIMITED(CURRENTLY KNOWN AS ESR ASSET MANAGEMENT (HOLDINGS) LIMITED) ANDPROPERTYLINK TRUST FOR THE YEAR ENDED JUNE 30, 2016
Consolidated Statement of Changes in EquityFor the year ended 30 June 2016
Share capital Capital reserve
Retainedearnings
(accumulatedlosses) Total
Note $ $ $ $
Balance at 1 July 2014 . . . . . . . . . . . . . . . . . . . . 21,650,643 — (4,236,110) 17,414,533Comprehensive income for the year . . . . . . . . . . — — 2,416,398 2,416,398
21,650,643 — (1,819,712) 19,830,931Shares issued during the year . . . . . . . . . . . . . . . . 22 5,865,449 — — 5,865,449Share issue costs . . . . . . . . . . . . . . . . . . . . . . . . . . (260,577) — — (260,577)Dividends paid or provided for . . . . . . . . . . . . . . 8 — — (557,253) (557,253)
Balance at 30 June 2015 . . . . . . . . . . . . . . . . . . . 27,255,515 — (2,376,965) 24,878,550
Balance at 1 July 2015 . . . . . . . . . . . . . . . . . . . . 27,255,515 — (2,376,965) 24,878,550Comprehensive income for the year . . . . . . . . . . — — 8,330,307 8,330,307
27,255,515 — 5,953,341 33,208,856Shares issued during the year . . . . . . . . . . . . . . . . 22 13,883,000 — — 13,883,000Share issue costs . . . . . . . . . . . . . . . . . . . . . . . . . . (540,038) — — (540,038)Equity restructure . . . . . . . . . . . . . . . . . . . . . . . . . — (20,556,446) — (20,556,446)Dividends paid or provided for . . . . . . . . . . . . . . 8 — — — —
Balance at 30 June 2016 . . . . . . . . . . . . . . . . . . . 40,598,477 (20,556,446) 5,953,341 25,995,372
The above consolidated statement of changes in equity should be read in conjunction with theaccompanying notes.
Equity restructure
Under agreements in place as a result of the merging of Propertylink Australasia Pty Limitedand the Echo Capital Holdings Pty Limited group into the Propertylink Group in 2011, entitiesassociated with senior management had rights related to profit share and the investment managementbusiness. Under a restructure negotiated during the latter half of calendar 2015, entities associated withmanagement agreed to exchange those rights for equity in the Group and earn out payments related tofuture performance fees. This has been accounted as an equity transaction with owners.
II-A-6

APPENDIX II-A AUDITED FINANCIAL STATEMENTS ON PROPERTYLINK FOR THETHREE YEARS ENDED 30 JUNE 2018
THE AUDITED FINANCIAL STATEMENTS OF PROPERTYLINK (HOLDINGS) LIMITED(CURRENTLY KNOWN AS ESR ASSET MANAGEMENT (HOLDINGS) LIMITED) ANDPROPERTYLINK TRUST FOR THE YEAR ENDED JUNE 30, 2016
Consolidated Statement of Cash FlowsFor the year ended 30 June 2016
2016 2015
Note $’000 $’000
CASH FLOWS FROM OPERATING ACTIVITIESReceipts from customers . . . . . . . . . . . . . . . . . . . . . . . . . . . . . . . . . . . . . . . . 14,052,216 9,690,800Interest received . . . . . . . . . . . . . . . . . . . . . . . . . . . . . . . . . . . . . . . . . . . . . . . 30,033 90,372Payments to suppliers and employees . . . . . . . . . . . . . . . . . . . . . . . . . . . . . . (4,237,585) (5,620,816)Finance costs paid . . . . . . . . . . . . . . . . . . . . . . . . . . . . . . . . . . . . . . . . . . . . . . (1,276,019) (603,181)Income tax (paid)/refunded . . . . . . . . . . . . . . . . . . . . . . . . . . . . . . . . . . . . . . (871,799) —
Net cash provided by operating activities . . . . . . . . . . . . . . . . . . . . . . . . . 25(a) 7,696,846 3,557,175
CASH FLOWS FROM INVESTING ACTIVITIESProceeds from sale of investments . . . . . . . . . . . . . . . . . . . . . . . . . . . . . . . . . 1,063,524 —Acquisition and improvement of investment properties . . . . . . . . . . . . . . . . — (5,856,547)Loan proceeds received from related parties . . . . . . . . . . . . . . . . . . . . . . . . . 3,600,000 57,683Payment for investment in associates and joint ventures . . . . . . . . . . . . . . . . (10,218,977) (14,171,953)Purchase of property, plant and equipment . . . . . . . . . . . . . . . . . . . . . . . . . . (541,638) —
Net cash used in investing activities . . . . . . . . . . . . . . . . . . . . . . . . . . . . . . (6,097,091) (19,970,817)
CASH FLOWS FROM FINANCING ACTIVITIESProceeds from issue of shares . . . . . . . . . . . . . . . . . . . . . . . . . . . . . . . . . . . . . — 5,493,196Payments to acquire non-controlling interest . . . . . . . . . . . . . . . . . . . . . . . . . (7,444,928) —Proceeds from borrowings . . . . . . . . . . . . . . . . . . . . . . . . . . . . . . . . . . . . . . . 10,870,012 11,163,460Repayment of borrowings . . . . . . . . . . . . . . . . . . . . . . . . . . . . . . . . . . . . . . . (2,856,611) (2,810,000)Dividends paid . . . . . . . . . . . . . . . . . . . . . . . . . . . . . . . . . . . . . . . . . . . . . . . . (557,257) (335,745)
Net cash provided by financing activities . . . . . . . . . . . . . . . . . . . . . . . . . . 11,216 13,510,911
Net increase in cash and cash equivalents . . . . . . . . . . . . . . . . . . . . . . . . . . . 1,610,971 (2,902,731)Cash and cash equivalents at the beginning of financial year . . . . . . . . . . . . 2,347,704 5,250,435
Cash and cash equivalents at the end of the period . . . . . . . . . . . . . . . . . . 3,958,675 2,347,704
The above consolidated statement of cash flow should be read in conjunction with theaccompanying notes.
II-A-7

APPENDIX II-A AUDITED FINANCIAL STATEMENTS ON PROPERTYLINK FOR THETHREE YEARS ENDED 30 JUNE 2018
THE AUDITED FINANCIAL STATEMENTS OF PROPERTYLINK (HOLDINGS) LIMITED(CURRENTLY KNOWN AS ESR ASSET MANAGEMENT (HOLDINGS) LIMITED) ANDPROPERTYLINK TRUST FOR THE YEAR ENDED JUNE 30, 2016
Notes to the Financial StatementsFor the year ended 30 June 2016
Note 1 Summary of Significant Accounting Policies
The financial report is for the entity Propertylink (Holdings) Limited as the parent entity ofPropertylink (Holdings) Limited and controlled entities and Propertylink Trust and controlled entities,together the Propertylink Group. At 30 June 2016 Propertylink (Holdings) Limited was an unlistedpublic company limited by shares, incorporated and domiciled in Australia. The separate financialstatements of the parent entity, Propertylink (Holdings) Limited, have not been presented within thisfinancial year as permitted by the Corporations Act 2001.
The financial report was authorised for issue by directors on 29 September 2016.
The following is a summary of the material accounting policies adopted by the economic entityin the preparation of the financial report. The accounting policies applied are the same as those appliedin the previous financial year unless otherwise stated.
Basis of preparation
These general purpose financial statements have been prepared in accordance with theCorporations Act 2001, Australian Accounting Standards and Interpretations of the AustralianAccounting Standards Board and International Financial Reporting Standards as issued by theInternational Accounting Standards Board. The Group is a for-profit entity for financial reportingpurposes under Australian Accounting Standards. Material accounting policies adopted in thepreparation of these financial statements are presented below and have been consistently applied unlessstated otherwise.
The financial statements except for cash flow information, have been prepared on an accrualsbasis and are based on historical costs, modified, where applicable, by the measurement at fair value ofselected non-current assets, financial assets and financial liabilities. The amounts presented in thefinancial statements have been rounded to the nearest dollar.
Going concern
The directors have determined that the Group’s financial report should be prepared on a goingconcern basis.
The following is a summary of the material accounting policies adopted by the Group in thepreparation of the financial report. The accounting policies have been consistently applied unlessotherwise stated.
(a) Principles of consolidation
The consolidated financial statements incorporate all of the assets, liabilities and results of thePropertylink Group and all of the subsidiaries (including any structured entities). Subsidiaries are
II-A-8

APPENDIX II-A AUDITED FINANCIAL STATEMENTS ON PROPERTYLINK FOR THETHREE YEARS ENDED 30 JUNE 2018
THE AUDITED FINANCIAL STATEMENTS OF PROPERTYLINK (HOLDINGS) LIMITED(CURRENTLY KNOWN AS ESR ASSET MANAGEMENT (HOLDINGS) LIMITED) ANDPROPERTYLINK TRUST FOR THE YEAR ENDED JUNE 30, 2016
Notes to the Financial Statements (continued)For the year ended 30 June 2016
entities the Parent controls. The Parent controls an entity when it is exposed to, or has rights to,variable returns from its involvement with the entity and has the ability to affect those returns throughits power over the entity. A list of the subsidiaries is provided in Note 14.
The assets, liabilities and results of all subsidiaries are fully consolidated into the financialstatements of the Group from the date on which control is obtained by the Group. The consolidation ofa subsidiary is discontinued from the date that control ceases. Inter-company transactions, balances andunrealised gains or losses on transactions between Group entities are fully eliminated on consolidation.Accounting policies of subsidiaries have been changed and adjustments made where necessary toensure uniformity of the accounting policies adopted by the Group.
(b) Business combination
Business combinations occur where an acquirer obtains control over one or more businesses.
A business combination is accounted for by applying the acquisition method, unless it is acombination involving entities or businesses under common control. The business combination will beaccounted for from the date that control is attained, whereby the fair value of the identifiable assetsacquired and liabilities (including contingent liabilities) assumed is recognised (subject to certainlimited exceptions).
When measuring the consideration transferred in the business combination, any asset orliability resulting from a contingent consideration arrangement is also included. Subsequent to initialrecognition, contingent consideration classified as equity is not remeasured and its subsequentsettlement is accounted for within equity. Contingent consideration classified as an asset or liability isremeasured in each reporting period to fair value, recognising any change to fair value in profit or loss,unless the change in value can be identified as existing at acquisition date.
All transaction costs incurred in relation to business combinations other than those associatedwith the issue of a financial instrument are recognised as expenses in profit or loss when incurred.
The acquisition of a business may result in the recognition of goodwill or a gain from a bargainpurchase.
(c) Goodwill
Goodwill is carried at cost less any accumulated impairment losses.
The amount of goodwill recognised on acquisition of each subsidiary in which the Group holdsa less than 100% interest will depend on the method adopted in measuring the non-controlling interest.The Group can elect in most circumstances to measure the non-controlling interest in the acquiree
II-A-9

APPENDIX II-A AUDITED FINANCIAL STATEMENTS ON PROPERTYLINK FOR THETHREE YEARS ENDED 30 JUNE 2018
THE AUDITED FINANCIAL STATEMENTS OF PROPERTYLINK (HOLDINGS) LIMITED(CURRENTLY KNOWN AS ESR ASSET MANAGEMENT (HOLDINGS) LIMITED) ANDPROPERTYLINK TRUST FOR THE YEAR ENDED JUNE 30, 2016
Notes to the Financial Statements (continued)For the year ended 30 June 2016
either at fair value (“full goodwill method”) or at the non-controlling interest’s proportionate share ofthe subsidiary’s identifiable net assets (“proportionate interest method”). In such circumstances, theGroup determines which method to adopt for each acquisition and this is stated in the respective notesto these financial statements disclosing the business combination.
Under the full goodwill method, the fair value of the non-controlling interests is determinedusing valuation techniques which make the maximum use of market information where available.Under this method, goodwill attributable to the non-controlling interest is recognised in theconsolidated financial statements.
Goodwill on acquisitions of subsidiaries is included in intangible assets. Goodwill onacquisition of associates is included in investments in associates.
Goodwill is tested for impairment annually and is allocated to the group’s cash-generating unitsor groups of cash-generating units, which represents the lowest level at which goodwill is monitoredbut where such level is not larger than an operating segment. Gains and losses on the disposal of anentity include the carrying amount of goodwill related to the entity sold.
Changes in the ownership interests in a subsidiary that do not result in a loss of control areaccounted for as equity transactions and do not affect the carrying amounts of goodwill.
(d) Income tax
The income tax expense (income) for the year comprises current income tax expense (income)and deferred tax expense (income).
Current income tax expense charged to the profit or loss is the tax payable on taxable income.Current tax liabilities (assets) are measured at the amounts expected to be paid to (recovered from) therelevant taxation authority.
Current and deferred income tax expense (income) is charged or credited outside the profit andloss when the tax relates to items that are recognised outside the profit and loss.
Except for business combinations, no deferred income tax is recognised from the initialrecognition of an asset or liability, excluding a business combination, where there is no effect onaccounting or taxable profit or loss.
Deferred tax assets and liabilities are calculated at the tax rates that are expected to apply to theperiod when the asset is realised or the liability is settled and their measurement also reflects themanner in which management expects to recover or settle the carrying amount of the related asset orliability. With respect to non-depreciable items of property, plant and equipment measured at fair value
II-A-10

APPENDIX II-A AUDITED FINANCIAL STATEMENTS ON PROPERTYLINK FOR THETHREE YEARS ENDED 30 JUNE 2018
THE AUDITED FINANCIAL STATEMENTS OF PROPERTYLINK (HOLDINGS) LIMITED(CURRENTLY KNOWN AS ESR ASSET MANAGEMENT (HOLDINGS) LIMITED) ANDPROPERTYLINK TRUST FOR THE YEAR ENDED JUNE 30, 2016
Notes to the Financial Statements (continued)For the year ended 30 June 2016
and items of investment property measured at fair value, the related deferred tax liability or deferredtax asset is measured on the basis that the carrying amount of the asset will be recovered entirelythrough sale. When an investment property that is depreciable is held by the company in a businessmodel whose objective is to consume substantially all of the economic benefits embodied in theproperty through use over time (rather than through sale), the related deferred tax liability or deferredtax asset is measured on the basis that the carrying amount of such property will be recovered entirelythrough use.
Deferred tax assets relating to temporary differences and unused tax losses are recognised onlyto the extent that it is probable that future taxable profit will be available against which the benefits ofthe deferred tax asset can be utilised.
Where temporary differences exist in relation to investments in subsidiaries, branches,associates, and joint ventures, deferred tax assets and liabilities are not recognised where the timing ofthe reversal of the temporary difference can be controlled and it is not probable that the reversal willoccur in the foreseeable future.
Current tax assets and liabilities are offset where a legally enforceable right of set-off exists andit is intended that net settlement or simultaneous realisation and settlement of the respective asset andliability will occur. Deferred tax assets and liabilities are offset where: (a) a legally enforceable right ofset-off exists; and (b) the deferred tax assets and liabilities relate to income taxes levied by the sametaxation authority on either the same taxable entity or different taxable entities, where it is intendedthat net settlement or simultaneous realisation and settlement of the respective asset and liability willoccur in future periods in which significant amounts of deferred tax assets or liabilities are expected tobe recovered or settled.
(e) Fair value of assets and liabilities
The Group measures some of its assets and liabilities at fair value on either a recurring ornon-recurring basis, depending on the requirements of the applicable accounting standard.
Fair value is the price the Group would receive to sell an asset or would have to pay to transfera liability in an orderly (i.e. unforced) transaction between independent, knowledgeable and willingmarket participants at the measurement date.
As fair value is a market-based measure, the closest equivalent observable market pricinginformation is used to determine fair value. Adjustments to market values may be made having regardto the characteristics of the specific asset or liability. The fair values of assets and liabilities that are nottraded in an active market are determined using one or more valuation techniques. These valuationtechniques maximise, to the extent possible, the use of observable market data.
II-A-11

APPENDIX II-A AUDITED FINANCIAL STATEMENTS ON PROPERTYLINK FOR THETHREE YEARS ENDED 30 JUNE 2018
THE AUDITED FINANCIAL STATEMENTS OF PROPERTYLINK (HOLDINGS) LIMITED(CURRENTLY KNOWN AS ESR ASSET MANAGEMENT (HOLDINGS) LIMITED) ANDPROPERTYLINK TRUST FOR THE YEAR ENDED JUNE 30, 2016
Notes to the Financial Statements (continued)For the year ended 30 June 2016
To the extent possible, market information is extracted from either the principal market for theasset or liability (ie the market with the greatest volume and level of activity for the asset or liability)or, in the absence of such a market, the most advantageous market available to the entity at the end ofthe reporting period (ie the market that maximises the receipts from the sale of the asset or minimisesthe payments made to transfer the liability, after taking into account transaction costs and transportcosts).
For non-financial assets, the fair value measurement also takes into account a marketparticipant’s ability to use the asset in its highest and best use or to sell it to another market participantthat would use the asset in its highest and best use.
The fair value of liabilities and the entity’s own equity instruments (excluding those related toshare based payment arrangements) may be valued, where there is no observable market price inrelation to the transfer of such financial instrument, by reference to observable market informationwhere such instruments are held as assets. Where this information is not available, other valuationtechniques are adopted and where significant, are detailed in the respective note to the financialstatements.
(f) Investment properties
Investment properties are properties held to earn rentals and/or for capital appreciation(including property under construction for such purposes). Investment properties are measured initiallyat its costs, including transaction costs. Subsequent to initial recognition, investment properties aremeasured at fair value. All of the Group’s property interests held under operating leases to earn rentalsor for capital appreciation purposes are accounted for as investment properties and are re-measuredusing a fair value model. Gains and losses arising from changes in the fair value of investmentproperties are included in profit or loss in the period in which they arise.
An investment property is derecognised upon disposal or when the investment property ispermanently withdrawn from use and no future economic benefits are expected from the disposal.
Any gain or loss arising on derecognition of the property (calculated as the difference betweenthe net disposal proceeds and the carrying amount of the asset) is included in profit or loss in the periodin which the property is derecognised.
(g) Property, plant and equipment
Each class of property, plant and equipment is carried at cost or fair value as indicated less,where applicable, any accumulated depreciation and impairment losses.
II-A-12

APPENDIX II-A AUDITED FINANCIAL STATEMENTS ON PROPERTYLINK FOR THETHREE YEARS ENDED 30 JUNE 2018
THE AUDITED FINANCIAL STATEMENTS OF PROPERTYLINK (HOLDINGS) LIMITED(CURRENTLY KNOWN AS ESR ASSET MANAGEMENT (HOLDINGS) LIMITED) ANDPROPERTYLINK TRUST FOR THE YEAR ENDED JUNE 30, 2016
Notes to the Financial Statements (continued)For the year ended 30 June 2016
Property
Freehold land and buildings are carried at their fair value (being the amount for which an assetcould be exchanged between knowledgeable willing parties in an arm’s length transaction), based onperiodic, but at least triennial, valuations by external independent valuers, less accumulateddepreciation for buildings.
Increases in the carrying amount arising on revaluation of land and buildings are credited to arevaluation surplus in equity. Decreases that offset previous increases of the same asset are recognisedagainst revaluation surplus directly in equity; all other decreases are recognised in profit or loss.
Any accumulated depreciation at the date of revaluation is eliminated against the gross carryingamount of the asset and the net amount is restated to the revalued amount of the asset.
Plant and equipment
Plant and equipment are measured on the cost basis and are therefore carried at cost lessaccumulated depreciation and any accumulated impairment losses. In the event the carrying amount ofplant and equipment is greater than its estimated recoverable amount, the carrying amount is writtendown immediately to its estimated recoverable amount and impairment losses recognised either inprofit or loss or as a revaluation decrease if the impairment losses relate to a revalued asset. A formalassessment of recoverable amount is made when impairment indicators are present (refer to Note 1(j)for details of impairment).
The cost of fixed assets constructed within the consolidated group includes the cost ofmaterials, direct labour, borrowing costs and an appropriate proportion of fixed and variable overheads.
Subsequent costs are included in the asset’s carrying amount or recognised as a separate asset,as appropriate, only when it is probable that future economic benefits associated with the item willflow to the Group and the cost of the item can be measured reliably. All other repairs and maintenanceare recognised as expenses in profit or loss in the financial period in which they are incurred.
Depreciation
The depreciable amount of all fixed assets including buildings and capitalised lease assets, butexcluding freehold land, is depreciated on a straight line basis over the asset’s useful life to theconsolidated group commencing from the time the asset is held ready for use. Leasehold improvementsare depreciated over the shorter of either the unexpired period of the lease or the estimated useful livesof the improvements.
The depreciation rates used for each class of depreciable assets are:
Class of fixed asset Depreciation rate
Plant and equipment . . . . . . . . . . . . . . . . . . . . . . . . . . . . . . . . . . . . . . . . . . . . . . . . . . . . . . 10% - 20% pa
II-A-13
APPENDIX II-A AUDITED FINANCIAL STATEMENTS ON PROPERTYLINK FOR THETHREE YEARS ENDED 30 JUNE 2018
THE AUDITED FINANCIAL STATEMENTS OF PROPERTYLINK (HOLDINGS) LIMITED(CURRENTLY KNOWN AS ESR ASSET MANAGEMENT (HOLDINGS) LIMITED) ANDPROPERTYLINK TRUST FOR THE YEAR ENDED JUNE 30, 2016
Notes to the Financial Statements (continued)For the year ended 30 June 2016
The assets’ residual values and useful lives are reviewed, and adjusted if appropriate, at the endof each reporting period.
An asset’s carrying amount is written down immediately to its recoverable amount if the asset’scarrying amount is greater than its estimated recoverable amount.
Gains and losses on disposals are determined by comparing proceeds with the carrying amount.These gains or losses are recognised in profit or loss when the item is derecognised. When revaluedassets are sold, amounts included in the revaluation surplus relating to that asset are transferred toretained earnings.
(h) Lease
Leases of fixed assets, where substantially all the risks and benefits incidental to the ownership of theasset—but not the legal ownership—are transferred to entities in the consolidated group, are classifiedas finance leases.
Finance leases are capitalised by recording an asset and a liability at the lower of the amountsequal to the fair value of the leased property or the present value of the minimum lease payments,including any guaranteed residual values. Lease payments are allocated between the reduction of thelease liability and the lease interest expense for the period.
Leased assets are depreciated on a straight-line basis over the shorter of their estimated usefullives or the lease term.
Lease payments for operating leases, where substantially all the risks and benefits remain withthe lessor, are recognised as expenses on a straight-line basis over the lease term.
Lease incentives under operating leases are recognised as a liability and amortised on astraight-line basis over the life of the lease term.
(i) Financial instruments
Initial recognition and measurement
Financial assets and financial liabilities are recognised when the entity becomes a party to thecontractual provisions of the instrument. For financial assets, this is equivalent to the date that thecompany commits itself to either purchase or sell the asset (i.e. trade date accounting is adopted).
Financial instruments are initially measured at fair value plus transaction costs, except wherethe instrument is classified ‘at fair value through profit or losses in which case transaction costs arerecognised as expenses in profit or loss immediately.
II-A-14

APPENDIX II-A AUDITED FINANCIAL STATEMENTS ON PROPERTYLINK FOR THETHREE YEARS ENDED 30 JUNE 2018
THE AUDITED FINANCIAL STATEMENTS OF PROPERTYLINK (HOLDINGS) LIMITED(CURRENTLY KNOWN AS ESR ASSET MANAGEMENT (HOLDINGS) LIMITED) ANDPROPERTYLINK TRUST FOR THE YEAR ENDED JUNE 30, 2016
Notes to the Financial Statements (continued)For the year ended 30 June 2016
Classification and subsequent measurement
Financial instruments are subsequently measured at fair value, amortised cost using theeffective interest method, or cost. Where available, quoted prices in an active market are used todetermine fair value. In other circumstances, valuation techniques are adopted.
Amortised cost is calculated as the amount at which the financial asset or financial liability ismeasured at initial recognition less principal repayments and any reduction for impairment, andadjusted for any cumulative amortisation of the difference between that initial amount and the maturityamount calculated using the effective interest method.
The effective interest method is used to allocate interest income or interest expense over therelevant period and is equivalent to the rate that exactly discounts estimated future cash payments orreceipts (including fees, transaction costs and other premiums or discounts) through the expected life(or when this cannot be reliably predicted, the contractual term) of the financial instrument to the netcarrying amount of the financial asset or financial liability. Revisions to expected future net cash flowswill necessitate an adjustment to the carrying amount with a consequential recognition of an income orexpense item in profit or loss.
The Group does not designate any interests in subsidiaries, associates or joint ventures as beingsubject to the requirements of Accounting Standards specifically applicable to financial instruments.Accordingly, such interests are accounted for on a cost basis in the parent’s separate financialstatements.
(i) Financial assets at fair value through profit or loss
Financial assets are classified at “fair value through profit or loss” when they are held fortrading for the purpose of short-term profit taking, derivatives not held for hedging purposes, or whenthey are designated as such to avoid an accounting mismatch or to enable performance evaluationwhere a group of financial assets is managed by key management personnel on a fair value basis inaccordance with a documented risk management or investment strategy. Such assets are subsequentlymeasured at fair value with changes in carrying amount included in profit or loss.
(ii) Loans and receivables
Loans and receivables are non-derivative financial assets with fixed or determinable paymentsthat are not quoted in an active market and are subsequently measured at amortised cost. Gains orlosses are recognised in profit or loss through the amortisation process and when the financial asset isderecognised.
II-A-15

APPENDIX II-A AUDITED FINANCIAL STATEMENTS ON PROPERTYLINK FOR THETHREE YEARS ENDED 30 JUNE 2018
THE AUDITED FINANCIAL STATEMENTS OF PROPERTYLINK (HOLDINGS) LIMITED(CURRENTLY KNOWN AS ESR ASSET MANAGEMENT (HOLDINGS) LIMITED) ANDPROPERTYLINK TRUST FOR THE YEAR ENDED JUNE 30, 2016
Notes to the Financial Statements (continued)For the year ended 30 June 2016
(iii) Held-to-maturity investments
Held-to-maturity investments are non-derivative financial assets that have fixed maturities andfixed or determinable payments, and it is the Group’s intention to hold these investments to maturity.They are subsequently measured at amortised cost. Gains or losses are recognised in profit or lossthrough the amortisation process and when the financial asset is derecognised.
(iv) Available-for-sale financial investments
Available-for-sale investments are non-derivative financial assets that are either not capable ofbeing classified into other categories of financial assets due to their nature or they are designated assuch by management. They comprise investments in the equity of other entities where there is neither afixed maturity nor fixed or determinable payments.
They are subsequently measured at fair value with any re-measurements other than impairmentlosses and foreign exchange gains and losses recognised in other comprehensive income. When thefinancial asset is derecognised, the cumulative gain or loss pertaining to that asset previouslyrecognised in other comprehensive income is reclassified into profit or loss.
Available-for-sale financial assets are classified as non-current assets when they are notexpected to be sold within 12 months after the end of the reporting period. All other available-for-salefinancial assets are classified as current assets.
(v) Financial liabilities
Non-derivative financial liabilities other than financial guarantees are subsequently measured atamortised cost. Gains or losses are recognised in profit or loss through the amortisation process andwhen the financial liability is derecognised.
Impairment
At the end of each reporting period, the Group assesses whether there is objective evidence thata financial asset has been impaired. A financial asset (or a group of financial assets) is deemed to beimpaired if, and only if, there is objective evidence of impairment as a result of one or more events (a“loss event”) having occurred, which has an impact on the estimated future cash flows of the financialasset(s).
In the case of available-for-sale financial assets, a significant or prolonged decline in the marketvalue of the instrument is considered to constitute a loss event. Impairment losses are recognised inprofit or loss immediately. Also, any cumulative decline in fair value previously recognised in othercomprehensive income is reclassified to profit or loss at this point
II-A-16

APPENDIX II-A AUDITED FINANCIAL STATEMENTS ON PROPERTYLINK FOR THETHREE YEARS ENDED 30 JUNE 2018
THE AUDITED FINANCIAL STATEMENTS OF PROPERTYLINK (HOLDINGS) LIMITED(CURRENTLY KNOWN AS ESR ASSET MANAGEMENT (HOLDINGS) LIMITED) ANDPROPERTYLINK TRUST FOR THE YEAR ENDED JUNE 30, 2016
Notes to the Financial Statements (continued)For the year ended 30 June 2016
In the case of financial assets carried at amortised cost, loss events may include: indicationsthat the debtors or a group of debtors are experiencing significant financial difficulty, default ordelinquency in interest or principal payments; indications that they will enter bankruptcy or otherfinancial reorganisation; and changes in arrears or economic conditions that correlate with defaults.
For financial assets carried at amortised cost (including loans and receivables), a separateallowance account is used to reduce the carrying amount of financial assets impaired by credit losses.After having taken all possible measures of recovery, if management establishes that the carryingamount cannot be recovered by any means, at that point the written-off amounts are charged to theallowance account or the carrying amount of impaired financial assets is reduced directly if noimpairment amount was previously recognised in the allowance account.
When the terms of financial assets that would otherwise have been past due or impaired havebeen renegotiated, the Group recognises the impairment for such financial assets by taking into accountthe original terms as if the terms have not been renegotiated so that the loss events that have occurredare duly considered.
Financial guarantees
Where material, financial guarantees issued that require the issuer to make specified paymentsto reimburse the holder for a loss it incurs because a specified debtor fails to make payment when dueare recognised as financial liabilities at fair value on initial recognition.
The fair value of financial guarantee contracts has been assessed using the probability weighteddiscounted cash flow approach. The probability has been based on:
Š the likelihood of the guaranteed party defaulting during the next reporting period;
Š the proportion of the exposure that is not expected to be recovered due to the guaranteedparty defaulting; and
Š the maximum loss exposure if the guaranteed party were to default.
Financial guarantees are subsequently measured at the higher of the best estimate of theobligation in accordance with AASB 137: Provisions, Contingent Liabilities and Contingent Assetsand the amount initially recognised less, when appropriate, cumulative amortisation in accordance withAASB 118: Revenue. Where the entity gives guarantees in exchange for a fee, revenue is recognisedunder AASB 118.
Derecognition
Financial assets are derecognised when the contractual rights to receipt of cash flows expire orthe asset is transferred to another party whereby the entity no longer has any significant continuing
II-A-17

APPENDIX II-A AUDITED FINANCIAL STATEMENTS ON PROPERTYLINK FOR THETHREE YEARS ENDED 30 JUNE 2018
THE AUDITED FINANCIAL STATEMENTS OF PROPERTYLINK (HOLDINGS) LIMITED(CURRENTLY KNOWN AS ESR ASSET MANAGEMENT (HOLDINGS) LIMITED) ANDPROPERTYLINK TRUST FOR THE YEAR ENDED JUNE 30, 2016
Notes to the Financial Statements (continued)For the year ended 30 June 2016
involvement in the risks and benefits associated with the asset. Financial liabilities are derecognisedwhen the related obligations are discharged, cancelled or have expired. The difference between thecarrying amount of the financial liability extinguished or transferred to another party and the fair valueof consideration paid, including the transfer of non-cash assets or liabilities assumed, is recognised inprofit or loss.
(j) Impairment of assets
At the end of each reporting period, the Group assesses whether there is any indication that anasset may be impaired. The assessment will include considering external sources of information andinternal sources of information, including dividends received from subsidiaries, associates or jointventures deemed to be out of pre-acquisition profits. If such an indication exists, an impairment test iscarried out on the asset by comparing the recoverable amount of the asset, being the higher of theasset’s fair value less costs of disposal and value in use to the asset’s carrying amount. Any excess ofthe asset’s carrying amount over its recoverable amount is recognised immediately in profit or loss,unless the asset is carried at a revalued amount in accordance with another Standard (eg in accordancewith the revaluation model in AASB 116: Property, Plant and Equipment). Any impairment loss of arevalued asset is treated as a revaluation decrease in accordance with that other Standard.
Where it is not possible to estimate the recoverable amount of an individual asset, the Groupestimates the recoverable amount of the cash-generating unit to which the asset belongs.
Impairment testing is performed annually for goodwill and intangible assets with indefinitelives.
(k) Investments in associates
An associate is an entity over which the Group has significant influence. Significant influenceis the power to participate in the financial and operating policy decisions of the entity but is not controlor joint control of those policies. Investments in associates are accounted for in the consolidatedfinancial statements by applying the equity method of accounting, whereby the investment is initiallyrecognised at cost (including transaction costs) and adjusted thereafter for the post-acquisition changein the Group’s share of net assets of the associate. In addition, the Group’s share of the profit or loss ofthe associate is included in the Group’s profit or loss.
The carrying amount of the investment includes, when applicable, goodwill relating to theassociate. Any discount on acquisition, whereby the Group’s share of the net fair value of the associateexceeds the cost of investment, is recognised in profit or loss in the period in which the investment isacquired.
Profits and losses resulting from transactions between the Group and the associate areeliminated to the extent of the Group’s interest in the associate.
II-A-18

APPENDIX II-A AUDITED FINANCIAL STATEMENTS ON PROPERTYLINK FOR THETHREE YEARS ENDED 30 JUNE 2018
THE AUDITED FINANCIAL STATEMENTS OF PROPERTYLINK (HOLDINGS) LIMITED(CURRENTLY KNOWN AS ESR ASSET MANAGEMENT (HOLDINGS) LIMITED) ANDPROPERTYLINK TRUST FOR THE YEAR ENDED JUNE 30, 2016
Notes to the Financial Statements (continued)For the year ended 30 June 2016
When the Group’s share of losses in an associate equals or exceeds its interest in the associate,the Group discontinues recognising its share of further losses unless it has incurred legal orconstructive obligations or made payments on behalf of the associate. Upon the associate subsequentlymaking profits, the Group will resume recognising its share of those profits once its share of the profitsequals the share of the losses not recognised.
(l) Interests in joint arrangements
Joint arrangements represent the contractual sharing of control between parties in a businessventure where unanimous decisions about relevant activities are required.
Separate joint venture entities providing joint venturers with an interest to net assets areclassified as a joint venture and accounted for using the equity method. Refer to Note 1(k) for adescription of the equity method of accounting.
Joint operations represent arrangements whereby joint operators maintain direct interests ineach asset and exposure to each liability of the arrangement. The Group’s interests in the assets,liabilities, revenue and expenses of joint operations are included in the respective line items of theconsolidated financial statements.
Gains and losses resulting from sales to a joint operation are recognised to the extent of theother parties’ interests. When the Group makes purchases from a joint operation, it does not recogniseits share of the gains and losses from the joint arrangement until it resells those goods/assets to a thirdparty.
(m) Employee benefits
Short-term employee benefits
Provision is made for the Group’s obligation for short-term employee benefits. Short-termemployee benefits are benefits (other than termination benefits) that are expected to be settled whollybefore 12 months after the end of the annual reporting period in which the employees render the relatedservice, including wages, salaries and sick leave. Short-term employee benefits are measured at the(undiscounted) amounts expected to be paid when the obligation is settled.
The Group’s obligations for short-term employee benefits such as wages, salaries and sickleave are recognised as a part of current trade and other payables in the statement of financial position.
Other long-term employee benefits
Provision is made for employees’ long service leave and annual leave entitlements not expectedto be settled wholly within 12 months after the end of the annual reporting period in which theemployees render the related service. Other long-term employee benefits are measured at the present
II-A-19

APPENDIX II-A AUDITED FINANCIAL STATEMENTS ON PROPERTYLINK FOR THETHREE YEARS ENDED 30 JUNE 2018
THE AUDITED FINANCIAL STATEMENTS OF PROPERTYLINK (HOLDINGS) LIMITED(CURRENTLY KNOWN AS ESR ASSET MANAGEMENT (HOLDINGS) LIMITED) ANDPROPERTYLINK TRUST FOR THE YEAR ENDED JUNE 30, 2016
Notes to the Financial Statements (continued)For the year ended 30 June 2016
value of the expected future payments to be made to employees. Expected future payments incorporateanticipated future wage and salary levels, durations of service and employee departures and arediscounted at rates determined by reference to market yields at the end of the reporting period ongovernment bonds that have maturity dates that approximate the terms of the obligations. Upon there-measurement of obligations for other long-term employee benefits, the net change in the obligationis recognised in profit or loss as a part of employee benefits expense.
The Group’s obligations for long-term employee benefits are presented as non-currentprovisions in its statement of financial position, except where the Group does not have anunconditional right to defer settlement for at least 12 months after the end of the reporting period, inwhich case the obligations are presented as current provisions.
(n) Provisions
Provisions are recognised when the group has a legal or constructive obligation, as a result ofpast events, for which it is probable that an outflow of economic benefits will result and that outflowcan be reliably measured.
Provisions are measured using the best estimate of the amounts required to settle the obligationat the end of the reporting period.
(o) Cash and cash equivalents
Cash and cash equivalents include cash on hand, deposits held at call with banks, other short-term highly liquid investments with original maturities of three months or less, and bank overdrafts.Bank overdrafts are shown within short-term borrowings in current liabilities on the statement offinancial position.
(p) Revenue and other income
Revenue from asset and property management is recognised on the basis of contractualobligations. Revenue from project management is recognised in accordance with contractualobligations on the basis of regular claims approved at stages of completion. Revenue fromadministration is recognised on the basis of an agreed fee for services rendered.
Interest revenue is recognised on a proportional basis taking into account the interest ratesapplicable to the financial assets.
All revenue is stated net of the amount of goods and services tax.
II-A-20

APPENDIX II-A AUDITED FINANCIAL STATEMENTS ON PROPERTYLINK FOR THETHREE YEARS ENDED 30 JUNE 2018
THE AUDITED FINANCIAL STATEMENTS OF PROPERTYLINK (HOLDINGS) LIMITED(CURRENTLY KNOWN AS ESR ASSET MANAGEMENT (HOLDINGS) LIMITED) ANDPROPERTYLINK TRUST FOR THE YEAR ENDED JUNE 30, 2016
Notes to the Financial Statements (continued)For the year ended 30 June 2016
(q) Trade and other receivables
Trade and other receivables include amounts due from customers for goods sold and servicesperformed in the ordinary course of business. Receivables expected to be collected within 12 monthsof the end of the reporting period are classified as current assets. All other receivables are classified asnon-current assets.
Trade and other receivables are initially recognised at fair value and subsequently measured atamortised cost using the effective interest method, less any provision for impairment. Refer toNote 1(i) for further discussion on the determination of impairment losses.
(r) Trade and other payables
Trade and other payables represent the liabilities for goods and services received by the Groupthat remain unpaid at the end of the reporting period. The balance is recognised as a current liabilitywith the amounts normally paid within 30 days of recognition of the liability.
(s) Borrowing costs
Borrowing costs that are directly attributable to the acquisition, construction or production of aqualifying asset are capitalised as part of the cost of that asset, which are assets that necessarily take asubstantial period of time to get ready for their intended use or sale, are added to the cost of thoseassets, until such time as the assets are substantially ready for their intended use or sale.
Investment income earned on the temporary investment of specific borrowing pending theirexpenditure on qualifying assets is deducted from the borrowing costs eligible for capitalisation.
All other borrowing costs are recognised in the statement of comprehensive income in theperiod in which they are incurred.
(t) Goods and Services Tax (GST)
Revenues, expenses and assets are recognised net of the amount of GST, except where theamount of GST incurred is not recoverable from the Australian Taxation Office (ATO).
Receivables and payables are stated inclusive of the amount of GST receivable or payable. Thenet amount of GST recoverable from, or payable to, the ATO is included with other receivables orpayables in the statement of financial position.
Cash flows are presented on a gross basis. The GST components of cash flows arising frominvesting or financing activities, which are recoverable from or payable to the ATO, are presented asoperating cash flows included in receipts from customers or payments to suppliers.
II-A-21

APPENDIX II-A AUDITED FINANCIAL STATEMENTS ON PROPERTYLINK FOR THETHREE YEARS ENDED 30 JUNE 2018
THE AUDITED FINANCIAL STATEMENTS OF PROPERTYLINK (HOLDINGS) LIMITED(CURRENTLY KNOWN AS ESR ASSET MANAGEMENT (HOLDINGS) LIMITED) ANDPROPERTYLINK TRUST FOR THE YEAR ENDED JUNE 30, 2016
Notes to the Financial Statements (continued)For the year ended 30 June 2016
(u) Comparative figures
When required by Accounting Standards, comparative figures have been adjusted to conform tochanges in presentation for the current financial year.
Where the Group retrospectively applies an accounting policy, makes a retrospectiverestatement of items in the financial statements or reclassifies items in its financial statements, a thirdstatement of financial position as at the beginning of the preceding period in addition to the minimumcomparative financial statement is presented.
(v) Critical accounting estimates and judgements
The directors evaluate estimates and judgements incorporated into the financial statementsbased on historical knowledge and best available current information. Estimates assume a reasonableexpectation of future events and are based on current trends and economic data, obtained bothexternally and within the Group.
Key estimates
Impairment—general
The group assesses impairment at each reporting date by evaluating conditions specific to thegroup that may lead to impairment of assets. Where an impairment trigger exists, the recoverableamount of the asset is determined. Value-in-use calculations performed in assessing recoverableamounts incorporate a number of key estimates. Impairment losses are recognised in the statement ofcomprehensive income.
Key judgements
The Group assesses its interest in its joint arrangements and associates annually to ensure that itis accounting for its joint arrangements and associates in accordance with Accounting Standards. Thisassessment includes a review of the arrangement between the parties, including whether any changeshave occurred during the year that would indicates a change in classification is required.
The Directors have an obligation to ensure that the carrying amount of investments inassociates and joint arrangements do not exceed fair value at each reporting date.
(w) New Accounting Standards for application in future periods
The AASB has issued a number of new and amended Accounting Standards and Interpretationsthat have mandatory application dates for future reporting periods, some of which are relevant to theGroup. The Group has decided not to early adopt any of the new and amended pronouncements. The
II-A-22

APPENDIX II-A AUDITED FINANCIAL STATEMENTS ON PROPERTYLINK FOR THETHREE YEARS ENDED 30 JUNE 2018
THE AUDITED FINANCIAL STATEMENTS OF PROPERTYLINK (HOLDINGS) LIMITED(CURRENTLY KNOWN AS ESR ASSET MANAGEMENT (HOLDINGS) LIMITED) ANDPROPERTYLINK TRUST FOR THE YEAR ENDED JUNE 30, 2016
Notes to the Financial Statements (continued)For the year ended 30 June 2016
Group’s assessment of the new and amended pronouncements that are relevant to the Group butapplicable in future reporting periods is set out below:
Š AASB 9: Financial Instruments and associated Amending Standards (applicable to annualreporting periods beginning on or after 1 January 2018).
The Standard will be applicable retrospectively (subject to the provisions on hedgeaccounting outlined below) and includes revised requirements for the classification andmeasurement of financial instruments, revised recognition and de-recognitionrequirements for financial instruments and simplified requirements for hedge accounting.
The key changes that may affect the Group on initial application include certainsimplifications to the classification of financial assets, simplifications to the accounting ofembedded derivatives, upfront accounting for expected credit loss, and the irrevocableelection to recognise gains and losses on investments in equity instruments that are notheld for trading in other comprehensive income. AASB 9 also introduces a new model forhedge accounting that will allow greater flexibility in the ability to hedge risk, particularlywith respect to hedges of non-financial items. Should the entity elect to change its hedgepolicies in line with the new hedge accounting requirements of the Standard, theapplication of such accounting would be largely prospective.
Although the directors anticipate that the adoption of AASB 9 may have an impact on theGroup’s financial instruments, including hedging activity, it is impracticable at this stageto provide a reasonable estimate of such impact.
Š AASB 15: Revenue from Contracts with Customers (applicable to annual reporting periodscommencing on or after 1 January 2018).
When effective, this Standard will replace the current accounting requirements applicableto revenue with a single, principles-based model. Except for a limited number ofexceptions, including leases, the new revenue model in AASB 15 will apply to allcontracts with customers as well as non-monetary exchanges between entities in the sameline of business to facilitate sales to customers and potential customers. The core principleof the Standard is that an entity will recognise revenue to depict the transfer of promisedgoods or services to customers in an amount that reflects the consideration to which theentity expects to be entitled in exchange for the goods or services. To achieve thisobjective, AASB 15 provides the following five-step process:
Š identify the contract(s) with a customer;
Š identify the performance obligations in the contract(s);
Š determine the transaction price;
Š allocate the transaction price to the performance obligations in the contract(s); and
Š recognise revenue when (or as) the performance obligations are satisfied.
II-A-23

APPENDIX II-A AUDITED FINANCIAL STATEMENTS ON PROPERTYLINK FOR THETHREE YEARS ENDED 30 JUNE 2018
THE AUDITED FINANCIAL STATEMENTS OF PROPERTYLINK (HOLDINGS) LIMITED(CURRENTLY KNOWN AS ESR ASSET MANAGEMENT (HOLDINGS) LIMITED) ANDPROPERTYLINK TRUST FOR THE YEAR ENDED JUNE 30, 2016
Notes to the Financial Statements (continued)For the year ended 30 June 2016
Although the directors anticipate that the adoption of AASB 15 may have an impact on theGroup’s financial statements, it is impracticable at this stage to provide a reasonableestimate of such impact.
Note 2 Parent Information
The following information has been extracted from the books and records of the parent and hasbeen prepared in accordance with Australian Accounting Standards.
2016 2015
$ $
STATEMENT OF FINANCIAL POSITIONASSETSCurrent assets . . . . . . . . . . . . . . . . . . . . . . . . . . . . . . . . . . . . . . . . . . . . . . . . . . 77,198,046 39,423,299Non-current assets . . . . . . . . . . . . . . . . . . . . . . . . . . . . . . . . . . . . . . . . . . . . . . 4,028,530 7,493,351
TOTAL ASSETS . . . . . . . . . . . . . . . . . . . . . . . . . . . . . . . . . . . . . . . . . . . . . . . 81,226,576 46,916,650
LIABILITIESCurrent liabilities . . . . . . . . . . . . . . . . . . . . . . . . . . . . . . . . . . . . . . . . . . . . . . . 44,806,261 13,032,364Non-current liabilities . . . . . . . . . . . . . . . . . . . . . . . . . . . . . . . . . . . . . . . . . . . . 19,233,094 10,984,653
TOTAL LIABILITIES . . . . . . . . . . . . . . . . . . . . . . . . . . . . . . . . . . . . . . . . . . 64,039,355 24,017,017
EQUITYIssued capital . . . . . . . . . . . . . . . . . . . . . . . . . . . . . . . . . . . . . . . . . . . . . . . . . . 40,598,377 27,255,515Capital reserve . . . . . . . . . . . . . . . . . . . . . . . . . . . . . . . . . . . . . . . . . . . . . . . . . (20,556,446) —Retained earnings . . . . . . . . . . . . . . . . . . . . . . . . . . . . . . . . . . . . . . . . . . . . . . . (2,854,710) (4,355,882)
TOTAL EQUITY . . . . . . . . . . . . . . . . . . . . . . . . . . . . . . . . . . . . . . . . . . . . . . 17,187,221 22,899,633
STATEMENT OF PROFIT OR LOSS AND OTHERCOMPREHENSIVE INCOME
Profit after income tax . . . . . . . . . . . . . . . . . . . . . . . . . . . . . . . . . . . . . . . . . . . 1,501,172 1,801,821
Total comprehensive income . . . . . . . . . . . . . . . . . . . . . . . . . . . . . . . . . . . . . 1,501,172 1,801,821
II-A-24

APPENDIX II-A AUDITED FINANCIAL STATEMENTS ON PROPERTYLINK FOR THETHREE YEARS ENDED 30 JUNE 2018
THE AUDITED FINANCIAL STATEMENTS OF PROPERTYLINK (HOLDINGS) LIMITED(CURRENTLY KNOWN AS ESR ASSET MANAGEMENT (HOLDINGS) LIMITED) ANDPROPERTYLINK TRUST FOR THE YEAR ENDED JUNE 30, 2016
Notes to the Financial Statements (continued)For the year ended 30 June 2016
Note 3 Fees and other income
2016 2015
$ $
Fee income:—Acquisitions . . . . . . . . . . . . . . . . . . . . . . . . . . . . . . . . . . . . . . . . . . . . . . . 2,065,329 3,414,638—Investment management . . . . . . . . . . . . . . . . . . . . . . . . . . . . . . . . . . . . . 5,377,291 2,371,920—Property management . . . . . . . . . . . . . . . . . . . . . . . . . . . . . . . . . . . . . . . 2,567,993 1,061,811—Other property services . . . . . . . . . . . . . . . . . . . . . . . . . . . . . . . . . . . . . . 746,740 1,476,043
Total revenue . . . . . . . . . . . . . . . . . . . . . . . . . . . . . . . . . . . . . . . . . . . . . . . . . . . 10,757,353 8,324,412
Other income:—Profit from discontinued infrastructure operations . . . . . . . . . . . . . . . . . 396,351 231,459—Interest—other corporations . . . . . . . . . . . . . . . . . . . . . . . . . . . . . . . . . . 30,033 90,372—Sundry . . . . . . . . . . . . . . . . . . . . . . . . . . . . . . . . . . . . . . . . . . . . . . . . . . . 97,133 2,766
Total other income . . . . . . . . . . . . . . . . . . . . . . . . . . . . . . . . . . . . . . . . . . . . . . . 523,517 324,597
Note 4 Tax expense
2016 2015
Note $ $
(a) The components of tax expense/(income) comprise:Current tax benefit . . . . . . . . . . . . . . . . . . . . . . . . . . . . . . . . . . . . . . . (505,857) 525,059Deferred tax asset . . . . . . . . . . . . . . . . . . . . . . . . . . . . . . . . . . . . . . . . 20 786,804 183,883
280,947 708,942
(b) Reconciliation of income tax expense/(benefit) to prima facie taxpayable
Profit before income tax expense . . . . . . . . . . . . . . . . . . . . . . . . . . 8,611,254 3,125,340
Prima facie tax expense at the Australian tax rate of 30% . . . . . . . . . 2,583,376 937,602
Tax effect of amounts which are not deductible/(taxable) incalculating taxable income
Propertylink Trust income . . . . . . . . . . . . . . . . . . . . . . . . . . . . . . . . . (2,126,091) (145,124)Non-deductible expenses . . . . . . . . . . . . . . . . . . . . . . . . . . . . . . . . . . 12,158 (14,098)Share equity cost written off . . . . . . . . . . . . . . . . . . . . . . . . . . . . . . . (82,699) —Capital gain sheltered by carrying forward capital loss . . . . . . . . . . . (118,905) —Adjustments in respect of prior year . . . . . . . . . . . . . . . . . . . . . . . . . 13,108 —Share of net profit of investment accounted for using the equity
method . . . . . . . . . . . . . . . . . . . . . . . . . . . . . . . . . . . . . . . . . . . . . . — (69,438)
280,947 708,942
II-A-25

APPENDIX II-A AUDITED FINANCIAL STATEMENTS ON PROPERTYLINK FOR THETHREE YEARS ENDED 30 JUNE 2018
THE AUDITED FINANCIAL STATEMENTS OF PROPERTYLINK (HOLDINGS) LIMITED(CURRENTLY KNOWN AS ESR ASSET MANAGEMENT (HOLDINGS) LIMITED) ANDPROPERTYLINK TRUST FOR THE YEAR ENDED JUNE 30, 2016
Notes to the Financial Statements (continued)For the year ended 30 June 2016
Note 5 Key management personnel compensation
The totals of remuneration paid to key management personnel (KMP) of the Group during theyear are as follows
Directors’ fees 2016 2015
$ $
Peter Lancken . . . . . . . . . . . . . . . . . . . . . . . . . . . . . . . . . . . . . . . . . . . . . . . . . . . . . 101,200 72,500Ian Hutchinson . . . . . . . . . . . . . . . . . . . . . . . . . . . . . . . . . . . . . . . . . . . . . . . . . . . . 82,200 60,000Chris Ryan . . . . . . . . . . . . . . . . . . . . . . . . . . . . . . . . . . . . . . . . . . . . . . . . . . . . . . . 111,000 60,000Derek Nix . . . . . . . . . . . . . . . . . . . . . . . . . . . . . . . . . . . . . . . . . . . . . . . . . . . . . . . . 50,000 50,000David Epper . . . . . . . . . . . . . . . . . . . . . . . . . . . . . . . . . . . . . . . . . . . . . . . . . . . . . . 50,000 50,000
394,400 292,500
During the 2016 year certain Directors were required to carry out additional duties, mainlyrelated to a management re-structure which was negotiated during the year and completed near the endof the year. As a result, Peter Lancken, Chris Ryan and Ian Hutchinson were paid fees to compensatethem for the additional duties. Those fees are included in this note.
Note 6 Auditors’ remuneration
2016 2015
$ $
Remuneration of the auditor of the parent entity for:—auditing or reviewing the financial statements . . . . . . . . . . . . . . . . . . . . . 117,284 44,083
Remuneration of the auditor of the subsidiary entity for:—auditing or reviewing the financial statements . . . . . . . . . . . . . . . . . . . . . 35,160 8,000
152,444 52,083
Note 7 Earnings per stapled security
2016 2015
$ $
Profit attributable to the ordinary stapled securityholders of the Group . . . . . . 8,330,307 2,416,398Weighted average number of ordinary stapled securities . . . . . . . . . . . . . . . . . 27,915,673 26,158,492(a) Basic earnings per stapled security (cents) . . . . . . . . . . . . . . . . . . . . . . . . . . 29.84 9.24
Adjustments for calculation of diluted earnings per stapled securityOptions exercised but not yet issued as shares . . . . . . . . . . . . . . . . . . . . . . . . . 4,982,206 4,982,206Weighted average number of ordinary stapled securities and potential
ordinary stapled securities . . . . . . . . . . . . . . . . . . . . . . . . . . . . . . . . . . . . . . . 32,897,879 31,140,698(b) Diluted earnings per stapled security (cents) . . . . . . . . . . . . . . . . . . . . . . . . 25.32 7.76
II-A-26

APPENDIX II-A AUDITED FINANCIAL STATEMENTS ON PROPERTYLINK FOR THETHREE YEARS ENDED 30 JUNE 2018
THE AUDITED FINANCIAL STATEMENTS OF PROPERTYLINK (HOLDINGS) LIMITED(CURRENTLY KNOWN AS ESR ASSET MANAGEMENT (HOLDINGS) LIMITED) ANDPROPERTYLINK TRUST FOR THE YEAR ENDED JUNE 30, 2016
Notes to the Financial Statements (continued)For the year ended 30 June 2016
Note 8 Dividends
2016 2015
$ $
Distributions provided for:Fully franked ordinary dividend of $Nil (2015: $557,253) franked at the tax
rate of 30% (2015: 30%). . . . . . . . . . . . . . . . . . . . . . . . . . . . . . . . . . . . . . . . . — 557,253
Balance of franking account at year end adjusted for franking credits/(debits)arising from: . . . . . . . . . . . . . . . . . . . . . . . . . . . . . . . . . . . . . . . . . . . . . . . . . . 418,898 657,722
—franking credit on income tax paid . . . . . . . . . . . . . . . . . . . . . . . . . . . . 871,799 ——franking debit on dividend provided . . . . . . . . . . . . . . . . . . . . . . . . . . . — (238,824)
1,290,697 418,898
Total dividends (cents) per share provided . . . . . . . . . . . . . . . . . . . . . . . . . . . . — 2.00
Note 9 Cash and cash equivalents
2016 2015
$ $
Cash at bank and on hand . . . . . . . . . . . . . . . . . . . . . . . . . . . . . . . . . . . . . . . . . 3,958,675 2,347,705
Note 10 Trade and other receivables
2016 2015
$ $
CurrentTrade receivables . . . . . . . . . . . . . . . . . . . . . . . . . . . . . . . . . . . . . . . . . . . . . . . . 2,471,897 1,393,946Sundry debtors . . . . . . . . . . . . . . . . . . . . . . . . . . . . . . . . . . . . . . . . . . . . . . . . . . 1,046,595 57,762Trust distribution . . . . . . . . . . . . . . . . . . . . . . . . . . . . . . . . . . . . . . . . . . . . . . . . 375,774 126,321
3,894,266 1,578,028Deposit . . . . . . . . . . . . . . . . . . . . . . . . . . . . . . . . . . . . . . . . . . . . . . . . . . . . . . . . 86,394 228,741Loans . . . . . . . . . . . . . . . . . . . . . . . . . . . . . . . . . . . . . . . . . . . . . . . . . . . . . . . . . 27,000 29,172
Total current trade and other receivables . . . . . . . . . . . . . . . . . . . . . . . . . . . . . . 4,007,660 1,835,941
Note 11 Other assets
2016 2015
$ $
CurrentPrepayments . . . . . . . . . . . . . . . . . . . . . . . . . . . . . . . . . . . . . . . . . . . . . . . . . . . . . . . . . 162,401 109,334
II-A-27

APPENDIX II-A AUDITED FINANCIAL STATEMENTS ON PROPERTYLINK FOR THETHREE YEARS ENDED 30 JUNE 2018
THE AUDITED FINANCIAL STATEMENTS OF PROPERTYLINK (HOLDINGS) LIMITED(CURRENTLY KNOWN AS ESR ASSET MANAGEMENT (HOLDINGS) LIMITED) ANDPROPERTYLINK TRUST FOR THE YEAR ENDED JUNE 30, 2016
Notes to the Financial Statements (continued)For the year ended 30 June 2016
Note 12 Associates and joint arrangements
a. Information about principal joint ventures and associates
Set out below are the material associates and joint ventures of the Group. The entities listedbelow have equity of ordinary shares or units in unit trusts. The proportion of equity held by the Groupgenerally equals the voting rights held by the Group.
Name Classification
Place ofincorporation/
business
Proportion of equity Measurementmethod
Carrying amount
2016 2015 2016 2015
% % $ $
Instruct CorporationPty Ltd . . . . . . . . . Joint venture Australia 0% 50% Equity accounted — 126,856
PAIP InvestmentPartnership . . . . . . Joint venture Australia 25% 25% Equity accounted 21,692,652 15,053,210
Auslog HoldingsTrust . . . . . . . . . . . Joint venture Australia 10% 10% Equity accounted 2,763,177 2,650,343
PHL Moelis BraesideTrust . . . . . . . . . . . Joint venture Australia 10% 10% Equity accounted 2,036,299 1,800,000
POP II InvestmentPartnership . . . . . . Joint venture Australia 20% 20% Equity accounted 6,214,788 4,680,806
PCII . . . . . . . . . . . . . . Joint venture Australia 7.50% 0% Equity accounted 882,364 —Propertylink
AustralianIndustrialPartnership II . . . . Joint venture Australia 3.95% 0% Equity accounted 3,297,157 —
POP III InvestmentPartnership . . . . . . Joint venture Australia 6.00% 0% Equity accounted 2,527,160 —
39,413,597 24,311,215
b. Contingent liabilities in respect of associates
The Group is not liable for any contingent liabilities arising from its interests in associates.
c. Commitments and contingent liabilities in respect of joint ventures
Refer to note 24 for details of limited guarantee issued to financiers of PAIP, which wasreleased on 15 August 2016.
II-A-28

APPENDIX II-A AUDITED FINANCIAL STATEMENTS ON PROPERTYLINK FOR THETHREE YEARS ENDED 30 JUNE 2018
THE AUDITED FINANCIAL STATEMENTS OF PROPERTYLINK (HOLDINGS) LIMITED(CURRENTLY KNOWN AS ESR ASSET MANAGEMENT (HOLDINGS) LIMITED) ANDPROPERTYLINK TRUST FOR THE YEAR ENDED JUNE 30, 2016
Notes to the Financial Statements (continued)For the year ended 30 June 2016
d. Summarised financial information for joint ventures
Set out below is the summarised financial information for joint ventures. Unless otherwisestated, the disclosed information reflects the amounts presented in the financial statements of each jointventure. The following summarised financial information, however, reflects the adjustments made bythe Group when applying the equity method, including adjustments for any differences in accountingpolicies between the Group and the joint ventures.
30 June 2016
InstructCorporation
Pty Ltd
PAIPInvestmentPartnership
AuslogHoldingsTrust
PHL MoelisBraesideTrust
POP IIInvestmentPartnership PCII
PropertylinkAustralianIndustrial
Partnership II
POP IIIInvestmentPartnership Total
$ $ $ $ $ $ $ $ $Summarised financial
positionCash and cash
equivalents . . . . . . . — 10,677 1,388,725 515,614 821 919,152 54,957,326 1,973,586 59,765,901Total current assets . . . — 1,671,303 1,636,025 764,564 921,512 1,046,747 70,694,828 2,241,924 78,976,902Total non-current
assets . . . . . . . . . . . . — 86,424,008 69,000,000 42,848,650 31,072,925 29,000,000 32,521,736 99,017,059 389,884,377Total current
liabilities . . . . . . . . . — (1,324,703) (1,337,449) (1,113,288) (920,497) (1,032,874) (947,811) (2,069,181) (8,745,804)Total non-current
liabilities . . . . . . . . . — — (41,666,875) (22,136,937) — (17,248,942) (18,701,965) (56,821,485) (156,576,204)Net assets . . . . . . . . . . — 86,770,608 27,631,701 20,362,988 31,073,940 11,764,932 83,566,787 42,368,316 303,539,272Group’s share (%) . . . . 0.00% 25.00% 10.00% 10.00% 20.00% 7.50% 3.95% 6.00%
Group’s share ofassociate’s netassets . . . . . . . . . . . . — 21,692,652 2,763,177 2,036,299 6,214,788 882,364 3,297,157 2,527,160 39,413,597
Summarised financialperformance
Revenue . . . . . . . . . . . — 21,417,807 6,351,862 6,959,842 8,805,826 1,603,607 2,192,988 1,692,504 49,024,435Depreciation and
amortisation . . . . . . — — — — — — — — —Interest income . . . . . . — 4,838,146 — 2,738 1,760,035 6,743 13,802 6,118 6,699,281Interest expense . . . . . — — (1,787,842) (897,741) (195) (479,186) (542,723) (545,529) (3,437,401)Other expenses . . . . . . — (2,371) (454,110) (2,398,946) — (2,858,984) (2,678,559) (484,163) (8,750,153)Profit or loss from
continuingoperations . . . . . . . . — 26,253,582 4,109,911 3,665,893 10,565,666 (1,727,820) (1,014,492) 668,929 43,536,161
Income tax expense . . — — — — — — — — —Profit after tax from
continuingoperations . . . . . . . . — 26,253,582 4,109,911 3,665,893 10,565,666 (1,727,820) (1,014,492) 668,929 43,536,161
Total comprehensiveincome . . . . . . . . . . — 26,253,582 4,109,911 3,665,893 10,565,666 (1,727,820) (1,014,492) 668,929 43,536,161
Group’s share ofjoint venture’stotalcomprehensiveincome . . . . . . . . . . — 6,563,396 410,992 366,589 2,119,387 (129,587) (18,657) 40,136 9,352,256
II-A-29

APPENDIX II-A AUDITED FINANCIAL STATEMENTS ON PROPERTYLINK FOR THETHREE YEARS ENDED 30 JUNE 2018
THE AUDITED FINANCIAL STATEMENTS OF PROPERTYLINK (HOLDINGS) LIMITED(CURRENTLY KNOWN AS ESR ASSET MANAGEMENT (HOLDINGS) LIMITED) ANDPROPERTYLINK TRUST FOR THE YEAR ENDED JUNE 30, 2016
Notes to the Financial Statements (continued)For the year ended 30 June 2016
30 June 2015
InstructCorporation
Pty Ltd
PAIPInvestmentPartnership
AuslogHoldingsTrust
PHL MoelisBraesideTrust
POP IIInvestmentPartnership PC II
PropertylinkAustralianInvestment
Partnership II
POP IIIInvestmentPartnership Total
$ $ $ $ $ $ $ $ $Summarised financial
positionCash and cash
equivalents . . . . . . . . . . 414,503 13,533 1,280,493 423,751 — — — — 2,132,280Total current assets . . . . . . 1,023,476 599,042 2,034,866 664,809 32,287 — — — 4,354,480Total non-current assets . . 133,979 59,866,240 67,830,962 40,816,759 23,403,015 — — — 192,050,955Total current liabilities . . . (903,743) (252,442) (1,695,590) (54,649) (31,272) — — — (2,937,695)Total non-current
liabilities . . . . . . . . . . . . — — (41,666,875) (22,793,299) — — — — (64,460,174)Net assets . . . . . . . . . . . . . 253,712 60,212,840 26,503,363 18,633,620 23,404,030 — — — 129,007,565Group’s share (%) . . . . . . . 50.00% 25.00% 10.00% 10.00% 20.00% 0.00% 0.00% 0.00%
Group’s share ofassociate’s netassets . . . . . . . . . . . . . . . 126,856 15,053,210 2,650,336 1,863,362 4,680,806 — — — 24,374,570
Summarised financialperformance
Revenue . . . . . . . . . . . . . . . 4,642,797 3,843,952 5,014,182 1,361,062 — — — — 14,861,993Depreciation and
amortisation . . . . . . . . . . (13,378) — — — — — — — (13,378)Interest income . . . . . . . . . — 2,936,835 — 2,219 31,272 — — — 2,970,326Interest expense . . . . . . . . . (5,055) — (1,979,626) (295,829) — — — — (2,280,510)Other expenses . . . . . . . . . (4,212,103) (11,600) (254,632) (433,835) — — — — (4,912,170)Profit or loss from
continuing operations . . 412,262 6,769,187 2,779,924 633,617 31,272 — — — 10,626,260Income tax expense . . . . . . (129,305) — — — — — — — —Profit after tax from
continuing operations . . 282,957 6,769,187 2,779,924 633,617 31,272 — — — 10,626,260
Total comprehensiveincome . . . . . . . . . . . . . . 282,957 6,769,187 2,779,924 633,617 31,272 — — — 10,626,260
Group’s share of jointventure’s totalcomprehensiveincome . . . . . . . . . . . . . 141,478 1,692,297 277,992 63,362 6,254 — — — 2,181,383
Note 13 Financial assets
2016 2015
$ $
Non-currentShares in joint venture entities . . . . . . . . . . . . . . . . . . . . . . . . . . . . . . . . . . . . . . . . . . . . — 126,856Units in unit trusts . . . . . . . . . . . . . . . . . . . . . . . . . . . . . . . . . . . . . . . . . . . . . . . . . . . . . . 39,413,597 24,184,359
39,413,597 24,311,215
II-A-30

APPENDIX II-A AUDITED FINANCIAL STATEMENTS ON PROPERTYLINK FOR THETHREE YEARS ENDED 30 JUNE 2018
THE AUDITED FINANCIAL STATEMENTS OF PROPERTYLINK (HOLDINGS) LIMITED(CURRENTLY KNOWN AS ESR ASSET MANAGEMENT (HOLDINGS) LIMITED) ANDPROPERTYLINK TRUST FOR THE YEAR ENDED JUNE 30, 2016
Notes to the Financial Statements (continued)For the year ended 30 June 2016
Note 14 Interests in subsidiaries
The subsidiaries listed below have either share capital consisting solely of ordinary shares orunits in unit trusts, which are held directly by the Group. The proportion of ownership interests heldequals the voting rights held by the Group. Each subsidiary’s principal place of business is also itscountry of incorporation or registration.
Country ofCorporation 2016 2015
(%) (%)
Parent Entity:Propertylink (Holdings) Ltd (stapled entity—Propertylink Trust)Subsidiaries of Propertylink (Holdings) LtdBRV Nominees Pty Ltd . . . . . . . . . . . . . . . . . . . . . . . . . . . . . . . . . . . . . . . . . . . . . Australia 100% 100%Propertylink Funds Management Pty Ltd . . . . . . . . . . . . . . . . . . . . . . . . . . . . . . . Australia 100% 100%Propertylink Admin Management Pty Ltd . . . . . . . . . . . . . . . . . . . . . . . . . . . . . . . Australia 100% 100%Propertylink Capital Pty Ltd . . . . . . . . . . . . . . . . . . . . . . . . . . . . . . . . . . . . . . . . . Australia 100% 100%Propertylink Services Management Pty Ltd . . . . . . . . . . . . . . . . . . . . . . . . . . . . . Australia 100% 100%Propertylink Investment Management Pty Ltd . . . . . . . . . . . . . . . . . . . . . . . . . . . Australia 100% 100%Infralink (Australasia) Pty Ltd . . . . . . . . . . . . . . . . . . . . . . . . . . . . . . . . . . . . . . . . Australia 100% 100%MITSA Pty Ltd . . . . . . . . . . . . . . . . . . . . . . . . . . . . . . . . . . . . . . . . . . . . . . . . . . . . Australia 100% 100%Propertylink (Australasia) Pty Ltd . . . . . . . . . . . . . . . . . . . . . . . . . . . . . . . . . . . . . Australia 100% 100%Propertylink WIM Pty Ltd . . . . . . . . . . . . . . . . . . . . . . . . . . . . . . . . . . . . . . . . . . . Australia 100% —Propertylink PAIP Pty Ltd . . . . . . . . . . . . . . . . . . . . . . . . . . . . . . . . . . . . . . . . . . . Australia 100% —Propertylink Nominees Pty Ltd . . . . . . . . . . . . . . . . . . . . . . . . . . . . . . . . . . . . . . . Australia 100% —BBR 15 Pty Ltd . . . . . . . . . . . . . . . . . . . . . . . . . . . . . . . . . . . . . . . . . . . . . . . . . . . Australia 100% —PAIP II MA Nominees Pty Ltd . . . . . . . . . . . . . . . . . . . . . . . . . . . . . . . . . . . . . . . Australia 100% —PAIP II BA Nominees Pty Ltd . . . . . . . . . . . . . . . . . . . . . . . . . . . . . . . . . . . . . . . . Australia 100% —
Controlled entities of Propertylink TrustPAIP PT . . . . . . . . . . . . . . . . . . . . . . . . . . . . . . . . . . . . . . . . . . . . . . . . . . . . . . . . . Australia 100% 100%PT Moelis Trust . . . . . . . . . . . . . . . . . . . . . . . . . . . . . . . . . . . . . . . . . . . . . . . . . . . Australia 100% 100%Propertylink Office Partnership Trust . . . . . . . . . . . . . . . . . . . . . . . . . . . . . . . . . . Australia 100% 100%POP 73 Miller Trust . . . . . . . . . . . . . . . . . . . . . . . . . . . . . . . . . . . . . . . . . . . . . . . . Australia 100% 100%POP II PT . . . . . . . . . . . . . . . . . . . . . . . . . . . . . . . . . . . . . . . . . . . . . . . . . . . . . . . . Australia 100% 100%PAIP II PT . . . . . . . . . . . . . . . . . . . . . . . . . . . . . . . . . . . . . . . . . . . . . . . . . . . . . . . Australia 100% —POP III PT . . . . . . . . . . . . . . . . . . . . . . . . . . . . . . . . . . . . . . . . . . . . . . . . . . . . . . . Australia 100% —
Subsidiary financial statements used in the preparation of these consolidated financialstatements have also been prepared as at the same reporting date as the Group’s financial statements.
II-A-31

APPENDIX II-A AUDITED FINANCIAL STATEMENTS ON PROPERTYLINK FOR THETHREE YEARS ENDED 30 JUNE 2018
THE AUDITED FINANCIAL STATEMENTS OF PROPERTYLINK (HOLDINGS) LIMITED(CURRENTLY KNOWN AS ESR ASSET MANAGEMENT (HOLDINGS) LIMITED) ANDPROPERTYLINK TRUST FOR THE YEAR ENDED JUNE 30, 2016
Notes to the Financial Statements (continued)For the year ended 30 June 2016
Note 15 Property, plant and equipment
2016 2015
$ $
Leasehold improvements at cost . . . . . . . . . . . . . . . . . . . . . . . . . . . . . . . . . . . . . . . . . 685,122 216,894Accumulated depreciation . . . . . . . . . . . . . . . . . . . . . . . . . . . . . . . . . . . . . . . . . . . . . (236,188) (91,538)
448,933 125,356
Office furniture and equipment at cost . . . . . . . . . . . . . . . . . . . . . . . . . . . . . . . . . . . . 200,738 127,327Accumulated depreciation . . . . . . . . . . . . . . . . . . . . . . . . . . . . . . . . . . . . . . . . . . . . . (87,751) (53,258)
112,987 74,070
Total . . . . . . . . . . . . . . . . . . . . . . . . . . . . . . . . . . . . . . . . . . . . . . . . . . . . . . . . . . . . . . 561,920 199,426
Note 16 Investment properties
73 Miller Street, North Sydney 2016 2015
$ $
At 1 July . . . . . . . . . . . . . . . . . . . . . . . . . . . . . . . . . . . . . . . . . . . . . . . . . . . . . . . . . 5,856,547 —Property acquisitions . . . . . . . . . . . . . . . . . . . . . . . . . . . . . . . . . . . . . . . . . . . . . . . — 5,856,547Capitalised straight-lining of fixed increases in operating leases inclusive of
lease incentives . . . . . . . . . . . . . . . . . . . . . . . . . . . . . . . . . . . . . . . . . . . . . . . . . 11,941 —Revaluation adjustment . . . . . . . . . . . . . . . . . . . . . . . . . . . . . . . . . . . . . . . . . . . . . 602,383 —
Investment properties at 30 June . . . . . . . . . . . . . . . . . . . . . . . . . . . . . . . . . . . . . . 6,470,871 5,856,547
Note 17 Intangible assets
2016 2015
$ $
Web development cost . . . . . . . . . . . . . . . . . . . . . . . . . . . . . . . . . . . . . . . . . . . . . . — 38,905Accumulated amortisation . . . . . . . . . . . . . . . . . . . . . . . . . . . . . . . . . . . . . . . . . . . — (17,927)
— 20,978
GoodwillCost . . . . . . . . . . . . . . . . . . . . . . . . . . . . . . . . . . . . . . . . . . . . . . . . . . . . . . . . . . . . 4,565,574 4,565,574Intangible assets net carrying amount . . . . . . . . . . . . . . . . . . . . . . . . . . . . . . . . . . 4,565,574 4,586,553
Note 18 Trade and other payables
2016 2015
$ $
CurrentTrade payables . . . . . . . . . . . . . . . . . . . . . . . . . . . . . . . . . . . . . . . . . . . . . . . . . . . 1,213,078 398,868Other payables and accrued expenses . . . . . . . . . . . . . . . . . . . . . . . . . . . . . . . . . 8,616,008 1,433,851GST payable . . . . . . . . . . . . . . . . . . . . . . . . . . . . . . . . . . . . . . . . . . . . . . . . . . . . . 287,959 284,883Bonds payable . . . . . . . . . . . . . . . . . . . . . . . . . . . . . . . . . . . . . . . . . . . . . . . . . . . 48,469 51,169
10,165,514 2,168,771
II-A-32

APPENDIX II-A AUDITED FINANCIAL STATEMENTS ON PROPERTYLINK FOR THETHREE YEARS ENDED 30 JUNE 2018
THE AUDITED FINANCIAL STATEMENTS OF PROPERTYLINK (HOLDINGS) LIMITED(CURRENTLY KNOWN AS ESR ASSET MANAGEMENT (HOLDINGS) LIMITED) ANDPROPERTYLINK TRUST FOR THE YEAR ENDED JUNE 30, 2016
Notes to the Financial Statements (continued)For the year ended 30 June 2016
Note 19 Borrowings
2016 2015
$ $
CurrentBank loan secured . . . . . . . . . . . . . . . . . . . . . . . . . . . . . . . . . . . . . . . . . . . . . . . 13,876,000 2,160,000Borrowing costs . . . . . . . . . . . . . . . . . . . . . . . . . . . . . . . . . . . . . . . . . . . . . . . . . (135,625) (130,239)Loan—others . . . . . . . . . . . . . . . . . . . . . . . . . . . . . . . . . . . . . . . . . . . . . . . . . . . 9,061,851 548,706
Total current borrowings . . . . . . . . . . . . . . . . . . . . . . . . . . . . . . . . . . . . . . . . . . 22,802,226 2,578,466
Non-currentBank loan secured . . . . . . . . . . . . . . . . . . . . . . . . . . . . . . . . . . . . . . . . . . . . . . . — 8,541,610Borrowing costs . . . . . . . . . . . . . . . . . . . . . . . . . . . . . . . . . . . . . . . . . . . . . . . . . — (90,739)
Total non-current borrowings . . . . . . . . . . . . . . . . . . . . . . . . . . . . . . . . . . . . . . — 8,450,870
Total borrowings . . . . . . . . . . . . . . . . . . . . . . . . . . . . . . . . . . . . . . . . . . . . . . . . 22,802,226 11,029,337
(a) Total current and non-current secured liabilities:Bank loan . . . . . . . . . . . . . . . . . . . . . . . . . . . . . . . . . . . . . . . . . . . . . . . . . . 13,876,000 10,701,610
(a) The bank debt is secured by general security agreements and covenants imposed by thebank have been met.
(b) The bank facility was due to expire on 27 February 2017, however, the bank facility wasfully repaid on 15 August 2016 as part of the IPO re-structure.
Note 20 Tax
2016 2015
$ $
Current liabilitiesIncome tax payable . . . . . . . . . . . . . . . . . . . . . . . . . . . . . . . . . . . . . . . . . . . . . . . . . . . 410,510 629,885
Non-current assetsDeferred tax assets . . . . . . . . . . . . . . . . . . . . . . . . . . . . . . . . . . . . . . . . . . . . . . . . . . . . 786,804 183,883
Balance asat 30 June
2016
(Charged)/Creditedto Income
(Charged)/Creditedto Equity
Balance asat 30 June
2015
(Charged)/Creditedto Income
(Charged)/Creditedto Equity
$ $ $ $ $ $
Deferred tax assets / (liabilities)Carried forward tax losses . . . . . . . . — — — — (54,241) —Capitalised issue costs . . . . . . . . . . . . 257,622 — 140,733 116,889 — 89,589Annual leave, other accruals and
provisions for doubtful debts . . . . 529,182 462,188 — 66,994 61,923 —
786,804 462,188 140,733 183,883 7,682 89,589
II-A-33

APPENDIX II-A AUDITED FINANCIAL STATEMENTS ON PROPERTYLINK FOR THETHREE YEARS ENDED 30 JUNE 2018
THE AUDITED FINANCIAL STATEMENTS OF PROPERTYLINK (HOLDINGS) LIMITED(CURRENTLY KNOWN AS ESR ASSET MANAGEMENT (HOLDINGS) LIMITED) ANDPROPERTYLINK TRUST FOR THE YEAR ENDED JUNE 30, 2016
Notes to the Financial Statements (continued)For the year ended 30 June 2016
Note 21 Provisions
2016 2015
$ $
CurrentEmployee benefits . . . . . . . . . . . . . . . . . . . . . . . . . . . . . . . . . . . . . . . . . . . . . . . . . . . . 236,275 36,954Provision for dividends . . . . . . . . . . . . . . . . . . . . . . . . . . . . . . . . . . . . . . . . . . . . . . . . — 559,469Provision for fringe benefits tax . . . . . . . . . . . . . . . . . . . . . . . . . . . . . . . . . . . . . . . . . 7,460 19,316Payroll liabilities . . . . . . . . . . . . . . . . . . . . . . . . . . . . . . . . . . . . . . . . . . . . . . . . . . . . . 112,046 84,364
Total current provisions . . . . . . . . . . . . . . . . . . . . . . . . . . . . . . . . . . . . . . . . . . . . . . . . 355,781 700,103
Non-currentEmployee benefits—long service leave . . . . . . . . . . . . . . . . . . . . . . . . . . . . . . . . . . . . 198,099 23,960
Provision for employee benefits
The current portion for this provision includes the total amount accrued for annual leaveentitlements and the amounts accrued for long service leave entitlements that have vested due toemployees having completed the required period of service. Based on past experience the Group doesnot expect the full amount of annual leave or long service leave balances classified as current liabilitiesto be settled within the next 12 months. However, these amounts must be classified as currentliabilities since the Group does not have an unconditional right to defer the settlement of these amountsin the event employees wish to use their leave entitlement.
The non-current portion for this provision includes amounts accrued for long service leaveentitlements that have not yet vested in relation to those employees who have not yet completed therequired period of service.
Provision for dividends
A provision has been recognised for dividends that have been declared, but are yet to be paid.
II-A-34

APPENDIX II-A AUDITED FINANCIAL STATEMENTS ON PROPERTYLINK FOR THETHREE YEARS ENDED 30 JUNE 2018
THE AUDITED FINANCIAL STATEMENTS OF PROPERTYLINK (HOLDINGS) LIMITED(CURRENTLY KNOWN AS ESR ASSET MANAGEMENT (HOLDINGS) LIMITED) ANDPROPERTYLINK TRUST FOR THE YEAR ENDED JUNE 30, 2016
Notes to the Financial Statements (continued)For the year ended 30 June 2016
Note 22 Issued capital
2016 2015
$ $
Fully paid ordinary shares . . . . . . . . . . . . . . . . . . . . . . . . . . . . . . . . . . . . . . . . . 40,598,477 27,255,515
No. No.
(a) Securities on issueShares at the beginning of the reporting period . . . . . . . . . . . . . . . . . . . . . 27,862,792 22,530,566Shares issued during the year . . . . . . . . . . . . . . . . . . . . . . . . . . . . . . . . . . . 15,945,455 5,332,226
Shares at the end of the reporting period . . . . . . . . . . . . . . . . . . . . . . . . . . 43,808,247 27,862,792
Options on issue at the beginning of the reporting period . . . . . . . . . . . . . — 4,982,206Options exercised during the year but not yet issued as shares (see
below) . . . . . . . . . . . . . . . . . . . . . . . . . . . . . . . . . . . . . . . . . . . . . . . . . . . 4,982,206
Options on issue at the end of the reporting period . . . . . . . . . . . . . . . . . . — —
The company issued the following shares during the year:
Š 45,455 shares at $1.10 per share in satisfaction of a staff bonus;
Š 8,700,000 shares at a nominal value of $1.59 per share as part consideration for theacquisition of BBR 15 Pty Limited from Echo Capital Holdings Trust on 29 June 2016;and
Š 7,200,000 shares at nil value in satisfaction of a management right to have Zero ExercisePrice Options issued to them under management services agreements first entered in 2011.
The shares are eligible for dividends. Ordinary shares participate in dividends and the proceedson winding up of the parent entity in proportion to the number of shares held.
At the shareholders’ meetings each ordinary share is entitled to one vote when a poll is called,otherwise each shareholder has one vote on a show of hands.
In September 2014 the holders of all options exercised the options and become entitled to havepartly paid securities issued. However under the terms of the option agreement no partly paid securitieswere to be issued until certain conditions precedent were satisfied. Securities once issued were to bepartly paid, which would not have created the desired capital structure at IPO. Propertylink and theholders of these rights agreed that the holders would be paid to relinquish their rights in exchange for arepayment of amounts already paid, plus a capital sum calculated with regard to the implied value ofsecurities at IPO. Those payments were made on 15 August 2016, and the rights to have securitiesissued were extinguished.
II-A-35

APPENDIX II-A AUDITED FINANCIAL STATEMENTS ON PROPERTYLINK FOR THETHREE YEARS ENDED 30 JUNE 2018
THE AUDITED FINANCIAL STATEMENTS OF PROPERTYLINK (HOLDINGS) LIMITED(CURRENTLY KNOWN AS ESR ASSET MANAGEMENT (HOLDINGS) LIMITED) ANDPROPERTYLINK TRUST FOR THE YEAR ENDED JUNE 30, 2016
Notes to the Financial Statements (continued)For the year ended 30 June 2016
(b) Capital management
Management controls the capital of the Group in order to maintain an acceptable debt to equityratio, provide the shareholders with adequate returns and ensure that the Group can fund its operationsand continue as a going concern.
The group’s debt and capital include ordinary share capital and financial liabilities, supportedby financial assets. There are no externally imposed capital requirements.
Management effectively manages the group’s capital by assessing the group’s financial risksand adjusting its capital structure in response to changes in these risks and in the market. Theseresponses include the management of debt levels, distributions to shareholders and share issues.
2016 2015
$ $
Total borrowings . . . . . . . . . . . . . . . . . . . . . . . . . . . . . . . . . . . . . . . . . . . . . . . . 22,802,226 11,029,337Trade and other payables . . . . . . . . . . . . . . . . . . . . . . . . . . . . . . . . . . . . . . . . . . 10,165,514 2,168,771Less cash and cash equivalents . . . . . . . . . . . . . . . . . . . . . . . . . . . . . . . . . . . . . (3,958,675) (2,347,705)
Net debt . . . . . . . . . . . . . . . . . . . . . . . . . . . . . . . . . . . . . . . . . . . . . . . . . . . . . . . 29,009,065 10,850,403Total equity . . . . . . . . . . . . . . . . . . . . . . . . . . . . . . . . . . . . . . . . . . . . . . . . . . . . 25,995,372 24,878,550
Total capital . . . . . . . . . . . . . . . . . . . . . . . . . . . . . . . . . . . . . . . . . . . . . . . . . . . . 55,004,437 35,728,953
Gearing ratio . . . . . . . . . . . . . . . . . . . . . . . . . . . . . . . . . . . . . . . . . . . . . . . . . . . 53% 30%
Note 23 Capital and leasing commitments
2016 2015
$ $
Operating lease commitmentsNon-cancellable operating leases contracted for but not recognised in the
financial statementsPayable—minimum lease payments . . . . . . . . . . . . . . . . . . . . . . . . . . . . . . . . . . .—not later than 12 months . . . . . . . . . . . . . . . . . . . . . . . . . . . . . . . . . . . . . . . . . . . 592,191 762,565—between 12 months and five years . . . . . . . . . . . . . . . . . . . . . . . . . . . . . . . . . . . 5,043,048 3,460,127—later than five years . . . . . . . . . . . . . . . . . . . . . . . . . . . . . . . . . . . . . . . . . . . . . . — 2,175,113
5,635,240 6,397,805
The property lease is a non-cancellable lease with a seven-year term, with rent payable monthlyin advance.
Note 24 Contingent liabilities and contingent assets
At 30 June 2016 Propertylink had a contingent liability in the form of a limited guaranteeissued to the financiers of PAIP. PAIP acquired Melbourne Markets assets in September 2015, which
II-A-36

APPENDIX II-A AUDITED FINANCIAL STATEMENTS ON PROPERTYLINK FOR THETHREE YEARS ENDED 30 JUNE 2018
THE AUDITED FINANCIAL STATEMENTS OF PROPERTYLINK (HOLDINGS) LIMITED(CURRENTLY KNOWN AS ESR ASSET MANAGEMENT (HOLDINGS) LIMITED) ANDPROPERTYLINK TRUST FOR THE YEAR ENDED JUNE 30, 2016
Notes to the Financial Statements (continued)For the year ended 30 June 2016
consist of industrial properties constructed on land leased from the Melbourne Markets Authority.Propertylink’s guarantee was several, could only be called in the event that some or all MelbourneMarkets ground leases were terminated or become valueless, and was limited to a maximum of $3.16mif called. As part of the IPO restructure process Propertylink was released from the limited guaranteeon 15 August 2016.
Other than that contingent liability, at balance date the group had no significant contingentassets or liabilities.
Note 25 Cash flow information
(a) Reconciliation of profit for the period to net cash flows from operating activities
2016 2015
$’000 $’000
Profit after income tax . . . . . . . . . . . . . . . . . . . . . . . . . . . . . . . . . . . . . . . . . . . . . 8,330,307 2,416,398Adjustments to reconcile profit before tax to net cash flows
Valuation (gains) on investment property . . . . . . . . . . . . . . . . . . . . . . . . . . (602,383) —Depreciation and amortisation expense . . . . . . . . . . . . . . . . . . . . . . . . . . . . 200,123 131,774Amortisation of borrowing costs . . . . . . . . . . . . . . . . . . . . . . . . . . . . . . . . . 159,489 —Straight-lining rental income adjustments . . . . . . . . . . . . . . . . . . . . . . . . . . (11,941) —Share of joint venture tax expenses . . . . . . . . . . . . . . . . . . . . . . . . . . . . . . . — 64,653Deferred tax credited to capitalised share issue costs . . . . . . . . . . . . . . . . . . 231,445 —Valuation (gains) on investment in joint ventures . . . . . . . . . . . . . . . . . . . . (5,946,927) —
(5,970,194) 196,427Changes in assets and liabilities(Increase)/decrease in trade and other receivable . . . . . . . . . . . . . . . . . . . . . . . . . (2,171,720) (176,060)(Increase)/decrease in other assets . . . . . . . . . . . . . . . . . . . . . . . . . . . . . . . . . . . . (53,067) (42,628)(Increase)/decrease in deferred tax assets . . . . . . . . . . . . . . . . . . . . . . . . . . . . . . . (602,921) (97,272)Increase in trade and other payables . . . . . . . . . . . . . . . . . . . . . . . . . . . . . . . . . . . 7,994,530 1,610,108Increase/(decrease) in income tax payable . . . . . . . . . . . . . . . . . . . . . . . . . . . . . . (219,376) (629,885)Increase/(decrease) in provisions (excluding provision for dividend) . . . . . . . . . 389,287 280,087
5,336,733 944,350
Net cash flows from operating activities . . . . . . . . . . . . . . . . . . . . . . . . . . . . . . 7,696,846 3,557,175
(b) Credit standby arrangement and loan facilities
At 30 June 2016 the company had a market rate loan facility amounting to $14,370,000 (2015:$14,370,000). This may be terminated under certain determined circumstance. At 30 June 2016,$13,876,000 of this facility was used (2015: $10,701,610). Interest rates are variable. The facility wasfully repaid on 15 August 2016.
II-A-37

APPENDIX II-A AUDITED FINANCIAL STATEMENTS ON PROPERTYLINK FOR THETHREE YEARS ENDED 30 JUNE 2018
THE AUDITED FINANCIAL STATEMENTS OF PROPERTYLINK (HOLDINGS) LIMITED(CURRENTLY KNOWN AS ESR ASSET MANAGEMENT (HOLDINGS) LIMITED) ANDPROPERTYLINK TRUST FOR THE YEAR ENDED JUNE 30, 2016
Notes to the Financial Statements (continued)For the year ended 30 June 2016
Note 26 Events after the reporting period
Security holders are advised of the following matters which occurred after balance date:
Š In May 2016 Propertylink and its investment partners in PAIP agreed to work towards anIPO involving the stapling of PAIP units to Propertylink securities. Propertylink and itsPAIP partners continued to pursue this outcome post year end, and on 15 August 2016 theIPO was completed. For further details please refer to the Prospectus and ProductDisclosure Statement (PDS), and to the Supplementary Prospectus and Product DisclosureStatement (Supplementary PDS), which may be found on the Propertylink web site.
Š As a result of the completion of the IPO, all Propertylink external debt as disclosed innote 18 was fully repaid. The debt repaid included secured bank loans and unsecured otherloans. Also at IPO completion the listed entity drew down on a new senior debt facilitywith Westpac Banking Corporation (for further details please refer to the PDS).
Š As disclosed in note 22, certain parties had a right to have partly paid securities issued tothem from options exercised in 2014. It was agreed with these parties during the IPOprocess that the partly paid securities would not be issued, monies already advanced as apart payment for the securities would be repaid, and a capital payment to compensate theholders for the cancellation of the rights would be made on IPO completion.
Š Again as a result of the stapling of PAIP to Propertylink on 15 August 2016, Propertylinkbecame entitled to an investment management performance fee of $25.2m payable by thePAIP owners. This fee funded a special dividend of 22c per share to Propertylink securityholders at the record date of 12 August 2016, and also funded staff bonus payments andother costs incurred as a result of the IPO.
Š In order to avoid a cross shareholding on completion of the stapling of Propertylink andPAIP, Propertylink Trust sold its investment interest in PAIP for approximately $21.2mimmediately prior to the stapling on 15 August 2016. Proceeds from the sale of thisinvestment funded a special distribution of 48c per unit to Propertylink Trustsecurityholders on record at 12 August 2016.
Š As disclosed in the Supplementary Prospectus and PDS, in July 2016 Propertylink formeda new fund, Propertylink Enhanced Partnership (PEP). Propertylink committedapproximately $17.7m in equity to PEP, with the balance of equity committed by aGoldman Sachs Investor entity. During August and September 2016 PEP completed theacquisition of approximately $142m of property.
II-A-38

APPENDIX II-A AUDITED FINANCIAL STATEMENTS ON PROPERTYLINK FOR THETHREE YEARS ENDED 30 JUNE 2018
THE AUDITED FINANCIAL STATEMENTS OF PROPERTYLINK (HOLDINGS) LIMITED(CURRENTLY KNOWN AS ESR ASSET MANAGEMENT (HOLDINGS) LIMITED) ANDPROPERTYLINK TRUST FOR THE YEAR ENDED JUNE 30, 2016
Notes to the Financial Statements (continued)For the year ended 30 June 2016
Note 27 Related party transactions
The Group’s main related parties are as follows
(a) Entities exercising control over the group:
No entity exercises control over the Group.
(b) Key management personnel:
Any person(s) having authority and responsibility for planning, directing and controlling theactivities of the entity, directly or indirectly, including any director (whether executive or otherwise) ofthat entity is considered key management personnel.
For details of disclosures relating to key management personnel, refer to Note 5: Keymanagement personnel compensation.
(c) Entities subject to significant influence by the group:
An entity which has the power to participate in the financial and operating policy decisions ofan entity, but does not have control over those policies, is an entity which holds significant influence.Significant influence may be gained by share ownership, statute or agreement.
For details of interests held in associates, refer to Note 12.
(d) Joint ventures accounted for under the equity method:
The Group has a various interest in the joint venture. The interest in joint venture is accountedfor in these consolidated financial statements of the Group, using the equity method of accounting.
For details of interests held in joint ventures, refer to Note 12.
(e) Other related parties
Other related parties include close family members of key management personnel and entitiesthat are controlled or jointly controlled by those key management personnel, individually orcollectively with their close family members.
(f) Transactions with related parties
Transactions between related parties are on normal commercial terms and conditions no morefavourable than those available to other parties unless otherwise stated.
II-A-39

APPENDIX II-A AUDITED FINANCIAL STATEMENTS ON PROPERTYLINK FOR THETHREE YEARS ENDED 30 JUNE 2018
THE AUDITED FINANCIAL STATEMENTS OF PROPERTYLINK (HOLDINGS) LIMITED(CURRENTLY KNOWN AS ESR ASSET MANAGEMENT (HOLDINGS) LIMITED) ANDPROPERTYLINK TRUST FOR THE YEAR ENDED JUNE 30, 2016
Notes to the Financial Statements (continued)For the year ended 30 June 2016
The following transactions occurred with related parties
2016 2015
$ $
i. Purchase of goods and servicesManagement services contractEcho Capital Holdings Trust . . . . . . . . . . . . . . . . . . . . . . . . . . . . . . . . . . . . 2,167,478 2,336,226Project management feesNix Anderson Pty Ltd . . . . . . . . . . . . . . . . . . . . . . . . . . . . . . . . . . . . . . . . . 108,000 140,700
ii. Shareholdings No No
Christopher Ryan . . . . . . . . . . . . . . . . . . . . . . . . . . . . . . . . . . . . . . . . . . . . . 872,573 872,573Peter Lancken . . . . . . . . . . . . . . . . . . . . . . . . . . . . . . . . . . . . . . . . . . . . . . . . 1,115,041 1,115,041Stephen Day . . . . . . . . . . . . . . . . . . . . . . . . . . . . . . . . . . . . . . . . . . . . . . . . . 7,235,996 1,193,996Derek Nix . . . . . . . . . . . . . . . . . . . . . . . . . . . . . . . . . . . . . . . . . . . . . . . . . . . 150,000 150,000David Epper . . . . . . . . . . . . . . . . . . . . . . . . . . . . . . . . . . . . . . . . . . . . . . . . . 77,273 77,273Ian Hutchinson . . . . . . . . . . . . . . . . . . . . . . . . . . . . . . . . . . . . . . . . . . . . . . . 25,000 25,000Peter McDonald . . . . . . . . . . . . . . . . . . . . . . . . . . . . . . . . . . . . . . . . . . . . . . 4,763,776 629,776Stuart Dawes . . . . . . . . . . . . . . . . . . . . . . . . . . . . . . . . . . . . . . . . . . . . . . . . 2,015,204 —
16,254,863 4,063,659
Note 28 Financial risk management
The group’s financial instruments consist mainly of deposits with banks, local money marketinstruments, short-term investments, accounts receivable and payable, loans to and from subsidiaries,bills, leases, preference shares, and derivatives.
The carrying amounts for each category of financial instruments, measured in accordance withAASB 139: Financial Instruments: Recognition and Measurement as detailed in the accountingpolicies to these financial statements, are as follows:
2016 2015
$ $
Financial assetsCash and cash equivalents . . . . . . . . . . . . . . . . . . . . . . . . . . . . . . . . . . . . . . . . . 3,958,675 2,347,705Loans and receivables . . . . . . . . . . . . . . . . . . . . . . . . . . . . . . . . . . . . . . . . . . . . 3,921,266 1,607,200
Total financial assets . . . . . . . . . . . . . . . . . . . . . . . . . . . . . . . . . . . . . . . . . . . . 7,879,941 3,954,905
Financial liabilitiesFinancial liabilities at amortised cost—Trade and other payables . . . . . . . . . . . . . . . . . . . . . . . . . . . . . . . . . . . . . . . . 10,165,514 2,168,771—Borrowings . . . . . . . . . . . . . . . . . . . . . . . . . . . . . . . . . . . . . . . . . . . . . . . . . . . 22,802,226 11,029,337
Total financial liabilities . . . . . . . . . . . . . . . . . . . . . . . . . . . . . . . . . . . . . . . . . 32,967,740 13,198,108
II-A-40

APPENDIX II-A AUDITED FINANCIAL STATEMENTS ON PROPERTYLINK FOR THETHREE YEARS ENDED 30 JUNE 2018
THE AUDITED FINANCIAL STATEMENTS OF PROPERTYLINK (HOLDINGS) LIMITED(CURRENTLY KNOWN AS ESR ASSET MANAGEMENT (HOLDINGS) LIMITED) ANDPROPERTYLINK TRUST FOR THE YEAR ENDED JUNE 30, 2016
Notes to the Financial Statements (continued)For the year ended 30 June 2016
Financial risk management policies
The directors’ overall financial risk management strategy seeks to assist the company inmeeting its financial targets, whilst minimising potential adverse effects on financial performance. Themain purpose of non-derivative financial instruments is to raise finance for company operations. Thecompany does not have any derivative instruments at 30 June 2016.
The finance committee, consisting of senior executives of the Group, meets on a regular basisto analyse financial risk exposure and to evaluate treasury management strategies in the context of themost recent economic conditions and forecasts. The finance committee’s overall risk managementstrategy seeks to assist the Group in meeting its financial targets, whilst minimising potential adverseeffects on financial performance.
The finance committee operates under policies approved by the Board of Directors. Financialrisk management policies are approved and reviewed by the Board on a regular basis. These includecredit risk policies and future cash flow requirements.
Specific financial risk exposures and management
The main risks the Group is exposed to through its financial instruments are credit risk,liquidity risk and market risk relating to interest rate risk and other price risk. There have been nosubstantive changes in the types of risks the company is exposed to, how these risks arise, or theBoard’s objectives, policies and processes for managing or measuring the risks from the previousperiod.
(a) Credit risk
Exposure to credit risk relating to financial assets arises from the potential non-performance bycounterparties of contract obligations that could lead to a financial loss to the Group.
Credit risk is managed through maintaining procedures ensuring, to the extent possible, thatcustomers and counterparties to transactions are of sound credit worthiness and includes the utilisationof systems for the approval, granting and renewal of credit limits, the regular monitoring of exposuresagainst such limits and the monitoring of the financial stability of significant customers andcounterparties. Such monitoring is used in assessing receivables for impairment. Credit terms aregenerally 30 to 45 days from the date of invoice
Risk is also minimised through investing surplus funds in financial institutions that maintain ahigh credit rating or in entities that the finance committee has otherwise assessed as being financiallysound.
II-A-41

APPENDIX II-A AUDITED FINANCIAL STATEMENTS ON PROPERTYLINK FOR THETHREE YEARS ENDED 30 JUNE 2018
THE AUDITED FINANCIAL STATEMENTS OF PROPERTYLINK (HOLDINGS) LIMITED(CURRENTLY KNOWN AS ESR ASSET MANAGEMENT (HOLDINGS) LIMITED) ANDPROPERTYLINK TRUST FOR THE YEAR ENDED JUNE 30, 2016
Notes to the Financial Statements (continued)For the year ended 30 June 2016
(b) Liquidity risk
Liquidity risk arises from the possibility that the Group might encounter difficulty in settling itsdebts or otherwise meeting its obligations related to financial liabilities. The Group manages this riskthrough the following mechanisms:
Š preparing forward-looking cash flow analyses in relation to its operational, investing andfinancing activities;
Š monitoring undrawn credit facilities;
Š obtaining funding from a variety of sources;
Š maintaining a reputable credit profile;
Š managing credit risk related to financial assets;
Š only investing surplus cash with major financial institutions; and
Š comparing the maturity profile of financial liabilities with the realisation profile offinancial assets
The table below reflects an undiscounted contractual maturity analysis for non-derivativefinancial liabilities. Financial guarantee liabilities are treated as payable on demand since the Grouphas no control over the timing of any potential settlement of the liability. The Group does not hold anyderivative financial liabilities directly
Cash flows realised from financial assets reflect management’s expectation as to the timing ofrealisation. Actual timing may therefore differ from that disclosed. The timing of cash flows presentedin the table to settle financial liabilities reflect the earliest contractual settlement dates and do notreflect management’s expectations that banking facilities will be rolled forward.
Financial liability and financial asset maturity analysis
Within 1 Year 1 to 5 years Total
2016 2015 2016 2015 2016 2015
$ $ $ $ $ $
Financial liabilities due forpayment
Secured loans . . . . . . . . . . . . . 13,876,000 2,160,000 — 8,541,610 13,876,000 10,701,610Trade and other payables . . . . 10,165,514 1,142,545 — — 10,165,514 1,142,545Amounts payable to related
parties . . . . . . . . . . . . . . . . . 3,600,000 1,026,226 — — 3,600,000 1,026,226
Total expected outflows . . . . . 27,641,514 4,328,771 — 8,541,610 27,641,514 12,870,381
II-A-42

APPENDIX II-A AUDITED FINANCIAL STATEMENTS ON PROPERTYLINK FOR THETHREE YEARS ENDED 30 JUNE 2018
THE AUDITED FINANCIAL STATEMENTS OF PROPERTYLINK (HOLDINGS) LIMITED(CURRENTLY KNOWN AS ESR ASSET MANAGEMENT (HOLDINGS) LIMITED) ANDPROPERTYLINK TRUST FOR THE YEAR ENDED JUNE 30, 2016
Notes to the Financial Statements (continued)For the year ended 30 June 2016
Within 1 Year 1 to 5 years Total
2016 2015 2016 2015 2016 2015
$ $ $ $ $ $
Financial assets—cash flowsrealisable
Cash and cash equivalents . . . 3,958,675 2,347,705 — — 3,958,675 2,347,705Trade, term and loan
receivables . . . . . . . . . . . . . 3,894,266 1,578,028 — — 3,894,266 1,578,028
Total expected inflows . . . . . . 7,852,941 3,925,733 — — 7,852,941 3,925,733
Net (outflow)/inflow onfinancial instruments . . . . . (19,788,573) (403,038) — (8,541,610) (19,788,573) (8,944,648)
The Group manages the liquidity required to meet its current liabilities from operating cashflows. Non-current liabilities in respect of bank loans are managed by way of re-negotiation or fromthe sale of medium to long term assets.
The maximum exposure to credit risk, excluding the value of any collateral or other security, atbalance date to recognised financial assets, is the carrying amount, net of any provisions forimpairment of those assets, as disclosed in the statement of financial position and notes to the financialstatements. The Group manages credit risk by ensuring that appropriate due diligence is carried outbefore entering into lease agreements with commercial tenants. Receivables balances are regularlymonitored so as to ensure minimum exposure to bad debts.
(c) Market risk
Interest rate risk
Exposure to interest rate risk arises on financial assets and financial liabilities recognised at theend of the reporting period whereby a future change in interest rates will affect future cash flows or thefair value of fixed rate financial instruments. The Group is also exposed to earnings volatility onfloating rate instruments. The financial instruments that expose the Group to interest rate risk arelimited to borrowings, listed shares, cash and cash equivalents.
Interest rate risk is managed using floating rate debt. At 30 June 2016 100% of group debt isfloating. The Group also manages interest rate risk by ensuring that, whenever possible, payables arepaid within any pre-agreed credit terms.
The net effective variable interest rate borrowings (i.e. unhedged debt) expose the Group tointerest rate risk which will impact future cash flows and interest charges and is indicated by thefollowing floating interest rate financial liabilities:
Floating rate instruments 2016 2015
Note $ $
Bank facilities . . . . . . . . . . . . . . . . . . . . . . . . . . . . . . . . . . . . . . . . . . . . . 18 13,876,000 10,701,610
II-A-43
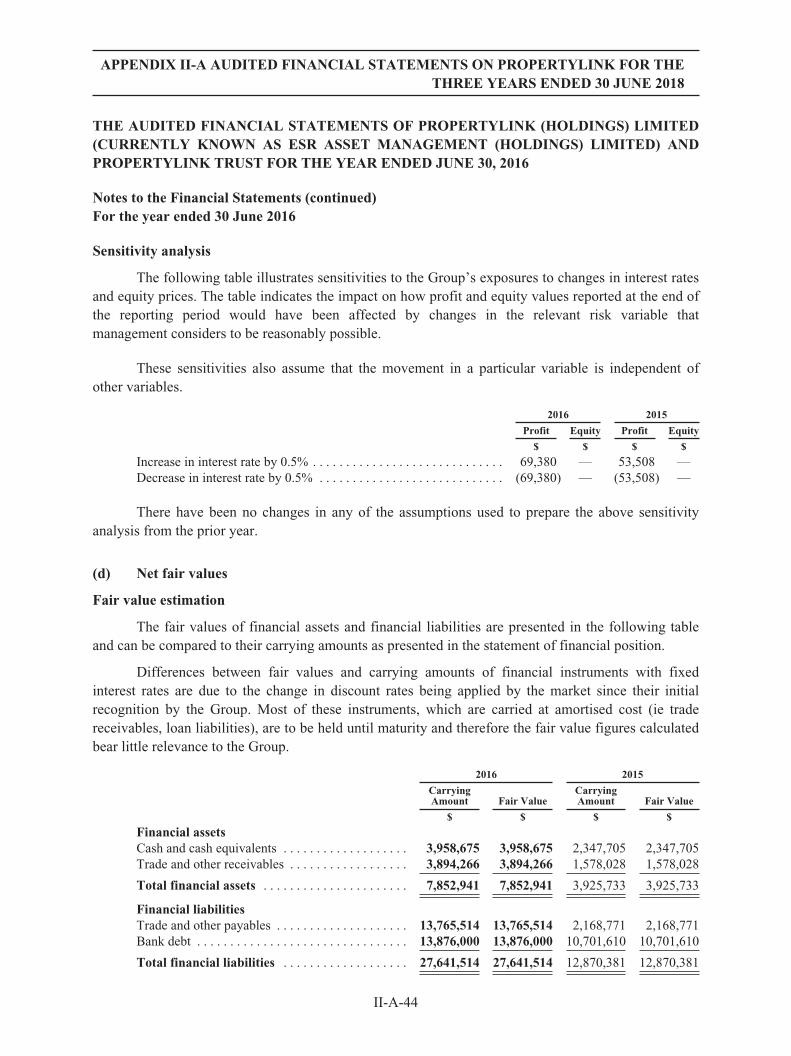
APPENDIX II-A AUDITED FINANCIAL STATEMENTS ON PROPERTYLINK FOR THETHREE YEARS ENDED 30 JUNE 2018
THE AUDITED FINANCIAL STATEMENTS OF PROPERTYLINK (HOLDINGS) LIMITED(CURRENTLY KNOWN AS ESR ASSET MANAGEMENT (HOLDINGS) LIMITED) ANDPROPERTYLINK TRUST FOR THE YEAR ENDED JUNE 30, 2016
Notes to the Financial Statements (continued)For the year ended 30 June 2016
Sensitivity analysis
The following table illustrates sensitivities to the Group’s exposures to changes in interest ratesand equity prices. The table indicates the impact on how profit and equity values reported at the end ofthe reporting period would have been affected by changes in the relevant risk variable thatmanagement considers to be reasonably possible.
These sensitivities also assume that the movement in a particular variable is independent ofother variables.
2016 2015
Profit Equity Profit Equity
$ $ $ $
Increase in interest rate by 0.5% . . . . . . . . . . . . . . . . . . . . . . . . . . . . . 69,380 — 53,508 —Decrease in interest rate by 0.5% . . . . . . . . . . . . . . . . . . . . . . . . . . . . (69,380) — (53,508) —
There have been no changes in any of the assumptions used to prepare the above sensitivityanalysis from the prior year.
(d) Net fair values
Fair value estimation
The fair values of financial assets and financial liabilities are presented in the following tableand can be compared to their carrying amounts as presented in the statement of financial position.
Differences between fair values and carrying amounts of financial instruments with fixedinterest rates are due to the change in discount rates being applied by the market since their initialrecognition by the Group. Most of these instruments, which are carried at amortised cost (ie tradereceivables, loan liabilities), are to be held until maturity and therefore the fair value figures calculatedbear little relevance to the Group.
2016 2015
CarryingAmount Fair Value
CarryingAmount Fair Value
$ $ $ $
Financial assetsCash and cash equivalents . . . . . . . . . . . . . . . . . . . 3,958,675 3,958,675 2,347,705 2,347,705Trade and other receivables . . . . . . . . . . . . . . . . . . 3,894,266 3,894,266 1,578,028 1,578,028
Total financial assets . . . . . . . . . . . . . . . . . . . . . . 7,852,941 7,852,941 3,925,733 3,925,733
Financial liabilitiesTrade and other payables . . . . . . . . . . . . . . . . . . . . 13,765,514 13,765,514 2,168,771 2,168,771Bank debt . . . . . . . . . . . . . . . . . . . . . . . . . . . . . . . . 13,876,000 13,876,000 10,701,610 10,701,610
Total financial liabilities . . . . . . . . . . . . . . . . . . . 27,641,514 27,641,514 12,870,381 12,870,381
II-A-44

APPENDIX II-A AUDITED FINANCIAL STATEMENTS ON PROPERTYLINK FOR THETHREE YEARS ENDED 30 JUNE 2018
THE AUDITED FINANCIAL STATEMENTS OF PROPERTYLINK (HOLDINGS) LIMITED(CURRENTLY KNOWN AS ESR ASSET MANAGEMENT (HOLDINGS) LIMITED) ANDPROPERTYLINK TRUST FOR THE YEAR ENDED JUNE 30, 2016
Notes to the Financial Statements (continued)For the year ended 30 June 2016
Note 29 Company details
The registered office of the company is
Level 29, 20 Bond Street
SYDNEY NSW 2000
II-A-45

APPENDIX II-A AUDITED FINANCIAL STATEMENTS ON PROPERTYLINK FOR THETHREE YEARS ENDED 30 JUNE 2018
THE AUDITED FINANCIAL STATEMENTS OF PROPERTYLINK (HOLDINGS) LIMITED(CURRENTLY KNOWN AS ESR ASSET MANAGEMENT (HOLDINGS) LIMITED) ANDPROPERTYLINK TRUST FOR THE YEAR ENDED JUNE 30, 2016
Directors’ Declaration
In accordance with a resolution of the directors of Propertylink Group, the directors of thecompany declare that:
1. The financial statements and notes, as set out on pages 9 to 36 (Note), are in accordancewith the Corporations Act 2001 and:
(a) comply with Australian Accounting Standards, which, as stated in accounting policyNote 1 to the financial statements, constitutes compliance with international financialreporting standards (IFRS); and
(b) give a true and fair view of the financial position as at 30 June 2016 and of theperformance for the year ended on that date of the consolidated group.
2. In the directors’ opinion there are reasonable grounds to believe that the company will beable to pay its debts as and when they become due and payable.
Peter Lancken Stuart Dawes
Chairman Chief Executive Officer29 September 2016 29 September 2016
Note:
Page references above refer to the original audited accounts. The equivalent pages in this appendix areII-A-4 to II-A-45.
II-A-46
APPENDIX II-A AUDITED FINANCIAL STATEMENTS ON PROPERTYLINK FOR THETHREE YEARS ENDED 30 JUNE 2018
THE AUDITED FINANCIAL STATEMENTS OF PROPERTYLINK (HOLDINGS) LIMITED(CURRENTLY KNOWN AS ESR ASSET MANAGEMENT (HOLDINGS) LIMITED) ANDPROPERTYLINK TRUST FOR THE YEAR ENDED JUNE 30, 2016
II-A-47
APPENDIX II-A AUDITED FINANCIAL STATEMENTS ON PROPERTYLINK FOR THETHREE YEARS ENDED 30 JUNE 2018
THE AUDITED FINANCIAL STATEMENTS OF PROPERTYLINK (HOLDINGS) LIMITED(CURRENTLY KNOWN AS ESR ASSET MANAGEMENT (HOLDINGS) LIMITED) ANDPROPERTYLINK TRUST FOR THE YEAR ENDED JUNE 30, 2016
II-A-48
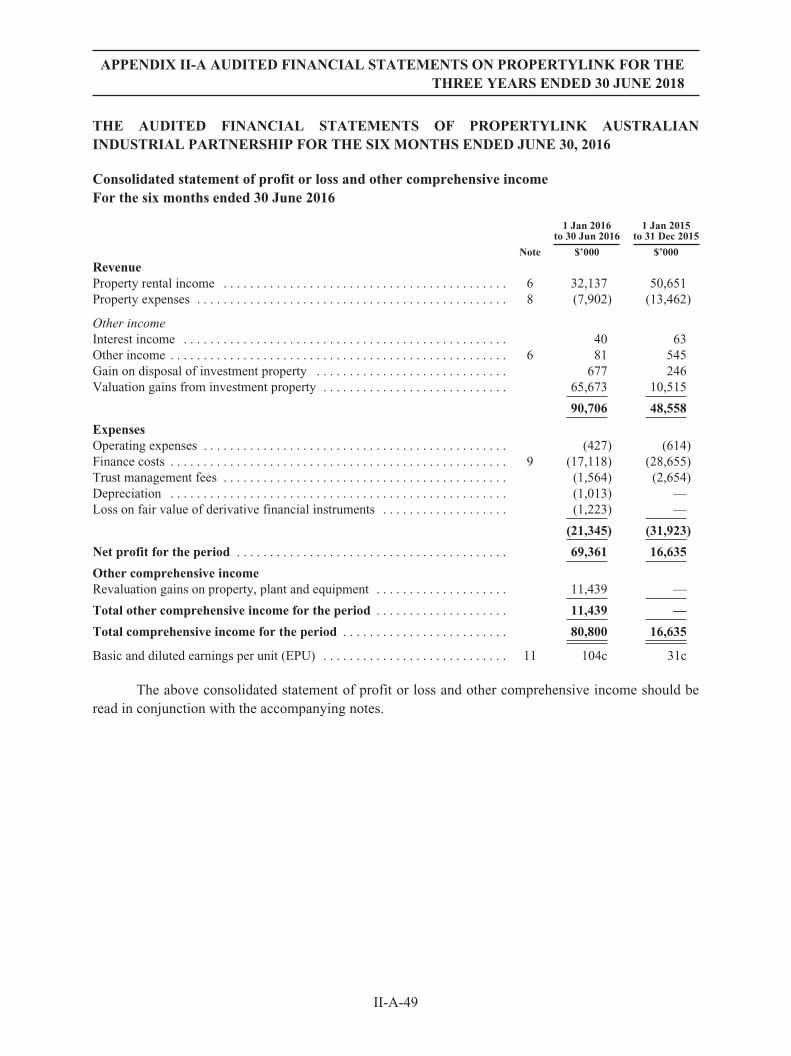
APPENDIX II-A AUDITED FINANCIAL STATEMENTS ON PROPERTYLINK FOR THETHREE YEARS ENDED 30 JUNE 2018
THE AUDITED FINANCIAL STATEMENTS OF PROPERTYLINK AUSTRALIANINDUSTRIAL PARTNERSHIP FOR THE SIX MONTHS ENDED JUNE 30, 2016
Consolidated statement of profit or loss and other comprehensive incomeFor the six months ended 30 June 2016
1 Jan 2016to 30 Jun 2016
1 Jan 2015to 31 Dec 2015
Note $’000 $’000
RevenueProperty rental income . . . . . . . . . . . . . . . . . . . . . . . . . . . . . . . . . . . . . . . . . . . 6 32,137 50,651Property expenses . . . . . . . . . . . . . . . . . . . . . . . . . . . . . . . . . . . . . . . . . . . . . . . 8 (7,902) (13,462)
Other incomeInterest income . . . . . . . . . . . . . . . . . . . . . . . . . . . . . . . . . . . . . . . . . . . . . . . . . 40 63Other income . . . . . . . . . . . . . . . . . . . . . . . . . . . . . . . . . . . . . . . . . . . . . . . . . . . 6 81 545Gain on disposal of investment property . . . . . . . . . . . . . . . . . . . . . . . . . . . . . 677 246Valuation gains from investment property . . . . . . . . . . . . . . . . . . . . . . . . . . . . 65,673 10,515
90,706 48,558
ExpensesOperating expenses . . . . . . . . . . . . . . . . . . . . . . . . . . . . . . . . . . . . . . . . . . . . . . (427) (614)Finance costs . . . . . . . . . . . . . . . . . . . . . . . . . . . . . . . . . . . . . . . . . . . . . . . . . . . 9 (17,118) (28,655)Trust management fees . . . . . . . . . . . . . . . . . . . . . . . . . . . . . . . . . . . . . . . . . . . (1,564) (2,654)Depreciation . . . . . . . . . . . . . . . . . . . . . . . . . . . . . . . . . . . . . . . . . . . . . . . . . . . (1,013) —Loss on fair value of derivative financial instruments . . . . . . . . . . . . . . . . . . . (1,223) —
(21,345) (31,923)
Net profit for the period . . . . . . . . . . . . . . . . . . . . . . . . . . . . . . . . . . . . . . . . . 69,361 16,635
Other comprehensive incomeRevaluation gains on property, plant and equipment . . . . . . . . . . . . . . . . . . . . 11,439 —
Total other comprehensive income for the period . . . . . . . . . . . . . . . . . . . . 11,439 —
Total comprehensive income for the period . . . . . . . . . . . . . . . . . . . . . . . . . 80,800 16,635
Basic and diluted earnings per unit (EPU) . . . . . . . . . . . . . . . . . . . . . . . . . . . . 11 104c 31c
The above consolidated statement of profit or loss and other comprehensive income should beread in conjunction with the accompanying notes.
II-A-49

APPENDIX II-A AUDITED FINANCIAL STATEMENTS ON PROPERTYLINK FOR THETHREE YEARS ENDED 30 JUNE 2018
THE AUDITED FINANCIAL STATEMENTS OF PROPERTYLINK AUSTRALIANINDUSTRIAL PARTNERSHIP FOR THE SIX MONTHS ENDED JUNE 30, 2016
Consolidated statement of financial positionAs at 30 June 2016
30 Jun2016
31 Dec2015
Note $’000 $’000
Current assetsCash and cash equivalents . . . . . . . . . . . . . . . . . . . . . . . . . . . . . . . . . . . . . . . . . . . . . . . 12 5,727 9,223Trade and other receivables . . . . . . . . . . . . . . . . . . . . . . . . . . . . . . . . . . . . . . . . . . . . . . 13 1,079 915Prepayments . . . . . . . . . . . . . . . . . . . . . . . . . . . . . . . . . . . . . . . . . . . . . . . . . . . . . . . . . . 1,860 1,007Receivable from unitholders . . . . . . . . . . . . . . . . . . . . . . . . . . . . . . . . . . . . . . . . . . . . . . 3,500 —Investment property held for sale . . . . . . . . . . . . . . . . . . . . . . . . . . . . . . . . . . . . . . . . . . 15 9,300 —
Total current assets . . . . . . . . . . . . . . . . . . . . . . . . . . . . . . . . . . . . . . . . . . . . . . . . . . . . 21,466 11,145
Non-current assetsProperty, plant and equipment . . . . . . . . . . . . . . . . . . . . . . . . . . . . . . . . . . . . . . . . . . . . 14 92,000 —Investment properties . . . . . . . . . . . . . . . . . . . . . . . . . . . . . . . . . . . . . . . . . . . . . . . . . . . 15 583,650 618,856
Total non-current assets . . . . . . . . . . . . . . . . . . . . . . . . . . . . . . . . . . . . . . . . . . . . . . . . 675,650 618,856
Total assets . . . . . . . . . . . . . . . . . . . . . . . . . . . . . . . . . . . . . . . . . . . . . . . . . . . . . . . . . . . 697,116 630,001
Current liabilitiesTrade and other payables . . . . . . . . . . . . . . . . . . . . . . . . . . . . . . . . . . . . . . . . . . . . . . . . 16 8,920 7,466Derivative financial instruments . . . . . . . . . . . . . . . . . . . . . . . . . . . . . . . . . . . . . . . . . . . 17 1,278 119Unearned income . . . . . . . . . . . . . . . . . . . . . . . . . . . . . . . . . . . . . . . . . . . . . . . . . . . . . . 1,371 1,330Distribution payable . . . . . . . . . . . . . . . . . . . . . . . . . . . . . . . . . . . . . . . . . . . . . . . . . . . . 3,313 2,377
Total current liabilities . . . . . . . . . . . . . . . . . . . . . . . . . . . . . . . . . . . . . . . . . . . . . . . . . 14,882 11,292
Non-current liabilitiesInterest-bearing loans and borrowings . . . . . . . . . . . . . . . . . . . . . . . . . . . . . . . . . . . . . . 18 337,663 345,475Preference units . . . . . . . . . . . . . . . . . . . . . . . . . . . . . . . . . . . . . . . . . . . . . . . . . . . . . . . . 18 199,294 199,294
Total non-current liabilities . . . . . . . . . . . . . . . . . . . . . . . . . . . . . . . . . . . . . . . . . . . . . 536,957 544,769
Total liabilities . . . . . . . . . . . . . . . . . . . . . . . . . . . . . . . . . . . . . . . . . . . . . . . . . . . . . . . . 551,839 556,061
NET ASSETS . . . . . . . . . . . . . . . . . . . . . . . . . . . . . . . . . . . . . . . . . . . . . . . . . . . . . . . . 145,277 73,940
EquityIssued capital . . . . . . . . . . . . . . . . . . . . . . . . . . . . . . . . . . . . . . . . . . . . . . . . . . . . . . . . . . 19 66,431 66,431Retained earnings . . . . . . . . . . . . . . . . . . . . . . . . . . . . . . . . . . . . . . . . . . . . . . . . . . . . . . 67,407 7,509Asset revaluation reserve . . . . . . . . . . . . . . . . . . . . . . . . . . . . . . . . . . . . . . . . . . . . . . . . 11,439 —
Total Equity . . . . . . . . . . . . . . . . . . . . . . . . . . . . . . . . . . . . . . . . . . . . . . . . . . . . . . . . . . 145,277 73,940
The above consolidated statement of financial position should be read in conjunction with theaccompanying notes.
II-A-50

APPENDIX II-A AUDITED FINANCIAL STATEMENTS ON PROPERTYLINK FOR THETHREE YEARS ENDED 30 JUNE 2018
THE AUDITED FINANCIAL STATEMENTS OF PROPERTYLINK AUSTRALIANINDUSTRIAL PARTNERSHIP FOR THE SIX MONTHS ENDED JUNE 30, 2016
Consolidated statement of changes in equityFor the six months ended 30 June 2016
IssuedCapital
RetainedEarnings
AssetRevaluation
reserveTotalEquity
Note $’000 $’000 $’000 $’000
Balance at 1 Jan 2015 . . . . . . . . . . . . . . . . . . . . . . . . . . . . . . . . . 39,181 — — 39,181Total comprehensive income for the period . . . . . . . . . . . . . . . . 11 — 16,635 — 16,635Contributions of equity net of issue costs . . . . . . . . . . . . . . . . . . 19 27,250 — — 27,250Distribution provided for or paid . . . . . . . . . . . . . . . . . . . . . . . . . — (9,126) — (9,126)
Balance at 31 Dec 2015 . . . . . . . . . . . . . . . . . . . . . . . . . . . . . . . 66,431 7,509 — 73,940
IssuedCapital
RetainedEarnings
AssetRevaluation
reserveTotalEquity
Note $’000 $’000 $’000 $’000
Balance at 1 Jan 2016 . . . . . . . . . . . . . . . . . . . . . . . . . . . . . . . . . 66,431 7,509 — 73,940Total comprehensive income for the period . . . . . . . . . . . . . . . . 11 — 69,361 11,439 80,800Contributions of equity net of issue costs . . . . . . . . . . . . . . . . . . 19 — — — —Distribution provided for or paid . . . . . . . . . . . . . . . . . . . . . . . . . — (9,463) — (9,463)
Balance at 30 Jun 2016 . . . . . . . . . . . . . . . . . . . . . . . . . . . . . . . 66,431 67,407 11,439 145,277
The above consolidated statement of changes in equity should be read in conjunction with theaccompanying notes.
II-A-51

APPENDIX II-A AUDITED FINANCIAL STATEMENTS ON PROPERTYLINK FOR THETHREE YEARS ENDED 30 JUNE 2018
THE AUDITED FINANCIAL STATEMENTS OF PROPERTYLINK AUSTRALIANINDUSTRIAL PARTNERSHIP FOR THE SIX MONTHS ENDED JUNE 30, 2016
Consolidated statement of cash flowsFor the six months ended 30 June 2016
1 Jan 2016to 30 Jun 2016
1 Jan 2015to 31 Dec 2015
Note $’000 $’000
Cash flows from operating activitiesCash receipts in the course of operations . . . . . . . . . . . . . . . . . . . . . . . . . . . . . 33,652 49,669Cash payments in the course of operations . . . . . . . . . . . . . . . . . . . . . . . . . . . . (12,753) (14,695)Finance costs . . . . . . . . . . . . . . . . . . . . . . . . . . . . . . . . . . . . . . . . . . . . . . . . . . . (16,327) (27,344)Rental bonds . . . . . . . . . . . . . . . . . . . . . . . . . . . . . . . . . . . . . . . . . . . . . . . . . . . 110 227
Net cash flows generated by operating activities . . . . . . . . . . . . . . . . . . . . . 20 4,682 7,857
Cash flows from investing activitiesAcquisition and improvement of investment property . . . . . . . . . . . . . . . . . . . (2,668) (264,904)Proceeds on disposal of investment property . . . . . . . . . . . . . . . . . . . . . . . . . . 14,764 13,814Interest received . . . . . . . . . . . . . . . . . . . . . . . . . . . . . . . . . . . . . . . . . . . . . . . . 41 63
Net cash flows generated by/(used in) investing activities . . . . . . . . . . . . . . 12,137 (251,027)
Cash flows from financing activitiesProceeds from loans . . . . . . . . . . . . . . . . . . . . . . . . . . . . . . . . . . . . . . . . . . . . . — 153,943Repayments of loans . . . . . . . . . . . . . . . . . . . . . . . . . . . . . . . . . . . . . . . . . . . . . (8,226) (7,530)Derivatives purchased . . . . . . . . . . . . . . . . . . . . . . . . . . . . . . . . . . . . . . . . . . . . (63) —Proceeds from issue of preference units . . . . . . . . . . . . . . . . . . . . . . . . . . . . . . — 81,749Loans to unitholders . . . . . . . . . . . . . . . . . . . . . . . . . . . . . . . . . . . . . . . . . . . . . (3,500) —Proceeds from issue of units . . . . . . . . . . . . . . . . . . . . . . . . . . . . . . . . . . . . . . . — 27,250Distributions paid to unitholders . . . . . . . . . . . . . . . . . . . . . . . . . . . . . . . . . . . . (8,526) (8,789)
Net cash flows (used in)/generated by financing activities . . . . . . . . . . . . . (20,315) 246,623
Net decrease in cash and cash equivalents . . . . . . . . . . . . . . . . . . . . . . . . . . . . (3,496) 3,453Cash and cash equivalents at the beginning of the period . . . . . . . . . . . . . . . . 9,223 5,770
Cash and cash equivalents at the end of the period . . . . . . . . . . . . . . . . . . . 12 5,727 9,223
The above consolidated statement of cash flows should be read in conjunction with theaccompanying notes.
II-A-52

APPENDIX II-A AUDITED FINANCIAL STATEMENTS ON PROPERTYLINK FOR THETHREE YEARS ENDED 30 JUNE 2018
THE AUDITED FINANCIAL STATEMENTS OF PROPERTYLINK AUSTRALIANINDUSTRIAL PARTNERSHIP FOR THE SIX MONTHS ENDED JUNE 30, 2016
Notes to the consolidated financial statementsFor the six months ended 30 June 2016
1. General information
The consolidated financial statements of the Propertylink Australian Industrial Partnership (the“Trust”) and its subsidiaries (the “Group”) for the six months ended 30 June 2016 were authorised forissue by the Trustee, Propertylink Investment Management Limited, on 29 September 2016. The Trustis registered and domiciled in Australia. The registered office is Level 29, 20 Bond Street, SydneyNSW 2000. The Group commenced operations on 23 September 2013. The principal activity of theGroup during the period was investment in industrial and commercial property within the geographicallocation of Australia.
Members of the consolidated group are all wholly owned subsidiary entities of the Trust, andfull details of the subsidiary entities are disclosed in note 27.
2. Basis of preparation
These general purpose consolidated financial statements have been prepared in accordance withAustralian Accounting Standards and Interpretations issued by the Accounting Standards Board andthe Corporations Act 2001 in Australia. Compliance with Australian Accounting Standards results infull compliance with the International Financial Reporting Standards (IFRS) as issued by theInternational Accounting Standards Board (IASB).
As the Group was stapled to the Propertylink Group on 15 August 2016, these financialstatements are prepared for a six month period so as to align reporting periods within the PropertylinkGroup, which has a 30 June year end. These financial statements are for a six month period andtherefore, the prior year is not directly comparable. This is the first period that the Group has preparedfinancial statements as at 30 June as it previously had a 31 December year end. The comparativeperiod was audited by another auditor who expressed an unmodified opinion.
The financial report has been prepared on an accrual basis and is based on historical costsexcept for investment properties, derivative financial instruments and property, plant and equipmentthat have been measured at fair value.
The Group is an entity of the kind referred to in ASIC Corporations (Rounding in Financial/Directors’ Reports) Instrument 2016/191, issued by the Australian Securities and InvestmentsCommission relating to the “rounding off” of amounts in the consolidated financial statements.Amounts in the consolidated financial statements have been rounded to the nearest thousand dollars,unless otherwise indicated.
The consolidated financial statements are presented in Australian Dollars which is the Group’sfunctional and presentation currency.
The Group is a for-profit entity for the purpose of preparing the consolidated financialstatements.
II-A-53

APPENDIX II-A AUDITED FINANCIAL STATEMENTS ON PROPERTYLINK FOR THETHREE YEARS ENDED 30 JUNE 2018
THE AUDITED FINANCIAL STATEMENTS OF PROPERTYLINK AUSTRALIANINDUSTRIAL PARTNERSHIP FOR THE SIX MONTHS ENDED JUNE 30, 2016
Notes to the consolidated financial statementsFor the six months ended 30 June 2016
2. Basis of preparation (continued)
The Trustee has determined that the Group’s consolidated financial statements have beenprepared on a going concern basis, which assumes continuity of normal business activities and therealisation of assets and settlement of liabilities in the ordinary course of business.
3. Reclassifications and disclosures
During the six months, the Group reclassified property constructed on underlying ground leaseagreements. These assets are now classified as Property, Plant and Equipment and are subject todepreciation over the shorter of the lease term or the assets useful life. Prior to this reclassification,such property has been classified as Investment Property and not subject to depreciation. As a result,the Melbourne Markets property has been reclassified from Investment Property to Property, Plant andEquipment.
New and amended standards adopted by the Trust
Other than as noted above, the accounting policies adopted are consistent with those of theprevious financial year. The Trust applied for the first time certain standards and amendments, whichare effective for annual periods beginning on or after 1 July 2015. The Trust has not early adopted anyother standard, interpretation or amendment that has been issued but is not yet effective.
The nature and the effect of the amendments that are of relevance to a real estate investor aredisclosed below. Although these amendments applied for the first time in 2016, they did not impact theannual consolidated financial statements of the Group.
Reference Title
Applicationdate of
standard
Applicationdate forTrust
AASB 2013-9 Amendments to Australian Accounting Standards—Conceptual Framework, Materiality and FinancialInstruments
1 Jan 2015 1 Jan 2015
The Standard contains three main parts and makesamendments to a number of Standards andInterpretations.
Part A of AASB 2013-9 makes consequentialamendments arising from the issuance of AASBCF 2013-1.
Part B makes amendments to particular AustralianAccounting Standards to delete references toAASB 1031 and also makes minor editorialamendments to various other standards.
II-A-54

APPENDIX II-A AUDITED FINANCIAL STATEMENTS ON PROPERTYLINK FOR THETHREE YEARS ENDED 30 JUNE 2018
THE AUDITED FINANCIAL STATEMENTS OF PROPERTYLINK AUSTRALIANINDUSTRIAL PARTNERSHIP FOR THE SIX MONTHS ENDED JUNE 30, 2016
Notes to the consolidated financial statementsFor the six months ended 30 June 2016
3. Reclassifications and disclosures (continued)
Part C makes amendments to a number of AustralianAccounting Standards, including incorporating Chapter 6Hedge Accounting into AASB 9 Financial Instruments.
AASB 2015-3 Amendments to Australian Accounting Standards arisingfrom the Withdrawal of AASB 1031 Materiality
The Standard completes the AASB’s project to removeAustralian guidance on materiality from AustralianAccounting Standards.
1 Jul 2015 1 Jul2015
Standards issued but not yet effective
The standards relevant to the Group that are issued but not yet effective up to the date ofissuance of the Group’s consolidated financial statements are disclosed below. This list of standardsand interpretations issued are those that the Group reasonably expects to have an impact on theGroup’s consolidated financial statements when applied at a future date. The Group intends to adoptthese standards when they become effective.
AASB 15 Revenue from Contracts with Customers
AASB 15 provides a new five step model for recognising revenue earned from a contract with acustomer and will replace the existing AASB 118 Revenue. It applies to all contracts with customersexcept leases, financial instruments and insurance contracts.
AASB 15 is effective for annual periods beginning on or after 1 January 2018 with earlyadoption permitted. The Group expects no significant impact of this standard on its consolidatedfinancial statements.
AASB 9 Financial Instruments
AASB 9 introduces new requirements for the classification and measurement of financialassets. Under AASB 9 financial assets are classified and measured based on the business model inwhich they are held and the characteristics of their contractual cash flows. AASB 9 also introducesadditional disclosure relating to financial liabilities.
AASB 9 is effective for annual periods beginning on or after 1 January 2018 with earlyadoption permitted. The Group expects no significant impact of this standard on its balance sheet andequity.
AASB 16 Leases
AASB 16 Leases will require the Trust to recognise a lease asset, and corresponding leaseliability, on the consolidated statement of financial position for operating leases for which it is the
II-A-55

APPENDIX II-A AUDITED FINANCIAL STATEMENTS ON PROPERTYLINK FOR THETHREE YEARS ENDED 30 JUNE 2018
THE AUDITED FINANCIAL STATEMENTS OF PROPERTYLINK AUSTRALIANINDUSTRIAL PARTNERSHIP FOR THE SIX MONTHS ENDED JUNE 30, 2016
Notes to the consolidated financial statementsFor the six months ended 30 June 2016
3. Reclassifications and disclosures (continued)
lessee from 1 July 2019. The Group is continuing to assess the impact of this standard, however it isnot practical to quantify the impact on the consolidated financial statement at the application date, asany quantification would be subject to the leases existing at that date, which is not guaranteed to occur.
4. Significant accounting judgements, estimates and assumptions
The preparation of the Group’s consolidated financial statements may require management tomake judgements, estimates and assumptions that affect the reported amounts of revenues, expenses,assets and liabilities, and the accompanying disclosures. Uncertainty about these assumptions andestimates could result in outcomes that require a material adjustment to the carrying amount of theassets or liabilities affected in future periods. The estimates and associated assumptions are based onhistorical experience and various other factors that are believed to be reasonable under thecircumstances.
Other disclosures relating to the Group’s exposure to risks and uncertainties include:
Š Capital management Note 23
Š Financial risk management objectives and policies Note 22
Š Sensitivity analyses disclosures Note 15, 22
Estimates and assumptions
The estimates and underlying assumptions are reviewed on an ongoing basis. The Group basedits assumptions and estimates on parameters available when the consolidated financial statements wereprepared. Existing circumstances and assumptions about future developments, however, may changedue to market changes or circumstances arising that are beyond the control of the Group. Such changesare reflected in the assumptions when they occur. The key estimates and assumptions are as follows:
Valuation of investment property and property, plant and equipment
The fair value of investment property is determined by real estate valuation experts usingrecognised valuation techniques and the principles of IFRS 13 Fair Value Measurement. Thesignificant methods and assumptions used by valuers in estimating the fair value of investmentproperty are set out in Note 15.
Valuation of derivatives
The fair value of derivatives is determined by the financial institution’s experts usingrecognised valuation techniques and the principles of IFRS 13 Fair Value Measurement. Refer toNote 17.
II-A-56
APPENDIX II-A AUDITED FINANCIAL STATEMENTS ON PROPERTYLINK FOR THETHREE YEARS ENDED 30 JUNE 2018
THE AUDITED FINANCIAL STATEMENTS OF PROPERTYLINK AUSTRALIANINDUSTRIAL PARTNERSHIP FOR THE SIX MONTHS ENDED JUNE 30, 2016
Notes to the consolidated financial statementsFor the six months ended 30 June 2016
5. Summary of significant accounting policies
Basis of consolidation
The consolidated financial statements comprise the financial statements of the Group and itssubsidiaries as at 30 June 2016. Control is achieved when the Group is exposed, or has rights, tovariable returns from its involvement with the investee and has the ability to affect those returnsthrough its power over the investee. Specifically, the Group controls an investee if and only if theGroup has:
Š Power over the investee (i.e. existing rights that give it the current ability to direct therelevant activities of the investee)
Š Exposure, or rights, to variable returns from its involvement with the investee, and
Š The ability to use its power over the investee to affect its returns
When the Group has less than a majority of the voting or similar rights of an investee, theGroup considers all relevant facts and circumstances in assessing whether it has power over aninvestee, including:
Š The contractual arrangement with the other vote holders of the investee
Š Rights arising from other contractual arrangements
Š The Trust’s voting rights and potential voting rights
The Group re-assesses whether or not it controls an investee if facts and circumstances indicatethat there are changes to one or more of the three elements of control. Consolidation of a subsidiarybegins when the Group obtains control over the subsidiary and ceases when the Group loses control ofthe subsidiary. Assets, liabilities, income and expenses of a subsidiary acquired or disposed of duringthe year are included in the consolidated statement of comprehensive income from the date the Groupgains control until the date the Group ceases to control the subsidiary.
Profit or loss and each component of other comprehensive income (OCI) are attributed to theequity holders of the parent of the Group and to the non-controlling interest, even if this results in thenon-controlling interests having a deficit balance. When necessary, adjustments are made to thefinancial statements of subsidiaries to bring their accounting policies in line with the Group’saccounting policies. All intra-group assets and liabilities, equity, income, expenses and cash flowsrelating to transactions between members of the Group are eliminated in full on consolidation.
Property acquisitions and business combination
Where property is acquired, via corporate acquisitions or otherwise, management considers thesubstance of the assets and activities of the acquired entity in determining whether the acquisitionrepresents the acquisition of a business.
II-A-57

APPENDIX II-A AUDITED FINANCIAL STATEMENTS ON PROPERTYLINK FOR THETHREE YEARS ENDED 30 JUNE 2018
THE AUDITED FINANCIAL STATEMENTS OF PROPERTYLINK AUSTRALIANINDUSTRIAL PARTNERSHIP FOR THE SIX MONTHS ENDED JUNE 30, 2016
Notes to the consolidated financial statementsFor the six months ended 30 June 2016
5. Summary of significant accounting policies (continued)
Where such acquisitions are not judged to be an acquisition of a business, they are not treatedas business combinations. Rather, the cost to acquire the corporate entity or assets and liabilities isallocated between the identifiable assets and liabilities (of the entity) based on their relative values atthe acquisition date. Accordingly, no goodwill or deferred taxation arises.
Borrowing costs
Borrowing costs directly attributable to the acquisition or construction of an asset thatnecessarily takes a substantial period of time to get ready for its intended use or sale are capitalised aspart of the cost of the asset. All other borrowing costs are expensed in the period in which they occur.Borrowing costs consist of interest and other costs that an entity incurs in connection with theborrowing of funds.
Investment property
Investment property comprises completed property and property under construction orre-development (including integral plant and equipment) that is held to earn rentals or for capitalappreciation or both.
Investment property is measured initially at cost, including transaction costs. The carryingamount also includes capital expenditure on investment property and components relating to leaseincentives and assets relating to fixed increases in operating lease rentals in future periods.
Subsequent to initial recognition, investment property is stated at fair value, which reflectsmarket conditions at the reporting date. Gains or losses arising from changes in the fair values ofinvestment properties are included in profit or loss in the period in which they arise.
The Trustee has adopted the following depreciation policy for investment properties: thebuildings and any component thereof (including plant and equipment) are not depreciated. Taxationallowances for the depreciation of buildings and plant and equipment are claimed by the Group andcontribute to the tax deferred component of distributions.
Transfers are made to (or from) investment property only when there is a change in use. For atransfer from investment property to owner-occupied property, the deemed cost for subsequentaccounting is the fair value at the date of change in use.
Investment property is derecognised either when it has been disposed of or when it ispermanently withdrawn from use and no future economic benefit is expected from its disposal. Thedifference between the net disposal proceeds and the carrying amount of the asset is recognised inprofit or loss in the period of derecognition.
II-A-58

APPENDIX II-A AUDITED FINANCIAL STATEMENTS ON PROPERTYLINK FOR THETHREE YEARS ENDED 30 JUNE 2018
THE AUDITED FINANCIAL STATEMENTS OF PROPERTYLINK AUSTRALIANINDUSTRIAL PARTNERSHIP FOR THE SIX MONTHS ENDED JUNE 30, 2016
Notes to the consolidated financial statementsFor the six months ended 30 June 2016
5. Summary of significant accounting policies (continued)
Non-current assets held for sale
Investment property is transferred to non-current assets held for sale when it is expected thatthe carrying amount will be recovered principally through sale rather than from continuing use. For thisto be the case, the property must be available for immediate sale in its present condition, subject onlyto terms that are usual and customary for sales of such property and its sale must be highly probable.
For the sale to be highly probable:
Š The Trustee must be committed to a plan to sell the property and an active programme tolocate a buyer and complete the plan must have been initiated
Š The property must be actively marketed for sale at a price that is reasonable in relation toits current fair value, and
Š The sale should be expected to qualify for recognition as a completed sale within one yearfrom the date of classification
On re-classification as held for sale, investment properties that are measured at fair valuecontinue to be so measured. Assets and liabilities classified as held for sale are presented separately ascurrent items in the consolidated statement of financial position.
Property, plant and equipment
Property, plant and equipment is carried at cost or fair value as indicated less, where applicable,any accumulated depreciation and impairment losses.
Property
Leasehold land and buildings are carried at their fair value (being the amount for which an assetcould be exchanged between knowledgeable willing parties in an arm’s length transaction), based onperiodic valuations by external independent valuers, less accumulated depreciation for buildings.
Increases in the carrying amount arising on revaluation of land and buildings are credited to arevaluation surplus in equity. Decreases that offset previous increases of the same asset are recognisedagainst revaluation surplus directly in equity; all other decreases are recognised in profit or loss.
Any accumulated depreciation at the date of revaluation is eliminated against the gross carryingamount of the asset and the net amount is restated to the revalued amount of the asset.
Depreciation
The depreciable amount is depreciated on a straight line basis over the asset’s useful life to theconsolidated group commencing from the time the asset is held ready for use. Leasehold improvements
II-A-59

APPENDIX II-A AUDITED FINANCIAL STATEMENTS ON PROPERTYLINK FOR THETHREE YEARS ENDED 30 JUNE 2018
THE AUDITED FINANCIAL STATEMENTS OF PROPERTYLINK AUSTRALIANINDUSTRIAL PARTNERSHIP FOR THE SIX MONTHS ENDED JUNE 30, 2016
Notes to the consolidated financial statementsFor the six months ended 30 June 2016
5. Summary of significant accounting policies (continued)
are depreciated over the shorter of either the unexpired period of the lease or the estimated useful livesof the improvements.
The assets’ residual values and useful lives are reviewed, and adjusted if appropriate, at the endof each reporting period.
An asset’s carrying amount is written down immediately to its recoverable amount if the asset’scarrying amount is greater than its estimated recoverable amount.
Gains and losses on disposal are determined by comparing proceeds with the carrying amount.These gains or losses are recognised in profit or loss when the item is derecognised. When revaluedassets are sold, amounts included in the revaluation surplus relating to that asset are transferred toretained earnings.
Trade and other receivables
Trade and other receivables are recognised at their original invoiced value except where thetime value of money is material, in which case receivables are recognised at fair value andsubsequently measured at amortised cost. A provision is made when there is objective evidence thatthe Group will not be able to recover balances in full. Balances are written off when the probability ofrecovery is assessed as being remote.
Trade and other payables
Liabilities are recognised for amounts to be paid in the future for goods or services received,based on invoices billed to the Group. The amounts are unsecured and are usually paid within 30 or 60days or recognition.
Distribution payable is recognised for the amount of distribution declared by the Trustee on orbefore the end of financial period but not distributed at balance date.
Cash and cash equivalents
Cash and cash equivalents in the consolidated statement of financial position comprise cash atbank and short-term deposits with an original maturity of three months or less, which are subject to aninsignificant risk of changes in value.
For the purpose of the consolidated statement of cash flows, cash and cash equivalents consistof cash and short-term deposits, as defined above, net of outstanding bank overdrafts as they areconsidered an integral part of the Group’s cash management.
II-A-60
APPENDIX II-A AUDITED FINANCIAL STATEMENTS ON PROPERTYLINK FOR THETHREE YEARS ENDED 30 JUNE 2018
THE AUDITED FINANCIAL STATEMENTS OF PROPERTYLINK AUSTRALIANINDUSTRIAL PARTNERSHIP FOR THE SIX MONTHS ENDED JUNE 30, 2016
Notes to the consolidated financial statementsFor the six months ended 30 June 2016
5. Summary of significant accounting policies (continued)
Interest bearing loans and borrowings
All loans and borrowings are initially recognised at fair value less directly attributabletransaction costs. After initial recognition, interest-bearing loans and borrowings are subsequentlymeasured at amortised cost using the effective interest method.
Leases
The determination of whether an arrangement is (or contains) a lease is based on the substanceof the arrangement at the inception of the lease. The arrangement is, or contains, a lease if fulfilment ofthe arrangement is dependent on the use of a specific asset or assets or the arrangement conveys a rightto use the asset or assets, even if that right is not explicitly specified in the arrangement.
Group as a lessee
A lease is classified at the inception date as a finance lease or an operating lease. Leases that donot transfer substantially all the risks and rewards of ownership of an asset to the Group are classifiedas operating leases. Operating lease payments are recognised as an operating expense in the statementof profit or loss on a straight-line basis over the lease term, except for contingent rental paymentswhich are expensed when they arise.
Group as a lessor
Leases in which the Group does not transfer substantially all the risks and rewards of ownershipof an asset are classified as operating leases. Initial direct costs incurred in negotiating and arrangingan operating lease are added to the carrying amount of the leased asset and recognised over the leaseterm on the same basis as rental income. Contingent rents are recognised as revenue in the period inwhich they are earned.
Revenue recognition
Revenue is recognised to the extent that it is probable that the economic benefits will flow tothe Group and the revenue can be reliably measured, regardless of when the payment is being received.Revenue is measured at the fair value of the consideration received or receivable, taking into accountcontractually defined terms of payment and excluding taxes or duty. The Group has concluded that it isthe principal in all of its revenue arrangements since it is the primary obligor, it has pricing latitude andis also exposed to credit risks.
The specific recognition criteria described below must also be met before revenue isrecognised.
II-A-61
APPENDIX II-A AUDITED FINANCIAL STATEMENTS ON PROPERTYLINK FOR THETHREE YEARS ENDED 30 JUNE 2018
THE AUDITED FINANCIAL STATEMENTS OF PROPERTYLINK AUSTRALIANINDUSTRIAL PARTNERSHIP FOR THE SIX MONTHS ENDED JUNE 30, 2016
Notes to the consolidated financial statementsFor the six months ended 30 June 2016
5. Summary of significant accounting policies (continued)
Rental income
The Group is the lessor in operating leases. Rental income arising from operating leases oninvestment property is accounted for on a straight-line basis over the lease terms and is included inrevenue in the consolidated statement of profit or loss due to its operating nature, except for contingentrental income which is recognised when it arises. The portion of rental income relating to fixedincreases in operating lease rentals in future periods is capitalised and recognised as a separatecomponent of the investment property.
Initial direct costs incurred in negotiating and arranging an operating lease are recognised as anexpense over the lease term on the same basis as the lease income.
Tenant lease incentives are recognised as a reduction of rental revenue on a straight-line basisover the term of the lease. The lease term is the non-cancellable period of the lease together with anyfurther term for which the tenant has the option to continue the lease, where, at the inception of thelease, the Trustee is reasonably certain that the tenant will exercise that option.
Amounts received from tenants to terminate leases or to compensate for dilapidations arerecognised in the consolidated statement of profit or loss when the right to receive them arises.
Service charges, management charges and other outgoings recoverable from tenants
Income arising from expenses recharged to tenants is recognised in the period in which thecompensation becomes receivable. Service and management charges and other such receipts areincluded in property rental income gross of the related costs, as the trustee considers that the Groupacts as principal in this respect.
Interest income
Interest income is recognised as it accrues using the effective interest rate (EIR) method. TheEIR is the rate that exactly discounts the estimated future cash receipts over the expected life of thefinancial instrument or a shorter period, where appropriate, to the net carrying amount of the financialasset. Interest income is included in the consolidated statement of profit or loss.
Dividends and distributions
Dividends and distributions are recognised as income when the right to receive payment isestablished.
Income tax
Under current Australian income tax legislation, the Group is not liable to pay income taxprovided unitholders are presently entitled to all the distributable income of the Group each year. The
II-A-62
APPENDIX II-A AUDITED FINANCIAL STATEMENTS ON PROPERTYLINK FOR THETHREE YEARS ENDED 30 JUNE 2018
THE AUDITED FINANCIAL STATEMENTS OF PROPERTYLINK AUSTRALIANINDUSTRIAL PARTNERSHIP FOR THE SIX MONTHS ENDED JUNE 30, 2016
Notes to the consolidated financial statementsFor the six months ended 30 June 2016
5. Summary of significant accounting policies (continued)
liability for capital gains tax that may arise if the units were sold is not accounted for in theseconsolidated financial statements.
Lease incentives
Prospective lessees may be offered incentives as an inducement to enter into non-cancellableoperating leases. These incentives may take various forms including rent-free months, upfront cashpayments, or a contribution to certain lessee costs such as a fitout contribution. Incentives areaccounted for on a straight-line basis over the lease term and included in rental income in the statementof profit or loss.
Financial instruments—initial recognition and subsequent measurement
A financial instrument is any contract that gives rise to a financial asset of one entity and afinancial liability or equity instrument of another entity.
(a) Financial assets
Initial recognition and measurement
Financial assets are classified, at initial recognition, as financial assets at fair value throughprofit or loss, loans and receivables, held-to-maturity investments, available-for-sale financial assets, oras derivatives designated as hedging instruments in an effective hedge, as appropriate.
All financial assets are recognised initially at fair value plus, in the case of financial assets notrecorded at fair value through profit or loss, transaction costs that are attributable to the acquisition ofthe financial asset.
Subsequent measurement
For purposes of subsequent measurement financial assets are classified in four categories:
Š Financial assets at fair value through profit or loss
Š Loans and receivables
Š Held-to-maturity investments
Š Available-for-sale financial investments
The Group’s financial assets comprise Trade and other receivables and the subsequentmeasurement is outlined below:
Loans and receivables
Loans and receivables are non-derivative financial assets with fixed or determinable paymentsthat are not quoted in an active market. After initial measurement, such financial assets are
II-A-63

APPENDIX II-A AUDITED FINANCIAL STATEMENTS ON PROPERTYLINK FOR THETHREE YEARS ENDED 30 JUNE 2018
THE AUDITED FINANCIAL STATEMENTS OF PROPERTYLINK AUSTRALIANINDUSTRIAL PARTNERSHIP FOR THE SIX MONTHS ENDED JUNE 30, 2016
Notes to the consolidated financial statementsFor the six months ended 30 June 2016
5. Summary of significant accounting policies (continued)
subsequently measured at amortised cost using the effective interest rate (EIR) method, lessimpairment. Amortised cost is calculated by taking into account any discount or premium onacquisition and fees or costs that are an integral part of the EIR. The EIR amortisation is included infinance income in the consolidated statement of profit or loss. The losses arising from impairment arerecognised in the consolidated statement of profit or loss in finance costs for loans and in cost of salesor other operating expenses for receivables.
This category generally applies to trade and other receivables.
De-recognition
A financial asset (or, where applicable, a part of a financial asset or part of a group of similarfinancial assets) is primarily de-recognised (i.e. removed from the Group’s consolidated statement offinancial position) when:
Š The rights to receive cash flows from the asset have expired; or
Š The Group has transferred its rights to receive cash flows from the asset or has assumed anobligation to pay the received cash flows in full without material delay to a third partyunder a “pass- through” arrangement; and either (a) the Group has transferred substantiallyall the risks and rewards of the asset, or (b) the Group has neither transferred nor retainedsubstantially all the risks and rewards of the asset, but has transferred control of the asset
When the Group has transferred its rights to receive cash flows from an asset or has enteredinto a pass-through arrangement, it evaluates if and to what extent it has retained the risks and rewardsof ownership. When it has neither transferred nor retained substantially all of the risks and rewards ofthe asset, nor transferred control of the asset, the Group continues to recognise the transferred asset tothe extent of the Group’s continuing involvement. In that case, the Group also recognises an associatedliability. The transferred asset and the associated liability are measured on a basis that reflects therights and obligations that the Group has retained.
(b) Impairment of financial assets
The Group assesses, at each reporting date, whether there is objective evidence that a financialasset or a group of financial assets is impaired. An impairment exists if one or more events that hasoccurred since the initial recognition of the asset (an incurred ‘loss event’) has an impact on theestimated future cash flows of the financial asset or the group of financial assets that can be reliablyestimated. Evidence of impairment may include indications that the debtors or a group of debtors isexperiencing significant financial difficulty, default or delinquency in interest or principal payments,the probability that they will enter bankruptcy or other financial reorganisation and observable dataindicating that there is a measurable decrease in the estimated future cash flows, such as changes inarrears or economic conditions that correlate with defaults.
II-A-64

APPENDIX II-A AUDITED FINANCIAL STATEMENTS ON PROPERTYLINK FOR THETHREE YEARS ENDED 30 JUNE 2018
THE AUDITED FINANCIAL STATEMENTS OF PROPERTYLINK AUSTRALIANINDUSTRIAL PARTNERSHIP FOR THE SIX MONTHS ENDED JUNE 30, 2016
Notes to the consolidated financial statementsFor the six months ended 30 June 2016
5. Summary of significant accounting policies (continued)
(c) Financial liabilities
Initial recognition and measurement
Financial liabilities are classified, at initial recognition, as financial liabilities at fair valuethrough profit or loss, loans and borrowings, payables, or as derivatives designated as hedginginstruments in an effective hedge, as appropriate.
All financial liabilities are recognised initially at fair value and, in the case of loans andborrowings and payables, net of directly attributable transaction costs.
The Trust’s financial liabilities include trade and other payables, loans and borrowings andderivative financial instruments.
Subsequent measurement
The measurement of financial liabilities depends on their classification and is as describedbelow:
Financial liabilities at fair value through profit or loss
Financial liabilities at fair value through profit or loss include financial liabilities held fortrading and financial liabilities designated upon initial recognition as at fair value through profit orloss.
Financial liabilities are classified as held for trading if they are incurred for the purpose ofrepurchasing in the near term. This category also includes derivative financial instruments entered intoby the Trust that are not designated as hedging instruments in hedge relationships as defined by IAS39. Separated embedded derivatives are also classified as held for trading unless they are designated aseffective hedging instruments.
Gains or losses on liabilities held for trading are recognised in the consolidated statement ofprofit or loss.
Financial liabilities designated upon initial recognition at fair value through profit or loss aredesignated at the initial date of recognition, and only if the criteria in IAS 39 are satisfied. The Trusthas not designated any financial liability as at fair value through profit or loss.
Loans and borrowings
After initial recognition, interest-bearing loans and borrowings are subsequently measured atamortised cost using the effective interest rate (EIR) method. Gains and losses are recognised in profitor loss when the liabilities are de-recognised as well as through the EIR amortisation process.
II-A-65

APPENDIX II-A AUDITED FINANCIAL STATEMENTS ON PROPERTYLINK FOR THETHREE YEARS ENDED 30 JUNE 2018
THE AUDITED FINANCIAL STATEMENTS OF PROPERTYLINK AUSTRALIANINDUSTRIAL PARTNERSHIP FOR THE SIX MONTHS ENDED JUNE 30, 2016
Notes to the consolidated financial statementsFor the six months ended 30 June 2016
5. Summary of significant accounting policies (continued)
Amortised cost is calculated by taking into account any discount or premium on acquisition andfees or costs that are an integral part of the EIR. The EIR amortisation is included in finance costs inthe consolidated statement of profit or loss.
This category generally applies to interest-bearing loans and borrowings. For more informationrefer Note 18.
De-recognition
A financial liability is de-recognised when the obligation under the liability is discharged orcancelled, or expires. When an existing financial liability is replaced by another from the same lenderon substantially different terms, or the terms of an existing liability are substantially modified, such anexchange or modification is treated as the de-recognition of the original liability and the recognition ofa new liability. The difference in the respective carrying amounts is recognised in the consolidatedstatement or profit or loss.
(d) Offsetting of financial instruments
Financial assets and financial liabilities are offset and the net amount is reported in theconsolidated statement of financial position if there is a currently enforceable legal right to offset therecognised amounts and there is an intention to settle on a net basis, to realise the assets and settle theliabilities simultaneously.
(e) Derivative financial instruments
Initial recognition and subsequent measurement
The Group uses derivative financial instruments, such as interest rate swaps, to hedge its risksassociated with interest rates. Such derivative financial instruments are initially recognised at fair valueon the date on which a derivative contract is entered into and are subsequently re-measured at fairvalue with the resulting gain or loss recognised in profit or loss. Derivatives are carried as financialassets when the fair value is positive and as financial liabilities when the fair value is negative. TheGroup has not applied hedge accounting to its derivative financial instruments.
The fair value of interest rate swaps is the estimated amount that the entity would receive orpay to transfer the swap at reporting date, taking into account current interest rates and the currentcreditworthiness of the swap counterparties.
II-A-66

APPENDIX II-A AUDITED FINANCIAL STATEMENTS ON PROPERTYLINK FOR THETHREE YEARS ENDED 30 JUNE 2018
THE AUDITED FINANCIAL STATEMENTS OF PROPERTYLINK AUSTRALIANINDUSTRIAL PARTNERSHIP FOR THE SIX MONTHS ENDED JUNE 30, 2016
Notes to the consolidated financial statementsFor the six months ended 30 June 2016
5. Summary of significant accounting policies (continued)
Fair value measurements
The Group measures derivatives and investment properties at fair value at each reporting date.Fair value related disclosures for items measured at fair value or where fair values are disclosed, aresummarised in the following notes:
Š Accounting policy disclosures Note 5Š Disclosures for valuation methods, significant estimates
and assumptions Notes 4, 5, 14, 15, 22Š Investment properties Note 15Š Derivatives and other financial instruments (including
those carried at amortised cost) Note 17, 22
Fair value is the price that would be received to sell an asset or paid to transfer a liability in anorderly transaction between market participants at the measurement date. The fair value measurementis based on the presumption that the transaction to sell the asset or transfer the liability takes placeeither:
Š In the principal market for the asset or liability Or
Š In the absence of a principal market, in the most advantageous market for the asset orliability
The Group must be able to access the principal or the most advantageous market at themeasurement date. The fair value of an asset or a liability is measured using the assumptions thatmarket participants would use when pricing the asset or liability, assuming that market participants actin their economic best interest.
A fair value measurement of a non-financial asset takes into account a market participant’sability to generate economic benefits by using the asset in its highest and best use or by selling it toanother market participant that would use the asset in its highest and best use.
The Group uses valuation techniques that are appropriate in the circumstances and for whichsufficient data are available to measure fair value, maximising the use of relevant observable inputsand minimising the use of unobservable inputs.
All assets and liabilities, for which fair value is measured or disclosed in the consolidatedfinancial statements are categorised within the fair value hierarchy (described as follows), based on thelowest level input that is significant to the fair value measurement as a whole:
Š Level 1—Quoted (unadjusted) market prices in active markets for identical assets orliabilities
Š Level 2—Valuation techniques for which the lowest level input that is significant to thefair value measurement is directly or indirectly observable
II-A-67

APPENDIX II-A AUDITED FINANCIAL STATEMENTS ON PROPERTYLINK FOR THETHREE YEARS ENDED 30 JUNE 2018
THE AUDITED FINANCIAL STATEMENTS OF PROPERTYLINK AUSTRALIANINDUSTRIAL PARTNERSHIP FOR THE SIX MONTHS ENDED JUNE 30, 2016
Notes to the consolidated financial statementsFor the six months ended 30 June 2016
5. Summary of significant accounting policies (continued)
Š Level 3—Valuation techniques for which the lowest level input that is significant to thefair value measurement is unobservable
For assets and liabilities that are recognised in the consolidated financial statements at fairvalue on a recurring basis, the Group determines whether transfers have occurred between levels in thehierarchy by re-assessing categorisation (based on the lowest level input that is significant to the fairvalue measurement as a whole) at the end of each reporting period.
Issued capital
Units on issue are recognised at the fair value of the consideration received by the Group. Anytransaction costs arising on the issue of units are recognised directly in equity as a reduction of theproceeds of units to which the costs relate.
Unitholder Funds
In accordance with the Trust Deed, the trustee determines the amount attributable tounitholders. Distributable income is calculated in accordance with the Trust Deed.
Goods and services tax (GST)
Revenues, expenses and assets are recognised net of the amount of GST, except where theamount of GST incurred is not recoverable from the Australian Tax Office. In these circumstances theGST is recognised as part of the cost of acquisition of the asset or as part of an item of the expense.Receivables and payables in the consolidated statement of financial position are shown inclusive ofGST. Cash flows are included in the consolidated statement of cash flows on a gross basis.
6. Revenue1 Jan 2016 to30 Jun 2016
1 Jan 2015 to31 Dec 2015
$’000 $’000
Rental income (excluding straight-lining) . . . . . . . . . . . . . . . . . . . . . . . . . . . . . 27,392 42,733Straight-lining of lease incentives . . . . . . . . . . . . . . . . . . . . . . . . . . . . . . . . . . . 127 1,064Outgoings recovery income . . . . . . . . . . . . . . . . . . . . . . . . . . . . . . . . . . . . . . . . 4,618 6,854
Total property rental income . . . . . . . . . . . . . . . . . . . . . . . . . . . . . . . . . . . . . . . 32,137 50,651Sundry income . . . . . . . . . . . . . . . . . . . . . . . . . . . . . . . . . . . . . . . . . . . . . . . . . . 43 212Make good recovery . . . . . . . . . . . . . . . . . . . . . . . . . . . . . . . . . . . . . . . . . . . . . 38 333
Total other income . . . . . . . . . . . . . . . . . . . . . . . . . . . . . . . . . . . . . . . . . . . . . . . 81 545
Total revenue . . . . . . . . . . . . . . . . . . . . . . . . . . . . . . . . . . . . . . . . . . . . . . . . . . 32,218 51,196
II-A-68

APPENDIX II-A AUDITED FINANCIAL STATEMENTS ON PROPERTYLINK FOR THETHREE YEARS ENDED 30 JUNE 2018
THE AUDITED FINANCIAL STATEMENTS OF PROPERTYLINK AUSTRALIANINDUSTRIAL PARTNERSHIP FOR THE SIX MONTHS ENDED JUNE 30, 2016
Notes to the consolidated financial statementsFor the six months ended 30 June 2016
7. Operating leases
Group as lessor
The Group has entered into leases on its property portfolio. The industrial property leasestypically have lease terms between 5 and 10 years and include clauses to enable periodic upwardrevision of the rental charge according to prevailing market conditions.
Future minimum rentals receivable under non-cancellable operating leases as at 30 June 2016and 31 December 2015 are as follows:
30 Jun 2016 31 Dec 2015
$’000 $’000
Within 1 year . . . . . . . . . . . . . . . . . . . . . . . . . . . . . . . . . . . . . . . . . . . . . . . . . . . . . 50,810 50,940After 1 year, but not more than 5 years . . . . . . . . . . . . . . . . . . . . . . . . . . . . . . . . . 125,714 132,145More than 5 years . . . . . . . . . . . . . . . . . . . . . . . . . . . . . . . . . . . . . . . . . . . . . . . . . 40,529 58,600
217,053 241,685
Group as lessee
The Group makes ground lease payments for certain industrial properties classified as Property,Plant and Equipment under non-cancellable operating leases expiring in 39 years. The leases havefixed escalation clauses. Commitments for minimum lease payments in relation to non-cancellablelease are as follows:
30 Jun 2016 31 Dec 2015
$’000 $’000
Within 1 year . . . . . . . . . . . . . . . . . . . . . . . . . . . . . . . . . . . . . . . . . . . . . . . . . . . . . 570 570After 1 year, but not more than 5 years . . . . . . . . . . . . . . . . . . . . . . . . . . . . . . . . . 3,414 3,414More than 5 years . . . . . . . . . . . . . . . . . . . . . . . . . . . . . . . . . . . . . . . . . . . . . . . . . 104,179 104,179
108,163 108,163
8. Expenses1 Jan 2016to 30 Jun
2016
1 Jan 2015to 31 Dec
2015
$’000 $’000
Repairs, maintenance and utilities . . . . . . . . . . . . . . . . . . . . . . . . . . . . . . . . . . . . . . 2,004 2,921Property insurance costs . . . . . . . . . . . . . . . . . . . . . . . . . . . . . . . . . . . . . . . . . . . . . . 409 680Statutory expenses . . . . . . . . . . . . . . . . . . . . . . . . . . . . . . . . . . . . . . . . . . . . . . . . . . 2,646 3,927Property management expenses . . . . . . . . . . . . . . . . . . . . . . . . . . . . . . . . . . . . . . . . 1,126 1,753Strata levies . . . . . . . . . . . . . . . . . . . . . . . . . . . . . . . . . . . . . . . . . . . . . . . . . . . . . . . . 29 67Leasing costs . . . . . . . . . . . . . . . . . . . . . . . . . . . . . . . . . . . . . . . . . . . . . . . . . . . . . . . 798 1,056Ground lease . . . . . . . . . . . . . . . . . . . . . . . . . . . . . . . . . . . . . . . . . . . . . . . . . . . . . . . 283 2,444Other . . . . . . . . . . . . . . . . . . . . . . . . . . . . . . . . . . . . . . . . . . . . . . . . . . . . . . . . . . . . . 607 909
Total property expenses . . . . . . . . . . . . . . . . . . . . . . . . . . . . . . . . . . . . . . . . . . . . . 7,902 13,757
II-A-69

APPENDIX II-A AUDITED FINANCIAL STATEMENTS ON PROPERTYLINK FOR THETHREE YEARS ENDED 30 JUNE 2018
THE AUDITED FINANCIAL STATEMENTS OF PROPERTYLINK AUSTRALIANINDUSTRIAL PARTNERSHIP FOR THE SIX MONTHS ENDED JUNE 30, 2016
Notes to the consolidated financial statementsFor the six months ended 30 June 2016
9. Finance cost1 Jan 2016to 30 Jun
2016
1 Jan 2015to 31 Dec
2015
$’000 $’000
Interest on bank loans . . . . . . . . . . . . . . . . . . . . . . . . . . . . . . . . . . . . . . . . . . . . . . . . 6,342 11,181Borrowing costs . . . . . . . . . . . . . . . . . . . . . . . . . . . . . . . . . . . . . . . . . . . . . . . . . . . . 417 628Interest on preference units . . . . . . . . . . . . . . . . . . . . . . . . . . . . . . . . . . . . . . . . . . . . 9,937 16,052Realised losses on interest rate swaps . . . . . . . . . . . . . . . . . . . . . . . . . . . . . . . . . . . . 422 794
Total finance costs . . . . . . . . . . . . . . . . . . . . . . . . . . . . . . . . . . . . . . . . . . . . . . . . . . 17,118 28,655
10. Segment information
The Group operates in one reportable segment: Australian industrial and logistics propertyinvestment—acquires, develops and leases industrial and logistics property within the geographicallocation of Australia. The Group has determined its one operating segment based on the internalinformation that is provided to the chief operating decision maker and which is used to make strategicdecisions. The Trustee has been identified as the Group’s chief operating decision maker.
11. Earnings per unit (EPU)
Basic and diluted EPU amounts are calculated by dividing the profit for the year attributable toordinary equity holders by weighted average number of units.
1 Jan 2016to 30 Jun
2016
1 Jan 2015to 31 Dec
2015
$’000 $’000
Basic and diluted earnings per Unit (EPU)Net profit for the period . . . . . . . . . . . . . . . . . . . . . . . . . . . . . . . . . . . . . . . . . . . 69,361 16,635Weighted average number of units . . . . . . . . . . . . . . . . . . . . . . . . . . . . . . . . . . 66,431,204 53,581,921
Basic and diluted EPU (cents) . . . . . . . . . . . . . . . . . . . . . . . . . . . . . . . . . . . . . . 104 31
12. Cash and cash equivalents30 Jun 2016 31 Dec 2015
$’000 $’000
Cash at bank . . . . . . . . . . . . . . . . . . . . . . . . . . . . . . . . . . . . . . . . . . . . . . . . . . . . . 5,727 9,223
Total cash and cash equivalents . . . . . . . . . . . . . . . . . . . . . . . . . . . . . . . . . . . . . . 5,727 9,223
Cash at bank earns interest at floating rates based on daily bank deposit rates.
II-A-70

APPENDIX II-A AUDITED FINANCIAL STATEMENTS ON PROPERTYLINK FOR THETHREE YEARS ENDED 30 JUNE 2018
THE AUDITED FINANCIAL STATEMENTS OF PROPERTYLINK AUSTRALIANINDUSTRIAL PARTNERSHIP FOR THE SIX MONTHS ENDED JUNE 30, 2016
Notes to the consolidated financial statementsFor the six months ended 30 June 2016
13. Trade and other receivables30 Jun 2016 31 Dec 2015
$’000 $’000
Rent and outgoings receivable . . . . . . . . . . . . . . . . . . . . . . . . . . . . . . . . . . . . . . . 926 814Provision for doubtful debts . . . . . . . . . . . . . . . . . . . . . . . . . . . . . . . . . . . . . . . . . (4) (56)Property deposits & due diligence cost . . . . . . . . . . . . . . . . . . . . . . . . . . . . . . . . . 157 157
Total trade and other receivables . . . . . . . . . . . . . . . . . . . . . . . . . . . . . . . . . . . . . 1,079 915
Refer to Note 22 for details on fair value measurement and the Group’s exposure to risksassociated with financial assets.
14. Property, plant and equipment30 Jun 2016 31 Dec 2015
$’000 $’000
Opening net book value . . . . . . . . . . . . . . . . . . . . . . . . . . . . . . . . . . . . . . . . . . . . . —Property reclassified from Investment Property to Property, Plant &
Equipment . . . . . . . . . . . . . . . . . . . . . . . . . . . . . . . . . . . . . . . . . . . . . . . . . . . . . 81,301 —Capital expenditure on owned property . . . . . . . . . . . . . . . . . . . . . . . . . . . . . . . . 17 —Capitalised straight-lining of fixed increases in operating leases inclusive of
lease incentives . . . . . . . . . . . . . . . . . . . . . . . . . . . . . . . . . . . . . . . . . . . . . . . . . 256 —Depreciation charge . . . . . . . . . . . . . . . . . . . . . . . . . . . . . . . . . . . . . . . . . . . . . . . . (1,013) —Revaluation adjustment . . . . . . . . . . . . . . . . . . . . . . . . . . . . . . . . . . . . . . . . . . . . . 11,439 —
Closing net book value . . . . . . . . . . . . . . . . . . . . . . . . . . . . . . . . . . . . . . . . . . . . . 92,000 —
Melbourne Markets property has been valued by Savills, an independent valuer, at 30 June2016 at $92m.
15. Investment property30 Jun 2016 31 Dec 2015
$’000 $’000
Industrial and commercial propertyAt the beginning of period . . . . . . . . . . . . . . . . . . . . . . . . . . . . . . . . . . . . . . . . . . 618,856 353,621Property acquisitions/(disposal) . . . . . . . . . . . . . . . . . . . . . . . . . . . . . . . . . . . . . . (13,898) 249,382Less: classified as property, plant & equipment . . . . . . . . . . . . . . . . . . . . . . . . . . (81,301) —Less: classified as held for sale . . . . . . . . . . . . . . . . . . . . . . . . . . . . . . . . . . . . . . . (9,300) —Capital expenditure on owned property . . . . . . . . . . . . . . . . . . . . . . . . . . . . . . . . 2,459 4,745Capitalised straight-lining of fixed increases in operating leases inclusive of
lease incentives . . . . . . . . . . . . . . . . . . . . . . . . . . . . . . . . . . . . . . . . . . . . . . . . . 1,163 594Gain/(loss) on fair value . . . . . . . . . . . . . . . . . . . . . . . . . . . . . . . . . . . . . . . . . . . . 65,673 10,514
Investment properties at the end of period . . . . . . . . . . . . . . . . . . . . . . . . . . . . . . 583,650 618,856
The carrying amount of investment property includes components related to deferred rent,capitalised lease incentives and leasing fees amounting to $1,757,171 (2015: $594,311)
II-A-71

APPENDIX II-A AUDITED FINANCIAL STATEMENTS ON PROPERTYLINK FOR THETHREE YEARS ENDED 30 JUNE 2018
THE AUDITED FINANCIAL STATEMENTS OF PROPERTYLINK AUSTRALIANINDUSTRIAL PARTNERSHIP FOR THE SIX MONTHS ENDED JUNE 30, 2016
Notes to the consolidated financial statementsFor the six months ended 30 June 2016
15. Investment property (continued)
The investment properties have been valued by Jones Lang LaSalle and Savills, independentvaluers, at 30 June 2016 at $592,950,000 including investment property classified as held for sale.
Fair value measurement—Investment property, investment property held for sale and propertyclassified as property, plant and equipment
The management group that determines the Group’s valuation policies and procedures forproperty valuations comprises the head of property and fund manager. Each year, the head of propertyand the fund manager appoint, after approval from the audit committee, an external valuer who isresponsible for the external valuations of the Group’s property. Selection criteria include marketknowledge, reputation, independence and whether professional standards are maintained.
Each property is considered a separate asset class based on its unique nature, characteristics andrisk. Each property is valued by an external valuer at least once in any 24-month period from the dateof the last valuation. In addition, the Trustee reviews the fair value of the properties at eachsix-monthly financial reporting date. If the Trustee believes that the fair value of a property ismaterially different from its current carrying amount, this property is valued by an external valuerwithin two months after the Trustee forms such opinion.
Highest and best use
For all investment property that is measured at fair value, the current use of the property isconsidered the highest and best use.
Fair value hierarchy
The fair values of investment property recognised in the consolidated statement of financialposition are Level 3 of the fair value measurement hierarchy (as disclosed in Note 5).
Valuation techniques used to derive fair values
The fair value is measured using capitalisation of net market income and discounted cash flow(DCF) approaches.
Capitalisation approach
The capitalisation approach involves the addition of expected rent for the various componentsof the property and the deduction of outgoings and other expenses (where appropriate) in order todetermine the net income of the property. This net market income is capitalised at the adoptedcapitalisation rate to derive a core value. The higher/lower the capitalisation rate is adopted, the lower/higher the valuation of a property.
II-A-72

APPENDIX II-A AUDITED FINANCIAL STATEMENTS ON PROPERTYLINK FOR THETHREE YEARS ENDED 30 JUNE 2018
THE AUDITED FINANCIAL STATEMENTS OF PROPERTYLINK AUSTRALIANINDUSTRIAL PARTNERSHIP FOR THE SIX MONTHS ENDED JUNE 30, 2016
Notes to the consolidated financial statementsFor the six months ended 30 June 2016
15. Investment property (continued)
Discounted cash flows (DCF) approach
The DCF approach involves discounting future net operating cash flows over a 10 yearinvestment horizon at the adopted discount rate to derive a net present value for the property. Thehigher/lower the discount rate is adopted, the lower/higher the valuation of a property.
The Group’s investment property including investment property classified as held for sale andproperty classified as Property, Plant and Equipment have been valued with the following keyunobservable inputs adopted:
Fair Value Valuationtechnique
Key unobservableinputs 30 Jun 2016 31 Dec 201530 Jun 2016 31 Dec 2015
$’000 $’000
684,950 618,856 Cap Approach Capitalisation rate 6.5% - 11.5% 7% - 10.75%(avg 7.76%) (avg 8.43%)
DCF Approach Discount rate 8% - 11.5% 8.5% - 10.75%(avg 8.78%) (avg 9.28%)
The table below highlights the sensitivity analysis of a 25 basis point change in capitalisationrate on the fair value of investment property:
- 25basis points
+ 25basis points
$’000 $’000
Fair value of investment property, PP&E and propertyheld for sale . . . . . . . . . . . . . . . . . . . . . . . . . . . . . . . . . . . . . . . .
30 Jun 2016 24,188 (22,733)
31 Dec 2015 17,226 (16,210)
16. Trade and other payables
30 Jun 2016 31 Dec 2015
$’000 $’000
Trade payables . . . . . . . . . . . . . . . . . . . . . . . . . . . . . . . . . . . . . . . . . . . . . . . . . . . . 2,373 1,833Accruals . . . . . . . . . . . . . . . . . . . . . . . . . . . . . . . . . . . . . . . . . . . . . . . . . . . . . . . . . 4,439 3,758Other payables . . . . . . . . . . . . . . . . . . . . . . . . . . . . . . . . . . . . . . . . . . . . . . . . . . . . 1,063 940Rental bonds . . . . . . . . . . . . . . . . . . . . . . . . . . . . . . . . . . . . . . . . . . . . . . . . . . . . . 1,045 935
Total trade and other payables . . . . . . . . . . . . . . . . . . . . . . . . . . . . . . . . . . . . . . . 8,920 7,466
Trade payables are non-interest bearing and are normally settled on 30 to 60 days terms. Referto Note 21 for amounts payable to related parties.
17. Derivative financial instruments
At 30 June 2016, the Group had interest rate swap agreements is place with a notional amountof $120m (2015: $120m) whereby the Group receives a variable rate and pays a fixed rate of interest of
II-A-73

APPENDIX II-A AUDITED FINANCIAL STATEMENTS ON PROPERTYLINK FOR THETHREE YEARS ENDED 30 JUNE 2018
THE AUDITED FINANCIAL STATEMENTS OF PROPERTYLINK AUSTRALIANINDUSTRIAL PARTNERSHIP FOR THE SIX MONTHS ENDED JUNE 30, 2016
Notes to the consolidated financial statementsFor the six months ended 30 June 2016
17. Derivative financial instruments (continued)
between 2.93% and 3.21%. In addition, at 30 June 2016, the Group had interest rate cap agreementswith notional amount of $52m (2015: Nil) whereby the Group receives a variable rate and pays a fixedrate of interest of 3% for each period the variable interest rate exceeds the fixed rate. The interest rateswaps and caps are being used to manage the Group’s interest rate risk exposure to changes in the cashflow of its secured bank loan, but they are not formally designated as cash flow hedges.
The aggregate fair value of the interest rate swaps and interest rate caps at the end of thereporting period was a liability of $1,278,180 (2015: $118,794).
The interest rate swaps and caps are classified in Level 2 of the fair value measurementhierarchy.
18. Interest-bearing loans and borrowings
Maturity 30 Jun 2016 31 Dec 2015
$’000 $’000
Non-currentWestpac loan facility, fully drawn . . . . . . . . . . . . . . . . . . . . . . . . . . . . 1-Jul-18 337,663 345,475Preference units . . . . . . . . . . . . . . . . . . . . . . . . . . . . . . . . . . . . . . . . . . 199,294 199,294
Total interest-bearing loans and borrowings . . . . . . . . . . . . . . . . . . . . 536,957 544,769
Senior debt funding is being provided by Westpac by way of a fully drawn commercial billfacility. The facility is subject to a margin of 1.5% over 90-day BBSY rate (excluding the effect ofrelated interest rate swaps) and establishment costs of $2,765,909 which are being amortised over thefacility period. The bill is secured against the Group’s investment properties. Subsequent to thereporting date, the Westpac facility was renegotiated (refer to Note 25).
The Group has been in compliance with all debt covenants during the period.
Preference units are unsecured and subject to 10% interest rate. Subsequent to the reportingdate, the preference units were converted to ordinary shares (refer to Note 25).
Refer to Note 22 for details on the Group’s exposure to risks associated with financialliabilities.
II-A-74

APPENDIX II-A AUDITED FINANCIAL STATEMENTS ON PROPERTYLINK FOR THETHREE YEARS ENDED 30 JUNE 2018
THE AUDITED FINANCIAL STATEMENTS OF PROPERTYLINK AUSTRALIANINDUSTRIAL PARTNERSHIP FOR THE SIX MONTHS ENDED JUNE 30, 2016
Notes to the consolidated financial statementsFor the six months ended 30 June 2016
19. Issued capital
Numberof units 30 Jun 2016 31 Dec 2015
$’000 $’000
Balance at the beginning of period . . . . . . . . . . . . . . . . . . . . . . . . . 39,180,538 66,431 39,181
Units issued 23 January 2015 . . . . . . . . . . . . . . . . . . . . . . . . . . . . . 5,791,592 5,792Units issued 11 June 2015 . . . . . . . . . . . . . . . . . . . . . . . . . . . . . . . . 1,345,412 1,345Units issued 26 June 2015 . . . . . . . . . . . . . . . . . . . . . . . . . . . . . . . . 10,770,576 10,771Units issued 16 September 2015 . . . . . . . . . . . . . . . . . . . . . . . . . . . 6,259,860 6,260Units issued 29 September 2015 . . . . . . . . . . . . . . . . . . . . . . . . . . . 3,082,276 3,082
Ordinary units at the end of period . . . . . . . . . . . . . . . . . . . . . . . . . 66,430,254 66,431 66,431
As stipulated in the Trust Deed each unit represents a right to an individual share in the Trustand does not extend to a right in the underlying assets of the Trust.
Subsequent to the reporting date, the units in the Trust were stapled to Propertylink securities toform the Propertylink Group (refer to Note 25).
20. Reconciliation of profit for the period to net cash flows from operating activities
1 Jan 2016to 30 Jun 2016
1 Jan 2015to 31 Dec 2015
$’000 $’000
Profit for the period . . . . . . . . . . . . . . . . . . . . . . . . . . . . . . . . . . . . . . . . . . . . 69,361 16,635Adjustments to reconcile profit before tax to net cash flows
Valuation (gains) on investment property . . . . . . . . . . . . . . . . . . . . . . . (65,673) (10,515)Net (gain) on disposal of investment property . . . . . . . . . . . . . . . . . . . . (677) (246)Interest income . . . . . . . . . . . . . . . . . . . . . . . . . . . . . . . . . . . . . . . . . . . . (40) (63)Amortisation of borrowing costs . . . . . . . . . . . . . . . . . . . . . . . . . . . . . . 414 —Depreciation . . . . . . . . . . . . . . . . . . . . . . . . . . . . . . . . . . . . . . . . . . . . . . 1,013 —Straight-lining rental income adjustments . . . . . . . . . . . . . . . . . . . . . . . (1,419) (594)Net loss on fair value of derivative financial instruments . . . . . . . . . . . 1,223 —
(65,159) (11,418)Changes in assets and liabilities(Increase)/decrease in rent and outgoings receivable . . . . . . . . . . . . . . . . . . . (163) (466)(Increase)/decrease in prepayments . . . . . . . . . . . . . . . . . . . . . . . . . . . . . . . . (853) (513)Increase in trade and other payables . . . . . . . . . . . . . . . . . . . . . . . . . . . . . . . . 1,454 2,828Increase/(decrease) in rent received in advance . . . . . . . . . . . . . . . . . . . . . . . 42 564Increase in rental bonds . . . . . . . . . . . . . . . . . . . . . . . . . . . . . . . . . . . . . . . . . — 227
480 2,640
Net cash flows from operating activities . . . . . . . . . . . . . . . . . . . . . . . . . . . 4,682 7,857
II-A-75

APPENDIX II-A AUDITED FINANCIAL STATEMENTS ON PROPERTYLINK FOR THETHREE YEARS ENDED 30 JUNE 2018
THE AUDITED FINANCIAL STATEMENTS OF PROPERTYLINK AUSTRALIANINDUSTRIAL PARTNERSHIP FOR THE SIX MONTHS ENDED JUNE 30, 2016
Notes to the consolidated financial statementsFor the six months ended 30 June 2016
21. Related party disclosures
The following table provides the total amount of transactions and outstanding balances thathave been entered into with related parties for the half-year ended 30 June 2016.
1 Jan 2016 to30 Jun 2016
1 Jan 2015 to31 Dec 2015
$’000 $’000
Purchase of goods and servicesPropertylink (Australasia) Pty Ltd
Property management services . . . . . . . . . . . . . . . . . . . . . . . . . 795 1,260Asset management fees . . . . . . . . . . . . . . . . . . . . . . . . . . . . . . . 1,535 2,654Leasing fees . . . . . . . . . . . . . . . . . . . . . . . . . . . . . . . . . . . . . . . . 316 209Sales commission . . . . . . . . . . . . . . . . . . . . . . . . . . . . . . . . . . . . 59 —Project management fees . . . . . . . . . . . . . . . . . . . . . . . . . . . . . . 37 —
2,742 4,123
30 Jun 2016 31 Dec 2015
Amounts owed by related partiesPropertylink Group . . . . . . . . . . . . . . . . . . . . . . . . . . . . . . . . . . . . . . . . . . 3,500 —
Amounts owed to related parties*Propertylink (Australasia) Pty Ltd . . . . . . . . . . . . . . . . . . . . . . . . . . . . . . . 1,136 912
* The amounts are included in trade and other payables
Terms and conditions of transactions with related parties
Transactions with related parties are made on terms equivalent to those that prevail in arm’slength transactions.
Transactions with Propertylink (Australasia) Pty Ltd are in respect of management and trustadministration services provided to the Group, pursuant to an investment management servicesagreement and property management services agreement.
There have been no guarantees provided or received for any related party receivables orpayables.
22. Financial risk management objectives and policies
The Group’s principal financial liabilities, other than derivatives, are loans and borrowings. Themain purpose of the Group’s loans and borrowings is to finance the acquisition and development of theGroup’s property portfolio. The Group has rent and other receivables, trade and other payables andcash and short-term deposits that arise directly from its operations.
The Group is exposed to market risk (including interest rate risk and real estate risk), credit riskand liquidity risk. The Trustee oversees the management of these risks. The Trustee is supported by a
II-A-76

APPENDIX II-A AUDITED FINANCIAL STATEMENTS ON PROPERTYLINK FOR THETHREE YEARS ENDED 30 JUNE 2018
THE AUDITED FINANCIAL STATEMENTS OF PROPERTYLINK AUSTRALIANINDUSTRIAL PARTNERSHIP FOR THE SIX MONTHS ENDED JUNE 30, 2016
Notes to the consolidated financial statementsFor the six months ended 30 June 2016
22. Financial risk management objectives and policies (continued)
financial committee that advises on financial risks and the appropriate financial risk governanceframework for the Group. The finance committee provides assurance to the Trustee that the Group’sfinancial risk activities are governed by appropriate policies and procedures and that financial risks areidentified, measured and managed in accordance with Group’s policies and risk objectives. Allderivative activities for risk management purposes are carried out by specialist teams that have theappropriate skills, experience and supervision. It is the Group’s policy that no trading in derivatives forspeculative purposes may be undertaken. The Trustee reviews and agrees policies for managing eachof these risks which are summarised below.
Market risk
Market risk is the risk that the fair values of future cash flows of a financial instrument willfluctuate because of changes in market prices. The financial instruments held by the Group that areaffected by market risk are principally the derivative financial instruments.
The sensitivity analyses in the following sections relate to the position as at 30 June 2016 and31 December 2015.
The sensitivity analysis has been prepared on the basis that the amount of net debt and the ratioof fixed to floating interest rates of the debt and derivatives are all constant and on the basis of thederivatives held at 30 June 2016.
The following assumptions have been made in calculating the sensitivity analysis:
Š The sensitivity of the relevant consolidated statement of profit or loss item is the effect ofthe assumed changes in respective market risks. This is based on the financial assets andfinancial liabilities held at 30 June 2016 and 31 December 2015.
Interest rate risk
Interest rate risk is the risk that the future cash flows of a financial instrument will fluctuatebecause of changes in market interest rates. The Group’s exposure to the risk of changes in marketinterest rates relates primarily to its long-term debt obligations with floating interest rates.
To manage its interest rate risk, the Group enters into interest rate swaps, in which it agrees toexchange, at specified intervals, the difference between fixed and variable rate interest amountscalculated by reference to an agreed-upon notional principal amount. The Group also enters intointerest rate caps agreements, in which it receives a variable rate and pays a fixed rate of interest foreach period the variable interest rate exceeds the fixed rate. These swaps and caps are designated tohedge underlying debt obligations. At 30 June 2016, after taking into account the effect of interest rateswaps, 51% of the Group’s borrowings are hedged (31 December 2015: 50%).
II-A-77

APPENDIX II-A AUDITED FINANCIAL STATEMENTS ON PROPERTYLINK FOR THETHREE YEARS ENDED 30 JUNE 2018
THE AUDITED FINANCIAL STATEMENTS OF PROPERTYLINK AUSTRALIANINDUSTRIAL PARTNERSHIP FOR THE SIX MONTHS ENDED JUNE 30, 2016
Notes to the consolidated financial statementsFor the six months ended 30 June 2016
22. Financial risk management objectives and policies (continued)
The analysis below describes reasonably possible movements in interest rates with all othervariables held constant, showing the impact on profit before tax and equity. It should be noted that theimpact of movement in the variable is not necessarily linear.
Š The sensitivity of the consolidated statement of profit or loss is the effect of the assumedchanges in interest rates on finance income less finance expense for one year, based on thefloating rate financial liabilities held at the reporting date, including the effect of hedginginstruments.
Š The sensitivity of equity is calculated by revaluing interest rate swaps designated as cashflow hedges, for the effects of the assumed changes in interest rates. As the Group did notdesignate any of its interest rate swaps as cash flow hedges, there is no impact on equity.
Increase/(decrease)in basis points
Effect on profitbefore tax
1 Jan 2016 to30 Jun 2016
1 Jan 2015 to31 Dec 2015
$’000 $’000
90-day BBSY interest rate . . . . . . . . . . . . . . . . . . . . . . . . . . +50 184 21-50 (186) (27)
Credit risk
Credit risk is the risk that a counterparty will not meet its obligations under a financialinstrument or customer contract, leading to a financial loss. The Trust is exposed to credit risks fromboth its leasing activities and financing activities, including deposits with banks and financialinstitutions and derivatives.
Tenant receivables
Tenants are assessed according to certain criteria prior to entering into lease arrangements.Credit risk is managed by requiring tenants to pay rentals in advance. The credit quality of the tenant isassessed based on an extensive credit rating scorecard at the time of entering into a lease agreement.Outstanding tenants’ receivables are regularly monitored. An impairment analysis is performed at eachreporting date on an individual basis for major tenants. The maximum exposure to credit risk at thereporting date is the carrying value of each class of financial asset.
Financial instruments and cash deposits
Credit risk from balances with banks and financial institutions is managed in accordance withthe Group’s policy. Investments of surplus funds are made with financial institutions that maintain ahigh credit rating or in entities that the finance committee has otherwise assessed as being financiallysound. The Group’s maximum exposure to credit risk for the components of the consolidated statementof financial position at 30 June 2016 and 31 December 2015 is the carrying amounts of each class offinancial instruments.
II-A-78

APPENDIX II-A AUDITED FINANCIAL STATEMENTS ON PROPERTYLINK FOR THETHREE YEARS ENDED 30 JUNE 2018
THE AUDITED FINANCIAL STATEMENTS OF PROPERTYLINK AUSTRALIANINDUSTRIAL PARTNERSHIP FOR THE SIX MONTHS ENDED JUNE 30, 2016
Notes to the consolidated financial statementsFor the six months ended 30 June 2016
22. Financial risk management objectives and policies (continued)
Liquidity risk
The Group’s objective is to maintain a balance between continuity of funding and flexibilitythrough the use of bank deposits and loans.
The table below summarises the maturity profile of the Group’s financial liabilities based oncontractual undiscounted payments (including interest payments):
Less than3 months
3 to 12months
1 to 5years > 5 years Total
$’000 $’000 $’000 $’000 $’000
As at 30 Jun 2016Interest-bearing loans and borrowings . . . . . . . . . . . . 2,911 8,626 351,292 — 362,829Preference units . . . . . . . . . . . . . . . . . . . . . . . . . . . . . . — — — 199,294 199,294Trade and other payables . . . . . . . . . . . . . . . . . . . . . . 13,605 — — — 13,605Derivative financial instruments . . . . . . . . . . . . . . . . . 316 962 — — 1,278
16,832 9,588 351,292 199,294 577,006
As at 31 Dec 2015Interest-bearing loans and borrowings . . . . . . . . . . . . 3,305 11,064 356,064 — 370,433Preference units . . . . . . . . . . . . . . . . . . . . . . . . . . . . . . — — — 199,294 199,294Trade and other payables . . . . . . . . . . . . . . . . . . . . . . 11,174 — — — 11,174Derivative financial instruments . . . . . . . . . . . . . . . . . 119 — — — 119
14,598 11,064 356,064 199,294 581,020
The Group assessed the concentration of risk with respect to refinancing its debt and concludedit to be low. The Group has sufficient funds to pay all its debt maturing within 12 months.
Fair values
Set out below is a comparison by class of the carrying amounts and fair value of the Group’sfinancial assets and liabilities that are carried in the consolidated financial statements:
Fair valuemeasurementhierarchy
Carrying amount Fair value
30 Jun2016
31 Dec2015
30 Jun2016
31 Dec2015
$’000 $’000 $’000 $’000
Financial assetsTrade and other receivables . . . . . . . . . . . . . . . 1,079 915 1,079 915Cash and cash equivalents . . . . . . . . . . . . . . . . 5,727 9,223 5,727 9,223
Financial liabilitiesInterest-bearing loans . . . . . . . . . . . . . . . . . . . Level 2 337,663 345,475 337,663 345,475Preference units . . . . . . . . . . . . . . . . . . . . . . . . Level 3 199,294 199,294 199,294 199,294Unearned income . . . . . . . . . . . . . . . . . . . . . . . Level 2 1,371 1,330 1,371 1,330Derivative financial instruments . . . . . . . . . . . Level 2 1,278 119 1,278 119Trade and other payables . . . . . . . . . . . . . . . . . 13,605 11,174 13,605 11,174
II-A-79

APPENDIX II-A AUDITED FINANCIAL STATEMENTS ON PROPERTYLINK FOR THETHREE YEARS ENDED 30 JUNE 2018
THE AUDITED FINANCIAL STATEMENTS OF PROPERTYLINK AUSTRALIANINDUSTRIAL PARTNERSHIP FOR THE SIX MONTHS ENDED JUNE 30, 2016
Notes to the consolidated financial statementsFor the six months ended 30 June 2016
22. Financial risk management objectives and policies (continued)
Management has assessed that the fair values of cash and cash equivalents, trade and otherreceivables and trade and other payables approximate their carrying amounts largely due to the short-term maturities of these instruments. The fair value of the financial assets and liabilities is included atthe amount of which the instrument could be exchanged in a current transaction between willingparties, other than in a forced or liquidation sale. The following methods and assumptions were used toestimate the fair values:
Š Receivables are evaluated by the Group based on parameters such as interest rates,individual creditworthiness of the customer, and the risk characteristics of the financedproject. Based on this evaluation, allowances are taken into account for the expected lossesof these receivables. As at 30 June 2016, the carrying amounts of such receivables, net ofallowances, were not materially different from their calculated fair values.
Š The valuation techniques applied to fair value of derivatives employ the use of marketobservable inputs and include swap models which use present value calculations. Themodel incorporates various inputs including the credit quality of counterparties andforward rates.
Š Fair values of the Group’s interest-bearing borrowings and loans are determined by usingthe DCF method using a discount rate that reflects the issuer’s borrowing rate including itsown non-performance risk as at 30 June 2016. As at 30 June 2016, the carrying amounts ofsuch interest-bearing loans were not materially different from their calculated fair values.
23. Capital management
The primary objective of the Group’s capital management is to ensure that it remains within itsquantitative banking covenants and maintains a strong credit rating. No changes were made in theobjectives, policies or processes during the half-year ending 30 June 2016.
The Group monitors capital primarily using a loan-to-value ratio (LVR), which is calculated asthe amount of outstanding debt divided by the valuation of the investment property portfolio. TheGroup’s policy is to keep its average LVR below 65%.
24. Commitments and contingencies
Commitments
As at 30 June 2016, the Trust had agreed contracts with third parties and is consequentlycommitted to future capital expenditure in respect of investment property of $600,000 (31 December2015: $164,000).
Contingencies
The Trust has no contingent assets or contingent liabilities in 2016 and 2015.
II-A-80

APPENDIX II-A AUDITED FINANCIAL STATEMENTS ON PROPERTYLINK FOR THETHREE YEARS ENDED 30 JUNE 2018
THE AUDITED FINANCIAL STATEMENTS OF PROPERTYLINK AUSTRALIANINDUSTRIAL PARTNERSHIP FOR THE SIX MONTHS ENDED JUNE 30, 2016
Notes to the consolidated financial statementsFor the six months ended 30 June 2016
25. Events occurring after reporting date
Security holders are advised of the following matters which occurred after balance date:
Š In May 2016 the PAIP investment partners agreed to work towards an Initial PublicOffering (IPO) involving the stapling of PAIP units to Propertylink securities to form thePropertylink Group. The PAIP partners and Propertylink continued to pursue this outcomepost year end, and on 15 August 2016 the IPO was completed. For further details pleaserefer to the Prospectus and Product Disclosure Statement (PDS), and to the SupplementaryProspectus and Product Disclosure Statement (Supplementary PDS), which may be foundon the Propertylink Group web site.
Š On 15 August 2016 all 199,293,612 preference units on issue were converted to ordinaryunits as part of the IPO restructure.
Š As a result of the completion of the IPO, all debt finance as disclosed in note 18 was fullyrepaid. At IPO completion the Propertylink Group listed entity drew down on a new seniordebt facility with Westpac Banking Corporation (for further details please refer to thePDS).
Š Again as a result of the stapling of PAIP to Propertylink on 15 August 2016, PAIP becameliable to an investment management performance fee of $25.2m payable to thePropertylink Group. This fee was incurred immediately prior to the IPO and was paid aspart of the IPO restructure and was not accrued in the 30 June 2016 financial report.
Š In July 2016 the Group entered in to a contract to sell 36 National Boulevard,Campbellfield for a price of $9.6m. The contract is due to be settled on 28 September2016.
Other than these matters the directors of the Trustee are not aware of any matter orcircumstance not otherwise dealt with in this report or the financial statements that has significantlyaffected or may significantly affect the operations of the Trust, the results of those operations or thestate of affairs of the Trust in the financial year subsequent to the period ended 30 June 2016.
II-A-81

APPENDIX II-A AUDITED FINANCIAL STATEMENTS ON PROPERTYLINK FOR THETHREE YEARS ENDED 30 JUNE 2018
THE AUDITED FINANCIAL STATEMENTS OF PROPERTYLINK AUSTRALIANINDUSTRIAL PARTNERSHIP FOR THE SIX MONTHS ENDED JUNE 30, 2016
Notes to the consolidated financial statementsFor the six months ended 30 June 2016
26. Auditors remuneration
During the period, the following fees were paid or payable for services provided by theauditors.
1 Jan 2016to 30 Jun
2016
1 Jan 2015to 31 Dec
2015
$’000 $’000
KPMGAudit and review of financial reports . . . . . . . . . . . . . . . . . . . . . . . . . . . . . . . . . . . . 80 —PricewaterhouseCoopersAudit and review of financial reports . . . . . . . . . . . . . . . . . . . . . . . . . . . . . . . . . . . . 76 45
Total remuneration for audit services . . . . . . . . . . . . . . . . . . . . . . . . . . . . . . . . . . . . 156 45
27. Interests in subsidiaries
The subsidiaries listed below have issued capital consisting solely of units, which are helddirectly by the Trust. The proportion of ownership interest held equals the voting rights held by theGroup. Each subsidiary’s principal place of business is also its country of incorporation or registration.
Country ofregistration
2016(%)
2015(%)
Parent Entity:Propertylink Australian Industrial PartnershipControlled entities of Propertylink AustralianIndustrial PartnershipPHL Hold Trust . . . . . . . . . . . . . . . . . . . . . . . . . . . . . . . . . . . . . . . . . . . . . Australia 100% 100%PHL Hold Trust 2 . . . . . . . . . . . . . . . . . . . . . . . . . . . . . . . . . . . . . . . . . . . Australia 100% 100%PHL NW Trust . . . . . . . . . . . . . . . . . . . . . . . . . . . . . . . . . . . . . . . . . . . . . Australia 100% 100%PHL V Trust . . . . . . . . . . . . . . . . . . . . . . . . . . . . . . . . . . . . . . . . . . . . . . . Australia 100% 100%PHL Q Trust . . . . . . . . . . . . . . . . . . . . . . . . . . . . . . . . . . . . . . . . . . . . . . . Australia 100% 100%PHL DX Trust . . . . . . . . . . . . . . . . . . . . . . . . . . . . . . . . . . . . . . . . . . . . . . Australia 100% 100%PHL MM Trust . . . . . . . . . . . . . . . . . . . . . . . . . . . . . . . . . . . . . . . . . . . . . Australia 100% 100%PHL N Pike Street Trust . . . . . . . . . . . . . . . . . . . . . . . . . . . . . . . . . . . . . . Australia 100% —PAIP N Airds Road Trust . . . . . . . . . . . . . . . . . . . . . . . . . . . . . . . . . . . . . Australia 100% —PAIP N Beaumont Road Trust No 2 . . . . . . . . . . . . . . . . . . . . . . . . . . . . . Australia 100% —PAIP N Beaumont Road Trust No 3 . . . . . . . . . . . . . . . . . . . . . . . . . . . . . Australia 100% —PAIP N Beaumont Road Trust No 11 . . . . . . . . . . . . . . . . . . . . . . . . . . . . Australia 100% —PAIP N Beaumont Road Trust No 12 . . . . . . . . . . . . . . . . . . . . . . . . . . . . Australia 100% —PAIP N Beaumont Road Trust No 15 . . . . . . . . . . . . . . . . . . . . . . . . . . . . Australia 100% —PAIP N Boundary Road Trust . . . . . . . . . . . . . . . . . . . . . . . . . . . . . . . . . . Australia 100% —PAIP N Brunker Road Trust . . . . . . . . . . . . . . . . . . . . . . . . . . . . . . . . . . . Australia 100% —PAIP N Gundah Road Trust . . . . . . . . . . . . . . . . . . . . . . . . . . . . . . . . . . . Australia 100% —PAIP N Mandarin Street Trust . . . . . . . . . . . . . . . . . . . . . . . . . . . . . . . . . Australia 100% —PAIP N McCredie Road Trust . . . . . . . . . . . . . . . . . . . . . . . . . . . . . . . . . Australia 100% —PAIP N Newton Road Trust No 1 . . . . . . . . . . . . . . . . . . . . . . . . . . . . . . . Australia 100% —PAIP N Newtown Road Trust No 2 . . . . . . . . . . . . . . . . . . . . . . . . . . . . . Australia 100% —
II-A-82

APPENDIX II-A AUDITED FINANCIAL STATEMENTS ON PROPERTYLINK FOR THETHREE YEARS ENDED 30 JUNE 2018
THE AUDITED FINANCIAL STATEMENTS OF PROPERTYLINK AUSTRALIANINDUSTRIAL PARTNERSHIP FOR THE SIX MONTHS ENDED JUNE 30, 2016
Notes to the consolidated financial statementsFor the six months ended 30 June 2016
27. Interests in subsidiaries (continued)Country ofregistration
2016(%)
2015(%)
PAIP N Niagala Close Trust . . . . . . . . . . . . . . . . . . . . . . . . . . . . . . . . . . . Australia 100% —PAIP N Orielton Road Trust . . . . . . . . . . . . . . . . . . . . . . . . . . . . . . . . . . . Australia 100% —PAIP N Pike Street Trust No 2 . . . . . . . . . . . . . . . . . . . . . . . . . . . . . . . . . Australia 100% —PAIP N Rodborough Road Trust No 1 . . . . . . . . . . . . . . . . . . . . . . . . . . . Australia 100% —PAIP N Rodborough Road Trust No 2 . . . . . . . . . . . . . . . . . . . . . . . . . . . Australia 100% —PAIP N Sylvania Way Trust . . . . . . . . . . . . . . . . . . . . . . . . . . . . . . . . . . . Australia 100% —PAIP V Cherry Lane Trust . . . . . . . . . . . . . . . . . . . . . . . . . . . . . . . . . . . . Australia 100% —PAIP V Lakes Drive Trust . . . . . . . . . . . . . . . . . . . . . . . . . . . . . . . . . . . . Australia 100% —PAIP V Main Road Trust . . . . . . . . . . . . . . . . . . . . . . . . . . . . . . . . . . . . . Australia 100% —PAIP V Mt Derrimut Road Trust . . . . . . . . . . . . . . . . . . . . . . . . . . . . . . . Australia 100% —PAIP V National Boulevard Trust . . . . . . . . . . . . . . . . . . . . . . . . . . . . . . Australia 100% —PAIP V Ricketts Road Trust . . . . . . . . . . . . . . . . . . . . . . . . . . . . . . . . . . . Australia 100% —PAIP V Strezlecki Avenue Trust . . . . . . . . . . . . . . . . . . . . . . . . . . . . . . . Australia 100% —PAIP V Taryn Drive Trust . . . . . . . . . . . . . . . . . . . . . . . . . . . . . . . . . . . . Australia 100% —PAIP V Whiteside Road Trust . . . . . . . . . . . . . . . . . . . . . . . . . . . . . . . . . Australia 100% —PAIP V Woodlands Drive Trust . . . . . . . . . . . . . . . . . . . . . . . . . . . . . . . . Australia 100% —PAIP WA Leadership Way Trust . . . . . . . . . . . . . . . . . . . . . . . . . . . . . . . Australia 100% —PAIP WA McDowell Street Trust . . . . . . . . . . . . . . . . . . . . . . . . . . . . . . . Australia 100% —PAIP WA Modal Crescent Trust . . . . . . . . . . . . . . . . . . . . . . . . . . . . . . . . Australia 100% —
28. Information relating to Propertylink Australian Industrial Partnership (the Parent)
30 Jun 2016 31 Dec 2015
$’000 $’000
Current assets . . . . . . . . . . . . . . . . . . . . . . . . . . . . . . . . . . . . . . . . . . . . . . . . . . . . 184,711 203,332
Total assets . . . . . . . . . . . . . . . . . . . . . . . . . . . . . . . . . . . . . . . . . . . . . . . . . . . . . . 244,711 263,332
Current liabilities . . . . . . . . . . . . . . . . . . . . . . . . . . . . . . . . . . . . . . . . . . . . . . . . . . 7,722 4,996
Total liabilities . . . . . . . . . . . . . . . . . . . . . . . . . . . . . . . . . . . . . . . . . . . . . . . . . . . . 207,015 204,290
Issued capital . . . . . . . . . . . . . . . . . . . . . . . . . . . . . . . . . . . . . . . . . . . . . . . . . . . . . 66,431 66,431Retained earnings . . . . . . . . . . . . . . . . . . . . . . . . . . . . . . . . . . . . . . . . . . . . . . . . . (28,736) (7,389)
1 Jan 2016to 30 Jun
2016
1 Jan 2015to 31 Dec
2015
$’000 $’000
Profit or loss of the Parent entity . . . . . . . . . . . . . . . . . . . . . . . . . . . . . . . . . . . . . . (11,884) 10,110
Total comprehensive income of the Parent entity . . . . . . . . . . . . . . . . . . . . . . . . . (11,884) 10,110
II-A-83

APPENDIX II-A AUDITED FINANCIAL STATEMENTS ON PROPERTYLINK FOR THETHREE YEARS ENDED 30 JUNE 2018
THE AUDITED FINANCIAL STATEMENTS OF PROPERTYLINK AUSTRALIANINDUSTRIAL PARTNERSHIP FOR THE SIX MONTHS ENDED JUNE 30, 2016
Trustee’s declaration to unitholders
The financial report has been prepared in accordance with Australian Accounting Standards andmandatory professional reporting requirements to the extent described in Note 2.
In the director’s opinion:
(a) the consolidated financial statements and notes of the Trust as set out on pages 7 to 37(Note):
(i) comply with Accounting standards and other mandatory professional reportingrequirements to the extent described in Note 2; and
(ii) present fairly, the Trust’s financial position as at 30 June 2016 and of its performancefor the year ended 30 June 2016; and
(b) there are reasonable grounds to believe that the Trust will be able to pay its debts as andwhen they become due and payable.
The consolidated financial statements and notes set out on pages 7 to 37 (Note) have beenapproved and adopted.
The Trustee is solely responsible for the information contained in the report and havedetermined that the accounting policies used are appropriate for internal purposes. This declaration ismade in accordance with a resolution of the Trustee, Propertylink Investment Management Limited.
Peter Lancken Stuart DawesDirector Director
Sydney29 September 2016
Note:
Page references above refer to the original audited accounts. The equivalent pages in this appendix areII-A-49 to II-A-83.
II-A-84

APPENDIX II-A AUDITED FINANCIAL STATEMENTS ON PROPERTYLINK FOR THETHREE YEARS ENDED 30 JUNE 2018
THE AUDITED FINANCIAL STATEMENTS OF PROPERTYLINK AUSTRALIANINDUSTRIAL PARTNERSHIP FOR THE SIX MONTHS ENDED JUNE 30, 2016
II-A-85

APPENDIX II-A AUDITED FINANCIAL STATEMENTS ON PROPERTYLINK FOR THETHREE YEARS ENDED 30 JUNE 2018
THE AUDITED FINANCIAL STATEMENTS OF PROPERTYLINK AUSTRALIANINDUSTRIAL PARTNERSHIP FOR THE SIX MONTHS ENDED JUNE 30, 2016
II-A-86

APPENDIX II-A AUDITED FINANCIAL STATEMENTS ON PROPERTYLINK FOR THETHREE YEARS ENDED 30 JUNE 2018
THE AUDITED FINANCIAL STATEMENTS OF PROPERTYLINK FOR THE YEARENDED JUNE 30, 2017
Consolidated Statement of Profit or Loss and Other Comprehensive IncomeFor the year ended 30 June 2017
30-Jun-2017 30-Jun-2016
Note $’000 $’000
RevenueProperty revenue . . . . . . . . . . . . . . . . . . . . . . . . . . . . . . . . . . . . . . . . . . . . . . . . . . 2(b) 57,387 505Management fee revenue . . . . . . . . . . . . . . . . . . . . . . . . . . . . . . . . . . . . . . . . . . . 2(c) 37,154 10,757Share of net profit of joint ventures . . . . . . . . . . . . . . . . . . . . . . . . . . . . . . . . . . . 11(b) 8,536 9,352Other income . . . . . . . . . . . . . . . . . . . . . . . . . . . . . . . . . . . . . . . . . . . . . . . . . . . .Gain on disposal of investment property . . . . . . . . . . . . . . . . . . . . . . . . . . . . . . . 5,689 —Net fair value gain on investment property . . . . . . . . . . . . . . . . . . . . . . . . . . . . . 8(a) 27,834 602Other income/(expenses) . . . . . . . . . . . . . . . . . . . . . . . . . . . . . . . . . . . . . . . . . . . 379 524
Total revenue and other income . . . . . . . . . . . . . . . . . . . . . . . . . . . . . . . . . . . . 136,979 21,740
ExpensesInitial public offering cost . . . . . . . . . . . . . . . . . . . . . . . . . . . . . . . . . . . . . . . . . . 15(d) (16,879) —Property expenses . . . . . . . . . . . . . . . . . . . . . . . . . . . . . . . . . . . . . . . . . . . . . . . . . 3 (15,980) (27)Employment and management costs . . . . . . . . . . . . . . . . . . . . . . . . . . . . . . . . . . (10,401) (7,239)Finance costs . . . . . . . . . . . . . . . . . . . . . . . . . . . . . . . . . . . . . . . . . . . . . . . . . . . . . 4 (9,983) (1,436)Occupancy costs . . . . . . . . . . . . . . . . . . . . . . . . . . . . . . . . . . . . . . . . . . . . . . . . . . (745) (795)Travel expenses . . . . . . . . . . . . . . . . . . . . . . . . . . . . . . . . . . . . . . . . . . . . . . . . . . . (625) (586)Legal and consultancy fees . . . . . . . . . . . . . . . . . . . . . . . . . . . . . . . . . . . . . . . . . . (746) (1,524)Depreciation and amortisation expense . . . . . . . . . . . . . . . . . . . . . . . . . . . . . . . . (145) (200)Administration and other expenses . . . . . . . . . . . . . . . . . . . . . . . . . . . . . . . . . . . . (2,289) (1,322)
Total expenses . . . . . . . . . . . . . . . . . . . . . . . . . . . . . . . . . . . . . . . . . . . . . . . . . . . (57,793) (13,129)
Profit before income tax . . . . . . . . . . . . . . . . . . . . . . . . . . . . . . . . . . . . . . . . . . . 79,186 8,611Tax expense . . . . . . . . . . . . . . . . . . . . . . . . . . . . . . . . . . . . . . . . . . . . . . . . . . . . . 5(b) (2,100) (281)
Profit after income tax . . . . . . . . . . . . . . . . . . . . . . . . . . . . . . . . . . . . . . . . . . . . 77,086 8,330
Other comprehensive income:Changes in the fair value of cash flow hedges . . . . . . . . . . . . . . . . . . . . . . . . . . . 16 644 —Revaluation gains on property, plant and equipment . . . . . . . . . . . . . . . . . . . . . . 9(a) 9,483 —
Total comprehensive income . . . . . . . . . . . . . . . . . . . . . . . . . . . . . . . . . . . . . . . 87,213 8,330
The above consolidated statement of profit or loss and other comprehensive income should beread in conjunction with the accompanying notes.
II-A-87
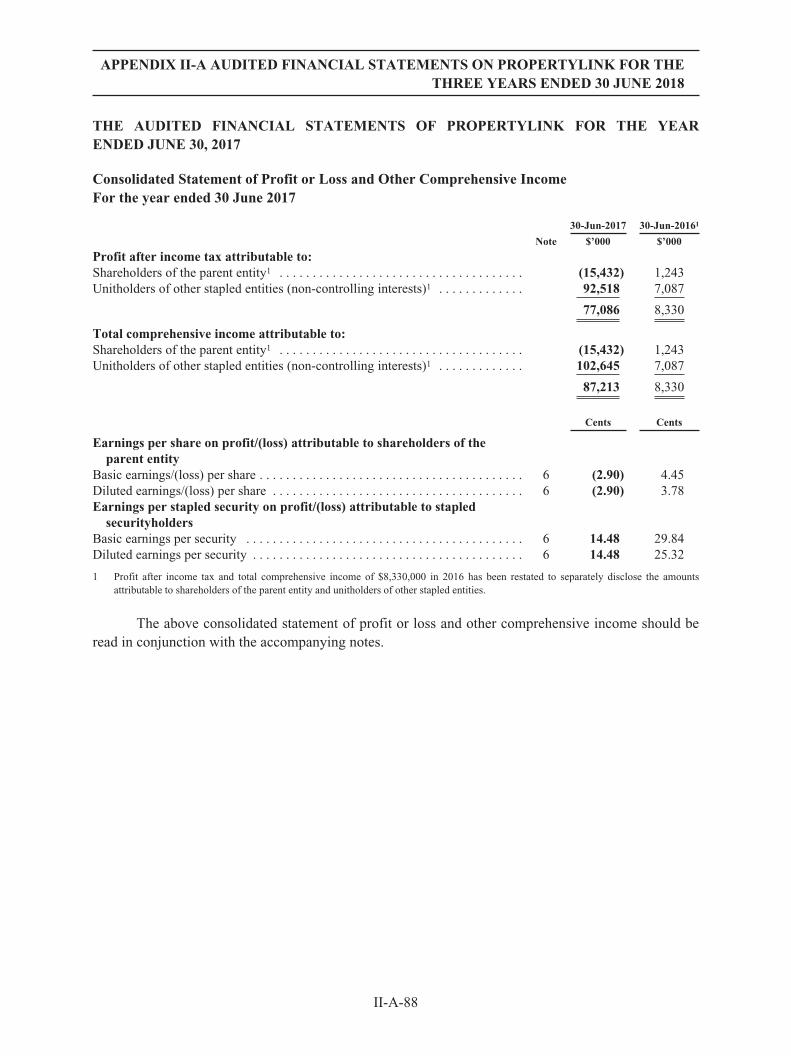
APPENDIX II-A AUDITED FINANCIAL STATEMENTS ON PROPERTYLINK FOR THETHREE YEARS ENDED 30 JUNE 2018
THE AUDITED FINANCIAL STATEMENTS OF PROPERTYLINK FOR THE YEARENDED JUNE 30, 2017
Consolidated Statement of Profit or Loss and Other Comprehensive IncomeFor the year ended 30 June 2017
30-Jun-2017 30-Jun-20161
Note $’000 $’000
Profit after income tax attributable to:Shareholders of the parent entity1 . . . . . . . . . . . . . . . . . . . . . . . . . . . . . . . . . . . . . (15,432) 1,243Unitholders of other stapled entities (non-controlling interests)1 . . . . . . . . . . . . . 92,518 7,087
77,086 8,330
Total comprehensive income attributable to:Shareholders of the parent entity1 . . . . . . . . . . . . . . . . . . . . . . . . . . . . . . . . . . . . . (15,432) 1,243Unitholders of other stapled entities (non-controlling interests)1 . . . . . . . . . . . . . 102,645 7,087
87,213 8,330
Cents Cents
Earnings per share on profit/(loss) attributable to shareholders of theparent entity
Basic earnings/(loss) per share . . . . . . . . . . . . . . . . . . . . . . . . . . . . . . . . . . . . . . . . 6 (2.90) 4.45Diluted earnings/(loss) per share . . . . . . . . . . . . . . . . . . . . . . . . . . . . . . . . . . . . . . 6 (2.90) 3.78Earnings per stapled security on profit/(loss) attributable to stapled
securityholdersBasic earnings per security . . . . . . . . . . . . . . . . . . . . . . . . . . . . . . . . . . . . . . . . . . 6 14.48 29.84Diluted earnings per security . . . . . . . . . . . . . . . . . . . . . . . . . . . . . . . . . . . . . . . . . 6 14.48 25.32
1 Profit after income tax and total comprehensive income of $8,330,000 in 2016 has been restated to separately disclose the amountsattributable to shareholders of the parent entity and unitholders of other stapled entities.
The above consolidated statement of profit or loss and other comprehensive income should beread in conjunction with the accompanying notes.
II-A-88

APPENDIX II-A AUDITED FINANCIAL STATEMENTS ON PROPERTYLINK FOR THETHREE YEARS ENDED 30 JUNE 2018
THE AUDITED FINANCIAL STATEMENTS OF PROPERTYLINK FOR THE YEARENDED JUNE 30, 2017
Consolidated Statement of Financial PositionAs at 30 June 2017
30-Jun-2017 30-Jun-20161
Note $’000 $’000ASSETSCURRENT ASSETSCash and cash equivalents . . . . . . . . . . . . . . . . . . . . . . . . . . . . . . . . . . . . . . . . . . 17(a) 20,002 3,959Trade and other receivables . . . . . . . . . . . . . . . . . . . . . . . . . . . . . . . . . . . . . . . . . 17(b) 4,472 4,008Prepayments . . . . . . . . . . . . . . . . . . . . . . . . . . . . . . . . . . . . . . . . . . . . . . . . . . . . . 1,709 162Investment properties held for sale . . . . . . . . . . . . . . . . . . . . . . . . . . . . . . . . . . . 10 31,550 —
TOTAL CURRENT ASSETS . . . . . . . . . . . . . . . . . . . . . . . . . . . . . . . . . . . . . . 57,733 8,129
NON-CURRENT ASSETSEquity accounted investments . . . . . . . . . . . . . . . . . . . . . . . . . . . . . . . . . . . . . . . 11(b) 63,345 39,414Investment properties . . . . . . . . . . . . . . . . . . . . . . . . . . . . . . . . . . . . . . . . . . . . . . 8(a) 572,756 6,471Property, plant and equipment . . . . . . . . . . . . . . . . . . . . . . . . . . . . . . . . . . . . . . . 9(a) 98,054 561Derivative financial instruments . . . . . . . . . . . . . . . . . . . . . . . . . . . . . . . . . . . . . 12(c) 644 —Deferred tax assets . . . . . . . . . . . . . . . . . . . . . . . . . . . . . . . . . . . . . . . . . . . . . . . . 5(c) 5,222 787Intangible assets . . . . . . . . . . . . . . . . . . . . . . . . . . . . . . . . . . . . . . . . . . . . . . . . . . 18 4,566 4,566
TOTAL NON-CURRENT ASSETS . . . . . . . . . . . . . . . . . . . . . . . . . . . . . . . . . 744,587 51,799
TOTAL ASSETS . . . . . . . . . . . . . . . . . . . . . . . . . . . . . . . . . . . . . . . . . . . . . . . . 802,320 59,928
LIABILITIESCURRENT LIABILITIESTrade and other payables . . . . . . . . . . . . . . . . . . . . . . . . . . . . . . . . . . . . . . . . . . . 17(c) 11,207 10,166Borrowings . . . . . . . . . . . . . . . . . . . . . . . . . . . . . . . . . . . . . . . . . . . . . . . . . . . . . . 13 — 22,802Current tax liabilities . . . . . . . . . . . . . . . . . . . . . . . . . . . . . . . . . . . . . . . . . . . . . . 3,793 411Employee benefits . . . . . . . . . . . . . . . . . . . . . . . . . . . . . . . . . . . . . . . . . . . . . . . . 466 356
TOTAL CURRENT LIABILITIES . . . . . . . . . . . . . . . . . . . . . . . . . . . . . . . . . 15,466 33,735
NON-CURRENT LIABILITIESEmployee benefits . . . . . . . . . . . . . . . . . . . . . . . . . . . . . . . . . . . . . . . . . . . . . . . . 283 198Borrowings . . . . . . . . . . . . . . . . . . . . . . . . . . . . . . . . . . . . . . . . . . . . . . . . . . . . . . 13 255,926 —
TOTAL NON-CURRENT LIABILITIES . . . . . . . . . . . . . . . . . . . . . . . . . . . . 256,209 198
TOTAL LIABILITIES . . . . . . . . . . . . . . . . . . . . . . . . . . . . . . . . . . . . . . . . . . . 271,675 33,933
NET ASSETS . . . . . . . . . . . . . . . . . . . . . . . . . . . . . . . . . . . . . . . . . . . . . . . . . . . 530,645 25,995
EQUITYEquity attributable to shareholders of the parent entityIssued capital . . . . . . . . . . . . . . . . . . . . . . . . . . . . . . . . . . . . . . . . . . . . . . . . . . . . 15(a) 5,364 40,598Reserves . . . . . . . . . . . . . . . . . . . . . . . . . . . . . . . . . . . . . . . . . . . . . . . . . . . . . . . . 16 (25,110) (20,556)Retained earnings/(accumulated losses)1 . . . . . . . . . . . . . . . . . . . . . . . . . . . . . . . (26,927) (1,828)
Parent entity shareholders’ interest . . . . . . . . . . . . . . . . . . . . . . . . . . . . . . . . . (46,673) 18,214
Equity attributable to unitholders of other stapled entitiesIssued capital . . . . . . . . . . . . . . . . . . . . . . . . . . . . . . . . . . . . . . . . . . . . . . . . . . . . 15(b) 525,206 —Reserves . . . . . . . . . . . . . . . . . . . . . . . . . . . . . . . . . . . . . . . . . . . . . . . . . . . . . . . . 16 (9,406) —Retained earnings/(accumulated losses)1 . . . . . . . . . . . . . . . . . . . . . . . . . . . . . . . 61,518 7,781
Other stapled unitholders’ interest . . . . . . . . . . . . . . . . . . . . . . . . . . . . . . . . . 577,318 7,781
TOTAL EQUITY . . . . . . . . . . . . . . . . . . . . . . . . . . . . . . . . . . . . . . . . . . . . . . . . 530,645 25,995
1 Retained earnings of $7,781,000 has been restated from the previously disclosed retained earnings of $5,953,000 to separately disclosethe retained earnings attributable to unitholders of other stapled entities.
The above consolidated statement of financial position should be read in conjunction with theaccompanying notes.
II-A-89

THE
AUDIT
ED
FIN
ANCIA
LST
ATEM
ENTSOFPROPERTYLIN
KFOR
THE
YEAR
ENDED
JUNE
30,2
017
Con
solid
ated
Statem
entof
Cha
nges
inEqu
ity
For
theye
aren
ded30
June
2017
Attribu
tableto
shar
eholde
rsof
thepa
rent
entity
Attribu
tableto
unitho
lder
sof
othe
rstap
leden
tities
1
Con
tribut
edeq
uity
Reser
ves
Retaine
dea
rnings
(acc
umulated
losses)
Total
Con
tribut
edeq
uity
Reser
ves
Retaine
dea
rnings
(acc
umulated
losses)
Total
Total
equity
Note
$’00
0$’00
0$’00
0$’00
0$’00
0$’00
0$’00
0$’00
0$’00
0
Balan
ceat
1Ju
ly20
15..
....
....
....
....
.27
,256
—(3,071
)24
,185
——
694
694
24,880
Com
preh
ensive
inco
mefortheye
ar..
....
....
——
1,24
31,24
3—
—7,08
77,08
78,33
0Sha
resissu
eddu
ring
theye
ar..
....
....
....
.15
13,882
——
13,882
——
——
13,883
Sha
reissu
eco
sts..
....
....
....
....
....
...
(540
)—
—(540
)—
——
—(540
)Equ
ityrestructure
....
....
....
....
....
....
16(a)
—(20,55
6)—
(20,55
6)—
——
—(20,55
6)
Balan
ceat
30Ju
ne20
16..
....
....
....
....
40,598
(20,55
6)(1,828
)18
,214
——
7,78
17,78
125
,995
Balan
ceat
1Ju
ly20
16..
....
....
....
....
.40
,598
(20,55
6)(1,828
)18
,214
——
7,78
17,78
125
,995
Com
preh
ensive
inco
mefortheye
ar..
....
....
——
(15,43
2)(15,43
2)—
10,127
92,518
102,64
587
,213
Cap
ital
realloca
tion
....
....
....
....
....
...
15(35,23
4)—
—(35,23
4)35
,234
——
35,234
—Sec
uritiesissu
eddu
ring
theye
ar..
....
....
..15
(b)
——
——
497,29
2—
—49
7,29
249
7,29
2Sha
reissu
eco
sts..
....
....
....
....
....
...
15(b)
——
——
(7,320
)—
—(7,320
)(7,320
)Equ
ityrestructure
....
....
....
....
....
....
15(d)
—(4,554
)—
(4,554
)—
(19,53
3)(1,424
)(20,95
7)(25,51
1)Dividen
dsan
ddistribu
tion
spa
idor
prov
ided
for
7—
—(9,667
)(9,667
)—
—(37,35
7)(37,35
7)(47,02
4)
Balan
ceat
30Ju
ne20
17..
....
....
....
....
5,36
4(25,11
0)(26,92
7)(46,67
3)52
5,20
6(9,406
)61
,518
577,31
853
0,64
5
1Retaine
dea
rnings
at1Ju
ly20
16of
$7,781
,000
($69
4,00
0at
1Ju
ly20
15)ha
sbe
enrestated
tosepa
rately
disclose
theretained
earnings
attributab
leto
unitho
ldersof
othe
rstap
leden
tities.
The
abov
eco
nsolidated
statem
ento
fch
ange
sin
equity
shou
ldbe
read
inco
njun
ctionwiththeacco
mpa
nyingno
tes.
II-A-90
APPENDIX II-A AUDITED FINANCIAL STATEMENTS ON PROPERTYLINK FOR THETHREE YEARS ENDED 30 JUNE 2018

APPENDIX II-A AUDITED FINANCIAL STATEMENTS ON PROPERTYLINK FOR THETHREE YEARS ENDED 30 JUNE 2018
THE AUDITED FINANCIAL STATEMENTS OF PROPERTYLINK FOR THE YEARENDED JUNE 30, 2017
Consolidated Statement of Cash FlowsFor the year ended 30 June 2017
30-Jun-2017 30-Jun-2016
Note $’000 $’000
CASH FLOWS FROM OPERATING ACTIVITIESReceipts from customers . . . . . . . . . . . . . . . . . . . . . . . . . . . . . . . . . . . . . . . . . . . . . 107,135 14,052Interest received . . . . . . . . . . . . . . . . . . . . . . . . . . . . . . . . . . . . . . . . . . . . . . . . . . . 50 30Payments to suppliers and employees . . . . . . . . . . . . . . . . . . . . . . . . . . . . . . . . . . . (54,084) (4,237)Finance costs paid . . . . . . . . . . . . . . . . . . . . . . . . . . . . . . . . . . . . . . . . . . . . . . . . . . (8,110) (1,276)Income tax paid . . . . . . . . . . . . . . . . . . . . . . . . . . . . . . . . . . . . . . . . . . . . . . . . . . . . (3,152) (872)
Net cash provided by operating activities . . . . . . . . . . . . . . . . . . . . . . . . . . . . . . 21 41,839 7,697
CASH FLOWS FROM INVESTING ACTIVITIESProceeds from sale of investments . . . . . . . . . . . . . . . . . . . . . . . . . . . . . . . . . . . . . 23,904 1,064Proceeds from sale of investment properties . . . . . . . . . . . . . . . . . . . . . . . . . . . . . 49,190 —Capital expenditure on investment properties . . . . . . . . . . . . . . . . . . . . . . . . . . . . . (17,624) —Capital expenditure on leasehold buildings . . . . . . . . . . . . . . . . . . . . . . . . . . . . . . (106) —Loan payments to related parties . . . . . . . . . . . . . . . . . . . . . . . . . . . . . . . . . . . . . . (3,540) —Loan proceeds from related parties . . . . . . . . . . . . . . . . . . . . . . . . . . . . . . . . . . . . . — 3,600Payment for investment in joint ventures . . . . . . . . . . . . . . . . . . . . . . . . . . . . . . . . (43,462) (10,219)Purchase of furniture, plant and equipment . . . . . . . . . . . . . . . . . . . . . . . . . . . . . . (37) (542)
Net cash provided by/(used by) investing activities . . . . . . . . . . . . . . . . . . . . . . 8,325 (6,097)
CASH FLOWS FROM FINANCING ACTIVITIESProceeds from issue of securities . . . . . . . . . . . . . . . . . . . . . . . . . . . . . . . . . . . . . . 497,292 —Securities issue costs . . . . . . . . . . . . . . . . . . . . . . . . . . . . . . . . . . . . . . . . . . . . . . . . (7,320) —Payments to acquire non-controlling interest . . . . . . . . . . . . . . . . . . . . . . . . . . . . . — (7,445)Equity restructuring payments . . . . . . . . . . . . . . . . . . . . . . . . . . . . . . . . . . . . . . . . (24,087) —Proceeds from borrowings . . . . . . . . . . . . . . . . . . . . . . . . . . . . . . . . . . . . . . . . . . . 291,640 10,870Repayment of borrowings . . . . . . . . . . . . . . . . . . . . . . . . . . . . . . . . . . . . . . . . . . . . (743,311) (2,857)Dividends and distributions paid . . . . . . . . . . . . . . . . . . . . . . . . . . . . . . . . . . . . . . . (48,335) (557)
Net cash provided by/(used by) financing activities . . . . . . . . . . . . . . . . . . . . . . (34,121) 11
Net increase in cash and cash equivalents . . . . . . . . . . . . . . . . . . . . . . . . . . . . . . . 16,043 1,611Cash and cash equivalents at the beginning of financial year . . . . . . . . . . . . . . . . 3,959 2,348
Cash and cash equivalents at the end of the year . . . . . . . . . . . . . . . . . . . . . . . . 20,002 3,959
The above consolidated statement of cash flows should be read in conjunction with theaccompanying notes.
II-A-91

APPENDIX II-A AUDITED FINANCIAL STATEMENTS ON PROPERTYLINK FOR THETHREE YEARS ENDED 30 JUNE 2018
THE AUDITED FINANCIAL STATEMENTS OF PROPERTYLINK FOR THE YEARENDED JUNE 30, 2017
Notes to the Financial StatementsFor the year ended 30 June 2017
About this Report
In this section
This section sets out the basis upon which the Group’s Financial Statements are prepared.
Specific accounting policies are described in their respective notes to the Financial Statements.This section also shows information on new or amended accounting standards and their impact on thefinancial position and performance of the Group.
(a) Basis of preparation
Propertylink Group stapled securities are quoted on the Australian Securities Exchange underthe “PLG” code and comprise one share in Propertylink (Holdings) Limited (PHL) and one unit in eachof Propertylink Australian Industrial Partnership (PAIP) and Propertylink Trust (PT). In accordancewith Australian Accounting Standards, the entities within the Group must be consolidated for financialreporting purposes. The parent entity, PHL, has been deemed the acquirer of PAIP and PT. TheseFinancial Statements therefore represent the consolidated results of PHL, and include PHL and itscontrolled entities, PAIP and its controlled entities and PT and its controlled entities (together the“Group”). Equity attributable to PAIP and PT stapled securityholders form a non-controlling interest.The amount of non-controlling interest attributable to stapled securityholders is disclosed in theStatement of Financial Position.
On 15 August 2016, the Group became unconditionally listed on the ASX following thesuccessful completion of an Initial Public Offering (IPO). The Financial Statements include profitsgenerated by the unlisted stapled PHL and PT group from 1 July 2016 to 15 August 2016, and profitsgenerated by the listed Propertylink Group from 16 August 2016 to 30 June 2017. Prior to 15 August2016, the units in PT were stapled to the shares in PHL, and comparative figures refer to prior periodresults of that stapled group. For clarity, comparative figures in the Financial Statements exclude thefinancial performance of PAIP.
Each entity forming part of the Group continues as a separate legal entity in its own right underthe Corporations Act 2001 and is therefore required to comply with the reporting and disclosurerequirements under the Corporations Act 2001 and Australian Accounting Standards.
The financial report was authorised for issue by Directors on 14 August 2017.
These general purpose Financial Statements have been prepared in accordance with therequirements of the Corporations Act 2001, Australian Accounting Standards and Interpretations of theAustralian Accounting Standards Board and International Financial Reporting Standards as issued bythe International Accounting Standards Board. The Group is a for-profit entity for financial reportingpurposes under Australian Accounting Standards.
II-A-92

APPENDIX II-A AUDITED FINANCIAL STATEMENTS ON PROPERTYLINK FOR THETHREE YEARS ENDED 30 JUNE 2018
THE AUDITED FINANCIAL STATEMENTS OF PROPERTYLINK FOR THE YEARENDED JUNE 30, 2017
Notes to the Financial Statements (continued)For the year ended 30 June 2017
Amounts in these Financial Statements have been presented in Australian dollars and roundedoff in accordance with ASIC Corporations (Rounding in Financial/Directors’ Reports) Instrument2016/191 to the nearest thousand dollars, unless otherwise indicated.
The Financial Statements except for cash flow information, have been prepared on an accrualsbasis and are based on historical costs, modified, where applicable, by the measurement at fair value ofselected non-current assets, financial assets and financial liabilities. Refer to the specific accountingpolicies within the notes to the Financial Statements for the basis of valuation of assets and liabilitiesmeasured at fair value.
These Financial Statements are prepared on a going concern basis, which assumes continuity ofnormal business activities and the realisation of assets and settlement of liabilities in the ordinarycourse of business.
The accounting policies adopted are consistent with those of the previous financial year andcorresponding interim reporting period, unless otherwise stated.
Critical accounting judgements, estimates and assumptions
The preparation of the Group’s consolidated financial statements may require management tomake judgements, estimates and assumptions that affect the reported amounts of revenues, expenses,assets and liabilities, and the accompanying disclosures. Uncertainty about these assumptions andestimates could result in outcomes that require a material adjustment to the carrying amount of theassets or liabilities affected in future periods. The estimates and associated assumptions are based onhistorical experience and various other factors that are believed to be reasonable under thecircumstances. Judgements and estimates which are material to the financial report are discussed in thefollowing notes:
Š Investment properties Note 8
Š Leasehold buildings Note 8, 9
Š Derivative financial instruments Note 12
(b) Principles of consolidation
The consolidated Financial Statements incorporate all of the assets, liabilities and results of thePropertylink Group and all of the subsidiaries.
(i) Controlled entities
Subsidiaries are all entities over which the Group has control. The Group controls an entitywhen it is exposed to, or has rights to, variable returns from its involvement with the entity and has theability to affect those returns through its power over the entity. A list of the subsidiaries is provided inNote 26. The assets, liabilities and results of all subsidiaries are fully consolidated into the financial
II-A-93
APPENDIX II-A AUDITED FINANCIAL STATEMENTS ON PROPERTYLINK FOR THETHREE YEARS ENDED 30 JUNE 2018
THE AUDITED FINANCIAL STATEMENTS OF PROPERTYLINK FOR THE YEARENDED JUNE 30, 2017
Notes to the Financial Statements (continued)For the year ended 30 June 2017
statements of the Group from the date on which control is obtained by the Group. The consolidation ofa subsidiary is discontinued from the date that control ceases. Inter-company transactions, balances andunrealised gains or losses on transactions between Group entities are fully eliminated on consolidation.Accounting policies of subsidiaries have been changed and adjustments made where necessary toensure uniformity of the accounting policies adopted by the Group.
(ii) Joint arrangements
Investments in joint arrangements are classified as joint ventures based on the contractual rightsand obligations each investor has, rather than the legal structure of the joint arrangement.
Joint ventures
Investments in joint ventures are accounted for using the equity method. Under this method, theinvestment is initially recognised at cost (including transaction costs) and adjusted thereafter for thepost-acquisition change in the Group’s share of net assets of the joint venture. In addition, the Group’sshare of the profit or loss of the joint venture is included in the Group’s profit or loss.
When the Group’s share of losses in a joint venture equals or exceeds its interest in the jointventure, the Group discontinues recognising its share of further losses unless it has incurred legal orconstructive obligations or made payments on behalf of the joint venture. Upon the joint venturesubsequently making profits, the Group will resume recognising its share of those profits once its shareof the profits equals the share of the losses not recognised.
(c) New Accounting Standards for application in future periods
Certain new accounting standards and interpretations have been published that are notmandatory for the 30 June 2017 reporting period. The Group’s assessment of the impact of these newstandards and interpretations is set out below:
AASB 9 Financial Instruments (effective application for the Group is 1 July 2018).
AASB 9 Financial Instruments addresses the classification, measurement and de-recognition offinancial assets and financial liabilities. It also sets out new rules for hedge accounting and impairmentof financial assets. The Group intends to apply the standard from 1 July 2018. It is not expected thatthe application of this standard will have a material impact on any of the amounts recognised in theconsolidated Financial Statements.
AASB 15: Revenue from Contracts with Customers (effective application for the Group is 1 July2018).
AASB 15 Revenue from Contracts with Customers clarifies the principles for recognitionrevenue from contracts with customers. It applies to all contracts with customers except leases,financial instruments and insurance contracts. The Group intends to apply the standard from 1 July
II-A-94

APPENDIX II-A AUDITED FINANCIAL STATEMENTS ON PROPERTYLINK FOR THETHREE YEARS ENDED 30 JUNE 2018
THE AUDITED FINANCIAL STATEMENTS OF PROPERTYLINK FOR THE YEARENDED JUNE 30, 2017
Notes to the Financial Statements (continued)For the year ended 30 June 2017
2018. The Group is continuing to assess the impact of this standard, however, it is not practical toquantify the impact on the consolidated Financial Statement at the application date.
AASB 16: Leases (effective application for the Group is 1 July 2019).
AASB 16 Leases introduces a single lessee accounting model and requires a lessee to recogniseassets and liabilities for all leases with a term of more than 12 months, unless the underlying asset is oflow value. The Group is continuing to assess the impact of this standard, however, it is not practical toquantify the impact on the consolidated Financial Statement at the application date. The Group intendsto apply the standard from 1 July 2019.
(d) Notes to the Financial Statements
The notes include information which is required to understand the financial statements and ismaterial and relevant to the operations, financial position and performance of the Group. Information isconsidered material and relevant if, for example:
Š the amount in question is significant because of its size or nature;
Š it is important in understanding the results of the Group;
Š it helps to explain the impact of significant changes in the Group’s business;
Š it relates to an aspect of the Group’s operations that is important to its future performance.
The notes are organised into the following sections:
Group performance Property portfolio assets
Capital and financial riskmanagement and workingcapital Other disclosures
1. Operating segments 8. Investmentproperties
12. Capital and financialrisk management
18. Intangible assets
2. Revenue 9. Property, plant andequipment
13. Borrowings 19. Security-basedpayments
3. Property expenses 10. Non-current assetsclassified as held forsale
14. Commitments andcontingencies
20. Auditors’remuneration
4. Finance costs 11. Equity accountedinvestments
15. Contributed equity 21. Cash flowinformation
5. Taxation 16. Reserves 22. Related parties6. Earnings per security 17. Working capital 23. Parent entity
disclosures7. Dividends and
distributions24. Events after the
reporting period25. Business
combinations26. Interests in
subsidiaries27. Company details
II-A-95
APPENDIX II-A AUDITED FINANCIAL STATEMENTS ON PROPERTYLINK FOR THETHREE YEARS ENDED 30 JUNE 2018
THE AUDITED FINANCIAL STATEMENTS OF PROPERTYLINK FOR THE YEARENDED JUNE 30, 2017
Notes to the Financial Statements (continued)For the year ended 30 June 2017
Group Performance
In this section
This section explains the results and performance of the Group. It provides additionalinformation about those individual line items in the Financial Statements that the Directors considermost relevant in the context of the operations of the Group.
Note 1 Operating segments
(a) Description of segments
The Board of Directors has been identified as the Group’s chief operating decision maker(CODM) as they are responsible for the strategic decision making within the Group. The Group’soperating segments have been determined based on the internal information that is provided to theCODM and which is used to make strategic decisions. Refer to the table below for a brief descriptionof the Group’s operating segments.
Segment Description
Property investment Acquires, improves and leases industrial property, and co-invests in industrialand commercial property, both within the geographical location of Australia.
Management services Fund and property management services for managed assets, and propertymanagement services for owned assets, within the geographical location ofAustralia.
(b) Segment information
Information related to each reporting segment for FY2017 is set out below. Segment profit(loss) before tax is used to measure performance because management believes that this information isthe most relevant in evaluating the results of the respective segments relative to other entities thatoperate in the same industries.
II-A-96

APPENDIX II-A AUDITED FINANCIAL STATEMENTS ON PROPERTYLINK FOR THETHREE YEARS ENDED 30 JUNE 2018
THE AUDITED FINANCIAL STATEMENTS OF PROPERTYLINK FOR THE YEARENDED JUNE 30, 2017
Notes to the Financial Statements (continued)For the year ended 30 June 2017
As a result of the stapling of PAIP in August 2016, the Group determined that it has tworeportable segments. For the year ended 30 June 2016, the Group considered that it operated in onlyone segment, being property management and investment within the geographical location ofAustralia. As a result of the determination that the Group has two reportable segments, comparativefigures for FY2016 are provided.
Year ended 30 June 2017Property
investmentsManagement
services Total
$’000 $’000 $’000
RevenueOperating revenue . . . . . . . . . . . . . . . . . . . . . . . . . . . . . . . . . . . . . . . . 65,603 37,154 102,757Net fair value gain on investment property . . . . . . . . . . . . . . . . . . . . . 27,834 — 27,834Other income . . . . . . . . . . . . . . . . . . . . . . . . . . . . . . . . . . . . . . . . . . . . 5,514 2 5,516
Segment revenue and other income . . . . . . . . . . . . . . . . . . . . . . . . . 98,951 37,156 136,107
Reconciliation to statutory revenue and other income:Other income . . . . . . . . . . . . . . . . . . . . . . . . . . . . . . . . . . . . . . . . . . . . 872
Total revenue and other income . . . . . . . . . . . . . . . . . . . . . . . . . . . 136,979
ExpensesProperty expenses . . . . . . . . . . . . . . . . . . . . . . . . . . . . . . . . . . . . . . . . (15,980) — (15,980)Other operating expenses . . . . . . . . . . . . . . . . . . . . . . . . . . . . . . . . . . (810) (140) (950)Finance costs . . . . . . . . . . . . . . . . . . . . . . . . . . . . . . . . . . . . . . . . . . . . (9,645) — (9,645)
Total segment expenses . . . . . . . . . . . . . . . . . . . . . . . . . . . . . . . . . . . (26,435) (140) (26,575)
Segment profit before income tax . . . . . . . . . . . . . . . . . . . . . . . . . . 72,517 37,016 109,532
Reconciliation to statutory profit after tax:Initial public offering cost . . . . . . . . . . . . . . . . . . . . . . . . . . . . . . . . . . (16,879)Employee benefits expenses . . . . . . . . . . . . . . . . . . . . . . . . . . . . . . . . (9,855)Other operating expenses . . . . . . . . . . . . . . . . . . . . . . . . . . . . . . . . . . (4,001)Finance costs and depreciation expense . . . . . . . . . . . . . . . . . . . . . . . (483)Tax expense . . . . . . . . . . . . . . . . . . . . . . . . . . . . . . . . . . . . . . . . . . . . . (2,100)
Profit after income tax attributable to owners of the stapledsecurities . . . . . . . . . . . . . . . . . . . . . . . . . . . . . . . . . . . . . . . . . . . . . 77,086
II-A-97

APPENDIX II-A AUDITED FINANCIAL STATEMENTS ON PROPERTYLINK FOR THETHREE YEARS ENDED 30 JUNE 2018
THE AUDITED FINANCIAL STATEMENTS OF PROPERTYLINK FOR THE YEARENDED JUNE 30, 2017
Notes to the Financial Statements (continued)For the year ended 30 June 2017
Year ended 30 June 2016Property
investmentManagement
services Total
$’000 $’000 $’000
RevenueOperating revenue . . . . . . . . . . . . . . . . . . . . . . . . . . . . . . . . . . . . . . . . . 9,783 10,757 20,540Other income . . . . . . . . . . . . . . . . . . . . . . . . . . . . . . . . . . . . . . . . . . . . . 603 — 603
Segment profit before income tax . . . . . . . . . . . . . . . . . . . . . . . . . . . . 10,386 10,757 21,143
Reconciliation to statutory revenue and other income:Other income . . . . . . . . . . . . . . . . . . . . . . . . . . . . . . . . . . . . . . . . . . . . . 597
Total revenue and other income . . . . . . . . . . . . . . . . . . . . . . . . . . . . . 21,740
ExpensesFinance costs . . . . . . . . . . . . . . . . . . . . . . . . . . . . . . . . . . . . . . . . . . . . . (1,436) — (1,436)Reconciliation to statutory profit after tax:Employee benefits expenses . . . . . . . . . . . . . . . . . . . . . . . . . . . . . . . . . (7,239)Other operating expenses . . . . . . . . . . . . . . . . . . . . . . . . . . . . . . . . . . . . (4,454)Tax expense . . . . . . . . . . . . . . . . . . . . . . . . . . . . . . . . . . . . . . . . . . . . . . (281)
Profit after income tax attributable to owners of the stapledsecurities . . . . . . . . . . . . . . . . . . . . . . . . . . . . . . . . . . . . . . . . . . . . . . 8,330
As at 30 June 2017Property
investmentManagement
services Total
$’000 $’000 $’000
AssetsEquity accounted investments . . . . . . . . . . . . . . . . . . . . . . . . . . . . . . . 63,345 — 63,345Investment properties . . . . . . . . . . . . . . . . . . . . . . . . . . . . . . . . . . . . . . 572,756 — 572,756Investment properties held for sale . . . . . . . . . . . . . . . . . . . . . . . . . . . 31,550 — 31,550Property, plant and equipment . . . . . . . . . . . . . . . . . . . . . . . . . . . . . . . 97,600 — 97,600Other assets . . . . . . . . . . . . . . . . . . . . . . . . . . . . . . . . . . . . . . . . . . . . . 18,407 2,353 20,760
Total segment assets . . . . . . . . . . . . . . . . . . . . . . . . . . . . . . . . . . . . . . 783,658 2,353 786,011
Reconciliation of segment assets to the Statement of FinancialPosition
Cash and cash equivalents . . . . . . . . . . . . . . . . . . . . . . . . . . . . . . . . . . 5,275Receivables and prepayments . . . . . . . . . . . . . . . . . . . . . . . . . . . . . . . 791Deferred tax assets . . . . . . . . . . . . . . . . . . . . . . . . . . . . . . . . . . . . . . . . 5,222Intangible assets . . . . . . . . . . . . . . . . . . . . . . . . . . . . . . . . . . . . . . . . . . 4,567Other plant and equipment . . . . . . . . . . . . . . . . . . . . . . . . . . . . . . . . . . 454Total assets . . . . . . . . . . . . . . . . . . . . . . . . . . . . . . . . . . . . . . . . . . . . . 802,320
Total segment liabilities . . . . . . . . . . . . . . . . . . . . . . . . . . . . . . . . . . . 206,343 609 206,952
Reconciliation of segment liabilities to the Statement of FinancialPosition
Intercompany payables . . . . . . . . . . . . . . . . . . . . . . . . . . . . . . . . . . . . . 60,180Other liabilities . . . . . . . . . . . . . . . . . . . . . . . . . . . . . . . . . . . . . . . . . . . 4,543
Total liabilities . . . . . . . . . . . . . . . . . . . . . . . . . . . . . . . . . . . . . . . . . . 271,675
Segment net assets . . . . . . . . . . . . . . . . . . . . . . . . . . . . . . . . . . . . . . . 577,315 1,744 579,059
II-A-98

APPENDIX II-A AUDITED FINANCIAL STATEMENTS ON PROPERTYLINK FOR THETHREE YEARS ENDED 30 JUNE 2018
THE AUDITED FINANCIAL STATEMENTS OF PROPERTYLINK FOR THE YEARENDED JUNE 30, 2017
Notes to the Financial Statements (continued)For the year ended 30 June 2017
As at 30 June 2016Property
investmentManagement
services Total
$’000 $’000 $’000
AssetsEquity accounted investments . . . . . . . . . . . . . . . . . . . . . . . . . . . . . . . . 39,414 — 39,414Investment properties . . . . . . . . . . . . . . . . . . . . . . . . . . . . . . . . . . . . . . . 6,471 — 6,471Other assets . . . . . . . . . . . . . . . . . . . . . . . . . . . . . . . . . . . . . . . . . . . . . . 589 2,573 3,162
Total segment assets . . . . . . . . . . . . . . . . . . . . . . . . . . . . . . . . . . . . . . . 46,474 2,573 49,047
Reconciliation of segment assets to the Statement of FinancialPosition
Cash and cash equivalents . . . . . . . . . . . . . . . . . . . . . . . . . . . . . . . . . . . 3,959Receivables and prepayments . . . . . . . . . . . . . . . . . . . . . . . . . . . . . . . . 1,008Deferred tax assets . . . . . . . . . . . . . . . . . . . . . . . . . . . . . . . . . . . . . . . . . 787Intangible assets . . . . . . . . . . . . . . . . . . . . . . . . . . . . . . . . . . . . . . . . . . . 4,566Other plant and equipment . . . . . . . . . . . . . . . . . . . . . . . . . . . . . . . . . . . 561
Total assets . . . . . . . . . . . . . . . . . . . . . . . . . . . . . . . . . . . . . . . . . . . . . . 59,928
Total segment liabilities . . . . . . . . . . . . . . . . . . . . . . . . . . . . . . . . . . . . 22,867 395 23,262
Reconciliation of segment liabilities to the Statement of FinancialPosition
Payables . . . . . . . . . . . . . . . . . . . . . . . . . . . . . . . . . . . . . . . . . . . . . . . . . 9,705Other liabilities . . . . . . . . . . . . . . . . . . . . . . . . . . . . . . . . . . . . . . . . . . . . 966
Total liabilities . . . . . . . . . . . . . . . . . . . . . . . . . . . . . . . . . . . . . . . . . . . 33,933
Segment net assets . . . . . . . . . . . . . . . . . . . . . . . . . . . . . . . . . . . . . . . . 23,607 2,178 25,785
Note 2 Revenue
(a) Revenue recognition
All revenue is stated net of the amount of goods and services tax.
Revenue is recognised to the extent that it is probable that the economic benefits will flow tothe Group and the revenue can be reliably measured, regardless of when the payment is being received.Revenue is measured at the fair value of the consideration received or receivable, taking into accountcontractually defined terms of payment and excluding taxes or duty. The Group has concluded that it isthe principal in all of its revenue arrangements since it is the primary obligor, it has pricing latitude andis also exposed to credit risks.
The specific recognition criteria described below must also be met before revenue isrecognised.
II-A-99

APPENDIX II-A AUDITED FINANCIAL STATEMENTS ON PROPERTYLINK FOR THETHREE YEARS ENDED 30 JUNE 2018
THE AUDITED FINANCIAL STATEMENTS OF PROPERTYLINK FOR THE YEARENDED JUNE 30, 2017
Notes to the Financial Statements (continued)For the year ended 30 June 2017
Rental income
The Group is the lessor in operating leases. Rental income arising from operating leases oninvestment property is accounted for on a straight-line basis over the lease terms and is included inrevenue in the consolidated statement of profit or loss.
Initial direct costs incurred in negotiating and arranging an operating lease are capitalised, thenrecognised as an expense over the lease term on the same basis as the lease income.
Lease incentives
Prospective lessees may be offered incentives as an inducement to enter into non-cancellableoperating leases. These incentives may take various forms including rent-free periods, upfront cashpayments, or a contribution to certain lessee costs such as fitout costs. Incentives are capitalised andamortised on a straight-line basis over the lease term as a reduction in rental income. The lease term isthe non-cancellable period of the lease together with any further term for which the tenant has theoption to continue the lease, where, at the inception of the lease, it is reasonably certain that the tenantwill exercise that option.
Amounts received from tenants to terminate leases or to compensate for dilapidations arerecognised in the consolidated statement of profit or loss when the right to receive them arises.
Service charges, management charges and other outgoings recoverable from tenants
Income arising from expenses recharged to tenants is recognised in the period in which thecompensation becomes receivable and is classified as outgoings recovery income.
Management fee income
Propertylink has contractual entitlements to management fee income, which are recognised asfollows:
Š Performance fees are generally only entitled to be charged on the sale of all assets of afund, so such fees are only recognised when all assets have been sold and Propertylink isentitled to charge fees;
Š Acquisition and other transaction related fees are recognised when the service has beenprovided and Propertylink is entitled to charge fees; and
Š Investment and property management services are provided on a monthly basis andrevenue is recognised each month.
Interest income
Interest income is recognised as it accrues using the effective interest rate method.
II-A-100

APPENDIX II-A AUDITED FINANCIAL STATEMENTS ON PROPERTYLINK FOR THETHREE YEARS ENDED 30 JUNE 2018
THE AUDITED FINANCIAL STATEMENTS OF PROPERTYLINK FOR THE YEARENDED JUNE 30, 2017
Notes to the Financial Statements (continued)For the year ended 30 June 2017
(b) Property revenue
2017 2016
$’000 $’000
Rental income . . . . . . . . . . . . . . . . . . . . . . . . . . . . . . . . . . . . . . . . . . . . . . . . . . . . . . . . . . . 45,790 517Outgoings recovery income . . . . . . . . . . . . . . . . . . . . . . . . . . . . . . . . . . . . . . . . . . . . . . . . . 11,134 —Straight-lining of lease incentives . . . . . . . . . . . . . . . . . . . . . . . . . . . . . . . . . . . . . . . . . . . . 264 (12)Make good recovery . . . . . . . . . . . . . . . . . . . . . . . . . . . . . . . . . . . . . . . . . . . . . . . . . . . . . . 199 —
Total property revenue . . . . . . . . . . . . . . . . . . . . . . . . . . . . . . . . . . . . . . . . . . . . . . . . . . . 57,387 505
(c) Fees and other income
2017 2016
$’000 $’000
Management fee income:—Performance1 . . . . . . . . . . . . . . . . . . . . . . . . . . . . . . . . . . . . . . . . . . . . . . . . . . . . . . . 25,159 ——Acquisitions . . . . . . . . . . . . . . . . . . . . . . . . . . . . . . . . . . . . . . . . . . . . . . . . . . . . . . . . 2,662 2,065—Investment management . . . . . . . . . . . . . . . . . . . . . . . . . . . . . . . . . . . . . . . . . . . . . . 4,830 5,377—Property management . . . . . . . . . . . . . . . . . . . . . . . . . . . . . . . . . . . . . . . . . . . . . . . . 3,577 2,568—Other property services . . . . . . . . . . . . . . . . . . . . . . . . . . . . . . . . . . . . . . . . . . . . . . . 926 747
Total management fee revenue . . . . . . . . . . . . . . . . . . . . . . . . . . . . . . . . . . . . . . . . . . 37,154 10,757
1 Investment mandates generally allow for a performance fee to be paid in the event of investment performance above minimumhurdle rates. During the year performance fees were derived from former PAIP investors.
Note 3 Property expenses
2017 2016
$’000 $’000
Council rates and land tax . . . . . . . . . . . . . . . . . . . . . . . . . . . . . . . . . . . . . . . . . . . . . . . 4,355 —Repairs, maintenance and utilities . . . . . . . . . . . . . . . . . . . . . . . . . . . . . . . . . . . . . . . . . 3,805 —Ground lease . . . . . . . . . . . . . . . . . . . . . . . . . . . . . . . . . . . . . . . . . . . . . . . . . . . . . . . . . 2,406 —Property management expenses . . . . . . . . . . . . . . . . . . . . . . . . . . . . . . . . . . . . . . . . . . . 2,046 —Depreciation . . . . . . . . . . . . . . . . . . . . . . . . . . . . . . . . . . . . . . . . . . . . . . . . . . . . . . . . . . 2,140 —Property insurance costs . . . . . . . . . . . . . . . . . . . . . . . . . . . . . . . . . . . . . . . . . . . . . . . . . 678 —Other . . . . . . . . . . . . . . . . . . . . . . . . . . . . . . . . . . . . . . . . . . . . . . . . . . . . . . . . . . . . . . . . 550 27
Total property expenses . . . . . . . . . . . . . . . . . . . . . . . . . . . . . . . . . . . . . . . . . . . . . . . . 15,980 27
II-A-101

APPENDIX II-A AUDITED FINANCIAL STATEMENTS ON PROPERTYLINK FOR THETHREE YEARS ENDED 30 JUNE 2018
THE AUDITED FINANCIAL STATEMENTS OF PROPERTYLINK FOR THE YEARENDED JUNE 30, 2017
Notes to the Financial Statements (continued)For the year ended 30 June 2017
Note 4 Finance costs
Finance costs include interest, amortisation of borrowing costs incurred in connection witharrangement of borrowings and realised gains and losses on interest rate swaps. Borrowing costs areexpensed as incurred unless they relate to qualifying assets.
2017 2016
$’000 $’000
Interest on bank loans . . . . . . . . . . . . . . . . . . . . . . . . . . . . . . . . . . . . . . . . . . . . . . . . . . . . . 8,004 866Interest on other loans . . . . . . . . . . . . . . . . . . . . . . . . . . . . . . . . . . . . . . . . . . . . . . . . . . . . . 81 344Borrowing costs1 . . . . . . . . . . . . . . . . . . . . . . . . . . . . . . . . . . . . . . . . . . . . . . . . . . . . . . . . . 1,898 226
Total finance costs . . . . . . . . . . . . . . . . . . . . . . . . . . . . . . . . . . . . . . . . . . . . . . . . . . . . . . . 9,983 1,436
1 Borrowing costs include $1,555,096 in unamortised borrowing costs incurred to establish pre-IPO facilities for PHL and PAIP.The establishment of a new facility at the time of the IPO resulted in these costs being written off when the pre-IPO facilitieswere extinguished.
Note 5 Taxation
Most of the Group’s profit is earned by trusts which are not subject to taxation. Income fromthe trusts is instead attributed to unitholders who pay income tax at their marginal tax rates. Income taxis in respect of Propertylink (Holdings) Ltd and its subsidiaries only.
The income tax expense (income) for the year comprises current income tax expense (income)and deferred tax expense (income).
Current income tax expense charged to the profit or loss is the tax payable on taxable income.Current tax liabilities (assets) are measured at the amounts expected to be paid to (recovered from) therelevant taxation authority.
Current and deferred income tax expense (income) is charged or credited outside the profit orloss when the tax relates to items that are recognised outside the profit or loss.
Except for business combinations, no deferred income tax is recognised from the initialrecognition of an asset or liability, excluding a business combination, where there is no effect onaccounting or taxable profit or loss.
Deferred tax assets and liabilities are calculated at the tax rates that are expected to apply to theperiod when the asset is realised or the liability is settled and their measurement also reflects themanner in which management expects to recover or settle the carrying amount of the related asset orliability. With respect to non-depreciable items of property, plant and equipment measured at fair valueand items of investment property measured at fair value, the related deferred tax liability or deferredtax asset is measured on the basis that the carrying amount of the asset will be recovered entirelythrough sale.
II-A-102
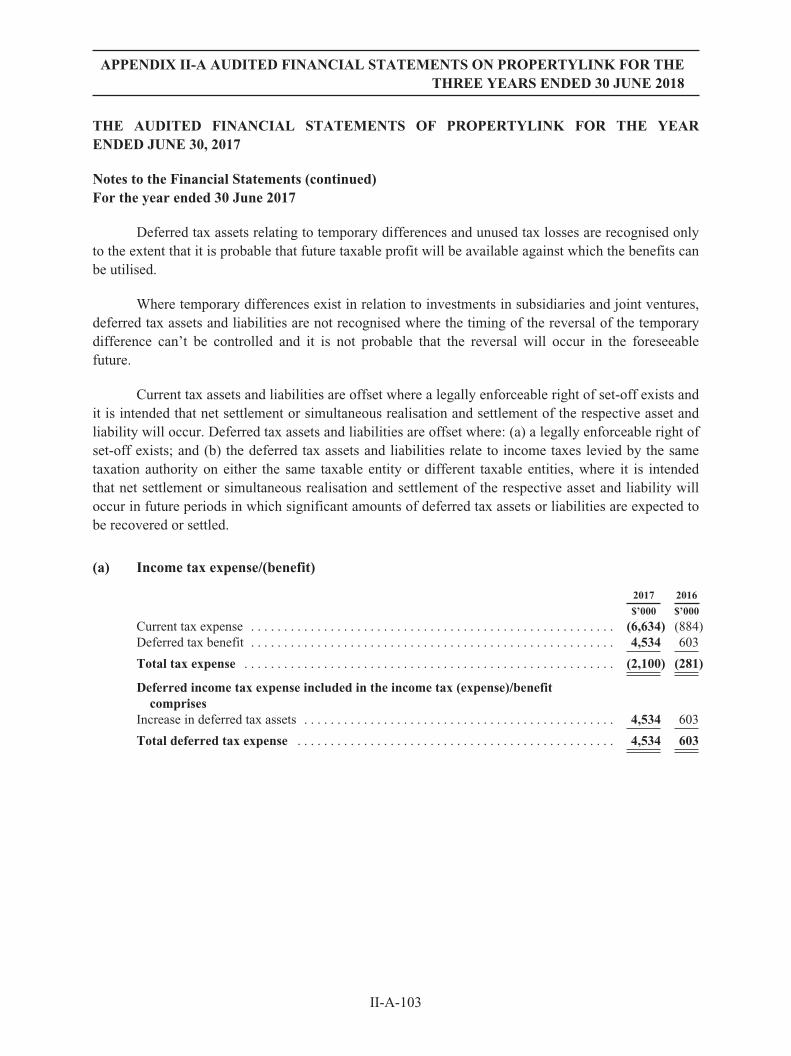
APPENDIX II-A AUDITED FINANCIAL STATEMENTS ON PROPERTYLINK FOR THETHREE YEARS ENDED 30 JUNE 2018
THE AUDITED FINANCIAL STATEMENTS OF PROPERTYLINK FOR THE YEARENDED JUNE 30, 2017
Notes to the Financial Statements (continued)For the year ended 30 June 2017
Deferred tax assets relating to temporary differences and unused tax losses are recognised onlyto the extent that it is probable that future taxable profit will be available against which the benefits canbe utilised.
Where temporary differences exist in relation to investments in subsidiaries and joint ventures,deferred tax assets and liabilities are not recognised where the timing of the reversal of the temporarydifference can’t be controlled and it is not probable that the reversal will occur in the foreseeablefuture.
Current tax assets and liabilities are offset where a legally enforceable right of set-off exists andit is intended that net settlement or simultaneous realisation and settlement of the respective asset andliability will occur. Deferred tax assets and liabilities are offset where: (a) a legally enforceable right ofset-off exists; and (b) the deferred tax assets and liabilities relate to income taxes levied by the sametaxation authority on either the same taxable entity or different taxable entities, where it is intendedthat net settlement or simultaneous realisation and settlement of the respective asset and liability willoccur in future periods in which significant amounts of deferred tax assets or liabilities are expected tobe recovered or settled.
(a) Income tax expense/(benefit)
2017 2016
$’000 $’000
Current tax expense . . . . . . . . . . . . . . . . . . . . . . . . . . . . . . . . . . . . . . . . . . . . . . . . . . . . . . . (6,634) (884)Deferred tax benefit . . . . . . . . . . . . . . . . . . . . . . . . . . . . . . . . . . . . . . . . . . . . . . . . . . . . . . . 4,534 603
Total tax expense . . . . . . . . . . . . . . . . . . . . . . . . . . . . . . . . . . . . . . . . . . . . . . . . . . . . . . . . (2,100) (281)
Deferred income tax expense included in the income tax (expense)/benefitcomprises
Increase in deferred tax assets . . . . . . . . . . . . . . . . . . . . . . . . . . . . . . . . . . . . . . . . . . . . . . . 4,534 603
Total deferred tax expense . . . . . . . . . . . . . . . . . . . . . . . . . . . . . . . . . . . . . . . . . . . . . . . . 4,534 603
II-A-103
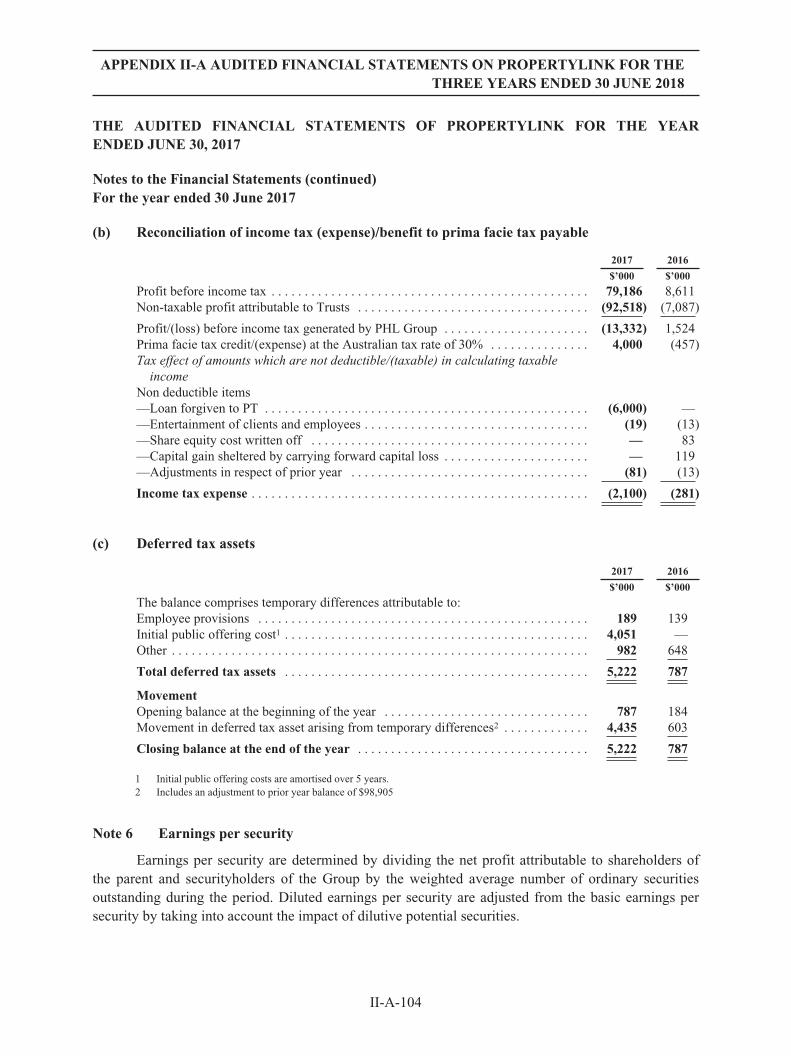
APPENDIX II-A AUDITED FINANCIAL STATEMENTS ON PROPERTYLINK FOR THETHREE YEARS ENDED 30 JUNE 2018
THE AUDITED FINANCIAL STATEMENTS OF PROPERTYLINK FOR THE YEARENDED JUNE 30, 2017
Notes to the Financial Statements (continued)For the year ended 30 June 2017
(b) Reconciliation of income tax (expense)/benefit to prima facie tax payable
2017 2016
$’000 $’000
Profit before income tax . . . . . . . . . . . . . . . . . . . . . . . . . . . . . . . . . . . . . . . . . . . . . . . . 79,186 8,611Non-taxable profit attributable to Trusts . . . . . . . . . . . . . . . . . . . . . . . . . . . . . . . . . . . (92,518) (7,087)
Profit/(loss) before income tax generated by PHL Group . . . . . . . . . . . . . . . . . . . . . . (13,332) 1,524Prima facie tax credit/(expense) at the Australian tax rate of 30% . . . . . . . . . . . . . . . 4,000 (457)Tax effect of amounts which are not deductible/(taxable) in calculating taxable
incomeNon deductible items—Loan forgiven to PT . . . . . . . . . . . . . . . . . . . . . . . . . . . . . . . . . . . . . . . . . . . . . . . . . (6,000) ——Entertainment of clients and employees . . . . . . . . . . . . . . . . . . . . . . . . . . . . . . . . . . (19) (13)—Share equity cost written off . . . . . . . . . . . . . . . . . . . . . . . . . . . . . . . . . . . . . . . . . . — 83—Capital gain sheltered by carrying forward capital loss . . . . . . . . . . . . . . . . . . . . . . — 119—Adjustments in respect of prior year . . . . . . . . . . . . . . . . . . . . . . . . . . . . . . . . . . . . (81) (13)
Income tax expense . . . . . . . . . . . . . . . . . . . . . . . . . . . . . . . . . . . . . . . . . . . . . . . . . . . (2,100) (281)
(c) Deferred tax assets
2017 2016
$’000 $’000
The balance comprises temporary differences attributable to:Employee provisions . . . . . . . . . . . . . . . . . . . . . . . . . . . . . . . . . . . . . . . . . . . . . . . . . . 189 139Initial public offering cost1 . . . . . . . . . . . . . . . . . . . . . . . . . . . . . . . . . . . . . . . . . . . . . . 4,051 —Other . . . . . . . . . . . . . . . . . . . . . . . . . . . . . . . . . . . . . . . . . . . . . . . . . . . . . . . . . . . . . . . 982 648
Total deferred tax assets . . . . . . . . . . . . . . . . . . . . . . . . . . . . . . . . . . . . . . . . . . . . . . 5,222 787
MovementOpening balance at the beginning of the year . . . . . . . . . . . . . . . . . . . . . . . . . . . . . . . 787 184Movement in deferred tax asset arising from temporary differences2 . . . . . . . . . . . . . 4,435 603
Closing balance at the end of the year . . . . . . . . . . . . . . . . . . . . . . . . . . . . . . . . . . . 5,222 787
1 Initial public offering costs are amortised over 5 years.2 Includes an adjustment to prior year balance of $98,905
Note 6 Earnings per security
Earnings per security are determined by dividing the net profit attributable to shareholders ofthe parent and securityholders of the Group by the weighted average number of ordinary securitiesoutstanding during the period. Diluted earnings per security are adjusted from the basic earnings persecurity by taking into account the impact of dilutive potential securities.
II-A-104

APPENDIX II-A AUDITED FINANCIAL STATEMENTS ON PROPERTYLINK FOR THETHREE YEARS ENDED 30 JUNE 2018
THE AUDITED FINANCIAL STATEMENTS OF PROPERTYLINK FOR THE YEARENDED JUNE 30, 2017
Notes to the Financial Statements (continued)For the year ended 30 June 2017
(a) Net profit used in calculating basic and diluted earnings per security
2017 2016
$’000 $’000
Profit/(loss) attributable to shareholders of the parent entity . . . . . . . . . . . . . . . . . . . . (15,432) 1,243Profit attributable to stapled securityholders . . . . . . . . . . . . . . . . . . . . . . . . . . . . . . . . 77,086 8,330
(b) Weighted average number of securities used as a denominator
2017 2016
No. of securities No. of securities
Weighted average number of ordinary stapled securities used incalculation of basic earnings per security . . . . . . . . . . . . . . . . . . . . . . . . 532,334,533 27,915,673
Weighted average number of ordinary stapled securities used incalculation of diluted earnings per security . . . . . . . . . . . . . . . . . . . . . . 532,334,533 32,897,879
(c) Basic and diluted earnings per security
2017 2016
cents cents
Basic earnings/(loss) per share—Parent . . . . . . . . . . . . . . . . . . . . . . . . . . . . (2.90) 4.45Diluted earnings/(loss) per share—Parent . . . . . . . . . . . . . . . . . . . . . . . . . . . (2.90) 3.78Basic earnings per security—Group . . . . . . . . . . . . . . . . . . . . . . . . . . . . . . . 14.48 29.84Diluted earnings per security—Group . . . . . . . . . . . . . . . . . . . . . . . . . . . . . . 14.48 25.32Adjustments for calculation of diluted earnings per stapled securityOptions exercised but not yet issued as shares . . . . . . . . . . . . . . . . . . . . . . . — 4,982,206Weighted average number of ordinary stapled securities and potential
ordinary stapled securities . . . . . . . . . . . . . . . . . . . . . . . . . . . . . . . . . . . . . 532,334,533 32,897,879
Note 7 Dividends and distributions
Dividends and distributions are recognised when declared.
2017 2016
$’000 $’000
Distributions paid:Fully franked ordinary dividend to pre IPO PHL shareholders on
15 August 2016 . . . . . . . . . . . . . . . . . . . . . . . . . . . . . . . . . . . . . . . . . . . . . 9,667 —Capital distribution to pre IPO PT unitholders on 15 August 2016 . . . . . . . . 21,082 —Profit distribution to PLG securityholders on 3 March 2017 . . . . . . . . . . . . 16,275 —
47,024 —
The balance of franking account at the end of the year was $399,624 (2016: $1,290,373).
II-A-105
APPENDIX II-A AUDITED FINANCIAL STATEMENTS ON PROPERTYLINK FOR THETHREE YEARS ENDED 30 JUNE 2018
THE AUDITED FINANCIAL STATEMENTS OF PROPERTYLINK FOR THE YEARENDED JUNE 30, 2017
Notes to the Financial Statements (continued)For the year ended 30 June 2017
Property Portfolio Assets
In this section
This section details the assets which are used to generate the Group’s performance and areconsidered to be the most relevant to the operations of the Group. The assets are detailed in thefollowing notes:
Investment properties: relates to freehold investment properties.
Property, plant and equipment: relates to leasehold buildings and furniture and equipment.
Non-current assets classified as held for sale: relates to investment properties which areexpected to be sold within 12 months of the balance sheet date and are currently marketed for sale.
Equity accounted investments: provides summarised financial information on joint ventures.The Group’s joint ventures comprise interests in property portfolio assets held through investments intrusts.
Note 8 Investment properties
Investment property comprises completed property and property under construction orre-development (including integral plant and equipment) that are held to earn rentals and for capitalappreciation.
Investment property is measured initially at cost, including transaction costs. The carryingamount also includes capital expenditure on investment property and components relating to leaseincentives and assets relating to fixed increases in operating lease rentals in future periods.
Subsequent to initial recognition, investment property is stated at fair value, which reflectsmarket conditions at the reporting date. Gains or losses arising from changes in the fair values ofinvestment properties are included in profit or loss in the period in which they arise.
Investment properties are not depreciated for accounting purposes. Taxation allowances for thedepreciation of buildings and plant and equipment contribute to the tax deferred component ofdistributions to stapled securityholders.
When an investment property is disposed of, the difference between the net disposal proceedsand the carrying amount of the asset is recognised in profit or loss.
II-A-106

APPENDIX II-A AUDITED FINANCIAL STATEMENTS ON PROPERTYLINK FOR THETHREE YEARS ENDED 30 JUNE 2018
THE AUDITED FINANCIAL STATEMENTS OF PROPERTYLINK FOR THE YEARENDED JUNE 30, 2017
Notes to the Financial Statements (continued)For the year ended 30 June 2017
(a) Reconciliation
2017 2016
$’000 $’000
Opening balance at the beginning of the period . . . . . . . . . . . . . . . . . . . . . . . . . . . . . . . 6,471 5,857Property acquisitions . . . . . . . . . . . . . . . . . . . . . . . . . . . . . . . . . . . . . . . . . . . . . . . . . . . . 583,978 —Property sales . . . . . . . . . . . . . . . . . . . . . . . . . . . . . . . . . . . . . . . . . . . . . . . . . . . . . . . . . . (32,966) —Capital expenditure . . . . . . . . . . . . . . . . . . . . . . . . . . . . . . . . . . . . . . . . . . . . . . . . . . . . . 17,624 —Less: classified as held for sale . . . . . . . . . . . . . . . . . . . . . . . . . . . . . . . . . . . . . . . . . . . . (31,550) —Capitalised straight-lining of fixed increases in operating leases inclusive of lease
incentives . . . . . . . . . . . . . . . . . . . . . . . . . . . . . . . . . . . . . . . . . . . . . . . . . . . . . . . . . . . 1,365 12Net fair value gain on investment property . . . . . . . . . . . . . . . . . . . . . . . . . . . . . . . . . . . 27,834 602
Closing balance at the end of the period . . . . . . . . . . . . . . . . . . . . . . . . . . . . . . . . . . . . . 572,756 6,471
The carrying amount of investment property includes components related to deferred rent,capitalised lease incentives and leasing fees amounting to $3,175,570 (2016: $11,941).
(b) Fair value measurement—investment property, investment property held for sale andproperty classified as property, plant and equipment
Each property is considered a separate asset class based on its unique nature, characteristics andrisk. The Group’s policies on investment property valuations require that:
Š management provide Directors with a view of the fair value of each property as eachsix-monthly reporting date approaches;
Š where the view indicates the fair value of a property may materially differ from the currentcarried value, the Directors require that management procure an independent externalvaluation; and
Š all properties in the portfolio are to be subject to an independent external valuation at leastonce in any 24 month period.
In accordance with policies, management provided the Directors with a view of propertycarrying values in May 2017. Following the presentation, five properties (representing 28% of the totalinvestment property portfolio value at 30 June 2017) were required to be independently valued byexternal valuers, and the remaining 25 properties (representing 72% of the investment propertyportfolio) were internally assessed. Following the assessments, the Directors instructed that therespective property carrying values be adjusted to the value determined under each of the aboveprocesses.
Highest and best use
For all investment property that is measured at fair value, the current use of the property isconsidered the highest and best use.
II-A-107

APPENDIX II-A AUDITED FINANCIAL STATEMENTS ON PROPERTYLINK FOR THETHREE YEARS ENDED 30 JUNE 2018
THE AUDITED FINANCIAL STATEMENTS OF PROPERTYLINK FOR THE YEARENDED JUNE 30, 2017
Notes to the Financial Statements (continued)For the year ended 30 June 2017
Fair value hierarchy
The fair values of investment property recognised in the consolidated statement of financialposition are Level 3 of the fair value measurement hierarchy (refer to Note 12(b)(iv)).
Valuation techniques used to derive fair values
The fair value is measured using capitalisation of net market income, discounted cash flow(DCF) approaches and comparable sales where appropriate.
Capitalisation (cap) approach
The capitalisation approach involves the addition of expected rent for the various componentsof the property and the deduction of outgoings and other expenses (where appropriate) in order todetermine the net income of the property. This net market income is capitalised at the adoptedcapitalisation rate to derive a market value. The higher/lower the capitalisation rate is adopted, thelower/ higher the valuation of a property.
Discounted cash flows (DCF) approach
The DCF approach involves discounting future net operating cash flows over a 10 yearinvestment horizon at the adopted discount rate to derive a net present value for the property. Thehigher/lower the discount rate is adopted, the lower/higher the valuation of a property.
The Group’s investment properties have been valued adopting the following key unobservableinputs:
Fair value Valuationtechnique
Key unobservableinputs2017 2016 2017 2016
$’000 $’000 $’000 $’000
Investmentproperties . . . . 604,306 6,471 Cap Approach Capitalisation rate 6.15% - 10.5% 6.75% - 7%
(avg 7.21%) (avg 6.875%)DCF Approach Discount rate 7.50% - 12.5% 8%
(avg 7.11%)
Key estimates: inputs used to measure fair value of investment properties and leaseholdbuildings
Judgement is required in determining the following key assumptions;
Š Adopted capitalisation rate: The rate at which net market rental revenue is capitalised todetermine the value of a property. The rate is determined with regard to market evidenceand the prior external valuation.
II-A-108

APPENDIX II-A AUDITED FINANCIAL STATEMENTS ON PROPERTYLINK FOR THETHREE YEARS ENDED 30 JUNE 2018
THE AUDITED FINANCIAL STATEMENTS OF PROPERTYLINK FOR THE YEARENDED JUNE 30, 2017
Notes to the Financial Statements (continued)For the year ended 30 June 2017
Š Adopted discount rate: The rate of return used to convert cash flows, payable orreceivable in the future, into present value. It reflects the opportunity cost of capital, thatis, the rate of return the cash can earn if put to other uses having similar risk. The rate isdetermined with regard to market evidence and the prior external valuation.
(c) Sensitivity information
The table below highlights the sensitivity analysis of a 25 basis point change in capitalisationrate on the fair value of investment property:
-25 basispoints
+ 25 basispoints
$’000 $’000
Change in fair value of investment properties . . . . . . . . . . . . . . . . . . . . . . . . . 2017 22,877 (21,309)2016 312 (290)
The table below highlights the sensitivity analysis of a 25 basis point change in discount rate onthe fair value of investment property:
-25 basispoints
+ 25 basispoints
$’000 $’000
Change in fair value of investment properties . . . . . . . . . . . . . . . . . . . . . . . . . 2017 8,769 (8,567)2016 128 (125)
Note 9 Property, plant and equipment
Property, plant and equipment is carried at cost or fair value as indicated less, where applicable,any accumulated depreciation and impairment losses.
Property—leasehold buildings
Leasehold buildings are carried at their fair value (being the amount for which an asset could beexchanged between knowledgeable willing parties in an arm’s length transaction), based on periodicvaluations by external independent valuers, less accumulated depreciation for buildings (refer to Note 8for more details).
Increases in the carrying amount arising on revaluation of buildings are credited to arevaluation reserve in equity. Decreases that offset previous increases of the same asset are recognisedagainst the revaluation reserve directly in equity; all other decreases are recognised in profit or loss.
Any accumulated depreciation at the date of revaluation is eliminated against the gross carryingamount of the asset and the net amount is restated to the revalued amount of the asset.
II-A-109

APPENDIX II-A AUDITED FINANCIAL STATEMENTS ON PROPERTYLINK FOR THETHREE YEARS ENDED 30 JUNE 2018
THE AUDITED FINANCIAL STATEMENTS OF PROPERTYLINK FOR THE YEARENDED JUNE 30, 2017
Notes to the Financial Statements (continued)For the year ended 30 June 2017
Depreciation
The depreciable amount is depreciated on a straight-line basis over the asset’s useful life to theconsolidated group commencing from the time the asset is held ready for use. Leasehold improvementsare depreciated over the shorter of either the unexpired period of the lease or the estimated useful livesof the improvements.
The depreciation rates used for each class of depreciable assets are:
Class of fixed asset Depreciation rate
Property—leasehold buildings 2.6% p.a.
The assets’ residual values and useful lives are reviewed, and adjusted if appropriate, at the endof each reporting period.
Gains and losses on disposal are determined by comparing proceeds with the carrying amount.These gains or losses are recognised in profit or loss when the item is derecognised. When revaluedassets are sold, amounts included in the revaluation surplus relating to that asset are transferred toretained earnings.
(a) Property, plant and equipment—reconciliation
2017 2016
$’000 $’000
Leasehold buildings at fair valueOpening balance at the beginning of the period . . . . . . . . . . . . . . . . . . . . . . . . . . . . . . — —Leasehold property acquisitions . . . . . . . . . . . . . . . . . . . . . . . . . . . . . . . . . . . . . . . . . . . 91,703 —Capital expenditure on leasehold property . . . . . . . . . . . . . . . . . . . . . . . . . . . . . . . . . . 106 —Capitalised straight-lining of fixed increases in operating leases . . . . . . . . . . . . . . . . . 331 —Capitalised straight-lining of fixed increases in ground leases . . . . . . . . . . . . . . . . . . . (1,883) —Depreciation . . . . . . . . . . . . . . . . . . . . . . . . . . . . . . . . . . . . . . . . . . . . . . . . . . . . . . . . . . (2,140) —Net fair value gain/(loss) on leasehold property . . . . . . . . . . . . . . . . . . . . . . . . . . . . . . 9,483 —
Closing balance at the end of the period . . . . . . . . . . . . . . . . . . . . . . . . . . . . . . . . . . . . 97,600 —
Other plant and equipment at costOffice leasehold improvements . . . . . . . . . . . . . . . . . . . . . . . . . . . . . . . . . . . . . . . . . . . 350 448Office equipment . . . . . . . . . . . . . . . . . . . . . . . . . . . . . . . . . . . . . . . . . . . . . . . . . . . . . . 104 113
Total other plant and equipment . . . . . . . . . . . . . . . . . . . . . . . . . . . . . . . . . . . . . . . . . . 454 561
Total property, plant and equipment . . . . . . . . . . . . . . . . . . . . . . . . . . . . . . . . . . . . . 98,054 561
The carrying amount of leasehold buildings includes components related to deferred rent,capitalised lease incentives and leasing fees amounting to ($3,486,532) (2016: $Nil).
Leasehold buildings consist of one property—Melbourne Markets. The property has beeninternally valued at 30 June 2017 at $97.6m.
II-A-110

APPENDIX II-A AUDITED FINANCIAL STATEMENTS ON PROPERTYLINK FOR THETHREE YEARS ENDED 30 JUNE 2018
THE AUDITED FINANCIAL STATEMENTS OF PROPERTYLINK FOR THE YEARENDED JUNE 30, 2017
Notes to the Financial Statements (continued)For the year ended 30 June 2017
(b) Fair value measurement
Fair value hierarchy
The fair values of property, plant and equipment recognised in the consolidated statement offinancial position are Level 3 of the fair value measurement hierarchy (refer to Note 12(b)(iv)).
Refer to Note 8(b) for valuation techniques and key estimates and judgements used to measurefair value of leasehold buildings. The Group’s leasehold buildings have been valued adopting thefollowing key unobservable inputs:
Fair value Valuationtechnique
Key unobservableinputs2017 2016 2017 2016
$’000 $’000 $’000 $’000
Leasehold buildings . . . . . . . . . 97,600 — Cap Approach Capitalisation rate 7.25% N/ADCF Approach Discount rate 8.75% N/A
(c) Sensitivity information
The table below highlights the sensitivity analysis of a 25 basis point change in capitalisationrate on the fair value of Melbourne Markets property:
-25 basispoints
+ 25 basispoints
$’000 $’000
Change in fair value of leasehold buildings . . . . . . . . . . . . . . . . . . . . . . . . . . . 2017 3,376 (3,151)2016 — —
The table below highlights the sensitivity analysis of a 25 basis point change in discount rate onthe fair value of Melbourne Markets property:
-25 basispoints
+ 25 basispoints
$’000 $’000
Change in fair value of leasehold buildings . . . . . . . . . . . . . . . . . . . . . . . . . . . 2017 1,529 (1,495)2016 — —
Note 10 Non-current assets classified as held for sale
Investment property is transferred to non-current assets held for sale when:
Š the property is available for immediate sale in its present condition; and
Š the Trustee is committed to a plan to sell the property at its current fair value with amarketing programme initiated; and
Š a sale is expected within one year
Investment properties held for sale continue to be measured at fair value and are presentedseparately as current items in the consolidated statement of financial position.
II-A-111

APPENDIX II-A AUDITED FINANCIAL STATEMENTS ON PROPERTYLINK FOR THETHREE YEARS ENDED 30 JUNE 2018
THE AUDITED FINANCIAL STATEMENTS OF PROPERTYLINK FOR THE YEARENDED JUNE 30, 2017
Notes to the Financial Statements (continued)For the year ended 30 June 2017
As at 30 June 2017 two of the Group’s investment properties with a fair value of $31.55m havebeen classified as held for sale. The sale of 150-156 McCredie Road, Smithfield, NSW was settled on12 July 2017 for $23m. The sale of 8 Sylvania Way, Lisarow, NSW is expected to settle by30 November 2017 for $9.63m.
Note 11 Equity accounted investments
(a) Information about principal joint ventures
Set out below are the material joint ventures of the Group. The entities listed below are unittrusts in which the Group holds equity. The proportion of equity held by the Group does not equal thevoting rights held by the Group. The entities are controlled jointly with the external investors. Thebelow entities were formed in Australia and their principal activity is property investment in Australia.
II-A-112

APPENDIX II-A AUDITED FINANCIAL STATEMENTS ON PROPERTYLINK FOR THETHREE YEARS ENDED 30 JUNE 2018
THE AUDITED FINANCIAL STATEMENTS OF PROPERTYLINK FOR THE YEARENDED JUNE 30, 2017
Notes to the Financial Statements (continued)For the year ended 30 June 2017
(b) Summarised financial information for equity accounted investments
Set out below is the summarised financial information for equity accounted investments,adjusted where necessary to reflect any differences in accounting policies between the Group and theinvestee:
30 June 2017
PropertylinkEnhancedPartnership
50 AnnPropertylinkEnhancedPartnership
PAIPInvestmentPartnership1
AuslogHoldingsTrust2
PHLMoelisBraesideTrust3
POP IIInvestmentPartnership4
PropertylinkCommercialIndustrialInvestments
PropertylinkAustralianIndustrial
Partnership II
POP IIIInvestmentPartnership Total
$’000 $’000 $’000 $’000 $’000 $’000 $’000 $’000 $’000 $’000Group’s share (%) . . . . . . . 25.00% 25.00% 0.00% 0.00% 10.00% 20.00% 7.50% 3.93% 11.21%Proportion of voting
rights . . . . . . . . . . . . . . . 50.00% 50.00% 0.00% 0.00% 50.00% 50.00% 50.00% 50.00% 50.00%Summarised financial
positionCash and cash
equivalents . . . . . . . . . . . 7,378 2,550 — — 268 1 1,018 2,903 1,220 15,338Total current assets . . . . . . 8,187 2,603 — — 563 706 1,036 4,111 1,457 18,663Total non-current assets . . 160,833 145,252 — — 49,330 31,163 29,000 252,113 108,700 776,391Current financial
liabilities . . . . . . . . . . . . (81) — — — (207) — (131) (212) (95) (726)Other current liabilities . . . (3,371) (2,999) — — (532) (304) (718) (5,431) (1,349) (14,704)Non-current financial
liabilities . . . . . . . . . . . . (74,479) (64,936) — — (23,948) — (17,313) (138,849) (55,991) (375,516)Net assets . . . . . . . . . . . . . . 91,089 79,920 — — 25,206 31,565 11,874 111,732 52,722 404,108
Group’s share of jointventure’s net assets . . . 22,772 19,980 — — 2,521 6,313 889 4,405 6,466 63,345
Summarised financialperformance for theyear ended 30 June2017
Revenue . . . . . . . . . . . . . . . 34,640 (7,262) 252 7,698 8,182 1,665 2,437 12,395 15,057 75,064Depreciation and
amortisation . . . . . . . . . . (62) — — — — — — (1,169) — (1,231)Interest income . . . . . . . . . 5 1 628 3 1 1,755 12 66 2 0 2,491Interest expense . . . . . . . . . (2,861) (389) — (1,035) (898) — (731) (2,903) (1,887) (10,704)Other expenses . . . . . . . . . (4,964) (583) (12) (1,679) (721) — (466) (7,695) (2,752) (18,872)Profit/(loss) from
continuing operations . . 26,758 (8,233) 868 4,987 6,564 3,420 1,252 694 10,438 46,748Income tax expense . . . . . . — — — — — — — — — —Profit/(loss) after tax from
continuing operations . . 26,758 (8,233) 868 4,987 6,564 3,420 1,252 694 10,438 46,748Total comprehensive
income/(loss) . . . . . . . . . 26,758 (8,233) 868 4,987 6,564 3,420 1,252 694 10,438 46,748
Group’s share of jointventure’s totalcomprehensiveincome . . . . . . . . . . . . . . 6,690 (2,058) 304 499 656 684 94 27 1,640 8,536
Distribution received . . . . 1,145 – 629 273 191 425 83 249 215 3,210
1 PT sold its investment in PAIP Investment Partnership immediately prior to the IPO on 15 August 2016, but received incomedistributions for the period 1 July to 15 August 2016.
2 The assets held by Auslog Holdings Trust were sold in February 2017 and the trust has been wound up.3 The asset held by PHL Moelis Braeside Trust was sold in July 2017. Refer to Note 24 for more details.4 The asset held by POP II, in which POP II Investment Partnership has 20% interest, was sold in July 2017. Refer to Note 24 for more
details.
II-A-113
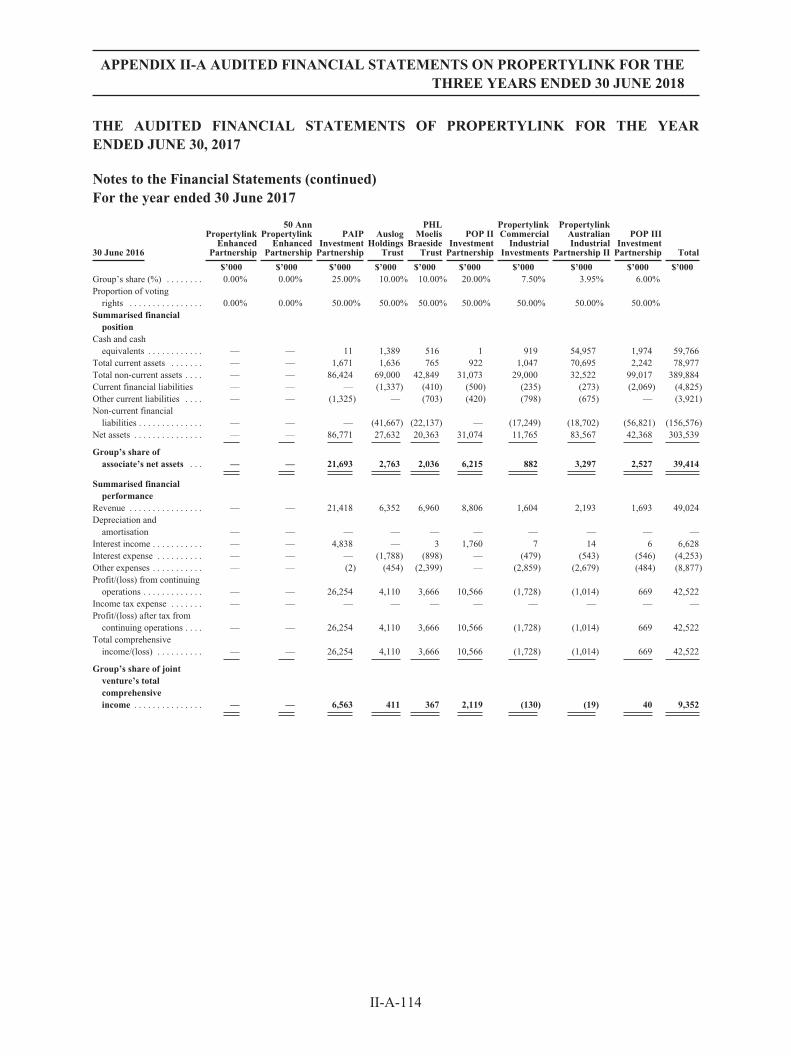
APPENDIX II-A AUDITED FINANCIAL STATEMENTS ON PROPERTYLINK FOR THETHREE YEARS ENDED 30 JUNE 2018
THE AUDITED FINANCIAL STATEMENTS OF PROPERTYLINK FOR THE YEARENDED JUNE 30, 2017
Notes to the Financial Statements (continued)For the year ended 30 June 2017
30 June 2016
PropertylinkEnhanced
Partnership
50 AnnPropertylink
EnhancedPartnership
PAIPInvestmentPartnership
AuslogHoldings
Trust
PHLMoelis
BraesideTrust
POP IIInvestmentPartnership
PropertylinkCommercial
IndustrialInvestments
PropertylinkAustralianIndustrial
Partnership II
POP IIIInvestmentPartnership Total
$’000 $’000 $’000 $’000 $’000 $’000 $’000 $’000 $’000 $’000Group’s share (%) . . . . . . . . 0.00% 0.00% 25.00% 10.00% 10.00% 20.00% 7.50% 3.95% 6.00%Proportion of voting
rights . . . . . . . . . . . . . . . . 0.00% 0.00% 50.00% 50.00% 50.00% 50.00% 50.00% 50.00% 50.00%Summarised financial
positionCash and cash
equivalents . . . . . . . . . . . . — — 11 1,389 516 1 919 54,957 1,974 59,766Total current assets . . . . . . . — — 1,671 1,636 765 922 1,047 70,695 2,242 78,977Total non-current assets . . . . — — 86,424 69,000 42,849 31,073 29,000 32,522 99,017 389,884Current financial liabilities — — — (1,337) (410) (500) (235) (273) (2,069) (4,825)Other current liabilities . . . . — — (1,325) — (703) (420) (798) (675) — (3,921)Non-current financial
liabilities . . . . . . . . . . . . . . — — — (41,667) (22,137) — (17,249) (18,702) (56,821) (156,576)Net assets . . . . . . . . . . . . . . . — — 86,771 27,632 20,363 31,074 11,765 83,567 42,368 303,539
Group’s share ofassociate’s net assets . . . — — 21,693 2,763 2,036 6,215 882 3,297 2,527 39,414
Summarised financialperformance
Revenue . . . . . . . . . . . . . . . . — — 21,418 6,352 6,960 8,806 1,604 2,193 1,693 49,024Depreciation and
amortisation — — — — — — — — — —Interest income . . . . . . . . . . . — — 4,838 — 3 1,760 7 14 6 6,628Interest expense . . . . . . . . . . — — — (1,788) (898) — (479) (543) (546) (4,253)Other expenses . . . . . . . . . . . — — (2) (454) (2,399) — (2,859) (2,679) (484) (8,877)Profit/(loss) from continuing
operations . . . . . . . . . . . . . — — 26,254 4,110 3,666 10,566 (1,728) (1,014) 669 42,522Income tax expense . . . . . . . — — — — — — — — — —Profit/(loss) after tax from
continuing operations . . . . — — 26,254 4,110 3,666 10,566 (1,728) (1,014) 669 42,522Total comprehensive
income/(loss) . . . . . . . . . . — — 26,254 4,110 3,666 10,566 (1,728) (1,014) 669 42,522
Group’s share of jointventure’s totalcomprehensiveincome . . . . . . . . . . . . . . . — — 6,563 411 367 2,119 (130) (19) 40 9,352
II-A-114
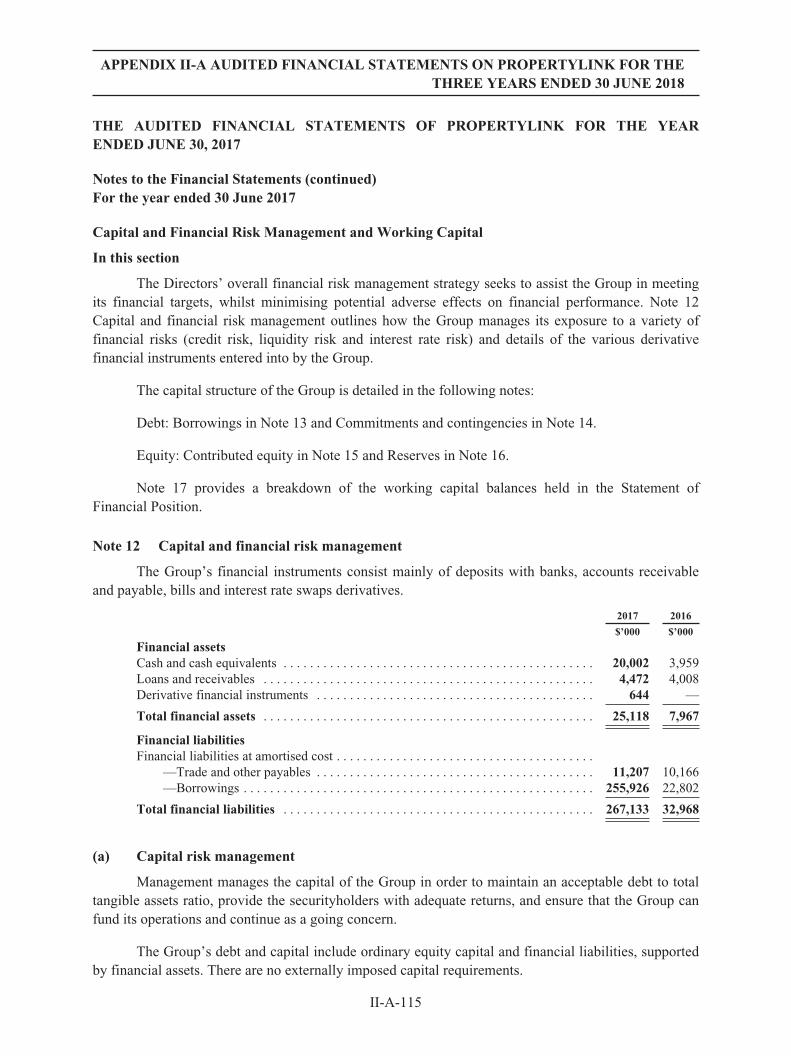
APPENDIX II-A AUDITED FINANCIAL STATEMENTS ON PROPERTYLINK FOR THETHREE YEARS ENDED 30 JUNE 2018
THE AUDITED FINANCIAL STATEMENTS OF PROPERTYLINK FOR THE YEARENDED JUNE 30, 2017
Notes to the Financial Statements (continued)For the year ended 30 June 2017
Capital and Financial Risk Management and Working Capital
In this section
The Directors’ overall financial risk management strategy seeks to assist the Group in meetingits financial targets, whilst minimising potential adverse effects on financial performance. Note 12Capital and financial risk management outlines how the Group manages its exposure to a variety offinancial risks (credit risk, liquidity risk and interest rate risk) and details of the various derivativefinancial instruments entered into by the Group.
The capital structure of the Group is detailed in the following notes:
Debt: Borrowings in Note 13 and Commitments and contingencies in Note 14.
Equity: Contributed equity in Note 15 and Reserves in Note 16.
Note 17 provides a breakdown of the working capital balances held in the Statement ofFinancial Position.
Note 12 Capital and financial risk management
The Group’s financial instruments consist mainly of deposits with banks, accounts receivableand payable, bills and interest rate swaps derivatives.
2017 2016
$’000 $’000
Financial assetsCash and cash equivalents . . . . . . . . . . . . . . . . . . . . . . . . . . . . . . . . . . . . . . . . . . . . . . . 20,002 3,959Loans and receivables . . . . . . . . . . . . . . . . . . . . . . . . . . . . . . . . . . . . . . . . . . . . . . . . . . 4,472 4,008Derivative financial instruments . . . . . . . . . . . . . . . . . . . . . . . . . . . . . . . . . . . . . . . . . . 644 —
Total financial assets . . . . . . . . . . . . . . . . . . . . . . . . . . . . . . . . . . . . . . . . . . . . . . . . . . 25,118 7,967
Financial liabilitiesFinancial liabilities at amortised cost . . . . . . . . . . . . . . . . . . . . . . . . . . . . . . . . . . . . . . .
—Trade and other payables . . . . . . . . . . . . . . . . . . . . . . . . . . . . . . . . . . . . . . . . . . 11,207 10,166—Borrowings . . . . . . . . . . . . . . . . . . . . . . . . . . . . . . . . . . . . . . . . . . . . . . . . . . . . . 255,926 22,802
Total financial liabilities . . . . . . . . . . . . . . . . . . . . . . . . . . . . . . . . . . . . . . . . . . . . . . . 267,133 32,968
(a) Capital risk management
Management manages the capital of the Group in order to maintain an acceptable debt to totaltangible assets ratio, provide the securityholders with adequate returns, and ensure that the Group canfund its operations and continue as a going concern.
The Group’s debt and capital include ordinary equity capital and financial liabilities, supportedby financial assets. There are no externally imposed capital requirements.
II-A-115

APPENDIX II-A AUDITED FINANCIAL STATEMENTS ON PROPERTYLINK FOR THETHREE YEARS ENDED 30 JUNE 2018
THE AUDITED FINANCIAL STATEMENTS OF PROPERTYLINK FOR THE YEARENDED JUNE 30, 2017
Notes to the Financial Statements (continued)For the year ended 30 June 2017
Management assesses the Group’s financial risks and adjusts its capital structure in response tochanges in these risks and the market. These responses may include the review of debt levels, reviewof distributions to securityholders, and issue of new securities.
The Group has a target gearing level of 30% to 40%. The table below details the calculation ofthe gearing ratio:
2017 2016
$’000 $’000
Total interest bearing liabilities1 . . . . . . . . . . . . . . . . . . . . . . . . . . . . . . . . . . . . 257,000 22,938Cash and cash equivalents . . . . . . . . . . . . . . . . . . . . . . . . . . . . . . . . . . . . . . . . . 20,002 3,959Total tangible assets2 . . . . . . . . . . . . . . . . . . . . . . . . . . . . . . . . . . . . . . . . . . . . . 797,754 55,362Gearing ratio3 . . . . . . . . . . . . . . . . . . . . . . . . . . . . . . . . . . . . . . . . . . . . . . . . . . 30.5% 36.9%Gearing ratio (look-through)4 . . . . . . . . . . . . . . . . . . . . . . . . . . . . . . . . . . . . . 35.2% N/A
1 Total interest bearing liabilities exclude unamortised borrowing costs.2 Total tangible assets comprise total assets less intangible assets.3 The gearing ratio is calculated as total interest bearing liabilities less cash and cash equivalents divided by total tangible assets
less cash and cash equivalents.4 The look-through gearing ratio is calculated on the same basis, by including the Group’s underlying interest in debt, cash and
tangible assets of equity accounted investments.
(b) Financial risk management
Management meets monthly to analyse financial risk and to evaluate treasury managementstrategies in the context of the most recent economic conditions and forecasts to assist the Group inmeeting its financial targets, whilst minimising potential adverse effects on financial performance.
Management operates under policies approved by the Board of Directors. Financial riskmanagement policies are reviewed and approved by the Board at least annually, including credit riskpolicies and future cash flow requirements.
Specific financial risk exposures and management
The main risks the Group is exposed to through its financial instruments are credit risk,liquidity risk and market risk relating to interest rates.
(i) Credit risk
Exposure to credit risk relating to financial assets arises from the potential non-performance bycounterparties of contract obligations that could lead to a financial loss to the Group.
The Group manages credit risk by:
Š maintaining procedures ensuring, to the extent possible, that customers and counterpartiesto transactions are of sound credit worthiness;
II-A-116

APPENDIX II-A AUDITED FINANCIAL STATEMENTS ON PROPERTYLINK FOR THETHREE YEARS ENDED 30 JUNE 2018
THE AUDITED FINANCIAL STATEMENTS OF PROPERTYLINK FOR THE YEARENDED JUNE 30, 2017
Notes to the Financial Statements (continued)For the year ended 30 June 2017
Š utilisation of systems for the approval, granting and renewal of credit limits;
Š regular monitoring of exposures against credit limits;
Š obtaining collateral where necessary in the form of tenant bonds;
Š regular monitoring of the financial stability of significant customers and counterparties.Credit terms are generally 30 to 45 days from the date of invoice; and
Š investing surplus funds in financial institutions that maintain a high credit rating or inentities that the senior executives have otherwise assessed as being financially sound.
The maximum exposure to credit risk at balance date to recognised financial assets, excludingthe value of any collateral or other security, is the carrying amount, net of any provisions forimpairment of those assets. The Group manages credit risk by ensuring that appropriate due diligenceis carried out before entering into lease agreements with tenants. Receivable balances are regularlyreviewed to reduce exposure to bad debts.
(ii) Liquidity risk
Liquidity risk arises from the possibility that the Group might encounter difficulty in settling itsdebts or otherwise meeting its obligations related to financial liabilities. The Group manages this riskby:
Š preparing forward-looking cash flows for its operational, investing and financingactivities;
Š monitoring undrawn credit facilities;
Š maintaining a reputable credit profile;
Š managing credit risk related to financial assets;
Š only investing surplus cash with major financial institutions; and
Š comparing the maturity profile of financial liabilities with the realisation profile offinancial assets.
The table below reflects an undiscounted contractual maturity analysis for financial assets andliabilities. Financial guarantee liabilities are treated as payable on demand since the Group has nocontrol over the timing of any potential settlement of the liability.
Cash flows realised from financial assets reflect management’s expectation as to the timing ofrealisation. Actual timing may therefore differ from that disclosed. The timing of cash flows presentedin the table to settle financial liabilities reflect the earliest contractual settlement dates and do notreflect management’s expectations that banking facilities will be rolled forward.
II-A-117

APPENDIX II-A AUDITED FINANCIAL STATEMENTS ON PROPERTYLINK FOR THETHREE YEARS ENDED 30 JUNE 2018
THE AUDITED FINANCIAL STATEMENTS OF PROPERTYLINK FOR THE YEARENDED JUNE 30, 2017
Notes to the Financial Statements (continued)For the year ended 30 June 2017
Financial liability and financial asset maturity analysis
Within 1 Year 1 to 5 years Total
2017 2016 2017 2016 2017 2016
$’000 $’000 $’000 $’000 $’000 $’000
Financial liabilities due for paymentSecured bank loans1 . . . . . . . . . . . . . . . . . . . . . . . . . . . 8,771 13,876 284,007 — 292,778 13,876Trade and other payables . . . . . . . . . . . . . . . . . . . . . . . 11,207 10,166 — — 11,207 10,166Derivative financial instruments2 . . . . . . . . . . . . . . . . 211 — — — 211 —Other loans . . . . . . . . . . . . . . . . . . . . . . . . . . . . . . . . . . — 9,062 — — — 9,062
Total expected outflows . . . . . . . . . . . . . . . . . . . . . . . 20,189 33,104 284,007 — 304,196 33,104
Financial assets—cash flows realisableCash and cash equivalents . . . . . . . . . . . . . . . . . . . . . . 20,002 3,959 — — 20,002 3,959Trade, term and loan receivables . . . . . . . . . . . . . . . . . 4,228 3,894 — — 4,228 3,894Derivative financial instruments2 . . . . . . . . . . . . . . . . — — 937 — 937 —
Total expected inflows . . . . . . . . . . . . . . . . . . . . . . . . 24,230 7,853 937 — 25,167 7,853
Net (outflow) / inflow on financial instruments . . . . . 4,041 (25,251) (283,070) — (279,029) (25,251)
1 Refer to Note 13. Includes estimated fees and interest.2 Derivative financial instruments comprise of interest rate swaps, for which only the net interest cash flows (not the notional principal) are
included. Refer to note 12(c) for fair value of derivatives.
The Group manages the liquidity required to meet its current liabilities from operating cashflows. Non-current liabilities in respect of bank loans are managed by way of renegotiation or from thesale of assets.
(iii) Market risk
Interest rate risk
Interest rate risk is the risk that the future cash flows of a financial instrument will fluctuatebecause of changes in market interest rates. The Group’s exposure to the risk of changes in marketinterest rates relates primarily to its long-term debt obligations with floating interest rates.
To manage interest rate risk, the Group enters into interest rate swaps, in which it agrees toexchange, at specified intervals, the difference between fixed and variable rate interest amountscalculated by reference to an agreed-upon notional principal amount. These swaps are designated tohedge underlying debt obligations. At 30 June 2017, after taking into account the effect of interest rateswaps, 69.1% of the Group’s borrowings are hedged (30 June 2016: Nil).
II-A-118

APPENDIX II-A AUDITED FINANCIAL STATEMENTS ON PROPERTYLINK FOR THETHREE YEARS ENDED 30 JUNE 2018
THE AUDITED FINANCIAL STATEMENTS OF PROPERTYLINK FOR THE YEARENDED JUNE 30, 2017
Notes to the Financial Statements (continued)For the year ended 30 June 2017
The net notional amount of variable rate debt (i.e. interest bearing loans net of interest rateswaps) and effective hedge rate are set out below:
2017 2016
Note $’000 $’000
Bank facilities . . . . . . . . . . . . . . . . . . . . . . . . . . . . . . . . . . . . . . . . . . . . . . . . . 13 257,000 13,876Less notional amount of interest rate swaps . . . . . . . . . . . . . . . . . . . . . . . . . . (177,500) —Unhedged debt . . . . . . . . . . . . . . . . . . . . . . . . . . . . . . . . . . . . . . . . . . . . . . . . 79,500 13,876Hedge rate (%) . . . . . . . . . . . . . . . . . . . . . . . . . . . . . . . . . . . . . . . . . . . . . . . . 69.1% 0.0%
Sensitivity analysis
The analysis below describes reasonably possible movements in interest rates with all othervariables held constant, showing the impact on profit before tax and equity. It should be noted that theimpact of movement in the variable is not necessarily linear.
Š The sensitivity of the consolidated statement of profit or loss is the effect of the assumedchanges in interest rates on finance income less finance expense for the period, based onthe floating rate financial liabilities held at the reporting date, including the effect ofhedging instruments.
Š The sensitivity of equity is calculated by revaluing interest rate swaps designated as cashflow hedges, for the effects of the assumed changes in interest rates.
The following table illustrates sensitivities to the Group’s exposures to changes in interest rates.The table indicates the impact on how profit and equity values reported at the end of the reportingperiod would have been affected by changes in the relevant risk variable that management considers tobe reasonably possible.
These sensitivities also assume that the movement in a particular variable is independent ofother variables.
2017 2016
Profit Equity Profit Equity
$’000 $’000 $’000 $’000
Increase in interest rate by 0.5% . . . . . . . . . . . . . . . . . . . . . . . . . . (398) 2,811 (69) (69)Decrease in interest rate by 0.5% . . . . . . . . . . . . . . . . . . . . . . . . . . 398 (2,539) 69 69
There have been no changes in any of the assumptions used to prepare the above sensitivityanalysis from the prior year.
(iv) Fair value
Fair value is the price that would be received to sell an asset or paid to transfer a liability in anorderly transaction between market participants at the measurement date. The fair value measurement
II-A-119

APPENDIX II-A AUDITED FINANCIAL STATEMENTS ON PROPERTYLINK FOR THETHREE YEARS ENDED 30 JUNE 2018
THE AUDITED FINANCIAL STATEMENTS OF PROPERTYLINK FOR THE YEARENDED JUNE 30, 2017
Notes to the Financial Statements (continued)For the year ended 30 June 2017
is based on the presumption that the transaction to sell the asset or transfer the liability takes placeeither:
Š In the principal market for the asset or liability; or
Š In the absence of a principal market, in the most advantageous market for the asset orliability.
The Group must be able to access the principal or the most advantageous market at themeasurement date. The fair value of an asset or a liability is measured using the assumptions thatmarket participants would use when pricing the asset or liability, assuming that market participants actin their economic best interest.
A fair value measurement of a non-financial asset takes into account a market participant’sability to generate economic benefits by using the asset in its highest and best use or by selling it toanother market participant that would use the asset in its highest and best use.
The Group uses valuation techniques that are appropriate in the circumstances and for whichsufficient data are available to measure fair value, maximising the use of relevant observable inputsand minimising the use of unobservable inputs.
All assets and liabilities, for which fair value is measured or disclosed in the consolidatedfinancial statements are categorised within the fair value hierarchy (described as follows), based on thelowest level input that is significant to the fair value measurement as a whole:
Š Level 1—Quoted (unadjusted) market prices in active markets for identical assets orliabilities
Š Level 2—Valuation techniques for which the lowest level input that is significant to thefair value measurement is directly or indirectly observable
Š Level 3—Valuation techniques for which the lowest level input that is significant to thefair value measurement is unobservable
All financial instruments were measured at Level 2 for the periods presented in this report.
For assets and liabilities that are recognised in the consolidated financial statements at fairvalue on a recurring basis, the Group determines whether transfers have occurred between levels in thehierarchy by reassessing categorisation (based on the lowest level input that is significant to the fairvalue measurement as a whole) at the end of each reporting period.
Fair value estimation
The fair values of financial assets and financial liabilities equal their carrying value presented inthe consolidated statement of financial position.
II-A-120

APPENDIX II-A AUDITED FINANCIAL STATEMENTS ON PROPERTYLINK FOR THETHREE YEARS ENDED 30 JUNE 2018
THE AUDITED FINANCIAL STATEMENTS OF PROPERTYLINK FOR THE YEARENDED JUNE 30, 2017
Notes to the Financial Statements (continued)For the year ended 30 June 2017
Management has assessed that the fair values of cash and cash equivalents, trade and otherreceivables and trade and other payables approximate their carrying amounts largely due to the short-term maturities of these instruments. The fair value of the financial assets and liabilities is included atthe amount of which the instrument could be exchanged in a current transaction between willingparties, other than in a forced or liquidation sale. The following methods and assumptions were used toestimate the fair values:
Š The valuation techniques applied to fair value of derivatives employ the use of marketobservable inputs and include swap models which use present value calculations. Themodel incorporates various inputs including the credit quality of counterparties andforward rates.
Š Fair values of the Group’s interest bearing borrowings and loans are determined by usingthe DCF method using a discount rate that reflects the issuer’s borrowing rate including itsown non-performance risk as at 30 June 2017. As at 30 June 2017, the fair value of theGroup’s interest bearing borrowings and loans is $257m.
(c) Derivative financial instruments
A derivative is a type of financial instrument typically used to manage risk. A hedge is where aderivative is used to manage an underlying exposure and the Group uses derivatives, such as interestrate swaps, to hedge its risks associated with interest rates. Derivatives are initially recognised at fairvalue on the date on which a derivative contract is entered into and are subsequently remeasured at fairvalue with any changes in fair value recognised in the Statement of Comprehensive Income.Derivatives are carried as financial assets when the fair value is positive and as financial liabilitieswhen the fair value is negative.
At inception, the Group can elect to formally designate and document the relationship betweencertain hedge derivative instruments (interest rate swaps) and the associated hedged items (bankborrowings). The Group also documents its assessment, both at hedge inception and on an ongoingbasis, of whether the derivatives that are used in hedging transactions have been and will continue tobe highly effective in offsetting changes in cash flows of hedged items.
Hedges that meet the strict criteria for hedge accounting are accounted for, as described below:
Cash flow hedges
A cash flow hedge is a hedge of the exposure to variability in cash flows attributable to aparticular risk to a highly probable forecast transaction pertaining to an asset or liability.
Any gains or losses arising from changes in the fair value of derivatives are taken directly toprofit or loss, except for the effective portion of cash flow hedges, which is recognised in othercomprehensive income and later reclassified to profit or loss when the hedge item affects profit or loss.
II-A-121

APPENDIX II-A AUDITED FINANCIAL STATEMENTS ON PROPERTYLINK FOR THETHREE YEARS ENDED 30 JUNE 2018
THE AUDITED FINANCIAL STATEMENTS OF PROPERTYLINK FOR THE YEARENDED JUNE 30, 2017
Notes to the Financial Statements (continued)For the year ended 30 June 2017
If the forecast transaction or firm commitment is no longer expected to occur, amountspreviously recognised in OCI are transferred to the statement of profit or loss. If the hedginginstrument expires or is sold, terminated or exercised without replacement or rollover (as part of thehedging strategy), or if its designation as a hedge is revoked, or when the hedge no longer meets thecriteria for hedge accounting, any cumulative gain or loss previously recognised in OCI remainsseparately in equity until the forecast transaction occurs or the firm commitment is met.
When a derivative is held as an economic hedge for a period beyond 12 months after the end ofthe reporting period, the derivative is classified as non-current consistent with the classification of theunderlying item. A derivative instrument that is a designated and effective hedging instrument isclassified consistent with the classification of the underlying hedged item.
At 30 June 2017, the Group had interest rate swap agreements in place with a notional amountof $177.5m (30 June 2016: $Nil) whereby the Group receives a variable rate and pays a fixed rate ofinterest of between 1.83% and 2.54%. The interest rate swaps are being used to manage the Group’sinterest rate risk exposure to changes in the cash flow of its secured bank loan and are formallydesignated as cash flow hedges.
The aggregate fair value of the interest rate swaps at the end of the reporting period was anasset of $644,279 (30 June 2016: $Nil).
The fair value of interest rate swaps is the estimated amount that the entity would receive orpay to transfer the swap at reporting date, taking into account current interest rates and the currentcreditworthiness of the swap counterparties. The fair value of derivatives is determined usingrecognised valuation techniques and the principles of IFRS 13 Fair Value Measurement. The interestrate swaps are classified in Level 2 of the fair value measurement hierarchy (refer to Note 12(b)(iv).
Note 13 Borrowings
Borrowings are initially recognised at fair value net of directly attributable transaction costs andsubsequently measured at amortised cost using the effective interest rate method. Under the effectiveinterest rate method, any transaction fees, costs, discounts and premiums directly related to theborrowings are capitalised to borrowings and amortised in profit or loss over the expected life of theborrowings.
II-A-122

APPENDIX II-A AUDITED FINANCIAL STATEMENTS ON PROPERTYLINK FOR THETHREE YEARS ENDED 30 JUNE 2018
THE AUDITED FINANCIAL STATEMENTS OF PROPERTYLINK FOR THE YEARENDED JUNE 30, 2017
Notes to the Financial Statements (continued)For the year ended 30 June 2017
All borrowings with contractual maturities greater than 12 months after reporting date areclassified as non-current liabilities.
2017 2016
$’000 $’000
CurrentBank loan secured . . . . . . . . . . . . . . . . . . . . . . . . . . . . . . . . . . . . . . . . . . . . . . . . . . . . . — 13,876Borrowing costs . . . . . . . . . . . . . . . . . . . . . . . . . . . . . . . . . . . . . . . . . . . . . . . . . . . . . . . — (136)Loan others . . . . . . . . . . . . . . . . . . . . . . . . . . . . . . . . . . . . . . . . . . . . . . . . . . . . . . . . . . . — 9,062
Total current borrowings . . . . . . . . . . . . . . . . . . . . . . . . . . . . . . . . . . . . . . . . . . . . . . — 22,802
Non-currentBank loan secured . . . . . . . . . . . . . . . . . . . . . . . . . . . . . . . . . . . . . . . . . . . . . . . . . . . . . 257,000 —Borrowing costs . . . . . . . . . . . . . . . . . . . . . . . . . . . . . . . . . . . . . . . . . . . . . . . . . . . . . . . (1,074) —
Total non-current borrowings . . . . . . . . . . . . . . . . . . . . . . . . . . . . . . . . . . . . . . . . . . 255,926 —
Total borrowings . . . . . . . . . . . . . . . . . . . . . . . . . . . . . . . . . . . . . . . . . . . . . . . . . . . . . 255,926 22,802
The bank loan is a commercial bill facility and is priced at a margin over 90-day BBSY rate.The facility is secured against the Group’s investment properties and property, plant and equipment,and by guarantees provided to the financier by certain Group entities. The facility is split into twotranches, a $150m facility drawn to $145m expiring on 15 August 2019, and a $150m facility drawn to$112m expiring on 15 August 2021.
The Group has been in compliance with all debt covenants during the year.
Refer to Note 12 for details on the Group’s exposure to risks associated with financialliabilities.
Note 14 Commitments and contingencies
(a) Commitments
(i) Lease payable commitments
The determination of whether an arrangement is (or contains) a lease is based on the substanceof the arrangement at the inception of the lease. The arrangement is, or contains, a lease if fulfilment ofthe arrangement is dependent on the use of a specific asset or assets or the arrangement conveys a rightto use the asset or assets, even if that right is not explicitly specified in the arrangement.
A lease is classified at the inception date as a finance lease or an operating lease. Leases that donot transfer substantially all the risks and rewards of ownership of an asset to the Group are classifiedas operating leases. Operating lease payments are recognised as an operating expense in the statementof profit or loss on a straight-line basis over the lease term, except for contingent rental paymentswhich are expensed when they arise.
II-A-123

APPENDIX II-A AUDITED FINANCIAL STATEMENTS ON PROPERTYLINK FOR THETHREE YEARS ENDED 30 JUNE 2018
THE AUDITED FINANCIAL STATEMENTS OF PROPERTYLINK FOR THE YEARENDED JUNE 30, 2017
Notes to the Financial Statements (continued)For the year ended 30 June 2017
The Group makes non-cancellable ground lease payments on land on which the MelbourneMarkets operate. The ground leases have fixed escalation clauses, and expire on 30 September 2055.The improvements constructed on the leased land are classified as Property, Plant and Equipment. TheGroup also makes lease payments on its office premises. Commitments for minimum lease paymentsin relation to non-cancellable leases are as follows:
2017 2016
$’000 $’000
Within 1 year . . . . . . . . . . . . . . . . . . . . . . . . . . . . . . . . . . . . . . . . . . . . . . . . . . . . . . . . . . 1,162 592After 1 year, but not more than 5 years . . . . . . . . . . . . . . . . . . . . . . . . . . . . . . . . . . . . . . 8,979 5,043More than 5 years . . . . . . . . . . . . . . . . . . . . . . . . . . . . . . . . . . . . . . . . . . . . . . . . . . . . . . . 102,199 —
112,340 5,635
(ii) Lease receivable commitments
Leases in which the Group does not transfer substantially all the risks and rewards of ownershipof an asset are classified as operating leases. Initial direct costs incurred in negotiating and arrangingan operating lease are added to the carrying amount of the leased asset and amortised over the leaseterm on the same basis as rental income.
The Group has entered into leases on its property portfolio. Industrial property leases typicallyhave initial lease terms of between 5 and 10 years and include clauses to enable periodic fixed upwardrevision.
Future minimum rentals receivable under non-cancellable operating leases are as follows:
2017 2016
$’000 $’000
Within 1 year . . . . . . . . . . . . . . . . . . . . . . . . . . . . . . . . . . . . . . . . . . . . . . . . . . . . . . . . . . 48,216 502After 1 year, but not more than 5 years . . . . . . . . . . . . . . . . . . . . . . . . . . . . . . . . . . . . . . 114,250 950More than 5 years . . . . . . . . . . . . . . . . . . . . . . . . . . . . . . . . . . . . . . . . . . . . . . . . . . . . . . . 32,392 2
194,858 1,454
(b) Contingencies
At 30 June 2017 the Group had no significant contingent assets or liabilities (30 June 2016:$3.16m liability).
II-A-124

APPENDIX II-A AUDITED FINANCIAL STATEMENTS ON PROPERTYLINK FOR THETHREE YEARS ENDED 30 JUNE 2018
THE AUDITED FINANCIAL STATEMENTS OF PROPERTYLINK FOR THE YEARENDED JUNE 30, 2017
Notes to the Financial Statements (continued)For the year ended 30 June 2017
Note 15 Contributed equity
(a) Contributed equity of shareholders of the parent entity
2017 2016
Note $’000 $’000
Opening balance at the beginning of the period . . . . . . . . . . . . . . . . . . . . 40,598 27,256Issue of ordinary equity, net of transaction costs . . . . . . . . . . . . . . . . . . . — 13,342Reallocation of capital to other stapled entity’s capital1 . . . . . . . . . . . . . . 15(b) (35,234) —
Closing balance at the end of the period . . . . . . . . . . . . . . . . . . . . . . . . . . 5,364 40,598
(b) Contributed equity of unitholders of other stapled entities
2017 2016
Note $’000 $’000
Opening balance at the beginning of the period . . . . . . . . . . . . . . . . . . . . — —Issue of ordinary equity . . . . . . . . . . . . . . . . . . . . . . . . . . . . . . . . . . . . . . . 497,292 —Less security issue costs . . . . . . . . . . . . . . . . . . . . . . . . . . . . . . . . . . . . . . (7,320) —Reallocation of capital from the parent entity’s capital1 . . . . . . . . . . . . . . 15(a) 35,234 —
Closing balance at the end of the period . . . . . . . . . . . . . . . . . . . . . . . . . . 525,206 —
1 PHL and PT were stapled prior to the IPO in August 2016, however, for Australian Financial Services Licence reasons no capital wasable to be allocated from PHL to PT until Propertylink Investment Management Limited, the Responsible Entity, was granted a retailLicence. Capital was reallocated from PHL to PT as part of the IPO restructuring process, and the amount reallocated was determinedhaving regard to a number of factors, including the amount of capital invested by PT.
(c) Number of securities on issue
2017 2016
No. ofsecurities
No. ofsecurities
Opening balance at the beginning of the period . . . . . . . . . . . . . . . . . . . . . . . 43,808,247 27,862,792Issue of additional equity . . . . . . . . . . . . . . . . . . . . . . . . . . . . . . . . . . . . . . . . . 558,972,083 15,945,455
Closing balance at the end of the period . . . . . . . . . . . . . . . . . . . . . . . . . . . . . 602,780,330 43,808,247
Each stapled security ranks equally with all other stapled securities for the purposes ofdistributions and on termination of the Group.
Each stapled security entitles the holder to vote in accordance with the provisions of theConstitutions and the Corporations Act 2001.
(d) Initial public offer
On 15 August 2016, the Propertylink Group completed a series of transactions which resultedin the stapling of PHL, PT and PAIP to form the listed Propertylink Group. PHL and PT werepreviously stapled, and since 15 August 2016 a stapled security comprises one PHL share, one PT unitand one PAIP unit. The stapled securities cannot be traded or dealt with separately.
II-A-125

APPENDIX II-A AUDITED FINANCIAL STATEMENTS ON PROPERTYLINK FOR THETHREE YEARS ENDED 30 JUNE 2018
THE AUDITED FINANCIAL STATEMENTS OF PROPERTYLINK FOR THE YEARENDED JUNE 30, 2017
Notes to the Financial Statements (continued)For the year ended 30 June 2017
During the IPO process PHL incurred transaction costs totalling $24.199m. In accordance withAustralian Accounting Standards, $16.879m in costs have been charged to the Statement of Profit orLoss, and $7.32m have been recognised as security issue costs in equity. PHL has re-charged $7.32min issue costs to PT ($4.77m) and PAIP ($2.55m) as capital raised was allocated to those two entities inthose proportions.
As part of the IPO process, there were also a series of equity restructure steps required in orderto ensure that the three entities could be stapled to form the listed Propertylink Group. Those stepsincluded a capital reorganisation in the PAIP Group, the issue of securities in PHL and PT to PAIPexisting investors, a capital reorganisation in PHL, a capital reorganisation in PT, and the recognitionof a liability for a performance fee payable to PHL by the PAIP existing investors.
Note 16 Reserves
(a) Reserves
2017 2016
$’000 $’000
Asset revaluation reserveOpening balance at the beginning of the period . . . . . . . . . . . . . . . . . . . . . . . . . . . . . . — —Changes in the fair value of leasehold buildings . . . . . . . . . . . . . . . . . . . . . . . . . . . . . . 9,483 —
Closing balance at the end of the period . . . . . . . . . . . . . . . . . . . . . . . . . . . . . . . . . . . . 9,483 —
Cash flow hedge reserveOpening balance at the beginning of the period . . . . . . . . . . . . . . . . . . . . . . . . . . . . . . — —Changes in the fair value of cash flow hedges . . . . . . . . . . . . . . . . . . . . . . . . . . . . . . . 644 —
Closing balance at the end of the period . . . . . . . . . . . . . . . . . . . . . . . . . . . . . . . . . . . . 644 —
Capital reserveOpening balance at the beginning of the period . . . . . . . . . . . . . . . . . . . . . . . . . . . . . . (20,556) —Equity restructure . . . . . . . . . . . . . . . . . . . . . . . . . . . . . . . . . . . . . . . . . . . . . . . . . . . . . (24,087) (20,556)
Closing balance at the end of the period . . . . . . . . . . . . . . . . . . . . . . . . . . . . . . . . . . . . (44,643) (20,556)
Total reserves . . . . . . . . . . . . . . . . . . . . . . . . . . . . . . . . . . . . . . . . . . . . . . . . . . . . . . . . (34,516) (20,556)
(b) Nature and purpose of reserves
Asset revaluation reserve
The asset revaluation reserve is used to record the fair value adjustment arising fromrevaluation of leasehold buildings classified as Property, plant and equipment in the Statement ofFinancial Position.
Cash flow hedge reserve
The cash flow hedge reserve is used to record the effective portion of changes in the fair valueof derivatives that are designated as cash flow hedges.
II-A-126

APPENDIX II-A AUDITED FINANCIAL STATEMENTS ON PROPERTYLINK FOR THETHREE YEARS ENDED 30 JUNE 2018
THE AUDITED FINANCIAL STATEMENTS OF PROPERTYLINK FOR THE YEARENDED JUNE 30, 2017
Notes to the Financial Statements (continued)For the year ended 30 June 2017
Capital reserve
The movement in the capital reserve during the 2017 year was the result of a series of equityrestructuring steps required to staple PAIP to PHL and PT to enable the completion of the IPO on15 August 2016. The 2016 equity restructure movement in the capital reserve resulted from theacquisition of a non-controlling interest (for further details, refer to Propertylink Group’s 2016Financial Statements).
Note 17 Working capital
(a) Cash and cash equivalents
Cash and cash equivalents comprise cash at bank and short-term deposits with an originalmaturity of three months or less, which are subject to an insignificant risk of changes in value.
(b) Trade and other receivables
Trade and other receivables include amounts due from customers for goods sold and servicesperformed in the ordinary course of business. Receivables expected to be collected within 12 monthsof the end of the reporting period are classified as current assets. All other receivables are classified asnon-current assets.
Trade and other receivables are initially recognised at fair value and subsequently measured atamortised cost using the effective interest method, less any provision for impairment.
2017 2016
$’000 $’000
Rent receivable . . . . . . . . . . . . . . . . . . . . . . . . . . . . . . . . . . . . . . . . . . . . . . . . . . . . . . . . . . . 1,074 9Less: provision for doubtful debts . . . . . . . . . . . . . . . . . . . . . . . . . . . . . . . . . . . . . . . . . . . . (4) —
Total rent receivables . . . . . . . . . . . . . . . . . . . . . . . . . . . . . . . . . . . . . . . . . . . . . . . . . . . . . 1,070 9
Fee receivable . . . . . . . . . . . . . . . . . . . . . . . . . . . . . . . . . . . . . . . . . . . . . . . . . . . . . . . . . . . 1,814 2,450Distribution receivable . . . . . . . . . . . . . . . . . . . . . . . . . . . . . . . . . . . . . . . . . . . . . . . . . . . . . 471 376Other receivables . . . . . . . . . . . . . . . . . . . . . . . . . . . . . . . . . . . . . . . . . . . . . . . . . . . . . . . . . 873 1,060Deposits paid . . . . . . . . . . . . . . . . . . . . . . . . . . . . . . . . . . . . . . . . . . . . . . . . . . . . . . . . . . . . 244 86Loans . . . . . . . . . . . . . . . . . . . . . . . . . . . . . . . . . . . . . . . . . . . . . . . . . . . . . . . . . . . . . . . . . . — 27
Total current trade and other receivables . . . . . . . . . . . . . . . . . . . . . . . . . . . . . . . . . . . . 4,472 4,008
II-A-127

APPENDIX II-A AUDITED FINANCIAL STATEMENTS ON PROPERTYLINK FOR THETHREE YEARS ENDED 30 JUNE 2018
THE AUDITED FINANCIAL STATEMENTS OF PROPERTYLINK FOR THE YEARENDED JUNE 30, 2017
Notes to the Financial Statements (continued)For the year ended 30 June 2017
(c) Trade and other payables
Trade and other payables represent the liabilities for goods and services received by the Groupthat remain unpaid at the end of the reporting period. The balance is recognised as a current liabilitywith the amounts normally paid within 30 days of recognition of the liability.
2017 2016
$’000 $’000
Trade payables . . . . . . . . . . . . . . . . . . . . . . . . . . . . . . . . . . . . . . . . . . . . . . . . . . . . . . . . . 2,128 1,218Other payables and accrued expenses . . . . . . . . . . . . . . . . . . . . . . . . . . . . . . . . . . . . . . . 7,031 8,612GST payable . . . . . . . . . . . . . . . . . . . . . . . . . . . . . . . . . . . . . . . . . . . . . . . . . . . . . . . . . . . 1,156 288Bonds payable . . . . . . . . . . . . . . . . . . . . . . . . . . . . . . . . . . . . . . . . . . . . . . . . . . . . . . . . . 892 48
11,207 10,166
Other Disclosures
In this section
This section includes other information that must be disclosed to comply with the AccountingStandards, the Corporations Act 2001 or the Corporations Regulations.
Note 18 Intangible assets
Goodwill represents the excess of the cost of an acquisition over the fair value of the Group’sshare of the net identifiable assets of the acquired subsidiary at the date of the acquisition.
2017 2016
$’000 $’000
GoodwillCost . . . . . . . . . . . . . . . . . . . . . . . . . . . . . . . . . . . . . . . . . . . . . . . . . . . . . . . . . . . . . . . . . . . 4,566 4,566Intangible assets net carrying amount . . . . . . . . . . . . . . . . . . . . . . . . . . . . . . . . . . . . . . . . . 4,566 4,566
Goodwill is not subject to amortisation and is tested annually for impairment, or morefrequently if events or changes in circumstances indicate that it might be impaired. An impairment lossis recognised in the Statement of Comprehensive Income for the amount by which the asset’s carryingamount exceeds its recoverable amount.
Management carry out a review of the recoverable amount of its goodwill at least annually.There has been no change in the carrying value of the goodwill as a result of the reviews.
II-A-128

APPENDIX II-A AUDITED FINANCIAL STATEMENTS ON PROPERTYLINK FOR THETHREE YEARS ENDED 30 JUNE 2018
THE AUDITED FINANCIAL STATEMENTS OF PROPERTYLINK FOR THE YEARENDED JUNE 30, 2017
Notes to the Financial Statements (continued)For the year ended 30 June 2017
Note 19 Security-based payments
2017 2016
$’000 $’000
Staff bonuses1 . . . . . . . . . . . . . . . . . . . . . . . . . . . . . . . . . . . . . . . . . . . . . . . . . . . . . . . . . . . . 558 —Directors’ fees2 . . . . . . . . . . . . . . . . . . . . . . . . . . . . . . . . . . . . . . . . . . . . . . . . . . . . . . . . . . . 260 —Consulting fees3 . . . . . . . . . . . . . . . . . . . . . . . . . . . . . . . . . . . . . . . . . . . . . . . . . . . . . . . . . . 223 —Executive KMP4 . . . . . . . . . . . . . . . . . . . . . . . . . . . . . . . . . . . . . . . . . . . . . . . . . . . . . . . . . . 842 —
1,883 —
1 Staff were awarded bonus payments as a result of the performance fee earned. The bonus payments were partly cash and partlysecurity based. This note details the security based bonus portion. The ordinary securities granted are escrowed until results forthe 2017 financial year are released, and vest at that date provided staff remain employed by Propertylink.
2 Directors’ fees of $260,000 were generated in the form of fully vested ordinary securities for additional duties performed inrelation to the IPO. These fees also included in Note 22(a) Key management personnel compensation.
3 Consulting fees of $224,000 to Blue Gum Capital Pty Ltd, an entity associated with Anthony Ryan, were generated in the formof fully vested ordinary securities in relation to advice provided to PHL in the process of preparing for the IPO. These fees arealso included in Note 22(b)(ii) Fees paid to key management personnel’s related parties.
4 Executive KMP have rights to security based payments in certain performance and service related circumstances. For fulldetails of these rights refer to the Remuneration Report.
Note 20 Auditors’ remuneration
2017 2016
$’000 $’000
Audit fees1
KPMG—audit and review of Financial Statements . . . . . . . . . . . . . . . . . . . . . . . . . . . . . . . . 425 —KPMG—other assurance services . . . . . . . . . . . . . . . . . . . . . . . . . . . . . . . . . . . . . . . . . . . . . . 57 —Bentleys—audit and review of Financial Statements . . . . . . . . . . . . . . . . . . . . . . . . . . . . . . . — 144PwC Australia2—audit and review of Financial Statements . . . . . . . . . . . . . . . . . . . . . . . . . 17 8
Total audit fees . . . . . . . . . . . . . . . . . . . . . . . . . . . . . . . . . . . . . . . . . . . . . . . . . . . . . . . . . . . 499 152
Transaction and other services feesKPMG—IPO related work . . . . . . . . . . . . . . . . . . . . . . . . . . . . . . . . . . . . . . . . . . . . . . . . . . . 450 —Bentleys—other . . . . . . . . . . . . . . . . . . . . . . . . . . . . . . . . . . . . . . . . . . . . . . . . . . . . . . . . . . . . 5 —
Total transaction and other services fees . . . . . . . . . . . . . . . . . . . . . . . . . . . . . . . . . . . . . . 455 —
Total audit, transaction and other services fees . . . . . . . . . . . . . . . . . . . . . . . . . . . . . . . . . 954 152
1 2017 fees relate to the Propertylink Group whereas 2016 fee relate to the previously stapled PHL and PT Group (i.e. excludingPAIP).
2 Fees were paid to PwC Australia for the audit of a subsidiary with an Australian Financial Services Licence. KPMG will auditthe subsidiary for FY2017.
II-A-129

APPENDIX II-A AUDITED FINANCIAL STATEMENTS ON PROPERTYLINK FOR THETHREE YEARS ENDED 30 JUNE 2018
THE AUDITED FINANCIAL STATEMENTS OF PROPERTYLINK FOR THE YEARENDED JUNE 30, 2017
Notes to the Financial Statements (continued)For the year ended 30 June 2017
Note 21 Cash flow information
Reconciliation of net profit to net cash flows from operating activities
30-Jun-2017 30-Jun-2016
$’000 $’000
Profit after income tax . . . . . . . . . . . . . . . . . . . . . . . . . . . . . . . . . . . . . . . . . . . . . 77,086 8,330Adjustments to reconcile profit before tax to net cash flows
Valuation (gains) on investment property . . . . . . . . . . . . . . . . . . . . . . . . . . (27,834) (602)Net gain on disposal of investment properties . . . . . . . . . . . . . . . . . . . . . . . (5,689) —Net loss on disposal of investments . . . . . . . . . . . . . . . . . . . . . . . . . . . . . . . 438 —Depreciation and amortisation expense . . . . . . . . . . . . . . . . . . . . . . . . . . . . 2,285 200Amortisation and write off of borrowing costs . . . . . . . . . . . . . . . . . . . . . . 1,873 159Amortisation of leasing costs . . . . . . . . . . . . . . . . . . . . . . . . . . . . . . . . . . . . 173 —Straight-lining rental income adjustments . . . . . . . . . . . . . . . . . . . . . . . . . . (1,697) (11)Straight-lining lease expense adjustments . . . . . . . . . . . . . . . . . . . . . . . . . . 1,883 —Deferred tax credited to capitalised share issue costs . . . . . . . . . . . . . . . . . — 231Valuation (gains)/losses on investment in joint ventures . . . . . . . . . . . . . . . (3,829) (5,947)
(32,397) (5,970)
Changes in assets and liabilities(Increase)/decrease in trade and other receivable . . . . . . . . . . . . . . . . . . . . . . . . (464) (2,172)(Increase)/decrease in other assets . . . . . . . . . . . . . . . . . . . . . . . . . . . . . . . . . . . . (1,546) (53)(Increase)/decrease in deferred tax assets . . . . . . . . . . . . . . . . . . . . . . . . . . . . . . (4,435) (603)Increase in trade and other payables . . . . . . . . . . . . . . . . . . . . . . . . . . . . . . . . . . 17 7,995Increase/(decrease) in income tax payable . . . . . . . . . . . . . . . . . . . . . . . . . . . . . . 3,383 (219)Increase/(decrease) in provisions (excluding provision for dividend) . . . . . . . . . 195 389
(2,850) 5,337
Net cash flows from operating activities . . . . . . . . . . . . . . . . . . . . . . . . . . . . . 41,839 7,697
Note 22 Related parties
(a) Key management personnel
Key management personnel compensation
2017 2016
$’000 $’000
Short-term benefits . . . . . . . . . . . . . . . . . . . . . . . . . . . . . . . . . . . . . . . . . . . . . . . . . 3,234 394Long-term benefits . . . . . . . . . . . . . . . . . . . . . . . . . . . . . . . . . . . . . . . . . . . . . . . . . 333 —Post-employment benefits . . . . . . . . . . . . . . . . . . . . . . . . . . . . . . . . . . . . . . . . . . . 114 —Security-based payments . . . . . . . . . . . . . . . . . . . . . . . . . . . . . . . . . . . . . . . . . . . . 1,102 —
4,783 394
The basis of amounts disclosed in FY2017 changed compared with amounts disclosed inFY2016 as a result of the IPO.
II-A-130

APPENDIX II-A AUDITED FINANCIAL STATEMENTS ON PROPERTYLINK FOR THETHREE YEARS ENDED 30 JUNE 2018
THE AUDITED FINANCIAL STATEMENTS OF PROPERTYLINK FOR THE YEARENDED JUNE 30, 2017
Notes to the Financial Statements (continued)For the year ended 30 June 2017
Equity instruments disclosures relating to key management personnel
The relevant interest in PLG stapled securities held during the period by each key managementpersonnel, including their personally related parties, are set out below:
Openingbalance
1-Jul-2016
Netacquisitions/disposals
Performancerights granted
Closing balance2017
Directors . . . . . . . . . . . . . . . . . . . . . . . . . . . . . . . 16,680,863 4,276,670 898,877 21,856,410Other key management personnel . . . . . . . . . . . . 180,500 559,143 — 739,643
Total . . . . . . . . . . . . . . . . . . . . . . . . . . . . . . . . . . 16,861,363 4,835,813 898,877 22,596,053
There were no loans with key management personnel or their related parties during the yearended 30 June 2017 and 30 June 2016.
(b) Transactions with related parties
Transactions between related parties are on normal commercial terms and conditions no morefavourable than those available to other parties unless otherwise stated.
The following transactions occurred with related parties:
2017 2016
$’000 $’000
i. Fee income from key management personnel’s related partiesProject management fees—Nix Anderson Pty Ltd (associated with Derek Nix)1 . . . 65 —Rent received—Blue Gum Capital Pty Ltd (associated with Anthony Ryan) . . . . . . 55 —
120 —
ii. Fees paid to key management personnel’s related partiesManagement services—Echo Capital Holdings Trust (“ECHT”)2 . . . . . . . . . . . . . . — 2,167Project management fees—Nix Anderson Pty Ltd (associated with Derek Nix)1 . . . 57 119Consulting fees—Blue Gum Capital Pty Ltd (associated with Anthony Ryan)3 . . . . 223 —
280 2,286
1 Project management fees received from and paid to Nix Anderson Pty Ltd were for project management services provided onnormal commercial terms and conditions.
2 Under arrangement in place in FY2016, ECHT provided management services to PHL. Stuart Dawes, Stephen Day and PeterMcDonald are associated with ECHT.
3 Consulting fees paid to Blue Gum Capital Pty Ltd for advice to PHL in connection with the IPO.
II-A-131

APPENDIX II-A AUDITED FINANCIAL STATEMENTS ON PROPERTYLINK FOR THETHREE YEARS ENDED 30 JUNE 2018
THE AUDITED FINANCIAL STATEMENTS OF PROPERTYLINK FOR THE YEARENDED JUNE 30, 2017
Notes to the Financial Statements (continued)For the year ended 30 June 2017
Note 23 Parent entity disclosures
The following information represents the standalone financial information for Propertylink(Holdings) Limited.
2017 2016
$’000 $’000
STATEMENT OF FINANCIAL POSITIONASSETSCurrent assets . . . . . . . . . . . . . . . . . . . . . . . . . . . . . . . . . . . . . . . . . . . . . . . . . . . . . . . . 27,779 77,198Non-current assets . . . . . . . . . . . . . . . . . . . . . . . . . . . . . . . . . . . . . . . . . . . . . . . . . . . . . 5,589 3,950
TOTAL ASSETS . . . . . . . . . . . . . . . . . . . . . . . . . . . . . . . . . . . . . . . . . . . . . . . . . . . . . 33,368 81,148
LIABILITIESCurrent liabilities . . . . . . . . . . . . . . . . . . . . . . . . . . . . . . . . . . . . . . . . . . . . . . . . . . . . . . 81,102 44,826Non-current liabilities . . . . . . . . . . . . . . . . . . . . . . . . . . . . . . . . . . . . . . . . . . . . . . . . . . 31 19,233
TOTAL LIABILITIES . . . . . . . . . . . . . . . . . . . . . . . . . . . . . . . . . . . . . . . . . . . . . . . . 81,133 64,059
EQUITYIssued capital . . . . . . . . . . . . . . . . . . . . . . . . . . . . . . . . . . . . . . . . . . . . . . . . . . . . . . . . . 5,364 40,500Capital reserve . . . . . . . . . . . . . . . . . . . . . . . . . . . . . . . . . . . . . . . . . . . . . . . . . . . . . . . . (25,110) (20,556)Retained earnings . . . . . . . . . . . . . . . . . . . . . . . . . . . . . . . . . . . . . . . . . . . . . . . . . . . . . (16,596) (2,855)Dividends provided . . . . . . . . . . . . . . . . . . . . . . . . . . . . . . . . . . . . . . . . . . . . . . . . . . . . (11,423) —
TOTAL EQUITY . . . . . . . . . . . . . . . . . . . . . . . . . . . . . . . . . . . . . . . . . . . . . . . . . . . . (47,765) 17,089
STATEMENT OF PROFIT OR LOSS AND OTHER COMPREHENSIVEINCOME
Profit after income tax . . . . . . . . . . . . . . . . . . . . . . . . . . . . . . . . . . . . . . . . . . . . . . . . . . (15,498) 1,505
Total comprehensive income1 . . . . . . . . . . . . . . . . . . . . . . . . . . . . . . . . . . . . . . . . . . . (15,498) 1,505
1 Total comprehensive income for the year ended 30 June 2017 includes an expense of $20.0m related to debt forgiveness of partof a loan to PT, and IPO costs of $16.879m.
Note 24 Events after the reporting period
On 21 July 2017, settlement occurred on the sale of 320 Pitt Street, Sydney for a sale price of$275m. The property was managed by the Group and was owned by Propertylink Office Partnership II(POP II) Trust in which the Group has a 5% interest. The property was the only asset of the POP IIgroup. As a result of the sale, PHL as manager, became entitled to a performance fee of approximately$17.5m. No part of this fee was accrued at 30 June 2017. PT will also receive its underlying 5% equityinvestment in POP II when the trust is wound up.
On 25 July 2017, settlement occurred on the sale of 90-110 Mills Road, Braeside, which wasthe only property asset of PHL Moelis Braeside Trust, in which the Group has a 10% interest. As aresult of the sale PHL as manager became entitled to a performance fee of approximately $1m, and PTwill receive its 10% equity investment in the trust when it is wound up.
II-A-132

APPENDIX II-A AUDITED FINANCIAL STATEMENTS ON PROPERTYLINK FOR THETHREE YEARS ENDED 30 JUNE 2018
THE AUDITED FINANCIAL STATEMENTS OF PROPERTYLINK FOR THE YEARENDED JUNE 30, 2017
Notes to the Financial Statements (continued)For the year ended 30 June 2017
On 15 July 2017, PAIP settled the sale of 150-156 McCredie Road, Smithfield, for a contractprice of $23m, as a result of a sale contract entered into in June 2017.
During July 2017, PT invested $20m in acquiring additional units in Propertylink AustralianIndustrial Partnership II (PAIP II), taking its equity investment in PAIP II to approximately $25m,which equates to a 17.13% economic interest.
Since the end of the year, other than the matters disclosed above, the Directors are not aware ofany matter or circumstance not otherwise dealt with in the Directors’ Report or the FinancialStatements that has significantly or may significantly affect the operations of the Group, or state of theGroup’s affairs in future financial periods.
Note 25 Business combinations
On 15 August 2016 the Propertylink Group completed an initial public offering (IPO), resultingin a listing of its securities on the ASX. On that date the units in PAIP were stapled to the units in PTand the shares in PHL, resulting in the consolidation of PAIP with a corresponding 100%non-controlling interest.
PAIP generates a stable rental income from the ownership of a diversified portfolio of industrialinvestment properties in Australia. Stapling of PAIP to PHL and PT on 15 August 2016 allowed theGroup to achieve its key objective of listing on the ASX so as to provide securityholders with superior,risk adjusted returns.
II-A-133

APPENDIX II-A AUDITED FINANCIAL STATEMENTS ON PROPERTYLINK FOR THETHREE YEARS ENDED 30 JUNE 2018
THE AUDITED FINANCIAL STATEMENTS OF PROPERTYLINK FOR THE YEARENDED JUNE 30, 2017
Notes to the Financial Statements (continued)For the year ended 30 June 2017
Information required to be disclosed by Australian Accounting Standards is already included inthese Financial Statements, and the following additional disclosure completes the information:
PAIP from15-Aug-2016
to 30-Jun-2017
Pro-forma PLGGroup2 from1-Jul-2016 to30-Jun-2017
$’000 $’000
RevenueProperty revenue . . . . . . . . . . . . . . . . . . . . . . . . . . . . . . . . . . . . . . . . . . . . . 56,774 65,336Net fair value gain on investment property . . . . . . . . . . . . . . . . . . . . . . . . . 27,442 27,604Other income . . . . . . . . . . . . . . . . . . . . . . . . . . . . . . . . . . . . . . . . . . . . . . . . 5,951 51,939
Total revenue and other income . . . . . . . . . . . . . . . . . . . . . . . . . . . . . . . . 90,167 144,879
ExpensesProperty expenses . . . . . . . . . . . . . . . . . . . . . . . . . . . . . . . . . . . . . . . . . . . . (15,977) (18,416)Finance costs . . . . . . . . . . . . . . . . . . . . . . . . . . . . . . . . . . . . . . . . . . . . . . . . (9,645) (14,204)Other expenses . . . . . . . . . . . . . . . . . . . . . . . . . . . . . . . . . . . . . . . . . . . . . . . (6,909) (31,830)
Total expenses . . . . . . . . . . . . . . . . . . . . . . . . . . . . . . . . . . . . . . . . . . . . . . . (32,531) (64,450)
Profit after income tax1 . . . . . . . . . . . . . . . . . . . . . . . . . . . . . . . . . . . . . . . 57,636 78,329
Other comprehensive incomeChanges in the fair value of cash flow hedges . . . . . . . . . . . . . . . . . . . . . . . 644 644Revaluation gains on property, plant and equipment . . . . . . . . . . . . . . . . . 9,483 9,686
Total comprehensive income . . . . . . . . . . . . . . . . . . . . . . . . . . . . . . . . . . . 67,763 88,659
1 No income tax applicable to PAIP.2 These pro-forma figures include the PAIP revenue and expenses from 1 July 2016 to 30 June 2017 as though PAIP was a
group member for the entire twelve month period.
Key assets and liabilities of PAIP at the date of business combination
As at15 August 2016
$’000
Assets acquiredInvestment properties . . . . . . . . . . . . . . . . . . . . . . . . . . . . . . . . . . . . . . . . . . . . . . . . . . . . . . 583,978Property, plant and equipment . . . . . . . . . . . . . . . . . . . . . . . . . . . . . . . . . . . . . . . . . . . . . . . 91,703Cash and other current assets . . . . . . . . . . . . . . . . . . . . . . . . . . . . . . . . . . . . . . . . . . . . . . . . 20,949
Total assets . . . . . . . . . . . . . . . . . . . . . . . . . . . . . . . . . . . . . . . . . . . . . . . . . . . . . . . . . . . . . . 696,630
Liabilities assumedCreditors and other current liabilities . . . . . . . . . . . . . . . . . . . . . . . . . . . . . . . . . . . . . . . . . . 12,200Bank loans . . . . . . . . . . . . . . . . . . . . . . . . . . . . . . . . . . . . . . . . . . . . . . . . . . . . . . . . . . . . . . . 337,735Other loans . . . . . . . . . . . . . . . . . . . . . . . . . . . . . . . . . . . . . . . . . . . . . . . . . . . . . . . . . . . . . . 346,695
Total liabilities . . . . . . . . . . . . . . . . . . . . . . . . . . . . . . . . . . . . . . . . . . . . . . . . . . . . . . . . . . . 696,630
Net assets acquired through stapling arrangements . . . . . . . . . . . . . . . . . . . . . . . . . . . . —
II-A-134
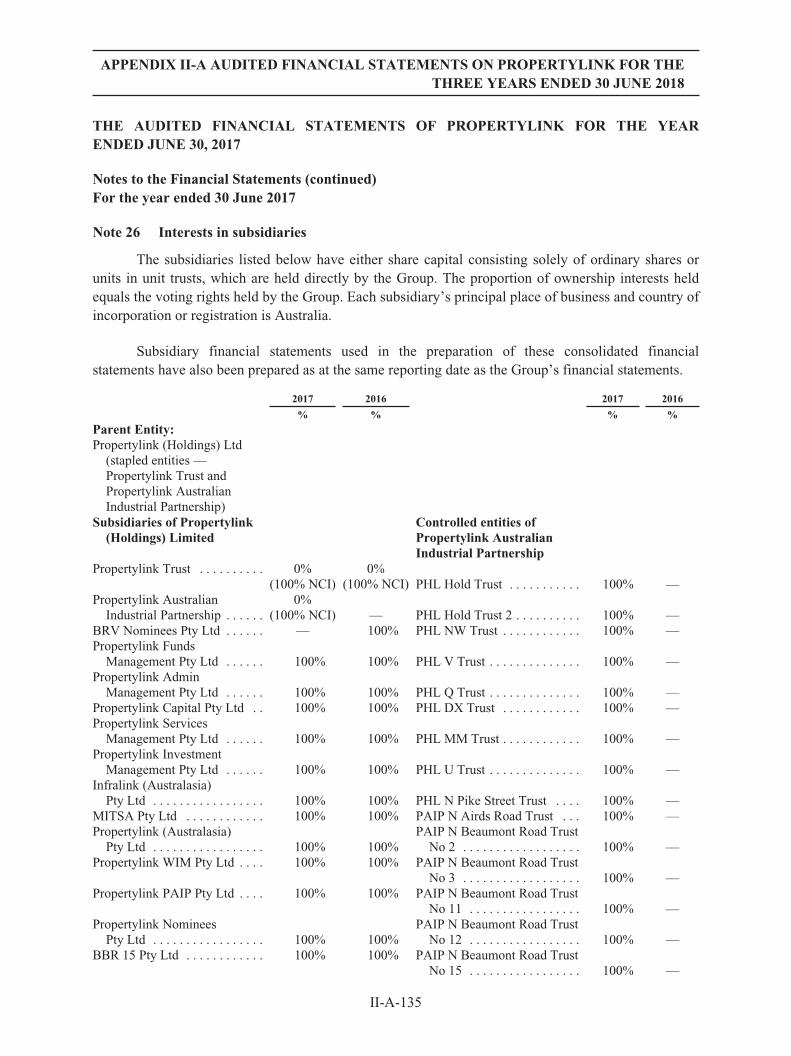
APPENDIX II-A AUDITED FINANCIAL STATEMENTS ON PROPERTYLINK FOR THETHREE YEARS ENDED 30 JUNE 2018
THE AUDITED FINANCIAL STATEMENTS OF PROPERTYLINK FOR THE YEARENDED JUNE 30, 2017
Notes to the Financial Statements (continued)For the year ended 30 June 2017
Note 26 Interests in subsidiaries
The subsidiaries listed below have either share capital consisting solely of ordinary shares orunits in unit trusts, which are held directly by the Group. The proportion of ownership interests heldequals the voting rights held by the Group. Each subsidiary’s principal place of business and country ofincorporation or registration is Australia.
Subsidiary financial statements used in the preparation of these consolidated financialstatements have also been prepared as at the same reporting date as the Group’s financial statements.
2017 2016 2017 2016
% % % %
Parent Entity:Propertylink (Holdings) Ltd
(stapled entities —Propertylink Trust andPropertylink AustralianIndustrial Partnership)
Subsidiaries of Propertylink(Holdings) Limited
Controlled entities ofPropertylink AustralianIndustrial Partnership
Propertylink Trust . . . . . . . . . . 0%(100% NCI)
0%(100% NCI) PHL Hold Trust . . . . . . . . . . . 100% —
Propertylink AustralianIndustrial Partnership . . . . . .
0%(100% NCI) — PHL Hold Trust 2 . . . . . . . . . . 100% —
BRV Nominees Pty Ltd . . . . . . — 100% PHL NW Trust . . . . . . . . . . . . 100% —Propertylink Funds
Management Pty Ltd . . . . . . 100% 100% PHL V Trust . . . . . . . . . . . . . . 100% —Propertylink Admin
Management Pty Ltd . . . . . . 100% 100% PHL Q Trust . . . . . . . . . . . . . . 100% —Propertylink Capital Pty Ltd . . 100% 100% PHL DX Trust . . . . . . . . . . . . 100% —Propertylink Services
Management Pty Ltd . . . . . . 100% 100% PHL MM Trust . . . . . . . . . . . . 100% —Propertylink Investment
Management Pty Ltd . . . . . . 100% 100% PHL U Trust . . . . . . . . . . . . . . 100% —Infralink (Australasia)
Pty Ltd . . . . . . . . . . . . . . . . . 100% 100% PHL N Pike Street Trust . . . . 100% —MITSA Pty Ltd . . . . . . . . . . . . 100% 100% PAIP N Airds Road Trust . . . 100% —Propertylink (Australasia)
Pty Ltd . . . . . . . . . . . . . . . . . 100% 100%PAIP N Beaumont Road Trust
No 2 . . . . . . . . . . . . . . . . . . 100% —Propertylink WIM Pty Ltd . . . . 100% 100% PAIP N Beaumont Road Trust
No 3 . . . . . . . . . . . . . . . . . . 100% —Propertylink PAIP Pty Ltd . . . . 100% 100% PAIP N Beaumont Road Trust
No 11 . . . . . . . . . . . . . . . . . 100% —Propertylink Nominees
Pty Ltd . . . . . . . . . . . . . . . . . 100% 100%PAIP N Beaumont Road Trust
No 12 . . . . . . . . . . . . . . . . . 100% —BBR 15 Pty Ltd . . . . . . . . . . . . 100% 100% PAIP N Beaumont Road Trust
No 15 . . . . . . . . . . . . . . . . . 100% —
II-A-135

APPENDIX II-A AUDITED FINANCIAL STATEMENTS ON PROPERTYLINK FOR THETHREE YEARS ENDED 30 JUNE 2018
THE AUDITED FINANCIAL STATEMENTS OF PROPERTYLINK FOR THE YEARENDED JUNE 30, 2017
Notes to the Financial Statements (continued)For the year ended 30 June 2017
2017 2016 2017 2016
% % % %
PAIP II MA NomineesPty Ltd . . . . . . . . . . . . . . . . . 100% 100%
PAIP N Boundary RoadTrust . . . . . . . . . . . . . . . . . . 100% —
PAIP II BA NomineesPty Ltd . . . . . . . . . . . . . . . . . 100% 100%
PAIP N Brunker RoadTrust . . . . . . . . . . . . . . . . . . 100% —
PEP Nominees I Pty Ltd . . . . . 100% — PAIP N Gundah RoadTrust . . . . . . . . . . . . . . . . . . 100% —
PEP Nominees II Pty Ltd . . . . . 100% — PAIP N Mandarin StreetTrust . . . . . . . . . . . . . . . . . . 100% —
PEP Nominees III Pty Ltd . . . . 100% — PAIP N McCredie RoadTrust . . . . . . . . . . . . . . . . . . 100% —
PAIP N Newton Road TrustNo 1 . . . . . . . . . . . . . . . . . . 100% —
Controlled entities ofPropertylink Trust
PAIP N Newton Road TrustNo 2 . . . . . . . . . . . . . . . . . . 100% —
PAIP PT . . . . . . . . . . . . . . . . . . — 100% PAIP N Niagala CloseTrust . . . . . . . . . . . . . . . . . . 100% —
PT Moelis Trust . . . . . . . . . . . . 100% 100% PAIP N Orielton RoadTrust . . . . . . . . . . . . . . . . . . 100% —
Propertylink Office PartnershipTrust . . . . . . . . . . . . . . . . . . . 100% 100%
PAIP N Pike Street TrustNo 2 . . . . . . . . . . . . . . . . . . 100% —
POP 73 Miller Trust . . . . . . . . . 100% 100% PAIP N Rodborough RoadTrust No 1 . . . . . . . . . . . . . 100% —
POP II PT . . . . . . . . . . . . . . . . . 100% 100% PAIP N Rodborough RoadTrust No 2 . . . . . . . . . . . . . 100% —
PAIP II PT . . . . . . . . . . . . . . . . 100% 100% PAIP N Sylvania WayTrust . . . . . . . . . . . . . . . . . . 100% —
POP III PT . . . . . . . . . . . . . . . . 100% 100% PAIP V Cherry Lane Trust . . . 100% —PEP PT . . . . . . . . . . . . . . . . . . . 100% — PAIP V Lakes Drive Trust . . . 100% —50 Ann PEP PT . . . . . . . . . . . . 100% — PAIP V Main Road Trust . . . . 100% —
PAIP V Mt Derrimut RoadTrust . . . . . . . . . . . . . . . . . . 100% —
PAIP V National BoulevardTrust . . . . . . . . . . . . . . . . . . 100% —
PAIP V Ricketts RoadTrust . . . . . . . . . . . . . . . . . . 100% —
PAIP V Strezlecki AvenueTrust . . . . . . . . . . . . . . . . . . 100% —
PAIP V Taryn Drive Trust . . . 100% —PAIP V Whiteside Road
Trust . . . . . . . . . . . . . . . . . . 100% —PAIP V Woodlands Drive
Trust . . . . . . . . . . . . . . . . . . 100% —PAIP WA Leadership Way
Trust . . . . . . . . . . . . . . . . . . 100% —PAIP WA McDow ell Street
Trust . . . . . . . . . . . . . . . . . . 100% —PAIP WA Modal Crescent
Trust . . . . . . . . . . . . . . . . . . 100% —
II-A-136

APPENDIX II-A AUDITED FINANCIAL STATEMENTS ON PROPERTYLINK FOR THETHREE YEARS ENDED 30 JUNE 2018
THE AUDITED FINANCIAL STATEMENTS OF PROPERTYLINK FOR THE YEARENDED JUNE 30, 2017
Notes to the Financial Statements (continued)For the year ended 30 June 2017
Note 27 Company details
The registered office of the company is:
Level 29, 20 Bond Street
SYDNEY NSW 2000
II-A-137

APPENDIX II-A AUDITED FINANCIAL STATEMENTS ON PROPERTYLINK FOR THETHREE YEARS ENDED 30 JUNE 2018
THE AUDITED FINANCIAL STATEMENTS OF PROPERTYLINK FOR THE YEARENDED JUNE 30, 2017
Directors’ Declaration
In accordance with a resolution of Propertylink (Holdings) Limited, the Directors declare that:
1. The Financial Statements and notes, as set out on pages 45 to 81 (Note), are in accordancewith the Corporations Act 2001 and:
(a) comply with Australian Accounting Standards, which, as stated in the “About thisReport” section of the Financial Statements, constitutes compliance with InternationalFinancial Reporting Standards (IFRS); and
(b) give a true and fair view of the financial position as at 30 June 2017 and of theperformance for the year ended on that date of the consolidated group.
2. In the Directors’ opinion there are reasonable grounds to believe that the company will beable to pay its debts as and when they become due and payable.
Peter Lancken Stuart Dawes
Chairman Chief Executive Officer14 August 2017 14 August 2017
Note:Page references above refer to the original audited accounts. The equivalent pages in this appendix areII-A-87 to II-A-137.
II-A-138

APPENDIX II-A AUDITED FINANCIAL STATEMENTS ON PROPERTYLINK FOR THETHREE YEARS ENDED 30 JUNE 2018
THE AUDITED FINANCIAL STATEMENTS OF PROPERTYLINK FOR THE YEARENDED JUNE 30, 2017
II-A-139

APPENDIX II-A AUDITED FINANCIAL STATEMENTS ON PROPERTYLINK FOR THETHREE YEARS ENDED 30 JUNE 2018
THE AUDITED FINANCIAL STATEMENTS OF PROPERTYLINK FOR THE YEARENDED JUNE 30, 2017
II-A-140

APPENDIX II-A AUDITED FINANCIAL STATEMENTS ON PROPERTYLINK FOR THETHREE YEARS ENDED 30 JUNE 2018
THE AUDITED FINANCIAL STATEMENTS OF PROPERTYLINK FOR THE YEARENDED JUNE 30, 2017
II-A-141

APPENDIX II-A AUDITED FINANCIAL STATEMENTS ON PROPERTYLINK FOR THETHREE YEARS ENDED 30 JUNE 2018
THE AUDITED FINANCIAL STATEMENTS OF PROPERTYLINK FOR THE YEARENDED JUNE 30, 2017
II-A-142

APPENDIX II-A AUDITED FINANCIAL STATEMENTS ON PROPERTYLINK FOR THETHREE YEARS ENDED 30 JUNE 2018
THE AUDITED FINANCIAL STATEMENTS OF PROPERTYLINK FOR THE YEARENDED JUNE 30, 2018
CONSOLIDATED STATEMENT OF PROFIT OR LOSS AND OTHER COMPREHENSIVEINCOMEFor the year ended 30 June 2018
2018 2017
Note $’000 $’000RevenueProperty revenue . . . . . . . . . . . . . . . . . . . . . . . . . . . . . . . . . . . . . . . . . . . . . . . . . . . . 2(b) 65,141 57,387Management fee revenue . . . . . . . . . . . . . . . . . . . . . . . . . . . . . . . . . . . . . . . . . . . . . 2(c) 31,484 37,154Share of net profit of joint ventures . . . . . . . . . . . . . . . . . . . . . . . . . . . . . . . . . . . . . 11(b) 19,805 8,536Other incomeGain on disposal of investment property . . . . . . . . . . . . . . . . . . . . . . . . . . . . . . . . . 75 5,689Net fair value gain on investment property . . . . . . . . . . . . . . . . . . . . . . . . . . . . . . . . 8(a) 57,893 27,834Other income . . . . . . . . . . . . . . . . . . . . . . . . . . . . . . . . . . . . . . . . . . . . . . . . . . . . . . . 661 379
Total revenue and other income . . . . . . . . . . . . . . . . . . . . . . . . . . . . . . . . . . . . . . 175,059 136,979
ExpensesInitial public offering cost . . . . . . . . . . . . . . . . . . . . . . . . . . . . . . . . . . . . . . . . . . . . . — (16,879)Property expenses . . . . . . . . . . . . . . . . . . . . . . . . . . . . . . . . . . . . . . . . . . . . . . . . . . . 3 (18,944) (15,980)Employment and management costs . . . . . . . . . . . . . . . . . . . . . . . . . . . . . . . . . . . . . (11,437) (10,401)Finance costs . . . . . . . . . . . . . . . . . . . . . . . . . . . . . . . . . . . . . . . . . . . . . . . . . . . . . . . 4 (9,936) (9,983)Occupancy costs . . . . . . . . . . . . . . . . . . . . . . . . . . . . . . . . . . . . . . . . . . . . . . . . . . . . (996) (745)Travel expenses . . . . . . . . . . . . . . . . . . . . . . . . . . . . . . . . . . . . . . . . . . . . . . . . . . . . . (589) (625)Legal and consultancy fees . . . . . . . . . . . . . . . . . . . . . . . . . . . . . . . . . . . . . . . . . . . . (752) (746)Depreciation and amortisation expense . . . . . . . . . . . . . . . . . . . . . . . . . . . . . . . . . . (104) (145)Administration and other expenses . . . . . . . . . . . . . . . . . . . . . . . . . . . . . . . . . . . . . . (3,561) (2,289)
Total expenses . . . . . . . . . . . . . . . . . . . . . . . . . . . . . . . . . . . . . . . . . . . . . . . . . . . . . (46,319) (57,793)
Profit before income tax . . . . . . . . . . . . . . . . . . . . . . . . . . . . . . . . . . . . . . . . . . . . . 128,740 79,186
Tax expense . . . . . . . . . . . . . . . . . . . . . . . . . . . . . . . . . . . . . . . . . . . . . . . . . . . . . . . . 5(b) (4,813) (2,100)
Profit after income tax . . . . . . . . . . . . . . . . . . . . . . . . . . . . . . . . . . . . . . . . . . . . . . 123,927 77,086
Other comprehensive income:Changes in the fair value of cash flow hedges . . . . . . . . . . . . . . . . . . . . . . . . . . . . . 16 (346) 644Revaluation gains on property, plant and equipment . . . . . . . . . . . . . . . . . . . . . . . . 9(a) 19,258 9,483
Total comprehensive income . . . . . . . . . . . . . . . . . . . . . . . . . . . . . . . . . . . . . . . . . 142,839 87,213
Profit after income tax attributable to:Shareholders of the parent entity . . . . . . . . . . . . . . . . . . . . . . . . . . . . . . . . . . . . . . . . 11,175 (15,432)Unitholders of other stapled entities (non-controlling interests) . . . . . . . . . . . . . . . 112,752 92,518
123,927 77,086
Total comprehensive income attributable to:Shareholders of the parent entity . . . . . . . . . . . . . . . . . . . . . . . . . . . . . . . . . . . . . . . . 11,175 (15,432)Unitholders of other stapled entities (non-controlling interests) . . . . . . . . . . . . . . . 131,664 102,645
142,839 87,213
Cents Cents
Earnings per share on profit/(loss) attributable to shareholders of the parententity
Basic earnings/(loss) per share . . . . . . . . . . . . . . . . . . . . . . . . . . . . . . . . . . . . . . . . . 6 1.86 (2.90)Diluted earnings/(loss) per share . . . . . . . . . . . . . . . . . . . . . . . . . . . . . . . . . . . . . . . . 6 1.85 (2.90)Earnings per stapled security on profit attributable to stapled security
holdersBasic earnings per security . . . . . . . . . . . . . . . . . . . . . . . . . . . . . . . . . . . . . . . . . . . . 6 20.61 14.48Diluted earnings per security . . . . . . . . . . . . . . . . . . . . . . . . . . . . . . . . . . . . . . . . . . 6 20.54 14.48
The above consolidated statement of profit or loss and other comprehensive income should be read inconjunction with the accompanying notes.
II-A-143

APPENDIX II-A AUDITED FINANCIAL STATEMENTS ON PROPERTYLINK FOR THETHREE YEARS ENDED 30 JUNE 2018
THE AUDITED FINANCIAL STATEMENTS OF PROPERTYLINK FOR THE YEARENDED JUNE 30, 2018
CONSOLIDATED STATEMENT OF FINANCIAL POSITIONAs at 30 June 2018
2018 2017
Note $’000 $’000
AssetsCurrent assetsCash and cash equivalents . . . . . . . . . . . . . . . . . . . . . . . . . . . . . . . . . . . . . . . . . . . . . . 17(a) 17,233 20,002Trade and other receivables . . . . . . . . . . . . . . . . . . . . . . . . . . . . . . . . . . . . . . . . . . . . . 17(b) 3,440 4,472Prepayments . . . . . . . . . . . . . . . . . . . . . . . . . . . . . . . . . . . . . . . . . . . . . . . . . . . . . . . . . 2,448 1,709Investment properties held for sale . . . . . . . . . . . . . . . . . . . . . . . . . . . . . . . . . . . . . . . . 10 — 31,550
Total current assets . . . . . . . . . . . . . . . . . . . . . . . . . . . . . . . . . . . . . . . . . . . . . . . . . . 23,121 57,733
Non-current assetsEquity accounted investments . . . . . . . . . . . . . . . . . . . . . . . . . . . . . . . . . . . . . . . . . . . 11(b) 100,855 63,345Investment properties . . . . . . . . . . . . . . . . . . . . . . . . . . . . . . . . . . . . . . . . . . . . . . . . . . 8(a) 696,200 572,756Property, plant and equipment . . . . . . . . . . . . . . . . . . . . . . . . . . . . . . . . . . . . . . . . . . . 9(a) 113,112 98,054Derivative financial instruments . . . . . . . . . . . . . . . . . . . . . . . . . . . . . . . . . . . . . . . . . . 12(c) 299 644Deferred tax assets . . . . . . . . . . . . . . . . . . . . . . . . . . . . . . . . . . . . . . . . . . . . . . . . . . . . 5(c) 4,408 5,222Intangible assets . . . . . . . . . . . . . . . . . . . . . . . . . . . . . . . . . . . . . . . . . . . . . . . . . . . . . . 18 4,566 4,566
Total non-current assets . . . . . . . . . . . . . . . . . . . . . . . . . . . . . . . . . . . . . . . . . . . . . . . 919,440 744,587
Total assets . . . . . . . . . . . . . . . . . . . . . . . . . . . . . . . . . . . . . . . . . . . . . . . . . . . . . . . . . 942,561 802,320
LiabilitiesCurrent liabilitiesTrade and other payables . . . . . . . . . . . . . . . . . . . . . . . . . . . . . . . . . . . . . . . . . . . . . . . 17(c) 19,308 11,207Current tax liabilities . . . . . . . . . . . . . . . . . . . . . . . . . . . . . . . . . . . . . . . . . . . . . . . . . . 2,358 3,793Employee benefits . . . . . . . . . . . . . . . . . . . . . . . . . . . . . . . . . . . . . . . . . . . . . . . . . . . . 543 466
Total current liabilities . . . . . . . . . . . . . . . . . . . . . . . . . . . . . . . . . . . . . . . . . . . . . . . . 22,209 15,466
Non-current liabilitiesEmployee benefits . . . . . . . . . . . . . . . . . . . . . . . . . . . . . . . . . . . . . . . . . . . . . . . . . . . . 357 283Borrowings . . . . . . . . . . . . . . . . . . . . . . . . . . . . . . . . . . . . . . . . . . . . . . . . . . . . . . . . . . 13 288,657 255,926
Total non-current liabilities . . . . . . . . . . . . . . . . . . . . . . . . . . . . . . . . . . . . . . . . . . . . 289,014 256,209
Total liabilities . . . . . . . . . . . . . . . . . . . . . . . . . . . . . . . . . . . . . . . . . . . . . . . . . . . . . . 311,223 271,675
Net assets . . . . . . . . . . . . . . . . . . . . . . . . . . . . . . . . . . . . . . . . . . . . . . . . . . . . . . . . . . . 631,338 530,645
EquityEquity attributable to shareholders of the parent entityIssued capital . . . . . . . . . . . . . . . . . . . . . . . . . . . . . . . . . . . . . . . . . . . . . . . . . . . . . . . . 15(a) 5,364 5,364Reserves . . . . . . . . . . . . . . . . . . . . . . . . . . . . . . . . . . . . . . . . . . . . . . . . . . . . . . . . . . . . 16 (23,673) (25,110)Retained earnings/(accumulated losses) . . . . . . . . . . . . . . . . . . . . . . . . . . . . . . . . . . . . (15,752) (26,927)
Parent entity shareholders’ interest . . . . . . . . . . . . . . . . . . . . . . . . . . . . . . . . . . . . . (34,061) (46,673)
Equity attributable to unitholders of other stapled entitiesIssued capital . . . . . . . . . . . . . . . . . . . . . . . . . . . . . . . . . . . . . . . . . . . . . . . . . . . . . . . . 15(b) 525,140 525,206Reserves . . . . . . . . . . . . . . . . . . . . . . . . . . . . . . . . . . . . . . . . . . . . . . . . . . . . . . . . . . . . 16 9,506 (9,406)Retained earnings/(accumulated losses) . . . . . . . . . . . . . . . . . . . . . . . . . . . . . . . . . . . . 130,753 61,518
Other stapled unitholders’ interest . . . . . . . . . . . . . . . . . . . . . . . . . . . . . . . . . . . . . . 665,399 577,318
Total equity . . . . . . . . . . . . . . . . . . . . . . . . . . . . . . . . . . . . . . . . . . . . . . . . . . . . . . . . . 631,338 530,645
The above consolidated statement of financial position should be read in conjunction with theaccompanying notes.
II-A-144

THE
AUDIT
ED
FIN
ANCIA
LST
ATEM
ENTSOFPROPERTYLIN
KFOR
THE
YEAR
ENDED
JUNE
30,2
018
CONSO
LID
ATED
STATEM
ENT
OFCHANGESIN
EQUIT
YFor
theye
aren
ded30
June
2018
Attribu
tableto
shar
eholde
rsof
thepa
rent
entity
Attribu
tableto
unitho
lder
sof
othe
rstap
leden
tities
Con
tribut
edeq
uity
Reser
ves
Retaine
dea
rnings
(acc
umulated
losses)
Total
Con
tribut
edeq
uity
Reser
ves
Retaine
dea
rnings
(acc
umulated
losses)
Total
Total
equity
Note
$’00
0$’00
0$’00
0$’00
0$’00
0$’00
0$’00
0$’00
0$’00
0
Balan
ceat
1Ju
ly20
16..
....
....
....
...
40,598
(20,55
6)(1,828
)18
,214
——
7,78
17,78
125
,995
Com
preh
ensive
inco
mefortheye
ar..
....
.—
—(15,43
2)(15,43
2)—
10,127
92,518
102,64
587
,213
Cap
ital
realloca
tion
....
....
....
....
....
15(a)
(35,23
4)—
—(35,23
4)35
,234
——
35,234
—Sec
uritiesissu
eddu
ring
theye
ar..
....
....
15(b)
——
——
497,29
2—
—49
7,29
249
7,29
2Sec
uritiesissu
eco
sts..
....
....
....
....
.15
(b)
——
——
(7,320
)—
—(7,320
)(7,320
)Equ
ityrestructure
....
....
....
....
....
.16
(a)
—(4,554
)—
(4,554
)—
(19,53
3)(1,424
)(20,95
7)(25,51
1)Dividen
dsan
ddistribu
tion
spa
idor
prov
ided
for
....
....
....
....
....
....
....
...
7—
—(9,667
)(9,667
)—
—(37,35
7)(37,35
7)(47,02
4)
Balan
ceat
30Ju
ne20
17..
....
....
....
.5,36
4(25,11
0)(26,92
7)(46,67
3)52
5,20
6(9,406
)61
,518
577,31
853
0,64
5
Balan
ceat
1Ju
ly20
17..
....
....
....
...
5,36
4(25,11
0)(26,92
7)(46,67
3)52
5,20
6(9,406
)61
,518
577,31
853
0,64
5Com
preh
ensive
inco
mefortheye
ar..
....
.—
—11
,175
11,175
—18
,912
112,75
213
1,66
414
2,83
9Sec
uritiesissu
eco
sts..
....
....
....
....
.15
(b)
——
——
(66)
——
(66)
(66)
Purch
aseof
secu
rities,n
etof
tran
saction
costs..
....
....
....
....
....
....
....
16(a)
—(1,529
)—
(1,529
)—
——
—(1,529
)Sec
urity-ba
sedpa
ymen
tsex
pens
e..
....
...
16(a)
—2,96
6—
2,96
6—
——
—2,96
6Dividen
dsan
ddistribu
tion
spa
idor
prov
ided
for
....
....
....
....
....
....
....
...
7—
——
——
—(43,51
7)(43,51
7)(43,51
7)
Balan
ceat
30Ju
ne20
18..
....
....
....
.5,36
4(23,67
3)(15,75
2)(34,06
1)52
5,14
09,50
613
0,75
366
5,39
963
1,33
8
The
abov
eco
nsolidated
statem
ento
fch
ange
sin
equity
shou
ldbe
read
inco
njun
ctionwiththeac
compa
nyingno
tes.
II-A-145
APPENDIX II-A AUDITED FINANCIAL STATEMENTS ON PROPERTYLINK FOR THETHREE YEARS ENDED 30 JUNE 2018

APPENDIX II-A AUDITED FINANCIAL STATEMENTS ON PROPERTYLINK FOR THETHREE YEARS ENDED 30 JUNE 2018
THE AUDITED FINANCIAL STATEMENTS OF PROPERTYLINK FOR THE YEARENDED JUNE 30, 2018
CONSOLIDATED STATEMENT OF CASH FLOWSFor the year ended 30 June 2018
2018 2017
Note $’000 $’000
Cash flows from operating activitiesReceipts from customers . . . . . . . . . . . . . . . . . . . . . . . . . . . . . . . . . . . . . . . . . . . . . . . . 112,884 107,135Interest received . . . . . . . . . . . . . . . . . . . . . . . . . . . . . . . . . . . . . . . . . . . . . . . . . . . . . . 119 50Payments to suppliers and employees . . . . . . . . . . . . . . . . . . . . . . . . . . . . . . . . . . . . . (29,679) (54,084)Finance costs paid . . . . . . . . . . . . . . . . . . . . . . . . . . . . . . . . . . . . . . . . . . . . . . . . . . . . . (9,577) (8,110)Income tax paid . . . . . . . . . . . . . . . . . . . . . . . . . . . . . . . . . . . . . . . . . . . . . . . . . . . . . . . (5,434) (3,152)
Net cash provided by operating activities . . . . . . . . . . . . . . . . . . . . . . . . . . . . . . . . . 21 68,313 41,839
Cash flows from investing activitiesProceeds from sale of investments . . . . . . . . . . . . . . . . . . . . . . . . . . . . . . . . . . . . . . . . 6,481 23,904Proceeds from sale of investment properties . . . . . . . . . . . . . . . . . . . . . . . . . . . . . . . . 32,259 49,190Capital expenditure on investment properties . . . . . . . . . . . . . . . . . . . . . . . . . . . . . . . (12,825) (17,624)Capital expenditure on leasehold buildings . . . . . . . . . . . . . . . . . . . . . . . . . . . . . . . . . (537) (106)Loan payments to related parties . . . . . . . . . . . . . . . . . . . . . . . . . . . . . . . . . . . . . . . . . — (3,540)Payment for investment in joint ventures . . . . . . . . . . . . . . . . . . . . . . . . . . . . . . . . . . . (24,712) (43,462)Payment for acquisition of investment properties . . . . . . . . . . . . . . . . . . . . . . . . . . . . (58,997) —Purchase of furniture, plant and equipment . . . . . . . . . . . . . . . . . . . . . . . . . . . . . . . . . (11) (37)
Net cash (used by)/provided by investing activities . . . . . . . . . . . . . . . . . . . . . . . . . (58,342) 8,325
Cash flows from financing activitiesProceeds from issue of securities . . . . . . . . . . . . . . . . . . . . . . . . . . . . . . . . . . . . . . . . . — 497,292Securities issue costs . . . . . . . . . . . . . . . . . . . . . . . . . . . . . . . . . . . . . . . . . . . . . . . . . . . (66) (7,320)Equity restructuring payments . . . . . . . . . . . . . . . . . . . . . . . . . . . . . . . . . . . . . . . . . . . — (24,087)Proceeds from borrowings . . . . . . . . . . . . . . . . . . . . . . . . . . . . . . . . . . . . . . . . . . . . . . 59,372 291,640Repayment of borrowings . . . . . . . . . . . . . . . . . . . . . . . . . . . . . . . . . . . . . . . . . . . . . . . (27,000) (743,311)Purchase of securities for security-based payments plans . . . . . . . . . . . . . . . . . . . . . . (1,529) —Dividends and distributions paid . . . . . . . . . . . . . . . . . . . . . . . . . . . . . . . . . . . . . . . . . (43,517) (48,335)
Net cash used by financing activities . . . . . . . . . . . . . . . . . . . . . . . . . . . . . . . . . . . . . (12,740) (34,121)
Net (decrease)/increase in cash and cash equivalents . . . . . . . . . . . . . . . . . . . . . . . . . . (2,769) 16,043Cash and cash equivalents at the beginning of financial year . . . . . . . . . . . . . . . . . . . 20,002 3,959
Cash and cash equivalents at the end of the year . . . . . . . . . . . . . . . . . . . . . . . . . . 17(a) 17,233 20,002
The above consolidated statement of cash flows should be read in conjunction with the accompanyingnotes.
II-A-146

APPENDIX II-A AUDITED FINANCIAL STATEMENTS ON PROPERTYLINK FOR THETHREE YEARS ENDED 30 JUNE 2018
THE AUDITED FINANCIAL STATEMENTS OF PROPERTYLINK FOR THE YEARENDED JUNE 30, 2018
NOTES TO THE FINANCIAL STATEMENTSFor the year ended 30 June 2018
ABOUT THIS REPORT
IN THIS SECTION
This section sets out the basis upon which the Group’s Financial Statements are prepared.
Specific accounting policies are described in their respective notes to the Financial Statements.This section also shows information on new or amended accounting standards and their impact on thefinancial position and performance of the Group.
(A) BASIS OF PREPARATION
Propertylink Group stapled securities are quoted on the Australian Securities Exchange underthe “PLG” code and comprise one share in Propertylink (Holdings) Limited (PHL) and one unit in eachof Propertylink Australian Industrial Partnership (PAIP) and Propertylink Trust (PT). In accordancewith Australian Accounting Standards, the entities within the Group must be consolidated for financialreporting purposes. The parent entity and deemed acquirer of PAIP and PT is PHL. These FinancialStatements therefore represent the consolidated results of PHL, and include PHL and its controlledentities, PAIP and its controlled entities and PT and its controlled entities (together the “Group”).Equity attributable to PAIP and PT form a non-controlling interest. The amount of non-controllinginterest attributable to stapled securityholders is disclosed in the Statement of Financial Position.
On 15 August 2016 the Group became listed on the ASX following the successful completionof an IPO. Therefore, comparative figures in these annual Financial Statements include profitsgenerated by the unlisted stapled PHL and PT group from 1 July 2016 to 15 August 2016, and profitsgenerated by the listed Propertylink Group from 16 August to 30 June 2017.
Each entity forming part of the Group continues as a separate legal entity in its own right underthe Corporations Act 2001 and is therefore required to comply with the reporting and disclosurerequirements under the Corporations Act 2001 and Australian Accounting Standards.
The financial report was authorised for issue by directors on 14 August 2018.
These general purpose Financial Statements have been prepared in accordance with therequirements of the Corporations Act 2001, Australian Accounting Standards and Interpretations of theAustralian Accounting Standards Board and International Financial Reporting Standards as issued bythe International Accounting Standards Board. The Group is a for-profit entity for financial reportingpurposes under Australian Accounting Standards.
Amounts in these Financial Statements have been presented in Australian dollars and roundedoff in accordance with ASIC Corporations (Rounding in Financial/Directors’ Reports) Instrument2016/191 to the nearest thousand dollars, unless otherwise indicated.
The Financial Statements except for cash flow information, have been prepared on an accrualsbasis and are based on historical costs, modified, where applicable, by the measurement at fair value of
II-A-147

APPENDIX II-A AUDITED FINANCIAL STATEMENTS ON PROPERTYLINK FOR THETHREE YEARS ENDED 30 JUNE 2018
THE AUDITED FINANCIAL STATEMENTS OF PROPERTYLINK FOR THE YEARENDED JUNE 30, 2018
NOTES TO THE FINANCIAL STATEMENTSFor the year ended 30 June 2018 (continued)
selected non-current assets, financial assets and financial liabilities. Refer to the specific accountingpolicies within the notes to the Financial Statements for the basis of valuation of assets and liabilitiesmeasured at fair value.
These Financial Statements are prepared on a going concern basis, which assumes continuity ofnormal business activities and the realisation of assets and settlement of liabilities in the ordinarycourse of business. Under their respective constitutions, PT, PHL and PAIP are entitled to have regardto the interests of all members of the stapled group. Accordingly, each member has provided the othermembers with a letter of financial support.
The accounting policies adopted are consistent with those of the previous financial year andcorresponding interim reporting period, unless otherwise stated.
CRITICAL ACCOUNTING JUDGEMENTS, ESTIMATES AND ASSUMPTIONS
The preparation of the Group’s consolidated financial statements may require management tomake judgements, estimates and assumptions that affect the reported amounts of revenues, expenses,assets and liabilities, and the accompanying disclosures. Uncertainty about these assumptions andestimates could result in outcomes that require a material adjustment to the carrying amount of theassets or liabilities affected in future periods. The estimates and associated assumptions are based onhistorical experience and various other factors that are believed to be reasonable under thecircumstances. Judgements and estimates which are material to the financial report are discussed in thefollowing notes:
Š Investment properties Note 8
Š Leasehold buildings Note 8, 9
Š Derivative financial instruments Note 12
Š Security-based payments Note 19
(B) PRINCIPLES OF CONSOLIDATION
The consolidated Financial Statements incorporate all of the assets, liabilities and results ofPropertylink Group and its subsidiaries.
(I) CONTROLLED ENTITIES
Subsidiaries are all entities over which the Group has control. The Group controls an entitywhen it is exposed to, or has rights to, variable returns from its involvement with the entity and has theability to affect those returns through its power over the entity. A list of the subsidiaries is provided inNote 25. The assets, liabilities and results of all subsidiaries are fully consolidated into the financialstatements of the Group from the date on which control is obtained by the Group. The consolidation of
II-A-148

APPENDIX II-A AUDITED FINANCIAL STATEMENTS ON PROPERTYLINK FOR THETHREE YEARS ENDED 30 JUNE 2018
THE AUDITED FINANCIAL STATEMENTS OF PROPERTYLINK FOR THE YEARENDED JUNE 30, 2018
NOTES TO THE FINANCIAL STATEMENTSFor the year ended 30 June 2018 (continued)
a subsidiary is discontinued from the date that control ceases. Inter-company transactions, balances andunrealised gains or losses on transactions between Group entities are fully eliminated on consolidation.Accounting policies of subsidiaries have been changed and adjustments made where necessary toensure uniformity of the accounting policies adopted by the Group.
(II) JOINT ARRANGEMENTS
Investments in joint arrangements are classified as joint ventures based on the contractual rightsand obligations each investor has, rather than the legal structure of the joint arrangement.
JOINT VENTURES
Investments in joint ventures are accounted for using the equity method. Under this method, theinvestment is initially recognised at cost (including transaction costs) and adjusted thereafter for thepost-acquisition change in the Group’s share of net assets of the joint venture. In addition, the Group’sshare of the profit or loss of the joint venture is included in the Group’s profit or loss.
When the Group’s share of losses in a joint venture equals or exceeds its interest in the jointventure, the Group discontinues recognising its share of further losses unless it has incurred legal orconstructive obligations or made payments on behalf of the joint venture. Upon the joint venturesubsequently making profits, the Group will resume recognising its share of those profits once its shareof the profits equals the share of the losses not recognised.
(C) NEW ACCOUNTING STANDARDS FOR APPLICATION IN FUTURE PERIODS
Certain new accounting standards and interpretations have been published that are notmandatory for the financial period ended 30 June 2018 but are available for early adoption. They havenot been applied in preparing these Financial Statements. The Group’s assessment of the impact ofthese new standards and interpretations is set out below:
AASB 9 FINANCIAL INSTRUMENTS (EFFECTIVE APPLICATION FOR THE GROUP IS1 JULY 2018).
AASB 9 Financial Instruments addresses the classification, measurement and recognition offinancial assets, financial liabilities and hedging. The standard becomes mandatory for the June 2019financial year, and will be applied prospectively.
AASB 9 introduces the concept that if a non-substantial modification is made to a borrowingfacility, the change in present value of the expected cash flows of that facility is recognisedimmediately in the Consolidated Statement of Profit or Loss and Other Comprehensive Income. Inanalysing each of the existing facilities at 30 June 2018, there has been one non-substantial debtmodification. The impact of this will be recognised in opening retained earnings in the 30 June 2019Financial Statements. This will not have a material impact to the Group.
II-A-149

APPENDIX II-A AUDITED FINANCIAL STATEMENTS ON PROPERTYLINK FOR THETHREE YEARS ENDED 30 JUNE 2018
THE AUDITED FINANCIAL STATEMENTS OF PROPERTYLINK FOR THE YEARENDED JUNE 30, 2018
NOTES TO THE FINANCIAL STATEMENTSFor the year ended 30 June 2018 (continued)
AASB 9 also introduces the expected credit loss model assessing impairment of financialinstruments, which will result in a change in how the impairment of trade receivables is assessed. Thiswill not have a material impact to the Group.
AASB 15: REVENUE FROM CONTRACTS WITH CUSTOMERS (EFFECTIVE APPLICATIONFOR THE GROUP IS 1 JULY 2018).
AASB 15 Revenue from Contracts with Customers provides a new five step model forrecognising revenue earned from a contract with a customer and will replace the existing AASB 118Revenue and AASB111 Construction Contracts. The standard becomes mandatory for the June 2019financial year. Based on the analysis performed under AASB 15, it is expected that there will be nomaterial impact to the Group. The key change will be added disclosure in the June 2019 ConsolidatedStatement of Profit or Loss and Other Comprehensive Income to separate Revenue from propertyactivities from Revenue from services, with comparative disclosures for June 2018.
AASB 16: LEASES (EFFECTIVE APPLICATION FOR THE GROUP IS 1 JULY 2019).
AASB 16 Leases provides a new model for accounting for leases. The standard becomesmandatory for the June 2020 financial year. Early adoption is permitted under certain circumstances.Management are in the process of performing their implementation and impact assessment of thestandard.
(D) NOTES TO THE FINANCIAL STATEMENTS
The notes include information which is required to understand the financial statements and ismaterial and relevant to the operations, financial position and performance of the Group. Information isconsidered material and relevant if, for example:
Š the amount in question is significant because of its size or nature;
Š it is important in understanding the results of the Group;
Š it helps to explain the impact of significant changes in the Group’s business;
Š it relates to an aspect of the Group’s operations that is important to its future performance.
The notes are organised into the following sections:
Group performance Property portfolio assets
Capital and financial riskmanagement and working
capital Other disclosures
1. Operating segments 8. Investmentproperties
12. Capital and financialrisk management
18. Intangible assets
2. Revenue 9. Property, plant &equipment
13. Borrowings 19. Security-basedpayments
3. Property expenses 10. Non-current assetsclassified as held forsale
14. Commitments andcontingencies
20. Auditors’remuneration
II-A-150

APPENDIX II-A AUDITED FINANCIAL STATEMENTS ON PROPERTYLINK FOR THETHREE YEARS ENDED 30 JUNE 2018
THE AUDITED FINANCIAL STATEMENTS OF PROPERTYLINK FOR THE YEARENDED JUNE 30, 2018
NOTES TO THE FINANCIAL STATEMENTSFor the year ended 30 June 2018 (continued)
Group performance Property portfolio assets
Capital and financial riskmanagement and working
capital Other disclosures
4. Finance costs 11. Equity accountedinvestments
15. Contributed equity 21. Cash flowinformation
5. Taxation 16. Reserves 22. Related parties
6. Earnings per stapledsecurity
17. Working capital 23. Parent entitydisclosures
7. Dividends anddistributions
24. Events after thereporting period
25. Interests insubsidiaries
26. Company details
GROUP PERFORMANCE
IN THIS SECTION
This section explains the results and performance of the Group. It provides additionalinformation about those individual line items in the Financial Statements that the Directors considermost relevant in the context of the operations of the Group.
NOTE 1 OPERATING SEGMENTS
(A) DESCRIPTION OF SEGMENTS
The Board of Directors has been identified as the Group’s chief operating decision maker(CODM) as they are responsible for the strategic decision making within the Group. The Group’soperating segments have been determined based on the internal information that is provided to theCODM and which is used to make strategic decisions. Refer to the table below for a brief descriptionof the Group’s operating segments.
Segment Description
Property investment Acquires, improves and leases industrial property, and co-invests inindustrial and commercial property, both within the geographical locationof Australia.
Management services Fund and property management services for managed assets, and propertymanagement services for owned assets, within the geographical location ofAustralia.
II-A-151

APPENDIX II-A AUDITED FINANCIAL STATEMENTS ON PROPERTYLINK FOR THETHREE YEARS ENDED 30 JUNE 2018
THE AUDITED FINANCIAL STATEMENTS OF PROPERTYLINK FOR THE YEARENDED JUNE 30, 2018
NOTES TO THE FINANCIAL STATEMENTSFor the year ended 30 June 2018 (continued)
(B) SEGMENT INFORMATION
Information related to each reporting segment for FY2018 is set out below. Segment profit(loss) before tax is used to measure performance because management believes that this information isthe most relevant in evaluating the results of the respective segments relative to other entities thatoperate in the same industries.
SEGMENT PROFIT AND LOSS
Year ended 30 June 2018Property
investmentsManagement
services Total
$’000 $’000 $’000
RevenueOperating revenue . . . . . . . . . . . . . . . . . . . . . . . . . . . . . . . . . . . . . . . . 84,714 31,484 116,198Net fair value gain on investment property . . . . . . . . . . . . . . . . . . . . . 57,893 — 57,893Other income . . . . . . . . . . . . . . . . . . . . . . . . . . . . . . . . . . . . . . . . . . . . 651 — 651
Segment revenue and other income . . . . . . . . . . . . . . . . . . . . . . . . . 143,258 31,484 174,742
Reconciliation to statutory revenue and other income:Other income . . . . . . . . . . . . . . . . . . . . . . . . . . . . . . . . . . . . . . . . . . . . 317
Total revenue and other income . . . . . . . . . . . . . . . . . . . . . . . . . . . 175,059
ExpensesProperty expenses . . . . . . . . . . . . . . . . . . . . . . . . . . . . . . . . . . . . . . . . (18,944) — (18,944)Other operating expenses . . . . . . . . . . . . . . . . . . . . . . . . . . . . . . . . . . (1,753) — (1,753)Finance costs . . . . . . . . . . . . . . . . . . . . . . . . . . . . . . . . . . . . . . . . . . . . (9,929) — (9,929)
Total segment expenses . . . . . . . . . . . . . . . . . . . . . . . . . . . . . . . . . . . (30,626) — (30,626)
Segment profit before income tax . . . . . . . . . . . . . . . . . . . . . . . . . . 112,632 31,484 144,116
Reconciliation to statutory profit after tax:Employee benefits expenses . . . . . . . . . . . . . . . . . . . . . . . . . . . . . . . . (10,444)Other operating expenses . . . . . . . . . . . . . . . . . . . . . . . . . . . . . . . . . . (5,138)Finance costs and depreciation expense . . . . . . . . . . . . . . . . . . . . . . . (111)Tax expense . . . . . . . . . . . . . . . . . . . . . . . . . . . . . . . . . . . . . . . . . . . . . (4,813)
Profit after income tax attributable to owners of the stapledsecurities . . . . . . . . . . . . . . . . . . . . . . . . . . . . . . . . . . . . . . . . . . . . . 123,927
II-A-152

APPENDIX II-A AUDITED FINANCIAL STATEMENTS ON PROPERTYLINK FOR THETHREE YEARS ENDED 30 JUNE 2018
THE AUDITED FINANCIAL STATEMENTS OF PROPERTYLINK FOR THE YEARENDED JUNE 30, 2018
NOTES TO THE FINANCIAL STATEMENTSFor the year ended 30 June 2018 (continued)
Year ended 30 June 2017Property
investmentsManagement
services Total
$’000 $’000 $’000
RevenueOperating revenue . . . . . . . . . . . . . . . . . . . . . . . . . . . . . . . . . . . . . . . . 65,603 37,154 102,757Net fair value gain on investment property . . . . . . . . . . . . . . . . . . . . . 27,834 — 27,834Other income . . . . . . . . . . . . . . . . . . . . . . . . . . . . . . . . . . . . . . . . . . . . 5,514 2 5,516
Segment revenue and other income . . . . . . . . . . . . . . . . . . . . . . . . . 98,951 37,156 136,107
Reconciliation to statutory revenue and other income:Other income . . . . . . . . . . . . . . . . . . . . . . . . . . . . . . . . . . . . . . . . . . . . 872
Total revenue and other income . . . . . . . . . . . . . . . . . . . . . . . . . . . 136,979
ExpensesProperty expenses . . . . . . . . . . . . . . . . . . . . . . . . . . . . . . . . . . . . . . . . (15,980) — (15,980)Other operating expenses . . . . . . . . . . . . . . . . . . . . . . . . . . . . . . . . . . (810) (140) (950)Finance costs . . . . . . . . . . . . . . . . . . . . . . . . . . . . . . . . . . . . . . . . . . . . (9,645) — (9,645)
Total segment expenses . . . . . . . . . . . . . . . . . . . . . . . . . . . . . . . . . . . (26,435) (140) (26,575)
Segment profit before income tax . . . . . . . . . . . . . . . . . . . . . . . . . . 72,516 37,016 109,532
Reconciliation to statutory profit after tax:Initial public offering cost . . . . . . . . . . . . . . . . . . . . . . . . . . . . . . . . . . (16,879)Employee benefits expenses . . . . . . . . . . . . . . . . . . . . . . . . . . . . . . . . (9,855)Other operating expenses . . . . . . . . . . . . . . . . . . . . . . . . . . . . . . . . . . (4,001)Finance costs and depreciation expense . . . . . . . . . . . . . . . . . . . . . . . (483)Tax expense . . . . . . . . . . . . . . . . . . . . . . . . . . . . . . . . . . . . . . . . . . . . . (2,100)
Profit after income tax attributable to owners of the stapledsecurities . . . . . . . . . . . . . . . . . . . . . . . . . . . . . . . . . . . . . . . . . . . . . 77,086
II-A-153

APPENDIX II-A AUDITED FINANCIAL STATEMENTS ON PROPERTYLINK FOR THETHREE YEARS ENDED 30 JUNE 2018
THE AUDITED FINANCIAL STATEMENTS OF PROPERTYLINK FOR THE YEARENDED JUNE 30, 2018
NOTES TO THE FINANCIAL STATEMENTSFor the year ended 30 June 2018 (continued)
SEGMENT ASSETS AND LIABILITIES
As at 30 June 2018Property
investmentsManagement
services Total
$’000 $’000 $’000
AssetsEquity accounted investments . . . . . . . . . . . . . . . . . . . . . . . . . . . . . . . 100,855 — 100,855Investment properties . . . . . . . . . . . . . . . . . . . . . . . . . . . . . . . . . . . . . 696,200 — 696,200Property, plant and equipment . . . . . . . . . . . . . . . . . . . . . . . . . . . . . . 112,750 — 112,750Other assets . . . . . . . . . . . . . . . . . . . . . . . . . . . . . . . . . . . . . . . . . . . . . 18,494 878 19,372
Total segment assets . . . . . . . . . . . . . . . . . . . . . . . . . . . . . . . . . . . . . 928,299 878 929,117
Reconciliation of segment assets to the Statement of FinancialPosition
Cash and cash equivalents . . . . . . . . . . . . . . . . . . . . . . . . . . . . . . . . . 2,889Receivables and prepayments . . . . . . . . . . . . . . . . . . . . . . . . . . . . . . . 434Intercompany receivables . . . . . . . . . . . . . . . . . . . . . . . . . . . . . . . . . . 725Deferred tax assets . . . . . . . . . . . . . . . . . . . . . . . . . . . . . . . . . . . . . . . 4,408Intangible assets . . . . . . . . . . . . . . . . . . . . . . . . . . . . . . . . . . . . . . . . . 4,566Other plant and equipment . . . . . . . . . . . . . . . . . . . . . . . . . . . . . . . . . 362
Total assets . . . . . . . . . . . . . . . . . . . . . . . . . . . . . . . . . . . . . . . . . . . . . 942,561
Total segment liabilities . . . . . . . . . . . . . . . . . . . . . . . . . . . . . . . . . . 250,744 237 250,981
Reconciliation of segment liabilities to the Statement ofFinancial Position
Intercompany payables . . . . . . . . . . . . . . . . . . . . . . . . . . . . . . . . . . . . 56,984Other liabilities . . . . . . . . . . . . . . . . . . . . . . . . . . . . . . . . . . . . . . . . . . 3,258
Total liabilities . . . . . . . . . . . . . . . . . . . . . . . . . . . . . . . . . . . . . . . . . . 311,223
Segment net assets . . . . . . . . . . . . . . . . . . . . . . . . . . . . . . . . . . . . . . . 677,555 641 678,196
II-A-154
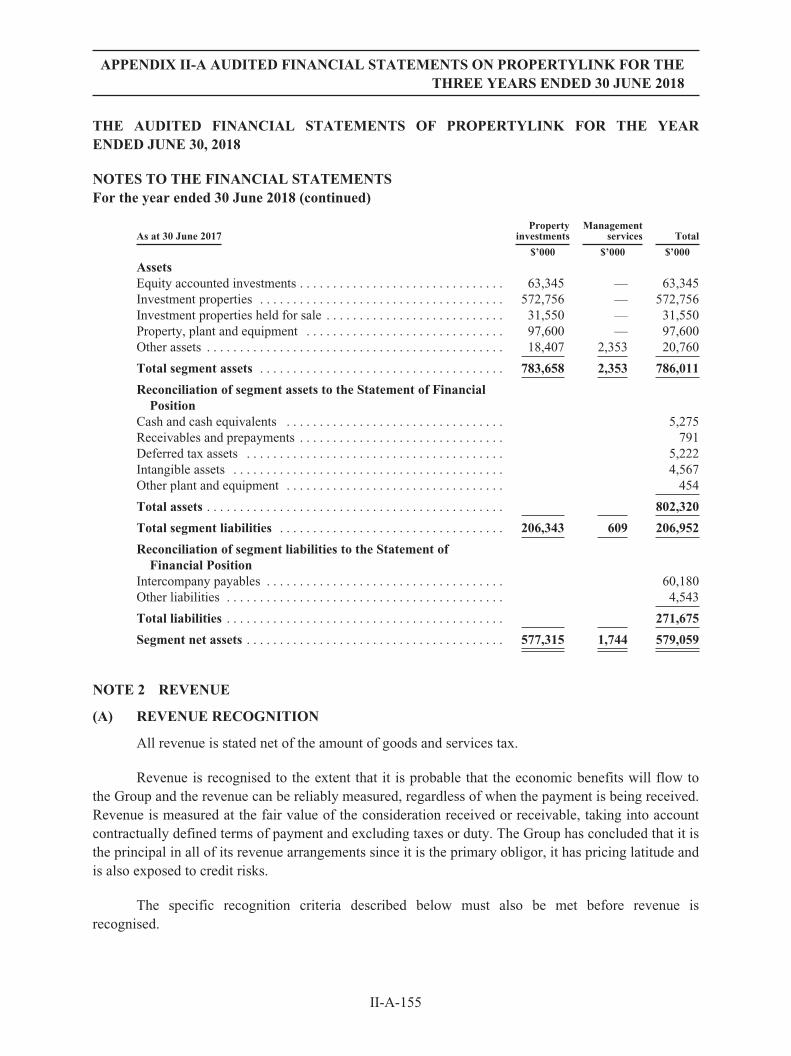
APPENDIX II-A AUDITED FINANCIAL STATEMENTS ON PROPERTYLINK FOR THETHREE YEARS ENDED 30 JUNE 2018
THE AUDITED FINANCIAL STATEMENTS OF PROPERTYLINK FOR THE YEARENDED JUNE 30, 2018
NOTES TO THE FINANCIAL STATEMENTSFor the year ended 30 June 2018 (continued)
As at 30 June 2017Property
investmentsManagement
services Total
$’000 $’000 $’000
AssetsEquity accounted investments . . . . . . . . . . . . . . . . . . . . . . . . . . . . . . . 63,345 — 63,345Investment properties . . . . . . . . . . . . . . . . . . . . . . . . . . . . . . . . . . . . . 572,756 — 572,756Investment properties held for sale . . . . . . . . . . . . . . . . . . . . . . . . . . . 31,550 — 31,550Property, plant and equipment . . . . . . . . . . . . . . . . . . . . . . . . . . . . . . 97,600 — 97,600Other assets . . . . . . . . . . . . . . . . . . . . . . . . . . . . . . . . . . . . . . . . . . . . . 18,407 2,353 20,760
Total segment assets . . . . . . . . . . . . . . . . . . . . . . . . . . . . . . . . . . . . . 783,658 2,353 786,011
Reconciliation of segment assets to the Statement of FinancialPosition
Cash and cash equivalents . . . . . . . . . . . . . . . . . . . . . . . . . . . . . . . . . 5,275Receivables and prepayments . . . . . . . . . . . . . . . . . . . . . . . . . . . . . . . 791Deferred tax assets . . . . . . . . . . . . . . . . . . . . . . . . . . . . . . . . . . . . . . . 5,222Intangible assets . . . . . . . . . . . . . . . . . . . . . . . . . . . . . . . . . . . . . . . . . 4,567Other plant and equipment . . . . . . . . . . . . . . . . . . . . . . . . . . . . . . . . . 454
Total assets . . . . . . . . . . . . . . . . . . . . . . . . . . . . . . . . . . . . . . . . . . . . . 802,320
Total segment liabilities . . . . . . . . . . . . . . . . . . . . . . . . . . . . . . . . . . 206,343 609 206,952
Reconciliation of segment liabilities to the Statement ofFinancial Position
Intercompany payables . . . . . . . . . . . . . . . . . . . . . . . . . . . . . . . . . . . . 60,180Other liabilities . . . . . . . . . . . . . . . . . . . . . . . . . . . . . . . . . . . . . . . . . . 4,543
Total liabilities . . . . . . . . . . . . . . . . . . . . . . . . . . . . . . . . . . . . . . . . . . 271,675
Segment net assets . . . . . . . . . . . . . . . . . . . . . . . . . . . . . . . . . . . . . . . 577,315 1,744 579,059
NOTE 2 REVENUE
(A) REVENUE RECOGNITION
All revenue is stated net of the amount of goods and services tax.
Revenue is recognised to the extent that it is probable that the economic benefits will flow tothe Group and the revenue can be reliably measured, regardless of when the payment is being received.Revenue is measured at the fair value of the consideration received or receivable, taking into accountcontractually defined terms of payment and excluding taxes or duty. The Group has concluded that it isthe principal in all of its revenue arrangements since it is the primary obligor, it has pricing latitude andis also exposed to credit risks.
The specific recognition criteria described below must also be met before revenue isrecognised.
II-A-155

APPENDIX II-A AUDITED FINANCIAL STATEMENTS ON PROPERTYLINK FOR THETHREE YEARS ENDED 30 JUNE 2018
THE AUDITED FINANCIAL STATEMENTS OF PROPERTYLINK FOR THE YEARENDED JUNE 30, 2018
NOTES TO THE FINANCIAL STATEMENTSFor the year ended 30 June 2018 (continued)
RENTAL INCOME
The Group is the lessor in operating leases. Rental income arising from operating leases oninvestment property is accounted for on a straight-line basis over the lease terms and is included inrevenue in the consolidated statement of profit or loss.
Initial direct costs incurred in negotiating and arranging an operating lease are capitalised, thenrecognised as an expense over the lease term on the same basis as the lease income.
LEASE INCENTIVES
Prospective lessees may be offered incentives as an inducement to enter into non-cancellableoperating leases. These incentives may take various forms including rent-free periods, upfront cashpayments, or a contribution to certain lessee costs such as fitout costs. Incentives are capitalised andamortised on a straight-line basis over the lease term as a reduction in rental income. The lease term isthe non-cancellable period of the lease together with any further term for which the tenant has theoption to continue the lease, where, at the inception of the lease, it is reasonably certain that the tenantwill exercise that option.
Amounts received from tenants to terminate leases or to compensate for dilapidations arerecognised in the consolidated statement of profit or loss when the right to receive them arises.
SERVICE CHARGES, MANAGEMENT CHARGES AND OTHER OUTGOINGSRECOVERABLE FROM TENANTS
Income arising from expenses recharged to tenants is recognised in the period in which thecompensation becomes receivable and is classified as outgoings recovery income.
MANAGEMENT FEE INCOME
Propertylink has contractual entitlements to management fee income, which are recognised asfollows:
Š Performance fees are generally only entitled to be charged on the sale of all assets of afund, so such fees are only recognised when all assets have been sold and the Group isentitled to charge fees;
Š Acquisition and other transaction related fees are recognised when the service has beenprovided and the Group is entitled to charge fees; and
Š Investment and property management services are provided on a monthly basis andrevenue is recognised each month.
INTEREST INCOME
Interest income is recognised as it accrues using the effective interest rate method.
II-A-156

APPENDIX II-A AUDITED FINANCIAL STATEMENTS ON PROPERTYLINK FOR THETHREE YEARS ENDED 30 JUNE 2018
THE AUDITED FINANCIAL STATEMENTS OF PROPERTYLINK FOR THE YEARENDED JUNE 30, 2018
NOTES TO THE FINANCIAL STATEMENTSFor the year ended 30 June 2018 (continued)
(B) PROPERTY REVENUE
2018 2017
$’000 $’000
Rental income . . . . . . . . . . . . . . . . . . . . . . . . . . . . . . . . . . . . . . . . . . . . . . . . . . . . . . . . . 53,371 45,790Outgoings recovery income . . . . . . . . . . . . . . . . . . . . . . . . . . . . . . . . . . . . . . . . . . . . . . . 10,258 11,134Straight-lining of lease incentives . . . . . . . . . . . . . . . . . . . . . . . . . . . . . . . . . . . . . . . . . . — 264Make good recovery . . . . . . . . . . . . . . . . . . . . . . . . . . . . . . . . . . . . . . . . . . . . . . . . . . . . . 1,512 199
Total property revenue . . . . . . . . . . . . . . . . . . . . . . . . . . . . . . . . . . . . . . . . . . . . . . . . . 65,141 57,387
(C) FEES AND OTHER INCOME
2018 2017
$’000 $’000
Management fee income:—Performance1 . . . . . . . . . . . . . . . . . . . . . . . . . . . . . . . . . . . . . . . . . . . . . . . . . . . . 22,273 25,159—Acquisitions . . . . . . . . . . . . . . . . . . . . . . . . . . . . . . . . . . . . . . . . . . . . . . . . . . . . . 704 2,662—Investment management . . . . . . . . . . . . . . . . . . . . . . . . . . . . . . . . . . . . . . . . . . . 4,555 4,830—Property management . . . . . . . . . . . . . . . . . . . . . . . . . . . . . . . . . . . . . . . . . . . . . 3,476 3,577—Other property services . . . . . . . . . . . . . . . . . . . . . . . . . . . . . . . . . . . . . . . . . . . . 476 926
Total management fee revenue . . . . . . . . . . . . . . . . . . . . . . . . . . . . . . . . . . . . . . . . . . . 31,484 37,154
1 Investment mandates generally allow for a performance fee to be paid in the event of investment performance above minimumhurdle rates. During the year performance fees were derived from PHL Moelis Braeside Trust, Propertylink Office PartnershipII and Propertylink Office Partnership investors.
NOTE 3 PROPERTY EXPENSES
2018 2017
$’000 $’000
Council rates and land tax . . . . . . . . . . . . . . . . . . . . . . . . . . . . . . . . . . . . . . . . . . . . . . . . 4,506 4,355Repairs, maintenance and utilities . . . . . . . . . . . . . . . . . . . . . . . . . . . . . . . . . . . . . . . . . . 4,727 3,805Ground lease . . . . . . . . . . . . . . . . . . . . . . . . . . . . . . . . . . . . . . . . . . . . . . . . . . . . . . . . . . 2,718 2,406Property management expenses . . . . . . . . . . . . . . . . . . . . . . . . . . . . . . . . . . . . . . . . . . . . 2,515 2,046Depreciation . . . . . . . . . . . . . . . . . . . . . . . . . . . . . . . . . . . . . . . . . . . . . . . . . . . . . . . . . . . 2,748 2,140Property insurance costs . . . . . . . . . . . . . . . . . . . . . . . . . . . . . . . . . . . . . . . . . . . . . . . . . . 679 678Other . . . . . . . . . . . . . . . . . . . . . . . . . . . . . . . . . . . . . . . . . . . . . . . . . . . . . . . . . . . . . . . . . 1,051 550
Total property expenses . . . . . . . . . . . . . . . . . . . . . . . . . . . . . . . . . . . . . . . . . . . . . . . . . 18,944 15,980
II-A-157

APPENDIX II-A AUDITED FINANCIAL STATEMENTS ON PROPERTYLINK FOR THETHREE YEARS ENDED 30 JUNE 2018
THE AUDITED FINANCIAL STATEMENTS OF PROPERTYLINK FOR THE YEARENDED JUNE 30, 2018
NOTES TO THE FINANCIAL STATEMENTSFor the year ended 30 June 2018 (continued)
NOTE 4 FINANCE COSTS
Finance costs include interest, amortisation of borrowing costs incurred in connection witharrangement of borrowings and realised gains and losses on interest rate swaps. Borrowing costs areexpensed as incurred unless they relate to qualifying assets.
2018 2017
$’000 $’000
Interest on bank loans . . . . . . . . . . . . . . . . . . . . . . . . . . . . . . . . . . . . . . . . . . . . . . . . . . . . . 9,545 8,004Interest on other loans . . . . . . . . . . . . . . . . . . . . . . . . . . . . . . . . . . . . . . . . . . . . . . . . . . . . . — 81Borrowing costs1 . . . . . . . . . . . . . . . . . . . . . . . . . . . . . . . . . . . . . . . . . . . . . . . . . . . . . . . . . 391 1,898
Total finance costs . . . . . . . . . . . . . . . . . . . . . . . . . . . . . . . . . . . . . . . . . . . . . . . . . . . . . . . 9,936 9,983
1 Borrowing costs for the year ended 30 June 2017 include $1,555,096 in unamortised borrowing costs incurred to establish preIPO facilities for PHL and PAIP. The establishment of a new facility at the time of the IPO resulted in these costs being writtenoff.
NOTE 5 TAXATION
Most of the Group’s profit is earned by trusts which are not subject to taxation. Income fromthe trusts is instead attributed to unitholders who pay income tax at their marginal tax rates. Income taxis in respect of Propertylink (Holdings) Ltd and its subsidiaries only.
The income tax expense (income) for the year comprises current income tax expense (income)and deferred tax expense (income).
Current income tax expense charged to the profit or loss is the tax payable on taxable income.Current tax liabilities (assets) are measured at the amounts expected to be paid to (recovered from) therelevant taxation authority.
Current and deferred income tax expense (income) is charged or credited outside the profit andloss when the tax relates to items that are recognised outside the profit and loss.
Except for business combinations, no deferred income tax is recognised from the initialrecognition of an asset or liability, excluding a business combination, where there is no effect onaccounting or taxable profit or loss.
Deferred tax assets and liabilities are calculated at the tax rates that are expected to apply to theperiod when the asset is realised or the liability is settled and their measurement also reflects themanner in which management expects to recover or settle the carrying amount of the related asset orliability. With respect to non-depreciable items of property, plant and equipment measured at fair valueand items of investment property measured at fair value, the related deferred tax liability or deferredtax asset is measured on the basis that the carrying amount of the asset will be recovered entirelythrough sale.
II-A-158

APPENDIX II-A AUDITED FINANCIAL STATEMENTS ON PROPERTYLINK FOR THETHREE YEARS ENDED 30 JUNE 2018
THE AUDITED FINANCIAL STATEMENTS OF PROPERTYLINK FOR THE YEARENDED JUNE 30, 2018
NOTES TO THE FINANCIAL STATEMENTSFor the year ended 30 June 2018 (continued)
Deferred tax assets relating to temporary differences and unused tax losses are recognised onlyto the extent that it is probable that future taxable profit will be available against which the benefits canbe utilised.
Where temporary differences exist in relation to investments in subsidiaries, branches,associates, and joint ventures, deferred tax assets and liabilities are not recognised where the timing ofthe reversal of the temporary difference can’t be controlled and it is not probable that the reversal willoccur in the foreseeable future.
Current tax assets and liabilities are offset where a legally enforceable right of set-off exists andit is intended that net settlement or simultaneous realisation and settlement of the respective asset andliability will occur. Deferred tax assets and liabilities are offset where: (a) a legally enforceable right ofset-off exists; and (b) the deferred tax assets and liabilities relate to income taxes levied by the sametaxation authority on either the same taxable entity or different taxable entities, where it is intendedthat net settlement or simultaneous realisation and settlement of the respective asset and liability willoccur in future periods in which significant amounts of deferred tax assets or liabilities are expected tobe recovered or settled.
(A) INCOME TAX EXPENSE/(BENEFIT):
2018 2017
$’000 $’000
Current tax expense . . . . . . . . . . . . . . . . . . . . . . . . . . . . . . . . . . . . . . . . . . . . . . . . . . . . . . (3,999) (6,634)Deferred tax (expense)/benefit . . . . . . . . . . . . . . . . . . . . . . . . . . . . . . . . . . . . . . . . . . . . . (814) 4,534
Total tax expense . . . . . . . . . . . . . . . . . . . . . . . . . . . . . . . . . . . . . . . . . . . . . . . . . . . . . . . (4,813) (2,100)
(B) RECONCILIATION OF INCOME TAX (EXPENSE)/BENEFIT TO PRIMA FACIETAX PAYABLE
2018 2017
$’000 $’000
Profit before income tax . . . . . . . . . . . . . . . . . . . . . . . . . . . . . . . . . . . . . . . . . . . . . . . 128,740 79,186Non-taxable profit attributable to Trusts . . . . . . . . . . . . . . . . . . . . . . . . . . . . . . . . . . . (112,748) (92,518)
Profit/(loss) before income tax generated by PHL Group . . . . . . . . . . . . . . . . . . . . . . 15,992 (13,332)Prima facie tax credit/(expense) at the Australian tax rate of 30% . . . . . . . . . . . . . . . (4,798) 4,000Tax effect of amounts which are not deductible/(taxable) in calculating taxable
incomeNon deductible items
—Loan forgiven to PT . . . . . . . . . . . . . . . . . . . . . . . . . . . . . . . . . . . . . . . . . . . . — (6,000)—Entertainment of clients and employees . . . . . . . . . . . . . . . . . . . . . . . . . . . . . (16) (19)—Adjustments in respect of prior year . . . . . . . . . . . . . . . . . . . . . . . . . . . . . . . . — (81)
Income tax expense . . . . . . . . . . . . . . . . . . . . . . . . . . . . . . . . . . . . . . . . . . . . . . . . . . (4,813) (2,100)
II-A-159
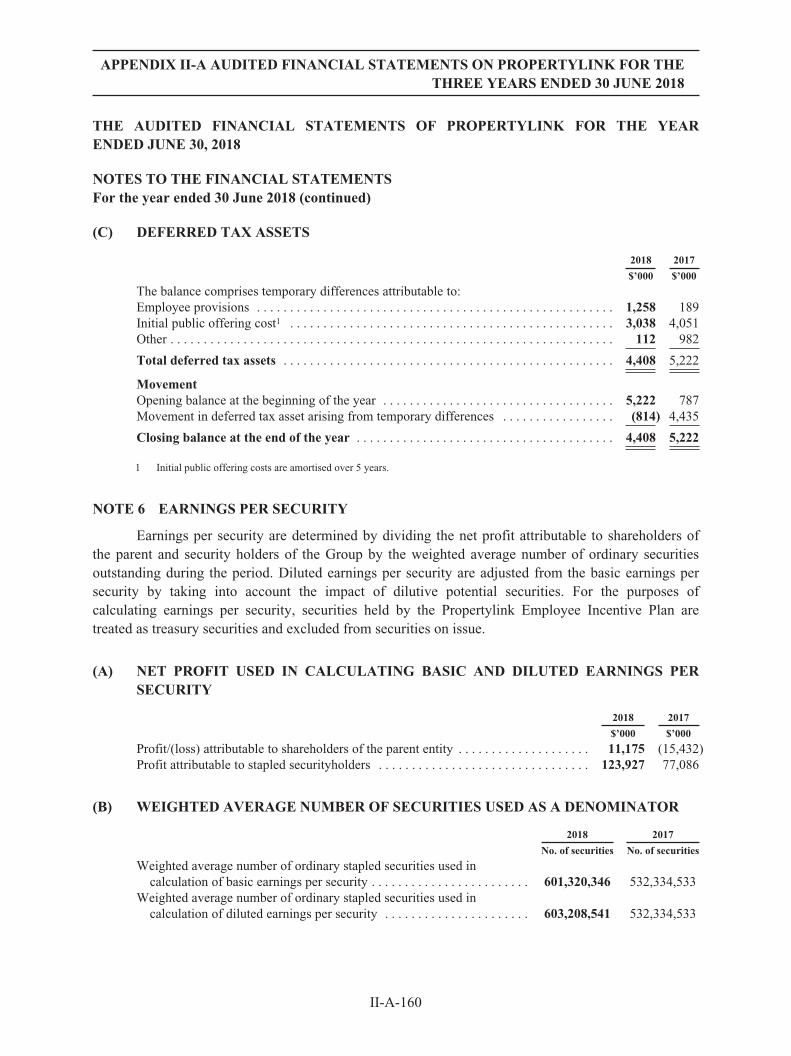
APPENDIX II-A AUDITED FINANCIAL STATEMENTS ON PROPERTYLINK FOR THETHREE YEARS ENDED 30 JUNE 2018
THE AUDITED FINANCIAL STATEMENTS OF PROPERTYLINK FOR THE YEARENDED JUNE 30, 2018
NOTES TO THE FINANCIAL STATEMENTSFor the year ended 30 June 2018 (continued)
(C) DEFERRED TAX ASSETS
2018 2017
$’000 $’000
The balance comprises temporary differences attributable to:Employee provisions . . . . . . . . . . . . . . . . . . . . . . . . . . . . . . . . . . . . . . . . . . . . . . . . . . . . . . 1,258 189Initial public offering cost1 . . . . . . . . . . . . . . . . . . . . . . . . . . . . . . . . . . . . . . . . . . . . . . . . . 3,038 4,051Other . . . . . . . . . . . . . . . . . . . . . . . . . . . . . . . . . . . . . . . . . . . . . . . . . . . . . . . . . . . . . . . . . . . 112 982
Total deferred tax assets . . . . . . . . . . . . . . . . . . . . . . . . . . . . . . . . . . . . . . . . . . . . . . . . . . 4,408 5,222
MovementOpening balance at the beginning of the year . . . . . . . . . . . . . . . . . . . . . . . . . . . . . . . . . . . 5,222 787Movement in deferred tax asset arising from temporary differences . . . . . . . . . . . . . . . . . (814) 4,435
Closing balance at the end of the year . . . . . . . . . . . . . . . . . . . . . . . . . . . . . . . . . . . . . . . 4,408 5,222
1 Initial public offering costs are amortised over 5 years.
NOTE 6 EARNINGS PER SECURITY
Earnings per security are determined by dividing the net profit attributable to shareholders ofthe parent and security holders of the Group by the weighted average number of ordinary securitiesoutstanding during the period. Diluted earnings per security are adjusted from the basic earnings persecurity by taking into account the impact of dilutive potential securities. For the purposes ofcalculating earnings per security, securities held by the Propertylink Employee Incentive Plan aretreated as treasury securities and excluded from securities on issue.
(A) NET PROFIT USED IN CALCULATING BASIC AND DILUTED EARNINGS PERSECURITY
2018 2017
$’000 $’000
Profit/(loss) attributable to shareholders of the parent entity . . . . . . . . . . . . . . . . . . . . 11,175 (15,432)Profit attributable to stapled securityholders . . . . . . . . . . . . . . . . . . . . . . . . . . . . . . . . 123,927 77,086
(B) WEIGHTED AVERAGE NUMBER OF SECURITIES USED AS A DENOMINATOR
2018 2017
No. of securities No. of securities
Weighted average number of ordinary stapled securities used incalculation of basic earnings per security . . . . . . . . . . . . . . . . . . . . . . . . 601,320,346 532,334,533
Weighted average number of ordinary stapled securities used incalculation of diluted earnings per security . . . . . . . . . . . . . . . . . . . . . . 603,208,541 532,334,533
II-A-160

APPENDIX II-A AUDITED FINANCIAL STATEMENTS ON PROPERTYLINK FOR THETHREE YEARS ENDED 30 JUNE 2018
THE AUDITED FINANCIAL STATEMENTS OF PROPERTYLINK FOR THE YEARENDED JUNE 30, 2018
NOTES TO THE FINANCIAL STATEMENTSFor the year ended 30 June 2018 (continued)
(C) BASIC AND DILUTED EARNINGS PER SECURITY
2018 2017
cents cents
Basic earnings/(loss) per share—Parent . . . . . . . . . . . . . . . . . . . . . . . . . . . . 1.86 (2.90)Diluted earnings/(loss) per share—Parent . . . . . . . . . . . . . . . . . . . . . . . . . . . 1.85 (2.90)Basic earnings per security—Group . . . . . . . . . . . . . . . . . . . . . . . . . . . . . . . 20.61 14.48Diluted earnings per security—Group . . . . . . . . . . . . . . . . . . . . . . . . . . . . . . 20.54 14.48Adjustments for calculation of diluted earnings per stapled security:Performance rights granted but not yet issued as securities . . . . . . . . . . . . . 1,888,195 —Weighted average number of ordinary stapled securities and potential
ordinary stapled securities . . . . . . . . . . . . . . . . . . . . . . . . . . . . . . . . . . . . . 603,208,541 532,334,533
NOTE 7 DIVIDENDS AND DISTRIBUTIONS
Dividends and distributions are recognised when declared.
2018 2017
$’000 $’000
Distributions paid:Fully franked ordinary dividend to pre IPO PHL shareholders on 15 August 2016 . . . . — 9,667Capital distribution to pre IPO PT unitholders on 15 August 2016 . . . . . . . . . . . . . . . . . — 21,082Profit distribution to PLG securityholders on 3 March 2017 . . . . . . . . . . . . . . . . . . . . . — 16,275Profit distribution to PLG securityholders on 4 September 2017 . . . . . . . . . . . . . . . . . . 21,821 —Profit distribution to PLG securityholders on 6 March 2018 . . . . . . . . . . . . . . . . . . . . . 21,696 —
43,517 47,024
The balance of franking account at end of the year was $5.8m (2017: $0.4m). The Group willseek to utilise these franking credits in future distributions.
II-A-161
APPENDIX II-A AUDITED FINANCIAL STATEMENTS ON PROPERTYLINK FOR THETHREE YEARS ENDED 30 JUNE 2018
THE AUDITED FINANCIAL STATEMENTS OF PROPERTYLINK FOR THE YEARENDED JUNE 30, 2018
NOTES TO THE FINANCIAL STATEMENTSFor the year ended 30 June 2018 (continued)
PROPERTY PORTFOLIO ASSETS
IN THIS SECTION
This section details the assets which are used to generate the Group’s performance and areconsidered to be the most relevant to the operations of the Group. The assets are detailed in thefollowing notes:
Investment properties: relates to freehold investment properties.
Property, plant and equipment: relates to leasehold buildings and furniture and equipment.
Non-current assets classified as held for sale: relates to investment properties which areexpected to be sold within 12 months of the balance sheet date and are currently marketed for sale.
Investments accounted for using the equity method: provides summarised financialinformation on joint ventures. The Group’s joint ventures comprise interests in property portfolioassets held through investments in trusts.
NOTE 8 INVESTMENT PROPERTIES
Investment property comprises completed property and property under construction orre-development (including integral plant and equipment) that are held to earn rentals and for capitalappreciation.
Investment property is measured initially at cost, including transaction costs. The carryingamount also includes capital expenditure on investment property and components relating to leaseincentives and assets relating to fixed increases in operating lease rentals in future periods.
Subsequent to initial recognition, investment property is stated at fair value, which reflectsmarket conditions at the reporting date. Gains or losses arising from changes in the fair values ofinvestment properties are included in profit or loss in the period in which they arise.
Investment properties are not depreciated for accounting purposes. Taxation allowances for thedepreciation of buildings and plant and equipment contribute to the tax deferred component ofdistributions to stapled security holders.
When an investment property is disposed of, the difference between the net disposal proceedsand the carrying amount of the asset is recognised in profit or loss.
II-A-162

APPENDIX II-A AUDITED FINANCIAL STATEMENTS ON PROPERTYLINK FOR THETHREE YEARS ENDED 30 JUNE 2018
THE AUDITED FINANCIAL STATEMENTS OF PROPERTYLINK FOR THE YEARENDED JUNE 30, 2018
NOTES TO THE FINANCIAL STATEMENTSFor the year ended 30 June 2018 (continued)
(A) RECONCILIATION
2018 2017
$’000 $’000
Opening balance at the beginning of the year . . . . . . . . . . . . . . . . . . . . . . . . . . . . . . . 572,756 6,471Property acquisitions . . . . . . . . . . . . . . . . . . . . . . . . . . . . . . . . . . . . . . . . . . . . . . . . . . 58,997 583,978Property sales . . . . . . . . . . . . . . . . . . . . . . . . . . . . . . . . . . . . . . . . . . . . . . . . . . . . . . . . (7,500) (32,966)Capital expenditure . . . . . . . . . . . . . . . . . . . . . . . . . . . . . . . . . . . . . . . . . . . . . . . . . . . 12,175 17,624Less: classified as held for sale . . . . . . . . . . . . . . . . . . . . . . . . . . . . . . . . . . . . . . . . . . — (31,550)Capitalised straight-lining of fixed increases in operating leases inclusive of lease
incentives . . . . . . . . . . . . . . . . . . . . . . . . . . . . . . . . . . . . . . . . . . . . . . . . . . . . . . . . . 1,879 1,365Net fair value gain/(loss) on investment property . . . . . . . . . . . . . . . . . . . . . . . . . . . . 57,893 27,834
Closing balance at the end of the year . . . . . . . . . . . . . . . . . . . . . . . . . . . . . . . . . . . . . 696,200 572,756
The carrying amount of investment property includes components related to deferred rent,capitalised lease incentives and leasing fees amounting to $5,038,011 (2017: $3,175,570).
(B) FAIR VALUE MEASUREMENT—INVESTMENT PROPERTY, INVESTMENTPROPERTY HELD FOR SALE AND PROPERTY CLASSIFIED AS PROPERTY,PLANT AND EQUIPMENT
Each property is considered a separate asset class based on its unique nature, characteristics andrisk. The Group’s policies on investment property valuations require that:
Š management provide Directors with a view of the fair value of each property as eachsix-monthly reporting date approaches;
Š where the view indicates the fair value of a property may materially differ from the currentcarried value, the Directors require that management procure an independent externalvaluation; and
Š all properties in the portfolio are to be subject to an independent external valuation at leastonce in any 24 month period.
In accordance with policies, management provided the Directors with an assessment ofestimated property values at 30 June 2018. Following the presentation, all properties were required tobe independently valued by external valuers. Following receipt of the valuations, the Directorsinstructed that the respective property carrying values be adjusted to the value determined by theindependent valuers.
HIGHEST AND BEST USE
For all investment property that is measured at fair value, the current use of the property isconsidered the highest and best use.
II-A-163

APPENDIX II-A AUDITED FINANCIAL STATEMENTS ON PROPERTYLINK FOR THETHREE YEARS ENDED 30 JUNE 2018
THE AUDITED FINANCIAL STATEMENTS OF PROPERTYLINK FOR THE YEARENDED JUNE 30, 2018
NOTES TO THE FINANCIAL STATEMENTSFor the year ended 30 June 2018 (continued)
FAIR VALUE HIERARCHY
The fair values of investment property recognised in the consolidated statement of financialposition are Level 3 of the fair value measurement hierarchy (refer to note 12(b)(iv)).
VALUATION TECHNIQUES USED TO DERIVE FAIR VALUES
The fair value is measured using capitalisation of net market income, discounted cash flow(DCF) approaches and comparable sales where appropriate.
CAPITALISATION (CAP) APPROACH
The capitalisation approach involves the addition of expected rent for the various componentsof the property and the deduction of outgoings and other expenses (where appropriate) in order todetermine the net income of the property. This net market income is capitalised at the adoptedcapitalisation rate to derive a market value. The higher/lower the capitalisation rate is adopted, thelower/ higher the valuation of a property.
DISCOUNTED CASH FLOWS (DCF) APPROACH
The DCF approach involves discounting future net operating cash flows over a 10 yearinvestment horizon at the adopted discount rate to derive a net present value for the property. Thehigher/lower the discount rate is adopted, the lower/higher the valuation of a property.
The Group’s investment property have been valued adopting the following key unobservableinputs:
Fair value Valuationtechnique
Keyunobservable
inputs2018 2017 2018 20171
$’000 $’000Investment properties . . . . . . 696,200 604,306 Cap approach Capitalisation rate 5.5% - 9.50%
(avg 6.61%)6.15% - 10.5%
(avg 7.21%)DCF approach Discount rate 7.0% - 9.50%
(avg 7.45%)7.50% - 12.5%
(avg 8.37%)
1 The 2017 comparative has been adjusted to reflect updated management information. The average discount rate has beenadjusted from 7.11% to 8.37%.
KEY ESTIMATES: INPUTS USED TO MEASURE FAIR VALUE OF INVESTMENTPROPERTIES AND LEASEHOLD BUILDINGS
Judgement is required in determining the following key assumptions;
Š Adopted capitalisation rate: The rate at which net market rental revenue is capitalised todetermine the value of a property. The rate is determined with regard to market evidenceand the prior external valuation.
II-A-164

APPENDIX II-A AUDITED FINANCIAL STATEMENTS ON PROPERTYLINK FOR THETHREE YEARS ENDED 30 JUNE 2018
THE AUDITED FINANCIAL STATEMENTS OF PROPERTYLINK FOR THE YEARENDED JUNE 30, 2018
NOTES TO THE FINANCIAL STATEMENTSFor the year ended 30 June 2018 (continued)
Š Adopted discount rate: The rate of return used to convert cash flows, payable orreceivable in the future, into present value. It reflects the opportunity cost of capital, thatis, the rate of return the cash can earn if put to other uses having similar risk. The rate isdetermined with regard to market evidence and the prior external valuation.
(C) SENSITIVITY INFORMATION
The table below highlights the sensitivity analysis of a 25 basis point change in capitalisationrate on the fair value of investment property:
-25basis points
+25basis points
$’000 $’000
Change in fair value of investment properties . . . . . . . . . . . . . . . . . . . . . . 2018 28,538 (25,883)2017 22,877 (21,309)
The table below highlights the sensitivity analysis of a 25 basis point change in discount rate onthe fair value of investment property:
-25basis points
+25basis points
$’000 $’000
Change in fair value of investment properties . . . . . . . . . . . . . . . . . . . . . . 2018 12,185 (13,002)2017 8,769 (8,567)
NOTE 9 PROPERTY, PLANT AND EQUIPMENT
Property, plant and equipment is carried at cost or fair value as indicated less, where applicable,any accumulated depreciation and impairment losses.
PROPERTY—LEASEHOLD BUILDINGS
Leasehold buildings are carried at their fair value (being the amount for which an asset could beexchanged between knowledgeable willing parties in an arm’s length transaction), based on periodicvaluations by external independent valuers, less accumulated depreciation for buildings (refer to note 8for more details).
Increases in the carrying amount arising on revaluation of buildings are credited to arevaluation reserve in equity. Decreases that offset previous increases of the same asset are recognisedagainst the revaluation reserve directly in equity; all other decreases are recognised in profit or loss.
Any accumulated depreciation at the date of revaluation is eliminated against the gross carryingamount of the asset and the net amount is restated to the revalued amount of the asset.
II-A-165
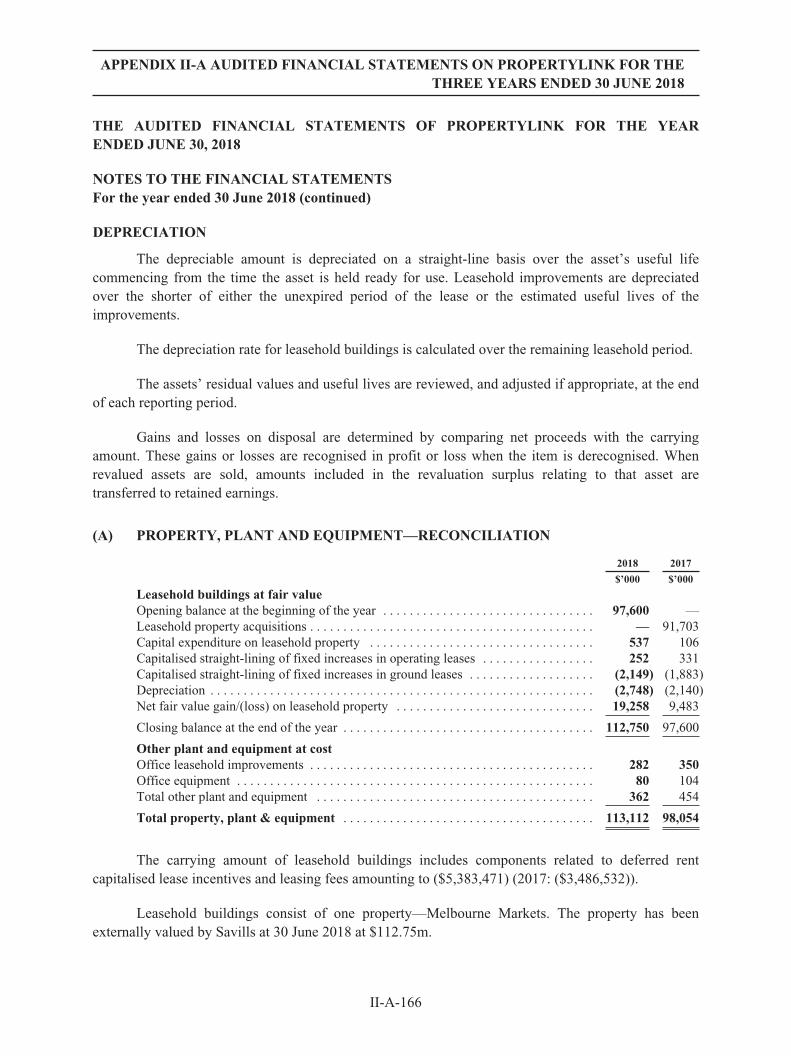
APPENDIX II-A AUDITED FINANCIAL STATEMENTS ON PROPERTYLINK FOR THETHREE YEARS ENDED 30 JUNE 2018
THE AUDITED FINANCIAL STATEMENTS OF PROPERTYLINK FOR THE YEARENDED JUNE 30, 2018
NOTES TO THE FINANCIAL STATEMENTSFor the year ended 30 June 2018 (continued)
DEPRECIATION
The depreciable amount is depreciated on a straight-line basis over the asset’s useful lifecommencing from the time the asset is held ready for use. Leasehold improvements are depreciatedover the shorter of either the unexpired period of the lease or the estimated useful lives of theimprovements.
The depreciation rate for leasehold buildings is calculated over the remaining leasehold period.
The assets’ residual values and useful lives are reviewed, and adjusted if appropriate, at the endof each reporting period.
Gains and losses on disposal are determined by comparing net proceeds with the carryingamount. These gains or losses are recognised in profit or loss when the item is derecognised. Whenrevalued assets are sold, amounts included in the revaluation surplus relating to that asset aretransferred to retained earnings.
(A) PROPERTY, PLANT AND EQUIPMENT—RECONCILIATION
2018 2017
$’000 $’000
Leasehold buildings at fair valueOpening balance at the beginning of the year . . . . . . . . . . . . . . . . . . . . . . . . . . . . . . . . 97,600 —Leasehold property acquisitions . . . . . . . . . . . . . . . . . . . . . . . . . . . . . . . . . . . . . . . . . . . — 91,703Capital expenditure on leasehold property . . . . . . . . . . . . . . . . . . . . . . . . . . . . . . . . . . 537 106Capitalised straight-lining of fixed increases in operating leases . . . . . . . . . . . . . . . . . 252 331Capitalised straight-lining of fixed increases in ground leases . . . . . . . . . . . . . . . . . . . (2,149) (1,883)Depreciation . . . . . . . . . . . . . . . . . . . . . . . . . . . . . . . . . . . . . . . . . . . . . . . . . . . . . . . . . . (2,748) (2,140)Net fair value gain/(loss) on leasehold property . . . . . . . . . . . . . . . . . . . . . . . . . . . . . . 19,258 9,483
Closing balance at the end of the year . . . . . . . . . . . . . . . . . . . . . . . . . . . . . . . . . . . . . . 112,750 97,600
Other plant and equipment at costOffice leasehold improvements . . . . . . . . . . . . . . . . . . . . . . . . . . . . . . . . . . . . . . . . . . . 282 350Office equipment . . . . . . . . . . . . . . . . . . . . . . . . . . . . . . . . . . . . . . . . . . . . . . . . . . . . . . 80 104Total other plant and equipment . . . . . . . . . . . . . . . . . . . . . . . . . . . . . . . . . . . . . . . . . . 362 454
Total property, plant & equipment . . . . . . . . . . . . . . . . . . . . . . . . . . . . . . . . . . . . . . 113,112 98,054
The carrying amount of leasehold buildings includes components related to deferred rentcapitalised lease incentives and leasing fees amounting to ($5,383,471) (2017: ($3,486,532)).
Leasehold buildings consist of one property—Melbourne Markets. The property has beenexternally valued by Savills at 30 June 2018 at $112.75m.
II-A-166

APPENDIX II-A AUDITED FINANCIAL STATEMENTS ON PROPERTYLINK FOR THETHREE YEARS ENDED 30 JUNE 2018
THE AUDITED FINANCIAL STATEMENTS OF PROPERTYLINK FOR THE YEARENDED JUNE 30, 2018
NOTES TO THE FINANCIAL STATEMENTSFor the year ended 30 June 2018 (continued)
(B) FAIR VALUE MEASUREMENT
FAIR VALUE HIERARCHY
The fair values of property, plant and equipment recognised in the consolidated statement offinancial position are Level 3 of the fair value measurement hierarchy (refer to note 12(b)(iv)).
Refer to note 8(b) for valuation techniques and key estimates and judgements used to measurefair value of leasehold buildings.
The Group’s leasehold buildings have been valued adopting the following key unobservableinputs:
Fair value Valuationtechnique
Keyunobservable
inputs2018 2017 2018 2017
$’000 $’000
Leasehold buildings . . . . 112,750 97,600 Cap approach Capitalisation rate 7.00% 7.25%DCF approach Discount rate 8.00% 8.75%
(C) SENSITIVITY INFORMATION
The table below highlights the sensitivity analysis of a 25 basis point change in capitalisationrate on the fair value of Melbourne Markets property:
-25basis points
+25basis points
$’000 $’000
Change in fair value of leasehold buildings . . . . . . . . . . . . . . . . . . . . . . . . 2018 4,000 (4,000)2017 3,376 (3,151)
The table below highlights the sensitivity analysis of a 25 basis point change in discount rate onthe fair value of Melbourne Markets property:
-25basis points
+25basis points
$’000 $’000
Change in fair value of leasehold buildings . . . . . . . . . . . . . . . . . . . . . . . . 2018 1,927 (1,883)2017 1,529 (1,495)
NOTE 10 NON-CURRENT ASSETS CLASSIFIED AS HELD FOR SALE
Investment property is transferred to non-current assets held for sale when:
Š the property is available for immediate sale in its present condition, and
Š the Trustee is committed to a plan to sell the property at its current fair value with anactive marketing programme initiated, and
Š a sale is expected within one year
II-A-167

APPENDIX II-A AUDITED FINANCIAL STATEMENTS ON PROPERTYLINK FOR THETHREE YEARS ENDED 30 JUNE 2018
THE AUDITED FINANCIAL STATEMENTS OF PROPERTYLINK FOR THE YEARENDED JUNE 30, 2018
NOTES TO THE FINANCIAL STATEMENTSFor the year ended 30 June 2018 (continued)
Investment properties held for sale continue to be measured at fair value and are presentedseparately as current items in the consolidated statement of financial position.
As at 30 June 2018 no properties are classified as held for sale (30 June 2017: $31.55m).
NOTE 11 EQUITY ACCOUNTED INVESTMENTS
(A) INFORMATION ABOUT PRINCIPAL JOINT VENTURES
Set out below are the material joint ventures of the Group. The entities listed below are unittrusts in which the Group holds equity. The proportion of equity held by the Group does not equal thevoting rights held by the Group. The entities are controlled jointly with the external investors. Theentities were formed in Australia and their principal activity is property investment in Australia.
II-A-168

THE
AUDIT
ED
FIN
ANCIA
LST
ATEM
ENTSOFPROPERTYLIN
KFOR
THE
YEAR
ENDED
JUNE
30,2
018
NOTESTO
THE
FIN
ANCIA
LST
ATEM
ENTS
For
theye
aren
ded30
June
2018
(con
tinu
ed)
(B)
SUM
MARIS
ED
FIN
ANCIA
LIN
FORM
ATIO
NFOR
EQUIT
YACCOUNTED
INVEST
MENTS
Set
outbe
low
isthe
summarised
fina
ncialinform
ation
foreq
uity
acco
unted
inve
stmen
ts,ad
justed
whe
rene
cessary
toreflectan
ydifferen
cesin
acco
unting
policies
betw
eentheGroup
andtheinve
stee
:
Pro
pertylink
Enh
ance
dPar
tner
ship
50Ann
Pro
pertylink
Enh
ance
dPar
tner
ship
Pro
pertylink
Aus
tralian
Com
mer
cial
Tru
stI
Aus
log
Holding
sTru
st1
PHL
Moe
lisBra
eside
Tru
st2
POPII
Inve
stmen
tPar
tner
ship
3
Pro
pertylink
Com
mercial
Indu
strial
Inve
stmen
ts
Pro
pertylink
Aus
tralian
Indu
strial
Par
tnersh
ipII
POPIII
Inve
stmen
tPar
tnersh
ipTotal
30Ju
ne20
18$’00
0$’00
0$’00
0$’00
0$’00
0$’00
0$’00
0$’00
0$’00
0$’00
0Group
’ssh
are(%
)..
....
....
....
....
....
....
....
25.00%
25.00%
15.00%
0.00
%0.00
%20
.00%
7.50
%17
.13%
11.21%
Propo
rtionof
voting
righ
ts..
....
....
....
....
....
.50
.00%
50.00%
50.00%
0.00
%0.00
%50
.00%
50.00%
50.00%
50.00%
Summar
ised
fina
ncialp
osition
Cashan
dca
sheq
uiva
lents..
....
....
....
....
....
..2,12
01,94
91,38
9—
——
1,07
51,46
51,82
29,82
0Total
curren
tassets
....
....
....
....
....
....
....
.3,12
02,13
31,75
1—
——
1,11
03,82
92,16
414
,107
Total
non-cu
rren
tassets..
....
....
....
....
....
....
180,25
116
2,53
417
5,98
8—
——
31,000
302,15
012
1,40
097
3,32
3Current
fina
ncialliabilities
....
....
....
....
....
...
(27)
——
——
—(30)
(127
)—
(184
)Other
curren
tliabilities
....
....
....
....
....
....
..(5,761
)(3,042
)(1,391
)—
——
(438
)(5,913
)(1,270
)(17,81
5)Non
-current
fina
ncialliabilities
....
....
....
....
....
(74,69
6)(65,01
7)(78,74
4)—
——
(17,37
6)(137
,623
)(55,71
2)(429
,168
)Net
assets
....
....
....
....
....
....
....
....
....
.10
2,88
796
,608
97,604
——
—14
,266
162,31
666
,582
540,26
3
Gro
up’s
shar
eof
jointve
ntur
e’sne
tas
sets
....
....
.25
,722
24,152
14,641
——
—1,07
027
,804
7,46
610
0,85
5
Summar
ised
fina
ncialp
erform
ance
Rev
enue
....
....
....
....
....
....
....
....
....
..30
,184
28,480
25,101
—90
1,25
24,40
952
,295
20,414
162,22
5Dep
reciationan
dam
ortisation
....
....
....
....
....
.(69)
——
——
——
(1,271
)—
(1,340
)Interest
inco
me
....
....
....
....
....
....
....
....
324
13—
1211
513
4522
247
Interest
expe
nse..
....
....
....
....
....
....
....
..(3,079
)(2,550
)(2,118
)—
(362
)—
(714
)(4,040
)(1,915
)(14,77
8)Other
expe
nses
....
....
....
....
....
....
....
....
.(5,808
)(4,374
)(3,026
)—
83—
(457
)(9,973
)(2,433
)(25,98
8)Profito
rloss
from
continuing
operations
....
....
....
21,231
21,580
19,970
—(177
)1,36
73,25
137
,056
16,088
120,36
6Inco
metaxex
pens
e..
....
....
....
....
....
....
...
——
——
——
——
——
Profita
fter
taxfrom
continuing
operations
....
....
...
21,231
21,580
19,970
—(177
)1,36
73,25
137
,056
16,088
120,36
6Total
compreh
ensive
inco
me..
....
....
....
....
....
21,231
21,580
19,970
—(177
)1,36
73,25
137
,056
16,088
120,36
6
Gro
up’s
shar
eof
jointve
ntur
e’stotalc
ompr
ehen
sive
inco
me..
....
....
....
....
....
....
....
....
...
5,30
85,39
53,00
3—
(18)
273
244
4,35
01,25
019
,805
Distribut
ionre
ceived
....
....
....
....
....
....
...
1,81
71,31
4—
—2,51
16,64
786
1,29
721
013
,882
1The
assets
held
byAus
logHolding
sTrust
wereso
ldin
Feb
ruary20
17an
dthetrus
twas
wou
ndup
.2
The
asseth
eldby
PHLM
oelisBraesideTrust
was
sold
inJu
ly20
17an
dthetrus
twas
wou
ndup
.3
The
asseth
eldby
POPII,inwhich
POPII
Inve
stmen
tPartnersh
ipha
s20
%interest,w
asso
ldin
July
2017
,and
thetrus
twas
wou
ndup
.
APPENDIX II-A AUDITED FINANCIAL STATEMENTS ON PROPERTYLINK FOR THETHREE YEARS ENDED 30 JUNE 2018
II-A-169
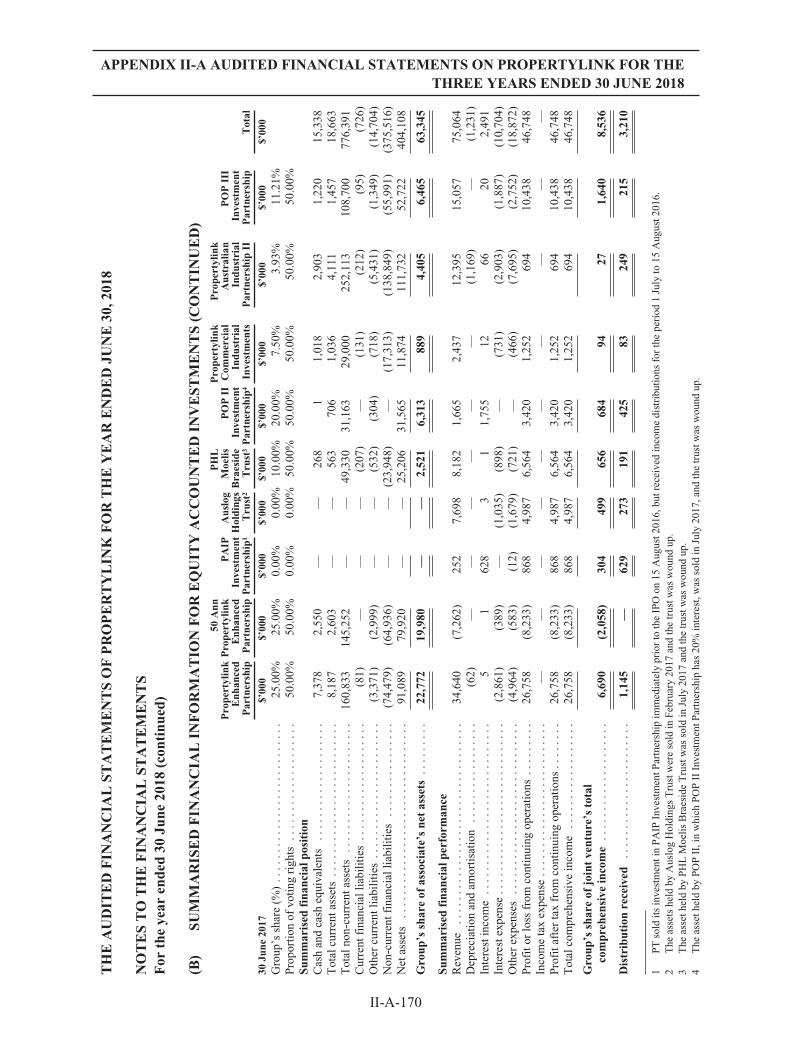
THE
AUDIT
ED
FIN
ANCIA
LST
ATEM
ENTSOFPROPERTYLIN
KFOR
THE
YEAR
ENDED
JUNE
30,2
018
NOTESTO
THE
FIN
ANCIA
LST
ATEM
ENTS
For
theye
aren
ded30
June
2018
(con
tinu
ed)
(B)
SUM
MARIS
ED
FIN
ANCIA
LIN
FORM
ATIO
NFOR
EQUIT
YACCOUNTED
INVEST
MENTS(C
ONTIN
UED)
Pro
pertylink
Enh
ance
dPar
tner
ship
50Ann
Pro
pertylink
Enh
ance
dPar
tner
ship
PAIP
Inve
stmen
tPar
tner
ship
1
Aus
log
Holding
sTru
st2
PHL
Moe
lisBra
eside
Tru
st3
POPII
Inve
stmen
tPar
tner
ship
4
Pro
pertylink
Com
mer
cial
Indu
strial
Inve
stmen
ts
Pro
pertylink
Aus
tralian
Indu
strial
Par
tner
ship
II
POPIII
Inve
stmen
tPar
tner
ship
Total
30Ju
ne20
17$’00
0$’00
0$’00
0$’00
0$’00
0$’00
0$’00
0$’00
0$’00
0$’00
0Group
’ssh
are(%
)..
....
....
....
....
....
....
.25
.00%
25.00%
0.00
%0.00
%10
.00%
20.00%
7.50
%3.93
%11
.21%
Propo
rtionof
voting
righ
ts..
....
....
....
....
..50
.00%
50.00%
0.00
%0.00
%50
.00%
50.00%
50.00%
50.00%
50.00%
Summar
ised
fina
ncialp
osition
Cashan
dca
sheq
uiva
lents
....
....
....
....
....
7,37
82,55
0—
—26
81
1,01
82,90
31,22
015
,338
Total
curren
tassets..
....
....
....
....
....
....
8,18
72,60
3—
—56
370
61,03
64,11
11,45
718
,663
Total
non-cu
rren
tassets
....
....
....
....
....
..16
0,83
314
5,25
2—
—49
,330
31,163
29,000
252,11
310
8,70
077
6,39
1Current
fina
ncialliabilities
....
....
....
....
....
(81)
——
—(207
)—
(131
)(212
)(95)
(726
)Other
curren
tliabilities
....
....
....
....
....
...
(3,371
)(2,999
)—
—(532
)(304
)(718
)(5,431
)(1,349
)(14,70
4)Non
-current
fina
ncialliabilities
....
....
....
....
(74,47
9)(64,93
6)—
—(23,94
8)—
(17,31
3)(138
,849
)(55,99
1)(375
,516
)Net
assets
....
....
....
....
....
....
....
....
.91
,089
79,920
——
25,206
31,565
11,874
111,73
252
,722
404,10
8
Gro
up’s
shar
eof
asso
ciate’sne
tas
sets
....
....
.22
,772
19,980
——
2,52
16,31
388
94,40
56,46
563
,345
Summar
ised
fina
ncialp
erform
ance
Rev
enue
....
....
....
....
....
....
....
....
..34
,640
(7,262
)25
27,69
88,18
21,66
52,43
712
,395
15,057
75,064
Dep
reciationan
dam
ortisation
....
....
....
....
.(62)
——
——
——
(1,169
)—
(1,231
)Interest
inco
me
....
....
....
....
....
....
....
.5
162
83
11,75
512
6620
2,49
1Interest
expe
nse..
....
....
....
....
....
....
...
(2,861
)(389
)—
(1,035
)(898
)—
(731
)(2,903
)(1,887
)(10,70
4)Other
expe
nses
....
....
....
....
....
....
....
.(4,964
)(583
)(12)
(1,679
)(721
)—
(466
)(7,695
)(2,752
)(18,87
2)Profito
rloss
from
continuing
operations
....
....
.26
,758
(8,233
)86
84,98
76,56
43,42
01,25
269
410
,438
46,748
Inco
metaxex
pens
e..
....
....
....
....
....
....
——
——
——
——
——
Profita
fter
taxfrom
continuing
operations
....
....
26,758
(8,233
)86
84,98
76,56
43,42
01,25
269
410
,438
46,748
Total
compreh
ensive
inco
me
....
....
....
....
..26
,758
(8,233
)86
84,98
76,56
43,42
01,25
269
410
,438
46,748
Gro
up’s
shar
eof
jointve
ntur
e’stotal
compr
ehen
sive
inco
me
....
....
....
....
....
6,69
0(2,058
)30
449
965
668
494
271,64
08,53
6
Distribut
ionre
ceived
....
....
....
....
....
...
1,14
5—
629
273
191
425
8324
921
53,21
0
1PTso
lditsinve
stmen
tinPAIP
Inve
stmen
tPartnersh
ipim
med
iately
priorto
theIP
Oon
15Aug
ust2
016,
butrec
eive
dinco
medistribu
tion
sforthepe
riod
1Ju
lyto
15Aug
ust2
016.
2The
assets
held
byAus
logHolding
sTrust
wereso
ldin
Feb
ruary20
17an
dthetrus
twas
wou
ndup
.3
The
asseth
eldby
PHLM
oelisBraesideTrust
was
sold
inJu
ly20
17an
dthetrus
twas
wou
ndup
.4
The
asseth
eldby
POPII,inwhich
POPII
Inve
stmen
tPartnersh
ipha
s20
%interest,w
asso
ldin
July
2017
,and
thetrus
twas
wou
ndup
.
II-A-170
APPENDIX II-A AUDITED FINANCIAL STATEMENTS ON PROPERTYLINK FOR THETHREE YEARS ENDED 30 JUNE 2018

APPENDIX II-A AUDITED FINANCIAL STATEMENTS ON PROPERTYLINK FOR THETHREE YEARS ENDED 30 JUNE 2018
THE AUDITED FINANCIAL STATEMENTS OF PROPERTYLINK FOR THE YEARENDED JUNE 30, 2018
NOTES TO THE FINANCIAL STATEMENTSFor the year ended 30 June 2018 (continued)
CAPITAL AND FINANCIAL RISK MANAGEMENT AND WORKING CAPITAL
IN THIS SECTION
The directors’ overall financial risk management strategy seeks to assist the Group in meetingits financial targets, whilst minimising potential adverse effects on financial performance. Note 12Capital and financial risk management outlines how the Group manages its exposure to a variety offinancial risks (credit risk, liquidity risk and interest rate risk) and details of the various derivativefinancial instruments entered into by the Group.
The capital structure of the Group is detailed in the following notes:
Debt: Borrowings in Note 13 and Commitments and contingencies in Note 14.
Equity: Contributed equity in Note 15 and reserves in Note 16.
Note 17 provides a breakdown of the working capital balances held in the Statement ofFinancial Position.
NOTE 12 CAPITAL AND FINANCIAL RISK MANAGEMENT
The Group’s financial instruments consist mainly of deposits with banks, accounts receivableand payable, bills and interest rate swap derivatives.
2018 2017
$’000 $’000
Financial assetsCash and cash equivalents . . . . . . . . . . . . . . . . . . . . . . . . . . . . . . . . . . . . . . . . . . . . . . 17,233 20,002Loans and receivables . . . . . . . . . . . . . . . . . . . . . . . . . . . . . . . . . . . . . . . . . . . . . . . . . 3,440 4,472Derivative financial instruments . . . . . . . . . . . . . . . . . . . . . . . . . . . . . . . . . . . . . . . . . 299 644
Total financial assets . . . . . . . . . . . . . . . . . . . . . . . . . . . . . . . . . . . . . . . . . . . . . . . . . 20,972 25,118
Financial liabilitiesFinancial liabilities at amortised cost
—Trade and other payables . . . . . . . . . . . . . . . . . . . . . . . . . . . . . . . . . . . . . . . . . 19,308 11,207—Borrowings . . . . . . . . . . . . . . . . . . . . . . . . . . . . . . . . . . . . . . . . . . . . . . . . . . . . 288,657 255,926
Total financial liabilities . . . . . . . . . . . . . . . . . . . . . . . . . . . . . . . . . . . . . . . . . . . . . . 307,965 267,133
(A) CAPITAL RISK MANAGEMENT
Management manages the capital of the Group in order to maintain an acceptable debt to totaltangible assets ratio, provide the securityholders with adequate returns, and ensure that the Group canfund its operations and continue as a going concern.
The Group’s debt and capital include ordinary equity capital and financial liabilities, supportedby financial assets. There are no externally imposed capital requirements.
II-A-171

APPENDIX II-A AUDITED FINANCIAL STATEMENTS ON PROPERTYLINK FOR THETHREE YEARS ENDED 30 JUNE 2018
THE AUDITED FINANCIAL STATEMENTS OF PROPERTYLINK FOR THE YEARENDED JUNE 30, 2018
NOTES TO THE FINANCIAL STATEMENTSFor the year ended 30 June 2018 (continued)
Management assesses the Group’s financial risks and adjusts its capital structure in response tochanges in these risks and the market. These responses may include the review of debt levels, reviewof distributions to securityholders, and issue of new securities.
The Group has a target gearing ratio of 30% to 40%. The table below details the calculation ofthe gearing ratio:
2018 2017
$’000 $’000
Total interest bearing liabilities1 . . . . . . . . . . . . . . . . . . . . . . . . . . . . . . . . . . . . . . . . 290,000 257,000Cash and cash equivalents . . . . . . . . . . . . . . . . . . . . . . . . . . . . . . . . . . . . . . . . . . . . . . 17,233 20,002Total tangible assets2 . . . . . . . . . . . . . . . . . . . . . . . . . . . . . . . . . . . . . . . . . . . . . . . . . . 937,995 797,754Gearing ratio3 . . . . . . . . . . . . . . . . . . . . . . . . . . . . . . . . . . . . . . . . . . . . . . . . . . . . . . . 29.6% 30.5%Gearing ratio (look-through)4 . . . . . . . . . . . . . . . . . . . . . . . . . . . . . . . . . . . . . . . . . . 34.9% 35.2%
1 Total interest bearing liabilities exclude unamortised borrowing costs.2 Total tangible assets comprise total assets less intangible assets.3 The gearing ratio is calculated as total interest bearing liabilities less cash and cash equivalents divided by total tangible assets
less cash and cash equivalents.4 The look-through gearing ratio is calculated on the same basis, by including the Group’s underlying interest in debt, cash and
tangible assets of equity accounted investments.
(B) FINANCIAL RISK MANAGEMENT
Management meets monthly to analyse financial risk and to evaluate treasury managementstrategies in the context of the most recent economic conditions and forecasts to assist the Group inmeeting its financial targets, whilst minimising potential adverse effects on financial performance.
Management operate under policies approved by the Board of Directors. Financial riskmanagement policies are reviewed and approved by the Board at least annually, including credit riskpolicies and future cash flow requirements.
SPECIFIC FINANCIAL RISK EXPOSURES AND MANAGEMENT
The main risks the Group is exposed to through its financial instruments are credit risk,liquidity risk and market risk relating to interest rates.
(I) CREDIT RISK
Exposure to credit risk relating to financial assets arises from the potential non-performance bycounterparties of contract obligations that could lead to a financial loss to the Group.
The Group manages credit risk by:
Š maintaining procedures ensuring, to the extent possible, that customers and counterpartiesto transactions are of sound credit worthiness;
Š utilisation of systems for the approval, granting and renewal of credit limits;
Š regular monitoring of exposures against credit limits;
II-A-172

APPENDIX II-A AUDITED FINANCIAL STATEMENTS ON PROPERTYLINK FOR THETHREE YEARS ENDED 30 JUNE 2018
THE AUDITED FINANCIAL STATEMENTS OF PROPERTYLINK FOR THE YEARENDED JUNE 30, 2018
NOTES TO THE FINANCIAL STATEMENTSFor the year ended 30 June 2018 (continued)
Š obtaining collateral where necessary in the form of tenant bonds;
Š regular monitoring of the financial stability of significant customers and counterparties.Credit terms are generally 30 to 45 days from the date of invoice;
Š investing surplus funds in financial institutions that maintain a high credit rating or inentities that the senior executives have otherwise assessed as being financially sound.
The maximum exposure to credit risk at balance date to recognised financial assets, excludingthe value of any collateral or other security, is the carrying amount, net of any provisions forimpairment of those assets. The Group manages credit risk by ensuring that appropriate due diligenceis carried out before entering into lease agreements with tenants. Receivable balances are regularlyreviewed to reduce exposure to bad debts.
(II) LIQUIDITY RISK
Liquidity risk arises from the possibility that the Group might encounter difficulty in settling itsdebts or otherwise meeting its obligations related to financial liabilities. The Group manages this riskby:
Š preparing forward-looking cash flows for its operational, investing and financingactivities;
Š monitoring undrawn credit facilities;
Š maintaining a reputable credit profile;
Š managing credit risk related to financial assets;
Š only investing surplus cash with major financial institutions; and
Š comparing the maturity profile of financial liabilities with the realisation profile offinancial assets.
The table below reflects an undiscounted contractual maturity analysis for financial assets andliabilities. Financial guarantee liabilities are treated as payable on demand since the Group has nocontrol over the timing of any potential settlement of the liability.
Cash flows realised from financial assets reflect management’s expectation as to the timing ofrealisation. Actual timing may therefore differ from that disclosed. The timing of cash flows presentedin the table to settle financial liabilities reflect the earliest contractual settlement dates and do notreflect management’s expectations that banking facilities will be rolled forward.
II-A-173

APPENDIX II-A AUDITED FINANCIAL STATEMENTS ON PROPERTYLINK FOR THETHREE YEARS ENDED 30 JUNE 2018
THE AUDITED FINANCIAL STATEMENTS OF PROPERTYLINK FOR THE YEARENDED JUNE 30, 2018
NOTES TO THE FINANCIAL STATEMENTSFor the year ended 30 June 2018 (continued)
Financial liability and financial asset maturity analysis
Within 1 year 1 to 5 years Total
2018 2017 2018 2017 2018 2017
$’000 $’000 $’000 $’000 $’000 $’000
Financial liabilities due for paymentSecured bank loans1 . . . . . . . . . . . . . . . . 10,380 8,771 327,262 284,007 337,642 292,778Trade and other payables . . . . . . . . . . . . 19,308 11,207 — — 19,308 11,207Derivative financial instruments2 . . . . . . 265 211 — — 265 211
Total expected outflows . . . . . . . . . . . . . 29,953 20,189 327,262 284,007 357,215 304,196
Financial assets—cash flows realisableCash and cash equivalents . . . . . . . . . . . 17,233 20,002 — — 17,233 20,002Trade, term and loan receivables . . . . . . 3,283 4,228 — — 3,283 4,228Derivative financial instruments2 . . . . . . — — 589 937 589 937
Total expected inflows . . . . . . . . . . . . . . 20,516 24,230 589 937 21,105 25,167
Net (outflow)/inflow on financialinstruments . . . . . . . . . . . . . . . . . . . . . (9,437) 4,041 (326,673) (283,070) (336,110) (279,029)
1 Refer to note 13. Includes estimated fees and interest.2 Derivative financial instruments comprise of interest rate swaps, for which only the net interest cash flows (not the notional
principal) are included. Refer to note 12(c) for fair value of derivatives.
The Group manages the liquidity required to meet its current liabilities from operating cashflows. Non-current liabilities in respect of bank loans are managed by way of re-negotiation or fromthe sale of assets.
(III) MARKET RISK
INTEREST RATE RISK
Interest rate risk is the risk that the future cash flows of a financial instrument will fluctuatebecause of changes in market interest rates. The Group’s exposure to the risk of changes in marketinterest rates relates primarily to its long-term debt obligations with floating interest rates.
To manage interest rate risk, the Group enters into interest rate swaps, in which it agrees toexchange, at specified intervals, the difference between fixed and variable rate interest amountscalculated by reference to an agreed-upon notional principal amount. These swaps are designated tohedge underlying debt obligations. At 30 June 2018, after taking into account the effect of interest rateswaps, 61.2% of the Group’s borrowings are hedged (30 June 2017: 69.1%).
II-A-174
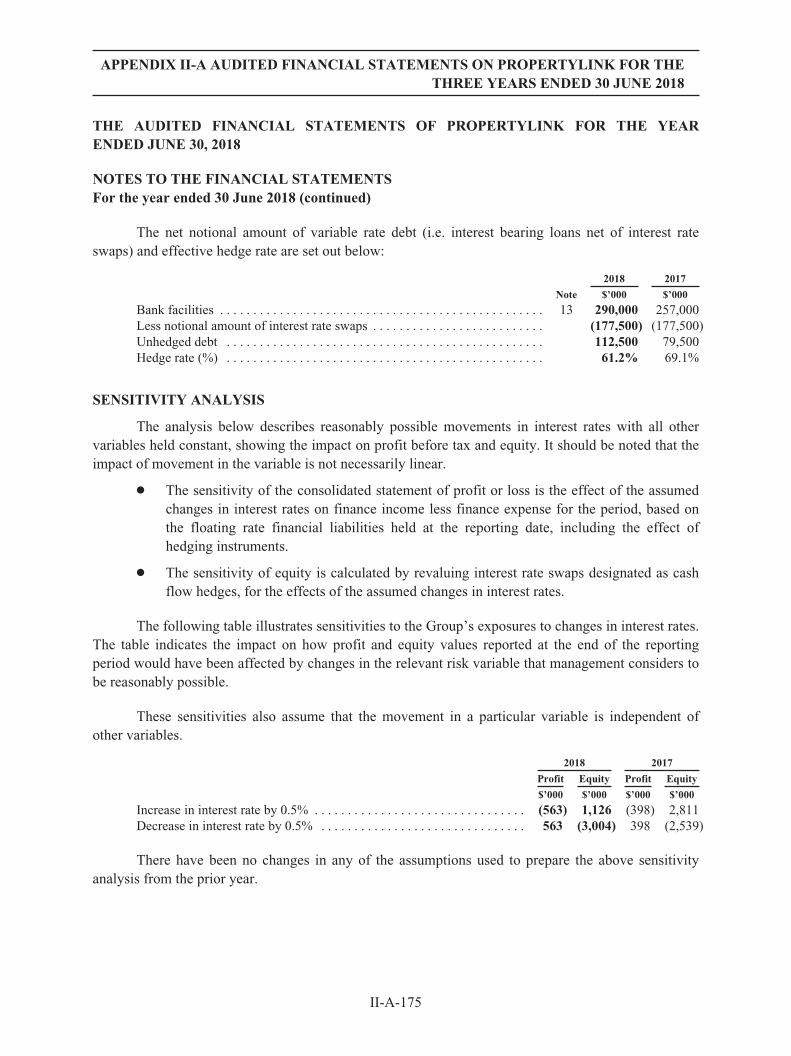
APPENDIX II-A AUDITED FINANCIAL STATEMENTS ON PROPERTYLINK FOR THETHREE YEARS ENDED 30 JUNE 2018
THE AUDITED FINANCIAL STATEMENTS OF PROPERTYLINK FOR THE YEARENDED JUNE 30, 2018
NOTES TO THE FINANCIAL STATEMENTSFor the year ended 30 June 2018 (continued)
The net notional amount of variable rate debt (i.e. interest bearing loans net of interest rateswaps) and effective hedge rate are set out below:
2018 2017
Note $’000 $’000
Bank facilities . . . . . . . . . . . . . . . . . . . . . . . . . . . . . . . . . . . . . . . . . . . . . . . . . 13 290,000 257,000Less notional amount of interest rate swaps . . . . . . . . . . . . . . . . . . . . . . . . . . (177,500) (177,500)Unhedged debt . . . . . . . . . . . . . . . . . . . . . . . . . . . . . . . . . . . . . . . . . . . . . . . . 112,500 79,500Hedge rate (%) . . . . . . . . . . . . . . . . . . . . . . . . . . . . . . . . . . . . . . . . . . . . . . . . 61.2% 69.1%
SENSITIVITY ANALYSIS
The analysis below describes reasonably possible movements in interest rates with all othervariables held constant, showing the impact on profit before tax and equity. It should be noted that theimpact of movement in the variable is not necessarily linear.
Š The sensitivity of the consolidated statement of profit or loss is the effect of the assumedchanges in interest rates on finance income less finance expense for the period, based onthe floating rate financial liabilities held at the reporting date, including the effect ofhedging instruments.
Š The sensitivity of equity is calculated by revaluing interest rate swaps designated as cashflow hedges, for the effects of the assumed changes in interest rates.
The following table illustrates sensitivities to the Group’s exposures to changes in interest rates.The table indicates the impact on how profit and equity values reported at the end of the reportingperiod would have been affected by changes in the relevant risk variable that management considers tobe reasonably possible.
These sensitivities also assume that the movement in a particular variable is independent ofother variables.
2018 2017
Profit Equity Profit Equity
$’000 $’000 $’000 $’000
Increase in interest rate by 0.5% . . . . . . . . . . . . . . . . . . . . . . . . . . . . . . . . (563) 1,126 (398) 2,811Decrease in interest rate by 0.5% . . . . . . . . . . . . . . . . . . . . . . . . . . . . . . . 563 (3,004) 398 (2,539)
There have been no changes in any of the assumptions used to prepare the above sensitivityanalysis from the prior year.
II-A-175

APPENDIX II-A AUDITED FINANCIAL STATEMENTS ON PROPERTYLINK FOR THETHREE YEARS ENDED 30 JUNE 2018
THE AUDITED FINANCIAL STATEMENTS OF PROPERTYLINK FOR THE YEARENDED JUNE 30, 2018
NOTES TO THE FINANCIAL STATEMENTSFor the year ended 30 June 2018 (continued)
(IV) FAIR VALUE
Fair value is the price that would be received to sell an asset or paid to transfer a liability in anorderly transaction between market participants at the measurement date. The fair value measurementis based on the presumption that the transaction to sell the asset or transfer the liability takes placeeither:
Š In the principal market for the asset or liability; or
Š In the absence of a principal market, in the most advantageous market for the asset orliability.
The Group must be able to access the principal or the most advantageous market at themeasurement date. The fair value of an asset or a liability is measured using the assumptions thatmarket participants would use when pricing the asset or liability, assuming that market participants actin their economic best interest.
A fair value measurement of a non-financial asset takes into account a market participant’sability to generate economic benefits by using the asset in its highest and best use or by selling it toanother market participant that would use the asset in its highest and best use.
The Group uses valuation techniques that are appropriate in the circumstances and for whichsufficient data are available to measure fair value, maximising the use of relevant observable inputsand minimising the use of unobservable inputs.
All assets and liabilities, for which fair value is measured or disclosed in the consolidatedfinancial statements are categorised within the fair value hierarchy (described as follows), based on thelowest level input that is significant to the fair value measurement as a whole:
Š Level 1—Quoted (unadjusted) market prices in active markets for identical assets orliabilities
Š Level 2—Valuation techniques for which the lowest level input that is significant to thefair value measurement is directly or indirectly observable
Š Level 3—Valuation techniques for which the lowest level input that is significant to thefair value measurement is unobservable
All financial instruments were measured at Level 2 for the periods presented in this report.
For assets and liabilities that are recognised in the consolidated financial statements at fairvalue on a recurring basis, the Group determines whether transfers have occurred between levels in thehierarchy by re-assessing categorisation (based on the lowest level input that is significant to the fairvalue measurement as a whole) at the end of each reporting period.
II-A-176

APPENDIX II-A AUDITED FINANCIAL STATEMENTS ON PROPERTYLINK FOR THETHREE YEARS ENDED 30 JUNE 2018
THE AUDITED FINANCIAL STATEMENTS OF PROPERTYLINK FOR THE YEARENDED JUNE 30, 2018
NOTES TO THE FINANCIAL STATEMENTSFor the year ended 30 June 2018 (continued)
FAIR VALUE ESTIMATION
The fair values of financial assets and financial liabilities equal their carrying value presented inthe consolidated statement of financial position.
Management has assessed that the fair values of cash and cash equivalents, trade and otherreceivables and trade and other payables approximate their carrying amounts largely due to theshort-term maturities of these instruments. The fair value of the financial assets and liabilities isincluded at the amount of which the instrument could be exchanged in a current transaction betweenwilling parties, other than in a forced or liquidation sale. The following methods and assumptions wereused to estimate the fair values:
Š The valuation techniques applied to fair value of derivatives employ the use of marketobservable inputs and include swap models which use present value calculations. Themodel incorporates various inputs including the credit quality of counterparties andforward rates.
Š Fair values of the Group’s interest-bearing borrowings and loans are determined by usingthe DCF method using a discount rate that reflects the issuer’s borrowing rate including itsown non-performance risk as at 30 June 2018. As at 30 June 2018, the fair value of theGroup’s interest-bearing borrowings and loans is $290m (30 June 2017: $257m).
(C) DERIVATIVE FINANCIAL INSTRUMENTS
A derivative is a type of financial instrument typically used to manage risk. A hedge is where aderivative is used to manage an underlying exposure and the Group uses derivatives, such as interestrate swaps, to hedge its risks associated with interest rates. Derivatives are initially recognised at fairvalue on the date on which a derivative contract is entered into and are subsequently re-measured atfair value with any changes in fair value recognised in the Statement of Comprehensive Income.Derivatives are carried as financial assets when the fair value is positive and as financial liabilitieswhen the fair value is negative.
At inception, the Group can elect to formally designate and document the relationship betweencertain hedge derivative instruments (interest rate swaps) and the associated hedged items (bankborrowings). The Group also documents its assessment, both at hedge inception and on an ongoingbasis, of whether the derivatives that are used in hedging transactions have been and will continue tobe highly effective in offsetting changes in cash flows of hedged items.
Hedges that meet the strict criteria for hedge accounting are accounted for, as described below:
CASH FLOW HEDGES
A cash flow hedge is a hedge of the exposure to variability in cash flows attributable to aparticular risk to a highly probable forecast transaction pertaining to an asset or liability.
II-A-177
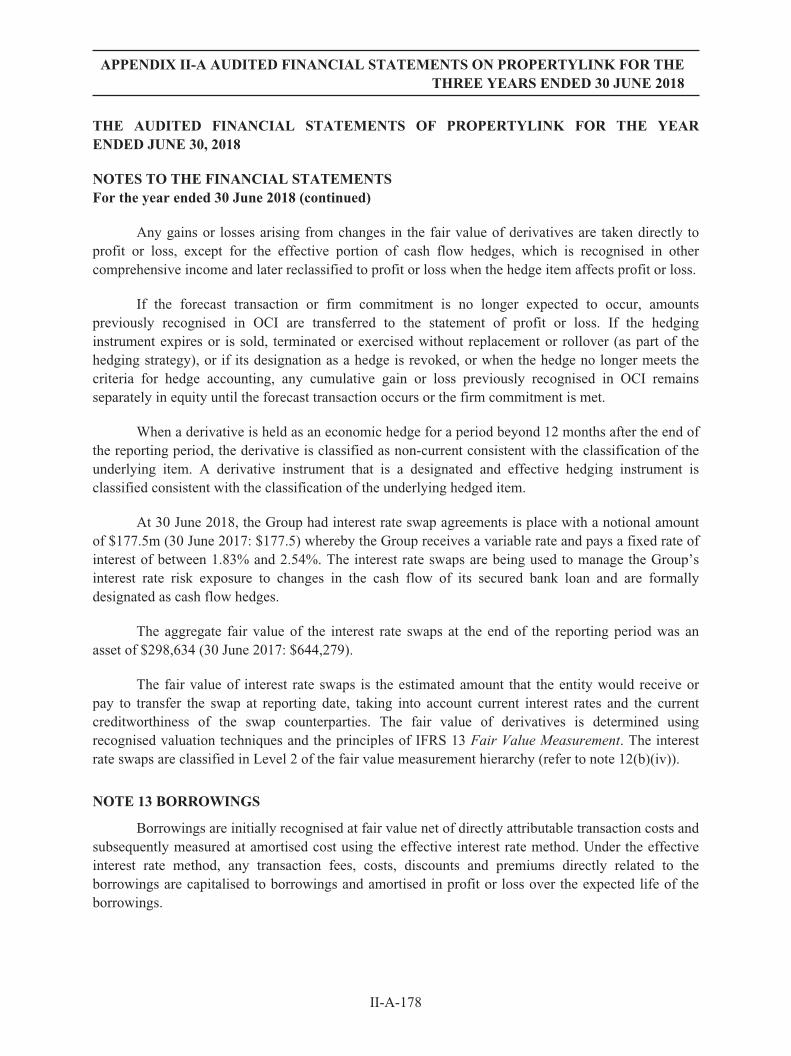
APPENDIX II-A AUDITED FINANCIAL STATEMENTS ON PROPERTYLINK FOR THETHREE YEARS ENDED 30 JUNE 2018
THE AUDITED FINANCIAL STATEMENTS OF PROPERTYLINK FOR THE YEARENDED JUNE 30, 2018
NOTES TO THE FINANCIAL STATEMENTSFor the year ended 30 June 2018 (continued)
Any gains or losses arising from changes in the fair value of derivatives are taken directly toprofit or loss, except for the effective portion of cash flow hedges, which is recognised in othercomprehensive income and later reclassified to profit or loss when the hedge item affects profit or loss.
If the forecast transaction or firm commitment is no longer expected to occur, amountspreviously recognised in OCI are transferred to the statement of profit or loss. If the hedginginstrument expires or is sold, terminated or exercised without replacement or rollover (as part of thehedging strategy), or if its designation as a hedge is revoked, or when the hedge no longer meets thecriteria for hedge accounting, any cumulative gain or loss previously recognised in OCI remainsseparately in equity until the forecast transaction occurs or the firm commitment is met.
When a derivative is held as an economic hedge for a period beyond 12 months after the end ofthe reporting period, the derivative is classified as non-current consistent with the classification of theunderlying item. A derivative instrument that is a designated and effective hedging instrument isclassified consistent with the classification of the underlying hedged item.
At 30 June 2018, the Group had interest rate swap agreements is place with a notional amountof $177.5m (30 June 2017: $177.5) whereby the Group receives a variable rate and pays a fixed rate ofinterest of between 1.83% and 2.54%. The interest rate swaps are being used to manage the Group’sinterest rate risk exposure to changes in the cash flow of its secured bank loan and are formallydesignated as cash flow hedges.
The aggregate fair value of the interest rate swaps at the end of the reporting period was anasset of $298,634 (30 June 2017: $644,279).
The fair value of interest rate swaps is the estimated amount that the entity would receive orpay to transfer the swap at reporting date, taking into account current interest rates and the currentcreditworthiness of the swap counterparties. The fair value of derivatives is determined usingrecognised valuation techniques and the principles of IFRS 13 Fair Value Measurement. The interestrate swaps are classified in Level 2 of the fair value measurement hierarchy (refer to note 12(b)(iv)).
NOTE 13 BORROWINGS
Borrowings are initially recognised at fair value net of directly attributable transaction costs andsubsequently measured at amortised cost using the effective interest rate method. Under the effectiveinterest rate method, any transaction fees, costs, discounts and premiums directly related to theborrowings are capitalised to borrowings and amortised in profit or loss over the expected life of theborrowings.
II-A-178

APPENDIX II-A AUDITED FINANCIAL STATEMENTS ON PROPERTYLINK FOR THETHREE YEARS ENDED 30 JUNE 2018
THE AUDITED FINANCIAL STATEMENTS OF PROPERTYLINK FOR THE YEARENDED JUNE 30, 2018
NOTES TO THE FINANCIAL STATEMENTSFor the year ended 30 June 2018 (continued)
All borrowings with contractual maturities greater than 12 months after reporting date areclassified as non-current liabilities.
2018 2017
$’000 $’000
Non-currentBank loan secured . . . . . . . . . . . . . . . . . . . . . . . . . . . . . . . . . . . . . . . . . . . . . . . . . . . . . 290,000 257,000Borrowing costs . . . . . . . . . . . . . . . . . . . . . . . . . . . . . . . . . . . . . . . . . . . . . . . . . . . . . . (1,343) (1,074)
Total non-current borrowings . . . . . . . . . . . . . . . . . . . . . . . . . . . . . . . . . . . . . . . . . . 288,657 255,926
Total borrowings . . . . . . . . . . . . . . . . . . . . . . . . . . . . . . . . . . . . . . . . . . . . . . . . . . . . . 288,657 255,926
The bank loan is a commercial bill facility and is priced at a margin over 90-day BBSY rate.The facility is secured against the Group’s investment properties and property, plant and equipment,and by guarantees provided to the financier by certain Group entities. The facility is split into twotranches, a $190m facility drawn to $155m expiring on 15 February 2021, and a $150m facility drawnto $135m expiring on 15 February 2023.
The Group has been in compliance with all debt covenants during the year.
Refer to Note 12 for details on the Group’s exposure to risks associated with financialliabilities.
NOTE 14 COMMITMENTS AND CONTINGENCIES
(A) COMMITMENTS
(I) CAPITAL COMMITMENTS
As at 30 June 2018, the Group had agreed contracts with third parties and is consequentlycommitted to future capital expenditure in respect of investment property of $1.1m (30 June 2017:$Nil).
(II) LEASE PAYABLE COMMITMENTS
The determination of whether an arrangement is (or contains) a lease is based on the substanceof the arrangement at the inception of the lease. The arrangement is, or contains, a lease if fulfilment ofthe arrangement is dependent on the use of a specific asset or assets or the arrangement conveys a rightto use the asset or assets, even if that right is not explicitly specified in the arrangement.
A lease is classified at the inception date as a finance lease or an operating lease. Leases that donot transfer substantially all the risks and rewards of ownership of an asset to the Group are classifiedas operating leases. Operating lease payments are recognised as an operating expense in the statementof profit or loss on a straight-line basis over the lease term, except for contingent rental paymentswhich are expensed when they arise.
II-A-179

APPENDIX II-A AUDITED FINANCIAL STATEMENTS ON PROPERTYLINK FOR THETHREE YEARS ENDED 30 JUNE 2018
THE AUDITED FINANCIAL STATEMENTS OF PROPERTYLINK FOR THE YEARENDED JUNE 30, 2018
NOTES TO THE FINANCIAL STATEMENTSFor the year ended 30 June 2018 (continued)
The Group makes non-cancellable ground lease payments on land on which the MelbourneMarkets operate. The ground leases have fixed escalation clauses, and expire on 30 September 2055.The improvements constructed on the leased land are classified as Property, Plant and Equipment. TheGroup also makes lease payments on its office premises. Commitments for minimum lease paymentsin relation to non-cancellable leases are as follows:
2018 2017
$’000 $’000
Within 1 year . . . . . . . . . . . . . . . . . . . . . . . . . . . . . . . . . . . . . . . . . . . . . . . . . . . . . . . . 1,525 1,162After 1 year, but not more than 5 years . . . . . . . . . . . . . . . . . . . . . . . . . . . . . . . . . . . . 9,466 8,979More than 5 years . . . . . . . . . . . . . . . . . . . . . . . . . . . . . . . . . . . . . . . . . . . . . . . . . . . . . 100,169 102,199
111,160 112,340
(III) LEASE RECEIVABLE COMMITMENTS
Leases in which the Group does not transfer substantially all the risks and rewards of ownershipof an asset are classified as operating leases. Initial direct costs incurred in negotiating and arrangingan operating lease are added to the carrying amount of the leased asset and amortised over the leaseterm on the same basis as rental income.
The Group has entered into leases on its property portfolio. Industrial property leases typicallyhave initial lease terms of between 5 and 10 years and include clauses to enable periodic fixed upwardrevision.
Future minimum rentals receivable under non-cancellable operating leases are as follows:
2018 2017
$’000 $’000
Within 1 year . . . . . . . . . . . . . . . . . . . . . . . . . . . . . . . . . . . . . . . . . . . . . . . . . . . . . . . . 52,885 48,216After 1 year, but not more than 5 years . . . . . . . . . . . . . . . . . . . . . . . . . . . . . . . . . . . . 122,752 114,250More than 5 years . . . . . . . . . . . . . . . . . . . . . . . . . . . . . . . . . . . . . . . . . . . . . . . . . . . . . 61,779 32,392
237,416 194,858
(B) CONTINGENCIES
At 30 June 2018 the Group had no contingent assets or liabilities (30 June 2017: $Nil).
NOTE 15 CONTRIBUTED EQUITY
(A) CONTRIBUTED EQUITY OF SHAREHOLDERS OF THE PARENT ENTITY
2018 2017
Note $’000 $’000
Opening balance at the beginning of the year . . . . . . . . . . . . . . . . . . . . . . . . . . . 5,364 40,598Reallocation of capital to other stapled entity’s capital1 . . . . . . . . . . . . . . . . . . . 15(b) — (35,234)
Closing balance at the end of the year . . . . . . . . . . . . . . . . . . . . . . . . . . . . . . . . . 5,364 5,364
II-A-180

APPENDIX II-A AUDITED FINANCIAL STATEMENTS ON PROPERTYLINK FOR THETHREE YEARS ENDED 30 JUNE 2018
THE AUDITED FINANCIAL STATEMENTS OF PROPERTYLINK FOR THE YEARENDED JUNE 30, 2018
NOTES TO THE FINANCIAL STATEMENTSFor the year ended 30 June 2018 (continued)
(B) CONTRIBUTED EQUITY OF UNITHOLDERS OF OTHER STAPLED ENTITIES
2018 2017
Note $’000 $’000
Opening balance at the beginning of the year . . . . . . . . . . . . . . . . . . . . . . . . . 525,206 —Issue of ordinary equity . . . . . . . . . . . . . . . . . . . . . . . . . . . . . . . . . . . . . . . . . . — 497,292Less security issue costs . . . . . . . . . . . . . . . . . . . . . . . . . . . . . . . . . . . . . . . . . (66) (7,320)Reallocation of capital from the parent entity’s capital1 . . . . . . . . . . . . . . . . . 15(a) — 35,234
Closing balance at the end of the year . . . . . . . . . . . . . . . . . . . . . . . . . . . . . . . 525,140 525,206
1 PHL and PT were stapled prior to the IPO in August 2016, however, for Australian Financial Services Licence reasons nocapital was able to be allocated from PHL to PT until Propertylink Investment Management Limited, the Responsible Entity,was granted a retail licence. Capital was reallocated from PHL to PT as part of the IPO restructuring process, and the amountreallocated was determined having regard to a number of factors, including the amount of capital invested by PT.
(C) NUMBER OF SECURITIES ON ISSUE
2018 2017
No. ofsecurities
No. ofsecurities
Opening balance at the beginning of the year . . . . . . . . . . . . . . . . . . . . . . . . 602,780,330 43,808,247Issue of additional equity . . . . . . . . . . . . . . . . . . . . . . . . . . . . . . . . . . . . . . . . — 558,972,083
Closing balance at the end of the year . . . . . . . . . . . . . . . . . . . . . . . . . . . . . . 602,780,330 602,780,330
Each stapled security ranks equally with all other stapled securities for the purposes ofdistributions and on termination of the Group.
Each stapled security entitles the holder to vote in accordance with the provisions of theConstitutions and the Corporations Act 2001.
II-A-181

APPENDIX II-A AUDITED FINANCIAL STATEMENTS ON PROPERTYLINK FOR THETHREE YEARS ENDED 30 JUNE 2018
THE AUDITED FINANCIAL STATEMENTS OF PROPERTYLINK FOR THE YEARENDED JUNE 30, 2018
NOTES TO THE FINANCIAL STATEMENTSFor the year ended 30 June 2018 (continued)
NOTE 16 RESERVES
(A) RESERVES
2018 2017
$’000 $’000
Asset revaluation reserveOpening balance at the beginning of the year . . . . . . . . . . . . . . . . . . . . . . . . . . . . . . . . 9,483 —Changes in the fair value of leasehold buildings . . . . . . . . . . . . . . . . . . . . . . . . . . . . . . 19,258 9,483
Closing balance at the end of the year . . . . . . . . . . . . . . . . . . . . . . . . . . . . . . . . . . . . . . 28,741 9,483
Cash flow hedge reserveOpening balance at the beginning of the year . . . . . . . . . . . . . . . . . . . . . . . . . . . . . . . . 644 —Changes in the fair value of cash flow hedges . . . . . . . . . . . . . . . . . . . . . . . . . . . . . . . (346) 644
Closing balance at the end of the year . . . . . . . . . . . . . . . . . . . . . . . . . . . . . . . . . . . . . . 298 644
Capital reserveOpening balance at the beginning of the year . . . . . . . . . . . . . . . . . . . . . . . . . . . . . . . . (44,643) (20,556)Equity restructure . . . . . . . . . . . . . . . . . . . . . . . . . . . . . . . . . . . . . . . . . . . . . . . . . . . . . — (24,087)
Closing balance at the end of the year . . . . . . . . . . . . . . . . . . . . . . . . . . . . . . . . . . . . . . (44,643) (44,643)
Security-based payments reserveOpening balance at the beginning of the year . . . . . . . . . . . . . . . . . . . . . . . . . . . . . . . . — —Security-based payments expense . . . . . . . . . . . . . . . . . . . . . . . . . . . . . . . . . . . . . . . . . 2,966 —Issue of securities to employees . . . . . . . . . . . . . . . . . . . . . . . . . . . . . . . . . . . . . . . . . . (127) —
Closing balance at the end of the year . . . . . . . . . . . . . . . . . . . . . . . . . . . . . . . . . . . . . . 2,839 —
Treasury securities reserveOpening balance at the beginning of the year . . . . . . . . . . . . . . . . . . . . . . . . . . . . . . . . — —Purchase of securities . . . . . . . . . . . . . . . . . . . . . . . . . . . . . . . . . . . . . . . . . . . . . . . . . . (1,529) —Issue of securities to employees . . . . . . . . . . . . . . . . . . . . . . . . . . . . . . . . . . . . . . . . . . 127 —
Closing balance at the end of the year . . . . . . . . . . . . . . . . . . . . . . . . . . . . . . . . . . . . . . (1,402) —
Total reserves . . . . . . . . . . . . . . . . . . . . . . . . . . . . . . . . . . . . . . . . . . . . . . . . . . . . . . . . (14,167) (34,516)
(B) NATURE AND PURPOSE OF RESERVES
ASSET REVALUATION RESERVE
The asset revaluation reserve is used to record the fair value adjustment arising fromrevaluation of leasehold buildings classified as Property, Plant & Equipment in the Statement ofFinancial Position.
CASH FLOW HEDGE RESERVE
The cash flow hedge reserve is used to record the effective portion of changes in the fair valueof derivatives that are designated as cash flow hedges.
II-A-182

APPENDIX II-A AUDITED FINANCIAL STATEMENTS ON PROPERTYLINK FOR THETHREE YEARS ENDED 30 JUNE 2018
THE AUDITED FINANCIAL STATEMENTS OF PROPERTYLINK FOR THE YEARENDED JUNE 30, 2018
NOTES TO THE FINANCIAL STATEMENTSFor the year ended 30 June 2018 (continued)
CAPITAL RESERVE
The movement in the capital reserve during the 2017 year was the result of a series of equityrestructuring steps required to staple PAIP to PHL and PT to enable the completion of the IPO on15 August 2016.
SECURITY-BASED PAYMENTS RESERVE
The security-based payment reserve is used to recognise the fair value of securities to be issuedunder the Employee Incentive Plan. Refer to Note 19 for further details.
TREASURY SECURITIES RESERVE
The treasury securities reserve is used to record the acquisition of securities purchased to fulfilthe obligations of the Employee Incentive Plan. As at 30 June 2018, the Group held 1,633,933 stapledsecurities (2017: Nil).
NOTE 17 WORKING CAPITAL
(A) CASH AND CASH EQUIVALENTS
Cash and cash equivalents of $17.2m (30 June 2017: $20.0m) comprise cash at bank andshort-term deposits with an original maturity of three months or less, which are subject to aninsignificant risk of changes in value.
(B) TRADE AND OTHER RECEIVABLES
Trade and other receivables include amounts due from customers for goods sold and servicesperformed in the ordinary course of business. Receivables expected to be collected within 12 monthsof the end of the reporting period are classified as current assets. All other receivables are classified asnon-current assets.
Trade and other receivables are initially recognised at fair value and subsequently measured atamortised cost using the effective interest method, less any provision for impairment.
2018 2017
$’000 $’000
Rent receivable . . . . . . . . . . . . . . . . . . . . . . . . . . . . . . . . . . . . . . . . . . . . . . . . . . . . . . . . . . . 1,218 1,074Less: provision for doubtful debts . . . . . . . . . . . . . . . . . . . . . . . . . . . . . . . . . . . . . . . . . . . . (244) (4)
Total rent receivables . . . . . . . . . . . . . . . . . . . . . . . . . . . . . . . . . . . . . . . . . . . . . . . . . . . . . 974 1,070
Fee receivable . . . . . . . . . . . . . . . . . . . . . . . . . . . . . . . . . . . . . . . . . . . . . . . . . . . . . . . . . . . 1,510 1,814Distribution receivable . . . . . . . . . . . . . . . . . . . . . . . . . . . . . . . . . . . . . . . . . . . . . . . . . . . . . 638 471Other receivables . . . . . . . . . . . . . . . . . . . . . . . . . . . . . . . . . . . . . . . . . . . . . . . . . . . . . . . . . 161 873Deposits paid . . . . . . . . . . . . . . . . . . . . . . . . . . . . . . . . . . . . . . . . . . . . . . . . . . . . . . . . . . . . 157 244
Total current trade and other receivables . . . . . . . . . . . . . . . . . . . . . . . . . . . . . . . . . . . . 3,440 4,472
II-A-183

APPENDIX II-A AUDITED FINANCIAL STATEMENTS ON PROPERTYLINK FOR THETHREE YEARS ENDED 30 JUNE 2018
THE AUDITED FINANCIAL STATEMENTS OF PROPERTYLINK FOR THE YEARENDED JUNE 30, 2018
NOTES TO THE FINANCIAL STATEMENTSFor the year ended 30 June 2018 (continued)
(C) TRADE AND OTHER PAYABLES
Trade and other payables represent the liabilities for goods and services received by the Groupthat remain unpaid at the end of the reporting period. The balance is recognised as a current liabilitywith the amounts normally paid within 30 days of recognition of the liability.
2018 2017
$’000 $’000
Trade payables . . . . . . . . . . . . . . . . . . . . . . . . . . . . . . . . . . . . . . . . . . . . . . . . . . . . . . . . . 3,799 2,128Other payables and accrued expenses . . . . . . . . . . . . . . . . . . . . . . . . . . . . . . . . . . . . . . . 13,334 7,031GST payable . . . . . . . . . . . . . . . . . . . . . . . . . . . . . . . . . . . . . . . . . . . . . . . . . . . . . . . . . . . 1,161 1,156Bonds payable . . . . . . . . . . . . . . . . . . . . . . . . . . . . . . . . . . . . . . . . . . . . . . . . . . . . . . . . . 1,014 892
19,308 11,207
OTHER DISCLOSURES
IN THIS SECTION
This section includes other information that must be disclosed to comply with the AccountingStandards, the Corporations Act 2001 or the Corporations Regulations.
NOTE 18 INTANGIBLE ASSETS
Goodwill represents the excess of the cost of an acquisition over the fair value of the Group’sshare of the net identifiable assets of the acquired subsidiary at the date of the acquisition.
2018 2017
$’000 $’000
GoodwillCost . . . . . . . . . . . . . . . . . . . . . . . . . . . . . . . . . . . . . . . . . . . . . . . . . . . . . . . . . . . . . . . . . . . 4,566 4,566Intangible assets net carrying amount . . . . . . . . . . . . . . . . . . . . . . . . . . . . . . . . . . . . . . . . . 4,566 4,566
Goodwill is not subject to amortisation and is tested annually for impairment, or morefrequently if events or changes in circumstances indicate that it might be impaired. An impairment lossis recognised in the Statement of Comprehensive Income for the amount by which the asset’s carryingamount exceeds its recoverable amount.
Management carry out a review of the recoverable amount of its goodwill at least annually.There has been no change in the carrying value of the goodwill as a result of the reviews.
II-A-184

APPENDIX II-A AUDITED FINANCIAL STATEMENTS ON PROPERTYLINK FOR THETHREE YEARS ENDED 30 JUNE 2018
THE AUDITED FINANCIAL STATEMENTS OF PROPERTYLINK FOR THE YEARENDED JUNE 30, 2018
NOTES TO THE FINANCIAL STATEMENTSFor the year ended 30 June 2018 (continued)
NOTE 19 SECURITY-BASED PAYMENTS
2018 2017
$’000 $’000
Staff bonuses1 . . . . . . . . . . . . . . . . . . . . . . . . . . . . . . . . . . . . . . . . . . . . . . . . . . . . . . . . . . . . 1,638 558Directors’ fees2 . . . . . . . . . . . . . . . . . . . . . . . . . . . . . . . . . . . . . . . . . . . . . . . . . . . . . . . . . . . — 260Consulting fees3 . . . . . . . . . . . . . . . . . . . . . . . . . . . . . . . . . . . . . . . . . . . . . . . . . . . . . . . . . . — 223Executive KMP4 . . . . . . . . . . . . . . . . . . . . . . . . . . . . . . . . . . . . . . . . . . . . . . . . . . . . . . . . . . 1,328 842
2,966 1,883
1 The Group has established an Employee Incentive Plan to reward staff for performance over the short and long term. Shortterm incentives are issued by the Plan in the form of Restricted Securities, and long term incentives are issued by the Plan inthe form of Performance Rights.
2 Directors’ fees of $260,000 for year ended 30 June 2017 were paid in the form of fully vested ordinary securities for additionalduties performed in relation to the IPO. These fees are also included in Note 22(a) Key management personnel compensation.
3 Consulting fees of $224,000 for year ended 30 June 2017 to Blue Gum Capital Pty Ltd, an entity associated with AnthonyRyan, were paid in the form of fully vested ordinary securities in relation to advice provided to PHL in the process of preparingfor the IPO. These fees are also included in Note 22(b)(ii) Fees paid to key management personnel’s related parties.
4 Executive KMP have rights to security based payments in certain performance and service related circumstances. For fulldetails of these rights refer to the Remuneration Report.
The Group’s Employee Incentive Plans have awarded grants of Restricted Securities andPerformance Rights to PLG stapled securities to eligible participants. The Short Term Incentive Plan(STI) grants are in the form of Restricted Securities, were for nil consideration, and are subject tosatisfying specific service conditions. The Long Term Incentive Plan (LTI) grants are in the form ofPerformance Rights, were for nil consideration, and are subject to satisfying specific futureperformance and service conditions.
In accordance with AASB 2 Share-based Payments, the year of employment in whichparticipants become eligible for the STI or LTI grants is included in the vesting period over which thefair value of the securities is amortised. The fair value of Restricted Securities and Performance Rightsgranted is recognised as an employee benefit expense, with a corresponding increase in the security-based payment reserve in equity.
SHORT TERM INCENTIVE (STI) PLANS
Eligible participants are usually granted Restricted Securities in August/September forperformance-based services for the preceding financial year. Participants usually must remain inemployment for the vesting period (generally approximately one year after grant) in order for theRestricted Securities to vest. Consequently, the fair value of the Restricted Securities granted isamortised over approximately 26 months.
The number of Restricted Securities granted in respect of the year ended 30 June 2018 was1,679,464 and the fair value of these Restricted Securities is $0.8467 per Restricted Security. The totalsecurity-based STI payment expense recognised during the year ended 30 June 2018 was $2,337,040.
II-A-185
APPENDIX II-A AUDITED FINANCIAL STATEMENTS ON PROPERTYLINK FOR THETHREE YEARS ENDED 30 JUNE 2018
THE AUDITED FINANCIAL STATEMENTS OF PROPERTYLINK FOR THE YEARENDED JUNE 30, 2018
NOTES TO THE FINANCIAL STATEMENTSFor the year ended 30 June 2018 (continued)
LONG TERM INCENTIVE (LTI) PLANS
Eligible participants are granted LTI Performance Rights based on future performance againstagreed key performance indicators, as a percentage of their remuneration mix. Participants generallymust both remain in employment for the vesting period, and meet the performance criteria, in order forthe Performance Rights to vest. Grants of Performance Rights are subject to measurement overapproximately three years, commencing at the start of the year of grant.
Where applicable, the fair value of Performance Rights reflects market vesting conditions. Thetotal expense is recognised over the vesting period, which is the period over which all of the specifiedvesting conditions are to be satisfied. At the end of each period, the Group revises its estimates of thenumber of Performance Rights that are expected to vest based on non-market vesting conditions. Theimpact of the revised estimates, if any, is recognised in profit or loss with a corresponding adjustmentto equity.
The number of performance rights granted in respect of the year ended 30 June 2018 was1,341,414. The weighted average fair value of these performance rights is $0.6342 per performanceright. The total security-based LTI payment expense recognised during the year ended 30 June 2018was $628,960.
KEY ASSUMPTIONS: FAIR VALUE OF PERFORMANCE RIGHTS GRANTED
Judgement is required in determining the fair value of performance rights granted. Fair valuesfor LTI Performance Rights granted during FY18 was independently determined with reference to:
Š the expected life of the rights;
Š the security price at grant date;
Š the expected price volatility of the underlying security;
Š the expected distribution yield; and
Š the risk free interest rate for the term of the rights and expected total securityholder returns(where applicable).
II-A-186

APPENDIX II-A AUDITED FINANCIAL STATEMENTS ON PROPERTYLINK FOR THETHREE YEARS ENDED 30 JUNE 2018
THE AUDITED FINANCIAL STATEMENTS OF PROPERTYLINK FOR THE YEARENDED JUNE 30, 2018
NOTES TO THE FINANCIAL STATEMENTSFor the year ended 30 June 2018 (continued)
NOTE 20 AUDITORS’ REMUNERATION
2018 2017
$’000 $’000
Audit feesKPMG-audit and review of Financial Statements . . . . . . . . . . . . . . . . . . . . . . . . . . . . . . . . . 355 425KPMG-other assurance services . . . . . . . . . . . . . . . . . . . . . . . . . . . . . . . . . . . . . . . . . . . . . . . 50 57PwC Australia-audit and review of Financial Statements . . . . . . . . . . . . . . . . . . . . . . . . . . . — 17
Total audit fees . . . . . . . . . . . . . . . . . . . . . . . . . . . . . . . . . . . . . . . . . . . . . . . . . . . . . . . . . . . 405 499
Transaction and other services feesKPMG-IPO related work . . . . . . . . . . . . . . . . . . . . . . . . . . . . . . . . . . . . . . . . . . . . . . . . . . . . — 450KPMG-Property consultancy services . . . . . . . . . . . . . . . . . . . . . . . . . . . . . . . . . . . . . . . . . . 24 —Bentleys-other . . . . . . . . . . . . . . . . . . . . . . . . . . . . . . . . . . . . . . . . . . . . . . . . . . . . . . . . . . . . . — 5
Total transaction and other services fees . . . . . . . . . . . . . . . . . . . . . . . . . . . . . . . . . . . . . . 24 455
Total audit, transaction and other services fees . . . . . . . . . . . . . . . . . . . . . . . . . . . . . . . . . 429 954
NOTE 21 CASH FLOWS INFORMATION
Reconciliation of net profit to net cash flows from operating activities
2018 2017
$’000 $’000
Profit after income tax . . . . . . . . . . . . . . . . . . . . . . . . . . . . . . . . . . . . . . . . . . . . . . . . . 123,927 77,086Adjustments to reconcile profit before tax to net cash flows
Net fair value gain on investment property . . . . . . . . . . . . . . . . . . . . . . . . . . . . . (57,893) (27,834)Net gain on disposal of investment properties . . . . . . . . . . . . . . . . . . . . . . . . . . . (75) (5,689)Net loss on disposal of investments . . . . . . . . . . . . . . . . . . . . . . . . . . . . . . . . . . . — 438Depreciation and amortisation expense . . . . . . . . . . . . . . . . . . . . . . . . . . . . . . . . 2,851 2,285Amortisation and write off of borrowing costs . . . . . . . . . . . . . . . . . . . . . . . . . . 360 1,873Amortisation of leasing costs . . . . . . . . . . . . . . . . . . . . . . . . . . . . . . . . . . . . . . . . 412 173Straight-lining rental income adjustments . . . . . . . . . . . . . . . . . . . . . . . . . . . . . . (2,379) (1,697)Straight-lining lease expense adjustments . . . . . . . . . . . . . . . . . . . . . . . . . . . . . . 2,149 1,883Security-based payments accrued . . . . . . . . . . . . . . . . . . . . . . . . . . . . . . . . . . . . . 2,966 —Valuation gains on investment in joint ventures . . . . . . . . . . . . . . . . . . . . . . . . . (11,929) (3,829)
(63,538) (32,397)
Changes in assets and liabilities(Increase)/decrease in trade and other receivable . . . . . . . . . . . . . . . . . . . . . . . . . . . . . 1,032 (464)(Increase)/decrease in other assets . . . . . . . . . . . . . . . . . . . . . . . . . . . . . . . . . . . . . . . . (739) (1,546)(Increase)/decrease in deferred tax assets . . . . . . . . . . . . . . . . . . . . . . . . . . . . . . . . . . . 814 (4,435)(Increase)/decrease in trade and other payables . . . . . . . . . . . . . . . . . . . . . . . . . . . . . . 8,102 17Increase/(decrease) in income tax payable . . . . . . . . . . . . . . . . . . . . . . . . . . . . . . . . . . (1,435) 3,383Increase/(decrease) in provisions (excluding provision for dividend) . . . . . . . . . . . . . 150 195
7,924 (2,850)
Net cash flows from operating activities . . . . . . . . . . . . . . . . . . . . . . . . . . . . . . . . . . 68,313 41,839
II-A-187

APPENDIX II-A AUDITED FINANCIAL STATEMENTS ON PROPERTYLINK FOR THETHREE YEARS ENDED 30 JUNE 2018
THE AUDITED FINANCIAL STATEMENTS OF PROPERTYLINK FOR THE YEARENDED JUNE 30, 2018
NOTES TO THE FINANCIAL STATEMENTSFor the year ended 30 June 2018 (continued)
NOTE 22 RELATED PARTIES
(A) KEY MANAGEMENT PERSONNEL
KEY MANAGEMENT PERSONNEL COMPENSATION
2018 2017
$’000 $’000
Short-term benefits . . . . . . . . . . . . . . . . . . . . . . . . . . . . . . . . . . . . . . . . . . . . . . . . . . . . . . . . 3,406 3,234Long-term benefits . . . . . . . . . . . . . . . . . . . . . . . . . . . . . . . . . . . . . . . . . . . . . . . . . . . . . . . . 42 333Post-employment benefits . . . . . . . . . . . . . . . . . . . . . . . . . . . . . . . . . . . . . . . . . . . . . . . . . . 92 114Security-based payments . . . . . . . . . . . . . . . . . . . . . . . . . . . . . . . . . . . . . . . . . . . . . . . . . . . 1,328 1,102
4,868 4,783
EQUITY INSTRUMENTS DISCLOSURES RELATING TO KEY MANAGEMENTPERSONNEL
The relevant interest in PLG stapled securities held during the period by each key managementpersonnel, including their personally related parties, are set out below:
Openingbalance
1-Jul-2017
Netacquisitions/
disposalsPerformance
rights grantedOther
change1
Closingbalance
2018
Directors . . . . . . . . . . . . . . . . . . . . . . 21,856,410 (2,580,219) 596,950 (6,596,195) 13,276,946Other key management personnel . . 739,643 (1,635,649) 413,369 6,385,211 5,902,574
Total . . . . . . . . . . . . . . . . . . . . . . . . 22,596,053 (4,215,868) 1,010,319 (210,984) 19,179,520
1 During FY18 Peter McDonald resigned as a Director but remains as other key management personnel, therefore his securitiesof 6,385,211 have been transferred from Directors to Other key management personnel. Derek Nix resigned as a Directortherefore his securities of 210,984 at the beginning of FY18 have been removed.
There were no loans with key management personnel or their related parties during the yearended 30 June 2018 and 30 June 2017.
(B) TRANSACTIONS WITH RELATED PARTIES
Transactions between related parties are on normal commercial terms and conditions no morefavourable than those available to other parties unless otherwise stated.
II-A-188

APPENDIX II-A AUDITED FINANCIAL STATEMENTS ON PROPERTYLINK FOR THETHREE YEARS ENDED 30 JUNE 2018
THE AUDITED FINANCIAL STATEMENTS OF PROPERTYLINK FOR THE YEARENDED JUNE 30, 2018
NOTES TO THE FINANCIAL STATEMENTSFor the year ended 30 June 2018 (continued)
The following transactions occurred with related parties:
2018 2017
$’000 $’000
i. Fee income from key management personnel’s related partiesProject management fees—Nix Anderson Pty Ltd (associated with Derek Nix)1 . . . . . 5 65Rent received—Blue Gum Capital Pty Ltd (associated with Anthony Ryan) . . . . . . . . 48 55
53 120
ii. Fees paid to key management personnel’s related partiesProject management fees—Nix Anderson Pty Ltd (associated with Derek Nix)1 . . . . . — 57Consulting fees—Blue Gum Capital Pty Ltd (associated with Anthony Ryan)2 . . . . . . — 223
— 280
1 Project management fees received from and paid to Nix Anderson Pty Ltd were for project management services provided onnormal commercial terms and conditions.
2 Consulting fees paid to Blue Gum Capital Pty Ltd for advice to PHL in regard to the IPO. Security-based portion of these feesis also included in Note 19.
II-A-189

APPENDIX II-A AUDITED FINANCIAL STATEMENTS ON PROPERTYLINK FOR THETHREE YEARS ENDED 30 JUNE 2018
THE AUDITED FINANCIAL STATEMENTS OF PROPERTYLINK FOR THE YEARENDED JUNE 30, 2018
NOTES TO THE FINANCIAL STATEMENTSFor the year ended 30 June 2018 (continued)
NOTE 23 PARENT ENTITY DISCLOSURES
The following information represents the standalone financial information for Propertylink(Holdings) Limited.
2018 2017
$’000 $’000
Statement of financial positionAssetsCurrent assets . . . . . . . . . . . . . . . . . . . . . . . . . . . . . . . . . . . . . . . . . . . . . . . . . . . . . . . . 98,530 27,779Non-current assets . . . . . . . . . . . . . . . . . . . . . . . . . . . . . . . . . . . . . . . . . . . . . . . . . . . . 13,308 5,589
Total assets . . . . . . . . . . . . . . . . . . . . . . . . . . . . . . . . . . . . . . . . . . . . . . . . . . . . . . . . . 111,839 33,368
LiabilitiesCurrent liabilities . . . . . . . . . . . . . . . . . . . . . . . . . . . . . . . . . . . . . . . . . . . . . . . . . . . . . 149,876 81,102Non-current liabilities . . . . . . . . . . . . . . . . . . . . . . . . . . . . . . . . . . . . . . . . . . . . . . . . . . 31 31
Total liabilities . . . . . . . . . . . . . . . . . . . . . . . . . . . . . . . . . . . . . . . . . . . . . . . . . . . . . . . 149,907 81,133
Equity/(deficit)Issued capital . . . . . . . . . . . . . . . . . . . . . . . . . . . . . . . . . . . . . . . . . . . . . . . . . . . . . . . . 5,364 5,364Capital reserve . . . . . . . . . . . . . . . . . . . . . . . . . . . . . . . . . . . . . . . . . . . . . . . . . . . . . . . (25,110) (25,110)Retained earnings . . . . . . . . . . . . . . . . . . . . . . . . . . . . . . . . . . . . . . . . . . . . . . . . . . . . . (18,322) (16,596)Dividends provided . . . . . . . . . . . . . . . . . . . . . . . . . . . . . . . . . . . . . . . . . . . . . . . . . . . . — (11,423)
Total equity/(deficit) . . . . . . . . . . . . . . . . . . . . . . . . . . . . . . . . . . . . . . . . . . . . . . . . . . (38,068) (47,765)
2018 2017
$’000 $’000
Statement of profit or loss and other comprehensive incomeProfit/(loss) after income tax . . . . . . . . . . . . . . . . . . . . . . . . . . . . . . . . . . . . . . . . . . . . 9,697 (15,498)
Total comprehensive income/(loss)1 . . . . . . . . . . . . . . . . . . . . . . . . . . . . . . . . . . . . . 9,697 (15,498)
1 Total comprehensive income for the year ended 30 June 2017 includes an expense of $20.0m related to debt forgiveness of partof a loan to PT, and IPO costs of $16.879m.
NOTE 24 EVENTS AFTER THE REPORTING PERIOD
Since the end of the year, the Directors are not aware of any matter or circumstance nototherwise dealt with in the Directors’ Report or the Financial Statements that has significantly or maysignificantly affect the operations of the Group, or state of the Group’s affairs in future financialperiods.
NOTE 25 INTERESTS IN SUBSIDIARIES
The subsidiaries listed below have either share capital consisting solely of ordinary shares orunits in unit trusts, which are held directly by the Group. The proportion of ownership interests heldequals the voting rights held by the Group. Each subsidiary’s principal place of business and country ofincorporation or registration is Australia.
II-A-190

APPENDIX II-A AUDITED FINANCIAL STATEMENTS ON PROPERTYLINK FOR THETHREE YEARS ENDED 30 JUNE 2018
THE AUDITED FINANCIAL STATEMENTS OF PROPERTYLINK FOR THE YEARENDED JUNE 30, 2018
NOTES TO THE FINANCIAL STATEMENTSFor the year ended 30 June 2018 (continued)
Subsidiary financial statements used in the preparation of these consolidated financialstatements have also been prepared as at the same reporting date as the Group’s financial statements.
PARENT ENTITY
Propertylink (Holdings) Ltd (stapled entities—Propertylink Trust and Propertylink AustralianIndustrial Partnership)
SUBSIDIARIES OF PROPERTYLINK(HOLDINGS) LTD
CONTROLLED ENTITIES OFPROPERTYLINK TRUST
2018 2017 2018 2017
% % % %Propertylink Trust . . . . . . . . . . . . 0% 0% PT Moelis Trust . . . . . . . . . . . — 100%
(100% NCI) (100% NCI)Propertylink Office
Partnership Trust . . . . . . . .Propertylink Australian
Industrial Partnership . . . . . . . 0% 0% 100% 100%(100% NCI) (100% NCI) POP 73 Miller Trust . . . . . . . . — 100%
Propertylink Funds ManagementPty Ltd . . . . . . . . . . . . . . . . . .
POP II PT . . . . . . . . . . . . . . . . 100% 100%100% 100% PAIP II PT . . . . . . . . . . . . . . . 100% 100%
Propertylink AdminManagement Pty Ltd . . . . . . .
POP III PT . . . . . . . . . . . . . . . 100% 100%100% 100% PEP PT . . . . . . . . . . . . . . . . . . 100% 100%
Propertylink Capital Pty Ltd . . . . 100% 100% 50 Ann PEP PT . . . . . . . . . . . . 100% 100%Propertylink Services
Management Pty Ltd . . . . . . . 100% 100% PURP PT . . . . . . . . . . . . . . . . . 100% —Propertylink Investment
Management Ltd . . . . . . . . . . . 100% 100%Infralink (Australasia) Pty Ltd . . 100% 100%MITSA Pty Ltd . . . . . . . . . . . . . . 100% 100%Propertylink (Australasia) Pty
Ltd . . . . . . . . . . . . . . . . . . . . . . 100% 100%Propertylink WIM Pty Ltd . . . . . 100% 100%Propertylink PAIP Pty Ltd . . . . . 100% 100%Propertylink Nominees Pty
Ltd . . . . . . . . . . . . . . . . . . . . . . 100% 100%BBR 15 Pty Ltd . . . . . . . . . . . . . 100% 100%PAIP II MA Nominees Pty
Ltd . . . . . . . . . . . . . . . . . . . . . . 100% 100%PAIP II BA Nominees Pty
Ltd . . . . . . . . . . . . . . . . . . . . . . 100% 100%PEP Nominees I Pty Ltd . . . . . . . 100% 100%PEP Nominees II Pty Ltd . . . . . . 100% 100%PEP Nominees III Pty Ltd . . . . . 100% 100%PURP Nominees I Pty Ltd . . . . . 100% —PURP Nominees II Pty Ltd . . . . 100% —PURP PHL Trust . . . . . . . . . . . . 100% —PHL N Orion Road Trust
No 2 . . . . . . . . . . . . . . . . . . . . 100% —Propertylink Employee Incentive
Plan Trust . . . . . . . . . . . . . . . . 100% —
II-A-191

APPENDIX II-A AUDITED FINANCIAL STATEMENTS ON PROPERTYLINK FOR THETHREE YEARS ENDED 30 JUNE 2018
THE AUDITED FINANCIAL STATEMENTS OF PROPERTYLINK FOR THE YEARENDED JUNE 30, 2018
NOTES TO THE FINANCIAL STATEMENTSFor the year ended 30 June 2018 (continued)
CONTROLLED ENTITIES OF PROPERTYLINK AUSTRALIAN INDUSTRIALPARTNERSHIP
2018 2017 2018 2017
% % % %
PHL Hold Trust . . . . . . . . . . . . . . . . . . . .100% 100% PAIP N McCredie Road Trust . . . . . . . — 100%PHL Hold Trust 2 . . . . . . . . . . . . . . . . . . .100% 100% PAIP N Newton Road Trust No 1 . . . .100% 100%PHL NW Trust . . . . . . . . . . . . . . . . . . . . .100% 100% PAIP N Newton Road Trust No 2 . . . .100% 100%PHL V Trust . . . . . . . . . . . . . . . . . . . . . . .100% 100% PAIP N Niangala Close Trust . . . . . . .100% 100%PHL Q Trust . . . . . . . . . . . . . . . . . . . . . . .100% 100% PAIP N Orielton Road Trust . . . . . . . .100% 100%PHL DX Trust . . . . . . . . . . . . . . . . . . . . .100% 100% PAIP N Pike Street Trust No 2 . . . . . . . — 100%PHL MM Trust . . . . . . . . . . . . . . . . . . . . .100% 100% PAIP N Rodborough Road
Trust No 1 . . . . . . . . . . . . . . . . . . . . .100% 100%PHL U Trust . . . . . . . . . . . . . . . . . . . . . . .100% 100%PHL N Pike Street Trust . . . . . . . . . . . . . . — 100% PAIP N Rodborough Road
Trust No 2 . . . . . . . . . . . . . . . . . . . . .100% 100%PHL N Orion Road Trust No 1 . . . . . . . .100% — PAIP N Sylvania Way Trust . . . . . . . . — 100%PAIP N Airds Road Trust . . . . . . . . . . . . .100% 100% PAIP V Cherry Lane Trust . . . . . . . . . .100% 100%PAIP N Beaumont Road Trust No 2 . . . . — 100% PAIP V Lakes Drive Trust . . . . . . . . . .100% 100%PAIP N Beaumont Road Trust No 3 . . . . — 100% PAIP V Main Road Trust . . . . . . . . . . .100% 100%
PAIP V Mt Derrimut Road Trust . . . . .100% 100%PAIP N Beaumont Road Trust No 11 . . . — 100% PAIP V National Boulevard Trust . . . . — 100%
PAIP V Ricketts Road Trust . . . . . . . .100% 100%PAIP N Beaumont Road Trust No 12 . . . — 100% PAIP V Strezlecki Avenue Trust . . . . .100% 100%PAIP N Beaumont Road Trust No 15 . . . — 100% PAIP V Taryn Drive Trust . . . . . . . . . .100% 100%
PAIP V Whiteside Road Trust . . . . . . .100% 100%PAIP N Boundary Road Trust . . . . . . . . .100% 100% PAIP V Woodlands Drive Trust . . . . . .100% 100%PAIP N Brunker Road Trust . . . . . . . . . .100% 100% PAIP WA Leadership Way Trust . . . . .100% 100%PAIP N Gundah Road Trust . . . . . . . . . . .100% 100% PAIP WA McDowell Street Trust . . . .100% 100%PAIP N Mandarin Street Trust . . . . . . . . .100% 100% PAIP N Newton Road Trust No 1 . . . .100% 100%
NOTE 26 COMPANY DETAILS
The registered office of the company is
Level 29, 20 Bond Street
SYDNEY NSW 2000
II-A-192
APPENDIX II-A AUDITED FINANCIAL STATEMENTS ON PROPERTYLINK FOR THETHREE YEARS ENDED 30 JUNE 2018
THE AUDITED FINANCIAL STATEMENTS OF PROPERTYLINK FOR THE YEARENDED JUNE 30, 2018
DIRECTORS’ DECLARATION
In accordance with a resolution of Propertylink (Holdings) Limited, the Directors declare that:
(1) The Financial Statements and notes, as set out on pages 51 to 87 (Note), are in accordancewith the Corporations Act 2001 and:
(a) comply with Australian Accounting Standards, which, as stated in the “About thisReport” section of the Financial Statements, constitutes compliance with InternationalFinancial Reporting Standards (IFRS); and
(b) give a true and fair view of the financial position as at 30 June 2018 and of theperformance for the year ended on that date of the consolidated group.
(2) In the Directors’ opinion there are reasonable grounds to believe that the company will beable to pay its debts as and when they become due and payable.
The Directors have been given the declarations by the Chief Executive Officer and ChiefFinancial Officer as required by Section 295A of the Corporations Act 2001.
Peter Lancken Stuart DawesChairman Managing Director and Chief Executive Officer14 August 2018 14 August 2018
Note:
Page references above refer to the original audited accounts. The equivalent pages in this appendix areII-A-143 to II-A-192.
II-A-193

APPENDIX II-A AUDITED FINANCIAL STATEMENTS ON PROPERTYLINK FOR THETHREE YEARS ENDED 30 JUNE 2018
THE AUDITED FINANCIAL STATEMENTS OF PROPERTYLINK FOR THE YEARENDED JUNE 30, 2018
II-A-194

APPENDIX II-A AUDITED FINANCIAL STATEMENTS ON PROPERTYLINK FOR THETHREE YEARS ENDED 30 JUNE 2018
THE AUDITED FINANCIAL STATEMENTS OF PROPERTYLINK FOR THE YEARENDED JUNE 30, 2018
II-A-195

APPENDIX II-A AUDITED FINANCIAL STATEMENTS ON PROPERTYLINK FOR THETHREE YEARS ENDED 30 JUNE 2018
THE AUDITED FINANCIAL STATEMENTS OF PROPERTYLINK FOR THE YEARENDED JUNE 30, 2018
II-A-196
APPENDIX II-A AUDITED FINANCIAL STATEMENTS ON PROPERTYLINK FOR THETHREE YEARS ENDED 30 JUNE 2018
THE AUDITED FINANCIAL STATEMENTS OF PROPERTYLINK FOR THE YEARENDED JUNE 30, 2018
II-A-197

APPENDIX II-B AUDITED FINANCIAL STATEMENTS ON PROPERTYLINKFOR THE PERIOD FROM 1 JULY 2018 TO 20 MARCH 2019
PROPERTYLINK GROUP CONSOLIDATED STATEMENT OF PROFIT OR LOSS ANDOTHER COMPREHENSIVE INCOMEFOR THE PERIOD ENDED 20 MARCH 2019
1-Jul-2018to 20-Mar-2019
1-Jul-2017to 31-Mar-2018
Note $’000(Unaudited)
$’000
RevenueProperty revenue . . . . . . . . . . . . . . . . . . . . . . . . . . . . . . . . . . . . . . . . . . . 2(b) 46,851 47,563Management fee revenue . . . . . . . . . . . . . . . . . . . . . . . . . . . . . . . . . . . . . 2(c) 11,323 29,280Share of net profit of joint ventures . . . . . . . . . . . . . . . . . . . . . . . . . . . . . 12(b) 15,802 15,949Other income / (expenses)Gain on disposal of investment property . . . . . . . . . . . . . . . . . . . . . . . . . — 75Net fair value gain on investment property . . . . . . . . . . . . . . . . . . . . . . . 9(a) 26,656 28,379Net fair value gain on listed entity investment . . . . . . . . . . . . . . . . . . . . 11 1,430 —Listed entity distributions . . . . . . . . . . . . . . . . . . . . . . . . . . . . . . . . . . . . . 5,947 —Other income . . . . . . . . . . . . . . . . . . . . . . . . . . . . . . . . . . . . . . . . . . . . . . 273 289
Total revenue and other income . . . . . . . . . . . . . . . . . . . . . . . . . . . . . . 108,282 121,535
ExpensesCorporate activity costs . . . . . . . . . . . . . . . . . . . . . . . . . . . . . . . . . . . . . . 4 (16,785) —Property expenses . . . . . . . . . . . . . . . . . . . . . . . . . . . . . . . . . . . . . . . . . . . 3 (9,845) (13,972)Employment and management costs . . . . . . . . . . . . . . . . . . . . . . . . . . . . (7,587) (9,021)Finance costs . . . . . . . . . . . . . . . . . . . . . . . . . . . . . . . . . . . . . . . . . . . . . . 5 (14,245) (7,226)Occupancy costs . . . . . . . . . . . . . . . . . . . . . . . . . . . . . . . . . . . . . . . . . . . . (73) (749)Travel expenses . . . . . . . . . . . . . . . . . . . . . . . . . . . . . . . . . . . . . . . . . . . . (413) (474)Legal and consultancy fees . . . . . . . . . . . . . . . . . . . . . . . . . . . . . . . . . . . (1,067) (556)Depreciation and amortisation expense . . . . . . . . . . . . . . . . . . . . . . . . . . (667) (78)Administration and other expenses . . . . . . . . . . . . . . . . . . . . . . . . . . . . . (2,580) (2,373)
Total expenses . . . . . . . . . . . . . . . . . . . . . . . . . . . . . . . . . . . . . . . . . . . . . (53,262) (34,449)
Profit before income tax . . . . . . . . . . . . . . . . . . . . . . . . . . . . . . . . . . . . 55,020 87,086Tax benefit/(expense) . . . . . . . . . . . . . . . . . . . . . . . . . . . . . . . . . . . . . . . . 6(a) 5,163 (5,142)
Profit after income tax . . . . . . . . . . . . . . . . . . . . . . . . . . . . . . . . . . . . . . 60,183 81,944
Other comprehensive income:Items that may be reclassified to profit or loss:Changes in the fair value of cash flow hedges . . . . . . . . . . . . . . . . . . . . . (1,761) (248)Items that will not be reclassified to profit or loss:Net fair value gain on property, plant and equipment . . . . . . . . . . . . . . . 10(a) — 11,168
Total comprehensive income . . . . . . . . . . . . . . . . . . . . . . . . . . . . . . . . . 58,422 92,864
The above consolidated statement of profit or loss and other comprehensive income should beread in conjunction with the accompanying notes.
II-B-1

APPENDIX II-B AUDITED FINANCIAL STATEMENTS ON PROPERTYLINKFOR THE PERIOD FROM 1 JULY 2018 TO 20 MARCH 2019
PROPERTYLINK GROUP CONSOLIDATED STATEMENT OF PROFIT OR LOSS ANDOTHER COMPREHENSIVE INCOMEFOR THE PERIOD ENDED 20 MARCH 2019
1-Jul-2018to 20-Mar-2019
1-Jul-2017to 31-Mar-2018
Note $’000(Unaudited)
$’000
Profit after income tax attributable to:Shareholders of the parent entity . . . . . . . . . . . . . . . . . . . . . . . . . . . . . . . . (12,255) 12,049Unitholders of other stapled entities (non-controlling interests) . . . . . . . . 72,438 69,895
60,183 81,944
Total comprehensive income attributable to:Shareholders of the parent entity . . . . . . . . . . . . . . . . . . . . . . . . . . . . . . . . (12,255) 12,049Unitholders of other stapled entities (non-controlling interests) . . . . . . . . 70,677 80,815
58,422 92,864
Earnings per share on profit/(loss) attributable to shareholders ofthe parent entity Cents Cents
Basic earnings/(loss) per share . . . . . . . . . . . . . . . . . . . . . . . . . . . . . . . . . . 7 (2.04) 2.00Diluted earnings/(loss) per share . . . . . . . . . . . . . . . . . . . . . . . . . . . . . . . . 7 (2.03) 2.00
Earnings per stapled security on profit attributable to stapledsecurity holders
Basic earnings per security . . . . . . . . . . . . . . . . . . . . . . . . . . . . . . . . . . . . . 7 10.00 13.63Diluted earnings per security . . . . . . . . . . . . . . . . . . . . . . . . . . . . . . . . . . . 7 9.96 13.59
The above consolidated statement of profit or loss and other comprehensive income should beread in conjunction with the accompanying notes.
II-B-2

APPENDIX II-B AUDITED FINANCIAL STATEMENTS ON PROPERTYLINKFOR THE PERIOD FROM 1 JULY 2018 TO 20 MARCH 2019
PROPERTYLINK GROUP CONSOLIDATED STATEMENT OF FINANCIAL POSITIONAS AT 20 MARCH 2019
20-Mar-2019 30-Jun-2018
Note $’000 $’000
ASSETSCURRENT ASSETSCash and cash equivalents . . . . . . . . . . . . . . . . . . . . . . . . . . . . . . . . . . . . . . . . . . 17(a) 10,161 17,233Trade and other receivables . . . . . . . . . . . . . . . . . . . . . . . . . . . . . . . . . . . . . . . . . 17(b) 5,270 3,440Prepayments . . . . . . . . . . . . . . . . . . . . . . . . . . . . . . . . . . . . . . . . . . . . . . . . . . . . . 3,073 2,448Current tax assets . . . . . . . . . . . . . . . . . . . . . . . . . . . . . . . . . . . . . . . . . . . . . . . . . 3,540 —
TOTAL CURRENT ASSETS . . . . . . . . . . . . . . . . . . . . . . . . . . . . . . . . . . . . . . 22,044 23,121
NON-CURRENT ASSETSEquity accounted investments . . . . . . . . . . . . . . . . . . . . . . . . . . . . . . . . . . . . . . . 12(b) 101,842 100,855Investment properties . . . . . . . . . . . . . . . . . . . . . . . . . . . . . . . . . . . . . . . . . . . . . . 9(a) 859,015 696,200Property, plant and equipment . . . . . . . . . . . . . . . . . . . . . . . . . . . . . . . . . . . . . . . 10(a) 3,068 113,112Investment in listed entity . . . . . . . . . . . . . . . . . . . . . . . . . . . . . . . . . . . . . . . . . . 11 135,679 —Derivative financial instruments . . . . . . . . . . . . . . . . . . . . . . . . . . . . . . . . . . . . . — 299Deferred tax assets . . . . . . . . . . . . . . . . . . . . . . . . . . . . . . . . . . . . . . . . . . . . . . . . 6(b) 6,848 4,408Intangible assets . . . . . . . . . . . . . . . . . . . . . . . . . . . . . . . . . . . . . . . . . . . . . . . . . . 18 4,604 4,566
TOTAL NON-CURRENT ASSETS . . . . . . . . . . . . . . . . . . . . . . . . . . . . . . . . . 1,111,056 919,440
TOTAL ASSETS . . . . . . . . . . . . . . . . . . . . . . . . . . . . . . . . . . . . . . . . . . . . . . . . 1,133,100 942,561
LIABILITIESCURRENT LIABILITIESTrade and other payables . . . . . . . . . . . . . . . . . . . . . . . . . . . . . . . . . . . . . . . . . . . 17(c) 21,944 19,308Lease liability . . . . . . . . . . . . . . . . . . . . . . . . . . . . . . . . . . . . . . . . . . . . . . . . . . . . 14 2,042 —Current tax liabilities . . . . . . . . . . . . . . . . . . . . . . . . . . . . . . . . . . . . . . . . . . . . . . — 2,358Employee benefits . . . . . . . . . . . . . . . . . . . . . . . . . . . . . . . . . . . . . . . . . . . . . . . . 382 543
TOTAL CURRENT LIABILITIES . . . . . . . . . . . . . . . . . . . . . . . . . . . . . . . . . 24,368 22,209
NON-CURRENT LIABILITIESDerivative financial instruments . . . . . . . . . . . . . . . . . . . . . . . . . . . . . . . . . . . . . 1,323 —Lease liability . . . . . . . . . . . . . . . . . . . . . . . . . . . . . . . . . . . . . . . . . . . . . . . . . . . . 14 15,749 —Employee benefits . . . . . . . . . . . . . . . . . . . . . . . . . . . . . . . . . . . . . . . . . . . . . . . . 430 357Borrowings . . . . . . . . . . . . . . . . . . . . . . . . . . . . . . . . . . . . . . . . . . . . . . . . . . . . . . 13 449,000 288,657
TOTAL NON-CURRENT LIABILITIES . . . . . . . . . . . . . . . . . . . . . . . . . . . . 466,502 289,014
TOTAL LIABILITIES . . . . . . . . . . . . . . . . . . . . . . . . . . . . . . . . . . . . . . . . . . . 490,870 311,223
NET ASSETS . . . . . . . . . . . . . . . . . . . . . . . . . . . . . . . . . . . . . . . . . . . . . . . . . . . 642,230 631,338
The above consolidated statement of financial position should be read in conjunction with theaccompanying notes.
II-B-3

APPENDIX II-B AUDITED FINANCIAL STATEMENTS ON PROPERTYLINKFOR THE PERIOD FROM 1 JULY 2018 TO 20 MARCH 2019
PROPERTYLINK GROUP CONSOLIDATED STATEMENT OF FINANCIAL POSITIONAS AT 20 MARCH 2019
20-Mar-2019 30-Jun-2018
Note $’000 $’000
EQUITYEquity attributable to shareholders of the parent entityIssued capital . . . . . . . . . . . . . . . . . . . . . . . . . . . . . . . . . . . . . . . . . . . . . . . . . . . . 16(a) 65,642 5,364Reserves . . . . . . . . . . . . . . . . . . . . . . . . . . . . . . . . . . . . . . . . . . . . . . . . . . . . . . . . (27,200) (23,673)Retained earnings / (accumulated losses) . . . . . . . . . . . . . . . . . . . . . . . . . . . . . . (28,007) (15,752)
Parent entity shareholders’ interest . . . . . . . . . . . . . . . . . . . . . . . . . . . . . . . . . 10,435 (34,061)
Equity attributable to unitholders of other stapled entitiesIssued capital . . . . . . . . . . . . . . . . . . . . . . . . . . . . . . . . . . . . . . . . . . . . . . . . . . . . 16(b) 464,862 525,140Reserves . . . . . . . . . . . . . . . . . . . . . . . . . . . . . . . . . . . . . . . . . . . . . . . . . . . . . . . . 7,745 9,506Retained earnings / (accumulated losses) . . . . . . . . . . . . . . . . . . . . . . . . . . . . . . 159,188 130,753
Other stapled unitholders’ interest . . . . . . . . . . . . . . . . . . . . . . . . . . . . . . . . . 631,795 665,399
TOTAL EQUITY . . . . . . . . . . . . . . . . . . . . . . . . . . . . . . . . . . . . . . . . . . . . . . . . 642,230 631,338
The above consolidated statement of financial position should be read in conjunction with theaccompanying notes.
II-B-4

APPENDIX II-B AUDITED FINANCIAL STATEMENTS ON PROPERTYLINKFOR THE PERIOD FROM 1 JULY 2018 TO 20 MARCH 2019
PROPERTYLIN
KGROUPCONSO
LID
ATED
STATEM
ENT
OFCHANGESIN
EQUIT
YFOR
THE
PERIO
DENDED
20M
ARCH
2019
Attribu
tableto
shar
eholde
rsof
thepa
rent
entity
Attribu
tableto
unitho
lder
sof
othe
rstap
leden
tities
Con
tribut
edeq
uity
Reser
ves
Retaine
dea
rnings
(acc
umulated
losses)
Total
Con
tribut
edeq
uity
Reser
ves
Retaine
dea
rnings
(acc
umulated
losses)
Total
Total
equity
Note
$’00
0$’00
0$’00
0$’00
0$’00
0$’00
0$’00
0$’00
0$’00
0
Balan
ceat
1Ju
ly20
17..
....
....
....
....
....
....
....
...
5,36
4(25,11
0)(26,92
7)(46,67
3)52
5,20
6(9,406
)61
,518
577,31
853
0,64
5Com
preh
ensive
inco
meforthepe
riod
....
....
....
....
....
.—
—12
,049
12,049
—10
,920
69,895
80,815
92,864
Sec
uritiesissu
eco
sts..
....
....
....
....
....
....
....
....
.16
(b)
——
——
(66)
——
(66)
(66)
Purch
aseof
secu
rities,n
etof
tran
sactionco
sts..
....
....
....
.—
(1,529
)—
(1,529
)—
——
—(1,529
)Sec
urity-ba
sedpa
ymen
tsex
pens
e..
....
....
....
....
....
...
—2,22
5—
2,22
5—
——
—2,22
5Dividen
dsan
ddistribu
tion
spa
idor
prov
ided
for..
....
....
...
8—
——
——
—(43,51
7)(43,51
7)(43,51
7)
Balan
ceat
31M
arch
2018
(una
udited
)..
....
....
....
....
.5,36
4(24,41
4)(14,87
8)(33,92
8)52
5,14
01,51
487
,896
614,55
058
0,62
2
Balan
ceat
1Ju
ly20
18..
....
....
....
....
....
....
....
...
5,36
4(23,67
3)(15,75
2)(34,06
1)52
5,14
09,50
613
0,75
366
5,39
963
1,33
8Com
preh
ensive
inco
meforthepe
riod
....
....
....
....
....
.—
—(12,25
5)(12,25
5)—
(1,761
)72
,438
70,677
58,422
Cap
ital
realloca
tion
....
....
....
....
....
....
....
....
....
1660
,278
——
60,278
(60,27
8)—
—(60,27
8)—
Purch
aseof
secu
rities,n
etof
tran
sactionco
sts..
....
....
....
.—
(2,471
)—
(2,471
)—
——
—(2,471
)Net
effect
ofsecu
rity-based
paym
ents
....
....
....
....
....
.—
(1,056
)—
(1,056
)—
——
—(1,056
)Dividen
dsan
ddistribu
tion
spa
idor
prov
ided
for..
....
....
...
8—
——
——
—(44,00
3)(44,00
3)(44,00
3)
Balan
ceat
20M
arch
2019
....
....
....
....
....
....
....
.65
,642
(27,20
0)(28,00
7)10
,435
464,86
27,74
515
9,18
863
1,79
564
2,23
0
The
abov
eco
nsolidated
statem
ento
fch
ange
sin
equity
shou
ldbe
read
inco
njun
ctionwiththeacco
mpa
nyingno
tes.
II-B-5
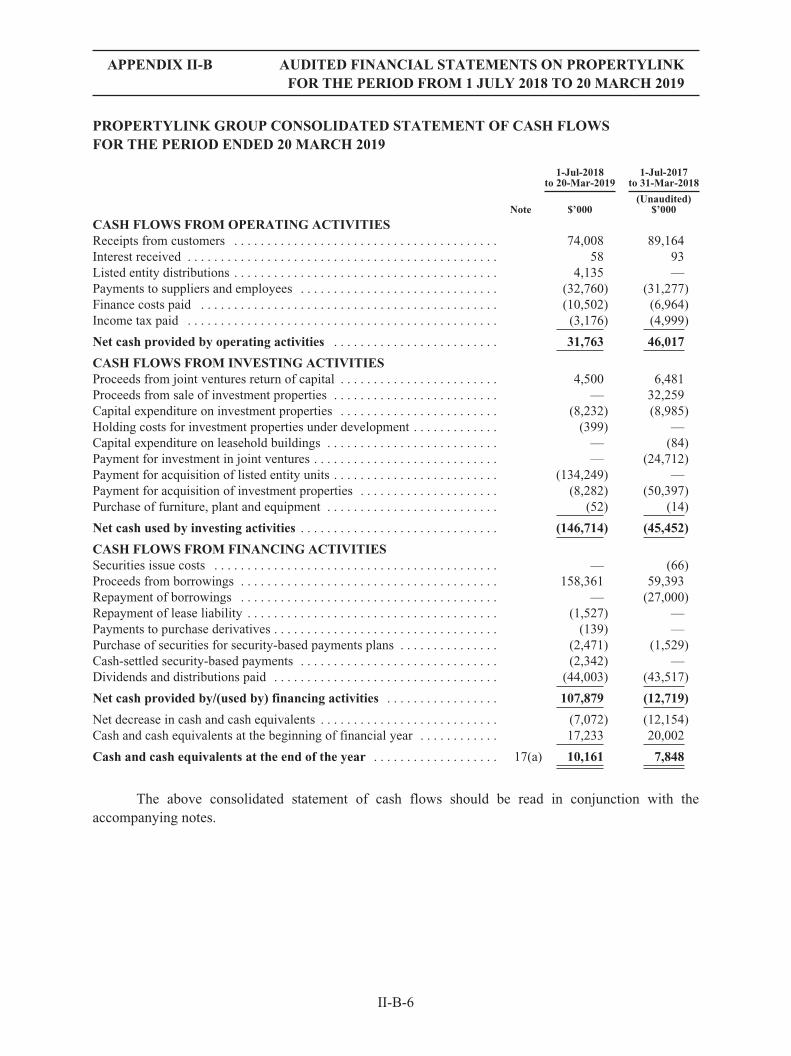
APPENDIX II-B AUDITED FINANCIAL STATEMENTS ON PROPERTYLINKFOR THE PERIOD FROM 1 JULY 2018 TO 20 MARCH 2019
PROPERTYLINK GROUP CONSOLIDATED STATEMENT OF CASH FLOWSFOR THE PERIOD ENDED 20 MARCH 2019
1-Jul-2018to 20-Mar-2019
1-Jul-2017to 31-Mar-2018
(Unaudited)Note $’000 $’000
CASH FLOWS FROM OPERATING ACTIVITIESReceipts from customers . . . . . . . . . . . . . . . . . . . . . . . . . . . . . . . . . . . . . . . . 74,008 89,164Interest received . . . . . . . . . . . . . . . . . . . . . . . . . . . . . . . . . . . . . . . . . . . . . . . 58 93Listed entity distributions . . . . . . . . . . . . . . . . . . . . . . . . . . . . . . . . . . . . . . . . 4,135 —Payments to suppliers and employees . . . . . . . . . . . . . . . . . . . . . . . . . . . . . . (32,760) (31,277)Finance costs paid . . . . . . . . . . . . . . . . . . . . . . . . . . . . . . . . . . . . . . . . . . . . . (10,502) (6,964)Income tax paid . . . . . . . . . . . . . . . . . . . . . . . . . . . . . . . . . . . . . . . . . . . . . . . (3,176) (4,999)
Net cash provided by operating activities . . . . . . . . . . . . . . . . . . . . . . . . . 31,763 46,017
CASH FLOWS FROM INVESTING ACTIVITIESProceeds from joint ventures return of capital . . . . . . . . . . . . . . . . . . . . . . . . 4,500 6,481Proceeds from sale of investment properties . . . . . . . . . . . . . . . . . . . . . . . . . — 32,259Capital expenditure on investment properties . . . . . . . . . . . . . . . . . . . . . . . . (8,232) (8,985)Holding costs for investment properties under development . . . . . . . . . . . . . (399) —Capital expenditure on leasehold buildings . . . . . . . . . . . . . . . . . . . . . . . . . . — (84)Payment for investment in joint ventures . . . . . . . . . . . . . . . . . . . . . . . . . . . . — (24,712)Payment for acquisition of listed entity units . . . . . . . . . . . . . . . . . . . . . . . . . (134,249) —Payment for acquisition of investment properties . . . . . . . . . . . . . . . . . . . . . (8,282) (50,397)Purchase of furniture, plant and equipment . . . . . . . . . . . . . . . . . . . . . . . . . . (52) (14)
Net cash used by investing activities . . . . . . . . . . . . . . . . . . . . . . . . . . . . . . (146,714) (45,452)
CASH FLOWS FROM FINANCING ACTIVITIESSecurities issue costs . . . . . . . . . . . . . . . . . . . . . . . . . . . . . . . . . . . . . . . . . . . — (66)Proceeds from borrowings . . . . . . . . . . . . . . . . . . . . . . . . . . . . . . . . . . . . . . . 158,361 59,393Repayment of borrowings . . . . . . . . . . . . . . . . . . . . . . . . . . . . . . . . . . . . . . . — (27,000)Repayment of lease liability . . . . . . . . . . . . . . . . . . . . . . . . . . . . . . . . . . . . . . (1,527) —Payments to purchase derivatives . . . . . . . . . . . . . . . . . . . . . . . . . . . . . . . . . . (139) —Purchase of securities for security-based payments plans . . . . . . . . . . . . . . . (2,471) (1,529)Cash-settled security-based payments . . . . . . . . . . . . . . . . . . . . . . . . . . . . . . (2,342) —Dividends and distributions paid . . . . . . . . . . . . . . . . . . . . . . . . . . . . . . . . . . (44,003) (43,517)
Net cash provided by/(used by) financing activities . . . . . . . . . . . . . . . . . 107,879 (12,719)
Net decrease in cash and cash equivalents . . . . . . . . . . . . . . . . . . . . . . . . . . . (7,072) (12,154)Cash and cash equivalents at the beginning of financial year . . . . . . . . . . . . 17,233 20,002
Cash and cash equivalents at the end of the year . . . . . . . . . . . . . . . . . . . 17(a) 10,161 7,848
The above consolidated statement of cash flows should be read in conjunction with theaccompanying notes.
II-B-6

APPENDIX II-B AUDITED FINANCIAL STATEMENTS ON PROPERTYLINKFOR THE PERIOD FROM 1 JULY 2018 TO 20 MARCH 2019
PROPERTYLINK GROUPABOUT THIS REPORT
In this section
This section sets out the basis upon which the Group’s Financial Statements are prepared.
Specific accounting policies are described in their respective notes to the Financial Statements.This section also shows information on new or amended accounting standards and their impact on thefinancial position and performance of the Group.
(a) Basis of preparation
Propertylink Group stapled securities were quoted on the Australian Securities Exchange underthe “PLG” code and comprise one share in Propertylink (Holdings) Limited (PHL) and one unit in eachof Propertylink Australian Industrial Partnership (PAIP) and Propertylink Trust (PT). In accordancewith International Financial Reporting Standards, the entities within the Group must be consolidatedfor financial reporting purposes. The parent entity and deemed acquirer of PAIP and PT is PHL. ThisInterim Financial Report (the “interim report”) therefore represents the consolidated results of PHL,and include PHL and its controlled entities, PAIP and its controlled entities and PT and its controlledentities (together the “Group”). Equity attributable to PAIP and PT form a non-controlling interest. Theamount of non-controlling interest attributable to stapled securityholders is disclosed in the Statementof Financial Position.
On 20 March 2019 ESR Real Estate (Australia) Pty Ltd (ESR) acquired 98% of PropertylinkGroup stapled securities, and was entitled to compulsorily acquire the balance of the stapled securities.Subsequently ESR completed the compulsory acquisition and the Group was delisted from the ASX on26 April 2019. These Financial Statements cover the period of 1 July 2018 to 20 March 2019, thedeemed date of acquisition of Propertylink by ESR.
The comparative figures in the Statement of Profit or Loss and Other Comprehensive Income,Statement of Changes in Equity and the Statement of Cash Flows, and relevant notes thereto, are forthe 9 months ended 31 March 2018 (being the closest comparable month end reporting date) and areunaudited. The difference in days between the period ended 1 July 2018 to 20 March 2019 for thecurrent period compared to 1 July 2017 to 31 March 2018 has no material impact to the comparabilityof the periods. The comparative figures in the Consolidated Statement of Financial Position, andrelevant notes thereto, are as at 30 June 2018 and were audited by the former auditors of thePropertylink Group.
The financial report was authorised for issue by directors on October 22, 2019.
The interim report has been prepared in accordance with the requirements of AASB 134 InterimFinancial Reporting (AASB 134) issued by the Australian Accounting Standards Board (“AASB”) andalso complies with IAS 34 Interim Financial Reporting issued by the International Accounting StandardsBoard (“IASB”). The interim report complies with the recognition and measurement criteria of AustralianAccounting Standards and other authoritative pronouncements issued by the AASB, which also complieswith the recognition and measurement criteria of International Financial Reporting Standards issued by theIASB. This interim report does not include all the information and disclosures required in annual financialstatements and should be read in conjunction with the Group’s annual consolidated financial report as at30 June 2018. The report has been prepared to comply with the requirements of the Hong Kong StockExchange for inclusion in the prospectus of ESR Cayman Ltd dated October 22, 2019.
II-B-7

APPENDIX II-B AUDITED FINANCIAL STATEMENTS ON PROPERTYLINKFOR THE PERIOD FROM 1 JULY 2018 TO 20 MARCH 2019
PROPERTYLINK GROUPABOUT THIS REPORT (continued)
The Group is a for-profit entity for financial reporting purposes under International FinancialReporting Standards.
Amounts in this interim report have been presented in Australian dollars and rounded off to thenearest thousand dollars, unless otherwise indicated.
The interim report except for cash flow information, have been prepared on an accruals basisand are based on historical costs, modified, where applicable, by the measurement at fair value ofselected non-current assets, financial assets and financial liabilities. Refer to the specific accountingpolicies within the notes to the interim report for the basis of valuation of assets and liabilitiesmeasured at fair value.
The interim report is prepared on a going concern basis, which assumes continuity of normalbusiness activities and the realisation of assets and settlement of liabilities in the ordinary course ofbusiness. Under their respective constitutions, PT, PHL and PAIP are entitled to have regard to theinterests of all members of the stapled group.
The accounting policies adopted are consistent with those of the previous financial year andcorresponding interim reporting period, unless otherwise stated.
Critical accounting judgements, estimates and assumptions
The preparation of the Group’s consolidated financial statements may require management tomake judgements, estimates and assumptions that affect the reported amounts of revenues, expenses,assets and liabilities, and the accompanying disclosures. Uncertainty about these assumptions andestimates could result in outcomes that require a material adjustment to the carrying amount of theassets or liabilities affected in future periods. The estimates and associated assumptions are based onhistorical experience and various other factors that are believed to be reasonable under thecircumstances. Judgements and estimates which are material to the financial report are discussed in thefollowing notes:
Š Investment properties Note 9
Š Leasehold buildings Note 9, 10
Š Derivative financial instruments
(b) Principles of consolidation
The consolidated Financial Statements incorporate all of the assets, liabilities and results ofPropertylink Group and its subsidiaries.
(i) Controlled entities
Subsidiaries are all entities over which the Group has control. The Group controls an entitywhen it is exposed to, or has rights to, variable returns from its involvement with the entity and has theability to affect those returns through its power over the entity. A list of the subsidiaries is provided inNote 23. The assets, liabilities and results of all subsidiaries are fully consolidated into the financial
II-B-8
APPENDIX II-B AUDITED FINANCIAL STATEMENTS ON PROPERTYLINKFOR THE PERIOD FROM 1 JULY 2018 TO 20 MARCH 2019
PROPERTYLINK GROUPABOUT THIS REPORT (continued)
statements of the Group from the date on which control is obtained by the Group. The consolidation ofa subsidiary is discontinued from the date that control ceases. Inter-company transactions, balances andunrealised gains or losses on transactions between Group entities are fully eliminated on consolidation.Accounting policies of subsidiaries have been changed and adjustments made where necessary toensure uniformity of the accounting policies adopted by the Group.
(ii) Joint arrangements
Investments in joint arrangements are classified as joint ventures based on the contractual rightsand obligations each investor has, rather than the legal structure of the joint arrangement.
Joint ventures
Investments in joint ventures are accounted for using the equity method. Under this method, theinvestment is initially recognised at cost (including transaction costs) and adjusted thereafter for thepost-acquisition change in the Group’s share of net assets of the joint venture. In addition, the Group’sshare of the profit or loss of the joint venture is included in the Group’s profit or loss.
When the Group’s share of losses in a joint venture equals or exceeds its interest in the jointventure, the Group discontinues recognising its share of further losses unless it has incurred legal orconstructive obligations or made payments on behalf of the joint venture. Upon the joint venturesubsequently making profits, the Group will resume recognising its share of those profits once its shareof the profits equals the share of the losses not recognised.
(c) New Accounting Standards applied in current period
Certain new accounting standards and interpretations are mandatory for the periods starting1 July 2018.
AASB 9 Financial Instruments (effective application for the Group is 1 July 2018).
AASB 9 Financial Instruments addresses the classification, measurement and recognition offinancial assets, financial liabilities and hedging.
The Group has applied AASB 9 hedge accounting requirements to its cash flow hedges.
ECL is calculated based on the simplified approach for trade and lease receivables (refer toNote 17(b)).
This standard did not have a material impact on the Group’s Financial Statements onapplication.
AASB 15: Revenue from Contracts with Customers (effective application for the Group is 1 July2018).
AASB 15 Revenue from Contracts with Customers provides a new five step model forrecognising revenue earned from a contract with a customer. This standard did not have an impact onthe Group’s Financial Statements on application.
II-B-9

APPENDIX II-B AUDITED FINANCIAL STATEMENTS ON PROPERTYLINKFOR THE PERIOD FROM 1 JULY 2018 TO 20 MARCH 2019
PROPERTYLINK GROUPABOUT THIS REPORT (continued)
Certain new accounting standards and interpretations have been published that are notmandatory for the financial period starting 1 July 2018 but are available for early adoption. The Grouphave early adopted the following standards in these Financial Statements:
AASB 16: Leases (effective application for the Group is 1 July 2018).
AASB 16 Leases provides a new model for accounting for leases. The standard becomesmandatory for the June 2020 financial year. Early adoption is permitted under certain circumstances.Subsequent to ESR’s acquisition of the Group, the Group was asked to early adopt AASB 16 from1 July 2018 so as to align accounting treatment with ESR policies, as ESR adopted AASB 16 for otherAustralian entities on 1 January 2019.
The Group applied AASB 16 using the modified retrospective approach, under which thecumulative effect of initial application is recognised in retained earnings at 1 July 2018. On transitionto AASB 16, the Group elected to apply the practical expedient to grandfather the assessment of whichtransactions are leases. It applied AASB 16 only to contracts that were previously identified as leases.Contracts that were not identified as leases under IAS 17 and IFRIC 4 were not reassessed for whetherthere is a lease. Therefore, the definition of a lease under AASB 16 was applied only to contractsentered into or changed on or after 1 July 2018.
As a lessee
As a lessee, the Group previously classified leases as operating or finance leases based on itsassessment of whether the lease transferred significantly all of the risks and rewards incidental toownership of the underlying asset to the Group. Under AASB 16, the Group recognises right-of-useassets and lease liabilities for its operating leases – i.e. these leases are on-balance sheet.
At transition, the ROU asset related to the Melbourne Markets ground lease is measured at fairvalue at 1 July 2018 and accounted for as investment property using the fair value model in IAS 40from 1 July 2018. For the remaining ROU assets, the Group has elected for them to be measured at anamount equal to the lease liability, adjusted by the amount of any prepaid or accrued lease payments.
There is no material impact on retained earnings as a result of the adoption of AASB 16.
As a lessor
The Group is not required to make any adjustments on transition to AASB 16 for leases inwhich it acts as a lessor, except for a sub-lease. The accounting for lessors under AASB 16 hasremained substantially unchanged.
Under AASB 16, the Group is required to assess the classification of a sub-lease with referenceto the right-of-use asset, not the underlying asset. At transition, the Melbourne Markets warehousesthat were classified as property, plant and equipment and measured under the fair value model wasreclassified to investment properties. This resulted in a decrease in property, plant and equipment andan increase in investment properties of $112.75m. The property, now classified as investment
II-B-10

APPENDIX II-B AUDITED FINANCIAL STATEMENTS ON PROPERTYLINKFOR THE PERIOD FROM 1 JULY 2018 TO 20 MARCH 2019
PROPERTYLINK GROUPABOUT THIS REPORT (continued)
properties, continues to be measured under the fair value model, with fair value movements recognisedin profit or loss. There is no impact to retained earnings.
The Group applied AASB 15 Revenue from Contracts with Customers to allocate considerationin the contract to each lease and non-lease component.
As a result of early adoption of AASB 16, the Group:
Š Recognised “right of use” lease asset and lease obligation liability of $17.5m in theStatement of Financial Position for its operating lease commitments; and
Š Recognised in the Statement of Profit or Loss and Other Comprehensive Income, theamortisation of the “right of use” asset of $0.6m and the finance expense associated withthe lease liability of $1.8m.
Š reclassified Melbourne Markets warehouses with carrying amount of $112.75m fromproperty, plant and equipment to investment properties
(d) Notes to the financial statements
The notes include information which is required to understand the financial statements and ismaterial and relevant to the operations, financial position and performance of the Group. Information isconsidered material and relevant if, for example:
Š the amount in question is significant because of its size or nature;
Š it is important in understanding the results of the Group;
Š it helps to explain the impact of significant changes in the Group’s business;
Š it relates to an aspect of the Group’s operations that is important to its future performance.
The notes are organised into the following sections:
Group performance Property portfolio assets
Capital and financial riskmanagement and working
capital Other disclosures
1. Operating segments 9. Investment properties 13. Borrowings 18. Intangible assets2. Revenue 10. Property, plant &
equipment14. Lease liability 19. Security-based
payments3. Property expenses 11. Investment in listed
entity15. Commitments
andcontingencies
20. Related parties
4. Corporate activity costs 12. Equity accountedinvestments
16. Contributedequity
21. Parent entitydisclosures
5. Finance costs 17. Workingcapital
22. Events after thereporting period
6. Taxation 23. Interests insubsidiaries
7. Earnings per stapledSecurity
24. Company details
8. Dividends anddistributions
II-B-11

APPENDIX II-B AUDITED FINANCIAL STATEMENTS ON PROPERTYLINKFOR THE PERIOD FROM 1 JULY 2018 TO 20 MARCH 2019
PROPERTYLINK GROUPNOTES TO THE FINANCIAL STATEMENTS
GROUP PERFORMANCE
In this section
This section explains the results and performance of the Group. It provides additionalinformation about those individual line items in the Financial Statements that the Directors considermost relevant in the context of the operations of the Group.
NOTE 1. OPERATING SEGMENTS
(a) Description of segments
The Board of Directors has been identified as the Group’s chief operating decision maker(CODM) as they are responsible for the strategic decision making within the Group. The Group’soperating segments have been determined based on the internal information that is provided to theCODM and which is used to make strategic decisions. Refer to the table below for a brief descriptionof the Group’s operating segments.
Segment Description
Property investment Acquires, improves and leases industrial property, and co-invests inindustrial and commercial property, both within the geographical locationof Australia.
Management services Fund and property management services for managed assets, and propertymanagement services for owned assets, within the geographical location ofAustralia.
(b) Segment information
Information related to each reporting segment for the period ended 20 March 2019 is set outbelow. Segment profit (loss) before tax is used to measure performance because management believesthat this information is the most relevant in evaluating the results of the respective segments relative toother entities that operate in the same industries.
Period 1 July 2018 to 20 March 2019Property
investmentsManagement
services Total
$’000 $’000 $’000
RevenueOperating revenue . . . . . . . . . . . . . . . . . . . . . . . . . . . . . . . . . . . . . . . . 62,498 11,323 73,821Net fair value gain on investment property . . . . . . . . . . . . . . . . . . . . . 26,656 — 26,656Net fair value gain on listed entity investment . . . . . . . . . . . . . . . . . . 1,430 — 1,430Listed entity distributions . . . . . . . . . . . . . . . . . . . . . . . . . . . . . . . . . . 5,947 5,947Other income . . . . . . . . . . . . . . . . . . . . . . . . . . . . . . . . . . . . . . . . . . . . 212 16 228
Segment revenue and other income . . . . . . . . . . . . . . . . . . . . . . . . . 96,743 11,339 108,082
Reconciliation to statutory revenue and other income:Other income . . . . . . . . . . . . . . . . . . . . . . . . . . . . . . . . . . . . . . . . . . . . 200
Total revenue and other income . . . . . . . . . . . . . . . . . . . . . . . . . . . 108,282
II-B-12
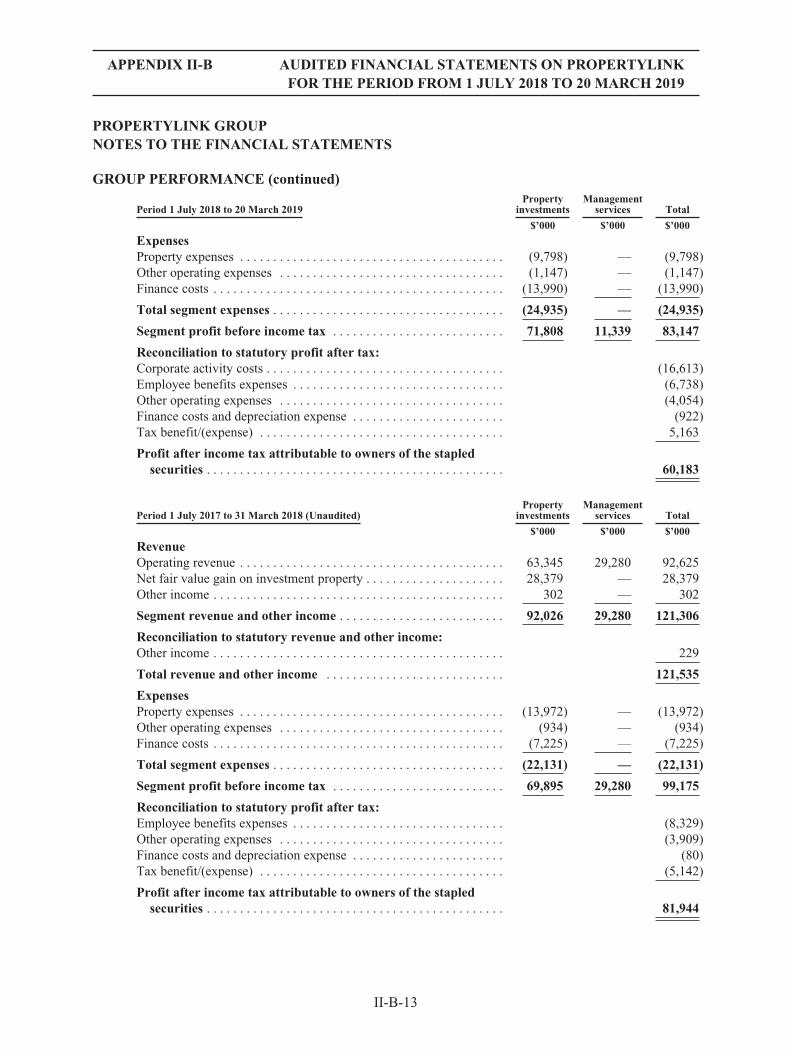
APPENDIX II-B AUDITED FINANCIAL STATEMENTS ON PROPERTYLINKFOR THE PERIOD FROM 1 JULY 2018 TO 20 MARCH 2019
PROPERTYLINK GROUPNOTES TO THE FINANCIAL STATEMENTS
GROUP PERFORMANCE (continued)
Period 1 July 2018 to 20 March 2019Property
investmentsManagement
services Total
$’000 $’000 $’000
ExpensesProperty expenses . . . . . . . . . . . . . . . . . . . . . . . . . . . . . . . . . . . . . . . . (9,798) — (9,798)Other operating expenses . . . . . . . . . . . . . . . . . . . . . . . . . . . . . . . . . . (1,147) — (1,147)Finance costs . . . . . . . . . . . . . . . . . . . . . . . . . . . . . . . . . . . . . . . . . . . . (13,990) — (13,990)
Total segment expenses . . . . . . . . . . . . . . . . . . . . . . . . . . . . . . . . . . . (24,935) — (24,935)
Segment profit before income tax . . . . . . . . . . . . . . . . . . . . . . . . . . 71,808 11,339 83,147
Reconciliation to statutory profit after tax:Corporate activity costs . . . . . . . . . . . . . . . . . . . . . . . . . . . . . . . . . . . . (16,613)Employee benefits expenses . . . . . . . . . . . . . . . . . . . . . . . . . . . . . . . . (6,738)Other operating expenses . . . . . . . . . . . . . . . . . . . . . . . . . . . . . . . . . . (4,054)Finance costs and depreciation expense . . . . . . . . . . . . . . . . . . . . . . . (922)Tax benefit/(expense) . . . . . . . . . . . . . . . . . . . . . . . . . . . . . . . . . . . . . 5,163
Profit after income tax attributable to owners of the stapledsecurities . . . . . . . . . . . . . . . . . . . . . . . . . . . . . . . . . . . . . . . . . . . . . 60,183
Period 1 July 2017 to 31 March 2018 (Unaudited)Property
investmentsManagement
services Total
$’000 $’000 $’000
RevenueOperating revenue . . . . . . . . . . . . . . . . . . . . . . . . . . . . . . . . . . . . . . . . 63,345 29,280 92,625Net fair value gain on investment property . . . . . . . . . . . . . . . . . . . . . 28,379 — 28,379Other income . . . . . . . . . . . . . . . . . . . . . . . . . . . . . . . . . . . . . . . . . . . . 302 — 302
Segment revenue and other income . . . . . . . . . . . . . . . . . . . . . . . . . 92,026 29,280 121,306
Reconciliation to statutory revenue and other income:Other income . . . . . . . . . . . . . . . . . . . . . . . . . . . . . . . . . . . . . . . . . . . . 229
Total revenue and other income . . . . . . . . . . . . . . . . . . . . . . . . . . . 121,535
ExpensesProperty expenses . . . . . . . . . . . . . . . . . . . . . . . . . . . . . . . . . . . . . . . . (13,972) — (13,972)Other operating expenses . . . . . . . . . . . . . . . . . . . . . . . . . . . . . . . . . . (934) — (934)Finance costs . . . . . . . . . . . . . . . . . . . . . . . . . . . . . . . . . . . . . . . . . . . . (7,225) — (7,225)
Total segment expenses . . . . . . . . . . . . . . . . . . . . . . . . . . . . . . . . . . . (22,131) — (22,131)
Segment profit before income tax . . . . . . . . . . . . . . . . . . . . . . . . . . 69,895 29,280 99,175
Reconciliation to statutory profit after tax:Employee benefits expenses . . . . . . . . . . . . . . . . . . . . . . . . . . . . . . . . (8,329)Other operating expenses . . . . . . . . . . . . . . . . . . . . . . . . . . . . . . . . . . (3,909)Finance costs and depreciation expense . . . . . . . . . . . . . . . . . . . . . . . (80)Tax benefit/(expense) . . . . . . . . . . . . . . . . . . . . . . . . . . . . . . . . . . . . . (5,142)
Profit after income tax attributable to owners of the stapledsecurities . . . . . . . . . . . . . . . . . . . . . . . . . . . . . . . . . . . . . . . . . . . . . 81,944
II-B-13

APPENDIX II-B AUDITED FINANCIAL STATEMENTS ON PROPERTYLINKFOR THE PERIOD FROM 1 JULY 2018 TO 20 MARCH 2019
PROPERTYLINK GROUPNOTES TO THE FINANCIAL STATEMENTS
GROUP PERFORMANCE (continued)
As at 20 March 2019Property
investmentsManagement
services Total
$’000 $’000 $’000
AssetsEquity accounted investments . . . . . . . . . . . . . . . . . . . . . . . . . . . . . 101,842 — 101,842Investment properties . . . . . . . . . . . . . . . . . . . . . . . . . . . . . . . . . . . . 859,015 — 859,015Investment in listed entity . . . . . . . . . . . . . . . . . . . . . . . . . . . . . . . . 135,679 — 135,679Other assets . . . . . . . . . . . . . . . . . . . . . . . . . . . . . . . . . . . . . . . . . . . 9,016 12,624 21,640
Total segment assets . . . . . . . . . . . . . . . . . . . . . . . . . . . . . . . . . . . . 1,105,552 12,624 1,118,176
Reconciliation of segment assets to the Statement of FinancialPosition
Cash and cash equivalents . . . . . . . . . . . . . . . . . . . . . . . . . . . . . . . . 7,397Receivables and prepayments . . . . . . . . . . . . . . . . . . . . . . . . . . . . . 600Intercompany receivables . . . . . . . . . . . . . . . . . . . . . . . . . . . . . . . . (11,133)Current tax assets . . . . . . . . . . . . . . . . . . . . . . . . . . . . . . . . . . . . . . . 3,540Deferred tax assets . . . . . . . . . . . . . . . . . . . . . . . . . . . . . . . . . . . . . . 6,848Intangible assets . . . . . . . . . . . . . . . . . . . . . . . . . . . . . . . . . . . . . . . . 4,604Other plant and equipment . . . . . . . . . . . . . . . . . . . . . . . . . . . . . . . . 3,068
Total assets . . . . . . . . . . . . . . . . . . . . . . . . . . . . . . . . . . . . . . . . . . . 1,133,100
Total segment liabilities . . . . . . . . . . . . . . . . . . . . . . . . . . . . . . . . . 460,188 645 460,833
Reconciliation of segment liabilities to the Statement ofFinancial Position
Intercompany payables . . . . . . . . . . . . . . . . . . . . . . . . . . . . . . . . . . 26,292Lease liability . . . . . . . . . . . . . . . . . . . . . . . . . . . . . . . . . . . . . . . . . . 2,933Other liabilities . . . . . . . . . . . . . . . . . . . . . . . . . . . . . . . . . . . . . . . . . 812
Total liabilities . . . . . . . . . . . . . . . . . . . . . . . . . . . . . . . . . . . . . . . . 490,870
Segment net assets . . . . . . . . . . . . . . . . . . . . . . . . . . . . . . . . . . . . . 645,364 11,979 657,343
As at 30 Jun 2018Property
investmentsManagement
services Total
$’000 $’000 $’000
AssetsEquity accounted investments . . . . . . . . . . . . . . . . . . . . . . . . . . . . . 100,855 — 100,855Investment properties . . . . . . . . . . . . . . . . . . . . . . . . . . . . . . . . . . . . 696,200 — 696,200Property, plant and equipment . . . . . . . . . . . . . . . . . . . . . . . . . . . . . 112,750 — 112,750Other assets . . . . . . . . . . . . . . . . . . . . . . . . . . . . . . . . . . . . . . . . . . . 18,494 878 19,372
Total segment assets . . . . . . . . . . . . . . . . . . . . . . . . . . . . . . . . . . . . 928,299 878 929,177
Reconciliation of segment assets to the Statement of Financial PositionCash and cash equivalents . . . . . . . . . . . . . . . . . . . . . . . . . . . . . . . . 2,889Receivables and prepayments . . . . . . . . . . . . . . . . . . . . . . . . . . . . . 434Intercompany receivables . . . . . . . . . . . . . . . . . . . . . . . . . . . . . . . . 725Deferred tax assets . . . . . . . . . . . . . . . . . . . . . . . . . . . . . . . . . . . . . . 4,408Intangible assets . . . . . . . . . . . . . . . . . . . . . . . . . . . . . . . . . . . . . . . . 4,566Other plant and equipment . . . . . . . . . . . . . . . . . . . . . . . . . . . . . . . . 362
Total assets . . . . . . . . . . . . . . . . . . . . . . . . . . . . . . . . . . . . . . . . . . . 942,561
Total segment liabilities . . . . . . . . . . . . . . . . . . . . . . . . . . . . . . . . . 250,744 237 250,981
II-B-14

APPENDIX II-B AUDITED FINANCIAL STATEMENTS ON PROPERTYLINKFOR THE PERIOD FROM 1 JULY 2018 TO 20 MARCH 2019
PROPERTYLINK GROUPNOTES TO THE FINANCIAL STATEMENTS
GROUP PERFORMANCE (continued)
As at 30 Jun 2018Property
investmentsManagement
services Total
$’000 $’000 $’000
Reconciliation of segment liabilities to the Statement of Financial PositionIntercompany payables . . . . . . . . . . . . . . . . . . . . . . . . . . . . . . . . . . . . 56,984Other liabilities . . . . . . . . . . . . . . . . . . . . . . . . . . . . . . . . . . . . . . . . . . 3,258
Total liabilities . . . . . . . . . . . . . . . . . . . . . . . . . . . . . . . . . . . . . . . . . . 311,223
Segment net assets . . . . . . . . . . . . . . . . . . . . . . . . . . . . . . . . . . . . . . . 677,555 641 678,196
NOTE 2. REVENUE
(a) Revenue recognition
All revenue is stated net of the amount of goods and services tax.
Revenue is recognised to the extent that it is probable that the economic benefits will flow tothe Group and the revenue can be reliably measured, regardless of when the payment is being received.Revenue is measured at the fair value of the consideration received or receivable, taking into accountcontractually defined terms of payment and excluding taxes or duty. The Group has concluded that it isthe principal in all of its revenue arrangements since it is the primary obligor, it has pricing latitude andis also exposed to credit risks.
The specific recognition criteria described below must also be met before revenue isrecognised.
Rental income
The Group is the lessor in operating leases. Rental income arising from operating leases oninvestment property is accounted for on a straight-line basis over the lease terms and is included inrevenue in the consolidated statement of profit or loss.
Initial direct costs incurred in negotiating and arranging an operating lease are capitalised, thenrecognised as an expense over the lease term on the same basis as the lease income.
Lease incentives
Prospective lessees may be offered incentives as an inducement to enter into non-cancellableoperating leases. These incentives may take various forms including rent-free periods, upfront cashpayments, or a contribution to certain lessee costs such as fitout costs. Incentives are capitalised andamortised on a straight-line basis over the lease term as a reduction in rental income. The lease term isthe non-cancellable period of the lease together with any further term for which the tenant has theoption to continue the lease, where, at the inception of the lease, it is reasonably certain that the tenantwill exercise that option.
Amounts received from tenants to terminate leases or to compensate for dilapidations arerecognised in the consolidated statement of profit or loss when the right to receive them arises.
II-B-15
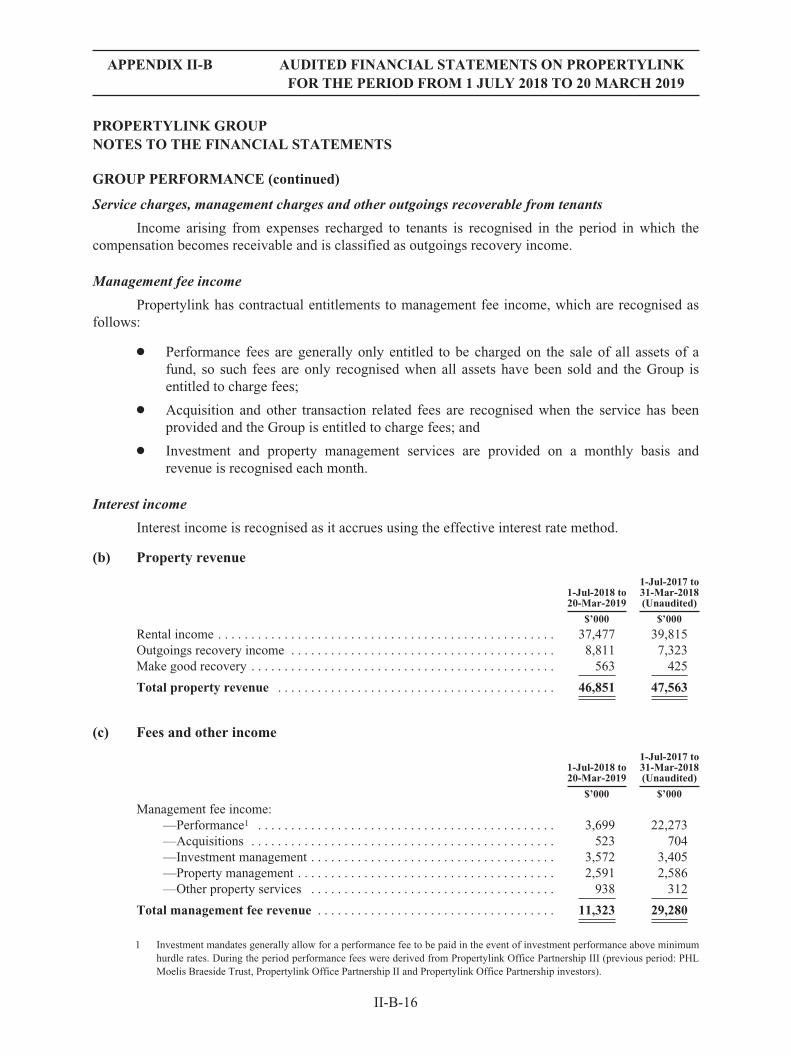
APPENDIX II-B AUDITED FINANCIAL STATEMENTS ON PROPERTYLINKFOR THE PERIOD FROM 1 JULY 2018 TO 20 MARCH 2019
PROPERTYLINK GROUPNOTES TO THE FINANCIAL STATEMENTS
GROUP PERFORMANCE (continued)
Service charges, management charges and other outgoings recoverable from tenants
Income arising from expenses recharged to tenants is recognised in the period in which thecompensation becomes receivable and is classified as outgoings recovery income.
Management fee income
Propertylink has contractual entitlements to management fee income, which are recognised asfollows:
Š Performance fees are generally only entitled to be charged on the sale of all assets of afund, so such fees are only recognised when all assets have been sold and the Group isentitled to charge fees;
Š Acquisition and other transaction related fees are recognised when the service has beenprovided and the Group is entitled to charge fees; and
Š Investment and property management services are provided on a monthly basis andrevenue is recognised each month.
Interest income
Interest income is recognised as it accrues using the effective interest rate method.
(b) Property revenue
1-Jul-2018 to20-Mar-2019
1-Jul-2017 to31-Mar-2018(Unaudited)
$’000 $’000
Rental income . . . . . . . . . . . . . . . . . . . . . . . . . . . . . . . . . . . . . . . . . . . . . . . . . . . 37,477 39,815Outgoings recovery income . . . . . . . . . . . . . . . . . . . . . . . . . . . . . . . . . . . . . . . . 8,811 7,323Make good recovery . . . . . . . . . . . . . . . . . . . . . . . . . . . . . . . . . . . . . . . . . . . . . . 563 425
Total property revenue . . . . . . . . . . . . . . . . . . . . . . . . . . . . . . . . . . . . . . . . . . 46,851 47,563
(c) Fees and other income
1-Jul-2018 to20-Mar-2019
1-Jul-2017 to31-Mar-2018(Unaudited)
$’000 $’000
Management fee income:—Performance1 . . . . . . . . . . . . . . . . . . . . . . . . . . . . . . . . . . . . . . . . . . . . . 3,699 22,273—Acquisitions . . . . . . . . . . . . . . . . . . . . . . . . . . . . . . . . . . . . . . . . . . . . . . 523 704—Investment management . . . . . . . . . . . . . . . . . . . . . . . . . . . . . . . . . . . . . 3,572 3,405—Property management . . . . . . . . . . . . . . . . . . . . . . . . . . . . . . . . . . . . . . . 2,591 2,586—Other property services . . . . . . . . . . . . . . . . . . . . . . . . . . . . . . . . . . . . . 938 312
Total management fee revenue . . . . . . . . . . . . . . . . . . . . . . . . . . . . . . . . . . . . 11,323 29,280
1 Investment mandates generally allow for a performance fee to be paid in the event of investment performance above minimumhurdle rates. During the period performance fees were derived from Propertylink Office Partnership III (previous period: PHLMoelis Braeside Trust, Propertylink Office Partnership II and Propertylink Office Partnership investors).
II-B-16

APPENDIX II-B AUDITED FINANCIAL STATEMENTS ON PROPERTYLINKFOR THE PERIOD FROM 1 JULY 2018 TO 20 MARCH 2019
PROPERTYLINK GROUPNOTES TO THE FINANCIAL STATEMENTS
GROUP PERFORMANCE (continued)
NOTE 3. PROPERTY EXPENSES
1-Jul-2018 to20-Mar-2019
1-Jul-2017 to31-Mar-2018(Unaudited)
$’000 $’000
Council rates and land tax . . . . . . . . . . . . . . . . . . . . . . . . . . . . . . . . . . . . . . . . . 3,162 3,351Repairs, maintenance and utilities . . . . . . . . . . . . . . . . . . . . . . . . . . . . . . . . . . . 3,472 3,424Ground lease . . . . . . . . . . . . . . . . . . . . . . . . . . . . . . . . . . . . . . . . . . . . . . . . . . . . — 2,039Property management expenses . . . . . . . . . . . . . . . . . . . . . . . . . . . . . . . . . . . . . 1,925 1,863Depreciation . . . . . . . . . . . . . . . . . . . . . . . . . . . . . . . . . . . . . . . . . . . . . . . . . . . . — 2,047Property insurance costs . . . . . . . . . . . . . . . . . . . . . . . . . . . . . . . . . . . . . . . . . . . 648 482Other . . . . . . . . . . . . . . . . . . . . . . . . . . . . . . . . . . . . . . . . . . . . . . . . . . . . . . . . . . 638 766
Total property expenses . . . . . . . . . . . . . . . . . . . . . . . . . . . . . . . . . . . . . . . . . . 9,845 13,972
NOTE 4. CORPORATE ACTIVITY COSTS
During the period Propertylink continued to operate the established business, and invested timeand resources in analysing the merits of acquiring Centuria Industrial REIT (CIP). On 13 September2018, Propertylink submitted a non-binding, indicative offer to acquire all outstanding units in CIP byway of an off-market takeover bid. Immediately prior to that offer, Propertylink had acquired a 17.7%interest in CIP. On 21 September 2018, ESR Real Estate (Australia) Pty Ltd (ESR) made an initial offerto acquire all outstanding Propertylink securities by way of an agreed takeover bid. Propertylink and itsadvisors devoted a significant amount of time and resources to assessing the merits of continuing with theCIP offer, compared with recommending to securityholders that they accept the ESR offer.
The CIP and ESR matters were occurring contemporaneously and costs pertaining to them areintertwined. Collectively the matters are referred to as “corporate activity” and the costs as “corporateactivity costs”.
NOTE 5. FINANCE COSTS
Finance costs include interest, amortisation of borrowing costs incurred in connection witharrangement of borrowings, realised gains and losses on interest rate swaps and interest on leaseliability. Borrowing costs are expensed as incurred unless they relate to qualifying assets.
1-Jul-2018 to20-Mar-2019
1-Jul-2017 to31-Mar-2018(Unaudited)
$’000 $’000
Interest on bank loans . . . . . . . . . . . . . . . . . . . . . . . . . . . . . . . . . . . . . . . . . . . . . 9,960 6,955Interest on lease liability . . . . . . . . . . . . . . . . . . . . . . . . . . . . . . . . . . . . . . . . . . 1,761 —Borrowing costs1 . . . . . . . . . . . . . . . . . . . . . . . . . . . . . . . . . . . . . . . . . . . . . . . . 2,524 271
Total finance costs . . . . . . . . . . . . . . . . . . . . . . . . . . . . . . . . . . . . . . . . . . . . . . 14,245 7,226
1 Borrowing costs for the period ended 20 March 2019 include $1,573,419 in unamortised borrowing costs incurred to establishcurrent facility. As at 20 March 2019 there is an expectation that the bank loans will be refinanced. Accordingly, the Groupdetermined that all borrowing costs would be written off as at 20 March 2019.
II-B-17

APPENDIX II-B AUDITED FINANCIAL STATEMENTS ON PROPERTYLINKFOR THE PERIOD FROM 1 JULY 2018 TO 20 MARCH 2019
PROPERTYLINK GROUPNOTES TO THE FINANCIAL STATEMENTS
GROUP PERFORMANCE (continued)
NOTE 6. TAXATION
Most of the Group’s profit is earned by trusts which are not subject to taxation. Income fromthe trusts is instead attributed to unitholders who pay income tax at their marginal tax rates. Income taxis in respect of Propertylink (Holdings) Ltd and its subsidiaries only.
The income tax expense (income) for the period comprises current income tax expense(income) and deferred tax expense (income).
Current income tax expense charged to the profit or loss is the tax payable on taxable income.Current tax liabilities (assets) are measured at the amounts expected to be paid to (recovered from) therelevant taxation authority.
Current and deferred income tax expense (income) is charged or credited outside the profit andloss when the tax relates to items that are recognised outside the profit and loss.
Except for business combinations, no deferred income tax is recognised from the initialrecognition of an asset or liability, excluding a business combination, where there is no effect onaccounting or taxable profit or loss.
Deferred tax assets and liabilities are calculated at the tax rates that are expected to apply to theperiod when the asset is realised or the liability is settled and their measurement also reflects themanner in which management expects to recover or settle the carrying amount of the related asset orliability. With respect to non-depreciable items of property, plant and equipment measured at fair valueand items of investment property measured at fair value, the related deferred tax liability or deferredtax asset is measured on the basis that the carrying amount of the asset will be recovered entirelythrough sale.
Deferred tax assets relating to temporary differences and unused tax losses are recognised onlyto the extent that it is probable that future taxable profit will be available against which the benefits canbe utilised.
Where temporary differences exist in relation to investments in subsidiaries, branches,associates, and joint ventures, deferred tax assets and liabilities are not recognised where the timing ofthe reversal of the temporary difference can’t be controlled and it is not probable that the reversal willoccur in the foreseeable future.
Current tax assets and liabilities are offset where a legally enforceable right of set-off exists andit is intended that net settlement or simultaneous realisation and settlement of the respective asset andliability will occur. Deferred tax assets and liabilities are offset where: (a) a legally enforceable right ofset-off exists; and (b) the deferred tax assets and liabilities relate to income taxes levied by the sametaxation authority on either the same taxable entity or different taxable entities, where it is intendedthat net settlement or simultaneous realisation and settlement of the respective asset and liability willoccur in future periods in which significant amounts of deferred tax assets or liabilities are expected tobe recovered or settled.
II-B-18

APPENDIX II-B AUDITED FINANCIAL STATEMENTS ON PROPERTYLINKFOR THE PERIOD FROM 1 JULY 2018 TO 20 MARCH 2019
PROPERTYLINK GROUPNOTES TO THE FINANCIAL STATEMENTS
GROUP PERFORMANCE (continued)
(a) Income tax expense/(benefit):
1-Jul-2018 to20-Mar-2019
1-Jul-2017 to31-Mar-2018
(Unaudited)$’000 $’000
Current tax (expense)/benefit . . . . . . . . . . . . . . . . . . . . . . . . . . . . . . . . . . . . . . . 2,723 (4,077)Deferred tax (expense)/benefit . . . . . . . . . . . . . . . . . . . . . . . . . . . . . . . . . . . . . . 2,440 (1,065)
Total tax expense . . . . . . . . . . . . . . . . . . . . . . . . . . . . . . . . . . . . . . . . . . . . . . . 5,163 (5,142)
(b) Reconciliation of income tax (expense)/benefit to prima facie tax payable
1-Jul-2018 to20-Mar-2019
1-Jul-2017to 31-Mar-
2018
(Unaudited)$’000 $’000
Profit before income tax . . . . . . . . . . . . . . . . . . . . . . . . . . . . . . . . . . . . . . . . . . . 55,020 87,086Non-taxable profit attributable to Trusts . . . . . . . . . . . . . . . . . . . . . . . . . . . . . . (72,452) (92,518)
Profit/(loss) before income tax generated by PHL Group . . . . . . . . . . . . . . . . . (17,432) 17,099Prima facie tax credit/(expense) at the Australian tax rate of 30% . . . . . . . . . . 5,230 (5,130)Tax effect of amounts which are not deductible/(taxable) in calculating
taxable incomeNon deductible items- Entertainment of clients and employees . . . . . . . . . . . . . . . . . . . . . . . . . . . . . (17) (12)Other adjustments- Lease adjustment (AASB 16 impact) . . . . . . . . . . . . . . . . . . . . . . . . . . . . . . . . (50) —
Income tax expense . . . . . . . . . . . . . . . . . . . . . . . . . . . . . . . . . . . . . . . . . . . . . . 5,163 (5,142)
(c) Deferred tax assets
20-Mar-2019 30-Jun-2018
$’000 $’000
The balance comprises temporary differences attributable to:Employee provisions . . . . . . . . . . . . . . . . . . . . . . . . . . . . . . . . . . . . . . . . . . . . . . 63 1,258Initial public offering cost1 . . . . . . . . . . . . . . . . . . . . . . . . . . . . . . . . . . . . . . . . . 1,531 3,038Corporate activity costs1 . . . . . . . . . . . . . . . . . . . . . . . . . . . . . . . . . . . . . . . . . . . 4,984 —Other . . . . . . . . . . . . . . . . . . . . . . . . . . . . . . . . . . . . . . . . . . . . . . . . . . . . . . . . . . 270 112
Total deferred tax assets . . . . . . . . . . . . . . . . . . . . . . . . . . . . . . . . . . . . . . . . . . 6,848 4,408
MovementOpening balance at the beginning of the year . . . . . . . . . . . . . . . . . . . . . . . . . . . 4,408 5,222Movement in deferred tax asset arising from temporary differences . . . . . . . . . 2,440 (814)
Closing balance at the end of the year . . . . . . . . . . . . . . . . . . . . . . . . . . . . . . . 6,848 4,408
1 Initial public offering and corporate activity costs are amortised over 5 years for tax purposes.
II-B-19

APPENDIX II-B AUDITED FINANCIAL STATEMENTS ON PROPERTYLINKFOR THE PERIOD FROM 1 JULY 2018 TO 20 MARCH 2019
PROPERTYLINK GROUPNOTES TO THE FINANCIAL STATEMENTS
GROUP PERFORMANCE (continued)
NOTE 7. EARNINGS PER SECURITY
Earnings per security are determined by dividing the net profit attributable to shareholders ofthe parent and security holders of the Group by the weighted average number of ordinary securitiesoutstanding during the period. Diluted earnings per security are adjusted from the basic earnings persecurity by taking into account the impact of dilutive potential securities. For the purposes ofcalculating earnings per security, securities held by the Propertylink Employee Incentive Plan aretreated as treasury securities and excluded from securities on issue.
(a) Net profit used in calculating basic and diluted earnings per security
1-Jul-2018 to20-Mar-2019
1-Jul-2017 to31-Mar-2018
(Unaudited)$’000 $’000
Profit/(loss) attributable to shareholders of the parent entity . . . . . . . . . . . . . . . (12,255) 12,049Profit attributable to stapled securityholders . . . . . . . . . . . . . . . . . . . . . . . . . . . 60,183 81,944
(b) Weighted average number of securities used as a denominator
20-Mar-2019 31-Mar-2018
(Unaudited)No. of securities No. of securities
Weighted average number of ordinary stapled securities used incalculation of basic earnings per security . . . . . . . . . . . . . . . . . . . . . . . . 601,837,410 601,378,137
Weighted average number of ordinary stapled securities used incalculation of diluted earnings per security . . . . . . . . . . . . . . . . . . . . . . . 604,357,823 603,149,394
(c) Basic and diluted earnings per security
20-Mar-2019 31-Mar-2018
(Unaudited)cents cents
Basic earnings/(loss) per share - Parent . . . . . . . . . . . . . . . . . . . . . . . . . . . . . (2.04) 2.00Diluted earnings/(loss) per share - Parent . . . . . . . . . . . . . . . . . . . . . . . . . . . (2.03) 2.00Basic earnings per security - Group . . . . . . . . . . . . . . . . . . . . . . . . . . . . . . . . 10.00 13.63Diluted earnings per security - Group . . . . . . . . . . . . . . . . . . . . . . . . . . . . . . 9.96 13.59Adjustments for calculation of diluted earnings per stapled security: . . . . . .Performance rights granted but not yet issued as securities . . . . . . . . . . . . . — 1,771,257Weighted average number of ordinary stapled securities and potential
ordinary stapled securities . . . . . . . . . . . . . . . . . . . . . . . . . . . . . . . . . . . . . 604,357,823 603,149,394
II-B-20

APPENDIX II-B AUDITED FINANCIAL STATEMENTS ON PROPERTYLINKFOR THE PERIOD FROM 1 JULY 2018 TO 20 MARCH 2019
PROPERTYLINK GROUPNOTES TO THE FINANCIAL STATEMENTS
GROUP PERFORMANCE (continued)
NOTE 8. DIVIDENDS AND DISTRIBUTIONS
Dividends and distributions are recognised when declared.
1-Jul-2018 to20-Mar-2019
1-Jul-2017 to31-Mar-2018
$’000 $’000
Distributions paid or declared: . . . . . . . . . . . . . . . . . . . . . . . . . . . . . . . . . . . . . . . . . . . .Profit distribution to PLG securityholders paid on 4 September 2017 . . . . . . . . . . . . . . — 21,821Profit distribution to PLG securityholders paid on 6 March 2018 . . . . . . . . . . . . . . . . . — 21,696Profit distribution to PLG securityholders paid on 4 September 2018 . . . . . . . . . . . . . . 22,303 —Profit distribution to PLG securityholders paid on 31 January 2019 . . . . . . . . . . . . . . . 21,700 —
44,003 43,517
PROPERTY PORTFOLIO ASSETS
In this section
This section details the assets which are used to generate the Group’s performance and areconsidered to be the most relevant to the operations of the Group. The assets are detailed in thefollowing notes:
Investment properties: relates to freehold and leasehold investment properties.
Property, plant and equipment: relates to leasehold premises and plant, furniture andequipment, both directly owned and leased.
Investment in listed entity: relates to investment in securities listed on ASX.
Investments accounted for using the equity method: provides summarised financialinformation on joint ventures. The Group’s joint ventures comprise interests in property portfolioassets held through investments in trusts.
NOTE 9. INVESTMENT PROPERTIES
Investment property comprises completed property and property under construction orre-development (including integral plant and equipment) that are held to earn rentals and for capitalappreciation. As reported in the Basis of Preparation section of this report, at the request of ESR theGroup early adopted AASB 16. Following adoption of AASB 16, the Group re-classified theMelbourne Markets asset from Property, Plant and Equipment to Investment Properties.
Investment property is measured initially at cost, including transaction costs. The carryingamount also includes capital expenditure on investment property and components relating to leaseincentives and assets relating to fixed increases in operating lease rentals in future periods.
II-B-21

APPENDIX II-B AUDITED FINANCIAL STATEMENTS ON PROPERTYLINKFOR THE PERIOD FROM 1 JULY 2018 TO 20 MARCH 2019
PROPERTYLINK GROUPNOTES TO THE FINANCIAL STATEMENTS
PROPERTY PORTFOLIO ASSETS (continued)
Subsequent to initial recognition, investment property is stated at fair value, which reflectsmarket conditions at the reporting date. Gains or losses arising from changes in the fair values ofinvestment properties are included in profit or loss in the period in which they arise.
Investment properties are not depreciated for accounting purposes. Taxation allowances for thedepreciation of buildings and plant and equipment contribute to the tax deferred component ofdistributions to stapled security holders.
When an investment property is disposed of, the difference between the net disposal proceedsand the carrying amount of the asset is recognised in profit or loss.
(a) Reconciliation
1-Jul-2018to 20-Mar-2019
1-Jul-2017to 30-Jun-2018
$’000 $’000Opening balance at the beginning of the year . . . . . . . . . . . . . . . . . . . . . . . 696,200 572,756Melbourne Markets reclassified to investment property1 . . . . . . . . . . . . . . 112,750 —Right of use asset recognised2 . . . . . . . . . . . . . . . . . . . . . . . . . . . . . . . . . . . 14,858 —
Opening balance following reclassification . . . . . . . . . . . . . . . . . . . . . . . . . 823,808 572,756Property acquisitions including acquisition costs . . . . . . . . . . . . . . . . . . . . 460 58,997Property sales . . . . . . . . . . . . . . . . . . . . . . . . . . . . . . . . . . . . . . . . . . . . . . . . — (7,500)Capital expenditure . . . . . . . . . . . . . . . . . . . . . . . . . . . . . . . . . . . . . . . . . . . . 7,148 12,175Property holding costs capitalised . . . . . . . . . . . . . . . . . . . . . . . . . . . . . . . . 399 —Capitalised straight-lining of fixed increases in operating leases inclusive
of lease incentives . . . . . . . . . . . . . . . . . . . . . . . . . . . . . . . . . . . . . . . . . . . 544 1,879Net fair value gain/(loss) on investment property . . . . . . . . . . . . . . . . . . . . 26,656 57,893
Closing balance at the end of the year . . . . . . . . . . . . . . . . . . . . . . . . . . . . . 859,015 696,200
The carrying amount of investment property includes components related to deferred rent,capitalised lease incentives and leasing fees amounting to $6,644,879 (30-Jun-2018: ($345,460)).
1 On 1 July 2018 Melbourne Markets has been reclassified from Property, Plant & Equipment to Investment Property. Refer toAASB 16 accounting policy note in the About this Report section.
2 On 1 July 2018 the Group recognised $14.16m “right of use” asset for Melbourne Markets use of land with correspondinglease liability for ground lease payments. At 20 March 2019 the “right of use” asset has been fair valued at $14.86m.
(b) Fair value measurement - Investment property, investment property held for sale andproperty classified as property, plant and equipment
Each property is considered a separate asset class based on its unique nature, characteristics andrisk. The Group’s policies on investment property valuations require that:
Š management provide Directors with a view of the fair value of each property as eachsix-monthly reporting date approaches;
Š where the view indicates the fair value of a property may materially differ from the currentcarried value, the Directors require that management procure an independent externalvaluation; and
II-B-22

APPENDIX II-B AUDITED FINANCIAL STATEMENTS ON PROPERTYLINKFOR THE PERIOD FROM 1 JULY 2018 TO 20 MARCH 2019
PROPERTYLINK GROUPNOTES TO THE FINANCIAL STATEMENTS
PROPERTY PORTFOLIO ASSETS (continued)
Š all properties in the portfolio are to be subject to an independent external valuation at leastonce in any 24 month period.
All investment properties were independently valued at 31 December 2018. In order to prepareaccounts at the date of acquisition the Group by ESR, Management provided the Directors with anassessment of property values at 20 March 2019. Those values were not materially different to thecarrying values of the investment properties at that date, and no further adjustments were made tocarrying values at 20 March 2019.
Highest and best use
For all investment property that is measured at fair value, the current use of the property isconsidered the highest and best use.
Fair value hierarchy
The fair values of investment property recognised in the consolidated statement of financialposition are Level 3 of the fair value measurement hierarchy.
Valuation techniques used to derive fair values
The fair value is measured using capitalisation of net market income, discounted cash flow(DCF) approaches and comparable sales where appropriate.
Capitalisation (cap) approach
The capitalisation approach involves the addition of expected rent for the various componentsof the property and the deduction of outgoings and other expenses (where appropriate) in order todetermine the net income of the property. This net market income is capitalised at the adoptedcapitalisation rate to derive a market value. The higher/lower the capitalisation rate is adopted, thelower/higher the valuation of a property.
Discounted cash flows (DCF) approach
The DCF approach involves discounting future net operating cash flows over a 10 yearinvestment horizon at the adopted discount rate to derive a net present value for the property. Thehigher/lower the discount rate is adopted, the lower/higher the valuation of a property.
The Group’s investment property have been valued adopting the following key unobservableinputs:
Fair value Valuationtechnique
Keyunobservable
inputs20 Mar 2019 30 Jun 2018 20 Mar 2019 30 Jun 2018
$’000 $’000
Investmentproperties . . . 859,015 696,200 Cap approach Capitalisation rate 5.35% - 8.50% 5.5% - 9.50%
(avg 6.41%) (avg 6.61%)DCF approach Discount rate 6.50% - 8.50% 7.0% - 9.50%
(avg 7.0%) (avg 7.45%)
II-B-23

APPENDIX II-B AUDITED FINANCIAL STATEMENTS ON PROPERTYLINKFOR THE PERIOD FROM 1 JULY 2018 TO 20 MARCH 2019
PROPERTYLINK GROUPNOTES TO THE FINANCIAL STATEMENTS
PROPERTY PORTFOLIO ASSETS (continued)
Key estimates: inputs used to measure fair value of investment properties and leaseholdbuildings
Judgement is required in determining the following key assumptions:
Š Adopted capitalisation rate: The rate at which net market rental revenue is capitalised todetermine the value of a property. The rate is determined with regard to market evidenceand the prior external valuation.
Š Adopted discount rate: The rate of return used to convert cash flows, payable orreceivable in the future, into present value. It reflects the opportunity cost of capital, thatis, the rate of return the cash can earn if put to other uses having similar risk. The rate isdetermined with regard to market evidence and the prior external valuation.
(c) Sensitivity information
The table below highlights the sensitivity analysis of a 25 basis point change in capitalisationrate on the fair value of investment property:
-25 basispoints
+25 basispoints
$’000 $’000
Change in fair value of investment properties . . . . . . . . . . . . . . . . . . . 20 Mar 2019 35,900 (31,750)30 Jun 2018 28,538 (25,883)
The table below highlights the sensitivity analysis of a 25 basis point change in discount rate onthe fair value of investment property:
-25 basispoints
+25 basispoints
$’000 $’000
Change in fair value of investment properties . . . . . . . . . . . . . . . . . . . 20 Mar 2019 15,266 (14,908)30 Jun 2018 12,185 (13,002)
NOTE 10. PROPERTY, PLANT AND EQUIPMENT
Property, plant and equipment is carried at cost or fair value as indicated less, where applicable,any accumulated depreciation and impairment losses.
Property – leasehold buildings
The Melbourne Markets leasehold property was previously classified as Property, Plant andEquipment. Following a change in accounting policy, the property has been reclassified to InvestmentProperty effective 1 July 2018.
Depreciation
The depreciable amount is depreciated on a straight-line basis over the asset’s useful lifecommencing from the time the asset is held ready for use. Leasehold property, plant and equipment aredepreciated over the shorter of either the unexpired period of the lease or the estimated useful lives ofthe improvements.
II-B-24

APPENDIX II-B AUDITED FINANCIAL STATEMENTS ON PROPERTYLINKFOR THE PERIOD FROM 1 JULY 2018 TO 20 MARCH 2019
PROPERTYLINK GROUPNOTES TO THE FINANCIAL STATEMENTS
PROPERTY PORTFOLIO ASSETS (continued)
The assets’ residual values and useful lives are reviewed, and adjusted if appropriate, at the endof each reporting period.
Gains and losses on disposal are determined by comparing net proceeds with the carryingamount. These gains or losses are recognised in profit or loss when the item is derecognised. Whenrevalued assets are sold, amounts included in the revaluation surplus relating to that asset aretransferred to retained earnings.
(a) Property, plant and equipment - reconciliation
1-Jul-2018to 20-Mar-2019
1-Jul-2017to 30-Jun-2018
$’000 $’000
Leasehold buildings at fair valueOpening balance at the beginning of the year . . . . . . . . . . . . . . . . . . . . . . . 112,750 97,600Reclassified to investment property . . . . . . . . . . . . . . . . . . . . . . . . . . . . . . . (112,750) —Capital expenditure on leasehold property . . . . . . . . . . . . . . . . . . . . . . . . . . — 537Capitalised straight-lining of fixed increases in operating lease income . . . — 252Capitalised straight-lining of fixed increases in ground lease payments . . . — (2,149)Depreciation . . . . . . . . . . . . . . . . . . . . . . . . . . . . . . . . . . . . . . . . . . . . . . . . . — (2,748)Net fair value gain/(loss) on leasehold property . . . . . . . . . . . . . . . . . . . . . — 19,258
Closing balance at the end of the year . . . . . . . . . . . . . . . . . . . . . . . . . . . . . — 112,750
Other plant and equipment at costOffice leasehold improvements . . . . . . . . . . . . . . . . . . . . . . . . . . . . . . . . . . 234 282Office equipment . . . . . . . . . . . . . . . . . . . . . . . . . . . . . . . . . . . . . . . . . . . . . 65 80Right of use assets . . . . . . . . . . . . . . . . . . . . . . . . . . . . . . . . . . . . . . . . . . . . 2,769 —
Total other plant and equipment . . . . . . . . . . . . . . . . . . . . . . . . . . . . . . . . . . 3,068 362
Total property, plant & equipment . . . . . . . . . . . . . . . . . . . . . . . . . . . . . 3,068 113,112
At 30 June 2018 leasehold buildings consisted of one property - Melbourne Markets. Theproperty has been reclassified to Investment Property on 1 July 2018.
II-B-25

APPENDIX II-B AUDITED FINANCIAL STATEMENTS ON PROPERTYLINKFOR THE PERIOD FROM 1 JULY 2018 TO 20 MARCH 2019
PROPERTYLINK GROUPNOTES TO THE FINANCIAL STATEMENTS
PROPERTY PORTFOLIO ASSETS (continued)
(b) Fair value measurement
Fair value hierarchy
The fair values of property, plant and equipment recognised in the consolidated statement offinancial position are Level 3 of the fair value measurement hierarchy.
Refer to note 9(b) for valuation techniques and key estimates and judgements used to measurefair value of leasehold buildings.
The Group’s leasehold buildings have been valued adopting the following key unobservableinputs:
Fair value Valuationtechnique
Keyunobservable
inputs20 Mar 2019 30 Jun 2018 20 Mar 2019 30 Jun 2018
$’000 $’000
Leaseholdbuildings . . . — 112,750 Cap approach Capitalisation rate N/A 7.00%
DCF approach Discount rate N/A 8.00%
(c) Sensitivity information
The table below highlights the sensitivity analysis of a 25 basis point change in capitalisationrate on the fair value of Melbourne Markets property:
-25 basispoints
+25 basispoints
$’000 $’000
Change in fair value of leasehold buildings . . . . . . . . . . . . . . . . . . . . . 20 Mar 2019 N/A N/A30 Jun 2018 4,000 (4,000)
The table below highlights the sensitivity analysis of a 25 basis point change in discount rate onthe fair value of Melbourne Markets property:
-25 basispoints
+25 basispoints
$’000 $’000
Change in fair value of leasehold buildings . . . . . . . . . . . . . . . . . . . . . 20 Mar 2019 N/A N/A30 Jun 2018 1,927 (1,883)
II-B-26
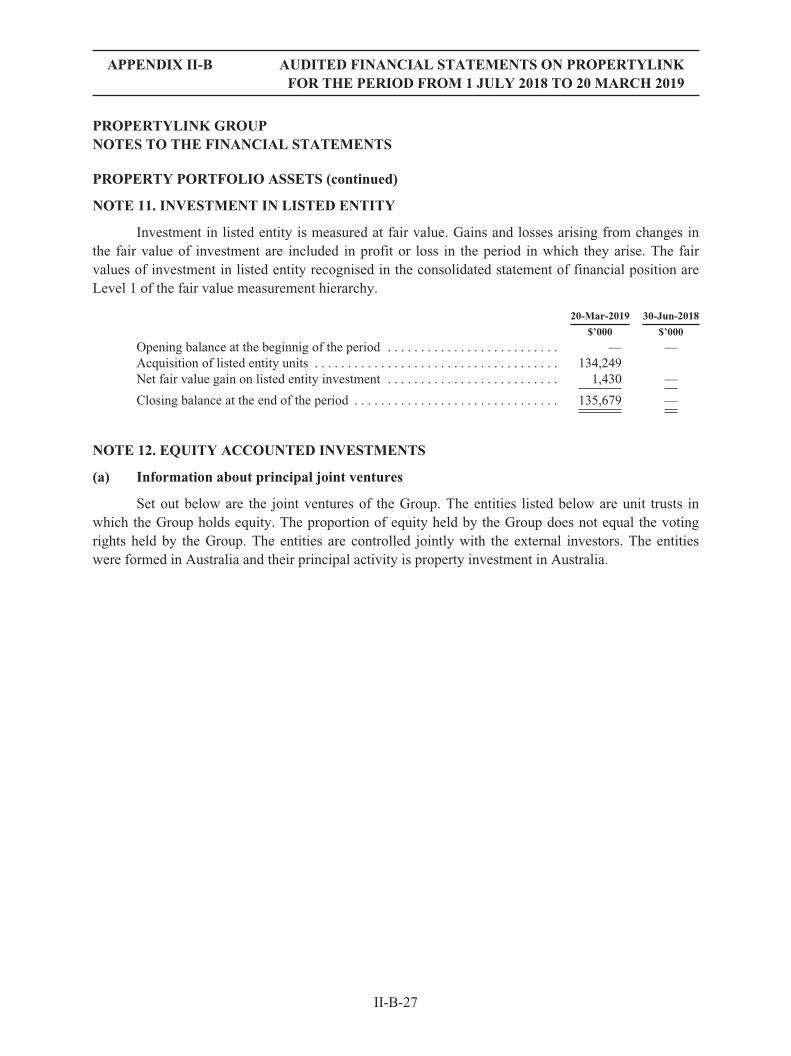
APPENDIX II-B AUDITED FINANCIAL STATEMENTS ON PROPERTYLINKFOR THE PERIOD FROM 1 JULY 2018 TO 20 MARCH 2019
PROPERTYLINK GROUPNOTES TO THE FINANCIAL STATEMENTS
PROPERTY PORTFOLIO ASSETS (continued)
NOTE 11. INVESTMENT IN LISTED ENTITY
Investment in listed entity is measured at fair value. Gains and losses arising from changes inthe fair value of investment are included in profit or loss in the period in which they arise. The fairvalues of investment in listed entity recognised in the consolidated statement of financial position areLevel 1 of the fair value measurement hierarchy.
20-Mar-2019 30-Jun-2018
$’000 $’000
Opening balance at the beginnig of the period . . . . . . . . . . . . . . . . . . . . . . . . . . — —Acquisition of listed entity units . . . . . . . . . . . . . . . . . . . . . . . . . . . . . . . . . . . . . 134,249Net fair value gain on listed entity investment . . . . . . . . . . . . . . . . . . . . . . . . . . 1,430 —
Closing balance at the end of the period . . . . . . . . . . . . . . . . . . . . . . . . . . . . . . . 135,679 —
NOTE 12. EQUITY ACCOUNTED INVESTMENTS
(a) Information about principal joint ventures
Set out below are the joint ventures of the Group. The entities listed below are unit trusts inwhich the Group holds equity. The proportion of equity held by the Group does not equal the votingrights held by the Group. The entities are controlled jointly with the external investors. The entitieswere formed in Australia and their principal activity is property investment in Australia.
II-B-27

APPENDIX II-B AUDITED FINANCIAL STATEMENTS ON PROPERTYLINKFOR THE PERIOD FROM 1 JULY 2018 TO 20 MARCH 2019
PROPERTYLIN
KGROUP
NOTESTO
THE
FIN
ANCIA
LST
ATEM
ENTS
PROPERTY
PORTFOLIO
ASS
ETS(con
tinu
ed)
(b)
Summar
ised
fina
ncialinf
ormationforeq
uity
acco
untedinve
stmen
ts
Set
outbe
low
isthesu
mmarised
fina
ncialinform
ation
foreq
uity
acco
unted
inve
stmen
ts,ad
justed
whe
rene
cessary
toreflectan
ydifferen
cesin
acco
unting
policies
betw
eentheGroup
andtheinve
stee
:
20M
arch
2019
Pro
pertylink
Enh
ance
dPar
tner
ship
50Ann
Pro
pertylink
Enh
ance
dPar
tner
ship
Pro
pertylink
Aus
tralian
Com
mer
cial
Tru
stI
PHL
Moe
lisBra
eside
Tru
st1
POPII
Inve
stmen
tPar
tnersh
ip2
Pro
pertylink
Com
mercial
Indu
strial
Inve
stmen
ts
Pro
pertylink
Aus
tralian
Indu
strial
Par
tnersh
ipII
POPIII
Inve
stmen
tPar
tnersh
ipTotal
Group
’ssh
are(%
)..
....
....
....
....
....
....
....
....
....
....
....
....
....
....
....
....
25.00%
25.00%
15.00%
0.00
%0.00
%7.50
%17
.13%
11.21%
Propo
rtionof
voting
righ
ts..
....
....
....
....
....
....
....
....
....
....
....
....
....
....
.50
.00%
50.00%
50.00%
0.00
%0.00
%50
.00%
50.00%
50.00%
Summar
ised
fina
ncialp
osition
$’00
0$’00
0$’00
0$’00
0$’00
0$’00
0$’00
0$’00
0$’00
0Cashan
dca
sheq
uiva
lents
....
....
....
....
....
....
....
....
....
....
....
....
....
....
...
2,86
23,58
42,25
8—
—82
52,28
92,84
014
,658
Total
curren
tassets..
....
....
....
....
....
....
....
....
....
....
....
....
....
....
....
...
3,99
22,94
12,71
2—
—64
14,03
53,08
017
,401
Total
non-cu
rren
tassets
....
....
....
....
....
....
....
....
....
....
....
....
....
....
....
.12
9,76
516
5,41
019
5,55
3—
—32
,800
325,03
412
6,16
297
4,72
4Current
fina
ncialliabilities
....
....
....
....
....
....
....
....
....
....
....
....
....
....
...
(42)
——
——
(165
)(708
)(240
)(1,155
)Other
curren
tliabilities
....
....
....
....
....
....
....
....
....
....
....
....
....
....
....
..(1,777
)(3,534
)(3,117
)—
—(188
)(2,574
)(297
)(11,48
7)Non
-current
fina
ncialliabilities
....
....
....
....
....
....
....
....
....
....
....
....
....
...
(50,91
3)(65,07
8)(78,85
4)—
—(17,37
1)(142
,882
)(68,98
7)(424
,085
)
Net
assets
....
....
....
....
....
....
....
....
....
....
....
....
....
....
....
....
....
....
81,025
99,739
116,29
4—
—15
,717
182,90
559
,718
555,39
8
Gro
up’s
shar
eof
jointve
ntur
e’sne
tas
sets
....
....
....
....
....
....
....
....
....
....
....
20,256
24,935
17,444
——
1,17
931
,331
6,69
710
1,84
2
1Ju
ly20
18to
20M
arch
2019
Summar
ised
fina
ncialp
erform
ance
Rev
enue
....
....
....
....
....
....
....
....
....
....
....
....
....
....
....
....
....
....
.28
,185
12,113
26,670
——
3,64
941
,869
11,900
124,38
6Dep
reciationan
dam
ortisation
....
....
....
....
....
....
....
....
....
....
....
....
....
....
(56)
——
——
—(990
)—
(1,046
)Interest
inco
me
....
....
....
....
....
....
....
....
....
....
....
....
....
....
....
....
....
2127
30—
—9
3122
140
Interest
expe
nse
....
....
....
....
....
....
....
....
....
....
....
....
....
....
....
....
...
(2,007
)(2,016
)(3,010
)—
—(561
)(3,282
)(1,608
)(12,48
4)Other
expe
nses
....
....
....
....
....
....
....
....
....
....
....
....
....
....
....
....
....
(3,997
)(3,321
)(3,893
)—
—(574
)(8,362
)(6,806
)(26,95
3)
Profito
rloss
from
continuing
operations
....
....
....
....
....
....
....
....
....
....
....
....
22,146
6,80
319
,797
——
2,52
329
,266
3,50
884
,043
Inco
metaxex
pens
e..
....
....
....
....
....
....
....
....
....
....
....
....
....
....
....
..—
——
——
——
——
Profita
fter
taxfrom
continuing
operations
....
....
....
....
....
....
....
....
....
....
....
..22
,146
6,80
319
,797
——
2,52
329
,266
3,50
884
,043
Total
compreh
ensive
inco
me
....
....
....
....
....
....
....
....
....
....
....
....
....
....
.22
,146
6,80
319
,797
——
2,52
329
,266
3,50
884
,043
Gro
up’s
shar
eof
jointve
ntur
e’stotalc
ompr
ehen
sive
inco
me..
....
....
....
....
....
....
...
5,53
61,70
12,97
0—
—18
95,01
339
315
,802
Distribut
ionre
ceived
....
....
....
....
....
....
....
....
....
....
....
....
....
....
....
..6,95
740
916
6—
—80
1,48
61,16
310
,261
1The
asseth
eldby
PHLM
oelisBraesideTrust
was
sold
inJu
ly20
17an
dthetrus
twas
wou
ndup
.2
The
asseth
eldby
POPII,inwhich
POPII
Inve
stmen
tPartnersh
ipha
s20
%interest,w
asso
ldin
July
2017
,and
thetrus
twas
wou
ndup
.
II-B-28

PROPERTYLIN
KGROUP
NOTESTO
THE
FIN
ANCIA
LST
ATEM
ENTS
PROPERTY
PORTFOLIO
ASS
ETS(con
tinu
ed)
(b)
Summar
ised
fina
ncialinf
ormationforeq
uity
acco
untedinve
stmen
ts(con
tinu
ed)
30Ju
ne20
18
Pro
pertylink
Enh
ance
dPar
tner
ship
50Ann
Pro
pertylink
Enh
ance
dPar
tner
ship
Pro
pertylink
Aus
tralian
Com
mer
cial
Tru
stI
PHL
Moe
lisBra
eside
Tru
st1
POPII
Inve
stmen
tPar
tnersh
ip2
Pro
pertylink
Com
mercial
Indu
strial
Inve
stmen
ts
Pro
pertylink
Aus
tralian
Indu
strial
Par
tnersh
ipII
POPIII
Inve
stmen
tPar
tnersh
ipTotal
Group
’ssh
are(%
)..
....
....
....
....
....
....
....
....
....
....
....
....
....
....
....
....
25.00%
25.00%
15.00%
10.00%
20.00%
7.50
%17
.13%
11.21%
Propo
rtionof
voting
righ
ts..
....
....
....
....
....
....
....
....
....
....
....
....
....
....
.50
.00%
50.00%
50.00%
50.00%
50.00%
50.00%
50.00%
50.00%
Summar
ised
fina
ncialp
osition
$’00
0$’00
0$’00
0$’00
0$’00
0$’00
0$’00
0$’00
0$’00
0Cashan
dca
sheq
uiva
lents
....
....
....
....
....
....
....
....
....
....
....
....
....
....
...
2,12
01,94
91,38
9—
—1,07
51,46
51,82
29,82
0Total
curren
tassets..
....
....
....
....
....
....
....
....
....
....
....
....
....
....
....
...
3,12
02,13
31,75
1—
—1,11
03,82
92,16
414
,107
Total
non-cu
rren
tassets
....
....
....
....
....
....
....
....
....
....
....
....
....
....
....
.18
0,25
116
2,53
417
5,98
8—
—31
,000
302,15
012
1,40
097
3,32
3Current
fina
ncialliabilities
....
....
....
....
....
....
....
....
....
....
....
....
....
....
...
(27)
——
——
(30)
(127
)—
(184
)Other
curren
tliabilities
....
....
....
....
....
....
....
....
....
....
....
....
....
....
....
..(5,761
)(3,042
)(1,391
)—
—(438
)(5,913
)(1,270
)(17,81
5)Non
-current
fina
ncialliabilities
....
....
....
....
....
....
....
....
....
....
....
....
....
...
(74,69
6)(65,01
7)(78,74
4)—
—(17,37
6)(137
,623
)(55,71
2)(429
,168
)
Net
assets
....
....
....
....
....
....
....
....
....
....
....
....
....
....
....
....
....
....
102,88
796
,608
97,604
——
14,266
162,31
666
,582
540,26
3
Gro
up’s
shar
eof
asso
ciate’sne
tas
sets
....
....
....
....
....
....
....
....
....
....
....
....
25,722
24,152
14,641
——
1,07
027
,804
7,46
610
0,85
5
1Ju
ly20
17to
31M
arch
2018
(una
udited
)Su
mmar
ised
fina
ncialp
erform
ance
Rev
enue
....
....
....
....
....
....
....
....
....
....
....
....
....
....
....
....
....
....
.23
,321
29,592
22,171
901,25
23,79
033
,439
11,850
125,50
5Dep
reciationan
dam
ortisation
....
....
....
....
....
....
....
....
....
....
....
....
....
....
(52)
——
——
—(955
)—
(1,007
)Interest
inco
me
....
....
....
....
....
....
....
....
....
....
....
....
....
....
....
....
....
219
712
115
937
1521
6Interest
expe
nse
....
....
....
....
....
....
....
....
....
....
....
....
....
....
....
....
...
(2,310
)(1,893
)(1,120
)(362
)—
(535
)(2,992
)(1,427
)(10,63
9)Other
expe
nses
....
....
....
....
....
....
....
....
....
....
....
....
....
....
....
....
....
(4,171
)(3,259
)(1,481
)83
—(348
)(7,402
)(1,706
)(18,28
4)
Profito
rloss
from
continuing
operations
....
....
....
....
....
....
....
....
....
....
....
....
16,790
24,459
19,577
(177
)1,36
72,91
622
,127
8,73
295
,791
Inco
metaxex
pens
e..
....
....
....
....
....
....
....
....
....
....
....
....
....
....
....
..—
——
——
——
——
Profita
fter
taxfrom
continuing
operations
....
....
....
....
....
....
....
....
....
....
....
..16
,790
24,459
19,577
(177
)1,36
72,91
622
,127
8,73
295
,791
Total
compreh
ensive
inco
me
....
....
....
....
....
....
....
....
....
....
....
....
....
....
.16
,790
24,459
19,577
(177
)1,36
72,91
622
,127
8,73
295
,791
Gro
up’s
shar
eof
jointve
ntur
e’stotalc
ompr
ehen
sive
inco
me..
....
....
....
....
....
....
...
4,19
96,11
52,94
4(18)
273
219
1,79
242
515
,949
Distribut
ionre
ceived
....
....
....
....
....
....
....
....
....
....
....
....
....
....
....
..1,92
81,00
6—
2,51
16,64
763
836
102
13,093
1The
asseth
eldby
PHLM
oelisBraesideTrust
was
sold
inJu
ly20
17an
dthetrus
twas
wou
ndup
.2
The
asseth
eldby
POPII,inwhich
POPII
Inve
stmen
tPartnersh
ipha
s20
%interest,w
asso
ldin
July
2017
,and
thetrus
twas
wou
ndup
.
II-B-29
APPENDIX II-B AUDITED FINANCIAL STATEMENTS ON PROPERTYLINKFOR THE PERIOD FROM 1 JULY 2018 TO 20 MARCH 2019

APPENDIX II-B AUDITED FINANCIAL STATEMENTS ON PROPERTYLINKFOR THE PERIOD FROM 1 JULY 2018 TO 20 MARCH 2019
PROPERTYLINK GROUPNOTES TO THE FINANCIAL STATEMENTS
CAPITAL MANAGEMENT
In this section
The capital structure of the Group is detailed in the following notes:
Debt: Borrowings in Note 13, Lease liability in Note 14 and Commitments and contingencies inNote 15.
Equity: Contributed equity in Note 16.
Note 17 provides a breakdown of the working capital balances held in the Statement ofFinancial Position.
NOTE 13. BORROWINGS
Borrowings are initially recognised at fair value net of directly attributable transaction costs andsubsequently measured at amortised cost using the effective interest rate method. Under the effectiveinterest rate method, any transaction fees, costs, discounts and premiums directly related to theborrowings are capitalised to borrowings and amortised in profit or loss over the expected life of theborrowings.
All borrowings with contractual maturities greater than 12 months after reporting date areclassified as non-current liabilities.
20-Mar-2019 30-Jun-2018
$’000 $’000
Non-currentBank loan secured . . . . . . . . . . . . . . . . . . . . . . . . . . . . . . . . . . . . . . . . . . . . . . . . 449,000 290,000Borrowing costs . . . . . . . . . . . . . . . . . . . . . . . . . . . . . . . . . . . . . . . . . . . . . . . . . . — (1,343)
Total non-current borrowings . . . . . . . . . . . . . . . . . . . . . . . . . . . . . . . . . . . . . 449,000 288,657
Total borrowings . . . . . . . . . . . . . . . . . . . . . . . . . . . . . . . . . . . . . . . . . . . . . . . . 449,000 288,657
The bank loan is a commercial bill facility and is priced at a margin over 90-day BBSY rate.The facility is secured against the Group’s investment properties, and by guarantees provided to thefinancier by certain Group entities. The facility is split into three tranches, a $190m facility drawn to$170m expiring on 15 February 2021, a $150m facility drawn to $135m expiring on 15 February 2023,and a $160m facility drawn to $144m expiring on 11 September 2020.
The Group has been in compliance with all debt covenants during the period. As at 20 March2019 there is an expectation that the bank loans will be refinanced. Accordingly, the Group determinedthat all borrowing costs would be written off at 20 March 2019. The bank loans continue to beclassified as non-current liabilities as they were not due for repayment in the twelve months following20 March 2019.
II-B-30

APPENDIX II-B AUDITED FINANCIAL STATEMENTS ON PROPERTYLINKFOR THE PERIOD FROM 1 JULY 2018 TO 20 MARCH 2019
PROPERTYLINK GROUPNOTES TO THE FINANCIAL STATEMENTS
CAPITAL MANAGEMENT (continued)
NOTE 14. LEASE LIABILITY
The Group has adopted AASB 16 Leases on 1 July 2018 which resulted in recognition of leaseliability. Refer to About this Report section (c) New Accounting Standards applied in the currentperiod for more information.
20-Mar-2019 30-Jun-2018
$’000 $’000
Current lease liability . . . . . . . . . . . . . . . . . . . . . . . . . . . . . . . . . . . . . . . . . . . . . 2,042 —Non-current lease liability . . . . . . . . . . . . . . . . . . . . . . . . . . . . . . . . . . . . . . . . . . 15,749 —
Total lease liability . . . . . . . . . . . . . . . . . . . . . . . . . . . . . . . . . . . . . . . . . . . . . . . 17,791 —
NOTE 15. COMMITMENTS AND CONTINGENCIES
(a) Commitments
(i) Capital commitments
As at 20 March 2019, the Group had no material capital commitments (30 June 2018: $$1.1m).
(ii) Lease receivable commitments
Leases in which the Group does not transfer substantially all the risks and rewards of ownershipof an asset are classified as operating leases. Initial direct costs incurred in negotiating and arrangingan operating lease are added to the carrying amount of the leased asset and amortised over the leaseterm on the same basis as rental income.
The Group has entered into leases on its property portfolio. Industrial property leases typicallyhave initial lease terms of between 5 and 10 years and include clauses to enable periodic fixed upwardrevision.
Future minimum rentals receivable under non-cancellable operating leases are as follows:
20-Mar-2019 30-Jun-2018
$’000 $’000
Within 1 year . . . . . . . . . . . . . . . . . . . . . . . . . . . . . . . . . . . . . . . . . . . . . . . . . . . . 53,417 52,885After 1 year, but not more than 5 years . . . . . . . . . . . . . . . . . . . . . . . . . . . . . . . . 116,111 122,752More than 5 years . . . . . . . . . . . . . . . . . . . . . . . . . . . . . . . . . . . . . . . . . . . . . . . . 52,050 61,779
221,578 237,416
(b) Contingencies
At 20 March 2019 the Group had no contingent assets or liabilities (30 June 2018: $Nil).
II-B-31

APPENDIX II-B AUDITED FINANCIAL STATEMENTS ON PROPERTYLINKFOR THE PERIOD FROM 1 JULY 2018 TO 20 MARCH 2019
PROPERTYLINK GROUPNOTES TO THE FINANCIAL STATEMENTS
CAPITAL MANAGEMENT (continued)
NOTE 16. CONTRIBUTED EQUITY
(a) Contributed equity of shareholders of the parent entity
20-Mar-2019 30-Jun-2018
Note $’000 $’000
Opening balance at the beginning of the year . . . . . . . . . . . . . . . . . . . . 5,364 5,364Reallocation of capital from other stapled entity’s capital1 . . . . . . . . . . 16(b) 60,278 —
Closing balance at the end of the year . . . . . . . . . . . . . . . . . . . . . . . . . . 65,642 5,364
(b) Contributed equity of unitholders of other stapled entities
20-Mar-2019 30-Jun-2018
Note $’000 $’000
Opening balance at the beginning of the year . . . . . . . . . . . . . . . . . . . . . 525,140 525,206Issue of ordinary equity . . . . . . . . . . . . . . . . . . . . . . . . . . . . . . . . . . . . . — —Less security issue costs . . . . . . . . . . . . . . . . . . . . . . . . . . . . . . . . . . . . . — (66)Reallocation of capital to the parent entity’s capital1 . . . . . . . . . . . . . . . 16(a) (60,278) —
Closing balance at the end of the year . . . . . . . . . . . . . . . . . . . . . . . . . . 464,862 525,140
The contributed equity of other stapled entities represents the issued capital of PT and PAIP.
1 On 29 August 2018 PT resolved to reallocate capital to PAIP and PHL so as to more closely align PLG capital with the capitalemployed by each of the stapled group members.
(c) Number of securities on issue
20-Mar-2019 30-Jun-2018
No. of securities No. of securities
Opening balance at the beginning of the year . . . . . . . . . . . . . . . . . . . . . . . 602,780,330 602,780,330Issue of additional equity . . . . . . . . . . . . . . . . . . . . . . . . . . . . . . . . . . . . . . . — —
Closing balance at the end of the year . . . . . . . . . . . . . . . . . . . . . . . . . . . . . 602,780,330 602,780,330
Each stapled security ranks equally with all other stapled securities for the purposes ofdistributions and on termination of the Group.
Each stapled security entitles the holder to vote in accordance with the provisions of theConstitutions and the Corporations Act 2001.
NOTE 17. WORKING CAPITAL
(a) Cash and cash equivalents
Cash and cash equivalents of $10.2m (30 Jun 2018: $17.2m) comprise cash at bank and short-term deposits with an original maturity of three months or less, which are subject to an insignificantrisk of changes in value.
II-B-32

APPENDIX II-B AUDITED FINANCIAL STATEMENTS ON PROPERTYLINKFOR THE PERIOD FROM 1 JULY 2018 TO 20 MARCH 2019
PROPERTYLINK GROUPNOTES TO THE FINANCIAL STATEMENTS
CAPITAL MANAGEMENT (continued)
(b) Trade and other receivables
Trade and other receivables include amounts due from customers for goods sold and servicesperformed in the ordinary course of business. Receivables expected to be collected within 12 monthsof the end of the reporting period are classified as current assets. All other receivables are classified asnon-current assets.
Trade and other receivables are initially recognised at fair value and subsequently measured atamortised cost using the effective interest method, less any provision for impairment.
The Group recognises an allowance for expected credit losses (ECLs) for all receivables held by theGroup. ECLs are based on the difference between the contractual cash flows due in accordance with thecontract and all the cash flows that the Group expects to receive. The expected cash flows will include cashflows from the sale of collateral held or other credit enhancements that are integral to the contractual terms.
For rent and other trade receivables, the Group applies a simplified approach in calculatingECLs. Therefore, the Group does not track changes in credit risk, but instead recognises a lossallowance based on lifetime ECLs at each reporting date (i.e., a loss allowance for credit lossesexpected over the remaining life of the exposure, irrespective of the timing of the default). The Grouphas established a provision matrix that is based on its historical credit loss experience, adjusted forforward-looking factors specific to the debtors and the economic environment. The loss allowancerelates to trade receivables due over 90 days.
20-Mar-2019 30-Jun-2018
$’000 $’000
Rent receivable . . . . . . . . . . . . . . . . . . . . . . . . . . . . . . . . . . . . . . . . . . . . . . . . . . 824 1,218Less: expected credit loss . . . . . . . . . . . . . . . . . . . . . . . . . . . . . . . . . . . . . . . . . . (154) (244)
Total rent receivables . . . . . . . . . . . . . . . . . . . . . . . . . . . . . . . . . . . . . . . . . . . . 670 974
Fee receivable . . . . . . . . . . . . . . . . . . . . . . . . . . . . . . . . . . . . . . . . . . . . . . . . . . . 1,537 1,510Distribution receivable . . . . . . . . . . . . . . . . . . . . . . . . . . . . . . . . . . . . . . . . . . . . 2,671 638Other receivables . . . . . . . . . . . . . . . . . . . . . . . . . . . . . . . . . . . . . . . . . . . . . . . . . 235 161Deposits paid . . . . . . . . . . . . . . . . . . . . . . . . . . . . . . . . . . . . . . . . . . . . . . . . . . . . 157 157
Total current trade and other receivables . . . . . . . . . . . . . . . . . . . . . . . . . . . 5,270 3,440
An aging analysis of the trade receivables, which comprise rent and fee receivables, based onthe invoice date and net of loss allowance, is as follows:
20-Mar-2019 30-Jun-2018
$’000 $’000
Within 90 days . . . . . . . . . . . . . . . . . . . . . . . . . . . . . . . . . . . . . . . . . . . . . . . . . . . 2,144 2,46891 to 180 days . . . . . . . . . . . . . . . . . . . . . . . . . . . . . . . . . . . . . . . . . . . . . . . . . . . 1 —Over 180 days . . . . . . . . . . . . . . . . . . . . . . . . . . . . . . . . . . . . . . . . . . . . . . . . . . . 62 16
Total . . . . . . . . . . . . . . . . . . . . . . . . . . . . . . . . . . . . . . . . . . . . . . . . . . . . . . . . . . . 2,207 2,484
II-B-33

APPENDIX II-B AUDITED FINANCIAL STATEMENTS ON PROPERTYLINKFOR THE PERIOD FROM 1 JULY 2018 TO 20 MARCH 2019
PROPERTYLINK GROUPNOTES TO THE FINANCIAL STATEMENTS
CAPITAL MANAGEMENT (continued)
(c) Trade and other payables
Trade and other payables represent the liabilities for goods and services received by the Groupthat remain unpaid at the end of the reporting period. The balance is recognised as a current liabilitywith the amounts normally paid within 30 days of recognition of the liability.
20-Mar-2019 30-Jun-2018
$’000 $’000
Trade payables . . . . . . . . . . . . . . . . . . . . . . . . . . . . . . . . . . . . . . . . . . . . . . . . . . . 14,614 3,799Other payables and accrued expenses . . . . . . . . . . . . . . . . . . . . . . . . . . . . . . . . . 5,680 13,334GST payable . . . . . . . . . . . . . . . . . . . . . . . . . . . . . . . . . . . . . . . . . . . . . . . . . . . . 461 1,161Bonds payable . . . . . . . . . . . . . . . . . . . . . . . . . . . . . . . . . . . . . . . . . . . . . . . . . . . 1,189 1,014
21,944 19,308
An aging analysis of the trade payables is as follows:
20-Mar-2019 30-Jun-2018
$’000 $’000
Within 90 days . . . . . . . . . . . . . . . . . . . . . . . . . . . . . . . . . . . . . . . . . . . . . . . . . . . 14,614 3,62791 to 180 days . . . . . . . . . . . . . . . . . . . . . . . . . . . . . . . . . . . . . . . . . . . . . . . . . . . — 172Over 180 days . . . . . . . . . . . . . . . . . . . . . . . . . . . . . . . . . . . . . . . . . . . . . . . . . . . — —
Total . . . . . . . . . . . . . . . . . . . . . . . . . . . . . . . . . . . . . . . . . . . . . . . . . . . . . . . . . . . 14,614 3,799
II-B-34

APPENDIX II-B AUDITED FINANCIAL STATEMENTS ON PROPERTYLINKFOR THE PERIOD FROM 1 JULY 2018 TO 20 MARCH 2019
PROPERTYLINK GROUPNOTES TO THE FINANCIAL STATEMENTS
OTHER DISCLOSURES
In this section
This section includes other information that must be disclosed to comply with the AccountingStandards, the Corporations Act 2001 or the Corporations Regulations.
NOTE 18. INTANGIBLE ASSETS
Goodwill represents the excess of the cost of an acquisition over the fair value of the Group’sshare of the net identifiable assets of the acquired subsidiary at the date of the acquisition.
20-Mar-2019 30-Jun-2018
$’000 $’000
Software . . . . . . . . . . . . . . . . . . . . . . . . . . . . . . . . . . . . . . . . . . . . . . . . . . . . . . . . 38 —GoodwillCost . . . . . . . . . . . . . . . . . . . . . . . . . . . . . . . . . . . . . . . . . . . . . . . . . . . . . . . . . . . 4,566 4,566
Intangible assets net carrying amount . . . . . . . . . . . . . . . . . . . . . . . . . . . . . . . . . 4,604 4,566
Goodwill is not subject to amortisation and is tested annually for impairment, or morefrequently if events or changes in circumstances indicate that it might be impaired. An impairment lossis recognised in the Statement of Comprehensive Income for the amount by which the asset’s carryingamount exceeds its recoverable amount.
Management carry out a review of the recoverable amount of its goodwill at least annually.There has been no change in the carrying value of the goodwill as a result of the reviews.
NOTE 19. SECURITY-BASED PAYMENTS
1-Jul-2018to
20-Mar-2019
1-Jul-2017to 31-Mar-
2018(Unaudited)
$’000 $’000
Staff bonuses1 . . . . . . . . . . . . . . . . . . . . . . . . . . . . . . . . . . . . . . . . . . . . . . . . . . . 1,285 1,953
1,285 1,953
1 The Group has established an Employee Incentive Plan to reward staff for performance over the short and long term. Shortterm incentives are issued by the Plan in the form of Restricted Securities, and long term incentives are issued by the Plan inthe form of Performance Rights.
The Group’s Employee Incentive Plans have awarded grants of Restricted Securities andPerformance Rights to PLG stapled securities to eligible participants. The Short Term Incentive Plan(STI) grants are in the form of Restricted Securities, were for nil consideration, and are subject tosatisfying specific service conditions. The Long Term Incentive Plan (LTI) grants are in the form ofPerformance Rights, were for nil consideration, and are subject to satisfying specific futureperformance and service conditions.
II-B-35

APPENDIX II-B AUDITED FINANCIAL STATEMENTS ON PROPERTYLINKFOR THE PERIOD FROM 1 JULY 2018 TO 20 MARCH 2019
PROPERTYLINK GROUPNOTES TO THE FINANCIAL STATEMENTS
OTHER DISCLOSURES (continued)
Short Term Incentive (STI) Plans
Eligible participants are usually granted Restricted Securities in August/September forperformance-based services for the preceding financial year. Participants usually must remain inemployment for the vesting period (generally approximately one year after grant) in order for theRestricted Securities to vest.
STI grants of Restricted Securities had a condition which entitled staff to early vesting in theevent of a change of control of the Group. As a result of this provision, all staff holding RestrictedSecurities became entitled to unrestricted securities, and sold them into the ESR bid for the Group’ssecurities.
Long Term Incentive (LTI) Plans
Employees (including senior executives) of the Group receive remuneration in the form ofsecurity-based payments, whereby employees render services as consideration for securities.
Following ESR’s bid for the Group, the then Propertylink Board considered the position ofholders of LTI Performance Rights, and decided that on a change of control all rights would beforfeited. However, the Board further decided that 50% of the value of the Performance Rights heldwould be paid to the holders as a cash bonus.
NOTE 20. RELATED PARTIES
(a) Key management personnel
Equity instruments disclosures relating to key management personnel
The relevant interest in PLG stapled securities held during the period by each key managementpersonnel, including their personally related parties, are set out below:
Openingbalance
1-Jul-2018Performancerights granted
Net acquisitions/disposals
Closingbalance
20-Mar-2019
Directors . . . . . . . . . . . . . . . . . . . . . . . . . . . . . . 13,276,946 824,889 (14,101,835) —Other key management personnel . . . . . . . . . . . 5,902,574 549,178 (6,451,752) —
Total . . . . . . . . . . . . . . . . . . . . . . . . . . . . . . . . . 19,179,520 1,374,067 (20,553,587) —
There were no loans with key management personnel or their related parties during the periodended 20 March 2019 and 30 June 2018.
II-B-36

APPENDIX II-B AUDITED FINANCIAL STATEMENTS ON PROPERTYLINKFOR THE PERIOD FROM 1 JULY 2018 TO 20 MARCH 2019
PROPERTYLINK GROUPNOTES TO THE FINANCIAL STATEMENTS
OTHER DISCLOSURES (continued)
(b) Transactions with related parties
Transactions between related parties are on normal commercial terms and conditions no morefavourable than those available to other parties unless otherwise stated.
The following transactions occurred with related parties:
1-Jul-2018to 20-Mar-2019
1-Jul-2017to 31-Mar-2018
(Unaudited)$’000 $’000
i. Fee income from key management personnel’s related partiesProject management fees - Nix Anderson Pty Ltd (associated with
Derek Nix) . . . . . . . . . . . . . . . . . . . . . . . . . . . . . . . . . . . . . . . . . . . . — 5Rent received - Blue Gum Capital Pty Ltd (associated with Anthony
Ryan) . . . . . . . . . . . . . . . . . . . . . . . . . . . . . . . . . . . . . . . . . . . . . . . . 21 36
21 41ii. Fee income from joint ventures
Performance fees . . . . . . . . . . . . . . . . . . . . . . . . . . . . . . . . . . . . . . . . . 3,699 17,506Investment management fees . . . . . . . . . . . . . . . . . . . . . . . . . . . . . . . . 3,546 3,330Property management fees . . . . . . . . . . . . . . . . . . . . . . . . . . . . . . . . . . 1,368 1,384Acquisition fees . . . . . . . . . . . . . . . . . . . . . . . . . . . . . . . . . . . . . . . . . . 523 704Other property services fees . . . . . . . . . . . . . . . . . . . . . . . . . . . . . . . . 938 308
10,074 23,231
NOTE 21. PARENT ENTITY DISCLOSURES
The following information represents the standalone financial information for Propertylink(Holdings) Limited.
20-Mar-2019 30-Jun-2018
$’000 $’000
STATEMENT OF FINANCIAL POSITIONASSETSCurrent assets . . . . . . . . . . . . . . . . . . . . . . . . . . . . . . . . . . . . . . . . . . . . . . . . . . . 8,050 26,610Non-current assets . . . . . . . . . . . . . . . . . . . . . . . . . . . . . . . . . . . . . . . . . . . . . . . . 18,439 13,308
TOTAL ASSETS . . . . . . . . . . . . . . . . . . . . . . . . . . . . . . . . . . . . . . . . . . . . . . . . 26,489 39,918
LIABILITIESCurrent liabilities . . . . . . . . . . . . . . . . . . . . . . . . . . . . . . . . . . . . . . . . . . . . . . . . . 16,726 77,955Non-current liabilities . . . . . . . . . . . . . . . . . . . . . . . . . . . . . . . . . . . . . . . . . . . . . 2,880 31
TOTAL LIABILITIES . . . . . . . . . . . . . . . . . . . . . . . . . . . . . . . . . . . . . . . . . . . 19,606 77,986
EQUITY/(DEFICIT)Issued capital . . . . . . . . . . . . . . . . . . . . . . . . . . . . . . . . . . . . . . . . . . . . . . . . . . . . 65,642 5,364Capital reserve . . . . . . . . . . . . . . . . . . . . . . . . . . . . . . . . . . . . . . . . . . . . . . . . . . . (25,110) (25,110)Retained earnings . . . . . . . . . . . . . . . . . . . . . . . . . . . . . . . . . . . . . . . . . . . . . . . . (33,649) (18,322)
TOTAL EQUITY/(DEFICIT) . . . . . . . . . . . . . . . . . . . . . . . . . . . . . . . . . . . . . 6,883 (38,068)
II-B-37
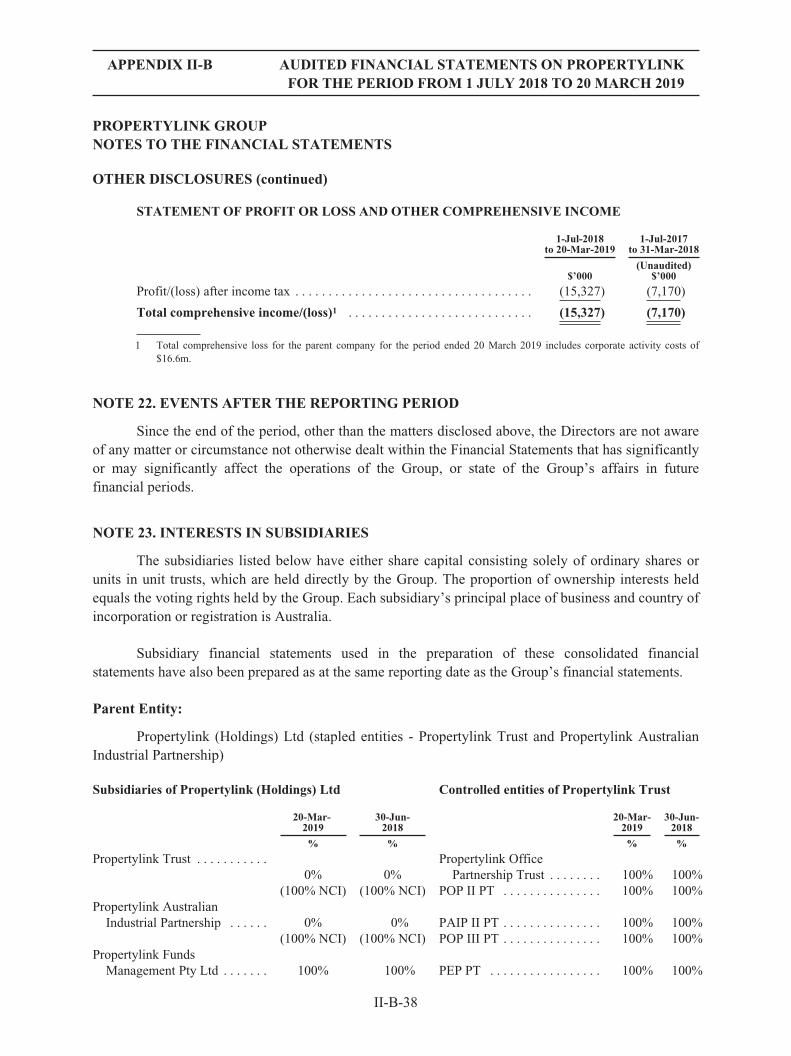
APPENDIX II-B AUDITED FINANCIAL STATEMENTS ON PROPERTYLINKFOR THE PERIOD FROM 1 JULY 2018 TO 20 MARCH 2019
PROPERTYLINK GROUPNOTES TO THE FINANCIAL STATEMENTS
OTHER DISCLOSURES (continued)
STATEMENT OF PROFIT OR LOSS AND OTHER COMPREHENSIVE INCOME
1-Jul-2018to 20-Mar-2019
1-Jul-2017to 31-Mar-2018
(Unaudited)$’000 $’000
Profit/(loss) after income tax . . . . . . . . . . . . . . . . . . . . . . . . . . . . . . . . . . . . (15,327) (7,170)
Total comprehensive income/(loss)1 . . . . . . . . . . . . . . . . . . . . . . . . . . . . (15,327) (7,170)
1 Total comprehensive loss for the parent company for the period ended 20 March 2019 includes corporate activity costs of$16.6m.
NOTE 22. EVENTS AFTER THE REPORTING PERIOD
Since the end of the period, other than the matters disclosed above, the Directors are not awareof any matter or circumstance not otherwise dealt within the Financial Statements that has significantlyor may significantly affect the operations of the Group, or state of the Group’s affairs in futurefinancial periods.
NOTE 23. INTERESTS IN SUBSIDIARIES
The subsidiaries listed below have either share capital consisting solely of ordinary shares orunits in unit trusts, which are held directly by the Group. The proportion of ownership interests heldequals the voting rights held by the Group. Each subsidiary’s principal place of business and country ofincorporation or registration is Australia.
Subsidiary financial statements used in the preparation of these consolidated financialstatements have also been prepared as at the same reporting date as the Group’s financial statements.
Parent Entity:
Propertylink (Holdings) Ltd (stapled entities - Propertylink Trust and Propertylink AustralianIndustrial Partnership)
Subsidiaries of Propertylink (Holdings) Ltd Controlled entities of Propertylink Trust
20-Mar- 30-Jun- 20-Mar- 30-Jun-2019 2018 2019 2018
% % % %
Propertylink Trust . . . . . . . . . . .0% 0%
Propertylink OfficePartnership Trust . . . . . . . . 100% 100%
(100% NCI) (100% NCI) POP II PT . . . . . . . . . . . . . . . 100% 100%Propertylink Australian
Industrial Partnership . . . . . . 0% 0% PAIP II PT . . . . . . . . . . . . . . . 100% 100%(100% NCI) (100% NCI) POP III PT . . . . . . . . . . . . . . . 100% 100%
Propertylink FundsManagement Pty Ltd . . . . . . . 100% 100% PEP PT . . . . . . . . . . . . . . . . . 100% 100%
II-B-38

APPENDIX II-B AUDITED FINANCIAL STATEMENTS ON PROPERTYLINKFOR THE PERIOD FROM 1 JULY 2018 TO 20 MARCH 2019
PROPERTYLINK GROUPNOTES TO THE FINANCIAL STATEMENTS
OTHER DISCLOSURES (continued)20-Mar- 30-Jun- 20-Mar- 30-Jun-
2019 2018 2019 2018
% % % %
Propertylink AdminManagement Pty Ltd . . . . . . . 100% 100% 50 Ann PEP PT . . . . . . . . . . . 100% 100%
Propertylink Capital Pty Ltd . . . 100% 100% PURP PT . . . . . . . . . . . . . . . . 100% 100%Propertylink Services
Management Pty Ltd . . . . . . . 100% 100%Propertylink Investment
Management Ltd . . . . . . . . . . 100% 100%Infralink (Australasia) Pty
Ltd . . . . . . . . . . . . . . . . . . . . . 100% 100%MITSA Pty Ltd . . . . . . . . . . . . . 100% 100%Propertylink (Australasia) Pty
Ltd . . . . . . . . . . . . . . . . . . . . . 100% 100%Propertylink WIM Pty Ltd . . . . 100% 100%Propertylink PAIP Pty Ltd . . . . 100% 100%Propertylink Nominees Pty
Ltd . . . . . . . . . . . . . . . . . . . . . 100% 100%BBR 15 Pty Ltd . . . . . . . . . . . . . 100% 100%PAIP II MA Nominees Pty
Ltd . . . . . . . . . . . . . . . . . . . . . 100% 100%PAIP II BA Nominees Pty
Ltd . . . . . . . . . . . . . . . . . . . . . 100% 100%PEP Nominees I Pty Ltd . . . . . . 100% 100%PEP Nominees II Pty Ltd . . . . . 100% 100%PEP Nominees III Pty Ltd . . . . . 100% 100%PURP Nominees I Pty Ltd . . . . 100% 100%PURP Nominees II Pty Ltd . . . . 100% 100%PURP PHL Trust . . . . . . . . . . . . 100% 100%PHL N Orion Road Trust
No 2 . . . . . . . . . . . . . . . . . . . . 100% 100%Propertylink Employee
Incentive Plan Trust . . . . . . . 100% 100%
Controlled entities of Propertylink Australian Industrial Partnership20-Mar-
201930-Jun-2018
20-Mar-2019
30-Jun-2018
% % % %
PHL Hold Trust . . . . . . . . . . . . .100% 100%
PAIP N Niagala CloseTrust . . . . . . . . . . . . . . . . . 100% 100%
PHL Hold Trust 2 . . . . . . . . . . .100% 100%
PAIP N Orielton RoadTrust . . . . . . . . . . . . . . . . . 100% 100%
PHL NW Trust . . . . . . . . . . . . .100% 100%
PAIP N Rodborough RoadTrust No 1 . . . . . . . . . . . . . 100% 100%
PHL V Trust . . . . . . . . . . . . . . .100% 100%
PAIP N Rodborough RoadTrust No 2 . . . . . . . . . . . . . 100% 100%
PHL Q Trust . . . . . . . . . . . . . . . 100% 100% PAIP V Cherry Lane Trust . . 100% 100%PHL DX Trust . . . . . . . . . . . . . . 100% 100% PAIP V Lakes Drive Trust . . 100% 100%PHL MM Trust . . . . . . . . . . . . . 100% 100% PAIP V Main Road Trust . . . 100% 100%
II-B-39

APPENDIX II-B AUDITED FINANCIAL STATEMENTS ON PROPERTYLINKFOR THE PERIOD FROM 1 JULY 2018 TO 20 MARCH 2019
PROPERTYLINK GROUPNOTES TO THE FINANCIAL STATEMENTS
OTHER DISCLOSURES (continued)20-Mar-
201930-Jun-2018
20-Mar-2019
30-Jun-2018
% % % %
PHL U Trust . . . . . . . . . . . . . . .100% 100%
PAIP V Mt Derrimut RoadTrust . . . . . . . . . . . . . . . . . 100% 100%
PHL N Orion Road TrustNo 1 . . . . . . . . . . . . . . . . . . . . 100% 100%
PAIP V Ricketts RoadTrust . . . . . . . . . . . . . . . . . 100% 100%
PAIP Holdco Pty Ltd . . . . . . . . .100% —
PAIP V Strezlecki AvenueTrust . . . . . . . . . . . . . . . . . 100% 100%
PAIP N Airds Road Trust . . . . . 100% 100% PAIP V Taryn Drive Trust . . 100% 100%PAIP N Boundary Road
Trust . . . . . . . . . . . . . . . . . . . 100% 100%PAIP V Whiteside Road
Trust . . . . . . . . . . . . . . . . . 100% 100%PAIP N Brunker Road Trust . . .
100% 100%PAIP V Woodlands Drive
Trust . . . . . . . . . . . . . . . . . 100% 100%PAIP N Gundah Road Trust . . .
100% 100%PAIP WA Leadership Way
Trust . . . . . . . . . . . . . . . . . 100% 100%PAIP N Mandarin Street
Trust . . . . . . . . . . . . . . . . . . . 100% 100%PAIP WA McDow ell Street
Trust . . . . . . . . . . . . . . . . . 100% 100%PAIP N New ton Road Trust
No 1 . . . . . . . . . . . . . . . . . . . . 100% 100%PAIP WA Modal Crescent
Trust . . . . . . . . . . . . . . . . . 100% 100%PAIP N New ton Road Trust
No 2 . . . . . . . . . . . . . . . . . . . . 100% 100%
NOTE 24. COMPANY DETAILS
The registered office of the company is
Level 29, 20 Bond Street
SYDNEY NSW 2000
II-B-40

APPENDIX II-B AUDITED FINANCIAL STATEMENTS ON PROPERTYLINKFOR THE PERIOD FROM 1 JULY 2018 TO 20 MARCH 2019
PROPERTYLINK GROUPDIRECTORS’ DECLARATION
In accordance with a resolution of Propertylink (Holdings) Limited, the Directors declare that:
1. The Financial Statements and notes, as set out on pages II-B-1 to II-B-40:
(a) comply with Australian Accounting Standards, which, as stated in the “About thisReport” section of the Financial Statements, constitutes compliance with InternationalFinancial Reporting Standards (IFRS); and
(b) give a true and fair view of the financial position as at 20 March 2019 and of theperformance for the period ended on that date of the consolidated group.
2. In the Directors’ opinion there are reasonable grounds to believe that the company will beable to pay its debts as and when they become due and payable.
Philip Pearce
Director, Chief Executive OfficerDateOctober 22, 2019
II-B-41

APPENDIX II-B AUDITED FINANCIAL STATEMENTS ON PROPERTYLINKFOR THE PERIOD FROM 1 JULY 2018 TO 20 MARCH 2019
Independent Auditor’s Report to the Directors of Propertylink Group
We set out below our report on the interim financial report (the “Stapled Group InterimFinancial Report”) of Propertylink Group (the “Stapled Group”) comprising the consolidated statementof financial position as at 20 March 2019, the consolidated statement of profit or loss and othercomprehensive income, consolidated statement of changes in equity and consolidated statement of cashflows for the period from 1 July 2018 to 20 March 2019, together with the notes thereto prepared onthe basis set out in the Basis of preparation note of the Stapled Group Interim Financial Report, forinclusion in the prospectus of ESR Cayman Ltd dated October 22, 2019 (the “Prospectus”).
The Stapled Group comprises Propertylink (Holdings) Limited, Propertylink Trust andPropertylink Australian Industrial Partnership and the entities controlled by them as at 20 March 2019or from time to time during the period from 1 July 2018 to 20 March 2019.
Opinion
We have audited the Stapled Group Interim Financial Report of the Stapled Group as at20 March 2019 and for the period then ended.
In our opinion the accompanying Stapled Group Interim Financial Report comprising theconsolidated statement of financial position as at 20 March 2019, the consolidated statement of profitor loss and other comprehensive income, consolidated statement of changes in equity and consolidatedstatement of cash flows for the period from 1 July 2018 to 20 March 2019 of the Stapled Group,together with the notes thereto are prepared, in all material respects in accordance with the basis ofpreparation set out in the Basis of preparation note of the Stapled Group Interim Financial Report.
Basis for Opinion
We conducted our audit in accordance with Australian Auditing Standards. Our responsibilitiesunder those standards are further described in the Auditor’s Responsibilities for the Audit of the InterimFinancial Report section of our report. We are independent of the Stapled Group in accordance withthe ethical requirements of the Accounting Professional and Ethical Standards Board’s APES 110Code of Ethics for Professional Accountants (the “Code”) that are relevant to our audit of the StapledGroup Interim Financial Report in Australia. We have also fulfilled our other ethical responsibilities inaccordance with the Code.
We believe that the audit evidence we have obtained is sufficient and appropriate to provide abasis for our opinion.
Other Matter
The Stapled Group Interim Financial Report has been prepared for the period from 1 July 2018to 20 March 2019. The corresponding prior period comparatives for the interim period comprising theconsolidated statement of profit or loss and other comprehensive income, consolidated statement ofchanges in equity and consolidated statement of cash flows of the Stapled Group for the period from1 July 2017 to 31 March 2018, together with the notes thereto was not subject to an audit as there wasno financial reporting requirement for that comparative interim period.
II-B-42

APPENDIX II-B AUDITED FINANCIAL STATEMENTS ON PROPERTYLINKFOR THE PERIOD FROM 1 JULY 2018 TO 20 MARCH 2019
Independent Auditor’s Report to the Directors of Propertylink Group (continued)
Responsibilities of the Directors for the Stapled Group Interim Financial Report
The directors of the Stapled Group are responsible for the preparation of the Stapled GroupInterim Financial Report that is prepared in accordance with the basis of preparation set out in theBasis of preparation note of the Stapled Group Interim Financial Report and for such internal control asthe directors determine is necessary to enable the preparation of the Stapled Group Interim FinancialReport that is prepared in accordance with the basis of preparation and is free from materialmisstatement whether due to fraud or error.
The directors have prepared the Stapled Group Interim Financial Report in accordance with therequirements of AASB 134 Interim Financial Reporting (“AASB 134”) issued by the AustralianAccounting Standards Board (“AASB”) and also complies with IAS 34 Interim Financial Reportingissued by the International Accounting Standards Board (“IASB”). The Stapled Group InterimFinancial Report complies with the recognition and measurement criteria of Australian AccountingStandards and other authoritative pronouncements issued by the AASB, which also complies with therecognition and measurement criteria of International Financial Reporting Standards issued by theIASB.
In preparing the Stapled Group Interim Financial Report, the directors are responsible forassessing the Stapled Group’s ability to continue as a going concern, disclosing, as applicable, mattersrelating to going concern and using the going concern basis of accounting unless the directors eitherintend to liquidate the Stapled Group or to cease operations, or have no realistic alternative but to doso.
Auditor’s Responsibilities for the Audit of the Interim Financial Report
Our objectives are to obtain reasonable assurance about whether the Stapled Group InterimFinancial Report as a whole is free from material misstatement, whether due to fraud or error, and toissue an auditor’s report that includes our opinion. Reasonable assurance is a high level of assurance,but is not a guarantee that an audit conducted in accordance with the Australian Auditing Standardswill always detect a material misstatement when it exists. Misstatements can arise from fraud or errorand are considered material if, individually or in the aggregate, they could reasonably be expected toinfluence the economic decisions of users taken on the basis of this interim financial report.
As part of an audit in accordance with the Australian Auditing Standards, we exerciseprofessional judgment and maintain professional scepticism throughout the audit. We also:
Š Identify and assess the risks of material misstatement of the Stapled Group InterimFinancial Report, whether due to fraud or error, design and perform audit proceduresresponsive to those risks, and obtain audit evidence that is sufficient and appropriate toprovide a basis for our opinion. The risk of not detecting a material misstatement resultingfrom fraud is higher than for one resulting from error, as fraud may involve collusion,forgery, intentional omissions, misrepresentations, or the override of internal control.
Š Obtain an understanding of internal control relevant to the audit in order to design auditprocedures that are appropriate in the circumstances, but not for the purpose of expressingan opinion on the effectiveness of the Stapled Group’s internal control.
II-B-43

APPENDIX II-B AUDITED FINANCIAL STATEMENTS ON PROPERTYLINKFOR THE PERIOD FROM 1 JULY 2018 TO 20 MARCH 2019
Independent Auditor’s Report to the Directors of Propertylink Group (continued)
Š Evaluate the appropriateness of accounting policies used and the reasonableness ofaccounting estimates and related disclosures made by the directors.
Š Conclude on the appropriateness of the directors’ use of the going concern basis ofaccounting and, based on the audit evidence obtained, whether a material uncertaintyexists related to events or conditions that may cast significant doubt on the StapledGroup’s ability to continue as a going concern. If we conclude that a material uncertaintyexists, we are required to draw attention in our auditor’s report to the related disclosures inthe Stapled Group Interim Financial Report or, if such disclosures are inadequate, tomodify our opinion. Our conclusions are based on the audit evidence obtained up to thedate of our auditor’s report. However, future events or conditions may cause the StapledGroup to cease to continue as a going concern.
Š Obtain sufficient appropriate audit evidence regarding the financial information of theentities or business activities within the Stapled Group in order to express an opinion onthe Stapled Group Interim Financial Report. We are responsible for the direction,supervision and performance of the Stapled Group audit. We remain solely responsible forour audit opinion.
We communicate with the directors regarding, among other matters, the planned scope andtiming of the audit and significant audit findings, including any significant deficiencies in internalcontrol that we identify during our audit.
We also provide the directors with a statement that we have complied with relevant ethicalrequirements regarding independence, and to communicate with them all relationships and othermatters that may reasonably be thought to bear on our independence, and where applicable, relatedsafeguards.
Ernst & Young
St Elmo WilkenPartner
SydneyOctober 22, 2019
II-B-44
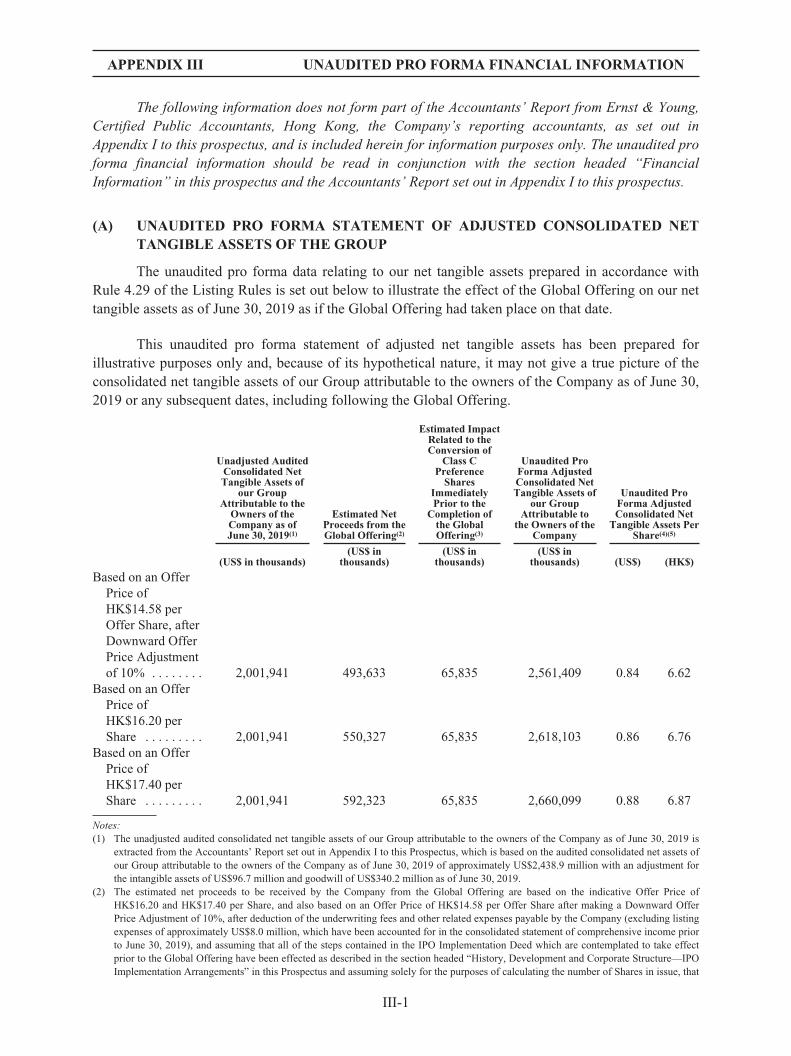
APPENDIX III UNAUDITED PRO FORMA FINANCIAL INFORMATION
The following information does not form part of the Accountants’ Report from Ernst & Young,Certified Public Accountants, Hong Kong, the Company’s reporting accountants, as set out inAppendix I to this prospectus, and is included herein for information purposes only. The unaudited proforma financial information should be read in conjunction with the section headed “FinancialInformation” in this prospectus and the Accountants’ Report set out in Appendix I to this prospectus.
(A) UNAUDITED PRO FORMA STATEMENT OF ADJUSTED CONSOLIDATED NETTANGIBLE ASSETS OF THE GROUP
The unaudited pro forma data relating to our net tangible assets prepared in accordance withRule 4.29 of the Listing Rules is set out below to illustrate the effect of the Global Offering on our nettangible assets as of June 30, 2019 as if the Global Offering had taken place on that date.
This unaudited pro forma statement of adjusted net tangible assets has been prepared forillustrative purposes only and, because of its hypothetical nature, it may not give a true picture of theconsolidated net tangible assets of our Group attributable to the owners of the Company as of June 30,2019 or any subsequent dates, including following the Global Offering.
Unadjusted AuditedConsolidated NetTangible Assets of
our GroupAttributable to the
Owners of theCompany as ofJune 30, 2019(1)
Estimated NetProceeds from theGlobal Offering(2)
Estimated ImpactRelated to theConversion of
Class CPreferenceShares
ImmediatelyPrior to the
Completion ofthe GlobalOffering(3)
Unaudited ProForma AdjustedConsolidated NetTangible Assets of
our GroupAttributable to
the Owners of theCompany
Unaudited ProForma AdjustedConsolidated Net
Tangible Assets PerShare(4)(5)
(US$ in thousands)(US$ in
thousands)(US$ in
thousands)(US$ in
thousands) (US$) (HK$)
Based on an OfferPrice ofHK$14.58 perOffer Share, afterDownward OfferPrice Adjustmentof 10% . . . . . . . . 2,001,941 493,633 65,835 2,561,409 0.84 6.62
Based on an OfferPrice ofHK$16.20 perShare . . . . . . . . . 2,001,941 550,327 65,835 2,618,103 0.86 6.76
Based on an OfferPrice ofHK$17.40 perShare . . . . . . . . . 2,001,941 592,323 65,835 2,660,099 0.88 6.87
Notes:(1) The unadjusted audited consolidated net tangible assets of our Group attributable to the owners of the Company as of June 30, 2019 is
extracted from the Accountants’ Report set out in Appendix I to this Prospectus, which is based on the audited consolidated net assets ofour Group attributable to the owners of the Company as of June 30, 2019 of approximately US$2,438.9 million with an adjustment forthe intangible assets of US$96.7 million and goodwill of US$340.2 million as of June 30, 2019.
(2) The estimated net proceeds to be received by the Company from the Global Offering are based on the indicative Offer Price ofHK$16.20 and HK$17.40 per Share, and also based on an Offer Price of HK$14.58 per Offer Share after making a Downward OfferPrice Adjustment of 10%, after deduction of the underwriting fees and other related expenses payable by the Company (excluding listingexpenses of approximately US$8.0 million, which have been accounted for in the consolidated statement of comprehensive income priorto June 30, 2019), and assuming that all of the steps contained in the IPO Implementation Deed which are contemplated to take effectprior to the Global Offering have been effected as described in the section headed “History, Development and Corporate Structure—IPOImplementation Arrangements” in this Prospectus and assuming solely for the purposes of calculating the number of Shares in issue, that
III-1

APPENDIX III UNAUDITED PRO FORMA FINANCIAL INFORMATION
the Listing Date is Friday, November 1, 2019. The calculation of net proceeds mentioned in the section headed “Future Plans and Use ofProceeds” in this Prospectus represents the estimated gross proceeds less all listing expenses (including such amounts already incurred in2018 and 2019).
(3) Immediately prior to the completion of the Global Offering, 49,071,962 of the Class C Preference Shares will be converted into Class CShares, after which the carrying amounts of US$65.8 million recorded as a liability of the Company will be transferred to the Company’sequity. Accordingly, for the purpose of the unaudited pro forma financial information, the unaudited pro forma adjusted net tangibleassets attributable to the owners of the Company will be increased by US$65.8 million, being the carrying amounts of such Class CPreference Shares as of June 30, 2019.
(4) The unaudited pro forma adjusted net tangible assets per Share is arrived at after the adjustments referred to in the preceding paragraphsand on the basis that 3,036,243,839 Shares, 3,036,901,934 Shares and 3,035,183,478 Shares were in issue (including 280,140,000 NewShares) based on an Offer Price of HK$16.20 per Share, HK$17.40 per Share or HK$14.58 per Share, being the final Offer Price underthe Downward Offer Price Adjustment, respectively, and assuming that all of the steps contained in the IPO Implementation Deed whichare contemplated to take effect pursuant to such agreement have been effected as described in the section headed “History, Developmentand Corporate Structure—IPO Implementation Arrangements” in this Prospectus and assuming solely for the purposes of calculating thenumber of Shares in issue, that the Listing Date is Friday, November 1, 2019.
(5) Save as aforesaid, no adjustment has been made to the unaudited pro forma adjusted net tangible assets to reflect any trading results orother transactions of our Group entered into subsequently to June 30, 2019.
(B) LETTER FROM THE REPORTING ACCOUNTANTS ON THE UNAUDITED PROFORMA FINANCIAL INFORMATION
The following is the text of a report received from our independent reporting accountants, Ernst& Young, Certified Public Accountants, Hong Kong, prepared for the purpose of incorporation in thisprospectus, in respect of the unaudited pro forma financial information of the Group.
22/F, CITIC Tower,1 Tim Mei Avenue,Central, Hong Kong
October 22, 2019
The DirectorsESR Cayman Limited
Dear Sirs,
We have completed our assurance engagement to report on the compilation of pro formafinancial information of ESR Cayman Limited (the “Company”) and its subsidiaries (hereinaftercollectively referred to as the “Group”) by the directors of the Company (the “Directors”) forillustrative purposes only. The pro forma financial information consists of the pro forma consolidatednet tangible assets as at June 30, 2019, and related notes as set out in Part A of Appendix III to thisProspectus issued by the Company (the “Pro Forma Financial Information”). The applicable criteria onthe basis of which the Directors have compiled the Pro Forma Financial Information are described innote in Part A of Appendix III to this Prospectus.
The Pro Forma Financial Information has been compiled by the Directors to illustrate theimpact of the global offering of shares of the Company on the Group’s financial position as at June 30,2019 as if the transaction had taken place at June 30, 2019. As part of this process, information aboutthe Group’s financial position, has been extracted by the Directors from the Group’s financialstatements for the period ended June 30, 2019, on which an accountants’ report has been published.
III-2

APPENDIX III UNAUDITED PRO FORMA FINANCIAL INFORMATION
Directors’ responsibility for the Pro Forma Financial Information
The Directors are responsible for compiling the Pro Forma Financial Information in accordancewith paragraph 4.29 of the Rules Governing the Listing of Securities on The Stock Exchange of HongKong Limited (the “Listing Rules”) and with reference to Accounting Guideline 7 “Preparation of ProForma Financial Information for Inclusion in Investment Circulars” issued by the Hong Kong Instituteof Certified Public Accountants (the “HKICPA”).
Our independence and quality control
We have complied with the independence and other ethical requirement of the Code of Ethicsfor Professional Accountants issued by the HKICPA, which is founded on fundamental principles ofintegrity, objectivity, professional competence and due care, confidentiality and professional behavior.
The firm applies Hong Kong Standard on Quality Control 1 Quality Control for Firms thatPerform Audits and Reviews of Financial Statements, and Other Assurance and Related ServicesEngagements and accordingly maintains a comprehensive system of quality control includingdocumented policies and procedures regarding compliance with ethical requirements, professionalstandards and applicable legal and regulatory requirements.
Reporting Accountants’ responsibilities
Our responsibility is to express an opinion, as required by paragraph 4.29(7) of the ListingRules, on the Pro Forma Financial Information and to report our opinion to you. We do not accept anyresponsibility for any reports previously given by us on any financial information used in thecompilation of the Pro Forma Financial Information beyond that owed to those to whom those reportswere addressed by us at the dates of their issue.
We conducted our engagement in accordance with Hong Kong Standard on AssuranceEngagements 3420 Assurance Engagements to Report on the Compilation of Pro Forma FinancialInformation Included in a Prospectus issued by the HKICPA. This standard requires that the reportingaccountants comply with ethical requirements and plan and perform procedures to obtain reasonableassurance about whether the Directors have compiled the Pro Forma Financial Information, inaccordance with paragraph 4.29 of the Listing Rules and with reference to Accounting Guideline 7“Preparation of Pro Forma Financial Information for Inclusion in Investment Circulars” issued byHKICPA.
For purposes of this engagement, we are not responsible for updating or reissuing any reports oropinions on any historical financial information used in compiling the Pro Forma FinancialInformation, nor have we, in the course of this engagement, performed an audit or review of thefinancial information used in compiling the Pro Forma Financial Information.
The purpose of Pro Forma Financial Information included in the Prospectus is solely toillustrate the impact of the global offering of shares of the Company on unadjusted financialinformation of the Group as if the transaction had been undertaken at an earlier date selected forpurposes of the illustration. Accordingly, we do not provide any assurance that the actual outcome ofthe transaction would have been as presented.
III-3

APPENDIX III UNAUDITED PRO FORMA FINANCIAL INFORMATION
A reasonable assurance engagement to report on whether the Pro Forma Financial Informationhas been properly compiled on the basis of the applicable criteria involves performing procedures toassess whether the applicable criteria used by the Directors in the compilation of the Pro FormaFinancial Information provide a reasonable basis for presenting the significant effects directlyattributable to the transaction, and to obtain sufficient appropriate evidence about whether:
Š The related pro forma adjustments give appropriate effect to those criteria; and
Š The Pro Forma Financial Information reflects the proper application of those adjustmentsto the unadjusted financial information.
The procedures selected depend on the reporting accountants’ judgment, having regard to thereporting accountants’ understanding of the nature of the Group, the transaction in respect of which thePro Forma Financial Information has been compiled, and other relevant engagement circumstances.
The engagement also involves evaluating the overall presentation of the Pro Forma FinancialInformation.
We believe that the evidence we have obtained is sufficient and appropriate to provide a basisfor our opinion.
Opinion
In our opinion:
(a) the Pro Forma Financial Information has been properly compiled on the basis stated;
(b) such basis is consistent with the accounting policies of the Group; and
(c) the adjustments are appropriate for the purpose of the Pro Forma Financial Information asdisclosed pursuant to paragraph 4.29(1) of the Listing Rules.
Yours faithfully,
Ernst & YoungCertified Public AccountantsHong Kong
III-4
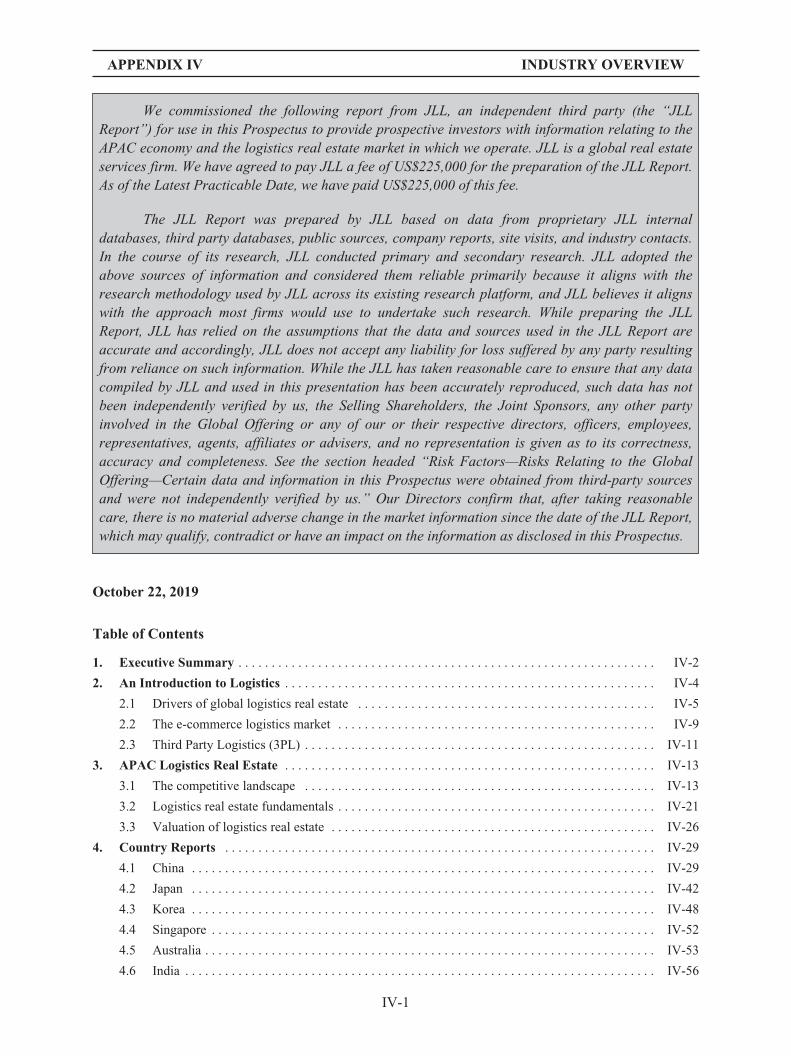
APPENDIX IV INDUSTRY OVERVIEW
We commissioned the following report from JLL, an independent third party (the “JLLReport”) for use in this Prospectus to provide prospective investors with information relating to theAPAC economy and the logistics real estate market in which we operate. JLL is a global real estateservices firm. We have agreed to pay JLL a fee of US$225,000 for the preparation of the JLL Report.As of the Latest Practicable Date, we have paid US$225,000 of this fee.
The JLL Report was prepared by JLL based on data from proprietary JLL internaldatabases, third party databases, public sources, company reports, site visits, and industry contacts.In the course of its research, JLL conducted primary and secondary research. JLL adopted theabove sources of information and considered them reliable primarily because it aligns with theresearch methodology used by JLL across its existing research platform, and JLL believes it alignswith the approach most firms would use to undertake such research. While preparing the JLLReport, JLL has relied on the assumptions that the data and sources used in the JLL Report areaccurate and accordingly, JLL does not accept any liability for loss suffered by any party resultingfrom reliance on such information. While the JLL has taken reasonable care to ensure that any datacompiled by JLL and used in this presentation has been accurately reproduced, such data has notbeen independently verified by us, the Selling Shareholders, the Joint Sponsors, any other partyinvolved in the Global Offering or any of our or their respective directors, officers, employees,representatives, agents, affiliates or advisers, and no representation is given as to its correctness,accuracy and completeness. See the section headed “Risk Factors—Risks Relating to the GlobalOffering—Certain data and information in this Prospectus were obtained from third-party sourcesand were not independently verified by us.” Our Directors confirm that, after taking reasonablecare, there is no material adverse change in the market information since the date of the JLL Report,which may qualify, contradict or have an impact on the information as disclosed in this Prospectus.
October 22, 2019
Table of Contents
1. Executive Summary . . . . . . . . . . . . . . . . . . . . . . . . . . . . . . . . . . . . . . . . . . . . . . . . . . . . . . . . . . . . . . . IV-2
2. An Introduction to Logistics . . . . . . . . . . . . . . . . . . . . . . . . . . . . . . . . . . . . . . . . . . . . . . . . . . . . . . . . IV-4
2.1 Drivers of global logistics real estate . . . . . . . . . . . . . . . . . . . . . . . . . . . . . . . . . . . . . . . . . . . . . IV-5
2.2 The e-commerce logistics market . . . . . . . . . . . . . . . . . . . . . . . . . . . . . . . . . . . . . . . . . . . . . . . . IV-9
2.3 Third Party Logistics (3PL) . . . . . . . . . . . . . . . . . . . . . . . . . . . . . . . . . . . . . . . . . . . . . . . . . . . . . IV-11
3. APAC Logistics Real Estate . . . . . . . . . . . . . . . . . . . . . . . . . . . . . . . . . . . . . . . . . . . . . . . . . . . . . . . . IV-13
3.1 The competitive landscape . . . . . . . . . . . . . . . . . . . . . . . . . . . . . . . . . . . . . . . . . . . . . . . . . . . . . IV-13
3.2 Logistics real estate fundamentals . . . . . . . . . . . . . . . . . . . . . . . . . . . . . . . . . . . . . . . . . . . . . . . . IV-21
3.3 Valuation of logistics real estate . . . . . . . . . . . . . . . . . . . . . . . . . . . . . . . . . . . . . . . . . . . . . . . . . IV-26
4. Country Reports . . . . . . . . . . . . . . . . . . . . . . . . . . . . . . . . . . . . . . . . . . . . . . . . . . . . . . . . . . . . . . . . . IV-29
4.1 China . . . . . . . . . . . . . . . . . . . . . . . . . . . . . . . . . . . . . . . . . . . . . . . . . . . . . . . . . . . . . . . . . . . . . . IV-29
4.2 Japan . . . . . . . . . . . . . . . . . . . . . . . . . . . . . . . . . . . . . . . . . . . . . . . . . . . . . . . . . . . . . . . . . . . . . . IV-42
4.3 Korea . . . . . . . . . . . . . . . . . . . . . . . . . . . . . . . . . . . . . . . . . . . . . . . . . . . . . . . . . . . . . . . . . . . . . . IV-48
4.4 Singapore . . . . . . . . . . . . . . . . . . . . . . . . . . . . . . . . . . . . . . . . . . . . . . . . . . . . . . . . . . . . . . . . . . . IV-52
4.5 Australia . . . . . . . . . . . . . . . . . . . . . . . . . . . . . . . . . . . . . . . . . . . . . . . . . . . . . . . . . . . . . . . . . . . . IV-53
4.6 India . . . . . . . . . . . . . . . . . . . . . . . . . . . . . . . . . . . . . . . . . . . . . . . . . . . . . . . . . . . . . . . . . . . . . . . IV-56
IV-1

APPENDIX IV INDUSTRY OVERVIEW
1. Executive Summary
This Report examines the factors that drive demand for logistics properties in the macro- andsocio-economic context in Asia Pacific (APAC). In particular, the Report examines both the historicaland future growth potential of e-commerce and third-party logistics service providers (3PL serviceproviders), and their impact on the logistics sector within the region. At a country level, the Reportassesses the logistics real estate market in China, Japan, South Korea, Singapore, Australia and India—with a focus on three countries: China, Japan, and South Korea.
APAC has been leading global economic growth over the past 15 years, with real GDP percapita growing at a compound annual growth rate (CAGR) of 4.1% from 2013 to 2018, compared tothe 1.7% growth in the U.S. and 1.8% in the European Union over the same period1. We expect thistrend to continue. Six economies in APAC—China, Japan, South Korea, Singapore, Australia andIndia—account for close to 90% of the nominal GDP in APAC. The region’s rapid economicexpansion has been a key driver for the growth of the APAC logistics real estate market. Other keyfactors include continued population growth, a rising middle class driving higher spending andconsumption growth, rapid uptake of mobile technology and consumption, and e-commerce growth.E-commerce in particular is expected to help drive future expansion of APAC’s logistics sector.
The APAC logistics real estate market continues to develop, although differences in the scaleand maturity between markets can be wide. Some markets, such as Australia and Japan, are relativelymature, while others are in their early growth phase of development. At an aggregate level, thepotential for further development is high. The APAC logistics real estate market attracts both globaland regional players, helping to support expansion of the sector. More high specification modernlogistics facilities are expected to be built over the next few years, with logistics floor space growingrapidly in China, Japan, South Korea, and India.
Logistics services provided to e-commerce companies primarily include, among others,warehousing and fulfilment, contract logistics, express delivery, freight forwarding, and groundtransportation. With total annual revenue of US$ 120 billion2, APAC accounted for 42.9% of theglobal e-commerce logistics market in 2018, nearly one-third larger than the North American share of32.3% and nearly double that of Europe at 21.3%. By 2023, APAC is expected to account for one halfof the global market (49.7%).
Many consumer goods manufacturers and e-commerce companies choose to outsource theirlogistics operations, and engage contract logistics companies to design and manage supply chain,distribution and warehousing. The 3PL market is comprised of freight-forwarding and contractlogistics. Globally in 2018, contract logistics accounted for approximately 60% of the entire global3PL market, and is expected to account for a similar proportion in 2023. This growth is primarilydriven by continued demand for contract logistics in APAC, particularly in China, Japan, South Korea,Singapore, Australia, and India.
Changing consumer expectations for express delivery and last-mile services increase demandfrom e-commerce companies, retailers and 3PL service providers for modern logistics facilities locatedaround major urban centers and transport nodes. China’s Belt and Road Initiative has directedsignificant investment into ports, railways, highways, power plants and economic zones to the benefitof destination markets in APAC. Improving transportation infrastructure facilitates the growth of
1 Oxford Economics, August 2019.2 Transport Intelligence, 2019.
IV-2

APPENDIX IV INDUSTRY OVERVIEW
modern logistics real estate markets, particularly in countries with relatively low logistics space percapita, such as China, South Korea, and India. Per capita stock of logistics facilities in the six largestlogistics markets in the region (China, Japan, South Korea, Singapore, Australia, and India) currentlymeasures just 0.5 sqm, almost one-seventh of the per capita space available in the US3. However,logistics space in the six countries as a share of population or GDP remains much lower than that in theUS, and the supply of modern facilities4 as a percentage of total warehouse space is relatively small.
China
As the world’s second largest out-sourced contract logistics market with revenue of US$33.9 billion in 2018, second only to the US, the China market is expected to grow at a 2018-2023CAGR of 11.3%5. Since the mid-2000s, growth in China’s 3PL market has been driven by a number offactors, including: increasing domestic consumption, expansion in the retail sector (especially thee-commerce sector), a growing manufacturing sector, import and export growth, and World TradeOrganization-related policy changes.
Despite the rapid growth in demand, the supply of logistics space remains relatively limited ona per capita basis. Nonetheless, growth in China’s e-commerce sector continues to drive increasingdevelopment activity. Many global 3PL service providers have strategically planned their expansionaround expressways in gateway cities. This has been evident in cities such as Shanghai, Beijing andGuangzhou, where there has been a gradual convergence of rents between satellite cities of majorurban centers and those in second-tier cities.
Japan
Japan has the second largest stock of logistics facilities after China in APAC, but a largeportion of its logistics facilities are owned by corporates for captive use, and the percentage of modernlogistics facilities is relatively low. Consequently, there is strong demand for large modern logisticsfacilities, especially in the Greater Tokyo and the Greater Osaka areas. The vacancy rate in areas closeto major urban centers remains low, largely due to strong demand from e-commerce and 3PL serviceproviders.
South Korea
South Korea’s logistics market is relatively less mature when compared with Japan. Theprimary logistics hubs in South Korea are within the Seoul Capital Area, or the Greater Seoul region,which consists of Seoul, Incheon, and the Gyeonggi province encircling Seoul. Between 2000 and2017, the Seoul Metropolitan area accounted for over 50% of national GDP growth6. Increasing levelsof online shopping, demand from 3PL service providers, and a strong infrastructure network aredriving demand for modern logistics properties, leading to the overall growth of the modern logisticsmarket.
3 JLL estimates, government data, Oxford Economics, 2Q19.4 References to modern facilities in the report refer to Grade A standards. The classification of modern and non-modern warehousing can
be found in section 3.2.5 Transport Intelligence, 2019.6 Regions and Cities at a Glance 2018, Korea (OECD).
IV-3

APPENDIX IV INDUSTRY OVERVIEW
Singapore
The expansion of the 3PL sector remains a key driver of leasing demand in Singapore. The 3PLsector has been a big beneficiary of the rise of e-commerce. This trend is expected to continue,supported by greater adoption of online shopping by consumers and technological advancement.
Australia
Occupier demand remained strong nationwide7. Demand over 2019 has remained strong withindustrial floor space take-up levels on track to reach similar levels recorded over the past fouryears—that is, above the 10-year annual average of 2.1 million sqm. National take-up levels have sofar reached 1.2 million sqm in 1H19. The demand-supply dynamic is relatively balanced nationally,translating to a relatively robust rental growth rate. Overall activity continues to be led by Melbournewith the concentration of transactions in the transport, postal and warehousing sector. We alsorecorded a marked improvement in the demand environment in Perth. Demand in Sydney remains firm,while the Brisbane occupier market continues its recovery. On a y-o-y basis, national prime weightedrents grew by 3.7%, supported by quarterly 2Q19 growth of 1.6%. However, there are significantdifferences across markets and precincts, with growth led by the Sydney and Melbourne industrialmarkets.
India
The logistics sector remains relatively under-developed and has significant growth potential.The introduction of the Goods and Services Tax reforms, implemented on July 1, 2017, has numerousbenefits for the logistics sector. Robust economic growth, a young demographic profile, an expanding3PL sector, growth in last-mile delivery, and the integration of technology and automation intowarehousing and logistics space have created an emerging source of occupier demand and have helpedsupport leasing volume and take-up rates. For example, in the first half of 2019, total absorptionreached 435,990 sqm (4.69 million sq ft) in NCR Delhi, up over 41% from 307,321 sqm.
2. An Introduction to Logistics
Modern economies critically depend on the flow of goods and services, and the speed at whichgoods can get from manufacturers to consumers is a vital component of the global economy. Withoutaffordable and reliable transport of freight, manufacturers would not be able to effectively meet theconsumption needs of customers around the world from their facilities. Thus, logistics constitutes animportant part in the growth and development of economies. A number of APAC countries are near thetop of trade logistics performance globally8. Japan (ranked 5th place) and Singapore (7th place) forinstance are near the top of a global league of 160 countries in terms of logistics performance,alongside markets in Europe (e.g. Germany and the United Kingdom are ranked first and ninth,respectively) and the US (14th place). Australia (18th place) and industrial powerhouses such as SouthKorea (25th place) and China (26th place) also rank highly, while India (44th place) and Southeast Asiancountries are much further down the ladder. However, there is significant potential for improvementacross all these countries, driven by tailwinds of rapid economic growth, rising domestic consumption,strong population growth, and relatively high spending on infrastructure.
7 JLL considers Sydney, Melbourne, Brisbane, Perth, Adelaide, and Canberra as Australia’s tier 1 cities8 World Bank’s Logistics Performance Index 2018—a biennial survey that measures the quality of a country’s supply chain, and trade and
transport infrastructure.
IV-4

APPENDIX IV INDUSTRY OVERVIEW
Table 1: Key Economic indicators
Real GDPper capita, US$ Total Population
Average householdpersonal disposable
incomePrivate consumption,
nominal, US$
CAGR % . . . . . . . . . . . . . . . . . . . . . . . 2013-2018
2018-2023F
2013-2018
2018-2023F
2013-2018
2018-2023F
2013-2018
2018-2023F
APAC . . . . . . . . . . . . . . . . . . . . . . . . . . 4.1 3.8 0.8 0.7 n/a n/a n/a n/aChina . . . . . . . . . . . . . . . . . . . . . . . . . . 6.3 5.4 0.5 0.3 5.3 4.2 8.0 10.6Japan . . . . . . . . . . . . . . . . . . . . . . . . . . 1.2 1.0 -0.2 -0.3 0.5 0.4 -1.9 1.7South Korea . . . . . . . . . . . . . . . . . . . . . 2.6 2.3 0.4 0.3 2.0 1.1 3.6 4.2Singapore . . . . . . . . . . . . . . . . . . . . . . . 2.2 1.1 1.1 1.0 2.7 1.1 2.1 6.9Australia . . . . . . . . . . . . . . . . . . . . . . . . 1.0 1.0 1.6 1.5 0.1 1.3 -1.2 6.2India . . . . . . . . . . . . . . . . . . . . . . . . . . . 6.3 5.8 1.2 1.0 3.6 4.8 8.6 11.1United States . . . . . . . . . . . . . . . . . . . . 1.7 1.2 0.7 0.7 2.3 1.4 4.3 4.0European Union (ex. U.K.) . . . . . . . . . 1.8 1.3 0.2 0.1 n/a n/a n/a n/a
Source: Oxford Economics, August 2019
2.1 Drivers of global logistics real estate
Macro-trends at the global and regional levels are important to the development of the logisticssector. Economic growth, consumption and retail spending, and e-commerce (and through this, supplychain modernization) all underpin growth in the logistics sector and thus demand for logistics realestate.
i. Economic Growth
There is a strong correlation between GDP growth and demand for logistics real estate, as theeconomic climate typically affects real estate decisions. In 2018, APAC had a population over3.6 billion people (around 50% of global population) and GDP of over US$ 28.6 trillion (over 33% ofglobal GDP)9. GDP per capita is forecast to expand at a 2018-23 CAGR of 3.8%, primarily led bygrowth in China and India.
Figure 1 below shows the size of major economies around the world between 2002 and 2023.APAC surpassed the US and Europe as the strongest growth region after the 2008 global financialcrisis, with 2008-18 CAGR at 4.2% in real terms (compared to 0.7% for Europe and 1.0% for the US).While APAC and European nominal GDP was broadly the same in 2005, APAC will be nearly twicethe size by the end of 2018. Similarly, APAC was around the same size as that of the US in 2008;however, it is forecast to grow to around 170% of the size of the US economy by 2023. A positivedemographic profile, rising household income, urbanization, and technological changes have allallowed the region to be the fastest growing globally.
Six economies—China, Japan, South Korea, Singapore, Australia, and India—currentlyaccount for close to 90% of APAC’s GDP in nominal US$ terms (refer to footnote 1). Also noteworthyis the growth of China’s economy (the red column) relative to other Asian economies, accounting forover half of the region’s output.
9 Unless otherwise stated, all data on this page are from Oxford Economics, August 2019.
IV-5

APPENDIX IV INDUSTRY OVERVIEW
Figure 1: Asia Pacific vs. United States and Europe nominal GDP
0
5
10
15
20
25
30
35
40
45
2002 2005 2008 2011 2014 2018 2020 2023
trillion, US$
United States Eurozone China Japan India Australia ASEAN South Korea
ChinaUSD 21.6 tn
JapanUSD 5.4 tn
IndiaUSD 4.5 tn
ASEANUSD 4.5 tn
South KoreaUSD 2.1 tn
AustraliaUSD 1.9 tn
USUSD24.9tn
EZUSD16.4tn
Source: Oxford Economics, August 2019
ii. Consumption and retail spending
The rise of Asia’s middle class10 is expected to be a dominant economic theme in the upcomingdecade and beyond. The combined number of middle class households in China, Japan, South Korea,Singapore, Australia, and India more than doubled between 2007 and 2018, rising from 215 million to443 million. This is four times the number of US households within the same income bracket. Thenumber of middle class households within these six APAC countries is projected to rise further,increasing to 634 million by 2027 (CAGR of 4.1% from 2018—2027)11.
Figure 2: Number of middle class households by country
350,000
400,000 No. of households, 000’s
89,086
228,624
7.2%
361,119
6.4%
1.6%
China India Singapore
2007 2017 2027
South Korea Australia USA Japan
1.5%1.3%
0.2%
0.2%
55,512
118,529
193,078
1,092
1,355
1,509
14,985
18,122
20,025
7,155
8,238
9,201
93,690
97,038
98,200
47,16548,893
48,950
Figures in bracket refer to 2007-2027 CAGR
300,000
250,000
200,000
150,000
100,000
50,000
-
Source: Oxford Economics, August 2019.Note: Middle-class households are defined by JLL as those households with per-capita incomes between US$13.7 and US$137 per day in2015 PPP terms. This implies an annual income for a four-person household of US$20,000 to US$200,000. This definition is broadly in linewith the Brookings Institution, 2017.
10 Middle-class households are defined by JLL as those households with per capita incomes between US$13.7 and US$137 per day in 2015PPP terms. This implies an annual income for a four-person household of US$20,000 to US$200,000. This definition is broadly in linewith the Brookings Institution (The Unprecedented Expansion of the Global Middle Class, An Update, 2017).
11 JLL, Oxford Economics, August 2019.
IV-6

APPENDIX IV INDUSTRY OVERVIEW
Growth in number of middle class households and disposable income and consumption levelsare key factors driving logistics market growth. Average household personal disposable income almostdoubled in China, and has grown by around 50% in India over the past decade (based on constant 2015prices and purchasing power parity basis)12. This trend has played a key role in the growth of thelogistics facilities sector. For example, over the same period, total logistics facilities in select ChinaTier 1 cities13 increased by over 400%14.
Average household disposable income levels (on a purchasing power parity basis) are expectedto grow by a CAGR of 4.2% in China and by 4.8% in India between 2018 and 2027. As such, averagehousehold income in China may be much closer to the levels in Japan and South Korea by 2027. Thismay result in further growth in logistics real estate given the expected rise in consumption levels.
Figure 3: Average household disposable Income in US$ (in real terms and on a PPP basis)
0
20
40
60
80
100
120
140
160
180
Singapore
US$, PPP
2007 2018 2027
Figures in boxes refer to 2018-2027 CAGR
IndiaChinaJapanSouth KoreaAustraliaUnited States
Source: Oxford Economics, August 2019.^Estimated.
Going forward, APAC’s substantial middle class population coupled with rapid economicgrowth and rising income levels are expected to support rising consumption levels in the region.Private consumption in China, Japan, South Korea, Singapore, Australia, and India is forecast to growat a 2019-2023 CAGR of 8.1%. This is around two times the anticipated 4.0% growth in the US.
Growth in consumer spending, particularly spending on fast moving consumer goods (FMCG),food and beverages, and apparel, is helping support demand for logistics real estate. FMCG productsare often low value and are sold in very large volumes. In order to optimize transportation andinventory levels, well located large distribution facilities with high capacity are best suited fordistributing these types of goods.
Logistics demands of fashion manufacturers and retailers are also becoming moresophisticated. Logistics companies are now required to undertake services such as order preparation for
12 Unless otherwise stated, all data on this page are from Oxford Economics, August 2019.13 Greater Shanghai, Greater Beijing and Greater Guangzhou.14 JLL estimates (GFA) based on a combination of information from public sources, company reports, site visits, and industry contacts,
2Q18.
IV-7

APPENDIX IV INDUSTRY OVERVIEW
direct distribution, multi-country consolidation, quality control operations, and value-added servicessuch as labelling, tagging, and co-packing.
Figure 4: Nominal private consumption growth (%) vs. population growth (%), 2018 to 2023F
Australia, 25
China, 1,416
Germany, 83
India, 1,356
Japan, 127
Singapore, 6
South Korea, 51
United Kingdom, 67
United States, 328
0%
2%
4%
6%
8%
10%
12%
14%
16%
-0.4% 0.1% 0.6% 1.1% 1.6%
Priv
ate
Con
sum
ptio
n G
row
th (
CA
GR
%)
Population Growth (CAGR %)
Source: Oxford Economics, August 2019.Note: Bubble size indicates total population by 2018; figure (in millions) beside each country.
iii. E-commerce
E-Commerce is a positive tailwind for consumption-driven demand for logistics real estate.With consumers increasingly using the internet and mobile devices to purchase goods, E-commercesales have grown at a faster pace than sales in traditional brick and mortar stores. Online spendingcontinues to evolve and grow. This is helping to drive growth in overall consumer spending, supportedby rising average household income. As shopping habits continue to shift online, further growth isexpected.
The rise of e-commerce platforms globally is the result of a number of factors; includingeconomic growth, robust consumption patterns, greater access to the internet, advancements intechnology, globalization, advancement in supply chain management, and cost efficiencies.
Figure 5: The global e-commerce market in 2018 (US$ billion)
US, 504.6
China, 636.1
Japan, 122.5
Korea, 46.4
India, 22.1
Australia, 10.6Singapore, 2.4
-5.0
0.0
5.0
10.0
15.0
20.0
25.0
30.0
35.0
0.0 5.0 10.0 15.0 20.0 25.0 30.0 35.0
Online retail growth (% p.a.)
Online retail as a % of total retail sales
Source: Statista, calculations by Transport Intelligence, 2019.Note: Bubble size indicates on-line retail sales in 2018 (total, US$ billion), except Australia and Singapore in 2017.
IV-8

APPENDIX IV INDUSTRY OVERVIEW
Online retail sales as a proportion of total retail sales (online retail penetration) are steadilyincreasing in almost all global markets year-on-year. Globally, online retail sales growth in 2018exceeded 21.54% (as compared to 2017 levels)15. Even in developed markets such as the US, Japanand South Korea, growth exceeded 10%. Growth in emerging markets in Asia was generally muchhigher.
Retail e-commerce sales in the six monitored markets in APAC totaled US$ 840 billion in201816, which is greater than any other region. E-commerce now accounts for 18% of all retail sales inAPAC as compared to 10% globally, and this proportion is expected to rise further. E-commercegrowth in China is the fastest in the region, with year-on-year growth of about 27% in 2018, followedby growth of about 15% in Korea and Singapore and growth of about 10% in Australia, India andJapan. China is the world’s largest e-commerce market, accounting for close to one-fourth of theworld’s e-commerce sales in 2018. E-commerce in China accounts for nearly 30% of its total retailsales, a much higher share than that of the US (~10% of total retail sales).
Another feature of the APAC e-commerce market is the rise of mobile commerce(m-commerce)—the use of smartphones to make digital purchases. Increasing use of apps amongconsumers, particularly in China, makes m-commerce convenient and fast for users. Mobile commerceis expected to continue to grow. Higher levels of mobile penetration, increasing affordability ofsmartphones, robust consumption growth and an increasing willingness among users to consume socialmedia and a range of services and content online, as well as the advent of 5G will all support mobilecommerce growth. This may compound the demand for new logistics space in Asia.
In terms of mobile penetration of population, APAC is expected to see the subscriberpenetration rate increase from 66% to 72% between 2018 and 202517. The mobile penetration rate inChina is expected to rise from 82% of its population in 2017 to 85% in 2025, matching the level of theUS. The Indian mobile penetration rate is expected to rise from 53% to 63% during the same period(an increase of over 100 million new potential m-commerce consumers)17.
2.2 The e-commerce logistics market
The growth of e-commerce has had a significant impact on demand for logistics real estate.Typically, e-commerce firms use three times the logistics space of brick-and-mortar retailers18. This islargely due to a more extensive product range, greater inventory levels, larger outbound shipping spacerequirements, and increased reverse logistics (process returns).
E-Commerce includes pure-play online retailers, existing brick-and-mortar retailers with omni-channel strategies, and consumer-direct wholesalers and manufacturers. Retailers with e-commerceplatforms need flexible and agile supply chains in order to meet rising customers’ expectations fordelivery speed, quality, cost, and flexibility. Logistics supply chains therefore need to adapt to thisshift. E-commerce supply chains extend from regional distribution to last-mile deliveries, generatingbroad-based demand for logistics real estate at each stage. As e-commerce evolves further, demandmay grow for high quality logistics facilities, both at central distribution points and at more regionallyoriented last-mile delivery levels.
15 Unless otherwise stated, all data on this page are from Transport Intelligence, 2019.16 e-commerce sales in 2018, except Australia and Singapore in 2017.17 “The Mobile Economy 2018” and “The Mobile Economy 2019”, GSM Association18 E-Commerce and a New Demand Model for Logistics Real Estate, July 2014 (Prologis Research)
IV-9

APPENDIX IV INDUSTRY OVERVIEW
E-commerce logistics can be divided into two broad groups: warehousing & fulfilmentactivities, and outbound shipping and last-mile activities. Between 2011 and 2017, e-commercelogistics costs ranged between 10% and 27% of sales for select retailers19.
Revenue of the global e-commerce logistics market is valued at US$ 279.8 billion in 2018, or8.1% of the value of online retail sales globally. The growth rate of 18.2% between 2017 and 2018 isfar higher than other logistics segments such as freight forwarding and contract logistics. Revenue ofthe global e-commerce contract logistics market is expected to grow at an expected CAGR of 15%between 2018 and 2023, much higher than an expected CAGR of 6% in total retail contract logisticsrevenue globally20.
APAC was the leading region in the global e-commerce logistics market in 2018. With totalindustry revenue of US$ 120 billion, APAC accounted for 42.9% of the global market in 2018, nearlyone-third larger than the North American share of 32.3% and nearly double that of Europe at 21.3%.China constitutes the largest market globally, with its e-commerce logistics revenue ofUS$ 90.3 billion surpassing that of the US (US$ 86.6 billion) in 2018.
Figure 6: Global e-commerce logistics market revenue by region
Figures in boxes refer to 2018-2023 CAGR
billion, US$
0Asia Pacific North America
2018 2023
Europe
15.1%
8.6%
8.3%
50
100
150
200
250
300
Source: Transport Intelligence, 2019
Revenue of APAC’s e-commerce logistics market expanded by 22.9% in 2018. It is expected togrow at a 2018-2023 CAGR of 15.1%. Consequently, by 2023, APAC is expected to account forone-half of global revenue (49.7%). The relative importance of North America and Europe maydiminish over time, with these markets representing just 46.1% of the market in 2023 compared to53.6% in 2018. The growth in APAC is expected to be driven primarily by rising online retailpenetration, and rapidly improving infrastructure.
19 Transport Intelligence based on 2011-2017 data and derived from company reports covering general goods, grocery, fashion & luxurygoods retailers across AP, Europe and North America.
20 Unless otherwise stated, all data on this page are from Transport Intelligence, 2019.
IV-10
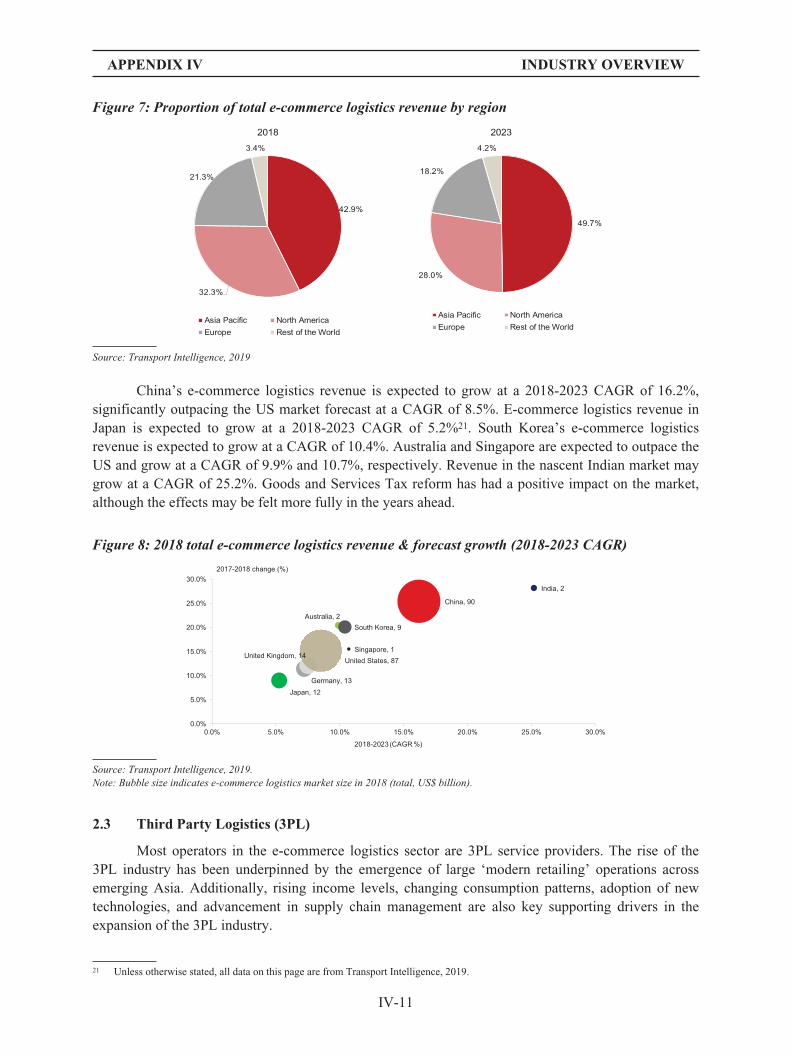
APPENDIX IV INDUSTRY OVERVIEW
Figure 7: Proportion of total e-commerce logistics revenue by region
42.9%
32.3%
21.3%
3.4%
2018
Asia Pacific North America
Europe Rest of the World
49.7%
28.0%
18.2%
4.2%
2023
Asia Pacific North America
Europe Rest of the World
Source: Transport Intelligence, 2019
China’s e-commerce logistics revenue is expected to grow at a 2018-2023 CAGR of 16.2%,significantly outpacing the US market forecast at a CAGR of 8.5%. E-commerce logistics revenue inJapan is expected to grow at a 2018-2023 CAGR of 5.2%21. South Korea’s e-commerce logisticsrevenue is expected to grow at a CAGR of 10.4%. Australia and Singapore are expected to outpace theUS and grow at a CAGR of 9.9% and 10.7%, respectively. Revenue in the nascent Indian market maygrow at a CAGR of 25.2%. Goods and Services Tax reform has had a positive impact on the market,although the effects may be felt more fully in the years ahead.
Figure 8: 2018 total e-commerce logistics revenue & forecast growth (2018-2023 CAGR)
Australia, 2
China, 90
Germany, 13
India, 2
Japan, 12
Singapore, 1
South Korea, 9
United Kingdom, 14United States, 87
0.0%
5.0%
10.0%
15.0%
20.0%
25.0%
30.0%
0.0% 5.0% 10.0% 15.0% 20.0% 25.0% 30.0%
2017-2018 change (%)
2018-2023 (CAGR %)
Source: Transport Intelligence, 2019.Note: Bubble size indicates e-commerce logistics market size in 2018 (total, US$ billion).
2.3 Third Party Logistics (3PL)
Most operators in the e-commerce logistics sector are 3PL service providers. The rise of the3PL industry has been underpinned by the emergence of large ‘modern retailing’ operations acrossemerging Asia. Additionally, rising income levels, changing consumption patterns, adoption of newtechnologies, and advancement in supply chain management are also key supporting drivers in theexpansion of the 3PL industry.
21 Unless otherwise stated, all data on this page are from Transport Intelligence, 2019.
IV-11

APPENDIX IV INDUSTRY OVERVIEW
Although some consumer goods and e-commerce firms manage their own logistics operations,many others rely on 3PL service providers to handle their distribution needs. Companies outsourcetransport and logistics operations because it is more expensive for them to operate their own fleet oftrucks and their own warehouses. Handing over this responsibility to a dedicated logistics providerallows companies to focus on their core business.
The 3PL market comprises of freight-forwarding and contract logistics. Currently, the level ofcontract logistics undertaken by logistics providers as a proportion of overall spending in logisticsoperations remains low in APAC. This is partly because there are relatively limited qualified locallogistics providers. As such, there may be room for more modern logistics providers to service theregion.
3PL revenue in APAC is projected to grow at a CAGR of around 6.9% between 2018 and 2023,almost triple the growth rate in North America and Europe (2018-2023 CAGR of 2.4% and 2.5%respectively). Globally, contract logistics accounted for about 60% of total 3PL revenue in 2018, whilefreight forwarding accounted for about 40%22.
Figure 9: Breakdown of global 3PL revenue by region
Asia Pacific Europe North America Global Asia Pacific Europe North America Global
61.6 69.251.3
195.7
83.3 76.155.9
230.1
134.7
85.964.2
304.2
0
50
100
150
200
250
300
350 billion, US$
2013 2018 2023F
Global contract logistics market
107.7 116.082.1
340.9
149.8 134.395.8
419.3
209.3
150.9108.4
515.2
0.0
100.0
200.0
300.0
400.0
500.0
600.0billion, US$
2013 2018 2023F
Global 3PL market
Source: Transport Intelligence, 2019
Table 2: Global 3PL revenue, historical and forecast growth rates
Global 3PL marketOf which: Global
contract logistics market
(% p.a.)2013-2018CAGR
2018-2023CAGR
2013-2018CAGR
2018-2023CAGR
APAC . . . . . . . . . . . . . . . . . . . . . . . . . . . . . . . . . . . . . . . . . . . . . . . . 6.8% 6.9% 7.9% 8.4%Europe . . . . . . . . . . . . . . . . . . . . . . . . . . . . . . . . . . . . . . . . . . . . . . . . 3.0% 2.4% 2.4% 2.9%North America . . . . . . . . . . . . . . . . . . . . . . . . . . . . . . . . . . . . . . . . . . 3.2% 2.5% 2.4% 2.1%Global . . . . . . . . . . . . . . . . . . . . . . . . . . . . . . . . . . . . . . . . . . . . . . . . 4.2% 4.2% 4.3% 4.7%
Source: Transport Intelligence, 2019.
i. Contract logistics market
The outsourcing of transport and logistics operations (most commonly warehousing anddistribution) by any company to a dedicated 3PL service provider is known as contract logistics.Companies outsource transport and logistics operations because it is typically more economical to hand
22 Unless otherwise stated, all data on this page are from Transport Intelligence, 2019.
IV-12

APPENDIX IV INDUSTRY OVERVIEW
over these functions to a dedicated logistics provider. Warehousing accounts for the greatest share ofglobal contract logistics revenue (45-55%). Transportation accounts for 35-45%, while value-addedservices constitute the remainder.
Globally, the outsourced contract logistics market (by revenue) is valued at US$ 241.4 billionin 2018. APAC is the largest regional contract logistics market, accounting for over one-third of theglobal market. In comparison, Europe’s market accounts for just under one-third of the global market,while North America’s market accounts for just under a quarter.
Figure 10: Global contract logistics revenue by region (2018)
Asia & Pacific Europe North America Rest of the World
37.3%
32.4%
23.9%
6.4%
Source: Transport Intelligence, 2019
Revenue of the APAC contract logistics market was valued at US$90.1 billion in 2018.23 Chinais the region’s largest market and grew by 12.5% in 2018, accounting for over half of overall regionalgrowth in 2018.
Going forward, global contract logistics industry revenue is forecast to grow at a 2018-2023CAGR of 4.7%. The potential for growth in APAC is large, and is projected to account for over 40% ofthe industry’s revenue globally by 2023. Regional markets including China and India are expected togrow at double-digit rates over the next five years. China is expected to account for 43.0% of theAPAC contract logistics revenue in 2023, up from 37.7% in 2018. The region is expected to accountfor six of the top ten markets globally in terms of contract logistics revenue growth, with China in firstplace, followed by India (second place), and with South Korea in seventh place.
3. APAC Logistics Real Estate
3.1 The competitive landscape
i. Transactional market
Investor interest in the APAC logistics sector has been gaining momentum in recent years. Newinvestors to the sector, coupled with the growth of assets under management from existing investorsand developers within the region, have created a competitive environment from both an investment anddevelopment standpoint. The depth of capital seeking investment into the sector has placed upwardpressure on land values and led to yield compression across most markets in the region.
23 Unless otherwise stated, all data on this page are from Transport Intelligence, 2019
IV-13

APPENDIX IV INDUSTRY OVERVIEW
More mature industrial markets like Australia and Japan have traditionally been some of thelargest beneficiaries of direct industrial sector investment. However, other markets in the region arenow attracting a deeper pool of investors. China, Korea and India, in particular, have recorded a greaterinflux of capital – both domestic and cross-border.
Investment demand is largely driven by the improving fundamentals of industrial markets andthe ongoing positive structural shifts in the sector. In particular, the expansion of e-commerceplatforms and rising requirements for 3PL services suggest increasing demand for industrial andlogistics space in the region.
Transaction volumes in the APAC industrial sector have been setting new records. Full-yearvolumes in 2017 grew by 34% compared with 2016. This momentum continued into 2018, reaching anall-time high of around US$ 31.0 billion24. Volumes have since moderated, with US$ 7.3 billiontransacted in the first half of 2019.
Figure 11: APAC logistics and industrial transaction volumes
25.0
30.0
35.0
0.0
5.0
10.0
15.0
20.0
2007 2008 2009 2010 2011 2012 2013 2014 2015 2016 2017 2018 2019*
billions, US$
Figures in boxes refer to annual total
14.5
8.76.8
12.314.6 14.6
20.1 19.917.6
16.6
22.4
31.0
7.3
Source: Real Capital Analytics, 2Q19.*1H19
Many institutional investors are also demanding scale and geographic diversification withintheir industrial exposure. As a result, specialist managers are moving into new markets, often with aview to undertake platform merger and acquisitions (M&A). Major capital investors are also lendingtheir support to specialist managers. Capital sources are increasingly partnering with expertise orspecialist managers with complementary skill sets and setting up joint ventures or separate accountinvestments.
Many institutional investors across North America, EMEA and APAC remain meaningfullyunder-invested to real estate, and their target allocation to the asset class may increase in the nearfuture.
The most preferred investment route into real estate is through private investment vehicles25.Most investors focus on the larger and more mature Australian and Japanese industrial markets.
24 Real Capital Analytics, 2Q19.25 ANREV Investment Intentions Surveys, 2018.
IV-14

APPENDIX IV INDUSTRY OVERVIEW
However, over the past few years, with the rapid influx of capital and new players into the sector,competition for opportunities is forcing investors to look beyond these markets and into the moreuntapped markets such as India, Southeast Asia and South Korea. Some notable examples includeinvestment vehicles managed by APG Group and CPPIB teaming up with ESR to develop logisticsfacilities in South Korea in 2015, and joint ventures between LOGOS and CPPIB and IvanhoeCambridge to invest in modern logistics real estate in Singapore and Indonesia in 2016. CPPIB alsopartnered with IndoSpace to develop product in India.
The private real estate funds landscape in APAC for logistics investments can be broadlysectioned into:
Š single country vehicles
Š pan-regional funds with an allocation to logistics
Given the complexities and regulatory regime governing the logistics sector in most markets,most single country logistics funds are established by domestic managers or pure-play operators whohave extensive experience and footprint in the targeted market. Over the last 12 to 18 months, there hasbeen increasing activity from several of these specialized players venturing into new markets orexpanding into existing ones. Globally, industrial funds raised US$ 54.7 billion in capital between2012 and 2017. APAC accounted for most of this (US$ 20.8 billion)—ahead of North America (US$18.7 billion) and Europe (US$ 9.9 billion)26. The significant amount of capital raised and theestablishment of follow-on vehicles indicate the sector’s growing appeal and the widening sources ofglobal and regional capital.
APAC open-end core funds are often the gateway vehicle for offshore investors to enter theregion as new entrants that seek low-risk investments. In the context of logistics, the strategy employedwould typically involve acquiring modern institutional-grade industrial facilities in prime locations. Astrategy further up the risk spectrum would see fund managers 1) tapping into assets in secondarylocations, 2) seeking assets that require value-add works, and 3) engaging in development projectssuch as build-to-core or build-to-suit.
ii. Logistics facilities overview
The APAC logistics real estate market continues to develop. Differences in the scale andmaturity between markets can be wide. Some markets, such as in Australia and Japan, are relativelymature, while others are in their early growth phase of development.
The APAC region still has significant growth potential. Developed markets such as the US andJapan have an average per capita stock of up to four sq.m. In contrast, Australia and Singapore haveper capita stock of just one to two sq.m on average. Per capita stock in South Korea, China and Indiaare even lower at less than one sq.m. Logistics real estate space per capita is lower across APAC, withper capita stock in China, Japan, South Korea, Singapore, Australia, and India measuring just 0.5 sqmin aggregate, almost one-seventh of the per capita space in the US27. As the APAC market matures, thelevel of logistics space required to serve the population is likely to rise, leading to greater requirementsfor logistics space.
26 PERE Research, 201827 Unless otherwise stated, all data on this page are JLL estimates based on a combination of information from public sources, company
reports, site visits, and industry contacts, Oxford Economics, April 2019.
IV-15
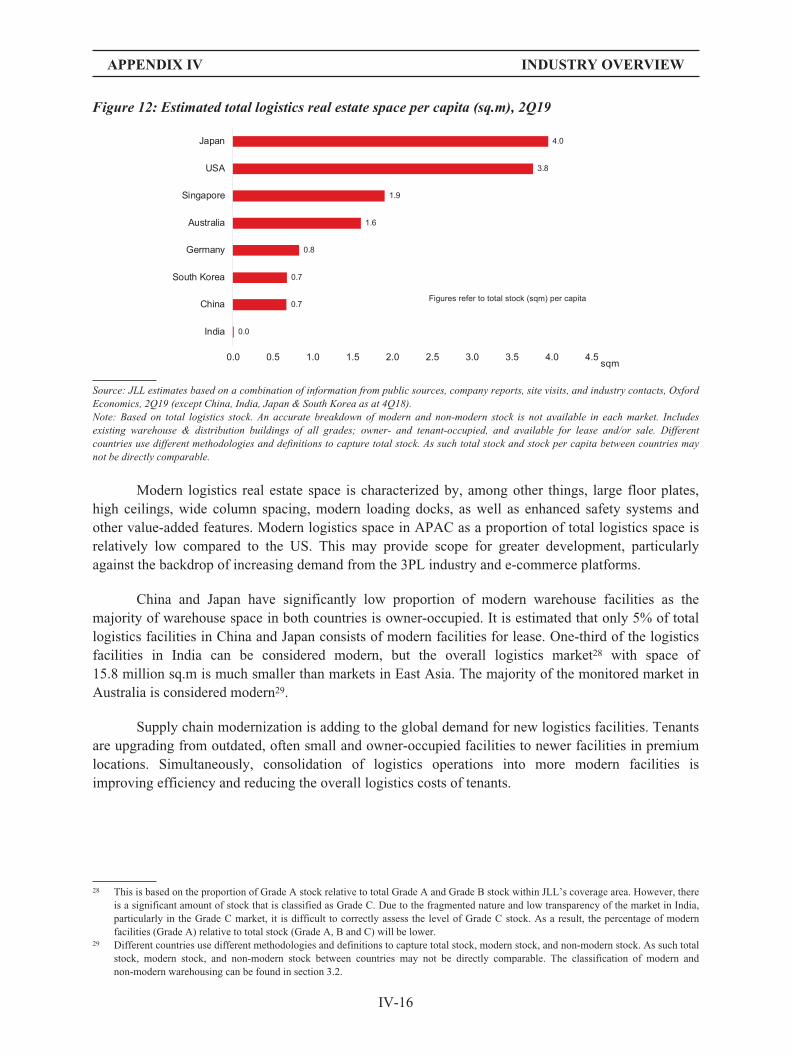
APPENDIX IV INDUSTRY OVERVIEW
Figure 12: Estimated total logistics real estate space per capita (sq.m), 2Q19
0.0
0.7
0.7
0.8
1.6
1.9
3.8
4.0
0.0 0.5 1.0 1.5 2.0 2.5 3.0 3.5 4.0 4.5
India
China
South Korea
Germany
Australia
Singapore
USA
Japan
sqm
Figures refer to total stock (sqm) per capita
Source: JLL estimates based on a combination of information from public sources, company reports, site visits, and industry contacts, OxfordEconomics, 2Q19 (except China, India, Japan & South Korea as at 4Q18).Note: Based on total logistics stock. An accurate breakdown of modern and non-modern stock is not available in each market. Includesexisting warehouse & distribution buildings of all grades; owner- and tenant-occupied, and available for lease and/or sale. Differentcountries use different methodologies and definitions to capture total stock. As such total stock and stock per capita between countries maynot be directly comparable.
Modern logistics real estate space is characterized by, among other things, large floor plates,high ceilings, wide column spacing, modern loading docks, as well as enhanced safety systems andother value-added features. Modern logistics space in APAC as a proportion of total logistics space isrelatively low compared to the US. This may provide scope for greater development, particularlyagainst the backdrop of increasing demand from the 3PL industry and e-commerce platforms.
China and Japan have significantly low proportion of modern warehouse facilities as themajority of warehouse space in both countries is owner-occupied. It is estimated that only 5% of totallogistics facilities in China and Japan consists of modern facilities for lease. One-third of the logisticsfacilities in India can be considered modern, but the overall logistics market28 with space of15.8 million sq.m is much smaller than markets in East Asia. The majority of the monitored market inAustralia is considered modern29.
Supply chain modernization is adding to the global demand for new logistics facilities. Tenantsare upgrading from outdated, often small and owner-occupied facilities to newer facilities in premiumlocations. Simultaneously, consolidation of logistics operations into more modern facilities isimproving efficiency and reducing the overall logistics costs of tenants.
28 This is based on the proportion of Grade A stock relative to total Grade A and Grade B stock within JLL’s coverage area. However, thereis a significant amount of stock that is classified as Grade C. Due to the fragmented nature and low transparency of the market in India,particularly in the Grade C market, it is difficult to correctly assess the level of Grade C stock. As a result, the percentage of modernfacilities (Grade A) relative to total stock (Grade A, B and C) will be lower.
29 Different countries use different methodologies and definitions to capture total stock, modern stock, and non-modern stock. As such totalstock, modern stock, and non-modern stock between countries may not be directly comparable. The classification of modern andnon-modern warehousing can be found in section 3.2.
IV-16

APPENDIX IV INDUSTRY OVERVIEW
Figure 13: Estimated modern logistics real estate space as a proportion of total logistics real estatespace, 2Q19
15.7
34.6
40.2
502.8
955.0
0 100 200 300 400 500 600 700 800 900 1000
India
South Korea
Australia
Japan
China
Million, sqm
% in circles refers to modern stock (red bar) as proportion of total stock
7%
5%
75%
28%
38%
Source: JLL estimates based on a combination of information from public sources, company reports, site visits, and industry contacts, 2Q19.Note: Total logistics includes existing warehouse & distribution buildings of all grades; owner- and tenant-occupied, and those available forlease and/or sale. Logistics facilities in Australia generally refers to modem space. Different countries use different methodologies anddefinitions to capture total stock, and modern and non-modern stock. As such total stock, modern and non-modern stock between countriesmay not be directly comparable.* India, Japan & South Korea as at 4Q18. Also see footnote 29.
The APAC logistics sector is expected to continue to grow, with more high specificationmodern logistics facilities expected to be built over the next few years. Logistics floor space is growingrapidly in China and Japan. The Indian logistics real estate market is also growing rapidly, supportedby the growth of the e-commerce sector, the implementation of the Goods and Services Tax, andvarious government initiatives.
The APAC logistics real estate market attracts both global and regional players. Global playerssuch as GLP and Goodman, which have worldwide operations, are estimated to have the largestlogistics holdings (by value) in APAC. Of APAC only owners and developers, ESR has the largestAPAC logistics real estate platform (owned and managed in APAC by gross floor area and by value)—see Figure 14 and 15 for additional details30.
Figure 14: Logistics stock owned and managed in APAC (by gross floor area)
23.5
11.7
6.95.6
4.6
0
5
10
15
20
25
GLP Goodman ESR Prologis Mapletree LogisticTrust
million, sqm
Source: JLL estimates based on companies’ financial reports, ESR dataNote: 1) Figures for ESR, Prologis and Mapletree as at 2Q19, Goodman as at 1Q19 and GLP as at 3Q17; 2) based on estimated total stockowned and managed across APAC (and not necessarily confined to the specific cities that JLL tracks and is used for the country specific data
30 See notes for Figure 14.
IV-17

APPENDIX IV INDUSTRY OVERVIEW
shown elsewhere in this report), 3) These are JLL estimates, and as such, the data may not necessarily match with internal data maintainedby the companies mentioned in the chart.
Figure 15: Logistics stock owned and managed in APAC (by value)
25.0
20.0
15.0
10.0
5.0
0.0
billion, US$
Goodman GLP ESR Prologis Mapletree Logistic Trust
22.6
21.020.2
12.2
5.8
Source: JLL estimates based on companies’ financial reports.Note: 1) Figures are as at 2Q19, except GLP which is as at 3Q17, 2) These are JLL estimates, and as such, the data may not necessarilymatch with internal data maintained by the companies mentioned in the chart.
Further growth in the sector is expected. A number of large owners and developers in APAChave relatively large development pipelines. Across China, Japan, South Korea, Singapore, Australia,and India, ESR has the largest development pipeline in aggregate by gross floor area, followed by GLPand Goodman from 2019 to 2020 (see Figure 16)31.
Figure 16: Development pipeline in aggregate across major APAC markets, planned or underdevelopment, 3Q19 – 2020^ (‘000 sq.m)
3.6
1.6
1.0
0.4
0.0
0.5
1.0
1.5
2.0
2.5
3.0
3.5
4.0
ESR GLP Goodman Prologis
million, sqm
Source: ESR data based on company data as at 2Q19; other companies’ data are JLL estimates based on a combination of public sources,company reports, site visits, industry contacts, 2Q19.^ Data for Korea is for the period between 3Q18-2020.Note: 1) Based on JLL coverage areas in Greater Shanghai, Greater Beijing, Greater Guangzhou, Tokyo, Osaka, Seoul, Delhi, Mumbai andAustralia (Sydney, Melbourne, Brisbane, Adelaide and Perth), 2) Pipeline for ESR includes eight projects which were not tracked in JLL’ssupply pipeline but provided by ESR, 3) Includes projects that are proposed, with plans submitted, with plans approved, and projects underconstruction that are tracked by JLL 4) The area (GFA), current status, and timing of these projects are JLL estimates. As such, theseestimates may not necessarily match with internal data maintained by the companies mentioned in the chart.
31 See chart note under Figure 16.
IV-18

APPENDIX IV INDUSTRY OVERVIEW
iii. Case studies
Goodman (Australia)
Goodman is a global real estate group that owns, develops and manages industrial real estate,including logistics facilities, warehouses and business parks, across 17 countries32. Goodman’s largestmarket is its home country of Australia. It is Australia’s largest REIT, with a market cap of aroundUS$18.4 billion (AU$ 27.1 billion, as at August 21, 2019)33. Goodman’s Australian and New Zealandportfolio (under management) spans 170 properties. The majority of assets are located across Sydney,Melbourne, and Brisbane, with the company employing around 300 people nationally. Total assetsunder management globally rose to US$ 31.3 billion (AU$ 44.1 billion) at the end of March 2019,from US$ 21.5 billion (AUD 23.4 billion) at the end of June 2013—an increase of 45.6% over theperiod34.
Table 3: Goodman AUM
FYE June 30, 2010 2011 2012 2013 2014 2015 2016 2017 2018 2019*
AUM (AU$ bn) . . . . . . . . . . . . . . . . . . . . . . 16.2 18.0 20.0 23.4 26.8 30.3 34.1 34.6 38.3 46.2% change (YoY) . . . . . . . . . . . . . . . . . . . . . . 11% 11% 17% 15% 13% 13% 1% 11% 21%
Source: Goodman FY presentations, AGM Chairman’s address, 2010-2019* As at June 30, 2019
Goodman has been one of the best performing REITs on the Australian stock exchange over thepast five years. Many of the largest A-REITs are diversified across multiple sectors, with Goodman thedominant logistics owner and developer in Australia. With its Australia home market dominance,Goodman has been able to capitalize on the structural and cyclical changes in the logistics sector, whileleveraging strong macro-economic fundamentals.
Figure 17: Indexed share price of Goodman against the S&P/ASX 200 A-REIT Index
Source: ASX, Yahoo Finance, JLL
A key supportive driver of the logistics market has been the rise of e-commerce in Australia.Between 2011 and February 2019, e-commerce spending rose by 175%, well ahead of spending growth
32 Unless otherwise stated, data related to Goodman are from Goodman’s financial reports, presentations, and website, 201833 Yahoo Finance, August 201934 Goodman FY presentation, AGM Chairman’s address, 2013 and 2018
IV-19
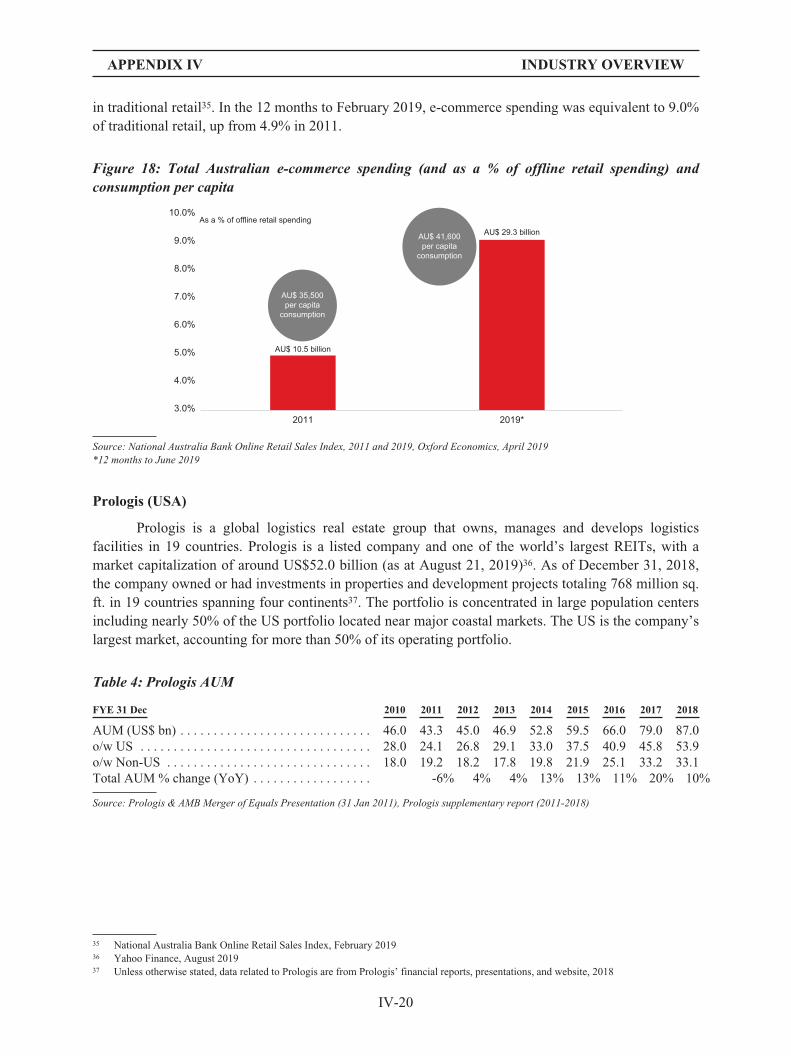
APPENDIX IV INDUSTRY OVERVIEW
in traditional retail35. In the 12 months to February 2019, e-commerce spending was equivalent to 9.0%of traditional retail, up from 4.9% in 2011.
Figure 18: Total Australian e-commerce spending (and as a % of offline retail spending) andconsumption per capita
10.0%
9.0%
8.0%
7.0%
6.0%
5.0%
4.0%
2011
AU$ 10.5 billion
As a % of offline retail spendingAU$ 29.3 billion
2019*3.0%
AU$ 35,500per capita
consumption
AU$ 41,600per capita
consumption
Source: National Australia Bank Online Retail Sales Index, 2011 and 2019, Oxford Economics, April 2019*12 months to June 2019
Prologis (USA)
Prologis is a global logistics real estate group that owns, manages and develops logisticsfacilities in 19 countries. Prologis is a listed company and one of the world’s largest REITs, with amarket capitalization of around US$52.0 billion (as at August 21, 2019)36. As of December 31, 2018,the company owned or had investments in properties and development projects totaling 768 million sq.ft. in 19 countries spanning four continents37. The portfolio is concentrated in large population centersincluding nearly 50% of the US portfolio located near major coastal markets. The US is the company’slargest market, accounting for more than 50% of its operating portfolio.
Table 4: Prologis AUM
FYE 31 Dec 2010 2011 2012 2013 2014 2015 2016 2017 2018
AUM (US$ bn) . . . . . . . . . . . . . . . . . . . . . . . . . . . . . 46.0 43.3 45.0 46.9 52.8 59.5 66.0 79.0 87.0o/w US . . . . . . . . . . . . . . . . . . . . . . . . . . . . . . . . . . . 28.0 24.1 26.8 29.1 33.0 37.5 40.9 45.8 53.9o/w Non-US . . . . . . . . . . . . . . . . . . . . . . . . . . . . . . . 18.0 19.2 18.2 17.8 19.8 21.9 25.1 33.2 33.1Total AUM % change (YoY) . . . . . . . . . . . . . . . . . . -6% 4% 4% 13% 13% 11% 20% 10%
Source: Prologis & AMB Merger of Equals Presentation (31 Jan 2011), Prologis supplementary report (2011-2018)
35 National Australia Bank Online Retail Sales Index, February 201936 Yahoo Finance, August 201937 Unless otherwise stated, data related to Prologis are from Prologis’ financial reports, presentations, and website, 2018
IV-20

APPENDIX IV INDUSTRY OVERVIEW
Figure 19: Indexed share price of Prologis against MSCI US REIT Index
Source: Yahoo Finance, JLL
A key macro tailwind for the sector in the US has been strong consumption growth, withconsumption per capita increasing from US$ 34,100 to US$ 41,400 between 2011 and 2018, a rise of21.4%38. Driven by the strong e-commerce growth, new facilities are being tailored to the high-tech,high-efficiency needs of a tenant’s evolving supply chain and distribution strategies. These properties,which comprise of large warehouses and distribution centers, count companies such as FedEx andAmazon as some of the largest users of this type of space. The rise of online shopping and appetite ofconsumers for rapid delivery have seen industries and companies opt for consolidation of operations.This has typically been done to improve supply chain efficiencies and to shift operations closer to largepopulation centers.
Figure 20: Total US e-commerce sales (and as a % of total retail sales) and consumption per capita^
11.0%
10.0%
9.0%
8.0%
7.0%
6.0%
5.0%
4.0%
3.0%
As a % of offline retail spending
US$ 198.6 billion
US$ 504.6 billion
US$ 34,100per capita
consumption
2011 2018
US$ 41,400per capita
consumption
Source: Statista, Oxford Economics, April 2019.^Per capita consumption refers to total retail sales, as at April 2019
3.2 Logistics real estate fundamentals
i. Specifications of modern logistics facilities
The classification of what constitutes modern and non-modern logistics facilities differs acrossmarkets. Specific market factors would typically dictate what type of facility is constructed. For
38 Oxford Economics, October 2018
IV-21
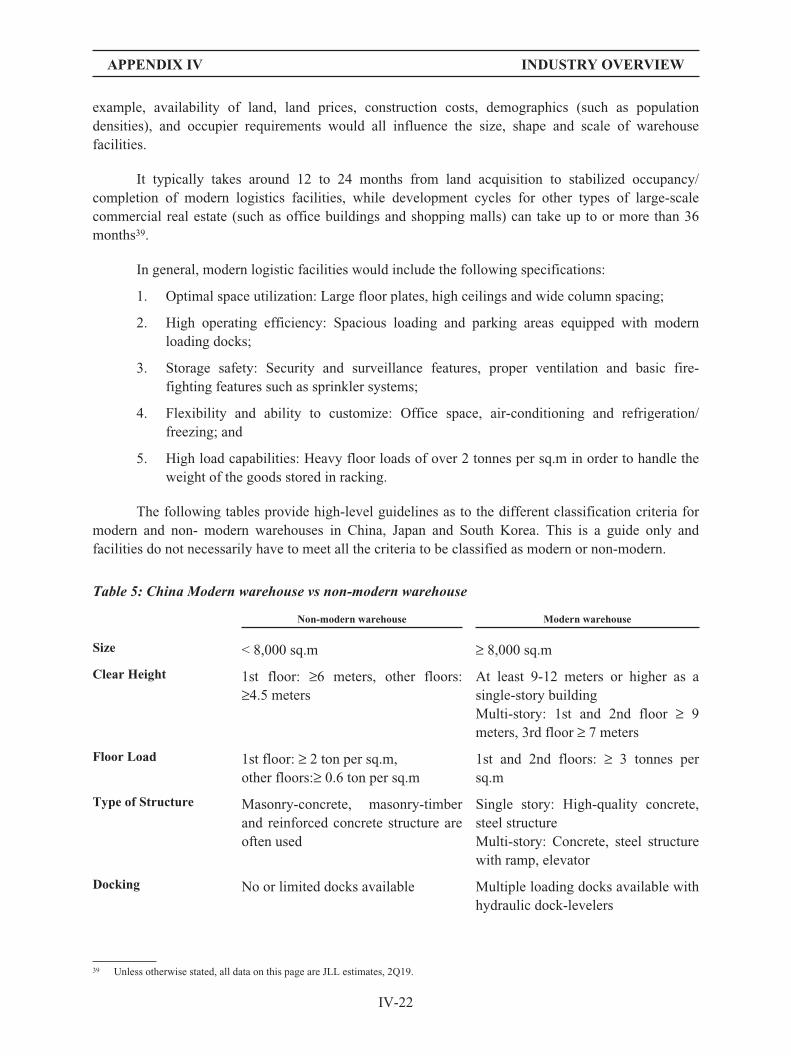
APPENDIX IV INDUSTRY OVERVIEW
example, availability of land, land prices, construction costs, demographics (such as populationdensities), and occupier requirements would all influence the size, shape and scale of warehousefacilities.
It typically takes around 12 to 24 months from land acquisition to stabilized occupancy/completion of modern logistics facilities, while development cycles for other types of large-scalecommercial real estate (such as office buildings and shopping malls) can take up to or more than 36months39.
In general, modern logistic facilities would include the following specifications:
1. Optimal space utilization: Large floor plates, high ceilings and wide column spacing;
2. High operating efficiency: Spacious loading and parking areas equipped with modernloading docks;
3. Storage safety: Security and surveillance features, proper ventilation and basic fire-fighting features such as sprinkler systems;
4. Flexibility and ability to customize: Office space, air-conditioning and refrigeration/freezing; and
5. High load capabilities: Heavy floor loads of over 2 tonnes per sq.m in order to handle theweight of the goods stored in racking.
The following tables provide high-level guidelines as to the different classification criteria formodern and non- modern warehouses in China, Japan and South Korea. This is a guide only andfacilities do not necessarily have to meet all the criteria to be classified as modern or non-modern.
Table 5: China Modern warehouse vs non-modern warehouse
Non-modern warehouse Modern warehouse
Size < 8,000 sq.m ≥ 8,000 sq.m
Clear Height 1st floor: ≥6 meters, other floors:≥4.5 meters
At least 9-12 meters or higher as asingle-story buildingMulti-story: 1st and 2nd floor ≥ 9meters, 3rd floor ≥ 7 meters
Floor Load 1st floor: ≥ 2 ton per sq.m,other floors:≥ 0.6 ton per sq.m
1st and 2nd floors: ≥ 3 tonnes persq.m
Type of Structure Masonry-concrete, masonry-timberand reinforced concrete structure areoften used
Single story: High-quality concrete,steel structureMulti-story: Concrete, steel structurewith ramp, elevator
Docking No or limited docks available Multiple loading docks available withhydraulic dock-levelers
39 Unless otherwise stated, all data on this page are JLL estimates, 2Q19.
IV-22

APPENDIX IV INDUSTRY OVERVIEW
Non-modern warehouse Modern warehouse
Fire Fighting None Sprinklers, fire hydrants withrequired dangerous goods & waterstorage system
Sky Lighting N/A 3% of roof area
Air Circulation N/A Control of the inner air quality
Source: JLL.Note: This is a general guide only. Facilities do not have to meet each criteria in order to be classified as modern or non-modern.
Table 6: Japan: Modern warehouse vs non-modern warehouse
Non-modern warehouse Modern warehouse
Size < 10,000 sq.m ≥ 10,000 sq.m
Clear Height 5-6 meters or lower Approximately 5-6 meters or higheras a single-story building
Floor Load < 1.5 tonnesSome landlords do not calculatefloor-loading data.
≥ 1.5 tonnes per sq.m
Type of Structure Steel structures are often used Reinforced concrete or steelreinforced concrete structures arepreferred with ramp way to connecteach floors
Docking No or limited docks available Multiple loading docks available withdock leveler
Fire Fighting Sprinklers, fire hydrants Sprinklers, fire hydrants
Sky Lighting N/A N/A
Air Circulation Not installed, usually tenants installthe system by themselves
Depends on what kind of tenants thefacility wants to attract, as some donot install air circulation systems
Source: JLL.Note: This is a general guide only. Facilities do not have to meet each criteria in order to be classified as modern or non-modern.
Table 7: South Korea: Modern warehouse vs non-modern warehouse
Non-modern warehouse Modern warehouse
Size < 10,000 Pyeong (33,000 sq.m);Facilities between 5,000 Pyeong to10,000 Pyeong (16,500 sq.m to33,000 sq.m) are generally classifiedas Grade B.
≥ 10,000 Pyeong (33,000 sq.m); builtafter 2010, located within 5KM ofhighway interchanges, accessible toall floors by ramp
Clear Height Approximately 5-6 meters At least 9-12 meters or higher as asingle-story building
IV-23

APPENDIX IV INDUSTRY OVERVIEW
Non-modern warehouse Modern warehouse
Floor Load Landlords do not calculate floor-loading data. This can result in floordepression if goods are storedbeyond the loading limit.
At least 3 tonnes per sq.m
Type of Structure Steel structure, sandwich panel PC structure
Docking No or limited docks available Multiple loading docks available withhydraulic devices
Fire Fighting None N/A
Sky Lighting N/A N/A
Air Circulation N/A N/A
Source: JLL.Note: This is a general guide only. Facilities do not have to meet each criteria in order to be classified as modern or non-modern.
ii. Online retail vs traditional retail
In some respects, online retailers and traditional retailers have similar requirements forwarehouses. For example, in terms of location, both online and offline retailers look for warehousesthat are in locations that serve a network of inner city distribution points—bricks-and-mortar stores inthe case of traditional retailers, and last-mile distribution centers in the case of online retailers.
Nonetheless, fulfilling online retail orders requires fundamentally different operationalcapabilities. Online retail requires fulfilment centers, including the picking, packaging and dispatchingof individual items for distribution to individual consumers. Driven by the need for both operationaland cost-efficiency, the demand for logistics real estate that online retail is creating has several traits:
Š Proximity to end-users/consumers—A key success factor for online retailers is howquickly products reach the buyer. Logistics facilities located in or near major urban areaswould typically be in relatively high demand.
Š Large contiguous space—Rapid volume growth is not uncommon for both new andestablished retailers. Additional space, either in the form of modifying the use of spacewithin the existing building, or in terms of the ability to expand into adjacent plots, can behighly attractive options for retailers. The largest e-commerce players in China such asAlibaba (through its Cainiao platform) and JD.com in recent years have driven a largeamount of e-commerce warehouse leasing. The scale of these firms and the range ofproducts they move around would typically exceed that of traditional retailers, and givethem uniquely large distribution networks that often lead to very large space requirements.
Š Ceiling height—The individual picking of items ordered online is a labor-intensiveoperation. A consequence is that items must be easily reachable if the operation is toremain efficient, usually around a maximum of 6 feet. While it is feasible in somelocations to build low-rise facilities, the most common practice has been to adapt existingfacilities with high eaves by introducing mezzanine floors or automated pickingcapabilities.
Š Efficient space—Online retailers typically need to react faster to orders; this requiresmore efficient space configuration to operate various functions (i.e. packaging, material
IV-24

APPENDIX IV INDUSTRY OVERVIEW
handling, and truck loading). Thus, the capacity of the building to offer the flexibility tohouse the optimal fulfilment operation is a key requirement. The higher volumes ofinventory and associated increase in inbound and outbound flows also create a need forincreased truck court and trailer parking space.
Š Technology—The shortage of labor in many markets and high labor costs are creatingdemand for automated warehouses, labor-saving equipment and advanced logisticsfacilities that respond to efficient warehousing and delivery. To date, there have been onlylimited examples of e-commerce firms in Asia utilizing automation technology. However,the adoption of this technology is expected to grow.
Š Floor load—Landlords typically do not calculate floor-loading data in non-modernfacilities. This can result in floor depression if goods are stored beyond the loading limit.Modern facilities in Japan have floor load of at least 1.5 tonnes per sq.m and those inChina and Korea have floor load of at least 3 tonnes per sq.m in order to withstand theweight of the goods stored in racking with the higher ceiling heights40.
Š Other areas of efficiency (truck yards/cross docking)—Non-modern warehousesgenerally have no or limited docks available, while modern facilities have multiple loadingdocks available (sometimes with dock levelers).
Š Office space—Modern logistics facilities may include accompanying office space in orderto provide a wider range of options for occupiers.
Š Amenities—The latest logistics facilities may include social amenities such as childday-care centers and employee relaxation and recreation facilities.
iii. Location of logistics facilities
Location is typically the most important factor when it comes to measuring the efficiency of awarehouse in the supply chain. However, there is more than one type of ideal location, depending onits specific function in the supply chain. For small packages, location next to a parcel’s hub or airportwill be important. For higher volume and lower value goods, location at a road interchange orproximity to a seaport may be more important. And in sectors where suppliers have to offer theircustomers a very high level of service (such as in the after-sales market), achieving deliveries in shorttime windows will play a critical factor in the structuring of a distribution network.
Š Location close to population centers with a large middle class—Ideal warehouselocations in Asia do share a few common themes—most position themselves to serve largeconsumer populations, whether in the form of delivery to homes or stores. This makes itimportant to be located close to population centers with a large middle class. While thereis industrial demand from manufacturers less sensitive to being located near consumers,this is a small share of the total. Most demand for space is generally for locations that arerelatively closer to the consumer base.
Š Geographic centrality—In other cases, tenants are willing to accept greater distance fromone city center if they can be within a similar distance from other cities; that is, theyprioritize locations suitable for multi-city (or regional) distribution. For example, satellitecities are a strong location type in China. Typically located just over the border from thecountry’s largest cities, these markets are attractive to “spill over” tenants who wish toserve consumer markets in the larger cities.
40 JLL estimates, 2Q19.
IV-25

APPENDIX IV INDUSTRY OVERVIEW
Š Rental, land, and build costs—The costs of renting, buying and building distributionwarehousing varies considerably. For example, lower rents and greater availability ofprojects can also be strong advantages for satellite markets in China as compared withlocations closer to a large city’s densely populated core area.
Š Building specification—The specification aspect has an important effect on rents.Typically, rents will be relatively higher for spaces that can fulfil very large spacerequirements of e-commerce logistics service providers, and space that provides efficientconfiguration and flexibility to house optimal fulfilment operations.
Š Other factors—Other factors involved in the decision-making for location of distributioncenters may include access to an affordable labor pool, and the availability and quality oflogistics service providers.
iv. Logistics project costs
Construction costs are typically higher for multi-story buildings than single-story buildings.Moreover, construction costs in major markets are higher because of higher labor costs. For example,construction costs in Beijing and Shanghai are higher than costs in other Tier 1 and 1.5 cities in China.
However, development margins for the various markets are not available on a consistent basis.They vary across companies and depend on many critical factors at the local level like land prices(which varies by location) and number of stories (given its impact on total rental income andrevenues). On the other hand, there would likely be a higher variation in rents rather than buildingefficiency, since most modern logistics real estate have relatively high efficiency to begin with.
Table 8: Estimated construction cost of logistics real estate
Country/city Estimated costs per sq.m
China—Greater Beijing &Greater Shanghai
RMB 2,250-2,750 (US$ 321-393) for single-story,RMB 3,000-3,500 (US$ 429-500) for multi-story
China—Greater Guangzhou &Wuhan
RMB 1,800-2,300 (US$ 257-329) for single-story,RMB 2,500-3,000 (US$ 357-429) for multi-story
Japan overall Reinforced concrete structure warehouse: JPY 125,000-135,000(US$ 1,180-1,270) per sqm
South Korea—Greater Seoul area KRW 650,000 to KRW 800,000 (US$ 535-659) per sq.m
Source: JLL estimates, 2Q19.Note: Exchange rates as at end-Aug 2019.
3.3 Valuation of logistics real estate
i. Factors driving valuation
The key factors that may determine logistics real estate pricing and cap rates in China, Japanand South Korea are also generally applicable to Singapore, Australia and India. Some of the keyfactors include:
Š Location: Location is a key determinant in the Tier 1 and Tier 1.5 cities41. Ideal locationsare typically those near expressway networks and located optimally to serve city and
41 JLL defines China’s Tier 1.5 cities as top second tier cities that have separated themselves from other Tier 2 cities to sit just below thelevel of Tier 1 cities, based on an analysis of a range of economic, business and property indicators. Examples are Tianjin and Wuhan.
IV-26

APPENDIX IV INDUSTRY OVERVIEW
regional distribution networks. In China, multiple developers have built warehousesclustered along the G2 Expressway that connects Beijing with Shanghai. Areas outsideShanghai’s city limits and in the neighboring city of Kunshan have also proved ideallocations along this stretch of highway for many developers. This demonstrates that somedevelopers have a greater preference for locations that are near key transport infrastructurerather than locations within the city limits of the largest nearby consumer market.
Š Infrastructure: Quality of infrastructure and connectivity is another key factor impactingvaluation. For example, tenant creditability and improving inland infrastructure (i.e. majorhighways) are having a positive effect on the Greater Tokyo inland logistics markets.
Š Specification/building age: The specification aspect typically has a greater impact onrents than cap rates. Age of assets may affect valuations, as older properties may havebeen built to slightly lower specifications in the first place, and generally would have alsosuffered some wear and tear over time. However, age only impacts rents and yields up to apoint. For example, many tenants in China generally opt for older assets in good locationsrather than newer assets in poorer locations. From an investment perspective, old assets instrong locations may also present opportunities for redevelopment. Similarly, building ageis not a big factor in determining yields for investors in Japan. Japan’s real estate pricesare reflective of land value – some investors are willing to buy older and inferior specassets with aggressive yields, as long as the location meets their requirements.
Š Availability to acquire assets: Asset availability is an important consideration forinvestors as the relative lack of liquidity limits investment activity and creates greatercompetitive tension. This may lead to investors expanding their investment criteria. Forexample, Tier 1.5 city assets may be a suitable market for investors that are unable tosecure assets in tier 1 cities.
Figure 21: Logistics gross rental yield spreads over costs of debt, 2Q19
365 350333
310 300
255225
180 175
100
51
0.0%
1.0%
2.0%
3.0%
4.0%
5.0%
6.0%
7.0%
8.0%
9.0%
0
50
100
150
200
250
300
350
400
Spreads (bps)
Yields spread over debt cost (bps) Industrial Market Yield (%)
310
Osaka
Wuhan
Tokyo
Guang
zhou
Seoul
Melbou
rne
Sydne
y
Shang
hai
Beijing
US avera
ge
Lond
on
Singap
ore
Source: JLL, 2Q19.Note: 1) Debt costs are based on investment grade borrowers, core stabilized assets fixed pricing on typical market maturities.2) In the calculation of the market yield, the transaction costs of purchasing or leasing of space is not included. The market yield thereforereflects the returns to investment before transaction costs, assuming full occupancy and that the current income being paid is the marketeffective rent.
IV-27

APPENDIX IV INDUSTRY OVERVIEW
As illustrated above, logistics facilities at key hubs in APAC generally offer more attractivevaluation premiums in terms of spreads, compared to those for more mature markets in the US andUK.
ii. Logistics vs office
The spread between office and logistics cap rates in primary markets in the US, such asChicago and Los Angeles, has narrowed from about 1.1% to nearly zero during the past decade.Logistics real estate cap rates (5.6% at end-2007 versus about 4.3% at 2Q19) have narrowed more thanoffice cap rates (4.8% at end-2007 versus 4.3% at 2Q19)42.
Nonetheless, spreads between prime logistics and prime office gross rental yields in APAC onaverage remain much wider than in the US and in Europe. One reason for the wider spread is that thelogistics real estate market in APAC is less mature than the US. The spread between prime logisticsand prime office gross rental yields in North Asia remained at 1.3% in 2Q1943. In China, spreads in theTier 1 cities stood at 2.1% as at 2Q19. The wider spreads in China and North Asia offer further roomfor yield compression in the logistics real estate sector.
Figure 22: Spreads between logistics & office cap rates
0.0%
2.1%
1.3%
0.0%
0.5%
1.0%
1.5%
2.0%
2.5%
North Asia (ex-China)ChinaUS
Source: NCREIF, JLL, 2Q19.Note: U.S. primary office markets (Seattle, San Francisco, Los Angeles, Boston, New York, Chicago, Washington D.C., Silicon Valley-SanJose); U.S. primary industrial markets (Atlanta, Chicago, Dallas, Inland Empire, Los Angeles, Northern NJ, Oakland-East Bay, Philadelphiaand Eastern PA). China: simple average of Beijing, Shanghai & Guangzhou; North Asia: simple average of Tokyo, Osaka & Seoul.
Also noteworthy is that logistics real estate is generally a more stable asset class than the officesector. Volatility (as measured by the standard deviation of annual changes in capital values) oflogistics assets in Shanghai was 9% as compared with 14% for modern office assets over the past 10years. Similarly, the volatility of logistics assets in Tokyo was 10% as compared with 16% for modernoffice assets over the same period44.
42 NCREIF, JLL, 2Q18.43 JLL, 2Q19. Simple average of Tokyo, Osaka & Seoul.44 JLL estimates, 2Q19.
IV-28
APPENDIX IV INDUSTRY OVERVIEW
4. Country Reports
4.1 China
Geographically, distribution centers in China are based in three major centers of economicactivity: the Pearl River Delta (south), the Yangtze River Delta (east) and the Beijing Tianjin area(northeast). Ports have historically played a vital role in the development of logistics facilities and havebeen clustered around these three distribution centers. Similarly, newer modes of transportation havealso primarily focused on these three centers.
China’s growing consumer class (especially in the middle-income segment) is underpinning therising consumption trends and subsequent growth in demand for high-quality logistics distributionspace. China’s household consumption has risen alongside average disposable income for the past twodecades. Increasing incomes in turn are driving retail sales across a range of product categories.China’s middle class and retail market are both growing geographically more diverse. Wealth andspending levels in the first twenty years of the country’s reform period were concentrated in the Tier 1cities such as Beijing and Shanghai. Those cities have continued to become more financially affluent,but in recent years, a growing population base in Tier 1.5, Tier 2, Tier 3, and even Tier 4 cities has alsoentered the consumer class.
The logistics sector in particular continues to offer attractive long-term opportunities as Chinabuilds its supply chain infrastructure. The inland relocation of manufacturing capacity—combined withdomestic consumption growth led by the rise of the middle class throughout the country—is creatingstrong demand for prime warehouse space. Many manufacturers and retailers are modernizing andstreamlining their supply chains, creating demand for modern, high-specification facilities.
China’s substantial investment in transportation infrastructure is also enabling businesses toexpand their distribution networks. Shanghai, Beijing and Guangzhou are the three major air cargohubs situated on mainland China. China’s extensive expressway network is supportive of the growth ofthe domestic logistics market, acting as a backbone for the truck-based distribution network.
In conjunction with the domestic consumption growth story, the rise in e-commerce spending isalso expected to be a major tailwind for the logistics real estate market. China’s rapidly growinge-commerce market continues to drive companies to invest in prime warehouses. This allowscompanies to strengthen their logistics capabilities while controlling costs and maintaining quality.
Location is a critical factor when it comes to assessing the potential success of a warehouse inChina. In some cases, the best location is one closest to a large city’s densely populated core areas.Typically, this is where most consumers and retail stores are concentrated. The complexity ofwarehouses in terms of specifications and space (e.g. demand for multi-story warehouses) also meansthat logistics real estate developers with the relevant capabilities have the ability to command premiumpricing in these markets. In other cases, occupiers may utilize a multi-city (or regional) distributionmodel. Occupiers who choose this strategy will prefer a location that is a greater distance from one citycenter if they can be within a similar distance to other cities.
Satellite cities are another strong location type in China. Located in proximity to the country’slargest cities, these markets are attractive to “spill-over” tenants who wish to serve consumer marketsin the big cities, but are unable to find warehouse space there due to supply constraints. Rents arerelatively low and there are typically more space options for tenants in satellite markets. In recent
IV-29

APPENDIX IV INDUSTRY OVERVIEW
years, satellite markets that sit between multiple large markets have emerged as ideal locations forregional distribution. For example, Langfang between Beijing and Tianjin, and Kunshan betweenShanghai and multiple Yangtze River Delta markets have emerged as significant distribution hubs.
i. Key tenants
The key tenants in China for logistics real estate primarily include blue-chip 3PL serviceproviders and e-commerce companies. E-commerce operators are a large source of demand forlogistics real estate in China, underpinned by trends in consumption patterns as well as the higherspace requirements for these operators (typically three times more space compared to traditional retail).E-commerce occupiers form a relatively larger proportion of the occupier base of many owners andmanagers of logistics space in China, including ESR, which has one of the largest e-commerceexposure in terms of floor area in China (see Figure 23)45.
Figure 23: E-commerce occupiers as % of total area occupied in China, September 2017
50.0%
40.0%
% of total leased NLA
30.0%
20.0%
10.0%
0.0%
ESR GLP
45%
28%
Source: Half Year and 2nd quarter FY2018 presentation (GLP), ESR.Note: As at September 2017 (latest publicly available data for GLP).
ii. Modern logistics space
Segmentation of total logistic space is not available on a consistent basis at the local level. Atthe national level, around 5% of total logistics stock is considered modern46. Nonetheless, there are anumber of major owners, managers and developers of logistics stock in China. GLP is estimated toown and manage around 6.2 million sq.m of logistics space in China with a supply pipeline of around1.4 million sqm until end-2020. Next is ESR, which has the second largest portfolio of stock ownedand managed in China (see Figure 24)47.
45 JLL estimates from company reports and presentations, ESR.46 JLL estimates based on a combination of information from public sources, company reports, site visits, and industry contacts. The broad
criteria for space to be considered modern is detailed in section 3.2.47 See chart note under Figure 24.
IV-30

APPENDIX IV INDUSTRY OVERVIEW
Figure 24: Key logistics players in Greater Beijing, Greater Shanghai & Greater Guangzhou:ranked by stock owned and managed (sq.m), 2Q19
million sqm
0.0GLP ESR Goodman Prologis Blogis*
1.0
2.0
3.0
4.0
5.0
7.0
6.06.2
2.3
1.8
1.2 1.1
Source: ESR data based on company data as at 2Q19; other companies’ data are JLL estimates based on a combination of public sources,company reports, site visits, industry contacts, 2Q19.Note: 1) JLL coverage areas in Greater Shanghai, Greater Beijing, and Greater Guangzhou, 2) These are JLL estimates, and as such, thedata may not necessarily match with internal data maintained by the companies mentioned in the chart.*Local owner or developer.
Figure 25: Key logistics players in Greater Beijing, Greater Shanghai & Greater Guangzhou—ranked by supply pipeline (sq.m), 3Q19-2020
1.5
1.0
1.4
1.0
0.6
0.2
0.5
GLP ESR Goodman Blogis*0.0
million sqm
Source: ESR data based on company data as at 2Q19; other companies’ data are JLL estimates based on a combination of public sources,company reports, site visits, industry contacts, 2Q19.Note: 1) Based on JLL coverage areas in Greater Shanghai, Greater Beijing & Greater Guangzhou, 2) Pipeline for ESR includes fiveprojects which were not tracked in JLL’s supply pipeline but provided by ESR, 3) These are JLL estimates, and as such, the data may notnecessarily match with internal data maintained by the companies mentioned in the chart.* Local owner or developer
IV-31

APPENDIX IV INDUSTRY OVERVIEW
iii. Government policies
China’s 13th Five Year Plan (2016-2020) includes a number of initiatives that provide supportfor the logistics sector in China48. Some of the key goals in the plan as follows:
Š Build a multi-level business and trade logistics network;
Š Strengthen business and trade logistics infrastructure;
Š Promote standardization in business and trade logistics construction;
Š Strengthen the “informationization” of business and trade logistics construction;
Š Promote the intensive development of business and trade logistics;
Š Promote the “professionalization” of development of business and trade logistics;
Š Promote the international development of business and trade logistics;
Š Accelerate the green transformation of business and trade logistics;
Š Establish a business and trade logistics credit system.
iv. Demand and supply
Greater Beijing, Greater Shanghai, Greater Guangzhou and Wuhan together have an averageoccupancy rate of 95% as at 2Q1949. In Beijing, the constraints on new supply becoming operationalcoupled with healthy demand has contributed to occupancy levels above 90%. The city governmentcontinues to restrict the amount of new warehouse land entering the market in its attempt to shiftnon-core administrative functions away from Beijing.
We have yet to see e-commerce tenants returning space in Beijing; rather, there are casesreported of such tenants consolidating space from nearby markets into the Chinese capital. Despitesofter economic growth, the average occupancy rate in Greater Beijing is expected to remain above90% in the next two years.
The average occupancy rate in the Shanghai logistics market stood at 93% as at 2Q19, close tothe market’s 2010 levels. There was still considerable leasing activity coming from manufacturingfirms and 3PL service providers. Looking ahead, demand should continue to be fundamentally drivenby local and regional consumer market growth. Bricks-and-mortar retailers and e-commerce firms(along with 3PL service providers serving them) are all seeking high quality modern warehouse space,while there will also be strong demand from manufacturers. Similar to Shanghai, the satellite cities ofJiaxing, Taicang and Kunshan recorded almost full occupancy levels at the end of 2Q19, reflectingcontinued strong momentum in tenant demand for space.
Going forward, the average occupancy rate in Greater Shanghai is forecast to continue toremain above 95% over the next two years because of a more limited supply pipeline.
48 China’s Ministry of Commerce.49 Unless otherwise stated, all data on this page are from JLL, 2Q19.
IV-32

APPENDIX IV INDUSTRY OVERVIEW
Figure 26: Average occupancy rates in China’s Tier 1 and non-Tier 1 logistics real estate markets
0%
20%
40%
60%
80%
100%occupancy
Tier 1 Non-Tier 1
20072008
20092010
20112012
20132014
20152016
20172018
2019F
Source: JLL, 2Q19.Note: Tier 1 markets: simple average of Beijing, Shanghai & Guangzhou.
The local government in Guangzhou has typically restricted logistics development. With supplyconstrained and rising tenant demand, vacancy has remained consistently low in Greater Guangzhou.Other submarkets such as Huangpu and Zengcheng also have very low space availability. Existingprojects close to Guangzhou’s city center are operating at near full occupancy50. However, most supplyin 2019 is located in areas where the demand for space has historically been lower. Nonetheless,leasing demand is expected to come from traditional retailers and manufacturers that are more cost-sensitive and less location-sensitive.
Leasing demand in Dongguan’s logistics market remains healthy. Ideally located for manyoccupiers and with well-developed road infrastructure, Dongguan is able to attract leasing demandfrom both e-commerce and traditional retailers who are looking to set up distribution centers to servenearby markets. There has also been recent demand outflow from nearby Shenzhen given the lack oflarge available space. Consequently, a growing number of retailers, such as Xiaomi and Ikea, arerelocating to Dongguan.
The overall occupancy rate in Guangzhou is forecast to remain stable at between 80% and 90%between 3Q19 and end-2020 as a result of the supply additions. Occupancy rates in Dongguan andFoshan are expected to stay in a range between 80% and 90% over the same period, as strong supplyadditions is being met with strong demand patterns and a relatively sophisticated logistics industry inthese two cities may increase the market’s appeal to potential tenants.
Recently the Wuhan warehouse market has recorded strong net take-up from 3PL serviceproviders and e-commerce firms. Consequently, overall occupancy remained at about 90% in 2Q19.
Typically, logistics occupancy is often higher and more stable than occupancy in officemarkets. For example, figure 27 shows the historical occupancy for the Shanghai logistics and officemarkets. Logistics occupancy is relatively more stable and has typically been higher since 2007.
50 Unless otherwise stated, all data on this page are from JLL, 2Q19.
IV-33

APPENDIX IV INDUSTRY OVERVIEW
Figure 27: Average occupancy rates in Shanghai logistics & office markets, 2Q19
70%2007
20082009
20102011
20122013
20142015
20162017
20182019F
80%
90%
100%occupancy
Shanghai logistics Shanghai office
Source: JLL, 2Q19.
v. Rents
Rents (average for the total market)51 in Beijing have increased by about 90% since end-2008and continue to grow at a strong pace as a result of near full market occupancy and driven by strongdemand from 3PL service providers and e-commerce companies. The average rental level is aroundRMB 1.54 per sq.m per day52. Much of the rental growth in 1H 2019 was led by new leases at primelocations. Due to their attractive positions in the market, landlords in Beijing Airport Logistics Parkand Tongzhou Logistics Park generally maintained strong bargaining power during lease negotiations.
Similarly, rents in Tianjin have increased by 58% since end-2008, supported by a rising middleclass and strong consumption demand. The average rental level is around RMB 1.01 per sq.m per dayin Tianjin and RMB 1.03 per sq.m per day in Langfang as at 2Q19. In Beijing, growing demandcoupled with limited space options for occupiers supported rental growth of 18.8% in 2018, and areexpected to drive growth of 12.6% for full year 2019 and 6.6% in 2020. Rents in Tianjin and Langfangare projected to remain generally steady over the same period.
Rents in Shanghai have increased by about 46% since end-2008. While rental growth has beenstrong, it has been relatively moderate compared to that of Beijing primarily because of greater supplyin Shanghai’s satellite cities. West Shanghai, Qingpu, Minhang, and the Northwest Logistics Zonerecorded strong rental growth, as did the Pudong Airport and Pudong submarkets in East Shanghai.Rents were relatively slower to rise in Lingang, where much of Shanghai’s vacancy remainsconcentrated. The average rental level in Shanghai is around RMB 1.44 per sq.m per day as at 2Q19.
Rents have grown at an even faster pace in Shanghai’s satellite cities. Given their proximity toShanghai and other major consumer markets such as Suzhou in the Yangtze Delta Region, Kunshanand Jiaxing are expected to continue to capture demand from regional distributors as well as spill-overdemand from the tight West Shanghai market. Kunshan recorded rental growth of about 70% since
51 All references to rents in the China section refer to the average for the total market. The total market includes both modern and non-modern warehouses.
52 Unless otherwise stated, all data on this page are from JLL, 2Q19 (except 4Q18 for Dongguan and Foshan).
IV-34

APPENDIX IV INDUSTRY OVERVIEW
end-2008, while rents in Jiaxing have increased by 66% since 2011. The average rental level is aroundRMB 1.16 per sq.m per day in Kunshan, RMB 0.96 per sq.m per day in Jiaxing, andRMB 0.91 per sq.m per day in Taicang as at 2Q19. Average rent of Pinghu, an emerging submarketthat lies in the east of Jiaxing, stood at RMB 0.93 per sq.m per day at 2Q19. Further moderate growthis expected, supported by a constrained supply pipeline.
Rents in Shanghai grew by 5.0% in 2018 and are forecast to continue to trend upward over2019 and 2020, growing at average of 3.5% per year. This is expected to be underpinned by strongdemand and limited supply. However, competition from satellite cities may result in broad growthacross all sub-markets. For example, rents in Kunshan, Taicang, and Jiaxing are expected to continueto trend upward. Kunshan in particular is expected to continue to capture demand from regionaldistributors as well as spill over demand from the tight West Shanghai market.
Rents in Guangzhou have increased by about 47% since end-2008 to stand at aroundRMB 1.21 per sq.m per day. With consistently high occupancy in core locations and higher vacanciesin emerging, less popular areas, steady rental growth is expected in Guangzhou over the next threeyears (average rental growth of 3.2% per year in the 2019-2020 period).
The average rental level is around RMB 1.17 per sq.m per day in Dongguan andRMB 1.02 per sq.m per day in Foshan as at 2Q19. Despite high supply in 2017, the tenant market morethan absorbed all new supply in Dongguan and the average occupancy rate increased to near 100% by2Q1953. Land constraints in nearby cities alongside a relatively tight Dongguan land market haverestricted new supply. This in part has kept rents at broadly high levels. Rents in Dongguan and Foshanare expected to grow at a similar rate as Guangzhou, supported by demand from the maturing logisticsindustry. The overall rental level in Wuhan is around RMB 0.88 per sq.m per day. This is anticipated tocontinue to trend upward primarily on account of strong demand from international operators.
Rental growth in the logistics segment has generally outpaced office rental growth over the pastdecade. For example, logistics rents in Shanghai increased by about 46% since end-2008 as comparedto 4% growth in overall office market rents. Rental growth in the logistics market is also generally lessvolatile. This can be particularly true for larger developers who service blue-chip clients in moremodern facilities.
53 Unless otherwise stated, all data on this page are from JLL, 2Q19.
IV-35

APPENDIX IV INDUSTRY OVERVIEW
Figure 28: Average rents in select China Tier 1 logistics markets, 2Q19
0.4
0.6
0.8
1.0
1.2
1.4
1.6
1.8
2007 2008 2009 2010 2011 2012 2013 2014 2015 2016 2017 2018F 2019F 2020F
RMB / sqm / day
Shanghai Beijing Guangzhou
Source: JLL, 2Q19.
vi. Investment Market
Investment interest in the China logistics sector remains high, driven by strong demand and arelative lack of supply. Many investors continue to seek investment opportunities, including foreignand domestic insurance and investment companies, as well as developers.
Interest in assets in the Tier 1 cities remains particularly strong. As investment companies anddevelopers remain active in seeking tradable facilities in Beijing, despite limited available targets, thegrowth in capital values has significantly outpaced rental growth over the past 10 years. This hasresulted in gross rental yields in Beijing compressing to 6.7%54 (about 200 basis points) sinceend-2008. Following a similar trend, market yields in Tianjin compressed by about 80 basis points to8.0% over the same period. Capital values in Beijing increased 25.5% in 2018 and outpaced rentalgrowth. Looking ahead, capital values are forecast to grow by an average of 12% per year for full year2019 and in 2020.
Similarly, market yields in Shanghai have compressed by over 230 basis points since end-2008to stand at 6.7% as at 2Q19. Market yields in Kunshan have also compressed by about 200 basis pointssince end-2008 to 7.0% at 2Q1955. Capital values in Shanghai increased 10.5% in 2018 and outpacedrental growth. Looking ahead, capital values are forecast to grow by an average of 5.0% for full year2019 and in 2020.
Investment demand in Guangzhou is high, partly because of the limited opportunity to acquireholdings in the area. Given the backdrop of relatively restrictive government policies, the Guangzhoumarket is likely to remain a key logistic market for many investors and developers in China.
Market yields in Guangzhou have compressed by about 70 basis points since end-2008 to standat 8.0%56 as at 2Q19. Yields in Dongguan are estimated to be 8.0% as at 2Q19. Lack of new supply,
54 Market yield is a gross rental yield. In the calculation of market yield, the transaction costs of purchasing or leasing of space is notincluded. The market yield therefore reflects the returns to investment before transaction costs, assuming full occupancy and that thecurrent income being paid is the market effective rent.
55 Unless otherwise stated, all data on this page are from JLL, 2Q19.56 A market average is provided as actual market yields vary widely
IV-36

APPENDIX IV INDUSTRY OVERVIEW
strong rents, high occupier demand, and locational advantages have supported investor interest. Capitalvalues in Guangzhou increased 4.9% in 2018 and are forecast to grow by an average of around 5.0%per year for full year 2019 and in 2020.
Average capital value growth in Wuhan has continued to outpace rental growth. As such,market average yields compressed from 9.0% in 2011 to 8.0% at 2Q19.
Figure 29: Average capital values in select China Tier 1 logistics markets, 2Q19
0
1,000
2,000
3,000
4,000
5,000
6,000
7,000
8,000
9,000
10,000
2007 2008 2009 2010 2011 2012 2013 2014 2015 2016 2017 2018F 2019F 2020F
RMB / sqm
Beijing Shanghai Guangzhou
Source: JLL, 2Q19.
Figure 30: Direct transaction volumes of industrial real estate in select China’s Tier 1 and non-Tier1 markets
0
1,000
2,000
3,000
4,000
5,000
6,000
2008 2009 2010 2011 2012 2013 2014 2015 2016 2017 2018
million, US$
Tier I cities Non-Tier 1 cities
2014-2018 direct transaction volumes grew 150% in Tier 1 cities and 195%in non-Tier 1 markets over the previous five years.
Source: JLL, Real Capital Analytics, 2019.Note: Tier 1 cities: Beijing, Shanghai and Guangzhou. Non-Tier 1 cities: the rest of China.
IV-37

APPENDIX IV INDUSTRY OVERVIEW
vii. Greater Beijing overview (Beijing, Tianjin & Langfang)
Strong demand trends led by an increasingly affluent middle class (which is drivingconsumption growth) is the key tailwind for the Beijing market, as it is for China in general. Thee-commerce industry is now one of the most important drivers of demand in the Greater Beijinglogistics market. The rapid growth of the business-to-consumer (B2C) e-commerce market hasaccounted for some of the largest spaces leased in and around Beijing. Traditionally, e-commerce firmshave leased space in Beijing for last-mile distribution activities and to serve the city’s population base.To serve the rest of North China, e-commerce firms have typically set up operations in the satellitemarkets of Langfang and northern Tianjin.
Figure 31: Greater Beijing Logistics market
Beijing
TianjinLangfang
Source: JLL.
3PL service providers constitute another major demand driver. Sustained growth in total retailsales over the past decade has led to robust demand from 3PL service providers. Besides e-commerceand 3PL service providers, there has been significant absorption from brick-and-mortar retailers andmanufacturers. Pharmaceutical companies have also been a key tenant for logistics space in thismarket.
Beijing is the capital of China and the logistics industry benefits indirectly from centralgovernment organizations located there. Beijing was the largest primary logistics hub before 2015,with total logistics space of around 2.4 million sq.m as at 2Q1957. However, supply within the citymoderated slightly post the roll-out of the policy of “shifting Beijing’s non-capital functions” in 2014.
57 Unless otherwise stated, all data on this page are from JLL, 2Q19.
IV-38

APPENDIX IV INDUSTRY OVERVIEW
In 2015, Tianjin surpassed Beijing to become the largest primary logistics hub in North China. TheGreater Beijing (Beijing, Tianjin, Langfang) area has around 6.3 million sq.m of existing internationalstandard logistics space as at 2Q19, accounting for about 12.5% of the space that JLL tracks across 24cities in China.
viii. Greater Shanghai overview (Shanghai and the satellite cities of Jiaxing, Taicang &Kunshan) 58
Shanghai is the largest logistics market in China, and acts as a key gateway city. Shanghai’sgrowing retail market has traditionally attracted both local and international retailers. Demand forlogistics space is fundamentally driven by local and regional consumer market growth, withbricks-and-mortar retailers and e-commerce firms (along with 3PL service providers serving them)seeking modern warehouse space. Manufacturers are another major demand driver in Shanghai.
Figure 32: Greater Shanghai Logistics market
Jiaxing
Kunshan
Taicang
Shanghai
Source: JLL.
Within Shanghai’s borders, occupiers that require to be close to the CBD would typically formthe occupier base, such as supermarket chains. The satellite cities of Shanghai have similar demand
58 Only logistics facilities in Shanghai, Jiaxing, Taicang & Kunshan are included when analyzing supply and demand in Greater Shanghaifor the purpose of this study (facilities in Suzhou are not included).
IV-39

APPENDIX IV INDUSTRY OVERVIEW
drivers to those of Shanghai. For example, Kunshan, Taicang and Jiaxing have easy access to Shanghaiconsumers while also enabling efficient distribution to the increasingly wealthy mid-size cities of theYangtze River Delta.
Kunshan is an important satellite city to Shanghai and by extension, one of the most importantlogistics markets in China. The proximity to Shanghai, notably the Shanghai CBD, makes Kunshan abetter positioned market than more distant suburbs in the city of Shanghai. Space in the city is in highdemand from occupants for regional (Yangtze Delta Region) distribution as well as for Shanghai citydistribution. Pinghu is an emerging submarket that is part of Jiaxing, and with less stock and lowerrental levels than Jiaxing. Projects in Pinghu are typically located along highways, attracting spilloverdemand from Shanghai and Jiaxing’s other more mature submarkets.
A few other emerging logistics locations can also be recognized as part of the Greater Shanghaimarket due to their proximity. One example is Suzhou, an emerging market that has benefited fromlimited supply and growing rents in Kunshan. A number of developers and investors are seekingopportunities in this area as an alternative to the Kunshan market. In particular, the Fenhu area of theWujiang submarket in Suzhou has attracted attention from developers and tenants for its proximity toShanghai and its good access to the G50 expressway, which connects Shanghai with the broaderYangtze River Delta.
The Greater Shanghai (Shanghai, Taicang, Kunshan, Jiaxing) area has around 10.2 million sqmof existing international standard logistics space as at 2Q19, accounting for about 20% of the space thatJLL tracks across 24 cities in China.
ix. Greater Guangzhou overview (Guangzhou, Foshan, Dongguan)
Similar to other China markets, strong consumption demand remains a key driver for theGreater Guangzhou market. As the key distribution center of South China, Guangzhou has attractedmany major e-commerce retailers. For example, JD.com, Amazon and Suning have set up regionaldistribution facilities in the city59. Demand from 3PL service providers has also remained strong andhas increased in lockstep with e-commerce players. Traditional retailers and supermarkets are alsoactive players in the warehouse leasing market. Guangzhou’s major submarkets include Huangpu,Zengcheng, Huadu and Conghua, with Huangpu being the core submarket as well as the largest interms of total logistics space.
Guangzhou’s lack of available space has led to demand spilling over to neighboring cities suchas Foshan and Dongguan. In recent years, e-commerce firms have expanded rapidly in the Pearl RiverDelta region, with Dongguan ranking among the most preferred locations to operate, behind onlyGuangzhou and Shenzhen. This expansion has stimulated demand from both e-commerce retailers and3PL service providers.
Traditionally a manufacturing base in South China, Dongguan’s development into a newregional logistics hub exemplifies the ongoing transformation of the Pearl River Delta region’s growthengine, from manufacturing and international trade towards industries that focus on domesticconsumption. Dongguan is located between two major Tier 1 cities in South China, Shenzhen andGuangzhou. Both these cities have traditionally been among the most supply-constrained logisticsmarkets in China. The city is surrounded by a comprehensive road network, including five major
59 Unless otherwise stated, all data on this page are from JLL, 2Q19
IV-40

APPENDIX IV INDUSTRY OVERVIEW
highways and within easy access to the Pearl River Estuary. This makes it highly accessible tosurrounding cities including Guangzhou and Zhongshan.
As Guangzhou’s occupancy rates increase in the core submarket and future supply isconcentrated in non-core areas, demand spill-over to Foshan and Dongguan is expected to continue.These markets have more available space and at broadly lower rental levels.
Further, strong infrastructure build-up is helping to integrate the Greater Bay Area (GBA),which includes the two Special Administrative Regions of Hong Kong and Macao and 9 municipalitiesin Guangdong. Geographically, the GBA is about three times the size of the San Francisco Bay Area,with a combined population of over 69 million people and GDP of around US$1.5 trillion (comparableto that of Tokyo Bay Area and New York Metropolitan Area)60. Recent landmark infrastructureprojects include the Hong Kong-Zhuhai-Macao Bridge and Guangzhou–Shenzhen–Hong KongExpress Rail Link. Upcoming projects such as Shenzhen–Zhongshan Bridge (2024) and the HumenSecond Bridge (2019) may further reduce travelling time across the Pearl River Delta region61.
The Greater Guangzhou (Guangzhou, Foshan, Dongguan) area has around 5.9 million sqm ofexisting international standard logistics space as at 2Q19, accounting for about 12% of the space thatJLL tracks across 24 cities in China.
Figure 33: Greater Guangzhou Logistics market
Guangzhou
DongguanFoshan
Source: JLL.
60 LegCo, JLL, 3Q18.61 Hong Kong and Macao Affair Office of Guangdong, JLL, 3Q18
IV-41

APPENDIX IV INDUSTRY OVERVIEW
x. Wuhan overview
Wuhan is characterized by its location advantage as central China’s logistics hub. With well-developed expressway networks, 3PL service providers can service adjacent provinces. Major occupiercategories include e-commerce companies, 3PL service providers, retailers and manufacturingcompanies.
The scale of e-commerce sales in Hubei province is highest in the Central China region. Wuhanaccounts for more than 70% of e-commerce sales in Hubei Province. Many well-known e-commercecompanies have set up their regional headquarters in Wuhan, including JD.com, MI, and VIPshop. Thesustained growth in consumer goods sales and the positive retail sentiment have supported the rapidexpansion of retailers in the area.
Logistics space in Wuhan currently totals around 1.6 million sq.m. Around 0.9 million sq.m ofwarehouse space is projected to be completed between 3Q19 and end-202062.
Among the six submarkets located around Wuhan’s urban district, Dongxihu and Huangpi areexpected to continue to perform strongly. Both are close to key infrastructure nodes, including theairport and the entrance of the G4 Expressway (the main traffic artery between northern and southernChina, connecting Beijing, Guangzhou and Hong Kong).
4.2 Japan
Japan is considered to be Asia’s logistics leader in terms of transportation connectivity. It isalso a major hub in manufacturing supply chains in Asia and a market leader in industries likeconsumer electronics and automobiles. Amidst strong regional demand and intensifying globalcompetition, Japan-based exporters have pursued a strategy of shifting towards higher value-addedproducts and off-shoring production by expanding supply chains within Asia.
Japan’s 2017 contract logistics growth was the strongest since 2010, although growth slowed in201863. The increase in global demand helped core Japanese industries boost production activity.Strong demand for logistics space from key occupier groups, including from e-commerce and 3PLservice providers, is expected to continue, even as new supply becomes operational. Occupancy ratesin areas close to major city centers64 are expected to remain high, supported by strong demand-sidedrivers.
i. Key tenants
E-commerce retailers currently occupy around 7% of modern logistics space in Japan.However, e-commerce occupiers form a relatively larger proportion of the occupier base of manyowners and managers of logistics space in Japan, including ESR, which has one of the largeste-commerce exposure in terms of floor area in Japan, with 30% of the area occupied in ESR’s logisticsportfolio in Japan occupied by e-commerce tenants (as at September 2017)65. Retail tenants that haveonline services occupy an additional estimated 14% of total space. This also includes space held byJ-REITs such as GLP, Daiwa House, and Mitsui Fudosan.
62 Unless otherwise stated, all data on this page are from JLL, 2Q19.63 Transport Intelligence, August 2019.64 Tier 1 cities in Japan are Tokyo and Osaka.65 Company reports and presentations, ESR.
IV-42
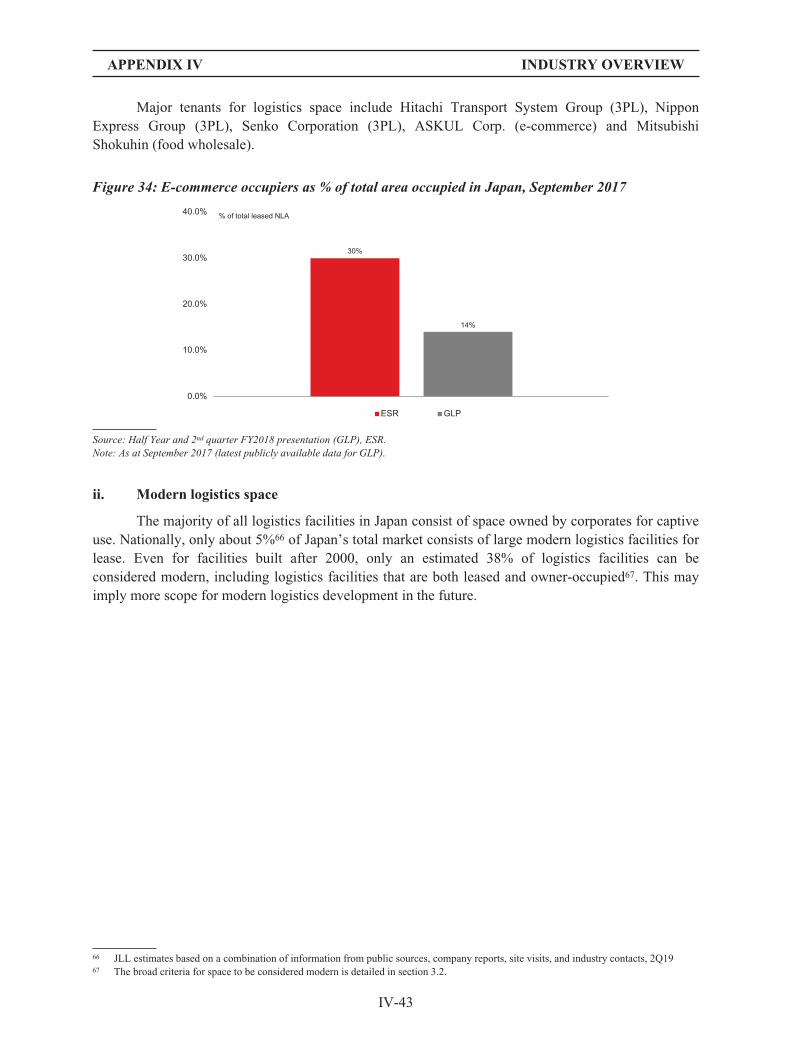
APPENDIX IV INDUSTRY OVERVIEW
Major tenants for logistics space include Hitachi Transport System Group (3PL), NipponExpress Group (3PL), Senko Corporation (3PL), ASKUL Corp. (e-commerce) and MitsubishiShokuhin (food wholesale).
Figure 34: E-commerce occupiers as % of total area occupied in Japan, September 2017
0.0%
10.0%
ESR GLP
14%
30%
20.0%
30.0%
40.0% % of total leased NLA
Source: Half Year and 2nd quarter FY2018 presentation (GLP), ESR.Note: As at September 2017 (latest publicly available data for GLP).
ii. Modern logistics space
The majority of all logistics facilities in Japan consist of space owned by corporates for captiveuse. Nationally, only about 5%66 of Japan’s total market consists of large modern logistics facilities forlease. Even for facilities built after 2000, only an estimated 38% of logistics facilities can beconsidered modern, including logistics facilities that are both leased and owner-occupied67. This mayimply more scope for modern logistics development in the future.
66 JLL estimates based on a combination of information from public sources, company reports, site visits, and industry contacts, 2Q1967 The broad criteria for space to be considered modern is detailed in section 3.2.
IV-43

APPENDIX IV INDUSTRY OVERVIEW
Figure 35: Key logistics players in Japan: ranked by stock owned and managed (sq.m)^, 2Q19
Daiwa HouseIndustry*
ESR Mitsui Fudosan*PrologisGLP
1.65
1.39
1.171.10
1.00
0.0
0.5
1.0
1.5
2.0
million sqm
Source: JLL estimates based on a combination of information from public sources, company reports, site visits, and industry contacts, 2Q19Note: 1) Excludes owner- occupier market, and based on JLL’s market coverage of Greater Tokyo and Greater Osaka, 2) These are JLLestimates, and as such, the data may not necessarily match with internal data maintained by the companies mentioned in the chart.^ Completions between 2015-2Q19. ESR data based on company data from 2Q19.*Local owner or developer.
A number of major logistics developers have relatively large supply pipelines. ESR has thelargest development pipeline (by gross floor area) in Japan (3Q19-2020), followed by Mitsui Fudosanand Daiwa House (see Figure 36)68.
Figure 36: Key logistics players in Japan: ranked by supply pipeline (sq.m), 3Q19-2020
1.51
ESR Daiwa HouseIndustry*
Mitsui Fudosan* Prologis GLP
0.490.59
0.44
0.19
0.0
0.5
1.0
1.5
2.0
million, sqm
Source: ESR data based on company data from 2Q19; other companies’ data are JLL estimates based on a combination of public sources,company reports, site visits, industry contacts, 2Q19.Note: 1) Excludes owner- occupier market, and based on JLL’s market coverage of Greater Tokyo and Greater Osaka, 2) These are JLLestimates, and as such, the data may not necessarily match with internal data maintained by the companies mentioned in the chart.*Local owner or developer.
iii. Government policies
The government’s focus on boosting economic growth and improving domestic consumption isexpected to be a major driver for the logistics industry. The government’s focus on infrastructure
68 See chart note under Figure 36.
IV-44

APPENDIX IV INDUSTRY OVERVIEW
spending may support further growth in the logistics sector. Landmark projects like the extension ofthe Gakan Expressway in Greater Tokyo and the Shin-meishin Expressway in Greater Osaka willfurther improve supply chain efficiency. Government support for automation and AI is also expected tolead to more efficient logistics operations.
iv. Greater Tokyo overview
Greater Tokyo (Tokyo, Kanagawa, Chiba, Ibaraki) has a population of around 39 millionpeople69 and is the economic center of Japan. The Port of Tokyo is Japan’s largest container port andthe Narita international airport is the gateway that serves Tokyo. In addition, an extensive highwaynetwork enables connectivity throughout the entire Greater Tokyo area (e.g. Gaikan Chuo Expressway,Ken-O Expressway).
Modern warehouses in Greater Tokyo primarily consist of properties located in Tokyo,Kanagawa, Chiba, Saitama, and Southern Ibaraki (along Ken-O Expressway). The rise of e-commerce,and the expansion of traditional retailers into online services, has helped support higher take-up rates.Further expansion of expressways is expected to increase demand for inland warehouses in the TokyoInland market. New routes are expected to further shorten delivery time and thus reduce the cost forlogistics companies.
Figure 37: Greater Tokyo Logistics market developing along the expressway network
Source: JLL.
Similar to most other APAC markets, e-commerce and 3PL service providers are key sourcesof demand, especially for newly completed warehouses. For example, Rakuten, a leading e-commercefirm, leased the 79,200-sq.m GLP Nagareyama 2 building in 2Q1870. On the supply side, growth ofnew modern logistics space is being supported by tight labor markets and a shortage of truck drivers
69 Ministry of Internal Affairs and Communications, 2018.70 Unless otherwise stated, all data on this page are from JLL, 2Q19.
IV-45

APPENDIX IV INDUSTRY OVERVIEW
and warehouse workers. This is making it imperative for latest logistics facilities to incorporateautomation and modern design.
The average occupancy rate for Greater Tokyo was about 97% in 2Q19. All prime space in theTokyo Bay area is fully occupied and the remaining vacant space in the Inland Area (close to the citycenter) are expected to be absorbed within a short time period, leading to upward pressure on rent andoccupancy rates. High occupancy rates will also be supported by proximity to the port and access toother infrastructure nodes.
Average market rents in the Greater Tokyo logistics market have trended moderately upwardsover the past five years. Rents have risen from about JPY 10,500 per sq.m per year in 2013 toJPY 11,700 per sq.m per year in 2Q19. However, rents of existing properties are expected to remaingenerally stable through to 2020. Any rental increase should be largely a result of new supply askingfor higher rents in order to reflect rising land prices and construction costs, and also because any newsupply is expected to be more modern and sophisticated in nature.
Investment interest in the sector remains strong. As such, average capital values of GreaterTokyo logistic properties have increased by about 33% between 4Q08 and 2Q19. Gross rental yieldshave compressed by 165 basis points in the Tokyo Bay and by 180 basis points in the Inland Area overthe same period, standing at 3.8% and 4.0%71 respectively as at 2Q19.
v. Greater Osaka overview
Greater Osaka (Osaka, Kobe, Kyoto, Wakayama) has a population of around 18 millionpeople72 and is the second largest urban area in Japan. As the economic center of the Kansai region, theGreater Osaka area is served by the Kansai International Airport as well as by the container ports ofKobe and Osaka. Developed highways have access throughout the entire Greater Osaka area (e.g.Shin-meishin Expressway). Modern warehouses in Greater Osaka are typically located in Osaka,Hyogo (southern area), Kyoto (southern area) and Wakayama (northern area).
71 Market yield is a gross rental yield. In the calculation of market yield, the transaction costs of purchasing or leasing of space is notincluded. The market yield therefore reflects the returns to investment before transaction costs, assuming full occupancy and that thecurrent income being paid is the market effective rent.
72 Ministry of Internal Affairs and Communications, 2018.
IV-46

APPENDIX IV INDUSTRY OVERVIEW
Figure 38: Greater Osaka Logistics market
Kyoto
OsakaKobe
Nara
Shin-MeishinMeishin
Dai2 Keihan
Kinki Expressway
In progress
In progress
In progress
Hanshin ExpressBayshore Line
Osaka Station
Kyoto Station
Sannomiya Station
Kobe Airport
Kansai InternationalAirport
Osaka InternationalAirport
Osaka Bay
Source: JLL.
Increasing supply has been rapidly absorbed by solid demand, particularly from e-commerceand 3PL service providers. Examples of companies that have taken space recently include Amazon,Rakuten and Askul.
Similar to Greater Tokyo, labor shortages are contributing to demand for modern logisticsfacilities in this region as well. Demand for newly completed warehouses has mainly come frome-commerce tenants. For example, Amazon leased the entire 64,000-sq.m (GFA) D project Ibaraki Bbuilding in 2Q1873.
The average occupancy rate stood at about 93% in Greater Osaka as at 2Q19. In the Inlandarea, there were no large multi-logistics facilities before 2015, although many properties have beenbuilt since 2017. Demand is steadily increasing and the existing vacancy is being gradually absorbedover time. In particular, demand for distribution facilities in the inland area is strong, and facilities arebeing occupied at a faster pace than those located in the Bay area. The lower supply profile is likely tolead to a more balanced demand-supply dynamic, which may support rental and occupancy growth.
Average rents in the Greater Osaka logistic market have been gradually trending upward inrecent years, and have risen from JPY 9,700 per sq.m per year in 2015 to around JPY 10,000 per sq.mper year in 2Q19.
By sub-market, rents in the Bay area have been on a downward trend because of the largesupply additions in 2016 and 2017. However, rents in the Inland area have been on an upward trend.
73 Unless otherwise stated, all data on this page are from JLL, 2Q19.
IV-47

APPENDIX IV INDUSTRY OVERVIEW
Relatively strong demand coupled with limited vacant logistics space has underpinned much of thisrental growth. Average rents of existing properties are expected to remain generally stable over theshort term.
With investment demand remaining strong, new facilities in bay side markets like Sakai Citymay receive high enquires and interest from investors. As such, market yields in Greater Osaka havecompressed by about 160 basis points since end-2008, falling to 4.0%74 in 2Q19.
4.3 Korea
The primary logistics hubs in Korea are within the Seoul Capital Area (Greater Seoul), whichconsists of the city of Seoul, the city of Incheon, and the Gyeonggi province encircling Seoul75. GreaterSeoul is the largest urban area in the country with a population of 25.7 million people (49.7% of thecountry’s population), and accounts for 56% of all logistics warehouse space in Korea in terms ofGFA76.
The Greater Seoul logistics market is largely concentrated within the southern region of theGyeonggi province. This area has access to good infrastructure, including access to two of the top fiveports as well as to major expressways. Affordable land is also generally widely available, allowing forlarge-scale projects. The Greater Seoul market can be divided into five submarkets:
1. Seoul & nearby areas (35% of modern logistics facilities of Greater Seoul77) consists ofthe city of Seoul and nearby satellite cities, including Gimpo, Goyang and Incheon. Thisarea is a key logistics hub because of its accessibility to the Seoul market, as well as toIncheon Port and Incheon International Airport.
2. The South East submarket (34% of the modern logistics facilities of Greater Seoul) is anemerging location, consisting of the cities of Icheon, Yeoju and Gwangju. The sub-marketis well connected with Seoul and its satellite cities via three primary highways—Gyeongbu, Jungbu and Yeongdong. Favorable development regulations and relativelyaffordable land costs have attracted major new developments and new tenants (e.g.e-commerce firms, 3PL service providers, fashion companies, and food brands).
3. The South West submarket (20% of modern logistics facilities of Greater Seoul)comprises the cities of Pyeongtaek, Anseong and Osan, and benefits from its proximity tothe West Coast Expressway and the Port of Pyeongtaek. This submarket typically handleslarge quantities of Chinese produced industrial goods and crops.
4. The Central Gyeonggi-do submarket (10% of modern logistics facilities of GreaterSeoul) encompasses Yongin, Gunpo and Suwon. Two major expressways, Gyeongbu andYeongdong, underpin the market. While demand has remained strong, it has beensomewhat capped by recent hikes in land prices.
5. The Other category submarket accounts for the remaining modern logistics facilities inGreater Seoul. This submarket comprises the Gyeonggi-do Province to the north and eastof Seoul.
74 Market yield is a gross rental yield. In the calculation of market yield, the transaction costs of purchasing or leasing of space is notincluded. The market yield therefore reflects the returns to investment before transaction costs, assuming full occupancy and that thecurrent income being paid is the market effective rent.
75 Seoul is considered Korea’s tier 1 city.76 National Logistics Information Centre, South Korea, 2Q18.77 Unless otherwise stated, all data on this page are JLL estimates, 2Q18.
IV-48

APPENDIX IV INDUSTRY OVERVIEW
Figure 39: Greater Seoul Logistics market
Source: JLL.
There are a number of regional and domestic owners, managers and developers of logistics realestate in Seoul. ESR subsidiary, Kendall Square, is the largest owner of logistics stock (by floor area)in Seoul, owning and managing around 593,300 sq.m of logistics space. Kendall Square also has thelargest logistics development pipeline (see Figure 40 and 41)78.
78 See chart notes under Figure 40 and Figure 41.
IV-49
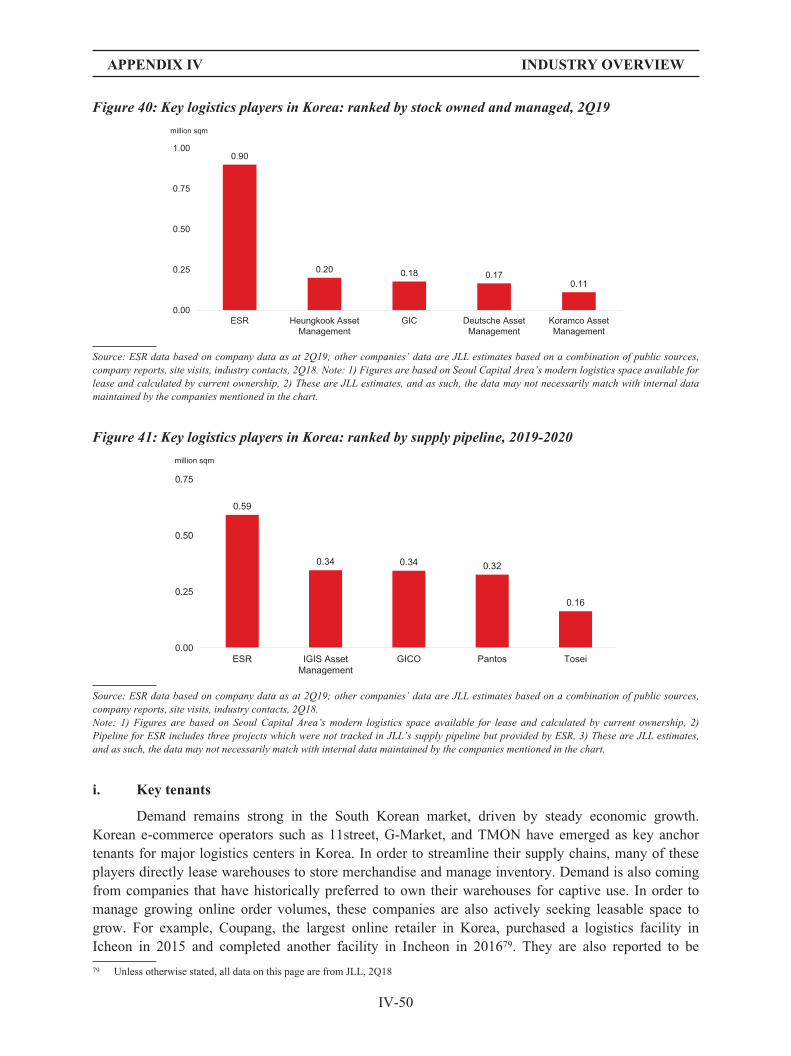
APPENDIX IV INDUSTRY OVERVIEW
Figure 40: Key logistics players in Korea: ranked by stock owned and managed, 2Q19
ESR Heungkook AssetManagement
GIC Deutsche AssetManagement
Koramco AssetManagement
0.90
0.20 0.18 0.170.11
0.00
0.25
0.50
0.75
1.00
million sqm
Source: ESR data based on company data as at 2Q19; other companies’ data are JLL estimates based on a combination of public sources,company reports, site visits, industry contacts, 2Q18. Note: 1) Figures are based on Seoul Capital Area’s modern logistics space available forlease and calculated by current ownership, 2) These are JLL estimates, and as such, the data may not necessarily match with internal datamaintained by the companies mentioned in the chart.
Figure 41: Key logistics players in Korea: ranked by supply pipeline, 2019-2020
0.59
ESR IGIS AssetManagement
GICO Pantos Tosei
0.34 0.34 0.32
0.16
0.00
0.25
0.50
0.75
million sqm
Source: ESR data based on company data as at 2Q19; other companies’ data are JLL estimates based on a combination of public sources,company reports, site visits, industry contacts, 2Q18.Note: 1) Figures are based on Seoul Capital Area’s modern logistics space available for lease and calculated by current ownership, 2)Pipeline for ESR includes three projects which were not tracked in JLL’s supply pipeline but provided by ESR, 3) These are JLL estimates,and as such, the data may not necessarily match with internal data maintained by the companies mentioned in the chart.
i. Key tenants
Demand remains strong in the South Korean market, driven by steady economic growth.Korean e-commerce operators such as 11street, G-Market, and TMON have emerged as key anchortenants for major logistics centers in Korea. In order to streamline their supply chains, many of theseplayers directly lease warehouses to store merchandise and manage inventory. Demand is also comingfrom companies that have historically preferred to own their warehouses for captive use. In order tomanage growing online order volumes, these companies are also actively seeking leasable space togrow. For example, Coupang, the largest online retailer in Korea, purchased a logistics facility inIcheon in 2015 and completed another facility in Incheon in 201679. They are also reported to be
79 Unless otherwise stated, all data on this page are from JLL, 2Q18
IV-50

APPENDIX IV INDUSTRY OVERVIEW
looking for logistics facilities across the Seoul Metropolitan Area (Gonjiam Logistics Center andDongsan Logistics Center), in order to keep pace with their expansion strategy.
In the medium term, online consumption growth is expected to continue to drive demand in thelogistics market. An increasing number of Korean consumers have started to purchase fresh produceand processed foods from online shopping malls. Many e-commerce businesses have expanded theirproduct categories to cater for these requirements.
3PL service providers are another key source of demand. 3PL service providers that need toachieve economies of scale typically need to occupy large-scale warehouse facilities. As a result, 3PLservice providers have become one of the largest sources of demand for modern logistics space inrecent years. Leading domestic 3PL service providers such as CJ Logistics and Lotte Logistics haverecently leased space in Jeongahn Logistics Center and Incheon Deokpyung Logistics Center,respectively. International 3PL service providers such as Pan Asia are also active and Li & Fung leasedspace in Logiport Icheon.
ii. Modern logistics space
Most logistics stock in South Korea is concentrated in the Seoul Metropolitan Area. Around28% of facilities in the Seoul Metropolitan Area can be considered modern80.
iii. Government policies
In order to boost 3PL utilization, the Korean government has introduced a tax incentiveprogram for freight owners81. This has the potential to reduce corporate tax liability for freight ownersif they were to outsource their logistics operations to 3PL service providers. The government is alsopromoting the construction of large planned logistics complexes. This is being done to preventdevelopers from building standalone logistics centers haphazardly. The program’s key incentivesinclude the exemption of acquisition and property taxes for the first five years.
Further, the government is focusing on creating “inner city logistics centers”. These centers,dubbed “e-Logis Towns”, are being developed by renovating old, obsolete truck terminals. Due to theirproximity to Seoul’s city center, these terminals are suitable for B2C delivery. The government hasalso prepared a 2016-2025 masterplan for the national logistics industry. This masterplan outlinesinitiatives that will help drive growth in the sector. Key measures include deregulating thecommercialization of new logistics technologies, promoting R&D for real time tracking, encouraginglogistics firms to expand overseas, and constructing large-scale logistics complexes near IncheonAirport to handle air cargo volumes.
iv. Greater Seoul overview
Historically, freight owners and 3PL service providers have preferred to build small-scalelogistics facilities, often at secondary locations and on an ad-hoc basis. However, more logisticsdevelopers are now focusing on large-scale modern logistics projects. This has boosted the supply ofoverall logistics space in Seoul.
80 JLL estimates based on a combination of information from public sources, company reports, site visits, and industry contacts, 2Q18. Thebroad criteria for space to be considered modern is detailed in section 3.2.
81 Special tax treatment control law (article 104-14).
IV-51

APPENDIX IV INDUSTRY OVERVIEW
Although a considerable amount of modern space has entered the market, absorption has alsobeen strong. New logistics facilities takes around three to six months to lease after completion. JLLestimates that the average occupancy rate for modern and non-modern warehousing space in GreaterSeoul currently stands at close to 95% and is expected to remain high going forward.
Rents in Seoul and nearby districts continue to outperform the broader market, owing to thesize and affluence of the consumer base (which in turn attracts key tenants), its superior accessibility tothe city center, and popularity with freight owners. This is marginally offset by lower growth in theSouth East submarket.
Despite over 5.9 million sq.m of new logistic space that is scheduled to be completed within theSeoul Metropolitan Area between 2018 and 202082, the overall occupancy rate is forecast to remainrelatively stable given sustained demand, especially for modern logistics facilities. Considering thesefactors, we expect that logistics rents for modern stock in Greater Seoul will continue to grow at amoderate pace over the 2018-2020 period.
Market yields on prime logistics properties have been trending downward as competition forassets among investors intensifies. Recent transaction evidence suggests that the average gross rentalyield stands at about 6%83. This represents a compression of over three percent since 2011.
4.4 Singapore
i. Singapore overview
Occupier demand in Singapore moderated in 1H19 against the backdrop of a slowing economy.However, the 3PL sector remains a key pillar in driving leasing demand. Steady physical spaceabsorption amid slowing new logistics space completions resulted in vacancy trending down to 10.7%in 2Q19, around 70bps lower than in the same period 12 months ago.
The 3PL industry has been a big beneficiary of the rise of e-commerce and the rapid take-upand advancement of technology of online retail platforms. Expectations are for this growth to continueas consumer adoption rates for retailers’ e-commerce platforms increase and as technology andautomation advances drive logistics expansion.
Table 9: Market snapshot, 2Q19
Total logistic space (million)* Major owners / developers Key market demand drivers
10.8 . . . . . . . . . . . . . . . . . . . . . . . . . . Mapletree, Ascendas, ESR 3PL service providers,manufacturing,e-commerce
Source: JLL, 2Q19.*Logistics market, NLA, sq.m.
ii. Major owners and developers
Across all sectors and over the last 15 years, Singapore has established itself as APAC’Sde-facto cross-border REIT hub. The market has grown considerably over this period, with the REIT
82 JLL estimates, 2Q1883 In the calculation of the market yield, the transaction costs of purchasing or leasing of space is not included. The yield therefore reflects
the returns to investment before transaction costs, assuming full occupancy and that the current income being paid is the market effectiverent.
IV-52

APPENDIX IV INDUSTRY OVERVIEW
market in Singapore the third largest (by market cap) in the APAC region. Subsequently, theproportional size of the REIT sector to the total real estate market is relatively high, ahead of Australia,Malaysia, and Japan.
Favorable fund structures, efficient tax regimes, and critical mass have all supported relativelyrapid growth in the Singaporean REIT sector. A number of IPOs over the past 12-24 months—KeppelKBS US REIT, Sasseur REIT, and Cromwell European REIT—highlight the strong momentum in thesector.
In terms of industrial REITs, this subsector is undergoing a period of consolidation. ESR, forexample, took over Cambridge REIT in January 2017, and merged with VIVA REIT in October 2018.The ESR-VIVA REIT merger is the first successful REIT merger in the Singapore REIT market. ESRhas also since become the largest unit holder in Sabana REIT, boosting its holding to 21.4% inMay 2019. In a separate transaction, ESR has also taken a majority stake in Sabana InvestmentPartners (SIP), an investment holding company which owns Sabana Property Management and SabanaReal Estate Investment Management. The combined ESR and VIVA platform has a total of 56 assets inSingapore, making it the third largest REIT in Singapore on this basis, and behind the governmentaffiliated Ascendas REIT and Mapletree Industrial Trust (see table 10)84. Sabana REIT currently holds19 assets in Singapore.
Table 10: REIT overview
REITSingapore
assetsTotal asset value (SGD,
billions)Market cap (SGD
billions)
Ascendas REIT . . . . . . . . . . . . . . . . . . . . . . . . . . . . . . . . . . . . . 78 11.1 9.4Mapletree Industrial Trust . . . . . . . . . . . . . . . . . . . . . . . . . . . . . 87 4.6 4.6ESR REIT* . . . . . . . . . . . . . . . . . . . . . . . . . . . . . . . . . . . . . . . . 56 3.3 1.7Mapletree Logistics Trust . . . . . . . . . . . . . . . . . . . . . . . . . . . . . 52 8.1 5.6AIMS AMP Capital Industrial REIT . . . . . . . . . . . . . . . . . . . . 25 1.5 1.0Sabana REIT^^ . . . . . . . . . . . . . . . . . . . . . . . . . . . . . . . . . . . . . 19 1.0 0.5Soilbuild REIT . . . . . . . . . . . . . . . . . . . . . . . . . . . . . . . . . . . . . 11 1.3 0.6Cache Logistics Trust . . . . . . . . . . . . . . . . . . . . . . . . . . . . . . . . 10 1.4 0.8Frasers Logistics and Industrial Trust** . . . . . . . . . . . . . . . . . . — 3.1 2.7EC World REIT^ . . . . . . . . . . . . . . . . . . . . . . . . . . . . . . . . . . . . — 1.5 0.6
Source: Companies’ financial reports and presentations, 2Q19. Market cap as at August 19, 2019.*Combined with Viva Industrial Trust.** Frasers Logistics and Ind Trust assets principally located in Australia.^EC World REIT assets principally located in China.^^Sabana REIT manager acquired by ESR.
4.5 Australia
i. Australia overview
Occupier demand remained strong nationwide85.Demand over 2019 has remained strong withindustrial floor space take-up levels on track to reach similar levels recorded over the past four years –that is, above the 10-year annual average of 2.1 million sqm. National take-up levels have so farreached 1.2 million sqm over 2019.
84 Companies’ financial reports and presentations, 4Q18.85 JLL considers Sydney, Melbourne, Brisbane, Perth, Adelaide, and Canberra as Australia’s tier 1 cities
IV-53

APPENDIX IV INDUSTRY OVERVIEW
Although the concentration of occupier activity has historically been in Sydney, the share ofdemand over the past six months has shifted toward the Melbourne market. Industrial take-up withinMelbourne over 2019YTD has been the highest in country, representing just over 40% (or520,000 sqm) of total national take-up levels. Melbourne’s West precinct has recorded the greatestamount of activity in the pre-lease market over this period, and mainly from occupiers within thetransport, warehousing and retail trade sectors. Demand has also improved in Brisbane and Perth.
Over 2019 the share of take-up from the retail trade sector has risen compared to 2018, from20% to currently 27% (or 328,000 sqm). This is attributable to the food retailing sub-sector(i.e. Kaufland and Woolworths). There have been 13 leases recorded from the retail trade sector over2019YTD, and most of these deals have been in Melbourne (West precinct).
The demand-supply dynamic is relatively balanced nationally, translating to a relatively robustrental growth rate. On a y-o-y basis, national prime weighted86 rents grew by 3.7%, supported byquarterly 2Q19 growth of 1.6%. However, there are significant differences across markets andprecincts. For instance, average rents in South Sydney grew by 5.0% y-o-y, 1.9% in BrisbaneSouthern, but fell by 4.8% in Perth East.
Nonetheless, national rents are expected to continue to rise moderately over the near/mediumterm. Convergence of rental growth rates is expected as more uniform economic growth emerges. Notethat logistics facilities in Australia tracked by JLL are typically considered modern87.
Table 11: Market snapshot, 2Q19
Stock (million)* Major owners / developers Key market demand drivers
Total: 40.2 . . . . . . . . . . . . . . . . . . . . . Goodman, Charter Hall, Logos Transportation and storage,retail / wholesale trade,manufacturing
Source: JLL, 2Q19.*GLA, sq.m.
ii. Major owners and developers
Australia’s logistics stock is primarily held by a core group of owners, the largest of whichhave actively expanded assets under management (AUM) through the development of major masterplanned industrial and business estates. Once completed, the assets are typically retained by the owner/developer in listed trusts and wholesale funds.
Most of the domestic institutions with substantial logistics holdings have sought to increasetheir exposure to the sector in recent years. A number of major offshore funds and smaller boutiquefunds are looking to grow their presence in the market. While the sector is dominated by a core groupof owners/developers, participation in specific local markets is due to the presence of a large number ofsmaller operators.
86 Weighted by Gross State Product.87 Logistics facilities in Australia generally refers to modern space. Different countries use different methodologies and definitions to
capture total stock, and modern and non-modern stock. As such total stock, modern and non-modern stock between countries may not bedirectly comparable. The classification of modern and non-modern warehousing can be found in section 3.2.
IV-54

APPENDIX IV INDUSTRY OVERVIEW
Figure 42: Australian AUM/total asset value of select REITs
35.0
30.0 28.9
billion, AU$
Dexus
Charte
r Hall
GPT^
Stock
land^
Growth
point
^
Prope
rtylin
k
Ascen
das^
Fras
ers P
rope
rty^
Goodm
an
Centu
ria C
apita
l
28.4
24.8
17.6
8.510.5
6.23.8
1.8 1.7
25.0
20.0
15.0
0.0
5.0
10.0
Source: JLL estimates based on company reports and presentations. Charter Hall and Stockland as at 4Q18, the others either as at 1Q19 or2Q19.Note: 1) Select REITs with industrial exposure (industrial AUM or industrial asset value) >AU$ 1.0 billion^ Value of total Australian assets (except for Stockland which includes commercial properties only)
Goodman is the largest logistics owner and developer among the listed REITs. Most of theother major top 10 REITs (by market cap) are diversified across different sectors. Goodman’s keyA-REIT competitors include: Charter Hall, Stockland, Dexus, Mirvac, GPT, Centuria, andPropertylink. Most of these REITs have broadly diversified portfolios across the office, logistics, retail,and residential sectors. While these are domestic REITs, the share register of many of these REITsshow significant foreign ownership. There have also been a number of public to private transactions,including ESR’s acquisition of Propertylink in November 2018. Propertylink has now been delistedfrom the Australian stock exchange.
A number of offshore REITs and private equity and developer companies also have significantexposure to the Australian logistics sector. These companies form a significant part of the competitivelandscape and include Frasers, Cache Logistics, Ascendas, Mapletree, Blackstone, LOGOS Property,and Altis, among others.
IV-55

APPENDIX IV INDUSTRY OVERVIEW
Figure 43: Logistics development pipeline of major Australian developers, 2Q19-2020
-
50,000
100,000
150,000
400,000
350,000
300,000
250,000
200,000
335,080
sqm, GLA
203,240
167,197149,437 147,724
122,388111,158 105,959 99,750
67,081
Charter Hall Goodman Dexus Frasers MAB Mirvac Brookfield Walker Fife Capital Lendlease
Source: JLL estimates based on a combination of information from public sources, company reports, site visits, and industry contacts, 2Q19.Note: 1) Based on JLL’s market coverage of Sydney, Melbourne, Brisbane, Adelaide, and Perth, and involved as a developer, 2) These areJLL estimates, and as such, the data may not necessarily match with internal data maintained by the companies mentioned in the chart,3) ESR acquired the business of Commercial and Industrial Property (CIP) from Charter Hall in 3Q18. CIP was responsible for thedevelopment of substantial component of Charter Hall logistics businesses in Australia.
4.6 India
i. India overview
Demand levels remained upbeat across both in Delhi and Mumbai. Demand in Delhisignificantly increased in 1H19 compared to the same period in 2018, with Gurgaon, and Sonipattaking the lead, having recorded significantly stronger demand. In the next largest market of Mumbai,occupier demand was strong, mostly driven by elevated demand in Bhiwandi.
IV-56

APPENDIX IV INDUSTRY OVERVIEW
Figure 44: NCR Delhi map
Source: JLL.
The logistics sector in India is undergoing rapid change. The expanding 3PL sector, last miledelivery, and the integration of technology and automation into warehousing and logistics space havecreated an emerging source of occupier demand and helped support leasing volumes and take-up rates.In the first half of 2019, total absorption reached 435,990 sqm (4.69 million sq ft) in NCR Delhi88, upover 41% from 307,321 sqm (3.31 million sq ft) in 1H18. This is equivalent to around 26% of totalIndia net absorption (1.7 mn sqm or 18.32 million sq ft), with rents in modern logistics facilitiesaveraging between a range of INR 182-226 per sqm per month (USD 2.5-3.1 per sqm per month / INR17-21 per sq ft per month). Over the same period, Mumbai recorded absorption of 352,382 sqm (3.79million sq ft). Average modern rents are moderately higher in Mumbai, ranging between INR 183-236per sqm per month (USD 2.5-3.2 per sqm per month / INR 17-22 per sq ft per month).
88 Unless otherwise stated, all data on this page are JLL estimates, 2Q19
IV-57

APPENDIX IV INDUSTRY OVERVIEW
Table 12: Market snapshot, 2Q19
Total logistics space (million)* Major owners / developers Key market demand drivers
Delhi—4.0 (43.2 sq ft) . . . . . . . . .Mumbai—3.5 (37.1 sq ft) . . . . . . .
IndoSpace, Allcargo ESR,Embassy
3PL service providers,e-commerce, Retailers
Source: JLL, 2Q19.*Estimated Grade A and Grade B warehouse market across JLL’s coverage areas, GFA, sq.m.
ii. Development potential of the logistics sector
The prospect for future growth in the logistics sector is positive. Robust economic growth,coupled with a supportive demographic profile can help sustain industry growth. Combined withaccommodative government policies and high investment into transport infrastructure, a solidframework exists for the sector to continue its growth trajectory.
The economy and demographics
Š Strong economic fundamentals: The Indian economic growth rate is anticipated to rise atan average pace of 6.6% per annum between 2019 and 202889. The political environmentis also relatively stable, with economic policies aimed at targeting sustained growth anddevelopment.
Š Positive demographic profile: Along with a large population, the relatively youngdemographic profile of India may also play a critical role in the development of thelogistics sector. The median age in India is approximately 26, which is relatively low on aglobal scale. This is reflected in falling dependency ratio estimates, a key component forsustained economic growth. Positive demographics may also mean positive implicationsfor consumption growth, especially when coupled with the growth in the middle classpopulation.
Š Rapid urbanization: Between 2015 and 2025, the urban population in India is expectedto increase by 99.8 million people. This is nearly four times the population of Australia.The impact of this generational shift and the expanding middle class may translate topositive flow-on effects on the growth and scale of the logistics sector. Between 2015 and2022, India’s middle class is expected to increase by 380 million people, ahead of China(350 million), and the rest of Asia (210 million)90.
Š E-commerce growth: India’s e-commerce industry (by revenue) is expected to grow fromUS$ 39 billion in 2017 to US$150 billion by 2022. This growth will supported by therising number of online shoppers, from 120 million in 2018 to an estimated 220 million by202591.
89 Unless otherwise stated, all data on this page are from Oxford Economics, October 2018.90 The Unprecedented Expansion of the Global Middle Class – An Update, February 2017 (The Brookings Institution).91 India Brand Equity Foundation (https://www.ibef.org/industry/ecommerce-presentation).
IV-58

APPENDIX IV INDUSTRY OVERVIEW
Figure 45: Indian urban population
2000 2005 2010 2015 2020 2025200.0
250.0
300.0
350.0
400.0
450.0
500.0
550.0
292.0
335.2
381.4
429.3
479.5
529.1million
Source: Oxford Economics, August 2019.
Public policy
Growth in the logistics sector in recent years has been driven in part by supportive governmentpolicies. There are several key government initiatives that have boosted growth in the sector.
Š Logistics granted infrastructure status: As part of the government’s push to bolster theinfrastructure development in the country, the government granted infrastructure status tothe logistics sector, with a key goal to incentivize investment into logistics. A key benefitfor owners/developers is access to funding at more competitive rates and the ability toaccess funding from the External Commercial Borrowings window. Additionally, thesector is now able to access long tenure funds from insurance and pension funds.
Š Establishment of a dedicated logistics division: The Department of Commerce created anew logistics division in July 2017. The primary mandate of this newly created division isto develop and provide action plans for the integrated development of the logistics sectorin India by 1) improving existing procedures, 2) introducing new technology, and 3)identifying process/procedural bottlenecks.
Š Goods and Services Tax introduction: The government introduced the Goods andServices Tax in 2017. There are many positive impacts of this on the logistics sector,including: organizations will now be able to explore a different distribution model (huband spoke), it will shift the focus to more efficient warehousing, and it will reducelocation-based tax compliance issues (fewer checkpoints), which should improve transittimes.
IV-59

APPENDIX IV INDUSTRY OVERVIEW
Infrastructure
Transport infrastructure plays a vital role in the logistics sector. A key consideration for mostoccupiers is access to major infrastructure nodes and the ease of movement of goods to and from theirfacility. Public expenditure on infrastructure has been high. Between 2006 and 2015, India’sinvestment in infrastructure grew at a CAGR of 17%, compared to 7-8% across the rest of Asia92. Keyinvestments include:
Š Road: The Ministry of Road Transport and Highways declared 2018-19 as the “Year ofConstruction”. Overall, more than about 61,300 km length of road projects, costing are inprogress. In the first nine months of FY 2018-19, 5,759 km has been completed93.
Š Rail: The Ministry of Railways is developing a Western Dedicated Freight Corridor(WDFC) and an Eastern Dedicated Freight Corridor (EDFC) to decease freight times. TheWDCF is expected to span 1,500 kilometers, while the EDFC will span around 1,900kilometers. Expected completion for both projects is late 2019.
Š Aviation: Domestic passenger traffic during the January-June 2019 period grew by 3.2%relative to the same period last year94. Higher passenger numbers is due in part to theimplementations of the National Civil Aviation Policy (2016), which incorporated anumber of objectives, including that India would become the third largest civil aviationmarket by 2022, up from ninth currently; cargo volumes should increase four-fold toaround 10 million tonnes by 2027, and that the Airport Authority of India would investaround INR 13,000 for infrastructure projects in 13 regional airports.
iii. Major owners and developers
The logistics market in India is highly fragmented. The market remains in the growth phasewith a number of active developers, the majority of whom are domestic focused. Across the 10developers with the largest supply pipelines in NCR Delhi and Mumbai, only ESR and IndoSpace(through investments by GLP) have a multi-country presence. Figure 47 illustrates the developmentpipelines of the major developers and operators in NCR Delhi and Mumbai. After IndoSpace, AllCargoand Embassy, ESR has the fourth largest logistics development pipeline (see Figure 47, and graphnotes).
92 Manufacturing and Logistics: On a Roller Coaster Ride! (JLL, January 2017).93 http://pib.gov.in/newsite/PrintRelease.aspx?relid=186932.94 http://dgca.nic.in/reports/Traffic-ind.htm (June 2019 report)
IV-60

APPENDIX IV INDUSTRY OVERVIEW
Figure 46: Total logistics development pipeline of major Indian developers in NCR Delhi andMumbai, from 2Q19 onwards
800,000
700,000
600,000
723,709
485,879 465,440425,492
263,842
202,527
sqm, GFA
500,000
400,000
300,000
200,000
100,000
-Indospace All Cargo ESR Ascendas
FirstSpaceEmbassy Antariksh
Source: JLL estimates based on a combination of information from public sources, company reports, site visits, and industry contacts, 2Q19.Note: 1) Based on JLL’s coverage areas of NCR Delhi and Mumbai. Development pipeline includes all known projects from 2Q19 onwards.This differs from Figure 16, which for greater consistency with the other markets, incorporates India’s development pipeline for the periodbetween 4Q18-2020, 2). These are JLL estimates, and as such, the data may not necessarily match with internal data maintained by thecompanies mentioned in the chart.
IV-61

APPENDIX V REGULATORY OVERVIEW
This Section sets out a summary of the major laws, regulations, rules and policies that governour business operations in the PRC, Japan, South Korea, Singapore, Australia and India.
A. PRC LAWS AND REGULATIONS
Set below is the summary of the PRC laws and regulations in relation to the business andoperation of our Company.
1. ESTABLISHMENT OF FOREIGN-INVESTED ENTERPRISES
The establishment, operation and management of companies in China is governed by CompanyLaw of the PRC (《中華人民共和國公司法》) (the “PRC Company Law”), promulgated by theStanding Committee of National People’s Congress (“NPC”) on December 29, 1993 and last amendedon October 26, 2018.
As our Company is a foreign investor under PRC law, all of the PRC Subsidiaries that arewholly foreign owned enterprises (“WFOE”) and/or Sino-foreign equity joint ventures (“EJV”) areregulated by laws and regulations governing foreign investment, including the Wholly Foreign-ownedEnterprise Law of the PRC (《中華人民共和國外資企業法》) (promulgated by the Standing Committeeof the NPC on April 12, 1986 and last amended on September 3, 2016), and the Equity Joint VentureLaw of the PRC (《中華人民共和國中外合資經營企業法》) (promulgated by the Standing Committeeof the NPC on July 8, 1979 and last amended on September 3, 2016).
Establishment of a foreign-invested enterprise with business that does not fall within SpecialAdministrative Measures (Negative List) for Foreign Investment Access (Edition 2018) (《外商投資准入特別管理措施(負面清單)(2019年版)》) (the “Measures”, the list provided therein, the “NegativeList”) promulgated by MOFCOM and the National Development and Reform Commission (“NDRC”)on June 30, 2019 and effective as of July 30, 2019, is required to complete filing formalities withMOFCOM in accordance with the Interim Administrative Measures for the Record-filing of theIncorporation and Change of Foreign-invested Enterprises (《外商投資企業設立及變更備案管理暫行辦法》) (“Circular 3”) issued by the MOFCOM on October 8, 2016 and amended on June 29, 2018.Building and leasing warehouses and affiliated facilities does not fall within the Negative List.
2. PRC MERGER AND ACQUISITION
Pursuant to Provisions on the Merger and Acquisition of Domestic Enterprises by ForeignInvestors (《關於外國投資者併購境內企業的規定》) which was promulgated by the MOFCOM, theState-owned Assets Supervision and Administration Commission of the State Council, SAT, the StateAdministration for Industry and Commerce (中華人民共和國國家工商行政管理總局) (“SAIC”), ChinaSecurities Regulatory Commission (“CSRC”) and the State Administration of Foreign Exchange (中華人民共和國國家外匯管理局) (“SAFE”) on August 8, 2006, and subsequently amended by theMOFCOM on June 22, 2009, provides that the scenarios qualify as an acquisition of a domesticenterprise by a foreign investor.
According to the Circular 3, where a non-foreign-invested enterprise changes into a foreign-invested enterprise due to acquisition, consolidation by a merger or otherwise, which is subject to filingas stipulated in the Measures, it is required to complete the filing formalities with MOFCOM.
V-1

APPENDIX V REGULATORY OVERVIEW
3. LAND USE RIGHTS FOR REAL ESTATE DEVELOPMENT
Although all land in the PRC is either state-owned or collectively-owned, individuals andentities may obtain land use rights and hold such land use rights for development purposes in differentways.
(i) Grant and transfer of land use right
On April 12, 1988, the NPC passed an amendment to the Constitution of the PRC (《中華人民共和國憲法》), which allowed the transfer of land use rights in accordance with PRC law. OnDecember 29, 1988, the Standing Committee of the NPC also amended the Land Administration Lawof the PRC (《中華人民共和國土地管理法》) to permit the grant and transfer of land use rights inaccordance with PRC law for value. On May 19, 1990, the State Council enacted the ProvisionalRegulations of the PRC Concerning the Grant and Assignment of the Right to Use State-owned Landin Urban Areas (《中華人民共和國城鎮國有土地使用權出讓和轉讓暫行條例》). These regulations,generally referred to as the Urban Land Regulations, formalized the process of the grant and transfer ofland use rights for value.
(ii) Ways of land use right grant
As of July 1, 2002, the grant of land use rights by way of competitive processes is governed bythe Regulations on the Grant of Use Right of State-Owned Land by Tender, Auction orListing-for-Bidding (《招標拍賣掛牌出讓國有土地使用權規定》), issued by the Ministry of Land andResources of the PRC (the “MLR”) on May 9, 2002 and revised as of September 28, 2007 with theRegulations on Granting State-Owned Construction Land Use Right through Bidding, Auction andListing (《招標拍賣掛牌出讓國有建設用地使用權規定》) (the “Land Grant Regulations”), whichbecame effective on November 1, 2007. The Land Grant Regulations specifically provide that land tobe used for industrial (including warehouse land, but excluding mining land), commercial, tourism,entertainment or commodity residential purposes, or where there are two or more intended users for thecertain piece of land, shall be granted by way of competitive processes (i.e. tender, auction or listingorganized and administered by the local government). A number of measures are provided by the LandGrant Regulations to ensure such grant of land use rights is conducted openly and fairly.
On June 11, 2003, the MLR promulgated the Regulations on Grant of State-Owned Land UseRights by Agreement (《協議出讓國有土地使用權規定》), which became effective on August 1, 2003,to regulate the granting of land use rights by agreement when there is only one applicant interested inthe land and the designated uses of which are other than for business purposes including commerce,tourism, entertainment or commodity housing, etc.
(iii) Land use right transfer from current land users
In addition to a direct grant from the government, an investor may also acquire land use rightsfrom land users that have already obtained the land use rights by entering into a transfer contract withsuch land users. For real estate development projects, the Law on the Administration of Urban RealEstate of the PRC (《中華人民共和國城市房地產管理法》) (the “Urban Real Estate Law”),promulgated by the Standing Committee of the NPC on July 5, 1994 and last amended on August 27,2009, requires that the following conditions must be fulfilled before land use right transfer can takeplace: (1) full payment of land use right grant premium and the obtaining of land use right certificate;and (2) investment or development has been made in accordance with the grant contract. Where the
V-2
APPENDIX V REGULATORY OVERVIEW
investment or development involves a building construction project, at least 25% of the total amount ofinvestment or development must have been made or completed. All rights and obligations of thecurrent holder under a land grant contract will be transferred contemporaneously to the assignee of theland use rights.
4. DEVELOPMENT OF WAREHOUSING PROJECTS
Approval or filing of the NDRC or its branches shall be required for foreign investmentprojects, according to the Administrative Measures for Approval and Record-filing of ForeignInvestment Projects (《外商投資項目核准和備案管理辦法》), promulgated by the NDRC on May 17,2014 and was amended on December 27, 2014. The investment projects specified in the Notice of theState Council on Promulgating the Catalog of Investment Projects Approved by the Government (2016Version) (the “Catalog”) (《國務院關於發佈政府核准的投資項目目錄(2016年本)的通知》), which waspromulgated and effective on December 12, 2016, shall be approved by the NDRC or other competentauthorities and the investment projects other than those specified in the Catalog shall be filed with thecompetent investment department of the local governments.
(i) Commencement of warehousing development projects
According to the Urban Real Estate Law, those who have obtained the right of land use by theway of grant for real estate development must develop the land in accordance with the land use andwithin the construction period as prescribed in the grant contract. When the land user fails tocommence development within one year of the date prescribed in the grant contract for starting thedevelopment, an idle land fee of no more than 20% of the land grant premium may be collected andwhen the land user fails to commence development two years after this date, the right to use the landmay be confiscated without any compensation, except where the delays are caused by force majeure,the activities of government, or the delay in the necessary preliminary work for starting thedevelopment.
Pursuant to the Measures on Disposal of Idle Land (《閒置土地處置辦法》), which waspromulgated on April 28, 1999 by the MLR and revised on June 1, 2012, land can be defined as idleland under any of the following circumstances: (a) development and construction of the state-ownedland is not commenced after one year of the prescribed time in the land use right grant contract orallocation decision; or (b) the development and construction of the state-owned land has beencommenced but the area of the development and construction that has been commenced is less thanone-third of the total area to be developed and constructed or the invested amount is less than 25% ofthe total amount of investment, and the development and construction have been continuouslysuspended for one year or more without an approval.
According to the new rules, “commencement of development” means, subject to the issuance ofthe construction permit, the completion of the excavation of foundation for projects requiringfoundation pit, the driving of all piles for projects using pile foundation, or the completion of one-thirdof the foundation for other projects. In addition, the new rules require that the land premium, relevanttaxes and governmental charges shall be excluded from the invested amount and the total investmentamount when calculating whether the investment commitment for the land has been satisfied. Further,according to the new rules, where land remains idle for at least one year but less than two years, theidle land fee shall be 20% of the land premium, as opposed to “up to 20%” under the previous rulespromulgated in 1999. In addition, a holder of a land use right cannot count the idle land fee in itsproduction costs.
V-3

APPENDIX V REGULATORY OVERVIEW
The policy was reinforced in the “Notice on Enhancing the Economical and Intensive Use ofLand” (國務院關於促進節約集約用地的通知) promulgated by the State Council on January 3, 2008which states, among other things, that: (i) policies in relation to the forfeiture of land use rights withoutcompensation for land which has remained “idle” for two years or more shall be strictly implemented;(ii) if any land remains “idle” for one year or more but less than two years, an “idle” land fee of 20% ofthe relevant land premium will be levied; and (iii) financial institutions are required to exercise cautionwhen approving financing for any property owner who, after one year from the commencement datestipulated in the land grant contract, fails to complete at least one-third of the development of the landor provide at least 25% of the total funds for investment in the project. Some of our land grantcontracts stipulate a minimum amount we have to invest in the relevant project, which may exceed theamount we deem commercially reasonable for the type of business we are engaging in. Furthermore,Ministry of Land and Resources of the PRC issued a Notice on Restricting the Administration ofConstruction Land and Promoting the Use of Approved Land (關於嚴格建設用地管理促進批而未用土地利用的通知) on August 11, 2009, which reiterates the rules regarding idle land.
(a) Planning of warehousing projects
Under the Urban and Rural Planning Law of the PRC (the “Urban and Rural Planning Law”)(《中華人民共和國城鄉規劃法》) issued on October 28, 2007 and last amended on April 23, 2019 andthe Regulations on Planning Administration regarding Granting and Transfer of State-Owned LandUse Right in Urban Area (《城市國有土地使用權出讓轉讓規劃管理辦法》) promulgated by theMinistry of Construction on December 4, 1992 and amended on January 26, 2011, a developer shallapply for a License for the Planning of Construction Land (《建設用地規劃許可證》) from themunicipal planning authority and then conduct all necessary planning and design works in accordancewith relevant planning and design requirements. A planning and design proposal in respect of theproject should be submitted to the municipal planning authority in compliance with the requirementsand procedures under the Urban and Rural Planning Law and a License for the Planning ofConstruction Projects (《建設工程規劃許可證》) from the municipal planning authority should beobtained by the developer.
(b) Construction Work Commencement Permit
The real estate developer shall apply for a Construction Work Commencement Permit (《建築工程施工許可證》) from the relevant construction authority in accordance with the Regulations onAdministration Regarding Permission for Commencement of Construction Works (《建築工程施工許可管理辦法》) promulgated by the Ministry of Construction on October 15, 1999 and last amended onSeptember 28, 2018.
(ii) Acceptance and examination upon completion of warehousing projects
Pursuant to the Development Regulations and the Administrative Measures for the RegistrationRegarding Acceptance Examination upon Completion of Buildings and Municipal Infrastructure (《房屋建築和市政基礎設施工程竣工驗收備案管理辦法》) promulgated by the Ministry of Construction onApril 4, 2000 and amended on October 19, 2009 by the Ministry of Housing and Urban-RuralDevelopment of the PRC (“MOHURD”) and the Provisions on Acceptance Examination uponCompletion of Buildings and Municipal Infrastructure (《房屋建築和市政基礎設施工程竣工驗收規定》) promulgated and implemented by the MOHURD on December 2, 2013, upon the completion ofreal estate development project, the developer shall submit an application to the competent departmentof real estate development of the local government at or above the county level, where the project is
V-4

APPENDIX V REGULATORY OVERVIEW
located, for examination upon completion of the building and for filing purposes, and to obtain theFiling Form for Acceptance and Examination upon Completion of Construction Project. A real estateproject shall not be delivered before passing this acceptance examination.
(iii) Lease of properties
Both the Urban Land Regulations and the Urban Real Estate Law permit the leasing of grantedland use rights and of the buildings or houses erected on the land. On December 1, 2010, theMOHURD promulgated the Administrative Measures for Commodity House Leasing (《商品房屋租賃管理辦法》) (the “New Lease Measures”), which became effective on February 1, 2011. Pursuant tothe New Lease Measures, parties thereto shall register and file with the local property administrationauthority within thirty days after entering into the lease contract. Non-compliance with suchregistration and filing requirements shall be subject to fines up to RMB10,000. According to the UrbanReal Estate Law, rental income derived from any building situated on allocated land where the land userights have been obtained through allocation, shall be turned over to the State.
Under the Contract Law of the PRC (《中華人民共和國合同法》) promulgated by the NPC onMarch 15, 1999 and effective as of October 1, 1999, the term of a leasing contract shall not exceed20 years.
5. REAL ESTATE REGISTRATION
The Interim Regulations on Real Estate Registration (《不動產登記暫行條例》), promulgatedby the State Council on November 24, 2014, became effective on March 1, 2015 and last amended onMarch 24, 2019, and its implementing rules provide that, among other things, the State implements auniform real estate registration system.
6. INSURANCE OF REAL ESTATE PROJECTS
There are no nationwide mandatory requirements in the PRC laws, regulations and governmentrules requiring a real estate developer to maintain insurance for its real estate projects. According to theConstruction Law of the People’s Republic of China (《中華人民共和國建築法》) promulgated by theStanding Committee of the NPC on November 1, 1997 and became effective on March 1, 1998 and lastamended on April 23, 2019, construction enterprises shall maintain work-related injury insurance foremployees and pay the insurance premium as required by PRC laws. Enterprises are encouraged totake out accident insurance and pay premiums for workers engaged in hazardous operations.
7. ENVIRONMENTAL PROTECTION
The laws and regulations governing the environmental requirements for real estate developmentin the PRC include the Environmental Protection Law of the PRC (《中華人民共和國環境保護法》),the Prevention and Control of Noise Pollution Law of the PRC (《中華人民共和國環境噪聲污染防治法》), the Environmental Impact Assessment Law of the PRC (《中華人民共和國環境影響評價法》),and the Administrative Regulations on Environmental Protection for Development Projects (《建設項目環境保護管理條例》). Pursuant to these laws and regulations, the construction enterprises shallobtain approval from or proceed filing procedure with the competent environmental protectionauthorities before the commencement of construction. For construction projects that have obtainedapproval from the competent environmental protection authorities, construction enterprises shallinspect the property to ensure compliance with the applicable environmental standards and regulationsbefore the property can be delivered to the purchasers.
V-5

APPENDIX V REGULATORY OVERVIEW
8. FIRE PROTECTION
According to Fire Protection Law of the PRC (《中華人民共和國消防法》) and Provisions ofSupervision and Management of Fire Protection Construction (《建設工程消防監督管理規定》), a realestate project shall get approval from or filing with relevant public security and fire protectionauthorities for fire protection design before the construction is started and subject to a fire protectionas-built acceptance inspection.
9. CIVIL AIR DEFENSE PROPERTY
Pursuant to the Law on National Defense (《中華人民共和國國防法》) promulgated by the NPCon March 14, 1997, as amended on August 27, 2009, national defense assets are owned by the state.Pursuant to the Law on Civil Air Defense (《中華人民共和國人民防空法》) (the “Civil Air DefenseLaw”), promulgated by the Standing Committee of the NPC on October 29, 1996, as amended onAugust 27, 2009, civil air defense is an integral part of national defense. The Civil Air Defense Lawencourages the public to invest in the construction of civil air defense property and investors in civil airdefense are permitted to use, manage the civil air defense property in time of peace and profittherefrom without prejudice to their functions as air defense property.
10. FOREIGN CURRENCY EXCHANGE
Pursuant to the PRC Foreign Exchange Administrative Regulations (《中華人民共和國外匯管理條例》) promulgated by the State Council and last amended on August 5, 2008, the RMB is generallyfreely convertible for current account items, but not for capital account items, such as directinvestment, loan, repatriation of investment and investment in securities outside the PRC, unless theprior approval of SAFE is obtained.
Pursuant to the Circular on Relevant Issues concerning Foreign Exchange Administration ofOverseas Investment and Financing and Return Investments Conducted by Domestic Residentsthrough Overseas Special Purpose Vehicles (《關於境內居民通過特殊目的公司境外投融資及返程投資外匯管理有關問題的通知》) (“SAFE Circular No. 37”), promulgated by SAFE and which becameeffective on July 4, 2014: (a) a PRC resident shall register with the local SAFE branch before he or shecontributes assets or equity interests in an overseas special purpose vehicle (“Overseas SPV”), that isdirectly established or controlled by the PRC resident for the purpose of conducting investment orfinancing; and (b) following the initial registration, the PRC resident is also required to register withthe local SAFE branch for any major change, in respect of the Overseas SPV. Pursuant to SAFECircular No. 37, failure to comply with these registration procedures may result in penalties.
Pursuant to the Circular of the State Administration of Foreign Exchange on FurtherSimplifying and Improving the Direct Investment-related Foreign Exchange Administration Policies(《國家外匯管理局關於進一步簡化和改進直接投資外匯管理政策的通知》) (“Circular 13”), which waspromulgated on February 13, 2015 and with effect from June 1, 2015, the foreign exchange registrationunder domestic direct investment and the foreign exchange registration under overseas directinvestment are directly reviewed and handled by banks in accordance with the Circular 13, and theSAFE and its branches shall perform indirect regulation over the foreign exchange registration viabanks.
V-6

APPENDIX V REGULATORY OVERVIEW
11. DIVIDEND
The principal laws governing dividend distributions by our PRC Subsidiaries include the PRCCompany Law. Dividend distribution by WFOEs and EJVs are further governed by the WhollyForeign-owned Enterprise Law of the PRC (《中華人民共和國外資企業法》) and its ImplementationRegulations (《中華人民共和國外資企業法實施細則》) promulgated by the State Council onDecember 12, 1990 and last revised on February 19, 2014, and/or the Equity Joint Venture Law of thePRC (《中華人民共和國中外合資經營企業法》) and the Implementation Regulations (《中華人民共和國中外合資經營企業法實施條例》) promulgated by the State Council on September 20, 1983 and lastrevised on March 2, 2019.
Under these laws and regulations, PRC companies, including WFOEs and EJVs, may paydividends only out of their accumulated profits, if any, determined in accordance with PRC accountingprinciples. In addition, PRC companies, including domestic companies, WFOEs and EJVs are requiredto set aside each year at least 10% of their after-tax profit based on PRC accounting principles to theirstatutory general reserves funds until the cumulative amount of such reserve fund reaches 50% of theirregistered capital. These reserves are not distributable as cash dividends. Furthermore, EJVs andWFOEs in the PRC may also be required to set aside individual funds for employee welfare, bonusesand development, at the discretion of such PRC companies and as stipulated in their articles ofassociation. These reserves or funds are not distributable as dividends.
12. STOCK OPTION PLAN
On December 25, 2006, the People’s Bank of China promulgated the Administrative Measuresfor Individual Foreign Exchange (《個人外匯管理辦法》). The Implementation Rules of theAdministrative Measures for Individual Foreign Exchange (《個人外匯管理辦法實施細則》) issued bySAFE on January 5, 2007 and amended on May 29, 2016, among other things, specify registrationrequirements for a PRC citizen’s participation in the employee stock ownership plans or stock optionplans of an overseas publicly-listed company. On February 15, 2012, SAFE promulgated Circular ofthe SAFE on Relevant Issues Concerning the Foreign Exchange Administration for DomesticIndividuals Participating in the Share Incentive Schemes of Overseas- Listed Companies (《國家外匯管理局關於境內個人參與境外上市公司股權激勵計劃外匯管理有關問題的通知》) (“Share IncentiveSchemes Circular 7”).
Under the SAFE regulations, in particular, the Share Incentive Schemes Circular 7, all PRCresidents who participate in an employee stock incentive plan or stock option plan of an overseaspublicly-listed company are required, through the PRC subsidiary of the overseas publicly-listedcompany, to jointly entrust a PRC agent to handle foreign exchange registration with SAFE or its localcounterpart and complete certain procedures relating to the share incentive schemes such as openingaccount and capital transfer. PRC residents include PRC nationals or foreign citizens having beenconsecutively residing in PRC for not less than one year, acting as directors, supervisors, seniormanagement personnel or other employees of PRC companies affiliated with such offshore listedcompany. A PRC agent could be a PRC subsidiary of such overseas publicly-listed companyparticipating in the share incentive scheme or another PRC institution qualified for asset trusteeship asdesignated by the PRC subsidiary and in accordance with PRC laws. The PRC agent is required toamend the SAFE registration with respect to the stock incentive plan if there is any material change tothe stock incentive plan, the PRC agent or the overseas entrusted institution or other material changes.The foreign exchange proceeds received by the PRC residents from sale of shares under share
V-7

APPENDIX V REGULATORY OVERVIEW
incentive plans granted by the overseas publicly-listed company must be remitted to bank accounts inChina opened by the PRC agents.
Further, a Notice Concerning Individual Income Tax on Earnings from Employee StockOptions (《關於個人股票期權所得徵收個人所得稅問題的通知》), jointly issued by the Ministry ofFinance and SAT on March 31, 2005 and supplemented on September 30, 2006, provides that domesticcompanies that implement employee share option programs must file the employee share option plansand other relevant documents with local tax authorities having jurisdiction over the companies beforeimplementing such plans, and must file share option exercise notices and other relevant documentswith local tax authorities before exercise by their employees of any share options.
13. TAXES
(i) PRC Deed Tax
Under the Provisional Regulation on the Deed Tax of the PRC (《中華人民共和國契稅暫行條例》) promulgated by the State Council on July 7, 1997 and with effect from October 1, 1997 andamended on March 2, 2019, deed tax applies to entities and individuals that accept the transfer ofland-use rights and the ownership of houses within the territory of the PRC.
(ii) Stamp Duty
Under the Interim Regulations on Stamp Duty of the PRC (《中華人民共和國印花稅暫行條例》) promulgated by the State Council on August 6, 1988, effective from October 1, 1988 andamended on January 8, 2011 for acceptance of property lease, cargo transportation, storage andcustody or certificates with contract nature, the duty rate is 0.1%.
(iii) Corporate Income Tax
Pursuant to the EIT Law the income tax for both domestic and foreign-invested enterprises is atthe same rate of 25%. Furthermore, resident enterprises, which refer to enterprises that are set up inaccordance with the PRC law, or that are set up in accordance with the law of the foreign country(region) but with its actual administration institution in the PRC, shall pay enterprise income taxoriginating both within and outside the PRC. While non-resident enterprises that have set upinstitutions or premises in the PRC shall pay enterprise income tax in relation to the income originatingfrom the PRC and obtained by their institutions or establishments, and the income incurred outside thePRC but there is an actual relationship with the institutions or establishments set up by suchenterprises. Where non-resident enterprises that have not set up institutions or establishments in thePRC, or where institutions or establishments are set up but there is no actual relationship with theincome obtained by the institutions or establishments set up by such enterprises, they shall payenterprise income tax in relation to the income originating from the PRC.
According to the implementation rules of the EIT Law, if an enterprise incorporated outside thePRC has its “de facto management body” located within the PRC, such an enterprise may berecognized as a PRC tax resident enterprise and subject to enterprise income tax at the rate of 25%.According to the EIT Law, dividends received by a qualified PRC tax resident enterprise from anotherqualified PRC tax resident enterprises are exempted from enterprise income tax.
V-8

APPENDIX V REGULATORY OVERVIEW
(iv) Value-added Tax
According to the Notice on All-out Launch of the Pilot Program of the Levying Value-addedTax in Lieu of Business Tax (《國家稅務總局關於全面推開營業稅改征增值稅試點有關稅收徵收管理事項的公告》) promulgated by the Ministry of Finance and the SAT on April 19, 2016, implemented onMay 1, 2016 and last amended on June 15, 2018, the value-added tax rather than the business tax willbe levied on the leasing and selling of the real estate, the transfer of land use right and the provision ofservice.
(v) Urban Land-use Tax
Pursuant to the Provisional Regulation Governing Land-Use Tax in Cities and Towns of thePRC (《中華人民共和國城鎮土地使用稅暫行條例》) enacted by the State Council on September 27,1988 and last revised on March 2, 2019, land-use taxes in respect of urban land is to be leviedaccording to the area of relevant land.
(vi) Real Estate Tax
Under the Interim Regulations on Real Estate Tax of the PRC (《中華人民共和國房產稅暫行條例》) promulgated by the State Council on September 15, 1986 and amended on January 8, 2011, realestate tax is charged at the rate of 1.2% if it is calculated on the basis of the residual value of a buildingwhich is the original value of a building minus certain percentage ranging from 10%-30% and at a rateof 12% if it is calculated on the basis of the rental of the real estate.
(vii) Land Appreciation Tax
Under the Interim Regulations on Land Appreciation Tax of the PRC (《中華人民共和國土地增值稅暫行條例》) promulgated by the State Council on December 13, 1993 and last amended onJanuary 8, 2011 as well as its implementation rules promulgated by the Ministry of Finance of the PRCon January 27, 1995, land appreciation tax is payable on the appreciation value derived from thetransfer of State-owned land use rights and buildings or other facilities on such land, after deductingthe deductible items.
14. LABOR PROTECTION
Pursuant to the Labor Law of the PRC (《中華人民共和國勞動法》) promulgated by theStanding Committee of the NPC on July 5, 1994 and last amended on December 29, 2018 and theLabor Contract Law of the PRC (《中華人民共和國勞動合同法》) promulgated by the StandingCommittee of the NPC on June 29, 2007 and amended on December 28, 2012, labor contracts shall beconcluded if labor relationships are to be established between the employer and the employees.
Pursuant to the Social Insurance Law of the PRC (《中華人民共和國社會保險法》) promulgatedby the Standing Committee of the NPC on October 28, 2010 and with effect from July 1, 2011,employees shall participate in basic pension insurance, basic medical insurance and unemploymentinsurance paid by both employers and employees. Employees shall also participate in work-relatedinjury insurance and maternity insurance paid by employers. An employer shall make registration withthe local social insurance agency in accordance with the provisions of the Social Insurance Law ofPRC. Moreover, an employer shall declare and make social insurance contributions in full and on time.Pursuant to the Regulations on Management of Housing Provident Fund (《住房公積金管理條例》)
V-9

APPENDIX V REGULATORY OVERVIEW
promulgated by the State Council on April 3, 1999 and last amended on March 24, 2019, employersshall undertake registration at the competent administrative center of housing provident fund and arealso obliged to timely pay and deposit housing provident fund for their employees in full amount.
15. PRIVATE EQUITY INVESTMENT FUNDS
The establishment, operation and administration of the private equity investment funds andfund managers may subject to the Company Law of the PRC and the Partnership Enterprise Law of thePRC (《中華人民共和國合夥企業法》), which is promulgated by the Standing Committee of the NPCon February 23, 1997 and amended on August 27, 2006.
Private equity investment funds are mainly regulated by rules and regulations enacted by CSRCand Asset Management Association of China (“AMAC”). The Interim Measures for the Supervisionand Administration of Private Investment Funds (《私募投資基金監督管理暫行辦法》) promulgated onAugust 21, 2014 by CSRC, provides that the CSRC and its local branches are responsible for thesupervision and administration of the private investment funds. A fund manager must carry outregistration with the AMAC after establishment and file records with the AMAC for the investmentfund upon completion of fund raising.
The AMAC issued a series of rules regulating registration of fund manager, filling of funds andfund raising, including but not limited to Circular on Promulgating the Measures for the Registration ofPrivate Equity Fund Managers and the Filling of Funds (Trial) (《關於發佈<私募投資基金管理人登記和基金備案辦法(試行)>的通知》) promulgated by AMAC on January 17, 2014 and effective as ofFebruary 7, 2014, and the Administration Measures for the Funding Raising of Private InvestmentFunds (《私募投資基金募集行為管理辦法》) promulgated by AMAC on April 15, 2016 and effectiveas of July 15, 2016.
B. JAPANESE LAWS AND REGULATIONS
The following is a brief overview of the Japanese legal framework relevant to our Company,addressing principally Japanese financial services laws and regulations, Japanese law governingTokutei Mokuteki Kaisha (“TMKs”) (as explained below), laws concerning real property in Japan,regulation on distribution of surplus, Japanese employment and labor law and foreign exchangeregulations.
1. REAL PROPERTY IN JAPAN
(i) Real Property Registration System
There is a real property registration system in Japan under which ownership of real property aswell as certain other real property-related rights (such as the right to use real property or the securityinterests over real property) are able to be registered. Registration is required to perfect the title or rightwith respect to real property as against third parties. The real property register, however, does notnecessarily reflect the true title or right or true holder. A party has no recourse to anyone but the sellerif, relying on the registry, it purchases real property or a related right from a seller and the informationcontained in the registry turns out to be incorrect. The purchaser may seek reimbursement from theseller pursuant to statutory or contract-based warranties, but in general cannot acquire the title or rightwith respect to the real property even if it is a bona fide purchaser.
V-10

APPENDIX V REGULATORY OVERVIEW
(ii) Sales and Leasing of Real Property
Under the Building Lots and Buildings Transaction Business Act of Japan, any person whointends to engage in the business of the sale and purchase of buildings and building lots and the agencyand brokerage of sale, purchase and leasing of buildings and building lots, referred to by this law as areal property trader, must first obtain a license from the Minister or the relevant governor. The Ministeror the relevant governor may revoke this license or suspend it, in whole or in part, for a period of up toone year if the real property trader enters into a transaction that violates this law or otherwise engagesin substantially inappropriate conduct.
(iii) Lease of Building
Leases of buildings in Japan are governed principally by the Civil Code and the Act on Landand Building Leases. In relation to building lease transactions, the Act on Land and Building Leasesgenerally takes priority over the Civil Code, principally in terms of protection of rights of lessees.Except where the Act on Land and Building Leases provides otherwise, its provisions are compulsorilyapplicable to building leases, regardless of the terms of the relevant lease agreement.
(a) Lease Term
A building lease agreement may have either a fixed or an indefinite term. Under the Act onLand and Building Leases, however, a building lease having a term of less than one year is deemed tohave an indefinite term. Even if the building lease is for a fixed term of one year or more, unless thelandlord gives notice of its intention not to renew the lease generally six months prior to the expirationof the term, the lease is automatically deemed to be renewed without a fixed term. This law providesthat a building lease may be terminated by the landlord on six months’ notice, unless longer noticeperiod is provided for in the relevant lease agreement. However, in the case of building leases having afixed term of one year or more, the lease generally cannot be terminated prior to the end of that termunless the lease agreement specifically provides otherwise.
Notwithstanding the foregoing, the landlord may not give notice of intention not to renew, or oftermination of, a lease unless it has a justifiable reason to do so in light of a number of factors,including, each of the landlord’s and the lessee’s need for the building for its own use, the history ofthe building lease, the present use of the leased building, the current condition of the building, and theamount of money the landlord is offering to pay the lessee in consideration of vacating the building.
(b) Adjustment of Rent
Pursuant to the Act on Land and Building Leases, either party to a building lease may demandthat the rent be increased or decreased, regardless of the provisions of the agreement, if the rent hasbecome unreasonable either: (a) as a result of any increase or decrease in taxes or other chargesimposed on the building or the land; (b) as a result of any increase or decrease in the price of buildingor land or any other change in economic condition; or (c) in light of the rents of comparable buildingsin the immediate area. This provision of the law, however, will not permit a landlord to demand anincrease in rent if the relevant lease agreement provides that the rent shall not increase for a specificperiod.
If no agreement is reached between the parties with respect to adjustment of the rent, eitherparty may seek a court order. In such cases, the court will determine whether and to what extent the
V-11

APPENDIX V REGULATORY OVERVIEW
amount of rent shall be adjusted taking into consideration various factors, including those described in(a) through (c) above. If the court determines that the rent should be decreased, the landlord will beordered to return any excess rent collected after the lessee’s initial demand and to pay interest on suchexcess amount, if any, at a rate of 10% per annum.
(c) Special Fixed-term Building Lease
The Act on Land and Building Leases provides that the rules regarding renewals of lease termsdo not apply to a type of special fixed-term building lease known as teiki tatemono chintaishaku.Further, the landlord and the lessee may exclude the application of the rules regarding adjustment ofrent described above.
2. FUND / INVESTMENT ADVISORY BUSINESS
Our broker business for sales and purchases of trust beneficiary interests or interests in privatefunds and investment advisory business are subject to regulations under the Financial Instruments andExchange Act of Japan (the “FIEA”) and certain other laws of Japan. For such businesses, we must beregistered as the financial instruments business operator under the FIEA. The Financial ServicesAgency of Japan may revoke such registration or issue an order of suspension of business or correctivemeasures under certain circumstances including the case of violation of detailed regulations under theFIEA.
3. TMK ACT
TMK is a special purpose corporation established under the Asset Liquidation Act of Japan(“TMK Act”), which can acquire, manage and dispose real properties either through direct ownershipor trust beneficiary interests in accordance with the TMK Act. Under the TMK Act, TMKs areauthorized to procure funds by issuing “asset backed securities” which are defined to include, amongothers, specified bonds and preferred contribution. TMKs also issue specified contributions, which donot constitute “asset backed securities” under the TMK Act. TMKs must conduct their operation inaccordance with an asset liquidation plan (an “ALP”) and are prohibited under the TMK Act fromengaging in any business other than so-called “liquidation of assets” and ancillary business inaccordance with the ALP.
4. JAPANESE EMPLOYMENT AND LABOR LAW
There are several laws and regulations in Japan which are intended to regulate labor marketsand employee/employer relations. These include the Labor Standards Act of Japan, which sets forthminimum labor conditions, the Minimum Wage Act of Japan which sets forth minimum wagerequirements, and the Industrial Safety and Health Act of Japan, which sets forth safety and sanitaryrequirements for the protection of employees. Under Japanese laws and regulations, employers areprohibited from terminating employees unless there are “objectively reasonable grounds” fortermination and the termination is “appropriate in the general societal terms”.
5. REGULATION ON DISTRIBUTION OF SURPLUS
Under the Companies Act of Japan (the “Japan Companies Act”), the distribution ofdividends by ESR LTD (“ESR Japan”), a stock company established under the Japan Companies Act,takes the form of distribution of surplus. ESR Japan’s articles of incorporation provide that it may
V-12
APPENDIX V REGULATORY OVERVIEW
declare and distribute surplus to the shareholders and/or their registered pledgees whose names areentered or recorded in its final shareholders’ register as of December 31 of each year. Under the JapanCompanies Act, the aggregate book value of surplus distributed by ESR Japan may not exceed adistributable amount, as calculated on the effective date of such distribution. The “distributableamount” at any given time is equal to: (a) the amount of its surplus, which is determined based on theaggregate of “other capital surplus” and “other retained earnings” at the end of the previous fiscal yearwith various adjustments; minus (b) the aggregate of: (i) the book value of the treasury stock; (ii) theamount of consideration for any treasury stock disposed of by the company after the end of theprevious fiscal year; and (iii) other amounts set forth in certain ordinances, subject to certainadjustments if extraordinary financial statements are approved as of or for a period from the beginningof the fiscal year to a specified date.
6. FOREIGN EXCHANGE REGULATIONS
Under the Foreign Exchange and Foreign Trade Act of Japan, foreign-related transactions(including acquisition and transfer of preferred contribution of TMKs and shares in respect of stockcompanies (the “Units”)) are regulated for the purpose of contribution to the sound development of theJapanese economy and of ensuring the equilibrium of foreign transactions and stability of currency.
In general, the acquisition of the Units by a non-resident of Japan from a resident of Japan maybe made without any restriction. However, in principle, a resident of Japan who transfers Units to anon-resident of Japan must file a post-facto report to the Minister of Finance following the transfer ofTMKs to the non-resident of Japan (in certain cases prior notifications may be required). In addition,all cash dividends and other cash distributions payable in Japanese yen may be converted into foreigncurrency and freely transferred out of Japan except as may be restricted for very limited circumstances,and subject to the reporting requirements unless exempted.
7. SUMMARY OF TAXATION IN JAPAN STRUCTURE
In principle, a TMK is subject to normal corporate tax rates on its taxable profit. However,where the TMK is a “tax-qualifying” TMK, it is allowed to take a deduction against taxable income inrespect of any dividend distributions which it makes to equity holders. In order to be a “tax-qualifying”TMK, a TMK needs to satisfy certain conditions set forth under the Special Taxation Measures Act ofJapan, including that TMK is officially registered under the TMK Act and more than 90% of theTMK’s “distributable profits” in respect of the fiscal year is declared and paid as a dividend to theequity holders.
C. SOUTH KOREAN LAWS AND REGULATIONS
1. FINANCIAL INVESTMENT SERVICES AND CAPITAL MARKETS ACT
Under the Financial Investment Services and Capital Markets Act (the “FSCMA”), an entitythat wishes to engage in collective investment business shall obtain authorization from the FinancialServices Commission of South Korea (the “FSC”), provided that, an entity that wishes to engage inhedge fund investment business (i.e. a collective investment scheme that issues collective investmentsecurities only through private placement other than private equity funds (as defined in the FSCMA))shall have its hedge fund investment business registered with the FSC. Therefore, if an entity intends toengage only in a hedge fund investment business, such entity need only to be registered with the FSCwithout separately obtaining a collective business authorization. Hedge funds may issue collective
V-13
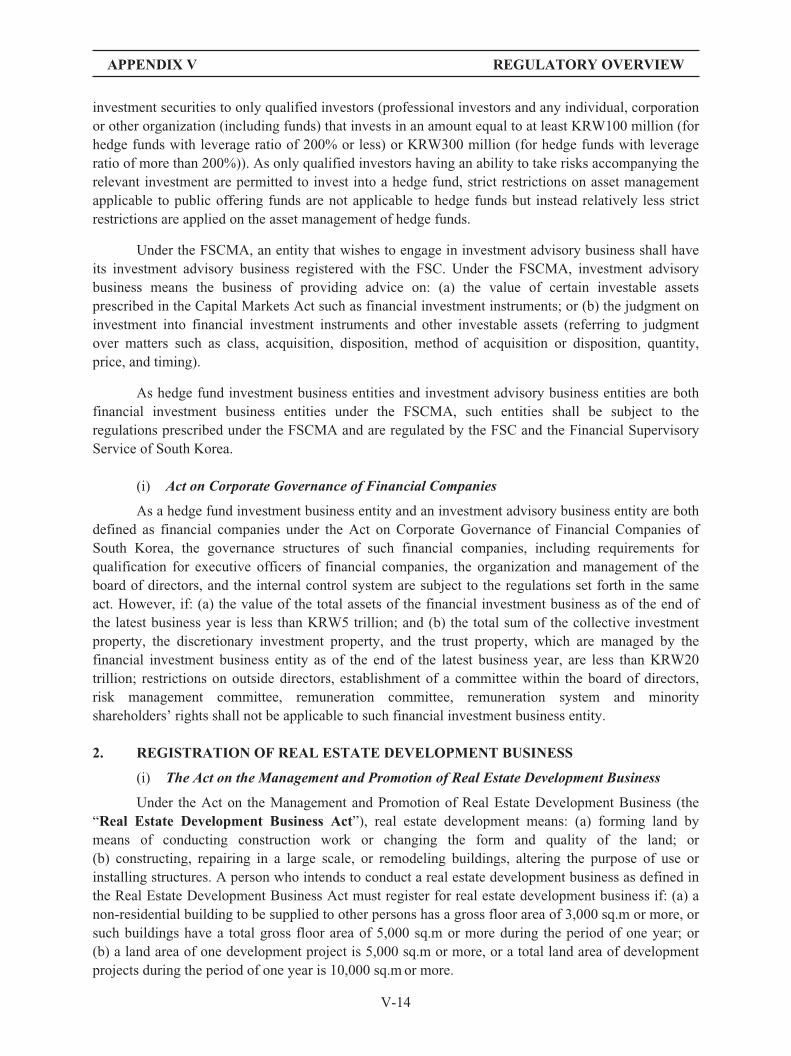
APPENDIX V REGULATORY OVERVIEW
investment securities to only qualified investors (professional investors and any individual, corporationor other organization (including funds) that invests in an amount equal to at least KRW100 million (forhedge funds with leverage ratio of 200% or less) or KRW300 million (for hedge funds with leverageratio of more than 200%)). As only qualified investors having an ability to take risks accompanying therelevant investment are permitted to invest into a hedge fund, strict restrictions on asset managementapplicable to public offering funds are not applicable to hedge funds but instead relatively less strictrestrictions are applied on the asset management of hedge funds.
Under the FSCMA, an entity that wishes to engage in investment advisory business shall haveits investment advisory business registered with the FSC. Under the FSCMA, investment advisorybusiness means the business of providing advice on: (a) the value of certain investable assetsprescribed in the Capital Markets Act such as financial investment instruments; or (b) the judgment oninvestment into financial investment instruments and other investable assets (referring to judgmentover matters such as class, acquisition, disposition, method of acquisition or disposition, quantity,price, and timing).
As hedge fund investment business entities and investment advisory business entities are bothfinancial investment business entities under the FSCMA, such entities shall be subject to theregulations prescribed under the FSCMA and are regulated by the FSC and the Financial SupervisoryService of South Korea.
(i) Act on Corporate Governance of Financial Companies
As a hedge fund investment business entity and an investment advisory business entity are bothdefined as financial companies under the Act on Corporate Governance of Financial Companies ofSouth Korea, the governance structures of such financial companies, including requirements forqualification for executive officers of financial companies, the organization and management of theboard of directors, and the internal control system are subject to the regulations set forth in the sameact. However, if: (a) the value of the total assets of the financial investment business as of the end ofthe latest business year is less than KRW5 trillion; and (b) the total sum of the collective investmentproperty, the discretionary investment property, and the trust property, which are managed by thefinancial investment business entity as of the end of the latest business year, are less than KRW20trillion; restrictions on outside directors, establishment of a committee within the board of directors,risk management committee, remuneration committee, remuneration system and minorityshareholders’ rights shall not be applicable to such financial investment business entity.
2. REGISTRATION OF REAL ESTATE DEVELOPMENT BUSINESS
(i) The Act on the Management and Promotion of Real Estate Development Business
Under the Act on the Management and Promotion of Real Estate Development Business (the“Real Estate Development Business Act”), real estate development means: (a) forming land bymeans of conducting construction work or changing the form and quality of the land; or(b) constructing, repairing in a large scale, or remodeling buildings, altering the purpose of use orinstalling structures. A person who intends to conduct a real estate development business as defined inthe Real Estate Development Business Act must register for real estate development business if: (a) anon-residential building to be supplied to other persons has a gross floor area of 3,000 sq.m or more, orsuch buildings have a total gross floor area of 5,000 sq.m or more during the period of one year; or(b) a land area of one development project is 5,000 sq.m or more, or a total land area of developmentprojects during the period of one year is 10,000 sq.m or more.
V-14

APPENDIX V REGULATORY OVERVIEW
The Real Estate Development Business Act further provides that a land owner not registered forreal estate development business may conduct real estate development jointly with a person registeredfor real estate development business (the “Registered Developer”); provided, that such land owner:(a) secures the title to the land under development; (b) deregisters, if any, mortgages, security interestsprovisionally registered, provisional attachments or any such encumbrances created over the land priorto the sale of such land (if the titleholder of such encumbrances provides consents to the real estatedevelopment on the land, such deregistration will not be required); and (c) enters into an agreementwith the Registered Developer setting forth the use and disposal of the real estate under development,distribution of profits and losses incurring from such real estate, allocation of project expenses, projectperiod and other responsibilities related to such project.
3. EMPLOYMENT, LABOR AND WORKPLACE SAFETY
(i) Employment—Labor Standards Act (“LS Act”)
The LS Act is the primary legislation in Korea governing employee relations and sets outminimum requirements for working conditions at the workplace. Any term or provision of anindividual employment agreement, the rules of employment which are made by employer or acollective bargaining agreement which fails to meet the minimum requirements under the LS Actbecomes null and void. In addition to the LS Act, there are a few statutes which apply to specific labor-related matters.
According to the LS Act, in order to enter into an employment relationship: (a) employers mustexecute written labor contracts with employees; (b) work hours shall not exceed 40 hours a week, eighthours a day (excluding hours of recess) in general, unless there is a separate agreement between theparties and overtime payment is provided to employees; (c) employers shall not, without justifiablecause, dismiss, lay off, suspend, or transfer a worker, reduce wages, or take other punitive measuresagainst employees; (d) employers shall establish its work safety measures and sanitation system andprovide employees with workplace safety training; and (e) employers are required to pay salaries toemployees on time and salaries paid to employees shall not be lower than the minimum salary standarddefined under the Minimum Wage Act.
(ii) Other Labor Related Regulation
The other main labor related laws in Korea include the Minimum Wage Act, the Wage ClaimGuarantee Act, the Employee Retirement Benefit Security Act, the Act on Equal Employment andSupport for Work-Family Reconciliation, the Act on the Promotion of Workers’ Participation andCooperation, the Occupational Safety and Health Act, and the Trade Union and Labor RelationsAdjustment Act.
In addition to the above legislations, employers are also required to make contributions to fourmajor social insurance (national health insurance, national pension, employment insurance andindustrial accident compensation insurance, respectively) in accordance with the National HealthInsurance Act, the National Pension Act, the Employment Insurance Act and the Industrial AccidentCompensation Insurance Act.
4. DIVIDEND DISTRIBUTION
The principal law regulating the dividend distribution by a company in Korea is the KoreanCommercial Code (the “KCC”). Under the KCC, a company may pay annual dividends only if the
V-15

APPENDIX V REGULATORY OVERVIEW
company has distributable profit. The amount of distributable profit is the amount equal to its netassets, subtracted by the sum of: (a) its stated capital; (b) the total amount of its capital surplus reserveand earned surplus reserve which have accumulated up to the end of the previous fiscal year; (c) itsearned surplus required to be accumulated for the then current fiscal year; and (d) the net assets statedin its balance sheet as being increased as a result of the evaluation of its assets and liabilities inaccordance with its accounting principles without being set off against any unrealized loss. Acompany’s earned surplus required to be accumulated for the then current fiscal year, which ismentioned in (c) above, is the legal reserve, the amount of which is equal to 10% of the amount of theannual dividend. A company may not pay any dividend unless it has set aside as such legal reserve orunless it has accumulated a legal reserve of not less than one-half of its stated capital. A company maynot use its legal reserve to pay cash dividends but may transfer amounts from its legal reserve to itscapital stock or use its legal reserve to reduce an accumulated deficit.
A company may distribute annual dividends in cash or in newly issued shares, but dividends innewly issued shares may not exceed one-half of the annual dividends. Under the KCC, in-kinddistribution of dividends, other than cash or newly issued shares, are permitted if provided for in thearticles of incorporation of the company. In principle, annual dividends, if any, must be approved at theannual general meeting of shareholders. The annual dividend is generally paid shortly thereafter to theshareholders as of the end of the preceding fiscal year. Under the KCC, the board of directors of acompany, instead of shareholders, may approve annual dividends if permitted by its articles ofincorporation. In addition, under the KCC, a company has no obligation to pay any annual cashdividend unclaimed for five years from the payment date, at which time rights to such dividends lapse.
5. FOREIGN INVESTMENT AND FOREIGN EXCHANGE CONTROLS
The Foreign Exchange Transactions Act (the “FETA”) applies to all matters concerningforeign exchange and foreign investment unless otherwise specified in other legislation, mainly theForeign Investment Promotion Act (the “FIPA”). The FSC has also adopted, pursuant to its authorityunder the FSCMA, regulations that regulate investments by foreigners in Korean securities. Under theFIPA, “foreign investment” is defined to include the case where a foreign entity holds 10% or more ofthe stocks or shares of a Korean corporation or company that is operated by a national of the Republicof Korea and the investment amount of such foreign entity is KRW 100 million or more.
Under the FIPA, international remittance of any profits arising from the shares held by aforeign investor, its sale proceeds and/or related commissions is guaranteed in accordance with thedetails of a report or permission on the related foreign investment that was filed or obtained as at thetime of such remittance, and such foreign investors and/or foreign investment companies are inprinciple treated in the same manner the nationals of the Republic of Korea or Korean corporations aretreated in respect of their business operation.
Pursuant to the Restriction of Special Taxation Act, foreign investment companies may beeligible for reductions or exemptions of certain taxes, including corporate tax, income tax, acquisitiontax, registration tax, property tax and aggregate land tax.
Under the FIPA a foreigner who intends to make a foreign investment is required to make aprior report thereon to the Minister of Trade, Industry and Energy, and a foreign investment companyis required to register as a foreign investment company with the Minister of Trade, Industry andEnergy after completing the payment of its contributions or acquisition of necessary shares.
V-16

APPENDIX V REGULATORY OVERVIEW
Under the FETA, any transaction that involves the transfer of shares and the payment of cash inconsideration for such shares between residents and non-residents of Korea is generally subject to areporting requirement that involves the filing of a report with the Bank of Korea or a relevant foreignexchange bank. However, no such reporting is necessary in connection with any purchase by anon-resident of shares in a Korean company from a resident for the purpose of foreign investmentspermitted under the FIPA.
Under FETA, if the South Korean government deems that: (a) the need to do so is inevitabledue to the outbreak of natural calamities, wars, conflict of arms or grave and sudden changes indomestic or foreign economic circumstances or other similar situations, the Ministry of Strategy andFinance may temporarily suspend payment, receipt or the whole or part of transactions to which theForeign Exchange Transaction Laws apply, or impose an obligation to safe-keep, deposit or sell meansof payment in or to certain South Korean governmental agencies or financial institutions; and (b) aninternational balance of payments and international finance are confronted or are likely to beconfronted with serious difficulty or the movement of capital between South Korea and abroad bringsor is likely to bring about serious obstacles in carrying out its currency policies, exchange rate policiesand other macroeconomic policies, the Ministry of Strategy and Finance may take measures to requireany person who intends to perform capital transactions to obtain permission or to require any personwho performs capital transactions to deposit part of the payments received in these transactions atcertain South Korean governmental agencies or financial institutions. However, the above provision ofthe FETA does not apply to any foreign investment companies prescribed by the FIPA.
6. TAX
(i) Withholding tax on dividend income
Under Korean tax laws, in the absence of a tax treaty between Korea and the country in whichthe foreign company resides, Korean sourced dividend income earned by a foreign company, whichdoes not have a permanent establishment in Korea, may be subject to Korean withholding tax at a rateof 22% (including local income tax) on the dividend amount.
(ii) Corporate Income Tax Act
Domestic corporations are required to pay corporate income tax in accordance with theCorporate Income Tax Act (“Tax Act”). Filing of corporate income tax return is required twice a year.The year-end return is due within three months of the fiscal year end and the interim return is duewithin two months after the end of the interim six-month period. Under the Tax Act, the tax rate is11% for the first KRW 200 million of taxable income, 22% for the taxable income over KRW200 million but less than KRW 20 billion, 24.2% for the taxable income exceeding KRW 20 billion butless than KRW 300 billion, and 27.5% for the taxable income exceeding KRW 300 billion.
If other deductions and credits are applicable under other tax laws than the Tax Act, theeffective tax rates applicable to domestic corporations can be further reduced.
D. SINGAPOREAN LAWS AND REGULATIONS
1. CAPITAL MARKET SERVICES LICENSE FOR REAL ESTATE INVESTMENTTRUST MANAGEMENT
The following is a brief overview of the Singapore legal framework relating to ESR-REITManager’s provision of REIT management (“REIT Management”) services in Singapore.
V-17

APPENDIX V REGULATORY OVERVIEW
A company that carries on a business in REIT Management is required to hold a capitalmarkets services license (the “CMS License”) under the Securities and Futures Act (Chapter 289 ofSingapore) (“SFA”).
REIT Management is defined in the SFA to mean managing the property of, or operating, a realestate investment trust. For the purposes of REIT Management, real estate investment trust is definedin the SFA as a collective investment scheme, (a) that is authorized under section 286 of the SFA orrecognized under section 287 of the SFA; (b) that is a trust; (c) that invests primarily in real estate andreal estate-related assets specified by the Monetary Authority of Singapore (“MAS”) in the Code onCollective Investment Schemes issued by the MAS on May 23, 2002 and last revised on October 8,2018, and (d) all or any units of which are listed for quotation on a corporation that is approved by theMAS under section 8(1) of the SFA as an approved exchange, which includes the Singapore ExchangeSecurities Trading Limited.
The Guidelines To All Holders Of A Capital Markets Services Licence For Real EstateInvestment Trust Management (Guidelines No SFA04-G07) issued by the MAS on January 1, 2016(the “Guidelines”) and the Notice To All Holders Of A Capital Markets Services Licence For RealEstate Investment Trust Management (Notice No SFA04-N14) issued by the MAS on January 1, 2016(the “Notice”) set out, inter alia, guidelines relating to the minimum licensing criteria for REITmanagers holding a CMS License and the corporate governance arrangements for REIT managers. TheGuidelines include requirements that the license holder be a Singapore-incorporated company, have apermanent physical office in Singapore, satisfy the MAS that its controlling shareholders, whereapplicable, have established track records in managing, investing in, or advising on the type of realestate to be invested by the REIT for the past five years at a minimum, and have good rankings in theirhome countries. REIT managers are also required to maintain a base capital of S$1 million and procureprofessional indemnity insurance with coverage that complies with the Guidelines. The Guidelines alsorequire that the license holder satisfy the MAS that it will discharge its duties efficiently, honestly andfairly, comply with the financial resources requirements set out in Part III of the Securities and Futures(Financial and Margin Requirements for Holders of Capital Market Services Licences) Regulations,conduct accounting, compliance and investor relations functions in relation to the management of theREIT in Singapore and that the Singapore operations of the license holder should have a meaningfulrole in the management of the REIT relative to any other related entities or branch offices, as the casemay be, which may also have responsibility for the management of the REIT.
License holders are also required to comply with any conditions set out in its CMS License forREIT Management granted by the MAS. The license holder, its officers, employees, representativesand substantial shareholders are required to be fit and proper persons, in accordance with the criteriaset out in the Guidelines on Fit and Proper Criteria (Guideline No. FSG-01) issued by the MAS onJuly 1, 2005 and last revised on October 8, 2018. The term “substantial shareholder” in this section ofthe Prospectus means a person who has a substantial shareholding in a company where: (a) he has aninterest or interests in one or more voting shares in the company; and (b) the total votes attached to thatshare, or those shares, is not less than 5% of the total votes attached to all the voting shares in thecompany. The Guidelines on Fit and Proper Criteria provide that the MAS will take into account, interalia, the following criteria in assessing whether a person is fit and proper to be licensed: (a) hishonesty, integrity and reputation; (b) his competence and capability; and (c) his financial soundness.
Section 96 of the SFA provides that the license holder shall obtain the approval of the MASprior to appointing its chief executive officer, any director and changing the nature of appointment of a
V-18

APPENDIX V REGULATORY OVERVIEW
director from non-executive to executive. The Guidelines provide that the chief executive officer anddirectors of the license holder should have at least 10 years of relevant experience, including five yearsat a management level. The chief executive officer (as defined in section 2(1) of the SFA) of thelicense holder should be resident in Singapore unless the license holder manages a REIT that isinvested primarily in foreign properties, in which case the chief executive officer may be resident inthat foreign country in which the REIT’s properties are primarily invested in, if the license holdersatisfies the MAS that this arrangement does not compromise the chief executive officer’s overallaccountability for the license holder, in particular, the effective governance and oversight of the REITportfolio and REIT Management activities.
The Guidelines further provide that license holders should have a minimum of three full-timerepresentatives (which may include the chief executive officer) who are resident in Singapore and whoeach have at least five years of experience relevant to REIT Management and who perform thefollowing functions: investment management, asset management, financing, marketing and investorrelations.
License holders must also comply with all principles and guidelines set out in the Code ofCorporate Governance issued by the MAS on January 1, 2003 and last revised on August 6, 2018 (the“Code of Corporate Governance”). Any deviation from the Code of Corporate Governance should beclearly explained in the annual report of the REIT.
2. OVERVIEW OF LABOR LAWS, RULES ON DISTRIBUTIONS AND EXCHANGECONTROLS
The following is a brief overview of the labor laws, rules on distributions, exchange controlsand regulations relating to the provision of property management services by companies in Singaporewhich may be material to ESR-REIT Manager, ESR Property Management (S) Pte. Ltd., InfinitysubPte. Ltd. and ESR Investment Management Pte. Ltd..
(i) Employment Act, Chapter 91 of Singapore
The Employment Act generally applies to persons who have entered into or work under acontract of service with an employer, save for section 33 and Part IV of the Employment Act whichshall only apply to (a) workmen who are in receipt of a salary not exceeding S$4,500 a month(excluding overtime payments, bonus payments, annual wage supplements, productivity incentivepayments and any allowance however described) or such other amount as may be prescribed by theMinister of Manpower; and (b) every employee (other than a workmen or a person employed in amanagerial or an executive position) who receives a salary not exceeding S$2,600 a month (excludingany overtime payment, bonus payment, annual wage supplement, productivity incentive payment andany allowance however described) or such other amount as the Minister of Manpower may prescribe.Section 33 of the Employment Act relates to the priority of salary of employees to other debts of anemployer while Part IV of the Employment Act relates to rest days, hours of work and other conditionsof service.
The Employment Act sets out certain basic terms and conditions of employment, including inrelation to notice of termination, payment of salary, rest days, hours of work, maternity protection andbenefits and holiday and sick leave entitlements. Section 8 of the Employment Act provides that everyterm of a contract of service, which provides a condition of service, which is less favorable to an
V-19
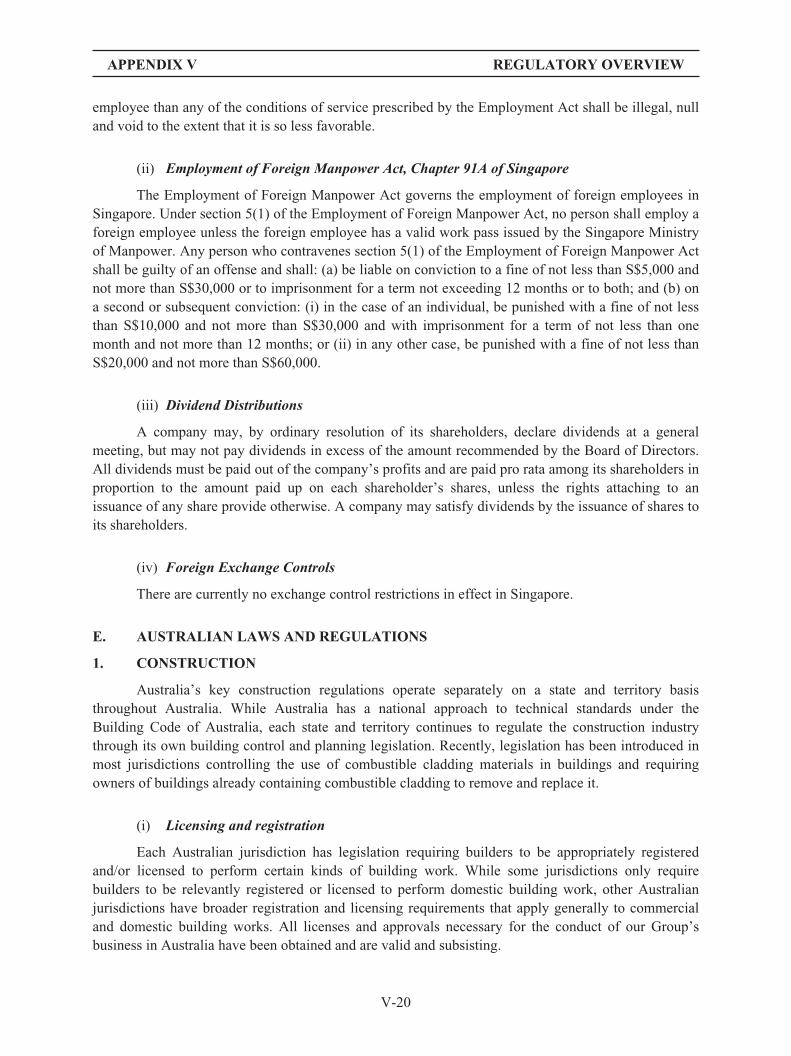
APPENDIX V REGULATORY OVERVIEW
employee than any of the conditions of service prescribed by the Employment Act shall be illegal, nulland void to the extent that it is so less favorable.
(ii) Employment of Foreign Manpower Act, Chapter 91A of Singapore
The Employment of Foreign Manpower Act governs the employment of foreign employees inSingapore. Under section 5(1) of the Employment of Foreign Manpower Act, no person shall employ aforeign employee unless the foreign employee has a valid work pass issued by the Singapore Ministryof Manpower. Any person who contravenes section 5(1) of the Employment of Foreign Manpower Actshall be guilty of an offense and shall: (a) be liable on conviction to a fine of not less than S$5,000 andnot more than S$30,000 or to imprisonment for a term not exceeding 12 months or to both; and (b) ona second or subsequent conviction: (i) in the case of an individual, be punished with a fine of not lessthan S$10,000 and not more than S$30,000 and with imprisonment for a term of not less than onemonth and not more than 12 months; or (ii) in any other case, be punished with a fine of not less thanS$20,000 and not more than S$60,000.
(iii) Dividend Distributions
A company may, by ordinary resolution of its shareholders, declare dividends at a generalmeeting, but may not pay dividends in excess of the amount recommended by the Board of Directors.All dividends must be paid out of the company’s profits and are paid pro rata among its shareholders inproportion to the amount paid up on each shareholder’s shares, unless the rights attaching to anissuance of any share provide otherwise. A company may satisfy dividends by the issuance of shares toits shareholders.
(iv) Foreign Exchange Controls
There are currently no exchange control restrictions in effect in Singapore.
E. AUSTRALIAN LAWS AND REGULATIONS
1. CONSTRUCTION
Australia’s key construction regulations operate separately on a state and territory basisthroughout Australia. While Australia has a national approach to technical standards under theBuilding Code of Australia, each state and territory continues to regulate the construction industrythrough its own building control and planning legislation. Recently, legislation has been introduced inmost jurisdictions controlling the use of combustible cladding materials in buildings and requiringowners of buildings already containing combustible cladding to remove and replace it.
(i) Licensing and registration
Each Australian jurisdiction has legislation requiring builders to be appropriately registeredand/or licensed to perform certain kinds of building work. While some jurisdictions only requirebuilders to be relevantly registered or licensed to perform domestic building work, other Australianjurisdictions have broader registration and licensing requirements that apply generally to commercialand domestic building works. All licenses and approvals necessary for the conduct of our Group’sbusiness in Australia have been obtained and are valid and subsisting.
V-20

APPENDIX V REGULATORY OVERVIEW
(ii) Planning
Each Australian jurisdiction has legislation to regulate the permitted use, development (andsubdivision) and protection of land. Such legislation commonly provides procedures for obtainingplanning permits, which allows land to be used or developed in accordance with the planning schemeor policy of the relevant jurisdiction and these permits are typically required before development andconstruction activity may take place. Failure to obtain, or comply with, a planning permit may result insignificant penalties. Our Group is also required to comply with legislation which addresses thepreservation of heritage values in places and buildings and the ecological values of threatened speciesof flora and fauna and is prohibited from, and may incur significant penalties for, polluting or causingenvironmental harm to land, air or water or emitting noise pollution unless authorized by a license.
(iii) Building Approvals
Each Australian jurisdiction commonly requires a works approval to be obtained beforebuilding works are commenced. Building approvals are usually issued by private or municipal buildingcertifiers or surveyors and form part of a broader process of certifying that building works reach certainnominated stages, prior to ultimately being certified as acceptable for occupancy. Building approvalsare intended to ensure the building works meet minimum requirements and that works are monitoredand certified as compliant. This regime also provides for issuing orders to rectify non-compliance, aswell as a range of activities where building works impact on third parties, such as adjacent properties.
(iv) Insurance
In addition to compulsory insurances required across all Australian industries, Australian statesand territories commonly require builders to take out specific insurance policies, often as a condition ofthe builder’s license of registration. Required insurances may include domestic building insurance,professional indemnity insurance, public liability insurance and/or structural defects/builders’indemnity insurance.
(v) Building standards
The Building Code of Australia (“BCA”) is an initiative of the Council of AustralianGovernments developed to establish a uniform set of technical provisions for the design andconstruction of buildings in Australia. At state and territory level, the BCA is adopted (subject to minorvariations and deletions) under the various building laws and regulations applicable in eachjurisdiction. Different classes of building must satisfy different requirements under the BCA. In linewith Commonwealth anti-discrimination legislation, buildings in all jurisdictions must be “accessible”as required by the BCA unless exempted
2. PROPERTY AND LEASING
Australia’s key property laws and regulations operate separately across the variousjurisdictions. Australia has a land title registration system known as “Torrens Title” which has a centralregistry of interests in land (including freehold title and certain leases) that is regulated by the landtitles body in the relevant jurisdiction. Certain legal requirements must be met before land in Australiacan be dealt with including that agreements to deal with land must be made in writing and documentsto be lodged for registration must be in the prescribed form and executed in accordance with therelevant registry requirements.
V-21

APPENDIX V REGULATORY OVERVIEW
3. FUNDS MANAGEMENT LAW AND REGULATIONS
The business of our Group may include in the future a funds management business. TheCorporations Act 2001 (Cth) (“Corporations Act”) is the primary legislation governing fundmanagers in Australia. The Australian Securities and Investments Commission (“ASIC”) is theprimary securities regulator, and monitors and enforces the Corporations Act and the associatedAustralian financial services license (“AFSL”) regime.
An AFSL is required in order to cover a range of regulated activities that our Group may beinvolved in, including the provision of investment management advice, the offer of interests in aninvestment fund and the provision of custodial and depository services. Investment funds structured asmanaged investment schemes generally require registration with ASIC if offered to retail clients, andmay register voluntarily in other cases.
The Corporations Act imposes various disclosure requirements and market misconductrequirements (aimed at preventing misleading or deceptive conduct in the provision of financialservices) to offers of interests in funds to retail and wholesale clients in Australia. In certain cases,notice of an offer needs to be lodged with ASIC.
(i) Australian financial services license compliance requirements
A holder of an AFSL must: (a) maintain minimum regulatory capital; (b) put in place adequatearrangements for the management of conflicts of interest; (c) have adequate risk management systems;(d) report significant breaches to ASIC; (e) ensure designated ‘responsible managers’ and otherpersonnel are trained and supervised; (f) if retail client services are provided, have adequateprofessional indemnity insurance and maintain appropriate internal and external dispute resolutionprocesses. An AFSL holder is subject to an overarching duty to ensure that financial services areprovided efficiently, honestly and fairly. Subject to some limited exemptions, issuers of interests in,and managers of, investment funds will generally need to hold an AFSL (regardless of whether theinvestors in the fund are retail clients or wholesale clients). Three entities in our Group currently holdan AFSL and our Group may hold additional AFSLs in the future.
(ii) Unit trusts (managed investment schemes)
The investment fund vehicle most commonly used in Australia is the unit trust. A unit trust is alegal arrangement under which a trustee is bound as a fiduciary to administer the pool of assets onbehalf of beneficiaries. Unit trusts can be regulated as ‘managed investment schemes’ under theCorporations Act and are required to be registered with ASIC if offered to retail clients.
(iii) Reform of stapled entity structures
Real estate funds commonly adopt stapled fund structures that involve an investor subscribingfor interests in a trust and either interests in a taxpaying trust or interests in an investment company.The interests of each investor in these entities are contractually stapled together in the sense that adealing in an interest of an investor in one entity requires a corresponding dealing in the interest of theinvestor in the other entity. Proposed legal reforms in Australia may limit the use of stapled structures.
4. EMPLOYMENT
The Fair Work Act 2009 (Cth) (“Fair Work Act”) is the principal source of industrial relationsregulation for our Group in respect of its employees in Australia. The Fair Work Act contains ten
V-22

APPENDIX V REGULATORY OVERVIEW
minimum employment conditions known as the National Employment Standards (“NES”) which applyto all employees (including executives). Supplementing the NES is a system of modern awards thatcovers employers and employees in certain industries and occupations and enterprise agreementswhich are collective agreements made between employers and employees.
Any member of our Group that is an employer must provide workers’ compensation insurancecoverage for its employees. They must also make superannuation contributions for their employeesand, in some circumstances, independent contractors.
In addition, uniform Workplace Health and Safety laws apply in all Australian states andterritories, except Victoria and Western Australia which apply similar laws with respect tooccupational health and safety.
5. COMPANY LAW
The establishment, operation and management of companies and managed investment schemesin Australia is governed primarily by the Corporations Act which is administered by the ASIC. TheCorporations Act applies to both domestic Australian companies and companies that were incorporatedoverseas, including companies with a majority of foreign investors. Company law regulates theregistration, powers, operation, governance and winding up of companies.
6. DISTRIBUTIONS
The principal legislation governing dividend distributions in Australia is the Corporations Act.To pay a dividend, the directors of an Australian company must be satisfied: (a) the company hassufficient net assets; (b) the dividend is fair and reasonable to the company’s shareholders as a whole;and (c) the dividend does not materially prejudice the company’s ability to pay its creditors.
The directors must also be satisfied that the company has sufficient profits and ensure anyrequirements imposed by the company’s constitution are met. In relation to trusts, distributions must bemade in accordance with the relevant trust deed.
7. FOREIGN INVESTMENT
Australia’s foreign investment regulatory framework comprises the Foreign Acquisitions andTakeovers Act 1975 (Cth) (“FATA”) and the Foreign Acquisitions and Fees Imposition Act 2015(Cth) and their associated regulations. Foreign investors must submit foreign investment proposals thatmeet certain criteria to the Australian Treasurer for approval. The Treasurer has the power to blockforeign investment approvals that are contrary to Australia’s national interest or apply conditions onthe way in which a proposal is to be implemented.
Under FATA, the members of our Group are classified as “foreign government investors”.Foreign government investors are generally required to obtain approval under FATA for eachacquisition they propose to make of land or shares or units in Australian companies or trusts in whichthe investor has an interest of 10% or more regardless of the value of the investment. Our Group hasobtained the necessary approvals for its current investments and activities in Australia.
8. APPLICABLE MAJOR TAXES
In Australia, foreign entities are, ordinarily, only taxed on income derived from sources inAustralia and capital gains made from dealing with certain assets that have a substantial connection
V-23

APPENDIX V REGULATORY OVERVIEW
with Australia, such as the sale of Australian real property (directly and in some cases indirectly),resource interests and business assets. Australian entities are taxed on their worldwide income (that is,from sources both in and outside Australia). Certain members of our Group are residents of Australiafor tax purposes.
(i) Income Tax
Under Australian Federal tax law, income tax is levied on “taxable income” which is theproduct of a taxpayer’s assessable income less allowable deductions. Assessable income includes“ordinary income” (e.g. business and investment income) and “statutory income” (e.g. capital gains,including in connection with the disposal of capital gains taxable assets such as real property). Thetaxable income of most companies is taxed at a flat rate of 30%. However, most companies withannual turnover less than A$50 million are taxed at a flat rate of 27.5% under rates applicable to the2019-20 income year. These rates apply to both resident and non-resident companies. The relevantdouble tax agreement may eliminate this tax for a non-resident company with no permanentestablishment or real property in Australia.
(ii) Withholding Tax
Australian withholding tax can be imposed on dividends, interest and royalties paid byresidents of Australia to non-residents. Under domestic law, the withholding rates are generally 30%for unfranked dividends, 10% for interest and 30% for royalties (subject to any domestic exemptionand unless a lower rate applies because Australia has a double taxation agreement with the country inwhich the non-resident resides or an exception applies). Dividends to which tax credits are attached arecalled franked dividends. Dividends may be franked, partly franked or unfranked. The franked part ofdividends is not subject to dividend withholding tax for dividends paid to non-residents.
In addition to dividend, interest and royalty withholding tax, taxable distributions by Australiantrusts to non-resident companies are subject to withholding tax payable at 30%. “Fund payments” (e.g.distribution of rent derived from real property investments) by “managed investment trusts” to mostnon-resident investors are subject to a final withholding tax which generally applies at a rate of 15%.
From July 1, 2019, the managed investment trust (“MIT”) withholding rate on certain “activebusiness income” increased from 15% to 30%, treating income, rent and capital gains derived by aMIT from certain categories of income, including agricultural land and certain residential housing, asactive income, meaning that such income will be subject to a withholding rate of 30%.
A non-final 12.5% withholding tax applies to proceeds of sales by non-residents of direct andindirect interests in certain Australian real property.
(iii) Transfer Pricing
Under Australia’s transfer pricing regime, related party arrangements must be conducted on anarm’s length basis or risk being subject to adjustment. The transfer pricing rules can apply tointernational agreements for the supply or acquisition of property (including intellectual property),good and services, insurance or finance (e.g. loans). Deductions for interest incurred by inbound andoutbound investment vehicles may be limited under what are known as the Australian thincapitalization rules. Broadly, a portion of interest (and related expenses) is denied as a deduction if theaverage debt of the Australian entity or operations exceeds 60% of the average assets of that entity, orthe entity’s Australian operations, that is, a 1.5:1 debt to equity ratio (subject to certain exceptions).
V-24

APPENDIX V REGULATORY OVERVIEW
(iv) Goods and Services Tax
In general, in Australia, the supplier of goods or services is required to remit GST to theAustralian Taxation Office equal to 10% of the value of the goods or services supplied. It is levied onthe supply of goods, services and other things such as property and rights. However, the supply ofcertain goods and services is GST-free (for example, exports) or input taxed (for example, financialservices). As with income tax, associated entities can elect to form a GST group. Generally,transactions within the group are ignored for GST purposes and the representative member isresponsible for the groups reporting obligations.
(v) Employment Tax
The Australian Federal Government imposes fringe benefits tax and payroll tax on employersin respect of non-cash benefits, reimbursements and wages provided to their employees.
(vi) Stamp Duty
Stamp duty is levied in each Australian jurisdiction (at varying rates) on certain transactions,such as: (a) the purchase of business assets in Western Australia, Queensland and the NorthernTerritory; (b) in some jurisdictions, the purchase of interests in partnerships and trusts where thepartnership or trust holds certain property located in that jurisdiction; and (c) in all states andterritories, the direct transfer of land and interests in land and certain goods.
(vii) Landholder Duty
In Australia, an indirect transfer of an interest in land may be subject to landholder duty. Ingeneral terms, landholder duty is imposed on the acquisition of shares or units in entities that hold(either directly or indirectly through related entities) land assets of a particular value in that state orterritory. The tests and thresholds that apply for determining when an entity is a landholder and when aliability is triggered varies between each jurisdiction, as well as by entity type.
F. INDIAN LAWS AND REGULATIONS
The following description is a summary of certain sector specific laws currently in force inIndia, which are applicable to ESR Advisers India Private Limited, ESR Bhiwandi Industrial ParkPrivate Limited and ESR Pune Industrial Park Realty Private Limited (together, the “IndianCompanies”).
1. PROPERTY RELATED LEGISLATION
(i) Transfer of Property Act, 1882 (“TP Act”)
The TP Act establishes the general principles relating to transfer of property in India. It forms abasis for identifying the categories of property that are capable of being transferred, the personscompetent to transfer property, the validity of restrictions and conditions imposed on the transfer andthe creation of contingent and vested interest in the property and mortgage of immovable property. Italso provides for the rights and liabilities of the vendor and purchaser in a transaction of sale ofimmovable property. The TP Act also governs lease agreements, including the rights and liabilities ofthe lessor and the lessee.
V-25
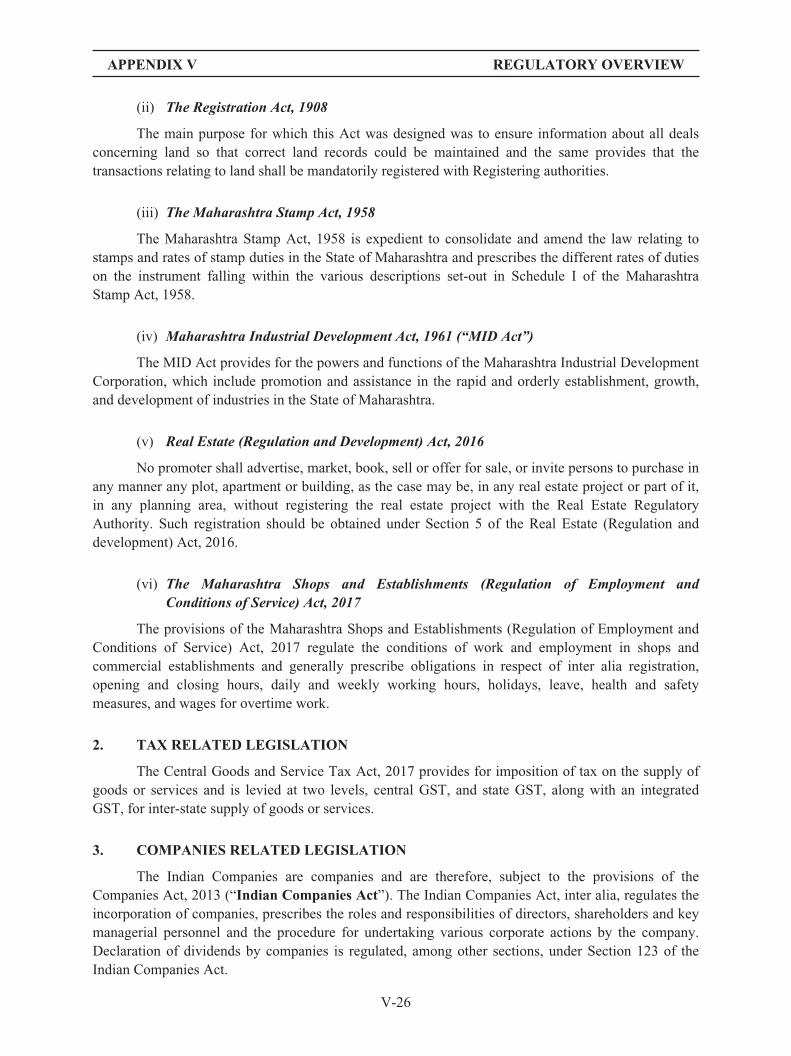
APPENDIX V REGULATORY OVERVIEW
(ii) The Registration Act, 1908
The main purpose for which this Act was designed was to ensure information about all dealsconcerning land so that correct land records could be maintained and the same provides that thetransactions relating to land shall be mandatorily registered with Registering authorities.
(iii) The Maharashtra Stamp Act, 1958
The Maharashtra Stamp Act, 1958 is expedient to consolidate and amend the law relating tostamps and rates of stamp duties in the State of Maharashtra and prescribes the different rates of dutieson the instrument falling within the various descriptions set-out in Schedule I of the MaharashtraStamp Act, 1958.
(iv) Maharashtra Industrial Development Act, 1961 (“MID Act”)
The MID Act provides for the powers and functions of the Maharashtra Industrial DevelopmentCorporation, which include promotion and assistance in the rapid and orderly establishment, growth,and development of industries in the State of Maharashtra.
(v) Real Estate (Regulation and Development) Act, 2016
No promoter shall advertise, market, book, sell or offer for sale, or invite persons to purchase inany manner any plot, apartment or building, as the case may be, in any real estate project or part of it,in any planning area, without registering the real estate project with the Real Estate RegulatoryAuthority. Such registration should be obtained under Section 5 of the Real Estate (Regulation anddevelopment) Act, 2016.
(vi) The Maharashtra Shops and Establishments (Regulation of Employment andConditions of Service) Act, 2017
The provisions of the Maharashtra Shops and Establishments (Regulation of Employment andConditions of Service) Act, 2017 regulate the conditions of work and employment in shops andcommercial establishments and generally prescribe obligations in respect of inter alia registration,opening and closing hours, daily and weekly working hours, holidays, leave, health and safetymeasures, and wages for overtime work.
2. TAX RELATED LEGISLATION
The Central Goods and Service Tax Act, 2017 provides for imposition of tax on the supply ofgoods or services and is levied at two levels, central GST, and state GST, along with an integratedGST, for inter-state supply of goods or services.
3. COMPANIES RELATED LEGISLATION
The Indian Companies are companies and are therefore, subject to the provisions of theCompanies Act, 2013 (“Indian Companies Act”). The Indian Companies Act, inter alia, regulates theincorporation of companies, prescribes the roles and responsibilities of directors, shareholders and keymanagerial personnel and the procedure for undertaking various corporate actions by the company.Declaration of dividends by companies is regulated, among other sections, under Section 123 of theIndian Companies Act.
V-26

APPENDIX V REGULATORY OVERVIEW
We are also required to comply with the Competition Act, 2002, as amended (“CompetitionAct”), which regulates practices having an appreciable adverse effect on competition in the relevantmarket in India and combinations (including mergers, amalgamations and acquisitions) in excess ofcertain thresholds.
4. EMPLOYMENT RELATED LEGISLATION
Certain other laws and regulations that may be applicable to us in India include the ContractLabor (Regulation & Abolition) Act, 1970, Ease of Compliance to maintain Registers under variousLabor Laws Rules, 2017, Employees’ Compensation Act, 1923, Employees’ Provident Funds andMiscellaneous Provisions Act, 1952, Employees’ State Insurance Act, 1948, Equal Remuneration Act,1976, Inter-State Migrant Workmen (Regulation of Employment and Conditions of Service) Act, 1979,The Building Construction and Other Construction Workers’ (Regulation and Employment andCondition of Service) Act, 1996, Maternity Benefit Act, 1961, Minimum Wages Act, 1948, Payment ofBonus Act, 1965, Payment of Gratuity Act, 1972, Payment of Wages Act, 1936, and SexualHarassment of Women at Workplace (Prevention, Prohibition and Redressal) Act, 2013.
5. FOREIGN INVESTMENT RELATED LEGISLATION
In addition to the above, the Indian Companies in India are required to comply with theprovisions of the Foreign Exchange Management Act, 1999 (“FEMA”), which was enacted toconsolidate and amend the law relating to foreign exchange in India.
Foreign investment in companies in the construction development sector and other financialservices sector are governed by the provisions of the FEMA read with the applicable regulations. TheConsolidated FDI Policy consolidates the policy framework on Foreign Direct Investment (“FDIPolicy”), with effect from August 28, 2017.
The RBI, in exercise of its power under the FEMA, has also notified the Foreign ExchangeManagement (Transfer or Issue of Security by a Person Resident outside India) Regulations, 2017 toprohibit, restrict or regulate, transfer by or issue of security to a person resident outside India.
In terms of the FDI Policy, foreign investment in the sector in which ESR Bhiwandi IndustrialPark Private Limited and ESR Pune Industrial Park Realty Private Limited operate are permitted up to100% under the automatic route, subject to the certain conditions relating to timing of exit by theinvestor; the project conforming to prescribed norms and standards including land use requirementsand provision of community amenities and common facilities as also the company obtaining allnecessary approvals for the development; sale of only developed plots by the company.
Further, foreign investment in the sector in which ESR Advisers India Private Limited operatesis permitted up to 100% under the government approval route and is subject to certain conditions suchas funding the company to the extent of minimum capitalization requirement.
6. OTHER REGULATIONS
ESR Bhiwandi Industrial Park Private Limited and ESR Pune Industrial Park Realty PrivateLimited, upon commencement of construction related activities, will also be governed by theprovisions of the National Building Code of India, 2016 (“NBC”), including in relation to fire and lifesafety. Many of the NBC provisions has been incorporated by various state governments and local
V-27

APPENDIX V REGULATORY OVERVIEW
bodies in their own building regulations. The Maharashtra Fire Prevention and Life Safety MeasuresRules, 2009, framed under the Maharashtra Fire Prevention and Life Safety Measures Act, 2006 areexamples to this, and are aimed to improve the status of fire safety measures in the state ofMaharashtra.
Further, ESR Bhiwandi Industrial Park Private Limited and ESR Pune Industrial Park RealtyPrivate Limited, upon commencement of construction related activities, will also be governed byvarious other acts, rules and policies such as the Right to Fair Compensation and Transparency in LandAcquisition, Rehabilitation and Resettlement Act, 2013 Maharashtra Municipal Corporations Act,1949. the Bombay Lifts Act, 1939 and the Bombay Lift Rules 1958, the Maharashtra Lifts, Escalatorsand Moving Walks Act, 2017 and the rules framed thereunder, Petroleum Act, 1934 and the PetroleumRules, 2002, Maharashtra (Urban Areas) Preservation of Trees Act, 1975, Ancient Monuments andArchaeological Sites and Remains Act, 1958, Aircraft Act, 1934, various labor laws, various taxrelated legislations and other applicable statutes for its day-to day operations.
Moreover, ESR Advisers India Private Limited will be governed by the provisions of the SEBI(Investment Advisers) Regulations, 2013 to the extent applicable to its investment advisory activities.
V-28

APPENDIX VI PROPERTY VALUATION
The following is the text of a letter, summary of values and valuation summary prepared for thepurpose of incorporation in this prospectus received from Beijing Colliers International Real EstateValuation Co., Ltd. (“Colliers International”), an independent valuer, in connection with theiropinions of value of certain property interests of the Group as at September 30, 2019.
Beijing Colliers International Real Estate Valuation Co., Ltd.
Suite 510, Tower W3, Oriental Plaza,No. 1 East Chang’an Ave., Dongcheng District,Beijing, China
October 22, 2019
The Board of DirectorsESR Cayman Limited
Dear Sir or Madam,
Re: Valuations of 33 Properties located in the PRC (Together known as the “Properties”,individually known as the “Property”)
INSTRUCTIONS
Instructions have been received from ESR Cayman Limited (the “Company”) to conductvaluations of the captioned properties held by each subsidiaries of ESR Cayman Limited (hereinaftertogether referred to as the “Group”), we confirm that we have carried out inspections, made relevantenquires and obtained such further information as we consider necessary to allow us to provide youwith our opinions of the market value of each Property, detailed in the attached valuation summaries asat September 30, 2019 (the “Date of Valuation”) for the purpose of incorporating in the prospectus.
For ease of reference a summary of the valuations is contained in the valuation schedule below.
BASIS OF VALUATIONS
Our valuations are provided on the basis of Market Value, which we define as “the estimatedamount for which an asset or liability should exchange on the valuation date between a willing buyerand a willing seller in an arm’s-length transaction after proper marketing and where the parties hadeach acted knowledgeably, prudently and without compulsion”.
VALUATION STANDARDS
These valuations have been carried out in accordance with the Royal Institution of CharteredSurveyors (RICS) Global Valuation Professional Standards, incorporating the International ValuationStandards of the International Valuation Standards Council (ISVC), and the requirements set out inChapter 5 of the Main Board Listing Rules and Practice Note 12 Governing the Listing of Securitiespublished by The Stock Exchange of Hong Kong Limited.
VALUATION APPROACHES
We have valued the Properties using the Income Approach by Income Capitalisation andDiscounted Cash Flow Methods, the Market Approach and the Cost Approach, as appropriate.
VI-1

APPENDIX VI PROPERTY VALUATION
For the property interests in Group I, which are completed and stabilised or completed and pre-stabilised, we have valued each of those property interests by the Income Capitalisation andDiscounted Cash Flow Methods.
The Income Capitalisation Method estimates the value of properties or assets on a marketbasis by capitalizing net rental income on a fully leased basis. This method is used when a property orasset is leased out for a specific term(s). This technique considers both the current passing rentalincome from existing tenancies and the potential future reversionary income at market level, bycapitalising both at appropriate rates. In calculating the net rental income for this purpose, deduction ismade for outgoings such as property management fees, capital expenditure, vacancy loss, and othernecessary expenses.
The Discounted Cash Flow (DCF) Method is the process of valuing an investment property orasset by undertaking an estimation of future cash flows and taking into account the time value ofmoney. During the DCF technique, the income is projected over the investment cycle and the netincome is calculated after the deduction of capital, operating, and other necessary expenses.
For the property interests in Group II, which are under development, we have valued suchproperty on the basis that it will be developed and completed in accordance with the latestdevelopment plan provided to us. We have assumed that all consents, approvals and licenses fromrelevant government authorities for the development plan have been obtained without onerousconditions or delays. We have taken into account the cost that will be expected to complete thedevelopment to reflect the quality of the completed project.
The Cost Approach provides an indication of value using the economic principle that a buyerwill pay no more for an asset than the cost to obtain an asset of equal utility whether by purchase orconstruction.
For the property interests in Group III, which are land yet to be developed, we have adopted theMarket Approach by making reference to sales comparables as available in the relevant market.
The Market Approach provides an indication of value by comparing the subject asset withidentical or similar assets for which price information is available. By analyzing such sales, whichqualify as ‘arms-length’ transactions, between willing buyers and sellers, adjustments are made forsize, location, time, amenities and other relevant factors when comparing such sales prices to assess thevalue of the subject asset. This approach is commonly used to value assets where reliable salesevidence of assets of a similar nature is available.
SOURCES OF INFORMATION
Although we have made independent enquires as much as possible, we have relied to a veryconsiderable extent on the information provided by the Company and have accepted such informationgiven to us as being true and correct for valuation purposes. This has included such matters asparticulars of occupancies, ownership titles, lettings, site and floor areas, statutory notices, easements,tenures, joint venture agreements, the identification of the property interests and all other relevantmatters. Dimensions, measurements and areas included in the valuation summaries are based oninformation provided to us by the Company, that we assume to be true and correct for valuationpurposes.
VI-2

APPENDIX VI PROPERTY VALUATION
In carrying out the valuations, we have relied on the rental information supplied of leases in theproperties effective on or before the September 30, 2019. We believe this to be adequate for valuationproposes. We have made no reference to any leases that became effective from October 1, 2019,onwards. Our independent research has included making reference to our internal data base, and thoseof government departments, researching open market transactions, and discussions with marketpractitioners. We have verified information to the extent possible.
Inspections of the properties have been made as detailed below.
TITLE DOCUMENTS
We have been provided with copies or extracts of some title documents relating to theProperties and have made relevant enquiries where possible. Due to the nature of the land registrationsystem in the PRC, we have not examined the original documents to verify the existing titles to theproperty interests the PRC or any material encumbrances that might be attached to the propertyinterests or any lease amendments. We have made assumptions that the full and proper ownership titleof the Properties has been obtained and all payable land premium or land-use rights fees have beenfully settled.
We have relied on the advices given by the Group’s legal adviser, Global Law Office,regarding the titles of the property interests in the PRC. We don’t accept liability for any interpretationthat we have placed on such information, which is more properly placed within the sphere of the legaladviser.
VALUATION ASSUMPTIONS AND CAVEATS
Our valuations have been made on the assumption that the owners can sell any of the Propertieson the open market without the benefit of deferred terms contracts, leasebacks, joint ventures,management agreements or any similar arrangements which would serve to affect the value of theProperties.
No allowances have been made in our valuations for any charges, mortgages or amounts owingon the Properties nor for any expenses or taxation which may be incurred in effecting a sale. Unlessotherwise stated, it is assumed that all Properties are free of any encumbrances, restrictions andoutgoings of an onerous nature which could affect its values.
We have conducted the valuations assuming:
Š The information about the Properties provided by the Company is true and correct.
Š The Properties are free from environmental problems and contamination and the groundconditions are satisfactory.
Š We have assumed proper title of all the Properties has been obtained, and the Property andthe interest valued therein can be freely transferred, mortgaged and let in the market.
Š All required approvals and certificates necessary for any development and occupation anduse of the Properties have been duly obtained and are in full force and effect.
Š In valuing the Properties held by the Company under development in the PRC, we havevalued such properties on the basis that they will be developed and completed in
VI-3

APPENDIX VI PROPERTY VALUATION
accordance with the latest development proposals provided to us. We have furtherassumed that all consents, approvals and licenses from relevant government authorities forsuch development proposals have been or will be obtained without onerous conditions ordelays.
Š The current tenancies of the Properties are of good covenant and will run the full term oftheir leases at the current contracted rental levels.
Š We have valued the portfolio assuming no reduction in value to reflect any possiblediminution in value resulting from a placing of the portfolio on the market together as oneat the same time for sale.
Š We are not aware of any easements or rights-of-way adversely affecting the properties andour valuations assume that none exists.
Š We have assumed that all information, estimates and opinions furnished to us andcontained in this report, including all information provided by the Company, are fit forvaluation purposes, and have been obtained from sources considered reliable and believedto be true and correct. We assume no responsibility for accuracy.
Š We have assumed that the Property has been constructed, occupied and used in fullcompliance with, and without contravention of, all relevant laws, ordinances and statutoryrequirements.
Š We have assumed that, for any use (s) of the Property upon which this valuation report isbased, any and all required licences, permits, certificates, and authorisations have beenobtained, and are capable of renewal without difficulty.
Š Where applicable no structural survey or testing of the services within or connected to theproperties has been carried out. As appropriate we have assumed the properties arestructurally sound, maintained in a condition fit for purpose, with all provided services inworking order.
Š Other assumptions used are set out in the valuation summaries attached hereto.
SITE MEASUREMENT
We have not carried out detailed site measurements to verify the correctness of the site areas inrespect of the Properties but have assumed that the site area information provided to us is true andcorrect in all respects, for valuation purposes. All documents and contracts have been used as referenceonly and all dimensions, measurements and areas are approximations.
SITE INSPECTION
We have inspected the Properties upon the instruction from the Company.
Site inspections of the Properties were carried out by Flora He, Dongbao Xu, Bill Zhou, KyleZeng, Henry Zhou, Kim Jin, Leo Sun, Chloe Wang, Aurora Chen, Yuqi Yang, Gladys Liu, Will Linand Yan Xu from 29 July 2019 to 16 August 2019.
Please be advised we have not carried out investigations to determine the suitability of theground conditions and the services etc. for any future development. Our valuations have been preparedon the assumption that these aspects are satisfactory.
VI-4

APPENDIX VI PROPERTY VALUATION
Moreover, we have not carried out any structural surveys or environmental assessments and areunable to report on issues such as rot, infestation or any other structural defects.
No tests were carried out on any of the services. We have assumed such are in good order forthe purpose of valuation.
CURRENCY
Unless otherwise stated, all monetary figures stated in this report are in Renminbi (RMB).
We hereby certify that we have neither present nor a prospective interest in the Properties or thevalues reported.
Our valuation summaries are attached hereto.
Yours faithfully,For and on behalf ofBeijing Colliers International Real Estate Valuation Co., Ltd.
Zhirong He (Flora He)FRICS MCOMFINExecutive DirectorValuation and Advisory Services I China
David FaulknerBSc (Hons) FRICS FHKIS RPS (GP) MAEManaging DirectorValuation and Advisory Services I Asia
Note:
Ms. Zhirong He (Flora He) (RICS Registration No.:1259301), FRICS, MCOMFIN, who is a Fellow of the Royal Institution of CharteredSurveyors. Flora is head of China Valuation Services team at Colliers International. She is suitably qualified to carry out the valuations andhas over 15 years’ experience in the valuation of properties of this magnitude and nature in China.
Mr. David Faulkner (RICS Registration No.:58391), BSc (Hons), FRICS, FHKIS, RPS (GP) MAE, who is a Fellow of the Royal Institution ofChartered Surveyors, a Fellow Member of the Hong Kong Institute of Surveyors and a Registered Professional Surveyor under the SurveyorsRegistration Ordinance (Cap. 417).
Neither the valuers nor Colliers International are aware of any pecuniary interest or conflict that could reasonably be regarded as beingcapable of affecting the ability to give an unbiased and objective, opinion of the values of the Properties.
VI-5

APPENDIX VI PROPERTY VALUATION
SCHEDULE OF VALUES CONTAINED IN VALUATION SUMMARIES
NO. PROPERTY
MARKET VALUE INEXISTING STATE AS ATSEPTEMBER 30, 2019
INTEREST TO BEATTRIBUTABLETO THE GROUP
MARKET VALUE INEXISTING STATE AS ATSEPTEMBER 30, 2019
ATTRIBUTABLETO THE GROUP
Group I—Property Interests Held by the Group which are Completed, Stablised and Pre-Stablised in the PRC
1. Jiangsu Friend Warehouse Co., Ltd. Phase I RMB914,000,000 100% RMB914,000,000
2. Jiangsu Friend Warehouse Co., Ltd. Phase II RMB580,000,000 100% RMB580,000,000
3. Jiangsu Friend Warehouse Co., Ltd. Phase III RMB1,170,000,000 100% RMB1,170,000,000
4. Langfang Weidu International Logistics Co., Ltd. RMB454,000,000 100% RMB454,000,000
5. Dongguan Huishang Electronic Commerce ServiceCo., Ltd.
RMB592,000,000 100% RMB592,000,000
6. Dongguan Hongshang Warehouse Co., Ltd. Phase I RMB374,000,000 100% RMB374,000,000
7. Dongguan Hongshang Warehouse Co., Ltd. Phase IV RMB238,000,000 100% RMB238,000,000
8. Tianjin Fanbin Warehouse Services Co., Ltd. Phase I RMB627,000,000 100% RMB627,000,000
9. Shenyang Yibei Warehouse Services Co., Ltd. RMB316,000,000 100% RMB316,000,000
10. Guangzhou Mingyue Warehousing Co., Ltd. Phase I RMB410,000,000 68.5% RMB280,900,000
11. Guangzhou Mingyue Warehousing Co., Ltd. Phase II RMB157,000,000 68.5% RMB107,500,000
12. Tianjin Fanxin Warehousing Service Ltd. RMB458,000,000 90% RMB412,200,000
13. Lekun Warehousing (Wuxi) Co., Ltd. RMB483,000,000 100% RMB483,000,000
14. Changsha Yizhu Warehouse Services Co., Ltd. Phase I RMB123,000,000 100% RMB123,000,000
15. Jilin Yiling Warehouse Services Co., Ltd. RMB405,000,000 100% RMB405,000,000
16 Shanghai Yi Bian Logistics Technology Co., Ltd RMB110,000,000 100% RMB110,000,000
17 Chongqing Yongxiang Warehouse Co., Ltd Phase I RMB198,000,000 100%1 RMB198,000,000
Group I Sub-total: RMB7,609,000,000 RMB7,384,600,000
Group II—Property Interests Held by the Group Under Development in the PRC
18. Chongqing Yongxiang Market Management Co., Ltd.Phase II&III
RMB283,000,000 100%1 RMB283,000,000
19. Shanghai Yurun Meat Food Co., Ltd. RMB1,087,000,000 74% RMB804,400,000
20. Changsha Yizhu Warehouse Services Co., Ltd. PhaseII RMB193,000,000 100% RMB193,000,000
21. Wenzhou Yirui Warehouse Services Co., Ltd. RMB144,000,000 100% RMB144,000,000
22. Shanghai Jiangnan Ships and Boats ManufacturingCo., Ltd. RMB141,000,000 100% RMB141,000,000
23. Fujian Pingfu Technology Development Co., Ltd. RMB72,000,000 90% RMB64,800,000
24. Suzhou Yishang Quansheng Warehouse Service Co.,Ltd. RMB67,000,000 55% RMB36,900,000
25. Qingyuan Anqing Information TechnologyDevelopment Co., Ltd. RMB133,000,000 95% RMB126,400,000
Group II Sub-total: RMB2,120,000,000 RMB1,793,500,000
Group III—Property Interest Held by the Group for Future Development in the PRC
26. Tianjin Fanbin Warehouse Services Co., Ltd. Phase II RMB4,000,000 100% RMB4,000,000
27. Wuhan Minglong Warehouse Co., Ltd. RMB66,000,000 100% RMB66,000,00028. Langfang Yizhi Hengjia Technology Co., Ltd. RMB87,000,000 100% RMB87,000,00029. Shanghai Yisi Warehouse Service Co., Ltd. RMB68,000,000 100% RMB68,000,00030. Pinghu Yixing Warehouse Services Co., Ltd. RMB111,000,000 100% RMB111,000,00031. Haining Haiyi Intelligent Equipment Co., Ltd. RMB33,000,000 100% RMB33,000,00032. Wuhan Yizhong Warehouse Services Co., Ltd. RMB22,000,000 100% RMB22,000,00033. Jieyang Yian Warehouse Services Co., Ltd. RMB69,000,000 100% RMB69,000,000
Group III Sub-total: RMB460,000,000 RMB460,000,000
Grand Total: RMB10,189,000,000 RMB9,638,100,000
Note:1. The subsidiary company of ESR Cayman Limited holds 50% of Chongqing Yongxiang’s registered capital, and will acquire the
remaining 50% shares at a pre-agreed price in accordance with the agreement between the shareholders.
VI-6
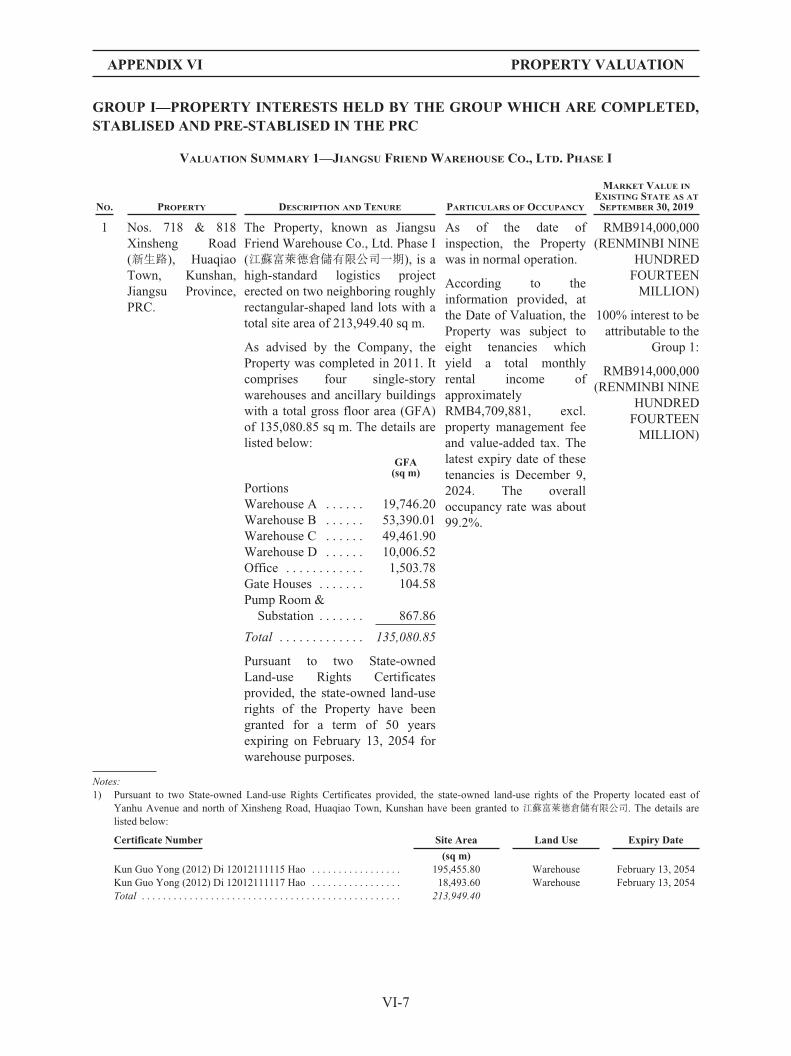
APPENDIX VI PROPERTY VALUATION
GROUP I—PROPERTY INTERESTS HELD BY THE GROUP WHICH ARE COMPLETED,STABLISED AND PRE-STABLISED IN THE PRC
VALUATION SUMMARY 1—JIANGSU FRIEND WAREHOUSE CO., LTD. PHASE I
NO. PROPERTY DESCRIPTION AND TENURE PARTICULARS OF OCCUPANCY
MARKET VALUE INEXISTING STATE AS ATSEPTEMBER 30, 2019
1 Nos. 718 & 818Xinsheng Road(新生路), HuaqiaoTown, Kunshan,Jiangsu Province,PRC.
The Property, known as JiangsuFriend Warehouse Co., Ltd. Phase I(江蘇富萊德倉儲有限公司一期), is ahigh-standard logistics projecterected on two neighboring roughlyrectangular-shaped land lots with atotal site area of 213,949.40 sq m.
As advised by the Company, theProperty was completed in 2011. Itcomprises four single-storywarehouses and ancillary buildingswith a total gross floor area (GFA)of 135,080.85 sq m. The details arelisted below:
As of the date ofinspection, the Propertywas in normal operation.
According to theinformation provided, atthe Date of Valuation, theProperty was subject toeight tenancies whichyield a total monthlyrental income ofapproximatelyRMB4,709,881, excl.property management feeand value-added tax. Thelatest expiry date of thesetenancies is December 9,2024. The overalloccupancy rate was about99.2%.
RMB914,000,000(RENMINBI NINE
HUNDREDFOURTEENMILLION)
100% interest to beattributable to the
Group 1:
RMB914,000,000(RENMINBI NINE
HUNDREDFOURTEENMILLION)
GFA(sq m)
PortionsWarehouse A . . . . . . 19,746.20Warehouse B . . . . . . 53,390.01Warehouse C . . . . . . 49,461.90Warehouse D . . . . . . 10,006.52Office . . . . . . . . . . . . 1,503.78Gate Houses . . . . . . . 104.58Pump Room &
Substation . . . . . . . 867.86
Total . . . . . . . . . . . . . 135,080.85
Pursuant to two State-ownedLand-use Rights Certificatesprovided, the state-owned land-userights of the Property have beengranted for a term of 50 yearsexpiring on February 13, 2054 forwarehouse purposes.
Notes:1) Pursuant to two State-owned Land-use Rights Certificates provided, the state-owned land-use rights of the Property located east of
Yanhu Avenue and north of Xinsheng Road, Huaqiao Town, Kunshan have been granted to 江蘇富萊德倉儲有限公司. The details arelisted below:
Certificate Number Site Area Land Use Expiry Date
(sq m)Kun Guo Yong (2012) Di 12012111115 Hao . . . . . . . . . . . . . . . . . 195,455.80 Warehouse February 13, 2054Kun Guo Yong (2012) Di 12012111117 Hao . . . . . . . . . . . . . . . . . 18,493.60 Warehouse February 13, 2054Total . . . . . . . . . . . . . . . . . . . . . . . . . . . . . . . . . . . . . . . . . . . . . . . . . 213,949.40
VI-7

APPENDIX VI PROPERTY VALUATION
2) Pursuant to nine Building Ownership Certificates provided, the building ownership of the Property located at Nos.718 & 818 XinshengRoad, Huaqiao Town, Kunshan is vested in江蘇富萊德倉儲有限公司. The details are listed below:
Certificate Number Detailed Location Building Use GFA
(sq m)Kun Fang Quan Zheng Hua Qiao Zi Di 131053354 Hao . . . . . . . . . . Building #6, No.
718 Xinsheng Road Warehouse 19,746.20Kun Fang Quan Zheng Hua Qiao Zi Di 131053355 Hao . . . . . . . . . . Building #4, No.
818 Xinsheng Road Warehouse 53,390.01Kun Fang Quan Zheng Hua Qiao Zi Di 131053357 Hao . . . . . . . . . . Building #3, No.
818 Xinsheng Road Warehouse 49,461.90Kun Fang Quan Zheng Hua Qiao Zi Di 131053356 Hao . . . . . . . . . . Building #2, No.
718 Xinsheng Road Warehouse 10,006.52Kun Fang Quan Zheng Hua Qiao Zi Di 131053358 Hao . . . . . . . . . . Building #5, No.
718 Xinsheng Road Office 1,503.78Kun Fang Quan Zheng Hua Qiao Zi Di 131053361 Hao . . . . . . . . . . Building #1, No.
718 Xinsheng Road Guard House 41.36Kun Fang Quan Zheng Hua Qiao Zi Di 131053359 Hao . . . . . . . . . . Building #2, No.
718 Xinsheng Road Guard House 40.65Kun Fang Quan Zheng Hua Qiao Zi Di 131053353 Hao . . . . . . . . . . Building #1, No.
718 Xinsheng Road Guard House 22.57Kun Fang Quan Zheng Hua Qiao Zi Di 131053360 Hao . . . . . . . . . . Building #7, No.
718 Xinsheng RoadPump Room &
Substation 867.86Total . . . . . . . . . . . . . . . . . . . . . . . . . . . . . . . . . . . . . . . . . . . . . . . . . . . 135,080.85
3) Pursuant to the Other Rights Certificates dated October 28, 2015 provided, the Property was mortgaged to 上海農商銀行濱江支行.4) Pursuant to the Company Business License No. 91320583753203478Y, 江蘇富萊德倉儲有限公司 with the address of No. 718 Xinsheng
Road, Huaqiao Town, Kunshan, has been in business from August 14, 2003 to January 17, 2033 with the business scope of從事倉庫、堆場的建設及經營 (不含運輸,不含危險化學品),並提供物業管理服務。(依法須經批准的項目,經相關部門批准後方可開展經營活動)
5) The Owner holds 100% leasehold interests of the Property.6) In the course of our valuation, we have made reference to various leasing properties, which have comparable characteristics on the
market. Comparables that had been selected range from RMB1.15 to 1.30 psm per day, exclusive of Value-added Tax (VAT) andproperty management fee. In the course of our valuation, we have considered the relevant adjustment factors such as the accessibility,size, environment, building facilities, age/maintenance, etc. to determine the market rent of the Property. The adopted market rent of theProperty, excluding VAT and property management fee, as at the Valuation Date is approximately RMB1.26 psm per day.
7) In DCF analysis, we have taken into account the determining factors of location, income and tenant mix of the Property and the rate ofreturn requirement of property investors, and arrived at a discount rate of 8.50%. A terminal capitalization rate of 5.75% was appliedwhen deriving the present value of the cash flows after 10 years. In Income Capitalisation Method, the adopted capitalization rate in ourvaluation is 6.40%. The capitalization rate will apply to the rental income generated until the expiry of the land-use rights of theProperty.
8) The general description and market information of the property are summarized as below:
Location : The Property is located at Nos. 718 & 818 Xinsheng Road, Huaqiao Town, Kunshan, JiangsuProvince, PRC.
Transportation : The Property is accessible by Xinsheng Road. Two expressways, namely G2 (Beijing—Shanghai) and G1501 (Shanghai Ring Expressway) are situated near the Property to the southand east, respectively.
Nature of Surrounding Area : The subject area is clustered with industrial and residential developments.
9) We have prepared our valuation based on the following assumptions:
Š the information of the Property provided by the Company is true and correct;
Š the site is free from contamination and the ground conditions are satisfactory;
Š the proper ownership title of the Property has been obtained, and all payable land premiums or land use rights fees have been fullysettled;
Š all required approvals and certificates necessary for the development and occupation and use of the Property have been dulyobtained and are in full force and effect; and
Š the Property can be freely transferred, mortgaged, sublet or otherwise disposed of in the market.
10) We have been provided with a copy of PRC legal opinion on the Property prepared by Global Law Office (環球律師事務所), whichcontains, inter alia, the following information:
Š 江蘇富萊德倉儲有限公司 has obtained the necessary permits and approvals for the construction work of the Property;
VI-8

APPENDIX VI PROPERTY VALUATION
Š 江蘇富萊德倉儲有限公司 has the right to use the land in accordance to the above mentioned state-owned land-use rights certificates.Under the premise of complying with the mortgage contract agreement hereinafter, 江蘇富萊德倉儲有限公司 has the right to use,transfer, lease, mortgage or other legal means to deal with the premise on the condition of adhering to the land-use and the landtenure;
Š The signed lease contracts by江蘇富萊德倉儲有限公司 and the lessees are effective.
11) The status of the title and grant of major approvals and licenses in accordance with the information provided by the Company are asfollows:
State-owned Land-use Rights Grant Contract YesState-owned Land-use Rights Certificate YesConstruction Land Planning Permit Not ApplicableConstruction Work Planning Permit Not ApplicableConstruction Work Commencement Permit Not ApplicableBuilding Ownership Certificate YesReal Estate Ownership Certificate Not ApplicableBusiness License Yes
VI-9

APPENDIX VI PROPERTY VALUATION
VALUATION SUMMARY 2—JIANGSU FRIEND WAREHOUSE CO., LTD. PHASE II
NO. PROPERTY DESCRIPTION AND TENUREPARTICULARS OF
OCCUPANCY
MARKET VALUE INEXISTING STATE AS ATSEPTEMBER 30, 2019
2 No. 516 FengshanRoad (逢善路),Huaqiao Town,Kunshan, JiangsuProvince, PRC.
The Property, known as JiangsuFriend Warehouse Co., Ltd. PhaseII (江蘇富萊德倉儲有限公司二期), isa high-standard logistics projecterected on a roughly trapezoidal-shaped land lot with a site area of85,136.80 sq m.
As advised by the Company, theProperty was completed in 2013. Itcomprises one single-storywarehouse, two two-storywarehouses and ancillary buildingswith a total gross floor area (GFA)of 85,507.95 sq m. The details arelisted below:
As of the date ofinspection, theProperty was in normaloperation.
According to theinformation provided,at the Date ofValuation, the Propertywas subject to threetenancies which yield atotal monthly rentalincome ofapproximatelyRMB2,705,979, excl.property managementfee and value-addedtax. The latest expirydate of these tenanciesis December 31, 2023.The overall occupancyrate was 100%.
RMB580,000,000(RENMINBI FIVE
HUNDRED EIGHTYMILLION)
100% interest to beattributable to the
Group 1:
RMB580,000,000(RENMINBI FIVE
HUNDRED EIGHTYMILLION)
GFA(sq m)
PortionsWarehouse A . . . . . . . 24,329.23Warehouse B . . . . . . . 26,273.78Warehouse C . . . . . . . 34,254.47Facility Rooms . . . . . . 613.77Gate Houses . . . . . . . . 36.70
Total . . . . . . . . . . . . . . 85,507.95
Pursuant to the State-ownedLand-use Rights Certificateprovided, the state-owned land-userights of the Property have beengranted for a term of 50 yearsexpiring on April 25, 2056 forwarehouse purposes.
Notes:1) Pursuant to the State-owned Land-use Rights Certificate, the state-owned land-use rights of the Property located east of Yanhu Avenue,
Huaqiao Town, Kunshan have been granted to江蘇富萊德倉儲有限公司. The details are listed below:
Certificate Number Site Area Land Use Expiry Date
(sq m)Kun Guo Yong (2012)Di 12012111114 Hao . . . . . . . . . . . . . . . . . . . . . . . . . . . . . . . . . . . . . . . . . . . . . . . . . . . . . . . . 85,136.80 Warehouse April 25, 2056Total . . . . . . . . . . . . . . . . . . . . . . . . . . . . . . . . . . . . . . . . . . . . . . . . . . . . . . . . . . . . . . . . . . . . . 85,136.80
2) Pursuant to six Building Ownership Certificates provided, the building ownership of the Property located at No.516 Fengshan Road,Huaqiao Town, Kunshan is vested in江蘇富萊德倉儲有限公司. The details are listed below:
Certificate Number Detailed Location Building Use GFA
(sq m)Kun Fang Quan Zheng Hua Qiao Zi Di 131088751 Hao . . . . . . . . . . . . . . . . . . . . . . . Building#3 Warehouse 24,329.23Kun Fang Quan Zheng Hua Qiao Zi Di 131088750 Hao . . . . . . . . . . . . . . . . . . . . . . . Building#4 Warehouse 26,273.78Kun Fang Quan Zheng Hua Qiao Zi Di 131088753 Hao . . . . . . . . . . . . . . . . . . . . . . . Building#2 Warehouse 34,254.47Kun Fang Quan Zheng Hua Qiao Zi Di 131088749 Hao . . . . . . . . . . . . . . . . . . . . . . . Building#6 Facility Room 613.77Kun Fang Quan Zheng Hua Qiao Zi Di 131088748 Hao . . . . . . . . . . . . . . . . . . . . . . . Building#7 Guard House 18.35Kun Fang Quan Zheng Hua Qiao Zi Di 131088747 Hao . . . . . . . . . . . . . . . . . . . . . . . Building#1 Guard House 18.35Total . . . . . . . . . . . . . . . . . . . . . . . . . . . . . . . . . . . . . . . . . . . . . . . . . . . . . . . . . . . . . . . 85,507.95
VI-10

APPENDIX VI PROPERTY VALUATION
3) Pursuant to the Other Rights Certificates dated October 28, 2015 provided, the Property was mortgaged to 上海農商銀行濱江支行.4) Pursuant to the Company Business License No. 91320583753203478Y, 江蘇富萊德倉儲有限公司 with the address of No. 718 Xinsheng
Road, Huaqiao Town, Kunshan, has been in business from August 14, 2003 to January 17, 2033 with the business scope of從事倉庫、堆場的建設及經營 (不含運輸,不含危險化學品),並提供物業管理服務。(依法須經批准的項目,經相關部門批准後方可開展經營活動)
5) The Owner holds 100% leasehold interests of the Property.6) In the course of our valuation, we have made reference to various leasing properties, which have comparable characteristics on the
market. Comparables that had been selected range from RMB1.15 to 1.30 psm per day, exclusive of Value-added Tax (VAT) andproperty management fee. In the course of our valuation, we have considered the relevant adjustment factors such as the accessibility,size, environment, building facilities, age/maintenance, etc. to determine the market rent of the Property. The adopted market rent of theProperty, excluding VAT and property management fee, as at the Valuation Date is approximately RMB1.26 psm per day.
7) In DCF analysis, we have taken into account the determining factors of location, income and tenant mix of the Property and the rate ofreturn requirement of property investors, and arrived at a discount rate of 8.50%. A terminal capitalization rate of 5.75% was appliedwhen deriving the present value of the cash flows after 10 years. In Income Capitalisation Method, the adopted capitalization rate in ourvaluation is 6.40%. The capitalization rate will apply to the rental income generated until the expiry of the land-use rights of theProperty.
8) The general description and market information of the property are summarized as below:
Location : The Property is located at No. 516 Fengshan Road, Huaqiao Town, Kunshan, JiangsuProvince, PRC.
Transportation : The Property is accessible by Fengshan Road. Two expressways, namely G2 (Beijing—Shanghai) and G1501 (Shanghai Ring Expressway) are situated near the Property to the southand east, respectively.
Nature of Surrounding Area : The subject area is clustered with industrial and residential developments.
9) We have prepared our valuation based on the following assumptions:
Š the information of the Property provided by the Company is true and correct;
Š the site is free from contamination and the ground conditions are satisfactory;
Š the proper ownership title of the Property has been obtained, and all payable land premiums or land use rights fees have been fullysettled;
Š all required approvals and certificates necessary for the development and occupation and use of the Property have been dulyobtained and are in full force and effect; and
Š the Property can be freely transferred, mortgaged, sublet or otherwise disposed of in the market.
10) We have been provided with a copy of PRC legal opinion on the Property prepared by Global Law Office (環球律師事務所), whichcontains, inter alia, the following information:
Š 江蘇富萊德倉儲有限公司 has obtained the necessary permits and approvals for the construction work of the Property;
Š 江蘇富萊德倉儲有限公司 has the right to use the land in accordance to the above mentioned state-owned land-use rights certificates.Under the premise of complying with the mortgage contract agreement hereinafter, 江蘇富萊德倉儲有限公司 has the right to use,transfer, lease, mortgage or other legal means to deal with the premise on the condition of adhering to the land-use and the landtenure;
Š The signed lease contracts by江蘇富萊德倉儲有限公司 and the lessees are effective.
11) The status of the title and grant of major approvals and licenses in accordance with the information provided by the Company are asfollows:
State-owned Land-use Rights Grant Contract YesState-owned Land-use Rights Certificate YesConstruction Land Planning Permit Not ApplicableConstruction Work Planning Permit Not ApplicableConstruction Work Commencement Permit Not ApplicableBuilding Ownership Certificate YesReal Estate Ownership Certificate Not ApplicableBusiness License Yes
VI-11

APPENDIX VI PROPERTY VALUATION
VALUATION SUMMARY 3—JIANGSU FRIEND WAREHOUSE CO., LTD. PHASE III
NO. PROPERTY DESCRIPTION AND TENUREPARTICULARS OF
OCCUPANCY
MARKET VALUE INEXISTING STATE AS ATSEPTEMBER 30, 2019
3 No. 369 PengqingRoad (蓬青路),Huaqiao Town,Kunshan, JiangsuProvince, PRC.
The Property, known as JiangsuFriend Warehouse Co., Ltd. PhaseIII (江蘇富萊德倉儲有限公司三期), isa high-standard logistics projecterected on an irregular-shaped landlot with a site area of 110,793.90 sqm.
As advised by the Company, theProperty was completed in 2017. Itcomprises three four-storywarehouses and ancillary buildingswith a total gross floor area (GFA)of 206,417.87 sq m. The details arelisted below:
As of the date ofinspection, the Propertywas in normal operation.
According to theinformation provided, atthe Date of Valuation,the Property was subjectto six tenancies whichyield a total monthlyrental income ofapproximatelyRMB5,913,418, excl.property managementfee and value-added tax.The latest expiry date ofthese tenancies isJanuary 31, 2024. Theoverall occupancy ratewas 100%.
RMB1,170,000,000(RENMINBI ONE
BILLION ONEHUNDREDSEVENTYMILLION)
100% interest to beattributable to the
Group 1:
RMB1,170,000,000(RENMINBI ONE
BILLION ONEHUNDREDSEVENTYMILLION)GFA
(sq m)
PortionsWarehouse A &
Ramp . . . . . . . . . . . . 83,330.97Warehouse B &
Ramp . . . . . . . . . . . . 55,969.41Warehouse C &
Ramp . . . . . . . . . . . . 66,226.96Facility Rooms . . . . . . 729.29Gate Houses . . . . . . . . 161.24
Total . . . . . . . . . . . . . . 206,417.87
Pursuant to the Real EstateOwnership Certificate provided, thestate-owned land-use rights of theProperty have been granted for aterm of 50 years expiring onApril 25, 2056 for warehousepurposes.
Notes:1) Pursuant to the Real Estate Ownership Certificate, the state-owned land-use rights of the Property located at No. 369 Pengqing Road,
Huaqiao Town, Kunshan, and the corresponding building ownership are vested in江蘇富萊德倉儲有限公司. The details are listed below:
Certificate Number Site Area Land Use GFA Building Use Expiry Date
(sq m) (sq m)Su (2018) Kun Shan ShiBu Dong Chan Quan Di . . . . . . . . . . . . . . . . . . . . . . . . . . . . 110,793.90 Warehouse 206,417.87 Warehouse April 25, 20560033137 HaoTotal . . . . . . . . . . . . . . . . . . . . . . . . . . . . . . . . . . . . . . . . . . . 110,793.90 206,417.87
2) Pursuant to the Real Estate Registration Certificate dated May 29, 2018 provided, the Property was mortgaged to 上海市農村商業銀行股份有限公司.
3) Pursuant to the Company Business License No. 91320583753203478Y, 江蘇富萊德倉儲有限公司 with the address of No. 718 XinshengRoad, Huaqiao Town, Kunshan, has been in business from August 14, 2003 to January 17, 2033 with the business scope of從事倉庫、堆場的建設及經營 (不含運輸,不含危險化學品),並提供物業管理服務。(依法須經批准的項目,經相關部門批准後方可開展經營活動)
4) The Owner holds 100% leasehold interests of the Property.5) In the course of our valuation, we have made reference to various leasing properties, which have comparable characteristics on the
market. Comparables that had been selected range from RMB1.15 to 1.30 psm per day, exclusive of Value-added Tax (VAT) and
VI-12

APPENDIX VI PROPERTY VALUATION
property management fee. In the course of our valuation, we have considered the relevant adjustment factors such as the accessibility,size, environment, building facilities, age/maintenance, etc. to determine the market rent of the Property. The adopted market rent of theProperty, excluding VAT and property management fee, as at the Valuation Date is approximately RMB1.30 psm per day.
6) In DCF analysis, we have taken into account the determining factors of location, income and tenant mix of the Property and the rate ofreturn requirement of property investors, and arrived at a discount rate of 8.50%. A terminal capitalization rate of 5.75% was appliedwhen deriving the present value of the cash flows after 10 years. In Income Capitalisation Method, the adopted capitalization rate in ourvaluation is 6.40%. The capitalization rate will apply to the rental income generated until the expiry of the land-use rights of theProperty.
7) The general description and market information of the property are summarized as below:
Location : The Property is located at No. 369 Pengqing Road, Huaqiao Town, Kunshan, JiangsuProvince, PRC.
Transportation : The Property is accessible by Pengqing Road. Two expressways, namely G2 (Beijing—Shanghai) and G1501 (Shanghai Ring Expressway) are situated near the Property to the southand east, respectively.
Nature of Surrounding Area : The subject area is clustered with industrial and residential developments.
8) We have prepared our valuation based on the following assumptions:
Š the information of the Property provided by the Company is true and correct;
Š the site is free from contamination and the ground conditions are satisfactory;
Š the proper ownership title of the Property has been obtained, and all payable land premiums or land use rights fees have been fullysettled;
Š all required approvals and certificates necessary for the development and occupation and use of the Property have been dulyobtained and are in full force and effect; and
Š the Property can be freely transferred, mortgaged, sublet or otherwise disposed of in the market.
9) We have been provided with a copy of PRC legal opinion on the Property prepared by Global Law Office (環球律師事務所), whichcontains, inter alia, the following information:
Š 江蘇富萊德倉儲有限公司 has obtained the necessary permits and approvals for the construction work of the Property;
Š 江蘇富萊德倉儲有限公司 has the right to use the land in accordance to the above mentioned real estate ownership certificate. Underthe premise of complying with the mortgage contract agreement hereinafter, 江蘇富萊德倉儲有限公司 has the right to use, transfer,lease, mortgage or other legal means to deal with the premise on the condition of adhering to the land-use and the land tenure;
Š The signed lease contracts by江蘇富萊德倉儲有限公司 and the lessees are effective.
10) The status of the title and grant of major approvals and licenses in accordance with the information provided by the Company are asfollows:
State-owned Land-use Rights Grant Contract YesState-owned Land-use Rights Certificate Not ApplicableConstruction Land Planning Permit Not ApplicableConstruction Work Planning Permit Not ApplicableConstruction Work Commencement Permit Not ApplicableBuilding Ownership Certificate Not ApplicableReal Estate Ownership Certificate YesBusiness License Yes
VI-13

APPENDIX VI PROPERTY VALUATION
VALUATION SUMMARY 4—LANGFANG WEIDU INTERNATIONAL LOGISTICS CO., LTD.
NO. PROPERTY DESCRIPTION AND TENUREPARTICULARS OF
OCCUPANCY
MARKET VALUE INEXISTING STATE AS ATSEPTEMBER 30, 2019
4 No. 14 FengwuRoad (凤舞道),Economic andTechnicalDevelopment Zone,Langfang, HebeiProvince, PRC
The Property, known as LangfangWeidu International LogisticsCo., Ltd. (廊坊唯度國際物流有限公司), is a logistics project erected ona roughly trapezoidal-shaped landlot with a site area of 105,562.70 sqm.
As advised by the Company, theProperty was completed in 2013. Itincludes four single-story logisticswarehouses and one four-storycomplex building with a total GFAof 71,686.55 sq m. Detailed GFAinformation of the Property is listedbelow:
According to theinformation provided, atthe Date of Valuation,the Property was innormal operation andwas subject to onetenancy which yields atotal monthly rentalincome of RMB2,394,909, excl. propertymanagement fee andvalue-added tax. Theexpiration date of thistenancies isDecember 15, 2021. Theoverall occupancy ratewas 100%.
RMB454,000,000(RENMINBI
FOUR HUNDREDFIFTY FOUR
MILLION)
100% interest to beattributable to the
Group 1:
RMB454,000,000(RENMINBI
FOUR HUNDREDFIFTY FOUR
MILLION)
GFA(sq m)
PortionsWarehouse 1 . . . . . . . . 16,317.73Warehouse 2 . . . . . . . . 19,301.21Warehouse 3 . . . . . . . . 15,081.68Warehouse 4 . . . . . . . . 17,812.99Gate Houses . . . . . . . . 3,172.94
Total . . . . . . . . . . . . . . 71,686.55
Pursuant to the State-ownedLand-use Rights Certificate, theland-use rights of the Property havebeen granted for warehouse usesfor a term of 50 years expiring onApril 14, 2061.
Notes:1) Pursuant to the State-owned Land-use Rights Certificate, the state-owned land-use rights of the Property located at No. 14, Feng Wu
Road, Langfang Economic and Technical Development Zone, are vested in 廊坊唯度國際物流有限公司. The details are listed below:
Certificate Number Site Area Land Use Expiry Date
(sq m)Lang Kai Guo Yong (2012) Di 47 Hao 105,562.70 Warehouse April 14, 2061Total . . . . . . . . . . . . . . . . . . . . . . . . . . . . . . . . . . . . . . . . . . . . . . . . . . . . . . . . . . . . . . . . . . . . 105,562.70
2) Pursuant to the Building Ownership Certificates, the building ownership of the Property located at No. 14, Feng Wu Road, LangfangEconomic and Technical Development Zone, is vested in廊坊唯度國際物流有限公司. The details are listed below:
Certificate NumberDetailedLocation Building Use GFA
(sq m)Lang Fang Shi Fang Quan Zheng Lang Kai Zi Di G5962 . . . . . . . . . . . . . . . . . . . . . . . . . . . . . . Block 1 Warehouse 16,317.73Lang Fang Shi Fang Quan Zheng Lang Kai Zi Di G5963 . . . . . . . . . . . . . . . . . . . . . . . . . . . . . . Block 2 Warehouse 19,301.21Lang Fang Shi Fang Quan Zheng Lang Kai Zi Di G5964 . . . . . . . . . . . . . . . . . . . . . . . . . . . . . . Block 3 Warehouse 15,081.68Lang Fang Shi Fang Quan Zheng Lang Kai Zi Di G5965 . . . . . . . . . . . . . . . . . . . . . . . . . . . . . . Block 4 Warehouse 17,812.99Lang Fang Shi Fang Quan Zheng Lang Kai Zi Di G5966 . . . . . . . . . . . . . . . . . . . . . . . . . . . . . . Block 5 Office 3,172.94Total . . . . . . . . . . . . . . . . . . . . . . . . . . . . . . . . . . . . . . . . . . . . . . . . . . . . . . . . . . . . . . . . . . . . . . . 71,686.55
3) Pursuant to the Real Estate Registration Certificate dated November 20, 2018 provided, the Property was mortgaged to 星展銀行(中國)有限公司上海分行.
4) Pursuant to the Company Business License No.91131000570090108E, 廊坊唯度國際物流有限公司 with the address of No. 14, Feng WuRoad, Langfang Economic and Technical Development Zone, Langfang, has been in business from March 15, 2011 to March 14, 2041
VI-14

APPENDIX VI PROPERTY VALUATION
with the business scope of 倉儲(危險品、煤炭及有污染貨物除外);房屋場地租賃,勞務服務,裝卸服務,貨物包裝服務(不含印刷),集裝箱拆箱、拼箱、修箱服務,倉儲設施安裝;物業服務(憑資質經營);商務信息諮詢服務,物流信息諮詢服務。(國家法律、行政法規禁限經營的商品和項目除外).
5) The Owner holds 100% leasehold interests of the Property.6) In the course of our valuation, we have made reference to various leasing properties, which have comparable characteristics on the
market. Comparables that had been selected range from RMB1.15 to 1.25 psm per day, exclusive of Value-added Tax (VAT) andproperty management fee. In the course of our valuation, we have considered the relevant adjustment factors such as the accessibility,size, environment, building facilities, age/maintenance, etc. to determine the market rent of the Property. The adopted market rent of theProperty, excluding VAT and property management fee, as at the Valuation Date is approximately RMB1.16 psm per day.
7) In DCF analysis, we have taken into account the determining factors of location, income and tenant mix of the Property and the rate ofreturn requirement of property investors, and arrived at a discount rate of 8.75%. A terminal capitalization rate of 5.75% was appliedwhen deriving the present value of the cash flows after 10 years. In Income Capitalisation Method, the adopted capitalization rate in ourvaluation is 6.40%. The capitalization rate will apply to the rental income generated until the expiry of the land-use rights of theProperty.
8) The general description and market information of the property are summarized as below:
Location : The Property is located at No.14 Fengwu Road, Economic and Technical Development Zone,Langfang, Hebei Province, PRC.
Transportation : The Property is accessible by Fengwu Road, which is a dual way road running in an east-westdirection. Yinghe North Road (銀河北路) is a two-lane dual way road to the east of theProperty that provides easy access to the downtown area of Langfang as well as to LangfangRailway Station.
Nature of Surrounding Area : The Property is situated in the Economic and Technical Development Zone, in the northernpart of Langfang. There are several industrial properties, residential properties and otheramenities near the Property.
9) We have prepared our valuation based on the following assumptions:
Š the information of the Property provided by the Company is true and correct;
Š the site is free from contamination and the ground conditions are satisfactory;
Š the proper ownership title of the Property has been obtained, and all payable land premiums or land use rights fees have been fullysettled;
Š all required approvals and certificates necessary for the development and occupation and use of the Property have been dulyobtained and are in full force and effect; and
Š the Property can be freely transferred, mortgaged, sublet or otherwise disposed of in the market.
10) We have been provided with a copy of PRC legal opinion on the Property prepared by Global Law Office (環球律師事務所), whichcontains, inter alia, the following information:
Š 廊坊唯度國際物流有限公司 has obtained the necessary permits and approvals for the construction work of the Property;
Š 廊坊唯度國際物流有限公司 has the right to use the land in accordance to the above mentioned state-owned land-use rightscertificates. Under the premise of complying with the mortgage contract agreement hereinafter, 廊坊唯度國際物流有限公司 has theright to use, transfer, lease, mortgage or other legal means to deal with the premise on the condition of adhering to the land-use andthe land tenure;
Š The signed lease contracts by廊坊唯度國際物流有限公司 and the lessees are effective.
11) The status of the title and grant of major approvals and licenses in accordance with the information provided by the Company are asfollows:
Land-use Rights Grant Contract NoState-owned Land-use Rights Certificate YesConstruction Land Planning Permit Not ApplicableConstruction Work Planning Permit Not ApplicableConstruction Work Commencement Permit Not ApplicableBuilding Ownership Certificate YesReal Estate Ownership Certificate Not ApplicableBusiness License Yes
VI-15

APPENDIX VI PROPERTY VALUATION
VALUATION SUMMARY 5—DONGGUAN HUISHANG ELECTRONIC COMMERCE SERVICE CO., LTD.
NO. PROPERTY DESCRIPTION AND TENUREPARTICULARS OF
OCCUPANCY
MARKET VALUE INEXISTING STATE AS ATSEPTEMBER 30, 2019
5 Xinji Village (新基村), Machong Town,Dongguan City,GuangdongProvince, PRC
The Property, known as DongguanHuishang Electronic CommerceService Co., Ltd. (東莞匯商電子商務服務有限公司), is a logisticsproject erected on an irregularly-shaped land lot with a site area ofapproximately 123,550.51 sq m.
As advised by the Company, theProperty was completed in 2014. Itcomprises four single-storywarehouses. According to theinformation provided, the Propertyhas a total gross floor area (GFA)of approximately 85,066.34 sq m.The details are listed below:
As of the date ofinspection, the Propertywas in normal operation.
According to theinformation provided, atthe Date of Valuation,the Property was subjectto one tenancy whichyields a total monthlyrental income ofapproximatelyRMB3,042,841, excl.property managementfee and value-added tax.The expiration date ofthe tenancy is May 31,2021. The overalloccupancy rate was100%.
RMB592,000,000(RENMINBI FIVE
HUNDREDNINETY TWO
MILLION)
100% interest to beattributable to the
Group 1:
RMB592,000,000(RENMINBI FIVE
HUNDREDNINETY TWO
MILLION)
GFA(sq m)
PortionsWarehouse A . . . . . . . 25,374.59Warehouse B . . . . . . . 26,881.87Warehouse C . . . . . . . 11,536.06Warehouse D . . . . . . . 21,273.82
Total . . . . . . . . . . . . . . 85,066.34
Pursuant to the Real EstateOwnership Certificates provided,the state-owned land-use rights ofthe Property have been granted fora term of 50 years expiring onFebruary 17, 2062 for industrialpurposes.
Notes:1) Pursuant to the Real Estate Ownership Certificates, the state-owned land-use rights of the Property located at Xinji Village, Machong
Town, Dongguan City, the corresponding building ownership are vested in 東莞匯商電子商務服務有限公司. The details are listed below:
Certificate Number Site Area Land Use GFA Building Use Expiry Date
(sq m) (sq m)
Yue Fang Di Quan Zheng Guan Zi Di 0900912122 Hao . . . 25,374.59Non- residential
(Industrial)
Yue Fang Di Quan Zheng Guan Zi Di 0900912123 Hao . . . 123,550.51Non- residential
(Industrial) 26,881.87Non- residential
(Industrial)February 17,
2062
Yue Fang Di Quan Zheng Guan Zi Di 0900912124 Hao . . . 11,536.06Non- residential
(Industrial)
Yue Fang Di Quan Zheng Guan Zi Di 0900912125 Hao . . . 21,273.82Non- residential
(Industrial)Total . . . . . . . . . . . . . . . . . . . . . . . . . . . . . . . . . . . . . . . . . . . . 123,550.51 85,066.34
2) Pursuant to the Real Estate Registration Certificate dated December 28, 2016 provided, the Property was mortgaged to上海農商銀行濱江支行.
3) Pursuant to the Company Business License No.914419005863609934, 東莞匯商電子商務服務有限公司 with the address of Xinji Village,Machong Town, Dongguan City, has been in business in the term from December 21, 2011 to December 21, 2061 with the businessscope of 倉儲服務 (不含化學危險品);物業管理服務;倉儲設施經營;企業管理諮詢;物業管理諮詢 (涉限除外,涉及國家專項規定的按有關規定辦理)。(依法須經批准的項目,經相關部門批准後方可開展經營活動)
4) The Owner holds 100% leasehold interests of the Property.
VI-16
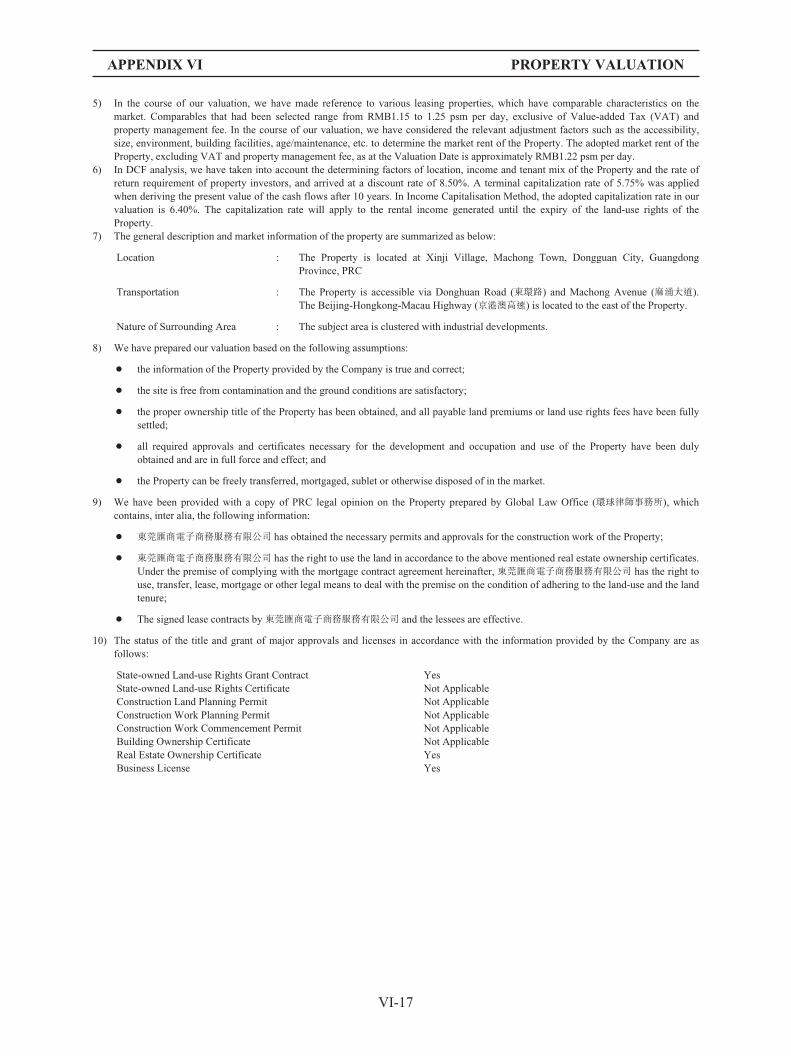
APPENDIX VI PROPERTY VALUATION
5) In the course of our valuation, we have made reference to various leasing properties, which have comparable characteristics on themarket. Comparables that had been selected range from RMB1.15 to 1.25 psm per day, exclusive of Value-added Tax (VAT) andproperty management fee. In the course of our valuation, we have considered the relevant adjustment factors such as the accessibility,size, environment, building facilities, age/maintenance, etc. to determine the market rent of the Property. The adopted market rent of theProperty, excluding VAT and property management fee, as at the Valuation Date is approximately RMB1.22 psm per day.
6) In DCF analysis, we have taken into account the determining factors of location, income and tenant mix of the Property and the rate ofreturn requirement of property investors, and arrived at a discount rate of 8.50%. A terminal capitalization rate of 5.75% was appliedwhen deriving the present value of the cash flows after 10 years. In Income Capitalisation Method, the adopted capitalization rate in ourvaluation is 6.40%. The capitalization rate will apply to the rental income generated until the expiry of the land-use rights of theProperty.
7) The general description and market information of the property are summarized as below:
Location : The Property is located at Xinji Village, Machong Town, Dongguan City, GuangdongProvince, PRC
Transportation : The Property is accessible via Donghuan Road (東環路) and Machong Avenue (麻涌大道).The Beijing-Hongkong-Macau Highway (京港澳高速) is located to the east of the Property.
Nature of Surrounding Area : The subject area is clustered with industrial developments.
8) We have prepared our valuation based on the following assumptions:
Š the information of the Property provided by the Company is true and correct;
Š the site is free from contamination and the ground conditions are satisfactory;
Š the proper ownership title of the Property has been obtained, and all payable land premiums or land use rights fees have been fullysettled;
Š all required approvals and certificates necessary for the development and occupation and use of the Property have been dulyobtained and are in full force and effect; and
Š the Property can be freely transferred, mortgaged, sublet or otherwise disposed of in the market.
9) We have been provided with a copy of PRC legal opinion on the Property prepared by Global Law Office (環球律師事務所), whichcontains, inter alia, the following information:
Š 東莞匯商電子商務服務有限公司 has obtained the necessary permits and approvals for the construction work of the Property;
Š 東莞匯商電子商務服務有限公司 has the right to use the land in accordance to the above mentioned real estate ownership certificates.Under the premise of complying with the mortgage contract agreement hereinafter, 東莞匯商電子商務服務有限公司 has the right touse, transfer, lease, mortgage or other legal means to deal with the premise on the condition of adhering to the land-use and the landtenure;
Š The signed lease contracts by東莞匯商電子商務服務有限公司 and the lessees are effective.
10) The status of the title and grant of major approvals and licenses in accordance with the information provided by the Company are asfollows:
State-owned Land-use Rights Grant Contract YesState-owned Land-use Rights Certificate Not ApplicableConstruction Land Planning Permit Not ApplicableConstruction Work Planning Permit Not ApplicableConstruction Work Commencement Permit Not ApplicableBuilding Ownership Certificate Not ApplicableReal Estate Ownership Certificate YesBusiness License Yes
VI-17

APPENDIX VI PROPERTY VALUATION
VALUATION SUMMARY 6—DONGGUAN HONGSHANG WAREHOUSE CO., LTD. PHASE I
NO. PROPERTY DESCRIPTION AND TENUREPARTICULARS OF
OCCUPANCY
MARKET VALUE INEXISTING STATE AS ATSEPTEMBER 30, 2019
6 Hongwuwo Village(洪屋渦村),Hongmei Town,Dongguan,GuangdongProvince, PRC
The Property, known as DongguanHongshang Warehouse Co., Ltd.Phase I (東莞鴻商倉儲服務有限公司一期), is a logistics project erectedon an irregular-shaped land lot witha site area of 102,017.30 sq m.
As advised by the Company, theProperty was completed in 2015. Itcomprises three single-storywarehouses with a total gross floorarea (GFA) of approximately62,342.77 sq m. The details arelisted below:
As of the date ofinspection, the Propertywas in normal operation.
According to theinformation provided, atthe Date of Valuation,the Property was subjectto two tenancies whichyield a total monthlyrental income ofapproximatelyRMB1,803,312, excl.property management feeand value-added tax. Thelatest expiration date ofthese tenancies isJanuary 31, 2025. Theoverall occupancy ratewas 100%.
RMB374,000,000(RENMINBI
THREEHUNDRED
SEVENTY FOURMILLION)
100% interest to beattributable to the
Group 1:
RMB374,000,000(RENMINBI
THREEHUNDRED
SEVENTY FOURMILLION)
GFA(sq m)
PortionsWarehouse 1 . . . . . . . . 27,056.75Warehouse 2 . . . . . . . . 23,783.75Warehouse 3 . . . . . . . . 11,502.27
Total . . . . . . . . . . . . . . 62,342.77
Pursuant to the Real EstateOwnership Certificates provided,the state-owned land-use rights ofthe Property have been granted fora term of 50 years expiring onNovember 14, 2063 for warehousepurposes.
Notes:1) Pursuant to the Real Estate Ownership Certificates, the state-owned land-use rights of the Property located at Hongwuwo Village,
Hongmei Town, Dongguan City, and the corresponding building ownership are vested in 東莞鴻商倉儲服務有限公司. The details arelisted below:
Certificate Number Site Area Land Use GFA Building Use Expiry Date
(sq m) (sq m)Yue Fang Di Quan Zheng Guan Zi Di
1300902319 Hao . . . . . . . . . . . . . . . . . . 27,056.75Non-residential
(Industrial)Yue Fang Di Quan Zheng Guan Zi Di
1300902320 Hao . . . . . . . . . . . . . . . . . . 102,017.30 Warehouse 23,783.75Non-residential
(Industrial)November 14, 2063
Yue Fang Di Quan Zheng Guan Zi Di1300902318 Hao . . . . . . . . . . . . . . . . . . 11,502.27
Non-residential(Industrial)
Total . . . . . . . . . . . . . . . . . . . . . . . . . . . . . . 102,017.30 62,342.77
2) Pursuant to the Real Estate Registration Certificate dated December 28, 2016 provided, the Property was mortgaged to上海農商銀行濱江支行.
3) Pursuant to the Company Business License No.914419000667183303, 東莞鴻商倉儲服務有限公司 with the address of No.11 ZhongxingRoad, Hongmei Town, Dongguan City has been in business in the term from June 24, 2013 to June 24, 2063 with the business scope of倉儲服務 (除危險品除外);企業管理服務、商務信息諮詢服務、物業管理項目 (涉限除外,涉及國家專項規定的按有關規定辦理)。(依法須經批准的項目,經相關部門批准後方可開展經營活動)
4) The Owner holds 100% leasehold interests of the Property.5) In the course of our valuation, we have made reference to various leasing properties, which have comparable characteristics on the
market. Comparables that had been selected range from RMB1.05 to 1.25 psm per day, exclusive of Value-added Tax (VAT) andproperty management fee. In the course of our valuation, we have considered the relevant adjustment factors such as the accessibility,size, environment, building facilities, age/maintenance, etc. to determine the market rent of the Property. The adopted market rent of theProperty, excluding VAT and property management fee, as at the Valuation Date is approximately RMB1.11 psm per day.
VI-18

APPENDIX VI PROPERTY VALUATION
6) In DCF analysis, we have taken into account the determining factors of location, income and tenant mix of the Property and the rate ofreturn requirement of property investors, and arrived at a discount rate of 8.75%. A terminal capitalization rate of 6.00% was appliedwhen deriving the present value of the cash flows after 10 years. In Income Capitalisation Method, the adopted capitalization rate in ourvaluation is 6.60%. The capitalization rate will apply to the rental income generated until the expiry of the land-use rights of the Property
7) The general description and market information of the property are summarized as below:
Location : The Property is located west of Wangsha Road (望沙路), Hongmei Town, Dongguan City,Guangdong Province, PRC.
Transportation : The Property is accessible by Wangsha Road. S3 Guangshen Yanjiang Highway (廣深沿江高速) is situated near the Property to the west.
Nature of Surrounding Area : The subject area is clustered with industrial developments.
8) We have prepared our valuation based on the following assumptions:
Š the information of the Property provided by the Company is true and correct;
Š the site is free from contamination and the ground conditions are satisfactory;
Š the proper ownership title of the Property has been obtained, and all payable land premiums or land use rights fees have been fullysettled;
Š all required approvals and certificates necessary for the development and occupation and use of the Property have been dulyobtained and are in full force and effect; and
Š the Property can be freely transferred, mortgaged, sublet or otherwise disposed of in the market.
9) We have been provided with a copy of PRC legal opinion on the Property prepared by Global Law Office (環球律師事務所), whichcontains, inter alia, the following information:
Š 東莞鴻商倉儲服務有限公司 has obtained the necessary permits and approvals for the construction work of the Property;
Š 東莞鴻商倉儲服務有限公司 has the right to use the land in accordance to the above mentioned real estate ownership certificates.Under the premise of complying with the mortgage contract agreement hereinafter,東莞鴻商倉儲服務有限公司 has the right to use,transfer, lease, mortgage or other legal means to deal with the premise on the condition of adhering to the land-use and the landtenure;
Š The signed lease contracts by東莞鴻商倉儲服務有限公司 and the lessees are effective.
10) The status of the title and grant of major approvals and licenses in accordance with the information provided by the Company are asfollows:
State-owned Land-use Rights Grant Contract YesState-owned Land-use Rights Certificate Not ApplicableConstruction Land Planning Permit Not ApplicableConstruction Work Planning Permit Not ApplicableConstruction Work Commencement Permit Not ApplicableBuilding Ownership Certificate Not ApplicableReal Estate Ownership Certificate YesBusiness License Yes
VI-19

APPENDIX VI PROPERTY VALUATION
VALUATION SUMMARY 7—DONGGUAN HONGSHANG WAREHOUSE CO., LTD. PHASE IV
NO. PROPERTY DESCRIPTION AND TENUREPARTICULARS OF
OCCUPANCY
MARKET VALUE INEXISTING STATE AS ATSEPTEMBER 30, 2019
7 Hongwuwo Village(洪屋渦村), HongmeiTown, Dongguan,GuangdongProvince, PRC
The Property, known as DongguanHongshang Warehouse Co., Ltd.Phase IV (東莞鴻商倉儲服務有限公司四期), is a logistics projecterected on a roughly rectangular-shaped land lot with a site area of69,260.50 sq m.
As advised by the Company, theProperty was completed in 2016. Itcomprises two one-storywarehouses and a two-story facilitybuilding with a total gross floorarea (GFA) of approximately40,383.04 sq m. The details arelisted below:
As of the date ofinspection, theProperty was in normaloperation.
According to theinformation provided,at the Date ofValuation, the Propertywas subject to threetenancies which yield atotal monthly rentalincome ofapproximatelyRMB1,181,205 excl.property managementfee and value-addedtax. The latestexpiration date of thesetenancies is May 14,2023. The overalloccupancy rate was100%
RMB238,000,000(RENMINBI TWO
HUNDRED THIRTYEIGHT MILLION)
100% interest to beattributable to the
Group 1:
RMB238,000,000(RENMINBI TWO
HUNDRED THIRTYEIGHT MILLION)
GFA(sq m)
PortionsWarehouse 1 . . . . . . . . 21,296.17Warehouse 2 . . . . . . . . 17,504.20Ancillary Buildings . . 1,582.67
Total . . . . . . . . . . . . . . 40,383.04
Pursuant to the Real EstateOwnership Certificates provided,the state-owned land-use rights ofthe Property have been granted fora term of 50 years expiring onMay 9, 2062 for warehousepurposes.
Notes:1) Pursuant to the Real Estate Ownership Certificates, the state-owned land-use rights of the Property located at Hongwuwo Village,
Hongmei Town, Dongguan, the corresponding building ownership are vested in 東莞鴻商倉儲服務有限公司. The details are listed below:
Certificate Number Site Area Land Use GFA Building Use Expiry Date
(sq m) (sq m)Yue (2017) Dong Guan Bu Dong Chan Quan Di 0048819 Hao . . . . 21,296.17 May 9, 2062Yue (2017) Dong Guan Bu Dong Chan Quan Di 0048855 Hao . . . . 69,260.50 Warehouse 17,504.20 Warehouse May 9, 2062Yue (2017) Dong Guan Bu Dong Chan Quan Di 0051777 Hao . . . . 1,582.67 May 9, 2062Total . . . . . . . . . . . . . . . . . . . . . . . . . . . . . . . . . . . . . . . . . . . . . . . . . . 69,260.50 40,383.04
2) Pursuant to the Real Estate Registration Certificate dated May 27, 2017 provided, the Property was mortgaged to上海農商銀行濱江支行.3) Pursuant to the Company Business License No.914419000667183303, 東莞鴻商倉儲服務有限公司 with the address of No.11 Zhongxing
Road, Hongmei Town, Dongguan City has been in business in the term from June 24, 2013 to June 24, 2063 with the business scope of倉儲服務 (除危險品除外);企業管理服務、商務信息諮詢服務、物業管理項目 (涉限除外,涉及國家專項規定的按有關規定辦理)。(依法須經批准的項目,經相關部門批准後方可開展經營活動。)
4) The Owner holds 100% leasehold interests of the Property.5) In the course of our valuation, we have made reference to various leasing properties, which have comparable characteristics on the
market. Comparables that had been selected range from RMB1.05 to 1.25 psm per day, exclusive of Value-added Tax (VAT) andproperty management fee. In the course of our valuation, we have considered the relevant adjustment factors such as the accessibility,size, environment, building facilities, age/maintenance, etc. to determine the market rent of the Property. The adopted market rent of theProperty, excluding VAT and property management fee, as at the Valuation Date is approximately RMB1.11 psm per day.
6) In DCF analysis, we have taken into account the determining factors of location, income and tenant mix of the Property and the rate ofreturn requirement of property investors, and arrived at a discount rate of 8.75%. A terminal capitalization rate of 6.00% was appliedwhen deriving the present value of the cash flows after 10 years. In Income Capitalisation Method, the adopted capitalization rate in our
VI-20

APPENDIX VI PROPERTY VALUATION
valuation is 6.60%. The capitalization rate will apply to the rental income generated until the expiry of the land-use rights of theProperty.
7) The general description and market information of the property are summarized as below:
Location : The Property is located west of Wangsha Road (望沙路), Hongmei Town, Dongguan City,Guangdong Province, PRC.
Transportation : The Property is accessible by Wangsha Road. S3 Guangshen Yanjiang Highway (廣深沿江高速) is situated near the Property to the west.
Nature of Surrounding Area : The subject area is clustered with industrial developments.
8) We have prepared our valuation based on the following assumptions:
Š the information of the Property provided by the Company is true and correct;
Š the site is free from contamination and the ground conditions are satisfactory;
Š the proper ownership title of the Property has been obtained, and all payable land premiums or land use rights fees have been fullysettled;
Š all required approvals and certificates necessary for the development and occupation and use of the Property have been dulyobtained and are in full force and effect; and
Š the Property can be freely transferred, mortgaged, sublet or otherwise disposed of in the market.
9) We have been provided with a copy of PRC legal opinion on the Property prepared by Global Law Office (環球律師事務所), whichcontains, inter alia, the following information:
Š 東莞鴻商倉儲服務有限公司 has obtained the necessary permits and approvals for the construction work of the Property;
Š 東莞鴻商倉儲服務有限公司 has the right to use the land in accordance to the above mentioned real estate ownership certificates.Under the premise of complying with the mortgage contract agreement hereinafter,東莞鴻商倉儲服務有限公司 has the right to use,transfer, lease, mortgage or other legal means to deal with the premise on the condition of adhering to the land-use and the landtenure;
Š The signed lease contracts by東莞鴻商倉儲服務有限公司 and the lessees are effective.
10) The status of the title and grant of major approvals and licenses in accordance with the information provided by the Company are asfollows:
State-owned Land-use Rights Grant Contract YesState-owned Land-use Rights Certificate Not ApplicableConstruction Land Planning Permit Not ApplicableConstruction Work Planning Permit Not ApplicableConstruction Work Commencement Permit Not ApplicableBuilding Ownership Certificate Not ApplicableReal Estate Ownership Certificate YesBusiness License Yes
VI-21

APPENDIX VI PROPERTY VALUATION
VALUATION SUMMARY 8—TIANJIN FANBIN WAREHOUSE SERVICES CO., LTD. PHASE I
NO. PROPERTY DESCRIPTION AND TENUREPARTICULARS OF
OCCUPANCY
MARKET VALUE INEXISTING STATE AS ATSEPTEMBER 30, 2019
8 No.78 FuyuanAvenue (復元道),DawangguzhuangTown, WuqingDistrict, Tianjin,PRC
The Property, known as TianjinFanbin Warehouse Services Co.,Ltd. Phase I (天津凡濱倉儲服務有限公司一期), is a logistics projecterected on a roughly rectangular-shaped land lot with a total site areaof 172,546.40 sq m.
As advised by the Company, theProperty was completed in 2015.Completed portion includes sixsingle-story warehouses, named A,B, C, D, E and F, and an annexbuilding and one guard room with atotal gross floor area (GFA) of106,615.78 sq m. The details arelisted below:
As of the date ofinspection, the Propertywas in normal operation.
According to theinformation provided, atthe Date of Valuation,the Property was subjectto four tenancies whichyield a total monthlyrental income ofapproximatelyRMB2,958,479, excl.property management feeand value-added tax. Thelatest expiry date of thesetenancies is March 31,2021. The overalloccupancy rate was100%.
RMB627,000,000(RENMINBI SIX
HUNDREDTWENTY SEVEN
MILLION)
100% interest to beattributable to the
Group 1:
RMB627,000,000(RENMINBI SIX
HUNDREDTWENTY SEVEN
MILLION)
GFA(sq m)
PortionsWarehouses . . . . . . . . 105,166.37Ancillary Building . . 1,449.41
Total . . . . . . . . . . . . . 106,615.78
Pursuant to the Real EstateOwnership Certificate provided, thestate-owned land-use rights of theProperty have been granted for aterm of 50 years expiring onFebruary 11, 2064 for warehousepurposes.
Notes:1) Pursuant to the Real Estate Ownership Certificate, the state-owned land-use rights of the Property, located at No. 78 Fuyuan Avenue,
Dawangguzhuang Town, Wuqing District, and the corresponding building ownership are vested in 天津凡濱倉儲服務有限公司. Thedetails are listed below:
Certificate Number Site Area Land Use GFA Building Use Expiry Date
(sq m) (sq m)Jin (2016) Wu Qing Qu BuDong Chan Quan Di 1038297 Hao . . . . . . . . . . . . . . . 172,546.40 Warehouse 106,615.78 Non-residential February 11, 2064Total . . . . . . . . . . . . . . . . . . . . . . . . . . . . . . . . . . . . . . . 172,546.40 106,615.78
2) Pursuant to the Real Estate Registration Certificate dated May 24, 2019 provided, the Property was mortgaged to 上海農村商業銀行股份有限公司濱江支行 and星展銀行(中國)有限公司上海分行.
3) Pursuant to the Company Business License No.91120222075910869L, 天津凡濱倉儲服務有限公司 with the address of No. 78 FuyuanAvenue, Dawangguzhuang Town, Wuqing District, Tianjin, has been in business from August 22, 2013 to August 21, 2043 with thebusiness scope of倉儲服務(易燃、易爆、易制毒、危險化學品除外)、企業管理服務、商務信息諮詢服務、物業服務;倉儲貨架、紙質包裝品(印刷除外)生產;自有倉庫及倉儲設施租賃。(依法須經批准的項目,經相關部門批准後方可開展經營活動)
4) The Owner holds 100% leasehold interests of the Property.5) In the course of our valuation, we have made reference to various leasing properties, which have comparable characteristics on the
market. Comparables that had been selected range from RMB1.05 to 1.20 psm per day, exclusive of Value-added Tax (VAT) andproperty management fee. In the course of our valuation, we have considered the relevant adjustment factors such as the accessibility,size, environment, building facilities, age/maintenance, etc. to determine the market rent of the Property. The adopted market rent of theProperty, excluding VAT and property management fee, as at the Valuation Date is approximately RMB1.06 psm per day.
6) In DCF analysis, we have taken into account the determining factors of location, income and tenant mix of the Property and the rate ofreturn requirement of property investors, and arrived at a discount rate of 8.50% A terminal capitalization rate of 5.75% was applied
VI-22

APPENDIX VI PROPERTY VALUATION
when deriving the present value of the cash flows after 10 years. In Income Capitalisation Method, the adopted capitalization rate in ourvaluation is 6.40%. The capitalization rate will apply to the rental income generated until the expiry of the land-use rights of theProperty.
7) The general description and market information of the property are summarized as below:
Location : The Property is located at No.78 Fuyuan Avenue, Dawangguzhuang Town, Wuqing District,Tianjin, PRC.
Transportation : The Property is accessible by Fuyuan Avenue (復元道) and an anonymous path, of which theformer is a two-lane dual-way road and the latter is a two-lane road.
Nature of Surrounding Area : The subject area is clustered with a number of industrial factories, warehouse properties andresidential and public facilities.
8) We have prepared our valuation based on the following assumptions:
Š the information of the Property provided by the Company is true and correct;
Š the site is free from contamination and the ground conditions are satisfactory;
Š the proper ownership title of the Property has been obtained, and all payable land premiums or land use rights fees have been fullysettled;
Š all required approvals and certificates necessary for the development and occupation and use of the Property have been dulyobtained and are in full force and effect; and
Š the Property can be freely transferred, mortgaged, sublet or otherwise disposed of in the market.
9) We have been provided with a copy of PRC legal opinion on the Property prepared by Global Law Office (環球律師事務所), whichcontains, inter alia, the following information:
Š 天津凡濱倉儲服務有限公司 has obtained the necessary permits and approvals for the construction work of the Property;
Š 天津凡濱倉儲服務有限公司 has the right to use the land in accordance to the above mentioned real estate ownership certificate.Under the premise of complying with the mortgage contract agreement hereinafter,天津凡濱倉儲服務有限公司 has the right to use,transfer, lease, mortgage or other legal means to deal with the premise on the condition of adhering to the land-use and the landtenure;
Š The signed lease contracts by天津凡濱倉儲服務有限公司 and the lessees are effective.
10) The status of the title and grant of major approvals and licenses in accordance with the information provided by the Company are asfollows:
State-owned Land-use Rights Grant Contract YesState-owned Land-use Rights Certificate Not ApplicableConstruction Land Planning Permit Not ApplicableConstruction Work Planning Permit Not ApplicableConstruction Work Commencement Permit Not ApplicableBuilding Ownership Certificate Not ApplicableReal Estate Ownership Certificate YesBusiness License Yes
VI-23

APPENDIX VI PROPERTY VALUATION
VALUATION SUMMARY 9—SHENYANG YIBEI WAREHOUSE SERVICES CO., LTD.
NO. PROPERTY DESCRIPTION AND TENUREPARTICULARS OF
OCCUPANCY
MARKET VALUE INEXISTING STATE AS ATSEPTEMBER 30, 2019
9 No.1 DongxuehuStreet (冬雪湖街),Shenbei NewDistrict, Shenyang,Liaoning Province,PRC
The Property, known as ShenyangYibei Warehouse Services Co.,Ltd. (瀋陽易北倉儲服務有限公司),is located along Dongxuehu Street,Shenbei New District. The Propertyis a logistics project with a site areaof 120,400.00 sq m.
As advised by the Company, theProperty was completed in 2018. Itcomprises three single-storywarehouses and ancillary facilitieswith a total gross floor area (GFA)of approximately 74,442.02 sq m.The details are listed below:
According to theinformation provided, atthe Date of Valuation,the Property was innormal operation andwas subject to threetenancies which yield atotal monthly rentalincome of approximatelyRMB 1,030,898, excl.property management feeand value-added tax. Thelatest expiration date ofthese tenancies isAugust 31, 2023. Theoverall occupancy ratewas about 57.0%.
RMB316,000,000(RENMINBI
THREEHUNDREDSIXTEENMILLION)
100% interest to beattributable to the
Group 1:
RMB316,000,000(RENMINBI
THREEHUNDREDSIXTEENMILLION)GFA
(sq m)
PortionsWarehouse A . . . . . . . 24,559.43Warehouse B . . . . . . . 24,615.92Warehouse C . . . . . . . 24,615.92Facility Room . . . . . . . 650.75
. Total . . . . . . . . . . . . . . 74,442.02
Pursuant to the Real EstateOwnership Certificates provided,the state-owned land-use rights ofthe Property have been granted fora term of 50 years expiring onJuly 17, 2066 for warehousepurposes.
Notes:1) Pursuant to the Real Estate Ownership Certificates, the state-owned land-use rights of the Property located at No. 1 Dongxuehu Street,
Shenbei New District, Shenyang, and the corresponding building ownership are vested in 瀋陽易北倉儲服務有限公司. The details arelisted below:
Certificate Number Site Area Land Use GFA Building Use Expiry Date
(sq m) (sq m)Liao (2018) Shen Yang ShiBu Dong Chan Quan Di0545560 Hao . . . . . . . . . . . . . . . . . . . . . . . . . . . . . . . . . . . . . . .
120,400.00 Warehouse
24,559.43 Warehouse
July 17,2066
Liao (2018) Shen Yang ShiBu Dong Chan Quan Di0545557 Hao . . . . . . . . . . . . . . . . . . . . . . . . . . . . . . . . . . . . . . . 24,615.92 WarehouseLiao (2018) Shen Yang ShiBu Dong Chan Quan Di0545559 Hao . . . . . . . . . . . . . . . . . . . . . . . . . . . . . . . . . . . . . . . 24,615.92 WarehouseLiao (2018) Shen Yang ShiBu Dong Chan Quan Di0545552 Hao . . . . . . . . . . . . . . . . . . . . . . . . . . . . . . . . . . . . . . . 650.75 OtherTotal . . . . . . . . . . . . . . . . . . . . . . . . . . . . . . . . . . . . . . . . . . . . . 120,400.00 74,442.02
2) Pursuant to the Real Estate Registration Certificate dated April 1, 2019 and June 25, 2019 provided, the Property was mortgaged to交通銀行股份有限公司上海松江支行 and星展銀行(中國)有限公司上海分行 respectively.
3) Pursuant to the Company Business License No.91210100MA0P479D47, 瀋陽易北倉儲服務有限公司 with the address of No. 1Dongxuehu Street, Shenbei New District, Shenyang, has been in business from December 8, 2015 to December 7, 2065 with the business
VI-24

APPENDIX VI PROPERTY VALUATION
scope of 從事倉儲服務(不含危險化學品);工業設施、倉儲設施的建設及經營;普通貨物倉儲及自有倉庫出租;物業管理;技術諮詢、技術服務;商務信息諮詢。(依法須經批准的項目,經相關部門批准後方可開展經營活動)
4) The Owner holds 100% leasehold interests of the Property.5) In the course of our valuation, we have made reference to various leasing properties, which have comparable characteristics on the
market. Comparables that had been selected range from RMB0.70 to 0.95 psm per day, exclusive of Value-added Tax (VAT) andproperty management fee. In the course of our valuation, we have considered the relevant adjustment factors such as the accessibility,size, environment, building facilities, age/maintenance, etc. to determine the market rent of the Property. The adopted market rent of theProperty, excluding VAT and property management fee, as at the Valuation Date is approximately RMB0.81 psm per day.
6) In DCF analysis, we have taken into account the determining factors of location, income and tenant mix of the Property and the rate ofreturn requirement of property investors, and arrived at a discount rate of 8.75%. A terminal capitalization rate of 6.00% was appliedwhen deriving the present value of the cash flows after 10 years. In Income Capitalisation Method, the adopted capitalization rate in ourvaluation is 6.85%. The capitalization rate will apply to the rental income generated until the expiry of the land-use rights of theProperty.
7) The general description and market information of the property are summarized as below:
Location : The Property is located at No.1 Dongxuehu Street, Shenbei New District, Shenyang, LiaoningProvince, PRC
Transportation : Shenbei Road is located to the south of the Property, which is a three-lane dual way main roadrunning in east-west direction in Shenbei New District.
Nature of Surrounding Area : The subject area is clustered by a cluster of industrial buildings and logistic parks along withother public facilities, Shenyang Aerospace University Station of Metro Line 2 can also befound in the vicinity of the Property.
8) We have prepared our valuation based on the following assumptions:
Š the information of the Property provided by the Company is true and correct;
Š the site is free from contamination and the ground conditions are satisfactory;
Š the proper ownership title of the Property has been obtained, and all payable land premiums or land use rights fees have been fullysettled;
Š all required approvals and certificates necessary for the development and occupation and use of the Property have been dulyobtained and are in full force and effect; and
Š the Property can be freely transferred, mortgaged, sublet or otherwise disposed of in the market.
9) We have been provided with a copy of PRC legal opinion on the Property prepared by Global Law Office (環球律師事務所), whichcontains, inter alia, the following information
Š 瀋陽易北倉儲服務有限公司 has obtained the necessary permits and approvals for the construction work of the Property;
Š 瀋陽易北倉儲服務有限公司 has the right to use the land in accordance to the above mentioned real estate ownership certificates.Under the premise of complying with the mortgage contract agreement hereinafter,瀋陽易北倉儲服務有限公司 has the right to use,transfer, lease, mortgage or other legal means to deal with the premise on the condition of adhering to the land-use and the landtenure;
Š The signed lease contracts by瀋陽易北倉儲服務有限公司 and the lessees are effective.
10) The status of the title and grant of major approvals and licenses in accordance with the information provided by the Company are asfollows:
State-owned Land-use Rights Grant Contract NoState-owned Land-use Rights Certificate Not ApplicableConstruction Land Planning Permit Not ApplicableConstruction Work Planning Permit Not ApplicableConstruction Work Commencement Permit Not ApplicableBuilding Ownership Certificate Not ApplicableReal Estate Ownership Certificate YesBusiness License Yes
VI-25

APPENDIX VI PROPERTY VALUATION
VALUATION SUMMARY 10—GUANGZHOU MINGYUE WAREHOUSING CO., LTD. PHASE I
NO. PROPERTY DESCRIPTION AND TENUREPARTICULARS OF
OCCUPANCY
MARKET VALUE INEXISTING STATE AS ATSEPTEMBER 30, 2019
10 No. 53 ChuangyeRoad (創業路),High-TechIndustrial Park ofGuangdongConghua Economicand DevelopmentZone, ConghuaDistrict,Guangzhou,GuangdongProvince, PRC
The Property, known asGuangzhou Mingyue WarehousingCo., Ltd. Phase I (廣州市銘粵倉儲有限公司一期), is a logistics projecterected on an irregular-shaped landlot with a site area of92,925.00 sq m.
As advised by the Company, theProperty was completed in 2014. Itcomprises one single-storywarehouse and several facilityrooms with a total gross floor area(GFA) of approximately 37,093.71sq m for storage uses. The detailsare listed below:
As of the date ofinspection, the Propertywas in normal operation.
According to theinformation provided, atthe Date of Valuation,the Property was subjectto one tenancy whichyields a total monthlyrental income ofapproximatelyRMB2,144,786, excl.property management feeand value-added tax. Theexpiration date of thistenancy is December 4,2024. The overalloccupancy rate was100%.
RMB410,000,000(RENMINBI
FOUR HUNDREDTEN MILLION)
68.5% interest tobe attributable to
the Group 1:
RMB280,900,000(RENMINBI
TWO HUNDREDEIGHTY
MILLION ANDNINE HUNDRED
THOUSAND)GFA(sq m)
PortionsWarehouse . . . . . . . . . 34,842.46CTU . . . . . . . . . . . . . . 688.74Bicycle Shed . . . . . . . . 68.93Carpentry Building . . . 148.90Recycling . . . . . . . . . . 168.68Tire . . . . . . . . . . . . . . . 532.37Guardhouse . . . . . . . . . 43.36HAZMAT . . . . . . . . . . 532.37Smoke Area . . . . . . . . 67.90
Total . . . . . . . . . . . . . . 37,093.71
Pursuant to the Real EstateOwnership Certificates provided,the state-owned land-use rights ofthe Property have been granted fora term of 50 years expiring onDecember 19, 2062 for industrialpurposes.
Notes:1) Pursuant to the Real Estate Ownership Certificates, the state-owned land-use rights of the Property located at No. 53 Chuangye Road,
High-Tech Industrial Park of Guangdong Conghua Economic and Development Zone, and the corresponding building ownership arevested in 廣州市銘粵倉儲有限公司. The details are listed below:
Certificate Number Site Area Land Use GFA Building Use Expiry Date
(sq m) (sq m)Yue (2016) Guang Zhou Shi Bu Dong Chan Quan
Di 09208982 Hao . . . . . . . . . . . . . . . . . . . . . . . . . 168.68 RecyclingYue (2016) Guang Zhou Shi Bu Dong Chan Quan
Di 09208983 Hao . . . . . . . . . . . . . . . . . . . . . . . . . 34,842.46 WarehouseYue (2016) Guang Zhou Shi Bu Dong Chan Quan
Di 09208975 Hao . . . . . . . . . . . . . . . . . . . . . . . . . 67.90 Smoke AreaYue (2016) Guang Zhou Shi Bu Dong Chan Quan
Di 09208995 Hao . . . . . . . . . . . . . . . . . . . . . . . . . 148.90 Carpentry BuildingYue (2016) Guang Zhou Shi Bu Dong Chan Quan
Di 09208989 Hao . . . . . . . . . . . . . . . . . . . . . . . . . 92,925.00 Industrial 532.37 Tire December 19, 2062Yue (2016) Guang Zhou Shi Bu Dong Chan Quan
Di 09209035 Hao . . . . . . . . . . . . . . . . . . . . . . . . . 68.93 Bicycle ShedYue (2016) Guang Zhou Shi Bu Dong Chan Quan
Di 09208991 Hao . . . . . . . . . . . . . . . . . . . . . . . . . 532.37 HAZMAT
VI-26

APPENDIX VI PROPERTY VALUATION
Certificate Number Site Area Land Use GFA Building Use Expiry Date
(sq m) (sq m)Yue (2016) Guang Zhou Shi Bu Dong Chan Quan
Di 09208979 Hao . . . . . . . . . . . . . . . . . . . . . . . . . 688.74 CTUYue (2016) Guang Zhou Shi Bu Dong Chan Quan
Di 09208999 Hao . . . . . . . . . . . . . . . . . . . . . . . . . 43.36 GuardhouseTotal . . . . . . . . . . . . . . . . . . . . . . . . . . . . . . . . . . . . . 92,925.00 37,093.71
2) Pursuant to the Real Estate Registration Certificate dated November 17, 2017 provided, the Property was mortgaged to匯豐銀行(中國)有限公司廣州分行.
3) Pursuant to the Company Business License No.914401010565708469, 廣州市銘粵倉儲有限公司 with the address of No. 53 Chuangye Road,High-Tech Industrial Park of Guangzhou Conghua Economic and Development Zone, Guangzhou, has been in business from December 6,2012 to December 5, 2062 with the business scope of 倉儲業(具體經營項目請登錄廣州市商事主體信息公示平臺查詢。涉及國家規定實施准入特別管理措施的外商投資企業,經營範圍以審批機關核定的為準;依法需經批准的項目,經相關部門批准後方可開展經營活動).
4) The Owner holds 100% leasehold interests of the Property.5) In the course of our valuation, we have made reference to various leasing properties, which have comparable characteristics on the
market. Comparables that had been selected range from RMB1.20 to 1.96 psm per day, exclusive of Value-added Tax (VAT) andproperty management fee. In the course of our valuation, we have considered the relevant adjustment factors such as the accessibility,size, environment, building facilities, age/maintenance, etc. to determine the market rent of the Property. The adopted market rent of theProperty, excluding VAT and property management fee, as at the Valuation Date is approximately RMB1.96 psm per day.
6) In DCF analysis, we have taken into account the determining factors of location, income and tenant mix of the Property and the rate ofreturn requirement of property investors, and arrived at a discount rate of 8.50%. A terminal capitalization rate of 5.75% was applied whenderiving the present value of the cash flows after 10 years. In Income Capitalisation Method, the adopted capitalization rate in our valuationis 6.40%. The capitalization rate will apply to the rental income generated until the expiry of the land-use rights of the Property.
7) The general description and market information of the property are summarized as below:
Location : The Property is located No. 53 Chuangye Road, High-Tech Industrial Park of GuangdongConghua Economic and Development Zone, Conghua District, Guangzhou, GuangdongProvince, PRC.
Transportation : The Property is accessible by Chuangye Road. Two expressways, namely G45 (Daqing—Guangzhou) and G94 (Pearl River Delta Ring Expressway) are situated near the Property tothe east and south, respectively.
Nature of Surrounding Area : The subject area is clustered with industrial developments.
8) We have prepared our valuation based on the following assumptions:
Š the information of the Property provided by the Company is true and correct;
Š the site is free from contamination and the ground conditions are satisfactory;
Š the proper ownership title of the Property has been obtained, and all payable land premiums or land use rights fees have been fullysettled;
Š all required approvals and certificates necessary for the development and occupation and use of the Property have been dulyobtained and are in full force and effect; and
Š the Property can be freely transferred, mortgaged, sublet or otherwise disposed of in the market.
9) We have been provided with a copy of PRC legal opinion on the Property prepared by Global Law Office (環球律師事務所), whichcontains, inter alia, the following information:
Š 廣州市銘粵倉儲有限公司 has obtained the necessary permits and approvals for the construction work of the Property;
Š 廣州市銘粵倉儲有限公司 has the right to use the land in accordance to the above mentioned real estate ownership certificates. Underthe premise of complying with the mortgage contract agreement hereinafter, 廣州市銘粵倉儲有限公司 has the right to use, transfer,lease, mortgage or other legal means to deal with the premise on the condition of adhering to the land-use and the land tenure;
Š The signed lease contracts by廣州市銘粵倉儲有限公司 and the lessees are effective.
10) The status of the title and grant of major approvals and licenses in accordance with the information provided by the Company are asfollows:
State-owned Land-use Rights Grant Contract YesState-owned Land-use Rights Certificate Not ApplicableConstruction Land Planning Permit Not ApplicableConstruction Work Planning Permit Not ApplicableConstruction Work Commencement Permit Not ApplicableBuilding Ownership Certificate Not ApplicableReal Estate Ownership Certificate YesBusiness License Yes
VI-27

APPENDIX VI PROPERTY VALUATION
VALUATION SUMMARY 11—GUANGZHOU MINGYUE WAREHOUSING CO., LTD. PHASE II
NO. PROPERTY DESCRIPTION AND TENUREPARTICULARS OF
OCCUPANCY
MARKET VALUE INEXISTING STATE AS ATSEPTEMBER 30, 2019
11 No. 135 XinxingRoad (新興路),Taiping Town,Conghua District,Guangzhou,GuangdongProvince, PRC
The Property, known as GuangzhouMingyue Warehousing Co., Ltd.Phase II (廣州市銘粵倉儲有限公司二期), is a logistics project erectedon an irregular-shaped land lot witha site area of 99,546.49 sq m.
As advised by the Company, theProperty was completed in 2017. Itcomprises two single-storywarehouses with a total GFA ofapproximately 13,734.79 sq m. Thedetails are listed below:
As of the date ofinspection, the Propertywas in normal operation.
According to theinformation provided, atthe Date of Valuation,the Property was subjectto one tenancy whichyields a total monthlyrental income ofapproximatelyRMB821,523, excl.property management feeand value-added tax. Theexpiration date of thistenancy is December 4,2024. The overalloccupancy rate was100%.
RMB157,000,000(RENMINBI ONE
HUNDREDFIFTY SEVEN
MILLION)
68.5% interest tobe attributable to
the Group 1:
RMB107,500,000(RENMINBI ONEHUNDRED ANDSEVEN MILLIONFIVE HUNDRED
THOUSAND)
GFA(sq m)
PortionsWarehouse . . . . . . . . . . 13,734.79
Total . . . . . . . . . . . . . . 13,734.79
Pursuant to the Real EstateOwnership Certificate provided, thestate-owned land-use rights of theProperty have been granted for aterm of 50 years expiring onDecember 19, 2062 for industrialpurposes.
Notes:1) Pursuant to the Real Estate Ownership Certificate, the state-owned land-use rights of the Property located at No. 135 Xinxing Road,
Taiping Town, Conghua District, Guangzhou, and the corresponding building ownership are vested in 廣州市銘粵倉儲有限公司. Thedetails are listed below:
Certificate Number Site Area Land Use GFA Building Use Expiry Date
(sq m) (sq m)Yue (2018) Guang Zhou Shi Bu Dong Chan Quan Di
09216989 Hao . . . . . . . . . . . . . . . . . . . . . . . . . . . . . . . . 99,546.49 Industrial 13,734.79 Warehouse December 19, 2062Total . . . . . . . . . . . . . . . . . . . . . . . . . . . . . . . . . . . . . . . . . . 99,546.49 13,734.79
2) Pursuant to the Real Estate Registration Certificate dated March 11, 2019 provided, the Property was mortgaged to 滙豐銀行(中國)有限公司廣州分行.
3) Pursuant to the Company Business License No.914401010565708469, 廣州市銘粵倉儲有限公司 with the address of No. 53 ChuangyeRoad, High-Tech Industrial Park of Guangzhou Conghua Economic and Development Zone, Guangzhou, has been in business fromDecember 6, 2012 to December 5, 2062 with the business scope of倉儲業(具體經營項目請登錄廣州市商事主體信息公示平臺查詢。涉及國家規定實施准入特別管理措施的外商投資企業,經營範圍以審批機關核定的為準;依法需經批准的項目,經相關部門批准後方可開展經營活動).
4) The Owner holds 100% leasehold interests of the Property.5) In the course of our valuation, we have made reference to various leasing properties, which have comparable characteristics on the
market. Comparables that had been selected range from RMB1.20 to 1.96 psm per day, exclusive of Value-added Tax (VAT) andproperty management fee. In the course of our valuation, we have considered the relevant adjustment factors such as the accessibility,size, environment, building facilities, age/maintenance, etc. to determine the market rent of the Property. The adopted market rent of theProperty, excluding VAT and property management fee, as at the Valuation Date is approximately RMB1.96 psm per day.
6) In DCF analysis, we have taken into account the determining factors of location, income and tenant mix of the Property and the rate ofreturn requirement of property investors, and arrived at a discount rate of 8.50%. A terminal capitalization rate of 5.75% was appliedwhen deriving the present value of the cash flows after 10 years. In Income Capitalisation Method, the adopted capitalization rate in ourvaluation is 6.40%. The capitalization rate will apply to the rental income generated until the expiry of the land-use rights of theProperty.
VI-28

APPENDIX VI PROPERTY VALUATION
7) The general description and market information of the property are summarized as below:
Location : The Property is located No. 135 Xinxing Road, Taiping Town, Conghua District, Guangzhou,Guangdong Province, PRC.
Transportation : The Property is accessible by Chuangye Road. Two expressways, namely G45 (Daqing—Guangzhou) and G94 (Pearl River Delta Ring Expressway) are situated near the Property tothe east and south, respectively.
Nature of Surrounding Area : The subject area is clustered with industrial developments.
8) We have prepared our valuation based on the following assumptions:
Š the information of the Property provided by the Company is true and correct;
Š the site is free from contamination and the ground conditions are satisfactory;
Š the proper ownership title of the Property has been obtained, and all payable land premiums or land use rights fees have been fullysettled;
Š all required approvals and certificates necessary for the development and occupation and use of the Property have been dulyobtained and are in full force and effect; and
Š the Property can be freely transferred, mortgaged, sublet or otherwise disposed of in the market.
9) We have been provided with a copy of PRC legal opinion on the Property prepared by Global Law Office (環球律師事務所), whichcontains, inter alia, the following information:
Š 廣州市銘粵倉儲有限公司 has obtained the necessary permits and approvals for the construction work of the Property;
Š 廣州市銘粵倉儲有限公司 has the right to use the land in accordance to the above mentioned real estate ownership certificate. Underthe premise of complying with the mortgage contract agreement hereinafter, 廣州市銘粵倉儲有限公司 has the right to use, transfer,lease, mortgage or other legal means to deal with the premise on the condition of adhering to the land-use and the land tenure;
Š The signed lease contracts by廣州市銘粵倉儲有限公司 and the lessees are effective.
10) The status of the title and grant of major approvals and licenses in accordance with the information provided by the Company are asfollows:
State-owned Land-use Rights Grant Contract YesState-owned Land-use Rights Certificate Not ApplicableConstruction Land Planning Permit Not ApplicableConstruction Work Planning Permit Not ApplicableConstruction Work Commencement Permit Not ApplicableBuilding Ownership Certificate Not ApplicableReal Estate Ownership Certificate YesBusiness License Yes
VI-29

APPENDIX VI PROPERTY VALUATION
VALUATION SUMMARY 12—TIANJIN FANXIN WAREHOUSING SERVICE LTD.
NO. PROPERTY DESCRIPTION AND TENUREPARTICULARS OF
OCCUPANCY
MARKET VALUE INEXISTING STATE AS ATSEPTEMBER 30, 2019
12 No. 80 FuyuanRoad (復元道),Jingbin IndustrialPark,DawangguzhuangTown, WuqingDistrict, Tianjin,PRC
The Property, known as TianjinFanxin Warehousing Service Ltd. (天津凡信倉儲服務有限公司), is alogistics project erected on a roughlyrectangular-shaped land lot with a sitearea of 115,917.90 sq m.
As advised by the Company, theProperty was completed in 2015. Itcomprises four single-storywarehouses and three ancillarybuildings with a total gross floor area(GFA) of 75,426.85 sq m. The detailsare listed below:
As of the date ofinspection, the Propertywas in normal operation.
According to theinformation provided, atthe Date of Valuation,the Property was subjectto one tenancy whichyields a total monthlyrental income ofapproximately RMB2,058,808, excl.property managementfee and value-added tax.The expiry date of thistenancy is March 31,2021. The overalloccupancy rate wasabout 98.2%.
RMB458,000,000(RENMINBI
FOURHUNDRED
FIFTY EIGHTMILLION)
90% interest to beattributable to the
Group 1:
RMB412,200,000(RENMINBI
FOURHUNDREDTWELVE
MILLION ANDTWO HUNDRED
THOUSAND)
GFA(sq m)
PortionsWarehouse 1 . . . . . . . . . . 17,582.93Warehouse 2 . . . . . . . . . . 17,116.41Warehouse 3 . . . . . . . . . . 17,615.46Warehouse 4 . . . . . . . . . . 21,694.42Ancillary Building 1 . . . . 29.92Ancillary Building 2 . . . . 13.60Ancillary Building 3 . . . . 1,374.11
Total . . . . . . . . . . . . . . . . 75,426.85
Pursuant to the Real EstateOwnership Certificate provided, thestate-owned land-use rights of theProperty have been granted for a termof 50 years expiring on February 25,2064 for warehouse purposes.
Notes:1) Pursuant to the Real Estate Ownership Certificate, the state-owned land-use rights of the Property located at No. 80 Fuyuan Road,
Tianjin Jingbin Industrial Park, Dawangguzhuang Town, Wuqing District, and the corresponding building ownership are vested in 天津凡信倉儲服務有限公司. The details are listed below:
Certificate Number Site Area Land Use GFA Building Use Expiry Date
(sq m) (sq m)Fang Di Zheng Jin Zi Di 122011521389 Hao . . . . . . . . 115,917.90 Warehouse 75,426.85 Non-residential February 25, 2064Total . . . . . . . . . . . . . . . . . . . . . . . . . . . . . . . . . . . . . . . . 115,917.90 75,426.85
2) Pursuant to the Real Estate Registration Certificate dated May 24, 2019 provided, the Property was mortgaged to 華僑永亨銀行(中國)有限公司北京分行 and星展銀行(中國)有限公司上海分行.
3) Pursuant to the Company Business License No.91120222094404494P, 天津凡信倉儲服務有限公司 with the address of No. 80 FuyuanRoad, Tianjin Jingbin Industrial Park, Dawangguzhuang Town, Wuqing District, Tianjin, has been in business from June 17, 2014 toJune 16, 2044 with the business scope of 倉儲服務(易制毒、危險化學品除外)、企業管理服務、商務信息諮詢服務、物業服務;倉儲設施租賃和經營。(依法須經批准的項目,經相關部門批准後方可開展經營活動)
4) The Owner holds 100% leasehold interests of the Property.5) In the course of our valuation, we have made reference to various leasing properties, which have comparable characteristics on the
market. Comparables that had been selected range from RMB1.05 to 1.20 psm per day, exclusive of Value-added Tax (VAT) andproperty management fee. In the course of our valuation, we have considered the relevant adjustment factors such as the accessibility,size, environment, building facilities, age/maintenance, etc. to determine the market rent of the Property. The adopted market rent of theProperty, excluding VAT and property management fee, as at the Valuation Date is approximately RMB1.06 psm per day.
6) In DCF analysis, we have taken into account the determining factors of location, income and tenant mix of the Property and the rate ofreturn requirement of property investors, and arrived at a discount rate of 8.50%. A terminal capitalization rate of 5.75% was applied
VI-30

APPENDIX VI PROPERTY VALUATION
when deriving the present value of the cash flows after 10 years. In Income Capitalisation Method, the adopted capitalization rate in ourvaluation is 6.40%. The capitalization rate will apply to the rental income generated until the expiry of the land-use rights of theProperty.
7) The general description and market information of the property are summarized as below:
Location : The Property is located at No. 80, Fuyuan Road, Jingbin Industrial Park, DawangguzhuangTown, Wuqing District, Tianjin, PRC.
Transportation : The Property is accessible by Fuyuan Road, which is a two-lane dual-way road connecting toEast Ring Road (東環路). East Ring Road is a three-lane dual-way road and it is portion of thering road running around Langfang downtown
Nature of Surrounding Area : The subject area is clustered with a number of industrial factories and warehouse properties.
8) We have prepared our valuation based on the following assumptions:
Š the information of the Property provided by the Company is true and correct;
Š the site is free from contamination and the ground conditions are satisfactory;
Š the proper ownership title of the Property has been obtained, and all payable land premiums or land use rights fees have been fullysettled;
Š all required approvals and certificates necessary for the development and occupation and use of the Property have been dulyobtained and are in full force and effect; and
Š the Property can be freely transferred, mortgaged, sublet or otherwise disposed of in the market.
9) We have been provided with a copy of PRC legal opinion on the Property prepared by Global Law Office (環球律師事務所), whichcontains, inter alia, the following information:
Š 天津凡信倉儲服務有限公司 has obtained the necessary permits and approvals for the construction work of the Property;
Š 天津凡信倉儲服務有限公司 has the right to use the land in accordance to the above mentioned real estate ownership certificate.Under the premise of complying with the mortgage contract agreement hereinafter,天津凡信倉儲服務有限公司 has the right to use,transfer, lease, mortgage or other legal means to deal with the premise on the condition of adhering to the land-use and the landtenure;
Š The signed lease contracts by天津凡信倉儲服務有限公司 and the lessees are effective.
10) The status of the title and grant of major approvals and licenses in accordance with the information provided by the Company are asfollows:
State-owned Land-use Rights Grant Contract YesState-owned Land-use Rights Certificate Not ApplicableConstruction Land Planning Permit Not ApplicableConstruction Work Planning Permit Not ApplicableConstruction Work Commencement Permit Not ApplicableBuilding Ownership Certificate Not ApplicableReal Estate Ownership Certificate YesBusiness License Yes
VI-31

APPENDIX VI PROPERTY VALUATION
VALUATION SUMMARY 13—LEKUN WAREHOUSING (WUXI) CO., LTD.
NO. PROPERTY DESCRIPTION AND TENUREPARTICULARS OF
OCCUPANCY
MARKET VALUE INEXISTING STATE AS ATSEPTEMBER 30, 2019
13 No. 182 XishanAvenue (錫山大道), XinwuDistrict, Wuxi,Jiangsu Province,PRC
The Property, known as LekunWarehousing (Wuxi) Co., Ltd. (樂坤倉儲(無錫)有限公司), is a logisticsproject erected on an irregular-shapedland lot with a site area of76,527.30 sq m.
As advised by the Company, theProperty was completed in 2018. Itcomprises two two-storey warehousesand other ancillary buildings with atotal gross floor area (GFA) of89,116.33 sq m. The details are listedbelow:
As of the date ofinspection, the Propertywas in normal operation.
According to theinformation provided, atthe Date of Valuation,the Property was subjectto three tenancies whichyield a total monthlyrental income ofapproximately RMB2,508,596, excl.property managementfee and value-added tax.The latest expiry date ofthese tenancies isOctober 31, 2026. Theoverall occupancy ratewas 100%.
RMB483,000,000(RENMINBI
FOURHUNDRED
EIGHTY THREEMILLION)
100% interest tobe attributable to
the Group 1:
RMB483,000,000(RENMINBI
FOURHUNDRED
EIGHTY THREEMILLION)
GFA(sq m)
PortionsWarehouse 1 . . . . . . . . . 49,207.40Warehouse 2 . . . . . . . . . 38,695.46Complex Building . . . . . 1,150.76Ancillary Building . . . . . 62.71
Total . . . . . . . . . . . . . . . . 89,116.33
Pursuant to the Real EstateOwnership Certificate provided, thestate-owned land-use rights of theProperty have been granted for a termof 50 years expiring on February 28,2066 for warehouse purposes.
Notes:1) Pursuant to the Real Estate Ownership Certificate provided, the state-owned land-use rights of the Property located at No. 182 Xishan
Avenue, Xinwu District, Wuxi have been granted to樂坤倉儲(無錫)有限公司. The details are listed below:
Certificate Number Site Area Land UseGFA(sq m)
BuildingUse Expiry Date
(sq m)Su (2019) Wu Xi Shi Bu Dong Chan Quan Di 0174640
Hao . . . . . . . . . . . . . . . . . . . . . . . . . . . . . . . . . . . . . . . . . . . 76,527.30 Warehouse 89,116.33 Warehouse February 28, 2066Total . . . . . . . . . . . . . . . . . . . . . . . . . . . . . . . . . . . . . . . . . . . . 76,527.30 89,116.33
2) Pursuant to the Real Estate Registration Certificate dated 28 June 2018 provided, the Property was mortgaged to 東亞銀行(中國)有限公司上海分行、東亞銀行(中國)有限公司無錫分行.
3) Pursuant to the Company Business License 91320214320515601P, 樂坤倉儲(無錫)有限公司 with the address of No. 182 XishanAvenue, Wuxi, has been in business from November 5, 2014 to November 4, 2044 with the business scope of倉儲(不含物流)及倉儲諮詢服務;自有房屋出租;物業管理;家用電器及電子產品的批發、佣金代理(拍賣除外)和進出口業務(以上商品進出口不涉及國營貿易管理商品,涉及配額、許可證管理商品,按國家有關規定辦理申請)
4) The Owner holds 100% leasehold interests of the Property.5) In the course of our valuation, we have made reference to various leasing properties, which have comparable characteristics on the
market. Comparables that had been selected range from RMB0.95 to 1.10 psm per day, exclusive of Value-added Tax (VAT) andproperty management fee. In the course of our valuation, we have considered the relevant adjustment factors such as the accessibility,size, environment, building facilities, age/maintenance, etc. to determine the market rent of the Property. The adopted market rent of theProperty, excluding VAT and property management fee, as at the Valuation Date is approximately RMB1.00 psm per day.
6) In DCF analysis, we have taken into account the determining factors of location, income and tenant mix of the Property and the rate ofreturn requirement of property investors, and arrived at a discount rate of 9.00%. A terminal capitalisation rate of 6.25% was appliedwhen deriving the present value of the cash flows after 10 years. In Income Capitalisation Method, the adopted capitalisation rate in ourvaluation is 6.85%. The capitalisation rate will apply to the rental income generated until the expiry of the land-use rights of the Property.
VI-32

APPENDIX VI PROPERTY VALUATION
7) The general description and market information of the property are summarised as below:
Location : The Property is located at No. 182 Xishan Avenue, Xinwu District, Wuxi, Jiangsu Province,PRC.
Transportation : The Property is accessible by Xishan Avenue, which is a three-lane dual-way road connectingto Gaolang Elevated Road (高浪路高架). Gaolang Elevated Road is a three-lane dual-way roadand connected to Beijing-Shanghai Expressway (京滬高速), which can provide convenientaccess to Suzhou, Changzhou and other neighbouring cities.
Nature of Surrounding Area : The subject area is clustered with a number of industrial factories and warehouse properties.
8) We have prepared our valuation based on the following assumptions:
Š the information of the Property provided by the Company is true and correct;
Š the site is free from contamination and the ground conditions are satisfactory;
Š the proper ownership title of the Property has been obtained, and all payable land premiums or land use rights fees have been fullysettled;
Š all required approvals and certificates necessary for the development and occupation and use of the Property have been dulyobtained and are in full force and effect; and
Š the Property can be freely transferred, mortgaged, sublet or otherwise disposed of in the market.
9) We have been provided with a copy of PRC legal opinion on the Property prepared by Global Law Office (環球律師事務所), whichcontains, inter alia, the following information:
Š 樂坤倉儲(無錫)有限公司 has obtained the necessary permits and approvals for the construction work of the Property;
Š 樂坤倉儲(無錫)有限公司 has the right to use the land in accordance to the above mentioned real estate ownership certificate.Under the premise of complying with the mortgage contract agreement hereinafter,樂坤倉儲(無錫)有限公司 has the right to use,transfer, lease, mortgage or other legal means to deal with the premise on the condition of adhering to the land-use and the landtenure;
Š The signed lease contracts by樂坤倉儲(無錫)有限公司 and the lessees are effective.
10) The status of the title and grant of major approvals and licences in accordance with the information provided by the Company are asfollows:
State-owned Land-use Rights Grant Contract NoState-owned Land-use Rights Certificate Not ApplicableConstruction Land Planning Permit Not ApplicableConstruction Work Planning Permit Not ApplicableConstruction Work Commencement Permit Not ApplicableBuilding Ownership Certificate Not ApplicableReal Estate Ownership Certificate YesBusiness License Yes
VI-33

APPENDIX VI PROPERTY VALUATION
VALUATION SUMMARY 14—CHANGSHA YIZHU WAREHOUSING SERVICES CO., LTD. PHASE I
NO. PROPERTY DESCRIPTION AND TENUREPARTICULARS OF
OCCUPANCY
MARKET VALUE INEXISTING STATE AS ATSEPTEMBER 30, 2019
14 No. 1Huangjiachong Lane(黃甲沖巷), LangliSub-district (榔梨街道), Changsha Town(長沙縣), Changsha,Hunan Province,PRC
The Property, known as ChangshaYizhu Warehouse Services Co.,Ltd. Phase I (長沙易竹倉儲服務有限公司一期).
The Property is a high-standardlogistics project erected on aroughly rectangular-shaped land lotwith a site area of 42,088.98 sq m,situated at the south ofWangjiachong Road. As advised bythe Company, the Property wascompleted in Q2 2019. It comprisesa single-storey warehouse and asingle-storey cold storage with atotal gross floor area (GFA) ofapproximately 22,426.24 sq m.
As of the date ofinspection, theProperty was in normaloperation. Accordingto the informationprovided, at the Date ofValuation, the Propertywas subject to onetenancy which yields atotal monthly rentalincome ofapproximatelyRMB414,655, excl.property managementfee and value-addedtax. The expirationdate of this tenancy isMay 31, 2029. Theoverall occupancy ratewas about 62.0%.
RMB123,000,000(RENMINBI ONE
HUNDRED TWENTYTHREE MILLION)
100% interest to beattributable to the
Group 1:
RMB123,000,000(RENMINBI ONE
HUNDRED TWENTYTHREE MILLION)
Pursuant to the Real EstateOwnership Certificate provided,the state-owned land-use rights ofthe Property have been granted fora term of 50 years expiring onNovember 30, 2067 for warehousepurposes.
Notes:1) Pursuant to the Real Estate Ownership Certificates, the state-owned land-use rights of the Property located at No. 1 Huangjiachong Lane,
Langli Sub-district, Changsha Town, Changsha, are vested in長沙易竹倉儲服務有限公司. The details are listed below:
Certificate Number Site Area Land Use GFA (sqm) Building Use Expiry Date
(sq m)Xiang (2019) Chang Sha Xian Bu Dong Chan Quan
Di 0041981 . . . . . . . . . . . . . . . . . . . . . . . . . . . . . . . . 42,088.98 Warehouse 14,764.72 Warehouse November 30, 2067Xiang (2019) Chang Sha Xian Bu Dong Chan Quan
Di 0041982 . . . . . . . . . . . . . . . . . . . . . . . . . . . . . . . . 7,639.30 WarehouseXiang (2019) Chang Sha Xian Bu Dong Chan Quan
Di 0041983 . . . . . . . . . . . . . . . . . . . . . . . . . . . . . . . . 22.22 GuardhouseTotal . . . . . . . . . . . . . . . . . . . . . . . . . . . . . . . . . . . . . . . 42,088.98 22,426.24
2) We have not been provided with any relevant information about mortgage and encumbrances of the Property. We are therefore unable tocomment on any related matters and advise that a legal opinion should be sought regarding the legality, transferability of title and theexistence of any current or potential encumbrances attached to the Property.
3) Pursuant to the Company Business License No.91430100MA4M0FDLXN, 長沙易竹倉儲服務有限公司 with the address of Room 301Building 3, Xingwei Chuangxin Park, No. 57 South Section of Huangxing Avenue, Changsha Economic Development Zone, Changsha,has been in business from August 9, 2017 to August 8, 2067 with the business scope of從事倉儲服務(除危險品、不含運輸)、工業及倉儲設施的建設及經營、物業管理、技術諮詢、商務信息諮詢、物流園經營服務。(依法須經批准的項目,經相關部門批准後方可開展經營活動)
4) The Owner holds 100% leasehold interests of the Property.5) In the course of our valuation, we have made reference to various leasing properties, which have comparable characteristics on the
market. Comparables that had been selected range from RMB0.95 to 1.00 psm per day, exclusive of Value-added Tax (VAT) andproperty management fee. In the course of our valuation, we have considered the relevant adjustment factors such as the accessibility,size, environment, building facilities, age/maintenance, etc. to determine the market rent of the Property. The adopted market rent of theProperty, excluding VAT and property management fee, as at the Valuation Date is approximately RMB1.10 psm per day for coldstorage and approximately RMB0.98 psm per day for warehouse.
6) In DCF analysis, we have taken into account the determining factors of location, income and tenant mix of the Property and the rate ofreturn requirement of property investors, and arrived at a discount rate of 9.00%. A terminal capitalisation rate of 6.25% was appliedwhen deriving the present value of the cash flows after 10 years. In Income Capitalisation Method, the adopted capitalisation rate in ourvaluation is 6.85%. The capitalisation rate will apply to the rental income generated until the expiry of the land-use rights of the Property.
VI-34
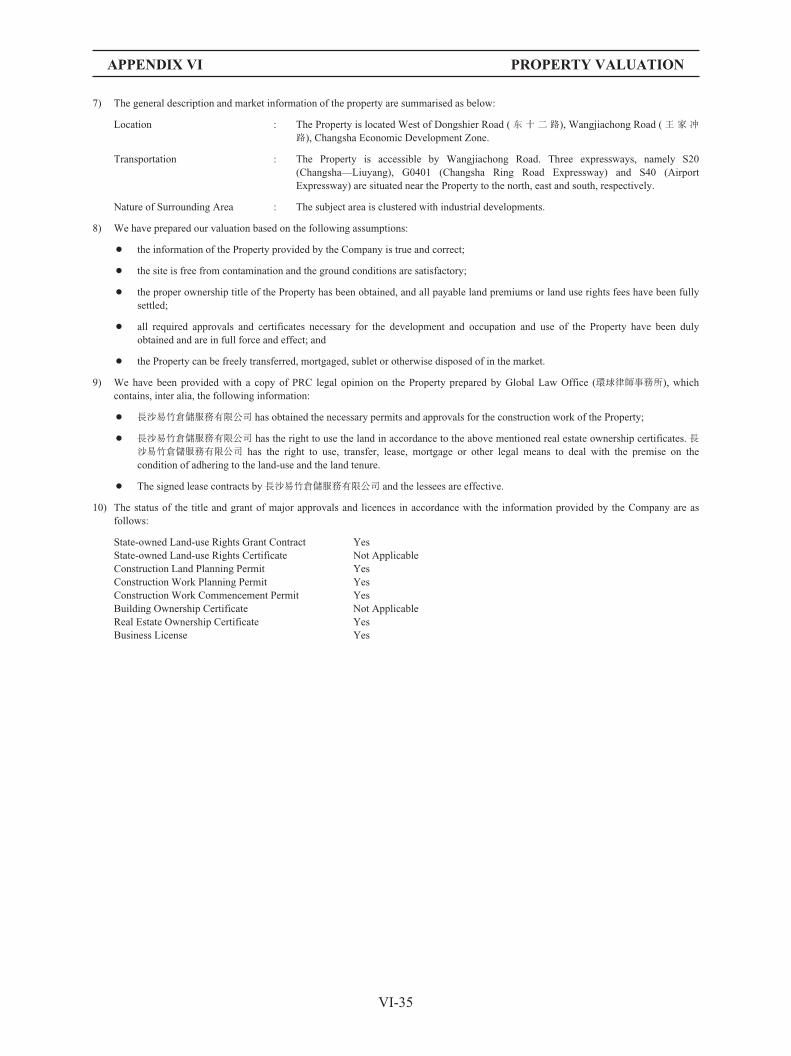
APPENDIX VI PROPERTY VALUATION
7) The general description and market information of the property are summarised as below:
Location : The Property is located West of Dongshier Road (东十二路), Wangjiachong Road (王家冲路), Changsha Economic Development Zone.
Transportation : The Property is accessible by Wangjiachong Road. Three expressways, namely S20(Changsha—Liuyang), G0401 (Changsha Ring Road Expressway) and S40 (AirportExpressway) are situated near the Property to the north, east and south, respectively.
Nature of Surrounding Area : The subject area is clustered with industrial developments.
8) We have prepared our valuation based on the following assumptions:
Š the information of the Property provided by the Company is true and correct;
Š the site is free from contamination and the ground conditions are satisfactory;
Š the proper ownership title of the Property has been obtained, and all payable land premiums or land use rights fees have been fullysettled;
Š all required approvals and certificates necessary for the development and occupation and use of the Property have been dulyobtained and are in full force and effect; and
Š the Property can be freely transferred, mortgaged, sublet or otherwise disposed of in the market.
9) We have been provided with a copy of PRC legal opinion on the Property prepared by Global Law Office (環球律師事務所), whichcontains, inter alia, the following information:
Š 長沙易竹倉儲服務有限公司 has obtained the necessary permits and approvals for the construction work of the Property;
Š 長沙易竹倉儲服務有限公司 has the right to use the land in accordance to the above mentioned real estate ownership certificates.長沙易竹倉儲服務有限公司 has the right to use, transfer, lease, mortgage or other legal means to deal with the premise on thecondition of adhering to the land-use and the land tenure.
Š The signed lease contracts by長沙易竹倉儲服務有限公司 and the lessees are effective.
10) The status of the title and grant of major approvals and licences in accordance with the information provided by the Company are asfollows:
State-owned Land-use Rights Grant Contract YesState-owned Land-use Rights Certificate Not ApplicableConstruction Land Planning Permit YesConstruction Work Planning Permit YesConstruction Work Commencement Permit YesBuilding Ownership Certificate Not ApplicableReal Estate Ownership Certificate YesBusiness License Yes
VI-35

APPENDIX VI PROPERTY VALUATION
VALUATION SUMMARY 15—JILIN YILING WAREHOUSE SERVICES CO., LTD.
NO. PROPERTY DESCRIPTION AND TENUREPARTICULARS OF
OCCUPANCY
MARKET VALUE INEXISTING STATE AS ATSEPTEMBER 30, 2019
15 South of FuminStreet (富民大街),Daling VehicleLogistics Park,Gongzhuling, JilinProvince, PRC
The Property, known as Jilin YilingWarehouse Services Co., Ltd. (吉林易嶺倉儲服務有限公司), is alogistics project erected on aroughly rectangular-shaped land lotwith a site area of 147,750.00 sq m.It is located in south of FuminStreet, Daling Vehicle LogisticsPark, Gongzhuling, Jilin.
At the date ofinspection, theProperty wascompleted and vacant.
RMB405,000,000(RENMINBI FOUR
HUNDRED ANDFIVE MILLION)
100% interest to beattributable to the
Group 1:
RMB405,000,000(RENMINBI FOUR
HUNDRED ANDFIVE MILLION)
The Property comprises six single-storey warehouses with a totalgross floor area (GFA) of94,402.71 sq m and it was recentlycompleted in August 2019. Thedetails are listed below:
GFA(sq m)
PortionWarehouse 1 . . . . . . . . 15,447.98Warehouse 2 . . . . . . . . 15,612.96Warehouse 3 . . . . . . . . 14,746.64Warehouse 4 . . . . . . . . 15,612.96Warehouse 5 . . . . . . . . 15,612.96Warehouse 6 . . . . . . . . 15,612.96Ancillary Room . . . . . 1,756.25
Total . . . . . . . . . . . . . . 94,402.71
Pursuant to the Real EstateOwnership Certificates provided,the land-use rights of the Propertyhave been granted for a term for50 years expiring on 5 June 2068for warehouse uses.
Notes:1) Pursuant to the Real Estate Ownership Certificate, the state-owned land-use rights of the Property located at south of Fumin Street,
Daling Vehicle Logistics Park, are vested in吉林易嶺倉儲服務有限公司. The details are listed below:
Certificate Number Site Area Land Use Expiry Date
(sq m)Ji (2018) Gong Zhu Ling Shi Bu Dong Chan Quan Di 0009534 Hao . . . . . . . . . . . . . . . . . . . 147,750.00 Warehouse 5 June 2068Total . . . . . . . . . . . . . . . . . . . . . . . . . . . . . . . . . . . . . . . . . . . . . . . . . . . . . . . . . . . . . . . . . . . . . 147,750.00
2) Pursuant to the Construction Land Planning Permit, the planning of the construction land of the Property has been approved to吉林易嶺倉儲服務有限公司. The details are listed below:
Certificate Number Project Name Detailed Location Site Area
(sq m)Di Zi Di DL2018-YD-006 Hao . . . . . . . . . . . . . . Jilin Yiling Warehouse Services
Co., Ltd. ESR Redwood DalingVehicle Logistics Park Phase I
South of Fumin Street, DalingVehicle Logistics Park
147,750.00
Total . . . . . . . . . . . . . . . . . . . . . . . . . . . . . . . . . . . 147,750.00
VI-36
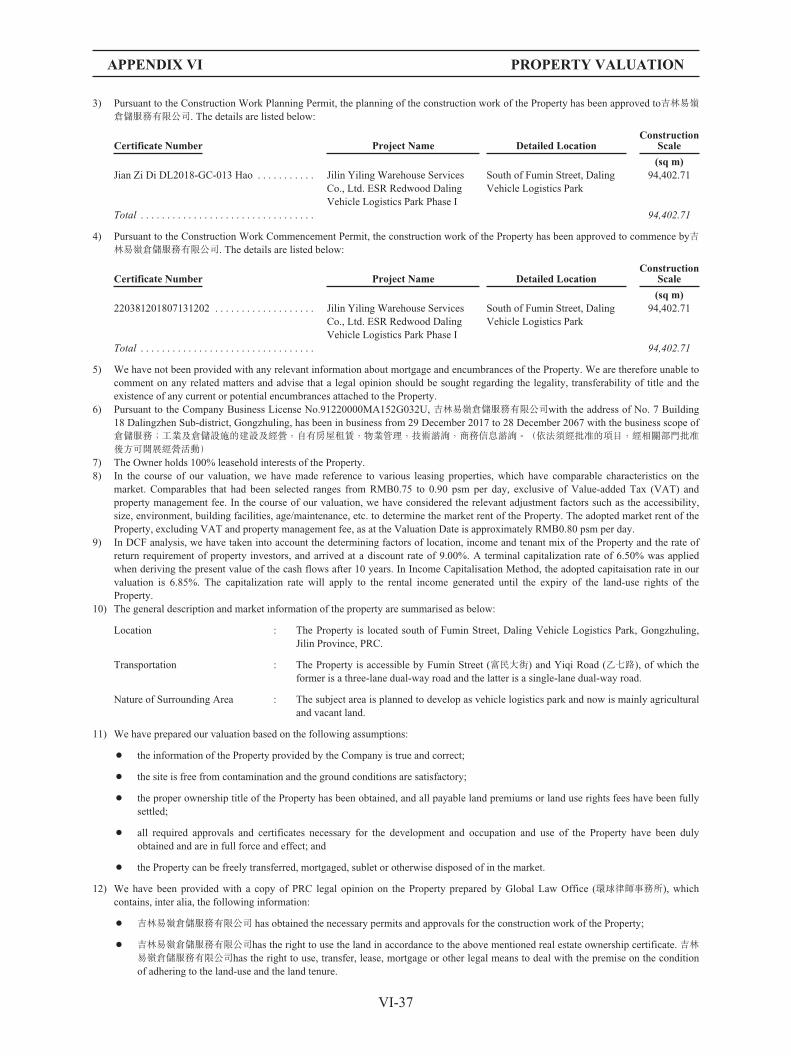
APPENDIX VI PROPERTY VALUATION
3) Pursuant to the Construction Work Planning Permit, the planning of the construction work of the Property has been approved to吉林易嶺倉儲服務有限公司. The details are listed below:
Certificate Number Project Name Detailed LocationConstruction
Scale
(sq m)Jian Zi Di DL2018-GC-013 Hao . . . . . . . . . . . Jilin Yiling Warehouse Services
Co., Ltd. ESR Redwood DalingVehicle Logistics Park Phase I
South of Fumin Street, DalingVehicle Logistics Park
94,402.71
Total . . . . . . . . . . . . . . . . . . . . . . . . . . . . . . . . . 94,402.71
4) Pursuant to the Construction Work Commencement Permit, the construction work of the Property has been approved to commence by吉林易嶺倉儲服務有限公司. The details are listed below:
Certificate Number Project Name Detailed LocationConstruction
Scale
(sq m)220381201807131202 . . . . . . . . . . . . . . . . . . . Jilin Yiling Warehouse Services
Co., Ltd. ESR Redwood DalingVehicle Logistics Park Phase I
South of Fumin Street, DalingVehicle Logistics Park
94,402.71
Total . . . . . . . . . . . . . . . . . . . . . . . . . . . . . . . . . 94,402.71
5) We have not been provided with any relevant information about mortgage and encumbrances of the Property. We are therefore unable tocomment on any related matters and advise that a legal opinion should be sought regarding the legality, transferability of title and theexistence of any current or potential encumbrances attached to the Property.
6) Pursuant to the Company Business License No.91220000MA152G032U, 吉林易嶺倉儲服務有限公司with the address of No. 7 Building18 Dalingzhen Sub-district, Gongzhuling, has been in business from 29 December 2017 to 28 December 2067 with the business scope of倉儲服務;工業及倉儲設施的建設及經營,自有房屋租賃,物業管理,技術諮詢,商務信息諮詢。(依法須經批准的項目,經相關部門批准後方可開展經營活動)
7) The Owner holds 100% leasehold interests of the Property.8) In the course of our valuation, we have made reference to various leasing properties, which have comparable characteristics on the
market. Comparables that had been selected ranges from RMB0.75 to 0.90 psm per day, exclusive of Value-added Tax (VAT) andproperty management fee. In the course of our valuation, we have considered the relevant adjustment factors such as the accessibility,size, environment, building facilities, age/maintenance, etc. to determine the market rent of the Property. The adopted market rent of theProperty, excluding VAT and property management fee, as at the Valuation Date is approximately RMB0.80 psm per day.
9) In DCF analysis, we have taken into account the determining factors of location, income and tenant mix of the Property and the rate ofreturn requirement of property investors, and arrived at a discount rate of 9.00%. A terminal capitalization rate of 6.50% was appliedwhen deriving the present value of the cash flows after 10 years. In Income Capitalisation Method, the adopted capitaisation rate in ourvaluation is 6.85%. The capitalization rate will apply to the rental income generated until the expiry of the land-use rights of theProperty.
10) The general description and market information of the property are summarised as below:
Location : The Property is located south of Fumin Street, Daling Vehicle Logistics Park, Gongzhuling,Jilin Province, PRC.
Transportation : The Property is accessible by Fumin Street (富民大街) and Yiqi Road (乙七路), of which theformer is a three-lane dual-way road and the latter is a single-lane dual-way road.
Nature of Surrounding Area : The subject area is planned to develop as vehicle logistics park and now is mainly agriculturaland vacant land.
11) We have prepared our valuation based on the following assumptions:
Š the information of the Property provided by the Company is true and correct;
Š the site is free from contamination and the ground conditions are satisfactory;
Š the proper ownership title of the Property has been obtained, and all payable land premiums or land use rights fees have been fullysettled;
Š all required approvals and certificates necessary for the development and occupation and use of the Property have been dulyobtained and are in full force and effect; and
Š the Property can be freely transferred, mortgaged, sublet or otherwise disposed of in the market.
12) We have been provided with a copy of PRC legal opinion on the Property prepared by Global Law Office (環球律師事務所), whichcontains, inter alia, the following information:
Š 吉林易嶺倉儲服務有限公司 has obtained the necessary permits and approvals for the construction work of the Property;
Š 吉林易嶺倉儲服務有限公司has the right to use the land in accordance to the above mentioned real estate ownership certificate.吉林易嶺倉儲服務有限公司has the right to use, transfer, lease, mortgage or other legal means to deal with the premise on the conditionof adhering to the land-use and the land tenure.
VI-37

APPENDIX VI PROPERTY VALUATION
13) The status of the title and grant of major approvals and licences in accordance with the information provided by the Company are asfollows:
State-owned Land-use Rights Grant Contract YesState-owned Land-use Rights Certificate Not ApplicableConstruction Land Planning Permit YesConstruction Work Planning Permit YesConstruction Work Commencement Permit YesBuilding Ownership Certificate Not ApplicableReal Estate Ownership Certificate Yes (for land only)Business License Yes
VI-38

APPENDIX VI PROPERTY VALUATION
VALUATION SUMMARY 16—SHANGHAI YI BIAN LOGISTICS TECHNOLOGY CO., LTD.
NO. PROPERTY DESCRIPTION AND TENUREPARTICULARS OF
OCCUPANCY
MARKET VALUE INEXISTING STATE AS ATSEPTEMBER 30, 2019
16 No. 268 Delin Road(德林路), PudongNew District,Shanghai, PRC
The Property, known asShanghai Yi Bian LogisticsTechnology Co., Ltd. (上海易弁物流科技有限公司), is a high-standard logistics project erectedon a roughly rectangular-shapedland lot with a total site area of20,066.00 sq m.
According to the Real EstateOwnership Certificate, theProperty was completed in 2005.It comprises one two-storeywarehouse and ancillarybuildings with a total gross floorarea (GFA) of 14,265.44 sq m.
Pursuant to the Real EstateOwnership Certificate provided,the land-use rights of theProperty have been granted for aterm of 50 years expiring on14 August 2053 for industrialand warehouse purposes.
At the date ofinspection, at the Dateof Valuation, theProperty was subject toone tenancy whichyields a total monthlyrental income ofapproximatelyRMB471,273, excl.property managementfee and value-addedtax. The latest expirydate of this tenancy is19 August 2022. Theoverall occupancy ratewas about 81.1%.
RMB110,000,000(RENMINBI ONEHUNDRED TEN
MILLION)
100% interest to beattributable to the
Group 1:
RMB110,000,000(RENMINBI ONEHUNDRED TEN
MILLION)
Notes:1) Pursuant to the Real Estate Ownership Certificate, the land-use rights of the Property located at No.268 Dellin Road, Pudong New
District, Shanghai, and the corresponding building ownership are vested in上海易弁物流科技有限公司. The details are listed below:
Certificate Number Site Area Land Use GFA Expiry Date
(sq m) (sq m)Hu (2019) Pu Zi Bu Dong Chan Quan Di 087248 Hao . . . . . . . . . . . . . . . . 20,066.00 Industrial and
Warehouse14,265.44 14 August 2053
Total . . . . . . . . . . . . . . . . . . . . . . . . . . . . . . . . . . . . . . . . . . . . . . . . . . . . . . . 20,066.00 14,265.44
2) We have not been provided with any relevant information about mortgage and encumbrances of the Property. We are therefore unable tocomment on any related matters and advise that a legal opinion should be sought regarding the legality, transferability of title and theexistence of any current or potential encumbrances attached to the Property.
3) Pursuant to the Company Business License No. 913100007737100208, 上海易弁物流科技有限公司 with the address of No.268 DelinRoad, China (Shanghai) Pilot Free Trade Zone, Shanghai, has been in business from 18 June 2001 to 17 June 2051 with the businessscope of 營範圍為:從事物流科技領域內的技術開發、技術轉讓、技術服務、技術咨詢,區內倉儲(除危險品)、物流業務,國際貿易、轉口貿易,區內企業間的貿易及貿易代理,通過國內有進出口經營權的企業代理與非區內企業從事貿易業務,區內商業性簡單加工及商品展示,中國(上海)自由貿易試驗區德林路 268號自有房產租賃業務,物業管理服務。(依法須經批准的項目,經相關部門批准後方可開展經營活動)
4) The Owner holds 100% leasehold interests of the Property.5) In the course of our valuation, we have made reference to various leasing properties, which have comparable characteristics on the
market. Comparables that had been selected ranges from RMB1.45 to 1.65 psm per day, exclusive of Value-added Tax (VAT) andproperty management fee. In the course of our valuation, we have considered the relevant adjustment factors such as the accessibility,size, environment, building facilities, age/maintenance, etc. to determine the market rent of the Property. The adopted market rent of theProperty, excluding VAT and property management fee, as at the Valuation Date is approximately RMB1.40 psm per day.
6) In DCF analysis, we have taken into account the determining factors of location, income and tenant mix of the Property and the rate ofreturn requirement of property investors, and arrived at a discount rate of 8.50%. A terminal capitalisation rate of 5.50% was appliedwhen deriving the present value of the cash flows after 10 years. In Income Capitalisation Method, the adopted capitalisation rate in ourvaluation is 6.15%. The capitalisation rate will apply to the rental income generated until the expiry of the land-use rights of the Property
VI-39

APPENDIX VI PROPERTY VALUATION
7) The general description and market information of the property are summarised as below:
Location : The Property is located at No.268 Delin Road, Pudong New District, Shanghai, PRC.
Transportation : The Property is accessible by Delin Roand, which is a two-lane dual-way road. Outer RingExpressway (外環高速) and Shanghai Beltway (上海繞城高速) are situated near the Property tothe east and south, respectively.
Nature of Surrounding Area : The subject area is situated within China (Shanghai) Pilot Free Trade Zone in easternShanghai. It enjoys a convenient transportation network. The subject area is clustered with anumber of warehouse properties and industrial factories.
8) We have prepared our valuation based on the following assumptions:
Š the information of the Property provided by the Company is true and correct;
Š the site is free from contamination and the ground conditions are satisfactory;
Š the proper ownership title of the Property has been obtained, and all payable land premiums or land use rights fees have been fullysettled;
Š all required approvals and certificates necessary for the development and occupation and use of the Property have been dulyobtained and are in full force and effect; and
Š the Property can be freely transferred, mortgaged, sublet or otherwise disposed of in the market.
9) We have been provided with a copy of PRC legal opinion on the Property prepared by Global Law Office (環球律師事務所), whichcontains, inter alia, the following information:
Š 上海易弁物流科技有限公司 has obtained the necessary permits and approvals for the construction work of the Property;
Š 上海易弁物流科技有限公司 has the right to use the land in accordance to the above mentioned real estate ownership certificate.上海易弁物流科技有限公司 has the right to use, transfer, lease, mortgage or other legal means to deal with the premise on the conditionof adhering to the land-use and the land tenure;
Š The signed lease contracts by上海易弁物流科技有限公司 and the lessees are effective.
10) The status of the title and grant of major approvals and licences in accordance with the information provided by the Company are asfollows:
State-owned Land-use Rights Grant Contract NoState-owned Land-use Rights Certificate Not ApplicableConstruction Land Planning Permit Not ApplicableConstruction Work Planning Permit Not ApplicableConstruction Work Commencement Permit Not ApplicableBuilding Ownership Certificate Not ApplicableReal Estate Ownership Certificate YesBusiness License Yes
VI-40

APPENDIX VI PROPERTY VALUATION
VALUATION SUMMARY 17—CHONGQING YONGXIANG WAREHOUSE CO., LTD PHASE I
NO. PROPERTY DESCRIPTION AND TENUREPARTICULARS OF
OCCUPANCY
MARKET VALUE INEXISTING STATE AS ATSEPTEMBER 30, 2019
17 Zone M, ChayuanGroup (茶園組團),Nan’an District,Chongqing, PRC
The Property, ChongqingYongxiang Warehouse Co., LtdPhase I (重慶永翔市場經營管理有限公司一期).
The Property is a high-standardlogistics project erected on aroughly rectangular-shaped land lotwith a site area of 80,784.00 sq m,situated at the along the easternside of Fuyuan Avenue, Nan’anDistrict, Chongqing. As advised bythe Company, the Property wascompleted in Q3 2019. It comprisestwo single-storey warehouses andother ancillary buildings with atotal gross floor area (GFA) ofapproximately 43,471.75 sq m.
Pursuant to the Real EstateOwnership Certificates provided,the land-use rights of the Propertyhave been granted for a term for50 years expiring on 11 July 2067for warehouse uses.
As of the date ofinspection, theProperty wascompleted and vacant.
RMB198,000,000(RENMINBI ONE
HUNDRED NINETYEIGHT MILLION)
100% interest1 to beattributable to the
Group 1:
RMB198,000,000(RENMINBI ONE
HUNDRED NINETYEIGHT MILLION)
Note:1. The subsidiary company of ESR Cayman Limited holds 50% of Chongqing Yongxiang’s registered capital, and will acquire the
remaining 50% shares at a pre-agreed price in accordance with the agreement between the shareholders.
Notes:1) Pursuant to the Real Estate Ownership Certificates, the land-use rights of the Property located in Zone M, Chayuan Group, Nan’an
District, Chongqing, are vested in重慶永翔市場經營管理有限公司. The details are listed below:
Certificate Number Site Area Land Use Expiry Date
(sq m)Yu (2017) Nan’an Qu Bu Dong Chan Quan Di 000895044 Hao . . . . . . . . . . . . . . . . . . . . . . . . 80,784.00 Warehouse 11 July 2067Total . . . . . . . . . . . . . . . . . . . . . . . . . . . . . . . . . . . . . . . . . . . . . . . . . . . . . . . . . . . . . . . . . . . . . . 80,784.00
2) Pursuant to the Construction Land Planning Permits, the planning of the construction land of the Property has been approved to重慶永翔市場經營管理有限公司. The details are listed below:
Certificate Number Location Site Area
(sq m)Di Zi Di 500108201700047 Hao . . . . . . . . . . . . . . . . . . . . . . . . . . . . . . . . . . . Plot M15-1/02, Chayuan Group, Nan’an
District80,784.00
Total . . . . . . . . . . . . . . . . . . . . . . . . . . . . . . . . . . . . . . . . . . . . . . . . . . . . . . . . . 80,784.00
3) Pursuant to the Construction Work Planning Permits, the planning of the construction work of the Property has been approved to重慶永翔市場經營管理有限公司. The details are listed below:
Certificate Number Project Name Detailed LocationConstruction
Scale
(sq m)Jian Zi Di 500108201800053 . . . . . . . . . . . . Chongqing Yongxiang Modern
Logistics Park Phase IPlot M15-1/02, Chayuan Group,Nan’an District
43,471.75
Total . . . . . . . . . . . . . . . . . . . . . . . . . . . . . . . . 43,471.75
VI-41

APPENDIX VI PROPERTY VALUATION
4) Pursuant to the Construction Work Commencement Permits, the construction work of the Property has been approved to commence by重慶永翔市場經營管理有限公司. The details are listed below:
Certificate Number Project Name Detailed LocationConstruction
Scale
(sq m)500114201808130101 . . . . . . . . . . . . . . . . . . Chongqing Yongxiang Modern
Logistics Park Phase IPlot M15-1/02, Chayuan Group,Nan’an District
43,471.75
Total . . . . . . . . . . . . . . . . . . . . . . . . . . . . . . . . 43,471.75
5) Pursuant to the Real Estate Registration Certificate dated 29 March 2019 provided, the Property was mortgaged to重慶農村商業銀行股份有限公司渝中支行.
6) Pursuant to the Company Business License No.915001085634987976, 重慶永翔市場經營管理有限公司with the address of No. 601 KejiWuye Centre Rongying Building, No. 8 Yuma Road, Nan’an District, Chongqing, has been in business from 15 November 2010 to2 November 2060 with the business scope of 市場設施租賃;市場管理服務;倉儲服務(除危險品、不含運輸);倉儲設施的租賃;物業管理(取得相關行政許可後,在許可範圍內從事經營);商務信息諮詢。(法律、法規禁止經營的,不得經營;法律、法規、國務院規定需審批的未獲審批前,不得經營)
7) The Owner holds 100% leasehold interests of the Property.8) In the course of our valuation, we have made reference to various leasing properties, which have comparable characteristics on the
market. Comparables that had been selected ranges from RMB0.90 to 1.05 psm per day, exclusive of Value-added Tax (VAT) andproperty management fee. In the course of our valuation, we have considered the relevant adjustment factors such as the accessibility,size, environment, building facilities, age/maintenance, etc. to determine the market rent of the Property. The adopted market rent of theProperty, excluding VAT and property management fee, as at the Valuation Date is approximately RMB0.84 psm per day.
9) In DCF analysis, we have taken into account the determining factors of location, income and tenant mix of the Property and the rate ofreturn requirement of property investors, and arrived at a discount rate of 8.75%. A terminal capitalisation rate of 6.0% was applied whenderiving the present value of the cash flows after 10 years. In Income Capitalisation Method, the adopted capitalisation rate in ourvaluation is 6.60%. The capitalisation rate will apply to the rental income generated until the expiry of the land-use rights of the Property.
10) The general description and market information of the property are summarised as below:
Location : The Property is located at Fuyuan Avenue, Nan’an District, Chongqing, PRC.
Transportation : The Property is accessible by Fuyuan Avenue (富源大道). Gangkou Avenue, X754 CountyRoad, Chongqing Belt Expressway and G50 (Hu (Shanghai)—Yu (Chongqing) Expressway),providing a convenient traffic network and easy access to the city centre, other districts ofChongqing and surrounding cities.
Nature of Surrounding Area : The subject area is a newly developing area surrounded by various vacant land, numbers ofdeveloping sites with construction in progress.
11) We have prepared our valuation based on the following assumptions:
Š the information of the Property provided by the Company is true and correct;
Š the site is free from contamination and the ground conditions are satisfactory;
Š the proper ownership title of the Property has been obtained, and all payable land premiums or land use rights fees have been fullysettled;
Š all required approvals and certificates necessary for the development and occupation and use of the Property have been dulyobtained and are in full force and effect; and
Š the Property can be freely transferred, mortgaged, sublet or otherwise disposed of in the market.
12) We have been provided with a copy of PRC legal opinion on the Property prepared by Global Law Office (環球律師事務所), whichcontains, inter alia, the following information:
Š 重慶永翔市場經營管理有限公司 has obtained the necessary permits and approvals for the construction work of the Property;
Š 重慶永翔市場經營管理有限公司 has the right to use the land in accordance to the above mentioned real estate ownership certificates.Under the premise of complying with the mortgage contract agreement hereinafter, 重慶永翔市場經營管理有限公司 has the right touse, transfer, lease, mortgage or other legal means to deal with the premise on the condition of adhering to the land-use and the landtenure.
Š The signed lease contracts by重慶永翔市場經營管理有限公司 and the lessees are effective.
VI-42

APPENDIX VI PROPERTY VALUATION
13) The status of the title and grant of major approvals and licences in accordance with the information provided by the Company are asfollows:
State-owned Land-use Rights Grant Contract YesState-owned Land-use Rights Certificate Not ApplicableConstruction Land Planning Permit YesConstruction Work Planning Permit YesConstruction Work Commencement Permit YesBuilding Ownership Certificate Not ApplicableReal Estate Ownership Certificate Yes (for land only)Business License Yes
VI-43

APPENDIX VI PROPERTY VALUATION
GROUP II—PROPERTY INTERESTS HELD BY THE GROUP UNDER DEVELOPMENT INTHE PRC
VALUATION SUMMARY 18—CHONGQING YONGXIANG MARKET MANAGEMENT CO., LTD. PHASES II & III
NO. PROPERTY DESCRIPTION AND TENUREPARTICULARS OF
OCCUPANCY
MARKET VALUE INEXISTING STATE AS ATSEPTEMBER 30, 2019
18 Zone M, ChayuanGroup (茶園組團),Nan’anDistrict,Chongqing, PRC
The Property, ChongqingYongxiang Warehouse Co., LtdPhases II & III (重慶永翔市場經營管理有限公司二期和三期),consists of three adjoining piecesof vacant land with a total sitearea of 185,253.00 sq m. It islocated along the eastern side ofFuyuan Avenue, Nan’an District,Chongqing.
According to the proposeddevelopment plan from theCompany, the Property willcomprise two phases with a totalplanned GFA of approximately104,643.07 sq m. Phase I isscheduled to complete in Q22019. Phases II & III arescheduled to complete in Q22020.
Pursuant to the Real EstateOwnership Certificates provided,the land-use rights of theProperty have been granted for aterm of 50 years expiring onJuly 11, 2067 for warehouseuses.
As of the date ofinspection, theProperty was stillunder construction.
RMB283,000,000(RENMINBI TWO
HUNDRED EIGHTYTHREE MILLION)
100% interest1 to beattributable to the
Group 2:
RMB283,000,000(RENMINBI TWO
HUNDRED EIGHTYTHREE MILLION)
Note:1. The subsidiary company of ESR Cayman Limited holds 50% of Chongqing Yongxiang’s registered capital, will acquire the remaining
50% shares at a pre-agreed price in accordance with the agreement between the shareholders.
Notes:1) Pursuant to the Real Estate Ownership Certificates, the land-use rights of the Property located in Zone M, Chayuan Group, Nan’an
District, Chongqing, are vested in重慶永翔市場經營管理有限公司. The details are listed below:
Certificate Number Site Area Land Use Expiry Date
(sq m)Yu (2017) Nan’an Qu Bu Dong Chan Quan Di 000894856 Hao . . . . . . . . . . . . . . . . . . . . . . 81,839.00 Warehouse July 11, 2067Yu (2017) Nan’an Qu Bu Dong Chan Quan Di 000895091 Hao . . . . . . . . . . . . . . . . . . . . . . 103,414.00 Warehouse July 11, 2067Total . . . . . . . . . . . . . . . . . . . . . . . . . . . . . . . . . . . . . . . . . . . . . . . . . . . . . . . . . . . . . . . . . . . . . 185,253.00
2) Pursuant to the Construction Land Planning Permits, the planning of the construction land of the Property has been approved to重慶永翔市場經營管理有限公司. The details are listed below:
Certificate Number Location Site Area (sq m)
Di Zi Di 500108201800012 Hao . . . . . . . . . . . . . . . . . . . . . . . . . . . . . . Plot M14-1/02, Chayuan Group, Nan’anDistrict 81,839.00
Di Zi Di 500108201800013 Hao . . . . . . . . . . . . . . . . . . . . . . . . . . . . . . Plot M17-1/02, Chayuan Group, Nan’anDistrict 103,414.00
Total . . . . . . . . . . . . . . . . . . . . . . . . . . . . . . . . . . . . . . . . . . . . . . . . . . . 185,253.00
VI-44

APPENDIX VI PROPERTY VALUATION
3) Pursuant to the Construction Work Planning Permits, the planning of the construction work of the Property has been approved to 重慶永翔市場經營管理有限公司. The details are listed below:
Certificate Number Project Name Detailed Location Construction Scale
(sq m)Jian Zi Di 500108201800092 . . . . . . . Chongqing Yongxiang Modern
Logistics Park Phase IIPlot M14-1/02, Chayuan Group,Nan’an District
47,092.36
Jian Zi Di 500108201800093 . . . . . . . Chongqing Yongxiang ModernLogistics Park Phase III
Plot M17-1/02, Chayuan Group,Nan’an District
57,550.71
Total . . . . . . . . . . . . . . . . . . . . . . . . . . . 104,643.07
4) Pursuant to the Construction Work Commencement Permits, the construction work of the Property has been approved to commence by重慶永翔市場經營管理有限公司. The details are listed below:
Certificate Number Project Name Detailed LocationConstructionScale (sq m)
500114201904040101 . . . . . . . . . . . . . . . . . . Chongqing Yongxiang ModernLogistics Park Phase II
Plot M14-1/02, Chayuan Group,Nan’an District 47,092.36
500114201904040201 . . . . . . . . . . . . . . . . . . Chongqing Yongxiang ModernLogistics Park Phase III
Plot M17-1/02, Chayuan Group,Nan’an District 57,550.71
Total . . . . . . . . . . . . . . . . . . . . . . . . . . . . . . . . 104,643.07
5) Pursuant to the Real Estate Registration Certificate dated March 29, 2019 provided, the Property was mortgaged to 重慶農村商業銀行股份有限公司渝中支行.
6) Pursuant to the Company Business License No.915001085634987976, 重慶永翔市場經營管理有限公司 with the address of No. 601 KejiWuye Centre Rongying Building, No. 8 Yuma Road, Nan’an District, Chongqing, has been in business from November 15, 2010 toNovember 2, 2060 with the business scope of 市場設施租賃;市場管理服務;倉儲服務(除危險品、不含運輸);倉儲設施的租賃;物業管理(取得相關行政許可後,在許可範圍內從事經營);商務信息諮詢。(法律、法規禁止經營的,不得經營;法律、法規、國務院規定需審批的未獲審批前,不得經營)
7) The Owner holds 100% leasehold interests of the Property.8) In the course of our valuation, we have made reference to various leasing properties, which have comparable characteristics on the
market. Comparables that had been selected range from RMB0.90 to 1.05 psm per day, exclusive of Value-added Tax (VAT) andproperty management fee. In the course of our valuation, we have considered the relevant adjustment factors such as the accessibility,size, environment, building facilities, age/maintenance, etc. to determine the market rent of the Property. The adopted market rent of theProperty, excluding VAT and property management fee, as at the Valuation Date is approximately RMB0.84 psm per day.
9) In the course of arriving at the Gross Development Value (GDV) of the Property, we have adopted the DCF Method and IncomeCapitalization Method. In DCF analysis, we have taken into account the determining factors of location, income and tenant mix of theProperty and the rate of return requirement of property investors and arrived at a discount rate of 8.75%. A terminal capitalization rate of6.0% was applied when deriving the present value of the cash flows after 10 years. In Income Capitalization Method, the adoptedcapitalization rate in our valuation is 6.60%. The capitalization rate will apply to the rental income generated until the expiry of theland-use rights of the Property.
10) The Gross Development Value of the Property as at the Valuation Date was assessed at RMB461,000,000. According to the informationprovided by the Company, the total outstanding construction cost, as at the Valuation Date, was approximately RMB126,200,000, whichhas been taken into account in our valuation.
11) The general description and market information of the property are summarized as below:
Location : The Property is located at Fuyuan Avenue, Nan’an District, Chongqing, PRC.
Transportation : The Property is accessible by Fuyuan Avenue (富源大道), a newly formed three-lane dual wayroad. Gangkou Avenue / 754 County Road, Chongqing Belt Expressway and Hu-YuExpressway, providing a convenient traffic network and easy access to the city center, otherdistricts of Chongqing and surrounding cities.
Nature of Surrounding Area : The subject area is a newly developing area surrounded by various vacant land, numbers ofdeveloping sites with construction in progress.
12) We have prepared our valuation based on the following assumptions:
Š the information of the Property provided by the Company is true and correct;
Š the site is free from contamination and the ground conditions are satisfactory;
Š the proper ownership title of the Property has been obtained, and all payable land premiums or land use rights fees have been fullysettled;
Š all required approvals and certificates necessary for the development and occupation and use of the Property have been dulyobtained and are in full force and effect; and
Š the Property can be freely transferred, mortgaged, sublet or otherwise disposed of in the market.
13) We have been provided with a copy of PRC legal opinion on the Property prepared by Global Law Office (環球律師事務所), whichcontains, inter alia, the following information:
Š 重慶永翔市場經營管理有限公司 has obtained the necessary permits and approvals for the construction work of the Property;
VI-45

APPENDIX VI PROPERTY VALUATION
Š 重慶永翔市場經營管理有限公司 has the right to use the land in accordance to the above mentioned real estate ownership certificate.Under the premise of complying with the mortgage contract agreement hereinafter, 重慶永翔市場經營管理有限公司 has the right touse, transfer, lease, mortgage or other legal means to deal with the premise on the condition of adhering to the land-use and the landtenure;
14) The status of the title and grant of major approvals and licenses in accordance with the information provided by the Company are asfollows:
State-owned Land-use Rights Grant Contract YesState-owned Land-use Rights Certificate Not ApplicableConstruction Land Planning Permit YesConstruction Work Planning Permit YesConstruction Work Commencement Permit YesBuilding Ownership Certificate Not ApplicableReal Estate Ownership Certificate Yes (for land only)Business License Yes
VI-46
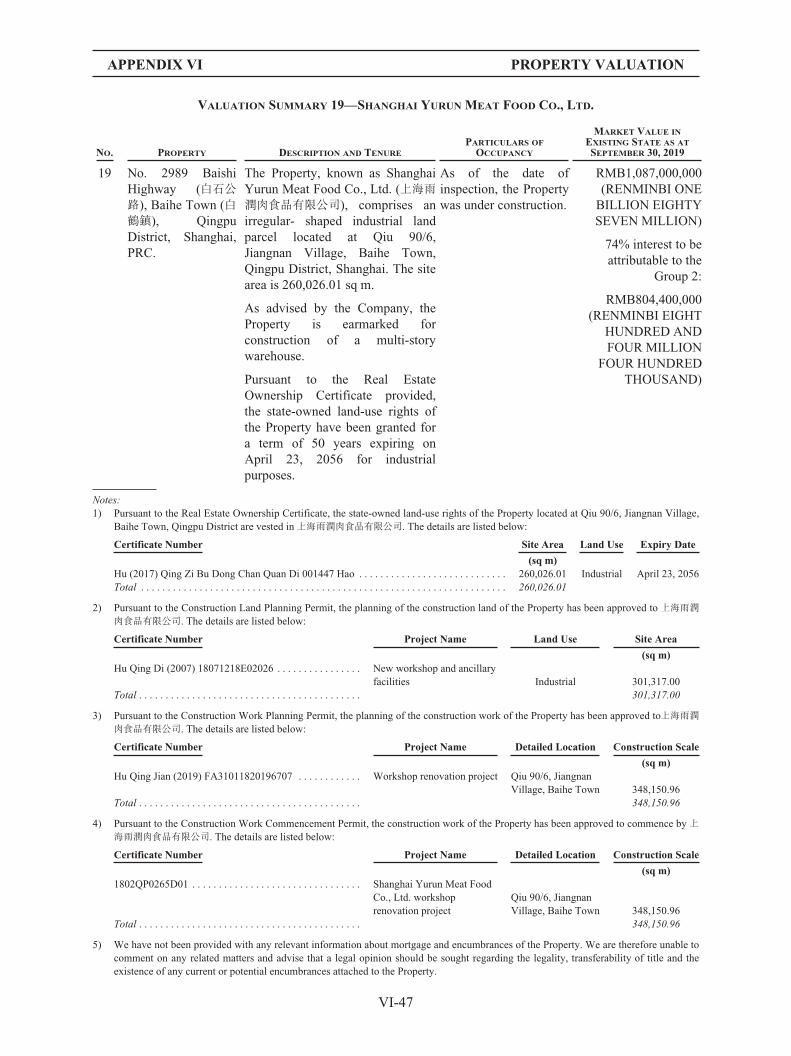
APPENDIX VI PROPERTY VALUATION
VALUATION SUMMARY 19—SHANGHAI YURUN MEAT FOOD CO., LTD.
NO. PROPERTY DESCRIPTION AND TENUREPARTICULARS OF
OCCUPANCY
MARKET VALUE INEXISTING STATE AS ATSEPTEMBER 30, 2019
19 No. 2989 BaishiHighway (白石公路), Baihe Town (白鶴鎮), QingpuDistrict, Shanghai,PRC.
The Property, known as ShanghaiYurun Meat Food Co., Ltd. (上海雨潤肉食品有限公司), comprises anirregular- shaped industrial landparcel located at Qiu 90/6,Jiangnan Village, Baihe Town,Qingpu District, Shanghai. The sitearea is 260,026.01 sq m.
As advised by the Company, theProperty is earmarked forconstruction of a multi-storywarehouse.
Pursuant to the Real EstateOwnership Certificate provided,the state-owned land-use rights ofthe Property have been granted fora term of 50 years expiring onApril 23, 2056 for industrialpurposes.
As of the date ofinspection, the Propertywas under construction.
RMB1,087,000,000(RENMINBI ONEBILLION EIGHTYSEVEN MILLION)
74% interest to beattributable to the
Group 2:
RMB804,400,000(RENMINBI EIGHT
HUNDRED ANDFOUR MILLION
FOUR HUNDREDTHOUSAND)
Notes:1) Pursuant to the Real Estate Ownership Certificate, the state-owned land-use rights of the Property located at Qiu 90/6, Jiangnan Village,
Baihe Town, Qingpu District are vested in上海雨潤肉食品有限公司. The details are listed below:
Certificate Number Site Area Land Use Expiry Date
(sq m)Hu (2017) Qing Zi Bu Dong Chan Quan Di 001447 Hao . . . . . . . . . . . . . . . . . . . . . . . . . . . . 260,026.01 Industrial April 23, 2056Total . . . . . . . . . . . . . . . . . . . . . . . . . . . . . . . . . . . . . . . . . . . . . . . . . . . . . . . . . . . . . . . . . . . . . 260,026.01
2) Pursuant to the Construction Land Planning Permit, the planning of the construction land of the Property has been approved to 上海雨潤肉食品有限公司. The details are listed below:
Certificate Number Project Name Land Use Site Area
(sq m)Hu Qing Di (2007) 18071218E02026 . . . . . . . . . . . . . . . . New workshop and ancillary
facilities Industrial 301,317.00Total . . . . . . . . . . . . . . . . . . . . . . . . . . . . . . . . . . . . . . . . . . 301,317.00
3) Pursuant to the Construction Work Planning Permit, the planning of the construction work of the Property has been approved to上海雨潤肉食品有限公司. The details are listed below:
Certificate Number Project Name Detailed Location Construction Scale
(sq m)Hu Qing Jian (2019) FA31011820196707 . . . . . . . . . . . . Workshop renovation project Qiu 90/6, Jiangnan
Village, Baihe Town 348,150.96Total . . . . . . . . . . . . . . . . . . . . . . . . . . . . . . . . . . . . . . . . . . 348,150.96
4) Pursuant to the Construction Work Commencement Permit, the construction work of the Property has been approved to commence by上海雨潤肉食品有限公司. The details are listed below:
Certificate Number Project Name Detailed Location Construction Scale
(sq m)1802QP0265D01 . . . . . . . . . . . . . . . . . . . . . . . . . . . . . . . . Shanghai Yurun Meat Food
Co., Ltd. workshoprenovation project
Qiu 90/6, JiangnanVillage, Baihe Town 348,150.96
Total . . . . . . . . . . . . . . . . . . . . . . . . . . . . . . . . . . . . . . . . . . 348,150.96
5) We have not been provided with any relevant information about mortgage and encumbrances of the Property. We are therefore unable tocomment on any related matters and advise that a legal opinion should be sought regarding the legality, transferability of title and theexistence of any current or potential encumbrances attached to the Property.
VI-47

APPENDIX VI PROPERTY VALUATION
6) Pursuant to the Company Business License No.91310118555980794Q, 上海雨潤肉食品有限公司 with the address of No. 2989 BaishiHighway Baihe Town, Qingpu District, Shanghai, has been in business from June 3, 2010 to June 2, 2040 with the business scope of 生猪定點屠宰,倉儲服務 (危險化學品除外),自有房屋租賃。(依法須經批准的項目,經相關部門批准後方可開展經營活動)
7) The Owner holds 100% leasehold interests of the Property.8) In assessing the market price of the Property, we have made reference to sales price of similar properties in the vicinity. Comparable
properties are located in close proximity to the Property with similar conditions, size and tenure, etc. Comparables that had been selectedrange from RMB2,000,000 to RMB2,750,000 per mu*. In the course of our valuation, we have considered the relevant adjustmentfactors such as the accessibility, size, plot ratio, zoning, environment, public facilities, etc. to determine the unit price of the Property.The adopted unit price of the Property is approximately RMB2,120,000 per mu.
*1 mu = 666.67 sq m
9) According to the information provided by the Company, the total construction cost incurred for the Property was approximatelyRMB250,700,000 as of the Date of Valuation, which has been taken into account in our valuation.
10) The general description and market information of the property are summarized as below:
Location : The Property is located south of Baishi Highway (白石公路), between Jiangping Road (江平路) and Nanxiang Road (南巷路), Qingpu District, Shanghai, PRC.
Transportation : The Property is accessible via Baishi Highway, Jiangping Road and Nanxiang Road. Threeexpressways, namely S26 (Shanghai- Changzhou), G2 (Beijing—Shanghai) and G1501(Shanghai Ring Expressway) are situated near the Property to the south, north and east,respectively.
Nature of Surrounding Area : The subject area is mixed use in nature, comprising industrial, residential and rural properties.
11) We have prepared our valuation based on the following assumptions:
Š the information of the Property provided by the Company is true and correct;
Š the site is free from contamination and the ground conditions are satisfactory;
Š the proper ownership title of the Property has been obtained, and all payable land premiums or land use rights fees have been fullysettled;
Š all required approvals and certificates necessary for the development and occupation and use of the Property have been dulyobtained and are in full force and effect; and
Š the Property can be freely transferred, mortgaged, sublet or otherwise disposed of in the market.
12) We have been provided with a copy of PRC legal opinion on the Property prepared by Global Law Office (環球律師事務所), whichcontains, inter alia, the following information:
Š 上海雨潤肉食品有限公司 has obtained the necessary permits and approvals for the renovation work of the Property;
Š 上海雨潤肉食品有限公司 has the right to use the land in accordance to the above mentioned real estate ownership certificate.上海雨潤肉食品有限公司 has the right to use, transfer, lease, mortgage or other legal means to deal with the premise on the condition ofadhering to the land-use and the land tenure;
13) The status of the title and grant of major approvals and licenses in accordance with the information provided by the Company are asfollows:
State-owned Land-use Rights Grant Contract YesState-owned Land-use Rights Certificate Not ApplicableConstruction Land Planning Permit YesConstruction Work Planning Permit YesConstruction Work Commencement Permit YesBuilding Ownership Certificate Not ApplicableReal Estate Ownership Certificate Yes (for land only)Business License Yes
VI-48

APPENDIX VI PROPERTY VALUATION
VALUATION SUMMARY 20—CHANGSHA YIZHU WAREHOUSING SERVICES CO., LTD. PHASE II
NO. PROPERTY DESCRIPTION AND TENUREPARTICULARS OF
OCCUPANCY
MARKET VALUE INEXISTING STATE AS ATSEPTEMBER 30, 2019
20 South and north ofWangjiachong Road(王家衝路) and westof Dongshier Road(東十二路),Changsha EconomicDevelopment Zone,Changsha, HunanProvince, PRC
The Property, known as ChangshaYizhu Warehouse Services Co.,Ltd. Phase II (長沙易竹倉儲服務有限公司二期).
The Property is a proposed high-standard logistics project that willbe erected on a roughlyrectangular-shaped land lot with asite area of 67,895.81 sq m,situated at the north ofWangjiachong Road. As advised bythe Company, it is earmarked forconstruction of multi-storywarehouses with a total GFA ofapproximately 67,366.07 sq m.
At the date ofinspection, theProperty was underconstruction.
RMB193,000,000(RENMINBI ONE
HUNDRED NINETYTHREE MILLION)
100% interest to beattributable to the
Group 2:
RMB193,000,000(RENMINBI ONE
HUNDRED NINETYTHREE MILLION)
Pursuant to the Real EstateOwnership Certificate provided,the state-owned land-use rights ofthe Property have been granted fora term of 50 years expiring onNovember 30, 2067 for warehousepurposes.
Notes:
1) Pursuant to the Real Estate Ownership Certificate, the state-owned land-use rights of the Property located west of Dongshier Road andnorth of Wangjiachong Road, Changsha Economic Development Zone, are vested in 長沙易竹倉儲服務有限公司 The details are listedbelow:
Certificate Number Site Area Land Use Expiry Date
(sq m)Xiang (2018) Chang Sha Xian Bu Dong Chan Quan Di 0003949 Hao . . . . . . . . . . . . . . 67,895.81 Warehouse November 30, 2067Total . . . . . . . . . . . . . . . . . . . . . . . . . . . . . . . . . . . . . . . . . . . . . . . . . . . . . . . . . . . . . . . . . 67,895.81
2) Pursuant to the Construction Land Planning Permit, the planning of the construction land of the Property has been approved to 長沙易竹倉儲服務有限公司 The details are listed below:
Certificate Number Location Site Area
(sq m)Jian Gui (Di) Zi Di Jing Kai Chu (2018)
0007 Hao . . . . . . . . . . . . . . . . . . . . . . . . .West of Dongshier Road, South of Nanzhuyuan Road, North ofWangjiachong Road, Changsha Economic Development Zone
67,895.81
Total . . . . . . . . . . . . . . . . . . . . . . . . . . . . . . 67,895.81
3) Pursuant to the Construction Work Planning Permit, the planning of the construction work of the Property has been approved to長沙易竹倉儲服務有限公司. The details are listed below:
Certificate Number Project Name Detailed Location Construction Scale
(sq m)Jian Gui [Jian] Zi Di Jing Kai 2
[2018]0063 Hao . . . . . . . . . . . . . . . . . . .Yishang Changsha E-commerceand Retail Logistics Park Phase II
West of Dongshier Road,South of Nanzhuyuan Road,North of WangjiachongRoad, Changsha EconomicDevelopment Zone
67,366.07
Total . . . . . . . . . . . . . . . . . . . . . . . . . . . . . . 67,366.07
VI-49

APPENDIX VI PROPERTY VALUATION
4) Pursuant to the Construction Work Commencement Permit, the construction work of the Property has been approved to commence by長沙易竹倉儲服務有限公司. The details are listed below:
Certificate Number Project Name Detailed Location Construction Scale
(sq m)430112201812240101 . . . . . . . . . . . . . . . . . Yishang Changsha E-
commerce and RetailLogistics Park Phase II
West of Dongshier Road, South ofNanzhuyuan Road, North ofWangjiachong Road, ChangshaEconomic Development Zone
67,366.07
Total . . . . . . . . . . . . . . . . . . . . . . . . . . . . . . 67,366.07
5) We have not been provided with any relevant information about mortgage and encumbrances of the Property. We are therefore unable tocomment on any related matters and advise that a legal opinion should be sought regarding the legality, transferability of title and theexistence of any current or potential encumbrances attached to the Property.
6) Pursuant to the Company Business License No.91430100MA4M0FDLXN, 長沙易竹倉儲服務有限公司 with the address of Room 301Building 3, Xingwei Chuangxin Park, No. 57 South Section of Huangxing Avenue, Changsha Economic Development Zone, Changsha,has been in business from August 9, 2017 to August 8, 2067 with the business scope of從事倉儲服務(除危險品、不含運輸)、工業及倉儲設施的建設及經營、物業管理、技術諮詢、商務信息諮詢、物流園經營服務。(依法須經批准的項目,經相關部門批准後方可開展經營活動)
7) The Owner holds 100% leasehold interests of the Property.8) In the course of our valuation, we have made reference to various leasing properties, which have comparable characteristics on the
market. Comparables that had been selected range from RMB0.95 to 1.00 psm per day, exclusive of Value-added Tax (VAT) andproperty management fee. In the course of our valuation, we have considered the relevant adjustment factors such as the accessibility,size, environment, building facilities, age/maintenance, etc. to determine the market rent of the Property. The adopted market rent of theProperty, excluding VAT and property management fee, as at the Valuation Date is approximately RMB0.98 psm per day.
9) In the course of arriving at the Gross Development Value (GDV) of the Property, we have adopted the DCF Method and IncomeCapitalization Method. In DCF analysis, we have taken into account the determining factors of location, income and tenant mix of theProperty and the rate of return requirement of property investors and arrived at a discount rate of 9.0%. A terminal capitalization rate of6.25% was applied when deriving the present value of the cash flows after 10 years. In Income Capitalization Method, the adoptedcapitalization rate in our valuation is 6.85%. The capitalization rate will apply to the rental income generated until the expiry of theland-use rights of the Property.
10) The Gross Development Value of the Property as at the Valuation Date was assessed at RMB340,000,000. According to the informationprovided by the Company, the total outstanding construction cost, as at the Valuation Date, was approximately RMB112,200,000, whichhas been taken into account in our valuation.
11) The general description and market information of the property are summarized as below:
Location : The Property is located west of Dongshier Road (東十二路), Wangjiachong Road (王家衝路),Changsha Economic Development Zone.
Transportation : The Property is accessible by Wangjiachong Road. Three expressways, namely S20(Changsha—Liuyang), G0401 (Changsha Ring Road Expressway) and S40 (AirportExpressway) are situated near the Property to the north, east and south, respectively.
Nature of Surrounding Area : The subject area is clustered with industrial developments.
12) We have prepared our valuation based on the following assumptions:
Š the information of the Property provided by the Company is true and correct;
Š the site is free from contamination and the ground conditions are satisfactory;
Š the proper ownership title of the Property has been obtained, and all payable land premiums or land use rights fees have been fullysettled;
Š all required approvals and certificates necessary for the development and occupation and use of the Property have been dulyobtained and are in full force and effect; and
Š the Property can be freely transferred, mortgaged, sublet or otherwise disposed of in the market.
13) We have been provided with a copy of PRC legal opinion on the Property prepared by Global Law Office (環球律師事務所), whichcontains, inter alia, the following information:
Š 長沙易竹倉儲服務有限公司 has obtained the necessary permits and approvals for the construction work of the Property;
Š 長沙易竹倉儲服務有限公司 has the right to use the land in accordance to the above mentioned real estate ownership certificate.長沙易竹倉儲服務有限公司 has the right to use, transfer, lease, mortgage or other legal means to deal with the premise on the conditionof adhering to the land-use and the land tenure;
VI-50

APPENDIX VI PROPERTY VALUATION
14) The status of the title and grant of major approvals and licenses in accordance with the information provided by the Company are asfollows:
State-owned Land-use Rights Grant Contract YesState-owned Land-use Rights Certificate Not ApplicableConstruction Land Planning Permit YesConstruction Work Planning Permit YesConstruction Work Commencement Permit YesBuilding Ownership Certificate Not ApplicableReal Estate Ownership Certificate Yes (for land only)Business License Yes
VI-51

APPENDIX VI PROPERTY VALUATION
VALUATION SUMMARY 21—WENZHOU YIRUI WAREHOUSE SERVICES CO., LTD.
NO. PROPERTY DESCRIPTION AND TENUREPARTICULARS OF
OCCUPANCY
MARKET VALUE INEXISTING STATE AS ATSEPTEMBER 30, 2019
21 Plot 26, Dingshan PhaseII (丁山二期), EconomicDevelopment Zone,Rui’an, Wenzhou,Zhejiang Province, PRC
The Property, known as WenzhouYirui Warehouse Services Co., Ltd.(溫州易瑞倉儲服務有限公司), islocated at the Plot 26, Dingshan PhaseII, Economic Development Zone,Rui’an, Wenzhou. The site area is86,666.70 sq m.
At the date ofinspection, theProperty was underconstruction.
RMB144,000,000(RENMINBI
ONE HUNDREDFORTY FOUR
MILLION)
100% interest tobe attributable to
the Group 2:
RMB144,000,000(RENMINBI
ONE HUNDREDFORTY FOUR
MILLION)
As advised by the Company, uponcompletion, the Property will mainlycomprise three high-standard three-story warehouses with ramp with aproposed construction scale ofapproximately 129,173.12 sq m. Atthe time of inspection, the Propertywas a piece of vacant land.
Pursuant to the Real EstateOwnership Certificate provided, theland-use rights of the Property havebeen granted to 溫州易瑞倉儲服務有限公司 for a term of 50 years expiringon November 8, 2068 for warehouseuses.
Notes:1) Pursuant to the Real Estate Ownership Certificate, the land-use rights of the Property located at Plot 26, Dingshan Phase II, Economic
Development Zone, Rui’an, Wenzhou, are vested in 溫州易瑞倉儲服務有限公司. The details are listed below:
Certificate Number Site Area Land Use Expiry Date
(sq m)Zhe (2018) Rui An Shi Bu Dong Chan Quan Di 0054819 Hao . . . . . . . . . . . . . . . . . . . . 86,666.70 Warehouse November 8, 2068Total . . . . . . . . . . . . . . . . . . . . . . . . . . . . . . . . . . . . . . . . . . . . . . . . . . . . . . . . . . . . . . . . . . 86,666.70
2) Pursuant to the Construction Work Planning Permits, the planning of the construction work of the Property has been approved to 溫州易瑞倉儲服務有限公司. The details are listed below:
Certificate Number Project Name Detailed LocationConstruction
Scale
(sq m)Jian Zi Di (2019) 0311104 Hao . . . . . . . . . . . . . . . . . . . . . . . . . . . . . Wenzhou Yirui Intelligent
Logistics Supply ChainProject . . . . . . . . . . . . . Dingshan Phase II 129,173.12
Total . . . . . . . . . . . . . . . . . . . . . . . . . . . . . . . . . . . . . . . . . . . . . . . . . . . . . . . . . . . . . . . . . . . . . . . . . . . . . . . . . . . . . 129,173.12
3) Pursuant to the Construction Work Commencement Permit, the construction work of the Property has been approved to commence by溫州易瑞倉儲服務有限公司. The details are listed below:
Certificate Number Project Name Detailed LocationConstruction
Scale
(sq m)330381201903220101 . . . . . . . . . . . . . . . . . . . . . . . . . . . . . . . . . . . . . Wenzhou Yirui Intelligent
Logistics Supply ChainProject
Dingshan Phase II 129,173.12
Total . . . . . . . . . . . . . . . . . . . . . . . . . . . . . . . . . . . . . . . . . . . . . . . . . . 129,173.12
4) We have not been provided with any relevant information about mortgage and encumbrances of the Property. We are therefore unable tocomment on any related matters and advise that a legal opinion should be sought regarding the legality, transferability of title and theexistence of any current or potential encumbrances attached to the Property.
VI-52

APPENDIX VI PROPERTY VALUATION
5) Pursuant to the Company Business License No.91330381MA2CRBNU06, 溫州易瑞倉儲服務有限公司with the address of Room 202 Unit4 Building 1, Mingzhu Tower, Yuhai Neighbourhood, Rui’an, has been in business from September 6, 2018 to September 5, 2068 withthe business scope of 從事倉儲服務(除危險品、不含運輸)、工業及倉儲設施的建設及經營;物業管理物流信息技術諮詢;商務信息諮詢(不含投資信息諮詢)依法須經批准的項目,經相關部門批准後方可開展經營活動)
6) The Owner holds 100% leasehold interests of the Property.7) In assessing the market price of the Property, we have made reference to sales price of similar properties in the vicinity. Comparable
properties are located in the close proximity to the Property with similar conditions, size and tenure, etc. Comparables that had beenselected range from RMB1,000,000 to RMB1,400,000 per mu*. In the course of our valuation, we have considered the relevantadjustment factors such as the accessibility, size, plot ratio, zoning, environment, public facilities, etc. to determine the unit price of theProperty. The adopted unit price of the Property is approximately RMB760,000 per mu.
*1 mu = 666.67 sq m
8) According to the information provided by the Company, the total construction cost incurred for the Property was approximatelyRMB44,800,000 as of the Date of Valuation, which has been taken into account in our valuation.
9) The general description and market information of the property are summarized as below:
Location : The Property is located north of Binjiang Avenue (濱江大道) and east of Fenghuang Road (鳳凰路), Economic Development Zone, Rui’an, Wenzhou, Zhejiang Province, PRC
Transportation : The Property is accessible via Binjiang Avenue. The S10 expressway (Ningbo—Taizhou—Wenzhou) is situated near the Property to the west, providing convenient traffic access todowntown Wenzhou and other neighboring cities.
Nature of Surrounding Area : The subject area is situated within the Rui’an Economic Development Zone at the eastern sideof Rui’an. It enjoys a convenient transportation network. It is surrounded by a cluster ofvacant land and industrial properties.
10) We have prepared our valuation based on the following assumptions:
Š the information of the Property provided by the Company is true and correct;
Š the site is free from contamination and the ground conditions are satisfactory;
Š the proper ownership title of the Property has been obtained, and all payable land premiums or land use rights fees have been fullysettled;
Š all required approvals and certificates necessary for the development and occupation and use of the Property have been dulyobtained and are in full force and effect; and
Š the Property can be freely transferred, mortgaged, sublet or otherwise disposed of in the market.
11) We have been provided with a copy of PRC legal opinion on the Property prepared by Global Law Office (環球律師事務所), whichcontains, inter alia, the following information:
Š 溫州易瑞倉儲服務有限公司 has obtained the necessary permits and approvals for the construction work of the Property;
Š 溫州易瑞倉儲服務有限公司 has the right to use the land in accordance to the above mentioned real estate ownership certificate.溫州易瑞倉儲服務有限公司 has the right to use, transfer, lease, mortgage or other legal means to deal with the premise on the conditionof adhering to the land-use and the land tenure;
12) The status of the title and grant of major approvals and licenses in accordance with the information provided by the Company are asfollows:
State-owned Land-use Rights Grant Contract YesState-owned Land-use Rights Certificate Not ApplicableConstruction Land Planning Permit Not ApplicableConstruction Work Planning Permit YesConstruction Work Commencement Permit YesBuilding Ownership Certificate Not ApplicableReal Estate Ownership Certificate Yes (for land only)Business License Yes
VI-53
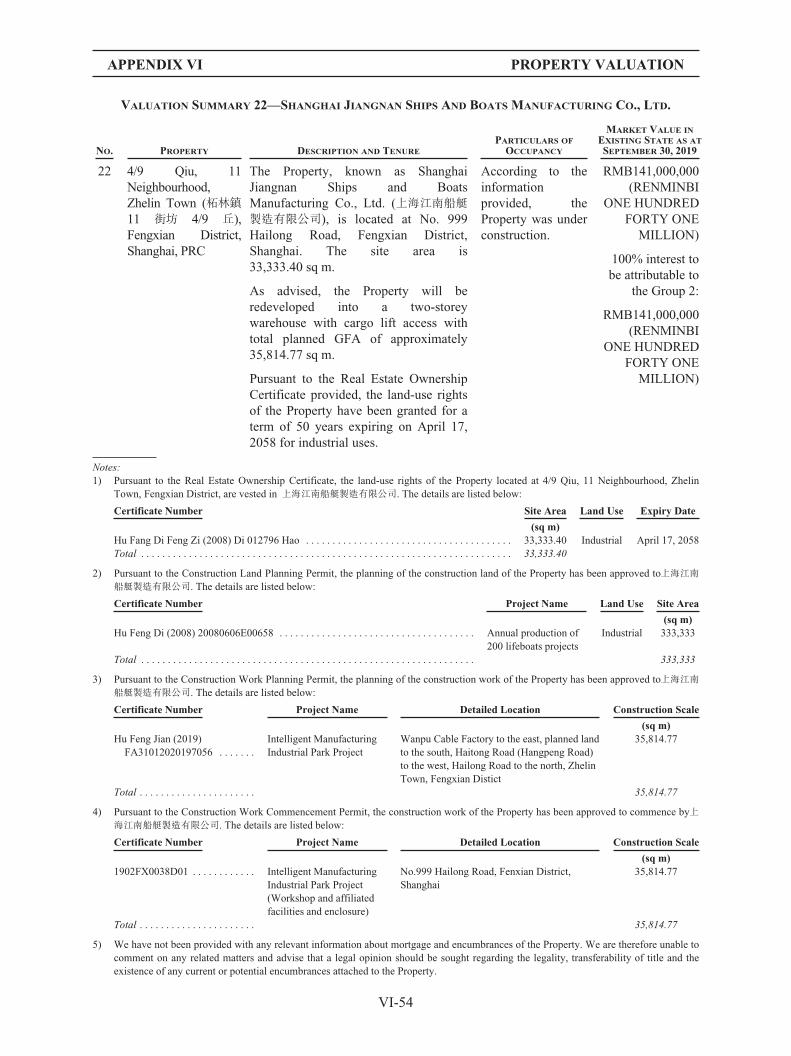
APPENDIX VI PROPERTY VALUATION
VALUATION SUMMARY 22—SHANGHAI JIANGNAN SHIPS AND BOATS MANUFACTURING CO., LTD.
NO. PROPERTY DESCRIPTION AND TENUREPARTICULARS OF
OCCUPANCY
MARKET VALUE INEXISTING STATE AS ATSEPTEMBER 30, 2019
22 4/9 Qiu, 11Neighbourhood,Zhelin Town (柘林鎮11 街坊 4/9 丘),Fengxian District,Shanghai, PRC
The Property, known as ShanghaiJiangnan Ships and BoatsManufacturing Co., Ltd. (上海江南船艇製造有限公司), is located at No. 999Hailong Road, Fengxian District,Shanghai. The site area is33,333.40 sq m.
According to theinformationprovided, theProperty was underconstruction.
RMB141,000,000(RENMINBI
ONE HUNDREDFORTY ONE
MILLION)
100% interest tobe attributable to
the Group 2:
RMB141,000,000(RENMINBI
ONE HUNDREDFORTY ONE
MILLION)
As advised, the Property will beredeveloped into a two-storeywarehouse with cargo lift access withtotal planned GFA of approximately35,814.77 sq m.
Pursuant to the Real Estate OwnershipCertificate provided, the land-use rightsof the Property have been granted for aterm of 50 years expiring on April 17,2058 for industrial uses.
Notes:1) Pursuant to the Real Estate Ownership Certificate, the land-use rights of the Property located at 4/9 Qiu, 11 Neighbourhood, Zhelin
Town, Fengxian District, are vested in 上海江南船艇製造有限公司. The details are listed below:
Certificate Number Site Area Land Use Expiry Date
(sq m)Hu Fang Di Feng Zi (2008) Di 012796 Hao . . . . . . . . . . . . . . . . . . . . . . . . . . . . . . . . . . . . . . . 33,333.40 Industrial April 17, 2058Total . . . . . . . . . . . . . . . . . . . . . . . . . . . . . . . . . . . . . . . . . . . . . . . . . . . . . . . . . . . . . . . . . . . . . . 33,333.40
2) Pursuant to the Construction Land Planning Permit, the planning of the construction land of the Property has been approved to上海江南船艇製造有限公司. The details are listed below:
Certificate Number Project Name Land Use Site Area
(sq m)Hu Feng Di (2008) 20080606E00658 . . . . . . . . . . . . . . . . . . . . . . . . . . . . . . . . . . . . . Annual production of
200 lifeboats projectsIndustrial 333,333
Total . . . . . . . . . . . . . . . . . . . . . . . . . . . . . . . . . . . . . . . . . . . . . . . . . . . . . . . . . . . . . . . 333,333
3) Pursuant to the Construction Work Planning Permit, the planning of the construction work of the Property has been approved to上海江南船艇製造有限公司. The details are listed below:
Certificate Number Project Name Detailed Location Construction Scale
(sq m)Hu Feng Jian (2019)
FA31012020197056 . . . . . . .Intelligent ManufacturingIndustrial Park Project
Wanpu Cable Factory to the east, planned landto the south, Haitong Road (Hangpeng Road)to the west, Hailong Road to the north, ZhelinTown, Fengxian Distict
35,814.77
Total . . . . . . . . . . . . . . . . . . . . . . 35,814.77
4) Pursuant to the Construction Work Commencement Permit, the construction work of the Property has been approved to commence by上海江南船艇製造有限公司. The details are listed below:
Certificate Number Project Name Detailed Location Construction Scale
(sq m)1902FX0038D01 . . . . . . . . . . . . Intelligent Manufacturing
Industrial Park Project(Workshop and affiliatedfacilities and enclosure)
No.999 Hailong Road, Fenxian District,Shanghai
35,814.77
Total . . . . . . . . . . . . . . . . . . . . . . 35,814.77
5) We have not been provided with any relevant information about mortgage and encumbrances of the Property. We are therefore unable tocomment on any related matters and advise that a legal opinion should be sought regarding the legality, transferability of title and theexistence of any current or potential encumbrances attached to the Property.
VI-54

APPENDIX VI PROPERTY VALUATION
6) Pursuant to the Company Business License No.91310120660777886K, 上海江南船艇製造有限公司 with the address of No. 148Gongpingcun Road, Zhelin Town, Fengxian District, Shanghai, has been in business from March 14, 2007 to March 13, 2037 with thebusiness scope of船艇、船用設備設計、製造、銷售,玻璃鋼製品製造,游艇銷售,從事貨物及技術的進出口業務,從事倉儲服務(除危險化學品),商務信息諮詢。(依法須經批准的項目,經相關部門批准後方可開展經營活動).
7) The Owner holds 100% leasehold interests of the Property.8) In the course of our valuation, we have made reference to various leasing properties, which have comparable characteristics on the
market. Comparables that had been selected ranges from RMB1.30 to 1.40 psm per day, exclusive of Value-added Tax (VAT) andproperty management fee. In the course of our valuation, we have considered the relevant adjustment factors such as the accessibility,size, environment, building facilities, age/maintenance, etc. to determine the market rent of the Property. The adopted market rent of theProperty, excluding VAT and property management fee, as at the Valuation Date is approximately RMB1.30 psm per day.
9) In the course of arriving at the Gross Development Value (GDV) of the Property, we have adopted the DCF Method and IncomeCapitalisation Method. In DCF analysis, we have taken into account the determining factors of location, income and tenant mix of theProperty and the rate of return requirement of property investors and arrived at a discount rate of 8.5%. A terminal capitalization rate of5.50% was applied when deriving the present value of the cash flows after 10 years. In Income Capitalisation Method, the adoptedcapitalisation rate in our valuation is 6.15%. The capitalization rate will apply to the rental income generated until the expiry of the land-use rights of the Property.
10) The Gross Development Value of the Property as at the Valuation Date were assessed at RMB262,000,000. According to the informationprovided by the Company, the total outstanding construction cost, as at the Valuation Date, was approximately RMB28,000,000, whichhas been taken into account in our valuation.
11) The general description and market information of the property are summarised as below:
Location : The Property is located at No. 999 Hailong Road (海龙路), Fengxian District, Shanghai, PRC
Transportation : The Property is accessible via Hailong Road. The G15 Expressway (Shenyang—Haikou) issituated near the Property to the north, providing convenient traffic access to downtownShanghai and other neighbouring cities.
Nature of Surrounding Area : The subject area is situated within Fengxian District in southern Shanghai. It enjoys aconvenient transportation network. It is surrounded by a cluster of vacant land and industrialproperties
12) We have prepared our valuation based on the following assumptions:
Š the information of the Property provided by the Company is true and correct;
Š the site is free from contamination and the ground conditions are satisfactory;
Š the proper ownership title of the Property has been obtained, and all payable land premiums or land use rights fees have been fullysettled;
Š all required approvals and certificates necessary for the development and occupation and use of the Property have been dulyobtained and are in full force and effect; and
Š the Property can be freely transferred, mortgaged, sublet or otherwise disposed of in the market.
13) We have been provided with a copy of PRC legal opinion on the Property prepared by Global Law Office (環球律師事務所), whichcontains, inter alia, the following information:
Š 上海江南船艇製造有限公司 has the right to use the land in accordance to the above mentioned real estate ownership certificate.上海江南船艇製造有限公司 has the right to use, transfer, lease, mortgage or other legal means to deal with the premise on the conditionof adhering to the land-use and the land tenure.
14) The status of the title and grant of major approvals and licenses in accordance with the information provided by the Company are asfollows:
State-owned Land-use Rights Grant Contract NoState-owned Land-use Rights Certificate Not ApplicableConstruction Land Planning Permit YesConstruction Work Planning Permit YesConstruction Work Commencement Permit YesBuilding Ownership Certificate Not ApplicableReal Estate Ownership Certificate Yes (for land only)Business License Yes
VI-55

APPENDIX VI PROPERTY VALUATION
VALUATION SUMMARY 23 – FUJIAN PINGFU SCIENCE AND TECHNOLOGY DEVELOPMENT CO., LTD.
NO. PROPERTY DESCRIPTION AND TENUREPARTICULARS OF
OCCUPANCY
MARKET VALUE INEXISTING STATE AS ATSEPTEMBER 30, 2019
23 Guilin Village,Danyang Town,Lianjiang County,Fuzhou, FujianProvince, PRC
The Property, known as Fujian PingfuScience and Technology DevelopmentCo., Ltd. (福建平福科技發展有限公司),is located at Guilin Village, DanyangTown, Lianjiang County, with a totalsite area of 168,781.00 sq m.
At the date ofinspection, theProperty was at anearly stage ofconstruction.
RMB72,000,000(RENMINBISEVENTY
TWO MILLION)
90% interest to beattributable to the
Group 2:
RMB64,800,000(RENMINBISIXTY FOUR
MILLION EIGHTHUNDRED
THOUSAND)
As advised by the Company, theProperty is earmarked for constructionof warehouses.
Pursuant to the Real Estate OwnershipCertificate provided, the land-use rightsof the Property have been granted for aterm of 50 years expiring on March 24,2069 for warehouse uses.
Notes:1) Pursuant to the Real Estate Ownership Certificate, the land-use rights of the Property located at Guilin Village, Danyang Town,
Lianjiang County, Fuzhou, are vested in福建平福科技發展有限公司. The details are listed below:
Certificate Number Site Area Land Use Expiry Date
(sq m)Min (2019) Lian Jiang Xian Bu Dong Chan Quan Di 0009746 Hao . . . . . . . . . . . . . . . . . . 168,781.00 Warehouse 24 March 2069Total . . . . . . . . . . . . . . . . . . . . . . . . . . . . . . . . . . . . . . . . . . . . . . . . . . . . . . . . . . . . . . . . . . . . 168,781.00
2) Pursuant to the Construction Land Planning Permit, the planning of the construction land of the Property has been approved to 福建平福科技發展有限公司. The details are listed below:
Certificate Number Location Site Area
(sq m)Lian Cun Di Zi Di 350122201900016 Hao . . . . . . . . . . . . . . . . . . . Guilin Village, Danyang Town, Lianjiang County,
Fuzhou168,781.00
Total . . . . . . . . . . . . . . . . . . . . . . . . . . . . . . . . . . . . . . . . . . . . . . . . . 168,781.00
3) We have not been provided with any relevant information about mortgage and encumbrances of the Property. We are therefore unable tocomment on any related matters and advise that a legal opinion should be sought regarding the legality, transferability of title and theexistence of any current or potential encumbrances attached to the Property.
4) Pursuant to the Company Business License No. 91350122MA2YQ1AL1U, 福建平福科技發展有限公司with the address of Room 203,Floor 2, Qiaolian Building, Danfeng Road, Lianjiang County, Fuzhou, Fujian Province, has been in business from 16 November 2017with the business scope of 從事計算機網絡科技領域內技術開發、技術服務;電子商務信息諮詢服務;房地產開發及銷售;房地產中介服務、物業管理、自有房租賃;汽車及汽車零配件、日用百貨、電子產品銷售;承辦,設計,製作,發布,代理國內各類廣告;會議及展覽服務;倉儲服務(除危險化學品);普通貨物道路運輸;機械設備(不含軌道交通運輸設備)的租賃;新能源技術研發;自營和代理各類商品和技術的進出口,但國家限定公司經營或禁止進出口的商品和技術除外。(依法須經批准的項目,經相關部門批准後方可開展經營活動)
5) The Owner holds 100% leasehold interests of the Property.6) In assessing the market price of the Property, we have made reference to sales price of similar properties in the vicinity. Comparable
properties are located in the close proximity to the Property with similar conditions, size and tenure, etc. Comparables that had beenselected range from RMB175,000 to RMB260,000 per mu*. In the course of our valuation, we have considered the relevant adjustmentfactors such as the accessibility, size, plot ratio, zoning, environment, public facilities, etc. to determine the unit price of the Property.The adopted unit price of the Property is approximately RMB212,000 per mu.
*1 mu = 666.67 sq m
7) According to the information provided by the Company, the total construction cost incurred for the Property was approximatelyRMB17,100,000 as of the Date of Valuation, which has been taken into account in our valuation.
VI-56

APPENDIX VI PROPERTY VALUATION
8) The general description and market information of the property are summarised as below:
Location : The Property is located at Guilin Village, Danyang Town, Lianjiang County, Fuzhou, FujianProvince, PRC
Transportation : The Property is accessible via G104 National Highway. The G15 Shengyang—HaikouExpressway (沈海高速) is situated near the Property to the east, providing convenient trafficaccess to downtown Fuzhou and other neighbouring cities.
Nature of Surrounding Area : The subject area is situated within the Danyang Town at the northern of Fuzhou. It enjoys aconvenient transportation network. It is surrounded by a cluster of vacant land and industrialproperties.
9) We have prepared our valuation based on the following assumptions:
Š the information of the Property provided by the Company is true and correct;
Š the site is free from contamination and the ground conditions are satisfactory;
Š the proper ownership title of the Property has been obtained, and all payable land premiums or land use rights fees have been fullysettled;
Š all required approvals and certificates necessary for the development and occupation and use of the Property have been dulyobtained and are in full force and effect; and
Š the Property can be freely transferred, mortgaged, sublet or otherwise disposed of in the market.
10) We have been provided with a copy of PRC legal opinion on the Property prepared by Global Law Office (環球律師事務所), whichcontains, inter alia, the following information:
Š 福建平福科技發展有限公司has obtained the Construction Land Planning Permit for the construction work of the Property;
Š 福建平福科技發展有限公司has the right to use the land in accordance to the above mentioned real estate ownership certificates.福建平福科技發展有限公司has the right to use, transfer, lease, mortgage or other legal means to deal with the premise on the conditionof adhering to the land-use and the land tenure.
11) The status of the title and grant of major approvals and licences in accordance with the information provided by the Company are asfollows:
State-owned Land-use Rights Grant Contract YesState-owned Land-use Rights Certificate NoConstruction Land Planning Permit YesConstruction Work Planning Permit NoConstruction Work Commencement Permit NoBuilding Ownership Certificate NoReal Estate Ownership Certificate Yes (for land only)Business License Yes
VI-57

APPENDIX VI PROPERTY VALUATION
VALUATION SUMMARY 24—SUZHOU YISHANG QUANSHENG WAREHOUSE SERVICE CO., LTD.
NO. PROPERTY DESCRIPTION AND TENUREPARTICULARS OF
OCCUPANCY
MARKET VALUE INEXISTING STATE AS ATSEPTEMBER 30, 2019
24 East of LianqiuRoad (联秋路) andnorth of DatongRoad (大同路), LiliTown, Suzhou,Jiangsu Province,PRC
The Property, known as SuzhouYishang Quansheng WarehouseService Co., Ltd. (蘇州易商全盛倉儲服務有限公司), is locatedeast of Lianqiu Road and northof Datong Road, Lili Town,Suzhou, Jiangsu Province. Thesite area is 39,839.57 sq m.
As advised by the Company, theProperty is a built-to-suitlogistics project comprising twosingle-storey warehouses with aplanned GFA of approximately29,287.38 sq m.
Pursuant to the Real EstateOwnership Certificate provided,the land-use rights of theProperty have been granted for aterm of 50 years expiring on11 June 2069 for industrial uses.
According to theinformation provided,the Property wasunder construction.
According to theinformation provided,at the date ofvaluation, theProperty waspreleased toone tenancy. With theassumption that theinitial investment ofthe project wasRMB153,000,000,the tenancy will yieldan initial monthlyrental income ofapproximatelyRMB1,170,930 excl.property managementfee. The overalloccupancy rate of theProperty will beabout 100.0%.
RMB67,000,000(RENMINBI SIXTYSEVEN MILLION)
55% interest to beattributable to the
Group 2:
RMB36,900,000(RENMINBITHIRTY SIX
MILLION ANDNINE HUNDRED
THOUSAND)
Notes:1) Pursuant to the Real Estate Ownership Certificate, the land-use rights of the Property located east of Lianqiu Road and north of Datong
Road, Lili Town, Suzhou, Jiangsu Province, are vested in蘇州易商全盛倉儲服務有限公司. The details are listed below:
Certificate Number Site Area Land Use Expiry Date
(sq m)Su (2019) Su Zhou Shi Wu Jiang Qu Bu Dong Chan Quan Di 9029915 Hao . . . . . . . . . . . . . . 39,839.57 Industrial 11 June 2069Total . . . . . . . . . . . . . . . . . . . . . . . . . . . . . . . . . . . . . . . . . . . . . . . . . . . . . . . . . . . . . . . . . . . . . . . 39,839.57
2) Pursuant to the Construction Land Planning Permit, the planning of the construction land of the Property has been approved to 蘇州易商全盛倉儲服務有限公司. The details are listed below:
Certificate Number Project Name Location Site Area (sq m)
Di Zi Di 320584201904007 Hao . . . . . . New Project of Warehouse andAuxiliary Room Phase I
East of Lianqiu Road, North ofDatong Road, Fenhu
39,839.57
Total . . . . . . . . . . . . . . . . . . . . . . . . . . . . 39,839.57
3) Pursuant to the Construction Work Planning Permit, the planning of the construction work of the Property has been approved to蘇州易商全盛倉儲服務有限公司. The details are listed below:
Certificate Number Project Name Detailed Location Construction Scale
(sq m)Jian Zi Di 320584201904019 . . . . . . . . . New Project of Warehouse and
Auxiliary Room Phase IEast of Lianqiu Road, North ofDatong Road, Fenhu
29,287.38
Total . . . . . . . . . . . . . . . . . . . . . . . . . . . . 29,287.38
4) Pursuant to the Construction Work Commencement Permit, the construction work of the Property has been approved to commence by蘇州易商全盛倉儲服務有限公司. The details are listed below:
Certificate Number Project Name Detailed Location Construction Scale
(sq m)320509201907020101 . . . . . . . . . . . . . . New Warehouse and Auxiliary
Phase IEast of Lianqiu Road, North ofDatong Road
29,287.38
Total . . . . . . . . . . . . . . . . . . . . . . . . . . . . 29,287.38
VI-58

APPENDIX VI PROPERTY VALUATION
5) Pursuant to the Company Business License No. 91320509MA1W43HJ18, 蘇州易商全盛倉儲服務有限公司 with the address of East ofFenhu Avenue, Lili Town, Wujiang District, Suzhou, has been in business from 11 February 2018 to 10 February 2068 with the businessscope of 從事倉儲服務(除危險品、不含運輸),工業及倉儲設施的建設及經營,物業管理。(依法須經批准的項目,經相關部門批准後方可開展經營活動).
6) We have not been provided with any relevant information about mortgage and encumbrances of the Property. We are therefore unable tocomment on any related matters and advise that a legal opinion should be sought regarding the legality, transferability of title and theexistence of any current or potential encumbrances attached to the Property.
7) The Owner holds 100% leasehold interests of the Property.8) In the course of our valuation, we have made reference to various leasing properties, which have comparable characteristics on the
market. Comparables that had been selected ranges from RMB1.05 to 1.15 psm per day, exclusive of Value-added Tax (VAT) andproperty management fee. In the course of our valuation, we have considered the relevant adjustment factors such as the accessibility,size, environment, building facilities, age/maintenance, etc. to determine the market rent of the Property. The adopted market rent of theProperty, excluding VAT and property management fee, as at the Valuation Date is approximately RMB1.20 psm per day.
9) In the course of arriving at the Gross Development Value (GDV) of the Property, we have adopted the DCF Method and IncomeCapitalisation Method. In DCF analysis, we have taken into account the determining factors of location, income and tenant mix of theProperty and the rate of return requirement of property investors and arrived at a discount rate of 8.75%. A terminal capitalization rate of6.0% was applied when deriving the present value of the cash flows after 10 years. In Income Capitalisation Method, the adoptedcapitalisation rate in our valuation is 6.60%. The capitalization rate will apply to the rental income generated until the expiry of the land-use rights of the Property.
10) The Gross Development Value of the Property as at the Valuation Date were assessed at RMB198,000,000. According to the informationprovided by the Company, the total outstanding construction cost, as at the Valuation Date, was approximately RMB43,000,000, whichhas been taken into account in our valuation.
11) The general description and market information of the property are summarised as below:
Location : East of Lianqiu Road and north of Datong Road, Lili Town, Suzhou, Jiangsu Province, PRC
Transportation : The Property is accessible via Lianqiu Road. The G50 Expressway (Shanghai—Chongqing) issituated north of the Property, providing convenient traffic access to Shanghai and otherneighbouring cities.
Nature of Surrounding Area : The subject area is situated within FOHO Economic Development Zone. It enjoys aconvenient transportation network. It is surrounded by a cluster of logistics and industrialproperties
12) We have prepared our valuation based on the following assumptions:
Š the information of the Property provided by the Company is true and correct;
Š the site is free from contamination and the ground conditions are satisfactory;
Š the proper ownership title of the Property has been obtained, and all payable land premiums or land use rights fees have been fullysettled;
Š all required approvals and certificates necessary for the development and occupation and use of the Property have been dulyobtained and are in full force and effect; and
Š the Property can be freely transferred, mortgaged, sublet or otherwise disposed of in the market.
13) We have been provided with a copy of PRC legal opinion on the Property prepared by Global Law Office (環球律師事務所), whichcontains, inter alia, the following information:
Š 蘇州易商全盛倉儲服務有限公司 has obtained the Construction Work Commencement Permit for the construction work of theProperty;
Š 蘇州易商全盛倉儲服務有限公司 has the right to use the land in accordance to the above mentioned real estate ownership certificate.蘇州易商全盛倉儲服務有限公司 has the right to use, transfer, lease, mortgage or other legal means to deal with the premise on thecondition of adhering to the land-use and the land tenure.
14) The status of the title and grant of major approvals and licences in accordance with the information provided by the Company are asfollows:
State-owned Land-use Rights Grant Contract NoState-owned Land-use Rights Certificate Not ApplicableConstruction Land Planning Permit YesConstruction Work Planning Permit YesConstruction Work Commencement Permit YesBuilding Ownership Certificate Not ApplicableReal Estate Ownership Certificate Yes (for land only)Business License Yes
VI-59

APPENDIX VI PROPERTY VALUATION
VALUATION SUMMARY 25—QINGYUAN ANQING INFORMATION TECHNOLOGY DEVELOPMENT CO., LTD.
NO. PROPERTY DESCRIPTION AND TENUREPARTICULARS OF
OCCUPANCY
MARKET VALUE INEXISTING STATE AS AT30 SEPTEMBER 2019
25 Xiuxi Village (秀溪村),Yuantan Town (源潭鎮) , QingchengDistrict (清城區),Qingyuan, GuangdongProvince, PRC
The Property, known as QingyuanAnqing Information TechnologyDevelopment Co., Ltd. (清遠市安清信息科技發展有限公司), is locatedXiuxi Village, Yuantan Town,Qingcheng District, Qingyuan,Guangdong Province. The site areais 175,993.02 sq m.
According to theinformation provided,the Property was at anearly stage ofconstruction.
RMB133,000,000(RENMINBI
ONE HUNDREDTHIRTY THREE
MILLION)
95% interest to beattributable to the
Group 2:
RMB126,400,000(RENMINBI
ONE HUNDREDTWENTY SIX
MILLION FOURHUNDRED
THOUSAND)
As advised by the Company, theProperty is earmarked forconstruction of warehouses.
Pursuant to the Real EstateOwnership Certificate provided, theland-use rights of the Property havebeen granted for a term of 50 yearsexpiring on November 18, 2068 forindustrial uses.
Notes:1) Pursuant to the Real Estate Ownership Certificate, the land-use rights of the Property located Xiuxi Village, Yuantan Town, Qingcheng
District, Qingyuan, are vested in清遠市安清信息科技發展有限公司. The details are listed below:
Certificate Number Site Area Land Use Expiry Date
(sq m)Yue (2019) Qing Yuan Shi Bu Dong Chan Quan Di 0010980 Hao . . . . . . . . . . . . . . . . 175,993.02 Warehouse 18 November 2068Total . . . . . . . . . . . . . . . . . . . . . . . . . . . . . . . . . . . . . . . . . . . . . . . . . . . . . . . . . . . . . . . . 175,993.02
2) Pursuant to the Construction Land Planning Permit, the planning of the construction land of the Property has been approved to 清遠市安清信息科技發展有限公司. The details are listed below:
Certificate Number Location Site Area
(sq m)Di Zi Di Yong Di Xu Ke B20190003 Hao . . . . . . . . . . . . . . . . . . . . . . . . . . . Xiuxi Village, Yuantan Town, Qingcheng
District, Qingyuan175,993.02
Total . . . . . . . . . . . . . . . . . . . . . . . . . . . . . . . . . . . . . . . . . . . . . . . . . . . . . . . . 175,993.02
3) We have not been provided with any relevant information about mortgage and encumbrances of the Property. We are therefore unable tocomment on any related matters and advise that a legal opinion should be sought regarding the legality, transferability of title and theexistence of any current or potential encumbrances attached to the Property.
4) Pursuant to the Company Business License No. 91441800MA51HX9G8T, 清遠市安清信息科技發展有限公司 with the address of No. 16,Level 3, Building 6, Jinmao Hanlinyuan, No.25 Jingfu Road,Qingcheng District, Qingyuan, has been in business from 11 April 2018with the business scope of 信息、汽車配件、電子科技領域內技術開發,技術咨詢,技術服務;企業管理咨詢;房地產經紀;物業管理;房屋租賃,有形動產經營租賃;從事貨物及技術的進出口業務;設計、制作、發布各類廣告;會展服務;自有設備租賃;汽車銷售;汽車配件加工;汽車零配件及用品銷售;軟件科技領域技術開發(不含增值電信)、技術轉讓、技術咨詢、技術服務;供應鏈管理;第三方物流管理,物流方案設計,貨運信息中介,貨運代理,倉儲服務(除危險化學品),冷凍信息服務;預包裝食品(憑許可證經營)、食用農產品(不含生豬產品、糧食)銷售;物流基地及其配套設施投資、建設、開發;商務信息咨詢。(以上項目不涉及外商投資准入特別管理措施。)(依法須經批准的項目,經相關部門批准後方可開展經營活動)
5) The Owner holds 100% leasehold interests of the Property.
6) In assessing the market price of the Property, we have made reference to sales price of similar properties in the vicinity. Comparableproperties are located in the close proximity to the Property with similar conditions, size and tenure, etc. Comparables that had beenselected range from RMB350,000 to RMB370,000 per mu*. In the course of our valuation, we have considered the relevant adjustmentfactors such as the accessibility, size, plot ratio, zoning, environment, public facilities, etc. to determine the unit price of the Property.The adopted unit price of the Property is approximately RMB380,000 per mu.
*1 mu = 666.67 sq m
7) According to the information provided by the Company, the total construction cost incurred for the Property was approximatelyRMB31,900,000 as of the Date of Valuation, which has been taken into account in our valuation.
VI-60

APPENDIX VI PROPERTY VALUATION
8) The general description and market information of the property are summarised as below:
Location : The Property is located Xiuxi Village, Yuantan Town, Qingcheng District, Qingyuan,Guangdong Province, PRC.
Transportation : The Property is near Zhandong Road (站東路). The National Highway G355 (G355國道) andG0423 Expressway (Lechang -Guangzhou) (樂廣高速) are situated near the Property to thesouth and east, providing convenient traffic access to downtown Qingyuan and otherneighbouring cities.
Nature of Surrounding Area : The subject area is situated within Qingcheng District in eastern Qingyuan. It enjoys aconvenient transportation network. It is surrounded by a cluster of vacant land and industrialproperties.
9) We have prepared our valuation based on the following assumptions:
Š the information of the Property provided by the Company is true and correct;
Š the site is free from contamination and the ground conditions are satisfactory;
Š the proper ownership title of the Property has been obtained, and all payable land premiums or land use rights fees have been fullysettled;
Š all required approvals and certificates necessary for the development and occupation and use of the Property have been dulyobtained and are in full force and effect; and
Š the Property can be freely transferred, mortgaged, sublet or otherwise disposed of in the market.
10) We have been provided with a copy of PRC legal opinion on the Property prepared by Global Law Office (環球律師事務所), whichcontains, inter alia, the following information:
Š 清遠市安清信息科技發展有限公司has obtained the Construction Land Planning Permit for the construction work of the Property;
Š 清遠市安清信息科技發展有限公司has the right to use the land in accordance to the above mentioned real estate ownershipcertificate. 清遠市安清信息科技發展有限公司has the right to use, transfer, lease, mortgage or other legal means to deal with thepremise on the condition of adhering to the land-use and the land tenure.
11) The status of the title and grant of major approvals and licences in accordance with the information provided by the Company are asfollows:
State-owned Land-use Rights Grant Contract YesState-owned Land-use Rights Certificate Not ApplicableConstruction Land Planning Permit YesConstruction Work Planning Permit NoConstruction Work Commencement Permit NoBuilding Ownership Certificate Not ApplicableReal Estate Ownership Certificate Yes (for land only)Business License Yes
VI-61

APPENDIX VI PROPERTY VALUATION
GROUP III—PROPERTY INTERESTS HELD BY THE GROUP FOR FUTUREDEVELOPMENT IN THE PRC
VALUATION SUMMARY 26—TIANJIN FANBIN WAREHOUSE SERVICES CO., LTD. PHASE II
NO. PROPERTY DESCRIPTION AND TENUREPARTICULARS OF
OCCUPANCY
MARKET VALUE INEXISTING STATE AS ATSEPTEMBER 30, 2019
26 No.78 FuyuanAvenue (復元道),DawangguzhuangTown, WuqingDistrict, Tianjin,PRC
The Property, known as Tianjin FanbinWarehouse Services Co., Ltd. Phase II(天津凡濱倉儲服務有限公司二期), is alogistics project erected on a roughlyrectangular-shaped land lot with a totalsite area of 172,546.40 sq m for theoverall development. At the time ofinspection, the Property was a piece ofvacant land.
At the date ofinspection, theProperty was stillvacant land.
RMB4,000,000(RENMINBI
FOUR MILLION)
100% interest tobe attributable to
the Group 3:
RMB4,000,000(RENMINBI
FOUR MILLION)Pursuant to the Real Estate OwnershipCertificate provided, the state-ownedland-use rights of the Property havebeen granted for a term of 50 yearsexpiring on February 11, 2064 forwarehouse purposes.
Notes:1) Pursuant to the Real Estate Ownership Certificate, the state-owned land-use rights of the Tianjin Fanbin Warehouse Services Co., Ltd
located at No. 78 Fuyuan Avenue, Dawangguzhuang Town, Wuqing District, are vested in 天津凡濱倉儲服務有限公司. The details arelisted below:
Certificate Number Site Area Land Use Expiry Date
(sq m)Jin (2016) Wu Qing Qu Bu Dong Chan Quan Di 038297 Hao . . . . . . . . . . . . . . . . . . . . 172,546.40 Warehouse February 11, 2064Total . . . . . . . . . . . . . . . . . . . . . . . . . . . . . . . . . . . . . . . . . . . . . . . . . . . . . . . . . . . . . . . . . 172,546.40
2) Pursuant to the Real Estate Registration Certificate dated May 24, 2019 provided, the Property was mortgaged to 上海農村商業銀行股份有限公司濱江支行 and星展銀行(中國)有限公司上海分行.
3) Pursuant to the Company Business License No.91120222075910869L, 天津凡濱倉儲服務有限公司 with the address of No. 78 FuyuanAvenue, Dawangguzhuang Town, Wuqing District, Tianjin, has been in business from August 22, 2013 to August 21, 2043 with thebusiness scope of 倉儲服務(易燃、易爆、易制毒、危險化學品除外)、企業管理服務、商務信息諮詢服務、物業服務;倉儲貨架、紙質包裝品(印刷除外)生產;自有倉庫及倉儲設施租賃。(依法須經批准的項目,經相關部門批准後方可開展經營活動)
4) The Owner holds 100% leasehold interests of the Property.5) In assessing the market price of the Property, we have made reference to sales price of similar properties in the vicinity. Comparable
properties are located in the close proximity to the Property with similar conditions, size and tenure, etc. Comparables that had beenselected range from RMB340,000 to RMB450,000 per mu*. In the course of our valuation, we have considered the relevant adjustmentfactors such as the accessibility, size, plot ratio, zoning, environment, public facilities, etc. to determine the unit price of the Property.The adopted unit price of the Property is approximately RMB400,000 per mu.
*1 mu = 666.67 sq m
6) The general description and market information of the property are summarized as below:
Location : The Property is located at No.78 Fuyuan Avenue, Dawangguzhuang Town, Wuqing District,Tianjin, PRC.
Transportation : The Property is accessible by Fuyuan Avenue (復元道) and an anonymous path, of which theformer is a two-lane dual-way road and the latter is a two-lane road.
Nature of Surrounding Area : The subject area is clustered with a number of industrial factories, warehouse properties andresidential and public facilities.
7) We have prepared our valuation based on the following assumptions:
Š the information of the Property provided by the Company is true and correct;
Š the site is free from contamination and the ground conditions are satisfactory;
Š the proper ownership title of the Property has been obtained, and all payable land premiums or land use rights fees have been fullysettled;
VI-62

APPENDIX VI PROPERTY VALUATION
Š all required approvals and certificates necessary for the development and occupation and use of the Property have been dulyobtained and are in full force and effect; and
Š the Property can be freely transferred, mortgaged, sublet or otherwise disposed of in the market.
8) We have been provided with a copy of PRC legal opinion on the Property prepared by Global Law Office (環球律師事務所), whichcontains, inter alia, the following information:
Š 天津凡濱倉儲服務有限公司 has the right to use the land in accordance to the above mentioned real estate ownership certificate.Under the premise of complying with the mortgage contract agreement hereinafter,天津凡濱倉儲服務有限公司 has the right to use,transfer, lease, mortgage or other legal means to deal with the premise on the condition of adhering to the land-use and the landtenure;
9) The status of the title and grant of major approvals and licenses in accordance with the information provided by the Company are asfollows:
State-owned Land-use Rights Grant Contract YesState-owned Land-use Rights Certificate Not ApplicableConstruction Land Planning Permit NoConstruction Work Planning Permit NoConstruction Work Commencement Permit NoBuilding Ownership Certificate Not ApplicableReal Estate Ownership Certificate Yes (for land only)Business License Yes
VI-63

APPENDIX VI PROPERTY VALUATION
VALUATION SUMMARY 27—WUHAN MINGLONG WAREHOUSE CO., LTD.
NO. PROPERTY DESCRIPTION AND TENUREPARTICULARS OF
OCCUPANCY
MARKET VALUE INEXISTING STATE AS ATSEPTEMBER 30, 2019
27 Junction of Majiadu(馬家渡) and YongliVillage (永利村),Caidian District,Wuhan, HubeiProvince, PRC
The Property, known as WuhanMinglong Warehouse Co., Ltd. (武漢明隆倉儲有限公司), is located at thejunction of Majiadu and Yongli Village,Caidian District in Wuhan. The site areais approximately 102,282.00 sq m.
At the date ofinspection, theProperty was stillvacant land.
RMB66,000,000(RENMINBISIXTY SIXMILLION)
100% interest tobe attributable to
the Group 3:
RMB66,000,000(RENMINBISIXTY SIXMILLION)
According to the Company, uponcompletion, the Property will mainlycomprise high-standard warehouses witha proposed construction scale ofapproximately 61,534.20 sq m. At thetime of inspection, the Property was apiece of vacant land.
Pursuant to the State-owned Land-useRights Certificate provided, the land-userights of the Property have been grantedfor a term of 50 years expiring onMarch 1, 2064 for warehouse uses.
Notes:1) Pursuant to the State-owned Land-use Rights Certificate, the land-use rights of the Property located at Majiadu, Yongli Village, Caidian
Neighborhood, Caidian District, are vested in 武漢明隆倉儲有限公司. The details are listed below:
Certificate Number Site Area Land Use Expiry Date
(sq m)Cai Guo Yong (2014) Di 2294 Hao . . . . . . . . . . . . . . . . . . . . . . . . . . . . . . . . . . . . . . . . . . . . 102,282.00 Warehouse March 1, 2064Total . . . . . . . . . . . . . . . . . . . . . . . . . . . . . . . . . . . . . . . . . . . . . . . . . . . . . . . . . . . . . . . . . . . . 102,282.00
2) Pursuant to the Construction Land Planning Permit, the planning of the construction land of the Property has been approved to 武漢明隆倉儲有限公司. The details are listed below:
Certificate Number Location Site Area
(sq m)Di Zi Di Wu Gui (Cai) Di (2014) 026 Hao . . . . . . . . . . . . . . . . . . . Majiadu, Yongli Village, Caidian Neighborhood,
Caidian District124,257.00
Total . . . . . . . . . . . . . . . . . . . . . . . . . . . . . . . . . . . . . . . . . . . . . . . . . 124,257.00
3) Pursuant to the Construction Work Planning Permit, the planning of the construction work of the Property has been approved to武漢明隆倉儲有限公司. The details are listed below:
Certificate Number Project Name Detailed Location Construction Scale
(sq m)Jian Zi Di Wu Gui (Cai) Jian (2015) 002
Hao . . . . . . . . . . . . . . . . . . . . . . . . . . . . Caidian District InternationalLogistics Park LogisticsWarehousing and DistributionCenter
Majiadu, Yongli Village,Caidian Neighborhood, CaidianDistrict
61,534.20
Total . . . . . . . . . . . . . . . . . . . . . . . . . . . . . 61,534.20
4) We have not been provided with any relevant information about mortgage and encumbrances of the Property. We are therefore unable tocomment on any related matters and advise that a legal opinion should be sought regarding the legality, transferability of title and theexistence of any current or potential encumbrances attached to the Property.
5) Pursuant to the Company Business License No.91420100063045353D, 武漢明隆倉儲有限公司 with the address of Hanyang Street,Caidian Street, Caidian District, Wuhan, has been in business from April 18, 2013 to April 17, 2043 with the business scope of倉儲設施的建設、經營(不含運輸),提供相關的配套服務及諮詢。(國家有專項規定的經審批後憑有限許可證經營)
6) The Owner holds 100% leasehold interests of the Property.7) In assessing the market price of the Property, we have made reference to sales price of similar properties in the vicinity. Comparable
properties are located in the close proximity to the Property with similar conditions, size and tenure, etc. Comparables that had beenselected range from RMB400,000 to RMB410,000 per mu*. In the course of our valuation, we have considered the relevant adjustment
VI-64

APPENDIX VI PROPERTY VALUATION
factors such as the accessibility, size, plot ratio, zoning, environment, public facilities, etc. to determine the unit price of the Property.The adopted unit price of the Property is approximately RMB430,000 per mu.
*1 mu = 666.67 sq m
8) The general description and market information of the property are summarized as below:
Location : The Property is located at the junction of Majiadu and Yongli Village, Caidian District,Wuhan, Hubei Province, PRC
Transportation : The Property is easily accessible by Provincial Highway 104, Hancai Highway and Beijing-Hong Kong-Macau Highway. Provincial Highway 104 is a four-lane dual-way main roadconnecting Caidian District with Wuhan City Proper. Hancai Highway starts fromMiliangshan Interchange (米糧山立交) and ends at Hanyi Highway (漢宜高速) in CaidianDistrict. Hancai Highway connects the Property with Wuhan Third Ring Road and Forth RingRoad of Wuhan City Proper for the Property, thus making the traffic conversion between cityring roads and highways more convenient. Beijing-Hong Kong-Macau Highway connectsBeijing with major cities in South China including Guangzhou and Zhuhai. Through Beijing-Hong Kong-Macau Highway, the Property is conveniently connected with Beijing,Guangzhou and other parts of China.
Nature of Surrounding Area : The subject area is situated at the core area of Caidian District, Wuhan. It enjoys a convenienttransportation network. It is surrounded by a cluster of vacant land and logisticsunderdeveloped properties
9) We have prepared our valuation based on the following assumptions:
Š the information of the Property provided by the Company is true and correct;
Š the site is free from contamination and the ground conditions are satisfactory;
Š the proper ownership title of the Property has been obtained, and all payable land premiums or land use rights fees have been fullysettled;
Š all required approvals and certificates necessary for the development and occupation and use of the Property have been dulyobtained and are in full force and effect; and
Š the Property can be freely transferred, mortgaged, sublet or otherwise disposed of in the market.
10) We have been provided with a copy of PRC legal opinion on the Property prepared by Global Law Office (環球律師事務所), whichcontains, inter alia, the following information:
Š 武漢明隆倉儲有限公司 has obtained the Construction Land Planning Permit & the Construction Work Planning Permit for theconstruction work of the Property;
Š 武漢明隆倉儲有限公司 has the right to use the land in accordance to the above mentioned state-owned land-use rights certificate.武漢明隆倉儲有限公司 has the right to use, transfer, lease, mortgage or other legal means to deal with the premise on the condition ofadhering to the land-use and the land tenure;
11) The status of the title and grant of major approvals and licenses in accordance with the information provided by the Company are asfollows:
State-owned Land-use Rights Grant Contract YesState-owned Land-use Rights Certificate YesConstruction Land Planning Permit YesConstruction Work Planning Permit YesConstruction Work Commencement Permit NoBuilding Ownership Certificate Not ApplicableReal Estate Ownership Certificate Not ApplicableBusiness License Yes
VI-65

APPENDIX VI PROPERTY VALUATION
VALUATION SUMMARY 28—LANGFANG YIZHI HENGJIA TECHNOLOGY CO., LTD.
NO. PROPERTY DESCRIPTION AND TENUREPARTICULARS OFOCCUPANCY
MARKET VALUE INEXISTING STATE AS ATSEPTEMBER 30, 2019
28 South of QingyangshuAvenue (青楊樹道) andeast of Chunhe Road(春和路), High-techIndustrial DevelopmentZone, Langfang, HebeiProvince, PRC
The Property, known as LangfangYizhi Hengjia Technology Co., Ltd.(廊坊市易智衡嘉科技有限公司), islocated south of Qingyangshu andeast of Chunhe Road, High-techIndustrial Development Zone,Langfang, Hebei Province. The sitearea is 66,638.01 sq m.
According to theinformation provided,the Property was stillvacant land.
RMB87,000,000(RENMINBI
EIGHTYSEVEN
MILLION)
100% interest tobe attributable to
the Group 3:
RMB87,000,000(RENMINBI
EIGHTYSEVEN
MILLION)
As advised by the Company, theProperty is earmarked forconstruction of warehouses.
Pursuant to the Real EstateOwnership Certificate provided, theland-use rights of the Property havebeen granted for a term of 50 yearsexpiring on March 28, 2069 forindustrial uses.
Notes:1) Pursuant to the Real Estate Ownership Certificate, the land-use rights of the Property located south of Qingyangshu Avenue and east of
Chunhe Road, High-tech Industrial Development Zone, Langfang, are vested in 廊坊市易智衡嘉科技有限公司. The details are listedbelow:
Certificate Number Site Area Land Use Expiry Date
(sq m)Ji (2019) Lang Fang Shi Bu Dong Chan Quan Di 0025324 Hao . . . . . . . . . . . . . . . . . . . . . . . 66,638.01 Industrial March 28, 2069Total . . . . . . . . . . . . . . . . . . . . . . . . . . . . . . . . . . . . . . . . . . . . . . . . . . . . . . . . . . . . . . . . . . . . 66,638.01
2) Pursuant to the Construction Land Planning Permit, the planning of the construction land of the Property has been approved to 廊坊市易智衡嘉科技有限公司. The details are listed below:
Certificate Number LocationSite Area(sq m)
Jian Zi Di 131002201900103 Hao . . . . . . . . . . . . . . . . . . . . . . South of Qingyangshu Avenue and east of Chunhe Road,High-tech Industrial Development Zone, Langfang
66,638.01
Total . . . . . . . . . . . . . . . . . . . . . . . . . . . . . . . . . . . . . . . . . . . . . 66,638.01
3) We have not been provided with any relevant information about mortgage and encumbrances of the Property. We are therefore unable tocomment on any related matters and advise that a legal opinion should be sought regarding the legality, transferability of title and theexistence of any current or potential encumbrances attached to the Property.
4) Pursuant to the Company Business License No.91131002MA0D6M386N,廊坊市易智衡嘉科技有限公司 with the address of Room 280-4,Langfang High-tech Industrial Development Zone Management Committee, Anci District, Langfang, has been in businessfrom 2 February 2019 to 1 February 2049 with the business scope of 資訊科技、電腦技術、智慧科技領域內技術研發、技術轉讓、技術諮詢、技術服務;智慧型機器研發、生產、銷售及租賃。(依法須經批准的項目,經相關部門批准後方可開展經營活動)
5) The Owner holds 100% leasehold interests of the Property.6) In assessing the market price of the Property, we have made reference to sales price of similar properties in the vicinity. Comparable
properties are located in the close proximity to the Property with similar conditions, size and tenure, etc. Comparables that had beenselected range from RMB1,150,000 to RMB1,350,000 per mu*. In the course of our valuation, we have considered the relevantadjustment factors such as the accessibility, size, plot ratio, zoning, environment, public facilities, etc. to determine the unit price of theProperty. The adopted unit price of the Property is approximately RMB863,000 per mu.
*1 mu = 666.67 sq m
7) According to the information provided by the Company, the total construction cost incurred for the Property was approximatelyRMB490,000 as of the Date of Valuation, which has been taken into account in our valuation.
VI-66

APPENDIX VI PROPERTY VALUATION
8) The general description and market information of the property are summarised as below:
Location : The Property is located south of Qingyangshu and east of Chunhe Road, High-tech IndustrialDevelopment Zone, Langfang, Hebei Province, PRC.
Transportation : The Property is near Chunhe Road. The S272 Expressway (Langfang—Cangzhou) and G3Expressway (Beijing—Taipei) are situated near the Property to the north and west, providingconvenient traffic access to downtown Langfang and other neighbouring cities.
Nature of Surrounding Area : The subject area is situated within Anci District in southern Langfang. It enjoys a convenienttransportation network. It is surrounded by a cluster of vacant land and industrial properties.
9) We have prepared our valuation based on the following assumptions:
Š the information of the Property provided by the Company is true and correct;
Š the site is free from contamination and the ground conditions are satisfactory;
Š the proper ownership title of the Property has been obtained, and all payable land premiums or land use rights fees have been fullysettled;
Š all required approvals and certificates necessary for the development and occupation and use of the Property have been dulyobtained and are in full force and effect; and
Š the Property can be freely transferred, mortgaged, sublet or otherwise disposed of in the market.
10) We have been provided with a copy of PRC legal opinion on the Property prepared by Global Law Office (環球律師事務所), whichcontains, inter alia, the following information:
Š 廊坊市易智衡嘉科技有限公司 has the right to use the land in accordance to the above mentioned real estate ownership certificate.廊坊市易智衡嘉科技有限公司 has the right to use, transfer, lease, mortgage or other legal means to deal with the premise on thecondition of adhering to the land-use and the land tenure.
11) The status of the title and grant of major approvals and licences in accordance with the information provided by the Company are asfollows:
State-owned Land-use Rights Grant Contract YesState-owned Land-use Rights Certificate YesConstruction Land Planning Permit YesConstruction Work Planning Permit NoConstruction Work Commencement Permit NoBuilding Ownership Certificate Not ApplicableReal Estate Ownership Certificate Yes (for land only)Business License Yes
VI-67

APPENDIX VI PROPERTY VALUATION
VALUATION SUMMARY 29—SHANGHAI YISI WAREHOUSE SERVICE CO., LTD.
NO. PROPERTY DESCRIPTION AND TENUREPARTICULARS OF
OCCUPANCY
MARKET VALUE INEXISTING STATE AS ATSEPTEMBER 30, 2019
29 South of LonghuAvenue (龍湖大道)and west of TongyiRoad (通義路),Emerging IndustryDemonstration Zone,Langfang, HebeiProvince, PRC
The Property, known as ShanghaiYisi Warehouse Service Co., Ltd.(上海易司倉儲服務有限公司), islocated South of Longhu Avenueand west of Tongyi Road, EmergingIndustry Demonstration Zone,Langfang, Hebei Province. The sitearea is 53,334.00 sq m.
According to theinformation provided,the Property was stillvacant land.
RMB68,000,000(RENMINBI SIXTYEIGHT MILLION)
100% interest to beattributable to the
Group 3:
RMB68,000,000(RENMINBI SIXTYEIGHT MILLION)
As advised by the Company, theProperty is earmarked forconstruction of warehouses.
Pursuant to the Real EstateOwnership Certificate provided, theland-use rights of the Property havebeen granted for a term of 50 yearsexpiring on December 23, 2063 forindustrial uses.
Notes:1) Pursuant to the Real Estate Ownership Certificate, the land-use rights of the Property located South of Longhu Avenue and west of
Tongyi Road, Emerging Industry Demonstration Zone, Langfang, are vested in上海易司倉儲服務有限公司. The details are listed below:
Certificate Number Site Area Land Use Expiry Date
(sq m)Ji (2019) Lang Fang Shi Bu Dong Chan Quan Di 0029689 Hao . . . . . . . . . . . . . . . . . . . . 53,334.00 Industrial December 23, 2063Total . . . . . . . . . . . . . . . . . . . . . . . . . . . . . . . . . . . . . . . . . . . . . . . . . . . . . . . . . . . . . . . . . . 53,334.00
2) We have not been provided with any relevant information about mortgage and encumbrances of the Property. We are therefore unable tocomment on any related matters and advise that a legal opinion should be sought regarding the legality, transferability of title and theexistence of any current or potential encumbrances attached to the Property.
3) Pursuant to the Company Business License No.91310117MA1J2AFT7T, 上海易司倉儲服務有限公司 with the address of No. 609 TahuiRoad, Shihudang Town, Songjiang District, Shanghai, has been in business from July 20, 2017 to July 19, 2067 with the business scopeof 倉儲服務(除危險品、食品),自有房屋租賃,物業管理,商務信息諮詢。(依法須經批准的項目,經相關部門批准後方可開展經營活動)
4) The Owner holds 100% leasehold interests of the Property.5) In assessing the market price of the Property, we have made reference to sales price of similar properties in the vicinity. Comparable
properties are located in the close proximity to the Property with similar conditions, size and tenure, etc. Comparables that had beenselected range from RMB1,150,000 to RMB1,350,000 per mu*. In the course of our valuation, we have considered the relevantadjustment factors such as the accessibility, size, plot ratio, zoning, environment, public facilities, etc. to determine the unit price of theProperty. The adopted unit price of the Property is approximately RMB848,000 per mu.
*1 mu = 666.67 sq m
6) The general description and market information of the property are summarised as below:
Location : The Property is located south of Longhu Avenue and west of Tongyi Road, EmergingIndustry Demonstration Zone, Langfang, Hebei Province, PRC.
Transportation : The Property is near Tongyi Road. The S272 Expressway (Langfang—Cangzhou) and G3Expressway (Beijing—Taipei) are situated near the Property to the north and west,providing convenient traffic access to downtown Langfang and other neighbouring cities.
Nature of Surrounding Area : The subject area is situated within Anci District in southern Langfang. It enjoys aconvenient transportation network. It is surrounded by a cluster of vacant land andindustrial properties.
7) We have prepared our valuation based on the following assumptions:
Š the information of the Property provided by the Company is true and correct;
Š the site is free from contamination and the ground conditions are satisfactory;
VI-68

APPENDIX VI PROPERTY VALUATION
Š the proper ownership title of the Property has been obtained, and all payable land premiums or land use rights fees have been fullysettled;
Š all required approvals and certificates necessary for the development and occupation and use of the Property have been dulyobtained and are in full force and effect; and
Š the Property can be freely transferred, mortgaged, sublet or otherwise disposed of in the market.
8) We have been provided with a copy of PRC legal opinion on the Property prepared by Global Law Office (環球律師事務所), whichcontains, inter alia, the following information:
Š 上海易司倉儲服務有限公司 has the right to use the land in accordance to the above mentioned real estate ownership certificate.上海易司倉儲服務有限公司 has the right to use, transfer, lease, mortgage or other legal means to deal with the premise on the conditionof adhering to the land-use and the land tenure.
9) The status of the title and grant of major approvals and licences in accordance with the information provided by the Company are asfollows:
State-owned Land-use Rights Grant Contract NoState-owned Land-use Rights Certificate Not ApplicableConstruction Land Planning Permit NoConstruction Work Planning Permit NoConstruction Work Commencement Permit NoBuilding Ownership Certificate Not ApplicableReal Estate Ownership Certificate Yes (for land only)Business License Yes
VI-69

APPENDIX VI PROPERTY VALUATION
VALUATION SUMMARY 30—PINGHU YIXING WAREHOUSE SERVICES CO., LTD.
NO. PROPERTY DESCRIPTION AND TENUREPARTICULARS OF
OCCUPANCY
MARKET VALUE INEXISTING STATE AS ATSEPTEMBER 30, 2019
30 East of BinggangRoad (濱港路) andnorth of MeiheRoad (梅河路),Dushangang Zone,Pinghu, ZhejiangProvince, PRC
The Property, known as Pinghu YixingWarehouse Services Co., Ltd. (平湖易興倉儲服務有限公司), is located east ofBinggang Road and north of MeiheRoad, Dushangang Zone, Pinghu,Zhejiang Province. The site area is100,000.00 sq m.
As advised by the Company, theProperty is earmarked for constructionof warehouses.
Pursuant to the Real Estate OwnershipCertificate provided, the land-use rightsof the Property have been granted for aterm of 50 years expiring on May 16,2069 for warehouse uses.
At the date ofinspection, theProperty was stillvacant land.
RMB111,000,000(RENMINBI
ONE HUNDREDELEVEN
MILLION)
100% interest tobe attributable to
the Group 3:
RMB111,000,000(RENMINBI
ONE HUNDREDELEVEN
MILLION)
Notes:1) Pursuant to the Real Estate Ownership Certificate, the land-use rights of the Property located east of Binggang Road and north of Meihe
Road, Dushangang Zone, Pinghu, are vested in平湖易興倉儲服務有限公司. The details are listed below:
Certificate Number Site Area Land Use Expiry Date
(sq m)Zhe (2019) Ping Hu Shi Bu Dong Chan Quan Di 0022372 Hao . . . . . . . . . . . . . . . . . . . . . . . 100,000.00 Warehouse 16 May 2069Total . . . . . . . . . . . . . . . . . . . . . . . . . . . . . . . . . . . . . . . . . . . . . . . . . . . . . . . . . . . . . . . . . . . . . 100,000.00
2) We have not been provided with any relevant information about mortgage and encumbrances of the Property. We are therefore unable tocomment on any related matters and advise that a legal opinion should be sought regarding the legality, transferability of title and theexistence of any current or potential encumbrances attached to the Property.
3) Pursuant to the Company Business License No.91330482MA2BCNTW59, 平湖易興倉儲服務有限公司 with the address of Room 391,Block 3, Pinghu Dushangang Economic Development Zone Management Committee, North of Zhaquan Avenue, Dushangang Town,Pinghu, Jiaxing, Zhejiang has been in business from 2 January 2019 to 1 January 2069 with the business scope of從事倉儲服務(除危險品、不含運輸)、工業及倉儲設施的建設及經營、物業管理。(依法須經批准的項目,經相關部門批准後方可開展經營活動)
4) The Owner holds 100% leasehold interests of the Property.
5) In assessing the market price of the Property, we have made reference to sales price of similar properties in the vicinity. Comparableproperties are located in the close proximity to the Property with similar conditions, size and tenure, etc. Comparables that had beenselected range from RMB700,000 to RMB500,000 per mu*. In the course of our valuation, we have considered the relevant adjustmentfactors such as the accessibility, size, plot ratio, zoning, environment, public facilities, etc. to determine the unit price of the Property.The adopted unit price of the Property is approximately RMB738,000 per mu.
*1 mu = 666.67 sq m
6) The general description and market information of the property are summarised as below:
Location : The Property is located east of Binggang Road and north of Meihe Road, Dushangang Zone,Pinghu, Zhejiang Province, PRC.
Transportation : The Property is near Chunhe Road. The S101 Expressway (Pinghu—Hangzhou) andG15 Expressway (Shenyang—Haikou) are situated near the Property to the north, providingconvenient traffic access to downtown Jiaxing and other neighbouring cities.
Nature of Surrounding Area : The subject area is situated within Dushangang in eastern Pinghu. It enjoys a convenienttransportation network. It is surrounded by a cluster of vacant land and industrial properties.
7) We have prepared our valuation based on the following assumptions:
Š the information of the Property provided by the Company is true and correct;
Š the site is free from contamination and the ground conditions are satisfactory;
VI-70

APPENDIX VI PROPERTY VALUATION
Š the proper ownership title of the Property has been obtained, and all payable land premiums or land use rights fees have been fullysettled;
Š all required approvals and certificates necessary for the development and occupation and use of the Property have been dulyobtained and are in full force and effect; and
Š the Property can be freely transferred, mortgaged, sublet or otherwise disposed of in the market.
8) We have been provided with a copy of PRC legal opinion on the Property prepared by Global Law Office (環球律師事務所), whichcontains, inter alia, the following information:
Š 平湖易興倉儲服務有限公司 has the right to use the land in accordance to the above mentioned real estate ownership certificate.平湖易興倉儲服務有限公司 has the right to use, transfer, lease, mortgage or other legal means to deal with the premise on the conditionof adhering to the land-use and the land tenure.
9) The status of the title and grant of major approvals and licences in accordance with the information provided by the Company are asfollows:
State-owned Land-use Rights Grant Contract NoState-owned Land-use Rights Certificate YesConstruction Land Planning Permit NoConstruction Work Planning Permit NoConstruction Work Commencement Permit NoBuilding Ownership Certificate Not ApplicableReal Estate Ownership Certificate Yes (for land only)Business License Yes
VI-71

APPENDIX VI PROPERTY VALUATION
VALUATION SUMMARY 31 – HAINING HAIYI INTELLIGENT EQUIPMENT CO., LTD.
NO. PROPERTY DESCRIPTION AND TENUREPARTICULARS OF
OCCUPANCY
MARKET VALUE INEXISTING STATE AS AT30 SEPTEMBER 2019
31 East of HainingAvenue (海寧大道)and north ofAnzhengShishang(安正時尚),Haining EconomicDevelopment Zone,Haining, ZhejiangProvince, PRC
The Property, known as HainingHaiyi Intelligent Equipment Co.,Ltd. (海寧海易智能裝備有限公司), islocated east of Haining Avenue andnorth of Anzheng Shishang, HainingEconomic Development Zone,Haining, Zhejiang Province. The sitearea is 85,371.00 sq m.
At the date ofinspection, theProperty was stillvacant land.
RMB33,000,000(RENMINBI
THIRTYTHREE
MILLION)
100% interest to beattributable to the
Group 3:
RMB33,000,000(RENMINBI
THIRTYTHREE
MILLION)
As advised by the Company, theProperty is earmarked forconstruction of industrials.
Pursuant to the Real EstateOwnership Certificate provided, theland-use rights of the Property havebeen granted for a term of 50 yearsexpiring on 9 September 2069 forindustrial uses.
Notes:1) Pursuant to the Real Estate Ownership Certificate, the land-use rights of the Property located east of Haining Avenue and north of
Anzheng Shishang, Haining Economic Development Zone, Haining, are vested in 海寧海易智能裝備有限公司. The details are listedbelow:
Certificate Number Site Area Land Use Expiry Date
(sq m)Zhe (2019) Hai Ning Shi Bu Dong Chan Quan Di 0059046 Hao . . 85,371.00 Industrial 9 September 2069Total . . . . . . . . . . . . . . . . . . . . . . . . . . . . . . . . . . . . . . . . . . . . . . . . . 85,371.00
2) We have not been provided with any relevant information about mortgage and encumbrances of the Property. We are therefore unable tocomment on any related matters and advise that a legal opinion should be sought regarding the legality, transferability of title and theexistence of any current or potential encumbrances attached to the Property.
3) Pursuant to the Company Business License No. 91330481MA2CUU2XXQ, 海寧海易智能裝備有限公司 with the address of Room 311,No.118 Longxing Road, Haining Economic Development Zone, Haining, Zhejiang has been in business from 10 May 2019 to 9 May2069 with the business scope of 工業及倉儲自動化設備的研發、設計、生產、銷售、安裝、維修、售後服務、技術服務及技術轉讓;工業機器人、汽車零部件及配件的製造;機械零部件加工;倉儲服務(不含危險化學品和易制毒化學品倉儲;不含物流配送);倉儲設施的租賃、管理;自有房屋租賃;物業管理;(依法須經批准的項目,經相關部門批准後方可開展經營活動)
4) The Owner holds 100% leasehold interests of the Property.5) In assessing the market price of the Property, we have made reference to sales price of similar properties in the vicinity. Comparable
properties are located in the close proximity to the Property with similar conditions, size and tenure, etc. Comparables that had beenselected range from RMB220,000 to RMB250,000 per mu*. In the course of our valuation, we have considered the relevant adjustmentfactors such as the accessibility, size, plot ratio, zoning, environment, public facilities, etc. to determine the unit price of the Property.The adopted unit price of the Property is approximately RMB255,000 per mu.*1 mu = 666.67 sq m
6) The general description and market information of the property are summarised as below:
Location : The Property is located east of Haining Avenue and north of Anzheng Shishang, HainingEconomic Development Zone, Haining, Zhejiang Province, PRC.
Transportation : The Property is near Haining Avenue. Haining Avenue and G60 Expressway (Shanghai—Kunming) are situated near the Property to the east, providing convenient traffic access todowntown Haining and other neighbouring cities.
Nature of Surrounding Area : The subject area is situated within Haining Economic Development Zone in northern Haining.It enjoys a convenient transportation network. It is surrounded by a cluster of vacant land andindustrial properties.
VI-72
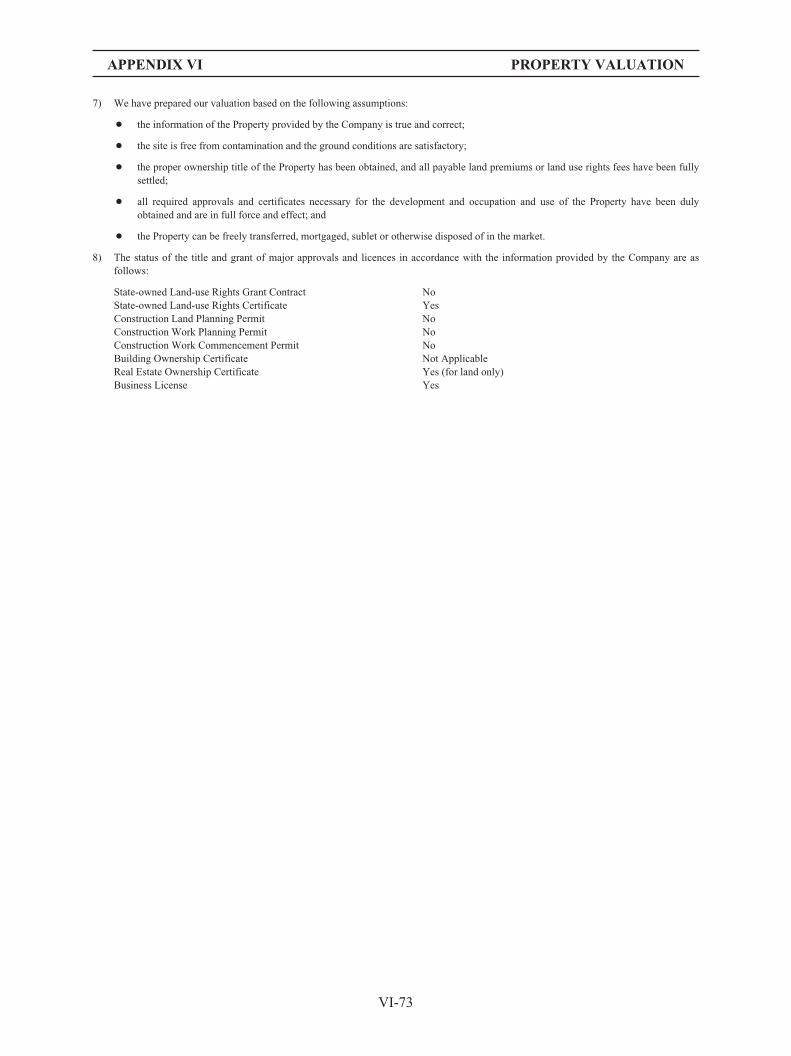
APPENDIX VI PROPERTY VALUATION
7) We have prepared our valuation based on the following assumptions:
Š the information of the Property provided by the Company is true and correct;
Š the site is free from contamination and the ground conditions are satisfactory;
Š the proper ownership title of the Property has been obtained, and all payable land premiums or land use rights fees have been fullysettled;
Š all required approvals and certificates necessary for the development and occupation and use of the Property have been dulyobtained and are in full force and effect; and
Š the Property can be freely transferred, mortgaged, sublet or otherwise disposed of in the market.
8) The status of the title and grant of major approvals and licences in accordance with the information provided by the Company are asfollows:
State-owned Land-use Rights Grant Contract NoState-owned Land-use Rights Certificate YesConstruction Land Planning Permit NoConstruction Work Planning Permit NoConstruction Work Commencement Permit NoBuilding Ownership Certificate Not ApplicableReal Estate Ownership Certificate Yes (for land only)Business License Yes
VI-73

APPENDIX VI PROPERTY VALUATION
VALUATION SUMMARY 32—WUHAN YIZHONG WAREHOUSE SERVICES CO., LTD.
NO. PROPERTY DESCRIPTION AND TENUREPARTICULARS OF
OCCUPANCY
MARKET VALUE INEXISTING STATE AS ATSEPTEMBER 30, 2019
32 West of theintersection ofHuayuanwan SecondStreet (花園灣二街)and Zhulin FourthRoad (竹林四路), DajiStreet (大集街),Caidian District,Wuhan HubeiProvince, PRC
The Property, known as WuhanYizhong Warehouse Services Co.,Ltd. (武漢易仲倉儲服務有限公司), islocated west of the intersection ofHuayuanwan Second Street andZhulin Fourth Road, Daji Street,Caidian District, Wuhan. The sitearea is approximately 61,911.00sq m.
As advised by the Company, theProperty is earmarked forconstruction of warehouses.
According to the record of WuhanNatural Resources and PlanningBureau, the land-use rights of theProperty have been granted for aterm of 50 years for industrial uses.
At the date ofinspection, theProperty was stillvacant land.
RMB22,000,000(RENMINBI
TWENTYTWO MILLION)
100% interest tobe attributable to
the Group 3:
RMB22,000,000(RENMINBI
TWENTY TWOMILLION
Notes:1) We have not been provided with any title documents except the Company Business License of the Property. In our valuation, we have
assumed 武漢易仲倉儲服務有限公司 has obtained the State-owned Land-use Rights for warehouse uses, and any land premium or otherrelevant fees have been fully paid and settled.
2) We have not been provided with any relevant information about mortgage and encumbrances of the Property. We are therefore unable tocomment on any related matters and advise that a legal opinion should be sought regarding the legality, transferability of title and theexistence of any current or potential encumbrances attached to the Property.
3) Pursuant to the Company Business License No. 91420114MA4K3Q4J00, 武漢易仲倉儲服務有限公司 with the address of Plant No.9,Industrial Project of Zhengdong Hetai Real Estate Management Co., Ltd., Longwang Village, Tushan Village, Zhashan Street, CaidianDistrict, Wuhan, has been in business from 22 April 2019 to 21 April 2069 with the business scope of 倉儲服務(除危險品、不含運輸);工業及倉儲設施的建設及租賃;物業管理;商務信息諮詢。(上述經營範圍不涉及外商投資准入特別管理措施範圍)(依法須經審批的項目,經相關部門審批後方可開展經營活動
4) The Owner holds 100% leasehold interests of the Property.5) In assessing the market price of the Property, we have made reference to sales price of similar properties in the vicinity. Comparable
properties are located in the close proximity to the Property with similar conditions, size and tenure, etc. Comparables that had beenselected range from RMB230,000 to RMB231,000 per mu*. In the course of our valuation, we have considered the relevant adjustmentfactors such as the accessibility, size, plot ratio, zoning, environment, public facilities, etc. to determine the unit price of the Property.The adopted unit price of the Property is approximately RMB233,000 per mu.
*1 mu = 666.67 sq m
6) According to the information provided by the Company, the total construction cost incurred for the Property was approximatelyRMB364,000 as of the Date of Valuation, which has been taken into account in our valuation.
7) The general description and market information of the property are summarised as below:
Location : West of the intersection of Huayuanwan Second and Zhulin Fourth Road, Daji Street, CaidianDistrict, Wuhan Hubei Province, PRC.
Transportation : The Property is near Huayuanwan Second Road and Zhulin Road. The G50 Expressway(Shanghai—Chongqing) and Wuhan Ring Expressway (武漢繞城高速) are situated near theProperty to the south and east respectively, providing convenient traffic access to downtownWuhan and other neighbouring cities.
Nature of Surrounding Area : The subject area is situated within Caidian District in southwest of Wuhan. It enjoys aconvenient transportation network. It is surrounded by a cluster of vacant land and industrialproperties.
8) We have prepared our valuation based on the following assumptions:
Š the information of the Property provided by the Company is true and correct;
VI-74

APPENDIX VI PROPERTY VALUATION
Š the site is free from contamination and the ground conditions are satisfactory;
Š the proper ownership title of the Property has been obtained, and all payable land premiums or land use rights fees have been fullysettled;
Š all required approvals and certificates necessary for the development and occupation and use of the Property have been dulyobtained and are in full force and effect; and
Š the Property can be freely transferred, mortgaged, sublet or otherwise disposed of in the market.
9) We have been provided with a copy of PRC legal opinion on the Property prepared by Global Law Office (環球律師事務所), whichcontains, inter alia, the following information:
Š 武漢易仲倉儲服務有限公司 has the right to use the land in accordance to the above mentioned real estate ownership certificate.武漢易仲倉儲服務有限公司 has the right to use, transfer, lease, mortgage or other legal means to deal with the premise on the conditionof adhering to the land-use and the land tenure.
10) The status of the title and grant of major approvals and licences in accordance with the information provided by the Company are asfollows:
State-owned Land-use Rights Grant Contract NoState-owned Land-use Rights Certificate NoConstruction Land Planning Permit NoConstruction Work Planning Permit NoConstruction Work Commencement Permit NoBuilding Ownership Certificate Not ApplicableReal Estate Ownership Certificate NoBusiness License Yes
VI-75

APPENDIX VI PROPERTY VALUATION
VALUATION SUMMARY 33—JIEYANG YIAN WAREHOUSE SERVICES CO., LTD.
NO. PROPERTY DESCRIPTION AND TENUREPARTICULARS OF
OCCUPANCY
MARKET VALUE INEXISTING STATE AS ATSEPTEMBER 30, 2019
33 Southeast side ofBaoshan Road (寶山路)and Yunbao Avenue(雲寶大道), JiedongDevelopment ZoneNew Industrial Park(揭東開發區新型工業園), Jieyang,Guangdong Province,PRC
The Property, known as JieyangYian Warehouse Services Co., Ltd.(揭陽易安倉儲服務有限公司), islocated Southeast side of BaoshanRoad and Yunbao Avenue, JiedongDevelopment Zone New IndustrialPark, Jieyang, with a total site areaof 88,999.30 sq m.
According to theinformation provided,the Property was stillvacant land.
RMB69,000,000(RENMINBI
SIXTYNINE MILLION)
100% interest tobe attributable to
the Group 3:
RMB69,000,000(RENMINBI
SIXTYNINE MILLION)
As advised by the Company, theProperty is earmarked forconstruction of warehouses.
Pursuant to the Real EstateOwnership Certificate provided, theland-use rights of the Property havebeen granted for a term of 50 yearsexpiring on June 26, 2069 forindustrial uses.
Notes:1) Pursuant to the Real Estate Ownership Certificate, the land-use rights of the Property located Southeast side of Baoshan Road and
Yunbao Avenue, Jiedong Development Zone New Industrial Park, Jieyang, are vested in 揭陽易安倉儲服務有限公司. The details arelisted below:
Certificate Number Site Area Land Use Expiry Date
(sq m)Yue (2019) Jie Dong Qu Bu Dong Chan Quan Di 0004029 Hao . . . . . . . . . . . . . . . . . . . . . . . 88,999.30 Warehouse 26 June 2069Total . . . . . . . . . . . . . . . . . . . . . . . . . . . . . . . . . . . . . . . . . . . . . . . . . . . . . . . . . . . . . . . . . . . . . . 88,999.30
2) Pursuant to the Construction Land Planning Permit, the planning of the construction land of the Property has been approved to 揭陽易安倉儲服務有限公司. The details are listed below:
Certificate Number Location Site Area
(mu)Di Zi Di 445203201905010 Hao . . . . . . . . . . . . . . . . . . . . . . . Southeast side of Baoshan Road and Yunbao Avenue,
Jiedong Development Zone New Industrial Park, Jieyang133.499
Total . . . . . . . . . . . . . . . . . . . . . . . . . . . . . . . . . . . . . . . . . . . . . 133.499
3) Pursuant to the Construction Work Planning Permit, the planning of the construction work of the Property has been approved to揭陽易安倉儲服務有限公司. The details are listed below:
Certificate Number Project Name Detailed LocationConstruction
Scale
(sq m)Jian Zi Di 445203201908020 Hao . . . . . . ESR e-Shang Group
Yuedong LogisticsHeadquarter Base
Southeast side of Baoshan Road andYunbao Avenue, Jiedong DevelopmentZone New Industrial Park, Jieyang
69,640.14
Total . . . . . . . . . . . . . . . . . . . . . . . . . . . . . 69,640.14
4) We have not been provided with any relevant information about mortgage and encumbrances of the Property. We are therefore unable tocomment on any related matters and advise that a legal opinion should be sought regarding the legality, transferability of title and theexistence of any current or potential encumbrances attached to the Property.
5) Pursuant to the Company Business License No. 91445200MA52E3J70X, 揭陽易安倉儲服務有限公司 with the address of RoomRoom301, Level 3, No.11 of North Area in Zhongxing Zilincheng, East of Jiedong Renmin Square, Jieyang, has been in business from24 October 2018 to 24 October 2068 with the business scope of 倉儲服務(不含化學危險品、不含道路運輸);倉儲設施的建設、經營、管理、租賃及配套服務;物業管理;物流信息技術諮詢服務。(依法須經批准的項目,經相關部門批准後方可開展經營活動)
6) The Owner holds 100% leasehold interests of the Property.7) In assessing the market price of the Property, we have made reference to sales price of similar properties in the vicinity. Comparable
properties are located in the close proximity to the Property with similar conditions, size and tenure, etc. Comparables that had beenselected range from RMB440,000 to RMB520,000 per mu*. In the course of our valuation, we have considered the relevant adjustment
VI-76
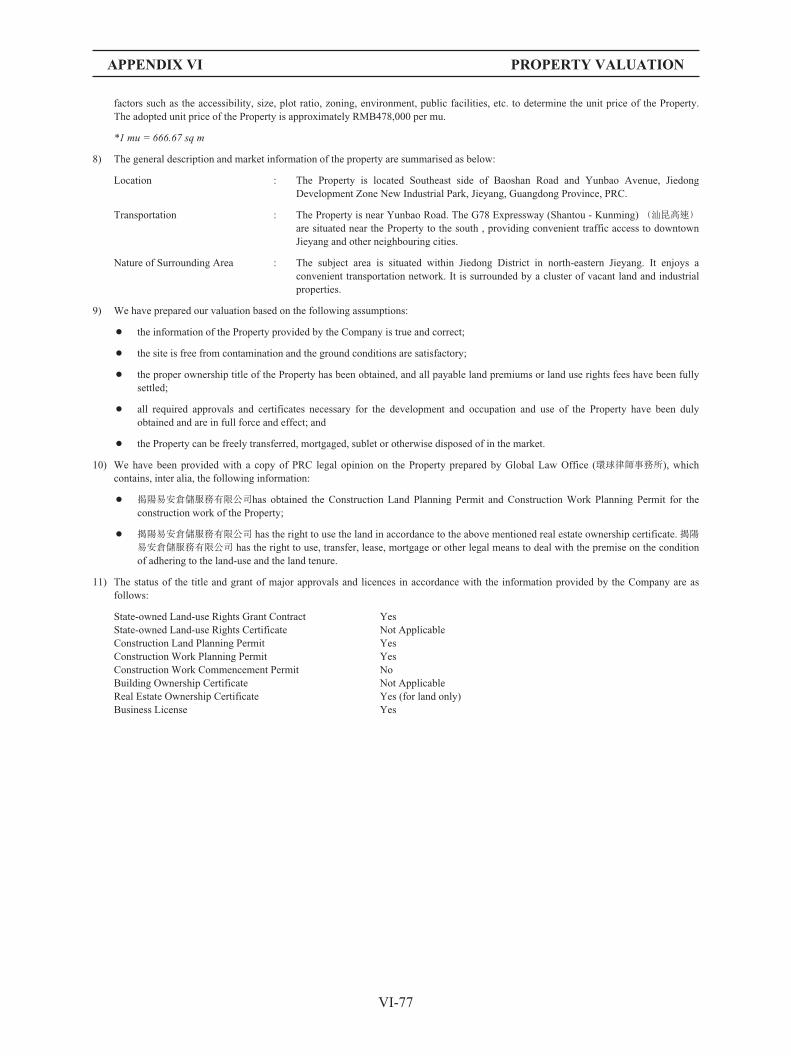
APPENDIX VI PROPERTY VALUATION
factors such as the accessibility, size, plot ratio, zoning, environment, public facilities, etc. to determine the unit price of the Property.The adopted unit price of the Property is approximately RMB478,000 per mu.
*1 mu = 666.67 sq m
8) The general description and market information of the property are summarised as below:
Location : The Property is located Southeast side of Baoshan Road and Yunbao Avenue, JiedongDevelopment Zone New Industrial Park, Jieyang, Guangdong Province, PRC.
Transportation : The Property is near Yunbao Road. The G78 Expressway (Shantou - Kunming) (汕昆高速)are situated near the Property to the south , providing convenient traffic access to downtownJieyang and other neighbouring cities.
Nature of Surrounding Area : The subject area is situated within Jiedong District in north-eastern Jieyang. It enjoys aconvenient transportation network. It is surrounded by a cluster of vacant land and industrialproperties.
9) We have prepared our valuation based on the following assumptions:
Š the information of the Property provided by the Company is true and correct;
Š the site is free from contamination and the ground conditions are satisfactory;
Š the proper ownership title of the Property has been obtained, and all payable land premiums or land use rights fees have been fullysettled;
Š all required approvals and certificates necessary for the development and occupation and use of the Property have been dulyobtained and are in full force and effect; and
Š the Property can be freely transferred, mortgaged, sublet or otherwise disposed of in the market.
10) We have been provided with a copy of PRC legal opinion on the Property prepared by Global Law Office (環球律師事務所), whichcontains, inter alia, the following information:
Š 揭陽易安倉儲服務有限公司has obtained the Construction Land Planning Permit and Construction Work Planning Permit for theconstruction work of the Property;
Š 揭陽易安倉儲服務有限公司 has the right to use the land in accordance to the above mentioned real estate ownership certificate.揭陽易安倉儲服務有限公司 has the right to use, transfer, lease, mortgage or other legal means to deal with the premise on the conditionof adhering to the land-use and the land tenure.
11) The status of the title and grant of major approvals and licences in accordance with the information provided by the Company are asfollows:
State-owned Land-use Rights Grant Contract YesState-owned Land-use Rights Certificate Not ApplicableConstruction Land Planning Permit YesConstruction Work Planning Permit YesConstruction Work Commencement Permit NoBuilding Ownership Certificate Not ApplicableReal Estate Ownership Certificate Yes (for land only)Business License Yes
VI-77

APPENDIX VI PROPERTY VALUATION
The following is the text of a letter, summary of valuations and valuation certificate preparedfor the purpose of incorporation in this Prospectus received from Cushman & Wakefield K.K., anindependent property valuer, in connection with its opinion of value of certain property interests of theGroup as at September 30, 2019.
Sanno Park Tower 13F2-11-1 Nagatacho, Chiyoda-ku
Tokyo, JAPAN
October 22, 2019
ESR Cayman Limited
Dear Sirs,
Instructions, Purpose & Valuation Date
In accordance with the instructions from ESR Cayman Limited (the “Company”) for us to valuethe properties in which the Company or its subsidiaries (collectively the “Group”) has interests inJapan (as more particularly described in the attached valuation report), we confirm that we haveinspected the properties, made relevant enquiries and obtained such further information as we considernecessary for the purpose of providing you with our opinion of the values of such properties as atSeptember 30, 2019.
Valuation Basis
Our valuation of each of the properties represents its market value which in accordance with theReal Estate Appraisal Standards (Japan) issued by Japan Ministry of Land, Infrastructure, Transportand Tourism and the International Valuation Standards (“IVS”) is defined as “the estimated amount forwhich an asset or liability should exchange on the valuation date between a willing buyer and a willingseller in an arm’s length transaction, after proper marketing and where the parties had each actedknowledgeably, prudently and without compulsion”.
We confirm that the valuations are undertaken in accordance with the requirements set out inChapter 5 of the Main Board Listing Rules and Practice Note 12 Governing the Listing of Securitiespublished by The Stock Exchange of the Hong Kong Limited.
Our valuation of each of the properties are on an entirety interest basis.
Valuation Assumptions
Our valuation of each of the properties exclude an estimated price inflated or deflated byspecial terms or circumstances such as a typical financing, sale and leaseback arrangements, specialconsiderations or concessions granted by anyone associated with the sale, or any element of valueavailable only to a specific owner or purchaser.
In the course of our valuation of the properties, we have relied on the information and advicegiven by the Group, regarding the titles to the properties and the interests of the Company in theproperties in Japan. Unless otherwise stated in the respective legal opinion, in valuing the properties,
VI-78

APPENDIX VI PROPERTY VALUATION
we have assumed that the Group has an enforceable title to each of the properties and has free anduninterrupted rights to use, occupy or assign the properties for the whole of the respective unexpiredland use term as granted and that any premium payable has already been fully paid.
In respect of the properties situated in Japan, the status of titles and grant of major certificates,approvals and licenses, in accordance with the information provided by the Company are set out in thenotes of the respective valuation report. We have assumed that all consents, approvals and licensesfrom relevant government authorities for the developments have been obtained without onerousconditions or delays. We have also assumed that the design and construction of the properties are incompliance with the local planning regulations and have been approved by the relevant authorities.
No allowance has been made in our valuations for any charges, mortgages or amounts owingon the properties nor any expenses or taxation which may be incurred in effecting a sale. Unlessotherwise stated, it is assumed that the properties are free from encumbrances, restrictions andoutgoings of any onerous nature which could affect their values.
Method of Valuation
The Property 1 and 2 are Tenant-Occupied Building and its Site. However, the efficiency ofland use of the current buildings is significantly lower than the permitted floor area ratio, and thebuildings do not conform to the site and the neighborhood. Therefore, we have concluded that thehighest and best use is to demolish the buildings after the expiration of the land lease agreement anddevelop a distribution facilities. Based on this conclusion, we first estimate the vacant land value afterthe building demolition by applying the Sales Comparison Approach and the DCF Method (assumingdevelopment of leased property). Then, considering the time, income and expense required for thebuilding demolition, we conclude the appraised value by using the DCF Method.
The Property 3 and 4 are Owner-Occupied Building and its Site. However, the existingbuildings are not in use and are undergoing demolition. Therefore, we have concluded that the highestand best use is to demolish the building and develop logistics facilities. Based on this conclusion, wefirst estimate the vacant land value after the building demolition by applying the Sales ComparisonApproach and the DCF Method (assuming development of leased property). Then, considering theexpense required for the building demolition (including the carrying-out of contaminated soil), weconclude the appraised value by using the DCF Method.
Source of Information
We have relied to a very considerable extent on the information given by the Company andhave accepted advice given to us on such matters as planning approvals, statutory notices, easements,tenures, identification of land and buildings, completion date of buildings, particulars of occupancy,tenancy details, site and floor areas, site and floor plans, number of parking spaces, interestsattributable to the Group and all other relevant matters.
Dimensions, measurements and areas included in the valuation report are based on the copies ofdocuments or other information provided to us by the Company and are therefore only approximations.No on-site measurement has been carried out. We have had no reason to doubt the truth and accuracyof the information provided to us by the Group which is material to the valuations. We were alsoadvised by the Group that no material facts have been omitted from the information provided.
VI-79

APPENDIX VI PROPERTY VALUATION
Title Investigation
We have been provided with extracts of documents relating to the properties in Japan.However, we have not inspected the original documents to ascertain any amendments which may notappear on the copies handed to us. We are also unable to ascertain the title of the properties and wehave therefore relied on the advice given by the Company or the Company’s legal adviser regardingthe interests of the Company in the properties in Japan.
Site Inspection
We (Assistant Valuer, Mr. Tadao Kawashima, a licensed real estate appraiser with 11 years ofexperience, Senior Valuer, Ms. Noriko Hattori, a licensed real estate appraiser with 13 years ofexperience and Associate Director, Ms. Naomi Rice, a licensed real estate appraiser with 20 years ofexperience), inspected the exterior and, wherever possible, the interior of the property on October 8,2019 for the Property 1 and 2, and on October 7, 2019 for the Property 3 and 4 respectively. Nostructural survey has been made, but in the course of our inspection, we did not note any seriousdefects. We are, however, not able to report that the properties are free of rot, infestation or any otherstructural defects. No tests were carried out to any of the services.
Unless otherwise stated, we have not been able to carry out on-site measurements to verify thesite and floor areas of the properties and we have assumed that the areas shown on the documentshanded to us are correct.
Currency
Unless otherwise stated, all monetary sums stated in our valuations are in Japanese Yen(“JPY”), the official currency of Japan.
Other Disclosure
We hereby confirm that Cushman & Wakefield K.K. and the valuers conducting the valuationshave no pecuniary or other interests that could conflict with the proper valuations of the properties orcould reasonably be regarded as being capable of affecting our ability to give an unbiased opinion. Weconfirm that we are an independent qualified valuer, as referred to Rule 5.08 of the Main Board ListingRules Governing the Listing of Securities on the Stock Exchange of Hong Kong Limited.
We enclose herewith a summary of valuations and valuation report for your attention.
Yours faithfully,For and on behalf of
Cushman & Wakefield K.K.
Katsuaki ShinoharaLREA(Japan), MRICS
DirectorHead of Valuation & Advisory, Japan
Naomi RiceLREA(Japan), MRICS, MAI
Associate DirectorValuation & Advisory, Japan
VI-80

APPENDIX VI PROPERTY VALUATION
Note: Mr. Katsuaki Shinohara is a Registered Professional Surveyor who has over 15 years’ experience in the valuation of properties in Japan.Mr. Shinohara has sufficient current national knowledge of the market, and the skills and understanding to undertake the valuationscompetently.Ms. Naomi Rice is a Registered Professional Surveyor who has over 20 years’ experience in the valuation of properties in Japan.Ms. Rice has sufficient current national knowledge of the market, and the skills and understanding to undertake the valuationscompetently.
VI-81
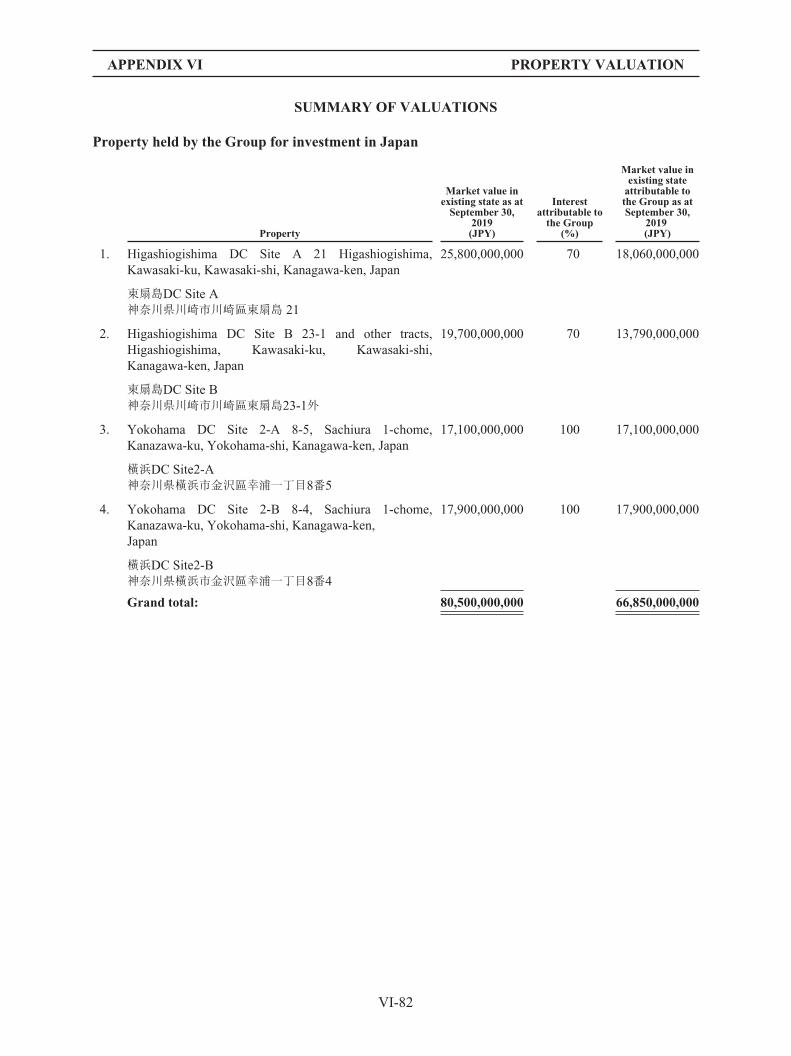
APPENDIX VI PROPERTY VALUATION
SUMMARY OF VALUATIONS
Property held by the Group for investment in Japan
Property
Market value inexisting state as atSeptember 30,
2019(JPY)
Interestattributable tothe Group
(%)
Market value inexisting stateattributable tothe Group as atSeptember 30,
2019(JPY)
1. Higashiogishima DC Site A 21 Higashiogishima,Kawasaki-ku, Kawasaki-shi, Kanagawa-ken, Japan
東扇島DC Site A神奈川県川崎市川崎區東扇島 21
25,800,000,000 70 18,060,000,000
2. Higashiogishima DC Site B 23-1 and other tracts,Higashiogishima, Kawasaki-ku, Kawasaki-shi,Kanagawa-ken, Japan
東扇島DC Site B神奈川県川崎市川崎區東扇島23-1外
19,700,000,000 70 13,790,000,000
3. Yokohama DC Site 2-A 8-5, Sachiura 1-chome,Kanazawa-ku, Yokohama-shi, Kanagawa-ken, Japan
橫浜DC Site2-A神奈川県橫浜市金沢區幸浦一丁目8番5
17,100,000,000 100 17,100,000,000
4. Yokohama DC Site 2-B 8-4, Sachiura 1-chome,Kanazawa-ku, Yokohama-shi, Kanagawa-ken,Japan
橫浜DC Site2-B神奈川県橫浜市金沢區幸浦一丁目8番4
17,900,000,000 100 17,900,000,000
Grand total: 80,500,000,000 66,850,000,000
VI-82

APPENDIX VI PROPERTY VALUATION
VALUATION REPORT
Property held by the Group for investment in Japan
No. Property Description and tenureParticulars ofoccupancy
Market Valuein existing state as atSeptember 30, 2019
1. Higashiogishima DCSite A
The property is a 39 years oldoffice erected upon a site area of77,723.49 sq m.
As at the valuation date,the property is leased byMitsubishi UFJ Trust andBanking Corporation(trustee), which owns theland and building, to anindependent third partyunder a fixed-term landleasehold agreement anda fixed-term buildinglease agreement.
JPY25,800,000,000
(70% interestattributable to the
Group:JPY18,060,000,000)
21 Higashiogishima,Kawasaki-ku,Kawasaki-shi,Kanagawa-ken,210-0869, Japan
The property comprises 4 buildingswith a total gross floor area of592.65 sq m. The property wascompleted in 1980.
Details of the property are shownas follows: -
東扇島DC Site A〒210-0869神奈川県川崎市川崎區東扇島21
UseGFA
(sq m )
Office . . . . . . . . . . . . . 436.09Guard house . . . . . . . . 10.48Propane store . . . . . . . 10.62Workshop . . . . . . . . . . 135.46
Total . . . . . . . . . . . . . . 592.65
The property is located in adistribution district with a highdensity of large-scale logisticsproperties in the metropolitanbayside area.
The Group has trust beneficiaryright of the property. The land andbuildings are owned by MitsubishiUFJ Trust and BankingCorporation (trustee).
Notes :-(1) According to the Real Estate Title Certificate Lot No. 21 Higashiogishima issued by Legal Affairs Bureau dated September 25, 2019, the
ownership right of the property with a total site area of 77,723.49 sq m have been vested in Mitsubishi UFJ Trust and BankingCorporation as trustee. RW Higashiogishima TMK has trust beneficiary right of the property. The Land leasehold right set forth inArticle 24 of the Land Lease and House Lease Act is also registered.
(2) According to the Real Estate Title Certificate Building No. 21 and 21-2 Higashiogishima issued by Legal Affairs Bureau datedSeptember 25, 2019, the ownership right of the property with a total GFA of 592.65 sq m have been vested in Mitsubishi UFJ Trust andBanking Corporation as trustee. RW Higashiogishima TMK has trust beneficiary right of the property.
(3) The property is leased to an independent third party under a fixed-term land leasehold agreement and a fixed-term building leaseagreement by June 25, 2022. The contract monthly rent is JPY56,400,299.
(4) The property is located in a Commercial Area with designated floor area ratio (“FAR”) of 400% and building cover ratio of 80%.(5) Our key assumptions of the valuation are:
(i) Assumed the redevelopment after the current lease term;(ii) The vacant land value after the lease term was estimated by applying the Sales Comparison Approach and the DCF Method
assuming development of leased property. The below is assumption summary of the DCF Method.— Assumed building is an eight-storey logistics facility with gross floor area for FAR of 310,670 sq m and net rentable area of
302,622 sq m which is based on the development plan provided by the Group.— Rental value for warehouse and office are JPY3,800 and JPY7,500 per month per tsubo1 consequently.
1 tsubo is approximately 3.30579 square meters
VI-83

APPENDIX VI PROPERTY VALUATION
— The discount rate of 3.9% is applied.— The terminal capitalization rate of 4.2% is applied;
(iii) We estimated the value of the subject property by using the DCF Method based on the below assumptions.— For the current lease term, income and expense are projected based on the current contract.— In the period of 33 months from the date of valuation, the current building will be demolished, and the subject property will be
a vacant land.— The discount rate of 3.9% is applied.
(6) The Beneficially Rights on the Real Estate Title Certificate of the property are legal, valid and enforceable.(7) The trust beneficiary right of the property was acquired by the Group on June 30, 2016. The details of the acquisition was not disclosed
for this valuation.
VI-84

APPENDIX VI PROPERTY VALUATION
No. Property Description and tenureParticulars ofoccupancy
Market Value inexisting state as atSeptember 30, 2019
2. HigashiogishimaDC Site B
23-1, 23-2, 23-5 and23-8,Higashiogishima,Kawasaki-ku,Kawasaki-shi,Kanagawa-ken,210-0869, Japan
東扇島DC Site B〒210-0869神奈川県川崎市川崎區東扇島23-1,23-2, 23-5, 23-8
The property is a 36 and 29 yearsold warehouse erected uponvarious parcels of adjoining landwith a total site area of 66,115.69sq m.
The property comprises 6 buildingswith a total gross floor area of41,558.85 sq m. The property wascompleted in 1983 and 1990
Details of the property are shownas follows: -
As at the valuation date,the property is leased byMitsubishi UFJ Trust andBanking Corporation(trustee), which owns theland and building, to anindependent third partyunder a fixed-term landleasehold agreement anda fixed-term buildinglease agreement.
JPY19,700,000,000
(70% interestattributable to the
Group:JPY13,790,000,000)
UseGFA
(sq m)
Warehouse andguardhouse . . . . . . . 89.39
Workshop . . . . . . . . . . 696.72Machine room . . . . . . . 16.41Bathroom . . . . . . . . . . 6.62Warehouse . . . . . . . . . 29,924.51Warehouse and
office . . . . . . . . . . . . 10,825.20
Total . . . . . . . . . . . . . . 41,558.85
The property is located in adistribution district with a highdensity of large-scale logisticsproperties in the metropolitanbayside area.
The Group has trust beneficiaryright of the property. The land andbuildings are owned by MitsubishiUFJ Trust and BankingCorporation (trustee).
Notes :-(1) According to the Real Estate Title Certificate Lot No. 23-1, 23-2, 23-5 and 23-8, Higashiogishima issued by Legal Affairs Bureau dated
September 9, 2019, the ownership right of the property with a total site area of 66,115.69 sq m have been vested in Mitsubishi UFJ Trustand Banking Corporation as trustee. RW Higashiogishima TMK has trust beneficiary right of the property. The Land leasehold right setforth in Article 24 of the Land Lease and House Lease Act is also registered.
(2) According to the Real Estate Title Certificate Building No. 23-1, 23-1-2, 23-1-3 and 23-2, Higashiogishima issued by Legal AffairsBureau dated September 25, 2019, the ownership right of the property with a total GFA of 41,558.85 sq m have been vested inMitsubishi UFJ Trust and Banking Corporation as trustee. RW Higashiogishima TMK has trust beneficiary right of the property.
(3) The property is leased to an independent third party under a fixed-term land leasehold agreement and a fixed-term building leaseagreement by June 25, 2022. The contract monthly rent is JPY67,360,362.
(4) The property is located in a Commercial Area with designated FAR of 400% and building cover ratio of 80%.(5) Our key assumptions of the valuation are:
(i) Assumed the redevelopment after the current lease term;(ii) The vacant land value after the lease term was estimated by applying the Sales Comparison Approach and the DCF Method
assuming development of leased property. The below is assumption summary of the DCF Method.— Assumed building is an eight-storey logistics facility with gross floor area for FAR of 264,453 sq m and net rentable area of
258,993 sq m which is based on the development plan provided by the Group.— Rental value for warehouse and office are JPY3,800 and JPY7,500 per month per tsubo consequently.— The discount rate of 3.9% is applied.— The terminal capitalization rate of 4.2% is applied;
VI-85

APPENDIX VI PROPERTY VALUATION
(iii) We estimated the value of the subject property by using the DCF Method based on the below assumptions.— For the current lease term, income and expense are projected based on the current contract.— In the period of 33 months from the date of valuation, the current building will be demolished, and the subject property will be
a vacant land.— The discount rate of 4.5% is applied.
(6) The Beneficially Rights on the Real Estate Title Certificate of the property are legal, valid and enforceable.(7) The trust beneficiary right of the property was acquired by the Group on June 30, 2016. The details of the acquisition was not disclosed
for this valuation.
VI-86
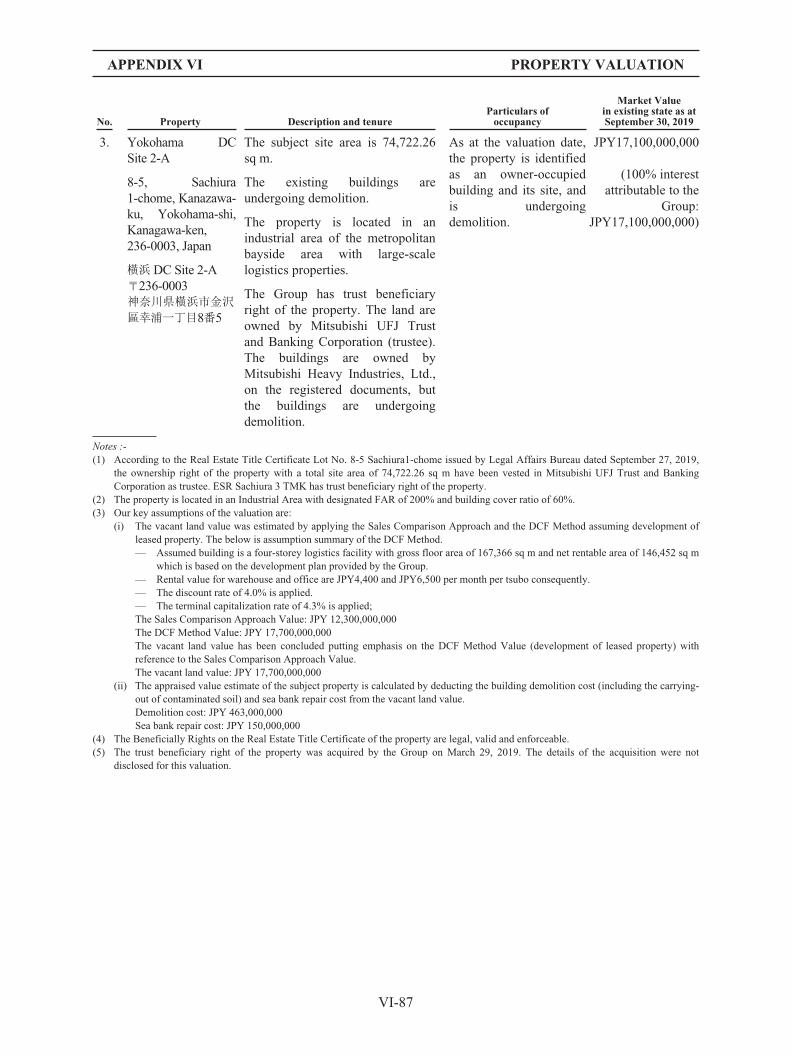
APPENDIX VI PROPERTY VALUATION
No. Property Description and tenureParticulars ofoccupancy
Market Valuein existing state as atSeptember 30, 2019
3. Yokohama DCSite 2-A
8-5, Sachiura1-chome, Kanazawa-ku, Yokohama-shi,Kanagawa-ken,236-0003, Japan
橫浜DC Site 2-A〒236-0003神奈川県橫浜市金沢區幸浦一丁目8番5
The subject site area is 74,722.26sq m.
The existing buildings areundergoing demolition.
The property is located in anindustrial area of the metropolitanbayside area with large-scalelogistics properties.
The Group has trust beneficiaryright of the property. The land areowned by Mitsubishi UFJ Trustand Banking Corporation (trustee).The buildings are owned byMitsubishi Heavy Industries, Ltd.,on the registered documents, butthe buildings are undergoingdemolition.
As at the valuation date,the property is identifiedas an owner-occupiedbuilding and its site, andis undergoingdemolition.
JPY17,100,000,000
(100% interestattributable to the
Group:JPY17,100,000,000)
Notes :-(1) According to the Real Estate Title Certificate Lot No. 8-5 Sachiura1-chome issued by Legal Affairs Bureau dated September 27, 2019,
the ownership right of the property with a total site area of 74,722.26 sq m have been vested in Mitsubishi UFJ Trust and BankingCorporation as trustee. ESR Sachiura 3 TMK has trust beneficiary right of the property.
(2) The property is located in an Industrial Area with designated FAR of 200% and building cover ratio of 60%.(3) Our key assumptions of the valuation are:
(i) The vacant land value was estimated by applying the Sales Comparison Approach and the DCF Method assuming development ofleased property. The below is assumption summary of the DCF Method.— Assumed building is a four-storey logistics facility with gross floor area of 167,366 sq m and net rentable area of 146,452 sq m
which is based on the development plan provided by the Group.— Rental value for warehouse and office are JPY4,400 and JPY6,500 per month per tsubo consequently.— The discount rate of 4.0% is applied.— The terminal capitalization rate of 4.3% is applied;The Sales Comparison Approach Value: JPY 12,300,000,000The DCF Method Value: JPY 17,700,000,000The vacant land value has been concluded putting emphasis on the DCF Method Value (development of leased property) withreference to the Sales Comparison Approach Value.The vacant land value: JPY 17,700,000,000
(ii) The appraised value estimate of the subject property is calculated by deducting the building demolition cost (including the carrying-out of contaminated soil) and sea bank repair cost from the vacant land value.Demolition cost: JPY 463,000,000Sea bank repair cost: JPY 150,000,000
(4) The Beneficially Rights on the Real Estate Title Certificate of the property are legal, valid and enforceable.(5) The trust beneficiary right of the property was acquired by the Group on March 29, 2019. The details of the acquisition were not
disclosed for this valuation.
VI-87

APPENDIX VI PROPERTY VALUATION
No. Property Description and tenureParticulars ofoccupancy
Market Valuein existing state
as atSeptember 30, 2019
4. Yokohama DCSite 2-B
8-4, Sachiura1-chome, Kanazawa-ku, Yokohama-shi,Kanagawa-ken,236-0003, Japan
橫浜DC Site 2-B〒236-0003神奈川県橫浜市金沢區幸浦一丁目8番4
The subject site area is 74,722.26sq m.
The existing buildings areundergoing demolition.
The property is located in anindustrial area of the metropolitanbayside area with large-scalelogistics properties.
The Group has trust beneficiaryright of the property. The land areowned by Mitsubishi UFJ Trustand Banking Corporation (trustee).The buildings are owned byMitsubishi Heavy Industries, Ltd.,on the registered documents, butthe buildings are undergoingdemolition.
As at the valuation date,the property is identifiedas an owner-occupiedbuilding and its site, andis undergoingdemolition.
JPY17,900,000,000
(100% interestattributable to the
Group:JPY17,900,000,000
Notes :-(1) According to the Real Estate Title Certificate Lot No. 8-4 Sachiura1-chome issued by Legal Affairs Bureau dated September 27, 2019,
the ownership right of the property with a total site area of 74,722.26 sq m have been vested in Mitsubishi UFJ Trust and BankingCorporation as trustee. ESR Sachiura 3 TMK has trust beneficiary right of the property.
(2) The property is located in an Industrial Area with designated FAR of 200% and building cover ratio of 60%.(3) Our key assumptions of the valuation are:
(i) The vacant land value was estimated by applying the Sales Comparison Approach and the DCF Method assuming development ofleased property. The below is assumption summary of the DCF Method.— Assumed building is a four-storey logistics facility with gross floor area for FAR of 163,622 sq m and net rentable area of
147,320.5 sq m which is based on the development plan provided by the Group.— Rental value for warehouse and office are JPY4,400 and JPY6,500 per month per tsubo consequently.— The discount rate of 4.0% is applied.— The terminal capitalization rate of 4.3% is applied;The Sales Comparison Approach Value: JPY 11,700,000,000The DCF Method Value: JPY 18,500,000,000The vacant land value has been concluded putting emphasis on the DCF Method Value (development of leased property) withreference to the Sales Comparison Approach Value.The vacant land value: JPY 18,500,000,000
(ii) The appraised value estimate of the subject property is calculated by deducting the building demolition cost (including the carrying-out of contaminated soil) and sea bank repair cost from the vacant land value.Demolition cost: JPY 463,000,000Sea bank repair cost: JPY 150,000,000
(4) The Beneficially Rights on the Real Estate Title Certificate of the property are legal, valid and enforceable.(5) The trust beneficiary right of the property was acquired by the Group on March 29, 2019. The details of the acquisition were not
disclosed for this valuation.
VI-88

APPENDIX VI PROPERTY VALUATION
The following is the text of a letter with the summary of values and valuation certificatesreceived from CBRE Limited, an independent valuer, prepared for the purpose of incorporation in thisdocument, in connection with their valuation as of September 30, 2019 of certain property interestsheld by the Group.
Suites 1204-06, 12/F, 3/F & 4/FThree Exchange Square
8 Connaught PlaceCentral, Hong Kong
T 852 2820 2800F 852 2810 0830
香港中環康樂廣場八號交易廣場第三期十二樓 1204-06室,三樓及四樓
電話 852 2820 2800傳真 852 2810 0830www.cbre.com.hk
地產代理 (公司 )牌照號碼Estate Agent’s License No: C-004065
October 22, 2019
The Board of DirectorsESR Cayman Limited
Dear Sirs,
In accordance with instructions from ESR Cayman Limited (the “Company”) to value certainproperty interests held by ESR Cayman Limited and its subsidiaries (collectively referred to as “theGroup”) in Australia, we confirm that we have carried out inspections, made relevant enquiries, andobtained such further information as we consider necessary for the purpose of providing you with ouropinion on the market values of property interests as of September 30, 2019 (the “Valuation Date”).
Valuation Basis, Assumptions and Methodology
Our valuation is prepared in accordance with the HKIS Valuation Standards (2017 Edition)published by the Hong Kong Institute of Surveyors (“the HKIS”), the RICS Valuation—GlobalStandards 2017 published by the Royal Institution of Chartered Surveyors (“RICS”) and InternationalValuation Standards (“IVS”) published by the International Valuation Standards Council.
Our valuation is made on the basis of Market Value which is defined as “the estimated amountfor which an asset or liability should exchange on the Valuation Date between a willing buyer and awilling seller in an arm’s-length transaction after proper marketing wherein the parties had each actedknowledgeably, prudently and without compulsion.”
VI-89

APPENDIX VI PROPERTY VALUATION
We have also complied with all the requirements contained in Chapter 5 of the RulesGoverning the Listing of Securities on The Stock Exchange of Hong Kong Limited (the “ListingRules”).
Our valuation has been made on the assumption that the owner sells the property on the openmarket without the benefit or burden of a deferred term contract, leaseback, joint venture, or anysimilar arrangement, which would serve to affect the values of the property interests.
No allowance has been made in our valuation for any charges, mortgages or amounts owingneither on the property nor for any expenses or taxation which may be incurred in effecting the sale.Unless otherwise stated, it is assumed that the properties are free from encumbrances, restrictions andoutgoings of an onerous nature which could affect their values.
In valuing the properties in Group I which are held by the Group for investment, we haveadopted the Income Capitalization Approach and Discounted Cash Flow (“DCF”) Approach, which areconsidered as appropriate and are commonly accepted approaches for logistics/industrial properties.The Income Capitalization Approach involves the capitalization of the net rental income derived fromthe existing tenancies with due allowance for the reversionary income potential of the property. TheDCF Approach involves discounting the future net cash flow of the property to its present value byusing an appropriate discount rate that reflects the rate of return required by a typical investor for aninvestment of this type. We have prepared a 10-year cash flow forecast for properties, with reference tothe current and anticipated market conditions. Where applicable, we have also considered the DirectComparison Approach as a reference check for the valuations arrived at from the IncomeCapitalization Approach and the DCF Approach, assuming sales with benefit of vacant possession intheir existing states by making reference to comparable sales transactions as available in the market.
Source of Information
We have relied on information provided by the Group, in particular, but not limited to planningapprovals, statutory notices, easements, site areas, floor areas, tenancy schedules and other relevantinformation. No on-site measurement has been taken. Dimensions, measurements and areas included inthe valuation certificates are only approximations. We have taken every reasonable care both duringand inspecting the information provided to us and in making relevant enquiries. We have no reason todoubt the truth and accuracy of the information provided to us by the Group, which is material to thevaluation. We were also advised by the Group that no material facts have been omitted from theinformation provided to us.
CBRE has conducted title searches for the properties. However, we have not scrutinized theoriginal documents to verify ownership or to ascertain the existence of any lease amendments whichmay not appear on the copies handed to us. It is assumed that, unless otherwise stated, the propertieshave no known encumbrances or liens that would adversely affect the market value of the property.During the course of our valuation, we have relied on information provided by the Group.
VI-90

APPENDIX VI PROPERTY VALUATION
Property Inspection
We have inspected the exterior of the properties and, where possible, the interior of theproperties. During the course of our inspection, we did not notice any serious defects. However, wehave not carried out any structural surveys, nor any tests were made on the building services, nor anyinvestigation to determine the presence of any deleterious or hazardous materials in the properties.Therefore, we are not able to report whether the properties are free of rot, infestation, deleteriousmaterials or any other structural defects.
We have not carried out site measurements to verify the correctness of the areas of theproperties. We have assumed that the areas shown on the documents and site plans provided to us arecorrect. During our inspection, we have not carried out investigations on the site to determine thesuitability of the ground conditions and the services for any future development. Our valuation is onthe basis that these aspects are satisfactory.
Inspections of the properties were carried out in the period between October 1, 2019 andOctober 9, 2019 by technical staff including Michael Pisano and Ryan Korda. Both are licensed andCertified Practicing Valuers within Australia and have more than 10 years of experience in thevaluation of properties in Australia.
Currency
Unless otherwise stated, all monetary amounts are stated in Australian Dollars (“AUD”), theofficial currency of Australia.
We enclose herewith our summary of values and valuation certificates.
Yours faithfully,For and on behalf ofCBRE Limited
Daniel MohrAAPI FRICS RICS Registered Valuer
Executive DirectorValuation & Advisory Services
Note: Mr. Daniel Mohr is a Fellow of the Royal Institution of Chartered Surveyors. He has over 15 years of valuation experience in Australia,PRC, Hong Kong and throughout Asia.
VI-91

APPENDIX VI PROPERTY VALUATION
SUMMARY OF VALUES
No. Property
Market value inexisting state as atSeptember 30, 2019
Interestsattributable tothe Group
Market valueattributable to the
Group as atSeptember 30, 2019
Group I—Properties held by the Group for investment in Australia
1. 15 Talavera Road,Macquarie Park,New South Wales, Australia
AUD 96,000,000 92.2% AUD 88,512,000
2. Gateway Estate,7-15 Gundah Road,Mount Kuring-Gai,New South Wales, Australia
AUD 63,100,000 92.2% AUD 58,178,200
3. 18-20 Orion Road,Lane Cove West,New South Wales, Australia
AUD 51,725,000 92.2% AUD 47,690,450
4. Melbourne Markets Warehousing,315 Cooper Street, EppingVictoria, Australia
AUD 116,000,000 92.2% AUD 106,952,000
Group I Sub-total: AUD 326,825,000 AUD 301,332,650
Grand Total: AUD 326,825,000 AUD 301,332,650
VI-92

APPENDIX VI PROPERTY VALUATION
Group I—Properties held by the Group for investment in Australia
VALUATION CERTIFICATE
Property Description and tenure Details of occupancyMarket Value as atSeptember 30, 2019
1. 15 Talavera Road,Macquarie Park,New South Wales,Australia
The property is an eight level officeand warehouse building completedin 1990, occupying a site with totalsite area of 15,080.0 sqm.
Located in Macquarie Park, a northwestern suburb of Sydney which isapproximately 12 kilometers north-west of North Sydney CBD and 15kilometers north-west of SydneyCBD. More particularly, theproperty is situated on the westernside of Talavera Road,approximately 200 meters from itsintersection with Lane Cove Road.
The ground level provides an entryfoyer, lobby café, parking, high-clearance warehouse and loadingdock, whilst Levels 2 to 4 aresecure parking and storage. Levels5 to 8 are commercial officeaccommodation with a centralatrium. The total lettable area of theproperty is 12,637.6 sqm.
There is a total of 512 car parkingspaces on site, comprising 501income generating spaces with 330secure, 46 tandem, 125 open ongrade. The remaining 11 spaces areset aside for visitors, contractorsand disabled persons.
The property is held freehold.
As at the valuation date,the office, warehouse andretail portions of theproperty were 100%leased, and were subjectto various leases at atotal annual rent ofapproximately AUD4,086,204, with the latestexpiry date on June 30,2027.
The carpark portion ofthe property with 501 carparking spaces wassubject to various leasesand license agreements ata total annual rent ofapproximately AUD1,263,603, with the latestexpiry date on June 30,2027.
The total annual otherincome includingsignage, telecoms andstoreroom rent, wasapproximately AUD90,378.
AUD96,000,000
(92.2% interestattributable to the
Group:AUD88,512,000)
Notes:1. According to the records of New South Wales Land Registry Services, the property is legally known as Lot 1 in Deposited Plan
1014894. The registered owner of the property is MISTA Pty Limited.2. The property is situated within an area zoned “B7 Business Park” under the Ryde Local Environmental Plan 2014.3. The property is subject to a mortgage in favor of Westpac Banking Corporation.4. The key assumptions of the valuation are considered as below:
Average Market Rent (psm) . . . . . . . . . . . . . . . . . . . . . . . . . . . . . . . . . . . . . . . . . . . . . . . . . . . . . . . . . . . . . AUD 356Capitalization Rate . . . . . . . . . . . . . . . . . . . . . . . . . . . . . . . . . . . . . . . . . . . . . . . . . . . . . . . . . . . . . . . . . . . . 5.75%Terminal Capitalization Rate . . . . . . . . . . . . . . . . . . . . . . . . . . . . . . . . . . . . . . . . . . . . . . . . . . . . . . . . . . . . 6.125%Discount Rate . . . . . . . . . . . . . . . . . . . . . . . . . . . . . . . . . . . . . . . . . . . . . . . . . . . . . . . . . . . . . . . . . . . . . . . . 6.50%
VI-93

APPENDIX VI PROPERTY VALUATION
We have made reference to recent leasing transactions within the property, as well as rental evidence of similar developments whichhave characteristics comparable to the property which indicate a range of AUD 295 psm to AUD 430 psm for office premises andAUD 140 psm to AUD 190 psm for warehouse premises. The adopted market rent of AUD 365 psm to AUD 385 psm for the officeportion and AUD 185 to AUD 195 psm for the warehouse portion are in line the relevant comparables.
We have gathered and analyzed the rates of return of relevant sales evidence which indicate equivalent yields of approximately 5.00% to6.30%, and IRR’s of approximately 6.25% to 7.10%. The adopted capitalization rate, terminal capitalization rate and discount rate arereasonable having regard to the analyzed yields, reflecting the nature, location, tenancy profile of the property when compared withcurrent market investment criteria.
We have also made reference to the unit prices of the various sales evidence which range from AUD 5,210 psm to AUD 13,990 psm.The adopted unit rate of approximately AUD 7,600 psm is consistent with the relevant comparables.
VI-94

APPENDIX VI PROPERTY VALUATION
VALUATION CERTIFICATE
Property Description and tenure Details of occupancyMarket Value as atSeptember 30, 2019
2. Gateway Estate,7-15 Gundah Road,Mount Kuring-Gai,New South Wales,Australia
Gateway Estate is a multi-unitindustrial complex extendingacross four buildings and 24separate units, completed in stagessince 2005, occupying a site withtotal site area of 58,320.0 sqm.
The property is located within theMount Kuring-Gai IndustrialEstate, approximately45 kilometers to the north of theSydney CBD, and approximately35 kilometers from North Sydney.More particularly it is located alongthe north western elevation ofGundah Road, which is acul-de-sac at its most north easternextremity.
The property provides modernoffice and high-clearancewarehouse accommodation, rollershutter door access and on gradeparking for tenants and visitors.The total lettaable area of theproperty is 32,846.0 sqm.
Two larger buildings are positionedto the northern portion of the sitewhich house Units 1 to 24, whilsttwo smaller buildings are locatedtowards the southern portion of thesite, housing Units A, B and C.
The property is held freehold.
As at the valuation date,a portion of the propertytotaling 31,472.0 sqmwas subject to variousleases at a total annualrent of approximatelyAUD 4,300,765, with thelatest expiry date onNovember 30, 2023.
The remaining portionwas vacant.
AUD63,100,000
(92.2% interestattributable to the
Group:AUD58,178,200)
Notes:1. According to the records of New South Wales Land Registry Services, the property is legally known as Lot 1 in Deposited Plan
1182846. The registered owner of the property is MISTA Pty Limited.2. The majority of site is zoned “IN1 General Industrial”, whilst the north western portion of site is zoned “E3 Environmental
Management” under the Hornsby Local Environmental Plan 2013.3. The property is subject to a mortgage in favor of Westpac Banking Corporation.4. The key assumptions of the valuation are considered as below:
Average Market Rent (psm) . . . . . . . . . . . . . . . . . . . . . . . . . . . . . . . . . . . . . . . . . . . . . . . . . . . . . . . . . . . . . AUD 133Capitalization Rate . . . . . . . . . . . . . . . . . . . . . . . . . . . . . . . . . . . . . . . . . . . . . . . . . . . . . . . . . . . . . . . . . . . . 6.375%Terminal Capitalization Rate . . . . . . . . . . . . . . . . . . . . . . . . . . . . . . . . . . . . . . . . . . . . . . . . . . . . . . . . . . . . 6.875%Discount Rate . . . . . . . . . . . . . . . . . . . . . . . . . . . . . . . . . . . . . . . . . . . . . . . . . . . . . . . . . . . . . . . . . . . . . . . . 7.00%
We have made reference to recent leasing transactions within the property, as well as rental evidence of similar developments whichhave characteristics comparable to the property which indicate a range of AUD 123 psm to AUD 215 psm. The adopted market rents ofAUD 130 psm to AUD 135 psm are in line with the relevant comparables.
VI-95

APPENDIX VI PROPERTY VALUATION
We have gathered and analyzed the rates of return of relevant sales evidence which indicate equivalent yields of approximately 3.80% to7.85%, and IRR’s of approximately 6.35% to 8.20%. The adopted capitalization rate, terminal capitalization rate and discount rate arereasonable having regard to the analyzed yields, reflecting the nature, location, tenancy profile of the property when compared withcurrent market investment criteria.
We have also made reference to the unit prices of the various sales evidence which range from AUD 1,225 psm to AUD 6,530 psm. Theadopted unit rate of approximately AUD 1,920 psm is consistent with the relevant comparables.
VI-96

APPENDIX VI PROPERTY VALUATION
VALUATION CERTIFICATE
Property Description and tenure Details of occupancyMarket Value as atSeptember 30, 2019
3. 18-20 Orion Road,Lane Cove West,New South Wales,Australia
The property is a nine-level officebuilding, with six split levels ofbasement car parking and on-gradeparking completed circa 1990,occupying a site with a total sitearea of 8,938.0 sqm.
The property is located in LaneCove West, approximately 12kilometers north-west of theSydney CBD. More specifically, itis situated on the north-westernside of Orion Road at its transitionwith Sam Johnson Way, whichprovides the sole access route intothe Lane Cove West industrialprecinct form Epping Road.
The property is adjacent to thevacant land at 14-16 Orion Road.
The office accommodation isarranged over ground and eightupper levels, with majority of theupper office floors subdivided toprovide multiple office suites. Achild care center operates on thelower ground level. The totallettable area of the property is8,749.8 sqm.
There is a total of 314 car parkingspaces, with 286 spaces over sixsplit levels of basement parkingand a further 28 on grade carparking spaces.
The property is held freehold.
As at the valuation date,a portion of the propertytotaling 7,463.5 sqm wassubject to various leasesat a total annual rent ofapproximately AUD2,121,651, with the latestexpiry date onJanuary 31, 2025.
The carpark portion ofthe property with 310 carparking spaces wassubject to various leasesand license agreements ata total annual rent ofapproximately AUD769,625, with the latestexpiry date on April 29,2035.
The remaining portionwas vacant.
The total annual otherincome including thechild care facility,storage, signage, telecomand product testingfacility, wasapproximatelyAUD 384,016.
AUD51,725,000
(92.2% interestattributable to the
Group:AUD47,690,450)
Notes:1. According to the records of New South Wales Land Registry Services, the property is legally known as Lot 2 in Deposited Plan
1095363. The registered owner of the property is Propertylink (Holdings) Limited.2. The property is situated within an area zoned “IN2 Light Industrial” under the Lane Cove Local Environmental Plan 2009.3. The property is subject to a mortgage in favor of Westpac Banking Corporation.4. The key assumptions of the valuation are considered as below:
Average Market Rent (psm) . . . . . . . . . . . . . . . . . . . . . . . . . . . . . . . . . . . . . . . . . . . . . . . . . . . . . . . . . . . . . AUD 309Capitalization Rate . . . . . . . . . . . . . . . . . . . . . . . . . . . . . . . . . . . . . . . . . . . . . . . . . . . . . . . . . . . . . . . . . . . . 6.50%Terminal Capitalization Rate . . . . . . . . . . . . . . . . . . . . . . . . . . . . . . . . . . . . . . . . . . . . . . . . . . . . . . . . . . . . 7.00%Discount Rate . . . . . . . . . . . . . . . . . . . . . . . . . . . . . . . . . . . . . . . . . . . . . . . . . . . . . . . . . . . . . . . . . . . . . . . . 7.00%
We have made reference to recent leasing transactions within the property, as well as rental evidence of similar developments whichhave characteristics comparable to the property which indicate a range of AUD 265 psm to AUD 350 psm. The adopted market rentalrates of AUD 303 psm to AUD 320 psm are in line the relevant comparables.
VI-97

APPENDIX VI PROPERTY VALUATION
We have gathered and analyzed the rates of return of relevant sales evidence which indicate equivalent yields of approximately 5.00% to7.00%, and IRR’s of approximately 6.25% to 7.20%. The adopted capitalization rate, terminal capitalization rate and discount rate arereasonable having regard to the analyzed yields, reflecting the nature, location, tenancy profile of the property when compared withcurrent market investment criteria.
We have also made reference to the unit prices of the various sales evidence which range from AUD 3,030 psm to AUD 13,990 psm.The adopted unit rate of approximately AUD 5,910 psm is consistent with the relevant comparables.
VI-98

APPENDIX VI PROPERTY VALUATION
VALUATION CERTIFICATE
Property Description and tenure Details of occupancyMarket Value as atSeptember 30, 2019
4. Melbourne MarketsWarehousing,315 Cooper Street,EppingVictoria, Australia
The property comprises 5 separatemulti-tenanted warehousescompleted circa 2015, occupying asite with a total site area of155,180.0 sqm.
Melbourne Markets Warehousingis situated on the southern side ofCooper Street, abutting the HumeFreeway (western site alignment),within Epping, approximately 18radial kilometers north of theMelbourne CBD.
The warehouses provide bothinsulated (sandwich panel) andconventional (concrete dado)accommodation, and can beaccessed via a mixture of on-gradeand recessed loading.
The warehouses provide directproximity warehousingaccommodation to the ‘tradingfloors’ of the Melbourne Marketwhich is Melbourne’s wholesalefruit and vegetable market place.
The warehouses are used forstorage and generally occupied bywholesalers, traders and farmingentities. The total lettable area ofthe property is 76,192.5 sqm.
The property is subject to aleasehold interest whereby Mistahave an interest as Lessee, havinga ground lease with a term certainof 36 years remaining. We havevalued the leasehold interest.
As at the valuation date,a portion of the propertytotaling 74,906.7 sqmwas subject to variousleases at a total annualrent of approximatelyAUD 9,404,609, with thelatest expiry date onSeptember 23, 2030.
The remaining portionwas vacant.
AUD116,000,000
(92.2% interestattributable to the
Group:AUD106,952,000)
Notes:1. The registered owner of the property is Secretary to the Department of Economic Development, Jobs, Transport and Resources.2. The property is subject to a ground lease between Melbourne Market Authority who are a state government owned entity (the lessor) and
Hansen Yuncken Pty Ltd as assigned to Propertylink (Mista Pty Ltd) (the lessee). The current ground rent is AUD 1,118,998 per annum,with a rent review scheduled for January 10, 2020 at a fixed rent of AUD 1,980,097 per annum.
3. The property is situated within an area zoned “Priority Development Zone” (PDZ) with “Design and Development Overlay” (DDO) on aportion of the property.
4. A small portion of the property is located within an area of cultural heritage sensitivity. We consider that it is unlikely to have materialimpact to the market value of the property.
VI-99

APPENDIX VI PROPERTY VALUATION
5. There is potential that the RLA 2003 may be applicable to some or all the leases. A recent ruling “CB Cold Storage Pty Ltd v IMCCGroup (Australia) Pty Ltd (2017)” by the Supreme Court has effectively determined that a lease for an industrial property (or anyproperty) that details the provision of services could be governed by the RLA 2003. As such, traditional warehousing, logistics andmanufacturing leases could be considered retail premises under the Act. The Supreme Court decision has led to much conjecture as towhat does / does not fall under the RLA 2003 (for all asset classes including industrial properties which have traditionally beenacknowledged as being excluded from the Act). A subsequent appeal was dismissed in the High Court ensuring this ruling and originaldecision stands. It is a critical assumption of this valuation that the RLA 2003 is not applicable to the leases. Should the RLA 2003 beapplicable, this could have an impact on the market value (and could also result in a State Land Tax liability payable to the tenant). Weare advised by the Group that the RLA is not applicable to any of the leases. Our view is that there is a fairly limited risk of the Actapplying and if it did apply that it would only apply to certain tenancies (i.e. risk is spread).
6. The property is subject to a mortgage in favor of Westpac Banking Corporation.7. The key assumptions of the valuation are considered as below:
Average Market Rent (psm) . . . . . . . . . . . . . . . . . . . . . . . . . . . . . . . . . . . . . . . . . . . . . . . . . . . . . . . . . . . . . AUD 137Capitalization Rate . . . . . . . . . . . . . . . . . . . . . . . . . . . . . . . . . . . . . . . . . . . . . . . . . . . . . . . . . . . . . . . . . . . . 6.25%Terminal Capitalization Rate . . . . . . . . . . . . . . . . . . . . . . . . . . . . . . . . . . . . . . . . . . . . . . . . . . . . . . . . . . . . 7.25%Discount Rate . . . . . . . . . . . . . . . . . . . . . . . . . . . . . . . . . . . . . . . . . . . . . . . . . . . . . . . . . . . . . . . . . . . . . . . . 7.50%
We have made reference to recent leasing transactions within the property, as well as rental evidence of similar developments whichhave characteristics comparable to the property which indicate a range of AUD 90 psm to AUD 168 psm for conventional warehouseproperties and AUD 115 psm to AUD 264 psm for temperature controlled / part specialized warehouse properties. The adopted marketrent of AUD 125 psm for the non-insulated warehouses and AUD 150 psm to AUD 200 psm for warehouses with insulation are in linethe relevant comparables.
We have gathered and analyzed the rates of return of relevant sales evidence which indicate equivalent yields of approximately 6.10% to11.05% and IRR’s of approximately 7.00% to 10.35% for leasehold assets; and equivalent yields of approximately 5.05% to 6.90% andIRR’s of approximately 5.60% to 7.85% for freehold assets. The adopted capitalization rate, terminal capitalization rate and discount rateare reasonable having regard to the analyzed yields, reflecting the nature, location, tenancy profile of the property when compared withcurrent market investment criteria, with consideration to the remaining leasehold interest.
VI-100

APPENDIX VI PROPERTY VALUATION
The following is the text of a letter and valuation certificate, prepared for the purpose ofincorporation in this prospectus received from Jones Lang LaSalle Corporate Appraisal and AdvisoryLimited, an independent valuer, in connection with its valuation as at September 30, 2019 of theproperty held by the Company.
Jones Lang LaSalle Corporate Appraisal andAdvisory Limited7th Floor One Taikoo Place 979 King’sRoad Quarry Bay Hong Kongtel +852 2846 5000 fax +852 2169 6001License No. C-030171
October 22, 2019
The Board of DirectorsESR Cayman Limited2406-07 Man Yee Building,68 Des Voeux Road Central,Hong Kong
Dear Sirs,
In accordance with your instructions to value the property held by ESR Cayman Limited (the“Company”) and its subsidiaries in Japan, we confirm that we have carried out inspections, maderelevant enquiries and searches and obtained such further information as we consider necessary for thepurpose of providing you with our opinion of the market value of the property interest as atSeptember 30, 2019 (the “valuation date”).
Our valuation is carried out on a market value basis. Market value is defined as “the estimatedamount for which an asset or liability should exchange on the valuation date between a willing buyerand a willing seller in an arm’s length transaction after proper marketing and where the parties hadeach acted knowledgeably, prudently and without compulsion”.
We have valued the property interest which is a logistic warehouse held for investment by theCompany in Japan by discount cash flow approach, we have considered it as fully operational andgoing concern property having regard to the trading accounts of previous years, where available, andtaking into account the future income stream, following consultation with the instructing party. To thisincome stream, an appropriate annual present value discount rate has been applied to arrive at anindicated market value.
Our valuation has been made on the assumption that the seller sells the property interest in themarket without the benefit of a deferred term contract, leaseback, joint venture, managementagreement or any similar arrangement, which could serve to affect the value of the property interest.
No allowance has been made in our report for any charge, mortgage or amount owing on any ofthe property interest valued nor for any expense or taxation which may be incurred in effecting a sale.Unless otherwise stated, it is assumed that the property is free from encumbrances, restrictions andoutgoings of an onerous nature, which could affect its value.
In valuing the property interest, we have complied with all requirements contained in Chapter 5of the Rules Governing the Listing of Securities issued by The Stock Exchange of Hong Kong Limited;
VI-101
APPENDIX VI PROPERTY VALUATION
the RICS Valuation—Global Standards 2017 published by the Royal Institution of CharteredSurveyors; the HKIS Valuation Standards published by the Hong Kong Institute of Surveyors; and theInternational Valuation Standards published by the International Valuation Standards Council.
We have relied to a very considerable extent on the information given by the Company andhave accepted advice given to us on such matters as tenure, planning approvals, statutory notices,easements, particulars of occupancy, lettings, and other relevant matters.
We have been shown copies of various title documents including land title documents relatingto the property interest and have made relevant enquiries. Where possible, we have examined theoriginal documents to verify the existing title to the property interest in Japan and any materialencumbrance that might be attached to the property interest or any tenancy amendment.
We have not carried out detailed measurements to verify the correctness of the areas in respectof the property but have assumed that the areas shown on the title documents and official site planshanded to us are correct. All documents and contracts have been used as reference only and alldimensions, measurements and areas are approximations. No on-site measurement has been taken.
We have inspected the exterior and, where possible, the interior of the property. However, wehave not carried out investigation to determine the suitability of the ground conditions and services forany development thereon. Our valuation has been prepared on the assumption that these aspects aresatisfactory. Moreover, no structural survey has been made, but, in the course of our inspection, we didnot note any serious defect. We are not, however, able to report whether the property is free of rot,infestation or any other structural defect. No tests were carried out on any of the services.
Inspection of the property was carried out on October 16, 2019 by Mr. Tanabe Yuma.Mr. Tanabe is a Certified Real Estate Appraiser in Japan and has more than 10 years’ experience in thevaluation of properties in Japan.
We have had no reason to doubt the truth and accuracy of the information provided to us by theCompany. We have also sought confirmation from the Company that no material factors have beenomitted from the information supplied. We consider that we have been provided with sufficientinformation to arrive an informed view, and we have no reason to suspect that any material informationhas been withheld.
Unless otherwise stated, all monetary figures stated in this report are in Japanese yen (JPY).
Our valuation is summarized below and the valuation certificate is attached.
Yours faithfully,for and on behalf of
Jones Lang LaSalle Corporate Appraisal andAdvisory Limited
Eddie T. W. YiuMRICS MHKIS RPS (GP)
Senior Director
Note: Eddie T.W. Yiu is a Chartered Surveyor who has 25 years’ experience in the valuation of properties in Hong Kong as well as relevantexperience in the Asia-Pacific region.
VI-102

APPENDIX VI PROPERTY VALUATION
VALUATION CERTIFICATE
Property interest held for investment by the Company in Japan
Property Description and tenure Particulars of occupancy
Market value inexisting state as atSeptember 30, 2019
JPY
No. 678-1,KawajimamachiOaza Tomori,Hiki-gun, Saitama,Japan
Land LotNos.678-1, 717-2and 462-2
The property comprises 3 parcels of landwith a total site area of approximately19,408.10 sq.m. and a building with atotal gross floor area (“GFA”) ofapproximately 39,795.74 sq.m. erectedthereon which was completed in 2017.
The building is mainly constructed withsteel framed / reinforced concretestructure.
The property comprises a 5-storeybuilding with floor loading capacity of1.5 tons per sq.m., the breakdown ofGFA of the building is as follows:-
The property was rentedto various tenants as atthe valuation date forwarehouse and ancillaryoffice purposes.
Please refer to note 4 to6 for details.
8,820,000,000
FloorGFA(sq.m.)
1F . . . . . . . . . . . . . . . . . . . . 9,064.582F . . . . . . . . . . . . . . . . . . . . 9,067.773F . . . . . . . . . . . . . . . . . . . . 9,067.774F . . . . . . . . . . . . . . . . . . . . 6,297.815F . . . . . . . . . . . . . . . . . . . . 6,297.81
Total . . . . . . . . . . . . . . . . . . 39,795.74The property is held under freeholdinterest.
Notes:1. Pursuant to the Real Estate Title Certificates (Land) Nos.0302000472853, 0302000472938 and 0302000472226 with registration
No.23520 dated August 27, 2019 issued by the Legal Affairs Bureau, the ownership rights of Land Lot Nos.678-1, 717-2 and 462-2 witha total site area of approximately 19,408.10 sq.m. are vested in Mitsubishi UFJ Trust and Banking Corporation as trustee. ESR 22Tokutei Mokuteki Kaisha, which is an indirect wholly-owned subsidiary of the Company, has beneficiary right of the trust over thelands.
2. Pursuant to the Real Estate Title Certificate (Building) No.0302010159840 with registration No.23521 dated August 27, 2019 issued bythe Legal Affairs Bureau, the ownership right of the building with a total GFA of approximately 39,795.74 sq.m. are vested in MitsubishiUFJ Trust and Banking Corporation as trustee. ESR 22 Tokutei Mokuteki Kaisha, which is an indirect wholly-owned subsidiary of theCompany, has beneficiary right of the trust over the building.
3. The property was acquired by the Company in August 2019 with a purchase price of JPY8,740,000,000.4. Pursuant to 2 Tenancy Agreements, portion of the property with a total net rentable area of approximately 16,022.13 sq.m. and 19
vehicle parking spaces were rented to an independent third party for fixed terms with the expiry dates on April 30, 2024 and March 31,2020 respectively at a total current monthly rent of JPY16,641,006 for warehouse, office and vehicle parking uses.
5. Pursuant to 2 Tenancy Agreements, portion of the property with a total net rentable area of approximately 22,767.82 sq.m. and 52vehicle parking spaces were rented to an independent third party for fixed terms with the expiry dates on March 31, 2023 andDecember 31, 2019 respectively at a total current monthly rent of JPY22,624,918 for warehouse, office and vehicle parking uses.
6. Pursuant to a Tenancy Agreement, the roof top of the property was rented to an independent third party for fixed terms with the expirydate on February 28, 2037 at a total current monthly rent of JPY44,367 for solar power generation use.
7. In undertaking our valuation, we have adopted the discount cash flow approach by taking into account the future income stream of theproperty, an appropriate discount rate at 4.2%, determined from consideration of various influential factors specific to the property, suchas investment risks, location, property use, type of ownership, term of building lease, etc., have been applied to arrive at the market valueof the property. A terminal capitalization rate at 4.6% have been applied to assess the residual value of the property after 10 years.
8. Our valuation has been made on the following assumptions:a. As for the ownership and other rights pertaining to the property, we have referred to the registry book at the Legal Affairs Bureau
and documents provided by the Company. Our valuation is based on the assumption that there are no security interest, attachment,provisional disposition or occupancy other than those mentioned in this report.
b. The Company has obtained relevant title certificates of the property and is entitled to legally use, transfer, lease, mortgage orotherwise dispose of the ownership rights of the property without any encumbrances.
VI-103

APPENDIX VI PROPERTY VALUATION
9. Details of the property:
a) General description of locationof the property
: The property is located in an industrial area with designated building coverratio (“BCR”) of 60% and designated floor area ratio (“FAR”) of 200%.It is approximately 4km from Kawajima entrance on the Ken-O Expresswayand approximately 3.5km from Takasaka station on the Tobu Tojo RailwayLine.The site is irregular in shape and the surrounding developments are mainlymiddle to large scale factories and warehouses.
b) Details of encumbrances, liens, pledges,mortgages against the property
: Nil
c) Details of investigations, notices, pendinglitigation, breaches of law or title defects
: Nil
d) Future plans for construction, renovation,improvement or development of theproperty and estimated associated costs
: As advised by the Company, there is no plan for new major development inthe next 12 months from the date of this document.
VI-104

APPENDIX VII SUMMARY OF THE CONSTITUTION OF OUR COMPANY ANDCAYMAN COMPANIES LAW
Set out below is a summary of certain provisions of the Memorandum and Articles ofAssociation of the Company and of certain aspects of Cayman Companies Law.
The Company was incorporated in the Cayman Islands as an exempted company with limitedliability on June 14, 2011 under the Cayman Companies Law. The Company’s constitutionaldocuments consist of its amended and restated memorandum of association (“Memorandum”) and itsamended and restated articles of association (“Articles”).
A. MEMORANDUM OF ASSOCIATION
The Memorandum provides, inter alia, that the liability of members of the Company is limitedand that the objects for which the Company is established are unrestricted (and therefore include actingas an investment company), and that the Company shall have and be capable of exercising any and allof the powers at any time or from time to time exercisable by a natural person or body corporatewhether as principal, agent, contractor or otherwise and, since the Company is an exempted company,that the Company will not trade in the Cayman Islands with any person, firm or corporation except infurtherance of the business of the Company carried on outside the Cayman Islands.
By special resolution the Company may alter the Memorandum with respect to any objects,powers or other matters specified in it.
B. ARTICLES OF ASSOCIATION
The Articles were conditionally adopted on October 12, 2019. A summary of certain provisionsof the Articles is set out below.
1. SHARES
(i) Classes of shares
The share capital of the Company consists of ordinary shares.
(ii) Variation of rights of existing shares or classes of shares
Subject to the Cayman Companies Law, if at any time the share capital of the Company isdivided into different classes of shares, all or any of the special rights attached to any class of sharesmay (unless otherwise provided for by the terms of issue of the shares of that class) be varied, modifiedor abrogated either with the consent in writing of the holders of not less than three-fourths in nominalvalue of the issued shares of that class or with the sanction of a special resolution passed at a separategeneral meeting of the holders of the shares of that class. The provisions of the Articles relating togeneral meetings shall mutatis mutandis apply to every such separate general meeting, but so that thenecessary quorum (other than at an adjourned meeting) shall be not less than two persons togetherholding (or, in the case of a shareholder being a corporation, by its duly authorized representative) orrepresenting by proxy not less than one-third in nominal value of the issued shares of that class. Everyholder of shares of the class shall be entitled on a poll to one vote for every such share held by him,and any holder of shares of the class present in person or by proxy may demand a poll.
Any special rights conferred upon the holders of any shares or class of shares shall not, unlessotherwise expressly provided in the rights attaching to the terms of issue of such shares, be deemed tobe varied by the creation or issue of further shares ranking pari passu therewith.
VII-1
APPENDIX VII SUMMARY OF THE CONSTITUTION OF OUR COMPANY ANDCAYMAN COMPANIES LAW
(iii) Alteration of capital
The Company may, by an ordinary resolution of its members: (a) increase its share capital bythe creation of new shares of such amount as it thinks expedient; (b) consolidate or divide all or any ofits share capital into shares of larger or smaller amount than its existing shares; (c) divide its unissuedshares into several classes and attach to such shares any preferential, deferred, qualified or specialrights, privileges or conditions; (d) subdivide its shares or any of them into shares of an amount smallerthan that fixed by the Memorandum; (e) cancel any shares which, at the date of the resolution, have notbeen taken or agreed to be taken by any person and diminish the amount of its share capital by theamount of the shares so canceled; (f) make provision for the allotment and issue of shares which do notcarry any voting rights; (g) change the currency of denomination of its share capital; and (h) reduce itsshare premium account in any manner authorized and subject to any conditions prescribed by law.
(iv) Transfer of shares
Subject to the Cayman Companies Law and the requirements of the Stock Exchange alltransfers of shares shall be effected by an instrument of transfer in the usual or common form or insuch other form as the Board may approve and may be under hand or, if the transferor or transferee is aClearing House (as defined in the Articles) or its nominee(s), under hand or by machine imprintedsignature, or by such other manner of execution as the Board may approve from time to time.
Execution of the instrument of transfer shall be by or on behalf of the transferor and thetransferee, provided that the Board may dispense with the execution of the instrument of transfer by thetransferor or transferee or accept mechanically executed transfers. The transferor shall be deemed toremain the holder of a share until the name of the transferee is entered in the register of members of theCompany in respect of that share.
The Board may, in its absolute discretion, at any time and from time to time remove any shareon the principal register to any branch register or any share on any branch register to the principalregister or any other branch register.
Unless the Board otherwise agrees, no shares on the principal register shall be removed to anybranch register nor shall shares on any branch register be removed to the principal register or any otherbranch register. All removals and other documents of title shall be lodged for registration andregistered, in the case of shares on any branch register, at the relevant registration office and, in thecase of shares on the principal register, at the place at which the principal register is located.
The Board may, in its absolute discretion, decline to register a transfer of any share (not being afully paid up share) to a person of whom it does not approve or on which the Company has a lien. Itmay also decline to register a transfer of any share issued under any share option scheme upon which arestriction on transfer subsists or a transfer of any share to more than four joint holders.
The Board may decline to recognize any instrument of transfer unless a certain fee, up to suchmaximum sum as the Stock Exchange may determine to be payable, is paid to the Company, theinstrument of transfer is properly stamped (if applicable), is in respect of only one class of share and islodged at the relevant registration office or the place at which the principal register is locatedaccompanied by the relevant share certificate(s) and such other evidence as the Board may reasonably
VII-2

APPENDIX VII SUMMARY OF THE CONSTITUTION OF OUR COMPANY ANDCAYMAN COMPANIES LAW
require is provided to show the right of the transferor to make the transfer (and if the instrument oftransfer is executed by some other person on his behalf, the authority of that person so to do).
The register of members may, subject to the Listing Rules, be closed at such time or for suchperiod not exceeding in the whole 30 days in each year as the Board may determine.
Fully paid shares shall be free from any restriction on transfer (except when permitted by theStock Exchange) and shall also be free from all liens.
(v) Power of the Company to purchase its own shares
The Company may purchase its own shares subject to certain restrictions and the Board mayonly exercise this power on behalf of the Company subject to any applicable requirement imposedfrom time to time by the Articles or any code, rules or regulations issued from time to time by theStock Exchange and/or the SFC.
Where the Company purchases for redemption a redeemable Share, purchases not madethrough the market or by tender shall be limited to a maximum price and, if purchases are by tender,tenders shall be available to all members alike.
(vi) Power of any subsidiary of the Company to own shares in the Company
There are no provisions in the Articles relating to the ownership of shares in the Company by asubsidiary.
(vii) Calls on shares and forfeiture of shares
The Board may, from time to time, make such calls as it thinks fit upon the members in respectof any monies unpaid on the shares held by them respectively (whether on account of the nominalvalue of the shares or by way of premium) and not by the conditions of allotment of such shares madepayable at fixed times. A call may be made payable either in one sum or by installments. If the sumpayable in respect of any call or installment is not paid on or before the day appointed for paymentthereof, the person or persons from whom the sum is due shall pay interest on the same at such rate notexceeding 20% per annum as the Board shall fix from the day appointed for payment to the time ofactual payment, but the Board may waive payment of such interest wholly or in part. The Board may,if it thinks fit, receive from any member willing to advance the same, either in money or money’sworth, all or any part of the money uncalled and unpaid or installments payable upon any shares heldby him, and in respect of all or any of the monies so advanced the Company may pay interest at suchrate (if any) not exceeding 20% per annum as the Board may decide.
If a member fails to pay any call or installment of a call on the day appointed for payment, theBoard may, for so long as any part of the call or installment remains unpaid, serve not less than 14days’ notice on the member requiring payment of so much of the call or installment as is unpaid,together with any interest which may have accrued and which may still accrue up to the date of actualpayment. The notice shall name a further day (not earlier than the expiration of 14 days from the dateof the notice) on or before which the payment required by the notice is to be made, and shall also namethe place where payment is to be made. The notice shall also state that, in the event of non-payment ator before the appointed time, the shares in respect of which the call was made will be liable to beforfeited.
VII-3

APPENDIX VII SUMMARY OF THE CONSTITUTION OF OUR COMPANY ANDCAYMAN COMPANIES LAW
If the requirements of any such notice are not complied with, any share in respect of which thenotice has been given may at any time thereafter, before the payment required by the notice has beenmade, be forfeited by a resolution of the Board to that effect. Such forfeiture will include all dividendsand bonuses declared in respect of the forfeited share and not actually paid before the forfeiture.
A person whose shares have been forfeited shall cease to be a member in respect of theforfeited shares but shall, nevertheless, remain liable to pay to the Company all monies which, at thedate of forfeiture, were payable by him to the Company in respect of the shares together with (if theBoard shall in its discretion so require) interest thereon from the date of forfeiture until payment atsuch rate not exceeding 20% per annum as the Board may prescribe.
2. DIRECTORS
(i) Appointment, retirement and removal
At any time or from time to time, the Board shall have the power to appoint any person as aDirector either to fill a casual vacancy on the Board or as an additional Director to the existing Boardsubject to any maximum number of Directors, if any, as may be determined by the members in generalmeeting. Any Director so appointed to fill a casual vacancy shall hold office only until the first generalmeeting of the Company after his appointment and be subject to re-election at such meeting. AnyDirector so appointed as an addition to the existing Board shall hold office only until the first annualgeneral meeting of the Company after his appointment and be eligible for re-election at such meeting.Any Director so appointed by the Board shall not be taken into account in determining the Directors orthe number of Directors who are to retire by rotation at an annual general meeting.
At each annual general meeting, one third of the Directors for the time being shall retire fromoffice by rotation. However, if the number of Directors is not a multiple of three, then the numbernearest to but not less than one third shall be the number of retiring Directors. The Directors to retire ineach year shall be those who have been in office longest since their last re-election or appointment but,as between persons who became or were last re-elected Directors on the same day, those to retire shall(unless they otherwise agree among themselves) be determined by lot.
No person, other than a retiring Director, shall, unless recommended by the Board for election,be eligible for election to the office of Director at any general meeting, unless notice in writing of theintention to propose that person for election as a Director and notice in writing by that person of hiswillingness to be elected has been lodged at the head office or at the registration office of theCompany. The period for lodgement of such notices shall commence no earlier than the day afterdespatch of the notice of the relevant meeting and end no later than seven days before the date of suchmeeting and the minimum length of the period during which such notices may be lodged must be atleast seven days.
A Director is not required to hold any shares in the Company by way of qualification nor isthere any specified upper or lower age limit for Directors either for accession to or retirement from theBoard.
A Director may be removed by an ordinary resolution of the Company before the expiration ofhis term of office (but without prejudice to any claim which such Director may have for damages forany breach of any contract between him and the Company) and the Company may by ordinary
VII-4

APPENDIX VII SUMMARY OF THE CONSTITUTION OF OUR COMPANY ANDCAYMAN COMPANIES LAW
resolution appoint another in his place. Any Director so appointed shall be subject to the “retirement byrotation” provisions. The number of Directors shall not be less than two.
The office of a Director shall be vacated if he:
(a) resigns;
(b) dies;
(c) is declared to be of unsound mind and the Board resolves that his office be vacated;
(d) becomes bankrupt or has a receiving order made against him or suspends payment orcompounds with his creditors generally;
(e) is prohibited from being or ceases to be a director by operation of law;
(f) without special leave, is absent from meetings of the Board for six consecutive months,and the Board resolves that his office be vacated;
(g) has been required by any stock exchange of the Relevant Territory (as defined in theArticles) to cease to be a Director; or
(h) is removed from office by the requisite majority of the Directors or otherwise pursuant tothe Articles.
From time to time the Board may appoint one or more of its body to be managing director, jointmanaging director or deputy managing director or to hold any other employment or executive officewith the Company for such period and upon such terms as the Board may determine, and the Boardmay revoke or terminate any of such appointments. The Board may also delegate any of its powers tocommittees consisting of such Director(s) or other person(s) as the Board thinks fit, and from time totime it may also revoke such delegation or revoke the appointment of and discharge any suchcommittees either wholly or in part, and either as to persons or purposes, but every committee soformed shall, in the exercise of the powers so delegated, conform to any regulations that may fromtime to time be imposed upon it by the Board.
(ii) Power to allot and issue shares and warrants
Subject to the provisions of the Cayman Companies Law, the Memorandum and Articles andwithout prejudice to any special rights conferred on the holders of any shares or class of shares, anyshare may be issued with or have attached to it such rights, or such restrictions, whether with regard todividend, voting, return of capital or otherwise, as the Company may by ordinary resolution determine(or, in the absence of any such determination or so far as the same may not make specific provision, asthe Board may determine). Any share may be issued on terms that, upon the happening of a specifiedevent or upon a given date and either at the option of the Company or the holder of the share, it isliable to be redeemed.
The Board may issue warrants to subscribe for any class of shares or other securities of theCompany on such terms as it may from time to time determine.
Where warrants are issued to bearer, no certificate in respect of such warrants shall be issued toreplace one that has been lost unless the Board is satisfied beyond reasonable doubt that the originalcertificate has been destroyed and the Company has received an indemnity in such form as the Boardthinks fit with regard to the issue of any such replacement certificate.
VII-5

APPENDIX VII SUMMARY OF THE CONSTITUTION OF OUR COMPANY ANDCAYMAN COMPANIES LAW
Subject to the provisions of the Cayman Companies Law, the Articles and, where applicable,the rules of any stock exchange of the Relevant Territory (as defined in the Articles) and withoutprejudice to any special rights or restrictions for the time being attached to any shares or any class ofshares, all unissued shares in the Company shall be at the disposal of the Board, which may offer, allot,grant options over or otherwise dispose of them to such persons, at such times, for such considerationand on such terms and conditions as it in its absolute discretion thinks fit, but so that no shares shall beissued at a discount.
Neither the Company nor the Board shall be obliged, when making or granting any allotmentof, offer of, option over or disposal of shares, to make, or make available, any such allotment, offer,option or shares to members or others whose registered addresses are in any particular territory orterritories where, in the absence of a registration statement or other special formalities, this is or may,in the opinion of the Board, be unlawful or impracticable. However, no member affected as a result ofthe foregoing shall be, or be deemed to be, a separate class of members for any purpose whatsoever.
(iii) Power to dispose of the assets of the Company or any of its subsidiaries
While there are no specific provisions in the Articles relating to the disposal of the assets of theCompany or any of its subsidiaries, the Board may exercise all powers and do all acts and things whichmay be exercised or done or approved by the Company and which are not required by the Articles orthe Cayman Companies Law to be exercised or done by the Company in general meeting, but if suchpower or act is regulated by the Company in general meeting, such regulation shall not invalidate anyprior act of the Board which would have been valid if such regulation had not been made.
(iv) Borrowing powers
The Board may exercise all the powers of the Company to raise or borrow money, to mortgageor charge all or any part of the undertaking, property and uncalled capital of the Company and, subjectto the Cayman Companies Law, to issue debentures, debenture stock, bonds and other securities of theCompany, whether outright or as collateral security for any debt, liability or obligation of the Companyor of any third party.
(v) Remuneration
The Directors shall be entitled to receive, as ordinary remuneration for their services, such sumsas shall from time to time be determined by the Board or the Company in general meeting, as the casemay be, such sum (unless otherwise directed by the resolution by which it is determined) to be dividedamong the Directors in such proportions and in such manner as they may agree or, failing agreement,either equally or, in the case of any Director holding office for only a portion of the period in respect ofwhich the remuneration is payable, pro rata. The Directors shall also be entitled to be repaid allexpenses reasonably incurred by them in attending any Board meetings, committee meetings or generalmeetings or otherwise in connection with the discharge of their duties as Directors. Such remunerationshall be in addition to any other remuneration to which a Director who holds any salaried employmentor office in the Company may be entitled by reason of such employment or office.
Any Director who, at the request of the Company, performs services which in the opinion of theBoard go beyond the ordinary duties of a Director may be paid such special or extra remuneration as
VII-6

APPENDIX VII SUMMARY OF THE CONSTITUTION OF OUR COMPANY ANDCAYMAN COMPANIES LAW
the Board may determine, in addition to or in substitution for any ordinary remuneration as a Director.An executive Director appointed to be a managing director, joint managing director, deputy managingdirector or other executive officer shall receive such remuneration and such other benefits andallowances as the Board may from time to time decide. Such remuneration shall be in addition to hisordinary remuneration as a Director.
The Board may establish, either on its own or jointly in concurrence or agreement withsubsidiaries of the Company or companies with which the Company is associated in business, or maymake contributions out of the Company’s monies to, any schemes or funds for providing pensions,sickness or compassionate allowances, life assurance or other benefits for employees (whichexpression as used in this and the following paragraph shall include any Director or former Directorwho may hold or have held any executive office or any office of profit with the Company or any of itssubsidiaries) and former employees of the Company and their dependents or any class or classes ofsuch persons.
The Board may also pay, enter into agreements to pay or make grants (revocable orirrevocable), whether or not subject to any terms or conditions, pensions or other benefits to employeesand former employees and their dependents, or to any of such persons, including pensions or benefitsadditional to those, if any, to which such employees or former employees or their dependents are ormay become entitled under any such scheme or fund as mentioned above. Such pension or benefitmay, if deemed desirable by the Board, be granted to an employee either before and in anticipation of,or upon or at any time after, his actual retirement.
(vi) Compensation or payments for loss of office
Payments to any present Director or past Director of any sum by way of compensation for lossof office or as consideration for or in connection with his retirement from office (not being a paymentto which the Director is contractually or statutorily entitled) must be approved by the Company ingeneral meeting.
(vii) Loans and provision of security for loans to Directors
The Company shall not directly or indirectly make a loan to a Director or a director of anyholding company of the Company or any of their respective close associates, enter into any guaranteeor provide any security in connection with a loan made by any person to a Director or a director of anyholding company of the Company or any of their respective close associates, or, if any one or more ofthe Directors hold(s) (jointly or severally or directly or indirectly) a controlling interest in anothercompany, make a loan to that other company or enter into any guarantee or provide any security inconnection with a loan made by any person to that other company.
(viii) Disclosure of interest in contracts with the Company or any of its subsidiaries
With the exception of the office of auditor of the Company, a Director may hold any otheroffice or place of profit with the Company in conjunction with his office of Director for such periodand upon such terms as the Board may determine, and may be paid such extra remuneration for thatother office or place of profit, in whatever form, in addition to any remuneration provided for by orpursuant to any other Articles. A Director may be or become a director, officer or member of any other
VII-7

APPENDIX VII SUMMARY OF THE CONSTITUTION OF OUR COMPANY ANDCAYMAN COMPANIES LAW
company in which the Company may be interested, and shall not be liable to account to the Companyor the members for any remuneration or other benefits received by him as a director, officer or memberof such other company. The Board may also cause the voting power conferred by the shares in anyother company held or owned by the Company to be exercised in such manner in all respects as itthinks fit, including the exercise in favor of any resolution appointing the Directors or any of them tobe directors or officers of such other company.
No Director or intended Director shall be disqualified by his office from contracting with theCompany, nor shall any such contract or any other contract or arrangement in which any Director is inany way interested be liable to be avoided, nor shall any Director so contracting or being so interestedbe liable to account to the Company for any profit realized by any such contract or arrangement byreason only of such Director holding that office or the fiduciary relationship established by it. ADirector who is, in any way, materially interested in a contract or arrangement or proposed contract orarrangement with the Company shall declare the nature of his interest at the earliest meeting of theBoard at which he may practically do so.
There is no power to freeze or otherwise impair any of the rights attaching to any share byreason that the person or persons who are interested directly or indirectly in that share have failed todisclose their interests to the Company.
A Director shall not vote or be counted in the quorum on any resolution of the Board in respectof any contract or arrangement or proposal in which he or any of his close associate(s) has/have amaterial interest, and if he shall do so his vote shall not be counted nor shall he be counted in thequorum for that resolution, but this prohibition shall not apply to any of the following matters:
(a) the giving of any security or indemnity to the Director or his close associate(s) in respectof money lent or obligations incurred or undertaken by him or any of them at the requestof or for the benefit of the Company or any of its subsidiaries;
(b) the giving of any security or indemnity to a third party in respect of a debt or obligation ofthe Company or any of its subsidiaries for which the Director or his close associate(s) has/have himself/themselves assumed responsibility in whole or in part whether alone orjointly under a guarantee or indemnity or by the giving of security;
(c) any proposal concerning an offer of shares, debentures or other securities of or by theCompany or any other company which the Company may promote or be interested in forsubscription or purchase, where the Director or his close associate(s) is/are or is/are to beinterested as a participant in the underwriting or sub-underwriting of the offer;
(d) any proposal or arrangement concerning the benefit of employees of the Company or anyof its subsidiaries, including the adoption, modification or operation of either: (A) anyemployees’ share scheme or any share incentive or share option scheme under which theDirector or his close associate(s) may benefit; or (B) any of a pension fund or retirement,death or disability benefits scheme which relates to Directors, their close associates andemployees of the Company or any of its subsidiaries and does not provide in respect ofany Director or his close associate(s) any privilege or advantage not generally accorded tothe class of persons to which such scheme or fund relates; and
VII-8

APPENDIX VII SUMMARY OF THE CONSTITUTION OF OUR COMPANY ANDCAYMAN COMPANIES LAW
(e) any contract or arrangement in which the Director or his close associate(s) is/are interestedin the same manner as other holders of shares, debentures or other securities of theCompany by virtue only of his/their interest in those shares, debentures or other securities.
3. PROCEEDINGS OF THE BOARD
The Board may meet anywhere in the world for the despatch of business and may adjourn andotherwise regulate its meetings as it thinks fit. Questions arising at any meeting shall be determined bya majority of votes. In the case of an equality of votes, the chairman of the meeting shall have a secondor casting vote.
4. ALTERATIONS TO THE CONSTITUTIONAL DOCUMENTS AND THECOMPANY’S NAME
To the extent that the same is permissible under Cayman Companies Law and subject to theArticles, the Memorandum and Articles may only be altered or amended, and the name of theCompany may only be changed, with the sanction of a special resolution of the Company.
5. MEETINGS OF MEMBERS
(i) Special and ordinary resolutions
A special resolution of the Company must be passed by a majority of not less than three-fourthsof the votes cast by such members as, being entitled so to do, vote in person or by proxy or, in the caseof members which are corporations, by their duly authorized representatives or, where proxies areallowed, by proxy at a general meeting of which notice specifying the intention to propose theresolution as a special resolution has been duly given.
Under Cayman Companies Law, a copy of any special resolution must be forwarded to theRegistrar of Companies in the Cayman Islands within 15 days of being passed.
An “ordinary resolution”, by contrast, is a resolution passed by a simple majority of the votes ofsuch members of the Company as, being entitled to do so, vote in person or, in the case of memberswhich are corporations, by their duly authorized representatives or, where proxies are allowed, byproxy at a general meeting of which notice has been duly given.
A resolution in writing signed by or on behalf of all members shall be treated as an ordinaryresolution duly passed at a general meeting of the Company duly convened and held, and whererelevant as a special resolution so passed.
(ii) Voting rights and right to demand a poll
Subject to any special rights, restrictions or privileges as to voting for the time being attached toany class or classes of shares at any general meeting: (a) on a poll every member present in person orby proxy or, in the case of a member being a corporation, by its duly authorized representative shallhave one vote for every share which is fully paid or credited as fully paid registered in his name in theregister of members of the Company but so that no amount paid up or credited as paid up on a share inadvance of calls or installments is treated for this purpose as paid up on the share; and (b) on a show of
VII-9

APPENDIX VII SUMMARY OF THE CONSTITUTION OF OUR COMPANY ANDCAYMAN COMPANIES LAW
hands every member who is present in person (or, in the case of a member being a corporation, by itsduly authorized representative) or by proxy shall have one vote. Where more than one proxy isappointed by a member which is a Clearing House (as defined in the Articles) or its nominee(s), eachsuch proxy shall have one vote on a show of hands. On a poll, a member entitled to more than one voteneed not use all his votes or cast all the votes he does use in the same way.
At any general meeting a resolution put to the vote of the meeting is to be decided by poll savethat the chairman of the meeting may, pursuant to the Listing Rules, allow a resolution to be voted onby a show of hands. Where a show of hands is allowed, before or on the declaration of the result of theshow of hands, a poll may be demanded by (in each case by members present in person or by proxy orby a duly authorized corporate representative):
(a) at least two members;
(b) any member or members representing not less than one-tenth of the total voting rights ofall the members having the right to vote at the meeting; or
(c) a member or members holding shares in the Company conferring a right to vote at themeeting on which an aggregate sum has been paid equal to not less than one-tenth of thetotal sum paid up on all the shares conferring that right.
Should a Clearing House (as defined in the Articles) or its nominee(s) be a member of theCompany, such person or persons may be authorized as it thinks fit to act as its representative(s) at anymeeting of the Company or at any meeting of any class of members of the Company provided that, ifmore than one person is so authorized, the authorization shall specify the number and class of shares inrespect of which each such person is so authorized. A person authorized in accordance with thisprovision shall be deemed to have been duly authorized without further evidence of the facts and beentitled to exercise the same rights and powers on behalf of the Clearing House (as defined in theArticles) or its nominee(s) as if such person were an individual member including the right to voteindividually on a show of hands.
Where the Company has knowledge that any member is, under the Listing Rules, required toabstain from voting on any particular resolution or restricted to voting only for or only against anyparticular resolution, any votes cast by or on behalf of such member in contravention of suchrequirement or restriction shall not be counted.
(iii) Annual general meetings
The Company must hold an annual general meeting each year other than the year of theCompany’s adoption of the Articles. Such meeting must be held not more than 15 months after theholding of the last preceding annual general meeting, or such longer period as may be authorized bythe Stock Exchange at such time and place as may be determined by the Board.
(iv) Notices of meetings and business to be conducted
An annual general meeting of the Company shall be called by at least 21 days’ notice inwriting, and any other general meeting of the Company shall be called by at least 14 days’ notice inwriting. The notice shall be exclusive of the day on which it is served or deemed to be served and ofthe day for which it is given, and must specify the time, place and agenda of the meeting andparticulars of the resolution(s) to be considered at that meeting and, in the case of special business, thegeneral nature of that business.
VII-10
APPENDIX VII SUMMARY OF THE CONSTITUTION OF OUR COMPANY ANDCAYMAN COMPANIES LAW
Except where otherwise expressly stated, any notice or document (including a share certificate)to be given or issued under the Articles shall be in writing, and may be served by the Company on anymember personally, by post to such member’s registered address or (in the case of a notice) byadvertisement in the newspapers. Any member whose registered address is outside Hong Kong maynotify the Company in writing of an address in Hong Kong which shall be deemed to be his registeredaddress for this purpose. Subject to the Cayman Companies Law and the Listing Rules, a notice ordocument may also be served or delivered by the Company to any member by electronic means.
Although a meeting of the Company may be called by shorter notice than as specified above,such meeting may be deemed to have been duly called if it is so agreed:
(a) in the case of an annual general meeting, by all members of the Company entitled to attendand vote thereat; and
(b) in the case of any other meeting, by a majority in number of the members having a right toattend and vote at the meeting holding not less than 95% of the total voting rights in theCompany.
All business transacted at an extraordinary general meeting shall be deemed special business.All business shall also be deemed special business where it is transacted at an annual general meeting,with the exception of certain routine matters which shall be deemed ordinary business.
Extraordinary general meetings shall also be convened on the requisition of one or moremembers holding at the date of deposit of the requisition, not less than one tenth of the paid up capitalof the Company having the right of voting at general meetings.
(v) Quorum for meetings and separate class meetings
No business shall be transacted at any general meeting unless a quorum is present when themeeting proceeds to business, and continues to be present until the conclusion of the meeting.
The quorum for a general meeting shall be two members present in person (or in the case of amember being a corporation, by its duly authorized representative) or by proxy and entitled to vote. Inrespect of a separate class meeting (other than an adjourned meeting) convened to sanction themodification of class rights the necessary quorum shall be two persons holding or representing byproxy not less than one-third in nominal value of the issued shares of that class.
(vi) Proxies
Any member of the Company entitled to attend and vote at a meeting of the Company isentitled to appoint another person as his proxy to attend and vote instead of him. A member who is theholder of two or more shares may appoint more than one proxy to represent him and vote on his behalfat a general meeting of the Company or at a class meeting. A proxy need not be a member of theCompany and shall be entitled to exercise the same powers on behalf of a member who is an individualand for whom he acts as proxy as such member could exercise. In addition, a proxy shall be entitled toexercise the same powers on behalf of a member which is a corporation and for which he acts as proxyas such member could exercise if it were an individual member. On a poll or on a show of hands, votesmay be given either personally (or, in the case of a member being a corporation, by its duly authorizedrepresentative) or by proxy.
VII-11

APPENDIX VII SUMMARY OF THE CONSTITUTION OF OUR COMPANY ANDCAYMAN COMPANIES LAW
The instrument appointing a proxy shall be in writing under the hand of the appointor or of hisattorney duly authorized in writing, or if the appointor is a corporation, either under seal or under thehand of a duly authorized officer or attorney. Every instrument of proxy, whether for a specifiedmeeting or otherwise, shall be in such form as the Board may from time to time approve, provided thatit shall not preclude the use of the two-way form. Any form issued to a member for appointing a proxyto attend and vote at an extraordinary general meeting or at an annual general meeting at which anybusiness is to be transacted shall be such as to enable the member, according to his intentions, toinstruct the proxy to vote in favor of or against (or, in default of instructions, to exercise his discretionin respect of) each resolution dealing with any such business.
6. ACCOUNTS AND AUDIT
The Board shall cause proper books of account to be kept of the sums of money received andexpended by the Company, and of the assets and liabilities of the Company and of all other mattersrequired by the Cayman Companies Law (which include all sales and purchases of goods by thecompany) necessary to give a true and fair view of the state of the Company’s affairs and to show andexplain its transactions.
The books of accounts of the Company shall be kept at the head office of the Company or atsuch other place or places as the Board decides and shall always be open to inspection by any Director.No member (other than a Director) shall have any right to inspect any account, book or document ofthe Company except as conferred by the Cayman Companies Law or ordered by a court of competentjurisdiction or authorized by the Board or the Company in general meeting.
The Board shall from time to time cause to be prepared and laid before the Company at itsannual general meeting balance sheets and profit and loss accounts (including every document requiredby law to be annexed thereto), together with a copy of the Directors’ report and a copy of the auditors’report. Copies of these documents shall be sent to every person entitled to receive notices of generalmeetings of the Company under the provisions of the Articles together with the notice of annualgeneral meeting, not less than 21 days before the date of the meeting.
Subject to the rules of any stock exchange of the Relevant Territory (as defined in the Articles),the Company may send summarized financial statements to members who have, in accordance with therules of that stock exchange of the Relevant Territory (as defined in the Articles), consented andelected to receive summarized financial statements instead of the full financial statements. Thesummarized financial statements must be accompanied by any other documents as may be requiredunder the rules of any stock exchange of the Relevant Territory, and must be sent to those membersthat have consented and elected to receive the summarized financial statements not less than 21 daysbefore the general meeting.
The Company shall appoint auditor(s) to hold office until the conclusion of the next annualgeneral meeting on such terms and with such duties as may be agreed with the Board. The auditors’remuneration shall be fixed by the Company in general meeting or by the Board if authority is sodelegated by the members.
The members may, at any general meeting convened and held in accordance with the Articlesof the Company, remove the auditors by special resolution at any time before the expiration of the termof office and shall, by ordinary resolution, at that meeting appoint new auditors in its place for theremainder of the term.
VII-12

APPENDIX VII SUMMARY OF THE CONSTITUTION OF OUR COMPANY ANDCAYMAN COMPANIES LAW
The auditors shall audit the financial statements of the Company in accordance with generallyaccepted accounting principles of Hong Kong, the International Accounting Standards or such otherstandards as may be permitted by the Stock Exchange.
7. DIVIDENDS AND OTHER METHODS OF DISTRIBUTION
The Company in general meeting may declare dividends in any currency to be paid to themembers but no dividend shall be declared in excess of the amount recommended by the Board.
Except in so far as the rights attaching to, or the terms of issue of, any share may otherwiseprovide:
(i) all dividends shall be declared and paid according to the amounts paid up on the shares inrespect of which the dividend is paid, although no amount paid up on a share in advance ofcalls shall for this purpose be treated as paid up on the share;
(ii) all dividends shall be apportioned and paid pro rata in accordance with the amount paid upon the shares during any portion(s) of the period in respect of which the dividend is paid;and
(iii) the Board may deduct from any dividend or other monies payable to any member all sumsof money (if any) presently payable by him to the Company on account of calls,installments or otherwise.
Where the Board or the Company in general meeting has resolved that a dividend should bepaid or declared, the Board may resolve:
(i) that such dividend be satisfied wholly or in part in the form of an allotment of sharescredited as fully paid up, provided that the members entitled to such dividend will beentitled to elect to receive such dividend (or part thereof) in cash in lieu of such allotment;or
(ii) that the members entitled to such dividend will be entitled to elect to receive an allotmentof shares credited as fully paid up in lieu of the whole or such part of the dividend as theBoard may think fit.
Upon the recommendation of the Board, the Company may by ordinary resolution in respect ofany one particular dividend of the Company determine that it may be satisfied wholly in the form of anallotment of shares credited as fully paid up without offering any right to members to elect to receivesuch dividend in cash in lieu of such allotment.
Any dividend, bonus or other sum payable in cash to the holder of shares may be paid by checkor warrant sent through the post. Every such check or warrant shall be made payable to the order of theperson to whom it is sent and shall be sent at the holder’s or joint holders’ risk and payment of thecheck or warrant by the bank on which it is drawn shall constitute a good discharge to the Company.Any one of two or more joint holders may give effectual receipts for any dividends or other moniespayable or property distributable in respect of the shares held by such joint holders.
Whenever the Board or the Company in a general meeting has resolved that a dividend be paidor declared, the Board may further resolve that such dividend be satisfied wholly or in part by thedistribution of specific assets of any kind.
VII-13

APPENDIX VII SUMMARY OF THE CONSTITUTION OF OUR COMPANY ANDCAYMAN COMPANIES LAW
The Board may, if it thinks fit, receive from any member willing to advance the same, andeither in money or money’s worth, all or any part of the money uncalled and unpaid or installmentspayable upon any shares held by him, and in respect of all or any of the monies so advanced may payinterest at such rate (if any) not exceeding 20% per annum, as the Board may decide, but a payment inadvance of a call shall not entitle the member to receive any dividend or to exercise any other rights orprivileges as a member in respect of the share or the due portion of the shares upon which payment hasbeen advanced by such member before it is called up.
All dividends, bonuses or other distributions unclaimed for one year after having been declaredmay be invested or otherwise used by the Board for the benefit of the Company until claimed and theCompany shall not be constituted a trustee in respect thereof. All dividends, bonuses or otherdistributions unclaimed for six years after having been declared may be forfeited by the Board and,upon such forfeiture, shall revert to the Company.
No dividend or other monies payable by the Company on or in respect of any share shall bearinterest against the Company.
The Company may exercise the power to cease sending checks for dividend entitlements ordividend warrants by post if such checks or warrants remain uncashed on two consecutive occasions orafter the first occasion on which such a check or warrant is returned undelivered.
8. INSPECTION OF CORPORATE RECORDS
For so long as any part of the share capital of the Company is listed on the Stock Exchange, anymember may inspect any register of members of the Company maintained in Hong Kong (except whenthe register of members is closed) without charge and require the provision to him of copies or extractsof such register in all respects as if the Company were incorporated under and were subject to theHong Kong Companies Ordinance.
9. RIGHTS OF MINORITIES IN RELATION TO FRAUD OR OPPRESSION
There are no provisions in the Articles concerning the rights of minority members in relation tofraud or oppression. However, certain remedies may be available to members of the Company underCayman Companies Law, as summarized in the paragraph headed “C. Cayman Companies Law – 6.Protection of Minorities and Shareholders’ Suits” of this Appendix to the Prospectus.
10. PROCEDURES ON LIQUIDATION
A resolution that the Company be wound up by the court or be wound up voluntarily shall be aspecial resolution.
Subject to any special rights, privileges or restrictions as to the distribution of available surplusassets on liquidation for the time being attached to any class or classes of shares:
(i) if the Company is wound up and the assets available for distribution among the membersof the Company are more than sufficient to repay the whole of the capital paid up at thecommencement of the winding up, then the excess shall be distributed pari passu amongsuch members in proportion to the amount paid up on the shares held by themrespectively; and
VII-14

APPENDIX VII SUMMARY OF THE CONSTITUTION OF OUR COMPANY ANDCAYMAN COMPANIES LAW
(ii) if the Company is wound up and the assets available for distribution among the membersas such are insufficient to repay the whole of the paid-up capital, such assets shall bedistributed so that, as nearly as may be, the losses shall be borne by the members inproportion to the capital paid up on the shares held by them, respectively.
If the Company is wound up (whether the liquidation is voluntary or compelled by the court),the liquidator may, with the sanction of a special resolution and any other sanction required by theCayman Companies Law, divide among the members in specie or kind the whole or any part of theassets of the Company, whether the assets consist of property of one kind or different kinds, and theliquidator may, for such purpose, set such value as he deems fair upon any one or more class or classesof property to be so divided and may determine how such division shall be carried out as between themembers or different classes of members and the members within each class. The liquidator may, withthe like sanction, vest any part of the assets in trustees upon such trusts for the benefit of members asthe liquidator thinks fit, but so that no member shall be compelled to accept any shares or otherproperty upon which there is a liability.
11. SUBSCRIPTION RIGHTS RESERVE
Provided that it is not prohibited by and is otherwise in compliance with the CaymanCompanies Law, if warrants to subscribe for shares have been issued by the Company and theCompany does any act or engages in any transaction which would result in the subscription price ofsuch warrants being reduced below the par value of the shares to be issued on the exercise of suchwarrants, a subscription rights reserve shall be established and applied in paying up the differencebetween the subscription price and the par value of such shares.
C. CAYMAN COMPANIES LAW
The Company was incorporated in the Cayman Islands as an exempted company on June 14,2011 subject to the Cayman Companies Law. Certain provisions of Cayman Companies Law are setout below but this paragraph of the Prospectus does not purport to contain all applicable qualificationsand exceptions or to be a complete review of all matters of the Cayman Companies Law and taxation,which may differ from equivalent provisions in jurisdictions with which interested parties may be morefamiliar.
1. COMPANY OPERATIONS
An exempted company such as the Company must conduct its operations mainly outside theCayman Islands. An exempted company is also required to file an annual return each year with theRegistrar of Companies of the Cayman Islands and pay a fee which is based on the amount of itsauthorized share capital.
2. SHARE CAPITAL
Under Cayman Companies Law, a Cayman Islands company may issue ordinary, preference orredeemable shares or any combination thereof. Where a company issues shares at a premium, whetherfor cash or otherwise, a sum equal to the aggregate amount or value of the premiums on those sharesshall be transferred to an account, to be called the “share premium account”. At the option of acompany, these provisions may not apply to premiums on shares of that company allotted pursuant toany arrangements in consideration of the acquisition or cancelation of shares in any other company and
VII-15

APPENDIX VII SUMMARY OF THE CONSTITUTION OF OUR COMPANY ANDCAYMAN COMPANIES LAW
issued at a premium. The share premium account may be applied by the company subject to theprovisions, if any, of its memorandum and articles of association, in such manner as the company mayfrom time to time determine including, but without limitation, the following:
(i) paying distributions or dividends to members;
(ii) paying up unissued shares of the company to be issued to members as fully paid bonusshares;
(iii) any manner provided in section 37 of the Cayman Companies Law;
(iv) writing-off the preliminary expenses of the company; and
(v) writing-off the expenses of, or the commission paid or discount allowed on, any issue ofshares or debentures of the company.
Notwithstanding the foregoing, no distribution or dividend may be paid to members out of theshare premium account unless, immediately following the date on which the distribution or dividend isproposed to be paid, the company will be able to pay its debts as they fall due in the ordinary course ofbusiness.
Subject to confirmation by the court, a company limited by shares or a company limited byguarantee and having a share capital may, if authorized to do so by its articles of association, by specialresolution reduce its share capital in any way.
3. FINANCIAL ASSISTANCE TO PURCHASE SHARES OF A COMPANY OR ITSHOLDING COMPANY
There are no statutory prohibitions in the Cayman Islands on the granting of financial assistanceby a company to another person for the purchase of, or subscription for, its own, its holding company’sor a subsidiary’s shares. Therefore, a company may provide financial assistance provided the directorsof the company, when proposing to grant such financial assistance, discharge their duties of care andact in good faith, for a proper purpose and in the interests of the company. Such assistance should beon an arm’s-length basis.
4. PURCHASE OF SHARES AND WARRANTS BY A COMPANY AND ITSSUBSIDIARIES
A company limited by shares or a company limited by guarantee and having a share capitalmay, if so authorized by its articles of association, issue shares which are to be redeemed or are liableto be redeemed at the option of the company or a member and, for the avoidance of doubt, it shall belawful for the rights attaching to any shares to be varied, subject to the provisions of the company’sarticles of association, so as to provide that such shares are to be or are liable to be so redeemed. Inaddition, such a company may, if authorized to do so by its articles of association, purchase its ownshares, including any redeemable shares; an ordinary resolution of the company approving the mannerand terms of the purchase will be required if the articles of association do not authorize the manner andterms of such purchase. A company may not redeem or purchase its shares unless they are fully paid.Furthermore, a company may not redeem or purchase any of its shares if, as a result of the redemptionor purchase, there would no longer be any issued shares of the company other than shares held astreasury shares. In addition, a payment out of capital by a company for the redemption or purchase of
VII-16

APPENDIX VII SUMMARY OF THE CONSTITUTION OF OUR COMPANY ANDCAYMAN COMPANIES LAW
its own shares is not lawful unless, immediately following the date on which the payment is proposedto be made, the company shall be able to pay its debts as they fall due in the ordinary course ofbusiness.
Shares that have been purchased or redeemed by a company or surrendered to the companyshall not be treated as canceled but shall be classified as treasury shares if held in compliance with therequirements of Section 37A(1) of the Cayman Companies Law. Any such shares shall continue to beclassified as treasury shares until such shares are either canceled or transferred pursuant to the CaymanCompanies Law.
A company incorporated in the Cayman Islands may be able to purchase its own warrants,subject to and in accordance with the terms and conditions of the relevant warrant instrument orcertificate. Thus there is no requirement under Cayman Companies Law that a company’smemorandum or articles of association contain a specific provision enabling such purchases. Thedirectors of a company may under the general power contained in its memorandum of association beable to buy, sell and deal in personal property of all kinds.
A subsidiary may hold shares in its holding company and, in certain circumstances, mayacquire such shares.
5. DIVIDENDS AND DISTRIBUTIONS
Subject to a solvency test, as prescribed in the Cayman Companies Law, and the provisions, ifany, of the company’s memorandum and articles of association, company may pay dividends anddistributions out of its share premium account. In addition, based upon English case law which is likelyto be persuasive in the Cayman Islands, dividends may be paid out of profits.
For so long as a company holds treasury shares, no dividend may be declared or paid, and noother distribution (whether in cash or otherwise) of the company’s assets (including any distribution ofassets to members on a winding up) may be made, in respect of a treasury share.
6. PROTECTION OF MINORITIES AND SHAREHOLDERS’ SUITS
It can be expected that the Cayman Islands courts will ordinarily follow English case lawprecedents (particularly the rule in the case of Foss v. Harbottle and the exceptions to that rule) whichpermit a minority member to commence a representative action against or derivative actions in thename of the company to challenge acts which are ultra vires, illegal, fraudulent (and performed bythose in control of the Company) against the minority, or represent an irregularity in the passing of aresolution which requires a qualified (or special) majority which has not been obtained.
Where a company (not being a bank) is one which has a share capital divided into shares, thecourt may, on the application of members holding not less than one-fifth of the shares of the companyin issue, appoint an inspector to examine the affairs of the company and, at the direction of the court, toreport on such affairs. In addition, any member of a company may petition the court, which may makea winding up order if the court is of the opinion that it is just and equitable that the company should bewound up.
Any shareholder of a company may petition the Court which may make a winding up order ifthe Court is of the opinion that it is just and equitable that the company should be wound up or, as an
VII-17

APPENDIX VII SUMMARY OF THE CONSTITUTION OF OUR COMPANY ANDCAYMAN COMPANIES LAW
alternative to a winding up order: (i) an order regulating the conduct of the company’s affairs in thefuture; (ii) an order requiring the company to refrain from doing or continuing an act complained of bythe shareholder petitioner or to do an act which the shareholder petitioner has complained it hasomitted to do; (iii) an order authorizing civil proceedings to be brought in the name and on behalf ofthe company by the shareholder petitioner on such terms as the Court may direct; or (iv) an orderproviding for the purchase of the shares of any shareholders of the company by other shareholders orby the company itself and, in the case of a purchase by the company itself, a reduction of thecompany’s capital accordingly.
In general, claims against a company by its members must be based on the general laws ofcontract or tort applicable in the Cayman Islands or be based on potential violation of their individualrights as members as established by a company’s memorandum and articles of association.
7. DISPOSAL OF ASSETS
There are no specific restrictions on the power of directors to dispose of assets of a company,however, the directors are expected to exercise certain duties of care, diligence and skill to the standardthat a reasonably prudent person would exercise in comparable circumstances, in addition to fiduciaryduties to act in good faith, for proper purpose and in the best interests of the company under Englishcommon law (which the Cayman Islands courts will ordinarily follow).
8. ACCOUNTING AND AUDITING REQUIREMENTS
A company must cause proper records of accounts to be kept with respect to: (i) all sums ofmoney received and expended by it; (ii) all sales and purchases of goods by it; and (iii) its assets andliabilities. Proper books of account shall not be deemed to be kept if there are not kept such books asare necessary to give a true and fair view of the state of the company’s affairs and to explain itstransactions.
If a company keeps its books of account at any place other than at its registered office or anyother place within the Cayman Islands, it shall, upon service of an order or notice by the TaxInformation Authority pursuant to the Tax Information Authority Law (2013 Revision) of the CaymanIslands, make available, in electronic form or any other medium, at its registered office copies of itsbooks of account, or any part or parts thereof, as are specified in such order or notice.
9. EXCHANGE CONTROL
There are no exchange control regulations or currency restrictions in effect in the CaymanIslands.
10. TAXATION
Pursuant to section 6 of the Tax Concessions Law (2018 Revision) of the Cayman Islands, theCompany has obtained an undertaking from the Governor-in-Cabinet that:
(i) no law which is enacted in the Cayman Islands imposing any tax to be levied on profits orincome or gains or appreciation shall apply to the Company or its operations; and
VII-18

APPENDIX VII SUMMARY OF THE CONSTITUTION OF OUR COMPANY ANDCAYMAN COMPANIES LAW
(ii) no tax be levied on profits, income, gains or appreciations or which is in the nature ofestate duty or inheritance tax shall be payable by the Company:
(a) on or in respect of the shares, debentures or other obligations of the Company; or
(b) by way of withholding in whole or in part of any relevant payment as defined insection 6(3) of the Tax Concessions Law (2018 Revision).
The undertaking for the Company is for a period of 30 years from February 25, 2019.
The Cayman Islands currently levy no taxes on individuals or corporations based upon profits,income, gains or appreciations and there is no taxation in the nature of inheritance tax or estate duty.There are no other taxes likely to be material to the Company levied by the Government of the CaymanIslands save for certain stamp duties which may be applicable, from time to time, on certaininstruments.
11. STAMP DUTY ON TRANSFERS
No stamp duty is payable in the Cayman Islands on transfers of shares of Cayman Islandscompanies, save for those which hold interests in land in the Cayman Islands.
12. LOANS TO DIRECTORS
There is no express provision prohibiting the making of loans by a company to any of itsdirectors. However, the company’s articles of association may provide for the prohibition of such loansunder specific circumstances.
13. INSPECTION OF CORPORATE RECORDS
The members of a company have no general right to inspect or obtain copies of the register ofmembers or corporate records of the company. They will, however, have such rights as may be set outin the company’s articles of association.
14. REGISTER OF MEMBERS
A Cayman Islands exempted company may maintain its principal register of members and anybranch registers in any country or territory, whether within or outside the Cayman Islands, as thecompany may determine from time to time. There is no requirement for an exempted company to makeany returns of members to the Registrar of Companies in the Cayman Islands. The names andaddresses of the members are, accordingly, not a matter of public record and are not available forpublic inspection. However, an exempted company shall make available at its registered office, inelectronic form or any other medium, such register of members, including any branch register ofmember, as may be required of it upon service of an order or notice by the Tax Information Authoritypursuant to the Tax Information Authority Law (2013 Revision) of the Cayman Islands.
15. REGISTER OF DIRECTORS AND OFFICERS
Pursuant to the Cayman Companies Law, the Company is required to maintain at its registeredoffice a register of directors, alternate directors and officers which is not available for inspection by the
VII-19
APPENDIX VII SUMMARY OF THE CONSTITUTION OF OUR COMPANY ANDCAYMAN COMPANIES LAW
public. A copy of such register must be filed with the Registrar of Companies in the Cayman Islandsand any change must be notified to the Registrar within 30 days of any change in such directors orofficers, including a change of the name of such directors or officers.
16. WINDING UP
A Cayman Islands company may be wound up by: (i) an order of the court; (ii) voluntarily byits members; or (iii) under the supervision of the court.
The court has authority to order winding up in a number of specified circumstances includingwhere, in the opinion of the court, it is just and equitable that such company be so wound up.
A voluntary winding up of a company (other than a limited duration company, for whichspecific rules apply) occurs where the company resolves by special resolution that it be wound upvoluntarily or where the company in general meeting resolves that it be wound up voluntarily becauseit is unable to pay its debt as they fall due. In the case of a voluntary winding up, the company isobliged to cease to carry on its business from the commencement of its winding up except so far as itmay be beneficial for its winding up. Upon appointment of a voluntary liquidator, all the powers of thedirectors cease, except so far as the company in general meeting or the liquidator sanctions theircontinuance.
In the case of a members’ voluntary winding up of a company, one or more liquidators areappointed for the purpose of winding up the affairs of the company and distributing its assets.
As soon as the affairs of a company are fully wound up, the liquidator must make a report andan account of the winding up, showing how the winding up has been conducted and the property of thecompany disposed of, and call a general meeting of the company for the purposes of laying before itthe account and giving an explanation of that account.
When a resolution has been passed by a company to wind up voluntarily, the liquidator or anycontributory or creditor may apply to the court for an order for the continuation of the winding upunder the supervision of the court, on the grounds that: (i) the company is or is likely to becomeinsolvent; or (ii) the supervision of the court will facilitate a more effective, economic or expeditiousliquidation of the company in the interests of the contributories and creditors. A supervision order takeseffect for all purposes as if it was an order that the company be wound up by the court except that acommenced voluntary winding up and the prior actions of the voluntary liquidator shall be valid andbinding upon the company and its official liquidator.
For the purpose of conducting the proceedings in winding up a company and assisting the court,one or more persons may be appointed to be called an official liquidator(s). The court may appoint tosuch office such person or persons, either provisionally or otherwise, as it thinks fit, and if more thanone person is appointed to such office, the court shall declare whether any act required or authorized tobe done by the official liquidator is to be done by all or any one or more of such persons. The courtmay also determine whether any and what security is to be given by an official liquidator on hisappointment. If no official liquidator is appointed, or during any vacancy in such office, all theproperty of the company shall be in the custody of the court.
VII-20

APPENDIX VII SUMMARY OF THE CONSTITUTION OF OUR COMPANY ANDCAYMAN COMPANIES LAW
17. RECONSTRUCTIONS
Reconstructions and amalgamations may be approved by a majority in number representing75% in value of the members or creditors, depending on the circumstances, as are present at a meetingcalled for such purpose and thereafter sanctioned by the courts. Whilst a dissenting member has theright to express to the court his view that the transaction for which approval is being sought would notprovide the members with a fair value for their shares, the courts are unlikely to disapprove thetransaction on that ground alone in the absence of evidence of fraud or bad faith on behalf ofmanagement, and if the transaction were approved and consummated the dissenting member wouldhave no rights comparable to the appraisal rights (i.e. the right to receive payment in cash for thejudicially determined value of their shares) ordinarily available, for example, to dissenting members ofa United States corporation.
18. TAKE-OVERS
Where an offer is made by a company for the shares of another company and, within fourmonths of the offer, the holders of not less than 90% of the shares which are the subject of the offeraccept, the offeror may, at any time within two months after the expiration of that four-month period,by notice require the dissenting members to transfer their shares on the terms of the offer. A dissentingmember may apply to the Cayman Islands courts within one month of the notice objecting to thetransfer. The burden is on the dissenting member to show that the court should exercise its discretion,which it will be unlikely to do unless there is evidence of fraud or bad faith or collusion as between theofferor and the holders of the shares who have accepted the offer as a means of unfairly forcing outminority members.
19. INDEMNIFICATION
Cayman Companies Law does not limit the extent to which a company’s articles of associationmay provide for indemnification of officers and directors, save to the extent any such provision may beheld by the court to be contrary to public policy, for example, where a provision purports to provideindemnification against the consequences of committing a crime.
VII-21

APPENDIX VIII STATUTORY AND GENERAL INFORMATION
A. FURTHER INFORMATION ABOUT OUR GROUP
1. INCORPORATION OF OUR COMPANY
We were incorporated in the Cayman Islands under the Cayman Companies Law as anexempted company with limited liability on June 14, 2011. We have established a principal place ofbusiness in Hong Kong at 2406-07 Man Yee Building, 68 Des Voeux Road, Central, Hong Kong, andregistered with the Registrar of Companies in Hong Kong as a non-Hong Kong company under Part 16of the Companies Ordinance on October 8, 2018 under the same address. Mr. Jinchu Shen has beenappointed as the authorized representative of our Company for the acceptance of service of process andnotices on behalf of the Company in Hong Kong.
As we were incorporated in the Cayman Islands, our corporate structure and Memorandum ofAssociation and Articles of Association are subject to the relevant laws and regulations of the CaymanIslands. A summary of the relevant laws and regulations of the Cayman Islands and of theMemorandum of Association and Articles of Association is set out in “Appendix VII—Summary of theconstitution of our Company and Cayman Companies Law” in this Prospectus.
2. CHANGES IN THE SHARE CAPITAL OF OUR COMPANY
As of the date of incorporation of our Company, our Company had an authorized share capitalof US$50,000, divided into 50,000,000 shares of a par value of US$0.001 each. On June 14, 2011, oneshare was allotted and issued at par value to the initial subscriber and transferred to WP OCIM at par.
The following changes in the authorized share capital of our Company have taken place sincethe date of incorporation of our Company up to the date of this Prospectus:
(i) on June 30, 2011, the authorized share capital was increased to US$216,000 and theordinary shares in our authorized share capital were re-classified and re-designated into118,800,000 Class A Shares and 97,200,000 Class B Shares;
(ii) on April 17, 2012, the authorized share capital was increased to US$300,000 anddivided into 165,000,000 Class A Shares and 135,000,000 Class B Shares;
(iii) on July 26, 2012, the authorized share capital was increased to US$1,300,000 and theshares in our authorized share capital were re-classified and re-designated into500,000,000 Class A Shares, 700,000,000 Class B Shares, and 100,000,000 Class CShares;
(iv) on August 28, 2013, we increased our authorized share capital to US$1,800,000 dividedinto 600,000,000 Class A Shares, 1,000,000,000 Class B Shares, and 200,000,000Class C Shares;
(v) on May 26, 2014, the 1,000,000 Class B Shares in our authorized share capital and heldsolely by WP OCIM were re-classified and re-designated into 1,000,000 Class B1Shares and the authorized share capital was increased to US$2,250,000 and the shares inour authorized share capital were re-classified and re-designated into 600,000,000Class A Shares, 1,000,000,000 Class B1 Shares, 50,000,000 Class B2 Shares,400,000,000 Class B3 Shares and 200,000,000 Class C Shares;
(vi) on September 25, 2015, the authorized share capital was decreased to US$2,050,000and the shares in our authorized share capital were re-classified and re-designated into600,000,000 Class A Shares, 1,000,000,000 Class B1 Shares, 50,000,000 Class B2Shares and 400,000,000 Class B3 Shares;
VIII-1

APPENDIX VIII STATUTORY AND GENERAL INFORMATION
(vii) on November 3, 2015, the authorized share capital was increased to US$2,650,000 andthe shares in our authorized share capital were re-classified and re-designated into600,000,000 Class A Shares, 1,000,000,000 Class B1 Shares, 100,000,000 Class B2Shares, 400,000,000 Class B3 Shares, 500,000,000 Class B4 Shares, 50,000,000Class B5 Shares;
(viii) on December 23, 2016, the authorized share capital was increased to US$3,300,000 andthe shares in our authorized share capital were re-classified and re-designated into600,000,000 Class A Shares, 1,000,000,000 Class B1 Shares, 100,000,000 Class B2Shares, 400,000,000 Class B3 Shares, 500,000,000 Class B4 Shares, 100,000,000Class B5 Shares, 300,000,000 Class C Shares and 300,000,000 Class C PreferenceShares;
(ix) on July 31, 2017, the authorized share capital was increased to US$3,600,000 and theshares in our authorized share capital were re-classified and re-designated into600,000,000 Class A Shares, 1,000,000,000 Class B1 Shares, 100,000,000 Class B2Shares, 400,000,000 Class B3 Shares, 500,000,000 Class B4 Shares, 100,000,000Class B5 Shares, 300,000,000 Class B6 Shares, 300,000,000 Class C Shares and300,000,000 Class C Preference Shares;
(x) on November 29, 2017, the authorized share capital was increased to US$3,800,000 andthe shares in our authorized share capital were re-classified and re-designated into600,000,000 Class A Shares, 1,000,000,000 Class B1 Shares, 100,000,000 Class B2Shares, 400,000,000 Class B3 Shares, 500,000,000 Class B4 Shares, 100,000,000Class B5 Shares, 300,000,000 Class B6 Shares, 200,000,000 Class B7 Shares,300,000,000 Class C Shares and 300,000,000 Class C Preference Shares;
(xi) on May 10, 2018, the authorized share capital was increased to US$4,100,000 and theshares in our authorized share capital were re-classified and re-designated into600,000,000 Class A Shares, 1,000,000,000 Class B1 Shares, 100,000,000 Class B2Shares, 400,000,000 Class B3 Shares, 500,000,000 Class B4 Shares, 100,000,000Class B5 Shares, 300,000,000 Class B6 Shares, 200,000,000 Class B7 Shares,300,000,000 Class B8 Shares, 300,000,000 Class C Shares and 300,000,000 Class CPreference Shares; and
(xii) on June 15, 2018, the authorized share capital was increased to US$4,400,000 and theshares in our authorized share capital were re-classified and re-designated into600,000,000 Class A Shares, 1,000,000,000 Class B1 Shares, 100,000,000 Class B2Shares, 400,000,000 Class B3 Shares, 500,000,000 Class B4 Shares, 100,000,000Class B5 Shares, 300,000,000 Class B6 Shares, 200,000,000 Class B7 Shares,300,000,000 Class B8 Shares, 300,000,000 Class B9 Shares, 300,000,000 Class CShares and 300,000,000 Class C Preference Shares.
Changes in the share capital of our Company taken place since the date of incorporation of ourCompany up to the date of this Prospectus are set out in the section headed “History, Development andCorporate Structure—Major Shareholding Changes of our Company” in the Prospectus.
Immediately following the completion of the Global Offering, the issued share capital of ourCompany will be US$3,036,584.643, divided into 3,036,584,643 Shares of US$0.001 each, all fullypaid or credited as fully paid and 4,963,415,357 Shares of US$0.001 each will remain unissued.
VIII-2
APPENDIX VIII STATUTORY AND GENERAL INFORMATION
Save as disclosed above and in this Prospectus, there has been no alteration in the authorized orissued share capital of our Company since its incorporation.
3. WRITTEN RESOLUTIONS OF OUR SHAREHOLDERS PASSED ON JUNE 4, 2019AND OCTOBER 12, 2019
Pursuant to the written resolutions of our Shareholders passed on June 4, 2019 and October 12,2019, respectively, resolutions were passed under which, among other things:
(i) the authorized share capital of our Company was increased from US$4,400,000 toUS$8,000,000 by the creation of a further 3,600,000,000 Shares upon completion of theShare Redesignation;
(ii) the Share Conversion and the Share Redesignation were approved and adopted witheffect from the Listing Date;
(iii) the Memorandum and the Articles of Association were approved and adopted witheffect from the Listing Date; and
(iv) conditional on: (a) the Listing Committee granting approval of the listing of, andpermission to deal in, the Shares in issue and to be issued as mentioned in thisProspectus; (b) the Offer Price being duly determined among our Company (forourselves and on behalf of the Selling Shareholders) and the Joint Global Coordinators(for themselves and on behalf of the Underwriters); and (c) the obligations of theUnderwriters under the Underwriting Agreements becoming unconditional and notbeing terminated in accordance with the terms of the Underwriting Agreements orotherwise, in each case on or before the dates as may be specified in the UnderwritingAgreements:
(a) the Global Offering was approved and the Directors were authorized to approvethe allotment and issuance of the New Shares;
(b) the rules of the Post-IPO Share Option Scheme were approved and adopted andthe Directors were authorized, at their absolute discretion, to grant options tosubscribe for Shares under the Post-IPO Share Option Scheme and to allot, issueand deal with Shares pursuant to the exercise of options granted under the Post-IPO Share Option Scheme;
(c) a general unconditional mandate was granted to our Directors to allot, issue anddeal with, otherwise than by way of rights or pursuant to the exercise of anyoptions which may be granted under any share option scheme or by virtue ofscrip dividend schemes or similar arrangements in accordance with our Articles,a total number of Shares of not more than the sum of:
(A) 20.0% of the total number of Shares in issue immediately followingcompletion of the Global Offering; and
(B) the total number of Shares repurchased by our Company (if any) underthe general mandate to repurchase Shares as referred to insub-paragraph (d) below; and
(d) a general unconditional mandate was granted to our Directors to exercise all ofthe powers of our Company to repurchase on the Stock Exchange, or on any
VIII-3

APPENDIX VIII STATUTORY AND GENERAL INFORMATION
other stock exchange on which our securities may be listed and which isrecognized by the SFC and the Stock Exchange, such number of Shares that willrepresent up to 10% of the total number of Shares in issue immediatelyfollowing completion of the Global Offering, and the said approval shall belimited accordingly.
Each of the general mandates referred to in sub-paragraphs (c) and (d) above willremain in effect until the earliest of:
(a) the conclusion of our next annual general meeting;
(b) the expiration of the period within which our next annual general meeting isrequired to be held; or
(c) the time when such mandate is revoked or varied by an ordinary resolution ofour Shareholders in a general meeting.
4. CHANGES IN THE SHARE CAPITAL OF OUR MAJOR SUBSIDIARIES
The following sets out the changes in the share capital of our Major Subsidiaries. For details ofour Major Subsidiaries, please refer to the section headed “History, Development and CorporateStructure—Our Major Subsidiaries” in this Prospectus.
Since February 20, 2018, Sunwood Singapore Holding Pte. Ltd. allotted and issued furthershares to its existing shareholders, amounting to an aggregate of 2,659,441 B1 ordinary shares toMr. Thomas Nam, 1,772,875 B2 ordinary shares to Mr. Jihun Kang; and 83,107,642 A ordinary sharesand 2,770,253 C preference shares to Moonwood Singapore Holdings Pte. Ltd.
On August 10 and 16, 2018, ESR Pte. Ltd allotted and issued 294,587,403 ordinary shares and13,881,087 ordinary shares, respectively, to our Company and Rosewood (Cayman) Holdings,representing approximately 95.5% and 4.5%, respectively, of its total issued share capital.
On June 21, 2018, RW Higashi Ogishima TMK issued 3,414 preference shares and 3,413preference shares to RW Higashi Ogishima GK and RW Higashi SPE 1 Pte. Ltd, respectively,representing approximately 1.35% and 1.35%, respectively, of its total issued share capital.
On October 16, 2018, CIP allotted and issued 253 ordinary shares to ESR Developments(Australia) Pty Ltd representing approximately 17.4% of its total issued shares after the issue, andfurther allotted and issued 128 ordinary shares to ESR Developments (Australia) Pty Ltd onFebruary 27, 2019, representing approximately 8.1% of its total issued shares after the issue. OnMarch 13, 2019, CIP further allotted and issued 271 ordinary shares to ESR Developments (Australia)Pty Ltd, representing approximately 14.6% of its total issued shares after the issue. On June 7, 2019,CIP further allotted and issued 156 ordinary shares to ESR Developments (Australia) Pty Ltd,representing approximately 7.8% of its total issued shares after the issue.
On October 22, 2018, ESR Funds Management (S) Limited allotted and issued 995,445ordinary shares and 681,818 ordinary shares to ESR Investment Management Pte. Ltd and SSPL,respectively, representing approximately 36.5% and 25.0%, respectively, of its total issued sharecapital.
On November 27, 2018, Shanghai Yurun Meat Food Co., Ltd. increased its registered sharecapital from RMB 84,000,000 to RMB 1,000,000,000. On May 9, 2019, its registered capital was
VIII-4

APPENDIX VIII STATUTORY AND GENERAL INFORMATION
reduced from RMB1,000,000,000 to RMB481,000,000. On June 12, 2019, its registered capital wasincreased from RMB481,000,000 to RMB 650,000,000.
Save as disclosed above, there has been no alteration in the registered or issued share capital ofany of our Major Subsidiaries within the two years immediately preceding the date of this Prospectus.
5. REPURCHASE BY OUR COMPANY OF OUR OWN SECURITIES
This section includes information relating to the repurchase of our own securities, includinginformation required by the Stock Exchange to be included in this Prospectus concerning suchrepurchase.
(i) Provisions of the Listing Rules
The Listing Rules permit companies with a primary listing on the Stock Exchange torepurchase their securities on the Stock Exchange subject to certain restrictions, the most important ofwhich are summarized below:
(a) Shareholders’ approval . . . . . . . All proposed repurchases of securities by a company with itsprimary listing on the stock exchange must be approved inadvance by an ordinary resolution of shareholders, either byway of general mandate or by specific approval of a specifictransaction.
Pursuant to the written resolutions of our Shareholders passedon October 12, 2019, our Directors were granted theRepurchase Mandate, as described in the sub-section headed“3. Written Resolutions of our Shareholders passed on June 4,2019 and October 12, 2019” in this section above.
(b) Source of funds . . . . . . . . . . . . . The repurchase of Shares listed on the Stock Exchange mustbe funded out of funds legally available for the purpose inaccordance with our Memorandum and Articles and theapplicable laws of the Cayman Islands. We may notrepurchase Shares on the Stock Exchange for considerationother than cash or for settlement other than in accordance withthe trading rules of the Stock Exchange. Subject to theforegoing, we may make repurchases with profits of ourCompany or out of a new issuance of shares made for thepurpose of the repurchase or, if authorized by our Articles andsubject to the Cayman Companies Law, out of capital and, inthe case of any premium payable on the repurchase, out ofprofits of our Company or from sums standing to the credit ofthe share premium account of our Company or, if authorizedby our Articles and subject to the Cayman Companies Law,out of capital.
(c) Share capital . . . . . . . . . . . . . . . The exercise in full of the Repurchase Mandate, on the basis of3,036,584,643 Shares in issue immediately after thecompletion of the Global Offering, could accordingly result inup to 303,658,464 Shares being repurchased by us during the
VIII-5

APPENDIX VIII STATUTORY AND GENERAL INFORMATION
course of the period prior to the date on which the RepurchaseMandate expires or terminates (as referred to in sub-paragraph(a) above).
(d) Shares to be repurchased . . . . . . The Listing Rules provide that the Shares which are proposedto be purchased by our Company must be fully paid up.
(e) Suspension of repurchases . . . . Shares repurchases are prohibited after a price-sensitivedevelopment has occurred or has been the subject of a decisionuntil the time the price-sensitive information has been publiclyannounced. In addition, the Stock Exchange reserves the rightto prohibit repurchases of Shares on the Stock Exchange if ourCompany has breached the Listing Rules.
(f) Reporting requirements . . . . . . . Repurchases of Shares on the Stock Exchange or otherwisemust be reported to the Stock Exchange not later than 30minutes before the earlier of the commencement of themorning trading session or any pre-opening session (HongKong time) on the following Business Day. In addition, we arerequired to disclose in our Company’s annual report detailsregarding repurchases of Shares made during the year,including the monthly breakdown of the number of Sharesrepurchased, purchase price per Share and the aggregate pricepaid. The directors’ report shall contain reference to thepurchases made during the year and the reasons for makingsuch purchases.
(g) Connected persons . . . . . . . . . . Our Company is prohibited from knowingly repurchasingShares on the Stock Exchange from a connected person and aconnected person is prohibited from knowingly selling hissecurities to our Company.
(ii) General Information relevant to the Repurchase Mandate
Our Directors believe that it is in the best interests of us and our Shareholders to have a generalauthority from the Shareholders to enable our Directors to repurchase Shares in the market.Repurchases of Shares will only be made when our Directors believe that such repurchases will benefitus and our Shareholders. Such repurchases may, depending on market conditions and fundingarrangements at the time, lead to an enhancement of our net value, our assets and/or our earnings perShare.
There may be a material adverse impact on our working capital or gearing position (ascompared with the position disclosed in this Prospectus) in the event that the Repurchase Mandate isexercised in full. However, our Directors do not propose to exercise the Repurchase Mandate to suchextent as would, in the circumstances, have a material adverse effect on our working capitalrequirements or the gearing levels, which in the opinion of our Directors are from time to timeappropriate for us.
None of our Directors or, to the best of their knowledge having made all reasonable enquiries,any of their respective associates has any present intention to sell any Shares to us or our subsidiaries ifthe Repurchase Mandate is exercised.
VIII-6

APPENDIX VIII STATUTORY AND GENERAL INFORMATION
Our Directors have undertaken to the Stock Exchange that, so far as the same may beapplicable, they will exercise the Repurchase Mandate only in accordance with the Listing Rules andthe applicable laws of the Cayman Islands. We shall procure the broker who affects the repurchase ofShares to disclose to the Stock Exchange the information in relation to the purchase as the StockExchange may request.
If as a result of a repurchase of Shares, a Shareholder’s proportionate interest in the votingrights of our Company increases, the increase will be treated as an acquisition for the purposes of theTakeovers Code. Accordingly, a Shareholder (or a group of shareholders acting in concert, as definedin the Takeovers Code) could obtain or consolidate control of our Company and become obliged tomake a mandatory offer in accordance with Rule 26 of the Takeovers Code. In the event that theRepurchase Mandate is exercised in full, the total interests of WP OCIM will be increased toapproximately 26.81%. Our Directors are not aware of any consequences that would arise under theTakeovers Code as a result of a repurchase pursuant to the Repurchase Mandate.
No connected person has notified us that he has a present intention to sell Shares to us, or hasundertaken not to do so, if the Repurchase Mandate is exercised.
B. FURTHER INFORMATION ABOUT OUR BUSINESS
1. SUMMARY OF MATERIAL CONTRACTS
The following contracts (not being contracts entered into in the ordinary course of business)were entered into by our Company or our subsidiaries within the two years preceding the date of thisProspectus and are or may be material:
(i) the IPO implementation deed dated October 18, 2019 and entered into between(a) Laurels Capital Investments Limited; (b) WP OCIM One LLC; (c) StichtingDepositary APG Strategic Real Estate Pool as depositary of APG Strategic Real EstatePool; (d) Redwood Investment Company, Ltd.; (e) Redwood Investor (Cayman) Ltd.;(f) Kurmasana Holdings, LLC; (g) our Company; (h) Redwood Consulting (Cayman)Ltd.; (i) Bohai Investment Holding Limited; (j) Luckfield Global Limited; (k) EmeraldEwood (Cayman) Limited; (l) SK Holdings Co., Ltd.; (m) General Electric PensionTrust; (n) Stepstone A Opportunities Fund, L.P.; (o) Stepstone Rivas Private EquityFund, L.P.; (p) Stepstone H Opportunities Fund, L.P.; (q) Stepstone AMP OpportunitiesFund, L.P.; (r) Stepstone FSS Opportunities Fund, L.P.; (s) Jingdong Logistics GroupCorporation; (t) Montsoreau Investment Limited; (u) Goldman Sachs InvestmentsHolding (Asia) Limited; and (v) Jeffrey Jin Chu Shen (沈晉初) to set out the terms inrelation to the implementation of the reorganization of our Company and, if necessary,the unwind of the reorganization of our Company;
(ii) the bid implementation agreement dated November 12, 2018 and entered into between(a) Propertylink (Holdings) Limited (currently known as ESR Asset Management(Holdings) Limited); (b) Propertylink Investment Management Limited as responsibilityentity of Propertylink Australian Industrial Partnership; (c) Propertylink InvestmentManagement Limited as responsibility entity of the Propertylink Trust; and (d) ESRReal Estate (Australia) Pty Ltd in relation to, inter alia, the implementation of thetakeover bid for all the Propertylink securities;
VIII-7

APPENDIX VIII STATUTORY AND GENERAL INFORMATION
(iii) a share subscription agreement dated November 29, 2017 and entered into between(a) our Company; (b) General Electric Pension Trust; (c) Stepstone A OpportunitiesFund, L.P.; (d) Stepstone Rivas Private Equity Fund, L.P.; (e) Stepstone HOpportunities Fund, L.P.; (f) Stepstone AMP Opportunities Fund, L.P.; and(g) Stepstone FSS Opportunities Fund, L.P. in relation to the subscription of(a) 39,289,643 Class B3 Shares at a subscription price of US$50,000,000 by GeneralElectric Pension Trust; (b) 5,500,550 Class B7 Shares at a subscription price ofUS$7,000,000 by Stepstone A Opportunities Fund, L.P.; (c) 11,786,893 Class B7Shares at a subscription price of US$15,000,000 by Stepstone Rivas Private EquityFund, L.P.; (d) 39,289,643 Class B7 Shares at a subscription price of US$50,000,000 byStepstone H Opportunities Fund, L.P.; (e) 2,357,379 Class B7 Shares at a subscriptionprice of US$3,000,000 by Stepstone AMP Opportunities Fund, L.P.; and (f) 11,786,893Class B7 Shares at a subscription price of US$15,000,000 by Stepstone FSSOpportunities Fund, L.P.;
(iv) a share subscription agreement dated April 24, 2018 and entered into between ourCompany and Jingdong Logistics Group Corporation in connection with thesubscription of 240,578,861 Class B8 Shares at an aggregate subscription price ofUS$306,160,659 by Jingdong Logistics Group Corporation;
(v) a share subscription agreement dated May 28, 2018 and entered into between ourCompany and Montsoreau Investment Limited in connection with the subscription of26,363,847 Class B9 Shares at an aggregate subscription price of US$40,000,000 byMontsoreau Investment Limited;
(vi) a cornerstone investment agreement dated October 16, 2019 entered into between ourCompany, OMERS Administration Corporation, Deutsche Securities Asia Limited,CLSA Capital Markets Limited and Morgan Stanley Asia Limited, pursuant to whichOMERS Administration Corporation agreed to subscribe for such number of OfferShares which upon completion of the Global Offering will represent nine (9) per cent ofour Company’s share capital (rounded down to the nearest whole board lot of 200Shares) at the Offer Price; and
(vii) the Hong Kong Underwriting Agreement.
2. INTELLECTUAL PROPERTY RIGHTS OF OUR GROUP
As of the Latest Practicable Date, we have registered or have applied for the registration of thefollowing intellectual property rights which are material in relation to our business.
(i) Trademarks
As of the Latest Practicable Date, we have registered the following trademarks which arematerial to our business:
No. Trademark Registered owner Class(es) Place of registration Registration numberExpiryDate
1. Our Company 36, 37, 39 Australia 1903386 January 30,2028
2. Our Company 36, 39 SouthKorea
41-0393568 April 6,2027
VIII-8

APPENDIX VIII STATUTORY AND GENERAL INFORMATION
3. Our Company 36,39
SouthKorea
41-0393570 April 6, 2027
4. Our Company 36,39
Japan 5908540 December 22,2026
5. Our Company 36,39
Japan 5906000 December 16,2026
6. Our Company 36 Singapore 40201611373R July 15, 2026
7. Our Company 36 Singapore 40201611376T July 15, 2026
8. Our Company 36 Hong Kong 303834478 July 11, 2026
9. Our Company 36,39
Hong Kong 303834351 July 11, 2026
10. Our Company 39 Hong Kong 303834342 July 11, 2026
11. Our Company 36 India 3837092 May 18, 2028
12. Our Company 39 India 3837093 May 18, 2028
13. Shanghai e-ShangWarehousing
39 PRC 20640090 September 13,2028
14. Shanghai e-ShangWarehousing
36 PRC 11145899 April 6, 2025
15. Shanghai e-ShangWarehousing
37 PRC 11145900 April 6, 2025
16. Shanghai e-ShangWarehousing
42 PRC 11145901 November 27,2023
17. Shanghai e-ShangWarehousing
39 PRC 11145835 March 20,2024
18. Shanghai e-ShangWarehousing
36 PRC 11753230 April 27,2024
19. Shanghai e-ShangWarehousing
39 PRC 11753229 July 20, 2025
20. Shanghai e-ShangWarehousing
36 PRC 11753227 April 27,2024
21. Shanghai e-ShangWarehousing
37 PRC 11753225 July 20, 2025
VIII-9

APPENDIX VIII STATUTORY AND GENERAL INFORMATION
22. Shanghai e-Shang Warehousing 36 PRC 15585696 December 13,2025
23. Shanghai e-Shang Warehousing 39 PRC 15585836 December 13,2025
24. Shanghai e-Shang Warehousing 42 PRC 15585995 December 20,2025
25. Shanghai e-Shang Warehousing 36 PRC 16493461 April 27,2026
26. Shanghai e-Shang Warehousing 39 PRC 16493460 February 27,2027
27. Shanghai e-Shang Warehousing 36 PRC 16493459 June 20, 2026
28. Shanghai e-Shang Warehousing 37 PRC 16493458 June 20, 2026
29. Shanghai e-Shang Warehousing 36 PRC 18652778 January 27,2027
30. Shanghai e-Shang Warehousing 39 PRC 18652777 January 27,2027
31. Shanghai e-Shang Warehousing 39 PRC 24242565 February 27,2029
32. Shanghai e-Shang Warehousing 36 PRC 24242566 February 27,2029
As of the Latest Practicable Date, we have applied for registration of the following trademarkswhich are material to our business:
No. Trademark Applicant Class(es)Place of
registrationApplicationnumber Application date
1. Our Company 36, 39 Australia 1903384 January 30, 2018
2. Our Company 36, 39 Australia 1903385 January 30, 2018
3. Our Company 37 Australia 2034055 January 30, 2018
4. Our Company 37 Australia 2034057 January 30, 2018
5. Our Company 36, 39 Cayman Islands T0000963 March 13, 2019
6. Our Company 36, 39 Cayman Islands T0000964 March 13, 2019
7. Our Company 36 India 3837090 May 18, 2018
8. Our Company 39 India 3837091 May 18, 2018
VIII-10

APPENDIX VIII STATUTORY AND GENERAL INFORMATION
No. Trademark Applicant Class(es)Place of
registrationApplicationnumber Application date
9. Our Company 35, 36 Singapore 40201980743R September 24, 2019
10. Our Company 35, 36 Singapore 40201920744Q September 24, 2019
(ii) Domain names
As of the Latest Practicable Date, we have registered the following domain names which arematerial to our business:
No. Domain name Registered Owner Date of Registration Expiry Date
1. esr.com Shanghai e-Shang Warehousing September 30, 1994 September 29, 2023
2. e-shang.com.cn Shanghaie-Shang Warehousing
May 13, 2011 May 13, 2023
3. ciproperty.com.au CIP June 17, 2017 June 17, 2021
Save as disclosed above, as of the Latest Practicable Date, there were no other trade or servicemarks, patents, intellectual or industrial property rights which were material in relation to our business.
VIII-11

APPENDIX VIII STATUTORY AND GENERAL INFORMATION
C. FURTHER INFORMATION ABOUT OUR DIRECTORS AND SUBSTANTIALSHAREHOLDERS
1. DISCLOSURE OF INTERESTS
Save as disclosed below, immediately following completion of the Global Offering (assumingthe Over-allotment Option and the Offer Size Adjustment Option are not exercised), so far as ourDirectors are aware, the interests or short positions of our Directors and the chief executives in anyShares, underlying shares and debentures of our Company or any associated corporations (within themeaning of Part XV of the SFO), which will have to be notified to our Company and the StockExchange pursuant to Divisions 7 and 8 of Part XV of the SFO (including interests and short positionswhich have been taken or deemed to have been taken under such provisions of the SFO) or which willbe required, pursuant to Section 352 of the SFO, to be entered in the register or which will be requiredto be notified to our Company and the Stock Exchange pursuant to the Model Code for SecuritiesTransactions by Directors of Listed Issuers contained in the Listing Rules, will be as follows:
Name of Director Capacity/Nature of interestNumber of Shares and
underlying Shares
Aggregate ownershippercentage uponcompletion of theGlobal Offering
(assuming the Over-allotment Optionand the Offer SizeAdjustment Optionare not exercised)
Mr. Jinchu Shen(1) . . . . . . . . . . . . Interest in a controlled corporation 285,758,717(2) 9.4%Mr. Stuart Gibson(3) . . . . . . . . . . . Interest in a controlled corporation 421,835,167(4) 13.9%Mr. Charles Alexander
Portes(3) . . . . . . . . . . . . . . . . . . Interest in a controlled corporation 421,835,167(4) 13.9%
Notes:(1) The relevant Shares are held by Laurels, which is wholly owned by The Shen Trust. In respect of The Shen Trust, the settlor is Rosy
Fortune Limited (the sole shareholder of which is Mr. Jinchu Shen). Mr. Jinchu Shen has a deemed interest under the SFO in the Sharesheld by The Shen Trust solely in his capacity as the sole shareholder of the settlor of The Shen Trust.
(2) Includes the interest in 3,899,928 Shares underlying the options pursuant to the Tier 1 ESOP.(3) Redwood Investor is owned as to 42.0% and 58.0% by Kurmasana Holdings, LLC and Redwood Investor (Cayman) Ltd, respectively, of
which Kurmasana Holdings, LLC is wholly-owned by Redwood Investor (Cayman) Ltd and the voting rights of Redwood Investor(Cayman) Ltd. are controlled as to 50% and 50% by Mr. Charles Alexander Portes and Mr. Stuart Gibson, respectively. Hence, each ofMr. Charles Alexander Portes, Mr. Stuart Gibson, Redwood Investor (Cayman) Ltd and Kurmasana Holdings, LLC will be deemed to beinterested in the Shares held by Redwood Investor. Redwood Consulting is owned as to 50.0% and 50.0% by Mr. Charles AlexanderPortes and Mr. Stuart Gibson, respectively. Hence each of Mr. Charles Alexander Portes and Mr. Stuart Gibson are deemed to beinterested in Shares held by Redwood Consulting.
(4) Includes his interest in 16,899,687 Shares underlying the options pursuant to the Tier 1 ESOP.
2(a). SUBSTANTIAL SHAREHOLDERS
For information on the persons who will, immediately following the completion of the GlobalOffering (assuming the Over-allotment Option is not exercised), have interests or short positions in ourShares or underlying Shares which would be required to be disclosed to our Company and the StockExchange under the provisions of Divisions 2 and 3 of Part XV of the SFO, please refer to the sectionheaded “Substantial Shareholders” in this Prospectus.
Save as disclosed in the section headed “Substantial Shareholders” in this Prospectus, as of theLatest Practicable Date, our Directors are not aware of any person who will, immediately following thecompletion of the Global Offering (assuming the Over-allotment Option is not exercised), beinterested, directly or indirectly, in 10% or more of the nominal value of any class of share capital
VIII-12

APPENDIX VIII STATUTORY AND GENERAL INFORMATION
carrying rights to vote in all circumstances at general meetings of any member of our Group or have anoption in respect of such capital.
2(b). INTERESTS IN OTHER MEMBERS OF OUR GROUP
So far as our Directors are aware, as at the Latest Practicable Date, the following persons(excluding us) are directly and indirectly interested in 10% or more of the nominal value of any classof share capital carrying rights to vote in all circumstances at general meetings of members of ourGroup:
Name of subsidiary Name of shareholder
Approximatepercentageof ownership
Chongqing Yongxiang Market Management Co.,Ltd. (重慶永翔市場經營管理有限公司) . . . . . . . 珠海融沁股權投資合夥企業(有限合夥) 50.0%
Zhuhai Siyi Investment Consulting PartnershipEnterprise (Limited Partnership) (珠海思易投資諮詢合夥企業(有限合夥)) . . . . . . . . . . . . . . . . . . 珠海融沁股權投資合夥企業(有限合夥) (作為有
限合夥人)50.0%
Alpha Offshore Holdings (HK) Limited . . . . . . . . Shanghai Transwin Logistics Co., Ltd. 45.0%ESR Funds Management (S) Limited . . . . . . . . . . Shanghai Summit Pte. Ltd. 25.0%Mingyue Logistics Pte Ltd . . . . . . . . . . . . . . . . . . RCLF Guangzhou 1 Pte. Ltd. 35.0%RW Higashi Pte. Ltd. . . . . . . . . . . . . . . . . . . . . . . RJLF II GP Pte Ltd (held on behalf of
Redwood Japan Logistics Fund II LimitedPartnership, in its capacity as the GP) 30.0%
Beijing Zhongzi Construction Investment andAssembly Technology Co. Ltd. (北京中資建投裝配技術有限公司) . . . . . . . . . . . . . . . . . . . . . . . 北京中資建投建築諮詢有限公司 30.0%
ABM Capital Limited . . . . . . . . . . . . . . . . . . . . . . Ambition Mind Holdings Limited 10.0%Indo Global Ranjangaon Infrastructure And
Utility Services Pvt. Ltd. . . . . . . . . . . . . . . . . . . Sanjiv Chamanlal Aurora 15.0%Manoj Nawalrai Hingorani 15.0%
Indo Global Infrastructures (Ranjangaon)Services Pvt. Ltd. . . . . . . . . . . . . . . . . . . . . . . . Sanjiv Chamanlal Aurora 14.3%
Manoj Nawalrai Hingorani 14.3%Xi’an Yihong Warehousing Services Co., Ltd.
(西安易宏倉儲服務有限公司) . . . . . . . . . . . . . . . 上海樓觀企業管理中心 15%Shanghai Yurun Meat Food Co., Ltd. (上海雨潤肉食品有限公司) . . . . . . . . . . . . . . . . . . . . . . . 嘉興易商股權投資合夥企業(有限合夥)
(Jiaxing Yishang Equity InvestmentPartnership (Limited Partnership) 26%
Altamount Road Property Private Limited . . . . . . Macrotech Developers Limited 41.0%Gati Realtors Private Limited . . . . . . . . . . . . . . . . Future Market Networks Limited 49%Hong Kong FuJin Investment Co., Limited . . . . . Hong Kong Brightcity Investment Co.,
Limited 10%
3. DIRECTORS’ SERVICE CONTRACTS
Each of our executive Directors has entered into a service contract with us for an initial term ofthree years commencing from the Listing Date and shall continue thereafter unless terminated by notless than six months’ written notice. The appointments of our executive Directors and non-executiveDirectors are also subject to the provisions of retirement and rotation of Directors under the Articles.The salary of each executive Director after each financial year is subject to adjustment as determinedby the Remuneration Committee and approved by a majority of the members of the Board (excludingthe Director whose salary is under review).
VIII-13

APPENDIX VIII STATUTORY AND GENERAL INFORMATION
Each of our non-executive Directors and independent non-executive Directors has entered intoa letter of appointment with our Company for a term of three years commencing from the Listing Dateunless terminated by one months’ written notice. The appointments of our independent non-executiveDirectors are also subject to the provisions of retirement and rotation of Directors under the Articles.Pursuant to the terms of the letters of appointment, there will be no director’s fee for our non-executiveDirectors and the intended annual director’s fee payable to each of our independent non-executiveDirectors is no more than HK$1 million.
Save for the director’s fee mentioned above, none of our independent non-executive Directorsis expected to receive any other remuneration for holding their office as an independent non-executiveDirector.
Save as disclosed above, none of our Directors has or will have a service contract with anymember of our Group, other than contracts expiring or determinable by the employer within one yearwithout the payment of compensation (other than statutory compensation).
4. DIRECTORS’ REMUNERATION
The remuneration of our Directors are paid in the form of salaries, allowances, employeebenefits, discretionary bonuses, fees and retirement benefits. For more information, see the sectionheaded “Directors and Senior Management—Remuneration of Directors and Senior Management” inthis Prospectus.
5. FURTHER INFORMATION ABOUT MR. JOSEPH RAYMOND GAGNON
On March 20, 2012, Mr. Gagnon was appointed as a director of Titan Group InvestmentLimited (“TGIL”), a company incorporated in the BVI engaged in oil storage services, and asubsidiary of Titan Petrochemicals Group Limited, which is a company listed on the Hong Kong StockExchange (Stock Code: 1192), engaged in the business of supplying oil products and provision ofbunker refueling services. At that time, TGIL was financially distressed, and Mr. Gagnon’s roleincluded seeking a means for restructuring the TGIL group for the benefit of its shareholders andcreditors. On June 18, 2012, one of TGIL’s shareholders made an application to the Eastern CaribbeanSupreme Court of the British Virgin Islands for the appointment of liquidators to TGIL. On July 17,2012, liquidators were appointed to TGIL as part of the restructuring. On July 4, 2012, Mr. Gagnonceased to be a director of TGIL. On September 15, 2012 a consortium agreed to purchase substantiallyall of the assets of the TGIL group.
6. OTHER INTERESTS OF DIRECTORS
Two of our non-executive Directors are employees of Warburg Pincus X and its affiliates,which have other investments in the real-estate sector in APAC, some of which may have businessoverlaps and potentially compete with our Company. In connection with their employment, these non-executive Directors may hold directorships in such businesses. Details of the relevant non-executiveDirectors’ directorships of potentially competing businesses as at the date of this Prospectus are as setout below. None of our Directors has an interest in any of the Company’s primary competitors.
Both Mr. Joseph Raymond Gagnon and Mr. Jeffrey David Perlman, are non-executive directorsof ARA Asset Management Holdings Pte. Ltd. (“ARA”). ARA is a real estate fund management andREIT manager. ARA or its affiliates are the REIT manager of Fortune REIT, listed on the Singapore
VIII-14

APPENDIX VIII STATUTORY AND GENERAL INFORMATION
Stock Exchange (Stock Code: F25U) and on the Hong Kong Stock Exchange (Stock Code: 0778),Suntec REIT and Cache Logistics Trust, listed on the Singapore Stock Exchange (Stock Code: T82U),and Hui Xian REIT and Prosperity REIT, listed in Hong Kong (Stock Code: 0808). ARA is primarilyfocused on office and retail properties.
Mr. Gagnon is also a non-executive director of New Ease Cayman Investment Group (“NewEase”), D&J Industrial Real Estate Group Limited (“Dongjiu”) and Kailong Holdings Limited(“Kailong”). New Ease is engaged in the development and operation of industrial parks (includinglogistics) in airport locations and providing integrated infrastructure solutions. New Ease operatessolely in the PRC and is focused on airport sites. Dongjiu is primarily engaged in the ownership,development and operation of business parks and industrial (primarily workshops) real-estate projects.Dongjiu operates solely in the PRC. Kailong is a real estate fund manager primarily focused on officereal-estate projects. Kailong operates in PRC, Hong Kong and the UK.
7. DISCLAIMERS
Save as disclosed in this Prospectus as at the date of this Prospectus:
(i) none of our Directors nor any of the persons listed in the sub-paragraph headed“E. Other information—7. Qualifications and consents of experts” in this section below:
(a) is interested, directly or indirectly, in the promotion of, or in any assets whichhave been, within the two years immediately preceding the issue of thisProspectus, acquired or disposed of by or leased to any member of our Group, orare proposed to be acquired or disposed of by or leased to any member of ourGroup;
(b) is materially interested in any contract or arrangement with our Group subsistingat the date of this Prospectus which is unusual in its nature or conditions orwhich is significant in relation to the business of our Group; and
(c) has any shareholding in any member of our Group or the right (whether legallyenforceable or not) to subscribe for or to nominate persons to subscribe forsecurities in any member of our Group;
(ii) none of our Directors are interested in any business apart from our Group’s businesswhich compete or is likely to compete, directly or indirectly, with the business of ourGroup; and
(iii) so far as is known to our Directors, none of our Directors or their associates or anyShareholder of our Company (which to the knowledge of our Directors owns 5% ormore of the issued share capital of our Company) has any interest in any of the fivelargest customers of our Group.
VIII-15

APPENDIX VIII STATUTORY AND GENERAL INFORMATION
D. KM ESOP, TIER 1 ESOP AND POST-IPO SHARE OPTION SCHEME
1. KM ESOP
The following is a summary of the principal terms of the KM ESOP of the Company. The termsof the KM ESOP are not subject to the provisions of Chapter 17 of the Listing Rules.
(i) Purpose of the KM ESOP
The purpose of the KM ESOP is to incentivize or reward eligible participants for theircontribution towards our Company’s operations, so as to: (a) motivate and encourage recipients tocontinue to perform well; (b) to retain the services of recipients whose work is vital to the growth andcontinued success of our Company; and (c) to link the personal interests of members of the Board andthe employees with those of the Shareholders.
(ii) Who may join
The Board may, at its discretion, grant an option to any director or employee of our Group, orany director or employee of any company which is under the control of our Company (an “EligiblePerson”).
(iii) Maximum number of shares
As of the date of the Prospectus, the number of Shares which may be issued upon exercise ofall outstanding options granted and yet to be exercised under the KM ESOP at any time shall notexceed 63,558,343 Shares.
(iv) Administration
Unless otherwise permitted or authorized by our Board, the Board has full authority toadminister the KM ESOP, including authority to interpret and construe any of its provisions and toadopt any regulations and any documents it thinks necessary or appropriate. The Board’s decision onany matter connected with the KM ESOP will be final and binding on all parties.
(v) Term of the KM ESOP
The term of the KM ESOP will terminate on the tenth anniversary of the commencement dateor at any earlier time determined by the Board. Termination of the KM ESOP will not affect optionsgranted before termination.
(vi) Vesting Period
Subject to other conditions of the KM ESOP being satisfied, the options which have beengranted shall be vested in accordance with the period as may be determined by our Board and set out inthe vesting schedule in the KM ESOP.
(vii) Exercise Price
The Board will decide the option price which will be stated at the date of grant. The optionprice may be nil unless the shares subject to the option are to be subscribed, when the option pricecannot be less than the nominal value of a share.
VIII-16

APPENDIX VIII STATUTORY AND GENERAL INFORMATION
The total amount payable on the exercise of an option is the relevant option price multiplied bythe number of shares in respect of which the option is exercised.
(viii) Settlement methods
In specified circumstances described in the paragraph headed “Exercise of Option” in thissection below, in lieu of the participant paying the exercise price to exercise an option, the participantwill receive a payment in cash equal to the value of the shares in respect of which the option is beingexercised less the exercise price otherwise payable for those shares (“Net Cash Settlement”).
In specified circumstances described in the paragraph headed “Exercise of Option” in thissection below, in lieu of the participant paying the exercise price, the participant will receive thegreatest number of whole shares as determined by the formula set out in the KM ESOP (“Net ShareSettlement”).
Apart from the Net Cash Settlement and Net Share Settlement arrangement, in specifiedcircumstances described in the paragraph headed “Exercise of Option” in this section below, theparticipant can purchase the Shares at the option price as stated in the award certificate or such otherdocument of the same nature.
(ix) Conditions of exercise
The Board may impose performance conditions before any option may vest. Any performancecondition will be specified in the award certificate or other document issued by the Board to evidencethe grant of an option. The extent to which any condition is met will be determined by the Board,whose decision will be final.
(x) Exercise of option
An option may be exercised in full or in part in accordance with the terms of the KM ESOP bydelivering to the address of our Company a written notice of exercise giving at least 7 days’ notice inthe prescribed form. The participant may also elect one of the following: (a) provide evidence to thesatisfaction of our Company that it has received or will receive as soon as practicable payment in fullof the Exercise Price for the aggregate number of Shares over which the option is to be exercised; or(b) deliver a written notice to our Company to confirm use of either the Net Share Settlement or NetCash Settlement arrangement.
In certain circumstances, an option may be settled by a payment in cash to the participant.
(xi) Non-transferability of the options
Unless otherwise permitted by our Board or any person authorized by our Board, the optionsshall be personal to the participant and the participant shall not transfer, assign, charge or dispose ofthe options or any interest or rights in respect of it.
(xii) Lapse of an option
An option shall lapse automatically (to the extent not already exercised and subject always tothe terms and conditions upon which the option was granted) on the earliest of:
(a) the tenth anniversary of the date of grant;
VIII-17

APPENDIX VIII STATUTORY AND GENERAL INFORMATION
(b) the expiry of three months from the date on which the participant ceases to be anEligible Person;
(c) the date of expiry of any of the periods referred to in the paragraphs headed “Rights onDeath, Retirement, Injury, Disability” and “Rights on Winding-Up” in this sectionbelow;
(d) the date on which a Participant ceases to be an Eligible Person in any circumstancesother than those referred to in the paragraphs headed “Rights on Death, Retirement,Injury, Disability” and “Effect of Dismissal or Ceasing Employment” in this sectionbelow;
(e) subject to the paragraph headed “Rights on Winding-Up” in this section below, thepassing of an effective resolution for the voluntary winding-up of the Company (exceptwhere the winding-up is for the purpose of a reconstruction or amalgamation);
(f) subject to the paragraph headed “Rights on Winding-Up” below, the expiry of onemonth following the making of an order by the court for the winding-up of theCompany (except where the winding-up is for the purpose of a reconstruction oramalgamation);
(g) the participant being declared bankrupt;
(h) the participant transferring, assigning, charging or otherwise disposing of the optionsunless in breach of the terms of the KM ESOP;
(i) as soon as any condition of exercise imposed can no longer in the opinion of the Boardbe met; or
(j) the participant, who is a Shareholder: (A) being deemed unable or admits inability topay its debts as they fall due; or (B) there has been a material breach of the provisions ofthe Articles by the participant which is not capable of remedy, or which is capable ofremedy but is not remedied within 30 days after the occurrence of such material breach.
(xiii) Rights on Death, Retirement, Injury, Disability
If the participant ceases to be an employee by reason of his death, the options may be exercisedby his personal representatives within twelve months from the date of death.
If the participant ceases to be an employee by reason of his injury, ill-health or disability, theoptions may be exercised, to the extent it is vested, within six months from the date of cessation ofemployment.
(xiv) Effect of dismissal or ceasing employment
If a participant’s employment with our Company or any member of our Group is terminated byway of: (a) his voluntary resignation within three months from the date of grant; (b) fundamentalbreach of his employment agreement or a material breach of his non-disclosure undertaking; or (c) hisserious misconduct, the option will lapse and cease to be exercisable immediately.
If a participant ceases to be employed by our Company by reason of redundancy or dismissalother than by summary dismissal, the option may be exercised to the extent that it is vested withinthree months from the date of cessation of employment.
VIII-18

APPENDIX VIII STATUTORY AND GENERAL INFORMATION
(xv) Rights on winding-up
If a notice is given by our Company to its shareholders to convene a general meeting for thepurposes of considering or approving a resolution to voluntarily wind-up our Company, to the extentthat an option is vested, it may be exercised at any time to the extent that it is vested, before therelevant resolution has been passed or defeated or the meeting adjourned indefinitely, conditionally onthe resolution being passed. If our Company is wound up by the court, to the extent that an option isvested and permissible by law, it may be exercised within one month of the winding-up order and willthen lapse. This sub-clause does not apply if the winding-up is for the purpose of a reconstruction oramalgamation
(xvi) Rights on reorganization or merger
If there is any variation of equity share capital in relation to: (a) an issue of Shares by way ofdividend, distribution or capitalization of profits or reserves, an offer or invitation made by way ofrights, a subdivision, consolidation, return, reduction; or (b) any other variation of the Company’sshare capital, consolidation, amalgamation or merger of our Company, the Board may adjust the termsof the KM ESOP or the option price for outstanding options with effect from the date of the relevantevent, so that the value of the shares subject to the options is equal to the value of those sharesimmediately before the occurrence of the event; and the exercise price payable to exercise an optionwill be the same as that immediately before the occurrence of the event.
(xvii) Board’s power to amend the KM ESOP
The Board can at any time amend any of the provisions of the KM ESOP in any respect, subjectto the requirement that no amendment that would abrogate or materially affect adversely the subsistingrights of a participant can be made without the written consent of, or by a resolution passed by, ameeting of participants who hold options to acquire 75% of the shares which would be delivered if allof the options granted and subsisting under the KM ESOP were exercised.
(xviii) Outstanding options granted under the KM ESOP
As of the Latest Practicable Date, options to subscribe for an aggregate of 63,558,343 Shares,representing approximately 2.09% of the total number of Shares in issue immediately after completionof the Global Offering, assuming that (a) the Offer Size Adjustment Option has not been exercised; (b)the incentivization arrangements related to Laurels and Mr. Jinchu Shen are settled entirely with thetransfer of Shares; (c) the Offer Price is determined to be HK$16.80, being the mid-point of the OfferPrice range; and (d) the Listing Date is November 1, 2019, are outstanding. If all the options grantedunder the KM ESOP are exercised, there would be a dilution effect on our Shareholders ofapproximately 2.05% but there will not be any material impact on the earnings per Share.
As of the Latest Practicable Date, none of the options granted under the KM ESOP (regardlessof PRC or non-PRC grantees) has been exercised. No further options will be issued under the KMESOP after the date of this Prospectus.
We have applied for, and have been granted an exemption from the SFC from strict compliancewith the disclosure requirements under paragraph 10(d) of Part I of the Third Schedule to theCompanies (Winding Up And Miscellaneous Provisions) Ordinance, and a waiver from the StockExchange from strict compliance with the disclosure requirements under Rule 17.02(1)(b) of and
VIII-19

APPENDIX VIII STATUTORY AND GENERAL INFORMATION
paragraph 27 of Appendix 1A to the Listing Rules in connection with the information of the optionsgranted under the KM ESOP. For further details, please refer to the section headed “Waivers andConsent from Strict Compliance with the Listing Rules and Exemptions from Companies (Winding Upand Miscellaneous Provisions) Ordinance—Waiver and Exemption in relation to the KM ESOP” inthis Prospectus.
The options have been granted based on the performance of the option holders who have madeimportant contributions to and are important to the long term growth and profitability of our Group.
As of the Latest Practicable Date, there were 163 option holders, comprising one seniormanagement of our Company and 162 other employees, who are not directors, connected persons orsenior management of our Company, of which (a) three employees have been granted options tosubscribe for 3,000,000 Shares or more; (b) 18 employees have been granted options to subscribe for1,000,001 to 3,000,000 Shares; and the remaining 141 employees have been granted options tosubscribe for 1,000,000 Shares or less.
(a) Senior management of our Company
Details of the options granted under the KM ESOP as of the Latest Practicable Date to thesenior management of our Company are set out below:
Name of participant
Positionheld with
ourGroup Address
ExercisePrice
Number ofShares
underlyingthe
outstandingoptions
under theKM ESOP Date of Grant(1)
ConsiderationPaid Vesting Period
Aggregateownershippercentage
uponcompletionof the GlobalOffering(2)
Senior management of our CompanyMr. Wee Peng Cho . . . . . . . . . . . . . . . Group
ChiefFinancialOfficer
5A BalmoralPark #09-02,Singapore259829
US$0.9445 4,652,000 January 2018 Nil January 1, 2018(30%)December 18,2018(23.33%)December 18,2019(23.33%)December 18,2020(23.33%)
0.15%
US$1.5172 65,910 February 2018 Nil 4 years from thedate of grant
0.0%
Subtotal: . . . . . . . . . . . . . . . . . . . . . . 4,717,910 0.15%
Notes:(1) The options may only be exercised after Listing, in accordance with the procedures set out in the subsection headed “—(x) Exercise of
option” above, and subject to the options not having lapsed as a result of the events set out in the subsection headed “—(xii) Lapse of anoption” above.
(2) This is calculated based on the assumption that (a) the Offer Size Adjustment Option has not been exercised; (b) the incentivizationarrangements related to Laurels and Mr. Jinchu Shen are settled entirely with the transfer of Shares; (c) the Offer Price is determined tobe HK$16.80, being the mid-point of the Offer Price range; and (d) the Listing Date is November 1, 2019.
(b) Other grantees who have been granted options to subscribe for 3,000,000 Shares or more
As of the Latest Practicable Date, there are three option holders (other than the seniormanagement of our Company) who have been granted options to subscribe for 3,000,000 Shares ormore under the KM ESOP, representing approximately 0.37% of the total number of Shares in issueimmediately after completion of the Global Offering, assuming that (a) the Offer Size Adjustment
VIII-20

APPENDIX VIII STATUTORY AND GENERAL INFORMATION
Option has not been exercised; (b) the incentivization arrangements related to Laurels andMr. Jinchu Shen are settled entirely with the transfer of Shares; (c) the Offer Price is determined to beHK$16.80, being the mid-point of the Offer Price range; and (d) the Listing Date is November 1, 2019.
Details of the options granted to option holders to subscribe for 3,000,000 Shares or more underthe KM ESOP as of the Latest Practicable Date are set out below:
Name ofparticipant
Positionheld withour Group Address
ExercisePrice
Number ofShares
underlyingthe
outstandingoptions
under theKM ESOP
Date ofGrant(1)
ConsiderationPaid Vesting Period
Aggregateownershippercentage
uponcompletion
of theGlobal
Offering(2)
Ms. SunDongying . . . . Senior vice
president,PRC
Flat A, 31/F,Block 6, VisionCity, 1 Yeung UkRoad, TsuenWan, NewTerritories, HongKong
US$0.4722 2,541,296 December2017
Nil All vested 0.08%
US$0.9445 1,429,328 December2017
Nil July 1, 2018 (25%)July 1, 2019 (25%)July 1, 2020 (25%)July 1, 2021 (25%)
0.05%
Mr. Zhou Bo . . . ChiefOperatingOfficer, PRC
Room 3403,Building 17,Laoximen XinYuan, Shanghai,the PRC
US$0.4722 1,482,423 December2017
Nil December 12, 2017(25%)July 1, 2018 (25%)July 1, 2019 (25%)July 1, 2020 (25%)
0.05%
US$0.9445 1,588,142 December2017
Nil July 1, 2018 (25%)July 1, 2019 (25%)July 1, 2020 (25%)July 1, 2021 (25%)
0.05%
Ms. Wang Anyi . FormerChiefFinancialOfficer
Flat A, 23F,Tower 3, Phase 2,Bel Air, 38 BelAir Avenue,Island South,Hong Kong
US$0.2520 4,189,286 February2014
Nil All vested 0.14%
Notes:(1) The options may only be exercised after Listing, in accordance with the procedures set out in the subsection headed “—(x) Exercise of
option” above, and subject to the options not having lapsed as a result of the events set out in the subsection headed “—(xii) Lapse of anoption” above.
(2) This is calculated based on the assumption that (a) the Offer Size Adjustment Option has not been exercised; (b) the incentivizationarrangements related to Laurels and Mr. Jinchu Shen are settled entirely with the transfer of Shares; (c) the Offer Price is determined tobe HK$16.80, being the mid-point of the Offer Price range; and (d) the Listing Date is November 1, 2019.
(c) Other grantees
As of the Latest Practicable Date, there are (i) 18 options holders who have been grantedoptions to subscribe for 1,000,001 to 3,000,000 Shares; and (ii) 141 option holders who have beengranted options to subscribe for 1,000,000 Shares or less under the KM ESOP, representingapproximately 0.97% and 0.60%, respectively, of the total number of Shares in issue immediately aftercompletion of the Global Offering, assuming that (a) the Offer Size Adjustment Option has not beenexercised; (b) the incentivization arrangements related to Laurels and Mr. Jinchu Shen are settledentirely with the transfer of Shares; (c) the Offer Price is determined to be HK$16.80, being themid-point of the Offer Price range; and (d) the Listing Date is November 1, 2019.
VIII-21

APPENDIX VIII STATUTORY AND GENERAL INFORMATION
Details of the options granted to option holders to subscribe for (i) 1,000,001 to 3,000,000Shares and (ii) 1,000,000 Shares or less under the KM ESOP as of the Latest Practicable Date are setout below:
ParticipantsExercisePrice
Number ofShares underlyingthe outstandingoptions under the
KM ESOP Date of Grant(1)Consideration
Paid Vesting Period
Aggregateownership
percentage uponcompletion ofthe GlobalOffering(2)
Option holders tosubscribe for1,000,001 to 3,000,000Shares . . . . . . . . . . . . .
US$0.4722toUS$1.5172
29,353,405 December 2017to February2019
Nil Varies from 3 to 4 yearsfrom the date of grant
0.97%
Option holders tosubscribe for1,000,000 Shares orless . . . . . . . . . . . . . . .
US$0.4722toUS$1.5172
18,256,553 December 2017to February2019
Nil Varies from 3 to 4 yearsfrom the date of grant
0.60%
Notes:(1) The options may only be exercised after Listing, in accordance with the procedures set out in the subsection headed “—(x) Exercise of
option” above, and subject to the options not having lapsed as a result of the events set out in the subsection headed “—(xii) Lapse of anoption” above.
(2) This is calculated based on the assumption that (a) the Offer Size Adjustment Option has not been exercised; (b) the incentivizationarrangements related to Laurels and Mr. Jinchu Shen are settled entirely with the transfer of Shares; (c) the Offer Price is determined tobe HK$16.80, being the mid-point of the Offer Price range; and (d) the Listing Date is November 1, 2019.
2. TIER 1 ESOP
The following is a summary of the principal terms of the Tier 1 ESOP of our Company adoptedby our Board pursuant to the Pre-IPO Shareholders’ Agreement. The terms of the Tier 1 ESOP are notsubject to the provisions of Chapter 17 of the Listing Rules.
(i) Purpose of the Tier 1 ESOP
The Tier 1 ESOP is intended to provide our Company with a flexible means of retaining,incentivizing, rewarding, remunerating, compensating and/or providing benefits to selectedparticipants. By aligning the interests of selected participants with those of the Shareholders,participants will be encouraged and motivated to continue their efforts towards enhancing the value ofour Company.
(ii) Selected participants to the Tier 1 ESOP
Selected participants to the Tier 1 ESOP are WP OCIM, Laurels, and Redwood Consulting(Cayman) Limited (“Redwood Consulting”).
(iii) Administration
The Board has full authority to administer the Tier 1 ESOP, including authority to interpret andconstrue any of its provisions and to adopt any regulations and any documents it thinks necessary orappropriate. The Board’s decision on any matter connected with the Tier 1 ESOP will be final andbinding on all parties.
(iv) Term of the Tier 1 ESOP
The Tier 1 ESOP will not be terminated while options are outstanding.
VIII-22

APPENDIX VIII STATUTORY AND GENERAL INFORMATION
(v) Exercise price
The Exercise Price is US$0.46 per option.
(vi) Straight-line vesting
36.91% of the options (the “Vested Percentage”) vested on the date of grant, and theremainder of the options vest daily on a straight line basis from December 7, 2017 until January 20,2021 (the “Vesting Period”).
(vii) Conditions of exercise
Conditions are attached to the grant of the options to each participant, which contain specificconditions in the event of a default or other leaver event which apply to the particular participant.
Unless otherwise permitted by the Board or as set out in the specific terms applicable to theoption, the options shall not, nor may any rights in respect of it, be transferred, assigned, charged orotherwise disposed of to any person.
(viii) Vesting events
If the following events occur, the options will vest in full:
(a) a strategic competitor acquires more than 29% of the fully diluted share capital orbecomes the largest shareholder in our Company;
(b) except where a successor company obtains control and exchanges the options underTier 1 ESOP for new options on economically equivalent terms, any person obtainscontrol of our Company (i.e. acquires the right to exercise more than 50% of thecontrolling rights in our Company);
(c) there is a sale of all or substantially all of the shares in our Company by way of a tradesale or by way of a sale to a third party;
(d) there is a disposal by one or more transactions of all or substantially all of the businessof our Company;
(e) there is a sale of all or substantially all of the shares in a project company or member ofour Group to which a senior manager provides services or by which a senior manager isemployed, as appropriate, by way of trade sale or by way of sale to a third party or thereis a disposal of all or substantially all of the business of the project company or amember of our Group to which a senior manager provides services or by which therelevant senior manager is employed; or
(f) there is a solvent winding-up of our Company.
(ix) Lapse of an option
Subject to the date specified in any specific conditions to which the option is subject, an optionwill lapse to the extent not exercised on the earliest of the following:
(a) the tenth anniversary of January 20, 2016, being the completion date of the 2016Merger;
VIII-23

APPENDIX VIII STATUTORY AND GENERAL INFORMATION
(b) the expiry of six months following the occurrence of the date on which a court sanctionsa compromise or arrangement between our Company and its Shareholders whichpermits exercise of the option;
(c) the passing of an effective resolution for the voluntary winding-up of our Company(except where the winding-up is for the purpose of a reconstruction or amalgamation orother specified situation);
(d) the expiry of one month following the making of an order by the court for thewinding-up of our Company (except where the winding-up is for the purpose of areconstruction or amalgamation or other specified situation);
(e) the participant being deprived of the legal or beneficial ownership of the option byoperation of law, or doing or omitting to do anything which causes the participant to beso deprived or being declared bankrupt; or
(f) the participant having breached transfer the restrictions on transfer contained in the Tier1 ESOP.
In relation to the options granted to Laurels (the “Laurels Options”) and in relation to theoptions granted to Redwood Consulting (the “Redwood Options’”), if during the Vesting the relevantdirectors or employees of the Group (in each case the “Relevant Employee”):
(a) resigns within 3 years of the date of grant of the Laurels Options or the part of theRedwood Options which are attributed to the relevant Director (the “Relevant Options”)or ceases to be employed other than in circumstances specified below, the relevant optionholder will retain the Relevant Options to the extent vested as at the date of termination;
(b) is dismissed for cause, or other specified events occur (including breaches of their relevantservice agreements), the Relevant Options will be forfeited to the extent unexercised withcertain exceptions;
(c) ceases to be employed due to dismissal without cause, the Relevant Options will vest infull.
(x) Rights on death or ill-health
If the Relevant Employee dies or ceases to be employed by our Company or its affiliates due toill health, the Relevant Options that are vested as at the date of cessation may be exercised.
(xi) Rights on a compromise or arrangement
If the court sanctions a compromise or arrangement between our Company and itsShareholders, provided an option is not to be exercised under the paragraph headed “Rights onReorganization or Merger” in this section below, the option can be exercised up to 20 days before andduring the period of six months commencing on the date when the court sanctions the compromise orarrangement.
(xii) Rights on winding up
If a notice is given by our Company to its to convene a general meeting for the purposes ofconsidering or approving a resolution to voluntarily wind-up our Company, to the extent that an option
VIII-24

APPENDIX VIII STATUTORY AND GENERAL INFORMATION
is vested, it may be exercised at any time to the extent that it is vested, before the relevant resolutionhas been passed or defeated or the meeting adjourned indefinitely, conditionally on the resolutionbeing passed. If our Company is wound up by the court, to the extent that an option is vested andexercise is permissible by law, it may be exercised within one month of the winding-up order and willthen lapse. This sub-clause does not apply if the winding-up is for the purpose of a reconstruction oramalgamation.
(xiii) Rights on reorganization or merger
If there is a variation in equity share capital of our Company or upon any consolidation,amalgamation or merger of our Company, the Board may adjust the terms of the Tier 1 ESOP or theoption price for outstanding options with effect from the date of the relevant event, so that the value ofthe shares subject to the options is equal to the value of those shares immediately before the occurrenceof the event; and the exercise price payable to exercise an option will be the same as that immediatelybefore the occurrence of the event. No such adjustment can reduce the option price to less than thenominal value of a Share.
(xiv) Outstanding options granted under the Tier 1 ESOP
In September 2018, Redwood Consulting exercised a portion of its options under the Tier 1ESOP, pursuant to an exercise option letter dated September 7, 2018, and nominated that 13,838,797Class B4 Shares and 18,633,334 Class B4 Shares be allotted to WP OCIM and SK, respectively,pursuant to sale and purchase agreements dated September 7, 2018 and September 14, 2018,respectively. For further details, please refer to the section headed “History, Development andCorporate Structure—Major Shareholding Changes of our Company” in this Prospectus.
As of the Latest Practicable Date, options to subscribe for an aggregate of 67,596,595 Shares,representing approximately 2.2% of the issued shares of our Company immediately following thecompletion of the Global Offering, are outstanding, as further described in the table below.
No further options will be issued under the Tier 1 ESOP after the date of the Prospectus.
The options have been granted based on the performance of the option holders who have madeimportant contributions to and are important to the long term growth and profitability of our Group.
VIII-25

APPENDIX VIII STATUTORY AND GENERAL INFORMATION
As of the Latest Practicable Date, there were three option holders. Details of the optionsgranted under the Tier 1 ESOP as of the Latest Practicable Date are set out below:
Name ofparticipant Address Exercise Price
Number of Sharesunderlying the
optionsunder the Tier 1
ESOPoutstanding Date of grant Vesting Period
Aggregatepercentage
ofshareholding
uponcompletionof the Global
Offering
WP OCIM Corporation TrustCenter, 1209 OrangeStreet, Wilmington,Delaware, 19801,United States
US$0.46 15,800,325 April 20, 2017 The VestedPercentage of thegrant vested on thedate of the grant, andthe remainingoptions vest daily ona straight line basisfrom December 7,2017 to January 20,2021
0.5%
Laurels P.O. Box 3340,Road Town, Tortola,British VirginIslands
US$0.46 15,800,325 April 20, 2017 As above 0.5%
RedwoodConsulting(Cayman)Limited
Intertrust CorporateServices (Cayman)Limited, 190 ElginAvenue, GeorgeTown, GrandCayman, KY1-9005Cayman Islands
US$0.46 35,995,945 April 20, 2017 As above 1.2%
Total: 67,596,598 2.2%
Under the terms of the IPO Implementation Deed, the holders of the Tier 1 ESOP have agreedto the Tier 1 Exercise.
As of the Listing Date, assuming the Offer Price is determined to be HK$16.80, the mid-pointof the Offer Price range, and the Listing Date is Friday, November 1, 2019:
Tier 1 ESOP
Immediately prior to the Tier 1 Exercise Immediately after the Tier 1 Exercise
Vested Unvested Total Options Vested Unvested Total Options
Shares issuedpursuant to theTier 1 Exercise(1)
WP OCIM . . . . . . . . . . . . . . . . . . 11,900,397 3,899,928 15,800,325 0 3,899,928 3,899,928 0Laurels . . . . . . . . . . . . . . . . . . . . . 11,900,397 3,899,928 15,800,325 0 3,899,928 3,899,928 3,450,861Redwood Consulting (Cayman)
Limited . . . . . . . . . . . . . . . . . . . 19,096,258 16,899,687 35,995,945 0 16,899,687 16,899,687 15,001,945
Note:(1) Taking into account agreements related to the ESOP Unwind and the Incentivization Unwind.
VIII-26

APPENDIX VIII STATUTORY AND GENERAL INFORMATION
3. POST-IPO SHARE OPTION SCHEME
The following is a summary of the principal terms of the Post-IPO Share Option Schemeconditionally adopted by the resolutions of our Shareholders passed at an extraordinary generalmeeting held on October 12, 2019.
(i) Purpose of the Post-IPO Share Option Scheme
The purpose of the Scheme is to provide incentives to participants to contribute to the Companyand to enable the Company to recruit high caliber employees and attract or retain human resources thatare valuable to the Group.
(ii) Selected participants to the Post-IPO Share Option Scheme
Any individual, being an employee, executive Director and non-executive Director (includingindependent non-executive Director), agent or consultant of our Company or its subsidiary who theBoard or its delegate(s) considers, in their sole discretion, to have contributed or will contribute to ourGroup is entitled to be granted options. However, no individual who is resident in a place where thegrant, acceptance or exercise of options pursuant to the Post-IPO Share Option Scheme is not permittedunder the laws and regulations of such place or where, in the view of the Board or its delegate(s),compliance with applicable laws and regulations in such place makes it necessary or expedient toexclude such individual, is eligible to be offered or granted options.
(iii) Maximum number of shares
The total number of Shares which may be issued upon exercise of all options to be grantedunder the Post-IPO Share Option Scheme is 303,658,464, being no more than 10% of the Shares inissue on completion of the Global Offering (the “Option Scheme Mandate Limit”). Options whichhave lapsed in accordance with the terms of the rules of the Post-IPO Share Option Scheme (or anyother share option schemes of our Company) shall not be counted for the purpose of calculating theOption Scheme Mandate Limit.
The overall limit on the number of Shares which may be issued upon exercise of all outstandingoptions granted and yet to be exercised under the Post-IPO Share Option Scheme and any other shareoption schemes of our Company at any time (and to which the provisions of Chapter 17 of the ListingRules are applicable) must not exceed 30% of the Shares in issue from time to time (the “OptionScheme Limit”). No options may be granted under any schemes of our Company (or its subsidiaries)if this will result in the Option Scheme Limit being exceeded.
The Option Scheme Mandate Limit may be refreshed at any time by obtaining prior approval ofour Shareholders in general meeting and/or such other requirements prescribed under the Listing Rulesfrom time to time. However, the refreshed Option Scheme Mandate Limit cannot exceed 10% of theShares in issue as of the date of such approval. Options previously granted under the Post-IPO ShareOption Scheme and any other share option schemes of our Company (and to which provisions ofChapter 17 of the Listing Rules are applicable) (including those outstanding, canceled or lapsed inaccordance with its terms or exercised), shall not be counted for the purpose of calculating therefreshed Option Scheme Mandate Limit.
Our Company may also grant options in excess of the Option Scheme Mandate Limit, providedsuch grant is to specifically identified selected participant and is first approved by Shareholders ingeneral meeting.
VIII-27

APPENDIX VIII STATUTORY AND GENERAL INFORMATION
(iv) Maximum entitlement of a grantee
Unless approved by our Shareholders, the total number of Shares issued and to be issued uponexercise of the options granted and to be granted under the Post-IPO Share Option Scheme and anyother share option scheme(s) of our Company to each selected participant (including both exercisedand outstanding options) in any 12-month period shall not exceed 1% of the total number of Shares inissue (the “Individual Limit”). Any grant of options to a selected participant which would result in theaggregate number of Shares issued and to be issued upon exercise of all options granted and to begranted to such selected participant (including exercised, canceled and outstanding options) in the 12month period up to and including the date of such further grant exceeding the Individual Limit shall besubject to separate approval of our Shareholders (with such selected participant and his associatesabstaining from voting).
(v) Performance target
The Post-IPO Share Option Scheme does not set out any performance targets that must beachieved before the options may be exercised. However, the Board or its delegate(s) may at their solediscretion specify, as part of the terms and conditions of any option, such performance conditions thatmust be satisfied before the option can be exercised.
(vi) Subscription price
The amount payable for each Share to be subscribed for under an option (“SubscriptionPrice”) in the event of the option being exercised shall be determined by the Board but shall be not lessthan the greatest of:
(a) the closing price of a Share as stated in the daily quotations sheet issued by the StockExchange on the date of grant;
(b) the average closing price of the Shares as stated in the daily quotations sheets issued bythe Stock Exchange for the five business days immediately preceding the date of grant;and
(c) the nominal value of the Shares.
(vii) Rights are personal to grantee
An option is personal to the grantee and shall not be transferable or assignable and no granteeshall in any way sell, transfer, charge, mortgage, encumber or create any interest in favor of any thirdparty over or in relation to any Option, except for the nominating a nominee to hold the Shares to beissued pursuant to the exercise of the Options on trust for the sole benefit of such grantee in accordancewith the terms of the Post-IPO Share Option Scheme.
(viii) Options granted to Directors or substantial shareholders of our Company
Each grant of options to any Director, chief executive or substantial shareholder of ourCompany (or any of their respective associates) must first be approved by the independentnon-executive Directors (excluding any independent non-executive Director who is a proposedrecipient of the grant of options).
Where any grant of options to a substantial shareholder or an independent non-executiveDirector of our Company (or any of their respective associates) would result in the number of Shares
VIII-28

APPENDIX VIII STATUTORY AND GENERAL INFORMATION
issued and to be issued upon exercise of all options already granted and to be granted (includingoptions exercised, canceled and outstanding) to the person in the 12-month period up to and includingthe date of such grant:
(a) representing in aggregate over 0.1% (or any other higher percentage as may from timeto time be specified by the Stock Exchange) of the Shares in issue; and
(b) having an aggregate value, based on the closing price of the Shares as stated in the dailyquotations sheets issued by the Stock Exchange on the date of grant, in excess ofHK$5 million (or such other higher amount as may from time to time be specified bythe Stock Exchange),
such further grant of options must also be first approved by the Shareholders (voting by way of poll) ina general meeting. In obtaining the approval, our Company shall send a circular to the Shareholders inaccordance with and containing such information as is required under the Listing Rules. All connectedpersons of our Company shall abstain from voting at such general meeting, except that any connectedperson may vote against the relevant resolution at the general meeting provided that his intention to doso has been stated in the circular to be sent to the Shareholders in connection therewith.
(ix) Grant of options
An offer of the grant of an option shall be made to a participant by letter or in such form as theBoard may from time to time determine specifying the number of Shares, the subscription price, anycondition (including but not limited to imposition of any performance target(s) and/or vesting scale),the Period in respect of which the offer is made, the date by which the option must be applied for beinga date not more than 28 days after the offer date (the “Acceptance Date”) and further requiring theParticipant to undertake to hold the option on the terms on which it is to be granted and to be bound bythe provisions of the scheme. Such offer shall be personal to the participant concerned and shall not betransferable.
An option shall be deemed to have been granted and accepted and to have taken effect when theduplicate letter or such other form constituting acceptance of the offer of the grant of the option dulysigned by the Grantee together with a remittance in favor of the Company of HK$1.00 (or suchequivalent in other currency as the Board may specify) by way of consideration for the grant thereof isreceived by the Company on or before the relevant Acceptance Date.
Any offer may be accepted in respect of less than the number of options for which it is offeredprovided that it is accepted in respect of options representing Shares constituting a board lot for dealingin Shares or a multiple thereof. To the extent that the offer is not accepted within 20 business daysfrom the date on which the letter containing the offer is delivered to that selected participant, it shall bedeemed to have been irrevocably declined.
(x) Restriction of grant of options
No offer shall be made and no option shall be granted to any selected participant incircumstances prohibited by the Listing Rules or at a time when the selected participant would or mightbe prohibited from dealing in Shares by the Listing Rules or by any applicable rules, regulations orlaw. No offer shall be made and no option shall be granted to any selected participant where suchperson is in possession of any unpublished inside information in relation to our Company until such
VIII-29
APPENDIX VIII STATUTORY AND GENERAL INFORMATION
inside information has been published in an announcement in accordance with the Listing Rules.Furthermore, no offer shall be made and no option shall be granted:
(a) during the period of 60 days immediately preceding the publication date of the annualresults or, if shorter, the period from the end of the relevant financial year up to thepublication date of the results; and
(b) during the period of 30 days immediately preceding the publication date of the half-yearresults or, if shorter, the period from the end of the relevant half-year period up to thepublication date of the results.
Such period will also cover any period of delay in the publication of any results announcement.
(xi) Time of exercise of an option
An option may, subject to the terms and conditions upon which such option is granted, beexercised in whole or in part by the grantee giving notice in writing to our Company in such form asthe Board may from time to time determine stating that the option is thereby exercised and the numberof Shares in respect of which it is exercised.
(xii) Cancelation of options
Any breaches of the rules of the Post-IPO Share Option Scheme by a grantee may result in theoptions granted to such grantee being cancelled by our Company. Any options granted but notexercised may be canceled with approval of the Board. Issuance of new options to the same granteemay only be made if there are unissued options available under the Post-IPO Share Option Scheme(excluding the canceled options) and in compliance with the terms of the Post-IPO Share OptionScheme.
(xiii) Lapse of option
An option shall lapse automatically (to the extent not already exercised) on the earliest of:
(a) the expiry of the period within which an option may be exercised, which is to bedetermined and notified by the Board to each grantee at the time of making an offer, andshall not expire later than ten years from the date of grant (the “Option Period”);
(b) the expiry of any of the periods for exercising the option as referred to in paragraph (ix)above;
(c) the date of commencement of the winding-up of our Company (as determined inaccordance with the Companies Ordinance or the Companies Law) or such otherapplicable law in the jurisdiction in which the winding-up takes place;
(d) the date on which the participant ceases to be an employee, director, agent or consultantof our Company or any subsidiary by reason of the termination of his employment,office, agency or consultancy on any of the following grounds: that he has been guiltyof serious misconduct; that he has been convicted of any criminal offense involving hisintegrity or honesty; or on any other grounds on which an employer or principal wouldbe entitled to summarily terminate his employment, office, agency or consultancy atcommon law or pursuant to any applicable laws or under the participant’s servicecontract, terms of office, agency or consultancy agreement or arrangement with theCompany or the relevant subsidiary;
VIII-30

APPENDIX VIII STATUTORY AND GENERAL INFORMATION
(e) the date on which the grantee ceases to be a participant on or after becoming bankruptor insolvent or making any arrangements or composition with his creditors generally; or
(f) the date on which the participant commits a breach of the rules of the Post-IPO ShareOption Scheme.
(xiv) Voting and dividend rights
No dividends shall be payable and no voting rights shall be exercisable in relation to anyoptions or Shares that are the subject of options that have not been exercised.
(xv) Effects of alterations in the capital structure of the company
In the event of an alteration in the capital structure of our Company whilst any option remainsexercisable by way of capitalization of profits or reserves, rights issue, subdivision or consolidation ofshares, or reduction of the share capital of our Company in accordance with legal requirements orrequirements of the Stock Exchange (other than any alteration in the capital structure of our Companyas a result of an issue of Shares as consideration in a transaction to which our Company is a party),such corresponding alterations (if any) shall be made to:
(a) the number or nominal amount of Shares comprised in each unexercised option; and/or
(b) the aggregate number of Shares subject to outstanding options; and/or
(c) the subscription price,
as the auditors or a financial adviser engaged by our Company for such purpose shall certify in writingto the Board that the adjustments satisfy the requirements set out in Rule 17.03(13) of the Listing Rulesor otherwise comply with the Listing Rules or other rules, practices or directions of the StockExchange in effect from time to time (other than any adjustment made on a capitalization issue, inwhich case such adjustment shall be made as the Board shall consider to be in its opinion fair andreasonable). Subject to the foregoing, any adjustment shall be made on the basis that each grantee shallhave the same proportion of the equity capital of our Company as that to which that grantee waspreviously entitled prior to such adjustments, and no adjustments shall be made which will enable aShare to be issued at less than its nominal value. The capacity of the auditors or financial adviser (asthe case may be) is that of experts and not of arbitrators and their certification shall, in the absence ofmanifest error, be final and binding on our Company and the grantees. The costs of the auditors orfinancial advisor (as the case may be) shall be borne by our Company.
(xvi) Death or cessation of employment of a selected participant
If a grantee ceases to be selected participant for any reason other than his death or thetermination of his employment, office, agency or consultancy on one or more of the grounds specifiedin paragraph (xiii)(d) above, the grantee may exercise the option up to his entitlement at the date ofcessation of his employment or office, agency or consultancy (to the extent not already exercised)within the period of one month following the date of such cessation, which date shall be the last actualworking day of his employment, office, agency or consultancy with the Company or the relevantsubsidiary whether payment in lieu of notice is made or not (if applicable).
If a grantee ceases to be selected participant by reason of death, and none of the events whichwould be a ground for termination of his employment or office, agency or consultancy under an event
VIII-31

APPENDIX VIII STATUTORY AND GENERAL INFORMATION
as described on paragraph (xiii)(d) above has occurred, the legal personal representative(s) of thegrantee shall be entitled within a period of 12 months from the date of death (or such longer period asthe Board may determine) to exercise the option in full (to the extent not already exercised).
(xvii) Rights on takeover and schemes of compromise or arrangement
If a general offer by way of takeover is made to all the holders of Shares (or all such holdersother than the offeror and/or any person controlled by the offeror and/or any person acting inassociation or concert with the offeror), and the offer becomes or is declared unconditional in allrespects, the grantee shall be entitled to exercise the option (to the extent not already exercised) at anytime within one month (or such other period as the Board or its delegate(s) may decide in their solediscretion) after the date on which the offer becomes or is declared unconditional. If the option is notexercised within the time specified, the option shall lapse.
If a compromise or arrangement between our Company and its members or creditors isproposed, our Company shall give notice to the grantee on the same date as it dispatches the notice toeach member or creditor of our Company summoning the meeting to consider such a compromise orarrangement, and thereupon the grantee (or his personal representatives) may until the expiry of theperiod commencing with such date and ending with earlier of the date two calendar months thereafteror the date on which such compromise or arrangement is sanctioned by the court exercise any of hisoptions (to the extent not already exercised) whether in full or in part, but the exercise of an option asaforesaid shall be conditional upon such compromise or arrangement being sanctioned by the court andbecoming effective, and upon such compromise or arrangement becoming effective, all options shalllapse except insofar as previously exercised under the Post-IPO Share Option Scheme. Our Companymay require the grantee to transfer or otherwise deal with the Shares issued as a result of the exerciseof options in these circumstances so as to place the grantee in the same position, as nearly as possible,as would have been the case had such Shares been subject to such compromise or arrangement. If theoption is not exercised within the time specified, the option shall lapse.
(xviii) Rights on a voluntary winding up
In the event a notice is given by our Company to its members to convene a general meeting forthe purposes of considering, and if thought fit, approving a resolution to voluntarily wind-up ourCompany, our Company shall give notice (“winding-up notice”) to all grantees on the same day as thepassing of the resolution or order. The grantee (or his legal personal representative(s)) may by notice inwriting to the Company within 21 days after the date of the winding-up notice elect to be treated as ifthe option (to the extent not already exercised) had been exercised immediately before the passing ofsuch resolution either to its full extent or to the extent specified in the Grantee’s notice, such notice tobe accompanied by a remittance for the full amount of the aggregate subscription price for the Sharesin respect of which the notice is given, whereupon the grantee will be entitled to receive out of theassets available in the liquidation pari passu with the holders of Shares such sum as would have beenreceived in respect of the Shares the subject of such election
(xix) Duration
The Post-IPO Share Option Scheme shall be valid and effective for the period of 10 yearscommencing on the date of adoption of the Post-IPO Share Option Scheme (after which, no furtheroptions shall be offered or granted under the Post-IPO Share Option Scheme), but in all other respects
VIII-32

APPENDIX VIII STATUTORY AND GENERAL INFORMATION
the provisions of the Post-IPO Share Option Scheme shall remain in full force and effect to the extentnecessary to give effect to the exercise of any options granted prior thereto or otherwise as may berequired in accordance with the provisions of the rules of the Post-IPO Share Option Scheme.
(xx) Alteration of the Post-IPO Share Option Scheme
The Post-IPO Share Option Scheme may be altered in any respect by resolution of the Boardexcept that any alteration to the advantage of the grantees or the participants in respect of matterscontained in Rule 17.03 of the Listing Rules; and any material alteration to the terms and conditions ofthe scheme or any change to the terms of options granted (save where the alterations take effectautomatically under the existing terms of the scheme) shall be subject to the approval of theshareholders of our Company in general meeting, provided that no such alteration shall operate toadversely affect the terms of issue of any option granted or agreed to be granted prior to such alterationexcept with the consent or sanction of such majority of the grantees as would be required of theshareholders of the Company under the Regulations for the time being of the Company for a variationof the rights attached to the Shares. After any alteration, the amended terms of the Scheme mustcomply with Chapter 17 of the Listing Rules.
Any change to the authority of the Board in relation to any alteration to the terms of the Schemeshall be subject to the approval of the shareholders of the Company in general meeting.
(xxi) Termination
Our Company by resolution in general meeting or the Board may at any time terminate thescheme and in such event no further options will be offered but the provisions of the Post-IPO ShareOption Scheme shall remain in force to the extent necessary to give effect to the exercise of any optiongranted prior thereto or otherwise as may be required in accordance with the provisions of the Scheme.All options granted prior to such termination but not yet exercised at the time of such termination shallcontinue to be valid and exercisable in accordance with the terms of the Post-IPO Share OptionScheme.
E. OTHER INFORMATION
1. LITIGATION
As of the Latest Practicable Date, save as disclosed in the section headed “Business–Compliance and Legal Proceedings” in this Prospectus, no member of our Group was engaged in anylitigation, arbitration or claim of material importance, and no litigation, arbitration or claim of materialimportance was known to the Directors to be pending or threatened by or against our Group, thatwould have a material adverse effect on our business, finance condition or results of operations.
2. JOINT SPONSORS
Each of the Joint Sponsors satisfies the independence criteria applicable to sponsors set out inRule 3A.07 of the Listing Rules. The Joint Sponsors will receive an aggregate fee of US$500,000 foracting as the sponsors for the Listing.
3. PRELIMINARY EXPENSES
The preliminary expenses relating to the incorporation of our Company were approximatelyUS$25,821 and have been paid by our Company.
VIII-33

APPENDIX VIII STATUTORY AND GENERAL INFORMATION
4. NO MATERIAL ADVERSE CHANGE
Save as disclosed in this Prospectus, our Directors confirm that there has been no materialadverse change in the financial or trading position or prospects of the Group since June 30, 2019 (beingthe date to which the latest audited combined financial statements of our Group were prepared), save asdisclosed in the section headed “Summary—Recent Developments” in this Prospectus.
5. PROMOTER
Our Company has no promoter for the purpose of the Listing Rules. No cash, securities or otherbenefit has been paid, allotted or given nor are any proposed to be paid, allotted or given to anypromoters in connection with the Global Offering and the related transactions described in thisProspectus within the two years immediately preceding the date of this Prospectus.
6. TAXATION OF HOLDERS OF SHARES
(i) Hong Kong
The sale, purchase and transfer of Shares registered with our Company’s Hong Kong branchregister of members will be subject to Hong Kong stamp duty, the current rate charged on each of thepurchaser and seller is 0.1% of the consideration or, if higher, the fair value of the Shares being sold ortransferred. Profits from dealings in the Shares arising in or derived from Hong Kong may also besubject to Hong Kong profits tax.
(ii) Cayman Islands
Under the present Cayman Islands law, there is no stamp duty payable in the Cayman Islandson transfer of Shares, as long as our Company does not hold any interests in land in the CaymanIslands.
(iii) Consultation with professional advisers
Intending holders of the Shares are recommended to consult their professional advisers if theyare in doubt as to the taxation implications of holding or disposing of or dealing in the Shares. It isemphasized that none of our Company, our Directors or the other parties involved in the GlobalOffering can accept responsibility for any tax effect on, or liabilities of, holders of Shares resultingfrom their holding or disposal of or dealing in Shares or exercise of any rights attaching to them.
VIII-34

APPENDIX VIII STATUTORY AND GENERAL INFORMATION
7. QUALIFICATIONS AND CONSENTS OF EXPERTS
The following are the qualifications of the experts who have given opinions or advice which arecontained in this Prospectus:
Name Qualifications
Deutsche Securities AsiaLimited
Licensed to conduct type 1 (dealing in securities), type 2 (dealing infutures contracts), type 4 (advising on securities), type 5 (advising onfutures contracts), type 6 (advising on corporate finance) and type 7(providing automated trading services) of regulated activities under theSFO
CLSA Capital MarketsLimited
Licensed to conduct type 4 (advising on securities) and type 6(advising on corporate finance) of regulated activities under the SFO
Ernst & Young Certified Public Accountants
KPMG Certified Public Accountants
Bentleys BrisbanePartnership
Certified Public Accountants
Global Law Office Legal advisers as to PRC law to our Company
Walkers (Hong Kong) Cayman Islands attorney-at-law
Beijing Colliers InternationalReal Estate Valuation Co.,Ltd.
Property valuer
Cushman & Wakefield K.K. Property valuer
CBRE Limited Property valuer
Jones Lang LaSalleCorporate Appraisal andAdvisory Limited
Property valuer
Jones Lang LaSalle Limited Industry consultant
Each of the experts named above has given and has not withdrawn its consent to the issue ofthis Prospectus with the inclusion or reproduction of its report, letter, summary of valuations, valuationcertificates and/or legal opinion (as the case may be) and references to its name included in the formand context in which it respectively appears.
8. BINDING EFFECT
This Prospectus shall have the effect, if an application is made pursuant to this Prospectus, ofrendering all persons concerned bound by all of the provisions (other than the penal provisions) ofsections 44A and 44B of the Companies (Winding Up and Miscellaneous Provisions) Ordinanceinsofar as applicable.
9. BILINGUAL PROSPECTUS
The English language and Chinese language versions of this Prospectus are being publishedseparately, in reliance upon the exemption provided by section 4 of the Companies Ordinance
VIII-35
APPENDIX VIII STATUTORY AND GENERAL INFORMATION
(Exemption of Companies and Prospectuses from Compliance with Provisions) Notice (Chapter 32L ofthe Laws of Hong Kong). In case of any discrepancies between the English language version andChinese language version of this Prospectus, the English language version shall prevail.
10. PARTICULARS OF THE SELLING SHAREHOLDERS, THE OVER-ALLOTMENTOPTION GRANTORS AND THE OFFER SIZE ADJUSTMENT OPTION GRANTORS
As of the Latest Practicable Date, Luckfield Global Limited is still obtaining certain approvalsto sell Shares pursuant to the International Placing, hence subject to such approvals being obtained,Luckfield Global Limited may or may not sell Shares pursuant to the International Placing. Suchdecision will be made prior to the time when the International Underwriting Agreement is proposed tobe entered into on or about the Price Determination Date. If Luckfield Global Limited is not a SellingShareholder, the Over-allotment Option Grantors will, on a pro-rata basis, sell additional Sale Sharesequal to the number of Shares which Luckfield Global Limited would have sold in the Global Offeringto ensure that the total number of Sale Shares in the Global Offering remains the same. The particularsof the Selling Shareholders, the Over-allotment Option Grantors and the Offer Size Adjustment OptionGrantors are set out as follows:
Name: WP OCIM
Place of incorporation: State of Delaware, United States of America
Date of incorporation: January 31, 2011
Registered office: Corporation Trust Center, 1209 Orange Street, County of New Castle,Wilmington, Delaware, 19801-1196, United States of America
Number of the Sale Shares (ifLuckfield Global Limited is aSelling Shareholder): 300,472,976
Number of Sale Shares (ifLuckfield Global Limited isnot a Selling Shareholder) 315,256,952
Maximum number of additionalShares which may berequired to sell pursuant tothe Offer Size AdjustmentOption 88,620,769
Maximum number of additionalShares which may berequired to sell pursuant tothe exercise of the Over-allotment Option
88,620,769 (assuming the Offer Size Adjustment Option has not beenexercised)
101,913,884 (assuming the Offer Size Adjustment Option is exercised in full)
Maximum aggregate number ofadditional Shares which maybe required to sell pursuant tothe exercise of the Offer SizeAdjustment Option and theOver-allotment Option 190,534,653
Name: Goldman Sachs Investments Holdings (Asia) Limited
Place of incorporation: Mauritius
Registered office: Level 3, Alexandra House, 35 Cybercity, Ebene, Mauritius
VIII-36

APPENDIX VIII STATUTORY AND GENERAL INFORMATION
Number of the Sale Shares (ifLuckfield Global Limited is aSelling Shareholder): 14,531,159
Number of Sale Shares (ifLuckfield Global Limited isnot a Selling Shareholder) 15,246,126
Maximum number of additionalShares which may berequired to sell pursuant tothe Offer Size AdjustmentOption 4,285,785
Maximum number of additionalShares which may berequired to sell pursuant tothe exercise of the Over-allotment Option
4,285,785 (assuming the Offer Size Adjustment Option has not beenexercised)
4,928,653 (assuming the Offer Size Adjustment Option is exercised in full)
Maximum aggregate number ofadditional Shares which maybe required to sell pursuant tothe exercise of the Offer SizeAdjustment Option and theOver-allotment Option 9,214,438
Name: APG-Stichting
Place of incorporation: The Netherlands
Registered office: Oude Lindestraat 70, 6411 EJ Heerlen, Netherlands
Number of the Sale Shares: 8,277,000
Name: General Electric Pension Trust
Place of incorporation: State of New York, United States of America
Registered office: c/o State Street Global, Advisors, 1600 Summer Street, Stamford, CT 06905,United States of America
Number of the Sale Shares (ifLuckfield Global Limited is aSelling Shareholder): 10,440,306
Number of Sale Shares (ifLuckfield Global Limited isnot a Selling Shareholder) 10,953,994
Maximum number of additionalShares which may berequired to sell pursuant tothe Offer Size AdjustmentOption 3,079,238
Maximum number of additionalShares which may berequired to sell pursuant tothe exercise of the Over-allotment Option
3,079,238 (assuming the Offer Size Adjustment Option has not beenexercised)
3,541,124 (assuming the Offer Size Adjustment Option is exercised in full)
VIII-37

APPENDIX VIII STATUTORY AND GENERAL INFORMATION
Maximum aggregate number ofadditional Shares which maybe required to sell pursuant tothe exercise of the Offer SizeAdjustment Option and theOver-allotment Option 6,620,362
Name: Emerald Ewood (Cayman) Limited
Place of incorporation: Cayman Islands
Registered office: Maples Corporate Services Limited, Ugland House, P.O. Box 309, GeorgeTown, Grand Cayman KY1-1104, Cayman Islands
Number of the Sale Shares: 8,178,660
Name: Montsoreau Investment Limited
Place of incorporation: BVI
Registered office: 2/F Palm Grove House P.O. Box 3340, Road Town, Tortola, British VirginIslands
Number of the Sale Shares (ifLuckfield Global Limited is aSelling Shareholder): 7,005,578
Number of Sale Shares (ifLuckfield Global Limited isnot a Selling Shareholder) 7,350,268
Maximum number of additionalShares which may berequired to sell pursuant tothe Offer Size AdjustmentOption 2,066,208
Maximum number of additionalShares which may berequired to sell pursuant tothe exercise of the Over-allotment Option
2,066,208 (assuming the Offer Size Adjustment Option has not beenexercised)
2,376,139 (assuming the Offer Size Adjustment Option is exercised in full)
Maximum aggregate number ofadditional Shares which maybe required to sell pursuant tothe exercise of the Offer SizeAdjustment Option and theOver-allotment Option 4,442,347
Name: Jingdong Logistics Group Corporation
Place of incorporation: Cayman Islands
Registered office: Offshore Incorporations (Cayman) Limited, Scotia Center, 4th Floor, P.O.Box 2804, George Town, Grand Cayman KY1-1112, Cayman Islands
Number of the Sale Shares: 8,277,000
Name: Luckfield Global Limited
Place of incorporation: BVI
VIII-38

APPENDIX VIII STATUTORY AND GENERAL INFORMATION
Registered office: Vistra Corporate Services Centre, Wickhams Cay II, Road Town, Tortola,VG1110, BVI
Number of the Sale Shares: 16,357,321
11. MISCELLANEOUS
Save as disclosed in this Prospectus,
(i) within the two years immediately preceding the date of this Prospectus:
(a) neither we nor any of our Major Subsidiaries has issued or agreed to issue anyshare or loan capital fully or partly paid up either for cash or for a considerationother than cash;
(b) no share or loan capital of our Company or any of our Major Subsidiaries isunder option or is agreed conditionally or unconditionally to be put underoption;
(c) no commission, discounts, brokerage or other special terms have been granted inconnection with the issuance or sale of any shares or loan capital of any MajorSubsidiary;
(d) no commission has been paid or payable (except commission tosub-underwriters) to any persons for subscription, agreeing to subscribe,procuring subscription or agreeing to procure subscription of any shares of ourCompany or any of our Major Subsidiaries;
(ii) no founder, management or deferred shares of our Company or any of our subsidiarieshave been issued or agreed to be issued;
(iii) there has not been any interruption in the business of our Company which may have orhave had a material adverse effect on the financial position of our Company in the 12months immediately preceding the date of this Prospectus;
(iv) the principal register of members of our Company will be maintained in the CaymanIslands by Walkers Corporate Limited and a branch register of members of ourCompany will be maintained in Hong Kong by Computershare Hong Kong InvestorServices Limited. Unless our Directors otherwise agree, all transfer and otherdocuments of title of Shares must be lodged for registration with and registered by ourCompany’s share register in Hong Kong and may not be lodged in the Cayman Islands.All necessary arrangements have been made to enable the Shares to be admitted toCCASS;
(v) no company within our Group is presently listed on any stock exchange or traded onany trading system;
(vi) our Company has no outstanding convertible debt securities or debentures;
(vii) none of the persons whose names are listed in the paragraph headed “—E. Otherinformation—7. Qualifications and Consents of Experts” in this section above isinterested beneficially or non-beneficially in any shares in any member of our Group orhas any right or option (whether legally enforceable or not) to subscribe for or tonominate persons to subscribe for, any securities in any member of our Group; and
(viii) there is no restriction affecting the remittance of profits or repatriation of capital intoHong Kong and from outside Hong Kong.
VIII-39

APPENDIX IX DOCUMENTS DELIVERED TO THE REGISTRAR OF COMPANIESIN HONG KONG AND AVAILABLE FOR INSPECTION
DOCUMENTS DELIVERED TO THE REGISTRAR OF COMPANIES
The documents attached to a copy of this Prospectus and delivered to the Registrar ofCompanies in Hong Kong for registration were, among other documents:
(a) copies of WHITE, YELLOW and GREEN Application Forms;
(b) the written consents referred to in the section headed “Statutory and GeneralInformation—E. Other Information—7. Qualifications and Consents of Experts” inAppendix VIII to this Prospectus;
(c) copies of the material contracts referred to in the section headed “Statutory and GeneralInformation—B. Further Information about our Business—1. Summary of MaterialContracts” in Appendix VIII to this Prospectus; and
(d) the statement of particulars of the Selling Shareholders, the Over-allotment OptionGrantors and the Offer Size Adjustment Option Grantors.
DOCUMENTS AVAILABLE FOR INSPECTION
Copies of the following documents will be available for inspection at the office of Latham &Watkins LLP at 18th Floor, One Exchange Square, 8 Connaught Place, Central, Hong Kong, duringnormal business hours up to and including the day which is 14 days from the date of this Prospectus:
(a) the Memorandum and Articles of Association;
(b) the Accountants’ Report prepared by Ernst & Young, the text of which is set out inAppendix I to this Prospectus;
(c) the audited financial statements of Propertylink for the two years ended June 30, 2017 and2018 and the audited financial statement on Propertylink Australian Industrial Partnershipfor the six months ended June 30, 2016 prepared by KPMG, the text of which is set out inAppendix II-A to this Prospectus;
(d) the audited financial statements of Propertylink (Holdings) Limited (currently known asESR Asset Management (Holdings) Limited) and Propertylink Trust for the year endedJune 30, 2016 prepared by Bentleys Brisbane Partnership, the text of which is set out inAppendix II-A to this Prospectus;
(e) the audited interim consolidated financial statements of Propertylink for the period fromJuly 1, 2018 to March 20, 2019 audited by Ernst & Young, Australia, the text of which isset out in Appendix II-B to this Prospectus;
(f) the report on the unaudited pro forma financial information from Ernst & Young, the textof which is set out in Appendix III to this Prospectus;
(g) the audited consolidated financial statements of our Group for the three years endedDecember 31, 2016, 2017 and 2018 and the six months ended June 30, 2019;
(h) the letter, summary of valuations and valuation certificates relating to the propertyinterests of our Group prepared by Beijing Colliers International Real Estate ValuationCo., Ltd., the texts of which are set out in Appendix VI to this Prospectus;
(i) the letter, summary of valuations and valuation certificates relating to the propertyinterests of our Group prepared by Cushman & Wakefield K.K., the texts of which are setout in Appendix VI to this Prospectus;
IX-1

APPENDIX IX DOCUMENTS DELIVERED TO THE REGISTRAR OF COMPANIESIN HONG KONG AND AVAILABLE FOR INSPECTION
(j) the letter, summary of valuations and valuation certificates relating to the propertyinterests of our Group prepared by CBRE Limited, the texts of which are set out inAppendix VI to this Prospectus;
(k) the letter, summary of valuations and valuation certificates relating to the propertyinterests of our Group prepared by Jones Lang LaSalle Corporate Appraisal and AdvisoryLimited, the texts of which are set out in Appendix VI to this Prospectus;
(l) the report issued by JLL, which is set forth in the section headed “Industry Overview” inAppendix IV to this Prospectus;
(m) the legal opinion issued by Global Law Office, our PRC legal advisers, in respect ofcertain aspects of our Group and the property interests of our Group in the PRC;
(n) the material contracts referred to in the section headed “Statutory and GeneralInformation—B. Further Information about our business—1. Summary of MaterialContracts” in Appendix VIII to this Prospectus;
(o) the written consents referred to in the section headed “Statutory and GeneralInformation—E. Other Information—7. Qualifications and Consents of Experts” inAppendix VIII to this Prospectus;
(p) the service contracts and letters of appointment referred to in the section headed “Statutoryand General Information—C. Further Information about our Directors and SubstantialShareholders—3. Directors’ Service Contracts” in Appendix VIII to this Prospectus;
(q) the terms of the Post-IPO Share Option Scheme;
(r) the terms of the KM ESOP;
(s) the terms of the Tier 1 ESOP;
(t) the statement of particulars of the Selling Shareholders, the Over-allotment OptionGrantors and the Offer Size Adjustment Option Grantors;
(u) a full list of all the grantees under the KM ESOP; and
(v) the Cayman Companies Law.
IX-2

ESR Cayman Limited
ESR C
ayman Lim
ited
ESR Cayman Limited
Stock Code: 1821
(Incorporated in the Cayman Islands with limited liability)
Joint Sponsors
Joint Global Coordinators and Joint Bookrunners
Joint Bookrunners
GLOBAL OFFERING
(in alphabetical order)