ESF Support for Families with Multiple Problems - GOV.UK
20
ESF Support for Families with Multiple Problems – December 2011 to August 2015 October 2015
-
Upload
khangminh22 -
Category
Documents
-
view
1 -
download
0
Transcript of ESF Support for Families with Multiple Problems - GOV.UK

ESF Support for Families
with Multiple Problems –
December 2011 to
August 2015
October 2015

2
Contents
Introduction ....................................................................................................... 2
Key Findings ..................................................................................................... 2
Background ...................................................................................................... 3
Data and Results .............................................................................................. 5
Tables ............................................................................................................... 9
Contacts ......................................................................................................... 20
Introduction
1. The European Social Fund Support for Families with Multiple Problems (ESF
Families programme) was launched in December 2011. It supported
disadvantaged families, facing multiple barriers to work, to move closer
towards and into sustainable employment. The programme was funded by the
2007–2013 European Social Fund (ESF) programme in England, under
DWP’s arrangements to act as one of the Co-Financing Organisations.
2. The ESF programme ended on the 30 June 2015, providers could continue to
submit claims for payments based on outcomes they’d delivered up to 24
August 2015. This publication gives information on attachments up to 30 June
2015 and information on outcomes and progress measures up to 24 August
2015.
Key Findings
3. The key findings on participation are:
By the end of the programme in June 2015 there had been 79,130
attachments (individual participants).
Of these, 25,320 started within the last twelve months of the programme. In
the final months of the programme the number of attachments dropped off.
Females made up 55% of all attachments.
4. For progress measures, the main findings are, that up to the 24 August 2015 :
108,110 progress measures have been achieved by 46,600 participants.
Of the 46,600 participants achieving progress measures, 25,180 have
achieved three, 11,140 two and 10,280 one progress measure.

ESF Support for Families with Multiple Problems
3
Of the 25,180 participants that have achieved three progress measures 27%,
6,870, of these have were claimed from March 2015 onwards.
5. For sustained job outcomes:
9,130 sustained job outcomes have been achieved. Around 40% of these –
3,550 - were achieved from March 2015 onwards
Overall job outcomes rates, for all participants, 18 months after joining the
programme are 11.8%.
18 month job outcome rates are 14.5% for JSA participants and for non-JSA
participants they are 8.4%.
6. From January 2013 onwards job outcome rates after 12 months are higher
than for previous periods. The overall rate for sustained job outcomes at 12
months is 8.0%, for those who joined in August 2014 it is 9.0%.
Background
7. The ESF Families programme was voluntary, operating across England. There
were twelve Contract Package Areas each with a single prime provider. There
were eight prime providers, some covering multiple areas. These are listed in
table 1.
8. Provision was open to any member of a family where one member of that
family (not necessarily the programme participant) was on a working age
benefit. Participants had to be over 16 years old, able to work in this country,
and either be out of work or working few enough hours to be on an out of work
benefit. The family of which they were a member must have been regarded as
facing multiple problems: the definition for which was determined locally, within
guidelines set out by DWP. Eligibility criteria for this provision and for the
Troubled Families Programme operated by the Department for Communities
and Local Government overlap, but are not identical.
9. The primary referral route for the programme was via Local Authorities. Since
September 2012 providers were also able to identify and refer eligible
participants themselves.
10. Once a participant was attached to the ESF Families programme, the relevant
provider had the whole of the contract term to work with them and their family,

ESF Support for Families with Multiple Problems
4
if this was considered appropriate, to help them move towards and find
sustained employment.
11. The ESF Families with Multiple Problems programme operated on a Payment
by Results basis. Providers could claim an interim progress measure payment
on agreement of an action plan after 10 weeks with the participant, but apart
from that payment triggers fall into two main categories:
Progress Measures: these were triggered where a participant completed
a prescribed set of activities designed to assist the family to resolve or
overcome particular problems. The exact activities attracting a progress
payment varied across Contract Package Areas to reflect the different
approaches taken and were contractually agreed between DWP and
providers. Typically, these covered activities designed to address problems
relating to housing, managing money and debt, family communications,
community involvement, skills for working or work placements. Progress
measures could be claimed from ten weeks after attachment and up to
three could be claimed for each participant. Including the interim progress
measure, 70% of funding for ESF Families is allocated to progress
measures.
Job Outcome Payments: these were paid when, in the case of a JSA
participant, they were recorded as having worked for 26 weeks. For the
non-JSA and JSA ex-IB participants, a payment was triggered after 13
weeks in work. Being in work was defined either by the benefit the
participant was on or for those not on benefits as 16 hours a week or more.
Weeks in work did not need to be consecutive and providers could claim
only one job outcome payment per participant.
12. Further information about the programme, including the nature of local
provision, exact eligibility criteria and all payment triggers can be found at:
https://www.gov.uk/government/publications/provider-guidance-esf-for-
families-with-multiple-problems
13. The contacts ended on the 30 June 2015 and providers had until 24 August
2015 to submit any final claims for outcomes payments and progress
measures.

ESF Support for Families with Multiple Problems
5
Data and Results
14. The data is taken from the Department’s payment administrative system.
They are rounded to the nearest 10, in line with standard DWP disclosure
control policy. Percentages are calculated before rounding.
15. Performance is reported against the programme's objective to support
participants towards and into work. It covers attachments (i.e. the number of
individual participants), progress measures and sustained job outcomes.
Tables referenced are at the back of the report.
16. Table 2 shows the build up of attachments over time. In total by the end of
the ESF Families programme in June 2015 there had been 79,130
attachments.
17. In 2012 there were 9,090 attachments and in 2013 there were 22,790. In
2014 there were 44,270 attachments and in 2015 there have been 2,980. As
the end of the programme approached the number of attachments dropped
off. In cases where participants have multiple attachments recorded the latest
one is taken.
18. Previously all figures were subject to revision especially figures for
attachments This is due to further claims being made and was most noticeable
for the latest month’s attachment figures, which were usually revised upwards
when reported in the subsequent publication. When we published the January
2015 statistical release, the January 2015 attachments were reported as 2,000
and now table 2 shows they are 2,360.
19. This is the last statistical release for the ESF Support for Families with Multiple
Problems programme and so no further revisions to the figures are expected.
20. Table 3 shows attachments by characteristics. It covers gender, ethnicity
and age group. It includes only those for whom we have information on
characteristics and the total is therefore marginally lower than the equivalent
figure in other tables.
21. There have been 43,490 female participants, making up 55% of the total.

ESF Support for Families with Multiple Problems
6
22. Attachments from ethnic minorities comprised 17% (13,040) of participants.
The largest ethnic minority group was Black or Black British, at 8% (5,940).
White people comprised 79% (62,530) of participants and 5% of participants
preferred not to say. The main difference with the overall unemployed
population is that there are fewer people who are Asian or Asian British: 4% of
the programme compared with 8% of the unemployed1.
23. Young people under 25 made up 19% (14,710) of participants. People over
50 made up 17% (13,320) of participants. The proportion of under 25s is
much lower than in the overall unemployed population (31%), this was
influenced by Work Programme eligibility on JSA being much earlier for this
group.
24. Table 4 shows the number of progress measure payments made each month.
This is split by whether the progress measure is the first, second or third
progress measure for that referral (individual). The approach to presenting
progress measures completed over time in this table has been revised for this
publication. In previous publications table 4 made an estimate of when
payment was made for the highest progress measure achieved by each
individual2. The table in this publication estimates when payments were made
for each of the progress measures achieved. The second part of Table 4 gives
the number of participants broken down by the highest progress measure
achieved.
25. There have been 108,110 progress measures payments, attributable to participants. By 24 August 2015 (the deadline for claims from providers) 46,600 participants had achieved at least one progress measure (excluding interim measures). 25,180 had achieved three progress measures, 11,140 had achieved two progress measures and the remaining 10,280 had achieved one.
26. In January 2013 changes were made to allow progress measures to be claimed individually rather than cumulatively. This transition to a new way of claiming introduced uncertainty into the breakdown by month prior to April 2013, so the monthly information for this period has been combined.
27. Of the 25,180 payments made for the third progress measure achieved by
participants, 27% (6,870) were achieved from March 2015 onwards.
1 General unemployment figures are from the official labour market statistics (Nomis) produced by the
Office for National Statistics (ONS)
2 The estimate was based on assumptions about when progress measures were achieved – which
limited the accuracy to which the 1st and 2nd progress measures are attributed

ESF Support for Families with Multiple Problems
7
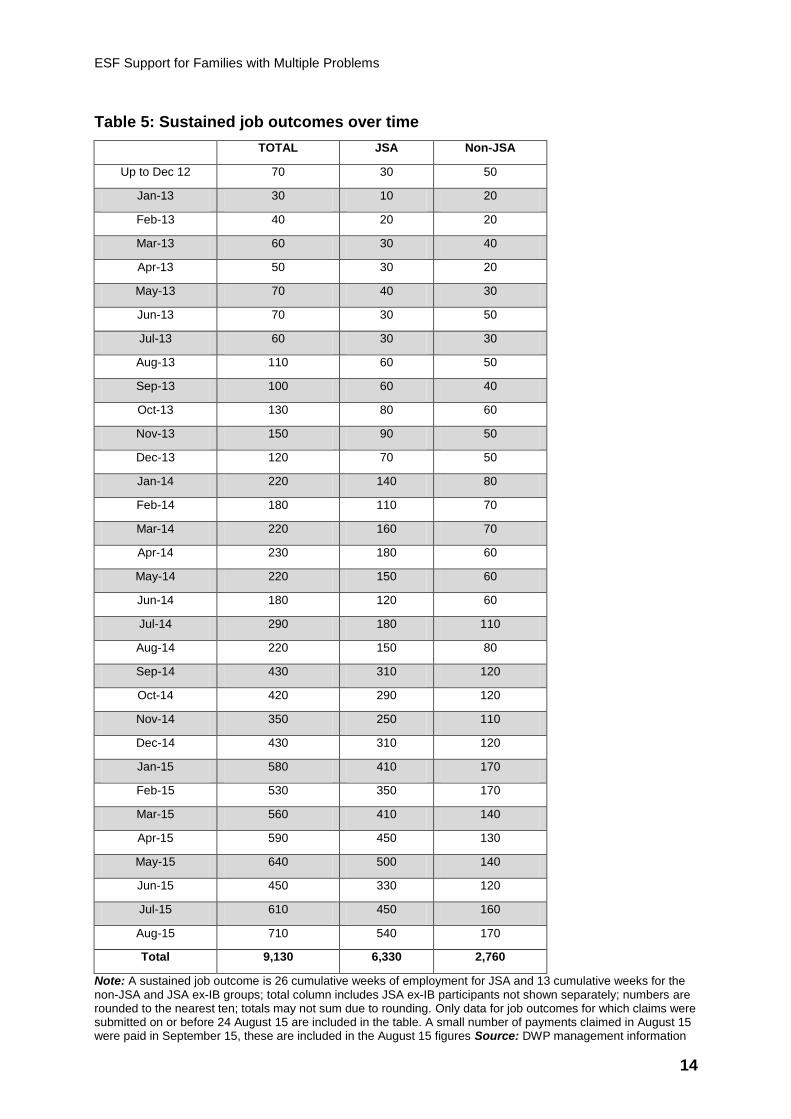
28. Looking at movement into work, table 5 shows that by 24 August 2015 there
were 9,130 sustained job outcomes. This includes 6,330 from JSA
participants, 2,760 from non-JSA participants and 40 from JSA ex-IB
participants. Note that whilst ex-IB JSA participants are a distinct group and
are included in totals, separate tables have not been included for them due to
their small volumes.
29. The majority of sustained job outcomes (6,290) were achieved from
September 2014, more than half (3,550) of these occurred from March 2015.
30. Tables 6-8 look at Job outcome rates. These are the proportions of
attachments moving into a sustained job outcome within a set period of time,
broken down by month of attachment3. The tables present achievement of
sustained job outcomes by 12, 15 and 18 months after attachment. These are
shown as table 6 for JSA participants, table 7 for non-JSA participants and
table 8 for all participants.
31. Job outcome rates are shown for participants by month of attachment, with the
exception of December 2011 to April 2012. Data for these months is
combined due to low volumes making the individual months’ data unreliable as
a guide to performance.
32. Looking at JSA participants, 9.3% had a sustained job outcome by 12 months,
12.3% by 15 months and 14.5% by 18 months after starting on the
programme.
33. For non-JSA participants, 6.1% had a sustained job outcome by 12 months,
increasing to 7.6% by 15 months and 8.4% by 18 months after starting on the
programme.
34. For the total, combining benefit groups for all participants starting provision up
to February 2014, 11.8% had achieved a sustained job outcome within 18
months.
3 A 12 month job outcome rate is the proportion of the cohort starting the programme in the listed
month achieving a sustained job outcome within a year of attachment. Additional participants in the
cohort will get a sustained job outcome by 15 or 18 months, making these job outcome rates higher
than the rate at 12 months.

ESF Support for Families with Multiple Problems
8
35. The table on JSA job outcomes shows higher levels for those who started from
January 2013 onwards than those who started before. The average level of
sustained job outcomes after 12 months was 9.5% for participants starting
from January 2013 onwards and 7.6% for those who started before.
36. The same is true of non-JSA Job Outcomes. For participants starting from
January 2013 onwards the average level of sustained job outcomes after 12
months was 6.5%, while for those who started before it was 4.6%.
37. The table on total job outcome rates shows large increases for 12 month
sustained job outcomes for participants who started from January 2013
onwards (8.4%) compared to those who started before (5.8%). This is a result
of both the increases mentioned in the previous two paragraphs and an
increase in the proportion of attachments being on JSA.
38. Attachments for each of the twelve Contract Package Areas are shown in
table 9. The Contract Package Area with the highest amount of attachments
was Greater Manchester, with 11,980 whilst Cornwall had the fewest, with
2,920.
39. Greater Manchester (6,900) had the most individuals for whom any progress
measures were paid and the South East (15,830) and Yorkshire & Humber
(15,590) had the most progress measures paid. East of England had the
fewest individuals with progress measures, at 1,440 and 2,710 progress
measures paid.
40. Table 10 shows sustained job outcomes by Contract Package Area. Greater
Manchester, with 1,350, achieved the most. This included 950 JSA job
outcomes and 380 non-JSA job outcomes. The South East had the second
highest JSA job outcomes, at 860, and West London had the second highest
non-JSA job outcomes, at 370.

ESF Support for Families with Multiple Problems
9
Tables
Table 1: Provider by Contract Package Area
Contract Package Area Area Provider
1 East of England Reed in Partnership
2 East Midlands Working Links
3 East London Reed in Partnership
4 West London Reed in Partnership
5 North East The Wise Group
6 Greater Manchester G4S
7 Cumbria, Merseyside and Lancashire Reed in Partnership
8 South East Skills Training
9 South West Twin Training
10 Cornwall Paragon
11 West Midlands EOS
12 Yorkshire and the Humber EOS

ESF Support for Families with Multiple Problems
10
Table 2: Attachments over time
2012 2013 2014 2015
January 30 1,000 3,000 2,360
February 150 1,170 3,550 610
March 510 1,350 3,860 10
April 480 1,360 3,850 0
May 950 1,600 3,910 0
June 1,190 1,690 3,750 0
July 990 2,110 4,140
August 950 2,000 3,270
September 890 2,350 3,670
October 1,010 3,000 3,960
November 1,200 2,920 3,580
December 740 2,250 3,720
Total 9,090 22,790 44,270 2,980
Note: Numbers are rounded to the nearest ten; totals may not sum due to rounding; January 2012 includes starts from December 2011. The programme ended on the 30th June 2015 Source: DWP management information

ESF Support for Families with Multiple Problems
11
Table 3: Attachments by characteristics, December 2011 to June 2015
Attachments %
Gender:
Males 35,510 45%
Females 43,490 55%
Ethnic Group:
Asian or Asian British 3,070 4%
Black or Black British 5,940 8%
Chinese/other 2,230 3%
Mixed 1,800 2%
White 62,530 79%
Prefer not to say 3,440 5%
Age:
<25 14,710 19%
25-49 50,960 64%
>50 13,320 17%
Total 79,000 100%
Note: Numbers are rounded to the nearest ten; the Total figure here represents only those for whom we have information on characteristics and is lower than the equivalent figure in other tables; totals may not sum due to rounding. Source: DWP management information

ESF Support for Families with Multiple Problems
12
Table 4: Progress measures over time
Attachments
Total
Progress
Measures
Progress measure completed
first second third
Dec11 to Mar13 12,610 2,110 990 650 480
Apr-13 1,360 1,240 680 380 180
May-13 1,600 1,170 620 390 170
Jun-13 1,690 1,610 810 510 290
Jul-13 2,110 1,570 800 510 270
Aug-13 2,000 1,720 870 550 300
Sep-13 2,350 1,960 940 640 380
Oct-13 3,000 2,550 1,180 850 530
Nov-13 2,920 2,620 1,210 850 560
Dec-13 2,250 2,930 1,370 970 590
Jan-14 3,000 3,220 1,530 1,080 620
Feb-14 3,550 3,780 1,710 1,300 770
Mar-14 3,860 3,590 1,610 1,200 780
Apr-14 3,850 3,790 1,840 1,200 740
May-14 3,910 4,350 2,090 1,440 820
Jun-14 3,750 4,490 2,060 1,500 920
Jul-14 4,140 5,360 2,480 1,820 1,060
Aug-14 3,270 4,560 2,020 1,580 950
Sep-14 3,670 5,460 2,390 1,830 1,230
Oct-14 3,960 6,020 2,620 2,030 1,370
Nov-14 3,580 5,230 2,190 1,760 1,280
Dec-14 3,720 4,910 2,070 1,640 1,200
Jan-15 2,360 6,220 2,630 2,090 1,510
Feb-15 610 5,640 2,460 1,870 1,320
Mar-15 10 5,690 2,290 1,990 1,410
Apr-15 0 5,110 1,840 1,820 1,440
May-15 0 4,320 1,310 1,530 1,480
Jun-15 0 3,070 910 1,090 1,070
Jul-15 - 2,600 710 880 1,000
Aug-15 - 1,240 390 390 460
Total 79,130 108,110 46,600 36,320 25,180
Progress Measures achieved
Highest Progress Measure achieved
for each individual
Any Total One Two Three
Participants 46,600 108,110 10,280 11,140 25,180

ESF Support for Families with Multiple Problems
13
Note: Numbers are rounded to the nearest ten; totals may not sum due to rounding. Only progress measures for which claims were submitted on or before 24 August 2015 are included in the table. Source: DWP management information
ESF Support for Families with Multiple Problems
14
Table 5: Sustained job outcomes over time
TOTAL JSA Non-JSA
Up to Dec 12 70 30 50
Jan-13 30 10 20
Feb-13 40 20 20
Mar-13 60 30 40
Apr-13 50 30 20
May-13 70 40 30
Jun-13 70 30 50
Jul-13 60 30 30
Aug-13 110 60 50
Sep-13 100 60 40
Oct-13 130 80 60
Nov-13 150 90 50
Dec-13 120 70 50
Jan-14 220 140 80
Feb-14 180 110 70
Mar-14 220 160 70
Apr-14 230 180 60
May-14 220 150 60
Jun-14 180 120 60
Jul-14 290 180 110
Aug-14 220 150 80
Sep-14 430 310 120
Oct-14 420 290 120
Nov-14 350 250 110
Dec-14 430 310 120
Jan-15 580 410 170
Feb-15 530 350 170
Mar-15 560 410 140
Apr-15 590 450 130
May-15 640 500 140
Jun-15 450 330 120
Jul-15 610 450 160
Aug-15 710 540 170
Total 9,130 6,330 2,760
Note: A sustained job outcome is 26 cumulative weeks of employment for JSA and 13 cumulative weeks for the non-JSA and JSA ex-IB groups; total column includes JSA ex-IB participants not shown separately; numbers are rounded to the nearest ten; totals may not sum due to rounding. Only data for job outcomes for which claims were submitted on or before 24 August 15 are included in the table. A small number of payments claimed in August 15 were paid in September 15, these are included in the August 15 figures Source: DWP management information

ESF Support for Families with Multiple Problems
15
Table 6: JSA job outcome rates
Date of attachment Attachments
Job outcomes by
12 Months 15 Months 18 Months
Dec11 to Apr12 420 10.2% 13.1% 16.9%
May-12 340 6.4% 8.2% 10.5%
Jun-12 410 6.5% 9.7% 12.8%
Jul-12 370 6.5% 8.9% 11.3%
Aug-12 380 9.7% 13.1% 16.2%
Sep-12 320 7.8% 8.8% 10.6%
Oct-12 430 7.3% 10.1% 12.2%
Nov-12 570 7.4% 10.4% 12.7%
Dec-12 330 5.7% 9.9% 13.3%
Jan-13 500 12.2% 16.2% 17.2%
Feb-13 560 11.4% 13.7% 16.2%
Mar-13 670 11.3% 13.6% 15.4%
Apr-13 680 9.4% 11.9% 14.4%
May-13 850 11.2% 14.0% 15.9%
Jun-13 880 9.0% 12.5% 14.3%
Jul-13 1,200 10.9% 14.1% 15.8%
Aug-13 1,300 10.0% 12.4% 15.1%
Sep-13 1,500 7.7% 10.6% 13.4%
Oct-13 1,970 8.0% 11.0% 13.8%
Nov-13 1,930 7.3% 10.7% 13.0%
Dec-13 1,490 8.7% 11.6% 13.9%
Jan-14 1,970 9.1% 11.9% 13.8%
Feb-14 2,330 11.1% 14.7% 17.6%
Mar-14 2,600 9.7% 12.8% -
Apr-14 2,690 9.3% 12.4% -
May-14 2,660 9.7% 12.9% -
Jun-14 2,420 9.5% - -
Jul-14 2,710 9.6% - -
Aug-14 2,180 9.9% - -
All 36,680 9.3% 12.3% 14.5%
Note: A sustained job outcome is 26 cumulative weeks of employment; numbers are rounded to the nearest ten; totals may not sum due to rounding. Only data for job outcomes for which claims were submitted on or before 24 August 2015 are included in the table. Source: DWP management information

ESF Support for Families with Multiple Problems
16
Table 7: Non-JSA job outcome rates
Date of attachment Attachments
Job outcomes by
12 Months 15 Months 18 months
Dec11 to Apr12 750 4.6% 6.2% 6.7%
May-12 610 4.4% 5.9% 7.4%
Jun-12 760 3.8% 4.3% 4.7%
Jul-12 620 5.8% 8.7% 9.4%
Aug-12 560 5.7% 7.0% 8.4%
Sep-12 560 4.1% 5.3% 5.9%
Oct-12 580 5.1% 6.8% 8.2%
Nov-12 630 4.0% 5.1% 6.1%
Dec-12 410 4.0% 5.4% 5.7%
Jan-13 490 5.1% 6.6% 8.2%
Feb-13 600 5.9% 7.2% 8.0%
Mar-13 670 5.5% 6.5% 7.6%
Apr-13 680 5.9% 7.1% 9.0%
May-13 750 6.2% 8.3% 8.9%
Jun-13 800 4.9% 7.1% 8.1%
Jul-13 900 6.0% 7.2% 8.0%
Aug-13 700 7.7% 10.5% 11.7%
Sep-13 840 5.7% 8.1% 10.2%
Oct-13 1,000 6.3% 8.9% 10.3%
Nov-13 970 7.0% 9.2% 10.3%
Dec-13 740 5.3% 6.9% 8.4%
Jan-14 1,010 5.0% 6.5% 7.6%
Feb-14 1,190 6.5% 8.6% 9.7%
Mar-14 1,240 6.8% 8.4% -
Apr-14 1,150 7.3% 8.9% -
May-14 1,220 8.3% 10.0% -
Jun-14 1,320 6.8% - -
Jul-14 1,410 7.9% - -
Aug-14 1,070 7.1% - -
All 24,220 6.1% 7.6% 8.4%
Note: A sustained job outcome is 13 cumulative weeks of employment; numbers are rounded to the nearest ten; totals may not sum due to rounding. Only data for job outcomes for which claims were submitted on or before 24 August 2015 are included in the table. Source: DWP management information

ESF Support for Families with Multiple Problems
17
Table 8: Total job outcome rates
Date of attachment Attachments
Job outcomes by
12 Months 15 Months 18 Months
Dec11 to Apr12 1,170 6.6% 8.6% 10.3%
May-12 950 5.3% 6.8% 8.6%
Jun-12 1,190 4.8% 6.2% 7.6%
Jul-12 990 6.0% 8.8% 10.1%
Aug-12 950 7.3% 9.4% 11.5%
Sep-12 890 5.5% 6.7% 7.7%
Oct-12 1,010 6.0% 8.2% 9.9%
Nov-12 1,200 5.6% 7.6% 9.3%
Dec-12 740 4.7% 7.4% 9.0%
Jan-13 1,000 8.6% 11.3% 12.6%
Feb-13 1,170 8.5% 10.4% 12.0%
Mar-13 1,350 8.4% 10.2% 11.6%
Apr-13 1,360 7.8% 9.8% 12.0%
May-13 1,600 8.9% 11.4% 12.7%
Jun-13 1,690 7.0% 9.9% 11.4%
Jul-13 2,110 8.8% 11.1% 12.4%
Aug-13 2,000 9.2% 11.7% 13.9%
Sep-13 2,350 7.0% 9.7% 12.2%
Oct-13 3,000 7.5% 10.4% 12.7%
Nov-13 2,920 7.1% 10.1% 12.1%
Dec-13 2,250 7.6% 10.1% 12.1%
Jan-14 3,000 7.7% 10.0% 11.8%
Feb-14 3,550 9.5% 12.6% 14.9%
Mar-14 3,860 8.7% 11.3% -
Apr-14 3,850 8.7% 11.4% -
May-14 3,910 9.3% 12.0% -
Jun-14 3,750 8.5% - -
Jul-14 4,140 9.0% - -
Aug-14 3,270 9.0% - -
ALL 61,210 8.0% 10.4% 11.8%
Note: A sustained job outcome is 26 cumulative weeks for JSA and 13 cumulative weeks for the non-JSA and JSA ex-IB groups; includes JSA ex-IB participants not shown separately; numbers are rounded to the nearest ten; totals may not sum due to rounding. Only data for job outcomes for which claims were submitted on or before 24 August 2015 are included in the table.Source: DWP management information

ESF Support for Families with Multiple Problems
18
Table 9: Attachments and progress measures by Contract Package Area
Highest Progress measure
achieved by each individual
Total
progress
measures
Attachments any one two three
East of England 3,010 1,440 550 490 390 2,710
East Midlands 8,760 5,490 730 1,480 3,280 13,540
East London 4,370 1,840 640 680 520 3,560
West London 4,110 2,290 760 780 750 4,560
North East 4,170 1,960 500 470 990 4,400
Greater
Manchester 11,980 6,900 1,920 1,670 3,310 15,190
Cumbria,
Merseyside and
Lancashire 6,160 3,490 810 700 1,980 8,130
South East 9,850 6,580 1,240 1,430 3,910 15,830
South West 4,690 2,550 860 780 910 5,160
Cornwall 2,920 1,940 230 320 1,390 5,050
West Midlands 9,000 5,700 800 1,110 3,790 14,390
Yorkshire &
Humber 10,120 6,430 1,240 1,230 3,970 15,590
Total 79,130 46,600 10,280 11,140 25,180 108,110
Note: Numbers are rounded to the nearest ten; totals may not sum due to rounding. Only progress measures for which claims were submitted on or before 24 August 2015 are included in the table. All but the final column contain information on an individual bases. Source: DWP management information

ESF Support for Families with Multiple Problems
19
Table 10: Sustained job outcomes by Contract Package Area
Total JSA Non-JSA
East of England 430 340 90
East Midlands 640 420 210
East London 810 510 290
West London 780 410 370
North East 380 240 140
Greater Manchester 1,350 950 380
Cumbria, Merseyside and Lancashire 860 610 240
South East 1,070 860 210
South West 540 360 170
Cornwall 430 260 180
West Midlands 850 620 220
Yorkshire & Humber 1,000 740 250
Total 9,130 6,330 2,760
Note: Includes JSA ex-IB participants not shown separately; numbers are rounded to the nearest ten; totals may not sum due to rounding. Only data for job outcomes for which claims were submitted on or before 24 August 2015 are included in the table. Source: DWP management information
20
Contacts
Press enquiries should be directed to the Department for Work and Pensions press
office:
Media Enquiries: 020 3267 5144
Website: https://www.gov.uk
Follow us on Twitter: www.twitter.com/dwppressoffice
Other enquiries about these statistics should be directed to:
Tetyana Mykhaylyk ([email protected])
National Statistics publications, and general information about the official statistics
system of the UK, are available from www.statistics.gov.uk