EPA Sector Notebook Project - Profile of the Aerospace Industry
131
Aerospace Industry Sector Notebook Project EPA/310-R-98-001. EPA Office of Compliance Sector Notebook Project Profile of the Aerospace Industry November 1998 Office of Compliance Office of Enforcement and Compliance Assurance U.S. Environmental Protection Agency 401 M St., SW (MC 2221-A) Washington, DC 20460
-
Upload
khangminh22 -
Category
Documents
-
view
1 -
download
0
Transcript of EPA Sector Notebook Project - Profile of the Aerospace Industry

Aerospace Industry Sector Notebook Project
EPA/310-R-98-001.
EPA Office of Compliance Sector Notebook Project
Profile of the Aerospace Industry
November 1998
Office of ComplianceOffice of Enforcement and Compliance Assurance
U.S. Environmental Protection Agency401 M St., SW (MC 2221-A)
Washington, DC 20460
Aerospace Industry Sector Notebook Project
Sector Notebook Project November 1998
This report is one in a series of volumes published by the U.S. Environmental Protection Agency(EPA) to provide information of general interest regarding environmental issues associated withspecific industrial sectors. The documents were developed under contract by Abt Associates(Cambridge, MA), Science Applications International Corporation (McLean, VA), and Booz-Allen& Hamilton, Inc. (McLean, VA). This publication may be purchased from the Superintendent ofDocuments, U.S. Government Printing Office. [A listing of available Sector Notebooks anddocument numbers is included on the following page.]
All telephone orders should be directed to:
Superintendent of DocumentsU.S. Government Printing OfficeWashington, DC 20402(202) 512-1800FAX (202) 512-22508:00 a.m. to 4:30 p.m., EST, M-F
Using the form provided at the end of this document, all mail orders should be directed to:
U.S. Government Printing OfficeP.O. Box 371954Pittsburgh, PA 15250-7954
Complimentary volumes are available to certain groups or subscribers, such as public andacademic libraries, Federal, State, and local governments, and the media from EPA’s NationalCenter for Environmental Publications and Information at (800) 490-9198. For furtherinformation, and for answers to questions pertaining to these documents, please refer to thecontact names and numbers provided within this volume.
Electronic versions of all Sector Notebooks are available via Internet on the Enviro$en$e WorldWide Web at http://www.epa.gov/oeca/sector/index.html. Enviro$ense is a free, public,environmental exchange system operated by EPA's Office of Enforcement and ComplianceAssurance and Office of Research and Development. The Network allows regulators, theregulated community, technical experts, and the general public to share information regarding:pollution prevention and innovative technologies; environmental enforcement and complianceassistance; laws, executive orders, regulations, and policies; points of contact for services andequipment; and other related topics. The Network welcomes receipt of environmental messages,information, and data from any public or private person or organization. Direct technicalquestions to the “Feedback” button on the bottom of the web page.
Cover photograph courtesy of The Boeing Company.

Aerospace Industry Sector Notebook Project
Sector Notebook Project November 1998

Aerospace Industry Sector Notebook Project
Sector Notebook Project November 1998
Sector Notebook Contacts
The Sector Notebooks were developed by the EPA’s Office of Compliance. Questions relating tothe Sector Notebook Project can be directed to:
Seth Heminway, Coordinator, Sector Notebook ProjectUS EPA Office of Compliance401 M St., SW (2223-A)Washington, DC 20460(202) 564-7017
Questions and comments regarding the individual documents can be directed to the appropriatespecialists listed below.
Document Number Industry Contact Phone (202)EPA/310-R-95-001. Dry Cleaning Industry Joyce Chandler 564-7073EPA/310-R-95-002. Electronics and Computer Industry* Steve Hoover 564-7007EPA/310-R-95-003. Wood Furniture and Fixtures Industry Bob Marshall 564-7021EPA/310-R-95-004. Inorganic Chemical Industry* Walter DeRieux 564-7067EPA/310-R-95-005. Iron and Steel Industry Maria Malave 564-7027EPA/310-R-95-006. Lumber and Wood Products Industry Seth Heminway 564-7017EPA/310-R-95-007. Fabricated Metal Products Industry* Scott Throwe 564-7013EPA/310-R-95-008. Metal Mining Industry Jane Engert 564-5021EPA/310-R-95-009. Motor Vehicle Assembly Industry Anthony Raia 564-6045EPA/310-R-95-010. Nonferrous Metals Industry Jane Engert 564-5021EPA/310-R-95-011. Non-Fuel, Non-Metal Mining Industry Rob Lischinsky 564-2628EPA/310-R-95-012. Organic Chemical Industry* Walter DeRieux 564-7067EPA/310-R-95-013. Petroleum Refining Industry Tom Ripp 564-7003EPA/310-R-95-014. Printing Industry Ginger Gotliffe 564-7072EPA/310-R-95-015. Pulp and Paper Industry Seth Heminway 564-7017EPA/310-R-95-016. Rubber and Plastic Industry Maria Malave 564-7027EPA/310-R-95-017. Stone, Clay, Glass, and Concrete Industry Scott Throwe 564-7013EPA/310-R-95-018. Transportation Equipment Cleaning Ind. Virginia Lathrop 564-7057EPA/310-R-97-001. Air Transportation Industry Virginia Lathrop 564-7057EPA/310-R-97-002. Ground Transportation Industry Virginia Lathrop 564-7057EPA/310-R-97-003. Water Transportation Industry Virginia Lathrop 564-7057EPA/310-R-97-004. Metal Casting Industry Jane Engert 564-5021EPA/310-R-97-005. Pharmaceuticals Industry Emily Chow 564-7071EPA/310-R-97-006. Plastic Resin and Man-made Fiber Ind. Sally Sasnett 564-7074EPA/310-R-97-007. Fossil Fuel Electric Power Generation Ind. Rafael Sanchez 564-7028EPA/310-R-97-008. Shipbuilding and Repair Industry Anthony Raia 564-6045EPA/310-R-97-009. Textile Industry Belinda Breidenbach 564-7022EPA/310-R-97-010. Sector Notebook Data Refresh-1997 Seth Heminway 564-7017EPA/310-R-98-001. Aerospace Industry Anthony Raia 564-6045EPA/310-R-98-002. Agricultural Chemical, Pesticide, and Shruti Sanghavi 564-4158
Fertilizer IndustryEPA/310-R-98-003. Agricultural Crop Production Industry Ginah Mortensen (913)551-5211EPA/310-R-98-004. Agricultural Livestock Production Ind. Ginah Mortensen (913)551-5211EPA/310-R-98-005. Oil and Gas Exploration and Production Dan Chadwick 564-7054
IndustryEPA/310-R-98-006. Local Government Operations John Dombrowski 564-7036*Spanish translations available.

Aerospace Industry Sector Notebook Project
Sector Notebook Project November 1998i
AEROSPACE INDUSTRYTABLE OF CONTENTS
LIST OF FIGURES . . . . . . . . . . . . . . . . . . . . . . . . . . . . . . . . . . . . . . . . . . . . . . . . . . . . . . . . . iii
LIST OF TABLES . . . . . . . . . . . . . . . . . . . . . . . . . . . . . . . . . . . . . . . . . . . . . . . . . . . . . . . . . iii
LIST OF ACRONYMS. . . . . . . . . . . . . . . . . . . . . . . . . . . . . . . . . . . . . . . . . . . . . . . . . . . . . . iv
I. INTRODUCTION TO THE SECTOR NOTEBOOK PROJECT. . . . . . . . . . . . . . . . . . . . . 1A. Summary of the Sector Notebook Project . . . . . . . . . . . . . . . . . . . . . . . . . . . . . . . . . 1B. Additional Information . . . . . . . . . . . . . . . . . . . . . . . . . . . . . . . . . . . . . . . . . . . . . . . 2
II. INTRODUCTION TO THE AEROSPACE INDUSTRY. . . . . . . . . . . . . . . . . . . . . . . . . . 3A. Introduction, Background, and Scope of the Notebook . . . . . . . . . . . . . . . . . . . . . . 3B. Characterization of the Aerospace Industry. . . . . . . . . . . . . . . . . . . . . . . . . . . . . . . . 4
1. Product Characterization . . . . . . . . . . . . . . . . . . . . . . . . . . . . . . . . . . . . . . . . 52. Industry Size and Geographic Distribution . . . . . . . . . . . . . . . . . . . . . . . . . . 113. Economic Trends . . . . . . . . . . . . . . . . . . . . . . . . . . . . . . . . . . . . . . . . . . . . . 14
III. INDUSTRIAL PROCESS DESCRIPTION. . . . . . . . . . . . . . . . . . . . . . . . . . . . . . . . . . . 17A. Aircraft Engines and Parts Industry . . . . . . . . . . . . . . . . . . . . . . . . . . . . . . . . . . . . 18
1. Materials . . . . . . . . . . . . . . . . . . . . . . . . . . . . . . . . . . . . . . . . . . . . . . . . . . . 182. Metal Shaping . . . . . . . . . . . . . . . . . . . . . . . . . . . . . . . . . . . . . . . . . . . . . . . 193. Metal Finishing . . . . . . . . . . . . . . . . . . . . . . . . . . . . . . . . . . . . . . . . . . . . . . 23
B. Aircraft Assembly . . . . . . . . . . . . . . . . . . . . . . . . . . . . . . . . . . . . . . . . . . . . . . . . . . 30C. Repair/Rework Operations . . . . . . . . . . . . . . . . . . . . . . . . . . . . . . . . . . . . . . . . . . . 33D. Space Vehicles and Guided Missiles. . . . . . . . . . . . . . . . . . . . . . . . . . . . . . . . . . . . 34E. Raw Materials Inputs and Pollution Outputs . . . . . . . . . . . . . . . . . . . . . . . . . . . . . . 34F. Management of Chemicals in Wastestream . . . . . . . . . . . . . . . . . . . . . . . . . . . . . . . 39
IV. CHEMICAL RELEASE AND TRANSFER PROFILE . . . . . . . . . . . . . . . . . . . . . . . . . . 41A. EPA Toxic Release Inventory for the Aerospace Industry. . . . . . . . . . . . . . . . . . . . 44B. Summary of Selected Chemicals Released . . . . . . . . . . . . . . . . . . . . . . . . . . . . . . . . 50C. Other Data Sources . . . . . . . . . . . . . . . . . . . . . . . . . . . . . . . . . . . . . . . . . . . . . . . . 53D. Comparison of Toxic Release Inventory Between Selected Industries . . . . . . . . . . . 56
V. POLLUTION PREVENTION OPPORTUNITIES . . . . . . . . . . . . . . . . . . . . . . . . . . . . . . 59A. Machining and Metalworking . . . . . . . . . . . . . . . . . . . . . . . . . . . . . . . . . . . . . . . . . 60B. Surface Preparation. . . . . . . . . . . . . . . . . . . . . . . . . . . . . . . . . . . . . . . . . . . . . . . . 61C. Solvent Cleaning and Degreasing . . . . . . . . . . . . . . . . . . . . . . . . . . . . . . . . . . . . . . 62D. Metal Plating and Surface Finishing. . . . . . . . . . . . . . . . . . . . . . . . . . . . . . . . . . . . 68E. Painting and Coating . . . . . . . . . . . . . . . . . . . . . . . . . . . . . . . . . . . . . . . . . . . . . . . . 68
VI. SUMMARY OF FEDERAL STATUTES AND REGULATIONS . . . . . . . . . . . . . . . . . . 75

Aerospace Industry Sector Notebook Project
Sector Notebook Project November 1998ii
A. General Description of Major Statutes . . . . . . . . . . . . . . . . . . . . . . . . . . . . . . . . . . 75B. Industry Specific Requirements . . . . . . . . . . . . . . . . . . . . . . . . . . . . . . . . . . . . . . . . 86C. Pending and Proposed Regulatory Requirements . . . . . . . . . . . . . . . . . . . . . . . . . . 91
VII. COMPLIANCE AND ENFORCEMENT HISTORY . . . . . . . . . . . . . . . . . . . . . . . . . . . 92A. Aerospace Industry Compliance History. . . . . . . . . . . . . . . . . . . . . . . . . . . . . . . . . 96B. Comparison of Enforcement Activity Between Selected Industries . . . . . . . . . . . . . 98C. Review of Major Legal Actions . . . . . . . . . . . . . . . . . . . . . . . . . . . . . . . . . . . . . . 103
1. Review of Major Cases . . . . . . . . . . . . . . . . . . . . . . . . . . . . . . . . . . . . . . . . 1032. Supplementary Environmental Projects (SEPs). . . . . . . . . . . . . . . . . . . . . . 103
VIII. COMPLIANCE ASSURANCE ACTIVITIES AND INITIATIVES . . . . . . . . . . . . . . 104A. Sector-related Environmental Programs and Activities. . . . . . . . . . . . . . . . . . . . . 104
1. Federal Activities . . . . . . . . . . . . . . . . . . . . . . . . . . . . . . . . . . . . . . . . . . . . 104B. EPA Voluntary Programs . . . . . . . . . . . . . . . . . . . . . . . . . . . . . . . . . . . . . . . . . . . 105C. Trade Association/Industry Sponsored Activity . . . . . . . . . . . . . . . . . . . . . . . . . . 113
1. Industry Research Programs . . . . . . . . . . . . . . . . . . . . . . . . . . . . . . . . . . . 1132. Trade Associations . . . . . . . . . . . . . . . . . . . . . . . . . . . . . . . . . . . . . . . . . . 115
IX. CONTACTS/ACKNOWLEDGMENTS/RESOURCE MATERIALS . . . . . . . . . . . . . . . 118
Aerospace Industry Sector Notebook Project
Sector Notebook Project November 1998iii
LIST OF FIGURES
Figure 1: Structure of the Aerospace Industry. . . . . . . . . . . . . . . . . . . . . . . . . . . . . . . . . . . . . . 5Figure 2: Number of Establishments and Value of Shipments for the Aerospace Industry. . . . . 8Figure 3: Value of Shipments and Number of Establishments for the Aircraft Industry . . . . . . . 9Figure 4: Value of Shipments and Number of Establishments for the Space Vehicles and
Guided Missiles Industry . . . . . . . . . . . . . . . . . . . . . . . . . . . . . . . . . . . . . . . . . . . . . . . 10Figure 5: Geographic Distribution of Aerospace Manufacturing Facilities . . . . . . . . . . . . . . . . 11Figure 6: The Aerospace Manufacturing Process. . . . . . . . . . . . . . . . . . . . . . . . . . . . . . . . . . 17Figure 7: Summary of TRI Releases and Transfers by Industry . . . . . . . . . . . . . . . . . . . . . . . . 57
LIST OF TABLES
Table 1: Products Included in the Aerospace Industry. . . . . . . . . . . . . . . . . . . . . . . . . . . . . . . . 6Table 2: Facility Size Distribution for the Aerospace Industry. . . . . . . . . . . . . . . . . . . . . . . . . 12Table 3: States with the Largest Number of Aerospace Manufacturing Facilities . . . . . . . . . . . 13Table 4: Top U.S. Aerospace Companies. . . . . . . . . . . . . . . . . . . . . . . . . . . . . . . . . . . . . . . . 13Table 5: Primary and Secondary Shaping Operations . . . . . . . . . . . . . . . . . . . . . . . . . . . . . . . 20Table 6: Material Input and Pollutant Outputs . . . . . . . . . . . . . . . . . . . . . . . . . . . . . . . . . . . . . 38Table 7: Source Reduction and Recycling Activity for Aerospace Manufacturers Facilities
(SICs 372 or 376) as Reported within TRI. . . . . . . . . . . . . . . . . . . . . . . . . . . . . . . . . . 40Table 8: 1996 TRI Releases for Aerospace Chemicals Facilities . . . . . . . . . . . . . . . . . . . . . . . 46Table 9: 1996 TRI Transfers for Aerospace Chemicals Facilities . . . . . . . . . . . . . . . . . . . . . . . 47Table 10: Top 10 TRI Releasing Facilities Reporting Only 372 or 376 SIC Codes to TRI. . . . 48Table 11: Top 10 TRI Releasing Facilities Reporting Aerospace SIC Codes to TRI. . . . . . . . 49Table 12: Air Pollutant Releases by Industry Sector (tons/year) . . . . . . . . . . . . . . . . . . . . . . . . 55Table 13: 1995 Toxics Release Inventory Data for Selected Industries. . . . . . . . . . . . . . . . . . . 57Table 14: Five-Year Enforcement and Compliance Summary for the Aerospace Industry. . . . 97Table 15: Five-Year Enforcement and Compliance Summary for Selected Industries . . . . . . . . 99Table 16: One-Year Enforcement and Compliance Summary for Selected Industries . . . . . . . 100Table 17: Five-Year Inspection and Enforcement Summary by Statute for Selected
Industries . . . . . . . . . . . . . . . . . . . . . . . . . . . . . . . . . . . . . . . . . . . . . . . . . . . . . . . . . . 101Table 18: One-Year Inspection and Enforcement Summary by Statute for Selected
Industries . . . . . . . . . . . . . . . . . . . . . . . . . . . . . . . . . . . . . . . . . . . . . . . . . . . . . . . . . . 102Table 19: Aerospace Industry Participation in the 33/50 Program. . . . . . . . . . . . . . . . . . . . . 107

Aerospace Industry Sector Notebook Project
Sector Notebook Project November 1998iv
LIST OF ACRONYMS
AIA- Aerospace Industries AssociationAFS - AIRS Facility Subsystem (CAA database)AIRS - Aerometric Information Retrieval System (CAA database)BIFs - Boilers and Industrial Furnaces (RCRA)BOD - Biochemical Oxygen Demand CAA - Clean Air ActCAAA - Clean Air Act Amendments of 1990CARB- California Air Resources BoardCERCLA - Comprehensive Environmental Response, Compensation and Liability ActCERCLIS - CERCLA Information SystemCFCs - ChlorofluorocarbonsCO - Carbon Monoxide COD - Chemical Oxygen Demand CSI - Common Sense Initiative CWA - Clean Water ActD&B - Dun and Bradstreet Marketing IndexDOC- Department of CommerceDOD- Department of DefenseDOE- Department of EnergyELP - Environmental Leadership Program EPA - United States Environmental Protection AgencyEPCRA - Emergency Planning and Community Right-to-Know Act FIFRA - Federal Insecticide, Fungicide, and Rodenticide ActFINDS - Facility Indexing SystemGPS- Global Positioning SystemHAPs - Hazardous Air Pollutants (CAA)HSDB - Hazardous Substances Data BankHVLP- High Volume/Low Pressure IDEA - Integrated Data for Enforcement AnalysisLDR - Land Disposal Restrictions (RCRA)LEPCs - Local Emergency Planning Committees MACT - Maximum Achievable Control Technology (CAA)MCLGs - Maximum Contaminant Level Goals MCLs - Maximum Contaminant Levels MEK - Methyl Ethyl KetoneMSDSs - Material Safety Data Sheets NAAQS - National Ambient Air Quality Standards (CAA)NAFTA - North American Free Trade AgreementNAICS- North American Industrial Classification System NCDB - National Compliance Database (for TSCA, FIFRA, EPCRA)NCP - National Oil and Hazardous Substances Pollution Contingency Plan NEC- Not Elsewhere ClassifiedNEIC - National Enforcement Investigation Center

Aerospace Industry Sector Notebook Project
Sector Notebook Project November 1998v
NESHAP - National Emission Standards for Hazardous Air PollutantsNO2 - Nitrogen DioxideNOV - Notice of Violation NOX - Nitrogen Oxide NPDES - National Pollution Discharge Elimination System (CWA)NPL - National Priorities List NRC - National Response Center NRMRL- National Risk Management Research LaboratoryNSPS - New Source Performance Standards (CAA)OAQPS- Office of Air Quality Planning and StandardsOAR - Office of Air and RadiationOECA - Office of Enforcement and Compliance AssuranceOEM- Original Equipment ManufacturerOMB- Office of Management and BudgetOPA - Oil Pollution ActOPPTS - Office of Prevention, Pesticides, and Toxic SubstancesOSHA - Occupational Safety and Health Administration OSW - Office of Solid WasteOSWER - Office of Solid Waste and Emergency ResponseOW - Office of WaterP2 - Pollution PreventionPCS - Permit Compliance System (CWA Database)POTW - Publicly Owned Treatments Works RCRA - Resource Conservation and Recovery ActRCRIS - RCRA Information SystemSARA - Superfund Amendments and Reauthorization Act SDWA - Safe Drinking Water ActSEPs - Supplementary Environmental Projects SERCs - State Emergency Response Commissions SIC - Standard Industrial Classification SO2 - Sulfur Dioxide SOX - Sulfur OxidesTOC - Total Organic Carbon TRI - Toxic Release InventoryTRIS - Toxic Release Inventory System TCRIS - Toxic Chemical Release Inventory SystemTSCA - Toxic Substances Control ActTSS - Total Suspended Solids UIC - Underground Injection Control (SDWA)UST - Underground Storage Tanks (RCRA)VOCs - Volatile Organic Compounds

Aerospace Industry Sector Notebook Project
Sector Notebook Project November 19981
I. INTRODUCTION TO THE SECTOR NOTEBOOK PROJECT
I.A. Summary of the Sector Notebook Project
Environmental policies based upon comprehensive analysis of air, water andland pollution (such as economic sector, and community-based approaches)are becoming an important supplement to traditional single-media approachesto environmental protection. Environmental regulatory agencies are beginningto embrace comprehensive, multi-statute solutions to facility permitting,compliance assurance, education/outreach, research, and regulatorydevelopment issues. The central concepts driving the new policy direction arethat pollutant releases to each environmental medium (air, water and land)affect each other, and that environmental strategies must actively identify andaddress these interrelationships by designing policies for the "whole" facility.One way to achieve a whole facility focus is to design environmental policiesfor similar industrial facilities. By doing so, environmental concerns that arecommon to the manufacturing of similar products can be addressed in acomprehensive manner. Recognition of the need to develop the industrial"sector-based” approach within the EPA Office of Compliance led to thecreation of this document.
The Sector Notebook Project was initiated by the Office of Compliance withinthe Office of Enforcement and Compliance Assurance (OECA) to provide itsstaff and managers with summary information for eighteen specific industrialsectors. As other EPA offices, states, the regulated community,environmental groups, and the public became interested in this project, thescope of the original project was expanded. The ability to designcomprehensive, common sense environmental protection measures for specificindustries is dependent on knowledge of several interrelated topics. For thepurposes of this project, the key elements chosen for inclusion are: generalindustry information (economic and geographic); a description of industrialprocesses; pollution outputs; pollution prevention opportunities; Federalstatutory and regulatory framework; compliance history; and a description ofpartnerships that have been formed between regulatory agencies, the regulatedcommunity and the public.
For any given industry, each topic listed above could alone be the subject ofa lengthy volume. However, in order to produce a manageable document, thisproject focuses on providing summary information for each topic. Thisformat provides the reader with a synopsis of each issue, and references wheremore in-depth information is available. Text within each profile wasresearched from a variety of sources, and was usually condensed from moredetailed sources pertaining to specific topics. This approach allows for a widecoverage of activities that can be further explored based upon the referenceslisted at the end of this profile. As a check on the information included, eachnotebook went through an external document review process. The Office of

Aerospace Industry Sector Notebook Project
Sector Notebook Project November 19982
Compliance appreciates the efforts of all those that participated in this processand enabled us to develop more complete, accurate and up-to-datesummaries. Many of those who reviewed this notebook are listed as contactsin Section IX and may be sources of additional information. The individualsand groups on this list do not necessarily concur with all statements within thisnotebook.
I.B. Additional Information
Providing Comments
OECA’s Office of Compliance plans to periodically review and update thenotebooks and will make these updates available both in hard copy andelectronically. If you have any comments on the existing notebook, or if youwould like to provide additional information, please send a hard copy andcomputer disk to the EPA Office of Compliance, Sector Notebook Project(2223-A), 401 M St., SW, Washington, DC 20460. Comments can also besent via the web page or to [email protected].
Adapting Notebooks to Particular Needs
The scope of the industry sector described in this notebook approximates thenational occurrence of facility types within the sector. In many instances,industries within specific geographic regions or states may have uniquecharacteristics that are not fully captured in these profiles. The Office ofCompliance encourages state and local environmental agencies and othergroups to supplement or re-package the information included in this notebookto include more specific industrial and regulatory information that may beavailable. Additionally, interested states may want to supplement the"Summary of Applicable Federal Statutes and Regulations" section with stateand local requirements. Compliance or technical assistance providers mayalso want to develop the "Pollution Prevention" section in more detail. Pleasecontact the appropriate specialist listed on the opening page of this notebookif your office is interested in assisting us in the further development of theinformation or policies addressed within this volume. If you are interested inassisting in the development of new notebooks, please contact the Office ofCompliance at 202-564-2395.
Aerospace Industry Introduction, Background, and Scope
Sector Notebook Project November 19983
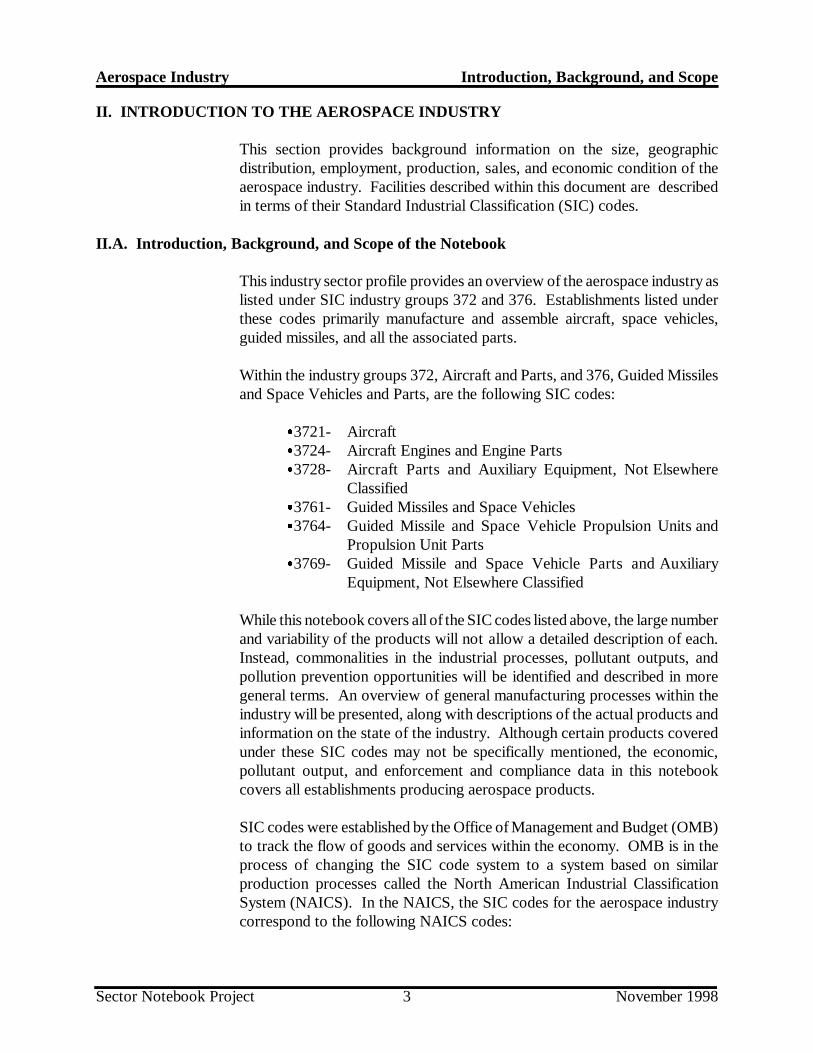
II. INTRODUCTION TO THE AEROSPACE INDUSTRY
This section provides background information on the size, geographicdistribution, employment, production, sales, and economic condition of theaerospace industry. Facilities described within this document are describedin terms of their Standard Industrial Classification (SIC) codes.
II.A. Introduction, Background, and Scope of the Notebook
This industry sector profile provides an overview of the aerospace industry aslisted under SIC industry groups 372 and 376. Establishments listed underthese codes primarily manufacture and assemble aircraft, space vehicles,guided missiles, and all the associated parts.
Within the industry groups 372, Aircraft and Parts, and 376, Guided Missilesand Space Vehicles and Parts, are the following SIC codes:
&3721- Aircraft&3724- Aircraft Engines and Engine Parts&3728- Aircraft Parts and Auxiliary Equipment, Not Elsewhere
Classified&3761- Guided Missiles and Space Vehicles&3764- Guided Missile and Space Vehicle Propulsion Units and
Propulsion Unit Parts&3769- Guided Missile and Space Vehicle Parts and Auxiliary
Equipment, Not Elsewhere Classified
While this notebook covers all of the SIC codes listed above, the large numberand variability of the products will not allow a detailed description of each.Instead, commonalities in the industrial processes, pollutant outputs, andpollution prevention opportunities will be identified and described in moregeneral terms. An overview of general manufacturing processes within theindustry will be presented, along with descriptions of the actual products andinformation on the state of the industry. Although certain products coveredunder these SIC codes may not be specifically mentioned, the economic,pollutant output, and enforcement and compliance data in this notebookcovers all establishments producing aerospace products.
SIC codes were established by the Office of Management and Budget (OMB)to track the flow of goods and services within the economy. OMB is in theprocess of changing the SIC code system to a system based on similarproduction processes called the North American Industrial ClassificationSystem (NAICS). In the NAICS, the SIC codes for the aerospace industrycorrespond to the following NAICS codes:

Aerospace Industry Introduction, Background, and Scope
Sector Notebook Project November 19984
SIC Industry Sector NAICS
3721 Aircraft 336411
3724 Aircraft Engines 336412
3728 Aircraft Parts 336413
3761 Guided Missiles and Space Vehicles 336414
3764 Space Vehicle Propulsion Units 336415
3769 Guided Missile and Space Vehicle Parts 336419
II.B. Characterization of the Aerospace Industry
There are many different aerospace products classified under the six aerospaceSIC codes. The products produced, geographical distribution, and economictrends of the aerospace industry are discussed below. Figure 1 represents thegeneral structure of the aerospace industry. The aerospace industryoperations are often classified as either military or commercial and as eitheroriginal equipment manufacturers (OEM) or rework. Most aerospacefacilities specialize in either military or commercial and either rework orOEM. OEM facilities might do both military and commercial work, andlikewise for rework facilities. Some facilities might even work in all areas ofthe industry, as indicated by the dotted circle in Figure 1.

Aerospace Industry Introduction, Background, and Scope
Sector Notebook Project November 19985
Figure 1: Structure of the Aerospace Industry
Source: NESHAP BID, USEPA/OAQPS, May 1994.
II.B.1. Product Characterization
The aerospace industry consists of manufacturers of aircraft, aircraft engines,aircraft parts, guided missiles and space vehicles, and guided missile and spacevehicle propulsion units and parts. Table 1 lists the products included inaircraft, aircraft engines, and space vehicle and missile categories. One sourceof manufacturer and model information is The Aerospace Sourcebook,published by Aviation Week & Space Technology.

Aerospace Industry Introduction, Background, and Scope
Sector Notebook Project November 19986
Table 1: Products Included in the Aerospace IndustryCategory Products
Military Fixed-Wing Aircraft AttackBombersCargo/Transport/RefuelingEarly WarningElectronic WarfareFightersObservationPatrol ASWReconnaissanceResearch/Test BedTrainingUtility
Commercial Fixed-Wing Aircraft Narrow Body TurbofansWide Body TurbofansTurboprops
Rotary-Wing Aircraft NavalScout/AttackTiltrotorTrainingTransportUtility
Business & General Aviation Aircraft TurbofanTurbopropReciprocating Engine-Powered
Gas Turbine Engines
Unmanned Aerial Vehicles andDrones
Space/Launch Vehicles Manned SystemsUnmanned Systems
Missiles Air-to-AirAir-to-SurfaceAnti-ArmorAnti-BallisticAnti-ShipAnti-SubmarineSurface-to-AirSurface-to-Surface
Source: Aerospace Source Book, Aviation Week & Space Technology, 1/12/98.
These manufacturing facilities are classified under SIC codes 372 and 376 aslisted above. In order to discuss the production of these parts in a sequentialmanner, Sections II and III of this profile are divided into four categories:aircraft parts, aircraft assembly, aircraft rework and repair, and space vehiclesand guided missiles.
The diverse nature of parts needed to produce these products requires the

Aerospace Industry Introduction, Background, and Scope
Sector Notebook Project November 19987
support of many other major U.S. industries. Many of the parts utilized byaerospace manufacturers are made by other industry sectors such as theplastics and rubber industry, the fabricated metal industry, the metal castingindustry, the glass industry, the textile industry, and the electronic componentsindustry. Manufacturing and assembling of complete units in the aerospaceindustry typically involves prime contractors and several tiers ofsubcontractors, as follows:
&Prime Contractors- Design (develop) and assemble or manufacture complete units.
&First Tier Subcontractors- Do major assembly and/or manufactureof sections of air/space craft withoutdesigning or assembling complete units.
&Second Tier Subcontractors- Make various subassemblies and sections.
&Third Tier Subcontractors- Produce machined components and sub-assemblies.
&Fourth Tier Subcontractors- Specialize in the production of particularcomponents and in specific processes.
Typically, those facilities designated as “prime contractors” are included inSIC codes 3721, 3724, 3761 and 3764. Both first and second tiersubcontractors correspond to SIC codes 3728 and 3769. Third and fourth tiersubcontractors may be included in a variety of industry SIC codes(EPA/OAQPS, 1994).
Figure 2 illustrates the distribution of manufacturing facilities and value ofshipments within the aerospace industry. These figures show that while theaircraft parts sector of the aerospace industry is by far the largest in terms ofnumber of establishments, the finished aircraft sector has the largest value ofshipments.
The aircraft-related portion of the aerospace industry is much larger than thespace vehicle and missile portion. The aircraft portion comprises 93 percentof the establishments and 79 percent of the value of shipments. However,considering the small percentage of facilities engaged in guided missile andspace vehicle manufacturing (2 percent), the value of shipments is relativelyhigh (15 percent). In general, facilities which are responsible for assemblingthe final aerospace products are few and their production rates are low, butthe value of each of their products greatly surpasses that of the supportingindustries.

Aerospace Industry Introduction, Background, and Scope
Sector Notebook Project November 19988
Figure 2: Number of Establishments and Value of Shipments for theAerospace Industry
Source: 1992 Census of Manufacturers, USDOC, 1995.
Aircraft Engines and Engine Parts and Aircraft Parts and Equipment
The aircraft engines, engine parts, and aircraft parts industry is classified underSIC 3724 and 3728. Facilities producing these parts employ processes similarto many other metal casting, fabricating, and finishing facilities, as well asprocesses from a wide range of other industries. Typical productsmanufactured by these facilities include: engines, exhaust systems, motors,brakes, landing gear, wing assemblies, propellers, and many other relatedproducts. The primary customers for these industries are the establishmentsinvolved in the assembly of aircraft, classified under SIC 3721.
Aircraft Assembly
The aircraft industry is made up of establishments primarily engaged inmanufacturing or assembling complete aircraft and is classified under SIC3721. This industry also includes establishments owned by aircraftmanufacturers and primarily engaged in research and development on aircraft,whether from enterprise funds or on a contract or fee basis (Census, 1995).There are many different types of aircraft included in this industry, fromairplanes and helicopters to blimps and balloons. However, this profilefocuses primarily on the production of airplanes since they represent thelargest portion of the industry. Typical products include fixed wing aircraft,helicopters, gliders, balloons, and research and development on aircraft.
The major customers of the aircraft industry are commercial airlines and

Aerospace Industry Introduction, Background, and Scope
Sector Notebook Project November 19989
(millions of dollars) (number of establishments)
Military Aircraft
Civilian Aircraft
Modification, Conversion, and Overhaul
Other Aeronautical Services
$21.8
$34.4$2.6
$3.9
2136
36
11
Figure 3: Value of Shipments and Number ofEstablishments for the Aircraft Industry
transport companies and the military. Figure 3 shows the distribution withinthe industry of value of shipments and number of establishments. Civilianaircraft represents the largest percentages in value of shipments and numberof establishments. Approximately one-third of the establishments in thisindustry are involved in the repair and rework of aircraft. These facilities willbe discussed in Section III.
Source: 1992 Census of Manufacturers, USDOC, 1995.
Guided Missiles and Space Vehicles and Associated Parts
The guided missiles and space vehicles industry includes establishmentsprimarily engaged in manufacturing and research and development on guidedmissiles and space vehicles, propulsion units, and parts. Typical productscovered under SIC 3761, 3764, and 3769 include guided and ballistic missiles,space and military rockets, space vehicles, propulsion units and engines formissiles and space vehicles, airframe assemblies, and research anddevelopment on these products. The primary customer for this industry is themilitary, however space vehicles are also used by commercial entities forreleasing communications satellites.
Figure 4 illustrates the specialization within the guided missile and spacevehicle industry. The Census of Manufacturers identifies only 31 facilities inthis sector. Value of shipment data is not available for facilities providingR&D and other services to protect individual facility confidentiality. Only six

Aerospace Industry Introduction, Background, and Scope
Sector Notebook Project November 199810
Figure 4: Value of Shipments and Number of Establishmentsfor the Space Vehicles and Guided Missiles Industry
facilities, or less than a quarter of the facilities in this industry, are producingcomplete space vehicles. The value of shipments for these facilities, however,comprised more than three-quarters of the total value of shipments for theindustry.
Source: 1992 Census of Manufacturers, USDOC, 1995.

Aerospace Industry Introduction, Background, and Scope
Sector Notebook Project November 199811
61 429
78 34
25
126
4
24 34
64
479
34
23
14
4
138
106
21
442
16
2
811
215
28
3
9
13
1
46
18
12
148
22
3
9
3
50 +15 - 492 - 140 - 1
Figure 5: Geographic Distribution of Aerospace Manufacturing Facilities
II.B.2. Industry Size and Geographic Distribution
Figure 5 shows the U.S. distribution of aerospace facilities. Generally, thegeographic distribution of aerospace facilities is determined by the location ofindustrialized areas of the country. As with many manufacturing industries,the ease of transportation of materials, products, and skilled workers influencefacility location.
Source: 1992 Census of Manufacturers, USDOC, 1995.
Table 2 lists the facility size distribution within the aerospace sectors. Aspreviously mentioned, the aircraft and aircraft parts industry (1,745 facilities)is more than ten times larger than the space vehicles, guided missiles, andparts industry (140 facilities). Aircraft and aircraft part manufacturinggenerally employs less people per facility than space vehicle and guided missilemanufacturing. However, the number of employees in the aircraft industriesstill overshadows that of the missile and space vehicle industries, 645.9thousand and 149.6 thousand respectively.

Aerospace Industry Introduction, Background, and Scope
Sector Notebook Project November 199812
Table 2: Facility Size Distribution for the Aerospace Industry
Employeesper Facility
Aircraft and AircraftEngines and Parts(SIC 372)
Aircraft ( SIC 3721) Aircraft Engines andEngine Parts (SIC 3724)
Aircraft Parts andEquipment (SIC 3728)
Number ofFacilities
Percentage ofFacilities
Number ofFacilities
Percentageof Facilities
Number ofFacilities
Percentage ofFacilities
Number ofFacilities
Percentage ofFacilities
1-9 652 37% 60 33% 112 26% 480 43%
10-49 543 31% 42 23% 130 29% 371 33%
50-249 340 19% 29 16% 129 29% 182 16%
250-2499 173 10% 32 18% 63 14% 78 7%
2500 + 37 2% 19 10% 8 2% 10 1%
Total 1,745 100% 182 100% 442 100% 1,121 100%
Employeesper Facility
Space Vehicles, GuidedMissiles, and Parts (SIC 376)
Space Vehicles andGuided Missiles (SIC 3761)
Space Propulsion Unitsand Parts (SIC 3764)
Space Vehicle and GuidedMissiles Parts (SIC 3769)
Number ofFacilities
Percentage ofFacilities
Number ofFacilities
Percentageof Facilities
Number ofFacilities
Percentage ofFacilities
Number ofFacilities
Percentage ofFacilities
1-9 26 19% 4 10% 6 14% 16 27%
10-49 27 19% 5 13% 8 19% 14 23%
50-249 31 22% 5 13% 8 19% 18 30%
250-2499 37 26% 12 32% 15 36% 10 17%
2500 + 19 14% 12 32% 5 12% 2 3%
Total 140 100% 38 100% 42 100% 60 100%
Source: 1992 Census of Manufacturers, Industry Series: Aerospace Equipment, Including Parts, US Department of Commerce, Bureau of theCensus, 1995.Note: 1992 Census of Manufacturers data are the most recent available. Changes in the number of facilities, location, and employment figuressince 1992 are not reflected in these data.

Aerospace Industry Introduction, Background, and Scope
Sector Notebook Project November 199813
Table 3 further divides the geographic distribution of aerospace facilities. Thetop states in which the aerospace industries are concentrated are given alongwith their respective number of establishments.
Table 3: States with the Largest Number of Aerospace Manufacturing Facilities
Aircraft and Aircraft Parts (SIC 372)
Space Vehicles, Guided Missilesand Associated Parts (SIC 376)
Top States Establishments Top States Establishments
States in which industry isconcentrated, based on number ofestablishments
CaliforniaTexasWashingtonConnecticut
393140136126
CaliforniaArizonaTexasAlabama
49987
Percent of Total 45% 52%
Source: 1992 Census of Manufacturers, Industry Series: Aerospace Equipment, Including Parts, USDepartment of Commerce, Bureau of the Census, 1995.
Dun & Bradstreet’s Million Dollar Directory, compiles financial data on U.S.companies including those operating within the aerospace industry. Dun &Bradstreet ranks U.S. companies, whether they are a parent company,subsidiary or division, by sales volume within their assigned 4-digit SIC code.Table 4 lists the top 10 aerospace companies by sales.
Table 4: Top U.S. Aerospace Companies
Rank Company 1997 Sales(millions of
dollars)
SIC Code(s) Reported
1 General Electric Co.- Fairfield, CT 79,179 3724, 3511, 3612, 3641, 3632, 4833
2 Lockheed Martin Co.- Bethesda, MD 26,875 3721, 3761, 3663, 3764. 3812, 3728
3 United Technologies Corp.- Hartford, CT 23,273 3724, 3585, 3534, 3721, 3842, 3714
4 The Boeing Co.- Seattle, WA 22,681 3721, 3663, 3761, 3764, 3812, 3728
5 Hughes Electronics Corp.- Los Angeles, CA 14,772 3761, 3812, 3714, 3651, 3663, 3699
6 Allied Signal Inc.- Morristown, NJ 13,971 3724, 3812, 3728, 3761, 3714, 2824,2821
7 McDonnell Douglas Corp*-Saint Louis, MO 13,834 3721, 3761, 3764, 3812, 6159
8 Textron Inc.- Providence, RI 9,274 3721, 3714, 3452, 3711, 6141, 6159
9 Northrop Grumman Corp.- Los Angeles, CA 8,071 3721, 3761, 3728, 3812, 3825, 4581
10 The BF Goodrich Co.- Richfield, OH 2,238 3728, 3724, 7699, 2821, 2843
Source: Dunn & Bradstreet’s Million Dollar Directory, 1997.Note: Not all sales can be attributed to the companies’ aerospace operations.*McDonnell Douglas Corp. is now part of The Boeing Co.

Aerospace Industry Introduction, Background, and Scope
Sector Notebook Project November 199814
Readers should note that: (1) companies are assigned a 4-digit SIC code thatresembles their principal industry most closely; and (2) sales figures includetotal company sales, including subsidiaries and operations (possibly not relatedto aerospace). Additional sources of company specific financial informationinclude Standard & Poor’s Stock Report Service, Ward’s Business Directoryof U.S. Public and Private Companies, Moody’s Manuals, and companyannual reports.
The Bureau of the Census publishes concentration ratios, which measure thedegree of competition in a market. They compute the percentage of the valueof products shipped by establishments classified within an industry of the totalvalue of these products shipped from any establishment. Within the aerospaceindustry, the aircraft industry and the space vehicle and guided missile industryhad the greatest coverage ratios in 1992: 97 percent each. The aircraftengine, aircraft parts, propulsion units, and auxiliary space vehicle equipmentcoverage ratios were 95, 74, 86, and 40 percent respectively.
II.B.3. Economic Trends
Growth in the U.S. aerospace industry will be influenced by several keyfactors, including constrained defense spending by the U.S. and foreigngovernments, increased productivity and technological innovation, foreigncompetition, continuing expansion of the global economy, investment inresearch and development, offsets and outsourcing, and support by foreigngovernments for their industries.
Domestic Trends
In recent years there has been considerable consolidation of aerospacecompanies, especially those supplying the military. This has resulted in somereductions in labor force and closing of some aerospace facilities in the U.S.However, in constant 1992 dollars, the value of U.S. shipments in 1996 ofcomplete aircraft (all types, civil and military) rose by about six percent overthe value of shipments in 1995. The value of those shipments was expectedto rise further by about thirty percent in 1997 and about five percent in 1998.
MilitaryIn September 1996, Congress passed a DOD budget for FY 1997 that, for thefirst time in more than a decade, did not reduce spending from the previousyear. In addition, the legislation provided more funding for procurement ofaircraft and missiles than DOD had requested. Also, DOD reduced fundingfor R&D, which means that private companies will have to increase their shareof the total amount spent on R&D if the overall level of technologyinvestment and advancement is to be maintained.
Aerospace Industry Introduction, Background, and Scope
Sector Notebook Project November 199815
In the missiles sector, air-to-surface weapons should experience the mostgrowth relative to other types of missiles. Strong focus will be placed onimproving guidance capabilities, mainly through the use of the U.S. GlobalPositioning System (GPS) (USDOC, 1998).
CommercialOf all the aerospace sectors, the large civil transport aircraft sector is expectedto experience the fastest rate of growth from 1997 through 2001. With thesignificant increase in production rates undertaken by Boeing in 1996, thevalue of shipments in 1997 of large civil transports could be as much as sixtypercent higher than that of 1996, with another increase of about ten percentexpected in 1998 (USDOC, 1998).
Even as U.S. aerospace workers are being laid off because of consolidationin some companies, workers are being hired by other firms because ofincreasing orders. Sales of large transport aircraft are expected to come fromthe retirement and replacement of aircraft plus additional aircraft to allow forair traffic growth (USDOC, 1998).
The aircraft engines and parts sectors also should see production andshipments increase as suppliers respond to increased production rates by themanufacturers of commercial transports. The market for commercialtransport engines alone is expected to total from $150 billion to $175 billionbetween 1996 and 2005 (USDOC, 1998).
International Trends
The internationalization of aerospace programs is increasing, and the U.S.aerospace industry is dependent on exports for a third of its market. The U.S.aerospace industry is affected significantly by the economies of foreigncountries. The average annual increase in world GDP is expected to be threepercent from 1996 through 2005. The main barriers facing U.S.manufacturers are foreign government support for their aerospace industriesthrough direct and indirect subsidies, tariffs, and difficult and expensivelicensing procedures. Additional access could be guaranteed if efforts succeedto expand membership and broaden the disciplines of several aircraft-relatedtrade agreements (USDOC, 1998).
MilitaryThe situation for firms in the defense industry is mixed. While somegovernments, such as those of North America and Europe (with the largestdefense budgets), continue to seek ways to reduce their military expenditures,governments in South America (with relatively small defense budgets) aremaintaining or increasing their defense spending. However, current economiccrises in Asia may reduce exports to some countries. The pace ofconsolidation in Europe of aerospace and defense companies, which began

Aerospace Industry Introduction, Background, and Scope
Sector Notebook Project November 199816
later than in the U.S., is escalating just as the merger rate in the U.S. appearsto be slowing (USDOC, 1998).
CommercialOverall improvement in the global economy has buoyed the fortunes of theworld’s airlines. World air passenger traffic rose each year from 1994 to1996, and increased traffic by airlines all over the world produced a significantturnaround in the large transport aircraft market, the largest part of theaircraft industry. The civil aircraft sector exports 60 percent of its totalproduction and represents about 20 percent of the overall U.S. aerospaceindustry (USDOC, 1998).
Asian economic problems have not had serious widespread impacts on theaerospace industry to date. Companies such as Lockheed Martin and Boeingestimate that about five percent of their contracts for the next five years aretied to that region. It is possible that, considering the strength of the industryand the economy outside of Asia, other customers may step in and eliminatelower production rates (Smith, 1998).
Commercial space launch providers also are benefiting from the improvedeconomic situation. Consumer demand for direct-to-home television, voiceand data transmission, and other satellite services is increasing the demand forsatellites and therefore for space launch vehicles to place them in orbit(USDOC, 1998).
Aerospace Industry Industrial Process Description
Sector Notebook Project November 199817
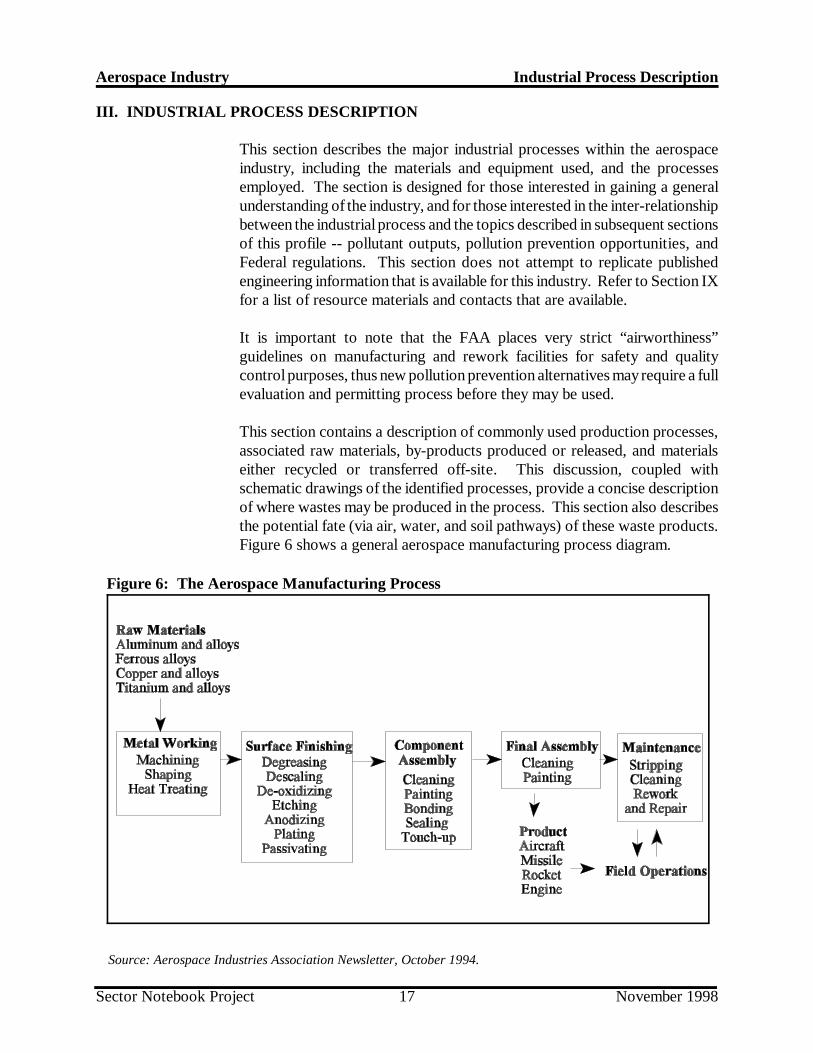
Figure 6: The Aerospace Manufacturing Process
III. INDUSTRIAL PROCESS DESCRIPTION
This section describes the major industrial processes within the aerospaceindustry, including the materials and equipment used, and the processesemployed. The section is designed for those interested in gaining a generalunderstanding of the industry, and for those interested in the inter-relationshipbetween the industrial process and the topics described in subsequent sectionsof this profile -- pollutant outputs, pollution prevention opportunities, andFederal regulations. This section does not attempt to replicate publishedengineering information that is available for this industry. Refer to Section IXfor a list of resource materials and contacts that are available.
It is important to note that the FAA places very strict “airworthiness”guidelines on manufacturing and rework facilities for safety and qualitycontrol purposes, thus new pollution prevention alternatives may require a fullevaluation and permitting process before they may be used.
This section contains a description of commonly used production processes,associated raw materials, by-products produced or released, and materialseither recycled or transferred off-site. This discussion, coupled withschematic drawings of the identified processes, provide a concise descriptionof where wastes may be produced in the process. This section also describesthe potential fate (via air, water, and soil pathways) of these waste products.Figure 6 shows a general aerospace manufacturing process diagram.
Source: Aerospace Industries Association Newsletter, October 1994.

Aerospace Industry Industrial Process Description
Sector Notebook Project November 199818
III.A. Aircraft Engines and Parts I ndustry
Manufacturing processes for aircraft engines and parts may consist of thefollowing basic operations: materials receiving, metal fabricating, machiningand mechanical processing, coating application, chemical milling, heattreating, cleaning, metal processing and finishing, coating removal(depainting), composite processing, and testing. Many facilities employ all ofthese processes in their operations, however, a facility may also employ onlya subset of these operations, as with a facility that produces a singlecomponent or a facility that provides a service such as painting(EPA/OAQPS, 1997).
In addition, there are a number of operations that may be used at aircraftengine and parts facilities but are not typical and are performed in conjunctionwith a variety of industries, such as foundry operations and manufacturing ofelectronic components. For more information on foundry operations, see theProfile of the Metal Casting Industry, EPA, 1997. For more information onelectronics and computers, see the Profile of the Electronics and ComputerIndustry, EPA, 1995.
III.A.1. Materials
There are many different materials involved in the production of engines andparts. The most common materials are alloys of aluminum, which are usedprimarily for aircraft structural components and exterior skin sections. Othermaterials are titanium, stainless steel, magnesium, and non-metallics such asplastics, fabrics, and composite materials. Typical forms of materials arehoneycomb, wire mesh, plate, sheet stock, bar cast, and forged materials.
Metallic Alloys
Aluminum is used as a primary structural material in the aerospace industrybecause of its light weight, and because its alloys can equal the strength ofsteel. The ability to resist atmospheric corrosion also favors the use ofaluminum. The type of alloy metal used depends on the desired characteristicsof the finished product such as strength, corrosion resistance, machinability,ductility, or weldability (Horne, 1986).
High strength alloys typically contain copper, magnesium, silicon, and zinc astheir alloying elements. Other alloying agents that may be used are: lithiumfor lightness; nickel for strength and ductility; chromium for tensile strengthand elastic limit; molybdenum for strength and toughness; vanadium for tensilestrength, ductility, and elastic limit; silicon as a deoxidizer; and powdermetallurgy alloys for strength, toughness, and corrosion resistance (Horne,1986).

Aerospace Industry Industrial Process Description
Sector Notebook Project November 199819
The development of the gas turbine and the evolution of engines requiredmaterials with great resistance to temperature, stress, and oxidation. Nickel-based alloys have a high resistance to oxidation and are used for compressorblades and guide vanes, discs, turbine blades, shafts, casings, combustionchambers, and exhaust systems. Titanium alloys have excellent toughness,fatigue strength, corrosion resistance, temperature resistance, and a lowerdensity than steel. Titanium alloys are frequently used to make hot-endturbine components and turbine rotor blades (Horne, 1986).
Non-Metallic Materials
Plastics, carbon and glass fibers, and synthetic resins and polymers are all usedin aerospace manufacturing. There are two types of plastics used,thermoplastics and thermosetting materials. Thermoplastic materials aresoftened by heating and will harden on cooling and can be extruded (materialis pressure forced through a shaped hole), injection molded (soft material isforced into a mold through a screw injector and pressure), or thermoformed(material is cast in a mold with heat and pressure). Thermosetting plastics arehardened by heating and form rigid three dimensional structures throughchemical reactions. They are typically compression molded (Horne, 1986).For more information on non-metallic materials, refer to the Profile of theRubber and Plastic Industry, EPA, 1995.
Carbon and glass fibre strands are used to reinforce plastics for strength andstiffness while remaining lightweight. Synthetic resins and polymers are usedas adhesives which produce smooth bonds and a stiff structure whichpropagates cracks more slowly than in a riveted structure (Horne, 1986).
III.A.2. Metal Shaping
Another major process in the manufacturing of aircraft and other aerospaceequipment is metal shaping. Shaping operations take raw materials and altertheir form to make the intermediate and final product shapes. There are twophases of shaping operations: primary and secondary. Primary shapingconsists of forming the metal from its raw form into a sheet, bar, plate, orsome other preliminary form. Secondary shaping consists of taking thepreliminary form and further altering its shape to an intermediate or finalversion of the product. Examples of primary and secondary shaping are listedin Table 5 below. Brief descriptions of the most common operations followthe table.

Aerospace Industry Industrial Process Description
Sector Notebook Project November 199820
Table 5: Primary and Secondary Shaping Operations
Primary Shaping Operations Secondary Shaping Operations
Abrasive Jet MachiningCastingDrawingElectrochemical MachiningElectron Beam MachiningExtrudingForgingImpact DeformationLASER Beam MachiningPlasma Arc MachiningPressure DeformationSand BlastingUltrasonic Machining
StampingTurningDrillingCutting and ShapingMillingReamingThreadingBroachingGrindingPolishingPlaningDeburring
Source: Pollution Prevention Options in Metal Fabricated Products, USEPA,January 1992.
Primary Shaping Operations
The most common primary shaping operations include casting, forging,extruding, rolling, cutting, coining, shearing, drawing, and spinning. Each ofthese operations is briefly described below.
Metal casting involves the introduction of molten metal into a mold or diehaving the external shape of the desired cast part. The mold or die is removedwhen the metal has cooled and solidified. Metal casting operations can beclassified as either foundries or diecasters. The primary difference is thatfoundries pour molten metal relying on gravity to fill the mold and die castersuse machines to inject molten metal under pressure into the mold. Foundrymolds are typically used only once for each part. They are often made of sandgrains bound together with chemicals or clay. Die casting molds are oftenreused thousands of times and are part of a larger diecasting machine that canachieve very high production rates. Foundries typically produce largerairplane parts such as engine blocks, turbine and compressor parts, and othermechanical parts from both ferrous and non-ferrous metals. Die casterstypically produce smaller intricate parts from non-ferrous metals(EPA/OECA, 1995). For a more detailed discussion of metal castingoperations see the Profile of the Metal Casting Industry, USEPA, 1997.
Once the molten metal is formed into a workable shape, shearing and formingoperations are usually performed. Shearing operations cut materials into adesired shape and size, while forming operations bend or form materials into

Aerospace Industry Industrial Process Description
Sector Notebook Project November 199821
specified shapes. Shearing operations include punching, piercing, blanking,cutoff, parting, and trimming. These operations produce holes, openings,blanks, or parts. Forming operations shape parts by forcing them into aspecific configuration, and include bending, extruding, drawing, spinning,coining, and forging. Bending is the simplest forming operation; the part issimply bent to a specific angle or shape and normally produce flat-shapes(EPA/OECA, 1995).
Extruding is the process of forming a specific shape from a solid blank byforcing the blank through a die of the desired shape. Complicated andintricate cross-sectional shapes can be produced by extruding. Rolling is atype of extruding that passes the material through a set or series of rollers thatbend and form the part into the desired shape. Coining, another type ofextruding, alters the form of the part by changing its thickness, producing athree-dimensional relief on one or both sides of the part, as found on coins(EPA/OECA, 1995).
Drawing and spinning form sheet stock into three-dimensional shapes.Drawing uses a punch to force the sheet stock into a die, where the desiredpart shape is formed in the space between the punch and die. In spinning,pressure is applied to the sheet while it spins on a rotating form so that thesheet acquires the shape of the form (EPA/OECA, 1995).
Forging operations produce a specific part shape, much like casting. Theforging process is used in the aerospace industry when manufacturing partssuch as pistons, connecting rods, and the aluminum and steel portion ofwheels. However, rather than using molten materials, forging uses externallyapplied pressure that either strikes or squeezes a heated blank into a die of therequired shape. Forging operations use machines that apply repeated hammerblows to a red-hot blank to force the material to conform to the shape of thedie opening. Squeezing acts in much the same way, except it uses pressureto squeeze rather than strike the blank. Forging typically uses a series of diecavities to change the shape of the blank in increments. Depending on theshape, a forging die can have from one to over a dozen individual cavities(EPA/OECA, 1995).
Secondary Shaping Operations
Shearing (or cutting) operations include punching, piercing, blanking, cutoff,parting, shearing, and trimming. Basically, these are operations that produceholes or openings, or that produce blanks or parts. The most common hole-making operation is punching. Piercing is similar to punching, but producesa raised-edge hole rather than a cut hole. Cutoff, parting, and shearing aresimilar operations with different applications: parting produces both a part andscrap pieces; cutoff and shearing produce parts with no scrap; shearing is usedwhere the cut edge is straight; and cutoff produces an edge shape rather than

Aerospace Industry Industrial Process Description
Sector Notebook Project November 199822
a straight edge. Trimming is performed to shape or remove excess materialfrom the edges of parts (EPA/OECA, 1995).
Turning, drilling, and reaming processes typically use a lathe, which holds andspins the workpiece against the edge of a cutting tool. Drilling machines aredesigned for making holes and for reaming, or enlarging or finishing existingholes. Milling machines use multiple edge cutters to cut unusual or irregularshapes into the workpiece (EPA/ORD, 1990).
Broaching is a process whereby internal surfaces such as holes of circular,square or irregular shapes, or external surfaces like keyways are finished. Amany-toothed cutting tool called a broach is used in this process. Thebroach’s teeth are graded in size in such a way that each one cuts a small chipfrom the workpiece as the tool is pushed or pulled either past the workpiecesurface, or through a leader hole. Broaching of round holes often givesgreater accuracy and better finish than reaming (EPA/ORD, 1990).
Deburring involves removing metal shavings and burrs clinging to the cutedges of parts after machining has been completed. Deburring is typicallydone by one of two processes. Small parts can be deburred in a tumblerwhere the burrs are smoothed off the part by the constant friction with thetumbling media. This process, however, is not appropriate for long parts.Instead, long parts are scrubbed with an abrasive pad by hand or buffed witha power tool. The buffing operation can be performed either by hand or in anautomatic operation (EPA/OAQPS, 1994).
Parts may also be honed and buffed to smooth their surfaces; spray-washedwith an alkaline cleaner; and blown dry using compressed air. A protectivecoating of oil may be applied to parts that are stored on-site or shipped off-site to a heat-treating facility (EPA/NRMRL, 1995).
The metal working process creates much heat and friction. If the heat andfriction are not reduced, the tools used in the process are quickly damagedand/or destroyed. Also, the quality of the products made is diminishedbecause of inefficient tools and damage to the product while it is beingmanufactured. Coolants reduce friction at the tool/substrate interface andtransfer heat away from the tools and the material being processed, reducingthe time to process the metal, increasing the quality of the workmanship, andincreasing tool life. The ability to transfer the heat away from the metalworking process is why metal working fluids are often called coolants (OhioEPA, 1993).
Oils are natural lubricants and provide this quality to coolants that arepetroleum-based. Other coolants’ ability to reduce friction comes fromlubricating additives. During the metal working process, heat diffuses into thecoolant. The heated coolant flows off the work area into a collection

Aerospace Industry Industrial Process Description
Sector Notebook Project November 199823
container or sump, where it cools off and then enters the cycle again. Waterhas excellent cooling characteristics and many coolants contain water or areprimarily water. Soluble oils and semi-synthetic oils have both water and oilcomponents. Coolants containing both oil and water require surfactants toform and maintain emulsions, a mixture of the oil and water, so that bothproperties can work together (Ohio EPA, 1993).
Heat Treating
Heat treating is the modification of the material’s or part’s metallurgicalproperties through the application of controlled heating and cooling cycles.For example, aluminum outer skin panels undergo a low temperature ovenbake after forming to provide greater stress tolerance. Heat treating can beperformed either before or after machining and includes carburizing(impregnating the surface with carbon), annealing (softening), stress relief,tempering, air furnace treating, and salt pot treating. Chemicals, such asmethanol, are often used in heat treating ovens to maintain a chemicallyreducing atmosphere in order to obtain the proper metallurgical properties onthe surface of the part being treated. After heat treating, the parts can eitherbe cooled in ambient air or placed in a liquid quenching bath. The quenchbath is typically a glycol solution, a chromate solution, or an oil(EPA/OAQPS, 1994).
Heat-treated parts can also be machined, honed, and deburred after they arereturned to the plant. After machining, the parts are typically sprayed with aprotective oil coating that controls corrosion until they are further processed(EPA/NRMRL, 1995).
III.A.3. Metal Finishing
Metal finishing and electroplating activities are performed on a number ofmetals and serve a variety of purposes; the primary purpose being protectionagainst corrosion. Without metal finishing, products made from metals wouldlast only a fraction of their unfinished life-span. Metal finishing alters thesurface of metal products to enhance properties such as corrosion resistance,wear resistance, electrical conductivity, electrical resistance, reflectivity,appearance, torque tolerance, solderability, tarnish resistance, chemicalresistance, ability to bond to rubber (vulcanizing), and a number of otherspecial properties (e.g. electropolishing sterilizes stainless steel) (EPA/ORD,1994).
These plating processes involve immersing the article to be coated or platedinto a series of baths consisting of acids, bases, salts, etc. A wide variety ofmaterials, processes, and products are used to clean, etch, and plate metallicand non-metallic surfaces. Typically, metal parts or work pieces undergo oneor more physical, chemical, and electrochemical processes. Physical processes
Aerospace Industry Industrial Process Description
Sector Notebook Project November 199824
include buffing, grinding, polishing, and blasting. Chemical processes includedegreasing, cleaning, pickling, milling, etching, polishing, and electrolessplating. Electrochemical processes include plating, electropolishing, andanodizing (EPA/ORD, 1994).
Cleaning/Preparing
CleaningAerospace components are cleaned frequently during manufacturing toremove contaminants such as dirt, grease, and oil, and to prepare thecomponents for the next operation. Cleaning is important in order to ensurethe successful application of later surface treatments. There are three maintypes of cleaning: aqueous, organic solvent, and abrasive. Aqueous cleaningcovers a wide variety of cleaning methods such as detergents, acids, andalkaline compounds to displace soil rather than dissolving it as in organicsolvent cleaning. Aqueous cleaners are either sprayed or used in cleaningbaths, ultrasonic baths, and in steam cleaning. Three types of aqueouscleaning favored by the aerospace industry are:
&emulsification cleaning- emulsification cleaning uses water-immisciblesolvents, surfactants, and emulsifiers. &acid cleaning- sulfuric acid or hydrochloric acid is used to removescale from metal; acid cleaning is sometimes known as pickling baths.&alkaline cleaning- alkaline cleaning solutions (usually hot) containbuilders (sodium salts of phosphate, carbonate, and hydroxide) andsurfactants (detergents and soap) (CARB, 1997).
Abrasive cleaning is mechanical cleaning using abrasives such as rough fabricscrubbing pads, sandpaper, tumbling barrels, buffing wheels, and blastingequipment. Abrasives may be added to acid or alkaline cleaning solutions toimprove cleaning action (CARB, 1997).
MaskingMaskants are coatings that are applied to a part to protect the surface fromchemical milling and surface treatment processes such as anodizing, plating,and bonding. Maskants are typically rubber- or polymeric-based substancesapplied to an entire part or subassembly by brushing, dipping, spraying, orflow coating. Two major types of maskants are used: solvent-based andwaterborne. After an adequate thickness of maskant has been applied to thepart, the maskant is cured in a bake oven. The maskant is then cut followinga specific pattern and manually stripped away from selected areas of the partwhere metal is to be removed. The maskant remaining on the part protectsthose areas from the etching solution.
Chemical MillingChemical milling is used to reduce the thickness of selected areas of metal

Aerospace Industry Industrial Process Description
Sector Notebook Project November 199825
parts in order to reduce weight. The process is typically used when the sizeor shape of parts precludes mechanical milling or when chemical milling isadvantageous due to shorter processing time or its batch capability. Chemicalmilling is accomplished by submerging the component in an appropriateetchant. Commonly used etchants are sodium hydroxide for aluminum, nitricacid and hydrofluoric acid for titanium, dilute sulfuric acid for magnesium, andaqua regia (a mixture of nitric and hydrochloric acids) for stainless steel. Thedepth of the cut is closely controlled by the length of time the component isin the etchant and the concentration of the etchant. When the milling has beencompleted, the part is removed from the etchant and rinsed with water. Somemetals may develop a smutty discoloration during the chemical millingprocess. A brightening solution, such as dilute nitric acid, is typically used asa final step in the process to remove the discoloration. After desmutting, thepart either goes back to chemical milling for further metal removal or to thestripping area to have the maskant removed. The maskant may be softenedin a solvent solution and then stripped off by hand (EPA/OAQPS, 1994).
AnodizingAnodizing uses the piece to be coated, generally with an aluminum surface,as an anode in an electrolytic cell. Anodizing provides aluminum parts witha hard abrasion- and corrosion-resistant film. This coating is porous, allowingit to be dyed or to absorb lubricants. This method is used both in decorativeapplication and in engineering applications such as aircraft landing gear struts.Anodizing is usually performed using either sulfuric, boric-sulfuric, or chromicacid often followed by a hot water bath, though nickel acetate or sodiumpotassium dichromate seal may also be used (EPA/OECA, 1995).
PassivationPassivation is a chemical process in which parts are immersed in a solutioncontaining a strong oxidizing agent. This forms a thin oxide layer on the partsurface, providing corrosion protection and increasing adhesion of subsequentcoatings. It is often used before maskant application in the chemical millingprocess (EPA/OAQPS, 1994).
PicklingPickling is a process of chemical abrasion/etching which prepares surfaces forgood paint adhesion. The pickling process is used mainly for preparing pipesystems and small parts for paint. However, the process and qualities willvary by facility. The process involves a system of dip tanks. In pickling steelparts, The first tank is used to remove any oil, grease, flux, and othercontaminants on the surface being pickled. The part is then immersed into a5-8% caustic soda and water mixture (pH 8-13) maintained at temperaturesof between 180(-200(F. Next, the steel is dipped into a 6-10% acid/watermixture maintained between 140(-160(F (EPA/OECA, 1997). Most carbonsteel is pickled with sulfuric or hydrochloric acid, while stainless steel ispickled with hydrochloric, nitric, and hydrofluoric acids (EPA/OECA, 1995).
Aerospace Industry Industrial Process Description
Sector Notebook Project November 199826
The fourth tank contains an acid rinse tank that is maintained at a pH of 5-7.Finally, the steel part is immersed in a rust preventative 5% phosphoricmixture. The part is then allowed to fully dry prior to paint application(EPA/OECA, 1997).
PolishingPolishing is used at some facilities to clean and finish the outer skin of theaircraft. The polish is a lightly abrasive metal cleaner that is buffed on themetal surface, then wiped off. The polish gives a mirror-like surface finish andis usually applied instead of paint. Polishing can also be used on other metalparts as a cleaning step.
Conversion CoatingsConversion coating is the process of changing a metal’s surface characteristicsby applying a reactive chemical to the metal’s surface or by reacting the metalin a chemical bath. The desired result is improved coating adhesion, increasedcorrosion resistance, or both (EPA/OAQPS, 1994).
Aluminum surfaces are treated with various conversion coatings dependingupon the anticipated environmental conditions or performance requirementssuch as corrosion, electrochemical insulation, and abrasion. Conversioncoatings are also used to enhance bond and paint adhesion. Typicaltreatments include chromate phosphates, chromate oxides, anodizing, andnon-chromate formulations (CARB, 1997).
Cadmium surfaces require either a phosphate or a chromate conversioncoating prior to painting. The phosphate conversion is designed to be painted;the chromate conversion is designed to add corrosion resistance to thecadmium and it may also be painted (CARB, 1997).
Magnesium must be treated with a conversion coating or anodized beforepainting to prevent corrosion and to prevent environmental damage byabrasion. Magnesium coatings utilize sodium dichromate solutions (CARB,1997).
Titanium must be treated with a conversion coating or anodized to protect itfrom corrosion and to improve adhesion bonding strength. Emersion bathsfor applying a conversion coating to titanium typically contain sodiumphosphate, potassium fluoride, and hydrofluoric acid (CARB, 1997).
Coating/Painting
A coating is a material that is applied to the surface of a part to form adecorative or functional solid film. Coatings are used for corrosion resistance,aircraft identification and improved visibility, and friction reduction. The mostcommon coatings are nonspecialized primers and topcoats, however there are

Aerospace Industry Industrial Process Description
Sector Notebook Project November 199827
also many specialized primers that provide characteristics such as fireresistance, flexibility, substrate compatibility, antireflection, sealing, adhesion,and enhanced corrosion protection (EPA/OAQPS, 1997).
Coatings are applied by spraying, brushing, rolling, flow coating, and dippingusing a variety of application equipment including conventional air spray, highvolume low pressure (HVLP) spray, and electrostatic spray. Many of theconventional methods such as rolling, flow coating, dip coating, and brushingare limited to the size and configuration of the part being painted (CARB,1997).
Painting involves the application of predominantly organic coatings to a workpiece for protective and/or decorative purposes. It is applied in various forms,including dry powder, solvent-diluted formulations, and water-borneformulations. Various methods of application are used, the most commonbeing spray painting and electrodeposition. Electrodeposition is the processof coating a work piece by either making it anodic or cathodic in a bath thatis generally an aqueous emulsion of the coating material. When applying thepaint as a dry powder, some form of heating or baking is necessary to ensurethat the powder adheres to the metal. These processes may result in solventwaste (and associated still bottom wastes generated during solventdistillation), paint sludge wastes, paint-bearing wastewaters, and paint solventemissions (EPA/OECA, 1995).
Spray painting is a process by which paint is placed into a pressurized cup orpot and is atomized into a spray pattern when it is released from the vesseland forced through an orifice. Differences in spray-painting equipment arebased on how the equipment atomizes paint. The more highly atomized thepaint, the more likely transfer efficiency is to decrease. Transfer efficiency isthe amount of paint applied to the object being painted, divided by the amountof paint used. Highly atomized paint spray can more readily drift away fromthe painting surface due to forces such as air currents and gravity (Ohio EPA,1994). Cleaning solvent can only be sprayed through a gun for nonatomizedand atomized cleaning using specific equipment as specified in the NESHAP.
The viscosity of paint may need adjustment before it can be sprayed. This isaccomplished by reduction with organic solvents, or with water for certainwater-based coatings. Using solvents for reduction requires the purchase ofadditional materials and increases air emissions. An alternative method ofreducing the viscosity is to use heat. Benefits from the purchase of paintheaters include lower solvent usage, lower solvent emissions, more consistentviscosities, and faster curing rates (Ohio EPA, 1994).
The following types of spray application equipment may be used in theaerospace industry:

Aerospace Industry Industrial Process Description
Sector Notebook Project November 199828
&Conventional Spray&High-Volume/Low-Pressure (HVLP)&Airless&Air-Assisted&Electrostatics&Rotary Atomization&Spray Booths
Electroplating
The metals used in electroplating operations (both common and preciousmetal plating) include cadmium, lead, chromium, copper, nickel, zinc, gold,and silver. Cyanides are also used extensively in electroplating solutions andin some stripping and cleaning solutions (EPA/OECA, 1995).
Electroless plating is the chemical deposition of a metal coating onto a metalobject, by immersion of the object in an appropriate plating solution. Inelectroless nickel plating, the source of nickel is a salt, and a reducer is usedto hold the metal ion in the solution. Immersion plating produces a metaldeposit by chemical displacement. Immersion plating baths are usuallyformulations of metal salts, alkalies, and complexing agents (typically cyanideor ammonia) (EPA/OECA, 1995).
Occasionally, touch-up plating is done on an in-house plating line that consistsof six separate tanks for cleaning, rinsing, and plating. Following touch-upplating, the parts are typically cleaned in a cold solvent-cleaning tank(EPA/NRMRL, 1995).
Equipment/Line Cleaning
Spray guns and coating lines used to apply the various coatings used ataerospace facilities must be cleaned when switching from one coating toanother and when they are not going to be immediately reused. Spray gunscan be cleaned either manually or with enclosed spray gun cleaners. Manualcleaning involves disassembling the gun and placing the parts in a vatcontaining an appropriate cleaning solvent. The residual paint is brushed orwiped off the parts. After reassembling, the cleaning solvent may be sprayedthrough the gun for a final cleaning. Paint hoses/coating lines are cleaned bypassing the cleaning solvent through the lines until all coating residue isremoved. Enclosed spray gun cleaners are self-contained units that pump thecleaning solvent through the gun within a closed chamber. After the cleaningcycle is complete, the guns are removed from the chamber and typicallyundergo some manual cleaning to remove coating residue from areas notexposed to the cleaning solvent, such as the seals under the atomizing cap(EPA/OAQPS, 1997).

Aerospace Industry Industrial Process Description
Sector Notebook Project November 199829
III.A.4. Composites Processing
The aerospace industry is increasingly substituting composites for metals inaircraft and space vehicles due to the superior strength-to-weight ratio,corrosion resistance, and fatigue life of composites. Composites arecomprised of a resin matrix that bonds together layers of reinforcing material.The resultant structure has mechanical properties superior to each individualcomponent. The resin matrix is usually a polymeric material such as epoxy,polyester, nylon, or phenolic. The reinforcing material or fiber is usuallycarbon (graphite), fiberglass, or Kevlar. The fibers are oriented at specificangles within the matrix to achieve desired strength characteristics. Methodsof forming composites include: injection molding, compression molding, andhand lay-up (or wet lay-up). Hand lay-up can involve applying resin on pre-woven fibers or can involve stacking thin sheets of pre-impregnated (prepreg)fiber material. Steps in hand lay-up are typically: lay-up, debulking, curing,and tear-down (break-out).
Injection molding is the process of shaping a material by applying heat andutilizing the pressure created by injecting a resin into a closed mold.Compression molding is the process of filling a mold with molding compound,closing the mold, and applying heat and pressure until the material has cured.Lay-up is the process of assembling composite parts by positioning reinforcingmaterial in a mold and impregnating the material with resin. With hand lay-up, reinforcing material with resin or prepreg can be added to an open molduntil the design thickness and contours are achieved. Debulking is thesimultaneous application of low-level heat and pressure to compositematerials to force out excess resin, trapped air, vapor, and volatiles frombetween the layers of the composite, thus removing voids within thecomposite.
Curing is the process of changing the resin into a solid material so that thecomposite part holds its shape. This is accomplished by heating the lay-upassembly in order to initiate a polymerization reaction within the resin. Oncethe reaction is complete, the resin solidifies and bonds the layers of compositematerials together. The curing process is typically performed in an autoclave(a pressurized oven), with the composite lay-up enclosed in a bag so that avacuum can be applied. The vacuum removes air and volatilized componentsof the resin from within the composite structure which may otherwise betrapped and create voids. Key parameters for curing are time, pressure,vacuum, temperature, and heating and cooling rates.
Break-out is the removal of the composite materials from the molds or curingfixtures (includes the application of release agents prior to filling the mold).

Aerospace Industry Industrial Process Description
Sector Notebook Project November 199830
III.B. Aircraft Assembly
Aircraft assembly requires the coordination of thousands of parts comingtogether to form one large final product. The total assembly process of acomplete aircraft can be close to two years. The relatively small number offinished products does not allow for a great deal of automation in theassembly process. Considerable coordination is needed between materialsdelivery and the production schedule in order to achieve efficient assembly.
Assembly Equipment
Typical materials handling equipment includes conveyors, cranes, industrialvehicles (e.g., forklifts, flatbeds, carts, special lift vehicles, etc.), andcontainers (EPA/OECA, 1997). Assembly facilities may also use jigs to aidin lining up or joining pieces.
Assembly jigs are essential for the successful assembly or large aerospaceproducts. Their main function is to identify the precise location of fittings forattachment of one component to another. Assembly jigs should beconstructed in a manner which allows them to be removed upon completionof the work without breaking down the entire jig structure. They requirematerials which will not bend or distort over a period of time or duringassembly operations. They must also provide easy access to locations wheremanual joining operations are needed (Horne, 1986).
Pin jigs are used to assemble the curved sheets that form the outside of thefuselage’s curved surface. The pin jig is simply a series of vertical screw jacksthat support curved pieces during construction. A pin jig is set up specificallyfor the curved piece under construction. The jig heights are determined fromthe engineering drawings and plans (EPA/OECA, 1997).
Specially designed locating jigs are required for skins to which stiffeners areto be riveted, such as airplane wings. Stiffeners are first placed in the jigs andthen locked in the required position on the completed wings. Wing skins arethen placed on the jig and held to a contoured shape with metal bands in orderto make contact with the stringers. Holes are drilled through the skin andstringers by using templates to locate hole positions. When all of the holeshave been drilled, they are filled with clamping bolts and the metal bands arereleased. The skin is taken out of the jig and the clamping bolts hold the skinin the desired shape until it is riveted together (Horne, 1986).
Fuselage assembly operations may follow these steps:
&bond stringers to fuselage skin&fit formers to assembly jig&assemble skin, drill flanges, and fit riveting clamps

Aerospace Industry Industrial Process Description
Sector Notebook Project November 199831
&replace clamps with rivets and remove panel from the jig&assemble panels and formers on fuselage assembly jig (Horne, 1986).
Welding/Riveting
Fusion WeldingFusion welding is performed with a metal arc in the presence of an inert gaswhich prevents the oxidation of the metals to be welded. An alternating ordirect current, depending on the type and thickness of the metal, is typicallyapplied through an electrode. The ideal current and pulse duration is selectedaccording to the wire composition, shielding gas, welding position, and wiresize (Horne, 1986).
Resistance WeldingResistance welding requires: a primary electrical circuit from a transformer;a secondary circuit and electrodes to conduct the current to the desired spot;a mechanical system to hold the components and apply force; and controlequipment to measure duration and magnitude of the electrical current. Press-type machines have a moveable welding head and force is applied by airthrough hydraulic cylinders. Seam welding is performed by power-drivenroller electrodes instead of the pointed electrodes used for spot welding.Leak-proof and pressure-tight welds are formed by the seam welding process,where each weld overlaps the previous one (Horne, 1986).
Pre-pressure jig welding uses a jig to clamp the components together torelieve the electrodes from clamping stress. This ensures that the desiredelectrode pressure is available (Horne, 1986).
Electron Beam WeldingElectron beam welding is achieved by concentrating a beam of high velocityelectrons onto the surfaces to be joined. The electrons are produced andaccelerated by an electron beam gun which consists of a filament emitter, abias electrode, and a positively charged anode. The electrons are generatedby thermionic emission from a filament. Their attraction to an anode givesthem speed and direction, and a bias electrode cup surrounding the emitterelectrostatically shapes ejected electrons into a beam. An electromagnetic lenssystem reconverges the beam once its left the anode and focusses it on thework piece (Horne, 1986).
RivetingRiveted joints are usually in sheet metal parts where the rivets take a shearingload. Riveted joints may be in single, double, triple, or quadruple rows andeither chain or zigzag (Horne, 1986).
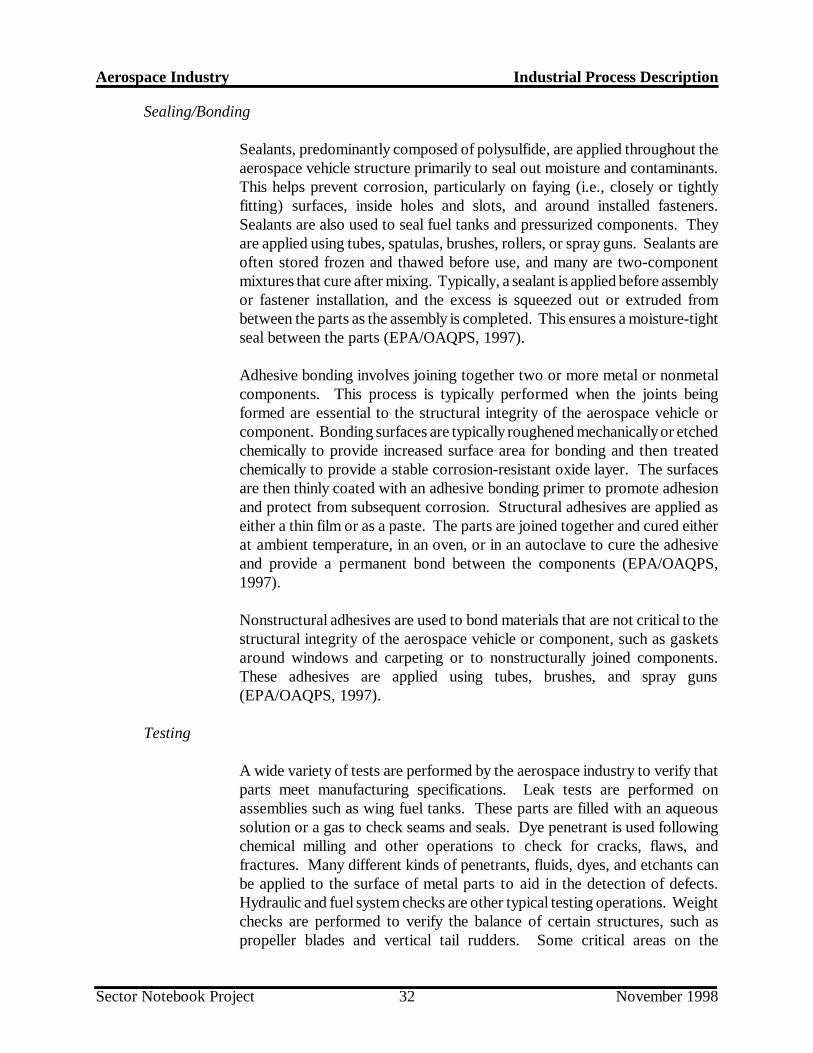
Aerospace Industry Industrial Process Description
Sector Notebook Project November 199832
Sealing/Bonding
Sealants, predominantly composed of polysulfide, are applied throughout theaerospace vehicle structure primarily to seal out moisture and contaminants.This helps prevent corrosion, particularly on faying (i.e., closely or tightlyfitting) surfaces, inside holes and slots, and around installed fasteners.Sealants are also used to seal fuel tanks and pressurized components. Theyare applied using tubes, spatulas, brushes, rollers, or spray guns. Sealants areoften stored frozen and thawed before use, and many are two-componentmixtures that cure after mixing. Typically, a sealant is applied before assemblyor fastener installation, and the excess is squeezed out or extruded frombetween the parts as the assembly is completed. This ensures a moisture-tightseal between the parts (EPA/OAQPS, 1997).
Adhesive bonding involves joining together two or more metal or nonmetalcomponents. This process is typically performed when the joints beingformed are essential to the structural integrity of the aerospace vehicle orcomponent. Bonding surfaces are typically roughened mechanically or etchedchemically to provide increased surface area for bonding and then treatedchemically to provide a stable corrosion-resistant oxide layer. The surfacesare then thinly coated with an adhesive bonding primer to promote adhesionand protect from subsequent corrosion. Structural adhesives are applied aseither a thin film or as a paste. The parts are joined together and cured eitherat ambient temperature, in an oven, or in an autoclave to cure the adhesiveand provide a permanent bond between the components (EPA/OAQPS,1997).
Nonstructural adhesives are used to bond materials that are not critical to thestructural integrity of the aerospace vehicle or component, such as gasketsaround windows and carpeting or to nonstructurally joined components.These adhesives are applied using tubes, brushes, and spray guns(EPA/OAQPS, 1997).
Testing
A wide variety of tests are performed by the aerospace industry to verify thatparts meet manufacturing specifications. Leak tests are performed onassemblies such as wing fuel tanks. These parts are filled with an aqueoussolution or a gas to check seams and seals. Dye penetrant is used followingchemical milling and other operations to check for cracks, flaws, andfractures. Many different kinds of penetrants, fluids, dyes, and etchants canbe applied to the surface of metal parts to aid in the detection of defects.Hydraulic and fuel system checks are other typical testing operations. Weightchecks are performed to verify the balance of certain structures, such aspropeller blades and vertical tail rudders. Some critical areas on the

Aerospace Industry Industrial Process Description
Sector Notebook Project November 199833
assembled components are checked for flaws, imperfections, and properalignment of parts by X-ray (EPA/OAQPS, 1994).
III.C. Repair/Rework Operations
Repair operations generally include all conversions, overhauls, maintenanceprograms, major damage repairs, and minor equipment repairs. Althoughspecific repair methods vary from job to job, many of the operations areidentical to new construction operations. Repair operations, however, aretypically on a smaller scale and are performed at a faster pace. Jobs can lastanywhere from one day to over a year. Repair jobs often have severe timeconstraints requiring work to be completed as quickly as possible in order toget the aircraft, missile, or space vehicle back in service. In many cases,piping, ventilation, electrical, and other machinery are prefabricated prior tothe major product’s arrival. Typical maintenance and repair operationsinclude:
&Cleaning and repainting the aircraft’s surfaces, superstructure, andinterior areas&Major rebuilding and installation of equipment such as turbines,generators, etc.&Systems overhauls, maintenance, and installation&System replacement and new installation of systems such asnavigational systems, combat systems, communication systems, etc.&Propeller and rudder repairs, modification, and alignment(EPA/OECA, 1997)
The depainting operation involves the removal of coatings from the outersurface of the aircraft. The two basic types are chemical depainting and blastdepainting. Methylene chloride is the most common chemical stripper solvent;however, the particular solvent used is highly dependent on the type ofcoating to be removed. Chemical depainting agents are applied to the aircraft,allowed to degrade the coating, and then scraped or washed off with thecoating residue. Blast depainting methods utilize a media such as plastic,wheat starch, carbon dioxide (dry ice), or high pressure water to removecoatings by physically abrading the coatings from the surface of the aircraft.Grit blasting and sand/glass blasting are also included in this category. Highintensity ultraviolet light stripping has been developed for use in conjunctionwith carbon dioxide methods and is under development at several facilities(EPA/OAQPS, 1994). However, FAA has strict guidelines for safety andquality control purposes which dictate the types of solvents and materials thatmay be used in aerospace operations. Thus, any alternative must go througha comprehensive study before it is approved for use. (See Section V- PollutionPrevention Opportunities)

Aerospace Industry Industrial Process Description
Sector Notebook Project November 199834
In addition, some larger facilities are capable of large repair and conversionprojects that could include: converting passenger planes to cargo planes,replacing segments of an aircraft that has been damaged, structuralreconfiguration and outfitting of combat systems, major remodeling ofinteriors or exteriors (EPA/OECA, 1997).
III.D. Space Vehicles and Guided Missiles
Many of the industrial processes involved in the production of space vehiclesand guided missiles are similar to those discussed above in the production ofaircraft parts and assembly. Because the number of establishments involvedin the production of space vehicles, guided missiles, and their associated partsis less than 10 percent of the total industry, no additional information onindustrial processes will be presented here. Also, due to the confidentialnature of some of these products, there is little information available onproduction technologies.
III.E. Raw Materials I nputs and Pollution Outputs
The Aerospace Industries Association estimates that there are 15,000 to30,000 different materials used in manufacturing, many of which may bepotentially toxic, highly volatile, flammable, contain chloroflourocarbons, orcontribute to global warming (AIA, 1994). Material inputs for aerospacemanufacturing include metals, solvents, paints and coatings, and plastics,rubbers, and fabrics. Metals used in manufacturing include steel, aluminum,titanium, and many specialty alloys. There is also a wide variety of paints,solvents, and coatings available to the aerospace industry. Many of thesematerials are specifically required by FAA guidelines.
Pollutants from metal fabricating processes are dependant on the metal andmachining techniques being used. Larger pieces of scrap metal are usuallyrecovered and reintroduced to the process, while smaller shavings may be sentoff-site for disposal or recovery.
Surface preparation operations generate wastes contaminated with solventsand/or metals depending on the type of cleaning operation. Degreasingoperations may result in solvent-bearing wastewaters, air emissions, andmaterials in solid form. Chemical surface treatment operations can result inwastes containing metals. Alkaline, acid, mechanical, and abrasive cleaningmethods can generate waste streams such as spent cleaning media,wastewaters, and rinse waters. Such wastes consist primarily of the metalcomplexes or particles, the cleaning compound, contaminants from the metalsurface, and water. In many cases, chemical treatment operations are used inconjunction with organic solvent cleaning systems. As such, many of thesewastes may be cross-contaminated with solvents (EPA/OECA, 1995).

Aerospace Industry Industrial Process Description
Sector Notebook Project November 199835
Surface finishing and related washing operations account for a large volumeof wastes associated with aerospace metal finishing. Metal plating and relatedwaste account for the largest volumes of metal (e.g., cadmium, chromium,copper, lead, mercury, and nickel) and cyanide bearing wastes (EPA/OECA,1995).
Air Emissions
Air emissions, primarily volatile organic compounds (VOCs), result mainlyfrom the sealing, painting, depainting, bonding, finishing application processesincluding material storage, mixing, applications, drying, and cleaning. Theseemissions are composed mainly of organic solvents which are used as carriersfor the paint or sealant and as chemical coating removers. Most aerospacecoatings are solvent-based, which contain a mixture of organic solvents, manyof which are VOC’s. The most common VOC solvents used in coatings aretrichloroethylene, 1,1,1-trichloroethane, toluene, xylene, methyl ethyl ketone,and methyl isobutyl ketone. The most common VOC solvent used for coatingremoval is methylene chloride. The VOC content ranges differ for the variouscoating categories. Air emissions from cleaning and degreasing operationsmay result through volatilization during storage, fugitive losses during use,and direct ventilation of fumes. Releases to the air from metal shapingprocesses contain products of combustion (such as fly ash, carbon, metallicdusts) and metals and abrasives (such as sand and metallic particulates).
Wastewater
Wastewater is produced by almost every stage of the manufacturing process.Metalworking fluids, used in machining and shaping metal parts, are acommon source of wastewater contamination. Metalworking fluids can bepetroleum-based, oil-water emulsions, or synthetic emulsions that are appliedto either the tool or the metal being tooled to facilitate the shaping operation.Waste cooling waters can be contaminated with metalworking fluids(EPA/OECA, 1995).
Surface preparation, cleaning, and coating removal often involves the use ofsolvents which can also contribute to wastewater pollution. The nature of thewaste will depend upon the specific cleaning application and manufacturingoperation. Solvents may be rinsed into wash waters and/or spilled into floordrains (EPA/OECA, 1995).
Wastewater may also be generated in operations such as quenching anddeburring. Such wastewater can be high in oil and suspended solids.Wastewater from metal casting and shaping mainly consists of cooling waterand wet scrubber effluent. The scrubber water is typically highly alkaline(EPA/OECA, 1997).
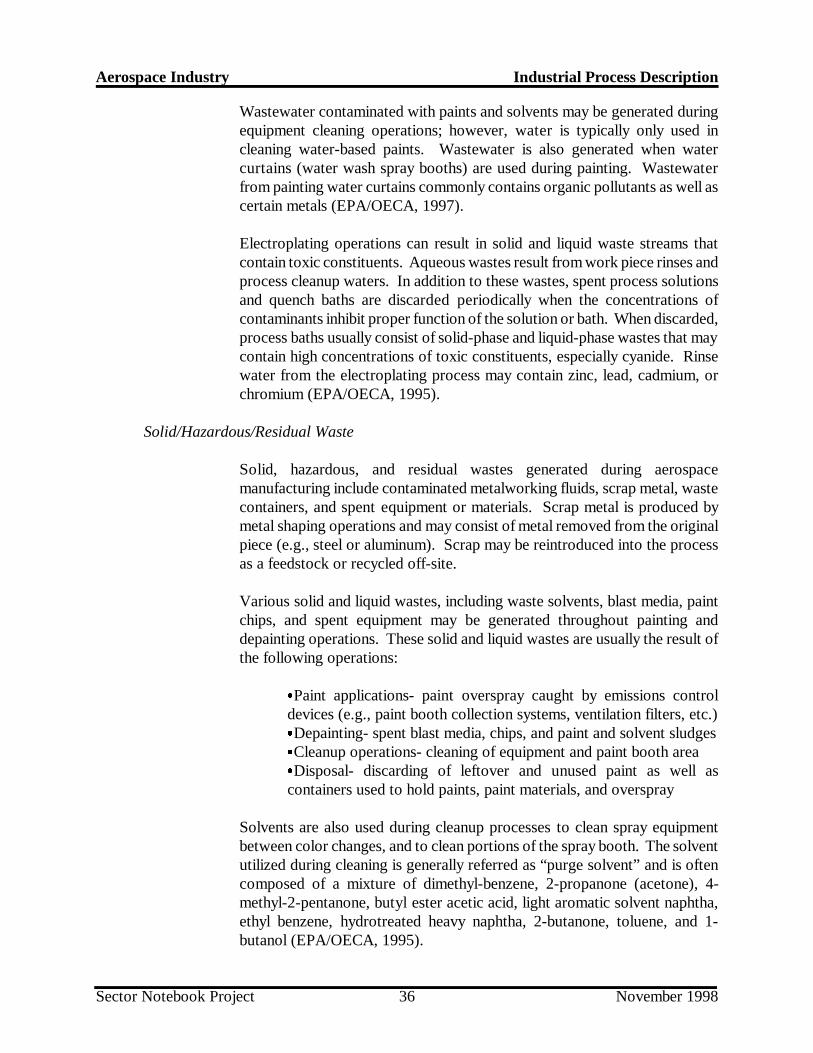
Aerospace Industry Industrial Process Description
Sector Notebook Project November 199836
Wastewater contaminated with paints and solvents may be generated duringequipment cleaning operations; however, water is typically only used incleaning water-based paints. Wastewater is also generated when watercurtains (water wash spray booths) are used during painting. Wastewaterfrom painting water curtains commonly contains organic pollutants as well ascertain metals (EPA/OECA, 1997).
Electroplating operations can result in solid and liquid waste streams thatcontain toxic constituents. Aqueous wastes result from work piece rinses andprocess cleanup waters. In addition to these wastes, spent process solutionsand quench baths are discarded periodically when the concentrations ofcontaminants inhibit proper function of the solution or bath. When discarded,process baths usually consist of solid-phase and liquid-phase wastes that maycontain high concentrations of toxic constituents, especially cyanide. Rinsewater from the electroplating process may contain zinc, lead, cadmium, orchromium (EPA/OECA, 1995).
Solid/Hazardous/Residual Waste
Solid, hazardous, and residual wastes generated during aerospacemanufacturing include contaminated metalworking fluids, scrap metal, wastecontainers, and spent equipment or materials. Scrap metal is produced bymetal shaping operations and may consist of metal removed from the originalpiece (e.g., steel or aluminum). Scrap may be reintroduced into the processas a feedstock or recycled off-site.
Various solid and liquid wastes, including waste solvents, blast media, paintchips, and spent equipment may be generated throughout painting anddepainting operations. These solid and liquid wastes are usually the result ofthe following operations:
&Paint applications- paint overspray caught by emissions controldevices (e.g., paint booth collection systems, ventilation filters, etc.)&Depainting- spent blast media, chips, and paint and solvent sludges&Cleanup operations- cleaning of equipment and paint booth area&Disposal- discarding of leftover and unused paint as well ascontainers used to hold paints, paint materials, and overspray
Solvents are also used during cleanup processes to clean spray equipmentbetween color changes, and to clean portions of the spray booth. The solventutilized during cleaning is generally referred as “purge solvent” and is oftencomposed of a mixture of dimethyl-benzene, 2-propanone (acetone), 4-methyl-2-pentanone, butyl ester acetic acid, light aromatic solvent naphtha,ethyl benzene, hydrotreated heavy naphtha, 2-butanone, toluene, and 1-butanol (EPA/OECA, 1995).

Aerospace Industry Industrial Process Description
Sector Notebook Project November 199837
Metalworking fluids typically become contaminated and spent with extendeduse and reuse. When disposed, these oils may contain toxics, including metals(cadmium, chromium, and lead), and therefore must be tested to determine ifthey are considered a RCRA hazardous waste. Many fluids may containchemical additives such as chlorine, sulfur, phosphorous compounds, phenols,cresols, and alkalines. In the past, such oils have commonly been mixed withused cleaning fluids and solvents (including chlorinated solvents)(EPA/OECA, 1995).
If metal coating operations use large quantities of molding sand, spent sandmay be generated. The largest waste by volume from metal casting operationsis waste sand. Other residual wastes may include dust from dust collectionsystems, slag, and off-spec products. Dust collected in baghouses mayinclude zinc, lead, nickel, cadmium, and chromium. Slag is a glassy masscomposed of metal oxides from the melting process, melted refractories, sand,and other materials (EPA/OECA, 1997).
Centralized wastewater treatment systems are common and can result in solid-phase wastewater treatment sludges. Any solid wastes (e.g., wastewatertreatment sludges, still bottoms, cleaning tank residues, machining fluidresidues, etc.) generated by the manufacturing process may also becontaminated with solvents (EPA/OECA, 1995).
Table 6 summarizes the material inputs and pollutant outputs from the variousaerospace manufacturing operations.
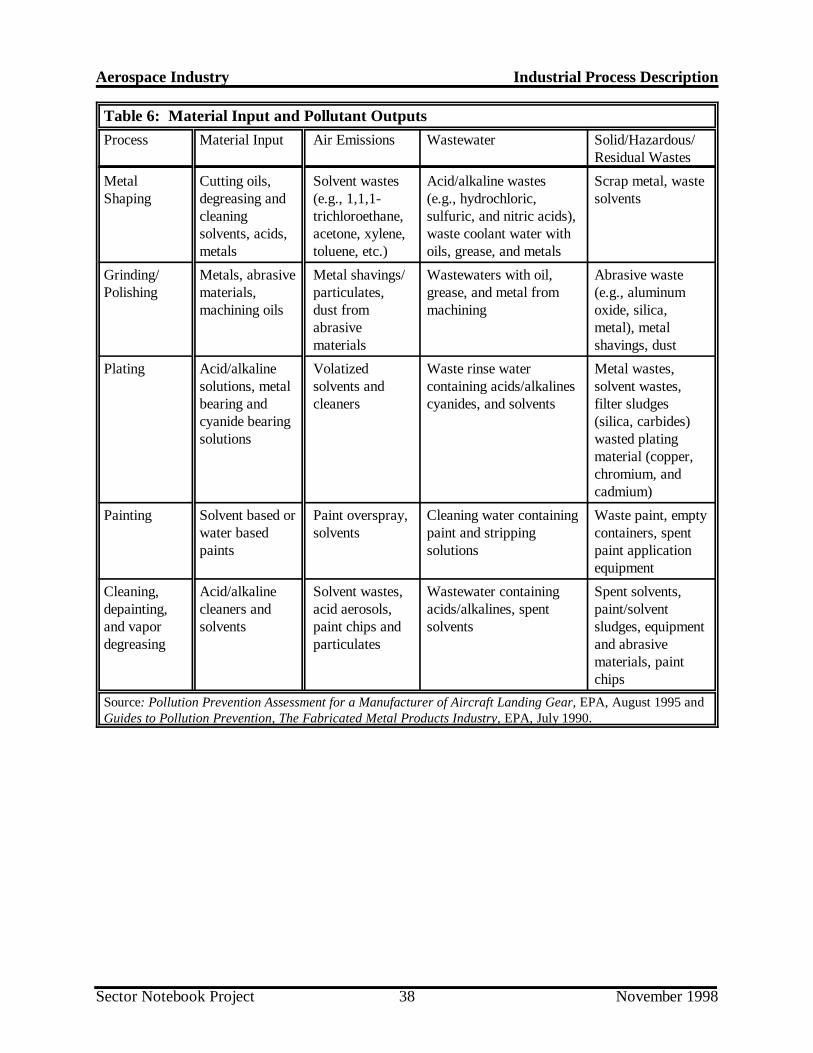
Aerospace Industry Industrial Process Description
Sector Notebook Project November 199838
Table 6: Material Input and Pollutant Outputs
Process Material Input Air Emissions Wastewater Solid/Hazardous/Residual Wastes
MetalShaping
Cutting oils,degreasing andcleaningsolvents, acids,metals
Solvent wastes(e.g., 1,1,1-trichloroethane,acetone, xylene,toluene, etc.)
Acid/alkaline wastes(e.g., hydrochloric,sulfuric, and nitric acids),waste coolant water withoils, grease, and metals
Scrap metal, wastesolvents
Grinding/Polishing
Metals, abrasivematerials,machining oils
Metal shavings/particulates,dust fromabrasivematerials
Wastewaters with oil,grease, and metal frommachining
Abrasive waste(e.g., aluminumoxide, silica,metal), metalshavings, dust
Plating Acid/alkalinesolutions, metalbearing andcyanide bearingsolutions
Volatizedsolvents andcleaners
Waste rinse watercontaining acids/alkalinescyanides, and solvents
Metal wastes, solvent wastes,filter sludges(silica, carbides)wasted platingmaterial (copper,chromium, andcadmium)
Painting Solvent based orwater basedpaints
Paint overspray,solvents
Cleaning water containingpaint and strippingsolutions
Waste paint, emptycontainers, spentpaint applicationequipment
Cleaning,depainting,and vapordegreasing
Acid/alkalinecleaners andsolvents
Solvent wastes,acid aerosols,paint chips andparticulates
Wastewater containingacids/alkalines, spentsolvents
Spent solvents,paint/solventsludges, equipmentand abrasivematerials, paintchips
Source: Pollution Prevention Assessment for a Manufacturer of Aircraft Landing Gear, EPA, August 1995 andGuides to Pollution Prevention, The Fabricated Metal Products Industry, EPA, July 1990.

Aerospace Industry Industrial Process Description
Sector Notebook Project November 199839
III.F. Management of Chemicals in Wastestream
The Pollution Prevention Act of 1990 (PPA) requires facilities to reportinformation about the management of Toxic Release Inventory (TRI)chemicals in waste and efforts made to eliminate or reduce those quantities.These data have been collected annually in Section 8 of the TRI reportingForm R beginning with the 1991 reporting year. The data summarized belowcover the years 1994-1997 and are meant to provide a basic understanding ofthe quantities of waste handled by the industry, the methods typically used tomanage this waste, and recent trends in these methods. TRI wastemanagement data can be used to assess trends in source reduction withinindividual industries and facilities, and for specific TRI chemicals. Thisinformation could then be used as a tool in identifying opportunities forpollution prevention and compliance assistance activities.
While the quantities reported for 1995 and 1996 are estimates of quantitiesalready managed, the quantities listed by facilities for 1997 and 1998 areprojections only. The PPA requires these projections to encourage facilitiesto consider future source reduction, not to establish any mandatory limits.Future-year estimates are not commitments that facilities reporting under TRIare required to meet
.Table 7 shows that the TRI reporting aerospace facilities managed about 37million pounds of production related wastes (total quantity of TRI chemicalsin the waste from routine production operations in column B) in 1996.Production related wastes were projected to continue to decrease slightly in1997 and 1998. Note that the effects of production increases and decreaseson the quantities of wastes generated are not evaluated here, but productionhas generally been increasing in recent years.
In 1995, about 34 percent of the industry’s TRI wastes were managed on-sitethrough recycling, energy recovery, or treatment as shown in columns C, D,and E, respectively. This decreased to 25 percent in 1996 and was expectedto slightly increase to over 30 percent in 1998. The majority of these on-sitemanaged wastes were recycled on-site in 1995. About 39 percent of theindustry’s TRI wastes were transferred off-site for recycling, energy recovery,or treatment as shown in columns F, G, and H. This increased to 50 percentin 1996. Most of the off-site managed wastes were recycled as well. Theremaining portion of the production related wastes, shown in column I, (31percent in 1995 and 27 percent in 1996) is either released to the environmentthrough direct discharges to air, land, water, and underground injection, or istransferred off-site for disposal.

Aerospace Industry Industrial Process Description
Sector Notebook Project November 199840
Table 7: Source Reduction and Recycling Activity for Aerospace ManufacturersFacilities (SICs 372 or 376) as Reported within TRI
A BOn-Site Off-Site
I
Year
Quantity ofProduction-
Related Waste
(106 lbs.)a
%Released
andDisposedc
Off-site
C D E F G H
%Recycled
% EnergyRecovery % Treated
%Recycled
% EnergyRecovery % Treated
1995 40.6 22% 0% 12% 26% 3% 10% 31%
1996 36.5 14% 0% 11% 36% 4% 10% 27%
1997 35.2 14% 0% 12% 36% 4% 10% 24%
1998 33.3 19% 0% 12% 33% 3% 10% 21%
Source: 1996 Toxics Release Inventory Database. a Within this industry sector, non-production related waste < 1% of production related wastes for 1995.b Total TRI transfers and releases as reported in Section 5 and 6 of Form R as a percentage ofproduction related wastes.c Percentage of production related waste released to the environment and transferred off-site fordisposal.

Aerospace Industry Chemical Releases and Transfers
Sector Notebook Project November 199841
IV. CHEMICAL RELEASE AND TRANSFER PROFILE
This section is designed to provide background information on the pollutantreleases that are reported by this industry. For industries that are required toreport, the best source of comparative pollutant release information is theToxic Release Inventory (TRI). A component of the Emergency Planning andCommunity Right-to-Know Act, TRI includes self-reported facility releaseand transfer data for over 600 toxic chemicals. Facilities within SIC Codes20 through 39 (manufacturing industries) that have more than 10 employees,and that are above weight-based reporting thresholds are required to reportTRI on-site releases and off-site transfers. The information presented withinthe sector notebooks is derived from the most recently available (1996) TRIreporting year (which includes over 600 chemicals), and focuses primarily onthe on-site releases reported by each sector. Because TRI requires consistentreporting regardless of sector, it is an excellent tool for drawing comparisonsacross industries. TRI data provide the type, amount and media receptor ofeach chemical released or transferred.
Although this sector notebook does not present historical informationregarding TRI chemical releases over time, please note that in general, toxicchemical releases have been declining. In fact, according to the 1996 ToxicRelease Inventory Public Data Release, reported onsite releases of toxicchemicals to the environment decreased by 5 percent (111.6 million pounds)between 1995 and 1996 (not including chemicals added and removed from theTRI chemical list during this period). Reported releases dropped by 48percent between 1988 and 1996. Reported transfers of TRI chemicals to off-site locations increased by 5 percent (14.3 million pounds) between 1995 and1996. More detailed information can be obtained from EPA's annual ToxicsRelease Inventory Public Data Release book (which is available through theEPCRA Hotline at 800-535-0202), or directly from the Toxic ReleaseInventory System database (for user support call 202-260-1531).
Wherever possible, the sector notebooks present TRI data as the primaryindicator of chemical release within each industrial category. TRI dataprovide the type, amount and media receptor of each chemical released ortransferred. When other sources of pollutant release data have been obtained,these data have been included to augment the TRI information.
TRI Data Limitations
Certain limitations exist regarding TRI data. Within some sectors, (e.g. drycleaning, printing and transportation equipment cleaning) the majority offacilities are not subject to TRI reporting because they are not consideredmanufacturing industries, or because they are below TRI reporting thresholds.For these sectors, release information from other sources has been included.
Aerospace Industry Chemical Releases and Transfers
Sector Notebook Project November 199842
Reported chemicals are limited to the approximately 600 TRI chemicals. Aportion of the emissions from aerospace facilities, therefore, are not capturedby TRI.
In addition, many facilities report more than one SIC code reflecting themultiple operations carried out on-site. Therefore, reported releases andtransfers may or may not all be associated with the industrial operationsdescribed in this notebook.
The reader should also be aware that TRI "pounds released" data presentedwithin the notebooks is not equivalent to a "risk" ranking for each industry.Weighting each pound of release equally does not factor in the relativetoxicity of each chemical that is released or the potential exposure tosurrounding populations. The Agency is in the process of developing anapproach to assign toxicological weightings to each chemical released so thatone can differentiate between pollutants with significant differences in toxicity.As a preliminary indicator of the environmental impact of the industry's mostcommonly released chemicals, the notebook briefly summarizes thetoxicological properties of the top five chemicals (by weight) reported by theindustry.
Definitions Associated With Section IV Data Tables
General Definitions
SIC Code -- is the Standard Industrial Classification (SIC) code, a statisticalclassification standard used for all establishment-based Federal economicstatistics. The SIC codes facilitate comparisons between facility and industrydata.
TRI Facilities -- are manufacturing facilities that have 10 or more full-timeemployees and are above established chemical throughput thresholds.Manufacturing facilities are defined as facilities in Standard IndustrialClassification primary codes 20-39. Facilities must submit estimates for allchemicals that are on the EPA's defined list and are above throughputthresholds.
Data Table Column Heading Definitions
The following definitions are based upon standard definitions developed byEPA’s Toxic Release Inventory Program. The categories below represent thepossible pollutant destinations that can be reported.

Aerospace Industry Chemical Releases and Transfers
Sector Notebook Project November 199843
Releases -- are on-site discharges of a toxic chemical to the environment.This includes emissions to the air, discharges to bodies of water, releases atthe facility to land, as well as contained disposal into underground injectionwells.
Releases to Air (Point and Fugitive Air Emissions) -- include all airemissions from industry activity. Point emissions occur through confined airstreams as found in stacks, vents, ducts, or pipes. Fugitive emissions includeequipment leaks, evaporative losses from surface impoundments and spills,and releases from building ventilation systems.
Releases to Water (Surface Water Discharges) -- encompass any releasesgoing directly to streams, rivers, lakes, oceans, or other bodies of water.Releases due to runoff, including storm water runoff, are also reportable toTRI.
Releases to Land -- occur within the boundaries of the reporting facility.Releases to land include disposal of toxic chemicals in landfills, landtreatment/application farming, surface impoundments, and other disposal onland (such as spills, leaks, or waste piles).
Underground Injection -- is a contained release of a fluid into a subsurfacewell for the purpose of waste disposal. Wastes containing TRI chemicals areinjected into either Class I wells or Class V wells. Class I wells are used toinject liquid hazardous wastes or dispose of industrial and municipalwastewaters beneath the lowermost underground source of drinking water.Class V wells are generally used to inject non-hazardous fluid into or abovean underground source of drinking water. TRI reporting does not currentlydistinguish between these two types of wells, although there are importantdifferences in environmental impact between these two methods of injection.
Transfers -- are transfers of toxic chemicals in wastes to a facility that isgeographically or physically separate from the facility reporting under TRI.Chemicals reported to TRI as transferred are sent to off-site facilities for thepurpose of recycling, energy recovery, treatment, or disposal. The quantitiesreported represent a movement of the chemical away from the reportingfacility. Except for off-site transfers for disposal, the reported quantities donot necessarily represent entry of the chemical into the environment.
Transfers to POTWs -- are wastewater transferred through pipes or sewersto a publicly owned treatments works (POTW). Treatment or removal of achemical from the wastewater depends on the nature of the chemical, as wellas the treatment methods present at the POTW. Not all TRI chemicals canbe treated or removed by a POTW. Some chemicals, such as metals, may beremoved but not destroyed and may be disposed of in landfills or dischargedto receiving waters.

Aerospace Industry Chemical Releases and Transfers
Sector Notebook Project November 199844
Transfers to Recycling -- are wastes sent off-site for the purposes ofregenerating or recovery by a variety of recycling methods, including solventrecovery, metals recovery, and acid regeneration. Once these chemicals havebeen recycled, they may be returned to the originating facility or soldcommercially.
Transfers to Energy Recovery -- are wastes combusted off-site in industrialfurnaces for energy recovery. Treatment of a chemical by incineration is notconsidered to be energy recovery.
Transfers to Treatment -- are wastes moved off-site to be treated througha variety of methods, including neutralization, incineration, biologicaldestruction, or physical separation. In some cases, the chemicals are notdestroyed but prepared for further waste management.
Transfers to Disposal -- are wastes taken to another facility for disposal,generally as a release to land or as an injection underground.
IV.A. EPA Toxic Release Inventory for the Aerospace Industry
This section summarizes TRI data of aerospace facilities reporting SIC codeswithin 372 and 376 as the primary SIC code for the facility.
According to the 1996 Toxics Release Inventory (TRI) data, 199 aerospacefacilities released (to the air, water, or land) and transferred (shipped off-siteor discharged to sewers) a total of approximately 27 million pounds of 65different toxic chemicals during calendar year 1996. This representsapproximately one half of one percent of the 5.6 billion pounds of releases andtransfers from all manufacturers (SICs 20-39) reporting to TRI that year.Facilities released an average of 43,862 pounds per facility and transferred andaverage of 93,503 pounds per facility. The top four chemicals released byweight are solvents-- methyl ethyl ketone, 1,1,1-trichloroethane,trichloroethylene, and toluene. These four account for about 66 percent (5.8million pounds) of the industry’s total releases. Nickel, chromium, sulfuricacid, and methyl ethyl ketone were the four top chemicals transferred byweight. These four account for 55 percent (10.2 million pounds) of the totalTRI chemicals transferred by the aerospace industry. Only 22 percent of the65 chemicals reported to TRI as releases or transfers were reported by morethan 10 facilities, evidence of the many different materials used by the industryand the variance between facilities on choice of these materials.
Releases
Table 8 presents the number and weights of chemicals released by aerospacefacilities reporting SIC 372 and 376. The total quantity of releases was 8.7million pounds or 32 percent of the total weight of chemicals released and

Aerospace Industry Chemical Releases and Transfers
Sector Notebook Project November 199845
transferred. The vast majority of air releases were solvents. Air emissionsaccount for 98 percent of total releases, 44 percent as fugitive air emissionsand 54 percent as point air releases. Methyl ethyl ketone was the topchemical released by the aerospace industry, accounting for 25 percent of totalreleases. Releases of 1,1,1-trichloroethane were the second greatest,representing 20 percent of the total. Twenty-four percent of fugitive airemissions were of 1,1,1-trichloroethane, and 32 percent of the point airreleases were methyl ethyl ketone. Nitrate compounds accounted for 74percent of water discharges.
Transfers
Table 9 presents the number and weights of chemicals transferred off-site byaerospace facilities reporting SIC 372 or 376 in 1996. The total amount oftransfers was 18.6 million pounds or 68 percent of the total releases andtransfers reported to the 1996 TRI by aerospace facilities. Transfers torecycling facilities accounted for the largest percentage, 70 percent, oftransfers. The next greatest percentage was 17 percent to treatment facilities.The majority of transfers consisted of metals, spent acids, and solvents. Sixty-six percent (12.3 million pounds) of the total transfers were metals. Nickelrepresented the largest quantity of transfers, 5.3 million pounds or 29 percentof the total. Chromium composed the second largest quantity of transferswith 12 percent of the total. The chemical with the largest quantity ofreleases, methyl ethyl ketone, accounted for about 6 percent of the totaltransfers.

Aerospace Industry Chemical Releases and Transfers
Sector Notebook Project November 199846
Table 8: 1996 TRI Releases for Aerospace Chemicals Facilities (SICs 372 or 376), By Number of Facilities Reporting (Releases Reported in Pounds/year)
Chemical Name# Reporting
ChemicalFugitive
AirPoint
AirWater
DischargesUnderground
InjectionLand
DisposalTotal
ReleasesAvg. Releases
Per FacilityMethyl Ethyl Ketone 67 704,499 1,484,499 505 0 0 2,189,503 32,679Nitric Acid 58 7,530 57,219 165 0 0 64,914 1,119Nickel 48 15,778 8,421 972 0 20,557 45,728 953Chromium 39 12,829 2,813 1,322 0 3,343 20,307 5211,1,1-trichloroethane 36 938,383 769,346 5 0 11,280 1,719,014 47,750Trichloroethylene 29 671,880 268,358 11 0 2,640 942,889 32,513Chromium Compounds 25 1,685 9,815 422 0 15,866 27,788 1,112Toluene 23 129,305 776,295 260 0 4,128 909,988 39,565Tetrachloroethylene 21 237,547 388,663 34 0 0 626,244 29,821Dichloromethane 20 591,048 99,403 18 0 0 690,469 34,523Cobalt 18 740 1,905 476 0 2,774 5,895 328Hydrogen Fluoride 16 2,841 14,889 0 0 0 17,730 1,108Ammonia 14 3,166 205,300 21,646 0 0 230,112 16,437Copper 12 311 255 26 0 0 592 49Nitrate Compounds 10 145 499 77,000 0 0 77,644 7,764Xylene (Mixed Isomers) 10 15,356 211,057 55 0 0 226,468 22,647Nickel Compounds 9 265 616 58 0 0 939 104Phosphoric Acid 9 923 1,301 0 0 0 2,224 247Methanol 8 13,247 32,566 0 0 0 45,813 5,727Aluminum (Fume or Dust) 8 282 112 0 0 0 394 49Sulfuric Acid (1994 and after "AcidAerosols" Only)
8 16 331 0 0 0 347 43
Hydrochloric Acid (1995 and after "AcidAerosols" Only)
7 190,257 54,062 0 0 0 244,319 34,903
Diisocyanates 6 390 230 0 0 0 620 103Certain Glycol Ethers 6 11,170 10,785 0 0 0 21,955 3,659Freon 113 6 114,487 34,782 0 0 0 149,269 24,878Methyl Isobutyl Ketone 6 26,191 78,205 0 0 0 104,396 17,399Phenol 6 118 2,997 0 0 0 3,115 519Lead 6 0 200 4 0 0 204 34Manganese 5 15 11 250 0 0 276 55Copper Compounds 4 0 281 543 0 0 824 206Cobalt Compounds 3 0 250 0 0 0 250 83Cyanide Compounds 3 0 0 0 0 0 0 0Lead Compounds 3 65 96 0 0 0 161 54Benzene 3 16,997 119,768 0 0 0 136,765 45,588Naphthalene 3 65,993 250 0 0 0 66,243 22,081Aluminum Oxide (Fibrous Forms) 3 290 784 0 0 45,000 46,074 15,358Chlorine 3 0 0 98 0 0 98 33Manganese Compounds 2 15 45 0 0 0 60 30Zinc Compounds 2 0 250 0 0 0 250 125Methyl Methacrylate 2 2,951 1,400 0 0 0 4,351 2,176Styrene 2 11,488 16,500 0 0 0 27,988 13,994Antimony 2 0 0 0 0 0 0 0Zinc (Fume or Dust) 2 5 5 18 0 0 28 14Antimony Compounds 1 5 4 0 0 0 9 9Barium Compounds 1 0 1 0 0 0 1 1Polychlorinated Alkanes 1 0 0 0 0 0 0 0Formaldehyde 1 0 0 0 0 0 0 0Isopropyl Alcohol (Manufacturing,Strong-acid Process Only, No Supplies)
1 90 2,172 0 0 0 2,262 2,262
N,n-dimethylformamide 1 250 250 0 0 0 500 500N-butyl Alcohol 1 0 15,233 0 0 0 15,233 15,233Bromotrifluoromethane 1 1,641 0 0 0 0 1,641 1,641Trichlorofluoromethane 1 3,500 430 0 0 0 3,930 3,930Sec-butyl Alcohol 1 14,000 8,800 0 0 0 22,800 22,800Picric Acid 1 0 0 0 0 0 0 0Biphenyl 1 0 0 0 0 0 0 01,2-dichlorobenzene 1 0 1,400 0 0 0 1,400 1,400Ethylbenzene 1 0 0 0 0 0 0 0Ethylene Glycol 1 0 0 0 0 0 0 0Cyclohexane 1 0 904 0 0 0 904 904Methyl Tert-butyl Ether 1 1,200 0 0 0 0 1,200 1,2001,1-dichloro-1-fluoroethane 1 22,000 0 0 0 0 22,000 22,000Mercury 1 0 0 0 0 0 0 0Silver 1 0 0 0 0 0 0 0Sodium Nitrite 1 250 4,200 0 0 0 4,450 4,450Aluminum Phosphide 1 0 0 0 0 0 0 0
________ ________ ________ ________ ________ ________ ________ ________199** 3,831,144 4,687,958 103,888 0 105,588 8,728,578 43,862
**Total number of facilities (not chemical reports) reporting to TRI in this industry sector.
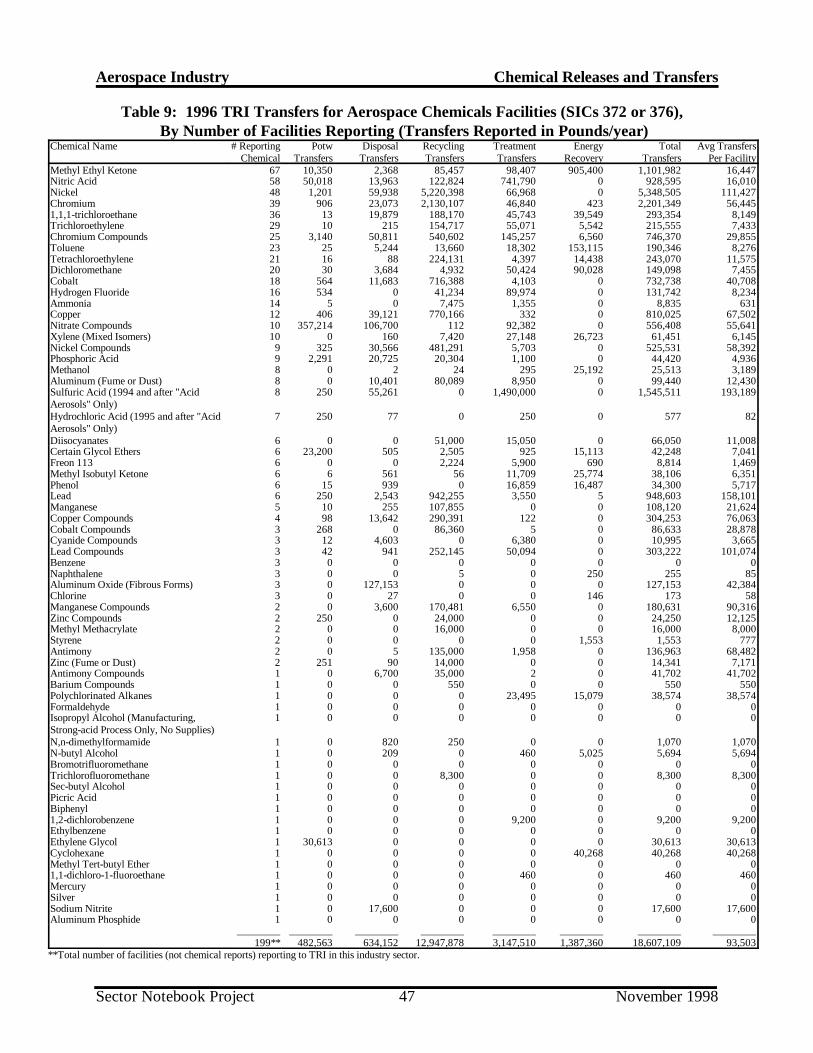
Aerospace Industry Chemical Releases and Transfers
Sector Notebook Project November 199847
Table 9: 1996 TRI Transfers for Aerospace Chemicals Facilities (SICs 372 or 376), By Number of Facilities Reporting (Transfers Reported in Pounds/year)
Chemical Name # ReportingChemical
PotwTransfers
DisposalTransfers
RecyclingTransfers
TreatmentTransfers
EnergyRecovery
TotalTransfers
Avg TransfersPer Facility
Methyl Ethyl Ketone 67 10,350 2,368 85,457 98,407 905,400 1,101,982 16,447Nitric Acid 58 50,018 13,963 122,824 741,790 0 928,595 16,010Nickel 48 1,201 59,938 5,220,398 66,968 0 5,348,505 111,427Chromium 39 906 23,073 2,130,107 46,840 423 2,201,349 56,4451,1,1-trichloroethane 36 13 19,879 188,170 45,743 39,549 293,354 8,149Trichloroethylene 29 10 215 154,717 55,071 5,542 215,555 7,433Chromium Compounds 25 3,140 50,811 540,602 145,257 6,560 746,370 29,855Toluene 23 25 5,244 13,660 18,302 153,115 190,346 8,276Tetrachloroethylene 21 16 88 224,131 4,397 14,438 243,070 11,575Dichloromethane 20 30 3,684 4,932 50,424 90,028 149,098 7,455Cobalt 18 564 11,683 716,388 4,103 0 732,738 40,708Hydrogen Fluoride 16 534 0 41,234 89,974 0 131,742 8,234Ammonia 14 5 0 7,475 1,355 0 8,835 631Copper 12 406 39,121 770,166 332 0 810,025 67,502Nitrate Compounds 10 357,214 106,700 112 92,382 0 556,408 55,641Xylene (Mixed Isomers) 10 0 160 7,420 27,148 26,723 61,451 6,145Nickel Compounds 9 325 30,566 481,291 5,703 0 525,531 58,392Phosphoric Acid 9 2,291 20,725 20,304 1,100 0 44,420 4,936Methanol 8 0 2 24 295 25,192 25,513 3,189Aluminum (Fume or Dust) 8 0 10,401 80,089 8,950 0 99,440 12,430Sulfuric Acid (1994 and after "AcidAerosols" Only)
8 250 55,261 0 1,490,000 0 1,545,511 193,189
Hydrochloric Acid (1995 and after "AcidAerosols" Only)
7 250 77 0 250 0 577 82
Diisocyanates 6 0 0 51,000 15,050 0 66,050 11,008Certain Glycol Ethers 6 23,200 505 2,505 925 15,113 42,248 7,041Freon 113 6 0 0 2,224 5,900 690 8,814 1,469Methyl Isobutyl Ketone 6 6 561 56 11,709 25,774 38,106 6,351Phenol 6 15 939 0 16,859 16,487 34,300 5,717Lead 6 250 2,543 942,255 3,550 5 948,603 158,101Manganese 5 10 255 107,855 0 0 108,120 21,624Copper Compounds 4 98 13,642 290,391 122 0 304,253 76,063Cobalt Compounds 3 268 0 86,360 5 0 86,633 28,878Cyanide Compounds 3 12 4,603 0 6,380 0 10,995 3,665Lead Compounds 3 42 941 252,145 50,094 0 303,222 101,074Benzene 3 0 0 0 0 0 0 0Naphthalene 3 0 0 5 0 250 255 85Aluminum Oxide (Fibrous Forms) 3 0 127,153 0 0 0 127,153 42,384Chlorine 3 0 27 0 0 146 173 58Manganese Compounds 2 0 3,600 170,481 6,550 0 180,631 90,316Zinc Compounds 2 250 0 24,000 0 0 24,250 12,125Methyl Methacrylate 2 0 0 16,000 0 0 16,000 8,000Styrene 2 0 0 0 0 1,553 1,553 777Antimony 2 0 5 135,000 1,958 0 136,963 68,482Zinc (Fume or Dust) 2 251 90 14,000 0 0 14,341 7,171Antimony Compounds 1 0 6,700 35,000 2 0 41,702 41,702Barium Compounds 1 0 0 550 0 0 550 550Polychlorinated Alkanes 1 0 0 0 23,495 15,079 38,574 38,574Formaldehyde 1 0 0 0 0 0 0 0Isopropyl Alcohol (Manufacturing, Strong-acid Process Only, No Supplies)
1 0 0 0 0 0 0 0
N,n-dimethylformamide 1 0 820 250 0 0 1,070 1,070N-butyl Alcohol 1 0 209 0 460 5,025 5,694 5,694Bromotrifluoromethane 1 0 0 0 0 0 0 0Trichlorofluoromethane 1 0 0 8,300 0 0 8,300 8,300Sec-butyl Alcohol 1 0 0 0 0 0 0 0Picric Acid 1 0 0 0 0 0 0 0Biphenyl 1 0 0 0 0 0 0 01,2-dichlorobenzene 1 0 0 0 9,200 0 9,200 9,200Ethylbenzene 1 0 0 0 0 0 0 0Ethylene Glycol 1 30,613 0 0 0 0 30,613 30,613Cyclohexane 1 0 0 0 0 40,268 40,268 40,268Methyl Tert-butyl Ether 1 0 0 0 0 0 0 01,1-dichloro-1-fluoroethane 1 0 0 0 460 0 460 460Mercury 1 0 0 0 0 0 0 0Silver 1 0 0 0 0 0 0 0Sodium Nitrite 1 0 17,600 0 0 0 17,600 17,600Aluminum Phosphide 1 0 0 0 0 0 0 0
________ ________ ________ ________ ________ ________ ________ ________199** 482,563 634,152 12,947,878 3,147,510 1,387,360 18,607,109 93,503
**Total number of facilities (not chemical reports) reporting to TRI in this industry sector.

Aerospace Industry Chemical Releases and Transfers
1 Being included on this list does not mean that the release is associated with non-compliance with environmentallaws.
Sector Notebook Project November 199848
The TRI database contains a detailed compilation of self-reported, facility-specific chemical releases only and not transfers. The top reporting facilitiesfor the aerospace industry are listed below in Tables 10 and 11. Facilities thathave reported the primary SIC codes covered under this notebook appear onthe first list. Table 11 contains additional facilities that have reported the SICcodes covered within this report, and one or more SIC codes that are notwithin the scope of this notebook. Therefore, the second list includes facilitiesthat conduct multiple operations -- some that are under the scope of thisnotebook, and some that are not. However, only one additional facilityappears on the second list, implying that the processes directly relating to theproduction of aerospace equipment is responsible for releases and transfersreported by aerospace facilities. Currently, the facility-level data do not allowpollutant releases to be broken apart by industrial process.
Table 10: Largest Quantity TRI Releasing Facilities Reporting Only 372 or376 SIC Codes to TRI1
Rank FacilitySIC Codes Reported in
TRI
Total TRIReleasesin Pounds
1 Boeing Commercial Airplane, Everett, WA 3721 784,581
2 Chem-fab Corp., Hot Springs, AR 3728 433,630
3 Raytheon Aircraft Co., Wichita, KS 3721 393,324
4 Douglas Aircraft Co.*, Long Beach, CA 3721 347,420
5 Pemco Aeroplex Inc., Birmingham, AL 3721 330,130
6 Thiokol Propulsion Group, Promontory, 3764 330,000
7 U.S. Air Force Plant 06 GA, Marietta, GA 3721 305,149
8 Cessna Aircraft, Wichita, KS 3721 266,709
9 Aerostructures Corp., Nashville, TN 3728, 3769 252,299
10 Menasco, Euless, TX 3728 240,000
TOTAL 3,683,242
Source: US EPA Toxics Release Inventory Database, 1996.*Douglas Aircraft Co. is now part of The Boeing Company.

Aerospace Industry Chemical Releases and Transfers
2 Being included on this list does not mean that the release is associated with non-compliance with environmentallaws.
Sector Notebook Project November 199849
Table 11: Largest Quantity TRI Releasing Facilities Reporting AerospaceSIC Codes to TRI2
Rank FacilitySIC Codes Reported in
TRI
Total TRIReleasesin Pounds
1 Boeing Wichita, Wichita, KS 3728,3679,3721,3724 1,254,080
2 Boeing Commercial Airplane, Everett, WA 3721 784,581
3 Chem-fab Corp., Hot Springs, AR 3728 433,630
4 Raytheon Aircraft Co., Wichita, KS 3721 393,324
5 Douglas Aircraft Co., Long Beach, CA 3721 347,420
6 Pemco Aeroplex Inc., Birmingham, AL 3721 330,130
7 Thiokol Propulsion Group, Promontory, 3764 330,000
8 U.S. Air Force Plant 06 GA, Marietta, GA 3721 305,149
9 Cessna Aircraft, Wichita, KS 3721 266,709
10 Aerostructures Corp., Nashville, TN 3728, 3769 252,299
TOTAL 4,697,322
Source: US EPA Toxics Release Inventory Database, 1996.*Douglas Aircraft Co. is now part of The Boeing Company.

Aerospace Industry Chemical Releases and Transfers
3 TOXNET is a computer system run by the National Library of Medicine that includes a number of toxicologicaldatabases managed by EPA, National Cancer Institute, and the National Institute for Occupational Safety andHealth. For more information on TOXNET, contact the TOXNET help line at 800-231-3766. Databases includedin TOXNET are: CCRIS (Chemical Carcinogenesis Research Information System), DART (Developmental andReproductive Toxicity Database), DBIR (Directory of Biotechnology Information Resources), EMICBACK(Environmental Mutagen Information Center Backfile), GENE-TOX (Genetic Toxicology), HSDB (HazardousSubstances Data Bank), IRIS (Integrated Risk Information System), RTECS (Registry of Toxic Effects of ChemicalSubstances), and TRI (Toxic Chemical Release Inventory). HSDB contains chemical-specific information onmanufacturing and use, chemical and physical properties, safety and handling, toxicity and biomedical effects,pharmacology, environmental fate and exposure potential, exposure standards and regulations, monitoring andanalysis methods, and additional references.
Sector Notebook Project November 199850
IV.B. Summary of Selected Chemicals Released
The following is a synopsis of current scientific toxicity and fate informationfor the top chemicals (by weight) that facilities within this sector self-reportedas released to the environment based upon 1995 TRI data. Because thissection is based upon self-reported release data, it does not attempt to provideinformation on management practices employed by the sector to reduce therelease of these chemicals. Information regarding pollutant release reductionover time may be available from EPA’s TRI and 33/50 programs, or directlyfrom the industrial trade associations that are listed in Section IX of thisdocument. Since these descriptions are cursory, please consult these sourcesfor a more detailed description of both the chemicals described in this section,and the chemicals that appear on the full list of TRI chemicals appearing inSection IV.A.
The brief descriptions provided below were taken from the HazardousSubstances Data Bank (HSDB) and the Integrated Risk Information System(IRIS). The discussions of toxicity describe the range of possible adversehealth effects that have been found to be associated with exposure to thesechemicals. These adverse effects may or may not occur at the levels releasedto the environment. Individuals interested in a more detailed picture of thechemical concentrations associated with these adverse effects should consulta toxicologist or the toxicity literature for the chemical to obtain moreinformation. The effects listed below must be taken in context of theseexposure assumptions that are explained more fully within the full chemicalprofiles in HSDB. For more information on TOXNET3 , contact theTOXNET help line at 1-800-231-3766.
1,1,1-Trichloroethane (CAS: 71-55-6)
Sources. 1,1,1-Trichloroethane is used as an equipment and parts cleaningand degreasing solvent in aerospace manufacturing and is also used as a paintsolvent.

Aerospace Industry Chemical Releases and Transfers
Sector Notebook Project November 199851
Toxicity. Repeated contact of 1,1,1-Trichloroethane (TCA) with skin maycause serious skin cracking and infection. Vapors cause a slight smarting ofthe eyes or respiratory system if present in high concentrations.
Exposure to high concentrations of TCA causes reversible mild liver andkidney dysfunction, central nervous system depression, gait disturbances,stupor, coma, respiratory depression, and even death. Exposure to lowerconcentrations of TCA leads to light-headedness, throat irritation, headache,disequilibrium, impaired coordination, drowsiness, convulsion and mildchanges in perception.
Carcinogenicity. There is currently no evidence to suggest that this chemicalis carcinogenic.
Environmental Fate. Releases of TCA to surface water or land will almostentirely volatilize. Releases of TCA to air may be transported long distancesand may partially return to earth in rain. In the lower atmosphere, TCAdegrades very slowly by photo oxidation and slowly diffuses to the upperatmosphere where photodegradation is rapid.
Any TCA that does not evaporate from soils leaches to groundwater.Degradation in soils and water is slow. TCA does not hydrolyze in water, nordoes it significantly bioconcentrate in aquatic organisms.
Physical Properties. TCA is a clear, colorless liquid with a mild, chloroform-like odor and slight solubility.
Methyl Ethyl Ketone (CAS: 78-93-3)
Sources. Methyl ethyl ketone (MEK) is used as an equipment and partscleaning and degreasing solvent and as a paint solvent.
Toxicity. Breathing moderate amounts of methyl ethyl ketone for shortperiods of time can cause adverse effects on the nervous system ranging fromheadaches, dizziness, nausea, and numbness in the fingers and toes tounconsciousness. Its vapors are irritating to the skin, eyes, nose, and throatand can damage the eyes. Repeated exposure to moderate to high amountsmay cause liver and kidney effects.
Carcinogenicity. EPA does not consider methyl ethyl ketone to be acarcinogen.
Environmental Fate. Most of the MEK released to the environment will endup in the atmosphere. MEK can contribute to the formation of air pollutants

Aerospace Industry Chemical Releases and Transfers
Sector Notebook Project November 199852
in the lower atmosphere. It can be degraded by microorganisms living inwater and soil.
Physical Properties. Methyl ethyl ketone is a clear, colorless, flammableliquid which decomposes explosively at 230(F. It has a fragrant mint-likeodor detectable at 2 to 85 parts per million.
Trichloroethylene (CAS: 79-01-6)
Sources. Trichloroethylene is used extensively as an equipment and partscleaning and degreasing solvent and as a paint solvent.
Toxicity. Trichloroethylene was once used as an anesthetic, though its usecaused several fatalities due to liver failure. Short term inhalation exposureto high levels of trichloroethylene may cause rapid coma followed by eventualdeath from liver, kidney, or heart failure. Short-term exposure to lowerconcentrations of trichloroethylene causes eye, skin, and respiratory tractirritation. Ingestion causes a burning sensation in the mouth, nausea, vomitingand abdominal pain. Delayed effects from short-tern trichlorethylenepoisoning include liver and kidney lesions, reversible nerve degeneration, andpsychic disturbances. Long-term exposure can produce headache, dizziness,weight loss, nerve damage, heart damage, nausea, fatigue, insomnia, visualimpairment, mood perturbation, sexual problems, dermatitis, and rarelyjaundice. Degradation products of trichloroethylene (particularly phosgene)may cause rapid death due to respiratory collapse.
Carcinogenicity. Trichloroethylene is considered by EPA to be a probablehuman carcinogen via both oral and inhalation exposure, based on limitedhuman evidence and sufficient animal evidence.
Environmental Fate. Trichloroethylene breaks down slowly in water in thepresence of sunlight and bioconcentrates moderately in aquatic organisms.The main removal of trichloroethylene from water is via rapid evaporation.Trichloroethylene does not photodegrade in the atmosphere, though it breaksdown quickly under smog conditions, forming other pollutants such asphosgene, dichloroacetyl chloride, and formyl chloride. In addition,trichloroethylene vapors may be decomposed to toxic levels of phosgene inthe presence of an intense heat source such as an open arc welder. Whenspilled on land, trichloroethylene rapidly volatilizes from surface soils. Someof the remaining chemical may leach through the soil to groundwater.
Physical Properties. Trichloroethylene is a colorless liquid with achloroform-like odor. It is a combustible liquid, but burns with difficulty, andit has a very low solubility.
Aerospace Industry Chemical Releases and Transfers
Sector Notebook Project November 199853
Toluene (CAS: 108-88-3)
Sources. Toluene is used as an equipment and parts cleaning and degreasingsolvent and as a paint solvent.
Toxicity. Inhalation or ingestion of toluene can cause headaches, confusion,weakness, and memory loss. Toluene may also effect the way the kidneys andliver function.
Reactions of toluene (see environmental fate) in the atmosphere contribute tothe formation of ozone in the lower atmosphere. Ozone can affect therespiratory system, especially in sensitive individuals such as asthma or allergysufferers.
Some studies have shown that unborn animals were harmed when high levelsof toluene were inhaled by their mothers, although the same effects were notseen when the mothers were fed large quantities of toluene. Note that theseresults may reflect similar difficulties in humans.
Carcinogenicity. There is currently no evidence to suggest that this chemicalis carcinogenic.
Environmental Fate. The majority of releases of toluene to land and waterwill evaporate. Toluene may also be degraded by microorganisms. Oncevolatized, toluene in the lower atmosphere will react with other atmosphericcomponents contributing to the formation of ground-level ozone and other airpollutants.
Physical Properties. Toluene, a volatile organic chemical (VOC), is acolorless liquid with a sweet, benzene-like odor. It is a Class IB flammableliquid.
IV.C. Other Data Sources
The toxic chemical release data obtained from TRI captures only about 237of the facilities in the aerospace industry. However, it allows for acomparison across years and industry sectors. Reported chemicals are limitedto the approximately 600 TRI chemicals. A significant portion of theemissions from aerospace facilities, therefore, are not captured by TRI. TheEPA Office of Air Quality Planning and Standards has compiled air pollutantemission factors for determining the total air emissions of priority pollutants(e.g., total hydrocarbons, SOx, NOx, CO, particulates, etc.) from manymanufacturing sources.

Aerospace Industry Chemical Releases and Transfers
Sector Notebook Project November 199854
The Aerometric Information Retrieval System (AIRS) contains a wide rangeof information related to stationary sources of air pollution, including theemissions of a number of air pollutants which may be of concern within aparticular industry. With the exception of volatile organic compounds(VOCs), there is little overlap with the TRI chemicals reported above. Table12 summarizes annual releases (from the industries for which a SectorNotebook Profile was prepared) of carbon monoxide (CO), nitrogen dioxide(NO2), particulate matter of 10 microns or less (PM10), total particulates(PT), sulfur dioxide (SO2), and volatile organic compounds (VOCs).

Aerospace Industry Chemical Releases and Transfers
Sector Notebook Project November 199855
Table 12: Air Pollutant Releases by Industry Sector (tons/year)
Industry Sector CO NO2 PM10 PT SO2 VOCMetal Mining 4,951 49,252 21,732 9,478 1,202 119,761
Oil and Gas Extraction 132,747 389,686 4,576 3,441 238,872 114,601
Non-Fuel, Non-Metal Mining 31,008 21,660 44,305 16,433 9,183 138,684
Textiles 8,164 33,053 1,819 38,505 26,326 7,113
Lumber and Wood Products 139,175 45,533 30,818 18,461 95,228 74,028
Wood Furniture and Fixtures 3,659 3,267 2,950 3,042 84,036 5,895
Pulp and Paper 584,817 365,901 37,869 535,712 177,937 107,676
Printing 8,847 3,629 539 1,772 88,788 1,291
Inorganic Chemicals 242,834 93,763 6,984 150,971 52,973 34,885
Plastic Resins and Man-made Fibers 15,022 36,424 2,027 65,875 71,416 7,580
Pharmaceuticals 6,389 17,091 1,623 24,506 31,645 4,733
Organic Chemicals 112,999 177,094 13,245 129,144 162,488 17,765
Agricultural Chemicals 12,906 38,102 4,733 14,426 62,848 8,312
Petroleum Refining 299,546 334,795 25,271 592,117 292,167 36,421
Rubber and Plastic 2,463 10,977 3,391 24,366 110,739 6,302
Stone, Clay, Glass and Concrete 92,463 335,290 58,398 290,017 21,092 198,404
Iron and Steel 982,410 158,020 36,973 241,436 67,682 85,608
Metal Castings 115,269 10,435 14,667 4,881 17,301 21,554
Nonferrous Metals 311,733 31,121 12,545 303,599 7,882 23,811
Fabricated Metal Products 7,135 11,729 2,811 17,535 108,228 5,043
Electronics and Computers 27,702 7,223 1,230 8,568 46,444 3,464
Motor Vehicle Assembly 19,700 31,127 3,900 29,766 125,755 6,212
Aerospace 4,261 5,705 890 757 3,705 10,804
Shipbuilding and Repair 109 866 762 2,862 4,345 707
Ground Transportation 153,631 594,672 2,338 9,555 101,775 5,542
Water Transportation 179 476 676 712 3,514 3,775
Air Transportation 1,244 960 133 147 1,815 144
Fossil Fuel Electric Power 399,585 5,661,468 221,787 13,477,367 42,726 719,644
Dry Cleaning 145 781 10 725 7,920 40
Source: U.S. EPA Office of Air and Radiation, AIRS Database, 1997.

Aerospace Industry Chemical Releases and Transfers
Sector Notebook Project November 199856
IV.D. Comparison of Toxic Release Inventory Between Selected Industries
The following information is presented as a comparison of pollutant releaseand transfer data across industrial categories. It is provided to give a generalsense as to the relative scale of TRI releases and transfers within each sectorprofiled under this project. Please note that the following figures and tablesdo not contain releases and transfers for industrial categories that are notincluded in this project, and thus cannot be used to draw conclusionsregarding the total release and transfer amounts that are reported to TRI.Similar information is available within the annual TRI Public Data ReleaseBook.
Figure 7 is a graphical representation of a summary of the TRI data for theaerospace industry and the other sectors profiled in separate notebooks. Thebar graph presents the total TRI releases and total transfers on the verticalaxis. Industry sectors are presented in the order of increasing SIC code. Thegraph is based on the data shown in Table 13 and is meant to facilitatecomparisons between the relative amounts of releases and transfers bothwithin and between these sectors. Table 13 also presents the average releasesper facility in each industry. The reader should note that differences in theproportion of facilities captured by TRI exist between industry sectors. Thiscan be a factor of poor SIC matching and relative differences in the numberof facilities reporting to TRI from the various sectors. In the case of theaerospace industry, the 1995 TRI data presented here covers 237 facilities.These facilities listed SIC 3721, 3724, 3728, 3761, 3764, or 3769 (aerospaceindustry) as a primary SIC code(s).

Aerospace Industry Chemical Releases and Transfers
Sector Notebook Project November 199857
0
100
200
300
400
500
600
22 24 25
2611
-263
1
2711
-278
9
2812
-281
9
2821
, 282
3, 2
824
2833
, 283
4
2861
-286
929
11 30 32 331
332,
336
333,
334 34 36 37
1
372,
376
3731
SIC Range
Tot
al P
ound
s (m
illio
ns)
Total Releases Total Transfers
Figure 7: Summary of TRI Releases and Transfers by Industry
Source: US EPA 1995 Toxics Release Inventory Database.
Key to Standard Industrial Classification CodesSIC Range Industry Sector SIC Range Industry Sector SIC Range Industry Sector
22 Textiles 2833, 2834 Pharmaceuticals 333, 334 Nonferrous Metals
24 Lumber and WoodProducts
2861-2869 Organic Chem. Mfg. 34 Fabricated Metals
25 Furniture and Fixtures 2911 Petroleum Refining 36 Electronic Equip. and Comp.
2611-2631 Pulp and Paper 30 Rubber and Misc. Plastics 371 Motor Vehicles, Bodies,Parts, and Accessories
2711-2789 Printing 32 Stone, Clay, and Concrete 372, 376 Aerospace
2812-2819 Inorganic ChemicalManufacturing
331 Iron and Steel 3731 Shipbuilding and Repair
2821, 2823,2824
Resins and Plastics 332, 336 Metal Casting

Aerospace Industry
Chem
ical Releases and T
ransfers
Secto
r No
teboo
k Pro
jectN
ovem
ber 199858
Table 13: 1995 Toxics Release Inventory Data for Selected IndustriesTRI Releases TRI Transfers
Industry SectorSIC
Range # TRI
Facilities
TotalReleases(million
lbs.)
AverageReleases
perFacility(lbs.)
TotalTransfers(million
lbs.)
AverageTransfers
perFacility(lbs.)
TotalReleases +Transfers
(million lbs.)
Average Releases+ Transfers per
Facility (lbs.)
Textiles 22 339 17.8 53,000 7.0 21,000 24.8 74,000
Lumber and Wood Products 24 397 30.0 76,000 4.1 10,000 34.1 86,000
Furniture and Fixtures 25 336 37.6 112,000 9.9 29,000 47.5 141,000
Pulp and Paper 2611-2631 305 232.6 763,000 56.5 185,000 289.1 948,000
Printing 2711-2789 262 33.9 129,000 10.4 40,000 44.3 169,000
Inorganic Chem. Mfg. 2812-2819 413 60.7 468,000 21.7 191,000 438.5 659,000
Resins and Plastics 2821,2823,2824
410 64.1 156,000 192.4 469,000 256.5 625,000
Pharmaceuticals 2833, 2834 200 29.9 150,000 147.2 736,000 177.1 886,000
Organic Chemical Mfg. 2861-2869 402 148.3 598,000 208.6 631,000 946.8 1,229,000
Agricultural Chemicals 287 236 77.1 327,000 11.4 48,000 88.5 375,000
Petroleum Refining 2911 180 73.8 410,000 29.2 162,000 103.0 572,000
Rubber and Misc. Plastics 30 1,947 143.1 73,000 102.6 53,000 245.7 126,000
Stone, Clay, and Concrete 32 623 43.9 70,000 31.8 51,000 75.7 121,000
Iron and Steel 331 423 90.7 214,000 513.9 1,215,000 604.6 1,429,000
Metal Casting 332, 336 654 36.0 55,000 73.9 113,000 109.9 168,000
Nonferrous Metals 333, 334 282 201.7 715,000 164 582,000 365.7 1,297,000
Fabricated Metals 34 2,676 83.5 31,000 350.5 131,000 434.0 162,000
Electronic Equip. andComp.
36 407 4.3 11,000 68.8 169,000 73.1 180,000
Motor Vehicles, Bodies,Parts, and Accessories
371 754 79.3 105,000 194 257,000 273.3 362,000
Aerospace 372, 376 237 12.5 53,000 17.1 72,000 29.6 125,000
Shipbuilding 3731 43 2.4 56,000 4.1 95,000 6.5 151,000
Source: US EPA Toxics Release Inventory Database, 1995.

Aerospace Industry Pollution Prevention Opportunities
Sector Notebook Project November 199859
V. POLLUTION PREVENTION OPPORTUNITIES
The best way to reduce pollution is to prevent it in the first place. Somecompanies have creatively implemented pollution prevention techniques thatimprove efficiency and increase profits while at the same time minimizingenvironmental impacts. This can be done in many ways such as reducingmaterial inputs, re-engineering processes to reuse by-products, improvingmanagement practices, and employing substitution of toxic chemicals. Somesmaller facilities are able to actually get below regulatory thresholds just byreducing pollutant releases through aggressive pollution prevention policies.
The Pollution Prevention Act of 1990 established a national policy ofmanaging waste through source reduction, which means preventing thegeneration of waste. The Pollution Prevention Act also established as nationalpolicy a hierarchy of waste management options for situations in which sourcereduction cannot be implemented feasibly. In the waste managementhierarchy, if source reduction is not feasible the next alternative is recyclingof wastes, followed by energy recovery, and waste treatment as a lastalternative.
In order to encourage these approaches, this section provides both generaland company-specific descriptions of some pollution prevention advances thathave been implemented within the aerospace industry. While the list is notexhaustive, it does provide core information that can be used as the startingpoint for facilities interested in beginning their own pollution preventionprojects. This section provides summary information from activities that maybe, or are being implemented by this sector. When possible, information isprovided that gives the context in which the technique can be used effectively.Please note that the activities described in this section do not necessarily applyto all facilities that fall within this sector. Facility-specific conditions must becarefully considered when pollution prevention options are evaluated, and thefull impacts of the change must examine how each option affects air, land andwater pollutant releases.
Pollution Prevention Techniques
This section lists many pollution prevention techniques geared toward theaerospace industry and its related processes. Some techniques may beapplicable to a number of different processes such as materials substitution oflow-solvent and less hazardous materials exist, while others are specific to asingle phase of aerospace manufacturing. Many of the techniques discussedbelow were obtained from the Profile of the Shipbuilding and RepairIndustry, EPA, 1997. It is important to note that the FAA places very strict“airworthiness” guidelines on manufacturing and rework facilities for safetyand quality control purposes, thus new pollution prevention alternatives mayrequire a full evaluation and permitting process before they may be used.
Aerospace Industry Pollution Prevention Opportunities
Sector Notebook Project November 199860
Because military facilities are not subject to FAA guidelines, they have agreater opportunity to implement P2 alternatives. As a result, studies havebeen conducted at various Air Force, Coast Guard, and Naval facilities whichare referenced in Section IX. Excellent information on military facility P2activities can be found at web sites of the Air Force Center for EnvironmentalExcellence (http://www.afcee.brooks.af.mil), and at the Navy’s P2 Libraryweb site (http://enviro.nfesc.navy.mil/p2library).
V.A. Machining and Metalworking
Coolant, or metalworking, fluids account for the largest waste streamgenerated by machining operations. Waste metalworking fluids are createdwhen the fluids are no longer usable due to contamination by oils or chemicaladditives. If the contamination rate of the metalworking fluids is reduced, theneed to replace them will be less frequent. This will reduce the wastegenerated.
Preventing Fluid Contamination
Fluid can become hazardous waste if it is contaminated. Although it is notpossible to eliminate contamination, it is possible to reduce the rate ofcontamination and thereby prolong its use.
The primary contaminant in these waste fluids is tramp oil. One way topostpone contamination is to promote better maintenance of the wipers andseals. A preventative maintenance program should be installed and enforcedin the machine shop. Scheduled sump and machine cleaning as well asperiodic inspections of the wipers and oil seals should be carried out. Theresponsibility for this should be assigned to some person or group in aposition of authority to ensure its success.
Synthetic Fluids
Synthetic fluids have many advantages over their non-synthetic counterparts.Usually the synthetic varieties do not lubricate as effectively, but they are lesssusceptible to contamination and highly resistant to biological breakdown.Most synthetic fluids have superior longevity and can operate over a largetemperature range without adverse side effects. Straight oils should bereplaced with synthetic ones when possible.
Recycling Fluids
Once all of the source reduction options have been considered, it is time toexplore the possibilities of reuse. It should be noted that in many cases, afterthe majority of the contaminants have been removed, further treatment withchemicals or concentrated fluid is necessary before the fluids can be
Aerospace Industry Pollution Prevention Opportunities
Sector Notebook Project November 199861
recirculated through the machines.
Filtration Filtration is a common way to remove particles from the fluid aswell as tramp oils or other contaminants. Many different types of filters canbe used depending on the medium to be filtered and the amount of filtrationdesired. Contaminated cutting fluids can be passed through a bag, disc, orcartridge filter or separated in a centrifuge.
Skimming and Flotation Although it is a slow process, skimming ofcontaminants is inexpensive and can be very effective. The principle is to letthe fluid sit motionless in a sump or a tank, and after a predetermined amountof time, the unwanted oils are skimmed off the surface and the heavierparticulate matter is collected off the bottom. A similar technique, flotation,injects high pressure air into contaminated cutting fluid. As the air comes outof solution and bubbles to the surface, it attaches itself to suspendedcontaminants and carries them up to the surface. The resulting sludge isskimmed off the surface and the clean fluid is reused.
Centrifugation Centrifugation uses the same settling principles as flotation,but the effects of gravity are multiplied thousands of times due to the spinningaction of the centrifuge. This will increase the volume of fluids which can becleaned in a given amount of time.
Pasteurization Pasteurization uses heat treatment to kill microorganisms inthe fluid and reduce the rate at which rancidity (biological breakdown) willoccur. Unfortunately, heat can alter the properties of the fluid and render itless effective. Properties lost in this way are usually impossible to recover.
Downgrading Sometimes it is possible to use high quality hydraulic oils ascutting fluids. After the oils have reached their normal usable life, they nolonger meet the high standards necessary for hydraulic components. At thistime they are still good enough to be used for the less demanding jobs. It maybe necessary to treat the fluid before it can be reused, but changing fluid’sfunctions in this manner has proven successful in the past.
V.B. Surface Preparation
The majority of wastes generated during surface preparation are spentabrasives and solvents mixed with paint chips. One way the volume of wastegenerated can be reduced is by using blast media that is relatively easy toreuse.
Improving Recyclability of Abrasive Blasting Media
Often, air powered cleaning equipment is used to screen abrasive to separate

Aerospace Industry Pollution Prevention Opportunities
Sector Notebook Project November 199862
it from large paint particles. These systems may also remove lighter dust fromthe heavy abrasive. This media separation can be especially important whenthe paint being removed contains heavy metals. An alternative to on-sitereclamation is to send it for processing off-site. It is very important that wastestreams, especially hazardous waste, are not mixed with used blasting media.Outside debris and other waste could render the media unfit for reuse.
Plastic Media Blasting
As a substitute for other blast media, the military has experimented extensivelywith plastic media stripping. This process is particularly good for strippingcoatings from parts with fragile substrates often found in the aerospaceindustry such as zinc, aluminum, and fiberglass. It can be a lengthy processbecause it strips paint layer by layer. The same types and quantities of wasteare generated as with grit blasting, but the plastic medium is more recyclablewith the use of pneumatic media classifiers that are part of the strippingequipment. The only waste requiring disposal is the paint waste itself.However, the use of plastic media is fairly limited. Plastic blasting media donot work well on epoxy paints. In addition, the blasting equipment isexpensive and requires trained operators.
Water Jet Stripping (Hydroblasting)
Hydroblasting is a cavitating high pressure water jet stripping system that canremove most paints. These system may use pressures as high as 50,000 psig.Hydroblasting is an excellent method for removing even hard coatings frommetal substrates. Some systems automatically remove the paint chips orstripped material from the water and reuse the water for further blasting. Byrecirculating the water in this manner, the amount of waste is greatly reduced.Wastewater from this process is usually suitable for sewer disposal after thepaint particles are removed. Although this process produces very little waste,it is not always as efficient as other blasting methods, has relatively highcapital and maintenance costs, and may not be adequate for fragile substrates.
V.C. Solvent Cleaning and Degreasing
Aerospace manufacturers often use large quantities of solvents in a variety ofcleaning and degreasing operations including parts cleaning, processequipment cleaning, and surface preparation for coating applications. Thefinal cost of solvent used for various cleanup operations is nearly twice theoriginal purchase price of the virgin solvent. The additional cost is primarilydue to the fact that for each drum purchased, extra disposal cost, hazardousmaterials transportation cost, and manifesting time and expense are incurred.With the rising cost of solvents and waste disposal services, combined withcontinuously developing regulation, reducing the quantities of solvents used

Aerospace Industry Pollution Prevention Opportunities
Sector Notebook Project November 199863
and solvent wastes generated can be extremely cost effective.
Eliminating the Use of Solvents
Eliminating the use of solvents avoids any waste generation associated withspent solvent. Elimination can be achieved by utilization of non-solventcleaning agents or eliminating the need for cleaning altogether. Solventelimination applications include the use of water-soluble cutting fluids,protective peel coatings, aqueous cleaners, and mechanical cleaning systems(USEPA/OECA, 1997).
Water-soluble Cutting Fluids Water-soluble cutting fluids can often be usedin place of oil-based fluids. The cutting oils usually consist of an oil-in-wateremulsion used to reduce friction and dissipate heat. If these fluids need to beremoved after the machining process is complete, solvents may be needed.
In efforts to eliminate solvent degreasing and its subsequent waste, specialwater-soluble cutting fluids have been developed. Systems are available thatcan clean the cutting fluid and recycle the material back to the cuttingoperation. Obstacles to implementing this method are: cost (water-solublefluids are generally more expensive), procurement (there are only a fewsuppliers available), and the inability to quickly switch between fluid typeswithout thoroughly cleaning the equipment (USEPA/OECA, 1997).
Aqueous Cleaners Aqueous cleaners, such as alkali, citric, and caustic base,are often useful substitutes for solvents. There are many formulations that aresuited for a variety of cleaning requirements. Many aqueous cleaners havebeen found to be as effective as the halogenated solvents that are commonlyemployed.
Aqueous stripping agents, such as caustic soda (NaOH), are often employedin place of methylene chloride based strippers. Caustic solutions have theadvantage of eliminating solvent vapor emissions. A typical caustic bathconsists of about 40 percent caustic solution heated to about 200 degreesFahrenheit. Caustic stripping is generally effective on alkyl resins and oilpaints (EPA, March 1997).
The Douglas Aircraft Division of McDonnell Douglas used a chromic acidsolution to clean aluminum parts. However, the solution began to corrode thesteel cleaning equipment parts. A scientist at McDonnell Douglas developeda sodium hydroxide-based process which cleaned parts sufficiently to detectcracks in the aluminum parts during testing. The new process saves anestimated $28,000 per year in chemical costs (Boeing, 1998).

Aerospace Industry Pollution Prevention Opportunities
Sector Notebook Project November 199864
In 1990, the Martin Marietta Astronautics Group (now Lockheed Martin)eliminated the use of 1,1,1-trichloroethane (TCA) and methyl ethyl ketone(MEK) for vapor degreasing. Six alternative aqueous cleaners were subjectedto a screening process that evaluated health hazards, treatability ofwastewater, corrosion potential, degreasing performance, and salt fogcorrosion resistance. From this study, Lockheed Martin selected a nontoxicaqueous terpene cleaner. The substitution of this cleaner saves hundreds ofthousands of dollars every year in material cost savings and ozone depletiontaxes (Dykema, 1993).
Lockheed Martin Tactical Aircraft Systems in Fort Worth, Texas, hassubstituted low vapor pressure solvent and aqueous cleaning for CFC-113 inall aspects of aircraft manufacturing. The low vapor pressure solvent is ablend of propylene glycol methyl ether acetate, isoparaffins, and butyl acetate.The solvent is effective on a variety of organic soils and is used for wiping thesurfaces of aircraft components and assemblies. The substitution of thiscleaner completely eliminated CFC emissions and reduced solvent use, solventcost, VOC emissions, and total air emissions (Evanoff, 1993).
The advantages of substituting aqueous cleaners include minimizing worker’sexposure to solvent vapors, reducing liability and disposal problemsassociated with solvent use, and cost. Aqueous cleaners do not volatilize asquickly as other solvents, thereby reducing losses due to evaporation. Sincemost aqueous cleaners are biodegradable, disposal is not a problem once theorganic or inorganic contaminants are removed (USEPA, March 1997).
The use of aqueous cleaners can also result in cost savings. Although someaqueous cleaners may cost less than an equivalent amount of solvent, thepurchase price of each is about the same. The cost of disposal, loss due toevaporation, and associated liabilities, however, favor aqueous cleaners.
The disadvantages of aqueous cleaners in place of solvents may include:possible incompatibilities with FAA guidelines, possible inability of theaqueous cleaners to provide the degree of cleaning required, incompatibilitybetween the parts being cleaned and the cleaning solution, need to modify orreplace existing equipment, longer required cleaning time, and problemsassociated with moisture left on parts being cleaned. Oils removed from theparts during cleaning may float on the surface of the cleaning solution andmay interfere with subsequent cleaning. Oil skimming is usually required(USEPA/OECA, 1997).
Mechanical Cleaning Systems Utilizing mechanical cleaning systems can alsoreplace solvents in degreasing and cleaning operations. In many cases, a highpressure steam gun or high pressure parts washer can clean parts and surfacesquicker and to the same degree of cleanliness as that of the solvents theyreplace. Light detergents can be added to the water supply for improved
Aerospace Industry Pollution Prevention Opportunities
Sector Notebook Project November 199865
cleaning. The waste produced by these systems is usually oily wastewater.This wastewater can be sent through an oil/water separator, the removedwater discharged to the sewer, and the oil residue sent to a petroleumrecycler. Some hot water wash and steam systems can be supplemented byemulsifying solutions to speed the process. Although these additives speedthe cleaning process, they can make separation of the oil from the water verydifficult and create problems with disposal of the waste.
Cryogenic stripping utilizes liquid nitrogen and non-abrasive plastic beads asblasting shot. This method relies on the freezing effect of the liquid nitrogenand the impact of the plastic shot. Subjecting the surface to extremely lowtemperatures creates stress between the coating and the substrate causing thecoating to become brittle. When the plastic shot hits the brittle coating,debonding occurs. The process is non-abrasive, and will not damage thesubstrate, but effects of the metal shrinkage, due to extremely lowtemperatures, should be monitored. The process does not produce liquidwastes, and nitrogen, chemically inert, is already present in the atmosphere(USEPA/OECA, 1997).
Thermal stripping methods can be useful for objects that cannot be immersed.In this process, superheated air is directed against the surface of the object.The high temperatures cause some paints to flake off. The removal resultsfrom the drying effects of the air and the uneven expansion of the paint andthe substrate. Some paints will melt at high temperatures, allowing the paintto be scraped off manually or with abrasives. Hand-held units are availablethat produce a jet of hot air. Electric units and open flame or torch units arealso used. While this system is easy to implement, it is limited to items thatare not heat sensitive and to coatings that are affected by the heat(USEPA/OECA, 1997).
McDonnell Douglas has developed two thermal stripping techniques. Thefirst one, known as FLASHJETTM, uses a high-intensity xenon lamp to heat thesurface paint and disintegrate it. A stream of dry ice pellets follows to carryaway the paint chips. FLASHJETTM was developed for use and tested onhelicopters at the McDonnell Douglas Helicopter Systems plant in Mesa,Arizona. FLASHJETTM reduced the manual work required by 10 to 15percent (Boeing, 1998).
The second technique was adapted from a technique to remove hydrocarbonsfrom engines. The Hot Gaseous Nitrogen (GN2) Purge heats the criticalengine surfaces, driving off the volatile hydrocarbons, which then leave theengine through the flow of nitrogen. This method eliminates the use of 1,1,1-trichloroethane for this type of engine cleaning (Boeing, 1998).
Hughes Aircraft Company developed a supercritical carbon dioxide (SCCO2)cleaning system to be used in many cleaning applications in the aerospace

Aerospace Industry Pollution Prevention Opportunities
Sector Notebook Project November 199866
industry. At temperatures and pressures close to or above its critical point(88(F and 1,073 psia), CO2 acts as an ideal solvent. It is also inexpensive andinert, non-combustible, naturally occurring, and does not contribute to smog.Efficient removal of oils, greases, fingerprints, solder flux residues have beenachieved by the SUPERSCRUBTM unit at Hughes (Chao).
Reducing the Use of Solvent
By eliminating the use or need for solvent cleaning, the problems associatedwith disposal of spent solvent are also eliminated. In cases where theelimination of solvent use is not possible or practical, utilization of varioussolvent waste reduction techniques can lead to a substantial savings in solventwaste.
Methods of reducing solvent usage can be divided into three categories:source control of air emissions, efficient use of solvent and equipment, andmaintaining solvent quality. Source control of air emissions addresses waysin which more of the solvent can be kept inside a container or cleaning tankby reducing the chances for evaporation loss. Efficient use of solvent andequipment through better operating procedures can reduce the amount ofsolvent required for cleaning. Maintaining the quality of solvent will extendthe life cycle effectiveness of the solvent.
Source Control of Air Emissions Source control of air emissions can beachieved through equipment modification and proper operation of equipment.Some simple control measures include installation and use of lids, an increaseof freeboard height of cleaning tanks, installation of freeboard chillers, andtaking steps to reduce solvent drag-out.
All cleaning units, including cold cleaning tanks and dip tanks, should havesome type of lid installed. When viewed from the standpoint of reducing airemissions, the roll-type cover is preferable to the hinge type. Lids that swingdown can cause a piston effect and force the escape of solvent vapor. Inoperations such as vapor degreasing, use of lids can reduce solvent loss from24 percent to 50 percent. For tanks that are continuously in use, covers havebeen designed that allow the work pieces to enter and leave the tank while thelid remains closed.
In an open top vapor degreaser, freeboard is defined as the distance from thetop of the vapor zone to the top of the tank. Increasing the freeboard willsubstantially reduce the amount of solvent loss. A freeboard chiller may alsobe installed above the primary condenser coil. This refrigerated coil, muchlike the cooling jacket, chills the air above the vapor zone and creates asecondary barrier to vapor loss. Reduction in solvent usage, by use offreeboard chillers, can be as high as 60 percent. The major drawback with afreeboard chiller is that it can introduce water (due to condensation from air)

Aerospace Industry Pollution Prevention Opportunities
Sector Notebook Project November 199867
into the tank.
In addition to measures that reduce air emissions through equipmentmodification, it is also possible to reduce emissions through proper equipmentlayout, operation, and maintenance. Cleaning tanks should be located in areaswhere air turbulence and temperature do not promote vapor loss.
Maximize the Dedication of the Process Equipment In addition to reductionin vapor loss, reducing the amount of solvent used can be achieved throughbetter operating practices that increase the efficiency of solvent cleaningoperations. Maximizing the dedication of the process equipment reduces theneed for frequent cleaning. By using a mix tank consistently for the sameformulation, the need to clean equipment between batches is eliminated.
Avoid Unnecessary Cleaning Avoiding unnecessary cleaning also offerspotential for waste reduction. For example, paint mixing tanks for two-partpaints are often cleaned between batches of the same product. The effect ofcross-contamination between batches should be examined from a productquality control viewpoint to see if the cleaning step is always necessary.
Proper Production Scheduling Proper production scheduling can reducecleaning frequency by eliminating the need for cleaning between theconclusion of one task and the start of the next. A simple example of thisprocedure is to have a small overlap between shifts that perform the sameoperation with the same equipment. This allows the equipment that wouldnormally be cleaned and put away at the end of each shift, such as paintingequipment, to be taken over directly by the relief.
Clean Equipment Immediately Cleaning equipment immediately after useprevents deposits from hardening and avoids the need for consuming extrasolvent. Letting dirty equipment accumulate and be cleaned later can alsoincrease the time required for cleaning.
Better Operating Procedures Better operating procedures can minimizeequipment clean-up waste. Some of the methods already discussed areexamples of better operating procedures. Better operator training, education,closer supervision, improved equipment maintenance, and increasing the useof automation are very effective in waste minimization.
Reuse Solvent Waste Reuse of solvent waste can reduce or eliminate wasteand result in a cost savings associated with a decrease in raw materialconsumption. The solvent from cleaning operations can be reused in othercleaning processes in which the degree of cleanliness required is much less.This will be discussed in more detail in the next section.
Solvent Recycling

Aerospace Industry Pollution Prevention Opportunities
Sector Notebook Project November 199868
Although not as preferable as source reduction, solvent recycling may be aviable alternative for some facilities. The goal of recycling is to recover fromthe waste solvent, a solvent of a similar purity to that of the virgin solvent foreventual reuse in the same operation, or of a sufficient purity to be used inanother application. Recycling can also include the direct use of solvent wastefrom one waste stream in another operation. There are a number of techniquesthat facilities can use onsite to separate solvents from contaminants includingdistillation, evaporation, sedimentation, decanting, centrifugation, filtering,and membrane separation.
V.D. Metal Plating and Surface Finishing
Pollution prevention opportunities in metal plating and surface finishingoperations are discussed in the Profile of the Fabricated Metal ProductsIndustry Sector Notebook. Readers are encouraged to consult this documentfor pollution prevention information relating to metal plating and surfacefinishing. An additional resource for pollution prevention informationregarding metal finishing can be found at the National Metal FinishingResource Center (http://www.nmfrc.org).
V.E. Painting and Coating
Painting and coating operations are typically the largest single source of VOCemissions from aerospace manufacturing and rework facilities. In addition,paint waste can account for more than half of the total hazardous wastegenerated. Paint waste may include leftover paint in containers, overspray,paint that is no longer usable (Non-spec paint), and rags and other materialscontaminated with paint. In many cases, the amount of paint waste generatedcan be reduced through the use of improved equipment, alternative coatings,and good operating practices. An additional resource for pollution preventioninformation regarding painting and coating can be found at the Paint andCoatings Resource Center (http://www.paintcenter.org).
Application Equipment
In order to effectively reduce paint waste and produce a quality coating,proper application techniques should be supplemented with efficientapplication equipment. Through the use of equipment with high transferefficiencies, the amount of paint lost to overspray is minimized.
High Volume Low Pressure (HVLP) Spray Guns The HVLP spray gun isbasically a conventional air spray gun with modifications and special nozzlesthat atomize the paint at very low air pressures. The atomizing pressure ofHVLP systems is often below 10 psi. The design of this gun allows bettertransfer efficiency and reduced overspray than that of conventional air guns.The low application pressure decreases excessive bounceback and allows

Aerospace Industry Pollution Prevention Opportunities
Sector Notebook Project November 199869
better adhesion of the coating to the substrate.
Although improvements are consistently being made to overcome itslimitations, most HVLP systems have some definite drawbacks, includingdifficulty atomizing viscous coatings, sensitivity to variations in incomingpressure, sensitivity to wind, and slow application rates.
Airless Spray Guns Instead of air passing through the spray gun, an airlesssystem applies static pressure to the liquid paint. As the paint passes throughthe nozzle, the sudden drop in pressure atomizes the paint and it is carried tothe substrate by its own momentum. Pressure is applied to the paint by apump located at a remote supply. These systems have become favorable overconventional air-spray systems for three main reasons:
1) reduced overspray and rebound, 2) high application rates and transfer efficiency,3) permits the use of high-build coatings with the result that fewercoats are required to achieve specific film thickness.
One major disadvantage of some airless spray systems is the difficultyapplying very thin coats. If coatings with less than a millimeter in thicknessare required, such as primers applied to objects that require weldability, it maybe difficult to use an airless system.
Electrostatic Spray Electrostatic spray systems utilize paint droplets that aregiven a negative charge in the vicinity of a positively charged substrate. Thedroplets are attracted to the substrate and a uniform coating is formed. Thissystem works well on cylindrical and rounded objects due to its “wrap-around” effect that nearly allows the object to be coated from one side. Verylittle paint is lost to overspray, and it has been noted to have a transferefficiency of over 95%.
In order for an electrostatic system to operate properly, the correct solventbalance is needed. The evaporation rate must be slow enough for the chargeddroplets to reach the substrate in a fluid condition to flow out into a smoothfilm, but fast enough to avoid sagging. The resistivity of the paint must alsobe low enough to enable the paint droplets to acquire the maximum charge.
Although the operating costs of electrostatic spray systems are relatively low,the initial capital investment can be high. This system has been found to workextremely well in small parts painting applications. Sometimes the installationof an electrostatic powder coating system can replace a water curtain spraypaint booth.
Heated Spray When paint is heated, its viscosity is reduced allowing it to beapplied with a higher solids content, thus requiring less solvent. When the

Aerospace Industry Pollution Prevention Opportunities
Sector Notebook Project November 199870
paint is heated in a special container and supplied to the gun at 140( to160(F, coatings of 2 to 4 millimeters dry-film thickness can be applied in oneoperation, resulting in considerable savings in labor cost. In addition, muchof the associated solvent emissions are eliminated.
Heating the coating prior to application can be used with both conventionaland airless spray applications. An in-line heater is used to heat the coatingbefore it reaches the gun. As the coating is propelled through the air, it coolsrapidly and increases viscosity after it hits the surface, allowing for betteradhesion to the substrate.
Plural Component Systems A common problem that facilities face whenworking with two-part coatings is overmixing. Once the component parts ofa catalyst coating are mixed, the coating must be applied. Otherwise, theexcess unused coating will cure and require disposal. Additionally, thecoating equipment must be cleaned immediately after use.
One large advantage of plural component technology is the elimination ofpaint waste generated by mixing an excess amount of a two part coating. Thisis achieved through the use of a special mixing chamber that mixes thepigment and catalyst seconds before the coating is applied. Each componentis pumped through a device that controls the mixing ratio and then iscombined in a mixing chamber. From the mixing chamber, the mixed coatingtravels directly to the spray guns. The only cleaning that is required is themixing chamber, gun, and the length of supply hose connecting them.
Wet Booth Generally, small-volume painting operations will find the lowerpurchase cost of a dry filter booth will meet their requirements. Onedisadvantage in the use of a dry-filter booth is in the disposal of the waste.Typically the majority of this waste is the filter media itself which has beencontaminated by a relatively small amount of paint. Reusable filters maydecrease waste volume and reduce disposal cost. In some applications,overspray can be collected for reuse.
If overall painting volume can justify the investment, a wet booth eliminatesdisposal of filter media and allows waste to be reduced in weight and volume.This is achieved by separating the paint from the water through settling,drying, or using a centrifuge or cyclone (Ohio EPA, 1994).
Recycle Paint Booth Water Various methods and equipment are used toreduce or eliminate the discharge of the water used in water-wash booths(water curtain). These methods and equipment prevent the continuousdischarge of booth waters by conditioning (i.e., adding detacifiers and paint-dispersing polymers) and removing paint solids. The most basic form of watermaintenance is the removal of paint solids by manual skimming and/or raking.This can be performed without water conditioning since some portion of
Aerospace Industry Pollution Prevention Opportunities
Sector Notebook Project November 199871
solvent-based paints usually float and/or sink. With the use of detacifiers andpaint-dispersing polymer treatments, more advanced methods of solidsremoval can be implemented. Some common methods are discussed below.
Wet-Vacuum Filtration Wet-vacuum filtration units consist of an industrialwet-vacuum head on a steel drum containing a filter bag. The unit is used tovacuum paint sludge from the booth. The solids are filtered by the bag andthe water is returned to the booth. Large vacuum units are also commerciallyavailable that can be moved from booth to booth by forklift or permanentlyinstalled near a large booth.
Tank-Side Weir A weir can be attached to the side of a side-draft booth tank,allowing floating material to overflow from the booth and be pumped to afiltering tank for dewatering.
Consolidator A consolidator is a separate tank into which booth water ispumped. The water is then conditioned by the introduction of chemicals.Detacified paint floats to the surface of the tank, where it is skimmed by acontinuously moving blade. The clean water is recycled to the booth.
Filtration Various types of filtration units are used to remove paint solidsfrom booth water. This is accomplished by pumping the booth water to theunit where the solids are separated and returning the water to the booth. Thesimplest filtration unit consists of a gravity filter bed utilizing paper or clothmedia. Vacuum filters are also employed, some of which require precoatingwith diatomaceous earth.
Centrifuge Methods Two common types of centrifugal separators are thehydrocyclone and the centrifuge. The hydrocyclone is used to concentratesolids. The paint booth water enters a cone-shaped unit under pressure andspins around the inside surface. The spinning imparts an increased force ofgravity, which causes most of the solid particles to be pulled outward to thewalls of the cone. Treated water exits the top of the unit and the solids exitfrom the bottom. Some systems have secondary filtration devices to furtherprocess the solids. The centrifuge works in a similar manner, except that thebooth water enters a spinning drum, which imparts the centrifugal forceneeded for separating the water and solids. Efficient centrifugation requiresclose control of the booth water chemistry to ensure a uniform feed. Also,auxiliary equipment such as booth water agitation equipment may be needed(EPA, 1995).
Alternative Coatings
The use of solvent-based coatings can lead to high costs to meet air and waterquality regulations. In efforts to reduce the quantity and toxicity of waste

Aerospace Industry Pollution Prevention Opportunities
Sector Notebook Project November 199872
paint disposal, alternative coatings have been developed that do not requirethe use of solvents and thinners. FAA guidelines may prohibit use of suchcoatings.
Powder Coatings Metal substrates can be coated with certain resins byapplying the powdered resin to the surface, followed by application of heat.The heat melts the resin, causing it to flow and form a uniform coating. Thethree main methods in use for applying the powder coating are fluidized bed,electrostatic spray, and flame spraying.
In flame spraying, the resin powder is blown through the gun by compressedair. The particles are melted in a high temperature flame and propelled againstthe substrate. This process is used widely with epoxy powders for aluminumsurfaces.
The electrostatic application method uses the same principles as theelectrostatic spray. The resin powder is applied to the surfaceelectrostatically. Heat is applied to the covered surface and the powder meltsto form the coating. The transfer efficiency and recyclability of this methodis very high.
The elimination of environmental problems associated with many liquid basedsystems is one of the major advantages of powder coatings. The use ofpowder coatings eliminates the need for solvents and thereby emits negligiblevolatile organic compounds (VOCs). Powder coatings also reduce the wasteassociated with unused two-part coatings that have already been mixed. Sincepowder overspray can be recycled, material utilization is high and solid wastegeneration is low. Recent case studies demonstrate that powder coatingsystems can be cleaner, more efficient, and more environmentally acceptable,while producing a higher quality finish than many other coating systems.
Water-Based Paints Water-based coatings are paints containing a substantialamount of water instead of volatile solvents. Alkyd, polyester, acrylic, andepoxy polymers can be dissolved and dispersed by water. In addition toreduction in environmental hazards due to substantially lower air emissions,a decrease in the amount of hazardous paint sludge generated can reducedisposal cost.
UV / EB Coatings Powder coatings require high temperatures for their cureand hence are not applicable to temperature sensitive substrates, such aspaper, wood or plastics. For such materials, the use of coatings systemscurable by ultra violate light or electron beams (UV/EB) have beendeveloped. The resins used in these coatings are basically the same as thoseused in conventional high performance coatings which have been modifiedto make them polymerizable by UV or EB energy. Thus they are liquids that

Aerospace Industry Pollution Prevention Opportunities
Sector Notebook Project November 199873
can be applied by conventional techniques such as spraying, roller coating,curtain coating, etc. (in contrast to powder coating which requires specializedapplication techniques). When exposed to the low level radiant energy, theyare instantly and completely cured with no heat application. Because of thediversity of raw materials that can be adapted to this technology, atremendous range of performance characteristics can be achieved. Inaddition, because no solvents are used in the coating formulations, there arevirtually no volatile organic compounds (VOCs) emitted, making themecologically preferred. Other advantages include the elimination of curingovens and incinerators which further aid the cleansing of the air as well assubstantial savings of space and fuel costs. The rapid curing cycle withoutthe need of a cool-down cycle allows for higher production rates andtherefore lower costs. UV/EB coatings can be used on metals, and areespecially useful when coating complex metal products that might containpaper, plastic or wood parts, because of the low temperature curing requiredby UV/EB. In addition, these, and other advantages which UV/EB provides,have led to rapid increase in their use in the manufacture of electroniccomponents.
Good Operating Practices
In many cases, simply altering a painting process can reduce wastes throughbetter management.
A good manual coating application technique is very important in reducingwaste. If not properly executed, spraying techniques have a high potential forcreating waste; therefore, proper application techniques are very important.
Reducing Overspray One of the most common means of producing paintwaste at facilities is overspray. Overspray not only wastes some of thecoating, it also presents environmental and health hazards. It is important thatfacilities try to reduce the amount of overspray as much as possible.Techniques for reducing overspray include:
1) triggering the paint gun at the end of each pass instead of carryingthe gun past the edge of the surface before reversing directions, 2) avoiding excessive air pressure, 3) keeping the gun perpendicular to the surface being coated.
Uniform Finish Application of a good uniform finish provides the surface withquality coating with a higher performance than an uneven finish. An unevencoating does not dry evenly and commonly results in using excess paint.
Overlap An overlap of 50 percent can reduce the amount of waste byincreasing the production rate and overall application efficiency. Overlap of50 percent means that for every pass that the operator makes with the spray

Aerospace Industry Pollution Prevention Opportunities
Sector Notebook Project November 199874
gun, 50 percent of the area covered by the previous pass is also sprayed. Ifless than a 50 percent overlap is used, the coated surface may appear streaked.If more than a 50 percent overlap is used, the coating is wasted and morepasses are required to coat the surface.
Paint Proportioning Mixing batches of paint on an as-needed basis, whetherthrough the use of a paint proportioning machine or otherwise, can reduce theamount of paint wasted. Recordkeeping requirements to track the amount ofpaint and thinner used can also help conserve materials and prevent waste.
General Housekeeping Small quantities of paint and solvents are frequentlylost due to poor housekeeping techniques. There are a variety of ways thatcan be implemented to control and minimize spills and leaks. Specificapproaches to product transfer methods and container handling can effectivelyreduce product loss.
The potential for accidents and spills is at the highest point when thinners andpaints are being transferred from bulk drum storage to the process equipment.Spigots, pumps, and funnels should be used whenever possible.
Evaporation can be controlled by using tight fitting lids, spigots, and otherequipment. The reduction in evaporation will increase the amount of availablematerial and result in lower solvent purchase cost.
Paint Containers A significant portion of paint waste is the paint that remainsinside a container after the container is emptied, and paint that is placed instorage, not used, and becomes outdated or non-spec. By consolidating paintuse and purchasing paint in bulk, large bulk containers have less surface areathan an equivalent volume of small cans, and the amount of drag-on paintwaste is reduced. Large bulk containers can sometimes be returned to thepaint supplier to be cleaned for reuse.
If the purchase of paint in bulk containers is not practical, the paint should bepurchased in the smallest amount required to minimize outdated or non-specpaint waste. Workers should not have to open a gallon can when only a quartis required. Usually, any paint that is left in the can will require disposal ashazardous waste.

Aerospace Industry Federal Statutes and Regulations
Sector Notebook Project November 199875
VI. SUMMARY OF FEDERAL STATUTES AND REGULATIONS
This section discusses the Federal regulations that may apply to this sector.The purpose of this section is to highlight and briefly describe the applicableFederal requirements, and to provide citations for more detailed information.The three following sections are included:
&Section VI.A. contains a general overview of major statutes&Section VI.B. contains a list of regulations specific to this industry&Section VI.C. contains a list of pending and proposed regulations
The descriptions within Section VI are intended solely for generalinformation. Depending upon the nature or scope of the activities at aparticular facility, these summaries may or may not necessarily describe allapplicable environmental requirements. Moreover, they do not constituteformal interpretations or clarifications of the statutes and regulations. Forfurther information, readers should consult the Code of Federal Regulationsand other state or local regulatory agencies. EPA Hotline contacts are alsoprovided for each major statute.
VI.A. General Description of Major Statutes
Resource Conservation and Recovery Act
The Resource Conservation And Recovery Act (RCRA) of 1976 whichamended the Solid Waste Disposal Act, addresses solid (Subtitle D) andhazardous (Subtitle C) waste management activities. The Hazardous andSolid Waste Amendments (HSWA) of 1984 strengthened RCRA’s wastemanagement provisions and added Subtitle I, which governs undergroundstorage tanks (USTs).
Regulations promulgated pursuant to Subtitle C of RCRA (40 CFR Parts260-299) establish a “cradle-to-grave” system governing hazardous wastefrom the point of generation to disposal. RCRA hazardous wastes include thespecific materials listed in the regulations (commercial chemical products,designated with the code "P" or "U"; hazardous wastes from specificindustries/sources, designated with the code "K"; or hazardous wastes fromnon-specific sources, designated with the code "F") or materials which exhibita hazardous waste characteristic (ignitability, corrosivity, reactivity, or toxicityand designated with the code "D").
Regulated entities that generate hazardous waste are subject to wasteaccumulation, manifesting, and record keeping standards. Facilities mustobtain a permit either from EPA or from a State agency which EPA hasauthorized to implement the permitting program if they store hazardouswastes for more than 90 days before treatment or disposal. Facilities may
Aerospace Industry Federal Statutes and Regulations
Sector Notebook Project November 199876
treat hazardous wastes stored in less-than-ninety-day tanks or containerswithout a permit. Subtitle C permits contain general facility standards suchas contingency plans, emergency procedures, record keeping and reportingrequirements, financial assurance mechanisms, and unit-specific standards.RCRA also contains provisions (40 CFR Part 264 Subpart S and §264.10) forconducting corrective actions which govern the cleanup of releases ofhazardous waste or constituents from solid waste management units atRCRA-regulated facilities.
Although RCRA is a Federal statute, many States implement the RCRAprogram. Currently, EPA has delegated its authority to implement variousprovisions of RCRA to 47 of the 50 States and two U.S. territories.Delegation has not been given to Alaska, Hawaii, or Iowa.
Most RCRA requirements are not industry specific but apply to any companythat generates, transports, treats, stores, or disposes of hazardous waste.Here are some important RCRA regulatory requirements:
&Identification of Solid and Hazardous Wastes (40 CFR Part 261) lays outthe procedure every generator must follow to determine whether the materialin question is considered a hazardous waste, solid waste, or is exempted fromregulation.
&Standards for Generators of Hazardous Waste (40 CFR Part 262)establishes the responsibilities of hazardous waste generators includingobtaining an EPA ID number, preparing a manifest, ensuring properpackaging and labeling, meeting standards for waste accumulation units, andrecordkeeping and reporting requirements. Generators can accumulatehazardous waste for up to 90 days (or 180 days depending on the amount ofwaste generated) without obtaining a permit.
&Land Disposal Restrictions (LDRs) (40 CFR Part 268) are regulationsprohibiting the disposal of hazardous waste on land without prior treatment.Under the LDRs program, materials must meet LDR treatment standards priorto placement in a RCRA land disposal unit (landfill, land treatment unit, wastepile, or surface impoundment). Generators of waste subject to the LDRs mustprovide notification of such to the designated TSD facility to ensure propertreatment prior to disposal.
&Used Oil Management Standards (40 CFR Part 279) impose managementrequirements affecting the storage, transportation, burning, processing, andre-refining of the used oil. For parties that merely generate used oil,regulations establish storage standards. For a party considered a used oilprocessor, re-refiner, burner, or marketer (one who generates and sellsoff-specification used oil directly to a used oil burner), additional tracking andpaperwork requirements must be satisfied.

Aerospace Industry Federal Statutes and Regulations
Sector Notebook Project November 199877
&RCRA contains unit-specific standards for all units used to store, treat, ordispose of hazardous waste, including Tanks and Containers. Tanks andcontainers used to store hazardous waste with a high volatile organicconcentration must meet emission standards under RCRA. Regulations (40CFR Part 264-265, Subpart CC) require generators to test the waste todetermine the concentration of the waste, to satisfy tank and containeremissions standards, and to inspect and monitor regulated units. Theseregulations apply to all facilities that store such waste, including large quantitygenerators accumulating waste prior to shipment off-site.
&Underground Storage Tanks (USTs) containing petroleum and hazardoussubstances are regulated under Subtitle I of RCRA. Subtitle I regulations (40CFR Part 280) contain tank design and release detection requirements, as wellas financial responsibility and corrective action standards for USTs. The USTprogram also includes upgrade requirements for existing tanks that must bemet by December 22, 1998.
&Boilers and Industrial Furnaces (BIFs) that use or burn fuel containinghazardous waste must comply with design and operating standards. BIFregulations (40 CFR Part 266, Subpart H) address unit design, provideperformance standards, require emissions monitoring, and restrict the type ofwaste that may be burned.
EPA's RCRA, Superfund and EPCRA Hotline, at (800) 424-9346, respondsto questions and distributes guidance regarding all RCRA regulations. TheRCRA Hotline operates weekdays from 9:00 a.m. to 6:00 p.m., ET, excludingFederal holidays.
Comprehensive Environmental Response, Compensation, and Liability Act
The Comprehensive Environmental Response, Compensation, and LiabilityAct (CERCLA), a 1980 law known commonly as Superfund, authorizes EPAto respond to releases, or threatened releases, of hazardous substances thatmay endanger public health, welfare, or the environment. CERCLA alsoenables EPA to force parties responsible for environmental contamination toclean it up or to reimburse the Superfund for response costs incurred by EPA.The Superfund Amendments and Reauthorization Act (SARA) of 1986revised various sections of CERCLA, extended the taxing authority for theSuperfund, and created a free-standing law, SARA Title III, also known as theEmergency Planning and Community Right-to-Know Act (EPCRA).
The CERCLA hazardous substance release reporting regulations (40 CFRPart 302) direct the person in charge of a facility to report to the NationalResponse Center (NRC) any environmental release of a hazardous substancewhich equals or exceeds a reportable quantity. Reportable quantities are listed

Aerospace Industry Federal Statutes and Regulations
Sector Notebook Project November 199878
in 40 CFR §302.4. A release report may trigger a response by EPA, or by oneor more Federal or State emergency response authorities.
EPA implements hazardous substance responses according to proceduresoutlined in the National Oil and Hazardous Substances Pollution ContingencyPlan (NCP) (40 CFR Part 300). The NCP includes provisions for permanentcleanups, known as remedial actions, and other cleanups referred to asremovals. EPA generally takes remedial actions only at sites on the NationalPriorities List (NPL), which currently includes approximately 1300 sites.Both EPA and states can act at sites; however, EPA provides responsibleparties the opportunity to conduct removal and remedial actions andencourages community involvement throughout the Superfund responseprocess.
EPA's RCRA, Superfund and EPCRA Hotline, at (800) 424-9346, answersquestions and references guidance pertaining to the Superfund program.The CERCLA Hotline operates weekdays from 9:00 a.m. to 6:00 p.m., ET,excluding Federal holidays.
Emergency Planning And Community Right-To-Know Act
The Superfund Amendments and Reauthorization Act (SARA) of 1986created the Emergency Planning and Community Right-to-Know Act(EPCRA, also known as SARA Title III), a statute designed to improvecommunity access to information about chemical hazards and to facilitate thedevelopment of chemical emergency response plans by State and localgovernments. EPCRA required the establishment of State emergencyresponse commissions (SERCs), responsible for coordinating certainemergency response activities and for appointing local emergency planningcommittees (LEPCs).
EPCRA and the EPCRA regulations (40 CFR Parts 350-372) establish fourtypes of reporting obligations for facilities which store or manage specifiedchemicals:
&EPCRA §302 requires facilities to notify the SERC and LEPC of thepresence of any extremely hazardous substance (the list of such substances isin 40 CFR Part 355, Appendices A and B) if it has such substance in excessof the substance's threshold planning quantity, and directs the facility toappoint an emergency response coordinator.
&EPCRA §304 requires the facility to notify the SERC and the LEPC in theevent of a release equaling or exceeding the reportable quantity of a CERCLAhazardous substance or an EPCRA extremely hazardous substance.
&EPCRA §311 and §312 require a facility at which a hazardous chemical, as

Aerospace Industry Federal Statutes and Regulations
Sector Notebook Project November 199879
defined by the Occupational Safety and Health Act, is present in an amountexceeding a specified threshold to submit to the SERC, LEPC and local firedepartment material safety data sheets (MSDSs) or lists of MSDS's andhazardous chemical inventory forms (also known as Tier I and II forms). Thisinformation helps the local government respond in the event of a spill orrelease of the chemical.
&EPCRA §313 requires manufacturing facilities included in SIC codes 20through 39, which have ten or more employees, and which manufacture,process, or use specified chemicals in amounts greater than thresholdquantities, to submit an annual toxic chemical release report. This report,known commonly as the Form R, covers releases and transfers of toxicchemicals to various facilities and environmental media, and allows EPA tocompile the national Toxic Release Inventory (TRI) database.
All information submitted pursuant to EPCRA regulations is publiclyaccessible, unless protected by a trade secret claim.
EPA's RCRA, Superfund and EPCRA Hotline, at (800) 424-9346, answersquestions and distributes guidance regarding the emergency planning andcommunity right-to-know regulations. The EPCRA Hotline operatesweekdays from 9:00 a.m. to 6:00 p.m., ET, excluding Federal holidays.
Clean Water Act
The primary objective of the Federal Water Pollution Control Act, commonlyreferred to as the Clean Water Act (CWA), is to restore and maintain thechemical, physical, and biological integrity of the nation's surface waters.Pollutants regulated under the CWA include "priority" pollutants, includingvarious toxic pollutants; "conventional" pollutants, such as biochemicaloxygen demand (BOD), total suspended solids (TSS), fecal coliform, oil andgrease, and pH; and "non-conventional" pollutants, including any pollutant notidentified as either conventional or priority.
The CWA regulates both direct and indirect discharges. The NationalPollutant Discharge Elimination System (NPDES) program (CWA §502)controls direct discharges into navigable waters. Direct discharges or "pointsource" discharges are from sources such as pipes and sewers. NPDESpermits, issued by either EPA or an authorized State (EPA has authorized 42States to administer the NPDES program), contain industry-specific,technology-based and/or water quality-based limits, and establish pollutantmonitoring requirements. A facility that intends to discharge into the nation'swaters must obtain a permit prior to initiating its discharge. A permitapplicant must provide quantitative analytical data identifying the types ofpollutants present in the facility's effluent. The permit will then set theconditions and effluent limitations on the facility discharges.

Aerospace Industry Federal Statutes and Regulations
Sector Notebook Project November 199880
A NPDES permit may also include discharge limits based on Federal or Statewater quality criteria or standards, that were designed to protect designateduses of surface waters, such as supporting aquatic life or recreation. Thesestandards, unlike the technological standards, generally do not take intoaccount technological feasibility or costs. Water quality criteria and standardsvary from State to State, and site to site, depending on the use classificationof the receiving body of water. Most States follow EPA guidelines whichpropose aquatic life and human health criteria for many of the 126 prioritypollutants.
Storm Water Discharges
In 1987 the CWA was amended to require EPA to establish a program toaddress storm water discharges. In response, EPA promulgated the NPDESstorm water permit application regulations. These regulations require thatfacilities with the following storm water discharges apply for an NPDESpermit: (1) a discharge associated with industrial activity; (2) a dischargefrom a large or medium municipal storm sewer system; or (3) a dischargewhich EPA or the State determines to contribute to a violation of a waterquality standard or is a significant contributor of pollutants to waters of theUnited States.
The term "storm water discharge associated with industrial activity" means astorm water discharge from one of 11 categories of industrial activity definedat 40 CFR 122.26. Six of the categories are defined by SIC codes while theother five are identified through narrative descriptions of the regulatedindustrial activity. If the primary SIC code of the facility is one of thoseidentified in the regulations, the facility is subject to the storm water permitapplication requirements. If any activity at a facility is covered by one of thefive narrative categories, storm water discharges from those areas where theactivities occur are subject to storm water discharge permit applicationrequirements.Those facilities/activities that are subject to storm water discharge permitapplication requirements are identified below. To determine whether aparticular facility falls within one of these categories, consult the regulation.
Category i: Facilities subject to storm water effluent guidelines, new sourceperformance standards, or toxic pollutant effluent standards.
Category ii: Facilities classified as SIC 24-lumber and wood products(except wood kitchen cabinets); SIC 26-paper and allied products (exceptpaperboard containers and products); SIC 28-chemicals and allied products(except drugs and paints); SIC 291-petroleum refining; and SIC 311-leathertanning and finishing.
Category iii: Facilities classified as SIC 10-metal mining; SIC 12-coal

Aerospace Industry Federal Statutes and Regulations
Sector Notebook Project November 199881
mining; SIC 13-oil and gas extraction; and SIC 14-nonmetallic mineralmining.
Category iv: Hazardous waste treatment, storage, or disposal facilities.
Category v: Landfills, land application sites, and open dumps that receive orhave received industrial wastes.
Category vi: Facilities classified as SIC 5015-used motor vehicle parts; andSIC 5093-automotive scrap and waste material recycling facilities.
Category vii: Steam electric power generating facilities.
Category viii: Facilities classified as SIC 40-railroad transportation; SIC 41-local passenger transportation; SIC 42-trucking and warehousing (exceptpublic warehousing and storage); SIC 43-U.S. Postal Service; SIC 44-watertransportation; SIC 45-transportation by air; and SIC 5171-petroleum bulkstorage stations and terminals.
Category ix: Sewage treatment works.
Category x: Construction activities except operations that result in thedisturbance of less than five acres of total land area.
Category xi: Facilities classified as SIC 20-food and kindred products; SIC21-tobacco products; SIC 22-textile mill products; SIC 23-apparel relatedproducts; SIC 2434-wood kitchen cabinets manufacturing; SIC 25-furnitureand fixtures; SIC 265-paperboard containers and boxes; SIC 267-convertedpaper and paperboard products; SIC 27-printing, publishing, and alliedindustries; SIC 283-drugs; SIC 285-paints, varnishes, lacquer, enamels, andallied products; SIC 30-rubber and plastics; SIC 31-leather and leatherproducts (except leather and tanning and finishing); SIC 323-glass products;SIC 34-fabricated metal products (except fabricated structural metal); SIC35-industrial and commercial machinery and computer equipment; SIC 36-electronic and other electrical equipment and components; SIC 37-transportation equipment (except ship and boat building and repairing); SIC38-measuring, analyzing, and controlling instruments; SIC 39-miscellaneousmanufacturing industries; and SIC 4221-4225-public warehousing andstorage.
Pretreatment Program
Another type of discharge that is regulated by the CWA is one that goes toa publicly-owned treatment works (POTWs). The national pretreatmentprogram (CWA §307(b)) controls the indirect discharge of pollutants toPOTWs by "industrial users." Facilities regulated under §307(b) must meet

Aerospace Industry Federal Statutes and Regulations
Sector Notebook Project November 199882
certain pretreatment standards. The goal of the pretreatment program is toprotect municipal wastewater treatment plants from damage that may occurwhen hazardous, toxic, or other wastes are discharged into a sewer systemand to protect the quality of sludge generated by these plants. Discharges toa POTW are regulated primarily by the POTW itself, rather than the State orEPA.
EPA has developed technology-based standards for industrial users ofPOTWs. Different standards apply to existing and new sources within eachcategory. "Categorical" pretreatment standards applicable to an industry ona nationwide basis are developed by EPA. In addition, another kind ofpretreatment standard, "local limits," are developed by the POTW in order toassist the POTW in achieving the effluent limitations in its NPDES permit.
Regardless of whether a State is authorized to implement either the NPDESor the pretreatment program, if it develops its own program, it may enforcerequirements more stringent than Federal standards.
Spill Prevention, Control and Countermeasure Plans
The 1990 Oil Pollution Act requires that facilities that could reasonably beexpected to discharge oil in harmful quantities prepare and implement morerigorous Spill Prevention Control and Countermeasure (SPCC) Plan requiredunder the CWA (40 CFR §112.7). There are also criminal and civil penaltiesfor deliberate or negligent spills of oil. Regulations covering response to oildischarges and contingency plans (40 CFR Part 300), and Facility ResponsePlans to oil discharges (40 CFR §112.20) and for PCB transformers and PCB-containing items were revised and finalized in 1995.
EPA’s Office of Water, at (202) 260-5700, will direct callers with questionsabout the CWA to the appropriate EPA office. EPA also maintains abibliographic database of Office of Water publications which can beaccessed through the Ground Water and Drinking Water resource center, at(202) 260-7786.
Safe Drinking Water Act
The Safe Drinking Water Act (SDWA) mandates that EPA establishregulations to protect human health from contaminants in drinking water.The law authorizes EPA to develop national drinking water standards and tocreate a joint Federal-State system to ensure compliance with these standards.The SDWA also directs EPA to protect underground sources of drinkingwater through the control of underground injection of liquid wastes.
EPA has developed primary and secondary drinking water standards under itsSDWA authority. EPA and authorized States enforce the primary drinking

Aerospace Industry Federal Statutes and Regulations
Sector Notebook Project November 199883
water standards, which are, contaminant-specific concentration limits thatapply to certain public drinking water supplies. Primary drinking waterstandards consist of maximum contaminant level goals (MCLGs), which arenon-enforceable health-based goals, and maximum contaminant levels(MCLs), which are enforceable limits set as close to MCLGs as possible,considering cost and feasibility of attainment.
The SDWA Underground Injection Control (UIC) program (40 CFR Parts144-148) is a permit program which protects underground sources of drinkingwater by regulating five classes of injection wells. UIC permits includedesign, operating, inspection, and monitoring requirements. Wells used toinject hazardous wastes must also comply with RCRA corrective actionstandards in order to be granted a RCRA permit, and must meet applicableRCRA land disposal restrictions standards. The UIC permit program isprimarily State-enforced, since EPA has authorized all but a few States toadminister the program.
The SDWA also provides for a Federally-implemented Sole Source Aquiferprogram, which prohibits Federal funds from being expended on projects thatmay contaminate the sole or principal source of drinking water for a givenarea, and for a State-implemented Wellhead Protection program, designed toprotect drinking water wells and drinking water recharge areas.
EPA’s Safe Drinking Water Hotline, at (800) 426-4791, answers questionsand distributes guidance pertaining to SDWA standards. The Hotlineoperates from 9:00 a.m. through 5:30 p.m., ET, excluding Federal holidays.
Toxic Substances Control Act
The Toxic Substances Control Act (TSCA) granted EPA authority to createa regulatory framework to collect data on chemicals in order to evaluate,assess, mitigate, and control risks which may be posed by their manufacture,processing, and use. TSCA provides a variety of control methods to preventchemicals from posing unreasonable risk.
TSCA standards may apply at any point during a chemical’s life cycle. UnderTSCA §5, EPA has established an inventory of chemical substances. If achemical is not already on the inventory, and has not been excluded by TSCA,a premanufacture notice (PMN) must be submitted to EPA prior tomanufacture or import. The PMN must identify the chemical and provideavailable information on health and environmental effects. If available dataare not sufficient to evaluate the chemicals effects, EPA can imposerestrictions pending the development of information on its health andenvironmental effects. EPA can also restrict significant new uses of chemicalsbased upon factors such as the projected volume and use of the chemical.

Aerospace Industry Federal Statutes and Regulations
Sector Notebook Project November 199884
Under TSCA §6, EPA can ban the manufacture or distribution in commerce,limit the use, require labeling, or place other restrictions on chemicals thatpose unreasonable risks. Among the chemicals EPA regulates under §6authority are asbestos, chlorofluorocarbons (CFCs), and polychlorinatedbiphenyls (PCBs).
EPA’s TSCA Assistance Information Service, at (202) 554-1404, answersquestions and distributes guidance pertaining to Toxic Substances ControlAct standards. The Service operates from 8:30 a.m. through 4:30 p.m., ET,excluding Federal holidays.
Clean Air Act
The Clean Air Act (CAA) and its amendments, including the Clean Air ActAmendments (CAAA) of 1990, are designed to “protect and enhance thenation's air resources so as to promote the public health and welfare and theproductive capacity of the population.” The CAA consists of six sections,known as Titles, which direct EPA to establish national standards for ambientair quality and for EPA and the States to implement, maintain, and enforcethese standards through a variety of mechanisms. Under the CAAA, manyfacilities will be required to obtain permits for the first time. State and localgovernments oversee, manage, and enforce many of the requirements of theCAAA. CAA regulations appear at 40 CFR Parts 50-99.
Pursuant to Title I of the CAA, EPA has established national ambient airquality standards (NAAQSs) to limit levels of "criteria pollutants," includingcarbon monoxide, lead, nitrogen dioxide, particulate matter, VOCs, ozone,and sulfur dioxide. Geographic areas that meet NAAQSs for a givenpollutant are classified as attainment areas; those that do not meet NAAQSsare classified as non-attainment areas. Under section 110 of the CAA, eachState must develop a State Implementation Plan (SIP) to identify sources ofair pollution and to determine what reductions are required to meet Federalair quality standards. Revised NAAQSs for particulates and ozone wereproposed in 1996 and will become effective in 2001.
Title I also authorizes EPA to establish New Source Performance Standards(NSPSs), which are nationally uniform emission standards for new stationarysources falling within particular industrial categories. NSPSs are based on thepollution control technology available to that category of industrial source(see 40 CFR 60).
Under Title I, EPA establishes and enforces National Emission Standards forHazardous Air Pollutants (NESHAPs), nationally uniform standards orientedtowards controlling particular hazardous air pollutants (HAPs). Title I,section 112(c) of the CAA further directed EPA to develop a list of sourcesthat emit any of 189 HAPs, and to develop regulations for these categories of

Aerospace Industry Federal Statutes and Regulations
Sector Notebook Project November 199885
sources. To date EPA has listed 174 categories and developed a schedule forthe establishment of emission standards. The emission standards will bedeveloped for both new and existing sources based on "maximum achievablecontrol technology" (MACT). The MACT is defined as the controltechnology achieving the maximum degree of reduction in the emission of theHAPs, taking into account cost and other factors.
Title II of the CAA pertains to mobile sources, such as cars, trucks, buses,and planes. Reformulated gasoline, automobile pollution control devices, andvapor recovery nozzles on gas pumps are a few of the mechanisms EPA usesto regulate mobile air emission sources.
Title IV of the CAA establishes a sulfur dioxide nitrous oxide emissionsprogram designed to reduce the formation of acid rain. Reduction of sulfurdioxide releases will be obtained by granting to certain sources limitedemissions allowances, which, beginning in 1995, will be set below previouslevels of sulfur dioxide releases.
Title V of the CAA of 1990 created a permit program for all "major sources"(and certain other sources) regulated under the CAA. One purpose of theoperating permit is to include in a single document all air emissionsrequirements that apply to a given facility. States are developing the permitprograms in accordance with guidance and regulations from EPA. Once aState program is approved by EPA, permits will be issued and monitored bythat State.
Title VI of the CAA is intended to protect stratospheric ozone by phasing outthe manufacture of ozone-depleting chemicals and restrict their use anddistribution. Production of Class I substances, including 15 kinds ofchlorofluorocarbons (CFCs) and chloroform, were phased out (except foressential uses) in 1996.
EPA's Control Technology Center, at (919) 541-0800, provides generalassistance and information on CAA standards. The Stratospheric OzoneInformation Hotline, at (800) 296-1996, provides general information aboutregulations promulgated under Title VI of the CAA, and EPA's EPCRAHotline, at (800) 535-0202, answers questions about accidental releaseprevention under CAA §112(r). In addition, the Technology TransferNetwork Bulletin Board System (modem access (919) 541-5742)) includesrecent CAA rules, EPA guidance documents, and updates of EPA activities.

Aerospace Industry Federal Statutes and Regulations
Sector Notebook Project November 199886
VI.B. Industry Specific Requirements
The aerospace industry is affected by several major federal environmentalstatutes. A summary of the major federal regulations affecting the aerospaceindustry follows. Other resources which are useful in understanding industryspecific requirements are:
1. The Paint and Coatings Resource Center web page(http://www.paintcenter.org)2. The Self Audit & Inspection Guide; For Facilities ConductingCleaning, Preparation, and Organic Coating of Metal Parts, publishedby the EPA.3. California EPA Air Resources Board Web Pages;
Compliance Handbooks and Pamphlets• http://www.arb.ca.gov/cd/cap/handbks.htmCompliance Training Courses • http://www.arb.ca.gov/cd/training.htm• http://www.arb.ca.gov/html/all.htm
Resource Conservation and Recovery Act (RCRA)
The Resource Conservation and Recovery Act (RCRA) was enacted in 1976to address problems related to hazardous and solid waste management.RCRA gives EPA the authority to establish a list of solid and hazardouswastes and to establish standards and regulations for the treatment, storage,and disposal of these wastes. Regulations in Subtitle C of RCRA address theidentification, generation, transportation, treatment, storage, and disposal ofhazardous wastes. These regulations are found in 40 CFR Part 124 and 40CFR Parts 260-279. Under RCRA, persons who generate waste mustdetermine whether the waste is defined as solid waste or hazardous waste.Solid wastes are considered hazardous wastes if they are listed by EPA ashazardous or if they exhibit characteristics of a hazardous waste: toxicity,ignitability, corrosivity, or reactivity.
Some wastes potentially generated at aerospace facilities that are consideredhazardous wastes are listed in 40 CFR Part 261. Some of the handling andtreatment requirements for RCRA hazardous waste generators are coveredunder 40 CFR Part 262 and include the following: determining whatconstitutes a RCRA hazardous waste (Subpart A); manifesting (Subpart B);packaging, labeling, and accumulation time limits (Subpart C); and recordkeeping and reporting (Subpart D).
Several common aerospace manufacturing operations have the potential togenerate RCRA hazardous wastes. Some of these wastes are identified below

Aerospace Industry Federal Statutes and Regulations
Sector Notebook Project November 199887
by process.
Machining and Other Metalworking&Metalworking fluids contaminated with oils, phenols, creosol, alkalies,phosphorus compounds, and chlorine
Cleaning and Degreasing&Solvents (F001, F002, F003, F004, F005)&Alkaline and Acid Cleaning Solutions (D002)&Cleaning filter sludges with toxic metal concentrations
Metal Plating and Surface Finishing and Preparation&Wastewater treatment sludges from electroplating operations (F006)&Spent cyanide plating bath solutions (F007)&Plating bath residues from the bottom of cyanide plating baths (F008)&Spent stripping and cleaning bath solutions from cyanide plating operations(F009)
Surface Preparation, Painting and Coating&Paint and paint containers containing paint sludges with solvents or toxicmetals concentrations&Solvents (F002, F003)&Paint chips with toxic metal concentrations&Blasting media contaminated with paint chips
Aerospace manufacturing and rework facilities may also generate usedlubricating oils which are regulated under RCRA but may or may not beconsidered a hazardous waste (40 CFR 266).
Many aerospace facilities store some hazardous wastes at the facility for morethan 90 days, and are therefore, a storage facility under RCRA. Storagefacilities are required to have a RCRA treatment, storage, and disposal facility(TSDF) permit (40 CFR Part 262.34). Some aerospace facilities areconsidered TSDF facilities and therefore may be subject to the followingregulations covered under 40 CFR Part 264: contingency plans andemergency procedures (40 CFR Part 264 Subpart D); manifesting, recordkeeping, and reporting (40 CFR Part 264 Subpart E); use and managementof containers (40 CFR Part 264 Subpart I); tank systems (40 CFR Part 264Subpart J); surface impoundments (40 CFR Part 264 Subpart K); landtreatment (40 CFR Part 264 Subpart M); corrective action of hazardouswaste releases (40 CFR Part 264 Subpart S); air emissions standards forprocess vents of processes that process or generate hazardous wastes (40CFR Part 264 Subpart AA); emissions standards for leaks in hazardous wastehandling equipment (40 CFR Part 264 Subpart BB); and emissions standardsfor containers, tanks, and surface impoundments that contain hazardouswastes (40 CFR Part 264 Subpart CC).
Aerospace Industry Federal Statutes and Regulations
Sector Notebook Project November 199888
Many aerospace manufacturing and rework facilities are also subject to theunderground storage tank (UST) program (40 CFR Part 280). The USTregulations apply to facilities that store either petroleum products orhazardous substances (except hazardous waste) identified under theComprehensive Environmental Response, Compensation, and Liability Act.UST regulations address design standards, leak detection, operating practices,response to releases, financial responsibility for releases, and closurestandards.
A number of RCRA wastes have been prohibited from land disposal unlesstreated to meet specific standards under the RCRA Land Disposal Restriction(LDR) program. The wastes covered by the RCRA LDRs are listed in 40CFR Part 268 Subpart C and include a number of wastes that couldpotentially be generated at aerospace manufacturing facilities. Standards forthe treatment and storage of restricted wastes are described in Subparts D andE, respectively.
Comprehensive Environmental Response, Compensation, and Liability Act (CERCLA)
The Comprehensive Environmental Response, Compensation, and LiabilityAct (CERCLA) and the Superfund Amendments and Reauthorization Act of1986 (SARA) provide the basic legal framework for the federal “Superfund”program to clean up abandoned hazardous waste sites (40 CFR Part 305). Metals and metal compounds often found in the aerospace industry’s airemissions, water discharges, or waste shipments for off-site disposal includechromium, manganese, aluminum, nickel, copper, zinc, and lead. Metals arefrequently found at CERCLA's problem sites. When Congress ordered EPAand the Public Health Service's Agency for Toxic Substances and DiseaseRegistry (ATSDR) to list the hazardous substances most commonly found atproblem sites and that pose the greatest threat to human health, lead, nickel,and aluminum were all included.
Title III of the 1986 SARA amendments (also known as Emergency Responseand Community Right-to-Know Act, EPCRA) requires all manufacturingfacilities, including aerospace facilities, to report annual information to thepublic about over 600 toxic substances as well as release of these substancesinto the environment (42 U.S.C. 9601). This is known as the Toxic ReleaseInventory (TRI). EPCRA also establishes requirements for Federal, State,and local governments regarding emergency planning.
Clean Air Act (CAA)
Under Title III of the 1990 Clean Air Act Amendments (CAAA), EPA isrequired to develop national emission standards for 189 hazardous airpollutants (NESHAP). EPA is developing maximum achievable controltechnology (MACT) standards for all new and existing sources. The National

Aerospace Industry Federal Statutes and Regulations
Sector Notebook Project November 199889
Emission Standards for Aerospace Manufacturing and Rework Facilities (40CFR Part 63 Subpart GG) were finalized in 1996 and apply to major sourceaerospace manufacturing and rework facilities. Facilities that emit ten ormore tons of any one HAP or 25 or more tons of two or more HAPscombined are major sources, and therefore are subject to the MACT(NESHAP) requirements. The MACT requirements apply to solvent cleaningoperations, primer and topcoat application operations, depainting operations,chemical milling maskant application operations, and handling and storage ofwaste. The standards set VOC emissions and content limits for different typesof solvents, chemical strippers and coatings. In addition, performancestandards are set to reduce spills, leaks, and fugitive emissions. Aerospacefacilities may also be subject to National Emissions Standards for: ChromiumEmissions From Hard and Decorative Chromium Electroplating andChromium Anodizing Tanks (40 CFR Part 63 Subpart N) if they performchromium electroplating or anodizing; and Halogenated Solvent Cleaning ifthey operate a solvent cleaning machine using a halogenated HAP solvent.These NESHAPs require emission limits, work practice standards, recordkeeping, and reporting.
Under Title V of the CAAA 1990 (40 CFR Parts 70-72) all of the applicablerequirements of the Amendments are integrated into one federal renewableoperating permit. Facilities defined as "major sources" under the Act mustapply for permits within one year from when EPA approves the state permitprograms. Since most state programs were not approved until afterNovember 1994, Title V permit applications, for the most part, began to bedue in late 1995. Due dates for filing complete applications vary significantlyfrom state to state, based on the status of review and approval of the state’sTitle V program by EPA.
A facility is designated as a major source for Title V if it releases a certainamount of any one of the CAAA regulated pollutants (SOx, NOx, CO, VOC,PM10, hazardous air pollutants, extremely hazardous substances, ozonedepleting substances, and pollutants covered by NSPSs) depending on theregion's air quality category. Title V permits may set limits on the amountsof pollutant emissions; require emissions monitoring, and record keeping andreporting. Facilities are required to pay an annual fee based on the magnitudeof the facility's potential emissions. It is estimated that as many as 2,869aerospace facilities will be designated as major sources and therefore mustapply for a Title V permit.
Under section 112(r) of CAA, owners and operators of stationary sourceswho produce, process, handle, or store substances listed under CAA section112(r)(3) or any other extremely hazardous substance have a “general duty”to initiate specific activities to prevent and mitigate accidental releases. Sincethe general duty requirements apply to stationary sources regardless of thequantity of substances managed at the facility, many aerospace manufacturing

Aerospace Industry Federal Statutes and Regulations
Sector Notebook Project November 199890
and reworking facilities are subject. Activities such as identifying hazardswhich may result from accidental releases using appropriate hazardassessment techniques; designing, maintaining and operating a safe facility;and minimizing the consequences of accidental releases if they occur areconsidered essential activities to satisfy the general duty requirements. Thesestatutory requirements have been in affect since the passage of the Clean AirAct Amendments in 1990. Although there is no list of “extremely hazardoussubstances,” EPA’s Chemical Emergency Preparedness and Prevention Officeprovides some guidance at its website: http://www.epa.gov/swercepp.html.
Also under section 112(r), EPA was required to develop a list of at least 100substances that, in the event of an accidental release, could cause death,injury, or serious adverse effects to human health or the environment. The listpromulgated by EPA is contained in 40 CFR 68.130 and includes acutelytoxic chemicals, flammable gases and volatile flammable liquids, and Division1.1 high explosive substances as listed by DOT in 49 CFR 172.101. Undersection 112(r)(7), facilities handling more than a threshold quantity (rangingfrom 500 to 20,000 pounds) of these substances are subject to chemicalaccident prevention provisions including the development and implementationof a risk management program (40 CFR 68.150-68.220). The requirementsin 40 CFR Part 68 begin to go into effect in June 1999. Some of the chemicalson the 112(r) list could be handled by aerospace manufacturers and reworkersin quantities greater than the threshold values.
Clean Water Act
Aerospace manufacturing and rework facility wastewater released to surfacewaters is regulated under the CWA. National Pollutant Discharge EliminationSystem (NPDES) permits must be obtained to discharge wastewater intonavigable waters (40 Part 122). Facilities that discharge to a POTW may berequired to meet National Pretreatment Standards for some contaminants.General pretreatment standards applying to most industries discharging to aPOTW are described in 40 CFR Part 403. In addition, effluent limitationguidelines, new source performance standards, pretreatment standards fornew sources, and pretreatment standards for existing sources may apply tosome aerospace manufacturing and rework facilities that carry outelectroplating or metal finishing operations. Requirements for theElectroplating Point Source Category and the Metal Finishing Point SourceCategory are listed under 40 CFR Part 413 and 40 CFR Part 433,respectively.
Storm water rules require certain facilities with storm water discharge fromany one of 11 categories of industrial activity defined in 40 CFR 122.26 besubject to the storm water permit application requirements (see SectionVI.A). Many aerospace facilities fall within these categories. To determinewhether a particular facility falls within one of these categories, the regulation
Aerospace Industry Federal Statutes and Regulations
Sector Notebook Project November 199891
should be consulted.
VI.C. Pending and Proposed Regulatory Requirements
Clean Water Act
Effluent limitation guidelines for wastewater discharges from metal productsand machinery (MP&M) industries are being developed. MP&M industrieshave been divided into two groups that originally were to be covered undertwo separate phases of the rulemaking. Effluent guidelines for Phase Iindustries and Phase II industries (which includes the aerospace industry) willnow be covered under a single regulation to be proposed in October 2000 andfinalized in December 2002. (Steven Geil, U.S. EPA, Office of Water,Engineering and Analysis Division, (202)260-9817, email:[email protected])
Clean Air Act
In December 1997, EPA published Control Technique Guidelines (CTG) forthe control of VOC emissions from coating operations at aerospacemanufacturing and rework operations. The CTG was issued to assist statesin analyzing and determining reasonably available control technology (RACT)standards for major sources of VOCs in the aerospace manufacturing andrework operations located within ozone NAAQS nonattainment areas. EPAestimates that there are approximately 2,869 facilities that could fall withinthis category. Within one year of the publication of the CTG, states mustadopt a RACT regulation at least as stringent as the limits recommended inthe CTG. Under Section 183(b)(3) of the Clean Air Act, EPA is required toissue the CTG for aerospace coating and solvent application operations basedon “best available control measures” (BACM) for emissions of VOCs.(Barbara Driscoll, U.S. EPA, Office of Air Quality Planning and Standards,(919) 541-0164)
Several National Emission Standards for Hazardous Air Pollutants(NESHAPs) relating to the aerospace industry are being developed forpromulgation by November of 2000. They include: Rocket Engine TestFiring, Engine Test Facilities, Miscellaneous Metal Parts and Products, andPlastic Parts and Products. (Contact: In the U.S. EPA Office of Air QualityPlanning and Standards, George Smith for information pertaining to theformer two, (919)541-1549; and Bruce Moore for the latter two, (919)541-5460)

Aerospace Industry Compliance and Enforcement History
Sector Notebook Project November 199892
VII. COMPLIANCE AND ENFORCEMENT HISTORY
Background
Until recently, EPA has focused much of its attention on measuringcompliance with specific environmental statutes. This approach allows theAgency to track compliance with the Clean Air Act, the ResourceConservation and Recovery Act, the Clean Water Act, and otherenvironmental statutes. Within the last several years, the Agency has begunto supplement single-media compliance indicators with facility-specific,multimedia indicators of compliance. In doing so, EPA is in a better positionto track compliance with all statutes at the facility level, and within specificindustrial sectors.
A major step in building the capacity to compile multimedia data for industrialsectors was the creation of EPA's Integrated Data for Enforcement Analysis(IDEA) system. IDEA has the capacity to "read into" the Agency's single-media databases, extract compliance records, and match the records toindividual facilities. The IDEA system can match Air, Water, Waste,Toxics/Pesticides/EPCRA, TRI, and Enforcement Docket records for a givenfacility, and generate a list of historical permit, inspection, and enforcementactivity. IDEA also has the capability to analyze data by geographic area andcorporate holder. As the capacity to generate multimedia compliance dataimproves, EPA will make available more in-depth compliance andenforcement information. Additionally, sector-specific measures of successfor compliance assistance efforts are under development.
Compliance and Enforcement Profile Description
Using inspection, violation and enforcement data from the IDEA system, thissection provides information regarding the historical compliance andenforcement activity of this sector. In order to mirror the facility universereported in the Toxic Chemical Profile, the data reported within this sectionconsists of records only from the TRI reporting universe. With this decision,the selection criteria are consistent across sectors with certain exceptions.For the sectors that do not normally report to the TRI program, data havebeen provided from EPA's Facility Indexing System (FINDS) which tracksfacilities in all media databases. Please note, in this section, EPA does notattempt to define the actual number of facilities that fall within each sector.Instead, the section portrays the records of a subset of facilities within thesector that are well defined within EPA databases.
As a check on the relative size of the full sector universe, most notebookscontain an estimated number of facilities within the sector according to theBureau of Census (See Section II). With sectors dominated by smallbusinesses, such as metal finishers and printers, the reporting universe within

Aerospace Industry Compliance and Enforcement History
4 EPA Regions include the following states: I (CT, MA, ME, RI, NH, VT); II (NJ, NY, PR, VI); III (DC, DE, MD,PA, VA, WV); IV (AL, FL, GA, KY, MS, NC, SC, TN); V (IL, IN, MI, MN, OH, WI); VI (AR, LA, NM, OK,TX); VII (IA, KS, MO, NE); VIII (CO, MT, ND, SD, UT, WY); IX (AZ, CA, HI, NV, Pacific Trust Territories); X(AK, ID, OR, WA).
Sector Notebook Project November 199893
the EPA databases may be small in comparison to Census data. However, thegroup selected for inclusion in this data analysis section should be consistentwith this sector's general make-up.
Following this introduction is a list defining each data column presentedwithin this section. These values represent a retrospective summary ofinspections and enforcement actions, and reflect solely EPA, State, and localcompliance assurance activities that have been entered into EPA databases.To identify any changes in trends, the EPA ran two data queries, one for thepast five calendar years (April 1, 1992 to March 31, 1997) and the other forthe most recent twelve-month period (April 1, 1996 to March 31, 1997). Thefive-year analysis gives an average level of activity for that period forcomparison to the more recent activity.
Because most inspections focus on single-media requirements, the dataqueries presented in this section are taken from single media databases. Thesedatabases do not provide data on whether inspections are state/local or EPA-led. However, the table breaking down the universe of violations does givethe reader a crude measurement of the EPA's and states' efforts within eachmedia program. The presented data illustrate the variations across EPARegions for certain sectors.4 This variation may be attributable to state/localdata entry variations, specific geographic concentrations, proximity topopulation centers, sensitive ecosystems, highly toxic chemicals used inproduction, or historical noncompliance. Hence, the exhibited data do notrank regional performance or necessarily reflect which regions may have themost compliance problems.
Compliance and Enforcement Data Definitions
General Definitions
Facility Indexing System (FINDS) -- assigns a common facility number toEPA single-media permit records. The FINDS identification number allowsEPA to compile and review all permit, compliance, enforcement and pollutantrelease data for any given regulated facility.
Integrated Data for Enforcement Analysis (IDEA) -- is a data integrationsystem that can retrieve information from the major EPA program officedatabases. IDEA uses the FINDS identification number to link separate datarecords from EPA’s databases. This allows retrieval of records from acrossmedia or statutes for any given facility, thus creating a "master list” of
Aerospace Industry Compliance and Enforcement History
Sector Notebook Project November 199894
records for that facility. Some of the data systems accessible through IDEAare: AFS (Air Facility Indexing and Retrieval System, Office of Air andRadiation), PCS (Permit Compliance System, Office of Water), RCRIS(Resource Conservation and Recovery Information System, Office of SolidWaste), NCDB (National Compliance Data Base, Office of Prevention,Pesticides, and Toxic Substances), CERCLIS (Comprehensive Environmentaland Liability Information System, Superfund), and TRIS (Toxic ReleaseInventory System). IDEA also contains information from outside sourcessuch as Dun and Bradstreet and the Occupational Safety and HealthAdministration (OSHA). Most data queries displayed in notebook sectionsIV and VII were conducted using IDEA.
Data Table Column Heading Definitions
Facilities in Search -- are based on the universe of TRI reporters within thelisted SIC code range. For industries not covered under TRI reportingrequirements (metal mining, nonmetallic mineral mining, electric powergeneration, ground transportation, water transportation, and dry cleaning), orindustries in which only a very small fraction of facilities report to TRI (e.g.,printing), the notebook uses the FINDS universe for executing data queries.The SIC code range selected for each search is defined by each notebook'sselected SIC code coverage described in Section II.
Facilities Inspected -- indicates the level of EPA and state agencyinspections for the facilities in this data search. These values show whatpercentage of the facility universe is inspected in a one-year or five-yearperiod.
Number of Inspections -- measures the total number of inspectionsconducted in this sector. An inspection event is counted each time it isentered into a single media database.
Average Time Between Inspections -- provides an average length of time,expressed in months, between compliance inspections at a facility within thedefined universe.
Facilities with One or More Enforcement Actions -- expresses the numberof facilities that were the subject of at least one enforcement action within thedefined time period. This category is broken down further into federal andstate actions. Data are obtained for administrative, civil/judicial, and criminalenforcement actions. A facility with multiple enforcement actions is onlycounted once in this column, e.g., a facility with 3 enforcement actions countsas 1 facility.
Total Enforcement Actions -- describes the total number of enforcementactions identified for an industrial sector across all environmental statutes. A

Aerospace Industry Compliance and Enforcement History
Sector Notebook Project November 199895
facility with multiple enforcement actions is counted multiple times, e.g., afacility with 3 enforcement actions counts as 3.
State Lead Actions -- shows what percentage of the total enforcementactions are taken by state and local environmental agencies. Varying levelsof use by states of EPA data systems may limit the volume of actionsrecorded as state enforcement activity. Some states extensively reportenforcement activities into EPA data systems, while other states may use theirown data systems.
Federal Lead Actions -- shows what percentage of the total enforcementactions are taken by the United States Environmental Protection Agency.This value includes referrals from state agencies. Many of these actions resultfrom coordinated or joint state/federal efforts.
Enforcement to Inspection Rate -- is a ratio of enforcement actions toinspections, and is presented for comparative purposes only. This ratio is arough indicator of the relationship between inspections and enforcement. Itrelates the number of enforcement actions and the number of inspections thatoccurred within the one-year or five-year period. This ratio includes theinspections and enforcement actions reported under the Clean Water Act(CWA), the Clean Air Act (CAA) and the Resource Conservation andRecovery Act (RCRA). Inspections and actions from the TSCA/FIFRA/EPCRA database are not factored into this ratio because most of the actionstaken under these programs are not the result of facility inspections. Also,this ratio does not account for enforcement actions arising from non-inspection compliance monitoring activities (e.g., self-reported waterdischarges) that can result in enforcement action within the CAA, CWA, andRCRA.
Facilities with One or More Violations Identified -- indicates thepercentage of inspected facilities having a violation identified in one of thefollowing data categories: In Violation or Significant Violation Status(CAA); Reportable Noncompliance, Current Year Noncompliance, SignificantNoncompliance (CWA); Noncompliance and Significant Noncompliance(FIFRA, TSCA, and EPCRA); Unresolved Violation and Unresolved HighPriority Violation (RCRA). The values presented for this column reflect theextent of noncompliance within the measured time frame, but do notdistinguish between the severity of the noncompliance. Violation status maybe a precursor to an enforcement action, but does not necessarily indicate thatan enforcement action will occur.
Media Breakdown of Enforcement Actions and Inspections -- fourcolumns identify the proportion of total inspections and enforcement actionswithin EPA Air, Water, Waste, and TSCA/FIFRA/EPCRA databases. Eachcolumn is a percentage of either the "Total Inspections,” or the "Total

Aerospace Industry Compliance and Enforcement History
Sector Notebook Project November 199896
Actions” column.
VII.A. Aerospace Industry Compliance History
Table 14 provides an overview of the reported compliance and enforcementdata for the aerospace industry over the past five years (April 1992 to April1997). These data are also broken out by EPA Regions thereby permittinggeographical comparisons. A few points evident from the data are listedbelow.
& Region IX and Region I had the most enforcement actions (43 and 36respectively), accounting for 62 percent of the total enforcement actions andonly 29 percent of the total inspections. Thus, these two Regions had thehighest enforcement/inspection ratios (0.26 and 0.19).
& Region IV had significantly more inspections (325) than the other Regions,27 percent of the total, but only 13 percent of enforcement actions.
& Enforcement actions were primarily state-lead (75 percent), especially inRegions with the greatest number of enforcement actions.
& Region V had the highest average time between inspections (23 months),which means that fewer inspections, in relation to the number of facilities,were done in Region V than in other Regions.

Aerospace Industry
Com
pliance and Enforcem
ent History
Secto
r No
teboo
k Pro
jectN
ovem
ber 199897
Table 14: Five-Year Enforcement and Compliance Summary for the Aerospace Industry
A B C D E F G H I JRegion Facilities
inSearch
FacilitiesInspected
Number ofInspections
AverageMonthsBetween
Inspections
Facilitieswith 1 or
MoreEnforcement
Actions
TotalEnforcement
Actions
PercentStateLead
Actions
PercentFederal
LeadActions
Enforcementto Inspection
Rate
I 34 28 185 11 16 36 50% 50% 0.19
II 7 6 29 14 3 3 67% 33% 0.10
III 12 9 117 6 4 6 83% 17% 0.05
IV 38 34 325 7 12 16 94% 6% 0.05
V 37 27 97 23 2 3 67% 33% 0.03
VI 37 27 134 17 7 14 79% 21% 0.10
VII 8 7 54 9 2 2 50% 50% 0.04
VIII 7 4 29 14 2 2 100% 0% 0.03
IX 47 33 163 17 17 43 93% 7% 0.26
X 10 9 73 8 2 2 0% 100% 0.03
TOTAL 237 184 1206 12 67 127 75% 25% 0.10

Aerospace Industry Compliance and Enforcement History
Sector Notebook Project November 199898
VII.B. Comparison of Enforcement Activity Between Selected Industries
Tables 15 and 16 allow the compliance history of the aerospace sector to becompared to the other industries covered by the industry sector notebooks.Comparisons between Tables 15 and 16 permit the identification of trends incompliance and enforcement records of the various industries by comparingdata covering the last five years (April 1992 to April 1997) to that of the pastyear (April 1996 to April 1997). Some points evident from the data are listedbelow.
& The one-year enforcement/inspection ratio (0.05) is only half of the five-yearratio (0.10).
& The aerospace industry data approximate the averages of the industriesshown for enforcement/inspection ratios, state-lead versus federal-leadactions, and facilities with one or more violations and enforcement actions.
Tables 17 and 18 provide a more in-depth comparison between the aerospaceindustry and other sectors by breaking out the compliance and enforcementdata by environmental statute. As in the previous Tables (Tables 15 and 16),the data cover the last five years (Table 17) and the last one year (Table 18)to facilitate the identification of recent trends. A few points evident from thedata are listed below.
& The aerospace industry has the highest percentage of RCRA inspections (54percent of total) of any industry.
& The one-year versus five-year breakdowns in terms of percent of totalinspections do not differ significantly. However, the percent of total actionspertaining to RCRA increased from 42 percent to 55 percent in the past year.CWA actions decreased from 11 percent to zero percent in the last year.

Aerospace Industry Compliance and Enforcement History
Sector Notebook Project November 199899
Tab
le 1
5: F
ive-
Yea
r E
nfor
cem
ent a
nd C
ompl
ianc
e S
umm
ary
for
Sel
ecte
d In
dust
ries
AB
CD
EF
GH
IJ
Indu
stry
Sec
tor
Fac
ilitie
sin
Sea
rch
Fac
ilitie
sIn
spec
ted
Num
ber
ofIn
spec
tions
Ave
rage
Mon
ths
Bet
wee
nIn
spec
tions
Fac
ilitie
s w
ith1
or M
ore
Enf
orce
men
tA
ctio
ns
Tot
alE
nfor
cem
ent
Act
ions
Per
cent
Sta
te L
ead
Act
ions
Per
cent
Fed
eral
Lead
Act
ions
Enf
orce
men
tto
Insp
ectio
nR
ate
Met
al M
inin
g1
,23
23
78
1,6
00
46
63
11
15
3%
47
%0
.07
Coa
l Min
ing
3,2
56
74
13
,74
85
28
81
32
89
%1
1%
0.0
4
Oil
and
Ga
s E
xtra
ctio
n4
,67
61
,90
26
,07
14
61
49
30
97
9%
21
%0
.05
Non
-Met
alli
c M
iner
al M
inin
g5
,25
62
,80
31
2,8
26
25
38
56
22
77
%2
3%
0.0
5
Tex
tiles
35
52
67
1,4
65
15
53
83
90
%1
0%
0.0
6
Lum
ber
and
Woo
d7
12
47
32
,76
71
51
34
26
57
0%
30
%0
.10
Fu
rnitu
re4
99
38
62
,37
91
36
59
18
1%
19
%0
.04
Pu
lp a
nd P
ape
r4
84
43
04
,63
06
15
04
78
80
%2
0%
0.1
0
Prin
ting
5,8
62
2,0
92
7,6
91
46
23
84
28
88
%1
2%
0.0
6
Inor
gani
c C
hem
ica
ls4
41
28
63
,08
79
89
23
57
4%
26
%0
.08
Res
ins
and
Ma
nma
de F
iber
s3
29
26
32
,43
08
93
21
97
6%
24
%0
.09
Pha
rma
ceu
tica
ls1
64
12
91
,20
18
35
12
28
0%
20
%0
.10
Org
ani
c C
hem
ica
ls4
25
35
54
,29
46
15
34
68
65
%3
5%
0.1
1
Agr
icu
ltura
l Che
mic
als
26
31
64
1,2
93
12
47
10
27
4%
26
%0
.08
Pet
role
um
Ref
inin
g1
56
14
83
,08
13
12
47
63
68
%3
2%
0.2
5
Ru
bber
and
Pla
stic
1,8
18
98
14
,38
32
51
78
27
68
2%
18
%0
.06
Sto
ne, C
lay,
Gla
ss a
nd C
oncr
ete
61
53
88
3,4
74
11
97
27
77
5%
25
%0
.08
Iron
and
Ste
el3
49
27
54
,47
65
12
13
05
71
%2
9%
0.0
7
Met
al C
ast
ings
66
94
24
2,5
35
16
11
31
91
71
%2
9%
0.0
8
Non
ferr
ous
Met
als
20
31
61
1,6
40
76
81
74
78
%2
2%
0.1
1
Fa
bric
ate
d M
eta
l Pro
duct
s2
,90
61
,85
87
,91
42
23
65
60
07
5%
25
%0
.08
Ele
ctro
nics
1,2
50
86
34
,50
01
71
50
25
18
0%
20
%0
.06
Au
tom
obile
Ass
embl
y1
,26
09
27
5,9
12
13
25
34
13
82
%1
8%
0.0
7
Aer
ospa
ce23
718
41,
206
1267
127
75%
25%
0.10
Shi
pbu
ildin
g a
nd R
epa
ir4
43
72
43
92
03
28
4%
16
%0
.13
Gro
und
Tra
nspo
rta
tion
7,7
86
3,2
63
12
,90
43
63
75
77
48
4%
16
%0
.06
Wa
ter
Tra
nspo
rta
tion
51
41
92
81
63
83
67
06
1%
39
%0
.09
Air
Tra
nspo
rta
tion
44
42
31
97
32
74
89
78
8%
12
%0
.10
Fos
sil F
uel
Ele
ctric
Pow
er3
,27
02
,16
61
4,2
10
14
40
37
89
76
%2
4%
0.0
6
Dry
Cle
ani
ng6
,06
32
,36
03
,81
39
55
56
69
5%
5%
0.0
2

Aerospace Industry
Com
pliance and Enforcem
ent History
Secto
r No
teboo
k Pro
jectN
ovem
ber 1998100
Table 16: One-Year Enforcement and Compliance Summary for Selected IndustriesA B C D E F G H
Facilities with 1 or MoreViolations
Facilities with 1 or moreEnforcement Actions Total
EnforcementActionsIndustry Sector
Facilities inSearch
FacilitiesInspected
Number ofInspections Number Percent* Number Percent*
Enforcement toInspection Rate
Metal Mining 1,232 142 211 102 72% 9 6% 10 0.05
Coal Mining 3,256 362 765 90 25% 20 6% 22 0.03
Oil and Gas Extraction 4,676 874 1,173 127 15% 26 3% 34 0.03
Non-Metallic Mineral Mining 5,256 1,481 2,451 384 26% 73 5% 91 0.04
Textiles 355 172 295 96 56% 10 6% 12 0.04
Lumber and Wood 712 279 507 192 69% 44 16% 52 0.10
Furniture 499 254 459 136 54% 9 4% 11 0.02
Pulp and Paper 484 317 788 248 78% 43 14% 74 0.09
Printing 5,862 892 1,363 577 65% 28 3% 53 0.04
Inorganic Chemicals 441 200 548 155 78% 19 10% 31 0.06
Resins and Manmade Fibers 329 173 419 152 88% 26 15% 36 0.09
Pharmaceuticals 164 80 209 84 105% 8 10% 14 0.07
Organic Chemicals 425 259 837 243 94% 42 16% 56 0.07
Agricultural Chemicals 263 105 206 102 97% 5 5% 11 0.05
Petroleum Refining 156 132 565 129 98% 58 44% 132 0.23
Rubber and Plastic 1,818 466 791 389 83% 33 7% 41 0.05
Stone, Clay, Glass and Concrete 615 255 678 151 59% 19 7% 27 0.04
Iron and Steel 349 197 866 174 88% 22 11% 34 0.04
Metal Castings 669 234 433 240 103% 24 10% 26 0.06
Nonferrous Metals 203 108 310 98 91% 17 16% 28 0.09
Fabricated Metal 2,906 849 1,377 796 94% 63 7% 83 0.06
Electronics 1,250 420 780 402 96% 27 6% 43 0.06
Automobile Assembly 1,260 507 1,058 431 85% 35 7% 47 0.04
Aerospace 237 119 216 105 88% 8 7% 11 0.05
Shipbuilding and Repair 44 22 51 19 86% 3 14% 4 0.08
Ground Transportation 7,786 1,585 2,499 681 43% 85 5% 103 0.04
Water Transportation 514 84 141 53 63% 10 12% 11 0.08
Air Transportation 444 96 151 69 72% 8 8% 12 0.08
Fossil Fuel Electric Power 3,270 1,318 2,430 804 61% 100 8% 135 0.06
Dry Cleaning 6,063 1,234 1,436 314 25% 12 1% 16 0.01
*Percentages in Columns E and F are based on the number of facilities inspected (Column C). Percentages can exceed 100% because violations and actionscan occur without a facility inspection.

Aerospace Industry Compliance and Enforcement History
Sector Notebook Project November 1998101
Tab
le 1
7: F
ive-
Yea
r In
spec
tion
and
Enf
orce
men
t Sum
mar
y by
Sta
tute
for
Sel
ecte
d In
dust
ries
Indu
stry
Sec
tor
Fac
ilitie
sIn
spec
ted
Tot
alIn
spec
tions
Tot
alE
nfor
cem
ent
Act
ions
Cle
an A
ir A
ctC
lean
Wat
er A
ctR
CR
AF
IFR
A/T
SC
A/
% o
f Tot
alIn
spec
tions
% o
fT
otal
Act
ions
% o
f Tot
alIn
spec
tions
% o
fT
otal
Act
ions
% o
f Tot
alIn
spec
tions
% o
fT
otal
Act
ions
% o
f Tot
alIn
spec
tions
% o
fT
otal
Act
ions
Met
al M
inin
g3
78
1,6
00
11
13
9%
19
%5
2%
52
%8
%1
2%
1%
17
%
Coa
l Min
ing
74
13
,74
81
32
57
%6
4%
38
%2
8%
4%
8%
1%
1%
Oil
and
Ga
s E
xtra
ctio
n1
,90
26
,07
13
09
75
%6
5%
16
%1
4%
8%
18
%0
%3
%
Non
-Met
alli
c M
iner
al M
inin
g2
,80
31
2,8
26
62
28
3%
81
%1
4%
13
%3
%4
%0
%3
%
Tex
tiles
26
71
,46
58
35
8%
54
%2
2%
25
%1
8%
14
%2
%6
%
Lum
ber
and
Woo
d4
73
2,7
67
26
54
9%
47
%6
%6
%4
4%
31
%1
%1
6%
Fu
rnitu
re3
86
2,3
79
91
62
%4
2%
3%
0%
34
%4
3%
1%
14
%
Pu
lp a
nd P
ape
r4
30
4,6
30
47
85
1%
59
%3
2%
28
%1
5%
10
%2
%4
%
Prin
ting
2,0
92
7,6
91
42
86
0%
64
%5
%3
%3
5%
29
%1
%4
%
Inor
gani
c C
hem
ica
ls2
86
3,0
87
23
53
8%
44
%2
7%
21
%3
4%
30
%1
%5
%
Res
ins
and
Ma
nma
de F
iber
s2
63
2,4
30
21
93
5%
43
%2
3%
28
%3
8%
23
%4
%6
%
Pha
rma
ceu
tica
ls1
29
1,2
01
12
23
5%
49
%1
5%
25
%4
5%
20
%5
%5
%
Org
ani
c C
hem
ica
ls3
55
4,2
94
46
83
7%
42
%1
6%
25
%4
4%
28
%4
%6
%
Agr
icu
ltura
l Che
mic
als
16
41
,29
31
02
43
%3
9%
24
%2
0%
28
%3
0%
5%
11
%
Pet
role
um
Ref
inin
g1
48
3,0
81
76
34
2%
59
%2
0%
13
%3
6%
21
%2
%7
%
Ru
bber
and
Pla
stic
98
14
,38
32
76
51
%4
4%
12
%1
1%
35
%3
4%
2%
11
%
Sto
ne, C
lay,
Gla
ss a
nd C
oncr
ete
38
83
,47
42
77
56
%5
7%
13
%9
%3
1%
30
%1
%4
%
Iron
and
Ste
el2
75
4,4
76
30
54
5%
35
%2
6%
26
%2
8%
31
%1
%8
%
Met
al C
ast
ings
42
42
,53
51
91
55
%4
4%
11
%1
0%
32
%3
1%
2%
14
%
Non
ferr
ous
Met
als
16
11
,64
01
74
48
%4
3%
18
%1
7%
33
%3
1%
1%
10
%
Fa
bric
ate
d M
eta
l1
,85
87
,91
46
00
40
%3
3%
12
%1
1%
45
%4
3%
2%
13
%
Ele
ctro
nics
86
34
,50
02
51
38
%3
2%
13
%1
1%
47
%5
0%
2%
7%
Au
tom
obile
Ass
embl
y9
27
5,9
12
41
34
7%
39
%8
%9
%4
3%
43
%2
%9
%
Aer
ospa
ce18
41,
206
127
34%
38%
10%
11%
54%
42%
2%9%
Shi
pbu
ildin
g a
nd R
epa
ir3
72
43
32
39
%2
5%
14
%2
5%
42
%4
7%
5%
3%
Gro
und
Tra
nspo
rta
tion
3,2
63
12
,90
47
74
59
%4
1%
12
%1
1%
29
%4
5%
1%
3%
Wa
ter
Tra
nspo
rta
tion
19
28
16
70
39
%2
9%
23
%3
4%
37
%3
3%
1%
4%
Air
Tra
nspo
rta
tion
23
19
73
97
25
%3
2%
27
%2
0%
48
%4
8%
0%
0%
Fos
sil F
uel
Ele
ctric
Pow
er2
,16
61
4,2
10
78
95
7%
59
%3
2%
26
%1
1%
10
%1
%5
%
Dry
Cle
ani
ng2
,36
03
,81
36
65
6%
23
%3
%6
%4
1%
71
%0
%0
%

Aerospace Industry Compliance and Enforcement History
Sector Notebook Project November 1998102
Tab
le 1
8: O
ne-Y
ear
Insp
ectio
n an
d E
nfor
cem
ent S
umm
ary
by S
tatu
te fo
r S
elec
ted
Indu
strie
s
Fac
ilitie
sIn
spec
ted
Tot
alIn
spec
tions
Tot
alE
nfor
cem
ent
Act
ions
Cle
an A
ir A
ctC
lean
Wat
er A
ctR
CR
AF
IFR
A/T
SC
A/
EP
CR
A/O
ther
Indu
stry
Sec
tor
% o
f Tot
alIn
spec
tions
% o
fT
otal
Act
ions
% o
f Tot
alIn
spec
tions
% o
fT
otal
Act
ions
% o
f Tot
alIn
spec
tions
% o
fT
otal
Act
ions
% o
f Tot
alIn
spec
tions
% o
fT
otal
Act
ions
Met
al M
inin
g1
42
21
11
05
2%
0%
40
%4
0%
8%
30
%0
%3
0%
Coa
l Min
ing
36
27
65
22
56
%8
2%
40
%1
4%
4%
5%
0%
0%
Oil
and
Ga
s E
xtra
ctio
n8
74
1,1
73
34
82
%6
8%
10
%9
%9
%2
4%
0%
0%
Non
-Met
alli
c M
iner
al M
inin
g1
,48
12
,45
19
18
7%
89
%1
0%
9%
3%
2%
0%
0%
Tex
tiles
17
22
95
12
66
%7
5%
17
%1
7%
17
%8
%0
%0
%
Lum
ber
and
Woo
d2
79
50
75
25
1%
30
%6
%5
%4
4%
25
%0
%4
0%
Fu
rnitu
re2
54
45
91
16
6%
45
%2
%0
%3
2%
45
%0
%9
%
Pu
lp a
nd P
ape
r3
17
78
87
45
4%
73
%3
2%
19
%1
4%
7%
0%
1%
Prin
ting
89
21
,36
35
36
3%
77
%4
%0
%3
3%
23
%0
%0
%
Inor
gani
c C
hem
ica
ls2
00
54
83
13
5%
59
%2
6%
9%
39
%2
5%
0%
6%
Res
ins
and
Ma
nma
de F
iber
s1
73
41
93
63
8%
51
%2
4%
38
%3
8%
5%
0%
5%
Pha
rma
ceu
tica
ls8
02
09
14
43
%7
1%
11
%1
4%
45
%1
4%
0%
0%
Org
ani
c C
hem
ica
ls2
59
83
75
64
0%
54
%1
3%
13
%4
7%
34
%0
%0
%
Agr
icu
ltura
l Che
mic
als
10
52
06
11
48
%5
5%
22
%0
%3
0%
36
%0
%9
%
Pet
role
um
Ref
inin
g1
32
56
51
32
49
%6
7%
17
%8
%3
4%
15
%0
%1
0%
Ru
bber
and
Pla
stic
46
67
91
41
55
%6
4%
10
%1
3%
35
%2
3%
0%
0%
Sto
ne, C
lay,
Gla
ss a
nd C
oncr
ete
25
56
78
27
62
%6
3%
10
%7
%2
8%
30
%0
%0
%
Iron
and
Ste
el1
97
86
63
45
2%
47
%2
3%
29
%2
6%
24
%0
%0
%
Met
al C
ast
ings
23
44
33
26
60
%5
8%
10
%8
%3
0%
35
%0
%0
%
Non
ferr
ous
Met
als
10
83
10
28
44
%4
3%
15
%2
0%
41
%3
0%
0%
7%
Fa
bric
ate
d M
eta
l8
49
1,3
77
83
46
%4
1%
11
%2
%4
3%
57
%0
%0
%
Ele
ctro
nics
42
07
80
43
44
%3
7%
14
%5
%4
3%
53
%0
%5
%
Au
tom
obile
Ass
embl
y5
07
1,0
58
47
53
%4
7%
7%
6%
41
%4
7%
0%
0%
Aer
ospa
ce11
921
611
37%
36%
7%0%
54%
55%
1%9%
Shi
pbu
ildin
g a
nd R
epa
ir2
25
14
54
%0
%1
1%
50
%3
5%
50
%0
%0
%
Gro
und
Tra
nspo
rta
tion
1,5
85
2,4
99
10
36
4%
46
%1
1%
10
%2
6%
44
%0
%1
%
Wa
ter
Tra
nspo
rta
tion
84
14
11
13
8%
9%
24
%3
6%
38
%4
5%
0%
9%
Air
Tra
nspo
rta
tion
96
15
11
22
8%
33
%1
5%
42
%5
7%
25
%0
%0
%
Fos
sil F
uel
Ele
ctric
Pow
er1
,31
82
,43
01
35
59
%7
3%
32
%2
1%
9%
5%
0%
0%
Dry
Cle
ani
ng1
,23
41
,43
61
66
9%
56
%1
%6
%3
0%
38
%0
%0
%

Aerospace Industry Compliance and Enforcement History
Sector Notebook Project November 1998103
VII.C. Review of Major Legal Actions
Major Cases/Supplemental Environmental Projects
This section provides summary information about major cases that haveaffected this sector, and a list of Supplemental Environmental Projects(SEPs).
VII.C.1. Review of Major Cases
As indicated in EPA’s Enforcement Accomplishments Report, FY1995 andFY1996 publications, one significant enforcement action was resolvedbetween 1995 and 1996 for the aerospace industry.
U.S. v. General Electric Company General Electric (GE) operates a facilityin Lynn, MA at which the company tests and manufactures aircraft. Theenforcement issues arose from GE’s failure to obtain prevention of significantdeterioration (PSD) permits for one boiler and for four test cells used for thetesting of jet engines. The boiler and the test cells emit NOx in quantities thattrigger the PSD new source review requirements of the Clean Air Act. GEinstalled/constructed two new test cells in the early 1980s and modified twotest cells in the late 1980s, without obtaining required permits. GEinstalled/constructed the boiler without obtaining an adequate permit. Theboiler also emitted NOx in excess of the levels permissible in EPA’s NewSource Performance Standards (NSPS).
VII.C.2. Supplementary Environmental Projects (SEPs)
SEPs are compliance agreements that reduce a facility's non-compliancepenalty in return for an environmental project that exceeds the value of thereduction. Often, these projects fund pollution prevention activities that canreduce the future pollutant loadings of a facility. Information on SEP casescan be accessed via the internet at the SEP National Database,http://es.epa.gov/oeca/sep/sepdb.
Aerospace Techniques, Inc., in Cromwell, Connecticut, performed a SEP inreturn for failing to submit a Toxic Release Inventory Form R for 1,1,1-trichloroethane. Aerospace Techniques achieved a 4,500 pound reduction in1,1,1-trichloroethane releases by replacing the larger of its two vapordegreasers with jet washing machines using heated aqueous cleaning solution.They also plan to scale back degreasing operations to final rinses and replacesix interim part-rinsing stations that utilize aqueous cleaner. The cost of thisproject was $9,766.

Aerospace Industry Activities and Initiatives
Sector Notebook Project November 1998104
VIII. COMPLIANCE ASSURANCE ACTIVITIES AND INITIATIVES
This section highlights the activities undertaken by this industry sector andpublic agencies to voluntarily improve the sector's environmentalperformance. These activities include those initiated independently byindustrial trade associations. In this section, the notebook also contains alisting and description of national and regional trade associations.
VIII.A. Sector-related Environmental Programs and Activities
VIII.A.1. Federal Activities
Propulsion Environmental Working Group
The Propulsion Environmental Working Group (PEWG) was formallychartered in 1994 by the Joint Propulsion Coordinating Committee (JPCC),a consortium of industry and Department of Defense participants. PEWG iscomposed of members from the Army, Navy, and Air Force, and ofcompanies such as Allied Signal, GE Aircraft Engines, Allison Engine,Williams Intl., P&W UTC, Teledyne, Continental, and Sundstrand.
PEWG’s chartered objectives include:&providing an open forum for information exchange on possibletechnologies to eliminate HAZMATs,&assisting team members with decisions regarding HAZMATs,identifying HAZMATs, and assisting in prevention and control ofHAZMATs,&assisting engine manufacturers and reworkers with compliance ofstate and federal regulations,&ensuring and assisting in the completion of required environmentaldocumentation such as EAs or EIAs,&establishing committees to address topics of interest for the teammembers.
Propulsion Product Group
The Air Force Propulsion Product Group (PPG) works to incorporateenvironmental, safety, and occupational health concerns into multiple weaponsystems. The PPG is a participant in the Propulsion Environmental WorkingGroup discussed above. Some of the accomplishment of the PPG are:
&eliminating the use of Class I Ozone Depleting Substances (ODS)&reducing the use of EPA-17 materials&facilitating the annual reduction of EPA-17 materials and Class IODS’s used by OEM’s.

Aerospace Industry Activities and Initiatives
Sector Notebook Project November 1998105
Airworthiness Assurance Center of Excellence
The FAA created the Airworthiness Assurance Center of Excellence (AACE)in September 1997 in an effort to “make a significant contribution to thereduction of accident rates over the next five years.” AACE is based at IowaState University and Ohio State University. The five principal areas ofresearch are maintenance, inspection and repair, propulsion and fuel systemssafety, crashworthiness, advanced materials, and landing gear systemsperformance and safety. A focus of the work is to develop crack detectionmethods for particularly small cracks which may be under several layers ofskin. Major airlines are also pushing for inspection techniques which do notrequire disassembly, thus preserving sealants and coatings (AW&ST, 3/30/98).
Joint EPA/NASA/USAF Interagency Depainting Study
NASA is conducting a technical assessment of alternative technologies foraerospace depainting operations on behalf of the EPA and the US Air Force.Such technologies are to be used as paint stripping processes which do notadversely affect the environment and which specifically do not involve the useof methylene chloride. The nine techniques subdivided into five removalmethod categories (abrasive, impact, cyrogenic, thermal, and molecularbonding disassociation).
Thai Airways/Government of Thailand/USEPA Solvent Elimination Project
The Government of Thailand, Thai Airways, and the USEPA SolventElimination Project studied methods of eliminating CFC-113 and methylchloroform use. This project was undertaken as part of the World BankGlobal Solvents Project under the Multilateral Fund of the Montreal Protocol.The manual developed under this project describes a step-by-step approachfor characterizing the use of ozone-depleting solvents and identifying andevaluating alternatives. For case studies on this topic, see Eliminating CFC-113 and Methyl Chloroform in Aircraft Maintenance Procedures, publishedby the Office of Air and Radiation of the USEPA in October 1993.
VIII.B. EPA Voluntary Programs
33/50 Program
The 33/50 Program is a groundbreaking program that has focused onreducing pollution from seventeen high-priority chemicals through voluntarypartnerships with industry. The program's name stems from its goals: a 33%reduction in toxic releases by 1992, and a 50% reduction by 1995, against abaseline of 1.5 billion pounds of releases and transfers in 1988. The resultshave been impressive: 1,300 companies joined the 33/50 Program(representing over 6,000 facilities) and reached the national targets a year

Aerospace Industry Activities and Initiatives
Sector Notebook Project November 1998106
ahead of schedule. The 33% goal was reached in 1991, and the 50% goal --a reduction of 745 million pounds of toxic wastes -- was reached in 1994.The 33/50 Program can provide case studies on many of the corporateaccomplishments in reducing waste (Contact 33/50 Program Director DavidSarokin -- 202-260-6396).
Table 19 lists those companies participating in the 33/50 program thatreported four-digit SIC codes within 372 and 376 to TRI. Some of thecompanies shown also listed facilities that are not producing aerospaceproducts. The number of facilities within each company that are participatingin the 33/50 program and that report aerospace SIC codes is shown. Whereavailable and quantfiable against 1988 releases and transfers, each company’s33/50 goals for 1995 and the actual total releases and transfers and percentreduction between 1988 and 1995 are presented. Thirteen of the seventeen33/50 target chemicals were reported to TRI by aerospace facilities in 1995.These 13 chemicals accounted for 77 percent of the total releases and 65percent of the total transfers reported to the 1995 TRI by aerospace facilities.
Table 19 shows that 47 companies comprised of 506 facilities reporting SIC372 and 376 participated in the 33/50 program. For those companies shownwith more than one aerospace facility, all facilities may not have participatedin 33/50. The 33/50 goals shown for companies with multiple aerospacefacilities, however, are company-wide, potentially aggregating more than onefacility and facilities not carrying out aerospace operations. In addition tocompany-wide goals, individual facilities within a company may have had theirown 33/50 goals or may be specifically listed as not participating in the 33/50program. Since the actual percent reductions shown in the last column applyto all of the companies’ aerospace facilities and only aerospace facilities,direct comparisons to those company goals incorporating non-aerospacefacilities or excluding certain facilities may not be possible. For informationon specific facilities participating in 33/50, contact David Sarokin (202-260-6907) at the 33/50 Program Office.
With the completion of the 33/50 program, several lessons were learned.Industry and the environment benefitted by this program for several reasons.Companies were willing to participate because cost savings and risk reductionwere measurable and no additional record keeping and reporting wasrequired. The goals of the program were clear and simple and EPA allowedindustry to achieve the goals in whatever manner they could. Therefore,when companies can see the benefits of environmental programs and be anactive part of the decision-making process, they are more likely toparticipate.
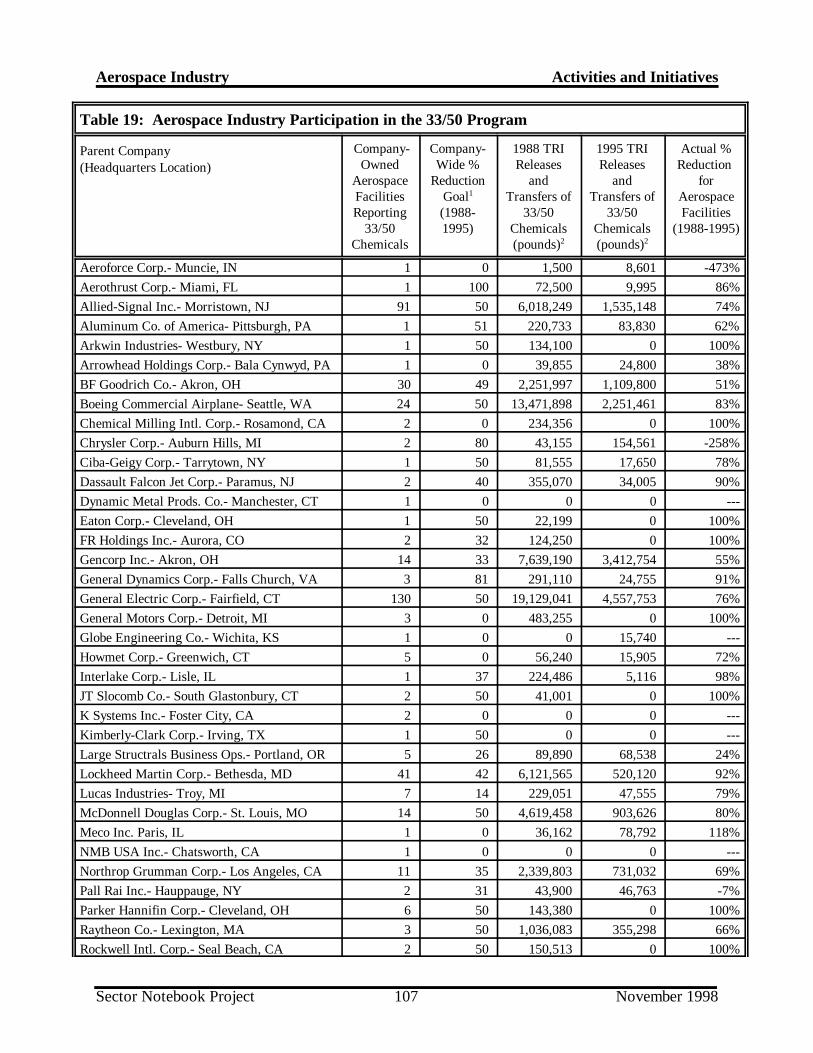
Aerospace Industry Activities and Initiatives
Sector Notebook Project November 1998107
Table 19: Aerospace Industry Participation in the 33/50 Program
Parent Company (Headquarters Location)
Company-Owned
AerospaceFacilitiesReporting
33/50Chemicals
Company-Wide %
ReductionGoal1
(1988-1995)
1988 TRIReleases
andTransfers of
33/50Chemicals(pounds)2
1995 TRIReleases
andTransfers of
33/50Chemicals(pounds)2
Actual %Reduction
forAerospaceFacilities
(1988-1995)
Aeroforce Corp.- Muncie, IN 1 0 1,500 8,601 -473%
Aerothrust Corp.- Miami, FL 1 100 72,500 9,995 86%
Allied-Signal Inc.- Morristown, NJ 91 50 6,018,249 1,535,148 74%
Aluminum Co. of America- Pittsburgh, PA 1 51 220,733 83,830 62%
Arkwin Industries- Westbury, NY 1 50 134,100 0 100%
Arrowhead Holdings Corp.- Bala Cynwyd, PA 1 0 39,855 24,800 38%
BF Goodrich Co.- Akron, OH 30 49 2,251,997 1,109,800 51%
Boeing Commercial Airplane- Seattle, WA 24 50 13,471,898 2,251,461 83%
Chemical Milling Intl. Corp.- Rosamond, CA 2 0 234,356 0 100%
Chrysler Corp.- Auburn Hills, MI 2 80 43,155 154,561 -258%
Ciba-Geigy Corp.- Tarrytown, NY 1 50 81,555 17,650 78%
Dassault Falcon Jet Corp.- Paramus, NJ 2 40 355,070 34,005 90%
Dynamic Metal Prods. Co.- Manchester, CT 1 0 0 0 ---
Eaton Corp.- Cleveland, OH 1 50 22,199 0 100%
FR Holdings Inc.- Aurora, CO 2 32 124,250 0 100%
Gencorp Inc.- Akron, OH 14 33 7,639,190 3,412,754 55%
General Dynamics Corp.- Falls Church, VA 3 81 291,110 24,755 91%
General Electric Corp.- Fairfield, CT 130 50 19,129,041 4,557,753 76%
General Motors Corp.- Detroit, MI 3 0 483,255 0 100%
Globe Engineering Co.- Wichita, KS 1 0 0 15,740 ---
Howmet Corp.- Greenwich, CT 5 0 56,240 15,905 72%
Interlake Corp.- Lisle, IL 1 37 224,486 5,116 98%
JT Slocomb Co.- South Glastonbury, CT 2 50 41,001 0 100%
K Systems Inc.- Foster City, CA 2 0 0 0 ---
Kimberly-Clark Corp.- Irving, TX 1 50 0 0 ---
Large Structrals Business Ops.- Portland, OR 5 26 89,890 68,538 24%
Lockheed Martin Corp.- Bethesda, MD 41 42 6,121,565 520,120 92%
Lucas Industries- Troy, MI 7 14 229,051 47,555 79%
McDonnell Douglas Corp.- St. Louis, MO 14 50 4,619,458 903,626 80%
Meco Inc. Paris, IL 1 0 36,162 78,792 118%
NMB USA Inc.- Chatsworth, CA 1 0 0 0 ---
Northrop Grumman Corp.- Los Angeles, CA 11 35 2,339,803 731,032 69%
Pall Rai Inc.- Hauppauge, NY 2 31 43,900 46,763 -7%
Parker Hannifin Corp.- Cleveland, OH 6 50 143,380 0 100%
Raytheon Co.- Lexington, MA 3 50 1,036,083 355,298 66%
Rockwell Intl. Corp.- Seal Beach, CA 2 50 150,513 0 100%
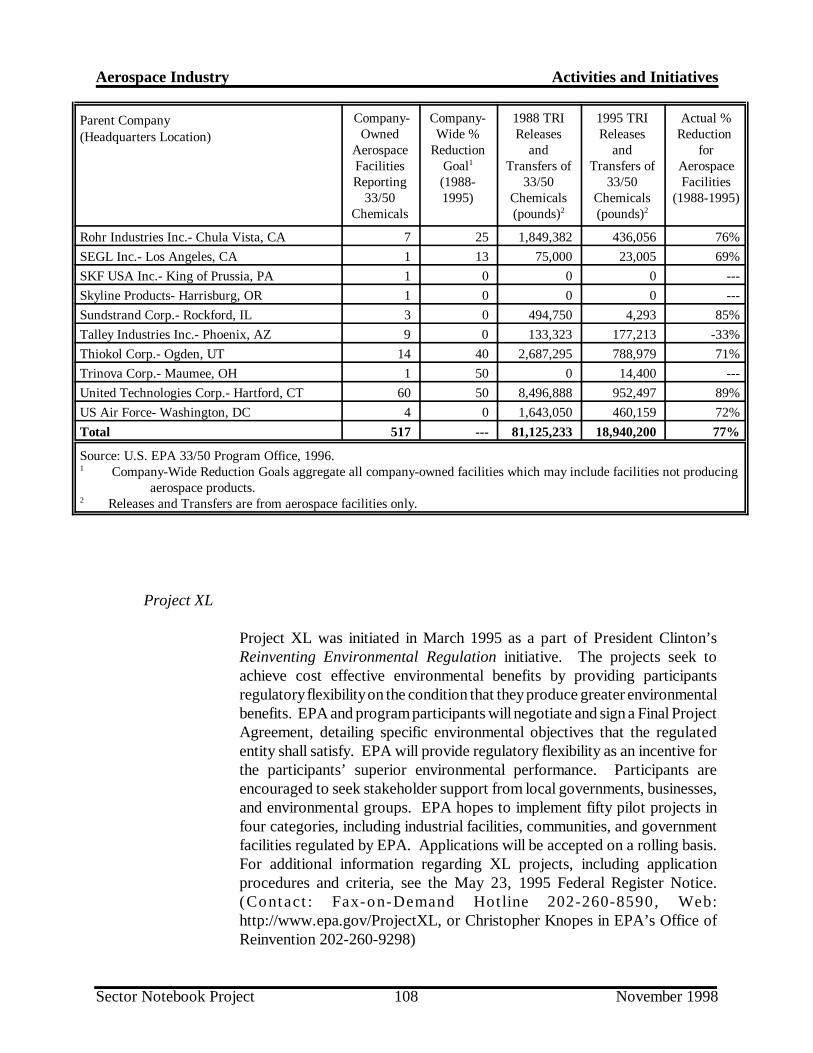
Aerospace Industry Activities and Initiatives
Parent Company (Headquarters Location)
Company-Owned
AerospaceFacilitiesReporting
33/50Chemicals
Company-Wide %
ReductionGoal1
(1988-1995)
1988 TRIReleases
andTransfers of
33/50Chemicals(pounds)2
1995 TRIReleases
andTransfers of
33/50Chemicals(pounds)2
Actual %Reduction
forAerospaceFacilities
(1988-1995)
Sector Notebook Project November 1998108
Rohr Industries Inc.- Chula Vista, CA 7 25 1,849,382 436,056 76%
SEGL Inc.- Los Angeles, CA 1 13 75,000 23,005 69%
SKF USA Inc.- King of Prussia, PA 1 0 0 0 ---
Skyline Products- Harrisburg, OR 1 0 0 0 ---
Sundstrand Corp.- Rockford, IL 3 0 494,750 4,293 85%
Talley Industries Inc.- Phoenix, AZ 9 0 133,323 177,213 -33%
Thiokol Corp.- Ogden, UT 14 40 2,687,295 788,979 71%
Trinova Corp.- Maumee, OH 1 50 0 14,400 ---
United Technologies Corp.- Hartford, CT 60 50 8,496,888 952,497 89%
US Air Force- Washington, DC 4 0 1,643,050 460,159 72%
Total 517 --- 81,125,233 18,940,200 77%
Source: U.S. EPA 33/50 Program Office, 1996.1 Company-Wide Reduction Goals aggregate all company-owned facilities which may include facilities not producing aerospace products.2 Releases and Transfers are from aerospace facilities only.
Project XL
Project XL was initiated in March 1995 as a part of President Clinton’sReinventing Environmental Regulation initiative. The projects seek toachieve cost effective environmental benefits by providing participantsregulatory flexibility on the condition that they produce greater environmentalbenefits. EPA and program participants will negotiate and sign a Final ProjectAgreement, detailing specific environmental objectives that the regulatedentity shall satisfy. EPA will provide regulatory flexibility as an incentive forthe participants’ superior environmental performance. Participants areencouraged to seek stakeholder support from local governments, businesses,and environmental groups. EPA hopes to implement fifty pilot projects infour categories, including industrial facilities, communities, and governmentfacilities regulated by EPA. Applications will be accepted on a rolling basis.For additional information regarding XL projects, including applicationprocedures and criteria, see the May 23, 1995 Federal Register Notice.(Contact : Fax-on-Demand Hot line 202-260-8590, Web:http://www.epa.gov/ProjectXL, or Christopher Knopes in EPA’s Office ofReinvention 202-260-9298)

Aerospace Industry Activities and Initiatives
Sector Notebook Project November 1998109
Energy Star® Buildings and Green Lights® Partnership
In 1991, EPA introduced Green Lights®, a program designed for businessesand organizations to proactively combat pollution by installing energy-efficient lighting technologies in their commercial and industrial buildings. InApril 1995, Green Lights® expanded into Energy Star® Buildings-- astrategy that optimizes whole-building energy-efficiency opportunities.
The energy needed to run commercial and industrial buildings in the UnitedStates produces 19 percent of U.S. carbon dioxide emissions, 12 percent ofnitrogen oxides, and 25 percent of sulfur dioxide, at a cost of 110 billiondollars a year. If implemented in every U.S. commercial and industrialbuilding, Energy Star® Buildings’ upgrade approach could prevent up to 35percent of the emissions associated with these buildings and cut the nation’senergy bill by up to 25 billion dollars annually.
The over 2,500 participants include corporations, small businesses,universities, health care facilities, nonprofit organizations, school districts, andfederal and local governments. As of January 1, 1998, EnergyStar®Buildings and Green Lights® Program participants have reduced theirannual energy use by 7 billion kilowatt hours and annually save more than 517million dollars. By joining, participants agree to upgrade 90 percent of theirowned facilities with energy-efficient lighting and 50 percent of their ownedfacilities with whole-building upgrades, where profitable, over a seven-yearperiod. Energy Star participants first reduce their energy loads with theGreen Lights approach to building tune-ups, then focus on “right sizing” theirheating and cooling equipment to march their new energy needs. EPApredicts this strategy will prevent more than 5.5 MMTCE of carbon dioxideby the year 2000. EPA’s Office of Air and Radiation is responsible foroperating the Energy Star Buildings and Green Lights Program. (Contact theEnergy Star Hotline number, 1-888-STAR-YES (1-888-872-7937) or MariaTikoff Vargas, Co-Director at (202) 564-9178 or visit the website athttp://www.epa.gov/buildings.)
WasteWi$e Program
The WasteWi$e Program was started in 1994 by EPA’s Office of Solid Wasteand Emergency Response. The program is aimed at reducing municipal solidwastes by promoting waste prevention, recycling collection and themanufacturing and purchase of recycled products. As of 1998, the programhad about 700 business, government, and institutional partners. Partnersagree to identify and implement actions to reduce their solid wastes settingwaste reduction goals and providing EPA with yearly progress reports for athree year period. EPA, in turn, provides partners with technical assistance,publications, networking opportunities, and national and regional recognition.(Contact: WasteWi$e Hotline at 1-800-372-9473 or Joanne Oxley, EPA

Aerospace Industry Activities and Initiatives
Sector Notebook Project November 1998110
Program Manager, 703-308-0199)
NICE3
The U.S. Department of Energy sponsors a grant program called NationalIndustrial Competitiveness through Energy, Environment, and Economics(NICE3). The NICE3 program provides funding to state and industrypartnerships (large and small business) for projects demonstrating advancesin energy efficiency and clean production technologies. The goal of theNICE3 program is to demonstrate the performance and economics ofinnovative technologies in the U.S., leading to the commercialization ofimproved industrial manufacturing processes. These processes shouldconserve energy, reduce waste, and improve industrial cost-competitiveness.Industry applicants must submit project proposals through a state energy,pollution prevention, or business development office. The following focusindustries, which represent the dominant energy users and waste generatorsin the U.S. manufacturing sector, are of particular interest to the program:Aluminum, Chemicals, Forest Products, Glass, Metal-casting, and Steel.Awardees receive a one-time, three-year grant of up to $400,000,representing up to 50 percent of a project’s total cost. In addition, up to$25,000 is available to support the state applicant’s cost share. (Contact:http//www.oit.doe.gov/Access/nice3, Steve Blazek, DOE, 303-275-4723 orEric Hass, DOE, 303-275-4728)
Design for the Environment (DfE)
DfE is working with several industries to identify cost-effective pollutionprevention strategies that reduce risks to workers and the environment. DfEhelps businesses compare and evaluate the performance, cost, pollutionprevention benefits, and human health and environmental risks associated withexisting and alternative technologies. The goal of these projects is toencourage businesses to consider and use cleaner products, processes, andtechnologies. For more information about the DfE Program, call (202) 260-1678. To obtain copies of DfE materials or for general information aboutDfE, contact EPA’s Pollution Prevention Information Clearinghouse at (202)260-1023 or visit the DfE Website at http://www.epa.gov/dfe.
Several DfE projects have been completed pertaining to the aerospaceindustry. Brief descriptions follow.
The National Science Foundation (NSF), the State of Massachusetts, theBiodegradable Polymer Research Center, the Toxics Use Reduction Institute,and the Center for Environmentally Advanced Materials were partners in aDfE project on aerospace metal degreasing.

Aerospace Industry Activities and Initiatives
Sector Notebook Project November 1998111
EPA established an interagency agreement with the Department of Energy,in partnership with the Joint Association for the Advancement of SupercriticalTechnology, to determine the suitability of supercritical carbon dioxide as analternative method for cleaning and degreasing parts. The degree ofcontaminant removal of the cleaners as well as human health andenvironmental effects were evaluated under this project. In anotheragreement with the Department of Energy, EPA obtained the services of theOak Ridge National Laboratory to perform research and prepare toxicitysummaries in support of EPA risk assessment activities conducted on allsegments of the aerospace DfE project.
The Experimental Aircraft Association (EAA) was awarded by the EPA fora demonstration project in small aircraft paint stripping. This project, begunas a DfE project jointly run by OPPT and the Coast Guard, exploredalternatives to methylene chloride and other hazardous solvent paint strippers.In the summer of 1997, the EAA completely stripped and repainted a smallplane using products that contained no chemicals on the EPA’s HazardousAir Pollutant list and that met the definition of low volatile organic chemical(VOC) releases (P2 Newsletter, 1997).
Small Business Compliance Assistance Centers
The Office of Compliance, in partnership with industry, academic institutions,environmental groups, and other federal and state agencies, has establishednational Compliance Assistance Centers for four specific industry sectorsheavily populated with small businesses that face substantial federalregulation. These sectors are printing, metal finishing, automotive servicesand repair, agriculture, painted coatings, small chemical manufacturers,municipalities, and transportation.
The purpose of the Centers is to improve compliance of the customers theyserve by increasing their awareness of the pertinent federal regulatoryrequirements and by providing the information that will enable them toachieve compliance. The Centers accomplish this by offering the following:
&“First-Stop Shopping” - serve as the first place that small businesses andtechnical assistance providers go to get comprehensive, easy to understandcompliance information targeted specifically to industry sectors.
&“Improved Information Transfer” - via the Internet and other means, createlinkages between the small business community and providers of technical andregulatory assistance and among the providers themselves to share tools andknowledge and prevent duplication of efforts.
&“Compliance Assistance Tools” - develop and disseminate plain-English

Aerospace Industry Activities and Initiatives
Sector Notebook Project November 1998112
guides, consolidated checklists, fact sheets, and other tools where needed bysmall businesses and their information providers.
&“Links Between Pollution Prevention and Compliance Goals” - provide easyaccess to information and technical assistance on technologies to helpminimize waste generation and maximize environmental performance.
&“Information on Ways to Reduce the Costs of Compliance” - identifytechnologies and best management practices that reduce pollution whilesaving money.
For general information regarding EPA’s compliance assistance centers,contact Lynn Vendinello at (202)564-7066, or go to http://www.epa.gov/oeca/mfcac.html.

Aerospace Industry Activities and Initiatives
Sector Notebook Project November 1998113
VIII.C. Trade Association/Industry Sponsored Activity
VIII.C.1. I ndustry Research Programs
NASA Langley Research Center and the Tidewater Interagency P2 Program
NASA’s Langley Research Center (LaRC) is devoted to aeronautics andspace research and has initiated a broad-based pollution prevention programguided by a Pollution Prevention Program Plan and implemented throughspecific projects. The Program Plan contains an environmental baseline,opportunities for P2, and establishes a framework to plan, implement, andmonitor specific prioritized P2 projects. LaRC is one of the participants in theTidewater Interagency Pollution Prevention Program (TIPPP). TIPPP wasdeveloped under an interagency agreement and designed to integrate P2concepts and practices at Federal installations in the Tidewater, Virginia area.
Air Force Center for Environmental Excellence
The Air Force Center for Environmental Excellence (AFCEE) is workingtoward environmental leadership and pollution prevention. TheEnvironmental Quality Directorate of the AFCEE has developed a BasePollution Prevention Management Action Plan (PPMAP). Each baseenvironmental manager must submit a PPMAP for his/her shop. Many AirForce Bases have also completed Pollution Prevention OpportunityAssessment Reports (OARs) which outline alternative approaches that a Basecan use for P2 in Base-specific operations, including rework of aircraft.
Lean Aircraft Initiative Program
The Lean Aircraft Initiative (LAI) is a three-year program which strives todefine and foster dynamic, fundamental change in both the U.S. defenseaircraft industry and government operations over the next decade. LAI is acooperative venture of private industry, the U.S. Air Force, and the EPA,supported by the analytical and research expertise of the MassachusettsInstitute of Technology. By building on and extending the “lean” paradigmthrough an organized process of research, the program seeks to develop theknowledge base that will lead to greater affordability of systems, higherquality, and increased efficiency including efficient use of materials.
Chemical Strategies Partnership
The Chemical Strategies Partnership (CSP), funded by the Pew CharitableTrusts, began a pilot project with Hughes Missile Systems Company andNortel. The CSP project aims to reduce their use and release of toxicchemicals in manufacturing while improving production efficiency andcompetitiveness.

Aerospace Industry Activities and Initiatives
Sector Notebook Project November 1998114
Joint Depot Environmental Panel (JDEP)
The Joint Policy Coordinating Group on Depot Maintenance in theDepartment of Defense chartered the Joint Depot Environmental Panel(JDEP) in 1988 to facilitate information exchange on environmental issues,technologies, and processes with potential application in the depotmaintenance community. The JDEP’s functions are to review the depot’scurrent environmental program, compile information on techniques andprocesses with potential application, coordinate the development andimplementation of environmental initiatives, and establish liaisons with federalagencies. The JDEP has hosted over 37 meetings and distributed over 500technical briefings. Total dismantling of JDEP will occur in October 1998.(see JASPPA below.)
Joint Group on Acquisition Pollution Prevention (JGAPP)
The Department of Defense has developed the Joint Group on AcquisitionPollution Prevention (JGAPP) as a military/industry initiative to reduce theuse of hazardous material in manufacturing processes. The initiative involvesseven major corporations and their related services. The JGAPP is workingwith manufacturers at their facilities to reduce the use of specific hazardousmaterials in all of the programs at the facility.
Joint Acquisition & Sustainment Pollution Prevention Activity (JASPPA)
The Joint Logistics Commanders of the Department of Defense tasked theJGAPP and JDEP to explore the possibility of a single pollution preventionactivity. Since then the JDEP and the Joint Pollution Prevention AdvisoryBoard (JPPAB, which JGAPP is part of) have been working and meetingtogether to develop various avenues of consideration for that tasking. As aresult, the JDEP and JPPAB have decided to merge to form a singleintegrated group called the Joint Acquisition & Sustainment PollutionPrevention Activity (JASPPA). The JASPPA will function as a singleintegrating activity for all pollution prevention efforts for both the acquisitionand sustainment communities. (For more information, contact Carl Adamsin the Joint Depot Maintenance Activities Group, (937)656-2771.)
Aerospace Environmental Roundtable
The Aerospace Environmental Roundtable is an informal monthly meetingcoordinated by the Aerospace Industries Association(AIA). Attendeesinclude other trade associations, contractors, and anyone else interested indiscussing environmental issues, increasing awareness, and sharinginformation pertaining to the aerospace industry. (For more information,contact Glynn Rountree, (202)371-8401.)

Aerospace Industry Activities and Initiatives
Sector Notebook Project November 1998115
VIII.C.2. Trade Associations
Aerospace Industries Association of America (AIA)1250 Eye St. NW, Suite1200Washington, DC 20005John Douglass, Pres.
(202)371-8400(202)371-8401 FAX
AIA was founded in 1919 as a trade association which represents the nation’smanufacturers of commercial, military and business aircraft, helicopters,aircraft engines, missiles, space craft, and related components and equipment.AIA maintains the AIA Aerospace Research Center to compile statistics onthe industry. AIA’s annual budget is roughly seven million dollars. Theypublish Aerospace Facts and Figures annually which contains statistical andanalytical information on aircraft production, missile programs, spaceprograms, and air transportation, as well as an annual report and an AIAnewsletter.
Aircraft Electronics Association (AEA)PO Box 1963Independence, MO 64055-0963Monte Mitchell, Pres.
(816)373-6565(816)478-3100 FAX
AEA was founded in 1958 by companies engaged in the sales, engineering,installation, and service of electronic aviation equipment and systems. AEAworks to advance the science of aircraft electronics, promote uniform andstable regulations and standards of performance, gather and disseminatetechnical data, and educate the aircraft electronics community and the public.They publish Avionics News, a monthly trade magazine. The annual budgetis one million dollars.
American Helicopter Society (AHS)217 N. Washington St.Alexandria, VA 22314Morris E. Flatter, Exec. Dir.
(703)684-6777(703)739-9279 FAX
AHS was founded in 1943 and is composed of aircraft designers, engineers,government personnel, operators, and industry executives in over fortycountries interested in V/STOL aircraft. AHS conducts research andeducational and technical meetings concerning professional training andupdated information. They publish an annual composite of technical paperspresented at the AHS forum, a quarterly journal, Journal of the AmericanHelicopter Society, A bimonthly magazine, VertFlite, and other technicalpapers. They operate on a one million dollar budget.

Aerospace Industry Activities and Initiatives
Sector Notebook Project November 1998116
Aviation Distributors and Manufacturers Association (ADMA)1900 Arch St.Philadelphia, PA 19103-1498Patricia A. Lilly, Exec. Dir.
(215)564-3484(215)564-2175 FAX
ADMA was founded in 1943 as an association of wholesalers andmanufacturers of general aviation aircraft parts, supplies, and equipment.They publish ADMA News bimonthly, Aviation Education News Bulletingbimonthly, and an annual directory.
Council of Defense and Space Industry Associations (CODSIA)2111 Wilson Blvd., Suite 400Arlington, VA 22201-3061Peter Scrivner, Exec. Sec.
(703)247-9490
CODSIA was founded in 1964 and is comprised of the Aerospace IndustriesAssociation of America, Contract Services Association of America, ElectronicIndustries Association, National Security Industrial Association, ShipbuildersCouncil of America, American Electronics Association, Professional ServicesCouncil, and Manufacturers’ Alliance for Productivity and Innovation.CODSIA holds three meetings per year in order to simplify, expedite, andimprove industry-wide communications regarding policies, regulations, andproblems.
Flight Safety Foundation (FSF)2200 Wilson Blvd. Ste. 500Arlington, VA 22201Stuart Matthews, Pres.
(703)522-8300(703)525-6047 FAX
FSF was founded in 1945 to represent aerospace manufacturers, domestic andforeign airlines, insurance companies, fuel and oil companies, schools, andmiscellaneous organizations having an interest in the promotion of safety inflight. They have an annual budget of 2.5 million dollars and publish severalbimonthly newsletters, studies, and an annual membership directory.
General Aviation Manufacturers Association (GAMA)1400 K St. NW, Ste. 801Washington, DC 20005Edward W. Simpson, Pres.
(202)393-1500(202)842-4063 FAX
GAMA was founded in 1970 as an association of manufacturers of aviationairframes, engines, avionics, and components. They strive to create a betterclimate for the growth of general aviation. GAMA publishes quarterly and
Aerospace Industry Activities and Initiatives
Sector Notebook Project November 1998117
annual reports as well as films and printed material on the aviation industry.
Helicopter Safety Advisory Conference (HSAC)PO Box 60220Houston, TX 77205Dick Landrum, Chm.
(713)960-7654(713)960-7660 FAX
HSAC is comprised of helicopter operators, manufacturers, and othersinvolved in the transport of workers by helicopter. HSAC promotes safetyand seeks to improve operations through establishment of standards ofpractice. HSAC was founded in 1979.
International Society of Transport Aircraft Trading (ISTAT)5517 Talon Ct.Fairfax, VA 22032-1737Dawn O’Day Foster, Exec. Dir.
(703)978-8156(703)503-5964 FAX
ISTAT was founded in 1983 as a society of professionals engaged in thepurchase, sale, financing, manufacturing, appraising, and leasing of new andused commercial aircraft. ISTAT publishes a quarterly newsletter, JeTrader,and an annual membership directory.
Light Aircraft Manufacturers Association (LAMA)22 Deer Oaks Ct.Pleasanton, CA 94588Lawrence P. Burke, Pres.
(510)426-0771
LAMA was founded in 1984 as an association of manufacturers ofexperimental and ultralight aircraft, suppliers to the homebuilt aircraftcommunity, media and other professionals involved with the light aircraftindustry. LAMA works to assure that the interests of the industry areproperly represented to the FAA and to Congress and provides uniformstandards of manufacturing quality and airworthiness. Lama publishesnewsletters, standards, and a membership directory.

Aerospace Industry Contacts and References
5 Many of the contacts listed above have provided valuable information and comments during the development ofthis document. EPA appreciates this support and acknowledges that the individuals listed do not necessarilyendorse all statements made within this notebook.
Sector Notebook Project November 1998118
IX. CONTACTS/ACKNOWLEDGMENTS/RESOURCE MATERIALSFor further information on selected topics within the aerospace industry a list of contacts andpublications are provided below.
Contacts5
Name Organization Telephone Subject
Anthony Raia USEPA, OECA (202)564-6045 General notebook contact
Linda Nunn California Air Resources Board (916)323-1070 Risk Reduction
Glynn Rountree Aerospace Industries Association (202)371-8401 Industry Activities
Steven Geil USEPA, OW (202)260-9817 Clean Water Act
Barbara Driscoll USEPA, OAQPS (919)541-0164 Clean Air Act
George Smith USEPA, OAQPS (919)541-1549 Rocket Engine TestFiring/ Engine TestFacilities NESHAPs
Bruce Moore USEPA, OAQPS (919)541-5460 Micellaneous MetalParts/ Plastic PartsNESHAPs
Ric Peri National Air TransportAssociation
(703)845-9000 Industry Activities
Mary Dominiak USEPA (202)260-7768 Design for theEnvironment
Lieutenant CommanderMichelle Fitzpatrick
US Coast Guard (860)441-2859 Aircraft Rework P2

Aerospace Industry Contacts and References
Sector Notebook Project November 1998119
Section II: Introduction to the Aerospace Industry
Aerospace Source Book, Aviation Week & Space Technology, January 12, 1998.
Smith, Bruce A., “Industry Outlook Is Mix of Growth, Stabilization,” Aviation Week & SpaceTechnology, March 23, 1998.
USDOC, 1992 Census of Manufactures Industry Series, Aerospace Equipment, Including Parts,Bureau of the Census, Economics and Statistics Administration, US Department of Commerce, 1995.
USDOC, U.S. Industry & Trade Outlook ‘98, International Trade Commission, US Department ofCommerce, McGraw-Hill, 1998.
USEPA/OAQPS, National Emission Standards for Hazardous Air Pollutants for Source Categories:Aerospace Manufacturing and Rework-- Background Information for Proposed Standards, Officeof Air Quality Planning and Standards, USEPA, Research Triangle Park, NC, May 1994.
Section III: I ndustrial Process Description
California Air Resources Board, Guidelines for the Aerospace Industry Facilities, EmissionsAssessment Branch, California Environmental Protection Agency, November 1997.
Horne, D.F. Aircraft Production Technology, Cambridge University Press, Cambridge, 1986.
Ohio EPA, Extending the Life of Metal Working Fluids, Fact Sheet Number 11, Office of PollutionPrevention, March 1993.
Ohio EPA, Pollution Prevention in Painting and Coating Operations, Fact Sheet Number 23, Officeof Pollution Prevention, September 1994.
USEPA, Guide to Cleaner Technologies, Alternative Metal Finishes, Office of Research andDevelopment, USEPA, September 1994.
USEPA/NRMRL, Environmental Research Brief, Pollution Prevention Assessment for aManufacturer of Aircraft Landing Gear, National Risk Management Research Library, USEPA,Cincinnati, OH, August 1995.
USEPA/OAQPS, Control of Volatile Organic Compound Emissions from Coating Operations atAerospace Manufacturing and Rework Operations, Office of Air Quality Planning and Standards,USEPA, Research Triangle Park, NC, December 1997.
USEPA/OAQPS, National Emission Standards for Hazardous Air Pollutants for Source Categories:Aerospace Manufacturing and Rework-- Background Information for Proposed Standards, Officeof Air Quality Planning and Standards, USEPA, Research Triangle Park, NC, May 1994.
USEPA/OPPT, Pollution Prevention Options in Metal Fabricated Products Industries, Office of

Aerospace Industry Contacts and References
Sector Notebook Project November 1998120
Pollution Prevention and Toxics, USEPA, January 1992.
USEPA/ORD, Guides to Pollution Prevention, The Fabricated Metal Products Industry, Office ofResearch and Development, USEPA, Washington, DC, July 1990.
USEPA/OW, Development Document for the Proposed Effluent Limitations Guidelines andStandards for the Metal Products and Machinery Phase I Point Source Category, Office of Water,USEPA, April 1995.
USEPA/OECA, Profile of the Motor Vehicle Assembly Industry, Office of Enforcement andCompliance Assurance, USEPA, September 1995.
Section IV: Chemical Release and Transfer Profile
1995 Toxics Release Inventory Public Data Release, USEPA Office of Pollution Prevention andToxics, April 1997. (EPA 745-R-97-005)
NIOSH Pocket Guide to Chemical Hazards, US Department of Health and Human Services, Centerfor Disease Control and Prevention, June 1994.
ChemFinder Database, <chemfinder.camsoft.com>
Section V: Pollution Prevention Opportunities
Air Force Center for Environmental Excellence, Environmental Quality Directorate, PollutionPrevention Model Shop Report, Flightline Maintenance Shops, Brooks Air Force Base, November30, 1994, modified June 30, 1995.
Boeing Company Web Site, <www.boeing.com/company/offices/aboutus/environment>.California Department of Health Services, Waste Reduction for the Aerospace Industry, ToxicSubstances Control Program, Alternative Technology Division, April 1990.
Chao, S.C. and McHardy, J., Progress in Supercritical CO2 Cleaning, Electro-Optical and DataSystems Group, Hughes Aircraft Company.
Dykema, Kevin J., and Larsen, George R., “The Greening of Corporate Culture: Shifting theEnvironmental Paradigm at Martin Marietta Astronautics Group,” Pollution Prevention Review,Spring 1993.
Evanoff, Stephen P., “Environmental Resources Management, Case Study #4: Substitution of LowVapor Pressure Organic Solvents and Aqueous Cleaners for CFC-113 Based Cleaning Solvents,”EPA/ICOLP Eliminating CFC-113 and Methyl Chloroform in Aircraft Maintenance Procedures,October 1993.
Ohio EPA, Extending the Life of Metal Working Fluids, Fact Sheet Number 11, Office of PollutionPrevention, March 1993.

Aerospace Industry Contacts and References
Sector Notebook Project November 1998121
Ohio EPA, Source Reduction and Metal Recovery Techniques for Metal Finishers, Fact SheetNumber 24, Office of Pollution Prevention, September 1994.
State of Michigan, Fact Sheet, Waste Reduction Checklist, Office of Waste Reduction Services,Departments of Commerce and Natural Resources, December 1989.
USEPA, Guide to Cleaner Technologies, Alternative Metal Finishes, Office of Research andDevelopment, USEPA, September 1994.
USEPA/NRMRL, Environmental Research Brief, Pollution Prevention Assessment for aManufacturer of Aircraft Landing Gear, National Risk Management Research Library, USEPA,Cincinnati, OH, August 1995.
USEPA/OAQPS, Control of Volatile Organic Compound Emissions from Coating Operations atAerospace Manufacturing and Rework Operations, Office of Air Quality Planning and Standards,USEPA, Research Triangle Park, NC, December 1997.
USEPA/OAR, Eliminating CFC-113 and Methyl Chloroform in Aircraft Maintenance Procedures,Office of Air and Radiation, USEPA, October 1993.
USEPA/OECA, Profile of the Shipbuilding and Repair Industry, Office of Enforcement andCompliance Assurance, USEPA, September 1997.
USEPA/OPPT, Pollution Prevention Options in Metal Fabricated Products Industries, Office ofPollution Prevention and Toxics, USEPA, January 1992.
USEPA/ORD, Guides to Pollution Prevention, The Fabricated Metal Products Industry, Office ofResearch and Development, USEPA, Washington, DC, July 1990.
Section VIII: Compliance Activities and Initiatives
Air Force Center for Environmental Excellence, Pollution Prevention Model Shop Report, FlightlineMaintenance Shops, Environmental Quality Directorate, AFCEE, Brooks AFB, June 30, 1995.
Dominiak, Mary, “EPA Award Presented to the Experimental Aircraft Association,” P2 Newsletter,December 1997.
Jaszczak, Sandra, ed. Gale Encyclopedia of Associations. 31st ed., International ThomsonPublishing Co., 1996.
NASA, Joint EPA/NASA/USAF Interagency Depainting Study, Fifth Progress Report, November1997.
“Project May Offer New Model for Supplier Relationships,” Business and the Environment, August1997.

Aerospace Industry Contacts and References
Sector Notebook Project November 1998122
USEPA/OAR, Eliminating CFC-113 and Methyl Chloroform in Aircraft Maintenance Procedures,Office of Air and Radiation, October 1993.