Environmental Review of the Proposed 130 MW Generating ...
506
PPSE-CPT-02 DNR Publication No. 12-2102015-750 Environmental Review of the Proposed 130 MW Generating Facility within the Cove Point Liquefaction Project December 2014
-
Upload
khangminh22 -
Category
Documents
-
view
1 -
download
0
Transcript of Environmental Review of the Proposed 130 MW Generating ...
PPSE-CPT-02 DNR Publication No. 12-2102015-750
Environmental Review of the Proposed 130 MW Generating Facility within the
Cove Point Liquefaction Project
December 2014


Environmental Review of the Proposed 130 MW Generating Facility within the Cove Point
Liquefaction Project
Prepared by
D. Mountain, M. Johnson, R. Keating Environmental Resources Management, Inc., Annapolis, MD
M. DiPrinzio, J. Flannery, M. Garrison, J. Ross
Environmental Resources Management, Inc., Malvern, PA
S. Harriott Versar, Inc. ESM Operations, Columbia, MD
P. Hall
Metametrics, Inc., Charlottesville, VA
M. Brown Spectrum Environmental Sciences, Inc., Frederick, MD
Prepared for
Maryland Department of Natural Resources Power Plant Research Program
Annapolis, MD
December 2014


FOREWORD
This report was prepared under the direction of Susan T. Gray at the Maryland Department of Natural Resources, Power Plant Research Program (PPRP). Under contract to PPRP, the following organizations were responsible for conducting the work associated with this environmental review:
• Environmental Resources Management, Inc., Annapolis, MD, under Contract # K00B0200092;
• Environmental Resources Management, Inc., Malvern, PA, under Contract #K00P2200625;
• Versar, Inc., Columbia, MD, under Contract #K00B140005; and
• Metametrics, Inc., Charlottesville, VA, under Contract #K00B-0400131.


ABSTRACT
This document summarizes the State of Maryland’s evaluation of the proposed Dominion Cove Point Generating Facility in Calvert County, Maryland. The project received final approval from the Public Service Commission (PSC) on 30 May 2014.
The Maryland Department of Natural Resources (DNR) Power Plant Research Program (PPRP), coordinating with other State agencies, prepared this environmental review document as part of the PSC licensing process, pursuant to Section 3-304 of the Natural Resources Article of the Annotated Code of Maryland. The results of PPRP’s analyses were used, as necessary, as the basis for establishing recommended license conditions, pursuant to Section 3-306 of the Natural Resources Article. PPRP’s recommendations are made in concert with other programs within DNR as well as other Executive Branch State Agencies – Departments of Agriculture, Business and Economic Development, Environment, Planning, and Transportation, and the Maryland Energy Administration.
This environmental review summarizes PPRP’s evaluation of the potential environmental and cultural resource impacts of Dominion’s proposed generating facility. The facility would supply electricity for the proposed Dominion Cove Point Liquefaction Project, a modification to the existing liquefied natural gas (LNG) import facility to allow for liquefaction and export of natural gas from the Cove Point terminal.
A draft version of this document was filed with the PSC as part of DNR’s direct testimony in PSC Case No. 9318. Appendix A includes the PSC order and final license conditions under Case No. 9318.


DNR – PPRP i COVE POINT ERD /DEC 2014
TABLE OF CONTENTS
FOREWORD ...................................................................................................... iii
ABSTRACT ......................................................................................................... iv
1.0 INTRODUCTION....................................................................................... 1
1.1 REPORT OBJECTIVES ................................................................................... 2 1.2 DOCUMENT ORGANIZATION ..................................................................... 2
2.0 PROJECT DESCRIPTION ........................................................................ 4
2.1 DCP LNG TERMINAL ................................................................................ 7 2.1.1 Existing Facilities ............................................................................... 7 2.1.2 Proposed New Operations and Components ...................................... 7
2.2 OFFSITE AREAS ........................................................................................... 9 2.2.1 Offsite Area A ..................................................................................... 9 2.2.2 Offsite Area B ................................................................................... 10
3.0 EXISTING CONDITIONS – SITE AND OFFSITE AREAS ............. 12
3.1 TOPOGRAPHY, SOILS, GEOLOGY AND WATER RESOURCES ................ 12 3.1.1 Soils ................................................................................................... 12 3.1.2 Geology ............................................................................................. 12 3.1.3 Hydrogeology .................................................................................... 14 3.1.4 Ground Water Use ............................................................................ 16
3.2 CLIMATOLOGY .......................................................................................... 18 3.3 AIR QUALITY ............................................................................................ 18 3.4 BIOLOGICAL RESOURCES – SITE AND OFFSITE AREAS ............................. 21
3.4.1 Aquatic Resources ............................................................................. 21 3.4.2 Wildlife .............................................................................................. 28 3.4.3 Vegetation ......................................................................................... 31 3.4.4 Wetlands ........................................................................................... 35 3.4.5 Threatened and Endangered Species................................................. 36
3.5 REGIONAL SOCIOECONOMIC SETTING ..................................................... 40 3.5.1 Population Trends ............................................................................ 40 3.5.2 Employment and Income Trends ...................................................... 41 3.5.3 Land Use and Zoning ....................................................................... 42 3.5.4 Transportation .................................................................................. 47 3.5.5 Public Services and Safety ................................................................ 49 3.5.6 Cultural Setting ................................................................................ 50
3.6 NOISE ........................................................................................................ 53 3.6.1 Definition of Noise ............................................................................ 53 3.6.2 Existing Noise Levels at the DCP LNG Terminal ........................... 55
4.0 AIR QUALITY IMPACTS ....................................................................... 58

DNR – PPRP ii COVE POINT ERD /DEC 2014
4.1 AIR QUALITY IMPACT ASSESSMENT BACKGROUND AND METHODOLOGY ................................................................................................ 58
4.1.1 Overview ........................................................................................... 58 4.1.2 Regulatory Considerations ............................................................... 58
4.2 PROPOSED PROJECT SOURCE CHARACTERIZATION ................................. 60 4.2.1 Overview ........................................................................................... 60 4.2.2 Potential Emissions from the Combustion Turbines (CTs) ............. 66 4.2.3 Potential Emissions from the Auxiliary Boilers ............................... 69 4.2.4 Potential Emissions from the Emergency Engines ........................... 72 4.2.5 Potential Emissions from the Thermal Oxidizer .............................. 73 4.2.6 Potential Emissions from the Ground Flares ................................... 75 4.2.7 Projected Actual Emissions Increase from the Existing Combustion Turbines ........................................................................................................ 78 4.2.8 Potential Emissions from Piping Component Leaks ........................ 79 4.2.9 Project-wide Maximum Potential Criteria Pollutant Emissions ..... 80 4.2.10 Ammonia Emissions ..................................................................... 83 4.2.11 Hazardous Air Pollutants Emissions ........................................... 84 4.2.12 Toxic Air Pollutant Emissions ..................................................... 88 4.2.13 Construction Emissions ................................................................ 90 4.2.14 Conformity Emissions .................................................................. 93
4.3 TAPS ANALYSIS ................................................................................... 97 4.4 PREVENTION OF SIGNIFICANT DETERIORATION (PSD) ........................ 102
4.4.1 Applicability ................................................................................... 102 4.4.2 Best Available Control Technology (BACT) Analyses ................... 103 4.4.3 NAAQS and PSD Increment Compliance Demonstration ............ 142
4.5 NONATTAINMENT NEW SOURCE REVIEW (NA-NSR).......................... 143 4.5.1 LAER Evaluation............................................................................ 143 4.5.2 Offsets ............................................................................................. 161 4.5.3 Additional NA-NSR Requirements................................................ 161
4.6 APPLICABLE REQUIREMENTS REVIEW ................................................ 162 4.6.1 Federal Requirements ..................................................................... 162 4.6.2 Maryland State Requirements ........................................................ 166
5.0 ANALYSIS OF OTHER ENVIRONMENTAL IMPACTS .............. 168
5.1 IMPACTS TO AQUATIC RESOURCES ........................................................ 168 5.1.1 DCP LNG Terminal ....................................................................... 168 5.1.2 Offsite Areas ................................................................................... 168 5.1.3 Fisheries of Special Concern ........................................................... 171
5.2 IMPACTS TO TERRESTRIAL RESOURCES .................................................. 171 5.2.1 Wildlife ............................................................................................ 171 5.2.2 Vegetation ....................................................................................... 175 5.2.3 Wetlands ......................................................................................... 177 5.2.4 Threatened and Endangered Species............................................... 179
5.3 GROUND WATER IMPACTS ..................................................................... 182

DNR – PPRP iii COVE POINT ERD /DEC 2014
5.3.1 Construction Impacts ..................................................................... 182 5.3.2 Routine and Accidental Releases to Ground Water ....................... 183
5.4 SOCIOECONOMIC AND CULTURAL IMPACTS ......................................... 183 5.4.1 Employment and Income ................................................................ 184 5.4.2 Population and Housing ................................................................. 185 5.4.3 Transportation ................................................................................ 186 5.4.4 Land Use ......................................................................................... 189 5.4.5 Property Values .............................................................................. 191 5.4.6 Visual Quality ................................................................................ 192 5.4.7 Government Finances ..................................................................... 193 5.4.8 Cultural Impacts ............................................................................. 195
5.5 NOISE IMPACTS ....................................................................................... 198 5.5.1 Summary of Regulatory Requirements .......................................... 198 5.5.2 Estimates of Noise Emissions from the Generating Equipment ..... 199 5.5.3 Comparison to Regulatory Standards and Impact Evaluation ...... 201
6.0 WATER SUPPLY ..................................................................................... 202
6.1 WATER REQUIREMENTS AND SOURCES ................................................. 202 6.1.1 Water for Construction ................................................................... 202 6.1.2 Water for Operation ........................................................................ 204
6.2 MARYLAND’S APPROPRIATIONS REGULATIONS .................................... 207 6.3 REASONABLENESS OF USE DETERMINATION ......................................... 208 6.4 GROUND WATER WITHDRAWAL IMPACTS ............................................ 210
6.4.1 Impacts to the Aquifer .................................................................... 210 6.4.2 Impacts to Other Users ................................................................... 217
6.5 RECOMMENDATIONS .............................................................................. 219
7.0 SUMMARY .............................................................................................. 220
7.1 AIR QUALITY ...................................................................................... 220 7.2 BIOLOGICAL RESOURCES ........................................................................ 223
7.2.1 DCP LNG Terminal ....................................................................... 223 7.2.2 Offsite Area A ................................................................................. 224 7.2.3 Offsite Area B ................................................................................. 224
7.3 SOCIOECONOMIC RESOURCES ................................................................ 225 7.4 NOISE ...................................................................................................... 228 7.5 WATER SUPPLY ....................................................................................... 229
8.0 REFERENCES .......................................................................................... 231

DNR – PPRP iv COVE POINT ERD /DEC 2014
APPENDICES
Appendix A PSC Order and Final License Conditions, Case No. 9318
Appendix B Potential Emissions and DCP Existing HAP Emission Inventory
Appendix C BACT-LAER Final Summary Table
Appendix D Detailed Review of Modeling Analysis
TABLES
Table 3.4-1 Representative Commercial and Game Fish Potentially Occurring in the Vicinity of the Terminal’s Offshore Pier . 21
Table 3.4-2 Other Representative Fish Potentially Occurring in the Vicinity of the Terminal’s Offshore Pier and Offsite Area B
..................................................................................................... 22
Table 3.4-3 Representative Aquatic Invertebrates Potentially Occurring in Shallow Areas in the Vicinity of the Terminal’s Offshore Pier .............................................................................................. 23
Table 3.4-4 Representative Aquatic Invertebrates Potentially Occurring in Open Water in the Vicinity of the Terminal’s Offshore Pier .............................................................................................. 24
Table 3.4-7 Birds of Conservation Concern that Occur in the New England/Mid-Atlantic Coast BCR, in the Vicinity of the Proposed Project ....................................................................... 30
Table 3.4-8 Specimen Trees Identified by DCP at Offsite Area A ......... 33
Table 3.4-9 Listed and Proposed Endangered and Threatened Species that Potentially Occur in the Vicinity of the Proposed Project ........................................................................................ 36
Table 3.5-1 Calvert County Traffic Volumes ............................................ 48
Table 3.6-1 Typical Sound Levels for Common Sources (dBA) ............. 54
Table 4.2-1 DCP Air Emission Sources ...................................................... 65
Table 4.2-2 Potential Emissions from the Frame 7 CTs During Normal Operation ................................................................................... 68
Table 4.2-3 Maximum Annual Potential Emissions from the Frame 7 CTs .............................................................................................. 69

DNR – PPRP v COVE POINT ERD /DEC 2014
Table 4.2-4 Potential Emissions from the Auxiliary Boilers During Normal Operation .................................................................... 70
Table 4.2-5 Maximum Annual Potential Emissions from the Auxiliary Boilers ......................................................................................... 71
Table 4.2-6 Potential Emissions from the Emergency Engines .............. 73
Table 4.2-7 Potential Emissions from the Thermal Oxidizer .................. 74
Table 4.2-8 Total Potential Emissions from the North Ground Flare ... 77
Table 4.2-9 Total Potential Emissions from the South Ground Flare .... 77
Table 4.2-10 Projected Actual Emissions Increase from the Existing Frame 5 CTs ............................................................................... 79
Table 4.2-11 Potential Emissions from Equipment Leaks ......................... 80
Table 4.2-12 Summary of Projected Short-term Emission Rates from the Proposed Project ....................................................................... 81
Table 4.2-13 Summary of Proposed Project Emissions (tpy)1 .................. 83
Table 4.2-14 Total Potential HAP Emissions from Existing and Proposed Operations ................................................................................. 86
Table 4.2-15 Summary Facility-Wide TAP Emissions ............................... 89
Table 4.2-16 Project Construction Emissions for Year 2014 ...................... 91
Table 4.2-17 Project Construction Emissions for Year 2015 ...................... 92
Table 4.2-18 Project Construction Emissions for Year 2016 ...................... 92
Table 4.2-19 Project Construction Emissions for Year 2017 ...................... 92
Table 4.2-20 Total Emissions from Project for General Conformity in 2014 - Washington DC AQCR (tpy) ....................................... 95
Table 4.2-21 Total Emissions from Project for General Conformity in 2015 - Washington DC AQCR (tpy) ....................................... 95
Table 4.2-22 Total Emissions from Project for General Conformity in 2016 - Washington DC AQCR (tpy) ....................................... 96
Table 4.2-23 Total Emissions from Project for General Conformity in 2017 - Washington DC AQCR (tpy) ....................................... 96
Table 4.2-24 Total Emissions from Project for General Conformity in 2018 Onward - Washington DC AQCR (tpy) ....................... 97
Table 4.3-1 TAP Analysis Operating Scenarios ........................................ 98
Table 4.3-2 Comparison of Facility-Wide TAP Emissions to AERs ...... 99
Table 4.4-1 PSD/NSR Applicability Analysis for Proposed Project ... 102

DNR – PPRP vi COVE POINT ERD /DEC 2014
Table 4.4-2 Proposed PM, PM10, PM2.5 BACT Determinations ......... 118
Table 4.4-3 Proposed CO BACT Determinations ................................... 128
Table 4.4-4 Proposed GHG BACT Determinations ............................... 141
Table 4.5-1 Proposed NOx LAER Limitations ........................................ 152
Table 4.5-2 Proposed VOC LAER Determinations ................................ 160
Table 4.6-1 NSPS Subpart IIII Emission Standards for the Emergency Generator and the Five Fire Pump Engines ....................... 165
Table 5.2-1 Construction and Operation Impacts to Upland and Wetlands, as Projected by DCP for the Project, in Acres .. 173
Table 5.2-2 Forest Mitigation Potential .................................................... 177
Table 5.2-3 Some Rare and Uncommon Species Occurring Along St. Paul’s Branch ........................................................................... 181
Table 5.4-1 Status of Vacant Housing in Calvert and Surrounding Counties, 2010 ......................................................................... 186
Table 5.5-1 Maryland State Maximum Allowable Noise Levels (dBA) for Receiving Land Use Categories (1) .................................. 198
Table 5.5-2 Octave Band Source Sound Power Levels (dB) (1) .............. 200
Table 5.5-3 Final Estimated Sound Pressure Levels at Receptor Locations (1) ............................................................................ 201
Table 6.1-1 Projected Water Demand for Construction ........................ 202
Table 6.1-2 Forecasted Timeframe for Construction Water Use .......... 203
Table 6.1-3 Projected Water Demand for Operation ............................. 205
Table 6.4-1 Lower Patapsco Aquifer Calculated Drawdown for 1 and 12 Years at the Proposed Withdrawal Rate of 233,000 gpd ... 216
Table 6.4-2 Lower Patapsco Aquifer Calculated Drawdown at the Proposed Withdrawal Rates after 12 Years ........................ 218
Table 7.1-1 DCP Air Emission Sources .................................................... 220
FIGURES
Figure 2.1-1 Dominion Cove Point Site Vicinity .......................................... 5
Figure 2.1-2 Location of Cove Point Terminal Site and Offsite Areas ...... 6
Figure 3.1-1 Geologic Cross-Section D-D’ ................................................... 13
Figure 3.1-2 Hydrograph for USGS Well CA Fd 85 .................................. 16
DNR – PPRP vii COVE POINT ERD /DEC 2014
Figure 3.5-1 Calvert County Land Use – 2010 ............................................ 44
Figure 3.5-2 Zoning in the Vicinity of the DCP LNG Terminal ............... 45
Figure 3.5-3 Protected Lands in Calvert County ....................................... 47
Figure 3.6-1 Noise Receptor Locations ........................................................ 56
Figure 6.4-1 Available Drawdown in the Lower Patapsco Aquifer at Well CA-95-0691 at Dominion Cove Point ......................... 212
Figure 6.4-2 Dominion Well CA-95-0691 Aquifer Test Data Evaluation ...................................................................... 215


DNR – PPRP 1 COVE POINT ERD / DEC 2014
1.0 INTRODUCTION
Dominion Cove Point LNG, LP (“DCP” or “Dominion”), operates a terminal facility in Calvert County where the company receives imported natural gas and conveys it to the interstate gas transmission system. The natural gas fuel is transported across sea by tanker vessel in liquefied form. At the DCP facility, the liquefied natural gas (LNG) is offloaded and processed into a gaseous form that meets the quality requirements for pipeline natural gas.
Dominion is planning to convert the facility to bi-directional operation, allowing for exports as well as imports of LNG. This modification includes the addition of electrical generation capacity at the site. Thus, DCP is proposing to construct and operate a generating station and associated facilities to be located at the terminal site (“Project” or “proposed Project”). In April 2013, Dominion submitted an application for a Certificate of Public Convenience and Necessity (CPCN) for the Project from the Maryland Public Service Commission (PSC) (“the Application” or “the CPCN Application”).
Dominion currently operates several small generating units at the Cove Point terminal to provide electric power for the entire facility. The Cove Point LNG facility is not connected to the electricity grid; it meets all of its power needs through on-site generation. Dominion is now proposing to add a generating station with nameplate capacity of 130 MW. This is a significant increase in capacity because the liquefaction process — converting pipeline natural gas to LNG for loading onto tankers and exporting — is much more energy-intensive compared to the import process.
The Department of Natural Resources (DNR) Power Plant Research Program (PPRP), coordinating with other State agencies, performed an environmental review of the proposed power plant at the DCP terminal site as part of the licensing process administered by the Maryland PSC. The description of this review is provided below in this document (“Document”). Before constructing the power plant, Dominion must obtain a CPCN from the PSC. PPRP conducted a review to evaluate the potential impacts to environmental and cultural resources for the proposed power plant, pursuant to Section 3-304 of the Natural Resources Article of the Annotated Code of Maryland.
Although the proposed generating station is only a portion of the proposed Project, many of the impacts from constructing and operating

DNR – PPRP 2 COVE POINT ERD / DEC 2014
the electric generating equipment cannot be separated from the larger project and, thus, cannot be evaluated on a stand-alone basis. Therefore, the State’s review of impacts to resources was not limited to the generation plant, but rather examined the proposed Project, as a whole.
PPRP used the analysis of potential impacts as the basis for establishing recommended license conditions for operating the proposed Project, pursuant to Section 3-306 of the Natural Resources Article. PPRP’s recommendations are made in concert with other units within DNR, as well as the Departments of Environment, Agriculture, Business and Economic Development, Planning, and Transportation, and the Maryland Energy Administration. Appendix A includes PSC Order No. 86372, dated 30 May 2014, which granted the CPCN, as well as the final conditions attached to the certificate.
1.1 REPORT OBJECTIVES
The purpose of PPRP’s environmental review document is to:
• Describe the State agencies’ evaluation of potential impacts associated with the proposed Dominion Cove Point generating facility;
• Discuss the results of those evaluations; and
• Identify the recommended license conditions that the State agencies developed to minimize or mitigate any adverse impacts.
A draft version of this document, including initial recommended license conditions, were submitted to the PSC as part of the proceedings for Case No. 9318. With the exception of this introduction and Appendix A (the PSC Order and final conditions), the remainder of the document contains no substantive changes from that draft.
1.2 DOCUMENT ORGANIZATION
This Document synthesizes the evaluations that PPRP has conducted. The information is organized into the following sections:
• Section 2 provides a description of the proposed Project.
• Section 3 describes existing environmental and socioeconomic conditions at the site and in the vicinity.
• Section 4 presents a regulatory applicability and impact analysis with respect to air emissions from the proposed facility.

DNR – PPRP 3 COVE POINT ERD / DEC 2014
• Section 5 addresses other impacts, including effects on biological and socioeconomic resources, and noise.
• Section 6 discusses water supply and impacts associated with groundwater use.
• Section 7 summarizes the findings of PPRP’s evaluations.


DNR – PPRP 4 COVE POINT ERD / DEC 2014
2.0 PROJECT DESCRIPTION
Dominion Cove Point LNG, LP, owns and operates the Cove Point LNG Terminal in Lusby, Calvert County, Maryland. At this time, Dominion proposes to expand its existing facilities and construct new facilities to enable the LNG terminal to function on a bi-directional basis. These upgrades will allow DCP to liquefy natural gas for loading onto LNG ships for export at the terminal (export service), in addition to its current import capability. DCP is requesting authorization from the Federal Energy Regulatory Commission (FERC) to construct and operate liquefaction facilities with LNG production capacity of up to 5.75 million metric tons per year, or approximately 1.4 billion cubic feet per day of natural gas.1
The Cove Point facility generates all of its own electricity to power the gas processing and terminal operations. The liquefaction project includes the addition of a new generating station with nameplate capacity of 130 MW. In addition to the modifications and new equipment to be installed at the terminal site, DCP proposes to use two nearby areas in Calvert County to support construction. DCP will use 96.9 acres of property at Offsite Area A and 5.9 acres at Offsite Area B for temporary construction laydown and parking areas.
1 In September 2013, DCP received the required approval of its export activities from the U.S. Department of Energy.

DNR – PPRP 5 COVE POINT ERD / DEC 2014
Figure 2.1-1 Dominion Cove Point Site Vicinity

DNR – PPRP 6 COVE POINT ERD / DEC 2014
Figure 2.1-2 Location of Cove Point Terminal Site and Offsite Areas

DNR – PPRP 7 COVE POINT ERD / DEC 2014
2.1 DCP LNG TERMINAL
2.1.1 Existing Facilities
The Cove Point terminal was initially permitted in 1972 as part of a project to import LNG and transport natural gas to U.S. markets. The facility was designed to receive imported LNG from ocean-going tanks, store LNG in insulated tanks, vaporize the LNG, and transport the vaporized LNG as pipeline-quality natural gas for consumption in the U.S. markets via an 88-mile pipeline that connected the terminal to the interstate pipeline grid. The terminal received ship-borne LNG imports between 1978 and 1980, after which time shipments ceased. In 2001, the terminal’s owner (then Columbia Gas) sought and obtained authorization from FERC to reactivate the facility, construct new equipment, and recommence LNG imports.
In 2005, Dominion sought FERC authorization for a major expansion of the terminal and pipeline facilities to increase capacity to supply consumers in markets throughout the Mid-Atlantic and Northeastern states. This expansion added two new gas-fired electric generating units at the terminal. The PSC granted a CPCN exemption for construction and operation of these units, because: all of the resulting power would be consumed at the terminal; and the total on-site generating capacity was less than 70 MW.
Over the years, FERC approved numerous other expansions and modifications of the terminal and its related pipeline facilities. As these expansions did not involve installation of additional generation, no PSC approval was needed regarding these matters. Subsequently, in June 2006, the FERC approved DCP’s request to construct additional facilities, including a 12 MW nominal capacity electric generating unit at the terminal. Since the added generation caused the total on-site generating capacity to exceed the 70 MW exemption threshold, Dominion applied for and received a CPCN from the PSC for the 12 MW unit.
2.1.2 Proposed New Operations and Components
The new DCP liquefaction facility will tie into the existing facility and will share common equipment and infrastructure, such as the LNG tanks, pumps, and piping, to support both importing and exporting LNG. The existing DCP pipeline will transport natural gas to the terminal for liquefaction. Feed gas will be delivered via the existing DCP pipeline, which terminates at the west side of the terminal. At present, this pipeline is used to receive gas produced by the existing regasification facility. The

DNR – PPRP 8 COVE POINT ERD / DEC 2014
liquefaction project will enable Dominion to liquefy natural gas at the terminal.
The liquefaction project will consist of one LNG train, capable of processing approximately 5.75 million metric tons per year, and two new natural gas-fired turbines to drive the main refrigerant compressors. Waste heat from the combustion turbines will be used to create steam for electricity generation and other on-site uses.
DCP requests authorization from the PSC to construct and operate a generating station with a 130 MW nameplate capacity, comprised of two 65 MW steam turbine generating units, and associated facilities. This is in order to provide additional power needed for the liquefaction facility. These generating units will operate in combined cycle mode, with steam generated from the waste heat from gas turbines used to mechanically drive the liquefaction process compressors. The steam turbines will be located at the terminal, and all of the power from these units will be consumed on site. The addition of these facilities will bring the terminal’s total on-site nameplate generating capacity to 210.9 MW. Only those generating units needed to meet the terminal’s electric requirements would be operated at any one time.
DCP will install a steam system to provide a heating medium to the liquefaction process and to generate electrical power for the terminal site. The heat recovery steam generator (HRSG) systems and the auxiliary boilers will generate superheated high pressure steam (SHS). Steam available from the HRSG boilers will not meet the total steam requirement, so DCP will install auxiliary boilers to supply the balance of the steam required. Dominion will install the HRSG systems in each gas turbine exhaust to recover heat from the flue gas. SHS will then drive the two steam turbines to generate electrical power. The system will produce sufficient electrical power to meet the entire facility’s requirements. A portion of the SHS stream is also removed for use in process heating.
The system will return steam condensate from each process use to the deaerator. Flash steam from the process and condensed steam from the steam turbines will also be returned to the deaerator. Make-up water will be delivered to the deaerator for removal of non-condensables. A set of boiler feed water pumps will serve the HRSG boilers and the auxiliary boilers. Boiler makeup water will originate from an on-site deep ground water well. Air-cooled condensers will condense steam exiting the turbines.

DNR – PPRP 9 COVE POINT ERD / DEC 2014
DCP will use the proposed additional generation exclusively to produce on-site electricity, with no electric power exported to the grid. To ensure that no power leaves the terminal, DCP will continue to maintain the protection equipment that currently prevents electricity produced at the terminal from flowing to the Southern Maryland Electric Cooperative, Inc. (“SMECO”), the local electric service provider for the area.
The existing Cove Point terminal property encompasses more than 1,000 acres. DCP will construct the liquefaction facility on 59.5 acres within the fenced area of the 131-acre operating industrial area. The existing construction access road used for a previous expansion project will be utilized for temporary access to the proposed Project during construction.
DCP will add additional loading pumps and vapor return blowers at the existing unloading facility to establish bi-directional capability. New piping will also be installed to connect the new vapor return blowers to the existing piping. DCP will modify the LNG transfer piping between the loading pier and the onshore terminal facilities to allow for bi-directional flow of LNG. This work will require replacing the existing expansion joints so that the necessary LNG flow rates for the new export services can be achieved. This modification will not affect the ability to maintain the existing import service. The change in operations will not increase the level of tanker traffic allowed at Cove Point under the facility’s existing U.S. Coast Guard authorization.
2.2 OFFSITE AREAS
DCP is limited in the amount of land it can disturb at the terminal site. Under an agreement with the Sierra Club and the Maryland Conservation Council, a significant amount of the 1,100-acre site must be preserved as natural habitat. Therefore, DCP proposes to use offsite areas to support construction activities for the liquefaction project. One laydown area, Offsite Area A, will provide a staging area for equipment and supplies, pre-assembly, and construction worker parking. A second laydown area, Offsite Area B, will provide a barging site to receive major equipment and supplies best transported by water. These are temporary uses only.
2.2.1 Offsite Area A
Offsite Area A consists of 179.4 acres. One hundred acres are owned by a private landowner, and DCP has acquired an option to purchase them. Calvert County owns the remaining 79.4 acres, and DCP will lease this land. Of the total 179.4 acres, DCP will use 96.9 acres as a laydown area.
DNR – PPRP 10 COVE POINT ERD / DEC 2014
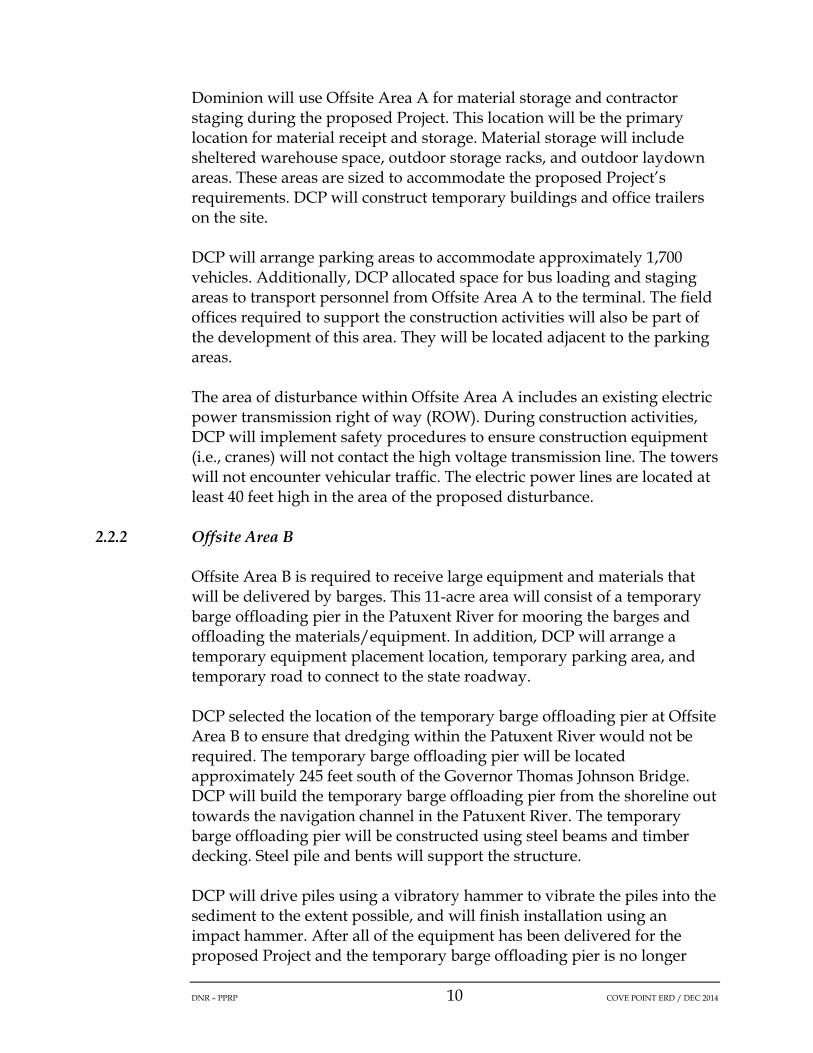
Dominion will use Offsite Area A for material storage and contractor staging during the proposed Project. This location will be the primary location for material receipt and storage. Material storage will include sheltered warehouse space, outdoor storage racks, and outdoor laydown areas. These areas are sized to accommodate the proposed Project’s requirements. DCP will construct temporary buildings and office trailers on the site.
DCP will arrange parking areas to accommodate approximately 1,700 vehicles. Additionally, DCP allocated space for bus loading and staging areas to transport personnel from Offsite Area A to the terminal. The field offices required to support the construction activities will also be part of the development of this area. They will be located adjacent to the parking areas.
The area of disturbance within Offsite Area A includes an existing electric power transmission right of way (ROW). During construction activities, DCP will implement safety procedures to ensure construction equipment (i.e., cranes) will not contact the high voltage transmission line. The towers will not encounter vehicular traffic. The electric power lines are located at least 40 feet high in the area of the proposed disturbance.
2.2.2 Offsite Area B
Offsite Area B is required to receive large equipment and materials that will be delivered by barges. This 11-acre area will consist of a temporary barge offloading pier in the Patuxent River for mooring the barges and offloading the materials/equipment. In addition, DCP will arrange a temporary equipment placement location, temporary parking area, and temporary road to connect to the state roadway.
DCP selected the location of the temporary barge offloading pier at Offsite Area B to ensure that dredging within the Patuxent River would not be required. The temporary barge offloading pier will be located approximately 245 feet south of the Governor Thomas Johnson Bridge. DCP will build the temporary barge offloading pier from the shoreline out towards the navigation channel in the Patuxent River. The temporary barge offloading pier will be constructed using steel beams and timber decking. Steel pile and bents will support the structure.
DCP will drive piles using a vibratory hammer to vibrate the piles into the sediment to the extent possible, and will finish installation using an impact hammer. After all of the equipment has been delivered for the proposed Project and the temporary barge offloading pier is no longer

DNR – PPRP 11 COVE POINT ERD / DEC 2014
needed, it will be removed and the piles will be either cut off just below mud-line or removed altogether. If a pile is unable to be vibrated out of the ground, it will be cutoff at or below the mud-line.
The haul path from Offsite Area B will be approximately 1,118 feet long and will intersect with Solomons Island Road. The path will be improved by stripping topsoil and covering it with either crane mats or stone bedding. Upon completion of all equipment deliveries, and when the offloading area is no longer required, the mats or stone will be removed and the site graded to pre-construction grade.

DNR – PPRP 12 COVE POINT ERD / DEC 2014
3.0 EXISTING CONDITIONS – SITE AND OFFSITE AREAS
3.1 TOPOGRAPHY, SOILS, GEOLOGY AND WATER RESOURCES
3.1.1 Soils
Construction of the Cove Point Liquefaction Facility will disturb 37.6 acres of soil inside the fence on the western side of the existing facility (Dominion Resource Report 7 Soil 2013). The proposed Project will disturb two predominant soil types, namely Downer-Dodon complex and Woodstown sandy loam. Both soil types are deep and moderately well drained soils that formed from sandy marine and alluvium deposits.
3.1.2 Geology
The Coastal Plain in southern Maryland consists of 2,600 feet of southeast dipping unconsolidated sedimentary deposits. The deposits contain clay, silt, sand, and gravel. The sediments of the Coastal Plain form a series of interbedded aquifers and confining beds ranging in age from Triassic to Holocene with the younger formations outcropping successively towards the southeast across southern Maryland and the Eastern Shore. Basement rocks of Precambrian and Paleozoic age underlie the Coastal Plain sediments.
Figure 3.1-1 shows a geologic cross-section presented in Drummond (2007) for Calvert County. Boring CA Fd 85, drilled in nearby Chesapeake Ranch Estates, depicts the underlying geology of the Cove Point site. The Coastal Plain stratigraphy presented in Figure 3.1-1, and described below, is based on the interpretations presented in the Maryland Geological Survey Report prepared by Drummond (2007).
• The undifferentiated sand, gravel, loam, and clay of upper Pliocene to Holocene age make up the minor and uppermost water bearing strata of the Lowland and Upland Deposits.
• The clayey and relatively impermeable formations of the Chesapeake Group underlie the surficial deposits and act as an effective upper confining unit for the Piney Point Formation.
• The Piney Point Formation consists of coarse quartz sand with commonly occurring zones of calcite-cemented sand and shell beds.
• The Nanjemoy Formation that progresses from sand at the Piney Point basal contact to predominately clayey material at depth.

DNR – PPRP 13 COVE POINT ERD / DEC 2014
Figure 3.1-1 Geologic Cross-Section D-D’
• The generally pink to gray colored plastic clay of the Marlboro
formation underlies the Nanjemoy.
• The Aquia Formation consists of a medium to coarse grained glauconitic quartz sand with typically minor amounts of shell material. Although the Aquia is predominately sand, some zones may contain significant quantities of clay and silt (Chappelle and Drummond 1983). The Aquia aquifer is separated from the underlying Cretaceous age aquifers by the silty and clayey Cretaceous and Paleocene Brightseat confining unit within the Brightseat Formation.
• The Brightseat Formation separates The Magothy Formation from the Aquia Formation. The Magothy aquifer comprises the sandy portion of the Magothy Formation. As shown in Figure 3.1, the Magothy aquifer pinches out in southern Calvert County, and thus may not be present beneath the Cove Point site.

DNR – PPRP 14 COVE POINT ERD / DEC 2014
• Drummond (2007) divides The Patapsco Formation of the Potomac Group into four hydrogeologic units: the Upper Patapsco confining unit; the Upper Patapsco aquifer; the Middle Patapsco confining unit; and the Lower Patapsco aquifer. The Arundel confining unit bounds the bottom of The Lower Patapsco aquifer. In Southern Maryland, the Patapsco aquifers consist of interwoven and locally discontinuous sand layers characteristic of floodplain and meandering streams deposits.
• The Patuxent Formation underlies the Lower Patapsco aquifer. The Arundel confining unit separates these two formations. The Patuxent Formation is the deepest Coastal Plain aquifer in Calvert County, and rests on the bedrock surface. The Patuxent Formation consists of sands and gravels and is considered an aquifer.
3.1.3 Hydrogeology
Well CA-Fd-85 on Figure 3.1-1 illustrates the hydrogeologic stratigraphy of the Dominion Cove Point site. As described in Section 3.1.4 below, the Dominion Cove Point facility only uses the Aquia and Lower Patapsco aquifers. Therefore only these two aquifers are described below.
3.1.3.1 Aquia Aquifer
The Aquia aquifer consists of the sandy Aquia Formation and is separated from the overlying Piney Point aquifer by the lower clayey portions of the Nanjemoy Formation and the Marlboro Clay. The base of the Aquia is bounded by the silty clayey portion of the Brightseat Formation and undifferentiated clayey formations collectively known as the Brightseat confining unit.
The Aquia aquifer extends from an estimated elevation of -450 to -580 feet msl in the vicinity of the Cove Point site and is used extensively for domestic and major-user supplies in Southern Maryland and the Eastern Shore. Transmissivity of the Aquia aquifer in southern Maryland ranges from 400 to 2,000 ft2/d (Drummond 2007).
Water levels in the Aquia aquifer at Solomons declined approximately 100 feet over the period 1975 to 2005, with most of the decline occurring since 1990. This acceleration in water level declines is due to the withdrawal from municipal well fields at Lexington Park in St. Mary’s County and Solomons Island in Calvert County.
The USGS maintains monitoring well CA Fd 54 at Calvert Cliffs State Park completed in the Aquia aquifer (Soeder et al. 2007). Water level data

DNR – PPRP 15 COVE POINT ERD / DEC 2014
collected continuously in this well between 1978 and 2003 shows a steep decline for the period. However, the water data collected over the past ten years indicates that the rate of decline of the potentiometric surface in the Aquia aquifer at this location has slowed (USGS Groundwater Watch 2013), and is now estimated to be about 0.3 to 0.4 feet/year in well CA Fd 54.
3.1.3.2 Lower Patapsco Aquifer
The Patapsco aquifers consist of interwoven and locally discontinuous sand layers characteristic of floodplain and meandering stream deposits. The Lower Patapsco aquifer is the lowest of the sandy units in the Patapsco Formation, and is bounded below by the clay of the Arundel confining unit.
Evaluation of six aquifer pump tests resulted in transmissivity values ranging from 380 to 1,000 ft2/day in the Upper Patapsco aquifer, and 200 to 4,000 ft2/day in the Lower Patapsco aquifer (Drummond 2007). Drummond (2007) presented a value of 2,700 ft2/d determined from a pumping test conducted in Lower Patapsco aquifer well CA-Fd-85 drilled on the nearby Chesapeake Ranch estates. This transmissivity value was reported by Drummond (2007) to be a composite value determined based on a generalized average from different slopes of the aquifer test drawdown versus time data.
Although an important aquifer in other areas of Southern Maryland, the Patapsco aquifer is not used as a significant source of water in southern Calvert County. However, due to the declining water levels and naturally occurring elevated arsenic concentrations in the Aquia Aquifer, water suppliers will likely shift a portion of future withdrawals to the Patapsco aquifer.
The Patuxent aquifer underlies the Lower Patapsco aquifer separated by the Arundel confining unit. The Patuxent aquifer is not currently used in Calvert County due to the depth to the aquifer and the productive nature of the shallower aquifers.
The regional rate of decline in the water level in an aquifer measures the feet per year that the water is dropping due to regional pumping. Drummond (2007) reported that hydrographs of four test wells screened in the Lower Patapsco aquifer show steady declines over several years of available record, even in Calvert and St. Mary’s Counties where the aquifer is not used for water supply. These declines are caused by increased withdrawals from the Lower Patapsco aquifer in Anne Arundel

DNR – PPRP 16 COVE POINT ERD / DEC 2014
and Prince George’s Counties, and indicates that the aquifer is hydraulically connected on a regional scale. USGS collected water level data from nearby monitoring well CA Fd 85. As shown in Figure 3.1-2, the water level declined 14 feet between 2001 and 2013, or about 1.2 ft/yr over this period. A well monitored by Drummond (2007) in Saint Mary’s County (SM-Dd-72) showed the same rate of decline.
Figure 3.1-2 Hydrograph for USGS Well CA Fd 85
From: USGS Groundwater Watch
3.1.4 Ground Water Use
3.1.4.1 On-Site Ground Water Use
MDE authorized DCP to withdraw ground water from the Aquia and Lower Patapsco aquifers in two separate appropriation permits. The table below summarizes the information related to the two appropriation permits. Both permits expire on August 1, 2021.
Permit No. Daily
Average (gpd)
Month of Maximum Use (gpd)
Source
CA1973G114(01) 40,000 60,000 Lower Patapsco well 229J. The

DNR – PPRP 17 COVE POINT ERD / DEC 2014
well is completed at a depth of 1,702 feet below ground surface
(bgs).
CA1973G014(09) 10,000 60,000 Two Aquia wells 128J and 230J for backup. One well is 650 feet bgs
and the other is 700 feet bgs.
The appropriation for the Lower Patapsco well is the primary appropriation for the operation of the vaporization process. Uses under this permit include supply for drinking water, the LNG vaporizer and general maintenance. Withdrawal data from the Lower Patapsco well over the past three years indicates an average annual use of 8,462 gpd and a month of maximum use of 32,657 gpd.
Dominion also holds a surface water appropriation for the extraction of water from Lake Levy and Osborn Pond (CA2004S003(04)). This appropriation expires on April 1, 2014. This appropriation provides for the extraction of water from the water bodies for the purpose of hydrostatic testing of LNG tanks constructed in the future for use in the existing vaporization process. However, under the 2005 Settlement Agreement with the Sierra Club and Maryland Conservation Council, Inc., extraction of water from these water bodies is prohibited, except for fire suppression and hydrostatic testing of new LNG storage tanks (Dominion Response to PPRP Data Requests 3-3 and 3-4).
3.1.4.2 Off-Site Ground Water Use
The upper Coastal Plain aquifers are used extensively in Calvert and Saint Mary’s counties. However, the Lower Patapsco aquifer, the primary source of water for the LNG plant, is used sparsely for water supply in Calvert and St. Mary’s counties. In addition to the Cove Point appropriation, MDE WMA reports that there is one ground water appropriation in the Lower Patapsco in Calvert and St. Mary’s counties. In the Lower Patapsco aquifer, the closest potential user identified, in either Maryland Geological Survey publications or from MDE WMA permit records, is the new well installed in 2011 by the Calvert County Department of Public Works (DPW). The well was installed to a depth of 1,788 feet in Prince Frederick, the county seat. Calvert County plans to use this well to supply potable water to its water supply system. The well is located approximately 14 miles north of the Cove Point facility. Based on the well depths, other users of the Patapsco aquifer in Saint Mary’s County appear to have wells completed in the Upper Patapsco aquifer.

DNR – PPRP 18 COVE POINT ERD / DEC 2014
3.2 CLIMATOLOGY
This discussion of climatology of the area is based on summarized data from the Patuxent Naval Air Station (Patuxent NAS). This is the closest airport to the DCP facility with archived climatological data. Patuxent NAS is located approximately 11 kilometers to the south-southeast of the DCP facility.
The climate in southern Maryland is classified as temperate with maritime influences from the Atlantic Ocean and the Chesapeake Bay. Based on climate normal data from 1981 through 2010,2 the normal average annual temperature at Patuxent NAS is 57.4 degrees Fahrenheit (°F). Summers are warm and relatively humid, and winters are generally mild because of the moderating influence from being in close proximity to the Atlantic Ocean and the Chesapeake Bay. The normal minimum temperature during winter is 29.7°F, and the normal maximum temperature during summer is 84.9°F.
Rainfall distribution throughout the year is generally uniform. The greatest intensities are confined to the late spring and summer, when the probability of the occurrence of severe thunderstorms is greatest. The normal annual precipitation is 46.65 inches.
3.3 AIR QUALITY
Air quality measurements have been taken at thousands of monitoring stations across the country for several decades. This has produced data that reflects ambient air concentrations of the “criteria” pollutants, nitrogen oxides (NOx), sulfur dioxide (SO2), particulate matter (PM10 and PM2.5), ozone (O3), carbon monoxide (CO), and lead (Pb). State, local and tribal air quality agencies operate and maintain most of the stations and follow nationally consistent procedures established by the U.S. Environmental Protection Agency (EPA). Data are routinely reported to and summarized by EPA in its Air Quality System (AQS), which can be accessed on the internet.3
2 http://www1.ncdc.noaa.gov/pub/data/normals/1981-2010/products/station/
3 http://www.epa.gov/airdata/

DNR – PPRP 19 COVE POINT ERD / DEC 2014
The pollutant monitors are situated above the ground to represent the human breathing height. If ambient air quality monitoring indicates that the concentration of a pollutant exceeds a National Ambient Air Quality Standard (NAAQS) in any area of the country, that area is labeled a “nonattainment area” for that pollutant. This means that the area is not meeting the NAAQS. Conversely, any area in which the concentration of a criteria pollutant is below the NAAQS is labeled an “attainment area.” This indicates that NAAQS are being met.
The states and EPA make the attainment/nonattainment designation on a pollutant-by-pollutant basis. The air quality in an area may simultaneously be designated attainment for some pollutants and nonattainment for other pollutants. For example, many cities are designated nonattainment for ozone, but are in attainment for the other criteria pollutants.
Since the late 1980s, the NAAQS for PM covered “PM10,” which represents PM less than 10 microns in diameter. In 1997, EPA revised the NAAQS for PM and added a standard for PM2.5, PM that is less than 2.5 microns in diameter. EPA published further revisions to the PM2.5 NAAQS in 2006 (24-hour NAAQS) and in 2012 (annual NAAQS). PM2.5, or “fine particulates,” is of concern because the particles’ small size allows them to be inhaled deeply into the lungs. These fine particles also contribute to regional haze and other air quality issues. In February 2011, EPA published updated designations of PM2.5 nonattainment areas.
EPA and the states make attainment designations based on air quality surveillance programs that measure pollutants in a network of nationwide monitoring stations. Historically, these networks were known as the State and Local Air Monitoring Stations (SLAMS), National Air Monitoring Stations (NAMS), and Photochemical Air Monitoring Stations (PAMS).4 The SLAMS network designation is still maintained; however, NAMS and PAMS have been folded into the National Core (NCore) Multipollutant Network and the PM2.5 Chemical Speciation Network. These two networks provide specialized measurements focused on understanding the underlying causes of (and potential solutions to) nonattainment of the ozone and PM2.5 NAAQS.
4 U.S. Environmental Protection Agency (USEPA). 1998. SLAMS/NAMS/PAMS Network Review Guidance. USEPA, Office of Air Quality Planning and Standards, Research Triangle Park, EPA-454/R-98-003, March 1998.

DNR – PPRP 20 COVE POINT ERD / DEC 2014
EPA’s six stated objectives for the monitoring network design for the SLAMS are to:
• Determine highest concentrations expected to occur in the area covered by the network;
• Determine representative concentrations in the areas of high population density;
• Determine the impact on ambient pollution levels of significant sources or source categories;
• Determine general background concentration levels;
• Determine the extent of regional pollutant transport among populated areas, and in support of secondary standards; and
• Determine the welfare-related impacts in more rural and remote areas (such as visibility impairment and effects on vegetation).
EPA further explains that SLAMS monitors are intended to be located so that the samples they collect are representative of air quality over the entire area they are intended to cover. EPA established “spatial scales of representativeness” to ensure that monitoring of specific pollutants is appropriate and representative. The scales of representativeness include microscale, middle scale, neighborhood scale, urban scale, and regional scale. The scale takes into consideration such factors as local terrain, pollutant-specific criteria, and population density. EPA reviews the program annually to “…improve the network to ensure that it provides adequate, representative, and useful air quality data.”
In summary, EPA and state air agencies have established a monitoring network designed to allow collection of monitoring data sufficient for EPA to determine ambient air quality of criteria pollutants. The monitoring data are used to determine background ambient concentrations of criteria pollutants, and to classify all areas of the county as attainment or nonattainment of the NAAQS.
Calvert County is in attainment for all criteria air pollutants except for ozone. It is designated as a “marginal” ozone nonattainment area (on a scale that ranges from worst to best air quality of extreme – severe – serious – moderate – marginal).
DNR – PPRP 21 COVE POINT ERD / DEC 2014
3.4 BIOLOGICAL RESOURCES – SITE AND OFFSITE AREAS
The data in this section of the Document is drawn from DCP’s CPCN Application.
3.4.1 Aquatic Resources
This section describes aquatic natural resources present in the vicinity of the proposed Project and the offsite areas. Section 3.4.5 discusses threatened and endangered species protected by the State of Maryland and by the federal Endangered Species Act (ESA) separately.
3.4.1.1 DCP LNG Terminal
A small nontidal wetland and an intermittent/ephemeral stream channel are located at the terminal. DCP refers to these as Wetland 1 and Waters of the U.S. #1 (WUS1), respectively. Wetland 1 is located directly below an outfall of an existing stormwater management pond located on the western portion of the terminal site. The WUS1 channel does not appear to support fish or permanent benthic populations.
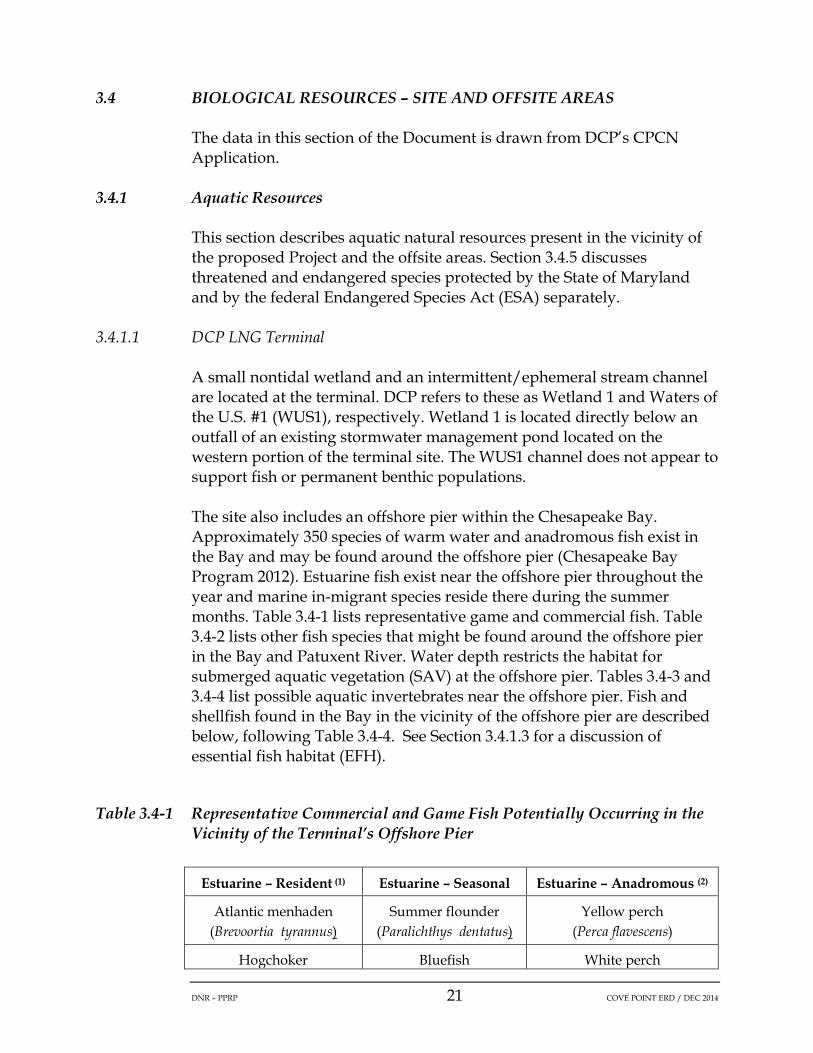
The site also includes an offshore pier within the Chesapeake Bay. Approximately 350 species of warm water and anadromous fish exist in the Bay and may be found around the offshore pier (Chesapeake Bay Program 2012). Estuarine fish exist near the offshore pier throughout the year and marine in-migrant species reside there during the summer months. Table 3.4-1 lists representative game and commercial fish. Table 3.4-2 lists other fish species that might be found around the offshore pier in the Bay and Patuxent River. Water depth restricts the habitat for submerged aquatic vegetation (SAV) at the offshore pier. Tables 3.4-3 and 3.4-4 list possible aquatic invertebrates near the offshore pier. Fish and shellfish found in the Bay in the vicinity of the offshore pier are described below, following Table 3.4-4. See Section 3.4.1.3 for a discussion of essential fish habitat (EFH).
Table 3.4-1 Representative Commercial and Game Fish Potentially Occurring in the Vicinity of the Terminal’s Offshore Pier
Estuarine – Resident (1) Estuarine – Seasonal Estuarine – Anadromous (2)
Atlantic menhaden (Brevoortia tyrannus)
Summer flounder (Paralichthys dentatus)
Yellow perch (Perca flavescens)
Hogchoker Bluefish White perch

DNR – PPRP 22 COVE POINT ERD / DEC 2014
(Trinectes maculates) (Pomatomus saltatrix) (Morone americana)
Atlantic silverside (Menidia menidia)
Weakfish (Cynoscion regalis)
Spotted bass (Morone saxatilis)
Winter flounder (Pleuronectes americanus)
Spot (Leiostomus xanthurus)
River herring (Alosa spp.)
Bay anchovy (Anchoa mitchilli)
Atlantic croaker (Micropogonias
undulates)
American shad (Alosa sapidissima)
Spotted sea trout
(Cynoscion nebulosus)
Black drum
(Pogonias cromis)
Silver perch
(Barirdiella chrysoura)
(1) The proposed Project is in an estuarine area. Warm water fish that typically reside in freshwater are only transient to the site. Species listed as residents are those that typically spawn in the Bay’s mainstream at these latitudes and will be found a mile offshore for at least part of their lifecycle. (2) Anadromous fish will be largely transient to the site, passing through as in-migrating adults and out-migrating juveniles. Young white perch and striped bass are the most likely to occur near the project area outside of migratory periods.
Table 3.4-2 Other Representative Fish Potentially Occurring in the Vicinity of the Terminal’s Offshore Pier and Offsite Area B (1)
Estuarine – Resident (2)
Estuarine – Seasonal
Estuarine – Anadromous (3)
Estuarine – Catadromous (4)
Striped blenny (Chasmodes bosquianus)
American halfbeak (Hypohamphus
meeki)
Atlantic sturgeon (Acipenser
oxyrhynchus)
American eel (Anguilla rostrata)
Feather blenny (Hypsoblennius hentz)
Atlantic needlefish (Strongulura marina)
Hickory shad (Alosa mediocris)
Bluegill (Lepomis macrochirus)
Black sea bass (Centropristis
striata)
Shortnose sturgeon (Acipenser
brevirostrum)
Green goby (Microgobius thalassinus)
Cownose ray (Rhinoptera bonasus)
Alewife (Alosa
pseudoharengus)

DNR – PPRP 23 COVE POINT ERD / DEC 2014
Naked goby (Gobiosoma bosc)
Lookdown (Selene vomer)
Lined seahorse (Hippocampus erectus)
Northern Puffer (Sphoeroides maculatus)
Longnose gar (Lepisosteus osseus)
Oyster toadfish (Opsanus tau)
Silver perch (Bairdiella hrysoura)
Skilletfish (Gobiesox strumosus)
Yellow perch (Perca flavescens)
(1) Source: Chesapeake Bay Program, 2012. Note that based on DNR analysis, there may be as many as 75 species of fish that inhabit this area of the Patuxent River. (2) The proposed project is an estuarine area. Warm water fish that typically reside in freshwater are only transient to the site. Species listed as residents are those that typically spawn in the Bay’s mainstream at these latitudes and will be found a mile offshore for at least part of their lifecycle. (3) Anadromous fish will be largely transient to the site. Young white perch and striped bass are the most likely to occur near the project area outside of migratory periods. (4) Catadromous fish migrate from freshwater rivers to the ocean to spawn. The American eel is the Bay’s only catadromous fish and will be transient to the project area.
Table 3.4-3 Representative Aquatic Invertebrates Potentially Occurring in Shallow Areas in the Vicinity of the Terminal’s Offshore Pier
Barnacles Plankton Epifauna Other Epifauna (1) Bivalves
Little gray barnacle
(Chthamalus fragilis)
Sea nettle (Chrysaora
quinquecirrha)
Bent mussel (Ischadium recurvum)
Ghost anemone (Diadumene leucolena)
Soft-shelled clam
(Mya arenaria)
Ivory barnacle (Balanus eburneus)
Sea squirt (Molgula
manhattensis)
Feather hydroid (Halocordyle
disticha)
Hard clam (Mercenaria mercenaria)
Bay barnacle (Balanus
Whip mud worm
(Polydora ligni)
American oyster
(Crassostrea

DNR – PPRP 24 COVE POINT ERD / DEC 2014
improvises) virginica)
Brackish-water clam
(Rangia cuneata)
(1) Other Epifauna that are found on pier pilings.
Table 3.4-4 Representative Aquatic Invertebrates Potentially Occurring in Open Water in the Vicinity of the Terminal’s Offshore Pier (1)
Macrozooplankton Nekton Benthic Invertebrates
Sea nettle (Chrysaora quinquecirrha)
Blue crab (Callinectes
sapidus)
Redbeard sponge (Microciona prolifera)
Winter jellyfish (Cyanea capillata)
Bryozoan
(Membranipora tenuis)
Moon jellyfish (Aurelia aurita)
Oyster flatworm (Stylochus
ellipticus)
Sea walnut (Mnemiopsis leidyi)
Whip mud worm (Polydora
lignin)
Pink comb jelly (Beroe ovate)
Thick-lipped oyster drill
(Eupleura caudate)
Black-fingered mud crab
(Paneopeus herbstii)
Fish
seasonally present (summer months). Additionally, the Patuxent River provides anadromous fish spawning and nursery habitat.
Oysters and Crabs
The Patuxent River possesses many natural oyster bars (NOBs). The waters in the vicinity of the temporary barge pier at Offsite Area B support oysters; the “Back of the Island” oyster bar is located in the area of the river surrounding the proposed pier. For 10 years, DNR seeded this bed intermittently. The NOB near Offsite Area B is not part of a designated oyster sanctuary and therefore is open for shellfish harvesting.
DNR – PPRP 25 COVE POINT ERD / DEC 2014
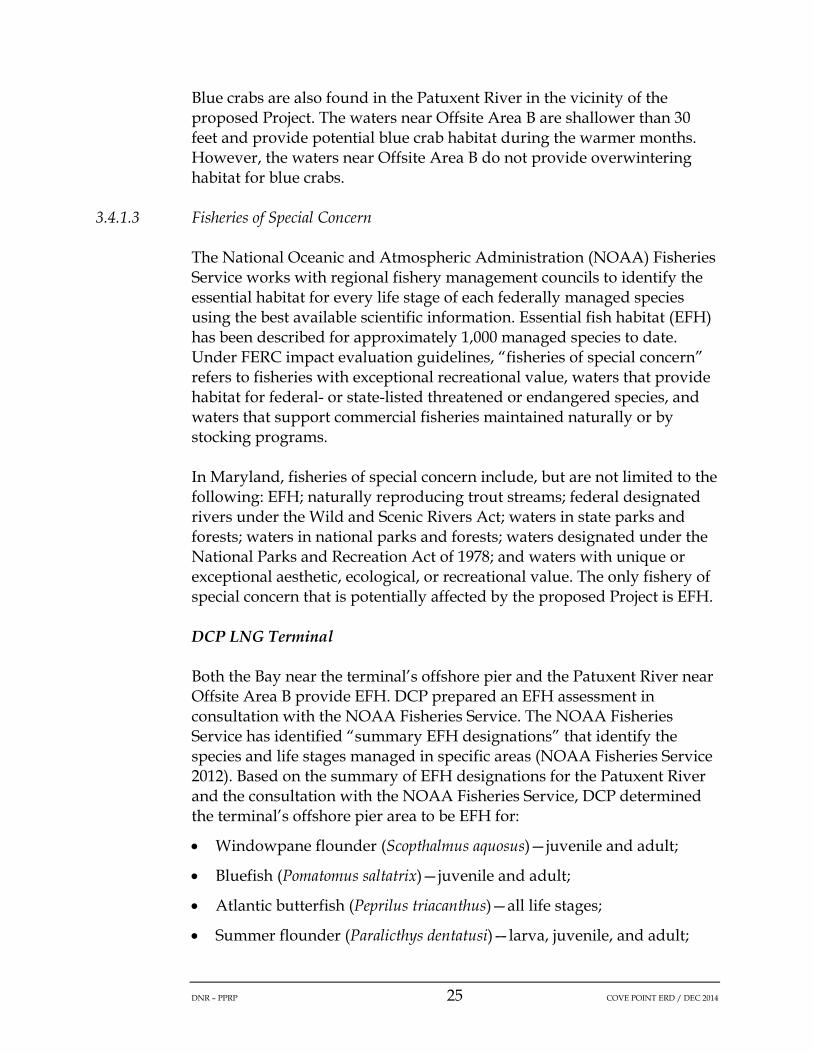
Blue crabs are also found in the Patuxent River in the vicinity of the proposed Project. The waters near Offsite Area B are shallower than 30 feet and provide potential blue crab habitat during the warmer months. However, the waters near Offsite Area B do not provide overwintering habitat for blue crabs.
3.4.1.3 Fisheries of Special Concern
The National Oceanic and Atmospheric Administration (NOAA) Fisheries Service works with regional fishery management councils to identify the essential habitat for every life stage of each federally managed species using the best available scientific information. Essential fish habitat (EFH) has been described for approximately 1,000 managed species to date. Under FERC impact evaluation guidelines, “fisheries of special concern” refers to fisheries with exceptional recreational value, waters that provide habitat for federal- or state-listed threatened or endangered species, and waters that support commercial fisheries maintained naturally or by stocking programs.
In Maryland, fisheries of special concern include, but are not limited to the following: EFH; naturally reproducing trout streams; federal designated rivers under the Wild and Scenic Rivers Act; waters in state parks and forests; waters in national parks and forests; waters designated under the National Parks and Recreation Act of 1978; and waters with unique or exceptional aesthetic, ecological, or recreational value. The only fishery of special concern that is potentially affected by the proposed Project is EFH.
DCP LNG Terminal
Both the Bay near the terminal’s offshore pier and the Patuxent River near Offsite Area B provide EFH. DCP prepared an EFH assessment in consultation with the NOAA Fisheries Service. The NOAA Fisheries Service has identified “summary EFH designations” that identify the species and life stages managed in specific areas (NOAA Fisheries Service 2012). Based on the summary of EFH designations for the Patuxent River and the consultation with the NOAA Fisheries Service, DCP determined the terminal’s offshore pier area to be EFH for:
• Windowpane flounder (Scopthalmus aquosus)—juvenile and adult;
• Bluefish (Pomatomus saltatrix)—juvenile and adult;
• Atlantic butterfish (Peprilus triacanthus)—all life stages;
• Summer flounder (Paralicthys dentatusi)—larva, juvenile, and adult;

DNR – PPRP 26 COVE POINT ERD / DEC 2014
• Black sea bass (Centropristus striata)—juvenile and adult;
• King mackerel (Scomberomorus cavalla)—all life stages;
• Spanish mackerel (Scomberomorus maculates)—all life stages;
• Cobia (Rachycentron canadum)—all life stages; and
• Red drum (Sciaenops occelatus)—all life stages.
The area near Offsite Area B’s temporary pier is determined to be EFH for:
• Windowpane flounder—juvenile and adult;
• Bluefish—juvenile and adult;
• Summer flounder—larva, juvenile, and adult;
• King mackerel—all life stages;
• Spanish mackerel—all life stages;
• Cobia—all life stages; and
• Red drum—all life stages.
The NOAA Fisheries Service concurred with DCP’s lists of species as the appropriate EFH species for the proposed Project (Nichols 2012). The NOAA Fisheries Service also indicated that juvenile and adult summer flounder and bluefish are the EFH species of concern for the Project (Nichols 2012). The following paragraphs describe these two species.
Summer Flounder
Adult and juvenile summer flounder are typically found offshore during the colder months, and are found in coastal and estuarine waters during warmer months. Wintering areas are located in Norfolk Canyon (east of Virginia) and Veatch Canyons (east of Rhode Island). In late April and early May, flounder migrate inshore. Adult flounder use the lower Bay in Virginia as a summer feeding area and migrate out of the Bay throughout the fall. Juveniles in the northern part of the range may move offshore during the winter or overwinter in estuaries. Juveniles in the southern part of the range typically overwinter in bays or sounds (Packer et al. 1999).
Adult summer flounder prefer sandy habitats and the high salinity areas of estuaries. Juveniles prefer sandy substrates or areas where the substrate transitions from fine sand to silt and clay. There is some evidence that the distribution of juvenile and adult summer flounder is more closely related

DNR – PPRP 27 COVE POINT ERD / DEC 2014
to substrate preference and not affected by salinity, though they are most often captured in higher salinity portions of estuaries. Although they are found in the Bay’s Maryland waters, they are more common in the Bay’s Virginia waters (Packer et al. 1999). Habitat of particular concern for summer flounder is shallow water habitat with SAV.
Adult summer flounder feed on fish and crustaceans. Prey species include windowpane flounder, winter flounder (Pleuronectes americanus), Atlantic menhaden (Brevoortia tyrannus), bay anchovy (Anchoa mitchilli), red hake (Urophycis chuss), scup (Stenotomus chrysops), Atlantic silverside (Menidia menidia), weakfish (Cynoscion regalis), bluefish, mummichog (Fundulus heteroclitus), shrimp, and small crustaceans. Juvenile summer flounder less than 3.9 inches long feed on crustaceans and polychaetes. The diet of larger juveniles also includes fish. Summer flounder are likely prey to large sharks, rays, and goosefish (Packer et al. 1999). Summer flounder are also harvested both commercially and recreationally in this part of their range.
Bluefish
Both adult and juvenile bluefish are found in the Bay seasonally, arriving in the spring and leaving in late fall (Murdy et al. 1997). Adults of this species are generally oceanic, but inhabit nearshore areas to offshore areas over the continental shelf. Bluefish are common in bays and larger estuaries. They typically are found in water with temperatures greater than 57.2ºF and can tolerate temperatures from 53.2 to 86.7ºF.
Juvenile bluefish are found in estuarine areas and prefer areas with salinities between 23 and 33 parts per thousand. They arrive in estuaries when temperatures are above 68.0ºF and leave when temperatures decline to 59.0ºF. Juveniles can tolerate temperatures above 50.0ºF and below 86.7ºF. During the day, they are generally found in tidal creeks or near shorelines. At night, they are found in open Bay or channel waters (Fahay et al. 1999).
Prey species for juvenile and adult bluefish consist of other fish species, including Atlantic menhaden, bay anchovy, Atlantic silverside, spot, and Atlantic croaker (Fahay et al. 1999). Bluefish are also harvested recreationally in this part of their range.

DNR – PPRP 28 COVE POINT ERD / DEC 2014
3.4.2 Wildlife
3.4.2.1 DCP LNG Terminal
Based on DCP’s supplemental filing to the PSC dated 1 August 2013 as part of its CPCN Application, approximately 22.5 acres of undeveloped land exists within the proposed Project’s 68.4-acre construction limit of disturbance. This area comprises deciduous forest and oldfield habitats. DNR and Calvert County designated part of the area outside and adjacent to the facility fence line as forest interior dwelling species (FIDS) habitat. FIDS habitat generally consists of interior areas of the forest that are more than 300 feet from the forest edge. Designation of FIDS habitat is based on the existence of forests greater than 50 acres and riparian corridors greater than 300 feet wide (Chesapeake Bay Critical Area Commission 2000). FIDS habitat is important to many wildlife species, including bird species that only reproduce in forest interior habitats. These include the scarlet tanager (Piranga olivacea), barred owl (Strix varia), pileated woodpecker (Dryocopus pileatus), and Eastern whip-poor-will (Caprimulgus vociferus) (Bushman and Therres 1988; Chesapeake Bay Critical Area Commission 2000).
The terminal site is within a fenced area, limiting movement of the surrounding forest’s large wildlife (e.g., white-tailed deer, Odocoileus virginianus) onto the site. Given the relatively developed nature of the site, land within the fenced area likely supports a suite of wildlife accustomed to human activity and noise. Small wildlife that may be found in the undeveloped areas within the fence line include skunks, squirrels, rodents, groundhogs (Marmota monax), birds, snakes, and toads.
3.4.2.2 Offsite Areas
Offsite Area A
Offsite Area A consists primarily of undeveloped forest, but it is bisected by an existing power line ROW. The site also includes a small area recently cleared along Maryland Route 2/4. Habitats at Offsite Area A include deciduous forest, coniferous forest, successional woodland, oldfield, and ruderal areas. DCP has indicated that Offsite Area A includes approximately 104.3 acres of FIDS habitat, and is part of a much larger forested FIDS parcel. According to DCP, about 59.7 of these acres are within Offsite Area A’s limit of disturbance. This parcel currently provides feeding, breeding, resting, and essential forest structure for breeding FIDS (Chesapeake Bay Critical Area Commission 2000).

DNR – PPRP 29 COVE POINT ERD / DEC 2014
DCP has indicated that no unique or diverse wildlife populations were observed during their field surveys in preparation for the proposed Project. Important recreational species that may use habitat at the site include white-tailed deer and wild turkey (Meleagris gallopavo). Other wildlife that may be found in the area include opossums, raccoons (Procyon lotor), skunks, beavers (Castor canadensis), groundhogs, red fox (Vulpes vulpes), squirrels, snakes, toads, and turtles.
Offsite Area B
Offsite Area B is located along the Patuxent River, but the site primarily consists of mowed grass and successional woodland. As with the terminal site, these human-influenced habitats support a suite of wildlife accustomed to human activity and noise. Wildlife that may be found at Offsite Area B include red-tailed foxes, raccoons, skunks, woodchucks, gray squirrels, snakes, toads, and turtles. There are likely no unique or diverse wildlife populations on the upland parts of Offsite Area B.
3.4.2.3 Regional Migratory Birds
The Project is located within the New England/Mid-Atlantic Coast Bird Conservation Region (BCR). The New England/Mid-Atlantic Coast BCR has the densest human population of any region in the country. Most of the region was cleared for agricultural use, but is now developed or forested (U.S. NABCI Committee 2000). The highest priority bird species in this BCR are found in coastal wetland and beach habitats, which include critical migration sites for shorebirds (U.S. NABCI Committee 2000). Islands in the Delaware and Chesapeake Bay area are important nesting areas for gulls, terns, and mixed species colonies of herons, egrets, and ibis (U.S. NABCI Committee 2000). Estuarine complexes and embayments created behind barrier beaches in this region are extremely important to wintering and migrating waterfowl. These include approximately 65 percent of the total wintering American black duck (Anas rubripes) population, along with large numbers of other waterfowl (U.S. NABCI Committee 2000).
Table 3.4-7 identifies the birds of conservation concern that may occur within the proposed Project. This is based on the birds of conservation concern lists for the New England/Mid-Atlantic Coast BCR, and on the available information regarding avian presence for Calvert County, Maryland (USFWS 2008).

DNR – PPRP 30 COVE POINT ERD / DEC 2014
Table 3.4-7 Birds of Conservation Concern that Occur in the New England/Mid-Atlantic Coast BCR, in the Vicinity of the Proposed Project (1)
Common Name (2)
Scientific Name Habitat
Red-throated Loon (nb) Gavia stellate Occasionally found in winter on the open
waters of the Chesapeake Bay.
Pied-billed Grebe
Podilymbus podiceps
Emergent wetlands with adjacent open water; breeds in Calvert County, MD.
Horned Grebe (nb) Podiceps auritus Found in winter on open water, including the
Chesapeake Bay.
Least Bittern Ixobrychus exilis
Freshwater marshes, especially those dominated by narrow-leaved cattails, but can breed in nearly any type of marsh; probable
breeding species in Calvert County, MD.
Bald Eagle Haliaeetus leucocephalus
Breeds in forested areas near large bodies of water. Confirmed breeding species in Calvert
County, MD.
Peregrine Falcon Falco peregrinus Typically breeds in cliffs or tall human-built structures. Breeds in Calvert County, MD.
Least Tern Sterna antillarum Nest on barren sand beaches and adapted
nesting to rooftops. Observed Calvert County, MD.
Short-eared Owl (nb) Asio flammeus
May be present in winter large hayfields, drier upland areas of salt marshes, and other areas of tall grass; however, habitats within
the project areas are not likely to support this species.
Eastern Whip-poor-will
Caprimulgus vociferous
Breeds in deciduous or mixed forests with little or no underbrush. This species nests on
the ground, directly on leaf litter. Possible breeding species in Calvert County, MD.
Red-headed Woodpecker
Melanerpes erythrocephalus
Old trees in open areas, especially in beech or oak. Confirmed breeding species in Calvert
County, MD.
Loggerhead Shrike
Lanius ludovicianus
Requires open habitat such as pastures, meadows, fallow fields where scattered
thorny shrubs are present.

DNR – PPRP 31 COVE POINT ERD / DEC 2014
Common Name (2)
Scientific Name Habitat
Brown-headed Nuthatch Sitta pusilla
Loblolly pine, willow oak woodlands along the edge of tidal wetlands; also upland pine woods. Confirmed as a breeding species in
Calvert County, MD.
Wood Thrush Hylocichla mustelina
Heavy deciduous or mixed forested areas, including riparian or wetlands. Confirmed breeding species in Calvert County, MD.
Prairie Warbler Dendroica discolor
Successional woodland with young trees (roughly three-to eight-years old) and brush;
shrubby woodland edges. Confirmed breeding species in Calvert County, MD.
Cerulean Warbler Dendroica cerulea
Breeds in forest with tall deciduous trees and open understory, such as wetlands and dry
slopes. Nests in mid to upper canopy.
Worm-eating Warbler
Helmitheros vermivorum
Hilly, upland broad-leaved forests; sometimes dense plantations with 10-15 year old growth. Breeding in Calvert County, MD.
Swainson’s Warbler
Limnothlypis swainsonii
Breeds in southern forests with thick undergrowth, especially canebrakes and
floodplain forests in lowlands and rhododendron mountain laurel in
Appalachians. Observed in Calvert County, MD.
Kentucky Warbler
Oporornis formosus
Ground nest in moist, deciduous woodland thickets, sometimes along streams.
Henslow’s Sparrow
Ammodramus henslowii
Breeds in grassy fields, sedge meadows, and pastures. Large open areas are preferred,
typically 25 to 250 acres.
(1) Source: USFWS 2008; Maryland Ornithological Society 2010; Trollinger and Reay 2001. (2) nb = non-breeding only
3.4.3 Vegetation
3.4.3.1 DCP LNG Terminal
The terminal site possesses two areas of deciduous forest; tulip poplar (Liriodendron tulipifera) dominates one area, and mixed oaks (Quercus spp.) dominate the second area. The tulip poplar forest consists of a dominant

DNR – PPRP 32 COVE POINT ERD / DEC 2014
tree canopy of tulip poplars. The understory species include American holly (Ilex opaca), black cherry (Prunus serotina), black gum (Nyssa sylvatica), pawpaw (Asimina triloba), and ironwood (Carpinus caroliniana). The herbaceous and shrub layer is dominated by autumn olive (Elaeagnus umbellata), common greenbrier (Smilax rotundifolia), catbrier (Smilax glauca), Japanese honeysuckle (Lonicera japonica), red cedar (Juniperus virginiana), wood sorrel species (Oxalis sp.), willow oak (Quercus phellos), wineberry (Rubus phoenicolasius), Christmas fern (Polystichum acrostichoides), poison ivy (Toxicodendron radicans), white snakeroot (Eupatorium rugosum), field garlic (Allium vineale), and Virginia creeper (Parthenocissus quinquefolia).
Principal species in the mixed oak forest canopy include white oak (Quercus alba), chestnut oak (Quercus prinus), northern red oak (Quercus rubra), black oak (Quercus velutina), and scarlet oak (Quercus coccinea). The shrub layer is typically dense and is dominated by ironwood, mountain laurel (Kalmia latifolia), sassafras (Sassafras albidum), and highbush blueberry (Vaccinium corymbosum). The herbaceous layer is moderately dense to dense, and includes sapling red maple (Acer rubrum), strawberry bush (Euonymus americanus), American holly, black gum, black huckleberry (Gaylussacia baccata), lowbush blueberry (Vaccinium angustifolium), hairy hawkweed (Hieracium gronovii), cucumber magnolia (Magnolia acuminata), spotted wintergreen (Chimaphila maculata), and black cherry.
A patch of old field habitat is located at the terminal site. This habitat is dominated by Korean bush-clover (Lespedeza cuneata), bull thistle (Cirsium vulgare), Japanese bristlegrass (Seteria faberii), yellow fox tail (Setaria pumila), crabgrass (Digitaria spp.), sweetgum (Liquidambar styraciflua), and common blackberry (Rubus allegheniensis). The terminal site possesses moderately large populations of invasive species, including wineberry, autumn olive, field garlic, bull thistle, Korean bush-clover and Japanese honeysuckle.
3.4.3.2 Offsite Areas
Offsite Area A
Offsite Area A possesses deciduous forest, mixed coniferous forest, and old field habitats. According to DCP, five specimen trees were located in the deciduous mixed oak forest at Offsite Area A, including two chestnut oaks, one southern red oak (Quercus falcata), and two tulip poplar (Table 3.4-8). Using Maryland Forest Conservation Act criteria, a specimen tree must possess a diameter of 30 inches or more measured at 4.5 feet above

DNR – PPRP 33 COVE POINT ERD / DEC 2014
the ground. Two other specimen trees were found on Offsite Area A in an American beech (Fagus grandifolia)/red maple forest, including an American beech and a tulip poplar. The designated forest types at Offsite Area A include a mixed oak, American beech/red maple, and Virginia pine (Pinus virginiana).
Table 3.4-8 Specimen Trees Identified by DCP at Offsite Area A (1)
Tree No.
Forest Type
DBH (inches)
Species Condition - Comments
1 Mixed Oak 47 Chestnut Oak
(Quercus prinus)
Fair/Poor—Double trunk with included bark; Heart rot; Large dead scaffold
branches
2 Mixed Oak 49 Chestnut Oak
(Quercus prinus)
Fair/Poor—Double trunk with included bark; Heart rot; Large dead scaffold
branches
3 Mixed Oak 37 Southern Red Oak
(Quercus falcate) Good—Double trunk
4 Mixed Oak 30 Tulip Poplar (Liriodendron
tulipifera) No notes on condition
5 Mixed Oak 34 Tulip Poplar (Liriodendron
tulipifera) Good
6 American Beech /
Red Maple 39
American Beech (Fagus grandifolia)
Excellent
7 American Beech /
Red Maple 31
Tulip Poplar (Liriodendron
tulipifera)
Fair—Bark stripping, broken limbs
(1) A specimen tree possesses a diameter of 30 inches or more measured at 4.5 feet above the ground, based on Maryland FCA.
The mixed oak deciduous forest at Offsite Area A is dominated by oak species including southern red oak, chestnut oak, white oak, black oak, and northern red oak. Common species within the shrub layer include mountain laurel, highbush blueberry, American holly, American beech,

DNR – PPRP 34 COVE POINT ERD / DEC 2014
red maple, ironwood, sweetgum, black huckleberry, sour cherry (Prunus cerasus), flowering dogwood (Cornus florida), black gum, poison ivy, Virginia pine, chestnut oak, lowbush blueberry, white oak, sassafras, sweet pepperbush (Clethra alnifolia), northern red oak, and mockernut hickory (Carya tomentosa). Principal species within the herbaceous layer include black huckleberry, American holly, sweetgum, black gum, ironwood, strawberry bush, Virginia pine, partridgeberry (Mitchella repens), southern red oak, deertongue grass (Dichanthelium clandestinum), lowbush blueberry, cranefly orchid (Tipularia discolor), catbrier, black cherry, mockernut hickory, mountain laurel, chestnut oak, red maple, northern red oak, red cedar, bigtooth aspen (Populus grandidentata), Virginia creeper, Christmas fern, sensitive fern (Onoclea sensibilis), sweetbay magnolia (Magnolia virginiana), false Solomon’s seal (Smilacina racemosa), deerberry (Vaccinium stamineum), wineberry, St. Andrew’s cross (Hypericum hypericoides), Japanese stiltgrass browntop (Microstegium vimineum), wild yamroot (Dioscorea villosa), common pawpaw, pink lady’s slipper (Cypripedium acaule), spotted wintergreen, common greenbrier, Japanese honeysuckle, Korean bush-clover, maple-leaved viburnum (Viburnum acerifolium), poison ivy, hay-scented fern (Dennstaedtia punctilobula), Jack-in-the-pulpit (Arisaema triphyllum), catbrier, lizard's tail (Saururus cernuus), arrow-leaved tearthumb (Tracaulon sagittatum), Indian cucumber root (Medeola virginiana), and unidentified mosses.
The American beech/red maple forest canopy is dominated by American beech and red maple. Common species within the shrub layer include American holly, mountain laurel, sweetbay magnolia, sweet pepperbush, highbush blueberry, Virginia pine, sweetgum, American beech, ironwood, and flowering dogwood. Principal species in the herbaceous layer include mountain laurel, American holly, red maple, mosses, sensitive fern, hay-scented fern, Japanese stiltgrass, sphagnum spp., sweetgum, skunk cabbage (Symplocarpus foetidus), catbrier, spikerush spp. (Eleocharis spp.), and lowbush blueberry.
The Virginia pine forest canopy is clearly dominated by Virginia pine. Common species within the shrub layer include sweetgum, tulip poplar, American holly, American beech, black oak, common greenbrier, Virginia pine, lowbush blueberry, sassafras, and mountain laurel. Principal species in the herbaceous layer include mountain laurel, American holly, American beech, Virginia pine, lowbush blueberry, spotted wintergreen, common greenbrier, moss spp., southern red oak, and red maple.
The old field parcel is dominated by broomsedge (Andrapogon virginicus), Virginia pine, common blackberry, sweetgum, American holly, mountain laurel, Korean bushclover, and big bluestem grass (Andropogon gerardii).

DNR – PPRP 35 COVE POINT ERD / DEC 2014
According to DCP, Offsite Area A possesses relatively few invasive species. Invasive species observed in the forest understory and in the old field parcel include wineberry, Japanese stiltgrass, Japanese honeysuckle, and Korean bush-clover.
Offsite Area B
Offsite Area B is predominantly mowed/maintained grass (5.7 acres) within the construction limit of disturbance, with small, successional woodland (0.2 acre) along the Patuxent River shoreline. Upland species found at this site include Indian hemp (Apocynum cannabinum), curly dock (Rumex crispus), red fescue (Festuca rubra), and common dandelion (Taraxacum officinale). The only invasive species observed at Offsite Area B was common reed (Phragmites australis).
3.4.4 Wetlands
3.4.4.1 DCP LNG Terminal
A forested wetland (Wetland 1) is located on the western portion of the fenced area at the terminal site. The wetland is a palustrine deciduous forested wetland with predominantly hydrophytic vegetation consisting of red maple and sweetgum for the overstory. Throughout the wetland understory, there is also false nettle, soft rush (Juncus effusus), and sweet pepperbush.
The terminal site contains an ephemeral stream that flows into an unnamed tributary that in turn flows into Grays Creek and ultimately into the Chesapeake Bay. This stream system is characterized by supporting numerous rare, threatened or endangered species.
3.4.4.2 Offsite Areas
Offsite Area A
According to DCP’s characterization, Offsite Area A includes three forested/emergent wetlands (Wetland 2, 3, and 6) and four forested wetlands (Wetland 4, 5, 7, and 8). Wetlands 2, 3, 6 predominantly contain hydrophytic vegetation, including green bulrush (Scirpus atrovirens), red maple, sweet pepperbush, soft rush, and poverty rush (Juncus tenuis). The forested portion of the wetlands consists of red maple, sweetgum, and highbush blueberry. Wetlands 4, 5, 7, and 8 consist of predominantly red maple, black gum, sweetbay magnolia, and sweet gum trees in the overstory. Other vegetation found throughout the forested wetlands

DNR – PPRP 36 COVE POINT ERD / DEC 2014
includes sweet pepperbush, common spike rush, sensitive fern, lizard tail, and sallow sedge (Carex lurida).
DNR concurs with DCP’s characterization of the ephemeral and intermittent streams at Offsite Area A. The numerous wetlands and streams on this site, including one ground water seep, characterize this site as an important headwater for St. Paul Branch and Hellen Creek, tributaries to the Patuxent River.
Offsite Area B
No nontidal wetlands exist at Offsite Area B. A small emergent wetland, Wetland 9, is located adjacent to, but is not part of, Offsite Area B. DCP defines the potential limit of disturbance on Offsite Area B in such a way to avoid impacts to Wetland 9.
3.4.5 Threatened and Endangered Species
DCP initiated informal consultations with the U.S. Fish and Wildlife Service (USFWS), the NOAA Fisheries Service, and DNR to determine the potential presence of federal and state listed species. Table 3.4-9 shows rare, threatened, and endangered species that are reported by the agencies to occur within the vicinity of the proposed Project areas. This table also provides information on habitat preference and known or potential proposed Project areas where these species may be found. This table is based on field surveys and consultation.
Table 3.4-9 Listed and Proposed Endangered and Threatened Species that Potentially Occur in the Vicinity of the Proposed Project (1)
Species Federal Status
Maryland State Status
Habitat Facilities Where it Occurs
Plants
Thread-leaved Gerardia (Agalinis setacea)
-- Endangered Sandy habitats and along the coast
terminal site

DNR – PPRP 37 COVE POINT ERD / DEC 2014
Species Federal Status
Maryland State Status
Habitat Facilities Where it Occurs
Potato Dandelion
(Krigia dandelion)
-- Endangered Low, damp, chiefly open sites, prairies,
fields, meadows, open woods, and roadsides,
light acidic soils, sandstone, chert, or
granite
terminal site
Engelmann’s Arrowhead (Sagittaria
engelmanniana)
-- Threatened Bog, ponds, and streams with acid
water
Offsite Area A
Kidneyleaf Grass-of- Parnassus (Parnassia asarifolia)
-- Endangered Wet areas, bogs swamps and moist
woods
Offsite Area A
Evergreen Bayberry (Morella
carolinensis)
-- Endangered Bogs, low pinelands, flatwoods, bays, savannahs, and
pocosins
Offsite Area A
Animals
Shortnose sturgeon (Acipenser
brevirostrum)
Endangered Coastal rivers and estuaries along the
East Coast
Offsite Area B
(Patuxent River)
Gulf of Maine DPS of Atlantic Sturgeon (Acipenser oxyrinchus oxyrinchus)
Threatened Coastal rivers and estuaries along the
East Coast
Offsite Area B
(Patuxent River)
New York Bight DPS of
Atlantic sturgeon
Endangered Coastal rivers and estuaries along the
East Coast
Offsite Area B
(Patuxent River)

DNR – PPRP 38 COVE POINT ERD / DEC 2014
Species Federal Status
Maryland State Status
Habitat Facilities Where it Occurs
Chesapeake Bay DPS of
Atlantic sturgeon
Endangered Coastal rivers and estuaries along the
East Coast
Offsite Area B
(Patuxent River)
Carolina DPS of Atlantic sturgeon
Endangered Coastal rivers and estuaries along the
East Coast
Offsite Area B
(Patuxent River)
South Atlantic DPS of Atlantic sturgeon
Endangered Coastal rivers and estuaries along the
East Coast
Offsite Area B
(Patuxent River)
(1) The table includes Federal or State Endangered and Federally or State Threatened Species. Rare Species or Species of Concern are not addressed in this table.
3.4.5.1 DCP LNG Terminal
DNR Heritage indicated that there is a record of two state endangered species, the potato dandelion (Krigia dandelion) and thread-leaved gerardia (Agalinis setacea) located at the terminal site. Additionally, DCP’s informal consultation with the USFWS and NOAA Fisheries Service indicated that there are no federal listed species of concern at the terminal site that would potentially be affected by the proposed Project. DCP conducted a survey for rare, threatened, and endangered plant species during spring, summer, and fall of 2012 at the terminal site. DCP did not identify any federal or state listed species during the survey.
The northeastern beach tiger beetle (Cicindela dorsalis dorsalis) was previously a concern for this site, but is not a species of concern for the proposed Project. Surveys for this species have taken place in the past, but no northeastern beach tiger beetles have been found on DCP’s property since 2004. In addition, as part of its previous Pier Reinforcement project, DCP expanded the potential habitat for the northeastern beach tiger beetle. This habitat area – and the beetle, should any ever be on the site – will not be affected by the proposed Project. In its August 9, 2012 letter, the USFWS did not identify the northeastern beach tiger beetle as a species of concern for the proposed Project.

DNR – PPRP 39 COVE POINT ERD / DEC 2014
According to DNR Heritage, larvae of two rare dragonfly species have been documented in the small, unnamed tributary to Grays Creek, roughly 500 feet downstream of the terminal site. These include Sable Clubtail (Gomphus rogersi; state-listed as In Need of Conservation) and Yellow-sided Skimmer (Libellula flavida; State Rare). In this same section of stream there are two uncommon dragonfly species: Brown Spiketail (Cordulegaster bilineata) and Gray Petaltail (Tachopteryx thoreyi). Both of these species have been identified as being species of Greatest Conservation Need in the DNR’s Wildlife Diversity Conservation Plan. The overall State goal for this site is to mimic natural infiltration patterns across the site so that water quantity and quality will be maintained.
3.4.5.2 Offsite Areas
Offsite Area A
DCP’s consultation with the USFWS and the NOAA Fisheries Service indicated that there are no federal listed species of concern at Offsite Area A. Consultation with DNR indicated there are state threatened and endangered species along the St. Paul Branch and its small tributaries at Offsite Area A. These Maryland State-listed species are the threatened Engelmann’s arrowhead (Sagittaria engelmanniana), the endangered kidneyleaf grass-of Parnassus (Parnassia asarifolia), and the endangered evergreen bayberry (Morella carolinensis).
During the rare, threatened, and endangered plant species survey of Offsite Area A, one Maryland State-listed species was observed, tobaccoweed (Elephantopus tomentosus). This species is considered endangered in Maryland (MDNR 2010). Four patches of tobaccoweed were observed during site surveys at Offsite Area A. No other rare, threatened, and endangered species were observed at Offsite Area A during field surveys.
Offsite Area B
During Dominion’s informal consultation, with the USFWS indicated that there are no federal listed species of concern at Offsite Area B. DCP’s consultation with the NOAA Fisheries Service indicated that the shortnose sturgeon (Acipenser brevirostrum) and Atlantic sturgeon (Acipenser oxyrinchus oxyrinchus) may occur in the Patuxent River, in the vicinity of the temporary pier at Offsite Area B (Table 3.4-9). DCP’s consultation with DNR indicated that DNR’s Wildlife and Heritage Service has no records of rare, threatened, and/or endangered species at Offsite Area B.

DNR – PPRP 40 COVE POINT ERD / DEC 2014
No state or federal listed species were observed during the rare, threatened, and endangered plant species survey of Offsite Area B.
3.5 REGIONAL SOCIOECONOMIC SETTING
Calvert County is Maryland’s smallest county in land area, with 213 square miles. A 35-mile long peninsula bounded by the Chesapeake Bay on the east and the Patuxent River on the west, the county is nine miles wide at its widest point. No part of the county is more than five miles from navigable water. The county seat is Prince Frederick, located near the mid-point of the county. Prince Frederick is about 35 miles southeast of Washington, D.C., and about 55 miles south of Baltimore.
Maryland State Highway 2/4 (MD 2/4) is the main north-south transportation artery in the county, linking it to Anne Arundel County and points north. At Solomons, MD 4 crosses the Patuxent River over the Governor Thomas Johnson Memorial Bridge into St. Mary’s County. The only other highway link to other counties in Maryland is MD 231 which crosses the Patuxent River into Charles County at Hallowing Point.
There are only two incorporated towns in Calvert County: North Beach and Chesapeake Beach. Both are located in the northeast corner of the county. There are several small communities within a 10 mile radius of DCP, including Lusby, White Sands, Cove Point, Long Beach, Calvert Beach, Dowell and Solomons. Two of these, Lusby and Solomons, are identified as town centers in the county’s Comprehensive Plan.
Tourism is one of the leading components of Calvert County’s economy, and the county’s population increases noticeably during the summer months. Although Lusby is emerging as a center for high technology development, the area around DCP remains predominantly rural in character.
3.5.1 Population Trends
Calvert County is Maryland’s fifteenth most populous county and the least populous county in Southern Maryland. In 2012, the population of Calvert County was 89,628, an increase of about one percent from 2010 (MDP 2013a). There were 30,875 households in the county in 2010. Population is projected to grow at a rate of less than one-half of one percent per year through 2040, to 101,450, while the number of households is projected to increase to 38,225 (MDP 2012a, MDP 2012b).
DNR – PPRP 41 COVE POINT ERD / DEC 2014
Population is relatively evenly distributed throughout the county. In 2010, 28,845 persons lived in the Solomons Island minor civil division (MCD), compared to 30,135 and 29,757 in the Prince Frederick MCD and Sunderland MCD, respectively (Census 2010). The most populous areas of the county are North Beach/Chesapeake Beach (Census Tract 8604.01) and Solomons (Census Tract 8610.03 and 8610.04). DCP’s terminal site is located in Census Tract 8610.01, just north of Solomons.
Since the late 1960s, the county’s population growth has been shaped by the suburbanization of the Washington, D.C. metropolitan area, the changing commuting patterns and the construction of major industrial facilities in the county, including the Calvert Cliffs Nuclear Power Plant and the DCP LNG facility. Significantly, Calvert County became more accessible to commuters with the widening of MD 2/4 to four lanes, completed in 1987, and construction of the Governor Thomas Johnson Memorial Bridge, which officially opened in 1978. From a 1970 population of 20,682, Calvert County’s population has increased by 3.7 percent annually.
3.5.2 Employment and Income Trends
Calvert County has the smallest labor force in Southern Maryland. In 2013, the county’s labor force has averaged 47,879 with an unemployment rate of 5.9 percent (DLLR 2013a). In 2013, the labor force in nearby St. Mary’s County has averaged 56,163, with an unemployment rate of 3.4 percent. Maryland’s overall unemployment rate was nearly 6.9 percent.
Most employed persons living in Calvert County commute to jobs outside the county. Between 2006 and 2010, nearly 27,000 commuted to jobs outside Calvert County, primarily to Prince George’s County, St. Mary’s County and Washington, D.C. (MDP 2013b). In contrast, about 5,300 commuted into Calvert County, primarily from St. Mary’s, Charles and Anne Arundel counties. Approximately 18,225 were intra-county commuters.
In 2011, there were 33,045 full- and part-time jobs in Calvert County, a slight decline from 2006 (MDP 2013c). Most jobs were in health care and social assistance (4,258), local government (3,852), retail trade (3,682) and construction (3,050). In 2011, the job base in St. Mary’s County was 63,519. Most jobs were in professional and technical services (11,101), retail trade (5,999), health care and social services (5,319), local government (3,874) and construction (3,057). Major employers in Calvert County (February 2013) are Calvert Memorial Hospital, Exelon/Calvert Cliffs Nuclear

DNR – PPRP 42 COVE POINT ERD / DEC 2014
Power Plant, Wal-Mart, Giant Food, ARC of Southern Maryland, Safeway and Navy Recreation Center (DBED 2013).
Per capita personal income in Calvert County rose to $41,541 in 2010 (2005 dollars), up from $37,868 in 2005 (MDP 2007c). In 2010, the highest earnings were associated with local government, utilities, construction, ambulatory health care services, professional and technical services, administrative and support services, and food services and drinking places. Per capital personal income in St. Mary’s County was $39,102 in 2010.
Tourism is an important part of the Calvert County economy. The county has 143 miles of Chesapeake Bay and Patuxent River shoreline and offers many recreational opportunities on land and water. In 2011, tourism-oriented industries (arts, entertainment and recreation; accommodation and food services) accounted for more than 13 percent of private, non-farm jobs in the county(MDP 2013c). In FY2012, more than 631,400 visitors were logged at key visitor sites throughout Calvert County, this was up more than 50 percent from FY 2009 (CCDED 2012). Major attractions in the county include Annmarie Gardens and the Calvert Marine Museum in Solomons; Breezy Point Park, Chesapeake Railway Museum, and Chesapeake Beach Water Park in Chesapeake Beach; Flags Pond Nature Park and Calvert Cliffs State Park in Lusby; and Cypress Swamp Sanctuary in Prince Frederick (SMHA 2003).
Like many Maryland counties, the traditional industries of farming, forestry and fishing are declining in Calvert County. In 2011, only 283 farm proprietors remained in the county (MDP 2013c). In 2010, earnings in forestry and fishing amounted to only $367,000 out of more than $961 million (2005 dollars) in total private earnings in the county (MDP 2012c). Cultivation in 2007 occurred on 26,443 acres among 274 farms; this was down from more than 41,000 acres in 1987 (MDP 2009). Major crops in Calvert County are corn (302,000 bushels in 2012) and soybeans (141,000 bushels) (USDA 2013).
3.5.3 Land Use and Zoning
Relentless suburbanization, farm economics and the increasing attractiveness of Calvert County as a tourism destination have challenged Calvert County to manage land use more effectively. The county has attempted to shape its land use through growth management since its 1974 Comprehensive Plan. With this plan, Calvert County adopted policies that constrained housing densities in rural areas, developed a transfer of development rights (TDR) program, and encouraged voluntary

DNR – PPRP 43 COVE POINT ERD / DEC 2014
clustering. Concern about residential sprawl and commercial strip development during the formulation of the County’s 1983 Comprehensive Plan led to the town center concept and the County’s adoption of the State Land Preservation Program. In the 1980s, the County also enacted an Adequate Public Facilities ordinance, which required mandatory clustering and impact fees. The County also created protection areas, and began purchasing and retiring development rights. Subsequently, in its 1997 Comprehensive Plan, the County sought: to reduce the rate of population growth by reducing the residential build-out cap to 37,000 households; to preserve prime farms, historic and natural resources; and to direct growth away from protected areas (DPZ 2006).
The Comprehensive Plan, as amended in 2010, currently guides land use in Calvert County (BCC 2010). The plan promotes Calvert County for high-technology industries, tourism, farming, resource conservation and as a retirement destination. Other plans, including the Southern Maryland Heritage Tourism Management Plan (SMHA 2003) also influence land use in the county. Land use is also an integral component of the county’s Land Preservation, Parks and Recreation Plan (BCC 2006) and the Comprehensive Water and Sewage Plan (DPZ 2011).
The 2010 Comprehensive Plan sets a number of land use and growth management objectives, including:
• Manage the amount and rate of residential growth;
• Preserve the county’s rural character;
• Develop town centers; and
• Direct residential, commercial and industrial growth to appropriate areas.
In 2010, of the total land area in the County, nearly 36,000 acres (26%) were in residential land uses; an increase of 11 percent from 2002. Industrial and institutional land acreage has also increased significantly, primarily at the expense of agricultural and forested lands. Calvert County’s land use in 2010 is shown in Figure 3.5-1.

DNR – PPRP 44 COVE POINT ERD / DEC 2014
Figure 3.5-1 Calvert County Land Use – 2010
Source: Maryland Department of Planning

DNR – PPRP 45 COVE POINT ERD / DEC 2014
Land use planning is regulated by the Calvert County Zoning Ordinance (DCPB 2012) and Town Center Master Plans. Residential areas are zoned Rural Community District (RCD), Residential District (RD), or are in Town Centers (TC). Much of the county is zoned Farm and Forest District (FFD). Calvert County seeks to preserve 40,000 acres of prime farms, forests, historic resources and sensitive areas by 2020. Land zoned RCD is primarily in the north of the County, with RD zones in the two incorporated towns and in Solomons. Land north of DCP is zoned FFD, and is zoned RD to the south. Land to the west of MD 2/4 is zoned RCD. The DCP terminal site is zoned Light Industrial (I-1) within the fenced boundary and FFD throughout the rest of the site (Figure 3.5-2).
Figure 3.5-2 Zoning in the Vicinity of the DCP LNG Terminal
Source: Maryland Department of Planning and Calvert County Department of Community Planning & Building
Surrounded on three sides by the Chesapeake Bay and its tributaries, much of Calvert County lies within the Critical Area. The Critical Area comprises all lands within 1000 feet of tidal waters, tidal wetlands, or tributaries to tidal waters. Land use within the Critical Area is governed

DNR – PPRP 46 COVE POINT ERD / DEC 2014
by the County’s Critical Area Program, as approved by the State’s Chesapeake Bay Critical Area Commission, and is regulated by the county’s Zoning Ordinance. Within the Critical Area, the Critical Area Buffer is a naturally vegetated area extending 100 feet landward from tidal waters, wetlands or tributaries. The Buffer may be expanded for adjacent steep slopes (>15%) and erodible soils to further protect non-tidal wetlands and environmentally sensitive areas. Activity within the buffer is further restricted by regulation.
In terms of land use, the Critical Area is classified into Resource Conservation Areas (RCAs), Limited Development Areas (LDAs), and Intensely Developed Areas (IDAs). The regulations associated with each classification are applied in addition to those for the local jurisdiction’s zoning districts. The DCP terminal property is partially within the Critical Area RCA zoning district along the Chesapeake Bay. However, the portion to be developed is not within the Critical Area. Offsite Area B falls entirely within the Critical Area.
One of the Comprehensive Plan’s four goals is to preserve the natural, cultural and historic assets of Calvert County (BCC 2010). Coincident with that is a vision of preserving 40,000 acres of farm and forest land by 2020. The County’s Land Preservation, Parks and Recreation Plan (BCC 2006) promotes three strategies for building on this vision. They are as follows:
• Implement zoning changes to allow farmers to have additional uses for agri-tourism, eco-tourism, and heritage tourism uses;
• Continue to work with the Economic Development Department and the Tri-County Agriculture Commission to develop and implement marketing programs; and
• Continue to fund County Purchase of Development Rights and urge the State to do the same.
Approximately 70 percent of Calvert County’s land is in agriculture and open space, or wetlands (DPZ 2011). State programs available to land owners are administered by the Maryland Agricultural Land Preservation Program, the Rural Legacy Program and the Maryland Environmental Trust. The County’s primary land preservation program involves transferable development rights for residential density or forest conservation. As of January 2009, 26,300 acres have been preserved (Figure 3.5-3) through State, County and private land preservation efforts (BCC 2010).

DNR – PPRP 47 COVE POINT ERD / DEC 2014
Figure 3.5-3 Protected Lands in Calvert County
Source: Maryland Department of Planning
3.5.4 Transportation
The primary transportation link throughout Calvert County is MD 2/4, which extends through almost the entire length of the county. From the north, MD 2/4 is formed in Sunderland, at the junction of MD 2 (from Annapolis) and MD 4 (from Upper Marlboro). MD 2 terminates at Solomons, while MD 4 continues across the Governor Thomas Johnson Memorial Bridge into St. Mary’s County. MD 231 is an east-west state highway that intersects MD 2/4 in Prince Frederick and connects Calvert

DNR – PPRP 48 COVE POINT ERD / DEC 2014
County with Charles County via the Benedict Bridge, which crosses the Patuxent River at Benedict. There are various other minor state highways that branch off MD 2/4, primarily to waterfront communities within the county. There are no active railroads or ferries serving Calvert County and no direct linkages to Maryland’s Eastern Shore.
Traffic volume growth on state highways in the county has slowed since the financial crisis of 2007 through 2009 (Table 3.5-1). In 2012, the average annual daily traffic (AADT) on MD 2/4 near its intersection with Cove Point Road was 21,591, down eight percent from 2006.
Table 3.5-1 Calvert County Traffic Volumes
Highway To AADT 2006 AADT 2012
MD 2/4 St. Mary’s County 25,800 26,811
MD 231 Charles County 10,961 12,371
MD 2 Anne Arundel County 10,871 10,371
MD 4 Anne Arundel County 46,111 45,831
Source: SHA, 2012.
Major transportation investments are required to address growing congestion on Calvert County roads. The County is currently constructing the Prince Frederick Loop Road, which involves the construction of two overpasses and an underpass, and the widening of MD 2/4. In addition, the Governor Thomas Johnson Memorial Bridge needs to be expanded to improve Calvert County’s connectivity to St. Mary’s County. The Maryland State Highway Administration’s (SHA’s) plans to upgrade MD 4 between MD 2 and MD 235, including the Governor Thomas Johnson Memorial Bridge and MD 235 intersection, are currently in the design and engineering phase.
The County considers the gradual conversion of MD 2/4 into a controlled access expressway as key to addressing future traffic congestion (BCC 2010). To that end, County policy articulates the prohibition of new access points to MD 2/4, the purchase of rights-of-way for new overpasses, coordination of development plan review with rights-of-way considerations, and the encouragement of planning and engineering solutions that minimize new traffic signals. The SHA is currently in the engineering and right-of-way acquisition phase of a project to upgrade
DNR – PPRP 49 COVE POINT ERD / DEC 2014
MD 2/4 to a six-lane divided highway with auxiliary lanes from south of MD 765 to north of Stoakley Road (MDOT 2013).
3.5.5 Public Services and Safety
Ground water is Calvert County's primary water source. Except for industrial demand from the Calvert Cliffs Nuclear Power Plant and the DCP terminal site, ground water usage is primarily from residential and small commercial users. Recent aquifer studies indicate that sufficient ground water is available to supply the County’s current private and commercial requirements through 2030 (DPZ 2011). Most Calvert residents are dependent on private individual water and septic systems. The developed part of the DCP terminal site is categorized W-3 and S-3, designations that are applied to areas where improvements to, or construction of new community and/or multi-use systems will be given immediate priority. DCP’s potable water is supplied from its own wells. Offsite Area A is in an area of no planned service (W-6 and S-6), while Offsite Area B is within an area with current service (W-1 and S-1).
Calvert County opened a new landfill in Appeal in 1993. However, most solid waste is collected at a transfer station in Lusby, operated by a private contractor, and is trucked out of Maryland for disposal.
There are 13 elementary schools, six middle schools, five high schools and two special education schools in Calvert County. Public school enrollment is projected to be 15,766 in September 2013, reflecting a decline that is expected to continue through 2018. At present, three public schools are over Adequate Public Facilities (APF) capacities, while two more are approaching capacity. These are all in the central or northern part of the County (BOE, undated).
Public safety is under the management of the Department of Public Safety, which includes the Calvert County Control Center, Emergency Management, Fire/Rescue/EMS, and the False Alarm Reduction Unit. The department coordinates its activities with the Calvert County Sheriff’s Office (CCSO) and Maryland State Police to prepare for and respond to emergency needs in the county. The control center operates Calvert County’s 911 system, including the maintenance of primary and backup communications centers.
The Emergency Management Division is responsible for disaster planning and coordinating response agencies in the event of an emergency. With 143 miles of shoreline and an average elevation of 120 feet above mean sea level, the county is susceptible to hurricanes and floods. Furthermore,

DNR – PPRP 50 COVE POINT ERD / DEC 2014
Calvert County hosts the Calvert Cliffs Nuclear Power Plant, the DCP LNG terminal, and is near the Patuxent River Naval Air Station. The Emergency Management Division is also responsible for developing and maintaining the Emergency Operations Plan.
Fire/Rescue/EMS units provide emergency response assistance in the event of fire, rescue, and/or medical emergencies. There are two volunteer fire departments, four combined volunteer fire departments/rescue squads, and one volunteer rescue squad in Calvert County. In addition, there is an advanced life support team (Co. 10) and a rescue dive team (Co. 12), both based in Prince Frederick.
Both the CCSO and Maryland State Police respond to traffic incidents on State highways in Calvert County. Established in 1654, the CCSO is the primary law enforcement agency for Calvert County and is located in Prince Frederick. Maryland State Police operate out of Barrack U in Prince Frederick. The Calvert County Detention Center, with a rated capacity of 172 inmates, is located in Prince Frederick.
Calvert Health System serves the residents of Calvert County. It consists of three medical centers in Dunkirk, Solomons, and Prince Frederick. There is also a community health center in North Beach. Calvert Memorial Hospital is the only hospital in the system. The hospital has 157 total beds, including 28 psychiatric unit beds. The hospital has affiliations with regional care providers such as the Washington Hospital Center, Children's National Medical Center, and Johns Hopkins and University of Maryland medical facilities.
3.5.6 Cultural Setting
The pre-history of Southern Maryland dates back 9,000 years. The earliest inhabitants of Calvert County were probably members of the Conoy or Piscataway, a sub-group of the Algonquians. Captain John Smith was the first documented European to see the Calvert County peninsula during his exploration of the Chesapeake Bay in 1608. Calvert County was officially established in July 1654. Prince Frederick became the County seat in 1725 by an Act of the Assembly.
There was little in the way of population growth and no large towns in the County before the Revolutionary War. Until the twentieth century, the County’s economy was largely dependent on agriculture, primarily tobacco, and fishery production. The Village of Solomons was settled in 1867 and briefly became a center for oystering and shipbuilding.
DNR – PPRP 51 COVE POINT ERD / DEC 2014
Prior to World War II, the highway and secondary road system in Calvert County was still underdeveloped. WWII brought significant changes to the county, however. In 1942, the Navy established an Amphibious Training Base (ATB) in Dowell and a Navy mine test station on Point Patience. The Patuxent Naval Air Station was constructed in St. Mary’s County, opposite Drum Point, in 1941 (Mansuetti 1954).
Although Calvert County was targeted as a vacation destination as early as the late 1800s, with the founding of Chesapeake Beach, improved highway access opened the rest of the county to tourism and seasonal residents after WWII. Calvert and Charles counties were connected by the Benedict Bridge across the Patuxent River at Hallowing Point in 1950. The Governor Thomas Johnson Memorial Bridge replaced ferry service between Calvert and St. Mary’s counties in 1978. A 38-mile four-lane segment of MD 4, running the length of the County, was constructed between 1964 and 1987.
Calvert County has acted aggressively through its comprehensive planning process and in its participation with regional, State and federal programs to preserve its heritage. Its Historic Preservation Commission has undertaken a cultural conservation study of the County’s tobacco culture, for example (SMHA 2003), and has developed an interpretive guide to historic road markers, County historic sites and National Register sites. The Comprehensive Plan identifies open spaces and greenways, primarily along the County’s 101 miles of shoreline on the Patuxent River and Chesapeake Bay. Eco-tourism and resource-based recreation have become the basis for its tourism program (BCC 2006).
There are more than 1,300 properties in Calvert County listed on the Maryland Inventory of Historic Properties (MIHP). In addition, more than 80 properties ranging from structures to farms are designated “historic districts,” governed by the county’s Historic District ordinance (BCC 1984). Historic Districts can take advantage of tax credits to assist in restoration.
With the goal of protecting both historic and archeological resources, the Historic District Commission reviews all development projects in the County. In addition to the Historic District ordinance, two town-center zoning ordinances and the multi-family and townhouse ordinance may require archaeological reconnaissance if a site is determined to have high potential (DPZ 2007). All projects undertaken by the County are subject to archaeological requirements. Calvert County subdivision regulations allow for the evaluation of cultural resources but do not guarantee that sites will be protected, preserved, or mitigated. Article 7-1.05 of the
DNR – PPRP 52 COVE POINT ERD / DEC 2014
Calvert County Zoning Ordinance provides an incentive for residential subdivisions to retain historic structures by allowing the lot on which the Historic District is located to be recorded regardless of whether the APF requirements are met.
An archaeological site that lies near the DCP terminal site is the Baltimore-Drum Point Railroad ROW (MIHP inventory number 18CV172). The abandoned railroad bed, large sections of which are still intact, runs the length of the county. The ROW is subject to a County easement for a trail on all development projects (DPZ 2007), and is a designated as the Baltimore-Drum Point Rail Trail in Maryland’s Greenways Program. Several other properties on the MIHP are located on or near Cove Point Road and H.G. Trueman Road in the vicinity of the DCP terminal site.
The Southern Maryland Heritage Area Tourism Management Plan is a major blueprint for highlighting the region’s cultural heritage (SMHA 2003). It defines five key resources – archaeological, architectural, cultural, historic, and natural (environmental) – that put Southern Maryland’s history and character into context. The Southern Maryland Heritage Area (SMHA) Certified Heritage Area (CHA) consists of eleven distinct clusters containing a concentration of heritage resources, existing or proposed interpretive facilities, and significant lands protected by federal, State and County ownership or easements. These clusters are connected by corridors such as scenic byways, trials and waterways. The plan identifies key themes to guide visitors through Southern Maryland’s history and identity. The plan also stresses stewardship principles for sustaining and enhancing the region’s heritage tourism initiative. All or parts of four heritage clusters are in Calvert County.
The Maryland Historical Trust’s (MHT’s) Maritime Archeology Program actively documents Maryland’s maritime and submerged historic resources. MHT has sponsored several cultural resources surveys of the remains of the Chesapeake Flotilla, associated with the first and second Battle of St. Leonard’s Creek in 1814. Several artifacts have been recovered and conserved.
Three of the many other heritage activities in the Southern Maryland involve transportation. Southern Maryland Heritage Driving Tours meander through Charles, St. Mary’s and Calvert counties using the themes Religious Heritage, Agricultural and Maritime Heritage, and Wars and Conflicts to direct tourists to interpretive sites, museums and festivals. The Star Spangled Banner Tour is one of 18 in the Maryland SHA’s Scenic Byways program. There are also four Southern Maryland

DNR – PPRP 53 COVE POINT ERD / DEC 2014
bicycle routes in Calvert County that have been developed by the Southern Maryland Travel and Tourism Committee.
At the federal level, Congress established the Captain John Smith Chesapeake National Historic Trail, the first water trail in the United States. Administered in coordination with the National Park Service and Chesapeake Bay Gateways Network, the trail encompasses the routes of Captain John Smith’s two voyages around the Chesapeake Bay in 1608, and includes gateways and public access sites in Calvert County.
The Star-Spangled Banner National Historic Trail is a 560-mile land and water route that tells the story of the War of 1812 in the Chesapeake Bay region. The trail connects historic sites in Maryland, Virginia, and the District of Columbia, tracing American and British troop movements and highlighting the Chesapeake region’s distinctive landscapes and waterways along the way. The trail bisects Calvert County from Solomons to Hallowing Point.
Created by the Chesapeake Bay Initiative Act of 1998, the Chesapeake Bay Gateways Network (CBGN) is a system of parks, refuges, museums, historic sites and water trails within the Chesapeake watershed region. More than 140 sites across 64,000 square miles are linked in a joint strategy to coordinate visitor experiences and impart the values of the Chesapeake Bay. There are gateways at Flag Ponds Nature Park and Calvert Cliffs State Park.
Calvert County is also a stop on the National Underground Railroad Network to Freedom and is on the Maryland Women’s Heritage Trail (MWHC 2003). Other federal, State, County, local and private cultural resources in Calvert County are too numerous to mention.
3.6 NOISE
3.6.1 Definition of Noise
Noise generally consists of many frequency constituents of varying loudness. Three decibels (dB) is approximately the smallest change in sound intensity that can be detected by the human ear. A tenfold increase in the intensity of sound is expressed by an additional 10 units on the dB scale, a 100-fold increase by an additional 20 dB. Because the sensitivity of the human ear varies according to the frequency of sound, a weighted noise scale quantifies impacts of noise on humans. This A-weighted decibel (dBA) scale assigns weights to the various components of noise

DNR – PPRP 54 COVE POINT ERD / DEC 2014
based on the human ear’s response to these components. For example, the ear perceives middle frequencies better than low or very high frequencies; therefore, noise composed predominantly of the middle frequencies is assigned a higher loudness value on the dBA scale. Subjectively, a tenfold increase in sound intensity (10 dB increase) is perceived as an approximate doubling of sound. Typical A-weighted sound levels for various noise sources are shown in Table 3.6-1.
Table 3.6-1 Typical Sound Levels for Common Sources (dBA)
Noise Source Typical Sound Pressure
Level
Lowest sound audible to human ear 10
Soft whisper in a quiet library 30-40
Light traffic, refrigerator motor, gentle breeze 50
Air conditioner at 6 meters, conversation 60
Busy traffic, noisy restaurant, freight train moving 30 mph at 30 meters
70
Subway, heavy city traffic, factory noise 80
Truck traffic, boiler room, lawnmower 90
Chain saw, pneumatic drill 100
Rock concert in front of speakers, sand blasting, thunder clap
120
Gunshot, jet plane 140
Noise monitoring is typically conducted continuously over a period of time to obtain a representative picture of the acoustic environment. The length of time required for noise monitoring, and the frequency of individual measurements, will vary depending upon a number of factors. These factors include surrounding land use, time of day, the purpose of noise monitoring, the number of locations at which sound levels are being measured, and the capabilities of the monitoring equipment being used.
Ambient sound pressure levels can also be expressed in various ways. Quite often, noise levels are measured or reported as equivalent sound levels, Leq, over a given time period. A one-hour Leq, for instance, is the constant sound level that has the same energy content as the actual sound variations over a one-hour monitoring period. Monitoring of the ambient

DNR – PPRP 55 COVE POINT ERD / DEC 2014
noise levels in a community is often reported as Leq as well as L90, the sound pressure level that is exceeded 90 percent of the time. The L90 is also called the “noise floor,” the minimum background noise level that is characteristic of that monitoring location. The difference between the L90 and the Leq is an indication of the variability of noise at a given location.
Since sound levels are expressed as relative intensities, multiple sound sources are not directly additive. Rather, the total noise is primarily a result of the source of highest intensity. For example, two sources, each having a noise rating of 50 dBA, will together be heard as 53 dBA; a source of 65 dBA combined with a source of 85 dBA will result in a noise level of 85.1 dBA. As the intensity difference between the two sources increases, the effects of the lower sound sources become negligible.
3.6.2 Existing Noise Levels at the DCP LNG Terminal
The applicant conducted an environmental sound pressure survey in the terminal site’s surrounding area in order to measure the existing noise levels of the site. The two nearest noise sensitive areas were selected as noise receptor locations for the survey. Receptor #1 is located across the road opposite the facility entrance; it represents the closest point where land could be used for residential purposes. Receptor #2 is a residence adjacent to the facility, to the west, currently inhabited by a DCP employee. The two receptor sites, both located on Cove Point Road, are shown in Figure 3.6-1.
The sound pressure levels were monitored continuously at Receptors #1 and #2 from 6:30 PM to 10:45 PM on March 9, 2010. Operations at the terminal site were sequentially brought online during this time period, starting from 45 percent send out (800 mmscfd) and ending at 100 percent send out (1,800 mmscfd). Throughout the survey, there were additional external noise sources that interfered with the sound measurements, such as local vehicular traffic and aircrafts. To account for this, traffic on Cove Point Road was stopped at three different times during monitoring. It is during these three time periods that the measured sound levels most accurately represented DCP’s contribution to the existing noise levels.
The sound level meters used during the survey were programmed to measure and log the L90 noise levels in one-minute averaging intervals. There was a noticeable reduction in the measured noise levels when traffic was stopped on Cove Point Road. Data during these time periods are much more representative of the noise contribution from the existing facility and the constant background noise level. The Day-Night Sound Level (Ldn) is commonly used to describe the impact of sources, such as

Figure 3.6-1 Noise Receptor Locations
Receptor #1
Receptor #2

DNR – PPRP 57 COVE POINT ERD / DEC 2014
the Cove Point facility, that operate at a constant noise level throughout day and night. The Ldn is a calculation of average noise levels over a 24-hour period, with a 10 dB penalty added for nighttime hours to account for the perceived greater sensitivity to noise impacts during the night.
The sound pressure levels reported by Dominion for Receptors #1 and #2 were 38.8 dBA and 36.3 dBA, respectively, measured with the existing facility in full operation and no traffic noise. The corresponding Day-Night Sound Levels are 45.2 dBA and 42.7 dBA, respectively. This indicates a relatively quiet setting, even with the noise from the existing terminal operations.

DNR – PPRP 58 COVE POINT ERD / DEC 2014
4.0 AIR QUALITY IMPACTS
4.1 AIR QUALITY IMPACT ASSESSMENT BACKGROUND AND METHODOLOGY
4.1.1 Overview
As part of the Certificate of Public Convenience and Necessity (CPCN) application process, the Power Plant Research Program (PPRP), in conjunction with the Maryland Department of Environment Air and Radiation Management Administration (MDE-ARMA), evaluates potential impacts to air quality resulting from proposed projects to be licensed in Maryland under COMAR 20.80. This evaluation includes emissions investigations and other studies, including air dispersion modeling assessments, to ensure that impacts to air quality from proposed projects are acceptable. PPRP and MDE-ARMA also conduct a complete air quality regulatory review for two purposes: 1) to assist in the impact assessment, because air quality regulatory standards and emissions limitations define levels to protect against adverse health, welfare, and environmental effects and 2) to ensure that the proposed project will meet all applicable regulatory requirements.
PPRP and MDE-ARMA conducted an air quality evaluation of the proposed Dominion Cove Point (DCP) Project, to confirm that projected maximum potential air pollutant emissions meet applicable regulatory thresholds and limits. The proposed Project was also evaluated to determine whether its emissions would have any significant impacts on the existing ambient air quality in the region. Effects on current ambient air quality were assessed by performing air dispersion modeling that predicts the ambient air concentrations resulting from emissions from the proposed Project.
4.1.2 Regulatory Considerations
The U.S. EPA defines concentration-based National Ambient Air Quality Standards (NAAQS) for several pollutants, which are set at levels considered to be protective of the public health and welfare. Specifically, NAAQS have been defined for six “criteria” pollutants, including particulate matter (PM), sulfur dioxide (SO2), carbon monoxide (CO), nitrogen dioxide (NO2), ozone, and lead (Pb). Three forms of PM are regulated: total particulates (PM or TSP), particulate matter less than 10 microns (PM10) and particulate matter less than 2.5 microns (PM2.5).

DNR – PPRP 59 COVE POINT ERD / DEC 2014
Air emissions limitations and pollution control requirements are generally more stringent for sources located in areas that do not currently meet a NAAQS for a particular pollutant. Areas not meeting a NAAQS are termed “nonattainment areas.”
Calvert County, where the proposed Project would be located, is currently designated as attainment for all pollutants except ozone. EPA treats the Northeastern United States, from northern Virginia to Maine, as an ozone nonattainment area known as the Northeast Ozone Transport Region. Because of the high levels of ozone historically measured in Calvert County (the location of the Project) during the ozone season (May-October), Calvert County has been designated a “marginal” ozone non-attainment area. Emissions of the two pollutants that contribute to the formation of ozone, volatile organic compounds (VOCs) and nitrogen oxides (NOx), are regulated more stringently in ozone nonattainment areas such as Calvert County. This is to ensure that air quality is not further degraded (i.e., the ambient air concentration of ozone does not continue to increase as new sources of ozone forming pollutant emissions are constructed).
Potential emissions from new and modified sources in nonattainment areas are evaluated through the Nonattainment New Source Review (NA-NSR) regulatory program. In Maryland, major new and modified sources in nonattainment areas must meet the regulatory requirements of COMAR 26.11.17. The goal of the NA-NSR program is to allow construction of new emission sources and modifications to existing sources, while ensuring that progress is made towards meeting, or attaining, the NAAQS. NA-NSR requires major sources to limit emissions of effected pollutants through the implementation of the most stringent levels of pollution control, known as Lowest Achievable Emission Rate (LAER). In addition, NA-NSR requires pollutant offsets to be obtained for every ton of pollutant emitted at a given ratio (1.3 to 1.0 in Maryland).
Potential emissions from new and modified sources located in attainment areas are evaluated through the Prevention of Significant Deterioration (PSD) program. The goal of the PSD program is to ensure that emissions from major sources do not degrade air quality in areas where NAAQS are currently being met. Triggering PSD requires use of the Best Available Control Technology (BACT) and requires affected sources to evaluate impacts, usually through dispersion modeling analyses.
Activities associated with the proposed Project have the potential to emit the following pollutants: PM, PM10, PM2.5, CO, NO2, SO2, Pb, ozone precursors (VOC and NOx), greenhouse gases (GHGs) measured as

DNR – PPRP 60 COVE POINT ERD / DEC 2014
carbon dioxide equivalent (CO2e), hazardous air pollutants (HAPs), and Toxic Air Pollutants (TAPs). Section 4.4 (PSD program) and Section 4.5 (NA-NSR program) discuss the results of the evaluation for the proposed Project.
The proposed Project will also be subject to other federal and State air regulations. These regulations apply either as a result of the type of emission source, or as a result of the pollutants to be emitted. These regulations, discussed in Section 4.6, specify pollutant emission limitations and requirements for monitoring, testing, recordkeeping, and reporting.
4.2 PROPOSED PROJECT SOURCE CHARACTERIZATION
4.2.1 Overview
DCP’s proposed generating station and facilities associated with the proposed Liquefaction Project (Project) will include construction of new facilities and expansion of existing facilities to provide gas liquefaction and LNG export capabilities. Table 4.2-1 summarizes the air emission sources to be installed or utilized as part of the proposed Project.
Frame 7 Combustion Turbines
The proposed Project will include two General Electric (GE) Frame 7 combustion turbines (CTs) each with a nominal 87.2-megawatt (MW) generating capacity. The Frame 7 CTs will be used solely to drive the refrigeration compressors used to liquefy natural gas. Two refrigeration systems, the propane refrigeration system and mixed refrigerant refrigeration system (each consisting of two compressors), will be closed loop systems with no emissions except for equipment component leaks discussed below. Each Frame 7 CT will have a heat recovery steam generator (HRSG), without duct firing, installed directly in the exhaust stream as part of the overall gas turbine structure. The HRSGs will generate steam that will be directed to two steam turbine power generators, rated at 65 MW each. Approximately 84 percent of the electric power required for the proposed Project will be generated inside the facility by steam from the HRSGs, with the remaining power provided by the two auxiliary boilers and the existing CTs. The Frame 7 CTs themselves will not generate electricity, and the LNG process will consume all electric power generated by the steam turbine power generators.

DNR – PPRP 61 COVE POINT ERD / DEC 2014
The Frame 7 CTs are each equipped with a selective catalytic reduction (SCR) system to control NOx emissions and a catalytic oxidizer to control CO and VOC emissions. The Frame 7 CTs will also each include dry low-NOx (DLN) combustors (specifically DLN1 7EA combustors) to control NOx emissions. During normal operation, the CTs will utilize a fuel mixture with process gas being at least 60 percent and, under certain conditions, higher than 85 percent of the fuel; pipeline natural gas will supply the remaining heat input required. The process gas used by the Frame 7 CTs will consist of boil-off gas from the LNG tanks and de-sulfurized flash gas (or offgas) from the nitrogen stripper. During startup and shutdown, the Frame 7 CTs will burn only pipeline natural gas.
Auxiliary Boilers
In addition to the HRSGs, two auxiliary boilers (each rated at 435 million British thermal units per hour, MMBtu/hr will provide steam to the steam turbines to generate the electrical power necessary for the proposed Project. Although the boilers are identified as auxiliary boilers, they will operate continuously as a normal part of the process operation. The auxiliary boilers are each equipped with an SCR system and low-NOx burners to control NOx emissions, and a catalytic oxidizer to control CO and VOC emissions. During normal operation, each auxiliary boiler will utilize 100 percent process gas for fuel. The auxiliary boilers will primarily burn boil-off gas during startup and low pressure fuel mix during shutdown. Low pressure fuel mix is process gas prior to compression by the fuel gas compressor. The auxiliary boilers will also maintain the ability to burn pipeline natural gas during startup and shutdown, if the primary fuels are not available.
Emergency Engines
Dominion will install six emergency engines as part of the proposed Project: one emergency generator rated at 1,550 horsepower (hp) and five emergency fire pump engines each rated at 350 hp. All six engines will combust ultra-low sulfur diesel fuel (ULSD).
Thermal Oxidizer
Prior to the liquefaction process, the pipeline natural gas brought into the DCP Terminal will go through a pretreatment process. This pretreatment process includes an acid gas removal unit and desulfurization process. A new thermal oxidizer will combust acid gas from the acid gas removal unit and desulfurization process. The offgas stream from the acid gas process is mainly CO2 (94 percent) and water (5.7 percent) with the

DNR – PPRP 62 COVE POINT ERD / DEC 2014
remainder a mix of methane (0.28 percent) and hydrogen sulfide (H2S) (0.02 percent). This offgas stream has a high heating value (HHV) of approximately 4 MMBtu/hr. The residual methane and H2S are oxidized with the assistance of up to 52 MMBtu/hr of process gas, for a total heat input of approximately 56 MMBtu/hr. The thermal oxidizer will employ an SCR system to control NOx emissions, and a catalytic oxidizer to control CO and VOC emissions.
Ground Flares
The proposed Project will include the installation and use of two ground flares, a North flare and a South flare. The North flare will consist of 26 pilots, each rated at 0.01 MMBtu/hr. The South flare will consist of 12 pilots, each rated at 0.01 MMBtu/hr. The pilots will operate continuously and burn 100 percent low pressure process gas. During facility restarts, mixed refrigerant, propane, and pipeline natural gas will be sent to the flares. Inert gas from warm ships coming into the DCP Terminal will also be vented to the flares.
Existing Frame 5 Combustion Turbines
The proposed Project will use two existing Frame 5 CTs to provide both supplemental power during initial start-up and emergency backup to meet the electric power requirements for the process. The existing CTs will provide a maximum combined 25 MW on a continuous basis and burn solely pipeline natural gas. There will be no modification of the existing CTs as part of the Project, just a projected increase of 42.65 MMBtu/hr per CT in their current actual usage, which is within their permitted limits. The existing CTs were previously permitted under Permit No. NSR-2005-01 and PSD-2005-01 at a potential rate of 302 MMBtu/hr each.
Equipment Component Leaks
The proposed Project will include fugitive emissions from various equipment components (i.e. connectors, valves, flanges, etc.) used to transport pipeline natural gas, process gas, propane, mixed refrigerant, and sour gas. A leak detection and repair (LDAR) program will be implemented to cover all equipment components to control fugitive VOC emissions. This LDAR program will follow the procedures outlined in the 28LAER LDAR program from the Texas Commission of Environmental Quality (TCEQ), Control Efficiencies for TCEQ Leak Detection and Repair Programs. The TCEQ LDAR program is considered one of the most comprehensive programs to address fugitive emissions from piping

DNR – PPRP 63 COVE POINT ERD / DEC 2014
components and was selected by DCP to maximize the emission reduction effects associated with implementing an LDAR program.
Roadways
DCP will utilize onsite roads for deliveries associated with normal operations. Fugitive dust emissions from traffic on roads are expected to be negligible (and therefore not quantified) because DCP will be required to employ best management practices such as water or chemical suppression and/or sweeping.
Storage Tanks
The proposed Project will also include the installation of 19 tanks, including:
• One boiler feed water chemical injection unit tank, (capacity to be determined);
• One acid tank for demineralization, 750 gallons;
• One caustic tank for demineralization, 750 gallons;
• One fresh amine storage tank, 56,000 gallons;
• One contaminated amine tank, 31,000 gallons;
• One antioxidant storage tank, (capacity to be determined);
• One antifoam storage tank, (capacity to be determined);
• One de-mineralized water tank, 24,000 gallons;
• One oil water separator, 12,000 gallons;
• One waste oil storage tank, 32,000 gallons;
• One propane make-up tank, 290,000 gallons;
• Two ethane make-up tanks, 28,000 gallons each;
• One aqueous ammonia storage drum, 20,000 gallons; and
• Two condensate storage tanks, 67,000 gallons each.
As discussed in Section 4.6, COMAR regulations apply to eight of the proposed tanks:
• Four propane make-up tanks, 102,500 gallons each;
• Two ethane make-up tanks, 34,000 gallons each; and

DNR – PPRP 64 COVE POINT ERD / DEC 2014
• Two condensate storage tanks, 35,000 gallons each.
No emissions are expected from any of the proposed tanks. Eleven of the tanks store material with a maximum true vapor pressure less than atmospheric, rendering working and breathing losses negligible. The remaining eight tanks, which store materials with a maximum true vapor pressure greater than atmospheric pressure, employ a closed-loop system such that there are no emissions to the atmosphere. Therefore, this evaluation of the proposed Project presents no VOC emissions from storage tanks.
Spray Dryer
DCP, in its CPCN Application, proposed the installation of a gas-fired spray dryer as part of the proposed Project. In September 2013, DCP notified PPRP and MDE-ARMA that it had eliminated the spray dryer from the proposed Project design, replacing it with an electric powered crystallizer, which would not generate any direct emissions. Therefore, there is no further discussion of the spray dryer in this document.
Ships at Berth
As part of the proposed Project, ships will dock at the DCP Terminal to load LNG for export. The total number of ships docking at the facility will not increase as a result of this proposed Project from the previously authorized number of approximately 200 ships per year, as permitted in the 2009 FERC Environmental Assessment for the Pier Reinforcement Project.
For this project, and consistent with the definition of secondary emissions (defined above), only those non-engine emissions from the ships at berth are considered part of the Project. In export mode, loading of LNG will be done by electric pumps owned and operated by DCP. Although there are no emissions associated with the use of electric pumps, there will be fugitive emissions from the piping components (i.e. connectors, valves, flanges, etc.) used to transport the natural gas, process gas, propane, mixed refrigerant and sour gas.
Table 4.2-1 summarizes the specifications of the proposed units included in the final proposed Project design.

DNR – PPRP 65 COVE POINT ERD / DEC 2014
Table 4.2-1 DCP Air Emission Sources
Component (Number of
Units) Type/Model
Rated Capacity of Each Unit
Fuel (normal operating
conditions)1
Projected Operations
CTs (2)
GE Frame 7EA with
DCN1 7EA Combustors
and associated
HRSG
1,062 MMBtu/hr
87.2 MW (nominal)
Pipeline Natural Gas and Process Gas (60-85%
mixture)
8,760 hours per year per
CT
Auxiliary Boilers (2)
Cleaver Brooks
435 MMBtu/hr
Process Gas 8,760 hours per year per
boiler
Emergency Generator (1)
To be determined
prior to construction
1,550-hp ULSD Fuel 500 hours per
year
Emergency Fire Pump Engines
(5)
To be determined
prior to construction
350-hp ULSD Fuel 104 hours per year per unit
Thermal Oxidizer (1)
Zeeco, Custom Design
56 MMBtu/hr Process Gas/
Acid Gas 8,760 hours
per year
Ground Flares (2 – total of 38
pilots)
To be determined
prior to construction
0.1 MMBtu/hr (per pilot)
Process Gas 8,760 hours per year per
flare
Existing Frame 5 Combustion Turbines (2)
GE Frame 5 302
MMBtu/hr 12.5 MW
Pipeline Natural Gas
8,760 hours per year per
CT Piping
Component Leaks
N/A N/A N/A 8,760 hours per year per component
Roadways N/A N/A N/A 8,760 hours
Source: DCP CPCN Application and responses to PPRP Data Requests Notes:
(1) Fuel use reflects normal operating conditions; fuel variations for non-normal operations are described in Section 4.2.1.

DNR – PPRP 66 COVE POINT ERD / DEC 2014
Potential annual emissions from the proposed Project are based on the worst-case emissions operating scenario utilizing maximum throughput and hours of operation for each source. All emission sources have a proposed operation of a maximum of 8,760 hours per year (hr/yr) each, except for the diesel fired engines. The potential annual emissions include emissions during startup and shutdown events associated with the four major pieces of equipment (the proposed two Frame 7 CTs and two auxiliary boilers), and facility restart emissions associated with the ground flares. Sections 4.2.2 through 4.2.8 describe proposed potential emissions of pollutants from each of the air emission sources.
DCP provided detailed engineering estimates to calculate potential emissions both in its CPCN Application and its responses to PPRP Data Requests. PPRP and MDE-ARMA independently calculated emissions from the proposed Project and the results are presented throughout this document with supporting calculations provided in Appendix B. PPRP and MDE-ARMA are in general agreement with DCP’s emission estimation methodologies. The potential emissions from the proposed Project use various calculation methodologies, including EPA’s Publication No. AP-42, Compilation of Air Pollutant Emission Factors, Fifth Edition (hereafter “EPA’s AP-42”); EPA’s Protocol for Equipment Leak Emission Estimates; material balance; vendor data; Engineering, Procurement, and Construction (EPC) design specifications; engineering estimates; New Source Performance Standards (NSPS) emission limits, existing permit limits; emission factors published by the Ventura County Air Pollution Control District; and emission factors published in the California Air Resources Board (CARB) California Air Toxic Emission Factor (CATEF) database. All condensable particulate emissions were assumed to be less than 2.5 microns as more detailed speciation data for process gas was not available for PM10 and PM2.5. Therefore, PM10 and PM2.5 emissions were considered to be equal. All filterable emissions were also considered to be less than 2.5 microns as more detailed specifications are not available. GHG emissions were calculated using methodologies from Mandatory Greenhouse Gas Reporting regulations found in 40 CFR §98.
4.2.2 Potential Emissions from the Combustion Turbines (CTs)
Potential emissions of pollutants from the proposed Frame 7 CTs and associated HRSGs were based on vendor specifications provided by GE, EPC design specifications, chemical mass balance, and published emission factors. Short-term emissions (pound per hour (lb/hr)) were calculated based on the Frame 7 CTs at normal operating conditions (i.e., turbines have reached a 100% load and operating temperatures that will allow the

DNR – PPRP 67 COVE POINT ERD / DEC 2014
control technologies to work) and a typical flow rate of 498,946 dry standard cubic feet per minute (dscfm).
GE provided short-term emission rates for NOx, CO, and VOC, which included the use of SCR and DLN combustors to control NOx emissions and a catalytic oxidizer to control CO and VOC emissions. The VOC emission factor provided by GE was presented in units of parts per million, volumetric dry (ppmvd) and required the use of the molecular weight of VOC to calculate emissions. In response to PPRP Data Request No. 1-28, DCP provided guidance from GE in which GE recommended the use of the molecular weight of methane as representative of the molecular weight of VOC in emission calculations. Typically the molecular weight of propane would be used for this conversion. However, given the process gas makeup, PPRP and MDE-ARMA agree the molecular weight of methane is more appropriate.
H2S, sulfuric acid mist (H2SO4 or SAM), and SO2 emissions from the Frame 7 CTs are based on 0.0001 mole % H2S in the fuel based on the EPC design specification, and a conservative assumption that all H2S in the fuel would be converted to each of the sulfur compounds (SO2, H2S, and H2SO4).
GHG emissions (CO2, methane (CH4), and nitrous oxide (N2O)) were calculated based on emission factors for natural gas from 40 CFR §98, Tables C-1 and C-2. Total GHG emissions (calculated as CO2e) were estimated using the Global Warming Potentials (GWPs) from 40 CFR §98, Table A-1.
Particulate emissions were calculated based on emission factors provided by GE. GE did not provide a PB emission factor, nor does EPA’s AP-42 Section 3.1 (April 2000) for Stationary Gas Turbines list a Pb emission factor. Therefore, the Pb emission factor for external combustion of natural gas from EPA’s AP-42 Section 1.4 (July 1998) was used to conservatively estimate Pb emissions.
Annual emissions were calculated using the short-term emission rates and assuming operating 8,760 hr/yr for each CT.
Table 4.2-2 summarizes the potential short-term and annual emission rates from the Frame 7 CTs during normal operation.
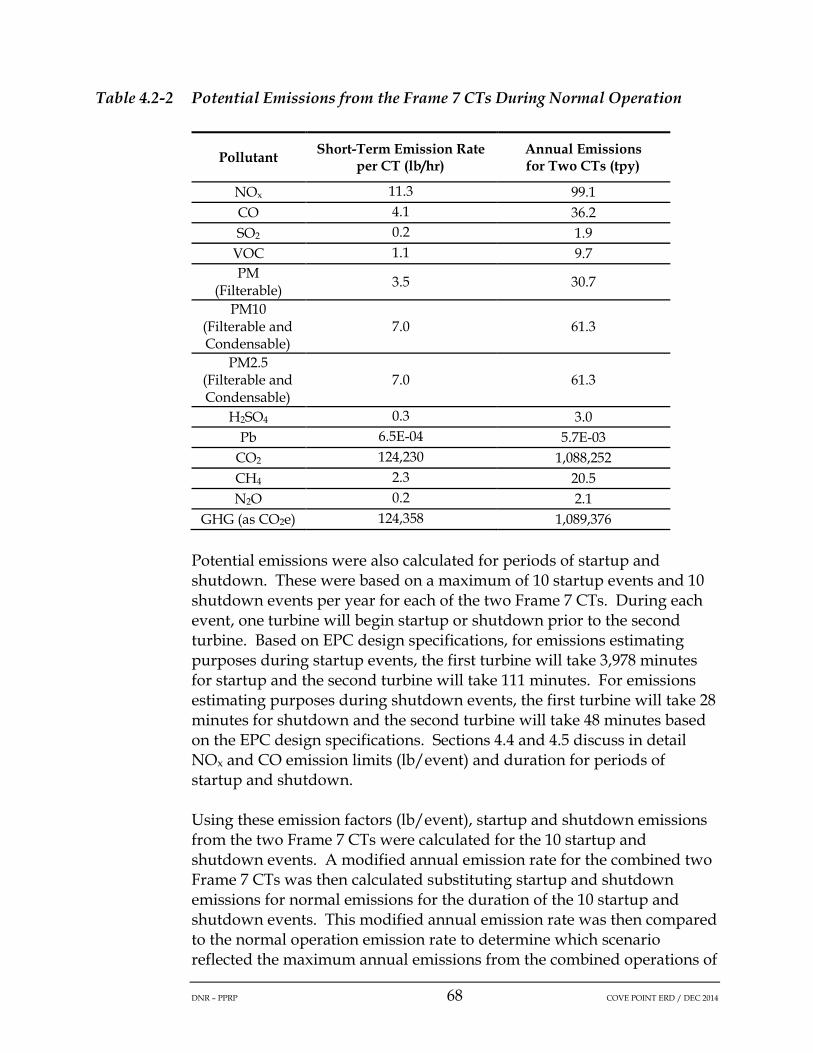
DNR – PPRP 68 COVE POINT ERD / DEC 2014
Table 4.2-2 Potential Emissions from the Frame 7 CTs During Normal Operation
Pollutant Short-Term Emission Rate per CT (lb/hr)
Annual Emissions for Two CTs (tpy)
NOx 11.3 99.1 CO 4.1 36.2 SO2 0.2 1.9
VOC 1.1 9.7 PM
(Filterable) 3.5 30.7
PM10
(Filterable and Condensable)
7.0 61.3
PM2.5
(Filterable and Condensable)
7.0 61.3
H2SO4 0.3 3.0 Pb 6.5E-04 5.7E-03
CO2 124,230 1,088,252 CH4 2.3 20.5 N2O 0.2 2.1
GHG (as CO2e) 124,358 1,089,376
Potential emissions were also calculated for periods of startup and shutdown. These were based on a maximum of 10 startup events and 10 shutdown events per year for each of the two Frame 7 CTs. During each event, one turbine will begin startup or shutdown prior to the second turbine. Based on EPC design specifications, for emissions estimating purposes during startup events, the first turbine will take 3,978 minutes for startup and the second turbine will take 111 minutes. For emissions estimating purposes during shutdown events, the first turbine will take 28 minutes for shutdown and the second turbine will take 48 minutes based on the EPC design specifications. Sections 4.4 and 4.5 discuss in detail NOx and CO emission limits (lb/event) and duration for periods of startup and shutdown.
Using these emission factors (lb/event), startup and shutdown emissions from the two Frame 7 CTs were calculated for the 10 startup and shutdown events. A modified annual emission rate for the combined two Frame 7 CTs was then calculated substituting startup and shutdown emissions for normal emissions for the duration of the 10 startup and shutdown events. This modified annual emission rate was then compared to the normal operation emission rate to determine which scenario reflected the maximum annual emissions from the combined operations of
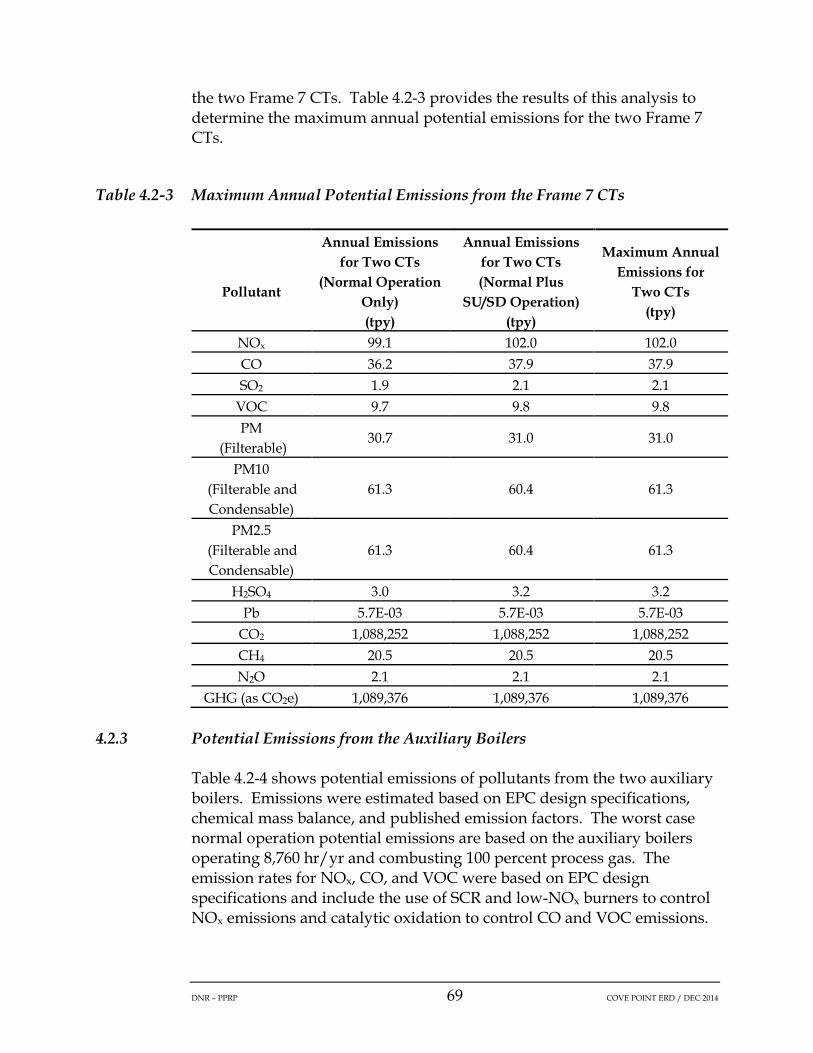
DNR – PPRP 69 COVE POINT ERD / DEC 2014
the two Frame 7 CTs. Table 4.2-3 provides the results of this analysis to determine the maximum annual potential emissions for the two Frame 7 CTs.
Table 4.2-3 Maximum Annual Potential Emissions from the Frame 7 CTs
Pollutant
Annual Emissions for Two CTs
(Normal Operation Only) (tpy)
Annual Emissions for Two CTs (Normal Plus
SU/SD Operation) (tpy)
Maximum Annual Emissions for
Two CTs (tpy)
NOx 99.1 102.0 102.0 CO 36.2 37.9 37.9 SO2 1.9 2.1 2.1
VOC 9.7 9.8 9.8 PM
(Filterable) 30.7 31.0 31.0
PM10 (Filterable and Condensable)
61.3 60.4 61.3
PM2.5 (Filterable and Condensable)
61.3 60.4 61.3
H2SO4 3.0 3.2 3.2 Pb 5.7E-03 5.7E-03 5.7E-03
CO2 1,088,252 1,088,252 1,088,252 CH4 20.5 20.5 20.5 N2O 2.1 2.1 2.1
GHG (as CO2e) 1,089,376 1,089,376 1,089,376
4.2.3 Potential Emissions from the Auxiliary Boilers
Table 4.2-4 shows potential emissions of pollutants from the two auxiliary boilers. Emissions were estimated based on EPC design specifications, chemical mass balance, and published emission factors. The worst case normal operation potential emissions are based on the auxiliary boilers operating 8,760 hr/yr and combusting 100 percent process gas. The emission rates for NOx, CO, and VOC were based on EPC design specifications and include the use of SCR and low-NOx burners to control NOx emissions and catalytic oxidation to control CO and VOC emissions.
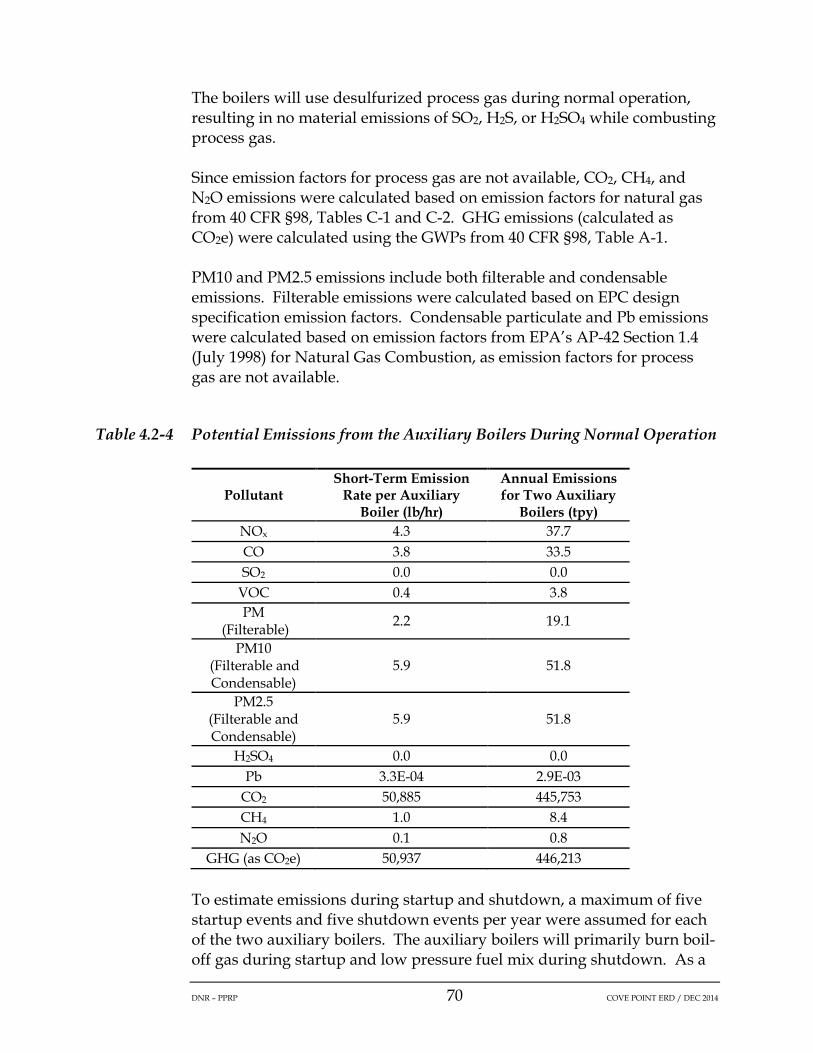
DNR – PPRP 70 COVE POINT ERD / DEC 2014
The boilers will use desulfurized process gas during normal operation, resulting in no material emissions of SO2, H2S, or H2SO4 while combusting process gas.
Since emission factors for process gas are not available, CO2, CH4, and N2O emissions were calculated based on emission factors for natural gas from 40 CFR §98, Tables C-1 and C-2. GHG emissions (calculated as CO2e) were calculated using the GWPs from 40 CFR §98, Table A-1.
PM10 and PM2.5 emissions include both filterable and condensable emissions. Filterable emissions were calculated based on EPC design specification emission factors. Condensable particulate and Pb emissions were calculated based on emission factors from EPA’s AP-42 Section 1.4 (July 1998) for Natural Gas Combustion, as emission factors for process gas are not available.
Table 4.2-4 Potential Emissions from the Auxiliary Boilers During Normal Operation
Pollutant Short-Term Emission
Rate per Auxiliary Boiler (lb/hr)
Annual Emissions for Two Auxiliary
Boilers (tpy) NOx 4.3 37.7 CO 3.8 33.5 SO2 0.0 0.0
VOC 0.4 3.8 PM
(Filterable) 2.2 19.1
PM10 (Filterable and Condensable)
5.9 51.8
PM2.5
(Filterable and Condensable)
5.9 51.8
H2SO4 0.0 0.0 Pb 3.3E-04 2.9E-03
CO2 50,885 445,753 CH4 1.0 8.4 N2O 0.1 0.8
GHG (as CO2e) 50,937 446,213
To estimate emissions during startup and shutdown, a maximum of five startup events and five shutdown events per year were assumed for each of the two auxiliary boilers. The auxiliary boilers will primarily burn boil-off gas during startup and low pressure fuel mix during shutdown. As a

DNR – PPRP 71 COVE POINT ERD / DEC 2014
backup, the auxiliary boilers will burn pipeline natural gas during startup and shutdown if the primary fuels are not available.
Emission factors for startup and shutdown were based on EPC design specifications. The EPC design specifications specified that each boiler will operate 4,816 minutes for each startup event and 83 minutes for each shutdown event. Sections 4.4 and 4.5 discuss the duration and NOx emission limits (lb/event) for periods of startup and shutdown.
A modified annual emission rate for the two auxiliary boilers was calculated substituting startup and shutdown emissions for normal emissions for the duration of the five startup and shutdown events. This modified annual emission rate was then compared to the normal operation emission rate to determine which scenario reflected the maximum annual emissions from the combined operations of the two auxiliary boilers. Table 4.2-5 provides the results of this analysis to determine the maximum annual potential emissions for the two auxiliary boilers.
Table 4.2-5 Maximum Annual Potential Emissions from the Auxiliary Boilers
Pollutant
Annual Emissions for Two Auxiliary Boilers (Normal Operation Only)
(tpy)
Annual Emissions for Two Auxiliary Boilers
(Normal & SU/SD Operation) (tpy)
Maximum Annual Emissions for Two Auxiliary
Boilers (tpy)
NOx 37.7 50.9 50.9 CO 33.5 45.2 45.2 SO2 0.0 0.2 0.2
VOC 3.8 4.3 4.3 PM
(Filterable) 19.1 19.7 19.7
PM10
(Filterable and
Condensable)
51.8 50.9 51.8
PM2.5
(Filterable and
Condensable)
51.8 50.9 51.8
H2SO4 0.0 0.2 0.2 Pb 2.9E-03 2.1E-04 2.9E-03

DNR – PPRP 72 COVE POINT ERD / DEC 2014
Pollutant
Annual Emissions for Two Auxiliary Boilers (Normal Operation Only)
(tpy)
Annual Emissions for Two Auxiliary Boilers
(Normal & SU/SD Operation) (tpy)
Maximum Annual Emissions for Two Auxiliary
Boilers (tpy)
CO2 445,753 445,753 445,753 CH4 8.4 8.4 8.4 N2O 0.8 0.8 0.8
GHG (as CO2e)
446,213 446,213 446,213
4.2.4 Potential Emissions from the Emergency Engines
Table 4.2-6 shows potential emissions of pollutants from the 1,550-hp emergency generator and five 350-hp emergency fire pump engines. No specific vendor has been selected for the emergency engines. At this time however, DCP noted in its CPCN Application that emergency engines will be designed to meet the PM (filterable), NOx, and CO standards provided in the NSPS for stationary ignition internal combustion engines (40 CFR §60 Subpart IIII).
Emissions of NOx, CO, and PM (filterable) from the 1,550-hp emergency engine were based on the emission factors provided in NSPS Subpart IIII. Emissions of VOC, SO2, H2S, H2SO4, PM10 and PM2.5 (condensable) were estimated utilizing EPA’s AP-42 Section 3.4 (October 1996) emission factors for the combustion of diesel in stationary diesel engines greater than 600 hp. CO2, CH4, and N2O emissions were calculated based on emission factors for No. 2 diesel fuel from 40 CFR §98, Tables C-1 and C-2. GHGs (calculated as CO2e) were estimated using the GWPs from 40 CFR §98, Table A-1.
NOx and PM (filterable) emissions for the five 350-hp emergency fire pump engines were based on applicable NSPS Subpart IIII emission limits. Emissions of CO, VOC, SO2, H2S, and H2SO4 were estimated utilizing EPA’s AP-42 Section 3.3 (October 1996) emission factors for the combustion of diesel in stationary diesel engines less than 600-hp. EPA’s AP-42 Section 3.3 (October 1996) does not provide an emission factors for PM10 and PM2.5 (condensable); therefore, the emission factor from EPA’s AP-42 Section 3.4 (October 1996) was conservatively used. CO2, CH4, and N2O emissions were calculated based on emission factors for No. 2 diesel fuel from 40 CFR §98, Tables C-1 and C-2. GHGs (calculated as CO2e) were calculated using the GWPs from 40 CFR §98, Table A-1.

DNR – PPRP 73 COVE POINT ERD / DEC 2014
The following assumptions were made to calculate emissions from both types of small engines:
• No more than 500 hr/yr operation for the 1,550-hp emergency generator;
• No more than 104 hr/yr operation per unit for each of the 350-hp emergency fire pump engines; and
• Potential emissions of H2S and H2SO4 were calculated conservatively assuming that all sulfur in the fuel is converted to both H2S and H2SO4.
Table 4.2-6 Potential Emissions from the Emergency Engines
Pollutant
1,550-hp Engine
Short-Term Emission
Rate (lb/hr)
1,550-hp Engine Annual
Emissions (tpy)
Five 350-hp Engines (Per
Unit) Short-Term Emission Rate
(lb/hr)
Five 350-hp Engines
(Combined) Annual
Emissions (tpy) NOx 16.3 4.1 2.31 0.6 CO 8.9 2.2 2.34 0.6 SO2 0.02 0.01 0.72 0.2
VOC 1.1 0.3 0.88 0.2 PM
(Filterable) 0.5 0.1 0.12 0.03
PM10
(Filterable and Condensable)
0.6 0.2 0.13 0.03
PM2.5
(Filterable and Condensable)
0.6 0.2 0.13 0.03
H2SO4 0.03 0.006 0.006 1.5E-3 Pb Negligible Negligible Negligible Negligible
CO2 1,769 442 400 104 CH4 0.07 0.02 0.016 0.004 N2O 0.01 0.004 0.003 0.001
GHG (as CO2e)
1,775 444 401 104
4.2.5 Potential Emissions from the Thermal Oxidizer
Table 4.2-7 shows potential emissions of pollutants from the thermal oxidizer. Potential emissions were based on the thermal oxidizer

DNR – PPRP 74 COVE POINT ERD / DEC 2014
operating 8,760 hr/yr and combusting a combination of process gas and acid gas from the acid gas process.
The emission rates for NOx, PM, PM10, PM2.5, CO, SO2, VOC, H2S, and H2SO4 were based on the EPC design specifications provided by DCP. The emission rates include the use of SCR to control NOx emissions and a catalytic oxidizer to control CO and VOC emissions. VOC emissions assume a 99.99 percent destruction efficiency from the thermal oxidizer for hydrocarbons with an additional 90 percent control from the catalytic oxidizer.
Emissions of Pb were estimated utilizing EPA’s AP-42 Section 1.4 (July 1998) for Natural Gas Combustion. Combustion related emissions of CO2, CH4, and N2O were calculated based on emission factors for natural gas from 40 CFR §98, Tables C-1 and C-2. Combusted and partially combusted CO2 and CH4 emissions from the acid gas stream were calculated using 40 CFR §98 Subpart W. Total GHGs (calculated as CO2e) were estimated using the GWPs from 40 CFR §98, Table A-1.
Table 4.2-7 Potential Emissions from the Thermal Oxidizer
Pollutant
Short-Term Emission Rate for Thermal Oxidizer
(lb/hr)
Annual Emissions for Thermal Oxidizer
(tpy)
NOx 1.4 6.2 CO 0.5 2.3 SO2 0.07 0.3
VOC 0.03 0.1 PM
(Filterable) 0.7 3.1
PM10 (Filterable and Condensable)
0.9 34.0
PM2.5 (Filterable and Condensable)
0.9 34.0
H2SO4 0.1 0.5 Pb 2.8E-05 1.2E-04
CO2 (Total) 88,161 386,146 CH4 (Total) 0.1 0.6
N2O 0.01 0.05 GHG (as CO2e) 88,168 386,177

DNR – PPRP 75 COVE POINT ERD / DEC 2014
4.2.6 Potential Emissions from the Ground Flares
The proposed Project includes the operation of two flares, the North flare (equipped with 26 pilots) and the South flare (equipped with 12 pilots). Table 4.2-8 summarizes annual potential emissions of pollutants from the North ground flares; Table 4.2-9 summarizes annual potential emissions of pollutants from the South ground flares. Potential emissions from the flares will be generated from three activities: combustion of low pressure gas in the pilots, combustion of gas sent to the flares during facility restarts, and combustion of inert gas sent to the flares from ships prior to ship loading (i.e., ship cooldown). None of the gas sent to the flares will contain any sulfur compounds; therefore, the flares will generate no SO2, H2S, or H2SO4 emissions.
4.2.6.1 Emissions from Pilots
The potential emissions from flare pilots are based on each of the flare pilots operating 8,760 hr/yr and combusting 100% low pressure process gas. Emissions of NOx, PM, PM10, PM2.5 CO, VOC, and Pb were estimated utilizing EPA’s AP-42 Section 1.4 (July 1998) for Natural Gas Combustion. CO2, CH4, and N2O emissions for combustion were calculated based on emission factors for natural gas from 40 CFR §98, Tables C-1 and C-2. GHGs (calculated as CO2e) were estimated using GWPs from 40 CFR §98, Table A-1. Table 4.2-8 shows annual potential emissions from the North ground flares from pilots. Table 4.2-9 shows annual potential emissions from the South ground flares from pilots.
4.2.6.2 Emissions from Facility Restarts
Potential emissions from ground flares for facility restarts were based on a maximum of 10 facility restarts per year, each lasting approximately one hour. This was based on the EPC design specifications. The restarts will be either warm facility restarts or cold facility restarts. Note that facilities have different startup times depending upon the amount of time that the unit has “stood still” or has not been operating since its last period of operation. These standstill periods result in start-types that are referred to as either cold, warm, or hot startups. Potential emissions were calculated for 10 warm facility restarts and 10 cold facility restarts. This was done to determine which restart generated the maximum emissions for each pollutant, both for the North flare and South flare.
Emissions of NOx, CO, PM, PM10, PM2.5, and Pb were estimated utilizing EPA’s AP-42 Section 1.4 (July 1998) for Natural Gas Combustion, as emission factors for process gas are not available. Emissions of VOC

DNR – PPRP 76 COVE POINT ERD / DEC 2014
during facility restarts were estimated based on a 99 percent destruction efficiency of the flares and using the chemical composition of the incoming gas provided in the EPC design specifications. Combusted CO2 and un-combusted CO2, CH4, and NO2 emissions from the incoming gas streams were calculated using both the methodologies specified in 40 CFR §98 Subpart W and the chemical composition of the incoming gas. GHGs (calculated as CO2e) were estimated using the GWPs from 40 CFR §98, Table A-1.
Table 4.2-8 shows the annual potential emissions from restarts of the North ground flares; Table 4.2-9 shows annual potential emissions from restarts of the South ground flares.
4.2.6.3 Emissions from Ship Venting to Flares
Potential emissions from venting inert gas from ships (or ship cooldown) to ground flares prior to loading LNG to the ships are based on venting gas a maximum of 12 times per year based on EPC design specifications, to both ground flares.
Emissions of NOx, CO, PM, PM10, PM2.5, and Pb were estimated utilizing EPA’s AP-42 Section 1.4 (July 1998) for Natural Gas Combustion. Emissions of VOC and CH4 during ship venting were estimated based on the mass flow of VOC and CH4 in the incoming gas based on EPC design specifications and the 99 percent destruction efficiency of the flares. Un-combusted CO2 was estimated based on the mass flow of CO2 (per EPC design specifications) to each flare. Combusted CO2 was estimated based on a carbon balance (per EPC design specifications) of the incoming gas stream to the flares. N2O emissions from the incoming gas streams were calculated using 40 CFR §98 Subpart W. GHGs (calculated as CO2e) were estimated using the GWPs from 40 CFR §98, Table A-1. Table 4.2-8 shows total potential emissions associated with the North flare from ship venting. Table 4.2-9 shows total potential emissions associated with the South flare from ship venting.
4.2.6.4 Ground Flares Total Potential Emissions
Table 4.2-8 summarizes annual potential emissions of pollutants from the North ground flares; Table 4.2-9 summarizes annual potential emissions of pollutants from the South ground flares.

DNR – PPRP 77 COVE POINT ERD / DEC 2014
Table 4.2-8 Total Potential Emissions from the North Ground Flare
Pollutant
Annual Emissions
from North Flare Pilots
(tpy)
Annual Emissions
from North Flare Facility Restarts (tpy)
Annual Emissions from
North Flare Ship Cooldown
(tpy)
Total Annual Emissions
from North Flare (tpy)
NOx 1.7 45.2 22.1 69.0 CO 1.4 20.0 9.8 31.2 SO2 0.0 0.0 0.0 0.0
VOC 0.09 9.8 1.0 10.8 PM
(Filterable) 0.03 0.4 0.2 0.7
PM10
(Filterable and Condensable)
0.1 1.8 0.9 2.8
PM2.5
(Filterable and Condensable)
0.1 1.8 0.9 2.8
H2SO4 0.0 0.0 0.0 0.0 Pb 8.6E-06 1.2E-04 5.8E-05 1.9E-04
CO2 1,332 29,460 9,890 40,682 CH4 0.03 86.3 31.7 118.1 N2O 0.003 0.06 0.03 0.08
GHG (as CO2e) 1,334 31,634 10,691 43,659
Table 4.2-9 Total Potential Emissions from the South Ground Flare
Pollutant
Annual Emissions
from South Flare Pilots
(tpy)
Annual Emissions
from South Flare Facility Restarts (tpy)
Annual Emissions from
South Flare Ship Cooldown
(tpy)
Total Annual Emissions
from South Flare (tpy)
NOx 0.8 2.3 37.9 41.0 CO 0.7 1.0 16.7 18.4 SO2 0.0 0.0 0.0 0.0
VOC 0.04 2.3 1.7 4.0 PM
(Filterable) 0.02 0.02 0.4 0.4
PM10
(Filterable and Condensable)
0.06 0.09 1.5 1.7
PM2.5
(Filterable and Condensable)
0.06 0.09 1.5 1.7

DNR – PPRP 78 COVE POINT ERD / DEC 2014
Pollutant
Annual Emissions
from South Flare Pilots
(tpy)
Annual Emissions
from South Flare Facility Restarts (tpy)
Annual Emissions from
South Flare Ship Cooldown
(tpy)
Total Annual Emissions
from South Flare (tpy)
H2SO4 0.0 0.0 0.0 0.0 Pb 4.0E-06 6.1E-06 1.0E-04 1.1E-04
CO2 615 2,198 16,955 19,767 CH4 0.01 2.3 54.4 56.7 N2O 0.001 0.004 0.05 0.05
GHG (as CO2e) 615 2,256 18,328 21,200
4.2.7 Projected Actual Emissions Increase from the Existing Combustion Turbines
Table 4.2-10 presents the projected actual emissions increase associated with the Project from the existing Frame 5 CTs. Projected actual emissions were calculated for the total projected increase usage of 85.3 MMBtu/hr (42.65 MMBtu/hr per unit) necessary to provide 25 MW of additional power to the process. Emission rates were based on existing Permit to Construct (Permit No. 009-5-0049 AND 0050 N), site-specific data, and published emission factors.
NOx, CO, VOC, PM, PM10, and PM2.5 emissions were calculated based on emission limits specified in existing Permit to Construct (Permit No. 009-5-0049 AND 0050 N) for the existing Frame 5 CTs.
SO2 emissions were calculated based on EPA’s AP-42 Section 3.1 (April 2000) for Stationary Gas Turbines. H2S and H2SO4 emissions were calculated based on site-specific fuel sulfur content data. These calculations assume that all sulfur in the fuel becomes both H2S and H2SO4.
No Pb emission factor is listed in EPA’s AP-42 Section 3.1 (April 2000) for Stationary Gas Turbines. Therefore, the Pb emission factor for external combustion of natural gas from EPA’s AP-42 Section 1.4 (July 1998) was used to conservatively estimate Pb emissions.
CO2, CH4, and N2O emissions were calculated based on emission factors for natural gas from 40 CFR §98, Tables C-1 and C-2. GHGs (calculated as CO2e) were estimated using the GWPs from 40 CFR §98, Table A-1.

DNR – PPRP 79 COVE POINT ERD / DEC 2014
Table 4.2-10 Projected Actual Emissions Increase from the Existing Frame 5 CTs
Pollutant Short-Term Emission
Rate Increase per Existing CT (lb/hr)
Annual Emissions Increase for Two Existing
CTs (tpy) NOx 0.7 6.0 CO 1.0 8.8 SO2 0.002 0.02
VOC 0.1 1.1 PM
(Filterable) 0.08 0.7
PM10 (Filterable and Condensable) 0.3 2.5
PM2.5 (Filterable and Condensable) 0.3 2.5
H2SO4 2.7E-03 0.02 Pb 2.1E-05 1.8E-04
CO2 4,989 43,704 CH4 0.09 0.8 N2O 0.01 0.08
GHG (as CO2e) 4,994 43,749
4.2.8 Potential Emissions from Piping Component Leaks
Table 4.2-11 presents potential emissions from piping component leaks. Potential emissions are calculated based on the number of each type of component (i.e., valves, connectors, flanges, pumps), the material that flows through the components, whether the material is a gas or liquid when passing through the component, and published emission factors.
Regulated pollutant emissions resulting from equipment leaks include VOC, H2S, CO2, CH4, and GHGs. Emissions of these pollutants were calculated based on both Table 2-4 of EPA’s Protocol for Equipment Leak Emission Estimates and the chemical composition of each material provided in the EPC design specification.
The implementation of an LDAR program is proposed to reduce emissions from equipment leaks. Emission estimates include the use of control efficiencies based on the 28LAER LDAR program from the Texas Commission of Environmental Quality (TCEQ), Control Efficiencies for TCEQ Leak Detection and Repair Programs. The emission factors utilized for VOC comply with the proposed LAER emission levels for the equipment components.

DNR – PPRP 80 COVE POINT ERD / DEC 2014
Table 4.2-11 Potential Emissions from Equipment Leaks
Pollutant Short-Term Emission Rate (lb/hr)
Annual Emissions (tpy)
VOC 0.6 2.5 H2S 2.3E-06 1.0E-05 CO2 0.2 0.9 CH4 0.6 2.6
GHG (as CO2e) 15 66
4.2.9 Project-wide Maximum Potential Criteria Pollutant Emissions
Table 4.2-12 summarizes the projected short-term emission rates for the proposed Project sources. Table 4.2-13 summarizes maximum annual emission rates (including startup/shutdown emissions) for the proposed Project. Table 4.2-13 also compares the maximum annual emission rates as determined by MDE-ARMA and PPRP with the emission rates submitted by DCP in its CPCN Application and subsequent amendments and responses to data requests.
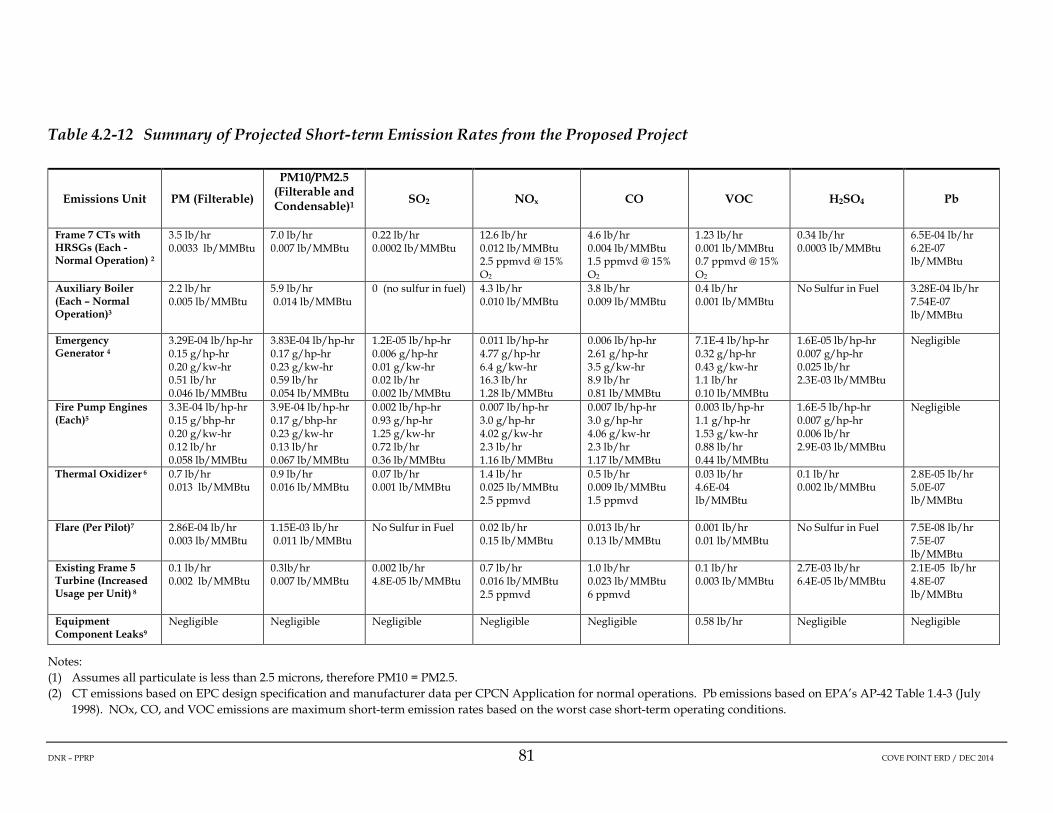
DNR – PPRP 81 COVE POINT ERD / DEC 2014
Table 4.2-12 Summary of Projected Short-term Emission Rates from the Proposed Project
Emissions Unit PM (Filterable)
PM10/PM2.5 (Filterable and Condensable)1
SO2 NOx CO VOC H2SO4 Pb
Frame 7 CTs with HRSGs (Each - Normal Operation) 2
3.5 lb/hr 0.0033 lb/MMBtu
7.0 lb/hr 0.007 lb/MMBtu
0.22 lb/hr 0.0002 lb/MMBtu
12.6 lb/hr 0.012 lb/MMBtu 2.5 ppmvd @ 15% O2
4.6 lb/hr 0.004 lb/MMBtu 1.5 ppmvd @ 15% O2
1.23 lb/hr 0.001 lb/MMBtu 0.7 ppmvd @ 15% O2
0.34 lb/hr 0.0003 lb/MMBtu
6.5E-04 lb/hr 6.2E-07 lb/MMBtu
Auxiliary Boiler (Each – Normal Operation)3
2.2 lb/hr 0.005 lb/MMBtu
5.9 lb/hr 0.014 lb/MMBtu
0 (no sulfur in fuel) 4.3 lb/hr 0.010 lb/MMBtu
3.8 lb/hr 0.009 lb/MMBtu
0.4 lb/hr 0.001 lb/MMBtu
No Sulfur in Fuel 3.28E-04 lb/hr 7.54E-07 lb/MMBtu
Emergency Generator 4
3.29E-04 lb/hp-hr 0.15 g/hp-hr 0.20 g/kw-hr 0.51 lb/hr 0.046 lb/MMBtu
3.83E-04 lb/hp-hr 0.17 g/hp-hr 0.23 g/kw-hr 0.59 lb/hr 0.054 lb/MMBtu
1.2E-05 lb/hp-hr 0.006 g/hp-hr 0.01 g/kw-hr 0.02 lb/hr 0.002 lb/MMBtu
0.011 lb/hp-hr 4.77 g/hp-hr 6.4 g/kw-hr 16.3 lb/hr 1.28 lb/MMBtu
0.006 lb/hp-hr 2.61 g/hp-hr 3.5 g/kw-hr 8.9 lb/hr 0.81 lb/MMBtu
7.1E-4 lb/hp-hr 0.32 g/hp-hr 0.43 g/kw-hr 1.1 lb/hr 0.10 lb/MMBtu
1.6E-05 lb/hp-hr 0.007 g/hp-hr 0.025 lb/hr 2.3E-03 lb/MMBtu
Negligible
Fire Pump Engines (Each)5
3.3E-04 lb/hp-hr 0.15 g/bhp-hr 0.20 g/kw-hr 0.12 lb/hr 0.058 lb/MMBtu
3.9E-04 lb/hp-hr 0.17 g/bhp-hr 0.23 g/kw-hr 0.13 lb/hr 0.067 lb/MMBtu
0.002 lb/hp-hr 0.93 g/hp-hr 1.25 g/kw-hr 0.72 lb/hr 0.36 lb/MMBtu
0.007 lb/hp-hr 3.0 g/hp-hr 4.02 g/kw-hr 2.3 lb/hr 1.16 lb/MMBtu
0.007 lb/hp-hr 3.0 g/hp-hr 4.06 g/kw-hr 2.3 lb/hr 1.17 lb/MMBtu
0.003 lb/hp-hr 1.1 g/hp-hr 1.53 g/kw-hr 0.88 lb/hr 0.44 lb/MMBtu
1.6E-5 lb/hp-hr 0.007 g/hp-hr 0.006 lb/hr 2.9E-03 lb/MMBtu
Negligible
Thermal Oxidizer 6 0.7 lb/hr 0.013 lb/MMBtu
0.9 lb/hr 0.016 lb/MMBtu
0.07 lb/hr 0.001 lb/MMBtu
1.4 lb/hr 0.025 lb/MMBtu 2.5 ppmvd
0.5 lb/hr 0.009 lb/MMBtu 1.5 ppmvd
0.03 lb/hr 4.6E-04 lb/MMBtu
0.1 lb/hr 0.002 lb/MMBtu
2.8E-05 lb/hr 5.0E-07 lb/MMBtu
Flare (Per Pilot)7 2.86E-04 lb/hr 0.003 lb/MMBtu
1.15E-03 lb/hr 0.011 lb/MMBtu
No Sulfur in Fuel 0.02 lb/hr 0.15 lb/MMBtu
0.013 lb/hr 0.13 lb/MMBtu
0.001 lb/hr 0.01 lb/MMBtu
No Sulfur in Fuel 7.5E-08 lb/hr 7.5E-07 lb/MMBtu
Existing Frame 5 Turbine (Increased Usage per Unit) 8
0.1 lb/hr 0.002 lb/MMBtu
0.3lb/hr 0.007 lb/MMBtu
0.002 lb/hr 4.8E-05 lb/MMBtu
0.7 lb/hr 0.016 lb/MMBtu 2.5 ppmvd
1.0 lb/hr 0.023 lb/MMBtu 6 ppmvd
0.1 lb/hr 0.003 lb/MMBtu
2.7E-03 lb/hr 6.4E-05 lb/MMBtu
2.1E-05 lb/hr 4.8E-07 lb/MMBtu
Equipment Component Leaks9
Negligible
Negligible
Negligible
Negligible
Negligible
0.58 lb/hr Negligible
Negligible
Notes: (1) Assumes all particulate is less than 2.5 microns, therefore PM10 = PM2.5. (2) CT emissions based on EPC design specification and manufacturer data per CPCN Application for normal operations. Pb emissions based on EPA’s AP-42 Table 1.4-3 (July
1998). NOx, CO, and VOC emissions are maximum short-term emission rates based on the worst case short-term operating conditions.

DNR – PPRP 82 COVE POINT ERD / DEC 2014
(3) Auxiliary Boiler emissions based on EPC design specification per CPCN Application for normal operations. Condensable PM and Pb emissions based on EPA’s AP-42 Table 1.4-2 (July 1998).
(4) Emergency Generator NOx, CO, and PM emissions based on NSPS IIII. SO2 and VOC emissions based on EPA’s AP-42 Table 3.4-1 (October 1996). Condensable PM emissions based on EPA’s AP-42 Table 3.4-2 (October 1996).
(5) Fire Pump Engine NOx and PM emissions based on NSPS IIII. CO, SO2, and VOC emissions based on EPA’s AP-42 Table 3-3.1 (October 1996). Condensable PM emissions based on EPA’s AP-42 Table 3.4-2 (October 1996).
(6) Thermal Oxidizer emissions based on EPC Design Specification per CPCN Application. Pb emissions based on EPA’s AP-42 Table 1.4-2 (July 1998). (7) Flare NOx and CO emissions based on EPA’s AP-42 Table 1.4-1 (July 1998). VOC, Pb, and PM emissions based on EPA’s AP-42 Table 1.4-2 (July 1998). (8) Existing Gas Turbines emissions from increased usage only. NOx, CO, and VOC emissions based on Permits NSR-2005-01 and PSD-2005-01. PM emissions based on existing
permit limit per CPCN Application. SO2 emissions based on EPA’s AP-42 Table 3.1-2a (April 2000). (9) Equipment component leaks emissions based on Table 2-4 of EPA’s Protocol for Equipment Leak Emission Estimates and the chemical composition of each material as provided
in the EPC design specification.

DNR – PPRP 83 COVE POINT ERD / DEC 2014
Table 4.2-13 Summary of Proposed Project Emissions (tpy)1
Unit (Number of
Units)
NOx CO SO2 VOC PM (Filterable)
PM10 and PM2.5
(Filterable and
Condensable)
H2S H2SO4 Pb GHG (as
CO2e)
Frame 7 CTs (2) 102.0 37.9 2.1 9.8 31.0 61.3 1.1 3.2 5.7E-03 1,089,376 Auxiliary Boilers (2) 50.9 45.2 0.16 4.3 19.7 51.8 0.08 0.23 2.9E-03 446,213 Emergency Generator (1) 4.1 2.2 0.005 0.3 0.1 0.1 0.002 0.006 - 444 Fire Pump Engines (5) 0.6 0.6 0.2 0.2 0.03 0.03 0.0005 0.0015 - 104
Thermal Oxidizer (1) 6.2 2.3 0.3 0.1 3.1 4.0 0.2 0.5 1.2E-04 386,177 North Flare (1) 69.0 31.2 - 10.8 0.7 2.8 - - 1.9E-04 43,659 South Flare (1) 41.0 18.4 - 4.0 0.4 1.7 - - 1.1E-04 21,200 Existing Frame 5 CTs (2) 6.0 8.8 0.02 1.1 0.7 2.5 0.008 0.02 1.8E-04 43,749 Equipment Component Leaks - - - 2.5 - - 0.00001 - - 66
TOTAL 279.3 146.6 2.8 33.3 55.7 124.2 1.4 4.0 0.01 2,030,988
DCP TOTALS2 279.2 146.3 2.8 33.2 55.7 124.2 1.4 4.0 0.04 2,030,983
Note 1: Road fugitive emissions are negligible and are therefore not listed in the table. Note 2: Source 16 December 2013 DCP CPCN Application Update in response to PPRP Data Request 9-1.
Small variations in emissions were noted between the emissions included in the CPCN Application and those emissions estimated by PPRP and MDE-ARMA. However, these variations are generally within rounding tolerances, with the exception of Pb. The Pb emissions submitted by DCP were significantly higher than the Pb emissions estimated by MDE-ARMA and PPRP. MDE-ARMA and PPRP determined this discrepancy was due to the use of an incorrect Pb emission factor by DCP of 5.0E-03 pound per million standard cubic feet (lb/MMscf) for several natural gas combustion sources. The correct Pb emission factor is 5.0E-4 lb/MMscf. Slight differences in NOx and CO are attributable to DCP using 1,000 kW to calculate emissions for the emergency generator instead of 1,156 kW (the correct conversion from 1,550-hp).
4.2.10 Ammonia Emissions
Ammonia is not a CAA regulated pollutant. However, it is of interest to the State as it reacts with nitric and sulfuric acids in the atmosphere to form fine particulate matter. DCP will inject ammonia in the SCR systems used on the CTs, auxiliary boilers, and thermal oxidizer. In the presence

DNR – PPRP 84 COVE POINT ERD / DEC 2014
of a catalyst, ammonia reacts with NOx and O2 and forms nitrogen gas (N2) and water. Unreacted ammonia that passes through the catalyst and is emitted to the atmosphere is known as ammonia slip.
DCP proposed an ammonia slip limit for all SCRs of no more than 5 ppmvd. A review of recently permitted combined cycle natural gas-fired combustion turbine projects, including those that have installed similar model GE units, confirms that many have been permitted with ammonia slip limits of 5 ppmvd corrected to 15 percent oxygen. Therefore, PPRP’s and MDE-ARMA’s recommended licensing conditions include a requirement for DCP to limit ammonia slip to 5 ppmvd or less. Compliance with the ammonia slip limit will be demonstrated through initial stack testing using EPA Method CTM-027, or equivalent method approved by MDE-ARMA, to be performed at least once every five years. The averaging period will be a 24-hour block average.
4.2.11 Hazardous Air Pollutants Emissions
HAPs are a list of pollutants included in Section 112(b) of the Clean Air Act (CAA). Table 4.2-14 presents an estimate of the total HAP emissions from the existing operations and proposed operations at the Cove Point LNG Terminal. A facility is considered a “major” source of HAPs if the potential to emit is 10 tpy or more of any individual HAP, or 25 tpy or more of all HAPs combined. The CPCN Application did not include an estimate of HAP emissions from existing facility operations. However, based on responses to PPRP Date Requests, PPRP and MDE-ARMA estimated HAP emissions from existing operations. As presented in Table 4.2-14, maximum total HAPs from the facility (existing and proposed operations) are estimated to be less than 25 tpy and all individual HAPs are estimated to be less than 10 tpy; therefore, the facility is not considered a major source of HAPs.
PPRP and MDE-ARMA also estimated HAP emissions from the proposed new operations. Appendix B provides backup calculations for HAP emissions from the existing and proposed operations, and includes certain discrepancies from those provided by DCP. Small discrepancies in emissions between PPRP and MDE-ARMA’s estimates and those by DCP are generally within rounding differences. The larger discrepancies are the result of four noted differences in HAP calculation methodologies.
The Pb emissions submitted by DCP were significantly higher than the Pb emissions estimated by PPRP and MDE-ARMA because DCP used an incorrect Pb emission factor in their calculations for several sources as 5.0E-03 pounds per million standard cubic feet (lb/MMscf) instead of

DNR – PPRP 85 COVE POINT ERD / DEC 2014
5.0E-04 lb/MMscf per EPA’s AP-42 Section 1.4 (July 1998) for Natural Gas Combustion.
DCP included emission estimates for the pollutant propylene in the HAP calculations for its proposed operations. Under Section 112(b) of CAA, propylene is not a regulated HAP, and is therefore excluded from MDE-ARMA and PPRP’s HAP emission estimates.
DCP included emissions from six additional HAP pollutants for the Frame 7 CTs that it did not include for the existing CTs. PPRP and MDE-ARMA included emissions from these additional HAP pollutants for all CTs, both proposed and existing.
DCP applied an additional high heating value scaling factor to some of the HAP emission calculations for the Frame 7 CTs. This caused potential emissions to be conservatively higher than the HAP emissions estimated by PPRP and MDE-ARMA.
HAP emissions were estimated from the existing and proposed natural gas/process gas burning emissions sources - including the existing and proposed CTs, auxiliary boilers, thermal oxidizer, flares, and existing natural gas external combustion engines - using emission factors from EPA’s AP-42 Section 1.4 (July 1998) for Natural Gas Combustion; EPA’s AP-42 Section 3.1 (April 2000) for Stationary Combustion Turbines; May 2001 published natural gas combustion emission factors from Ventura County, California APCD; and emission factors published in the CARB CATEF database. Emission factors from Ventura County and CARB were used only when emission factors were not available from EPA’s AP-42.
Formaldehyde emissions associated with the proposed CTs, auxiliary boiler, and thermal oxidizer will be controlled by 50% from use of oxidation catalysts. In the CPCN Application, DCP states that the oxidation catalyst may control other HAP emissions, but DCP conservatively assumed no other HAPs would be controlled, other than formaldehyde.
HAP emissions from the diesel burning emission sources, including all of the proposed emergency engines and existing internal combustion engines, were estimated utilizing emission factors from EPA’s AP-42 Section 3.3 (October 1996) for Gasoline and Diesel Industrial Engines and Section 3.4 (October 1996) for Large Stationary Diesel and All Stationary Dual-fuel Engines. The appropriate emission factor was used based on the size of the engine.

DNR – PPRP 86 COVE POINT ERD / DEC 2014
HAP emissions from existing and proposed fugitive equipment leaks were calculated based on Table 2-4 of EPA’s Protocol for Equipment Leak Emission Estimates and the chemical composition of each material as provided by DCP.
Table 4.2-14 includes the calculated emissions for total polycyclic aromatic hydrocarbons (PAH), only for those emission units without available speciated HAP emission factors.
Table 4.2-14 Total Potential HAP Emissions from Existing and Proposed Operations
HAP Pollutant Existing
Operations (tpy)
Proposed Operations
(tpy)
Facility Total (tpy)
1,1,2-Trichloroethane 7.9E-05 - 7.9E-05 1,1,2,2-Tetrachloroethane 9.9E-05 - 9.9E-05
1,3-Butadiene 3.0E-03 4.2E-03 7.2E-03 1,3-Dichloropropene 6.6E-05 - 6.6E-05 2-Chloronaphthalene 2.3E-06 1.8E-04 1.8E-04 2-Methylnaphthalene 2.7E-04 2.6E-03 2.8E-03
2,2,4-Trimethylpentane 6.2E-04 - 6.2E-04 3-Methylchloranthrene 1.1E-05 1.2E-05 2.3E-05
7,12-Dimethylbenz(a)anthracene 1.0E-04 1.1E-04 2.1E-04
Acenaphthene 1.5E-05 2.5E-05 4.0E-05 Acenaphthylene 2.5E-05 4.0E-05 6.5E-05
Acetaldehyde 0.2 0.4 0.6 Acrolein 0.06 0.07 0.1
Anthracene 1.5E-05 2.0E-05 3.6E-05 Arsenic 1.3E-03 1.3E-03 2.6E-03
Benz(a)anthracene 1.1E-05 1.5E-05 2.6E-05 Benzene 0.1 0.3 0.4
Benzo(a)pyrene 7.6E-06 8.7E-06 1.6E-05 Benzo(b)fluoranthene 1.2E-05 1.5E-05 2.7E-05
Benzo(e)pyrene 4.6E-06 2.8E-04 2.9E-04 Benzo(g,h,i)perylene 8.7E-06 9.7E-03 1.8E-05 Benzo(k)fluoranthene 1.1E-05 1.3E-05 2.4E-05
Beryllium 7.6E-05 7.9E-05 1.6E-04 Biphenyl 5.3E-04 - 5.3E-04 Cadmium 7.0E-03 7.2E-03 1.4E-02
Carbon Tetrachloride 9.1E-05 - 9.1E-05 Chlorobenzene 7.5E-05 - 7.5E-05
Chloroform 7.1E-05 - 7.1E-05

DNR – PPRP 87 COVE POINT ERD / DEC 2014
HAP Pollutant Existing
Operations (tpy)
Proposed Operations
(tpy)
Facility Total (tpy)
Chromium 8.9E-03 9.2E-03 1.8E-02 Chrysene 7.4E-04 5.8E-02 5.9E-02
Cobalt 5.3E-04 5.5E-04 1.1E-03 Dibenzo(a,h)anthracene 7.6E-06 9.2E-06 1.7E-05
Dichlorobenzene 7.6E-03 7.9E-03 1.6E-02 Ethylbenzene 0.2 0.3 0.5
Ethylene Dibromide 1.1E-04 - 1.1E-04 Fluoranthene 1.5E-03 0.1 0.1
Fluorene 3.2E-05 7.2E-05 1.0E-04 Formaldehyde 3.8 3.6 7.4
Hexane 2.3 4.5 6.8 Indeno(1,2,3-cd)pyrene 1.1E-05 1.3E-05 2.5E-05
Lead 5.6E-03 9.2E-03 1.5E-02 Manganese 2.4E-03 2.5E-03 4.9E-03
Mercury 1.7E-03 1.7E-03 3.4E-03 Methanol 6.2E-03 - 6.2E-03
Methylene Chloride 5.0E-05 - 5.0E-05 Naphthalene 8.6E-03 1.5E-02 2.4E-02
Nickel 1.3E-02 1.4E-02 2.7E-02 PAH 1.2E-02 2.1E-02 3.3E-02
Perylene 4.7E-06 3.7E-04 3.8E-04 Phenanthrene 1.3E-04 2.4E-04 3.7E-04
Phenol 6.0E-05 - 6.0E-05 Propylene Oxide 0.2 0.3 0.4
Pyrene 3.5E-05 4.6E-05 8.1E-05 Selenium 1.5E-04 1.6E-04 3.1E-04 Styrene 5.9E-05 - 5.9E-05
Tetrachloroethane 6.2E-06 - 6.2E-06 Toluene 0.8 1.3 2.2
Vinyl Chloride 3.7E-05 - 3.7E-05 Xylenes 0.4 0.7 1.1
Total HAPs 8.2 11.8 20.0 Max Individual HAP 7.4
DCP Total HAPs1 (See Note) 8.2 13.4 21.5
Note: (1) Source 19 August 2013 DCP CPCN Application Update
Table 4.2-14 indicates that the maximum individual HAP emitted by DCP for the total proposed operations and existing operations is formaldehyde at 7.4 tpy (3.8 tpy from existing operations and 3.6 tpy from proposed

DNR – PPRP 88 COVE POINT ERD / DEC 2014
operations). As previously mentioned, DCP proposes that use of oxidation catalysts on the Frame 7 CTs, auxiliary boilers, and thermal oxidizer will result in 50 percent control of formaldehyde. Without this level of control (50 percent), formaldehyde emissions resulting from the proposed operations would increase from 3.6 tpy to 6.9 tpy. This, together with the existing formaldehyde emissions, would cause the facility-wide to be above the 10 tpy major source threshold.
Therefore, the recommended licensing conditions include a requirement for DCP to conduct an initial stack test on the Frame 7 CTs, auxiliary boilers, and thermal oxidizer to demonstrate that the combined total potential formaldehyde emissions are less than 6.2 tpy for all sources associated with this proposed Project. The emission factor demonstrated during these initial stack tests will be used to calculate emissions for each the Frame 7 CTs, auxiliary boilers and thermal oxidizer based on their maximum potential operating scenario in any 12-month rolling period. DCP will be required to document these calculations, in addition to emissions from other proposed Project sources calculated using approved emission factors. This must be done to demonstrate that DCP maintains its minor source status below the 10 tpy major source threshold for potential emissions of formaldehyde, as an individual HAP. The method used for testing formaldehyde is Method 323, or equivalent method approved by MDE-ARMA.
4.2.12 Toxic Air Pollutant Emissions
The Maryland TAP regulations include provisions for exempting sources with low levels of TAP emissions as well as provisions for exempting certain types of sources, such as fuel burning equipment. Therefore, all of the fuel burning equipment at the DCP facility is exempt from the Maryland TAP regulations (CTs, auxiliary boilers, emergency generator, and fire pump engines). The following emission sources were the only sources included in emission estimates:
• The proposed thermal oxidizer;
• The proposed ground flares (North and South);
• Fugitive emissions from proposed and existing equipment component leaks; and
• Ammonia slip emissions from the proposed SCR system for the thermal oxidizer.
TAP emissions from the thermal oxidizer and flares were estimated using emission factors from EPA’s AP-42 Section 1.4 (July 1998) for Natural Gas

DNR – PPRP 89 COVE POINT ERD / DEC 2014
Combustion and May 2001 published natural gas combustion emission factors from Ventura County, California APCD. TAP emissions from existing and proposed fugitive equipment leaks were calculated based on both Table 2-4 of EPA’s Protocol for Equipment Leak Emission Estimates and the chemical composition of each material as provided by DCP. Ammonia slip emissions from the thermal oxidizer SCR were calculated based on the proposed limit of 5 ppmvd corrected to 15 percent O2 and design parameters provided by DCP. Table 4.2-15 summarizes the maximum total short term (lb/hr) and annual (lb/yr) emission rates for each pollutant from all of these sources.
Table 4.2-15 Summary Facility-Wide TAP Emissions
TAP Pollutant Facility- Wide Emissions (lb/hr)
Facility- Wide Emissions (lb/yr)
2-Methylnaphthalene 1.23E-03 4.01E-02 3-Methylchloranthrene 9.26E-05 3.01E-03
7,12-Dimethylbenz(a)anthracene 8.23E-04 2.67E-02 Acenaphthene 9.26E-05 3.01E-03
Acenaphthylene 9.26E-05 3.01E-03 Acetaldehyde 0.22 6.59
Acrolein 0.14 4.51 Ammonia 1.05 9,200
Anthracene 1.23E-04 4.01E-03 Arsenic 1.03E-02 0.33 Barium 0.23 7.35
Benz(a)anthracene 9.26E-05 3.01E-03 Benzene 42.02 429.72
Benzo(a)pyrene 6.17E-05 2.00E-03 Benzo(b)fluoranthene 9.26E-05 3.01E-03 Benzo(g,h,i)perylene 6.17E-05 2.00E-03 Benzo(k)fluoranthene 9.26E-05 3.01E-03
Beryllium 6.17E-04 2.00E-02 Butane 108.35 6,407.08
Cadmium 5.66E-02 1.84 Chromium 7.20E-02 2.34 Chrysene 9.26E-05 3.01E-03
Cobalt 4.32E-03 0.14 Copper 4.37E-02 1.42
Dibenzo(a,h)anthracene 6.17E-05 2.00E-03 Dichlorobenzene 6.17E-02 2.00
Fluoranthene 1.54E-04 5.01E-03

DNR – PPRP 90 COVE POINT ERD / DEC 2014
TAP Pollutant Facility- Wide Emissions (lb/hr)
Facility- Wide Emissions (lb/yr)
Fluorene 1.44E-04 4.68E-03 Formaldehyde 0.87 23.09
Hydrogen Sulfide 3.99E-02 349.31 Indeno(1,2,3-cd)pyrene 9.26E-05 3.01E-03
Manganese 1.95E-02 0.63 Mercury 1.34E-02 0.43
Molybdenum 5.66E-02 1.84 Nickel 0.11 3.51
Nitrous Oxide 12.10 378.31 Phenanthrene 8.74E-04 2.84E-02
Pyrene 2.57E-04 8.35E-03 Respirable PM1 3.91 169.25
Selenium 1.23E-03 4.01E-02 Sulfuric Acid Mist 0.11 1,005.23
Toluene 1.88 56.18 Vanadium 0.12 3.84
Xylenes 1.40 41.75 Zinc 1.49 48.42
Note: (1) Respirable particulate assumed to be 1% of PM10 total.
4.2.13 Construction Emissions
Construction activities at the DCP site will generate air emissions during the construction and installation of the proposed Project. Air emissions were estimated for the following activities:
• Barges – transport of equipment to the DCP site (note that only those emissions which occur within the Washington DC Air Quality Control Region have been included);
• Construction Equipment Engines – operation of fossil fuel burning air compressors, backhoes, cranes, and other construction equipment;
• On-road Vehicle Travel – operation of fossil fuel burning commuter buses, passenger vehicles, and diesel or gasoline trucks for workers to travel to and from the proposed Project site;
• Off-road Vehicle Travel – operation of fossil fuel burning dump trucks, light/medium duty trucks, and water/fuel trucks;
• Off-shore Marine Vessels – offshore construction equipment such as survey boats, barges, cranes, and tugboats;

DNR – PPRP 91 COVE POINT ERD / DEC 2014
• Earthmoving Equipment and Fugitives – use of bulldozing, grading, and land disturbance; and wind erosion.
DCP estimated emissions from these sources using EPA’s AP-42 factors, EPA NONROADS or MOBILE6.2 models, and/or the Analysis of Commercial Marine Vessels Emissions and Fuel Consumption Data5 in the CPCN Application. Tables 4.2-16 through 4.2-19 summarize the emissions from these sources for each anticipated year of construction (2014 – 2017). As indicated in the following tables, project construction emissions estimated by DCP and the State (PPRP and MDE-ARMA) are within rounding differences.
Table 4.2-16 Project Construction Emissions for Year 2014
Source NOX CO SO2 VOC PM10 PM2.5 GHG (as CO2e)
Construction Equipment Engines 170.8 181.6 9.4 15.3 14.3 14.3 32,466 On-Road Vehicle Travel 0.1 0.9 0.0 0.04 0.0 0.0 42 Off-Road Vehicle Travel -- -- -- -- 22.1 2.2 -- Off-Shore Marine Vessels 0.0 0.0 0.0 0.0 0.0 0.0 0.0 Earthmoving Fugitives -- -- -- -- 20.2 10.1 -- Storage Piles -- -- -- -- -- TOTAL 170.9 182.5 9.4 15.4 56.5 26.6 32,508 DCP TOTAL 171.1 183.0 9.4 15.4 57.5 26.8 32,497
5 http://www.epa.gov/otaq/models/nonrdmdl/c-marine/r00002.pdf

DNR – PPRP 92 COVE POINT ERD / DEC 2014
Table 4.2-17 Project Construction Emissions for Year 2015
Source NOX CO SO2 VOC PM10 PM2.5 GHG (as CO2e)
Construction Equipment Engines 283.8 377.9 15.7 34.1 27.0 27.0 54808 On-Road Vehicle Travel 0.4 3.7 0.0 0.2 0.0 0.0 207 Off-Road Vehicle Travel -- -- -- -- 31.5 3.1 -- Off-Shore Marine Vessels 40.5 6.4 90.7 0.7 1.1 1.1 2761 Earthmoving Fugitives -- -- -- -- 11.9 6.1 -- Storage Piles -- -- -- -- 1.8 0.3 --
TOTAL 324.7 388.0 106.4 35.0 73.4 37.7 57,776
DCP TOTAL 325.1 388.3 106.3 35.0 73.2 37.6 57,781
Table 4.2-18 Project Construction Emissions for Year 2016
Source NOX CO SO2 VOC PM10 PM2.5 GHG (as CO2e)
Construction Equipment Engines 212.7 297.2 11.6 27.5 20.9 20.9 41288 On-Road Vehicle Travel 0.3 3.6 0.0 0.2 0.0 0.0 174 Off-Road Vehicle Travel -- -- -- -- 5.1 0.5 -- Off-Shore Marine Vessels 0.0 0.0 0.0 0.0 0.0 0.0 0 Earthmoving Fugitives -- -- -- -- 0.0 0.0 -- Storage Piles -- -- -- -- 1.8 0.3 -- TOTAL 213.0 300.8 11.6 27.7 27.8 21.7 41,462 DCP TOTAL 213.1 300.7 11.6 27.7 27.8 21.7 41,442
Table 4.2-19 Project Construction Emissions for Year 2017
Source NOX CO SO2 VOC PM10 PM2.5 GHG (as CO2e)
Construction Equipment Engines 122.0 153.9 8.4 16.1 14.4 14.4 31918 On-Road Vehicle Travel 0.1 1.3 0.0 0.1 0.0 0.0 57 Off-Road Vehicle Travel -- -- -- -- 46.9 4.7 -- Off-Shore Marine Vessels 0.0 0.0 0.0 0.0 0.0 0.0 0 Earthmoving Fugitives -- -- -- -- 0.7 0.4 -- Storage Piles -- -- -- -- 1.8 0.3 -- TOTAL 122.1 155.2 8.4 16.2 63.8 19.7 31,975 DCP TOTAL 122.5 155.3 8.4 16.2 63.8 19.7 31,980

DNR – PPRP 93 COVE POINT ERD / DEC 2014
4.2.14 Conformity Emissions
Under the CAA and Maryland Air regulations, General conformity addresses the sources of emissions not covered by PSD and NA-NSR permitting (i.e., emissions from construction activities and mobile sources) to ensure that they conform to the State Implementation Plan (SIP). General Conformity is a federal requirement and must consider the proposed Project as a whole, which means that this evaluation includes emissions sources at the DCP site in Maryland, as well as at the gas pipeline sites in Virginia (Loudoun and Pleasant Valley) that are included in Dominion’s project-related construction plans.
Under the CAA, a general conformity determination is required if a federal action is likely to generate direct and indirect emissions that would exceed the conformity threshold levels of the pollutant(s) for which an air basin is designated nonattainment, or is currently a maintenance area (40 CFR §93, Subpart B). According to the conformity regulations, emissions from sources subject to major or minor PSD and/or NA-NSR permits or requirements are exempt and are deemed to have conformed (40 CFR §93.153(d)(1)). The thresholds for general conformity in the State of Maryland (COMAR 26.11.26) and the Commonwealth of Virginia (9 VAC 5-160) are the same as the federal thresholds specified in 40 CFR §93.153(b). Maryland and parts of Virginia are located in the ozone transport region.
Calvert County is designated as a nonattainment area for ozone, and Loudoun and Fairfax Counties in Virginia are designated as nonattainment areas for ozone and PM2.5. The three counties are within the Washington DC Air Quality Control Region (AQCR)6. Therefore, a general conformity determination is required only if emissions of any ozone precursor (i.e., NOx or VOC) or emissions of PM2.5 or its precursors (NOx or SO2), exceeds federal conformity applicability thresholds during
6 Aside from the three affected counties in the Washington DC AQCR, during the transport of equipment to the proposed Project in 2015, barge emissions would occur in other counties that are in nonattainment areas for ozone and PM2.5 (i.e., other AQCRs), but estimated emissions from barge transport in other AQCRs are below the applicable general conformity thresholds.

DNR – PPRP 94 COVE POINT ERD / DEC 2014
construction and from non-permitted operations (those not included in the PSD or NA-NSR permits) of the Cove Point facility. The conformity applicability thresholds for the proposed Project area are 100 tpy of NOx, 50 tpy of VOC, 100 tpy of PM2.5, and 100 tpy of SO2.
Total emissions for conformity purposes were calculated summing the expected construction emissions from the DCP site (emissions calculated as discussed in Section 4.2.13), the Loudoun M&R site, and Pleasant Valley Compressor Station, as well as from barge emissions, and emissions from other non-permitted operations. According to FERC Resource Report 9 (submitted September 11, 2013 to the PSC), DCP states that barge emissions will result from the transportation of equipment to Offsite Area B. Although the exact routes of the barges have not yet been determined, DCP indicated that one barge will travel from Fairless Hills, PA; 25 barges will travel from Baltimore, MD; and 16 barges will travel from Corpus Christi, TX. Note that although the barges commute as far as from Corpus Christi, TX, emissions from barge transport are only estimated in all nonattainment counties along the barge route. Emissions were estimated based on these anticipated routes and the emission factors from Analysis of Commercial Marine Vessels Emissions and Fuel Consumption Data7. Non-permitted on-going operations for the proposed Project will generate emissions from the following activities:
• New Employees Commuting – Vehicle emissions from an increase in the number of employees commuting to the facility;
• Waste Haulers – Truck emissions from the increase in waste hauling trucks needed for the site; and
• Marine Vessels – Emissions from the LNG carriers and supporting marine vessels such as tugboats and security vessels.
Emissions from these sources were calculated using emission factors from EPA NONROADS or MOBILE6.2 models.
DCP calculated, and PPRP and MDE-ARMA verified, emissions associated with these activities. Tables 4.2-20 through 4.2-23 show the results in comparison to the general conformity thresholds for all construction years. Small variations in emissions between the CPCN Application and the State’s estimates were noted and are generally within
7 http://www.epa.gov/otaq/models/nonrdmdl/c-marine/r00002.pdf

DNR – PPRP 95 COVE POINT ERD / DEC 2014
rounding tolerances. Table 4.2-24 shows non-permitted operational emissions from the proposed Project for year 2018 forward. Since DCP is in an attainment area for PM2.5, emissions of PM2.5 and SO2 as a precursor are not included in the following tables.
Table 4.2-20 Total Emissions from Project for General Conformity in 2014 - Washington DC AQCR (tpy)
Source NOx SO2 VOC PM2.5 Barges -- -- -- -- Cove Point Facility Construction 170.9 Attainment 15.4 Attainment Loudoun M&R Site Construction -- -- -- -- Pleasant Valley Compressor Station Construction -- -- -- -- Cove Point Facility Non-Permitted Operational Emissions -- Attainment -- Attainment General Conformity Threshold 100 100 50 100 Total 170.9 0.0 15.4 0.0 DCP Total 171.1 0 15.4 0 General Conformity Threshold Exceeded? (Yes/No) Yes No No No
Table 4.2-21 Total Emissions from Project for General Conformity in 2015 - Washington DC AQCR (tpy)
Source NOx SO2 VOC PM2.5 Barges 1.8 -- 0.0 -- Cove Point Facility Construction 324.7 Attainment 35.0 Attainment Loudoun M&R Site Construction -- -- -- -- Pleasant Valley Compressor Station Construction -- -- -- -- Cove Point Facility Non-Permitted Operational Emissions -- Attainment -- Attainment General Conformity Threshold 100 100 50 100 Total 326.6 0.0 35.0 0.0 DCP Total 326.9 0 35.0 0 General Conformity Threshold Exceeded? (Yes/No) Yes No No No

DNR – PPRP 96 COVE POINT ERD / DEC 2014
Table 4.2-22 Total Emissions from Project for General Conformity in 2016 - Washington DC AQCR (tpy)
Source NOx SO2 VOC PM2.5 Barges -- -- -- -- Cove Point Facility Construction 213.0 Attainment 27.7 Attainment Loudoun M&R Site Construction 4.2 0.2 0.8 2.3 Pleasant Valley Compressor Station Construction 13.6 0.6 4.3 3.5 Cove Point Facility Non-Permitted Operational Emissions -- Attainment -- Attainment General Conformity Threshold 100 100 50 100 Total 230.8 0.8 32.8 5.8 DCP Total 230.9 0.8 32.8 5.8 General Conformity Threshold Exceeded? (Yes/No) Yes No No No
Table 4.2-23 Total Emissions from Project for General Conformity in 2017 - Washington DC AQCR (tpy)
Source NOx SO2 VOC PM2.5 Barges -- -- -- -- Cove Point Facility Construction 122.0 Attainment 16.2 Attainment Loudoun M&R Site Construction 0.0 0.0 0.0 0.3 Pleasant Valley Compressor Station Construction 0.6 0.0 0.2 0.4 Cove Point Facility Non-Permitted Operational Emissions 77.2 Attainment 2.3 Attainment General Conformity Threshold 100 100 50 100 Total 199.9 0.0 18.7 0.7 DCP Total 200.37 0.03 18.6 0.7 General Conformity Threshold Exceeded? (Yes/No) Yes No No No

DNR – PPRP 97 COVE POINT ERD / DEC 2014
Table 4.2-24 Total Emissions from Project for General Conformity in 2018 Onward - Washington DC AQCR (tpy)
Source NOx SO2 VOC PM2.5 Barges -- -- -- -- Cove Point Facility Construction -- Attainment -- Attainment Loudoun M&R Site Construction -- -- -- -- Pleasant Valley Compressor Station Construction -- -- -- -- Cove Point Facility Non-Permitted Operational Emissions 77.2
Attainment 2.3
Attainment General Conformity Threshold 100 100 50 100 Total 77.2 0.0 2.3 0 DCP Total 77.2 0 2.3 0 General Conformity Threshold Exceeded? (Yes/No) No No No No
Tables 4.2-20 through 4.2-23 indicate that the projected total emissions from construction of the proposed Project exceed the general conformity thresholds of 100 tpy for NOx in 2014, 2015, 2016, and 2017 in the Washington DC AQCR, as defined in 40 CFR §93.153(b)(1). At this time, DCP has made the necessary commitments to FERC to demonstrate conformance with the SIP for Maryland. Specifically, DCP has purchased 625 tons of NOx and 166 tons of VOC emission reduction credits (ERCs) in accordance with 40 CFR §93.158(a)(2).
4.3 TAPS ANALYSIS
TAPs are those pollutants that are known or suspected to cause serious health problems. TAPs are regulated by Maryland under COMAR 26.11.15 and .16 and are divided into two categories—Class I and Class II. Class I TAPs are known as potential carcinogens specifically identified in COMAR 26.11.16.06. Class II TAPs include all other chemical compounds that have other potential acute or chronic health effects.
A TAPs analysis, consistent with COMAR, was conducted for the proposed Project using six different operating scenarios to account for all reasonable operating scenarios of the emission sources identified in Section 4.2.12. Table 4.3-1 presents these scenarios.

DNR – PPRP 98 COVE POINT ERD / DEC 2014
Table 4.3-1 TAP Analysis Operating Scenarios
The maximum total short term (lb/hr) and annual (lb/yr) emission rates for each pollutant were determined for the six operating scenarios in Table 4.3-1. These were used to conduct the multi-step analysis to assess impacts from TAPs.
The first step in the process is determining if any of the TAPs meet the criteria for the Small Emitter Exemption as set forth in COMAR 26.11.15.03(B)(3)(a) and (b). The Small Emitter threshold is defined as follows:
For a Class I pollutant:
• The total allowable emissions of the TAP from the premises are 0.5 lb/hr (0.23 kilogram per hour, kg/hr) or less;
• The total allowable emissions of the TAP from the premises are 350 lb/yr (159 kilograms per year, kg/yr) or less;
• All applicable TLV-based, threshold-based, or special screening levels for the TAP are greater than 200 micrograms per cubic meter (μg/m3) and;
Operating Scenario
Thermal Oxidizer Ground Flares Fugitive
Emissions
Ammonia Slip Emissions from SCRs
Normal Operation Normal Operation Pilot emissions only Normal
Operation Normal
Operation
Ship Cooldown Normal Operation
Pilot emissions and venting of ships during
cooldown
Normal Operation
Normal Operation
Warm Restart Normal Operation
Pilot emissions and venting during a warm
facility restart
Normal Operation
Normal Operation
Cold Restart Normal Operation
Pilot emissions and venting during a cold
facility restart
Normal Operation
Normal Operation
Warm Restart and Ship Cooldown
Normal Operation
Pilot emissions and venting from both
warm facility restart and ship cooldown
Normal Operation
Normal Operation
Cold Restart and Ship Cooldown
Normal Operation
Pilot emissions and venting from both cold facility restart and ship
cooldown
Normal Operation
Normal Operation

DNR – PPRP 99 COVE POINT ERD / DEC 2014
• The applicable risk-based screening level is greater than 1 μg/m3.
For a Class II pollutant:
• The total allowable emissions of the TAP from the premises are 0.5 lb/hr (0.23 kg/hr) or less; and
• All applicable TLV-based, threshold-based, or special screening levels for the TAP are greater than 200 μg/m3.
For the proposed Project, eight TAP pollutants meet all of the criteria for the Small Emitter Exemption and do not require further evaluation as part of the TAP analysis. These eight pollutants are ethylbenzene, heptane, hexane, isopentane, naphthalene, neopentane, octane, and pentane.
The second step of the TAP analysis process is to compare the emission rates for each pollutant that does not qualify for the Small Emitter Exemption to its respective allowable emission rate (AER) calculated under COMAR 26.11.16.02A. The AERs are based on dividing established screening levels for each pollutant (at 1-hour, 8-hour, and annual averaging periods) by a conversion factor (specified in COMAR 26.11.16.02A). The conversion factors for sources that are either non-stack sources or stack sources with downwash were used, as these best represented the types of sources being evaluated in the TAP analysis. Table 4.3-2 presents the calculated AER for each pollutant and a summary determination as to whether the facility-wide emissions for each pollutant are below the AER.
Table 4.3-2 Comparison of Facility-Wide TAP Emissions to AERs
TAP Pollutant AER
1-hour (lb/hr)
AER 8-hour (lb/hr)
AER Annual (lb/yr)
Facility- Wide
Emissions (lb/hr)
Facility- Wide
Emissions (lb/yr)
Below 1-
hour AER?
Below 8-hour AER?
Below Annual AER?
2-Methylnaphthalene - 0.104 - 1.23E-03 4.01E-02 YES
3-Methylchloranthrene - 0.072 - 9.26E-05 3.01E-03 YES 7,12-Dimethylbenz(a)anthracene
- 0.017 - 8.23E-04 2.67E-02
YES
Acenaphthene - 0.072 - 9.26E-05 3.01E-03 YES
Acenaphthylene - 0.088 - 9.26E-05 3.01E-03 YES
Acetaldehyde 1.614 8.244 182.48 0.22 6.59 YES YES YES
Acrolein 0.008 0.006 - 0.14 4.51 NO NO
Ammonia 0.874 0.624 - 1.05 9,200 NO NO
Anthracene - 0.072 - 1.23E-04 4.01E-03 YES
Arsenic - 0.0004 0.073 1.03E-02 0.33 NO NO

DNR – PPRP 100 COVE POINT ERD / DEC 2014
TAP Pollutant AER
1-hour (lb/hr)
AER 8-hour (lb/hr)
AER Annual (lb/yr)
Facility- Wide
Emissions (lb/hr)
Facility- Wide
Emissions (lb/yr)
Below 1-
hour AER?
Below 8-hour AER?
Below Annual AER?
Barium - 0.018 - 0.23 7.35 NO
Benz(a)anthracene - - - 9.26E-05 3.01E-03
Benzene 0.286 0.057 47.445 42.02 429.72 NO NO NO
Benzo(a)pyrene - - - 6.17E-05 2.00E-03
Benzo(b)fluoranthene - - - 9.26E-05 3.01E-03
Benzo(g,h,i)perylene - 0.072 - 6.17E-05 2.00E-03 YES
Benzo(k)fluoranthene - - - 9.26E-05 3.01E-03
Beryllium - 1.79E-06 0.146 6.17E-04 2.00E-02 NO YES
Butane - 85.201 - 108.35 6,407.08 NO
Cadmium - 7.17E-05 0.219 5.66E-02 1.84 NO NO
Chromium - 0.018 - 7.20E-02 2.34 NO
Chrysene - - - 9.26E-05 3.01E-03
Cobalt - 0.001 - 4.32E-03 0.14 NO
Copper - 0.007 - 4.37E-02 1.42 NO
Dibenzo(a,h)anthracene - - - 6.17E-05 2.00E-03
Dichlorobenzene - - - 6.17E-02 2.00
Fluoranthene - 0.294 - 1.54E-04 5.01E-03 YES
Fluorene - 0.072 - 1.44E-04 4.68E-03 YES
Formaldehyde - 0.073 29.197 0.87 23.09 NO YES
Hydrogen Sulfide 0.250 0.050 - 3.99E-02 349.31 YES YES
Indeno(1,2,3-cd)pyrene - - - 9.26E-05 3.01E-03
Manganese - 0.007 - 1.95E-02 0.63 NO
Mercury 0.001 0.0004 - 1.34E-02 0.43 NO NO
Molybdenum - 0.018 - 5.66E-02 1.84 NO
Nickel - 0.004 - 0.11 3.51 NO
Nitrous Oxide - 3.227 - 12.10 378.31 NO
Phenanthrene - 0.035 - 8.74E-04 2.84E-02 YES
Pyrene - 0.072 - 2.57E-04 8.35E-03 YES
Respirable PM1 - 0.108 - 3.91 169.25 NO
Selenium - 0.007 - 1.23E-03 4.01E-02 YES
Sulfuric Acid Mist - 0.007 - 0.11 1,005.23 NO
Toluene - 2.701 - 1.88 56.18 YES
Vanadium - 0.002 - 0.12 3.84 NO
Xylenes 23.344 15.562 - 1.40 41.75 YES YES
Zinc 3.584 1.792 - 1.49 48.42 YES YES
Note 1: Respirable particulate assumed to be 1% of PM10 total.
All pollutants that are emitted at rates greater than their respective AERs require an air dispersion modeling analysis be conducted to determine if

DNR – PPRP 101 COVE POINT ERD / DEC 2014
emissions of these pollutants will adversely impact public health beyond the property line. Using AERMOD, DCP determined the maximum modeled concentration for each pollutant emission rate and compared these emission rates to the allowable ambient levels (AALs) for each pollutant. The results of DCP’s analysis are presented in Section 7 of the CPCN Application. All pollutants’ modeled impacts were below their respective allowable ambient screening levels, and therefore demonstrate that the proposed Project is in compliance with the TAP ambient air requirements. PPRP and MDE-ARMA have verified that the TAPs analyses provided by DCP adequate to demonstrate compliance with Maryland TAPs regulations.
Under COMAR 26.11.15.05, DCP is required to install and operate Best Available Control Technology for Toxics (T-BACT) on all new sources that emit TAPs. As discussed in Section 4.5, LDAR constitutes LAER for piping components and thus constitutes T-BACT for fugitive TAPs emissions.
Although sources of TAPs, themselves, the flares and the thermal oxidizer are being installed and operated by DCP to control emissions. DCP proposed, and PPRP and MDE-ARMA agrees, that T-BACT for the flares and thermal oxidizers is equivalent to the BACT/LAER determinations for these sources. For the flares, T-BACT is to ensure that complete combustion of the flare gas occurs by requiring the presence of a pilot flame, the use of good operating practices, and maintaining proper combustion efficiency. For the thermal oxidizer, T-BACT is the use of SCR and an oxidation catalyst. This is further discussed in Sections 4.4 and 4.5, which address PM BACT and VOC LAER.
Ammonia emissions result from the use of the SCR control system on the thermal oxidizer. The use of the SCR is required to comply with BACT/LAER for NO2/NOx. DCP proposed T-BACT to be good operating practices to minimize ammonia slip emissions, including not injecting ammonia until the SCR reaches an appropriate operating temperature.
PPRP and MDE-ARMA concur with the DCP proposed T-BACT determinations.

DNR – PPRP 102 COVE POINT ERD / DEC 2014
4.4 PREVENTION OF SIGNIFICANT DETERIORATION (PSD)
4.4.1 Applicability
DCP is an existing major stationary source for air permitting purposes. This means that potential emissions of one or more pollutants from sources associated with existing operations are above major source thresholds. Therefore, PSD applicability for the proposed Project is determined by evaluating if there is a significant net emissions increase of pollutants associated with the installation and operation of sources presented in DCP’s CPCN Application. As discussed in Section 3.3, the DCP facility is located in an attainment area for all pollutants except ozone. Therefore, applicability with PSD regulations is evaluated for attainment pollutants against their respective Significant Emissions Rate (SER). Under PSD, the facility is considered to undergo a major modification if the net emissions increase of any pollutant is greater than the SER for that pollutant. Pollutants with emissions equal to or higher than the SER would subject that pollutant to PSD requirements. Table 4.4-1 presents a summary of the proposed Project’s potential emissions for applicable pollutants.
Table 4.4-1 PSD/NSR Applicability Analysis for Proposed Project
Pollutants Potential
Emissions (tpy)
Significant Emission Rate
(tons)
PSD/NSR Triggered? (Yes/No)
NOx 279.3 40 Yes CO 146.6 100 Yes
PM (TSP) (Filterable Only) 55.7 25 Yes
PM10
(Filterable and Condensable) 124.2 15 Yes
PM2.5
(Filterable and Condensable) 124.2 10 Yes
SO2 2.8 40 No VOC 33.3 25 Yes
GHGs (as CO2e) 2,030,988 75,000 Yes Hydrogen Sulfide 1.4 10 No
Sulfuric Acid Mist (SAM) 4.0 7 No Lead (Pb) 0.01 0.6 No
As seen in Table 4.4-1, potential NOx, CO, PM, PM10, PM2.5, VOC, and GHG emissions exceed their pollutant-specific SER; therefore, the proposed Project triggers PSD requirements and must:

DNR – PPRP 103 COVE POINT ERD / DEC 2014
• Demonstrate use of BACT for pollutants with significant emissions (Section 4.4.2);
• Assess the ambient impact of emissions through the use of dispersion modeling or other means; if the impacts are significant, evaluate (through cumulative multi-source modeling analysis) compliance with the NAAQS and consumption of PSD increments (Section 4.4.3); and
• Conduct additional impact assessments that analyze impairment to visibility, soils, and vegetation as a result of the modification, as well as impacts on Class I areas (Section 4.4.3).
4.4.2 Best Available Control Technology (BACT) Analyses
Based on potential emissions for the proposed Project, DCP must demonstrate BACT for NOx, CO, PM, PM10, PM2.5 and GHG emissions for all proposed Project emissions sources (Frame 7 CTs, auxiliary boilers, emergency generator, fire pump engines, thermal oxidizer, flares, paved roads, and equipment components). In the CPCN Application, DCP conducted a control technology analysis for these sources. PPRP and MDE-ARMA reviewed DCP’s control technology analysis and requested clarification on certain aspects of the analyses. PPRP and MDE-ARMA’s BACT determination was developed based on the information presented in DCP’s CPCN Application and on additional information provided by DCP in responses to PPRP Data Requests. This section summarizes the BACT analysis conducted by PPRP and MDE-ARMA, and provides a determination for each source for each pollutant that triggers PSD applicability.
NOx is subject to both PSD review (as a major source in a NO2 attainment area) and NA-NSR (as a major source of the ozone precursor NOx in an ozone nonattainment area). Because LAER, by definition, must be at least as stringent as BACT, the NOx control technology demonstration is presented in the LAER discussion in Section 4.5.
4.4.2.1 BACT Analysis Process
BACT for any source is defined in COMAR 26.11.17.01(B)(5) as:
(a)…an emissions limitation, including a visible emissions standard, based on the maximum degree of reduction for each regulated NSR pollutant which would be emitted from any proposed major stationary source or major modification which the [MDE-ARMA], on a case-by-case basis, taking into account energy, environmental, and economic impacts and other costs,

DNR – PPRP 104 COVE POINT ERD / DEC 2014
determines is achievable for that source or modification through application of production processes or available methods, systems, and techniques, including fuel cleaning or treatment or innovative fuel combination techniques for control of the pollutant.
(b) Application of best available control technology may not result in emissions of any pollutant which would exceed the emissions allowed by an applicable standard under 40 CFR 60 and 61.
(c) If the [MDE-ARMA] determines that technological or economic limitations on the application of measurement methodology to a particular emissions unit would make the imposition of an emissions standard infeasible, a design, equipment, work practice, operational standard, or combination of these, may be prescribed instead to satisfy the requirement for the application of best available control technology. This standard shall, to the degree possible, set forth the emissions reduction achievable by implementation of the design, equipment, work practice, or operation, and shall provide for compliance by means which achieve equivalent results.
BACT analyses are conducted using EPA’s “top-down” BACT approach, as described in EPA’s Draft New Source Review Workshop Manual8. The five basic steps of a top-down BACT analysis are listed below:
Step 1: Identify potential control technologies;
Step 2: Eliminate technically infeasible options;
Step 3: Rank remaining control technologies by control effectiveness;
Step 4: Evaluate the most effective controls and document results; and
Step 5: Select BACT.
The first step is to identify potentially “available” control options for each emission unit triggering PSD, for each pollutant under review. Available
8 EPA 1990.

DNR – PPRP 105 COVE POINT ERD / DEC 2014
options consist of a comprehensive list of those technologies with a potentially practical application to the emission unit in question. The list includes technologies used to satisfy BACT requirements, innovative technologies, and controls applied to similar source categories.
After identifying potential technologies, the second step is to eliminate technically infeasible options from further consideration. To be considered feasible for BACT, a technology must be both available and applicable.
The third step is to rank the technologies not eliminated in Step 2 in order of descending control effectiveness for each pollutant of concern. If the highest ranked technology is proposed as BACT, it is not necessary to perform any further technical or economic evaluation. Potential adverse impacts, however, must still be identified and evaluated.
The fourth step entails an evaluation of energy, environmental, and economic impacts for determining a final level of control. The evaluation begins with the most stringent control option and continues until a technology under consideration cannot be eliminated based on adverse energy, environmental, or economic impacts. The economic or “cost-effectiveness” analysis is conducted in a manner consistent with EPA’s OAQPS Control Cost Manual, Sixth Edition9 and subsequent revisions.
The fifth and final step is to select as BACT the emission limit from application of the most effective of the remaining technologies under consideration for each pollutant of concern.
4.4.2.2 BACT Limits Proposed by DCP
Although DCP conducted a control technology analysis for all sources associated with the proposed Project, DCP did not propose associated emissions limits using those control technologies for all sources. Therefore, PPRP and MDE-ARMA used the information provided by DCP’s CPCN Application and in subsequent responses to data requests to conduct the BACT determination for each source, for each pollutant triggering PSD. The following tables summarize these determinations: Table 4.4-2 for CO, Table 4.4-3 for PM, PM10, and PM2.5; and Table 4.4-4 for GHGs.
9 EPA, January 2002

DNR – PPRP 106 COVE POINT ERD / DEC 2014
4.4.2.3 BACT Determinations
PPRP and MDE-ARMA, conducted an independent analysis of DCP’s top-down BACT evaluation. The analysis was conducted for each proposed piece of equipment with the potential to emit CO, PM, PM10, PM2.5 and/or GHGs. PPRP and MDE-ARMA evaluated the approach used by DCP to identify all potentially available control technologies, assess these technologies, and make a final BACT determination for each emission source. The following sections present a discussion of the control technologies that PPRP and MDE-ARMA identified as potentially available, the reasons why some were deemed infeasible, DCP’s proposed BACT, and PPRP and MDE-ARMA determination of BACT.
To determine the best control technology employed as BACT, PPRP and MDE-ARMA reviewed the following sources. Appendix C provides a summary of this review.
• EPA’s RACT/BACT/LAER Clearinghouse (RBLC) database;
• EPA’s New Source Review website;
• In-house experts;
• State air regulatory agency contacts;
• Technical books and articles;
• State permits issued for similar sources that have not yet been entered into the RBLC; and
• Guidance documents and personal communications with state agencies.
PM, PM10, PM2.5 BACT
Particulate matter emissions result from each combustion source proposed by DCP. The following provides a summary of the BACT evaluation conducted for each piece of equipment with respect to PM, PM10, and PM2.5 emissions.
Combustion Turbines
Filterable PM
There are several post-combustion particulate matter control systems potentially feasible to reduce the filterable portion of PM, PM10, and

DNR – PPRP 107 COVE POINT ERD / DEC 2014
PM2.5 emissions from CTs. These including the following, listed below in order of decreasing potential control efficiency:
• Fabric filters/baghouse;
• Electrostatic precipitators (ESPs);
• Scrubber technologies; and
• Cyclones/centrifugal collectors.
Fabric Filters/Baghouse
Fabric filters/baghouses use a filter material to remove particles from a gas stream. The polluted gas stream flows through filters/bags onto which particles are collected. Baghouses are typically employed for industrial applications to provide particulate control at a relatively high efficiency.
Electrostatic Precipitators (ESPs)
ESPs serve as a particulate collection devices and are used on a wide variety of industrial sources, including boilers. An ESP is a particulate control device that uses electrical forces to move particles out of the flowing gas stream onto collector plates. The particles are given an electric charge by forcing them to pass through a region of gaseous ion flow. The term for this region of gaseous ion flow is the corona. An electrical field generated by electrodes at the center of the gas stream forces the charged particles to the walls or plates of the ESP.
Removal of the particles collected on the plates of an ESP is required to maintain sufficient area to continuously clean the flowing gas stream. The removal of particles from the plates must be done in a manner to minimize re-entrainment of the particles collected. The particles are removed from the plate by “rapping” or knocking loose the particles from the collector plates and the particles collected in a hopper, which is below the plates.
Scrubber
Scrubbers can be employed to control particulate matter in certain industrial applications. Wet scrubbers operate in such a manner that flue gas passes through a water (or other solvent) stream whereby particles in the gas stream are removed through inertial impaction and/or condensation of liquid droplets on the particles in the gas stream.

DNR – PPRP 108 COVE POINT ERD / DEC 2014
Cyclones/Centrifugal Collectors
Cyclones/centrifugal collectors are generally used in industrial applications to control large diameter particles (>10 micron). Cyclones are designed based on the principle of imparting a centrifugal force on the gas stream and entrained particles outward toward an outer wall. Upon contact with an outer wall, the particles slide down the cyclone wall and are collected at the bottom of the unit. The design of a centrifugal collector provides for a means of allowing the clean gas to exit through the top of the device. Cyclones are inefficient for the removal of small particles.
Condensable PM
There are two types of add-on controls for controlling the condensable portion of PM10 and PM2.5: catalytic oxidation and thermal oxidation. These oxidation technologies are available to combust certain high molecular weight condensable organics, thereby reducing condensable PM emissions.
Evaluate Options
Each of the technologies introduced in this section for controlling the filterable portion of PM are generally available. However, PPRP and MDE-ARMA determined based on a review of the RBLC and other recent permits issued for similar sources, that no gas-fired CTs have installed post-combustion control technologies for PM. Instead BACT for gas-fired CTs is the use of good combustion practices to minimize PM emissions. At this time, given that no post-combustion control sources have been demonstrated in practice on a gas-fired CT, such technologies are not deemed available for the DCP CTs.
Thermal oxidation and catalytic oxidation are generally available to control the condensable portion of PM from certain sources. However, for the proposed Project, the CTs are already combusting the fuel gas in an efficient combustion unit. Adding a process to oxidize condensables from the combustion of the gas fired in the CTs would generally only introduce additional combustion emissions without any discernible reduction in condensable PM. Given that the CTs are highly efficient combustion sources that would already have combusted available condensables in the fuel stream, the use of an additional combustion source (such as an oxidation control system) is not considered feasible for the DCP CTs.

DNR – PPRP 109 COVE POINT ERD / DEC 2014
Summary Determination
DCP proposed that PM (filterable) BACT for the Frame 7 CT units is the use of good combustion practices combined with the use of process fuel gas and pipeline natural gas. DCP proposed BACT for PM10 and PM2.5 (filterable and condensable) for the Frame 7 CT units is the use of good combustion practices combined with the use of process fuel gas and pipeline natural gas. Utilizing these technologies, DCP proposed to achieve emissions rates of 0.007 lb/MMBtu (7.0 lb/hr) for PM10 and PM2.5 (condensable and filterable) and 0.0033 lb/MMBtu (3.5 lb/hr) for PM (filterable).
PPRP and MDE-ARMA confirmed, based on a review of the RBLC and other recent permits for CTs (included in Appendix C), that there are no instances of add-on controls determined as BACT for PM, PM10 or PM2.5 for CTs. PPRP and MDE-ARMA’s review identified lower PM, PM10 and PM2.5 emission limits have been imposed in permits for other CTs within the US. However, in general, these permits are for CTs of a different manufacturer, CT type, capacity, or of an end use other than to drive the refrigeration system in an LNG operation (Brunswick, Calpine Russell City Energy Center, Dahlberg, Huntington Beach, Oregon Clean Energy Center, Pioneer Valley Energy Center, and Western Farmers Electric Anadarko). In addition, certain units have yet to demonstrate the ability to achieve the lower limits in practice (Cricket Valley, Palmdale, Gibson County, and Warren County). Certain units with lower limits combust different fuel types (PSEG FOSSIL LLC Kearny Generating Station, Port Dolphin Energy Center, and Hyperion Energy).
Certain other permits appear to have lower emission rates than proposed by DCP. However, the limits for these facilities are based solely on filterable PM rather than Maryland’s definition of PM10 and PM2.5 which include filterable and condensable PM. These facilities include: Carty Plant, International Station Power Plant, Kalama Energy Center, Moxie Liberty Generating Station, Moxie Patriot Generating Station, and Wallula Power Plant.
One facility that will use similar equipment for the same purpose as DCP proposed is the Sabine Pass LNG & Liquefaction project, which has CTs from the same manufacturer (GE), but a different engine (GE LM2500+G4 instead of DCP’s Frame 7EA). The emissions levels for PM10 and PM2.5 for Sabine Pass are 0.0073 lb/MMBtu, which was approved as BACT, compared to DCP’s PM10 and PM2.5 emission limits of 0.007 lb/MMBtu. Therefore, the emission levels proposed by DCP are, in fact, lower than the BACT limits issued for the Sabine Pass LNG facility.

DNR – PPRP 110 COVE POINT ERD / DEC 2014
PPRP and MDE-ARMA concur that the use of good combustion practices and the use of process fuel gas and pipeline natural gas to meet emission limits of 0.007 lb/MMBtu for each PM10 and PM2.5 emissions (filterable and condensable), and 0.0033 lb/MMBtu for PM emissions (filterable) represent BACT during normal operations.
DCP will conduct initial and annual performance testing for PM by using EPA test Method 5, and for PM10 and PM2.5 by using Method 201A/202 to demonstrate compliance with the BACT limits. DCP will base the averaging period for PM by Method 5 on an average of three test runs. DCP will base the averaging period for PM10 and PM2.5 by Methods 201A/202 on an average of three stack test runs. To ensure continuous compliance with PM, PM10, and PM2.5 limits, DCP must calculate emissions based on fuel flow and emission factors developed during annual stack testing and must update emissions on a rolling 12-month basis.
In response to PPRP Data Request No. 4, DCP provided design specifications with PM10 and PM2.5 emission rates specific for startup and shutdown that were higher than those proposed for normal operation. Therefore, PPRP and MDE-ARMA have determined that the Frame 7 CTs will be subject to the following limits during startup and shutdown as BACT:
• PM10 (filterable and condensable) emissions will be limited to 300.8 pounds per startup event, from both Frame 7 CTs combined;
• PM2.5 (filterable and condensable) emissions will be limited to 300.8 pounds per startup event, from both Frame 7 CTs combined;
• PM10 (filterable and condensable) emissions will be limited to 5.6 pounds per shutdown event, from both Frame 7 CTs combined; and
• PM2.5 (filterable and condensable) emissions will be limited to 5.6 pounds per shutdown event, from both Frame 7 CTs combined.
During periods of startup and shutdown, DCP will take all reasonable efforts to minimize emissions. The Frame 7 CTs will be designed to meet the proposed startup and shutdown emission limits for PM10 and PM2.5. Startup and shutdown emissions will be calculated based on the number of these events and the projected emission factor. They will then be included in the project-wide cap to minimize emissions during those times.

DNR – PPRP 111 COVE POINT ERD / DEC 2014
Auxiliary Boilers
The boilers that will be used in conjunction with the proposed Project are referred to as auxiliary boilers. However, the boilers are a primary source of steam to the HRSGs, and as such, are much larger in heat input capacity than most auxiliary boilers. DCP notes that the “auxiliary boilers” are intended to operate at all times during normal operations. During normal operation, each auxiliary boiler will exclusively utilize process gas for fuel. The auxiliary boilers will primarily burn boil-off gas during startup and low pressure fuel mix during shutdown. However, they have the ability to burn pipeline natural gas during startup and shutdown if the primary fuels are not available.
The technologies potentially available to control PM (filterable) emissions from boilers are the same as those presented in this document for CTs. These are listed in order of decreasing potential control efficiency:
• Fabric filters/baghouse;
• Electrostatic precipitators;
• Scrubbers technology; and
• Centrifugal collectors/cyclones.
Particulate add-on control systems have not been employed to remove particulate matter from natural gas-fired boilers of this size range. Compared to other fuel burning sources, combustion of natural gas generates low PM emissions due to their low ash and sulfur content.
Similar to the CTs, there are two types of add-on control for reducing the condensable portion of PM10 and PM2.5: catalytic oxidation and thermal oxidation. Similar to the CTs, the use of an additional combustion source such as an oxidation control system is not considered feasible for the DCP auxiliary boilers, in part because the auxiliary boilers are highly efficient combustion sources that would already have combusted available condensables in the fuel stream.
DCP proposed a PM (filterable) emission limit of 0.005 lb/MMBtu and PM10 and PM2.5 (filterable and condensable) emission limits of 0.014 lb/MMBtu each. A review of other permits and the RBLC confirmed that there are no large natural gas-fired boilers (>250MMBtu) that employ post-combustion control technology for PM. The determinations for large boilers identify the use of clean fuels (i.e., low-sulfur, low-ash content) and good combustion practices as BACT for PM, PM10, and PM2.5.

DNR – PPRP 112 COVE POINT ERD / DEC 2014
There are several facilities that have BACT emission limits lower than those DCP is proposing. However, the majority of these sources have rated capacities ranging between 24 MMBtu/hr and 300 MMBtu/hr (much lower than the DCP auxiliary boiler rated capacity of 435 MMBtu/hr). These facilities include: Avenal Energy Project, Caithnes Bell Point Energy Center, Carty Plant, CPV St. Charles, Cricket Valley, Forsyth Energy Plant, Genova Arkansas, LLC, Hess Newark Energy Center, Kalama Energy Center, Mankato, Maidsville Power, Minnesota Steel, Nellis Air Force Base, Ohio River Plant, Oregon Clean Energy Center, PacifiCorp, Palmdale Hybrid Power Project, Pioneer Valley, Port Dolphin Energy LLC, Sevier Power, Shintech Plaquemine Plant 2, St. Josephs Energy Center, Texstar Gas Process Facility, Titan Tire Corp, Warren County Power Plant – Dominion, Williams Refining and Marketing, and Wolverine Power.
PPRP and MDE-ARMA determined, based on a review of the RBLC and/or recent permits, that there are two larger auxiliary boilers (between 365 MMBtu and 555 MMBtu) with lower BACT emission limitations at the following facilities: Iowa Fertilizer Company and the John W. Turk Jr. Power Plant. The Iowa Fertilizer Company has a proposed filterable PM BACT limit of 0.0024 lb/MMBtu for a 472-MMBtu/hr auxiliary boiler firing natural gas (compared to 0.005 for the proposed DCP boilers). This unit will not include any post-combustion controls. Although the permit for this unit was issued in 2012, the facility has not been constructed; therefore, this emission limitation has not been demonstrated in practice. The John W. Turk Jr. Power Plant has a proposed PM10 emission limit of 0.004 lb/MMBtu, measured on a 3-hour average for a 555 MMBtu/hr boiler. This emission limit is solely for the filterable portion of PM10 and is therefore not directly comparable to the DCP auxiliary boilers’ PM10 and PM2.5 emission limits.
Summary Determination
During normal operations, the auxiliary boilers proposed by DCP will burn process gas and employ good combustion practices to minimize PM. DCP proposed a PM emission limit of 0.005 lb/MMBtu and PM10 and PM2.5 emission limits of 0.014 lb/MMBtu each, to apply at all times, based on the EPC design specifications, as BACT for these units.
PPRP and MDE-ARMA concur that PM BACT for the auxiliary boilers is the use of process gas (during normal operations) and good combustion practices to achieve a PM (filterable) emission limit of 0.005 lb/MMBtu and PM10 and PM2.5 (filterable and condensable) emission limits of 0.014 lb/MMBtu each. To demonstrate compliance with the BACT limits, DCP

DNR – PPRP 113 COVE POINT ERD / DEC 2014
will be required to conduct initial and annual performance testing for PM using Method 5, and for PM10 and PM2.5 using Method 201A/202. DCP will base the averaging period for PM by Method 5 on the average of three test runs. DCP will base the averaging period for PM10 and PM2.5 by Methods 201A/202 on an average of three stack test runs. To ensure continuous compliance with PM, PM10, and PM2.5, DCP must calculate emissions based on fuel flow and emission factors developed during annual stack testing and update emissions on a rolling 12-month basis.
PPRP and MDE-ARMA have determined that the auxiliary boilers will be subject to the following limits during startup and shutdown, as specified in the EPC design specifications provided by DCP in its response to PPRP Data Request No. 4:
• PM10 (filterable and condensable) emissions will be limited to 296.8 pounds per startup event, from each auxiliary boiler;
• PM2.5 (filterable and condensable) emissions will be limited to 296.8 pounds per startup event, from each auxiliary boiler;
• PM10 (filterable and condensable) emissions will be limited to 4.9 pounds per shutdown event, from each auxiliary boiler; and
• PM2.5 (filterable and condensable) emissions will be limited to 4.9 pounds per shutdown event, from each auxiliary boiler.
During periods of startup and shutdown, DCP will take all reasonable efforts to minimize emissions. The auxiliary boilers will be designed to meet the proposed startup and shutdown emission limits for PM10 and PM2.5. Startup and shutdown emissions will be calculated based on the number of these events and the projected emission factors. The project-wide cap will include startup and shutdown emissions in order to minimize emissions during those times.
Emergency Engines
DCP proposed emission rates in compliance with NSPS Subpart IIII as BACT for PM, PM10, and PM2.5 for the 1,550-hp emergency generator and the five 350-hp fire pump engines. These will fire ultra-low sulfur diesel (ULSD) fuel to maintain a PM emission rate of 0.15 g/hp-hr (0.20 g/kw-hr) and PM10 and PM2.5 (filterable and condensable) emission rates of 0.17 g/hp-hr (0.23 g/kw-hr) each. The PM10 and PM2.5 emission rates represents a filterable portion equivalent to the NSPS Subpart IIII PM limit and a condensable portion equivalent to 0.02 g/hp-hr, as estimated via EPA’s AP-42, Section 3.4 (October 1996). A review of the RBLC and other recently permitted emergency engines led PPRP and
DNR – PPRP 114 COVE POINT ERD / DEC 2014
MDE-ARMA to conclude that there are currently no facilities employing post-combustion controls on internal combustion (IC) engines to achieve BACT for particulate emissions, for engines of similar size to the proposed DCP emergency engines. Technologies that are listed in the summary of RBLC and recent permits review, provided in Appendix C, rely on the use of good combustion practices, NSPS compliant engines, and clean fuels such as ULSD, to achieve BACT for PM (filterable) and PM10 and PM2.5 (filterable and condensable).
PPRP and MDE-ARMA’s BACT review found a wide-range of emission limits for emergency generators, with the lowest being 0.02 g/hp-hr at both the Moxie Energy and Moxie Liberty facilities in Pennsylvania. These facilities have not been built, nor have the limits been demonstrated in practice. If DCP were able to achieve these lower limits (a difference of 0.15 g/hp-hr), the reduction would result in a decrease of less than 0.13 tpy of emissions for the emergency generator, given the expected limited hours of operation for the emergency generator (500 hours/year) including 100 hours for maintenance and testing purposes.
Based on its BACT review, PPRP and MDE-ARMA also found a range of emission limits for fire pump engines, with the lowest being 0.07 g/hp-hr at the Mankato Power facility. This is a difference of 0.1 g/hp-hr compared to DCP’s proposed PM10 and PM2.5 emission rates. However, the expected hours of operation for the fire pumps are 104 hours/year each, including 100 hours for maintenance and testing purposes. Given the expected limited operation of the fire pumps, the net potential decrease in emissions if the facility were to achieve the lower emission levels for PM10 and PM2.5 would be approximately 0.004 tpy each for the combined emergency fire pumps. The State does not believe any material environmental benefit would be realized by requiring lower limits.
Summary Determination
PPRP and MDE-ARMA determined that there is no environmental benefit associated with requiring lower emission rates for emergency engines, given that these sources will be used for maintenance and testing purposes only. Therefore, BACT for the 1,550-hp emergency generator and the five 350-hp fire pump engines is the exclusive use of ULSD fuel along with good combustion practices and the engines being designed to achieve a PM emission limit of 0.20 g/kw-hr (0.15 g/hp-hr), and PM10 and PM2.5 emission limits of 0.23 g/kw-hr (0.17 g/hp-hr). To monitor hours of operation, DCP will be required to install a non-resettable operating hour meter (or equivalent software) on each emergency engine.

DNR – PPRP 115 COVE POINT ERD / DEC 2014
Thermal Oxidizer
DCP is not proposing any post-combustion control technology on the exhaust side of thermal oxidizers for particulate matter control.
PM emissions from the DCP thermal oxidizer will be minimal based on system design. The thermal oxidizer will be equipped with an oxidation catalyst for control of CO emissions. This will have little effect on PM emissions due to the dilute methane concentration levels.
DCP proposed a PM emission rate of 0.7 lb/hr (equivalent to 0.013 lb/MMBtu) and PM10 and PM2.5 emission rates of 0.9 lb/hr (equivalent to 0.016 lb/MMBtu) from the thermal oxidizer, to apply at all times. PPRP and MDE-ARMA evaluated other permits and RBLC findings and concluded that no thermal oxidizers have installed post-combustion control technologies for particulate matter. Instead BACT for thermal oxidizers is the use of good combustion practices to minimize particulate matter emissions. Review of the RBLC and other recent permits identified a thermal oxidizer with PM10/PM2.5 emission limits lower than DCP’s proposed limits. The Lake Charles Gasification Facility thermal oxidizer has PM10/PM2.5 limits of 0.3 lb/hr (0.007 lb/MMBtu). However, the Lake Charles Gasification facility fires natural gas in the thermal oxidizer. In contrast, DCP proposed to combust process gas that would otherwise be flared, should natural gas be used instead.
Summary Determination
As previously stated, PPRP and MDE-ARMA determined, based on review of the RBLC and other recent permits, that there are no thermal oxidizers that required post-combustion control for particulate matter emissions, PPRP and MDE-ARMA concur that BACT is the use of good combustion practices, firing of process gas, and operation by manufacturer specifications to achieve a PM emission rate of 0.013 lb/MMBtu and PM10 and PM2.5 emission rates of 0.016 lb/MMBtu, at all times.
DCP will be required to conduct initial and annual performance testing for PM using Method 5 and for PM10 and PM2.5 using Method 201A/202 to demonstrate compliance with the BACT limit. The averaging period for PM by Method 5 will be based on an average of three test runs. DCP will base the averaging period for PM10 and PM2.5 by Methods 201A/202 on an average of three stack test runs. The thermal oxidizer will be designed to meet the proposed limits at all times. To ensure continuous compliance with PM10/PM2.5, DCP shall calculate emissions based on fuel flow and
DNR – PPRP 116 COVE POINT ERD / DEC 2014
emission factors developed during annual stack testing and update emissions on a rolling 12-month basis.
During periods of startup and shutdown, DCP will take all reasonable efforts to minimize emissions. Startup and shutdown emissions will be included in the project-wide cap to minimize emissions during those times.
Flares
DCP is not proposing any post-combustion control technologies be employed on the exhaust side of the flares for particulate matter control.
To ensure complete combustion of the flare gas, DCP proposed that BACT would be the presence of a pilot flame at all times to ensure complete combustion. This practice will minimize emissions of PM, PM10 and PM2.5.
There are no controls identified for reducing PM for flares based on PPRP and MDE-ARMA’s review of the RBLC and recent permits. PPRP and MDE-ARMA conclude that maintaining the presence of a pilot flame and maintaining proper combustion is the best means to minimize particulate emissions for flares, and is considered as BACT. By maintaining a pilot flame and employing proper combustion practices, DCP will maintain a PM emission limit of 0.7 tpy, and a PM10 and PM2.5 emission limit of 2.8 tpy for the North Flare for each pollutant; and PM emission limits of 0.4 tpy and PM10 and PM2.5 emission limits of 1. 7 tpy from the South Flare for each pollutant. These emissions are based on EPA’s AP-42 Section 1.4 (July 1998) emission factors of 1.9 lb/MMscf for PM, and 5.7 lb/MMscf for PM10 and PM2.5, per pilot.
The annual PM, PM10, and PM2.5 emission limits for the flares include emissions from all three of the following operations:
• Emissions from LNG ships during ship cool-down (only
when ships come in warm);
• Emissions from mixed refrigerant, propane, and feed gas during plant start-ups (warm and cold start-ups); and
• Emissions from plant emergencies, and upset conditions.

DNR – PPRP 117 COVE POINT ERD / DEC 2014
PPRP and MDE-ARMA reviewed other permits and RBLC findings and found PM emissions limits as low as 0.0019 lb/MMBtu (Homeland Energy Solutions). This value is marginally lower than that estimated by DCP (0.003 lb/MMBtu). However, if DCP were required to meet a lower value of 0.0019 lb/MMBtu, the potential net reduction in PM emissions would be less than 0.02 tpy for both flares combined. Therefore, there is no discernible environmental benefit of achieving levels below those documented by DCP based on the manufacturer specifications for the proposed flares.
Summary Determination
Based on other flares identified in recent permits and the RBLC, PPRP and MDE-ARMA concur that BACT for particulate matter is maintaining a pilot flame, maintaining proper combustion efficiency, and designing the flares to achieve emission limits of 0.7 tpy for PM and 2.8 tpy for PM10 and PM2.5 each for the North Flare; and 0.4 tpy for PM and 1.7 tpy for PM10 and PM2.5 each for the South Flare. DCP will be required to continuously monitor for the presence of a pilot flame.
Roadways
DCP will utilize onsite roads for deliveries associated with normal operations. Fugitive PM emissions from traffic on onsite roadways are expected to be negligible, but must be addressed as part of the PM, PM10, and PM2.5 BACT determinations. Therefore, PPRP and MDE-ARMA determined PM, PM10, and PM2.5 BACT for the roadways. DCP must take reasonable precautions to minimize particulate matter emissions from onsite roadways including, but not limited to, the use of water or chemical suppression and sweeping as BACT.
Summary
Table 4.4-2 presents a summary of proposed PM, PM10, and PM2.5 BACT determinations.

DNR – PPRP 118 COVE POINT ERD / DEC 2014
Table 4.4-2 Proposed PM, PM10, PM2.5 BACT Determinations
Emission Source
Proposed BACT limit BACT Determination
Frame 7 CTs
PM (filterable): 0.0033 lb/MMBtu (3 stack test run avg., Method 5 stack test or equivalent method approved by MDE-ARMA)
PM10 and PM2.5 each (filterable + condensable):
0.007 lb/MMBtu (3 stack test run avg., Method 201A/202 stack test or equivalent method approved by MDE-
ARMA)
Exclusive use of facility process fuel gas or pipeline quality
natural gas and good combustion practices
Frame 7 CTs (Startup
Shutdown events)
300.8 lb PM10 and PM2.5 each (filterable + condensable) per startup event and 5.6 lb PM10/PM2.5 (filterable +
condensable) per shutdown event from both CTs combined
Limits on emission during startup and shutdown events,
designed to meet emission limits
Auxiliary Boilers
PM (filterable):0.005 lb/MMBtu (3 stack test run avg., Method 5 stack test or equivalent method approved by
MDE-ARMA)
PM10 and PM2.5 each (filterable + condensable): 0.014 lb/MMBtu (3 stack test run avg., Method 201A/202
stack test or equivalent method approved by MDE-ARMA)
Exclusive use of facility process fuel gas during normal
operation and good combustion practices
Auxiliary Boilers (Startup
Shutdown events)
296.8 lb PM10 and PM2.5 each (filterable + condensable) per startup event and 4.9 lb PM10/PM2.5 (filterable + condensable) per shutdown event from each auxiliary
boiler
Limits on emission during startup and shutdown events,
designed to meet emission limits
Emergency Generator
PM (filterable): 0.15 g/hp-hr (0.2 g/kW-hr)
PM10 and PM2.5 each (filterable + condensable): 0.17 g/hp-hr (0.23 g/kw-hr)
Exclusive use of ULSD fuel, good combustion practices and designed to achieve emission
limits
Fire Pump Engines
PM (filterable): 0.15 g/hp-hr (0.2 g/kW-hr) Design
PM10 and PM2.5 each (filterable + condensable): 0.17 g/hp-hr (0.23 g/kw-hr)
Exclusive use of ULSD fuel, good combustion practices, and
designed to achieve emission limits
Thermal Oxidizer
PM (filterable): 0.013 lb/MMBtu (3 stack test run avg., Method 5 stack test
or equivalent method approved by MDE-ARMA)
PM10 and PM2.5 each (filterable + condensable): 0.016 lb/MMBtu (3 stack test run avg., Method 201A/202
stack test or equivalent method approved by MDE-ARMA)
Good combustion practices and firing process fuel gas; designed to meet the emission limits at all
times
North and South
Flares
North Flare - PM (filterable): 0.7 tpy (12-month rolling average)
North Flare - PM10 and PM2.5 each (filterable + condensable):
2.8 tpy (12-month rolling average)
South Flare – PM (filterable): 0.4 tpy (12-month rolling average)
South Flare – PM10 and PM2.5 each (filterable + condensable):
1.7 tpy (12-month rolling average)
Maintain a pilot flame at all times, maintain proper
combustion efficiency, and designed to achieve emission
limits
DNR – PPRP 119 COVE POINT ERD / DEC 2014
Emission Source
Proposed BACT limit BACT Determination
Roadways N/A
Minimize particulate matter emissions from onsite roadways
including, but not limited to, the use of water or chemical suppression and sweeping
CO BACT
Combustion Turbines
There are two practical methods for controlling CO emissions from combustion processes: efficient combustion (also referred to as good combustion) and add-on control equipment. Efficient combustion is inherent in the design of a combustor system to enhance the combustion reaction and minimize the formation of CO. Control equipment for CO emissions from combustion turbines are described below. They are listed in order of decreasing potential control efficiency.
• Catalytic Oxidizer/Oxidation Catalyst;
• Dry low-NOx (DLN) Combustors; and
• EMxTM (formerly SCONOx).
Catalytic Oxidizer/Oxidation Catalyst
Catalytic oxidizers/oxidation catalyst are pollution control devices installed downstream of a combustion system. This is a post-combustion control process where CO emissions are reduced by allowing unburned CO to react with oxygen at the surface of a precious metal. Combustion of CO starts at about 300ºF, with an efficiency of 90% occurring at temperatures above 600ºF. The oxidation catalyst can be located directly after the CT, with catalyst size dependent upon the exhaust flow, temperature, and desired efficiency. Both efficient combustion and add-on control can be used, alone or in combination, to achieve the various degrees of CO emissions required.
Catalytic oxidation is the control technology most often used with gas turbines and consists of a catalyst bed located in the HRSG downstream of the burner where the temperature is in the range of 700 – 1100°F. The oxidation catalyst causes a small pressure drop (approximately 1.5 inches of water), which causes a slight loss in power output from the turbine. No additional reactants are required since there is sufficient oxygen in the gas

DNR – PPRP 120 COVE POINT ERD / DEC 2014
stream for the oxidation reactions to proceed in the presence of the catalyst. The catalyst is subject to loss of activity over time due to physical deterioration or chemical deactivation. Oxidation catalyst vendors typically guarantee catalyst life for three years. Oxidation catalysts are considered technically feasible and available for the DCP CTs.
Dry low-NOx (DLN) Combustors/Good Combustion Practices
While used primarily to minimize NOx emissions, DLN combustors and good combustion practices in combination have surrogate impacts in reducing CO emissions. DLN combustors and good combustion practices are feasible and available for the DCP CTs.
EMxTM (formerly SCONOx)
One other add-on control technology that results in minor reductions in CO emissions for CTs is EMxTM (formerly SCONOx). EMx™ is a catalytic oxidation and absorption control technology that uses a platinum-based oxidation catalyst coated with potassium carbonate (K2CO3) to oxidize and remove both NOx and CO without a reagent such as ammonia. The EMx™ system reduces CO emissions by oxidizing the CO to CO2. This technology is primarily used for NOx reduction, but there has been measurable oxidation of CO to CO2 with use of EMx™. However, the demonstrated application for EMx™ is currently limited to combined cycle combustion turbine units under 50 MW in size10. The CTs proposed for this Project are nominal 87 MW units, and as such, EMx™ is considered technically infeasible for this proposed Project.
Summary Determination
PPRP and MDE-ARMA determined based on a review of recent permits and the RBLC that the most efficient manner to control CO emissions from natural gas-fired CTs is through the use of an oxidation catalyst system and efficient combustion. In its CPCN Application, DCP proposed to achieve compliance with BACT through the installation of an oxidation catalyst system to achieve a proposed limit of 1.5 ppmvd@15% O2 during normal operations. In addition, DCP proposed BACT for startup and shutdown to be compliance with an annual tons per year limit. DCP also specified efficient combustion in the design of the Frame 7 CTs. There are
10 http://emerachem.com/application/gas-turbine/

DNR – PPRP 121 COVE POINT ERD / DEC 2014
numerous entries in the RBLC that led PPRP and MDE-ARMA to conclude that the use of oxidation catalyst systems to control CO emissions for CTs is considered BACT.
PPRP and MDE-ARMA determined based on a review of recent permits and the RBLC (as summarized in Appendix C) that there was one facility, Kleen Energy Systems, LLC, with a lower CO emissions limit (0.9 ppmvd at 15% O2) than proposed by DCP. Kleen Energy Systems uses the same control technology (oxidation catalyst) as that proposed by DPC. However, the Kleen Energy CT is from a different manufacturer and at a much larger generating capacity. All other reported BACT CO emission limits were higher than that proposed by DCP.
PPRP and MDE-ARMA concur that BACT for CO emissions will be the exclusive use of facility process fuel gas or pipeline quality natural gas, use of an oxidation catalyst system, and efficient combustion to achieve an emission limit of 1.5 ppmvd at 15% O2 on a 3-hour block average during normal operations. This 3-hour averaging period is consistent with recently issued PSD permits. CO CEMS will be required for continuous compliance demonstration purposes. In addition, DCP will be required to perform initial and annual stack testing, through the use of Method 10, or equivalent test method requiring MDE approval. As an alternative to annual stack testing, DCP can choose to demonstrate compliance with BACT through the use of certified CO CEMS, upon written notification by MDE-ARMA.
During periods of startup and shutdown, CO emissions are higher due to limitations surrounding both the ability to ensure good combustion practices and the oxidation catalyst’s ability to operate at lower temperature levels. The rate at which the CT starts is particularly affected by the ability of the corresponding heat recovery steam generator (HRSG) to accept heat. Therefore, a fast startup rate for the CT reduces the ability of the HRSG to operate optimally and to minimize emissions.
To ensure optimal performance during normal operation, the CT startup is designed such that it is held in a startup mode until it reaches a certain operating point when good combustion practices can be achieved. This is also the minimum temperature for operation of the oxidation catalyst.
PPRP and MDE-ARMA determined based on a review of other permits and the RBLC database that post-combustion controls are not considered technically feasible for startup and shutdown emissions and that BACT for natural-gas fired CTs for startup and shutdown emissions is to ensure that correct procedures were followed to allow for optimal performance

DNR – PPRP 122 COVE POINT ERD / DEC 2014
during normal operations and that the number of annual startup and shutdown events be limited.
PPRP and MDE-ARMA have determined that the Frame 7 CTs shall be subject to the following limits during startup and shutdown, as specified in the EPC design specifications provided by DCP in its response to PPRP Data Request No. 4, dated 7 August 2013. Also, the startup and shutdown emissions must be included in the project-wide annual emission limit:
• CO emissions will be limited to 562.4 pounds per startup event, from both Frame 7 CTs combined, as determined by CEMS;
• CO emissions will be limited to 59.2 pounds per shutdown event, from both Frame 7 CTs combined, as determined by CEMS.
PPRP and MDE-ARMA determined based on a review of recent permits and the RBLC (included in Appendix C) for similar equipment that lower startup and shutdown emission rates have been achieved (at a normalized emission rate of pound per event per megawatt (lb/event/MW) for CTs at certain facilities. However, for BACT purposes, these have been eliminated from further consideration due to differences in combustion turbine generating capacity, manufacturer, or model type. These facilities include: Bridgeport Energy, Catoctin Energy Project, Cherry Point Cogeneration Project, CPV Valley Energy Center, Elk Hills Power Plant, La Paloma Generating Company, Sevier Power, Sutter Power Plant, and Warren County.
Compliance with all CO emission limits for the CTs will be demonstrated using the annual stack testing or CO CEMS.
Auxiliary Boilers
Emissions of CO from auxiliary boilers can be reduced through the use of the following control technologies. These are listed below in order of decreasing potential control efficiency:
• Catalytic oxidation;
• Good combustion; or
• Thermal oxidation.
In the CPCN Application, DCP notes, and PPRP and MDE-ARMA agree that thermal oxidation is not technically feasible because the boilers are already highly efficient combustion units. Good combustion and catalytic oxidation are both technically feasible and available technologies for this

DNR – PPRP 123 COVE POINT ERD / DEC 2014
proposed Project. Catalytic oxidation can reduce CO emissions by as much at 90%.
During normal operation, each auxiliary boiler will utilize 100% process gas for fuel. The auxiliary boilers will primarily burn boil-off gas during startup and low pressure fuel mix during shutdown. The auxiliary boilers need to maintain the ability to burn pipeline natural gas during startup and shutdown if the primary fuels are not available.
DCP proposed to utilize both a catalytic oxidizer and good combustion practices to achieve an emission rate of 0.0088 lb/MMBtu during normal operations.
Summary Determination
PPRP and MDE-ARMA determined based on a review of the RBLC and other recent permits that there is one facility, Iowa Fertilizer Company, that has proposed a more stringent CO BACT limit of 0.0013 lb/MMBtu for a 472 MMBtu/hr auxiliary boiler firing natural gas. The permit for this unit was issued in 2012. However, this facility has not yet been constructed. As such, the equipment has not been demonstrated in practice to achieve the limit set in the permit. Three additional units (Brunswick, Harrisonburg Resource Recovery Facility, and Toledo Supplier Park – Paint Shop) also reported a more stringent CO BACT limit; however, these units were smaller than the DCP auxiliary boiler (i.e., 20-67 MMBtu/hr range). Thus, the limits associated with these units are not considered comparable to the DCP auxiliary boiler. Therefore, PPRP and MDE-ARMA concur that BACT is the exclusive use of facility process fuel gas during normal operation, the use of an oxidation catalyst and good combustion practices to achieve an emissions limit of 0.0088 lb/MMBtu.
DCP will be required to perform initial and annual stack testing using Method 10 (or equivalent test method approved by MDE) for CO to demonstrate compliance with the BACT limit of 0.0088 lb/MMBtu. The stack testing will result in CO emissions over a three hour period (average of three 1-hour test runs), and the BACT limit for CO will be based on a 3-hour block average. As an alternative to annual stack testing, DCP can choose to demonstrate compliance with BACT through the use of certified CO CEMS, upon written notification by MDE-ARMA.
To ensure continuous compliance with CO, DCP shall calculate emissions based on fuel flow and emission factors developed during annual stack testing and to update emissions on a 12-month rolling basis. Since there is

DNR – PPRP 124 COVE POINT ERD / DEC 2014
no CO CEMS required for the auxiliary boilers, DCP must also continuously monitor and record inlet and outlet catalyst bed temperature.
PPRP and MDE-ARMA have determined that the auxiliary boilers will also be subject to the following limits during startup and shutdown, as specified in the EPC design specifications provided by DCP in its response to PPRP Data Request No. 4:
• CO emissions will be limited to 2,618.5 pounds per startup event, from each auxiliary boiler;
• CO emissions will be limited to 35.9 pounds per shutdown event, from each auxiliary boiler.
During periods of startup and shutdown, DCP must take all reasonable efforts to minimize emissions. The auxiliary boilers will be designed to meet the proposed startup and shutdown emission limits for CO. Startup and shutdown emissions will be calculated based on the number of these events and the projected emission factor. Startup and shutdown emissions will be included in the project-wide cap to minimize emissions during those times.
Emergency Engines
DCP proposed that CO BACT for the 1,550-hp emergency generator is an emission rate of 2.6 g/hp-hr, which is equivalent to the limit provided in 40 CFR 60, Subpart IIII. DCP also proposed that CO BACT for the 350-hp fire pump engines is an emission rate of 3.0 g/hp-hr, based on EPA’s AP-42 Section 3.3 (October 1996) emission factors for diesel-fueled industrial engines. DCP proposed this because Subpart IIII does not have emission limits for fire pump engines model year 2008 and later. Compliance with these emission rates will be met through the exclusive use of ULSD fuel and good combustion practices. PPRP and MDE-ARMA determined based on review of recent permits and the RBLC for similar sized emergency engines that good combustion practices have been determined to be BACT.
For the emergency generator, PPRP and MDE-ARMA determined based on review of recent permits and RBLC data that there were CO BACT emission limits that are lower than the limits proposed by DCP, with the lowest being Moxie Energy and Moxie Liberty, both with CO emission limits of 0.13 g/hp-hr. These units have not been demonstrated in practice at this time. Given the limited hours of use for emergency purposes (500 hr/yr), including 100 hours for testing and emergency

DNR – PPRP 125 COVE POINT ERD / DEC 2014
purposes and the emissions reduction 2.1 tpy if DCP were to achieve the lower CO limit, there is only a minimal net environmental benefit of achieving levels below the 2.6 g/hp-hr (40 CFR 60, Subpart IIII limit).
PPRP and MDE-ARMA determined based on review of the RBLC and other recently permitted fire pump engines that there are certain BACT determinations with lower emissions limits than proposed by DCP. The lowest CO emission rate identified for fire pumps of a similar size to those proposed by DCP was for the Mankato Energy Center in Minnesota with four 290-hp fire pump engines, and an emission rate of 0.25 g/hp-hr. However, given the limited hours of use for emergency purposes (104 hr/yr) including 100 hours for testing and emergency purposes and minimal emissions reduction (0.55 tpy, total), there is only a minimal net environmental benefit of achieving levels below 6.68e-3 lb/hp-hr or 3.0 g/hp-hr (EPA’s AP-42 Section 3.3 (October 1996) factor for diesel fueled industrial engines).
Summary Determination
Based on these findings, PPRP and MDE-ARMA concur that CO BACT for the 1,550-hp emergency engine and 350-hp fire pump engines is good combustion practices and designed to achieve the applicable emission limits. Emissions from the emergency generator will not exceed 3.5 g/kW-hr (2.6 g/hp-hr) and the fire pump engines will not exceed 6.68e-3 lb/hp-hr (3.0 g/hp-hr or 4.0 g/kW-hr). DCP will demonstrate compliance through the implementation of the requirements listed under 40 CFR 60, Subpart IIII for the emergency engines. The emergency engines will be designed to meet these emission limits. To monitor hours of operation, DCP will be required to install a non-resettable operating hour meter (or equivalent software) on each emergency engine.
Thermal Oxidizer
Control options for thermal oxidizers vary depending on the material(s) being combusted. Given the purpose of the proposed DCP thermal oxidizer, which will be employed as a control device, the technologies potentially available to reduce CO emissions include an oxidation catalyst and good combustion practices. The characteristics of the DCP process stream that is controlled by the thermal oxidizer makes it difficult to compare emissions rates with other thermal oxidizers in the RBLC and other recent permits reviewed. The DCP gas stream delivered to the thermal oxidizer is comprised of mainly inert constituents with trace quantities of methane and H2S. The fuel used to fire the thermal oxidizer will be process gas. Equivalent to the control of CO from the boilers, DCP

DNR – PPRP 126 COVE POINT ERD / DEC 2014
proposed to equip the thermal oxidizer with an oxidation catalyst and use good combustion practices to control CO emissions at a rate of 1.5 ppmvd at 15% O2 based on manufacturer specifications, at all times.
PPRP and MDE-ARMA evaluated other permits and RBLC findings for comparable emission limits. Based on these findings, DCP’s proposed emission limit of 1.5 ppmvd @ 15% O2, which equates to approximately 0.009 lb/MMBtu, is more stringent than all comparable thermal oxidizers identified through this review.
Summary Determination
PPRP and MDE-ARMA conclude that BACT for the thermal oxidizer is the use of an oxidation catalyst and good combustion practices to achieve a CO emission rate of 1.5 ppmvd @ 15% O2 at all times. DCP will be required to perform stack testing using Method 10 (or equivalent test method approved by MDE) for CO to demonstrate compliance with the BACT limit. The stack testing will result in CO emissions over a three hour period (average of three 1-hour test runs), and the BACT limit for CO will be based on a 3-hour block average.
The thermal oxidizer will be designed to meet the proposed limit at all times. To ensure continuous compliance with CO, DCP shall calculate emissions based on fuel flow and emission factors developed during annual stack testing and update emissions on a rolling 12-month basis. Since there is no CO CEMS required for the auxiliary boilers, DCP shall also continuously monitor and record inlet and outlet catalyst bed temperature.
During periods of startup and shutdown, DCP will take all reasonable efforts to minimize emissions. The project-wide cap will include startup and shutdown emissions to minimize emissions during those times.
Flares
CO emissions can be controlled from flares by ensuring complete combustion of the flare gas. This is achieved by maintaining a pilot flame, which DCP proposed as BACT. DCP estimates CO emissions of 31.2 tpy for the North Flare, and 18.4 tpy from the South Flare based on the EPA’s AP-42 Section 1.4 (July 1998) for Natural Gas Combustion emission factor of 84 lb/MMscf. This level of CO emissions is equivalent to 0.013 lb/hr or 0.13 lb/MMBtu per pilot.

DNR – PPRP 127 COVE POINT ERD / DEC 2014
The annual CO emission estimates for the flares include emissions from all three of the processes directed to the flares:
• Emissions from LNG ships during ship cool-down (only when
ships come in warm); • Emissions from mixed refrigerant, propane, and feed gas during
plant start-ups (warm and cold start-ups); and • Emissions from plant emergencies and upset conditions.
PPRP and MDE-ARMA reviewed other permits and RBLC findings which demonstrated highly variable CO emission rates for flares due to a variety of process vent streams being delivered to flares as a control option.
A summary of comparable flares includes the Formosa Point Comfort Plant (CO emission rate of 3.6 lb/hr), Sabine Pass LNG Terminal (CO emission rate of 705 lb/hr), and Breitburn Energy – Newlove Lease (CO emission rate of 0.037 lb/MMBtu for a significantly larger unit). While these CO limits are highly variable, all flares achieve CO control by ensuring a pilot flame is maintained.
Summary Determination
No other flares have been required to install post-combustion pollution controls. BACT for CO for the DCP flares is to maintain a pilot flame, following good operating practices including maintaining proper combustion, and designed the flare to achieve an emissions limit of 31.2 tpy for North Flare, and 18.4 tpy for the South Flare.
Summary
Table 4.4-3 presents a summary of proposed CO BACT limitations.

DNR – PPRP 128 COVE POINT ERD / DEC 2014
Table 4.4-3 Proposed CO BACT Determinations
Emission Source Proposed BACT limit
BACT Determination
Frame 7 CTs 1.5 ppmvd at 15% oxygen (3-hr block avg., CEM)
Exclusive use of facility process fuel gas or pipeline quality natural gas,
use of an oxidation catalyst and efficient combustion
Frame 7 CTs (Startup
Shutdown events)
562.4 lb per startup event and 59.2 lb per
shutdown event from both CTs combined , CEM
Limits on emissions during startup and shutdown events
Auxiliary Boilers 0.0088 lb/MMBtu
(3-hr block avg., Method 10 stack test or equivalent method approved by MDE)
Exclusive use of facility process fuel gas during normal operation, good
combustion practices, and operation of an oxidation catalyst
Auxiliary Boilers (Startup
Shutdown events)
2,618.5 lb per startup event and 35.9 lb per shutdown event from each auxiliary
boiler
Limits on emissions during startup and shutdown events, designed to
meet emission limits.
Emergency Generator
2.6 g/hp-hr (3.49 g/kW-hr) Design specification and installation of a
non-resettable hour meter
Good combustion practices and designed to meet emission limit
Fire Pump Engines
3.0 g/hp-hr (4.02 g/kW/hr) Design specification and installation of a
non-resettable hour meter
Good combustion practices and designed to meet emission limit
Thermal Oxidizer
1.5 ppmvd @ 15% oxygen (3-hr block avg., Method 10 stack test or equivalent method approved by MDE)
Good combustion practices with oxidation catalyst, designed to meet
emission limit at all times
North and South Flares
North Flare – 31.2 tpy South Flare – 18.4 tpy
(12-month rolling avg.)
Maintaining a pilot flame at the flare tips at all times, good combustion
practices, and designed to meet emission limits
GREENHOUSE GAS BACT
The Tailoring Rule regulates emissions from six covered GHGs: CO2, CH4, N2O, hydrofluorocarbons (HFCs), perfluorocarbons (PFCs), and sulfur hexafluoride (SF6). Typically, GHG emissions are listed in terms of carbon dioxide equivalents (CO2e). GHG emissions associated with combustion equipment are limited to CO2, CH4 and N2O. In order to calculate GHG emissions, global warming potential (GWP) values are used to normalize emissions of pollutants such as CH4 and N2O that are deemed to have a greater detrimental impact on a per pound basis than CO2. The GWP for CO2 has a value of 1.0, CH4 have a value of 25 and N2O has a value of 298. The evaluation of technologies to minimize GHG emissions from combustion sources typically focuses on CO2 emissions and mechanisms to reduce CO2 emissions. This dominates the GHG emission value for combustion equipment. As such, the BACT evaluation

DNR – PPRP 129 COVE POINT ERD / DEC 2014
presented in this document refers to CO2 as the primary GHG pollutant for the proposed DCP combustion equipment. Other non-combustion sources of GHGs include components of the gas pipeline and circuit breakers that contain SF6.
Although there is a recently proposed NSPS for Greenhouse Gas Emissions for New Stationary Sources: Electric Utility Generating Units, Subpart TTTT; the proposed Project would not be subject to this standard. The recently proposed Subpart TTTT applies to a project that is constructed for the purposes of supplying, one-third or more of its potential electric output and more than 219,000-MWh net-electrical output to a utility distribution system, on a 3 year rolling average basis. As explained throughout this ERD, none of the output generated by the proposed CTs will be supplied to a utility distribution system.
An additional important consideration for BACT evaluations of GHGs is the source definition or redefinition issue. EPA permit guidance (USEPA, PSD and Title V Permitting Guidance for Greenhouse Gases, March 2011) indicates that the CAA does not provide latitude for a permitting authority to redefine a source as part of a BACT evaluation (for example, requiring a proposed fossil fuel-fired power plant to consider using wind turbines). In this case, the reason for requesting a CPCN to build a generation unit is specifically to provide additional power to meet the demands of the liquefaction process. Unlike a typical power plant, the power generated by these units will all be consumed onsite. The CPCN Application sets forth the business objective for the liquefaction facility: to construct and operate a gas liquefaction process. In Step 1 of a BACT evaluation, the State may only consider technologies that are relevant to the proposed equipment that fits within the business objectives of the project. Thus, based on EPA guidance, the State may not redefine the emissions source – or in this case, the use of CTs to drive a compressor -- that has been proposed by the applicant. This is discussed in further detail in sections below.
In general, there are two strategies available to minimize GHG emissions from combustion equipment: add-on control via carbon capture systems to strip CO2 from the flue gas stream for subsequent re-use or sequestration and/or energy efficiency methods.
Carbon Sequestration and Capture
In general, the availability is limited for add-on control options to potentially remove GHGs from an exhaust stream. Carbon capture and sequestration (CCS), or re-use is the only potentially available add-on

DNR – PPRP 130 COVE POINT ERD / DEC 2014
control option at this time, and even this technology is limited in its development.
In order to capture CO2 emissions from the flue gas, CO2 must first be separated from the exhaust stream. A variety of technologies can accomplish this, and may include the following:
• Pre-combustion systems designed to separate CO2 and hydrogen in the high-pressure syngas typically produced at integrated gasification combined cycle power plants; and
• Post-combustion systems that separate CO2 from flue gas such as:
o Chemical absorption through the use of an aqueous solution of amines as chemical solvents; or
o Physical absorption through the use of an absorption process called Rectisol or Selexol.
Oxygen combustion can make separation easier. It employs oxygen instead of ambient air for make-up air supplied for combustion in the boiler.
While numerous carbon capture, storage, and beneficial CO2 use demonstration projects are in various stages of planning and implementation across the globe, including several in the U.S. that are funded by the Department of Energy (DOE), the technologies needed for a full-scale generating facility are not yet commercially demonstrated in practice. In fact, President Obama formed an Interagency Task Force on Carbon Capture and Storage, co-chaired by DOE and EPA, in early 2010 to develop a federal strategy for overcoming the barriers to the widespread, cost-effective deployment of CCS within 10 years. The Task Force’s ultimate goal is to bring five to ten commercial demonstration projects online by 2016.
After CO2 is separated, it must be prepared for beneficial reuse or transport to a sequestration or storage facility, if a storage facility is not locally available for direct injection. In order to transport CO2, it must be compressed and delivered via pipeline to a storage facility. Although beneficial reuse options are developing with solutions such as the use of captured material to enhance oil or gas recovery from well fields in the petroleum industry. However, currently, the demand for CO2 for such applications is well below the quantity of CO2 that is available for capture from electric generating units (EGUs).

DNR – PPRP 131 COVE POINT ERD / DEC 2014
Without a market to use the recovered CO2, the material would instead require sequestration, or permanent storage. The geological formations in the vicinity of the proposed Project provide limited if any alternatives to adequately and permanently store recovered CO2. Sequestration of CO2 is generally accomplished via available geologic reservoirs that must be either local to the point of capture, or accessible via pipeline to enable the transportation of recovered CO2 to the permanent storage location. Storage facilities may include any of the following:
• Geologic formations;
• Depleted oil and gas reservoirs;
• Unmineable coal seams;
• Saline formations;
• Basalt formations; or
• Terrestrial ecosystems.
There is active on-going research in Maryland for potentially suitable geologic storage formations in the State. However, extensive characterization studies are still needed to determine their extent and storage potential for CO2. These studies would take several years of investigation, including drilling characterization wells, and would likely require small-scale injection testing before determining their full-scale viability.
There are neither local geologic reservoirs, nor pipelines, dedicated to CO2 transport that are available in the vicinity of the proposed Project at this time. In addition, carbon capture technologies have yet to be demonstrated for a facility of similar size to the proposed Project. Even if CCS was considered technically available, given the guidance from DOE (August 2010 Report of the Interagency Task Force on Carbon Capture and Storage), CCS for a 550 MW natural gas-fired CCCT facility increases capital cost by an estimated $340 million and adds a 15% energy penalty. For the proposed Project, the potential additional capital cost for CCS is estimated at $108 million (linearly scaled to 174.2 MW). This would be 30% of the total cost for the CT systems. In addition, the annual operating costs for the system would increase, given the 15% energy penalty associated with operating a CCS system.
Therefore, options involving carbon capture and sequestration are not currently considered feasible for any of the equipment proposed in the CPCN Application.

DNR – PPRP 132 COVE POINT ERD / DEC 2014
Energy efficiency methods to minimize GHG emissions are provided on a source-by-source basis. These are described in the following paragraphs.
Combustion Turbines
Available technologies considered for CTs focus on energy efficiency solutions and clean fuel options. An emissions reduction strategy focused on energy efficiency options primarily focuses on increasing the thermal efficiency of a combustion turbine that would thereby require less fuel for a given output, resulting ultimately in lower emissions of GHGs. There are several potential strategies for improving energy efficiency, including: selection of a more efficient electric generating unit, combustion air cooling, or cogeneration/combined heat and power techniques. Separately, the selection of lower carbon containing fuels, such as natural gas, or even process gas in the case of DCP provide the opportunity for additional GHG emission reductions. This is in contrast to coal-fired combustion units. This section outlines these potential strategies with respect to feasibility for the proposed Project.
More Efficient EGU
Maximizing EGU efficiency is an alternative available to reduce the consumption of fuel required to generate a fixed amount of output. There are efficiency losses inherent in a combined cycle CT design of the turbine and the heat recovery systems. The mechanical input to the compressor consumes energy and is integral to how a CT works. Therefore, there is no opportunity for efficiency gains other than the differences in design between manufacturers or models. Heat recovery in the exhaust is another point of efficiency loss that is dependent on design of the heat recovery system and varies between manufacturers and models.
Efficiency of turbines employed as part of an EGU can vary widely. One alternative to reduce CO2 emissions is to maximize turbine efficiency through various design techniques. Any increase in energy efficiency within the operation of the turbine yields reductions in the generation of CO2 emissions on a per unit output basis. For example, turbine suppliers offer several different models of combustion turbines having a variety of efficiency ratings.
EPA published guidance that evaluated the availability of high efficiency combustion turbines with recognized thermal efficiencies in the range of 50% to over 56%. While the guidance addressed applications where an increased efficiency was achieved via design, there are a variety of other factors that may render an alteration to the combustion turbine design

DNR – PPRP 133 COVE POINT ERD / DEC 2014
infeasible for certain applications. This is true in the case of the proposed Project. This is even more possible in this case, given the special circumstances of the proposed Project. In the proposed Project, the use of the CT will directly drive the refrigeration system used to liquefy the natural gas; it will not be used for energy generation for public consumption. However, at this time, the selection of a more efficient EGU is considered a technically feasible option for the proposed Project.
Combustion Air Cooling
During summer months, a common method used to improve energy efficiency of combustion turbines is to cool the combustion air prior to entering the combustion turbine. Cooling the combustion air via heat exchange systems maximizes the expansion of the air molecules and enhances the work these expanding gases perform on the turbine blades. Hence higher amounts of electricity are produced. A higher amount of electricity generated improves the overall efficiency of the EGU. Based on general guidance available with respect to combustion air cooling, achievable reductions in fuel usage and CO2 emissions could be in the range of 10 – 15%11. As such, while this technology is considered technically feasible, other options - such as a more efficient EGU - are considered more effective in terms of overall net environmental benefit.
Cogeneration / CHP as a CO2 Reduction Technique
Combined Heat and Power (CHP) is a technique involving the operation of a combustion system to generate heat for electric power generation, as well as to provide thermal energy to a process. The electric power is distributed for use, while thermal energy is used locally to support heating systems or industrial processes. A CHP system allows for the use of energy in the form of heat to provide thermal energy that would otherwise be lost in cooling water for a traditional EGU. For combustion turbine systems, the more likely CHP technique would be to provide space heating for nearby buildings or to provide makeup heat to nearby coal-fired EGUs (likely application for power plants with CT and coal fired EGUs onsite). The use of this otherwise lost heat would thereby improve the overall efficiency of the EGU or process and, subsequently, reduce overall CO2 emissions, on an equivalent basis.
11 RTP Environmental Associates, Hyperion Energy Center Best Available Control Technology (BACT) Analysis for Emissions of Carbon Dioxide, March 2009

DNR – PPRP 134 COVE POINT ERD / DEC 2014
The use of a CHP system provides an opportunity to extract additional energy from heat otherwise lost in a traditional EGU. This type of system however does require the removal of steam from the steam turbine, which would thus reduce the magnitude of electric power generation recognized in the CHP. This electrical energy is instead transformed to thermal energy for use on a more local basis. The advantage of a CHP system over a traditional EGU operation is the net improvement of overall fuel efficiency.
Since DCP is already employing HRSGs as a means to recover otherwise lost heat, there is no remaining heat for use in a CHP system. For a CHP system to be beneficial there must be a local need for thermal energy, as thermal energy cannot be effectively transported over extended distances. Given the proposed selection of a more efficient CT by DCP for the proposed Project, there is no reasonable net environmental benefit of a CHP system for this application.
Use of Lower Carbon-Containing Fuels
CO2 is produced as a combustion product of any carbon-containing fuel. All fossil fuels contain varying amounts of fuel bound carbon that is converted during the combustion process to produce CO and CO2. The use of gaseous fuels (such as natural gas, process gas, refinery gas, or syngas derived from higher carbon containing solid fuels) instead of higher carbon-containing fuels (such as coal, pet-coke or fuel oils (residual or distillate)) is an additional potentially feasible alternative to reduce the generation of CO2 emissions from combustion turbines.
Natural gas combustion results in lower GHG emissions than coal combustion (117 lb/MMBtu versus 210 lb/MMBtu, based on 40 CFR 98 Subpart C). The use of lower carbon containing fuels in combustion turbines, pending the definition of the source, is an effective means to reduce the generation of CO2 during the combustion process. In fact, for the proposed Project, DCP proposed to employ process gas, in addition to the use of natural gas. Given its composition, process gas has a slightly lower GHG generation rate than natural gas. Therefore, the use of lower carbon-containing fuels is a potentially technically feasible option for the proposed Project.
BACT for CTs
Critical to the proposed Project are the operation of CTs. These CTs will operate with a different purpose than CTs for power generation generally permitted by the PSC. As presented by DCP in its CPCN Application, the

DNR – PPRP 135 COVE POINT ERD / DEC 2014
primary purpose of the CTs for this proposed Project is to directly drive the refrigeration system for use in liquefying natural gas. The mechanical power required to drive the refrigeration system will be solely provided by the proposed GE 7EA CTs with DLN1 combustors. As proposed, the Project is completely self-sufficient, with respect to electricity requirements; and the CTs will supply the electrical demand of the liquefaction process.
DCP proposed the use of process fuel gas supplemented with pipeline-quality natural gas, which are both low carbon containing fuels. As compared to other potential fossil fuel options, this will result in reduced GHG emissions. In fact, the use of process fuel gas instead of flaring the gas, results in significantly lower overall emissions for the process in general. DCP proposed that BACT for GHGs is the selection of the GE 7EA CT, as an efficient form of power generation.
When compared to similar liquefaction processes in the United States, the proposed Project provides for an overall minimization of GHG emissions. This is due to the selection of the CT model and the incorporation of additional design features to enhance the overall efficiency of the liquefaction process. Unlike other LNG facilities in this country, the proposed DCP facility incorporates the use of process fuel gas from the nitrogen gas stripper instead of flaring this gas. By using the process gas as a fuel instead of flaring it, DCP is able to reduce the quantity of natural gas used to generate the same level of heat output needed to drive the LNG process. Regardless of how the process gas or natural gas is combusted, GHG emissions are generated. Therefore, reducing the overall quantity of gas (process gas or pipeline natural gas) used to generate the required power results in a reduction of GHG emissions. As such, DCP’s proposed use of process gas to drive energy production is a design feature that minimizes the generation of GHG emissions from the overall liquefaction process.
The GE 7EA with DLN1 combustors has the ability to fire both process gas and pipeline natural gas and the turbines are manufactured to match the output requirements for driving refrigerant compressors. Since the CTs proposed for the Project are mechanical drive turbines, it is not feasible to directly measure the efficiency of the CTs. This is the case because the CTs directly drive the refrigerant compressors, instead of producing power. Any measure of efficiency would need to include the efficiency of the refrigerant compressors because the CTs directly drive the compressors. Therefore, it is not possible to isolate the CTs in order to compare them with other CTs recently permitted in the power generation sector.

DNR – PPRP 136 COVE POINT ERD / DEC 2014
In addition to the use of efficient GE 7EA turbines, DCP also proposed using HRSG technology to capture heat from the turbines to produce electricity and produce steam for the LNG process. The use of HRSG is an accepted energy efficiency technique that helps to minimize the overall amount of heat input required to drive the LNG process.
PPRP and MDE-ARMA concur that GHG BACT for the CTs proposed for the Project is the use of GE 7EA turbines with DLN1 combustors firing pipeline natural gas and process fuel gas, in addition to the use of HRSGs. GHG emissions for the CTs will be limited to 117 lb/MMBtu heat input for each turbine. The determination of CO2 emissions from the CTs will be documented by EPA Method 3A on an annual basis. As an alternative to annual stack testing, DCP can choose to demonstrate compliance with BACT through the use of certified CO2 CEMS, upon written notification to MDE-ARMA. A CO2 emission rate for each turbine will be developed based on the concentration defined during the Method 3A testing, in conjunction with the heat input recorded during the testing. CO2 emissions will then be calculated on a monthly basis based on fuel consumption and the established CO2 emission rate. CH4 and N2O emissions from the CTs will be calculated in accordance with the methodology and emission factors provided in 40 CFR 98, Subpart C. On a monthly basis, fuel consumption, coupled with the respective emission factors and global warming potentials (25 for CH4 and 298 for N2O), will be used to calculate the CH4 and N2O emissions on a CO2e basis. These emissions will be summed with the CO2 contribution to calculate total GHG (as CO2e) emissions for the CTs. These emissions will be required to be included in the quarterly reports for comparison with the 12-month rolling GHG (as CO2e) limit for the proposed Project.
Auxiliary Boilers
With respect to the use of CCS techniques, there is currently no technically feasible add-on control technology to reduce GHG emissions from the auxiliary boilers. This is the case given the current technical and economic issues previously presented for the CTs. Other methods to reduce GHGs from boilers include efficient boiler design, cleaner fuels and good combustion practices. DCP is proposing all of these for the Project’s auxiliary boilers.
GHG emissions from the boilers will be controlled by the use of pipeline-quality natural gas and process fuel gas from LNG production, as well as good combustion practices and the selection of an efficient steam boiler design. These types of GHG controls are similar to recently permitted projects that include natural gas-fired auxiliary boilers.

DNR – PPRP 137 COVE POINT ERD / DEC 2014
To demonstrate compliance with GHG BACT, DCP will be required to conduct an annual combustion tune-up on the auxiliary boilers. The results of the combustion tune-up must be provided to MDE-ARMA in the subsequent quarterly report. GHG emissions for the auxiliary boilers will be limited to 117 lb/MMBtu heat input for each auxiliary boiler. The determination of CO2 emissions from the auxiliary boilers must be documented by EPA Method 3A on an annual basis. As an alternative to annual stack testing, DCP can choose to demonstrate compliance with BACT through the use of certified CO2 CEMS, upon written notification to MDE-ARMA. A CO2 emission rate for each auxiliary boiler will be developed based on the concentration defined during the Method 3A testing, in conjunction with the heat input recorded during the testing. On a monthly basis, CO2 emissions will be calculated based on fuel consumption and the established CO2 emission rate. CH4 and N2O emissions from the auxiliary boilers will be calculated in accordance with the methodology and emission factors in 40 CFR 98, Subpart C. On a monthly basis, fuel consumption, coupled with the respective emission factors and global warming potentials (25 for CH4 and 298 for N2O), will be used to calculate the CH4 and N2O emissions on a CO2e basis. These emissions will be summed with the CO2 contribution to calculate total GHG (as CO2e) emissions for the auxiliary boilers. These emissions will be required to be included in the quarterly reports for comparison with the 12-month rolling GHG (as CO2e) limit for the proposed Project.
DCP will be required to submit an operations and maintenance plan that describes how to minimize, monitor, and calculate emissions during startup, shutdown, malfunction and any operating condition other than normal operation for the auxiliary boilers.
Emergency Engines
There is currently no technically feasible add-on control technology to reduce GHG emissions from emergency engines. Therefore, DCP proposed to limit GHG emissions from the emergency engines (1,550-hp and 350-hp) through the use of good combustion practices. This GHG BACT requirement is similar to recently permitted projects that include diesel fuel oil-fired emergency engines. To demonstrate compliance with the GHG BACT determination, DCP will be required to maintain the emergency generator and fire pumps in accordance with manufacturer’s specifications. GHG emissions on a CO2e basis from the emergency engines will be calculated based on the methodology included in 40 CFR 98, Subpart C and included in the 12-month rolling GHG limit for the proposed Project. DCP will be required to include these emissions in the

DNR – PPRP 138 COVE POINT ERD / DEC 2014
quarterly reports for comparison with the 12-month rolling GHG limit for the proposed Project.
Thermal Oxidizer
The proposed Project involves the installation of a thermal oxidizer to control the offgas stream from the acid gas removal unit and desulfurization process. This gas stream is comprised mainly of CO2 and water, with a small amount of methane and H2S. A thermal oxidizer is a control device used to regulate a variety of pollutants, in this case VOCs (methane) and H2S. The thermal oxidizer discharge will be directed to an SCR and catalytic oxidizer. There is currently no technically or economically feasible add-on control technology to reduce GHG emissions from a source such as the thermal oxidizer. DCP estimated emissions using a factor of 1,574 lb CO2e/MMBtu for the thermal oxidizer through the use of good combustion practices. PPRP and MDE-ARMA agree that BACT for GHG emissions from thermal oxidizers is the use of good combustion practices.
GHG emissions on a CO2e basis from the thermal oxidizer are comprised of two sources, the combustion of process gas and a result of the CO2 present in the acid gas stream. The combustion emissions will be calculated based on the methodology included in 40 CFR 98, Subpart C and included in the 12-month rolling GHG (asCO2e) limit for the proposed Project. The emission from the acid gas will be calculated based on the methodology included in 40 CFR 98, Subpart W and included in the 12-month rolling GHG limit for the proposed Project. DCP will be required to include the combined GHG emissions for the thermal oxidizer in the quarterly reports for comparison with the 12-month rolling GHG (as CO2e) limit for the proposed Project.
Flares
The proposed Project involves the installation of two flares to reduce emissions from various processes. Flares are control devices and will be used to regulate the venting of VOCs and GHGs. The use of add-on control equipment for flares to reduce GHGs is currently not a technically feasible option. However, the use of the flares will be used to minimize GHG emissions from the unit operations being controlled. The flares will be controlling off-gas that contains methane (which is a GHG with a GWP of 25)and will convert it to CO2 (GWP of 1) in the flare. Therefore, the use of the flare serves to reduce the overall GHG (as CO2e) emission contribution for the proposed Project.

DNR – PPRP 139 COVE POINT ERD / DEC 2014
DCP proposed both maintaining a pilot flame at all times and following proper operations as BACT for GHGs. The presence of a pilot flame will ensure that complete combustion occurs of the gases being flared. DCP also proposed to follow good operating practices in order to maintain a high combustion efficiency. PPRP and MDE-ARMA agree that BACT for GHGs is the presence of a pilot flame , as well as good operating practices . This approach has been accepted as BACT for similar operations, such as the Sabine Pass LNG Terminal. The following summary details the unit operations and GHG emission calculation methods to be used and which must be included in the 12-month rolling GHG limit for the proposed Project.
• Pilots: 40 CFR §98, Subpart C
• Restarts: 40 CFR §98, Subpart W
• Ship Venting: Carbon Balance Equation and 40 CFR 98, Subpart W
DCP will be required to include these emissions in the quarterly reports for comparison with the 12-month rolling GHG (as CO2e) limit for the proposed Project. In addition, DCP will be required to continuously monitor for the presence of a pilot flame.
Piping Component Leaks
Leaks from piping components have been identified as potential sources of GHG emissions. Piping components include potential fugitive emissions of CH4 and CO2 from rotary shaft seals, connection interfaces, valve stems, and similar points. Currently the only proven method to reduce emissions from fugitive component leaks is to implement a leak detection and repair program (LDAR).
As BACT for pipeline components, DCP proposed an LDAR program following the procedures outlined by the Texas Commission on Environmental Quality (TCEQ) as BACT for piping components, including the following:
• Conducting audio, visual, olfactory (AVO) leak detection program performed on a routine basis;
• Conducting quarterly/semi-annual/annual monitoring of components using an approved gas analyzer; and
• Implementing a leak tagging and repair framework to eradicate leaks in a timely fashion.
DNR – PPRP 140 COVE POINT ERD / DEC 2014
Given that this proposed program will be employed to minimize emissions of VOCs to address LAER requirements, as well as to limit GHG emissions from equipment leaks, PPRP and MDE-ARMA agree with the use of the LDAR Monitoring Plan and Program following the guidance in the TCEQ 28LAER as BACT for GHGs. The use of an AVO program in addition to gas analyzer monitoring will help to minimize emissions resulting from equipment leaks. The presence of mercaptans in natural gas enables an AVO program to readily identify leaking components in the natural gas system. Fugitive emissions from the natural gas pipeline will be calculated based on the results of gas analyzer monitoring, the use of emission factors from Table 2-4 of EPA’s Protocol for Equipment Leak Emission Estimates, and the chemical composition of each material as provided in the EPC design specification.
DCP will be required to apply control efficiencies, as described TCEQ’s Control Efficiencies for TCEQ Leak Detection and Repair Programs for the 28LAER program. DCP will be required to include these emissions in the 12-month rolling GHG limit for the proposed Project. In addition, DCP will be required to include these emissions in the quarterly reports for comparison with the 12-month rolling GHG limit for the proposed Project.
Circuit Breakers
Certain circuit breakers have been identified as potential sources of GHG emissions. Circuit breakers can be insulated with sulfur hexafluoride (SF6), a source of GHGs, which can leak over time from wear and tear.
In response to PPRP Data Request 4, DCP explained that, as the proposed Project does not include the use of circuit breakers containing SF6 there are no GHG emissions associated with circuit breakers for the proposed Project.
Project-Wide GHG (as CO2e) Limit
A project-wide GHG emissions limit is part of GHG BACT for the proposed Project. GHG emissions from the CTs, auxiliary boiler, emergency generator, fire pump engines, thermal oxidizer, and equipment leaks may not exceed 2,030,988 tons (CO2e) in any consecutive rolling 12-month period.
CO2 emissions for the CTs will be based on a facility-derived emission rate developed using Test Method 3A and heat input during performance testing. In lieu of testing, DCP may elect to install and certify a CO2
CEMS. To calculate CO2 emissions, the CO2 emission rate will be used

DNR – PPRP 141 COVE POINT ERD / DEC 2014
along with fuel consumption for each CT. CH4 and N2O emissions from the CTs will be calculated in accordance with the methodology and emission factors noted in 40 CFR 98, Subpart C.
CO2, CH4, and N2O emissions from the remaining combustion sources will be calculated in accordance with the methodology and appropriate emission factors noted in 40 CFR 98, Subparts C and W. On a monthly basis, fuel consumption, coupled with the respective emission factors and global warming potentials (25 for CH4 and 298 for N2O), will be used to calculate the CH4 and N2O emissions on a CO2e basis.
DCP will be required to track fuel usage in all the combustion sources, and calculate a consecutive rolling 12-month average GHG (as CO2e) emissions value. DCP will be required to include these emissions in both the quarterly and annual reports.
Summary
Table 4.4-4 presents a summary of proposed GHG BACT limitations for all sources.
Table 4.4-4 Proposed GHG BACT Determinations
Emission Source Proposed BACT limit BACT Determination
CTs
117 lb/MMBtu per turbine (3-hr block avg., Method 3A stack test or
equivalent method approved by MDE)
Project-wide GHG emissions limit of 2,030,988 tons (12-month rolling
average)
High efficiency GE 7EA CTs with HRSGs equipped with DLN1
combustors and exclusive use of facility process fuel gas or pipeline
quality natural gas
Auxiliary Boilers
117 lb/MMBtu per turbine (3-hr block avg., Method 3A stack test or
equivalent method approved by MDE)
Project-wide GHG emissions limit of 2,030,988 tons (12-month rolling
average)
Exclusive use of facility process fuel gas during normal operation,
efficient boiler design and good combustion practices
Emergency Engines
(Emergency Generator and 5
Fire Pump Engines)
Project-wide GHG emissions limit of 2,030,988 tons (12-month rolling
average) Use of good combustion practices
Thermal Oxidizer
Project-wide GHG emissions limit of 2,030,988 tons (12-month rolling
average) Good combustion practices

DNR – PPRP 142 COVE POINT ERD / DEC 2014
Emission Source Proposed BACT limit BACT Determination
Flares (North and South)
Project-wide GHG emissions limit of 2,030,988 tons (12-month rolling
average)
Maintaining a pilot flame at all times and good operating practices to
maintain high combustion efficiency
Equipment Leaks Project-wide GHG emissions limit of 2,030,988 tons (12-month rolling
average)
Implement LDAR Monitoring Plan following TCEQ 28LAER guidance
4.4.3 NAAQS and PSD Increment Compliance Demonstration
The proposed Project triggers PSD requirements for GHG (CO2e), NO2, PM, PM10, PM2.5, and CO. Consequently, DCP completed relevant impact assessment modeling analyses for NO2, PM10, PM2.5 and CO.
PPRP and MDE-ARMA independently reviewed the air quality modeling analyses conducted by DCP. Appendix D to this Environmental Review Document contains a detailed summary of PPRP and MDE-ARMA’s analysis. A brief summary of PPRP and MDE-ARMA’s conclusions is provided in the following section.
4.4.3.1 Air Quality Modeling Analysis Conclusions
PPRP and MDE-ARMA agree that the air quality modeling analyses conducted by DCP in support of the proposed Project are adequate to demonstrate compliance with PSD Significant Impact Levels (SILs) in Class I and Class II areas, PSD increments, and the NAAQS. The following summarizes the review conducted by PPRP and MDE-ARMA and provides associated conclusions:
• DCP utilized the most recent available version of all executables within the AERMOD modeling system.
• The critical NAAQS and PSD increment results have been verified. The extended startup operations for the turbines and auxiliary boilers, as described in the CPCN application, will not cause or contribute to any exceedance of a NAAQS or PSD increment.
• Use of the SILs and existing measurement data are justified in order to address requirements stemming from the January 2013 D.C. Circuit Court ruling, which is discussed in detail in Appendix D.
• The load analyses conducted by DCP are appropriate, and the worst case loads were used to assess compliance with the PSD increment and NAAQS.

DNR – PPRP 143 COVE POINT ERD / DEC 2014
• The analyses successfully demonstrate acceptable impacts with regard to Maryland’s TAPs program, as well as local plume induced visibility degradation.
• The qualitative analysis provided by DCP for secondary PM2.5 formation and potential effects on the PM2.5 NAAQS is adequate and conforms to recent EPA guidance, and the formation of secondary PM2.5 due to proposed Project’s related NOx emissions is expected to be zero or less than zero, due to the requirement to offset NOx emissions from the proposed Project.
• The Class I screening approach is adequate to demonstrate that the proposed Project will not be expected to exceed the Class I SILs for NO2, PM10, and PM2.5.
4.5 NONATTAINMENT NEW SOURCE REVIEW (NA-NSR)
The proposed Project is located in Calvert County, Maryland which is designated as a marginal nonattainment area for ozone. NOx and VOCs are regulated by EPA and MDE as ozone pre-cursor pollutants. Potential NOx and VOCs emissions from the proposed Project are greater than 25 tpy; therefore, it triggers requirements of NA-NSR. Table 4.2-13 presents potential emissions from the proposed Project.
Because the proposed Project is subject to NA-NSR requirements for NOx
and VOCs, it must meet the following requirements for each pollutant:
• Implement LAER level of pollution control from all project sources;
• Obtain emissions reductions (offsets) for projected potential emissions;
• Certify that all other sources in Maryland owned by DCP comply with all applicable requirements of the Clean Air Act (CAA); and
• Demonstrate through an analysis of alternative sites, sizes, production processes, and environmental control techniques that benefits of the proposed source significantly outweigh the environmental and social costs imposed as a result of its location, construction, or modification.
The following sections review the proposed Project in relation to these NA-NSR requirements.
4.5.1 LAER Evaluation
LAER is defined in COMAR 26.11.17.01(B)(15) as:
DNR – PPRP 144 COVE POINT ERD / DEC 2014
(a) … for any emissions unit, the more stringent rate of emissions based on the following:
(i) The most stringent emissions limitation which is contained in the implementation plan of any state for the class or category of stationary source, unless the owner or operator of the proposed stationary source demonstrates that these limitations are not achievable; or
(ii) The most stringent emissions limitation which is achieved in practice by the class or category of stationary sources, with this limitation, when applied to a modification, meaning the lowest achievable emissions rate for the new or modified emissions units within the stationary source.
(b) The application of this definition does not permit a proposed new or modified emissions unit to emit any pollutant in excess of the amount allowable under 40 CFR 60.
In general, the procedure used to identify and determine LAER requirements are similar to, but more stringent than, the procedure to determine BACT requirements (see Section 4.4). For example, in addition to reviewing available control technologies, any State Implementation Plan (SIP) must consider all applicable emissions limits in effect as part of the procedure to determine LAER requirements.
After reviewing the applicant’s LAER proposal in the CPCN Application, PPRP and MDE-ARMA conducted a LAER evaluation for the applicable proposed DCP NOx and VOC emitting sources, including: Frame 7 CTs, auxiliary boilers, emergency generator, five fire pump engines, thermal oxidizer, two ground flares, and fugitive equipment leaks from components. The proposed Project also includes 19 tanks to support the process operation for the proposed Project. However, no emissions from these tanks are anticipated given that 11 of the tanks store material with a maximum true vapor pressure less than atmospheric, rendering working and breathing losses negligible. In addition, the remaining eight tanks store material with a maximum true vapor pressure greater than atmospheric pressure and employ a closed-loop system such that there are no emissions to the atmosphere. Therefore, no VOC LAER evaluation is needed for the storage tanks.
DNR – PPRP 145 COVE POINT ERD / DEC 2014
The NOx and VOC LAER evaluations were conducted in accordance with EPA’s guidance in the draft New Source Review Workshop Manual (EPA 1990) and applicable federal and Maryland regulations. The objective of the LAER analyses was to identify applicable federal and State of Maryland air regulations and “achieved in practice” limitations for each piece of new proposed equipment with the potential to emit NOx or VOCs.
To identify applicable federal regulations and limitations, 40 CFR §60, §61, and §63 were evaluated to determine whether any of the proposed emission sources would be subject to any NSPS (40 CFR §60) or NESHAP (40 CFR §61 and 40 CFR §63) standards. PPRP and MDE-ARMA also reviewed COMAR requirements to identify applicable State of Maryland NOx and VOC requirements. Section 4.6 provides the detailed results of this regulatory review.
To identify source-specific NOx and VOC LAER emission limits applicable to the proposed Project, PPRP and MDE-ARMA conducted a comprehensive review. In their review, the agencies included assessment of NOx and VOC LAER emission limits that have already been established for identical or similar equipment as documented in the RBLC database. As a part of their review, the agencies also identified and assessed other recently issued permits for the construction of new facilities that provide gas liquefaction and LNG export that have not yet appeared in the RBLC. A review of other informational sources, including state websites where LNG export projects are currently being proposed (Texas, Louisiana, Oregon, and Alaska), and the California Air Resources Board (CARB) database were also included in the review. Appendix C provides NOx and VOC LAER emission limit review tables.
NOx LAER
Combustion Turbines
For the NOx LAER analysis the following control technologies were assessed.
• Selective Catalytic Reduction (SCR);
• Selective Non-Catalytic Reduction (SNCR);
• EMXTM/SCONOXTM;
• Dry Low-NOx (DLN) Combustors;
• Catalytic Combustion (XONONTM);

DNR – PPRP 146 COVE POINT ERD / DEC 2014
• Water/Steam Injection; and
• Good Combustion Practices.
Both XONONTM and EMXTM/SCONOXTM were determined to be technically infeasible. XONONTM is not available for the GE 7EA CT, and EMXTM/SCONOXTM has not been demonstrated to operate on larger CTs. In addition, these technologies are not capable of achieving NOx reductions at the level that SCR can accommodate on CTs.
Of the remaining control technologies that were technically feasible, a combination of SCR and DLN results in the lowest NOx achievable emission rate. This is technology that DCP proposed. Other potentially available technologies do not provide a means to reduce NOx emissions to the levels achievable through the use of SCR and DLN. Furthermore, other potentially available technologies were not identified in the RBLC or recent permits as LAER for NOx for CTs.
DCP proposed a NOx LAER emission rate for each of the two Frame 7 process and natural gas-fired combustion turbines not to exceed 2.5 ppmvd at 15% oxygen based on a 3-hour block average during normal operations. DCP proposed achieving this NOx LAER emission limit through the following means: use of a combination of pipeline natural gas and process gas (consisting of boil-off gas from the LNG tanks and flash gas from the nitrogen stripper) as fuel for the two combustion turbines; use of a DLN combustor turbine design (DLN1); and use of a SCR system to further reduce NOx emissions from the combustion turbines.
For similar CT projects which exclusively use pipeline natural gas, the current NOx LAER emission rate is 2.0 ppmvd at 15% oxygen based on a 3-hour block average. However, since DCP proposed to also use process gas, which consists of nitrogen stripper off gas, the process gas is expected to have a higher nitrogen component as compared to pipeline natural gas.
It is noted that a DLN1+ combustion turbine is commercially available. This is rated to achieve a NOx LAER emission rate of 2.0 ppmvd at 15 % oxygen, based on a 3-hour block average for CTs fired exclusively with natural gas.
As introduced by DCP its CPCN Application, use of process gas has a greater variability (30%) of the Wobbe Index (i.e., fuel heating value/square root of the fuel specific gravity) as compared to pipeline natural gas (5%). The design fuel specifications for the combustion turbines have upper and lower Wobbe Index limits that determine fuel
DNR – PPRP 147 COVE POINT ERD / DEC 2014
use acceptability. The DLN combustor can utilize a fuel with a Wobbe Index that varies up to 30% while the DLN1+ can only utilize a fuel with a Wobbe Index that varies by no more than 5%. Therefore the use of a DLN1+ combustion turbine at DCP would limit the CTs to natural gas as a fuel source and would require the flaring of 100% of the process gas.
To assess impacts on NOx emission of the DLN1+ technology, DCP conducted a NOx emissions analysis, which evaluated two Frame 7 CTs NOx emission scenarios. Scenario 1 consisted of two DLN1 combustion turbines using 40% pipeline natural gas and 60% process gas and flaring the remainder of the process gas. Scenario 2 consisted of two DLN1+ Frame 7 CTs using 100% pipeline natural gas as fuel and flaring 100% the process gas. The results of this comparative analysis showed that Scenario 1 resulted in a lower emission rate (more than a 195 lb/hr difference) than emissions calculated in Scenario 2. The results of this comparative analysis indicate that the ability to use process gas in the DLN combustor will result in lower NOx emissions for the proposed Project than if the DLN1+ combustor was required. Use of the DLN1+ combustor would eliminate the ability of the proposed Project to fire process gas in the CTs. Therefore, although the DLN1+ combustor may provide for an apparent lower concentration level for the CTs, the fact that DCP would have to flare 100% of the process gas would result in higher overall NOx emissions.
As a result of our analysis, PPRP and MDE-ARMA agree that the following meets LAER for the Frame 7 CTs: a NOx emission limit of 2.5 ppmvd at 15%O2, based on a 3-hour block average for normal operation to be achieved through the use of the use of process fuel gas and pipeline natural gas, SCR, and DLN. This proposed LAER limit applies during normal operation only (excluding periods of startup and shutdown). Continuous compliance demonstration purposes require NOx CEMS. In addition, DCP will be required to perform annual stack testing through the use of Method 7E, or an equivalent test method requiring MDE approval. As an alternative to annual stack testing, DCP can choose to demonstrate compliance with LAER through the use of certified NOx CEMS, upon written notification to MDE-ARMA.
PPRP and MDE-ARMA determined based on a review of other permits and the RBLC database that post-combustion controls are not considered technically feasible during startup and shutdown conditions and that LAER for natural-gas fired CTs for startup and shutdown emissions was to ensure that correct procedures were followed to allow for optimal performance during normal operations and that of the emissions during each startup and shutdown event should be limited.
DNR – PPRP 148 COVE POINT ERD / DEC 2014
PPRP and MDE-ARMA have determined that the Frame 7 CTs will also be subject to the following limits during startup and shutdown, as specified in the EPC design specifications provided by DCP in its response to PPRP Data Request No. 4. Also the startup and shutdown emissions must be included in the project-wide annual emission limits. The limits are as follows:
• NOx emissions will be limited to 1,304.5 pounds per startup event
from both Frame 7 CTs combined, as determined by CEMS. • NOx emissions will be limited to 48.5 pounds per shutdown event
from both Frame 7 CTs combined, as determined by CEMS.
Auxiliary Boilers
For the proposed Project, DCP proposed a NOx LAER emission rate for the auxiliary boilers of 0.0099 lb/MMBtu based on a 30-day rolling average during normal operations. DCP stated in its CPCN Application that the auxiliary boilers will provide auxiliary steam to supplement the steam generated by the HRSGs. During normal operation, each auxiliary boiler will utilize 100% process gas for fuel. The auxiliary boilers will primarily burn boil-off gas during startup and low pressure fuel mix during shutdown. The auxiliary boilers will be required to maintain the ability to burn pipeline natural gas during startup and shutdown, if the primary fuels are not available.
The auxiliary boilers will be operated continuously and will use low-NOx burners with post-combustion SCR NOx control technology. This will be applied to reduce NOx emissions by 90%. As indicated in PPRP and MDE-ARMA’s RBLC and recent permit review, provided in Appendix C, auxiliary boilers burning pipeline quality natural gas exclusively are permitted to achieve a LAER NOx emission rate as low as 0.0035 lb/MMBtu (Minnesota Steel). However, the emission limit has not yet been demonstrated in practice, as this unit is not yet operational. The unit burns exclusively natural gas, whereas the proposed Project will primarily burn process fuel gas. The proposed NOx LAER emission limit for the proposed Project auxiliary boilers is not to exceed 0.0099 lb/MMBtu.
PPRP and MDE-ARMA concur that a NOx emission limit for the auxiliary boilers of 0.0099 lb/MMBtu during normal operation is LAER, given that process gas will be the primary fuel source for the auxiliary boilers during normal operation. This LAER limit will be achieved through the use of process fuel gas and pipeline natural gas, low-NOx burners, and SCR. The NOx LAER emissions limit will be based on a 3-hour block average, which differs from that proposed by DCP. However, a 30-day rolling average is

DNR – PPRP 149 COVE POINT ERD / DEC 2014
not considered acceptable as MDE-ARMA requires 3-hour averaging for other auxiliary boilers recently permitted in the State of Maryland. Continuous compliance demonstration purposes will require a NOx CEMS. In addition, DCP will be required to perform annual stack testing, through the use of Method 7E, or an equivalent test method requiring MDE approval. In lieu of stack testing, DCP may elect to use NOx CEMS.
PPRP and MDE-ARMA have determined that the auxiliary boilers will also be subject to the following limits during startup and shutdown. In making this determination, the agencies used the EPC design specifications provided by DCP in its response to PPRP Data Request No. 4. Also the startup and shutdown emissions must be included in the project-wide annual emission limits. The limits are as follows:
• NOx emissions will be limited to 2,946.2 pounds per startup event from each auxiliary boiler, as determined by CEMS.
• NOx emissions will be limited to 38.9 pounds per shutdown event from each auxiliary boiler, as determined by CEMS.
Emergency Engines
The proposed Project will operate six emergency diesel-fired engines to support operations proposed in the CPCN Application. DCP proposed to install five emergency fire pump engines, and one emergency generator. The five fire pump engines will be nominally rated at 350-hp, and the emergency generator will be nominally rated at 1,550-hp. Operation of the emergency generator will be limited to 500 hr/yr, including up to 100 hr/yr for maintenance and testing. Operation of the emergency fire pump engines will be limited to 104 hr/yr each, including up to 100 hr/yr for maintenance and testing. ULSD fuel will be used exclusively to fire each of these sources. DCP proposed compliance with NSPS Subpart IIII as NOx LAER: 6.4 g/kW-hr (4.8 g/hp-hr) for the emergency generator and 4.0 g/kW-hr (3.0 g/hp-hr) for the fire pump engines. The NSPS Subpart IIII limits are combined NOx plus nonmethane hydrocarbons (NMHC) emissions limits. For the purposes of this proposed Project, NMHC is equivalent to VOC emissions.
A review of the RBLC and other recent permits by PPRP and MDE-ARMA identified emergency generators with limits lower than the NOx emission rate that DCP proposed for the proposed Project (4.8 g/hp-hr). The lowest of these identified was a 2.6 g/hp-hr limit for the Kalama Energy Center emergency generator, which was achieved using good combustion practices. Based on the limited hours of operation of the emergency generator (500 hours/yr, each), the net potential decrease in NOx

DNR – PPRP 150 COVE POINT ERD / DEC 2014
emissions would be 1.8 tpy, should DCP be required to comply with a limit of 2.6 g/hp-hr. Given the degree of emissions associated with achieving lower NOx limits, PPRP and MDE-ARMA feel that there is no environmental benefit in establishing emission limits for the emergency engines below the NSPS limit.
A review of the RBLC and other recent permits by PPRP and MDE-ARMA, summarized in Appendix C, identified fire pump engines with limits below the proposed NOx emission rates for the proposed Project (3.0 g/hp-hr each). The lowest of these was 2.1 g/hp-hr for the Victorville 2 Hybrid Power Project, to be achieved through the use of good combustion practices. Based on the limited hours of operation of the fire pump engines (104 hours/yr, each), should DCP be required to comply with the lowest limit of 2.1 g/hp-hr, the net potential decrease in NOx emissions is 0.04 tpy per engine.
PPRP and MDE-ARMA concur that an emission limit of 6.4 g/kW-hr (4.8 g/hp-hr) based on a combination of NOx and NMHC emissions for the 1,550-hp emergency generator to be achieved through the use of good combustion practices is LAER. PPRP and MDE-ARMA also concur that a limit of 4.0 g/kW-hr (3.0 g/hp-hr) based on a combination of NOx and NMHC emissions to be achieved through the use of good combustion practices for the five 350-hp fire pump engines is LAER. The emergency engines will be designed to meet these emission limits. To monitor hours of operation, DCP will be required to install a non-resettable operating hour meter (or equivalent software) on each emergency engine.
Thermal Oxidizer
The thermal oxidizer controls the off-gas stream from the acid gas process. The off-gas stream consists of mainly CO2 (94%) and H2O (5.7%), with the remainder of the off gas stream consisting of a mix of CH4 (0.28%) and H2S (0.02%). The off gas stream has a combined heating value of approximately 4 MMBtu/hour (HHV). Residual CH4 and H2S are oxidized with the assistance of up to 52 MMBtu/hour of process fuel gas, for a total heat input into the thermal oxidizer of approximately 56 MMBtu/hour.
DCP proposed to use SCR to control NOx emissions from the thermal oxidizer to meet NOx LAER requirements, with an emissions limit of 2.5 ppmvd at 15% O2 based on a three hour averaging period, to apply at all times. DCP did not propose a NOx LAER startup and shutdown limit for the thermal oxidizer.

DNR – PPRP 151 COVE POINT ERD / DEC 2014
It should be noted that the calculated NOx rate for the thermal oxidizer is 0.025 lb/MMBtu based on 56 MMBtu/hour. PPRP and MDE-ARMA determined based on a review of the RBLC and recent permits that there was one BACT determination for a thermal oxidizer with a lower emission rate of 0.02 lb/MMBtu at Shintech Plaquemine. However, upon further review of the Shintech Plaquemine permit application, this limit is based on a manufacturer’s guarantee of 7 ppmvd and a heat input of 72 MMBtu/hr (a combination of natural gas and waste gas). The 7 ppmvd that the emission rate is based on is higher than the 2.5 ppmvd limit for the proposed Project. Therefore, PPRP and MDE-ARMA concur that NOx LAER for the thermal oxidizer is 2.5 ppmvd at 15% O2 (3-hr block averaging period) to be achieved through the use of SCR. DCP will be required to demonstrate compliance based on three 1-hour stack tests (3-hour averaging period), through the use of Method 7E, or an equivalent test method requiring MDE approval.
Also, DCP will be required to design the thermal oxidizer to meet the proposed emission limit at all times. To ensure continuous compliance with NOx, DCP must calculate emissions based on fuel flow and emission factors developed during annual stack testing and must update emissions on a rolling 12-month basis. DCP must also continuously monitor ammonia feed rate, gas stream flow rate, and catalyst bed inlet gas temperature.
During periods of startup and shutdown, DCP must take all reasonable efforts to minimize emissions. DCP will be required to include startup and shutdown emissions in the project-wide cap to minimize emissions during those times.
Flares
The proposed Project will include the installation and use of two flares, a North flare and a South flare. The North flare will consist of 26 pilots each rated at 0.01 MMBtu/hr and the South flare will consist of 12 pilots each rated at 0.01 MMBtu/hr. The pilots will operate continuously and will burn process gas. The annual NOx emission estimates for the flares include emissions from three processes directed to the flares:
• Emissions from LNG ships during ship cool-down (only when
ships come in warm); • Emissions from mixed refrigerant, propane, and feed gas during
plant start-ups (warm and cold start-ups); and • Emissions from unplanned plant emergencies/upset conditions.

DNR – PPRP 152 COVE POINT ERD / DEC 2014
DCP proposed meeting NOx LAER by: ensuring complete combustion of the flare gas through maintaining a pilot flame, following good operating practices, and maintaining proper combustion efficiency. However, DCP did not propose an emission limit associated with this control technique.
Based on the information presented in the CPCN Application, DCP estimates an annual emission limit of 69.0 tpy for the North Flare, and 41.0 tpy from the South Flare. These estimated emissions are based on using the EPA’s AP-42 Section 1.4 (July 1998) for Natural Gas Combustion emission factors of 100 lb/MMscf for the pilots and 190 lb/MMBtu for emissions associated with ship cooldowns and facility restarts. For comparison purposes, this level of NOx emissions is equivalent to 0.015 lb/hr or 0.15 lb/MMBtu per pilot.
The review of the RBLC and other recent permits by PPRP and MDE-ARMA, provided in Appendix C, identified several emission rates lower than 0.15 lb/MMBtu. However, these lower emission rates are for flares that are significantly larger than the DCP flares; approximately 6-50 MMBtu/hr, as compared to 0.1 MMBtu/hr flare pilots for the proposed Project. Therefore, PPRP and MDE-ARMA do not consider these lower emission rates to be representative for the DCP North and South flares. As such, PPRP and MDE-ARMA propose that NOx LAER for the North and South flares is 69.0 tpy and 41.0 tpy, respectively. These are to be achieved through maintaining a pilot flame, following good operating practices, and maintaining proper combustion efficiency. DCP will be required to continuously monitor for the presence of a pilot flame.
Summary
Table 4.5-1 provides a summary of the NOx LAER determination for the proposed Project for each of the following: Frame 7 CTs, auxiliary boilers, emergency generator, fire pump engines, thermal oxidizer, and flares.
Table 4.5-1 Proposed NOx LAER Limitations
Emission Source Control Technology Proposed LAER for NOx
Frame 7 CTs
Use of dry low-NOx combustor turbine design (DLN1), use of facility process fuel gas and pipeline natural
gas during normal operation and SCR system
2.5 ppmvd @15% O2, 3-hr block avg., CEM

DNR – PPRP 153 COVE POINT ERD / DEC 2014
Emission Source Control Technology Proposed LAER for NOx
Frame 7 CTs (Startup
Shutdown events)
Limits on emissions during startup and shutdown events
1,304.5 lb per startup event and 48.5 lb per shutdown event from
both CTs combined, CEM
Auxiliary Boilers
Exclusive use of facility process fuel gas during normal operation and use of a post-combustion SCR system and
low-NOx burners
0.0099 lb/MMBtu, 3-hr block avg., CEM
Auxiliary Boiler (Startup
Shutdown events)
Limits on emissions during startup and shutdown events
2,946.2 lb per startup event and 38.9 lb per shutdown event from each
auxiliary boiler
Emergency Generator
Good combustion practices and designed to achieve emission limit
6.4 g/kW-hr (4.8 g/hp-hr) combined NOx and NMHC Design specification and installation of a
non-resettable hour meter
Fire Pump Engines
Good combustion practices and designed to achieve emissions limit
4.0 g/kW-hr (3.0 g/hp-hr) combined NOx and NMHC Design specification and installation of a
non-resettable hour meter
Thermal Oxidizer Use of SCR system, designed to meet the emission limit at all times
2.5 ppmvd @15% O2, 3-hr block avg., Method 7 stack test or equivalent method approved by
MDE-ARMA
Flares
A pilot flame to be maintained at the North and South flare tips at all times, good operating practices, maintenance of proper combustion efficiency, and designed to achieve emission limits
North Flare – 69.0 tpy South Flare – 41.0 tpy
(12-month rolling avg.)
VOC LAER
Combustion Turbines
VOC emissions from combustion turbines are primarily the result of the incomplete combustion of fuel. For the VOC LAER analysis the following control technologies were assessed.
• Oxidation Catalyst;
• Thermal Oxidation; and
• Good Combustion Practices.
PPRP and MDE-ARMA determined that thermal oxidation was technically infeasible given that the level of VOCs for an already efficient combustion device firing gas - such as the GE 7EA CT proposed by DCP - would already be minimized as much as possible via combustion. The addition of a thermal oxidizer would only result in additional emissions from the burning of fuel, with no discernible reduction in VOC emissions.

DNR – PPRP 154 COVE POINT ERD / DEC 2014
Of the remaining control technologies that were technically feasible, a combination of oxidation catalyst and good combustion practices represent the most effective VOC control.
DCP proposed use of an oxidation catalyst and good combustion practices to achieve a rate of 0.7 ppmvd during normal operations. DCP proposed compliance with an annual emissions limit as VOC LAER for startup and shutdown. Review of the RBLC and recent permits by PPRP and MDE-ARMA identified only one facility that had a VOC limit lower than the proposed DCP limit. Chouteau Power Plant has a VOC limit of 0.3 ppm; however, this facility had a different CT manufacturer and also fires exclusively pipeline natural gas. All other facilities had a VOC emission limit of 0.7 ppmvd or higher. Therefore, PPRP and MDE-ARMA concur that VOC LAER is an emissions limit of 0.7 ppmvd at 15% O2 (as methane) during normal operations, on a 3-hour block averaging period, to be achieved through the use of good combustion practice, the use of process fuel gas and pipeline natural gas, and operation of an oxidation catalyst. Compliance will be demonstrated based on three 1-hour stack tests (3-hour block averaging period) through the use of Method 18, 25A, or an equivalent test method requiring MDE approval.
To ensure continuous compliance with VOC LAER, DCP will be required to utilize CO CEMS data as a surrogate for VOC emissions. DCP will be required to develop a correlation between CO emissions as measured by the CO CEMS and VOC emissions during an initial stack test following EPA Reference Method 18, 25A or equivalent. DCP will be required to operate the CO CEMS to demonstrate compliance with the VOC limits. Stack testing of the CT/HRSG will also be conducted annually after the initial test to verify the CO and VOC emission correlation or to establish a new correlation if conditions have changed. As an alternative to annual stack testing, DCP can choose to demonstrate compliance with LAER through the use of certified VOC CEMS, upon written notification to MDE-ARMA.
PPRP and MDE-ARMA have determined that the Frame 7 CTs will also be subject to the following limits during startup and shutdown. These limits are based on the EPC design specifications provided by DCP in its response to PPRP Data Request No. 4. Also the startup and shutdown emissions must be included in the project-wide annual emission limits. The limits are as follows:
• VOC emissions will be limited to 101.1 pounds per startup event
from both Frame 7 CTs combined, as determined by CEMS.
DNR – PPRP 155 COVE POINT ERD / DEC 2014
• VOC emissions will be limited to 4.8 pounds per shutdown event from both Frame 7 CTs combined, as determined by CEMS.
During periods of startup and shutdown, DCP will be required to take all reasonable efforts to minimize emissions. DCP will be required to design the Frame 7 CTs to meet the startup and shutdown emission limits. DCP will be required to calculate startup and shutdown emissions based on the number of these events and the projected emission factor. DCP will be required to include these emissions in the project-wide cap to minimize emissions during those times.
Auxiliary Boilers
Similar to the CTs, VOC emissions from auxiliary boilers are primarily the result of the incomplete combustion of fuel. The auxiliary boilers are expected to provide efficient combustion of the proposed fuel types. Specifically, during normal operation, each auxiliary boiler will use 100% process gas for fuel. DCP will operate the auxiliary boilers continuously. The boilers will burn primarily boil-off gas during startup, and low pressure fuel mix during shutdown. The auxiliary boilers need to maintain the ability to burn pipeline natural gas during startup and shutdown if the primary fuels are not available.
DCP proposed the use of good combustion practices and an oxidation catalyst to be used to maintain a VOC LAER emission limit of 0.001 lb/MMBtu during normal operations. DCP proposed VOC LAER during startup and shutdown to be compliance with an annual VOC emission limit. Review of the RBLC and recent permits by PPRP and MDE-ARMA did not find any auxiliary boilers permitted with a VOC limit below 0.001 lb/MMBtu. Therefore, PPRP and MDE-ARMA concur that VOC LAER is an emission rate of 0.001 lb/MMBtu, based on a 3-hour block averaging period, to be achieved through the use of good combustion practices, the use of process fuel gas and pipeline natural gas, and an oxidation catalyst. As discussed later in this section, separate LAER limits are proposed to apply during startup and shutdown events. Compliance will be demonstrated based on three 1-hour stack tests (3-hour block averaging period), through the use of Method 18, 25A, or an equivalent test method requiring MDE approval on an annual basis. As an alternative to annual stack testing, DCP can choose to demonstrate compliance with LAER through the use of certified VOC CEMS, upon written notification to MDE-ARMA.
To ensure continuous compliance with VOC, DCP will be required to calculate emissions based on fuel flow and emission factors developed

DNR – PPRP 156 COVE POINT ERD / DEC 2014
during annual stack testing and update emissions on a rolling 12-month basis. DCP must also continuously monitor and record inlet and outlet catalyst bed temperature.
PPRP and MDE-ARMA have determined that the auxiliary boilers will also be subject to the following limits during startup and shutdown. These limits are based on the EPC design specifications provided by DCP in its response to PPRP Data Request No. 4. Also the startup and shutdown emissions must be included in the project-wide annual emission limits. The limits are as follows:
• VOC emissions will be limited to 130.6 pounds per startup event from each auxiliary boiler.
• VOC emissions will be limited to 1.8 pounds per shutdown event from each auxiliary boiler.
During periods of startup and shutdown, DCP must take all reasonable efforts to minimize emissions. The auxiliary boilers will be designed to meet the startup and shutdown emission limits. Startup and shutdown emissions must be calculated based on the number of these events and the projected emission factor. These emission must be included in the project-wide cap to minimize emissions during those times.
Emergency Engines
The proposed Project will operate six emergency diesel- fired engines to support operations, as specified in the CPCN Application. DCP proposed to install five emergency fire pump engines, and one emergency generator. The five fire pump engines and the emergency generator will be nominally rated at 350-hp and 1,550-hp, respectively. Normal operation of the emergency generator and emergency fire pump engines will be limited to 100 hr/yr for maintenance and testing. Each of these sources will be fired exclusively on ULSD fuel and employ good combustion practices to achieve VOC LAER limits. DCP proposed compliance with NSPS Subpart IIII as VOC LAER: 6.4 g/kW-hr (4.8 g/hp-hr) for the emergency generator and 4.0 g/kW-hr (3.0 g/hp-hr) for the fire pump engines. Note that in NSPS Subpart IIII these are combined NOx and NMHC emissions limits. For purposes of the proposed Project NMHC are equivalent to VOC emissions.
A review of the RBLC and recent permits by PPRP and MDE-ARMA identified emergency engines with VOC limits below the NSPS-based NOx and VOC emission limit that DCP proposed for the Project. The lowest of these is 0.01 g/bhp-hr for the Moxie Liberty LLC and Moxie Energy LLC

DNR – PPRP 157 COVE POINT ERD / DEC 2014
facilities. Although these may appear to be a lower emission limit, upon further review of the Moxie permits, these limits, together with the NOx limit would be 4.94 g/bhp-hr. This is higher than the limit proposed by DCP for the proposed Project (4.8 g/hp-hr – combined for NOx and VOC). Similarly, for the next lowest limit identified (Sabine Pass), the combined NOx and VOC emission limit is 12.27 lb/hr or 8.4 g/hp-hr. This is also higher than the 4.8 g/hp-hr limit for the proposed Project. GP Allendale is the only other facility that appears to have a lower emission limit. GP Allendale has a combined NOx and VOC emission limit of 11.72 lb/hr or 3.8 g/hp-hr. Should DCP be required to comply with a limit as low as 3.8 g/hp-hr, the net potential decrease in VOC emissions would be 0.82 tpy. This amount is based on the limited hours of operation proposed for the emergency generator.
A review of the RBLC and recent permits by PPRP and MDE-ARMA identified fire pump engines with VOC limits below the NSPS-based VOC emission limit DCP provided for the proposed Project. The lowest of these is 0.05 g/hp-hr for the Crescent City facility. Similar to the limits for the emergency generator, although this limit appears to be lower, it is not. The combined NOx and VOC emission limit for the Crescent City facility is 9.55 g/hp-hr; this is higher than the proposed 3.0 g/hp-hr limit for the proposed Project. The same is true for the Mankato Power, Oregon Clean Energy Center, and Western Devcon facilities. There are two facilities – Moxie Liberty LLC and Moxie Energy LLC – that have a combined NOx and VOC emission limit of 2.7 g/hp-hr. However, neither of these facilities have been built. Based on the limited hours of operation of the fire pump engines the net potential decrease in VOC emissions is 0.01 tpy per engine, 0.06 tpy total should DCP be required to comply with a limit as low as 2.7 g/hp-hr.
Given the degree of emission reduction associated with achieving lower VOC limits, PPRP and MDE-ARMA believe that there is no environmental benefit in establishing emission limits for the emergency engines below the NSPS limit. Therefore, PPRP and MDE-ARMA agree that the LAER will be the emission limit of 6.4 g/kW-hr (4.8 g/hp-hr) based on a combination of NOx and NMHC emissions for the 1,550-hp emergency generator that DCP can achieve through the use of good combustion practices. PPRP and MDE-ARMA also agree that the LAER will be the limit of 4.0 g/kW-hr (3.0 g/hp-hr) based on a combination of NOx and NMHC emissions that DCP can achieve through the use of good combustion practices for the five 350-hp fire pump engines. DCP will be required to design the emergency engines to meet these emission limits. To monitor hours of operation, DCP will install a non-resettable operating hour meter (or equivalent software) on each emergency engine.
DNR – PPRP 158 COVE POINT ERD / DEC 2014
Thermal Oxidizer
The thermal oxidizer controls the off gas stream from the acid gas process. The off gas stream consists mainly of CO2 (94%) and H2O (5.7%). The remainder of the off gas stream consists of a mix of CH4 (0.28%) and H2S (0.02%), with a combined heating value of approximately 4 MMBtu/hour (HHV). Residual CH4 and H2S are oxidized with the assistance of up to 52 MMBtu/hour of process fuel gas, for a total heat input of approximately 56 MMBtu/hour.
DCP proposed to use an oxidation catalyst to control VOC emissions from the thermal oxidizer to meet a VOC LAER emission limit of 0.03 lb/hr, at all times. For the thermal oxidizer, DCP did not propose VOC LAER for startup and shutdown. A review of the RBLC and recent permits by PPRP and MDE-ARMA found no VOC limits for thermal oxidizers below the proposed DCP limit. Therefore, PPRP and MDE-ARMA concur that VOC LAER for the thermal oxidizer is 0.03 lb/hr. DCP can achieve this through the use of oxidation catalyst. Compliance is based on three 1-hour stack tests (3-hour block averaging period) through the use of Method 18, 25A, or an equivalent test method requiring MDE approval.
To ensure continuous compliance with VOC, DCP must calculate emissions based on fuel flow and emission factors developed during annual stack testing and must update emissions on a rolling 12-month basis. DCP must also continuously monitor and record inlet and outlet catalyst bed temperature.
During periods of startup and shutdown, DCP must take all reasonable efforts to minimize emissions. DCP must include startup and shutdown emissions in the project-wide cap to minimize emissions during those times.
Flares
The proposed Project will include the installation and use of two flares, a North flare and a South flare. The North flare will consist of 26 pilots each rated at 0.1 MMBtu/hr and the South flare will consist of 12 pilots each rated at 0.1 MMBtu/hr. The pilots will operate continuously and burn process gas. The annual VOC emission estimates for the flares include emissions from the three processes directed to the flares:
• Emissions from LNG ships during ship cool-down (only when
ships come in warm);

DNR – PPRP 159 COVE POINT ERD / DEC 2014
• Emissions from mixed refrigerant, propane, and feed gas during plant start-ups (warm and cold start-ups); and
• Emissions from unplanned plant emergencies, and upset conditions.
DCP proposed to meet VOC LAER requirements by ensuring that complete combustion of the flare gas occurs by maintaining a pilot flame at the North and South flare tips at all times, following good operating practices, and maintaining proper combustion efficiency. However, DCP did not propose an emission limit associated with this control technique.
Based on the information presented in the CPCN Application, DCP estimates an annual emission rate of 10.8 tpy for the North Flare, and 4.0 tpy from the South Flare. These emissions are calculated using EPA’s AP-42 Section 1.4 (July 1998) for Natural Gas Combustion emission factor of 5.5 lb/MMscf for the pilots and the gas composition specific for the proposed Project for flare cooldowns and restarts. For comparison purposes, this level of VOC emissions is equivalent to 0.001 lb/hr or 0.01 lb/MMBtu per pilot.
A review of the RBLC and recent permits by PPRP and MDE-ARMA found several facilities with emission rates lower than 0.01 lb/MMBtu. However, all of the lower emission rates are for flares that are significantly larger than the DCP flares (approximately 17-50 MMBtu/hr compared to the DCP 0.1 MMBtu/hr). Therefore, PPRP and MDE-ARMA do not consider these lower emission rates to be representative for the DCP North and South flares. As such, PPRP and MDE-ARMA propose that VOC LAER for the North and South flares is 10.8 tpy and 4.0 tpy, respectively. These are to be achieved through maintaining a pilot flame, following good operating practices, and maintaining proper combustion efficiency. DCP will be required to design the flares to achieve these emission limits. DCP must also continuously monitor for the presence of pilot flame during operations through the use of a thermocouple or equivalent monitoring method.
Piping Component Leaks
The proposed Project will result in fugitive VOC emissions (2.53 tpy) from potential leaks in the piping equipment components. These components include pumps, flanges, connectors, pump seals, and pressure relief valves. A review of recent permits and the RBLC by PPRP and MDE-ARMA determined that VOC LAER is to implement an LDAR program. To meet VOC LAER requirements, PPRP and MDE-ARMA concur that
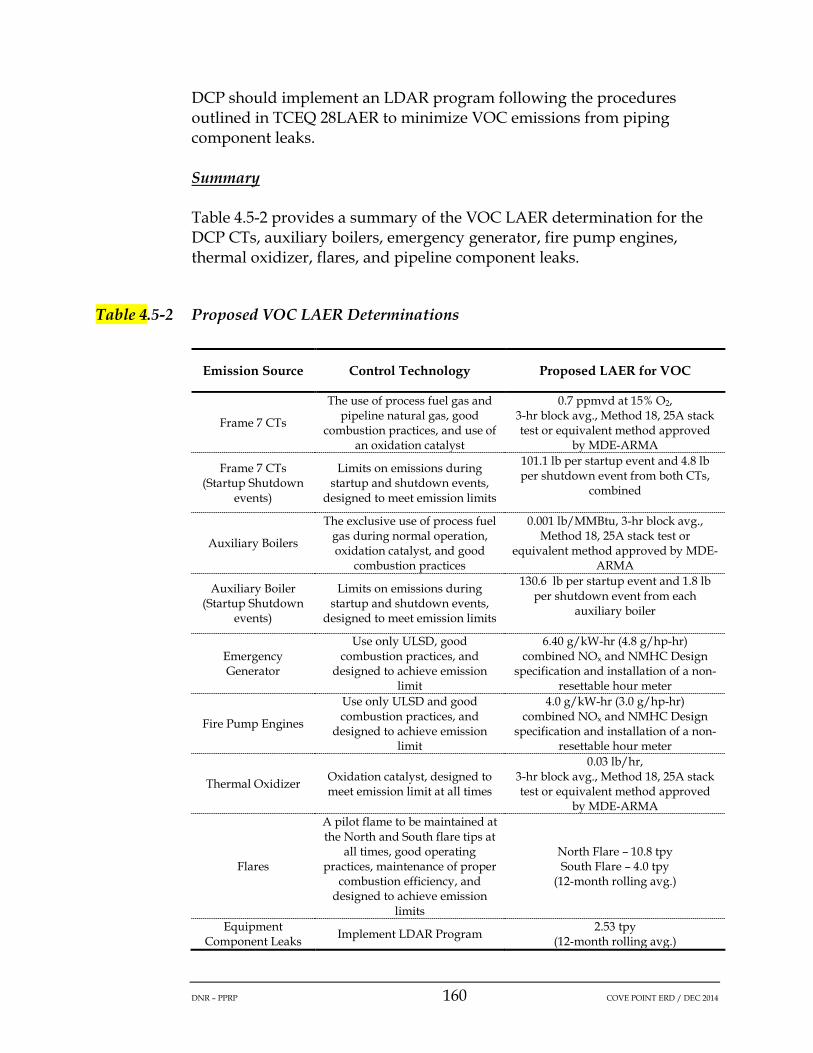
DNR – PPRP 160 COVE POINT ERD / DEC 2014
DCP should implement an LDAR program following the procedures outlined in TCEQ 28LAER to minimize VOC emissions from piping component leaks.
Summary
Table 4.5-2 provides a summary of the VOC LAER determination for the DCP CTs, auxiliary boilers, emergency generator, fire pump engines, thermal oxidizer, flares, and pipeline component leaks.
Table 4.5-2 Proposed VOC LAER Determinations
Emission Source Control Technology Proposed LAER for VOC
Frame 7 CTs
The use of process fuel gas and pipeline natural gas, good
combustion practices, and use of an oxidation catalyst
0.7 ppmvd at 15% O2, 3-hr block avg., Method 18, 25A stack test or equivalent method approved
by MDE-ARMA
Frame 7 CTs (Startup Shutdown
events)
Limits on emissions during startup and shutdown events,
designed to meet emission limits
101.1 lb per startup event and 4.8 lb per shutdown event from both CTs,
combined
Auxiliary Boilers
The exclusive use of process fuel gas during normal operation, oxidation catalyst, and good
combustion practices
0.001 lb/MMBtu, 3-hr block avg., Method 18, 25A stack test or
equivalent method approved by MDE-ARMA
Auxiliary Boiler (Startup Shutdown
events)
Limits on emissions during startup and shutdown events,
designed to meet emission limits
130.6 lb per startup event and 1.8 lb per shutdown event from each
auxiliary boiler
Emergency Generator
Use only ULSD, good combustion practices, and
designed to achieve emission limit
6.40 g/kW-hr (4.8 g/hp-hr) combined NOx and NMHC Design
specification and installation of a non-resettable hour meter
Fire Pump Engines
Use only ULSD and good combustion practices, and
designed to achieve emission limit
4.0 g/kW-hr (3.0 g/hp-hr) combined NOx and NMHC Design
specification and installation of a non-resettable hour meter
Thermal Oxidizer Oxidation catalyst, designed to meet emission limit at all times
0.03 lb/hr, 3-hr block avg., Method 18, 25A stack test or equivalent method approved
by MDE-ARMA
Flares
A pilot flame to be maintained at the North and South flare tips at
all times, good operating practices, maintenance of proper
combustion efficiency, and designed to achieve emission
limits
North Flare – 10.8 tpy South Flare – 4.0 tpy
(12-month rolling avg.)
Equipment Component Leaks Implement LDAR Program 2.53 tpy
(12-month rolling avg.)

DNR – PPRP 161 COVE POINT ERD / DEC 2014
4.5.2 Offsets
In addition to meeting NOx and VOC LAER requirements, triggering NA-NSR also requires that DCP obtain NOx and VOC emission offsets for the proposed Project. In accordance with COMAR 26.11.17, the proposed Project must meet the “reasonable further progress requirements” of the CAA by attaining NOx and VOC creditable emission offsets at a ratio of 1.3 to 1.0.
The NOx and VOC offsets may be from sources located within the ozone non-attainment area in which the proposed Project is located. Specifically, COMAR 26.11.17.04D includes the following requirements:
(1) Generally, ERCs are acceptable if obtained from within the same area as the new or modified emissions unit. The [MDE-ARMA] may allow the owner or operator to obtain VOC or NOx emission reductions from other areas if:
(a) The other area has an equal or higher nonattainment classification than the area in which the emissions unit is located; and
(b) Emissions of the particular pollutant from the other area have been demonstrated to contribute to a violation of the National Ambient Air Quality Standard in the area in which the new emissions unit is located.
(2) The [MDE-ARMA] shall give preference to ERCs from emissions units located as close to the proposed emissions unit site as possible.
Projected NOx emissions from the proposed Project are 279 tpy, this will require 363 tpy of NOx offsets. VOC emissions will be 33 tpy, this will require 43 tpy of VOC offsets.
4.5.3 Additional NA-NSR Requirements
NA-NSR requires that DCP certify that all existing sources owned or operated in the same state as the proposed source are in compliance with all emission limitations and standards under the CAA. In its response to PPRP Data Request No. 1-15, DCP provided that all existing sources owned or operated in the State of Maryland are in compliance with all emission limitations and standards under the CAA.
In its CPCN Application, DCP conducted an alternative analysis where it evaluated four main alternatives: taking no action, making use of other
DNR – PPRP 162 COVE POINT ERD / DEC 2014
existing or proposed LNG facilities to meet the purpose of the Project, meeting the purpose of the Project though conservation of other energy sources, and/or changing the location of the Project. PPRP and MDE-ARMA have reviewed this analysis and consider it to be adequate.
The applicant is also required to demonstrate that the benefits of the proposed source outweigh the environmental and social costs imposed by the construction of the source. Neither potential air emissions from the construction nor operation of the proposed Project are expected to result in significant, adverse local or regional impacts to air quality, or to local vegetation (see Section 4.4.3 and Appendix D).
4.6 APPLICABLE REQUIREMENTS REVIEW
This section briefly outlines the applicable federal and State of Maryland air quality requirements to which the proposed Project will be subject. These are in addition to the PSD and NA-NSR requirements addressed in Section 4.4 and 4.5.
4.6.1 Federal Requirements
4.6.1.1 New Source Performance Standards (NSPS)
The proposed Project will be subject to NSPS 40 CFR §60, Subpart A, which applies to all affected sources (unless specifically stated in the subpart itself) and provides general provisions and requirements (notification, reporting, etc.). The proposed Project will also be subject to the following NSPS subparts:
• 40 CFR §60 Subpart KKKK, “Standards of Performance for Stationary Combustion Turbines”,
• 40 CFR §60 Subpart Db – “Standards of Performance for Industrial-Commercial-Institutional Steam Generating Units”,
• 40 CFR §60, Subpart IIII, “Standards of Performance for Stationary Compression Ignition Internal Combustion Engines”, and
• 40 CFR §60 Subpart Kb, “Standards of Performance for Volatile Organic Liquid Storage Vessels (Including Petroleum Liquid Storage Vessels) for which Construction, Reconstruction, or Modification Commenced After July 23, 1984” as discussed below.
Combustion Turbines
DNR – PPRP 163 COVE POINT ERD / DEC 2014
The two Frame 7 combustion turbines, each rated at a maximum heat input of 1,062 MMBtu per hour, are subject to NSPS 40 CFR §60 Subpart KKKK, Standards of Performance for Stationary Combustion Turbines. The CTs are subject to Subpart KKK, as they will have a heat input at peak load equal to or greater than 10.7 gigajoules (10 MMBtu) per hour, based on the higher heating value of the fuel; and they are planned to be constructed after February 18, 2005. Each of the Frame 7 CTs will be equipped with a HRSG (which is also subject to Subpart KKKK) and is therefore exempt from the requirements of Subparts Da, Db, and Dc.
Based on the requirements set forth in NSPS 40 CFR §60.4320 and Table 1 to Subpart KKKK of Part 60, the NOx emissions from each CT is limited to15 ppm at 15%O2 or 54 nanograms per Joule (ng/J) (0.43 pound per megawatt-hour [lb/MWh] of useful output).
Based on the requirements set forth in NSPS 40 CFR §60.4330, the two Frame 7 CTs will also be required to have a SO2 emission limit of 110 ng/J (0.90 lb/MWh) gross output. As an alternative to this limit, DCP may be prohibited from burning any fuels in the combustion turbines that contains total potential sulfur emissions in excess of 26 ng/J (0.060 lb/MMBtu) heat input.
NSPS 40 CFR §60, Subpart KKKK includes general compliance requirements (40 CFR §60.4333), monitoring requirements (40 CFR §60.4335 through 40 CFR §60.4370), reporting requirements (40 CFR §60.4375-§60.4395), and performance testing provisions (40 CFR §60.4400-§60.4415). To demonstrate compliance with NSPS Subpart KKKK, DCP must install a NOx CEMS meeting the requirements of 40 CFR §60.4345 and DCP must only burn natural gas and/or process gas with sulfur content below the applicable limit.
PPRP and MDE-ARMA have determined that the proposed CTs will comply with all applicable provisions of Subpart KKKK, if constructed and operated as proposed. Although not a part of this CPCN, it should be noted that the existing CT’s are also subject to NSPS, Subpart KKKK.
Auxiliary Boilers
The auxiliary boilers, each rated at 435 MMBtu/hr, are subject to NSPS 40 CFR §60 Subpart Db – Standards of Performance for Industrial-Commercial-Institutional Steam Generating Units. This provision applies to all steam generating units having a heat capacity of more than 29 MW (100 MMBtu/hr). Based on the requirements in 40 CFR §60.44b(a), the NOx emission limit for the two proposed auxiliary boilers is 86 ng/J of NOx
DNR – PPRP 164 COVE POINT ERD / DEC 2014
(0.20 lb/MMBtu). The NOx emission limit will apply at all times, including startup, shutdown, and malfunction. Additionally, pursuant to 40 CFR §60.48b(b), DCP must install a CEMS for NOx and O2 (or CO2) on each of the two auxiliary boilers exhaust stacks. Performance testing will also be required, in accordance with 40 CFR §60.46b(c). Applicable NOx reporting and recordkeeping requirements for the two proposed auxiliary boilers will also be required, as specified in 40 CFR §60.49b.
PPRP and MDE-ARMA have determined that the proposed auxiliary boilers will comply with all applicable provisions of Subpart Db, if constructed and operated as proposed.
Emergency Generator and Fire Pump Engines
The proposed emergency generator, rated at 1,550-hp and each of the five proposed fire pump engines, rated at 350-hp are subject to NSPS 40 CFR §60, Subpart IIII, Standards of Performance for Stationary Compression Ignition Internal Combustion Engines. The proposed emergency generator is a stationary compression ignition (CI) internal combustion engine (ICE) that is manufactured after April 1, 2006, and ordered after July 11, 2005. Thus, it is subject to NSPS 40 CFR §60 Subpart IIII. The proposed fire pump engines are subject to NSPS 40 CFR §60 Subpart IIII since they are National Fire Protection Association (NFPA) fire pump engines manufactured after April 1, 2006 and ordered after July 11, 2005.
Subpart IIII requirements are specific to the type of fuel used. 40 CFR §60.4207 requires that all owners and operators of stationary CI ICE comply with the fuel requirements of 40 CFR §80.510(b). Specifically, all non-road diesel fuel must meet a maximum sulfur content limit of 15 ppm.
Monitoring, compliance, testing, notification, reporting, and recordkeeping requirements are stipulated in 40 CFR §60.4200 through 40 CFR §60.4219, with applicable provisions also found in 40 CFR §60.7 and 40 CFR §60.8. Based on the provisions set forth in 40 CFR §60.4211(f), the emergency generator and each fire pump engine are restricted to operating no more than 100 hours each, per each calendar year for routine maintenance and testing. Table 4.6-1 presents emission limits both for the emergency generator and the five fire pump engines.

DNR – PPRP 165 COVE POINT ERD / DEC 2014
Table 4.6-1 NSPS Subpart IIII Emission Standards for the Emergency Generator and the Five Fire Pump Engines
Emergency Engine Model Year
Units NMHC+NOx CO PM
350-hp Fire Pump Engines1 225<kW<450 (300<hp<600) 2009+
g/hp-hr g/kW-hr
3.0 4.0
N/A N/A
0.15 0.20
1,550-hp Emergency Generator2 Disp<10 and <2,237kW (3,000hp) 2006+ g/kW-hr 6.4 3.5 0.20
Note 1: Emission limits in 40 CFR §60 IIII, Table 4. Note 2: Emission limits in 40 CFR §60.4202 and 40 CFR §89.112, Table 1.
In addition, the diesel fuel combusted in the emergency generator and five fire pump engines must meet the requirements of 40 CFR §60.4207.
PPRP and MDE-ARMA have determined that the proposed emergency engines will comply with all applicable provisions of Subpart IIII, if constructed and operated as proposed.
Volatile Organic Liquid Storage Vessels
The proposed Project will include eight volatile organic storage vessels that are subject to NSPS 40 CFR §60 Subpart Kb, Standards of Performance for Volatile Organic Liquid Storage Vessels (Including Petroleum Liquid Storage Vessels) for which Construction, Reconstruction, or Modification Commenced After July 23, 1984. This standard applies to the volatile organic storage vessels that have a capacity greater than or equal to 75 cubic meters (m3). The eight volatile organic storage vessels included in the proposed Project that are subject to Subpart Kb include the four Propane Make-Up Tanks, two Ethane Make-Up Tanks, and two Condensate Storage Tanks. The two Condensate Storage Tanks are exempt from 40 CFR §60.110b(d)(4) requirements as these tanks have a design capacity less than 1,589.874 m3 and are used for condensate stored, processed, or treated prior to custody transfer. The other six tanks included in the proposed Project are subject to NSPS Subpart Kb requirements. The four Propane Make-Up Tanks and the two Ethane Make-Up Tanks are subject to the requirements of 40 CFR §60.112b(b) as each of these tanks have a storage capacity of more than 75 m3 and contain a volatile organic liquid (i.e., ethane or propane), with a true vapor pressure more than 76.6 kilopascals (kPa).

DNR – PPRP 166 COVE POINT ERD / DEC 2014
To comply with the requirements of Subpart Kb, DCP must employ a closed-loop system such that there are no emissions to the atmosphere from the tanks.
4.6.1.2 National Emissions Standards for Hazardous Air Pollutants (NESHAPs)
Total potential HAP emissions from the existing DCP LNG facility in combination with the new HAP emissions anticipated to be emitted from the proposed Project will result in total DCP facility potential HAP emissions of less than 25 tpy, and emissions of any individual HAP of less than 10 tpy. As a result, the entire DCP facility will still be considered a minor source (i.e., area source) of HAPs.
The emergency generator and five fire pump engines will be subject to 40 CFR §63 Subpart ZZZZ, National Emission Standards of Hazardous Air Pollutants for Stationary Reciprocating Internal Combustion Engines. This requirement is known as reciprocating internal combustion engines (RICE MACT). RICE MACT applies to engines at both major and area sources of HAPs. The only provision of Subpart ZZZZ that applies to the proposed emergency generator and the proposed five fire pump engines is the applicable requirements of NSPS Subparts IIII under 40 CFR §63.6590(c)(1). Section 4.6.1.1 discusses the applicability of 40 CFR §60 Subpart IIII to the proposed Project’s emergency engines.
4.6.1.3 Greenhouse Gas Mandatory Reporting Rule
The DCP facility, including the proposed Project, is subject to the provisions and requirements of the Greenhouse Gas Mandatory Reporting Rule as specified in 40 CFR §98.
4.6.1.4 Acid Rain Provisions
The proposed Project is not an affected source as defined by 40 CFR 72.6. Therefore, the proposed Project is not subject to Acid Rain Provisions.
4.6.2 Maryland State Requirements
The proposed Project will be subject to a number of Maryland air quality requirements, both Project-wide and emission unit specific. These requirements are included in Appendix A, Recommended License Conditions.
DNR – PPRP 167 COVE POINT ERD / DEC 2014
4.6.2.1 Regional Greenhouse Gas Initiative
The State regulates the Regional Greenhouse Gas Initiative (RGGI) under Maryland’s CO2 Budget rules, which are set forth in COMAR 26.09. DCP must comply with all applicable provisions of COMAR 26.09 for the Frame 7 CTs, including monitoring CO2 emissions associated with the production of electricity, as set forth in 40 CFR 75.

DNR – PPRP 168 COVE POINT ERD / DEC 2014
5.0 ANALYSIS OF OTHER ENVIRONMENTAL IMPACTS
5.1 IMPACTS TO AQUATIC RESOURCES
This section describes potential impacts on aquatic natural resources resulting from the construction and operation of the Project.
5.1.1 DCP LNG Terminal
According to DCP, construction at the terminal will have no impacts on the Bay’s aquatic environment at the terminal’s offshore pier. Fish, oysters, crabs, and other aquatic organisms in this area will not likely be directly affected. The proposed Project could, however, indirectly affect aquatic resources upon completion, as a result of increased ship traffic at the terminal.
To minimize potential impacts to surface waters during construction, DCP will implement, to the extent practicable, best management practices (BMPs) that conform to the MDE 2011 Maryland Standards and Specifications for Soil Erosion and Sediment Control, and FERC’s Procedures.
5.1.2 Offsite Areas
5.1.2.1 Offsite Area A
Based on DCP’s description of the proposed Project, construction at Offsite Area A will consist primarily of terrestrial clearing and grading to provide a level surface for use as parking, contractor staging, and equipment assembly areas. Trees and vegetation will be permanently cleared from Offsite Area A, except for areas within 100 feet of streams, wetlands, and other sensitive natural resources. Some areas of steep slopes may also be avoided. The proposed Project will impact one area of aquatic habitat. DCP proposed to construct an access road across part of WUS4 and Wetland 4.
DCP indicates that a bottomless arch culvert will be placed at the location of the stream crossing of WUS4. DCP will fill and grade Wetland 4 at the location of the construction road crossing (refer to Section 5.2.4). The WUS4 crossing will not impact important or unique fish. The placement of the culvert and filling of the wetland will result in a potential loss of ephemeral aquatic habitat in a small area. Nearby areas of similar habitat will remain available. Impacts to WUS4 upstream and downstream from the construction road crossing will be avoided to minimize impacts on

DNR – PPRP 169 COVE POINT ERD / DEC 2014
aquatic resources. The 100-foot buffer around other streams and wetlands will minimize potential impacts to onsite streams, nontidal wetlands, and aquatic resources. DCP will manage stormwater onsite in accordance with the MDE’s stormwater management guidance.
5.1.2.2 Offsite Area B
Offsite Area B is adjacent to the mainstem of the Patuxent River. It experiences, therefore, significant boating, recreational and commercial uses. The fish species listed in the DCP application materials are not comprehensive for this site. Approximately 75 species of fish may inhabit this area due to the site being in a tidal portion of the river, significant spawning habitat being present upstream, and the site’s location relative to the Chesapeake Bay. In addition, DNR is considering alternative uses for the pier to improve public accessibility to the mainstem of the river after completion of the Project. Therefore, PPRP recommends consultation to evaluate possible alternatives. Offsite Area B is also adjacent to the United States Naval Testing Center. DCP should coordinate with the naval site regarding new disturbances, including increased boating traffic. Finally, this site is within an approximately 20-acre Natural Oyster Bar (NOB), which will likely be affected by pier construction and barging activities.
Pier Construction Impacts
According to DCP, potential impacts as a result of construction activities at Offsite Area B are primarily associated with construction of the temporary barge offloading pier. Installation and removal of the piles supporting the temporary pier will cause in-water disturbance. DNR recommends a time-of-year restriction for this NOB from December 16 to March 14 and June 1 to September 30 for any in-river construction work, including pier and piling installation and removal.
Up to 24 hollow steel piles, each of 36 inches in diameter, will be installed using a vibratory hammer to the extent possible, and then driven the remaining distance with an impact hammer, as needed. This will result in the temporary loss of 0.004 acre of benthic habitat within the footprint of the piles. Installation of the piles will re-suspend particulates in the vicinity of the piles, resulting in turbidity. Re-suspended sediment will temporarily decrease visibility near the activity and impair the ability of sight-dependent predatory fish to feed.
Resettling of suspended sediments after pile driving is complete may also cover fish eggs, larvae, and some benthic prey species that may be within

DNR – PPRP 170 COVE POINT ERD / DEC 2014
the local turbidity plume. The extent of this plume is expected to remain close to the pile installation site, although some sediment is expected to reach the nearby NOB. The water column disturbance associated with in-water construction will cause mobile species, such as fish, to avoid the area during construction. Fish species using the area will likely return after construction activities have ceased. Installation of the temporary barge offloading pier will result in a temporary loss of open water habitat, but will also temporarily provide hard substrate within the water column that may provide habitat for epibenthic organisms. The temporary pier will also shade 0.15 acre of water, which will limit visibility in the water column and lower the potential for SAV to develop in the area.
In Maryland, local regulatory and resource agencies typically reference the Woodrow Wilson Bridge construction project (a Potomac River crossing completed in 2006) as a benchmark when considering other pile driving projects. Based on that experience, driving piles with a diameter greater than or equal to 48 inches can cause pressure waves that are lethal to fish. Past coordination with the NOAA Fisheries Service indicated that driving of piles greater than or equal to 48 inches in diameter would require mitigation to dampen the pressure wave effects. Pressure waves would need to be mitigated to six pounds per square inch or below, which is approximately 187 decibel re: 1 μPa•sec (Nichols 2008a). Because the piles for the temporary pier will have a diameter smaller than 48 inches, this is not a concern for the Project.
To further minimize the potential for underwater noise, piles will be vibrated into place using a vibratory hammer rather than an impact hammer. Vibration of the piles will further reduce the underwater pressure waves and noise associated with the Project. If needed to ensure secure pile installation, DCP will drive piles to their final depth with an impact hammer after piles have been vibrated into place to the maximum extent possible.
The proposed Project would differ from the Woodrow Wilson Bridge project in several important aspects, including type of hammer used for primary pile driving activity, number of piles, and total length and cross-sectional area affected. As a part of the proposed Project, DCP will drive substantially smaller piles and will primarily use a vibratory hammer,rather than an impact hammer. The temporary pier will remain in place only during proposed Project construction in order to support equipment offloading. After it is no longer needed, the temporary pier will be removed. DCP will remove piles using a vibratory hammer. If a pile cannot be removed, it will be cut just below the mud line and removed from the water column. After the removal of the piles, the area of

DNR – PPRP 171 COVE POINT ERD / DEC 2014
benthic habitat lost by the installation of the piles will become available for benthic organisms and will likely be recolonized. The removal of the piles will have similar impacts to the installation of the piles.
Barge Operations
During the construction of the proposed Project, an estimated 42 barge dockings will occur at the temporary pier at Offsite Area B. The tugboats pushing these barges will have a draft of approximately 6 feet. The proximity of the barge pier to the NOB raises concern regarding the potential for tugboat propellers to suspend significant amounts of bottom sediments, which could resettle on oysters. Accidental grounding also poses a threat of direct impacts to the NOB.
PPRP recommends that DCP mitigate potential oyster impacts by funding enhancements to the existing resource. This would consist of placing hard substrate if necessary, and spreading oyster spat to seed new growth. DCP is currently working with DNR to develop a mitigation plan that will specify the area to be enhanced and how the enhancement activities will be monitored and evaluated. PPRP recommends that DCP obtain DNR approval on this plan before construction begins at Offsite Area B.
Upon completion of the Project, DCP will dismantle the temporary pier. The materials could be used to provide artificial reef material for the benefit of aquatic life in the area. DNR is in the process of developing specific recommendations and requirements for pier materials to enable this reuse application. The oyster mitigation plan will incorporate these requirements.
5.1.3 Fisheries of Special Concern
According to DCP, after review of the EFH assessment, the NOAA Fisheries Service has no concerns regarding DCP’s findings that there will be no adverse impact to federal resources.
5.2 IMPACTS TO TERRESTRIAL RESOURCES
5.2.1 Wildlife
5.2.1.1 DCP LNG Terminal
According to DCP, the terminal portion of the proposed Project will be constructed within the existing fenced area, and will use the existing

DNR – PPRP 172 COVE POINT ERD / DEC 2014
constructed access road. Additional habitats on site will not be disturbed. FIDS habitat does not occur within the existing fenced area at the terminal. Per the County FIDS mapping, however, clearing within the fenced area will convert some adjacent FIDS habitat to edge habitat.
Wildlife within the project area will likely disperse and move to other nearby habitat areas when construction activities begin. The site will be cleared and graded and wildlife habitat will be lost. In addition to loss of habitat, noise, light, and activities from construction will have both temporary and permanent effects on wildlife. Construction at the terminal will clear a total of 11.8 acres of forested area. Noise and light from construction will also affect wildlife outside the terminal construction area. This will likely cause some wildlife to avoid the area. Other wildlife accustomed to the noise and light from the existing terminal may not be as greatly affected. DCP expects construction activity to occur primarily during daytime hours; greater noise and disturbance is expected to occur during this time.
In its response dated August 9, 2012, USFWS did not identify any bald eagle nests or habitats of concern at the terminal. DNR is not aware of any current bald eagle nests within the operating industrial area of the terminal. However, should any nests be identified, DCP must either manage work at the site in accordance with the National Bald Eagle Management Guidelines, or coordinate further with the USFWS on appropriate mitigation measures.
Within the existing industrial area of the terminal, migratory bird habitat is fragmented and located in close proximity to existing equipment and associated human activity. Higher quality habitat is located outside the operating industrial area of the terminal and this habitat will not be disturbed. Clearing of vegetation can also result in colonization or expansion of invasive plant species, thereby altering remaining habitat. Tree and vegetation removal can result in the direct loss of nests, eggs, and nestlings if clearing occurs within the nesting season. Persistent disturbances relating to noise and human presence can cause birds to leave an area and adults to abandon nests. If nests are abandoned, mortality from exposure, starvation and predation can result in the loss of hatchlings.
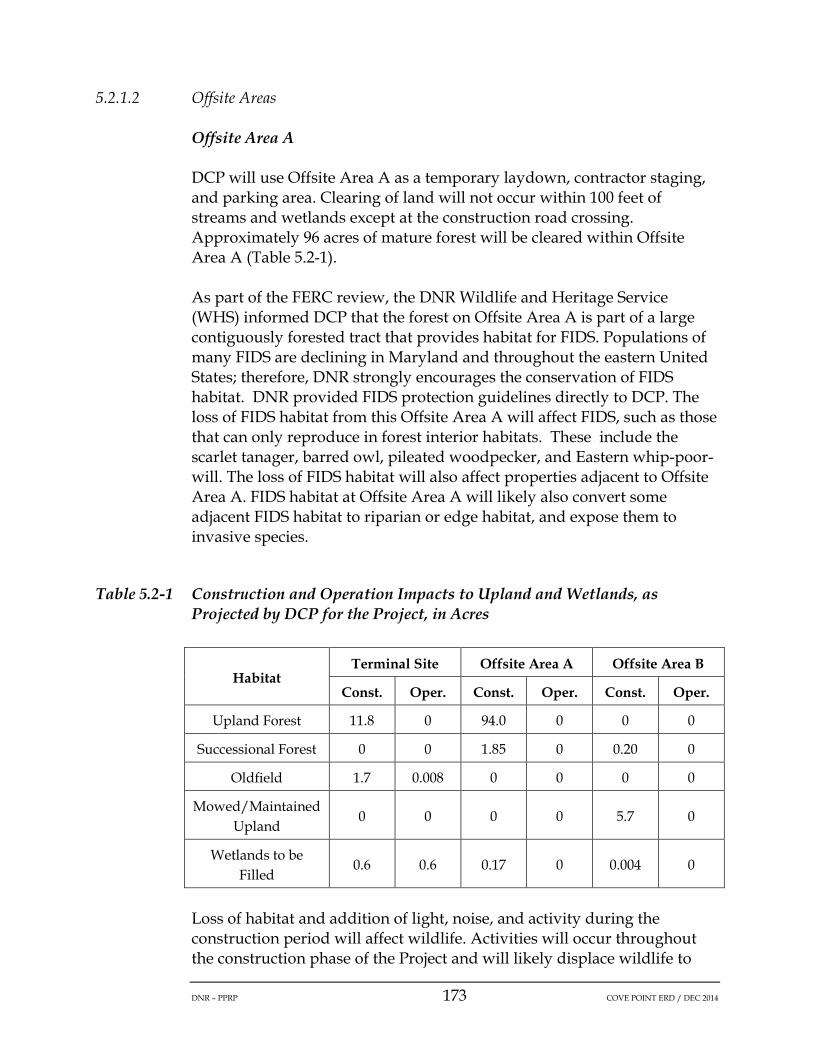
DNR – PPRP 173 COVE POINT ERD / DEC 2014
5.2.1.2 Offsite Areas
Offsite Area A
DCP will use Offsite Area A as a temporary laydown, contractor staging, and parking area. Clearing of land will not occur within 100 feet of streams and wetlands except at the construction road crossing. Approximately 96 acres of mature forest will be cleared within Offsite Area A (Table 5.2-1).
As part of the FERC review, the DNR Wildlife and Heritage Service (WHS) informed DCP that the forest on Offsite Area A is part of a large contiguously forested tract that provides habitat for FIDS. Populations of many FIDS are declining in Maryland and throughout the eastern United States; therefore, DNR strongly encourages the conservation of FIDS habitat. DNR provided FIDS protection guidelines directly to DCP. The loss of FIDS habitat from this Offsite Area A will affect FIDS, such as those that can only reproduce in forest interior habitats. These include the scarlet tanager, barred owl, pileated woodpecker, and Eastern whip-poor-will. The loss of FIDS habitat will also affect properties adjacent to Offsite Area A. FIDS habitat at Offsite Area A will likely also convert some adjacent FIDS habitat to riparian or edge habitat, and expose them to invasive species.
Table 5.2-1 Construction and Operation Impacts to Upland and Wetlands, as Projected by DCP for the Project, in Acres
Habitat Terminal Site Offsite Area A Offsite Area B
Const. Oper. Const. Oper. Const. Oper.
Upland Forest 11.8 0 94.0 0 0 0
Successional Forest 0 0 1.85 0 0.20 0
Oldfield 1.7 0.008 0 0 0 0
Mowed/Maintained Upland
0 0 0 0 5.7 0
Wetlands to be Filled
0.6 0.6 0.17 0 0.004 0
Loss of habitat and addition of light, noise, and activity during the construction period will affect wildlife. Activities will occur throughout the construction phase of the Project and will likely displace wildlife to

DNR – PPRP 174 COVE POINT ERD / DEC 2014
nearby habitats where construction-related activity is not ongoing. Noise and light from contractor activities has the potential to affect wildlife outside the Offsite Area A limit of disturbance. This may cause some wildlife to avoid the area. DCP expects construction activity to occur primarily during daytime hours, with greater noise and disturbance expected to occur during this time.
Clearing of vegetation can also result in colonization or expansion of invasive plant species, which will alter remaining habitat. Tree and vegetation removal can result in the direct loss of nests, eggs, and nestlings if clearing occurs within the nesting season. Disturbance from noise and human presence can cause birds to leave an area and adults to abandon nests. If nests are abandoned, mortality from exposures, starvation and predation can result in the loss of hatchlings.
According to DCP, mitigation at Offsite Area A to reduce impacts to migratory birds will include:
• Maintaining 100-foot buffers along streams, wetlands, and other sensitive resources (threatened and endangered species and their habitats, etc.) and avoiding steep slopes where possible;
• Restoration planting, where vegetation and tree removal are temporary, using native vegetation species;
• Clearing and temporary stabilization for erosion and sediment control, to be conducted in 20-acre blocks rather than clearing the entire area at one time (this will allow bird species to relocate from the area);
• Use of BMPs and proper procedures to avoid spills and contamination of aquatic habitats including open water and wetlands; and
• Preserving about 43.7 percent (73.72 acres) of forested habitat on the site.
Offsite Area B
Offsite Area B is a largely mowed and maintained area that provides limited habitat for migratory birds. Use of the site is temporary and DCP will restore the site after the construction phase of the proposed Project. Construction of the barge offloading pier will temporarily affect the Patuxent River adjacent to Offsite Area B.
Clearing along the water’s edge, human presence, noise, light, and equipment unloading and associated activities will affect wildlife found at the site during use of Offsite Area B. DNR has concluded that a Waterfowl

DNR – PPRP 175 COVE POINT ERD / DEC 2014
Concentration Area does not exist at the site. Therefore, time-of-year restrictions are not applicable for waterfowl. DCP, however, has indicated that it will comply with all time-of-year restrictions included as permit conditions. Wildlife is expected to avoid the area during periods of activity at Offsite Area B. Impacts from tree clearing will be temporary, and DCP will replant trees along the water’s edge to restore habitat when Offsite Area B is no longer used. Noise and light from construction activities may extend beyond the boundaries of Offsite Area B. Noise and light impacts will decrease with distance from the site.
Noise and activity from pile driving would cause waterfowl or other aquatic bird species to leave the area until the activity has ceased. Use of a vibratory hammer as the primary pile installation method will minimize the percussive noise and water column disturbance associated with pile installation. Installation of the piles will re-suspend particulates in the vicinity of the piles resulting in turbidity. Re-suspended sediment will temporarily decrease visibility near the activity and impair the ability of sight-dependent diving birds (e.g., common loon [Gavia immer], horned grebe [Podiceps auritus] and other waterfowl) to feed.
Construction at Offsite Area B is not located in a migratory nesting area and impacts will be short-term. DCP has designed the proposed Project to avoid and minimize impacts to migratory birds. DCP will maintain buffers along water features and other sensitive resources. To minimize potential impacts to surface waters during construction, DCP indicated it will also implement BMPs that conform to MDE’s 2011 Maryland Standards and Specifications for Soil Erosion and Sediment Control, as well as FERC’s Procedures. After construction is complete, DCP indicated that it will plant native vegetation in disturbed areas.
5.2.2 Vegetation
5.2.2.1 DCP LNG Terminal
Table 5.2-1 lists the amount of vegetation clearing estimated by DCP for construction of the Project. The undeveloped areas within the terminal’s fence line will be cleared for operation, removing 11.8 acres of forest and 0.008 acres of oldfield habitat. DCP prepared a Forest Stand Delineation and Forest Conservation Plan, as required by Calvert County, Maryland, in consultation with the Department of Community Planning & Building. To meet the County requirements under the Forest Conservation Act, DCP will purchase transferable development rights (TDRs) representing 13 acres to be placed into permanent forest conservation.

DNR – PPRP 176 COVE POINT ERD / DEC 2014
5.2.2.2 Offsite Areas
Offsite Area A
DCP will permanently clear vegetation for the Project on a large part of Offsite Area A, removing about 96 acres of forest (including 94 acres of mature forest and 1.85 acres of successional forest). After construction, DCP will reseed the area with native species. DCP prepared a Forest Stand Delineation and Forest Conservation Plan, as required by Calvert County, Maryland, in consultation with the Department of Community Planning and Building. Forest retention for Offsite Area A will meet the requirements for Calvert County’s Forest Conservation Plan, but DNR recommends additional mitigation to offset the loss of high-quality forest resources. Dominion should plant new forest to replace the trees being removed, at a ratio of 1:1. DCP can use forest preservation in lieu of new plantings, but preservation should be credited at a ratio of 2:1 (i.e., 2 acres of preserved forest would offset 1 acre of forest removal).
DCP’s proposed mitigation includes the preservation in perpetuity of the 102-acre Offsite Area E. This parcel contains approximately 88 acres of forest (all of this forest is mapped by Calvert County as potential FIDS habitat), as well as 24 acres of tidal and non-tidal wetlands. It also possesses over 3,000 linear feet of Hellen Creek and five tributaries, and other ecologically valuable habitats. Table 5.2-2 below lists additional sites that Dominion is evaluating.

DNR – PPRP 177 COVE POINT ERD / DEC 2014
Table 5.2-2 Forest Mitigation Potential
Proposed Action Amount (acres)
Credit Ratio Mitigation Credit (acres)
Preserving additional Forest Retention Area on Offsite Area A above the County’s required retention threshold
1 2:1 0.5
Preservation of forest at Offsite Area E 88.0 1:1 88.0
Purchase of 88 standard TDRs from County locations in connection with preservation of Offsite Area E
88.0 -- --
Preservation Site 1 25.6 2:1 12.8
Presentation Site 2 9.64 2:1 4.82
Planting of forest (Calvert County and/or surrounding areas)
5 to 15 1:1 5 to 15
Total mitigation from above sites 217.24 to 227.24
111.12 to 121.12
Source: DCP
Offsite Area B
DCP will clear the undeveloped areas of Offsite Area B for construction, removing 0.2 acres of successional woodland and 5.7 acres of mowed/maintained area. After construction, DCP will re-seed Offsite Area B with native vegetation.
5.2.3 Wetlands
5.2.3.1 DCP LNG Terminal
Operation of the DCP liquefaction facility will result in the permanent filling of 0.06 acre of nontidal wetlands. These permanent impacts are unavoidable. They will be mitigated under the terms of the Joint Nontidal Wetlands Permit, under development by MDE and the U.S. Army Corps of Engineers (USACE), and the MDE Section 401 Water Quality Certification. On December 11, 2012, DCP met with USACE and MDE to begin the joint wetlands permit application process A follow-up meeting was held with USACE and MDE on February 28, 2013. On March 29, 2013, DCP submitted its joint wetlands permit application to USACE and MDE

DNR – PPRP 178 COVE POINT ERD / DEC 2014
concurrently with its application to FERC. [update status as appropriate when public notice is released]
5.2.3.2 Offsite Areas
Offsite Area A
Construction of Offsite Area A will result in wetland impacts, requiring filling 0.17 acres of nontidal wetland. According to DCP, impacts to the wetland and stream will be temporary, and they will be restored to pre-construction conditions.
The ephemeral and intermittent streams at Offsite Area A are well-defined and appear to be appropriately characterized by DCP. The numerous wetlands and streams on site, including one ground water seep, characterize this site as an important headwater for St. Paul Branch and Hellen Creek. These are both tributaries to the Patuxent River. Offsite Area A is also both privately owned and County-owned property.
The extensive proposed upland forest clearing at this site, and the apparent increase in impervious surface, will likely increase polluted runoff and sedimentation into the stream systems and wetlands, owing to the conversion of stream water from subsurface to surface. This will result in degradation of the existing habitat, increased sedimentation, and increased water temperatures. The ecological importance of the wetlands and intermittent streams are critical. Therefore, DCP must evaluate stormwater management (SWM) using the 2011 MDE standards and by maximizing stream buffers and reforestation, when applicable. DNR encourages DCP and Calvert County to complete an updated, final maximized stream buffer plan to protect the riparian areas and natural infiltration capability throughout the site. They should also incorporate these concepts into the overall Stormwater Management Plan.
DCP also suggests that seasonally high flows may be passing through these systems. These high flows may be exacerbated by increasing impervious surface adjacent to these areas. DCP must minimize surface water runoff into adjacent habitats, and it must maintain the hydrology of Offsite Area A by incorporating innovative SWM designs. However, even with these measures, stream degradation could still occur. Potential stream degradation could include increased bed and bank erosion, reduction in habitat structure, bank destabilization, and increased channelization. DNR strongly recommends: increasing stream buffers at Offsite Area A, to the maximum extent possible; and maintaining site

DNR – PPRP 179 COVE POINT ERD / DEC 2014
hydrological conditions so that existing surface flow remains consistent, while preserving the existing ground water area.
The stream to be bridged at Offsite Area A flows into St. Paul’s Branch, a tributary of Hellen Creek, and is upstream of the Hellen Creek Hemlock Preserve, an isolated stand of Canadian hemlock. The Preserve is the southern-most hemlock forest in the eastern United States. Some species of plants and animals found within this preserve are more typical of Appalachian forest. The sensitivity of this environment should not be underestimated. Upstream sedimentation and pollution introduction will be detrimental to this area.
Offsite Area B
Construction of the temporary barge offloading pier at Offsite Area B will result in filling 0.004 acres of the Patuxent River streambed, which are regulated as tidal wetlands by MDE. DCP has indicated that these construction impacts are unavoidable, and that DCP will mitigate for them under the terms of either the USACE Section 404 permit, the MDE Tidal Wetlands Permit, or the MDE Section 401 Water Quality Certification. On December 11, 2012, DCP met with USACE and MDE for a pre-application meeting to begin the joint permit application process. A follow-up meeting was held with USACE and MDE on February 28, 2013. On March 29, 2013, DCP submitted its joint wetlands permit application to USACE and MDE concurrently with its application to FERC.
5.2.4 Threatened and Endangered Species
5.2.4.1 DCP LNG Terminal
The terminal site possesses an ephemeral stream that flows into an unnamed tributary. The unnamed tributary, in turn, flows into Grays Creek and then ultimately into the Chesapeake Bay. Larvae of two rare dragonfly species have been documented in the small, unnamed tributary to Grays Creek, roughly 500 feet downstream of the anticipated stream and wetland impacts. These dragonflies include Sable Clubtail (Gomphus rogersi, state-listed as In Need of Conservation) and Yellow-sided Skimmer (Libellula flavida, State Rare). In this same section of stream, there are two uncommon dragonfly species, including Brown Spiketail (Cordulegaster bilineata) and Gray Petaltail (Tachopteryx thoreyi). Both of these dragonflies have been identified as being species of Greatest Conservation Need in DNR’s Wildlife Diversity Conservation Plan. The overall DNR goal for the terminal site is to mimic natural infiltration patterns across the site so that water quantity and quality will be

DNR – PPRP 180 COVE POINT ERD / DEC 2014
maintained. In order to minimize sedimentation and changes in stream hydrology from the proposed work, DNR recommends the following:
• Minimizing impervious surface area (methods are outlined in the MDE stormwater management manual);
• Locating impervious surfaces as far as possible from permanent and intermittent streams and their floodplains;
• Designing SWM to meet or exceed the 2011 standards, maximizing the use of nonstructural BMPs dispersed across the site to infiltrate stormwater, maintaining existing hydrology and minimizing surface runoff, and incorporating these concepts into the proposed Stormwater Management Plan;
• Maximizing forest retention and maximizing forested stream and wetland buffers;
• Pursuing BMPs for erosion control including stabilizing soil immediately (within 24 hours). Special efforts should be made to retain fine silt, sand, and clay sediments including the incorporation of redundant/additional control measures in the sediment and erosion control plan to ensure maximum filtration of any sediment-laden runoff (e.g., accelerated stabilization, super silt fence instead of silt fence, second row of silt fence, etc.); and
• Inspecting and maintaining SWM measures on a daily basis to ensure that they are functional from the initial stages through final construction, and correcting problems immediately (within 24 hours).
The adults of the rare dragonfly species at the terminal site should be further protected by avoiding instream work during the emergence and egg-laying stages of their life cycle, normally May 1 through June 30 of any given year. In addition, DNR recommends a time-of-year restriction for any instream work, from March 1 through June 15, to protect spawning resident and anadromous fish.
Finally, DCP determined that the implementation of the ballast water management program to LNG ships at the terminal’s offshore pier will have no operational impacts to shortnose sturgeon (Acipenser brevirostrum) and Atlantic sturgeon (Acipenser oxyrinchus oxyrinchus), including the Gulf of Maine Distinct Population Segment (DPS), New York Bight DPS, Chesapeake Bay DPS, Carolina DPS, and South Atlantic DPS.

DNR – PPRP 181 COVE POINT ERD / DEC 2014
5.2.4.2 Offsite Areas
Offsite Area A
Several rare and uncommon species occur along St. Paul’s Branch and its small tributaries. DNR previously provided DCP with a summary of these species. Some of the species are listed in Table 5.2-3 below. These wetland plant species and odonates are highly vulnerable to changes in hydrology, water chemistry, and water quality that occur with forest clearing and development activity in adjacent uplands.
Table 5.2-3 Some Rare and Uncommon Species Occurring Along St. Paul’s Branch
Scientific Name Common Name State Status (1)
Sagittaria engelmanniana Engelmann’s Arrowhead Threatened
Parnassia asarifolia Kidneyleaf Grass-of-
Parnassus Endangered
Morella carolinensis Evergreen Bayberry Endangered
Cordulegaster bilineata Brown Spiketail Watchlist/GCN
Cordulegaster erronea Tiger Spiketail Watchlist/GCN
(1) GCN= species designated in Maryland’s Wildlife Diversity Plan as being in Greatest Conservation Need
Regarding protection of the rare species known to occur in St. Paul’s Branch and its tributaries, DNR recommends that the measures for protecting rare dragonfly habitat, provided above for the terminal site, should also be applied to Offsite Area A. These protection measures will also offer habitat protection to the rare wetland plant species known to occur in the vicinity. Extensive upland forest clearing is proposed at Offsite Area A, and significant hydrological changes could occur to water quality of the ground water-fed streams and wetlands, both on site and downstream.
Surveys conducted by DCP at Offsite Area A found State-listed Endangered tobaccoweed (Elephantopus tomentosus) at the site. DNR has worked with DCP to pursue protection for the upland habitat that harbors this species, as required under the Forest Conservation Act. DNR requested that DCR identify a block of habitat that encompasses three of the patches of tobaccoweed identified on the property, plus a 100-foot buffer in order to provide habitat connectivity for this population. DNR

DNR – PPRP 182 COVE POINT ERD / DEC 2014
also recommends that a habitat block be identified and protected for the stand of tobaccoweed at the northern end of the parcel. The DNR WHS has reviewed the DCP response to comments regarding the adequacy of rare plant species survey work conducted on Offsite Area A.
Offsite Area B
Work on the upland portion of Offsite Area B will not affect rare, threatened, or endangered species. The NOAA Fisheries Service identified shortnose and Atlantic sturgeon as species that may potentially be affected by the construction, use, and removal of the temporary pier on the Patuxent River. DCP prepared an evaluation of the potential effects on both species of sturgeon and submitted it to NOAA Fisheries Service on February 27, 2012. This determined that the work at Offsite Area B, including the temporary barge offloading pier, is not likely to adversely affect shortnose and Atlantic sturgeon.
5.3 GROUND WATER IMPACTS
Dominion is proposing to use ground water from an existing well completed in the Lower Patapsco aquifer to support the construction of the liquefaction facility and the operation of both the new liquefaction and existing vaporization facility. Impacts to the Lower Patapsco aquifer, and other users associated with the proposed use of ground water, are presented in Section 6.0.
Construction and operation of a power plant has the potential to affect ground water resources in other ways, aside from direct withdrawal. PPRP’s evaluation indicates that the potential for such impacts is very low, as discussed in the following sections.
5.3.1 Construction Impacts
The site does not necessitate construction dewatering, the primary cause of impacts to ground water during construction, because the water table in the surficial aquifer resides 40 to 50 feet below the ground surface. This is based on hydrogeological information collected by GZA GeoEnvironmental, Inc. (GZA) in 2004 and 2012 (DCP Response to PPRP Data Request 1-8b). In 2012, GZA installed a two-inch diameter ground water observation well at a depth of 50 feet below ground surface. No water was measured in the well on two separate monitoring events, in June and July 2012, indicating that the ground water table is below 50 feet, at least during the summer months. Additionally, Dominion indicated

DNR – PPRP 183 COVE POINT ERD / DEC 2014
that the proposed depths of foundations for the equipment and buildings constructed to support the liquefaction process would be no deeper than 5.0 feet below the ground surface (DCP Response to PPRP Data Request 1-8c). Thus, the bottom of the foundations will not intercept the water table.
5.3.2 Routine and Accidental Releases to Ground Water
In Resource Report 2 Water Use and Quality, DCP has indicated that a Spill Prevention, Control, and Countermeasures (SPCC) Plan will be developed and implemented, in accordance with EPA requirements to address refueling, storage and containment of hazardous materials, and spill cleanup and reporting. Proper implementation of the SPCC Plan will protect ground water quality, and prevent accidental releases to ground water.
5.4 SOCIOECONOMIC AND CULTURAL IMPACTS
Socioeconomic impacts from construction and operation of electric generation facilities at Cove Point would contribute to overall impacts from construction and operation of the DCP liquefaction facility as a whole, but would constitute a small part of the Project’s effect on Calvert, surrounding counties and the State. The purpose of the generating station is to provide on-site electricity needed to power the liquefaction facility, which would enable DCP to provide gas liquefaction services for the export of LNG. Moreover, the generating station, as designed by DCP, is closely intertwined with the components of the broader Liquefaction Project at the Cove Point LNG Terminal. For example, the combustion turbines are used both in the liquefaction process and in the electric generation process. Because the generating station is located within and is integral to the liquefaction facility, it is difficult to segregate the generating station from the larger liquefaction facility for purposes of evaluating socioeconomic impacts. This may be why DCP’s CPCN application does not for the most part attempt to parse impacts associated with the generating station from impacts associated with the overall liquefaction project.
Taken alone, economic impacts from the electric generation component are relatively insignificant and would not trigger some of the downstream impacts on land use, traffic or cultural resources that are expected from the LNG liquefaction project taken as a whole. Still, the effects are not separable. As a hypothetical example, one cannot assume that construction worker traffic associated with the power plant does not contribute to congestion at nearby intersections during the peak year of

DNR – PPRP 184 COVE POINT ERD / DEC 2014
construction of the liquefaction facility simply because, alone, the power plant construction traffic does not cause congestion. PPRP’s analysis of the Project’s socioeconomic impacts recognizes the interconnectedness of the potential impacts, as does the mitigation laid out in PPRP’s recommended license conditions.
5.4.1 Employment and Income
Employment and income impacts from construction of the DCP liquefaction facility would be sizable, although only a fraction would be attributable to the electric generation component. An independent analysis of a generic 130 MW conventional natural gas combined cycle facility, for example, estimated an on-site construction labor force of approximately 120 full-time equivalent (FTE) jobs (360 person-years of employment) and $14 million in wage and salary compensation (2012 dollars) over a three year construction period. For the overall liquefaction project, construction requirements amount to more than 6,300 person-years of employment over the construction period, with 2,167 jobs on site in the peak construction year (2015). Considering multiplier effects, the Project would create nearly 12,000 person-years of employment in Maryland during construction. DCP estimates that labor income from construction employment in the state would be in the range of $627 to $779 million (2012 dollars).
Construction expenditures for materials and equipment are expected to be about $975 million (2011 dollars). Since many components are highly specialized and manufactured out-of-state, Maryland would capture only a fraction of the benefit from purchases of equipment. However, DCP estimates that in a mid-case scenario, the Project would generate more than $900 million in value-added state-wide, and $1.7 billion in business sales (2012 dollars).
Once the facility is operational, employment requirements of the facility would be 26 FTE-equivalent jobs, although post-construction employment impacts attributable to electric generation are a fraction of those associated with the Project as a whole. Operations and maintenance (O&M) employment and earnings would have a small positive effect upon the regional economy. Economic multipliers suggest that employment at the facility would add more than 100 indirect and induced jobs and more than $10 million in annual earnings to the state economy. Unlike the construction era, jobs generated both directly and indirectly by the Project would be permanent over the facility’s operational life.

DNR – PPRP 185 COVE POINT ERD / DEC 2014
Other economic benefits from operating the facility would be O&M expenditures on goods and services. DCP estimates that non-labor O&M expenditures would generate nearly $26 million in value-added in Maryland on sales of more than $65 million annually.
DCP’s construction labor demand is significant in the context of Southern Maryland’s economy. In 2008, there were 7,850 persons in construction and extraction occupations in the Southern Maryland workforce investment area (Calvert, Charles and St. Mary’s counties). The Maryland Department of Labor, Licensing, and Regulation (DLLR) expects this to increase to 8,640 occupations by 2018 (DLLR 2013b). Combined with other nearby counties in Maryland, more than 100,000 people are projected to be skilled in construction and extraction occupations in 2018. To the extent that Maryland’s construction labor force has the skills to construct a natural gas liquefaction facility, this suggests that Maryland labor will satisfy construction worker demand for DCP, much of which resides within daily commuting distance of the construction site.
5.4.2 Population and Housing
The degree to which population and housing are affected by construction of the liquefaction facility will depend largely upon the number of workers who migrate with their families into the region. As noted, a substantial pool of construction labor resides in Southern Maryland and nearby counties. This would reduce migration into the region. However, shortages of particular skills among local construction workers could stimulate in-migration during the construction period, and DCP’s EPC contractor would relocate its core project team to the county.. Still, DCP and its EPC contractor have executed a Project Labor Agreement suggesting that most construction jobs will go to local union members living in Calvert and nearby counties.
Construction workers recruited from outside the area would likely reside in transient accommodation, although some might permanently migrate to Southern Maryland. In addition to more than 2,800 hotel, motel and B&B rooms in Southern Maryland (Maryland Office of Tourism, 2013), there were 33,780 housing units in Calvert County in 2010, and more than 580,000 in the adjacent counties of Anne Arundel, Prince George’s and St. Mary’s (MDP undated). In that year, vacancy rates were 8.6% in Calvert, 6.2% in Anne Arundel, 7.4% in Prince George’s, and 8.9% in St. Mary’s, indicating nearly 44,000 vacant units in the four counties, of which more than 32% were rental properties. Nearly one-half of the vacant units in Calvert County and one-third in St. Mary’s County were for seasonal, recreational, or occasional use (Table 5.4-1). If vacancy rate trends have

DNR – PPRP 186 COVE POINT ERD / DEC 2014
continued since 2010, there would be adequate housing for in-migrating households.
Table 5.4-1 Status of Vacant Housing in Calvert and Surrounding Counties, 2010
Calvert County
St. Mary's County
Anne Arundel County
Prince George’s County
For rent 392 960 3,589 9,246
Rented, not occupied 43 54 278 405
For sale only 469 514 2,458 5,095
Sold, not occupied 93 127 478 656
For seasonal, recreational, or occasional use
1,275 1,231 2,892 676
Other vacant 635 792 3,189 8,062
Total: 2,907 3,678 13,184 24,140
Source: U.S. Bureau of the Census, Census 2010. Prepared by the Maryland Department of Planning
Few population and housing impacts would be attributable to the electric generation component of the Project since only a fraction of the labor force is expected to be employed to install the HRSGs and associated equipment. Occupational skills for constructing generation facilities are anticipated to be available locally.
Conversion of the terminal to a liquefaction facility is expected to increase direct employment by 26 jobs on average through 2040, and create indirect and induced jobs in Calvert County and surrounding areas. Whether these jobs are filled by local residents is unknown, but even if most are filled by migrants, the effect on population and housing would be insignificant.
5.4.3 Transportation
During construction, Calvert County would see an increase in traffic on major roads leading to the construction site, particularly during the peak construction period when more than 2,000 construction workers are on-site. During shift changes, local traffic congestion is expected at intersections near DCP, and traffic volumes could cause periodic delays

DNR – PPRP 187 COVE POINT ERD / DEC 2014
until distance from the site distributes traffic throughout Southern Maryland’s highway network. Because the projected operational workforce is much smaller, post-construction traffic impacts are expected to be insignificant.
To quantify traffic impacts, DCP conducted a traffic impact study (Lenhart, 2012). The study area consisted of the intersections of MD 2/4 with MD 497 (Cove Point Road), MD 497 with MD 765 (H.G. Trueman Road), MD 497 with Little Cove Point Road, and MD 497 with the DCP site entrance. The intersection of MD 497 and MD 765 is signalized, while the remaining intersections are stop-controlled.
To satisfy Calvert County’s Adequate Public Facility Ordinance (APFO) requirements, DCP used the Highway Capacity Software (HCS) methodology to analyze post-construction traffic impacts. Using this methodology, level of service (LOS) is defined in terms of the average total vehicle delay of all movements through an intersection. LOS categories “A” through “F” identify different levels of service. Free flow, where the average delay is less than ten seconds, is assigned LOS A, while forced flow (> 80 seconds) is assigned LOS “F.” HCS also assigns LOS to individual turning movements in an intersection. For the construction phase, the performance of intersections was measured using Critical Lane Volume (CLV) analysis to determine a LOS, as mandated by the Maryland State Highway Administration (SHA). CLV analysis entails summing the highest through movement volumes plus the opposing left hand turns for each signal phase (the critical volume for that phase) and compares this to a theoretical capacity value of 1,600 vehicles per hour. Congested intersections are assigned LOS ratings of “E” or “F”, where LOS “E” indicates a CLV between 1,450 and 1,600. The CLV for an intersection rated LOS “F” exceeds 1,600 vehicles per hour (vph). LOS “D” or better is considered acceptable.
DCP’s CLV analysis of existing conditions found that all intersections currently operate at LOS A in the morning and evening peak hours, but the HCS methodology indicated that MD 497 traffic turning left onto southbound MD 2/4 is experiencing unacceptable delays. DCP recommended installation of a traffic signal at the intersection of MD 2/4 and MD 497 to improve the LOS for this traffic movement. Installation of the traffic signal would also facilitate the traffic flows to and from Offsite Area A, where most construction workers are expected to park. Therefore, DCP has recommended the intersection be signalized for the construction phase of the Project with a full, four-way traffic signal. DCP’s HCS analysis also projected that vehicles turning left onto MD 497 from Little Cove Point Road would experience LOS “E” during the morning peak

DNR – PPRP 188 COVE POINT ERD / DEC 2014
period in post-construction years, and recommended construction of a right-turn lane from eastbound MD 497 to southbound Little Cove Point Road to reduce delays.
Analysis of construction era traffic impacts identified several additional improvements to the intersection of MD 2/4 and MD 497 to improve traffic flows and highway safety. These included lengthening the southbound left turn lane onto MD 497; installing a left turn lane on MD 2/4 to provide a queue area for construction workers turning into Offsite Area A; and constructing left turn, through, and right turn lanes on the east leg of MD 497 at MD 2/4. The traffic impact study (TIS) also recommended temporary use of a construction access road from MD 497 east of the existing site driveway. This access road was last used for the Cove Point Expansion Project and will need to be re-established for this Project.
The SHA concurs with the findings of the TIS and will not require the submission of any additional traffic analyses for the Project as currently proposed (SHA 2012a). An access permit will be required for all construction within the SHA right of way. Calvert County also concurs that recommended improvements satisfy post-construction APFO requirements. PPRP has recommended a licensing condition requiring DCP to obtain any required permits from the District Office of the Maryland SHA and Calvert County Department of Public Works (DPW), as appropriate.
Transport of oversized and/or overweight equipment from Offsite Area B could also affect traffic during construction, although it is uncertain whether any equipment exclusively associated with electric generation would be shipped to DCP via barge. DCP indicated that it may barge the two combustion turbines to Offsite Area B. DCP did not identify a designated truck route, but trucks exiting Offsite Area B would presumably turn left onto Solomons Island Road and access MD 2/4 either from Thomas Johnson Road or H.G. Trueman Road. Solomons Island Road is classified as a Major County Road between Lore Road and Charles Street.
To the extent that any loads of materials or equipment for the Project are oversized or overweight, the SHA requires hauling permits when moving these loads (SHA 2008). Oversize loads exceed 8 feet 9 inches in width, 13 feet six inches in height, or 55 feet in length. Overweight loads exceed 45 tons.

DNR – PPRP 189 COVE POINT ERD / DEC 2014
State hauling permits pertain only to State-maintained roads and bridges. While transport of oversize/overweight loads would be mainly over State roads, Offsite Area B is accessed from Solomons Island Road, a County road (CO 1090). In addition, a County road would connect MD 2/4 with Offsite Area A. Calvert County does not issue hauling permits for local roadways. However, the County does require a bond for oversize/ overweight vehicles traveling over County roads in the event that the road surface is damaged (Carlson 2013). There is no specific weight limit that triggers the bond requirement, but in general, multi-axle vehicles larger than dump trucks require bonding. If a road surface is damaged by oversize/overweight vehicles during construction of the liquefaction facility, DCP would be required to remedy the damages. PPRP has recommended a licensing condition requiring DCP, prior to dispatching oversize/overweight vehicles to the Project’s staging or construction sites, to comply with all weight and size restrictions and/or bonding requirements on all State and Calvert County roadways and to obtain appropriate oversize/overweight approvals, as necessary. There are no designated truck routes in Calvert County. However, DCP should submit a travel routing plan to the Calvert County DPW prior to dispatching oversize/overweight vehicles to the staging or construction sites in the event that county personnel are needed to remove signs or other obstacles that could be damanged or impede transport.
DCP should also dispatch large equipment from Offsite Area B at night in order to mitigate disruptions to traffic, a recommendation to which DCP has already agreed.
5.4.4 Land Use
Within Maryland, permanent land use impacts associated with construction and operation of the DCP liquefaction facility are expected to be confined to the existing fenced area that currently houses landside components of the LNG import terminal. Direct impacts to land use at the terminal would permanently consume 59.5 acres within the fenced area, which is zoned industrial and has, for the most part, been graded and developed. Additional land would be used for a temporary access road from Cove Point Road to the construction site. Aerial photographs indicate that an access road existed at the same location during the Cove Point Expansion Project from 2006 to 2009.
During construction, the Project would also disturb 96.9 acres of Offsite Area A, and 5.9 acres of Offsite Area B. Offsite Area A, comprising 100 acres owned by DCP and 79.4 acres leased from Calvert County, would be used for laydown/staging and construction worker parking. Offsite Area

DNR – PPRP 190 COVE POINT ERD / DEC 2014
B would be leased to host a temporary pier for offloading materials and equipment, a staging area, parking area, and an access driveway to Solomons Island Road.
Development of Offsite Area A for construction staging and parking would require the clearing of 95.8 acres of forest. Post-construction, the access road would be removed and a stream restored to pre-construction conditions. The leased portion of the site was platted in 1994 as the Waterford subdivision consisting of 48.23 acres divided into 24 lots, and a conservation easement of 27.59 acres of open space and one acre of dedicated recreation area. The subdivision was purchased by the County in 1995, but no lots were sold. The County has proposed abandoning the development whereby the replat would remove the recorded Deed of Conservation Easement from the property (DCPB 2013b). DCP has proposed donating the 100-acre parcel it owns to Calvert County after the modifications to the DCP facility are complete.
Approximately 5.7 acres of Offsite Area B would be graded for offloading equipment from barges and staging it for transport to the terminal construction site. The pier at Offsite Area B would be removed and disturbed land would be restored after construction of the liquefaction facility is complete. Offsite Area B is within Planning Sub-Area C in the Solomons Town Center Master Plan and Zoning Ordinance (BCC 2009). This area is considered to be a prime entry point for residents and visitors to Solomons. The property, itself, is within an undeveloped part of Solomons and is designated an Agricultural Preservation District, an Overlay District which imposes special regulations in addition to those associated with the primary zoning (Town Center) for the parcel. The parcel is not under easement and, therefore, is not permanently protected by State or County land preservation programs.
Offsite Area B is entirely located in the Chesapeake Bay Critical Area and is designated to be within a Limited Development Area (LDA). LDAs are those areas which are currently developed in low or moderate intensity uses. Calvert County’s Critical Area regulations are codified in Article 8 – Environmental Requirements of its Zoning Ordinance (CBP 2013). A permit is required for all development projects in the Critical Area. Significant actions in the Critical Area, as defined in Article 8, require Critical Area Commission (CAC) staff review. Earlier this year, DCP entered into consultation with Calvert County and the CAC regarding development of Offsite Area “B” and in October, Calvert County sent its Critical Area Consistency Report to CAC. CAC approval awaits issuance of a wetlands permit.

DNR – PPRP 191 COVE POINT ERD / DEC 2014
While direct and permanent impacts to land use would be confined to the terminal site within an area that has already been substantially developed for LNG operations, land use in Offsite Area A would be permanently changed in terms of its natural resource value. However, the land would presumably be reclaimed from its temporary use after title is transferred to the County. Replatting the County-owned part of Offsite Area A from a residential subdivision so that it can be leased to DCP for construction staging and parking would remove a Deed of Conservation on approximately 28 acres of the 79.4-acre parcel. With respect to Offsite Area B, construction of a barge pier and offloading area would preempt 5.7 acres of the 11-acre parcel from existing uses, although the upland area would continue to serve as an overflow parking area for special events at the Calvert Marine Museum. Post-construction, DCP will restore Offsite Area B to its original condition with the barge pier removed.
Few indirect impacts on land use are expected from the Project. The DCP LNG facility is buffered from surrounding land uses by a forested area, most of which is in conservation easement; a state park; and a County-operated recreational facility. Over more than 30 years, DCP has had little direct influence on southern Calvert County’s growth and development. Changes to Offsite Area A are not anticipated to influence nearby land uses. The leased property is adjacent to County-owned land that is part of the Appeal landfill and is heavily forested. Neither it, nor the purchased 100 acres, is currently developed. Restoration of Offsite Area A from its temporary purpose is expected to restore the site’s consistency with current zoning (RCD). Post-construction, land use change at Offsite Area B is likely to be influenced more by Solomons’ growth and development than by the Project. Although the terminal site is within an Agricultural Preservation District zoning overlay, the property is not under easement. The Solomons Town Center Master Plan recommends evaluating the Zoning Ordinance land use chart for properties in this sub-area if the Agricultural Preservation District designation is removed (BCC 2009).
5.4.5 Property Values
The DCP LNG facility has operated in southern Calvert County for more than 30 years. Over that time the County’s population has grown by more than 250 percent. Of 377 residential structures within one mile of the DCP facility (as of 2011), 323 were built after the facility commenced operations in 1978. This suggests that housing demand has not been significantly affected by proximity to DCP. Extensively buffered by surrounding forest, much in land preservation easements, the facility is mostly isolated from its neighbors.

DNR – PPRP 192 COVE POINT ERD / DEC 2014
Even if current property values were affected, it is unlikely they would be further influenced by the proposed modifications, particularly the electric generation component of the Project. DCP has addressed noise concerns by proposing to construct a sound barrier within the fenced perimeter of the site, and modifications are not expected to change the facility’s existing profile. Neighboring property values are more likely to be influenced by factors other than the operation of the Cove Point liquefaction project and the temporary construction-related activities at Offsite Area A and Offsite Area B.
5.4.6 Visual Quality
The DCP liquefaction facility would be located within a 131-acre fenced area, itself within a 1,017-acre site in southern Calvert County. Most of the undeveloped part of the site is forested and protected under conservation easements. Calvert County holds an easement for 91 acres which has been developed for recreational activities. Since the perimeter of the fenced area is less than one-tenth of a mile from Cove Point Road, vegetation only partly buffers views of the facility from that direction, particularly in winter when foliage is reduced. Otherwise, the facility is not visible from the surrounding area other than from the crest of the Governor Thomas Johnson Memorial Bridge, which is nearly six miles away. However, foreground views of Solomons and the Patuxent River, not distant views of the DCP LNG facility, dominate views from the crest of the bridge.
Along Cove Point Road, LNG storage tanks are the most striking reminder of DCP where the facility is visible. Existing generation facilities have a relatively low profile. DCP notes that none of the equipment associated with the Project would be taller than the existing LNG storage tanks. DCP did not identify construction equipment, but cranes would likely be visible on occasion, as would construction vehicles entering the site via the temporary access road. The proposed 60-foot sound barrier installed along the west and south sides of the site would be partly visible from Cove Point Road but not from the Calvert County recreation facility. DCP has proposed installing additional vegetative screening where needed to mitigate views from nearby properties.
Additional outdoor lighting would add to the luminance of the DCP liquefaction facility although these modifications would be confined to the fenced area and access road. Outdoor lighting is required on all new and modified Project components to satisfy operational, OSHA and Department of Homeland Security requirements. PPRP has recommended a licensing condition requiring DCP to develop a lighting distribution plan to mitigate intrusive night lighting and avoid undue glare onto
DNR – PPRP 193 COVE POINT ERD / DEC 2014
adjoining properties. The condition requires the plan to conform to Calvert County Zoning Ordinance 6-6.01 – Outdoor Light.
5.4.7 Government Finances
During construction, revenues from taxes on construction worker wages, income taxes on indirect and induced employment incomes, and sales taxes on consumption expenditures would accrue to Maryland and local governments. Depending on where construction labor resides and where materials and supplies are procured, nearby states would reap fiscal benefits as well. However, as most of the construction labor force is expected to be drawn from workers living in Calvert, St. Mary’s, Charles, Prince George’s, Anne Arundel, and other nearby counties, including those in northern Virginia, the Project would generate the most income tax revenues in these jurisdictions.
Once operational, the most significant revenue impact to Calvert County would be from property taxes. DCP is the second largest tax payer in the county (DFB 2012). Property tax revenues from all sources are projected to be $137.2 million of total revenues ($305.6 million) in FY 2014. In its application, DCP estimated that the Project would generate approximately $40 million annually in new property tax revenue. However, in November 2013, the Calvert County Board of County Commissioners approved a five-year Payment in Lieu of Taxes (PILOT) and tax relief agreement with DCP that includes a one-time payment in FY 2018 of $25 million and guarantees $15.1 million in annual payments on existing equipment for the duration of the PILOT. After the PILOT term, DCP will receive 42 percent relief on real and personal property taxes for nine years, after which the facility will become taxable at 100 percent of its value. Calvert County estimates that it will receive on average $55 million in total tax revenues annually once the facility is operational.
Construction could marginally affect public services in Calvert and nearby counties. Impacts, to the extent they occur, would be most pronounced in Calvert County. Population effects from in-migrating construction workers and their families have already been discussed. However, the Project could also increase demands upon State and County emergency services, particularly fire, rescue, and police services, particularly when construction traffic is added to other commuting traffic. Injuries from accidents at the construction site could place additional demands on rescue and medical services.
DCP would provide some degree of occupational health on-site, including emergency response. The County’s fire, rescue, and EMS service would be
DNR – PPRP 194 COVE POINT ERD / DEC 2014
available through the 9-1-1 dispatch center to provide additional resources as necessary. Emergency services in response to offsite incidents would be dispatched through 9-1-1, as well. The Solomons Volunteer Rescue Squad and Fire Department (VRSFD) Company would be the first unit to respond to emergencies at the site.
Local fire, rescue and EMS companies have operated in an environment that includes the Calvert Cliffs Nuclear Power Plant and the DCP LNG terminal for many years. DCP meets with Calvert County emergency management and fire department personnel regularly, and many first responders have attended specialized LNG fire suppression training courses. As a result, the County believes that resource levels are adequate for the additional incident response activity anticipated during DCP’s expansion (Richardson 2013).
Still, Calvert County’s fire, rescue, and EMS department is a volunteer system, and construction at the terminal site could strain local resources. DCP has stated that it plans to minimize impacts on emergency services through training and close cooperation among DCP contractors. In addition, Solomons VRSFD Chief Officers will be working with DCP to provide additional refresher training and drills as the project moves forward. Prior to construction, DCP should contact the County’s fire, rescue, and EMS department to address site safety/EMS coverage during construction, and to establish timely response options and facilitate emergency vehicle access throughout the site in case of an accident or injury. Where existing emergency response capabilities are determined to be inadequate, DCP should assist these organizations through contributions, training, and general support.
Construction could also require additional police services, particularly for traffic management and incident response, although intersection improvements developed in consultation with SHA are expected to reduce the need for traffic management services by State and County law enforcement agencies. However, added traffic during construction is likely to increase the number of traffic incidents requiring police and/or EMS response.
Construction and operation of the DCP liquefaction facility would have a minor impact upon the Calvert County DPW. DPW would be responsible for reviewing and issuing the grading permit for the site and would provide personnel during the transport of oversized/overweight loads on County roads. Since access to the site is via State roads, the DPW would have no official role in the design or permitting of traffic mitigation facilities, although it would provide input to the SHA. Solid waste from

DNR – PPRP 195 COVE POINT ERD / DEC 2014
construction would be handled privately by DCP, and would not use the county’s solid waste disposal facilities (Carlson 2013).
In summary, given a significant post-construction tax revenue stream and minimal project-related outlays from county budgets for public services during construction and operation, the net fiscal impact of the DCP liquefaction project on Calvert County is expected to be extremely favorable.
5.4.8 Cultural Impacts
Construction of the DCP liquefaction facility would include clearing and grading, installation of pilings and underground utilities, foundation construction, and erection of equipment and buildings. Most potential effects on cultural resources would be within the terminal site, along with Offsite Area A and Offsite Area B, although some visual and noise impacts could extend beyond the Project boundaries to nearby cultural resources. Construction of a temporary pier and barge operations at Offsite Area B could potentially affect underwater archeological resources in the Patuxent River. Other nuisance impacts, such as construction worker traffic congestion, could affect cultural resources indirectly by altering the aesthetics of the area. Post-construction impacts on cultural resources would be confined to the terminal site, as both offsite areas would be abandoned after restoration.
Calvert County contains numerous cultural resources, though few are in close proximity to DCP. Construction and operation of the facility would affect even fewer.
As part of DCP’s cultural resource assessment, Phase I archeological surveys were conducted at Offsite Area A and Offsite Area B. No archeological survey was conducted at the terminal site because previous surveys found no cultural resources. The Maryland Historical Trust (MHT) concurs that the terminal site has very little archeological potential and requires no further investigation.
A Phase I archeological survey conducted at Offsite Area A revealed cultural resource deposits in only two shovel test pits, neither of which was considered significant. Additional shovel tests in the area of a previously identified archeological site (18CV301), within the DCP-owned parcel of Offsite Area A, yielded 23 historic period artifacts. This area was identified as a nineteenth century farmstead during an archeological survey conducted in 1989 in support of SMECO’s transmission line expansion. As a result of an absence of supporting archival material as

DNR – PPRP 196 COVE POINT ERD / DEC 2014
well as severe disturbance during ROW clearing for the transmission line, no further archeological work was recommended, nor was the site considered to be eligible for listing in the National Register of Historic Places (NRHP).
DCP’s archeological survey on County-owned property within Offsite Area A also identified a previously unknown historic site (18CV505). Although a lack of substantial cultural materials and supporting documentation resulted in a no further work recommendation, a Phase II evaluation was undertaken at the request of Calvert County’s Staff Archeologist. Excavations revealed structural features and led to the recovery of numerous artifacts suggesting nineteenth century occupancy by slaves or laborers. Since the site retains depositional integrity, it is considered to be eligible for listing in the NRHP and therefore construction and operation of Offsite Area A should avoid this site.
PPRP has recommended a licensing condition requiring DCP to establish an archeological protection zone for site 18CV505 by erecting temporary protective fencing around this area during construction, and avoiding any ground disturbance within the perimeter of this area, except with the written approval of the MHT.
DCP conducted Phase I archeological surveys on both the onshore and offshore parts of Offshore Area B that construction and barge operation activities would potentially disturb. The onshore part of the property was found to have been substantially compromised in the past by dredge spoils during construction of the Governor Thomas Johnson Memorial Bridge. Since the onshore survey revealed no cultural materials of historical significance, DCP recommended no further investigations in areas where soil disturbance did not exceed two feet below current grade. A haul road extending to the offshore pier is not expected to extend below fill depths.
An underwater survey of the offshore part of Offsite Area B identified four underwater targets (01, 03, 06, and 07) that could represent submerged cultural resources and which could be adversely affected unless the sites are avoided. MHT’s review of the Phase I survey generally concurred with the Phase I findings, but also recommended avoidance of three additional targets (08, 09, and 10). Additional Phase I submerged cultural resource assessments on Targets 06 and 08, by DCP’s consultants, determined that both are modern debris and not significant historic cultural resources.

DNR – PPRP 197 COVE POINT ERD / DEC 2014
In its review of DCP’s TIS and proposed roadway improvements to mitigate congestion from construction traffic, the SHA determined that the improvements to MD 497 had the potential to impact historic properties (SHA 2013). Subsequent consultation between DCP and the MHT regarding two sites in the vicinity of the roadway resulted in a determination by the MHT of no effect on these properties.
Visual analysis concluded that the DCP liquefaction facility would not be visible from most public perspectives due to vegetation buffers around the fenced area of development. As a result, views of the facility would be confined to some locations along Cove Point Road where vegetation only partly blocks views of the facility. While there are some properties along Cove Point Road that are listed in the Maryland Inventory of Historic Places (MIHP), their locations are such that they are not expected to be adversely affected by construction or post-construction activities at the Project site. Similarly, most public views of Offsite Area A (from MD 2/4) are expected to be shielded by a 100-foot vegetation buffer along the eastern property line. Activities occurring at Offsite Area B are likely to be visible, particularly from the Patuxent River and Waterman’s Park, although not from Solomon’s historic core.
This suggests that construction and operation of the facility would not significantly affect other existing or emerging State and county cultural components in the lower Patuxent peninsula. A “cluster” (Cluster 10) of the SMHA overlays parts of Calvert and St. Mary’s counties, and MD 2/4 is a designated “corridor.” Clusters and corridors are key elements of the SMHA Tourism Management Plan, where clusters represent a concentration of heritage resources (e.g., museums, historic sites, parks, etc.) and corridors between the clusters represent key linkages that connect various components of the heritage region (SMHA 2003).
The management plan also considers existing and proposed trail systems to be significant nature and eco-tourism attractions to the SMHA, and identifies both the Baltimore and Drum Point Rail Trail and Flag Ponds to Solomons Trail in southern Calvert County as SMHA greenways. The Flag Ponds to Solomons Trail is also identified as a potential greenway by the Maryland Greenways and Water Trails Program. Calvert County has associated the trail with a War of 1812 – Star Spangled Banner Hiking/Biking theme and identifies it as a potential acquisition project in its Land Preservation, Parks and Recreation Plan (BCC 2006). None of these trail systems would be adversely affected by the Project.
As the visual setting of the DCP facility from the Chesapeake Bay is expected to be largely unchanged by the Project, it is unlikely the Project
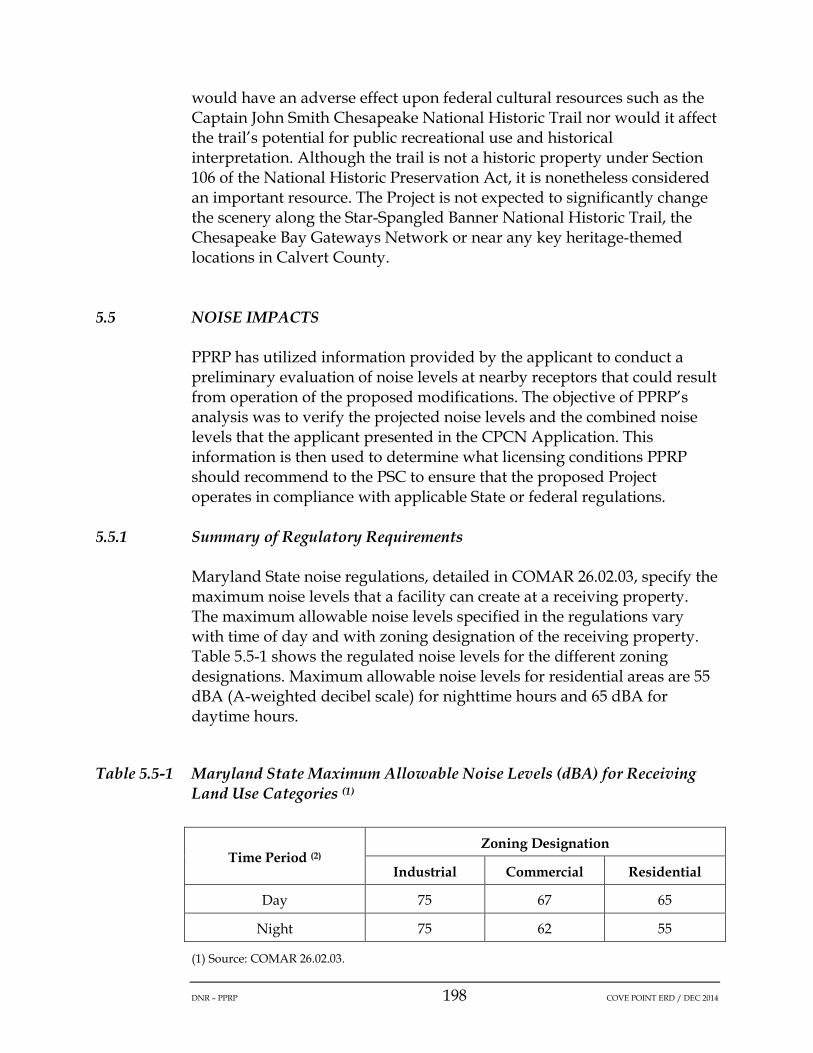
DNR – PPRP 198 COVE POINT ERD / DEC 2014
would have an adverse effect upon federal cultural resources such as the Captain John Smith Chesapeake National Historic Trail nor would it affect the trail’s potential for public recreational use and historical interpretation. Although the trail is not a historic property under Section 106 of the National Historic Preservation Act, it is nonetheless considered an important resource. The Project is not expected to significantly change the scenery along the Star-Spangled Banner National Historic Trail, the Chesapeake Bay Gateways Network or near any key heritage-themed locations in Calvert County.
5.5 NOISE IMPACTS
PPRP has utilized information provided by the applicant to conduct a preliminary evaluation of noise levels at nearby receptors that could result from operation of the proposed modifications. The objective of PPRP’s analysis was to verify the projected noise levels and the combined noise levels that the applicant presented in the CPCN Application. This information is then used to determine what licensing conditions PPRP should recommend to the PSC to ensure that the proposed Project operates in compliance with applicable State or federal regulations.
5.5.1 Summary of Regulatory Requirements
Maryland State noise regulations, detailed in COMAR 26.02.03, specify the maximum noise levels that a facility can create at a receiving property. The maximum allowable noise levels specified in the regulations vary with time of day and with zoning designation of the receiving property. Table 5.5-1 shows the regulated noise levels for the different zoning designations. Maximum allowable noise levels for residential areas are 55 dBA (A-weighted decibel scale) for nighttime hours and 65 dBA for daytime hours.
Table 5.5-1 Maryland State Maximum Allowable Noise Levels (dBA) for Receiving Land Use Categories (1)
Time Period (2) Zoning Designation
Industrial Commercial Residential
Day 75 67 65
Night 75 62 55
(1) Source: COMAR 26.02.03.

DNR – PPRP 199 COVE POINT ERD / DEC 2014
(2) Day refers to the hours between 7 AM and 10 PM. Night refers to the hours between 10 PM and 7 AM.
The State regulations provide certain exemptions for specified noise sources and noise-generating activities. For example, motor vehicles on public roads are exempt from Maryland noise regulations; however, while on industrial property, trucks are considered part of the industrial source and are regulated as such. The regulations also allow for construction activity to generate noise levels up to 90 dBA during daytime hours, but construction may not exceed the nighttime standard for the given zoning designation.
DCP must also comply with noise guidelines set by FERC. Projects under FERC jurisdiction must meet the Ldn of 55 dBA at nearby sensitive noise receptors, such as residences, schools, and hospitals. The Ldn calculation weights nighttime noise more heavily than daytime noise. The FERC requirement of 55 dBA for sound pressure levels is a more stringent requirement than the Maryland state regulations. As a result, the estimated combined sound pressure levels for the DCP modifications must meet the FERC requirement of 55 dBA for the Ldn.
5.5.2 Estimates of Noise Emissions from the Generating Equipment
A list of all the noise sources involved in the proposed Project was given in the Application. The power level for each octave band was also provided for each noise source. PPRP selected the highest noise contributors from the list of sources to estimate the projected sound pressure levels at two receptor locations. To ensure that all estimates would be conservative, the measured distance between each receptor location and the nearest edge of the power block was used to estimate the projected levels. The source power data, expressed as sound power levels in dB, is presented in Table 5.5-2.
The sound power levels for each source assumes a degree of noise control such as: 1) low noise equipment, 2) installing equipment silencers, 3) applying acoustic lagging to piping and ducts, 4) enclosing equipment in buildings, 5) sound barriers, and 6) attenuation due to absorption in air. These control measures are reflected in the source sound power levels provided in the CPCN Application.
PPRP estimated the projected sound pressure level (Lp) for each receptor location using the following formula (Kurze and Beranek 1980):
Lp = Lw + DI - 20 log(r) - Ae - 11

DNR – PPRP 200 COVE POINT ERD / DEC 2014
where:
• Lw is the octave band source sound power level in dB;
• DI is a source directivity factor (we assumed hemispherical spreading, DI = 3);
• r is the distance from the source to the receptor location in meters; and
• Ae is the excess attenuation due to absorption in air, conservatively assumed to be zero.
The projected sound pressure levels for Receptor #1 and Receptor #2 were estimated to be 50.5 dBA and 45.8 dBA, respectively. The corresponding projected Day-Night Sound levels, with the addition of 6.4 dBA to account for the night time penalty, would then be 56.9 dBA and 52.2 dBA.
Table 5.5-2 Octave Band Source Sound Power Levels (dB) (1)
Sources Octave band Frequencies, Hz
dB 63 125 250 500 1,000 2,000 4,000 8,000
Amine Pump
90 93 95 98 98 97 92 84 104
NGL Re-inject
Pump 98 100 100 101 99 96 90 83 107
LNG Prod. Pump
101 103 103 104 102 99 94 86 110
MPHP Disch. Pipe
117 117 105 92 84 78 67 61 120
Propane Transfer
Pump 91 94 96 99 99 98 93 85 105
LNG Loading Pump
97 100 102 105 105 104 99 91 111
Fuel Gas Compressor
110 104 84 70 67 63 53 49 111
Utlstm Gen 122 116 95 81 79 75 65 61 116
BFW Pump 94 97 99 102 102 101 96 88 108

DNR – PPRP 201 COVE POINT ERD / DEC 2014
(1) Source: Appendix B, Cove Point LNG Project, Front end Engineering Design Environmental Sound Pressure Level Study, 24 March 2013.
5.5.3 Comparison to Regulatory Standards and Impact Evaluation
Table 5.5-3 presents the Day-Night Sound levels for the existing sound, the projected sound, and the combined sound at the DCP facility. The combined pressure levels at Receptor #1 and Receptor #2 were found to be 57.2 dBA and 52.6 dBA, respectively.
Table 5.5-3 Final Estimated Sound Pressure Levels at Receptor Locations (1)
Sound Level (1) Receptor #1 (dBA) Receptor #2 (dBA)
Existing Ldn 45.2 42.7
Projected Ldn 56.9 52.2
Combined Ldn 57.2 52.6
(1) Ldn is the Day-Night Sound Level expressed in A-weighted decibels (dBA).
The available information indicates that the units, as presently proposed, will comply with the FERC sound pressure requirements. There is some potential for slight exceedances of the FERC noise standards at Receptor #1. However, the projected levels were calculated using a number of conservative assumptions, such as:
• PPRP’s analysis did not fully take into account the effects of the 60-foot sound barrier wall at the two receptor locations, to the extent that the barrier effects were not incorporated into the data on equipment noise characteristics provided by DCP;
• PPRP’s analysis did not assume any excess attenuation beyond average absorption in the atmosphere, which can have a significant effect on noise propagation over distance; and
• PPRP’s analysis did not take into account any seasonal attenuation effects associated with wind, temperature, and humidity that could also affect noise propagation.
To address these uncertainties, PPRP recommends that the applicant conduct noise monitoring after the liquefaction project is in operation to confirm that facility operations comply with regulatory requirements.

DNR – PPRP 202 COVE POINT ERD / DEC 2014
6.0 WATER SUPPLY
6.1 WATER REQUIREMENTS AND SOURCES
6.1.1 Water for Construction
During the construction of the Project, Dominion has indicated a need for water for fugitive dust mitigation, hydrostatic testing of tanks and piping, and steam flushing. The water requested during construction is in addition to the ground water appropriation the facility currently holds for withdrawal of 40,000 gallons per day (gpd) annual average and 60,000 gpd month of maximum use from the Lower Patapsco aquifer to operate the LNG vaporization system [Permit No. CA1973G114(01)] (Dominion Response to PPRP Data Request 1-6c).
In response to PPRP Data Request 1-6a, DCP provided the breakdown of the construction water demand presented in Table 6.1-1.
Table 6.1-1 Projected Water Demand for Construction
Water Use Projected Demand (gpd)
Fugitive Dust Mitigation 20,000
Hydrostatic Testing 9,000
Steam Flushing (Blow) 7,000
Potable Water 3,000
Concrete Curing, Grout Preparation 1,000
Based on DCP’s response to PPRP Data Request 1-6a-c and responses to PPRP Data Request 1-7a-d, the bases for the uses of water are as follows:
• Fugitive Dust Mitigation – Estimated to need four to five 4,000-gallon water truck loads per day;
• Hydrostatic Testing – Hydrostatic Testing will be conducted sporadically throughout the construction period. The daily average is calculated using an estimated 6,750,000 gallons needed to perform hydrostatic testing, divided by 750 days;

DNR – PPRP 203 COVE POINT ERD / DEC 2014
• Steam Flushing – Steam is used to blow out or clean the auxiliary and HRSG boilers along with the piping upstream of the steam turbines. The steam flushing or blows will occur two to four times during the commissioning phase (DCP Response to PPRP Data Request 1-6b). The daily average demand is based on using 5,250,000 gallons estimated to perform steam blows divided by 750 days. Steam flushing or blows will be conducted over a several week period late in the construction;
• Potable Water – Potable water is only needed for drinking; portable restrooms will be provided and showers will not be provided. The estimate is based on a peak manpower of 2,000 times 1.5 gallons per day; and
• Concrete Curing – Water is required for on-site mixing of cementitious grout, and for curing of concrete and grout. Concrete mixing or batching will not be performed on-site. Concrete curing will be conducted sporadically throughout the construction period. The daily average is calculated using an estimated 750,000 gallons divided by 750 days.
Table 6.1-2 provides the proposed forecast of water demand during construction. This table is based on DCP’s response to PPRP Data Request 1-7d.
Table 6.1-2 Forecasted Timeframe for Construction Water Use
Construction Period Forecasted Water Use
2014 – Q3 through Q4 30,000 – 40,000 gpd
2015 – Q1 through Q2 30,000 – 40,000 gpd
2015 – Q3 through 2016 – Q2 20,000 – 30,000 gpd
2016 – Q3 through 2017 – Q3 40,000 gpd
Dominion requested a modification in the amounts provided below to the existing ground water appropriation from the existing Lower Patapsco Production well to meet the construction water demand:
• Average Daily Use. The annual average water requirement is 40,000 gpd; and

DNR – PPRP 204 COVE POINT ERD / DEC 2014
• Month of Maximum Use. The month of maximum use requirement is 60,000 gpd.
Considering the existing appropriation for the operation of the LNG vaporization process, the liquefaction facility will need a total of 80,000 gpd on an annual average, and 120,000 gpd for the month of maximum use, during the construction period.
With respect to other potential on-site sources of water for construction use, Dominion considered using Chesapeake Bay water, water from Lake Levy and/or Lake Osborne, and water from the Calvert County municipal supply as alternatives to using ground water. However, as explained in DCP’s response to PPRP Data Request 1-3b, all three potential sources were determined to not be viable for the following reasons:
• Chesapeake Bay. Dominion does not have an existing water intake in the Chesapeake Bay, and the environmental covenants, discussed below, on the land outside the fenced area preclude the installation of a water line from the Bay to the site.
• Lake Levy. Pumping water from Lake Levy or Lake Osborne is not viable because of the environmental covenants placed on the land outside of the facility’s fenced area (DCP Response to PPRP Data Requests 1-3b and 3-3). The environmental covenant, executed in the 2005 Settlement Agreement, prohibits extraction of water from these water bodies, with the exception of water for fire suppression and the hydrostatic testing of new LNG storage tanks, subject to conditions.
• Calvert County Municipal Supply. Calvert County indicated that there was not adequate capacity in its current supply to provide the required amount of water for the Cove Point proposed Project.
6.1.2 Water for Operation
Dominion has requested an appropriation of ground water to support the operation of both the vaporization and liquefaction operations. As detailed in Appendix A-4 of the CPCN Application, Table 6.1-3 summarizes Dominion’s projected operational water demand after the facility is fully operational.

DNR – PPRP 205 COVE POINT ERD / DEC 2014
Table 6.1-3 Projected Water Demand for Operation
Water Use Projected Demand (gpd)
Steam Turbine Boiler Makeup 200,000
Fire Suppression 10,000
LNG Vaporizer 8,000
Drinking Water 3,000
General Maintenance 5,000
Contingency (10%) 23,000
Average Annual Total 250,000 (rounded)
Based on DCP’s responses to PPRP Data Requests 1-6a and 1-2a-e, as well as Appendix A-4 of the CPCN Application, the bases for the uses of water are as follows:
• Steam Turbine Boiler Makeup – Steam will be generated from the waste heat produced from the natural gas turbines. Water will be needed for the steam. The estimate of the amount of water is based on a water flow rate of up to 130 gallons per minute (gpm) and 100 percent facility operation. The Water Process Flow Diagram (Figure 5 in Appendix A-4 of the Dominion CPCN Application) indicates that the rate of water use for the steam turbine boiler will range from 95 to 130 gpm. While the facility’s long-term availability is intended to be in the range of 93 percent, the annual amount of water needed for steam generation was calculated at 100 percent availability to account for years in which there are no outages. DCP further clarified the operating assumptions for the steam generator in response to PPRP Data Request 3-1. DCP indicated that the liquefaction process is continuous, meaning that the power is needed to keep any stored LNG in a liquefied state, even when exports of LNG are not occurring;
• Fire Suppression – The estimate is based on a total annual use of 250,000 gallons for testing in the spring and fall;
• LNG Vaporizer – The estimate is based on the use of 10 existing vaporizers, with each vaporizer bath having a capacity of approximately 23,000 gallons. The vaporizer baths are drained

DNR – PPRP 206 COVE POINT ERD / DEC 2014
approximately once per year for maintenance and testing, and the baths must be refilled. The estimate assumes that major repairs to all the baths are needed concurrently. A total of 230,000 gallons of water would be needed that month, or about 8,000 gpd;
• Drinking Water – The estimate is based on 200 people on-site using 15 gpd per person for drinking water, hand washing and restrooms facilities;
• General Maintenance – The water is needed for equipment washdown and other maintenance activities; and
• Contingency – DCP indicated that the contingency value is intended to cover items such as outage and maintenance events, as well as operational variation.
Dominion requested a ground water appropriation in the amounts provided below from the existing Lower Patapsco Production well to meet the operational water demand:
• Average Daily Use. The annual average water requirement is 250,000 gpd; and
• Month of Maximum Use. The month of maximum use requirement is 375,000 gpd.
Dominion explained the basis for the month of maximum use value in its response to PPRP Data Request 1-2e. DCP explained that the value was calculated by multiplying the annual average use of 250,000 gpd by a factor of 1.5 to account for variations in process requirements. The calculation assumes that the steam generators will operate at 100 percent availability during the month of maximum use, or 730 hours (i.e., 8,760 hours per year/12 months). The factor of 1.5 also assumes that the episodic uses of water, including fire suppression, LNG vaporizer and maintenance, will be required at the maximum amount estimated each day during the month of maximum use.
DCP further clarified the assumptions related to the month of maximum use value in its response to PPRP Data Request 3-2. DCP provided the following reasons to support of the month of maximum use value:
• Increased rates of blowdown for the steam systems can be experienced during unit start-up or periods of steam chemistry upset. Blowdown rates can vary from 1 to 5 percent of the circulating steam in the system; and

DNR – PPRP 207 COVE POINT ERD / DEC 2014
• Increased water demand can occur due to episodic events, such as tube leaks, draining and refilling of boilers or HRSGs in response to malfunction or maintenance, performance of chemical cleaning, hydrostatic testing, and back flushing of water treatment components and for washing the gas turbines.
With respect to the level of use to operate the LNG vaporization process, DCP indicated in its response to PPRP Data Request 1-6 that the average annual water use of 8,462 gpd was low compared to the permitted volume of 40,000 gpd. DCP indicated that it needs the ability to operate at full capacity for vaporization, both during the construction period and later, when the liquefaction process comes on-line.
DCP is also proposing to maintain its existing appropriation for the Aquia aquifer (CA1973G014(09)) from well 128J as a backup. As part of the construction of the liquefaction facility, well 230J completed in the Aquia aquifer will be abandoned.
6.2 MARYLAND’S APPROPRIATIONS REGULATIONS
The withdrawal of ground water to supply construction and operation water to the Dominion Cove Point facility requires a new appropriation issued by the Maryland PSC through this CPCN proceeding. The State of Maryland has a statutory requirement to conserve and protect the water resources of the State and to control the appropriation and use of ground water. Although the PSC is the actual permitting authority for the facility’s water appropriations, MDE’s statutes and regulations in COMAR 26.17.06, as administered by the MDE Water Management Administration (WMA), are used to guide the State’s decision regarding water appropriations.
Maryland water allocations are guided by the common law doctrine of reasonable use. This doctrine provides landowners the opportunity to make reasonable use of the water associated with their property, limited by the rights of other landowners and the assurance that the use will not harm the water resources of the State. Additionally, the use of the water needs to be beneficial, which means that the use of water is: 1) necessary; 2) non-wasteful; 3) reasonably non-damaging to the resource and other users; and 4) in the best interest of the public.
COMAR 26.17.06.05A states that MDE WMA will grant an appropriation for a beneficial use if three conditions are met:

DNR – PPRP 208 COVE POINT ERD / DEC 2014
1. The requested appropriation is reasonable in relation to the anticipated level of use;
2. The requested appropriation does not have an unreasonable impact on the State’s water resources; and
3. The requested appropriation or use does not have an unreasonable impact on other users of the resource.
COMAR 26.17.06.05B provides criteria for determining reasonableness. Key criteria considered in the review of the use of ground water for construction include:
1. The extent and amount of harm to the aquifer and other users it may cause;
2. The practicality of adjusting the quantity of water used by a user to reduce impacts;
3. Aggregate changes and cumulative impact that this and future appropriations in an area may have on the waters of the State; and
4. The contribution that the proposed appropriation may make to future degradation of the waters of the State.
MDE WMA is tasked under COMAR 26.17.06.02 as the trustee for the State’s water resources. The agency is authorized to control the appropriation of ground water to provide for the greatest possible use of the waters of the State, while protecting the water supply resources from mismanagement or overuse.
6.3 REASONABLENESS OF USE DETERMINATION
MDE WMA accepts that DCP’s proposed uses and amounts of use of water during construction are reasonable. Additionally, MDE WMA understands that water will continue to be needed to operate the vaporization process during the construction period. MDE WMA recommends that the full appropriation for the operation of the combined vaporization and liquefaction facility be issued with the CPCN. Initially, the amounts in the full appropriation will be used for construction and for operation of the vaporization unit. Thus, MDE recommends that this one appropriation be issued to DCP rather than issuing two separate appropriations - one for the construction period, and a new and separate appropriation for the operation of the combined vaporization and liquefaction facility. The new appropriations will replace the existing
DNR – PPRP 209 COVE POINT ERD / DEC 2014
permit CA 1973G114(01) and would be effective immediately upon issuance of the CPCN.
MDE WMA accepts that DCP’s proposed uses of water during operation of the facility are reasonable, and the estimates of water use for each category are reasonable. However, MDE WMA does not accept the amounts of water requested by Dominion for the average annual use and the month of maximum use. MDE WMA recommends the following alternative appropriation amounts for operation:
• Average Daily Use. The annual average water requirement is 233,000 gpd; and
• Month of Maximum Use. The maximum daily water use is 275,000 gpd.
DCP indicated in its response to PPRP Data Request 1-2a that the proposed liquefaction facility will operate an estimated 93 percent of the time. This would be the typical operation and, therefore, provides the basis for determining the average annual use amount (93 percent of 250,000 gpd). The 233,000 gpd includes some contingency to account for years when the facility operates more than 93 percent of the time. Dominion also indicated that the water use rate for the steam turbines will range from 95 to 130 gpm. The water demand value of 200,000 gpd for steam turbine boiler makeup is based on the maximum 130 gpm rate.
The month of maximum use value recommended by MDE WMA is based on the assumption that the proposed liquefaction facility operates 100 percent of the time for the entire month, and the episodic water uses, including fire suppression, LNG vaporizer, and maintenance, will be required at the maximum amount estimated each day during the month of maximum use. These assumptions result in a value of 250,000 gpd. MDE WMA adds a contingency of 10 percent for a total of 275,000 gpd. Dominion determined the month of maximum use amount by multiplying an arbitrary factor of 1.5 to the average annual amount. MDE WMA does not agree that the factor of 1.5 is a reasonable approach to forecast water demand during the month of maximum use.
Lastly, MDE WMA recommends that the ground water appropriation of 10,000 gpd annual average, and 60,000 gpd month of maximum use, provided by the Aquia well 128J, be maintained to provide a backup supply. MDE WMA also recommends maintaining the surface water appropriation of 74,000 gpd annual average and 7,200,000 gallons maximum daily withdrawal from Lake Levy and Osborn pond for

DNR – PPRP 210 COVE POINT ERD / DEC 2014
hydrostatic testing. A backup supply is warranted to account for the possibility that the Lower Patapsco well is shut down.
6.4 GROUND WATER WITHDRAWAL IMPACTS
This section presents the evaluation of the ground water withdrawal impacts associated with using the Lower Patapsco aquifer for the operation of both the liquefaction and vaporization processes. The impacts evaluated in this section relate to the larger and long-term withdrawal of ground water for operations. Impacts associated with the proposed use of 80,000 gpd annual average during the three to four year construction period are predicted to be much less.
6.4.1 Impacts to the Aquifer
COMAR 26.17.06.05.D(3) indicates that an appropriation of ground water cannot be issued if the proposed withdrawal will exceed the sustained yield of a confined aquifer. The Lower Patapsco aquifer is considered to be a confined aquifer. COMAR 26.17.06.05.D(4) provides the method to determine whether the regional sustained yield potentiometric surface (i.e., the level to which water will rise in a well) of a confined aquifer is being exceeded. This is done by ensuring that the regional sustained yield potentiometric surface is not lowered below 80 percent of the drawdown available between the top of the aquifer and the historical pre-pumping level of the potentiometric surface.
The method used to calculate the 80 percent management level for the Lower Patapsco aquifer at Cove Point is described below. Figure 6.4-1 illustrates the calculation of the 80 percent management level for the Lower Patapsco aquifer at Cove Point.
• The land surface elevation at well CA-95-0691 is approximately 120 feet above mean sea level (msl), and the static water level in the well is -24 feet msl (138.2 feet below ground surface, bgs, from the 2008 aquifer test plus 6.0 feet to account for the regional rate of decline between 2008 and 2013 per Figure 3.1-2).
• Drummond (2007) reported that the historical pre-pumping water level elevation in the Lower Patapsco aquifer at Huntingtown (18 miles north, but along Coastal Plain strike) is about 33 feet msl.
• The top of the Lower Patapsco aquifer is estimated to occur at -1,320 msl at Cove Point based the interpretation of the driller’s log for well CA-95-0691 (top of sand was 1,440 feet bgs on driller’s log).

DNR – PPRP 211 COVE POINT ERD / DEC 2014
• The difference between the top of the Lower Patapsco aquifer and the historic, pre-pumping water level is 1,353 feet (1,320 feet plus 33 feet).
• Eighty percent of 1,353 feet is 1,082 feet; subtracting 1,082 feet from 33 feet msl results in an 80 percent management level of -1,049 feet msl.
• Remaining available drawdown is the difference between the current water level of -24 feet msl and the 80 percent management level of -1,049 feet msl, which leaves 1,025 feet of remaining available drawdown.
The value of –1,049 msl for the 80 percent management value is consistent with the approximate elevation of -1,050 msl shown on Figure 48 in the Maryland Geological Survey Report of Investigations No. 76 (Drummond 2007).

DNR – PPRP 212 COVE POINT ERD / DEC 2014
Figure 6.4-1 Available Drawdown in the Lower Patapsco Aquifer at Well CA-95-0691 at Dominion Cove Point
The level of the potentiometric surface within the Lower Patapsco aquifer was calculated using the Theis modified non-equilibrium equation (Theis 1935) to evaluate the long-term regional impact of the proposed withdrawal on the aquifer and other users. The Theis equation is for non-steady flow in a homogenous, isotropic, confined aquifer with a single

DNR – PPRP 213 COVE POINT ERD / DEC 2014
production well. It is based on the assumptions that: 1) no recharge is provided during the period of withdrawal, and 2) the aquifer boundaries are infinite.
The Theis equation is the method used by MDE WMA to project future drawdown from confined Coastal Plain aquifers that are large, and can be modeled as a relatively homogeneous unit at a given locale. The Theis equation is an appropriate method to determine long-term drawdown because the Lower Patapsco aquifer is confined and relatively homogenous in makeup at Cove Point. In addition, the distance to the aquifer boundary in the up slope outcrop area is over 40 miles west of the site (Curtin et al. 2010). This distance is too great to impact the analysis in any meaningful way.
The following equation (Theis 1935) is used to calculate drawdown at selected time intervals:
TuQWs
π4)(
= (1)
where:
s = drawdown at time t;
S = storativity;
T = transmissivity; and
Q = well discharge rate.
W(u) = the well function; an exponential integral that can be expanded as an infinite series approximation as:
...!5*5!4*4!3*3
)ln(5772.0)( +−+−+−−=uuuuuuW (2)
where u is defined as:
TtSru
4
2
= (3)
and:

DNR – PPRP 214 COVE POINT ERD / DEC 2014
r = distance in feet from the center of the pumped well to a point where the drawdown is measured.
The properties of the Lower Patapsco aquifer used in this analysis are as follows:
• Transmissivity – 4,790 feet squared per day (ft2/d); and
• Storativity – 0.0005 (unitless).
Transmissivity is the rate at which water moves through a unit width of aquifer under a hydraulic gradient of one. The transmissivity value was obtained from a 24-hour continuous-rate single-well pumping test conducted by Dominion in well CA-95-0691 in 2008. The well was pumped at a rate of 953 gpm and water levels were measured during drawdown and recovery using a pressure transducer. DCP provided the results of the pumping test in response to PPRP Data Request 1-4a and b.
In response to PPRP Data Request 1-4a and b, DCP indicated that transmissivity values were determined using two different approaches. Dominion used the Jacob equation to calculate the hydraulic conductivity and storativity. Based on an aquifer thickness of 148 feet for the Lower Patapsco aquifer, Dominion calculated a transmissivity value of 5,357 ft2/d using this method. Dominion also applied the Cooper-Jacob straight line method to calculate a transmissivity value of 8,765 ft2/d.
MDE WMA used the Cooper-Jacob Method to evaluate DCP’s pumping test drawdown and recovery results. Figure 6.4-2 shows the results of the analysis and the determination of transmissivity. Figure 6.4-2 also shows that the Cooper-Jacob straight line method resulted in a transmissivity value of 4,790 ft2/d.
The transmissivity values calculated by Dominion and MDE are above the range of values of 500 to 4,000 ft2/d presented for pumping tests conducted in the Lower Patapsco in Charles, Saint Mary’s and Calvert counties (Andreasen et al. 2013; Drummond 2007). Furthermore, Drummond (2007) reported a value of 2,700 ft2/d calculated from a pumping test conducted in Lower Patapsco aquifer well CA-Fd-85 drilled on the nearby Chesapeake Ranch estates. This transmissivity value was to be a composite value determined using the Cooper-Jacob solution, based on a generalized average from different slopes of the aquifer test drawdown versus time data. The higher transmissivity values determined from the aquifer test conducted in the Cove Point well could
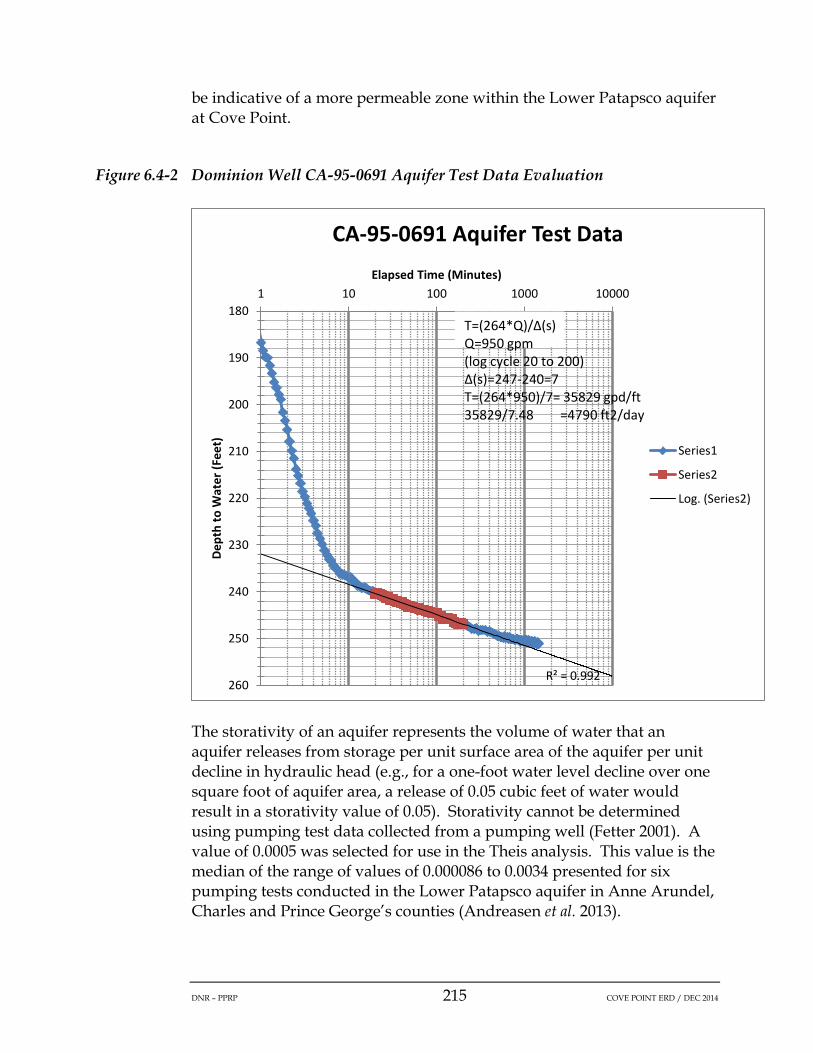
DNR – PPRP 215 COVE POINT ERD / DEC 2014
be indicative of a more permeable zone within the Lower Patapsco aquifer at Cove Point.
Figure 6.4-2 Dominion Well CA-95-0691 Aquifer Test Data Evaluation
The storativity of an aquifer represents the volume of water that an aquifer releases from storage per unit surface area of the aquifer per unit decline in hydraulic head (e.g., for a one-foot water level decline over one square foot of aquifer area, a release of 0.05 cubic feet of water would result in a storativity value of 0.05). Storativity cannot be determined using pumping test data collected from a pumping well (Fetter 2001). A value of 0.0005 was selected for use in the Theis analysis. This value is the median of the range of values of 0.000086 to 0.0034 presented for six pumping tests conducted in the Lower Patapsco aquifer in Anne Arundel, Charles and Prince George’s counties (Andreasen et al. 2013).
R² = 0.992
180
190
200
210
220
230
240
250
260
1 10 100 1000 10000
Dept
h to
Wat
er (F
eet)
Elapsed Time (Minutes)
CA-95-0691 Aquifer Test Data
Series1
Series2
Log. (Series2)
T=(264*Q)/Δ(s) Q=950 gpm (log cycle 20 to 200) Δ(s)=247-240=7 T=(264*950)/7= 35829 gpd/ft 35829/7.48 =4790 ft2/day

DNR – PPRP 216 COVE POINT ERD / DEC 2014
Using the values for transmissivity and storativity listed above, MDE and PPRP used the Theis method to calculate drawdowns in the Lower Patapsco aquifer at various distances for one year and twelve years at the annual average rate of 233,000 gpd. The evaluation extends to a 12-year time period because that is the life of the appropriations permit. DCP will need to renew its water appropriations permit after 12 years; at that time, the impacts will be re-evaluated. Table 6.4-1 lists the results of the drawdown calculations.
Table 6.4-1 Lower Patapsco Aquifer Calculated Drawdown for 1 and 12 Years at the Proposed Withdrawal Rate of 233,000 gpd
Distance from
Pumping Well (feet)
Distance from Pumping
Well (miles)
Theis Calculated
Drawdown - One Year (feet)
Theis Calculated
Drawdown - Twelve Years (feet)
Theis Calculated
Drawdown - Twelve Years (feet)
Plus Regional Drawdown of 1.2
ft./yr. 5 10.1 11.4 25.8
100 7.0 8.3 22.7 200 6.3 7.6 22.0 500 5.4 6.6 21.0
1,320 0.25 4.4 5.6 20.0 2,640 0.50 3.6 4.9 19.3 5,280 1.0 2.9 4.2 18.6
10,560 2.0 2.2 3.5 17.9 15,840 3.0 1.8 3.1 17.5 26,400 5.0 1.3 2.5 16.9 52,800 10.0 0.6 1.8 16.2 73,920 14.0 0.4 1.5 15.9
Based on the Theis analysis, the calculated drawdown after twelve years is 5.6, 4.9 and 4.2 feet at distances from the pumping well of one-quarter mile, one-half mile, and one mile, respectively. The 5.6 feet of projected drawdown at one-quarter mile is about 0.5 percent of the remaining available drawdown of 1,025 feet.
In addition, MDE and PPRP developed an estimate of the regional rate of decline to evaluate cumulative impacts on the Lower Patapsco aquifer associated with both the proposed 233,000 gpd withdrawal and the withdrawals of other users. Based on the long-term decline in the water level measured in USGS well CA-Fd-85 at nearby Chesapeake Ranch (Figure 3.1-2), the regional rate of decline in the Lower Patapsco aquifer water level is estimated to be about 1.2 feet/year over the period 2001 to 2013. Thus, after 12 years, there will be 14.4 additional feet of drawdown

DNR – PPRP 217 COVE POINT ERD / DEC 2014
due to the regional rate of decline in the aquifer. The last column in Table 6.4-1 includes the sum of the total cumulative effect of the proposed withdrawal of 233,000 gpd at Cove Point, plus the 14.4 feet of additional drawdown that will be realized after 12 years due to the regional rate of decline.
The calculated drawdown associated with the 233,000 gpd withdrawal, combined with the 14.4 additional feet of regional drawdown, could create a total drawdown after 12 years of 20.0, 19.3 and 18.6 feet, at distances from the pumping well of one-quarter mile, one-half mile, and one mile, respectively. Drawdown of 20.0 feet at one-quarter mile represents about 2.0 percent of the available drawdown of 1,025 feet. The calculated drawdown at these distances is small, especially when compared to the 1,025 feet of available drawdown remaining in the Lower Patapsco at the Cove Point site.
6.4.2 Impacts to Other Users
The Lower Patapsco aquifer is used sparsely for water supply in Calvert and St. Mary’s counties. A review of water appropriation permits issued by MDE-WMA indicates that there is one ground water appropriation in the Lower Patapsco aquifer in Calvert and St. Mary’s counties, in addition to the Cove Point appropriation. The closest potential user in the Lower Patapsco aquifer identified in either a Maryland Geological Survey publication (Drummond 2007) or MDE WMA permit records is the new well installed in 2011 by the Calvert County Department of Public Works (DPW). The well was installed to a depth of 1,788 feet and is located in Prince Frederick approximately 14 miles north of the Cove Point site. Calvert County plans to use this well to supply potable water to its water supply system in Prince Frederick.
As shown in Table 6.4-1, after 12 years at a withdrawal rate of 233,000 gpd, calculated drawdown at the Calvert County DPW location, 14 miles from the Cove Point well, is 1.5 feet. The drawdown would be 15.9 feet, including the additional 14.4 feet of drawdown to account for the regional rate of water level decline.
The potential for short-term withdrawal impacts to other users associated with the drawdown caused by the month of maximum use withdrawal of 275,000 gpd for a 60-day period was also evaluated using the Theis method. A 60-day period was used for the month of maximum use impact evaluation, rather than 30 days, to account for the unlikely scenario that the highest monthly use for the beginning of a new year occurs after the highest monthly use for the previous year. Worst-case

DNR – PPRP 218 COVE POINT ERD / DEC 2014
impacts from the month of maximum use withdrawal would occur at the end of year 12. They are calculated by running a Theis simulation for 42,000 gpd for 60 days and adding these results to the drawdown values for the 233,000 gpd withdrawal listed in Table 6.4-1, including the 14.4 feet to account for the regional rate of decline. The simulation at 42,000 gpd represents the incremental increase in pumping from the average annual amount of 233,000 gpd to the 275,000 gpd during the month of maximum use. Table 6.4-2 lists the results of the drawdown analysis associated with the month of maximum use withdrawal.
Table 6.4-2 Lower Patapsco Aquifer Calculated Drawdown at the Proposed Withdrawal Rates after 12 Years
Distance from
Pumping Well (feet)
Distance from
Pumping Well
(miles)
Theis Calculated Drawdown for 233,000 gpd for 12
Years (feet)
Theis Calculated Drawdown for 42,000 gpd for 60 Days (feet)
Total Calculated Drawdown
During Periods of
Maximum Use after 12 Years
(feet)
Total of all Theis
Calculated Drawdowns Plus 14.4 foot Regional Rate of Decline at Year 12 (feet)
5 11.4 1.7 13.1 27.5 100 8.3 1.1 9.4 23.8 200 7.6 1.0 8.6 23.0 500 6.6 0.8 7.4 21.8
1,320 0.25 5.6 0.6 6.2 20.6 2,640 0.50 4.9 0.5 5.4 19.8 5,280 1.0 4.2 0.4 4.6 19.0
10,560 2.0 3.5 0.2 3.7 18.1 15,840 3.0 3.1 0.2 3.3 17.7 26,400 5.0 2.5 0.1 2.6 17.0 52,800 10.0 1.8 0.0 1.8 16.2 73,920 14.0 1.5 0.0 1.5 15.9
As shown in Table 6.4-2, calculated drawdown after 60 days at a withdrawal rate of an additional 42,000 gpd is 0.0 feet at a distance of 14 miles from the pumping well, which represents the distance to the Calvert County DPW well in Prince Frederick. The drawdown directly attributable to the DCP well, including the higher pumping rate associated with the month of maximum use, is still projected to be 1.5 feet after 12 years at the Calvert County DPW well. The overall drawdown of 15.9 feet at that distance includes the regional rate of decline.
The remaining available drawdown in the Lower Patapsco aquifer at Prince Frederick is estimated using the 80 percent management level

DNR – PPRP 219 COVE POINT ERD / DEC 2014
of -950 msl—presented in Drummond (2007)—and the estimated value of -35 msl for the current potentiometric surface - obtained from Curtin et al. (2010). The remaining available drawdown is the difference between the current water level of -35 feet msl, and the 80 percent management level of -950 feet msl. This leaves 915 feet of remaining available drawdown. This calculated drawdown amount of 1.5 feet at the Calvert County DPW well in Prince Frederick attributed to the DCP well is small, especially when compared to the 915 feet of available drawdown in the Lower Patapsco aquifer at Prince Frederick. Therefore, pumping the well at DCP will have no adverse impacts on the Calvert County DPW well located 14 miles away.
6.5 RECOMMENDATIONS
MDE WMA recommends that DCP be granted an appropriation to use ground water from the Lower Patapsco aquifer for twelve years to support the construction and operation of the new liquefaction unit and the existing vaporization unit. MDE WMA accepts that Dominion’s proposed uses of water during construction of the liquefaction unit and operation of the vaporization and liquefaction units are reasonable relative to the anticipated level of use. Additionally, the proposed withdrawal of ground water will not adversely impact the Lower Patapsco aquifer, or users of the aquifer.
In summary, MDE WMA recommends the appropriation be granted with the following amounts:
• Average Daily Use. The annual average water requirement is 233,000 gpd from the Lower Patapsco aquifer; and
• Month of Maximum Use. The maximum daily water use is 275,000 gpd from the Lower Patapsco aquifer for the month of maximum use.
The existing appropriation for the vaporization process [CA1973G114(01)] would be superseded by the issuance of the CPCN, and one new appropriation would commence, for use in construction and operations of both the vaporization and liquefaction processes.

DNR – PPRP 220 COVE POINT ERD / DEC 2014
7.0 SUMMARY
PPRP has conducted a thorough review of the potential environmental and socioeconomic effects from the proposed Dominion Cove Point project. In consultation with other State agencies, PPRP has developed recommendations to the PSC for licensing conditions that should be imposed for the proposed Project, to minimize the potential for any adverse impacts to the State from the proposed Project. This section summarizes the key elements of PPRP’s analyses, describes our findings, and highlights the State’s licensing recommendations.
7.1 AIR QUALITY
PPRP and MDE-ARMA conducted an air quality evaluation of the proposed Dominion Cove Point (DCP) Project, to confirm that projected maximum potential air pollutant emissions meet applicable regulatory thresholds and limits. The proposed project was also evaluated to determine whether emissions would have any significant impacts on the ambient air quality in the region. Effects on ambient air quality were assessed by performing air dispersion modeling that predicts the impacts on ambient air concentrations resulting from emissions for the proposed project.
Table 7.1-1 summarizes the emission sources and specifications of the proposed units included in the proposed facility design.
Table 7.1-1 DCP Air Emission Sources
Component (Number of
Units) Type/Model
Rated Capacity of Each Unit
Fuel (normal operating
conditions)
Projected Operations
CTs (2)
GE Frame 7EA with
DCN1 7EA Combustors
and associated
HRSG
1,062 MMBtu/hr
87.2 MW (nominal)
Pipeline Natural Gas and Process Gas (60-85%
mixture)
8,760 hours per year per
CT

DNR – PPRP 221 COVE POINT ERD / DEC 2014
Component (Number of
Units) Type/Model
Rated Capacity of Each Unit
Fuel (normal operating
conditions)
Projected Operations
Auxiliary Boilers (2)
Cleaver Brooks
435 MMBtu/hr
Process Gas 8,760 hours per year per
boiler
Emergency Generator (1)
To be determined
prior to construction
1,550-hp Ultra Low
Sulfur Diesel (ULSD) Fuel
500 hours per year
Emergency Fire Water Pump (5)
To be determined
prior to construction
350-hp ULSD Fuel 104 hours per year per unit
Thermal Oxidizer (1)
Zeeco, Custom Design
56 MMBtu/hr Process Gas/
Acid Gas 8,760 hours
per year
Ground Flares (2 – total of 38
pilots)
To be determined
prior to construction
0.1 MMBtu/hr (per pilot)
Process Gas 8,760 hours per year per
flare
Existing Frame 5 Combustion Turbines (2)
GE Frame 5 302
MMBtu/hr 12.5 MW
Pipeline Natural Gas
8,760 hours per year per
CT
Pipeline Component
Leaks N/A N/A N/A
8,760 hours per year per component
Roadways N/A N/A N/A 8,760 hours
As discussed in Section 4.4, potential NOx, CO, PM, PM10, PM2.5, VOC, and GHG emissions exceed their individual pollutant-specific significance emission thresholds; therefore, the proposed DCP Project “triggers” PSD requirements and must:

DNR – PPRP 222 COVE POINT ERD / DEC 2014
• Demonstrate use of BACT for pollutants triggering PSD requirements (Section 4.4.2);
• Assess the ambient impact of emissions through the use of dispersion modeling or other means. If the impacts are significant, evaluate (through cumulative multi-source modeling analysis) compliance with the NAAQS and consumption of PSD increments (Section 4.4.3); and
• Conduct additional impact assessments that analyze impairment to visibility, soils, and vegetation as a result of the modification, as well as impacts on Class I areas (Section 4.4.3).
Based on potential emissions for the project, DCP must demonstrate BACT for NOx, CO, PM, PM10, PM2.5 and GHG emissions for all proposed project emissions sources (Frame 7 combustion turbines, auxiliary boilers, emergency generator, fire pump engines, thermal oxidizer, flares, paved roads, and equipment components). In the April 2013 CPCN Application, DCP conducted a control technology analysis for these sources. PPRP and MDE-ARMA reviewed DCP’s control technology analysis and requested clarification on certain aspects of the analyses. PPRP and MDE-ARMA’s BACT determination was developed based on the information presented in DCP’s April 2013 CPCN Application and additional information provided by DCP in responses to DNR Data Requests. Note that if there is an applicable New Source Performance Standard (NSPS) for equipment, then the determination of BACT and LAER must be at least as stringent as the applicable NSPS.
In addition, the project triggers nonattainment New Source Review (NA-NSR) for ozone, including NOx and VOCs which are ozone precursors. As such, NOx is subject to both PSD review (as a major source in a NO2 attainment area) and NA-NSR (as a major source of the ozone precursor NOx in an ozone nonattainment area). Because LAER, by definition, must be at least as stringent as BACT, the NOx control technology demonstration is presented in the LAER discussion in Section 4.5.
Since the DCP Project is subject to NA-NSR requirements for NOx and VOCs, it must meet the following requirements for these pollutants:
• Implement LAER level of pollution control from all project sources;
• Obtain emissions reductions (offsets) for projected potential emissions;
• Certify that all other sources in Maryland owned by Dominion Cove Point LNG, LP comply with all applicable requirements of the Clean Air Act (CAA); and

DNR – PPRP 223 COVE POINT ERD / DEC 2014
• Demonstrate through an analysis of alternative sites, sizes, production processes, and environmental control techniques that benefits of the proposed source significantly outweigh the environmental and social costs imposed as a result of its location, construction, or modification.
Impact assessment modeling evaluations demonstrate that while operating within the restrictions included in the State’s recommended license conditions (Appendix A), emissions from the proposed project are not predicted to cause any significant adverse impacts to air quality. Specifically, air emissions from the proposed DCP Project will not adversely affect ambient air quality or PSD increments; the project’s impacts on visibility in the surrounding Class I areas are likely to be minimal; and there are no projected unacceptable impacts from toxic air pollutants.
In conclusion, evaluation of the project and its potential emissions indicate that, if designed and operated in accordance with the recommended licensing conditions, Dominion Cove Point will meet all applicable State and federal air quality requirements.
7.2 BIOLOGICAL RESOURCES
7.2.1 DCP LNG Terminal
Wildlife at the terminal site are likely to be affected in the long-term by the clearing of 11.8 acres of mature forest. In the short-term, wildlife will be affected by noise, light, human presence, and construction activities. Larvae of two rare dragonfly species have been documented in the small, unnamed tributary to Grays Creek, roughly 500 feet downstream of the proposed stream and wetland impacts. These dragonflies include Sable Clubtail (Gomphus rogersi, state-listed as In Need of Conservation) and Yellow-sided Skimmer (Libellula flavida, State Rare). In this same section of stream, there are two uncommon dragonfly species, including Brown Spiketail (Cordulegaster bilineata) and Gray Petaltail (Tachopteryx thoreyi). Both of these dragonflies have been identified as being species of Greatest Conservation Need in DNR’s Wildlife Diversity Conservation Plan. DNR recommends protecting these species through minimizing sedimentation and changes to stream hydrology (see Section 5.2.3.1).
DNR – PPRP 224 COVE POINT ERD / DEC 2014
7.2.2 Offsite Area A
The proposed Project will use Offsite Area A as a temporary laydown, contractor staging, and parking area. DCP will clear approximately 94 acres of mature and successional forest within Offsite Area A. DCP has indicated that clearing of land will not occur within 100 feet of streams and wetlands (except at the construction road crossing), nor within 100 feet of populations of listed threatened and endangered species. In particular, three populations of tobaccoweed (Elephantopus tomentosus; State-listed Endangered) occur at Offsite Area A. These will be protected by the DCP 100-foot buffer.
Nearly all of the forested lands to be cleared at Offsite Area A provide important habitat for forest interior dwelling birds and other wildlife. The loss of FIDS habitat from this area will negatively affect FIDS, such as those that can only reproduce in forest interior habitats. Forested edge habitats remaining on the site will be left vulnerable to colonization by introduced invasive plants, altering the habitats negatively. Despite DCP’s proposed measures to mitigate these effects (including preservation of Offsite Area E; see Section 5.2.2.2), these valuable habitats, and the wildlife that depend on them, will likely remain negatively affected. The proposed Project will require additional mitigation measures to adequately protect Maryland natural resources.
7.2.3 Offsite Area B
Proposed work at Offsite Area B for the construction of a temporary barge offloading pier will affect a Natural Oyster Bar. Therefore, specific time-of-year restrictions may be applicable depending on the final plans for the pier. Installation of the 24 hollow steel piles (36 inches in diameter) for the pier will re-suspend particulates in the vicinity of the piles, resulting in turbidity. Re-suspended sediment will temporarily decrease visibility near the activity, and impair the ability of sight-dependent predatory fish to feed. Resettling of suspended sediments after pile driving is complete may also cover fish eggs, larvae, and some benthic prey species that may be within the local turbidity plume. The extent of this plume, however, is expected to remain somewhat close to the pile installation site. DNR is recommending that DCP be required to implement measures to mitigate potential impacts to oysters.

DNR – PPRP 225 COVE POINT ERD / DEC 2014
7.3 SOCIOECONOMIC RESOURCES
PPRP examined the impacts on socioeconomic resources from the proposed Project. This section addresses the specific areas of employment, population, land use, traffic, visual quality, taxes/revenue, and historic and cultural resources.
Employment and income impacts from construction of the DCP liquefaction facility would be sizable, although only a fraction would be attributable to the electric generation component. In total, construction requirements amount to more than 6,556 person-years of employment over the four year construction period, with 2,167 jobs on site in the peak construction year (2015). Considering indirect and induced (multiplier) effects, the proposed Project would create more than 15,000 person-years of employment in Maryland during construction. DCP estimates that labor income from employment in the State would be in the range of $811.7 to $1,010.6 million (2012 dollars).
Once the facility is operational, employment requirements of the proposed Project would be 26 FTE-equivalent jobs. As a result, operations and maintenance (O&M) employment and earnings would have a small, though positive effect upon the regional economy. Economic multipliers suggest that the proposed Project would add more than 100 indirect and induced jobs, and more than $10 million in annual earnings to the State economy. Unlike the construction era, jobs generated both directly and indirectly by the proposed Project would be permanent over the facility’s operational life.
The degree to which population and housing are affected by construction of the liquefaction facility will depend largely upon the number of workers who migrate with their families into the region. As noted, a substantial pool of construction labor resides in Southern Maryland and nearby counties. This would reduce migration into the region. However, shortages of particular skills among local construction workers could stimulate in-migration during the construction period. DCP’s EPC contractor would relocate its core project team to Calvert County. Still, DCP has stated that its EPC contractor has made a commitment to work with the local building trades to staff the proposed Project, and that it expects to draw most construction workers from Calvert and nearby counties. Construction workers recruited from outside the area would likely reside in transient accommodation, although some might permanently migrate to Southern Maryland.
DNR – PPRP 226 COVE POINT ERD / DEC 2014
Permanent impacts to land use would be confined to the existing fenced area that currently hosts landside components of the LNG import terminal. Land use in Offsite Area A would be permanently changed in terms of its natural resource value, but the land would presumably be reclaimed from its temporary use after title is transferred to the County. Replatting the County-owned part of Offsite Area A from a residential subdivision would remove a Deed of Conservation on approximately 28 acres of the 79.4-acre parcel. This replatting is necessary so that this property can be leased to DCP for construction staging and parking. Construction of a barge pier and offloading area at Offsite Area B would preempt 5.7 acres of the 11-acre parcel from existing uses. However, the upland area would continue to serve as an overflow parking area for special events at the Calvert Marine Museum. Post-construction, DCP will restore Offsite Area B to its original condition, with the barge pier removed.
With respect to visual impacts, the proposed Project would be located within a 131-acre fenced area, itself within a 1,017-acre site in southern Calvert County. Most of the undeveloped part of the site is forested and protected under conservation easements. Since the perimeter of the fenced area is less than one-tenth of a mile from Cove Point Road, vegetation only partly buffers views of the facility from that direction, particularly in winter when foliage is reduced. Otherwise, the facility is not visible from the surrounding area. Along Cove Point Road, views (where available) of DCP are dominated by one or more of the seven large LNG storage tanks; existing generation facilities have a relatively low profile. DCP notes that none of the equipment associated with the proposed Project would be taller than the existing LNG storage tanks. DCP’s CPCN Application did not identify visual impacts of construction equipment, but cranes would likely be visible on occasion.
Additional outdoor lighting would add to the visual setting of the proposed Project, although these modifications would be confined to the fenced area. Outdoor lighting is required on all new and modified Project components to satisfy operational, OSHA and Homeland Security requirements. Recommended licensing conditions will mitigate intrusive night lighting onto adjoining properties.
With respect to government finances, once operational, the most significant revenue impact to Calvert County would be from property taxes. In November 2013, the Calvert County Board of County Commissioners approved a five-year Payment in Lieu of Taxes (PILOT) and tax relief agreement with DCP. The agreement includes a one-time payment in FY 2018 of $25 million and guarantees $15.1 million in annual
DNR – PPRP 227 COVE POINT ERD / DEC 2014
payments on existing equipment for the duration of the PILOT. After the PILOT term, DCP will receive 42 percent relief on real and personal property taxes for nine years, after which the liquefaction facility will become taxable at 100 percent of its value. Calvert County estimates that it will receive on average $55 million in total tax revenues annually once the proposed Project is operational.
Construction could marginally affect local expenditures on public services in Calvert and nearby counties. Impacts, to the extent they occur, would be most pronounced in Calvert County. The proposed Project could increase demands upon State and County emergency services such as fire, rescue, and police services. This is particularly true when construction traffic is added to other commuting traffic. Injuries from accidents at the construction site could place additional demands on rescue and medical services; although DCP would provide some degree of occupational health on-site, including emergency response. Given a significant post-construction tax revenue stream and minimal project-related outlays from County budgets for public services during construction and operation, the proposed Project’s net fiscal impact on Calvert County is expected to be extremely favorable.
Most potential effects on cultural resources would be within the terminal site, Offsite Area A, and Offsite Area B. As part of DCP’s cultural resource assessment, Phase I archeological surveys were conducted at Offsite Area A and Offsite Area B. An archeological survey was not conducted at the terminal site because surveys conducted prior to previous development at the facility found no cultural resources. The Maryland Historical Trust concurs that the terminal site has very little archeological potential and requires no further investigation.
The Phase I archeological survey in Offsite Area B led DCP to recommend no further investigations in the onshore portion of Offsite Area B because the property was found to have been substantially compromised in the past by dredge spoils from construction of the Governor Thomas Johnson Memorial Bridge. No cultural materials were recovered during the current survey. Offshore, however, archeological surveys identified five underwater targets that should be avoided during construction and operation of the barge pier at Offsite Area B. These targets are addressed in recommended licensing conditions.
PPRP concludes that DCP will have no significant impacts to socioeconomic resources if the proposed Project is operated in accordance with the recommended licensing conditions.

DNR – PPRP 228 COVE POINT ERD / DEC 2014
7.4 NOISE
PPRP has utilized information provided by the applicant to conduct a preliminary evaluation of noise levels at nearby receptors that could result from operation of the proposed Project. PPRP’s objective for this analysis was to verify the projected noise levels, and the combined noise levels, that the applicant presented in the CPCN Application. This analysis is then used to determine the licensing conditions that PPRP will recommend to the PSC to ensure that the proposed Project will operate in compliance with applicable State or federal regulations.
The applicant conducted an environmental sound pressure survey in the terminal site’s surrounding area in order to measure the existing noise levels of the site. The sound pressure levels reported by Dominion for Receptors #1 and #2 were 38.8 dBA and 36.3 dBA, respectively, measured with the existing facility in full operation and no traffic noise. The corresponding Day-Night Sound Levels are 45.2 dBA and 42.7 dBA, respectively. This indicates a relatively quiet setting.
A list of all the noise sources involved in the proposed Project was given in the CPCN Application. The power level for each octave band was also provided for each noise source. The highest noise contributors from the list of sources were selected to estimate the projected sound pressure levels at the nearest residential receptor locations.
All of the noise sources must comply with State noise regulations, as listed in COMAR 26.02.03, as well as noise guidelines set by FERC. The available information indicates that the units, as presently proposed, will comply with COMAR requirements and with FERC sound pressure requirements. There is some potential for slight exceedances of the noise standards at Receptor #1 (56.9 dBA calculated, vs. a standard of 55 dBA). However, the projected levels were calculated using a number of conservative assumptions, such as:
• PPRP’s analysis did not fully take into account the effects of the 60-foot sound barrier wall at the two receptor locations, to the extent that the barrier effects were not incorporated into the data on equipment noise characteristics provided by DCP;

DNR – PPRP 229 COVE POINT ERD / DEC 2014
• PPRP’s analysis did not assume any excess attenuation beyond average absorption in the atmosphere, which can have a significant effect on noise propagation over distance; and
• PPRP’s analysis did not take into account any seasonal attenuation effects associated with wind, temperature, and humidity that could also affect noise propagation.
To address these uncertainties, PPRP recommends that the applicant conduct noise monitoring after the proposed Project is in operation to confirm that facility operations comply with regulatory requirements.
7.5 WATER SUPPLY
Dominion has indicated a need for water for fugitive dust mitigation, hydrostatic testing of equipment and piping, and steam flushing during construction of the Project. To support construction, Dominion requested 40,000 gallons per day (gpd) annual average and 60,000 gpd month of maximum use from the existing production well completed in the Lower Patapsco aquifer. The water requested during construction is in addition to the ground water appropriation DCP currently holds for withdrawal of 40,000 gpd annual average and 60,000 gpd during the month of maximum use from the Lower Patapsco aquifer to operate the LNG vaporization system [Permit No. CA1973G114(01)]. MDE WMA accepts that Dominion’s proposed uses and amounts of use of water during construction are reasonable. Additionally, MDE WMA understands that water will continue to be needed to operate the vaporization process during the construction period.
Dominion requested a ground water appropriation in the amount of 250,000 gpd as an annual average, and 375,000 gpd during the month of maximum use, from the Lower Patapsco aquifer. This would meet the operational water demand for both the existing LNG vaporization process and new liquefaction process. The majority of the water is needed for the steam turbine boiler (approximately 200,000 gpd). Dominion explained that the month of maximum use value was calculated by multiplying the annual average use of 250,000 gpd by a factor of 1.5 to account for variations in process requirements.
MDE WMA does not accept Dominion’s requested average annual or month of maximum use amounts for operations as a reasonable estimate

DNR – PPRP 230 COVE POINT ERD / DEC 2014
based on the anticipated level of use. DCP indicated that the steam turbine will typically operate an estimated 93 percent of the time. This operating assumption provides the basis for determining the average annual use amount (93 percent of 250,000 gpd). The 233,000 gpd includes some contingency to account for years when the facility operates more than 93 percent of the time.
MDE WMA has proposed a month of maximum use amount based on the assumption that the facility operates 100 percent of the time for the entire month, and the episodic water uses, including fire suppression, LNG vaporizer and maintenance, will be required at the maximum amount estimated each day during the month of maximum use. These assumptions result in a value of 250,000 gpd. MDE WMA adds a contingency of 10 percent for a total of 275,000 gpd.
PPRP and MDE WMA recommend that Dominion be granted an appropriation to use ground water from the Lower Patapsco aquifer for twelve years to support the construction and operation of the new liquefaction unit and the existing vaporization unit. MDE WMA accepts that Dominion’s proposed uses of water during construction of the liquefaction unit and operation of the vaporization and liquefaction units are reasonable relative to the anticipated level of use, taking into account the modified appropriation amounts, as discussed above.
PPRP and MDE WMA conducted an evaluation of potential drawdown impacts associated with the proposed withdrawal over the 12-year life of the appropriation permit. The State concludes that the proposed withdrawal of ground water will not adversely impact the Lower Patapsco aquifer or users of the aquifer.


DNR – PPRP 231 COVE POINT ERD / DEC 2014
8.0 REFERENCES
AB 2588 Combustion Emission Factors. Ventura County Air Pollution Control District. May 17, 2001.
BCC 1984. Code of Calvert County. Chapter 57. Historic Districts. Adopted by the Board of County Commissioner of Calvert County 1-24-1984 by Res. No. 4-84. As amended.
Andreasen, D. C., A. W. Staley, and G. Achmad. 2013. Maryland Coastal Plain Aquifer Information System: Hydrogeologic Framework. Maryland Department of Natural Resources Maryland Geological Survey Open-File Report No. 12-02-20.
BCC 2006. Calvert County Land Use, Parks and Recreation Plan. Board of County Commissioners. Approved and Adopted December 2006.
BCC 2009. Solomons Town Center Master Plan and Zoning Ordinance. Board of County Commissioners of Calvert County. Master Plan Adopted August 25, 2009. Zoning Ordinance Effective Date: September 22, 2009.
BCC 2010. Comprehensive Plan. Calvert County, Maryland. Adopted 2004. Amended 2010.
BCC 2013. Adopted Operating and Capital Budget, Fiscal Year 2014. Prepared by the Department of Finance and Budget for the Board of County Commissioners of Calvert County.
BOE, undated. Education Facilities Master Plan, FY 2015. Board of Education of Calvert County, Prince Frederick, Maryland.
Bushman, E.S. and G.D. Therres. 1988. Habitat management guidelines for forest interior breeding birds of coastal Maryland. Maryland Department of Natural Resources Wildlife Technical Publication 88-1. Annapolis, Maryland.
California Air Resources Board (CARB) California Air Toxic Emission Factor (CATEF) database. http://www.arb.ca.gov/ei/catef/catef.htm.
DNR – PPRP 232 COVE POINT ERD / DEC 2014
Carlson 2013. Personal communication with Terry P. Carlson, P.E., Director of Public Works, Calvert County Public Works Department. Prince Frederick, Maryland. September 5, 2013.
CCDED 2012. Calvert County, Maryland State of the Economy. Calvert County Department of Economic Development. 2012.
Census 2010. 2010 Census Interactive Population Search. www.census.gov/2010census/
Chesapeake Bay Critical Area Commission. 2000. A Guide to the Conservation of Forest Interior Dwelling Birds in the Chesapeake Bay Critical Area. Maryland Department of Natural Resources, Annapolis, Maryland.
Chesapeake Bay Program. 2008. Bay Field Guide – Eastern Oyster. Annapolis, Maryland. http://www.chesapeakebay.net/bfg_eastern_oyster.aspx.
Chesapeake Bay Program. 2012. Fish Guide. http://www.chesapeakebay.net/fieldguide/categories/category/fish.
CPB 2013a. Calvert County Zoning Ordinance. Department of Community Planning and Building. http://md-calvertcounty.civicplus.com/index.aspx?NID=568. Accessed August, 23, 2013.
Control Efficiencies for TCEQ Leak Detection and Repair Programs. Texas Commission of Environmental Quality (TCEQ). Revised 07/11 (APDG 6129v2).
DBED 2013. Calvert County, Maryland. Brief Economic Facts. Division of Business Development. Maryland Department of Business & Economic Development. Baltimore, Maryland, February, 2013.
DCPB 2012. Calvert County Zoning Ordinance. Calvert County Department of Community Planning and Building. Revised December, 2012.
DCPB 2013. SD 93-23 Waterford Subdivision. Interoffice Memorandum to Planning Commission, from Yolanda Hipski, Planning Commission Administrator. Department of Community Planning and Building. August 14, 2013.

DNR – PPRP 233 COVE POINT ERD / DEC 2014
DFB 2012. Calvert County Maryland Comprehensive Annual Financial Report for the Fiscal Year Ended June 30, 2012. Prepared by the Department of Finance and Budget.
DLLR 2013a. Civilian Labor Force, Employment & Unemployment by Place of Residence (LAUS). Department of Labor, Licensing and Regulation. http://www.dllr.state.md.us/lmi/laus/. Accessed August 14, 2013.
DLLR 2013b. Construction and Extraction Occupations – Southern Maryland WIA Occupational Projections – 2008-2018. Maryland Department of Labor, Licensing and Regulation. http://www.dllr.state.md.us/lmi/iandoproj/southern/. Accessed August 18, 2013.
DPZ 2006. Planning, Growth Management and Quality of Life: Making the Connection. Prepared by the Calvert County Department of Planning and Zoning. October 2006.
DPZ 2007. Cultural Resources Review in Calvert County, Maryland. Calvert County Planning and Zoning. Prince Frederick, Maryland. August 3, 2007.
DPZ 2011. Calvert County Comprehensive Water and Sewage Plan 2011 Update. Prepared by the Calvert County Department of Planning and Zoning. March 2011.
Draft New Source Review Workshop Manual. EPA. October 1990.
Drummond, David. 2007. Water-Supply Potential of the Coastal Plain Aquifers in Calvert, Charles, and St. Mary’s Counties. Report of Investigations No. 76. Maryland Geological Survey, Baltimore, Maryland.
EPA Region 4 National Combustion Turbine Spreadsheet. http://www.epa.gov/region4/air/permits/national_ct_list.xls
Fahay, Michael P., Peter L. Berrien, Donna L. Johnson, and Wallace W. Morse. 1999. Essential Fish Habitat Source Document: Bluefish, Pomatomus saltatrix, Life History and Habitat Characteristics. NOAA Technical Memorandum NMFS-NE-144. National Marine Fisheries Service Northeast Region Northeast Fisheries Science Center, Woods Hole, Massachusetts.

DNR – PPRP 234 COVE POINT ERD / DEC 2014
Fetter, C. W. 2001. Applied Hydrogeology, Fourth Edition. Prentice-Hall Inc., Upper Saddle River, New Jersey.
FERC 2011. Environmental Assessment for the Sabine Pass Liquefaction Project, Cameron Parish, Louisiana. Federal Energy Regulatory Commission, Office of Energy Projects. Docket No. CP11-72-000. December 2011.
Maryland Ornithological Society. 2010. 2nd Atlas of the Breeding Birds of Maryland and the District of Columbia. A project of the Maryland Ornithological Society and The Maryland Department of Natural Resources and the United States Geological Survey. Edited by Walter G. Ellison. The Johns Hopkins University Press. Baltimore, Maryland.
MDOT 2013. 2013 - 2018 Final Consolidated Transportation Program (CTP). Maryland Department of Transportation. Office of Planning and Capital Programming.
MDNR 2012. MERLIN Online Mapping. http://www.mdmerlin.net/.
MDP 2009. Acres of Land in Farms for Maryland and its Jurisdictions. Prepared by the Maryland Department of Planning from the 1997, 2002 and 2007 Census of Agriculture. March, 2009.
MDP 2012a. Historical and Projected Population for Maryland’s Jurisdictions. Prepared by the Maryland Department of Planning. March, 2012.
MDP 2012b. Historical and Projected Households for Maryland’s Jurisdictions. Prepared by the Maryland Department of Planning. March, 2012.
MDP 2012c. Personal Income by Major Source and Earnings by Industry. Prepared by the Maryland Department of Planning from US BEA Table CA05N. May, 2012.
MDP 2013a. Total Resident Population for Maryland’s Jurisdictions. Prepared by the Maryland Department of Planning. March, 2013.
MDP 2013b. 2006-2010 American Community Survey: Journey-to-Work Commutation. Prepared by the Maryland Department of Planning from 2006 to 2010 American Community Survey (ACS), March 2013.
DNR – PPRP 235 COVE POINT ERD / DEC 2014
MDP 2013c. Full and Part-Time Jobs by Place of Work. Prepared by the Maryland Department of Planning from U.S. BEA Table CA25N, May 2013.
MDP undated. 2010 Census Profile of General Population and Housing Characteristics. Source: U.S. Census Bureau, Census 2010. Prepared by the Maryland Department of Planning, Projections and Data Analysis, State Data Center.
Murdy, Edward O., Ray S. Birdsong, and John A. Musick. 1997. Fishes of the Chesapeake Bay. Smithsonian Institution Press, Washington, D.C.
NOAA Climate Data 1981-2010. http://www1.ncdc.noaa.gov/pub/data/normals/1981 2010/products/station/
NOAA Fisheries Service. 2012. Summary of Essential Fish Habitat (EFH) Designations – Patuxent River, Maryland. http://www.nero.noaa.gov/hcd/md5.html
NRCS. 2012b. Official Soil Series Descriptions. United States Department of Agriculture. http://soils.usda.gov/technical/classification/osd/index.html.
Nichols, John. 2008a. National Marine Fisheries Service – Habitat Conservation Division.
OAQPS Control Cost Manual, Fifth Edition. EPA 1996.
Packer, David B., Sara J. Griesbach, Peter L. Berrien, Christine A. Zetlin, Donna L. Johnson, and Wallace W. Morse. 1999. Essential Fish Habitat Source Document: Summer Flounder, Paralichthys dentatus, Life History and Habitat Characteristics. NOAA Technical Memorandum NMFS-NE-151. National Marine Fisheries Service Northeast Region Northeast Fisheries Science Center, Woods Hole, Massachusetts.
Protocol for Equipment Leak Emission Estimates. EPA-453/R-95-017. November 1995.
Schaffner, Linda C. and Robert J. Diaz. 1988. Distribution and Abundance of Overwintering Blue Crabs, Callinectes sapidus, in the Lower Chesapeake Bay. Estuaries. 11(1) 68-72.

DNR – PPRP 236 COVE POINT ERD / DEC 2014
SMHA 2003. The Southern Maryland Heritage Area. Heritage Tourism Management Plan. Prepared by Redman/Johnson Associates. April 2003.
SHA 2008. Maryland Oversize/Overweight Hauling Permit Manual. Maryland State Highway Administration, Office of Traffic & Safety, Motor Carrier Division. Permit Manual as of April 10, 2008.
SHA 2012a. State Highway Location Reference. Calvert County. Highway Information Services Division. December 31, 2012.
SHA 2012b. RE: Calvert County MD 497 east of Little Cove Point Road, Dominion Cove Point LNG, Traffic Impact Study, Mile Point 1.48. Letter communication to Mr. Michael Lenhart, President – Lenhart Traffic Consulting, Inc. from Steven D. Foster, Chief, Access Management Division. SHA Tracking No. 12APCA0005XX. November 21, 2012.
SHA 2013. Re: Calvert County Dominion Cove Point LNG MD 497 and MD 2/4, Mile Points: 1.3 & 4.36. Letter communication to Mr. Joseph J. Kadjeski, Collinson Oliff & Associates, Inc. from Steven D. Foster, Chief, Access Management Division. SHA Tracking No. 12APCA0005XX. April 9, 2013.
Trollinger, Jeffrey B. and Karen K. Reay. 2001. The Virginia Breeding Bird Atlas Project 1985-1989. Virginia Department of Game and Inland Fisheries and the Virginia Society of Ornithology (VDGIF and VSO). Special Publication Number 3, Wildlife Diversity Division, Virginia Department of Game and Inland Fisheries. Richmond, Virginia.
U.S. NABCI Committee. 2000. North American Bird Conservation Initiative. Bird Conservation Region Descriptions, A Supplement to the North American Bird Conservation Initiative Bird Conservation Region Maps. U.S. NABCI Committee. September. Arlington, Virginia. Downloaded from the website: http://www.nabci-us.org/aboutnabci/bcrdescrip.pdf
U.S. Environmental Protection Agency (USEPA) 1998 SLAMS/NAMS/PAMS Network Review Guidance. USEPA, Office of Air Quality Planning and Standards, Research Triangle Park, EPA-454/R-98-003, March 1998.

DNR – PPRP 237 COVE POINT ERD / DEC 2014
USDA 2013. 2012 Quick Stats. Calvert County, Maryland. U.S. Dept. of Agriculture, National Agricultural Statistics Service. http://quickstats.nass.usda.gov. Accessed August 16, 2013.
USFWS. 2008. Birds of Conservation Concern 2008. United States Fish and Wildlife Service, Division of Migratory Bird Management, Arlington, Virginia. December. Downloaded from the website: http://www.fws.gov/migratorybirds/NewReportsPublications/SpecialTopics/BCC2008/BCC2008.pdf
White, Christopher P. 1989. Chesapeake Bay Nature of the Estuary A Field Guide. Tidewater Publisher. Centreville, Maryland.


Appendix A PSC Order and Final License Conditions


ORDER NO. 86372
IN THE MATTER OF THE APPLICATION OF DOMINION COVE POINT LNG, LP FOR A CERTIFICATE OF PUBLIC CONVENIENCE AND NECESSITY TO CONSTRUCT A GENERATING STATION WITH A NAME-PLATE CAPACITY OF 130 MW AT THE DOMINION COVE POINT LIQUEFIED NATURAL GAS TERMINAL IN CALVERT COUNTY, MARYLAND ____________________________________
* * * * * * * * * * * * *
BEFORE THE PUBLIC SERVICE COMMISSION
OF MARYLAND
_____________
CASE NO. 9318 _____________
Before: W. Kevin Hughes, Chairman Lawrence Brenner, Commissioner
Kelly Speakes-Backman, Commissioner Anne E. Hoskins, Commissioner
Issued: May 30, 2014
i

APPEARANCES:
Lisa S. Booth, William H. Baxter II, John H. Burnes, Jr., Kevin Finto, Harry M. Johnson, III, Janna R. Chesno, and Paul Korman, on behalf of Dominion Cove Point LNG, LP.
Sean Canavan, on behalf of Accokeek, Mattawoman, Piscataway Creeks Communities Council, Inc.
Joshua Berman, Curtis Cooper, and Diana Dascalu-Joffe, on behalf of the Sierra Club and Chesapeake Climate Action Network.
Brent Bolea and Sondra McLemore, on behalf of the Maryland Department of Natural Resources, Power Plant Research Program.
Donald R. Hayes on behalf of Washington Gas Light Company.
Peter Saar, on behalf of the Office of Maryland People's Counsel.
Janice M. Flynn and Ryan C. McLean on behalf of the Staff of the Public Service Commission of Maryland.
ii

I. INTRODUCTION/ EXECUTIVE SUMMARY
On April 1, 2013, Dominion Cove Point LNG, LP (“DCP” or the “Company”)
filed with this Commission an application for a Certificate of Public Convenience and
Necessity (“CPCN”) pursuant to § 7-207 and § 7-208 of the Public Utilities Article
(“PUA”) of the Maryland Annotated Code and Code of Maryland Regulations
(“COMAR”) Title 20, Subtitle 79 to construct an electric Generating Station with a
name-plate capacity of 130 MW (“Generating Station” or “Station”) at its existing
liquefied natural gas (“LNG”) terminal site in Calvert County, Maryland. DCP also
seeks a waiver of the requirement to request the CPCN at least two years before
beginning construction of the Station. PUA § 7-208(b)( 1).
DCP is a limited partnership existing under the laws of Delaware. DCP owns
and operates a federally-approved LNG terminal (“Terminal”) near Cove Point in
Calvert County, Maryland. The Terminal is designed to receive imported LNG from
tanker ships, store LNG in tanks, and vaporize and transport the vaporized LNG over
an 88-mile pipeline to the interstate gas transmission system.
DCP is proposing to construct the Station to provide electricity to an expanded
bi-directional import and export LNG facility (“LNG facility” or “Project”), for which
it is seeking regulatory approval from the Federal Energy Regulatory Commission
(“FERC”).1 The proposed 130 MW Generating Station will serve only the liquefaction
Project's needs, with no current plans to connect it to the State's electric grid.
1 This application is pending before FERC in Docket No. CP-13-113-000. The documents supporting DCP's FERC
application were also supplied to this Commission, along with updates and supplements.
3
This application for a CPCN is more complex than most because it involves
overlapping consideration by us of the Generating Station and by the FERC of the larger
LNG facility. However even DCP acknowledges, and we agree, that the two are
intertwined. We have recognized the unique circumstances of this case as we have
applied the considerations our statute requires to the facts presented by the parties and the
public in their comments.
For the reasons discussed in this order, we grant the CPCN for the electric
Generating Station, subject to significant new conditions. One of the new conditions is
that this CPCN is conditional upon FERC approval of the Cove Point LNG expanded
export facility, and all FERC conditions associated with that approval, because the sole
purpose of the Generating Station would be to serve the proposed expanded LNG
operations and because of the functional integration of the generation station within the
LNG facility.
Because we have found that, as proposed by DCP, the Generating Station and the
LNG facility will not provide net economic benefit to Maryland citizens, we have
modified the proposed conditions to require DCP to contribute $8 million per year for five
years ($40 million total) to the State’s Strategic Energy Investment Fund (“SEIF”), to be
used for the development of renewable and clean energy resources in Maryland,
greenhouse gas mitigation, energy efficiency programs, or demand response programs.
We have also modified the proposed condition of a contribution to the Maryland Energy
Assistance Program to direct that DCP contribute $400,000 per year for each of the 20
years the terminal is under contract to operate, for a total of $8 million. We direct DCP to
4
advise us in writing within ten days of its acceptance or rejection of the Conditions set
forth in Appendix A of this Order.
II. PROCEDURAL HISTORY
Upon receiving DCP's application, the Commission docketed Case No. 9318 and
delegated it to the Public Utility Law Judge Division. A pre-hearing conference was held
on May 8, 2013, at which the entities present were DCP, the Maryland Department of
Natural Resources (“DNR”) Power Plant Research Program (“PPRP”), Washington Gas
Light Company (“WGL”), the Office of People's Counsel (“OPC”), the Sierra Club
(“SC”), and the Staff of the Public Service Commission (“Staff”). Motions to intervene
from SC, WGL, and Chesapeake Climate Action Network (“CCAN”) were granted. DCP
stated that a copy of the public version of the CPCN Application had been made available
at the library in Calvert County. The application was deemed complete on June 5, 2013.
DCP filed numerous supplements to the application between April and November 1, 2013,
when the Public Utility Law Judge issued an order adopting a procedural schedule that
had been proposed by the parties.2 On November 25, 2013, by Order No. 86025, the
Commission rescinded its delegation to the Public Utility Law Judge Division and,
without disturbing the amended procedural schedule adopted on November 14, 2014,
determined that it would hear the case en banc. On December 10, 2013, the Accokeek,
Mattawoman, Piscataway Creeks Communities Council, Inc. (“AMP Creeks Council” or
“AMP”) filed a Petition to Intervene Out-of-Time (“Petition”) in Case No. 9318. The
Commission granted the Petition on January 7, 2014.
2 That schedule was amended on November 14, 2013 to correct an administrative error.
5

On July 17, 2013, DCP filed the direct testimony of Robert B. McKinley, Vice
President, Generation Construction for Dominion Resources Services, Inc.; Robert M.
Bisha, Director, Environmental Business Support for Dominion Resources Services, Inc.;
and Richard B. Gangle, an Environmental Consultant with the Environmental Business
Support Group at Dominion Resources Services, Inc. The direct testimony of all other
parties was filed on January 15, 2014, including PPRP witnesses Susan T. Gray, Deputy
Director of PPRP and the project manager for reviewing the CPCN Application filed by
DCP; William V. Paul, Chief of the Combustion and Metallurgical Division of the
Maryland Department of the Environment's (“MDE”) Air and Radiation Management
Administration (“ARMA” or “MDE-ARMA”) (air quality impacts); Mark DiPrinzio, a
partner and senior air quality professional at Environmental Resources Management, Inc.
(“ERM”); John W. Grace, Chief of the Source Protection and Appropriation Division of
MDE's Water Management Administration (“WMA”); Robert W. Keating, a geologist
with ERM; Peter D. Hall, President of Metametrics, Inc., and a consulting economist with
specialties in regional economics and socioeconomic impact assessments; Steve Harriott,
an Ecologist and Professional Wetland Scientist with Versar, Inc., the Biology Integrator
contractor to PPRP; and Diane Mountain, Senior Project Manager at ERM and a
registered Professional Engineer in Maryland. Dr. Steven L. Estomin, Senior Economist
and Principal with Exeter Associates, Inc., submitted reply testimony on behalf of PPRP.
Direct testimony also was filed by AMP witness Dr. Donald Helm, who currently
occupies the Samuel P. Massey Chair of Excellence, Emeritus at the United States
Department of Energy (“DOE”); Sierra Club and CCAN (jointly “SC-CCAN”) witnesses
William E. Powers, a consultant on environmental permitting and energy matters and the
6
owner of Powers Engineering, and Susan E. Allison, an instructional assistant with the
Calvert County Adult Education Program; and Staff witness Ralph DeGeeter, a
Generation/Transmission Engineer with the Commission's Engineering Division.
Reply testimony was filed on January 29, 2014. DCP filed reply testimony by its
witnesses McKinley, Bisha, and Gangle, as well as that of Michael D. Frederick,
Vice President, LNG Operations for DCP. PPRP filed the reply testimony of its witnesses
Gray, Paul, DiPrinzio, Grace, Hall and Estomin. SC-CCAN filed the reply testimony of
its witnesses Powers and Allison.
On January 15, 2014, PPRP filed its Environmental Review of the proposed
130 MW Generating Station within the Project (the “Environmental Review”). PPRP's
Initial Recommended License Conditions were included as Appendix A to the
Environmental Review. The Environmental Review concludes that although the proposed
130 MW Generating Station is only a portion of the proposed Project, its impact cannot be
separated from the larger liquefaction Project; therefore the State's environmental review
was not limited to the Generating Station, but rather “examined the proposed Project as a
whole.”3 In the Secretarial Letter dated January 15, 2014, the participating State Agencies
provided their conclusion that “the power plant site is suitable and that the proposed
generating facility can be constructed and operated in accordance with all applicable
environmental regulations, provided that [the State Agencies'] recommendations are
incorporated as conditions to the CPCN.”4
3 Environmental Review at 2.
4 Letter dated January 15, 2014, to W. Kevin Hughes, Chairman from Earl F. Hance, Secretary, et al., filed on January
27, 2014 (the "Secretarial Letter").
7

On January 23, 2014, DCP filed a Motion to Strike Portions of Intervener
Testimony Related to Hydraulic Fracturing, seeking to exclude a portion of Dr. Helm’s
testimony. On January 27, 2014, AMP filed its opposition to DCP’s Motion to Strike and
on January 31, 2014, DCP filed a Reply Memorandum in support of its Motion to Strike.
PPRP filed comments in support of the Motion to Strike and SC-CCAN filed comments
opposing the Motion to Strike. The Commission granted DCP’s Motion to Strike on the
first day of evidentiary hearings, February 20, 2014, concluding that Dr. Helm’s testimony
relating to the environmental and geological impacts of hydraulic fracturing is outside the
scope of this proceeding and is instead within FERC’s purview to evaluate the
environmental impacts as they relate to the proposed LNG facility.5
On February 5, 2014 SC-CCAN and AMP filed a Request for Extension of Time
to file Public Comments (Request) seeking an additional 60 days for the public to file
comments after the March 1, 2014 public hearing. DCP opposed the Request. On
February 21, 2014, the Commission ruled and granted an extension of 30 days for public
comment.
The Commission held evidentiary hearings on February 20, 21, and 24, 2014 in
Baltimore, MD and conducted a public hearing on March 1, 2014 in Lusby, Maryland.
PPRP filed the State Agencies' final recommendations and conditions for the
Project on April 17, 2014, which proposed four new conditions and modified three other
proposed conditions. On April 30, 2014, the Commission sought additional comment on
the new and modified proposed conditions, to which Commission Staff, DCP, and /SC-
CCAN filed comments on May 14, 2014. On May 6, 2014, the Commission requested
5 Tr. p. 9.
8

comment regarding the existence of a risk study for this Project, to which PPRP, DCP,
SC-CCAN and Commission Staff filed comments on May 14, 2014.
On May 15, 2014, FERC issued its Staff Environmental Assessment (“EA”), of
which the Commission takes judicial notice.6 FERC has not yet completed its regulatory
review of the proposed LNG Project or addressed the recommendations contained in the
Environmental Assessment.
III. APPLICABLE LAW
The scope of the State’s jurisdiction over the siting and operation of this LNG
Project is complex, due to the integrated components of the proposed Generating Station
and the liquefaction facilities. As PPRP witness Susan Gray noted:
This Project is unlike other CPCN reviews in my experience in that it involves a generating station that is located within and is integral to a larger Liquefaction Project that DCP is seeking to construct and operate ... Moreover, the generating station ... is very closely intertwined with the components of the broader Liquefaction Project ... the combustion turbines themselves are dual purpose; they are used both to mechanically drive the compressors used for liquefaction process and to provide the electricity that is needed to serve other aspects of the liquefaction process. Further, the DCP's Liquefaction Project is concurrently under review by the Federal Energy Regulatory Commission.
Statutory authority for reviewing a CPCN application is found in § 7-207(e) of the
Public Utilities Article, which states that prior to taking action on an application for a
CPCN for a generating station, the Commission must give due consideration to the
following factors:
6 Judicial Notice, May 21, 2014. On May 27, 2014 DCP and SC-CCAN filed Comments on the Judicial Notice, neither
of which objected to it.
9

(1) The recommendation of the governing body of each county or municipal corporation in which any portion of the construction of the generating station or overhead transmission line is proposed to be located; and
(2) The effect of the generating station or overhead transmission line on:
(i) the stability and reliability of the electric system;
(ii) economics;
(iii) esthetics;
(iv) historic sites;
(v) aviation safety, as determined by the Maryland Aviation Administration and the administrator of the Federal Aviation Administration;
(vi) when applicable, air and water pollution; and
(vii) the availability of means for the required timely disposal of wastes produced by any generating station.
Under § 7-208 of the PUA, the Commission also is required to include in the
CPCN the requirements of the Federal and State environmental laws and standards that
are identified by MDE, and the methods and conditions that the Commission determines
are appropriate to comply with those environmental laws and standards.7
While this application raises unique questions of law and fact given the
interdependency between the electric Generating Station and the larger liquefaction
Project, FERC has primary jurisdiction for evaluating and licensing the liquefaction
Project.8 Federal law includes provisions for State input into LNG licensing
determinations, recognizing State interests in protecting the environment and the health
7 Although § 7-208 is silent as to specific considerations the Commission is to apply, § 7-208(b)(1) provides, “To obtain
the certificate of public convenience and necessity required under § 7-207 of this subtitle for construction under this section … .” thus incorporating of all of § 7-207, including its considerations which we apply herein. 8 Pub. L. 109-58, § 372(b); 42 USC § 15928(b).
10

and safety of its residents when LNG facilities are constructed and operated. Moreover,
in 2005, the Maryland General Assembly passed legislation requiring the Commission to
adopt regulations “to ensure to the greatest extent practicable the operational safety of
liquefied natural gas facilities”.9 In response, the Commission promulgated COMAR
20.55.02.02(A)(4), which incorporates by reference the federal regulations governing
federal safety standards for liquefied natural gas facilities.
This is not the first time this Commission has reviewed an application involving
the LNG facility at Cove Point. From 2002 through 2004, in Case No. 8917, the
Commission reviewed the operational safety of the Cove Point facility prior to the
resumption of imports to ensure the facility posed little or no safety risks. In that
proceeding, Cove Point LNG Limited Partnership (the predecessor of DCP)
acknowledged the Commission’s role under PUA 11-101(b) to “ensure to the greatest
extent practicable the operational safety of liquefied natural gas facilities.”10
IV. SUMMARY OF PARTIES' POSITIONS
A. Dominion Cove Point
DCP urges that the scope of the Commission's review in this case is not simply
limited to the Generating Station for which DCP seeks this CPCN. Noting that “DCP's
Project is not just to construct an electric generating facility” and that the “Generating
Facility is an integral part of this unique Project,” DCP concludes that an “analysis of the
costs and benefits of the Generating Facility must consider the costs and benefits of the
9 PUA 11-101(b).
10 Cove Point LNG Limited Partnership Case No. 8917 Initial Report at 7. Dominion Resources, Inc. acquired Cove
Point LNG Limited Partnership on September 5, 2002, and the company changed its name to Dominion Cove Point, LP or DCP effective December 17, 2002.
11
entire Project.”11 As a result, in much of its analysis, DCP submits the characteristics of
the overall Project, not on the Generating Station characteristics alone.
DCP challenges AMP's assertion that the Commission has no authority to review
the economic impact of the overall Project. “The record,” according to DCP, “reflects that
the generating facility and the liquefaction process are inseparably integrated.”12 DCP
also rejects AMP's argument that, as Federal permits are also necessary for construction of
the Project, any action by this Commission would establish a new permit requirement,
impermissibly conflicting with Federal law. DCP argues that “under AMP's ... specious
reasoning, no state could ever evaluate a federally permitted project because that review
would be preempted by the federal action.”13 Under the same logic, DCP rejects AMP's
arguments that approval by the Calvert County Board of Commissioners is preempted by
Federal Law.14
Dominion Cove Point states that “the Project meets the criteria set out in
Section 7-207(e) of the Public Utility Article.”15 Addressing each of those requirements in
turn, DCP then notes that “the Project and the CPCN have the unanimous support of the
Calvert County Board of Commissioners,” an indication that the Project will have
significant public benefits, according to DCP.16
11 DCP In. Br. at 10.
12 DCP Rep. Br. at 4, citing Tr. 234-235 (Gangle).
13 DCP Rep. Br. at 4-5.
14 Given that the County Commissioners unanimously approved the Project, DCP stated that no conflict between
Federal and State law currently exists. DCP admits that if a conflict between Federal and State decisions were to arise, Federal law would govern. (DCP Rep. Br. at 6, citations omitted.) 15
DCP In. Br. at 1. 16
DCP In. Br. at 12.
12
As to the question of the Generating Station's impact on the stability and reliability
of Maryland's electric system, DCP urges that the facility will have no adverse impact, as
all the power it supplies will be consumed within the LNG plant.17 DCP stated in its brief
that it accepted the Staff's proposal to undertake a “collaborative study of a potential
interconnection with the grid.” If a study shows that grid interconnection is feasible and
“warranted,” DCP concludes that such interconnection would not undermine the electric
system's stability and reliability. Further, according to DCP, this Commission would be
able to review any new transmission line in a separate CPCN proceeding.18
Addressing economics, DCP states that “the Project will result in significant net
economic benefits in Maryland.”19 In support of its assertion, DCP states that “thousands”
of workers will be employed in construction of the overall LNG facility, and that 75 full-
time permanent jobs will be created. DCP also asserts that “the Project will yield
approximately $40 million per year in incremental revenue to the County,” which will
satisfy a net present value analysis and likely outweigh any increase in the price of natural
gas caused by export of LNG.20 During the evidentiary hearing, DCP witness McKinley
testified that construction of the new Generating Station will account for approximately 20
percent of the man-hours and overall costs of the entire project. Additionally, he
estimated that the Generating Station would employ approximately 20 to 23 full-time
employees or about 30 percent of the full-time permanent jobs for the entire project.21
17 DCP In. Br. at 13.
18 DCP In. Br. at 13.
19 DCP In. Br. at14.
20 DCP Rep. Br. at 11-12.
21 Tr. at 343-345.
13
To bolster its position, DCP cites a U.S. Department of Energy study showing
consistent net economic benefits from the export of liquefied natural gas on a national
basis. While the Company admitted that liquefaction of natural gas at Cove Point could
put some upward pressure on the prices of natural gas and electricity, the Company also
maintains that such increases would be spread over the entire period that Cove Point
exports LNG. The benefits of increased employment, however, would be “front loaded,”
so that the local economy would see growth before it felt any effects of increased natural
gas prices.22
Addressing esthetic, noise, and historic site issues, DCP states, as a general matter,
that the Cove Point site has been an industrial site for 40 years. “The site is a 131-acre
industrial area within a 1,017-acre forested site that is otherwise undeveloped.”23 The new
Generating Station will be contained within the 131 acre site and will be obscured by old
growth trees, according to DCP. Where legal requirements are subjective, such as the
areas of esthetics and historic site impacts, DCP provides the reasons that Project impacts
will either be nonexistent, insignificant, temporary, or well contained. Further, DCP
states that exhaust stacks at the new site will be the same height as existing LNG storage
tanks, and vapor plumes from those stacks would likely not be visible, due to low
moisture exhaust from the combustion turbines (“CTs”). To further mitigate any esthetic
impact arising from the Project, DCP plans to build a 60 foot tall sound wall that, while
partially visible from Cove Point Road, will not be visible from the Cove Point recreation
22 DCP In. Br. at 16.
23 DCP In. Br. at 17.
14

area. DCP also states that it will work with PPRP to determine if other measures to limit
views of the sound wall are feasible.24
To accommodate construction vehicles and equipment, DCP will clear nearly 100
acres in “Offsite Area A.” DCP will plant a 100 foot tree buffer to shield Offsite Area A,
will keep 13.5 acres of Offsite Area A forested, and will replant trees, where possible,
under a Forest Conservation Plan with Calvert County. At the end of construction, Offsite
Area A will be transferred to Calvert County.25
Visual effects at Offsite Area B, which will be used for barge deliveries,
equipment storage, and parking during construction, will be temporary. Once
construction is finished, DCP states that it will remove its temporary barge pier and return
Offsite Area B to its original condition within 30 days. For that reason, DCP concludes
that Offsite Area B will “not significantly affect the cultural attractiveness of the Lower
Patuxent Peninsula.”26
As to noise impacts, DCP notes that the Project is required to meet all applicable
limitations on the noise it emits. DCP claims that it is “buying ... the quietest equipment
available” and “we're spending tens of millions of dollars to make sure we are meeting the
noise requirements.”27
Referring to the possible effect of the Project on historic sites, DCP first notes that
it will abide by a request by the Maryland Historic Trust to preserve a 50 foot buffer
around a likely historic site on Offsite Area A. Further, it will avoid five sites on Offsite
24 DCP In. Br. at 17-18.
25 DCP In. Br. at 18-19.
26 DCP In. Br. at 19, citing PPRP Ex. 12 at 12 (Hall Direct).
27 DCP In. Br. at 19-20, citing Tr. 392, McKinley.
15

Area B that possibly contain historic material. DCP therefore concludes that its actions
will not adversely affect Maryland historic resources.28
DCP asserts that the Project will have no adverse effect on aviation safety. DCP
consulted with the Patuxent Naval Air Station, which had no concerns about the proposed
facility. The Company further notes that Federal Aviation Administration (“FAA”)
guidelines do not require that the FAA be notified about the Project's details unless
proposed structures exceed 200 feet in height, and none of the permanent or proposed
structures at the Project do so.29
The issue of the Project's compliance with Federal and State clean air laws has
taken up perhaps the largest amount of time and testimony in this proceeding. DCP
maintains that “the Project complies with all of the applicable major statutory source
permitting requirements under the Federal Clean Air Act (“CAA”) and COMAR, Title 26
(Department of the Environment), Subtitle 11 (Air Quality).” DCP also asserts that it has
complied with all other elements and standards that are applicable to the proposed
Project.30 DCP maintains that overall, the Project will minimize emissions. It will use
“process gas” for generation, rather than burning off (or “flaring”) such gas into the
atmosphere. Further, purchase of emissions offsets “ensures that the Project will not add
incremental emissions, and DCP has acquired the necessary offsets.”31
Specifically addressing Federal New Source requirements, DCP notes that there
are two components; Non-Attainment New Source Review (“NA-NSR”) and Prevention
28 DCP In. Br. at 20-21.
29 DCP In. Br. at 21.
30 Included in those categories are New Source Performance Standards ("NSPS"), Maximum Achievable Control
Technology ("MACT"), National Ambient Air Quality Standards ("NAAQs"), visibility standards and impacts to vegetation and growth, and modeling of air toxins. DCP In. Br. at 21-22. 31
DCP Rep. Br. at 22.
16
of Significant Deterioration (“PSD”). NA-NSR is generally the more stringent standard.
Maryland is in a non-attainment area for ozone, meaning its ozone levels exceed Federal
standards during certain seasons.32 As the Project will emit ozone precursors, specifically
nitrogen oxide (“NOx”) and volatile organic compounds (“VOCs”) in a non-attainment
area for ozone, those emissions will be subject to Lowest Achievable Emission Rate
(“LAER”) standards. The LAER standards require DCP to employ specific technologies,
purchase emissions offsets, and conduct an alternatives analysis.33 NOx is also subject to
the Best Available Control Technology (“BACT”) standard, as are greenhouse gasses
(“GHGs”), particulate matter (“PM”), carbon monoxide (“CO”), and sulfur dioxide
(“SO2”). DCP states that the Project has “an inherently low-emitting design” and “was
designed from the beginning to meet LAER and BACT.”34 For example, the Cove Point
LNG facility will be “the only LNG facility in the United States using exhaust heat to
generate electricity.” Other LNG plants simply release exhaust heat to the atmosphere.35
DCP has accepted all of PPRP's proposed conditions relating to applicable PSD
and NA-NSR requirements, an action that DCP concludes satisfies all applicable Federal
and State emissions requirements. DCP therefore focused its arguments on rebutting
challenges from those parties urging that the emission rates and amounts approved by
PPRP are not low enough. In approaching challenges to its emissions levels, DCP notes
that COMAR 26.11.17.01(B)(15)(ii) defines LAER as “[t]he most stringent emissions
limitation which is achieved in practice by the class or category or statutory sources, with
32 Gangle Dir. at 6.
33 DCP In. Br. at 22.
34 DCP In. Br. at 23.
35 DCP In. Br. at 24.
17
this limitation, when applied to a modification, meaning the lowest achievable emissions
rate for the new or modified emissions units within the stationary source.” The same
principle underlies the definition of BACT, as “LAER is similar to BACT, but ‘is always
at least as stringent as BACT’.”36 DCP maintains that “the courts and EPA have
interpreted the word 'achievable' to mean that a facility can comply with the BACT limit
continuously under all reasonably foreseeable worst case conditions.”37
Based on its definition of BACT and LAER, DCP rejects arguments by other
parties that LAER and BACT limits lower than those predicted at Cove Point were
achievable at other plants and should be achievable at Cove Point. DCP asserts that while
LAER for “typical turbines” that burn pipeline natural gas is 2.0 ppm, the Project cannot
meet that low emission level because it will use “process” gas, which is created when
pipeline natural gas is pre-treated during the liquefaction process.38 Because of this pre-
treating, it contains more NOx than pipeline gas. As a result, according to DCP, it cannot
produce emissions at the 2.0 ppm level.
In addition to relying on the use of process gas rather than pipeline natural gas to
justify a 2.5 ppm rather than a 2.0 NOx emission rate, DCP addressed legal emission rates
in Southern California, upon which the environmental intervenors had relied for their
2.0 ppm NOx recommendation. DCP noted that California's South Coast Air Quality
Management District (“SCAQMD”) covers the smoggiest region of the United States, an
area classified as an extreme ozone non-attainment area.”39 Supporting its position that
36 DCP In. Br. at 24, citing PPRP Ex. 4 at 4-5 (Paul Direct).
37 DCP In. Br. at 26.
38 DCP In. Br. at 27, 28.
39 DCP Rep. Br. at 16.
18

different NOx limits are appropriate for differently sized gas boilers, and that, in general,
one emissions limit is not right for all technologies, DCP notes that the rules governing
NOx emissions in SCAQMD are different for boilers used to generate electricity, boilers
in petroleum refineries, or boilers at reclamation sites.40 Further, DCP maintains that
Rule 114b, applicable in SCAQMD, would regulate process gas in a way not applicable to
DCP's boilers, even if they were located in the SCAQMD district.41
DCP illustrates its position with other references to differences between
technology in SCAQMD and the Cove Point facility. According to DCP, SC-CCAN
make the same mistake regarding emission limits for combustion turbines as for boilers –
that is, they “ignore both the type of unit and fuel in arguing that the NOx limit for the
combustion turbines should be 2 ppm in this case.”42 DCP claims that SC-CCAN for the
first time in their initial brief argued that scrubbers on combustion turbines should be able
to achieve 92% reduction of NOx emissions, resulting in an overall emission limit of 2
ppm. There is no evidence, according to DCP, that supports 92% or counters responses
from combustion turbine vendors that an emission limit lower than 2.5 ppm could not be
achieved.43
DCP objects to SC-CCAN's proposal to implement a “safety valve,” a requirement
for a specific emissions limit with a qualification that a higher limit could be accepted if
the lower limit proved unachievable. DCP argues that such a “limit” would not qualify as
40 DCP Rep. Br. at 17.
41 DCP Rep. Br. at 17.
42 DCP Rep. Br. at 19.
43 DCP Rep. Br. at 19-20.
19

LAER, which “is based on what is known to be achievable at the time of permitting.”44
Based on its analysis, DCP concludes that LAER for the combustion turbines is 2.5 ppm
NOx.45
DCP also opposes SC-CCAN's proposal that only leakless components be used in
its piping system. SC-CCAN, DCP states, cited no comparable facility that employed
only leakless technology, or cited to any permit or regulation requiring such usage. As
there are “thousands of valves, connectors, and pumps in a variety of services and
locations,” and leakless connectors are welded shut and are inaccessible, DCP finds a
totally leakless requirement impractical.46 According to DCP, because the leak detection
and repair (“LDAR”) program is designed to satisfy LAER requirements, DCP has
proffered that as the appropriate standard in this case.47
As to water usage, DCP states there is a lack of evidence that subsidence due to
such usage will be a problem. Nonetheless, DCP agreed after conclusion of the hearings
to a new condition that will provide $190,000 for the Maryland Geological Survey
(“MGS”) to conduct subsidence monitoring in and near Calvert County.48
DCP also urges Commission acceptance of its waiver request under PUA
§ 7-208(b)(1), to enable it to begin construction prior to the two-year required waiting
period. In support, DCP cites the thorough study to which its CPCN application has been
44 DCP Rep. Br. at 21.
45 DCP Rep. Br. at 21.
46 DCP Rep. Br. at 23.
47 DCP Rep. Br. at 23.
48 See Final Recommended Licensing Conditions of the Reviewing State Agencies, April 17, 2014, proposed additional
consideration J-2.
20

subjected, DCP's acceptance of all proposed conditions, and the lack of any opposition to
its waiver request.49
B. Power Plant Research Program
PPRP submitted testimony through DNR in this proceeding. PPRP witness Susan
T. Gray explained that PPRP is responsible for coordinating the review of projects
requiring a CPCN from the Public Service Commission with other units within the DNR
and with various State agencies, including MDE, the Department of Agriculture, the
Departments of Business and Economic Development, Planning, and Transportation, and
the Maryland Energy Administration. Ms. Gray further explained the connection between
this Commission's work and PPRP's responsibility in CPCN cases as follows:
Under Maryland's Power Plant Siting Act of 1971, Chapter 31 of the Laws of Maryland of 1971, which is codified in various parts of the Maryland Code, including Sections 7-207 and 7-208 of the Public Utility Companies Article and Sections 3-301 through 3-306 of the Natural Resources Article, the Public Service Commission is required to consider environmental and socioeconomic impacts associated with the construction and operation of ... electric Generating Stations in the state.50
Ms. Gray also noted that Region III of the Environmental Protection Agency
reviews DCP's CPCN application and forwards its comments to MDE and PPRP for
evaluation and response. She noted that “no CPCN should be issued until EPA and public
comments on the air permit and conditions are responded to in this case.”51
49 DCP Rep. Br. at 25. DCP also notes the reasons that the Project will not be subject to RGGI emissions requirements
and will not be required to purchase GHG allowances. The Company will be subject to RGGI reporting requirements and will apply for a waiver of any remaining requirements to purchase RGGI allowances. DCP Rep. Br. at 24. 50
Gray Dir. at 2. 51
Gray Dir. at 4. PPRP and MDE provided responses to public comments on air quality related to the proposed Project in its April 17, 2014 filing.
21

Ms. Gray summarized the testimony of DNR witnesses by noting that “based on
the information provided, the proposed Project can be constructed and operated in such a
way that complies with all applicable environmental and socioeconomic regulations,
provided that the proposed licensing conditions are incorporated into [a] CPCN that may
be issued in this case, and that DCP complies with those conditions.”52
DNR has submitted numerous conditions (“licensing conditions”) applicable to
DCP's proposed Generating Station at the Cove Point LNG facility. As DNR reviewed
the Project in light of Federal as well as State environmental standards, its testimony and
proposed conditions are keyed to those standards. The conditions cover all stages of the
Generating Station from preparation for construction to post-construction and operation.
Some PPRP conditions were submitted after formal hearings in this matter and are
discussed throughout this Order.
DNR witness Paul detailed the reports, scientific literature, and proposed emission
sources that he consulted in reaching his conclusions that “emissions from the proposed
Project will not adversely affect the relevant National Ambient Air Quality Standards
(“NAAQS”) or PSD increments and impacts from emissions from the proposed Project
will be acceptable53.”
The potential emissions from these sources reviewed by Mr. Paul include six
“criteria pollutants”:
1. Carbon monoxide (“CO”);
2. Nitrogen Dioxide (“NO2”);
52 Gray Dir. at 8.
53 Paul Dir. at 9.
22

3. Sulfur dioxide (“SO2”);
4. Particulate matter (“PM”):
a. PM less than 10 microns (“PM10”); b. PM less than 2.5 microns (“PM2.5”)
5. Lead;
6. Ozone, formed from precursor pollutants:
a. Volatile organic compounds (“VOCs”); and b. Nitrogen oxides (“NOx”)54
Mr. Paul stated that the air quality in Calvert County near the Project is “in
attainment” of the NAAQS for all criteria pollutants except ozone. Due to the area's
attainment status for most criteria pollutants, emission of those pollutants must meet
Prevention of Significant Deterioration (“PSD”) standards, expressed in tons of emissions
per year. Emission sources subject to PSD standards must show that emission of criteria
pollutants are controlled to a level representing BACT and do not violate NAAQS.55
Emissions in nonattainment Areas must meet more stringent standards, including a
level of control technology that results in the LAER. Additionally, sources subject to NA-
NSR must also, among other efforts, secure emission reduction credits or offsets sufficient
to result in a net positive air quality benefit from the Project. He also noted that the two
Frame 7 CTs, which are part of the Generating Station, are subject to New Source
Performance Standards for Stationary Combustion Turbines (40 CFR Part 60, Subpart
54 Paul Dir. at 2-3.
55 Paul Dir. at 5-8.
23

KKKK). Further, individual combustion turbines in the Project will be subject to State air
quality requirements in COMAR.56
Mr. Paul noted that the emission sources subject to BACT for the Project are: the
combustion turbines, the auxiliary boilers, the emergency generator, the fire pump
engines, thermal oxidizer, ground flares, piping components, and paved roads. All of the
foregoing emission sources, except the paved roads, are also subject to LAER, presumably
for ozone precursors.57 While his testimony contains further details, Mr. Paul's conclusion
is “that DCP will be able to construct and operate the proposed Project in conformance
with applicable PSD and NA-NSR requirements, provided that the CPCN incorporates the
recommended licensing conditions … and that the proposed Project is constructed and
operated in accordance with these conditions.”58
DNR witness DiPrinzio discussed the ambient air quality present in Calvert
County, and described the operating restrictions and pollution control systems that will
limit air emissions from the Project to acceptable levels.59 In addition to the criteria
pollutants discussed by Mr. Paul, Mr. DiPrinzio referred to hazardous air pollutants
(“HAPs”), toxic air pollutants (“TAPs”), and GHGs, consisting of CO2, methane (“CH4”),
NO2, hydrofluorocarbons (“HFCs”), per fluorocarbons (“PFCs”), and sulfur hexafluoride
(“SF6”).60
Mr. DiPrinzio's testimony differs from Mr. Paul's in that Mr. DiPrinzio discussed
the specific operating restrictions and technologies the various emitters at the Project, such
56 Paul Dir. at 14-15.
57 Paul Dir. at 7-8.
58 Paul Dir. at 12.
59 DiPrinzio Dir. at 2-3.
60 DiPrinzio Dir. at 4.
24

as the combustion turbines and auxiliary boilers, will use to reduce emissions.61 He
concluded that emissions of TAP and HAP from the Project were in compliance with
Maryland regulations. Mr. DiPrinzio cautioned that without proper control by oxidation
catalysts, emissions of formaldehyde could exceed the 10 ton per year major HAP
threshold.62
Overall, Mr. DiPrinzio concluded that the potential emissions projected by DCP
for the proposed Project were reasonable and acceptable.63 The remainder of Mr.
DiPrinzio's direct testimony described the various BACT and LAER protocols applicable
to the various Project emissions, as summarized in Appendix B attached to this Order.
Mr. DiPrinzio also discussed the concept of General Conformity, designed to
ensure that Federal actions comply with NAAQS and with State Implementation Plans.
Generally, emission sources subject to PSD or NA-NSR requirements are deemed in
conformance.64 A General Conformity evaluation, however, revealed that construction
and operations at the Project but outside PSD NA-NSR permit areas will exceed the
General Conformity threshold for NOx and VOCs in the D.C. area until 2017. Therefore,
as required, DCP has purchased emission reduction credits for 625 tons of NOx and 166
tons of VOCs to offset its own emissions of those pollutants.65
Mr. DiPrinzio stated that there were three forms of NOx emissions,66 and also
noted control of 95% NOx emissions (as opposed to PPRP's proposed condition of 90%
61 DiPrinzio Dir. at 4-5.
62 DiPrinzio Dir. at 11.
63 DiPrinzio Dir. at 12.
64 DiPrinzio Dir. at 9. A general Conformity analysis is performed by FERC, not by the State. (Tr. at 598 – Paul.)
65 DiPrinzio Dir. at 10.
66 Tr. at 572.
25

NOx control) was hypothetically achievable in a short period of time, but not across the
wide range of operating conditions for years in the future.67
On the issue of NOx emissions comparisons and in response to SC-CCAN
assertions that lower emissions levels are possible, PPRP adds the additional detail in its
reply testimony:
…[t]he University of California permit, to which [SC-CCAN] witness Powers refers, does include a 5 ppmvd NOx limit; however, this is based on a calendar quarter average. The more comparable NOx limit of 9 ppmvd on a 3 hour rolling average (also included in the referenced permit) is in fact higher than the NOx LAER limit proposed by DCP and recommended by PPRP and MDE-ARMA.68
Addressing Mr. Powers' assertion that “Dominion has not adequately mitigated the
air impacts of emissions from marine vessels” and “therefore understated Dominion's
offsetting obligations,” and that “[a] requirement that LNG tankers only operate on natural
gas and that tugboats be equipped with selective catalytic reduction (SCR) would result in
no net increase in air emissions from marine vessels,” Mr. DiPrinzio noted that such
emissions were subject to FERC's General Conformity determination. However, as
General Conformity is included in Maryland regulations as COMAR 26.11.26, “PPRP and
MDE-ARMA reviewed General Conformity and determined that DCP has met all
regulatory requirements as set forth in COMAR.”69
Another means of reducing NOx emissions is through the use of leakless
components, which eliminate the need for piping joints. Mr. DiPrinzio, however, stated
67 Tr. at 583-84.
68 DiPrinzio Rep. T. at 4.
69 DiPrinzio Rep. T. at 7.
26

that LAER for NOx could be achieved without use of leakless components through the 28
LAER program and best practice conditions PPRP has proposed.70
Mr. DiPrinzio also addressed the concept of conformity; he explained that a
conformity analysis addresses overall unpermitted emissions “that may result from the
Project, and may require, even after adherence to conditions, a purchase of pollution
offsets. The purpose of conformity review is to ensure that the State is not worse off, in
terms of environmental pollution, than before the Project was constructed.”71
DNR witness Garrison performed an independent review of DCP's analysis of
potential air quality impacts due to increased emissions from DCP's Project. His
testimony examines in further detail certain air quality tests and procedures and pollution
limits already described by Mr. DiPrinzio and Mr. Paul. He assessed the Project's
emissions compared to NAAQS PSD increments, Class I area air quality thresholds,
impacts of growth related to the Project, and other impacts, such as to visibility and soil.72
Mr. Garrison noted that in determining if specific emissions would violate
NAAQS, significant impact levels (“SILs”) are established for each pollutant and
averaging period under study. Air quality modeling is then performed in the area where
the project will be located. Mr. Garrison determined that DCP used an appropriate
modeling methodology to determine the impact of significant emissions from the
70 Tr. at 588-594.
71 Tr. at 629-631.
72 Mr. Garrison defined NAAQS as prescribing ground-level concentrations of specific pollutants at levels that the EPA
concludes protect public health with a margin of safety. Concentrations of pollutants are expressed in terms of parts per million or micrograms per cubic meter ("µg/m3"). "Attainment" areas are those with ambient pollutant concentrations below the NAAQS, and nonattainment areas have higher levels of pollutants than NAAQS allows. PSD increments represent the increase in ambient air concentrations of NO2, SO2, PM10 and PM2.5 that NAAQS allow, but to be acceptable, PSD increments must be significantly lower than NAAQS. The amount of increase in pollutants is determined by whether the source of the pollutant is categorized as in a Class I, II, or III region. Class I regions are the most sensitive and subject to the highest degree of protection. National and state parks are often Class I regions. Garrison Dir. at 2-3.
27

proposed Project. He noted that maximum emission impacts from the Project were
expected to exceed the SILs for PM2.5 using 24-hour averages and annual averages and
NO2 for one-hour averages. Those results triggered the need for additional cumulative
modeling, which demonstrated compliance with applicant NAAQS and PSD increments.73
Mr. Garrison also performed his own modeling, which “verified that the proposed Project
is not expected to cause or contribute to any violation of applicable NAAQS or PSD
increments.”74
PPRP and MDE-ARMA requested further tests to determine if PM2.5, which can
develop from NOx emissions, would exceed the PM2.5 NAAQS. Because Calvert County
is a nonattainment area for ozone, of which NOx is a precursor, and because DCP will
have to purchase NOx offsets in the local air shed, “it is reasonable to conclude that the net
effect of secondary formation of PM2.5 due to NOx to the local air shed as a whole is zero
or less.”75
Mr. Garrison also reviewed DCP's studies of possible visibility impairment and
soil pollution from air emissions. He agreed with DCP's conclusion that no such adverse
effects were likely due to emissions from the Project.76
It also was necessary to determine the effect of Project emissions on Federal Class
I areas, which are particularly sensitive to impacts on visibility. Of special concern in this
case was visibility at Calvert Cliffs State Park, only 1.5 kilometers above the Cove Point
LNG terminal. Mr. Garrison concluded that any plume from the Project would be “well
73 Garrison Dir. at 8.
74 Garrison Dir. at 10.
75 Garrison Dir. at 10.
76 Garrison Dir. at 11.
28

below ... critical contract criteria for visibility impairment against an open background.”77
Mr. Garrison also reviewed DCP's toxic air pollutant analysis for 20 toxic compounds,
and found they were all “well below the acceptable Ambient Levels found in COMAR
26.11.16.09,” and are otherwise in compliance with Maryland TAPs requirements.78
Maryland requires a permit to appropriate and use the waters of the State. The
CPCN application at issue here also constitutes an application for a water use permit,
which is included in the grant of a CPCN.79 DNR witness Grace addressed water issues in
this proceeding for PPRP. He concluded that the various licensing conditions that he
proposed, if included in any CPCN granted to DCP in this case, “will ensure that all State
regulatory requirements applicable to the requested appropriation are met.”80
Mr. Grace noted that the sources of information for his evaluation were an
Environmental Review Document prepared by the PPRP, DCP's Application to
Appropriate and Use Waters of the State, other DNR publications, previous permit
decisions by the DNR-WMA, and his own personal knowledge.
He further noted that COMAR authorizes a permit for use of the State's water only
if three criteria are satisfied: (1) the amount of water appropriated must be reasonable in
relation to anticipated use during the permit period; (2) the anticipated use must not
unreasonably impact the waters of the State; and (3) the proposed use must not
unreasonably impact other users of the water at issue.81
77 Garrison Dir. at 14.
78 Garrison Dir. at 14-15.
79 DCP In. Br. at 9.
80 Grace Dir. at 2-3.
81 Grace Dir. at 4-5.
29

In examining DCP's water use proposal through the lens of the above
requirements, Mr. Grace reported DCP's projected water requirements as follows:
DCP has requested to use the following average water amounts per day of groundwater from the Lower Patapsco aquifer:
200,000 gallons per day for steam turbine boiler makeup;
26,000 gallons per day for operating vaporizers in the event that LNG import occurs;
23,000 gallons per day, a 10% contingency on top of the estimated demand;
250,000 average total gallons per day (rounded).
DCP's month of maximum use estimate was 375,000 gallons per day (1.5 times the
average amount). DCP requested an additional groundwater appropriation to support
construction of the project as follows:
40,000 gallons per day; 60,000 during month of maximum use.82
DNR's own estimates of appropriate water usage for the Project differed from
those of Mr. Grace, as follows:
233,000 gallons per day; 275,000 maximum monthly usage, based on the assumption that the facility operates 100% of the time for the entire month.83
DNR-WMA determined that the estimated withdrawal amounts of 233,000 and
275,000 gallons per day were reasonable.84
82 Grace Dir. at 5-6.
83 Grace Dir. at 6-7.
30

Mr. Grace determined that the withdrawal of the stated amounts over a 12-year
period would result in a maximum five foot drop in the level of the Lower Patapsco
aquifer and that DCP's water appropriation would not exceed the sustained yield of the
Lower Patapsco aquifer. When combined with “regional drawdown” of the aquifer of
14.4 additional feet, the withdrawal could create a maximum drawdown of water from the
aquifer of 20.0 feet, from an aquifer with 1,025 feet of drawdown available.85
Mr. Grace concluded that there were no other locally available sources of water,
such as the Chesapeake Bay, Lake Levy, or Calvert County's water supply, to satisfy
DCP's needs at the Project.86 He concluded, however, that DCP's proposed drawdowns
from the Lower Patapsco aquifer would not adversely impact other water users, would be
consistent with the State's regulations, and would be consistent with conditions imposed
on other water users in the State.87
DNR witness Keating supported the analysis of Mr. Grace in estimating DCP's
potential usage of groundwater from the Lower Patapsco aquifer. Mr. Keating used an
equation to calculate drawdown of the water level in the Lower Patapsco aquifer over
12 years, at 233,000 gallons per day, at various distances from the pumping well. The
estimated drawdowns were as follows:
Distance From Well 12 Year Drawdown
¼ mile 5.6 feet
½ mile 4.9 feet
1 mile 4.2 feet
84 Grace Dir. at 8-9.
85 Grace Dir. at 11.
86 Grace Dir. at 8.
87 Grace Dir. at 12-14.
31

In addition, Mr. Keating estimated the regional rate of aquifer decline, from
general usage other than that of the Project, to be 1.2 feet per year, for 12 years, for a total
of 14.4 feet. When combined with the drawdown specifically from the Project, the
estimated drawdowns for the above distances would total 20.0, 19.3, and 18.6 feet,
respectively. All numbers are based on an assumed daily usage of 233,000 gallons of
water per day. Mr. Keating noted that there are 1,025 feet of water available in the Lower
Patapsco aquifer at Cove Point.
To address concerns about the Project's effect on water available to the Calvert
County Department of Public Works (“DPW”), Mr. Keating also evaluated the effect of
withdrawal of 275,000 gallons per day for a 60-day period and concluded that the effect
on the Lower Patapsco aquifer of an additional drawdown of 42,000 gallons per day
(above 233,000) gallons per day, at a distance of 14 miles from the Project, would result
in a drawdown of 0.0 feet. In short, according to Mr. Keating the maximum monthly
drawdown would have “no discernible effect” on the water supply of the Calvert
County Department of Public Works (“Calvert County DPW”).88
Mr. Grace addressed the testimony of AMP's witness Dr. Helms in reply
testimony. He reported that even accounting for water usage by residents of Calvert and
Charles Counties between 2002 and 2030, there would still be 1000 feet of water available
in the Lower Patapsco aquifer above the 80% management level. Further, an on-site
aquifer test predicted that water usage by DCP would only result in a drawdown of five
feet at one-half mile from the production well. Mr. Grace concluded that “given the large
amount of available drawdown in the region of the use, and the relatively small drawdown
88 Keating Dir. at 11.
32

projected from the proposed use, the MDE WMA does not concur with Dr. Helm's
recommendation of the need to evaluate the additional impact from DCP's request on
water levels.”89 However, after conclusion of the hearings, PPRP submitted a proposed
additional condition that requires DCP to establish a trust in the amount of $190,000 for
the Maryland Geological Survey to conduct subsidence monitoring in or near Calvert
County.90
The effect of the Project on local economic conditions was also an issue in this
case. Some parties also raised economic concerns relating to the State as a whole. DNR
witness Hall addressed a wide range of economic issues. As esthetic concerns may also
affect economics, especially in areas such as Calvert County where tourism is important,
Mr. Hall also addressed issues surrounding visual impact. Mr. Hall is a consulting
economist who specializes in regional economies and socioeconomic impact
assessments.91 Mr. Hall's sources for his analyses and conclusions included
documentation filed in support of the Project, interviews with experts at “many” State
agencies, including the State Highway Administration (“SHA”) and the Maryland
Historical Trust. He also visited the Cove Point site in person. His review covered
economic impacts, population and housing impacts, and transportation, land use, property
value, visual, government revenue, and historical and cultural resource impacts. Mr.
Hall's analyses at times attempt to isolate the effects of the Generating Station, while at
other times he reviewed the effect of the entire Project.
89 Grace Rep. at 4.
90 See Final Recommended Licensing Conditions of the Reviewing State Agencies, April 17, 2014, at 56.
91 Hall Dir. at 1.
33

Mr. Hall concluded that the employment and income effects of the Project would
be significant, but that only a small portion of such effects would be attributable to the
electric Generating Station.92 He estimated that construction of the Generating Station
would result in an on-site construction labor force of about 120 full-time equivalent
(“FTE”) jobs (360 person years over three years) and more than $14 million in wage and
salary compensation He noted that his estimates were “significantly less than the 6,300
person-years and $700 million in labor income DCP estimated the entire project would
generate.” (Emphasis supplied.) He also estimated that the entire Project would generate
26 FTE jobs, but FTE jobs generated by the Generating Station alone would, again, be
significantly fewer.93 He concluded that the overall impacts of the Generating Station
would be “relatively small” compared to the overall Project94. Mr. Hall also concluded
that “few population and housing impacts would be attributable to the electric generation
component of the overall Project.”95
Traffic affecting several places on Calvert County roads and intersections are
cause for concern, according to Mr. Hall. Those concerns have given rise to licensing
conditions H-1 through H-7 proposed by PPRP. The conditions require DCP to develop
and submit traffic management plans for construction equipment to the appropriate local
and state authorities, and to monitor traffic at key intersections during construction.
92 Hall Dir. at 4.
93 Hall Dir. at 4-5.
94 Hall Dir. at 5.
95 Hall Dir. at 6.
34

The Project's impact on Calvert County's Department of Public Works would be
limited, according to Mr. Hall, to the requirement that DPW issue grading permits, and
provide personnel to accompany oversized/overweight loads.96
Mr. Hall predicted that, overall, direct and permanent impacts to land use would be
confined to the DCP site within an area already developed. Few indirect impacts on land
use from the LNG site are expected, according to Mr. Hall, as the LNG site is buffered by
forest area under conservation easement, State park land, and a recreation area.97
Mr. Hall concluded that, as Calvert County's population has grown by more than
250% during the 30 years the Cove Point facility has been in place, the proposed Project
will have little or no effect on property values. He expects that the proposed Generating
Station will have an especially limited effect, due to construction of a sound barrier within
the perimeter of the site.98
Mr. Hall forecasted the following revenue impacts:
• $25 million payment in lieu of taxes (“PILOT”) (2018); • $15.1 million in annual payments on existing equipment
for the duration of the five-year PILOT 2019-2022); • After the PILOT expires, DCP will receive 42% relief
on real and personal property taxes for nine years (2023-2031);
• At the end of the nine-year period, the Project will be
taxable at 100% of its value, at an estimated $55 million in annual tax revenues (2032 and thereafter).99
96 Hall Dir. at 17.
97 Hall Dir. at 12-13.
98 Hall Dir. at 13-14.
99 Hall Dir. at 15-16.
35

As Calvert County's fire, rescue, and emergency medical departments are
volunteer systems, Mr. Hall concluded that the Project could have some adverse impact on
those resources. PPRP has proposed a licensing condition requiring development of
timely response options between the Project and Calvert County's Fire-Rescue-EMS
Division and creation of emergency vehicle access lanes on the site.100
Mr. Hall's overall conclusion was that the net fiscal impact of the Project will be
positive for Calvert County, given the size of potential tax revenue and minimal Project-
related outlays by the County.101
Visual impacts of the Project would be limited, according to Mr. Hall, due to forest
buffers. Outdoor lighting required by OSHA and Homeland Security should be mitigated
by PPRP's proposed licensing condition that DCP develop a lighting distribution and glare
reduction plan.102.
Mr. Hall noted that there are few cultural resources close to DCP and that previous
archaeological surveys at the DCP site revealed no cultural resources to be present. A
formerly unknown historic site was discovered in Offsite Area A, which the Maryland
Historical Trust has determined to be eligible for listing in the National Registry of
Historic Places and which should be protected by a 50 foot buffer zone. Testing also
identified four underwater locations possibly representing submerged cultural resources.
PPRP recommended a licensing condition directing DCP, in constructing its barge pier in
Offsite Area B, to avoid those spots by as much as 20 to 35 feet.103
100 Hall Dir. at 16-17.
101 Id.
102 Hall Dir. at 14-15.
103 Hall Dir. at 20.
36

Mr. Hall reported that PPRP has concluded that construction and operation of the
Project would not affect cultural resources such as the Southern Maryland Heritage Area,
Baltimore and Drum Point Rail Trail, Flag Ponds-to-Solomons Trail, Captain John Smith
Chesapeake National Historic Trail, Star Spangled Banner National Historic Trail, or The
Chesapeake Bay Gateways Network.104
Construction of the Project will disturb certain areas of existing forest and
shoreline, or “aquatic and terrestrial resources.” DNR witness Harriott assessed possible
Project impacts on those resources, including construction sites A and B, which are not at
the LNG terminal. He noted 103.99 acres of forest will be lost, but it will be mitigated by
217 to 227 acres of forest protected per PPRP condition B-6.105
Mr. Harriott also maintained that destruction of forest in Offsite Area A could
adversely affect forest interior dwelling species (“FIDS”), such as the scarlet tanager,
barred owl, pileated woodpecker, and eastern whippoorwill. He further stated that during
the construction period, light, noise, and activity would affect wildlife, and vegetation
clearing could cause loss of nests and nestlings, as well as colonization of invasion
species106.
DCP proposes to mitigate clearing effects in Offsite Area A with 100 foot stream
and wetland buffers, planting of native vegetation, and use of best practices. Mr. Harriott
noted that Offsite Area B is a temporary site that will be restored after the construction
104 Hall Dir. at 21-22.
105 Harriott Dir. at 3-4.
106 Harriott Dir. at 5-6.
37

phase of the Project, it is not located in a migrating bird nesting area, and that construction
effects will be short term.107
The proposed Project will result in the permanent filling of 0.06 acre of non-tidal
wetlands at the LNG terminal, and 0.17 acre of non-tidal wetlands at offsite Area A. Mr.
Harriott noted that forest clearing in Offsite Area A “will likely increase polluted runoff
and sedimentation into the stream systems and wetlands ... . This will result in
degradation of the existing habitat, increased sedimentation, and increased water
temperatures,” due to “the conversion of stream water from subservice to surface.” Mr.
Harriott emphasized that “DCP ... must evaluate [stream water management] using the
2011 [Maryland Department of the Environment] standards and by maximizing stream
buffers and reforestation when applicable.” DCP has completed “an updated, final
maximized stream buffer plan to protect the riparian areas and natural infiltration
capability …” of Offsite Area A.108
Mr. Harriott stressed that a stream to be bridged at Offsite Area A is upstream of
Helen Creek Hemlock Preserve, the southern most hemlock forest in the United States.
He noted that excessive sedimentation and pollution from upstream sources would be
detrimental to the hemlock forest.109
Mr. Harriott referenced other threatened or endangered species that could be
affected by the construction or operation of the Project, including rare dragonflies and
107 Harriott Dir. at 6-7.
108 Harriott Dir. at 8.
109 Harriott Dir. at 10.
38

sturgeon, as well as certain plants. He relied on DNR's recommended conditions as the
appropriate means of mitigating potential adverse impacts on those species.110
As construction of the temporary barge offloading pier in Offsite Area B will
potentially have adverse noise impacts, Mr. Harriott noted that a vibratory rather than an
impact hammer would reduce noise and also reduce water turbidity. He further pointed
out that Dominion will contribute to oyster restoration efforts, prepare an oyster mitigation
plan, plant oyster shell and spat near Offsite Area B, and create artificial reefs following
the end of construction and the dismantling of the barge pier at Offsite Area B.111
DNR witness Mountain examined the potential noise levels associated with the
construction and operation of the Project. She noted, first, that noise from the power plant
will be indistinguishable from overall Project noise. Accordingly, she evaluated the noise
sources associated both with the proposed Generating Station and with associated
facilities at the proposed LNG terminal.112
Ms. Mountain noted that COMAR 26.02.03 specifies that maximum allowable
noise levels for residential areas are 55 dBA at night and 65 dBA during the day. She
estimated potential noise impacts of 57.2 and 52.6 at the nearest property boundaries,
indicating “a slight exceedance of the 55 dBA nighttime limit at one location.” She
opined that PPRP's assumptions were conservative, however, and actual noise levels were
expected to be less than those calculated. With adherence to PPRP's license conditions,
Ms. Mountain concluded that DCP was capable of meeting regulatory standards regarding
110 Harriott Dir. at 10-12.
111 Harriott Dir. at 13-16.
112 Mountain Dir. at 3.
39

noise, noting that the licensing conditions simply require DCP to measure sound levels
and “make operational or design changes as needed to assure regulatory compliance.”113
In his reply testimony, Mr. Hall addressed esthetic, sewerage, traffic,
deforestation, and viewscape issues, several of them raised by Mrs. Susan Allison in
letters commenting on DCP's CPCN application. As to sewerage capacity during the
Project's construction phase, Mr. Hall stated that the Calvert County Department of Public
Works “expects the water and [sewer] mains will be in place before the commencement of
construction at the terminal site.”114
Regarding traffic, Mr. Hall referred to recommended license condition H-2, which
requires DCP to submit a Transportation Management Plan and a Maintenance of Traffic
Plan for overweight loads to the State Highway Authority. Further, Mr. Hall noted that
DCP would be required to monitor traffic congestion at the intersection of MD 2/MD 4
and make shift changes or roadway improvements, if necessary.115
As to esthetic concerns, Mr. Hall added, in relation to concealment of the 60 foot
sound barrier along the west and south sides of the Cove Point site, DCP has proposed
installing additional natural screening at the site, and that PPRP is continuing to evaluate
the potential visual impact of the proposed installation.116
Dr. Estomin submitted reply testimony in response to the direct testimony of SC-
CCAN witness Powers. Dr. Estomin addressed Mr. Powers' assertion that export of
liquefied natural gas from Cove Point would raise natural gas prices in Maryland, to the
113 Mountain Dir. at 4-5.
114 Hall Rep. T. at 4.
115 Hall Rep. T. at 4-5.
116 Hall Rep. T. at 6.
40
detriment of Maryland customers. Dr. Estomin countered that Mr. Powers had not
demonstrated his conclusion “with any reasonable degree of certainty.”117 Dr. Estomin
also asserted that Mr. Powers had not quantified the price impact of natural gas export to
determine if economic impacts on prices and employment in Maryland would be
meaningful.
Dr. Estomin also related that the U.S. Department of Energy, Office of Fossil
Energy (“DOE/FE”) addressed the issue of economic benefits related to LNG export in its
Docket No. 11-128-LNG. DOE/FE concluded that export from Cove Point of
0.77 Bcf/day of natural gas was “not inconsistent with the public interest.” The DOE/FE
further found that LNG exports were not likely to affect the overall level of employment
in the United States, or reduce the quantity of natural gas to domestic customers such that
the economic benefits of export would be negated.118
On April 17, 2014, PPRP submitted new conditions for incorporation into the
CPCN. Those conditions addressed new landscaping requirements, monitoring ground
subsidence due to water usage, and a requirement that DCP make a one-time contribution
to the Maryland Energy Assistance Program. In addition, a newly proposed condition (J-
4) is intended to support the State’s greenhouse gas reduction goals through either an offer
to support adoption of DCP’s EDGESM technology by Maryland utilities or establishment
of a trust or similar instrument in the event that any utilities have not executed a licensing
agreement for the technology by January 1, 2017. Included in the conditions are
provisions allowing PPRP to inspect and confirm that DCP is adhering to all
117 Estomin Rep. T. at 4.
118 Estomin Rep. T. at 7.
41

requirements. DCP has agreed to all prior and new conditions. Certain of these
conditions are discussed elsewhere in this Order.
C. Accokeek, Mattawoman, Piscataway Creeks Communities Council, Inc.
AMP opposes granting the CPCN. It turns first to a general legal argument
regarding the issue of Calvert County's right to approve or disapprove of the LNG Project.
Noting that this Commission is required to give weight to the opinions of local governing
bodies, and that testimony at the March 1, 2014 public hearing indicated that the Calvert
County Board of County Commissioners (“Board”) was unanimously in favor of the
Project, AMP nonetheless asserted that the Board was preempted from attempting to use
its recommendation power to approve the liquefaction project by the National Gas Act
(“NGA”) in U.S.C.S. § 717, et seq., which gives the FERC “exclusive power” to regulate
the siting, construction, and operation of LNG terminals.119.
AMP also argues that the Board is preempted from any intentional attempt to
regulate the siting of an LNG terminal based on the economics of LNG export. According
to AMP, the DOE, under the NGA, has exclusive power to consider the economic impact
of LNG export and import.120 In sum, AMP maintains that as “the DOE specifically
considered many of the facts that DCP and Commissioner Clark now put forth in favor of
the Liquefaction Project,” the Board's arguments cannot be given weight in the ultimate
decision in this case, as that would essentially preempt overriding Federal authority.121
AMP further urges that the Board's recommendation lacks validity, as it was not
based on the Comprehensive Plan of Calvert County. AMP's argument is that the Board
119 AMP In. Br. at 17.
120 AMP In. Br. at 19, citing 15 U.S.C.S. § 717 b.
121 AMP In. Br. at 20-21.
42

has not actually made a determination specifically regarding the Generating Station, so it
cannot have determined that the Generating Station was consistent with Calvert County's
Comprehensive Plan.122
AMP then asserted that “construction of a Generating Station is not consistent with
the Energy subsection of the Calvert County Comprehensive Plan.”123 The first objective
of the Comprehensive Plan, AMP notes, is to promote energy conservation and efficient
use of energy resources. AMP contends that construction of the Generating Station would
accomplish neither of those objectives. Even at a 50% capacity factor, according to AMP,
the “station would still use more energy than all Calvert County residences combined.”124
AMP also concludes that other goals of the Comprehensive Plan, including ensuring that
renewable energy sources are used, that energy use does not adversely impact the
environment, and that energy consumption is reduced, are inconsistent with approval of
the Generating Station. The Project's use of natural gas, in AMP's view, would expel
“millions of tons” of pollution per year into the atmosphere, and will increase energy
consumption.125
AMP finds that the Board did not base its recommended approval of the
Generating Station on the County's Comprehensive Plan, and that the Plan's requirements
do not support construction of the Generating Station. Therefore, AMP proposes that “the
122 AMP In. Br. at 21-22.
123 AMP In. Br. at 22.
124 AMP In. Br. at 22-23.
125 AMP In. Br. at 24
43

PSC should consider this application as if the Board had made the negative recommenda-
tion required by the County Comprehensive Plan.”126
As to economic issues, AMP argues, first, that DCP's Project does not have
sufficient economic benefit to merit grant of a CPCN. AMP's thesis, essentially, is that an
electric Generating Station that is not connected to the PJM grid, and benefits only one
customer, has no benefit to the public at large that justifies the pollution from its fossil
fuel-based generation.
AMP asserts that “the only benefits [that DCP] asserted under § 7-207(e)(2) are
economic benefits,” and those benefits are either uncertain or inadequate.127 AMP rejects
what it understands as DCP's “statutory interpretation” of the § 7-207 standards,
specifically that “the mere construction of a new [generating] facility would satisfy the
requirements of § 7-20(e)(2)(ii).” Such an interpretation, according to AMP, would
ironically take economic impacts out of the picture, rendering the statute meaningless.128
AMP further points out that the Maryland Legislature exempted some smaller generating
stations that serve only one customer from CPCN requirements, including consideration
of the stations' economic effects, but did not exempt from economic scrutiny generating
stations of the size DCP proposes to build, requiring a focus on economics in the case of
DCP's proposal for a large generator. AMP admits that “new generating capacity is
presumed to create a benefit under the Electric Customer Choice and Competition Act”
because new generating stations supposedly compete with existing stations, creating
economic efficiency. As DCP's generating station will not provide power to the
126 AMP In. Br. at 24.
127 AMP In. Br. at 3-4.
128 AMP In. Br. at 6.
44

marketplace, AMP concludes that its economic benefits would be “substantially smaller”
than a plant of equal capacity that did provide electricity to the grid.129
AMP also argues against the Project because it will not contribute to the stability
and reliability of Maryland's electric system. AMP points out that DCP itself does not
assert that the Project will contribute to stability and reliability, as it will not export any
power. AMP therefore urges that the Project's failure to actively contribute to the stability
and reliability of the State's electric system is a negative where grant of a CPCN is
concerned.130 AMP argues an agreement DCP signed with the Sierra Club and the
Maryland Conservation Council also prohibits export of power from the Cove Point site.
AMP states that the agreement would prohibit export of power by DCP from Cove Point
even if a study agreed to by DCP showed that such export was feasible.131
AMP also claims that DCP has failed to provide the Commission with enough
information for it to evaluate the economic impact of the Generating Station. AMP notes
that, according to PPRP, DCP's application covered the liquefaction project as a whole,
and was not focused on the generating plant.132 DCP witness McKinley's estimate that the
generating plant accounted for about 20% of the entire project's effects was undocumented
and unsupported, according to AMP.133 As it concludes that DCP has not provided
complete or even adequate information on the Generating Station itself, and that the
Commission cannot consider the effect of the Generating Station on economics without
129 AMP In. Br. at 11.
130 AMP In. Br. at 12.
131AMPIn.Br.at13-14
132 AMP In. Br. at 25.
133 AMP In. Br. at 27 and 42-43.
45

such information, AMP therefore urges the Commission to deny DCP's request for a
CPCN.
AMP also contends that the Commission cannot approve the overall Project based
on DCP's economic arguments. The Department of Energy, according to AMP, has
“exclusive authority” to consider the economic benefits of LNG export, for the
Commission to rule on the Project based on economic considerations would, in DCP's
view, establish a new licensing condition.134
AMP concludes that the economic consequences of the overall Project are
currently unknown, and would be negative if known. While AMP admits that the Project
will likely generate $34.1 million in total tax revenue per year for Calvert County, it
argues that negatives, including air pollution, decrease in manufacturing, and costs of
additional County services, outweigh the monetary benefits.
More broadly, AMP contends that the economic studies submitted by DCP to this
record focus on national costs and benefits rather than those unique to Maryland. Further,
the studies show that those who would benefit most from LNG export would be “gas
companies, resource owners, and owners of natural resource stocks.”135 In support of its
argument, AMP notes that the Cove Point terminal is owned by Dominion Cove Point
LNG, LP, which is in turn owned by other Dominion entities, and that Dominion
Resources will be the ultimate beneficiary of contracts for LNG export. In addition, AMP
134 AMP In. Br. at 28.
135 AMP In. Br. at 31-32, citing Tr. at 708,
46

contends that such export to other countries will increase natural gas prices in Maryland,
to the detriment of Maryland consumers.136
AMP focuses its reply brief on an analysis of the Commission's statutory
responsibility in deciding to grant or deny DCP's application for a CPCN. AMP urges the
Commission to consider its broader statutory authority, and it should “look beyond the
applicable [permitting] regulations.”137 AMP argues that if the Commission were to
simply grant the CPCN based on the analyses and recommendations of State agencies,
essentially in a rubber stamp process, that would not satisfy the requirement of PUA § 7-
207(e) that the Commission exercise “due consideration” of various effects the Generating
Station could have on air, water, the environment, etc.138 AMP emphasizes that “[i]f the
Commission were merely collecting and rubber stamping the Maryland Department of the
Environment's, and other bodies' determinations, that would not require consideration.”139
AMP also notes, however, that “[i]t is clear that the necessary technical expertise to
understand and apply the relevant environmental regulations rests with the Maryland
Department of the Environment, Department of Natural Resources, and associated bodies,
rather than with the Commission.”140 AMP therefore sees that “a larger purpose” for the
Commission is necessary if the entity with “lesser expertise” (the Commission) had
permitting power over “state authorities, with presumably greater expertise.”141
AMP concludes as follows:
136 AMP In. Br. at 34-35.
137 AMP Rep. Br. at 6.
138 AMP Rep. Br. at 6.
139 AMP Rep. Br. at 6.
140 AMP Rep. Br. at 9.
141 AMP Rep. Br. at 9.
47
The only statutory construction that doesn't render the statute ridiculous is that the relevant Maryland Departments are required to inform the Commission of the Generating Station's impacts on the environment, including compliance with the applicable regulations and satisfaction of permit conditions, and then the Commission uses that information to inform its analysis of whether the harms to the environment outweigh the benefits generated by the other factors.
***
These provisions only make sense if the Commission is empowered to consider the overall effects on the environment, rather than simply judging compliance.142
AMP concludes that “the Commission may look at environmental damage that
may be legally allowable, but nonetheless not in the public interest in Maryland.”143
AMP argues that, even though the Generating Station for which DCP requests a
CPCN and the larger LNG plant are intertwined, the Commission has authority only to
review the Generating Station. AMP contends that DCP did not demonstrate the
economic effects of the Generating Station in isolation, even though DCP admitted that
would be possible, and that DCP attempted to place on other parties the burden of
quantifying the negative effects of DCP's Generating Station.
AMP contends that DCP “has simply decided not to” model the economic impact
of LNG export on Maryland consumers.144 While AMP maintains that the Commission
may only address the CPCN request related to the Generating Station, AMP also
maintains that even if the Commission were to address the larger economic effects of the
142 AMP Rep. Br. at 10-11.
143 AMP Rep. Br. at 12.
144 AMP Rep. Br. at 18.
48

LNG plant, it has neither the necessary information nor the legal authority to do so. On
the latter point, AMP contends that Maryland's Federally approved Coastal Zone
Management Program grants the Commission power to license Generating Stations under
§ 7-207(e), but not to consider the economics of LNG export. AMP states that “[i]n
general, states are prohibited from regulating LNG terminals by the Natural Gas Act, 15
U.S.C. §§ 717 et seq.,”145 but that the National Oceanic Atmospheric Administration
specifically permits Maryland to exercise its authority over Generating Stations under
existing State law. AMP reiterates, however, that under federal law, the Commission
cannot consider the economics of the LNG plant, as that would essentially open the way
for the Commission to impose conditions on the entire LNG facility, contrary to Federal
law.
D. Sierra Club – Chesapeake Climate Action Network
SC-CCAN oppose the Project on grounds that, when considered in light of the
statutory criteria of PUA § 7-207(e)(2)(i)-(vii), it is a net negative. SC-CCAN first note
that the 130 MW Generating Station will not contribute to the “stability and reliability” of
the State's electric grid, as the plant will be for the sole use of the Cove Point LNG facility
and will not, at this time nor in the near future, provide electricity to the grid. SC-CCAN
points out that while DCP agreed to assist in a study of the feasibility of running a
transmission line from the plant to the grid, the Company has consistently maintained that
running such a line is not possible and is in fact prohibited by an agreement among
Dominion, Sierra Club, and the Maryland Conservation Council.146
145 AMP Rep. Br. at 19.
146 SC-CCAN In. Br. at 9-10.
49
SC-CCAN focused its analysis on the air pollution impacts of the generating plant,
as well as on whether the Project will have economic benefits outweighing likely
negatives, or “dis-benefits.” As to air emissions, SC-CCAN emphasizes the general point
that DCP is seeking to emit more than two million tons of GHGs per year and will be
compensating only by withdrawing emission allowances from a Limited Industrial
Exemption Set-Aside, rather than purchasing new allowances.147
At a more detailed level, SC-CCAN contends that DCP has not minimized air
pollution consistent with the Federal BACT and LAER requirements, especially as
Calvert County and Maryland as a whole are non-attainment areas for ozone and its
precursors, NOx and VOCs. Specifically, “the NOx LAER for auxiliary boilers should be
5 ppm ... as a 3-hour average, not 8.2 ppm as currently proposed.”148 In support of this
assertion, SC-CCAN reports that “numerous comparable boilers” have achieved the 5
ppm, 3-hour limit, and that California's SCAQMD requires all boilers, steam generators,
and process heaters of size 75 MMBtu or larger burning natural gas to achieve a NOx
emission rate of 5 ppm on a 15 minute average, and all such equipment between 20 and 75
MMBtu/hr burning any gaseous fuel to achieve the same limits.149 Those limits, according
to SC-CCAN, are “considerably more stringent than DCP's proposed 8.2 ppm rate at a 3-
hour average.”150
SC-CCAN rejects DCP's and PPRP's arguments that the large size of the proposed
Cove Point boilers would prevent achievement of a 5 ppm, three-hour average emission.
147 SC-CCAN In. Br. at 27-28.
148 SC-CCAN In. Br. at 30. Emphasis original.
149 SC-CCAN In. Br. at 30.
150 SC-CCAN In. Br. at 30-31.
50

SC-CCAN point out that larger sources, even according to PPRP, are usually subject to
more restrictive requirements than smaller sources. SC-CCAN also rejects arguments by
PPRP that the larger amount of nitrogen in process gas would inevitably lead to higher
NOx emissions when combusted. SC-CCAN points out that witness Powers testified that
the Company's testimony acknowledged that process gas has a lower heating value than
pipeline gas. As process gas burns cooler than pipeline gas, it would not emit as much
NOx as pipeline gas.151 Most fundamentally, SC-CCAN rejects PPRP's witness Powers'
assertion that the ability of a pollution source in California to reduce emissions below
DCP's projected level is irrelevant to DCP's Project. On the contrary,
SC-CCAN argues that adopting a lower rate of emissions achievable elsewhere “is in fact
precisely what LAER requires.” (Emphasis in original) SC-CCAN emphasizes that “if a
class of sources is required to achieve an emission rate in California, under Maryland's
definition of LAER this class of sources must meet the same standard in Maryland.”152 As
PPRP has not chosen to adopt LAER standards applicable in California, SC-CCAN argues
that Marylanders will be exposed to unnecessarily high levels of air pollution.153
SC-CCAN similarly contends that DCP's and PPRP's NOx limit for
combustion turbines is not LAER – and for the same reason: DCP and PPRP have
ignored lower limits achieved elsewhere. “The NOx LAER ... for combustion turbines
should be 2.0 ppm ... as a 3-hour average, not 2.5 ppm as currently proposed.”154 SC-
151 SC-CCAN In. Br. at 32.
152 SC-CCAN In. Br. at 33.
153 SC-CCAN In. Br. at 34.
154 SC-CCAN In. Br. at 34.
51
CCAN concludes that the 2.0 ppm NOx emission rate on a 3-hour average “has been
achieved in practice by many units,” and therefore can and must be achieved by DCP.155
In sum, SC-CCAN asserts that PPRP’s response that emissions from this Project
will not contribute to a violation of ambient air quality standards is “perverse and
incorrect,” and apparently based on DCP's purchase of emission offsets from facilities
already curtailing their emissions.156
On the subject of air quality, SC-CCAN argues that DCP should control fugitive
emissions through use of all “leakless” components at its Cove Point facility.157 At
present, however, DCP plans to rely on leak detection and repair (“LDAR”) to prevent
some fugitive emissions, rather than on 100% leakless technology. SC-CCAN argues that
instead of employing an LDAR approach that, according to DCP, could entail a 15-day
lapse between leak and repair, DCP should install leakless technology that would prevent
leaks altogether.158
To DCP's contention that strict California NOx emission limits are not applicable
to the Cove Point boilers due to use of process gas, SC-CCAN responds that the
SCAQMD rules require “any unit burning gaseous fuels” to meet a “5 ppm NOx with a
stringent 15 minute average time.” (Emphasis in original). SC-CCAN further claims that
155 At a more detailed level, SC-CCAN notes that to achieve a LAER NOx emissions rate of 2.0 ppm, the selected
catalytic converters attached to the turbines would need to reduce NOx concentration by 92%. DCP determined, from information provided by PPRP in response to data requests, that Cormetech and Haldor Topsoe, providers of SCRs to the Project, could achieve a NOx removal efficiency of 95%. SC-CCAN also criticizes DCP for supporting DCP's proposed selective catalytic reduction ("SCR") 90% control efficiency limitation only with an EPA document from 2000 that references control efficiencies from 65% to 90%. SC-CCAN also notes that NOx emissions can be reduced to 2.0 by injection of additional ammonia into the combustion process, and that this has been done at "other combustion turbines" with less ammonia emission ("ammonia slip") than DCP currently predicts.SC-CCAN In. Br. at 35-36. 156
SC-CCAN In. Br. at 36-37. 157
. (SC-CCAN admits that DCP plans to use some leakless products, including leakless canned motor pumps, magnetic drive pumps, welded connections, and possible other technologies at Cove Point.) 158
SC-CCAN In. Br. at 38.
52

the SCAQMD Rule 1146 applies to an “extremely broad class of units” that includes
boilers, steam generators, and process heaters larger than 5 MMBH, which SC-CCAN
claims belongs to the same class of category as DCP's auxiliary boilers that burn process
gas.159
SC-CCAN dismisses DCP's reliance on vendor statements that NOx emissions
proposed by PPRP are the lowest achievable. The only vendor guarantee,
SC-CCAN notes, is from Cleaver-Brooks, manufacturer of the auxiliary boiler, not Haldor
Topsoe, and that the guarantee promises to achieve DCP's goals, not a specific emission
level. Based on its analysis, SC-CCAN continues its insistence that 5.0 ppm NOx is
LAER for DCP's auxiliary boilers.
SC-CCAN also claims that NOx LAER for the Project's combustion turbines is 2.0
ppm and asserts that DCP appears to rely on a hearsay conversation and information from
a boiler manufacturer rather than an SCR manufacturer for its claim that 2.5 ppm is LAER
for NOx in this case.160 SC-CCAN further objected to PPRP's LAER review as not
including “the right sources.” Specifically, SC-CCAN objected that Southern California
sources were left out of PPRP's study, but that PPRP would have discovered in the
SCAQMD area comparable boilers with more stringent limits than PPRP was
proposing.161
SC-CCAN also devotes considerable argument to showing that the generating
plant (and indeed the entire Cove Point facility) will entail a net economic disadvantage
for Maryland and the surrounding region. While SC-CCAN admits that the Project will
159 SC-CCAN Rep. Br. at 8.
160 SC-CCAN Rep. Br. at 11.
161 SC-CCAN Rep. Br. at 12. SC-CCAN's position on the need for leakless components is the same as in its initial brief.
53

have “localized tax and wage benefits” in Calvert County, SC-CCAN urges that other
“dis-benefits” of the Project significantly outweigh the benefits. A main focus of
SC-CCAN's concern is its contention that export of LNG from Cove Point will cause a
significant increase in natural gas prices for Maryland residents. Such price increases will
not only harm most Maryland residents, SC-CCAN claims, but it will help only the oil
and gas industry, owners of domestic gas resources, and other investors in the gas
industry.162 SC-CCAN hypothesized that increased natural gas prices would lead to
increased coal usage in Maryland, with added air pollution “in [a] state suffering from the
worst air quality in the east.”163
SC-CCAN notes, however, that only one study, the Navigant study commissioned
by DCP, has attempted to isolate the impact of LNG exports from Cove Point. That
study, according to SC-CCAN, “casts serious doubts on the benefits of [the Cove Point]
project.” It found that at the Henry Hub natural gas prices would increase from 4.1% to
6.0% over the years 2020 to 2040 if during that period DCP were regularly exporting
LNG from Cove Point.164 In its Reply Brief, SC-CCAN states that the Navigant study
predicted an increase in natural gas prices between $47 million and $107 million for the
2017 – 2040 period.165
SC-CCAN further notes that a September 2013 DOE order approving exports of
770 million cubic feet of natural gas to “non-free-trade countries” does not give DCP's
argument the support that DCP contends it does. The DOE order takes a national
162 SC-CCAN In. Br. at 12-13.
163 SC-CCAN In. Br. at 15.
164 SC-CCAN In. Br. at 18
165 SC-CCAN Rep. Br. at 15.
54
perspective, is not specific to Maryland or the East Coast, is based on studies that pre-date
the Navigant study, and does not address environmental issues. SC-CCAN also points out
that the broad national scope of the DOE order, combined with DOE's presumption that
export projects are beneficial unless specifically shown to be otherwise, undermines the
DOE study as support for the Project.166 In addition, SC-CCAN argues that Dr. Estomin's
contention that increased LNG export could raise natural gas prices region-wide does not
help Maryland customers.167
SC-CCAN also challenges PPRP's conclusion as to the positive economic impacts
of the Project. SC-CCAN notes that DCP will participate in a PILOT program that
requires a one-time payment of $25 million to Calvert County in 2018, followed by five
years of additional payments by DCP to Calvert County, followed in turn by 42% tax
relief on all real and personal taxes paid by DCP for the following nine years.168
“The income stream,” from property taxes SC-CCAN assert, “will drop
precipitously between years 5 and 6” after Project construction to levels that could result
in lower tax income to the County than if DCP had simply been taxed on its existing
infrastructure.169 SC-CCAN also points out that as DCP could not move its facility to
another locale or close – in violation of its contracts to supply LNG – Calvert County does
not need to provide DCP with such generous tax incentives to remain.
SC-CCAN also claims that an economic analysis focused narrowly on DCP's
Generating Station will show that construction could not be shown to be economic. The
166 SC-CCAN In. Br. at 23.
167 SC-CCAN Rep. Br. at 16.
168 SC-CCAN In. Br. at 24; We note that Hall’s Direct Testimony refers to a one-time payment of $25 million to Calvert
County in 2018 as the first year of the five year PILOT, with the additional $15.1 million annual payments taking place in years two through five (Hall Dir. At 15-16). 169
SC-CCAM Rep. Br. at 16.
55
data on which to base such a showing has never been provided, according to SC-CCAN.
Without such data, SC-CCAN argues that the adverse environmental and esthetic impacts
of the Generating Station would outweigh the (unquantified) economic benefits.
As to esthetic benefits or “dis-benefits” of the Project, SC-CCAN notes that the
offshore pier at Offsite Area B and related construction equipment will be visible from
Solomons Island, a significant tourist venue. SC-CCAN predicts that such a visible
change “will alter the character and reduce the tourism appeal of the island.”170 The
Project will also increase traffic congestion in the area, and will stress the locale's sewage
disposal capacity, according to SC-CCAN. Planning for the sanitary needs of 1,441
construction workers has not been adequate, SC-CCAN maintains.171
In its reply filing, SC-CCAN posits that regardless of whether the Commission
addresses only the effects of the proposed Generating Station or the entire Project, the
“dis-benefits” outweigh the benefits.172 The visual impacts, combined with concerns
about traffic, inadequate sewage treatment, and limitations on transmitting electricity to
the grid, combined with air emission issues, all fail to support DCP's CPCN application.
SC-CCAN also reiterates that the Project's incremental greenhouse gas emissions
significantly impair Maryland's ability to achieve in-state greenhouse gas reduction
targets. Because the facility will be exempt from RGGI and instead would utilize a
Limited Industrial Set-Aside, SC-CCAN asserts that greenhouse gas emissions in
Maryland will “rise precipitously.”173
170 SC-CCAN In. Br. at 40-41.
171 SC-CCAN In. Br. at 43.
172 SC-CCAN Rep. Br. at 5.
173 SC-CCAN Rep. Br. at 6.
56

Should the Commission approve the CPCN over its objection, SC-CCAN would
require several additional conditions be imposed. First, SC-CCAN proposes DCP make
“[a] significant investment in carbon-free Maryland-based renewables.” Such an
investment in wind and solar generation would, according to SC-CCAN, mitigate the
Project's greenhouse gas emissions, benefit the stability and reliability of the electric grid
once the wind and solar generators were connected to the grid, and by adding electricity to
the system, would help lower electricity prices.174
The second new condition SC-CCAN would impose would be a fuel emission
limit for the combustion turbines of 2.0 ppm NOx as a three-hour average and a final
emission limit for the auxiliary boilers of 5.0 ppm NOx as a three-hour average. SC-
CCAN also urges the Commission to require DCP to maximize the use of leakless piping
components at the facility.175
The final additional conditions proposed by SC-CCAN address esthetic impacts.
They would require an additional tree buffer around the Project's 60 foot high sound wall
and the parking lot and warehouse area at Offsite Area A, and would require that the barge
offloading and other functions at Offsite Area B be moved to another location.176
E. Commission Staff
Staff witness DeGeeter addressed only the possible effect of DCP's Project on the
stability and reliability of the electric transmission system in Maryland. Mr. DeGeeter
concluded that the Project would have no adverse impact on the grid, as long as Staff's
proposed conditions were adopted. While noting that the plant would not contribute to the
174 SC-CCAN Rep. Br. at 24-28.
175 SC-CCAN Rep. Br. at 28.
176 SC-CCAN Rep. Br. at 29.
57

stability and reliability of the grid, as it will serve solely the liquefaction facility and will
not be available to support other demand, he also notes that the Commission previously
has approved islanded projects that benefited a single customer. Staff disagrees with
AMP's division of the PUA § 7-207(e)(2) considerations into positive, negative, and
neutral categories. Further, Staff asserts that “[t]he statute ... does not create a distinction
between entities that will sell power to the grid and those that do not”, as AMP also tried
to create. Staff also denies other assertions by AMP, including a claim that power from
generating plants larger than 70 MW must be sold to the grid, and therefore that power
from DCP's generators must be sold to the grid. In sum, Staff states that “there is no
statutory requirement that the project provide positive benefits to the grid.” Instead, the
Project could not be approved by the Commission if it would adversely impact the grid's
stability or reliability.177
Mr. DeGeeter proposes a condition that DCP undertake a detailed feasibility study
of the costs and benefits of interconnecting to PJM's system, and report on the results on a
quarterly calendar basis. A second proposed condition would require DCP to submit to
the Commission and other relevant State agencies a status report on the FERC licensing of
the proposed facility within six months after the effective date of the CPCN and every
three months thereafter. Three other conditions involved notification of changes in the
physical set-up of the facility, delay in meeting the June 30, 2017 in-service date, and
notice of compliance with all requirements five days before start-up.178
177 Staff Rep. Br. at 2.
178 Staff In. Br. at 9-12.
58

F. Public Comment
At the March 1, 2014 Public Hearing, approximately 80 members of the public
provided comments (some representing larger groups of people) both in support of and
opposed to the proposed Project. Few, if any, of the commenters specifically separated
out the potential impacts of the Generating Station from the broader impacts of the
integrated LNG Project. Comments were related to potential economic, environmental,
social and safety impacts from the Project, including the Generating Station. In addition,
over 60,000 written public comments and letters, both for and against the Project, were
submitted to the Commission prior to the extended comment period deadline. CCAN
submitted thousands of these letters to the record in this case, essentially all of them
opposing construction of the Project and its Generating Station. Many of the letters
forwarded by CCAN raised concerns relating to fracking.179 Many also requested that the
Commission urge FERC to require completion of a full Environmental Impact Statement
as part of the review of the Project,180 and that the Commission reject the entire LNG
Project. Letters in opposition were also sent individually from members of the public,
some raising concerns about potential safety hazards to neighborhoods adjacent to the
Project.
Letters supporting DCP's proposal were received from State and county officials
and members of the public, many of them also members of construction unions. These
letters focused predominantly on potential economic benefits that would flow from the
Project.
179 The Commission ruled that fracking is outside the scope of this proceeding. Therefore, we do not give weight to
comments relating to potential impacts to or from hydraulic fracturing. 180
FERC has primary jurisdiction to review the entire Project and to determine whether an EIS is required. On May 15, 2014, FERC issued a draft Environmental Assessment which concluded that an EIS is not required for this Project.
59

V. DISCUSSION AND FINDINGS
A. Introduction
On April 1, 2013, Dominion Cove Point, LNG, LP filed with this Commission an
application for a CPCN for 130 MW of generating capacity at its proposed Cove Point
LNG export facility in Calvert County, Maryland. While we note that the Generating
Station and the larger liquefaction Project are integrally related (for example, the
generating facility would not be needed if the LNG export facility is not built and
operated), our task is to review DCP's request for a CPCN for the Generating Station.
That task is made more difficult by the fact that DCP, and to some extent other parties,
have provided testimony that addresses the Project as a whole and have not seriously
attempted to isolate information that applies uniquely to the Generating Station that we
must review. In fact, DCP states that “the Generation Facility and the liquefaction process
are inseparably integrated.”181 In contrast, AMP argues that the Commission must limit its
review of the economic impacts of the proposed project to the generating facility, citing
PUA § 7-207(e)(2)182 and asserts that the Commission is preempted from considering the
economic benefits associated with the entire Project, arguing that responsibility rests with
FERC and the DOE.183
Oral testimony roughly estimates that the effects of the generating facilities may
account for between 5% and 20% of the overall effects of the Project, but we have nothing
beyond that to further refine the appropriate number. Nonetheless, the generating station,
181 DCP Rep. Br. at 4, citing Tr. 234-235 (Day 1, Gangle).
182 AMP In. Br. at 3.
183 AMP In. Br. at 17-18, 27-28.
60
being only a component of the larger facility, is likely directly responsible for only a
fraction of the air emissions, water impacts, and economic effects of the entire Project.
As DCP notes, the Natural Gas Act and FERC precedent expressly contemplate
that states will conduct their own review of LNG terminal facilities under applicable state
and federal laws.184 However, DCP selectively identifies which issues it believes the
Maryland Commission can and should review. In its Motion to Strike testimony
regarding the potential impact of hydraulic fracturing (“fracking”) on the economic and
environmental impacts of the Project, Dominion argued:
DCP seeks Commission approval to construct and operate an electric generating station as part of a project to provide liquefaction services to customers who will supply their own natural gas. While there is broad environmental review of DCP's proposed project ... this case is ultimately, like case No. 9218, limited in its inquiry to the proposed generation station.185
DCP witness McKinley testified at the hearing that the Company's position is that
the CPCN only covers the power block, not the entire liquefaction facility.186
Given the unique factual and jurisdictional situation, we conclude that the
environmental impacts of the generating facility should be evaluated as part of the entire
project or “stationary source” pursuant to the legal requirements under the Federal Clean
Air Act.187 Similarly, the evaluation of potential safety and security impacts of siting the
proposed generating facility adjacent to (and intertwined with) the liquefaction facility and
storage tanks also should take into account the possibility of a combined accident. In that
184 DCP Rep. Br. at 4, citing Sabine Pass Liquefaction, LLC, pp. 32-40.
185 DCP Motion to Strike at 6, citing In the Matter of Calvert Cliffs 3 Nuclear Project,
2010. 186
Mr. McKinley notes that the CPCN covers the entire facility for air emissions. Tr. at 364-365. 187
See DCP In. Br. at 11, citing CAA.
61

situation, the safety impact of the generating facility cannot be segregated from the safety
impact of the overall facility.
In contrast, the economic and reliability impacts of the proposed generating
facility can be evaluated independently of the economic impacts of the liquefaction
facility, which will be reviewed by the FERC. The liquefaction facility has received
conditional approval from DOE to export LNG.188 DCP failed to provide either Maryland-
specific or facility-specific economic impact analysis for the liquefaction facility, although
it acknowledges that natural gas prices will increase at least to some degree for Maryland
customers as a result of increased exports of LNG. Consequently, the record is
insufficient to assess the economic element of PUA § 7-207 based on the liquefaction
Project as a whole.
As noted earlier, we heard from approximately 80 members of the public at our
March 1, 2014, public hearing in Lusby, Maryland and received over 60,000 written
comments after the public hearing. We are greatly appreciative of the time and effort
citizens have taken to share their views on the proposed LNG Project, including the
Generating Station. We have carefully reviewed the in-person and written comments of
citizens in favor of and against the Project, as those comments relate to the proposed
Generating Station which is within our jurisdiction. We have considered public comments
about potential safety and environmental impacts of the Generating Station, which will be
located within the LNG facility footprint and near residential neighborhoods, as well as
potential economic benefits and harms. Consistent with the limited nature of the CPCN
188 DOE Order No. 3331, FE Docket No. 11-128-LNG (2013) (Order Conditionally Granting Long-Term Multi-
Contract Authorization to Export Liquefied Natural Gas by Vessel From the Cove Point LNG Terminal to Non-Free Trade Agreement Nations); DCP In. Br. at 5-6, citing DCP Ex. 8 (DOE Order).
62

application filed with us, we cannot give weight to arguments that we should reject the
entire LNG Project, as that issue is not before us.
We have reviewed the extensive record in this matter carefully. We
conclude that if all conditions imposed under this Order are met to address the
environmental, economic, health and safety impacts demonstrated in this proceeding, the
Generating Station can be built in conformity with applicable Maryland and Federal laws
and standards, and in a way that will be consistent with the public convenience and
necessity standard. Therefore, we grant the CPCN, subject to the significant conditions
proposed by PPRP and subject to the additional conditions we impose, including a new
condition of FERC approval and issuance of a permit for the LNG export facility.
B. PUA Section 7-207 Elements
To justify issuance of a CPCN, DCP has the burden to demonstrate that the
benefits of the generating facility, including economic benefits, outweigh the
environmental, safety, and societal costs of siting the generating facility within the
liquefaction Project in Lusby, Maryland. In determining if DCP has met its burden, the
Commission must consider the factors delineated in PUA §7-207 of the Public Utilities
Article, including but not limited to (1) the recommendation of the local government; (2)
the effect of the generating station on the stability and reliability of the electric system; (3)
economics; (4) esthetics, historic sites, and aviation safety as determined by the Maryland
Aviation Administration and the administrator of the Federal Aviation Administration; (5)
air and water pollution; and (6) the availability of means for the required timely disposal
of wastes produced by the generating station.
1. Recommendations of Local Government
63

The Calvert County Board of Commissioners voted unanimously to support this
Project.189 We decline to go behind or discount those recommendations as requested by
AMP.
2. The Stability and Reliability of the Electric System
DCP decided to build a generation plant that would solely serve DCP's
liquefaction Project. There is no tie to the electric grid and as a result, and no evidence
that the generation station will contribute to the stability of the State's electric grid;
however AMP and SC-CCAN acknowledge it will not have an adverse impact either.190
While Commission Staff proposed a condition whereby DCP would study the potential of
connecting the plant to the grid, and DCP accepted this condition, the proposal is too
speculative to be quantifiable or counted as a potential benefit of this generation station.
DCP acknowledged that it would be difficult to tie to the grid, both technically and
legally.191 Consequently, we do not adopt Staff’s proposed condition for DCP to
undertake an interconnection study.
3. Economics
PPRP witness Hall concluded that the employment and income effects of the LNG
Project would be significant, but that only a small portion of such effects would be
attributable to the electric generation station. He estimated that construction of the
Generating Station would result in an on-site construction labor force of about 120 full-
time equivalent (“FTE”) jobs for three years. He noted that his estimates were
189 March 1, 2014 Tr., p. 10; Letter to David Collins from Calvert County Board of County Commissioners (March 25,
2014). 190
AMP In. Br. at 12; SC/CAN In. Br. at 10. 191
DCP Reply Br. at 10; SC-CCAN In. Br. pp. 10-11.; DCP In. Br. at 13
64

“significantly less” than DCP estimated the entire project would generate. He also
estimated that the entire Project would provide 26 FTE permanent jobs, but FTE jobs
needed to operate the Generating Station alone would also be significantly fewer. He
concluded that the overall impacts of the Generating Station would be “relatively small”
compared to the overall Project.192 DCP did not provide a study to support the number of
construction jobs that will be needed to build the generating stations or the number of
new, permanent jobs that will be required to operate the Station. In response to
questioning at the hearing, Dominion estimated that approximately 20% of the “dollar
impact” from the Project could be attributed to the Generating Station,193 PPRP estimated
that the economic effects of the generating facility would be much smaller, approximately
5% of the total LNG facility temporary construction jobs and 2% of the overall salary and
wage costs.194 DCP testified that it will pay $40 million in new revenue to the County,
some through a Payment in Lieu of Taxes agreement due to the LNG project expansion.195
In November, 2013 the Calvert County Board of County Commissioners approved a five-
year Payment in Lieu of Taxes (PILOT) and tax relief agreement with DCP that includes a
one-time payment in FY 2018 of $25 million and guarantees $15.1 million in annual
payments on existing equipment for the duration of the PILOT. After the PILOT term,
DCP will receive 42% relief on real and personal property taxes for nine years, after
which the Project will become taxable at 100% of its value. Calvert County estimates that
it will receive an average of $55 million in total tax revenues annually once the facility is
192 DCP In. Br. at 1.
193 Tr. p. 344.
194 PPRP In. Br. at 19.
195 DCP In. Br., p. 14.
65

operational.196 AMP challenged the purported tax revenue benefit, and claimed that rather
than generating up to $40 million per year in property taxes for Calvert County, the
Project will generate $34.1 million.197 Beyond tax revenues, DCP and local supporters cite
benefits including re-establishment of disturbed oyster beds at Offsite Area B, limited
highway improvements and the possibility of additional land preserved from
development.198
The Generating Station's “island mode” of electricity generation is not a positive
factor in calculating its economic effects. It provides no additional economic benefits as a
source of electric capacity and energy for Maryland customers. Nor does it provide value
as a potential “Black Start” facility that could be used in electric outages to support the
needs of residents and businesses. Additionally, by not connecting to the larger grid, the
generation station is exempt from purchasing Regional Greenhouse Gas Initiative
(“RGGI”) carbon emission allowances, even though it will emit significant carbon
emissions. Therefore it will not contribute to the strategic energy infrastructure that
would otherwise be gained for Maryland consumers, as it would be if it were connected to
the grid. Instead, DCP plans to avail itself of a portion of the free Limited Industrial
Exemption set-aside allowances to account for its carbon emissions.199 Consequently,
there is no economic or environmental benefit from the purchase of RGGI allowances;
instead there is a loss of industrial allowances which might otherwise be used by a future
industrial project or power plant.
196 Hall Dir. T., pp. 15-16. Other parties descriptions of the PILOT are less clear and we accept Mr. Hall’s testimony.
197 AMP In. Br. at 29-30.
198 Conditions B-3, B-6, B-8, and H-7.
199 DCP Reply Br., p. 24.
66

4. Esthetics, Historic Sites, Aviation Safety, and Waste Disposal.
As to the issue of historic sites, aviation safety, esthetics, and waste disposal, we
incorporate conditions proposed by PPRP related to cultural resources (conditions E1- E-
3), visual quality (condition F-1), traffic (conditions H-1- H-7), noise (condition I1- I2)
and landscaping (condition J-1).200 We find these conditions adequately address the
concerns raised by AMP and SC-CCAN (“Environmental Parties”).
5. Air and Water Pollution
A serious consideration in determining whether a power generation plant warrants
a CPCN is the impact the proposed facility will have on the surrounding air and water
quality. As to air pollution, the proposed power plant will emit carbon dioxide, NOx,
VOCs, and will utilize other hazardous materials, including ammonia. There is significant
contention among the parties regarding the degree to which air emissions can and should
be controlled, in order to comply with the requirements under the Federal Clean Air Act.
The dispute focuses on the LAER and on the BACT limits for the combustion turbines
and auxiliary boilers, on greenhouse gas emissions, on the possible utilization of leakless
piping, and on the extent of pollution from export ships.
DCP asserts, and PPRP agrees, that higher emissions levels than those advocated
by SC-CCAN are appropriate because the Project is the only United States LNG plant to
use “process gas” to generate electricity rather than to flare it; by re-using process gas,
DCP avoids adding 195 lb/hr of NOx per hour to the atmosphere.201 Due to the use of
process gas, DCP claims that NOx emissions at the Project will be 2.5 ppm, rather than
200 See Final Recommended Licensing Conditions of the Reviewing State Agencies. April 17, 2014.
201 DCP In. Br., pp. 27-28.
67

the 2.0 ppm proposed by the Environmental Parties. DCP explains that “the NOx level in
the gas stream exiting the combustion turbine to the inlet of the SCR (here, 25 [sic]
ppm).”202 The dispute with the Environmental Parties revolves around whether the SCR
can reduce NOx by 90% or 95%. In support of its 90% number, DCP reports that its
vendors could not cost effectively and reliably design SCRs to achieve an emission limit
lower than 2.5 ppm using process gas. DCP's witness Gangle also explained the
engineering restrictions, such as back pressure and structural loss, prevent addition of
enough catalysts to the SCR to effect a reduction in NOx from 2.5 to 2.0 ppm.
We find that the Project's use of process gas in electricity generation and the
configuration of the site - essentially a re-use of gas - gives the Project unique features
that make one-to-one comparisons to other LNG plants difficult. This is especially true
when other plants, which may have lower emissions of certain pollutants, use only
pipeline gas and may use different equipment, or measure emissions over different time
periods, than the Cove Point Project. We also note there is a benefit from DCP's use of
process gas at Cove Point, which is the reduction of flared gas at the site. We accept the
testimony of witnesses Gangle and DiPrinzio that the appropriate level of reduction in
NOx emissions is 2.5 ppm.203 We do not find the record evidence proffered by the
Environmental Parties overcomes PPRP’s conclusion that a reduction in NOx emissions
from 2.5 ppm to 2.0 ppm is not feasible, given boiler manufacturers' engineering
constraints, the use of process gas, and avoidance of more than the minimal necessary
amounts of flared gas. In short, we find based on the record that DCP's proposed
202 DCP In. Br. at 29.
203 Gangle Rep. T. at 3; DiPrinzio Rep. T. at 3.
68

treatment of NOx and VOCs will result in LAER for those emissions, even though lower
emission rates may be achievable in other locations using other technologies or with
different fuel sources.
In reviewing PPRP's BACT recommendations, we note that BACT is based on the
individual characteristics of each plant. In many cases BACT in the present case consists
of best combustion practices. The record does not provide detail about the actual nature
of such best practices. Given that PPRP will be monitoring the ongoing construction and
operation of the Cove Point facility, we encourage PPRP or its designee to ensure that the
application of best combustion practices is defined precisely and makes use of current
techniques.
We approve the NOx emission levels proposed by PPRP and DCP for the
Generating Station's combustion turbine and auxiliary boilers. PPRP identified several
emissions permits, similar to those identified by AMP witness Powers, that included lower
emission levels than DCP proposes here. Those permits, however, “were all for auxiliary
boilers burning only pipeline natural gas.” According to PPRP, some of the permits “had
not yet been demonstrated” and were for boilers of smaller size than the proposed Cove
Point boiler.204
Other findings by PPRP also suggest that DCP has achieved the lowest emission
levels that it can reasonably achieve on a sustained basis. Specifically, while PPRP agrees
that the type of auxiliary boilers to be used at Cove Point could achieve an
“instantaneous” emissions reduction of 95%, such a reduction has not been shown to be
sustainable over the life of the catalytic reduction technology used on the boiler. DCP
204 DiPrinzio Rep. T. at 4.
69
states that when process gas is used, engineers for the vendors providing DCP's pollution
reduction equipment agree that PPRP's proposed emission limits are the lowest achievable
over the long term.205 While SC-CCAN identify examples of lower emission levels in
California, the factual circumstances are different and not transferable to this Project. We
will not deny a CPCN on the basis of testimony that DCP could achieve lower rates of
emissions with technology using a different fuel, or at a different sized facility, or to
achieve a goal that the manufacturer of the technology cannot affirm is routinely
achievable.
We are satisfied that DCP has achieved VOC LAER and GHG BACT for
emissions from piping component leakage. While it would be desirable if no emissions
from piping components occurred, the record does not support requiring DCP to install
100% leakless components, as SC-CCAN urge. Some pipe joints need to be constructed
so they can open, according to the Company, and leakless components would not retain
that capability.206 Use of certain leakless components, plus requirement of a formalized
leak detection and repair program (“LDAR”) in PPRP's proposed conditions meets even
stringent national requirements in non-attainment areas.207 We accept that DCP's
procedures for controlling NOx emissions from its two gas flares will achieve LAER for
that emission and BACT for CO.
DCP has accepted all of PPRP's conditions relating to air pollution from the
Project, which we adopt herein.208 The Project's emissions will comply with Maryland
205 DCP In. Br. at 27-28.
206 DCP In. Br., 36 – 37.
207 DCP In. Br., p. 35.
208 See PPRP Final Recommended License Conditions; Air Quality Requirements, pp 2-46. April 17, 2014.
70

standards for toxic air pollutants, with visibility standards, standards for impact on
vegetation, and with the requisite Federal air pollution standards.209
As to the facility's use of water resources of the State, the record contains no
evidence that water usage by the Project will cause any water shortage for other users of
the same aquifer. There is likewise no evidence that water usage at issue here will cause
any statistically significant level of subsidence in land above or around the aquifer. Even
AMP’s expert witness, Dr. Helm, acknowledged that DCP’s water drawdown will not
cause any significant land subsidence.210 We note, however, that very little, if any
subsidence research has been undertaken in Southern Maryland. Therefore, we adopt the
additional condition (J-2) proposed by PPRP requiring DCP to establish a trust in the
amount of $190,000 to conduct on-going subsistence monitoring.
C. Evaluation of Statutory Factors
In evaluating the delineated statutory factors under PUA § 7-207, we weigh the
economic benefits created by construction and operation of the Generating Station against
a number of negative impacts, including most significantly increased emissions of criteria
pollutants, VOCs and GHGs that will impact air quality and our climate; use of a limited
supply of free industrial GHG emission set aside allowances; increased noise from the
Generating Station; clear cutting of trees; and additional burden on Calvert County's
transportation infrastructure and on the water resources of the State.211
These potential negative impacts of the generation station are considerable, many
of which will continue through the operational life of the Generating Station. DCP has
209 DCP In. Br. at 23-24.
210 Tr. 510.
211 See, e.g., In re Mirant Mid-Atlantic, LLC, 96 Md. P.S.C. 241, 2005 WL 4658876, at *13 (Md. P.S.C. 2005).
71

not demonstrated that these impacts would be offset by the relatively limited and short-
lived monetary benefits accruing to Calvert County through construction employment or
through the longer-term tax payments from the Generating Station. The negative impacts
also occur without the positive benefit of the Generating Station contributing to the
Maryland grid, or to the State's efforts to curtail climate change and to conserve energy.
Moreover, the larger LNG Project, of which the generation plant is an essential part, is
reported as likely to increase natural gas prices in Maryland to some extent,212 an increase
that will have a disproportionate impact on residential customers.
We note that the Navigant Study found that Henry Hub natural gas prices would
be 5.7% higher in 2020 due to the additional demand created by the projects exports.213
Dr. Estomin, using an averaged value of $0.13/Mcf, calculated that the incremental gas
cost to Maryland attributable to the Cove Point LNG exports would be $26.8 million per
year in real dollars.214 In addition to not being connected to the grid and participating in
RGGI, even under the most conservative of RGGI allowance price scenarios, Maryland
citizens are deprived of nearly $16 million in revenues associated with compliance costs
between the projected in-service date of the DCP plant through the year 2020.215 It is clear
to us that the “costs” to Maryland’s ratepayers could be well in excess of $75 million by
2025.
We therefore conclude, based on the record, that the construction of the island
mode Generating Station with the conditions proposed by PPRP does not provide
212 SCCAN Exhibit 1 (Navigant Study);DCP Rep. Br. at 12.
213 Navigant at 20.
214 SC-CCAN Rep. Br. at 15.
215 The “minimum reserve price” of a RGGI allowance is defined by regulation as $2.00 in 2014, increased by a factor
of 1.025 every calendar year thereafter. COMAR 26.09.01.02(B)(72-2).
72

sufficient economic and other benefits to residents of Maryland to justify granting a
CPCN.
In the aggregate, the negatives created by construction and operation of the
Generating Station require provision of additional economic benefits to the State before
the CPCN can be approved. We find that DCP’s last minute agreement to Condition J-4
of a $20.38 million “in-kind” contribution and funding to support Maryland’s Greenhouse
Gas Reduction Act (“GGRA”)216 goals too speculative and insufficient to provide the
necessary offsetting economic benefits to Maryland residents.
In developing additional conditions, we focus on actions that will benefit both the
environmental and economic interests of the State by benefiting renewable and clean
energy resources, reducing or mitigating climate change effects, and promoting beneficial
changes in generation and electric usage by consumers. SC-CCAN suggested that we add
an additional condition that DCP make “[a] significant investment in carbon-free
Maryland-based renewables.”217 We concur with SC-CCAN and Commission Staff that
DCP’s proposal to contribute their conservation voltage reduction services valued at
$20.38 million could be more effectively utilized through a direct contribution to the
consumer side, through the State's Strategic Energy Investment Fund (“SEIF”).218 In
finding so, and in considering the longer term impact of the Generating Station, we also
conclude that the proposed amount of contribution is insufficient. We therefore direct
that the funds earmarked by DCP to provide grants to utilities wishing to adopt DCP's
216 Environment Article, §§ 2-11201 – 1211.
217 SC-CCAN Rep. Br. at 24-28.
218 See Staff Comment on PPRP Modified Final Conditions and Cove Point LNG Terminal Expansion Project Risk
Study, May 14, 2014.
73
EDGE technology be increased to $40 million and contributed, over a five-year period, to
the SEIF, a fund administered by the Maryland Energy Administration (“MEA”) and
authorized by State Government Article § 9-2013-05.
If DCP accepts this modified condition, within 90 days of the commencement of
construction of the Generating Station, DCP shall make the first of five annual
installments of $8 million, for a total of $40 million, into the SEIF. The funds shall be
used solely for the purpose of investing in the promotion, development, and
implementation of one or more of the following categories: (1) renewable and clean
energy resources; (2) greenhouse gas reduction or mitigation programs; (3) cost-effective
energy efficiency and conservation programs, projects, or activities; or (4) demand
response programs that are designed to promote changes in electric usage by customers.
Given the expected impact from the Project of increasing gas rates to Maryland
residents, we are particularly sensitive to the potential increase in gas prices for low
income residents. We find that the proposed condition J-3 that would require DCP to
provide a one-time contribution of $400,000 to the Maryland Energy Assistance Program
or other Maryland low income energy assistance program to be insufficient.219 We direct
instead that DCP provide this level of contribution for each of the expected 20 years that
the plant is under contract to operate, for a total of $8 million.
D. Ensuring Public Safety
Separate from the delineated statutory elements in PUA § 7-207, we consider
potential safety risks from an accident at the 130 MW Generating Station that may be
exacerbated by the facility’s integration with the LNG facility. As noted previously, our
219 SC-
Ccan In. Br., pp. 17-18; SC-CCAN Ex. 1 at 20.
74

review of these facilities is also consistent with our duty under PUA § 11-101(b), and the
regulations thereunder, to ensure “to the greatest extent practicable” the operational safety
of these facilities. As an integrated project, including LNG facilities and a large electric
generation station, we consider the operational safety of DCP’s proposal on a total project
basis.
The physical integration of the combustion turbines with the LNG facilities, and
the location of the integrated facilities in a condensed footprint and in very close
proximity to thousands of residents raise safety and security questions that must be
considered. Safety issues are of significant concern to us in evaluating whether
construction of the proposed Generating Station is in the public interest and whether
additional protections are necessary. We are committed to ensuring that all available
safety measures, including a comprehensive Emergency Response Plan (“ERP”) for the
facility and the surrounding population, and a plan for compensating jurisdictions for
funding project-specific security and emergency management costs, are developed and
implemented prior to site preparation of the Generating Station.
We recognize that FERC has responsibility for evaluating the risk and potential
impact of explosions and other hazardous incidents as part of its LNG licensing
determination. FERC has oversight in ensuring that on-site facilities are safely constructed
and installed, and the U.S. Department of Transportation’s Pipeline and Hazardous
Materials Safety Administration (DOT/PHMSA) is responsible for setting the federal
safety standards for natural gas pipelines and related facilities. Design, construction, and
operation of the facilities must be done in accordance with FERC and PHMSA standards.
We also acknowledge that FERC has oversight over LNG ERPs, and established related
75

guidance in 2005 pursuant to the Energy Policy Act of 2005. However, Federal law also
includes provisions for State input into LNG licensing determinations, recognizing State
interests in ensuring the health and safety of its residents are protected when LNG
facilities are constructed and operated.
At the March 1, 2014 public hearing in Lusby, Maryland we heard earnest and
significant concerns from members of the public, particularly residents who live in close
proximity to the facility, about potential safety hazards and inadequate emergency
response and evacuation procedures. In addition, members of the public submitted written
comments expressing safety-related concerns. The commenters raised the issue of
potential increased risk for residents who live in close proximity to the plant due to the
tight spacing of the new generators, process equipment and storage tanks within the sound
abatement walled-area.220
Commenters also cited a DNR/PPRP study titled “Cove Point LNG Terminal
Expansion Project Risk Study,” dated June 28, 2006 and revised January 14, 2010, which
reported the results of a detailed quantitative risk analysis (“QRA”) that was conducted
when the generation facilities were last expanded, and questioned why a QRA was not
completed for this expansion Project.221 On May 6, 2014, the Commission requested
comment on whether an updated risk analysis had been performed for the expanded
Project and whether such an analysis has been filed with the FERC or any other
government agency. On May 14, 2014, PPRP filed comments stating that FERC had not
requested an updated QRA for the proposed LNG Project and PPRP had not prepared
220 Dale Allison Letter dated March 30, 2014.
221 Susan Allison Letter dated March 30, 2014.
76

one.222 PPRP further noted that FERC Staff’s Environmental Assessment (“EA”) of the
proposed DCP LNG Project was scheduled to be released on May 15, 2014, which it
was.223
DCP noted that the Project was designed to be consistent with the requirements set
forth in 49 CFR Part 193 (federal regulations governing safety, security and
environmental protection of LNG facilities). It also noted that the public safety and risk
assessment issues for which the Commission sought comment are being “thoroughly
addressed” by FERC and DOT PHMSA, referring us also to the EA noted above by
PPRP.
The EA includes an extensive discussion of potential safety risks related to the
proposed facility. Among the significant EA safety findings and conclusions are the
following:
• The principal hazards associated with the substances involved in the liquefaction, storage, and vaporization of LNG result from cryogenic and flashing liquid releases; flammable vapor dispersion; vapor cloud ignition; pool fires; overpressures, and toxicity.224
• Siting of the facility with regard to potential off-site consequences from these hazards is also required by DOT’s regulations under 49 CFR 193, Subpart B.225
• DCP’s siting analysis indicates that the siting of the proposed facility would not have a significant impact on public safety.226
222 May 14, 2014 Letter from Susan T. Gray, Deputy Director, PPRP.
223 FERC Staff concluded that with appropriate mitigating measures, the proposed Project would “not constitute a major
federal action significantly affecting the quality of the human environment,” and thus an Environmental Impact Statement (EIS) was not warranted. (cite) Pursuant to PUA § 3-111(d), on May 21, 2014 the Commission took judicial notice of the document titled “Environmental Assessment for the Cove Point Liquefaction Project” issued by FERC on May 15, 2014 as filed for Comment in FERC Docket No. CP13-113-000. 224
Id. 225
Id.
77

• Sufficient layers of safeguards would be included in the facility designs to mitigate the potential that could impact the safety of the off-site public.
The EA requires DCP to fulfill a number of safety-related conditions before
construction can commence, including filing and FERC approval of final project design
elements relating to, and not limited to, DOT’s spill determination, wind speeds and
vapor fences.227
In addition, the EA indicates that pursuant to NGA section 3A(e), FERC must
require an LNG terminal operator “to develop an emergency response plan (ERP) in
consultation with the U.S. Coast Guard and state and local agencies.”228 The EA notes
that there is an existing ERP in place at the site. It has been updated periodically since
1978 as new projects have changed the configuration of the facility. However, the report
states that “the existing ERP would need to be updated to include the proposed
liquefaction facilities and emergencies related to refrigerant handling.”229 Therefore, the
EA concludes that:
• Prior to initial site preparation, DCP should file its updated ERP to include the Liquefaction Facilities as well as instructions to handle on-site refrigerant and NGL-related emergencies. DCP should file the updated ERP with the Secretary [of FERC] for review and written approval by the Director of OEP.
• Prior to initial site preparation, DCP should file an ERP that includes a Cost-Sharing Plan identifying the mechanism for funding all Project-specific security/emergency management costs that would be imposed on state and
226 Id. FERC staff also declined to require a Quantitative Risk Assessment as part of the EA and instead evaluated the
project based on compliance with DOT’s federal safety standards as delineated in 49 CFR 193. See EA at 148. 227
See EA at 133, 148, 150. 228
FERC May 15, 2014 EA Report (Emergency Response §2.8.7) at 158. 229
Id. OEP refers to the Office of Energy Programs at FERC.
78

local agencies. In addition to the funding of direct transit-related security/emergency management costs, this comprehensive plan should include funding mechanisms for the capital costs associated with any necessary security/emergency management equipment and personnel base. DCP should file the ERP, including the Cost-Sharing Plan, with the Secretary for review and written approval by the Director of OEP.230
The EA also noted receipt of a comment on the evacuation route stating that “[it]
did not identify any incident from the siting analysis that would change or impact the
evacuation routes that have been established for the existing facility.”231 The EA further
states that “the Memorandums of Understanding established between the USCG, Calvert
County Sheriff’s Office, and the [Maryland DNR] ensures enforcement of the
safety/security zone while LNG vessels are in transit and moored at the facility.”232
In recognition of the EA’s findings and recommendations and the proximity of
residents to the proposed new Generating Station, which would be integrated with the
proposed expanded liquefaction Project, we find that a revised and strengthened condition
G-1 is required; that is, a condition requiring completion of an updated ERP as reflected in
the EA before commencement of construction of the generation facilities.233 We find that
directing DCP to address any additional emergency planning - including offsite - that is
230 Id. (Emphasis original)
231 Id. The EA describes that “DCP’s existing emergency response plan indicates coordination with the Maryland State
Police and Calvert County Sheriff’s Office for offsite emergency organization. The Maryland State Police and Calvert County Sheriff’s Office would provide the necessary law enforcement assistance, which includes evacuating individuals from designated public and private areas.” 232
Id. at 159. 233
DCP has previously filed a Cove Point ERP with this Commission. On August 19. 2003 it filed a Supplemental Report in CN 8917 describing the Cove Point ERP which had been upgraded to include: then current emergency and safety equipment; improved communication systems with local emergency response and law enforcement agencies; guidance to aid in the emergency classification process; results of coordination meetings held with various first responder organizations. DCP also described the 2003 revised ERP which was to incorporate among other elements an offsite evacuation plan developed in conjunction with the Calvert County Division of Emergency Management. (DCP CN 8913 2003 Supplemental Report at 2.)
79

identified during the ERP updating process would further ensure the operational safety of
the facility and the safety of residents who live close by.
Therefore, we direct DCP to file with us prior to initial site preparation for the
Generating Station any updates proposed to its existing ERP in accordance with the
recommendations set forth in the EA, and to address any safety issues raised by or
associated with the proposed generation facilities approved under this CPCN.
As noted above, the EA also proposes to require DCP to file a cost-sharing plan
with FERC that will identify the mechanisms for funding all project-specific security and
emergency management equipment costs that would be imposed on State and local
agencies. We expect that existing relationships with State and local emergency response
officials as described in the current ERP will continue, or that those relationships would
be enhanced. DCP has notified the Maryland State Fire Marshall and Calvert County
Public Safety personnel about the planned expansion and the need to revise the ERP.
DCP states that a more formal emergency planning dialogue with these stakeholders will
be completed during final site design. We direct DCP to work with Maryland State and
local law enforcement and emergency management agencies (including Maryland
Emergency Management Agency) during that process to ensure that the ERP adequately
incorporates each agency’s vital emergency preparedness and response capabilities in the
event of an emergency at the facility.
The key elements of ERP plans and procedures include identification and
assessment of hazards; prompt notification and mobilization of emergency response
resources; development and maintenance of appropriate emergency response capabilities;
and ongoing training programs. In order to ensure that the revised ERP incorporates
80
sufficient safety protocols, we direct as a condition of our approval that DCP’s updated
ERP be filed 60 days before any site preparation begins. If we find the revised ERP
deficient with regard to off-site safety protocols, the 60-day period will allow us the
opportunity to take steps to address those deficiencies or raise any concerns with the
federal agencies with which we cooperate in assuring the operational safety of these
facilities.
We revise condition G-1 to read as follows:
G-1. At least 60 days prior to commencing site preparation for construction, DCP
shall file with the PSC the State Fire Marshall’s final report regarding this Project,
including any measures to address any additional conditions or requirements identified by
the State Fire Marshall. Also, at least 60 days prior to commencing site preparation for
construction, DCP shall file a revised Emergency Response Plan (ERP) that reflects and
responds to the findings of the EA and any related FERC Order, and addresses the need
for additional off-site safety protocols and resources. Without supplanting revisions
responsive to FERC, the updated ERP shall address:
1. Site safety EMS coverage during construction and operations, including
timely response options and emergency vehicle access throughout the site in
case of an accident, injury or other emergency;
2. Where additional hazards are identified in the ERP process or existing
emergency response capabilities are determined to be inadequate, DCP shall
plan for implementing necessary upgrades, including assisting emergency
response organizations through contributions, requisite training and general
support to ensure the public’s safety. Prior to commencing construction of the
81

Generating Station, DCP shall file with the Commission an executed cost-
sharing plan that has the concurrence of each affected State and local agency
identified in the ERP;
3. DCP will work with Federal, State and local officials to determine in the
updated ERP whether an off-site emergency plan is needed as part of
emergency management, including whether an off-site evacuation plan is
needed, and if so present the plan to develop an off-site emergency plan that
includes consideration of residents who would have to rely on Cove Point
Road to evacuate the area in the event of an emergency at the LNG facility. If
DCP and the Federal, State and local officials with responsibilities for
emergency planning and response in the event of an emergency at the LNG
facility conclude that an off-site emergency plan or an off-site evacuation plan
is not needed, the bases for these conclusions shall be set forth in conjunction
with and at the time of issuance of the revised ERP.
Recognizing that we have added conditions and changed the conditions proposed
by PPRP on April 17, 2014, we direct DCP to advise us in writing of its acceptance or
rejection of the Conditions set forth in Appendix A within ten days of this Order.
IT IS, THEREFORE, this 30th day of May, in the year Two Thousand Fourteen,
by the Public Service Commission of Maryland,
ORDERED: (1) That the Certificate of Public Convenience and Necessity for
which Dominion Cove Point applied on April 1, 2013, is hereby granted, subject to the
conditions and requirements set out in Appendix A to this Order; and
82

(2) That DCP’s request for a waiver of section § 7-208(b)(1) of the PUA is
hereby granted, contingent upon DCP fulfilling all pre-construction conditions and
requirements as directed by FERC and by this Commission.
/s/ W. Kevin Hughes
/s/ Lawrence Brenner
/s/ Kelly Speakes-Backman
/s/ Anne E. Hoskins Commissioners*
*Commissioner Harold D. Williams did not participate in this decision.
83

APPENDIX A
Final License Conditions PSC Case No. 9318 Dominion Cove Point Project
CPCN GENERAL REQUIREMENTS
Gen.-1 Prior to commencing construction of the generating station, DCP shall file with the Commission notification that FERC has issued all required pre-construction approvals pursuant to the EA and the final FERC order authorizing construction of the LNG facility.
Gen.-2 Except as otherwise provided for in the following provisions, the application for the Certificate of Public Convenience and Necessity (CPCN) is considered to be part of this CPCN for the Dominion Cove Point (DCP) Project. In the application, estimates of dimensions, volumes, emission rates, operating rates, feed rates and hours of operation are not deemed to constitute enforceable numeric limits except to the extent that they are necessary to make a determination of applicable regulations. Construction of the DCP Project shall be undertaken in accordance with the CPCN application filed with the Maryland Public Service Commission (PSC) on 1 April 2013 and supplemental filings on 15 May 2013, 20 May 2013, 21 May 2013, 23 May 2013, 31 May 2013, 3 June 2013, 19 June 2013, 3 July 2013, 8 July 2013, 19 July 2013, 29 July 2013, 5 August 2013, 14 August 2013, 16 August 2013, 23 August 2013, 5 September 2013, 16 September 2013, 25 September 2013, 26 September 2013, 27 September 2013, 2 October 2013, 8 October 2013, 11 October 2013, 15 October 2013, 21 October 2013, 31 October 2013, 12 November 2013, 2 December 2013, 18 December 2013, and 2 January 2014. If there are any inconsistencies between the conditions specified below and the application, the conditions in this CPCN shall take precedence. If CPCN conditions incorporate federal or state laws through paraphrased language, where there is any inconsistency between the paraphrased language and the actual state or federal laws being paraphrased, the applicable federal or state laws shall take precedence.
Gen.-3 All provisions of this CPCN that apply to DCP shall apply to all subsequent owners and/or operators of the facility. In the event of any change in control or ownership, DCP shall notify the succeeding owner/operator of the existence of the requirements of this CPCN by letter and shall send a copy of that letter to the PSC and the Maryland Department of the Environment (MDE).
Gen.-4 If any provision of this CPCN shall be held invalid for any reason, the remaining provisions shall remain in full force and effect and such invalid provision shall be considered severed and deleted from this CPCN.
Appendix A - 1

Gen.-5 Representatives of the PSC shall be afforded access to the DCP Project facility at any reasonable time to conduct inspections and evaluations necessary to assure compliance with the CPCN. DCP shall provide such assistance as may be necessary to conduct such inspections and evaluations by representatives of the PSC effectively and safely.
Gen.-6 Representatives of the Maryland Department of the Environment (MDE), Department of Natural Resources (DNR), and the Calvert County Health Department shall be afforded access to the DCP Project facility at any reasonable time to conduct inspections and evaluations necessary to assure compliance with the CPCN requirements. DCP shall provide such assistance as reasonably may be necessary to conduct such inspections and evaluations effectively and safely, which may include but need not be limited to the following:
a) Inspecting construction authorized under this CPCN;
b) Sampling any materials stored or processed on site, or any waste or discharge into the environment;
c) Inspecting any monitoring or recording equipment required by this CPCN or applicable regulations;
d) Having access to or copying any records required to be kept by DCP pursuant to this CPCN or applicable regulations;
e) Obtaining any photographic documentation and evidence; and
f) Determining compliance with the conditions and regulations specified in the CPCN.
Appendix A - 2

AIR QUALITY REQUIREMENTS
I. GENERAL
A-I-1 MDE Air and Radiation Management Administration (ARMA) shall have concurrent jurisdiction with the PSC to enforce the air quality conditions of the CPCN.
A-I-2 The CPCN serves as the Prevention of Significant Deterioration (PSD)
approval, Nonattainment New Source Review (NA-NSR) approval, and air quality construction permit for the DCP Project and does not constitute the permit to construct or approvals until such time as DCP has provided documentation demonstrating that nitrogen oxides (NOx) emission offsets totaling at least 375 tons and volatile organic compound (VOC) emission offsets totaling at least 45 tons, each based on an offset ratio of 1.3 to 1.0, have been obtained and approved by MDE-ARMA and are federally enforceable.
A-I-3 For air permitting purposes, the DCP Project shall be defined as the following:
a) Two General Electric (GE) Frame 7EA combustion turbines (CTs) with heat
recovery steam generators (HRSGs) each rated at 1,062 million British Thermal Units per hour (MMBtu/hr) with a nominal net 87.2 megawatt (MW) rated capacity, equipped with dry low-NOx (DLN1) combustors, selective catalytic reduction systems (SCRs), and oxidation catalysts (F7CT-A, F7CT-B).
b) Two auxiliary boilers, each rated at 435 MMBtu/hr, equipped with an
oxidation catalyst, low-NOx burner, and SCR (AUXB-A, AUXB-B). c) One 1,550-horsepower (hp) diesel-fired emergency generator (EG-A). d) Five 350-hp diesel-fired emergency fire pump engines (FP-A, FP-B, FP-C,
FP-D, FP-E). e) One 56-MMBtu/hr thermal oxidizer equipped with SCR and an oxidization
catalyst (TO-A). f) Two ground flares, North Flare and South Flare (NF, SF). g) Two existing GE MS5001 Frame 5 combustion turbines providing a total
maximum of 25 MW on a continuous basis (F5CT 214 JA, F5CT 214 JB).
Appendix A - 3

h) Piping components associated with this project, including valves, connectors, flanges, pump seals, and pressure relief valves within the facility boundary (FUG-A).
i) Eight storage vessels:
1. Four 102,500-gallon propane make-up tanks (TANK-P1, TANK-P2,
TANK-P3, TANK-P4) 2. Two 34,000-gallon ethane make-up tanks (TANK-E1, TANK-E2) 3. Two 35,000-gallon condensate storage tanks (TANK-C1, TANK-C2)
A-I-4 In accordance with COMAR 26.11.02.04B, the air quality provisions expire if,
as determined by MDE-ARMA:
a) Substantial construction or modification is not commenced within 18 months after the date of issuance of the CPCN final order;
b) Construction or modification is substantially discontinued for a period of 18
months after the construction or modification has commenced; or c) The source is not completed within a reasonable period after the date of
issuance of the CPCN final order.
A-I-5 At least 60 days prior to the anticipated date of start-up of the Project, DCP shall submit to MDE-ARMA an application for a State permit to operate.
A-I-6 DCP shall submit to MDE-ARMA, not later than 12 months after the date the affected source commences operation, an administratively complete application for modification of the Dominion Cove Point facility Part 70 (Title V Operating) Permit. [COMAR 26.11.03.17(F)(2) & 26.11.03.02(B)(4)]
A-I-7 All records and logs required by this CPCN shall be maintained at the facility
for at least five years (unless otherwise noted) after the completion of the calendar year in which they were collected. These data shall be readily available for inspection by representatives of MDE-ARMA.
A-I-8 Maryland CO2 Budget Trading Program – DCP shall comply with all
applicable requirements for CO2 reporting and emission reduction program. [COMAR 26.09]
Appendix A - 4
II. DEFINITIONS A-II-1 “Commence” as applied to the construction of the Project means that the owner
or operator either has:
a) Begun, or caused to begin, a continuous program of actual on-site construction of the source, to be completed within a reasonable time; or
b) Entered into binding agreements or contractual obligations, which cannot be
canceled or modified without substantial loss to the owner or operator, to undertake a program of actual on-site construction of the source to be completed within a reasonable time.
A-II-2 “Facility Restart” as it relates to the DCP Project North and South Flares is
defined as the startup of project operations, the period during which mixed refrigerant, propane, and/or natural gas in the system are vented to the North and South Flares prior to the startup of the sources.
A-II-3 “Normal Operation” as it relates to the DCP Project combustion turbines and
auxiliary boilers is defined as the period of time from when startup ceases until shutdown begins.
A-II-4 “Startup” as it relates to the DCP Project combustion turbines is defined as the
period of time from initiation of combustion firing until the unit reaches at least 60% load. Startup as it relates to the DCP Project auxiliary boilers is defined as the period of time from initiation of fuel combustion until the unit reaches at least 25% load.
A-II-5 “Shutdown” as it relates to the DCP Project combustion turbines is defined as
that period of time during which the turbine output is lowered with the intent to shut down, beginning at the point at which the load drops below 60%. Shutdown as it relates to the DCP Project auxiliary boilers is defined as the period of time during which the auxiliary boiler steam output is lowered with the intent to shut down, beginning at the point at which the unit reaches at least 25% load.
A-II-6 “Malfunction” is defined as any sudden, infrequent, and not reasonably
preventable failure of air pollution control equipment, process equipment, or a process that operates in an abnormal or unusual manner. Failures that are caused in part by poor maintenance or careless operation are not malfunctions.
Appendix A - 5

A-II-7 “Warm Ships” as they relate to the DCP Project North and South Flares are defined as ships which come into the terminal and require a cool-down process prior to commencing loading of the liquefied natural gas (LNG).
III. PROJECT-WIDE CONDITIONS A-III-1 Any circuit breakers DCP installs in conjunction with this Project shall not
contain sulfur hexafluoride (SF6). A-III-2 The proposed DCP Project is subject to all applicable federally enforceable
State air quality requirements including, but not limited to, the following regulations:
a) Testing and Monitoring - Requires DCP to follow test methods described
in 26.11.01.04C to determine compliance. MDE-ARMA may require DCP to install, use, and maintain monitoring equipment or employ other methods as specified by MDE-ARMA to determine the quantity or quality, or both, of emissions discharged into the atmosphere and to maintain records and make reports on these emissions to MDE-ARMA in a manner and on a schedule approved by MDE-ARMA or the control officer. [COMAR 26.11.01.04]
b) Emission Statements - Requires DCP to submit a certified, facility-wide
emission statement to MDE-ARMA by April 1 of each year for the previous calendar year. [COMAR 26.11.01.05-1]
c) Malfunctions and Other Temporary Increases of Emissions - Requires
DCP to report the onset and the termination of the occurrence of excess emissions, expected to last or actually lasting for one hour or more to MDE-ARMA by telephone. Telephone reports shall include all information required by COMAR 26.11.01.07C(2). [COMAR 26.11.01.07]
d) Continuous Emission Monitoring Requirements - Requires DCP to
operate all Continuous Emission Monitors (CEMS) under the requirements of COMAR 26.11.01.11. This requirement is applicable to the NOx and oxygen (O2) (or carbon dioxide, CO2) CEMS that are planned to be installed to meet 40 CFR §60 Subpart Db requirements for the auxiliary boilers and 40 CFR §60 Subpart KKKK requirements for the combustion turbines. This requirement is also applicable to the CO CEMS that are required to be installed on the Frame 7 combustion turbines under COMAR 26.11.01.04B. [COMAR 26.11.01.11]
Appendix A - 6

e) Particulate Matter From Confined Sources - Prohibits DCP from causing
or permitting particulate matter to be discharged from any installation constructed on or after January 17, 1972 in excess of 0.05 gr/SCFD (115 mg/dscm). [COMAR 26.11.06.03B(1)(a)]
f) Particulate Matter From Unconfined Sources - Prohibits DCP from
causing or permitting emissions from an unconfined source without taking reasonable precautions to prevent particulate matter from becoming airborne. These reasonable precautions shall include, when appropriate as determined by MDE-ARMA, the installation and use of hoods, fans, and dust collectors to enclose, capture, and vent emissions. In making this determination, MDE-ARMA shall consider technological feasibility, practicality, economic impact, and the environmental consequences of the decision. [COMAR 26.11.06.03C]
g) Particulate Matter from Materials Handling and Construction -
Prohibits DCP from causing or permitting any material to be handled, transported, or stored, or a building, its appurtenances, or a road to be used, constructed, altered, repaired, or demolished without taking reasonable precautions to prevent particulate matter from becoming airborne. [COMAR 26.11.06.03D]
h) Control of NSPS Sources - Prohibits DCP from constructing, modifying, or
operating, or causing to be constructed, modified, or operated, a New Source Performance Standard (NSPS) source as defined in COMAR 26.11.01.01B(23), which results or will result in violation of the provisions of 40 CFR §60, as amended. [COMAR 26.11.06.12]
i) Control of PSD Sources – Prohibits DCP from constructing, modifying, or
operating, or causing to be constructed, modified, or operated, a Prevention of Significant Deterioration (PSD) source as defined in COMAR 26.11.01.01B(37), which results or will result in violation of the provisions of 40 CFR §52.21, as amended, except that the reviewing authority is MDE-ARMA instead of the U.S. Environmental Protection Agency (EPA) Administrator unless otherwise specified in 40 CFR §52.116, and the applicable procedures are those set forth in COMAR 26.11.02. [COMAR 26.11.06.14]
Appendix A - 7

j) Nonattainment Provisions for Major New Sources and Major Modifications - General Conditions – Prohibits DCP from commencing construction or modification of any proposed emissions unit without first obtaining all permits and approvals required. Requires DCP to certify that all existing major stationary sources owned or operated by DCP, or any entity controlling, controlled by, or under common control with DCP, in the State are in compliance with all applicable emission limitations or are in compliance with an approved federally enforceable plan for compliance. Requires DCP to obtain more than equivalent emission offsets from existing sources in the area impacted by the proposed new major stationary source or major modification. The offset ratio for VOC and NOx shall equal or exceed 1.3 to 1 for sources of VOC or NOx in Calvert County. Requires DCP to comply with all other applicable requirements of COMAR 26.11.17.03A and COMAR 26.11.17.03B(1-7). [COMAR 26.11.17.03]
k) General Conformity – Requires DCP to comply with the general conformity requirements of 40 CFR 93 Subpart B. [COMAR 26.11.26.09]
A-III-3 The proposed DCP Project is subject to all applicable State-Only air quality
requirements including, but not limited to, the following regulations: a) Nuisance – Prohibits DCP from operating or maintaining the facility in such
a manner that a nuisance or air pollution is created. [COMAR 26.11.06.08] b) Odors – Prohibits DCP from causing or permitting the discharge into the
atmosphere of gases, vapors, or odors beyond the property line in such a manner that a nuisance or air pollution is created. [COMAR 26.11.06.09]
c) Toxic Air Pollutants - Requires DCP to quantify emissions of each toxic air pollutant (TAP) that will be discharged from affected installations and submit that information to MDE-ARMA. Prohibits DCP from constructing, reconstructing, operating, or causing to be constructed, reconstructed, or operated, any new installation or source that will discharge a TAP to the atmosphere without installing and operating the Best Available Control Technology for toxics (T-BACT) and demonstrating that emissions discharged by the new installation or source will not unreasonably endanger human health by performing an analysis as specified under COMAR 26.11.15 and 26.11.16. [COMAR 26.11.15 and COMAR 26.11.16]
Appendix A - 8

d) Fee Schedule – Requires DCP to pay annual Title V operating permit fees. [COMAR 26.11.02.19A]
e) Emission Certification – Requires DCP to certify the actual emissions of
regulated air pollutants from all installations at the plant or facility. Certification shall be on a form obtained from MDE-ARMA and shall be submitted to MDE-ARMA not later than April 1 of the year following the year for which certification is required. An emission certification submitted pursuant to this section and which contains all information required by COMAR 26.11.01.05-1 for NOx and VOC, satisfies the requirements of COMAR 26.11.01.05-1. [COMAR 26.11.02.19D]
A-III-4 Emissions for all sources identified as part of the DCP Project, including
emissions during periods of startup and shutdown, shall be limited to the following, in tons per year, in any consecutive 12-month rolling period:
Pollutant Project-Wide Emission
Limit (tons per year)
Particulate Matter (PM) – Filterable 55.7 Particulate Matter less than 10 microns (PM10) – Filterable and Condensable
124.2
Particulate Matter less than 2.5 microns (PM2.5) – Filterable and Condensable
124.2
Nitrogen Oxides (NOx) 279.3 Carbon Monoxide (CO) 146.6 Volatile Organic Compounds (VOCs) 33.3 Greenhouse Gas (GHG) as Carbon Dioxide Equivalent (CO2e)
2,030,988
Formaldehyde 6.2 A-III-5 To meet BACT, DCP shall take precautions to minimize particulate matter
emissions from onsite roadways including, but not limited to, the use of water or chemical suppression and sweeping.
Compliance Demonstration
Testing and Monitoring Requirements A-III-6 Compliance with the Project-wide GHG limit is based on the currently accepted
global warming potentials (GWPs) from 40 CFR §98 Subpart A of 1 for CO2, 25 for methane (CH4), and 298 for nitrous oxide (N2O).
Appendix A - 9

A-III-7 DCP may submit to MDE-ARMA a request to reduce the frequency of stack testing for any source.
Recordkeeping and Reporting Requirements
A-III-8 DCP shall submit a quarterly report to MDE-ARMA to be postmarked by the 30th day of the month following the end of each calendar quarter that includes the following information: a) Lists instances of deviations from permit requirements.
b) Summarizes separately the date, time, and duration of each startup,
shutdown, or malfunction that occurred for each Frame 7 combustion turbine or auxiliary boiler identified as part of the DCP Project during the prior quarterly period. The report shall include total monthly and consecutive rolling 12-month hours of startup, shutdown, and malfunction for each source. The report shall also include the total NOx, VOC, CO, PM, PM10, PM2.5 and GHG emissions for each startup and shutdown event.
c) Summarizes the downtime or malfunction of all CEMS required for DCP
Project emission sources. The report shall include the date and time of each period during which the CEMS was inoperative and the nature of the monitoring system repairs or adjustments completed.
d) Summarizes the monthly and consecutive rolling 12-month total emissions
(in tons per month and tons per year) of PM, PM10, PM2.5, NOx, CO, VOCs, and GHGs (as CO2e) separately for each emission unit and total emissions of those pollutants for all DCP Project sources.
A-III-9 DCP shall provide MDE-ARMA with the manufacturer, make, and model,
vendor specifications, or other details requested by MDE-ARMA upon selection of auxiliary sources (thermal oxidizer, emergency engines, flare).
A-III-10 DCP shall furnish written notification to MDE-ARMA and EPA for the Frame 7
combustion turbines and auxiliary boilers subject to an NSPS of the following events: [40 CFR §60.7(a)]
a) The date construction commenced within 30 days after such date;
Appendix A - 10

b) The actual startup date within 15 days after such date; and c) The anticipated date of compliance stack testing at least 30 days prior to
such date. IV. COMBUSTION TURBINES
Emission Unit Number(s): F7CT-A, F7CT-B Two GE Frame 7EA combustion turbines (CTs) with heat recovery steam generators (HRSGs) equipped with dry low-NOx (DLN1) combustors, SCRs, and oxidation catalysts
Applicable Requirements
A-IV-1 The Frame 7 CT/HRSGs are subject to all applicable federally enforceable State air quality requirements including, but not limited to, the following regulations:
a) Visible Emissions – Prohibits DCP from causing or permitting the
discharge of emissions from any fuel burning equipment, other than water in an uncombined form as specified in Table A-1. [COMAR 26.11.09.05A(1)]
b) Control of Sulfur Oxides From Fuel Burning Equipment - Prohibits
DCP from burning, selling, or making available for sale process gas used as fuel with a sulfur content by weight of greater than 0.3 percent. [COMAR 26.11.09.07A(1)(d)]
c) Control of NOx Emissions for Major Stationary Sources – Requires DCP
to comply with all applicable provisions of COMAR 26.11.09.08. DCP shall demonstrate compliance with the emission limits of COMAR 26.11.09.08 by complying with the emission limits specified in Table A-1. [COMAR 26.11.09.08]
A-IV-2 The Frame 7 CT/HRSGs are subject to 40 CFR §60 Subpart KKKK - Standards
of Performance for Stationary Combustion Turbines; 40 CFR §60.4300, et seq., which contain various requirements for emission limitations, monitoring, testing, recordkeeping, and reporting for NOx and SO2, including but not limited to those specified in Table A-1 and the following:
Appendix A - 11

a) Excess Emissions—DCP shall follow the calculation procedures set forth in 40 CFR §60.4350 for purposes of identifying excess emissions. [40 CFR §60.4350]
b) Fuel Sulfur Content—DCP may elect not to monitor the total sulfur
content of the fuel combusted in the turbines, if the fuel is demonstrated not to exceed potential sulfur emissions of 26 ng sulfur dioxide (SO2)/Joule (J) (0.060 lb SO2/MMBtu) heat input using one of the methods given in 40 CFR §60.4365. If DCP elects to comply with the minimum fuel sulfur content limit under 40 CFR§60.4330, DCP must monitor the total sulfur content of the fuel using the methods described in 40 CFR §60.4415 at a frequency described in 40 CFR §60.4370. [40 CFR §60.4360]
Operational and Emission Limits A-IV-3 Best Available Control Technology (BACT) - BACT for each Frame 7 CT
shall be the efficient design of the CTs with dry low NOx (DLN1) combustors and heat recovery steam generators (HRSGs), use of facility process fuel gas or pipeline quality natural gas fuel only, operation of an oxidation catalyst, operation of an SCR system, and application of good combustion practices to achieve the emission limitations and operational limits as specified in Table A-1.
A-IV-4 Lowest Achievable Emission Rate (LAER) - LAER for each Frame 7 CTs
shall be to meet the emission limitations and operational limits as specified in Table A-1 to be achieved through the use of a selective catalytic reduction (SCR) system, DLN1 combustors, oxidation catalyst, and good combustion practices.
A-IV-5 DCP shall comply with emission limitations during facility startup and
shutdown events specified in Table A-1. These emissions shall be included in demonstrating compliance with the Project-wide emissions (Condition A-III-4) limits, on a consecutive 12-month rolling basis.
A-IV-6 DCP shall limit emissions of ammonia resulting from un-reacted ammonia
(ammonia slip) from each of the SCRs to be installed on the Frame 7 CTs as specified in Table A-1.
Compliance Demonstration Testing and Monitoring Requirements
Appendix A - 12

A-IV-7 At least 30 days prior to conducting any compliance stack test, DCP shall submit a test protocol to MDE-ARMA for review and approval.
a) Compliance stack testing shall be conducted in accordance with MDE-
ARMA Technical Memorandum (TM) 91-01, "Test Methods and Equipment Specifications for Stationary Sources" (January 1991), as amended by Supplement 3 (December 1997), 40 CFR §60, or subsequent test protocols approved by MDE-ARMA; and
b) Test ports shall be located in accordance with TM 91-01 (January 1991), or subsequent or alternative measures approved by MDE-ARMA.
A-IV- 8 Initial compliance stack testing of each Frame 7 CT shall be conducted within
180 days after initial startup to quantify pollutant emissions and demonstrate compliance with the emission limits specified in the CPCN for the following pollutants: NOx, VOC, PM, PM10, PM2.5, CO, ammonia, and CO2 while operating at 90% or higher capacity. Subsequent stack tests shall be conducted annually for NOx, VOC, PM, PM10, PM2.5, CO, and CO2 and at least every five years for ammonia. As an alternative to annual stack testing for NOx, VOC, CO, and CO2, DCP may choose to demonstrate compliance with emission limitations by installing and operating a certified CEMS, upon written notification to MDE-ARMA.
A-IV- 9 Compliance testing shall be conducted by the methods specified in Table A-1.
A-IV-10 DCP shall conduct initial and subsequent performance tests on the Frame 7 CTs
for NOx as specified in Table A-1. [40 CFR §60.4400]
A-IV-11 DCP shall conduct an initial and subsequent performance tests on each of the Frame 7 CTs for SO2 according to applicable procedures in 40 CFR §60.4415 only if periodic monitoring of sulfur content is performed for compliance with the alternative fuel sulfur content limit. [40 CFR §60.4415]
A-IV-12 Compliance stack testing of each of the Frame 7 CTs shall be conducted within 180 days after initial startup to demonstrate that the formaldehyde emission rate is in compliance with the emission limit specified in Condition A-III-4. Testing for formaldehyde emissions shall be conducted according to EPA Method 323, or equivalent method approved by MDE.
A-IV-13 Continuous compliance monitoring for the Frame 7 CTs shall be conducted as specified in Table A-1.
A-IV-14 Unless otherwise approved by MDE-ARMA, DCP shall install on each Frame 7 CT a CO2 CEMS or calibrated in-line fuel flow-meters as specified under 40 CFR 75.10(3) to measure CO2 emissions associated with the production of
Appendix A - 13

electricity. Emissions of CO2 from the Frame 7 CTs are to be monitored and recorded hourly utilizing a data handling acquisition system (DHAS) installed, calibrated, and maintained in accordance with 40 CFR 75. [40 CFR 75.10(3)]
A-IV-15 DCP shall meet the emission limitations for visible emissions as specified in
Table A-1. [COMAR 26.11.09.05A(1&5)] A-IV-16 DCP shall install a fuel flow meter and continuously monitor the fuel flow for
each Frame 7 CT. The fuel flow shall be recorded monthly. A-IV-17 Compliance with the BACT and LAER emission limitations shall be
demonstrated as follows:
a) DCP shall obtain vendor guarantees to demonstrate compliance with the BACT and LAER emission limits.
b) Emissions of NOx, CO and VOC shall be calculated using vendor guaranteed emission rates, stack exhaust oxygen content, stack outlet flowrate, and hours of operation. Emissions of PM, PM10, and PM2.5 shall be calculated using vendor guaranteed emission rates and hours of operation. Monthly emission totals shall be used to calculate 12-month rolling period emissions.
c) CH4 and N2O emissions from the Frame 7 CTs shall be calculated in
accordance with the methodology and emission factors noted in 40 CFR 98, Subpart C. On a monthly basis, fuel consumption, coupled with the appropriate emission factors and global warming potentials (25 for CH4 and 298 for N2O), shall be used to calculate the CH4 and N2O emissions on a CO2e basis. These emission rates, summed with the monthly CO2 emissions based on stack testing shall be used to establish GHG emissions from the Frame 7 CTs on a CO2e basis.
Recordkeeping and Reporting Requirements
A-IV-18 Final results of each compliance stack test must be submitted to MDE-ARMA within 60 days after completion of the test.
A-IV-19 DCP shall submit a formaldehyde emission analysis following the completion
of the initial stack testing for the Frame 7 CTs, auxiliary boilers, and thermal oxidizer which demonstrates that the combined formaldehyde emissions from these tests in addition to the formaldehyde emissions from the other project sources as calculated based on approved emission factors, are less than the limit specified in Condition A-III-4.
Appendix A - 14

A-IV-20 Unless otherwise approved by MDE-ARMA, DCP shall submit electronic quarterly reports from the DHAS of CO2 emissions to the EPA Clean Air Markets Business System as specified in 40 CFR 75.64. [40 CFR 75.64]
A-IV-21 DCP shall submit to MDE-ARMA the results of visible emissions observations
in each quarterly report.
A-IV-22 DCP shall submit the following CEMS reports to MDE-ARMA for all CEMS required to be operated under this Project:
a) CEMS System Downtime Reports as required by COMAR 26.11.01.11E(1). b) Quarterly CEMS Summary Reports as required by COMAR
26.11.01.11E(2)(c). [COMAR 26.11.01.11E]
A-IV-23 DCP shall submit reports of excess emissions and monitor downtime associated with the Frame 7 CTs, in accordance with 40 CFR §60.7(c). Excess emissions as defined in 40 CFR §60.4380 (NOx) and 40 CFR §60.4385 (SO2) must be reported for all periods of unit operation, including startup, shutdown, and malfunction. [40 CFR §60.4375]
A-IV-24 DCP shall maintain annual fuel use records on site for not less than 3 years, and
make these records available to MDE-ARMA upon request. [COMAR 26.11.09.08K]
A-IV-25 DCP shall comply with all applicable NOx reporting and recordkeeping
requirements for each of the Frame 7 CTs as specified in 40 CFR §60.4375-40 CFR §60.4395.
A-IV-26 If DCP elects to demonstrate compliance with the SO2 emissions limit in 40
CFR §60.4330 using methods described in §60.4415(a) as described in Table A-1, DCP shall submit periodic representative fuel sampling records as part of the quarterly report to MDE-ARMA to be postmarked by the 30th day of the month following the end of each calendar quarter.
Appendix A - 15

V. AUXILIARY BOILERS
Emission Unit Number(s): AUXB-A, AUXB-B Two auxiliary boilers with SCRs, low-NOx burners, and catalytic oxidizers
Applicable Requirements A-V-1 The auxiliary boilers are each subject to all applicable federally enforceable
State air quality requirements including, but not limited to, the following regulations:
a) Visible Emissions - Prohibits DCP from causing or permitting the discharge
of emissions from auxiliary boilers, other than water in an uncombined form, as specified in Table A-2. [COMAR 26.11.09.05A(1)]
b) Control of Sulfur Oxides From Fuel Burning Equipment - Prohibits
DCP from burning, selling, or making available for sale process gas used as fuel with a sulfur content by weight of greater than 0.3 percent. [COMAR 26.11.09.07A(1)(d)]
c) Control of NOx Emissions for Major Stationary Sources - Requires DCP to comply with all applicable provisions of COMAR 26.11.09.08. DCP shall demonstrate compliance with the emission limits of COMAR 26.11.09.08 by complying with the emission limits specified in Table A-2.
A-V-2 The auxiliary boilers are subject to NSPS 40 CFR §60 Subpart Db - Standards of Performance for Industrial-Commercial-Institutional Generating Units, which contain various requirements for emission limitations, monitoring, testing, recordkeeping, and reporting for NOx, including but not limited to those specified in Table A-2.
Operational and Emission Limits A-V-3 Best Available Control Technology (BACT) - For each of the auxiliary
boilers, BACT shall be the efficient boiler design of the auxiliary boiler, use of facility process fuel only during normal operation, operation of a low-NOx burner, operation of an oxidation catalyst, operation of a SCR system, and application of good combustion controls in order to comply with the emission limits specified in Table A-2.
A-V-4 Lowest Achievable Emission Rate (LAER) - Emissions from the auxiliary
boilers shall meet the LAER limits specified in Table A-2, through the use of
Appendix A - 16

efficient boiler design, use of facility process fuel only during normal operation, SCRs, low-NOx burners, oxidation catalysts, and good combustion practices.
A-V-5 DCP shall comply with the emission limitations during facility startup and
shutdown events as specified in Table A-2 for each auxiliary boiler. These emissions shall be included in demonstrating compliance with the Project-wide emissions (Condition A-III-4) limits, on a consecutive 12-month rolling average basis.
A-V-6 DCP shall limit emissions of ammonia resulting from un-reacted ammonia
(ammonia slip) from each of the SCRs to be installed on the auxiliary boilers as specified in Table A-2.
Compliance Demonstration Testing and Monitoring Requirements A-V-7 At least 30 days prior to conducting any compliance stack test, DCP shall
submit a test protocol to MDE-ARMA for review and approval. a) Compliance stack testing shall be conducted in accordance with MDE-
ARMA Technical Memorandum (TM) 91-01, "Test Methods and Equipment Specifications for Stationary Sources" (January 1991), as amended by Supplement 3 (December 1997), 40 CFR §60, or subsequent test protocols approved by MDE-ARMA; and
b) Test ports shall be located in accordance with TM 91-01 (January 1991), or subsequent or alternative measures approved by MDE-ARMA.
A-V-8 Initial compliance stack testing of the auxiliary boilers shall be conducted
within 180 days after initial startup to quantify emissions and demonstrate compliance with emission limits specified in the CPCN for the following pollutants: NOx, VOC, PM, PM10, PM2.5, CO, ammonia, and CO2. Subsequent stack tests shall be conducted annually for NOx, VOC, PM, PM10, PM2.5, CO, and CO2 and at least every five years for ammonia. As an alternative to annual stack testing for VOC, CO, and CO2, DCP may choose to demonstrate compliance with emission limitations by installing and operating a certified CEMS, upon written notification to MDE-ARMA.
A-V-9 Compliance testing shall be conducted by the methods specified in Table A-2.
A-V-10 DCP shall conduct initial and subsequent performance tests on the auxiliary
boilers, for NOx as specified in Table A-2. [40 CFR §60.46b(c)]
Appendix A - 17
A-V-11 Compliance stack testing of each of the auxiliary boilers shall be conducted within 180 days after initial startup to demonstrate that the formaldehyde emission rate is in compliance with the emission limit specified in Condition A-III-4. Testing for formaldehyde emissions shall be conducted according to EPA Method 323, or equivalent method approved by MDE.
A-V-12 Continuous compliance monitoring for the auxiliary boilers shall be conducted
as specified in Table A-2. A-V-13 Unless otherwise approved by MDE-ARMA, DCP shall install on each
auxiliary boiler a CO2 CEMS or calibrated in-line fuel flow-meters as specified under 40 CFR 75.10(3) to measure CO2 emissions associated with the production of electricity. Emissions of CO2 from the auxiliary boilers are to be monitored and recorded hourly utilizing a data handling collection system (DHAS) installed, calibrated, and maintained in accordance with 40 CFR 75. [40 CFR 75.10(3)]
A-V-14 To demonstrate compliance with the GHG BACT, DCP shall conduct an annual
combustion tune-up on the auxiliary boilers to ensure efficient operation.
A-V-15 DCP shall meet the emission limitations for visible emissions as specified in Table A-2. [COMAR 26.11.09.05A(1&5)]
A-V-16 DCP shall install a fuel flow meter on each auxiliary boiler and continuously
monitor the fuel flow to each auxiliary boiler. The fuel flow shall be recorded monthly.
A-V-17 Compliance with the BACT and LAER emission limitations shall be demonstrated as follows:
a) DCP shall obtain vendor guarantees to demonstrate compliance with the
BACT and LAER emission limits.
b) Emissions of NOx, VOC, CO, PM, PM10 filterable, and PM2.5 filterable shall be calculated using fuel measurements, vendor guaranteed emission rates, and hours of operation. Emissions of PM10 condensable and PM2.5 condensable shall be calculated using fuel measurements, AP-42 emissions factors, and hours of operation. Monthly emission totals shall be used to calculate 12-month rolling period emissions.
c) CH4 and N2O emissions from the auxiliary boilers shall be calculated in
accordance with the methodology and emission factors noted in 40 CFR 98, Subpart C. On a monthly basis, fuel consumption, coupled with the appropriate emission factors and global warming potentials (25 for CH4 and
Appendix A - 18
298 for N2O), shall be used to calculate the CH4 and N2O emissions on a CO2e basis. These emission rates, summed with the monthly CO2 emissions based on stack testing shall be used to establish GHG emissions from the auxiliary boilers on a CO2e basis.
A-V-18 All monitoring devices required to demonstrate continuous compliance shall be
installed, calibrated, and maintained according to manufacturer’s specifications.
Recordkeeping and Reporting Requirements
A-V-19 DCP shall comply with all applicable NOx reporting and recordkeeping requirements for each of the auxiliary boilers as specified in 40 CFR §60.49(b).
A-V-20 Final results of each compliance stack test must be submitted to MDE-ARMA
within 60 days after completion of the test. A-V-21 DCP shall submit a formaldehyde emission analysis following the completion
of initial stack testing for the Frame 7 CTs, auxiliary boilers, and thermal oxidizer which demonstrates that the combined formaldehyde emissions from these tests in addition to the formaldehyde emissions from the other project sources as calculated based on approved emission factors, are less than the limit specified in Condition A-III-4.
A-V-22 Unless otherwise approved by MDE-ARMA, DCP shall submit electronic
quarterly reports from the DHAS of CO2 emissions to the EPA Clean Air Markets Business System as specified in 40 CFR 75.64. [40 CFR 75.64]
A-V-23 The results of the combustion tune-up required to satisfy the GHG BACT
compliance demonstration requirement for the auxiliary boilers shall be provided to MDE-ARMA in the subsequent quarterly report.
A-V-24 DCP shall submit to MDE-ARMA the results of the visible emissions
observations in each quarterly report.
A-V-25 DCP shall maintain annual fuel use records on site for not less than 3 years, and make these records available to MDE-ARMA upon request. [COMAR 26.11.09.08K]
VI. DIESEL-FIRED EMERGENCY ENGINES
Emission Unit Number(s): EG-A 1,550-hp emergency generator FP-A, FP-B, FP-C, FP-D, and FP-E Five 350-hp diesel-fired emergency fire pump engines
Appendix A - 19

Applicable Requirements A-VI-1 The emergency generator and five emergency fire pump engines are each
subject to all applicable federally enforceable State air quality requirements including, but not limited to, the following regulations: a) Visible Emissions During Idle Mode – Except as provided in COMAR
26.11.09.05E(4), prohibits DCP from causing or permitting the discharge of emissions from any internal combustion engine, operating at idle, greater than 10 percent opacity. [COMAR 26.11.09.05E(2)]
b) Visible Emissions During Operating Mode - Except as provided in
COMAR 26.11.09.05E(4), prohibits DCP from causing or permitting the discharge of emissions from any internal combustion engine, operating at other than idle conditions, greater than 40 percent opacity. [COMAR 26.11.09.05E(3)]
c) Exceptions to Visible Emissions Standards for Internal Combustion
Engines:
i. COMAR 26.11.09.05E(2) does not apply for a period of two consecutive minutes after a period of idling of 15 consecutive minutes for the purpose of clearing the exhaust system.
ii. COMAR 26.11.09.05E(3) does not apply to emissions resulting
directly from cold engine start-up and warm-up for the following maximum periods: 1. Engines that are idled continuously when not in service: 30 minutes 2. All other engines: 15 minutes.
iii. COMAR 26.11.09.05E(2) and (3) do not apply while maintenance,
repair, or testing is being performed by qualified mechanics. [COMAR 26.11.09.05E(4)]
d) Control of Sulfur Oxides From Fuel Burning Equipment – Prohibits
DCP from burning, selling, or making available for sale distillate fuel oils with a sulfur content of greater than 0.3 percent. [COMAR 26.11.09.07A(1)(c)]
Appendix A - 20

e) Control of NOx Emissions for Major Stationary Sources – Fuel Burning Equipment with a Rated Heat Input of Less than 100 MMBtu/hr - Requires DCP to comply with the requirements of COMAR 26.11.09.08E, including conducting a combustion analysis for each installation and attending operator training programs sponsored by MDE-ARMA, EPA, or equipment vendors every three years. [COMAR 26.11.09.08E]
f) Control of NOx Emissions for Major Stationary Sources - Requires DCP,
for all fuel burning equipment with a capacity factor (as defined in 40 CFR §72.2) of 15 percent or less, to comply with the following requirements. i. Provide certification of the capacity factor of the equipment to MDE-
ARMA in writing; and
ii. Require each operator of an installation to attend operator training programs at least once every 3 years, on combustion optimization that are sponsored by the MDE, the EPA, or equipment vendors. [COMAR 26.11.09.08G(1)]
A-VI-2 The emergency generator is subject to all applicable State-Only air quality
requirements including the prohibition of operation of the emergency generator except for emergencies, testing, and maintenance purposes, and the operation of the emergency generator for testing or maintenance purposes between 12:01 a.m. and 2:00 p.m. on any day on which the MDE-ARMA forecasts that the air quality will be code orange, code red, or code purple unless the engine fails a test and engine maintenance and a re-test are necessary. [COMAR 26.11.36.03A]
A-VI-3 The emergency generator and fire pump engines shall be fueled with ultra-low
sulfur diesel fuel only with a sulfur content not to exceed 15 parts per million by weight (ppmw).
A-VI-4 The emergency generator and each of the five fire pump engines are subject to 40 CFR §63 Subpart ZZZZ - National Emission Standards of Hazardous Air Pollutants for Stationary Reciprocating Internal Combustion Engines. The emergency generator and the five fire pump engines shall comply with all the applicable requirements of NSPS Subparts IIII under 40 CFR §63.6590(c)(1).
Appendix A - 21

Operational and Emission Limits A-VI-5 The emergency generator and the five fire pump engines are subject to NSPS 40
CFR §60, Subpart IIII, Standards of Performance for Stationary Compression Ignition Internal Combustion Engines. DCP shall meet the monitoring, compliance, testing, notification, reporting, and recordkeeping requirements of 40 CFR §60.4200 to 40 CFR §60.4219 and related applicable provisions of 40 CFR §60.7 and 40 CFR §60.8. The diesel fuel combusted in the emergency generator and the five fire pump engines shall meet the requirements of 40 CFR §60.4207. DCP shall meet the following limits for the emergency generator and the five fire pump engines:
a) Under 40 CFR §60.4202 and 40 CFR §89.112, Table 1, emissions from the
1,550-hp emergency generator shall not exceed 6.4 g/kW-hour (4.8 g/hp-hr ) combined non-methane hydrocarbons (NMHC) and NOx, 3.5 g/kW-hour (2.6 g/hp-hr ) CO, and 0.20 g/kW-hour (0.15 g/hp-hr ) PM filterable.
b) Under 40 CFR §60 Subpart IIII, Table 4, emissions from the five 350-hp fire
pump engines shall not exceed 4.0 g/kW-hr (3.0 g/hp-hour) combined NMHC and NOx and 0.20 g/kW-hr (0.15 g/hp-hour) PM filterable.
c) Under 40 CFR §60.4211(f), DCP shall be restricted to operating the emergency generator and each fire pump engine no more than 100 hours per calendar year each for routine maintenance and testing.
A-VI-6 Best Available Control Technology (BACT) – For the 1,550-hp emergency
diesel generator, BACT shall be the exclusive use of ultra low sulfur diesel (ULSD) fuel and good combustion practices. The emergency generator shall be designed to meet the following emission limits at all times: a) NOx and NMHC emissions shall not exceed 6.4 g/kW-hr (4.8 g/hp-hr);
b) CO emissions shall not exceed 3.5 g/kW-hr (2.6 g/hp-hr);
c) PM filterable emissions shall each not exceed 0.20 g/kW-hr (0.15 g/hp-hr);
d) PM10 filterable and condensable emissions shall not exceed 0.23 g/kW-hr
(0.17 g/hp-hr);
Appendix A - 22

e) PM2.5 filterable and condensable emissions shall not exceed 0.23 g/kW-hr (0.17 g/hp-hr); and
f) GHG emissions shall be calculated and included in the project-wide GHG
12-month rolling limit.
A-VI-7 Best Available Control Technology (BACT) – For each of the five nominal 350-hp fire pump engines, BACT shall be the exclusive use of ULSD fuel and good combustion practices. The fire pump engines shall be designed to meet the following emission limits at all times:
a) NOx and NMHC emissions shall not exceed 4.0 g/kW-hr (3.0 g/hp-hr);
b) CO emissions shall not exceed 6.68e-3 lb/hp-hr (3.0 g/bhp-hr or 4.0 g/kW-
hr);
c) PM filterable emissions shall not exceed 0.20 g/kW-hr (0.15 g/hp-hr);
d) PM10 filterable and condensable emissions shall not exceed 0.23 g/kW-hr
(0.17 g/bhp-hr);
e) PM2.5 filterable and condensable emissions shall not exceed 0.23 g/kW-hr
(0.17 g/bhp-hr); and
f) GHG emissions shall be calculated and included in the project-wide GHG
12-month rolling limit.
A-VI-8 Lowest Achievable Emission Rate (LAER) - The emergency generator and five fire pump engines shall be designed to meet the following limits through the use of ULSD fuel and good combustion practices at all times:
a) Combined NOx and NMHC emissions shall not exceed 6.4 g/kW-hr (4.8
g/hp-hr) for the 1,550-hp emergency generator; and
b) Combined NOx and NMHC emissions shall not exceed 4.00 g/kW-hr (3.0
g/hp-hr) for each of the five fire pump engines.
Appendix A - 23

A-VI-9 The emergency generators and fire water pump engine are subject to the following requirements of 40 CFR Part 60 Subpart IIII:
a) DCP shall purchase an engine certified to the emission standards in
§60.4204(b), or §60.4205(b) or (c), as applicable, for the same model year and maximum (or in the case of fire pumps, NFPA nameplate) engine power. The engine must be installed and configured according to the manufacturer's emission-related specifications [40 CFR 60.4211(c)].
b) DCP must operate and maintain the stationary CI ICE according to the
manufacturer's written instructions or procedures developed by the owner or operator that are approved by the engine manufacturer, over the entire life of the engine. [40 CFR 60.4206]
Compliance Determination
Testing and Monitoring Requirements
A-VI-10 For the emergency generator, DCP shall install and maintain a non-resettable operating hour meter, or equivalent, to indicate the elapsed operating time.
A-VI-11 For each of the fire pump engines, DCP shall install and maintain a non-
resettable operating hour meter, or equivalent, to indicate the elapsed operating time.
A-VI-12 Compliance with the BACT and LAER emission limitations for the emergency
generator and fire water pump engines shall be demonstrated as follows:
a) DCP shall obtain vendor guarantees to demonstrate compliance with the BACT and LAER emission limits.
b) Emissions of NOx, CO, PM, PM10 filterable, and PM2.5 filterable shall be calculated using fuel measurements, NSPS Subpart IIII emissions standards, and hours of operation. Emissions of VOC, PM10 condensable, and PM2.5 condensable shall be calculated using fuel measurements, AP-42 emissions factors, and hours of operation. Monthly emission totals shall be used to calculate 12-month rolling period emissions.
c) CH4 and N2O emissions from the emergency generators and fire water
pumps shall be calculated in accordance with the methodology and emission factors noted in 40 CFR 98, Subpart C. On a monthly basis, fuel consumption, coupled with the appropriate emission factors and global warming potentials (25 for CH4 and 298 for N2O), shall be used to
Appendix A - 24
calculate the CH4 and N2O emissions on a CO2e basis. These emission rates, summed with the monthly CO2 emissions based on stack testing shall be used to establish GHG emissions from the auxiliary boilers on a CO2e basis.
Recordkeeping and Reporting Requirements
A-VI-13 DCP shall comply will all applicable reporting and recordkeeping requirements for the emergency generator and each of the five fire pump engines as specified in 40 CFR §60.4214.
A-VI-14 DCP shall maintain records onsite of the hours of operation of the emergency
generator and each of the five fire pump engines, including date, time, and duration and an explanation of reasons for operation of each engine.
A-VI-15 DCP shall maintain the following records required by COMAR
26.11.09.08G(1):
a) Maintain the results of the combustion analysis at the site for at least 2 years and make these results available to the MDE-ARMA and the EPA upon request; and
b) Maintain a record of training program attendance for each operator at the
site, and make these records available to the MDE-ARMA upon request [COMAR 26.11.09.08G(1)].
A-VI–16 DCP shall provide fuel supplier certifications for each fuel delivery that
documents the sulfur content of the ultra-low sulfur diesel (ULSD) is 15 ppm sulfur by weight or less. Fuel supplier certification shall include the following information:
a) The name of the oil supplier; b) The date of the delivery; c) The amount of fuel delivered; and d) A statement from the fuel supplier that the diesel fuel oil complies with the
specifications of 40 CFR 80.510. A-VI-17 DCP shall maintain annual fuel use records on site for not less than 3 years, and
make these records available to MDE-ARMA upon request. [COMAR 26.11.09.08K(3)]
Appendix A - 25

VII. THERMAL OXIDIZER
Emission Unit Number(s): TO-A 56 MMBtu/hr thermal oxidizer with SCR and oxidation catalyst
Applicable Requirements A-VII-1 The Thermal Oxidizer is subject to all applicable federally enforceable State air
quality requirements including, but not limited to, the following regulations:
a) Visible Emission Limit - Prohibits DCP from causing or permitting the discharge of emissions from any installation or building, other than water in an uncombined form, as specified in Table A-3. [COMAR 26.11.06.02C(1)]
b) Sulfur Compounds From Other Than Fuel Burning Equipment –
Prohibits DCP from causing or permitting the discharge into the atmosphere from installations other than fuel-burning equipment of gases containing more than 500 ppm of sulfur dioxide. [COMAR 26.11.06.05B(1)]
c) Sulfur Compounds From Other Than Fuel Burning Equipment -
Prohibits DCP from causing or permitting the discharge into the atmosphere from installations other than fuel burning equipment of gases containing sulfuric acid, sulfur trioxide, or any combination of them greater than 35 milligrams per cubic meter reported as sulfuric acid. [COMAR 26.11.06.05B(2)]
Operational and Emission Limits A-VII-2 Best Available Control Technology (BACT) – For the thermal oxidizer,
BACT shall be the operation of an oxidation catalyst, operation of a SCR system, and good combustion practices to achieve the emission limitations specified in Table A-3.
A-VII-3 Lowest Achievable Emission Rate (LAER) - Emissions from the thermal
oxidizer shall meet the LAER limits specified in Table A-3 through the use of an SCR, oxidation catalyst, and good combustion practices.
A-VII-4 Best Available Control Technology for Toxics (T-BACT) – Emissions from
the thermal oxidizer shall comply with T-BACT requirements through the use of an SCR, oxidation catalyst, good operating practices, and shall minimize ammonia slip emissions by not injecting ammonia until the SCR reaches an appropriate operating temperature. [COMAR 26.11.15.05]
Appendix A - 26

A-VII-5 DCP shall limit emissions of ammonia resulting from un-reacted ammonia
(ammonia slip) from the SCR to be installed on the thermal oxidizer as specified in Table A-3.
Compliance Determination Testing and Monitoring Requirements
A-VII-6 At least 30 days prior to conducting any compliance stack test, DCP shall
submit a test protocol to MDE-ARMA for review and approval. a) Compliance stack testing shall be conducted in accordance with MDE-
ARMA Technical Memorandum (TM) 91-01, "Test Methods and Equipment Specifications for Stationary Sources" (January 1991), as amended by Supplement 3 (December 1997), 40 CFR §60, or subsequent test protocols approved by MDE-ARMA; and
b) Test ports shall be located in accordance with TM 91-01 (January 1991),
or subsequent or alternative measures approved by MDE-ARMA.
A-VII-7 Initial compliance stack testing of the thermal oxidizer shall be conducted
within 180 days after initial startup to quantify pollutant emissions and demonstrate compliance with the emission limits specified in the CPCN for the following pollutants: NOx, VOC, PM, PM10, PM2.5, ammonia, and CO. Subsequent stack tests shall be conducted annually.
A-VII-8 Compliance testing shall be conducted by the methods specified in Table A-3. A-VII-9 Compliance stack testing for the thermal oxidizer shall be conducted within 180
days after initial startup to demonstrate that the formaldehyde emission rate is in compliance with the emission limit specified in Condition A-III-4. Testing for formaldehyde emissions shall be conducted according to EPA Method 323, or equivalent method approved by MDE.
A-VII-10 Continuous compliance monitoring for the thermal oxidizer shall be
achieved as specified in Table A-3. A-VII-11 DCP shall install a fuel flow meter and continuously monitor the fuel flow
for the thermal oxidizer. The fuel flow shall be recorded monthly.
A-VII-12 Compliance with the BACT and LAER emission limitations shall be demonstrated as follows:
Appendix A - 27

a) DCP shall obtain vendor guarantees to demonstrate compliance with the BACT and LAER emission limits.
b) Emissions of NOx and CO shall be calculated using vendor guaranteed emission rates, stack exhaust oxygen content, stack outlet flowrate, and hours of operation. Emissions of VOC, PM, PM10, and PM2.5 shall be calculated using vendor guaranteed emission rates and hours of operation. Monthly emission totals shall be used to calculate 12-month rolling period emissions.
c) CO2, CH4 and N2O emissions from the combustion of fuel in the thermal
oxidizer shall be calculated in accordance with the methodology and emission factors noted in 40 CFR 98, Subpart C. On a monthly basis, fuel consumption, coupled with the appropriate emission factors and global warming potentials (1 for CO2, 25 for CH4 and 298 for N2O), shall be used to calculate emissions on a CO2e basis. CO2, CH4 and N2O emissions resulting from combusted and un-combusted off-gas (i.e., acid gas) in the thermal oxidizer shall be calculated in accordance with the methodology and emission factors noted in 40 CFR 98, Subpart W. The sum of these emission rates shall establish GHG emissions from the thermal oxidizer on a CO2e basis.
A-VII-13 All monitoring devices required to demonstrate continuous compliance shall be
installed, calibrated, and maintained according to manufacturer’s specifications. Recordkeeping and Reporting
A-VII-14 Final results of each compliance stack test must be submitted to MDE-ARMA within 60 days after completion of the test.
A-VII-15 DCP shall submit a formaldehyde emission analysis following the
completion of the initial stack testing for the Frame 7 CTs, auxiliary boilers, and thermal oxidizer which demonstrates that the combined formaldehyde emissions from these tests in addition to formaldehyde emissions from the other project sources as calculated based on approved emission factors, are less than the limit specified in Condition A-III-4.
VIII. NORTH AND SOUTH FLARES
Emission Unit Number(s): NF North Flare (26 pilots) SF South Flare (12 pilots)
Appendix A - 28

Applicable Requirements
A-VIII-1 The North and South Flares are each subject to all applicable federally
enforceable State air quality requirements including, but not limited to, the following regulations:
a) Visible Emission Limit - Except as provided in
COMAR26.11.06.02A(2), prohibits DCP from causing or permitting the discharge of emissions from any installation or building, other than water in an uncombined form, which is greater than 20 percent opacity. [COMAR 26.11.06.02C(1)]
b) Sulfur Compounds From Other Than Fuel Burning Equipment –
Prohibits DCP from causing or permitting the discharge into the atmosphere from installations other than fuel-burning equipment of gases containing more than 500 ppm of sulfur dioxide. [COMAR 26.11.06.05B(1)]
c) Sulfur Compounds From Other Than Fuel Burning Equipment -
Prohibits DCP from causing or permitting the discharge into the atmosphere from installations other than fuel-burning equipment of gases containing sulfuric acid, sulfur trioxide, or any combination of them greater than 35 milligrams per cubic meter reported as sulfuric acid. [COMAR 26.11.06.05B(2)]
Operational and Emission Limits A-VIII-2 Best Available Control Technology (BACT) – For the North and South
flares, BACT shall be the presence of pilot flame, good operating practices, proper combustion, and designed to achieve the following emission limits:
a) For the North Flare:
i. NOx emissions shall not exceed 69.0 tpy on a 12-month rolling
basis, at all times;
ii. PM emissions shall not exceed 0.7 tpy, on a 12-month rolling basis, at all times;
Appendix A - 29

iii. PM10 and PM2.5 each shall not exceed 2.8 tpy, on a 12-month rolling basis, at all times; and
iv. CO emissions shall not exceed 31.2 tpy, on a 12-month rolling basis, at all times.
b) For the South Flare:
i. NOx emissions shall not exceed 41.0 tpy on a 12-month rolling
basis, at all times;
ii. PM emissions shall not exceed 0.4 tpy, on a 12-month rolling basis, at all times;
iii. PM10 and PM2.5 each shall not exceed 1.7 tpy, on a 12-month rolling basis, at all times; and
iv. CO emissions shall not exceed 18.4 tpy, on a 12-month rolling basis, at all times.
c) GHG emissions shall be calculated and included in the project-wide GHG
12-month rolling limit.
A-VIII-3 Lowest Achievable Emission Rate (LAER) – For the North and South flares LAER shall be the presence of pilot flame, good operating practices, proper combustion and designed to achieve the following emission limits:
a) For the North Flare:
i. NOx emissions shall not exceed 69.0 tpy on a 12-month rolling average basis, at all times; and
ii. VOC emissions shall not exceed 10.8 tpy on a 12-month rolling average basis, at all times.
b) For the South Flare:
Appendix A - 30

i. NOx emissions shall not exceed 41.0 tpy on a 12-month rolling average basis, at all times; and
ii. VOC emissions shall not exceed 4.0 tpy on a 12-month rolling
average basis, at all times.
A-VIII-4 Best Available Control Technology for Toxics (T-BACT) – Emissions
from the North and South Flares shall comply with T-BACT requirements through the presence of pilot flame and the use of good operating practices and maintaining proper combustion efficiency. [COMAR 26.11.15.05]
A-VIII-5 DCP shall be limited to 10 facility restarts during any 12-month rolling
period to meet BACT and LAER requirements. These restarts can be warm or cold facility restarts, but venting to flares during any restart shall be limited to one hour to each flare (North and South) per restart event.
A-VIII-6 DCP shall limit flaring of gas vented from warm ships during the cool-
down process to a maximum of 12 events in any rolling 12-month period. Compliance Determination Testing and Monitoring Requirements
A-VIII-7 Compliance with the BACT and LAER emission limitations shall be
demonstrated as follows:
a) The facility shall continuously monitor for the presence of pilot flame.
b) Emissions of NOx, VOC, CO, PM, PM10, and PM2.5 shall be calculated using fuel measurements, AP-42 emissions factors, and hours of operation. Monthly emission totals shall be used to calculate 12-month rolling period emissions.
c) CO2, CH4 and N2O emissions from the flare pilots shall be calculated in accordance with the methodology and emission factors noted in 40 CFR 98, Subpart C. CO2, CH4 and N2O emissions resulting from flaring combusted and un-combusted gas streams during facility restarts and cool-downs shall be calculated in accordance with the methodology and emission factors noted in 40 CFR 98, Subpart W and the chemical composition of each gas stream. On a monthly basis, fuel consumption, coupled with the appropriate emission factors and global warming
Appendix A - 31

potentials (1 for CO2, 25 for CH4 and 298 for N2O), shall be used to calculate emissions on a CO2e basis. The sum of these emission rates shall establish GHG emissions from the North and South Flare on a CO2e basis.
Recordkeeping and Reporting A-VIII-8 DCP shall continuously monitor for the presence of pilot flame during
operations through the use of a thermocouple or equivalent monitoring method.
IX. COMPONENT LEAKS
Emission Unit Number(s): FUG-A Piping components associated with this project, including
valves, connectors, flanges, pump seals, and pressure relief valves within the facility boundary
Applicable Requirements A-IX-1 The component leaks are subject to all applicable federally enforceable State air
quality requirements including, but not limited to, the control of VOC Component Leaks, except as provided in COMAR 26.11.19.16D, requires DCP to comply with the following:
a) Visually inspect all components on the premises for leaks at least once
each calendar month; b) Tag any leak immediately so that the tag is clearly visible. The tag shall be
made of a material that will withstand any weather or corrosive conditions to which it may be normally exposed. The tag shall bear an identification number, the date the leak was discovered, and the name of the person who discovered the leak. The tag shall remain in place until the leak has been repaired;
c) Take immediate action to repair all observed VOC leaks that can be
repaired within 48 hours; d) Repair all other leaking components not later than 15 days after the leak is
discovered. If a replacement part is needed, the part shall be ordered within 3 days after discovery of the leak, and the leak shall be repaired within 48 hours after receiving the part;
Appendix A - 32

e) Maintain a supply of components or component parts that are recognized by the source to wear or corrode, or that otherwise need to be routinely replaced, such as seals, gaskets, packing, and pipe fittings;
f) Maintain a log that includes the name of the person conducting the
inspection and the date on which leak inspections are made, the findings of the inspection, and a list of leaks by tag identification number. The log shall be made available to the MDE-ARMA upon request. Leak records shall be maintained for a period of not less than 2 years from the date of their occurrence; and
g) Components that cannot be repaired as required because they are
inaccessible, or that cannot be repaired during operation of the source, shall be identified in the log and included within the source's maintenance schedule for repair during the next source shutdown. [COMAR 26.11.19.16]
Operational and Emission Limits
A-IX-2 Best Available Control Technology (BACT) – GHG BACT shall be the implementation of an LDAR Monitoring Plan and Program following the procedures outlined in the TCEQ 28LAER Texas Commission of Environmental Quality’s (TCEQ’s) Control Efficiencies for TCEQ Leak Detection and Repair Programs, as amended. GHG emissions shall be calculated and included in the project-wide GHG 12-month rolling limit.
A-IX-3 Lowest Achievable Emission Rate (LAER) – VOC emissions from component
leaks shall not exceed 2.53 tpy from all components associated with the project on a 12-month rolling basis through the implementation of the VOC LDAR Monitoring Plan and Program.
A-IX-4 Best Available Control Technology for Toxics (T-BACT) – Emissions from
component leaks shall comply with T-BACT requirements through the implementation of a VOC LDAR Monitoring Plan and Program. [COMAR 26.11.15.05]
A-IX-5Emissions from component leaks shall be calculated based on the results of gas
analyzer monitoring and through the use of Table 2-4 of EPA’s Protocol for Equipment Leak Emission Estimates and the chemical composition of each material and shall consider the control efficiencies based on 28LAER LDAR program.
Appendix A - 33

X. VOLATILE ORGANIC COMPOUND VESSELS (STORAGE TANKS)
Emission Unit Number(s): TANK-P1 Propane make-up tank, 102,500 gallons TANK-P2 Propane make-up tank, 102,500 gallons TANK-P3 Propane make-up tank, 102,500 gallons TANK-P4 Propane make-up tank, 102,500 gallons TANK-E1 Ethane make-up tank, 34,000 gallons TANK-E2 Ethane make-up tank, 34,000 gallons TANK-C1 Condensate storage tank, 35,000 gallons TANK-C2 Condensate storage tank, 35,000 gallons
Applicable Requirements
A-X-1 The volatile organic compound storage tanks are each subject to all applicable
federally enforceable State air quality requirements including, but not limited to, the following regulations:
a) Control of Gasoline and Volatile Organic Compound Storage and
Handling, General Standards – Large Storage Tanks – Prohibits DCP from placing or storing VOC having a true vapor pressure (TVP) between 1.5 psia (10.3 kilonewtons/square meter) and 11 psia (75.6 kilonewtons/square meter) in any closed tank with a capacity of 40,000 gallons or greater unless the tank is equipped with a properly installed, operating, and well maintained vapor control system capable of collecting the vapors from the tank and disposing of these vapors to prevent their emissions to the atmosphere. [COMAR 26.11.13.03A(1)(b)(iii)]
b) Control of Gasoline and Volatile Organic Compound Storage and
Handling, General Standards – For loading of trucks to haul condensate from the two 67,000-gallon condensate storage tanks offsite, prohibits DCP from causing or permitting gasoline or VOC having a TVP of 1.5 psia (10.3 kilonewtons/square meter) or greater to be loaded into any tank truck, railroad tank car, or other contrivance unless the:
i. Loading connections on the vapor lines are equipped with fittings
that have no leaks and that automatically and immediately close upon disconnection to prevent release of gasoline or VOC from these fittings; and
Appendix A - 34
ii. Equipment is maintained and operated in a manner to prevent
avoidable liquid leaks during loading or unloading operations. [COMAR 26.11.13.04(D)]
A-X-2 The volatile organic compound storage vessels are each subject to NSPS 40 CFR
§60 Subpart Kb, Standards of Performance for Volatile Organic Liquid Storage Vessels (Including Petroleum Liquid Storage Vessels) for which Construction, Reconstruction, or Modification Commenced After July 23, 1984. DCP shall comply with the requirements of Subpart Kb through the use of a closed-loop system such that there are no emissions to the atmosphere from the four Propane Make-Up Tanks, two Ethane Make-Up Tanks, and two Condensate Storage Tanks.
XI. NOTIFICATION REQUIREMENTS A-XI-1 All air quality notifications and reports required by this CPCN shall be submitted
to: Administrator, Compliance Program Air and Radiation Management Administration 1800 Washington Boulevard Baltimore, Maryland 21230
A-XI-2 All notifications and reports required by 40 CFR §60 Subpart KKKK, Subpart IIII, Subpart Db, Subpart Kb, and 40 CFR §63 Subpart ZZZZ shall be submitted to:
Director, Air Protection Division U.S. EPA – Region 3 1650 Arch Street Philadelphia, Pennsylvania 19103-2029
A-XI-3 Information copies of the reports regarding air quality requirements as described
in the conditions of Case 9318 (A-I-2, A-I-5, A-I-6, A-III-2b, A-III-7, A-III-8, A-III-9, A-III-10, A-IV-7, A-IV-18, A-V-7, A-V-20, A-VII-6, A-VII-14) shall be submitted to the Power Plant Research Program at:
Director Power Plant Assessment Division Department of Natural Resources Tawes State Office Building, B-3 580 Taylor Avenue Annapolis, Maryland 21401
Appendix A - 35
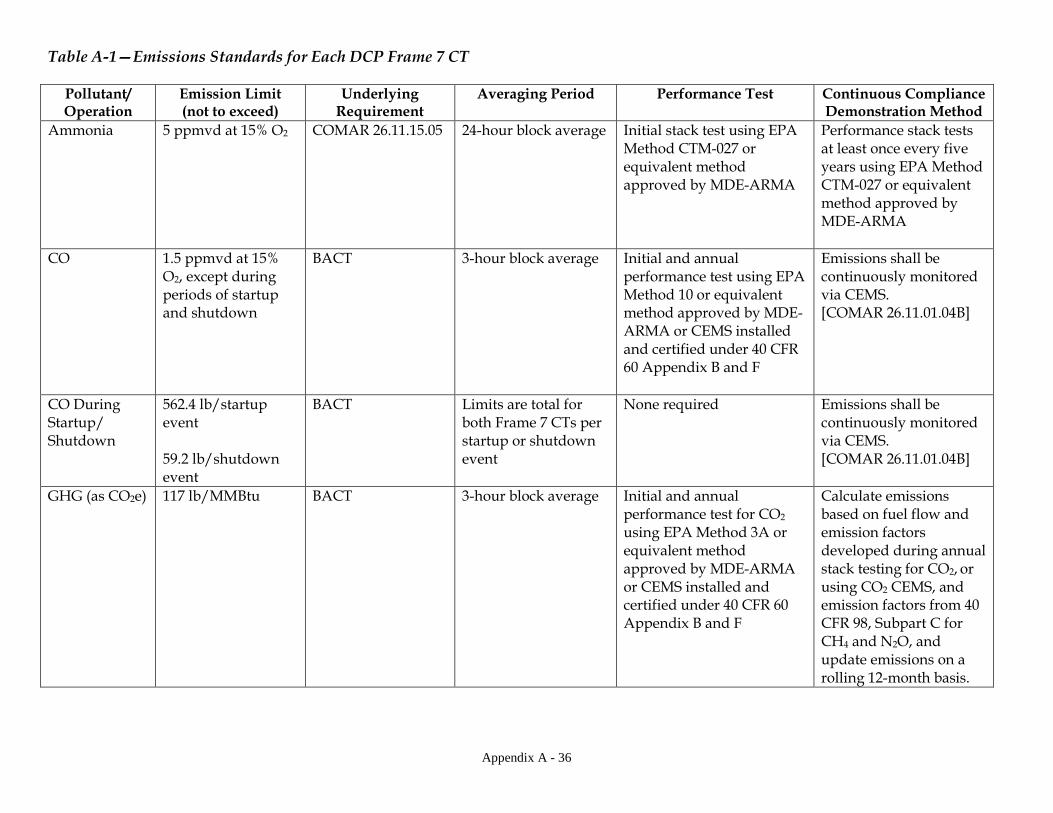
Table A-1—Emissions Standards for Each DCP Frame 7 CT
Pollutant/ Operation
Emission Limit (not to exceed)
Underlying Requirement
Averaging Period
Performance Test
Continuous Compliance Demonstration Method
Ammonia 5 ppmvd at 15% O2 COMAR 26.11.15.05 24-hour block average Initial stack test using EPA Method CTM-027 or equivalent method approved by MDE-ARMA
Performance stack tests at least once every five years using EPA Method CTM-027 or equivalent method approved by MDE-ARMA
CO 1.5 ppmvd at 15% O2, except during periods of startup and shutdown
BACT
3-hour block average Initial and annual performance test using EPA Method 10 or equivalent method approved by MDE-ARMA or CEMS installed and certified under 40 CFR 60 Appendix B and F
Emissions shall be continuously monitored via CEMS. [COMAR 26.11.01.04B]
CO During Startup/ Shutdown
562.4 lb/startup event 59.2 lb/shutdown event
BACT Limits are total for both Frame 7 CTs per startup or shutdown event
None required Emissions shall be continuously monitored via CEMS. [COMAR 26.11.01.04B]
GHG (as CO2e) 117 lb/MMBtu
BACT 3-hour block average
Initial and annual performance test for CO2 using EPA Method 3A or equivalent method approved by MDE-ARMA or CEMS installed and certified under 40 CFR 60 Appendix B and F
Calculate emissions based on fuel flow and emission factors developed during annual stack testing for CO2, or using CO2 CEMS, and emission factors from 40 CFR 98, Subpart C for CH4 and N2O, and update emissions on a rolling 12-month basis.
Appendix A - 36
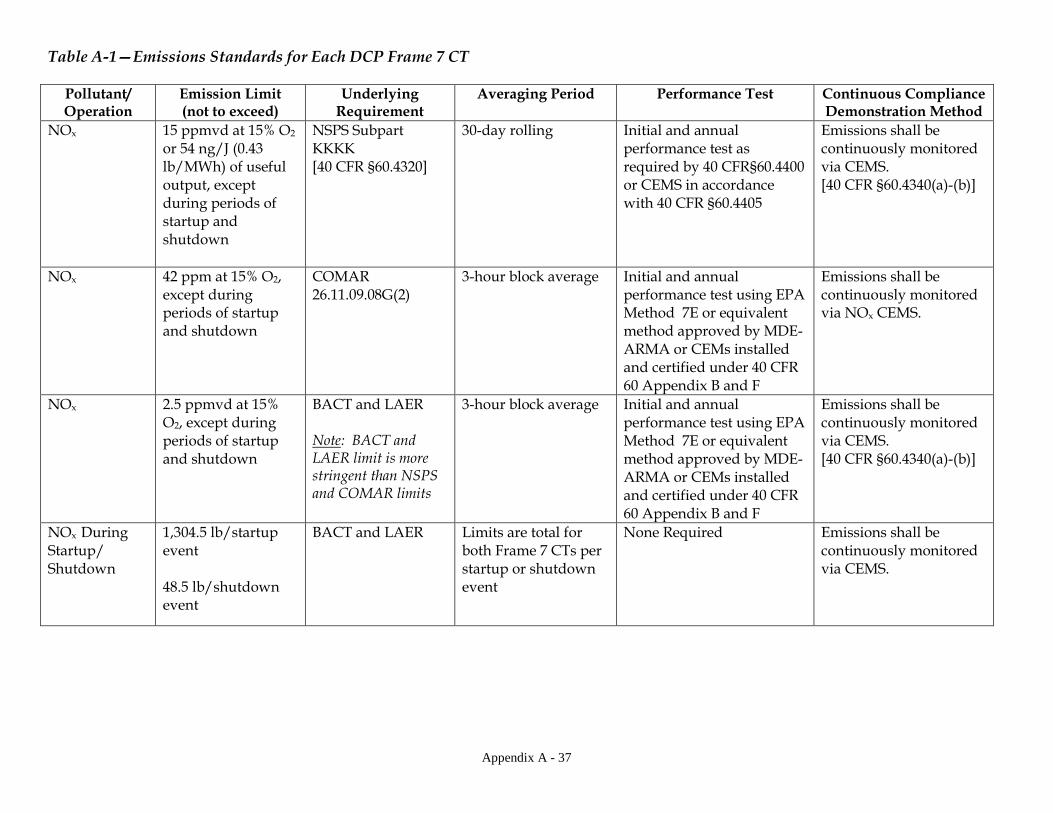
Table A-1—Emissions Standards for Each DCP Frame 7 CT
Pollutant/ Operation
Emission Limit (not to exceed)
Underlying Requirement
Averaging Period
Performance Test
Continuous Compliance Demonstration Method
NOx
15 ppmvd at 15% O2
or 54 ng/J (0.43 lb/MWh) of useful output, except during periods of startup and shutdown
NSPS Subpart KKKK [40 CFR §60.4320]
30-day rolling Initial and annual performance test as required by 40 CFR§60.4400 or CEMS in accordance with 40 CFR §60.4405
Emissions shall be continuously monitored via CEMS. [40 CFR §60.4340(a)-(b)]
NOx 42 ppm at 15% O2, except during periods of startup and shutdown
COMAR 26.11.09.08G(2)
3-hour block average Initial and annual performance test using EPA Method 7E or equivalent method approved by MDE-ARMA or CEMs installed and certified under 40 CFR 60 Appendix B and F
Emissions shall be continuously monitored via NOx CEMS.
NOx 2.5 ppmvd at 15% O2, except during periods of startup and shutdown
BACT and LAER Note: BACT and LAER limit is more stringent than NSPS and COMAR limits
3-hour block average Initial and annual performance test using EPA Method 7E or equivalent method approved by MDE-ARMA or CEMs installed and certified under 40 CFR 60 Appendix B and F
Emissions shall be continuously monitored via CEMS. [40 CFR §60.4340(a)-(b)]
NOx During Startup/ Shutdown
1,304.5 lb/startup event 48.5 lb/shutdown event
BACT and LAER Limits are total for both Frame 7 CTs per startup or shutdown event
None Required Emissions shall be continuously monitored via CEMS.
Appendix A - 37

Table A-1—Emissions Standards for Each DCP Frame 7 CT
Pollutant/ Operation
Emission Limit (not to exceed)
Underlying Requirement
Averaging Period
Performance Test
Continuous Compliance Demonstration Method
PM Filterable 0.0033 lb/MMBtu
(filterable only)
BACT
Average of three test runs
Initial and annual performance test using EPA Method 5 or equivalent method approved by MDE-ARMA
Calculate emissions based on fuel flow and emission factors developed during annual stack testing and update emissions on a rolling 12-month basis
PM10 filterable and condensable
0.007 lb/MMBtu (filterable and condensable), except during periods of startup and shutdown
BACT Average of three test runs
Initial and annual performance test using EPA Methods 201A/202 or equivalent method approved by MDE-ARMA
Calculate emissions based on fuel flow and emission factors developed during annual stack testing and update emissions on a rolling 12-month basis.
PM10 filterable and condensable During Startup/ Shutdown
300.8 lbs/startup event 5.6 lbs/shutdown event
BACT Limits are total for both Frame 7 CTs per startup or shutdown event
None Required Designed to meet emission limits.
PM2.5 filterable and condensable
0.007 lb/MMBtu (filterable and condensable), except during periods of startup and shutdown
BACT Average of three test runs
Initial and annual performance test using EPA Methods 201A/202 or equivalent method approved by MDE-ARMA
Calculate emissions based on fuel flow and emission factors developed during annual stack testing and update emissions on a rolling 12-month basis.
Appendix A - 38
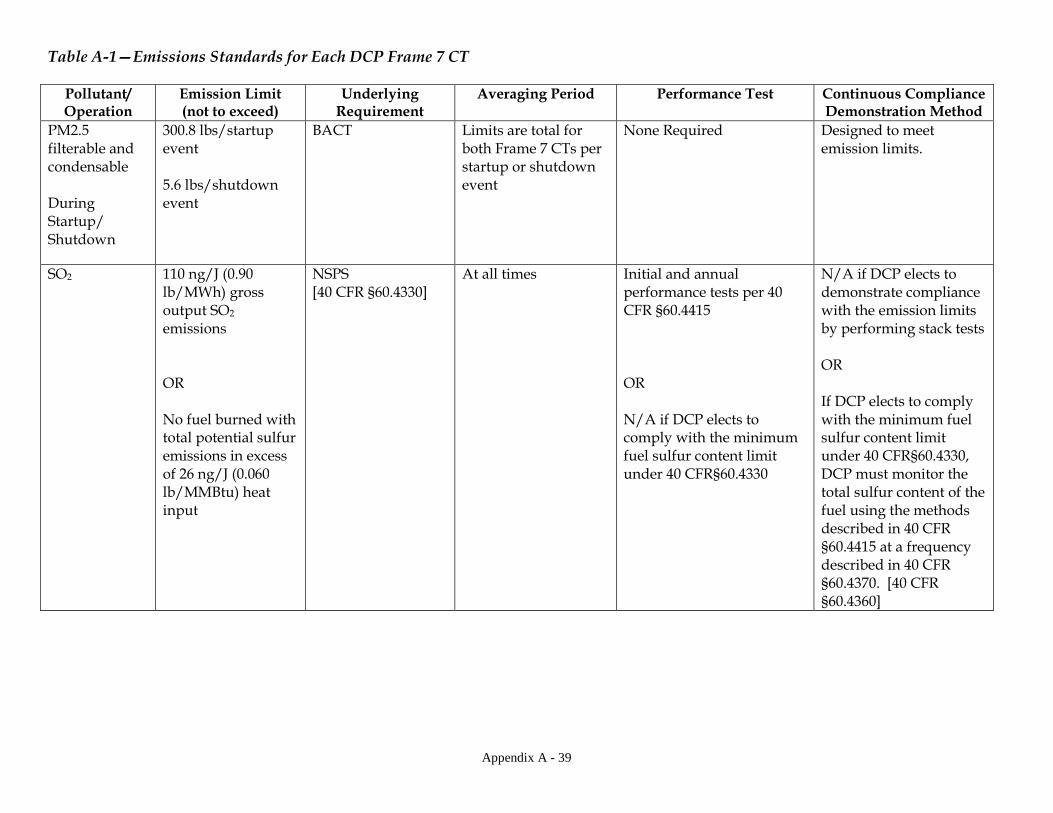
Table A-1—Emissions Standards for Each DCP Frame 7 CT
Pollutant/ Operation
Emission Limit (not to exceed)
Underlying Requirement
Averaging Period
Performance Test
Continuous Compliance Demonstration Method
PM2.5 filterable and condensable During Startup/ Shutdown
300.8 lbs/startup event 5.6 lbs/shutdown event
BACT Limits are total for both Frame 7 CTs per startup or shutdown event
None Required Designed to meet emission limits.
SO2 110 ng/J (0.90 lb/MWh) gross output SO2 emissions OR No fuel burned with total potential sulfur emissions in excess of 26 ng/J (0.060 lb/MMBtu) heat input
NSPS [40 CFR §60.4330]
At all times Initial and annual performance tests per 40 CFR §60.4415 OR N/A if DCP elects to comply with the minimum fuel sulfur content limit under 40 CFR§60.4330
N/A if DCP elects to demonstrate compliance with the emission limits by performing stack tests OR If DCP elects to comply with the minimum fuel sulfur content limit under 40 CFR§60.4330, DCP must monitor the total sulfur content of the fuel using the methods described in 40 CFR §60.4415 at a frequency described in 40 CFR §60.4370. [40 CFR §60.4360]
Appendix A - 39

Table A-1—Emissions Standards for Each DCP Frame 7 CT
Pollutant/ Operation
Emission Limit (not to exceed)
Underlying Requirement
Averaging Period
Performance Test
Continuous Compliance Demonstration Method
Visible Emissions
20% Opacity COMAR 26.11.09.05A(1)
At all times, except as provided in COMAR 26.11.09.05A(3)
Initial Method 9 for 1 hour within 180 days of initial startup [COMAR 26.11.09.05A(1&5)]
Visible observation in accordance with EPA Reference Method 22 at least once each calendar quarter to verify that there are no visible emissions during operation. If visible emissions are observed then inspect combustion control system, perform necessary adjustments and/or repairs within 48 hours, and document in writing the results of inspection, adjustments and or repairs. After 48 hours, if the required adjustments and/or repairs have not eliminated the visible emissions, perform Method 9 observations once daily for at least one hour until corrective actions have reduced the visible emissions to less than 20 percent opacity. [COMAR 26.11.02.02(H)]
Appendix A - 40
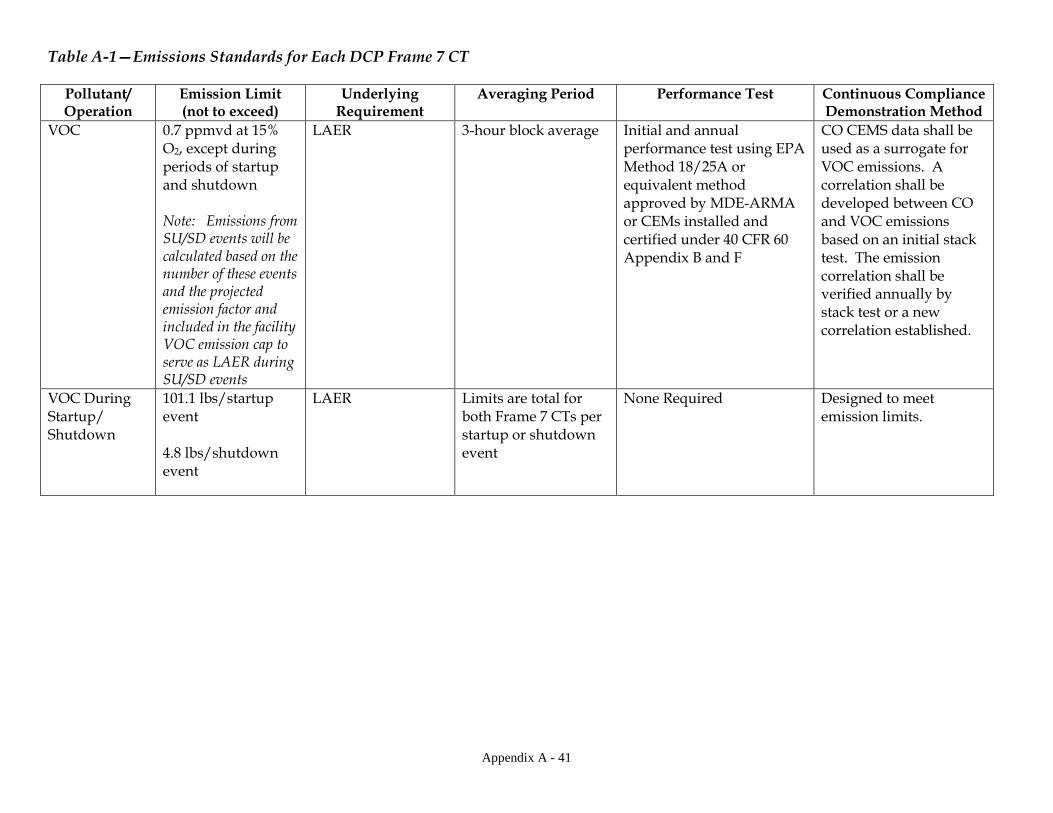
Table A-1—Emissions Standards for Each DCP Frame 7 CT
Pollutant/ Operation
Emission Limit (not to exceed)
Underlying Requirement
Averaging Period
Performance Test
Continuous Compliance Demonstration Method
VOC 0.7 ppmvd at 15% O2, except during periods of startup and shutdown Note: Emissions from SU/SD events will be calculated based on the number of these events and the projected emission factor and included in the facility VOC emission cap to serve as LAER during SU/SD events
LAER 3-hour block average Initial and annual performance test using EPA Method 18/25A or equivalent method approved by MDE-ARMA or CEMs installed and certified under 40 CFR 60 Appendix B and F
CO CEMS data shall be used as a surrogate for VOC emissions. A correlation shall be developed between CO and VOC emissions based on an initial stack test. The emission correlation shall be verified annually by stack test or a new correlation established.
VOC During Startup/ Shutdown
101.1 lbs/startup event 4.8 lbs/shutdown event
LAER Limits are total for both Frame 7 CTs per startup or shutdown event
None Required Designed to meet emission limits.
Appendix A - 41

Table A-2—Emissions Standards for Each DCP Auxiliary Boiler
Pollutant/ Operation
Emission Limit (not to exceed)
Underlying Requirement
Averaging Period
Performance Test
Continuous Compliance Demonstration Method
Ammonia 5 ppmvd at 15% O2 COMAR 26.11.02.02H
24-hour block average Initial stack test using EPA Method CTM-027 or equivalent method approved by MDE-ARMA
Performance stack tests at least once every five years using EPA Method CTM-027 or equivalent method approved by MDE-ARMA
CO 0.0088 lb/MMBtu, except during periods of startup and shutdown
BACT
3-hour block average Initial and annual performance test using EPA Method 10 or equivalent method approved by MDE-ARMA or CEMs installed and certified under 40 CFR 60 Appendix B and F
Calculate emissions based on fuel flow and emission factors developed during annual stack testing and update emissions on a rolling 12-month basis. Continuously monitor and record inlet and outlet catalyst bed temperature.
CO During Startup and Shutdown
2,618.5 lb/startup event 35.9 lb/shutdown event
BACT Limits per startup or shutdown event
None Required Designed to meet emission limit.
Appendix A - 42

Table A-2—Emissions Standards for Each DCP Auxiliary Boiler
Pollutant/ Operation
Emission Limit (not to exceed)
Underlying Requirement
Averaging Period
Performance Test
Continuous Compliance Demonstration Method
GHG (as CO2e) 117 lb/MMBtu
BACT 3-hour block average
Initial and annual performance test for CO2 using EPA Method 3A or equivalent method approved by MDE-ARMA or CEMs installed and certified under 40 CFR 60 Appendix B and F
Calculate emissions based on fuel flow and emission factors developed during annual stack testing for CO2, or using CO2 CEMS, and emission factors from 40 CFR 98, Subpart C for CH4 and N2O, and update emissions on a rolling 12-month basis.
NOx 86 ng/J (0.20 lb/MMBtu)
NSPS Subpart Db [40 CFR§60.44b(a)] Note: NSPS limit is as or more stringent than COMAR 26.11.09.08B(1)(c) and COMAR 26.11.09.08G(1).
30-day rolling, at all times
Initial and annual performance test per 40 CFR §60.46b(c)
NOx and CO2 or O2 emissions shall be continuously monitored via CEMS. [40 CFR §60.48b(b)]
NOx 0.0099 lb/MMBtu, except during periods of startup and shutdown
BACT and LAER Note: BACT and LAER limit is more stringent than COMAR and NSPS limits.
3-hour block average Initial and annual performance test using EPA Method 7E or equivalent method approved by MDE-ARMA or CEMs installed and certified under 40 CFR 60 Appendix B and F
NOx and CO2 or O2 emissions shall be continuously monitored via CEMS. [40 CFR §60.48b(b)]
NOx During
Startup/ Shutdown
2,946.2 lb/startup event 38.9 lb/shutdown event
BACT and LAER Limits per startup or shutdown event
None Required NOx and CO2 or O2 emissions shall be continuously monitored via CEMS. [40 CFR §60.48b(b)]
Appendix A - 43

Table A-2—Emissions Standards for Each DCP Auxiliary Boiler
Pollutant/ Operation
Emission Limit (not to exceed)
Underlying Requirement
Averaging Period
Performance Test
Continuous Compliance Demonstration Method
PM Filterable 0.005 lb/MMBtu
(filterable only)
BACT
Average of three test runs
Initial and annual performance test using EPA Method 5 or equivalent method approved by MDE-ARMA
Calculate emissions based on fuel flow and emission factors developed during annual stack testing and update emissions on a rolling 12-month basis.
PM10 filterable and condensable
0.014 lb/MMBtu (filterable and condensable), except during periods of startup and shutdown
BACT Average of three test runs
Initial and annual performance test using EPA Methods 201A/202 or equivalent method approved by MDE-ARMA
Calculate emissions based on fuel flow and emission factors developed during annual stack testing and update emissions on a rolling 12-month basis.
PM10 filterable and condensable During
Startup/ Shutdown
296.8 lb/startup event 4.9 lb/shutdown event
BACT Limits per startup or shutdown event
None Required Designed to meet emission limit.
Appendix A - 44

Table A-2—Emissions Standards for Each DCP Auxiliary Boiler
Pollutant/ Operation
Emission Limit (not to exceed)
Underlying Requirement
Averaging Period
Performance Test
Continuous Compliance Demonstration Method
PM2.5 filterable and condensable
0.014 lb/MMBtu (filterable and condensable), except during periods of startup and shutdown Note: Emissions from SU/SD events will be calculated based on the number of these events and the projected emission factor and included in the facility PM2.5 emission cap to serve as BACT during SU/SD events
BACT Average of three test runs
Initial and annual performance test using EPA Methods 201A/202 or equivalent method approved by MDE-ARMA
Calculate emissions based on fuel flow and emission factors developed during annual stack testing and update emissions on a rolling 12-month basis.
PM2.5 filterable and condensable During
Startup/ Shutdown
296.8 lb/startup event 4.9 lb/shutdown event
BACT Limits per startup or shutdown event
None Required Designed to meet emission limit.
Appendix A - 45

Table A-2—Emissions Standards for Each DCP Auxiliary Boiler
Pollutant/ Operation
Emission Limit (not to exceed)
Underlying Requirement
Averaging Period
Performance Test
Continuous Compliance Demonstration Method
Visible Emissions
20% Opacity COMAR 26.11.09.05A(1)
At all times, except as provided in COMAR 26.11.09.05A(3)
Initial Method 9 for 1 hour within 180 days of initial startup [COMAR 26.11.09.05A(1&5)]
Visible observation in accordance with EPA Reference Method 22 at least once each calendar quarter to verify that there are no visible emissions during operation. If visible emissions are observed then inspect combustion control system, perform necessary adjustments and/or repairs within 48 hours, and document in writing the results of inspection, adjustments and or repairs. After 48 hours, if the required adjustments and/or repairs have not eliminated the visible emissions, perform Method 9 observations once daily for at least one hour until corrective actions have reduced the visible emissions to less than 20 percent opacity. [COMAR 26.11.02.02(H)]
Appendix A - 46

Table A-2—Emissions Standards for Each DCP Auxiliary Boiler
Pollutant/ Operation
Emission Limit (not to exceed)
Underlying Requirement
Averaging Period
Performance Test
Continuous Compliance Demonstration Method
VOC 0.001 lb/MMBtu, except during periods of startup and shutdown Note: Emissions from SU/SD events will be calculated based on the number of these events and the projected emission factor and included in the facility VOC emission cap to serve as LAER during SU/SD events
LAER 3-hour block average Initial and annual performance test using EPA Method 18/25A or equivalent method approved by MDE-ARMA or CEMs installed and certified under 40 CFR 60 Appendix B and F
Calculate emissions based on fuel flow and emission factors developed during annual stack testing and update emissions on a rolling 12-month basis. Continuously monitor and record inlet and outlet catalyst bed temperature.
VOC During
Startup/ Shutdown
130.6 lb/startup event 1.8 lb/shutdown event
LAER Limits per startup or shutdown event
None Required Designed to meet emission limit.
Appendix A - 47

Table A-3—Emissions Standards for DCP Thermal Oxidizer
Pollutant/ Operation
Emission Limit (not to exceed)
Underlying Requirement
Averaging Period
Performance Test
Continuous Compliance Demonstration Method
Ammonia 5 ppmvd at 15% O2 COMAR 26.11.15.05 24-hour block average Initial stack test using EPA Method CTM-027 or equivalent method approved by MDE-ARMA
Performance stack tests at least once every five years using EPA Method CTM-027 or equivalent method approved by MDE-ARMA
CO 1.5 ppmvd at 15% O2
BACT
3-hour block average Initial and annual performance test using EPA Method 10, or equivalent method approved by MDE-ARMA
Calculate emissions based on fuel flow and emission factors developed during annual stack testing and update emissions on a rolling 12-month basis. Continuously monitor and record inlet and outlet catalyst bed temperature. Designed to meet emission limit at all times.
Appendix A - 48

Table A-3—Emissions Standards for DCP Thermal Oxidizer
Pollutant/ Operation
Emission Limit (not to exceed)
Underlying Requirement
Averaging Period
Performance Test
Continuous Compliance Demonstration Method
NOx 2.5 ppmvd at 15% O2
BACT and LAER
3-hour block average Initial and annual performance test using EPA Method 7E or equivalent method approved by MDE-ARMA
Calculate emissions based on fuel flow and emission factors developed during annual stack testing and update emissions on a rolling 12-month basis. Continuously monitor ammonia feed rate, gas stream flow rate, and catalyst bed inlet gas temperature. Designed to meet emission limit at all times.
PM Filterable 0.013 lb/MMBtu
(filterable only)
BACT
Average of three test runs
Initial and annual performance test using EPA Method 5 or equivalent method approved by MDE-ARMA
Calculate emissions based on fuel flow and emission factors developed during annual stack testing and update emissions on a rolling 12-month basis.
Appendix A - 49

Table A-3—Emissions Standards for DCP Thermal Oxidizer
Pollutant/ Operation
Emission Limit (not to exceed)
Underlying Requirement
Averaging Period
Performance Test
Continuous Compliance Demonstration Method
PM10 filterable and condensable
0.016 lb/MMBtu (filterable and condensable)
BACT Average of three test runs
Initial and annual performance test using EPA Methods 201A/202 or equivalent method approved by MDE-ARMA
Calculate emissions based on fuel flow and emission factors developed during annual stack testing and update emissions on a rolling 12-month basis. Designed to meet emission limit at all times.
PM2.5 filterable and condensable
0.016 lb/MMBtu (filterable and condensable)
BACT Average of three test runs
Initial and annual performance test using EPA Methods 201A/202 or equivalent method approved by MDE-ARMA
Calculate emissions based on fuel flow and emission factors developed during annual stack testing and update emissions on a rolling 12-month basis. Designed to meet emission limit at all times.
Appendix A - 50
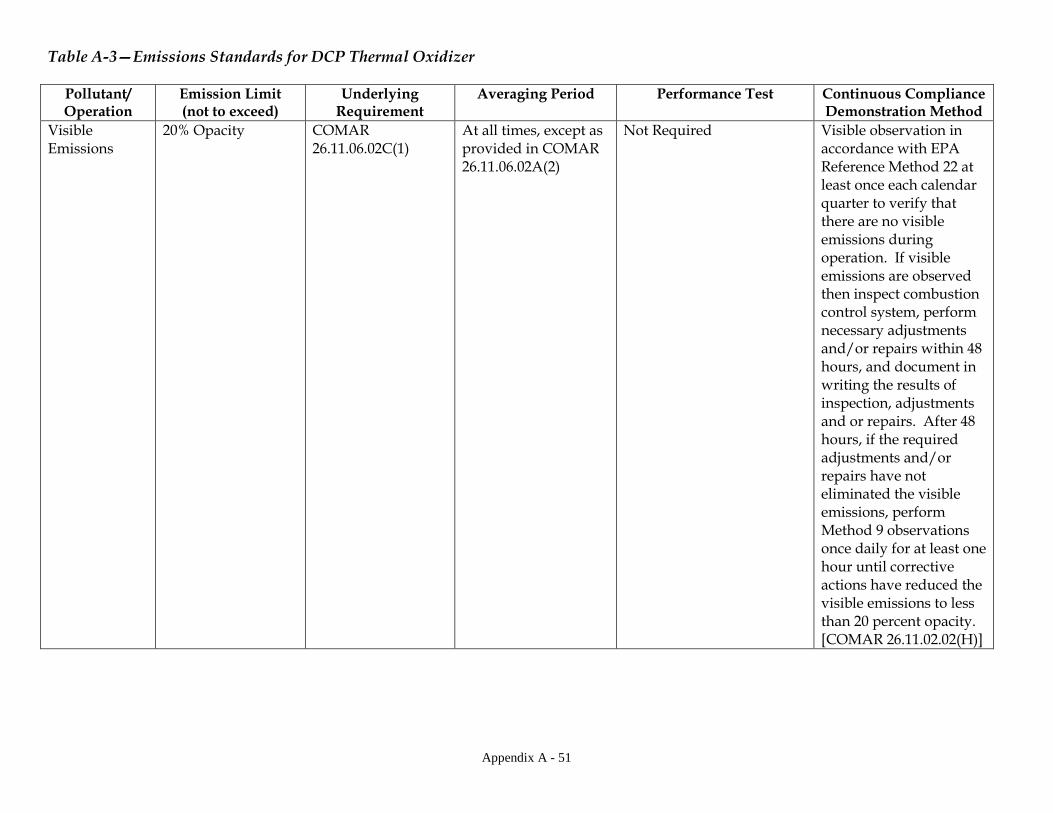
Table A-3—Emissions Standards for DCP Thermal Oxidizer
Pollutant/ Operation
Emission Limit (not to exceed)
Underlying Requirement
Averaging Period
Performance Test
Continuous Compliance Demonstration Method
Visible Emissions
20% Opacity COMAR 26.11.06.02C(1)
At all times, except as provided in COMAR 26.11.06.02A(2)
Not Required Visible observation in accordance with EPA Reference Method 22 at least once each calendar quarter to verify that there are no visible emissions during operation. If visible emissions are observed then inspect combustion control system, perform necessary adjustments and/or repairs within 48 hours, and document in writing the results of inspection, adjustments and or repairs. After 48 hours, if the required adjustments and/or repairs have not eliminated the visible emissions, perform Method 9 observations once daily for at least one hour until corrective actions have reduced the visible emissions to less than 20 percent opacity. [COMAR 26.11.02.02(H)]
Appendix A - 51

Table A-3—Emissions Standards for DCP Thermal Oxidizer
Pollutant/ Operation
Emission Limit (not to exceed)
Underlying Requirement
Averaging Period
Performance Test
Continuous Compliance Demonstration Method
VOC 0.03 lb/hr LAER 3-hour block average Initial and annual performance test using EPA Method 18/25A or equivalent method approved by MDE-ARMA
Calculate emissions based on fuel flow and emission factors developed during annual stack testing and update emissions on a rolling 12-month basis. Continuously monitor and record inlet and outlet catalyst bed temperature. Designed to meet emission limit at all times.
Appendix A - 52

TERRESTRIAL AND AQUATIC ECOLOGY
B-1. Construction and operation of the DCP facility, including its appurtenant features and two Offsite Areas A and B, shall be undertaken in accordance with this CPCN and shall comply with all applicable local, State, and Federal laws and regulations, including but not limited to the following:
a. Nontidal Wetlands - COMAR 26.23 applies to activities conducted in nontidal wetlands.
b. Waterway Construction – COMAR 26.17.04 applies to activities in State waterways.
c. Water Quality and Water Pollution Control - COMAR 26.08.01 through COMAR 26.08.04 applies to discharges to surface water and maintenance of surface water quality.
d. Erosion and Sediment Control - COMAR 26.17.01 applies to the preparation, submittal, review, approval, and enforcement of erosion and sediment control plans.
e. Forest Conservation - Maryland's Forest Conservation regulations, COMAR 08.19.01 through 08.19.06, apply to the development of local forest conservation programs and the preparation of forest conservation plans.
f. Wildlife Conservation – Maryland Natural Resource Article §10-2A-01, the Nongame and Endangered Species Conservation Act.
B-2. DCP shall comply with Best Management Practices for Nontidal Wetlands of Special State Concern and Expanded Buffers, COMAR 26.23.06.03. DCP shall implement these practices at the edges of 100-foot buffers along all streams and nontidal wetlands at Offsite Area A. These practices and techniques will include but not be limited to use of adequately sized temporary sediment traps, bioretention, super silt fencing, and other specialized techniques specifically needed for limiting the quantity of sediment entering existing forested wetlands and streams during the construction process.
B-3. All portions of the main plant and Offsite Areas disturbed during construction shall be stabilized as soon as practicable after the cessation of construction activities within that portion of the construction footprint, followed by seed application, in accordance with the best management practices presented in the MDE document 2011 Maryland Standards and Specifications for Soil Erosion and Sediment Control, and as approved by Calvert County. In wetlands and wetland buffers, seed application shall consist of the following species: annual ryegrass (Lolium multiflorum), millet (Setaria italica), barley (Hordeum spp.), oats (Uniola spp.), and/or rye (Secale cereale). Other non-persistent vegetation may be acceptable, but must be approved by MDE Water Management Administration. Kentucky 31 fescue and other non-native invasive species shall never be used in wetlands or buffers.
B-4. DCP shall advise the PSC and PPRP that copies of contract specifications for tree
Appendix A - 53

clearing, construction, and rehabilitation of the construction footprints are available sixty (60) days prior to the beginning of construction. During any site clearing, DCP and its contractors shall leave tree roots and stumps in place, except where such roots and stumps interfere with structure locations, access roads, or other components of the power or linear facilities. Cleared trees may be cut and windrowed along the edges of the construction footprint for wildlife habitat where acceptable. Brush may be shredded and distributed along the edges of the cleared construction footprint as a ground cover to stabilize the soil surface.
B-5. DCP shall reduce tree clearing or trimming to the maximum extent practicable. At least sixty (60) days prior to clearing or construction within these areas DCP will submit to the Maryland Department of Natural Resources Department of Forestry (DNR Forestry) and PPRP for approval all Calvert County-approved Forest Conservation Plans. Grasses will be planted along streams and other open areas where acceptable. If the areas along streams are wetlands or wetland buffers, only grasses listed in Condition B-3 or others approved by MDE Water Management Administration shall be used. If areas along streams are uplands, the following grass species may be used: blue joint grass (Calamagrostis canadensis), switchgrass (Panicum virgatum), little bluestem (Schizachyrium scoparium), or Indian grass (Sorghastrum nutans). Other non-persistent vegetation may be acceptable, but must be approved by DNR or MDE Water Management Administration. Kentucky 31 fescue and silky bush clover (Lespedeza cuneata) shall never be used.
B-6. DCP shall work with DNR and Calvert County to determine areas within Offsite Area A where trees can be planted after construction of the proposed Project is complete, and will replant those areas as requested by Calvert County. In addition, DCP shall provide mitigation in compensation for the loss of mature forest and other natural resources at Offsite Area A. This mitigation shall consist of a combination of property purchase and preservation in perpetuity of existing forest tracts; purchase of transferable development rights (TDRs); and new tree planting in Calvert County and/or surrounding areas. All tree planting areas shall be maintained on at least an annual basis for a minimum of five years, and must be preserved in perpetuity. At least sixty (60) days prior to clearing or construction within Offsite Area A, DCP will submit for approval a draft mitigation/preservation plan to the Maryland Department of Natural Resources and Calvert County. At a minimum, this mitigation/preservation plan shall include the following:
a. Preservation of an additional 13.5 acres of the Forest Retention Area on Offsite Area A above the County’s required retention threshold.
b. Preservation in perpetuity of Offsite Area E, which is already owned by Dominion, in an undeveloped condition.
c. Purchase of 88 TDRs from one or more landowners in Calvert County, to be applied to the Offsite Area E property.
d. Arranging for the 88.8 forested acres on Offsite Area E to be designated as Forest Retention Area to be reviewed and approved by Calvert County.
e. Purchase of Preservation Site 1 (Barrett site), and preservation in perpetuity of 26.2 acres, resulting in 13.1 acres of mitigation credit.
f. Preservation in perpetuity of 9.64 acres on Preservation Site 2 (DOH site, already owned by Dominion), resulting in 4.82 acres of mitigation credit.
Appendix A - 54

g. Tree planting at sites within Calvert County or, if necessary, outside the county, totaling 15.0 acres.
B-7. Prior to construction of any part of the DCP facilities, DCP shall submit comprehensive protection plans for rare, threatened and endangered species at Offsite Area A, for approval by DNR Wildlife and Heritage Service and PPRP. These will include plans for protection and future expansion of tobaccoweed (Elephantopus tomentosus) populations at Offsite Area A. The plans must be prepared by qualified personnel, and will contain exact current mapping of the known site populations of this species, with reference to the proposed Offsite A facilities, depicted at an appropriate scale. The plans will also contain, at a minimum, a description of effective measures for avoiding impacts to this species, as well as all other appropriate mitigative measures.
B-8. DCP shall prepare and implement an oyster mitigation plan that includes restoring hard bottom and planting oyster shell/spat in the vicinity of Offsite Area B. DCP shall obtain DNR approval of the plan prior to the start of construction. The plan must include the following elements:
a. The area of mitigation shall encompass a minimum of 4 acres, and shall entail placing 2 to 4 inches of a shell/cultch base with a top layer of spat on shell. This represents 2:1 mitigation for the anticipated maximum impact area of 2 acres.
b. DCP shall provide funding to DNR to support the following surveys of the natural oyster bar near Offsite Area B: once prior to the start of construction, at least once during construction, and at the conclusion of the construction period.
c. Based on an evaluation of the survey results, DNR will determine the extent of impacts to the natural oyster bar as a result of DCP’s construction support activities. If the extent of impacts exceeds the anticipated maximum of 2 acres, DCP will conduct additional mitigation at a 2:1 ratio, with a minimum of 1 additional acre of mitigation to be implemented.
d. If there is any incidence of tug or barge grounding or other direct impacts observed during the construction period, DCP shall notify DNR regarding the date and time of such incident, the likely cause of the incident, and the steps that DCP will take to prevent recurrence. Barge deliveries to Offsite Area B shall not continue until DCP receives approval from DNR.
B-9. DCP shall prepare and implement a plan to utilize as artificial reef components those materials that may be suitable for such use at the end of the construction period. Suitable materials may include some portion or all of the barge pier and concrete foundations removed from the terminal site. DCP shall submit a draft plan prior to the start of construction, and shall obtain DNR approval of the plan prior to the start of operation. The plan must cover the following elements: a. Maryland’s Artificial Reef Management Plan must be followed at all times
(http://www.dnr.maryland.gov/fisheries/reefs/MarylandReefPlanFINALWOAPPENDIXB.pdf).
Appendix A - 55

b. DCP shall contact DNR twelve months (one year) prior to pier dismantling so that DNR can provide to DCP updated material requirements and confirmation of the deposition site. In addition, DNR also requests a three-month notice prior to reef material deposition.
c. Pier material must be dismantled in such a way to eliminate exposed rebar or metal that would pose an underwater hazard.
d. Pier material must be deposited on a DNR approved site. e. The proposed reef material will be sized appropriately for an oyster and fish reef. f. Placement of reef material will minimize fine material deposition (to less than two
inches) including sediment attached to the pier material. g. DCP will wet the material prior to onsite deposition. h. The DNR Artificial Reef Coordinator or a designated DNR staff person must be on site
to inspect the material before overboard deployment. DNR may reject the material if it does not meet specifications.
i. DCP must place DNR buoys at the four corners of the proposed reef site to ensure proper deposition and to warn boaters of potential hazardous conditions. Once the deposition of reef material is complete, the site must be inspected to ensure stability of the material on the bottom and that no hazardous conditions exist resulting from deposition such as sharp edges, exposed rebar, or structurally unsound stacking. After underwater inspection and DNR review ensuring that the material is safely deposited on the bottom, the buoys may be removed, but long-term buoy placement at this reef site is at the discretion of the United States Coast Guard (USCG) regional commander.
j. Reef material must have a minimum of 15 feet of top clearance at mean-low-water to ensure navigational access.
k. Two months prior to the first deployment of reef material, DCP must contact the USCG so that the USCG can prepare a “notice to mariners” (NTM) and Marine Information Broadcast (MIB), and provide two weeks notice for any additional buoy deployments.
l. DCP must provide a schedule for material deposition on the reef to DNR to ensure that staff will have sufficient time to observe and confirm coordinates and location of material deployment. Where practicable, DNR staff shall be allowed to ride on the tug and/or barge. DNR staff must be provided 3 months notice prior to first deployment date, to ensure that DNR staff have sufficient time to confer with USCG.
m. DNR will not take ownership of this material until it is deposited on the bottom and it has been inspected and the inspection report provided to DNR for review and concurrence.
B-10. To minimize potential impacts to oysters near Offsite Area B, DCP shall not conduct any in-river construction work, including pier and piling installation and removal, during the periods 16 December through 14 March and 1 June through 30 September.
B-11. The CPCN is not an authorization to discharge wastewater to waters of the State. If required by MDE, DCP shall obtain a discharge permit from MDE under the National Pollutant Discharge Elimination System (NPDES) for the DCP facility.
B-12. DCP shall ensure that the dock, barges, tugs, and all other facilities do not delay public
Appendix A - 56

ingress/egress from the public boating ramp adjacent to Offsite Area B.
B-13. DCP shall obtain applicable State and federal dredge-and-fill and waterway construction permits. DCP shall not commence construction of any aspect of the project that is under the jurisdiction of Section 404 of the Clean Water Act covered by the Joint Federal/State Application for the Alteration of Any Floodplain, Waterway, Tidal or Nontidal Wetland in Maryland, until such application has been approved by the U.S. Army Corps of Engineers and MDE.
B-14. DCP shall not commence construction on any aspect of the project that is under the jurisdiction of the Chesapeake Bay Critical Area Commission (CAC) until it has received approval from the CAC. All site preparation and construction activities shall be implemented in accordance with the CAC-approved plans.
B-15. No in-stream work at Offsite Area A can be conducted from 1 March through 15 June in order to protect spawning resident and anadromous fish.
STORMWATER MANAGEMENT/EROSION AND SEDIMENT CONTROL
C-1. At a minimum, sediment control during construction of all aspects of this project shall include the following Best Management Practices (BMPs): construction of earth dikes and retaining walls in appropriate locations, sediment traps, use of super silt fences, stabilizing disturbed areas as quickly as possible, and converting silt traps to permanent features as soon as practicable. In addition, on Offsite Area A, a double row of super silt fence (spaced 3’ to 4’ apart) shall be used at all locations where super silt fence is shown on the overall sediment and erosion control plan (File No. B-47-4N). The first row of super silt fence must be routinely cleared as needed and there is no need to place hay bales in between the two rows.
C-2. Topsoil from those areas to be graded on Offsite Area A, that are located between the populations of known rare, threatened, and endangered plants shall be separately stockpiled and later re-spread in the same areas for final grading of the project. These stockpiled topsoils shall be placed in upland areas, and shall be protected during construction by using double rows of super silt fence until they are used and re-spread.
C-3. At a minimum, storm water management plans for all aspects of this project shall include:
• groundwater infiltration and peak flow attenuation;
• grading to encourage overland flow;
• slope minimization to decrease flow velocities and reduce erosion;
• conveyance of runoff via a closed storm water sewer system discharging into an engineered stormwater management facility consistent with the latest MDE guidelines when overland flow is not desirable;
• utilize a storm water drain collection system;
• minimize slopes to decrease flows;
Appendix A - 57

• utilize vegetation filters, physical structures, including outfall pipes, to control release rates from an engineered stormwater management facility consistent with MDE’s latest guidelines; and
• direct controlled flow to existing culverts under road to natural drainage area.
WATER SUPPLY
D-1. This CPCN authorizes Dominion Cove Point to appropriate and use groundwaters of the State from the Lower Patapsco aquifer. The appropriation will be tracked under MDE WMA permit number CA1973G114. The groundwater appropriation will be subject to the following conditions:
a. Allocation—The groundwater withdrawal granted by this appropriation is limited to a daily average of 233,000 gallons on a yearly basis and a daily average of 275,000 gallons for the month of maximum use;
b. Use—The water is to be used to support the operation of the Dominion Cove Point (DCP) LNG liquefaction and vaporization facility and construction-related activities for the liquefaction facility. Uses for the water for operations include, but are limited to, potable and sanitary uses, steam turbine boiler makeup, fire suppression, LNG vaporizer, tank/line hydrostatic testing, and general maintenance. Uses for the water for construction of the liquefaction facility include, but are limited to, dust suppression, hydrostatic testing of pipes and tanks, steam flushing, potable water, and concrete curing and grout preparation;
c. Source—The water shall be withdrawn from one existing production well completed in the Lower Patapsco Aquifer; and
d. Location—The point of withdrawal shall be located at the site of the DCP facility, 2100 Cove Point Road, Lusby, Calvert County, Maryland.
D-2. Well pump or water intake of well pump placement—DCP shall not place a submersible well pump or water intake part of the well pump lower than the top of the confined aquifer from which the water is being withdrawn.
D-3. Change of Operations—DCP shall report any anticipated change in appropriation, which may result in a new or different use, quantity, source, or place of use of water, to MDE WMA by submission of a new application.
D-4. Permit Review—DCP shall be queried every three years (triennial review) regarding water withdrawal under the terms and conditions of this appropriation. Failure to return the triennial review query will result in suspension or revocation of this appropriation.
D-5. Appropriation Duration and Renewal—The appropriation will expire in twelve (12) years from the effective date of this CPCN. In order to renew the permit, DCP shall file a renewal application with MDE WMA no later than 45 days prior to the expiration.
Appendix A - 58

D-6. Additional Permit Conditions—MDE WMA may at any time (including triennial review or when a change application is submitted) revise any condition of this appropriation or add additional conditions concerning the character, amount, means, and manner of the appropriation or use, which may be necessary to properly protect, control, and manage the water resources of the State. Condition revisions and additions will be accompanied by issuance of a revised appropriation.
D-7. Right of Entry—DCP shall allow authorized representatives of MDE WMA and the PSC access to the facility to conduct inspections and evaluations necessary to assure compliance with the conditions of this appropriation. DCP shall provide such assistance as may be necessary to effectively and safely conduct such inspections and evaluations.
D-8. Appropriation Suspension or Revocation—MDE WMA may suspend or revoke this appropriation upon violation of the conditions of this appropriation, or upon violation of any regulation promulgated pursuant to Title 5 of the Environment Article, Annotated Code of Maryland (2007 replacement volume) as amended.
D-9. Drought Period Emergency Restrictions—If MDE WMA determines that a drought period or emergency exists, DCP may be required under MDE WMA’s direction to stop or reduce groundwater withdrawal. Any cessation or reduction of water withdrawal must continue for the duration of the drought period or emergency, or until MDE WMA directs Dominion Cove Point that water withdrawal under standard appropriation conditions may be resumed.
D-10. Non-Transferable—This appropriation is only transferable to a new owner if the new owner acquires prior authorization to continue this appropriation by filing a new application with MDE WMA. Authorization will be accomplished by issuance of a new appropriation permit by MDE WMA.
D-11. DCP shall conduct the following monitoring activities in support of the groundwater appropriation:
a. Flow Measurement—Measure all groundwater withdrawn using a flow meter;
b. Water Level Measurements—Install pumping equipment in the production well so that water levels can be measured during withdrawal and non-withdrawal periods without dismantling any equipment. Any opening for tape measurements of water levels shall have a minimum inside diameter of 0.5 inch and be sealed by a removable cap or plug. DCP shall provide a tap for taking raw groundwater samples before water enters a treatment facility, pressure tank, or storage tank.
c. Withdrawal Reports—Submit withdrawal records to MDE WMA semi-annually (for July-December, no later than January 31; for January-June, no later than July 31). These records shall show the total quantity of groundwater withdrawn each month under this appropriation.
Appendix A - 59

CULTURAL RESOURCES
E-1. DCP shall establish an archeological protection zone for site 18CV505 in Offsite Area A by erecting temporary protective fencing around it during construction and avoiding any ground disturbance within the perimeter of this area, except with the written approval of the Maryland Historical Trust (MHT).
E-2. DCP shall avoid identified offshore underwater targets in Offsite Area B that could represent submerged cultural resources by the following minimum recommended distances.
Target Avoidance Distance from Center Point (meters)
01 20
03 30
07 20
09 35
10 30
E-3. In the event that relics of unforeseen archeological sites are revealed and identified during construction within the LNG Terminal site, Offsite Area A, or Offsite Area B, DCP shall consult with the MHT and shall develop and implement a plan for avoidance and protection, data recovery, or destruction without recovery of such relics or sites, subject to MHT’s written approval.
VISUAL QUALITY
F-1. DCP shall develop a lighting distribution plan for operation that will mitigate intrusive night lighting and avoid undue glare onto adjoining properties. The plan shall conform to Article 6-6 of the Calvert County Zoning Ordinance. DCP shall coordinate development of the plan with PPRP and the Calvert County Department of Planning and Zoning. DCP shall submit the plan to PPRP and the PSC for review and approval prior to operation of the facility.
EMERGENCY PREPAREDNESS AND SECURITY
G-1. At least 60 days prior to commencing site preparation for construction, DCP shall file with the
PSC the State Fire Marshall’s final report regarding this Project, including any measures to
Appendix A - 60

address any additional conditions or requirements identified by the State Fire Marshall. Also at
least 60 days prior to commencing site preparation for construction, DCP shall file a revised
Emergency Response Plan (ERP) that reflects and responds to the findings of the EA and any
related FERC Order, and addresses the need for additional off-site safety protocols and
resources. Without supplanting revisions responsive to FERC, the updated ERP shall address:
1. Site safety/ EMS coverage during construction and operations, including timely
response options and emergency vehicle access throughout the site in case of an accident, injury
or other emergency;
2. Where additional hazards are identified in the ERP process or existing emergency
response capabilities are determined to be inadequate, DCP shall plan for implementing
necessary upgrades, including assisting emergency response organizations through contributions,
requisite training and general support to ensure the public’s safety. Prior to commencing
construction of the generating station, DCP shall file with the Commission an executed cost-
sharing plan that has the concurrence of each affected State and local agency identified in the
ERP;
3. DCP shall work with Federal, State and local officials to determine in the updated
ERP whether an off-site emergency plan is needed as part of emergency management, including
whether an off-site evacuation plan is needed, and if so present the plan to develop an off-site
emergency plan that includes consideration of residents who would have to rely on Cove Point
Road to evacuate the area in the event of an emergency at the LNG facility. If DCP and the
federal, state and local officials with responsibilities for emergency planning and response in the
event of an emergency at the LNG facility conclude that an off-site emergency plan or an off-site
Appendix A - 61

evacuation plan is not needed, the bases for these conclusions shall be set forth in conjunction
with and at the time of issuance of the revised ERP.
TRAFFIC
H-1. DCP shall obtain any required utility and lane closure permits from the District Office of the Maryland State Highway Administration and access permits for work on the State roadways from SHA’s Access Management Division and permits from the Calvert County Department of Public Works, as appropriate.
H-2. DCP shall submit to the SHA a Transportation Management Plan (TMP) that details work zone impact management strategies at intersections that will be reconstructed for the Project, and how they will be implemented. The TMP will, at minimum, include a Traffic Control Plan, Transportation Operations strategies and Public Information and Outreach strategies. The TMP must be approved by the SHA prior to the issuance of an access permit for construction within the right-of-way.
H-3. Prior to dispatching oversize/overweight vehicles to the staging or construction site for the Project, DCP shall comply with all weight and size restrictions and/or bonding requirements on all State and Calvert County roadways and obtain appropriate oversize/overweight approvals as necessary.
H-4. DCP shall submit to the SHA a mobile Maintenance of Traffic (MOT) plan for the transport of oversize/overweight loads over State highways. The plan shall address utility adjustments, utility line clearances, bridging over culverts, loads on bridges, adjustment to traffic signals, road closures, median cross-overs and emergency vehicle access. The MOT plan must be approved by the SHA prior to dispatching oversize/overweight vehicles to staging or construction sites.
H-5. DCP shall submit a travel routing plan to the Calvert County Department of Public Works prior to dispatching oversize/overweight vehicles on County roads to the staging or construction site.
H-6. DCP shall dispatch large equipment from Offsite Area B at night to mitigate disruptions to traffic unless otherwise specified by SHA.
H-7. During construction, DCP shall monitor traffic congestion at the intersections of MD 2/MD 4 both north and south of the MD 2/MD 4 intersection with MD 497 in the morning and evening peak periods to determine if construction worker traffic is congesting these intersections. If intersections are determined to operate at an unacceptable Level-of-Service (LOS “E” or “F”) or are expected to operate at an unacceptable LOS when construction worker traffic peaks, DCP shall, in consultation
Appendix A - 62

with and with the approval of the SHA, develop a plan to mitigate the Project generated traffic impacts through shift scheduling, roadway improvements or other means. Mitigation shall be in place prior to the peak construction year.
NOISE
I-1. DCP shall monitor noise levels after the plant is operational. The scope of work for the noise monitoring shall be provided to PPRP and the PSC for review and approval, and to Calvert County, within one year after the issuance of this CPCN. Measurements shall be taken while the plant is operating at full load, to represent maximum noise emissions. At a minimum, DCP shall monitor noise levels at the two noise sensitive areas identified in the CPCN Application. DCP shall submit noise monitoring results to PPRP and the PSC within six months after the facility first begins commercial operation.
I-2. DCP shall operate all equipment at the Cove Point terminal site in compliance with applicable noise regulations. If the post-construction noise monitoring indicates that the facility is not operating in compliance with those standards, DCP shall work with PPRP, the PSC and Calvert County to incorporate appropriate noise mitigation strategies into facility design or operation to ensure regulatory compliance.
ADDITIONAL CONDITIONS
J-1. Prior to beginning operation of the facility, DCP shall submit to PPRP for review and approval a landscaping plan that, at minimum, addresses the visibility of the proposed sound barrier from Cove Point Road in the vicinity of the site entrance. The plan shall include representative photo simulations of views of the proposed facility from Cove Point Road at the site entrance both before and after landscaping is in place, and during seasons of peak and minimum foliage.
J-2. (a) To confirm the findings of the Reviewing State Agencies that no statistically significant indication of subsidence is expected to occur as a result of the Project, DCP shall establish a trust or similar instrument in the amount of $190,000 for the Maryland Geological Survey (MGS) to conduct subsidence monitoring in and near Calvert County. The trust or similar instrument, which is a one-time contribution from DCP, must be established prior to the start of construction. The terms and conditions of the trust or similar instrument shall be mutually agreeable to both parties.
(b) DCP shall allow authorized representatives of MGS reasonable access to the facility to conduct monitoring for the Calvert County subsidence study. DCP shall provide reasonable assistance as may be necessary to effectively and safely conduct such monitoring.
J-3. During the first twenty years of operation of the facility, DCP shall make an annual contribution in the amount of $400,000 to the Maryland Energy Assistance Program, or other Maryland low income energy assistance program to be specified by the Maryland Public Service Commission by January 1, 2016.
Appendix A - 63

J-4. Within 90 days of the commencement of construction of the generating station, DCP shall make the first of five annual installments of $8 million (for a total of $40 million) into the Maryland Strategic Energy Investment Fund (SEIF) to be used by the Maryland Energy Administration solely for the purpose of investing in the promotion, development, and implementation of one or more of the following categories: (1) renewable and clean energy resources; (2) greenhouse gas reduction or mitigation programs; (3) cost-effective energy efficiency and conservation programs, projects, or activities; or (4) demand response programs that are designed to promote changes in electric usage by customers.
Appendix A - 64

APPENDIX B
Pollutant or Emittor PM BACT
PM, PM10, PM2.5 Good combustion practices.
PM, PM10, PM2.5 for ground flares Good operating practices; combustion effi-ciency; use of a pilot flame.
PM, PM10, PM2.5 for paved roads Expected to be negligible; take reasonable precautions.
Frame 7 Combustion Turbines Exclusive use of facility process fuel gas or pipeline quality natural gas, oxidation catalyst system, efficient combustion.
Auxiliary Boilers Same as for Frame 7 CTs.
Emergency Engines Good combustion practices; use of ultra low sulfur diesel ("ULSD").
Thermal Oxidizer Use of oxidation catalyst and good combustion practices.
Ground flares Use of a pilot flame.
Appendix B - 1

Pollutant or Emittor CO BACT
Frame 7 CTs Exclusive use of facility process fuel gas or pipeline quality natural gas, use of oxidation catalyst system, and efficient combustion.
Auxiliary Boilers Same as for Frame 7 CTs.
Emergency Engines Good combustion practices, use of ultra-low sulfur diesel.
Thermal Oxidizer Oxidation catalyst and good combustion practices
Ground Flares Pilot flame, proper combustion designed to achieve an emissions limit of 31.2 tpy for north flare, 18.4 tpy for south flare.
Pollutant or Emittor Green House Gasses BACT
Frame 7 CTs Use of GE 7 EA turbines with dry low NOx combustors firing pipeline natural gas or process fuel gas.
Auxiliary Boilers Use of pipeline quality natural gas and process fuel gas from LNG production; good combus-tion practices, efficient steam boiler design.
Emergency Engines Good combustion practices.
Thermal Oxidizer Good combustion practices.
Ground Flares Use of pilot flame; good operating practices.
Piping Components Use of LDAR monitoring program.
Appendix B - 2

Pollutant or Emittor LAER
NOX LAER for Frame 7 CTs An emission limit of 2.5 ppmvd at 15% O2 on a three-hour block average.
NOX LAER for Auxiliary Boilers An emission limit of 0.009916/MMBtu based on a three-hour block average.
NOX LAER for Emergency Engines 6.4 g/kW-hr based on a combination of NOx and non-methane hydrocarbon emissions.
NOX LAER for Thermal Oxidizer 2.5 ppmvd at 15% O2 based on a three-hour averaging period.
NOX LAER for the Ground Flares 69.0 tons per year for the North flare and 41.0 tons per year for the South flare.
VOC LAER for the Frame 7 CTs 0.7 ppmvd at 15% 02 on a three-hour average basis.
VOC LAER for Auxiliary Boilers Emission limit of 0.001 lb/MMBtu during normal operations, based on a three-hour block averaging period.
VOC LAER for the Emergency Engines 6.4 g/kW-hr (4.8 g/hp-hr), based on a combina-tion of NOx and NMHC emissions, when NMHC equals NOx.
VOC LAER for the Thermal Oxidizer 0.03 lb/hr through use of an oxidation catalyst.
VOC LAER for the Ground Flares 10.8 tpy for the north flare and 4.0 tpy for the south flare to be achieved by presence of a pilot flame, good operating practices, proper combus-tion efficiency.
VOC LAER for the piping components Use of an LDAR Monitoring Program following procedures outlined in the TCEQ 28 LAER LDR program.
Appendix B - 3
Appendix B Potential Emissions and DCP Existing HAP Emission Inventory

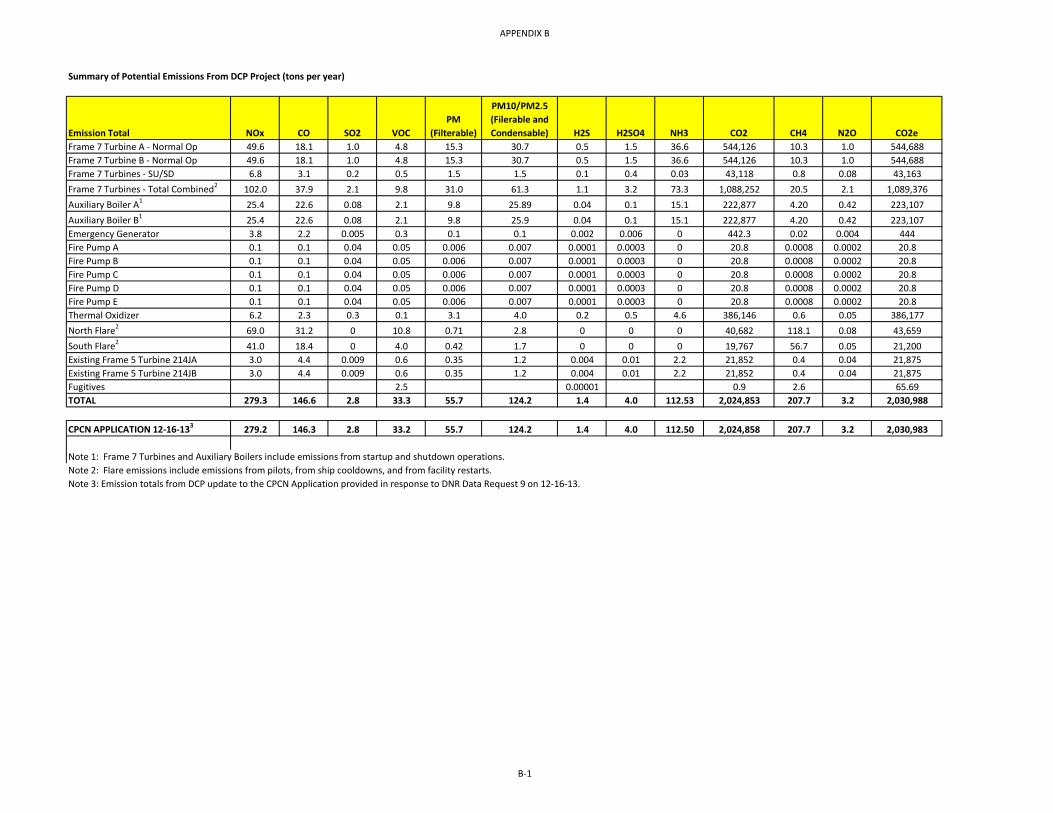
APPENDIX B
B-1
Summary of Potential Emissions From DCP Project (tons per year)
Emission Total NOx CO SO2 VOCPM
(Filterable)
PM10/PM2.5 (Filerable and Condensable) H2S H2SO4 NH3 CO2 CH4 N2O CO2e
Frame 7 Turbine A - Normal Op 49.6 18.1 1.0 4.8 15.3 30.7 0.5 1.5 36.6 544,126 10.3 1.0 544,688Frame 7 Turbine B - Normal Op 49.6 18.1 1.0 4.8 15.3 30.7 0.5 1.5 36.6 544,126 10.3 1.0 544,688Frame 7 Turbines - SU/SD 6.8 3.1 0.2 0.5 1.5 1.5 0.1 0.4 0.03 43,118 0.8 0.08 43,163Frame 7 Turbines - Total Combined2 102.0 37.9 2.1 9.8 31.0 61.3 1.1 3.2 73.3 1,088,252 20.5 2.1 1,089,376Auxiliary Boiler A1 25.4 22.6 0.08 2.1 9.8 25.89 0.04 0.1 15.1 222,877 4.20 0.42 223,107Auxiliary Boiler B1 25.4 22.6 0.08 2.1 9.8 25.9 0.04 0.1 15.1 222,877 4.20 0.42 223,107Emergency Generator 3.8 2.2 0.005 0.3 0.1 0.1 0.002 0.006 0 442.3 0.02 0.004 444Fire Pump A 0.1 0.1 0.04 0.05 0.006 0.007 0.0001 0.0003 0 20.8 0.0008 0.0002 20.8Fire Pump B 0.1 0.1 0.04 0.05 0.006 0.007 0.0001 0.0003 0 20.8 0.0008 0.0002 20.8Fire Pump C 0.1 0.1 0.04 0.05 0.006 0.007 0.0001 0.0003 0 20.8 0.0008 0.0002 20.8Fire Pump D 0.1 0.1 0.04 0.05 0.006 0.007 0.0001 0.0003 0 20.8 0.0008 0.0002 20.8Fire Pump E 0.1 0.1 0.04 0.05 0.006 0.007 0.0001 0.0003 0 20.8 0.0008 0.0002 20.8Thermal Oxidizer 6.2 2.3 0.3 0.1 3.1 4.0 0.2 0.5 4.6 386,146 0.6 0.05 386,177North Flare2 69.0 31.2 0 10.8 0.71 2.8 0 0 0 40,682 118.1 0.08 43,659South Flare2 41.0 18.4 0 4.0 0.42 1.7 0 0 0 19,767 56.7 0.05 21,200Existing Frame 5 Turbine 214JA 3.0 4.4 0.009 0.6 0.35 1.2 0.004 0.01 2.2 21,852 0.4 0.04 21,875Existing Frame 5 Turbine 214JB 3.0 4.4 0.009 0.6 0.35 1.2 0.004 0.01 2.2 21,852 0.4 0.04 21,875Fugitives 2.5 0.00001 0.9 2.6 65.69TOTAL 279.3 146.6 2.8 33.3 55.7 124.2 1.4 4.0 112.53 2,024,853 207.7 3.2 2,030,988
CPCN APPLICATION 12-16-133 279.2 146.3 2.8 33.2 55.7 124.2 1.4 4.0 112.50 2,024,858 207.7 3.2 2,030,983
Note 1: Frame 7 Turbines and Auxiliary Boilers include emissions from startup and shutdown operations.Note 2: Flare emissions include emissions from pilots, from ship cooldowns, and from facility restarts.Note 3: Emission totals from DCP update to the CPCN Application provided in response to DNR Data Request 9 on 12-16-13.

APPENDIX B
B-2
HAPs5.35.3
0.3910.60.090.09
0.0040.00050.00050.00050.00050.0005
0.020.250.030.350.35
0.00411.8
13.9
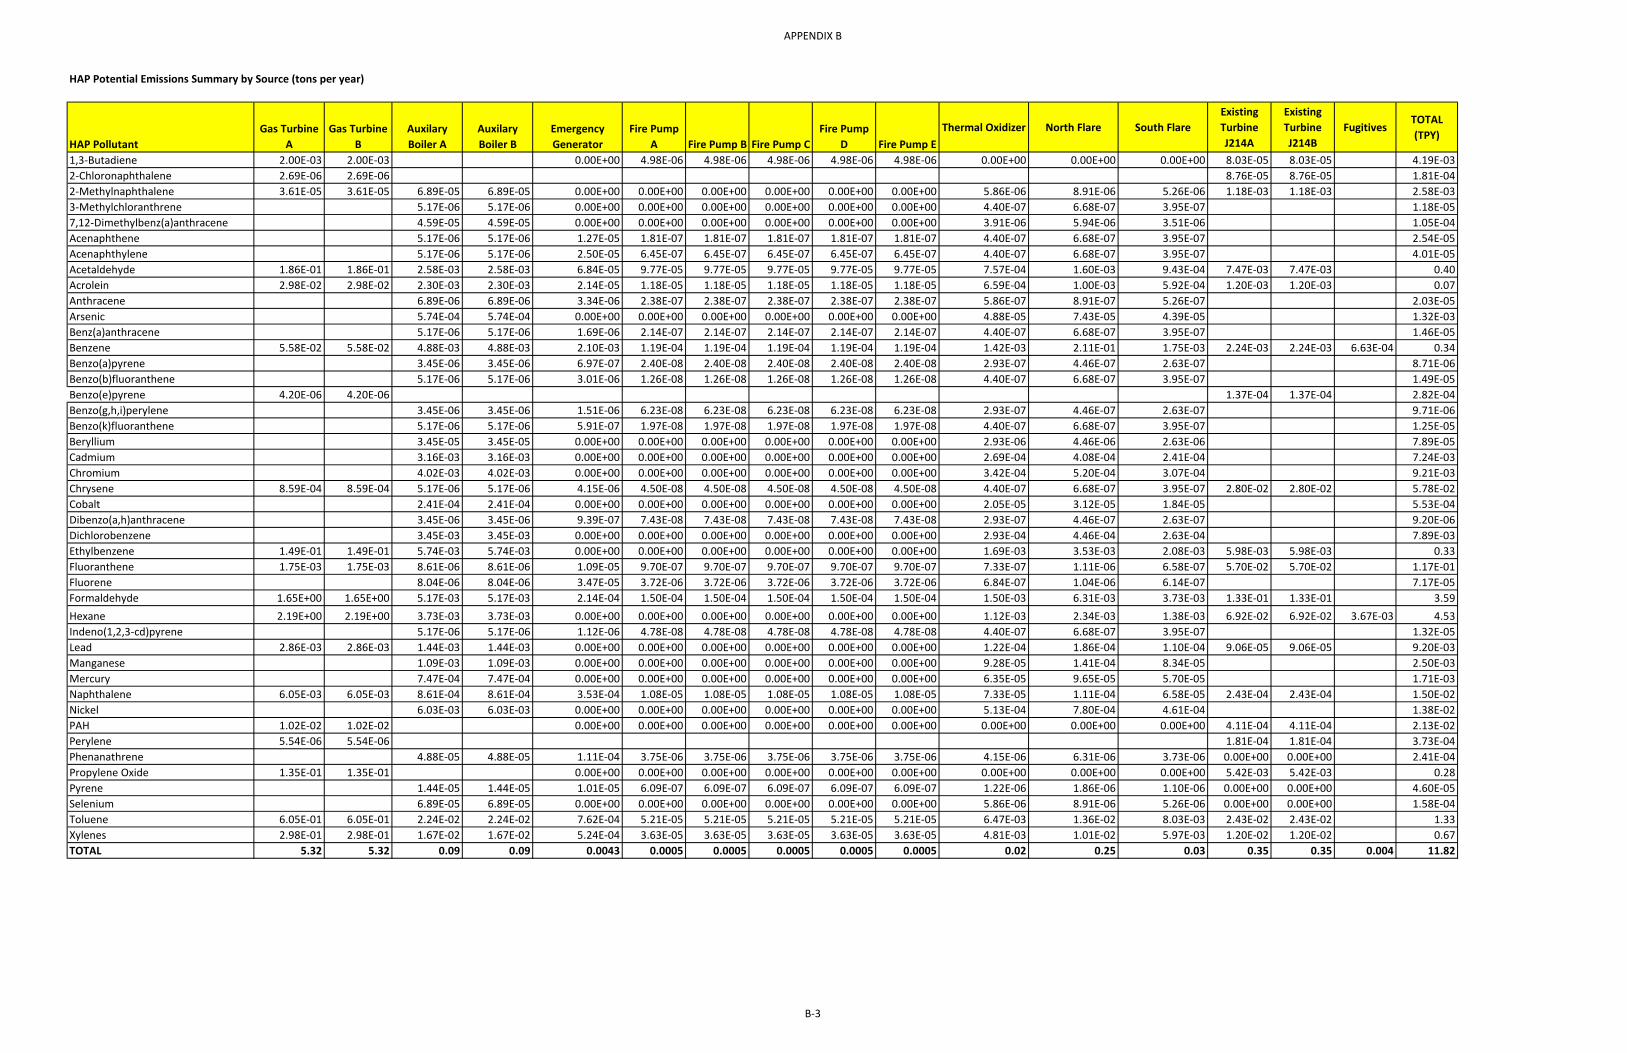
APPENDIX B
B-3
HAP Potential Emissions Summary by Source (tons per year)
HAP PollutantGas Turbine
A Gas Turbine
B Auxilary Boiler A
Auxilary Boiler B
Emergency Generator
Fire Pump A Fire Pump B Fire Pump C
Fire Pump D Fire Pump E
Thermal Oxidizer North Flare South FlareExisting Turbine J214A
Existing Turbine J214B
FugitivesTOTAL (TPY)
1,3-Butadiene 2.00E-03 2.00E-03 0.00E+00 4.98E-06 4.98E-06 4.98E-06 4.98E-06 4.98E-06 0.00E+00 0.00E+00 0.00E+00 8.03E-05 8.03E-05 4.19E-032-Chloronaphthalene 2.69E-06 2.69E-06 8.76E-05 8.76E-05 1.81E-042-Methylnaphthalene 3.61E-05 3.61E-05 6.89E-05 6.89E-05 0.00E+00 0.00E+00 0.00E+00 0.00E+00 0.00E+00 0.00E+00 5.86E-06 8.91E-06 5.26E-06 1.18E-03 1.18E-03 2.58E-033-Methylchloranthrene 5.17E-06 5.17E-06 0.00E+00 0.00E+00 0.00E+00 0.00E+00 0.00E+00 0.00E+00 4.40E-07 6.68E-07 3.95E-07 1.18E-057,12-Dimethylbenz(a)anthracene 4.59E-05 4.59E-05 0.00E+00 0.00E+00 0.00E+00 0.00E+00 0.00E+00 0.00E+00 3.91E-06 5.94E-06 3.51E-06 1.05E-04Acenaphthene 5.17E-06 5.17E-06 1.27E-05 1.81E-07 1.81E-07 1.81E-07 1.81E-07 1.81E-07 4.40E-07 6.68E-07 3.95E-07 2.54E-05Acenaphthylene 5.17E-06 5.17E-06 2.50E-05 6.45E-07 6.45E-07 6.45E-07 6.45E-07 6.45E-07 4.40E-07 6.68E-07 3.95E-07 4.01E-05Acetaldehyde 1.86E-01 1.86E-01 2.58E-03 2.58E-03 6.84E-05 9.77E-05 9.77E-05 9.77E-05 9.77E-05 9.77E-05 7.57E-04 1.60E-03 9.43E-04 7.47E-03 7.47E-03 0.40Acrolein 2.98E-02 2.98E-02 2.30E-03 2.30E-03 2.14E-05 1.18E-05 1.18E-05 1.18E-05 1.18E-05 1.18E-05 6.59E-04 1.00E-03 5.92E-04 1.20E-03 1.20E-03 0.07Anthracene 6.89E-06 6.89E-06 3.34E-06 2.38E-07 2.38E-07 2.38E-07 2.38E-07 2.38E-07 5.86E-07 8.91E-07 5.26E-07 2.03E-05Arsenic 5.74E-04 5.74E-04 0.00E+00 0.00E+00 0.00E+00 0.00E+00 0.00E+00 0.00E+00 4.88E-05 7.43E-05 4.39E-05 1.32E-03Benz(a)anthracene 5.17E-06 5.17E-06 1.69E-06 2.14E-07 2.14E-07 2.14E-07 2.14E-07 2.14E-07 4.40E-07 6.68E-07 3.95E-07 1.46E-05Benzene 5.58E-02 5.58E-02 4.88E-03 4.88E-03 2.10E-03 1.19E-04 1.19E-04 1.19E-04 1.19E-04 1.19E-04 1.42E-03 2.11E-01 1.75E-03 2.24E-03 2.24E-03 6.63E-04 0.34Benzo(a)pyrene 3.45E-06 3.45E-06 6.97E-07 2.40E-08 2.40E-08 2.40E-08 2.40E-08 2.40E-08 2.93E-07 4.46E-07 2.63E-07 8.71E-06Benzo(b)fluoranthene 5.17E-06 5.17E-06 3.01E-06 1.26E-08 1.26E-08 1.26E-08 1.26E-08 1.26E-08 4.40E-07 6.68E-07 3.95E-07 1.49E-05Benzo(e)pyrene 4.20E-06 4.20E-06 1.37E-04 1.37E-04 2.82E-04Benzo(g,h,i)perylene 3.45E-06 3.45E-06 1.51E-06 6.23E-08 6.23E-08 6.23E-08 6.23E-08 6.23E-08 2.93E-07 4.46E-07 2.63E-07 9.71E-06Benzo(k)fluoranthene 5.17E-06 5.17E-06 5.91E-07 1.97E-08 1.97E-08 1.97E-08 1.97E-08 1.97E-08 4.40E-07 6.68E-07 3.95E-07 1.25E-05Beryllium 3.45E-05 3.45E-05 0.00E+00 0.00E+00 0.00E+00 0.00E+00 0.00E+00 0.00E+00 2.93E-06 4.46E-06 2.63E-06 7.89E-05Cadmium 3.16E-03 3.16E-03 0.00E+00 0.00E+00 0.00E+00 0.00E+00 0.00E+00 0.00E+00 2.69E-04 4.08E-04 2.41E-04 7.24E-03Chromium 4.02E-03 4.02E-03 0.00E+00 0.00E+00 0.00E+00 0.00E+00 0.00E+00 0.00E+00 3.42E-04 5.20E-04 3.07E-04 9.21E-03Chrysene 8.59E-04 8.59E-04 5.17E-06 5.17E-06 4.15E-06 4.50E-08 4.50E-08 4.50E-08 4.50E-08 4.50E-08 4.40E-07 6.68E-07 3.95E-07 2.80E-02 2.80E-02 5.78E-02Cobalt 2.41E-04 2.41E-04 0.00E+00 0.00E+00 0.00E+00 0.00E+00 0.00E+00 0.00E+00 2.05E-05 3.12E-05 1.84E-05 5.53E-04Dibenzo(a,h)anthracene 3.45E-06 3.45E-06 9.39E-07 7.43E-08 7.43E-08 7.43E-08 7.43E-08 7.43E-08 2.93E-07 4.46E-07 2.63E-07 9.20E-06Dichlorobenzene 3.45E-03 3.45E-03 0.00E+00 0.00E+00 0.00E+00 0.00E+00 0.00E+00 0.00E+00 2.93E-04 4.46E-04 2.63E-04 7.89E-03Ethylbenzene 1.49E-01 1.49E-01 5.74E-03 5.74E-03 0.00E+00 0.00E+00 0.00E+00 0.00E+00 0.00E+00 0.00E+00 1.69E-03 3.53E-03 2.08E-03 5.98E-03 5.98E-03 0.33Fluoranthene 1.75E-03 1.75E-03 8.61E-06 8.61E-06 1.09E-05 9.70E-07 9.70E-07 9.70E-07 9.70E-07 9.70E-07 7.33E-07 1.11E-06 6.58E-07 5.70E-02 5.70E-02 1.17E-01Fluorene 8.04E-06 8.04E-06 3.47E-05 3.72E-06 3.72E-06 3.72E-06 3.72E-06 3.72E-06 6.84E-07 1.04E-06 6.14E-07 7.17E-05Formaldehyde 1.65E+00 1.65E+00 5.17E-03 5.17E-03 2.14E-04 1.50E-04 1.50E-04 1.50E-04 1.50E-04 1.50E-04 1.50E-03 6.31E-03 3.73E-03 1.33E-01 1.33E-01 3.59Hexane 2.19E+00 2.19E+00 3.73E-03 3.73E-03 0.00E+00 0.00E+00 0.00E+00 0.00E+00 0.00E+00 0.00E+00 1.12E-03 2.34E-03 1.38E-03 6.92E-02 6.92E-02 3.67E-03 4.53Indeno(1,2,3-cd)pyrene 5.17E-06 5.17E-06 1.12E-06 4.78E-08 4.78E-08 4.78E-08 4.78E-08 4.78E-08 4.40E-07 6.68E-07 3.95E-07 1.32E-05Lead 2.86E-03 2.86E-03 1.44E-03 1.44E-03 0.00E+00 0.00E+00 0.00E+00 0.00E+00 0.00E+00 0.00E+00 1.22E-04 1.86E-04 1.10E-04 9.06E-05 9.06E-05 9.20E-03Manganese 1.09E-03 1.09E-03 0.00E+00 0.00E+00 0.00E+00 0.00E+00 0.00E+00 0.00E+00 9.28E-05 1.41E-04 8.34E-05 2.50E-03Mercury 7.47E-04 7.47E-04 0.00E+00 0.00E+00 0.00E+00 0.00E+00 0.00E+00 0.00E+00 6.35E-05 9.65E-05 5.70E-05 1.71E-03Naphthalene 6.05E-03 6.05E-03 8.61E-04 8.61E-04 3.53E-04 1.08E-05 1.08E-05 1.08E-05 1.08E-05 1.08E-05 7.33E-05 1.11E-04 6.58E-05 2.43E-04 2.43E-04 1.50E-02Nickel 6.03E-03 6.03E-03 0.00E+00 0.00E+00 0.00E+00 0.00E+00 0.00E+00 0.00E+00 5.13E-04 7.80E-04 4.61E-04 1.38E-02PAH 1.02E-02 1.02E-02 0.00E+00 0.00E+00 0.00E+00 0.00E+00 0.00E+00 0.00E+00 0.00E+00 0.00E+00 0.00E+00 4.11E-04 4.11E-04 2.13E-02Perylene 5.54E-06 5.54E-06 1.81E-04 1.81E-04 3.73E-04Phenanathrene 4.88E-05 4.88E-05 1.11E-04 3.75E-06 3.75E-06 3.75E-06 3.75E-06 3.75E-06 4.15E-06 6.31E-06 3.73E-06 0.00E+00 0.00E+00 2.41E-04Propylene Oxide 1.35E-01 1.35E-01 0.00E+00 0.00E+00 0.00E+00 0.00E+00 0.00E+00 0.00E+00 0.00E+00 0.00E+00 0.00E+00 5.42E-03 5.42E-03 0.28Pyrene 1.44E-05 1.44E-05 1.01E-05 6.09E-07 6.09E-07 6.09E-07 6.09E-07 6.09E-07 1.22E-06 1.86E-06 1.10E-06 0.00E+00 0.00E+00 4.60E-05Selenium 6.89E-05 6.89E-05 0.00E+00 0.00E+00 0.00E+00 0.00E+00 0.00E+00 0.00E+00 5.86E-06 8.91E-06 5.26E-06 0.00E+00 0.00E+00 1.58E-04Toluene 6.05E-01 6.05E-01 2.24E-02 2.24E-02 7.62E-04 5.21E-05 5.21E-05 5.21E-05 5.21E-05 5.21E-05 6.47E-03 1.36E-02 8.03E-03 2.43E-02 2.43E-02 1.33Xylenes 2.98E-01 2.98E-01 1.67E-02 1.67E-02 5.24E-04 3.63E-05 3.63E-05 3.63E-05 3.63E-05 3.63E-05 4.81E-03 1.01E-02 5.97E-03 1.20E-02 1.20E-02 0.67TOTAL 5.32 5.32 0.09 0.09 0.0043 0.0005 0.0005 0.0005 0.0005 0.0005 0.02 0.25 0.03 0.35 0.35 0.004 11.82

APPENDIX B
B-4
Frame 7 Combustion Turbines - Potential to Emit Calculations for Normal Operation
Operating Information - Normal OperationParameter Value Units
Unit Rating 1,062 MMBtu/hrStack Outlet Flowrate 875,000 acfmStack Outlet Flowrate 535,925 scfmStack Outlet Flowrate 498,946 dscfmExhaust Moisture Content 6.90 %Exhaust Oxygen Content 13.50 %Fuel High Heat Value 307,777 Btu/lb-moleFuel High Heat Value 812.1 Btu/scfFuel Usage Rate 1.3 MMscf/hrFuel Usage Rate 67,941.33 lb/hrFuel Molecular Weight 19.69 lb/lb-moleHours of Operation 8760 hr/yr
SO2, H2SO4, and H2S Emission Equation:Emissions (lb/hr) = fuel usage (lb/hr) * [MW of pollutant/MW of fuel] * mole percent of pollutant in fuel
NOX/CO/VOC/Ammonia Emission Equation:Emissions (lb/hr) = ppm/10E6 * 0.076 * dscfm * 60min/hr * MW of pollutant/29 *[(20.9-actual O2%)/(20.9-design O2%)
Where:0.076 = Density of air at 60F (lb/scf)29 = Molecular weight of air (lb/lb-mol)20.9 = Ambient O2 Concentration (%)
CO2, CH4, N2O Emission Equation:Emissions (lb/hr) = EF (kg/MMBTU) * Unit Rating (MMBTU/hr) * 2.2046 lbs/kg
HAP Emission Equation:Emissions (lb/hr) = EF(lb/MMscf) / HHV * Unit Rating (MMbtu/hr)Emissions (lb/hr) = EF(lb/MMBtu) * Unit Rating (MMbtu/hr)
Where:HHV = Site-specific fuel high heating value (btu/scf)
8/14/13 EPC Design Specification
8/14/13 EPC Design Specification
8/14/13 EPC Design Specification8/14/13 EPC Design Specification (Fuel Mix)
Calculated based on 379 scf/lb-molCalculated based on unit rating and HHV
Calculated based on 379 scf/lb-mol
Source/Basis8/14/13 EPC Design Specification
8/14/13 EPC Design Specification - 100% load at 389FPer CPCN Application - At 60F
Per CPCN Application - based on moisture content

APPENDIX B
B-5
Frame 7 Combustion Turbines - Potential to Emit Calculations for Normal Operation
Potential Emissions of Criteria Pollutants - Normal OperationCombined Emissions
PollutantEmission
Factor (EF) EF Units lb/hr TPY TPYNOX 2.5 ppmvd (exhaust - 15% O2) 11.32 49.6 99.14CO 1.5 ppmvd (exhaust - 15% O2) 4.13 18.1 36.22
SO2 0.0001 mol % H2S (fuel) 0.22 1.0 1.94VOC 0.7 ppmvd (exhaust - 15% O2) 1.10 4.8 9.68
H2S 0.0001 mol % H2S (fuel) 0.12 0.5 1.03
Sulfuric Acid Mist (H2SO4) 0.0001 mol % H2S (fuel) 0.34 1.5 2.96Ammonia 5 ppmvd (exhaust - 15% O2) 8.36 36.6 73.27CO2 53.06 kg/MMBTU 124,229.7 544,126.2 1,088,252.3CH4 0.001 kg/MMBTU 2.34 10.3 20.51N2O 0.0001 kg/MMBTU 0.23 1.0 2.05CO2e 124,358.0 544,688.1 1,089,376.3PM Filterable 3.5 lb/hr 3.50 15.3 30.66PM10/2.5 Condensable 3.5 lb/hr 3.50 15.3 30.66PM10/2.5 Filterable and Condensable 7.00 30.66 61.32
Potential Emissions of Hazardous Air Pollutants - Normal Operation
HAP PollutantEmission
Factor (EF) EF Units Source Basis lb/hr ton/yr lb/hr ton/yr1,3-Butadiene 4.30E-07 lb/MMBTU AP-42 Table 3.1-3 4.57E-04 2.00E-03 9.13E-04 4.00E-032-Chloronaphthalene 4.69E-07 lb/MMscf CARB CATEF II Database 6.13E-07 2.69E-06 1.23E-06 5.37E-062-Methylnaphthalene 6.30E-06 lb/MMscf CARB CATEF II Database 8.24E-06 3.61E-05 1.65E-05 7.22E-05Acetaldehyde 4.00E-05 lb/MMBTU AP-42 Table 3.1-3 4.25E-02 1.86E-01 8.50E-02 3.72E-01Acrolein 6.40E-06 lb/MMBTU AP-42 Table 3.1-3 6.80E-03 2.98E-02 1.36E-02 5.95E-02Benzene 1.20E-05 lb/MMBTU AP-42 Table 3.1-3 1.27E-02 5.58E-02 2.55E-02 1.12E-01Benzo(e)pyrene 7.33E-07 lb/MMscf CARB CATEF II Database 9.59E-07 4.20E-06 1.92E-06 8.40E-06Chrysene 1.50E-04 lb/MMscf CARB CATEF II Database 1.96E-04 8.59E-04 3.92E-04 1.72E-03Ethylbenzene 3.20E-05 lb/MMBTU AP-42 Table 3.1-3 3.40E-02 1.49E-01 6.80E-02 2.98E-01Fluoranthene 3.05E-04 lb/MMscf CARB CATEF II Database 3.99E-04 1.75E-03 7.98E-04 3.49E-03Formaldehyde 7.10E-04 lb/MMBTU AP-42 Table 3.1-3 (50% control) 3.77E-01 1.65E+00 7.54E-01 3.30E+00Hexane 3.82E-01 lb/MMscf CARB CATEF II Database 5.00E-01 2.19E+00 9.99E-01 4.38E+00Lead 5.00E-04 lb/MMscf AP-42 Table 1.4-3 6.54E-04 2.86E-03 1.31E-03 5.73E-03Naphthalene 1.30E-06 lb/MMBTU AP-42 Table 3.1-3 1.38E-03 6.05E-03 2.76E-03 1.21E-02PAH 2.20E-06 lb/MMBTU AP-42 Table 3.1-3 2.34E-03 1.02E-02 4.67E-03 2.05E-02Perylene 9.68E-07 lb/MMscf CARB CATEF II Database 1.27E-06 5.54E-06 2.53E-06 1.11E-05Propylene Oxide 2.90E-05 lb/MMBTU AP-42 Table 3.1-3 3.08E-02 1.35E-01 6.16E-02 2.70E-01Toluene 1.30E-04 lb/MMBTU AP-42 Table 3.1-3 1.38E-01 6.05E-01 2.76E-01 1.21E+00Xylenes 6.40E-05 lb/MMBTU AP-42 Table 3.1-3 6.80E-02 2.98E-01 1.36E-01 5.95E-01
TOTAL HAPS 1.21 5.32 2.43 10.64Note1 : 50% control for formaldehyde assumes 50% control from Oxidation Catalyst
8/14/13 EPC Design Specification
Emissions per Unit Combined Emissions
8/14/13 EPC Design Specification8/14/13 EPC Design Specification
Source/Basis
8/14/13 EPC Design Specification
8/14/13 EPC Design Specification40 CFR 98 Table C-140 CFR 98 Table C-240 CFR 98 Table C-2
8/14/13 EPC Design Specification - Assume all fuel H2S becomes H2SO4
8/14/13 EPC Design Specification - Assume all fuel H2S becomes H2S
8/14/13 EPC Design Specification
8/14/13 EPC Design Specification - Assumes all fuel H2S becomes SO2
GWPs from 40 CFR 98 Table A-1
Emission per Unit

APPENDIX B
B-6
Frame 7 Combustion Turbines - Potential to Emit Calculations for Startup
Operating Information - StartupParameter Turbine 1 Turbine 2 Units
Unit Rating 1,062 1,062 MMBtu/hr
Stack Outlet Flowrate - Startup 693,409 430,638 acfmExhaust Moisture Content 6.90 6.90 %Exhaust Oxygen Content 13.50 13.50 %Fuel High Heat Value 380,662.00 380,662.00 Btu/lb-moleFuel High Heat Value 1,004.4 1,004.4 Btu/scfFuel Usage Rate 1.06 1.06 MMscf/hrFuel Usage Rate 49,938.79 49,938.79 lb/hrFuel Molecular Weight 17.9 17.9 lb/lb-moleNumber of Startup/Shutdowns 10 10 events/yr
Duration of Startup 66.3 1.9 hr/eventNumber of UnitsNote: Per EPC Design Specification, Combustion Turbines will burn only pipeline natural gas during startup.
SO2, H2SO4, and H2S Emission Equation:Emissions (lb/hr) = fuel usage (lb/hr) * [MW of pollutant/MW of fuel] * mole percent of pollutant in fuel
CO2, CH4, N2O Emission Equation:Emissions (lb/hr) = EF (kg/MMBTU) * Unit Rating (MMBTU/hr) * 2.2046 lbs/kg
HAP Emission Equation:Emissions (tons/year) = EF(lb/MMscf) / HHV * Unit Rating (MMbtu/hr) * Hours/year / 2000 lb/tonEmissions (tons/year) = EF(lb/MMBtu) * Unit Rating (MMbtu/hr) * Hours/year / 2000 lb/ton
Where:HHV = Site-specific fuel high heating value (btu/scf)
8/14/13 EPC Design Specification
Source/Basis8/14/13 EPC Design Specification
Per 8/14/13 EPC Design Specification - At 386F (Turbine 1), 374.6F (Turbine 2)
8/14/13 EPC Design Specification8/14/13 EPC Design Specification (Pipeline)
Calculated based on 379 scf/lb-molCalculated based on unit rating and HHV
Calculated based on 379 scf/lb-mol8/14/13 EPC Design Specification (Pipeline)
Per CPCN Application Appendix B Per 8/14/13 EPC Design, first turbine will take 3978 minutes (66.3 hours), the second will 111 minutes
(1.85 hours)2 units
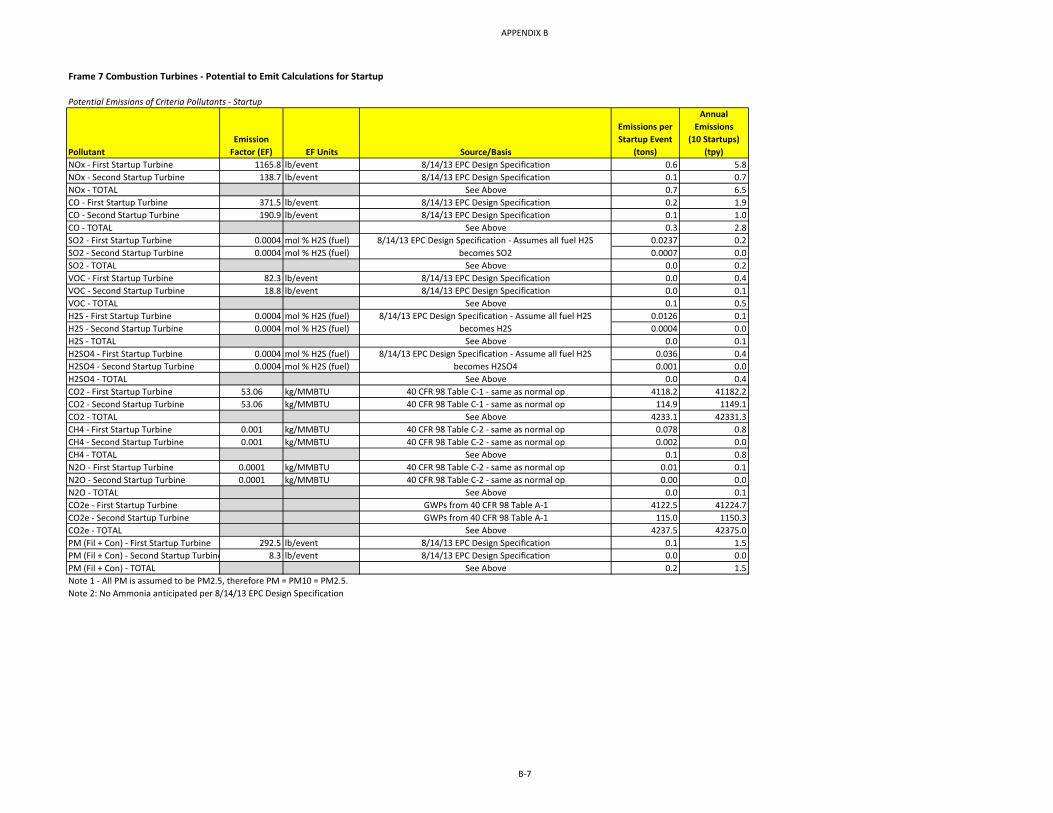
APPENDIX B
B-7
Frame 7 Combustion Turbines - Potential to Emit Calculations for Startup
Potential Emissions of Criteria Pollutants - Startup
PollutantEmission
Factor (EF) EF Units
Emissions per Startup Event
(tons)
Annual Emissions
(10 Startups) (tpy)
NOx - First Startup Turbine 1165.8 lb/event 0.6 5.8NOx - Second Startup Turbine 138.7 lb/event 0.1 0.7NOx - TOTAL 0.7 6.5CO - First Startup Turbine 371.5 lb/event 0.2 1.9CO - Second Startup Turbine 190.9 lb/event 0.1 1.0CO - TOTAL 0.3 2.8SO2 - First Startup Turbine 0.0004 mol % H2S (fuel) 0.0237 0.2SO2 - Second Startup Turbine 0.0004 mol % H2S (fuel) 0.0007 0.0SO2 - TOTAL 0.0 0.2VOC - First Startup Turbine 82.3 lb/event 0.0 0.4VOC - Second Startup Turbine 18.8 lb/event 0.0 0.1VOC - TOTAL 0.1 0.5H2S - First Startup Turbine 0.0004 mol % H2S (fuel) 0.0126 0.1H2S - Second Startup Turbine 0.0004 mol % H2S (fuel) 0.0004 0.0H2S - TOTAL 0.0 0.1H2SO4 - First Startup Turbine 0.0004 mol % H2S (fuel) 0.036 0.4H2SO4 - Second Startup Turbine 0.0004 mol % H2S (fuel) 0.001 0.0H2SO4 - TOTAL 0.0 0.4CO2 - First Startup Turbine 53.06 kg/MMBTU 4118.2 41182.2CO2 - Second Startup Turbine 53.06 kg/MMBTU 114.9 1149.1CO2 - TOTAL 4233.1 42331.3CH4 - First Startup Turbine 0.001 kg/MMBTU 0.078 0.8CH4 - Second Startup Turbine 0.001 kg/MMBTU 0.002 0.0CH4 - TOTAL 0.1 0.8N2O - First Startup Turbine 0.0001 kg/MMBTU 0.01 0.1N2O - Second Startup Turbine 0.0001 kg/MMBTU 0.00 0.0N2O - TOTAL 0.0 0.1CO2e - First Startup Turbine 4122.5 41224.7CO2e - Second Startup Turbine 115.0 1150.3CO2e - TOTAL 4237.5 42375.0PM (Fil + Con) - First Startup Turbine 292.5 lb/event 0.1 1.5PM (Fil + Con) - Second Startup Turbine 8.3 lb/event 0.0 0.0PM (Fil + Con) - TOTAL 0.2 1.5Note 1 - All PM is assumed to be PM2.5, therefore PM = PM10 = PM2.5. Note 2: No Ammonia anticipated per 8/14/13 EPC Design Specification
See Above
Source/Basis8/14/13 EPC Design Specification8/14/13 EPC Design Specification
40 CFR 98 Table C-2 - same as normal op
8/14/13 EPC Design Specification - Assumes all fuel H2S becomes SO2
8/14/13 EPC Design Specification - Assume all fuel H2S becomes H2S
See Above8/14/13 EPC Design Specification8/14/13 EPC Design Specification
See Above
40 CFR 98 Table C-1 - same as normal op40 CFR 98 Table C-1 - same as normal op
40 CFR 98 Table C-2 - same as normal op40 CFR 98 Table C-2 - same as normal op
40 CFR 98 Table C-2 - same as normal op
8/14/13 EPC Design Specification8/14/13 EPC Design Specification
See Above
8/14/13 EPC Design Specification8/14/13 EPC Design Specification
See Above
See Above
GWPs from 40 CFR 98 Table A-1GWPs from 40 CFR 98 Table A-1
See Above8/14/13 EPC Design Specification - Assume all fuel H2S
becomes H2SO4
See Above
See Above
See Above
See Above

APPENDIX B
B-8
Frame 7 Combustion Turbines - Potential to Emit Calculations for Startup
Potential Emissions of Hazardous Air Pollutants - Startup
HAP PollutantEmission
Factor (EF) EF Units Source Basis First Startup (TPY) Second Startup TOTAL1,3-Butadiene 4.30E-07 lb/MMBTU AP-42 Table 3.1-3 1.51E-05 4.22E-07 0.0001556072-Chloronaphthalene 4.69E-07 lb/MMscf CARB CATEF II Database 1.64E-08 4.59E-10 1.68979E-072-Methylnaphthalene 6.30E-06 lb/MMscf CARB CATEF II Database 2.21E-07 6.16E-09 2.26987E-06Acetaldehyde 4.00E-05 lb/MMBTU AP-42 Table 3.1-3 1.41E-03 3.93E-05 0.01447506Acrolein 6.40E-06 lb/MMBTU AP-42 Table 3.1-3 2.25E-04 6.29E-06 0.00231601Benzene 1.20E-05 lb/MMBTU AP-42 Table 3.1-3 4.22E-04 1.18E-05 0.004342518Benzo(e)pyrene 7.33E-07 lb/MMscf CARB CATEF II Database 2.57E-08 7.17E-10 2.64097E-07Chrysene 1.50E-04 lb/MMscf CARB CATEF II Database 5.26E-06 1.47E-07 5.40445E-05Ethylbenzene 3.20E-05 lb/MMBTU AP-42 Table 3.1-3 1.13E-03 3.14E-05 0.011580048Fluoranthene 3.05E-04 lb/MMscf CARB CATEF II Database 1.07E-05 2.98E-07 0.00010989
Formaldehyde 7.10E-04 lb/MMBTUAP-42 Table 3.1-3 (50% control) 1.25E-02 3.49E-04 0.128466158
Hexane 3.82E-01 lb/MMscf CARB CATEF II Database 1.34E-02 3.74E-04 0.13763327Lead 5.00E-04 lb/MMscf AP-42 Table 1.4-3 1.75E-05 4.89E-07 0.000180148Naphthalene 1.30E-06 lb/MMBTU AP-42 Table 3.1-3 4.58E-05 1.28E-06 0.000470439PAH 2.20E-06 lb/MMBTU AP-42 Table 3.1-3 7.75E-05 2.16E-06 0.000796128Perylene 9.68E-07 lb/MMscf CARB CATEF II Database 3.39E-08 9.47E-10 3.48767E-07Propylene Oxide 2.90E-05 lb/MMBTU AP-42 Table 3.1-3 1.02E-03 2.85E-05 0.010494419Toluene 1.30E-04 lb/MMBTU AP-42 Table 3.1-3 4.58E-03 1.28E-04 0.047043945Xylenes 6.40E-05 lb/MMBTU AP-42 Table 3.1-3 2.25E-03 6.29E-05 0.023160096
TOTAL HAPS 3.71E-02 1.04E-03 0.38Note1 : 50% control for formaldehyde assumes 50% control from Oxidation Catalyst
TPY

APPENDIX B
B-9
Frame 7 Combustion Turbines - Potential to Emit Calculations for Shutdown
Operating Information - ShutdownParameter Turbine 1 Turbine 2 Units
Unit Rating 1,062 1,062 MMBtu/hr
Stack Outlet Flowrate - Shutdown 661,005 691,105 acfmStack Outlet Flowrate - Shutdown 415,224 423,891 scfm
Stack Outlet Flowrate - Shutdown 386,574 394,642 dscfmExhaust Moisture Content 6.90 6.90 %Exhaust Oxygen Content 13.50 13.50 %Fuel High Heat Value 380,662.00 380,662.00 Btu/lb-moleFuel High Heat Value 1,004.4 1,004.4 Btu/scfFuel Usage Rate 1.1 1.1 MMscf/hrFuel Usage Rate 49,938.79 49,938.79 lb/hrFuel Molecular Weight 17.9 17.9 lb/lb-moleNumber of Startup/Shutdowns 10 10 events/yr
Duration of Shutdown 0.467 0.8 hr/eventNumber of UnitsNote: Combustio turbines will burn only pipeline natural gas during shutdown per DCP response to DR3-5
SO2, H2SO4, and H2S Emission Equation:Emissions (lb/hr) = fuel usage (lb/hr) * [MW of pollutant/MW of fuel] * mole percent of pollutant in fuel
Ammonia Emission EquationEmissions (lb/hr) = ppm/10E6 * 0.076 * dscfm * 60min/hr * MW of pollutant/29 *[(20.9-actual O2)/(20.9-design O2)
Where:0.076 = Density of air at 60F (lb/scf)29 = Molecular weight of air (lb/lb-mol)20.9 = Ambient O2 Concentration (%)
CO2, CH4, N2O Emission Equation:Emissions (lb/hr) = EF (kg/MMBTU) * Unit Rating (MMBTU/hr) * 2.2046 lbs/kg
HAP Emission Equation:Emissions (tons/year) = EF(lb/MMscf) / HHV * Unit Rating (MMbtu/hr) * Hours/year / 2000 lb/tonEmissions (tons/year) = EF(lb/MMBtu) * Unit Rating (MMbtu/hr) * Hours/year / 2000 lb/ton
Where:HHV = Site-specific fuel high heating value (btu/scf)
8/14/13 EPC Design Specification
Source/Basis8/14/13 EPC Design Specification
Per 8/14/13 EPC Design Specification - at 367.8F ( Turbine 1), 387.8F (Turbine 2)
Per CPCN Application - At 60FPer CPCN Application - based on moisture
content
8/14/13 EPC Design Specification8/14/13 EPC Design Specification (Fuel Mix)
Calculated based on 379 scf/lb-molCalculated based on unit rating and HHV
Calculated based on 379 scf/lb-mol8/14/13 EPC Design SpecificationPer CPCN Application Appendix B
Per 8/14/13 EPC Design, first turbine will take 28 minutes (0.5 hours), the second will 48 minutes
(0.8 hours)2 units

APPENDIX B
B-10
Frame 7 Combustion Turbines - Potential to Emit Calculations for Shutdown
Potential Emissions of Criteria Pollutants - Shutdown
PollutantEmission
Factor (EF) EF Units
Emissions per Shutdown
(tons)
Combined Emissions
(tpy)NOx - First Shutdown Turbine 30.9 lb/event 0.0 0.2NOx - Second Shutdown Turbine 17.6 lb/event 0.0 0.1NOx - TOTAL 0.0 0.2CO - First Shutdown Turbine 56.4 lb/event 0.0 0.3CO - Second Shutdown Turbine 2.8 lb/event 0.0 0.0CO - TOTAL 0.0 0.3SO2 - First Shutdown Turbine 0.0004 mol % H2S (fuel) 0.0002 0.0SO2 - Second Shutdown Turbine 0.0004 mol % H2S (fuel) 0.0003 0.0SO2 - TOTAL 0.0005 0.0VOC - First Shutdown Turbine 4 lb/event 0.0 0.0VOC - Second Shutdown Turbine 0.8 lb/event 0.0 0.0VOC - TOTAL 0.0 0.0H2S - First Shutdown Turbine 0.0004 mol % H2S (fuel) 0.0001 0.0H2S - Second Shutdown Turbine 0.0004 mol % H2S (fuel) 0.0002 0.0H2S - TOTAL 0.0 0.0H2SO4 - First Shutdown Turbine 0.0004 mol % H2S (fuel) 0.000 0.0H2SO4 - Second Shutdown Turbine 0.0004 mol % H2S (fuel) 0.000 0.0H2SO4 - TOTAL 0.0 0.0Ammonia - First Shutodwn 5 ppmvd (exhaust - 15% 0.0 0.0Ammonia - Second Shutdown 5 ppmvd (exhaust - 15% 0.0 0.0Ammonia - TOTAL 0.0 0.0CO2 - First Shutdown Turbine 53.06 kg/MMBTU 29.0 289.9CO2 - Second Shutdown Turbine 53.06 kg/MMBTU 49.7 496.9CO2 - TOTAL 78.7 786.8CH4 - First Shutdown Turbine 0.001 kg/MMBTU 0.001 0.0CH4 - Second Shutdown Turbine 0.001 kg/MMBTU 0.001 0.0CH4 - TOTAL 0.0 0.0N2O - First Shutdown Turbine 0.0001 kg/MMBTU 0.00 0.0N2O - Second Shutdown Turbine 0.0001 kg/MMBTU 0.00 0.0N2O - TOTAL 0.0 0.0CO2e - First Shutdown Turbine 29.0 290.2CO2e - Second Shutdown Turbine 49.7 497.4CO2e - TOTAL 78.8 787.6PM (Fil + Con) - First Shutdown Turbine 2.6 lb/event 0.0 0.0PM (Fil + Con) - Second Shutdown Turb 3 lb/event 0.0 0.0PM (Fil + Con) - TOTAL 0.0 0.0Note 1 - All PM is assumed to be PM2.5, therefore PM = PM10 = PM2.5.
See Above
Shutdown
Source/Basis8/14/13 EPC Design Specification8/14/13 EPC Design Specification
See Above
8/14/13 EPC Design Specification8/14/13 EPC Design Specification
See Above
See Above8/14/13 EPC Design Specification8/14/13 EPC Design Specification
See Above
8/14/13 EPC Design Specification - Assumes all fuel H2S becomes SO2
8/14/13 EPC Design Specification - Assume all fuel H2S becomes H2S
See Above
See Above
40 CFR 98 Table C-1 - same as normal op40 CFR 98 Table C-1 - same as normal op
See Above
8/14/13 EPC Design Specification - Assume all fuel H2S becomes H2SO4
8/14/13 EPC Design Specification8/14/13 EPC Design Specification
See Above
GWPs from 40 CFR 98 Table A-1GWPs from 40 CFR 98 Table A-1
See Above8/14/13 EPC Design Specification8/14/13 EPC Design Specification
See Above
40 CFR 98 Table C-2 - same as normal op40 CFR 98 Table C-2 - same as normal op
See Above40 CFR 98 Table C-2 - same as normal op40 CFR 98 Table C-2 - same as normal op

APPENDIX B
B-11
Frame 7 Combustion Turbines - Potential to Emit Calculations for Shutdown
Potential Emissions of Hazardous Air Pollutants - Shutdown
HAP PollutantEmission
Factor (EF) EF Units Source Basis First Shutdown econd Shutdow TOTAL1,3-Butadiene 4.30E-07 lb/MMBTU AP-42 Table 3.1-3 1.07E-07 1.83E-07 2.89218E-062-Chloronaphthalene 4.69E-07 lb/MMscf CARB CATEF II Database 1.16E-10 1.98E-10 3.14072E-092-Methylnaphthalene 6.30E-06 lb/MMscf CARB CATEF II Database 1.55E-09 2.66E-09 4.21888E-08Acetaldehyde 4.00E-05 lb/MMBTU AP-42 Table 3.1-3 9.91E-06 1.70E-05 0.00026904Acrolein 6.40E-06 lb/MMBTU AP-42 Table 3.1-3 1.59E-06 2.72E-06 4.30464E-05Benzene 1.20E-05 lb/MMBTU AP-42 Table 3.1-3 2.97E-06 5.10E-06 0.000080712Benzo(e)pyrene 7.33E-07 lb/MMscf CARB CATEF II Database 1.81E-10 3.10E-10 4.90863E-09Chrysene 1.50E-04 lb/MMscf CARB CATEF II Database 3.70E-08 6.34E-08 1.0045E-06Ethylbenzene 3.20E-05 lb/MMBTU AP-42 Table 3.1-3 7.93E-06 1.36E-05 0.000215232Fluoranthene 3.05E-04 lb/MMscf CARB CATEF II Database 7.52E-08 1.29E-07 2.04247E-06
Formaldehyde 7.10E-04 lb/MMBTUAP-42 Table 3.1-3 (50% control) 8.80E-05 1.51E-04 0.00238773
Hexane 3.82E-01 lb/MMscf CARB CATEF II Database 9.42E-05 1.62E-04 0.002558114Lead 5.00E-04 lb/MMscf AP-42 Table 1.4-3 1.23E-07 2.11E-07 3.34832E-06Naphthalene 1.30E-06 lb/MMBTU AP-42 Table 3.1-3 3.22E-07 5.52E-07 8.7438E-06PAH 2.20E-06 lb/MMBTU AP-42 Table 3.1-3 5.45E-07 9.35E-07 1.47972E-05Perylene 9.68E-07 lb/MMscf CARB CATEF II Database 2.39E-10 4.09E-10 6.48234E-09Propylene Oxide 2.90E-05 lb/MMBTU AP-42 Table 3.1-3 7.19E-06 1.23E-05 0.000195054Toluene 1.30E-04 lb/MMBTU AP-42 Table 3.1-3 3.22E-05 5.52E-05 0.00087438Xylenes 6.40E-05 lb/MMBTU AP-42 Table 3.1-3 1.59E-05 2.72E-05 0.000430464
TOTAL HAPS 2.61E-04 4.48E-04 0.007Note1 : 50% control for formaldehyde assumes 50% control from Oxidation Catalyst
TPY
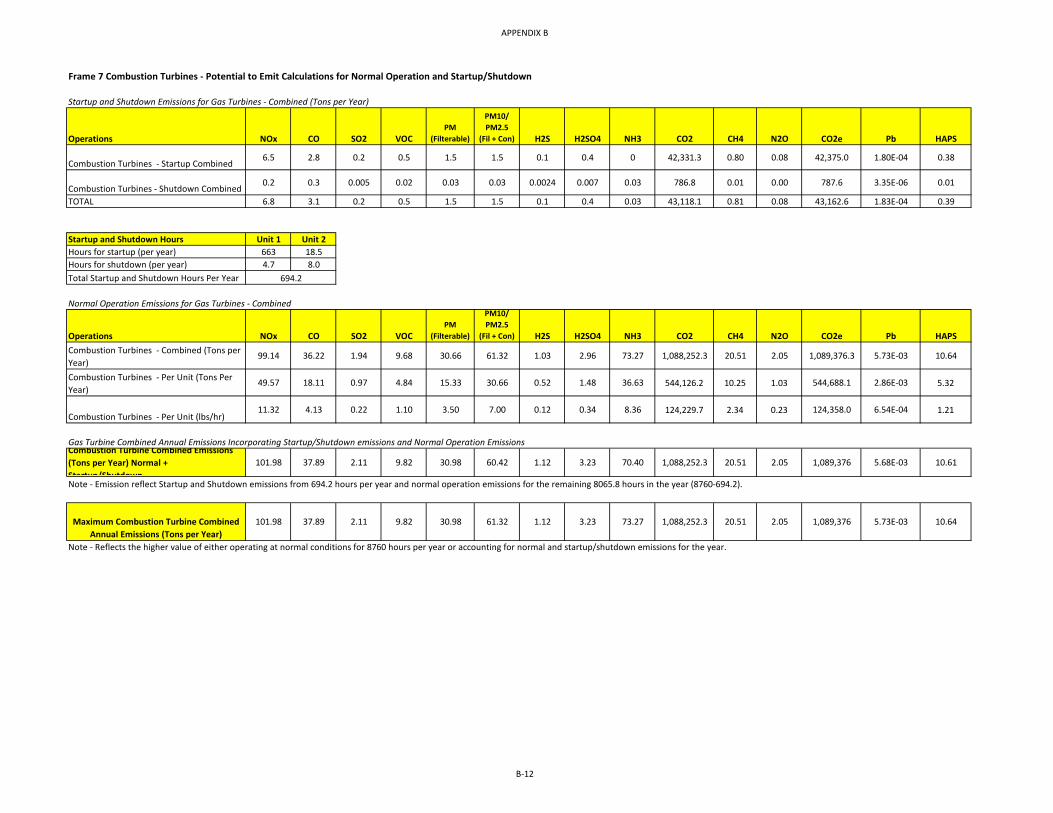
APPENDIX B
B-12
Frame 7 Combustion Turbines - Potential to Emit Calculations for Normal Operation and Startup/Shutdown
Startup and Shutdown Emissions for Gas Turbines - Combined (Tons per Year)
Operations NOx CO SO2 VOCPM
(Filterable)
PM10/ PM2.5
(Fil + Con) H2S H2SO4 NH3 CO2 CH4 N2O CO2e Pb HAPS
Combustion Turbines - Startup Combined6.5 2.8 0.2 0.5 1.5 1.5 0.1 0.4 0 42,331.3 0.80 0.08 42,375.0 1.80E-04 0.38
Combustion Turbines - Shutdown Combined0.2 0.3 0.005 0.02 0.03 0.03 0.0024 0.007 0.03 786.8 0.01 0.00 787.6 3.35E-06 0.01
TOTAL 6.8 3.1 0.2 0.5 1.5 1.5 0.1 0.4 0.03 43,118.1 0.81 0.08 43,162.6 1.83E-04 0.39
Startup and Shutdown Hours Unit 1 Unit 2Hours for startup (per year) 663 18.5Hours for shutdown (per year) 4.7 8.0Total Startup and Shutdown Hours Per Year
Normal Operation Emissions for Gas Turbines - Combined
Operations NOx CO SO2 VOCPM
(Filterable)
PM10/ PM2.5
(Fil + Con) H2S H2SO4 NH3 CO2 CH4 N2O CO2e Pb HAPSCombustion Turbines - Combined (Tons per Year)
99.14 36.22 1.94 9.68 30.66 61.32 1.03 2.96 73.27 1,088,252.3 20.51 2.05 1,089,376.3 5.73E-03 10.64
Combustion Turbines - Per Unit (Tons Per Year)
49.57 18.11 0.97 4.84 15.33 30.66 0.52 1.48 36.63 544,126.2 10.25 1.03 544,688.1 2.86E-03 5.32
Combustion Turbines - Per Unit (lbs/hr)11.32 4.13 0.22 1.10 3.50 7.00 0.12 0.34 8.36 124,229.7 2.34 0.23 124,358.0 6.54E-04 1.21
Gas Turbine Combined Annual Emissions Incorporating Startup/Shutdown emissions and Normal Operation EmissionsCombustion Turbine Combined Emissions (Tons per Year) Normal + Startup/Shutdown
101.98 37.89 2.11 9.82 30.98 60.42 1.12 3.23 70.40 1,088,252.3 20.51 2.05 1,089,376 5.68E-03 10.61
Note - Emission reflect Startup and Shutdown emissions from 694.2 hours per year and normal operation emissions for the remaining 8065.8 hours in the year (8760-694.2).
Maximum Combustion Turbine Combined Annual Emissions (Tons per Year)
101.98 37.89 2.11 9.82 30.98 61.32 1.12 3.23 73.27 1,088,252.3 20.51 2.05 1,089,376 5.73E-03 10.64
Note - Reflects the higher value of either operating at normal conditions for 8760 hours per year or accounting for normal and startup/shutdown emissions for the year.
694.2

APPENDIX B
B-13
Auxiliary Boilers - Potential to Emit Calculations for Normal Operation
Operating Information - Normal OperationParameter Value Units
Unit Rating 435 MMBtu/hrStack Outlet Flowrate 146,000 acfmStack Outlet Flowrate 99,895 scfmStack Outlet Flowrate 82,313 dscfmExhaust Moisture Content 17.60 %Exhaust Oxygen Content 2.40 %Fuel High Heat Value 251,481.00 Btu/lb-moleFuel High Heat Value 663.54 Btu/scfHours of Operation 8760 hr/yrNumber of Units 2.00
Potential Emissions of Criteria Pollutants - Normal Operation Combined
Pollutant Emission Factor (EF) EF Units lb/hr TPY TPYNOx 0.010 lb/MMBTU 4.31 18.9 37.72CO 0.009 lb/MMBTU 3.83 16.8 33.53SO2 0VOC 0.001 lb/MMBTU 0.44 1.9053 3.81H2S 0H2SO4 0Ammonia 5 ppmvd (exhaust) 3.45 15.1 30.22CO2 53.06 kg/MMBTU 50,885.1 222,876.5 445,753.1CH4 0.001 kg/MMBTU 0.96 4.2 8.40N2O 0.0001 kg/MMBTU 0.10 0.4 0.84CO2e 50,937.6 223,106.7 446,213.4PM Filterable 0.005 lb/MMBTU 2.18 9.5 19.05PM10/2.5 Condensable 5.7 lb/MMscf 3.74 16.4 32.73PM10/2.5 Filterable and Condensable 5.91 25.9 51.79
NOx, CO, VOC, PM filterable Emission Equation:
Emissions (lb/hr) = EF (lb/MMBTU) * Unit Rating (MMBTU/hr)
PM Condensable Emission Equation:Emissions (lb/hr) = EF (lb/MMscf) / HHV * Unit Rating (MMBTU/hr)
Where:HHV = Site-specific fuel high heating value (btu/scf)
Ammonia Emission Equation:Emissions (lb/hr) = ppm/10E6 * 0.076 * dscfm * 60min/hr * MW/29 *[(20.9-actualO2)/(20.9-design O2)
CO2, CH4, N2O Emission Equation:Emissions (lb/hr) = EF (kg/MMBTU) * Unit Rating (MMBTU/hr) * 2.2046 lbs/kg
HAP Emission Equation:Emissions (lb/hr) = EF(lb/MMscf) / HHV * Unit Rating (MMbtu/hr)
Where:HHV = Site-specific fuel high heating value (btu/scf)
Emissions per Unit
8/14/13 EPC Design Specification
Source/Basis8/14/13 EPC Design Specification
Per 8/14/13 EPC Design Specification - At 300FPer CPCN Application - At 60F
Per CPCN Application
8/14/13 EPC Design Spec. - No sulfur in HP fuel
8/14/13 EPC Design Specification8/14/13 EPC Design Specification (LP fuel)
Calculated based on 379 scf/lb-mol
Source/Basis8/14/13 EPC Design Specification8/14/13 EPC Design Specification
8/14/13 EPC Design Specification8/14/13 EPC Design Spec. - No sulfur in HP fuel8/14/13 EPC Design Spec. - No sulfur in HP fuel
8/14/13 EPC Design Specification40 CFR 98 Table C-140 CFR 98 Table C-240 CFR 98 Table C-2
GWPs from 40 CFR 98 Table A-18/14/13 EPC Design Specification
AP-42 Table 1.4-2
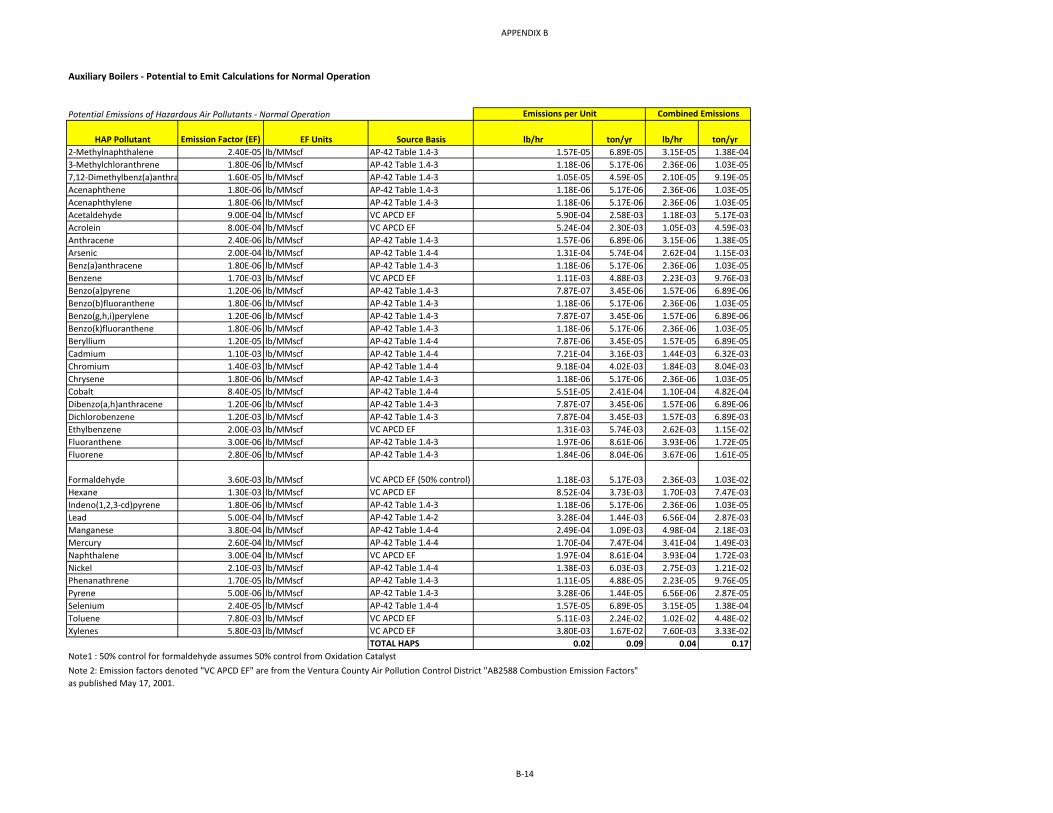
APPENDIX B
B-14
Auxiliary Boilers - Potential to Emit Calculations for Normal Operation
Potential Emissions of Hazardous Air Pollutants - Normal Operation
HAP Pollutant Emission Factor (EF) EF Units Source Basis lb/hr ton/yr lb/hr ton/yr2-Methylnaphthalene 2.40E-05 lb/MMscf AP-42 Table 1.4-3 1.57E-05 6.89E-05 3.15E-05 1.38E-043-Methylchloranthrene 1.80E-06 lb/MMscf AP-42 Table 1.4-3 1.18E-06 5.17E-06 2.36E-06 1.03E-057,12-Dimethylbenz(a)anthra 1.60E-05 lb/MMscf AP-42 Table 1.4-3 1.05E-05 4.59E-05 2.10E-05 9.19E-05Acenaphthene 1.80E-06 lb/MMscf AP-42 Table 1.4-3 1.18E-06 5.17E-06 2.36E-06 1.03E-05Acenaphthylene 1.80E-06 lb/MMscf AP-42 Table 1.4-3 1.18E-06 5.17E-06 2.36E-06 1.03E-05Acetaldehyde 9.00E-04 lb/MMscf VC APCD EF 5.90E-04 2.58E-03 1.18E-03 5.17E-03Acrolein 8.00E-04 lb/MMscf VC APCD EF 5.24E-04 2.30E-03 1.05E-03 4.59E-03Anthracene 2.40E-06 lb/MMscf AP-42 Table 1.4-3 1.57E-06 6.89E-06 3.15E-06 1.38E-05Arsenic 2.00E-04 lb/MMscf AP-42 Table 1.4-4 1.31E-04 5.74E-04 2.62E-04 1.15E-03Benz(a)anthracene 1.80E-06 lb/MMscf AP-42 Table 1.4-3 1.18E-06 5.17E-06 2.36E-06 1.03E-05Benzene 1.70E-03 lb/MMscf VC APCD EF 1.11E-03 4.88E-03 2.23E-03 9.76E-03Benzo(a)pyrene 1.20E-06 lb/MMscf AP-42 Table 1.4-3 7.87E-07 3.45E-06 1.57E-06 6.89E-06Benzo(b)fluoranthene 1.80E-06 lb/MMscf AP-42 Table 1.4-3 1.18E-06 5.17E-06 2.36E-06 1.03E-05Benzo(g,h,i)perylene 1.20E-06 lb/MMscf AP-42 Table 1.4-3 7.87E-07 3.45E-06 1.57E-06 6.89E-06Benzo(k)fluoranthene 1.80E-06 lb/MMscf AP-42 Table 1.4-3 1.18E-06 5.17E-06 2.36E-06 1.03E-05Beryllium 1.20E-05 lb/MMscf AP-42 Table 1.4-4 7.87E-06 3.45E-05 1.57E-05 6.89E-05Cadmium 1.10E-03 lb/MMscf AP-42 Table 1.4-4 7.21E-04 3.16E-03 1.44E-03 6.32E-03Chromium 1.40E-03 lb/MMscf AP-42 Table 1.4-4 9.18E-04 4.02E-03 1.84E-03 8.04E-03Chrysene 1.80E-06 lb/MMscf AP-42 Table 1.4-3 1.18E-06 5.17E-06 2.36E-06 1.03E-05Cobalt 8.40E-05 lb/MMscf AP-42 Table 1.4-4 5.51E-05 2.41E-04 1.10E-04 4.82E-04Dibenzo(a,h)anthracene 1.20E-06 lb/MMscf AP-42 Table 1.4-3 7.87E-07 3.45E-06 1.57E-06 6.89E-06Dichlorobenzene 1.20E-03 lb/MMscf AP-42 Table 1.4-3 7.87E-04 3.45E-03 1.57E-03 6.89E-03Ethylbenzene 2.00E-03 lb/MMscf VC APCD EF 1.31E-03 5.74E-03 2.62E-03 1.15E-02Fluoranthene 3.00E-06 lb/MMscf AP-42 Table 1.4-3 1.97E-06 8.61E-06 3.93E-06 1.72E-05Fluorene 2.80E-06 lb/MMscf AP-42 Table 1.4-3 1.84E-06 8.04E-06 3.67E-06 1.61E-05
Formaldehyde 3.60E-03 lb/MMscf VC APCD EF (50% control) 1.18E-03 5.17E-03 2.36E-03 1.03E-02Hexane 1.30E-03 lb/MMscf VC APCD EF 8.52E-04 3.73E-03 1.70E-03 7.47E-03Indeno(1,2,3-cd)pyrene 1.80E-06 lb/MMscf AP-42 Table 1.4-3 1.18E-06 5.17E-06 2.36E-06 1.03E-05Lead 5.00E-04 lb/MMscf AP-42 Table 1.4-2 3.28E-04 1.44E-03 6.56E-04 2.87E-03Manganese 3.80E-04 lb/MMscf AP-42 Table 1.4-4 2.49E-04 1.09E-03 4.98E-04 2.18E-03Mercury 2.60E-04 lb/MMscf AP-42 Table 1.4-4 1.70E-04 7.47E-04 3.41E-04 1.49E-03Naphthalene 3.00E-04 lb/MMscf VC APCD EF 1.97E-04 8.61E-04 3.93E-04 1.72E-03Nickel 2.10E-03 lb/MMscf AP-42 Table 1.4-4 1.38E-03 6.03E-03 2.75E-03 1.21E-02Phenanathrene 1.70E-05 lb/MMscf AP-42 Table 1.4-3 1.11E-05 4.88E-05 2.23E-05 9.76E-05Pyrene 5.00E-06 lb/MMscf AP-42 Table 1.4-3 3.28E-06 1.44E-05 6.56E-06 2.87E-05Selenium 2.40E-05 lb/MMscf AP-42 Table 1.4-4 1.57E-05 6.89E-05 3.15E-05 1.38E-04Toluene 7.80E-03 lb/MMscf VC APCD EF 5.11E-03 2.24E-02 1.02E-02 4.48E-02Xylenes 5.80E-03 lb/MMscf VC APCD EF 3.80E-03 1.67E-02 7.60E-03 3.33E-02
TOTAL HAPS 0.02 0.09 0.04 0.17Note1 : 50% control for formaldehyde assumes 50% control from Oxidation CatalystNote 2: Emission factors denoted "VC APCD EF" are from the Ventura County Air Pollution Control District "AB2588 Combustion Emission Factors" as published May 17, 2001.
Emissions per Unit Combined Emissions

APPENDIX B
B-15
Auxiliary Boilers - Potential to Emit Calculations for Startup/Shutdown Operation
Operating Information - Startup/ShutdownParameter Startup Value Shutdown Value Units Source/Basis
Unit Rating 435 435 MMBtu/hr
Stack Outlet Flowrate 117,961 111960 acfmStack Outlet Flowrate 81,363 77316 scfmStack Outlet Flowrate 67,043 63709 dscfmExhaust Moisture Content 17.60 17.6 %Exhaust Oxygen Content 2.40 2.40 %
Fuel High Heat Value 296,607 251,481 Btu/lb-moleFuel High Heat Value 782.6 663.5 Btu/scf
Fuel Usage Rate 0.56 0.66 MMscf/hrFuel Usage Rate 27,601.06 35,002.64 lb/hr
Fuel Molecular Weight 18.68 20.1 lb/lb-molNumber of Starups/Shutdowns 5.00 5 events/year
Duration 80.27 1.383 hr/eventNumber of Units 2.00
Potential Emissions of Criteria Pollutants - Startup/Shutdown
PollutantStartup Emission
Factor (EF)
Shutdown Emission Factor
(EF) EF Units Source/BasisEmissions per Startup (tons)
Emissions per Unit (TPY)
Combined Emissions (TPY)
Emissions per Shutdown
(tons)Emissions per
Unit (TPY)Combined
Emissions (TPY)NOx 2946.2 38.9 lb/event 1.47 7.37 14.73 0.019 0.097 0.195CO 2618.5 35.9 lb/event 1.31 6.55 13.09 0.018 0.090 0.180SO2 0.0004 0.0004 mol % H2S (fuel) 0.02 0.08 0.15 0.0003 0.002 0.003VOC 130.6 1.8 lb/event 0.07 0.33 0.65 0.0009 0.005 0.009H2S 0.0004 0.0004 mol % H2S (fuel) 0.008 0.04 0.08 0.0002 0.001 0.002H2SO4 0.0004 0.0004 mol % H2S (fuel) 0.02 0.12 0.23 0.0005 0.002 0.005Ammonia 0 5 ppmvd (exhaust) 0.0 0.0 0.0 0.0018 0.009 0.018CO2 53.06 53.06 kg/MMBTU 2,042.2 10,210.9 20,421.9 35.20 176.0 352.0CH4 0.001 0.001 kg/MMBTU 0.038 0.192 0.38 0.0007 0.0033 0.007N2O 0.0001 0.0001 kg/MMBTU 0.004 0.019 0.04 0.0001 0.0003 0.001CO2e 2,044.3 10,221.5 20,443.0 35.2318 176.2 352.3PM10/2.5 Filterable and Condensable 296.8 4.9 lb/event 0.15 0.74 1.48 0.002 0.012 0.025Note 1 - All PM is assumed to be PM2.5, therefore PM = PM10 = PM2.5.
Ammonia Emission Equation:Emissions (lb/hr) = ppm/10E6 * 0.076 * dscfm * 60min/hr * MW/29 *[(20.9-actualO2)/(20.9-design o2)
SO2, H2SO4, and H2S Emission Equation:Emissions (lb/hr) = fuel usage (lb/hr) * [MW of pollutant/MW of fuel] * mole percent of pollutant in fuel
CO2, CH4, N2O Emission Equation:Emissions (lb/hr) = EF (kg/MMBTU) * Unit Rating (MMBTU/hr) * 2.2046 lbs/kg
8/14/13 EPC Design Specification
8/14/13 EPC Design Specification - Startup (BOG), Shutdown (LP Fuel)
Calculated based on 379 scf/lb-mol
8/14/13 EPC Design SpecificationCalculated based on 379 scf/lb-mol
Per 8/14/13 EPC Design Specifications - at 293.9F (Startup), 293F (Shutdown)
8/14/13 EPC Design Specification8/14/13 EPC Design Specification
Per 8/14/13 EPC Design, startup will take 4816 minutes (80.3 hours)and shutdown will take 83
minutes (1.4 hours)
Includes planned and unplanned
Per CPCN Application - At 60FPer CPCN Application
8/14/13 EPC Design Specification - Startup (BOG), Shutdown (LP Fuel)
8/14/13 EPC Design Specification
Startup
40 CFR 98 Table C-240 CFR 98 Table C-2
GWPs from 40 CFR 98 Table A-1
8/14/13 EPC Design Specification8/14/13 EPC Design Specification8/14/13 EPC Design Specification
40 CFR 98 Table C-1
8/14/13 EPC Design Specification8/14/13 EPC Design Specification8/14/13 EPC Design Specification8/14/13 EPC Design Specification
Shutdown

APPENDIX B
B-16
Auxiliary Boilers - Potential to Emit Calculations for Startup/Shutdown Operation
HAP Emission Equation:Emissions (tons/year) = EF(lb/MMscf) / HHV * Unit Rating (MMbtu/hr) * Event Duration (hours) / 2000 lb/ton
Where:HHV = Site-specific fuel high heating value (btu/scf)
Potential Emissions of Hazardous Air Pollutants - Startup/Shutdown
HAP PollutantEmission Factor
(EF) EF Units Source BasisEmissions per Startup
(tons)Emissions per Unit (TPY)
Combined Emissions (TPY)
Emissions per Shutdown
(tons)Emissions per Unit (TPY)
Combined Emissions (TPY)
2-Methylnaphthalene 2.40E-05 lb/MMscf AP-42 Table 1.4-3 5.35E-07 2.68E-06 5.35E-06 1.09E-08 5.44E-08 1.09E-073-Methylchloranthrene 1.80E-06 lb/MMscf AP-42 Table 1.4-3 4.02E-08 2.01E-07 4.02E-07 8.16E-10 4.08E-09 8.16E-097,12-Dimethylbenz(a)anthra 1.60E-05 lb/MMscf AP-42 Table 1.4-3 3.57E-07 1.78E-06 3.57E-06 7.26E-09 3.63E-08 7.26E-08Acenaphthene 1.80E-06 lb/MMscf AP-42 Table 1.4-3 4.02E-08 2.01E-07 4.02E-07 8.16E-10 4.08E-09 8.16E-09Acenaphthylene 1.80E-06 lb/MMscf AP-42 Table 1.4-3 4.02E-08 2.01E-07 4.02E-07 8.16E-10 4.08E-09 8.16E-09Acetaldehyde 9.00E-04 lb/MMscf VC APCD EF 2.01E-05 1.00E-04 2.01E-04 4.08E-07 2.04E-06 4.08E-06Acrolein 8.00E-04 lb/MMscf VC APCD EF 1.78E-05 8.92E-05 1.78E-04 3.63E-07 1.81E-06 3.63E-06Anthracene 2.40E-06 lb/MMscf AP-42 Table 1.4-3 5.35E-08 2.68E-07 5.35E-07 1.09E-09 5.44E-09 1.09E-08Arsenic 2.00E-04 lb/MMscf AP-42 Table 1.4-4 4.46E-06 2.23E-05 4.46E-05 9.07E-08 4.53E-07 9.07E-07Benz(a)anthracene 1.80E-06 lb/MMscf AP-42 Table 1.4-3 4.02E-08 2.01E-07 4.02E-07 8.16E-10 4.08E-09 8.16E-09Benzene 1.70E-03 lb/MMscf VC APCD EF 3.79E-05 1.90E-04 3.79E-04 7.71E-07 3.85E-06 7.71E-06Benzo(a)pyrene 1.20E-06 lb/MMscf AP-42 Table 1.4-3 2.68E-08 1.34E-07 2.68E-07 5.44E-10 2.72E-09 5.44E-09Benzo(b)fluoranthene 1.80E-06 lb/MMscf AP-42 Table 1.4-3 4.02E-08 2.01E-07 4.02E-07 8.16E-10 4.08E-09 8.16E-09Benzo(g,h,i)perylene 1.20E-06 lb/MMscf AP-42 Table 1.4-3 2.68E-08 1.34E-07 2.68E-07 5.44E-10 2.72E-09 5.44E-09Benzo(k)fluoranthene 1.80E-06 lb/MMscf AP-42 Table 1.4-3 4.02E-08 2.01E-07 4.02E-07 8.16E-10 4.08E-09 8.16E-09Beryllium 1.20E-05 lb/MMscf AP-42 Table 1.4-4 2.68E-07 1.34E-06 2.68E-06 5.44E-09 2.72E-08 5.44E-08Cadmium 1.10E-03 lb/MMscf AP-42 Table 1.4-4 2.45E-05 1.23E-04 2.45E-04 4.99E-07 2.49E-06 4.99E-06Chromium 1.40E-03 lb/MMscf AP-42 Table 1.4-4 3.12E-05 1.56E-04 3.12E-04 6.35E-07 3.17E-06 6.35E-06Chrysene 1.80E-06 lb/MMscf AP-42 Table 1.4-3 4.02E-08 2.01E-07 4.02E-07 8.16E-10 4.08E-09 8.16E-09Cobalt 8.40E-05 lb/MMscf AP-42 Table 1.4-4 1.87E-06 9.37E-06 1.87E-05 3.81E-08 1.90E-07 3.81E-07Dibenzo(a,h)anthracene 1.20E-06 lb/MMscf AP-42 Table 1.4-3 2.68E-08 1.34E-07 2.68E-07 5.44E-10 2.72E-09 5.44E-09Dichlorobenzene 1.20E-03 lb/MMscf AP-42 Table 1.4-3 2.68E-05 1.34E-04 2.68E-04 5.44E-07 2.72E-06 5.44E-06Ethylbenzene 2.00E-03 lb/MMscf VC APCD EF 4.46E-05 2.23E-04 4.46E-04 9.07E-07 4.53E-06 9.07E-06Fluoranthene 3.00E-06 lb/MMscf AP-42 Table 1.4-3 6.69E-08 3.35E-07 6.69E-07 1.36E-09 6.80E-09 1.36E-08Fluorene 2.80E-06 lb/MMscf AP-42 Table 1.4-3 6.25E-08 3.12E-07 6.25E-07 1.27E-09 6.35E-09 1.27E-08
Formaldehyde 3.60E-03 lb/MMscfVC APCD EF (50% control) 8.03E-05 4.02E-04 8.03E-04 1.63E-06 8.16E-06 1.63E-05
Hexane 1.30E-03 lb/MMscf VC APCD EF 2.90E-05 1.45E-04 2.90E-04 5.89E-07 2.95E-06 5.89E-06Indeno(1,2,3-cd)pyrene 1.80E-06 lb/MMscf AP-42 Table 1.4-3 4.02E-08 2.01E-07 4.02E-07 8.16E-10 4.08E-09 8.16E-09Lead 5.00E-04 lb/MMscf AP-42 Table 1.4-2 1.12E-05 5.58E-05 1.12E-04 2.27E-07 1.13E-06 2.27E-06Manganese 3.80E-04 lb/MMscf AP-42 Table 1.4-4 8.48E-06 4.24E-05 8.48E-05 1.72E-07 8.62E-07 1.72E-06Mercury 2.60E-04 lb/MMscf AP-42 Table 1.4-4 5.80E-06 2.90E-05 5.80E-05 1.18E-07 5.89E-07 1.18E-06Naphthalene 3.00E-04 lb/MMscf VC APCD EF 6.69E-06 3.35E-05 6.69E-05 1.36E-07 6.80E-07 1.36E-06Nickel 2.10E-03 lb/MMscf AP-42 Table 1.4-4 4.68E-05 2.34E-04 4.68E-04 9.52E-07 4.76E-06 9.52E-06Phenanathrene 1.70E-05 lb/MMscf AP-42 Table 1.4-3 3.79E-07 1.90E-06 3.79E-06 7.71E-09 3.85E-08 7.71E-08Pyrene 5.00E-06 lb/MMscf AP-42 Table 1.4-3 1.12E-07 5.58E-07 1.12E-06 2.27E-09 1.13E-08 2.27E-08Selenium 2.40E-05 lb/MMscf AP-42 Table 1.4-4 5.35E-07 2.68E-06 5.35E-06 1.09E-08 5.44E-08 1.09E-07Toluene 7.80E-03 lb/MMscf VC APCD EF 1.74E-04 8.70E-04 1.74E-03 3.54E-06 1.77E-05 3.54E-05Xylenes 5.80E-03 lb/MMscf VC APCD EF 1.29E-04 6.47E-04 1.29E-03 2.63E-06 1.31E-05 2.63E-05
TOTAL HAPS 0.000704 0.003519 0.007038 0.000014 0.000072 0.000143
Note1 : 50% control for formaldehyde assumes 50% control from Oxidation CatalystNote 2: Emission factors denoted "VC APCD EF" are from the Ventura County Air Pollution Control District "AB2588 Combustion Emission Factors" as published May 17, 2001.
Startup Shutdown

APPENDIX B
B-17
Auxiliary Boilers- Potential to Emit Calculations for Normal Operation and Startup/Shutdown
Potential Emissions for Auxiliary Boilers - Startup and Shutdown (Tons per Year)
Operations NOx CO SO2 VOCPM
(Filterable)
PM10/ PM2.5
(Fil + Con) H2S H2SO4 NH3 CO2 CH4 N2O CO2e Pb HAPSStartup Emissions - Per Unit 7.37 6.55 0.08 0.33 0.74 0.74 0.04 0.12 0.00 10,210.93 0.19 0.02 10,221.48 5.58E-05 0.00Shutdown Emissions - Per Unit 0.10 0.09 0.00 0.00 0.01 0.01 0.00 0.00 0.01 175.98 0.00 0.00 176.16 1.13E-06 0.00Startup and Shutdown Emissions - Per Unit 7.46 6.64 0.08 0.33 0.75 0.75 0.04 0.12 0.01 10,386.91 0.20 0.02 10,397.64 5.69E-05 0.00
Potential Emissions for Auxiliary Boilers - Normal Operation - Per Unit
Operations NOx CO SO2 VOCPM
(Filterable)
PM10/ PM2.5
(Fil + Con) H2S H2SO4 NH3 CO2 CH4 N2O CO2e Pb HAPS
Normal Emissions (Tons per Year) - Per Unit18.86 16.77 0.00 1.91 9.53 25.89 0.00 0.00 15.11 222,876.54 4.20 0.42 223,106.72 1.44E-03 0.09
Normal Emissions (lbs/hr) - Per Unit 4.31 3.83 0.00 0.44 2.18 5.91 0.00 0.00 3.45 50,885.05 0.96 0.10 50,937.61 1.12E-05 0.02
Normal Emissions (Tons per Year) - Combined37.72 33.53 0.00 3.81 19.05 51.79 0.00 0.00 30.22 445,753.08 8.40 0.84 446,213.45 2.87E-03 0.17
Hours of Operation Unit 1 Unit 2Hours for startup 401.333 401.333Hours for shutdown 6.9 6.9TOTAL 408.3 408.3
Auxiliary Boilers Combined Annual Emissions Incorporating Startup/Shutdown emissions and Normal Operation Emissions
Operations NOx CO SO2 VOCPM
(Filterable)
PM10/ PM2.5
(Fil + Con) H2S H2SO4 NH3 CO2 CH4 N2O CO2e Pb HAPSAuxiliary Boilers Total Normal + Startup/Shutdown Emissions - Per Unit
25.45 22.62 0.08 2.15 9.84 25.44 0.04 0.12 14.41 222,876.54 4.20 0.42 223,107 1.03E-04 0.09
Auxiliary Boilers Total Normal + Startup/Shutdown Emissions - Combined
50.89 45.24 0.16 4.30 19.67 50.88 0.08 0.24 28.83 445,753.08 8.40 0.84 446,213 2.07E-04 0.17
Note - Emission reflect Startup and Shutdown emissions from 408.3 hours per year and normal operation emissions for the remaining 8351.7 hours in the year (8760-408.3).
Maximum Auxiliary Boiler Annual Emissions - Per Unit
25.45 22.62 0.08 2.15 9.84 25.89 0.04 0.12 15.11 222,876.54 4.20 0.42 223,107 1.44E-03 0.09
Maximum Auxiliary Boiler Annual Emissions - Combined
50.89 45.24 0.16 4.30 19.67 51.79 0.08 0.24 30.22 445,753.08 8.40 0.84 446,213 2.87E-03 0.17
Note - Reflects the higher value of either operating at normal conditions for 8760 hours per year or accounting for normal and startup/shutdown emissions for the year.

APPENDIX B
B-18
Emergency Generators - Potential to Emit Calculations
Operating InformationParameter Value Units
Unit Rating 1550 hpUnit Rating 1156 kW
Max Heat Input Rating 10.85 MMBTU/hrFuel High Heat Value 0.138 MMbtu/galFuel Sulfur Content 15 ppmHours of Operation 500 hr/yrNumber of Units 1Note: The CPCN Application listed 1000 ekw, however the calculated kw value of 1156 was used for all emissions calculations.
Potential Emissions of Criteria Pollutants
PollutantEmission
Factor (EF) EF Units lb/hr TPY
NOx 5.97 g/kW-hr 15.21 3.80CO 3.5 g/kW-hr 8.92 2.23SO2 1.2E-05 lb/hp-hr 0.019 0.005VOC 7.05E-04 lb/hp-hr 1.09 0.27H2S 15 ppm (fuel) 0.009 0.002H2SO4 15 ppm (fuel) 0.025 0.006Ammonia 0CO2 73.96 kg/MMBTU 1769.1 442.28CH4 0.003 kg/MMBTU 0.07 0.02N2O 0.0006 kg/MMBTU 0.01 0.004CO2e 1775.20 443.80PM Filterable 0.2 g/kW-hr 0.51 0.13PM10/2.5 Condensable 0.0077 lb/MMBTU 0.08 0.02PM10/2.5 Filterable and Condensable 0.59 0.15
H2SO4, and H2S Emission Equation:Emissions (lb/hr) = ppm/10E6 * MMbtu/hr * 1/HHV * MW of pollutant/MW of S * p *3785.41178/453.562
Where:p = density of diesel fuel 0.843 grams/cm33785.41178 conversion from cm3 to gallons453.562 conversion from grams to pounds
NOx, CO, PM Filterable Emission Equation:Emissions (lb/hr) = EF (g/kW-hr) / 453.6 g/lb * Unit Rating (kW)
PM Condensable Emission EquationEmissions (lb/hr) = EF (lb/MMBTU) * Unit Rating (MMBTU/hr)
SO2, VOC Emission EquationEmissions (lb/hr) = EF (lb/hp-hr) * Unit Rating (hp)
Note 1 - The NOx emission factor of 5.97 g/kw-hr was derived by subtracting the AP-42 emission factor for VOC (7.05E-04 lb/hp-hr or 0.43 g/kw-hr) from the NSPS Subpart IIII combined NOx and NMHC emission factor of 6.40 g/kw-hr.
Source/Basis8/14/13 EPC Design Specification
Calculated based on 1HP = 0.7457 kw
Source/Basis
40 CFR 98 Table C-1NSPS Subpart IIII and 40CFR 80.510
Calculated using average brake-specific fuel consumption (BSFC) of 7,000 Btu/hp-hr
Proposed limit per CPCN Application
NSPS Subpart IIII and 40CFR 89.112 (See Note 1)
40 CFR 98 Table C-1 (No. 2 Fuel)40 CFR 98 Table C-240 CFR 98 Table C-2
GWPs from 40 CFR 98 Table A-1
None anticipated
AP-42 Table 3.4-2
NSPS Subpart IIII and 40CFR 89.112AP-42 Table 3.4-1 and sulfur content
AP-42 Table 3.4-1 (TOC = VOC)Assume all fuel sulfur becomes H2S
Assume all fuel sulfur becomes H2SO4
NSPS Subpart IIII and 40CFR 89.112
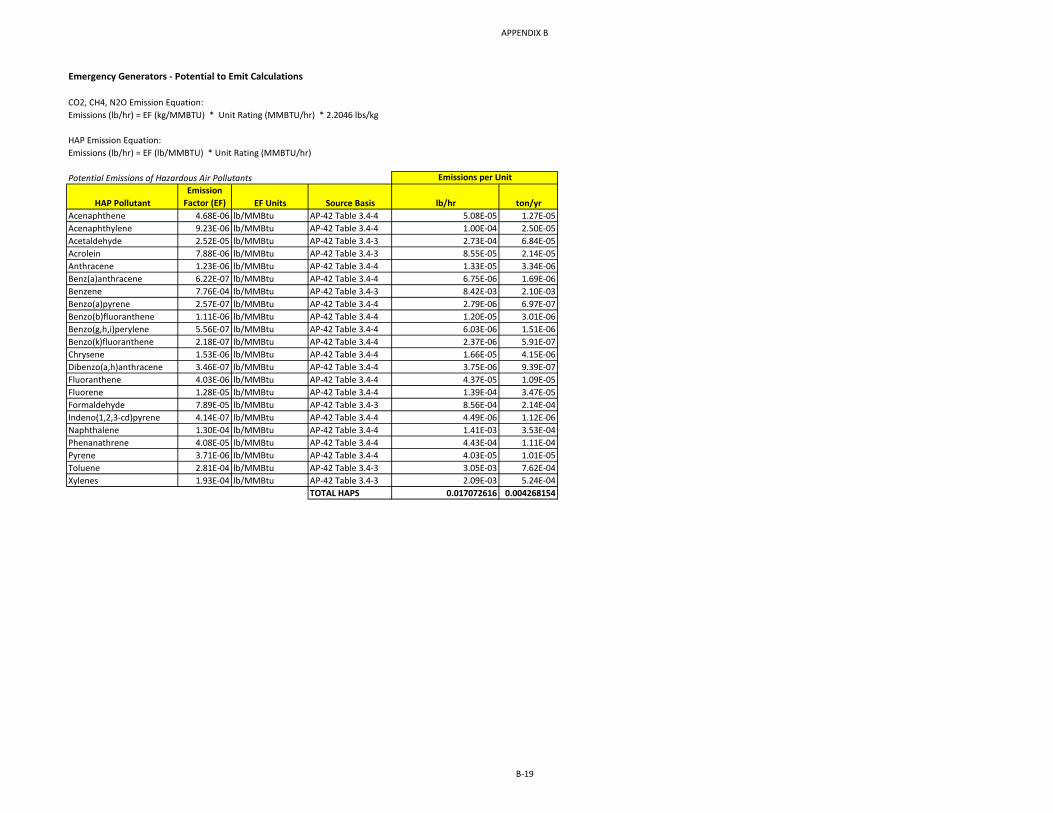
APPENDIX B
B-19
Emergency Generators - Potential to Emit Calculations
CO2, CH4, N2O Emission Equation:Emissions (lb/hr) = EF (kg/MMBTU) * Unit Rating (MMBTU/hr) * 2.2046 lbs/kg
HAP Emission Equation:Emissions (lb/hr) = EF (lb/MMBTU) * Unit Rating (MMBTU/hr)
Potential Emissions of Hazardous Air Pollutants
HAP PollutantEmission
Factor (EF) EF Units Source Basis lb/hr ton/yrAcenaphthene 4.68E-06 lb/MMBtu AP-42 Table 3.4-4 5.08E-05 1.27E-05Acenaphthylene 9.23E-06 lb/MMBtu AP-42 Table 3.4-4 1.00E-04 2.50E-05Acetaldehyde 2.52E-05 lb/MMBtu AP-42 Table 3.4-3 2.73E-04 6.84E-05Acrolein 7.88E-06 lb/MMBtu AP-42 Table 3.4-3 8.55E-05 2.14E-05Anthracene 1.23E-06 lb/MMBtu AP-42 Table 3.4-4 1.33E-05 3.34E-06Benz(a)anthracene 6.22E-07 lb/MMBtu AP-42 Table 3.4-4 6.75E-06 1.69E-06Benzene 7.76E-04 lb/MMBtu AP-42 Table 3.4-3 8.42E-03 2.10E-03Benzo(a)pyrene 2.57E-07 lb/MMBtu AP-42 Table 3.4-4 2.79E-06 6.97E-07Benzo(b)fluoranthene 1.11E-06 lb/MMBtu AP-42 Table 3.4-4 1.20E-05 3.01E-06Benzo(g,h,i)perylene 5.56E-07 lb/MMBtu AP-42 Table 3.4-4 6.03E-06 1.51E-06Benzo(k)fluoranthene 2.18E-07 lb/MMBtu AP-42 Table 3.4-4 2.37E-06 5.91E-07Chrysene 1.53E-06 lb/MMBtu AP-42 Table 3.4-4 1.66E-05 4.15E-06Dibenzo(a,h)anthracene 3.46E-07 lb/MMBtu AP-42 Table 3.4-4 3.75E-06 9.39E-07Fluoranthene 4.03E-06 lb/MMBtu AP-42 Table 3.4-4 4.37E-05 1.09E-05Fluorene 1.28E-05 lb/MMBtu AP-42 Table 3.4-4 1.39E-04 3.47E-05Formaldehyde 7.89E-05 lb/MMBtu AP-42 Table 3.4-3 8.56E-04 2.14E-04Indeno(1,2,3-cd)pyrene 4.14E-07 lb/MMBtu AP-42 Table 3.4-4 4.49E-06 1.12E-06Naphthalene 1.30E-04 lb/MMBtu AP-42 Table 3.4-4 1.41E-03 3.53E-04Phenanathrene 4.08E-05 lb/MMBtu AP-42 Table 3.4-4 4.43E-04 1.11E-04Pyrene 3.71E-06 lb/MMBtu AP-42 Table 3.4-4 4.03E-05 1.01E-05Toluene 2.81E-04 lb/MMBtu AP-42 Table 3.4-3 3.05E-03 7.62E-04Xylenes 1.93E-04 lb/MMBtu AP-42 Table 3.4-3 2.09E-03 5.24E-04
TOTAL HAPS 0.017072616 0.004268154
Emissions per Unit

APPENDIX B
B-20
Fire Pump Engines - Potential to Emit Calculations
Operating InformationParameter Value Units
Unit Rating 350 hpUnit Rating 261 kW
Max Heat Input Rating 2.45 MMBTU/hrFuel High Heat Value 0.138 MMBTU/gal 40 CFR 98 Table C-1Fuel Sulfur Content 15 ppmHours of Operation 104 hr/yr Proposed limit per CPCN ApplicationNumber of Units 5
Potential Emissions of Criteria Pollutants Combined (5)
PollutantEmission
Factor (EF) EF Units lb/hr TPY TPYNOx 1.86 g/hp-hr 1.44 0.075 0.37CO 6.68E-03 lb/hp-hr 2.34 0.122 0.61SO2 2.1E-03 lb/hp-hr 0.718 0.037 0.19VOC 2.51E-03 lb/hp-hr 0.88 0.046 0.23H2S 15 ppm (fuel) 0.0020 0.00010 5.18E-04H2SO4 15 ppm (fuel) 0.0057 0.00030 1.49E-03Ammonia 0 0 0 0.00CO2 73.96 kg/MMBTU 399.5 20.77 103.87CH4 0.003 kg/MMBTU 0.016 0.0008 0.004N2O 0.0006 kg/MMBTU 0.003 0.0002 0.001CO2e 400.9 20.84 104.22PM Filterable 0.15 g/hp-hr 0.12 0.006 0.03PM10/2.5 Condensable 0.0077 lb/MMBtu 0.02 0.001 0.00PM10/2.5 Filterable and Condensable 0.13 0.007 0.03Note 1 - AP-42 Section 3.3 does not provide an emission factor for particualte condensable; therefore, the emission factor from AP-42 Section 3.4 was co
H2SO4, and H2S Emission Equation:Emissions (lb/hr) = ppm/10E6 * MMbtu/hr * 1/HHV * MW of pollutant/MW of S * p *3785.41178/453.562
Per DR#1-30 Response - Wherep = density of diesel fuel 0.843 grams/cm33785.41178 conversion from cm3 to gallons453.562 conversion from grams to pounds
NOx, PM filterable Emission Equation:Emissions (lb/hr) = EF (g/kW-hr) / 453.6 g/lb * Unit Rating (kW)
PM Condensable Emission EquationEmissions (lb/hr) = EF (lb/MMBTU) * Unit Rating (MMBTU/hr)
CO, SO2, VOC Emission EquationEmissions (lb/hr) = EF (lb/hp-hr) * Unit Rating (hp)
CO2, CH4, N2O Emission Equation:Emissions (lb/hr) = EF (kg/MMBTU) * Unit Rating (MMBTU/hr) * 2.2046 lbs/kg
AP-42 Table 3.3-1
AP-42 Table 3.4-2
None anticipated
AP-42 Table 3.3-1AP-42 Table 3.3-1 (TOC = VOC)
Assume all fuel sulfur becomes H2SAssume all fuel sulfur becomes H2SO4
NSPS Subpart IIII
Calculated using average brake-specific fuel consumption (BSFC) of 7,000 Btu/hp-hr
Source/Basis8/14/13 EPC Design Specification8/14/13 EPC Design Specification
Source/BasisNSPS Subpart IIII (See Note 2)
40 CFR 98 Table C-1 (No.2 Fuel)40 CFR 98 Table C-240 CFR 98 Table C-2
GWPs from 40 CFR 98 Table A-1
Emissions per Unit
NSPS Subpart IIII and 40CFR 80.510
Note 2 - The NOx emission factor of 1.86 g/hp-hr was derived by subtracting the AP-42 emission factor for VOC (2.51E-03 lb/hp-hr or 1.14 g/hp-hr) from the NSPS Subpart IIII combined NOx and NMHC emission factor of 3.0 g/hp-hr.

APPENDIX B
B-21
Fire Pump Engines - Potential to Emit Calculations
HAP Emission Equation:Emissions (lb/hr) = EF (lb/MMBTU) * Unit Rating (MMBTU/hr)
Potential Emissions of Hazardous Air Pollutants
HAP PollutantEmission
Factor (EF) EF Units Source Basis lb/hr ton/yr lb/hr ton/yr1,3-Butadiene 3.91E-05 lb/MMBtu AP-42 Table 3.3-2 9.58E-05 4.98E-06 4.79E-04 2.49E-05Acenaphthene 1.42E-06 lb/MMBtu AP-42 Table 3.3-2 3.48E-06 1.81E-07 1.74E-05 9.05E-07Acenaphthylene 5.06E-06 lb/MMBtu AP-42 Table 3.3-2 1.24E-05 6.45E-07 6.20E-05 3.22E-06Acetaldehyde 7.67E-04 lb/MMBtu AP-42 Table 3.3-2 1.88E-03 9.77E-05 9.40E-03 4.89E-04Acrolein 9.25E-05 lb/MMBtu AP-42 Table 3.3-2 2.27E-04 1.18E-05 1.13E-03 5.89E-05Anthracene 1.87E-06 lb/MMBtu AP-42 Table 3.3-2 4.58E-06 2.38E-07 2.29E-05 1.19E-06Benz(a)anthracene 1.68E-06 lb/MMBtu AP-42 Table 3.3-2 4.12E-06 2.14E-07 2.06E-05 1.07E-06Benzene 9.33E-04 lb/MMBtu AP-42 Table 3.3-2 2.29E-03 1.19E-04 1.14E-02 5.94E-04Benzo(a)pyrene 1.88E-07 lb/MMBtu AP-42 Table 3.3-2 4.61E-07 2.40E-08 2.30E-06 1.20E-07Benzo(b)fluoranthene 9.91E-08 lb/MMBtu AP-42 Table 3.3-2 2.43E-07 1.26E-08 1.21E-06 6.31E-08Benzo(g,h,i)perylene 4.89E-07 lb/MMBtu AP-42 Table 3.3-2 1.20E-06 6.23E-08 5.99E-06 3.11E-07Benzo(k)fluoranthene 1.55E-07 lb/MMBtu AP-42 Table 3.3-2 3.80E-07 1.97E-08 1.90E-06 9.87E-08Chrysene 3.53E-07 lb/MMBtu AP-42 Table 3.3-2 8.65E-07 4.50E-08 4.32E-06 2.25E-07Dibenzo(a,h)anthracene 5.83E-07 lb/MMBtu AP-42 Table 3.3-2 1.43E-06 7.43E-08 7.14E-06 3.71E-07Fluoranthene 7.61E-06 lb/MMBtu AP-42 Table 3.3-2 1.86E-05 9.70E-07 9.32E-05 4.85E-06Fluorene 2.92E-05 lb/MMBtu AP-42 Table 3.3-2 7.15E-05 3.72E-06 3.58E-04 1.86E-05Formaldehyde 1.18E-03 lb/MMBtu AP-42 Table 3.3-2 2.89E-03 1.50E-04 1.45E-02 7.52E-04Indeno(1,2,3-cd)pyrene 3.75E-07 lb/MMBtu AP-42 Table 3.3-2 9.19E-07 4.78E-08 4.59E-06 2.39E-07Naphthalene 8.48E-05 lb/MMBtu AP-42 Table 3.3-2 2.08E-04 1.08E-05 1.04E-03 5.40E-05Phenanathrene 2.94E-05 lb/MMBtu AP-42 Table 3.3-2 7.20E-05 3.75E-06 3.60E-04 1.87E-05Pyrene 4.78E-06 lb/MMBtu AP-42 Table 3.3-2 1.17E-05 6.09E-07 5.86E-05 3.04E-06Toluene 4.09E-04 lb/MMBtu AP-42 Table 3.3-2 1.00E-03 5.21E-05 5.01E-03 2.61E-04Xylenes 2.85E-04 lb/MMBtu AP-42 Table 3.3-2 6.98E-04 3.63E-05 3.49E-03 1.82E-04
TOTAL HAPS 9.49E-03 4.94E-04 4.75E-02 2.47E-03
Emissions per Unit Combined Emissions

APPENDIX B
B-22
Thermal Oxidizer - Potential to Emit Calculations
Operating InformationParameter Value Units
Acid Gas Stream Flow Rate 1,928 lb-mol/hrAcid Gas Stream Flow Rate 18 MMscfdAcid Gas Stream High Heat Value 2,272 Btu/lb-molAcid Gas High Heat Value 6.0 Btu/scfHydrocarbons to Thermal Oxidizer 2,556 lb/hrBurner Rating 56 MMBTU/hrFuel Gas High Heat Value 380,662 Btu/lb-molFuel Gas High Heat Value 1,004 Btu/scfStack Flowrate 42,000 acfmStack Flowrate 26,963 scfmStack Flowrate 24,024 dscfmExhaust Moisture Content 10.9 %Exhaust Oxygen Content 1.6 %Hydrocarbon Destruction Efficiency 99.99 %Hours of Operation 8760 hr/yrNumber of Units 1
Component Mole % Molecular Weight Mass %Methane 0.31 16.04 0.116Ethane 0.02 30.07 0.012
Propane 0.01 44.10 0.009i-Butane 1.00E-03 58.12 0.001n-Butane 2.00E-03 58.12 0.003
Pentanes+ 0.00E+00 72.15 0.0CO2 95.85 44.01 98.244
Nitrogen 1.00E-03 28.01 0.001H2S 0.0001 34.08 0.0H2O 3.79 18.02 1.591
Mercury -- 200.59 --Benzene 1.30E-02 78.11 0.024
VOC 0.03 -- 0.04TOTAL 4.29E+03
Note -Acid Gas Stream Mole % Composition based on 8/14/13 EPC Desgin Specification
8/14/13 EPC Design Specification (pipeline)Calculated based on 379 scf/lb-mol
Per CPCN Application
Acid Gas Stream Composition
8/14/13 EPC Design Specification
Source/Basis
Calculated based on 379 scf/lb-mol
Calculated based on 379 scf/lb-mol8/14/13 EPC Design Specification
8/14/13 EPC Design Specification8/14/13 EPC Design Specification
Per CPCN Application
8/14/13 EPC Design Specification - At 350FPer CPCN Application - At 60 degrees Fahrenheit
8/14/13 EPC Design Specification8/14/13 EPC Design Specification

APPENDIX B
B-23
Thermal Oxidizer - Potential to Emit Calculations
Potential Emissions of Criteria Pollutants
PollutantEmission
Factor (EF) EF Units lb/hr TPYNOX 2.5 ppmvd 1.421 6.23 CO 1.5 ppmvd 0.52 2.27 SO2 0.00117 lb-mol/hr 0.07 0.33
VOC 0.026 lb/hr 0.026 0.11H2S 0.00117 lb-mol/hr 0.04 0.17 H2SO4 0.00117 lb-mol/hr 0.11 0.50 Ammonia 5 ppmvd 1.1 4.60 CO2 - Fuel Gas Combustion 53.06 kg/MMBtu 6,550.72 28,692.15 CO2 - Uncombusted 95.85 mol% CO2 (acid gas) 81,219.04 355,739.39 CO2 - Combusted -- -- 391 1,714.50 CO2 Total -- -- 88,161.20 386,146.04 CH4 - Fuel Gas Combustion 0.001 kg/MMBtu 0.12 0.54 CH4 - Uncombusted 0.31 mol% CH4 (acid gas) 0.01 0.04 CH4 - Total -- -- 0.13 0.58 N2O 0.0001 kg/MMBtu 0.01 0.05 CO2e -- -- 88,168.20 386,176.73 PM Filterable 0.7 lb/hr 0.70 3.07 PM10/2.5 Condensable 0.0018 lb-mol/hr 0.21 0.91 PM10/2.5 Filterable and Condensable 0.91 3.97
NOX/CO/VOC/Ammonia Emission Equation:Emissions (lb/hr) = ppm/10E6 * 0.076 * dscfm * 60min/hr * MW of pollutant/29 *[(20.9-actual O2%)/(20.9-design O2%)
Where0.076 - density of air at 60F (lb/scf)29 - Molecular weight of air (lb/lb-mol)20.9 - ambient O2 Concentraiont (%)
SO2, H2S, H2SO4, PM Condensable Emission Equation:Emissions (lb/hr) = EF(lb-mol/hr) * Molecular weight of pollutant (lb/lb-mol)
CO2, CH4, N2O Emission Equation: (Fuel gas combustion)Emissions (lb/hr) = EF (kg/MMBTU) * Unit Rating (MMBTU/hr) * 2.2046 lbs/kg
Uncombusted CO2 Emission Equation: (Acid Gas)Emissions (lb/hr) = mole percent CO2 in gas stream * Flowrate (MMscfd) / 24 hrs/day * 1000000 scf/MMscf * 0.0526 (density of CO2) * 2.20462 lbs/kg
Density of GHG Per 40 CFR 98 Subpart W - Use 0.0526 kg/ft3 for CO2 and N2 O, and 0.0192 kg/ft3 for CH4 at 60 °F and 14.7 psia.
Combusted CO2 Emission Equation: (Acid Gas)Emissions (lb/hr) = destruction eff. * Flowrate (MMscfd) / 24 hrs/day * 1000000 scf/MMscf * 0.0526 (density of CO2) * 2.20462 lbs/kg * [MCH4 + (2*MC2) + (3*MC3) + (4*MC4) + (5*MC5)+ (6*MBenzene]
Where:M = Mole percent of compounds in gas stream (such as methane, ethane, propane, butane, and pentanes-plus).C# = Number of carbon atoms in the compound: 1 for methane, 2 for ethane, 3 for propane, 4 for butane, 5 for pentanes-plus, and 6 for benzene.
Uncombusted CH4 Emission Equation: (Acid Gas)lb/hr = mole percent CH4in gas stream * Flowrate (MMscfd) / 24 hrs/day * 1000000 scf/MMscf * (1 - destruction eff.) * 0.0192(density of CH4) * 2.20462 lbs/kg
Density of GHG Per 40 CFR 98 Subpart W - Use 0.0526 kg/ft3 for CO2 and N2 O, and 0.0192 kg/ft3 for CH4 at 60 °F and 14.7 psia.
8/14/13 EPC Design Specification8/14/13 EPC Design Specification
See above
See above
40 CFR 98 Table C-2
40 CFR 98 Table C-2
See above
40 CFR 98 Eq. W-19 and W-36
8/14/13 EPC Design Specification8/14/13 EPC Design Specification8/14/13 EPC Design Specification
8/14/13 EPC Design Spec - 99.99% destruction efficiency of hydrocarbons to TO _ 90% control
from oxidation catalyst8/14/13 EPC Design Specification8/14/13 EPC Design Specification
40 CFR 98 Table C-1 (Natural Gas)8/14/13 EPC Design Specification
40 CFR 98 Eq. W-20 and W-3640 CFR 98 Eq. W-21 and W-36
Emissions per Unit
Source/Basis

APPENDIX B
B-24
Thermal Oxidizer - Potential to Emit Calculations
HAP /TAP Emission Equation:Emissions (lb/hr) = EF(lb/MMscf) / HHV * Unit Rating (MMbtu/hr)
Where:HHV = Site-specific fuel high heating value (btu/scf)
Potential Emissions of Hazardous Air Pollutants
HAP PollutantEmission
Factor (EF) EF Units Source Basis lb/hr ton/yr2-Methylnaphthalene 2.40E-05 lb/MMscf AP-42 Table 1.4-3 1.34E-06 5.86E-063-Methylchloranthrene 1.80E-06 lb/MMscf AP-42 Table 1.4-3 1.00E-07 4.40E-077,12-Dimethylbenz(a)anthracene 1.60E-05 lb/MMscf AP-42 Table 1.4-3 8.92E-07 3.91E-06Acenaphthene 1.80E-06 lb/MMscf AP-42 Table 1.4-3 1.00E-07 4.40E-07Acenaphthylene 1.80E-06 lb/MMscf AP-42 Table 1.4-3 1.00E-07 4.40E-07Acetaldehyde 3.10E-03 lb/MMscf VC APCD EF 1.73E-04 7.57E-04Acrolein 2.70E-03 lb/MMscf VC APCD EF 1.51E-04 6.59E-04Anthracene 2.40E-06 lb/MMscf AP-42 Table 1.4-3 1.34E-07 5.86E-07Arsenic 2.00E-04 lb/MMscf AP-42 Table 1.4-4 1.12E-05 4.88E-05Benz(a)anthracene 1.80E-06 lb/MMscf AP-42 Table 1.4-3 1.00E-07 4.40E-07Benzene 5.80E-03 lb/MMscf VC APCD EF 3.23E-04 1.42E-03Benzo(a)pyrene 1.20E-06 lb/MMscf AP-42 Table 1.4-3 6.69E-08 2.93E-07Benzo(b)fluoranthene 1.80E-06 lb/MMscf AP-42 Table 1.4-3 1.00E-07 4.40E-07Benzo(g,h,i)perylene 1.20E-06 lb/MMscf AP-42 Table 1.4-3 6.69E-08 2.93E-07Benzo(k)fluoranthene 1.80E-06 lb/MMscf AP-42 Table 1.4-3 1.00E-07 4.40E-07Beryllium 1.20E-05 lb/MMscf AP-42 Table 1.4-4 6.69E-07 2.93E-06Cadmium 1.10E-03 lb/MMscf AP-42 Table 1.4-4 6.13E-05 2.69E-04Chromium 1.40E-03 lb/MMscf AP-42 Table 1.4-4 7.81E-05 3.42E-04Chrysene 1.80E-06 lb/MMscf AP-42 Table 1.4-3 1.00E-07 4.40E-07Cobalt 8.40E-05 lb/MMscf AP-42 Table 1.4-4 4.68E-06 2.05E-05Dibenzo(a,h)anthracene 1.20E-06 lb/MMscf AP-42 Table 1.4-3 6.69E-08 2.93E-07Dichlorobenzene 1.20E-03 lb/MMscf AP-42 Table 1.4-3 6.69E-05 2.93E-04Ethylbenzene 6.90E-03 lb/MMscf VC APCD EF 3.85E-04 1.69E-03Fluoranthene 3.00E-06 lb/MMscf AP-42 Table 1.4-3 1.67E-07 7.33E-07Fluorene 2.80E-06 lb/MMscf AP-42 Table 1.4-3 1.56E-07 6.84E-07
Formaldehyde 1.23E-02 lb/MMscf VC APCD EF (50% control) 3.43E-04 1.50E-03Hexane 4.60E-03 lb/MMscf VC APCD EF 2.56E-04 1.12E-03Indeno(1,2,3-cd)pyrene 1.80E-06 lb/MMscf AP-42 Table 1.4-3 1.00E-07 4.40E-07Lead 5.00E-04 lb/MMscf AP-42 Table 1.4-2 2.79E-05 1.22E-04Manganese 3.80E-04 lb/MMscf AP-42 Table 1.4-4 2.12E-05 9.28E-05Mercury 2.60E-04 lb/MMscf AP-42 Table 1.4-4 1.45E-05 6.35E-05Naphthalene 3.00E-04 lb/MMscf VC APCD EF 1.67E-05 7.33E-05Nickel 2.10E-03 lb/MMscf AP-42 Table 1.4-4 1.17E-04 5.13E-04Phenanathrene 1.70E-05 lb/MMscf AP-42 Table 1.4-3 9.48E-07 4.15E-06Pyrene 5.00E-06 lb/MMscf AP-42 Table 1.4-3 2.79E-07 1.22E-06Selenium 2.40E-05 lb/MMscf AP-42 Table 1.4-4 1.34E-06 5.86E-06Toluene 2.65E-02 lb/MMscf VC APCD EF 1.48E-03 6.47E-03Xylenes 1.97E-02 lb/MMscf VC APCD EF 1.10E-03 4.81E-03
TOTAL HAPS 4.63E-03 2.03E-02Note 1: 50% control for formaldehyde assumes 50% control from Oxidation Catalyst
Emissions per Unit
Note 2: Emission factors denoted "VC APCD EF" are from the Ventura County Air Pollution Control District "AB2588 Combustion Emission Factors" as published May 17, 2001.

APPENDIX B
B-25
Thermal Oxidizer - Potential to Emit Calculations
Potential Emissions of Toxic Air Pollutants not classified as HAPs
TAP PollutantEmission
Factor (EF) EF Units Source Basis lb/hr ton/yrBarium 4.40E-03 lb/MMscf AP-42 Table 1.4-4 2.45E-04 1.07E-03Butane 2.1 lb/MMscf AP-42 Table 1.4-3 1.17E-01 5.13E-01Copper 8.50E-04 lb/MMscf AP-42 Table 1.4-4 4.74E-05 2.08E-04Molybdenum 1.10E-03 lb/MMscf AP-42 Table 1.4-4 6.13E-05 2.69E-04Vanadium 2.30E-03 lb/MMscf AP-42 Table 1.4-4 1.28E-04 5.62E-04Zinc 2.90E-02 lb/MMscf AP-42 Table 1.4-4 1.62E-03 7.08E-03
Emissions per Unit
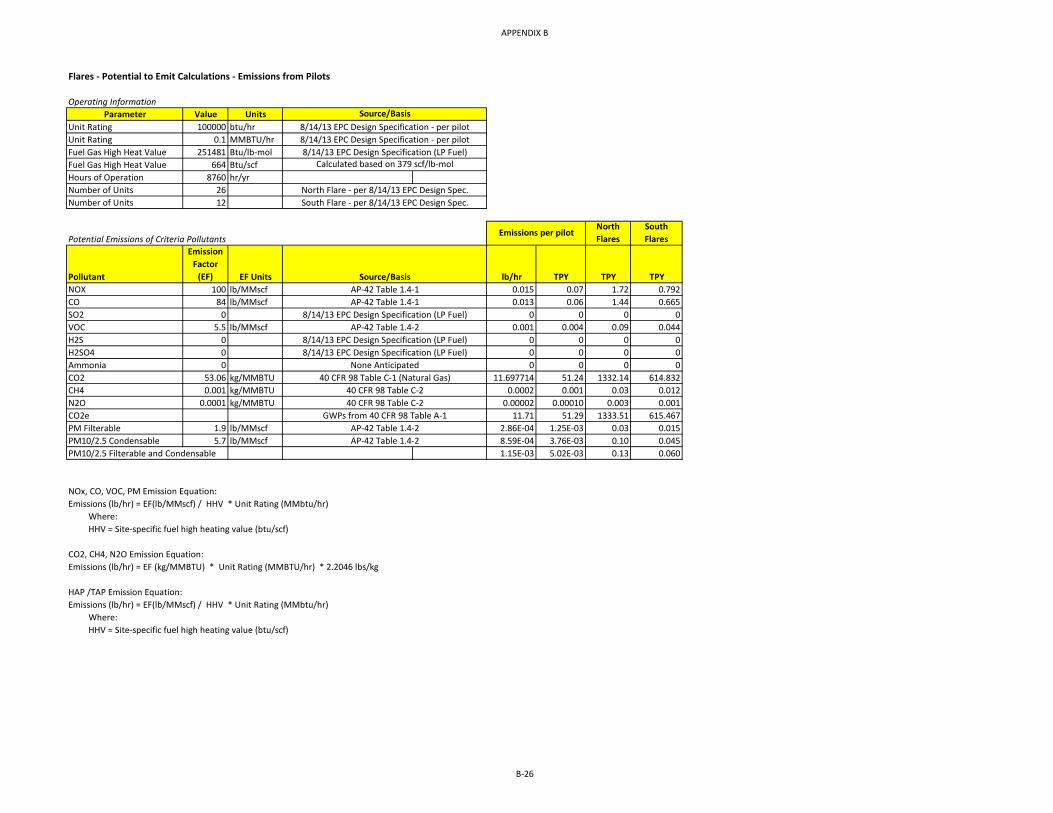
APPENDIX B
B-26
Flares - Potential to Emit Calculations - Emissions from Pilots
Operating InformationParameter Value Units
Unit Rating 100000 btu/hrUnit Rating 0.1 MMBTU/hrFuel Gas High Heat Value 251481 Btu/lb-molFuel Gas High Heat Value 664 Btu/scfHours of Operation 8760 hr/yrNumber of Units 26Number of Units 12
Potential Emissions of Criteria PollutantsNorth Flares
South Flares
Pollutant
Emission Factor
(EF) EF Units lb/hr TPY TPY TPYNOX 100 lb/MMscf 0.015 0.07 1.72 0.792CO 84 lb/MMscf 0.013 0.06 1.44 0.665SO2 0 0 0 0 0VOC 5.5 lb/MMscf 0.001 0.004 0.09 0.044H2S 0 0 0 0 0H2SO4 0 0 0 0 0Ammonia 0 0 0 0 0CO2 53.06 kg/MMBTU 11.697714 51.24 1332.14 614.832CH4 0.001 kg/MMBTU 0.0002 0.001 0.03 0.012N2O 0.0001 kg/MMBTU 0.00002 0.00010 0.003 0.001CO2e 11.71 51.29 1333.51 615.467PM Filterable 1.9 lb/MMscf 2.86E-04 1.25E-03 0.03 0.015PM10/2.5 Condensable 5.7 lb/MMscf 8.59E-04 3.76E-03 0.10 0.045PM10/2.5 Filterable and Condensable 1.15E-03 5.02E-03 0.13 0.060
NOx, CO, VOC, PM Emission Equation:Emissions (lb/hr) = EF(lb/MMscf) / HHV * Unit Rating (MMbtu/hr)
Where:HHV = Site-specific fuel high heating value (btu/scf)
CO2, CH4, N2O Emission Equation: Emissions (lb/hr) = EF (kg/MMBTU) * Unit Rating (MMBTU/hr) * 2.2046 lbs/kg
HAP /TAP Emission Equation:Emissions (lb/hr) = EF(lb/MMscf) / HHV * Unit Rating (MMbtu/hr)
Where:HHV = Site-specific fuel high heating value (btu/scf)
AP-42 Table 1.4-2AP-42 Table 1.4-2
Source/BasisAP-42 Table 1.4-1AP-42 Table 1.4-1
8/14/13 EPC Design Specification (LP Fuel)
8/14/13 EPC Design Specification (LP Fuel)8/14/13 EPC Design Specification (LP Fuel)
GWPs from 40 CFR 98 Table A-1
Emissions per pilot
Source/Basis8/14/13 EPC Design Specification - per pilot8/14/13 EPC Design Specification - per pilot8/14/13 EPC Design Specification (LP Fuel)
Calculated based on 379 scf/lb-mol
AP-42 Table 1.4-2
None Anticipated40 CFR 98 Table C-1 (Natural Gas)
40 CFR 98 Table C-240 CFR 98 Table C-2
North Flare - per 8/14/13 EPC Design Spec.South Flare - per 8/14/13 EPC Design Spec.

APPENDIX B
B-27
Flares - Potential to Emit Calculations - Emissions from Pilots
Potential Emissions of Hazardous Air Pollutants
HAP Pollutant
Emission Factor
(EF) EF Units Source Basis lb/hr ton/yr lb/hr ton/yr lb/hr ton/yr2-Methylnaphthalene 2.40E-05 lb/MMscf AP-42 Table 1.4-3 3.62E-09 1.58E-08 9.40E-08 4.12E-07 4.34E-08 1.90E-073-Methylchloranthrene 1.80E-06 lb/MMscf AP-42 Table 1.4-3 2.71E-10 1.19E-09 7.05E-09 3.09E-08 3.26E-09 1.43E-087,12-Dimethylbenz(a)anthrac 1.60E-05 lb/MMscf AP-42 Table 1.4-3 2.41E-09 1.06E-08 6.27E-08 2.75E-07 2.89E-08 1.27E-07Acenaphthene 1.80E-06 lb/MMscf AP-42 Table 1.4-3 2.71E-10 1.19E-09 7.05E-09 3.09E-08 3.26E-09 1.43E-08Acenaphthylene 1.80E-06 lb/MMscf AP-42 Table 1.4-3 2.71E-10 1.19E-09 7.05E-09 3.09E-08 3.26E-09 1.43E-08Acetaldehyde 4.30E-03 lb/MMscf VC APCD EF 6.48E-07 2.84E-06 1.68E-05 7.38E-05 7.78E-06 3.41E-05Acrolein 2.70E-03 lb/MMscf VC APCD EF 4.07E-07 1.78E-06 1.06E-05 4.63E-05 4.88E-06 2.14E-05Anthracene 2.40E-06 lb/MMscf AP-42 Table 1.4-3 3.62E-10 1.58E-09 9.40E-09 4.12E-08 4.34E-09 1.90E-08Arsenic 2.00E-04 lb/MMscf AP-42 Table 1.4-4 3.01E-08 1.32E-07 7.84E-07 3.43E-06 3.62E-07 1.58E-06Benz(a)anthracene 1.80E-06 lb/MMscf AP-42 Table 1.4-3 2.71E-10 1.19E-09 7.05E-09 3.09E-08 3.26E-09 1.43E-08Benzene 8.00E-03 lb/MMscf VC APCD EF 1.21E-06 5.28E-06 3.13E-05 1.37E-04 1.45E-05 6.34E-05Benzo(a)pyrene 1.20E-06 lb/MMscf AP-42 Table 1.4-3 1.81E-10 7.92E-10 4.70E-09 2.06E-08 2.17E-09 9.51E-09Benzo(b)fluoranthene 1.80E-06 lb/MMscf AP-42 Table 1.4-3 2.71E-10 1.19E-09 7.05E-09 3.09E-08 3.26E-09 1.43E-08Benzo(g,h,i)perylene 1.20E-06 lb/MMscf AP-42 Table 1.4-3 1.81E-10 7.92E-10 4.70E-09 2.06E-08 2.17E-09 9.51E-09Benzo(k)fluoranthene 1.80E-06 lb/MMscf AP-42 Table 1.4-3 2.71E-10 1.19E-09 7.05E-09 3.09E-08 3.26E-09 1.43E-08Beryllium 1.20E-05 lb/MMscf AP-42 Table 1.4-4 1.81E-09 7.92E-09 4.70E-08 2.06E-07 2.17E-08 9.51E-08Cadmium 1.10E-03 lb/MMscf AP-42 Table 1.4-4 1.66E-07 7.26E-07 4.31E-06 1.89E-05 1.99E-06 8.71E-06Chromium 1.40E-03 lb/MMscf AP-42 Table 1.4-4 2.11E-07 9.24E-07 5.49E-06 2.40E-05 2.53E-06 1.11E-05Chrysene 1.80E-06 lb/MMscf AP-42 Table 1.4-3 2.71E-10 1.19E-09 7.05E-09 3.09E-08 3.26E-09 1.43E-08Cobalt 8.40E-05 lb/MMscf AP-42 Table 1.4-4 1.27E-08 5.54E-08 3.29E-07 1.44E-06 1.52E-07 6.65E-07Dibenzo(a,h)anthracene 1.20E-06 lb/MMscf AP-42 Table 1.4-3 1.81E-10 7.92E-10 4.70E-09 2.06E-08 2.17E-09 9.51E-09Dichlorobenzene 1.20E-03 lb/MMscf AP-42 Table 1.4-3 1.81E-07 7.92E-07 4.70E-06 2.06E-05 2.17E-06 9.51E-06Ethylbenzene 9.50E-03 lb/MMscf VC APCD EF 1.43E-06 6.27E-06 3.72E-05 1.63E-04 1.72E-05 7.53E-05Fluoranthene 3.00E-06 lb/MMscf AP-42 Table 1.4-3 4.52E-10 1.98E-09 1.18E-08 5.15E-08 5.43E-09 2.38E-08Fluorene 2.80E-06 lb/MMscf AP-42 Table 1.4-3 4.22E-10 1.85E-09 1.10E-08 4.81E-08 5.06E-09 2.22E-08Formaldehyde 1.70E-02 lb/MMscf VC APCD EF 2.56E-06 1.12E-05 6.66E-05 2.92E-04 3.07E-05 1.35E-04Hexane 6.30E-03 lb/MMscf VC APCD EF 9.49E-07 4.16E-06 2.47E-05 1.08E-04 1.14E-05 4.99E-05Indeno(1,2,3-cd)pyrene 1.80E-06 lb/MMscf AP-42 Table 1.4-3 2.71E-10 1.19E-09 7.05E-09 3.09E-08 3.26E-09 1.43E-08Lead 5.00E-04 lb/MMscf AP-42 Table 1.4-2 7.54E-08 3.30E-07 1.96E-06 8.58E-06 9.04E-07 3.96E-06Manganese 3.80E-04 lb/MMscf AP-42 Table 1.4-4 5.73E-08 2.51E-07 1.49E-06 6.52E-06 6.87E-07 3.01E-06Mercury 2.60E-04 lb/MMscf AP-42 Table 1.4-4 3.92E-08 1.72E-07 1.02E-06 4.46E-06 4.70E-07 2.06E-06Naphthalene 3.00E-04 lb/MMscf VC APCD EF 4.52E-08 1.98E-07 1.18E-06 5.15E-06 5.43E-07 2.38E-06Nickel 2.10E-03 lb/MMscf AP-42 Table 1.4-4 3.16E-07 1.39E-06 8.23E-06 3.60E-05 3.80E-06 1.66E-05Phenanathrene 1.70E-05 lb/MMscf AP-42 Table 1.4-3 2.56E-09 1.12E-08 6.66E-08 2.92E-07 3.07E-08 1.35E-07Pyrene 5.00E-06 lb/MMscf AP-42 Table 1.4-3 7.54E-10 3.30E-09 1.96E-08 8.58E-08 9.04E-09 3.96E-08Selenium 2.40E-05 lb/MMscf AP-42 Table 1.4-4 3.62E-09 1.58E-08 9.40E-08 4.12E-07 4.34E-08 1.90E-07Toluene 3.66E-02 lb/MMscf VC APCD EF 5.52E-06 2.42E-05 1.43E-04 6.28E-04 6.62E-05 2.90E-04Xylenes 2.72E-02 lb/MMscf VC APCD EF 4.10E-06 1.80E-05 1.07E-04 4.67E-04 4.92E-05 2.15E-04
TOTAL HAPS 1.80E-05 7.87E-05 4.67E-04 2.05E-03 2.16E-04 9.45E-04
Note: Emission factors denoted "VC APCD EF" are from the Ventura County Air Pollution Control District "AB2588 Combustion Emission Factors" as published May 17, 2001.
South FlaresEmissions per Unit North Flares

APPENDIX B
B-28
Flares - Potential to Emit Calculations - Emissions from Pilots
Potential Emissions of Toxic Air Pollutants not classified as HAPs
TAP Pollutant
Emission Factor
(EF) EF Units Source Basis lb/hr ton/yr lb/hr ton/yr lb/hr ton/yrBarium 4.40E-03 lb/MMscf AP-42 Table 1.4-4 6.63E-07 2.90E-06 1.72E-05 7.55E-05 7.96E-06 3.49E-05Butane 2.1 lb/MMscf AP-42 Table 1.4-3 3.16E-04 1.39E-03 8.23E-03 3.60E-02 3.80E-03 1.66E-02Copper 8.50E-04 lb/MMscf AP-42 Table 1.4-4 1.28E-07 5.61E-07 3.33E-06 1.46E-05 1.54E-06 6.73E-06Molybdenum 1.10E-03 lb/MMscf AP-42 Table 1.4-4 1.66E-07 7.26E-07 4.31E-06 1.89E-05 1.99E-06 8.71E-06Vanadium 2.30E-03 lb/MMscf AP-42 Table 1.4-4 3.47E-07 1.52E-06 9.01E-06 3.95E-05 4.16E-06 1.82E-05Zinc 2.90E-02 lb/MMscf AP-42 Table 1.4-4 4.37E-06 1.91E-05 1.14E-04 4.98E-04 5.24E-05 2.30E-04
Emissions per Unit North Flares South Flares
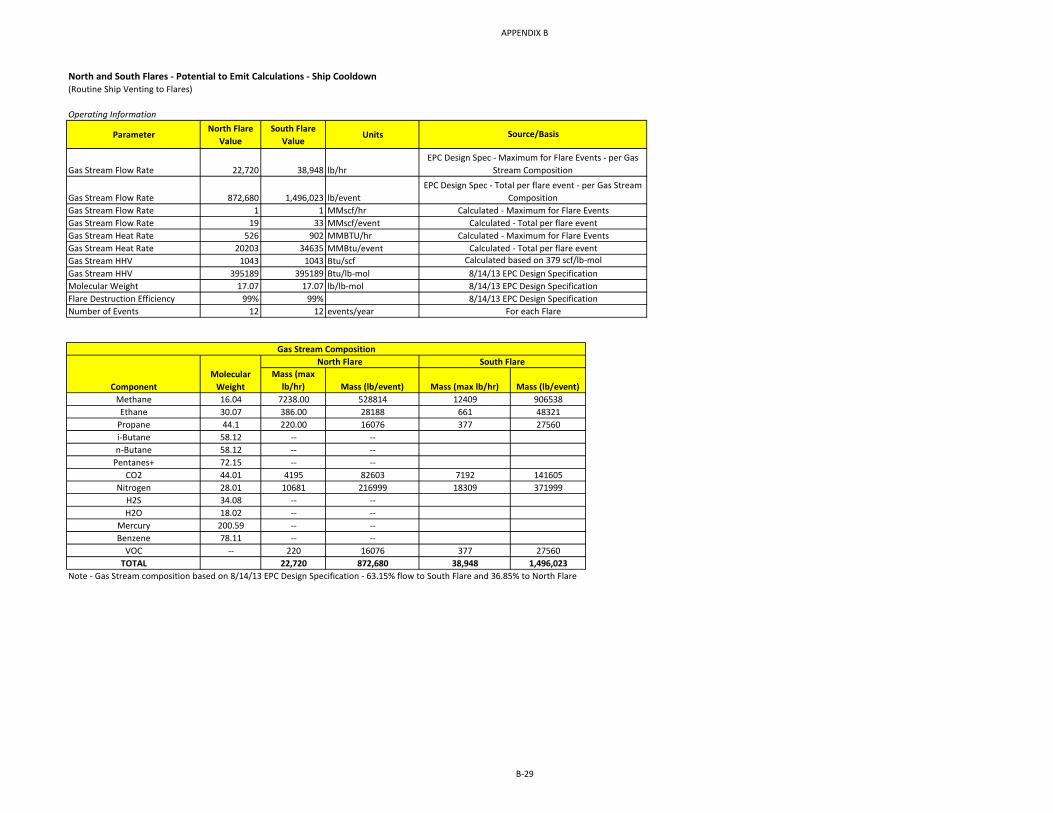
APPENDIX B
B-29
North and South Flares - Potential to Emit Calculations - Ship Cooldown(Routine Ship Venting to Flares)
Operating Information
ParameterNorth Flare
ValueSouth Flare
ValueUnits
Gas Stream Flow Rate 22,720 38,948 lb/hr
Gas Stream Flow Rate 872,680 1,496,023 lb/eventGas Stream Flow Rate 1 1 MMscf/hrGas Stream Flow Rate 19 33 MMscf/eventGas Stream Heat Rate 526 902 MMBTU/hrGas Stream Heat Rate 20203 34635 MMBtu/eventGas Stream HHV 1043 1043 Btu/scfGas Stream HHV 395189 395189 Btu/lb-molMolecular Weight 17.07 17.07 lb/lb-molFlare Destruction Efficiency 99% 99%Number of Events 12 12 events/year
Mass (max lb/hr) Mass (lb/event) Mass (max lb/hr) Mass (lb/event)
Methane 16.04 7238.00 528814 12409 906538Ethane 30.07 386.00 28188 661 48321
Propane 44.1 220.00 16076 377 27560i-Butane 58.12 -- --n-Butane 58.12 -- --
Pentanes+ 72.15 -- --CO2 44.01 4195 82603 7192 141605
Nitrogen 28.01 10681 216999 18309 371999H2S 34.08 -- --H2O 18.02 -- --
Mercury 200.59 -- --Benzene 78.11 -- --
VOC -- 220 16076 377 27560TOTAL 22,720 872,680 38,948 1,496,023
Note - Gas Stream composition based on 8/14/13 EPC Design Specification - 63.15% flow to South Flare and 36.85% to North Flare
Molecular Weight
North Flare South Flare
Calculated - Maximum for Flare EventsCalculated - Total per flare event
Calculated based on 379 scf/lb-mol
8/14/13 EPC Design Specification8/14/13 EPC Design Specification
For each Flare
Gas Stream Composition
8/14/13 EPC Design Specification
Component
Source/Basis
EPC Design Spec - Maximum for Flare Events - per Gas Stream Composition
EPC Design Spec - Total per flare event - per Gas Stream Composition
Calculated - Maximum for Flare EventsCalculated - Total per flare event

APPENDIX B
B-30
North and South Flares - Potential to Emit Calculations - Ship Cooldown(Routine Ship Venting to Flares)
Potential Emissions of Criteria Pollutants
PollutantEmission
Factor (EF) EF Units lb/hr lb/event TPY lb/hr lb/event TPYNOX 190 lb/MMscf 95.8 3,681.41 22.1 164.3 6,311.0 37.9 CO 84 lb/MMscf 42.4 1,627.57 9.8 72.6 2,790.1 16.7 SO2 0 - - - - - -
VOC 2.200 160.760 1.0 3.8 275.6 1.7 H2S 0 - - - - - - H2SO4 0 - - - - - - Ammonia 0 - - - - - -
Uncombusted CO2 4,195.0 82,603.0 495.6 7,192.0 141,605.0 849.6 Combusted CO2 21,431.4 1,565,766 9,394.6 36,739.8 2,684,170 16,105.0 Total CO2 See Above 25,626.4 1,648,369 9,890.2 43,931.8 2,825,775 16,954.6
CH4 72.4 5288.1 31.7 124.1 9,065.4 54.4 N2O 1.00E-04 kg/MMBTU 0.1 4.5 0.03 0.2 7.6 0.05 CO2e 27,470.5 1,781,900 10,691.4 47,093.3 3,054,685 18,328.1 PM Filterable 1.9 lb/MMscf 1.0 36.8 0.2 1.6 63.1 0.4 PM10/2.5 Filterable and Condensable 7.6 lb/MMscf 3.8 147.3 0.9 6.6 252.4 1.5
NOx, CO, PM Emission Equation:Emissions (lb/hr) = EF(lb/MMscf) / HHV * Unit Rating (MMbtu/hr)
Where:HHV = Site-specific fuel high heating value (btu/scf)
Uncombusted CO2, VOC Emission EquationEmissions (lb/hr) = Pollutant in Gas Stream flow rate per mass balance (lb/hr) * (1 - destruction efficiency)
Combusted CO2 Emission Equation: (Carbon Mass Balance Equation)Emissions (lb/hr) = Destruction eff. * MWCO2 * [MCH4/MWCH4 + (2 * MC2/MWC2) + (3* MC3/MWC3)]
Where:M = Mass flow to flare of compound (such as methane, ethane, propane, butane, and pentanes-plus).MW = Molecular weight of compoundC# = Number of carbon atoms in the compound: 1 for methane, 2 for ethane, 3 for propane, 4 for butane, and 5 for pentanes-plus.
N2O Emission Equation: Emissions (lb/hr) = EF (kg/MMBTU) * Unit Rating (MMBTU/hr) * 2.2046 lbs/kg
HAP /TAP Emission Equation:Emissions (lb/hr) = EF(lb/MMscf) / HHV * Unit Rating (MMbtu/hr)
Where:HHV = Site-specific fuel high heating value (btu/scf)
South Flare
40 CFR 98 Eq W-40
Source/BasisAP-42 Table 1.4-1AP-42 Table 1.4-1No Sulfur in fuel
Mass balance - see composition above (plus destruction efficiency)
AP-42 Table 1.4-2
No Sulfur in fuelNone Anticipated
No Sulfur in fuel
AP-42 Table 1.4-2GWPs from 40 CFR 98 Table A-1
Mass balance - see composition above (plus destruction efficiency)
Carbon Balance Equation - see below
North Flare
Mass balance - see composition above = mass flow

APPENDIX B
B-31
North and South Flares - Potential to Emit Calculations - Ship Cooldown(Routine Ship Venting to Flares)
Potential Emissions of Hazardous Air Pollutants
HAP PollutantEmission
Factor (EF) EF Units Source Basis lb/hr lb/event TPY lb/hr lb/event TPY2-Methylnaphthalene 2.40E-05 lb/MMscf AP-42 Table 1.4-3 1.21E-05 4.65E-04 2.79E-06 2.08E-05 7.97E-04 4.78E-063-Methylchloranthrene 1.80E-06 lb/MMscf AP-42 Table 1.4-3 9.08E-07 3.49E-05 2.09E-07 1.56E-06 5.98E-05 3.59E-077,12-Dimethylbenz(a)anthracene 1.60E-05 lb/MMscf AP-42 Table 1.4-3 8.07E-06 3.10E-04 1.86E-06 1.38E-05 5.31E-04 3.19E-06Acenaphthene 1.80E-06 lb/MMscf AP-42 Table 1.4-3 9.08E-07 3.49E-05 2.09E-07 1.56E-06 5.98E-05 3.59E-07Acenaphthylene 1.80E-06 lb/MMscf AP-42 Table 1.4-3 9.08E-07 3.49E-05 2.09E-07 1.56E-06 5.98E-05 3.59E-07Acetaldehyde 4.30E-03 lb/MMscf VC APCD EF 2.17E-03 8.33E-02 5.00E-04 3.72E-03 1.43E-01 8.57E-04Acrolein 2.70E-03 lb/MMscf VC APCD EF 1.36E-03 5.23E-02 3.14E-04 2.33E-03 8.97E-02 5.38E-04Anthracene 2.40E-06 lb/MMscf AP-42 Table 1.4-3 1.21E-06 4.65E-05 2.79E-07 2.08E-06 7.97E-05 4.78E-07Arsenic 2.00E-04 lb/MMscf AP-42 Table 1.4-4 1.01E-04 3.88E-03 2.33E-05 1.73E-04 6.64E-03 3.99E-05Benz(a)anthracene 1.80E-06 lb/MMscf AP-42 Table 1.4-3 9.08E-07 3.49E-05 2.09E-07 1.56E-06 5.98E-05 3.59E-07Benzene 8.00E-03 lb/MMscf VC APCD EF 4.04E-03 1.55E-01 9.30E-04 6.92E-03 2.66E-01 1.59E-03Benzo(a)pyrene 1.20E-06 lb/MMscf AP-42 Table 1.4-3 6.05E-07 2.33E-05 1.40E-07 1.04E-06 3.99E-05 2.39E-07Benzo(b)fluoranthene 1.80E-06 lb/MMscf AP-42 Table 1.4-3 9.08E-07 3.49E-05 2.09E-07 1.56E-06 5.98E-05 3.59E-07Benzo(g,h,i)perylene 1.20E-06 lb/MMscf AP-42 Table 1.4-3 6.05E-07 2.33E-05 1.40E-07 1.04E-06 3.99E-05 2.39E-07Benzo(k)fluoranthene 1.80E-06 lb/MMscf AP-42 Table 1.4-3 9.08E-07 3.49E-05 2.09E-07 1.56E-06 5.98E-05 3.59E-07Beryllium 1.20E-05 lb/MMscf AP-42 Table 1.4-4 6.05E-06 2.33E-04 1.40E-06 1.04E-05 3.99E-04 2.39E-06Cadmium 1.10E-03 lb/MMscf AP-42 Table 1.4-4 5.55E-04 2.13E-02 1.28E-04 9.51E-04 3.65E-02 2.19E-04Chromium 1.40E-03 lb/MMscf AP-42 Table 1.4-4 7.06E-04 2.71E-02 1.63E-04 1.21E-03 4.65E-02 2.79E-04Chrysene 1.80E-06 lb/MMscf AP-42 Table 1.4-3 9.08E-07 3.49E-05 2.09E-07 1.56E-06 5.98E-05 3.59E-07Cobalt 8.40E-05 lb/MMscf AP-42 Table 1.4-4 4.24E-05 1.63E-03 9.77E-06 7.26E-05 2.79E-03 1.67E-05Dibenzo(a,h)anthracene 1.20E-06 lb/MMscf AP-42 Table 1.4-3 6.05E-07 2.33E-05 1.40E-07 1.04E-06 3.99E-05 2.39E-07Dichlorobenzene 1.20E-03 lb/MMscf AP-42 Table 1.4-3 6.05E-04 2.33E-02 1.40E-04 1.04E-03 3.99E-02 2.39E-04Ethylbenzene 9.50E-03 lb/MMscf VC APCD EF 4.79E-03 1.84E-01 1.10E-03 8.22E-03 3.16E-01 1.89E-03Fluoranthene 3.00E-06 lb/MMscf AP-42 Table 1.4-3 1.51E-06 5.81E-05 3.49E-07 2.59E-06 9.96E-05 5.98E-07Fluorene 2.80E-06 lb/MMscf AP-42 Table 1.4-3 1.41E-06 5.43E-05 3.26E-07 2.42E-06 9.30E-05 5.58E-07Formaldehyde 1.70E-02 lb/MMscf VC APCD EF 8.58E-03 3.29E-01 1.98E-03 1.47E-02 5.65E-01 3.39E-03Hexane 6.30E-03 lb/MMscf VC APCD EF 3.18E-03 1.22E-01 7.32E-04 5.45E-03 2.09E-01 1.26E-03Indeno(1,2,3-cd)pyrene 1.80E-06 lb/MMscf AP-42 Table 1.4-3 9.08E-07 3.49E-05 2.09E-07 1.56E-06 5.98E-05 3.59E-07Lead 5.00E-04 lb/MMscf AP-42 Table 1.4-2 2.52E-04 9.69E-03 5.81E-05 4.32E-04 1.66E-02 9.96E-05Manganese 3.80E-04 lb/MMscf AP-42 Table 1.4-4 1.92E-04 7.36E-03 4.42E-05 3.29E-04 1.26E-02 7.57E-05Mercury 2.60E-04 lb/MMscf AP-42 Table 1.4-4 1.31E-04 5.04E-03 3.02E-05 2.25E-04 8.64E-03 5.18E-05Naphthalene 3.00E-04 lb/MMscf VC APCD EF 1.51E-04 5.81E-03 3.49E-05 2.59E-04 9.96E-03 5.98E-05Nickel 2.10E-03 lb/MMscf AP-42 Table 1.4-4 1.06E-03 4.07E-02 2.44E-04 1.82E-03 6.98E-02 4.19E-04Phenanathrene 1.70E-05 lb/MMscf AP-42 Table 1.4-3 8.58E-06 3.29E-04 1.98E-06 1.47E-05 5.65E-04 3.39E-06Pyrene 5.00E-06 lb/MMscf AP-42 Table 1.4-3 2.52E-06 9.69E-05 5.81E-07 4.32E-06 1.66E-04 9.96E-07Selenium 2.40E-05 lb/MMscf AP-42 Table 1.4-4 1.21E-05 4.65E-04 2.79E-06 2.08E-05 7.97E-04 4.78E-06Toluene 3.66E-02 lb/MMscf VC APCD EF 1.85E-02 7.09E-01 4.25E-03 3.16E-02 1.22E+00 7.29E-03Xylenes 2.72E-02 lb/MMscf VC APCD EF 1.37E-02 5.27E-01 3.16E-03 2.35E-02 9.03E-01 5.42E-03
TOTAL HAPS 6.02E-02 2.31E+00 1.39E-02 1.03E-01 3.96E+00 2.38E-02
North Flare South Flare
Note: Emission factors denoted "VC APCD EF" are from the Ventura County Air Pollution Control District "AB2588 Combustion Emission Factors" as published May 17, 2001.

APPENDIX B
B-32
North and South Flares - Potential to Emit Calculations - Ship Cooldown(Routine Ship Venting to Flares)
Potential Emissions of Toxic Air Pollutants not classified as HAPs
TAP PollutantEmission
Factor (EF) EF Units Source Basis lb/hr lb/event TPY lb/hr lb/event TPYBarium 4.40E-03 lb/MMscf AP-42 Table 1.4-4 2.22E-03 8.53E-02 5.12E-04 3.80E-03 1.46E-01 8.77E-04Butane 2.1 lb/MMscf AP-42 Table 1.4-3 1.06E+00 4.07E+01 2.44E-01 1.82E+00 6.98E+01 4.19E-01Copper 8.50E-04 lb/MMscf AP-42 Table 1.4-3 4.29E-04 1.65E-02 9.88E-05 7.35E-04 2.82E-02 1.69E-04Molybdenum 1.10E-03 lb/MMscf AP-42 Table 1.4-3 5.55E-04 2.13E-02 1.28E-04 9.51E-04 3.65E-02 2.19E-04Vanadium 2.30E-03 lb/MMscf AP-42 Table 1.4-4 1.16E-03 4.46E-02 2.67E-04 1.99E-03 7.64E-02 4.58E-04Zinc 2.90E-02 lb/MMscf AP-42 Table 1.4-4 1.46E-02 5.62E-01 3.37E-03 2.51E-02 9.63E-01 5.78E-03
North Flare South Flare
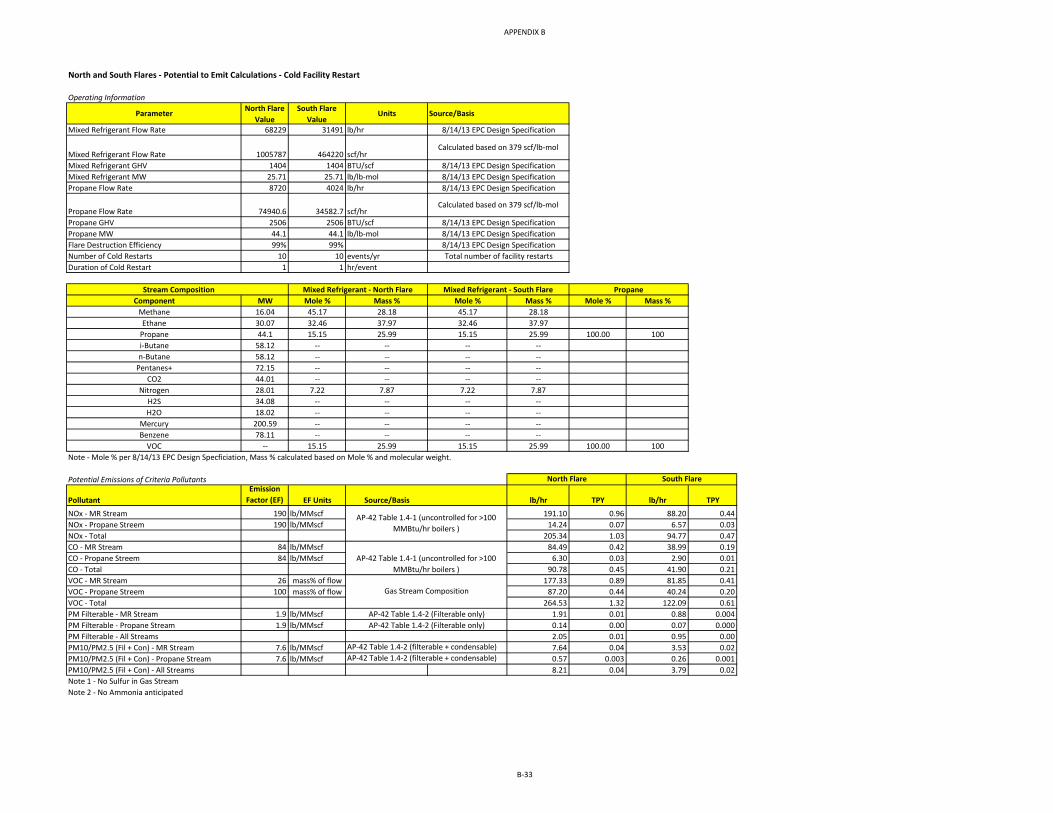
APPENDIX B
B-33
North and South Flares - Potential to Emit Calculations - Cold Facility Restart
Operating Information
Parameter North Flare Value
South Flare Value
Units Source/Basis
Mixed Refrigerant Flow Rate 68229 31491 lb/hr
Mixed Refrigerant Flow Rate 1005787 464220 scf/hrMixed Refrigerant GHV 1404 1404 BTU/scfMixed Refrigerant MW 25.71 25.71 lb/lb-molPropane Flow Rate 8720 4024 lb/hr
Propane Flow Rate 74940.6 34582.7 scf/hrPropane GHV 2506 2506 BTU/scfPropane MW 44.1 44.1 lb/lb-molFlare Destruction Efficiency 99% 99%Number of Cold Restarts 10 10 events/yrDuration of Cold Restart 1 1 hr/event
Component MW Mole % Mass % Mole % Mass % Mole % Mass %Methane 16.04 45.17 28.18 45.17 28.18Ethane 30.07 32.46 37.97 32.46 37.97
Propane 44.1 15.15 25.99 15.15 25.99 100.00 100i-Butane 58.12 -- -- -- --n-Butane 58.12 -- -- -- --
Pentanes+ 72.15 -- -- -- --CO2 44.01 -- -- -- --
Nitrogen 28.01 7.22 7.87 7.22 7.87H2S 34.08 -- -- -- --H2O 18.02 -- -- -- --
Mercury 200.59 -- -- -- --Benzene 78.11 -- -- -- --
VOC -- 15.15 25.99 15.15 25.99 100.00 100Note - Mole % per 8/14/13 EPC Design Specficiation, Mass % calculated based on Mole % and molecular weight.
Potential Emissions of Criteria Pollutants
PollutantEmission
Factor (EF) EF Units Source/Basis lb/hr TPY lb/hr TPY
NOx - MR Stream 190 lb/MMscf 191.10 0.96 88.20 0.44NOx - Propane Streem 190 lb/MMscf 14.24 0.07 6.57 0.03NOx - Total 205.34 1.03 94.77 0.47CO - MR Stream 84 lb/MMscf 84.49 0.42 38.99 0.19CO - Propane Streem 84 lb/MMscf 6.30 0.03 2.90 0.01CO - Total 90.78 0.45 41.90 0.21VOC - MR Stream 26 mass% of flow 177.33 0.89 81.85 0.41VOC - Propane Streem 100 mass% of flow 87.20 0.44 40.24 0.20VOC - Total 264.53 1.32 122.09 0.61PM Filterable - MR Stream 1.9 lb/MMscf 1.91 0.01 0.88 0.004PM Filterable - Propane Stream 1.9 lb/MMscf 0.14 0.00 0.07 0.000PM Filterable - All Streams 2.05 0.01 0.95 0.00PM10/PM2.5 (Fil + Con) - MR Stream 7.6 lb/MMscf 7.64 0.04 3.53 0.02PM10/PM2.5 (Fil + Con) - Propane Stream 7.6 lb/MMscf 0.57 0.003 0.26 0.001PM10/PM2.5 (Fil + Con) - All Streams 8.21 0.04 3.79 0.02Note 1 - No Sulfur in Gas StreamNote 2 - No Ammonia anticipated
Calculated based on 379 scf/lb-mol
8/14/13 EPC Design Specification8/14/13 EPC Design Specification8/14/13 EPC Design SpecificationTotal number of facility restarts
8/14/13 EPC Design Specification
Calculated based on 379 scf/lb-mol
8/14/13 EPC Design Specification8/14/13 EPC Design Specification8/14/13 EPC Design Specification
Mixed Refrigerant - North Flare Propane Stream Composition
AP-42 Table 1.4-2 (filterable + condensable)AP-42 Table 1.4-2 (filterable + condensable)
North Flare
Mixed Refrigerant - South Flare
South Flare
AP-42 Table 1.4-1 (uncontrolled for >100 MMBtu/hr boilers )
AP-42 Table 1.4-1 (uncontrolled for >100 MMBtu/hr boilers )
Gas Stream Composition
AP-42 Table 1.4-2 (Filterable only)AP-42 Table 1.4-2 (Filterable only)

APPENDIX B
B-34
North and South Flares - Potential to Emit Calculations - Cold Facility Restart
Potential Emissions of Greenhouse Gas Pollutants
PollutantEmission
Factor (EF) EF Units Source/Basis lb/hr TPY lb/hr TPY
Un combusted CO2 0 mol% of flow 0 0 0 0Combusted CO2 179,599 897.99 82,893 414 Total CO2 179,599 897.99 82,893 414 CH4 mol% of flow 192 1 89 0 N2O 1.00E-04 kg/MMBtu 0.31 0.00 0 0 CO2e 184,499 922 85,155 426
Un combusted CO2 0 mol% of flow 0 0 0 0Combusted CO2 25,810 129 11,911 60 Total CO2 25,810 129 11,911 60 CH4 0 mol% of flow - - - - N2O 1.00E-04 kg/MMBtu 0 0 0.02 0.00 CO2e 25,823 129 11,916 60
Total CO2 205,409 1,027 94,804 474.02 CH4 192 1 89 0.44 N2O 0 0 0.16 0.00 CO2e 210,322 1,052 97,071.57 485.36
NOx, CO, PM Emission Equation:Emissions (lb/hr) = EF(lb/MMscf) * Unit Rating (scf/hr) / 1,000,000 scf/1MMscf
VOC Emission Equation:Emissions (lb/hr) = Fuel Flowrate (lb/hr) * Mass percent of pollutant * (1-Destruction Efficiency)
Uncombusted CO2 Emissions Equation:Emissions (lb/hr) = mole percent CO2 in gas stream * Flowrate (scf/hr) * 0.0526 kg/cf (density of CO2) * 2.20462 lbs/kg
Density of GHG Per 40 CFR 98 Subpart W - Use 0.0526 kg/ft3 for CO2 and N2 O, and 0.0192 kg/ft3 for CH4 at 60 °F and 14.7 psia.
Combusted CO2 Emissions Equation:lb/hr = Destruction Eff. * Fuel Flowrate (scf/hr) * 0.0526 kg/cf (density of CO2) * 2.20462 lb/kg * [MCH4 + (2*MC2) + (3*MC3) + (4*MC4) + (5*MC5)+ (6 * MBenzene)]
Where:M = Mole percent of compounds in gas stream (such as methane, ethane, propane, butane, and pentanes-plus).C# = Number of carbon atoms in the compound: 1 for methane, 2 for ethane, 3 for propane, 4 for butane, 5 for pentanes-plus, 6 for benzene.
CH4 Emission Equation:Emissions (lb/hr) = mole percent CH4 in gas stream * Flowrate (scf/hr) * 0.0192 kg/cf (density of CH4) * 2.20462 lb/kg * (1-Destruction Eff.)
Density of GHG Per 40 CFR 98 Subpart W - Use 0.0526 kg/ft3 for CO2 and N2 O, and 0.0192 kg/ft3 for CH4 at 60 °F and 14.7 psia.
N2O Emission Equation: Emissions (lb/hr) = EF (kg/MMBTU) * Unit Rating (scf/hr) / 1,000,000 scf/1MMscf * HHV * 2.2046 lbs/kg
Where:HHV = Site-specific fuel high heating value (btu/scf)
HAP /TAP Emission Equation:Emissions (lb/hr) = EF(lb/MMscf) * Flow Rate (scf/hr) / 1,000,000 scf/MMscfNote: HAP Emissions were calcualted for each material flow and then summed.
40 CFR 98 Eq. W-19 and W-36See above
Total
40 CFR 98 Eq. W-40GWPs from 40 CFR 98 Table A-1
North Flare South Flare
MR Stream
Propane Stream
40 CFR 98 Eq. W-20 and W-3640 CFR 98 Eq. W-21 and W-36
See above40 CFR 98 Eq. W-19 and W-36
40 CFR 98 Eq. W-40GWPs from 40 CFR 98 Table A-1
40 CFR 98 Eq. W-20 and W-3640 CFR 98 Eq. W-21 and W-36

APPENDIX B
B-35
North and South Flares - Potential to Emit Calculations - Cold Facility Restart
Potential Emissions of Hazardous Air Pollutants
HAP PollutantEmission
Factor (EF) EF Units Source Basis lb/hr tpy lb/hr tpy2-Methylnaphthalene 2.40E-05 lb/MMscf AP-42 Table 1.4-3 2.59E-05 1.30E-07 1.20E-05 5.99E-083-Methylchloranthrene 1.80E-06 lb/MMscf AP-42 Table 1.4-3 1.95E-06 9.73E-09 8.98E-07 4.49E-097,12-Dimethylbenz(a)anthracene 1.60E-05 lb/MMscf AP-42 Table 1.4-3 1.73E-05 8.65E-08 7.98E-06 3.99E-08Acenaphthene 1.80E-06 lb/MMscf AP-42 Table 1.4-3 1.95E-06 9.73E-09 8.98E-07 4.49E-09Acenaphthylene 1.80E-06 lb/MMscf AP-42 Table 1.4-3 1.95E-06 9.73E-09 8.98E-07 4.49E-09Acetaldehyde 4.30E-03 lb/MMscf VC APCD EF 4.65E-03 2.32E-05 2.14E-03 1.07E-05Acrolein 2.70E-03 lb/MMscf VC APCD EF 2.92E-03 1.46E-05 1.35E-03 6.73E-06Anthracene 2.40E-06 lb/MMscf AP-42 Table 1.4-3 2.59E-06 1.30E-08 1.20E-06 5.99E-09Arsenic 2.00E-04 lb/MMscf AP-42 Table 1.4-4 2.16E-04 1.08E-06 9.98E-05 4.99E-07Benz(a)anthracene 1.80E-06 lb/MMscf AP-42 Table 1.4-3 1.95E-06 9.73E-09 8.98E-07 4.49E-09Benzene 8.00E-03 lb/MMscf VC APCD EF 8.65E-03 4.32E-05 3.99E-03 2.00E-05Benzo(a)pyrene 1.20E-06 lb/MMscf AP-42 Table 1.4-3 1.30E-06 6.48E-09 5.99E-07 2.99E-09Benzo(b)fluoranthene 1.80E-06 lb/MMscf AP-42 Table 1.4-3 1.95E-06 9.73E-09 8.98E-07 4.49E-09Benzo(g,h,i)perylene 1.20E-06 lb/MMscf AP-42 Table 1.4-3 1.30E-06 6.48E-09 5.99E-07 2.99E-09Benzo(k)fluoranthene 1.80E-06 lb/MMscf AP-42 Table 1.4-3 1.95E-06 9.73E-09 8.98E-07 4.49E-09Beryllium 1.20E-05 lb/MMscf AP-42 Table 1.4-4 1.30E-05 6.48E-08 5.99E-06 2.99E-08Cadmium 1.10E-03 lb/MMscf AP-42 Table 1.4-4 1.19E-03 5.94E-06 5.49E-04 2.74E-06Chromium 1.40E-03 lb/MMscf AP-42 Table 1.4-4 1.51E-03 7.57E-06 6.98E-04 3.49E-06Chrysene 1.80E-06 lb/MMscf AP-42 Table 1.4-3 1.95E-06 9.73E-09 8.98E-07 4.49E-09Cobalt 8.40E-05 lb/MMscf AP-42 Table 1.4-4 9.08E-05 4.54E-07 4.19E-05 2.09E-07Dibenzo(a,h)anthracene 1.20E-06 lb/MMscf AP-42 Table 1.4-3 1.30E-06 6.48E-09 5.99E-07 2.99E-09Dichlorobenzene 1.20E-03 lb/MMscf AP-42 Table 1.4-3 1.30E-03 6.48E-06 5.99E-04 2.99E-06Ethylbenzene 9.50E-03 lb/MMscf VC APCD EF 1.03E-02 5.13E-05 4.74E-03 2.37E-05Fluoranthene 3.00E-06 lb/MMscf AP-42 Table 1.4-3 3.24E-06 1.62E-08 1.50E-06 7.48E-09Fluorene 2.80E-06 lb/MMscf AP-42 Table 1.4-3 3.03E-06 1.51E-08 1.40E-06 6.98E-09Formaldehyde 1.70E-02 lb/MMscf VC APCD EF 1.84E-02 9.19E-05 8.48E-03 4.24E-05Hexane 6.30E-03 lb/MMscf VC APCD EF 6.81E-03 3.40E-05 3.14E-03 1.57E-05Indeno(1,2,3-cd)pyrene 1.80E-06 lb/MMscf AP-42 Table 1.4-3 1.95E-06 9.73E-09 8.98E-07 4.49E-09Lead 5.00E-04 lb/MMscf AP-42 Table 1.4-2 5.40E-04 2.70E-06 2.49E-04 1.25E-06Manganese 3.80E-04 lb/MMscf AP-42 Table 1.4-4 4.11E-04 2.05E-06 1.90E-04 9.48E-07Mercury 2.60E-04 lb/MMscf AP-42 Table 1.4-4 2.81E-04 1.40E-06 1.30E-04 6.48E-07Naphthalene 3.00E-04 lb/MMscf VC APCD EF 3.24E-04 1.62E-06 1.50E-04 7.48E-07Nickel 2.10E-03 lb/MMscf AP-42 Table 1.4-4 2.27E-03 1.13E-05 1.05E-03 5.24E-06Phenanathrene 1.70E-05 lb/MMscf AP-42 Table 1.4-3 1.84E-05 9.19E-08 8.48E-06 4.24E-08Pyrene 5.00E-06 lb/MMscf AP-42 Table 1.4-3 5.40E-06 2.70E-08 2.49E-06 1.25E-08Selenium 2.40E-05 lb/MMscf AP-42 Table 1.4-4 2.59E-05 1.30E-07 1.20E-05 5.99E-08Toluene 3.66E-02 lb/MMscf VC APCD EF 3.96E-02 1.98E-04 1.83E-02 9.13E-05Xylenes 2.72E-02 lb/MMscf VC APCD EF 2.94E-02 1.47E-04 1.36E-02 6.78E-05
TOTAL HAPS 1.29E-01 6.44E-04 5.95E-02 2.97E-04
Potential Emissions of Toxic Air Pollutants not classified as HAPs
TAP PollutantEmission
Factor (EF) EF Units Source Basis lb/hr ton/yr lb/hr ton/yrBarium 4.40E-03 lb/MMscf AP-42 Table 1.4-4 4.76E-03 2.38E-05 2.19E-03 1.10E-05Butane 2.1 lb/MMscf AP-42 Table 1.4-3 2.27E+00 1.13E-02 1.05E+00 5.24E-03Copper 8.50E-04 lb/MMscf AP-42 Table 1.4-3 9.19E-04 4.59E-06 4.24E-04 2.12E-06Molybdenum 1.10E-03 lb/MMscf AP-42 Table 1.4-3 1.19E-03 5.94E-06 5.49E-04 2.74E-06Vanadium 2.30E-03 lb/MMscf AP-42 Table 1.4-4 2.49E-03 1.24E-05 1.15E-03 5.74E-06Zinc 2.90E-02 lb/MMscf AP-42 Table 1.4-4 3.13E-02 1.57E-04 1.45E-02 7.23E-05
North Flare South Flare
North Flare South Flare
Note: Emission factors denoted "VC APCD EF" are from the Ventura County Air Pollution Control District "AB2588 Combustion Emission Factors" as published May 17, 2001.

APPENDIX B
B-36
North and South Flares - Potential to Emit Calculations - Warm Facility Restart
Operating Information
Parameter North Flare Value
South Flare Value
Units Source/Basis
Mixed Refrigerant Flow Rate 352,026 162474 lb/hrMixed Refrigerant Flow Rate 5,189,342 2395081 scf/hr Calculated based on 379 scf/lb-molMixed Refrigerant GHV 1404 1404 BTU/scfMixed Refrigerant MW 25.71 25.71 lb/lb-molFeed Gas Stream Flow Rate 1,999,600 lb/hrFeed Gas Stream Flow Rate 42,314,260 scf/hr Calculated based on 379 scf/lb-molFeed Gas Stream GHV 1004 BTU/scfFeed Gas Stream MW 17.91 lb/lb-molPropane Flow Rate 8,720 4024 lb/hrPropane Flow Rate 74,937 34586 scf/hr Calculated based on 379 scf/lb-molPropane GHV 2506 2506 BTU/scfPropane MW 44.1 44.1 lb/lb-molFlare Destruction Efficiency 99% 99%Number of Warm Restarts 10 10 events/yr Total number of facility restartsDuration of Warm Restart 1 1 hr/event
Component MW Mole % Mass % Mole % Mass % Mole % Mass % Mole % Mass %Methane 16.04 45.17 28.18 45.17 28.16 90.83 81.48Ethane 30.07 32.46 37.96 32.46 37.95 2.50 4.20
Propane 44.1 15.15 25.99 15.15 26.03 100.00 100 1.00 2.47i-Butane 58.12 -- -- -- -- 0.20 0.65n-Butane 58.12 -- -- -- -- 0.30 0.98
Pentanes+ 72.15 -- -- -- -- 0.17 0.69CO2 44.01 -- -- -- -- 1.96 4.82
Nitrogen 28.01 7.22 7.87 7.22 7.85 3 4.7H2S 34.08 -- -- -- -- -- --H2O 18.02 -- -- -- -- 0.02 0.02
Mercury 200.59 -- -- -- -- 2.00E-09 0.00Benzene 78.11 -- -- -- -- 4.57E-04 2.00E-03
VOC -- 15.15 25.99 15.15 26.03 100.00 100 1.67 4.78Note: All chemical compositions per 8/14/13 EPC Design Specification
8/14/13 EPC Design Specification8/14/13 EPC Design Specification
8/14/13 EPC Design Specification8/14/13 EPC Design Specification8/14/13 EPC Design Specification
8/14/13 EPC Design Specification
8/14/13 EPC Design Specification8/14/13 EPC Design Specification8/14/13 EPC Design Specification
8/14/13 EPC Design Specification
Mixed Refrigerant - South Flare Propane Mixed Refrigerant - North Flare Stream Composition Feed Gas (North Flare)

APPENDIX B
B-37
North and South Flares - Potential to Emit Calculations - Warm Facility Restart
Potential Emissions of Criteria Pollutants
PollutantEmission
Factor (EF) EF Units Source/Basis lb/hr TPY lb/hr TPY
NOx - MR Stream 190 lb/MMscf 986.0 4.9 455.1 2.3
NOx - Feed Gas Stream 190 lb/MMscf 8039.7 40.2NOx - Propane Streem 190 lb/MMscf 14.2 0.1 6.6 0.0NOx - Total 9039.9 45.2 461.6 2.3CO - MR Stream 84 lb/MMscf 435.90 2.18 201.2 1.0CO - Feed Gas Stream 84 lb/MMscf 3554.40 17.77CO - Propane Streem 84 lb/MMscf 6.29 0.03 2.9 0.0CO - Total 3996.6 19.98 204.1 1.0VOC - MR Stream 26 mass% of flow 914.9 4.6 422.9 2.1VOC - Feed Gas Stream 4.7 mass% of flow 955.8 4.8VOC - Propane Streem 100 mass% of flow 87.2 0.4 40.2 0.2VOC - Total 1957.9 9.79 463.2 2.3PM Filterable - MR Stream 1.9 lb/MMscf 9.9 0.05 4.6 0.02PM Filterable - Feed Gas Stream 1.9 lb/MMscf 80.4 0.40PM Filterable - Propane Stream 1.9 lb/MMscf 0.1 0.00 0.1 0.00PM Filterable - All Streams 90.4 0.45 4.6 0.02PM10/PM2.5 (Fil + Con) - MR Stream 7.6 lb/MMscf 39.4 0.2 18.2 0.1PM10/PM2.5 (Fil + Con) - Feed Gas Stream 7.6 lb/MMscf 321.6 1.6PM10/PM2.5 (Fil + Con) - Propane Streem 7.6 lb/MMscf 0.6 0.003 0.3 0.001PM10/PM2.5 (Fil + Con) - All Streams 361.6 1.8 18.5 0.1Note 1 - All PM is assumed to be PM2.5, therefore PM = PM10 = PM2.5. Note 2 - No Sulfur in Gas StreamNote 3 - No Ammonia anticipated
Potential Emissions of Greenhouse Gas Pollutants
PollutantEmission
Factor (EF) EF Units Source/Basis lb/hr TPY lb/hr TPY
Un combusted CO2 0 mol% of flow 0 0 0 0Combusted CO2 926,635.79 4,633.18 427,678.07 2,138.39 Total CO2 926,635.79 4,633.18 427,678.07 2,138.39 CH4 mol% of flow 992.20 4.96 457.94 2.29 N2O 1.00E-04 kg/MMBtu 1.61 0.01 0.74 0.00 CO2e 951,919.35 4,760 439,347.40 2,196.74
Un combusted CO2 1.96 mol% of flow 96,175.03 0 0 0Combusted CO2 4,939,564.73 24,697.82 Total CO2 5,035,739.75 24,697.82 - - CH4 mol% of flow 16,268.63 81.34 N2O 1.00E-04 kg/MMBtu 9.37 0.05 CO2e 5,445,246.62 26,745.36 - -
Un combusted CO2 0 mol% of flow 0 0 0 0Combusted CO2 25,809.06 129.05 11,911.77 59.56 Total CO2 25,809.06 129.05 11,911.77 59.56 CH4 0 mol% of flow 0 0 0 0N2O 1.00E-04 kg/MMBtu 0.04 0.00 0.02 0.00 CO2e 25,821.40 129.11 11,917.46 59.59
Total CO2 5,988,184.61 29,460.05 439,589.84 2,197.95 CH4 17,260.83 86.30 457.94 2.29 N2O 11.01 0.06 0.76 0.00 CO2e 6,422,987.37 31,634.06 451,264.87 2,256.32
GWPs from 40 CFR 98 Table A-1Total
See above40 CFR 98 Eq. W-19 and W-36
40 CFR 98 Eq. W-40
AP-42 Table 1.4-2 (filterable + condensable)
40 CFR 98 Eq. W-19 and W-36
AP-42 Table 1.4-2 (filterable + condensable)
AP-42 Table 1.4-1 (uncontrolled for >100 MMBtu/hr boilers )
AP-42 Table 1.4-2 (filterable + condensable)
See above
North Flare
40 CFR 98 Eq. W-40GWPs from 40 CFR 98 Table A-1
North Flare
40 CFR 98 Eq. W-19 and W-3640 CFR 98 Eq. W-40
GWPs from 40 CFR 98 Table A-1Propane Stream
40 CFR 98 Eq. W-20 and W-3640 CFR 98 Eq. W-21 and W-36
See above
Feed Gas Stream40 CFR 98 Eq. W-20 and W-3640 CFR 98 Eq. W-21 and W-36
South Flare
MR Stream
South Flare
Gas Stream Composition
40 CFR 98 Eq. W-20 and W-3640 CFR 98 Eq. W-21 and W-36
AP-42 Table 1.4-1 (uncontrolled for >100 MMBtu/hr boilers )
AP-42 Table 1.4-2 (Filterable only)AP-42 Table 1.4-2 (Filterable only)
AP-42 Table 1.4-2 (Filterable only)

APPENDIX B
B-38
North and South Flares - Potential to Emit Calculations - Warm Facility Restart
NOx, CO, PM Emission Equation:Emissions (lb/hr) = EF(lb/MMscf) * Flow rate (scf/hr) / 1,000,000 scf/1MMscf
VOC Emission Equation:Emissions (lb/hr) = Fuel Flowrate (lb/hr) * Mass percent of pollutant * (1-Destruction Efficiency)
Uncombusted CO2 Emissions Equation:Emissions (lb/hr) = mole percent CO2 in gas stream * Flowrate (scf/hr) * 0.0526 kg/cf (density of CO2) * 2.20462 lbs/kg
Density of GHG Per 40 CFR 98 Subpart W - Use 0.0526 kg/ft3 for CO2 and N2 O, and 0.0192 kg/ft3 for CH4 at 60 °F and 14.7 psia.
Combusted CO2 Emissions Equation:lb/hr = Destruction Eff. * Fuel Flowrate (scf/hr) * 0.0526 kg/cf (density of CO2) * 2.20462 lb/kg * [MCH4 + (2*MC2) + (3*MC3) + (4*MC4) + (5*MC5)+ (6 * MBenzene)]
Where:M = Mole percent of compounds in gas stream (such as methane, ethane, propane, butane, and pentanes-plus).C# = Number of carbon atoms in the compound: 1 for methane, 2 for ethane, 3 for propane, 4 for butane, 5 for pentanes-plus, 6 for benzene.
CH4 Emission Equation:Emissions (lb/hr) = mole percent CH4 in gas stream * Flowrate (scf/hr) * 0.0192 kg/cf (density of CH4) * 2.20462 lb/kg * (1-Destruction Eff.)
Density of GHG Per 40 CFR 98 Subpart W - Use 0.0526 kg/ft3 for CO2 and N2 O, and 0.0192 kg/ft3 for CH4 at 60 °F and 14.7 psia.
N2O Emission Equation: Emissions (lb/hr) = EF (kg/MMBTU) * Unit Rating (scf/hr) / 1,000,000 scf/1MMscf * HHV * 2.2046 lbs/kg
Where:HHV = Site-specific fuel high heating value (btu/scf)
HAP /TAP Emission Equation (Except for Benzene):Emissions (lb/hr) = EF(lb/MMscf) * Flow Rate (scf/hr) / 1,000,000 scf/MMscfNote: HAP Emissions were calcualted for each material flow and then summed.
Benzene Emission EquationEmissions (lb/hr) = mass % of Benzene in feed fas flow * Feed gas flow rate (lb/hr)

APPENDIX B
B-39
North and South Flares - Potential to Emit Calculations - Warm Facility Restart
Potential Emissions of Hazardous Air Pollutants
HAP PollutantEmission
Factor (EF) EF Units Source Basis lb/hr tpy lb/hr tpy2-Methylnaphthalene 2.40E-05 lb/MMscf AP-42 Table 1.4-3 1.14E-03 5.71E-06 5.83E-05 2.92E-073-Methylchloranthrene 1.80E-06 lb/MMscf AP-42 Table 1.4-3 8.56E-05 4.28E-07 4.37E-06 2.19E-087,12-Dimethylbenz(a)anthracene 1.60E-05 lb/MMscf AP-42 Table 1.4-3 7.61E-04 3.81E-06 3.89E-05 1.94E-07Acenaphthene 1.80E-06 lb/MMscf AP-42 Table 1.4-3 8.56E-05 4.28E-07 4.37E-06 2.19E-08Acenaphthylene 1.80E-06 lb/MMscf AP-42 Table 1.4-3 8.56E-05 4.28E-07 4.37E-06 2.19E-08Acetaldehyde 4.30E-03 lb/MMscf VC APCD EF 2.05E-01 1.02E-03 1.04E-02 5.22E-05Acrolein 2.70E-03 lb/MMscf VC APCD EF 1.28E-01 6.42E-04 6.56E-03 3.28E-05Anthracene 2.40E-06 lb/MMscf AP-42 Table 1.4-3 1.14E-04 5.71E-07 5.83E-06 2.92E-08Arsenic 2.00E-04 lb/MMscf AP-42 Table 1.4-4 9.52E-03 4.76E-05 4.86E-04 2.43E-06Benz(a)anthracene 1.80E-06 lb/MMscf AP-42 Table 1.4-3 8.56E-05 4.28E-07 4.37E-06 2.19E-08
Benzene (North Flare 2.10E-03 mass % of feed f Gas Stream Composition 4.20E+01 2.10E-01 1.94E-02 9.72E-05
Benzene (South Flare 8.00E-03 lb/MMscf VC APCD EFBenzo(a)pyrene 1.20E-06 lb/MMscf AP-42 Table 1.4-3 5.71E-05 2.85E-07 2.92E-06 1.46E-08Benzo(b)fluoranthene 1.80E-06 lb/MMscf AP-42 Table 1.4-3 8.56E-05 4.28E-07 4.37E-06 2.19E-08Benzo(g,h,i)perylene 1.20E-06 lb/MMscf AP-42 Table 1.4-3 5.71E-05 2.85E-07 2.92E-06 1.46E-08Benzo(k)fluoranthene 1.80E-06 lb/MMscf AP-42 Table 1.4-3 8.56E-05 4.28E-07 4.37E-06 2.19E-08Beryllium 1.20E-05 lb/MMscf AP-42 Table 1.4-4 5.71E-04 2.85E-06 2.92E-05 1.46E-07Cadmium 1.10E-03 lb/MMscf AP-42 Table 1.4-4 5.23E-02 2.62E-04 2.67E-03 1.34E-05Chromium 1.40E-03 lb/MMscf AP-42 Table 1.4-4 6.66E-02 3.33E-04 3.40E-03 1.70E-05Chrysene 1.80E-06 lb/MMscf AP-42 Table 1.4-3 8.56E-05 4.28E-07 4.37E-06 2.19E-08Cobalt 8.40E-05 lb/MMscf AP-42 Table 1.4-4 4.00E-03 2.00E-05 2.04E-04 1.02E-06Dibenzo(a,h)anthracene 1.20E-06 lb/MMscf AP-42 Table 1.4-3 5.71E-05 2.85E-07 2.92E-06 1.46E-08Dichlorobenzene 1.20E-03 lb/MMscf AP-42 Table 1.4-3 5.71E-02 2.85E-04 2.92E-03 1.46E-05Ethylbenzene 9.50E-03 lb/MMscf VC APCD EF 4.52E-01 2.26E-03 2.31E-02 1.15E-04Fluoranthene 3.00E-06 lb/MMscf AP-42 Table 1.4-3 1.43E-04 7.14E-07 7.29E-06 3.64E-08Fluorene 2.80E-06 lb/MMscf AP-42 Table 1.4-3 1.33E-04 6.66E-07 6.80E-06 3.40E-08Formaldehyde 1.70E-02 lb/MMscf VC APCD EF 8.09E-01 4.04E-03 4.13E-02 2.07E-04Hexane 6.30E-03 lb/MMscf VC APCD EF 3.00E-01 1.50E-03 1.53E-02 7.65E-05Indeno(1,2,3-cd)pyrene 1.80E-06 lb/MMscf AP-42 Table 1.4-3 8.56E-05 4.28E-07 4.37E-06 2.19E-08Lead 5.00E-04 lb/MMscf AP-42 Table 1.4-2 2.38E-02 1.19E-04 1.21E-03 6.07E-06Manganese 3.80E-04 lb/MMscf AP-42 Table 1.4-4 1.81E-02 9.04E-05 9.23E-04 4.62E-06Mercury 2.60E-04 lb/MMscf AP-42 Table 1.4-4 1.24E-02 6.19E-05 6.32E-04 3.16E-06Naphthalene 3.00E-04 lb/MMscf VC APCD EF 1.43E-02 7.14E-05 7.29E-04 3.64E-06Nickel 2.10E-03 lb/MMscf AP-42 Table 1.4-4 9.99E-02 5.00E-04 5.10E-03 2.55E-05Phenanathrene 1.70E-05 lb/MMscf AP-42 Table 1.4-3 8.09E-04 4.04E-06 4.13E-05 2.07E-07Pyrene 5.00E-06 lb/MMscf AP-42 Table 1.4-3 2.38E-04 1.19E-06 1.21E-05 6.07E-08Selenium 2.40E-05 lb/MMscf AP-42 Table 1.4-4 1.14E-03 5.71E-06 5.83E-05 2.92E-07Toluene 3.66E-02 lb/MMscf VC APCD EF 1.74E+00 8.71E-03 8.89E-02 4.45E-04Xylenes 2.72E-02 lb/MMscf VC APCD EF 1.29E+00 6.47E-03 6.61E-02 3.30E-04
TOTAL HAPS 4.73E+01 2.36E-01 2.90E-01 1.45E-03
North Flare South Flare
Note: Emission factors denoted "VC APCD EF" are from the Ventura County Air Pollution Control District "AB2588 Combustion Emission Factors" as published May 17, 2001.

APPENDIX B
B-40
North and South Flares - Potential to Emit Calculations - Warm Facility Restart
Potential Emissions of Toxic Air Pollutants not classified as HAPsTAP Pollutant Emission EF Units Source Basis lb/hr tpy lb/hr tpyBarium 4.40E-03 lb/MMscf AP-42 Table 1.4-4 2.09E-01 1.05E-03 1.07E-02 5.35E-05Butane 2.1 lb/MMscf AP-42 Table 1.4-3 9.99E+01 5.00E-01 5.10E+00 2.55E-02Copper 8.50E-04 lb/MMscf AP-42 Table 1.4-3 4.04E-02 2.02E-04 2.07E-03 1.03E-05Molybdenum 1.10E-03 lb/MMscf AP-42 Table 1.4-3 5.23E-02 2.62E-04 2.67E-03 1.34E-05Vanadium 2.30E-03 lb/MMscf AP-42 Table 1.4-4 1.09E-01 5.47E-04 5.59E-03 2.79E-05Zinc 2.90E-02 lb/MMscf AP-42 Table 1.4-4 1.38E+00 6.90E-03 7.05E-02 3.52E-04
North Flare South Flare

APPENDIX B
B-41
North and South Flares - Potential to Emit Calculations - Summary
Total Flare Emissions for each Pollutant = Pilot Emissions + Cool Down Emissions + Maximum(Cold or Warm Restart Emissions)
Criteria Pollutant Pilots Cool DownCold
RestartWarm
Restart TOTAL Pilots Cool DownCold
RestartWarm
Restart TOTALNOX 1.72 22.1 1.03 45.20 69.00 0.79 37.87 0.47 2.31 40.97CO 1.44 9.77 0.45 19.98 31.19 0.67 16.74 0.21 1.02 18.43SO2 0.00 0.00 0.00 0.00VOC 0.09 0.96 1.32 9.79 10.85 0.04 1.65 0.61 2.32 4.01H2S 0.00 0.00 0.00 0.00H2SO4 0.00 0.00 0.00 0.00Ammonia 0.00 0.00 0.00 0.00CO2 1332.14 9890.22 1027.04 29460.05 40682.40 614.83 16954.65 474.02 2197.95 19767.43CH4 0.03 31.73 0.96 86.30 118.06 0.01 54.39 0.44 2.29 56.69N2O 0.003 0.027 0.002 0.055 0.08 0.001 0.046 0.001 0.004 0.05CO2e 1333.51 10691.40 1051.61 31634.06 43658.97 615.47 18328.11 485.36 2256.32 21199.90PM Filterable 0.03 0.22 0.01 0.45 0.71 0.02 0.38 0.00 0.02 0.42PM10/2.5 Filterable and Condensable 0.13 0.88 0.04 1.81 2.82 0.06 1.51 0.02 0.09 1.67Lead 8.58E-06 5.81E-05 2.70E-06 1.19E-04 1.86E-04 3.96E-06 9.96E-05 1.25E-06 6.07E-06 1.10E-04
South Flare (TPY)North Flare (TPY)

APPENDIX B
B-42
North and South Flares - Potential to Emit Calculations - Summary
HAP Pollutant Pilots Cool DownCold
RestartWarm
Restart TOTAL Pilots Cool DownCold
RestartWarm
Restart TOTAL1,3-Butadiene 0.00E+00 0.00E+00 0.00E+00 0.00E+00 0.00E+00 0.00E+00 0.00E+00 0.00E+00 0.00E+00 0.00E+002-Methylnaphthalene 4.12E-07 2.79E-06 1.30E-07 5.71E-06 8.91E-06 1.90E-07 4.78E-06 5.99E-08 2.92E-07 5.26E-063-Methylchloranthrene 3.09E-08 2.09E-07 9.73E-09 4.28E-07 6.68E-07 1.43E-08 3.59E-07 4.49E-09 2.19E-08 3.95E-077,12-Dimethylbenz(a)anthracene 2.75E-07 1.86E-06 8.65E-08 3.81E-06 5.94E-06 1.27E-07 3.19E-06 3.99E-08 1.94E-07 3.51E-06Acenaphthene 3.09E-08 2.09E-07 9.73E-09 4.28E-07 6.68E-07 1.43E-08 3.59E-07 4.49E-09 2.19E-08 3.95E-07Acenaphthylene 3.09E-08 2.09E-07 9.73E-09 4.28E-07 6.68E-07 1.43E-08 3.59E-07 4.49E-09 2.19E-08 3.95E-07Acetaldehyde 7.38E-05 5.00E-04 2.32E-05 1.02E-03 1.60E-03 3.41E-05 8.57E-04 1.07E-05 5.22E-05 9.43E-04Acrolein 4.63E-05 3.14E-04 1.46E-05 6.42E-04 1.00E-03 2.14E-05 5.38E-04 6.73E-06 3.28E-05 5.92E-04Anthracene 4.12E-08 2.79E-07 1.30E-08 5.71E-07 8.91E-07 1.90E-08 4.78E-07 5.99E-09 2.92E-08 5.26E-07Arsenic 3.43E-06 2.33E-05 1.08E-06 4.76E-05 7.43E-05 1.58E-06 3.99E-05 4.99E-07 2.43E-06 4.39E-05Benz(a)anthracene 3.09E-08 2.09E-07 9.73E-09 4.28E-07 6.68E-07 1.43E-08 3.59E-07 4.49E-09 2.19E-08 3.95E-07Benzene 1.37E-04 9.30E-04 4.32E-05 2.10E-01 2.11E-01 6.34E-05 1.59E-03 2.00E-05 9.72E-05 1.75E-03Benzo(a)pyrene 2.06E-08 1.40E-07 6.48E-09 2.85E-07 4.46E-07 9.51E-09 2.39E-07 2.99E-09 1.46E-08 2.63E-07Benzo(b)fluoranthene 3.09E-08 2.09E-07 9.73E-09 4.28E-07 6.68E-07 1.43E-08 3.59E-07 4.49E-09 2.19E-08 3.95E-07Benzo(g,h,i)perylene 2.06E-08 1.40E-07 6.48E-09 2.85E-07 4.46E-07 9.51E-09 2.39E-07 2.99E-09 1.46E-08 2.63E-07Benzo(k)fluoranthene 3.09E-08 2.09E-07 9.73E-09 4.28E-07 6.68E-07 1.43E-08 3.59E-07 4.49E-09 2.19E-08 3.95E-07Beryllium 2.06E-07 1.40E-06 6.48E-08 2.85E-06 4.46E-06 9.51E-08 2.39E-06 2.99E-08 1.46E-07 2.63E-06Cadmium 1.89E-05 1.28E-04 5.94E-06 2.62E-04 4.08E-04 8.71E-06 2.19E-04 2.74E-06 1.34E-05 2.41E-04Chromium 2.40E-05 1.63E-04 7.57E-06 3.33E-04 5.20E-04 1.11E-05 2.79E-04 3.49E-06 1.70E-05 3.07E-04Chrysene 3.09E-08 2.09E-07 9.73E-09 4.28E-07 6.68E-07 1.43E-08 3.59E-07 4.49E-09 2.19E-08 3.95E-07Cobalt 1.44E-06 9.77E-06 4.54E-07 2.00E-05 3.12E-05 6.65E-07 1.67E-05 2.09E-07 1.02E-06 1.84E-05Dibenzo(a,h)anthracene 2.06E-08 1.40E-07 6.48E-09 2.85E-07 4.46E-07 9.51E-09 2.39E-07 2.99E-09 1.46E-08 2.63E-07Dichlorobenzene 2.06E-05 1.40E-04 6.48E-06 2.85E-04 4.46E-04 9.51E-06 2.39E-04 2.99E-06 1.46E-05 2.63E-04Ethylbenzene 1.63E-04 1.10E-03 5.13E-05 2.26E-03 3.53E-03 7.53E-05 1.89E-03 2.37E-05 1.15E-04 2.08E-03Fluoranthene 5.15E-08 3.49E-07 1.62E-08 7.14E-07 1.11E-06 2.38E-08 5.98E-07 7.48E-09 3.64E-08 6.58E-07Fluorene 4.81E-08 3.26E-07 1.51E-08 6.66E-07 1.04E-06 2.22E-08 5.58E-07 6.98E-09 3.40E-08 6.14E-07Formaldehyde 2.92E-04 1.98E-03 9.19E-05 4.04E-03 6.31E-03 1.35E-04 3.39E-03 4.24E-05 2.07E-04 3.73E-03Hexane 1.08E-04 7.32E-04 3.40E-05 1.50E-03 2.34E-03 4.99E-05 1.26E-03 1.57E-05 7.65E-05 1.38E-03Indeno(1,2,3-cd)pyrene 3.09E-08 2.09E-07 9.73E-09 4.28E-07 6.68E-07 1.43E-08 3.59E-07 4.49E-09 2.19E-08 3.95E-07Lead 8.58E-06 5.81E-05 2.70E-06 1.19E-04 1.86E-04 3.96E-06 9.96E-05 1.25E-06 6.07E-06 1.10E-04Manganese 6.52E-06 4.42E-05 2.05E-06 9.04E-05 1.41E-04 3.01E-06 7.57E-05 9.48E-07 4.62E-06 8.34E-05Mercury 4.46E-06 3.02E-05 1.40E-06 6.19E-05 9.65E-05 2.06E-06 5.18E-05 6.48E-07 3.16E-06 5.70E-05Naphthalene 5.15E-06 3.49E-05 1.62E-06 7.14E-05 1.11E-04 2.38E-06 5.98E-05 7.48E-07 3.64E-06 6.58E-05Nickel 3.60E-05 2.44E-04 1.13E-05 5.00E-04 7.80E-04 1.66E-05 4.19E-04 5.24E-06 2.55E-05 4.61E-04PAH 0.00E+00 0.00E+00 0.00E+00 0.00E+00 0.00E+00 0.00E+00 0.00E+00 0.00E+00 0.00E+00 0.00E+00Phenanathrene 2.92E-07 1.98E-06 9.19E-08 4.04E-06 6.31E-06 1.35E-07 3.39E-06 4.24E-08 2.07E-07 3.73E-06Propylene Oxide 0.00E+00 0.00E+00 0.00E+00 0.00E+00 0.00E+00 0.00E+00 0.00E+00 0.00E+00 0.00E+00 0.00E+00Pyrene 8.58E-08 5.81E-07 2.70E-08 1.19E-06 1.86E-06 3.96E-08 9.96E-07 1.25E-08 6.07E-08 1.10E-06Selenium 4.12E-07 2.79E-06 1.30E-07 5.71E-06 8.91E-06 1.90E-07 4.78E-06 5.99E-08 2.92E-07 5.26E-06Toluene 6.28E-04 4.25E-03 1.98E-04 8.71E-03 1.36E-02 2.90E-04 7.29E-03 9.13E-05 4.45E-04 8.03E-03Xylenes 4.67E-04 3.16E-03 1.47E-04 6.47E-03 1.01E-02 2.15E-04 5.42E-03 6.78E-05 3.30E-04 5.97E-03TOTAL HAPS 0.25 0.03
North Flare (TPY) SouthFlare (TPY)

APPENDIX B
B-43
North and South Flares - Potential to Emit Calculations - Summary
TAP Pollutant Pilots cool downcold
restartwarm restart TOTAL Pilots cool down cold restart
warm restart TOTAL
Barium 7.55E-05 5.12E-04 2.38E-05 1.05E-03 1.63E-03 3.49E-05 8.77E-04 1.10E-05 5.35E-05 9.65E-04Butane 3.60E-02 2.44E-01 1.13E-02 5.00E-01 7.80E-01 1.66E-02 4.19E-01 5.24E-03 2.55E-02 4.61E-01Copper 1.46E-05 9.88E-05 4.59E-06 2.02E-04 3.16E-04 6.73E-06 1.69E-04 2.12E-06 1.03E-05 1.86E-04Molybdenum 1.89E-05 1.28E-04 5.94E-06 2.62E-04 4.08E-04 8.71E-06 2.19E-04 2.74E-06 1.34E-05 2.41E-04Vanadium 3.95E-05 2.67E-04 1.24E-05 5.47E-04 8.54E-04 1.82E-05 4.58E-04 5.74E-06 2.79E-05 5.05E-04Zinc 4.98E-04 3.37E-03 1.57E-04 6.90E-03 1.08E-02 2.30E-04 5.78E-03 7.23E-05 3.52E-04 6.36E-03
North Flare (TPY) SouthFlare (TPY)

APPENDIX B
B-44
Existing Frame 5 Combustion Turbines - Projected Actual Emissions Increase
Operating InformationParameter Value Units
Unit Rating 302 MMBTU/hrProjected increase usage (total) 85.3 MMBTU/hrProjected increase usage (per unit) 42.65 MMBTU/hrStack Outlet Flowrate 268531 dscfmFuel High Heat Value 1031 Btu/scfFuel Sulfur Content 0.000051 %Fuel Sulfur Content 0.015 gr/100 scfHours of Operation 8760 hr/yrNumber of units 2
Potential Emissions of Criteria PollutantsCombined Emissions
PollutantEmission
Factor (EF) EF Units lb/hr TPY TPYNOX 2.5 ppmvd (exhaust) NSR Approval Permit No. NSR-2005-01 0.69 3.0 6.01CO 6 ppmvd (exhaust) PSD Approval Permit No. PSD-2005-01 1.00 4.4 8.78
SO2 0.000048 lb/MMBtu 0.002 0.009 0.02VOC 0.003 lb/MMBtu NSR Approval Permit No. NSR-2005-01 0.13 0.6 1.12H2S 0.015 gr/100 scf Assume all fuel sulfur becomes H2S 9.42E-04 4.13E-03 0.01H2SO4 0.015 gr/100 scf Assume all fuel sulfur becomes H2So4 2.71E-03 1.19E-02 0.02
Ammonia 5 ppmvd (exhaust) 0.51 2.2 4.44CO2 53.06 kg/MMBtu 4,989.07 21,852.15 43,704.30CH4 0.001 kg/MMBtu 0.09 0.4 0.82N2O 0.0001 kg/MMBtu 0.01 0.04 0.08CO2e 4,994.23 21,874.72 43,749.43PM Filterable 0.0019 lb/MMBtu Permit Limit 0.08 0.35 0.71PM10/2.5 Condensable 0.0047 lb/MMBtu Permit Limit 0.20 0.88 1.76PM10/2.5 Filterable and Condensable 0.28 1.2 2.47Note 1 - All PM is assumed to be PM2.5, therefore PM = PM10 = PM2.5.
NOX/CO/Ammonia Emissions Equation:Emissions (lb/hr) = ppm/10E6 * 0.076 * dscfm * 60min/hr * MW/29
SO2, VOC, PM Emission Equation:Emissions (lb/hr) = EF (lb/MMBtu) * Unit Rating (MMbtu/hr)
H2S and H2SO4 Emissions Equation:Emissions (lb/hr) = fuel sulfur content (gr/100 scf) * 1/100 / 7,000 gr/lb * Unit Rating (MMbtu/hr) * 10e6 / HHV(btu/scf) * MW of pollutant / MW of Sulfur
CO2, CH4, N2O Emission Equation: Emissions (lb/hr) = EF (kg/MMBTU) * Unit Rating (MMBTU/hr) * 2.2046 lbs/kg
Note: Emissions calculated by multiplying the ratio of the increased usage to the total rating of the turbine (i.e. 42.65/302).
Emission per Unit
Source/Basis
40 CFR 98 Table C-140 CFR 98 Table C-240 CFR 98 Table C-2
Engineering Estimate of Ammonia Slip from SCR
AP-42 Table 3.1-2a - corrected using site-specific fuel sulfur content
Source/BasisPer CPCN Application
Site-specific data
Stack test data
Site-specific data
Provide continuous 25 MW - Per 8/14/13 EPC Design Spec.
Assume equal usage of identical units
Site-specific value based on 2010 average

APPENDIX B
B-45
Existing Frame 5 Combustion Turbines - Projected Actual Emissions Increase
HAP Emission Equation:Emissions (lb/hr) = EF(lb/MMscf) / HHV * Unit Rating (MMbtu/hr)Emissions (lb/hr) = EF(lb/MMBtu) * Unit Rating (MMbtu/hr)
Where:HHV = Site-specific fuel high heating value (btu/scf)
Potential Emissions of Hazardous Air Pollutants
HAP PollutantEmission
Factor (EF) EF Units Source Basis lb/hr ton/yr lb/hr ton/yr1,3-Butadiene 4.30E-07 lb/MMBTU AP-42 Table 3.1-3 1.83E-05 8.03E-05 3.67E-05 1.61E-042-Chloronaphthalene 4.69E-07 lb/MMscf CARB CATEF II Database 2.00E-05 8.76E-05 4.00E-05 1.75E-042-Methylnaphthalene 6.30E-06 lb/MMscf CARB CATEF II Database 2.69E-04 1.18E-03 5.37E-04 2.35E-03Acetaldehyde 4.00E-05 lb/MMBTU AP-42 Table 3.1-3 1.71E-03 7.47E-03 3.41E-03 1.49E-02Acrolein 6.40E-06 lb/MMBTU AP-42 Table 3.1-3 2.73E-04 1.20E-03 5.46E-04 2.39E-03Benzene 1.20E-05 lb/MMBTU AP-42 Table 3.1-3 5.12E-04 2.24E-03 1.02E-03 4.48E-03Benzo(e)pyrene 7.33E-07 lb/MMscf CARB CATEF II Database 3.13E-05 1.37E-04 6.25E-05 2.74E-04Chrysene 1.50E-04 lb/MMscf CARB CATEF II Database 6.40E-03 2.80E-02 1.28E-02 5.60E-02Ethylbenzene 3.20E-05 lb/MMBTU AP-42 Table 3.1-3 1.36E-03 5.98E-03 2.73E-03 1.20E-02Fluoranthene 3.05E-04 lb/MMscf CARB CATEF II Database 1.30E-02 5.70E-02 2.60E-02 1.14E-01Formaldehyde 7.10E-04 lb/MMBTU AP-42 Table 3.1-3 3.03E-02 1.33E-01 6.06E-02 2.65E-01Hexane 3.82E-01 lb/MMscf CARB CATEF II Database 1.58E-02 6.92E-02 3.16E-02 1.38E-01Lead 5.00E-04 lb/MMscf AP-42 Table 1.4-3 2.07E-05 9.06E-05 4.14E-05 1.81E-04Naphthalene 1.30E-06 lb/MMBTU AP-42 Table 3.1-3 5.54E-05 2.43E-04 1.11E-04 4.86E-04PAH 2.20E-06 lb/MMBTU AP-42 Table 3.1-3 9.38E-05 4.11E-04 1.88E-04 8.22E-04Perylene 9.68E-07 lb/MMscf CARB CATEF II Database 4.13E-05 1.81E-04 8.26E-05 3.62E-04Propylene Oxide 2.90E-05 lb/MMBTU AP-42 Table 3.1-3 1.24E-03 5.42E-03 2.47E-03 1.08E-02Toluene 1.30E-04 lb/MMBTU AP-42 Table 3.1-3 5.54E-03 2.43E-02 1.11E-02 4.86E-02Xylenes 6.40E-05 lb/MMBTU AP-42 Table 3.1-3 2.73E-03 1.20E-02 5.46E-03 2.39E-02
TOTAL HAPS 0.08 0.35 0.16 0.70
Emissions per Unit Combined Emissions

APPENDIX B
B-46
New Fugitive Leaks from Equipment Components - Potential to Emit Calculations
Feed Gas Dry Gas PropaneMixed Refrigerant Sour Gas Feed Gas Dry Gas Propane
Mixed Refrigerant Sour Gas
TOC 0.90 0.95 1.000 0.92 0.0017 Component Con. Eff.VOC 0.05 0.05 1.000 0.26 0.00037 97%Hexane (listed as n-hex 86.18 0.03 0.031 0 0 1.4E-03 1.5E-03 0.00 0.00 0.00 Connectors/Flanges 97%Benzene 78.11 0.004 0.0046 0 0.013 1.7E-04 2.1E-04 0.00 0.00 2.37E-04 Open Ended Lines 100%Hydrogen Sulfide 34.08 0.0004 0 0 0.0001 7.6E-06 0.0E+00 0.00 0.00 7.94E-07 Pump Seals 93%CO2 44.01 1.9992 0.0046 0 95.853 4.9E-02 1.2E-04 0.00 0.00 9.83E-01 Pressure Relief Valves 100%CH4 16.04 90.832 92.656 45.165 0.311 8.1E-01 8.6E-01 0.00 2.82E-01 1.16E-03Butane 58.12 0.4998 0.51 0 0.003 0.02 0.02 0 0 4.06E-05Isopentane (i-pentane) 72.15 0.05 0.051 0 0 2.0E-03 2.1E-03 0 0 1.70E-06Pentane (n-pentane) 72.15 0.05 0.051 0 0 2.0E-03 2.1E-03 0 0 1.70E-06Neopentane 72.15 0.02 0.02 0 0 8.1E-04 8.5E-04 0 0 0Heptane 100.2 0.015 0.015 0 0 8.4E-04 8.8E-04 0 0 0Octane 114.23 0.005 0.0051 0 0 3.2E-04 3.4E-04 0 0 0N2 28.01 2.9988 3.0615 7.22 0.001 4.7E-02 4.9E-02 7.87E-02 6.52E-06Ethane 30.07 2.499 2.55 32.46 0.017 4.2E-02 4.4E-02 3.80E-01 1.19E-04Propane 44.1 0.9996 1.02 100 15.154 0.009 2.5E-02 2.6E-02 2.60E-01 9.25E-05Oxygen 16 0.02 0.02 0 0 1.8E-04 1.9E-04H2O 18.02 0.015 0 0 3.793 1.5E-04 0.0E+00 1.59E-02TOTAL Weight 1791.436 1737.763 2571.0424 4292.943Note: Mol % from 8/14/13 EPC Design Spectification, except for Sour Gas - Butane, Isopentane, and Pentane which are based on the CPCN Application data per DCP response to DR3-5d.
VOC includes - Propane, Benzene, hexane, Octane, heptane, butane, pentane
Pollutant Calculation Method:Table 2-4 of EPA’s Protocol for Equipment Leak Emission EstimatesEmissions (lb/hr) = EF(kg material/hr) * weight fraction TOC in material * number of sources * 2.20462 lb/kg * WF of pollutant in material/TOC WF * (1- control efficiency)
PollutantTCEQ LDAR 28 LAER Control
Efficiencies
Mol %
MW
Weight Fraction
Valves

APPENDIX B
B-47
New Fugitive Leaks from Equipment Components - Potential to Emit Calculations
Potential Emissions of Criteria and Hazardous Air PollutantsEPA EF
Component Material Service Quantity kg/hr Lb/hr TPY Lb/hr TPY Lb/hr TPY Lb/hr TPY Lb/hr TPY Lb/hr TPY Lb/hr TPY Lb/hr TPYValves Feed Gas Gas 788 4.50E-03 2.12E-01 9.28E-01 1.14E-02 4.97E-02 3.38E-04 1.48E-03 4.09E-05 1.79E-04 1.78E-06 7.82E-06 1.15E-02 5.05E-02 1.91E-01 8.35E-01Connectors/Flanges Feed Gas All 1425 3.90E-04 3.32E-02 1.45E-01 1.78E-03 7.80E-03 5.30E-05 2.32E-04 6.41E-06 2.81E-05 2.80E-07 1.23E-06 1.81E-03 7.91E-03 2.99E-02 1.31E-01Open Ended Lines Feed Gas All 0Pump Seals Feed Gas Gas 26 0.0024 8.70E-03 3.81E-02 4.66E-04 2.04E-03 1.39E-05 6.09E-05 1.68E-06 7.36E-06 7.33E-08 3.21E-07 4.73E-04 2.07E-03 7.83E-03 3.43E-02Pressure Relief Valves Feed Gas Gas 34 0.0088 0.00E+00 0.00E+00 0.00E+00 0.00E+00 0.00E+00 0.00E+00 0.00E+00 0.00E+00 0.00E+00 0.00E+00 0.00E+00 0.00E+00 0.00E+00 0.00E+00Valves Dry Gas Gas 788 0.0045 2.23E-01 9.76E-01 1.20E-02 5.24E-02 3.61E-04 1.58E-03 4.85E-05 2.12E-04 2.73E-05 1.20E-04 2.01E-01 8.79E-01Connectors/Flanges Dry Gas All 1425 3.90E-04 3.49E-02 1.53E-01 1.87E-03 8.21E-03 5.65E-05 2.48E-04 7.60E-06 3.33E-05 4.28E-06 1.88E-05 3.14E-02 1.38E-01Open Ended Lines Dry Gas All 0Pump Seals Dry Gas Gas 26 0.0024 9.15E-03 4.01E-02 4.91E-04 2.15E-03 1.48E-05 6.48E-05 1.99E-06 8.72E-06 1.12E-06 4.91E-06 8.24E-03 3.61E-02Pressure Relief Valves Dry Gas Gas 34 0.0088 0.00E+00 0.00E+00 0.00E+00 0.00E+00 0.00E+00 0.00E+00 0.00E+00 0.00E+00 0.00E+00 0.00E+00 0.00E+00 0.00E+00Valves Propane Gas 315 0.0045 9.38E-02 4.11E-01 9.38E-02 4.11E-01Valves Propane Light Liquid 1260 0.0025 2.08E-01 9.13E-01 2.08E-01 9.13E-01Connectors/Flanges Propane Gas 570 3.90E-04 1.47E-02 6.44E-02 1.47E-02 6.44E-02Connectors/Flanges Propane Light Liquid 2280 2.10E-04 3.17E-02 1.39E-01 3.17E-02 1.39E-01Open Ended Lines Propane -- 0Pump Seals Propane Gas 11 0.0024 4.07E-03 1.78E-02 4.07E-03 1.78E-02Pump Seals Propane Light Liquid 42 0.013 8.43E-02 3.69E-01 8.43E-02 3.69E-01Pressure Relief Valves Propane Gas 14 0.0088 0.00E+00 0.00E+00 0.00E+00 0.00E+00Pressure Relief Valves Propane Light Liquid 54 0.0075 0.00E+00 0.00E+00 0.00E+00 0.00E+00Valves Mixed Refr Gas 315 0.0045 8.64E-02 3.78E-01 2.44E-02 1.07E-01 2.64E-02 1.16E-01Valves Mixed Refr Light Liquid 1260 0.0025 1.92E-01 8.41E-01 5.42E-02 2.37E-01 5.87E-02 2.57E-01Connectors/Flanges Mixed Refr Gas 570 3.90E-04 1.35E-02 5.93E-02 3.82E-03 1.67E-02 4.14E-03 1.81E-02Connectors/Flanges Mixed Refr Light Liquid 2280 2.10E-04 2.92E-02 1.28E-01 8.23E-03 3.61E-02 8.92E-03 3.91E-02Open Ended Lines Mixed Refr -- 0Pump Seals Mixed Refr Gas 11 0.0024 3.75E-03 1.64E-02 1.06E-03 4.64E-03 1.15E-03 5.03E-03Pump Seals Mixed Refr Light Liquid 42 0.013 7.76E-02 3.40E-01 2.19E-02 9.59E-02 2.37E-02 1.04E-01Pressure Relief Valves Mixed Refr Gas 14 0.0088 0.00E+00 0.00E+00 0.00E+00 0.00E+00 0.00E+00 0.00E+00Pressure Relief Valves Mixed Refr Light Liquid 54 0.0075 0.00E+00 0.00E+00 0.00E+00 0.00E+00 0.00E+00 0.00E+00Valves Sour Gas Gas 525 0.0045 2.58E-04 1.13E-03 5.83E-05 2.55E-04 3.70E-05 1.62E-04 1.24E-07 5.43E-07 1.54E-01 6.73E-01 1.82E-04 7.95E-04Connectors/Flanges Sour Gas All 950 3.90E-04 4.05E-05 1.78E-04 9.14E-06 4.00E-05 5.80E-06 2.54E-05 1.95E-08 8.52E-08 2.41E-02 1.05E-01 2.85E-05 1.25E-04Open Ended Lines Sour Gas All 0Pump Seals Sour Gas Gas 18 0.0024 1.10E-05 4.83E-05 2.49E-06 1.09E-05 1.58E-06 6.91E-06 5.29E-09 2.32E-08 6.55E-03 2.87E-02 7.75E-06 3.39E-05Pressure Relief Valves Sour Gas Gas 23 0.0088 0.00E+00 0.00E+00 0.00E+00 0.00E+00 0.00E+00 0.00E+00 0.00E+00 0.00E+00 0.00E+00 0.00E+00 0.00E+00 0.00E+00
TOTAL 1.36 5.96 0.58 2.53 8.4E-04 3.7E-03 1.5E-04 6.6E-04 2.29E-06 1.00E-05 0.20 0.87 0.59 2.59 15.00 65.69Note: Counts/Components based on 8/14/13 EPC Design Specification.
CO2eTOC VOC MethaneHexane Benzene Hydrogen Sulfide Carbon Dioxide

APPENDIX B
B-48
New Fugitive Leaks from Equipment Components - Potential to Emit Calculations
Potential Emissions of Toxic Air Pollutants not classified as HAPsEPA EF
Component Material Service Quantity kg/hr Lb/hr TPY Lb/hr TPY Lb/hr TPY Lb/hr TPY Lb/hr TPY Lb/hr TPYValves Feed Gas Gas 788 4.50E-03 3.8E-03 1.7E-02 4.7E-04 2.1E-03 4.7E-04 2.1E-03 1.9E-04 8.3E-04 2.0E-04 8.6E-04 7.5E-05 3.3E-04Connectors/Flanges Feed Gas All 1425 3.90E-04 6.0E-04 2.6E-03 7.4E-05 3.2E-04 7.4E-05 3.2E-04 3.0E-05 1.3E-04 3.1E-05 1.4E-04 1.2E-05 5.1E-05Open Ended Lines Feed Gas All 0Pump Seals Feed Gas Gas 26 0.0024 1.6E-04 6.8E-04 1.9E-05 8.5E-05 1.9E-05 8.5E-05 7.8E-06 3.4E-05 8.1E-06 3.5E-05 3.1E-06 1.3E-05Pressure Relief Valves Feed Gas Gas 34 0.0088 0.0E+00 0.0E+00 0.0E+00 0.0E+00 0.0E+00 0.0E+00 0.0E+00 0.0E+00 0.0E+00 0.0E+00 0.0E+00 0.0E+00Valves Dry Gas Gas 788 0.0045 4.0E-03 1.8E-02 5.0E-04 2.2E-03 5.0E-04 2.2E-03 2.0E-04 8.7E-04 2.1E-04 9.1E-04 7.9E-05 3.4E-04Connectors/Flanges Dry Gas All 1425 3.90E-04 6.3E-04 2.7E-03 7.8E-05 3.4E-04 7.8E-05 3.4E-04 3.1E-05 1.4E-04 3.2E-05 1.4E-04 1.2E-05 5.4E-05Open Ended Lines Dry Gas All 0Pump Seals Dry Gas Gas 26 0.0024 1.6E-04 7.2E-04 2.0E-05 8.9E-05 2.0E-05 8.9E-05 8.2E-06 3.6E-05 8.5E-06 3.7E-05 3.2E-06 1.4E-05Pressure Relief Valves Dry Gas Gas 34 0.0088 0.00E+00 0.00E+00 0.0E+00 0.0E+00 0.0E+00 0.0E+00 0.0E+00 0.0E+00 0.0E+00 0.0E+00 0.0E+00 0.0E+00Valves Sour Gas Gas 525 0.0045 6.3E-06 2.8E-05 2.7E-07 1.2E-06 2.7E-07 1.2E-06Connectors/Flanges Sour Gas All 950 3.90E-04 1.0E-06 4.4E-06 4.2E-08 1.8E-07 4.2E-08 1.8E-07Open Ended Lines Sour Gas All 0Pump Seals Sour Gas Gas 18 0.0024 2.7E-07 1.2E-06 1.1E-08 5.0E-08 1.1E-08 5.0E-08Pressure Relief Valves Sour Gas Gas 23 0.0088 0.0E+00 0.0E+00 0.0E+00 0.0E+00 0.0E+00 0.0E+00
TOTAL 9.4E-03 4.1E-02 1.2E-03 5.1E-03 1.2E-03 5.1E-03 4.6E-04 2.0E-03 4.8E-04 2.1E-03 1.8E-04 8.0E-04
Note: TAP emissions not shown for Propane or Mixed Refrigerant as these materials do not contain any of the TAP pollutants listed.
OctaneButane Isopentane Pentane NeoPentane Heptane

APPENDIX B
B-49
Potential to Emit Calculations - References and Assumptions
2.2046 pounds453.6 grams
379.0 scf/lbmol
PollutantGlobal Warming Potential (100 yr.)
CO2 1CH4 25N2O 298Note 1: GWPs reflect amended GWP in the Federal Register 11/29/13
Pollutant MW UnitsMW of SO2 64.066 lb/lb-moleMW of H2SO4 98.079 lb/lb-moleMW of H2S 34.08 lb/lb-moleMW of CO 28.01 lb/lb-moleMW of NO2 46.0055 lb/lb-moleMW of Ammonia 17.0 lb/lb-moleMW of VOC 16.04 lb/lb-moleMW of S 32.065 lb/lb-moleMW of PM 115.067 lb/lb-moleNote 1: Per DCP response to DR#1-29 PM MW based on MW of NH4HSO4Note 2: Methane MW used as representative of VOC MW per DCP response to DR#2-9
1 kilogram =
Table A–1 to Subpart A of Part 98
Conversion Assumptions
Molecular Weights
1 pound = Volume that a lb mol of gas occupies at 60F and 14.7
PSI

APPENDIX B
B-50
Ammonia Slip Emissions - New and Existing Equipment - Potential to Emit Calculations For TAP Analysis
Emission UnitExaust Flowrate
(dscfm)
Exhuast Oxygen
Content (%)Emissions
(lb/hr)Emissions
(tpy)Thermal Oxidizer 5 ppmvd (exhaust) 24,024 1.60 1.1 4.6
Ammonia Emission Calculations:Emissions (lb/hr) = ppm/10E6 * 0.076 * dscfm * 60min/hr * MW/29 *[(20.9-actualO2)/(20.9-design O2)
MW of Ammonia 170.076 - density of air at 60F (lb/scf)29 - Molecular weight of air (lb/lb-mol)20.9 - ambient O2 Concentraiont (%)
Concentration

APPENDIX B
B-51
Existing Fugitive Leaks from Equipment Components - Potential To Emit Calculations For TAP Analysis
Mixed Refrigerant Isopentane
Pipeline Gas Boil Off
TOC 0.850 1.000 0.97 0.98VOC 0.290 1.000 0.02 1.90E-03Hexane 0 0 1.0E-03 1.2E-03Benzene 0 0 0 0Hydrogen Sulfide 0 0 0 0Butane 0 0 3.9E-03 2.2E-04Isopentane 0.290 1.00 7.0E-04 7.1E-05Pentane 0 0 5.6E-04 7.6E-05Neopentane 0 0 0 0Heptane 0 0 0 0Octane 0 0 0 0Boil Off Voc percentage provided as 0.0019 in 6-13-13 response to DR2-11All other Weight Fractions per CPCN Application Appendix H, Page H-39
Calculation MethodTable 2-4 of EPA’s Protocol for Equipment Leak Emission Estimates
Emissions lb/hr = EF(kg material/hr) * weight fraction TOC in material * number of sources * 2.20462 * WF of pollutant in material/TOC WF * control efficiency2.20462 conversion from kg to lbs
Pollutant
Weight Fraction

APPENDIX B
B-52
Existing Fugitive Leaks from Equipment Components - Potential To Emit Calculations For TAP Analysis
Potential Emissions of Criteria, Hazardous Air Pollutants, and Toxic Air PollutantsEPA EF
Component Material Service Quantity kg/hr Lb/hr TPY Lb/hr TPY Lb/hr TPY Lb/hr TPY Lb/hr TPY Lb/hr TPYValves Mixed RefrigeLight Liquid 3 2.50E-03 1.4E-02 6.2E-02 4.80E-03 2.10E-02 4.8E-03 2.1E-02Pump Seals Mixed RefrigeLight Liquid 1 1.30E-02 2.4E-02 1.1E-01 8.31E-03 3.64E-02 8.3E-03 3.6E-02Compressor Seals Mixed RefrigeGas 1 8.80E-03 1.6E-02 7.2E-02 5.63E-03 2.46E-02 5.6E-03 2.5E-02Pressure Relief Valves Mixed RefrigeGas 1 8.80E-03 1.6E-02 7.2E-02 5.63E-03 2.46E-02 5.6E-03 2.5E-02Flanges Mixed RefrigeGas 40 3.90E-04 2.9E-02 1.3E-01 9.97E-03 4.37E-02 1.0E-02 4.4E-02Flanges Mixed RefrigeLight Liquid 33 1.10E-04 6.8E-03 3.0E-02 2.32E-03 1.02E-02 2.3E-03 1.0E-02Open Ended Lines Mixed RefrigeGas 38 2.00E-03 1.4E-01 6.2E-01 4.86E-02 2.13E-01 4.9E-02 2.1E-01Sampling Connectors Mixed RefrigeGas 5 8.80E-03 8.2E-02 3.6E-01 2.81E-02 1.23E-01 2.8E-02 1.2E-01Valves Isopentane Gas 0 4.50E-03 0.0E+00 0.0E+00 0.00E+00 0.00E+00 0.0E+00 0.0E+00Valves Isopentane Light Liquid 2 2.50E-03 1.1E-02 4.8E-02 1.10E-02 4.83E-02 1.1E-02 4.8E-02Flanges Isopentane Light Liquid 16 1.10E-04 3.9E-03 1.7E-02 3.88E-03 1.70E-02 3.9E-03 1.7E-02Pressure Relief Valves Isopentane Gas 0 8.80E-03 0.0E+00 0.0E+00 0.00E+00 0.00E+00 0.0E+00 0.0E+00Valves Pipeline Light Liquid 1673 2.50E-03 8.9E+00 3.9E+01 1.84E-01 8.08E-01 9.2E-03 4.0E-02 3.6E-02 1.6E-01 6.5E-03 2.8E-02 5.2E-03 2.3E-02Valves Pipeline Gas 3114 4.50E-03 3.0E+01 1.3E+02 6.18E-01 2.71E+00 3.1E-02 1.4E-01 1.2E-01 5.3E-01 2.2E-02 9.5E-02 1.7E-02 7.6E-02Open Ended Lines Pipeline Light Liquid 280 1.40E-03 8.4E-01 3.7E+00 1.73E-02 7.57E-02 8.6E-04 3.8E-03 3.4E-03 1.5E-02 6.0E-04 2.6E-03 4.8E-04 2.1E-03Open Ended Lines Pipeline Gas 881 2.00E-03 3.8E+00 1.7E+01 7.77E-02 3.40E-01 3.9E-03 1.7E-02 1.5E-02 6.6E-02 2.7E-03 1.2E-02 2.2E-03 9.5E-03Sampling Connections Pipeline Gas 746 8.80E-03 1.4E+01 6.1E+01 2.89E-01 1.27E+00 1.4E-02 6.3E-02 5.6E-02 2.5E-01 1.0E-02 4.4E-02 8.1E-03 3.5E-02Pressure Relief Valves Pipeline Gas 610 8.80E-03 1.1E+01 5.0E+01 2.37E-01 1.04E+00 1.2E-02 5.2E-02 4.6E-02 2.0E-01 8.3E-03 3.6E-02 6.6E-03 2.9E-02Pump Seals Pipeline Light Liquid 27 1.30E-02 7.5E-01 3.3E+00 1.55E-02 6.78E-02 7.7E-04 3.4E-03 3.0E-03 1.3E-02 5.4E-04 2.4E-03 4.3E-04 1.9E-03Compressor Seals Pipeline Gas 13 8.80E-03 2.4E-01 1.1E+00 5.04E-03 2.21E-02 2.5E-04 1.1E-03 9.8E-04 4.3E-03 1.8E-04 7.7E-04 1.4E-04 6.2E-04Compressor Seals Boil Off Gas 2 8.80E-03 3.8E-02 1.7E-01 7.37E-05 3.23E-04 4.7E-05 2.0E-04 8.5E-06 3.7E-05 2.8E-06 1.2E-05 2.9E-06 1.3E-05Flanges Boil Off Gas 74 3.90E-04 6.2E-02 2.7E-01 1.21E-04 5.29E-04 7.6E-05 3.3E-04 1.4E-05 6.1E-05 4.5E-06 2.0E-05 4.8E-06 2.1E-05Man-Way Pipeline Gas 5 8.80E-03 9.4E-02 4.1E-01 1.94E-03 8.50E-03 9.7E-05 4.2E-04 3.8E-04 1.7E-03 6.8E-05 3.0E-04 5.4E-05 2.4E-04Connectors Pipeline Gas 12760 2.00E-04 5.5E+00 2.4E+01 1.13E-01 4.93E-01 5.6E-03 2.5E-02 2.2E-02 9.6E-02 3.9E-03 1.7E-02 3.2E-03 1.4E-02Connectors Pipeline Light Liquid 2364 2.10E-04 1.1E+00 4.6E+00 2.19E-02 9.59E-02 1.1E-03 4.8E-03 4.3E-03 1.9E-02 7.7E-04 3.4E-03 6.1E-04 2.7E-03Flanges Pipeline Gas 1300 3.90E-04 1.1E+00 4.7E+00 2.24E-02 9.79E-02 1.1E-03 4.9E-03 4.4E-03 1.9E-02 7.8E-04 3.4E-03 6.3E-04 2.7E-03Flanges Pipeline Light Liquid 4305 1.10E-04 1.0E+00 4.4E+00 2.09E-02 9.15E-02 1.0E-03 4.6E-03 4.1E-03 1.8E-02 7.3E-04 3.2E-03 5.8E-04 2.6E-03Venting Pipeline N/A N/A 1.28E+00 5.61E+00 2.64E-02 1.16E-01 1.32E-03 5.79E-03 5.2E-03 2.3E-02 9.25E-04 4.1E-03 7.40E-04 3.2E-03
TOTAL 80.47 352.46 1.78 7.79 0.08 0.36 0.32 1.41 0.19 0.81 0.05 0.20
Venting - Notes from CPCN Application Appendix H, Page H-3910. Natural gas vented - potential annual natural gas volume gas based on 2011 volume vented plus 20% contingency (cf/yr): 27600011. Natural gas vented - potential hourly natural gas volume vented is an annual average based on 8,760.12. The site-specfic density of Natural Gas: 0.56 *density of air = 4.193672 lb/100 scf (the density of air is at 70oF and 14.696 psia)
Total Natural Gas Vented (lb/hr) = Natural Gas Vented (cf/yr) * 4.193672 lb/100 scf / 100 * 8760 hours/yr1.321293918 Total natural gas vented lb/hr
TOC VOCAdditional TAPS
Hexane Butane Isopentane Pentane

APPENDIX B
B-53
Toxic Air Pollutatant - Potential to Emit Annual Emission Totals
TAP Pollutant CAS HAPAmmonia
slipThermal Oxidizer
North Flare
South Flare
Existing Fugitives
New Fugitives
2-Methylnaphthalene 91576 YES 5.86E-06 8.91E-06 5.26E-06 2.00E-05 4.01E-023-Methylchloranthrene 56495 YES 4.4E-07 6.68E-07 3.95E-07 1.50E-06 3.01E-037,12-Dimethylbenz(a)anthracene 57976 YES 3.91E-06 5.94E-06 3.51E-06 1.34E-05 2.67E-02Acenaphthene 83329 YES 4.4E-07 6.68E-07 3.95E-07 1.50E-06 3.01E-03Acenaphthylene 208968 YES 4.4E-07 6.68E-07 3.95E-07 1.50E-06 3.01E-03Acetaldehyde 75070 YES 0.000757 0.001597 0.000943 3.30E-03 6.59E+00Acrolein 107028 YES 0.000659 0.001003 0.000592 2.25E-03 4.51E+00Ammonia 7664417 NO 4.60E+00 0.00 0.00 4.60 9200.00Anthracene 120127 YES 5.86E-07 8.91E-07 5.26E-07 2.00E-06 4.01E-03Arsenic 7440382 YES 4.88E-05 7.43E-05 4.39E-05 1.67E-04 3.34E-01Barium 7440393 NO 1.07E-03 1.63E-03 9.65E-04 3.67E-03 7.35E+00Benz(a)anthracene 56553 YES 4.4E-07 6.68E-07 3.95E-07 1.50E-06 3.01E-03Benzene 71432 YES 0.001416 0.211025 0.001755 0.00 6.63E-04 2.15E-01 429.72Benzo(a)pyrene 50328 YES 2.93E-07 4.46E-07 2.63E-07 1.00E-06 2.00E-03Benzo(b)fluoranthene 205992 YES 4.4E-07 6.68E-07 3.95E-07 1.50E-06 3.01E-03Benzo(g,h,i)perylene 191242 YES 2.93E-07 4.46E-07 2.63E-07 1.00E-06 2.00E-03Benzo(k)fluoranthene 205089 YES 4.4E-07 6.68E-07 3.95E-07 1.50E-06 3.01E-03Beryllium 7440417 YES 2.93E-06 4.46E-06 2.63E-06 1.00E-05 2.00E-02Butane 106978 NO 5.13E-01 7.80E-01 4.61E-01 1.41E+00 0.04 3.20E+00 6407.08Cadmium 7440439 YES 0.000269 0.000408 0.000241 9.18E-04 1.84E+00Chromium 7440473 YES 0.000342 0.00052 0.000307 1.17E-03 2.34E+00Chrysene 218019 YES 4.4E-07 6.68E-07 3.95E-07 1.50E-06 3.01E-03Cobalt 7440484 YES 2.05E-05 3.12E-05 1.84E-05 7.01E-05 1.40E-01Copper 7440508 NO 2.08E-04 3.16E-04 1.86E-04 7.10E-04 1.42E+00Dibenzo(a,h)anthracene 53703 YES 2.93E-07 4.46E-07 2.63E-07 1.00E-06 2.00E-03Dichlorobenzene 25321226 YES 0.000293 0.000446 0.000263 1.00E-03 2.00E+00Ethylbenzene 100414 YES 0.001685 0.003527 0.002084 7.30E-03 14.59Fluoranthene 206440 YES 7.33E-07 1.11E-06 6.58E-07 2.50E-06 5.01E-03Fluorene 86737 YES 6.84E-07 1.04E-06 6.14E-07 2.34E-06 4.68E-03Formaldehyde 50000 YES 0.001502 0.006312 0.003729 1.15E-02 23.09Heptane 142825 NO 0 0.002118 2.12E-03 4.24E+00Hexane Hexane, other isomeYES 0.001123 0.002339 0.001382 0.36 3.67E-03 3.70E-01 740.77Hydrogen Sulfide 7783064 YES 0.17 0.00 0.00 0.00 1.00E-05 1.75E-01 349.31Indeno(1,2,3-cd)pyrene 193395 YES 4.4E-07 6.68E-07 3.95E-07 1.50E-06 3.01E-03Isopentane 78784 YES 0.81 0.005084 8.20E-01 1639.81Manganese 7439965 YES 9.28E-05 0.000141 8.34E-05 3.17E-04 6.35E-01Mercury 7439976 YES 6.35E-05 9.65E-05 5.7E-05 2.17E-04 4.34E-01Molybdenum 7439987 NO 2.69E-04 4.08E-04 2.41E-04 9.18E-04 1.84E+00Naphthalene 91203 YES 7.33E-05 0.000111 6.58E-05 2.50E-04 5.01E-01Neopentane 463821 NO 0 0.002033 2.03E-03 4.07E+00Nickel 7440020 YES 0.000513 0.00078 0.000461 1.75E-03 3.51E+00Nitrous Oxide 10024972 YES 0.05 0.08 0.05 1.89E-01 378.31Octane 111659 YES 0 0.000805 8.05E-04 1.61E+00Pentane 109660 YES 0.20 0.005084 2.07E-01 414.93Phenanathrene 85018 YES 4.15E-06 6.31E-06 3.73E-06 1.42E-05 2.84E-02Pyrene 129000 YES 1.22E-06 1.86E-06 1.1E-06 4.17E-06 8.35E-03Respirable PM PM, not otherwise s YES 0.04 0.03 0.02 8.46E-02 169.25Selenium 7782492 YES 5.86E-06 8.91E-06 5.26E-06 2.00E-05 4.01E-02Sulfuric Acid Mist 7664939 YES 0.50 0.00 0.00 5.03E-01 1005.23Toluene 108883 YES 0.006472 0.01359 0.008029 2.81E-02 56.18Vanadium 7440622 NO 5.62E-04 8.54E-04 5.05E-04 1.92E-03 3.84Xylenes 1330207 YES 0.004811 0.0101 0.005967 2.09E-02 41.75Zinc 7440666 NO 7.08E-03 1.08E-02 6.36E-03 2.42E-02 48.42
TOTAL TAPS 4.60E+00 1.31E+00 1.16E+00 5.62E-01 2.79E+00 6.04E-02 10.48 20,965.84
Note 1: Fuel burning sources are exempt from TAP regulations, and are not included in the TAP emission totals.Note 2: The HAP Lead is exempt, and does not require a TAP analysis.Note 3: Respirable particulate assumed to be 1% of total PM10 (including filterable and condensable emissions).Note 4: Flare emissions reflect maximum emissions of pilot + cooldown+ maximum(warm or cold restarts)
Annual TAP Emissions (TPY) FACILITY TOTAL (TPY)
FACILITY TOTAL (lb/yr)

APPENDIX B
B-54
Toxic Air Pollutatant - Potential to Emit Short-Term Emission Totals
TAP Pollutant CASAmmonia
slipThermal Oxidizer
North Flare
South Flare
Existing Fugitives
New Fugitives
2-Methylnaphthalene 91576 1.34E-06 1.15E-03 7.91E-05 1.23E-033-Methylchloranthrene 56495 1.00E-07 8.66E-05 5.93E-06 9.26E-057,12-Dimethylbenz(a)anthracene 57976 8.92E-07 7.69E-04 5.27E-05 8.23E-04Acenaphthene 83329 1.00E-07 8.66E-05 5.93E-06 9.26E-05Acenaphthylene 208968 1.00E-07 8.66E-05 5.93E-06 9.26E-05Acetaldehyde 75070 1.73E-04 2.07E-01 1.42E-02 2.21E-01Acrolein 107028 1.51E-04 1.30E-01 8.90E-03 1.39E-01Ammonia 7664417 1.05 1.05Anthracene 120127 1.34E-07 1.15E-04 7.91E-06 1.23E-04Arsenic 7440382 1.12E-05 9.62E-03 6.59E-04 1.03E-02Barium 7440393 2.45E-04 2.12E-01 1.45E-02 2.26E-01Benz(a)anthracene 56553 1.00E-07 8.66E-05 5.93E-06 9.26E-05Benzene 71432 3.23E-04 4.20E+01 2.64E-02 0.00 1.51E-04 42.02Benzo(a)pyrene 50328 6.69E-08 5.77E-05 3.96E-06 6.17E-05Benzo(b)fluoranthene 205992 1.00E-07 8.66E-05 5.93E-06 9.26E-05Benzo(g,h,i)perylene 191242 6.69E-08 5.77E-05 3.96E-06 6.17E-05Benzo(k)fluoranthene 205089 1.00E-07 8.66E-05 5.93E-06 9.26E-05Beryllium 7440417 6.69E-07 5.77E-04 3.96E-05 6.17E-04Butane 106978 1.17E-01 1.01E+02 6.92E+00 0.32 0.01 108.35Cadmium 7440439 6.13E-05 5.29E-02 3.63E-03 5.66E-02Chromium 7440473 7.81E-05 6.73E-02 4.61E-03 7.20E-02Chrysene 218019 1.00E-07 8.66E-05 5.93E-06 9.26E-05Cobalt 7440484 4.68E-06 4.04E-03 2.77E-04 4.32E-03Copper 7440508 4.74E-05 4.09E-02 2.80E-03 4.37E-02Dibenzo(a,h)anthracene 53703 6.69E-08 5.77E-05 3.96E-06 6.17E-05Dichlorobenzene 25321226 6.69E-05 5.77E-02 3.96E-03 6.17E-02Ethylbenzene 100414 3.85E-04 4.57E-01 3.13E-02 4.89E-01Fluoranthene 206440 1.67E-07 1.44E-04 9.89E-06 1.54E-04Fluorene 86737 1.56E-07 1.35E-04 9.23E-06 1.44E-04Formaldehyde 50000 3.43E-04 8.17E-01 5.60E-02 8.74E-01Heptane 142825 0 0.000484 4.84E-04Hexane Hexane, other isomers 2.56E-04 3.03E-01 2.08E-02 0.08 0.00 4.07E-01Hydrogen Sulfide 7783064 3.99E-02 0.00 0.00 3.99E-02Indeno(1,2,3-cd)pyrene 193395 1.00E-07 8.66E-05 5.93E-06 9.26E-05Isopentane 78784 0.19 0.001161 1.87E-01Manganese 7439965 2.12E-05 1.83E-02 1.25E-03 1.95E-02Mercury 7439976 1.45E-05 1.25E-02 8.57E-04 1.34E-02Molybdenum 7439987 6.13E-05 5.29E-02 3.63E-03 5.66E-02Naphthalene 91203 1.67E-05 1.44E-02 9.89E-04 1.54E-02Neopentane 463821 0 0.000464 4.64E-04Nickel 7440020 1.17E-04 1.01E-01 6.92E-03 1.08E-01Nitrous Oxide 10024972 0.01 11.13 0.96 12.10Octane 111659 0 0.000184 1.84E-04Pentane 109660 0.05 0.001161 4.74E-02Phenanathrene 85018 9.48E-07 8.17E-04 5.60E-05 8.74E-04Pyrene 129000 2.79E-07 2.40E-04 1.65E-05 2.57E-04Respirable PM PM, not otherwise specified, respe 0.01 3.654318 0.250387 3.91E+00Selenium 7782492 1.34E-06 1.15E-03 7.91E-05 1.23E-03Sulfuric Acid Mist 7664939 0.11 1.15E-01Toluene 108883 1.48E-03 1.76E+00 1.21E-01 1.88E+00Vanadium 7440622 1.28E-04 1.11E-01 7.58E-03 1.18E-01Xylenes 1330207 1.10E-03 1.31E+00 8.97E-02 1.40E+00Zinc 7440666 1.62E-03 1.39E+00 9.56E-02 1.49E+00
TOTAL TAP 175.55
Short-Term TAP Emissions (lb/hr) FACILITY TOTAL (lb/hr)

APPENDIX B
B-55
Toxic Air Pollutatant - MDE COMAR 26.11.15 and 26.11.16 Analysis
1-hr 8-hr Annual1-hr
(lb/hr)8-hr
(lb/hr)Annual (lb/yr)
lb/hr lb/yr 1-hr 8-hr Annual
2-Methylnaphthalene 91576 29.1 0.104 1.23E-03 4.01E-02 PASS3-Methylchloranthrene 56495 20 0.072 9.26E-05 3.01E-03 PASS7,12-Dimethylbenz(a)anthracene 57976 4.8 0.017 8.23E-04 2.67E-02 PASSAcenaphthene 83329 20 0.072 9.26E-05 3.01E-03 PASSAcenaphthylene 208968 24.6 0.088 9.26E-05 3.01E-03 PASSAcetaldehyde 75070 450.41 2300 0.5 1.614 8.244 182.482 0.22 6.59 PASS PASS PASSAcrolein 107028 2.29 1.8 0.008 0.006 0.14 4.51 NO NOAmmonia 7664417 243.78 174.13 0.874 0.624 1.05 9,200 NO NOAnthracene 120127 20 0.072 1.23E-04 4.01E-03 PASSArsenic 7440382 0.1 0.0002 0.0004 0.073 1.03E-02 0.33 NO NOBarium 7440393 5 0.018 0.23 7.35 NOBenz(a)anthracene 56553 9.26E-05 3.01E-03Benzene 71432 79.87 15.97 0.13 0.286 0.057 47.445 42.02 429.72 NO NO NOBenzo(a)pyrene 50328 6.17E-05 2.00E-03Benzo(b)fluoranthene 205992 9.26E-05 3.01E-03Benzo(g,h,i)perylene 191242 20 0.072 6.17E-05 2.00E-03 PASSBenzo(k)fluoranthene 205089 9.26E-05 3.01E-03Beryllium 7440417 0.0005 0.0004 1.79E-06 0.146 6.17E-04 2.00E-02 NO PASSButane 106978 23771 85.201 108.35 6,407.08 NOCadmium 7440439 0.02 0.0006 7.17E-05 0.219 5.66E-02 1.84 NO NOChromium 7440473 5 0.018 7.20E-02 2.34 NOChrysene 218019 9.26E-05 3.01E-03Cobalt 7440484 0.2 0.001 4.32E-03 0.14 NOCopper 7440508 2 0.007 4.37E-02 1.42 NODibenzo(a,h)anthracene 53703 6.17E-05 2.00E-03Dichlorobenzene 25321226 6.17E-02 2.00Ethylbenzene 100414 868.4 3.113 0.49 14.59Fluoranthene 206440 82 0.294 1.54E-04 5.01E-03 PASSFluorene 86737 20 0.072 1.44E-04 4.68E-03 PASSFormaldehyde 50000 20.3 0.08 0.073 29.19708 0.87 23.09 NO PASSHeptane 142825 20490.8 16392.6 73.444 58.755 4.84E-04 4.24Hexane Hexane, other isom 35247.4 17623.7 126.335 63.167 0.41 740.77Hydrogen Sulfide 7783064 69.69 13.94 0.250 0.050 3.99E-02 349.31 PASS PASSIndeno(1,2,3-cd)pyrene 193395 9.26E-05 3.01E-03Isopentane 78784 17705.5 63.461 0.19 1,639.81Manganese 7439965 2 0.007 1.95E-02 0.63 NOMercury 7439976 0.3 0.1 0.001 0.0004 1.34E-02 0.43 NO NOMolybdenum 7439987 5 0.018 5.66E-02 1.84 NONaphthalene 91203 786.4 524.3 2.819 1.879 1.54E-02 0.50Neopentane 463821 17705.5 63.461 4.64E-04 4.07Nickel 7440020 1 0.004 0.11 3.51 NONitrous Oxide 10024972 900.2 3.227 12.10 378.31 NOOctane 111659 14014.7 50.232 1.84E-04 1.61Pentane 109660 17705.5 63.461 4.74E-02 414.93Phenanathrene 85018 9.8 0.035 8.74E-04 2.84E-02 PASSPyrene 129000 20 0.072 2.57E-04 8.35E-03 PASSRespirable PM PM, not otherwise specified, r 30 0.108 3.91 169.25 NOSelenium 7782492 2 0.007 1.23E-03 4.01E-02 PASSSulfuric Acid Mist 7664939 2 0.007 0.11 1,005.23 NOToluene 108883 753.6 2.701 1.88 56.18 PASSVanadium 7440622 0.5 0.002 0.12 3.84 NOXylenes 1330207 6512.88 4341.92 23.344 15.562 1.40 41.75 PASS PASSZinc 7440666 1000 500 3.584 1.792 1.49 48.42 PASS PASSNote: Those pollutants in grey meet the small emitter exemption for all screening levels.
Small Emitter Exemption
Small Emitter ExemptionSmall Emitter Exemption
Small Emitter Exemption
Small Emitter ExemptionSmall Emitter Exemption
Small Emitter Exemption
Small Emitter Exemption
Screening Level (ug/m3) Allowable Emission Rate Emissions Emissions Below AER?
TAP Pollutant CAS
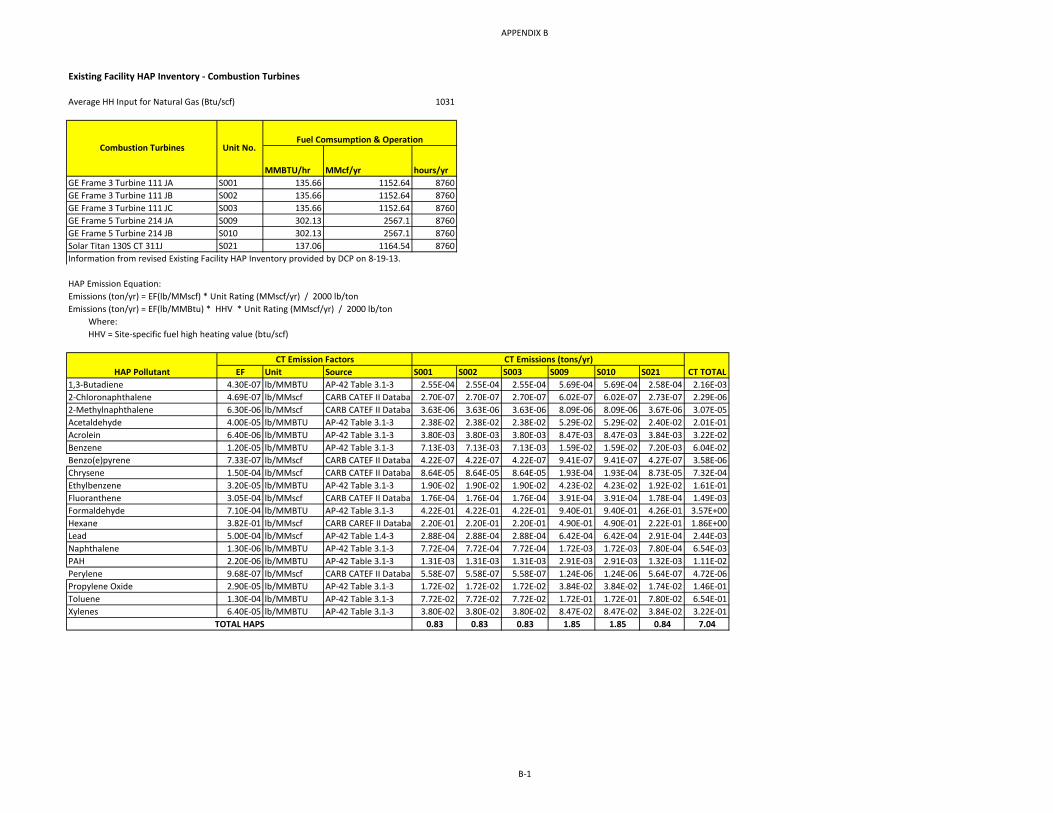
APPENDIX B
B-1
Existing Facility HAP Inventory - Combustion Turbines
Average HH Input for Natural Gas (Btu/scf) 1031
MMBTU/hr MMcf/yr hours/yrGE Frame 3 Turbine 111 JA S001 135.66 1152.64 8760GE Frame 3 Turbine 111 JB S002 135.66 1152.64 8760GE Frame 3 Turbine 111 JC S003 135.66 1152.64 8760GE Frame 5 Turbine 214 JA S009 302.13 2567.1 8760GE Frame 5 Turbine 214 JB S010 302.13 2567.1 8760Solar Titan 130S CT 311J S021 137.06 1164.54 8760Information from revised Existing Facility HAP Inventory provided by DCP on 8-19-13.
HAP Emission Equation:Emissions (ton/yr) = EF(lb/MMscf) * Unit Rating (MMscf/yr) / 2000 lb/tonEmissions (ton/yr) = EF(lb/MMBtu) * HHV * Unit Rating (MMscf/yr) / 2000 lb/ton
Where:HHV = Site-specific fuel high heating value (btu/scf)
EF Unit Source S001 S002 S003 S009 S010 S0211,3-Butadiene 4.30E-07 lb/MMBTU AP-42 Table 3.1-3 2.55E-04 2.55E-04 2.55E-04 5.69E-04 5.69E-04 2.58E-04 2.16E-032-Chloronaphthalene 4.69E-07 lb/MMscf CARB CATEF II Databas 2.70E-07 2.70E-07 2.70E-07 6.02E-07 6.02E-07 2.73E-07 2.29E-062-Methylnaphthalene 6.30E-06 lb/MMscf CARB CATEF II Databas 3.63E-06 3.63E-06 3.63E-06 8.09E-06 8.09E-06 3.67E-06 3.07E-05Acetaldehyde 4.00E-05 lb/MMBTU AP-42 Table 3.1-3 2.38E-02 2.38E-02 2.38E-02 5.29E-02 5.29E-02 2.40E-02 2.01E-01Acrolein 6.40E-06 lb/MMBTU AP-42 Table 3.1-3 3.80E-03 3.80E-03 3.80E-03 8.47E-03 8.47E-03 3.84E-03 3.22E-02Benzene 1.20E-05 lb/MMBTU AP-42 Table 3.1-3 7.13E-03 7.13E-03 7.13E-03 1.59E-02 1.59E-02 7.20E-03 6.04E-02Benzo(e)pyrene 7.33E-07 lb/MMscf CARB CATEF II Databas 4.22E-07 4.22E-07 4.22E-07 9.41E-07 9.41E-07 4.27E-07 3.58E-06Chrysene 1.50E-04 lb/MMscf CARB CATEF II Databas 8.64E-05 8.64E-05 8.64E-05 1.93E-04 1.93E-04 8.73E-05 7.32E-04Ethylbenzene 3.20E-05 lb/MMBTU AP-42 Table 3.1-3 1.90E-02 1.90E-02 1.90E-02 4.23E-02 4.23E-02 1.92E-02 1.61E-01Fluoranthene 3.05E-04 lb/MMscf CARB CATEF II Databas 1.76E-04 1.76E-04 1.76E-04 3.91E-04 3.91E-04 1.78E-04 1.49E-03Formaldehyde 7.10E-04 lb/MMBTU AP-42 Table 3.1-3 4.22E-01 4.22E-01 4.22E-01 9.40E-01 9.40E-01 4.26E-01 3.57E+00Hexane 3.82E-01 lb/MMscf CARB CAREF II Databa 2.20E-01 2.20E-01 2.20E-01 4.90E-01 4.90E-01 2.22E-01 1.86E+00Lead 5.00E-04 lb/MMscf AP-42 Table 1.4-3 2.88E-04 2.88E-04 2.88E-04 6.42E-04 6.42E-04 2.91E-04 2.44E-03Naphthalene 1.30E-06 lb/MMBTU AP-42 Table 3.1-3 7.72E-04 7.72E-04 7.72E-04 1.72E-03 1.72E-03 7.80E-04 6.54E-03PAH 2.20E-06 lb/MMBTU AP-42 Table 3.1-3 1.31E-03 1.31E-03 1.31E-03 2.91E-03 2.91E-03 1.32E-03 1.11E-02Perylene 9.68E-07 lb/MMscf CARB CATEF II Databas 5.58E-07 5.58E-07 5.58E-07 1.24E-06 1.24E-06 5.64E-07 4.72E-06Propylene Oxide 2.90E-05 lb/MMBTU AP-42 Table 3.1-3 1.72E-02 1.72E-02 1.72E-02 3.84E-02 3.84E-02 1.74E-02 1.46E-01Toluene 1.30E-04 lb/MMBTU AP-42 Table 3.1-3 7.72E-02 7.72E-02 7.72E-02 1.72E-01 1.72E-01 7.80E-02 6.54E-01Xylenes 6.40E-05 lb/MMBTU AP-42 Table 3.1-3 3.80E-02 3.80E-02 3.80E-02 8.47E-02 8.47E-02 3.84E-02 3.22E-01
0.83 0.83 0.83 1.85 1.85 0.84 7.04TOTAL HAPS
CT TOTAL
Combustion Turbines Unit No. Fuel Comsumption & Operation
CT Emission Factors CT Emissions (tons/yr)HAP Pollutant
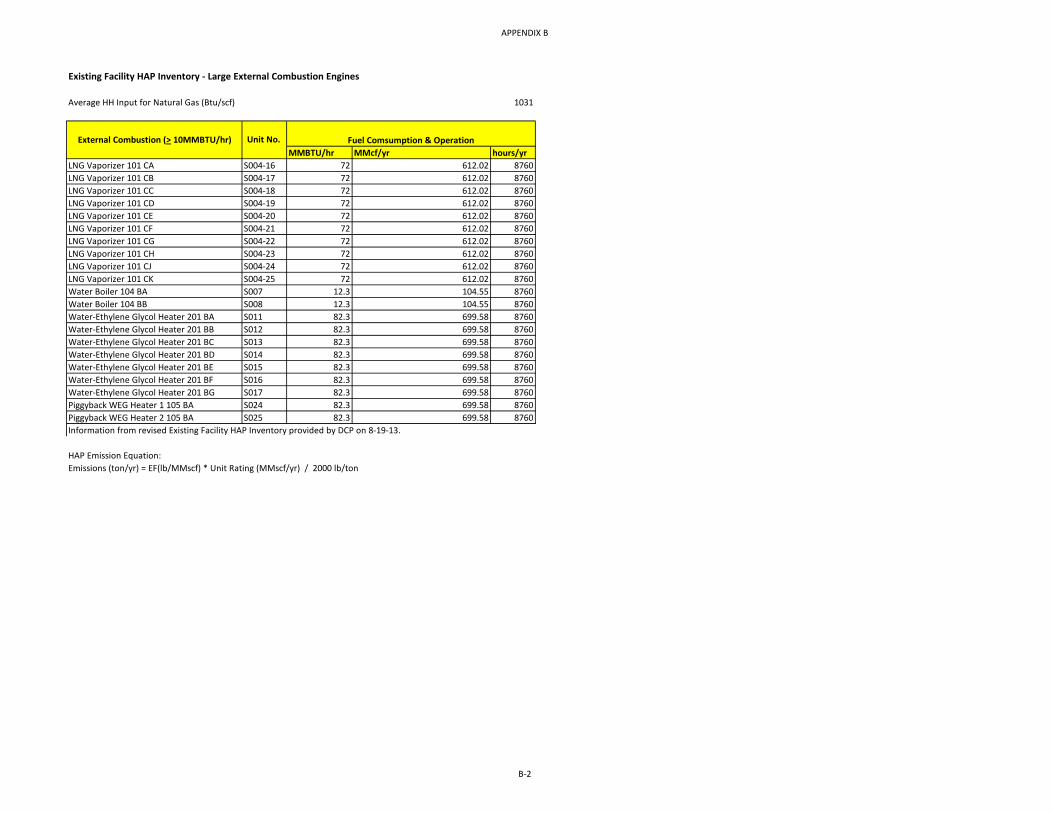
APPENDIX B
B-2
Existing Facility HAP Inventory - Large External Combustion Engines
Average HH Input for Natural Gas (Btu/scf) 1031
MMBTU/hr MMcf/yr hours/yrLNG Vaporizer 101 CA S004-16 72 612.02 8760LNG Vaporizer 101 CB S004-17 72 612.02 8760LNG Vaporizer 101 CC S004-18 72 612.02 8760LNG Vaporizer 101 CD S004-19 72 612.02 8760LNG Vaporizer 101 CE S004-20 72 612.02 8760LNG Vaporizer 101 CF S004-21 72 612.02 8760LNG Vaporizer 101 CG S004-22 72 612.02 8760LNG Vaporizer 101 CH S004-23 72 612.02 8760LNG Vaporizer 101 CJ S004-24 72 612.02 8760LNG Vaporizer 101 CK S004-25 72 612.02 8760Water Boiler 104 BA S007 12.3 104.55 8760Water Boiler 104 BB S008 12.3 104.55 8760Water-Ethylene Glycol Heater 201 BA S011 82.3 699.58 8760Water-Ethylene Glycol Heater 201 BB S012 82.3 699.58 8760Water-Ethylene Glycol Heater 201 BC S013 82.3 699.58 8760Water-Ethylene Glycol Heater 201 BD S014 82.3 699.58 8760Water-Ethylene Glycol Heater 201 BE S015 82.3 699.58 8760Water-Ethylene Glycol Heater 201 BF S016 82.3 699.58 8760Water-Ethylene Glycol Heater 201 BG S017 82.3 699.58 8760Piggyback WEG Heater 1 105 BA S024 82.3 699.58 8760Piggyback WEG Heater 2 105 BA S025 82.3 699.58 8760Information from revised Existing Facility HAP Inventory provided by DCP on 8-19-13.
HAP Emission Equation:Emissions (ton/yr) = EF(lb/MMscf) * Unit Rating (MMscf/yr) / 2000 lb/ton
External Combustion (> 10MMBTU/hr) Unit No. Fuel Comsumption & Operation

APPENDIX B
B-3
Existing Facility HAP Inventory - Large External Combustion Engines
EF Unit Source Vaporizer Boiler Heater2-Methylnaphthalene 2.40E-05 lb/MMscf AP-42 Table 1.4-3 7.34E-06 1.25E-06 8.39E-06 1.52E-043-Methylchloranthrene 1.80E-06 lb/MMscf AP-42 Table 1.4-3 5.51E-07 9.41E-08 6.30E-07 1.14E-057,12-Dimethylbenz(a)anthracene 1.60E-05 lb/MMscf AP-42 Table 1.4-3 4.90E-06 8.36E-07 5.60E-06 1.01E-04Acenaphthene 1.80E-06 lb/MMscf AP-42 Table 1.4-3 5.51E-07 9.41E-08 6.30E-07 1.14E-05Acenaphthylene 1.80E-06 lb/MMscf AP-42 Table 1.4-3 5.51E-07 9.41E-08 6.30E-07 1.14E-05Acetaldehyde 3.10E-03 lb/MMscf VC APCD EF 9.49E-04 1.62E-04 1.08E-03 1.96E-02Acrolein 2.70E-03 lb/MMscf VC APCD EF 8.26E-04 1.41E-04 9.44E-04 1.70E-02Anthracene 2.40E-06 lb/MMscf AP-42 Table 1.4-3 7.34E-07 1.25E-07 8.39E-07 1.52E-05Arsenic 2.00E-04 lb/MMscf AP-42 Table 1.4-4 6.12E-05 1.05E-05 7.00E-05 1.26E-03Benz(a)anthracene 1.80E-06 lb/MMscf AP-42 Table 1.4-3 5.51E-07 9.41E-08 6.30E-07 1.14E-05Benzene 5.80E-03 lb/MMscf VC APCD EF 1.77E-03 3.03E-04 2.03E-03 3.66E-02Benzo(a)pyrene 1.20E-06 lb/MMscf AP-42 Table 1.4-3 3.67E-07 6.27E-08 4.20E-07 7.58E-06Benzo(b)fluoranthene 1.80E-06 lb/MMscf AP-42 Table 1.4-3 5.51E-07 9.41E-08 6.30E-07 1.14E-05Benzo(g,h,i)perylene 1.20E-06 lb/MMscf AP-42 Table 1.4-3 3.67E-07 6.27E-08 4.20E-07 7.58E-06Benzo(k)fluoranthene 1.80E-06 lb/MMscf AP-42 Table 1.4-3 5.51E-07 9.41E-08 6.30E-07 1.14E-05Beryllium 1.20E-05 lb/MMscf AP-42 Table 1.4-4 3.67E-06 6.27E-07 4.20E-06 7.58E-05Cadmium 1.10E-03 lb/MMscf AP-42 Table 1.4-4 3.37E-04 5.75E-05 3.85E-04 6.94E-03Chromium 1.40E-03 lb/MMscf AP-42 Table 1.4-4 4.28E-04 7.32E-05 4.90E-04 8.84E-03Chrysene 1.80E-06 lb/MMscf AP-42 Table 1.4-3 5.51E-07 9.41E-08 6.30E-07 1.14E-05Cobalt 8.40E-05 lb/MMscf AP-42 Table 1.4-4 2.57E-05 4.39E-06 2.94E-05 5.30E-04Dibenzo(a,h)anthracene 1.20E-06 lb/MMscf AP-42 Table 1.4-3 3.67E-07 6.27E-08 4.20E-07 7.58E-06Dichlorobenzene 1.20E-03 lb/MMscf AP-42 Table 1.4-3 3.67E-04 6.27E-05 4.20E-04 7.58E-03Ethylbenzene 6.90E-03 lb/MMscf VC APCD EF 2.11E-03 3.61E-04 2.41E-03 4.36E-02Fluoranthene 3.00E-06 lb/MMscf AP-42 Table 1.4-3 9.18E-07 1.57E-07 1.05E-06 1.89E-05Fluorene 2.80E-06 lb/MMscf AP-42 Table 1.4-3 8.57E-07 1.46E-07 9.79E-07 1.77E-05Formaldehyde 1.23E-02 lb/MMscf VC APCD EF 3.76E-03 6.43E-04 4.30E-03 7.76E-02Hexane 4.60E-03 lb/MMscf VC APCD EF 1.41E-03 2.40E-04 1.61E-03 2.90E-02Indeno(1,2,3-cd)pyrene 1.80E-06 lb/MMscf AP-42 Table 1.4-3 5.51E-07 9.41E-08 6.30E-07 1.14E-05Lead 5.00E-04 lb/MMscf AP-42 Table 1.4-2 1.53E-04 2.61E-05 1.75E-04 3.16E-03Manganese 3.80E-04 lb/MMscf AP-42 Table 1.4-4 1.16E-04 1.99E-05 1.33E-04 2.40E-03Mercury 2.60E-04 lb/MMscf AP-42 Table 1.4-4 7.96E-05 1.36E-05 9.09E-05 1.64E-03Naphthalene 3.00E-04 lb/MMscf VC APCD EF 9.18E-05 1.57E-05 1.05E-04 1.89E-03Nickel 2.10E-03 lb/MMscf AP-42 Table 1.4-4 6.43E-04 1.10E-04 7.35E-04 1.33E-02Phenanathrene 1.70E-05 lb/MMscf AP-42 Table 1.4-3 5.20E-06 8.89E-07 5.95E-06 1.07E-04Pyrene 5.00E-06 lb/MMscf AP-42 Table 1.4-3 1.53E-06 2.61E-07 1.75E-06 3.16E-05Selenium 2.40E-05 lb/MMscf AP-42 Table 1.4-4 7.34E-06 1.25E-06 8.39E-06 1.52E-04Toluene 2.65E-02 lb/MMscf VC APCD EF 8.11E-03 1.39E-03 9.27E-03 1.67E-01Xylenes 1.97E-02 lb/MMscf VC APCD EF 6.03E-03 1.03E-03 6.89E-03 1.24E-01
2.73E-02 4.67E-03 3.12E-02 5.63E-01Note: Emission factors denoted "VC APCD EF" are from the Ventura County Air Pollution Control District "AB2588 Combustion Emission Factors" as published May 17, 2001.
Total Annual Emissions (tons/yr)
(10 Vaporizers, 2 Boilers, & 9 Heaters)
Emission FactorsAnnual Emissions for each Source Type (tons/year)
HAP Pollutant
TOTAL HAPS

APPENDIX B
B-4
Existing Facility HAP Inventory - Small External Combustion Engines
Average HH Input for Natural Gas (Btu/scf) 1031Average Heat Input for Fuel Oil (MMBtu/MMgal) 137,030
MMBTU/hr MMcf/yr hours/yrLNG emergency Vent Heater 117C S005 2.33 1.13 500Liquefaction Heater 148C S006 8.90 75.65 8760Emergency Vent Heater 217C S018 1.30 0.63 500ASU Fuel Gas Heater 312C S022 0.93 7.91 8760Information from revised Existing Facility HAP Inventory provided by DCP on 8-19-13.
HAP Emission Equation:Emissions (ton/yr) = EF(lb/MMscf) * Unit Rating (MMscf/yr) / 2000 lb/ton
EF Unit Source S005 S006 S018 S0222-Methylnaphthalene 2.40E-05 lb/MMscf AP-42 Table 1.4-3 1.36E-08 9.08E-07 7.56E-09 9.49E-08 1.02E-063-Methylchloranthrene 1.80E-06 lb/MMscf AP-42 Table 1.4-3 1.02E-09 6.81E-08 5.67E-10 7.12E-09 7.68E-087,12-Dimethylbenz(a)anthracene 1.60E-05 lb/MMscf AP-42 Table 1.4-3 9.04E-09 6.05E-07 5.04E-09 6.33E-08 6.83E-07Acenaphthene 1.80E-06 lb/MMscf AP-42 Table 1.4-3 1.02E-09 6.81E-08 5.67E-10 7.12E-09 7.68E-08Acenaphthylene 1.80E-06 lb/MMscf AP-42 Table 1.4-3 1.02E-09 6.81E-08 5.67E-10 7.12E-09 7.68E-08Acetaldehyde 4.30E-03 lb/MMscf VC APCD EF 2.43E-06 1.63E-04 1.35E-06 1.70E-05 1.83E-04Acrolein 2.70E-03 lb/MMscf VC APCD EF 1.53E-06 1.02E-04 8.51E-07 1.07E-05 1.15E-04Anthracene 2.40E-06 lb/MMscf AP-42 Table 1.4-3 1.36E-09 9.08E-08 7.56E-10 9.49E-09 1.02E-07Arsenic 2.00E-04 lb/MMscf AP-42 Table 1.4-4 1.13E-07 7.57E-06 6.30E-08 7.91E-07 8.53E-06Benz(a)anthracene 1.80E-06 lb/MMscf AP-42 Table 1.4-3 1.02E-09 6.81E-08 5.67E-10 7.12E-09 7.68E-08Benzene 8.00E-03 lb/MMscf VC APCD EF 4.52E-06 3.03E-04 2.52E-06 3.16E-05 3.41E-04Benzo(a)pyrene 1.20E-06 lb/MMscf AP-42 Table 1.4-3 6.78E-10 4.54E-08 3.78E-10 4.75E-09 5.12E-08Benzo(b)fluoranthene 1.80E-06 lb/MMscf AP-42 Table 1.4-3 1.02E-09 6.81E-08 5.67E-10 7.12E-09 7.68E-08Benzo(g,h,i)perylene 1.20E-06 lb/MMscf AP-42 Table 1.4-3 6.78E-10 4.54E-08 3.78E-10 4.75E-09 5.12E-08Benzo(k)fluoranthene 1.80E-06 lb/MMscf AP-42 Table 1.4-3 1.02E-09 6.81E-08 5.67E-10 7.12E-09 7.68E-08Beryllium 1.20E-05 lb/MMscf AP-42 Table 1.4-4 6.78E-09 4.54E-07 3.78E-09 4.75E-08 5.12E-07Cadmium 1.10E-03 lb/MMscf AP-42 Table 1.4-4 6.22E-07 4.16E-05 3.47E-07 4.35E-06 4.69E-05Chromium 1.40E-03 lb/MMscf AP-42 Table 1.4-4 7.91E-07 5.30E-05 4.41E-07 5.54E-06 5.97E-05Chrysene 1.80E-06 lb/MMscf AP-42 Table 1.4-3 1.02E-09 6.81E-08 5.67E-10 7.12E-09 7.68E-08Cobalt 8.40E-05 lb/MMscf AP-42 Table 1.4-4 4.75E-08 3.18E-06 2.65E-08 3.32E-07 3.58E-06Dibenzo(a,h)anthracene 1.20E-06 lb/MMscf AP-42 Table 1.4-3 6.78E-10 4.54E-08 3.78E-10 4.75E-09 5.12E-08Dichlorobenzene 1.20E-03 lb/MMscf AP-42 Table 1.4-3 6.78E-07 4.54E-05 3.78E-07 4.75E-06 5.12E-05Ethylbenzene 9.50E-03 lb/MMscf VC APCD EF 5.37E-06 3.59E-04 2.99E-06 3.76E-05 4.05E-04Fluoranthene 3.00E-06 lb/MMscf AP-42 Table 1.4-3 1.70E-09 1.13E-07 9.45E-10 1.19E-08 1.28E-07Fluorene 2.80E-06 lb/MMscf AP-42 Table 1.4-3 1.58E-09 1.06E-07 8.82E-10 1.11E-08 1.19E-07Formaldehyde 1.70E-02 lb/MMscf VC APCD EF 9.61E-06 6.43E-04 5.36E-06 6.72E-05 7.25E-04Hexane 6.30E-03 lb/MMscf VC APCD EF 3.56E-06 2.38E-04 1.98E-06 2.49E-05 2.69E-04Indeno(1,2,3-cd)pyrene 1.80E-06 lb/MMscf AP-42 Table 1.4-3 1.02E-09 6.81E-08 5.67E-10 7.12E-09 7.68E-08Lead 5.00E-04 lb/MMscf AP-42 Table 1.4-2 2.83E-07 1.89E-05 1.58E-07 1.98E-06 2.13E-05Manganese 3.80E-04 lb/MMscf AP-42 Table 1.4-4 2.15E-07 1.44E-05 1.20E-07 1.50E-06 1.62E-05Mercury 2.60E-04 lb/MMscf AP-42 Table 1.4-4 1.47E-07 9.83E-06 8.19E-08 1.03E-06 1.11E-05Naphthalene 3.00E-04 lb/MMscf VC APCD EF 1.70E-07 1.13E-05 9.45E-08 1.19E-06 1.28E-05Nickel 2.10E-03 lb/MMscf AP-42 Table 1.4-4 1.19E-06 7.94E-05 6.62E-07 8.31E-06 8.96E-05Phenanathrene 1.70E-05 lb/MMscf AP-42 Table 1.4-3 9.61E-09 6.43E-07 5.36E-09 6.72E-08 7.25E-07Pyrene 5.00E-06 lb/MMscf AP-42 Table 1.4-3 2.83E-09 1.89E-07 1.58E-09 1.98E-08 2.13E-07Selenium 2.40E-05 lb/MMscf AP-42 Table 1.4-4 1.36E-08 9.08E-07 7.56E-09 9.49E-08 1.02E-06Toluene 3.66E-02 lb/MMscf VC APCD EF 2.07E-05 1.38E-03 1.15E-05 1.45E-04 1.56E-03Xylenes 2.72E-02 lb/MMscf VC APCD EF 1.54E-05 1.03E-03 8.57E-06 1.08E-04 1.16E-03
6.74E-05 4.51E-03 3.76E-05 4.72E-04 5.09E-03
Note: Emission factors denoted "VC APCD EF" are from the Ventura County Air Pollution Control District "AB2588 Combustion Emission Factors" as published May 17, 2001.
Total
External Combustion (<10 MMBTU/hr)
Unit No. Fuel Comsumption & Operation
Emission Factors Small Engines (tons/year)HAP Pollutant
TOTAL HAPS

APPENDIX B
B-5
Existing Facility HAP Inventory - Internal Combustion Engines
Average HH Input for Natural Gas (Btu/scf) 1031Average Heat Input for Fuel Oil (MMBtu/MMgal) 137,030
Fuel Units Days/yr hours/yr
Emergency Generator 1 215 JA S019 1.67 MMscf/yr 365 200 8.6 AP-42 Table 3.2-2
Emergency Generator 1 215 JB S020 1.67 MMscf/yr 365 200 8.6 AP-42 Table 3.2-2
Black-Start Generator 301J S023 1.475 MMscf/yr 365 200 7.6 AP-42 Table 3.2-2Emergency Generator (605hp. Offshore) TBD 0.02 MMgal/yr 365 500 4.44 AP-42 Section 3.4Fire Pump (360 hp) N/A 0.01 MMgal/yr 365 500 2.64 AP-42 Table 3.3-2Fire Pump (375 hp) N/A 0.01 MMgal/yr 365 500 2.75 AP-42 Table 3.3-2Onan Generator (465 hp) 110-JA N/A 0.01 MMgal/yr 365 500 3.41 AP-42 Table 3.3-2Onan Generator (465 hp) 110-JB N/A 0.01 MMgal/yr 365 500 3.41 AP-42 Table 3.3-2Onan Generator (465 hp) 110-JC N/A 0.01 MMgal/yr 365 500 3.41 AP-42 Table 3.3-2Fire Pump (340 hp) N/A 0.01 MMgal/yr 365 500 2.49 AP-42 Table 3.3-2Information from revised Existing Facility HAP Inventory provided by DCP on 8-19-13.
HAP Emission Equation for Natural Gas ICE Engines:Emissions (ton/yr) = EF(lb/MMBtu) * HHV * Unit Rating (MMscf/yr) / 2000 lb/ton
Where:HHV = Site-specific fuel high heating value (btu/scf)
HAP Emission Equation for Fuel Oil EnginesEmissions (ton/yr) = EF (lb/MMBtu) * Unit Rating (MMBtu/hr) * Hours of operation per year / 2000 lbs/ton
Natural Gas Reciprocating
Engines (4-stroke lean burn)
EF Reference
MMBtu/hr calculated based on
HP and brake specific fuel
consumption of 7335 BTU/bhp-hr
Internal Combustion Engines Unit No. Fuel Comsumption & Operation MMBTU/hr
Source Notes

APPENDIX B
B-6
Existing Facility HAP Inventory - Internal Combustion Engines
AP-42 Table 3.2-2
AP-42 Section 3.4
AP-42 Table 3.3-2
lb/MMBTU lb/MMBTU lb/MMBTU S019 S020 S0231,1,2 Trichloroethane 3.18E-05 2.74E-05 2.74E-05 2.42E-05 0.00E+00 0.00E+00 0.00E+00 0.00E+00 0.00E+00 7.89E-051,1,2,2-Tetrachloroethane 4.00E-05 3.44E-05 3.44E-05 3.04E-05 0.00E+00 0.00E+00 0.00E+00 0.00E+00 0.00E+00 9.93E-051,3-Butadiene 2.67E-04 3.91E-05 2.30E-04 2.30E-04 2.03E-04 0.00E+00 2.58E-05 2.69E-05 3.33E-05 2.44E-05 0.000841,3-Dicloropropene 2.64E-05 2.27E-05 2.27E-05 2.01E-05 0.00E+00 0.00E+00 0.00E+00 0.00E+00 0.00E+00 6.55E-052-Methylnaphthalene 3.32E-05 2.86E-05 2.86E-05 2.52E-05 0.00E+00 0.00E+00 0.00E+00 0.00E+00 0.00E+00 8.24E-052,2,4-Trimethylpentane 2.50E-04 2.15E-04 2.15E-04 1.90E-04 0.00E+00 0.00E+00 0.00E+00 0.00E+00 0.00E+00 0.000621Acenaphthene 1.25E-06 1.08E-06 1.08E-06 9.50E-07 0.00E+00 0.00E+00 0.00E+00 0.00E+00 0.00E+00 3.1E-06Acenaphthylene 5.53E-06 4.76E-06 4.76E-06 4.20E-06 0.00E+00 0.00E+00 0.00E+00 0.00E+00 0.00E+00 1.37E-05Acetaldehyde 8.36E-03 2.52E-05 7.67E-04 7.20E-03 7.20E-03 6.36E-03 2.80E-05 5.06E-04 5.27E-04 6.54E-04 4.78E-04 0.024253Acrolein 5.14E-03 7.88E-06 9.25E-05 4.42E-03 4.42E-03 3.91E-03 8.74E-06 6.11E-05 6.36E-05 7.89E-05 5.77E-05 0.013186Benzene 4.40E-04 7.76E-04 9.33E-04 3.79E-04 3.79E-04 3.35E-04 8.61E-04 6.16E-04 6.42E-04 7.96E-04 5.82E-04 0.006179Benzo(b)fluoranthene 1.66E-07 1.43E-07 1.43E-07 1.26E-07 0.00E+00 0.00E+00 0.00E+00 0.00E+00 0.00E+00 4.12E-07Benzo(e)pyrene 4.15E-07 3.57E-07 3.57E-07 3.16E-07 0.00E+00 0.00E+00 0.00E+00 0.00E+00 0.00E+00 1.03E-06Benzo(g,h,i)perylene 4.14E-07 3.56E-07 3.56E-07 3.15E-07 0.00E+00 0.00E+00 0.00E+00 0.00E+00 0.00E+00 1.03E-06Biphenyl 2.12E-04 1.83E-04 1.83E-04 1.61E-04 0.00E+00 0.00E+00 0.00E+00 0.00E+00 0.00E+00 0.000526Carbon Tetrachloride 3.67E-05 3.16E-05 3.16E-05 2.79E-05 0.00E+00 0.00E+00 0.00E+00 0.00E+00 0.00E+00 9.11E-05Chlorobenzene 3.04E-05 2.62E-05 2.62E-05 2.31E-05 0.00E+00 0.00E+00 0.00E+00 0.00E+00 0.00E+00 7.55E-05Chloroform 2.85E-05 2.45E-05 2.45E-05 2.17E-05 0.00E+00 0.00E+00 0.00E+00 0.00E+00 0.00E+00 7.07E-05Chrysene 6.93E-07 5.97E-07 5.97E-07 5.27E-07 0.00E+00 0.00E+00 0.00E+00 0.00E+00 0.00E+00 1.72E-06Ethylbenzene 3.97E-05 3.42E-05 3.42E-05 3.02E-05 0.00E+00 0.00E+00 0.00E+00 0.00E+00 0.00E+00 9.85E-05Ethylene Dibromide 4.43E-05 3.81E-05 3.81E-05 3.37E-05 0.00E+00 0.00E+00 0.00E+00 0.00E+00 0.00E+00 0.00011Fluoranthene 1.11E-06 9.56E-07 9.56E-07 8.44E-07 0.00E+00 0.00E+00 0.00E+00 0.00E+00 0.00E+00 2.76E-06Fluorene 5.67E-06 4.88E-06 4.88E-06 4.31E-06 0.00E+00 0.00E+00 0.00E+00 0.00E+00 0.00E+00 1.41E-05Formaldehyde 5.28E-02 7.89E-05 1.18E-03 4.55E-02 4.55E-02 4.01E-02 8.75E-05 7.79E-04 8.11E-04 1.01E-03 7.36E-04 0.136489Hexane 1.11E-03 9.56E-04 9.56E-04 8.44E-04 0.00E+00 0.00E+00 0.00E+00 0.00E+00 0.00E+00 0.002755Methanol 2.50E-03 2.15E-03 2.15E-03 1.90E-03 0.00E+00 0.00E+00 0.00E+00 0.00E+00 0.00E+00 0.006205Methylene Chloride 2.00E-05 1.72E-05 1.72E-05 1.52E-05 0.00E+00 0.00E+00 0.00E+00 0.00E+00 0.00E+00 4.96E-05Naphthalene 7.44E-05 6.40E-05 6.40E-05 5.66E-05 0.00E+00 0.00E+00 0.00E+00 0.00E+00 0.00E+00 0.000185PAH 2.12E-04 1.68E-04 0.00E+00 0.00E+00 0.00E+00 2.35E-04 1.11E-04 1.16E-04 1.43E-04 1.05E-04 0.000996Phenanathrene 1.04E-05 8.95E-06 8.95E-06 7.91E-06 0.00E+00 0.00E+00 0.00E+00 0.00E+00 0.00E+00 2.58E-05Phenol 2.40E-05 2.07E-05 2.07E-05 1.82E-05 0.00E+00 0.00E+00 0.00E+00 0.00E+00 0.00E+00 5.96E-05Pyrene 1.36E-06 1.17E-06 1.17E-06 1.03E-06 0.00E+00 0.00E+00 0.00E+00 0.00E+00 0.00E+00 3.38E-06Styrene 2.36E-05 2.03E-05 2.03E-05 1.79E-05 0.00E+00 0.00E+00 0.00E+00 0.00E+00 0.00E+00 5.86E-05Tetrachloroethane 2.48E-06 2.13E-06 2.13E-06 1.89E-06 6.16E-06Toluene 4.08E-04 2.81E-04 4.09E-04 3.51E-04 3.51E-04 3.10E-04 3.12E-04 2.70E-04 2.81E-04 3.49E-04 2.55E-04 0.003177Vinyl Chloride 1.49E-05 1.28E-05 1.28E-05 1.13E-05 0.00E+00 0.00E+00 0.00E+00 0.00E+00 0.00E+00 3.7E-05Xylenes 1.84E-04 1.93E-04 2.85E-04 1.58E-04 1.58E-04 1.40E-04 2.14E-04 1.88E-04 1.96E-04 2.43E-04 1.78E-04 0.001962
6.21E-02 6.21E-02 5.49E-02 1.75E-03 2.56E-03 2.66E-03 3.30E-03 2.42E-03 1.98E-01Note: PAH emissions were not calculated for Natural Gas ICE engines since speciated PAH emissions were calculated.
340HP ICE (tons/year)
ICE totalNatural Gas ICE Engines
(tons/year)605HP ICE
(tons/year)360 HP ICE (tons/year)
375HP ICE (tons/year)
465HP ICE (tons/year)
TOTAL HAPS
HAP Pollutant
Emission Factors

APPENDIX B
B-7
Existing Facility HAP Inventory - Fugitive Equipment Leaks
PollutantMixed
RefrigerantIsopentane
Pipeline Gas
Boil Off
TOC 0.850 1.000 0.97 0.98VOC 0.290 1.000 0.02 1.90E-03Hexane 0 0 1.0E-03 1.2E-03Benzene 0 0 0 0Hydrogen Sulfide 0 0 0 0Butane 0 0 3.9E-03 2.2E-04Isopentane 0.290 1.00 7.0E-04 7.1E-05Pentane 0 0 5.6E-04 7.6E-05Neopentane 0 0 0 0Heptane 0 0 0 0Octane 0 0 0 0Information from revised Existing Facility HAP Inventory provided by DCP on 8-19-13.
Calculation MethodTable 2-4 of EPA’s Protocol for Equipment Leak Emission Estimates
lb/hr = EF(kg material/hr) * weight fraction TOC in material * number of sources * 2.20462 lb/kg * WF of pollutant in material/TOC WF * control efficiency
Weight Fraction

APPENDIX B
B-8
Existing Facility HAP Inventory - Fugitive Equipment Leaks
EPA EFComponent Material Service Quantity kg/hr Lb/hr TPY Lb/hr TPY Lb/hr TPY Lb/hr TPYValves Mixed RefrigeLight Liquid 3 2.50E-03 1.4E-02 6.2E-02 4.80E-03 2.10E-02Pump Seals Mixed RefrigeLight Liquid 1 1.30E-02 2.4E-02 1.1E-01 8.31E-03 3.64E-02Compressor Seals Mixed RefrigeGas 1 8.80E-03 1.6E-02 7.2E-02 5.63E-03 2.46E-02Pressure Relief Valves Mixed RefrigeGas 1 8.80E-03 1.6E-02 7.2E-02 5.63E-03 2.46E-02Flanges Mixed RefrigeGas 40 3.90E-04 2.9E-02 1.3E-01 9.97E-03 4.37E-02Flanges Mixed RefrigeLight Liquid 33 1.10E-04 6.8E-03 3.0E-02 2.32E-03 1.02E-02Open Ended Lines Mixed RefrigeGas 38 2.00E-03 1.4E-01 6.2E-01 4.86E-02 2.13E-01Sampling Connectors Mixed RefrigeGas 5 8.80E-03 8.2E-02 3.6E-01 2.81E-02 1.23E-01Valves Isopentane Gas 0 4.50E-03 0.0E+00 0.0E+00 0.00E+00 0.00E+00Valves Isopentane Light Liquid 2 2.50E-03 1.1E-02 4.8E-02 1.10E-02 4.83E-02Flanges Isopentane Light Liquid 16 1.10E-04 3.9E-03 1.7E-02 3.88E-03 1.70E-02Pressure Relief Valves Isopentane Gas 0 8.80E-03 0.0E+00 0.0E+00 0.00E+00 0.00E+00Valves Pipeline Light Liquid 1673 2.50E-03 8.9E+00 3.9E+01 1.84E-01 8.08E-01 9.2E-03 4.0E-02Valves Pipeline Gas 3114 4.50E-03 3.0E+01 1.3E+02 6.18E-01 2.71E+00 3.1E-02 1.4E-01Open Ended Lines Pipeline Light Liquid 280 1.40E-03 8.4E-01 3.7E+00 1.73E-02 7.57E-02 8.6E-04 3.8E-03Open Ended Lines Pipeline Gas 881 2.00E-03 3.8E+00 1.7E+01 7.77E-02 3.40E-01 3.9E-03 1.7E-02Sampling Connections Pipeline Gas 746 8.80E-03 1.4E+01 6.1E+01 2.89E-01 1.27E+00 1.4E-02 6.3E-02Pressure Relief Valves Pipeline Gas 610 8.80E-03 1.1E+01 5.0E+01 2.37E-01 1.04E+00 1.2E-02 5.2E-02Pump Seals Pipeline Light Liquid 27 1.30E-02 7.5E-01 3.3E+00 1.55E-02 6.78E-02 7.7E-04 3.4E-03Compressor Seals Pipeline Gas 13 8.80E-03 2.4E-01 1.1E+00 5.04E-03 2.21E-02 2.5E-04 1.1E-03Compressor Seals Boil Off Gas 2 8.80E-03 3.8E-02 1.7E-01 7.37E-05 3.23E-04 4.7E-05 2.0E-04Flanges Boil Off Gas 74 3.90E-04 6.2E-02 2.7E-01 1.21E-04 5.29E-04 7.6E-05 3.3E-04Man-Way Pipeline Gas 5 8.80E-03 9.4E-02 4.1E-01 1.94E-03 8.50E-03 9.7E-05 4.2E-04Connectors Pipeline Gas 12760 2.00E-04 5.5E+00 2.4E+01 1.13E-01 4.93E-01 5.6E-03 2.5E-02Connectors Pipeline Light Liquid 2364 2.10E-04 1.1E+00 4.6E+00 2.19E-02 9.59E-02 1.1E-03 4.8E-03Flanges Pipeline Gas 1300 3.90E-04 1.1E+00 4.7E+00 2.24E-02 9.79E-02 1.1E-03 4.9E-03Flanges Pipeline Light Liquid 4305 1.10E-04 1.0E+00 4.4E+00 2.09E-02 9.15E-02 1.0E-03 4.6E-03Venting Pipeline N/A N/A 1.28E+00 5.61E+00 2.64E-02 1.16E-01 1.32E-03 5.79E-03
TOTAL 80.47 352.46 1.78 7.79 0.08 0.36 0.00 0.00
Venting - Notes from CPCN Application Appendix H, Page H-3910. Natural gas vented - potential annual natural gas volume gas based on 2011 volume vented plus 20% contingency (cf/yr): 27600011. Natural gas vented - potential hourly natural gas volume vented is an annual average based on 8,760.12. The site-specfic density of Natural Gas: 0.56 *density of air = 4.193672 lb/100 scf (the density of air is at 70oF and 14.696 psia)
Total Natural Gas Vented (lb/hr) = Natural Gas Vented (cf/yr) * 4.193672 lb/100 scf / 100 * 8760 hours/yr1.321293918 Total natural gas vented lb/hr
Hexane BenzeneTOC VOC

APPENDIX B
B-9
Existing Facility HAP Inventory - Existing Operations HAP Total
HAP Pollutant CTsLarge
EnginesSmall
EnginesICE Engines Fugitives TOTAL HAPs
Proposed Operations
HAPS (tons/yr)
Facility-Wide HAPS
(tons/yr)1,1,2 Trichloroethane 7.89318E-05 7.89E-05 7.89E-051,1,2,2-Tetrachloroethane 9.92853E-05 9.93E-05 9.93E-051,3-Butadiene 2.16E-03 0 0 0.000839827 3.00E-03 4.19E-03 7.19E-031,3-Dicloropropene 6.55283E-05 6.55E-05 6.55E-052-Chloronaphthalene 2.29E-06 2.29E-06 1.81E-04 1.83E-042-Methylnaphthalene 3.07E-05 0.0001515 1.02E-06 8.24068E-05 2.66E-04 2.58E-03 2.85E-032,2,4-Trimethylpentane 0.000620533 6.21E-04 6.21E-043-Methylchloranthrene 0.00E+00 1.136E-05 7.68E-08 0 1.14E-05 1.18E-05 2.33E-057,12-Dimethylbenz(a)anthracene 0.00E+00 0.000101 6.83E-07 0 1.02E-04 1.05E-04 2.07E-04Acenaphthene 0.00E+00 1.136E-05 7.68E-08 3.10267E-06 1.45E-05 2.54E-05 4.00E-05Acenaphthylene 0.00E+00 1.136E-05 7.68E-08 1.37262E-05 2.52E-05 4.01E-05 6.53E-05Acetaldehyde 2.01E-01 0.0195696 0.000183 0.024252606 0.25 0.40 0.64Acrolein 3.22E-02 0.0170445 0.000115 0.013185869 0.06 0.07 0.13Anthracene 0.00E+00 1.515E-05 1.02E-07 0 1.53E-05 2.03E-05 3.56E-05Arsenic 0.00E+00 0.0012626 8.53E-06 0 1.27E-03 1.32E-03 2.59E-03Benz(a)anthracene 0.00E+00 1.136E-05 7.68E-08 0 1.14E-05 1.46E-05 2.60E-05Benzene 6.04E-02 0.036614 0.000341 0.006178942 0.10 0.34 0.45Benzo(a)pyrene 0.00E+00 7.575E-06 5.12E-08 0 7.63E-06 8.71E-06 1.63E-05Benzo(b)fluoranthene 0.00E+00 1.136E-05 7.68E-08 4.12034E-07 1.19E-05 1.49E-05 2.68E-05Benzo(e)pyrene 3.58E-06 1.03008E-06 4.61E-06 2.82E-04 2.87E-04Benzo(g,h,i)perylene 0.00E+00 7.575E-06 5.12E-08 1.0276E-06 8.65E-06 9.72E-06 1.84E-05Benzo(k)fluoranthene 0.00E+00 1.136E-05 7.68E-08 0 1.14E-05 1.25E-05 2.40E-05Beryllium 0.00E+00 7.575E-05 5.12E-07 0 7.63E-05 7.90E-05 1.55E-04Biphenyl 0.000526212 5.26E-04 5.26E-04Cadmium 0.00E+00 0.006944 4.69E-05 0 6.99E-03 7.24E-03 1.42E-02Carbon Tetrachloride 9.10943E-05 9.11E-05 9.11E-05Chlorobenzene 7.54568E-05 7.55E-05 7.55E-05Chloroform 7.07408E-05 7.07E-05 7.07E-05Chromium 0.00E+00 0.0088379 5.97E-05 0 8.90E-03 9.21E-03 1.81E-02Chrysene 7.32E-04 1.136E-05 7.68E-08 1.72012E-06 7.45E-04 5.78E-02 5.85E-02Cobalt 0.00E+00 0.0005303 3.58E-06 0 5.34E-04 5.53E-04 1.09E-03Dibenzo(a,h)anthracene 0.00E+00 7.575E-06 5.12E-08 0 7.63E-06 9.21E-06 1.68E-05Dichlorobenzene 0.00E+00 0.0075753 5.12E-05 0 7.63E-03 7.90E-03 1.55E-02Ethylbenzene 1.61E-01 0.043558 0.000405 9.85407E-05 0.21 0.33 0.53Ethylene Dibromide 0.000109958 1.10E-04 1.10E-04Fluoranthene 1.49E-03 1.894E-05 1.28E-07 2.75517E-06 1.51E-03 0.12 0.12Fluorene 0.00E+00 1.768E-05 1.19E-07 1.40737E-05 3.19E-05 7.17E-05 1.04E-04Formaldehyde 3.57E+00 0.0776469 0.000725 0.136488777 3.79 3.59 7.38Hexane 1.86E+00 0.0290387 0.000269 0.002755167 0.36 2.26 4.53 6.79Indeno(1,2,3-cd)pyrene 0.00E+00 1.136E-05 7.68E-08 0 1.14E-05 1.32E-05 2.46E-05Lead 2.44E-03 0.0031564 2.13E-05 0 5.62E-03 9.20E-03 1.48E-02Manganese 0.00E+00 0.0023988 1.62E-05 0 2.42E-03 2.50E-03 4.92E-03Mercury 0.00E+00 0.0016413 1.11E-05 0 1.65E-03 1.71E-03 3.36E-03Methanol 0.006205331 6.21E-03 6.21E-03Methylene Chloride 4.96427E-05 4.96E-05 4.96E-05Naphthalene 6.54E-03 0.0018938 1.28E-05 0.000184671 8.63E-03 1.50E-02 2.36E-02
Existing Operations (tons/yr)

APPENDIX B
B-10
Existing Facility HAP Inventory - Existing Operations HAP Total
HAP Pollutant CTsLarge
EnginesSmall
EnginesICE Engines Fugitives TOTAL HAPs
Proposed Operations
HAPS (tons/yr)
Facility-Wide HAPS
(tons/yr)
Existing Operations (tons/yr)
Nickel 0.00E+00 0.0132568 8.96E-05 0 1.33E-02 1.38E-02 2.72E-02PAH 1.11E-02 0 0 0.00099613 1.21E-02 2.13E-02 3.33E-02Perylene 4.72E-06 4.72E-06 3.73E-04 3.77E-04Phenanathrene 0.00E+00 0.0001073 7.25E-07 2.58142E-05 1.34E-04 2.41E-04 3.75E-04Phenol 5.95712E-05 5.96E-05 5.96E-05Propylene Oxide 1.46E-01 0 0 0 0.15 0.28 0.43Pyrene 0.00E+00 3.156E-05 2.13E-07 3.3757E-06 3.52E-05 4.60E-05 8.12E-05Selenium 0.00E+00 0.0001515 1.02E-06 0 1.53E-04 1.58E-04 3.10E-04Styrene 5.85783E-05 5.86E-05 5.86E-05Tetrachloroethane 6.15569E-06 6.16E-06 6.16E-06Toluene 6.54E-01 0.1672881 0.001561 0.003176966 0.83 1.33 2.16Vinyl Chloride 3.69838E-05 3.70E-05 3.70E-05Xylenes 3.22E-01 0.1243614 0.00116 0.001961699 0.45 0.67 1.12
TOTAL HAPS (tons/yr) 8.16 11.82 19.98


Appendix C BACT-LAER Final Summary Table


COPM
(filterable)PM10/PM2.5
(filterable and condensable) NOx VOC GHG (CO2e)Process Fuel Throughput Rate Manufacturer APC BACT BACT BACT LAER LAER BACT
0.0033 lb/MMBtu (filterable)
CT 1.5 ppmvd @15% O2 3.5 lb/hr (filterable)
0.007 lb/MMBtu (filterable + condensable)
2.5 ppmvd @ 15% O2 0.7 ppmvd @15% O2Cove Point Limits 4.6 lb/hr 0.04 gr/scf (1.9 lb/MMscf) (filterable) 7.0 lb/hr (filterable + condensable) 12.6 lb/hr 1.23 lb/hr 544,249 tpy, each
0.004 lb/MMBtu 0.08 gr/scf (4 lb/MMscf) 0.012 lb/MMBtu 0.001 lb/MMBtuALLEGHENY ENERGY SUPPLY CO. LLC 2071 MMBTU/H GOOD COMBUSTION PRACTICES 6 PPM@15% O2 0.012 LB/MMBTU 2.5 PPMAMELIA ENERGY CENTER 180 MW GOOD COMBUSTION PRACTICE 208 LB 208 LB/H 36.8 LB/HANCLOTE POWER GENERATING FACILITY, FL 556.2 MW GOOD COMBUSTION PRACTICE 0.15 lb/MMBtu 0.3 lb/MMBtu, 12-mo rolling avgAPPLIED ENERGY SCR 2 ppm; 1-hr avg 2 ppm; 1-hr avgARSENAL HILL POWER PLANT 2110 MMbtu/hr 143.1 lb/hr 30.15 lb/hr 12.06 lb/hr
ATHENS GENERATING PLANT 3100 MMBtu/H DLNB, SCR 2.0 ppmvd @ 15% O2, 3-hr block avg; 23.4 lb/hr4.0 ppmvd @ 15% O2, 3-hr block avg.; 16.8 lb/hr
AVENAL * 180 MW Oxidation Catalyst, SCR, LNB , NG 2.0 ppmvd (1.5 post demo), 1-hr avg 8.9 lb/hr, 12-month rolling 8.9 lb/hr, 12-month rolling 2 ppmvd, 1-hr avg; 13.55 lb/hrBARTON SHOALS ENERGY 173 MW GOOD COMBUSTION PRACTICES 0.041 LB/MMBTU 0.0092 LBBAYONNE ENERGY CENTER 603 MMBtu/H SCR 5.0 ppmvd, 1-hr avg 5.0 lb/hr 5.0 lb/hr 2.5 ppmvd @ 15% O2,; 0.0092 lb/MMBtu 1.93 lb/hr; 2.5 ppmvdBERRIEN ENERGY, LLC 1584 MMBTU/H CATALYTIC OXIDATION. 2 PPMDV @ 15% O2 2.5 PPMDBLACK HILLS CORP./NEIL SIMPSON TWO 40 MW GOOD COMBUSTION PRACTICE 37.2 PPMV @ 15% O2 2.5 PPMBLUEWATER ENERGY CENTER LLC 180 MW CATALYTIC AFTERBURNER 41.7 LB/H 28 lb/hrBRAZOS VALLEY ELECTRIC GENERATI 175 MW GOOD COMBUSTION CONTROLS 92.4 LB/H 32.4 LB/H 10.3 lb/hrBRAZOS VALLEY ELECTRIC GENERATI 175 MW, EA GOOD COMBUSTION CONTROLS 92.4 LB/H 32.4 LB/H 9.5 lb/hrBRUNSWICK 3,442 MMBtu/hr LNB, SCR, Oxidation Catalyst 1.5 ppmvd, 3-hr rolling avg 0.0033 lb/MMBtu, 3-hr avg 2.0 ppmvd, 1-hr rolling avg 0.7 ppmvdBLYTHE ENERGY PROJECT, CA 170 MW SCR 4.0 ppmvd 2.0 ppmvd, 1-hr rolling avgCALHOUN PORT AUTHORITY, ED JOSLIN 195 MW SCR 4.0 ppmvd, 24-hr rolling 18.0 lb/hr 18.0 lb/hr 2.0 ppmvd, 24-hr rolling 2.0 ppmvdCALPINE RUSSELL CITY ENERGY CENTER 2038.6 mmbtu/hr Siemens Westingho Oxidation Catalyst, SCR, dry low NOx burners 2.0 ppmvd, 1-hr avg 0.0036 lb/MMbtu 0.0036 lb/MMbtu 2.0 ppmvd, 1-hr rolling avgCANE ISLAND POWER PARK 1860 MMBtu/hr SCR 6.0 ppmvd, 12-month 2 gr s/100 scf gas 2.0 ppmvd, 24-hr avgCARTY PLANT 2866 MMBtu/hr SCR 2.5 lb/mmcf 2.0 ppmvd @ 15% O2, 3-hr rolling avgCATOCTIN, PPRP 2.0 ppmvd, 3-hr avg 2.0 ppmvd @ 15% O2CARTY PLANT 2866 MMBtu/hr SCR 2.5 lb/mmcf 2ppm, 3-hr avgCHANNEL ENERGY CENTER, LLC 180 MW SCR 4.0 ppmvd 27.0 lb/hr 27.0 lb/hr 2.0 ppmvd @ 15% O2, 3-hr rolling avg 2.0 ppmvd @ 15% O2CHERRY POINT, BP WEST COAST PRODUCTS 720 MW Oxidation Catalyst, SCR (w/ and without df) 2.0 ppmvd @ 15% O2 29.2 lb/hr 2.5 ppmvd, 3-hr 6.9 lb/hrCHEYENNE GENERATING STATION, WY 40 MW 4.0 ppmvd @ 15% O2, 3-hr 4 lb/hr 3.0 ppmvd, 3-hr; 4.6 lb/hr 3.0 ppmvd, 3-hr; 3 lb/hrCHOCOLATE BAYOU PLANT 70 MW, TOTAL GOOD COMBUSTION PRACTICES 66.81 L/h 6.14 lb/hrCHOCTAW GAS GENERATION, LLC 2737 MMBTU/H GOOD COMBUSTION PRACTICES 22.3 PPMVD @ 15% O2 3.5 PPMVCHOUTEAU POWER PLANT 1882 MMBtu/hr 8 ppmvd 6.59 lb/hr 2 ppm; 15.25 lb/hr 0.3 ppm, 3-hr avg.; 5.27 lb/hrCLOVIS ENERGY FACILITY 1515 MMBTU/H COMBUST NATURAL GAS. 37.6 LB/H 24.6 LB/HCLOVIS ENERGY FACILITY 643 MMBTU/H ONLY COMBUST NATURAL GAS 57.1 LB/H 24.6 LB/HCOB ENERGY FACILITY, LLC 1150 MW CATALYTIC OXIDATION 2 PPMVD @ 15% O2 0.03 lb/mmbtu 2.5 PPMV 7.1 lb/hrCOLUSA GENERATING STATION, CA 172 MW DLNB, oxidation cat 3 ppmvd, 3-hr 2 ppmvd @ 15% O2, 1-hr; 19.6 lb/hr 2.0 ppmvd 1-hr rolling avg.; 11 lb/hrCOPPER MOUNTAIN POWER 600 MW OXIDATION CATALYST 3 PPMVD 2 PPMVD 4 ppmvdCRICKET VALLEY 1,000 MW, 333 MW each Oxidation Catalyst, SCR 2 ppmvd, 3-hr avg 0.006 lb/mmbtu 0.006 lb/mmbtu 2 ppmvd, 1-hr avg 2 ppmvd, 1-hr avgCPV CANA 1680 MMBTU/H COMBUSTION CONTROLS 8 PPMVD @ 15% O2 2.5 PPMV
CPV ST. CHARLES DLB, SCR 2.0 ppmvd @ 15% O2, 3-hr avg 0.012 lb/MMBtu, 3-hr avg 0.012 lb/MMBtu, 3-hr avg 2.0 ppmvd @ 15% O2, 3-hr rolling avg 1.0 ppmvd @ 15% O2, 1-hr avg.; 2 ppmvdCPV VALLEY, WAWAYANKA NY (PROPOSED) 630 MW DLNB, water injection, SCR, oxidation catalyst 2.0 ppm, .0183 lb/mmbtu 0.0073 lb/mmbtu 2.0 ppm, .0075 lb/mmbtu 0.7 ppm, .0028 lb/mmbtuCRESCENT CITY POWER 2006 MMBTU/H COMBUSTION PRACTICES 17.7 LB/H 21.8 LB/HCRESCENT CITY POWER 759 MMBTU/H COMBUSTION PRACTICES 6.6 LB/H 21.8 LB/HCURRANT CREEK MODE OF OPERATION 3 PPMVD 2.25 PPMDALBERG COMBUSTION TURBINE ELECTRIC GENERATING FACILITY 1530 MW DLNB 9.0 ppmvd @ 15% O2 9.1 lb/hr, 3-hr avg 9.0 ppm @ 15% O2, 3-hr avg.; 42 ppm 5.0 ppmvd @ 15% O2, 3;hr avg.; 5 ppmvdDEER CREEK STATION 300 MW SCR 10.5 lb/hr, 3-hr avg 23.2 lb/hr, 3-hr avg 25.8 lb/hr , 3-hr avg.; 220 lb/ssperiodDEER PARK ENERGY CENTER, TX * 180 MW SCR 4.0 ppmvd @ 15% O2, 3-hr 27 lb/hr 2 ppmvd, 3-hr avg 2 ppmvd, 3-hr avgDELTA POWER PLANT 11240 Gal/Hr SCR 6.0 ppmvd, 3-hr rolling avg 0.0135 lb/MMBtu 9.0 ppmvd 1.2 ppmvd @ 15% O2DELTA POWER PLANT 11240 Gal/Hr SCR 6.0 ppmvd, 3-hr rolling avg 0.0141 lb/MMBtu 2.0 ppmvd; 3.5 ppmvd 1.2 ppmvd @ 15% O2DUKE ENERGY ARLINGTON VALLEY (AVEFII) 325 MW CATALYTIC OXIDIZER 3 PPM 2 PPM 4 ppmvdDUKE ENERGY ARLINGTON VALLEY (AVEFII) 325 MW CATALYTIC OXIDIZER 2 PPM 2 PPM 1 ppmvdDUKE ENERGY DALE, LLC 170 MW EACH GE 7FA Combined EFFICIENT COMBUSTION 0.0330 LB/MMBTU 0.013 LBDUKE ENERGY FAYETTE, LLC 280 MW OXIDATION CATALYST 5 PPMVD @ 15% O2 2.5 PPMVDUKE ENERGY, HANGING POINT 170 MW 8 ppmvdDUKE ENERGY HANGING ROCK ENERGY 172 MW 25.7 LB/H 21.1 LB/H 3.2 lb/hrDUKE ENERGY STEPHENS, LLC STEP 1701 MMBTU/H COMBUSTION CONTROL 10 PPM 3.5 PPM 45.6 lb/hrDUKE ENERGY WASHINGTON COUNTY LLC 170 MW 78 LB/H 32.3 LB/H 19.6 lb/hrDUKE ENERGY WASHINGTON COUNTY LLC 170 MW 43 LB/H 24.7 LB/H 3 lb/hrDUKE ENERGY WYTHE, LLC 170 MW GOOD COMBUSTION PRACTICES. 9 PPMVD 2.5 PPMV 3 lb/hrDUKE ENERGY WYTHE, LLC 170 MW GOOD COMBUSTION PRACTICES 14.6 PPMVD 2.5 PPMV 3 lb/hrDUKE ENERGY-JACKSON FACILITY 170 MW GOOD OPERATING PRACTICE 23.6 PPM @ 15% O2 3.5 PPMEDINBURG ENERGY LIMITED PARTNERSHIP 180 MW CORRECTED TO 15% O2 AT FULL LOAD, WITH 43 LB/H 104 LB/HEFFINGHAM COUNTY 3.0 ppmvd @ 15% O2 0.0084 lb/mmbtu 2.5 ppmvd @ 15% O2 1.4 ppmvd @ 15% O2EFFINGHAM POWER PLANT 668 MW DLNB, SCR 2.0 ppmvEL CAJON ENERGY LLC 49.95 MW SCR 2.5 ppmv 2.0 ppmvd, 1-hr avg.EL DORADO ENERGY, LLC 475 MW OXIDATION CATALYST 2.6 PPM @ 15% O2 R 3.5 PPM 5.2 lb/hrEL JOSLIN POWER PLANT 195 MW SCR 4.0 ppmvd 18 lb/hr 18 lb/hr 2.0 ppmvd @ 15% O2ELK HILLS POWER PLANT, CA * 500 MW DLNB, SCR 4.0 ppmvd @ 15% O2, 3-hr 2.5 ppmvd @ 15% O2, 1-hrEL PASO MERCHANT ENERGY CO. 1737 MMBTU/H GOOD COMBUSTION PRACTICE 13.8 PPMV @ 15% O2 3.5 PPMVEMPIRE POWER PLANT, NY 2099 mmbtu/hr DLNB, SCR, OC 2 ppmvd, 3-hr avg 1 ppmvdENERGY - RIVERSIDE PLANT 1885 mmbtu/h GOOD COMBUSTION PRACTICES 10 PPM 4.6 ppmvdENNIS TRACTEBEL POWER 350 MW 124 LB/H 91.67 LB/ESCONDIDO ENERGY CENTER LLC 46.5 MW SCR 2.5 ppmvd @ 15% O2 2.0 ppmvd @ 15% O2, 1-hr avg.ES JOSLIN POWER PLANT, TX * 195 MW SCR 4.0 ppmvd @ 15% O2, 24-hr rolling 18.0 lb/hr (total) 2 ppmvd, 3-hr avg 2 ppmvdCRESCENT CITY POWER 187 MW 17.7 lb/hrCRICKET VALLEY 1,000 MW, 333 MW each Oxidation Catalyst, SCR 2 ppmvd, 3-hr avg 0.006 lb/mmbtu 0.006 lb/mmbtu 2 ppmvd, 1-hr avg 2 ppmvd, 1-hr avgFAIRBAULT ENERGY CENTER 10 ppmvd, 9 ppmvd 0.01 lb/mmbtu 0.01 lb/mmbtu 3.0 ppmvd; 6.0 ppmvd 1.0 ppmvd, 1.5 ppmvdFAIRLESS ENERGY LLC 1190 MW OXIDATION CATALYST 3 PPMVD @ 15% O2 2.5 PPMVFAYETTEVILLE GENERATION, LLC 154 MW COMBUSTION CONTROL 9 PPMVD 3.5 PPMVFORSYTH ENERGY PLANT 1844.3 MMbtu/hr 11.6 ppmvdFPL BARTOW POWER PLANT 4.1 ppmvd 15 ppmvd 1.2 ppmvd @ 15% O2FPL EVERGLADES 400 MW (two) DLN, SCR 9.0 ppmvd 2.0 ppmvd 1.0 ppmvdFPL MANATEE PLANT - UNIT 3 170 MW GOOD COMBUSTION DESIGN AND PRACTICES 10 PPMVD @ 15% O2 0 2.5 PPMV 1.3 ppmvdFPL MARTIN PLANT 170 MW GOOD COMBUSTION DESIGN AND PRACTICES 10 PPMVD @ 15% O2 0 2.5 PPM 4 ppmvd, 1.3 ppmvdFPL PORT EVERGLADES 250 MW DLNB, SCR 2.0 ppmvd @ 15% O2; 15 ppmvd 1.2 ppmvd @ 15% O2; 4.1 ppmvdFPL WEST COUNTY ENERGY CENTER, FLORIDA 1250 MW DLNB, SCR, OC 4.1 ppmvd @ 15% O2 2 ppmvd @ 15% O2; 8.0 ppmvd 1.2 ppmvd @ 15% O2FPL TURKEY POINT POWER PLANT 170 MW (4 units) 4.1 ppmvd @ 15% O2 2 ppmvd @ 15% O2 1.3 ppmvdGARRISON ENERGY CENTER * 2260 mmbtu/hr Low NoX Combustors, SCR 2 ppmvd @ 15% O2GEISMAR PLANT 40 MW EACH NATURAL GAS AS FUEL. 44 LB/H 14.5 LB/HGENOVA ARKANSAS I, LLC 170 MW CATALYST 10.2 PPMVD @ 15% O2 3.5 PPMV

COPM
(filterable)PM10/PM2.5
(filterable and condensable) NOx VOC GHG (CO2e)Process Fuel Throughput Rate Manufacturer APC BACT BACT BACT LAER LAER BACT
GENOVA ARKANSAS I, LLC 200 MMBTU/H GOOD COMBUSTION PRACTICES 0.25 LB/MMBTU 3.5 PPMVGENOVA ARKANSAS I, LLC 170 MW GOOD COMBUSTION PRACTICE 8.2 PPMVD @ 15% O2 3.5 PPMVGENOVA ARKANSAS I, LLC 170 MW GOOD COMBUSTION PRACTICE 30 PPMVD @ 15% O2 3.5 PPMVGENOVA OK I POWER PROJECT 1705 MMBTU/H COMBUSTION CONTROL 8.2 PPM @ 15% O2 3.5 PPMVGENOVA OK I POWER PROJECT 1872 MMBTU/H COMBUSTION CONTROL 30 PPM @ 15% O2 3.5 PPMGENOVA OK I POWER PROJECT 1767 MMBTU/H CATALYTIC OXIDATION 10.2 PPM @ 15% O2 3.5 PPMGENPOWER EARLEYS, LLC 1715 MMBTU/H GOOD COMBUSTION PRACTICES AND DESIGN 9 PPMVD 2.5 PPMVGENPOWER EARLEYS, LLC 1715 MMBTU/H GOOD COMBUSTION PRACTICE AND DESIGN 14 PPMVD 2.5 PPMVGREAT RIVER ENERGY - ELK RIVER STATION 2169 MMBTU/H DLNB 4.0 ppm, 4-hr rolling avg 9 ppm, 4-hr avg; 25 ppmGIBSON COUNTY, TN Oxidation Catalyst, LNB, SCR 3 ppmvd @ 15% O2 0.0088 lb/mmbtu 0.0048 lb/mmbtu (Filterable) 2 ppmvd @ 15% O2 1679459 tpyGILA BEND POWER GENERATING STATION 170 MW OXIDATION CATALYST 4 PPM @ 15% O2 2 PPM GREATER DES MOINES ENERGY CENTER 350 MW CATALYTIC OXIDATION 0.012 LB/MMBTU 0.011 LB/hHARTBURG POWER, LP PROPER OPERATION 0.03 LB/MMBTU 5 PPMVDHARTBURG POWER, LP 277 mw PROPER OPERATION 15 PPM 5 PPMVDHAWKEYE, IOWA (DRAFT APP) 0.0115 lb/mmbtu 0.0063 lb/mmbtu 0.011 lb/mmbtu .011 lb/mmbtu .0016 lb/mmbtuHAYWOOD ENERGY CENTER, LLC 1990 MMBTU/H GOOD COMBUSTION PRACTICE 129.3 L/H 28.5 LB/HHAYWOOD ENERGY CENTER, LLC 1990 MMBTU/H GOOD COMBUSTION PRACTICE 46 LB/H 24.1 LB/HHENRY COUNTY POWER 171 MW FUEL. 181.3 T/YR 0.014 LB/MMBTUHENRY COUNTY POWER 171 MW DESIGN. 41.4 LB/H 25.3 LB/HHESS NEWARK GENERATING STATION 2320 mmbtu/hr each 2 ppmvd @ 15% O2 11 lb/hr 2 ppmvd @ 15% O2 1.0 ppmvd @15% O2HIGH BRIDGE GENERATING PLANT 330 MEGAWATTS GOOD COMBUSTION PRACTICES 10 PPM @ 15% O2 2 ppmvdHIGH DESERT POWER PROJECT * 190 MW DLNB, SCR 4.0 ppmvd @ 15% O2, 1-hr 2.5 ppmvd @ 15% O2, 1-hr; 18 lb/hrHIGH DESERT POWER PROJECT * 190 MW DLNB, SCR 4.0 ppmvd @ 15% O2, 1-hr 2.0 ppmvd @ 15% O2, 1-hr; 13.55 lb/hrHILLABY ENERGY CENTER 2142 MMBTU/H LNB, SCR 27.5 lb/hr 24.6 lb/hr; 0.009 lb/MMBtu 18.1 lb/hr; 0.0068 lb/mmbtuHINES ENERGY COMPLEX, POWER BLOCK 3 1830 MMBTU/H PRACTICES. 10 PPM 0 2.5 PPMV 2 ppmvdHINES POWER BLOCK 4 530 MW GOOD COMBUSTION 8 PPM 2.5 PPM 3.2 lb/hrHORSESHOE ENERGY PROJECT 310 MW TOTAL GOOD COMBUSTION CONTROL 40 PPM @ 15% 02 12.5 PPMHOUSTON OPERATIONS -- BATTLEGR 87 mw GOOD COMBUSTION PRACTICES 25 PPMVD @ 15% O2 4 PPMVD
HOWARD DOWN STATION 5000 MMFT3/YR SCR5.0 ppmvd @ 15% O2, 3-hr rolling avg. based on 1-hr block 5.0 lb/hr (filterable), avg. based on 3 tests 2.5 ppmvd @ 15% O2, 3-hr rolling avg; 5.4 lb/hr
HUNGTINGTON BEACH, CA 939 MW Mitsubishi Power Systems 2.0 ppmvd, 24-hr 4.5 lb/hr 2.0 ppmvd, 1-hr 1.0 ppmvd, 3-hrHYPERION ENERGY 3.0 ppmvd 0.011 lb/mmbtu 0.006 lb/MMbtu(filt) 2.0 ppmvd 3.0 ppmvdINTERNATIONAL STATION POWER PLANT (CHUGACH ELECTRIC) 59900 HP LNB, SCR 0.0066 lb/MMBtu 5.0 ppm, 4-hr avgINVENERGY NELSON LLC 220 MW 5 ppmvd, 1-hr avg 0.012 lb/MMBtu 4.5 ppmvd, 1-hr avg 4.0 ppmvd, 1-hr avgIVANPAH ENERGY CENTER, L.P. 500 MW CATALYTIC OXIDATION 4 PPMVD 11.25 LB/H (FPM10) 2 PPMVD 2.3 ppmvdJACKSON COUNTY POWER, LLC 305 MW GOOD COMBUSTION 51.1 LB/H 36 LB/HJAMES CITY ENERGY PARK 1973 MMbtu/hr 9 ppmvdJEA/BRANDY BRANCH 1911 MMBTU/H GOOD COMBUSTION 12.21 PPMVD 3.5 PPMVKALAMA ENERGY CENTER, WA 2247 mmbtu/hr Oxidation Catalyst, LNB, SCR 2.0 ppmvd, 1-hr avg, 11.3 lb/hr 0.0068 lb/mmbtu, 17.1 lb/hr 0.0068 lb/mmbtu, 17.1 lb/hr 2.0 ppmvd, 1-hr avg, 18.5 lb/hr 1 ppmvd, 1-hr avg, 3.2 lb/hrKALKASKA GENERATING, INC 605 MW OXIDATION CATALYST. 5 PPMVD @ 15% O2 3.5 ppmKENNECOTT REPOWER 2082 mmbtu/hr Oxidation Catalyst, LNB, SCR 2 ppmvd @ 15% O2 18.8 lb/hr 2 ppmvd @ 15% O2 2 ppmvd @ 15% O2KING POWER STATION, TX 1350 MW 2.0 ppmvd, 3-hr avg 11.1 lb/hr 2 ppmvd, 1-hr avg 1.8 ppmvdKLAMATH GENERATION, LLC 480 MW CATALYTIC OXIDATION 5 PPMVD @ 15% O2 2.5 PPMV 7.2 lb/hrKLEEN ENERGY SYSTEMS, LLC; CT 2136 MMBtu/hr Oxidation Catalyst 0.9 ppmvd, 1-hr 15.5 lb/hr; 16.2 lb/hr 10 lb/hr; 10.8 lb/hrLANGLEY GULCH POWER PLANT 2375.28 MMBtu/hr Oxidation Catalyst, LNB, SCR 2 ppmvd, 3-hr avg 2 ppmvd, 3-hr avg 2 ppmvd, 3-hr avgLANGLEY GULCH POWER PLANT with duct 2.0 ppmvd @ 15% O2, 3-hr rolling avg; 96 ppmvd 11.5 ppmvdLA PAZ GENERATING FACILITY 1080 MW OXIDATION CATALYST 3 PPMVD 2 PPMVD 2.5 lb/mmbtuLA PAZ GENERATING FACILITY 1040 MW OXIDATION CATALYST 3 PPMV 2 PPMVD 4.5 ppmvdLAWRENCE ENERGY 180 MW CATALYST 9.8 LB/H 4.1 LB/HLEWIS CREEK PLANT 513 MW DLNB, SCR 12.0 ppmd @ 15% O2, 3-hr rolling avg. 2 ppmvd @ 15% O2, 3-hr rolling avg. 1.7 ppmvdLIBERTY GENERATING STATION 256 MMBTU/H CO CATALYST 100 PPMVD @ 7% O2 0.03 LB/MMBTU 2.5 PPMVLIBERTY GENERATING STATION 3202 MMBTU/H CO CATALYST 15.4 LB15.4 LB/H 2.5 PPMVLIBERTY GENERATING STATION 2964 MMBTU/H CO CATALYST 2 PPMVD @ 15% O2 2.5 PPMVLIMA ENERGY COMPANY 170 MW 251 LB 251 LB/H 178 LB/HLIMERICK POWER STATION 550 MW 10 PPM @ 15% O2 2 PPM LIVE OAKS 600 MW Oxidation Catalyst, LNB, SCR 2.0 ppm, 3-hour avg. 2.5 ppm, 3-hour avg; 87 tpy 2.0 ppm, 3-hour avgMADISON BELL ENERGY CENTER 275 MW SCR 17.5 ppmvd @ 15% O2, 1-hr rolling avg 2 ppmvd @ 15% O2, 24-hr rolling avg. 2.5 ppm @ 15% O2, 1-hr avg.MAGNOLIA POWER PROJECT, SCPPA 181 NET MW (GAS T USCR SYSTEM AND OXIDATION CATALYST 2 PPMVD @ 15% O2 0.01 G/SCF 2 PPMVD 2 ppmvdMANKATO ENERGY CENTER 800 MMBTU/H OXIDATION CATALYST 4 PPMVD @15% 02 0.009 lb/mmbtu 3 PPMVDMANKATO ENERGY CENTER 1916 MMBTU/H COMBUSTION 4 PPMVD 15% 02 3 PPMVDMANKATO ENERGY CENTER (WITH DUCT) 1827 MMBTU/H COMBUSTION 4.8 PPMVD @15% 02 0.009 lb/mmbtu 5.5 PPMV 4 ppmvdMCINTOSH COMBINED CYCLE FACILITY 140 MW CATALYTIC OXIDATION 2 PPM @ 15% O2 0.009 LB/MMBTU 2.5 PPM 2 ppmvd
MGM MIRAGE 4.6 MMBTY/HLEAN PRE-MIX TECHNOLOGY AND LIMITING THE FUEL TO NATURAL GAS ONLY 0.0056 lb/MMBtu 0.0071 lb/MMBtu 0.178 lb/MMBtu; 5 ppmvd 0.024 lb/MMBtu; 0.11 lb/hr
MIDLAND COGENERATION (MCV) 984 MMBTU/H CATALYTIC OXIDATION ARE COST 26 LB/HMIDLAND COGENERATION (MCV) 984 MMBTU/H CONTROL WAS COST PROHIBITIVE. 26 LB/HMIRANT AIRSIDE INDUSTRIAL PARK 170 MW GOOD COMBUSTION PRACTICES. 10.3 PPMVD @ 15% O2MIRANT GASTONIA POWER FACILITY 175 MW GOOD COMBUSTION PRACTICES 20 PPMVD 2.5 PPMVMIRANT GASTONIA POWER FACILITY 175 MW GOOD COMBUSTION PRACTICES 20.6 PPMVD 2.5 PPMVMIRANT GASTONIA POWER FACILITY 175 MW GOOD COMBUSTION PRACTICES 10 PPMVD 2.5 PPMVMIRANT GASTONIA POWER FACILITY 175 MW GOOD COMBUSTION PRACTICES 9 PPMVD 2.5 PPMVMIRANT SUGAR CREEK LLC 1490.5 MMBTU/H GAS AS FUEL. 9 PPMVD @ 15% O2 3 PPMVDMIRANT SUGAR CREEK LLC 1490.5 MMBTU/H AS FUEL. 14 PPMVD @ 15% O2 3 PPMVDMIRANT WYANDOTTE LLC 2200 MMBTU/H CATALYTIC OXIDATION SYSTEM. 3.8 PPM 10 ppmMOUNTAIN CREEK STREAM ELECTRIC STATION 2.5 ppmvd, 1-hr rolling avg. 1.4 ppmvd , 3-hr rolling avg.MOXIE LIBERTY, PA * 454 MW Mitsubishi / Siemens SGT6-8000H 2.0 ppmvd @15% O2 0.0057 lb/mmbtu 0.0057 lb/mmbtu 2.0 ppmvd @15% O2 1.0 ppmvd @15% O2MOXIE PATRIOT, LLC GENERATING STATION, VA 472 MW each (4) Mitsubishi / Siemens SGT6-8000H 2.0 ppmvd @15% O2 0.0057 lb/mmbtu 0.0057 lb/mmbtu 2.0 ppmvd; 111.2 tpy 1.0 ppmvd @15% O2MURRAY ENERGY FACILITY 173 MW GOOD COMBUSTION PRACTICE 12 PPM @ 15% O2 25 LB/H 3 PPM MUSTANG ENERGY PROJECT 0 COMBUSTION CONTROLS 40 PPM @ 15% 02 48.49 T/YNATURAL GAS-FIRED POWER GENERATION FACILITY 250 MW SCR 15.0 ppmvd @ 15% O2, 24-hr rolling avg. 2 ppmvd @ 15% O2, 24-hr rolling avg. 4 ppm @ 15% O2NELSON ENERGY CENTER 220 MW each DLNB, SCR 5.0 ppmvd @ 15% O2 4.5 ppmvd @ 15% O2 4.0 ppmvd @ 15% O2NINEMILE POINT (ENTERGY LOUISIANNE) 7146 MMBtu/hr Oxidation catalyst 3.0 ppmvd 26.23 lb/hr 1.4 ppmvdNORTON ENERGY STORAGE, LLC 300 MW EFFECTIVE. 23 LB/H 14.5 LB/HNORTON ENERGY STORAGE, LLC 300 MW EFFECTIVE. 38 LB/H 16 LB/HOHIO RIVER CLEAN FUELS, LLC 232000 KW SCR 23.LB/H, 3-hr avg. 18.21 LB/HR, 3-hr avg. 28.53 lb/hr, 3-hr avg; 123.3 tpy 26.62 lb/hr, 3-hr avg.; 114.99 tpyORANGE GROVE PROJECT 49.8 MW SCR 2.5 ppm, 1;hr avg. 2.0 ppm, 1-hr avg.OREGON CLEAN ENERGY CENTER, OHIO 800 MW 0.0049 lb/mmbtu 2.0 ppmvd @15% O2 1.0 ppmvd @15% O2 318,404 lb/hr, 840lb/MW-hrOTAY MESA ENERGY CENTER 171.7 MW SCR 2 ppmvd; 1-hr avg; 14.8 lb/hr 2 ppmvd; 1-hr avgOUC CURTIS H. STANTON ENERGY CENTER 1765 MMBTU/H LNB, SCR, Water Injection 8.0 ppmvd @ 15% O2, 24-hr 2 GR S/100 SCF GAS 8 ppmvd @ 15% O2; 2 ppmvdOXY COGENERATION FACILITY 87 MW (EACH) GOOD COMBUSTION PRACTICES 112 LB/H 55.3 LB/HOXY COGENERATION FACILITY 255 MMBTU/H GOOD COMBUSTION PRACTICES. 64.3 LB/H 16.9 LB/HOXY COGENERATION FACILITY 255 MMBTU/H GOOD COMBUSTION PRACTICES. 117 LB/H 115 LB/HPACICORP LAKESIDE, UTAH 629 MW Oxidation Catalyst, LNB, SCR, HRSG 3.0 ppmvd @15% O2 0.01 lb/mmbtu 2.0 ppmvd @ 15% O2PALMDALE 570 MW Oxidation Catalyst, LNB, SCR 2.0 ppmvd (1.5 post demo), 1-hr avg 0.0048 lb/MMBtu 0.0048 lb/MMBtu 2 ppmvd; 1-hr avg 774 lb/MW-hr, 7,319 BTU/kw-hrPANDA CULLODEN GENERATING STATION 300 MW PRACTICES TO MINIMIZE INCOMPLETE 8.2 PPM 3.5 PPM

COPM
(filterable)PM10/PM2.5
(filterable and condensable) NOx VOC GHG (CO2e)Process Fuel Throughput Rate Manufacturer APC BACT BACT BACT LAER LAER BACT
PATTILLO BRANCH POWER 350 MW Oxidation Catalyst, SCR 2 ppm, 3-hr avg 2 ppmvd, 24-hr rolling 2.0 ppmvd, 3-hr avgPERRYVILLE POWER STATION 170 MW FUEL. 25 PPM @ 15 % O2 4.5 PPMPERRYVILLE POWER STATION 310 MMBTU/H AS FUEL. 0.08 LB/MMBTU 4.5 PPMPERRYVILLE POWER STATION 183 MW NATURAL GAS AS FUEL 108.2 LB/H 4.5 PPMPIKE GENERATION FACILITY 2168 MMBTU/H EFFICIENT COMBUSTION PRACTICES 40 PPMV @ 15% O2 44.2 LB/H 3.5 PPMVPIKE GENERATION FACILITY 2168 MMBTU/H EFFICIENT COMBUSTION PRACTICES 40 PPMV @ 15% O2 44.2 LB/H 3.5 PPMVPIKE GENERATION FACILITY 2168 MMBTU/H EFFICIENT COMBUSTION PRACTICES 40 PPMV @ 15% O2 44.2 LB/H 3.5 PPMVPIKE GENERATION FACILITY 2168 MMBTU/H EFFICIENT COMBUSTION PRACTICES 40 PPMV @ 15% O2 44.2 LB/H 3.5 PPMVPIONEER VALLEY ENERGY CENTER 431 MW LNB, SCR, OC, burning NG as a fuel with ULSD as backup 2.0 ppmvd @15% O2 0.004 lb/mmbtu 2.0 ppmvd @15% O2PLANT MCDONOUGH COMBINED CYCLE 254 MW Oxidation Catalyst 1.8 ppm, 3-hr avg 1 ppm, 3-hr avgPLAQUEMINE COGENERATION FACILITY 2876 MMBTU/H GOOD COMBUSTION PRACTICES 212.5LB/H 240 LB/H, hourly max; 480 lb/hrPORT DOLPHIN ENERGY CENTER, LLC SCR 0.165 G/KW-H, 3-hr rolling avg 0.0065 G/KW-H, 3-hr rolling avg 0.0065 G/KW-H, 3-hr rolling avg 0.02 G/KW-hr, 3-hr rolling avg. 0.15 g/kwhr, 3-hr rolling avg.PORT WESTWARD PLANT 325 MW, EACH PRACTICES. 4.9 PPM @ 15% O2 0.1 GR/DSCF 2.5 PPMPOWER LANE STEAM PLANT 8.44 MW SCR 0.3 G/BHp-H 4.5 lb/hr (filterable only) 0.04 g/bhp-hr, 1 g/bhp-hrPROGRESS BARTOW POWER PLANT 1972 MMBTU/H DLNB, water injection 8.0 ppmvd, 24-hr block avg 15 ppmvd, 30-day basis; 42 ppmvd 1.2 ppmvd; 1.5 ppmvd
PSEG FOSSIL LLC KEARNY GENERATING STATION 8940000 MMBTU/H SCR and NG for Fuel5.0 ppmvd @ 15% O2, 3-hr rolling avg. based on 1-hr block 6.0 lb/hr, avg. of 3 tests 6.0 lb/hr, avg. of 3 tests 2.5 ppmvd @ 15% O2, 3-hr rolling avg; 4.39 lb/hr
4.0 ppmvd @ 15% O2, avg. of 3 tests; 2.33 lb/hr
PSO RIVERSIDE JENKS POWER STA DLNB 59 lb/hr, short term 10 lb/hr, short term 9.0 ppmvdPSO SOUTHWESTERN POWER PLT DLNB 25 PPMVD @ 15% O2 0.0093 lb/mmbtu 9.0 ppmRAWHIDE ENERGY STATION 1400 MMBTU/H DLNB 18 lb/hr 18 lb/hr 9.0 ppmvd @ 15% O2, 3-hr rolling avg.; 100 ppmvdREDBUD POWER PLANT 1832 MMBTU/H GOOD COMBUSTION PRACTICES/DESIGN 17.2 PP 0.012 lb/mmbtu 3.5 PPMVRELIANT ENERGY CHOCTAW COUNTY, LLC 230 MW SCR 18.36 PPMV @ 1`5% 02 3.5 PPMV 3.64 pmvdRELIANT ENERGY CHOCTAW COUNTY, LLC 230 MW 18.36 PPMV @ 15% 02 3.5 PPMVRELIANT ENERGY CHOCTAW COUNTY, LLC 230 MW SCR 18.36 PPMV @ 15 02 3.5 PPMVRIVERSIDE PLANT - NORTHERN STATES 1885 MMbtu/hr 10 ppmvdROCKY MOUNTAIN ENERGY CENTER, LLC 300 MW Oxidation Catalyst, LNB, SCR 3.0 ppm 0.0074 lb/MMBtu 3.0 ppm, 1-hr max 0.0029 lb/MMBtuROCKY MOUNTAIN ENERGY CENTER, LLC. 2311 MMBTU/H AND OXIDATION CATALYST (CONTROL) 9 PPMVD 3 PPM RUSSELL CITY ENERGY CENTER 600 MW SCR 2.0 ppmvSABINE PASS LNG TERMINAL 286 MMBtu/hr Good combustion practices and NG, water injection 17.46 lb/hr 2.08 lb/hr 2.08 lb/hr 22.94 lb/hr 0.66 lb/hr 4,872,107 tpySACRAMENTO MUNICIPAL UTILITY DISTRICT 1611 MMBTU/H GOOD COMBUSTION CONTROL 4 PPM @ 15% O2 2 PPM 1.4 ppmSAND HILL ENERGY CENTER 164 MW 98.2 LB/h 46 LB/HSATSOP, DUKE ENERGY, WA 600 MW 2.0 ppmvd @15% O2 2.5 ppmvd @ 15% O2 2.78 ppmvd @ 15% O2SERVIER POWER, UTAH 580 MW Oxidation Catalyst, LNB, SCR 3 ppmvd @ 15% O2, 3-hr 14 lb/hr - 30 day rol 14 lb/hr - 30 day rol 2.0 ppmvd @ 15% O2, 3-hr 3 ppmvd @ 15% O2, 3-hrSHADY HILLS GENERATING STATION 170 MW DLNB 6.5 ppmvd @ 15% O2 9.0 ppmvd @ 15% O2, 24-hr block avg.; 59 lb/hrSILVER BOW GEN 500 MW 139.9 LB/H 25.2 LB/HSILVER BOW GEN 500 MW 139.9 LB/H 25.2 LB/HSOUTH SHORE POWER LLC 172 MW PRACTICES. 4 PPMVD @ 15% O2 7.3 lb/hrSPC POWER PLANT 580 MW DLNB, SCR 2.0 ppmvSTERNE ELECTRIC GENERATING FACILITY 190 MW GOOD COMBUSTION PRACTICES. 109.4 LB/H 45.4 LB/HST. JOSEPHS ENERGY CENTER 1350 MW (4 turbines) LNB, SCR, Oxidation Catalyst, HRSG 2.0 ppmvd @ 15% O2, 3-hr 0.0092 lb/mmbtu, 15 lb/hr 0.0092 lb/mmbtu, 15 lb/hr 2.0 ppmvd @ 15% O2, 3-hr 1.0 ppmvd @ 15% O2, 3-hr 7,646 btu/kw-hrSUMAS ENERGY 2 GENERATION FACILITY 660 MW OXIDATION CATALYST 2 PPMV 377 LB/D 2 PPMVD 420 lb/daySUMAS ENERGY 2 GENERATION FACILITY 334.5 MW COMBUSTION CATALYSIS 0.011 LB/MMBTU 0.008 LBTECO BAYSIDE POWER STATION 170 MW PRACTICES 7.8 PPMVD AT 15%O2TENASKA FLUVANNA 61200 MMSCF/YR BEST COMBUSTION CONTROL PRACTICES 21 PPMVDTHOMAS B. FITZHUGH GENERATING 170.6 MW NOX COMBUSTORS 10 PPM @ 15% O2THOMAS B. FITZHUGH GENERATING 220 MMBTU/H GOOD COMBUSTION PRACTICES AND DESIGN 12 PPM @ 15% O2THOMAS C. FERGUSON POWER PLANT 390 MW DLNB, SCR 4.0 ppmvd @ 15% O2, 3-hr rolling avg. 33.43 lb/hr, 1-hr avg 2.0 ppmvd @ 15% O2, 24-hr rolling avg. 2.0 ppmvd @ 15% O2, 3-hr avg.TRACY SUBSTATION EXPANSION PROJECT 306 MW SCR 3.5 ppmvd @ 15% O2, 3-hr 0.011 lb/MMbu 2.0 ppmvd @ 15% O2, 3-hrVA POWER - POSSUM POINT 1937 MMBTU/H 63 LB/H 0.03 LB/MMBTUVA POWER - POSSUM POINT 1937 MMBTU/H 32 LB/H 0.03 LB/MMBTUVERNON CITY LIGHT & POWER 43 MW GAS TURBI ALSTOM GTX100 NESCR SYSTEM, AND OXIDATION CATALYST 2 PPMVD @ 15% O2 0.01 G/SCF 2 PPMVD 2 ppmvdVICTORVILLE 2 HYBRID POWER PROJECT * 154 MW Oxidation Catalyst, SCR 2 ppmvd, 1-hr avg; 7.65 lb/hr, 1-hr avg 12 lb/hr, 12-month rolling 2 ppmvd, 1-hr avg; 11.55 lb/hr, 1-hr avgVIRGINIA ELECTRIC AND POWER COMPANY COMBINED CYCLE FACILITY 2996 MMBTU/H DLNB, SCR 2.0 ppmvd @ 15% O2; 25.3 lb/hr 0.7 ppmvd @ 15% O2; 2.6 lb/hrWALLULA POWER PLANT 1300 MW; 325 MW each OXIDATION CATALYST, Use of NG 2 PPMDV @ 15% 02 0.0029 GR/DSCF 2.5 PPMD 5 ppmvdWANAPA ENERGY CENTER 2384.1 MMBTU/H OXIDATION CATALYST. 2 PPMDV @ 15% O2 2 PPMDVWANSLEY COMBINED CYCLE ENERGY 167 MW GOOD COMBUSTION PRACTICE 2 PPM @ 15% O2 0.011 LB/MMBTU 3 PPM @WARREN COUNTY POWER PLANT - DOMINION 2996 MMBtu/hr Oxidation Catalyst, LNB, SCR 1.5 ppmvd, 1-hr 8.0 lb/hr 8.0 lb/hr 2.0 PPMvd, 1-hr avg 2.6 lb/hr, 3-hr avgWEATHERFORD ELECTRIC GENERATION 1910 MMBTU/H 31 LB/H31 LB/H 18 LB/H 63 LB/HWEATHERFORD ELECTRIC GENERATION 1079 MMBTU/H 58 LB/H58 LB/H 14 LB/H 35 LB/HWELLTON MOHAWK GENERATING STATION 180 MW OXIDATION CATALYST 3 PPM @ 15% O2 2 PPM 3 ppmWELLTON MOHAWK GENERATING STATION 170 MW OXIDATION CATALYST 3 PPM @ 15% O2 2 PPM WESTERN FARMERS ELECTRIC ANADARKO 462.7 MMBTU/H Water Injection 63 ppm @ 15% O2 4.0 lb/hr (filterable only) 25.0 ppm; 42 lb/hrWOODBRIDGE ENERGY CENTER 2.0 ppmvd @ 15% O2 0.0084 lb/mmbtu 0.0084 lb/mmbtu 2.0 ppmvd @ 15% O2 2.0 ppmvd @ 15% O2 312,885 lb/hrWOLVERINE (SUMPTER POWER PLANT) 130 MW 0.048 lb/MMBtu 0.0066 lb/MMBtu, 7.4 lb/hr 9 ppm, 24-hr avg 954 lb/MW-hr

COPM
(filterable)PM10/PM2.5
(filterable and condensable) NOx VOC GHG (CO2e)Process Fuel Throughput Rate Manufacturer APC BACT BACT BACT LAER LAER BACT
Aux Boiler 0.0088 lb/MMBtu 0.005 lb/MMBtu 0.014 lb/MMBtu 0.01 lb/MMbtu 0.001 lb/MMBtuCPV LIMITS 435 MMBtu/hr 3.8 lb/hr 2.2 lb/hr 5.9 lb/hr 4.3 lb/hr 0.4 lb/hr 222,927 tpy, each
0.02 g/dscf 0.06 g/dscfACE ETHANOL - STANLEY 11 MMBTU/H 0.08LB/MMBTU 0.0075LB/MMBTU 0.04LB/MMBTU 0.0054LB/MMBTUACE ETHANOL - STANLEY 34 MMBTU/H 0.08LB/MMBTU 0.0075LB/MMBTU 0.04LB/MMBTU 0.0054LB/MMBTUACE ETHANOL - STANLEY 60 MMBTU/H 0.08LB/MMBTU 0.0075LB/MMBTU 0.04LB/MMBTU 0.0054LB/MMBTUACE ETHANOL - STANLEY 80 MMBTU/H 0.08LB/MMBTU 0.0075LB/MMBTU 0.04LB/MMBTU 0.0054LB/MMBTUAMERICAN MUNCIPAL POWER GENERATING STATION 150 MMbtu/hr 12.6 lb/hr 21 lb/hr 0.83 lb/hrAVENAL ENERGY PROJECT 37.4 MMBtu/hr DLN, PIPELINE QUALITY NATURAL GAS, OPERATIONAL RES 50 ppmvd, 3-hr avg, 0.03 lb/MMbtu 0.0034 gr/dscf 0.0034 gr/dscf 9 ppmvd, 3-hr avg @ 3% O2, 0.011 lb/mmbtuBLANDIN PAPER/RAPIDS ENERGY CENTER 280 mmbtu/hr LNB WITH FGR 0.035 lb/mmbtuBRUNSWICK 66.7 MMBtu/hr 2.5 lb/hr 0.5 lb/hr 0.8 lb/hr 0.4 lb/hrCAITHNES BELL POINT ENERGY CENTER 24 mmbtu/hr 0.036 lb/mmbtu 0.0033 lb/mmbtu (< FPM10) 0.011 lb/MMbtuCARTY PLANT 91 MMBtu/hr LNB 2.5 lb/mmcf, 0.002 lb/mmbtu 4.5 lb/hrCHOUTEAU POWER PLANT 33.5 MMBtu/hr Donley boiler , LNB 5.02 lb/hr 0.07 lb/MMBtu, 2.36 lb/hr 0.54 lb/hrCPV ST CHARLES 93 mmbtu/hr LNB WITH FGR 0.02 lb/mmbtu, 3-hr avg 0.005 lb/mmbtu, 3-hr avg 0.005 lb/mmbtu, 3-hr avg (fil only) 0.011 lb/mmbtu, 3-hr avg 0.002 lb/mmbtu, 3-hr avgCPV VALLEY, WAWAYANKA NY (PROPOSED) 73.5 mmbtu/hr 0.0721 lb/mmbtu .0063 lb/mmbtu 0.0450 lb/mmbtu 0.0038 lb/mmbtuCRICKET VALLEY 48.6 MMbtu/hr 0.0375 lb/mmbtu 0.005 lb/mmbtu 0.005 lb/mmbtu 0.036 lb/MMbtu 0.005 lb/MMbtu, 1-hrDRY FORK STATION 134 mmbtu/hr LNB WITH FGR-LIMITED TO 2000-HRS OF ANNUAL OPERATI 0.08 lb/mmbtu, annual 0.04 lb/mmbtu, 5.4 lb/hrFAIBAULT ENERGY PARK 40 MMBTU/H 0.084LB/MMBTU 0.008LB/MMBTU 0.006LB/MMBTUFORSYTH ENERGY PLANT 110 mmbtu/hr 0.0824 lb/mmbtu .007 lb/mmbtu (< FPM10) 0.1370 lb/mmbtu 0.59 lb/hrFPL WEST COUNTY ENERGY CENTER 99.8 mmbtu/hr 0.05 lb/mmbtu 2 gs/100scf gasGENOVA ARKANSAS, LLC 33 MMbtu/hr Low NOx burner, FGR (option 1) 0.04 lb/mmbtu 0.012 lb/MMBtu 0.018 lb/MMbtu 0.04 lb/MMbtuHARRISONBURG RESOURCE RECOVER FACILITY 43.2 MMBTU/H 3.56LB/H 0.23LB/HHESS NEWARK ENERGY CENTER 6.2 MMbtu/hr 0.05 lb/mmbtu 0.005 lb/MMbtu 0.005 lb/MMbtu 0.05 lb/mmbtu 0.004 lb/mmbtuIOWA FERTILIZER COMPANY 472.4 mmbtu/hr GCP 0.0013 lb/mmbtu 0.0024 lb/MMbtu 0.0024 lb/MMbtu 0.0125 lb/mmbtu 0.0014 lb/mmbtu 51,748 tpyJOHN W. TURK JR. POWER PLANT 555 mmbtu/hr LNB 0.036 lb/mmbtu, 30-day rolling avg 0.004 lb/mmbtu, 3-hr avg (fil only) 0.11 lb/mmbtu, 30-day rolling avg. 0.0055 lb/mmbtuKALAMA ENERGY CENTER, WA 36.5 mmbtu/hr 30 ppmvd, 0.81 lb/hr, 0.02 lb/mmbtu 0.28 lb/hr 0.28 lb/hr 12 ppmvd, .54 lb/hrKARN WEADOCK GENERATING COMPLEX 200 mmbtu/hr LNB 0.035 lb/mmbtu 0.018 lb/mmbtu, 30-day rolling avg. 0.0013 lb/mmbtuLAKE CHARLES COGENERATION 983 mmbtu/hr ULNB 33.7 lb/hr 6.99 lb/hr 0.035 lb/mmbtu, 32.84 mmbtu/hrMAIDSVILLE POWER, WV 225 mmbtu/hr 0.04 lb/mmbtu 0.0022 lb/mmbtu 0.0022 lb/mmbtu (fil) 0.098 lb/mmbtuMANKATO ENERGY CENTER 70 MMbtu/hr 0.06 lb/mmbtu 0.008 lb/mmbtu 0.008 lb/mmbtu 0.036 lb/mmbtu 0.007 lb/mmbtuMINNESOTA STEEL 99 MMbtu/hr 0.08 lb/MMbtu 0.0025 gr/dscf 0.0035 lb/MMbtuMONTVILLE POWER LLC 82 MW, 995 mmbtu/hr Regenerative SCR 0.1 lb/mmbtu, 8-hr block avg 0.026 lb/mmbtu 0.06 lb/mmbtu 5.5 lb/hrNELLIS AIRFORCE BASE 6.5 mmbtu/hr 0.037 lb/mmbtu 0.0077 lb/mmbtu 0.03 lb/mmbtu 0.062 lb/mmbtuNINEMILE POINT (ENTERGY LOUISIANNE) 338 MMBtu/hr 84 lb/MMscf (0.01 lb MMBTU) 7.6 lb/hr 7.6 lb/hr 5.5 lb/MMscfOHIO RIVER CLEAN FUELS, LLC 1200 mmbtu/hr LNB, SCR 36 lb/hr, 3-hr avg. 18.7 lb/hr, 3-hr avg. 120 lb/hr, 524.2 tpy 13 lb/hr, 56.9 tpyOHIO RIVER PLANT 365 MMSCF/YR (39 MMBTU/YR) 0.32PPHOREGON CLEAN ENERGY CENTER, OHIO 90 mmbu/hr LNG, FGR 0.037 lb/mmbtu 0.005 lb/mmbtu 0.01 lb/mmbtu 0.004 lb/mmbtu 11,671 tpy, 12-month rollingPACICORP, LAKESIDE, UTAH 61.2 mmbtu/hr 0.037 lb/mmbtu 0.01 lb/mmbtu 0.017 lb/mmbtuPALMDALE HYBRID POWER PROJECT 110 MMBtu/hr 50 ppmvd, 0.03 lb/MMbtu 0.8 lb/hr 0.8 lb/hr 9 ppmvd, 2-hr avg @ 3% O2, .011 lb/MMbtuPIONEER VALLEY 21 mmbtu/hr 0.037 lb/mmbtu 0.0048 lb/mmbtu 0.029 lb/mmbtu 0.003 lb/mmbtuPLANT MCDONOUGH COMBINED CYCLE 200 mmbtu/hr 0.037 lb/mmbtu 0.0051 lb/mmbtuPORT DOLPHIN ENERGY LLC 278 mmbtu/hr SCR 0.015 lb/mmbtu, 3-hr rolling avg 0.01 lb/mmbtu, 3-hr rolling avg 0.0075 lb/mmbtu, 3-hr rolling avg 0.012 lb/mmbtu, 3-hr avg 0.0054 lb/mmbtuPROGRESS BARTOW POWER PLANT 99 mmbtu/hr 0.08 lb/mmbtu 2 gr/100scfPSEG LAWRENBURG ENERGY FACILITY 124.6 mmbtu/hr 0.082 lb/mmbtu 0.928 lb/hr 0.036 lb/mmbtu 0.0054 lb/mmbtuPLANT MCDONOUGH COMBINED CYCLE 200 MMbtu/hr 0.0370 lb/MMbtu 0.0051 lb/MMbtuQUAD GRAPHICS OKC FAC 600 HP 0.035LB/MMBTU 0.52LB/HRINCON POWER PLANT 83 MMBTU/H 0.093LB/MMBTU 0.055LB/MMBTU 0.004LB/MMBTUROCKY MOUNTAIN ENERGY CENTER, LLC * 129 mmbtu/hr 0.039 lb/mmbtu 0.038 lb/mmbtuSATSOP, DUKE ENERGY 29.3 mmbtu/hr 0.035 lb/mmbtuSERVIER POWER, UTAH 85 mmbtu/hr ULNB FGR 0.0375 lb/mmbtu 0.01 lb/MMbtu 0.01 lb/MMbtu 0.017 lb/mmbtu, 3-hr avgSHINTECH PLAQUEMINE PLANT 2 250 mmbtu/hr LNB. SCR 0.0362 lb/mmbtu 0.005 lb/mmbtu 0.01 lb/mmbtu, 0.2 lb/mmbtuSPIRITWOOD STATION (GREAT RIVER ENERGY) 281 mmbtu/hr LNB with FGR 0.08 lb/mmbtu 0.03 lb/mmbtu 0.035 lb/mmbtu 0.005 lb/mmbtuST. JOSEPHS ENERGY CENTER 80 MMbtu/hr LNB, FGR 0.083 lb/mmbtu, 6.64 lb/hr 0.0075 lb/mmbtu, .6 lb/hr 0.0075 lb/mmbtu, .6 lb/hr 0.032 lb/mmbtu, 2.56 lb/hr 0.005 lb/mmbtu, 0.4 lb/hr 81,996 tpySTOCKTON COGEN COMPANY 178 mmbtu/hr 7 ppmvd, 0.0085 lb/mmbtuSUNBURY GENERATION LP/SUNBURY SES 106,000 mmbtu 0.074 lb/mmbtu 0.008 lb/mmbtu 0.036 lb/mmbtu, 7.6 tpy 0.005 lb/mmbtu, 1.1 tpyTEXSTAR GAS PROCESS FACILITY 93 MMbtu/hr 7.05 lb/hr 0.64 lb/hr 8.39 lb/hr 0.46 lb/hrTITAN TIRE CORP 50 MMbtu/hr 4.15 lb/hr 0.02 lb/mmbtu 0.0940 lb/hr (<FPM10) 2.47 lb/hr 0.27 lb/hrTOLEDO SUPPLIER PARK- PAINT SHOP 20.4 mmbtu/hr 1.7LB/H 0.04 lb/h 20.4 MMBTU/H 0.11LB/HVICTORVILLE 2 HYBRID POWER PROJECT 35 MMBtu/hr 50 ppmvd, 1-hr avg 0.2 gr/100dscf 9 ppmvd, 1-hr avgWARREN COUNTY POWER PLANT - DOMINION 88 MMbtu/hr ULNB 0.037 lb/MMbtu 0.005 lb/MMBtu 0.007 lb/mmbtu 0.011 lb/MMbtu 0.005 lb/mmbtuWE ENERGIES - BIOMASS FUELED COGENERATION FACILITY 350 mmbtu/hr ULNB 10 ppmvd@5% O2 0.06 lb/mmbtu, 30-day rollingWILLIAMS REFINING AND MARKETING 95 mmbtu/hr 0.09 lb/MMbtu 0.0075 lb/MMbtuWOLVERINE POWER 72.40 MMbtu/hr 6.11 lb/hr 0.11 lb/hr (FPM) 2.17 lb/hr (TPM10) 1.67 lb/hr 0.30 lb/hrWOODBRIDGE ENERGY CENTER, NJ 91.6 MMBtu/hr LNB 0.038 lb/mmbtu 0.010 lb/mmbtu 0.0015 lb/mmbtu, .14 lb/hr

COPM
(filterable)PM10/PM2.5
(filterable and condensable) NOx VOC GHG (CO2e)Process Fuel Throughput Rate Manufacturer APC BACT BACT BACT LAER LAER BACT
E-gen 1, 500 kW 8.9 lb/hr 0.51 lb/hr 0.59 lb/hr 16.3 lb/hr 1.1 lb/hr0.81 lb/MMBTU 0.046 lb/MMBtu 0.054 lb/MMBtu 1.48 lb/MMBtu 0.10 lb/MMBtu 444 tpy0.006 lb/bhp-hr 3.29E-4 lb/hp-hr 3.83E-4 lb/hp-hr 0.011 lb/hp-hr 7.1E-4 lb/hp-hr
3.50 g/kW-hr 0.20 g/kW-hr 0.23 g/kW-hr 6.40 g/kW-hr 0.50 g/kW-hr2.6 g/hp-hr 0.15 g/hp-hr 0.17 g/hp-hr 4.77 g/hp-hr 0.32 g/hp-hr
ACE ETHANOL - STANLEY 1850 bhp 1 g/hp-hr 0.07 g/hp-hr 13 g/hp-hr 0.12 g/hp-hrAVENAL ENERGY PROJECT 550kW Exhausted to oxidation catalyst, SCR 1 g/hp-hr 0.34 g/hp-hr 0.34 g/hp-hr 0.21 g/hp-hrBRUNSWICK 2200 kW 3.5 g/kW-hr, 2.6 g/hp-hr 0.2 g/kW-hr, 0.15 g/hp-hr 0.4 g/kW-hr, 0.3 g/hp-hr 6.4 g/kW-hr, 4.8 g/hp-hr 6.4 g/kW-hr, 4.8 g/hp-hrCHOUTEAU POWER PLANT 2200 HP 12.66 lb/hr 0.72 lb/hr 23.15 lb/hr, 6.4 g/kw-hr 1.55 lb/hrCONCORD STEAM CORPORATION 5.6mmbtu/hr, 11.6 mmbtu/hr OPERATES LESS THAN 500-HRS 1.98 lb/mmbtu, avg of 3 1-hr testsCORNELL COMBINED HEAT AND POWER PROJECT 1000 KW 0.19 lb/hrCPV ST CHARLES N/A 2.6 g/hp-hr 0.15 g/hp-hr 4.8 g/hp-hr 4.8 g/hp-hrCPV VALLEY, WAWAYANKA NY (PROPOSED) 1.5 MW 0.1361 lb/mmbtu 0.0091 lb/mmbtu 1.5 lb/mmbtu 0.0331 lb/mmbtuCREOLE TRAIL LNG IMPORT TERMINAL 2168 HP each (2) GCP AND GOOD ENGINE DESIGN INCORPORATING FUEL IN 12.24 lb/hr 0.69 lb/hr 37.95 lb/hr, 9.49 tpy 1.67 lb/hrCRICKET VALLEY 25.08 lb/hr 1.45 lb/hr 20.55 lb/hr; .70 lb/mmbtu 0.95 lb/hrDRY FORK STATION 2377 HP EPA TIER II CERTIFED ENGINE WITH 500-HRS OF OPERATION2.6 g/hp-hr 0.15 g/hp-hr 4.8 g/hp-hrDUKE ENERGY WASHINGTON COUNTY LLC 600 hp 15.2 lb/h 0.72 lb/hr 12.4 lb/hr 1.76 lb/hDUKE ENERGY STEPHENS, LLC STEPHENS ENERGY 749 bhp 2.66 lb/mmbtu 2.16 lb/mmbtu 1.7 lb/hFAIRBAULT ENERGY PARK 670 hp 0.76 lb/mmbtu 0.1 lb/mmbtu 0.024 lb/hp-hr, 3-hr avg 0.1 lb/mmbtu, 0.0007 lb/hp-hrFLOPAM INC. FACILITY 591 HP ULSD 0.03 lb/hr 6.32 lb/hrFORSYTH ENERGY 11.4 mmbtu/hr LAER 2.05 g/hp-hr (assumes 40% efficiency) 1.14 lb/hr 7.7 g/hp-hr 1.04 lb/hrFPL PORT EVERGLADES PLANT 2250 KW DLN/SoLo NOx/DLE 3.5 g/kw-hr 0.2 g/kw-hr 6.4 g/kw-hrFPL WEST COUNTY ENERGY CENTER 2,250 kW 8.5 g/hp-hr 0.4 g/hp-hr 6.9 g/hp-hrGAINESVILLE RENEWABLE ENERGY CENTER 564 kw Notification, Recordkeeping and Reporting Requirements 3.5 g/kw-hr 0.2 g/kw-hr 6.4 g/kw-hrGP ALLENDALE LP 1400 hp 3.03 lb/hr 0.25 lb/hr (total) 0.2 lb/hr (fil) 11.4 lb/hr 0.32 lb/hr, 0.08 tpyGP CLARENDON LP 1400 hp GOOD MANAGEMENT PRACTICE PLAN 3.03 lb/hr 0.25 lb/hr (total) 0.2 lb/hr (fil) 11.4 lb/hr 0.32 lb/hr, 0.08 tpyHARRAH'S OPERATING COMPANY, INC. 1232 hp 0.0055 lb/hp-hr .024 lb/hp-hr 0.0007 lb/hp-hrINGENCO - CHARLES CITY PLANT 550 hp 3.3 lb/mmbtu 0.2 lb/mmbtu 2.4 lb/mmbtu 0.4 lb/mmbtuINTERNATIONAL POWER STATION 1500 kW TUBOCHARGER AND AFTERCOOLER 0.03 g/hp-hr 0.03 g/hp-hr (TPM10) 6.4 g/kw-hr 6.4 g/kW-hrJOHN W. TURK JR. POWER PLANT GCP 3.5 g/kw-hr 0.2 g/kw-hr 6.4 g/kw-hr 6.4 g/kW-hr, 3 hourKALAMA ENERGY CENTER, WA 1127 hp EPA Tier II 2.6 g/hp-hr 33.6 tpy, 12-month rollingLAKE CHARLES COGENERATION 1341 hp NSPS IIII 0.62 lb/hr 0.06 lb/hr (< FPM10) 17.09 lb/hrLANGLEY GULCH POWER PLANT 750 kW TIER 2 ENGINE-BASED AND GCP 3.5 g/kW-hr 0.2 g/kW-hr 6.4 g/kW-hr 6.4 g/kW-hrMANKATO ENERGY CENTER 1850 hp 1.0 g/hp-hr 0.70 g/hp-hr 0.07 g/hp-hr 12.70 g/hp-hr 0.12 g/hp-hrMAIDSVILLE POWER, WV 1801 hp 2.20 g/hp-hr 1.13 lb/hr 5.3 g/hp-hr 1.21 lb/hrMGM MIRAGE 3622 HP TURBOCHARGER AAND AFTER-COOLER 0.0017 lb/hp-hr 0.01 LB/HP-H, 37.4 lb/hr 0.0003 lb/hp-hrMGM MIRAGE 2206 Hp TURBOCHARGING, AFTER-COOLING, AND LEAN-BURN TEC0.0018 lb/hp-hr 0.0131 lb/hp-hr, 28.98 lb/hr 0.0003 lb/hp-hrMOXIE ENERGY LLC/PATRIOT GENERATION PLT 0.13 gm/bhp-hr, 0.42 lb/hr 0.02 gm/bhp-hr 4.93 g/bhp-hr, 16 lb/hr 0.01 g/bhp-hrMOXIE LIBERTY LLC/ASYLUM POWER PL T 0.13 gm/bhp-hr, 0.42 lb/hr 0.02 gm/bhp-hr 4.93 g/bhp-hr 0.01 g/bhp-hrMUSKOGEE TILE PLANT 0.0067 lb/hp-hr 0.0022 lb/hp-hr <(FPM10) 0.0025 lb/lb-hrNELLIS AIR FORCE BASE >500 hp 0.22 g/hp-hr 7.58 g/hp-hr 0.2 g/hp-hrNINEMILE POINT (ENTERGY LOUISIANNE) 1250 HP 2.6 g/hp-hr 0.15 g/hp-hr 0.15g/hp-hr 6.4 g/kW-hr 1 g/hp-hrOHIO RIVER CLEAN FUELS 2911 hp NSPS IIII, GCP, GOOD ENGINE, ITR, TURBOCHARGER, AND L 3.5 g/kw-hr 0.20 g/kw-hr (<FPM10) 6.4 g/kW-hr, 26.47 lb/hr 6.4 g/kW-hr (NOx+NMHC), 1.39 lb/hrOREGON CLEAN ENERGY CENTER, OHIO 2250 kw EPA Tier II 3.5 g/kW-hr 0.2 g/kW-hr 5.61 g/kw-hr (NOx), 6.4 g NHMC+NOx/kw-hr 0.79 g/kw-hr 878 tpy, 12-month rollingPACIFIC BELL 2935 hp 8.5 g/hp-hr 6.9 g/hp-hr 1 g/hp-hPACIFICORP 1500 hp NSPS IIIIPALM BEACH RENEWABLE ENERGY PARK 250 kw GCP AND ULSD FUEL 3.5 g/kw-hr 0.2 g/kW-hr (total) 4 g/kw-hrPLAQUEMINE PVC PLANT GCP AND GASEOUS FUEL BURNING 0.95 lb/mmbtu 0.31 lb/mmbtu 4.41 lb/mmbtuPIONEER VALLEY 2174 hp 12.20 lb/hr 0.91 lb/hr 37.47 lb/hr 1.67 lb/hrSABINE PASS LNG TERMINAL 660 hp 0.55 lb/hr 12.2 lb/hr 0.07 lb/hSABINE PASS LNG TERMINAL 2220 hp 0 0SALT CREEK GAS PLANT, EXXON 2000 hp 8.99 lb/hr 0.53 lb/hr (FPM10) 84.5 lb/hr 1.32 lb/hrSHADY HILLS GENERATING STATION 2.5MW GOOD ENGINE 8.5 g/hp-hr 0.4 g/hp-hr 6.9 g/hp-hr, 3 1-hr testsSLOAN QUARRY 12 gal/hr 0.1 lb/T 0.058 lb/T 0.032 lb/TSUMPTER POWER PLANT 732 HP GCP 0.31 g/hp-hr 0.05 g/hp-hr 0.0573 lb/mmbtu 4.85 g/hp-hr 716.6 lb/hrST. JOSEPHS ENERGY CENTER 2012 hp; 1006 hp NSPS IIII 2.6 g/hp-hr 0.15 g/hp-hr 0.15 g/hp-hr 4.8 g/hp-hr (NOx+NMHC) 1.04 lb/hrTATE AND LYLE INGREDIENTS AMERICAS 700 KW 0.2 g/kw-hr 6.2 g/kw-hr, 2.39 tpy 0.2 g/kw-hrVICTORVILLE 2 HYBRID POWER PROJECT 2000 kW 15 ppmvd fuel sulfur 3.5 g/kW-hr; 2.6 g/hp-hr 0.2 g/kW-hr; 0.15 g/hp-hr 6g/kW-hr; 4.5 g/hp-hrVIRGINIA ELECTRIC AND POWER COMPANY COMBINED CYCLE FACILITY 2194 HP
3.5 g/kw-hr, 12.6 lb/hr 0.2 g/kw-hr 6.4 g/kw-hr, 23.1 lb/hr 6.4 g/kw-hr, 23.1 lb/hr
WARREN COUNTY POWER PLANT - DOMINION 298 hp and 2193 hp NSPS IIIIWOLVERINE POWER 4000 HP 0.15 g/hp-hr 1.76 lb/hr (TPM10)WOODBRIDGE ENERGY CENTER, NJ 1500 kw 0.45 g/hp-hr 21.16 lb/hr 0.036 lb/mmbtu, 0.49 lb/hr

COPM
(filterable)PM10/PM2.5
(filterable and condensable) NOx VOC GHG (CO2e)Process Fuel Throughput Rate Manufacturer APC BACT BACT BACT LAER LAER BACT
Fire Pump Engines 2.3 lb/hr 0.12 lb/hr 0.13 lb/hr 2.3 lb/hr 0.88 lb/hr1.17 lb/MMBTU 0.058 lb/MMBTU 0.067 lb/MMBTU 1.16 lb/MMBTU 0.44 lb/MMBTU0.007 lb/hp-hr 3.3E-4 lb/hp-hr 3.9E-4 lb/hp-hr 0.007 lb/hp-hr 0.003 lb/hp-hr 21 tpy4.06 g/kw-hr 0.20 g/kw-hr 0.23 g/kw-hr 4.02 g/kw-hr 1.53 g/kw-hr2.3 g/hp-hr 0.15 g/hp-hr 0.17 g/hp-hr 3.0 g/hp-hr 1.1 g/hp-hr
ARSENAL HILL POWER PLANT DFP DIESEL FIRE PUMP DIESEL 310 hp USE OF LOW-SULFUR FUELS, LIMITING OPERATING-HRS AN 2.07 g/hp-hr 0.68 lb/hr 9.16 lb/hr 0.77 lb/hrAVENAL ENERGY PROJECT EMERGENCY FIREWATER PU DIESEL 228 Hp turbocharger and inter-/after-cooler 0.447 g/hp-hr 15 ppmvd fuel sulfur 15 ppmvd fuel sulfur 3.4 g/hp-hrBRUNSWICK 305 bhp 3.5 g/kW-hr; 2.6 g/hp-hr 0.54 g/kW-hr 0.4 g/kW-hr 4.0 g/kW-hr 4.0 g/kW-hrBLYTHE ENERGY PROJECT II FIRE PUMP DIESEL 303 HP 0.7 lb/hr 0.1 lb/hr 7.5 lb/hrCARTY PLANT NSPS IIII 0.2 g/kW-hr; 0.15 g/hp-hr 0.2 g/kW-hr; 0.15 g/hp-hr 3.0 g/hp-hrCHOUTEAU POWER PLANT EMERGENCY FIRE PUMP (267 ULSD 267 HP 3.5 g/kW-hr; 2.6 g/hp-hr 0.24 lb/hr 4.59 lb/hr, 7.8 g/hp-hr 0.66 lb/hrCRESCENT CITY 2.01 g/hp-hr 0.15 g/hp-hr 9.5 g/hp-hr 0.05 g/hp-hrCRICKET VALLEY 0.19 lb/mmbtu 0.032 lb/mmbtu 0.032 lb/mmbtu 0.95 lb/mmbtu 0.035 lb.mmbtuCREOLE TRAIL LNG POWER 525 HP 6.74 lb/hr 0.09 lb/hrCPV ST CHARLES EMERGENCY FIRE WATER PUDIESEL 300 HP 2.6 g/hp-hr 0.15 g/hp-hr 3 g/hp-hrCPV VALLEY, WAWAYANKA NY (PROPOSED) 0.7533 lb/mmbtu .0441 lb/mmbtu 0.859 lb/mmbtu .3612 lb/mmbtuDRY FORK STATION DIESEL-FIRED FIRE PUMP EN DIESEL 360 HP TIER II CERTIFIED ENGINE-500-HRS OF ANNUAL OPERATION2.6 g/hp-hr 0.15 g/hp-hr 4.8 g/hp-hrDUKE ENERGY HANGING ROCK ENERGY FACILITY 265 hp 1.8 lb/hr 0.66 lb/hr 10.2 lb/h 0.66 lb/hrDUKE ENERGY WASHINGTON COUNTY LLC 400 hp 2.76 lb/hr 0.88 lb/h 12.8 lb/hDUKE ENERGY STEPHENS, LLC STEPHENS ENERGY 265 hp 0.95 lb/mmbtu 4.41 lb/mmbtu 0.7 lb/hFAIRBAULT ENERGY PARK 250 hp 0.95 lb/mmbtu 0.31 lb/mmbtu 0.36 lb/mmbtuFLOPAM INC. FACILITY 591 HP 0.03 lb/hr 6.32 lb/hrFLOPAM INC. FACILITY 193 hp 0.16 lb/hr 1.28 lb/hrFLOPAM INC. FACILITY Fire Pump Engines - 2 units DIESEL 444 hp 0.65 lb/hr 5.82 lb/hrFORSYTH ENERGY 11.4 mmbtu/hr 2.05 g/hp-hr (assumes 40% efficiency) 1.14 lb/hr 7.7 g/hp-hr 1.04 lb/hrFPL BARTOW POWER PLANT 2.6 g/hp-hr 7.8 g/hp-hr (combined)FPL PORT EVERGLADES PLANT FIRE PUMP ULSD 300 HP 0.15 g/hp-hr 3 g/hp-hrFPL WEST COUNTY ENERGY CENTER ONE EMERGENCY DIESEL FIR FUEL OIL 2.6 g/hp-hr 0.4 g/b-hp-hr 7.8 g/bhp-hrGAINESVILLE RENEWABLE ENERGY CENTER Emergency Diesel Fire Pump - 275 HP 275 HP COMPLY WITH 40 CFR 60.4211 2.6 g/hp-hr 0.15 g/hp-hr 3 g/hp-hrGP ALLENDALE 525 hp 1.27 lb/hr 0.41 lb/hr 0.41 lb/hr 5.9 lb/hr 0.47 lb/hrINGENCO CHESTER PLANT 350kw 4.3 lb/mmbtu 0.3 lb/mmbtu 0.4 lb/mmbtuJOHN W. TURK JR. POWER PLANT FIRE PUMP ENGINE G CP 3.5 g/kw-hr 0.2 g/kw-hr 6.4 g/kw-hr, 3-hr avg 6.4 g/kw-hrKALAMA ENERGY CENTER EMERGENCY FIRE PUMP GENULSD 36.5 mmbtu/hr ULNB 7.1 tpy, 12-month rollingLA COUNTY PROBATION FACILITY 240 hp 0.44 g/hp-hr 0.14 g/hp-hr 4.2 g/hp-hrLANGLEY GULCH POWER PLANT FIRE PUMP ENGINE DIESEL 235 kW TIER 3 ENGINE-BASED, GCP 0.2 g/kW-hr; 0.15 g/hp-hr 4.0 g/kW-hr, 3.0 g/hp-hr 4 g/kw-hrLIVE OAKS 300 hp NSPS IIII (sulfur limit)MAIDSVILLE ENERGY, WV 85 hp 23.6 g/hp-hr 0.56 lb/hr 0.56 lb/hr 56 g/hp-hr 0.64 lb/hrMANKATO POWER 290 hp 0.25 g/hp-hr 0.07 g/hp-hr 0.07 g/hp-hr 5.7 g/hp-hr 0.08 g/hp-hrMOXIE ENERGY LLC/PATRIOT GENERATION PLT Fire Pump Engine - 460 BHP Diesel 460 HP 0.5 g/hp-hr 0.09 g/hp-hr 2.6 g/hp-hr 0.1 g/hp-hrMOXIE LIBERTY LLC/ASYLUM POWER PL T FIRE PUMP Diesel 0.5 g/hp-hr 0.09 g/hp-hr 2.6 g/hp-hr 0.1 g/hp-hrMUSKOGEE PORCELAIN FLOOR TILE PLT 0.0067 lb/hp-hr 0.0025 lb/lb-hrNINEMILE POINT (ENTERGY LOUISIANNE) 350 HP 3.5 g/kW-hr; 2.6 g/hp-hr 0.2 g/kW-hr; 0.15 g/hp-hr 0.2 g/kW-hr; 0.15 g/hp-hr 1 g/hp-hr, 1.3 g/kw-hrOHIO RIVER CLEAN FUELS FIRE PUMP ENGINES (2) Diesel 300 hp NSPS IIII, GCP AND GOOD ENGINE 2.6 g/hp-hr 0.4 g/hp-hr (< FPM10) 7.8 g/hp-hr, 4.89 lb/hr 7.8 g/hp-hr (combined), 0.26 lb/hrOREGON CLEAN ENERGY CENTER, OHIO 1.3 mmbtu/hr NSPS IIII 3.5 g/kW-hr; 2.6 g/hp-hr 0.2 g/kW-hr; 0.15 g/hp-hr 4.0 g/kW-hr, 3.0 g/hp-hr 0.5 g/kw-hr 87 tpy, 12-month rollingPIONNER VALLEY 270 hp 1.85 lb/hr 0.15 lb/hr 3.24 lb/hr 0.49 lb/hrPROGRESS BARTOW POWER PLANT EMERGENCY DIESEL FIRE PUFUEL OIL 300 HP 2.6 g/bhp-hr 7.8 g/bhp-hrSABINE PASS LNG TERMINAL 660 hp 0.55 lb/h 12.2 lb/hr 0.07 lb/hSABINE PASS LNG TERMINAL 300 hp 0.18 lb/hr 3.44 lb/hr 0.1 lb/hrST. JOSEPHS ENERGY CENTER 371 hp NSPS IIII 3.5 g/kW-hr; 2.6 g/hp-hr 0.2 g/kW-hr; 0.15 g/hp-hr 0.2 g/kW-hr; 0.15 g/hp-hr 3.0 g/hp-hr (NOx+NMHC) 0.16 lb/hr 172 tpyVICTORVILLE 2 HYBRID POWER PROJECT EMERGENCY FIRE WATER PUDIESEL 135 kW (182 hp) OPERATIONAL RESTRICTION OF 50 HR/YR, OPERATE AS RE 3.5 g/kW-hr; 2.6 g/hp-hr 0.2 g/kW-hr; 0.15 g/hp-hr 3.8 g/kW-hr; 2.1 g/hp-hrVIRGINIA ELECTRIC AND POWER COMPANY COMBINED CYCLE FACILITY EMERGENCY FIRE WATER PUULSD 2.3 mmbtu/hr ULNB
3.5 g/kw-hr, 1.7 lb/hr, 0.4 tpy 0.2 g/kw-hr 4.0 g/kw-hr, 2 lb/hr 4.0 g/kw-hr, 2 lb/hr
WESTERN DEVCON 415 hp 6.9 g/hp-hr 1 g/hp-hrWOLVERINE POWER FIRE PUMP Diesel 420 hp 0.15 g/hp-hr 3.0 g/hp-hrWOODBRIDGE ENERGY CENTER, NJ 315 hp 3.5 g/kW-hr; 2.6 g/hp-hr 1.93 lb/hr 0.074 lb/mmbtu

COPM
(filterable)PM10/PM2.5
(filterable and condensable) NOx VOC GHG (CO2e)Process Fuel Throughput Rate Manufacturer APC BACT BACT BACT LAER LAER BACT
Thermal Ox 1.5 ppmvd @ 15% O2 0.7 lb/hr 0.9 lb/hr 2.5 ppmvd @ 15% O2 0.026 lb/hr 386,153 tpy0.5 lb/hr 0.013 lb/MMBtu 0.016 lb MMBtu 1.4 lb/hr 4.6E-4 lb/MMBtu
0.009 lb/MMBtu 0.025 lb/MMBtu 99.99% reduction
BILLINGS REFINERY WWTF THERMAL OXIDIZER REFINERY FUEL G 6500 btu/hr PROPER EQUIPMENT DESIGN AND OPERATION 0.0110 lb/hr (filterable) 25 ppmv 8% O2, 365 day rolling avg.FLOPAM INC. Thermal Oxidizers natural gas GCP 0.08 lb/MMBtu 0.008 lb/mmbtu 0.133 lb/mmbtu 0.005 lb/mmbtu, 99% reductionGARYVILLE REFINERY SRU THERMAL OXIDIZER NO NATURAL GAS 63.7 mmbtu/hr OPTIMIZED AIR-FUEL RATIO 0.04 lb.mmbtu 0.075 lb/MMBTU 0.2 lb/mmbtuHOMELAND ENERGY SOLUTIONS, LLC, PN 06-672 THERMAL OXIDIZER FOR HR SYNGAS 250 mmbtu/hr LOW NOX BURNERS 0.0860 lb/mmbtu 0.01 lb/MMBTU 0.04 lb/mmbtu, 0.2 lb/mmbtu 0.006 lb/mmbtu, 98% reductionLAKE CHARLES GASIFICATION FACILITY THERMAL OXIDIZERS (2) NATURAL GAS 40.9 mmbtu/hr NO ADDITIONAL CONTROL 91.85 lb/hr 0.3 lb/hr 2.45 lb/hrPLAQUEMINE PVC PLANT GAS THERMAL OXIDIZERS A & B (M-5 & M-6) 72 mmbtu/hr GCP AND SELECTIVE CATALYTIC REDUCTION (SCR) 0.11 lb/mmbu 0.0075 lb/mmbtu 0.025 lb/mmbtuSHINTECH PLAQUEMINE PLANT 2 EQT126, EQT127 - TWO THERM NATURAL GAS 72 mmbtu/hr GCP 0.08 lb/mmbtu 0.0077 lb/MMbtu 0.02 lb/mmbtuVENOCO- ELLWOOD ONSHORE FACLITY Enclosed Thermal Oxidizer NATURAL GAS 35000 mmbtu Burner design, forced air blower, temperature controller 0.1 lb/mmbtu 0.04 lb/mmbtu 0.0027 lb/mmbtu
Spray Dryer 0.05 lb/hr Not Reported 0.2 gr/dscf 0.06 lb/hr 0.003 lb/hr 307 tpy600,000 btu/hr 0.08 lb/MMBtu 0.03 lb/hr 0.10 lb/MMBtu 0.005 lb/MMBtu
0.05 lb/MMBtu
PYRAMAX CERAMICS, LLC - KING'S M:U FACILITY SPRAY DRYERS/PETTETIZERS 75 mmtu/hr LOW NOX BURNERS AND GCP, filter 13.7 lb/hr (0.18 lb/MMBTU) 0.01 gr/dscf, 8.53 lb/hr 2.25 lb/hr, 3-hour avg. 11.78 lb/hrFlare 0.013 lb/hr 2.86E-4 lb/hr 1.15E-3 lb/hr 0.02 lb/hr 0.001 lb/hr
(Limits per Pilot) 0.13 lb/MMBtu 0.003 lb/MMBtu 0.011 lb/MMBtu 0.15 lb/MMBtu 0.01 lb/MMBtu
AIR PRODUCTS HYDROGEN, STEAM, AND ELECTRICITY PRODUCTIO Flare Pilots only 0.043 lb/hr 0.022 lb/hr 0.031 lb/hrBREITBURN ENERGY- NEWLOVE LEASE Horizontal Enclosed Flare Field gas 50 mmbtu/hr Forced draft enclosed flare. 0.0371 lb/mmbtu 0.0146 lb/mmbtu 0.0013 lb/mmbtuENTERPRISE MONT BELVIEU COMPLEX Flare - Normal Operation 372.7 lb/hr 376.6 lb/hr 468.1 lb/hrFLINT HILLS RESOURCES INSTALLATION OF BOILERS 884.57 lb/hr 130.28 lb/hr 1150.93 lb/hrFORMOSA POINT COMFORT PLANT FLARE 9.77 lb/hr 1.14 lb/hr 0.22 lb/hrFORMOSA POINT COMFORT PLANT FLARE (1067) 13.84 lb/hr 1.92 lb/hr 7.55 lb/hrFORMOSA POINT COMFORT PLANT FLARE (1087) 12.42 lb/hr 1.45 lb/hr 0.14 lb/hrFORMOSA POINT COMFORT PLANT FLARE (8003B) 3.6 lb/hr 1.8 lb/hr 1.21 lb/hrHOMELAND ENERGY SOLUTIONS, LLC, PN 06-672 BIOMETHANATOR FLARE, EP METHANE / SYNG 6.4 mmbtu/hr 0.3700 LB/MMBTU 0.0019 LB/MMBTU 0.07 lb/mmbtu 0.052 lb/mmbtuHOMELAND ENERGY SOLUTIONS, LLC, PN 06-672 STARTUP AND SHUTDOWN F NATURAL GAS OR 25 mmbtu/hr FLARE 1.1 lb/MMBTU 0.0076 LB/MMBTU 0.2 lb/mmbtu 0.06 lb/mmbtuPETROROCK- TUNNELL LEASE Enclosed Ground Flare Field Gas 17 mmbtu/hr Burner design, premix, and combustion temperature control 0.02 lb/mmbtu 0.004 lb/mmbtuPOINT THOMSON PRODUCTION FACILITY Combustion (Flares) Fuel Gas 35 MMscf/yr 0.37 lb/MMbtu 0.0264 lb/mmbtu 0.068 lb/mmbtuSABINE PASS LNG TERMINAL (MARINE FLARE) Marine Flare NATURAL GAS 1590 mmbtu/hr maintain the presence of the flame 705.49 lb/hr 14.97 lb/hr 185.16 lb/hr, 2.13 tpy 10.83 lb/hr, 0.12 tpy 2909 tpySABINE PASS LNG TERMINAL (WET/DRY GAS FLARES (4)) Wet/Dry Gas Flares (4) NATURAL GAS 0.26 mmbtu/hr maintain the presence of the flame 0.11 lb/hr 0.01 lb/hr 0.03 lb/hr, 0.11 tpy 0.01 lb/hr, 0.01 tpy 133 tpyNORCO HYDROGEN PLANT Flare (EQT0003) natural gas 0.31 mmbtu/hr Mainta ensure the flame at the flare tips 0.01 lb/hr 0.03 lb/hr, 0.09 tpySUN COMPANY, INC., TOLEDO REFINERY PROCESS GASES 12.8 lb/hr 1.16 lb/hr
Fugitive Emissions from Equipment Components 2.53 tpy 55.32 tpy
BATON ROUGE JUNCTION FACILITY CONDUCT A LEAK DETECTION AND REPAIR PROGRAM AS SPECIFIED BY 40 CFR 63 SUBPART R 7.44 tpyCREOLE TRAIL LNG IMPORT TERMINAL 0.62 lb/hr, 2.74 tpySABINE PASS LNG TERMINAL conduct a leak detection and repair (LDAR) program 5.03 lb/hr, 17.21 tpy 89,629 tpy

Conversions3.412142 (MMBtu/hr)/MWh
1020 btu/scf7000 gr/lb
1000000 btu/mmbtu

Appendix D Detailed Review of Modeling Analysis

Memorandum Environmental Resources Management
75 Valley Stream Parkway Suite 200 Malvern, PA 19355 (610) 913-0300 (610) 913-0301 (fax)
To: Susan Gray
Company: Maryland Department of Natural Resources, Power Plant Research Program
From: Mark Garrison/Tom Wickstrom
Date: September 13, 2013
Subject: Review of air quality modeling analyses in support of the CPCN Application for Dominion Cove Point LNG, LP
The following memorandum provides a review of the air quality modeling analyses included with the Certificate of Public Convenience and Necessity (CPCN) application submitted by Dominion Cove Point LNG (DCP), LP for their proposed Project at their LNG Terminal in Calvert County, MD. ERM has reviewed the analyses on behalf of PPRP and MDE-ARMA.
1. Overview
The proposed DCP Project triggers New Source Review (NSR) and Prevention of Significant Deterioration (PSD) permitting requirements. The Project triggers PSD requirements for Greenhouse Gases (GHG), NO2, PM, PM10, PM2.5, and CO. DCP consequently completed relevant modeling analyses for NO2, PM10, PM2.5 and CO. In addition to these PSD pollutants, DCP also conducted Maryland-specific Toxic Air Pollutant (TAP) analyses for 20 air toxic compounds that exceed Maryland TAP modeling thresholds.
DCP also conducted an analysis of visibility impacts on the nearby Calvert Cliffs State Park, as well as a screening analysis to address project impacts on Class I areas within 300 km of the LNG Terminal.
DCP submitted an air quality modeling protocol to MDE-ARMA in 2012. PPRP, MDE-ARMA, and EPA Region III reviewed the protocol in light of evolving guidance and provided comments to DCP. A revised protocol dated March 11, 2013 was submitted that addressed the comments with the exception of including a discussion of secondary PM2.5 formation. The modeling report submitted by DCP incorporated this discussion. This memo is based on a revised modeling report submitted by DCP in August 2013.

P A G E 2
2. Review of Air Quality Modeling Methodology
2.1. Model Selection
DCP utilized the latest version of the AERMOD (version 12345) dispersion model for all analyses conducted in the CPCN application, with the exception of the visibility analysis of the Calvert Cliffs State Park, which was conducted with the VISCREEN visibility screening model. DCP utilized all the latest versions of the supporting processing programs for AERMOD, including AERMET version 12345, AERSURFACE version 13016, and AERMINUTE version 11325 (for meteorological data processing), and AERMAP version 11103 (for receptor elevations and hill scales). PPRP and MDE-ARMA approve of the use of the selected models and supporting processing programs, and agree that the use of these models represents a best practice approach for determining the impacts of the proposed Project on air quality.
2.2. Meteorological Data
AERMOD requires the use of representative meteorological data. DCP proposed the use of a 60-m meteorological measurement tower located at the Calvert Cliffs Nuclear Power Plant for use in their air quality modeling analysis. The Calvert Cliffs meteorological tower is located approximately 5 km northwest of DCP. The tower has two levels of wind speed, wind direction, and temperature located at 10-m and 60-m from the base of the tower. PPRP and MDE-ARMA note that the meteorological data from this tower was also used in a modeling analysis to support a CPCN application for the Calvert Cliffs Nuclear Power Plant. PPRP and MDE-ARMA support the use of meteorological data from this tower for the proposed Project, due to the close proximity of the meteorological monitoring station to DCP. A wind rose for the 10-m level of the tower is shown below:

P A G E 3
DCP processed the meteorological data from the Calvert Cliffs meteorological tower using AERMET. DCP chose default options and made use of AERSURFACE to develop the appropriate surface characteristics needed by AERMET. DCP also used meteorological data from Reagan National Airport (DCA) in Washington, DC to substitute for any missing hours in the Calvert Cliffs meteorological data record. DCP used AERSURFACE to develop the appropriate surface characteristics for any hours where DCA meteorological data were used. DCP processed 1-minute wind data from DCA using the NCDC 1-minute ASOS data archive. Finally, DCP used upper air data from Sterling, VA as the source of morning sounding data to establish the profile of potential temperature used by AERMOD. PPRP and MDE-ARMA approve the steps that DCP has taken to develop the meteorological data, and note that all options within AERMET and the associated processor programs conform with EPA guidance and best practices.
2.3. Receptor Grid DCP utilized the AERMAP terrain processor to develop elevation and critical hill elevations for each receptor used in the air quality

P A G E 4
modeling analyses. DCP utilized National Elevation Dataset (NED) data as the source of input elevation data. The receptor grid developed by DCP is as follows:
• 100-meter spacing around the facility fence line; • 50-meter spacing from the fence line out to 2-km from the
facility; • 100-meter spacing from 2-km to 5 km from the facility; • 500-meter spacing from 5-km to 10-km from the facility; and • 1000-meter spacing from 10-km to 25-km of the facility.
The receptor grid utilized by DCP is sufficient to determine maximum predicted impacts from AERMOD. PPRP and MDE-ARMA have compiled a separate receptor grid to use in verification runs for the DCP Project. This receptor grid was constructed as follows:
• 50-meter spacing around the facility fence line; • 100-meter spacing from the fence line out to 2-km from the
facility; • 200-meter spacing from 2-km to 4 km from the facility; • 500-meter spacing from 4-km to 6-km from the facility; and • 1000-meter spacing from 6-km to 20-km of the facility.
PPRP utilized this slightly smaller and less finely spaced receptor grid to aid in the verification of select modeling analyses during the review of the CPCN application. PPRP and MDE-ARMA also used AERMAP, and used NED data as the source of elevations in this analysis.
2.4. Background Pollutant Concentrations
DCP developed background concentrations for the triggered PSD pollutants to establish existing air quality in the vicinity of the LNG Terminal. DCP used ambient monitor data from 2009-2011 to establish representative background concentrations. The following background values were identified by DCP:
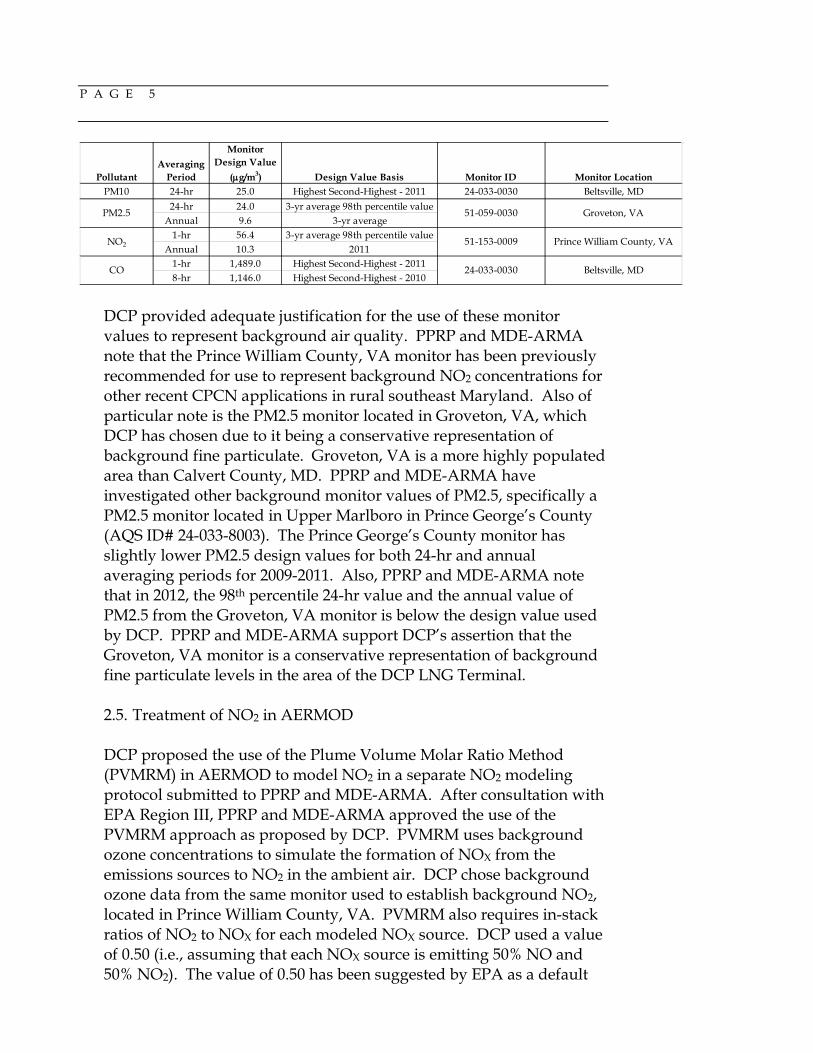
P A G E 5
DCP provided adequate justification for the use of these monitor values to represent background air quality. PPRP and MDE-ARMA note that the Prince William County, VA monitor has been previously recommended for use to represent background NO2 concentrations for other recent CPCN applications in rural southeast Maryland. Also of particular note is the PM2.5 monitor located in Groveton, VA, which DCP has chosen due to it being a conservative representation of background fine particulate. Groveton, VA is a more highly populated area than Calvert County, MD. PPRP and MDE-ARMA have investigated other background monitor values of PM2.5, specifically a PM2.5 monitor located in Upper Marlboro in Prince George’s County (AQS ID# 24-033-8003). The Prince George’s County monitor has slightly lower PM2.5 design values for both 24-hr and annual averaging periods for 2009-2011. Also, PPRP and MDE-ARMA note that in 2012, the 98th percentile 24-hr value and the annual value of PM2.5 from the Groveton, VA monitor is below the design value used by DCP. PPRP and MDE-ARMA support DCP’s assertion that the Groveton, VA monitor is a conservative representation of background fine particulate levels in the area of the DCP LNG Terminal.
2.5. Treatment of NO2 in AERMOD
DCP proposed the use of the Plume Volume Molar Ratio Method (PVMRM) in AERMOD to model NO2 in a separate NO2 modeling protocol submitted to PPRP and MDE-ARMA. After consultation with EPA Region III, PPRP and MDE-ARMA approved the use of the PVMRM approach as proposed by DCP. PVMRM uses background ozone concentrations to simulate the formation of NOX from the emissions sources to NO2 in the ambient air. DCP chose background ozone data from the same monitor used to establish background NO2, located in Prince William County, VA. PVMRM also requires in-stack ratios of NO2 to NOX for each modeled NOX source. DCP used a value of 0.50 (i.e., assuming that each NOX source is emitting 50% NO and 50% NO2). The value of 0.50 has been suggested by EPA as a default
PollutantAveraging
Period
Monitor Design Value
(µg/m3) Design Value Basis Monitor ID Monitor LocationPM10 24-hr 25.0 Highest Second-Highest - 2011 24-033-0030 Beltsville, MD
24-hr 24.0 3-yr average 98th percentile valueAnnual 9.6 3-yr average
1-hr 56.4 3-yr average 98th percentile valueAnnual 10.3 2011
1-hr 1,489.0 Highest Second-Highest - 20118-hr 1,146.0 Highest Second-Highest - 2010
PM2.5
NO2
CO 24-033-0030 Beltsville, MD
Prince William County, VA
Groveton, VA
51-153-0009
51-059-0030

P A G E 6
conservative value. Actual ratios of NO2 to NOX are typically much less for combustion sources. DCP also used the default internal ambient equilibrium value within PVMRM of 90% NO2/NOX. PPRP and MDE-ARMA conclude that DCP has taken an overall conservative approach to the use of PVMRM, which will result in accurate yet still conservative modeled concentrations of NO2 for both the 1-hr and annual averages.
To account for background NO2 in the air quality modeling analysis, DCP has characterized the NO2 monitor data from the Prince William County monitor on a variable basis. Specifically, DCP has calculated the 3-year average of the 3rd highest NO2 monitor concentrations on an hour of day and seasonal basis. The latest version of AERMOD has been specially designed to accommodate variable background values, and this approach is in conformance with EPA guidance on NO2 modeling approaches. Although this is a less conservative approach than simply adding the overall design value to each modeled concentration, PPRP and MDE-ARMA conclude that the inherent conservative assumptions in the application of PVMRM allow for adequate protection of the NO2 NAAQS in the air quality modeling analysis.
2.6. DCP Source Characteristics, Load Analyses, and Intermittent Emissions
The Project related sources of emissions and their normal operating stack characteristics are presented in the table below:
UTM Coordinates
Base
Elevation Stack
Height Stack Gas
Temp
Stack Gas Exit
Velocity Stack Diam.
Model ID Description m m m m K m/s m
HRSGN North HRSG Stack 376788.6 4249756 36.6 48.77 471.48 22.11 4.88
HRSGS South HRSG Stack 376785.7 4249623 36.6 48.77 471.48 22.11 4.88
NEWTO Thermal Oxidizer 376940.2 4250183 35.1 20.73 449.82 4.24 2.44
NEWAUXA Auxiliary Boiler A 376869.4 4249624 38.1 41.15 422.04 24.57 1.89
NEWAUXB Auxiliary Boiler B 376909.9 4249623 38.1 41.15 422.04 24.57 1.89
NEWFLRN North Flare 376597.5 4250189 35.1 19.78 1273 20 0.28
NEWFLRS South Flare 376535.8 4249963 35.1 19.32 1273 20 0.19

P A G E 7
UTM Coordinates
Base
Elevation Stack
Height Stack Gas
Temp
Stack Gas Exit
Velocity Stack Diam.
Model ID Description m m m m K m/s m
NEWFIRE1 Fire Pump 1 377108.7 4249610 35.1 6.1 857.04 49.62 0.15
NEWFIRE2 Fire Pump 2 377108.6 4249605 35.1 6.1 857.04 49.62 0.15
NEWEG1 Emergency Generator 376785.7 4249701 35.1 6.1 749.82 92.75 0.23
NEWEVAP Spray Dryer 377020.9 4249667 38.1 9.14 449.82 1.62 0.3
NEWFIRE3 Fire Pump 3 377108.5 4249600 35.1 6.1 857.04 49.62 0.15
NEWFIRE4 Fire Pump 4 377108.4 4249596 35.1 6.1 857.04 49.62 0.15
NEWFIRE5 Fire Pump 5 377108.3 4249591 35.1 6.1 857.04 49.62 0.15
DCP conducted comprehensive load analyses for the new turbines and new flares. The results of these analyses are presented in Attachment D of the air quality modeling report that was included in the CPCN application. The particular load that caused the worst case dispersion was used in the PSD increment and NAAQS modeling analyses for each pollutant and averaging period combination.
In addition to the various load analyses, DCP also conducted analyses of startup and shutdown of the turbines and auxiliary boilers. DCP has indicated that there will be 10 startups and shutdowns for the turbines per year, and 5 startups and shutdowns for the auxiliary boilers per year. DCP has cited recent EPA guidance pertaining to modeling short term averaging periods and intermittent emissions to justify annualizing the emissions associated with these events, and with flaring events associated with restarts and ship venting. EPA has provided guidance that supports annualizing startup and shutdown emissions providing that the events are intermittent in nature. The low number of startup and shutdown events seems to support the use of the EPA guidance in this regard. However, DCP has indicated that the first turbine startup (assuming both turbines are not operating) will be 66 hours in duration. DCP also indicates that the auxiliary boiler startups will be 80 hours in duration. Recognizing that planned and unplanned startups and shutdowns will be intermittent, and the EPA guidance is likely applicable, PPRP and MDE-ARMA have investigated the effect of prorating the lbs/event emissions of NOX over the duration of the event rather than annualizing the total startup and shutdown emissions. Emissions of PM10 and PM2.5 were not adjusted, as DCP’s calculated emissions during normal operation exceed the startup and shutdown emissions. These NOX adjustments

P A G E 8
are included below, along with the emission rates associated with the worst case dispersion scenarios used in the NAAQS and PSD increment modeling analyses, as applicable:
It should be noted that this more conservative approach did not change the overall results of the 1-hr NO2 NAAQS analysis, presented in Section 3.2 of this memo.
2.7. Modeling Background Source Inventory
DCP compiled a comprehensive background inventory for use in the PSD increment and NAAQS modeling analyses. DCP used stack parameter and emission data from MDE to assemble the modeling inventory, and conducted file reviews to identify potential emissions for background sources. The MDE inventory included emissions and stack parameter data for both major and minor sources of air pollution. For regional sources located within 20 km of the DCP Terminal, no screening technique was used to exclude smaller emissions sources. For sources further than 20 km and within approximately 52 km, only major emissions sources were considered. The 52 km distance
Emissions (lb/hr)
Model ID Description CO 1-hr CO 8-hrNOX 1-
hrNOX
AnnualPM10 and
PM2.5 24-hr
PM10 and PM2.5
Annual
HRSGNNorth HRSG Stack 105.83 105.83 17.62 9.1 7 7
HRSGSSouth HRSG Stack 105.83 105.83 12.59 9.1 7 7
NEWTOThermal Oxidizer 0.52 0.52 1.42 1.42 0.9 0.9
NEWAUXAAuxilliary Boiler A 3.83 3.83 36.82 5.8 5.91 5.91
NEWAUXBAuxilliary Boiler B 3.83 3.83 36.82 5.8 5.91 5.91
NEWFLRN North Flare 4041.29 4041.29 0.39 0.39 361.81 0.64NEWFLRS South Flare 276.88 72.79 0.18 0.18 6.59 0.38NEWFIRE1 Fire Pump 1 2.34 2.34 0.03 0.03 0.0016 0.0016NEWFIRE2 Fire Pump 2 2.34 2.34 0.03 0.03 0.0016 0.0016
NEWEG1Emergency Generator 7.72 7.72 0.81 0.81 0.03 0.03
NEWEVAP Evaporator 0.05 0.05 0.06 0.06 0.0275 0.0275NEWFIRE3 Fire Pump 3 2.34 2.34 0.03 0.03 0.0016 0.0016NEWFIRE4 Fire Pump 4 2.34 2.34 0.03 0.03 0.0016 0.0016NEWFIRE5 Fire Pump 5 2.34 2.34 0.03 0.03 0.0016 0.0016
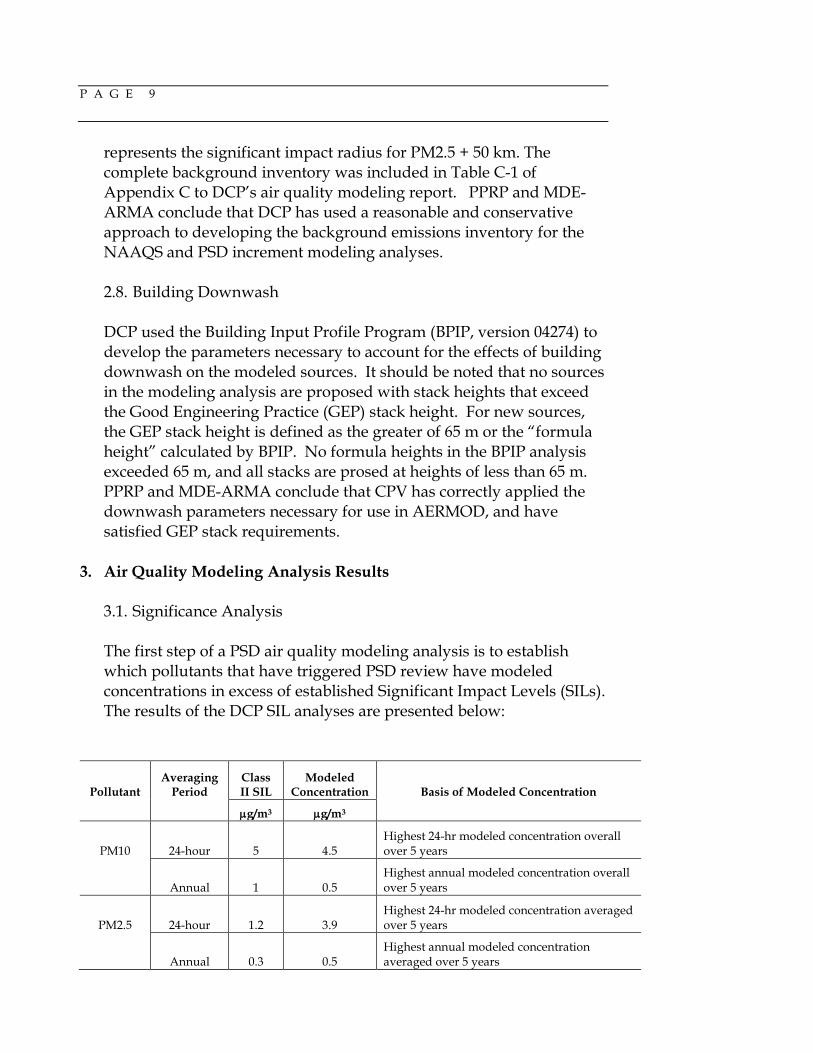
P A G E 9
represents the significant impact radius for PM2.5 + 50 km. The complete background inventory was included in Table C-1 of Appendix C to DCP’s air quality modeling report. PPRP and MDE-ARMA conclude that DCP has used a reasonable and conservative approach to developing the background emissions inventory for the NAAQS and PSD increment modeling analyses.
2.8. Building Downwash
DCP used the Building Input Profile Program (BPIP, version 04274) to develop the parameters necessary to account for the effects of building downwash on the modeled sources. It should be noted that no sources in the modeling analysis are proposed with stack heights that exceed the Good Engineering Practice (GEP) stack height. For new sources, the GEP stack height is defined as the greater of 65 m or the “formula height” calculated by BPIP. No formula heights in the BPIP analysis exceeded 65 m, and all stacks are prosed at heights of less than 65 m. PPRP and MDE-ARMA conclude that CPV has correctly applied the downwash parameters necessary for use in AERMOD, and have satisfied GEP stack requirements.
3. Air Quality Modeling Analysis Results 3.1. Significance Analysis
The first step of a PSD air quality modeling analysis is to establish which pollutants that have triggered PSD review have modeled concentrations in excess of established Significant Impact Levels (SILs). The results of the DCP SIL analyses are presented below:
Pollutant Averaging
Period Class II SIL
Modeled Concentration Basis of Modeled Concentration
µg/m3 µg/m3
PM10 24-hour 5 4.5 Highest 24-hr modeled concentration overall over 5 years
Annual 1 0.5 Highest annual modeled concentration overall over 5 years
PM2.5 24-hour 1.2 3.9 Highest 24-hr modeled concentration averaged over 5 years
Annual 0.3 0.5 Highest annual modeled concentration averaged over 5 years
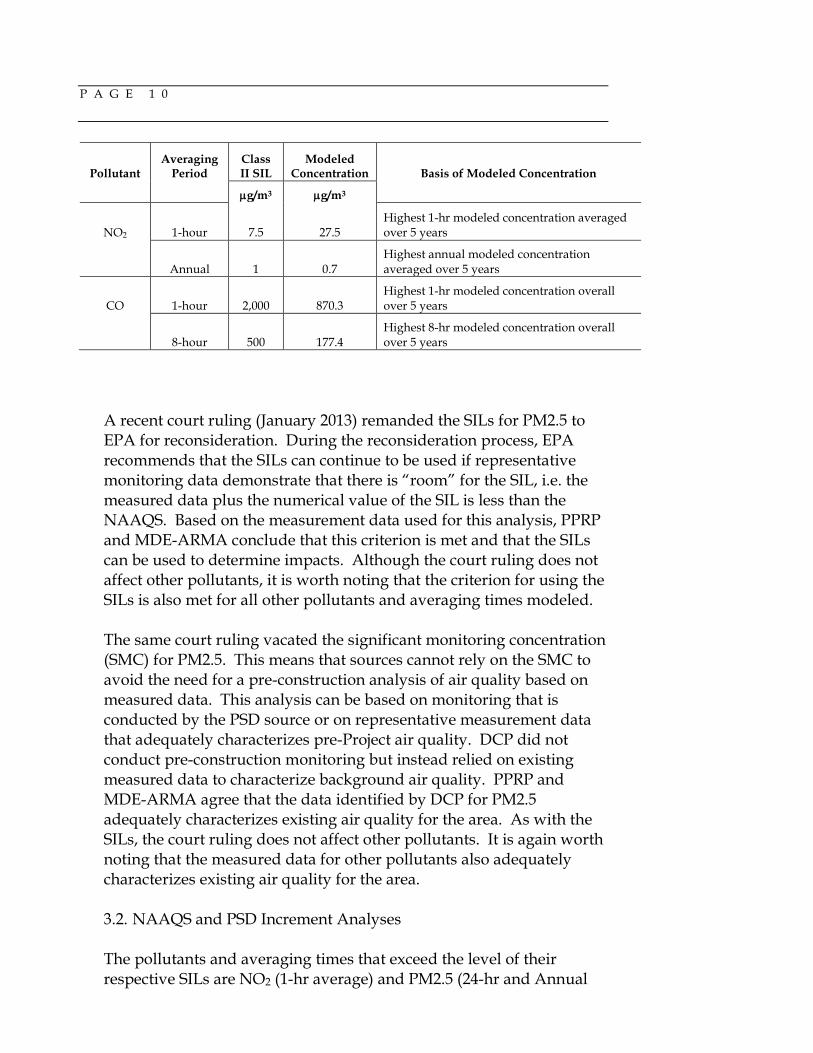
P A G E 1 0
Pollutant Averaging
Period Class II SIL
Modeled Concentration Basis of Modeled Concentration
µg/m3 µg/m3
NO2 1-hour 7.5 27.5 Highest 1-hr modeled concentration averaged over 5 years
Annual 1 0.7 Highest annual modeled concentration averaged over 5 years
CO 1-hour 2,000 870.3 Highest 1-hr modeled concentration overall over 5 years
8-hour 500 177.4 Highest 8-hr modeled concentration overall over 5 years
A recent court ruling (January 2013) remanded the SILs for PM2.5 to EPA for reconsideration. During the reconsideration process, EPA recommends that the SILs can continue to be used if representative monitoring data demonstrate that there is “room” for the SIL, i.e. the measured data plus the numerical value of the SIL is less than the NAAQS. Based on the measurement data used for this analysis, PPRP and MDE-ARMA conclude that this criterion is met and that the SILs can be used to determine impacts. Although the court ruling does not affect other pollutants, it is worth noting that the criterion for using the SILs is also met for all other pollutants and averaging times modeled.
The same court ruling vacated the significant monitoring concentration (SMC) for PM2.5. This means that sources cannot rely on the SMC to avoid the need for a pre-construction analysis of air quality based on measured data. This analysis can be based on monitoring that is conducted by the PSD source or on representative measurement data that adequately characterizes pre-Project air quality. DCP did not conduct pre-construction monitoring but instead relied on existing measured data to characterize background air quality. PPRP and MDE-ARMA agree that the data identified by DCP for PM2.5 adequately characterizes existing air quality for the area. As with the SILs, the court ruling does not affect other pollutants. It is again worth noting that the measured data for other pollutants also adequately characterizes existing air quality for the area.
3.2. NAAQS and PSD Increment Analyses
The pollutants and averaging times that exceed the level of their respective SILs are NO2 (1-hr average) and PM2.5 (24-hr and Annual

P A G E 1 1
averages). Therefore, an analysis to demonstrate compliance with the NAAQS and PSD increments are required, as applicable. The analyses for the NAAQS provided by DCP are shown below:
DCP noted in the CPCN application that all modeled concentrations that exceeded the NAAQS did not have a significant contribution from DCP sources. DCP provided adequate supporting documentation in the application to support this assertion. However, when presenting controlling concentrations, DCP presented the highest modeled concentrations that were under the NAAQS regardless if DCP sources were significantly contributing to that modeled concentration. While this approach still adequately demonstrates that the NAAQS are not endangered due to the proposed Project and any existing DCP source, it slightly overestimates the proposed Project’s impact with regard to the NAAQS. PPRP and MDE-ARMA conducted verification analyses of the NAAQS runs provided by DCP. These verification runs only considered receptors where the proposed Project caused a modeled concentration in excess of the SIL for each applicable pollutant and averaging time. The results of these verification analyses are presented below:
It should be noted that for the 1-hr NO2 NAAQS analysis, both the DCP and PPRP analyses present the highest concentration that is lower than the level of the NAAQS. DCP provided a cause and contribute analysis that demonstrated that the proposed Project does not contribute to any exceedance of the NAAQS. The PPRP and MDE-ARMA analysis confirmed that no NAAQS violations due to
PollutantAveraging
Period
Modeled Maximum Impact
DCP AnalysisBackground
ConcentrationModeled +
Background NAAQSµg/m3 µg/m3 µg/m3 µg/m3
24-hr 10.998 24 34.998 35Annual 2.3 9.6 11.900 12
NO2 1-hour 154.93 33.06 187.99 188
PM2.5
PollutantAveraging
Period
Modeled Maximum Impact
PPRP AnalysisBackground
ConcentrationModeled +
Background NAAQSµg/m3 µg/m3 µg/m3 µg/m3
24-hr 5.30 24 29.30 35Annual 1.17 9.6 10.77 12
NO2 1-hour 159.18 28.8 187.98 188
PM2.5

P A G E 1 2
background inventory sources had significant contributions from the DCP Project. The maximum concentration of NO2 due to the proposed Project when a NAAQS violation was predicted was 1.30 µg/m3. PPRP and MDE-ARMA conclude that the proposed Project will not cause or contribute to a violation of the 1-hr NO2 NAAQS. In addition to the NAAQS analyses, DCP is also required to demonstrate compliance with the PM2.5 PSD increment. The DCP application is the first one to be submitted following the PM2.5 major source baseline date of October 20, 2010 and the PM2.5 trigger date of October 20, 2011. DCP is therefore the only source that needs to be considered in the increment analysis. It should be noted that there is no PSD increment for NO2 for the 1-hr standard. The results of DCP’s PSD increment analysis, as well as the PPRP and MDE-ARMA verification analysis are presented below:
PPRP and MDE-ARMA have verified the analyses presented by DCP and conclude that the proposed Project will not cause or contribute to any exceedance of the applicable NAAQS or PSD increments. 3.3. Secondary Formation of PM2.5 In addition to the analyses above, PPRP and MDE-ARMA have requested that DCP submit a further analysis to address the formation of secondary PM2.5 due to Project related NOX emissions. Although DCP has followed the conservative modeling assumption in EPA’s
PollutantAveraging
Period
Modeled Concentration - DCP Analysis Increment
µg/m3 µg/m3
24-hr 3.7 9Annual 0.5 4
PollutantAveraging
Period
Modeled Concentration - PPRP Analysis Increment
µg/m3 µg/m3
24-hr 3.70 9Annual 0.56 4
PM2.5
PM2.5

P A G E 1 3
March 23, 2010 memo on recommended modeling procedures for demonstrating compliance with the PM2.5 NAAQS, more recent EPA guidance released March 4, 2013 suggests that secondary formation of PM2.5 should be addressed more directly, either through a qualitative, semi quantitative (hybrid approach), or fully quantitative analysis. In a May 6, 2013 response to data requests from PPRP and MDE-ARMA, DCP provided supplemental information in the form of a qualitative analysis to support the conclusion that secondary formation of PM2.5 due to the Project will not endanger the PM2.5 NAAQS. DCP’s primary argument was that although the proposed Project involves a significant increase in emission of NOX, a precursor to secondary PM2.5, these emissions of NOX are required to be offset due to Calvert County’s nonattainment status with respect to ozone. Therefore, it is reasonable to conclude that the net effect of secondary formation of PM2.5 due to NOX to the local airshed as a whole is zero or less than zero. DCP also provided supporting information describing how nitrate particulates (due to NOX) are of secondary importance to the overall formation of secondary PM2.5 when compared to sulfate particulates in the area of the Project. The emissions of SO2 due to the proposed Project are minor. Therefore, it is reasonable to conclude that the proposed Project will not cause an exceedance of the NAAQS due to the formation of secondary particulate matter. PPRP and MDE-ARMA believe that the supplemental information provided by DCP, and the conservative nature of the PM2.5 modeling analysis (by following EPA’s 2010 guidance) are adequate to demonstrate compliance with the PM2.5 NAAQS. 3.4. Toxic Air Pollutant (TAP) Analyses The proposed DCP Project triggers requirements to assess potential impacts of toxic air pollutants (TAPs). Maryland’s TAPs regulation for new sources specifically exempts fuel burning equipment. However, emissions of TAPs from the new thermal oxidizer, flares, ammonia slip from the thermal oxidizer SCR, and fugitive emissions from equipment leaks do require an analysis of potential impacts per the Maryland TAPs regulations found at COMAR 26.11.15 and 26.11.16. Overall, 20 listed TAP compounds were analyzed. A complete description of the emissions scenarios modeled, and the results of the modeling analyses for each TAP was included in Chapter 7 of the air quality modeling report included with the CPCN application. All modeled impacts
P A G E 1 4
were well below the Acceptable Ambient Levels (AALs) found in COMAR 26.11.16.09. The AALS represent concentrations that provide a safety margin to ensure public health is protected from toxic and non-carcinogenic health effects from air toxic compounds. PPRP and MDE-ARMA have verified that the TAPs analyses provide by DCP are adequate to demonstrate compliance with Maryland TAPs regulations.
3.5. Class I Screening Analyses
The DCP LNG Terminal is located within 300 km of five Federally protected Class I areas. These areas are listed below, with the distance from DCP noted:
• Dolly Sods Wilderness Area – 260 km • Otter Creek Wilderness Area – 283 km • Shenandoah National Park – 158 km • James River Face Wilderness Area – 275 km • Brigantine Wilderness Refuge – 212 km
DCP submitted an initial letter to federal land managers (FLMs) in October 2012 disclosing the projected emissions from the proposed Project. The FLMs have adopted a threshold for new sources of air pollution to use to assist in the determination of whether an analysis of air quality related values (AQRVs) such as deposition and visibility impacts should be required for Class I areas. This threshold is referred to as the Q/D ratio, where Q is the total emissions of NOX, SO2, PM, and Sulfuric Acid from the proposed project in tons, and D is the distance to the Class I area of concern in km. A Q/D ratio of less than 10 generally indicates that a project is unlikely to adversely affect AQRVs in the Class I area. The highest Q/D ratio at the time of the October 2012 letter was 4.4. A response from the US Fish and Wildlife Service (FWS) indicted that an AQRV analysis would not be requested as part of the permit application process. It should be noted that DCP has since revised their projected Project related emissions, and in a revised letter to FLMs in July 2013 indicated that the highest Q/D ratio was 2.5. PPRP and MDE-ARMA agree with the determination by FWS that an AQRV analysis should not be required for the proposed DCP Project.
Although an AQRV analysis is not required for the proposed Project, DCP has completed a screening analysis to demonstrate that the proposed Project emissions will have a minimal impact in relation to

P A G E 1 5
Class I PSD increments by demonstrating impacts less than the Class I SILs for NO2, PM10 and PM2.5. The screening approach made use of AERMOD and receptors placed at exactly 50 km from the DCP LNG Terminal (50 km is the limit of AERMOD’s capabilities per EPA guidance). The receptors were placed at locations along a circle defining a distance of 50 km from DCP at directions that coincided with the actual direction of each Class I area. DCP provided a figure illustrating these receptor locations in Section 6 of the air quality modeling report included with the CPCN application. The maximum results of the AERMOD analyses for NO2, PM10 and PM2.5 for these receptors are provided below:
PPRP and MDE-ARMA believe that this analysis represents a reasonable screening approach to demonstrating impacts less than the Class I SILs, and notes that these results are highly conservative, given that the closet Class I area is located 158 km away as opposed to 50 km away. Consequently, PPRP and MDE-ARMA do not request any additional analyses for these five Class I areas, and does not anticipate any further requests from EPA or FLMs regarding Class I area impacts.
3.6. Class II Visibility Analysis
DCP provided an analysis of potential visibility impacts on the Calvert Cliffs State Park. The park is just to the north of the DCP LNG Terminal and is generally wooded. There is a public vista in the park located along the shoreline that provides views looking out into the Chesapeake Bay. This vista area is approximately 1.5 km north-northeast of the DCP LNG Terminal. DCP focused their analysis of potential visibility impacts on this area of the park.
DCP utilized the VISCREEN visibility model. VISCREEN is an EPA approved screening model used to assess plume induced visibility
Maximum Concentration at 50 km from DCP (µg/m3)
PollutantAveraging
Period 2001 2002 2003 2004 2005NO2 Annual 0.008 0.007 0.006 0.006 0.006 0.1
24-hour 0.05 0.06 0.05 0.05 0.06 0.32Annual 0.007 0.006 0.005 0.005 0.005 0.224-hour 0.05 0.06 0.05 0.05 0.06 0.07Annual 0.007 0.006 0.005 0.005 0.005 0.06
PM10
PM2.5
Class I SIL
(µg/m3)
P A G E 1 6
impacts. A complete description of the methodology used is included in Section 5.2 of the air quality modeling report included in the CPCN application. The results of DCP’s VISCREEN analysis indicated that expected plume induced visibility impacts would be well below the VISCREEN critical contrast criteria for visibility impairment against an open background. Using sky as background as opposed to terrestrial background is appropriate in this case, as the Calvert Cliff State Park vista overlooks the Chesapeake Bay, and where a terrestrial background is unlikely to be within an individual’s view while observing the bay from the park. PPRP and MDE-ARMA agree with DCP’s visibility analysis, and conclude that it appropriately and conservatively accounts for potential visibility impairment due to the proposed Project.
4. Conclusions
The air quality modeling analyses conducted by DCP in support of the proposed Project are adequate to demonstrate compliance with PSD Significant Impact Levels (SILs) in Class I and Class II areas, PSD increments, and the NAAQS. The following summarizes the review conducted by PPRP and MDE-ARMA and associated conclusions:
• DCP utilized the most recent available version of all executables within the AERMOD modeling system.
• The critical NAAQS and PSD increment results have been verified, and the extended startup operations described in the CPCN application for the turbines and auxiliary boilers will not cause or contribute to any exceedance of a NAAQS or PSD increment.
• Use of the SILs and existing measurement data are justified in order to address requirements stemming from a January 2013 court ruling.
• The load analyses conducted by DCP are appropriate, and the worst case loads were used to assess compliance with the PSD increment and NAAQS.
• The analyses successfully demonstrate acceptable impacts with regard to Maryland’s TAPs program, as well as local plume induced visibility degradation.
• The qualitative analysis provided by DCP for secondary PM2.5 formation and potential effects on the PM2.5 NAAQS is adequate and conforms to recent EPA guidance, and the formation of secondary PM2.5 due to Project related NOX emissions is expected

P A G E 1 7
to be zero or less than zero due to the requirement to offset NOX emissions from the Project.
• The Class I screening approach is adequate to demonstrate that the proposed Project will not be expected to exceed the Class I SILs for NO2, PM10, and PM2.5.