environmental impact assessment proposed qvpi cebu marble ...
368
ENVIRONMENTAL IMPACT ASSESSMENT PROPOSED QVPI CEBU MARBLE AND AGGREGATES PROJECT MUNICIPALITY OF PINAMUNGAHAN, CITY OF NAGA, AND CITY OF TOLEDO, CEBU MAIN REPORT QUARRY VENTURES PHILIPPINES, INC. 117 Shaw Boulevard, Pasig City, 1600 February 2019
-
Upload
khangminh22 -
Category
Documents
-
view
0 -
download
0
Transcript of environmental impact assessment proposed qvpi cebu marble ...
ENVIRONMENTAL IMPACT ASSESSMENT
PROPOSED QVPI CEBU MARBLE AND
AGGREGATES PROJECT
MUNICIPALITY OF PINAMUNGAHAN, CITY OF NAGA, AND CITY OF TOLEDO,
CEBU
MAIN REPORT
QUARRY VENTURES PHILIPPINES, INC.
117 Shaw Boulevard, Pasig City, 1600
February 2019

QUARRY VENTURES PHILIPPINES, INC. Environmental Impact Assessment
February 2019 i
Table of Contents
Executive Summary ................................................................................................................................. 1
1 Project Description ....................................................................................................................... 1-9
1.1 Project Background .............................................................................................................. 1-9
1.2 Project Location ................................................................................................................... 1-9
1.3 Project Accessibility ........................................................................................................... 1-17
1.4 Project Rationale ................................................................................................................ 1-17
1.5 Project Alternatives ............................................................................................................ 1-18
1.5.1 Alternative Project Location ...................................................................................... 1-18
1.5.2 Mining Method Selection ........................................................................................... 1-18
1.5.3 Power ......................................................................................................................... 1-18
1.5.4 Environmental Impact ................................................................................................ 1-18
1.5.5 Consequences of not proceeding with the Project .................................................... 1-19
1.6 Project Components .......................................................................................................... 1-19
1.6.1 Status of the Current Operation ................................................................................ 1-19
1.6.2 Major Components .................................................................................................... 1-21
1.6.3 Support Facilities ........................................................................................................ 1-29
1.6.4 Pollution Control Devices/Facilities ........................................................................... 1-30
1.6.5 Utilities ....................................................................................................................... 1-31
1.7 Process / Technology ......................................................................................................... 1-37
1.8 Project Size ......................................................................................................................... 1-56
1.8.1 Availability of Raw Materials...................................................................................... 1-56
1.8.2 Production Capacity and Area ................................................................................... 1-56
1.8.3 Mine Life .................................................................................................................... 1-56
1.9 Project Phases .................................................................................................................... 1-57
1.9.1 Pre-Construction Phase.............................................................................................. 1-57
1.9.2 Construction Phase .................................................................................................... 1-57
1.9.3 Operation Phase ......................................................................................................... 1-58
1.9.4 Abandonment Phase .................................................................................................. 1-58
1.10 Project Manpower ............................................................................................................. 1-60
1.11 Project Cost ........................................................................................................................ 1-60
2 Analysis of Key Environmental Impacts ..................................................................................... 2-61
2.1 Land .................................................................................................................................... 2-61
2.1.1 Land Use and Classification ........................................................................................ 2-61
2.1.2 Geology and Geomorphology .................................................................................... 2-73

QUARRY VENTURES PHILIPPINES, INC. Environmental Impact Assessment
February 2019 ii
2.1.3 Pedology ..................................................................................................................... 2-88
2.1.4 Terrestrial Ecology ................................................................................................... 2-135
2.2 Water ............................................................................................................................... 2-167
2.2.1 Hydrology/Hydrogeology ......................................................................................... 2-167
2.2.2 Oceanography .......................................................................................................... 2-172
2.2.3 Water Quality ........................................................................................................... 2-173
2.2.4 Water Quality Monitoring of Parcel 1 ...................................................................... 2-207
2.2.5 Freshwater Ecology .................................................................................................. 2-211
2.2.6 Marine Ecology ........................................................................................................ 2-215
2.3 Air ..................................................................................................................................... 2-215
2.3.1 Meteorology/Climatology ........................................................................................ 2-215
2.3.2 Air Quality ................................................................................................................ 2-221
2.4 People .............................................................................................................................. 2-232
2.4.2 Migration Pattern ..................................................................................................... 2-258
2.4.3 Socioeconomic Profile .............................................................................................. 2-261
2.4.4 Perception Survey .................................................................................................... 2-267
3 Impact Management Plan ........................................................................................................ 3-284
3.1 Land Resources ................................................................................................................ 3-284
3.2 Water Resources .............................................................................................................. 3-284
3.3 Air Quality ........................................................................................................................ 3-285
3.4 Social Development ......................................................................................................... 3-286
4 Environmental Risk Assessment .............................................................................................. 4-299
4.1 Risk Assessment Framework ............................................................................................ 4-299
4.2 Consequence Rating ........................................................................................................ 4-301
4.3 Risk Characterization ....................................................................................................... 4-301
4.4 Hazard Identification ........................................................................................................ 4-301
4.4.1 Marble and Aggregates Quarry ................................................................................ 4-301
4.4.2 Hazard Analysis Matrix ............................................................................................. 4-302
4.4.3 Risk Screening of Hazardous Substances at the Project Site ................................... 4-305
4.4.4 Hazardous Characteristics of Diesel ......................................................................... 4-305
4.4.5 Mass Movement of Rocks and Soil from Overburden and Waste Dump Sites ....... 4-308
4.4.6 Flooding and Mass Release of Sediments from Settling Ponds ............................... 4-308
4.4.7 Occupational Safety Hazards ................................................................................... 4-308
4.4.8 Natural Hazards Due to Extreme Climate Events .................................................... 4-309
4.5 Risk Management ............................................................................................................ 4-310
4.5.1 Recommendations ................................................................................................... 4-310

QUARRY VENTURES PHILIPPINES, INC. Environmental Impact Assessment
February 2019 iii
5 Social Development Plan and IEC IMPLEMENTATION ............................................................. 5-315
5.1 Existing SDP and IEC ......................................................................................................... 5-315
5.2 Social Development Program .......................................................................................... 5-325
5.2.1 Indicative Social Development Plan ......................................................................... 5-325
5.3 Information and Education Campaign (IEC) ..................................................................... 5-329
5.4 Complaints Resolution ..................................................................................................... 5-331
6 Environmental Compliance Monitoring ................................................................................... 6-332
6.1 Environmental Performance (Parcel 1) ............................................................................ 6-332
6.2 Environmental Monitoring Plan ....................................................................................... 6-335
6.3 Multi-Sectoral Monitoring Framework ............................................................................ 6-344
6.4 Environmental Guarantee and Monitoring Fund Commitment ...................................... 6-348
7 Decommissioning / Abandonment / Rehabilitation Policy ...................................................... 7-349
7.1 Decommissioning Plan ..................................................................................................... 7-349
7.1.1 List of Equipment that Require Decommissioning ................................................... 7-349
7.1.2 Decommissioning Strategy, Timing and Techniques ............................................... 7-349
7.2 Final Mine Rehabilitation Plan ......................................................................................... 7-350
7.2.1 Rehabilitation Strategy ............................................................................................ 7-350
7.2.2 Objectives and Methodology ................................................................................... 7-351
7.2.3 Materials, Operational, and Financial Resources .................................................... 7-351
7.3 Social Plans ....................................................................................................................... 7-351
7.3.1 Retrenchment Packages........................................................................................... 7-351
7.3.2 Labor Support Policies and Programs ...................................................................... 7-351
7.4 Maintenance and Monitoring Plans................................................................................. 7-352
7.4.1 Maintenance and Monitoring Program and Procedures ......................................... 7-352
7.4.2 Long Term management and maintenance ............................................................. 7-353
8 Institutional Plan for EMP Implementation ............................................................................. 8-354
List of Figures
Figure 1-1: Project Location Map ....................................................................................................... 1-11
Figure 1-2: Project Location Map by Parcel ....................................................................................... 1-12
Figure 1-3: Drone Shot of Parcel 1 ..................................................................................................... 1-13
Figure 1-4: Drone Shot of Parcel 2 ..................................................................................................... 1-14
Figure 1-5: Drone Shot of Parcel 3 ..................................................................................................... 1-15
Figure 1-6: Drone Shot of Parcel 5 ..................................................................................................... 1-16
Figure 1-7: Parcel 1 Operation - Project Layout ................................................................................. 1-20
Figure 1-8: Drilling and Blasting Diagram ........................................................................................... 1-24
Figure 1-9: Blasting Nomenclature .................................................................................................... 1-26
Figure 1-10: Schematic Diagram of Crushing Plant ............................................................................ 1-27

QUARRY VENTURES PHILIPPINES, INC. Environmental Impact Assessment
February 2019 iv
Figure 1-11: Loading and Hauling Diagram ........................................................................................ 1-28
Figure 1-12: Crushing, Conveying, and Stockpiling Diagram ............................................................. 1-29
Figure 1-13: Site Development Plan for Parcel 1 ............................................................................... 1-32
Figure 1-14: Site Development Plan for Parcel 2 ............................................................................... 1-33
Figure 1-15: Site Development Plan for Parcel 3 ............................................................................... 1-34
Figure 1-16: Site Development Plan for Parcel 5 ............................................................................... 1-35
Figure 1-17: Proposed Acces Road for Parcel 3 ................................................................................. 1-36
Figure 1-18: Laying out of Wiresaw to cut the Marble into Blocks ................................................... 1-38
Figure 1-19: Toppling Bancatta Using Titano Jack ............................................................................. 1-39
Figure 1-20: Toppling Bancatta Using Hydro Bag .............................................................................. 1-40
Figure 1-21: Toppling Bancatta Using Airpillow ................................................................................. 1-41
Figure 1-22: Mining Plan - Parcel 1 Year 2 ......................................................................................... 1-45
Figure 1-23: Mining Plan - Parcel 1 Year 3 ......................................................................................... 1-45
Figure 1-24: Mining Plan - Parcel 1 Year 4 ......................................................................................... 1-45
Figure 1-25: Mining Plan - Parcel 1 Year 5 ......................................................................................... 1-46
Figure 1-26: Mining Plan - Parcel 2 Year 2 ......................................................................................... 1-46
Figure 1-27: Mining Plan - Parcel 2 Year 3 ......................................................................................... 1-46
Figure 1-28: Mining Plan - Parcel 2 Year 4 ......................................................................................... 1-47
Figure 1-29: Mining Plan - Parcel 2 Year 5 ......................................................................................... 1-47
Figure 1-30: Mining Plan - Parcel 3 Aggregates Year 2 ...................................................................... 1-47
Figure 1-31: Mining Plan - Parcel 3 Aggregates Year 3 ...................................................................... 1-48
Figure 1-32: Mining Plan - Parcel 3 Aggregates Year 4 ...................................................................... 1-48
Figure 1-33: Mining Plan - Parcel 3 Aggregates Year 5 ...................................................................... 1-48
Figure 1-34: Mining Plan - Parcel 3 Marble Year 2............................................................................. 1-49
Figure 1-35: Mining Plan - Parcel 3 Marble Year 3............................................................................. 1-49
Figure 1-36: Mining Plan - Parcel 3 Marble Year 4............................................................................. 1-49
Figure 1-37: Mining Plan - Parcel 3 Marble Year 5............................................................................. 1-50
Figure 1-38: Mining Plan - Parcel 5 Year 0 ......................................................................................... 1-50
Figure 1-39: Mining Plan - Parcel 5 Year 1 ......................................................................................... 1-50
Figure 1-40: Mining Plan - Parcel 5 Year 2 ......................................................................................... 1-51
Figure 1-41: Mining Plan - Parcel 5 Year 3 ......................................................................................... 1-51
Figure 1-42: Mining Plan - Parcel 5 Year 4 ......................................................................................... 1-52
Figure 1-43: Mining Plan - Parcel 5 Year 5 ......................................................................................... 1-52
Figure 1-44: Estimated 5-Year and 25-Year Mine Area for Parcel 1 and 2 ........................................ 1-53
Figure 1-45: Estimated 5-Year and 25-Year Mine Area for Parcel 3 .................................................. 1-54
Figure 1-46: Estimated 5-Year and 25-Year Mine Area for Parcel 5 .................................................. 1-55
Figure 2-1: Land Classification Map of the Project Site ..................................................................... 2-64
Figure 2-2: Naga City Zoning Map (2018) .......................................................................................... 2-68
Figure 2-3: Toledo CityExisting Land Use Map (2006) ...................................................................... 2-69
Figure 2-4: Project Site’s Proximity to Nearby Protected Area.......................................................... 2-71
Figure 2-5: Project Site’s Proximity to Nearby Watershed ................................................................ 2-72
Figure 2-6: Stratigraphy of Cebu ........................................................................................................ 2-78
Figure 2-7: Geologic Map of Cebu ..................................................................................................... 2-81
Figure 2-8: Geologic Map of MPSA .................................................................................................... 2-82
Figure 2-9: Slope Map of the MPSA .................................................................................................. 2-83
Figure 2-10: Distribution of Active Faults and Trenches .................................................................... 2-85
Figure 2-11: Landslide and Flooding Susceptibility of the Project Area ............................................ 2-87
Figure 2-12: Soil Sampling Map ......................................................................................................... 2-93

QUARRY VENTURES PHILIPPINES, INC. Environmental Impact Assessment
February 2019 v
Figure 2-13: Soil Sampling Stations in Parcel 1 and 2 ........................................................................ 2-94
Figure 2-14: Soil Sampling Station in Parcel 3 .................................................................................... 2-95
Figure 2-15: Soil Sampling Station in Parcel 5 .................................................................................... 2-96
Figure 2-16: Soil Map of the Project area (Cities of Toledo and Naga), Province of Cebu Indicating Soil
Series Numbers ................................................................................................................................ 2-108
Figure 2-17: Soil Textural Analysis of the Soil Sampling Locations .................................................. 2-110
Figure 2-18: Start of Slake Test, Parcel 1 ......................................................................................... 2-111
Figure 2-19: 10 Minutes After Slake Test, Parcel 1 .......................................................................... 2-112
Figure 2-20: Start of Slake Test, Parcel 3 ......................................................................................... 2-113
Figure 2-21: 10 Minutes After Slake Test, Parcel 3 .......................................................................... 2-113
Figure 2-22: Start of Slake Test, Parcel 5 ......................................................................................... 2-114
Figure 2-23: 10 Minutes After Slake Test of Parcel 5 ....................................................................... 2-115
Figure 2-24: Soil pH of the 4 Soil Sampling locations ....................................................................... 2-117
Figure 2-25: Provincial Soil pH Map ................................................................................................. 2-118
Figure 2-26: Soil Organic Matter Content ........................................................................................ 2-119
Figure 2-27: Provincial Soil Organic Matter Map ............................................................................. 2-120
Figure 2-28: Total Nitrogen Content ................................................................................................ 2-121
Figure 2-29: Total Phosphorus Content ........................................................................................... 2-122
Figure 2-30: Provincial Soil Phosphorus Map .................................................................................. 2-123
Figure 2-31: Exchangeable Calcium Content ................................................................................... 2-124
Figure 2-32: Exchangeable Potassium Content ............................................................................... 2-125
Figure 2-33: Provincial Soil Potassium Map ..................................................................................... 2-126
Figure 2-34: Exchangeable Magnesium Content ............................................................................. 2-127
Figure 2-35: Exchangeable Sodium Content .................................................................................... 2-128
Figure 2-36: Metallic Essential Micro nutrient Iron ......................................................................... 2-129
Figure 2-37: Metallic Essential Micro Nutrient Zinc......................................................................... 2-130
Figure 2-38: Heavy Metal Arsenic Content ...................................................................................... 2-131
Figure 2-39 Heavy Metal Cadmium Content ................................................................................... 2-131
Figure 2-40: Heavy Metal Mercury Content .................................................................................... 2-132
Figure 2-41: Heavy Metal Lead Content .......................................................................................... 2-133
Figure 2-42: Terrestrial Ecology Sampling Map ............................................................................... 2-138
Figure 2-43: Terrestrial Ecology Observation Points in Parcels 1 and 2 .......................................... 2-139
Figure 2-44: Terrestrial Ecology Observation Points in Parcel 3 ...................................................... 2-140
Figure 2-45: Terrestrial Ecology Observation Points in Parcel 5 ...................................................... 2-141
Figure 2-46: Ecological Indices Formulae ......................................................................................... 2-142
Figure 2-47: Watershed Map of Cebu .............................................................................................. 2-169
Figure 2-48: Water Sampling Locations ........................................................................................... 2-177
Figure 2-49: Water Sampling Stations in Parcels 1 and 2 ................................................................ 2-178
Figure 2-50: Water Sampling Stations in Parcel 3 ............................................................................ 2-179
Figure 2-51: Water Sampling Station in Parcel 5 ............................................................................. 2-180
Figure 2-52: Groundwater Sample Collection at a Spring Box ......................................................... 2-181
Figure 2-53: Stream Grab Water Sampling ...................................................................................... 2-182
Figure 2-54: Groundwater Total Coliform Count ............................................................................. 2-186
Figure 2-55: Groundwater Fecal Coliform Count ............................................................................. 2-186
Figure 2-56: Groundwater pH Levels ............................................................................................... 2-187
Figure 2-57: Groundwater Temperature Levels .............................................................................. 2-187
Figure 2-58: Groundwater Oil and Grease Levels ............................................................................ 2-188
Figure 2-59: Groundwater Total Dissolved Solids Levels ................................................................. 2-189
QUARRY VENTURES PHILIPPINES, INC. Environmental Impact Assessment
February 2019 vi
Figure 2-60: Groundwater Dissolved Oxygen Levels ....................................................................... 2-189
Figure 2-61: Groundwater Conductivity Levels ............................................................................... 2-190
Figure 2-62: Groundwater Chemical Oxygen Demand Levels ......................................................... 2-191
Figure 2-63: Groundwater Biological Oxygen Demand Levels ......................................................... 2-191
Figure 2-64: Groundwater Mercury Levels ...................................................................................... 2-192
Figure 2-65: Groundwater Lead Levels ............................................................................................ 2-193
Figure 2-66: Groundwater Cadmium Levels .................................................................................... 2-193
Figure 2-67: Groundwater Hexavalent Chromium Levels ................................................................ 2-194
Figure 2-68: Groundwater Arsenic Levels ........................................................................................ 2-194
Figure 2-69: Surface Water Total Coliform Count ........................................................................... 2-195
Figure 2-70: Surface Water Fecal Coliform Count ........................................................................... 2-196
Figure 2-71: Surface Water pH Level ............................................................................................... 2-196
Figure 2-72: Surface Water Temperature Levels ............................................................................. 2-197
Figure 2-73: Surface Water Oil and Grease Levels ........................................................................... 2-198
Figure 2-74: Surface Water Conductivity Levels .............................................................................. 2-198
Figure 2-75: Surface Water Total Dissolved Solids Levels................................................................ 2-199
Figure 2-76: Surface Water Total Suspended Solids Levels ............................................................. 2-200
Figure 2-77: Surface Water Chemical Oxygen Demand Levels ........................................................ 2-201
Figure 2-78: Surface Water Dissolved Oxygen Levels ...................................................................... 2-202
Figure 2-79: Surface Water Biological Oxygen Demand Levels ....................................................... 2-203
Figure 2-80: Surface Water Lead Content ....................................................................................... 2-203
Figure 2-81: Surface Water Mercury Content ................................................................................. 2-204
Figure 2-82: Surface Water Cadmium Content ................................................................................ 2-204
Figure 2-83: Surface Water Chromium Content .............................................................................. 2-205
Figure 2-84: Parcel 1 Water Monitoring Stations ............................................................................ 2-207
Figure 2-85: DO Levels from Parcel 1 Monitoring Stations .............................................................. 2-208
Figure 2-86: BOD Levels from Parcel 1 Monitoring Stations ........................................................... 2-209
Figure 2-87: pH Levels from Parcel 1 Monitoring Stations .............................................................. 2-210
Figure 2-88: TSS Levels from Parcel 1 Monitoring Stations ............................................................. 2-210
Figure 2-89: The Udlom Creek during Dry Season ........................................................................... 2-213
Figure 2-90: The Udlom Creek during Wet Season .......................................................................... 2-214
Figure 2-91: Climate Map of the Philippines ................................................................................... 2-216
Figure 2-92: PAGASA Observed Climatological Ranges, and 2020 & 2050 Projections ................... 2-217
Figure 2-93: Wind Rose Diagram for Cebu ...................................................................................... 2-219
Figure 2-94: Annual Average Wind Speeds ...................................................................................... 2-220
Figure 2-95: Air Sampling Map ......................................................................................................... 2-223
Figure 2-96: Air Sampling Stations in Parcels 1 and 2 ...................................................................... 2-224
Figure 2-97: Air Sampling Station in Parcel 3 ................................................................................... 2-225
Figure 2-98: Air Sampling Station in Parcel 5 ................................................................................... 2-226
Figure 3-1: Settling Pond / Silt Trap Design ..................................................................................... 3-285
Figure 4-1: Risk Assessment Framework ......................................................................................... 4-300
Figure 6-1: Additional Air Monitoring Station between Parcel 1 and 2 ........................................... 6-346
Figure 6-2: Additional Air Monitoring Station near Parcel 3 ........................................................... 6-347
Figure 8-1: QVPI Table of Organization ............................................................................................ 8-355
Table of Tables
Table 1-1: Parcel 1 Coordinate Points .................................................................................................. 1-9

QUARRY VENTURES PHILIPPINES, INC. Environmental Impact Assessment
February 2019 vii
Table 1-2: Parcel 2 Coordinate Points ................................................................................................ 1-10
Table 1-3: Parcel 3 Coordinate Points ................................................................................................ 1-10
Table 1-4: Parcel 5 Coordinate Points ................................................................................................ 1-10
Table 1-5: Summary of Major Components ....................................................................................... 1-21
Table 1-6: Proposed Support Facilities .............................................................................................. 1-30
Table 1-7: Estimated Power Requirements per Parcel ...................................................................... 1-31
Table 1-8: Limestone Quarry Details ................................................................................................. 1-42
Table 1-9: Pit Bottom ......................................................................................................................... 1-42
Table 1-10: Mining Area to be Disturbed per Year ............................................................................ 1-42
Table 1-11: Coordinates and Mine Life Capacity of Parcel 1 ............................................................. 1-42
Table 1-12: Coordinates and Mine Life Capacity of Parcel 2 ............................................................. 1-43
Table 1-13: Coordinates and Mine Life Capacity of Parcel 3 ............................................................. 1-43
Table 1-14: Coordinates and Mine Life Capacity of Parcel 5 ............................................................. 1-43
Table 1-15: Estimated Production Capacity per Parcel...................................................................... 1-56
Table 1-16: Proposed Final Land Use ................................................................................................. 1-59
Table 1-17: Manpower for Existing Operation and Expansion .......................................................... 1-60
Table 2-1: Distribution of Land Uses in Cebu (2007) ......................................................................... 2-62
Table 2-2: Area Coverage (in has.) of Selected Crops in Cebu (2006-2008) ...................................... 2-62
Table 2-3: Municipality of Pinamungahan Land Distribution ............................................................ 2-65
Table 2-4: Naga City Land Distribution .............................................................................................. 2-65
Table 2-5: Toledo City Land Distribution ........................................................................................... 2-66
Table 2-6: Toledo City Existing Urban Land Use ................................................................................ 2-66
Table 2-7: Soil Sampling locations and Coordinates of the Four Surface Soil Sampling Locations ... 2-89
Table 2-8: Requested Chemical and Physical Parameters ................................................................. 2-89
Table 2-9: Soil Bulk Density Profile Samplings in Parcel 1 and Parcel 5. ............................................ 2-90
Table 2-10: Dominant Land Use of the Soil Sampling Locations........................................................ 2-92
Table 2-11: Area of Each Cebu Soil Types, Proportionate Extent ...................................................... 2-97
Table 2-12: Typical Soil Morphological Characteristics of Lugo Clay ............................................... 2-106
Table 2-13: Typical Soil Morphological Characteristics of Mandaue Clay Loam (157) .................... 2-109
Table 2-14: Results of Nutrients Analysis in reference to the BSWM Standards ............................ 2-115
Table 2-15: BSWM Soil Fertility Rating ............................................................................................ 2-116
Table 2-16: Metal Concentrations for All Soil Sampling Locations .................................................. 2-116
Table 2-17: Description of the location of the Study Sites .............................................................. 2-136
Table 2-18: Taxonomic List of Plants Found in the Study ................................................................ 2-146
Table 2-19: Diversity of Plots per Study Site .................................................................................... 2-153
Table 2-20: Importance Index Value of Parcel 1 .............................................................................. 2-153
Table 2-21: Importance Index Value of Parcel 2 .............................................................................. 2-155
Table 2-22: Importance Index Value of Parcel 3a ............................................................................ 2-156
Table 2-23: Importance Index Value of Parcel 3b ............................................................................ 2-157
Table 2-24: Importance Index Value of Parcel 5 .............................................................................. 2-158
Table 2-25: Summary Description of Study Sites ............................................................................. 2-161
Table 2-26: Taxonomic List of Wildlife in the Study Sites ................................................................ 2-162
Table 2-27: Seasonal Temperature increases (in °C) in 2020 and 2050 under medium-range emission
scenario in the province of Cebu ..................................................................................................... 2-172
Table 2-28: Seasonal rainfall change (in %) in 2020 and 2050 under medium-range emissionscenario
in the province of Cebu .................................................................................................................... 2-172
Table 2-29: Frequency of extreme events in 2020 and 2050 under medium – range emission scenario
in Cebu ............................................................................................................................................. 2-172

QUARRY VENTURES PHILIPPINES, INC. Environmental Impact Assessment
February 2019 viii
Table 2-30: Groundwater Quality Sampling Stations ...................................................................... 2-174
Table 2-31: Stream Water Quality Sampling Stations on the Udlom Creek .................................... 2-175
Table 2-32: Lists of Parameters Analyzed for Ground and Stream Water Quality .......................... 2-182
Table 2-33: Container Requirements and Sample Maximum Holding time .................................... 2-183
Table 2-34: Laboratory Analytical Methods ..................................................................................... 2-183
Table 2-35: DAO 2016 - 08 Water Body Classification and Usage of Fresh Waters ........................ 2-184
Table 2-36: Summary of Laboratory Results .................................................................................... 2-206
Table 2-37: Sampling Location and Coordinates ............................................................................. 2-221
Table 2-38: Air Quality Compounds and Parameters Tested........................................................... 2-221
Table 2-39: Ambient Air Monitoring Equipment Specifications ...................................................... 2-227
Table 2-40: Observed 24-hours Ambient Air Concentrations .......................................................... 2-228
Table 2-41: Observed 24-hour Noise Level Propagation in Decibels dB(A) at Station A1 ............... 2-229
Table 2-42: Observed 24-hour Noise Level Propagation in Decibels dB(A) at Station A2 ............... 2-229
Table 2-43: Observed 24-hour Noise Level Propagation in Decibels dB(A) at Station A3 ............... 2-230
Table 2-44: Observed 24-hour Noise Level Propagation in Decibels dB(A) at Station A4 ............... 2-230
Table 2-45: Direct Impact Barangays by MPSA Parcel ..................................................................... 2-233
Table 2-46: Population and Growth Rate of Impact Cities and Municipality, 2010 and 2015 ........ 2-234
Table 2-47: Population and Growth Rate of Impact Cities and Municipality, 2010 and 2015 ........ 2-235
Table 2-48: Population Data from Barangay Profiles (2018) ........................................................... 2-235
Table 2-49: Household Population by Age Group and Sex, and Age Composition: CEBU (Excluding
Cities of Cebu, Lapu-Lapu, and Mandaue), 2015 ............................................................................. 2-235
Table 2-50: Household Population by Age Group and Sex, and Age Composition: City of Naga, 2015 2-
236
Table 2-51. Household Population by Age Group and Sex, and Age Composition: Barangay Cogon,
City of Naga, 2010 ............................................................................................................................ 2-237
Table 2-52: Household Population by Age Group and Sex, and Age Composition: Barangay
Tagjaguimit, City of Naga, 2010 ....................................................................................................... 2-237
Table 2-53: Household Population by Age Group and Sex, and Age Composition: Municipality of
Pinamungahan, 2015 ....................................................................................................................... 2-238
Table 2-54: Household Population by Age Group and Sex, and Age Composition: Barangay Lamac,
Municipality of Pinamungahan, 2010 .............................................................................................. 2-239
Table 2-55: Household Population by Age Group and Sex, and Age Composition: Toledo City, 2015 . 2-
239
Table 2-56: Household Population by Age Group and Sex, and Age Composition: Barangay Bulongan,
Toledo City, 2010 ............................................................................................................................. 2-240
Table 2-57: Household Population by Age Group and Sex, and Age Composition: Barangay Media
Once, Toledo City, 2010 ................................................................................................................... 2-241
Table 2-58: Household Population by Age Group and Sex, and Age Composition: Barangay Poog,
Toledo City, 2010 ............................................................................................................................. 2-241
Table 2-59: Age Dependency Ratio of Impact Cities and Municipality, 2010 .................................. 2-242
Table 2-60. Age Dependency Ratio of Impact Barangays within the City of Naga, 2010 ................ 2-242
Table 2-61: Age Dependency Ratio of Impact Barangays within the Municipality of Pinamungahan,
2010 ................................................................................................................................................. 2-243
Table 2-62. Age Dependency Ratio of Impact Barangays within Toledo City, 2010 ........................ 2-243
Table 2-63: Population Density of Impact Barangays, 2015 ............................................................ 2-244
Table 2-64: Household Population, Number of Households, and Average Household Size of Impact
Cities and Municipality, 2015 ........................................................................................................... 2-244
Table 2-65: Ethnicity in the Impact Areas within the City of Naga, 2010 ........................................ 2-245

QUARRY VENTURES PHILIPPINES, INC. Environmental Impact Assessment
February 2019 ix
Table 2-66: Ethnicity in the Impact Areas within the Municipality of Pinamungahan, 2010 .......... 2-245
Table 2-67: Ethnicity in the Impact Areas within Toledo City, 2010 ................................................ 2-245
Table 2-68: Household Population 10 Years Old and Over by Marital Status in the Impact Areas
within the City of Naga, 2010 .......................................................................................................... 2-246
Table 2-69: Household Population 10 Years Old and Over by Marital Status in the Impact Areas
within the Municipality of Pinamungahan, 2010 ............................................................................. 2-247
Table 2-70: Household Population 10 Years Old and Over by Marital Status in the Impact Areas
within Toledo City, 2010 .................................................................................................................. 2-247
Table 2-71: Religious Affiliation in the Impact Areas within the City of Naga, 2010 ....................... 2-247
Table 2-72: Religious Affiliation in the Impact Areas within the Municipality of Pinamungahan, 2010
......................................................................................................................................................... 2-248
Table 2-73: Religious Affiliation in the Impact Areas within Toledo City, 2010 ............................... 2-248
Table 2-74: Highest Grade/Year Completed by School Age in the Impact Areas within the City of
Naga, 2010 ....................................................................................................................................... 2-250
Table 2-75: Highest Grade/Year Completed by School Age in the Impact Areas within the
Municipality of Pinamungahan, 2010 .............................................................................................. 2-250
Table 2-76: Highest Grade/Year Completed by School Age in the Impact Areas within Toledo City,
2010 ................................................................................................................................................. 2-251
Table 2-77: Year Building/House was Built by First Household within the Housing Unit in the Impact
Areas within the City of Naga, 2010 ................................................................................................ 2-251
Table 2-78: Year Building/House was Built by First Household within the Housing Unit in the Impact
Areas within the Municipality of Pinamungahan, 2010 ................................................................... 2-252
Table 2-79: Year Building/House was Built by First Household within the Housing Unit in the Impact
Areas within Toledo City, 2010 ........................................................................................................ 2-252
Table 2-80: Tenure Status of the Lot by First Household within the Housing Unit in the Impact Areas
within the City of Naga, 2010 .......................................................................................................... 2-253
Table 2-81: Tenure Status of the Lot by First Household within the Housing Unit in the Impact Areas
within the Municipality of Pinamungahan, 2010 ............................................................................. 2-253
Table 2-82: Tenure Status of the Lot by First Household within the Housing Unit in the Impact Areas
within Toledo City, 2010 .................................................................................................................. 2-254
Table 2-83: Type of Building/House in the Impact Areas within the City of Naga, 2010 ................ 2-254
Table 2-84: Type of Building/House in the Impact Areas within the Municipality of Pinamungahan,
2010 ................................................................................................................................................. 2-254
Table 2-85: Type of Building/House in the Impact Areas within Toledo City, 2010 ........................ 2-255
Table 2-86: Construction Materials of the Roof by First Household within the Housing Unit in the
Impact Areas within the City of Naga, 2010 .................................................................................... 2-255
Table 2-87: Construction Materials of the Roof by First Household within the Housing Unit in the
Impact Areas within the Municipality of Pinamungahan, 2010 ...................................................... 2-256
Table 2-88: Construction Materials of the Roof by First Household within the Housing Unit in the
Impact Areas within Toledo City, 2010 ............................................................................................ 2-256
Table 2-89: Construction Materials of the Outer Walls by First Household within the Housing Unit in
the Impact Areas within the City of Naga, 2010 .............................................................................. 2-257
Table 2-90: Construction Materials of the Outer Walls by First Household within the Housing Unit in
the Impact Areas within the Municipality of Pinamungahan, 2010 ................................................ 2-257
Table 2-91: Construction Materials of the Outer Walls by First Household within the Housing Unit in
the Impact Areas within Toledo City, 2010 ...................................................................................... 2-258
Table 2-92: Place of Residence Five Years Ago in the Impact Areas within the City of Naga, 2010 2-258

QUARRY VENTURES PHILIPPINES, INC. Environmental Impact Assessment
February 2019 x
Table 2-93. Place of Residence in Cebu Province Five Years Ago in the Impact Areas within the City of
Naga, 2010 ....................................................................................................................................... 2-259
Table 2-94: Place of Residence Five Years Ago in the Impact Areas within the Municipality of
Pinamungahan, 2010 ....................................................................................................................... 2-259
Table 2-95: Place of Residence in Cebu Province Five Years Ago in the Impact Areas within the
Municipality of Pinamungahan, 2010 .............................................................................................. 2-260
Table 2-96: Place of Residence Five Years Ago of Population in the Impact Areas within Toledo City,
2010 ................................................................................................................................................. 2-260
Table 2-97: Place of Residence in Cebu Province Five Years Ago in the Impact Areas within Toledo
City, 2010 ......................................................................................................................................... 2-261
Table 2-98: Literacy of the Household Population 10 Years Old and Over by Age Group in the City of
Naga, 2015 ....................................................................................................................................... 2-262
Table 2-99: Literacy of the Household Population 10 Years Old and Over by Age Group in
Pinamunhgahan Municipality, 2015 ................................................................................................ 2-263
Table 2-100: Literacy of the Household Population 10 Years Old and Over by Age Group in Toledo
City, 2015 ......................................................................................................................................... 2-263
Table 2-101: Household Population 5 to 24 Years Old Who Were Currently Attending School by Age
Group in the City of Naga, 2015 ....................................................................................................... 2-264
Table 2-102: Household Population 5 to 24 Years Old Who Were Currently Attending School by Age
Group in Pinamungahan Municipality, 2015 ................................................................................... 2-264
Table 2-103: Household Population 5 to 24 Years Old Who Were Currently Attending School by Age
Group in Toledo City, 2015 .............................................................................................................. 2-265
Table 2-104: Public Schools within the Impact Barangays .............................................................. 2-265
Table 2-105: Gainful Workers 15 Years Old and Over by Major Occupation Group within Cebu
Province and Impact Cities and Municipality, 2015 ......................................................................... 2-266
Table 2-106: Comparative Poverty Statistics of Cebu Province: 2006, 2009, 2012 ......................... 2-267
Table 2-107: Gender of Survey Respondents .................................................................................. 2-267
Table 2-108: Age of Survey Respondents ........................................................................................ 2-268
Table 2-109: Birthplace of Survey Respondents .............................................................................. 2-268
Table 2-110: Civil Status of Survey Respondents ............................................................................. 2-268
Table 2-111: Ethnicity of Survey Respondents ................................................................................ 2-269
Table 2-112: Religious Affiliation of Survey Respondents ............................................................... 2-269
Table 2-113: Settlement History of Survey Respondents ................................................................ 2-270
Table 2-114: Sources of Income of Survey Respondents ................................................................. 2-270
Table 2-115: Estimated Household Income of Survey Respondents ............................................... 2-271
Table 2-116: Availability of Farmland to Survey Respondents ........................................................ 2-272
Table 2-117: Tenurial Status on Farmland of Survey Respondents ................................................. 2-272
Table 2-118: Farm Products of Survey Respondents ....................................................................... 2-272
Table 2-119: Number of Years of the Housing Units of Survey Respondents ................................. 2-273
Table 2-120: Ownership of the Housing Units of the Survey Respondents ..................................... 2-273
Table 2-121: Ownership of Lots of the Survey Respondents ........................................................... 2-274
Table 2-122: Highest Educational Attainment of the Survey Respondents ..................................... 2-274
Table 2-123. Household Members of the Survey Respondents Who Experienced Illness .............. 2-275
Table 2-124: Illnesses experienced by the household members of the Survey Respondents ........ 2-275
Table 2-125: Health facilities and providers accessed by the Survey Respondents ........................ 2-275
Table 2-126: Water Source of the Survey Respondents .................................................................. 2-276
Table 2-127. Toilet Facilities of the Survey Respondents ................................................................ 2-276
Table 2-128: Type of Waste Disposal of the Survey Respondents .................................................. 2-277

QUARRY VENTURES PHILIPPINES, INC. Environmental Impact Assessment
February 2019 xi
Table 2-129: Perceived Community Problems of the Survey Respondents .................................... 2-277
Table 2-130: Solutions to the community problems Proposed by the Survey Respondents .......... 2-278
Table 2-131: Awareness of the Survey Respondents on the Proposed Quarry Operation ............. 2-279
Table 2-132. Sources of Information of the Survey Respondents on the Proposed Quarry Operation 2-
279
Table 2-133. Advantages of the Proposed Quarry Project Perceived by the Survey Respondents. 2-280
Table 2-134. Disadvantages of the Proposed Quarry Project Perceived by the Survey Respondents .. 2-
280
Table 3-1: Matrix of Major Impacts, Mitigation/Enhancement Measures and Environmental
Management Plan ............................................................................................................................ 3-287
Table 4-1: Hazard Analysis Matrix.................................................................................................... 4-302
Table 4-2: Physico-chemical and Toxicological Properties of Diesel ............................................... 4-306
Table 4-3: Effects of radiation from fire........................................................................................... 4-306
Table 4-4: Identified hazards and corresponding mitigating measures .......................................... 4-311
Table 5-1: Summary of SDMP Activities........................................................................................... 5-315
Table 5-2: Summary of IEC Activities ............................................................................................... 5-323
Table 5-3: Indicative Social Development Plan/ Social Development and Management Program –
Programs/Projects/Activities ........................................................................................................... 5-326
Table 5-4: Indicative IEC for the QVPI Mining Project ..................................................................... 5-330
Table 6-1: Summary of Compliances to ECC Conditions .................................................................. 6-333
Table 6-2: Environmental Monitoring Plan ...................................................................................... 6-336
Table 7-1: Decommissioning Strategy and Timing ........................................................................... 7-349
List of Annexes
Annex 1: Accountability Statements
Annex 2: PEMAPS
Annex 3: Environmental Compliance Certificate
Annex 4: Copy of CMR and SMR Submitted
Annex 5: Mineral Production Sharing Agreement
Annex 6: Feasibility Study
Annex 7: Exploration Report
Annex 8: Terrestrial Sampling Photo Documentation
Annex 9: Ecological Indices Formula
Annex 10: Perception Survey Form
Annex 11: Perception Survey Photo Documentation
Annex 12: Complaint Resolution Correspondence
Annex 13: Certification on Latest Available CLUP

QUARRY VENTURES PHILIPPINES, INC. Environmental Impact Assessment
February 2019 1
EXECUTIVE SUMMARY
Project Fact Sheet:
Name of Project QVPI Cebu Marble and Aggregates Quarry Project
Location Parcel 1: Barangay Tagjaguimit, City of Naga and Barangay Lamac, Municipality of Pinamungahan.
Parcel 2: Barangay Tagjaguimit, City of Naga. Parcel 3: Barangays Media Once, Bulongan, and Poog, City of Toledo Parcel 5: Barangay Cogon, City of Naga
MPSA No. 111-98-VII Total MPSA Area: 607.50 hectares Date granted: May 26, 1998 Validity: May 25, 2023
ECC 07-07-07-27-0263-303A
Nature of Project Resource Extractive Industry
Size Existing ECC: Production Capacity: 3,000 m3/y Area: 14.02 hectares Proposed Operation: Production Capacity: 21,000MT/Yr of Marble, 973,900 MT/Yr of Limestone
Aggregates, and 924,000MT/Yr of Basalt, for 4 parcels Parcel 1: 6,000 cubic meter/yr (Marble Blocks) Parcel 2: 16,200 MT/Yr (Marble Blocks) Parcel 3: 990,000 MT/Yr, broken down as follow: 16,100 MT/yr Marble Blocks 973,900 MT/yr Aggregates Parcel 5: 1,937,000 MT/Yr (Basalt) Area: A total of 567 hectares, over 4 parcels. Parcel 1: 81 hectares (mine area = 2.8has.) Parcel 2: 81 hectares (mine area = 2.5has.) Parcel 3: 324 hectares (mine area = 22.9has.) Parcel 5: 81 hectares (mine area = 18.7has.)
Commodity Existing: Marble Blocks and Boulders Proposed: Limestone and basalt which will be processed into marble and aggregate products.
Mining Method Surface Mining Method (Quarrying) - unchanged
Proponent Profile
Proponent Name Quarry Ventures Philippines, Inc.
Address 117 Shaw Boulevard, Pasig City, 1600
Contact Person Engr. Ser Allain Pleyto
Contact Number 0917-5907233
Project Preparer

QUARRY VENTURES PHILIPPINES, INC. Environmental Impact Assessment
February 2019 2
Office Address: Unit 10C, Lansbergh Place 170 Tomas Morato, Quezon City
Authorized Representative/ Contact Person (s):
Engr. Paulo Noni T. Tidalgo Managing Director
Contact Number (02) 376-0043
Comparative Matrix of Existing and Proposed Project Components
Project Components Existing Planned
Quarry
Parcel 1 - Covered by MPSA No.
111-98-VII - 14.2 hectares
- Same MPSA - 81 hectares
Parcel 2 - Covered by MPSA No. 111-98-VII
- 81 hectares
Parcel 3 - Covered by MPSA No. 111-98-VII
- 324 hectares
Parcel 5 - Covered by MPSA No. 111-98-VII
- 81 hectares
Quarry Facilities
- Stockpile - Admin building, staff
house, laboratory, motor pool and nursery
- Waste dump
- Stockpile Parcel 1: 0.5 hectares Parcel 2: 0.5 hectares Parcel 3: 1 hectare Parcel 5: 1 hectare
- Admin building, staff house, laboratory, motor pool and nursery Parcel 1: 3,100m2 Parcel 2: 1,100m2 Parcel 3: 6,000m2 Parcel 5: 4,100m2
- 2 Crushers (Parcel 3 and 5) 960,000 MT/yr. 250MT/hr
- Parcel 3 Road Network: 500m
Extraction Method Surface Mining – Quarrying
Extraction Rate
- Parcel 1: 3,000 m3/y - Parcel 1: 3,000 cubic meter/yr (Marble Blocks)
- Parcel 2: 16,200 MT/Yr (Marble Blocks)
- Parcel 3: 990,000 MT/Yr, broken down as follows: 16,200 MT/yr Marble Blocks 973,800 MT/yr Aggregates
- Parcel 5: 1,937,000 MT/Yr (Basalt)
Total Project Area 567 hectares

QUARRY VENTURES PHILIPPINES, INC. Environmental Impact Assessment
February 2019 3
Project Components Existing Planned
Commodity Marble Blocks and Boulders
Limestone and basalt which will be processed into marble and
aggregate products.
Waste Management
Quarry Pollution Control Structures
- - Drainage systems - settling ponds
Parcel 1: 1 Parcel 2: 1 Parcel 3: 2 Parcel 5: 1
- Silt collector sump Parcel 1: 2 Parcel 2: 2 Parcel 3: 9 Parcel 5: 5
Domestic Wastewater Treatment
Septic tanks
Solid and Hazardous waste
- waste segregation - Materials Recovery Facility - storage area (laydown): hazardous - haulage and treatment/disposal of hazardous wastes by the
EMB accredited treaters
Process Documentation of the Conduct of Environmental Impact Assessment
The terms of reference used for this Environmental Impact Assessment (EIA) was consistent with
that stipulated in the Revised Procedural Manual (RMP) for Department of Environment and
Natural Resources (DENR) Administrative Order (DAO) NO. 2003-30, Implementing Rules and
Regulations of Presidential Decree No. 1586 “Establishing the Philippine Environmental Impact
Statement System.”
The Environmental Impact Assessment (EIA) Team is comprised of multi-disciplinary
specialists/experts who have extensive training and experience on their respective fields and in
the conduct of EIA for various industry sectors.
EPRMP Team
This study is a conglomeration and integration of the various technical, environmental,
institutional/legal and social inputs and findings of the following specialists/experts:
EPRMP Team Member Field of Expertise/Module Preparer Registration No.
Paulo Noni T. Tidalgo, EM, RN Environment, Mining and Geology
IPCO-103
Bernardo V. Valmonte, Jr., EM Mining and Geology IPCO-073
Wilfredo Sanidad, PhD. Water Quality IPCO-139
Czarina May M. Olores Environmental Management IPCO-075
Gilbert Hernandez Social Expert

QUARRY VENTURES PHILIPPINES, INC. Environmental Impact Assessment
February 2019 4
EPRMP Team Member Field of Expertise/Module Preparer Registration No.
Maribel Agoo, PhD Terrestrial Ecology
Einre Jinji Elcid Quiambao Project Coordinator IPCO-154
EIA Study Schedule and Area
The scope of the study was discussed during the Technical Scoping Meeting held on 25 April, 2016
at the EIA Conference Room, 2nd Floor EMB Building, DENR Compound, Visayas Avenue, Diliman,
Quezon City. The meeting was facilitated by the EMB Case handlers and was attended by the
Environmental Management Bureau (EMB) Review Committee Members, representatives from
QVPI and Axceltechs.
Below is the EIA study schedule.
Activities Date
IEC and Public Scoping February 9-11, 2016
Technical Scoping April 25, 2016
Baseline Sampling June 23-27, 2016
Gathering of secondary data June 23, 2016 – November 30, 2017
The area subjected to the EIA was based on the perceived direct and indirect impact areas of the
proposed project. As stipulated in DAO 2017-15, known as the “Guidelines on Public Participation
under the Philippine Environmental Impact Statement System,” direct impact area shall be
delineated based on the result of the assessment of the project’s impact on air, water, land, and
people.
Aspect Direct Impact Area
Land - Area within the MPSA and the periphery of the mining area
Water - Receiving bodies of water near the project site - Underlying aquifer
Air - Area within the MPSA, and the community
People - Brgy. Tagjaguimit and Cogon, City of Naga - Brgy. Lamac, Municipality of Pinamungahan - Brgy. Bulongan, Media Once, and Poog, City of Toledo
On the other hand, areas not directly subjected to any activities/construction and those outside
the project area but are within the jurisdiction of the Municipality of Pinamungajan, City of
Toledo, and City of Naga are considered as indirect impact areas. For social impacts, the study
focused on six (6) direct impact barangays, consistent with the provision of DAO 2017-15.
EIA Methodology

QUARRY VENTURES PHILIPPINES, INC. Environmental Impact Assessment
February 2019 5
Primary and secondary data were utilized for the assessment of the project impacts. Primary data
were obtained from conducted on-site investigation and field sampling/surveys while secondary
data were acquired from the proponent and government agencies/institutions. Relevant and
previously conducted studies were also considered. The following are the sampling/assessment
methodologies employed by the EIA team for the study:
Module Methodology
Land Land Use Gathering and review of secondary data
Geology and Geomorphology Gathering and review of secondary data
Natural Hazards Gathering and review of secondary data
Pedology Soil sampling and laboratory analysis
Water Hydrology and Hydrogeology Gathering and review of secondary data
Water Quality In-situ measurements; grab sampling and laboratory analysis
Air and Noise Meteorology Gathering and review of secondary data
Air and Noise Quality High volume sampler (TSP and metals) Colorimetric-Pararosaline Greiss-Saltzman Atomic Absorption Spectrophotometry Sound level meter for noise
People Socio-economic Profile Gathering and review of secondary data Perception survey
Public Participation
Stakeholders’ participation in the conduct of EIA study includes participation in the following:
Information, Education and Communication (IEC) and Public Scoping activities on February 9-
11, 2016. Among the attendees of the first IEC were Barangay officials including the Chairman,
Purok Leaders, Home Owners Association Leaders, representatives of nearby industries while
the latter was participated by stakeholders from the government agencies.;
Perception surveys in 11 barangays on September 19 – October 10, 2016 where a total of 300
individuals were surveyed.
Project Alternative
Since mining projects are site specific because mineral extraction can only be undertaken where
economic deposits occur, the proponent has not considered any alternative project site. Initial
feasibility conducted, drilling/geologic results and environmental considerations reveal that
extraction of resource in the area is best suitably done through surface mining method. See
Section 1.5 for the details on the Project Alternatives

QUARRY VENTURES PHILIPPINES, INC. Environmental Impact Assessment
February 2019 6
Summary of Environmental Risk Assessment
Hazards associated with the marble and aggregates quarry are mass movement of soil/rocks from
the quarry sites; mass release of sediments from settling ponds; flooding; occupational safety
hazards; fire/explosion hazards from storage liquid fuel (diesel), exposure to dusts; siltation and
contamination of surface water bodies; soil erosion and loss of soil fertility; and natural calamities,
especially during extreme climate events; and exposure to high intensity noise.
Occupational safety hazards may occur at the various operation units from the quarry site.
Outcome of occupational safety hazards include deaths and injuries resulting from
ground/structure failure, fall from heights, being struck or crushed by equipment parts or falling
rocks/debris, vehicular/equipment accidents, and others. Mass movement of soil and rocks may
occur quarry sites and in disturbed elevated areas. Mass release of sediments and flooding may
arise mainly due to breach of containing walls of impoundment and dikes especially at settling
ponds. Such incidents may be triggered by natural events such as extreme climate events
(torrential rains, strong typhoons, storm surges, etc.) earthquakes and subsidence; faulty
engineering design; inadequate maintenance of structures; and sabotage. Water contamination
could result from the release mining overburden and wastes to water bodies. The surface water
bodies could also become heavily silted. Fire/explosion hazards may arise from the storage and
utilization of coal and liquid fuel (diesel).

QUARRY VENTURES PHILIPPINES, INC. Environmental Impact Assessment
February 2019 7
Major Project Impact
EIA Study Module
Impact Mitigation Residual Effect
Land Removal of topsoil and Vegetation cover Alteration of topography; lowering of landform elevation
Mining in blocks; Progressive revegetation of mined-out blocks
Revegetated quarry area
Water Increase TSS and turbidity of water Erosion control structures such as appropriate drainage, catch basins and sediment settling ponds; quarrying to be done in stages
Small soil particles suspended in the pond may flowout, regular monitoring and maintenance of the pond shall strictly implememted.
Air Local increase in TSP and noise levels Air pollution due quarry operation
Proper and regular maintenance of equipment Water spraying; mining activities to be confined during daytime as much as possible IEC on proper scheduling of hauler trucks to avoid busy and late hours
Dust will be generated during blasting, movements of mobile equipments and quarrying operation. Controlled blasting will be implemented by the company. Water sprinkling will be done to alleviate excessive dust generation.
People Local government generation of revenues from taxes, permits and LGU share in the quarrying activities Payment of local taxes and fees to Municipal and Barangay Local Government Units Generation of employment Generation of livelihood opportunities by putting-up food stalls, variety stores and other services near the quarry area which
Implementation of community development programs through Social Development Management Plan equivalent to 1.5% of Operating cost based on the identified needs of the communities Total taxes paid to the national government will exceed >Excise Tax: 60% goes to the national government; 40%, to the local government– -20% for host Provinces -45% for host Municipalities
Enhancement socio-economic welfare of the community

QUARRY VENTURES PHILIPPINES, INC. Environmental Impact Assessment
February 2019 8
EIA Study Module
Impact Mitigation Residual Effect
might cause problems of congestion, peace and order and security breaches
-35% for host Barangays Occupation Fees and Real Property Tax to province and municipalities IEC on nature of jobs the proponents require and qualification Consultation on job requirements and qualification Skills training to upgrade local skills of residents that can be hired by the project Implementation livelihood development programs through the SDMP Coordination with the Barangay LGUs to monitor issuance of business permits in small- to medium- scale commercial establishments to ensure proper zoning of business areas, peace and order, solid waste management

QUARRY VENTURES PHILIPPINES, INC. Environmental Impact Assessment
February 2019 1-9
1 PROJECT DESCRIPTION
1.1 Project Background
In 1986, Teresa Marble Corporation (TMC), sister company of Quarry Ventures Phils. Inc. (QVPI),
acquired a small-scale mining permit for an area in Sitio Gaway-gaway, Barangay Uling, Naga; also
known as the Rosatta Quarry. For said operation, TMC hired six (6) skilled quarry men from
Antipolo, Rizal ans started producing marble blocks using air compressor and jack hammers.
Come 1994, TMC turned over its mining rights to QVPI. The latter then applied for a Mineral
Production Sharing Agreement (MPSA) in 1998; and in 1999, QVPI modernized the operations by
using wiresaw, hydraulic jack, rotary drill and bigger backhoe. The company also bought the
processing plant of Phoenix Marble in Brgy. Uling, Naga.
In 2006, QVPI started operating 5 hectares in Barangay Tagjaguimit Uling under a small-scale
quarry permit.
QVPI applied for an Environmental Compliance Certificate for its quarry operation in Parcel 1. The
ECC for such was eventually issued in 2008 denominated as 07-07-07-27-0263-303A (Annex 3). The
Declaration of Mining Feasibility was also approved for Parcel 1 (14 hec.) in 2009.
1.2 Project Location
The proposed Project of QVPI is located in the Municipalities of Pinamungahan, Naga City and
Toledo City, all in the Province of Cebu. It has a total area of 567 hectares divided into four (4)
parcels covered by MPSA No. III – 98 – VII. The geographical coordinates and specific location per
parcel is shown below:
Parcel 1 is located in Barangay Tagjaguimit, City of Naga and Barangay Lamac in the Municipality
of Pinamungahan.
Table 1-1: Parcel 1 Coordinate Points
Corner Latitude Longitude
1 10°15’30”N 123°40’00”E
2 10°16’00”N 123°40’00”E
3 10°16’00”N 123°40’30”E
4 10°15’30”N 123°40’30”E
Total Area 81 hectares
Parcel 2 is located in Barangay Lamac, Municipality of Pinamungahan.

QUARRY VENTURES PHILIPPINES, INC. Environmental Impact Assessment
February 2019 1-10
Table 1-2: Parcel 2 Coordinate Points
Corner Latitude Longitude
1 10°16’30”N 123°40’00”E
2 10°17’00”N 123°40’00”E
3 10°17’00”N 123°40’30”E
4 10°16’30”N 123°40’30”E
Total Area 81 hectares
Parcel 3 is located in Barangays Media Once, Bulungan, and Poog, all in the City of Toledo.
Table 1-3: Parcel 3 Coordinate Points
Corner Latitude Longitude
1 10°18’00”N 123°39’30”E
2 10°19’00”N 123°39’30”E
3 10°19’00”N 123°40’00”E
4 10°19’30”N 123°40’00”E
5 10°19’30”N 123°40’30”E
6 10°18’30”N 123°40’30”E
7 10°18’30”N 123°40’00”E
8 10°18’00”N 123°40’00”E
Total Area 324 hectares
Parcel 5 is located in Barangay Cogon, City of Naga
Table 1-4: Parcel 5 Coordinate Points
Corner Latitude Longitude
1 10°17’00”N 123°44’00”E
2 10°17’30”N 123°44’00”E
3 10°17’30”N 123°44’30”E
4 10°17’00”N 123°44’30”E
Total Area 81 hectares
Parcel 4 of MPSA No. III – 98 – VII is already coverd with ECC no. 9107-028-302A. It is currently
non-operational and is not covered in this study. It is currently non-operational. All quarry
activities are focused on Parcel 1, covered by ECC no. 07-07-07-27-0263-303A. It is this project’s
objective to cover Parcels 1, 2, 3, and 5 with a single ECC. Parcel 4 shall remain separate and non-
operational.

QUARRY VENTURES PHILIPPINES, INC. Environmental Impact Assessment
February 2019 1-11
Figure 1-1: Project Location Map
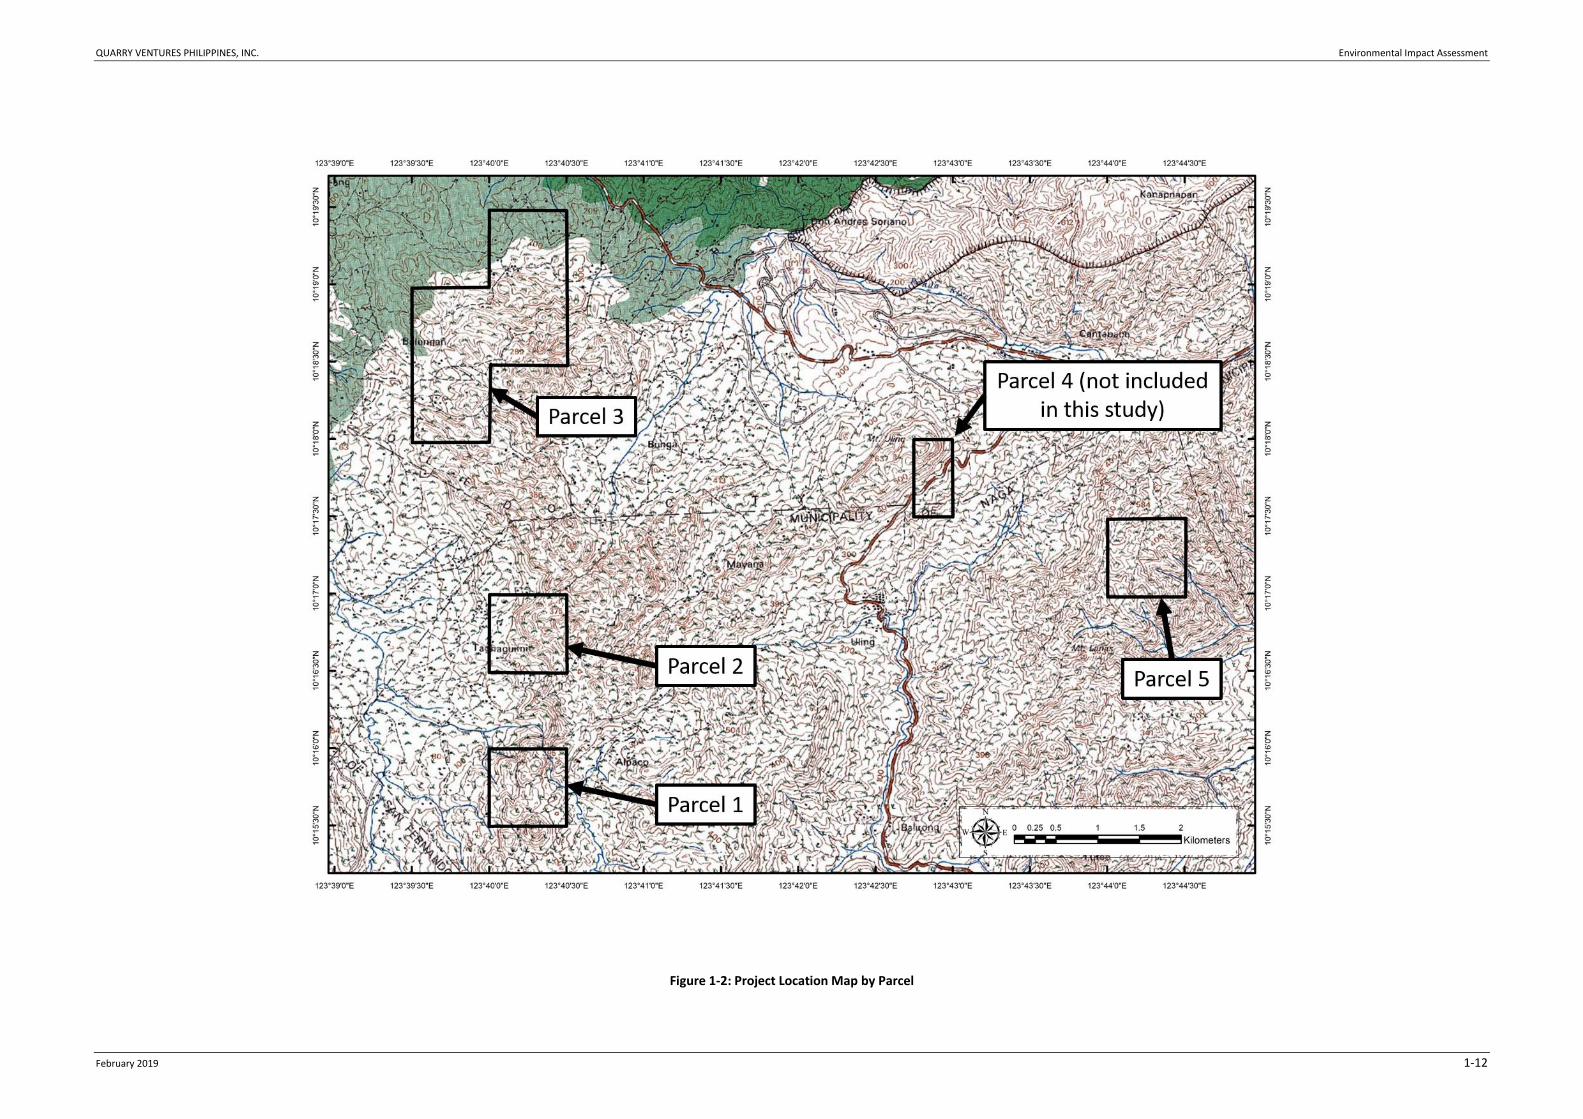
QUARRY VENTURES PHILIPPINES, INC. Environmental Impact Assessment
February 2019 1-12
Figure 1-2: Project Location Map by Parcel

QUARRY VENTURES PHILIPPINES, INC. Environmental Impact Assessment
February 2019 1-13
Figure 1-3: Drone Shot of Parcel 1

QUARRY VENTURES PHILIPPINES, INC. Environmental Impact Assessment
February 2019 1-14
Figure 1-4: Drone Shot of Parcel 2

QUARRY VENTURES PHILIPPINES, INC. Environmental Impact Assessment
February 2019 1-15
Figure 1-5: Drone Shot of Parcel 3
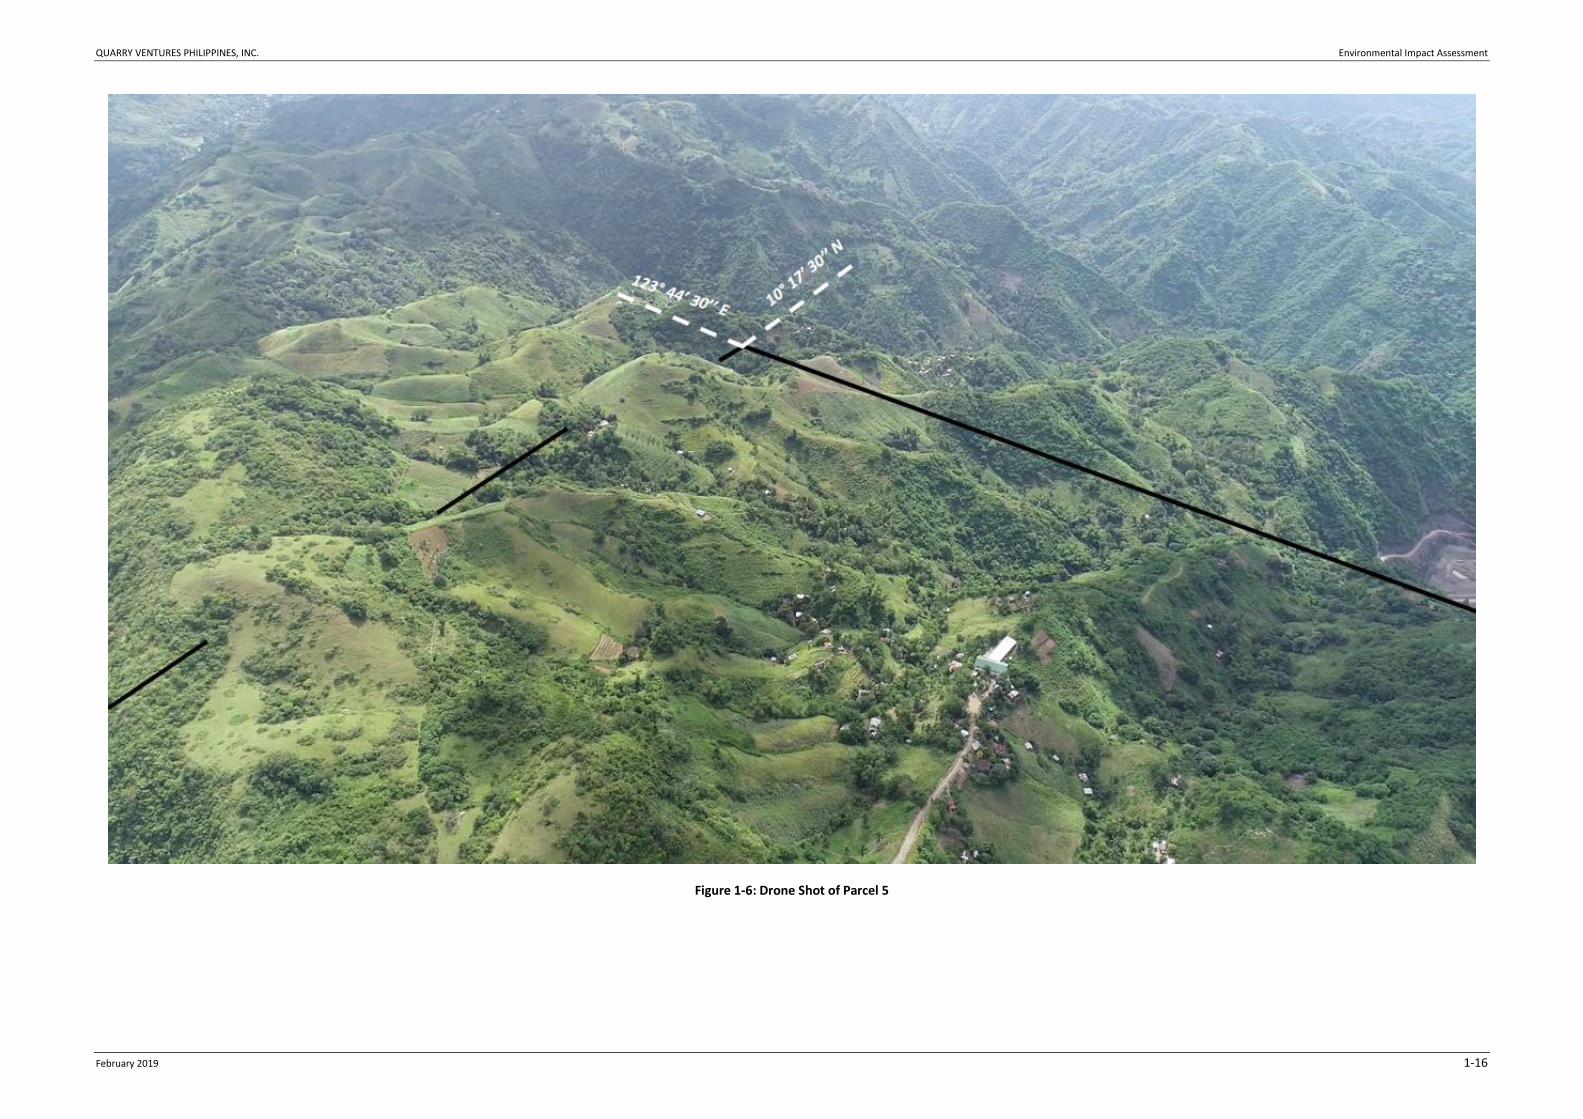
QUARRY VENTURES PHILIPPINES, INC. Environmental Impact Assessment
February 2019 1-16
Figure 1-6: Drone Shot of Parcel 5

QUARRY VENTURES PHILIPPINES, INC. Environmental Impact Assessment
February 2019 1-17
1.3 Project Accessibility
Cebu Island can be reached by daily commercial airline flights from Manila to Cebu City or by
commercial ferries also from Manila and from other central Visayan localities. The City of Naga is
approximately 25 km south of Cebu City, the capital of the province of Cebu. While Toledo City is
situated 47 km away from Cebu City.
Parcel 1 can be reached from Cebu City to Naga City thru the South Reclamation Project Highway,
thence to Barangay Tajaguimit by a barangay road.
Parcels 2 and 3 can be access from Cebu City to Naga City through the South Reclamation Project
Highway, thence to Brgy. Media Once or Poog (Toledo City) via the Hega-Uling Road and finally
by barangay roads to the project area. The said areas can also be reached via the Manipis Road
from Tabunoc town to Toledo City.
Parcel 5 can be reached from Cebu City to Naga City thru the South Reclamation Project Highway,
thence to Brgy. Lanas, Naga via the Cebu Trans-Central Highway, and then by a barangay road to
the western edge of the Parcel 5 claim block.
1.4 Project Rationale
The proponent engaged the project, not just for profit, but for the development of the
community. The sites were a good source of marble and aggregates, and the actual project site
is not fit for agriculture. The National Government and the LGU will benefit from the project
through taxes, fees, and duties it would garner. The project would also promote employment to
the local community, and provisions of community development projects. The project will have
significant impact in local and national economy. The key beneficiaries will include the local
workforce and businesses allied to the mining operations. Education and development of new
enterprises in the host communities will create employment and new skills.
Substantial earnings could be derived from direct employment while potential additional earning
could be derived from entrepreneurship. Health and sanitation would be improved as support
from the company in form of available medical team could be relied upon. Improvement of
infrastructure will provide better services to the community. This will develop them into future
better students and hopefully obtain good employment.

QUARRY VENTURES PHILIPPINES, INC. Environmental Impact Assessment
February 2019 1-18
Skills acquired as a result of employment and technology transfer is useful for other opportunities
that might come along. Revenues in form of taxes and other valuable monetary support from
SDMP, EPEP and FMRDP could also be realized.
1.5 Project Alternatives
1.5.1 Alternative Project Location
Since mining projects are site specific because mineral extraction can only be undertaken where
economic deposits occur, the proponent has not considered any alternative project site. Initial
feasibility conducted, drilling/geologic results and environmental considerations reveal that
extraction of resource in the area is best suitably done through surface mining method.
1.5.2 Mining Method Selection
Marble and aggregates are extracted through physical removal of the quarry, which involves
cutting and blasting. Considering the target minerals, these would be the best methods available
for extraction. These methods, however, would induce dust generation so proper mitigating
measures would be implemented all throughout the operation.
Safety of the community and employees would also be considered due to the nature of the mining
method. Proper measures, like wearing of PPE’s and informing the community of blast schedules,
will be observed.
1.5.3 Power
Power to the site will be supplied by the Visayan Electric Company (VECO). Generators will be
installed on standby, in case of power failures, that could generate 120 KW of power.
1.5.4 Environmental Impact
The major environmental impact that will be brought about by the project modification
considering all the above mentioned alternatives is dust generation.

QUARRY VENTURES PHILIPPINES, INC. Environmental Impact Assessment
February 2019 1-19
1.5.5 Consequences of not proceeding with the Project
Left untouched, the parcels 1, 2, and 5 are hilly areas and wouldn’t be suitable for agriculture
without proper slope stabilization. Terracing may be employed, but since the hills are rich in
marble and aggregates, the soil may prove to be too hard for crops.
1.6 Project Components
1.6.1 Status of the Current Operation
Parcel I of MPSA III-98-VII was partially declared last 2007. It started as a commercial production
last 2009. Out of 14 hectares that was partially declared, only 4 hectares was disturbed.
Production area is approximately 1 hectare; 3 hectares were used as stockpile area of marble
block by-products, wasted and haul access road.
Average production is around 1,700 m3 per year. Marble quarry operation is using wire
saws/diamond beads. Power is supplied by 220 KVA, 440 Volt Generator Set. Water is required to
cool off diamond beads and consumes around 50m3 of water for wire saws and drilling machines.
Waste/Marble Block by-products are stock piled along the slope and will be subjected to size
reduction by hydraulic breaker to be used or sold as reclamation materials, armor rock, quarry
run rock (QRR) and /filling materials. There is no crushing plant facility in the quarry at present.
Since there are no Mined-Out areas, tree planting was done along the quarry road and was also
done on private private/public land with memorandum of agreement. The total area planted as
of 2018 is around 20.16 hectares equivalent to 68,050 assorted trees.
Quarry drainage/Run-off Water is through drainage canals from top-most portion of quarry bench
passing through series of silt traps and finally settled to silt collector sumps below the quarry road.
The length of the quarry access road is around 500 meters leading to Barangay road.
Support facilities are Quarry Field Office, Pantry areas, Motorpool/Washing Area with Water-Oil
Separator, Holding Area for chemical, oil and waste materials, Electrical Motorpool and 10-Footer
container van serving as storage/tool room.

QUARRY VENTURES PHILIPPINES, INC. Environmental Impact Assessment
February 2019 1-20
Figure 1-7: Parcel 1 Operation - Project Layout

QUARRY VENTURES PHILIPPINES, INC. Environmental Impact Assessment
February 2019 1-21
1.6.2 Major Components
A `summary of the major components of the project is given in Table 1-5.
Table 1-5: Summary of Major Components
Project Components Existing Planned
Quarry
Parcel 1 - Covered by MPSA No.
111-98-VII - 14.2 hectares
- Same MPSA - 81 hectares
Parcel 2 - Covered by MPSA No. 111-98-VII
- 81 hectares
Parcel 3 - Covered by MPSA No. 111-98-VII
- 324 hectares
Parcel 5 - Covered by MPSA No. 111-98-VII
- 81 hectares
Quarry Facilities
- Stockpile - Admin building, staff
house, laboratory, motor pool and nursery
- Waste dump
- Stockpile Parcel 1: 0.5 hectares Parcel 2: 0.5 hectares Parcel 3: 1 hectare Parcel 5: 1 hectare
- Admin building, staff house, laboratory, motor pool and nursery Parcel 1: 3,100m2 Parcel 2: 1,100m2 Parcel 3: 6,000m2 Parcel 5: 4,100m2
- 2 Crushers (Parcel 3 and 5) 960,000 MT/yr. 250MT/hr
- Parcel 3 Road Network: 500m
Extraction Method Surface Mining – Quarrying
Extraction Rate
- Parcel 1: 3,000 m3/y - Parcel 1: 3,000 cubic meter/yr (Marble Blocks)
- Parcel 2: 16,200 MT/Yr (Marble Blocks)
- Parcel 3: 990,000 MT/Yr, broken down as follows: 16,200 MT/yr Marble Blocks 973,800 MT/yr Aggregates
- Parcel 5: 1,937,000 MT/Yr (Basalt)
Total Project Area 567 hectares
Commodity Marble Blocks and Boulders
Limestone and basalt which will be processed into marble and
aggregate products.
Waste Management
Quarry Pollution Control Structures
- - Drainage systems - settling ponds
Parcel 1: 1 Parcel 2: 1 Parcel 3: 2 Parcel 5: 1
- Silt collector sump

QUARRY VENTURES PHILIPPINES, INC. Environmental Impact Assessment
February 2019 1-22
Project Components Existing Planned
Parcel 1: 2 Parcel 2: 2 Parcel 3: 9 Parcel 5: 5
Domestic Wastewater Treatment
Septic tanks
Solid and Hazardous waste
- waste segregation - Materials Recovery Facility - storage area (laydown): hazardous - haulage and treatment/disposal of hazardous wastes by the
EMB accredited treaters
A detailed description of the project components is provided in the succeeding discussions.
Mining Method (Current Operation)
Marble Block Operation
After 2 working benches have been developed, the first step in the process is topping and or
facing. Topping is the removal of the cracky portion and irregular surface wherein cutting is done
horizontally. Facing on the other hand, is the removal of the cracky portion and undesired
color/surface using wiresaw and cutting is done vertically. It will then be the bench height. Once
planar surface is exposed, the quarry block is evaluated for color, solidity and its amenability to
be cut into slabs or tiles. The bad and unsuitable marble quarry block is removed to access the
inner and more likely good quality blocks.
The good quality deposit/block is the prepared for production through wire sawing. This entails
drilling of intersecting holes. Vertical and horizontal holes are drilled using rotary drills, MPH-100.
The intersected drill holes are where the diamond cable of the wiresaw is made to pass prior to
actual cutting of the Quarry block. Cutting is both Vertical and Horizontal planes.
The quarry block is then cut into bancatta using diamond wire and wiresaw machines. First step
is the horizontal cut, followed by vertical side cut to separate the quarry block from the solid mass.
After cutting the horizontal and side channel, cutting of vertical cut is made from the nearest free
face (Bancatta Cutting) once the bancatta is cut and or separated vertically and horizontally, it is
then toppled by the use of either hydraulic jack (titano jack), air bags or hydro bags. Quarry waste
materials consisting of clay, soil and small fragments are placed in front of bancatta to serve as
cushion when bancatta is toppled down in order to prevent breaking of bancatta. The toppled
bancatta then inspected and laid out to give the best block that can be produced with regards to

QUARRY VENTURES PHILIPPINES, INC. Environmental Impact Assessment
February 2019 1-23
soundness, color and tone. The end product of the marble block is also considered during the lay-
out. Marble block sizes range around 1.5m (W) x 1.3m (H) x 2.0m to 3.0m (L). Marble blocks are
separated from bancatta using wiresaw especially designated to cut smaller sizes and or by line
drilling using jack hammers and splitted by wedging using steel plug and feathers.
When blocks are separated, it is then classified as to size, color tone and overall quality. Blocks
are then marked with identification and coded. Each block produced has its own index card for
references. Blocks are then loaded into a Reo 5 tonner truck for delivery to plant site together
with each index card.
Limestone Boulders Operation
By product of marble blocks are scraps and boulders. Scrap blocks are processed in the plant to
produce marble strips, normally 300mm x random or 400mm by random. Boulders normally head
size and below are being sold locally which are being used as backfilling materials and together
with small sizes, clay etc are used for reclamation purposes.
Mining Method (Proposed Operation)
Surface Mining Method, particularly, quarrying will be employed for the whole project operation.
The quarry operation will be divided into two stages; the quarry development and the production
stage.
Development phase is the stage in quarry where preparation for full blasts operation will be
carried out. It will involve removal and grubbing of vegetative covers, stripping of overburden and
establishment of production benches, drainage canals, settling ponds and access roads to the
deposit.
The extraction or production stage is the actual removal of the deposit from the developed
(cleared) benches. The major activities in this stage are drilling for quality control and simply
ripping and dozing on soft and medium ground while drilling, cutting, and blasting for hard rock
area followed by loading and hauling of quarry materials.

QUARRY VENTURES PHILIPPINES, INC. Environmental Impact Assessment
February 2019 1-24
Figure 1-8: Drilling and Blasting Diagram
The marble extraction will utilize the use of diamond wiresaw complimented by rock drilling.
When the blocks are already separated from the big mass or bancatta, it will undergo quality
checking as to size, color, tone, and overall quality. The blocks that pass the quality checking will
be mark with identification numbers and client codes prior to delivery to the processing plant.
Loosened/Blasted limestone and basalt materials from the bench will be loaded by either a wheel
loader or backhoe (excavator) shovel into a 25-ton truck and will be transported to the crusher or
nearby area. By the time the loosened materials are fully hauled out, a new loading area will be
available. The cycle of drilling for quality control, blasting, excavation, loading and hauling
continues until all programmed benches have been subjected for production and resource
exhaustion.
Blasting Operation
For soft ores, rippers and the excavator will be used to extract and load the limestone to the
dump trucks. For hard ores, blasting will be employed. Only government authorized blasting
contractors will be engaged in the blasting. Controlled blasting using delays will be used to
minimize ground vibrations, fly rocks and misfires. Desired boulder size is less than 1m. The
following blasting parameters will be used:

QUARRY VENTURES PHILIPPINES, INC. Environmental Impact Assessment
February 2019 1-25
When blasting is needed, the quarry will be prepared for a conventional drill and blast
operation with a bench height of 10 meters. Blasting and explosive materials will be provided
by the blasting contractor.
Two drilling patterns will be used for the production blast: staggered pattern and square
pattern. Timing system used is the hole by hole blasting with blast design composed of the
following. The blasting nomenclature are shown in Figure 1-9.
Free End Blast;
Forward Echelon;
Reversed Echelon; and
“V” Blast.
Blast Geometry/Parameter:
Drill Hole Diameter - 89 to 102mm
Bench Height - 10 m
Sub-drill - 1.00 m
Burden - 3.00 m
Spacing - 3.50 m
Typical loading of 10m hole:
Explosive Column - 7.60 m
Stemming height - 2.40 m
Kilograms (kgs) of Explosive/hole - 38 kgs

QUARRY VENTURES PHILIPPINES, INC. Environmental Impact Assessment
February 2019 1-26
Source: Blasting and Explosives Quick Reference Guide, Dyno Nobel Asia Pacific, Pty Limited 2011
Figure 1-9: Blasting Nomenclature
Crushing of Aggregates
The Project is expected to produce a total of 973,800 MTPY of limestone aggregates and 924,000
MTPY of basalt aggregates covering two (2) 500 TPH crushing plants in Parcels 3 and 5
respectively.
The blasted materials will undergo crushing, screening and classifying processes with the
introduction of water spray to eliminate dust, silt and other materials that are not part of the final
product. The run-of-mine-ore will undergo three stages: (1) crushing, (2) screening and (3)
classifying:
Below are the discussions on each stage of processing:
a. Blasted materials from the quarry are fed into the feeding hopper to the reciprocating
feeder and to the grizzly bars.
b. The undersize from the grizzly bars will go to the primary crusher with a jaw opening of
3-inch.

QUARRY VENTURES PHILIPPINES, INC. Environmental Impact Assessment
February 2019 1-27
c. The crushed products from the primary jaw crusher is conveyed to the triple deck
vibrating screen with an opening of 1 ½ inch, ¾ inch and 3/8 inch respectively.
d. The oversize from the 11/2 inch opening is then fed into the secondary cone crusher for
further grinding and then returned to the triple deck vibrating screen.
e. The undersize passing through the ¾ inch opening will be conveyed to the stockpile area
designated as G-1, which is estimated to comprise about 35% of the total product ratio.
f. The materials passing through the ¾ inch screen opening and retained at the 3/8 inch
screen opening is conveyed to the stockpile area designated as G-3/4. This product is
estimated to make up 31% of the total production.
g. The materials passing through the 3/8 inch screen materials comprises the slimes and
the G-3/8 product that is estimated to be about 18% of the total product. These
materials are conveyed to the stockpile area for G-3/8.
h. The slimes and silt goes to the sand classifier to separate the sand materials from the
silt. The washed sand materials are transported through a conveyor to the S-1 stockpile
while the waste water goes to the settling pond where it will undergo a series of settling
process. Clear water sorted at the last pond is being recycled to the crusher. The settling
ponds are regularly dredged to maintain its capacity and the collected silt materials are
dried up at the adjacent drying beds. Silt materials are hauled to the base coarse
stockpile for mixing.
The crushing schematic diagram is shown in Figure 1-10 below.
Figure 1-10: Schematic Diagram of Crushing Plant

QUARRY VENTURES PHILIPPINES, INC. Environmental Impact Assessment
February 2019 1-28
Haul Road and Access Road
Quarry haul and access roads will be developed in the project area. The said facilities will be
constructed following the topographic surface contour and shall have a maximum gradient of 8%
to ensure safety and efficiency. Haul road and access road shall be ballasted with waste rock
extracted from the quarry area to provide stability.
Figure 1-11: Loading and Hauling Diagram
Stockpile and Dumps
For the expansion, stockpile and waste dumps will still be established within the quarry site. All
good materials will be hauled from the quarry site to the stockpile area. Moreover, all quarry
wastes specifically topsoil and boulders will be stockpiled in the waste dump area and will be
utilized as a backfilling materials during progressive rehabilitation.
Stockpile slope will be kept at low angle and height to minimize slumping. The proposed height
of the stockpile will depend on the angle-of-repose of the material. This is to ensure that the
maximum volume of materials will be stockpiled without sacrificing safety.
The stockpile and dumps to be constructed will have the following area:

QUARRY VENTURES PHILIPPINES, INC. Environmental Impact Assessment
February 2019 1-29
Parcel Covered Area
Parcel 1 0.5 hectare
Parcel 2 0.5 hectare
Parcel 3 1 hectare
Parcel 5 1 hectare
Figure 1-12: Crushing, Conveying, and Stockpiling Diagram
1.6.3 Support Facilities
The following facilities will be constructed within the MPSA area to support the proposed project
operation:
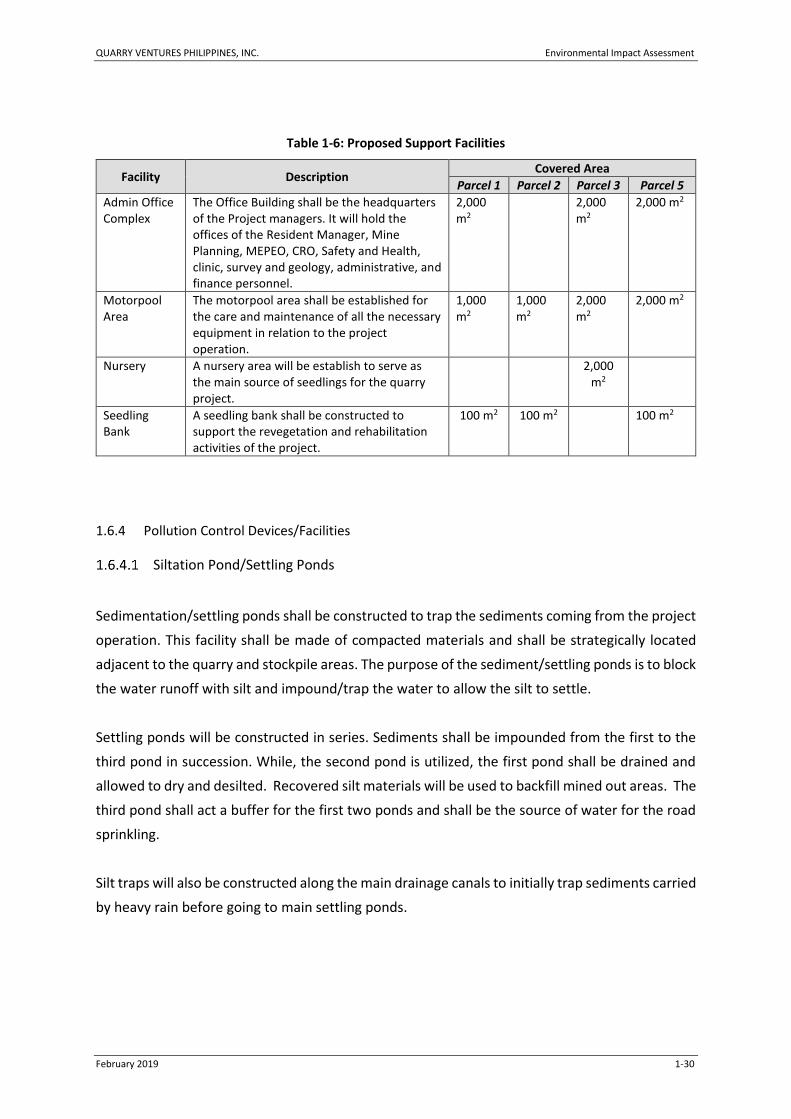
QUARRY VENTURES PHILIPPINES, INC. Environmental Impact Assessment
February 2019 1-30
Table 1-6: Proposed Support Facilities
Facility Description Covered Area
Parcel 1 Parcel 2 Parcel 3 Parcel 5
Admin Office Complex
The Office Building shall be the headquarters of the Project managers. It will hold the offices of the Resident Manager, Mine Planning, MEPEO, CRO, Safety and Health, clinic, survey and geology, administrative, and finance personnel.
2,000 m2
2,000 m2
2,000 m2
Motorpool Area
The motorpool area shall be established for the care and maintenance of all the necessary equipment in relation to the project operation.
1,000 m2
1,000 m2
2,000 m2
2,000 m2
Nursery A nursery area will be establish to serve as the main source of seedlings for the quarry project.
2,000 m2
Seedling Bank
A seedling bank shall be constructed to support the revegetation and rehabilitation activities of the project.
100 m2 100 m2 100 m2
1.6.4 Pollution Control Devices/Facilities
Siltation Pond/Settling Ponds
Sedimentation/settling ponds shall be constructed to trap the sediments coming from the project
operation. This facility shall be made of compacted materials and shall be strategically located
adjacent to the quarry and stockpile areas. The purpose of the sediment/settling ponds is to block
the water runoff with silt and impound/trap the water to allow the silt to settle.
Settling ponds will be constructed in series. Sediments shall be impounded from the first to the
third pond in succession. While, the second pond is utilized, the first pond shall be drained and
allowed to dry and desilted. Recovered silt materials will be used to backfill mined out areas. The
third pond shall act a buffer for the first two ponds and shall be the source of water for the road
sprinkling.
Silt traps will also be constructed along the main drainage canals to initially trap sediments carried
by heavy rain before going to main settling ponds.

QUARRY VENTURES PHILIPPINES, INC. Environmental Impact Assessment
February 2019 1-31
Quarry Drainage
Quarry drainage to be constructed will have a sufficient depth to handle volume of storm runoff
and will be laid along the bench toe. Berms will be provided on the unprotected crest side to
ensure safety.
1.6.5 Utilities
Water Requirement
Minimal water requirement will be needed by the project. The water requirement is estimated to
be 10-15 m3/day. Domestic water requirement for mine offices and other facilities will be sourced
from deepwell/groundwater available on site. Mine water diverted through canals and collected
in settling ponds can be recycled for road spraying and truck/equipment washing.
Power Requirement
The power requirement for each parcel are the following. The power is supplied by by the Visayan
Electric Company (VECO) which draws their supply from National Power Corporation (NPC) and
generators.
Table 1-7: Estimated Power Requirements per Parcel
Parcel Power Requirement (KW) Source
Parcel 1 120 Generator or VECO
Parcel 2 120 Generator or VECO
Parcel 3 120 Generator or VECO
Parcel 5 120 Generator or VECO

QUARRY VENTURES PHILIPPINES, INC. Environmental Impact Assessment
February 2019 1-32
Figure 1-13: Site Development Plan for Parcel 1

QUARRY VENTURES PHILIPPINES, INC. Environmental Impact Assessment
February 2019 1-33
Figure 1-14: Site Development Plan for Parcel 2
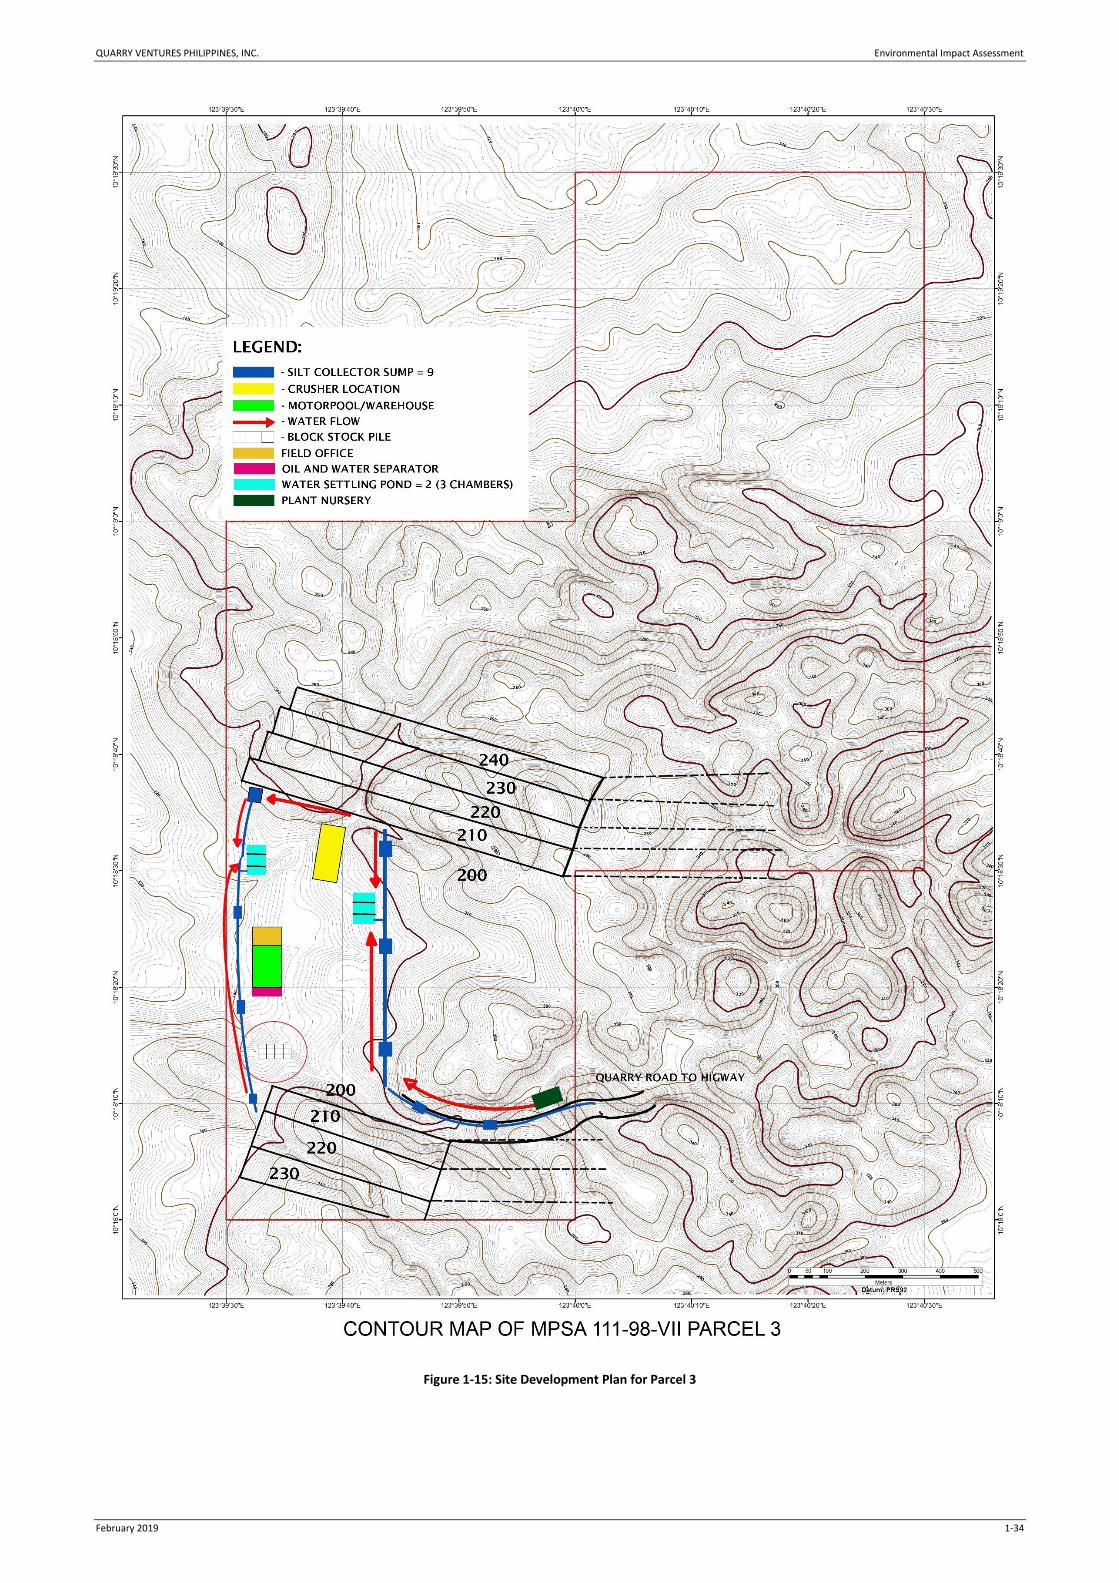
QUARRY VENTURES PHILIPPINES, INC. Environmental Impact Assessment
February 2019 1-34
Figure 1-15: Site Development Plan for Parcel 3

QUARRY VENTURES PHILIPPINES, INC. Environmental Impact Assessment
February 2019 1-35
Figure 1-16: Site Development Plan for Parcel 5

QUARRY VENTURES PHILIPPINES, INC. Environmental Impact Assessment
February 2019 1-36
Figure 1-17: Proposed Acces Road for Parcel 3

QUARRY VENTURES PHILIPPINES, INC. Environmental Impact Assessment
February 2019 1-37
1.7 Process / Technology
There is already an existing marble quarrying operation being conducted by QVPI in Parcel 1
covering 14.999 hectares of the 81 hectares alloted in the ECC. This operation will continue to be
implemented in Parcel 1 and will be introduced to Parcel 2 and part of Parcel 3. The marble
quarrying operation will utilize the use of diamond wiresaw complimented by rock drilling. This
method is a three-step block cutting.
First, a quarry rock area to be put into production will be qualify by means of color, structural
discontinuities. From the defined quarry block, each bancatta will be laid out, normally with a
width of 2.6 meters. Each quarry block will have three to four (3-4) bancattas that will measure
for around 10m x 7m x 2.6m.
After the two (2) working benches have been developed, topping or facing will be conducted. This
is done to remove the blocks with cracks, weathered and irregular outer layer of the mineable
marble block using the wiresaw. Once the planar surface is exposed, the quarry block will be
evaluated for color, solidity and its amenability to be cut into slabs and tiles. The unsuitable
marble quarry block will be removed to access the inner part to expose the high-quality marble.
The high-quality marble will then be prepared for wiresaw cutting. This will entail the drilling of
intersecting holes (25-32 mm) by a rock drill equipment. Vertical and horizontal holes will be
drilled on the edges of the defined quarry block to be mined using rotary drill (MPH-100 drill). On
the intersected drill holes the diamond cable of wiresaw will be made to pass, prior to actual
cutting of the marble block. Cutting will be done in horizontal and vertical motion.

QUARRY VENTURES PHILIPPINES, INC. Environmental Impact Assessment
February 2019 1-38
Figure 1-18: Laying out of Wiresaw to cut the Marble into Blocks
The marble block will be cut again into bancattas using wiresaw after drilling the required holes
intersecting horizontally and vertically. Once the bancatta has been cut (10m x 8m x 2.6m) and or
separated from the mass, it will then be toppled by the use of hydraulic jack, air jack or hydro bag
or combination of any of the three. Quarry waste materials comprising of clay, soil and small
marble fragments will be placed in front of the bancatta to serve as cushion during the toppling
process. The toppled bancatta will be inspected and laid out to give the best block that can be
produced with regards to soundness, color and tone. These will be done either by drilling with
jackhammers and will be spilled by wedging or cut by small wiresaw designed for block trimming.

QUARRY VENTURES PHILIPPINES, INC. Environmental Impact Assessment
February 2019 1-39
Figure 1-19: Toppling Bancatta Using Titano Jack

QUARRY VENTURES PHILIPPINES, INC. Environmental Impact Assessment
February 2019 1-40
Figure 1-20: Toppling Bancatta Using Hydro Bag
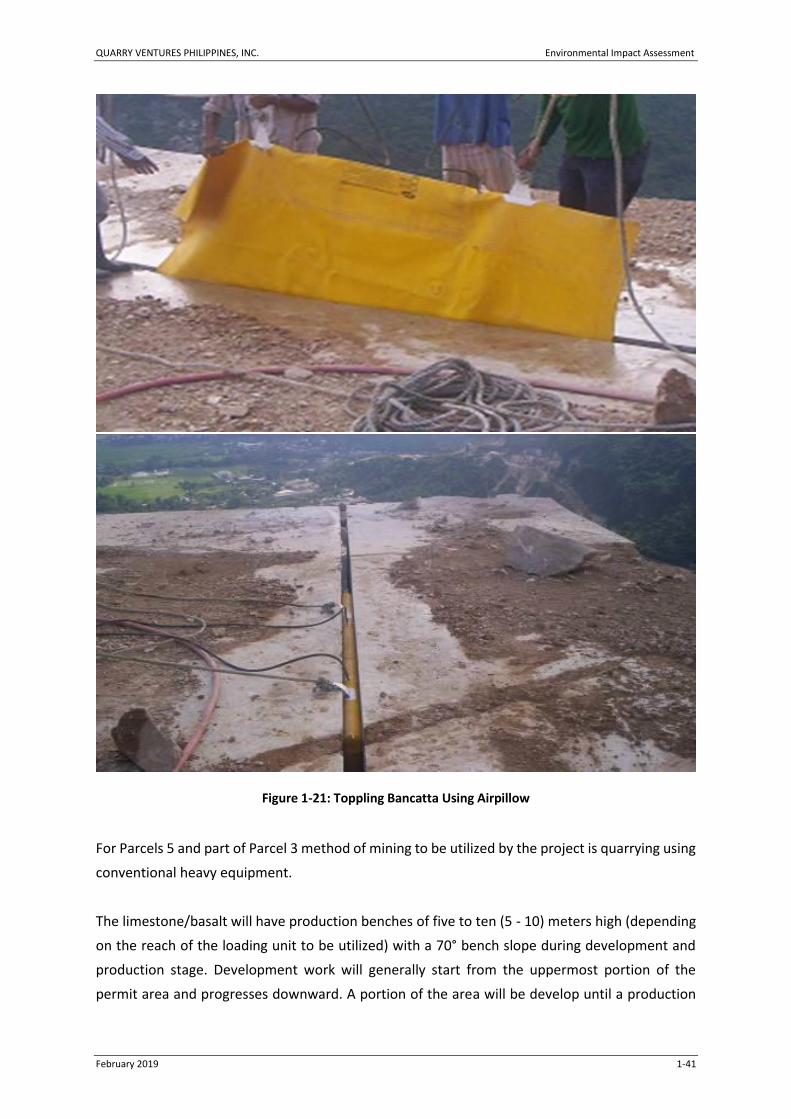
QUARRY VENTURES PHILIPPINES, INC. Environmental Impact Assessment
February 2019 1-41
Figure 1-21: Toppling Bancatta Using Airpillow
For Parcels 5 and part of Parcel 3 method of mining to be utilized by the project is quarrying using
conventional heavy equipment.
The limestone/basalt will have production benches of five to ten (5 - 10) meters high (depending
on the reach of the loading unit to be utilized) with a 70° bench slope during development and
production stage. Development work will generally start from the uppermost portion of the
permit area and progresses downward. A portion of the area will be develop until a production

QUARRY VENTURES PHILIPPINES, INC. Environmental Impact Assessment
February 2019 1-42
bench with a slope of about 70° and a loading area of 30 meters, will be formed enough to sustain
the safe movement of quarry equipment. Once a bench is formed, a new working level below (5
– 10 m downward) will be worked out to form another set of bench. Should safety and economy
warrant, the cycle of creating a new working level (benches) at lower elevation will continue until
desired target is reached. Incidental production is generally common in the development stage.
Limestone and basalt materials may be extracted while access and benches are being established.
Generally, the working parameters of the limestone quarry will be the following:
Table 1-8: Limestone Quarry Details
Parameters Devt / Prod’n stage Final Pit
Bench slope 70° - 75° 60-70°
Bench height 5 - 10 m 5m
Bench width 30 m (min.) 10m
Pit slope 60-70° (max.) 60-70°
Table 1-9: Pit Bottom
Year 1 Year 2 Year 3 Year 4 Year 5
Parcel 1 marble Construction and Development
260 260 260 260
Parcel 2 marble Construction and Development
280 280 280 280
Parcel 3 marble Construction and Development
200 200 200 200
Parcel 3 aggregates Construction and Development
200 200 200 200
Parcel 5 aggregates 370 330 310 310 310
Table 1-10: Mining Area to be Disturbed per Year
Year 1 Year 2 Year 3 Year 4 Year 5
Parcel 1 marble Construction and Development
1 1.9 2.4 2.8
Parcel 2 marble Construction and Development
1.45 1.93 2.3 2.5
Parcel 3 marble Construction and Development
1.15 2.26 2.8 3.1
Parcel 3 aggregates Construction and Development
2.61 5.96 13.56 19.8
Parcel 5 aggregates 4.51 7.37 10.67 14.92 18.7
Table 1-11: Coordinates and Mine Life Capacity of Parcel 1
Year Latitude Longitude Capacity
Year 5 10°15’30”N 123°40’00”E 300,000MT

QUARRY VENTURES PHILIPPINES, INC. Environmental Impact Assessment
February 2019 1-43
Year Latitude Longitude Capacity
Year 5 10°15’40”N 123°40’00”E
Year 5 10°15’44”N 123°40’08”E
Year 5 10°15’40”N 123°40’05”E
Year 5 10°15’30”N 123°40’05”E
Year 25 10°15’40”N 123°40’15”E 1.8MMT
Year 25 10°15’30”N 123°40’15”E
Table 1-12: Coordinates and Mine Life Capacity of Parcel 2
Year Latitude Longitude Capacity
Year 5 10°16’35”N 123°40’15”E
300,000MT Year 5 10°16’40”N 123°40’15”E
Year 5 10°16’30”N 123°40’28”E
Year 5 10°16’30”N 123°40’20”E
Year 25 10°16’40”N 123°40’20”E
2MMT Year 25 10°16’55”N 123°40’30”E
Year 25 10°16’30”N 123°40’30”E
Table 1-13: Coordinates and Mine Life Capacity of Parcel 3
Year Latitude Longitude Capacity
Year 5 10°18’00”N 123°39’35”E
400,000MT Year 5 10°18’10”N 123°39’35”E
Year 5 10°18’10”N 123°39’55”E
Year 5 10°18’00”N 123°39’55”E
Year 5 10°18’35”N 123°39’30”E
7MMT
Year 5 10°18’50”N 123°39’30”E
Year 5 10°18’45”N 123°39’45”E
Year 5 10°18’45”N 123°40’00”E
Year 5 10°18’30”N 123°40’00”E
Year 5 10°18’30”N 123°39’45”E
Year 25 10°18’10”N 123°39’45”E
1.5MMT Year 25 10°18’20”N 123°39’45”E
Year 25 10°18’20”N 123°40’00”E
Year 25 10°19’05”N 123°40’00”E 35MMT
Year 25 10°19’05”N 123°40’30”E
Table 1-14: Coordinates and Mine Life Capacity of Parcel 5
Year Latitude Longitude Capacity
Year 5 10°17’00”N 123°44’15”E
60MMT
Year 5 10°17’12”N 123°44’15”E
Year 5 10°17’12”N 123°44’20”E
Year 5 10°17’18”N 123°44’20”E
Year 5 10°17’18”N 123°44’15”E
Year 5 10°17’22”N 123°44’15”E
Year 5 10°17’22”N 123°44’30”E
Year 5 10°17’26”N 123°44’30”E

QUARRY VENTURES PHILIPPINES, INC. Environmental Impact Assessment
February 2019 1-44
Year Latitude Longitude Capacity
Year 5 10°17’26”N 123°44’15”E
Year 5 10°17’26”N 123°44’15”E
The mine plans for all the parcels and the details are given in Figure 1-22 to Figure 1-43.

QUARRY VENTURES PHILIPPINES, INC. Environmental Impact Assessment
August 2018 1-45
Figure 1-22: Mining Plan - Parcel 1 Year 2
Figure 1-23: Mining Plan - Parcel 1 Year 3
Figure 1-24: Mining Plan - Parcel 1 Year 4

QUARRY VENTURES PHILIPPINES, INC. Environmental Impact Assessment
August 2018 1-46
Figure 1-25: Mining Plan - Parcel 1 Year 5
Figure 1-26: Mining Plan - Parcel 2 Year 2
Figure 1-27: Mining Plan - Parcel 2 Year 3

QUARRY VENTURES PHILIPPINES, INC. Environmental Impact Assessment
August 2018 1-47
Figure 1-28: Mining Plan - Parcel 2 Year 4
Figure 1-29: Mining Plan - Parcel 2 Year 5
Figure 1-30: Mining Plan - Parcel 3 Aggregates Year 2

QUARRY VENTURES PHILIPPINES, INC. Environmental Impact Assessment
August 2018 1-48
Figure 1-31: Mining Plan - Parcel 3 Aggregates Year 3
Figure 1-32: Mining Plan - Parcel 3 Aggregates Year 4
Figure 1-33: Mining Plan - Parcel 3 Aggregates Year 5

QUARRY VENTURES PHILIPPINES, INC. Environmental Impact Assessment
August 2018 1-49
Figure 1-34: Mining Plan - Parcel 3 Marble Year 2
Figure 1-35: Mining Plan - Parcel 3 Marble Year 3
Figure 1-36: Mining Plan - Parcel 3 Marble Year 4

QUARRY VENTURES PHILIPPINES, INC. Environmental Impact Assessment
August 2018 1-50
Figure 1-37: Mining Plan - Parcel 3 Marble Year 5
Figure 1-38: Mining Plan - Parcel 5 Year 0
Figure 1-39: Mining Plan - Parcel 5 Year 1

QUARRY VENTURES PHILIPPINES, INC. Environmental Impact Assessment
August 2018 1-51
Figure 1-40: Mining Plan - Parcel 5 Year 2
Figure 1-41: Mining Plan - Parcel 5 Year 3

QUARRY VENTURES PHILIPPINES, INC. Environmental Impact Assessment
August 2018 1-52
Figure 1-42: Mining Plan - Parcel 5 Year 4
Figure 1-43: Mining Plan - Parcel 5 Year 5

QUARRY VENTURES PHILIPPINES, INC. Environmental Impact Assessment
August 2018 1-53
Figure 1-44: Estimated 5-Year and 25-Year Mine Area for Parcel 1 and 2

QUARRY VENTURES PHILIPPINES, INC. Environmental Impact Assessment
August 2018 1-54
Figure 1-45: Estimated 5-Year and 25-Year Mine Area for Parcel 3

QUARRY VENTURES PHILIPPINES, INC. Environmental Impact Assessment
August 2018 1-55
Figure 1-46: Estimated 5-Year and 25-Year Mine Area for Parcel 5

QUARRY VENTURES PHILIPPINES, INC. Environmental Impact Assessment
February 2019 1-56
1.8 Project Size
1.8.1 Availability of Raw Materials
The estimated basalt deposit in Parcel 5 hosted by the Cansi Basalt are 82. 33 million cubic meters
of indicated resources and 45.94 million cubic meters of inferred resources. The
limestone/marble deposits within the Uling Limestone in Parcel 2 have an indicated resource of
61.22 million cubic meters and 29.8 million cubic meters of inferred resources. In Parcel 3, the
indicated resource is 262.60 million cubic meters and the inferred resource is 37.9 million cubic
meters. These were based on the Geologic Exploration and Resource Assessment Report prepared
by Competent Person Geologist Rolando Pena in 2015.
1.8.2 Production Capacity and Area
Currently, QVPI have an allowable production capacity of 3,000 m3/y of marble blocks and boulders
covering a total area of 14.02 hectares as per the approved ECC. The proposed project expansion
will cover a total area of 567 hectares having an annual production rate of 37,100 MT/yr of
Marble, 973,900 MT/yr of Limestone Aggregates and 1,937,000 MT/yr of Basalt.
Table 1-15: Estimated Production Capacity per Parcel
Parcel Area (current)
Area (expansion)
Production Capacity (current)
Production Capacity
Parcel 1 14.02 hectares
81 hectares 3,000 m3 or 4,800 MT marble blocks/year
6,000 m3 or 9,600 MT marble blocks/year
Parcel 2 81 hectares 16,200 MT marble blocks/year
Parcel 3 324 hectares 16, 100 MT marble blocks/year
973, 900 MT limestone aggregates per year
Parcel 5 81 hectares 1,937,000 MT basalt/year
1.8.3 Mine Life
Marble Quarry
Parcel Proposed Extraction
Capacity Mineral Reserve
Capacity Estimated Mine Life
Parcel 1 3,000 m3/yr 274,510 m3 92 years
Parcel 2 6,750 m3/yr 61,230,00 m3 9,071 years
Parcel 3 6,750 m3/yr 262,600,000 m3 38,904 years
Aggregates Quarry

QUARRY VENTURES PHILIPPINES, INC. Environmental Impact Assessment
February 2019 1-57
Parcel Proposed Extraction
Capacity Mineral Reserve
Capacity Estimated Mine Life
Parcel 3 990,000 MT/yr 709,020,000 MT 716
Parcel 5 1,937,400 MT/yr 230,440,000 MT 119
Based on the calculation of the proposed extraction capacity, and the mineral reserve capacity,
the mine life for the project area is estimated to last for 38,000 years for marble and 700 years
for the aggregates. However, the proponent only plans to operate on the project site up to the
MPSA validity of 5 years, subject to renewal, if necessary.
1.9 Project Phases
1.9.1 Pre-Construction Phase
This phase involves the hiring of skilled local employees in preparation for project development.
During this phase all permits mandated by the government shall be acquired by the company
prior to the construction phase.
The Information Education and Communication (IEC) campaign shall be continuously
implemented to update the stakeholders on the current and future development of the project.
1.9.2 Construction Phase
This phase will require hiring of additional manpower to support the construction activities of the
project. Local hiring of skilled individual will be prioritized/implemented by the company.
Construction of haul road and access road shall be the first activity during this phase. The
construction of these facilities shall be conducted in a manner wherein minimal disturbance will
be created. All roads shall follow the topographic contour of the area and shall be equipped with
road drainage for further environmental measures.
Temporary settling ponds shall be developed within the construction area to cater the mitigation
of possible siltation and water contamination. If the constructed ponds will no longer be usable
during the operation phase, such facility shall be dewatered, backfilled and revegetated.
The construction of horizontal buildings shall conform to the Building Code of the Philippines to
ensure safety and stability. Clearing, grubbing and compaction will be done at the region wherein
QUARRY VENTURES PHILIPPINES, INC. Environmental Impact Assessment
February 2019 1-58
construction will be conducted. The said activity shall be limited to the area wherein the facilities
will be erected to minimize the expanse of disturbance.
A series of settling ponds will be established within the quarry area with the use of backhoe to
facilitate the excavation of soil. All waste materials will be stockpiled at the waste dump and shall
be utilized as a backfilling medium for progressive rehabilitation.
1.9.3 Operation Phase
Upon the completion of all the support facilities and other project components, operation phase
will initiate. Surface mining method will be utilized by the project operation. Quarry operation will
be started from clearing and grubbing of the identified quarry area, stripping of overburden
materials, followed by the development of the production benches, bench sampling, actual
quarrying and hauling of limestone (marble and aggregates) and basalt.
The topsoil or overburden will be transported to waste dump area or in a previously
excavated/mined-out areas and/or designated topsoil stockpile area to be used in the progressive
rehabilitation activity.
Water impounded in the settling pond shall be utilized as the source of water for the sprinkling of
haul roads and access roads. Environmental management and monitoring shall be regularly
implemented during this phase to alleviate further environmental contamination.
1.9.4 Abandonment Phase
Consistent with the basic policy of the State to assure the availability, sustainability and equitable
distribution of the country's natural resources, the Philippine Government adopts the policy that
mining activities shall be managed in a technically, financially, socially, culturally and
environmentally responsible manner to promote the general welfare of the country. One of
objectives of this policy is the establishment of a functional post-disturbance land use capability.
Moreover, remediation and rehabilitation of abandoned mines shall be accorded top priority to
address the negative impacts of past mining activities. This is through protection and
conservation of environment by identification of appropriate rehabilitation and mitigating
measures per project component to inhibit and/or prevent any possible risks or adverse impacts
that could endanger human and its environment.
Listed below are the major objectives of Final Mine Rehabilitation Plan:

QUARRY VENTURES PHILIPPINES, INC. Environmental Impact Assessment
February 2019 1-59
Rehabilitate/re-vegetate all the disturbed areas within the MPSA affected by quarry
operations by reshaping/re-contouring affected areas prior to re-vegetation;
Progressively rehabilitate the area to a condition agreed/suggested by the community
during the stakeholder consultation;
Minimize long term visual impacts due to the inactivity of the mine site by employing
effective mitigation and measures creating landforms with vegetation compatible with
the surrounding thus establishing a functional post-disturbance land use capability;
Eliminate safety and health risks of the inactive mine site to the surrounding communities;
Remove all unnecessary mine facilities and equipment used in operations and rehabilitate
the areas prior to abandonment; and
Provide the estimated cost that will be incurred from the implementation of the identified
rehabilitation and/or decommissioning strategies and the consequent final land use.
Proposed Final Land Use for each Component
The proposed final land use for the project will be a stable and revegetated mined-out area that
is sustainable and promotes the recolonization of the pre-project flora and fauna.
Table 1-16: Proposed Final Land Use
Mine Component Final Land Use
Quarry area Revegetated area. This will entail backfilling using the materials from the waste dump, soil conditioning, planting with endemic species and maintenance works.
Crusher To be dismantled and utilize in other mining project owned by the company.
Admin building, staff house, laboratory, motor pool and nursery
Facilities/structures that are usable maybe donated to the community. This however will depend on the FMRDP consultation to be conducted upon the issuance of the ECC and/or during the preparation of the FMRDP report.
Siltation Ponds Revegetated area. All siltation ponds in the quarry area will be maintained until full rehabilitation of the mined-out parcels. As rehabilitation is progressive, settling ponds that are no longer required will be decommissioned and rehabilitated. The excavated materials may, in the future have economic value; otherwise, these will be used for backfill, grading or removed from the site.
Haul roads and access roads If considered useful by the community, internal haul road can be left. If not required, these will be re-planted; water diversion measures will be installed for runoff interception and to enhance re-vegetation. Signs, guardrails and barriers will be removed or retained depending upon the consultation with the stakeholders.
Stockpile/Stockyard Area Revegetated area This will entail backfilling using the materials from the waste dump, soil conditioning, planting with endemic species and maintenance works.

QUARRY VENTURES PHILIPPINES, INC. Environmental Impact Assessment
February 2019 1-60
A Final Mine Rehabilitation and Decommissioning Plan (FMRDP) will be prepared and submitted
to the Mines and Geosciences Bureau for review and approval. Among the plans to be considered
are appropriate rehabilitation and decommissioning plans that will best benefit the community.
1.10 Project Manpower
An additional of 80 manpower will be needed to facilitate the project operation. Parcel 1 and 2
is run with 53 personnel, and the same number of Plant/Maintenance Repair and Quarry
Operation personnel will be needed for Parcel 3 and Parcel 5 each. The breakdown of the
manpower requirement is given below.
Table 1-17: Manpower for Existing Operation and Expansion
Position Current Personnel for Parcel 1 and 2 Additional for Parcel 3 and 5
Quarry Manager 1
PCO 1
CRO 1
SHE 1
MEPEO 1
Tenement 1
Admin 5
Accounting / Finance 5
Plant/Maintenance Repair 18 40 – 20
Quarry Operation 19 40
Total 153
1.11 Project Cost
The indicative project cost to put-up the project is PHP150 Million.
QUARRY VENTURES PHILIPPINES, INC. Environmental Impact Assessment
February 2019 2-61
2 ANALYSIS OF KEY ENVIRONMENTAL IMPACTS
2.1 Land
2.1.1 Land Use and Classification
General Description of the Province of Cebu
The Province of Cebu is one of the most densely populated areas in the Philippines. To sustain
such a great number of inhabitants, extensive cultivation of the land for the production of
foodstuffs has to be done. The people being primarily corn consumers clear every available spot
of their land to plant this cereal crop, whether the land is suitable or not for such cultivation. Since
Cebu is typically a hilly province, the planting of any clean-cultured-crop, like corn, would
inevitably accelerate soil erosion. This is the main cause that besets the present agriculture of
Cebu Province. Low production and crop failure mean individual poverty and finally low
government revenue. The province of Cebu to date is one of the severely eroded areas in the
Philippines.
The Province of Cebu lies centrally in the Visayan Islands and is approximately between 9°25’ and
11°21’ North latitude and between 123°18’ and 124°40’ East latitude. The mainland Cebu is a long
and narrow island measuring nearly 220 kilometers long and 36 kilometers wide measured at its
widest portion (Asturias - Danao City). The total land area is 486,850 hectares representing Cebu
Island and number of smaller islands on the North, East and West of the mainland. These are
Bantayan, Camotes, Badian and Mactan Islands.
Present Land Use
Agricultural crops include coconut, sugarcane, corn, vegetables, irrigated and non-irrigated paddy
rice and root crops. Extensive areas of grasses and shrubs together with small area of forest make
up most of the remaining area. Development of land use can be accomplished by:
1. Total change of crops grown
2. Retention of the present cropping system by instituting modern farm practices
3. Introduction of crop diversification (e. g. intercropping).
There are six (6) major land use categories identified in the Province of Cebu namely: agricultural,
grassland, shrub-land, woodland, wetland (Brackish water) and special land use. Each of these
categories was determined on the percentage of the dominant/associated land use over the area.

QUARRY VENTURES PHILIPPINES, INC. Environmental Impact Assessment
February 2019 2-62
Land Use and Extent
Agricultural land use covers about 216,493 hectares or 45% of the province area. Grasses
dominate the non-agricultural area covering about 237,471 hectares or 49%. Forest area (Natural
planted and planted area) is about 8,016 hectares or 2%.
Agricultural Land Use
There are about 216,493 hectares or 45% of the province is devoted to the production of
agricultural crops. Among the agricultural crops, coconut is the most dominant covering an
average of 42,590 hectares. Banana is the second widely cultivated crops and covers an average
of 9,172 hectares. This is followed by sugarcane (6,127 has.), mango (5,609.33 has.), cassava
(2,749 has.), camote (2,095 has.), and mongo (1,213 has.). Table 2-1 shows the distribution of
land use in Cebu, and Table 2-2 shows the area coverage of major crops in Cebu from 2006 to
2008.
Table 2-1: Distribution of Land Uses in Cebu (2007)
Land Use Area (has.) %
Agricultural 216,493 45%
Grassland/Shrubland Areas 237,471 49%
Woodland/Forest Areas 8,016 2%
Wetland Areas 9,463 2%
Miscellaneous Areas 9,307 2%
Total (in hectares) 480,750 100%
Table 2-2: Area Coverage (in has.) of Selected Crops in Cebu (2006-2008)
Crops 2006 2007 2008 Average
Abaca 162 162 170 164.67
Banana 9,177 9,177 9,162 9,172.00
Cabbage 566 592 598 585.33
Calamansi 120 120 122 120.67
Camote 2,280 1,830 2,175 2,095.00
Cassava 3,195 2,520 2,532 2,749.00
Coconut 42,590 42,590 42,590 42,590.00
Coffee 12 8 11 10.33
Eggplant 980 920 937 945.67
Garlic 3 1 - 2.00
Mango 5,605 5,605 5,618 5,609.33
Mongo 1,340 1,150 1,149 1,213.00
Onion 2 - - 2.00
Peanut 525 510 509 514.67
Pineapple 7 7 7 7.00
Sugarcane 5,551 4,467 8,363 6,127.00
Tobacco 110 110 40 86.67
Tomato 860 695 690 748.33

QUARRY VENTURES PHILIPPINES, INC. Environmental Impact Assessment
February 2019 2-63
Grassland and Shrubland
Grassland and shrubland widely covers the entire province of 237,539 hectares or 35% of the
entire province. It covers most of the undulating terrain, volcanic and limestone hills and
mountains.
Woodland
Woodland covers about 8,016 hectares or 2% of the entire province. These areas consist mainly
of forest, mostly found in major karst, volcanic and limestone hills. Ipil-ipil is common in all
municipalities. They are being used as shade trees, wind breaks, firewood, herbage for livestock
and vegetative terrace.
Wetland (Brackish water)
Wetland areas of the province of Cebu, covers about 9,463 hectares or 2%. This category includes
low-lying areas mostly coastal swamp otherwise known as active tidal flats, covered mainly with
mangrove trees and nipa palms. Also included in this category are areas extending inland along
rivers or creeks which during high tides are subject to brackish water inundations. Mangrove tree
type is extensively grown in the province. Fishpond is mainly concentrated in the municipalities
of Talisay, Carcar, Argao, Badian, Moalboal, Ronda Dumanjug, Pinamungahan, Toledo City,
Tubuelan, San Remedios, Medellin, Daanbantayan, Bogo, Danao City, Lilo-an, Consolacion,
Mandaue City, Lapulapu City, and Cordova. Salt beds exist in the municipalities of Bogo,
Medellien, Danao City and Mandaue City.

QUARRY VENTURES PHILIPPINES, INC. Environmental Impact Assessment
February 2019 2-64
Figure 2-1: Land Classification Map of the Project Site

QUARRY VENTURES PHILIPPINES, INC. Environmental Impact Assessment
February 2019 2-65
Special land Uses
This type of Land use is composed of the Mine areas pit/Quarry, Airport, River wash areas, Bodies
of Water (e.g. Lakes and rivers) and Water Dams or 4% of the total land area of the province.
Pinamungahan Municipality Land Use
The municipality of Pinamungahan covers a total of 11,725.27 hectares. Large extent of the
existing general land use is allotted for agricultural use. However, based on the Municipal
Agriculture Officer, the productive area only covers 3,902.75 hectares.
Table 2-3: Municipality of Pinamungahan Land Distribution
Land Use Categories Land Area (hectares
Existing Proposed
Agricultural 5,884.77 3,939.00
Grassland 5,028.50 -
Forest/Timberland
- Production 3,242.77
- Protection 3,124.70
Built-up area 265.00 365.00
Industrial - 431.00
Tourism - 15.94
Quarry Area - 75.3
Mangroves 41.50 150.00
Fishponds 506.00 397.50
Total 11,725.27 11,725.27
Source: Comprehensive Land Use Book of Pinamungahan (1995-2005)
Naga City Land Use
The City of Naga Cebu is currently undertaking their CLUP updating, and was not able to provide
any copies of it. They, however, were able to provide a copy of the current Zoning Map, which
shows Parcel 5 of the QVPI quarry area, and a copy of their 1996-2005 CLUP. Naga City has a total
land area of 9,298.45 hectares, with 28 barangays. The zoning map of Naga city is presented in
Figure 2-2.
Table 2-4: Naga City Land Distribution
Land Use Categories Land Area (hectares
Existing Proposed
Agricultural 1,875.00 1,687.50
Grassland 5.911.73 0

QUARRY VENTURES PHILIPPINES, INC. Environmental Impact Assessment
February 2019 2-66
Land Use Categories Land Area (hectares
Existing Proposed
Forest/Timberland
- Production 0 2,148.98
- Protection 9.80 2.321.02
Built-up area 681.61 1,265.06
Special Eco. Zone 0 764.90
Industrial 273.00 424.80
Mangrove 6.00 6.00
Tourism 28.60 8.00
Utility (Dumping Site, Abbatoir) 0.50 4.50
Mineral Lands 512.00 0.00
Planned Unit for Development (PUD) 0 611.00
Reclamation 0 1,000.00
Fishponds 0 56.48
Total 9,298.24 10,298.24
Source: Naga City CLUP (1996-2005)
Toledo City Land Use
The latest copy of of the CLUP that Toledo Cuty was able to provide was from 2006. Toledo City
has a total land area of 21,627.70 has. It has 38 barangays and 292.88 has. for Urban Land Use.
The existing land use map of Toledo City is presented in Figure 2-3.
Table 2-5: Toledo City Land Distribution
Land Use Categories Area (has.) Percentage Distribution
Agricultural Land 8,355.00 38.63%
Forest Land 5,333.00 24.66%
Mining/Industrial Area 4,717.50 21.81%
Idle/Vacant Land 2,380.00 11.00%
Built-Up Area 727.20 3.36%
Swamp/Mangrobe/Fishponds 115.00 0.53%
Total 21,627.70 100.00%
Source: Toledo City Comprehensive Land Use Plan (2006-2015)
Table 2-6: Toledo City Existing Urban Land Use
Land Use Categories Area (has.) Percentage Distribution
Residential 141.42 48.29%
Industrial 88.96 30.37%
Commercial 23.71 8.10%
Parks/Open Space 20.85 7.12%
Institutional 13.64 4.66%

QUARRY VENTURES PHILIPPINES, INC. Environmental Impact Assessment
February 2019 2-67
Cemete ry 4.3 1.47%
Total 292.88 100.00%

QUARRY VENTURES PHILIPPINES, INC. Environmental Impact Assessment
February 2019 2-68
Figure 2-2: Naga City Zoning Map (2018)

QUARRY VENTURES PHILIPPINES, INC. Environmental Impact Assessment
February 2019 2-69
Figure 2-3: Toledo CityExisting Land Use Map (2006)

QUARRY VENTURES PHILIPPINES, INC. Environmental Impact Assessment
February 2019 2-70
Impact in terms of compatibility with existing land use
The actual land use near the project sites are mainly agricultural. Most of the parcels have small
rice farms on the low areas surrounding it. The proponent would stay within the boundaries of
their MPSA, and would observe an adequate buffer area along its borders, to minimize any
negative effects the project may have to the adjacent areas. The proponent would also employ
proper rehabilitation processes to ensure that the mined out will be backfilled so it could be used
for agriculture, or other purposes deemed necessary by the LGU and the nearby communities.
Impact on compatibility with classification as an Environmentally Critical Area (ECA)
The nearest protected area to the project is the Central Cebu Protected Landscape and the Central
Cebu River Basin. The Central Cebu Protected Landscape is found about 20km north east of the
project site, while the Central Cebu River Basin is 10km to the east. The protected area is home
to a number of endemic and indigenous flora and fauna. Due to the distance of the project site,
extraction activities would not disrupt ecological activities, nor affect the Central Cebu Protected
Landscape.
The marble and aggregate extraction involves extensive ground movement, and could cause
disturbances to nearby tributaries and streams going towards the river basin. Necessary
measures will be taken to avoid this, like concentrating activities away from water sources, and
providing proper drainage during heavy rains. Figure 2-4 shows the location of the project site
relative to the nearest protected area, and Figure 2-5 shows its location relative to the nearest
river basin.

QUARRY VENTURES PHILIPPINES, INC. Environmental Impact Assessment
February 2019 2-71
Source: https://www.google.com/maps/d/viewer?mid=1YbuJg66imB9oiwYyZI7FNXX6E8k&hl=en_US&ll=10.519207900000007%2C123.8187977&z=9
Figure 2-4: Project Site’s Proximity to Nearby Protected Area

QUARRY VENTURES PHILIPPINES, INC. Environmental Impact Assessment
February 2019 2-72
Source: https://www.google.com/maps/d/viewer?mid=1tWPz0l4Cu9021ny2h-5wFtp2cs8&hl=en_US&ll=10.372044860731421%2C123.89720950000003&z=12
Figure 2-5: Project Site’s Proximity to Nearby Watershed
QUARRY VENTURES PHILIPPINES, INC. Environmental Impact Assessment
February 2019 2-73
Impact in existing land tenure issues
CARP-related Issues
There are no known CARP areas/CARP-related issues within the project area.
Impairment of visual aesthetics
Marble and aggregates extraction require an open pit method of mining which could be unsightly
to most people, due to exposure and excavation of the soil. In order to minimize the aesthetic
impairment, the management will maintain the project site’s buffer areas which would provide a
vegetated border. The mined-out areas would also be rehabilitated and re-vegetated following
the conditions agreed/suggested by the host communities.
Devaluation of land value as a result of improper solid waste management and other related impacts
Extraction of marble and aggregates only require physical removal of the desired material. There
would be no chemical treatment, nor processing, within the project site. Due to this method, the
main source of solid waste would only come from anthropological activities such as office wastes,
equipment maintenance spillages, and kitchen wastes from the canteens. The expected solid
waste generated will be handled by a waste management plan, which would involve proper
collection, treatment, and disposal of wastes. Recyclables and biodegradable waste may be sent
to nearby Material Recovery Facilities for further use, or in the case of biodegradables, be broken
down to compost.
Equipment and vehicle maintenance will also be supervised by trained mechanics/personnel to
ensure good running conditions. Storage depots for fuel and oils will be constructed avoid soil
and water contamination of oil and other chemicals. Generator sets will also be contained in a
special room to avoid contamination from accidental spillages.
2.1.2 Geology and Geomorphology
Cebu Island is located in the central Visayan group of Isalnds. It is bounded to the west by Negros
Island and to the east by Leyte and Bohol Islands. West of Negros is the Negros Trench where
subduction is currently active. To the east, the active Philippine Fault traverses the whole length
of Leyte.

QUARRY VENTURES PHILIPPINES, INC. Environmental Impact Assessment
February 2019 2-74
Cebu is within the Visayan Sea Basin that encompasses the whole island of Cebu and portions of
Negros, Bohol, and Leyte. The principalstructural grain in this region is north-south to NNE-SSW.
The island of Cebu itself is elongated along a NNE-SSW direction and major tectonic elements on
the island conform to this direction. The style of deformation in the Visayan region is strongly
influenced by the 3 major tectonic elements, namely the Negros Trench, the Philippine Trench,
and the Philippine Fault.
Change in surface landform/geomorphology/topography/terrain/slope
The Tunlob Schist is considered as the oldest formation in Cebu, possibly of the Jurassic age. It
consists of strongly foliated, faulted, and folded chloriticorthoschist and micaceous paraschist.
The Tunlob is presumed to constitute the basement of the stratigraphic package in Cebu.
Succeeding the Tunlob is the Mananga Group, a sequence of Formations at Mananga Valley,
consisting of Tuburan Limestone, Cansi Basalt, and Pandan Formation. These units have
intertonguing, gradational, or conformable relations with each other. The Cansi Basalt consists
of pillow lavas, flow breccias, and agglomerates which apparently has an intertonguing relation
with the Tuburan Limestone. The Cansi ranges in composition from typical basalt to pyroxene
andesite. The Tuburan Limestone is an orbitolina-bearing carbonate formation which was
observed to lie on top of the Cansi but elsewhere also shows up as clasts in the volcaniclastics of
the Cansi. In northeastern Maypay area, it was observed to rest on the Tunlob Schist. The
orbitolinid assemblage and rudistsin the Tuburan, indicate an Early Cretaceous age for the
formation. The Pandan Formation is a thick sequence of highly folded, steeply dipping limestone,
shale, and conglomerate lying uncomfortably over the Cansi Basalt. Fossils belonging to
Globotuncana species in the limestone and clastic rocks of the Pandacan indicate a Late
Cretaceous age. The formation has an estimated thickness of 2,000m.
The Bantoon Serpentinite are lenticular bodies of serpentinized peridotite occupying major fault
zones in Central Cebu. The Serpentinites intrude Tunlob Schist, Cansi basalt, and Pandan
Formation and could have been emplaced during the Late Cretaceous time.
Also intruding the Cretaceous volcanic and sedimentary rocks in the central highlands of Cebu are
elongated stocks and dikes of diorite, quartz diorite, andesite, and dacite designated collectively
as Lutopan Diorite. Radiometric dating of diorite samples range in age from Early Eocene (50.7
Ma) to late Early Cretaceous (108 Ma) suggesting multiple phases of intrusion by these diorite
bodies.
Suceeding the Lutopan Diorite is the Baye Limestone, which rests above the formations of the
Mananga Group. The Baye is a 20-m thick Nummulite-bearing formation with an indicated age of

QUARRY VENTURES PHILIPPINES, INC. Environmental Impact Assessment
February 2019 2-75
Middle – Late Eocene. Stratigraphically above the Baye Limestone is the Lutak Limestone, an 80-
m thick fossiliferous carbonate formation confined around Lutak area in the central part of
Pandan Valley in Central Cebu. The Lutak Limestone unconformably overlies siltstones of the
Pandan Formation. Fossils in the limestone span NP 23 – NP 24 zones, equivalent to Early – Late
Oligocene.
These 2 limestone formations are succeeded by the Naga Group, consisting of the Cebu Formation
and Malubog Formation. These are intertonguing formations that represent the start of basin
formation in Cebu. The Cebu Formation is subdivided into 2 members, namely, Lower Coal
Measures and Ilag Limestone. Comprising the Lower Coal Measures are basal conglomerate
grading to sandstone, siltstone, and mudstone occasionally with interbeds of coal and
conglomerates. They lie uncomfortably above the Lutak Limestone is an orbitoid-rich limestone
which alsi contains other foraminifers and molluscan fragments. It is thinly to thickly bedded,
occasionally marly, with thin interbeds of sandstone and shale. The Ilag conformably overlies,
and in places, intertongues with the Coal Measures. Like the Lower Coal Measures, the thickness
of the limestone varies to a large degree but rarely exceeds 60m. Conformably overlying the Cebu
Formation is the Malubog Formation, consisting of mudstone, shale, and limestone with
subordinate sandstone, conglomerate and coal stringers. The Formation is subdivided into 2
members, namely, a lower Cantabaco Mudstone Member and an upper Alpaco Member. The
Cantabaco consists dominantly of mudstone and shale with local lenticular limestone at the base
and thin sandstone interbeds and coastal stringers towards its top. The Alpaco is composed of
limestones and carbonaceous clastic rocks with associated coal seams. Fossils in the Malubog
Formation indicate an age of Late Oligocene to Early Miocene for the formation. The lower
Malubog is around 460m in the Naga-Toldeo City area but the whole formation could reach up to
1,200m near Uling.
Resting conformably above the Malubog Formation is the Uling Limestone. It is a coralline
limestone unti with admixed algae and benthic foraminifera. The limestone is assigned a Middle
Miocene age and has an estimated thickness of 200-250m. Unconformably overlying the Malubog
Formation is the Luka Formation, exposed in the Luka area, northeast of Balamban. It consists of
alternating beds of sandstone, conglomerate, and mudstone with lenses of limestone. It is also
considered Middle Miocene in age.
Late Middle Miocene plutonic intrusions represented by small stocks of diorite and quartz
monzonite in the western part of central eastern Talambanwere designated by MMAJ-JICA (1990)
as Talamban Diorite. Other diorite bodies were reported in Maypay, Malugan, Mangilamon, and
Sibakan. Radiometric K-Ar dating (10.2Ma – 12.5Ma) indicates a late Middle Miocene age for the
intrusives. Andesite flows and pyroclastic rocks of probable Middle to Late Miocene age in the

QUARRY VENTURES PHILIPPINES, INC. Environmental Impact Assessment
February 2019 2-76
southwestern range of Central Cebu were named Bulacao Andesite. Exposures of massive
volcanic flows and pyroclastic rocks also occur in the central highlands.
Middle Miocene to early Late Miocene clastic rocks and limestone in central Cebu were lumped
into the Talavera Group, composed of Toledo Formation and Maingit Formation. An angular
conformity separates the Toledo Formation from the underlying Malubog Formation. The Toledo
Formation consists of shale and sandstone with occasional beds of calcarenite and conglomeratic
limestone. It lies conformably over the Uling Formation, with some intertonguing relationships
between Uling and Toldeo and thus consider the Uling as the shallow water equivalent of the
Toledo. Large foraminifera in the Toledo Formation indicate a Middle Miocene age. Its thickness
ranges from 620m to 1,860m. The Maingit Formation may be divided into 3 memebrs, namely, a
lower limestone member, a middle conglomerate member, and an upper sandstone-shale
sequence. The lower member is a lenticular coralline unit which is only around 30m thick. The
middle member is a conglomerate with pebble to boulder size clasts of basement rocks and
limestone. The upper sandstone-shale sequence has occasional stringers of coal and thin beds of
limestone. The formation has an aggregate thickness of 1,175m, with the middle member
accounting for 575m and the upper member constituting 550m. Foraminifera and nannofossils
from the Maingit indicate an age of late Middle Miocene to early Late Miocene.
Unconformably overlying the Maingit and Toledo formations is the Barili Formation, which is
subdivided into a lower limestone member, and an upper Bolok-bolok member. The lower
limestone member is composed of a basal conglomerate and a 200-350m thick section of coralline
limestone with abundant fossils dated Late Miocene. The upper Bolok-bolok member consists
chiefly of calcareous fossiliferous mudstone with subordinate interbeds of siltstone, sandstone,
and on places, basal carbonaceous shale or poorly bedded lenticular sandstone and
conglomerate. The Bolok-bolok has an age of Late Miocene to early Pliocene and attain a
thickness of 500m. It was probably deposited in a deep basinal environment.
Above the Barili Formation and older rock units is the Carcar Limestone, a coralline carbonate unti
that fringes the coastal areas of Cebu except a narrow strip between Ginatilan and Malabuyoc in
the south. The Carcar is separated from the underlying Barili Formation by an angular
unconformity. It is porous, coralline, massive to bedded, fossiliferous and in places, dolomitic. In
places, it is intercalated with marl and grades into rubbly to conglomeratic limestone.
Foraminifera and nannoplankton inidicate a Pleistocene age but may extend down to Late
Pleistocene. The Carcar has an average thickness of around 300m, with a maximum of 375m.
The stratigraphic package in Southern Cebu is widely different from that of northern – Central
Cebu discussed above. This is represented by a sequence of sedimentary rocks spanning Late
Oligocene to Early Miocene time, composed of Calagasan Formation, Butong Limestone, and

QUARRY VENTURES PHILIPPINES, INC. Environmental Impact Assessment
February 2019 2-77
Linut-od Formation, comprising the Argao Group. The Late Oligocene Calagasan Formation is the
oldest sedimentary unit mapped in southern Cebu. It consists of thick sequence of conglomerate,
sandstone, mudstone, and carbonaceous shale with interbeds of limestone and coal. The
measured thickness of the formation ranges from 720m to 1,300m. The Butong Limestone is a
lenticular body which ranges in thickness from less than 36m to a maximum of 388m. It
conformably overlies or intertongues with the Calagasan and likewise dated Late Oligocene based
on foraminifera. The Linut-of Formation which overlies the Butong Limestone, consists of a
succession of conglomerate, sandstone, mudstone, and shale with coal interbeds. Compared to
Calagasan, the mudstones are more dominant. It is Early Miocene in age and has a thickness
ranging from 325m to 1,300m.
The stratigraphy of Cebu is given in Figure 2-6.

QUARRY VENTURES PHILIPPINES, INC. Environmental Impact Assessment
February 2019 2-78
Figure 2-6: Stratigraphy of Cebu
Geologic Structures
The major tectonic elements of Cebu are aligned mainly along a NNE-SSW direction, which
conforms to the orientation of its elongation (Figure 2-7). The Cebu Arch, a major structural

QUARRY VENTURES PHILIPPINES, INC. Environmental Impact Assessment
February 2019 2-79
feature of the island that stretches for 200km is essentially a doubly plunging northeast-trending
anticlinorium in which the basement has been exposed at its central part and many stratigraphic
units are generally aligned in a northeast direction. It is bounded on the west by the Tañon Strait
(actually sub-basin and part trough) and on the east by the Cebu Strait Sub-basin and NW Leyte
thrust belt.
On the north and south of the island, the dominant fault sets trend N-S to NNE but those in central
Cebu trend NE Thrust faults and fold sets trending NNE are consistent with an echelon dextral
wrench faults that could be rejuvenated pre-existing normal faults which controlled down-
warping during the Late Oligocene to Middle Miocene. Sedimentary beds in the south generally
strike NNE and dip to the NW and SE. In the north, folding of the sedimentary formations is more
open compared to those in the south.
Local Geology
The area coverd by the parcels of MPSA 111 is underlain by the Mananga Group (MG), Lutopan
Diorite (LD), Cebu Formation (CF), Malubog Formation (MbF), Uling Limestone (UL), and Toldeo
Formation (TF). The project involves physical extraction of marble and aggregate deposits from
the terrain. This would mean leveling off natural landforms. Slope management is essential to
protect both the workers on the site, and the nearby communities. Landforms may be reduced
to ground level after extraction. This would expose soil for agricultural use, or further
infrastructure development for the communities.
Parcel 1, 2, and 3
The Middle Miocene UL largely occupies these 3 parcels. An arm of the limestone extends
northwest, partly covering Parcel 4 to the west. The Early Miocene MbF partly encompasses the
UL and underlies portions of Parcels 4 and 5. The MG, consisting mostly of volcanic and pyroclastic
rocks of Cansi Basalt largely underlies the eastern portion of the area covered by MPSA 111,
including a large chunk of Parcel 5. Other stratigraphic units in the area cover less space, such as
LD, CF, and TF. Faults traversing the area are generally oriented northeast.
Parcel 5
The MG consisting mostly of volcanic and pyroclastic rocks of Cansi Basalt largely underlies the
eastern portion of the area covered by MPSA 111, including Parcel 5. Parcel 5 is entirely underlain
by the Cretaceous MG, consisting of Cansi Basalt, Tuburan Limestone, and Pandan Formation.
The Early Miocene MbF partly encompasses the UL and underlies portions of Parcels 4 and 5.
QUARRY VENTURES PHILIPPINES, INC. Environmental Impact Assessment
February 2019 2-80
Four main rock types were identified in Parcel 5 during the semi-detailed geological exploration
survey covering the QVPI basalt aggregate project area, namely:
1. Basalt – andesite flows with minor andesite dikes (Cansi Basalt)
2. Basaltic pyroclastics and agglomerates (Cansi Basalt)
3. Interbedded sandstone – siltstone – conglomerate with minor limestone (Pandan
Formation)
4. Calcareous mudstone – siltstone (MbF)
The basalt–andesite flows have limited exposures mainly along the lower creek level in Parcel 5,
while the intercalated abasltic pyroclastics and agglomerates, have a more widespread
distribution along the eastern flank of the claim block, and appear to be more dominant up-
section above the basalt-andesite flows.
The basaltic pyroclastics mapped in the survey area probably represent the upper sections of the
Cansi Volcanics from elevations 230 to almost 500masl. Towars the southeast where structural
deformation (due to earlier thrust faulting) is evident, the basaltic pyroclastics are
metamorphosed to some degree (as metavolcanics) and are cut by andesite dikes.
The interbedded sandstone-siltstone-conglomerate-limestone sedimentary units of the Pandan
Formation outcrop along the southern portion of Parcel 5 and to a limited extent, along the
northern-central portion of the QVPI area. These partly deformed and slightly metamorphosed
units appear as erosional windows (300 – 500masl elevation) below the overlying mudstone –
siltstone beds of the MbF. However, the sediments appearing as erosional windows may also be
interpreted as slices of the Pandan Formation thrusted into the older Cansi Volcanics during
earlier tectonic events.
A prominent north-south trending ridge – Mt. Cabalauan – which occupies the northwestern
segment of Parcel 5 area, is underlain by the fine calcareous sedimentary rocks of the MbF. This
sedimentary ridge (380 – 584masl elevation) is part of the Mt. Lanas – Mt. Cabalauan Range and
serves as younger unconformable capping over the much older rock types in the survey area older
rock types in the survey area.
The Local Geologic Map of the MPSA is presented in Figure 2-8, and the Slope Map is presented
in Figure 2-9.

QUARRY VENTURES PHILIPPINES, INC. Environmental Impact Assessment
February 2019 2-81
Figure 2-7: Geologic Map of Cebu

QUARRY VENTURES PHILIPPINES, INC. Environmental Impact Assessment
February 2019 2-82
Figure 2-8: Geologic Map of MPSA

QUARRY VENTURES PHILIPPINES, INC. Environmental Impact Assessment
February 2019 2-83
Figure 2-9: Slope Map of the MPSA
QUARRY VENTURES PHILIPPINES, INC. Environmental Impact Assessment
February 2019 2-84
Change in sub-surface geology/underground conditions
The underground conditions for marble and aggregates extraction would not be severely affected.
After removing the quarry materials, left over soil, and mineral specimens that did not meet
quality requirements will be used as backfill. Most marble deposits are only above ground so the
quarry would stop once ground level is reached. Aggregate quarry would follow the same process
as marble but it involves blasting to physically loosen rocks. The primary effect of this would be
intense vibrations during the blasting. To avoid complications, like landslides, explosive materials
will be strategically placed to avoid damages outside the area, and scheduled to minimize
vibration only at the desired time.
Inducement of subsidence, liquefaction, landslides, mud/debris flow
Earthquake Hazards (Seismic Hazards)
Regional seismicity suggests vulnerability of the area to earthquake hazards. Intense ground
shaking is the main hazard associated with earthquakes, with ground rupture/fissuring,
liquefaction and landslides as collateral hazards. The degree and extent by which the area is
affected by these seismic hazards will be dependent on the magnitude of the earthquake,
proximity to the earthquake source (epicenter), and site ground condition.
The potential earthquake generators that may affect the project area as shown in Figure 2-10
include the East Bohol Fault, Central Leyte Fault, and Central Negros Fault. Recent recorded
earthquakes from 2013 and 2016 indicates that the faults are still active.

QUARRY VENTURES PHILIPPINES, INC. Environmental Impact Assessment
February 2019 2-85
Figure 2-10: Distribution of Active Faults and Trenches

QUARRY VENTURES PHILIPPINES, INC. Environmental Impact Assessment
February 2019 2-86
Landslides and Flooding Hazards
The sites are primarily in areas with high susceptibility to landslides. This due to the outcrops rich
in marble deposits and mineral deposits for aggregates. During the quarry operation, these
outcrops will be stabilized by benching to minimize landslide to the community and the site
workers. Extraction of materials will also be strategically planned to maintain stability of the
structures, and to avoid falling debris. Once the quarry has reached it decommissioning and
abandonment phase, the stabilized and leveled site could be further developed.
There are several tributaries near or passing through the project sites, though it is not highly
susceptible to flooding. In order to maintain this, settling ponds will be constructed to minimize
sedimentation, and also to hold some of the precipitation before it flows through the tributaries.
Trees and plants will also be planted along the buffer areas on the borders of the project sites to
improve water retention in the soil.
Figure 2-11 shows the landslide and flooding susceptibility of the areas near the project site.

QUARRY VENTURES PHILIPPINES, INC. Environmental Impact Assessment
February 2019 2-87
Figure 2-11: Landslide and Flooding Susceptibility of the Project Area

QUARRY VENTURES PHILIPPINES, INC. Environmental Impact Assessment
February 2019 2-88
2.1.3 Pedology
Methodology
Soils Literature
The published reports, literatures of the soils and land use reconnaissance surveys and soils map
of Cebu Province (1947), The Soils/Land Resources Project, The Physical Environment (Volume I),
1986 were gathered from the Bureau of Soils and Water Management (BSWM and served as
references) . Climatic data from PAGASA were also gathered and incorporated elsewhere in the
study. NAMRIA Topographic Map of the cities of Naga and Toledo (1:50,000 Scale) were also used
as reference points to establish the soil sampling locations.
Reconnaissance and Ocular Surveys
A Reconnaissance and ocular survey was initially made by the Axceltechs EIA study team on June
23, 2016. Field work activities that involved the field assessments of the present land use, soil
characterization and, soil sampling activities were made on June 24 - 26.
The study on soils, agriculture and land use covered the review of existing literatures and maps
of the project area mentioned earlier. To date, there are very limited soils related studies, and
soils related literature for the Cities of Naga and Toledo in the province of Cebu.
Soil Sampling
A. Disturbed Samplings
The soil Investigation studies covered the four (4) soil sampling locations within Parcel 1 Brgy.
Tagjaguimit, City of Naga; Parcel 2, Brgy. Lamac, Municipality of Pinamungahan; Parcel 3, Brgy.
Bulongan, Toledo City and, Parcel 5, Brgy. Cogon, City of Naga.
Site selection criteria of the soil sampling locations within the MPSA coverage were made in
accordance with the present land use, slope and soil color. Their corresponding locations,
geographic coordinates and photographs of the four sampling locations are presented in Table 1.
1.
From each soil sampling location, disturbed composite soil samples were collected within the 0 –
30 cm depth using an ordinary spade. The representative soil samples were collected randomly
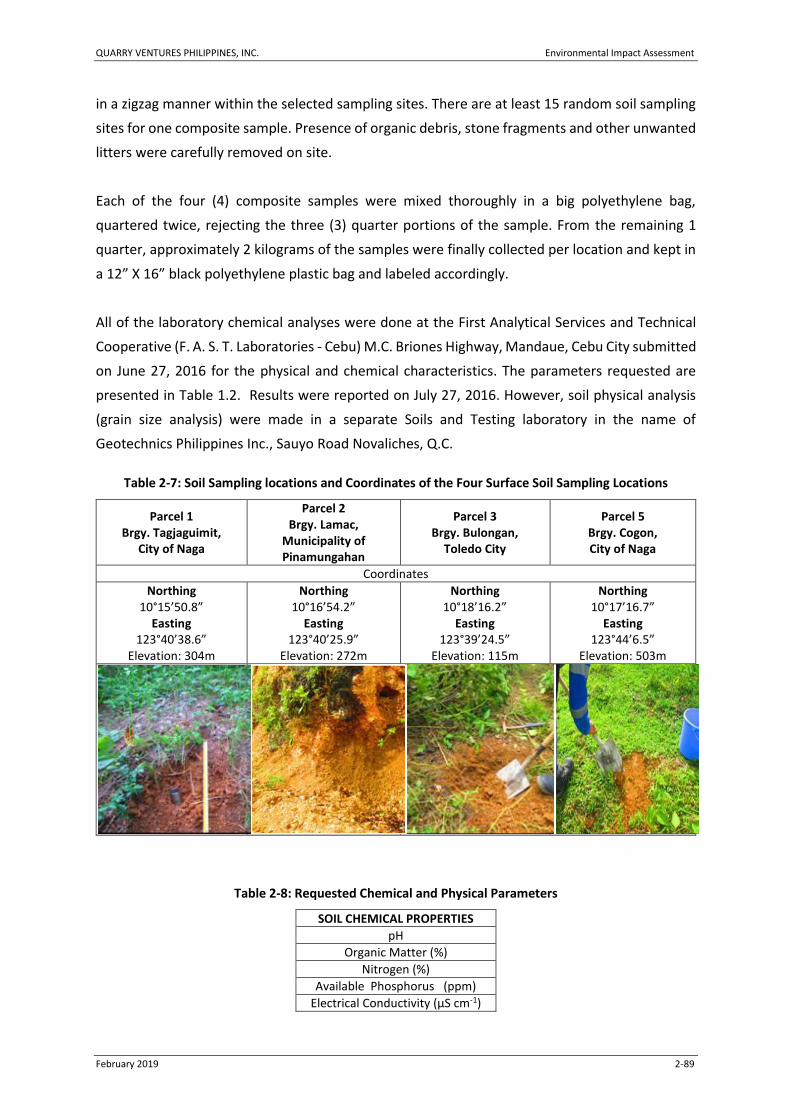
QUARRY VENTURES PHILIPPINES, INC. Environmental Impact Assessment
February 2019 2-89
in a zigzag manner within the selected sampling sites. There are at least 15 random soil sampling
sites for one composite sample. Presence of organic debris, stone fragments and other unwanted
litters were carefully removed on site.
Each of the four (4) composite samples were mixed thoroughly in a big polyethylene bag,
quartered twice, rejecting the three (3) quarter portions of the sample. From the remaining 1
quarter, approximately 2 kilograms of the samples were finally collected per location and kept in
a 12” X 16” black polyethylene plastic bag and labeled accordingly.
All of the laboratory chemical analyses were done at the First Analytical Services and Technical
Cooperative (F. A. S. T. Laboratories - Cebu) M.C. Briones Highway, Mandaue, Cebu City submitted
on June 27, 2016 for the physical and chemical characteristics. The parameters requested are
presented in Table 1.2. Results were reported on July 27, 2016. However, soil physical analysis
(grain size analysis) were made in a separate Soils and Testing laboratory in the name of
Geotechnics Philippines Inc., Sauyo Road Novaliches, Q.C.
Table 2-7: Soil Sampling locations and Coordinates of the Four Surface Soil Sampling Locations
Parcel 1 Brgy. Tagjaguimit,
City of Naga
Parcel 2 Brgy. Lamac,
Municipality of Pinamungahan
Parcel 3 Brgy. Bulongan,
Toledo City
Parcel 5 Brgy. Cogon, City of Naga
Coordinates
Northing 10°15’50.8”
Easting 123°40’38.6”
Elevation: 304m
Northing 10°16’54.2”
Easting 123°40’25.9”
Elevation: 272m
Northing 10°18’16.2”
Easting 123°39’24.5”
Elevation: 115m
Northing 10°17’16.7”
Easting 123°44’6.5”
Elevation: 503m
Table 2-8: Requested Chemical and Physical Parameters
SOIL CHEMICAL PROPERTIES
pH
Organic Matter (%)
Nitrogen (%)
Available Phosphorus (ppm)
Electrical Conductivity (μS cm-1)
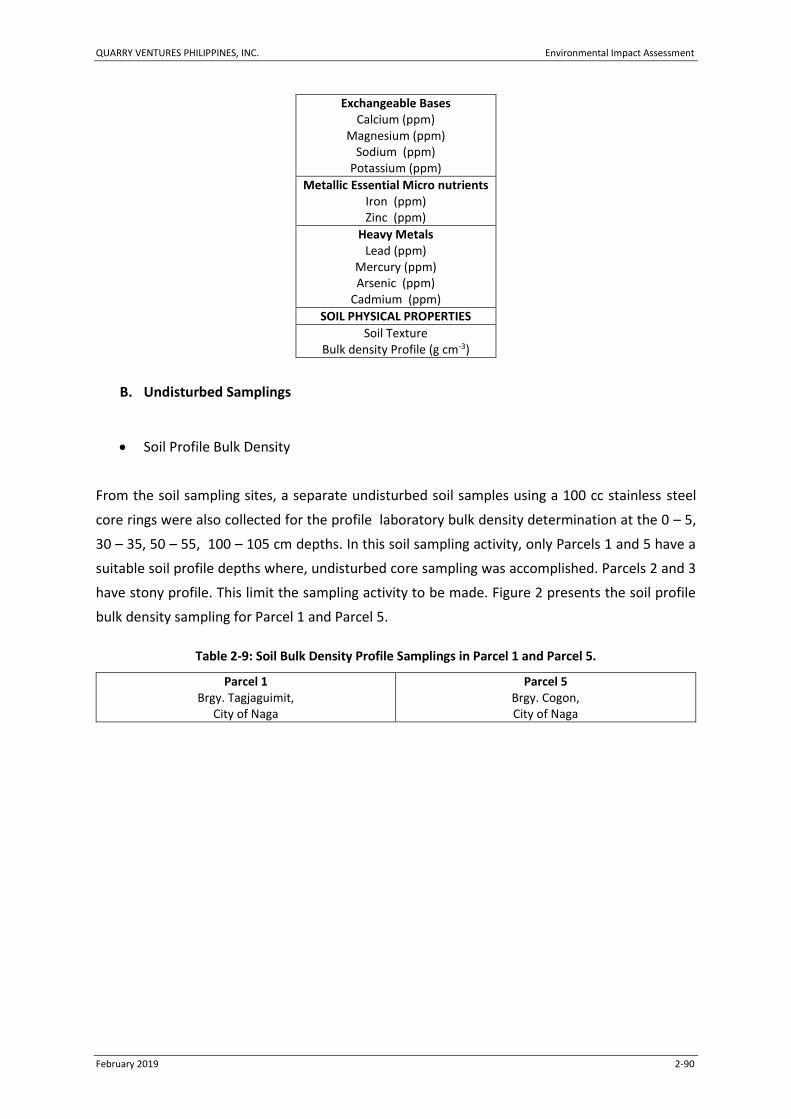
QUARRY VENTURES PHILIPPINES, INC. Environmental Impact Assessment
February 2019 2-90
Exchangeable Bases Calcium (ppm)
Magnesium (ppm) Sodium (ppm)
Potassium (ppm)
Metallic Essential Micro nutrients Iron (ppm) Zinc (ppm)
Heavy Metals Lead (ppm)
Mercury (ppm) Arsenic (ppm)
Cadmium (ppm)
SOIL PHYSICAL PROPERTIES
Soil Texture Bulk density Profile (g cm-3)
B. Undisturbed Samplings
Soil Profile Bulk Density
From the soil sampling sites, a separate undisturbed soil samples using a 100 cc stainless steel
core rings were also collected for the profile laboratory bulk density determination at the 0 – 5,
30 – 35, 50 – 55, 100 – 105 cm depths. In this soil sampling activity, only Parcels 1 and 5 have a
suitable soil profile depths where, undisturbed core sampling was accomplished. Parcels 2 and 3
have stony profile. This limit the sampling activity to be made. Figure 2 presents the soil profile
bulk density sampling for Parcel 1 and Parcel 5.
Table 2-9: Soil Bulk Density Profile Samplings in Parcel 1 and Parcel 5.
Parcel 1 Brgy. Tagjaguimit,
City of Naga
Parcel 5 Brgy. Cogon, City of Naga

QUARRY VENTURES PHILIPPINES, INC. Environmental Impact Assessment
February 2019 2-91
Slake test
Slake test or test for soil friability was done in situ and, is an indicator of soil cohesiveness
especially when wet. This soil physical property determine the soil stability even when mechanical
manipulation is employed (i.e. tillage). The assessment should be done with dry soil samples and
is further explained below:
A soil fragment (at least 1 cm x 1 cm in size) is gently immersed in distilled or rainwater and
response to wetting is observed for a period of time (i.e. 10 minutes). The soil is therefore
classified in terms of its response to wetting and is described below:
Slake test is not applicable on sandy/stony soils (Class 0). Class 1 = Very unstable. Soil fragment disintegrates in <5 seconds; very fine bubbles may emerge. Class 2 = Unstable. Soil fragment goes slumping within 5‐10 seconds. Class 3 = Moderately Stable. Slumping of sub-crust but most of the crust is intact. Class 4 = Very Stable. No slumping of particles is evident after several minutes of being immersed in water; whole fragment remains intact with no swelling; large bubbles may emerge.
Soil correlation with the use of the old Soil Survey reports and maps of Cebu province were made
in the identification and delineation of soil types and soil sampling locations. Primary information
on the agricultural productivity, cultural practices, cropping calendar and use of farm inputs (agri-
chemicals) were collected through informal interviews among the locals. The dominant land use
of the four (4) soil sampling locations is presented in Table 1.3.
The impact of the proposed mining project on the soil and vegetation were assessed and the
proven corresponding mitigation measures were given.

QUARRY VENTURES PHILIPPINES, INC. Environmental Impact Assessment
February 2019 2-92
Table 2-10: Dominant Land Use of the Soil Sampling Locations
Parcel 1 Brgy. Tagjaguimit,
City of Naga
Parcel 2 Brgy. Lamac,
Municipality of Pinamungahan
Parcel 3 Brgy. Bulongan,
Toledo City
Parcel 5 Brgy. Cogon, City of Naga
Grassland/Shrubland and Patches of coconut
2nd growth forest Mixed
Vegetation/Cropland
Mixed Cropland/Grassland
Pasture
A soil sampling map is presented in Figure 2-12.

QUARRY VENTURES PHILIPPINES, INC. Environmental Impact Assessment
February 2019 2-93
Figure 2-12: Soil Sampling Map

QUARRY VENTURES PHILIPPINES, INC. Environmental Impact Assessment
February 2019 2-94
Figure 2-13: Soil Sampling Stations in Parcel 1 and 2

QUARRY VENTURES PHILIPPINES, INC. Environmental Impact Assessment
February 2019 2-95
Figure 2-14: Soil Sampling Station in Parcel 3

QUARRY VENTURES PHILIPPINES, INC. Environmental Impact Assessment
February 2019 2-96
Figure 2-15: Soil Sampling Station in Parcel 5
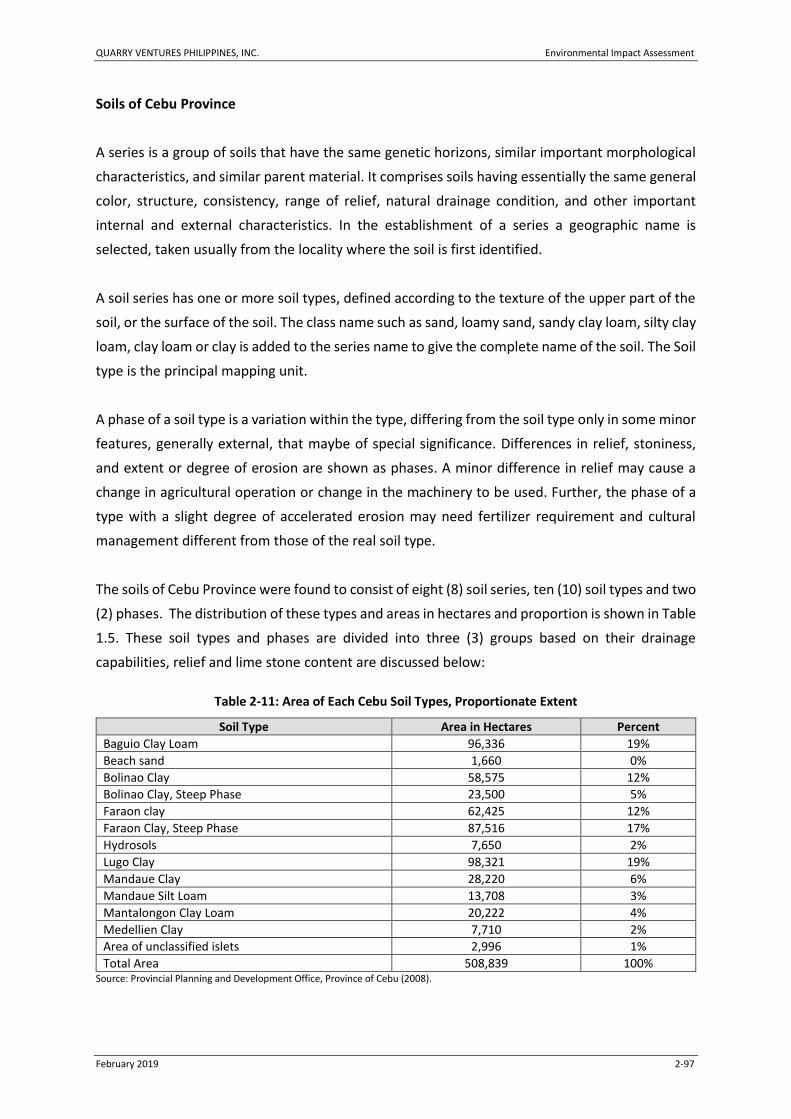
QUARRY VENTURES PHILIPPINES, INC. Environmental Impact Assessment
February 2019 2-97
Soils of Cebu Province
A series is a group of soils that have the same genetic horizons, similar important morphological
characteristics, and similar parent material. It comprises soils having essentially the same general
color, structure, consistency, range of relief, natural drainage condition, and other important
internal and external characteristics. In the establishment of a series a geographic name is
selected, taken usually from the locality where the soil is first identified.
A soil series has one or more soil types, defined according to the texture of the upper part of the
soil, or the surface of the soil. The class name such as sand, loamy sand, sandy clay loam, silty clay
loam, clay loam or clay is added to the series name to give the complete name of the soil. The Soil
type is the principal mapping unit.
A phase of a soil type is a variation within the type, differing from the soil type only in some minor
features, generally external, that maybe of special significance. Differences in relief, stoniness,
and extent or degree of erosion are shown as phases. A minor difference in relief may cause a
change in agricultural operation or change in the machinery to be used. Further, the phase of a
type with a slight degree of accelerated erosion may need fertilizer requirement and cultural
management different from those of the real soil type.
The soils of Cebu Province were found to consist of eight (8) soil series, ten (10) soil types and two
(2) phases. The distribution of these types and areas in hectares and proportion is shown in Table
1.5. These soil types and phases are divided into three (3) groups based on their drainage
capabilities, relief and lime stone content are discussed below:
Table 2-11: Area of Each Cebu Soil Types, Proportionate Extent
Soil Type Area in Hectares Percent
Baguio Clay Loam 96,336 19%
Beach sand 1,660 0%
Bolinao Clay 58,575 12%
Bolinao Clay, Steep Phase 23,500 5%
Faraon clay 62,425 12%
Faraon Clay, Steep Phase 87,516 17%
Hydrosols 7,650 2%
Lugo Clay 98,321 19%
Mandaue Clay 28,220 6%
Mandaue Silt Loam 13,708 3%
Mantalongon Clay Loam 20,222 4%
Medellien Clay 7,710 2%
Area of unclassified islets 2,996 1%
Total Area 508,839 100% Source: Provincial Planning and Development Office, Province of Cebu (2008).

QUARRY VENTURES PHILIPPINES, INC. Environmental Impact Assessment
February 2019 2-98
A. Poorly Drained Lowland
Cebu Hydrosol – The marshes, swamplands, and all wetlands along the coast of Cebu which upon
high tide were covered by sea water are classified under hydrosol. There are soils that have water
which is the principal gross component. Soils in the hydrosol areas are accumulation or deposits
of fine silt, clay, and sand forming into a low delta. Such soils have very poor agricultural value
because of their poor drainage and high salt content. In the city of Mandaue, beds for salt making
are constructed. Others use these areas as fishponds.
B. Moderately Drained Areas
These areas have a flat to very gently undulating surface. There are two soil series under this
drainage condition, namely the Mandaue and Medellien series. The former is of alluvial formation
while the latter is an upland soil that have been formed from limestone and shale. The soil types
in these series are best agricultural soils in found in the province.
Soils in the Mandaue series are generally cultivated to lowland rice as the land is level and slightly
compacted layers below the subsoil favor the retention of irrigation water. The Medellien soil on
the other hand is devoted mostly to sugarcane production.
Mandaue Series
The alluvial soils of Cebu Province are classified under this series. These are young secondary soils
of recent formation having almost flat topography. These soils have been deposited and formed
along some of the big rivers on both sides of the coast on the central part of the island. These
alluvial deposits consists of a series of layers of sand, silt and clay which in some places reach to
a depth of about ten (10) meters.
The surface soil and the subsequent layers beneath are free of carbonates. The depth of
groundwater varies from two (2) to five (5) meters.
Mandaue series are generally brown to light brown colored soils having fairly thick surface layer
with a texture ranging sandy loam to clay loam.
Mandaue Clay Loam – The alluvial plains along the eastern coastal areas of Cebu having an
aggregate area of 28,220 hectares are classified under this type.
QUARRY VENTURES PHILIPPINES, INC. Environmental Impact Assessment
February 2019 2-99
Mandaue Silt Loam – This soil type that covers an area of 13,705 hectares is located in the western
coastal part of Cebu from Asturias to Toledo City forming the low, level alluvial plains and fringing
from mountain ranges.
Soil erosion on these types is not a problem. On the other hand, eroded materials from the upper
areas are deposited on this type.
C. Calcareous Flat Upland
Medellien Series
Medellien soil, which is found on the northern part of Cebu is flat to gently undulating upland.
Small areas are also distributed in Talisay, Oslob and Pacijan Island with an aggregated area of
7,710 hectares. The series represent about 1.58% of the land area of the province.
This soil type has a poorer drainage condition in contrast with the Mandaue series because, the
surface soil and the soils beneath it have a heavier texture.
The soil of these series are cultivated to sugarcane, with corn as minor crops. The water table of
the series ranges from four (4) to ten (10) meters below the surface of the ground.
Medellien Clay (159). This is the only type classified under the series. The surface soil of Medellien
clay which ranges in thickness from 25 to 30 cm. has a characteristic of black color. Very sticky
when wet and become hard when dry. The subsoil is as thick as the surface. The substratum which
is also clayey has a much lighter color and also differs in structure and consistency.
This soil type is devoted mostly to the growing of sugarcane.
D. Calcareous Flat Lowland
Beach Sand – This soil type, as the name implies, is found in the coasts of Cebu province like
Liloan, Danao City, Cebu City, Talisay City, Toledo city, Bantayan Island, and Camotes Islands. It
has the same elevation as the Mandaue soils. This Soil Type is not extensively distributed as it
represents only about 1,660 hectares.
This soil type being sandy textured, is well drained, allows the air to circulate freely and does not
hold water. These conditions limit specific crop to grow. Coconut is noted to be very well adopted
to this soil type.

QUARRY VENTURES PHILIPPINES, INC. Environmental Impact Assessment
February 2019 2-100
E. Calcareous Hilly and Mountainous Areas
Soils in the province of Cebu are predominantly of limestone formation. Limestone is a form of
sedimentary rock which originated from compact limy sediments. They are formed through the
accumulation of coral animals that secrete limy materials which hardens and accumulate in thick
deposits and is commonly called coralline limestone. Lime Deposit can be brought about by
chemical precipitation of the lime in sea water. The rock formed this way is hard and massive.
Another source of limestone rocks is the accumulation and deposition of fragments of sea shells.
The Calcareous soils in Cebu are located on the upland areas and majority of them are having a
rolling to hilly and mountainous topography, clayey in texture and either black or red in color.
The Calcareous areas of Cebu are well drained both externally and internally. Being principally of
the porous kind of limestone, makes water to percolate easily.
Faraon Series
Faraon is one of the several soil series classified under the category of calcareous hilly and
mountainous areas. The topographic features of this series include areas that are rolling to hilly.
The hilly areas, with rounded tops gradually rise in slopes. There are cases, however, where the
slopes are very steep with as high as 450 angle or more and taper to pointed tops.
Generally Faraon soils are well drained. The topography of the land favors rapid flow of runoff.
Water does not stagnate in pockets.
Native vegetation of Faraon soils is a wide association of second-growth and virgin forests.
Groundwater table is seldom reached in the hilly areas.
There are two soil types identified under this series, namely Faraon clay and Faraon clay, steep
phase. The former includes the rolling and smooth hilly areas while the latter consists of the very
steep hills with narrow tops.
Faraon clay – This soil type is common along the coastal hilly areas of Cebu, including a small part
in the Camotes Group. This type has an aggregate area of 40,435 hectares. The Intermediate
layers are wanting and only the surface soil which is immediately followed by the bedrock appears
more common. There are cases where true soils are formed as fast as the parent materials are
developed.

QUARRY VENTURES PHILIPPINES, INC. Environmental Impact Assessment
February 2019 2-101
Faraon clay varies in depth from ten (10) to twenty five (25) cm. Soil erosion, which is very
prevalent on this type, has washed away the entire surface soil leaving only a part of the subsoil
or sometimes exposing hard rocks.
Faraon soils are black. This color maybe attributed to organic matter. As this soil has been
developed under alkaline condition, the alkali must have dissolved the organic matter which
imparted color to the soil. In areas where severe sheet erosion has completely removed the
surface soil, the subsoil appears gray.
The surface soil of this type is moderately friable except, when it is puddled. This soil type is widely
utilized and planted to coconut, corn cassava, banana, and numerous kinds of fruit trees. The
uncultivated areas are mostly abandoned farms where soil conditions do not warrant farming.
Faraon clay steep phase – This type differs from the Faraon clay in topography, because of its
very rough topography and very steep slopes reaching as high as 100 percent. The hill tops are
narrow and sharp. It is more generally more elevated than the Faraon clay type. This hills united
together to form a long range. There is rarely any part in this soil type which does not have an
undulating surface. This type has a total area of 87,516 hectares or about 17.98 percent of the
land area of Cebu.
The soils of this type are also well drained. Water freely flows down the slope or percolates into
the soil and through the porous rocks. In general, this type is widely covered by forest compared
to the other types under this series. No groundwater was observed on this soil type.
The surface soil of this phase measures from ten (10) to fifteen (15) cm deep. It is shallower than
the Faraon Clay. The Soil is also black in color, moderately friable when just dry and with granular
structure. In highly eroded areas the surface appears white or gray. Erosion is very prevalent on
this soil type.
In spite of its very steep slope, the area is also planted to coconut and corn.
Bolinao Clay – This type is most important soil of the Bolinao series. It is widely cultivated to
economic crops. The chief characteristic of Bolinao clay is its red-colored surface soil. The surface
soil is heavy clay and ranges in depth from fifteen (15) to twenty (20) cm. This soil is moderately
friable when dry, but sticky when wet. When it contains the optimum amount of moisture it is
friable and can be plowed easily. Unlike other clay soils, Bolinao clay does not harden and form
surface crust upon drying. When dry, the soil remains just friable to almost powdery.

QUARRY VENTURES PHILIPPINES, INC. Environmental Impact Assessment
February 2019 2-102
The subsoil of this type is also clayey just as thick as the surface with a brownish red color. In
structure, it has a coarse good blocky form and slightly sticky consistency when wet but, slightly
hard when dry.
This soil type, which exists principally on the northern part of Cebu like in San Remigio, Medellien,
Daan Bantayan and in the islands of Mactan and Camotes is planted to mostly corn, some areas
are cultivated to cassava, coconut, Kapok and Maguey.
Bolinao clay, steep phase – The roughly rolling and hilly areas classified under Bolinao Series fall
under the steep phase. This type is found in Sogod, Bogo, and San Remigio on the northern part
of Cebu and a portion in the Camotes islands with a total area of 23,500 hectares. This hilly areas
are well drained as the runoff water easily finds its way to the streams and rivers. This type has a
higher elevation than the original soil type under this series. The highest area is located in
Dalaguete some 100 meters above sea level.
Generally, Bolinao steep phase is stonier in the surface than the Bolinao Clay. Likewise, there are
also numerous limestone outcrops that make any farm operations unmanageable. This condition
maybe attributed to frequent and severe erosion which naturally exposed the once buried rocks.
The surface soil of this phase is thin having only an average of ten (10) cm. deep. It is also red in
color, moderately friable when dry, but slightly plastic when wet. It has a good coarse blocky or
granular structure that makes it easy to work on.
A large portion of this phase is not cultivated because of the rocky, depleted and eroded soil of
the area. The cultivated portions are open land covered by shrubs, low growing trees of the
molave type. In other portions cogon grass make up the rest of the soil cover of these phase.
The cultivated crops of this soil type include corn, cassava, coconut, tobacco, bananas and
maguey. As on the other types under this series, coconut, kapok and many other crops are also
chlorotic. Corn has a very poor stand on this soil phase.
Lugo Series
This soil series is also calcareous although parent rock material is made of shale. A wide area under
this series is found on the northern part of Cebu. Another Large area is located on the central
portion, and another area near the southern end of the province.

QUARRY VENTURES PHILIPPINES, INC. Environmental Impact Assessment
February 2019 2-103
Lugo series are upland soils which are roughly rolling to almost hilly in topography that range in
elevation from 75m to 180m above sea level for areas between the towns of Carcar and Barile
and, from 90m to 220m for areas between Lugo and Bogo towns. These hilly areas may have wide
and almost undulating tops that are adapted for cultivation but, has a rough terrain owing to the
numerous gullies, streams and creeks which cut its surface.
Lugo soils are also well drained like Faraon. The drainage condition is mostly external or by runoff.
These runoffs are responsible for severe soil erosion which is very noticeable on this soil. There is
no instance of water logging occur on any part of this series.
Lugo series are residual soils which have been developed from shale rocks. These shale rocks are
calcareous. Limestone rocks are not found on this soil series.
This soil series is widely cultivated to crops. Practically the whole area is denuded of forest trees.
These are areas covered with cogon grass. These are abandoned farms whose soils are so badly
eroded that no substantial crops can be grown.
Soil of the Lugo series is clayey and black in color, like those of the Faraon and Medellien. It is very
sticky and plastic when wet, and tends to harden very slightly when dried. It has a fine granular
structure which is very easy to work on with any agricultural implement. The subsoil is also clayey
and has a dark brown to yellowish brown color.
Lugo clay – This soil type was referred to by some geologists as belonging to Barile Limy clay. Lugo
clay, however, was first described and delineated as a soil type on the northern part of Cebu. The
same type also exists between the towns of Carcar and Barili, and also between Sibonga and
Dumanjug municipalities and, all together a total of 98,321 hectares.
This soil type is upland, roughly rolling to hilly areas which is dissected by numerous gullies and
creeks. The hills have rounded tops while the slopes are oftentimes steep.
Lugo clay are residual soils developed from limy shale. It has a characteristic of being black
surfaced soil which is rather thin, averaging 15 cm deep. Soil erosion is also severe on this soil
type that, a greater part of the surface soil especially along the slopes has been washed down.
Corn, coconut, tobacco and sugarcane are the principal crops planted on this soil type.
F. Non Calcareous, Hilly, and Mountainous Areas

QUARRY VENTURES PHILIPPINES, INC. Environmental Impact Assessment
February 2019 2-104
Some of the rugged mountainous areas occupying the central portion of Cebu Province are not
calcareous. They are lofty mountains with a characteristic of having a deep and V-shaped gorges.
The elevation of most of the peaks can reach as high as 1,000 meters above sea level. They have
sharp-edged tops with very steep, precipitous slopes.
Vegetation in this region is mostly grass. Small patches of virgin forest still stand in widely
distributed areas. The remainder of the area which constitutes a small portion is under cultivation.
The grassland consists mostly of talahib, cogon, ferns and a mixture of low growing shrubs that
are vegetation characteristic of areas having high altitude. Along the creeks are bamboo groves
and second growth trees.
In general the area is well drained because of its topography. The drainage is mostly external as
the water rapidly flows as runoff. Hence, the deeper layers of the soil have very little chance of
getting wet.
These mountainous areas are believed to have been formed during the pre-Miocene period. Their
bedrocks consist of igneous and metamorphic materials like diorite, quartz, andesite, slate,
greenstone, sandstone, and shale which were partly coal bearing.
Baguio Series
This soil series occupies the north central portion of Cebu Province. It represents the highest, bold
and rugged mountains. It is characterized by narrow, sharp-topped edges with steep, almost
precipitous slopes, and separated from each other by deep V-shaped Gorges. Elevation ranges
from 200 to 1,000 meters above sea level. Narrow and long valleys between the mountain ranges
are common and well inhabited.
The bedrocks of these mountains which were classified as basement complex and emerged during
the pre-Meiocene time consist of igneous rocks, diorite, quartz diorite, and andesite flows that
make most of the big boulders along the Talisay-Toledo road.
Native vegetation of this soil series consists primarily of grassland with occasional patches of virgin
forest and second growth trees. The grassland areas are dominantly vegetated with cogon grass
intermixed with ground ferns and many kinds of low shrubs.
Soils of the Baguio series are fairly deep. It is much deeper than either the Faraon, Lugo, or Bolinao
soils. There is only one soil type identified in this series. This is Baguio clay loam.

QUARRY VENTURES PHILIPPINES, INC. Environmental Impact Assessment
February 2019 2-105
Baguio clay loam – The soil of this type, which is of residual formation, has dark brown to brown
surface soil that ranges in depth from 20 to 30 cm. The surface soil is much thicker at the lower
part of the slopes than on the tops or upper sides. Its medium coarse granular structure is
desirable for plowing. This soil, however, tends to harden when plowed too wet.
The surface soil is fairly rich in organic matter. Those under grasslands have darker color than
those under cultivation or under forest cover whose color tends toward the brighter tinge or
brown. All these soil color reflect on the organic matter content of the soil.
It is situated on the central upper portion of the headwaters of many rivers that flow to the lower
plain are located in this area. In addition, the watershed that collects water for Cebu City is also
located on this soil type. Because of these important functions, it is advisable that this soil type
be fully reforested.
Because of its high elevation, good quality vegetables are grown in this soil type. Spiny bamboos
are also abundantly growing wild along gullies and banks of creeks. This soil type has an area of
96,336 hectares.
Mantalongon Series
This series is found only on the southern part of Cebu and on the central portion west of the town
of Dalaguete. This series like that of the Baguio series is characterized by a high, rough mountain
with steep slopes. Its altitude reaches up to 1000 meters. Because of this elevation, the weather
is cool and rainfall is usually abundant. Rainfall in Mantalongon averages 2,353.5 mm per annum
which is the maximum mean precipitation recorded in Cebu.
Soils of the Mantalongon series are residual materials having been developed from underlying
rocks which were mostly shale, sandstone, and conglomerate. It is brown to light brown, friable
and granular. The substratum is made of reddish brown to grayish brown colored shale rocks. The
shale rocks have platy structure which is arranged in beds lying parallel. It is boundaries separating
each soil layer are smooth and gradual.
Mantalongon clay loam – This soil type is found on the south central portion of Cebu occupying
the highly elevated and very rugged mountains between the towns of Dalaguete and Badian. The
topography of this soil type, although very irregular, has rather smooth surface, unlike that of
Baguio clay loam which has sharp-edged tops. It, however, has also steep slopes.

QUARRY VENTURES PHILIPPINES, INC. Environmental Impact Assessment
February 2019 2-106
Mantalongon clay loam is dominantly covered by cogon grass. There are very few small patches
of forest. The remaining areas are planted to coconut, corn, bananas, abaca, sweet potatoes, and
some lowland rice.
Mantolongon soils which range from 10 to 25cm deep are light to dark brown in color. It is fairly
friable and can be easily worked. However, because of its steep slopes only small patches can be
cultivated.
Mantalongon clay loam is well adopted to growing semi-temperate crops. The area is noted for
the production of cabbage, lettuce, cauliflower, everlasting and some trees like pines. On account
of the high elevation which is over 1,000 meters above sea level, with rainfall evenly distributed
throughout the year. This soil type has an area of 20,225 hectares.
Soil erosion / loss of topsoil / overburden
Soil is generally a variable mixture of minerals, organic matter, water and air. It covers the earth
in a thin layer and primarily gives mechanical support to plants. It is the product of action of the
physical, biological, and chemical forces upon the rocks for thousands of years. Soil formation is
apparently a slow process. Soil characteristics vary greatly from place to place. It is, therefore,
very necessary to understand these characteristics because, the more we understand these
characteristics, the more we can manage the soil in determining the capacity of the soil to produce
the products needed by man.
Figure 2-16 shows the Soil Map of the Project area (Cities of Toledo and Naga in red outline).
Based on the soil survey and assessment conducted, Parcels 1, 2 and 3 belongs to the Lugo clay
series (156). Lugo clay is the only type under this series and has the following characteristics
(Table 2.1). Parcel 5 on the other hand belongs to the Mandaue Clay Loam series (157). For
brevity, the typical soil profile morphological characteristics of the Mandaue Clay Loam series is
presented in Table 2.2.
Table 2-12: Typical Soil Morphological Characteristics of Lugo Clay
Depth (cm) Characteristics
0 - 20
A dark gray to black surface layer; heavy clay with medium to fine granular structure; very sticky and plastic when wet but slightly friable when dry. Upon drying soil particles do not clod nor harden like other clays. It is fairly rich in organic matter and devoid of any skeleton.
20 - 30 A light yellowish brown clay with a good coarse granular structure that is sticky and plastic when wet but friable when dry. There is no coarse skeleton. Soft concretion-like limestone which are spherical to irregularly shaped forms are present in this layer. This
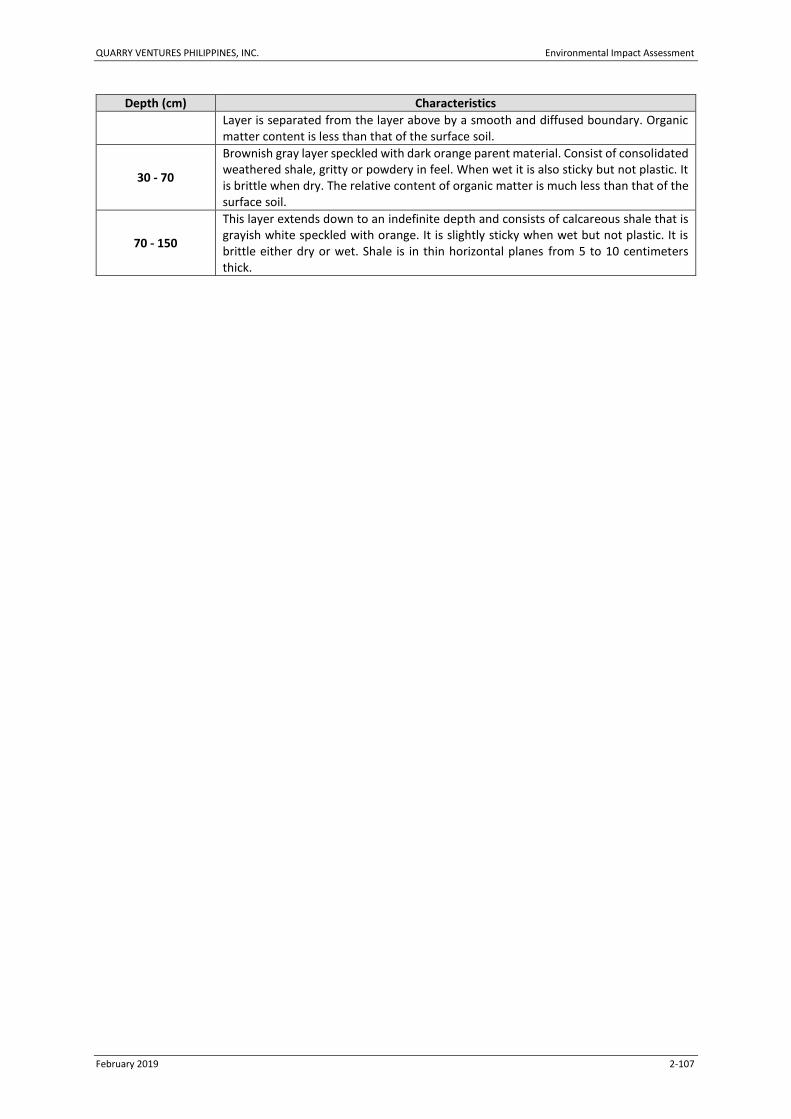
QUARRY VENTURES PHILIPPINES, INC. Environmental Impact Assessment
February 2019 2-107
Depth (cm) Characteristics
Layer is separated from the layer above by a smooth and diffused boundary. Organic matter content is less than that of the surface soil.
30 - 70
Brownish gray layer speckled with dark orange parent material. Consist of consolidated weathered shale, gritty or powdery in feel. When wet it is also sticky but not plastic. It is brittle when dry. The relative content of organic matter is much less than that of the surface soil.
70 - 150
This layer extends down to an indefinite depth and consists of calcareous shale that is grayish white speckled with orange. It is slightly sticky when wet but not plastic. It is brittle either dry or wet. Shale is in thin horizontal planes from 5 to 10 centimeters thick.

QUARRY VENTURES PHILIPPINES, INC. Environmental Impact Assessment
February 2019 2-108
Figure 2-16: Soil Map of the Project area (Cities of Toledo and Naga), Province of Cebu Indicating Soil Series Numbers

QUARRY VENTURES PHILIPPINES, INC. Environmental Impact Assessment
February 2019 2-109
Table 2-13: Typical Soil Morphological Characteristics of Mandaue Clay Loam (157)
Depth (cm) Characteristics
0 - 20
Surface layer, light brown to dark brown gray clay loam; good to poor coarse blocky structure. When wet, it is moderately friable to slightly hard but hard when dry. It has a moderate amount of organic matter it is non calcareous but slightly to moderately alkaline. There are no stones or boulders of any kind in this layer. Thickness varies from 20 to 30 centimeters.
20 - 50
Dark brown to dark grayish brown clay loam; good coarse blocky structure. When wet, it is slightly compact and hard, and when dry, it is very hard and compact. Poor in organic matter; non calcareous; with pH 7.96 which is medium alkaline. Separated from the above layer by a wavy and diffused boundary.
50 - 120
Yellowish brown clay loam, with a moderately coarse columnar structure. When dry it is hard and compact but becomes only slightly soft and compact when wet. It is also non- calcareous with a pH value of 7.84 which is medium alkaline. No coarse skeleton, Separated from the above layer by a wavy and diffused boundary.
120- 150
Yellowish brown with mottling of brown to dark brown clay loam. It has a medium coarse granular structure and the same consistency as the above layer. Also non-calcareous and free of any coarse skeleton. This layer has a pH value of 7.84 which is slightly alkaline. Separated from the above layer by a wavy and diffused boundary. Some times in deep layer of this series may be found pebbles of river wash origin.
Soil Physical Properties of Sampling Locations
Soil Texture
Soil Texture refers to the relative proportion of the sand, silt and clay of the soil matrix as a whole.
The amount of any of these soil aggregates greatly influence soil structure and consistency. The
soil texture has a considerable effect on many factors which includes plant growth as it
determines the amount of nutrients, gas, soil and water movement and, the tillage requirements
of particular soils. Figure 2-17 presents the Soil textural analysis of the four (4) sampling locations
within the project site. All of the sampling locations have a clay texture. The heaviest textured soil
is parcel 3 having a clay/silt percentage of 95. The rest of the sampling sites have a medium
texture.

QUARRY VENTURES PHILIPPINES, INC. Environmental Impact Assessment
February 2019 2-110
Figure 2-17: Soil Textural Analysis of the Soil Sampling Locations
Slake Test
Slaking is the breakdown of large, air-dry soil aggregates (>2-5 mm) into smaller sized micro-
aggregates (<0.25 mm) when they are suddenly immersed in water. Slaking occurs when
aggregates are not strong enough to withstand internal stresses caused by rapid water uptake.
Internal stresses result from differential swelling of clay particles, trapped and escaping air in soil
pores, rapid release of heat during wetting, and the mechanical action of moving water.
In contrast to slaking, tests for aggregate stability measure how well soil withstands external
destructive forces, such as the splashing impact of raindrops. Poor aggregate stability and slaking
resulted in a detached soil particles that settle into the soil micropores, and cause surface sealing,
reduced infiltration and plant available water, and increased runoff and erosion.
Why it is important: Slaking indicates the stability of soil aggregates resistance to erosion and
suggests how well soil can maintain its structure to provide water and air for plants and soil biota
when it is rapidly wetted. Limited slaking suggests that organic matter is present in soil to help
bind soil particles and micro-aggregates into larger, stable aggregates.
This test is not applicable in sandy and stony soils. This therefore allowed that parcels 1, 3 and 5
to be tested. Parcel 2 has a stony surface soil rendering it to be classified as Class 0.

QUARRY VENTURES PHILIPPINES, INC. Environmental Impact Assessment
February 2019 2-111
Slake test of Parcel 1 is shown in Figure 2-18 (start of the slake test) and, Figure 2-19 (end of the
Slake test). The soil fragment (at least 2 – 5 cm x 2 – 5 cm in size) was taken at the immediate soil
surface.
Soil response to wetting is observed for a period of 10 minutes. The result shows that the soil can
be classified as Class 4 or very stable (Figure 2-19). There is no slumping of particles is evident
after 10 minutes of being immersed in water. The whole fragment remains intact with no evidence
of swelling or disintegration of particles.
Figure 2-18: Start of Slake Test, Parcel 1

QUARRY VENTURES PHILIPPINES, INC. Environmental Impact Assessment
February 2019 2-112
Figure 2-19: 10 Minutes After Slake Test, Parcel 1
Similarly, Parcel 3 surface soil wet cohesiveness was tested in situ during the field soil sampling
activities. A representative fragment of the soil surface is collected and immersed in distilled
water inside a stainless steel basin (Figure 2-20). A period of 10 minutes of water submergence
is allowed before observance of any slaking property. Figure 2-21 showed after 10 minutes of
water immersion, there was no slumping of particles the whole fragment remains intact, no
evidence of swelling or disintegration of particles was observed. This soil is therefore classified as
Class 4 or very stable.

QUARRY VENTURES PHILIPPINES, INC. Environmental Impact Assessment
February 2019 2-113
Figure 2-20: Start of Slake Test, Parcel 3
Figure 2-21: 10 Minutes After Slake Test, Parcel 3

QUARRY VENTURES PHILIPPINES, INC. Environmental Impact Assessment
February 2019 2-114
The Slake test procedure is repeated in Parcel 5. (Figure 2-22). A period of 10 minutes of water
submergence is allowed before observance of any slaking property of the soil. Figure 2-23 shows
that the soil of Parcel 5 is very stable (Class 4). There was no slumping of sub-crust.
Figure 2-22: Start of Slake Test, Parcel 5

QUARRY VENTURES PHILIPPINES, INC. Environmental Impact Assessment
February 2019 2-115
Figure 2-23: 10 Minutes After Slake Test of Parcel 5
Change in soil quality/fertility
A summary of the soil sampling results are given in Table 2-14 and Table 2-16.
Table 2-14: Results of Nutrients Analysis in reference to the BSWM Standards
Location/Coordinates Soil Type Parameters
pH OM N P K Na Ca Mg Zn Fe
Brgy. Tagjaguimit, City of Naga (Parcel I) N 10°15’50.8” E 123°40’38.6”
Mandaue Clay
Loam 7.26 2.61 0.13 13.8 307 76.4 9900 878 31 20,400
Brgy. Lamac, Municipality of Pinamungahan (Parcel II) N 10°16’54.2” E 123°40’25.9”
Mandaue Clay
Loam 7.98 1.82 0.1 6.3 508 208 48500 1596 41 15,500
Brgy. Bulongan, Toledo City (Parcel III) N 10°18’16.2” E 123°39’24.5”
Lugo Clay 7.93 1.47 0.12 4.99 84.5 200 9800 655 48 25,300
Brgy Cogon , City of Naga (Parcel V) N 10°17’16.7”
Mandaue Clay
Loam 5.6 2.38 0.08 214 234 104 4000 3884 55 23,800

QUARRY VENTURES PHILIPPINES, INC. Environmental Impact Assessment
February 2019 2-116
E 123°44’6.5”
Adequate (Favorable)
Moderate (Moderately unfavorable)
Deficient (Unfavorable)
Table 2-15: BSWM Soil Fertility Rating
Soil Fertility Rating Guideline
PARAMETER UNITS Adequate (Favorable) Moderate (Moderately
Unfavorable) Deficient
(Unfavorable)
Soil pH 5.5 – 8.5 5.0 – 5.5 <5.0 / > 8.5
Organic Matter % >3 2 - 3 <2
Nitrogen ppm 0.6 – 1.0 0.3 – 0.6 <0.1
Phosphorus ppm 20 - 30 >30 <10
Potassium ppm 234 - 468 117 - 234 <39
Sodium ppm 161 - 459 37 - 160 <23
Calcium ppm 2,000 – 4,000 400 – 2,000 <200
Magnesium ppm 360 - 840 120 - 360 <60
Zinc ppm >1.5 0.5 – 1.5 <0.5
Iron ppm 2.5 – 4.4 >4.5 <2.5
Table 2-16: Metal Concentrations for All Soil Sampling Locations
Location/Coordinates Soil Type Metal Concentration of Soil Sampling Locations
Mercury Lead Arsenic Cadmium
Brgy. Tagjaguimit, City of Naga (Parcel I) N 10°15’50.8” E 123°40’38.6”
Mandaue Clay Loam
0.1 0.48 3.1 0.62
Brgy. Lamac, Municipality of Pinamungahan (Parcel II) N 10°16’54.2” E 123°40’25.9”
Mandaue Clay Loam
0.1 3.5 5.7 0.83
Brgy. Bulongan, Toledo City (Parcel III) N 10°18’16.2” E 123°39’24.5”
Lugo Clay 0.1 5.92 12.1 1.29
Brgy Cogon , City of Naga (Parcel V) N 10°17’16.7” E 123°44’6.5”
Mandaue Clay Loam
0.1 8.97 2 1.22
US EPA STANDARD 0.3 10 6.3 0.603
Soil pH
Shown in Figure 2-24 is the soil pH of the 4 soil sapling sites within the project area. The laboratory
analysis using electrometric method revealed that the pH of the soil in Parcel 1 to be near neutral
(7.26). Parcel 2 and 3 are having a pH value of 7.98 and 7.93 and is rated by the Bureau of Soils
and Water Management (BSWM) to be moderately alkaline.

QUARRY VENTURES PHILIPPINES, INC. Environmental Impact Assessment
February 2019 2-117
On the other hand, Parcel 5 soil sampling site soil reaction is rated as moderately acid. This is
believed to be brought about by the land use (i.e. intensive cropping activity within the site), and
now abandoned when the productivity becomes poor (personal communication among farmers).
The low pH in this site is also indicated by the present vegetation (mainly grasses) that is
undergoing various stages of litter decomposition at the surface. The process greatly affects the
soil reaction most especially in the surface horizon, and is reflected by the latest soil testing
activity.
The results reflect the information from the soil pH map presented in the Cebu Provincial
Agricultural Profile by the Department of Agriculture, 2011 (Figure 2-25).
Figure 2-24: Soil pH of the 4 Soil Sampling locations

QUARRY VENTURES PHILIPPINES, INC. Environmental Impact Assessment
February 2019 2-118
Source: Cebu Provincial Agricultural Profile, Department of Agriculture, Regional Field Unit – 7, 2011
Figure 2-25: Provincial Soil pH Map

QUARRY VENTURES PHILIPPINES, INC. Environmental Impact Assessment
February 2019 2-119
Soil Organic Matter Content
Soil organic matter (SOM) is one of the important sources of organic nitrogen. It enhances the soil
microbial activities, it also greatly influences the gas exchange of the soil matrix, and it improves
the structure of the soil, increases soil water holding capacity, and cation exchange capacity.
The laboratory test of the surface soil in the project areas revealed that the soil in Parcel 1 and
Parcel 5 have a medium level of (SOM) of 2.6 and 2.58%, respectively. Parcels 2 and 3 on the other
hand, showed to have a low SOM of 1.82 and 1.47%, respectively (Figure 2-26). For optimum
crop/plant production, the soil must have at least 3% SOM minimum. Figure 2-27 shows the
provincial soil organic matter of Cebu.
Figure 2-26: Soil Organic Matter Content

QUARRY VENTURES PHILIPPINES, INC. Environmental Impact Assessment
February 2019 2-120
Source: Cebu Provincial Agricultural Profile, Department of Agriculture, Regional Field Unit – 7, 2011
Figure 2-27: Provincial Soil Organic Matter Map
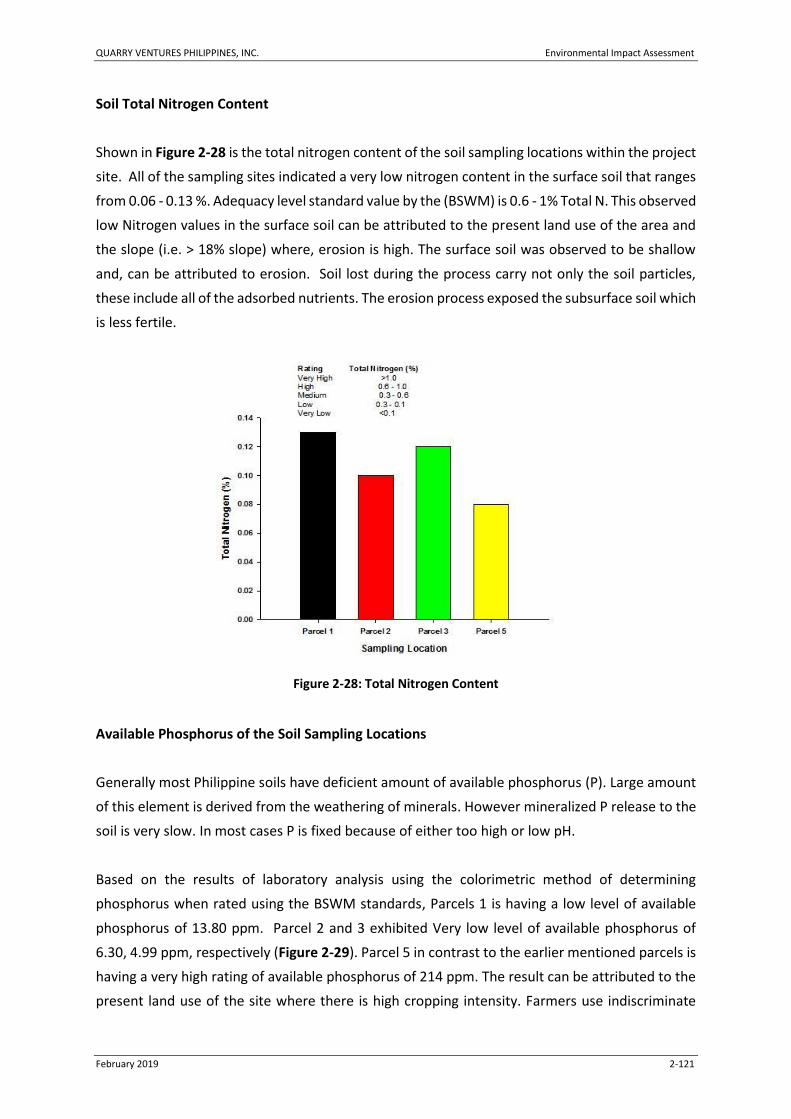
QUARRY VENTURES PHILIPPINES, INC. Environmental Impact Assessment
February 2019 2-121
Soil Total Nitrogen Content
Shown in Figure 2-28 is the total nitrogen content of the soil sampling locations within the project
site. All of the sampling sites indicated a very low nitrogen content in the surface soil that ranges
from 0.06 - 0.13 %. Adequacy level standard value by the (BSWM) is 0.6 - 1% Total N. This observed
low Nitrogen values in the surface soil can be attributed to the present land use of the area and
the slope (i.e. > 18% slope) where, erosion is high. The surface soil was observed to be shallow
and, can be attributed to erosion. Soil lost during the process carry not only the soil particles,
these include all of the adsorbed nutrients. The erosion process exposed the subsurface soil which
is less fertile.
Figure 2-28: Total Nitrogen Content
Available Phosphorus of the Soil Sampling Locations
Generally most Philippine soils have deficient amount of available phosphorus (P). Large amount
of this element is derived from the weathering of minerals. However mineralized P release to the
soil is very slow. In most cases P is fixed because of either too high or low pH.
Based on the results of laboratory analysis using the colorimetric method of determining
phosphorus when rated using the BSWM standards, Parcels 1 is having a low level of available
phosphorus of 13.80 ppm. Parcel 2 and 3 exhibited Very low level of available phosphorus of
6.30, 4.99 ppm, respectively (Figure 2-29). Parcel 5 in contrast to the earlier mentioned parcels is
having a very high rating of available phosphorus of 214 ppm. The result can be attributed to the
present land use of the site where there is high cropping intensity. Farmers use indiscriminate

QUARRY VENTURES PHILIPPINES, INC. Environmental Impact Assessment
February 2019 2-122
amount of fertilizers such as urea (45% N) and Complete fertilizer (14 – 14 – 14) which contain
available P. Residual traces of phosphorus can be easily detected by the soil test. Livestock like
cattle and carabao and goat normally graze the area. All of these can contribute to the increase
of available phosphorus in the surface soil. Figure 2-30 shows the provincial soil phosphorus map.
Figure 2-29: Total Phosphorus Content

QUARRY VENTURES PHILIPPINES, INC. Environmental Impact Assessment
February 2019 2-123
Source: Cebu Provincial Agricultural Profile, Department of Agriculture, Regional Field Unit – 7, 2011
Figure 2-30: Provincial Soil Phosphorus Map

QUARRY VENTURES PHILIPPINES, INC. Environmental Impact Assessment
February 2019 2-124
Soil Exchangeable Bases of the Sampling Locations
Using the BSWM standard for exchangeable Calcium (Ca), the laboratory test showed that Ca is
abundant in all of the sampling locations. This is simply because, the soil parent material in all of
the parcels sampled is limestone known to be high in calcium. Parcel 5 have the lowest amount
of exchangeable Ca of 4,000ppm but, still rated to be high when compared to the standard. The
highest was found in Parcel 3 of 69,800ppm (Figure 2-31).
Figure 2-31: Exchangeable Calcium Content
Potassium (K) is one of the essential elements required by plants in large quantities. Basically,
potassium is required in the development of young plants such as leaves, flowers and seeds and
the quality of the produce. Three of the soils of all of the Parcels sampled have a high to very high
level of Exchangeable K of 234; 307 and 508ppm for Parcels 5, 1, and 2, respectively. The lowest
amount of exchangeable K was found in Parcel 3 of 84.5ppm and is rated low when compared to
the BSWM standard (Figure 2-32). Figure 2-33 shows the provincial soil phosphorus map.
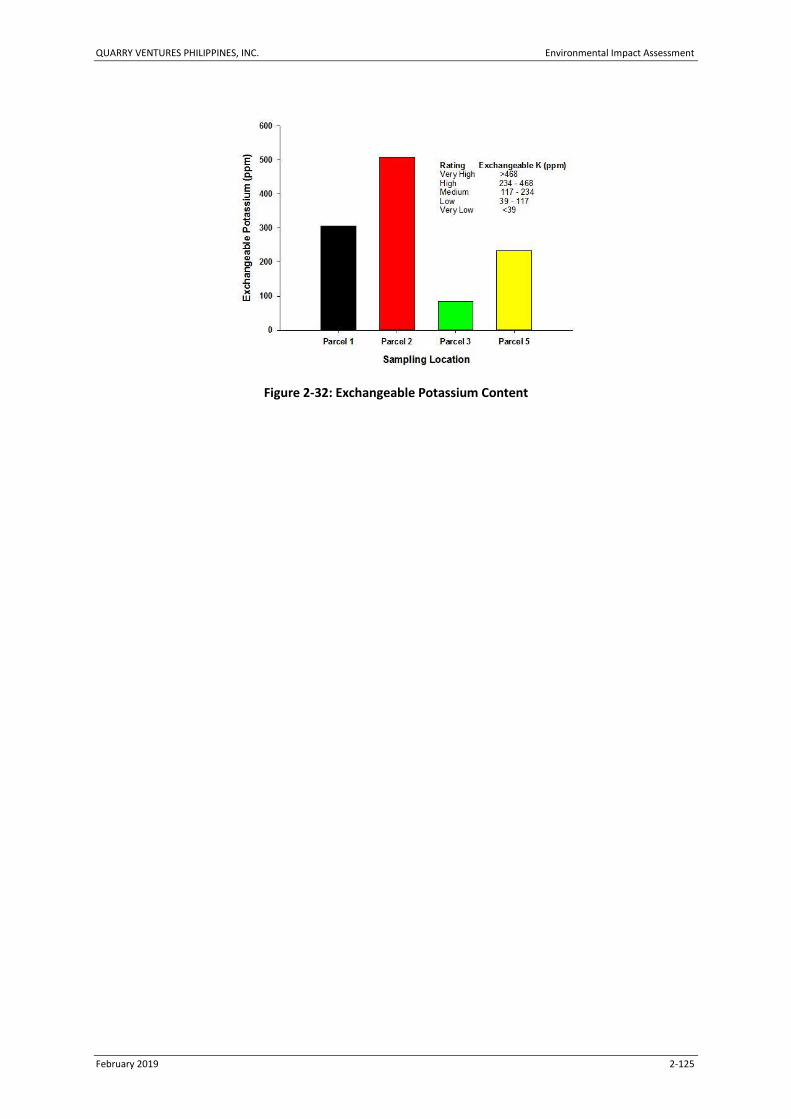
QUARRY VENTURES PHILIPPINES, INC. Environmental Impact Assessment
February 2019 2-125
Figure 2-32: Exchangeable Potassium Content

QUARRY VENTURES PHILIPPINES, INC. Environmental Impact Assessment
February 2019 2-126
Source: Cebu Provincial Agricultural Profile, Department of Agriculture, Regional Field Unit – 7, 2011
Figure 2-33: Provincial Soil Potassium Map

QUARRY VENTURES PHILIPPINES, INC. Environmental Impact Assessment
February 2019 2-127
Magnesium (Mg) as an essential nutrients in higher plants is a component of the green pigment
in the plant leaves (i.e. chlorophyll) and, act as catalyst to the translocation of phosphorus in the
plant vascular tissues. It also aid in the formation of fats and oil in fruits.
The levels of exchangeable Mg is shown in Figure 2-34. Using the BSWM sets of standard for
exchangeable Mg showed that all of the parcels sampled have a very high amount of
exchangeable Mg. The lowest exchangeable Mg of 655.0ppm was given by Parcel 3. The highest
on the other hand was given by Parcel 5 of 3,884.00ppm.
Figure 2-34: Exchangeable Magnesium Content
The exchangeable Sodium (Na) is very necessary for the plant in order to maintain turgidity of the
cell wall and is also needed in large quantities by plants. However, excess level of this essential
element in the soil is detrimental as it causes wilting as the plant loses water from their tissues
thru plasmolysis. Sodium level of the soil is medium to high levels when compared to the BSWM
standard (Figure 2.9) exchangeable amount of Exchangeable Na was found in Parcel 1 of 76.4ppm.
The highest on the other hand was in Parcel 2 of 208.00ppm.

QUARRY VENTURES PHILIPPINES, INC. Environmental Impact Assessment
February 2019 2-128
Figure 2-35: Exchangeable Sodium Content
Metallic Essential Micro nutrients of the Soil Sampling Locations
The metallic essential nutrients Iron (Fe) and Zinc (Zn) of the soil sampling locations analyses of
the four (4) soil sampling locations in the project site is shown in Figure 2.10a and Figure 2.10b,
respectively.
Iron (Fe) is essential in the synthesis and maintenance of chlorophyll in plants. Also, Fe has been
strongly associated with protein metabolism. Figure 2-36 showed that the soil of all parcels
sampled have an adequate level of iron when compared to the BSWM standard. The lowest Fe
content of 15,500ppm was inferred in Parcel 2 and, the highest was given by Parcel 3 of
25,300ppm.

QUARRY VENTURES PHILIPPINES, INC. Environmental Impact Assessment
February 2019 2-129
Figure 2-36: Metallic Essential Micro nutrient Iron
Figure 2-37 presents the zinc content of the sampling locations. This trace metal is Zn is an
essential component of several metallo-enzymes in plants and, therefore is necessary for several
different function in plant metabolism. Essential element Zn is commonly deficient in soils with
high pH. However, on all of the Parcels sampled, they exhibited an adequate level of zinc. Parcel
1 have 31.0ppm of zinc which is the lowest. The highest level of zinc was found in Parcel 5 of
55.0ppm.

QUARRY VENTURES PHILIPPINES, INC. Environmental Impact Assessment
February 2019 2-130
Figure 2-37: Metallic Essential Micro Nutrient Zinc
Heavy Metal Content
Results of the Heavy metal analysis were compared to the United States Environmental protection
Agency (US EPA, 1974) standards for Arsenic, Cadmium, Lead and Mercury.
The heavy metal Arsenic (As) content of Parcels 1, 2 and 5 (Figure 2-38) did not exceed the US
EPA standard levels of soil contamination of 6.3ppm of 5.70, 2.00, 3.10ppm, respectively. Again,
this results can be attributed to the present land use. For example, Parcel 2 is a second growth
forest that, there is no, agricultural activities and other anthropogenic activities that introduce As
to the soil and, therefore can be considered as soil inherent As content. Parcel 3 soil sampling
location on the other hand, exceeded the USEPA standard limit with As content of 12.10ppm. This
is perhaps again, can be attributed to the present land use where, it is heavily farmed and, the
constant use of agri-chemicals may have introduced the heavy metal in the soil. Further,
accumulation of the heavy metal arsenic can be also attributed to the soil texture of the soil where
it is clay, rendering very poor drainage and therefore limit leaching of the highly water soluble As.

QUARRY VENTURES PHILIPPINES, INC. Environmental Impact Assessment
February 2019 2-131
Figure 2-38: Heavy Metal Arsenic Content
Heavy metal Cadmium (Cd) soil laboratory analysis revealed that all soil of the sampling locations
exceeded the US EPA standard for Cd of 0.603ppm. Cadmium is notably high in non-calcareous
soils, hence, the high concentrations in areas where intensive addition of soil amendments like
fertilizers and pesticides were made may have contributed to the observed elevated levels of Cd
in the surface soil. The rest can be attributed to the inherent parent materials content of Cd and
is apparent in Parcel 2 where not much interventions are employed (Figure 2-39).
Figure 2-39 Heavy Metal Cadmium Content

QUARRY VENTURES PHILIPPINES, INC. Environmental Impact Assessment
February 2019 2-132
In terms of the presence of Heavy metal Mercury (Hg), all of the soil sampling location have very
low levels of Hg (i.e. <0.1ppm) when compared to the US EPA standard of 0.3 ppm and is
presented in Figure 2-40.
Figure 2-40: Heavy Metal Mercury Content
Soil lead becomes a health risk when directly ingested or inhaled as dust. Backyard garden
produce, which has accumulated lead in its tissue or has soil particles adhering to it, can also be
a hazard if eaten. Lead poisoning is a particular concern for young children (under the age of six)
because their rapidly developing bodies are very sensitive to the effects of lead, and their play
habits tend to increase exposure.
Lead (Pb) content of the four (4) soil sampling location are shown in Figure 2-41. Although, the
presence of heavy metal Pb is detected it indicated to be still under the acceptable limit. Parcel
5 have the lowest level of Pb of 0.48ppm, and the highest level was found in Parcel 2 of 8.97ppm.
The U.S. EPA standard is 10.0 ppm.

QUARRY VENTURES PHILIPPINES, INC. Environmental Impact Assessment
February 2019 2-133
Figure 2-41: Heavy Metal Lead Content
Assessment of Impacts and Mitigating Measures
Natural Topography
Change in topography is inherent to any surface mining activity. Activities that would generate
the most significant impact to geology and geomorphology are the site preparation (i.e.
overburden removal and grading) and the quarrying activity itself.
To minimize the impact on the natural topography, mining activity will be conducted in
conformance with the mining plan and bench parameter of at least 3m bench width and
minimum of 10m bench height. The mined-out areas will be recontoured following the
topography. The contours shall be appropriately designed (catch bench width, bench height,
bench angle, general slope angle, slope height, etc.) based on the geology of the area and on
the original land configuration of the area to be mined.
Haul Roads and Access Roads
Quarry development will start from the construction of access/haul road within the quarry
site, which is designed to facilitate opening of benches. The haul road is set to have a width
of 15 meters with a maximum grade of 8–10%.

QUARRY VENTURES PHILIPPINES, INC. Environmental Impact Assessment
February 2019 2-134
Movement of large machinery across the landscape during development and quarry
operations may lead to soil compaction. As the soil is compacted, infiltration and percolation
rates as well as soil porosity drastically decline. With this, the potential of the soil for plant
establishment is compromised due to less pore spaces that impede the movement of oxygen
and water through the soil profile. In addition, as water is unable to percolate down through
the soil, it inevitably will move across the landscape as surface runoff transporting loose soil
which may reach nearby surface waters.
The haul ramp will be developed from the access road and initially following the natural
topography of the area. The roads will be constructed with an overall width of about 30 m
which incorporates provision for ditch and berm. Pre-emptive measures through
implementation of appropriate slope/ground failure monitoring plan will be adopted to
identify any instability at an early, non-critical stage so that safety measures can be initiated
to prevent or minimize impacts.
Waste Stockpile Area
Waste stockpile area will be designated in the mine out area to accommodate waste and
topsoil recovered as the project progress. The topsoil will be used in the progressive and final
rehabilitation of the disturbed areas. Stockpile slope will be kept at a low angle and height to
minimize slumping.
Stockpiling of the topsoil for prolonged periods may deteriorate the biological components in
the soil deteriorating its quality. Stripping of soil at unsuitable moisture content (i.e. when
wet or saturated) may also lead to compaction and loss of soil structure.
Recovered topsoil during operation will immediately be used as potting medium in the
nursery or can immediately be spread to a previously mined area. Since stripping of the
topsoil and overburden material is proposed to be done ahead of quarrying phase, stockpiling
of topsoil in the early stages of the project is inevitable. With this, topsoil will initially be piled
on designated topsoil areas. Drainage canals will be provided to divert surface runoff away
from the piles as well as to collect storm water intercepted within the stockpile area to the
designated sedimentation ponds.
To avoid soil erosion or down cutting of the base of stockpiles, stockpiles will not be placed
on natural drainage lines. Weep holes will also be placed to drain off accumulated water

QUARRY VENTURES PHILIPPINES, INC. Environmental Impact Assessment
February 2019 2-135
inside the stockpile and also for better soil aeration to maintain or enhance the growth of
beneficial microorganisms in the soil. To avoid the deterioration of the soil quality, the topsoil
will be stored in small mounds no more than 3-meters high. An embankment grade of
approximately 1V:4H (or depending on the angle of repose) will be followed to limit the
potential for erosion of the outer pile face. In addition, topsoil stockpiles will be seeded and
fertilized. The addition of biosolids, compost, manure, crop/plant residues or other readily
available organic-matter-rich materials will also help enhance the biological growth in the soil
as well as improve soil structure thus will be considered in the rehabilitation plan. The
stockpile will be properly protected from the direct exposure to high temperatures and strong
winds by planting of N-fixing leguminous cover crops.
Contaminated Land
Soil contamination may also occur due to accidental spill of oil and fuel (hydrocarbons) and
improper disposal of domestic waste.
Waste oils and lubricants shall be properly handled, stored and disposed in accordance with
RA 6969. Hazardous materials and wastes shall be contained in areas with lining or in storage
tanks. Safety procedures shall be implemented to avoid spillage. In case of accidental spills,
contaminated soil shall immediately be removed to avoid further dispersion of contaminants.
Spill kits shall be made available at all times.
2.1.4 Terrestrial Ecology
The forest types of Cebu Island are identified as mangrove forest, beach forest, molave forest of
the coastal plain, the molave forest of the hill zone, and the dipterocarp forest of the higher
elevation (Seidenschwarz, 1988).
The island’s remaining forests are characterized mainly by forest over limestone, in its original
and regenerating state. These cover only 17km2 which is about 0.3% of the total land area of
Cebu (Jakosalem et al., 2012; Dutson et al., 1993). These are fairly well-studied as critical habitats
of fauna of Cebu. In particular, forest patches of Tabunan, Dalaguete, Boljoon, Argao, Alcoy,
Alegria, Carmen, Alegria-Malabuyoc, Mananga Watershed Reserve, Kotkot-Lusaran Watershed
Reserve (Anon, 2008; Jakosalem et al., 2012; Paguntalan and Jakosalem, undated; Orlanes, 2002;
Hafner et al., 2003). The forest over limestone is the equivalent of the molave forest of the coastal
plain and hill zone in the forest classification of Seidenschwarz (1988).

QUARRY VENTURES PHILIPPINES, INC. Environmental Impact Assessment
February 2019 2-136
The forest in Tabunan is characterized with a multi-storey vertical strata with emergent, canopy
and lower canopy layers and with an average of 82.66% crown closure, by Orlanes (2002). Within
a 600 m2, 111 species in 71 genera and 36 families have been documented. Dutson et al. (1993)
however that there is no more closed canopy dipterocarp in Cebu.
Some of the species which are commonly documented in these forests, outside of the study sites
are: Swietenia macrophylla, Leucaena leucocephala, Gmelina arborea, Tectona grandis, Albizia
saman, Sterculia philippinensis, Diospyros philippensis, Cinnamomum cebuense, Alstonia
macrophylla, Palaquium philippense, Melia dubia, Vitex parviflora, Casuarina rumphiana,
Canarium sp., Artocarpus sp., Buchanania sp., Nauclea sp., Pittosporum pentandrum, Medinilla
albiflora, Ficus spp., Homolanthus sp., Mallotus sp., Syzygium sp., Macaranga sp., Leea sp., Dillenia
sp., Mangifera sp., Eucalyptus sp. Calamus sp. Helicia sp., Melastoma sp., Leucosyke capitellata,
Dracaena sp., Breynia sp., Lansium domesticum, Musa textiles, Colocasia esculenta and ferns like
Platycerium and Asplenium (Anon, 2008; Anon, 2014; Jakosalem et al., 2012; Orlanes, 2002;
Paguntalan and Jakosalem, undated; Paguntalan and Jakosalem, 2008).
The study sites of the proposed Cebu quarry project was not covered by any of these published
studies. These are located a few kilometers from Carmen Copper Consolidated, a leader in the
copper mining sub-sector (Cinco, 2012) and the Tabunan forest which is within the Cebu Central
Protected Landscape. It is north of the other well-studied forests of Southern Cebu which are
declared as Key Biodiversity Areas (KBA) or proposed as a Local Conservation Area (LCS).
Methodology
Vegetation Study
Five study sites were designated to represent the four parcels (Parcel 1, Parcel 2, Parcel 3, and
Parcel 5). Since Parcel 3 was a big area, it was then divided into two study sites (Parcel 3A and
3B). Table 2-17 shows the study sites coordinates per parcel.
Table 2-17: Description of the location of the Study Sites
Parcel Description of Location
of Study Sites Waypoint Reference
Latitude Longitude Altitude Date/Time
I Operational Quarry Site 277 10°15’53.9”N 123°40’23.7”E 292 June 25 11:25
278 10°15’53.4”N 123°40’24.4”E 290 11:36
279 10°15’53.5”N 123°40’23.0”E 308 11:46
280 10°15’53.7”N 123°40’22.8”E 308 12:01
281 10°15’52.5”N 123°40’23.1”E 291 12:11
II Along the road and cliff 266 10°16’58.6”N 123°40’20.7”E 275 June 24 15:04

QUARRY VENTURES PHILIPPINES, INC. Environmental Impact Assessment
February 2019 2-137
Parcel Description of Location
of Study Sites Waypoint Reference
Latitude Longitude Altitude Date/Time
267 10°16’57.8”N 123°40’20.5”E 280 15:12
268 10°16’57.7”N 123°40’21.0”E 303 15:29
269 10°16’57.3”N 123°40’20.5”E 317 15:47
270 10°16’57.0”N 123°40’20.3”E 320 15:50
3A Limestone hill with small village
252 10°18’17.8”N 123°39’32.6”E 160 June 24 8:52
253 10°18’17.4”N 123°39’33.7”E 164 8:53
254 10°18’16.6”N 123°39’37.2”E 174 9:01
255 10°18’13.5”N 123°39’40.2”E 190 9:07
256 10°18’13.3”N 123°39’40.5”E 190 9:08
257 10°18’12.0”N 123°39’42.1”E 193 9:10
258 10°18’10.2”N 123°39’42.2”E 199 9:20
3B Limestone hills with small village
259 10°18’58.6”N 123°40’28.9”E 289 13.43
260 10°18’57.8”N 123°40’28.6”E 308 13:49
261 10°18’57.3”N 123°40’28.0”E 311 13:56
262 10°18’57.4”N 123°40’29.2”E 323 14:05
263 10°18’57.1”N 123°40’29.4”E 333 14:11
264 10°18’58.0”N 123°40’28.6”E 325 14:15
265 10°18’57.1”N 123°40’26.8”E 340 14:18
V Rest house 271 10°17’20.9”N 123°55’01.6”E 525 Jun 25 9:22
272 10°17’22.7”N 123°44’01.8”E 539 9:35
273 10°17’21.9”N 123°44’02.9”E 535 9:52
274 10°17’22.8”N 123°44’04.0”E 531 10:01
275 10°17’22.3”N 123°44’01.4”E 534 10:14:23
276 10°17’22.3”N 123°44’01.3”E 533 10:14:54
Within each study site, 2-3 plots were established. These plots represented the different forest
types or states of integrity of the forest type within the area. If only one forest type of the same
state of integrity was found, then the plots were established at different altitudes.
The sampling sites for the Terrestrial Ecology is shown in Figure 2-42.

QUARRY VENTURES PHILIPPINES, INC. Environmental Impact Assessment
February 2019 2-138
Figure 2-42: Terrestrial Ecology Sampling Map

QUARRY VENTURES PHILIPPINES, INC. Environmental Impact Assessment
February 2019 2-139
Figure 2-43: Terrestrial Ecology Observation Points in Parcels 1 and 2

QUARRY VENTURES PHILIPPINES, INC. Environmental Impact Assessment
February 2019 2-140
Figure 2-44: Terrestrial Ecology Observation Points in Parcel 3

QUARRY VENTURES PHILIPPINES, INC. Environmental Impact Assessment
February 2019 2-141
Figure 2-45: Terrestrial Ecology Observation Points in Parcel 5

QUARRY VENTURES PHILIPPINES, INC. Environmental Impact Assessment
February 2019 2-142
The plots were 25m2 with dimensions of 5x5m. Since the trees were only less than 10cm2, only
the number of individuals per plot were counted and the frequency as they occur in the different
plots was considered to derive the importance value index.
Ecological Indices, such as Shannon-Wiener Species Diversity Index, Margalef Species Richness
Index, and Equitability Index were computed to estimate and compare the species diversity of the
plots within each Study Site or Parcel (Figure 2-46). The data of all the plots within each Study
Site or Parcel were then combined for the calculation of Study Site or Parcel’s respective Species
Diversity and Equitability Indices. These indices were used to estimate diversity index taking into
account number of species and relative abundance of different species in order to generate a
better analysis of community composition or structure (Magurran, 1988; Henderson and Seaby,
1997).
Figure 2-46: Ecological Indices Formulae
The dominant species was also identified per parcel based on the calculated Importance Value
Index of the species which is derived based on the species relative abundance (relative density)
Shannon-Wiener Diversity Index:
Margalef Species Richness Index:
Equitability Index:
Relative Density: Number of Individuals of Species x100
Total Number of Individuals of all Species
Relative Frequency: Number of Occurrences of Species x100
Total Number of Occurences of all Species
Importance Value Index: Relative Density + Relative Frequency

QUARRY VENTURES PHILIPPINES, INC. Environmental Impact Assessment
February 2019 2-143
and relative occurrence (relative frequency). Relative basal area is not derived as the diameter of
the thin stems were not measured.
Floristic Inventory
Samples of plants species were collected in triplicates to serve as voucher specimens. These were
then pressed in old newspapers and preserved with denatured alcohol, and dried in an oven.
These were then identified by comparison with specimens in the Philippine National Herbarium,
comparison with digital images from on-line sources, photos and illustrations from published print
sources, and use of identification keys in literature.
Wildlife Inventory
To determine the avifauna in the site, a 100m transect walk was conducted for each of the five
study sites. All birds observed and/or heard were recorded using their species/local name.
Interviews were also conducted to gather additional information on the bird species observed by
the locals in the area.
The mammal inventory was also carried out through the same transects used for the birds.
Mammals observed were recorded using there species/local name. Interviews were also
conducted to ask locals about mammals they observed in the area.
Amphibians, reptiles and invertebrates were observed and recorded mainly through the 100m
transect line but whenever possible opportunistic catching was employed. Area along the
established transect was thoroughly checked and searched. Aside from the species identification,
other relevant information on each site were also noted and recorded. Upon capture,
photographs were taken and the captured individuals were returned to the site of capture.
Secondary literature and databases were also surveyed for information on flora and fauna of the
forests of Cebu.
Vegetation removal and loss of habitat
Description of the Vegetation
The dominant vegetation of the study sites is forest over limestone, particularly a scrub
vegetation. It is composed mostly of thin-stemmed trees, not more than 10cm diameter. These

QUARRY VENTURES PHILIPPINES, INC. Environmental Impact Assessment
February 2019 2-144
are also low trees of about 5 – 8m height, and small crowns. A few emergent trees may occur
within the scrub forest. Most of these forests are either intact or fairly undisturbed tracts of
vegetation in an advanced state of succession, remnants of the original vegetation and/or highly
disturbed forests in the early stages of succession.
The suite of species found in scrub type of vegetation include Gomphia serrata, Cratoxylum
sumatranum, Wendlandia sp., Flueggea virosa, Alstonia macrophylla, Neonauclea formicaria,
Heterospathe philippinensis, Alchornea rugosa, Aglaia cumingiana, Polyscias nodosa, and Ficus
spp., among others.
In more disturbed vegetation (i.e. Parcel 5) where only small fragments of the original vegetation
remain, typical secondary forest species occur like Macaranga grandifolia, Macaranga tanarius,
Mallotus sp., Homalanthus populneus, Melochia umbellata, Commersonia bartramia, Acalypha
amentacea, and several Ficus spp. can also be found. Species of Breynia, Phyllanthus, Glochidion,
Flemingia strobilifera, and Urena lobata, grow on the loose rocks and thin soils of the forest floor.
The cultivated landscape is composed of corn fields and backyard fruit trees like Mangifera indica,
Artocarpus heterophyllus, Syzygium cuminii, Garcinia mangostana, Cocos nucifera, Psidium
guajava, Bixa orellana, Muntingia calabura, Theobroma cacao, and Musa sp. with other crops used
by the locals like Leucaena leucocephala and Gliricidia sepium for firewood and fodder.
No pure strands of reforestation species was found. Some escapes from reforestation areas
sporadically thrive on the edges of the forest like Gmelina arborea, Swietenia macrophylla,
Tectona grandis, Leucaena leucocephala, and Acacia auriculiformis.
Description of the Flora
There are 14 species of ferns in 11 genera and 8 families. These form dense mats, occasional
small clusters, and singly as individuals. Nephrolepis spp. and Sphaerostephanos unitus occur as
dense mats in more open or exposed disturbed areas. Two species of Drynaria (D. sparsiflora and
D. quercifolia) can be found attached on trees or rock formations. Pteris vittata, a common fern
in mining areas, can be found here singly on pockets of soil. The other species of Davallia,
Microsorum, Adiantum, Lygodium, Selaginella, and Tectaria are found in shaded and moist
conditions.
There are also 180 species of angiosperms or flowering plants, in 157 genera, and 67 families in
the study sites (Table 2-18). Of these, 10 species are endemic to Philippines, which include
Parishia malabog, Semecarpus glauciphyllus, Alstonia macrophylla, Parsonia alboflavescens,

QUARRY VENTURES PHILIPPINES, INC. Environmental Impact Assessment
February 2019 2-145
Wrightia candollei, Heterospathe philippinensis, Trichosanthes villosa subsp. mindorensis, Ficus
balete, Ficus gigantifolia, and Ardisia romanii.

QUARRY VENTURES PHILIPPINES, INC. Environmental Impact Assessment
February 2019 2-146
Table 2-18: Taxonomic List of Plants Found in the Study
Family Scientific Name Conservation Status Native/Endemic/exotic Invasive
Davalliaceae Davallia solida Exotic
Lygodiaceae Lygodium japonicum Exotic
Nephrolepidaceae Nephrolepis spp. Least Concern (IUCN 2019)
Polypodiaceae Drynaria quercifolia Vulnerable (DENR, 2007)
Polypodiaceae Drynaria sparsisora
Polypodiaceae Phymatosorus scolopendria Vulnerable (DENR, 2007) Invasive species (IUCN, 2010)
Polypodiaceae Microsorum sp. Least Concern (IUCN 2019)
Pteridaceae Adiantum caudatum
Pteridaceae Adiantum tenerum
Pteridaceae Pteris vittata Least Concern (IUCN 2019)
Selaginellaceae Selaginella sp.
Tectariaceae Tectaria devexca
Thelypteridaceae Sphaerostephanos unitus
Thelypteridaceae Pneumatopteris sp
Acanthaceae Hemigraphis sp.
Amaranthaceae Amaranthus spinosus
Anacardiaceae Buchanania arborescens
Anacardiaceae Koordersiodendron pinnatum Vulnerable (DENR, 2007), Threatened
(DENR, 2017)
Anacardiaceae Mangifera indica Data Deficient (IUCN 2019)
Anacardiaceae Parishia malabog Endemic
Anacardiaceae Semecarpus glauciphyllus Endemic
Annonaceae Annona reticulata
Annonaceae Artabotrys sp.
Annonaceae Goniothalamus sp.
Annonaceae Uvaria grandiflora
Apiaceae Centella asiatica Least Concern (IUCN 2019)
Apocynaceae Alstonia macrophylla Least Concern (IUCN, 2017) Endemic
Apocynaceae Dischidia hirsuta
Apocynaceae Parsonsia alboflavescens
Apocynaceae Tabernaemontana pandacaqui
Apocynaceae Wrightia candollei Endemic

QUARRY VENTURES PHILIPPINES, INC. Environmental Impact Assessment
February 2019 2-147
Family Scientific Name Conservation Status Native/Endemic/exotic Invasive
Araceae Alocasia sp.
Araceae Colocasia esculenta Least Concern (IUCN 2019)
Araceae Epipremnum pinnatum
Araceae Pothoidium sp.
Araceae Pothos rumphii
Araceae Syngonium sp.
Araliaceae Polyscias aherniana
Araliaceae Polyscias nodosa Least Concern (IUCN 2019)
Araliaceae Schefflera sp.
Arecaceae Areca catechu
Arecaceae Cocos nucifera
Arecaceae Corypha sp.
Arecaceae Heterospathe philippinensis Endemic
Asteraceae Artemisia sp.
Asteraceae Blumea balsamifera
Asteraceae Chromolaena odorata
Asteraceae Mikania scandens Secure (NatureServe)
Begoniaceae Begonia sp.
Bixaceae Bixa Orellana
Boraginaceae Ehretia macrophylla
Campanulaceae Isotoma sp.
Clusiaceae Garcinia mangostana
Commelinaceae Commelina sp.
Convolvulaceae Merremia peltata
Convolvulaceae Merremia tridentata
Crassulaceae Bryophyllum pinnatum
Cucurbitaceae Trichosanthes villosa subsp. mindorensis Endemic
Dilleniaceae Dillenia sp.
Dioscoreaceae Dioscorea sp.
Dipterocarpaceae Shorea sp.
Elaeocarpaceae Muntingia calabura
Euphorbiaceae Acalypha amentacea
Euphorbiaceae Actephila sp.
Euphorbiaceae Alchornea rugosa

QUARRY VENTURES PHILIPPINES, INC. Environmental Impact Assessment
February 2019 2-148
Family Scientific Name Conservation Status Native/Endemic/exotic Invasive
Euphorbiaceae Breynia sp.
Euphorbiaceae Croton sp.
Euphorbiaceae Euphorbia hirta
Euphorbiaceae Phyllanthus littoralis Least Concern (IUCN 2019)
Euphorbiaceae Homalanthus populneus Least Concern (IUCN 2019)
Euphorbiaceae Macaranga grandifolia Vulnerable (IUCN 2019)
Euphorbiaceae Macaranga tanarius
Euphorbiaceae Mallotus sp.
Euphorbiaceae Manihot esculenta
Fabaceae Acacia auriculiformis Least Concern (IUCN 2019)
Fabaceae Albizzia sp.
Fabaceae Alysicarpus sp.
Fabaceae Archidendron clypearia
Fabaceae Bauhinia sp.
Fabaceae Caesalpinia latisiliqua
Fabaceae Calopogonium sp.
Fabaceae Crotalaria sp.
Fabaceae Desmodium heterocarpon
Fabaceae Flemingia strobilifera
Fabaceae Gliricidia sepium
Fabaceae Intsia bijuga Vulnerable (IUCN 2019)
Fabaceae Leucaena leucocephala
Fabaceae Mimosa pudica Least Concern (IUCN 2019)
Fabaceae Phanera sp.
Fabaceae Pterocarpus indicus Critically Endangered (DENR, 2007),
Vulnerable (DENR, 2017), Endangered (IUCN, 2019)
Fabaceae Samanea saman Secure (NatureServe)
Fabaceae Senna alata Secure (NatureServe)
Fabaceae Uraria lagopoides
Flacourtiacae Flacourtia sp.
Gesneriaceae Aeschynanthus sp.
Gesneriaceae Rhynchotechum discolor
Hypericaceae Cratoxylum sumatranum Least Concern (IUCN 2019)

QUARRY VENTURES PHILIPPINES, INC. Environmental Impact Assessment
February 2019 2-149
Family Scientific Name Conservation Status Native/Endemic/exotic Invasive
Lamiaceae Callicarpa sp.
Lamiaceae Gmelina arborea
Lamiaceae Hyptis sp.
Lamiaceae Leucas decemdentata
Lamiaceae Stachytarpheta jamaicensis
Lamiaceae Tectona grandis
Lauraceae Litsea glutinosa
Leeaceae Leea manillensis
Loranthaceae Amyema sp.
Lythraceae Lagerstroemia indica Least Concern (IUCN 2019)
Malpighiaceae Hiptage luzonica
Malvaceae Commersonia bartramia
Malvaceae Melochia umbellata
Malvaceae Theobroma cacao
Malvaceae Urena lobata
Melastomataceae Medinilla sp.
Meliaceae Aglaia cumingiana Vulnerable (DENR, 2007), Threatened
(DENR, 2017), Vulnerable (IUCN, 2019)
Meliaceae Melia azedarach Least Concern (IUCN 2019)
Meliaceae Swietenia macrophylla Vulnerable (IUCN, 2019)
Meliaceae Unidentified
Menispermaceae Menispermaceae
Moraceae Artocarpus sp.
Moraceae Artocarpus heterophyllus
Moraceae Cecropia peltata
Moraceae Ficus balete Endemic
Moraceae Ficus botryocarpa
Moraceae Ficus chrysolepis
Moraceae Ficus cumingii
Moraceae Ficus gigantifolia Endemic
Moraceae Ficus pedunculosa
Moraceae Ficus pseudopalma
Moraceae Ficus septica
Moraceae Ficus sp.

QUARRY VENTURES PHILIPPINES, INC. Environmental Impact Assessment
February 2019 2-150
Family Scientific Name Conservation Status Native/Endemic/exotic Invasive
Moraceae Ficus subulata
Moraceae Ficus ulmifolia
Moraceae Streblus sp.
Musaceae Musa sp.
Myrtaceae Decaspermum sp.
Myrtaceae Psidium guajava
Myrtaceae Syzygium cuminii
Myrtaceae Syzygium spp.
Ochnaceae Gomphia serrata Least Concern (IUCN, 2019)
Oleaceae Jasminum sp.
Onagraceae Jussiaea sp.
Onagraceae Ludwigia hyssopifolia Least Concern (IUCN, 2019)
Orchidaceae Geodorum densiflorum
Orchidaceae Nervilia sp.
Pandanaceae Pandanus sp.
Phyllanthaceae Antidesma sp.
Phyllanthaceae Breynia spp.
Phyllanthaceae Flueggea virosa
Phyllanthaceae Phyllanthus spp.
Primulaceae Ardisia serrata
Primulaceae Ardisia romanii Threatened (DENR, 2007), Vulnerable
(DENR, 2017) Endemic
Piperaceae Piper spp.
Pittosporaceae Pittosporum pentandrum
Poaceae Eleusine indica Least Concern (IUCN, 2019)
Poaceae Panicum repens Least Concern (IUCN, 2019)
Poaceae Paspalum conjugatum Least Concern (IUCN, 2019)
Poaceae Saccharum spontaneum Least Concern (IUCN, 2019)
Poaceae Themeda intermedia
Poaceae Thysanolaena latifolia
Poaceae Zea mays
Rosaceae Rubus sp.
Rubiaceae Canthium sp.
Rubiaceae Hedyotis sp.

QUARRY VENTURES PHILIPPINES, INC. Environmental Impact Assessment
February 2019 2-151
Family Scientific Name Conservation Status Native/Endemic/exotic Invasive
Rubiaceae Ixora macrophylla
Rubiaceae Morinda citrifolia
Rubiaceae Mussaenda sp.
Rubiaceae Neonauclea formicaria
Rubiaceae Wendlandia sp.
Rutaceae Citrus sp.
Rutaceae Melicope sp.
Rutaceae Micromelum sp.
Salicaceae Homalium sp.
Sapindaceae Arytera sp. or Alectryon sp.
Sapindaceae Cardiospermum halicacabum
Sapindaceae Guioa sp.
Sapindaceae Harpullia cupanioides
Solanaceae Solanum diphyllum
Solanaceae Solanum erianthum
Taccaceae Tacca palmata
Theaceae Gordonia sp.
Thymelaeaceae Wikstoremia sp.
Tliaceae Colona serratifolia
Ulmaceae Celtis sp,
Ulmaceae Trema orientalis Trema orientalis
Urticaceae Boehmeria heterophylla
Urticaceae Elatostema sp.
Urticaceae Leucosyke capitellata
Urticaceae Maoutia sp.
Moraceae Poikilospermum suaveolens
Verbenaceae Lantana camara
Verbenaceae Vitex parviflora Endangered (DENR, 2007), Endangered (DENR, 2017), Vulnerable (IUCN, 2019)
Vitaceae Ampelocissus sp.
Vitaceae Tetrastigma sp.
Zingiberaceae Alpinia sp.

QUARRY VENTURES PHILIPPINES, INC. Environmental Impact Assessment
February 2019 2-152
There are plants in the study sites which have been assessed to be threatened and included in the
National List of Threatened Philippine Plants (DENR, 2007 and DENR, 2017). These are
Pterocarpus indicus (Vulnerable), Vitex parviflora (Endangered), Koordersiodendron pinnatum
(Threatened), Drynaria quercifolia (Vulnerable), Microsorum scolopendria (Vulnerable), and
Ardisia romanii (Other Threatened Species).
Globally, Pterocarpus indicus, Aglaia cumingiana, and Vitex parviflora are assessed as Vulnerable
while Gomphia serrata, Alstonia macrophylla, and Ludwigia hyssopifolia are considered as Low
Risk and Least Concern (IUCN, 2017).
Secondary forest tree species also occur, but less commonly than the forest over limestone trees,
which include Macaranga grandifolius, Macaranga tanarius, Acalypha amentacea, Homalanthus
populneus, and Commersonia bartramia.
Weed species are mostly found on open areas and edges of natural stands of forests. These
include Mimosa pudica, Lantana camara, Blumea balsamifera, Chromolaena odorata, Mikania
scandens, Crotalaria sp., Desmodium sp., among others.
The most widespread of the species, as these were recorded in 4-5 of the study sites, are Breynia
sp., Cratoxylum sumatranum, an unidentified species (Meliaceae), Flueggea virosa, Neonauclea
formicaria, Alstonia macrophylla, Phyllanthus sp., and Wendlandia sp.
Tectaria devexca is also a limestone-specific species.
Description of the Study Sites/Parcels
Study Site/Parcel 1
This Study Site is within Parcel 1 where there is a quarrying activity. The vegetation in the vicinity
of Parcel 1 is highly modified, with either land bare and exposed or sparsely covered with
vegetation, mostly grasses and weeds.
In the proposed site for development, there are two vegetation types, i.e. an open scrub with
sparse trees and a dense scrub forest. There are about 12-25 species of plants (trees, shrubs,
herbs, and ferns) in a 25m2 plot. Table 2-19 shows the diversity by sampling plot.

QUARRY VENTURES PHILIPPINES, INC. Environmental Impact Assessment
February 2019 2-153
Table 2-19: Diversity of Plots per Study Site
Parcel 1 A B C D
Number of Species 12 25 14 12
Shannon-Wiener Index 2.441 3.149 2.552 2.393
Margalef Index 4.168 6.989 4.415 3.967
Equitability 0.61 0.827 0.67 0.629
Parcel 2 A B
Number of Species 13 31
Shannon-Wiener Index 2.394 3.329
Margalef Index 3.375 7.708
Equitability 0.668 0.929
Parcel 3 A A B C
Number of Species 16 20 23
Shannon-Wiener Index 2.622 2.753 2.968
Margalef Index 4.666 5.302 6.005
Equitability 0.661 0.693 0.748
Parcel 3 B A B C
Number of Species 17 13 15
Shannon-Wiener Index 2.738 2.513 2.537
Margalef Index 4.911 4.328 4.158
Equitability 0.822 0.754 0.761
Parcel 5 A B C
Number of Species 10 18 25
Shannon-Wiener Index 2.206 2.803 3.108
Margalef Index 3.4 4.744 6.506
Equitability 0.598 0.76 0.843
The dense scrub forest, represented by two plots has a higher species diversity (Shannon-Weiner
Index: 3.149), species richness (Margalef Index: 6.989) and Equitability Index (0.827) compared to
that of the open scrub, represented by one plot (Shannon-Weiner Index: 2.393-2.552, Margalef
Index: 3.967-4.168, Equitability Index: 0.61-0.67).
In both vegetation types, the dominant tree species are Wendlandia sp., Alstonia macrophylla,
Ficus pseudopalma, Solanum erianthum and Neonauclea formicaria (Table 2-20). The ground
flora is composed of Nephrolepis sp., Crotalaria sp., Lantana camara, Cardiospermum halicacaum
and Blumea balsamifera which are spruced occasionally in different parts of the open scrubland.
Other tree species which may be found are Cratoxylum sumatranum, Heterospathe philippinensis,
Ficus septica, F. ulmifolia, Buchanania arborescens, Homalanthus populneus, and Polyscias spp.
Heterospathe philippinensis is an emergent tree rising over the low trees in the area.
Table 2-20: Importance Index Value of Parcel 1
Species Density Relative Density
Frequency Relative
Frequency Index Value
Wendlandia sp. 4.00 5 1 6.35 11.35
Nephrolepis sp. 4.00 5 1 6.35 11.35
Crotalaria sp. 5.00 6.25 0.75 4.76 11.01
Alstonia macrophylla 4.00 5 0.75 4.76 9.76
Lantana camara 5.00 6.25 0.5 3.17 9.42

QUARRY VENTURES PHILIPPINES, INC. Environmental Impact Assessment
February 2019 2-154
Species Density Relative Density
Frequency Relative
Frequency Index Value
Ficus pseudopalma 3.00 3.75 0.75 4.76 8.51
Cardiospermum halicacabum 4.00 5 0.5 3.17 8.17
Solanum erianthum 3.00 3.75 0.5 3.17 6.92
Neonauclea formicaria 3.00 3.75 0.5 3.17 6.92
Blumea balsamifera 3.00 3.75 0.5 3.17 6.92
Citrus sp. 2.00 2.5 0.5 3.17 5.67
Cratoxylum sumtranum 2.00 2.5 0.5 3.17 5.67
Heterospathe philippinensis 2.00 2.5 0.5 3.17 5.67
Breynia sp. 2.00 2.5 0.5 3.17 5.67
Carmona retusa 2.00 2.5 0.5 3.17 5.67
Alchornea rugosa 3.00 3.75 0.25 1.59 5.34
Ficus septica 2.00 2.5 0.25 1.59 4.09
Psidium guajava 2.00 2.5 0.25 1.59 4.09
Phyllanthus spp. 2.00 2.5 0.25 1.59 4.09
Adiantum caudatum 2.00 2.5 0.25 1.59 4.09
Acalypha amentacea 1.00 1.25 0.25 1.59 2.84
Aglaia cumingiana 1.00 1.25 0.25 1.59 2.84
Buchanania arborescens 1.00 1.25 0.25 1.59 2.84
Ficus ulmifolia 1.00 1.25 0.25 1.59 2.84
Homalanthus populneus 1.00 1.25 0.25 1.59 2.84
Meliaceae 1.00 1.25 0.25 1.59 2.84
Polyscias aherniana 1.00 1.25 0.25 1.59 2.84
Polyscias nodosa 1.00 1.25 0.25 1.59 2.84
Schefflera sp. 1.00 1.25 0.25 1.59 2.84
Drynaria quercifolia 1.00 1.25 0.25 1.59 2.84
Epipremnum pinnatum 1.00 1.25 0.25 1.59 2.84
Leucas decemdentata 1.00 1.25 0.25 1.59 2.84
Medinilla sp. 1.00 1.25 0.25 1.59 2.84
Piper sp. 3 1.00 1.25 0.25 1.59 2.84
Pneumatopteris 1.00 1.25 0.25 1.59 2.84
Rubus sp. 1.00 1.25 0.25 1.59 2.84
Uvaria grandiflora 1.00 1.25 0.25 1.59 2.84
Solanum diphyllum 1.00 1.25 0.25 1.59 2.84
Sphaerostephanos unitus 1.00 1.25 0.25 1.59 2.84
Urena lobata 1.00 1.25 0.25 1.59 2.84
Adiantum tenerum 1.00 1.25 0.25 1.59 2.84
Total 80.00 100 15.75 100.00 200.00
Study Site 2/Parcel 2
Study Site 2 is within Parcel 2 which is a small hill, characteristic of the limestone landscape in
many parts of Cebu. The hill, on one of its slopes, is vertically exposed and without vegetation.
The other hills in the vicinity are of the same state.
Two plots were established within the site to represent two vegetation types: the open scrub and
closed or dense scrub forest. There were 13-31 of ferns and flowering plant species within a 25m2
plot of vegetation (Table 2-19).

QUARRY VENTURES PHILIPPINES, INC. Environmental Impact Assessment
February 2019 2-155
The open scrub vegetation has lower species diversity index (Shannon-Wiener: 2.394), species
richness index (Margalef 3.375), and Equitability Index (0.668) than the dense scrub forest
(Shannon-Wiener: 3.329; Margalef: 7.708; Equitability Index: 0.929).
The dominant tree species are Ficus septica, Syzygium sp., Alstonia macrophylla, Cratoxylum
sumatranum, and Gomphia serrata (Table 2-21). The ground flora in this closed scrub forest is
composed of Urena lobata, Dischidia sp., Phyllanthus sp., Breynia sp., and ferns like Adiantum
tenerum, Drynaria sparsisora, Hemigraphis, and Amyema. The more exposed vegetation yields
weedy species like Stachytarpheta jamaicensis, Eleusine indica, Crotalaria sp., and Lantana
camara.
Table 2-21: Importance Index Value of Parcel 2
Species Density Relative Density
Frequency Relative
Frequency Index Value
Stachytarpheta jamaicensis 8.00 9.52 1.00 4.55 14.07
Urena lobata 6.00 7.14 1.00 4.55 11.69
Dischidia sp. 5.00 5.95 1.00 4.55 10.50
Phyllanthus sp. 5.00 5.95 1.00 4.55 10.50
Adiantum tenerum 4.00 4.76 1.00 4.55 9.31
Eleusine indica 5.00 5.95 0.50 2.27 8.23
Breynia sp. 3.00 3.57 1.00 4.55 8.12
Drynaria sparsisora 3.00 3.57 1.00 4.55 8.12
Crotalaria 4.00 4.76 0.50 2.27 7.03
Ficus septica 2.00 2.38 1.00 4.55 6.93
Syzygium sp. 1 2.00 2.38 1.00 4.55 6.93
Alstonia macrophylla 3.00 3.57 0.50 2.27 5.84
Cratoxylum sumatranum 3.00 3.57 0.50 2.27 5.84
Hemigraphis sp. 3.00 3.57 0.50 2.27 5.84
Amyema sp. 2.00 2.38 0.50 2.27 4.65
Gomphia serrata 2.00 2.38 0.50 2.27 4.65
Flueggea virosa 2.00 2.38 0.50 2.27 4.65
Dioscorea sp. 2.00 2.38 0.50 2.27 4.65
Lantana camara 2.00 2.38 0.50 2.27 4.65
Leucas decemdentata 2.00 2.38 0.50 2.27 4.65
Selaginella sp. 2.00 2.38 0.50 2.27 4.65
Alchornea rugosa 1.00 1.19 0.50 2.27 3.46
Arytera sp. 1.00 1.19 0.50 2.27 3.46
Decaspermum sp. 1.00 1.19 0.50 2.27 3.46
Meliaceae 1.00 1.19 0.50 2.27 3.46
Syzygium sp. 2 1.00 1.19 0.50 2.27 3.46
Wendlandia 1.00 1.19 0.50 2.27 3.46
Homalium sp. 1.00 1.19 0.50 2.27 3.46
Liana 1.00 1.19 0.50 2.27 3.46
Medinilla sp. 1.00 1.19 0.50 2.27 3.46
Melicope sp. 1.00 1.19 0.50 2.27 3.46
Pteris vittata 1.00 1.19 0.50 2.27 3.46
Sapindaceae sp. 1.00 1.19 0.50 2.27 3.46
Solanum diphyllum 1.00 1.19 0.50 2.27 3.46
Solanum erianthum 1.00 1.19 0.50 2.27 3.46
Total 84.00 100.00 22.00 100.00 200.00

QUARRY VENTURES PHILIPPINES, INC. Environmental Impact Assessment
February 2019 2-156
Study Site 3/Parcel 3A
Study Site 3 is within Parcel 3 which is one of the massive hills in the area which are covered with
scrub vegetation or forest over limestone, with a slope facing other hills within the range. The
area is bounded by a small village where the flora consists of cultivated crops like corn and
Manihot esculenta, cultivated fruit trees, i.e. Mangifera indica, Cocos nucifera, Artocarpus
heterophyllus, and a few individuals of Swietenia macrophylla and Gmelina arborea. In more open
and untended areas, thickets of Psidium guajava, Blumea balsamifera, and dense cover of
Nephrolepis sp. occur.
The plots were established at low, mid, and top elevation of the hill. It was noted that the species
diversity and species richness increase with altitude (Shannon-Wiener: 2.672-2.968; Margalef:
4.66-6.005). The Equitability Index (0.661-0.748) also indicates high evenness of species at higher
elevation. There are about 16-23 individuals in a sample plot of 25m2 in this study site.
The dominant tree species are Cratoxylum sumatranum, Flueggea virosa, Gomphia serrata, Ficus
gigantifolia, Wendlandia sp., Ficus pseudopalma, and Neonauclea formicaria (Table 2-22). The
ground vegetation is dominated by Phyllanthus sp., Flemingia sp., Piper sp., and ferns like Pteris
vittata and Davallia sp. The fairly undisturbed state of the forest is evidenced by the presence of
terrestrial orchids like Nervilia sp. and Geodorum sp., which occur in shaded and moist conditions.
Table 2-22: Importance Index Value of Parcel 3a
Species Density Relative Density
Frequency Relative
Frequency Index Value
Cratoxylum sumatranum 13.00 13.00 1.00 5.08 18.08
Flueggea virosa 12.00 12.00 1.00 5.08 17.08
Gomphia serrata 8.00 8.00 1.00 5.08 13.08
Ficus gigantifolia 6.00 6.00 1.00 5.08 11.08
Phyllanthus sp. 5.00 5.00 0.67 3.39 8.39
Wendlandia sp. 5.00 5.00 0.67 3.39 8.39
Ficus pseudopalma 3.00 3.00 1.00 5.08 8.08
Flemingia sp. 3.00 3.00 1.00 5.08 8.08
Macaranga tanarius 4.00 4.00 0.67 3.39 7.39
Neonauclea formicaria 3.00 3.00 0.67 3.39 6.39
Piper sp. 3.00 3.00 0.67 3.39 6.39
Ficus sp. 2.00 2.00 0.67 3.39 5.39
Glochidion sp. 2.00 2.00 0.67 3.39 5.39
Maoutia sp. 2.00 2.00 0.67 3.39 5.39
Microsorum sp. 2.00 2.00 0.67 3.39 5.39
Pteris vittata 2.00 2.00 0.67 3.39 5.39
Alstonia macrophylla 2.00 2.00 0.33 1.69 3.69
Davallia sp. 2.00 2.00 0.33 1.69 3.69
Ixora macrophylla 2.00 2.00 0.33 1.69 3.69
Pothoidium sp. 2.00 2.00 0.33 1.69 3.69

QUARRY VENTURES PHILIPPINES, INC. Environmental Impact Assessment
February 2019 2-157
Species Density Relative Density
Frequency Relative
Frequency Index Value
Adiantum caudatum 1.00 1.00 0.33 1.69 2.69
Breynia sp. 1.00 1.00 0.33 1.69 2.69
Canthium sp. 1.00 1.00 0.33 1.69 2.69
Discorea sp. 1.00 1.00 0.33 1.69 2.69
Ficus botryocarpa 1.00 1.00 0.33 1.69 2.69
Ficus ulmifolia 1.00 1.00 0.33 1.69 2.69
Geodorum densiflorum 1.00 1.00 0.33 1.69 2.69
Gmelina arborea 1.00 1.00 0.33 1.69 2.69
Heterospathe philippinensis 1.00 1.00 0.33 1.69 2.69
Meliaceae 1.00 1.00 0.33 1.69 2.69
Melicope sp. 1.00 1.00 0.33 1.69 2.69
Microsorum scolopendria 1.00 1.00 0.33 1.69 2.69
Nervilia sp. 1.00 1.00 0.33 1.69 2.69
Polyscias aherniana 1.00 1.00 0.33 1.69 2.69
Schefflera sp. 1.00 1.00 0.33 1.69 2.69
Tabernaemontana pandacaqui
1.00 1.00 0.33 1.69 2.69
Tectaria devexca 1.00 1.00 0.33 1.69 2.69
Total 100.00 100.00 19.67 100.00 200.00
Study Site 4/Parcel 3B
Study Site 4 or Parcel 3B, is on the other side of Study Site 3 (Parcel 3A), with a more gradual and
wind exposed slope. Only about 13-17 species can be found in a 25m2 plot. The Species Diversity
and Species Richness are comparable to Study Site 3/Parcel 3A which ranges from 2.513-2.738 for
Shannon-Wiener Index and 4.158 – 4.911 for Margalef Index. The Equitability Index ranges from
0.754-0.822.
As in Study Site 3/Parcel 3A, the prevailing vegetation is a dense scrub dominated by similar
species like Gomphia serrata, Flueggea virosa, Harpullia cupainioides, Acalypha amentacea,
Neonauclea formicaria, Cratoxylum sumatranum, Alstonia macrophylla, and Wendlandia sp. The
ground vegetation is dominated by Phyllanthus sp., Breynia sp., and Piper sp. A few unique plants
(not found in other plots) are found here like Ardisia romanii, Ardisia pyramidalis, and Canthium
sp (Table 2-23).
Table 2-23: Importance Index Value of Parcel 3b
Species Density Relative Density
Frequency Relative
Frequency Index Value
Gomphia serrata 8.00 11.27 1.00 6.67 17.93
Phyllanthus sp. 7.00 9.86 1.00 6.67 16.53
Flueggea virosa 6.00 8.45 1.00 6.67 15.12
Harpullia cupainioides 6.00 8.45 1.00 6.67 15.12
Acalypha amentacea 4.00 5.63 1.00 6.67 12.30
Neonauclea sp. 5.00 7.04 0.67 4.44 11.49
Breynia sp. 1 3.00 4.23 1.00 6.67 10.89

QUARRY VENTURES PHILIPPINES, INC. Environmental Impact Assessment
February 2019 2-158
Species Density Relative Density
Frequency Relative
Frequency Index Value
Piper sp. 2 4.00 5.63 0.67 4.44 10.08
Ardisia pyramidalis 3.00 4.23 0.67 4.44 8.67
Ficus pedunculosa 3.00 4.23 0.67 4.44 8.67
Cratoxylum sumatranum 4.00 5.63 1.00 6.67 12.30
Alstonia macrophylla 2.00 2.82 0.67 4.44 7.26
Ardisia romanii 2.00 2.82 0.67 4.44 7.26
Wendlandia sp. 2.00 2.82 0.67 4.44 7.26
Alchornea rugosa 2.00 2.82 0.33 2.22 5.04
Uvaria lagopodioides 2.00 2.82 0.33 2.22 5.04
Antidesma sp. 1.00 1.41 0.33 2.22 3.63
Artocarpus sp. 1 1.00 1.41 0.33 2.22 3.63
Buchanania arborescens 1.00 1.41 0.33 2.22 3.63
Canthium sp. 1.00 1.41 0.33 2.22 3.63
Meliaceae 1.00 1.41 0.33 2.22 3.63
Polyscias nodosa 1.00 1.41 0.33 2.22 3.63
Syzygium sp. 1.00 1.41 0.33 2.22 3.63
Wikstroemia sp. 1.00 1.41 0.33 2.22 3.63
Total 71.00 100.00 15.00 100.00 200.00
Study Site 5/Parcel 5
Study Site 4 is within Parcel 5 which is a highly disturbed area and is bounded by an upland farming
village. The proposed site for development includes areas with cultivated fruit trees or crops like
Artocarpus heterophyllus, Mangifera indica, Theobroma cacao, Musa sp., Syzygium cuminii,
Muntingia calabura, and other trees for household use, as firewood and food for animals, like
Gliricidia sepium and Leucaena leucocephala.
The number of species that may be found in a 25m2 plot ranges from 10-25. Species diversity may
range from 2.206 -3.108 (Shannon-Wiener Index) and species richness 3.4-6.506 (Margalef Index).
Equitability Index ranges from 0.598-0.843.
These remnants of forests which occur as small fragments or strands of plant thickets is
dominantly composed of Cratoxylum sumatranum, Trema orientalis, Ficus ulmifolia, Flueggea
virosa, and Neonauclea formicaria. Secondary forest trees also occur like Acalypha amentacea,
Homalanthus populneus, Macaranga tanarius, Commersonia bartramia, Melochia umbellata, and
Colona serratifolia, indicating its disturbed state. Non-tree species found are Nephrolepis sp.,
Breynia sp., Flemingia sp. Lygodium japonicum, Desmodium sp., and Dioscorea sp (Table 2-24).
Table 2-24: Importance Index Value of Parcel 5
Species Density Relative Density
Frequency Relative
Frequency Index Value
Cratoxylum sumatranum 7.00 7.78 1.00 5.88 13.66
Nephrolepis sp. 9.00 10.00 0.33 1.96 11.96
Psidium guajava 7.00 7.78 0.67 3.92 11.70

QUARRY VENTURES PHILIPPINES, INC. Environmental Impact Assessment
February 2019 2-159
Species Density Relative Density
Frequency Relative
Frequency Index Value
Trema orientalis 5.00 5.56 1.00 5.88 11.44
Breynia sp. 5.00 5.56 0.67 3.92 9.48
Ficus ulmifolia 3.00 3.33 1.00 5.88 9.22
Trema sp. 3.00 3.33 1.00 5.88 9.22
Flemingia sp. 4.00 4.44 0.67 3.92 8.37
Flueggea virosa 4.00 4.44 0.67 3.92 8.37
Neonauclea formicaria 4.00 4.44 0.67 3.92 8.37
Acalypha amentacea 3.00 3.33 0.67 3.92 7.25
Buchanania sp. 3.00 3.33 0.67 3.92 7.25
Homalanthus populneus 3.00 3.33 0.67 3.92 7.25
Poikilospermum suaveolens 3.00 3.33 0.67 3.92 7.25
Drynaria quercifolia 2.00 2.22 0.67 3.92 6.14
Macaranga tanarius 2.00 2.22 0.67 3.92 6.14
Lygodium japonicum 3.00 3.33 0.33 1.96 5.29
Commersonia bartramia 2.00 2.22 0.33 1.96 4.18
Ficus botryocarpa 2.00 2.22 0.33 1.96 4.18
Leucosyke capitellata 2.00 2.22 0.33 1.96 4.18
Melochia umbellata 2.00 2.22 0.33 1.96 4.18
Muntingia calabura 2.00 2.22 0.33 1.96 4.18
Albizia sp. 1.00 1.11 0.33 1.96 3.07
Colona serratifolia 1.00 1.11 0.33 1.96 3.07
Desmodium sp. 1.00 1.11 0.33 1.96 3.07
Dioscorea sp. 1.00 1.11 0.33 1.96 3.07
Ficus cumingii 1.00 1.11 0.33 1.96 3.07
Ficus septica 1.00 1.11 0.33 1.96 3.07
Gliricida sepium 1.00 1.11 0.33 1.96 3.07
Kalanchoe pinnata 1.00 1.11 0.33 1.96 3.07
Melia 1.00 1.11 0.33 1.96 3.07
Merremia tridentata 1.00 1.11 0.33 1.96 3.07
Total 90.00 100.00 17.00 100.00 200.00
Comparison of the Vegetation of the Study Sites/Parcels
Of the five study sites, Parcels 2 and 3 (A&B) are partly disturbed scrub vegetation in an advanced
stage of development. These are composed of a suite of tree species which typically occur in
forest over limestone.
The species diversity ranges from 2.949-3.341 (Shannon-Wiener Index), species richness 5.396-
7.674 (Margalef Index) while Equitability Index ranges from 0.894-0.94 for the combined plot data
within each of these study sites representing this vegetation type. There also are about 24 to 37
species in a 25m2 plot in this vegetation type.
Parcel 1 also has a natural stand of vegetation which is exposed to the threats of the quarry
activity. It is in a disturbed state brought about by the clearing of some areas for the expansion
of the quarry site. In spite of its disturbed state, it has the highest species diversity (Shannon-
Wiener Index 3.542), species richness (Margalef Index: 9.128) and Equitabiltiy Index of 0.954. It

QUARRY VENTURES PHILIPPINES, INC. Environmental Impact Assessment
February 2019 2-160
should however be noted that the calculated indices represent the combined data of two
different forest types, i.e. an open scrub with sparse trees and a dense scrub vegetation.
In contrast, the landscape of Parcel 5 has been mainly modified by the local people through
agricultural activities and forest product harvesting, with just fragments or strands of the original
vegetation left. The Species Diversity Index of the combined plot data for the study site is 3.191
(Shannon-Wiener Index), Species Richness Index 6.667 (Margalef Index) and its Equitability Index
is 0.929. Table 2-25 shows the summary of the study sites.

QUARRY VENTURES PHILIPPINES, INC. Environmental Impact Assessment
February 2019 2-161
Table 2-25: Summary Description of Study Sites
Parcel 1 Parcel 2 Parcel 3A Parcel 3B Parcel 5
Type of vegetation open scrub and dense scrub
forest dense scrub forest dense scrub forest dense scrub forest
cultivated land; forest fragments or strands
Status of Integrity Highly disturbed Partly disturbed Advanced state of
development Advanced state of
development Highly disturbed
Dominant tree species
Wendlandia sp. Ficus septica Cratoxylum
sumatranum Gomphia serrata Cratoxylum sumatranum
Alstonia macrophylla Syzygium sp. 1 Flueggea virosa Flueggea virosa Trema orientalis
Ficus pseudopalma Alstonia macrophylla Gomphioa serrata Harpullia
cupainioides Ficus ulmifolia
Solanum erianthum Cratoxylum sumatranum Ficus gigantifolia Acalypha amentacea Flueggea virosa
Neonauclea formicaria Gomphia serrata Wendlandia sp. Neonauclea formicaria
Neonauclea formicaria
Dominant ground species
Nephrolepis sp. Stachytarpheta
jamaicensis Phyllanthus sp. Phyllanthus sp. Nephrolepis sp.
Crotalaria sp. Urena lobata Flemingia sp. Breynia sp. Psidium guajava
Lantana camara Dischidia sp. Piper sp. Piper sp. Breynia sp.
Cardiospermum halicacabum Phyllanthus sp. Ficus sp. Alchornea rugosa Flemingia sp.
Blumea balsamifera Adiantum tenerum Glochidion sp. Cathium sp. Drynaria quersifolia
Number of Species 41 35 37 24 31
Shannon-Wiener Index
3.542 3.341 3.227 2.949 3.191
Margalef Index 9.128 7.674 7.817 5.396 6.667
Equitability 0.954 0.94 0.894 0.928 0.929
Insert consolidated data/discussion/table of previously conducted (as part of monitoring, if any) flora and fauna survey for Parcel 1

QUARRY VENTURES PHILIPPINES, INC. Environmental Impact Assessment
February 2019 2-162
Threat to existence and/or loss of important local species
Wildlife Species Composition and Noteworthy Species
A total of 36 species of vertebrate fauna and several undetermined invertebrates were recorded
in the five study sites, through on-site interviews with locals, and though desktop research. The
survey revealed 25 species of birds, 2 species of mammals, 9 species of herpetofauna (reptiles
and amphibians), and undetermined number of invertebrates. Table 2-26 shows the list of
species found in the study sites.
The terrestrial expert was not able to trap, nor capture, faunal specimens since the observation
sites are near areas with frequent disturbances (quarry sites, highways, residential areas,
agricultural areas). A qualitative assessment was conducted instead to mitigate the project’s
impact on the terrestrial fauna of the area.
Table 2-26: Taxonomic List of Wildlife in the Study Sites
Classification Scientific Name Common Name
AVIFAUNA
Order Strigiformes
Family: Tytonidae Tyto longimembris Eastern Grass Owl, Kwago
Order Gruiformes
Family: Rallidae Gallirallus torquatus Barred Rail
Order Apodiformes
Family: Apodidae Collocalia esculenta Glossy Swiftlet Collocalia troglodytes Pygmy Swiftlet Aerodramus amelis Grey Swiftlet
Order Coraciiformes
Family: Alcedinidae Halcyon smyrnensis White-throated Kingfisher
Order Columbiformes
Family: Columbidae Geopelia striata Zebra Dove Streptopelia bitorquata Island Collared-Dove Treron verans Pink-necked green Pigeon Phapitreron leucotis White-eared Brown Dove Chalcophaps indica Emerald Dove
Order Cuculiformes
Family: Cuculidae Centropus viridis Philippine Coucal
Order Passiformes
Family: Pyncnonotidae Pycnonotus goiavier Yellow-vented Bulbul Ixos philippinus Philippine Bulbul

QUARRY VENTURES PHILIPPINES, INC. Environmental Impact Assessment
February 2019 2-163
Classification Scientific Name Common Name
Family: Sylviidae Orthotomus castaneiceps Philippine Tailorbird Megalurus timoriensis Tawny Grassbird Cisticola juncidis Zitting Cisticola
Family: Turdidae Copsychus saularis Oriental Magpie-robin
Family: Rhipidurae Rhipidura javanica Pied Fantail
Family: Laniidae Lanius cristatus Brown Shrike, Taras/Panalan Lanius schach Long-tail Shrike
Family: Nectariniidae Nectarinia jugularis Olive-backed Sunbird
Family: Dicaeidae Dicaeum austral Red-keeled Flowerpecker
Family: Estrildidae Lonchora atricapilla Chestnut Munia, Maya
Family Passeridae Passer montanus Eurasian Tree Sparrow, Maya
MAMMALIAN FAUNA
Order Primates
Family: Cercopithecidae Macaca fasicularis Crab-eating Macaque, Unggoy
Order Carnivora Family: Viveridae Viverra tangalunga Malayan Civet
*Various species insectivorous bats and fruit bats might roost in caves and limestone forest.
HERPETOFAUNA
Order Squamata
Family: Pythonidae Python reticulatus Python/Sawa
Family: Phasianidae Varanus nuchalis Bayawak
Family: Scincidae Lamprolepis smaragdina Green Tree-skink Eutropis indesprensa Ground Skink Parvoscincus steerei Small Ground Skink
Family: Gekkonidae Gekko gecko Tokay Gecko
Order Anura
Family: Bufonidae Rhinella marina Marine Toad
Family: Ceratobractchidae Platymantis dorsalis Common Forest Frog
Family: Microphylidae Kaloula picta Slender-digit Narrow-mouth Frog
INVERTEBRATES
Millipedes, various Insects (ants, beetles, moths, butterflies, dragonfly, etc.) and native/endemic land snails.
Majority of the species recorded were native/resident species with at least 24 species (67%) that
are not endemic. This followed by 11 endemic species (30%) and one invasive species (3%).

QUARRY VENTURES PHILIPPINES, INC. Environmental Impact Assessment
February 2019 2-164
Parcel 1, Parcel 2 and Parcel 3A-3B have fragmented to primary growth forest over limestone
which support various endemic species, while Parcel 5 supports few native wildlife because of the
extent of disturbance. Cebu island endemic birds and herpetofauna were not observed on the
sites. However, the importance of the forest stand cannot be underestimated as it is located
between Tabunan forest and Alcoy forest, two of the remaining habitats of the Cebu noteworthy
wildlife species forest thus may serve as a good forest corridor for what may be the two sub-
populations.
In general, the area was found to have less diversity and abundance of wildlife compared with
more complex ecosystem in a lowland evergreen rainforest or a dipterocarp forest. But this area
constitute the remaining vital native forest patches of Cebu that support native, endemic and
threatened species.
Threat to abundance, frequency, and distribution of important species
Birds
The 25 species of birds belong to 15 families and 7 orders. Majority of this are native/resident
species but not endemic with 17 (72%) species which is followed by seven (11%) endemic species
and one (5%) migratory species. The seven (7) endemics to the Philippines are Collocalia
troglodytes (Pygmy Swift), Aerodramus amelis (Grey Sweftlet), Phapitreron leucotis (White-eared
Brown Dove), Centropus viridis (Philippine Coucal), Ixos philippinus (Philippine Bulbul),
Orthotomus castaneiceps (Philippine Tailorbird) and Dicaeum australe (Red-keeled
Flowerpecker). Those endemic birds have fairly-widespread to widespread distribution in the
Philippines and can manage to adapt and survive in open and disturbed areas. In terms of
population status, none of the recorded birds are listed under any threatened status.
It was also observed in Parcel 1 that several species of swifts and swiftlets (including the
endemics) utilize narrow caves and steep cliffs as their roosting and breeding sites. While in Parcel
5, only common native birds were observed due to the highly fragmented patch of vegetation and
other cultivated or propagated fruit trees.
The Order Passeriformes is the most represented with 13 species, mostly insectivores and
omnivores, which are highly adaptable to open disturbed areas. Emerald doves, zebra doves, rails
and other medium-size birds were hunted for food by the local people.

QUARRY VENTURES PHILIPPINES, INC. Environmental Impact Assessment
February 2019 2-165
The presence of endemic species serves as a good biological indicator of disturbances or
deterioration of the environment. The forest patch of Parcel 2 and Parcel 3A-3B with remaining
limestone forest, will also serve as forest corridor of endemic birds from its north in Tabunan
forest and Alcoy forest in the south.
Mammals
The mammals that were reported to be found in the forests by the locals were the crab-eating
macaque (Macaca fasicularis) and Malayan civet (Viverra tangalunga) in which the latter species’
excrement was documented in Parcel 3. It was also noted that bats, both microchiropterans
(insectivorous bats) and megachiropterans (fruit bats), though not observed in the surveyed area
are believed to roost in the caves and remnant limestone forest. Most likely, Parcel 1, Parcel 2,
Parcel 3A-3B could support various species because of the presence of caves and abundant food
plants of these wildlife (i.e. Ficus sp., Syzygium sp.), and prey (various species of invertebrates)
which could support native, endemic, and threatened species.
Parcel 5 could no longer support mammalian population because of the degree of disturbance of
the vegetation and other anthropogenic factors. Small terrestrial mammals like rats or shrews
were not observed in the field nor actually seen during the day by local informants. However, it
is also likely that these small mammals are present in the area only that they are cryptic or
nocturnal in habits.
Reptiles and Amphibians
During the survey, various species of amphibians and reptiles were observed and heard in the
area especially in the Parcel 1, 2 and 3A-3B which still have remaining tracks of limestone forest.
While in Parcel 5, only the invasive marine toad (Rhinella marina) was observed because of the
poor condition of the vegetation could not support native/endemic species. In Parcel 1, 2, and
3A-3B, the limestone or karst substrates can sustain the relative moisture condition needed for
most amphibians to survive. The presence on the site of certain plant taxa/species belonging to
Pandanus sp. Arecaceae, Araceae (Alocasia sp.), Aspleniaceae (Asplenium spp.), Polypodiaceae
(Microsorum sp., Drynaria sp.), among others, serve as the major microhabitat attributes to the
relatively rich amphibian diversity in the area. Further taxonomic and phylogenetic study are
needed to be done on the genus Platymantis sp. found in the limestone forest that might
represent a cryptic species and new to science.
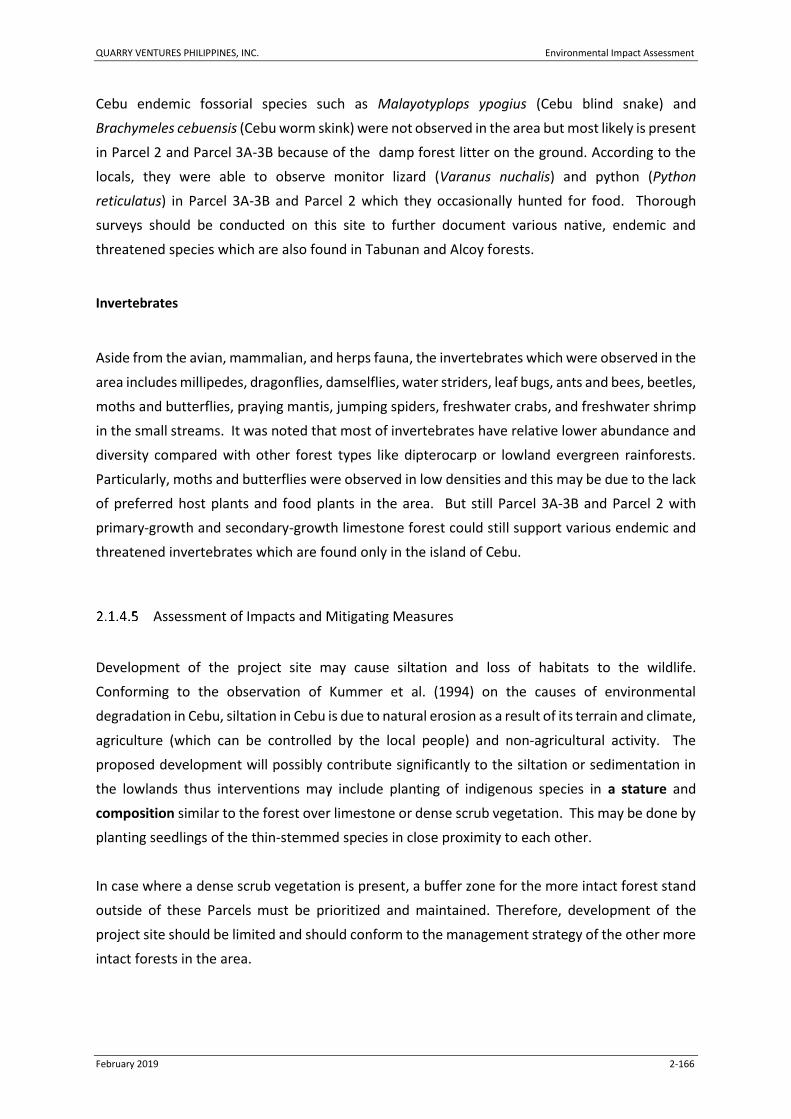
QUARRY VENTURES PHILIPPINES, INC. Environmental Impact Assessment
February 2019 2-166
Cebu endemic fossorial species such as Malayotyplops ypogius (Cebu blind snake) and
Brachymeles cebuensis (Cebu worm skink) were not observed in the area but most likely is present
in Parcel 2 and Parcel 3A-3B because of the damp forest litter on the ground. According to the
locals, they were able to observe monitor lizard (Varanus nuchalis) and python (Python
reticulatus) in Parcel 3A-3B and Parcel 2 which they occasionally hunted for food. Thorough
surveys should be conducted on this site to further document various native, endemic and
threatened species which are also found in Tabunan and Alcoy forests.
Invertebrates
Aside from the avian, mammalian, and herps fauna, the invertebrates which were observed in the
area includes millipedes, dragonflies, damselflies, water striders, leaf bugs, ants and bees, beetles,
moths and butterflies, praying mantis, jumping spiders, freshwater crabs, and freshwater shrimp
in the small streams. It was noted that most of invertebrates have relative lower abundance and
diversity compared with other forest types like dipterocarp or lowland evergreen rainforests.
Particularly, moths and butterflies were observed in low densities and this may be due to the lack
of preferred host plants and food plants in the area. But still Parcel 3A-3B and Parcel 2 with
primary-growth and secondary-growth limestone forest could still support various endemic and
threatened invertebrates which are found only in the island of Cebu.
Assessment of Impacts and Mitigating Measures
Development of the project site may cause siltation and loss of habitats to the wildlife.
Conforming to the observation of Kummer et al. (1994) on the causes of environmental
degradation in Cebu, siltation in Cebu is due to natural erosion as a result of its terrain and climate,
agriculture (which can be controlled by the local people) and non-agricultural activity. The
proposed development will possibly contribute significantly to the siltation or sedimentation in
the lowlands thus interventions may include planting of indigenous species in a stature and
composition similar to the forest over limestone or dense scrub vegetation. This may be done by
planting seedlings of the thin-stemmed species in close proximity to each other.
In case where a dense scrub vegetation is present, a buffer zone for the more intact forest stand
outside of these Parcels must be prioritized and maintained. Therefore, development of the
project site should be limited and should conform to the management strategy of the other more
intact forests in the area.

QUARRY VENTURES PHILIPPINES, INC. Environmental Impact Assessment
February 2019 2-167
Seeds and seedlings of the indigenous species may be collected directly from the forests and
propagated in nurseries by the local people.
Threatened species of flora encountered during mine activities will be noted and propagated in
the nursery. Propagated species will eventually be used for rehabilitation of mined out areas.
Mine plans also show that only a portions of the MPSA area would be affected, leaving enough
space to serve as buffer, and remain undistrubed for the fauna to migrate away from the mine
area.
2.2 Water
2.2.1 Hydrology/Hydrogeology
The province of Cebu has numerous river systems and tributaries all throughout the island. Figure
2-47 shows the tributaries going through the project site. The noted major creek passing through
the site is the Udlom Creek, in Parcel 1. This creek carries the run off and effluents from the
nearby rice farms, animal farms, and communities.
Most households and major water suppliers in Cebu makes use of the island’s groundwater
sources for their daily needs. Since the prominent mineral of Cebu soil is limestone, rain runoffs
goes directly to water tables due to less water retention.
It is worth noting, however, that the only major tributary within the MPSA is a small portion of
the Udlom Creek, which is a seasonal creek that serves as a drainiage for the nearby community
and poultry farm. It only has water during the rainy season, and goes dry during summer months.
Parcel 2 and 3
The main drainage body of these parcels are the Pandan River on the northeast, and the
Cabiangan River to the west. Majority of the creek tributaries, however, lead to the Cabiangan
River.
Parcel 5
Run off from Parcel 5 drains mainly towards the head waters of the Pandan River to the north,
Abuno River to the southeast, and Pandan River again on the west. The creeks and tributaries are
used for irrigation by the community. Their drinking water are extracted through deepwells.

QUARRY VENTURES PHILIPPINES, INC. Environmental Impact Assessment
February 2019 2-168

QUARRY VENTURES PHILIPPINES, INC. Environmental Impact Assessment
February 2019 2-169
Figure 2-47: Watershed Map of Cebu

QUARRY VENTURES PHILIPPINES, INC. Environmental Impact Assessment
February 2019 2-170
Change in drainage morphology / inducement of flooding / reduction in stream volumetric flow
There are no major body of water going through the project sites. Udlom Creek passes through
the side of the target quarry area, and could be easily avoided during operation. There would
also be no diversion of water systems. The outlet from the sedimentation ponds will be
constructed to join in the existing drainage or canals. During the quarry activities, there would be
removal of topsoil, which would be transferred to a stockpile. The stockpile is going to be placed
away from Udlom Creek to avoid sedimentation, and possible landslide that could block the
waterflow.
Change in stream, lake water depth
Sediments could be transported to the tributaries and river systems by surface runoffs. This
would lead to blockages and rise in the depth. Sedimentation ponds will constructed on the
project sites to minimize the sediments going into the tributaries from the quarry activities.
Soils in the province of Cebu are predominantly of limestone formation. Limestone is a
sedimentary rock that is composed of calcium carbonate. These may have formed through the
accumulation of marine invertebrates or through the chemical precipitation of calcium carbonate.
The Calcareous soils in Cebu are located on the upland areas and majority of them are having a
rolling to hilly and mountainous topography, clayey in texture and either black or red in color. The
soil of the project area belongs to the moderately drained areas of the province
These areas have a flat to gently undulating surface. There are two soil series under this drainage
condition, namely the Mandaue and Medellien series. The former is of alluvial formation while
the latter is an upland soil that have been formed from limestone and shale. The soil types in
these series are best agricultural soils in found in the province (i.e. Mandaue clay loam and Lugo
Clay).
Soils in the Mandaue series are generally cultivated to lowland rice as the land is level and slightly
compacted layers below the subsoil favor the retention of irrigation water. The Medellien soil on
the other hand is devoted mostly to sugarcane production.
These soils when tested for rapid wetting (Slaking Test) have shown to be very stable (see Section
2.1.3.2). The Soil crust remain intact when subjected to saturated conditions. There is no instance

QUARRY VENTURES PHILIPPINES, INC. Environmental Impact Assessment
February 2019 2-171
of water logging occur on any part of this series and very minimal erosion brought about by either
surface runoff and flooding. In relation to erosion by the action of water, these soils are noted to
be resistant to sheet and gully erosion and is brought about by the presence of high calcium in
the soil.
Depletion of water resources / competition in water use
The quarry activities would not be utilizing the water sources within the project site. The primary
water utility will be for domestic use like washing of equipment, spraying over dusty areas, and
drinking of the workers. Water source for such activities will be sourced from local water districts
or water suppliers.
Impacts to Floods and Droughts and Effects of Climate Change
The projected seasonal temperature increase, seasonal rainfall change and, frequency of extreme
events in 2020 and 2050 of PAGASA (Climate Change in the Philippines, February 2011) under the
medium-range emission scenario are shown in Table 2-27. According to the publication, all areas
of the Philippines will get warmer, more so in the relatively warmer summer months. Mean
temperatures in all areas in the Philippines are expected to rise by 0.9°C to 1.1°C in 2020 and by
1.8°C to 2.2°C in 2050. Likewise, all seasonal mean temperatures will also have increases in these
time slices; and these increases during the four seasons are quite consistent in all parts of the
country. Largest temperature increase is projected during the summer (MAM) season.
In Cebu province there is a projected temperature increase during the summer months (MAM) of
1.2°C in 2020 and a projected increase of 2.4°C in 2050.
Generally, there is reduction in rainfall in most parts of the country during the summer (MAM)
season. However, rainfall increase is likely during the southwest monsoon (JJA) season until the
transition (SON) season in most areas of Luzon and Visayas, and also, during the northeast
monsoon (DJF) season, particularly, in provinces/areas characterized as Type II climate in 2020
and 2050. There is however, generally decreasing trend in rainfall in Mindanao, especially by
2050.
Cebu Province is under the Type III climate (seasons not very pronounced, relatively dry from
November to April and wet for the rest of the year). The projection shows an increase of about

QUARRY VENTURES PHILIPPINES, INC. Environmental Impact Assessment
February 2019 2-172
7.7 mm rainfall during the wettest months (SON) and an average increase of 0.8mm on the driest
months of the year (MAM).
The projection, however, shows reduction in the number of days when rainfall is more than 150
mm (
Table 2-29), which can be associated to prolonged drought. In the years 2006 to 2035, PAGASA
predicts the occurrence of four (4) extreme rainfall events while seventeen (17) is expected during
years 2036 – 2065.
With regards to the impact of the proposed modification of the QVPI Project to flooding, since
there will be slow and minimal ground disturbance considering the nature of Marble quarrying
and extraction process. This is coupled by the inherent parent material characteristics of being
highly fragmented and porous nature of the Marble quarry, therefore, rate of runoff and the
water infiltration rate will not be altered, thus, the project does not contribute in any manner to
flooding.
Table 2-27: Seasonal Temperature increases (in °C) in 2020 and 2050 under medium-range emission scenario in the province of Cebu
Province Station
OSERVED BASELINE (1971 – 2000)
Change in 2020 (2006 -2035)
Change in 2050 (2036 – 2065)
DJF MAM JJA SON DJF MAM JJA SON DJF MAM JJA SON
Cebu Mactan 26.8 28.4 28.2 27.9 0.9 1.2 1.1 1.0 1.9 2.4 2.1 1.9
Table 2-28: Seasonal rainfall change (in %) in 2020 and 2050 under medium-range emissionscenario in the province of Cebu
Province Station
OSERVED BASELINE (1971 – 2000)
Change in 2020 (2006 -2035)
Change in 2050 (2036 – 2065)
DJF MAM JJA SON DJF MAM JJA SON DJF MAM JJA SON
Cebu Mactan 324 228.3 595.1 607.4 17.7 0.8 7.7 7.7 19.6 0.5 18.9 17.8
Table 2-29: Frequency of extreme events in 2020 and 2050 under medium – range emission scenario in Cebu
Province Station
No. of Days w/ Tmax >35 oC
No of Dry Days No of Days w/Rainfall
>150mm
Observed (‘71 –‘00)
2020 2050 Observed (‘71 –‘00)
2020 2050 Observed (‘71 –‘00)
2020 2050
Cebu Mactan 25 1488 2463 7112 5720 5693 12 4 17
2.2.2 Oceanography

QUARRY VENTURES PHILIPPINES, INC. Environmental Impact Assessment
February 2019 2-173
The project site is located approximately 8km from the northern and southern shores of the Cebu
Island. There would be no port facility to be constructed for this project, so the study in
oceanography was not included in this report.
2.2.3 Water Quality
This section presents the results of the baseline water quality sampling activities held on June 24
– 26, 2016. The data were used to assess the project potential impacts to the ground and stream
waters within and outside of the project site.
The national and local regulations used in the water quality assessment, water quality sampling
stations, sampling procedures, analytical methods and the limitations of the study are detailed in
the succeeding subsections.
National and Local Regulations on Water Quality
The national legislation for the protection and conservation of water bodies in the country is the
Republic Act No. 9275 (RA 9275), The Philippine Clean Water Act of 2004 (CWA 2004). Pursuant
to the section 19e and 19f of this act, the Department of Environment and Natural Resources
(DENR) is the implementing arm in the implementation of the Rules and Regulations (IRR) of CWA
2004 under the Administrative Order No. 10, series of 2005 (DAO 2005-10) for the prevention and
abatement of water pollution.
The DENR Administrative Order 08, series of 2016 hereby adopts and promulgates these Water
Quality Guidelines (WQG) and General Effluent Standards (GES).The DAO 2016-08 was the
guidelines used in assessing the current conditions of the streams water within or near the project
site.
The groundwater quality of the sampling sites were assessed according to the drinking water
guidelines specified in the Department of Health (DOH) Administrative Order 2007-12, otherwise
known as the Philippine National Standards for Drinking Water 2007 (PNSDW 2007).
Sampling Sites
A total of seven (7) sampling sites that include ground and stream waters were established within
and outside the project area.
Groundwater sampling stations were established at the Barangay sources of potable water and
non-potable water supply. Five (5) sampling sites were established at the areas surrounding the

QUARRY VENTURES PHILIPPINES, INC. Environmental Impact Assessment
February 2019 2-174
project area. The groundwater sampling stations descriptions and their locations are presented
in Table 2-30.
There is only one natural water way named Udlom Creek that was sampled within the project
site, in Parcel 1. The downstream and upstream portions of the creek was sampled. This comprises
the two (2) stream water stations established within the project site. Table 2-31 provides
description of the stream water sampling sites. After the baseline sampling conducted for this
study, QVPI used 3 monitoring stations instead of 2, to improve the monitoring data of the water
quality.
Sampling Methodology
In-situ Measurements
Hand held multi tester meter (Eutech Instrument CyberScan PCD 650 Model) was used to
determine the level of dissolved oxygen (DO) in the surface water, ambient temperature (°C),
electrical conductivity (EC μS/cm), pH, and Total Suspended Solids (TSS, mg/L) of the ground and
stream waters. All equipment was calibrated prior to sampling to ensure the validity and reliability
of the data gathered. The sampling areas are shown in Table 2-30 and Table 2-31, and Figure
2-48.
Table 2-30: Groundwater Quality Sampling Stations
Sampling Station
Photo Groundwater Source and
Sampling locations Coordinates
GW1
Groundwater Type: Spring Location: Parcel 3,Brgy. Bulongan,Toledo City
Latitude: 10°18’20.6”N Longitude: 123°39’22.8”E Elev.: 105m
GW2
Groundwater Type: Spring Box Location: Parcel 3,Brgy. Bulongan,Toledo City
Latitude: 10°18’16.6”N Longitude: 123°39’24.0”E Elev.: 113m

QUARRY VENTURES PHILIPPINES, INC. Environmental Impact Assessment
February 2019 2-175
Sampling Station
Photo Groundwater Source and
Sampling locations Coordinates
GW3
Groundwater Type: Spring Box Location: Parcel 2,Lamac City of Naga
Latitude: 10°16’47.5”N Longitude: 123°40’7.7”E Elev.: 163m
GW4
Groundwater Type: Spring Box Location: Parcel 1, Tagbuang Tubig, City of Naga
Latitude: 10°15’51.1”N Longitude: 123°40’38.2”E Elev.: 304m
GW5
Groundwater Type: Spring Box Location: Parcel 5,Brgy. Cogon, City of Naga
Latitude: 10°17’14.0”N Longitude: 123°44’6.3”E Elev.: 484m
Table 2-31: Stream Water Quality Sampling Stations on the Udlom Creek
Sampling Station
Photo Location of Water
Body Coordinates
SW1
Downstream
Sampling Location: Parcel 1 (Udlom Creek) Taghaguimit, Tagbuang Tubig, City of Naga
Latitude: 10°15’47.6”N Longitude: 123°40’28.6”E Elev.: 277m

QUARRY VENTURES PHILIPPINES, INC. Environmental Impact Assessment
February 2019 2-176
Sampling Station
Photo Location of Water
Body Coordinates
SW2
Upstream
Sampling Location: Parcel 1 (Udlom Creek) Taghaguimit, Tagbuang Tubig, City of Naga
Latitude: 10°15’39.6”N Longitude: 123°40’39.2”E Elev.: 280m

QUARRY VENTURES PHILIPPINES, INC. Environmental Impact Assessment
February 2019 2-177
Figure 2-48: Water Sampling Locations

QUARRY VENTURES PHILIPPINES, INC. Environmental Impact Assessment
February 2019 2-178
Figure 2-49: Water Sampling Stations in Parcels 1 and 2

QUARRY VENTURES PHILIPPINES, INC. Environmental Impact Assessment
February 2019 2-179
Figure 2-50: Water Sampling Stations in Parcel 3

QUARRY VENTURES PHILIPPINES, INC. Environmental Impact Assessment
February 2019 2-180
Figure 2-51: Water Sampling Station in Parcel 5

QUARRY VENTURES PHILIPPINES, INC. Environmental Impact Assessment
February 2019 2-181
Sampling and Handling Procedures
Water sampling Handling techniques are based on the water quality monitoring manual issued by
the Environmental Management Bureau, DENR (2008).
Groundwater Samples were obtained directly from the main sources of water supply like spring
box, concrete water reservoir. Sampling containers were directly filled with water from the
faucets (Figure 2-52).
Figure 2-52: Groundwater Sample Collection at a Spring Box
The middle portion of the selected surface water collection site having the deepest water level
and with fastest current was chosen as the sampling point. Grab water samples were collected by
first rinsing the container at least three times with the stream water before the actual sample
collection. Sampling was made by submerging the Fast laboratory provided containers, facing
downward at a depth approximately 20 cm or whenever the water depth of stream permits
(Figure 2-53). Sterilized Bottles for coliform were only filled to the line to allow headspace for
proper mixing of samples. Samples for oil and grease were obtained from the surface of the water
using wide mouthed glass bottles and immediately covered with aluminum foil prevent any oil
and grease from adhering to the container cap.

QUARRY VENTURES PHILIPPINES, INC. Environmental Impact Assessment
February 2019 2-182
Figure 2-53: Stream Grab Water Sampling
Parameters, Preservation and Analytical Methods for Stream and Groundwater Quality
The Physical and chemical properties, organic and inorganic composition, level of bacteriological
contamination and the presence of heavy metals were determined by subjecting all of samples to
analyses and is presented in Table 2.3.
Table 2-32: Lists of Parameters Analyzed for Ground and Stream Water Quality
For every parameters it requires a specific type of container and volume. Sampling containers
were prepared according to the specifications approved by the PNSDW and DAO 2016 – 08 for
Physical and Chemical
Properties
- pH
- Temperature
- Electrical Conductivity
- Oil and grease
- Biochemical Oxygen Demand
- Total Dissolved Solids
- Chemical Oxygen Demand
- Total Suspended Solids
- Dissolved Oxygen
Bacteriological Parameters - Total Coliform
- Fecal Coliform
Metals and
Cations
- Arsenic (As)
- Cadmium (Cd)
- Lead (Pb)
- Mercury (Hg)
- Chromium (Cr+6)

QUARRY VENTURES PHILIPPINES, INC. Environmental Impact Assessment
February 2019 2-183
the ground and surface water quality, respectively. All of the Samples were submitted within 6
hours to the F.A. S. T. laboratory In Mandaue City and , is accredited by DENR and Certified by the
department of Trade and Industry (DTI) as conforming to PNS ISO/IEC 17025:2005. The bottle
requirements and maximum holding time are detailed in Table 2-33.
Table 2-33: Container Requirements and Sample Maximum Holding time
Parameters Sample Volume
Container Handling/ Preservation Maximum
Holding Time
TSS & TDS 1L Polyethylene washed with phosphate-free detergent and ion free water
Cool stored at ≤ 6°C 7 Days
BOD & COD 1L Polyethylene washed with phosphate-free detergent and ion free water
Cool stored at ≤ 6°C 48 hours
Total Coliform Fecal Coliform
250 ml Glass, sterilized Cool stored at < 10°C 6 hours
Oil and Grease 1L Wide mouthed glass, with Aluminum foil
Cool stored at ≤ 6°C 28 Days
Cr+6 500 ml Polyethylene rinsed with Nitric Acid (HNO3)
Cool stored at ≤ 6°C 28 Days
Total Metals - Arsenic (As) - Cadmium (Cd) - Total Calcium (Ca) - Lead (Pb) - Mercury (Hg)
1L Polyethylene rinsed with Nitric Acid (HNO3)
Cool stored at ≤ 6°C; Filtered on site
6 Months
Table 2-34: Laboratory Analytical Methods
Parameters Laboratory Method Method of Detection
Limit
Physical and Chemical Properties
BOD 5210 B 5-Day BOD Test 1mg/L
Oil and Grease 5520 B Partition – Gravimetric 1.94mg/L
Chemical Oxygen Demand 5220 B Open Reflux -
TSS 2540 D Gravimetric 2.5mg/L
TDS Gravimetry 1.0mg/L
Bacterial Parameters
Total Coliform Multiple Tube Fermentation Technique 1.1MPN/100 ml
Fecal Coliform Multiple Tube Fermentation Technique 1.1MPN/100 ml
Total Metals
-Arsenic (As) Silver Diethyldithiocarbamate- Colorimetric 0.01mg/L
- Cadmium (Cd) 3030 F. Nitric-Hydrochloric Acid Digestion
3111 B. Direct Air-Acetvlene Flame AAS 0.002mg/L
- Chromium (Cr+6) Flame Atomic Absorption Spectrometric 0.005mg/L
- Lead (Pb) Flame Atomic Absorption Spectrometric 0.01mg/L
- Mercury (Hg) 31 12 B. Cold Vapor AAS Spectrometric 0.001mg/L

QUARRY VENTURES PHILIPPINES, INC. Environmental Impact Assessment
February 2019 2-184
Table 2-34 lists the laboratory methods used by F.A.S.T. laboratory for the analysis of samples,
the corresponding method detection limits. These analytical methods are included in the list of
test procedures Reference: APHA-AWWA and WEF 2012 Standard Methods for the
Examination of Water and Wastewater, 22nd ed. Further, these are the same procedures as
described in the DAO 2016-08 and PNSDW, 2007.
The Water Quality of the ground and surface water within and outside the proposed QVPI Cebu
Marble and Aggregates Project were assessed based on the Local guidelines (DAO 2016 - 08 and,
PNSDW 2007) and available related data pertaining to water quality.
Groundwater
Groundwater sources within and outside the project area are mostly for drinking and domestic
consumption, hence, the laboratory water quality tests were compared to the PNSDW 2007
values (i.e. inorganic chemical constituent with health significance, microbiological quality and
physical and chemical acceptability aspects.
Stream
The DAO 2016 - 08 describes the classification and beneficial use of fresh water bodies in the
Philippines. This Guideline prescribes water quality criteria for a water body corresponding to the
water designated best use of the water source.
Table 2-35: DAO 2016 - 08 Water Body Classification and Usage of Fresh Waters
Classification Beneficial Use*
Class AA Public Water Supply Class I This class is intended primarily for waters having watersheds, which are uninhabited and / or otherwise declared as protected areas, and which require only approved disinfection to meet the latest PNSDW.
Class A Public Water Supply Class II - Intended as sources of water supply requiring conventional treatment (coagulation, sedimentation, filtration, and disinfection) to meet the PNSDW 2007.
Class B Recreational Water Class I – Intended for primary contact recreation (bathing, swimming, swimming, etc.).
Class C 1. Fishery Water For the propagation and growth of fish and other aquatic resources 2. Recreational Water Class II – For boating, fishing, or similar activities 3. For Agriculture, Irrigation, and Livestock Watering
Class D Navigable waters *Note: For unclassified water bodies, classification shall be based on the beneficial use as determined by the Environmental Management
Bureau (EMB).

QUARRY VENTURES PHILIPPINES, INC. Environmental Impact Assessment
February 2019 2-185
Groundwater Quality
Groundwater Microbiological Quality of the Project Site
The groundwater sampling stations within the project area utilizes the water coming from springs
for drinking and other domestic water use. Exception is the GW1, where it is presently used as
water hole for domestic animals and for plant watering.
In terms of the presence of pathogens in the groundwater stations sampled, all of the GW
sampling stations have elevated total coliform when compared to the PNSDW 2007. Highest total
coliform counts were detected in GW5 (Parcel 5, Brgy. Cogon, City of Naga) of 14,000.00
MPN/100ml. The lowest of 2,700.00MPN/100ml in GW4 (Parcel 1, Tagbuang Tubig, City of Naga).
This is perhaps due to the very leaky subsurface soil conditions of the MPSA area, and the present
land use where, animal droppings can contaminate both storm and agricultural runoffs that can
reach the aquifers of the Barangays.
Three of the groundwater sampling station is used by the local population as their source of
drinking water. Based on these results, a conventional treatment process as prescribed by PNSDW
2007 (i.e. coagulation, sedimentation, filtration, and disinfection) shall be used to completely
eliminate pathogens before it can be used safely for drinking.
Sources of coliform in groundwater can include: Agricultural runoff, Effluent from septic systems
or sewage discharges, Infiltration of domestic or wild animal fecal matter.
Poor well maintenance and the construction (particularly shallow dug wells) can also increase the
risk of bacteria and other harmful organisms getting into a well water supply.
Elevated levels of fecal coliforms in all of the GW sampling Stations were also observed. GW5 fecal
coliform is 3900MPN/100ml. The rest of the sampling stations is having fecal coliform of
1,700MPN/100ml. Again, when these waters are intended to be used for drinking, the
conventional treatment process prescribed by the PNSDW 2007 shall be imposed.
Figure 2-54 and Figure 2-55 presents the groundwater quality assessments for fecal and total
coliform content made on the four (4) QVPI parcels and Barangays that encompasses the project
site, alongside with the PNSDW 2007 limits.
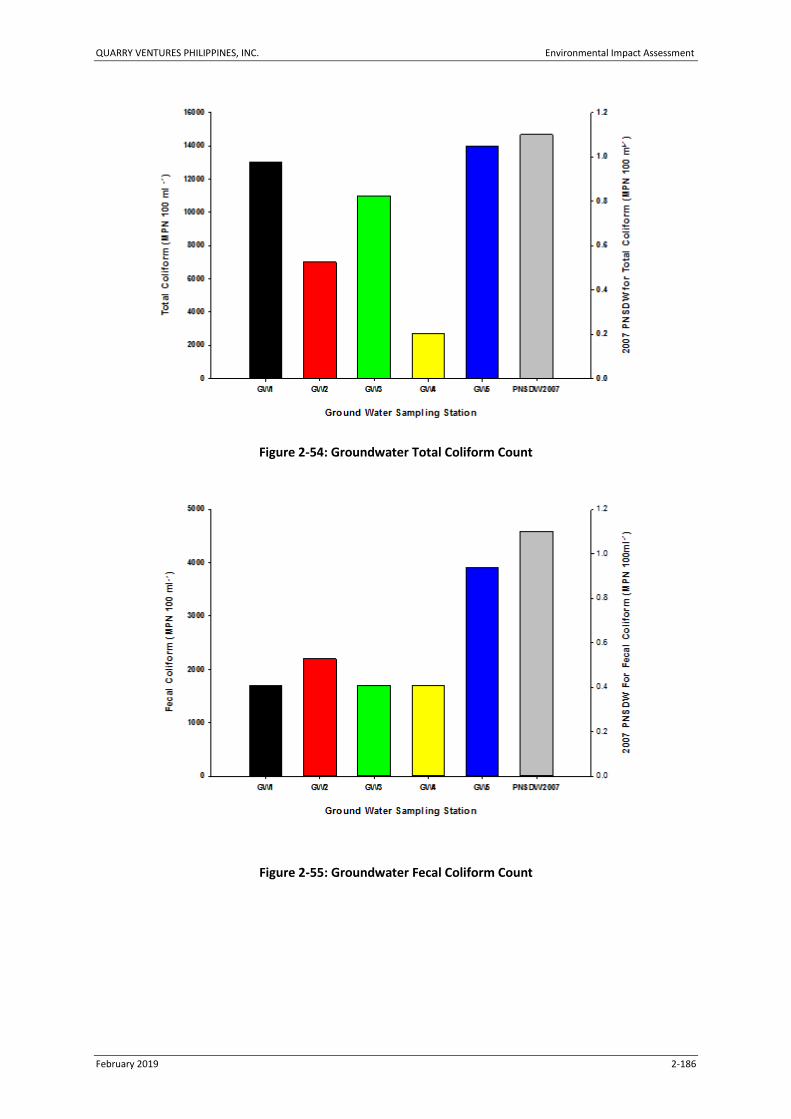
QUARRY VENTURES PHILIPPINES, INC. Environmental Impact Assessment
February 2019 2-186
Figure 2-54: Groundwater Total Coliform Count
Figure 2-55: Groundwater Fecal Coliform Count
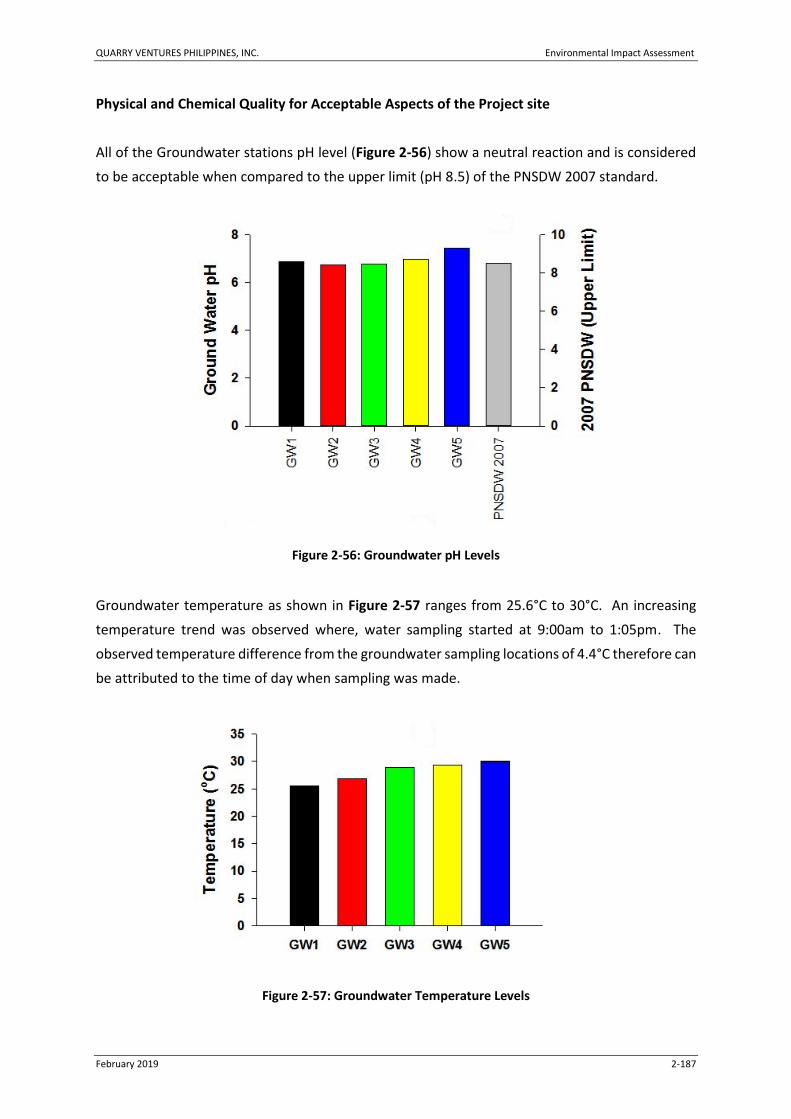
QUARRY VENTURES PHILIPPINES, INC. Environmental Impact Assessment
February 2019 2-187
Physical and Chemical Quality for Acceptable Aspects of the Project site
All of the Groundwater stations pH level (Figure 2-56) show a neutral reaction and is considered
to be acceptable when compared to the upper limit (pH 8.5) of the PNSDW 2007 standard.
Figure 2-56: Groundwater pH Levels
Groundwater temperature as shown in Figure 2-57 ranges from 25.6°C to 30°C. An increasing
temperature trend was observed where, water sampling started at 9:00am to 1:05pm. The
observed temperature difference from the groundwater sampling locations of 4.4°C therefore can
be attributed to the time of day when sampling was made.
Figure 2-57: Groundwater Temperature Levels

QUARRY VENTURES PHILIPPINES, INC. Environmental Impact Assessment
February 2019 2-188
Figure 2-58 also shows the oil and grease laboratory test for all the groundwater sampling
stations. The parameter have no applicable standard using the PNSDW 2007. Result showed that
all of the groundwater station have less than the detection limit of 1.94mg/l. For presentation
purposes all of the ground water sampling locations were given the same values of 1.94 mg/l.
Figure 2-58: Groundwater Oil and Grease Levels
Dissolved Solids refer to any minerals, salts, metals, cations or anions dissolved in water. Total
dissolved solids (TDS) comprise inorganic salts (principally calcium, magnesium, potassium,
sodium, bicarbonates, chlorides, and sulfates) and some small amounts of organic matter that are
dissolved in water. Figure 2-59 shows the concentrations of dissolved inorganic ions over all the
5 groundwater sampling station were higher than the PNSDW 2007 standard of 500mg/L. In this
case drinking water in these groundwater sampling stations is not acceptable. Although many
health specialists believe that ideal drinking water should be under 50ppm or lower.

QUARRY VENTURES PHILIPPINES, INC. Environmental Impact Assessment
February 2019 2-189
Figure 2-59: Groundwater Total Dissolved Solids Levels
Figure 2-60 shows the dissolved oxygen (DO) content of 5 groundwater sampling stations.
Dissolved oxygen refers to the level of free, non-compound oxygen present in water or other
liquids. It is an important parameter in assessing water quality because of its influence on the
organisms living within a body of water. A dissolved oxygen level that is too high or too low can
harm aquatic life and affect water quality. The lowest DO levels were given by GW2 and GW3
(Parcel 3 and Parcel 2) of 4.01, 4.02mg/L, respectively. The highest DO content of the
groundwater stations is in GW 5 of 8.6mg/L. The parameter have no applicable standard under
the PNSDW 2007.
Dissolved oxygen levels is highly affected by temperature, salinity and pressure changes. As such,
dissolved oxygen levels can range from less than 1mg/L to more than 20mg/L depending on how
all of these factors interact. The effect of temperature in the amount of DO in groundwater is
clearly demonstrated in GW5. Ambient water temperature of 30°C gave an equivalent reading of
8.6mg/L, in contrast with GW 1 and GW2 of 6.74, 4.01mg/L sample readings temperature taken
between 25.6–26.80°C, respectively.
Moreover, oxygen affects a vast number of other water indicators, not only biochemical but
esthetic ones like the odor, clarity and taste. Consequently, Dissolved oxygen is perhaps the most
well-established indicator of water quality.
Figure 2-60: Groundwater Dissolved Oxygen Levels
Also shown in Figure 2-61 are the electrical conductivity (EC) readings of the five Groundwater
sampling stations. This parameter is one of those with no applicable standards (i.e. PNSDW 2007,
DAO2016 -08).

QUARRY VENTURES PHILIPPINES, INC. Environmental Impact Assessment
February 2019 2-190
Conductivity is a measure of water’s capability to pass electrical flow. This ability is directly
related to the concentration of ions in the water. These conductive ions come from dissolved
salts and inorganic materials such as alkalis, chlorides, sulfides and carbonate compounds. The
more ions that are present, the higher the conductivity of water. Likewise, the fewer ions that
are in the water, the less conductive it is. Distilled or deionized water can act as an insulator due
to its very low (if not negligible) conductivity value. Sea water, on the other hand, has a very high
conductivity.
If the groundwater is intended for irrigation and drinking purposes high EC readings are indicators
of its harmful effects both to human and plant life. Using the BSWM standard on the EC reading
of all the groundwater sampling stations in all of the parcels is having a medium rating and is
considered to be appropriate when used as irrigation water. Moreover, as a general rule, if the
EC reading of more than 1μS/cm the water therefore cannot be used for irrigation purposes
because of its high salt content.
Figure 2-61: Groundwater Conductivity Levels
In environmental chemistry, the COD test is commonly used to indirectly measure the amount of
organic compounds in water. The parameter is very useful to those concerned with water quality
since they represent the amount of oxygen necessary for the aerobic biological oxidation of the
organics in a water sample to carbon dioxide and water. Figure 2-62 showed that GW2 sampling
station have the lowest COD levels of 1mg/L and the highest is given by GW5 of 9mg/L. The rest
of the GW sampling stations have the same COD of 2mg/L. The lower the value the better is the
water quality. In other countries like India, COD standard is zero (0) for their drinking water.

QUARRY VENTURES PHILIPPINES, INC. Environmental Impact Assessment
February 2019 2-191
Figure 2-62: Groundwater Chemical Oxygen Demand Levels
Biological oxygen demand (BOD) on the other hand, is a measure of the amount of oxygen
consumed by the bacteria that are decomposing organic matter. Similarly the lower the value in
the water the more acceptable is the groundwater for drinking purposes. All of the GW sampling
station have BOD levels of more than 1mg/L (Figure 2-63). This indicate that these waters are
contaminated and is not supposed to be not safe as source of drinking water.
Figure 2-63: Groundwater Biological Oxygen Demand Levels
Inorganic Chemical Constituent of the Project site
Heavy metals are naturally occurring elements that have a high atomic weight and a density at
least 5 times greater than that of water. Their multiple industrial, domestic, agricultural, medical

QUARRY VENTURES PHILIPPINES, INC. Environmental Impact Assessment
February 2019 2-192
and technological applications have led to their wide distribution in the environment; raising
concerns over their potential effects on human health and the environment. Their toxicity
depends on several factors including the dose, route of exposure, and chemical species, as well
as the age, gender, genetics, and nutritional status of exposed individuals. Because of their high
degree of toxicity, arsenic, cadmium, chromium, lead, and mercury rank among the priority
metals that are of public health significance.
Figure 2-64 to Figure 2-68 show the metallic contents that are dissolved with the groundwater.
The levels of Metallic mercury of the ground water sampling locations are presented in Figure
2-64. Laboratory analysis shows that all of the sampling locations have a negligible Hg content of
<0.001 mg/l (i.e. less than the method detection limit). For presentation purposes all of the
sampling locations have the same value of <0.001 mg/l and compared to the PNSDW 2007
standard of 0.001 mg/l for Hg.
Other inorganic chemical constituent (i.e. lead, Hexavalent Chromium and Cadmium) are also
having negligible levels that is less than the method detection limit of 0.01 0.005, and 0.002 mg/l
respectively. Exception is the elevated level of arsenic in GW1, 0.020 mg/l (Figure 2-68). This is
twice the limit set by the PNSDW 2007 of .001 mg/l. This result can be anthropogenic in nature
considering the present land use near GW1 (Crop land, small scale Mango plantation). Farmers
are constantly applying pesticides and other Agri-chemicals which is a good source of arsenic and
may have reached the ground water.
Figure 2-64: Groundwater Mercury Levels

QUARRY VENTURES PHILIPPINES, INC. Environmental Impact Assessment
February 2019 2-193
Figure 2-65: Groundwater Lead Levels
Figure 2-66: Groundwater Cadmium Levels

QUARRY VENTURES PHILIPPINES, INC. Environmental Impact Assessment
February 2019 2-194
Figure 2-67: Groundwater Hexavalent Chromium Levels
Figure 2-68: Groundwater Arsenic Levels
Degradation of surface water quality
Surface Water Microbiological Quality of the Project Site
There is only one river system encountered in the QVPI project areas, the downstream and
upstream portion of the Udlom Creek. In all surface water stations sampled showed the presence
of coliform bacteria (Figure 2-69). Though the total coliform counts laboratory analysis results of
the Downstream (SW1) and Upstream (SW2) showed to be below the DAO 2016-08 standard for
Class C fresh bodies of water of 10,000 MPM/100ml, these areas are within the highly disturbed
portion of the project site. High agricultural activity and, perhaps the ongoing construction of a

QUARRY VENTURES PHILIPPINES, INC. Environmental Impact Assessment
February 2019 2-195
large scale poultry production housing that is very near to SW2 grab water sampling station, may
have triggered the presence of the bacterial organism.
Figure 2-69: Surface Water Total Coliform Count
Fecal Coliform were also observed in all sampling stations and are above the standard set by the
DAO 2016 - 08 fresh water guidelines for Class C waters of 400 MPN/100 ml (Figure 2-70). The
SW1 and SW2 stations have elevated fecal coliform count of 680 and 1,700 MPN/100 ml,
respectively. These values can be highly attributed to the high agricultural activity going on
throughout the year. Drainage and runoff waters enter these river system. Farming activity in
most cases use livestock (carabaos) for land their land preparation, these animals are seen bathing
on the water ways. These areas are also observed to be highly populated thus, human excreta
and domestic wastes from these barangays greatly contribute to the presence of high fecal
coliform.

QUARRY VENTURES PHILIPPINES, INC. Environmental Impact Assessment
February 2019 2-196
Figure 2-70: Surface Water Fecal Coliform Count
Physical and Chemical Quality for Acceptable Aspects of the Project site
Figure 2-71 shows the surface water reaction pH level of the sampling stations. SW1 and SW2
have a slightly alkaline reaction of 7.55 and 7.83 respectively. This is a common reaction in
limestone areas.
Figure 2-71: Surface Water pH Level
Surface Water Sampling Station
SW1 SW2 DAO 2016-08
pH
0
2
4
6
8
10
DA
O 2
016
-08 (
Up
per
Ran
ge,
cla
ss C
)
0
2
4
6
8
10

QUARRY VENTURES PHILIPPINES, INC. Environmental Impact Assessment
February 2019 2-197
Surface water temperature of the downstream (SW1) and upstream (SW2) sampling stations, as
shown in Figure 2-72, are 30 and 27.4°C, respectively. This values are normal surface water
readings. Any variation in the temperature can be attributed to the time of day when sampling
was made.
Figure 2-72: Surface Water Temperature Levels
Figure 2-73 shows the oil and grease laboratory test to the two surface water sampling station.
There is no applicable standard using the PNSDW 2007. Result showed that all of the groundwater
station have less than the detection limit of 1.94mg/L. This indicate the absence of oil and grease
on the surface water of the Project area.

QUARRY VENTURES PHILIPPINES, INC. Environmental Impact Assessment
February 2019 2-198
Figure 2-73: Surface Water Oil and Grease Levels
The surface water sampling stations electrical conductivity (EC) readings as shown in Figure 2-74
gave a medium rating of when compared to the BSWM standards. The lower reading was
recorded in the downstream of the Udlom Creek (SW1) of 507.7µS/cm. The upstream portion of
the river gave a higher reading of 746.5µS/cm. Results indicated, these surface water coming
from Udlom Creek can be safely used for irrigation purposes.
Figure 2-74: Surface Water Conductivity Levels

QUARRY VENTURES PHILIPPINES, INC. Environmental Impact Assessment
February 2019 2-199
Total Dissolved Solids (TDS) (Figure 2-75) usually refers to the mineral content of water, although
it can also include dissolved organic material. In essence, TDS is the total amount of material
remaining after evaporation of the water. TDS include common salts such as sodium, chloride,
calcium, magnesium, potassium, sulphates and bicarbonates.
The parameter have no applicable standard under the DAO 2016-08. However, the US EPA have
set 500mg/L to provide for palatability of drinking water. Downstream portion of the sampling
station (SW1) gave a lower reading of 477.7mg/L when compared to the upstream portion of
Udlom Creek (SW2) of 701.3mg/L.
Figure 2-75: Surface Water Total Dissolved Solids Levels
The Total Suspended Solids (TSS) in the two surface water sampling station is shown in Figure
2-76. TSS are the most visible indicators of water quality. These suspended particles can come
from soil erosion, runoff, discharges, stirred bottom sediments or algal blooms. While it is
possible for some streams to have naturally high levels of suspended solids, clear water is usually
considered an indicator of healthy water. The downstream and upstream surface water sampling
station have a TSS reading of 57.0 and 44.0mg/L, respectively. This is lower to the standard set
by the DAO 2016-08 of 100mg/L for Class C surface waters. Most people consider water with TSS

QUARRY VENTURES PHILIPPINES, INC. Environmental Impact Assessment
February 2019 2-200
concentration less than 20mg/L to be clear. Water with TSS levels between 40 and 80mg/L tends
to appear cloudy, while water with concentrations over 150mg/L to be dirty.
Figure 2-76: Surface Water Total Suspended Solids Levels
Level of COD in the surface water sampling stations (SW1 and SW2) show an increasing level of
42 52mg/L, respectively. Again, this water chemical property is one of the water parameters with
no standard values using the DAO 2016-08. However, COD determine the amount of organic
pollutants found in surface water (e.g. lakes and rivers). A lower COD level is desired before any
surface water can be utilized for its best use. Advanced countries use a maximum oxygen demand
between 200 and 1000mg/L must be reached before waste water or industrial water can be
returned to the environment. Therefore, COD level in the two SW sampling station is acceptable
for domestic use. The COD levels of the sampling sites are shown in Figure 2-77.

QUARRY VENTURES PHILIPPINES, INC. Environmental Impact Assessment
February 2019 2-201
Figure 2-77: Surface Water Chemical Oxygen Demand Levels
In terms of the DO level of the SW water sampling station, the level of DO in comparison to the
DAO 2016-08 standard is higher with 4.85 and 5.68mg/L, respectively. The levels indicate that
fish and other aquatic animals can thrive in this waters. The amount of dissolved oxygen in
streams is dependent on the water temperature, the quantity of sediment in the stream, the
amount of oxygen taken out of the system by respiring and decaying organisms, and the amount
of oxygen put back into the system by photosynthesizing plants, stream flow, and aeration. Figure
2-78 shows the DO levels from the sampling sites, compared to DAO 2016-08 standard.

QUARRY VENTURES PHILIPPINES, INC. Environmental Impact Assessment
February 2019 2-202
Figure 2-78: Surface Water Dissolved Oxygen Levels
Biochemical oxygen demand (BOD) is a measure of the amount of oxygen that bacteria will
consume while decomposing organic matter under aerobic conditions. BOD is determined by
incubating a sealed sample of water for five days and measuring the loss of oxygen from the
beginning to the end of the test. When compared to the DAO 2016 -08 standard for BOD, the
SW2 (upstream) have 17mg/L, which exceeded the standard BOD levels of 7mg/L. In contrast,
the W1 (downstream) is below the Dao 2016-08 standard with only 4 mg/L (Figure 2-79).
This result indicated that surface water flowing and coming from the upstream portion of the
water body sampled (i.e. Udlom Creek) with high BOD, it will accelerate bacterial growth in the
river and consume the oxygen levels in the river. The oxygen may diminish to levels that are lethal
for most fish and many aquatic insects. It is therefore desirable to have a low BOD values in
surface waters specially the effluent water or runoff. Organic matter discharges from the nearby
community and agricultural industries contirbute to raising the BOD levels over the prescribed
limit.

QUARRY VENTURES PHILIPPINES, INC. Environmental Impact Assessment
February 2019 2-203
Figure 2-79: Surface Water Biological Oxygen Demand Levels
Inorganic Chemical Constituent of the Project site
In terms of metals and the wet chemistry tests conducted, all of the stream water sampling
stations passed the DAO 2016 - 08 fresh water guidelines for Class C waters (Figure 2-80 and
Figure 2-83). This indicate that, the natural bodies of water around the QVPI MPSA does not
contain elevated levels of heavy metals.
Figure 2-80: Surface Water Lead Content
QUARRY VENTURES PHILIPPINES, INC. Environmental Impact Assessment
February 2019 2-204
Figure 2-81: Surface Water Mercury Content
Figure 2-82: Surface Water Cadmium Content

QUARRY VENTURES PHILIPPINES, INC. Environmental Impact Assessment
February 2019 2-205
Figure 2-83: Surface Water Chromium Content

QUARRY VENTURES PHILIPPINES, INC. Environmental Impact Assessment
February 2019 2-206
A summary of the results is given in Table 2-36.
Table 2-36: Summary of Laboratory Results
Parameters SW1 SW2 GW1 GW2 GW3 GW4 GW5 Standards
pH 7.55 7.83 6.89 6.74 6.78 6.99 7.43 6.5 – 8.5 (PNSDW) 6.5 – 9.0 (DAO2016-8)
TDS (mg/l) 477.7 701.3 631.1 584.8 506.1 593.8 509.1 500 (PNSDW)
DO (mg/l) 4.85 5.68 6.74 4.01 4.02 6.95 8.61 5.0 (DAO2016-8)
Conductivity (µS/cm) 507.7 746.5 672.0 622.2 537.4 632.4 542.2 1,000 (BSWM)
Total Coliform (MPN/100ml) 1,700 7,000 13,000 7,000 11,000 2,700 14,000 <1.1 (PNSDW & DAO2016-8)
Fecal Coliform (MPN/100ml) 680 1,700 1,700 2,200 1,700 1,700 3,900 <1.1 (PNSDW & DAO2016-8)
BOD (mg/L) 4 16 2 1 2 2 9 7 (DAO2016-8)
COD (mg/L) 42 52 74 43 23 34 31 100 (DAO2016-8)
O&G (mg/L) <1.94 <1.94 <1.94 <1.94 <1.94 <1.94 <1.94 2.0 (DAO2016-8)
TSS (mg/L) 57 44 5 1 1 1 1 80 (DAO2016-8)
Hg (mg/L) <0.001 <0.001 <0.001 <0.001 <0.001 <0.001 <0.001 0.001 (PNSDW) 0.002 (DAO2016-8)
Pb (mg/L) <0.01 <0.01 <0.01 <0.01 <0.01 <0.01 <0.01 0.01 (PNSDW) 0.05 (DAO2016-8)
Cd (mg/L) <0.002 <0.002 <0.002 <0.002 <0.002 <0.002 <0.002 0.003 (PNSDW) 0.005 (DAO2016-8)
As (mg/L) <0.01 <0.01 0.02 <0.01 <0.01 <0.01 <0.01 0.05 (PNSDW) 0.02 (DAO2016-8)
Cr+6 (mg/L) <0.005 <0.005 <0.005 <0.005 <0.005 <0.005 <0.005 0.05 (Total Cr, PNSDW) 0.01 (DAO2016-8)

QUARRY VENTURES PHILIPPINES, INC. Environmental Impact Assessment
February 2019 2-207
2.2.4 Water Quality Monitoring of Parcel 1
The water quality monitoring stations for Parcel 1 are presented below:
Figure 2-84: Parcel 1 Water Monitoring Stations

QUARRY VENTURES PHILIPPINES, INC. Environmental Impact Assessment
February 2019 2-208
Dissolved Oxygen
Water quality monitoring for all stations covering February 2017 to Octoober 2018 (except April
to Oct station 2, and Jun, Sept and Oct Station 3) recorded high results for dissolve oxygen. The
high concentration of DO indicates that fish and other aquatic animals can thrive in this water, or
high activity on the water body.
Figure 2-85: DO Levels from Parcel 1 Monitoring Stations
Biological Oxygen Demand
BOD levels in July 2017, August 2017, March to July 2018, and September to October 2018
exceeded the standard set by DENR. Excessive BOD concentration will accelerate the bacterial
growth and consume the oxygen levels in the river that may affect the aquatic resources in the
river.
A spike on the BOD level was observed during the sampling conducted in May and July 2018. The
sampling coincided with the discharge of the nearby poultry farm into the Udlom Creek, and being
summer, the water level was not enough to dilute the discharge.

QUARRY VENTURES PHILIPPINES, INC. Environmental Impact Assessment
February 2019 2-209
Figure 2-86: BOD Levels from Parcel 1 Monitoring Stations
pH
Almost all of the sampling stations recorded pH levels within the DENR Standards. The limestone
deposits present in the area helps in neutralizing water pollutants that might lower the creek’s
pH.

QUARRY VENTURES PHILIPPINES, INC. Environmental Impact Assessment
February 2019 2-210
Figure 2-87: pH Levels from Parcel 1 Monitoring Stations
Total Suspended Solids
Majority of the TSS monitoring results are within the DENR standard, only Station 2 Sept 2017,
Station 1 March 2018 and July 2018 exceeded the DAO 2016-08 DENR standard.
Figure 2-88: TSS Levels from Parcel 1 Monitoring Stations
Assessment of Impacts and Mitigating Measures
Quarrying activities will entail removal of vegetation and stripping of topsoil to be able to expose
and extract the materials. These activities may result to accelerated erosion in which, silt
materials that are carried by surface runoff may potentially reach the rivers draining the area. If
not mitigated, eroded materials reaching the waterways may cause siltation of rivers and increase
their total suspended solids and turbidity.
Series of siltation ponds will be constructed within the project area. These ponds shall be
appropriately designed to effectively arrest the silt coming from the quarry area to meet the
required water quality of the recycled water and DAO 35 effluent standards in case of water
discharge. Sediments shall be impounded from the first to the third pond in succession. While the
second pond is utilized, the first pond shall be drained and allowed to dry and desilted. Recovered

QUARRY VENTURES PHILIPPINES, INC. Environmental Impact Assessment
February 2019 2-211
silt materials will be used to backfill mined out areas. The third pond shall act as a buffer for the
first two ponds and shall be the source of recycled water for road sprinkling.
An overall pit drainage management will be implemented in such a way that pit drainage will be
directed towards the toe of the benches. From the benches, the drainage will be directed to silt
traps. All drainage coming from the active areas will eventually pass thru a siltation pond.
The current operation (14 hectares quarry) has an existing siltation ponds and pit drainage to
mitigate possible water contamination. Also, monthly water quality sampling is done for
monitoring purposes.
As for domestic water use, septic tanks will be constructed on the project site for the employee’s
use. This would mitigate the rise of BOD levels due to the discharge of wastewater directly into
the water bodies.
2.2.5 Freshwater Ecology
This section deals with the effects of the project on the organisms that thrive within the only
nearby body of water, Udlom Creek. Udlom Creek is the closest natural body of water to the
project site, located on the northeastern part of Parcel 1, and traversing from west to east, where
it flows to the communities.
Threat to Existence and/or Loss of Important Local Species and Habitat
The Udlom Creek is bounded on both sides by drainages coming from agricultural areas, and a
chicken farm. Nearby communities also direct their drainage towards the creek. However, the
creek remains seasonal. It does not have water present during the summer months, but has
flowing water during the monsoon season. During dry seasons, large organisms like catfish and
frogs tend to hide in areas where there is constant water, or move to a different water source.
On the other hand, small organisms, like benthos, algae, and planktons dies off once the creek
dries up.
The common of the phytoplankton in the area belong to the Cyanobacteria phylum, or blue-green
algae, which is common in freshwater sources globally. Under right conditions, cyanobacteria is
known to reproduce at a high rate, causing algal blooms, which is dangerous to the environment

QUARRY VENTURES PHILIPPINES, INC. Environmental Impact Assessment
February 2019 2-212
since they release cyanotoxins. In this case, however, there are no algal blooms observed since
the water near the project site have just come in during the time of sampling.
Comparison photos of the site during dry and wet seasons are given in Figure 2-89 and Figure
2-90.

QUARRY VENTURES PHILIPPINES, INC. Environmental Impact Assessment
February 2019 2-213
Figure 2-89: The Udlom Creek during Dry Season

QUARRY VENTURES PHILIPPINES, INC. Environmental Impact Assessment
February 2019 2-214
Figure 2-90: The Udlom Creek during Wet Season

QUARRY VENTURES PHILIPPINES, INC. Environmental Impact Assessment
February 2019 2-215
Assessment on Impacts and Mitigating Measures
The project activities would generate sedimentations to the Udlom Creek during rains, or the
settling of airborne dust particles on the water’s surface. This would cause interference on the
photosynthetic process of phytoplanktons, and gas exchange with aquatic organisms. During dry
seasons, when the creek is dried up, sediment depositions could raise the level of the creek, and
make shallower during the wet season. As a mtigating measure, the proponent would sprinkle
water over dry open roads. The buffer zone around the mine area will also be maintained to avoid
the dust from reaching the nearby community, and minimize the sediments going towatds the
creek during wet season.
2.2.6 Marine Ecology
The project site is located approximately 8km from the northern and southern shores of the Cebu
Island. There would be no port facility to be constructed for this project, so the study in marine
ecology was not included in this report.
2.3 Air
2.3.1 Meteorology/Climatology
Change in the local micro-climate
The climate of Cebu belongs to Type 3 of the Modified Coronas Classification having indistinct wet
and dry seasons. This type of climate is relatively dry from November to April and wet the rest of
the year (Figure 2-91).

QUARRY VENTURES PHILIPPINES, INC. Environmental Impact Assessment
February 2019 2-216
Figure 2-91: Climate Map of the Philippines

QUARRY VENTURES PHILIPPINES, INC. Environmental Impact Assessment
February 2019 2-217
Data on climatological normals and projections on temperature and rainfall data, were obtained
from the Philippine Atmospheric Geophysical and Astronomical Services Administration
(PAGASA). Climatological data used for Region 7 were from the nearest PAGASA synoptic station
located Mactan International Airport, Cebu. The observed ranges, and estimated projections by
2020 and 2050 are presented in Figure 2-92.
Figure 2-92: PAGASA Observed Climatological Ranges, and 2020 & 2050 Projections
Rainfall
Rainfall normal values recorded in Mactan Synoptic Station reflect the characteristics of a Type 3
climate having relatively indistinct seasons. Relatively low amounts of rainfall were recorded
during the months of November to April ranging from 324mm to 228.3mm. The months of June
to October experience high amounts of rainfall ranging from 595.1mm to 607.4mm. Lowest
monthly rainfall is typically experienced March to May. On the other hand, highest monthly
rainfall usually occurs between September to November. The average annual rainfall is estimated
to rise by 8.48% in 2020, and 14.20% by 2050 according to PAGASA’s projections.
Temperature

QUARRY VENTURES PHILIPPINES, INC. Environmental Impact Assessment
February 2019 2-218
Average temperatures recorded in the area typically vary between 26.8°C and 28.4°C with an
annual average equal to 27.8°C. This is projected to rise by an average of 1.05°C by 2020, and
2.08°C by 2050.
Tropical Cyclones/Typhoons
Between 1971-2000, there were a total of 25 extreme climatological events observed in Cebu.
This includes extreme temperature changes, dry days, and extreme rainfall. Occurrence of such
events is expected to rise to 1488 by 2020, and 2463 by 2050.
Wind Speed and Direction
The prevailing wind direction for most of the year is north-easterly from March to December.
Wind speed, on the other hand, is strong during December to April, and relatively calm from June
to October. Movements of air streams in the area are generally influenced by Southwest
Monsoon (Habagat) which affects the country from May to September. Rainfall during the wet
months is usually brought by this phenomenon.
Figure 2-93 presents the wind rose diagram and frequency table of wind speed and direction for
Cebu, while Figure 2-94 presents the average wind speeds per month.

QUARRY VENTURES PHILIPPINES, INC. Environmental Impact Assessment
February 2019 2-219
Source: https://www.meteoblue.com/en/weather/forecast/modelclimate/cebu-
city_philippines_1717512
Figure 2-93: Wind Rose Diagram for Cebu

QUARRY VENTURES PHILIPPINES, INC. Environmental Impact Assessment
February 2019 2-220
Source: https://www.meteoblue.com/en/weather/forecast/modelclimate/cebu-city_philippines_1717512
Figure 2-94: Annual Average Wind Speeds
Contribution in terms of greenhouse gas emission
The contribution of the project to global climate change was assessed by identifying possible
sources and sinks of greenhouse gases (GHGs). Greenhouse gas emissions of the project are
limited to carbon dioxide (CO2), nitrous oxide (N2O), and methane (CH4).
Carbon dioxide enters the atmosphere through the burning of fossil fuels, solid waste, trees and
wood products, and also as a result of other chemical reaction. It is also removed from the
atmosphere (or “sequestered”) when it is absorbed by plants as part of the biological carbon
cycle. Nitrous oxide is emitted during agricultural and industrial activities, as well as during
combustion of fossil fuels and solid waste. Methane is emitted during the production and
transport of coal, natural gas, and oil. Methane emissions also result from livestock and other
agricultural practices and by the decay of organic waste in municipal solid waste landfills. (US EPA)
GHG emissions of the project would mainly come from land clearing/land use conversion, burning
of fossil fuels. The amount of GHG emissions will depend on the vegetation’s biomass and actual
fuel consumption. The Intergovernmental Panel on Climate Change (IPCC) has set guidelines for
national GHG inventories. However, it was pointed out by IPCC that for land-use change and

QUARRY VENTURES PHILIPPINES, INC. Environmental Impact Assessment
February 2019 2-221
forestry, calculations of emissions have inherently large uncertainties and errors. Removal of
vegetation cover leads to CO2 emissions because the carbon sequestered in the plants is emitted
to the atmosphere if not counter-balanced by revegetation. With this, GHG contribution as a
result of land clearing can be considered relatively small. Progressive rehabilitation of mined-out
and degraded areas will be implemented to offset the GHG emissions of the project due to land
clearing (removal of carbon sink). On the other hand, GHG emissions contributed by burning of
fuel would mainly come from the use of equipment for mining, transport of ores and other
activities that use energy from burning fossil fuels. When fossil fuels are burned to produce
energy, the carbon stored in them is emitted almost entirely as CO2. Emissions of fossil fuel GHGs
shall be mitigated through regular vehicle/equipment maintenance to maximize fuel efficiency.
2.3.2 Air Quality
Degradation of air quality (remove inappropriate heading)
Axceltechs, Inc. hired the services of CRL Calabarquez Corporation to conduct ambient air
sampling test within the location defined on Table 2-37. The project includes ambient air and
noise monitoring for 24 hours in terms of parameters specified in Table 2-38. The sites were
chosen to cover the span of the MPSA area and community. Although the windrose indicate that
the primary wind direction blow towards NNE, these sites are closest to the primary receptors in
the community. These communities would, however, not be directly affected by the quarry, even
if some are within MPSA boundaries, since the quarry activities would be limited to the quarry
area, as specified in the mine plans from Figure 1-22 to . The sampling was conducted on January
17-22, 2017.
Table 2-37: Sampling Location and Coordinates
Station Name Coordinates
Station A1: Parcel 1 Tagjagumit Elementary School N 10°15’52.60” E 123°40’45.51”
Station A2: Parcel 2 Near Community Deep Well N 10°16’47.85” E 123°40’9.89”
Station A3: Parcel 3 Near Chapel N 10°18’18.97” E 123°39’22.56”
Station A4: Parcel 5 Near Cogon Chapel N 10°17’11.19” E 123°44’18.22”
Table 2-38: Air Quality Compounds and Parameters Tested
Sampling Station Name/Description Parameters Tested*
Ambient Noise
Station A1: Parcel 1 Tagjagumit Elementary School TSP, PM10, NO2, SO2 Yes
Station A2: Parcel 2 Near Community Deep Well TSP, PM10, NO2, SO2 Yes
Station A3: Parcel 3 Near Chapel TSP, PM10, NO2, SO2 Yes
Station A4: Parcel 5 Near Cogon Chapel TSP, PM10, NO2, SO2 Yes *TSP = Total Suspended Particles; PM10 = Particulate Matter at 10µ; As = Arsenic; Cd = Cadmium; Cr = Chromium; Pb = Lead;
Hg = Mercury; NO2 = Nitrogen Dioxide; SO2 = Sulfur Dioxide

QUARRY VENTURES PHILIPPINES, INC. Environmental Impact Assessment
February 2019 2-222
This section of the report will be used to evaluate actual concentration of air pollutants as baseline
data at the project site. The will also serve as a pertinent document for the firm’s compliance with
the Department of Environment and Natural Resources (DENR). The results are then compared
with the DENR Standards under National Ambient Air Quality Standards (NAAQS) and National
Ambient Air Quality Guideline Values (NAAQGV) of Republic Act 8749 or known as the Philippine
Clean Air Act of 1999 and with standards under National Institute for Occupational Safety and
Health (NIOSH).
The Air Sampling Map is shown in Figure 2-95.

QUARRY VENTURES PHILIPPINES, INC. Environmental Impact Assessment
February 2019 2-223
Figure 2-95: Air Sampling Map

QUARRY VENTURES PHILIPPINES, INC. Environmental Impact Assessment
February 2019 2-224
Figure 2-96: Air Sampling Stations in Parcels 1 and 2

QUARRY VENTURES PHILIPPINES, INC. Environmental Impact Assessment
February 2019 2-225
Figure 2-97: Air Sampling Station in Parcel 3

QUARRY VENTURES PHILIPPINES, INC. Environmental Impact Assessment
February 2019 2-226
Figure 2-98: Air Sampling Station in Parcel 5

QUARRY VENTURES PHILIPPINES, INC. Environmental Impact Assessment
February 2019 2-227
Sampling Equipment
There were three (3) types of ambient air sampler used (see Table 2-39).
Table 2-39: Ambient Air Monitoring Equipment Specifications
Equipment Name/Description Brand/Model Testing Capabilites
High Volume Sampler Tisch Environmental/5005 TSP
Dual Channel Dust Sampler Instrumex PM10
Personal Sampler SKC NO2, SO2
Anemometer Lutron Wind Speed *TSP = Total Suspended Particles; PM10 = Particulate Matter at 10µ; As = Arsenic; Cd = Cadmium; Cr = Chromium; Pb = Lead; Hg = Mercury; NO2 = Nitrogen Dioxide; SO2 = Sulfur Dioxide
The high volume sampler is equipped with all-weather shelter timer and flowchart meter and is
powered by electricity through external power sources. The personal sampler is equipped with
flow meter powered by external/internal power sources and a low flow controller. It is attached
to parallel tubing with two (2) pieces of midget impingers. For SO2, the bubbler has a straight
orifice nozzle while for NO2 the bubbler has a fritted nozzle. While for the anemometer, it has a
range of 0.4 m/s - 30.0 m/s and is calibrated against standards that are traceable to National
Institute of Standards and Technology (NIST).
Sampling Methods
The ambient air quality monitoring conducted by CRL Calabarquez Corporation was performed at
an elevation of at least two (2) meters above the ground level and sampling was strategically
stationed within the vicinity and immediate community of the project site. After sampling was
conducted for each station, the gas samples were carefully recovered in the sampling bottles and
preserved at low temperature and were immediately submitted to the laboratory for analysis.
Filtration Method by High Volume Sampler (for TSP Sampling)
Principle of Sampling - Ambient air was drawn through a glass fiber filter over a period of time.
Particles having a diameter of 20-50 µm were collected ordinarily. The filter paper containing the
sample was weighed hence the final weight of the sample over that of the standard volume of air
sampled gave the concentration of TSP.
Reference Method (EPA, Appendix J to Part 50) (for PM10 Sampling)
Principle of Sampling - Ambient air was drawn at a constant flow rate into a specially shaped inlet
where the suspended particulate matter is inertially separated into one or more size fractions
within PM10 size range. The particles were collected in a glass fiber filter over the specified
sampling period and determined by measuring gravimetrically. The filter paper containing the

QUARRY VENTURES PHILIPPINES, INC. Environmental Impact Assessment
February 2019 2-228
sample was weighed hence the final weight of the sample over that of the standard volume of air
sampled gave the concentration of PM10.
Absorption in Liquids for Gaseous Pollutants (for NO2, SO2 SAMPLING)
Principle of Sampling - A known volume of air (0.4L/min for NO2, 0.5L/min for SO2) was sampled
with a wet-chemical system where a constant volume of air sample passes through a suitable
reagent (absorbing reagent) that was reactive to the specific pollutant desired. As the air sample
passes through the bubbler rack, the air diffuses forming air bubbles and slowly reacts to the
chemical reagent forming a complex ion. The SKC personal sampler was calibrated with NIST
traceable digital calibrator to assure its accuracy. The samples were then analyzed using
prescribed and approved methods.
Results
The results of the air sampling is given below:
Table 2-40: Observed 24-hours Ambient Air Concentrations
Station No. Location Date and Time
of Sampling TSP PM10 NO2 SO2
A1 Parcel 1 Tagjagumit Elementary School Jan. 17-18, 2017
23.6 15.4 2.7 ND 1125H - 1125H
A2 Station A2: Parcel 2 Near Community
Deep Well Jan. 17-18, 2017
8.9 3.0 1.9 ND 1415H - 1415H
A3 Station A3: Parcel 3 Near Chapel Jan. 17-18, 2017
23.2 2.5 1.8 3.7 1629H - 1629H
A4 Station A4: Parcel 5 Near Cogon Chapel Jan. 17-18, 2017
19.7 1.7 1.6 3.2 1415H - 1415H
DENR Standard (NAAQGV)
24-hr Sampling 24-hr Sampling 230 150 150 180
ND = Not Detected or Below the Method Detection Limit for SO2 = 0.60µg
N/A = No Applicable DENR Standard
It could be observed that all parameters are below the threshold levels specified in DENR
Standards, over a 24-hours observation period. This could be attributed to the remoteness of the
project site and community. There are several other mining companies that could be found in
the vicinity of the MPSA area, however due to a moratorium from DENR, all mining companies in
Cebu have paused their operations.

QUARRY VENTURES PHILIPPINES, INC. Environmental Impact Assessment
February 2019 2-229
Increase in the ambient noise level
Sampling Equipment
A digital sound level meter (precision type) was used in the noise monitoring activity conducted
by CRL Calabarquez Corporation. The sound level meter used was Lutron that meets the ANSI-SI.4
1983 standard. The equipment has a range of 30 dB and maximum of 130 dB and resolution of
0.1 dB. This noise meter has internal oscillation system with 1Khzsquare wave generator for
calibration.
Sampling Methodology
The noise measurement was conducted within the three (3) stations. The lowest and highest noise
levels monitored were manually recorded. The multiple sounds reading each station was recorded
and summarized by getting its logarithmic average. The result of this gave the equivalent noise
level (Leq).
Results
The results of the noise levels reading during the 24-hour observation periods are given in Table
2-41 to Table 2-43.
Table 2-41: Observed 24-hour Noise Level Propagation in Decibels dB(A) at Station A1
Sampling Time Average dB(A) DENR Standard Maximum Allowable
NoiseLevel, dB(A)*** Remarks
January 17-18, 2017, 1020H - 1220H
52.4 50 Exceeded
1220H - 1420H 53.8 50 Exceeded
1420H - 1620H 48.5 50 Within
1620H - 1820H 50.5 50 Exceeded
1820H - 2020H 47.0 45 Exceeded
2020H - 2220H 45.5 45 Exceeded
2220H - 0020H 45.0 40 Exceeded
0020H - 0220H 44.0 40 Exceeded
0220H - 0420H 43.4 40 Exceeded
0420H - 0620H 43.5 40 Exceeded
0620H - 0820H 52.0 45 Exceeded *AveLeq = 10*Log{[(10(Min/10)+10(Max/10))/2]} ***Category "D" A section primarily as a heavy industrial area 0900 H – 1800 H – 75 dB (Daytime) [Maximum allowable limit based on division of 24-hour sampling] 1800 H – 2200 H – 70 dB (Evening) [Maximum allowable limit based on division of 24-hour sampling] 2200 H – 0500 H – 65 dB (Nighttime) [Maximum allowable limit based on division of 24-hour sampling] 0500 H – 0900 H – 70 dB (Morning) [Maximum allowable limit based on division of 24-hour sampling] Note: Monitoring was conducted on a 2-hour interval. In practice, the start of sampling time is used as the basis for noise divisions.
Table 2-42: Observed 24-hour Noise Level Propagation in Decibels dB(A) at Station A2

QUARRY VENTURES PHILIPPINES, INC. Environmental Impact Assessment
February 2019 2-230
Sampling Time Average dB(A) DENR Standard Maximum Allowable Noise
Level, dB(A)*** Remarks
January 18-19, 2017, 1349H - 1549H
45.5 50 Within
1549H - 1749H 44.9 50 Within
1749H - 1949H 45.3 50 Within
1949H - 2149H 45.2 45 Exceeded
2149H - 2349H 43.9 45 Within
2349H - 0149H 42.7 40 Exceeded
0149H - 0349H 41.4 40 Exceeded
0349H - 0549H 41.2 40 Exceeded
0549H - 0749H 45.3 45 Exceeded
0749H - 0949H 47.5 45 Exceeded
0949H - 1149H 47.4 50 Within
1149H - 1349H 49.5 50 Within *AveLeq = 10*Log{[(10(Min/10)+10(Max/10))/2]} ***Category "D" A section primarily as a heavy industrial area 0900 H – 1800 H – 75 dB (Daytime) [Maximum allowable limit based on division of 24-hour sampling] 1800 H – 2200 H – 70 dB (Evening) [Maximum allowable limit based on division of 24-hour sampling] 2200 H – 0500 H – 65 dB (Nighttime) [Maximum allowable limit based on division of 24-hour sampling] 0500 H – 0900 H – 70 dB (Morning) [Maximum allowable limit based on division of 24-hour sampling] Note: Monitoring was conducted on a 2-hour interval. In practice, the start of sampling time is used as the basis for noise divisions.
Table 2-43: Observed 24-hour Noise Level Propagation in Decibels dB(A) at Station A3
Sampling Time Average dB(A) DENR Standard Maximum Allowable Noise
Level, dB(A)*** Remarks
January 18-19, 2017, 1518H - 1718H
45.6 50 Within
1718H - 1918H 45.1 50 Within
1918H - 2118H 44.1 45 Within
2118H - 2318H 44.2 45 Within
2318H - 0118H 42.3 40 Exceeded
0118H - 0318H 41.2 40 Exceeded
0318H - 0518H 40.3 40 Exceeded
0518H - 0718H 41.0 45 Within
0718H - 0918H 43.7 45 Within
0918H - 1118H 40.9 50 Within
1118H - 1318H 42.9 50 Within
1318H - 1518H 47.3 50 Within *AveLeq = 10*Log{[(10(Min/10)+10(Max/10))/2]} ***Category "A" A section primarily as a residential area 0900 H – 1800 H – 75 dB (Daytime) [Maximum allowable limit based on division of 24-hour sampling] 1800 H – 2200 H – 70 dB (Evening) [Maximum allowable limit based on division of 24-hour sampling] 2200 H – 0500 H – 65 dB (Nighttime) [Maximum allowable limit based on division of 24-hour sampling] 0500 H – 0900 H – 70 dB (Morning) [Maximum allowable limit based on division of 24-hour sampling] Note: Monitoring was conducted on a 2-hour interval. In practice, the start of sampling time is used as the basis for noise divisions.
Table 2-44: Observed 24-hour Noise Level Propagation in Decibels dB(A) at Station A4
Sampling Time Average dB(A) DENR Standard Maximum Allowable Noise
Level, dB(A)*** Remarks
January 21-22, 2017, 1042H - 1242H
52.4 50 Exceeded
1242H - 1442H 50.2 50 Exceeded
1442H - 1642H 61.0 50 Exceeded
1642H - 1842H 65.3 50 Exceeded
1842H - 2042H 56.9 45 Exceeded
2042H - 2242H 49.3 45 Exceeded

QUARRY VENTURES PHILIPPINES, INC. Environmental Impact Assessment
February 2019 2-231
Sampling Time Average dB(A) DENR Standard Maximum Allowable Noise
Level, dB(A)*** Remarks
2242H - 0042H 52.9 40 Exceeded
0042H - 0242H 46.2 40 Exceeded
0242H - 0442H 46.0 40 Exceeded
0442H - 0642H 48.3 40 Exceeded
0642H - 0842H 54.8 45 Exceeded
0842H - 1042H 69.0 45 Exceeded *AveLeq = 10*Log{[(10(Min/10)+10(Max/10))/2]} ***Category "A" A section primarily as a residential area 0900 H – 1800 H – 75 dB (Daytime) [Maximum allowable limit based on division of 24-hour sampling] 1800 H – 2200 H – 70 dB (Evening) [Maximum allowable limit based on division of 24-hour sampling] 2200 H – 0500 H – 65 dB (Nighttime) [Maximum allowable limit based on division of 24-hour sampling] 0500 H – 0900 H – 70 dB (Morning) [Maximum allowable limit based on division of 24-hour sampling] Note: Monitoring was conducted on a 2-hour interval. In practice, the start of sampling time is used as the basis for noise divisions.
Noise measurement was conducted 4 times every 2 hours interval so that a representative
reading of noise level propagation will be monitored with respect to the time increment based on
a 24-hour monitoring test. Monitoring was conducted on a sunny, cloudy and rainy weather
associated with light to moderate winds. The prevailing winds at the time of sampling came from
various directions. Measured noise level at all stations which exceeded the DENR Standard for
noise mostly came from occasional passing vehicles, dogs, roosters, insects, birds, residential
area, school activities, and from airplane/helicopter.
Assessment of Impacts and Mitigating Measures
The project’s primary impact on ambient air quality is the generation of TSP and PM10, from the
crushers and the transport of minerals over dry open roads. NOx and SOx is also generated by the
operation of heavy machineries and generator sets during the mineral extraction.
In order to mitigate the dispersion of the pollutants into the community, the proponent shall
maintain the buffer zone between the project site and the nearby community. Particularly if the
nearby community is located on the north-eastern boundary of the mine area, where there are
strong prevailing winds during March to December as indicated in the wind rose for Cebu. The
crushers would also have to be properly maintained to minimize the emmision of particulates into
the air. Heavy machineries and vehicles must have their engines regularly checked to minimize
generation of NOx and SOx.
Parcel 1 and 2
The nearest communities to these parcels are situated between the 2, and east of Parcel 1.
Considering the wind rose of Cebu, the community that would be greatly affected by the project
would be the one on the east of Parcel 1. Station A1 of the Air Quality Sampling is situated within

QUARRY VENTURES PHILIPPINES, INC. Environmental Impact Assessment
February 2019 2-232
the community, and did not register any exceedances on the air quality standards, nor did Station
A2, within Parcel 2. The noise level readings however showed exceedances at several periods
within a day, in both stations. This was due to the sampling stations being situated within the
communities. Noise came from passing vehicles, anthropological activities, and animal noises.
Parcel 3
The main community near Parcel 3 lie along the national road that goes through the western and
northern portion of the site. Being near the national road, Station A3 registered noise levels
exceeding the prescribed standard during night time. This was attributed to the noise coming
from passing vehicles, and noisy celebrations by the community. Air quality from this station did
not show any exceedances.
Parcel 5
The community is within the boundaries of Parcel 5, but the mine area will be placed south of the
community. Other quarry areas could also be found northeast and southwest of the MPSA
boundary. Due to the proximity, the buffer between the mine area and the community would be
properly observed and monitored to minimize the effects of the project. Air quality sampling did
not find any exceedances in the area. However, the noise levels show exceedances due to the
noise coming from the community and the school nearby.
According to the PAGASA climatological projections, Cebu would experience increase in rainfall
and and temperatues. The open roads within the project site would have to be sprinkled with
water during the dry season to avoid the suspension of particles into the air during transport of
materials.
The noise generated by the project activities could also impact the nearby communities. Blasting
and crushing activities generates high noise levels that could be harmful during long exposure
times. Proper PPEs will be provided by the proponent for employees working near the crusher,
and during blasting schedules. Buffer zones around crushers will also be extablished to minimize
the noise reaching the nearby communities. Blasting schedules will be properly displayed within
the communities, and warning signals will used before the actual blasting.
2.4 People

QUARRY VENTURES PHILIPPINES, INC. Environmental Impact Assessment
February 2019 2-233
The focus of the study is the six (6) barangays within two (2) cities and one (1) municipality of the
Province of Cebu. The barangays include Cogon, and Tagjaguimit in the City of Naga; Lamac in
the Municipality of Pinamungahan; and Bulongan, Media Once, and Poog in Toledo City.
The barangays are within the Mineral Production Sharing Agreement area of Quarry Ventures
Philippines, Inc. denominated as MPSA No. III-98-VII which was divided into four (4) parcels. The
six (6) barangays are identified as the direct impact areas and the remaining barangays within the
City of Naga, Municipality of Pinamungahan, and Toledo City are considered as the indirect impact
areas.
Table 2-45: Direct Impact Barangays by MPSA Parcel
Parcel City/ Municipality Barangay
1 City of Naga Tagjaguimit
Pinamungahan Lamac
2 City of Naga Tagjaguimit
3 City of Toledo
Bulongan
Media Once
Poog
5 City of Naga Cogon
Methodology
Various methods were employed in gathering information on the socio-economic conditions of
the impact barangays. These methods include the review of secondary data, the conduct of
perception survey, focus group discussions, and information, education, and communication.
The preparer looked-into the available secondary data from concerned local government units
and other relevant agencies to establish the socio-economic condition of the impact communities.
These include the following:
Barangay Profile;
City/Municipal Comprehensive Land Use Plan (CLUP);
2010 Census of Population and Household, Philippine Statistics Authority;
2015 Census of Population and Household, Philippine Statistics Authority.
It is of note that during the data gathering for this report on site, it was found out that the data
from the municipality, cities, and barangays are severly lacking, with the latest CLUPs available
being from 1995 (Municipality of Pinamungahan), 1996 (Naga City), and 2006 (Toledo City). The
barangays also doesn’t have any update profile available, nor were they covered by the
Community-Based Monitoring System (CBMS) Program. For this report, the affected barangays
were asked by the Preparers to manually fill up a CBMS Barangay Profile form to the best of their

QUARRY VENTURES PHILIPPINES, INC. Environmental Impact Assessment
February 2019 2-234
capacity. The latest data is used in this report when available and applicable. A certification from
the covered cities and municipality is attached as Annex 13, stating that the latest version of the
CLUP is still being processed.
Demographic Baseline Information of Impact Areas
Population Size and Growth Rate
The project area encompasses two (2) cities and one (1) municipality within Cebu Province: the
City of Naga, Municipality of Pinamungahan, and Toledo City. Based on the population data of the
Philippine Statistics Authority (PSA), the population of City of Naga and Municipality of
Pinamungahan grew a little faster than Cebu Province, while Toledo City has the slowest
population growth rate from 2010 to 2015 (Table 2-46).
The City of Naga is a component city covering twenty-nine (29) barangays. Its population grew by
2.6% which accounts for 14,292 persons within five (5) years. It has a total land area of 10,197
hectares.
The Municipality if Pinamungahan is classified as 2nd Income class municipality with Php45 million
or more but less than Php55 million average annual income. Pinamungahan has a total land area
of 10,916, encompassing twenty-six (26) barangays. Its population growth rate from 2010 to 2015
was 2.6% or 7,977 persons.
Toledo City is a 3rd Income Class Component City. It has an average annual income of Php35 million
or more but less than Php45 million. With a population growth rate of 1.7%, its population grew
by 13,610 persons from 2010 to 2015. It has a total land area of 21,628 hectares covering thirty-
nine (39) barangays.
Table 2-46: Population and Growth Rate of Impact Cities and Municipality, 2010 and 2015
Area 2010 Population 2015 Population Population Growth Rate
(%)
Cebu Province (excluding Cebu, Mandaue, and Lapu-Lapu Cities)
2,613,842 2,938,982 2.3
City of Naga 101,458 115,750 2.6
Pinamungahan Municipality 57,978 65,955 2.6
Toledo City 156,725 170,335 1.7 Sources: 2010 Census of Population and Housing (Philippine Statistics Authority, 2011)
2015 Census of Population (Philippine Statistics Authority, 2016)

QUARRY VENTURES PHILIPPINES, INC. Environmental Impact Assessment
February 2019 2-235
Population information within the impact barangays is presented in Table 2-47. Among the impact
barangays, Lamac in Pinamungahan has the highest population growth rate of 5.7% (1,486
persons) while Tagjaguimit in the City of Naga has the lowest with 0.13% (15 persons) within five
(5) years covering 2010 to 2015.
Table 2-47: Population and Growth Rate of Impact Cities and Municipality, 2010 and 2015
City/Municipality Barangay 2010 Population 2015 Population Population Growth Rate (%)
City of Naga Cogon 3,583 4,267 3.5
Tagjaguimit 2,302 2,317 0.13
Pinamungahan Muncipality
Lamac 4,467 5,953 5.7
Toledo City
Bulongan 2,359 2,647 2.3
Media Once 6,477 7,128 1.9
Poog 5,662 5,989 1.1 Sources: 2010 Census of Population and Housing (Philippine Statistics Authority, 2011) 2015 Census of Population (Philippine Statistics Authority, 2016)
The latest data gathered from the Barangay Profiles of 2018 are presented below:
Table 2-48: Population Data from Barangay Profiles (2018)
City/Municipality Barangay Population
City of Naga Cogon 4,267
Tagjaguimit 3,064
Pinamungahan Muncipality Lamac 6,361
Toledo City
Bulongan 2,653
Media Once 7,364
Poog 6,039
Population Composition
Based on the sex and age-group disaggregated data from PSA, Cebu Province has a young
population. Majority or 10.92% of its population were 5 to 9 years old. A high percentage were
also noted in 10 to 14 years and 15 to 19 years age groups. The sex ratio in 2015 was 103:100 or
there were 103 males for every 100 female population. It was observed, however, that females
have higher life expectancy than males. (Table 2-49)
Table 2-49: Household Population by Age Group and Sex, and Age Composition: CEBU (Excluding Cities of Cebu, Lapu-Lapu, and Mandaue), 2015
Age Group 2015 Population
Age Composition (%) Both Sexes Males Females
Under 1 134,843 69,718 65,125 2.23%
1 – 4 535,613 277,384 258,229 8.86%
5 – 9 659,602 340,479 319,123 10.92%

QUARRY VENTURES PHILIPPINES, INC. Environmental Impact Assessment
February 2019 2-236
Age Group 2015 Population
Age Composition (%) Both Sexes Males Females
10 – 14 627,617 323,501 304,116 10.39%
15 – 19 592,544 303,162 289,382 9.81%
20 – 24 567,332 286,998 280,334 9.39%
25 – 29 499,352 254,311 245,041 8.26%
30 – 34 433,173 222,560 210,613 7.17%
35 – 3 9 386,046 198,020 188,026 6.39%
40 – 44 337,940 172,980 164,960 5.59%
45 – 49 301,521 152,661 148,860 4.99%
50 – 54 259,243 129,940 129,303 4.29%
55 – 59 213,818 105,529 108,289 3.54%
60 – 64 171,426 81,388 90,038 2.84%
65 – 69 121,368 55,386 65,982 2.01%
70 – 74 85,446 36,698 48,748 1.41%
75 – 79 59,424 23,517 35,907 0.98%
80 years old & over 55,595 19,228 36,367 0.92%
Total 6,041,903 3,053,460 2,988,443 100.00 Source: 2015 Census of Population (Philippine Statistics Authority, 2016)
Table 2-50 presents the sex and age-group disaggregated data on population for the City of Naga.
It also has a very young population, similar to the Cebu Province. Most of its inhabitants fall within
the age groups of 5 to 9 years old (11.31%), 10 to 14 years old (10.79%), and 15 to 19 years old
(9.96%). It has the same sex ratio as the Cebu Province.
Table 2-50: Household Population by Age Group and Sex, and Age Composition: City of Naga, 2015
Age Group 2015 Population
Age Composition (%) Both Sexes Males Females
Under 1 2,593 1,355 1,238 2.24%
1 – 4 10,375 5,465 4,910 8.96%
5 – 9 13,092 6,796 6,296 11.31%
10 – 14 12,494 6,527 5,967 10.79%
15 – 19 11,523 5,831 5,692 9.96%
20 – 24 11,036 5,649 5,387 9.53%
25 – 29 9,725 4,974 4,751 8.40%
30 – 34 8,485 4,352 4,133 7.33%
35 – 3 9 7,707 3,953 3,754 6.66%
40 – 44 6,534 3,339 3,195 5.64%
45 – 49 5,814 3,030 2,784 5.02%
50 – 54 4,757 2,402 2,355 4.11%
55 – 59 3,847 1,917 1,930 3.32%
60 – 64 2,989 1,511 1,478 2.58%
65 – 69 1,895 870 1,025 1.64%
70 – 74 1,242 540 702 1.07%
75 – 79 874 350 524 0.76%
80 years old & over 768 254 514 0.66%
Total 115,750 59,115 56,635 100.00 Source: 2015 Census of Population (Philippine Statistics Authority, 2016)

QUARRY VENTURES PHILIPPINES, INC. Environmental Impact Assessment
February 2019 2-237
The population composition of the two (2) impact barangays within the City of Naga are shown in
Table 2-51 and Table 2-52. The dominant age groups in Barangay Cogon, in 2010, were 5 to 9
years old and 15 to 19 years old. Each age group composed of 11.92% of the total population. It
has a sex ratio of 108:100 and females have higher life expectancy than males. As of 2018, there
are 2,107 male and 2,160 are female residents in Cogon.
Table 2-51. Household Population by Age Group and Sex, and Age Composition: Barangay Cogon, City of Naga, 2010
Age Group 2010 Population
Age Composition (%) Both Sexes Males Females
Under 1 100 51 49 2.79
1 – 4 354 183 171 9.88
5 – 9 427 215 212 11.92
10 – 14 424 228 196 11.83
15 – 19 427 222 205 11.92
20 – 24 337 168 169 9.41
25 – 29 292 162 130 8.15
30 – 34 255 135 120 7.12
35 – 3 9 198 97 101 5.53
40 – 44 184 110 74 5.14
45 – 49 152 80 72 4.24
50 – 54 110 49 61 3.07
55 – 59 112 59 53 3.13
60 – 64 64 31 33 1.79
65 – 69 57 24 33 1.59
70 – 74 36 19 17 1.00
75 – 79 31 18 13 0.87
80 years old & over 23 8 15 0.64
Total 3,583 1,859 1,724 100.00 Source: 2010 Census of Population and Housing (Philippine Statistics Authority, 2011)
In Barangay Tagjaguimit, the age group in 2010 that has the biggest percentage was 10 to 14 years
old (13.38%). This was followed by 5 to 9 years old (12.16%) and 15 to 19 years old (11.99%) age
groups. There were 109 males for every 100 females. Females have higher expectancy rate than
males. As of June 2018, there are 3,064 residents in Tagjaguimit, 1,581 are male and 1,483 are
female.
Table 2-52: Household Population by Age Group and Sex, and Age Composition: Barangay Tagjaguimit, City of Naga, 2010
Age Group 2010 Population
Age Composition (%) Both Sexes Males Females
g 63 29 34 2.74
1 – 4 246 122 124 10.69
5 – 9 280 146 134 12.16
10 – 14 308 171 137 13.38
15 – 19 276 155 121 11.99

QUARRY VENTURES PHILIPPINES, INC. Environmental Impact Assessment
February 2019 2-238
20 – 24 191 103 88 8.30
25 – 29 167 100 67 7.25
30 – 34 101 53 48 4.39
35 – 3 9 123 62 61 5.34
40 – 44 112 60 52 4.87
45 – 49 118 59 59 5.13
50 – 54 77 34 43 3.34
55 – 59 71 32 39 3.08
60 – 64 57 31 26 2.48
65 – 69 36 16 20 1.56
70 – 74 36 17 19 1.56
75 – 79 23 9 14 1.00
80 years old & over 17 3 14 0.74
Total 2,302 1,202 1,100 100.00 Source: 2010 Census of Population and Housing (Philippine Statistics Authority, 2011)
The 2015 census results on sex and age-group disaggregated data was used and shows a very
young population in the Municipality of Pinamungahan. The majority of the population was 5-9
years old (12.37%). The male population dominates the population with 1.05:1 sex ratio (Table
2-53).
Table 2-53: Household Population by Age Group and Sex, and Age Composition: Municipality of Pinamungahan, 2015
Age Group 2015 Population
Age Composition (%) Both Sexes Males Females
Under 1 1,572 810 762 2.38%
1 – 4 6,267 3,292 2,975 9.50%
5 – 9 8,160 4,302 3,858 12.37%
10 – 14 7,529 3,983 3,546 11.42%
15 – 19 6,684 3,474 3,210 10.13%
20 – 24 5,976 3,101 2,875 9.06%
25 – 29 5,127 2,671 2,456 7.77%
30 – 34 4,264 2,271 1,993 6.47%
35 – 3 9 3,893 2,019 1,874 5.90%
40 – 44 3,361 1,734 1,627 5.10%
45 – 49 2,993 1,478 1,515 4.54%
50 – 54 2,711 1,376 1,335 4.11%
55 – 59 2,239 1,112 1,127 3.39%
60 – 64 1,767 814 953 2.68%
65 – 69 1,211 566 645 1.84%
70 – 74 980 424 556 1.49%
75 – 79 631 250 381 0.96%
80 years old & over 590 223 367 0.89%
Total 65,955 33,900 32,055 100.00 Source: 2015 Census of Population (Philippine Statistics Authority, 2016)
The biggest percentage of the 2010 population of Barangay Lamac is within the 10 to 14 years old
age group (10.77%). This was followed closely by the 15 to 19 years old age group with 10.63%.

QUARRY VENTURES PHILIPPINES, INC. Environmental Impact Assessment
February 2019 2-239
The ratio of males to females is approximately 1:1 (Table 2-54). As of 2018, there are 6,852
residents in Lamac, 3,511 are male and 3,341 are female.
Table 2-54: Household Population by Age Group and Sex, and Age Composition: Barangay Lamac, Municipality of Pinamungahan, 2010
Age Group 2010 Population
Age Composition (%) Both Sexes Males Females
Under 1 88 49 39 1.97
1 – 4 415 223 192 9.29
5 – 9 448 231 217 10.03
10 – 14 481 237 244 10.77
15 – 19 475 223 252 10.63
20 – 24 378 198 180 8.46
25 – 29 349 187 162 7.81
30 – 34 329 166 163 7.37
35 – 3 9 317 160 157 7.10
40 – 44 274 135 139 6.13
45 – 49 211 114 97 4.72
50 – 54 163 81 82 3.65
55 – 59 156 70 86 3.49
60 – 64 126 55 71 2.82
65 – 69 99 42 57 2.22
70 – 74 74 32 42 1.66
75 – 79 43 21 22 0.96
80 years old & over 41 20 21 0.92
Total 4,467 2,244 2,223 100.00 Source: 2010 Census of Population and Housing (Philippine Statistics Authority, 2011)
The 2015 population of Toledo City is 6% of the total household population of Cebu Province. The
sex and age-group disaggregated data of Toledo City reveals that the highest percentage among
age-group is within 5 to 9 years old (12.07%). Male population dominates the females with
105:100 sex ratio. It was observed, however, that females have higher life expectancy than males
(Table 2-55).
Table 2-55: Household Population by Age Group and Sex, and Age Composition: Toledo City, 2015
Age Group 2015 Population
Age Composition (%) Both Sexes Males Females
Under 1 4,176 2,137 2,039 2.45%
1 – 4 16,450 8,540 7,910 9.66%
5 – 9 20,268 10,555 9,713 11.90%
10 – 14 18,648 9,625 9,023 10.95%
15 – 19 17,119 8,827 8,292 10.05%
20 – 24 15,852 8,147 7,705 9.31%

QUARRY VENTURES PHILIPPINES, INC. Environmental Impact Assessment
February 2019 2-240
Age Group 2015 Population
Age Composition (%) Both Sexes Males Females
25 – 29 13,875 7,243 6,632 8.15%
30 – 34 11,868 6,220 5,648 6.97%
35 – 3 9 10,532 5,506 5,026 6.18%
40 – 44 9,065 4,649 4,416 5.32%
45 – 49 7,752 3,935 3,817 4.55%
50 – 54 6,730 3,385 3,345 3.95%
55 – 59 5,806 2,906 2,900 3.41%
60 – 64 4,609 2,235 2,374 2.71%
65 – 69 3,169 1,487 1,682 1.86%
70 – 74 2,139 960 1,179 1.26%
75 – 79 1,361 624 737 0.80%
80 years old & over 916 368 548 0.54%
Total 170,335 87,349 82,986 100.00 Source: 2015 Census of Population (Philippine Statistics Authority, 2016)
Majority of the population of Barangay Bulongan in 2010 was within ages 5 to 9 years old
(13.78%), 10 to 14 years old (12.38%), and 1 to 4 years old (11.36%). It has a sex ratio of 106:100
where males dominated the total population (Table 2-56). As of 2018, there are 2,653 residents
in Bulongan, 1,220 are male and 1,433 are female.
Table 2-56: Household Population by Age Group and Sex, and Age Composition: Barangay Bulongan, Toledo City, 2010
Age Group 2010 Population
Age Composition (%) Both Sexes Males Females
Under 1 72 28 44 3.05
1 – 4 268 135 133 11.36
5 – 9 325 169 156 13.78
10 – 14 292 155 137 12.38
15 – 19 218 118 100 9.24
20 – 24 174 92 82 7.38
25 – 29 161 90 71 6.82
30 – 34 158 87 71 6.70
35 – 3 9 136 72 64 5.77
40 – 44 113 59 54 4.79
45 – 49 115 54 61 4.87
50 – 54 99 47 52 4.20
55 – 59 75 36 39 3.18
60 – 64 61 31 30 2.59
65 – 69 39 16 23 1.65
70 – 74 24 11 13 1.02
75 – 79 17 7 10 0.72
80 years old & over 12 5 7 0.51
Total 2,359 1,212 1,147 100.00 Source: 2010 Census of Population and Housing (Philippine Statistics Authority, 2011)
In Barangay Media Once, the age group in 2010 that has the biggest percentage was 10 to 14
years old (12.26%). This was followed by 5 to 9 years old (11.87%) and 15 to 19 years old (11.24%)

QUARRY VENTURES PHILIPPINES, INC. Environmental Impact Assessment
February 2019 2-241
age groups. There were 108 males for every 100 females (Table 2-57). As of 2018, there are 7,364
residents in Media Once.
Table 2-57: Household Population by Age Group and Sex, and Age Composition: Barangay Media Once, Toledo City, 2010
Age Group 2010 Population
Age Composition (%) Both Sexes Males Females
Under 1 182 93 89 2.81
1 – 4 675 345 330 10.42
5 – 9 769 417 352 11.87
10 – 14 794 415 379 12.26
15 – 19 728 376 352 11.24
20 – 24 612 319 293 9.45
25 – 29 494 271 223 7.63
30 – 34 409 216 193 6.31
35 – 3 9 416 207 209 6.42
40 – 44 343 170 173 5.30
45 – 49 290 150 140 4.48
50 – 54 250 126 124 3.86
55 – 59 175 96 79 2.70
60 – 64 133 67 66 2.05
65 – 69 81 38 43 1.25
70 – 74 56 30 26 0.86
75 – 79 39 20 19 0.60
80 years old & over 31 12 19 0.48
Total 6,477 3,368 3,109 100.00 Source: 2010 Census of Population and Housing (Philippine Statistics Authority, 2011)
The majority of the 2010 population in Barangay Poog was 5 to 9 years old (13.23%). This is
followed by age groups within 10 to 14 years old (11.44%) and 15 to 19 years old (11.07%). The
barangay has a sex ratio of 108:100 or 108 males for every 100 female population (Table 2-58).
As of 2018, there are 6,039 residents in Poog, 3,108 are male and 2,931 are female.
Table 2-58: Household Population by Age Group and Sex, and Age Composition: Barangay Poog, Toledo City, 2010
Age Group 2010 Population
Age Composition (%) Both Sexes Males Females
Under 1 154 78 76 2.72
1 – 4 593 313 280 10.47
5 – 9 749 385 364 13.23
10 – 14 648 341 307 11.44
15 – 19 627 326 301 11.07
20 – 24 545 293 252 9.63
25 – 29 434 242 192 7.67
30 – 34 369 196 173 6.52
35 – 3 9 331 157 174 5.85
40 – 44 282 142 140 4.98
45 – 49 229 127 102 4.04

QUARRY VENTURES PHILIPPINES, INC. Environmental Impact Assessment
February 2019 2-242
Age Group 2010 Population
Age Composition (%) Both Sexes Males Females
50 – 54 226 116 110 3.99
55 – 59 166 79 87 2.93
60 – 64 116 55 61 2.05
65 – 69 85 42 43 1.50
70 – 74 55 27 28 0.97
75 – 79 27 10 17 0.48
80 years old & over 26 10 16 0.46
Total 5,662 2,939 2,723 100.00 Source: 2010 Census of Population and Housing (Philippine Statistics Authority, 2011)
Based on 2010 data from PSA, the Municipality of Pinamungahan has the highest dependency
ratio as compared to the City of Naga and Toledo City, which indicated 70 young (0 -14 years old)
and old dependents (65 years old and above) for every 100 working population. Table 2-59 also
shows that Toledo City has the highest number of working age population (15 and 64 years old).
Table 2-59: Age Dependency Ratio of Impact Cities and Municipality, 2010
Age Group
City of Naga Pinamungahan
Municipality Toledo City
No. Dependency
Ratio No.
Dependency Ratio
No. Dependency
Ratio
Working Age (15 and 64)
62,288 34,220 94,163
Dependent Population 39,170 63:100 23,758 70:100 62,562 66:100
Young (0 -14) 35,020 56:100 20,794 61:100 55,978 59:100
Old (65 and above) 4,150 6:100 2,964 9:100 6,584 7:100 Source: Computed based on 2010 Census of Population and Housing (Philippine Statistics Authority, 2011)
Among the barangays within the City of Naga, Tagjaguimit has the highest dependency ratio of
78:100. This means that for every 100 working-age population there were about 78 dependents,
69 young dependents and 9 old dependents. (Table 2-60)
Table 2-60. Age Dependency Ratio of Impact Barangays within the City of Naga, 2010
Age Group Cogon Tagjaguimit
No. Dependency Ratio No. Dependency Ratio
Working Age (15 and 64) 2,131 1,293
Dependent Population 1,452 68:100 1,009 78:100
Young (0 -14) 1,305 61:100 897 69:100
Old (65 and above) 147 7:100 112 9:100 Source: Computed based on 2010 Census of Population and Housing (Philippine Statistics Authority, 2011)
In the Municipality of Pinamungahan, Lamac has a dependency ratio of 61 young and old
dependents for every 100 working-age population. This is slightly lower than the average
dependency ratio in the municipality. (Table 2-61)

QUARRY VENTURES PHILIPPINES, INC. Environmental Impact Assessment
February 2019 2-243
Table 2-61: Age Dependency Ratio of Impact Barangays within the Municipality of Pinamungahan, 2010
Age Group Lamac
No. Dependency Ratio
Working Age (15 and 64) 2,778
Dependent Population 1,689 61:100
Young (0 -14) 1,432 55:100
Old (65 and above) 257 6:100 Source: Computed based on 2010 Census of Population and Housing (Philippine Statistics Authority, 2011)
Barangay Bulongan has the highest dependency ratio among the three (3) impact barangays
within Toledo City. Table 2-62 indicated 80 dependent population for every 100 working-age
population. Barangay Bulongan have the same ratio of the old population dependent on the
working-age population which is 7:100.
Table 2-62. Age Dependency Ratio of Impact Barangays within Toledo City, 2010
Age Group
Bulongan Media Once Poog
No. Dependency
Ratio No.
Dependency Ratio
No. Dependency
Ratio
Working Age (15 and 64)
1,310 3,850 3,325
Dependent Population
1,049 80:100 2,627 68:100 2,337 70:100
Young (0 -14) 957 73:100 2,420 63:100 2,144 65:100
Old (65 and above)
92 7:100 207 5:100 193 5:100
Source: Computed based on 2010 Census of Population and Housing (Philippine Statistics Authority, 2011)

QUARRY VENTURES PHILIPPINES, INC. Environmental Impact Assessment
February 2019 2-244
Population Distribution
Based on available data presented in Table 2-63, the most densely populated impact barangay is
Media Once in Toledo City. The gross population density of Media Once is eleven (11) persons per
hectare of land.
Table 2-63: Population Density of Impact Barangays, 2015
City/Municipality Barangay 2015 Population Land Area (Hectares) Population Density (No. of
Persons per Hectare)
City of Naga Cogon 4,267 715.3287 5.97
Tagjaguimit 2,317 537.4519 4.31
Pinamungahan Muncipality
Lamac 5,953 589.12 10.1
Toledo City
Bulongan 2,647 725 3.65
Media Once 7,128 621.0984 11.48
Poog 5,989 - - Sources: 2015 Census of Population (Philippine Statistics Authority, 2016)
PSA data on 2015 Census of Population indicate that Cebu Province has an average household
size of 4.4. The same household size was observed in the City of Naga and Toledo City. The
Municipality of Pinamunganhan, as presented in Table 2-64, has the highest average household
size which is 4.8 or almost 5 members.
Table 2-64: Household Population, Number of Households, and Average Household Size of Impact Cities and Municipality, 2015
Area 2015 Households
Population Number of Households
Average Households Size
Cebu Province (excluding Cebu, Mandaue, and Lapu-Lapu Cities)
2,928,034 669,322 4.4
City of Naga 115,409 26,177 4.4
Pinamungahan Municipality 65,937 13,874 4.8
Toledo City 169,714 38,259 4.4 Sources: 2015 Census of Population (Philippine Statistics Authority, 2016)
Other Demographic Information
Ethnicity
The residents of the impact barangays in the City of Naga has eleven (11) different ethnicities.
Most residents across the impact barangays are Cebuanos. (Table 2-65)

QUARRY VENTURES PHILIPPINES, INC. Environmental Impact Assessment
February 2019 2-245
Table 2-65: Ethnicity in the Impact Areas within the City of Naga, 2010
Ethnicity
Barangays
Cogon Tagjaguimit
No. % No. %
Aromanen-Manobo 0 - 0 -
Bisaya/Binisaya 3 0.08 0 -
Cebuano 3,577 99.83 2,296 99.74
Cotabateño 0 - 0 -
Cotabateño-Chavacano 0 - 2 0.09
Cuyonon/Cuyonen 0 - 0 -
Hiligaynon Ilonggo 1 0.03 0 -
Maranao 2 0.06 0 -
Sama Bangingi 0 - 3 0.13
Tagalog 0 - 0 -
Waray 0 - 1 0.04
Total 3,583 100.00 2,302 100.00 Source: 2010 Census of Population and Housing (Philippine Statistics Authority, 2011)
As presented in Table 2-66, the majority of the ethnic groupings in Lamac is Cebuano followed by
Caviteño-Chavacano.
Table 2-66: Ethnicity in the Impact Areas within the Municipality of Pinamungahan, 2010
Ethnicity
Barangays
Lamac
No. %
Aeta/Ayta 1 0.02
Bisaya/Binisaya 0 -
Boholano 2 0.04
Caviteño-Chavacano 4 0.09
Cebuano 4,453 99.69
Cotabateño-Chavacano 3 0.07
Diangan 0 -
Tagalog 1 0.02
Waray 1 0.02
Zambageño-Chavacano 1 0.02
Total 4,467 100.00 Source: 2010 Census of Population and Housing (Philippine Statistics Authority, 2011)
The dominant ethnic groups in the three (3) impact barangays in Toledo City is Cebuano. Though
there are residents who belong to other ethnicities, such as Hiligaynon and Tagalog to name a
few. (Table 2-67)
Table 2-67: Ethnicity in the Impact Areas within Toledo City, 2010
Ethnicity
Barangays
Bulongan Media Once Poog
No. % No. % No. %
Abelling/ Abellen/ Aberling/ Aborlin
0 - 8 0.12 0 -
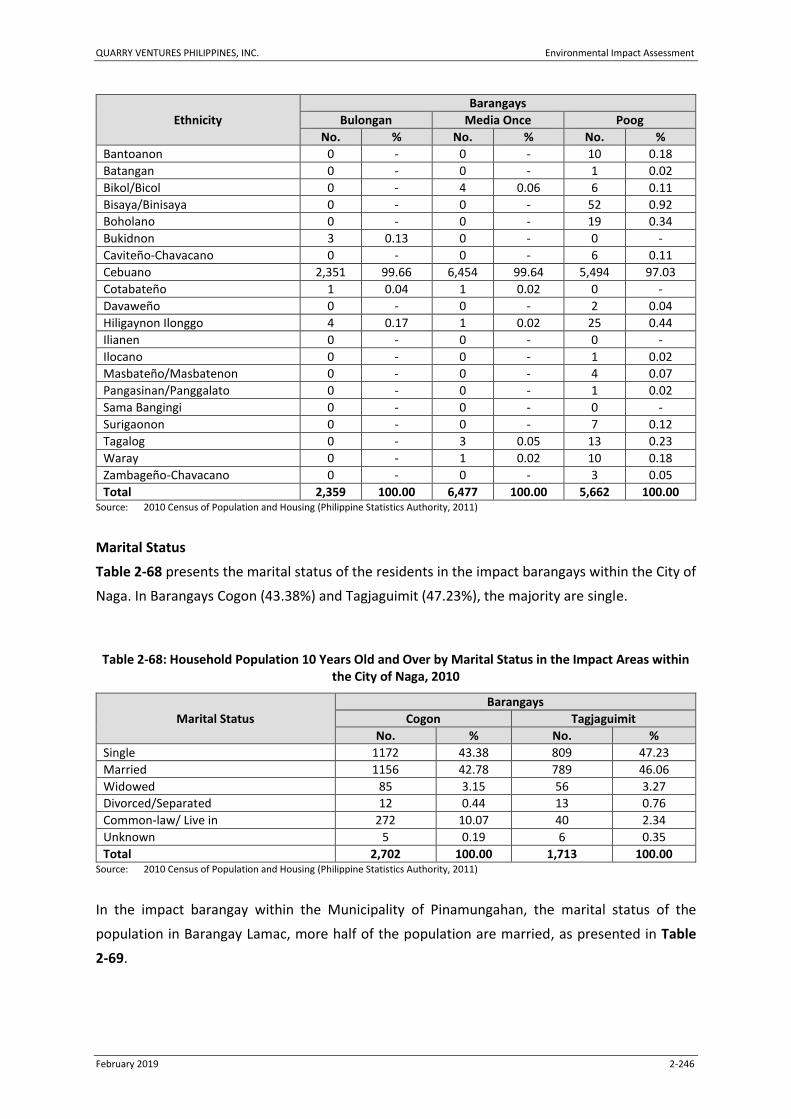
QUARRY VENTURES PHILIPPINES, INC. Environmental Impact Assessment
February 2019 2-246
Ethnicity
Barangays
Bulongan Media Once Poog
No. % No. % No. %
Bantoanon 0 - 0 - 10 0.18
Batangan 0 - 0 - 1 0.02
Bikol/Bicol 0 - 4 0.06 6 0.11
Bisaya/Binisaya 0 - 0 - 52 0.92
Boholano 0 - 0 - 19 0.34
Bukidnon 3 0.13 0 - 0 -
Caviteño-Chavacano 0 - 0 - 6 0.11
Cebuano 2,351 99.66 6,454 99.64 5,494 97.03
Cotabateño 1 0.04 1 0.02 0 -
Davaweño 0 - 0 - 2 0.04
Hiligaynon Ilonggo 4 0.17 1 0.02 25 0.44
Ilianen 0 - 0 - 0 -
Ilocano 0 - 0 - 1 0.02
Masbateño/Masbatenon 0 - 0 - 4 0.07
Pangasinan/Panggalato 0 - 0 - 1 0.02
Sama Bangingi 0 - 0 - 0 -
Surigaonon 0 - 0 - 7 0.12
Tagalog 0 - 3 0.05 13 0.23
Waray 0 - 1 0.02 10 0.18
Zambageño-Chavacano 0 - 0 - 3 0.05
Total 2,359 100.00 6,477 100.00 5,662 100.00 Source: 2010 Census of Population and Housing (Philippine Statistics Authority, 2011)
Marital Status
Table 2-68 presents the marital status of the residents in the impact barangays within the City of
Naga. In Barangays Cogon (43.38%) and Tagjaguimit (47.23%), the majority are single.
Table 2-68: Household Population 10 Years Old and Over by Marital Status in the Impact Areas within the City of Naga, 2010
Marital Status
Barangays
Cogon Tagjaguimit
No. % No. %
Single 1172 43.38 809 47.23
Married 1156 42.78 789 46.06
Widowed 85 3.15 56 3.27
Divorced/Separated 12 0.44 13 0.76
Common-law/ Live in 272 10.07 40 2.34
Unknown 5 0.19 6 0.35
Total 2,702 100.00 1,713 100.00 Source: 2010 Census of Population and Housing (Philippine Statistics Authority, 2011)
In the impact barangay within the Municipality of Pinamungahan, the marital status of the
population in Barangay Lamac, more half of the population are married, as presented in Table
2-69.

QUARRY VENTURES PHILIPPINES, INC. Environmental Impact Assessment
February 2019 2-247
Table 2-69: Household Population 10 Years Old and Over by Marital Status in the Impact Areas within the Municipality of Pinamungahan, 2010
Marital Status
Barangays
Lamac
No. %
Single 1,349 38.37
Married 1,826 51.93
Widowed 166 4.72
Divorced/Separated 29 0.82
Common-law/ Live in 146 4.15
Unknown 0 -
Total 3,516 100.00 Source: 2010 Census of Population and Housing (Philippine Statistics Authority, 2011)
Of the household population 10 years old and over in the impact barangays in Toledo City, the
majority are married except for Barangay Poog where single status dominates the population. The
details of the marital status of the population within the impact barangays in Toledo City is
presented in Table 2-70.
Table 2-70: Household Population 10 Years Old and Over by Marital Status in the Impact Areas within Toledo City, 2010
Marital Status
Barangays
Bulongan Media Once Poog
No. % No. % No. %
Single 706 41.68 2130 43.91 1882 45.18
Married 788 46.52 2312 47.66 1796 43.11
Widowed 74 4.37 159 3.28 145 3.48
Divorced/Separated 18 1.06 24 0.49 48 1.15
Common-law/ Live in 103 6.08 220 4.54 295 7.08
Unknown 5 0.30 6 0.12 0 45.18
Total 1,694 100.00 4,851 100.00 4,166 100.00 Source: 2010 Census of Population and Housing (Philippine Statistics Authority, 2011)
Religion
The religion of most of the residents residing in the impact barangays within the City of Naga is
Roman Catholic. Other religions such as Evangelicals, Iglesia ni Kristo, and Seventh Day Adventists
are also present. (Table 2-71)
Table 2-71: Religious Affiliation in the Impact Areas within the City of Naga, 2010
Religion
Barangays
Cogon Tagjaguimit
No. % No. %
Bible Baptist Church 0 - 0 -
Evangelicals (Philippine Council of Evangelical Churches)
20 0.56 15 0.65

QUARRY VENTURES PHILIPPINES, INC. Environmental Impact Assessment
February 2019 2-248
Religion
Barangays
Cogon Tagjaguimit
No. % No. %
Iglesia ni Cristo 14 0.39 0 -
Jesus is Lord Church 0 - 0 -
Roman Catholic including Catholic Charismatic
3,541 98.83 2,287 99.35
Seventh Day Adventist 5 0.14 0 -
Other Religious Affiliations 3 0.08 0 -
Total 3,583 100.00 2,302 100.00 Source: 2010 Census of Population and Housing (Philippine Statistics Authority, 2011)
Shown in Table 2-72 is the list of religious affiliations of the residents within Lamac indicates that
majority are Roman Catholics. Thirty-six (36) or almost 1 percent of the population belong to
Church of Jesus Christ of the Latter Day Saints.
Table 2-72: Religious Affiliation in the Impact Areas within the Municipality of Pinamungahan, 2010
Religion
Barangays
Lamac
No. %
Aglipay 0 -
Association of Fundamental Baptist Churches in the Philippines 1 0.02
Bible Baptist Church 6 0.13
Church of Jesus Christ of the Latter Day Saints 36 0.81
Evangelicals (Philippine Council of Evangelical Churches) 6 0.13
Faith Tabernacle Church (Living Rock Ministries) 6 0.13
Lutheran Church of the Philippines 0 -
Philippine Grace Gospel 0 -
Philippine Independent Catholic Church 4 0.09
Roman Catholic including Catholic Charismatic 4,333 97.00
Seventh Day Adventist 5 0.11
Other Religious Affiliations 70 1.57
Tribal Religions 0 -
Total 4,467 100.00 Source: 2010 Census of Population and Housing (Philippine Statistics Authority, 2011)
The most dominant religion in the impact barangays for Toledo City is Roman Catholic. It was also
observed that a considerable number of residents from the five (5) barangays are also members
of other religious organizations such as Aglipay, Bible Baptist Church, Evangelicals, and Iglesia ni
Cristo. (Table 2-73)
Table 2-73: Religious Affiliation in the Impact Areas within Toledo City, 2010
Religion
Barangays
Bulongan Media Once Poog
No. % No. % No. %
Aglipay 142 6.02 31 0.48 0 -
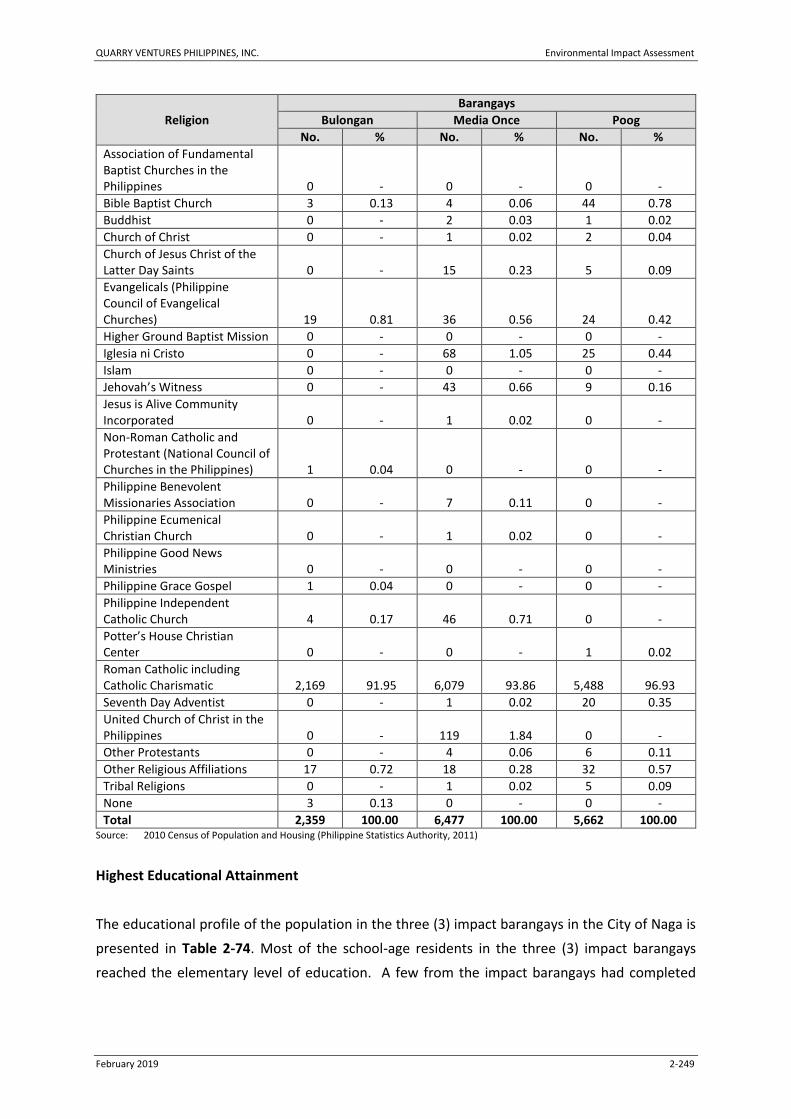
QUARRY VENTURES PHILIPPINES, INC. Environmental Impact Assessment
February 2019 2-249
Religion
Barangays
Bulongan Media Once Poog
No. % No. % No. %
Association of Fundamental Baptist Churches in the Philippines 0 - 0 - 0 -
Bible Baptist Church 3 0.13 4 0.06 44 0.78
Buddhist 0 - 2 0.03 1 0.02
Church of Christ 0 - 1 0.02 2 0.04
Church of Jesus Christ of the Latter Day Saints 0 - 15 0.23 5 0.09
Evangelicals (Philippine Council of Evangelical Churches) 19 0.81 36 0.56 24 0.42
Higher Ground Baptist Mission 0 - 0 - 0 -
Iglesia ni Cristo 0 - 68 1.05 25 0.44
Islam 0 - 0 - 0 -
Jehovah’s Witness 0 - 43 0.66 9 0.16
Jesus is Alive Community Incorporated 0 - 1 0.02 0 -
Non-Roman Catholic and Protestant (National Council of Churches in the Philippines) 1 0.04 0 - 0 -
Philippine Benevolent Missionaries Association 0 - 7 0.11 0 -
Philippine Ecumenical Christian Church 0 - 1 0.02 0 -
Philippine Good News Ministries 0 - 0 - 0 -
Philippine Grace Gospel 1 0.04 0 - 0 -
Philippine Independent Catholic Church 4 0.17 46 0.71 0 -
Potter’s House Christian Center 0 - 0 - 1 0.02
Roman Catholic including Catholic Charismatic 2,169 91.95 6,079 93.86 5,488 96.93
Seventh Day Adventist 0 - 1 0.02 20 0.35
United Church of Christ in the Philippines 0 - 119 1.84 0 -
Other Protestants 0 - 4 0.06 6 0.11
Other Religious Affiliations 17 0.72 18 0.28 32 0.57
Tribal Religions 0 - 1 0.02 5 0.09
None 3 0.13 0 - 0 -
Total 2,359 100.00 6,477 100.00 5,662 100.00 Source: 2010 Census of Population and Housing (Philippine Statistics Authority, 2011)
Highest Educational Attainment
The educational profile of the population in the three (3) impact barangays in the City of Naga is
presented in Table 2-74. Most of the school-age residents in the three (3) impact barangays
reached the elementary level of education. A few from the impact barangays had completed

QUARRY VENTURES PHILIPPINES, INC. Environmental Impact Assessment
February 2019 2-250
college education and academic degree holders: 55 or 1.76% in Cogon; and 12 or 0.60% in
Tagjaguimit.
Table 2-74: Highest Grade/Year Completed by School Age in the Impact Areas within the City of Naga, 2010
Grade/Year
Barangays
Cogon Tagjaguimit
No. % No. %
No Grade Completed 299 9.56 169 8.48
Preschool 78 2.49 71 3.56
Elementary Level 1,203 38.45 907 45.51
Elementary Graduate 421 13.45 282 14.15
High School Level 459 14.67 303 15.20
High School Graduate 509 16.27 222 11.14
Post-Secondary Level 13 0.42 0 -
Post-Secondary Graduate 24 0.77 4 0.20
College Level 65 2.08 23 1.15
Academic Degree Holder 55 1.76 12 0.60
Post Baccalaureate 1 0.03 0 -
Not Reported 2 0.06 0 -
Total 3,129 100.00 1,993 100.00 Source: 2010 Census of Population and Housing (Philippine Statistics Authority, 2011)
Majority of the school-age population in Lamac have reached elementary education, 1,447 or
36.5%. Shown in Table 2-75 that 16.20% of the school-age population in Barangay Lamac reached
high school education while another 16.20% complete high school education.
Table 2-75: Highest Grade/Year Completed by School Age in the Impact Areas within the Municipality of Pinamungahan, 2010
Grade/Year
Barangays
Lamac
No. %
No Grade Completed 191 4.82
Preschool 91 2.30
Elementary Level 1,447 36.50
Elementary Graduate 583 14.71
High School Level 642 16.20
High School Graduate 642 16.20
Post-Secondary Level 0 -
Post-Secondary Graduate 29 0.73
College Level 208 5.25
Academic Degree Holder 129 3.25
Post Baccalaureate 2 0.05
Not Reported 0 -
Total 3,964 100.00 Source: 2010 Census of Population and Housing (Philippine Statistics Authority, 2011)

QUARRY VENTURES PHILIPPINES, INC. Environmental Impact Assessment
February 2019 2-251
Consistent with the data from other impact barangays, most of the school-age population within
the impact barangays in Toledo City reached the elementary level of education. Barangay Media
Once has the highest percentage of the school-age population that reached the elementary level
with 18.42% (1,035) as shown in Table 2-76.
Table 2-76: Highest Grade/Year Completed by School Age in the Impact Areas within Toledo City, 2010
Grade/Year
Barangays
Bulongan Media Once Poog
No. % No. % No. %
No Grade Completed 116 5.75 309 5.50 189 3.85
Preschool 84 4.16 126 2.24 215 4.37
Elementary Level 764 37.84 2,210 39.32 1,657 33.71
Elementary Graduate 298 14.76 474 8.43 473 9.62
High School Level 294 14.56 1,035 18.42 850 17.29
High School Graduate 319 15.80 882 15.69 743 15.12
Post-Secondary Level 3 0.15 12 0.21 26 0.53
Post-Secondary Graduate 9 0.45 18 0.32 42 0.85
College Level 89 4.41 325 5.78 383 7.79
Academic Degree Holder 43 2.13 227 4.04 324 6.59
Post Baccalaureate 0 - 0 - 12 0.24
Not Reported 0 - 2 0.04 1 0.02
Total 2,019 100.00 5,620 100.00 4,915 100.00 Source: 2010 Census of Population and Housing (Philippine Statistics Authority, 2011)
Housing
Majority of housing units in Barangays Cogon and Tagjaguimit were built in 2001 to 2005. Houses
in Barangay Cogon that were built in 2001 to 2005 comprises 28.76% or 222 of the total housing
units. (Table 2-77)
Table 2-77: Year Building/House was Built by First Household within the Housing Unit in the Impact Areas within the City of Naga, 2010
Year
Barangays
Cogon Tagjaguimit
No. % No. %
2010 12 1.55 23 4.65
2009 44 5.70 29 5.86
2008 42 5.44 27 5.45
2007 35 4.53 38 7.68
2006 38 4.92 33 6.67
2001-2005 222 28.76 119 24.04
1991-2000 184 23.83 111 22.42
1981-1990 87 11.27 55 11.11
1971-1980 46 5.96 26 5.25
1970 or Earlier 13 1.68 13 2.63
Not Applicable 2 0.26 1 0.20
Don't Know 15 1.94 10 2.02
Not Reported 32 4.15 10 2.02

QUARRY VENTURES PHILIPPINES, INC. Environmental Impact Assessment
February 2019 2-252
Year
Barangays
Cogon Tagjaguimit
No. % No. %
Total 772 100.00 495 100.00 Source: 2010 Census of Population and Housing (Philippine Statistics Authority, 2011)
Housing units in Barangay Lamac were built in 1991 to 2000. In Barangay Lamac houses that were
built in 1991 to 2000 comprises 307 or 27% of the total housing units. (Table 2-78)
Table 2-78: Year Building/House was Built by First Household within the Housing Unit in the Impact Areas within the Municipality of Pinamungahan, 2010
Year
Barangays
Lamac
No. %
2010 12 1.06
2009 38 3.34
2008 52 4.57
2007 30 2.64
2006 69 6.07
2001-2005 228 20.05
1991-2000 307 27.00
1981-1990 151 13.28
1971-1980 53 4.66
1970 or Earlier 24 2.11
Not Applicable 0 -
Don't Know 122 10.73
Not Reported 51 4.49
Total 1137 100.00 Source: 2010 Census of Population and Housing (Philippine Statistics Authority, 2011)
In Barangays Bulongan, Media Once, and Poog most of the housing units were built in 1991 to
2000. It is also observed in Table 2-79 that a considerable number of houses were built in 1970
or earlier.
Table 2-79: Year Building/House was Built by First Household within the Housing Unit in the Impact Areas within Toledo City, 2010
Year
Barangays
Bulongan Media Once Poog
No. % No. % No. %
2010 14 2.55 37 2.70 23 1.96
2009 37 6.74 101 7.38 49 4.18
2008 19 3.46 88 6.43 61 5.20
2007 23 4.19 81 5.92 64 5.46
2006 18 3.28 85 6.21 56 4.77
2001-2005 108 19.67 275 20.10 200 17.05
1991-2000 139 25.32 297 21.71 338 28.82
1981-1990 66 12.02 170 12.43 192 16.37
1971-1980 35 6.38 89 6.51 99 8.44

QUARRY VENTURES PHILIPPINES, INC. Environmental Impact Assessment
February 2019 2-253
Year
Barangays
Bulongan Media Once Poog
No. % No. % No. %
1970 or Earlier 24 4.37 31 2.27 33 2.81
Not Applicable 0 - 6 0.44 6 0.51
Don't Know 12 2.19 50 3.65 1 0.09
Not Reported 54 9.84 58 4.24 51 4.35
Total 549 100.00 1368 100.00 1173 100.00 Source: 2010 Census of Population and Housing (Philippine Statistics Authority, 2011)
Most of the housing units in Barangay Cogon were built in lots that are rented-free with the
consent of the owner. However, in Barangay Tagjaguimit, the majority or 63.23% of the residents
built their housing units on their own or amortized lots.
Table 2-80: Tenure Status of the Lot by First Household within the Housing Unit in the Impact Areas within the City of Naga, 2010
Type of Building/House
Barangays
Cogon Tagjaguimit
No. % No. %
Owned/Amortized 365 47.28 313 63.23
Rented 12 1.55 9 1.82
Rent-free With Consent of Owner 354 45.85 152 30.71
Rent-free Without Consent of Owner 5 0.65 2 0.40
Not Applicable 0 - 1 0.20
Not Reported 36 4.66 18 3.64
Total 772 100.00 495 100.00 Source: 2010 Census of Population and Housing (Philippine Statistics Authority, 2011)
In Barangay Lamac most of the housing units (406 or 98.78%) were built in owned or amortized
lots. (Table 2-81)
Table 2-81: Tenure Status of the Lot by First Household within the Housing Unit in the Impact Areas within the Municipality of Pinamungahan, 2010
Tenure Status
Barangays
Lamac
No. %
Owned/Amortized 508 44.68
Rented 32 2.81
Rent-free With Consent of Owner 539 47.41
Rent-free Without Consent of Owner 4 0.35
Not Applicable 0 -
Not Reported 54 4.75
Total 1137 100.00 Source: 2010 Census of Population and Housing (Philippine Statistics Authority, 2011)
Barangay Media Once has the most number of housing units (1,368) among the impact barangays
in Toledo City. These housing units are mostly built in lots that are owned or amortized (568 or

QUARRY VENTURES PHILIPPINES, INC. Environmental Impact Assessment
February 2019 2-254
41.52%). In Barangay Poog 35.89% or 421 housing units were built in owned/amortized lots and
349 or 33.59% of the housing units were built in a rented lots. In Barangay Bulongan, most of the
housing units were built on lots that are rent-free with the consent of owners. (Table 2-82)
Table 2-82: Tenure Status of the Lot by First Household within the Housing Unit in the Impact Areas within Toledo City, 2010
Tenure Status
Barangays
Bulongan Media Once Poog
No. % No. % No. %
Owned/Amortized 170 30.97 568 41.52 421 35.89
Rented 32 5.83 161 11.77 394 33.59
Rent-free With Consent of Owner
292 53.19 559 40.86 275 23.44
Rent-free Without Consent of Owner
0 - 12 0.88 6 0.51
Not Applicable 0 - 0 - 2 0.17
Not Reported 55 10.02 68 4.97 75 6.39
Total 549 100.00 1,368 100.00 1,173 100.00 Source: 2010 Census of Population and Housing (Philippine Statistics Authority, 2011)
Majority of the type of housing units within the six (6) impact barangays are single houses, as
presented in Table 2-83, Table 2-84, and Table 2-85. In Barangay Cogon, duplex type of house was
also built. In Tagjaguimit, two (2) commercial/industrial/agricultural type of building/house are
also present.
Table 2-83: Type of Building/House in the Impact Areas within the City of Naga, 2010
Type of Building/House
Barangays
Cogon Tagjaguimit
No. % No. %
Single House 770 99.74 493 99.60
Duplex 2 0.26 0 -
Multi-unit Residential 0 - 0 -
Commercial/Industrial/Agricultural 0 - 2 0.40
Institutional Living Quarter 0 - 0 -
Other Housing Unit 0 - 0 -
Not Reported 0 - 0 -
Total 772 100.00 495 100.00 Source: 2010 Census of Population and Housing (Philippine Statistics Authority, 2011)
Duplex and Multi-unit Residential type of housing are found in Barangay Lamac. There is also one
(1) institutional living quarter built in this barangay.
Table 2-84: Type of Building/House in the Impact Areas within the Municipality of Pinamungahan, 2010

QUARRY VENTURES PHILIPPINES, INC. Environmental Impact Assessment
February 2019 2-255
Type of Building/House
Barangays
Lamac
No. %
Single House 1097 96.48
Duplex 21 1.85
Multi-unit Residential 15 1.32
Commercial/Industrial/Agricultural 0 -
Institutional Living Quarter 1 0.09
Other Housing Unit 0 -
Not Reported 3 0.26
Total 1,137 100.00 Source: 2010 Census of Population and Housing (Philippine Statistics Authority, 2011)
Duplex type of housing is also prevalent in Barangays Media Once and Poog. Multi-unit Residential
also built in these barangays while two (2) commercial/industrial/agricultural type of
building/house was built in Barangay Poog.
Table 2-85: Type of Building/House in the Impact Areas within Toledo City, 2010
Type of Building/House
Barangays
Bulongan Media Once Poog
No. % No. % No. %
Single House 549 100.00 1349 98.61 1082 92.24
Duplex 0 - 14 1.02 44 3.75
Multi-unit Residential 0 - 5 0.37 45 3.84
Commercial/ Industrial/ Agricultural
0 - 0 - 2 0.17
Institutional Living Quarter 0 - 0 - 0 -
Other Housing Unit 0 - 0 - 0 -
Not Reported 0 - 0 - 0 -
Total 549 100.00 1,368 100.00 1,173 100.00 Source: 2010 Census of Population and Housing (Philippine Statistics Authority, 2011)
The dominant housing in the impact barangays within the City of Naga is made of galvanized
iron/aluminum roof materials. A considerable number of housing units with roofing materials that
are made of light materials like cogon, nipa, or anahaw.
Table 2-86: Construction Materials of the Roof by First Household within the Housing Unit in the Impact Areas within the City of Naga, 2010
Roof Materials
Barangays
Cogon Tagjaguimit
No. % No. %
Galvanized Iron/Aluminum 726 94.04 462 93.33
Tile Concrete/Clay Tile 0 - 0 -
Half Galvanized Iron and Half Concrete 0 - 0 -
Wood 0 - 2 0.40
Cogon/Nipa/Anahaw 40 5.18 31 6.26
Asbestos 0 - 0 -

QUARRY VENTURES PHILIPPINES, INC. Environmental Impact Assessment
February 2019 2-256
Roof Materials
Barangays
Cogon Tagjaguimit
No. % No. %
Makeshift/Salvaged/Improvised Materials
1 0.13 0 -
Others 3 0.39 0 -
Not Reported 2 0.26 0 -
Total 772 100.00 495 100.00 Source: 2010 Census of Population and Housing (Philippine Statistics Authority, 2011)
Though the roofing materials of housing units within the impact barangays in Pinamungahan are
mostly galvanized iron or aluminum, a quite number of housing units have roofs that are made of
cogon, nipa, or anahaw.
Table 2-87: Construction Materials of the Roof by First Household within the Housing Unit in the Impact Areas within the Municipality of Pinamungahan, 2010
Roof Materials
Barangays
Lamac
No. %
Galvanized Iron/Aluminum 990 87.07
Tile Concrete/Clay Tile 2 0.18
Half Galvanized Iron and Half Concrete 4 0.35
Wood 12 1.06
Cogon/Nipa/Anahaw 129 11.35
Asbestos 0 -
Makeshift/Salvaged/Improvised Materials 0 -
Others 0 -
Not Reported 0 -
Total 1137 100.00 Source: 2010 Census of Population and Housing (Philippine Statistics Authority, 2011)
The same description as the other impact barangays, roof materials used in the housing units built
within the impact barangays in Toledo City is mostly galvanized iron or aluminum. There are also
housing units that used cogon, nipa, or anahaw as well as wood as roofing materials.
Table 2-88: Construction Materials of the Roof by First Household within the Housing Unit in the Impact Areas within Toledo City, 2010
Roof Materials
Barangays
Bulongan Media Once Poog
No. % No. % No. %
Galvanized Iron/ Aluminum 486 88.52 1265 92.47 1011 86.19
Tile Concrete/ Clay Tile 0 - 1 0.07 9 0.77
Half Galvanized Iron and Half Concrete 2 0.36 1 0.07 76 6.48
Wood 0 - 1 0.07 13 1.11
Cogon/Nipa/ Anahaw 60 10.93 99 7.24 53 4.52
Makeshift/Salvaged/ Improvised Materials 0 - 1 0.07 10 0.85
Others 1 0.18 0 - 1 0.09
Total 549 100.00 1368 100.00 1173 100.00

QUARRY VENTURES PHILIPPINES, INC. Environmental Impact Assessment
February 2019 2-257
Source: 2010 Census of Population and Housing (Philippine Statistics Authority, 2011)
Outer wall materials of housing units in Barangay Tagjaguimit (42.22) are mostly made of wood.
A Higher percentage of housing units made of bamboo, sawali, cogon, or nipa were also noted in
these two (2) barangays. In Barangay Cogon, the majority of the housing units' outer wall is made
from light materials such as bamboo, sawali, cogon, or nipa (31.99%). (Table 2-89)
Table 2-89: Construction Materials of the Outer Walls by First Household within the Housing Unit in the Impact Areas within the City of Naga, 2010
Outer Walls Materials
Barangays
Cogon Tagjaguimit
No. % No. %
Concrete/ Brick/ Stone 174 22.54 51 10.30
Wood 194 25.13 209 42.22
Half Concrete/ Brick/ Stone and Half Wood 132 17.10 39 7.88
Galvanized Iron/ Aluminum 1 0.13 3 0.61
Bamboo/ Sawali/ Cogon/ Nipa 247 31.99 192 38.79
Makeshift/ Salvaged/ Improvised Materials 5 0.65 1 0.20
Others 15 1.94 0 -
Not Reported 4 0.52 0 -
Total 772 100.00 495 100.00 Source: 2010 Census of Population and Housing (Philippine Statistics Authority, 2011)
Majority of the housing units in Barangays Lamac are made of wood (40.72%), and concrete
(35.09%). (Table 2-90)
Table 2-90: Construction Materials of the Outer Walls by First Household within the Housing Unit in the Impact Areas within the Municipality of Pinamungahan, 2010
Outer Walls Materials
Barangays
Lamac
No. %
Concrete/ Brick/ Stone 399 35.09
Wood 463 40.72
Half Concrete/ Brick/ Stone and Half Wood 105 9.23
Galvanized Iron/ Aluminum 1 0.09
Bamboo/ Sawali/ Cogon/ Nipa 154 13.54
Makeshift/ Salvaged/ Improvised Materials 2 0.18
Not Reported 13 1.14
Total 1137 100.00 Source: 2010 Census of Population and Housing (Philippine Statistics Authority, 2011)
In Barangays Media Once and Poog, the majority used concrete, brick, or stone as outer wall
materials of the housing units. In Barangay Bulongan, the majority of the housing units are made
of bamboo, sawali, cogon, or nipa. (Table 2-91)

QUARRY VENTURES PHILIPPINES, INC. Environmental Impact Assessment
February 2019 2-258
Table 2-91: Construction Materials of the Outer Walls by First Household within the Housing Unit in the Impact Areas within Toledo City, 2010
Outer Walls Materials
Barangays
Bulongan Media Once Poog
No. % No. % No. %
Concrete/ Brick/ Stone 137 24.95 452 33.04 450 38.36
Wood 158 28.78 343 25.07 325 27.71
Half Concrete/ Brick/ Stone and Half Wood
59 10.75 228 16.67 247 21.06
Galvanized Iron/ Aluminum 0 - 2 0.15 7 0.60
Bamboo/ Sawali/ Cogon/ Nipa 184 33.52 339 24.78 133 11.34
Makeshift/ Salvaged/ Improvised Materials
10 1.82 4 0.29 8 0.68
Others 1 0.18 0 - 0 -
Not Reported 0 - 0 - 3 0.26
Total 549 100.00 1368 100.00 1173 100.00 Source: 2010 Census of Population and Housing (Philippine Statistics Authority, 2011)
2.4.2 Migration Pattern
There are 98 to 99 percent of the population in Barangays Cogon and Tagjaguimit were already
residing in Cebu Province in 2005. About 2 percent of the population migrated in Cebu. In
Barangay Tagjaguimit, 2010 data showed that one (1) resident lived in the province was Ilocos
Norte while two (2) residents came from Negros Orinetal five (5) years ago. (Table 2-92)
Table 2-92: Place of Residence Five Years Ago in the Impact Areas within the City of Naga, 2010
Province/City
Barangays
Cogon Tagjaguimit
No. % No. %
City of Manila 5 0.16 0 -
City of Las Piñas 2 0.06 0 -
Ilocos Norte 0 - 1 0.05
Cavite 1 0.03 0 -
Quezon 2 0.06 0 -
Negros Occidental 7 0.22 0 -
Bohol 3 0.10 0 -
Cebu 3,099 99.04 1,990 99.85
Negros Oriental 2 0.06 2 0.10
Leyte 3 0.10 0 -
Misamis Oriental 1 0.03 0 -
Cotabato (North Cotabato) 2 0.06 0 -
South Cotabato 2 0.06 0 -
Total 3129 100.00 1993 100.00 Source: 2010 Census of Population and Housing (Philippine Statistics Authority, 2011)
As presented in Table 2-93, some residents from the impact barangays within the City of Naga
came from other city or municipality in Cebu five (5) years prior to 2010. In Barangay Cogon,

QUARRY VENTURES PHILIPPINES, INC. Environmental Impact Assessment
February 2019 2-259
twenty-eight individuals from Barangay Cogon were found to be residing in Minglanilla five (5)
years prior to 2010.
Table 2-93. Place of Residence in Cebu Province Five Years Ago in the Impact Areas within the City of Naga, 2010
City/Municipality in Cebu Province
Barangays
Cogon Tagjaguimit
No. % No. %
Alcantara 1 0.03 0 -
Barili 1 0.03 0 -
Carmen 1 0.03 0 -
Cebu City (Capital) 17 0.55 0 -
Danao City 1 0.03 0 -
Lapu-Lapu City (Opon) 2 0.06 0 -
Liloan 1 0.03 0 -
Mandaue City 2 0.06 0 -
Minglanilla 28 0.90 0 -
Moalboal 1 0.03 0 -
City of Naga 3,027 97.68 1,986 99.80
Pinamungahan 2 0.06 0 -
Ronda 1 0.03 0 -
City of Talisay 2 0.06 4 0.20
Toledo City 10 0.32 0 -
Cebu Total 3,099 100.00 1,990 100.00 Source: 2010 Census of Population and Housing (Philippine Statistics Authority, 2011)
Almost all of the residents in Barangay Lamac stayed within Cebu Province for more than five
years. As shown in Table 2-94, nine (9) residents in Barangay Lamac resided in other areas than
Cebu Province in 2005.
Table 2-94: Place of Residence Five Years Ago in the Impact Areas within the Municipality of Pinamungahan, 2010
Province/City
Barangays
Lamac
No. %
Rizal 2 0.05
Oriental Mindoro 4 0.10
Cebu 3955 99.77
Negros Oriental 1 0.03
Leyte 2 0.05
Total 3,964 100.00 Source: 2010 Census of Population and Housing (Philippine Statistics Authority, 2011)
In Barangay Lamac, twenty-six (26) residents stayed in other cities/municipalities within Cebu.
(Table 2-95)

QUARRY VENTURES PHILIPPINES, INC. Environmental Impact Assessment
February 2019 2-260
Table 2-95: Place of Residence in Cebu Province Five Years Ago in the Impact Areas within the Municipality of Pinamungahan, 2010
City/Municipality in Cebu Province
Barangays
Lamac
No. %
Aloguinsan 1 0.03
Balamban 1 0.03
Borbon 2 0.05
Cebu City (Capital) 12 0.30
Lapu-Lapu City (Opon) 3 0.08
Liloan 2 0.05
Minglanilla 1 0.03
Moalboal 2 0.05
Oslob 1 0.03
Pinamungahan 3,917 99.04
Ronda 1 0.03
Total 3,943 100.00 Source: 2010 Census of Population and Housing (Philippine Statistics Authority, 2011)
In Toledo City, barangays Bulongan, Media Once, and Poog, have immigrants from other
provinces.
Table 2-96: Place of Residence Five Years Ago of Population in the Impact Areas within Toledo City, 2010
Province/City
Barangays
Bulongan Media Once Poog
No. % No. % No. %
City of Manila 0 - 1 0.02 0 -
City of Marikina 2 0.10 0 - 0 -
Quezon City 0 - 1 0.02 1 0.02
Isabela 0 - 1 0.02 0 -
Laguna 0 - 5 0.09 0 -
Quezon 1 0.05 0 - 0 -
Camarines Sur 0 - 0 - 1 0.02
Masbate 0 - 1 0.02 3 0.06
Negros Occidental 0 - 0 - 8 0.16
Bohol 0 - 17 0.30 3 0.06
Cebu 2016 99.85 5588 99.43 4873 99.15
Negros Oriental 0 - 1 0.02 6 0.12
Leyte 0 - 0 - 8 0.16
Southern Leyte 0 - 0 - 1 0.02
Zamboanga Del Norte 0 - 1 0.02 0 -
Bukidnon 0 - 0 - 2 0.04
Lanao Del Norte 0 - 2 0.04 0 -
Misamis Oriental 0 - 1 0.02 0 -
Davao (Davao Del Norte) 0 - 0 - 5 0.10
Davao Del Sur 0 - 0 - 1 0.02
South Cotabato 0 - 0 - 1 0.02
Surigao Del Norte 0 - 0 - 2 0.04
Surigao Del Sur 0 - 1 0.02 0 -
Total 2,019 100.00 5,620 100.00 4,915 100.00

QUARRY VENTURES PHILIPPINES, INC. Environmental Impact Assessment
February 2019 2-261
Source: 2010 Census of Population and Housing (Philippine Statistics Authority, 2011)
Almost all of the residents from the impact Barangays in Toledo City who stayed within Cebu
Province for the past five (5) years from 2010 resided within Toledo City. Only a few in-migrated
from other city/municipality in Cebu Province as shown in Table 2-97.
Table 2-97: Place of Residence in Cebu Province Five Years Ago in the Impact Areas within Toledo City, 2010
City/Municipality in Cebu Province
Barangays
Bulongan Media Once Poog
No. % No. % No. %
Alcoy 0 - 1 0.02 0 -
Balamban 0 - 0 - 0 -
Bantayan 0 - 2 0.04 9 0.18
Barili 0 - 1 0.02 0 -
Carmen 0 - 1 0.02 0 -
Cebu City (Capital) 4 0.20 0 - 30 0.62
Consolacion 0 - 1 0.02 0 -
Dalaguete 0 - 2 0.04 1 0.02
Danao City 1 0.05 1 0.02 0 -
Lapu-Lapu City (Opon) 0 - 5 0.09 7 0.14
Malabuyoc 0 - 0 - 1 0.02
Mandaue City 1 0.05 8 0.14 3 0.06
Medellin 0 - 0 - 6 0.12
Minglanilla 0 - 5 0.09 0 -
City of Naga 0 - 0 - 1 0.02
Pinamungahan 0 - 2 0.04 0 -
San Remigio 1 0.05 0 - 0 -
Tabogon 0 - 1 0.02 0 -
City of Talisay 0 - 0 - 2 0.04
Toledo City 2,009 99.65 5,558 99.46 4,813 98.77
Total 2,016 100.00 5,588 100.00 4,873 100.00 Source: 2010 Census of Population and Housing (Philippine Statistics Authority, 2011)
2.4.3 Socioeconomic Profile
Health and Sanitation
Data on health services of the impact cities and municipality were sourced from the Cities and
Municipalities Competitive Index, and some from the 2018 barangay profiles.
The City of Naga has nine (9) doctors, 28 nurses, and 30 midwives deployed in public health
facilities. While private medical facilities employ 286 doctors, 171 nurses, and 41 midwives. There
are 31 private health facilities established in the City of Naga. Specifically to Cogon, they have
eleven (11) health workers, one (1) nutrition scholar, and one (1) nurse. They also have a Health
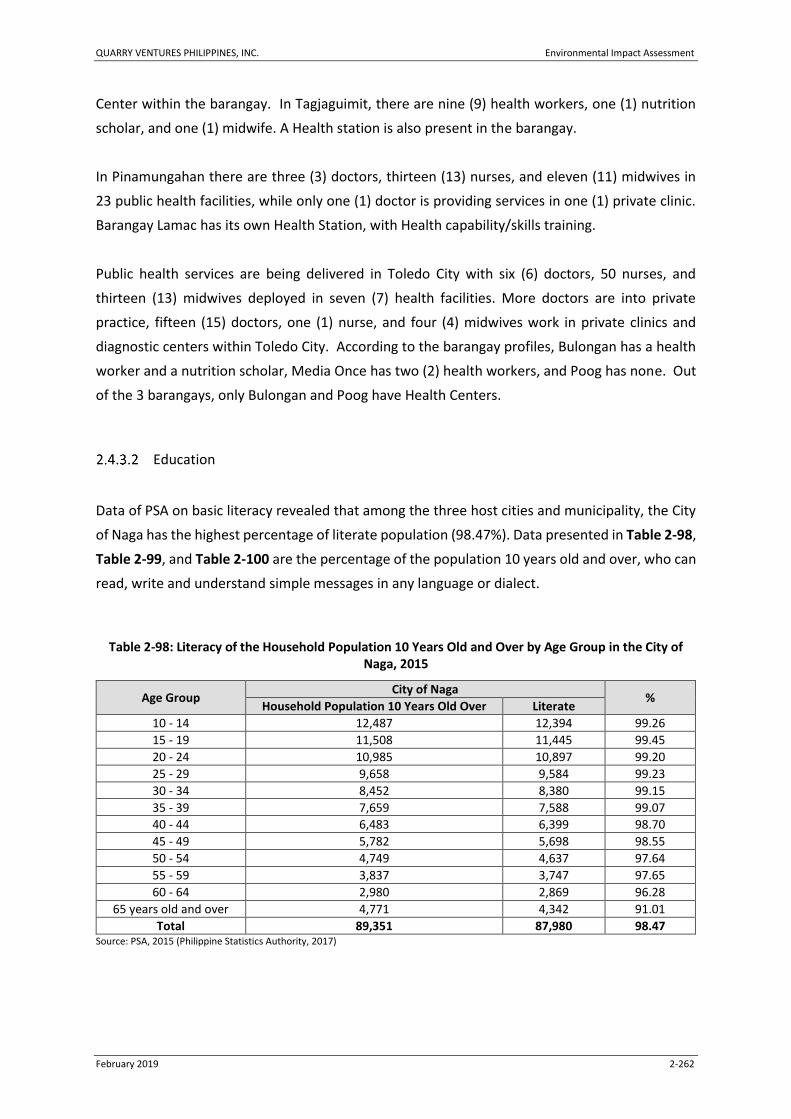
QUARRY VENTURES PHILIPPINES, INC. Environmental Impact Assessment
February 2019 2-262
Center within the barangay. In Tagjaguimit, there are nine (9) health workers, one (1) nutrition
scholar, and one (1) midwife. A Health station is also present in the barangay.
In Pinamungahan there are three (3) doctors, thirteen (13) nurses, and eleven (11) midwives in
23 public health facilities, while only one (1) doctor is providing services in one (1) private clinic.
Barangay Lamac has its own Health Station, with Health capability/skills training.
Public health services are being delivered in Toledo City with six (6) doctors, 50 nurses, and
thirteen (13) midwives deployed in seven (7) health facilities. More doctors are into private
practice, fifteen (15) doctors, one (1) nurse, and four (4) midwives work in private clinics and
diagnostic centers within Toledo City. According to the barangay profiles, Bulongan has a health
worker and a nutrition scholar, Media Once has two (2) health workers, and Poog has none. Out
of the 3 barangays, only Bulongan and Poog have Health Centers.
Education
Data of PSA on basic literacy revealed that among the three host cities and municipality, the City
of Naga has the highest percentage of literate population (98.47%). Data presented in Table 2-98,
Table 2-99, and Table 2-100 are the percentage of the population 10 years old and over, who can
read, write and understand simple messages in any language or dialect.
Table 2-98: Literacy of the Household Population 10 Years Old and Over by Age Group in the City of Naga, 2015
Age Group City of Naga
% Household Population 10 Years Old Over Literate
10 - 14 12,487 12,394 99.26
15 - 19 11,508 11,445 99.45
20 - 24 10,985 10,897 99.20
25 - 29 9,658 9,584 99.23
30 - 34 8,452 8,380 99.15
35 - 39 7,659 7,588 99.07
40 - 44 6,483 6,399 98.70
45 - 49 5,782 5,698 98.55
50 - 54 4,749 4,637 97.64
55 - 59 3,837 3,747 97.65
60 - 64 2,980 2,869 96.28
65 years old and over 4,771 4,342 91.01
Total 89,351 87,980 98.47 Source: PSA, 2015 (Philippine Statistics Authority, 2017)

QUARRY VENTURES PHILIPPINES, INC. Environmental Impact Assessment
February 2019 2-263
The municipality of Pinamungahan has the lowest percentage on literacy, among the host
communities. Based on the 2015 statistics, the literacy rate of Pinamungahan is 97.29% and the
age group 65 years old and over has the highest illiteracy statistics.
Table 2-99: Literacy of the Household Population 10 Years Old and Over by Age Group in Pinamunhgahan Municipality, 2015
Age Group Pinamungahan
% Household Population 10 Years Old Over Literate
10 - 14 7,529 7,459 99.07
15 - 19 6,681 6,629 99.22
20 - 24 5,975 5,925 99.16
25 - 29 5,124 5,060 98.75
30 - 34 4,259 4,197 98.54
35 - 39 3,893 3,826 98.28
40 - 44 3,359 3,291 97.98
45 - 49 2,991 2,896 96.82
50 - 54 2,710 2,585 95.39
55 - 59 2,239 2,136 95.40
60 - 64 1,767 1,638 92.70
65 years old and over 3,411 2,942 86.25
Total 49,938 48,584 97.29 Source: PSA, 2015 (Philippine Statistics Authority, 2017)
In Toledo City, there were about 2% of the population 10 years old and over who were considered
illiterate. The highest percentage of illiteracy is observed among the 65 years old and above age
groups.
Table 2-100: Literacy of the Household Population 10 Years Old and Over by Age Group in Toledo City, 2015
Age Group Toledo City
% Household Population 10 Years Old Over Literate
10 - 14 18,588 18,494 99.49
15 - 19 17,054 16,967 99.49
20 - 24 15,779 15,673 99.33
25 - 29 13,791 13,715 99.45
30 - 34 11,788 11,694 99.20
35 - 39 10,462 10,336 98.80
40 - 44 9,000 8,876 98.62
45 - 49 7,713 7,555 97.95
50 - 54 6,703 6,540 97.57
55 - 59 5,794 5,619 96.98
60 - 64 4,601 4,446 96.63
65 years old and over 7,572 6,853 90.50
Total 128,845 126,768 98.39 Source: PSA, 2015 (Philippine Statistics Authority, 2017)

QUARRY VENTURES PHILIPPINES, INC. Environmental Impact Assessment
February 2019 2-264
Table 2-101 present the out-of-school children (6 to 14 years old) and out –of-school youth (15
to 24 years) in the City of Naga. Out-of-school children are persons who are attending school while
the out-of-school youth are those who are not attending school, have not finished any college or
post -secondary course, and are not working. Almost all of the children in the City of Naga are
attending school, while there were a lot of youth who are not attending school or currently
working.
Table 2-101: Household Population 5 to 24 Years Old Who Were Currently Attending School by Age Group in the City of Naga, 2015
Age Group
City of Naga
% Household Population 5 to 24 Years Old
Household Population 5 to 24 Years Old Who Were Currently Attending School
5 - 9 13,090 12,399 94.72
10 - 14 12,487 12,019 96.25
15 - 19 11,508 6,907 60.02
20 - 24 10,985 1,298 11.82
Total 48,070 32,623 67.87 Source: PSA, 2015 (Philippine Statistics Authority, 2017)
In the municipality of Pinamungahan, only 10% of the population of ages 20 to 24 years old are in
school or who are currently employed. Higher percentage of children 5 to 14 years old within the
municipality are currently attending school.
Table 2-102: Household Population 5 to 24 Years Old Who Were Currently Attending School by Age Group in Pinamungahan Municipality, 2015
Age Group
Pinamungahan
% Household Population 5 to 24 Years Old
Household Population 5 to 24 Years Old Who Were Currently
Attending School
5 - 9 8,160 7,856 96.27
10 - 14 7,529 7,391 98.17
15 - 19 6,681 3,847 57.58
20 - 24 5,975 598 10.01
Total 28,345 19,692 69.47 Source: PSA, 2015 (Philippine Statistics Authority, 2017)
In Toledo City, only 55.93% of the youth ages 15 to 19 years old were attending school and only
11.72% of 20 to 24 years old youth are in school or are currently employed.

QUARRY VENTURES PHILIPPINES, INC. Environmental Impact Assessment
February 2019 2-265
Table 2-103: Household Population 5 to 24 Years Old Who Were Currently Attending School by Age Group in Toledo City, 2015
Age Group
Toledo City
% Household Population 5 to 24 Years Old
Household Population 5 to 24 Years Old Who Were Currently Attending School
5 - 9 20,250 19,389 95.75
10 - 14 18,588 17,716 95.31
15 - 19 17,054 9,539 55.93
20 - 24 15,779 1,849 11.72
Total 71,671 48,493 67.66 Source: PSA, 2015 (Philippine Statistics Authority, 2017)
The public elementary and secondary schools present in the impact barangays are presented in
Table 2-104.The number of enrollees during the school year 2015-2016 by gender is also shown.
Each of the impact barangay has an elementary school. Secondary schools, from Grade 7 to 10,
are accessible in all impact barangays within the City of Naga. Among the barangays in
Pinamungahan, secondary school is only available in Barangay Lamac. In the impact barangays
within Toledo City, secondary school is only available in barangays Media Once. Toledo City also
has a vocational school that offers secondary education from Grade 7 to 11.
Table 2-104: Public Schools within the Impact Barangays
Name of Public School
Enrollees SY 2015-2016
Males Females Total
No. % No. %
Elementary Schools
Cogon Elementary School 212 49.77 214 50.23 426
Tagjaguimit Elementary School 315 51.89 292 48.11 607
Lamac Elementary School 687 55.58 549 44.42 1,236
Bulongan Elementary School 307 53.02 272 46.98 579
Media Once Elementary School 472 55.14 384 44.86 856
Poog Elementary School 509 54.15 431 45.85 940
Secondary Schools
Cogon National High School 74 44.31 93 55.69 167
Tagjaguimit National High School 119 50.21 118 49.79 237
Lamac National High School 391 46.33 453 53.67 844
Media Once National High School 226 53.94 193 46.06 419
Toledo National Vocational School 434 46.32 503 53.68 937
Employment Profile
As presented in Table 2-105, most of the gainful workers (15 years old and above) residing in the
impact cities and municipality are Craft and Related Trades Workers. The PSA workers in this
occupational group apply specific knowledge and skills in the fields to construct and maintain
buildings, form metal, erect metal structures, set machine tools, or make, fit, maintain and repair
machinery, equipment or tools, carry out printing work, produce or process foodstuffs, textiles,

QUARRY VENTURES PHILIPPINES, INC. Environmental Impact Assessment
February 2019 2-266
or wooden, metal and other articles, including handicraft goods. This differs to the data in the
Province of Cebu. The most number of workers in Cebu belong to the Elementary Occupations
group. Occupations in this group involve the performance of simple and routine tasks which may
require the use of handheld tools and considerable physical effort.
Table 2-105: Gainful Workers 15 Years Old and Over by Major Occupation Group within Cebu Province and Impact Cities and Municipality, 2015
Major Occupation Group Cebu Province City of Naga
Pinamungahan Municipality
Toledo City
No. % No. % No. % No. %
Managers 86,270 7.55 1,944 4.69 985 4.27 3,991 6.75
Professionals 59,142 5.18 2,269 5.47 784 3.40 2,870 4.85
Technicians and Associate Professionals
49,815 4.36 2,345 5.65 706 3.06 2,639 4.46
Clerical Support Workers 51,933 4.54 2,097 5.05 604 2.62 2,734 4.62
Service and Sales Workers 164,984 14.44 6,360 15.33 3,173 13.77 7,798 13.19
Skilled Agricultural Forestry and Fishery Workers
199,402 17.45 3,734 9.00 3,971 17.23 7,002 11.84
Craft and Related Trades Workers
177,066 15.50 8,915 21.49 6,839 29.67 14,400 24.36
Plant and Machine Operators and Assemblers
122,281 10.70 5,441 13.12 2,053 8.91 5,603 9.48
Elementary Occupations 229,631 20.10 8,296 20.00 3,913 16.98 11,996 20.29
Armed Forces Occupations 610 0.05 19 0.05 7 0.03 20 0.03
Other Occupation Not Elsewhere Classified
- - - - - - - -
Not Reported 1,574 0.14 66 0.16 13 0.06 64 0.11
Total 1,142,708 100.00 41,486 100.00 23,048 100.00 59,117 100.00 Source: PSA, 2015 (Philippine Statistics Authority, 2017)
Poverty Incidence
Based on the 2012 Official Poverty Statistics published by PSA, poverty incidence in the province
of Batangas increased from 2006, to 2009, and to 2012. The recorded poverty incidence in Cebu
in 2012 was 18.9%, it is lower than the national average which was 19.7%. It was also observed
that the magnitude of poor families and population continuously increased from the three survey
periods. The Annual per Capita Poverty Threshold in rural areas of Cebu increased in 2012 with
Php 18,570 compared to the value during 2006 (Php 14,850) and 2009 (Php 17,505.00). The value
for the province of Cebu was lower than the Annual Per Capita Poverty Threshold for the whole
country which is Php 18,935.00. Poverty threshold is the minimum income required for a
family/individual to meet the basic food and non-food requirements (Philippine Statistics
Authority, 2013).

QUARRY VENTURES PHILIPPINES, INC. Environmental Impact Assessment
February 2019 2-267
Table 2-106: Comparative Poverty Statistics of Cebu Province: 2006, 2009, 2012
Indicators Year
2006 2009 2012
Poverty Incidence Among Population (%) 25.2 22.3 18.9
Magnitude of Poor Population 1,184,478 1,108,152 1,000,163
Magnitude of Poor Families 209,301 200,481 185,603
Annual per Capita Poverty Threshold (in Pesos) 14,850 17,505 18,570 Source: 2012 Full Year Official Poverty Statistics (Philippine Statistics Authority, 2013)
2.4.4 Perception Survey
A Perception Survey for the direct impact barangays were conducted from September 19 to
October 10, 2016. The survey was conducted in the barangays of Cogon and Tagjaguimit in the
City of Naga; Lamac in the Municipality of Pinamungahan; and Bulongan, Media Once, and Poog
in Toledo City with a total of 300 respondents. The surveys were participated by different sectors
such as members of the barangay council and other barangay functionaries, senior citizens, health
workers, farmers, women and youth sectors.
The survey questionnaire was divided into seven (7) major components, namely (1) Socio-
Demographic; (2) Socio-Economic; (3) Housing Condition; (4) Education and Health Situation; (5)
Perceived Community Problems and Proposed Solutions; (6) Project Awareness and Acceptability;
and (7) Perceived Advantages and Disadvantages of the Proposed Project.
The Survey Questionnaire is attached as Annex 10. The documentation of the conducted survey
is found in Annex 11.
Demographic Profile of Survey Respondents
Gender. Majority of the respondents are females with 56.33% (169) of the total respondents.
Males comprise 28.33% of the total respondents. Ten (10) percent of the respondents did not
identify their gender.
Table 2-107: Gender of Survey Respondents
Gender
Co
gon
Tagj
agu
imit
Lam
ac
Bu
lon
gan
Me
dia
On
ce
Po
og
Total %
Female 31 33 33 34 19 19 169 56.33%
Male 16 14 13 10 19 13 85 28.33%
No. Answer 3 3 4 6 12 18 46 15.33%
Total 50 50 50 50 50 50 300 100%

QUARRY VENTURES PHILIPPINES, INC. Environmental Impact Assessment
February 2019 2-268
Age. Table 2-108 shows the age distribution of the respondents. The most number of respondents
came from the age bracket 40-49 years old with 19.00% followed by age brackets 60 to 69 years
old with 18.67%.
Table 2-108: Age of Survey Respondents
Age
Co
gon
Tagj
agu
imit
Lam
ac
Bu
lon
gan
Me
dia
On
ce
Po
og
Total %
15-19 2 4 1 7 4 7 25 8.33%
20-29 10 8 5 1 7 13 44 14.67%
30-39 16 8 6 6 8 11 55 18.33%
40-49 12 7 10 15 9 4 57 19.00%
50-59 4 16 17 5 4 7 53 17.67%
60-69 6 6 8 14 14 8 56 18.67%
70 and over 0 1 3 2 4 0 10 3.33%
Total 50 50 50 50 50 50 300 100.00%
Birthplace. Majority (67.82%) of the respondents were born in the barangay. There were
12.33%% of them who were born from other province and 7.67% from other municipalities in
Cebu. Only 10.33% of the respondents came from other barangay within the respective
municipality/city as presented in Table 2-109.
Table 2-109: Birthplace of Survey Respondents
Birthplace
Co
gon
Tagj
agu
imit
Lam
ac
Bu
lon
gan
Me
dia
On
ce
Po
og
Total %
Within Barangay 36 43 40 26 27 36 208 69.33%
Different Barangay 11 1 2 4 7 6 31 10.33%
Other part of Cebu 3 4 7 3 6 0 23 7.67%
Outside Cebu 0 2 1 16 10 8 37 12.33%
No Answer 0 0 0 1 0 0 1 0.33%
Total 50 50 50 50 50 50 300 100.00%
Civil Status. Most of the respondents were married with 56.33% of the total respondents. There
were 21.67% who were single. Sixty-four (64) or 21.33% of the respondents were widowed. Only
0.67% were separated from their partners. The details are shown in Table 2-110.
Table 2-110: Civil Status of Survey Respondents

QUARRY VENTURES PHILIPPINES, INC. Environmental Impact Assessment
February 2019 2-269
Civil Status
Co
gon
Tagj
agu
imit
Lam
ac
Bu
lon
gan
Me
dia
On
ce
Po
og
Total %
Married 30 36 40 23 19 21 169 56.33%
Single 8 12 4 10 13 18 65 21.67%
Separated 2 0 0 0 0 0 2 0.67%
Widowed 10 2 6 17 18 11 64 21.33%
No Answer 0 0 0 0 0 0 0 0.00%
Total 50 50 50 50 50 50 300 100.00%
Ethnicity. Majority of the respondents (88.33%) are Cebuano. The next most common ethnicity
among the respondents is Ilonggo with 5.67% followed by Waray with 3.00% of the total
respondents as shown in Table 2-111.
Table 2-111: Ethnicity of Survey Respondents
Ethnic Group
Co
gon
Tagj
agu
imit
Lam
ac
Bu
lon
gan
Me
dia
On
ce
Po
og Total %
Sugbuhanon 49 49 44 48 40 35 265 88.33%
Tagalog 0 1 0 0 0 0 1 0.33%
Ilonggo 0 0 3 0 3 11 17 5.67%
Waray 0 0 0 1 6 2 9 3.00%
Negros 0 0 2 0 0 0 2 0.67%
Zamboanga 0 0 1 0 0 0 1 0.33%
Davao 0 0 0 0 1 0 1 0.33%
Other 0 0 0 0 0 2 2 0.67%
No Answer 1 0 0 1 0 0 2 0.67%
Total 50 50 50 50 50 50 300 100.00%
Religion. Most of the respondents or 86.00% are Roman Catholics. A considerable number of
respondents are also affiliated with Iglesia ni Cristo (8.67%) as shown in Table 2-112.
Table 2-112: Religious Affiliation of Survey Respondents
Religion
Co
gon
Tagj
agu
imit
Lam
ac
Bu
lon
gan
Me
dia
On
ce
Po
og
Total %
Roman Catholic 48 43 47 37 42 41 258 86.00%
Iglesia ni Cristo 2 0 1 11 7 5 26 8.67%
Born Again 0 7 0 2 0 0 9 3.00%
Protestant 0 0 2 0 1 3 6 2.00%
Bible Baptist 0 0 0 0 0 0 0 0.00%
No Answer 0 0 0 0 0 1 1 0.33%

QUARRY VENTURES PHILIPPINES, INC. Environmental Impact Assessment
February 2019 2-270
Religion
Co
gon
Tagj
agu
imit
Lam
ac
Bu
lon
gan
Me
dia
On
ce
Po
og
Total %
Total 50 50 50 50 50 50 300 100.00%
Settlement History. Twenty-one percent of the survey respondents have been residing in the
barangay for 21 to 30 years. There were 20.33% who has been residing in the barangay for 41 to
50 years. Only 1.33% of the total respondents reside in the barangay for 71 to 80 years. The details
are shown in Table 2-113.
Table 2-113: Settlement History of Survey Respondents
Years of Residency
Co
gon
Tagj
agu
imit
Lam
ac
Bu
lon
gan
Me
dia
On
ce
Po
og
Total %
1-10 0 2 4 1 5 2 14 4.67%
11-20 5 2 4 8 6 10 35 11.67%
21-30 9 7 5 9 12 21 63 21.00%
31-40 14 8 6 10 5 12 55 18.33%
41-50 14 8 10 15 10 4 61 20.33%
51-60 2 17 14 4 8 1 46 15.33%
61-70 5 3 5 1 2 0 16 5.33%
71-80 0 1 2 1 0 0 4 1.33%
No Answer 1 2 0 1 2 0 6 2.00%
Total 50 50 50 50 50 50 300 100.00%
Socio-Economic Profile of the Respondents
Source of Income. Most (28.67%) of the respondents are not employed and has no regular
sources of income. Farmers comprise 13.33% of the total respondents. Twenty (20) survey
respondents or 6.67% rely on employment for construction work as their source of income.
Salaried employees/ workers composed of 22.00% of the respondents. Some of them depend on
vending (13.67%) and carpentry (2.33%). Government employees mostly as part of the office of
the barangay council compose the 1.00% of the respondents while 4.67% of them said that they
source their income from other means. The details are shown in Table 2-114.
Table 2-114: Sources of Income of Survey Respondents

QUARRY VENTURES PHILIPPINES, INC. Environmental Impact Assessment
February 2019 2-271
Income Source
Co
gon
Tagj
agu
imit
Lam
ac
Bu
lon
gan
Me
dia
On
ce
Po
og
Total %
Farming 0 8 17 6 4 5 40 13.33%
Salaried 17 8 6 5 17 13 66 22.00%
Construction Work 3 1 6 1 2 7 20 6.67%
Government Employee 0 2 0 1 0 0 3 1.00%
Vending 4 5 12 5 8 7 41 13.67%
Carpentry 0 0 0 1 4 2 7 2.33%
Pension 0 2 0 6 11 0 19 6.33%
None 26 23 9 19 4 5 86 28.67%
Other 0 1 0 2 0 11 14 4.67%
No Answer 0 0 0 4 0 0 4 1.33%
Total 50 50 50 50 50 50 300 100.00%
Estimated household income. Majority of the respondents (26.00%) earn a monthly income of
P5,000 and over, while 25.67% were not income earners that they don’t have any work at all or
the survey question was not applicable to them. There were 19.00% of the total respondents who
were earning an income of P2,000 –P2,999.00. The details are shown in Table 2-115.
Table 2-115: Estimated Household Income of Survey Respondents
Income Range
Co
gon
Tagj
agu
imit
Lam
ac
Bu
lon
gan
Me
dia
On
ce
Po
og Total %
less than 1,000 0 3 0 2 1 3 9 3.00%
P1,000 - P1,999 0 10 0 4 3 4 21 7.00%
P2,000 - P2,999 1 3 11 14 19 9 57 19.00%
P3,000 - P3,999 1 1 26 0 0 5 33 11.00%
P4,000 - P4,999 10 6 3 3 0 1 23 7.67%
P5,000 & over 15 7 4 4 22 26 78 26.00%
Not Applicable 23 20 6 23 5 0 77 25.67%
None 0 0 0 0 0 2 2 0.67%
Total 50 50 50 50 50 50 300 100.00%
Tenurial Status of Farmland. Only a few (27.33% or 82) from the survey respondents owns or
farms a parcel of farmland. Majority or 69.67% (209) of the survey respondents do not have
farmlands. (Table 2-116)

QUARRY VENTURES PHILIPPINES, INC. Environmental Impact Assessment
February 2019 2-272
Table 2-116: Availability of Farmland to Survey Respondents
Availability of Farm Land
Co
gon
Tagj
agu
imit
Lam
ac
Bu
lon
gan
Me
dia
On
ce
Po
og Total %
Yes 7 19 39 5 5 7 82 27.33%
None 43 30 8 41 45 42 209 69.67%
No Answer o 1 3 4 0 1 9 3.00%
Total 50 50 50 50 50 50 300 100.00%
For those who have farmlands, 20.33% of them owns the land that they farm and till themselves.
Almost 10% utilizes the farmland under lease contract and 14.00% of the survey respondents
owns a farmland but lease it to other farmers. (Table 2-117)
Table 2-117: Tenurial Status on Farmland of Survey Respondents
Tenurial Status
Co
gon
Tagj
agu
imit
Lam
ac
Bu
lon
gan
Me
dia
On
ce
Po
og Total %
Owned 2 0 0 0 0 0 2 0.67%
Owned-Farmed 2 5 38 4 4 8 61 20.33%
Leased 7 22 7 3 3 0 42 14.00%
Tenancy/Rented 0 0 0 0 1 0 1 0.33%
Others 1 0 0 2 0 0 3 1.00%
None 0 0 0 0 42 42 14.00%
No Answer 38 23 5 41 42 0 149 49.67%
Total 50 50 50 50 50 50 300 100.00%
Farm Products. Table 2-118 show the goods that the farmers in the area produce. Corn (16.17%)
and banana (13.77%) are the most common products that they produce. Some 8.38% of the total
products comprise Root crops, coconut (5.99%) and mango (3.59%). Only 5.79% of them are into
poultry production.
Table 2-118: Farm Products of Survey Respondents
Farm Products
Co
gon
Tagj
agu
imit
Lam
ac
Bu
lon
gan
Me
dia
On
ce
Po
og
Total %
Corn 7 25 36 5 1 7 81 16.17%
Banana 8 20 30 6 3 2 69 13.77%
Mango 1 3 13 0 1 18 3.59%
Sugracane 0 9 1 0 0 0 10 2.00%
Coconut 5 10 12 0 1 2 30 5.99%
Rice 0 2 0 1 0 0 3 0.60%
Rootcrops 1 8 33 0 0 0 42 8.38%
Other fruit bearing tree 0 1 12 0 0 0 13 2.59%
Poultry 4 16 8 1 0 0 29 5.79%
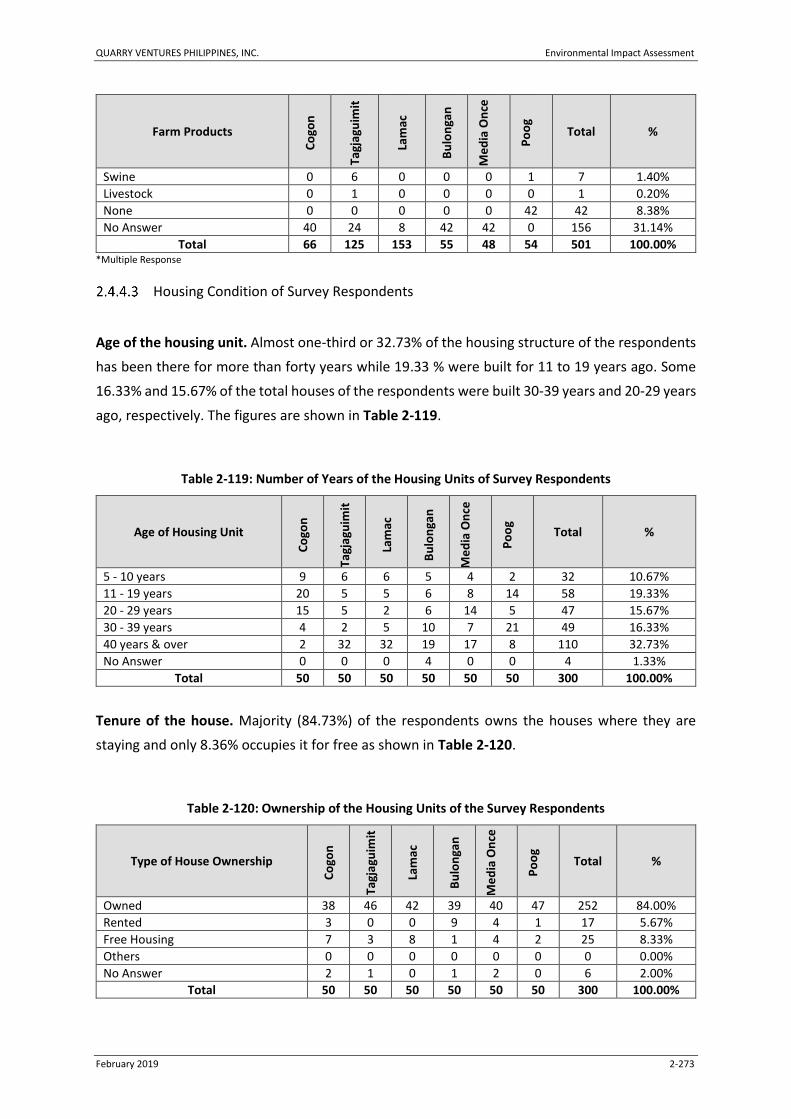
QUARRY VENTURES PHILIPPINES, INC. Environmental Impact Assessment
February 2019 2-273
Farm Products
Co
gon
Tagj
agu
imit
Lam
ac
Bu
lon
gan
Me
dia
On
ce
Po
og
Total %
Swine 0 6 0 0 0 1 7 1.40%
Livestock 0 1 0 0 0 0 1 0.20%
None 0 0 0 0 0 42 42 8.38%
No Answer 40 24 8 42 42 0 156 31.14%
Total 66 125 153 55 48 54 501 100.00% *Multiple Response
Housing Condition of Survey Respondents
Age of the housing unit. Almost one-third or 32.73% of the housing structure of the respondents
has been there for more than forty years while 19.33 % were built for 11 to 19 years ago. Some
16.33% and 15.67% of the total houses of the respondents were built 30-39 years and 20-29 years
ago, respectively. The figures are shown in Table 2-119.
Table 2-119: Number of Years of the Housing Units of Survey Respondents
Age of Housing Unit
Co
gon
Tagj
agu
imit
Lam
ac
Bu
lon
gan
Me
dia
On
ce
Po
og
Total %
5 - 10 years 9 6 6 5 4 2 32 10.67%
11 - 19 years 20 5 5 6 8 14 58 19.33%
20 - 29 years 15 5 2 6 14 5 47 15.67%
30 - 39 years 4 2 5 10 7 21 49 16.33%
40 years & over 2 32 32 19 17 8 110 32.73%
No Answer 0 0 0 4 0 0 4 1.33%
Total 50 50 50 50 50 50 300 100.00%
Tenure of the house. Majority (84.73%) of the respondents owns the houses where they are
staying and only 8.36% occupies it for free as shown in Table 2-120.
Table 2-120: Ownership of the Housing Units of the Survey Respondents
Type of House Ownership
Co
gon
Tagj
agu
imit
Lam
ac
Bu
lon
gan
Me
dia
On
ce
Po
og
Total %
Owned 38 46 42 39 40 47 252 84.00%
Rented 3 0 0 9 4 1 17 5.67%
Free Housing 7 3 8 1 4 2 25 8.33%
Others 0 0 0 0 0 0 0 0.00%
No Answer 2 1 0 1 2 0 6 2.00%
Total 50 50 50 50 50 50 300 100.00%

QUARRY VENTURES PHILIPPINES, INC. Environmental Impact Assessment
February 2019 2-274
Lot ownership. Over half (48.33%) of the lots occupied by the houses of the survey respondents
were owned while 42.67% of them are renting the lots for free as shown in Table 2-121.
Table 2-121: Ownership of Lots of the Survey Respondents
Type of Lot Ownership
Co
gon
Tagj
agu
imit
Lam
ac
Bu
lon
gan
Me
dia
On
ce
Po
og
Total %
Owned 38 41 38 11 7 10 145 48.33%
Rented 3 0 3 11 6 1 24 8.00%
Rent-Free 8 9 9 27 36 39 128 42.67%
Others 1 0 0 1 0 0 2 0.67%
No Answer 0 0 0 0 1 0 1 0.33%
Total 50 50 50 50 50 50 300 100.00%
Education, Health and Sanitation Situation of Survey Respondents
Educational Attainment. Almost half or 45.67% of the survey respondents reached or finished
high school while 38.00% studied or finished elementary education. There were 5.33% of them
who entered or finished college and only 7.33% attended vocational schooling. The details are
shown in Table 2-122.
Table 2-122: Highest Educational Attainment of the Survey Respondents
Educational Attainment
Co
gon
Tagj
agu
imit
Lam
ac
Bu
lon
gan
Me
dia
On
ce
Po
og
Total %
Elementary 9 33 25 26 15 6 114 38.00%
High School 33 12 17 16 25 34 137 45.67%
Vocational 5 3 4 4 6 0 22 7.33%
College 2 1 0 1 2 10 16 5.33%
None 0 0 4 2 1 0 7 2.33%
No Answer 1 1 0 1 1 0 4 1.33%
Total 50 50 50 50 50 50 300 100.00%
Household members experienced sickness. Majority or 39.33% of the respondents answered
that two (2) members of the household got sick from the previous year. This was followed by the
20.67% of the responded with only one (1) members of the household experienced illness and
18.00% said that three (3) member got sick last year. Only 3.00% of the respondents answered
that no one in the household experienced illness the previous year. Details are presented in Table
2-123.

QUARRY VENTURES PHILIPPINES, INC. Environmental Impact Assessment
February 2019 2-275
Table 2-123. Household Members of the Survey Respondents Who Experienced Illness
Number
Co
gon
Tagj
agu
imit
Lam
ac
Bu
lon
gan
Me
dia
On
ce
Po
og
Total %
1 3 5 7 14 22 11 62 20.67%
2 22 6 23 22 24 21 118 39.33%
3 11 10 14 4 0 15 54 18.00%
4 6 13 2 0 1 0 22 7.33%
5 6 4 1 1 0 1 13 4.33%
6 1 9 0 1 1 0 12 4.00%
7 and up 0 1 0 0 0 0 1 0.33%
None 0 0 1 5 1 2 9 3.00%
No Answer 1 2 2 3 1 0 9 3.00%
Total 50 50 50 50 50 50 300 100.00%
Illnesses experienced by the household members of the respondents. For those who got sick
during the previous year, 40.86% of them acquired cough and colds while 36.38% experienced
fever. One respondent from Barangay Tagjaguimit specifically identified that a household
member suffered from stroke (others). As shown in Table 2-124.
Table 2-124: Illnesses experienced by the household members of the Survey Respondents
Illness
Co
gon
Tagj
agu
imit
Lam
ac
Bu
lon
gan
Me
dia
On
ce
Po
og
Total %
Cough and Colds 43 49 46 42 33 33 246 40.86%
Fever 38 47 42 32 25 35 219 36.38%
Diarrhea 19 30 19 3 6 15 92 15.28%
Infection 1 0 0 16 10 6 33 5.48%
Others 0 1 0 0 0 1 2 0.33%
None 0 0 0 0 1 1 2 0.33%
No Answer 1 0 3 3 1 0 8 1.33%
Total 102 127 110 96 76 91 602 100.00% * Multiple Responses
Health facilities and providers accessed by survey respondents. Most of the respondents or
56.77% availed of the services of the Barangay Health Center for treatment. About a quarter or
26.40% opted to treat illnesses within their homes. The details are shown in Table 2-125.
Table 2-125: Health facilities and providers accessed by the Survey Respondents

QUARRY VENTURES PHILIPPINES, INC. Environmental Impact Assessment
February 2019 2-276
Health Facility/ Provider
Co
gon
Tagj
agu
imit
Lam
ac
Bu
lon
gan
Me
dia
On
ce
Po
og
Total %
Barangay Health Center 44 42 43 11 22 10 172 56.77%
BHW 0 0 0 0 0 1 1 0.33%
Private doctor 1 3 1 1 0 3 9 2.97%
Home 0 0 0 29 22 29 80 26.40%
Hospital 3 5 1 0 3 8 20 6.60%
Herbalist 0 0 0 3 1 2 6 1.98%
No Answer 2 0 5 6 2 0 15 4.95%
Total 50 50 50 50 50 53 303 100.00%
Water Source. More than half of the respondents (62.00%) source their water through hand-
pump deep well followed by a communal water source at 13.67%. Some of the respondents or
12.00% are already connected with the Local Water District as presented in Table 2-126.
Table 2-126: Water Source of the Survey Respondents
Source of Water
Co
gon
Tagj
agu
imit
Lam
ac
Bu
lon
gan
Me
dia
On
ce
Po
og
Total %
Well 3 0 5 10 7 9 34 11.33%
Hand-pump 46 49 20 32 31 8 186 62.00%
Communal 0 1 0 3 9 28 41 13.67%
MCWD 0 0 25 4 2 5 36 12.00%
No Answer 1 0 0 1 1 0 3 1.00%
Total 50 50 50 50 50 50 300 100.00%
Toilet Facility. Table 2-127 shows the type of toilet facilities of the survey respondents. Most of
them (90.00%) have the water-sealed toilet facility but there are still 4.33% of them who were
using communal toilet facility and 2.67% share common toilet facility with relatives.
Table 2-127. Toilet Facilities of the Survey Respondents
Toilet Facility
Co
gon
Tagj
agu
imit
Lam
ac
Bu
lon
gan
Me
dia
On
ce
Po
og
Total %
Owned, Water Sealed 42 45 48 37 48 50 270 90.00%
Communal 2 3 1 7 0 0 13 4.33%
Common Toilet with Relatives 5 1 0 1 1 0 8 2.67%
None/Anywhere 0 1 1 4 0 0 6 2.00%
No Answer 1 0 0 1 1 0 3 1.00%
Total 50 50 50 50 50 50 300 100.00%

QUARRY VENTURES PHILIPPINES, INC. Environmental Impact Assessment
February 2019 2-277
Waste disposal. Data presented in Table 2-128 shows the type of garbage disposal of the survey
respondents. Majority (65.67%) of them dispose their waste in the common dumpsite while
16.67% dispose it in their own backyard. About 10% of the respondents said that their wastes
were collected by the barangay. There were 4.67% who dispose waste through other means or
burning.
Table 2-128: Type of Waste Disposal of the Survey Respondents
Type of Waste Disposal
Co
gon
Tagj
agu
imit
Lam
ac
Bu
lon
gan
Me
dia
On
ce
Po
og
Total %
Collected by Barangay 0 4 0 2 10 14 30 10.00%
Communal Disposal 38 35 28 35 34 27 197 65.67%
Backyard Disposal 7 8 19 2 5 9 50 16.67%
Other - burning 3 3 1 7 0 0 14 4.67%
No Answer 2 0 2 4 1 0 9 3.00%
Total 50 50 50 50 50 50 300 100.00%
Perceived Community Problems and Proposed Solutions
Perceived community problems. The table below shows the perceived problems facing the
residents in the barangay. Most of the responses identified unemployment (26.13%) and poverty
(15.13%) as the main problem in their barangay. The need to train the residents on Solid Waste
Management was also identified as a problem with 11.69% of the responses as well as the lack of
capitalization for small business (11.00%). Insufficient support for schooling (8.74%) and Lack of
support for farming (5.89%) were also a pressing concern. Other specific problems identified are
shown in Table 2-129.
Table 2-129: Perceived Community Problems of the Survey Respondents
Community Problems
Co
gon
Tagj
agu
imit
Lam
ac
Bu
lon
gan
Me
dia
On
ce
Po
og
Total %
Unemployment 48 42 45 41 49 41 266 26.13%
Poverty 35 44 42 9 5 19 154 15.13%
Inaccessibility to clean & Drinking water 8 9 4 1 0 0 22 2.16%
Lack of water for irrigation 2 1 1 1 0 1 6 0.59%
Malnutrition 5 5 3 2 2 2 19 1.87%
Limited school supplies 3 1 5 0 1 5 15 1.47%
Insufficient support for schooling 15 29 8 6 9 22 89 8.74%

QUARRY VENTURES PHILIPPINES, INC. Environmental Impact Assessment
February 2019 2-278
Community Problems
Co
gon
Tagj
agu
imit
Lam
ac
Bu
lon
gan
Me
dia
On
ce
Po
og
Total %
Lack of assistance for livelihood 1 1 6 2 2 5 17 1.67%
Limited number of teachers 8 2 0 1 0 2 13 1.28%
Lack of small business capital 26 36 38 2 2 8 112 11.00%
Limited medical supplies 12 13 2 3 4 5 39 3.83% Lack of transportation facilities (bridge, road)
6 0 5 0 3 11 25 2.46%
Lack of recreational facilities 5 0 3 1 1 7 17 1.67%
Lack of support for farming 16 5 29 2 3 5 60 5.89% Lack of support for training the People’s Organizations
12 3 7 2 1 5 30 2.95%
Lack of training to ensure proper Solid Waste Management
38 38 35 2 3 3 119 11.69%
Others 2 2 1 0 0 1 6 0.59%
No Answer 2 0 2 4 1 0 9 0.88%
Total 244 231 236 79 86 142 1018 100.00% * Multiple Responses
Proposed solutions to the community problems. The proposed solutions to the community
problems identified by survey respondents are presented in this section. The survey shows that
most of the respondents suggest that generating and availability of jobs and setting up livelihood
programs (39.57%) in the community are the main solution to the identified problems in the
community. Respondents also suggest that support for health (22.75%), support for the education
of children (12.92%), support farming (11.44%), Road construction (6.19%) and the availability of
clean and drinking water (4.44%) can also be part of the priority programs to help address the
problems in their community. The details are shown in Table 2-130.
Table 2-130: Solutions to the community problems Proposed by the Survey Respondents
Proposed Solutions
Co
gon
Tagj
agu
imit
Lam
ac
Bu
lon
gan
Me
dia
On
ce
Po
og
Total %
Jobs and livelihood 57 49 47 45 48 48 294 39.57%
Clean drinking water 12 13 4 0 3 1 33 4.44%
Support for education of children 21 32 9 7 6 21 96 12.92%
Support for farming 23 13 30 4 7 8 85 11.44%
Road construction 17 0 12 4 4 9 46 6.19%
Support for health 49 48 35 4 8 25 169 22.75%
Others 3 0 5 0 0 0 8 1.08%
No Answer 4 0 3 4 1 0 12 1.62%
Total 186 155 145 68 77 112 743 100.00% * Multiple Responses

QUARRY VENTURES PHILIPPINES, INC. Environmental Impact Assessment
February 2019 2-279
Project Awareness
The figure below, Table 2-131, shows the level of awareness of the respondents on the proposed
project.
Most of the respondents (55.00%) have no prior knowledge about the proposed quarry
operations before the conduct of the survey while a little less half (119 or 39.67%) of the total
number of the respondents were already aware or have prior knowledge.
Table 2-131: Awareness of the Survey Respondents on the Proposed Quarry Operation
Awareness
Co
gon
Tagj
agu
imit
Lam
ac
Bu
lon
gan
Me
dia
On
ce
Po
og
Total %
Aware 30 32 7 19 11 20 119 39.67%
Not aware 13 17 41 30 37 27 165 55.00%
No Answer 7 1 2 1 2 3 16 5.33%
Total 50 50 50 50 50 50 300 100.00%
Source of Information. Table 2-132 shows the source of information of the respondents on the
proposed project. Majority of the respondents (16.82%) who have prior knowledge about the
project before the conduct of the survey sourced their information through community meetings.
There are 14.67% of them learned about it through the barangay council members or officials and
12% through word of mouth.
Table 2-132. Sources of Information of the Survey Respondents on the Proposed Quarry Operation
Information Source
Co
gon
Tagj
agu
imit
Lam
ac
Bu
lon
gan
Me
dia
On
ce
Po
og
Total %
Word of mouth 15 1 5 8 3 4 36 12.00%
Barangay Council or Officials 13 18 3 3 1 6 44 14.67%
Meetings 2 11 1 12 11 11 48 16.00%
Others - Relatives 0 2 0 0 0 0 2 0.67%
No Answer 20 18 41 27 35 29 170 56.67%
Total 50 50 50 50 50 50 300 100.00%
Perceived Advantages and Disadvantages of the Proposed Project

QUARRY VENTURES PHILIPPINES, INC. Environmental Impact Assessment
February 2019 2-280
Perceived Advantages. Almost half (43.24%) of the respondents said that the project will provide
employment opportunities for the residents of the barangay. There are 14.25% who said that it
will create business opportunity and 14.50% of them said that additional income for the barangay
will be available. There are 107 respondents who refused to give their answers, Barangay Lamac
has the most number of respondents who did not give their answer. The details of the responses
for each barangay are shown in Table 2-133.
Table 2-133. Advantages of the Proposed Quarry Project Perceived by the Survey Respondents
Advantages
Co
gon
Tagj
agu
imit
Lam
ac
Bu
lon
gan
Me
dia
On
ce
Po
og
Total %
Employment opportunities 37 24 11 35 37 32 176 43.24%
Livelihood and business opportunities 33 17 4 1 2 1 58 14.25%
Additional income for the Barangay and city/ municipality
32 18 4 2 1 2 59 14.50%
Social development projects in the barangay 1 2 0 0 0 1 4 0.98%
Others 2 0 0 0 0 1 3 0.74%
None 0 0 0 0 0 0 0 0.00%
No Answer 12 13 39 14 13 16 107 26.29%
Total 117 74 58 52 53 53 407 100% * Multiple Responses
Perceived Disadvantages. Majority of the responses identify environmental degradation
(25.35%) to be the most disadvantageous to the community followed by disturbance of peace and
order (12.81%) and loss of jobs and livelihood (3.06%). Some 1.23% of them believe that the
project will cause in-migration. There are 0.28% of the responses said that the proposed project
has no disadvantages. However, more than half (57.38%) did not provide answers. Higher
percentage of responses in Barangay Lamac expressed that the proposed project might result to
environmental degradation. Table 2-134 shows the detailed responses for each barangay.
Table 2-134. Disadvantages of the Proposed Quarry Project Perceived by the Survey Respondents
Disadvantages
Co
gon
Tagj
agu
imit
Lam
ac
Bu
lon
gan
Me
dia
On
ce
Po
og
Total %
Environmental Degradation 4 11 38 7 12 19 91 25.35%
Loss of current sources income 1 0 9 1 0 0 11 3.06%
Disturb peace & order in the community 2 2 5 7 11 19 46 12.81%
Influx of migrants 0 0 4 0 0 0 4 1.11%
None 0 0 0 0 0 1 1 0.28%
No Answer 46 39 11 42 38 30 206 57.38%
Total 53 52 67 57 61 69 359 100.00% * Multiple Responses

QUARRY VENTURES PHILIPPINES, INC. Environmental Impact Assessment
February 2019 2-281
Assessment of Impacts and Mitigating Measures
Displacement of settlers
The proposed site for development is currently upland rural communities. Due to the proposed
project, the area will be converted to industrial zones. Based on the initial survey, ten (10) puroks
within the six (6) impact barangays will be directly affected by the project in terms of land
utilization. The data presented in Table 2-134 is a result of initial appraisal in the area.
Table 2-134. Purok and Households to be Directly Affected
City/ Municipality Barangay Total No. of Purok/Sitio
No. of Affected Purok/Sitio
City of Naga Cogon 10 1
Tagjaguimit 7 1
Pinamungahan Municipality Lamac 20 1
Toledo City
Bulongan 8 1
Media Once 14 1
Poog 14 1
TOTAL 6 73 6
However, there are no households that would be affected within these sitios. Despite being
within the MPSA boundaries, there are no households that is in the actual quarry area, as specified
in the mine plans. Proper buffer areas will be established between the quarry area and the
affected houses. There wouldn’t be any settlers displaced during the project phases.
In-migration
One possible impact in every development in an area is in-migration. Presence of opportunities
for jobs and livelihood brought by the development activity will invite workers from other areas
to migrate in the impact Barangays. Influx of workers from other areas is expected during the
development and construction phase as well as during the operation phase with the introduction
of other economic activities related to the quarry operations.
In-migrants will add to the continuously increasing population of the Barangays and the Cities and
Municipality. As observed, the population composition of the impact barangays is expansive,
wherein an increasing very young population is manifested. The natural increase in population in
the areas will already cause competition in accessing the basic services and available economic
opportunities in the areas. With the entry of in-migrants, further competition in terms of local
employment, public utilities, and access to basic services will be experienced. Also, in-migration

QUARRY VENTURES PHILIPPINES, INC. Environmental Impact Assessment
February 2019 2-282
may also lead to proliferation of informal settlers in the project impact barangays. In-migration
may also introduce lifestyles and behaviors different from the locals which may lead to social
tensions.
To mitigate potential impacts due to in-migration, the following management measures shall be
implemented:
Implement priority local hiring policy for qualified local workers;
Coordinate with barangay or/and municipal LGU as to relevant ordinance on providing
opportunities for local employment;
Conduct consultation with barangay LGUs on requirements and process of hiring to
maximize employment of local residents;
Require and monitor contractor commitments on providing local employment;
Coordination with the municipal and barangay peace and order councils to ensure peace and
order; and
Coordination meetings shall also be undertaken regularly with the LGUs to identify threats
and vulnerabilities in the society as well as to develop programs to prevent foreseen social
problems.
Cultural/lifestyle change
Land use conversions will also impact on the livelihood and job opportunities of the residents in
the area. The once farming area will be transformed into an industrialized community. The talents
and skills of the existing residents may not be suitable or limited to supply to the needed
manpower of the operations. The proponent in coordination with the Public Employment Service
Offices of the impact Cities and Municipality will implement a training and skills development
program for the residents of the impact Barangay. This will ensure the employability of the impact
barangay residents in the proposed project. Also, in order to prevent the proliferation of poor
families in the area, the proponent will also provide training and opportunities for livelihood
development.
Competition on existing Resources and Basic Services
The existing resources and basic services in the areas are considered limited due to the current
financial capacity of the LGUs to develop its natural resources to improve public utilities and the
enhancement its basic services to constituents. The entry of the proposed project may cause
further competition in the access of these resources and services. On the other hand, the
proposed project may also provide opportunities for the development and enhancement of these
services to ensure.

QUARRY VENTURES PHILIPPINES, INC. Environmental Impact Assessment
February 2019 2-283
Currently, the residents have limited access to water and power supply. Although there are
identified water source in the area, the waterworks system has limited capacity to reach other
areas in the Municipality. The same with the power supply, a number of residents do not have
access to electricity. In terms of basic services, the health sector needs improvement in order to
ensure better health services to the residents. In terms of education, the existing classroom-
student ration is very low despite the fact that not all children of school age are enrolled in any
educational institutions. Also, based on the level of education attained by the residents in the
municipality and the barangay, opportunities to access and complete college education are very
limited.
The proposed project has already identified measures on how not to compete with the existing
resources and services in the community. In terms of power supply, the proponent will put up a
power plant to ensure its own supply of power needed for the operations. In terms of water use,
additional demand from the proposed project on the existing demand of the communities will be
for domestic use only because the proposed project will operate on a closed circuit design, which
will allow the plant to recycle approximately 90% of its water supply.
The existence of the project will somehow provide opportunities for the improvement of services
on education and health. Enhancement the education, health, as well as the social welfare
services and public infrastructures will be enhanced due to the additional income opportunities
of the LGUs from the taxes and fees to be collected from the proposed projects as well as the
mandatory assistance of the proponent through the Social Development and Management
Program and Corporate Social Responsibility Program.
Traffic congestion
The project will cause an increase in traffic given the number of workers to be employed and
delivery of some construction materials. This has the potential to add traffic congestion and affect
sensitive receptors such as schools and community centers that may potentially cause road
accidents. Heavy loads traversing infrastructure may also be over or near load bearing limits.
To mitigate traffic congestion and road safety concerns, a traffic management plan, in
coordination with concerned LGUs and DPWH, will be prepared and implemented. IEC will also
be conducted to communicate traffic impact and management plan to the community especially
the host and neighboring barangays. Proper scheduling of delivery of construction materials will
also be implemented to avoid peak hours/ traffic congestion and minimize the occurrence of
accidents. Safety warnings and signage shall be installed.
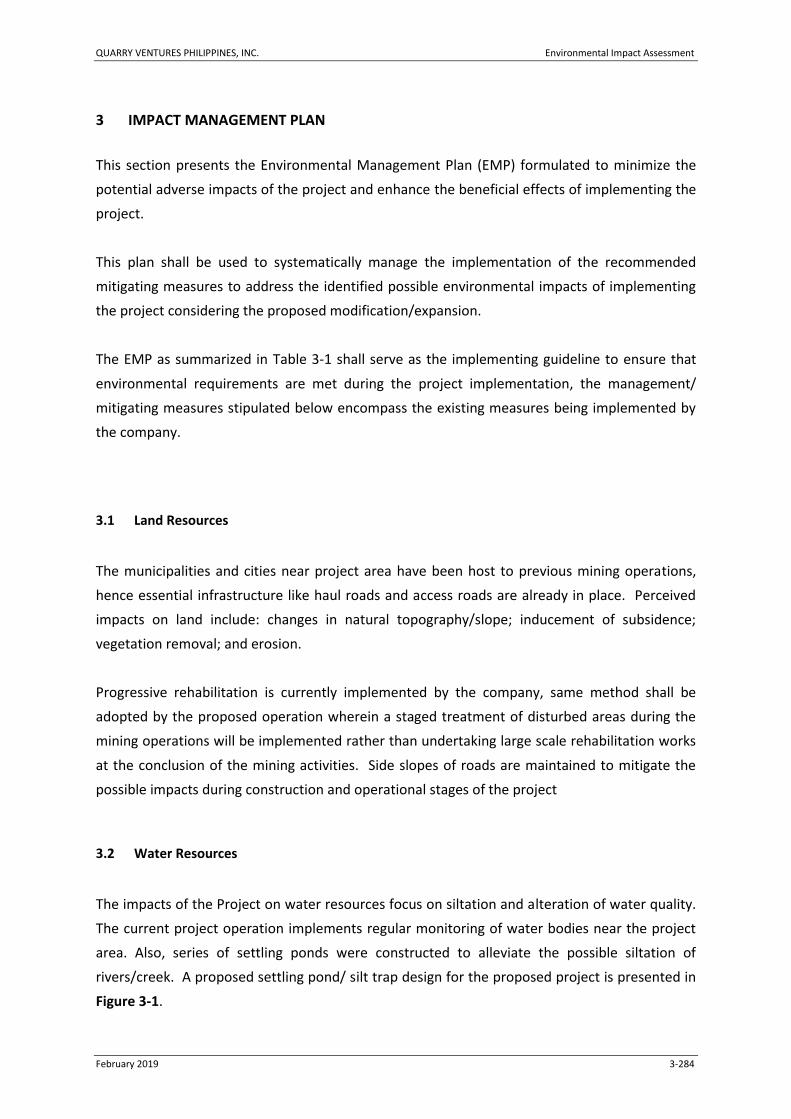
QUARRY VENTURES PHILIPPINES, INC. Environmental Impact Assessment
February 2019 3-284
3 IMPACT MANAGEMENT PLAN
This section presents the Environmental Management Plan (EMP) formulated to minimize the
potential adverse impacts of the project and enhance the beneficial effects of implementing the
project.
This plan shall be used to systematically manage the implementation of the recommended
mitigating measures to address the identified possible environmental impacts of implementing
the project considering the proposed modification/expansion.
The EMP as summarized in Table 3-1 shall serve as the implementing guideline to ensure that
environmental requirements are met during the project implementation, the management/
mitigating measures stipulated below encompass the existing measures being implemented by
the company.
3.1 Land Resources
The municipalities and cities near project area have been host to previous mining operations,
hence essential infrastructure like haul roads and access roads are already in place. Perceived
impacts on land include: changes in natural topography/slope; inducement of subsidence;
vegetation removal; and erosion.
Progressive rehabilitation is currently implemented by the company, same method shall be
adopted by the proposed operation wherein a staged treatment of disturbed areas during the
mining operations will be implemented rather than undertaking large scale rehabilitation works
at the conclusion of the mining activities. Side slopes of roads are maintained to mitigate the
possible impacts during construction and operational stages of the project
3.2 Water Resources
The impacts of the Project on water resources focus on siltation and alteration of water quality.
The current project operation implements regular monitoring of water bodies near the project
area. Also, series of settling ponds were constructed to alleviate the possible siltation of
rivers/creek. A proposed settling pond/ silt trap design for the proposed project is presented in
Figure 3-1.

QUARRY VENTURES PHILIPPINES, INC. Environmental Impact Assessment
February 2019 3-285
Figure 3-1: Settling Pond / Silt Trap Design
3.3 Air Quality
Possible adverse effects on air and noise quality shall be managed/minimized by implementing
the established procedures (i.e. setting of speed limits, scheduling of activities, etc.). Established
green belts or buffer zones will also be maintained and enhanced. Regular water sprinkling,
covering the trucks with tarpaulin or canvass during transport, proper maintenance of heavy
equipment and pollution control devices in the plant will still be carried out.

QUARRY VENTURES PHILIPPINES, INC. Environmental Impact Assessment
February 2019 3-286
3.4 Social Development
Significant social impacts include psychosocial impacts and influx of migrant. These shall be
mitigated through the continued implementation of the different programs such as the IEC,
SDMP, and the established safety, health and environmental programs/procedures.

QUARRY VENTURES PHILIPPINES, INC. Environmental Impact Assessment
February 2019 3-287
Table 3-1: Matrix of Major Impacts, Mitigation/Enhancement Measures and Environmental Management Plan
Project Phase/ Activity
Environmental Component Likely
to be Affected Potential Impact
Options for Prevention or Mitigation or Enhancement
Responsible Entity
Cost Guarantee /
Financial Arrangements
I. PRE-CONSTRUCTION
Exploration Activities
People Disturbance of livelihood in the exploration area
Conduct consultation with stakeholders to get their views and comments on the project
QVPI Php5,000
Pre-operating Expenses
Consultation with stakeholders and affected persons or communities near the project area
People Community expressed concerns on: - Livelihood - Employment - Waste
management
Conduct focus group discussions and consultation meetings with LGUs and key stakeholders to get their views and comments on how to address their concerns
QVPI
Php50,000 Pre-operating expenses
Acquisition of applicable permits and licenses
People Disclosure of project components and activities
Submission of complete requirements for the processing of all permits.
QVPI
Php15 million Pre-operating expenses
Local sourcing of labor and materials during procurement and planning
People Local hiring of staff and local purchases of materials
Priority will be given to the barangays within the primary impact zones.
Local labor requirements shall be posted in barangay halls and other public places.
QVPI
Minimal Pre-operating expenses
II. CONSTRUCTION
Site preparation and construction of mine facilities
Terrestrial biology Loss of vegetation due to site clearing
Disturbance/displacement of wildlife
Annual monitoring of terrestrial flora and
fauna
Establishment of buffer zones along the
project site perimeter
Include flora and fauna protection programs in
SDMP
QVPI; MMT
Php30,000
Included EPEP, ECC condition
Land Generation of unwanted materials
Materials recovered from vegetation removal
can be used as:
QVPI

QUARRY VENTURES PHILIPPINES, INC. Environmental Impact Assessment
February 2019 3-288
Project Phase/ Activity
Environmental Component Likely
to be Affected Potential Impact
Options for Prevention or Mitigation or Enhancement
Responsible Entity
Cost Guarantee /
Financial Arrangements
(solid waste/biomass)
o trash lines on steep slopes to mitigate soil erosion
o compost material/surface mulch for immediate soil cover and for improving SOM content of soils
Water quality Sedimentation of water bodies by eroded soils
Increase water turbidity and total suspended solids
Surface runoffs
Discharge of domestic water
Erosion control structures such as appropriate drainage, catch basins, oil separators, and sediment settling ponds
Minimized ground clearings and disturbances
Scheduling of construction during dry months
Implement re-use of recovered topsoil for rehabilitation
Use of bio-engineering measures for stabilization/maintenance of side slope of roads (e.g. thru installation of coco-net mattings)
Septic tanks for domestic water
QVPI Included in the project cost
Included EPEP, ECC condition
Air quality Noise disturbance
Dust generation
Vehicle/equipment emissions
Strictly implement covering of hauling trucks and water spraying;
Proper maintenance of vehicles and equipment
Provision of dust and noise PPEs to employees
Establishment and maintenance of buffer zones
QVPI Included EPEP, ECC condition
People Fear and loss of livelihood and small farm/agroforest lands
Fear of resettlement or relocation of shelters
IEC on the nature and operation of the mine, mitigating measures and benefits
QVPI CRO
Included in the project cost
Included in SDMP and IEC Program

QUARRY VENTURES PHILIPPINES, INC. Environmental Impact Assessment
February 2019 3-289
Project Phase/ Activity
Environmental Component Likely
to be Affected Potential Impact
Options for Prevention or Mitigation or Enhancement
Responsible Entity
Cost Guarantee /
Financial Arrangements
Fear of landslides and flooding due to quarrying activities
Economic Opportunity loss of income from agricultural activities due to removal of crops and use of the land for mine development and road works
Generation of employment
Generation of livelihood opportunities spurred by the multiplier effect of the construction activities
Local government generation of revenues from fees and permits
Preferential hiring of qualified barangay residents (LGCP R.A. 7160; 1995 PMA R.A. 7942)
Barangay Consultation on job requirements and qualification
Training to upgrade local skills of residents who can be hired by the project
Development of small and medium enterprises like transport, construction and utility services
Prompt processing of permits and payment of necessary fees
Barangay LGUs; QVPI CRO; TESDA/TLRC
Included in the project cost
Included in SDMP and IEC Program
Peace & Order Economic activities and other services near the quarry development and construction area that might cause problems on peace
Coordination with the Barangay LGU to ensure authorized establishments and control of unauthorized entry of outsiders.
Proper induction of construction workers.
QVPI CRO; QVPI Security
Included in the project cost
Included in SHP and EPEP
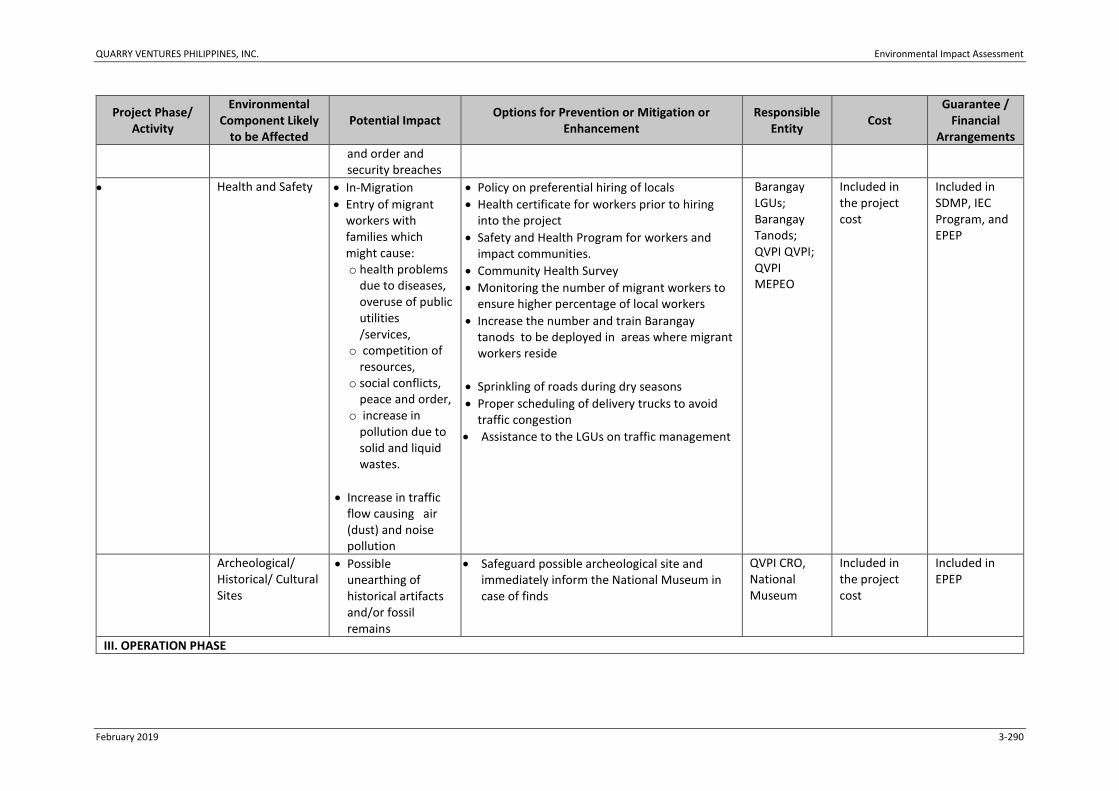
QUARRY VENTURES PHILIPPINES, INC. Environmental Impact Assessment
February 2019 3-290
Project Phase/ Activity
Environmental Component Likely
to be Affected Potential Impact
Options for Prevention or Mitigation or Enhancement
Responsible Entity
Cost Guarantee /
Financial Arrangements
and order and security breaches
Health and Safety In-Migration
Entry of migrant workers with families which might cause: o health problems
due to diseases, overuse of public utilities /services,
o competition of resources,
o social conflicts, peace and order,
o increase in pollution due to solid and liquid wastes.
Increase in traffic flow causing air (dust) and noise pollution
Policy on preferential hiring of locals
Health certificate for workers prior to hiring into the project
Safety and Health Program for workers and impact communities.
Community Health Survey
Monitoring the number of migrant workers to ensure higher percentage of local workers
Increase the number and train Barangay tanods to be deployed in areas where migrant workers reside
Sprinkling of roads during dry seasons
Proper scheduling of delivery trucks to avoid traffic congestion
Assistance to the LGUs on traffic management
Barangay LGUs; Barangay Tanods; QVPI QVPI; QVPI MEPEO
Included in the project cost
Included in SDMP, IEC Program, and EPEP
Archeological/ Historical/ Cultural Sites
Possible unearthing of historical artifacts and/or fossil remains
Safeguard possible archeological site and immediately inform the National Museum in case of finds
QVPI CRO, National Museum
Included in the project cost
Included in EPEP
III. OPERATION PHASE
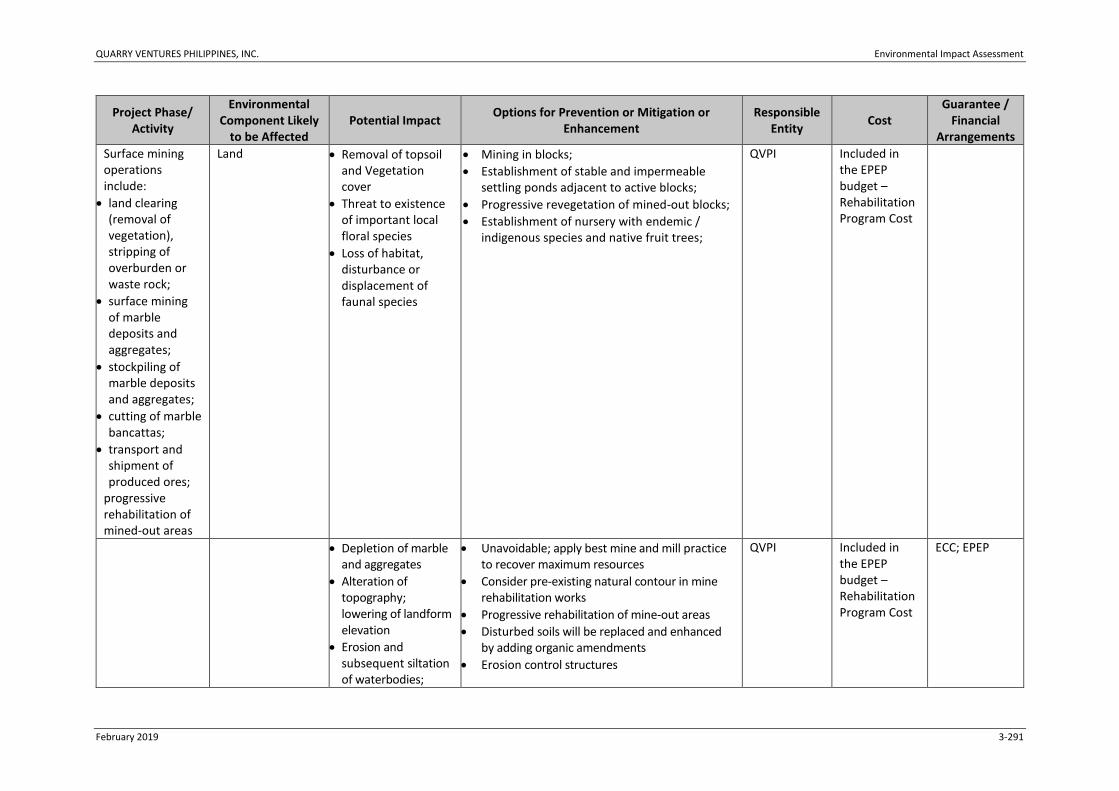
QUARRY VENTURES PHILIPPINES, INC. Environmental Impact Assessment
February 2019 3-291
Project Phase/ Activity
Environmental Component Likely
to be Affected Potential Impact
Options for Prevention or Mitigation or Enhancement
Responsible Entity
Cost Guarantee /
Financial Arrangements
Surface mining operations include:
land clearing (removal of vegetation), stripping of overburden or waste rock;
surface mining of marble deposits and aggregates;
stockpiling of marble deposits and aggregates;
cutting of marble bancattas;
transport and shipment of produced ores;
progressive rehabilitation of mined-out areas
Land
Removal of topsoil and Vegetation cover
Threat to existence of important local floral species
Loss of habitat, disturbance or displacement of faunal species
Mining in blocks;
Establishment of stable and impermeable settling ponds adjacent to active blocks;
Progressive revegetation of mined-out blocks;
Establishment of nursery with endemic / indigenous species and native fruit trees;
QVPI Included in the EPEP budget – Rehabilitation Program Cost
Depletion of marble and aggregates
Alteration of topography; lowering of landform elevation
Erosion and subsequent siltation of waterbodies;
Unavoidable; apply best mine and mill practice to recover maximum resources
Consider pre-existing natural contour in mine rehabilitation works
Progressive rehabilitation of mine-out areas
Disturbed soils will be replaced and enhanced by adding organic amendments
Erosion control structures
QVPI Included in the EPEP budget – Rehabilitation Program Cost
ECC; EPEP

QUARRY VENTURES PHILIPPINES, INC. Environmental Impact Assessment
February 2019 3-292
Project Phase/ Activity
Environmental Component Likely
to be Affected Potential Impact
Options for Prevention or Mitigation or Enhancement
Responsible Entity
Cost Guarantee /
Financial Arrangements
increase surface runoff
Disturbance of soil profile
Geology Inducement of subsidence/ collapse
generation of open areas with greater potential for runoff, erosion and landslides
Implement a suitable and appropriate slope / ground failure monitoring plan to detect instability at an early and non-critical stage so that safety measures could be initiated to prevent or minimize impacts
Familiarize / orient / train mining personnel, staff and workers on recognition of the various slope / ground failure modes, hazard warning signs and standard operating procedures to be observed in the case of ground failure events or impending event;
Identification, early recognition and monitoring of warning signs of potential and impending slope stability problems.
Implement appropriate and safe engineering and geotechnical design;
Formulation and implementation of subsidence control measures including subsidence prediction;
QVPI; MMT Included in the EPEP budget – Rehabilitation Program Cost
ECC; EPEP; Environmental Occupational Health Plan
Sewage and wastewater generation
Solid waste generation
Provision of septic tanks
Proper disposal of waste recycling, reuse; regular disposal
Toilets/sanitary facilities
QVPI Solid Waste Management Plan;
Water Increase TSS and turbidity of water
Surface runoffs
Discharge of domestic water
Erosion control structures such as appropriate drainage, catch basins and sediment settling ponds; mining to be done in stages
Oil separators and septic tanks
QVPI Included in the EPEP budget

QUARRY VENTURES PHILIPPINES, INC. Environmental Impact Assessment
February 2019 3-293
Project Phase/ Activity
Environmental Component Likely
to be Affected Potential Impact
Options for Prevention or Mitigation or Enhancement
Responsible Entity
Cost Guarantee /
Financial Arrangements
Air Local increase in TSP and noise levels
Air pollution due construction equipment
Proper and regular maintenance of equipment
Water spraying; mining activities to be confined during daytime as much as possible
IEC on proper scheduling of hauler trucks to avoid busy and late hours
Maintenance of buffer zones
QVPI Included in the EPEP budget
Biological Vegetation is cleared during mining and smothered by stockpiling
Loss of soil due to erosion would reduce survivability of plants having no substrate to anchor themselves to and obtain nutrients
Loss of habitat to birds and small animals such as lizards & amphibians
Retain existing vegetation in areas of low mineral content
Rehabilitation of open areas and enrichment planting and reforestation in buffer zones and mined out areas
Fire protection by setting up of fire lines
Establishing check dams in gullies
Establish vegetative bands at least 20 m width along creeks and ravines which would serve as habitats of endangered species of plants & animals
Conduct progressive rehabilitation of mined out parcels
Implementation of ANR particularly in riparian areas
Earth-balling of rare, endemic, threatened species diversity in the project site
QVPI Included in the EPEP budget
Economic Enhancement socio-economic welfare of the community
Local government generation of revenues from taxes, permits and
Implementation of community development programs through Social Development Management Plan equivalent to 1.5% of Operating cost based on the identified needs of the communities
Total taxes paid to the national government will exceed >Excise Tax: 60% goes to the national government; 40%, to the local government--
QVPI CRO; Barangay LGU
Included in the project cost
Included in EPEP, SDMP, SHP

QUARRY VENTURES PHILIPPINES, INC. Environmental Impact Assessment
February 2019 3-294
Project Phase/ Activity
Environmental Component Likely
to be Affected Potential Impact
Options for Prevention or Mitigation or Enhancement
Responsible Entity
Cost Guarantee /
Financial Arrangements
LGU share in the quarrying activities
Payment of local taxes and fees to Municipal and Barangay Local Government Units
Generation of employment
Generation of livelihood opportunities by putting-up food stalls, variety stores and other services near the quarry area which might cause problems of congestion, peace and order and security breaches
-20% for host Provinces -45% for host Municipalities -35% for host Barangays
Occupation Fees and Real Property Tax to province and municipalities
IEC on nature of jobs the proponents require and qualification
Consultation on job requirements and qualification
Skills training to upgrade local skills of residents that can be hired by the project
Implementation livelihood development programs through the SDMP
Coordination with the Barangay LGUs to monitor issuance of business permits in small- to medium- scale commercial establishments to ensure proper zoning of business areas, peace and order, solid waste management
Health and safety In-migration
Entry of migrant workers with families which might cause health problems due to diseases, overuse of public utilities /services, competition for resources, social
Policy on preferential hiring of qualified barangay residents (LGCP R.A. 7160; 1995 PMA R.A. 7942)
Management of entry of migrant workers.
Health certificate for workers prior to hiring into the project.
Proponent provides health clinic with a Doctor, Nurse and Health workers in the quarry area.
Assistance in providing access to health and education services through the SDMP
QVPI CRO; Barangay LGU QVPI Safety and Health Office
Included in the project cost
Included in EPEP, SDMP, SHP
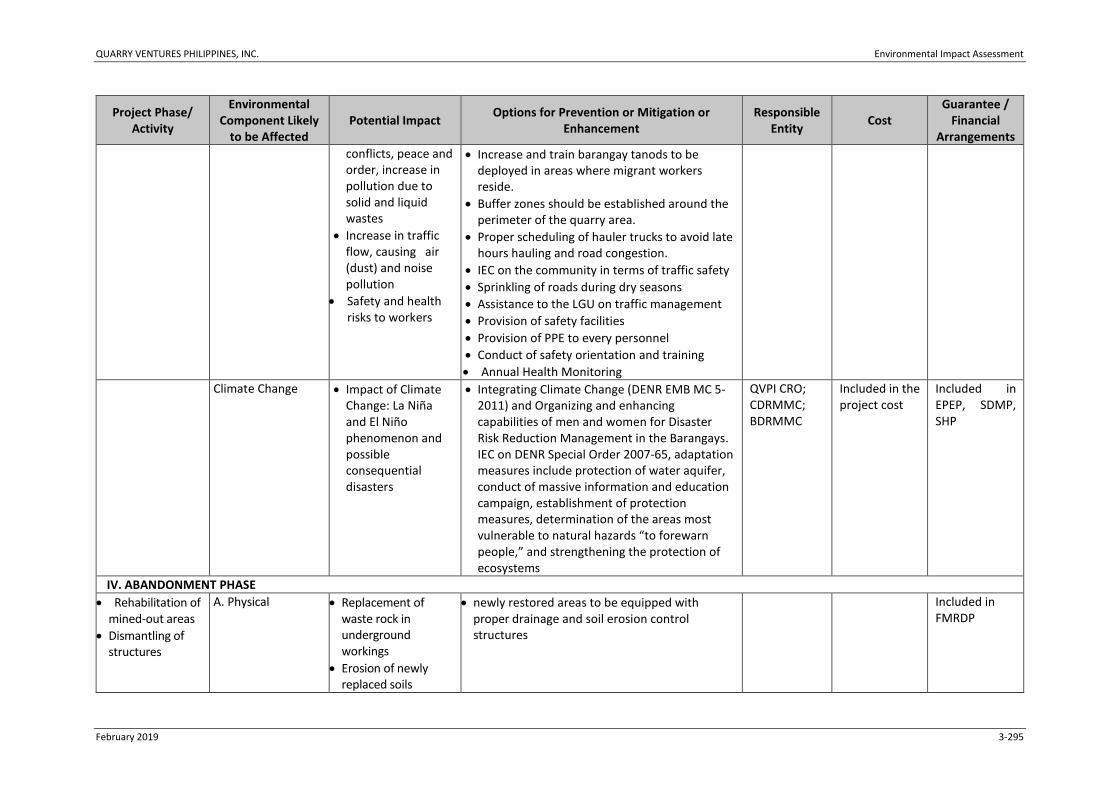
QUARRY VENTURES PHILIPPINES, INC. Environmental Impact Assessment
February 2019 3-295
Project Phase/ Activity
Environmental Component Likely
to be Affected Potential Impact
Options for Prevention or Mitigation or Enhancement
Responsible Entity
Cost Guarantee /
Financial Arrangements
conflicts, peace and order, increase in pollution due to solid and liquid wastes
Increase in traffic flow, causing air (dust) and noise pollution
Safety and health risks to workers
Increase and train barangay tanods to be deployed in areas where migrant workers reside.
Buffer zones should be established around the perimeter of the quarry area.
Proper scheduling of hauler trucks to avoid late hours hauling and road congestion.
IEC on the community in terms of traffic safety
Sprinkling of roads during dry seasons
Assistance to the LGU on traffic management
Provision of safety facilities
Provision of PPE to every personnel
Conduct of safety orientation and training
Annual Health Monitoring
Climate Change Impact of Climate Change: La Niña and El Niño phenomenon and possible consequential disasters
Integrating Climate Change (DENR EMB MC 5- 2011) and Organizing and enhancing capabilities of men and women for Disaster Risk Reduction Management in the Barangays. IEC on DENR Special Order 2007-65, adaptation measures include protection of water aquifer, conduct of massive information and education campaign, establishment of protection measures, determination of the areas most vulnerable to natural hazards “to forewarn people,” and strengthening the protection of ecosystems
QVPI CRO; CDRMMC; BDRMMC
Included in the project cost
Included in EPEP, SDMP, SHP
IV. ABANDONMENT PHASE
Rehabilitation of mined-out areas
Dismantling of structures
A. Physical Replacement of waste rock in underground workings
Erosion of newly replaced soils
newly restored areas to be equipped with proper drainage and soil erosion control structures
Included in FMRDP

QUARRY VENTURES PHILIPPINES, INC. Environmental Impact Assessment
February 2019 3-296
Project Phase/ Activity
Environmental Component Likely
to be Affected Potential Impact
Options for Prevention or Mitigation or Enhancement
Responsible Entity
Cost Guarantee /
Financial Arrangements
B. Biological Establishing vegetative cover in the area
Return of the avifauna and increase in population of small animals due to presence of habitat
Use indigenous species that were once thriving in the area (refer to list of species)
Bring back the habitat of the fauna by increasing vegetative cover
Included in FMRDP
C. Socio-Economic Termination of LGU revenues from taxes, permits and share when the company ceases operation
Loss of Jobs/ Unemployment of mine workers
Loss of market of the established livelihood dependent on the mine operation
Transfer of company social assets/ facilities and services to the community
Timely announcement and preparation of decommissioning/ Abandonment
Retrenchment Package to be offered to affected employees/workers.
Assistance in job hunting or transfer employment to other projects of the company.
Assistance to employees and their families in establishing livelihood or income generating activities, through capital assistance.
Assistance to the community in establishing market/clients other than the company/ mine operations
Identify diversity of products and services that will cater the needs of the community, adjacent barangays and City proper
Consultation with the community through the BLGU on the social assets/ facilities and services to be transferred, acceptable to them. A Memorandum of Agreement or Deed of Donation will be crafted in order to ensure the responsibility of the community on the sustainable management of the transferred facilities and/or services
QVPI CRO; HR and Finance Office
Included in the project cost
Included in FMRDP

QUARRY VENTURES PHILIPPINES, INC. Environmental Impact Assessment
February 2019 3-297
Project Phase/ Activity
Environmental Component Likely
to be Affected Potential Impact
Options for Prevention or Mitigation or Enhancement
Responsible Entity
Cost Guarantee /
Financial Arrangements
The loss of employment and job opportunities in the area may result to out-migration to search for jobs in other places
Discontinuation of the social services offered by QVPI through CSR and SDMP
Establishment of livelihood projects for workers and their families as part of the retrenchment package
Ensure sustainability of the livelihood projects established through the SDMP
Assistance in the strengthening of the BLGU to increase their capacity to manage the social services to be transferred
IEC on the job and livelihood opportunities in accomplishing the final land-use and that the final land-use will spur economic growth to the community
Implement remaining community development activities to support the communities during closure and rehabilitation through the FMRDP Social Plan
QVPI CRO; HR and Finance Office
Included in the project cost
Included in FMRDP

QUARRY VENTURES PHILIPPINES, INC. Environmental Impact Assessment
February 2019 3-298
The implementation of progressive rehabilitation is the major key to minimize the impact to
nature. Mined out and other affected areas will be rehabilitated as soon as practically possible to
avoid prolonged exposure to weathering making the area more impoverished and difficult to
rehabilitate.
Rehabilitation of mined out areas will consider planting common, endemic or indigenous plant
species. The loss of vegetation in the critical locations will be replaced with proper species suitable
to the existing site conditions.
The Project’s mining method will involve dividing the mining area into several sub-blocks, wherein
at a particular span of time, all the mining activities are concentrated only in a particular block.
Such practice will minimize disturbance and it will give ample time for displaced wildlife to
transfer to adjacent areas for refuge. The company will ensure that only vegetation within the
mining areas will be removed; removal of affected vegetation will be gradual and the adjacent
forested area will be conserved. This will serve as transitory habitat for wildlife species.
Mined-out and other affected areas will be rehabilitated as soon as practically possible. The top
soil extracted and stored prior to mining will be re-established in the area and planting of
vegetation will follow. Seedlings will be planted along with pioneer species along mined out areas
to ensure that vegetation will be re-established. Rehabilitation of the area will also guarantee
habitat for wildlife in the future.

QUARRY VENTURES PHILIPPINES, INC. Environmental Impact Assessment
February 2019 4-299
4 ENVIRONMENTAL RISK ASSESSMENT
The Risk Assessment in this EIA shall consider the hazards of implementing the project with
regards to safety, environment and the social aspects, consistent with the requirements of the
Philippine Mining Act of 1995 (R.A. 7942) and its Implementing Rules and Regulations.
Risk Assessment is the overall process of risk analysis and risk evaluation.
Risk Analysis is the systematic use of available information to determine how often specified
events may occur and the magnitude of their consequences. It is the systematic approach for
describing and/or calculating risk. It involves the identification of undesired events, and the
causes and consequences of these events.
Risk Evaluation is the process used to determine risk management priorities by comparing the
level of risk against predetermined standards, target risk levels or other criteria.
In risk assessment the words Hazards and Risks are often used and it is necessary to be clear. In
this document, a hazard is anything that has the potential to cause harm and risk is how likely it
is that a hazard will cause actual harm.
During the risk assessment, hazards are evaluated in terms of the likelihood that a problem may
occur and the damage it would cause if such an event did occur. Adequate safety and emergency
preparedness requires considering all of the possible hazards that could be encountered. Some
hazards, however, are more likely to cause problems than others at a given time and some would
result in greater damage than others.
4.1 Risk Assessment Framework
The guiding framework used in the risk assessment is the Australian / New Zealand Standard for
Risk Management (AS/NZS 4360:2004). This Standard was prepared by the Joint Standards
Australia / Standards New Zealand Committee OB-007, Risk Management as a revision of AS/NZS
4360:1999. It provides a generic framework for establishing the context, identifying, analyzing,
evaluating, treating, monitoring and communicating risk.
As a guide, the general step in doing the risk assessment is thru the AS/NZS4360:2004 as
presented in Figure 4-1 below:

QUARRY VENTURES PHILIPPINES, INC. Environmental Impact Assessment
February 2019 4-300
Figure 4-1: Risk Assessment Framework
Communicate and consult - Communicate and consult with internal and external stakeholders as
appropriate at each stage of the risk management process and concerning the process as a whole.
Establish the context - Establish the external, internal and risk management context in which the
rest of the process will take place. Criteria against which risk will be evaluated should be
established and the structure of the analysis defined.
Identify risks - Identify where, when, why and how events could prevent, degrade, delay or
enhance the achievement of the objectives.
Analyze risks - Identify and evaluate existing controls. Determine consequences and likelihood
and hence the level of risk. This analysis should consider the range of potential consequences and
how these could occur.

QUARRY VENTURES PHILIPPINES, INC. Environmental Impact Assessment
February 2019 4-301
Evaluate risks - Compare estimated levels of risk against the pre-established criteria and consider
the balance between potential benefits and adverse outcomes. This enables decisions to be made
about the extent and nature of treatments required and about priorities.
Treat risks - Develop and implement specific cost-effective strategies and action plans for
increasing potential benefits and reducing potential costs.
Monitor and review - It is necessary to monitor the effectiveness of all steps of the risk
management process. This is important for continuous improvement. Risks and the effectiveness
of treatment measures need to be monitored to ensure changing circumstances do not alter
priorities.
4.2 Consequence Rating
Consequence analysis involved the estimation of unwanted consequences, effects, impacts or
outcomes of projected major hazard incidents involving specific activities and substances in the
facility. Major hazard incidents mean accidents involving hazardous activities or substances that
have an impact in terms of death, injury or evacuation of people, damage to property or lasting
harm to the environment.
The consequence analysis focused on accident scenarios that involve the release of flammable
and explosive substances. Estimated was the consequence of worst-case accident scenario
involving the storage and utilization of diesel fuel and on-site blasting activities.
4.3 Risk Characterization
Due to the qualitative nature of this ERA, risk characterization focused on description of the risks
associated with the various hazards inherent to activities, substances and conditions at the quarry
site. This included natural hazards arising from extreme climate events such as tropical cyclones,
flooding, landslides and storm surges; as well as from earthquakes.
4.4 Hazard Identification
4.4.1 Marble and Aggregates Quarry

QUARRY VENTURES PHILIPPINES, INC. Environmental Impact Assessment
February 2019 4-302
Hazards associated with the marble and aggregates quarry component include mass movement
of soil and rocks, release of sediments from settling ponds, occupational safety hazards, and fire
due to storage/utilization of flammable substances, particularly liquid fuel.
Fire hazard is chiefly attributable to storage of diesel and lube oil. Occupational safety hazards
may occur at the various project phases and processes from ground clearing to mineral extraction.
Outcomes from occupational safety hazards include deaths and injuries resulting from
ground/structure failure, fall from heights, being struck or crushed by equipment parts or falling
rocks/debris, vehicular/ equipment accidents, and others. Mass movement of soil/ rocks/
sediments may result from breach of containing walls of impoundment and berms, overburden
storage facilities and settling ponds. It may also arise as a direct result of mineral extraction
activities. Such incidents may be triggered by natural events such as inclement weather conditions
(heavy and sustained rains, typhoons, storm surges, etc.), earthquakes and subsidence; faulty
engineering design; inadequate maintenance of structures; and sabotage. The water bodies could
also become heavily silted with sediments.
4.4.2 Hazard Analysis Matrix
The hazards and risks associated with the various quarry activities, processes and conditions are
listed in the Table 4-1.
Table 4-1: Hazard Analysis Matrix
Hazard Classification/ Unit Operation
Major Hazards Initiating/ Contributing
Factors At Risk Sector
1. Storage of Liquid fuel (Diesel)
Fire and explosion following major releases/ spills
Presence of ignition sources; breach of containment; mechanical impacts; exposure to fires and high heat; corrosion; defective or substandard tank materials; breach of bund walls; vandalism
- Persons, equipment, and structures within the hazard area.
2. Waste and overburden dumps and stock yards
- land and rock slides - siltation of surface water bodies;
Heavy rains, typhoons, earthquakes, defective engineering design.
- Surrounding communities, personnel and workers
- Ecological entities
3. Settling and Wastewater Ponds
Breach of containment of ponds and drainage system could cause flooding of low-lying areas, siltation, and
natural disasters (earthquakes, extreme weather); engineering problems; sabotage
- surface waters - aquatic ecological
entities - surrounding
communities

QUARRY VENTURES PHILIPPINES, INC. Environmental Impact Assessment
February 2019 4-303
Hazard Classification/ Unit Operation
Major Hazards Initiating/ Contributing
Factors At Risk Sector
contamination of surface water bodies.
4. Occupational Safety Hazards
A. Site Preparation
a. Surveying - fall from heights - vehicular accidents
inherent geological formations; adverse weather conditions; human error; vehicular failure
- surveying team
b. Clearing and Grubbing
- being struck by falling trees, debris and equipment part -vibration and noise from power saws and other equipment -vehicular and equipment accidents (overturning, fall from heights, etc.)
human error; equipment failure; adverse weather conditions
- clearing team
c. Laying Out
- fall from heights; being struck by vehicles and earth moving equipment - vehicular and earth moving equipment accidents -electrocution
human error, equipment/ vehicular failure breach of protocols
- workers, drivers, and operators on site
B. Open Pit Surface Quarry
a. Drilling and Excavation
- fall from the edge of a
bench
- being struck by falling
rocks/debris at the foot
of a face
- inhalation of and
contact with dusts which
predisposes the
respiratory system
- Harmful noise levels
- Being struck by a
moving part of the
drilling equipment
Human error, breach of
protocols, equipment
failure, face instability
- Drilling operators and
assistants
b. Blasting
- physical harm - collateral damage from debris - inhalation of dust - damage to structures
Human error, breach of protocols, equipment failure
- Quarry workers - Nearby community
c. Mineral Extraction
-inhalation of and
contact with dust which
could predispose the
respiratory system
lack of or inappropriate
protective equipment
- Mining pit operators
and workers,
neighboring
communities

QUARRY VENTURES PHILIPPINES, INC. Environmental Impact Assessment
February 2019 4-304
Hazard Classification/ Unit Operation
Major Hazards Initiating/ Contributing
Factors At Risk Sector
d. Mineral Loading
- Being struck by falling
rocks from loading arm
- falls while gaining
access to operator’s
cabin
-vehicular accidents
breach of protocols,
human error, failure of
hydraulic system, and
other equipment uneven
ground
- driver, operator,
assistants,
trespassers
e. Hauling and Transport
- Vehicular accidents (fall
from edge of bench,
collision with other
vehicles or structures,
overturning, etc.)
- inhalation of and/or
contact with dusts
- high level noise
incompetent driving,
heavy rains and flooding,
trespassing, breach of
protocols brake failure
- driver, pedestrians,
driver of smaller
vehicles,
f. Stockpiling
- inhalation of and
contact with dust which
could predispose the
respiratory system
airborne dusts especially
with strong winds
- workers, nearby
communities
5. Natural calamities due to extreme climate events (as predicted in years 2020 and 2050)
Increased frequency and
intensity of tropical
cyclones
- flooding of low lying
areas; rock and
landslides
poor engineering design
and zoning, poor
maintenance of
structures, defective
warning systems;
infrastructures along
riverbanks and flood
plains
- personnel and
workers of the
project; contractors,
nearby communities
Increased intensity and
frequency of rains
during rainy season
- flooding of low lying
areas; rock/ landslides;
increased soil erosion
and loss of fertility
-same as above- -same as above-
- farmers
Drier dry seasons and
increased ambient
temperatures
- fire incidents;
increased airborne
dusts; drying of water
reservoirs and sources
presence of ignition
sources, especially near
storage of fuel and
chemicals;
indiscriminate disposal
of live cigarette butts
inadequate dust
suppression system;
forest/ vegetation
denudation
- personnel, workers,
contractors, nearby
communities
Natural Calamities due
to Earthquakes
- collapse of
infrastructures and
buildings; spillage of fuel
poor engineering design
and zoning; poor
maintenance of
-same as above

QUARRY VENTURES PHILIPPINES, INC. Environmental Impact Assessment
February 2019 4-305
Hazard Classification/ Unit Operation
Major Hazards Initiating/ Contributing
Factors At Risk Sector
predisposing to fires;
landslides; tsunami
structures and
equipment; location of
buildings and other
infrastructures
4.4.3 Risk Screening of Hazardous Substances at the Project Site
A risk screening procedure was undertaken to determine the type of environmental risk
assessment to be undertaken and to prioritize the environmental risks presented by the various
hazardous substances and activities. The criteria and process used in risk screening was primarily
based on Annex 2-7e (Guidelines for the Conduct of Environmental Risk Assessment) of the
Revised Procedural Manual of DAO 2003-30. The screening criteria for hazardous substances are
(1) inherent hazardous characteristics of the substance and (2) maximum quantity involved. After
classifying the substances according to defined categories (i.e. flammable, oxidizing, toxic, etc.),
their respective maximum inventories were compared to DENR’s threshold inventory levels
(Levels 1 and 2), which are defined in the Revised DAO 2003-30 guideline. A facility that will
manufacture, process or store any hazardous substance in excess of DENR's Threshold Inventory
Level 2 is required to undertake a quantitative risk assessment. Those with any hazardous
substance exceeding Level 1 threshold inventory but below Level 2 threshold inventory is required
to undertake Hazard Analysis Study, and Emergency/Contingency Plan based on the study and
worst-case scenario. For substances with maximum inventory below Level 1, a risk screening and
emergency plan based on hazard analysis is required.
As far as hazardous substance is concerned, QVPI will only store and use diesel, a substance
that is considered as flammable. Diesel will be used as fuel for vehicles, generator sets and
equipment at the quarry site. Maximum inventory of diesel at the Plant site is minimal at
approximately 700 tons. Given these data, the ERA Coverage was determined as Level 1.
4.4.4 Hazardous Characteristics of Diesel
Diesel is a moderately flammable liquid fuel. The National Fire Protection Agency (NFPA) of the
U.S.A. assigns to diesel a Flammability Rating 2 (ignites when moderately heated). Distillation
temperature of diesel at 90% point is between 282-338°C. Its minimum flash point temperature
is 52°C. Its other physic-chemical and toxicological properties are listed in Table 4-2. Fuel oil is less
flammable than diesel.

QUARRY VENTURES PHILIPPINES, INC. Environmental Impact Assessment
February 2019 4-306
Table 4-2: Physico-chemical and Toxicological Properties of Diesel
Property Value/ Description
CAS RN No(s). 68334-30-5; 68476-30-2; 68476-31-3
UN Number 1993
Maximum Inventory at the Site 50 m3
Flammability Designation/Code Moderately Flammable
Flash Point, °C 52
Lower flammability limits in air (%) 1.3
Upper flammability limits in Air (%) 6
Autoignition Temperature, °C 254-285
Boiling/Condensation point (°C) at 1 atm 282-338
Specific gravity (liquid) 0.841 at 16°C
Vapor pressure 0.0028 bar at 21°C Sources: CAMEO Chemical Inventory; NREL Liquid Fuels Database, 2007.
Fire and Explosion Hazards of Diesel
Vapor cloud explosions and vapor cloud fires are not significant hazards to this particular
substance and activity due to the low vapor pressure of the liquid (0.042 psia at 21°C). The more
probable accident scenario for this type of substance is a pool or tank-top fire.
Hazards from fires are associated with their direct heating effect, by convection within the fire
itself, and thermal radiation from the fire. In case of fire engulfment, the effects of fire on humans
are usually on the skin and on the lungs. Smoke rather than the fire itself is the most common
cause of death indoors. Fires emit radiation, which can produce considerable impact on nearby
equipment and may cause harm to people. Thermal radiation levels and their damaging effects
on equipment and people are described in Table 4-3 (CCPS-AIChE, 1994).
Table 4-3: Effects of radiation from fire.
Incident Flux (KW/m2)
Type of Damage Caused
Equipment People
37.5
Damage to process equipment (steel structure, piping, vessels, etc,) after several minutes of exposure.
100% fatality in 1 min.; 1% fatality in 10 sec.
25.0 Minimum energy level to ignite wood at indefinitely long exposure without flame
100% fatality in 1 min.; Significant injury in 10 sec.
12.5 Minimum energy to ignite wood with a flame; melts or degrades plastic materials
30% fatality in 1 min.; 1st degree burns in 10 sec.
10.0
People will feel pain after 5 seconds and receive second degree burns after 14 seconds. Usually used to define the fatality zone, as
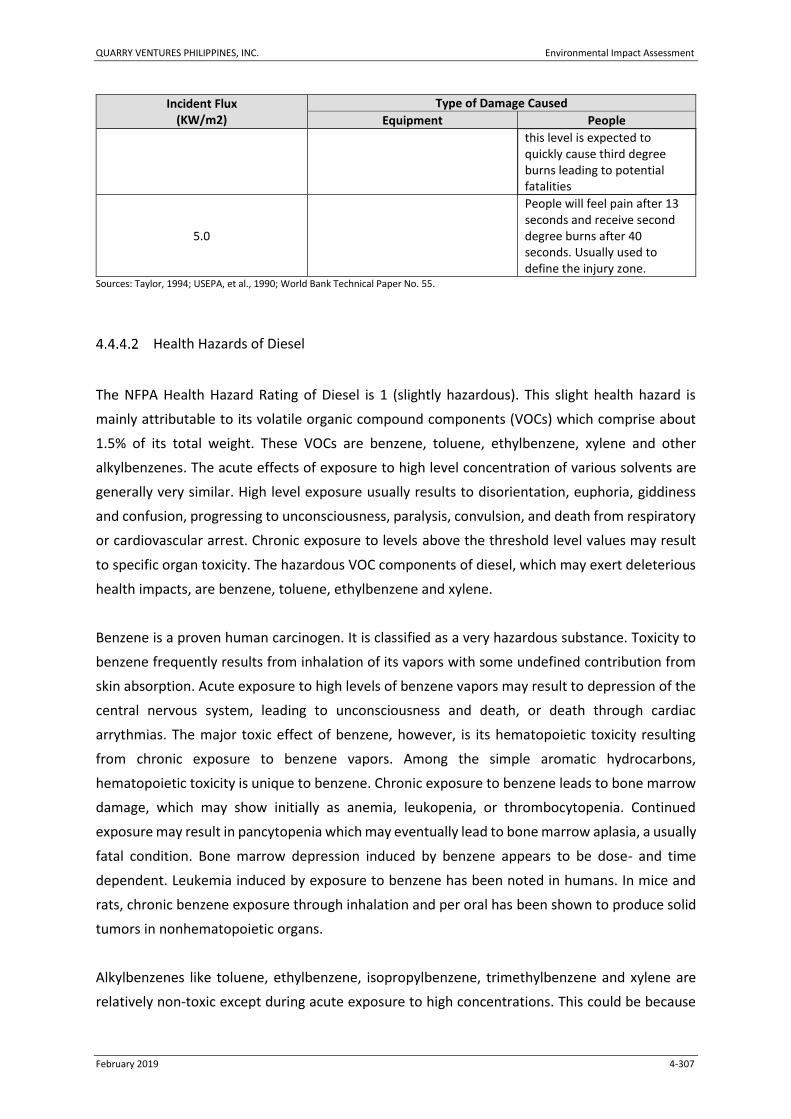
QUARRY VENTURES PHILIPPINES, INC. Environmental Impact Assessment
February 2019 4-307
Incident Flux (KW/m2)
Type of Damage Caused
Equipment People
this level is expected to quickly cause third degree burns leading to potential fatalities
5.0
People will feel pain after 13 seconds and receive second degree burns after 40 seconds. Usually used to define the injury zone.
Sources: Taylor, 1994; USEPA, et al., 1990; World Bank Technical Paper No. 55.
Health Hazards of Diesel
The NFPA Health Hazard Rating of Diesel is 1 (slightly hazardous). This slight health hazard is
mainly attributable to its volatile organic compound components (VOCs) which comprise about
1.5% of its total weight. These VOCs are benzene, toluene, ethylbenzene, xylene and other
alkylbenzenes. The acute effects of exposure to high level concentration of various solvents are
generally very similar. High level exposure usually results to disorientation, euphoria, giddiness
and confusion, progressing to unconsciousness, paralysis, convulsion, and death from respiratory
or cardiovascular arrest. Chronic exposure to levels above the threshold level values may result
to specific organ toxicity. The hazardous VOC components of diesel, which may exert deleterious
health impacts, are benzene, toluene, ethylbenzene and xylene.
Benzene is a proven human carcinogen. It is classified as a very hazardous substance. Toxicity to
benzene frequently results from inhalation of its vapors with some undefined contribution from
skin absorption. Acute exposure to high levels of benzene vapors may result to depression of the
central nervous system, leading to unconsciousness and death, or death through cardiac
arrythmias. The major toxic effect of benzene, however, is its hematopoietic toxicity resulting
from chronic exposure to benzene vapors. Among the simple aromatic hydrocarbons,
hematopoietic toxicity is unique to benzene. Chronic exposure to benzene leads to bone marrow
damage, which may show initially as anemia, leukopenia, or thrombocytopenia. Continued
exposure may result in pancytopenia which may eventually lead to bone marrow aplasia, a usually
fatal condition. Bone marrow depression induced by benzene appears to be dose- and time
dependent. Leukemia induced by exposure to benzene has been noted in humans. In mice and
rats, chronic benzene exposure through inhalation and per oral has been shown to produce solid
tumors in nonhematopoietic organs.
Alkylbenzenes like toluene, ethylbenzene, isopropylbenzene, trimethylbenzene and xylene are
relatively non-toxic except during acute exposure to high concentrations. This could be because

QUARRY VENTURES PHILIPPINES, INC. Environmental Impact Assessment
February 2019 4-308
their major metabolic pathway is toward metabolites that have low toxicity and are readily
excreted. Unlike benzene, they have not been demonstrated to be carcinogenic. Acute exposure
to very high levels of these substances could result to acute toxicity manifested by central nervous
system (CNS) depression, symptoms typical of acute solvent toxicity. Long term exposure could
lead to CNS function impairment (Cragg et. al. 1989; Bardodej and Cirek 1988).
4.4.5 Mass Movement of Rocks and Soil from Overburden and Waste Dump Sites
Waste rocks and soil materials generated from mining and beneficiation/ sizing activities to be
disposed into a series of waste dump stockpiles or used as backfill. Major hazards associated with
mine waste dumps are mass movement of rocks and soil (eg. landslides and rockslides), soil
erosion and runoffs. Such events could be initiated by natural hazards such as earthquakes, heavy
rains and typhoons, and breaching of berms. Rock slides and landslides can result to loss of lives
and injuries, siltation and contamination surface waters, and damage to terrestrial and aquatic
environments. The disturbed condition of soil and rocks at mine sites also predisposes to mass
movement of rocks and soil at the site, especially during inclement weather conditions and
earthquakes. Such events could put to risk the workers at the site, as well as the mining
equipment.
4.4.6 Flooding and Mass Release of Sediments from Settling Ponds
The quarry areas will be equipped with drainage systems that will drain into settling ponds to
mitigate the impacts of surface runoffs that could lead to soil erosion, siltation and pollution of
water bodies. Breaching of settling ponds could lead to flooding and mass release of sediments.
Factors that may contribute to such accidents are natural hazards like strong earthquakes, long
duration heavy rains, strong typhoons, faulty engineering design, and sabotage.
Mass release of sediments and flooding can result to injuries, heavy siltation of affected surface
water systems, and destruction and siltation of affected terrestrial and aquatic environments.
4.4.7 Occupational Safety Hazards
Occupational safety issues involving the project are listed in the Hazard Analysis Matrix (Table
4-1). Occupational safety issues associated with quarry activities include fall from heights; rock
falls and soil movement accidents; vehicular/equipment accidents; being struck by equipment

QUARRY VENTURES PHILIPPINES, INC. Environmental Impact Assessment
February 2019 4-309
parts, debris, etc.; respiratory, eye and skin ailments; and hearing impairment due to high
intensity noise.
4.4.8 Natural Hazards Due to Extreme Climate Events
The increasing frequency and intensity of extreme climate events are being attributed as direct
consequences of global climate change, which is primarily due to global warming. As stated by
the Manila Observatory (2010) in its paper Technical Primer on Climate Change in the Philippine,
“Climate change will increase the magnitude and frequency of weather hazards to an unknown
degree”. This phenomenon poses an increased risk of disasters in the Philippines, as risk is not
only proportional to the magnitude of events but on the number of people affected and their
capacity to recover from the impacts of an event.
Other direct impacts of climate change in the Philippines are significant increases in frequency of
high extreme ambient temperature (>35oC), which manifests as significant increase in the
frequency of hot days and warm nights; drier dry seasons; and wetter rainy seasons. Based on
climate modeling conducted by PAGASA for the various regions of the Philippines, annual mean
temperatures are expected to rise by 0.9 degrees Celsius to 1.1 degrees in 2020 and by 1.8
degrees to 2.1 degrees in 2050” (Hilario, et al., n.d.). PAGASA likewise predicted that “the drier
seasons of March-April-May will become drier still, while the wetter season of Sept- Oct. and
November will become wetter” (Hilario, et al., n.d.)
Projected Hazards by 2020
The projected increased rainfall intensity during the wet months implies greater risks from
hazards brought about by flooding, landslides, soil erosion, siltation of surface water bodies, and
loss of soil fertility. The unusually drier periods during the dry months, coupled with ambient
temperature extremes, implies greater risks from fire, low water supply, greater airborne dusts,
drying up of water reservoir, and dry season related diseases (i.e. respiratory ailments, heat
strokes, etc.).
Projected Hazards by 2050
The period from 2036 to 2065 is predicted to experience a decrease in rainfall in the months of
March to May. The rest of the months will experience increases in rainfall, with the rainiest
months being September to November. The decrease of rainfall in the dry months, coupled with
increased frequency in the occurrence of high extreme temperatures, could result to greater risks

QUARRY VENTURES PHILIPPINES, INC. Environmental Impact Assessment
February 2019 4-310
from drying up of surface water bodies, fire, greater airborne dusts, and diseases that thrive
during the dry and hot seasons (i.e. respiratory ailments, heat strokes, prickly heat, nose bleeding,
exacerbation of heart conditions, etc.). Assuming that the mining operations in the area is still
ongoing, this could also mean greater risks from occupational safety and health hazards, as
workers become more prone to fatigue, dizzy spells, dehydration, and heat stroke in extremely
hot conditions. They may also suffer more from skin irritations and contact dermatitis, due to
increased sweating and more airborne dusts. The temperature rise is expected to bring about an
increase in the frequency, strength and range of tropical cyclones (Manila Observatory, 2010).
4.5 Risk Management
The risk assessment conducted showed that risks expected from the project are relatively low and
can be prevented and/or controlled with application of appropriate mitigation measures. In
particular, risk from explosion and fire hazards associated with fuel storage and utilization are low
and manageable. Other hazards identified are mass movement of rocks and soil, flooding and
mass release of sediments from settling ponds, occupational safety hazards, and natural
calamities.
The control and prevention of project-associated risks is dependent on the Company’s resolve
and capability to pursue their risk management and emergency plans. It would be for the interest
of the Company and the surrounding communities that identified risks be appropriately mitigated
and/or prevented. Major considerations in risk reduction are appropriate project design;
compliance with standards in the design, construction and maintenance of the mining equipment
and facilities; well-maintained safety systems; well-trained and motivated workforce; and the
establishment of an appropriate emergency response and contingency systems. To prevent
and/or control the identified risks and hazards in the marble and aggregates quarry of QVPI should
continue to vigorously pursue the implementation of its Safety and Health Program and its
Emergency Preparedness and Response Plan that are already in place.
4.5.1 Recommendations
Hazards associated with the marble and aggregates quarry are mass movement of soil/rocks from
the quarry sites; mass release of sediments from settling ponds; flooding; occupational safety
hazards; fire/explosion hazards from storage liquid fuel (diesel), exposure to dusts; siltation and
contamination of surface water bodies; soil erosion and loss of soil fertility; and natural calamities,
especially during extreme climate events; and exposure to high intensity noise.

QUARRY VENTURES PHILIPPINES, INC. Environmental Impact Assessment
February 2019 4-311
Occupational safety hazards may occur at the various operation units from the quarry site.
Outcome of occupational safety hazards include deaths and injuries resulting from
ground/structure failure, fall from heights, being struck or crushed by equipment parts or falling
rocks/debris, vehicular/equipment accidents, and others. Mass movement of soil and rocks may
occur quarry sites and in disturbed elevated areas. Mass release of sediments and flooding may
arise mainly due to breach of containing walls of impoundment and dikes especially at settling
ponds. Such incidents may be triggered by natural events such as extreme climate events
(torrential rains, strong typhoons, storm surges, etc.) earthquakes and subsidence; faulty
engineering design; inadequate maintenance of structures; and sabotage. Water contamination
could result from the release mining overburden and wastes to water bodies. The surface water
bodies could also become heavily silted. Fire/explosion hazards may arise from the storage and
utilization of coal and liquid fuel (diesel).
Particular recommendations to mitigate and manage identified hazards are listed in Table 169
Table 4-4: Identified hazards and corresponding mitigating measures
Hazard Classification/ Unit Operation
Major Hazards Mitigating Measures
A. Fire and Explosion
1. Liquid Fuel Storage (Diesel)
Fire following major releases/ spills
- Remove/reduce ignition sources in the area. - Ensure regular inspection and maintenance bund containments (bund capacity should at least be 110% of the tank’s capacity). - Ensure regular inspection and maintenance of tanks, piping, hoses, valves, gauges and other accessories. - Maintain a safety radius or buffer zone around the facility. - Ensure provision of fire control devices and
systems.
- Ensure strict adherence to Emergency
Preparedness and Response and Plan (EPRP)
- Ensure maintenance of properly functioning fire
trucks, fire extinguishers and other fire- fighting
equipment.
2. Blasting
- physical harm - collateral damage from debris - inhalation of dust - damage to structures
- Maintain a safety radius or buffer zone during
blasting schedule. - Ensure provision of fire control devices and
systems.
- Ensure strict adherence to Emergency
Preparedness and Response and Plan (EPRP)

QUARRY VENTURES PHILIPPINES, INC. Environmental Impact Assessment
February 2019 4-312
- Ensure maintenance of properly functioning fire trucks, fire extinguishers and other fire- fighting equipment.
B. Flooding and Mass Movement of Rocks and Soil
1. Stockpiles - land and rock slides - siltation of surface water bodies;
- Ensure regular inspections and proper maintenance of containment berms. - Batter off final stockpile slope to at most 20 degrees. - Use wastes and overburden as backfill. - Ensure proper siting of the stockpile
2. Settling Ponds
- Breach of containment of ponds and drainage system could cause flooding of low lying areas; and siltation and contamination of surface water bodies
- Ensure appropriate siting, design and construction of the facilities. - Ensure regular, as well as emergency inspections and monitoring of structures - Ensure proper and regular maintenance of the facility. - Strictly implement security measures to prevent sabotage of infrastructures.
C. Occupational Hazards
1. Site Preparation
a. surveying - fall from heights - vehicular accidents
- Ensure that vehicles used are well maintained and suitable for the terrain. - Strictly implement safety protocols.
b. Clearing and Waste Stripping
- being struck by felling trees, debris and equipment part - vibrations and noise from power saws and other equipment - vehicular and equipment accidents (overturning, fall from heights, etc.)
- Adopt and implement the safest methods/ technology. - Ensure that persons doing specialized tasks (eg. Tree felling) are fully trained. – Use of well- maintained equipment. - Ensure use of personal protection gears
c. Laying Out
- fall from heights; being struck by vehicles and earth moving equipment - vehicular and earth moving equipment accidents - electrocution
- Use of well- maintained and suitable equipment and vehicles. - Use of properly trained crew and operators, especially drivers of large equipment like cranes and earth moving vehicles.
2. Open Pit Mining Operation
a. Drilling and Excavation
- fall from the edge of a bench - being struck by falling rocks/debris at the foot of a face - inhalation of and contact with dusts which predisposes to respiratory diseases - Harmful noise levels - Being struck by a moving part of the drilling equipment
- Use of well- maintained and suitable equipment and vehicles. - Use of properly trained crew and operators, especially drivers of large equipment like cranes and earth moving vehicles.
b. Mineral Extraction - inhalation of and contact with dusts, which could
- Ensure use of appropriate personal protection equipment.

QUARRY VENTURES PHILIPPINES, INC. Environmental Impact Assessment
February 2019 4-313
predispose to respiratory diseases
- Use of appropriate equipment and vehicles with protective operator cabin.
c. Loading
- Being struck by falling rocks from loading arm - falls while gaining access to operator’s cabin - vehicular accidents
- Ensure that drivers are well- trained. - Ensure use of appropriate and properly maintained vehicles and equipment. - Ensure implementation of safety protocols.
3. Transport Minerals
- Vehicular accidents (fall from edge of bench, collision with other vehicles or structures, overturning, etc.) - inhalation of and/or contact with dusts - high level noise
- Avoid operation during inclement weather. - Maintain proper security and cordon off hazardous areas. - Ensure good maintenance and regular testing vehicles, especially of brakes. - Driver/operator cabs are protected from dusts and heat. - Restrict access to vehicles
4. Mineral Stockpiling
- inhalation of and contact with dusts, which could predispose to respiratory diseases
- Provide workers and operators with personal protection equipment (e.g. masks, gloves, goggles).
D. Natural Calamities Due to Extreme Climate Events
1. Increased frequency, intensity and range of tropical cyclones
- flooding of low lying areas; rock and landslides
- Ensure regular review of the Project’s ERPP to ensure its adequacy and effectiveness to respond to changing situations.
2. Increased intensity and frequency of rains during wet season
- flooding of low lying areas; rock/landslides; increased soil erosion and loss of soil fertility
- Ensure strict implementation of and compliance with the safety and health program, especially the EPRP. - Ensure regular and timely inspections and monitoring of containment dikes, retaining walls, and other retaining structures. - Ensure that all personnel, workers and contractors are properly oriented of the EPRP and ensure the regular conduct of emergency drills for situations such as fires, tsunami, flooding and earthquakes. - Conduct seminars, workshops, and other education/ information campaigns on climate change, its impacts and appropriate responses to mitigate impacts (tailored to the specific condition in the area).
3. Drier dry seasons and increased ambient temperatures
- fire incidents; increased airborne dusts; drying of water reservoirs and sources; increased diseases (i.e. respiratory, skin diseases, heat strokes, dizzy spells other diseases linked with hot, dry seasons)
- Ensure the implementation of the rehabilitation and reforestation program of mined-out areas and other denuded areas. - Strictly implement fire prevention and control measures and protocols. - Ensure strict implementation of dust suppression measures. - provide personnel protective equipment to workers, especially dust masks, eye goggles.
E. Earthquakes and Tsunamis
- collapse of infrastructures and buildings; spillage of fuel predisposing to fires; landslides; tsunami
- Formulate and implement an earthquake and tsunami emergency response plan that includes the following: monitoring and warning system; system of communication within and outside the mine site; SOPs for all personnel, workers and contractors; and evacuation plan. - Conduct regular and timely orientation and drills of all personnel, workers, contractors, as well as

QUARRY VENTURES PHILIPPINES, INC. Environmental Impact Assessment
February 2019 4-314
nearby communities, on the earthquake/tsunami emergency response plan and procedures. - Ensure regular and timely inspections and
monitoring of all buildings and infrastructures
within the mine site. - Ensure proper zoning and location, as well as
good engineering, of buildings and other infrastructures.

QUARRY VENTURES PHILIPPINES, INC. Environmental Impact Assessment
February 2019 5-315
5 SOCIAL DEVELOPMENT PLAN AND IEC IMPLEMENTATION
5.1 Existing SDP and IEC
The following tables presents the current SDMP and IEC projects implemented by QVPI on the host community. Most of the SDP activities involve
infrastructures for the impact barangays. The company also started a radio program that serves as their main IEC activity. The “Ikaw Ug Mina” program
discusses the benefits of mining to the community.
Table 5-1: Summary of SDMP Activities
Year Program/Projects/Activities Status No. of
Beneficiaries Brgy. Covered
Planned Budget (Php)
Actual Cost (Php)
2006 Roofing materials for the basketball court of Barangay Uling
completed 2,072 Uling 5,000.00 25,000.00
Establish candle & soap products completed 35 Uling 5,000.00 5,000.00
YEAR 2006 TOTAL 10,000.00 30,000.00
2008 Construction Materials for the improvement of Brgy. Hall of Tagjaguimit
completed 2,960 Tagjaguimit 50,000.00
YEAR 2008 TOTAL 50,000.00
2009 Livelihood Program 50
Establish sub-crop farming completed Tagjaguimit 16,000.00
Establish livelihood for livestock completed Tagjaguimit 16,000.00
Establish candle & soap products completed Tagjaguimit 12,000.00
Infrastructure completed
Brgy. Uling Uling
Construction of Brgy. Hall completed 5,400 Uling 40,000.00 30,348.00 Street lightings completed Uling 7,250.00 Road repair and maintenance completed Uling 25,000.00 37,029.10 Brgy. Tagjaguimit
Construction of Brgy. Hall completed 2,960 Tagjaguimit 22,950.00 Street lightings completed Tagjaguimit
Road repair and maintenance completed Tagjaguimit 12,500.00 104,542.00 Other SDMP Related Activities

QUARRY VENTURES PHILIPPINES, INC. Environmental Impact Assessment
February 2019 5-316
Year Program/Projects/Activities Status No. of
Beneficiaries Brgy. Covered
Planned Budget (Php)
Actual Cost (Php)
Educational Assistance
Financial Assistance completed 2 Uling 5,000.00 20,346.10 Incentives Uling & Tagjaguimit 5,000.00
Health and Sanitation
Dental & Medical Mission completed all residents Uling, Tagjaguimit,
Mayana, Balirong, Alpaco, Lutac
30,000.00
Health Seminars completed 6,000.00
Meeting/ Consultation with barangay completed 4,000.00
Sports Program completed 5,164 Uling & Tagjaguimit 4,000.00 27,800.00 Cultural Heritage completed 5,164 Uling & Tagjaguimit 4,000.00 3,000.00 Other Community Assitance
City of Naga completed City of Naga 9,719.10 Brgy. Balirong completed Brgy. Balirong 48,950.38 Brgy. Alpaco completed Brgy. Alpaco 102,028.85
YEAR 2009 TOTAL 179,500.00 413,963.53
2010 Livelihood Program
Establish sub-crop farming completed Tagjaguimit 30,000.00
Establish livelihood for livestock completed Tagjaguimit 24,000.00
Establish candle & soap products completed 15 Tagjaguimit 26,000.00 2,000.00 Infrastructure
Brgy. Uling
Construction of Brgy. Hall completed 5,400 Uling 20,000.00 864.00 Street lightings completed Uling 15,000.00
Road repair and maintenance completed Uling 62,500.00 101,491.00 Brgy. Tagjaguimit
Road construction & school building completed 2,960 Tagjaguimit 143,174.00 Street lightings completed Tagjaguimit
Road repair and maintenance completed Tagjaguimit 62,500.00 57,500.00 Other SDMP Related Activities
Educational Assistance
Financial Assistance completed 2 Uling & Tagjaguimit 12,500.00
Incentives completed 2 Uling & Tagjaguimit 12,500.00

QUARRY VENTURES PHILIPPINES, INC. Environmental Impact Assessment
February 2019 5-317
Year Program/Projects/Activities Status No. of
Beneficiaries Brgy. Covered
Planned Budget (Php)
Actual Cost (Php)
Health and Sanitation
Dental & Medical Mission completed all residents Uling, Tagjaguimit,
Mayana, Balirong, Alpaco, Lutac
75,000.00 7,273.25
Health Seminars completed 15,000.00
Meeting/ Consultation with barangay completed Uling & Tagjaguimit 10,000.00
Sports Program completed 5,164 Uling & Tagjaguimit 10,000.00
Cultural Heritage completed 5,164 Uling & Tagjaguimit 10,000.00 35,000.00 Other Community Assitance
City of Naga completed City of Naga 12,500.00 Brgy. Lanas completed Brgy. Lanas 2,000.00 Brgy. Balirong completed Brgy. Balirong 26,236.70 Brgy. Alpaco completed Brgy. Alpaco 12,841.80
YEAR 2010 TOTAL 385,000.00 400,880.75
2011 Livelihood Program
Establish sub-crop farming completed 10 Tagjaguimit 6,000.00 2,000.00 Establish livelihood for livestock completed Tagjaguimit 6,000.00
Establish candle & soap products completed Tagjaguimit 4,000.00
Infrastructure
Brgy. Uling Uling 37,170.00 Construction of Brgy. Hall completed 5,400 Uling
Street lightings completed Uling 1,025.00 Road repair and maintenance completed Uling 12,500.00 176,556.45 Diesel Allocation completed Uling 8,944.38 Brgy. Tagjaguimit
Road construction & school building completed 2,960 Tagjaguimit 184,890.00 Street lightings completed Tagjaguimit
Road repair and maintenance completed Tagjaguimit 12,500.00 206,675.80 Other SDMP Related Activities
Educational Assistance completed 10,350.00 Financial Assistance completed 2 Uling & Tagjaguimit 2,500.00 3,000.00 Incentives completed 2 Uling & Tagjaguimit 2,500.00
Health and Sanitation 7,700.00

QUARRY VENTURES PHILIPPINES, INC. Environmental Impact Assessment
February 2019 5-318
Year Program/Projects/Activities Status No. of
Beneficiaries Brgy. Covered
Planned Budget (Php)
Actual Cost (Php)
Dental & Medical Mission completed all residents Uling, Tagjaguimit,
Mayana, Balirong, Alpaco, Lutac
15,000.00 3,000.00
Health Seminars completed 3,000.00
Sports Program completed 5,164 Uling & Tagjaguimit 2,000.00 19,750.00 Cultural Heritage completed 5,164 Uling & Tagjaguimit 2,000.00 171,909.50 Other Community Assitance
City of Naga completed City of Naga 9,000.00 Brgy. Lanas completed Brgy. Lanas 2,500.00 Brgy. Balirong completed Brgy. Balirong 127,363.75 Brgy. Alpaco completed Brgy. Alpaco 47,300.70 San Fernando completed San Fernando 3,000.00 Pinamungajan completed Pinamungajan 13,000.00 DENR 7 completed DENR7 2,000.00
YEAR 2011 TOTAL 68,000.00 1,037,135.58
2012 Livelihood Support 14,080.90 Establish sub-crop farming completed 15 Tagjaguimit 6,000.00
Goat Raising completed Tagjaguimit 8,000.00
Establish & support sewing machine completed 10 Uling 6,000.00
Infrastructure Support 193,868.29 Re-construction of Brgy. Hall completed 2960 Tagjaguimit
Replacement of Streetlights completed Uling 5,000.00
Road repair & maintenance completed Uling & Tagjaguimit 25,000.00
Others SDMP Related Activities
Educational Assistance 13,350.00 Financial assistance to scholar completed Uling & Tagjaguimit 2,500.00
Incentives to deserving students completed Uling & Tagjaguimit 2,000.00
Health and Sanitation
Medical Mission in coordination with health organization (private/public)
completed all residents Uling, Tagjaguimit,
Mayana, Balirong, Alpaco, Lutac
15,000.00 576,000.00
Health Seminars completed 1,000.00
Information, Education, Communication
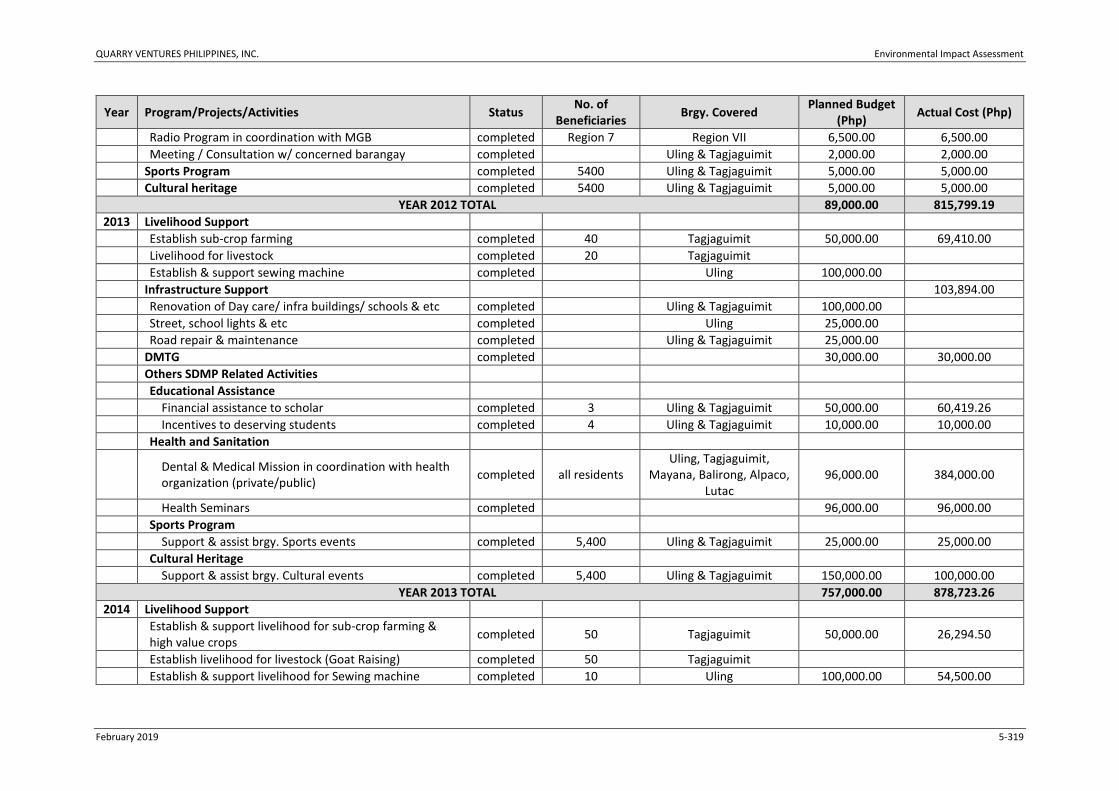
QUARRY VENTURES PHILIPPINES, INC. Environmental Impact Assessment
February 2019 5-319
Year Program/Projects/Activities Status No. of
Beneficiaries Brgy. Covered
Planned Budget (Php)
Actual Cost (Php)
Radio Program in coordination with MGB completed Region 7 Region VII 6,500.00 6,500.00 Meeting / Consultation w/ concerned barangay completed Uling & Tagjaguimit 2,000.00 2,000.00 Sports Program completed 5400 Uling & Tagjaguimit 5,000.00 5,000.00 Cultural heritage completed 5400 Uling & Tagjaguimit 5,000.00 5,000.00
YEAR 2012 TOTAL 89,000.00 815,799.19
2013 Livelihood Support
Establish sub-crop farming completed 40 Tagjaguimit 50,000.00 69,410.00 Livelihood for livestock completed 20 Tagjaguimit
Establish & support sewing machine completed Uling 100,000.00
Infrastructure Support 103,894.00 Renovation of Day care/ infra buildings/ schools & etc completed Uling & Tagjaguimit 100,000.00
Street, school lights & etc completed Uling 25,000.00
Road repair & maintenance completed Uling & Tagjaguimit 25,000.00
DMTG completed 30,000.00 30,000.00 Others SDMP Related Activities
Educational Assistance
Financial assistance to scholar completed 3 Uling & Tagjaguimit 50,000.00 60,419.26 Incentives to deserving students completed 4 Uling & Tagjaguimit 10,000.00 10,000.00 Health and Sanitation
Dental & Medical Mission in coordination with health organization (private/public)
completed all residents Uling, Tagjaguimit,
Mayana, Balirong, Alpaco, Lutac
96,000.00 384,000.00
Health Seminars completed 96,000.00 96,000.00 Sports Program
Support & assist brgy. Sports events completed 5,400 Uling & Tagjaguimit 25,000.00 25,000.00 Cultural Heritage
Support & assist brgy. Cultural events completed 5,400 Uling & Tagjaguimit 150,000.00 100,000.00
YEAR 2013 TOTAL 757,000.00 878,723.26
2014 Livelihood Support
Establish & support livelihood for sub-crop farming & high value crops
completed 50 Tagjaguimit 50,000.00 26,294.50
Establish livelihood for livestock (Goat Raising) completed 50 Tagjaguimit
Establish & support livelihood for Sewing machine completed 10 Uling 100,000.00 54,500.00
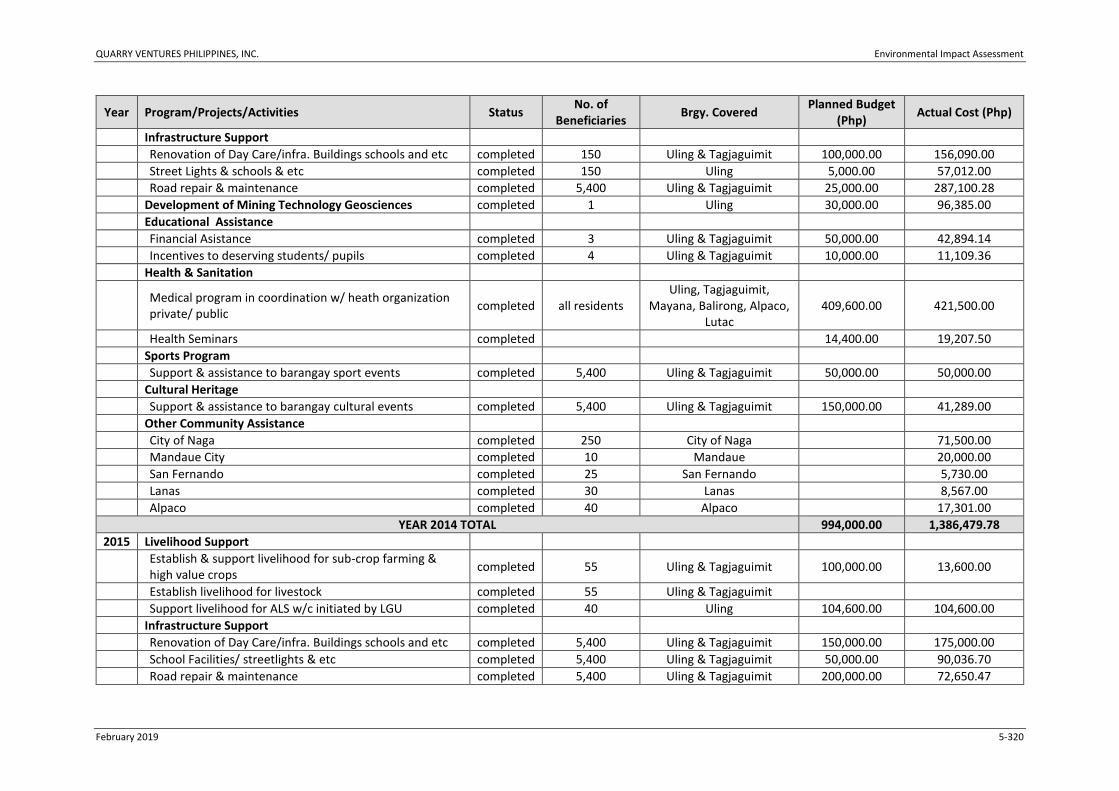
QUARRY VENTURES PHILIPPINES, INC. Environmental Impact Assessment
February 2019 5-320
Year Program/Projects/Activities Status No. of
Beneficiaries Brgy. Covered
Planned Budget (Php)
Actual Cost (Php)
Infrastructure Support
Renovation of Day Care/infra. Buildings schools and etc completed 150 Uling & Tagjaguimit 100,000.00 156,090.00 Street Lights & schools & etc completed 150 Uling 5,000.00 57,012.00 Road repair & maintenance completed 5,400 Uling & Tagjaguimit 25,000.00 287,100.28 Development of Mining Technology Geosciences completed 1 Uling 30,000.00 96,385.00 Educational Assistance
Financial Asistance completed 3 Uling & Tagjaguimit 50,000.00 42,894.14 Incentives to deserving students/ pupils completed 4 Uling & Tagjaguimit 10,000.00 11,109.36 Health & Sanitation
Medical program in coordination w/ heath organization private/ public
completed all residents Uling, Tagjaguimit,
Mayana, Balirong, Alpaco, Lutac
409,600.00 421,500.00
Health Seminars completed 14,400.00 19,207.50 Sports Program
Support & assistance to barangay sport events completed 5,400 Uling & Tagjaguimit 50,000.00 50,000.00 Cultural Heritage
Support & assistance to barangay cultural events completed 5,400 Uling & Tagjaguimit 150,000.00 41,289.00 Other Community Assistance
City of Naga completed 250 City of Naga 71,500.00 Mandaue City completed 10 Mandaue 20,000.00 San Fernando completed 25 San Fernando 5,730.00 Lanas completed 30 Lanas 8,567.00 Alpaco completed 40 Alpaco 17,301.00
YEAR 2014 TOTAL 994,000.00 1,386,479.78
2015 Livelihood Support
Establish & support livelihood for sub-crop farming & high value crops
completed 55 Uling & Tagjaguimit 100,000.00 13,600.00
Establish livelihood for livestock completed 55 Uling & Tagjaguimit
Support livelihood for ALS w/c initiated by LGU completed 40 Uling 104,600.00 104,600.00 Infrastructure Support
Renovation of Day Care/infra. Buildings schools and etc completed 5,400 Uling & Tagjaguimit 150,000.00 175,000.00 School Facilities/ streetlights & etc completed 5,400 Uling & Tagjaguimit 50,000.00 90,036.70 Road repair & maintenance completed 5,400 Uling & Tagjaguimit 200,000.00 72,650.47

QUARRY VENTURES PHILIPPINES, INC. Environmental Impact Assessment
February 2019 5-321
Year Program/Projects/Activities Status No. of
Beneficiaries Brgy. Covered
Planned Budget (Php)
Actual Cost (Php)
Educational Asistance
Financial Assistance/ scholars completed 3 Uling & Tagjaguimit 66,000.00 62,000.00 Incentives to deserving students/pupils completed 3 Uling & Tagjaguimit 25,000.00 17,210.00 Financial Assistanc to Day Care Teacher completed 1 Uling 55,000.00 55,000.00 Health and Sanitation
Medical support in coordination w/ health organization private/ public
completed all residents Uling, Tagjaguimit,
Mayana, Balirong, Alpaco, Lutac
480,000.00 13,294.00
Health - Regular doctors consultation completed 14,400.00 13,200.00 Feeding Program completed 48,000.00 48,000.00 Sports Program
Support & assistance to barangay sports events completed 5,400 Uling & Tagjaguimit 50,000.00 50,000.00 Cultural Heritage
Support & assistance to barangay sports events completed 5,400 Uling & Tagjaguimit 100,000.00 100,000.00 Development of Mining Technology Geosciences
Financial Assistance to deserving student completed 1 Uling & Tagjaguimit 120,000.00 97,045.60 Other Community Assistance 9,719.00
YEAR 2015 TOTAL 1,563,000.00 921,355.77
2016 Livelihood Support
Establish & support subcrop farming completed 55 Tagjaguimit 100,000.00
Establish livelihood for livestock completed 55 Tagjaguimit 66,000.00 Support Alternative Livelihood System completed 45 Uling 45,000.00 47,700.00 Infrastructure Support
Construction of Barangay Health Center completed 2,960 Tagjaguimit 200,000.00 206,875.00 Renovation of Day Care Center, schools & etc completed 5,400 Uling & Tagjaguimit 44,000.00 96,412.00 Street, School Lights & Maintenance completed Uling 46,100.00 66,236.00 Road repair & maintenance completed Uling & Tagjaguimit 46,100.00 53,566.00 Development of Mining Technology Geosciences
College Scholarship completed 1 Uling 120,000 112,876 Others SDMP Related Activities
Educational Assistance
Financial assistance to scholar completed 3 Uling & Tagjaguimit 12,500.00 18,250.00 Incentives to deserving students completed 3 Uling & Tagjaguimit 25,000.00 27,000.00

QUARRY VENTURES PHILIPPINES, INC. Environmental Impact Assessment
February 2019 5-322
Year Program/Projects/Activities Status No. of
Beneficiaries Brgy. Covered
Planned Budget (Php)
Actual Cost (Php)
Financial assistance to Day Care completed 1 Uling 55,000.00 69,340.00 Health and Sanitation
Medical Support completed all residents Uling, Tagjaguimit,
Mayana, Balirong, Alpaco, Lutac
192,000.00 195,142.00
Health (regular Medical Consultation) completed 14,400.00 14,400.00 Feeding Program completed 102 48,000.00 48,000.00 Sports Program
Assistance to Brgy. Sports events completed 5,400 Uling & Tagjaguimit 50,000.00 57,000.00 Cultural Heritage
Asistance of Cultural events completed 5,400 Uling & Tagjaguimit 50,000.00 52,000.00 Other Community Assistance 301,742.00
YEAR 2016 TOTAL 1,048,100.00 1,432,539.00
2017 Livelihood Support
Support sub-crop farming of high value crops completed 55 Tagjaguimit 60,000.00 - Support livelihood for livestock completed 55 Tagjaguimit 60,000.00 60,000.00 Support Alternative Livelihood System completed
Pipefitting & structural Fabrication completed 45 Uling 100,000.00 18,975.00 Infrastructure Support
Continuation construction of Brgy. Health completed 2,960
Center extension Tagjaguimit 75,000.00 75,000.00 Maintenance of day Care Center, school completed
and etc. / ALS Support 150 Uling 60,000.00 53,822.00 Street and school lights Maintenance / completed
Barangay beautification 74 Uling 10,000.00 1,197.90 Road repair and Maintenance completed 5,400 Uling & Tagjaguimit 35,000.00 22,553.00 Development of Mining Technology Geosciences
College Scholarship completed 1 Uling 60,000.00 73,120.03 Others SDMP Related Activities
Educational Assistance
Financial assitance to scholar completed 3 Uling & Tagjaguimit 72,000.00 29,000.00 Incentives to deserving students completed 3 Uling & Tagjaguimit 15,000.00 14,995.65 Financial assistance to Day Care Teacher completed 1 Uling 60,000.00 66,000.00

QUARRY VENTURES PHILIPPINES, INC. Environmental Impact Assessment
February 2019 5-323
Year Program/Projects/Activities Status No. of
Beneficiaries Brgy. Covered
Planned Budget (Php)
Actual Cost (Php)
Brigada eskwela completed 3 Uling, Tagja, Cogon 10,000.00 3,774.00 Health and Sanitation
Medical Support completed all residents Uling, Tagjaguimit,
Mayana, Balirong, Alpaco, Lutac
280,000.00 467,266.00
Feeding Program completed 75 Uling & Tagjaguimit 48,000.00 48,000.00 Sports Program completed 5,400 Uling & Tagjaguimit 50,000.00 50,000.00 Cultural Heritage completed 5,400 Uling & Tagjaguimit 35,000.00 35,000.00 Community Development Assistance completed
Support for basic health & medical care & services at VCMMC (Vicente Mendiola Memorial Hospital)
completed all residents City of Naga 280,000.00 280,000.00
Pinamungajan Medical Mission completed Pinamungajan 60,000.00 60,000.00 Pinamungajan Feeding Program completed Pinamungajan 60,000.00 60,000.00 Contingency funds complied Uling 50,000.00 29,693.50
YEAR 2017 TOTAL 1,480,000.00 1,488,397.08
Table 5-2: Summary of IEC Activities
Year Program/Projects/Activities Status No. of
Beneficiaries Brgy. Covered
Planned Budget (Php)
Actual Cost (Php)
2009 IEC
Radio Program completed Region 7 Region VII 6,500.00 12,500.00 Pulong-pulong
Advertisement
YEAR 2009 TOTAL 6,500.00 12,500.00
2010 IEC
Radio Program completed Region VII 32,500.00
Pulong-pulong
Advertisement
YEAR 2010 TOTAL 32,500.00
2011 IEC
Radio Program completed Region VII 6,500.00 6,500.00 Meeting in w/ consultation w/ concerned barangay completed 2,000.00

QUARRY VENTURES PHILIPPINES, INC. Environmental Impact Assessment
February 2019 5-324
Year Program/Projects/Activities Status No. of
Beneficiaries Brgy. Covered
Planned Budget (Php)
Actual Cost (Php)
Advertisement
YEAR 2011 TOTAL 8,500.00 6,500.00
2012 IEC
Radio Program in coordination with MGB completed Region 7 Region VII 6,500.00 6,500.00 Meeting / Consultation w/ concerned barangay completed Uling & Tagjaguimit 2,000.00 2,000.00
YEAR 2012 TOTAL 8,500.00 8,500.00
2013 IEC
Radio Program in coordination with MGB completed Region VII Region VII 13,000.00 13,000.00 Meeting / Consultation w/ concerned barangay completed 20 Uling & Tagjaguimit 2,000.00 2,000.00
YEAR 2013 TOTAL 15,000.00 15,000.00
2014 IEC
Radio Program in coordination with MGB completed Region VII Region VII 13,000.00 13,100.00 Meeting/ Consultation w/ concerned barangay completed 20 Uling & Tagjaguimit 2,000.00 2,000.00
YEAR 2014 TOTAL 15,000.00 15,000.00
2015 IEC
Radio Program in coordination with MGB completed Region VII Region VII 70,000.00 22,449.00 Meeting/ Consultation w/ concerned barangay completed 10,800.00 10,000.00
YEAR 2015 TOTAL 80,800.00 32,449.00
2016 IEC 15,000.00
Support one radio program completed Region VII Region VII
Meeting / Consultation LGU's completed 31,465 Sibago, Lamac, Cogon, Tagjaguimit, Bulongan,
Media Once, Poog 230,500.00 184,260.00
YEAR 2016 TOTAL 245,500.00 184,260.00
2017 IEC
Support One (1) Radio Program completed Region VII 23,000.00 - Meeting/ Consultation w/ concerned barangay completed Uling & Tagjaguimit 67,000.00 33,792.36
YEAR 2017 TOTAL 1,170,000.00 1,482,189.44
2018 IEC
Meeting/ Consultation w/ concerned barangay completed 212 Cogon, Campo 8, Media
Once, Poog 45,000.00 44,250.00
YEAR 2018 TOTAL 45,000.00 44,250,00

QUARRY VENTURES PHILIPPINES, INC. Environmental Impact Assessment
February 2019 5-325
5.2 Social Development Program
5.2.1 Indicative Social Development Plan
As mandated by law, the proponent has to formulate and implement a five-year Social
Development and Management Program (SDMP). In essence, Indicative Social Development Plan
(ISDP) of QVPI will be realized through the SDMP.
It is the goal of the SDMP is to assist the community to attain socio-economic growth during the
time of mine development and address the various possible socio-economic issues raised by the
stakeholders. Its formulation has to be in consultation with the various stakeholders taking into
consideration the existing barangay and/or city/municipal development plans. In so doing, the
SDMP will be a significant part of the medium and long-term development of the concerned
barangays and the city/municipality.
The implementation, monitoring, and evaluation of the SDMP will be executed in coordination
and partnership between the company, through its Community Relations Staff and various
stakeholders (i.e. LGUs, government agencies). Through this system, the participation and
awareness of the stakeholders regarding the various aspects of the Project is ensured and will
develop a sense of ownership of the community to the SDMP Programs/Projects/Activities
(P/P/As). In this manner, the sustainability of the SDMP P/P/As will be made certain.
The SDMP of QVPI shall be formulated to provide assistance in improving the socio-economic
status of the residents within the six (6) impact barangays. The indicative
Programs/Projects/Activities to be implemented in the SDMP/ISDP of QVPI is presented in Table
5-3.

QUARRY VENTURES PHILIPPINES, INC. Environmental Impact Assessment
February 2019 5-326
Table 5-3: Indicative Social Development Plan/ Social Development and Management Program – Programs/Projects/Activities
Concerns Community Beneficiary
Community Member
Responsible
Government Agency/ Non-government Agency and
Services Proponent Indicative Timeline
Source of Fund
Unemployment/ Lack of Livelihood
Gender Responsive Livelihood / Employment and Credit Facilities (Men, Women, Youth & Elderly)
Employment and skills development
Skills training program: to give local residents of project-impact barangays the chance to qualify and compete for available employment opportunities during the implementation of the project or in other areas
Affected Men, Women, Youth & Elderly
Barangay officials
Association Chairperson
LGU City/Municipal Planning and Development Office
Host Barangays
City/Municipal Social Worker Department (C/MSWD)
TESDA, TLRC, DOST, and DSWD
QVPI Community Relations
Officer
Pre-construction
Construction
Operation
LGU –IRA/ Proponent
Health Services
Medical and dental missions
Skills enhancement for barangay health workers
Support to the Rural Health Unit programs and activities
Support to the improvement of health facilities
Conduct campaign on good health and sanitation
Host Barangay
Barangay Officials
City/Municipal and Barangay Health Workers
City/Municipal Health Office (C/MHO)
Barangay Disaster Risk Reduction and Management Councils
Host Barangays
QVPI Community Relations Officer
QVPI Safety and Health Officer
Pre-construction
Construction
Operation
LGU –IRA/ Proponent
Education

QUARRY VENTURES PHILIPPINES, INC. Environmental Impact Assessment
February 2019 5-327
Concerns Community Beneficiary
Community Member
Responsible
Government Agency/ Non-government Agency and
Services Proponent Indicative Timeline
Source of Fund
School supplies donation for underprivileged children
Assistance for development/improvement of school facilities (day care centers, existing schools)
Provision of scholarship to qualified students
Capacity building of teachers
Non-formal education for adults
Project Affected Families
Barangay Officials (specifically the Council Member for Education)
Department of Educaiton (DepEd)
Host Barangays
QVPI Community Relations Officer
Pre-construction
Construction
Operation
LGU –IRA/ Proponent
Environment, Health and Sanitation
Implementation of Solid Waste Management in compliance to Republic Act 9003
Good Housekeeping and Sanitation
Project Affected Community
Barangay Officials (specifically the Council Member for Environment)
Environment and Natrual Resources Office (ENRO)
C/MHO
Host Barangays
QVPI Community Relations Officer
QVPI Mine Environmental Protection and Enhancement Officer / Pollution Control Officer
Pre-construction
Construction
Operation
LGU –IRA/ Proponent
Resettlement
Implementation of Resettlement Action Plan for affected tenants/households
Baragays Alfaco, Cogon, Tagjaguimit in the City of Naga; Barangays Camugao, LAmac, and Sibago in the
Barangay Councils
Affected Tenants and Households
LGU Municipal (City/Municipal Planning and Development Office)
Inter-agency Committee for Resettlement (C/MSWD, C/MHO, C/MAO, C/MENRO, C/ME, PNP, DepEd
QVPI Community Relations Officer
Pre-construction LGU/ Proponent

QUARRY VENTURES PHILIPPINES, INC. Environmental Impact Assessment
February 2019 5-328
Concerns Community Beneficiary
Community Member
Responsible
Government Agency/ Non-government Agency and
Services Proponent Indicative Timeline
Source of Fund
Municipality of Pinamungahan, and Barangays Bulongan, Bunga, Media Once, and Poog in Toledo City.

QUARRY VENTURES PHILIPPINES, INC. Environmental Impact Assessment
February 2019 5-329
5.3 Information and Education Campaign (IEC)
Implementation of an intensive and consistent IEC Plan is the key to build a positive rapport with
the impact communities and other stakeholders. Through this, an open communication line is
established between QVPI, Barangay and City/Municipal LGUs, and the residents of impact
barangays. An open communication ensures accessibility of bringing community concerns to the
attention of the company. It is also a way for the Company to communicate efforts and activities
that addressed community concerns, intervention to avoid or mitigate negative impacts of the
operations, as well as to enhance positive impacts through a strong partnership with the impact
communities.
QVPI is currently implementing IEC activities with the direct impact communities through
continuous community meetings and interactions. Also, as part of its commitment to disseminate
information about Responsible Mining in the Philippines, QVPI provides sponsorship and
patronizes the Radio Program: “Ikaw ug ang Mina”.
The IEC activities of QVPI will be based on the IEC framework outlined in Table 5-4.

QUARRY VENTURES PHILIPPINES, INC. Environmental Impact Assessment
February 2019 5-330
Table 5-4: Indicative IEC for the QVPI Mining Project
Target Sector Identified as Needing Project IEC
Major Topics of Concern in Relation to Project
IEC Schemes/ Strategy/ Methods
Information Medium Indicative Timeline and
Frequency Indicative Cost
Local Government Units
Project affected communities
Non-Government Organizations
Relevant National/Regional Government Agencies (i.e. EMB and MGB)
Environmental Impact Assessment (EIA) Process
EIS Report Findings
Projects description (i.e. projects components, size/coverage, capacity, among others)
Inclusive and Participatory
Invitation letters
Audio-visual presentation
IEC materials of the Project’s information
Prior to project construction and implementation
Cost of meals
Cost of IEC materials
Local Government Units
Project affected communities
Non-Government Organizations
Projects impact and mitigating measures
Projects primary and secondary impact areas
Inclusive and Participatory
Invitation letters
Posters
Prior to project construction and implementation
Cost of meals
Cost of IEC materials
Local Government Units,
Host and Neighboring Communities
All Sectors of Affected Communities (i.e. Youth, Women, Senior Citizen)
Non-Government Organizations Relevant National/Regional Government Agencies (i.e. EMB and MGB)
Projects SDMP coverage, implementation and source of fund
Inclusive and Participatory
Invitation letters
Posters
MMT and Mine Rehabilitation Fund Committee (MRFC) memorandum and official communication
During the SDMP approval process
Regular consultation after SDMP approval
Cost of meals
Cost of honorarium
Cost of transportation
Cost of venue
Local Government Units
Project affected communities
Projects Environmental Protection and Enhancement Program (EPEP) /
Inclusive and Participatory
Invitation letters
Posters
MMT and Mine Rehabilitation Fund
During the EPEP approval process
Every quarter upon the approval
Cost of meals
Cost of honorarium
Cost of transportation
Cost of venue

QUARRY VENTURES PHILIPPINES, INC. Environmental Impact Assessment
February 2019 5-331
Target Sector Identified as Needing Project IEC
Major Topics of Concern in Relation to Project
IEC Schemes/ Strategy/ Methods
Information Medium Indicative Timeline and
Frequency Indicative Cost
Relevant National/Regional Government Agencies (i.e. EMB and MGB)
QVPIs Environmental Policy
Committee (MRFC) memorandum and official communication
Local Government Units
Project affected communities
Relevant National/Regional Government Agencies (i.e. EMB and MGB)
Projects Safety and Health Program (SHP)
QVPIs Safety and Health Policy
Inclusive and Participatory
Invitation letters
Posters
MMT and Mine Rehabilitation Fund Committee (MRFC) memorandum and official communication
During the EPEP approval process
Every quarter upon the approval
Cost of meals
Cost of honorarium
Cost of transportation
Cost of venue
5.4 Complaints Resolution
At the time of this application, there is only one formal complained against the proponent back in 2011. The complaint was filed for an alleged
indiscriminate blasting. The complaint was received in March 2011, and went through investigations by MGB. The case was eventually resolved by
October of the same year, and resolution is attached as Annex 12.

QUARRY VENTURES PHILIPPINES, INC. Environmental Impact Assessment
February 2019 6-332
6 ENVIRONMENTAL COMPLIANCE MONITORING
This section presents the proposed framework for compliance monitoring of the project including
environmental performance indicators and standards of environmental parameters necessary to
monitor the identified key environmental impacts of the proposed project and modification.
As required under DENR Memorandum Circular 2010-14 and the Revised Procedural Manual for
DAO 2003-30, and as a pro-active tool in minimizing/eliminating adverse project consequences to
the environment, an “Environmental Quality Performance Level” (EQPL) has been identified for
each critical parameter associated with identified significant project impacts. The limit level shall
be the regulated threshold of pollutant (standard that must not be exceeded) while the action
level is set lower than the limit level wherein management measures must be implemented so as
not to reach the regulated threshold.
Also, the following mechanisms and monitoring schemes are discussed:
Environmental Monitoring Plan
Multi-sectoral Monitoring Framework
Environmental Guarantee and Monitoring Fund Commitment
6.1 Environmental Performance (Parcel 1)
Parcel 1 is already in operation, covered with ECC 07-07-07-02-0263-303-A. The operation in this
area only covers 14.02 hectares out of the 81 hectares allotted, as of June 2017. Monitoring
documents are regularly being submitted to the DENR EMB Region 7, which includes the
Compliance Monitoring Report (CMR) and the Self-Monitoring Report (SMR). The latest of which,
at the time of this writing, is the CMR for the period of January to June 2017.
According to the CMR, the majority of the waste generated on Parcel 1, are liquid and solid
wastes, particularly used oil, items with lead and mercury compounds, grease trap wastes, and
domestic wastes. QVPI’s reported domestic wastes generated for the period of January to June
is 183.2kg. The generated waste were segregated, and disposed of properly through the LGU’s
Material Recovery Facility (MRF), and the used oil was collected by a DENR-approved transporter.
The company strictly implements and complies with the conditions specified in the issued ECC,
the table below summarizes the company’s ECC compliance:

QUARRY VENTURES PHILIPPINES, INC. Environmental Impact Assessment
February 2019 6-333
Table 6-1: Summary of Compliances to ECC Conditions
Condition/Requirement/Commitment Compliance Status and Summary of Actions Taken
1. Soil/mud from tires of truck and equipment shall be removed before leaving the area.
Implemented on day to day operations.
2. Indigenous trees species and ornamental plants shall be planted at the strategic location of the project site to compensate the loss of vegetation within the area to be quarried.
Assigned Nursery Tender do the tree planting and monitoring of all trees planted.
3. A private nursery with at least Five Thousand (5,000) seedlings shall be established at the project site one (1) month after project implementation and tree planting activities shall be conducted at potential areas.
Already complied through National Greening Program.
4. All hauling trucks shall be provided with tank contained with water to be used for spraying trucks’ wheel while in transit on the rough road.
Conditional
5. All hauling trucks shall be covered with canvass or any equivalent materials while in transit.
Complied with
6. Siltation pond shall be constructed to collect run off water.
Complied with
7. Proper benching pattern shall be implemented. Complied with
8. Proper stockpiling of spoils shall be conducted. Complied with
9. Stripped overburden shall not be left in the slope of the bench or road so that corrosion will not occur.
Complied with
10. Drainage system shall be constructed at strategic places to prevent run-off water from causing erosion.
Complied with (visible at the Quarry Area leading to the silt pond. This is also part of EPEP compliance)
11. A licensed blaster shall be assigned to monitor the blasting operation.
Implemented whenever there’s a blasting activity.
12. Wet cutting shall be employed. Implemented
13. Quarry safety rules and regulations shall be enforced.
The company’s safety officer diligently imposes what’s best with regards to safety at the quarry operation.
14. Safety skills training shall be provided and annual safety and health program shall be implemented.
Complied with Reflected to the Report on Safety submitted to MGB Office)
15. Proper equipment servicing and maintenance practices shall be implemented.
Complied with
16. Blasting firing procedures, fly rocks prevention measures, warning procedures and notifications and soft or light (controlled) blasting shall be strictly implemented.
Implemented whenever there’s blasting activity
17. That in the blast hole loading procedures, unauthorized or unwanted personnel will not be allowed within the blasting area.
Implemented whenever there’s blasting activity
18. That safe handling, storage and use of explosives and blasting agents and the after blasting procedures should be properly implemented.
Implemented whenever there’s blasting activity

QUARRY VENTURES PHILIPPINES, INC. Environmental Impact Assessment
February 2019 6-334
Condition/Requirement/Commitment Compliance Status and Summary of Actions Taken
19. The proponent operations shall conform to the provision of RA 9003 (Act Providing for an Ecological Solid Waste Management Program), RA 9275 (Philippine Clean Water Act of 20014) and RA 8749 (Philippine Clean Air Act of 1990).
All legal and necessary permits were acquired and implemented as can be reflected in the SMR submitted to EMB office)
20. The proponent shall make available a budget of One Hundred Fifty-Four Thousand (154,000.00) Pesos based on the project schedule as indicated in the submitted Environmental Management Plan Summary for the implementation of the project and proposed mitigating measures in the operational and abandonment phase. An accomplishment report on the implemented mitigating measures and the corresponding cost of the EMP activities shall be submitted to this Office on quarterly bases for monitoring.
Complied with As reflected on the Monitoring Trust Fund (MTF) and Rehabilitation Cash Fund (RCF).
21. The proponent shall undertake an effective and wide Information, Education and Communication (IEC) Campaign to explain publicly its mitigating measures as well as the condition of the ECC. It shall open opportunities to educate the public especially the affected community, interested academic institutions and other parties on the environment and human health safety features of the project.
Sponsorship or patronizing radio program (Kalambuan Sa Mina)
22. The proponent shall set-up an Environmental Unit before project implementation who shall handle the environmental aspects of the project, which shall have the following responsibilities: a. Monitoring requirements as defined
under the EMP; b. Monitor actual project impact vis-a-vis
predicted impacts and management measures in the EMP.
c. Make recommendation for the revision of the EMP as necessary.
d. Ensure that the post assessment permits are in place.
e. Ensure that monitoring and reporting are undertaken.
f. Ensure compliance to all the conditions.
Complied with
23. That a 2’x4’ billboard containing this message: “Notice to Public, This project (title of the project) of (Name of the proponent) has been issued an Environmental Compliance Certificate (ECC Number) by the Environmental and Management Bureau of the Department of Environment and Natural Resources, Region
Complied

QUARRY VENTURES PHILIPPINES, INC. Environmental Impact Assessment
February 2019 6-335
Condition/Requirement/Commitment Compliance Status and Summary of Actions Taken
VII. This message must be installed at all entry and exit points and at all perimeters of the project facing the road to inform the general public within before the project implementation. A copy of this certificate shall be also posted by the Proponent at the Barangay bulletin board of the affected barangays within thirty days from receipt of the certificate. Furthermore, proponent shall provide copies of the approved ECC to the government agencies concerned such as; DOLE, LGUs concerned, DENR, MGB, CENRO-Toledo City, PENRO -Cebu and PENRO Capitol. An accomplishment report which shall include picture verification of compliance to the posting of notices and the billboards shall be submitted to this office within ninety days from receipt of the ECC.
24. In case of abandonment, the Proponent shall notify the EMB Reginal Office concerned within three (3) months prior to the abandonment and the Proponent shall submit its abandonment mitigation plan.
This will be implemented on the abandonment stage of the project
25. No other activities should be undertaken other that was stipulated in the submitted IEE document. Should there be an expansion of the Project beyond the project description, construction of other structures beyond those stated in the IEE document or any change in the activity shall be made subject to a new Environmental Impact Assessment.
Complied with – part of this EPRMP
26. In case of Transfer of ownership of this project, these same convictions and restrictions shall apply and the transferee shall be required to notify the EMB Regional Office concerned within fifteen (15) days as regards to transfer of ownership
No transfer of ownership
6.2 Environmental Monitoring Plan
The Environmental Quality Performance Levels (EQPLs) presented below for the Self–Monitoring
Plan is only applicable for Effluent and Emissions regulations. The limit indicated in the EQPL
range represents the DAO 90-35 standards for the particular parameter as well as Clean Air Act
standards for the emissions. It should be noted that the values for the EQPL alert and action are
only indicative values to be used as a guide in the management scheme and will be further revised
or updated during project implementation.

QUARRY VENTURES PHILIPPINES, INC. Environmental Impact Assessment
February 2019 6-336
Table 6-2: Environmental Monitoring Plan
Key Environmental
Aspects per Project Phase
Project Activity Potential Impacts per Envi. Sector
Parameter to be monitored
Sampling and Measurement Plan
Lead person Estimated cost (Php)
EQPL Management Scheme
Method Frequency Location EQPL Range Management measure
Alert Action Limit Alert Action Limit
I. Construction Phase
Land Clearing of vegetation and earth moving activities; change in land use
Decrease in diversity and abundance Possible extirpation of species
Flora: Biodiversity indices, species richness and abundance Rehabilitation and restoration works to establish forest cover Fauna: Biodiversity indices, species richness and abundance
Sampling and interviews
Semi-annual Baseline sampling stations
Proponent thru MEPEO; MMT; Third party consultant
150,000 / sampling
- n/a - - n/a - - n/a - - n/a - - n/a - - n/a -
Water Generation of turbid run-off, discharge of turbid waters from settling ponds; other discharges from project
Siltation and contamination from petroleum spilling / washing and domestic sewage
pH, temp, DO, BOD, TSS, Oil and Grease, coliforms,
Grab sampling method; laboratory analysis
Quarterly Baseline sampling stations / or may vary depending on the final project design (i.e. where appropriate)
Proponent thru MEPEO; MMT
100,000 / monitoring
BOD = 40 mg/L Oil and grease = 3 mg/L Total coliforms = 600 MPN/100 mL TSS=more than 10% increase
BOD = 45 mg/L Oil and grease = 4 mg/L Total coliforms = 800 MPN/100 mL TSS=more than 20% increase
BOD = 50 mg/L Oil and grease = 5 mg/L Total coliforms = 1,000 MPN/100 mL TSS=not more than 30% increase
Investigate the source and identify possible pollutant sources
Investigate the source If the problem is within the operation area, conduct adjustments/ appropriate corrective action at identified pollutant source Reconduct sampling / water quality monitoring
Temporarily stop activities contributing to the pollutant load Evaluate existing mitigation measures for possible need for additional mitigation measures If the source is not related to the project, inform MMT regarding possible source for the group’s investigation and coordination with the LGU
Air Increased vehicular traffic and excavation activities
Dust generation; vehicle emissions; noise generation
TSP, NO2 , SO2 , and noise
1-hr ambient averaging period
Quarterly Baseline sampling stations / or may vary depending on the final project design (i.e. where appropriate)
Proponent thru MEPEO; MMT
25,000 / monitoring
TSP= 200μg / Ncm NO2= 140 μg / Ncm SO2= 240 μg / Ncm
TSP= 250μg / Ncm NO2= 200 μg / Ncm SO2= 290 μg / Ncm
TSP= 300μg / Ncm NO2= 260 μg / Ncm SO2= 340 μg / Ncm
Check equipment operations
Implement appropriate corrective action
Corrective action on the quarry operation
People Site preparation (clearing, grubbing and
Psycho-social concerns due to Physical and
IEC conducted
FGDs, KIIs, Household survey (when
Annual Impact communities
Proponent through CRO
150,000 per monitoring
Manifestations/ observations during
Incident Report Complaint Received
Implement measures
- Verify and validate report
Investigate - Take action
based on the
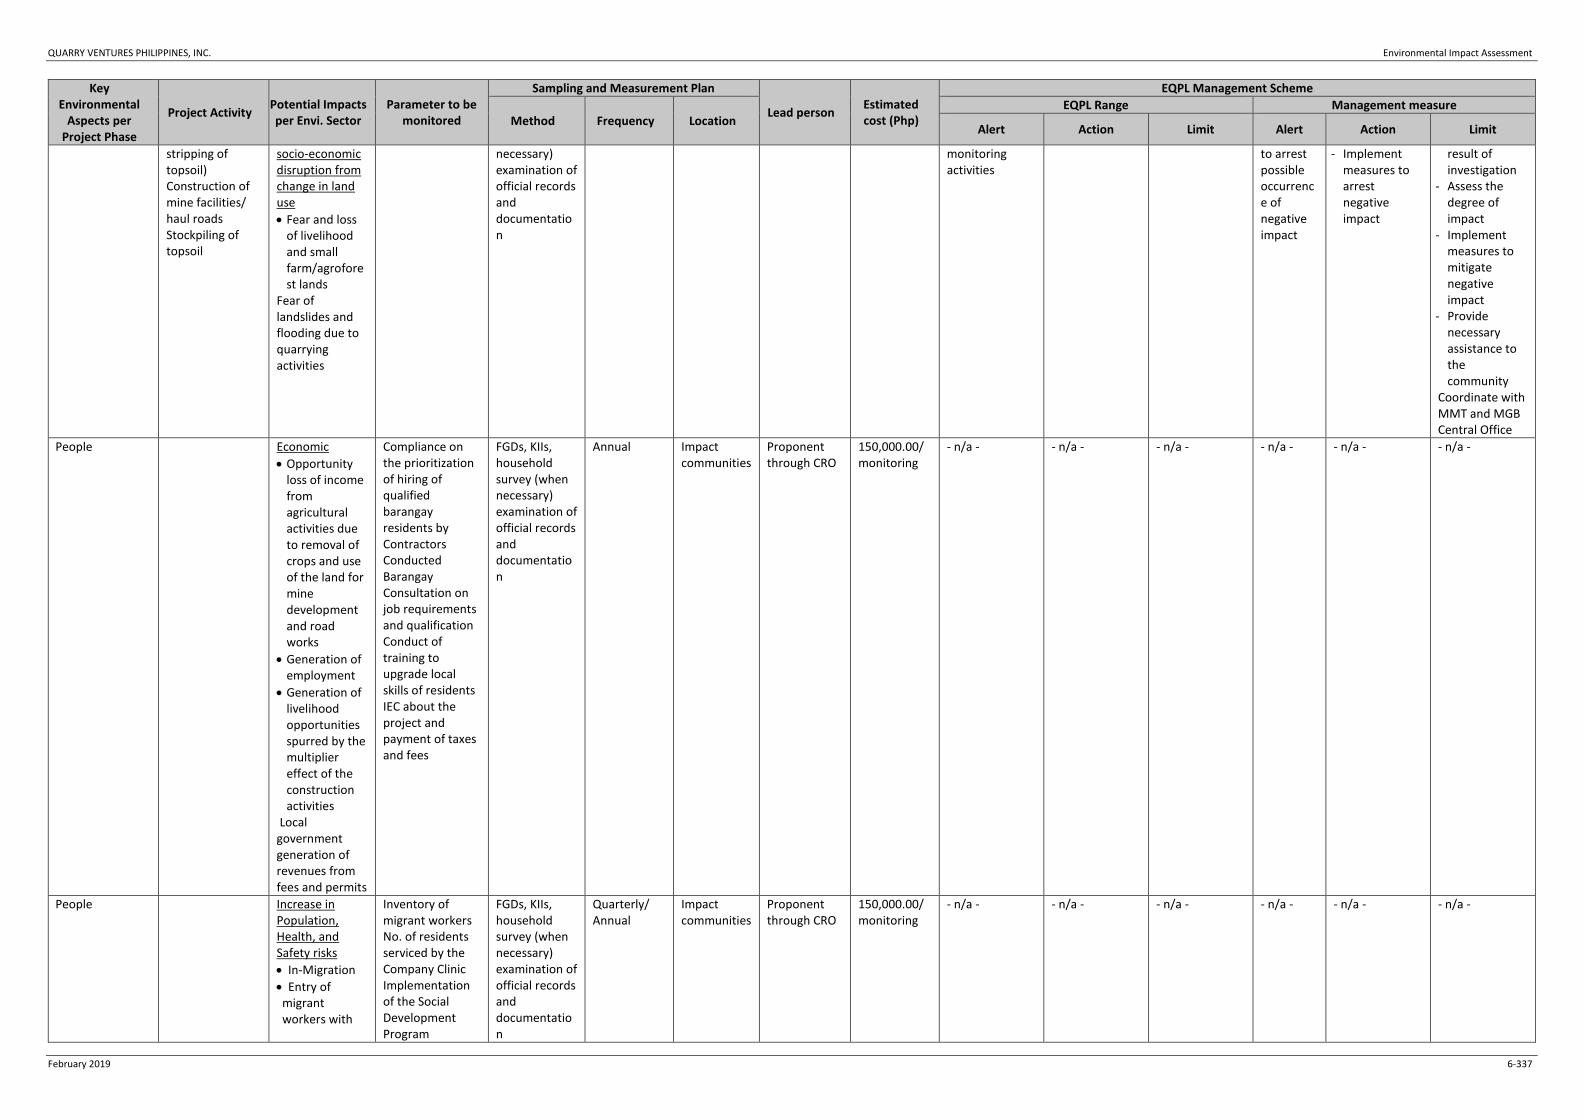
QUARRY VENTURES PHILIPPINES, INC. Environmental Impact Assessment
February 2019 6-337
Key Environmental
Aspects per Project Phase
Project Activity Potential Impacts per Envi. Sector
Parameter to be monitored
Sampling and Measurement Plan
Lead person Estimated cost (Php)
EQPL Management Scheme
Method Frequency Location EQPL Range Management measure
Alert Action Limit Alert Action Limit
stripping of topsoil) Construction of mine facilities/ haul roads Stockpiling of topsoil
socio-economic disruption from change in land use
Fear and loss of livelihood and small farm/agroforest lands
Fear of landslides and flooding due to quarrying activities
necessary) examination of official records and documentation
monitoring activities
to arrest possible occurrence of negative impact
- Implement measures to arrest negative impact
result of investigation
- Assess the degree of impact
- Implement measures to mitigate negative impact
- Provide necessary assistance to the community
Coordinate with MMT and MGB Central Office
People
Economic
Opportunity loss of income from agricultural activities due to removal of crops and use of the land for mine development and road works
Generation of employment
Generation of livelihood opportunities spurred by the multiplier effect of the construction activities
Local government generation of revenues from fees and permits
Compliance on the prioritization of hiring of qualified barangay residents by Contractors Conducted Barangay Consultation on job requirements and qualification Conduct of training to upgrade local skills of residents IEC about the project and payment of taxes and fees
FGDs, KIIs, household survey (when necessary) examination of official records and documentation
Annual Impact communities
Proponent through CRO
150,000.00/monitoring
- n/a - - n/a - - n/a - - n/a - - n/a - - n/a -
People
Increase in Population, Health, and Safety risks
In-Migration
Entry of migrant workers with
Inventory of migrant workers No. of residents serviced by the Company Clinic Implementation of the Social Development Program
FGDs, KIIs, household survey (when necessary) examination of official records and documentation
Quarterly/ Annual
Impact communities
Proponent through CRO
150,000.00/monitoring
- n/a - - n/a - - n/a - - n/a - - n/a - - n/a -

QUARRY VENTURES PHILIPPINES, INC. Environmental Impact Assessment
February 2019 6-338
Key Environmental
Aspects per Project Phase
Project Activity Potential Impacts per Envi. Sector
Parameter to be monitored
Sampling and Measurement Plan
Lead person Estimated cost (Php)
EQPL Management Scheme
Method Frequency Location EQPL Range Management measure
Alert Action Limit Alert Action Limit
families which might cause: o health
problems due to diseases, overuse of public utilities /services,
o competition of resources,
o social conflicts, peace and order,
o increase in pollution due to solid and liquid wastes.
Increase in traffic flow causing air (dust) and noise pollution
Crime rate Implementation of Health Program Air and noise monitoring
Peace and Order Economic activities and other services near the quarry development and construction area that might cause problems on peace and order and security breaches
Crime Rate FGDs, KIIs, household survey (when necessary) examination of official records and documentation
Quarterly/Annual
Impact communities
Proponent through CRO
150,000.00/monitoring
- n/a - - n/a - - n/a - - n/a - - n/a - - n/a -
Cultural and Historical Possible unearthing of historical artifacts and/or fossil remains
Found artifacts and/or fossil remains
Examination of official records and documentation
As needed Construction and Quarry Area
Proponent through CRO
150,000.00/monitoring
- n/a - - n/a - - n/a - - n/a - - n/a - - n/a -
II. OPERATION PHASE
Land Clearing of vegetation; mining operations, and change in land use
Decrease diversity and abundance (i.e. flora and fauna) Possible extirpation of species
Flora: Species diversity and abundance Fauna: Species diversity and abundance
Sampling and interviews Transect survey, mist
Semi-annual Semi-annual
Baseline sampling stations
Proponent thru MEPEO; MMT; 3rd party consultant
150,000 / sampling
- n/a - - n/a - - n/a - - n/a - - n/a - - n/a -

QUARRY VENTURES PHILIPPINES, INC. Environmental Impact Assessment
February 2019 6-339
Key Environmental
Aspects per Project Phase
Project Activity Potential Impacts per Envi. Sector
Parameter to be monitored
Sampling and Measurement Plan
Lead person Estimated cost (Php)
EQPL Management Scheme
Method Frequency Location EQPL Range Management measure
Alert Action Limit Alert Action Limit
Rehabilitation and restoration works in establishing forest cover
netting and cage trapping Site observation and documentation
Semi- annual
Water Decrease in groundwater recharge and deterioration of groundwater quality
Groundwater level (depth of water table) Total coliform and heavy metals
Grab Sampling and Laboratory analysis
Semi-annual (wet season - dry season)
GWS-2 (Well nearest the project site)
Proponent thru MEPEO; MMT
30,000 / monitoring
25% decrease in groundwater level
50% decrease in groundwater level
75% decrease in groundwater level Total Coliform=1.1MPN/100mL As=0.05mg/L Cd=0.003mg/L Cr(Total)=0.05mg/L Pb=0.01mg/L Hg=0.001mg/L
- n/a - Intensification of rehabilitation/ revegetation activities
Provision of alternative water source (especially to nearby farms) while intensifying rehabilitation/ revegetation activities
Generation of turbid run-off discharge of turbid waters from settling ponds; other discharges from project operations / facilities
Siltation and decrease in water quality
BOD, TSS, Oil and Grease, total coliform, Heavy metals (Pb, Hg, As, Cd, Cr6+)
Grab sampling method; laboratory analysis
Quarterly Annual
Baseline sampling including downstream of WQS-6/ or may vary depending on the final project design (i.e. where appropriate)
Proponent thru MEPEO; MMT
150,000 / sampling
BOD = 40 mg/L Oil and grease = 3 mg/L Total coliforms = 600 MPN/100 mL TSS=more than 10% increase
BOD = 45 mg/L Oil and grease = 4 mg/L Total coliforms = 800 MPN/100 mL TSS=more than 20% increase
BOD = 50 mg/L Oil and grease = 5 mg/L Total coliforms = 1,000 MPN/100 mL TSS=not more than 30% increase
Investigate the source and identify possible pollutant sources
Investigate the source If the problem is within the operation area, conduct adjustments/ appropriate corrective action at identified pollutant source Reconduct sampling / water quality monitoring
Temporarily stop activities contributing to the pollutant load Evaluate existing mitigation measures for possible need for additional mitigation measures If the source is not related to the project, inform MMT regarding possible source for the group’s investigation and coordination with the LGU
Freshwater Ecology
Biota siltation Biological indices of freshwater biota
Scientifically accepted methodologies
Quarterly for the first year
- n/a - - n/a - - n/a - - n/a - - n/a - - n/a -
Air Vehicular movements, land
Dust generation TSP 1-hr ambient averaging period
Quarterly Appropriate stations based on the
Proponent thru MEPEO; MMT
25,000 / monitoring
TSP= 200μg / Ncm
TSP= 250μg / Ncm
TSP= 300μg / Ncm
Check equipment
Implement appropriate
Corrective action on the

QUARRY VENTURES PHILIPPINES, INC. Environmental Impact Assessment
February 2019 6-340
Key Environmental
Aspects per Project Phase
Project Activity Potential Impacts per Envi. Sector
Parameter to be monitored
Sampling and Measurement Plan
Lead person Estimated cost (Php)
EQPL Management Scheme
Method Frequency Location EQPL Range Management measure
Alert Action Limit Alert Action Limit
stripping / excavation
project’s activities / progress
NO2= 140 μg / Ncm SO2= 240 μg / Ncm
NO2= 200 μg / Ncm SO2= 290 μg / Ncm
NO2= 260 μg / Ncm SO2= 340 μg / Ncm
operations
corrective action
quarry operation
Operation of motorized heavy equipment, vehicles and diesel power sources
Generation of SO2 and NO2 emissions and noise
SO2 , NO2 and noise
1-hr ambient averaging period
Quarterly Baseline sampling / or may vary depending on the final project design (i.e. where appropriate)
Proponent thru MEPEO; MMT
75,000 / sampling
TSP= 200μg / Ncm NO2= 140 μg / Ncm SO2= 240 μg / Ncm
TSP= 250μg / Ncm NO2= 200 μg / Ncm SO2= 290 μg / Ncm
TSP= 300μg / Ncm NO2= 260 μg / Ncm SO2= 340 μg / Ncm
Check equipment operations
Implement appropriate corrective action
Corrective action on the quarry operation
People Surface Mining/ Quarry Activities
Economic
Enhancement socio-economic welfare of the community
Local government generation of revenues from taxes, permits and LGU share in the quarrying activities
Payment of local taxes and fees to Municipal and Barangay Local Government Units
Generation of employment
Generation of livelihood opportunities by putting-up food stalls, variety stores and other services near the quarry area which might cause problems of congestion, peace and order and security breaches
Employment, Tax revenues to LGUs, community projects initiated by the proponent, other benefits of the community from the project
FGDs, KIIs, household survey (when necessary) examination of official record (e.g. revenue reports)
Annual Project affected barangay
Proponent through CRO; MMT, third party
150,000.00/monitoring
Manifestations/ observations during monitoring activities
Incident Report Complaint Received
Implement measures to arrest possible occurrence of negative impact
- Verify and validate report
- Implement measures to arrest negative impact
Investigate - Take action
based on the result of investigation
- Assess the degree of impact
- Implement measures to mitigate negative impact
- Provide necessary assistance to the community
Coordinate with MMT and MGB Central Office

QUARRY VENTURES PHILIPPINES, INC. Environmental Impact Assessment
February 2019 6-341
Key Environmental
Aspects per Project Phase
Project Activity Potential Impacts per Envi. Sector
Parameter to be monitored
Sampling and Measurement Plan
Lead person Estimated cost (Php)
EQPL Management Scheme
Method Frequency Location EQPL Range Management measure
Alert Action Limit Alert Action Limit
People
Increase in Population, Health, and Safety risks
In-Migration
Entry of migrant workers with families which might cause: o health
problems due to diseases, overuse of public utilities /services,
o competition of resources,
o social conflicts, peace and order,
o increase in pollution due to solid and liquid wastes.
Increase in
traffic flow
causing air
(dust) and
noise pollution
Safety and health risks to workers
Inventory of migrant workers No. of residents serviced by the Company Clinic Implementation of the Social Development Program Crime rate Implementation of Health Program Air and noise monitoring Safety Reports Inventory of PPEs
FGDs, KIIs, household survey (when necessary) examination of official records and documentation
Quarterly/ Annual
Impact communities
Proponent through CRO
150,000.00/monitoring
- n/a - - n/a - - n/a - - n/a - - n/a - - n/a -
Climate Change Impact of Climate Change: La Niña and El Niño phenomenon and possible consequential disasters
Trainings and IEC conducted
FGDs, KIIs, household survey (when necessary) examination of official records and documentation
Quarterly/ Annual
Impact communities
Proponent through CRO
150,000.00/monitoring
- n/a - - n/a - - n/a - - n/a - - n/a - - n/a -
III. ABANDONMENT PHASE
Land Rehabilitation works
Decrease in diversity and abundance Possible extirpation of species
Flora: Biodiversity indices, species richness and abundance Fauna:
Sampling and interviews Site observation and
Duration is for 2 years after the cease of operation following a semi-annual
Baseline sampling stations
Proponent thru MEPEO; MMT; 3rd party consultant
- n/a - - n/a - - n/a - - n/a - - n/a - - n/a -

QUARRY VENTURES PHILIPPINES, INC. Environmental Impact Assessment
February 2019 6-342
Key Environmental
Aspects per Project Phase
Project Activity Potential Impacts per Envi. Sector
Parameter to be monitored
Sampling and Measurement Plan
Lead person Estimated cost (Php)
EQPL Management Scheme
Method Frequency Location EQPL Range Management measure
Alert Action Limit Alert Action Limit
Biodiversity indices, species richness and abundance
documentation Transect survey, mist netting and cage trapping
monitoring pattern
People
Removal / dismantling of unnecessary infrastructures
Safety issue, eyesore to landscape
To be identified in the Final Mine Rehabilitation and Decommissioning Plan (FMRDP)
Based on methodology presented in the FMRDP
Once Site location auxiliary facilities
Proponent thru MEPEO; MMT; 3rd party consultant
- n/a - - n/a - - n/a - - identify the need for clean-up -
- n/a - - n/a - - n/a -
Water People:
Disposal of solid wastes and hazardous materials
Water quality Health Hazard
Based on the result of the Environmental Site Assessment (ESA) that will be conducted prior to abandonment
Based on the recommendation of the ESA that will be conducted prior to abandonment
Once Project site Proponent thru MEPEO; MMT; 3rd party consultant
- n/a - - n/a - - n/a - - n/a - - n/a - - n/a - - identify the need for clean-up -
People
Economic Termination of LGU revenues from taxes, permits and share when the company ceases operation Loss of Jobs/ Unemployment of mine workers Loss of market of the established livelihood dependent on the mine operation Transfer of company social assets/ facilities and services to the community
As discussed in the FMRDP
Based on Methodology in FMRDP
- n/a - - n/a - - n/a - - n/a - Manifestations/ observations during monitoring activities
Incident Report Complaint Received
Implement measures to arrest possible occurrence of negative impact
- Verify and validate report
- Implement
measures to arrest negative impact
- Investigate
- Take action based on the result of investigation
- Assess the degree of impact
- Implement measures to mitigate negative impact
- Provide necessary assistance to the community
Out-migration and psycho-social concerns on the closure of the operation The loss of employment and job opportunities in the area may
As discussed in the FMRDP
Based on Methodology in FMRDP
- n/a - - n/a - - n/a - - n/a - - n/a - - n/a - - n/a - - n/a - - n/a - - n/a -

QUARRY VENTURES PHILIPPINES, INC. Environmental Impact Assessment
February 2019 6-343
Key Environmental
Aspects per Project Phase
Project Activity Potential Impacts per Envi. Sector
Parameter to be monitored
Sampling and Measurement Plan
Lead person Estimated cost (Php)
EQPL Management Scheme
Method Frequency Location EQPL Range Management measure
Alert Action Limit Alert Action Limit
result to out-migration to search for jobs in other places Discontinuation of the social services offered by QVPI through CSR and SDMP

QUARRY VENTURES PHILIPPINES, INC. Environmental Impact Assessment
February 2019 6-344
6.3 Multi-Sectoral Monitoring Framework
Multi-sectoral monitoring for the project shall be based on the guidelines/requirements of the
Revised Procedural Manual for DENR Administrative Order 2003-30 (Implementing Rules and
Regulations Of Presidential Decree No. 1586, Establishing the Philippine Environmental Impact
Statement System) and the DENR Administrative Order 1996-40 (Implementing Rules and
Regulations of Republic Act 7942, also known as Philippine Mining Act of 1995.
A Multi-partite Monitoring Team (MMT) will be established who will assess and validate
compliance with the relevant environmental standards. The MMT will be composed by
representatives of the following offices:
Mines and Geosciences Bureau Regional Office No. VII (Chairman)
Department of Environment and Natural Resources Regional Office No. VII (Member)
Environmental Management Bureau Regional Office No. VII (Member)
LGU – City of Naga (Member)
LGU – City of Toledo (Member)
LGU – Municipality of Pinamungahan (Member)
NGO Representative (Member)
Quarry Ventures Philippines Inc. (Member)
The MMT shall have the following functions:
Monitor, assess, and validate the project’s compliance as stated in the EIA Report, ECC,
EPEP, and other relevant environmental standards
Set-up project specific (location-based) environmental standards in accordance with
environmental standards identified above
Prepare members of the MMT to handle monitoring activities through proper trainings
Management and disposition of complaints formally filed against the project proponent and
its contractors
Fiduciary management of funds allocated for the above purposes
As stated under the Philippine Environmental Impact Statement System (PEISS), MMTs are
organized to encourage public participation, to promote greater stakeholder vigilance and to
provide appropriate check and balance mechanisms in the monitoring of project implementation.
The MMT is recommendatory to EMB/MGB. MMTs have the primary responsibility of validation
of Proponent’s environmental performance, with the following specific functions:
a. Validate project compliance with the conditions stipulated in the ECC and the EMP;
b. Validate Proponent’s conduct of self-monitoring;

QUARRY VENTURES PHILIPPINES, INC. Environmental Impact Assessment
February 2019 6-345
c. Receive complaints, gather relevant information to facilitate determination of validity of
complaints or concerns about the project and timely transmit to the Proponent and EMB
recommended measures to address the complaint;
d. Prepare, integrate and disseminate simplified validation reports to community stakeholders;
e. Make regular and timely submission of MMT Reports based on the EMB-prescribed format.
Proposed Environmental Monitoring Stations
Currently, QVPI is conducting the monitoring of the water quality for Parcel 1, with the stations
presented in Figure 2-84. Air Quality and Soil Quality Monitoring is not currently being
undertaken in the SMR, CMR, nor the MMT inspections.
It is proposed that the baseline sampling stations for Air Quality and Soil Quality, used in this study
be considered as monitoring stations for the future, with some additional stations to improve the
data collection.
Soil Quality stations would follow the baseline station locations (Figure 2-12 to Figure 2-15), and
additional station will be determined during the construction and pre-operation stages of the
project, to concentrate on the effects of the quarry activities as the quarry area increase through
the years.
Additional air quality stations are proposed as part of the air quality monitoring, together with
the previous stations used in the baseline analysis (Figure 2-95 to Figure 2-98). These would allow
to better monitor the air quality of the community near the quarry area. The additional stations
are presented below:

QUARRY VENTURES PHILIPPINES, INC. Environmental Impact Assessment
February 2019 6-346
Figure 6-1: Additional Air Monitoring Station between Parcel 1 and 2

QUARRY VENTURES PHILIPPINES, INC. Environmental Impact Assessment
February 2019 6-347
Figure 6-2: Additional Air Monitoring Station near Parcel 3

QUARRY VENTURES PHILIPPINES, INC. Environmental Impact Assessment
February 2019 6-348
6.4 Environmental Guarantee and Monitoring Fund Commitment
The Philippine EIS System defines Environmental Monitoring Fund (EMF) and Environmental
Guarantee Fund (EGF) below:
Environmental Monitoring Fund (EMF) - a fund that a proponent establishes in support of the
activities of the MMT. EMF administration and management guidelines based on the framework
agreed upon and specified in the MMT MOA.
Environmental Guarantee Fund (EGF) - fund required to be established for all co-located or single
projects that have been determined by DENR to pose a significant public risk or where the project
requires rehabilitation or restoration.
For mining projects, the following are established in lieu of the EMF and EGF:
Mine Rehabilitation Fund (MRF) – consists of a Monitoring Trust Fund (MTF) amounting to no
less than P 100,000.00 and a Rehabilitation Cash Fund (RCF) equivalent to 10% of the
Environmental Protection and Enhancement Program (EPEP) or 5 million pesos whichever is
lower. The MTF covers the maintenance and other operating budget for transportation and travel
expenses, laboratory analysis, supplies and materials, communication services, and other
reasonable expenses incurred by the MMT (equivalent to the EMF). The RCF on the other hand
funds the project’s approved rehabilitation activities including research programs as defined in
their approved EPEP and annual EPEP.
Mine Waste and Tailings Fee (MWTF) – amount paid by the proponent as required by DAO No.
1996-40 based on the amount of mine waste and mill tailings generated by the project every six
months with the purpose of ensuring compensation of damages caused by the mining project
(equivalent to EGF)
Also, the proponent shall establish a Final Mine Rehabilitation and/or Decommissioning Fund
(FMRDF) based on the approved Final Mine Rehabilitation and/or Decommissioning Plan
(FMRDP). The fund is established following a pre-defined schedule totaling to the full cost of the
FMRDP prior to the end of the operating life of the mine.
QVPI is committed to establishing the needed funds after approval of all the required documents
including the approval of the amended ECC.

QUARRY VENTURES PHILIPPINES, INC. Environmental Impact Assessment
February 2019 7-349
7 DECOMMISSIONING / ABANDONMENT / REHABILITATION POLICY
Consistent with the approved Final Mine Rehabilitation and/or Decommissioning Plan (FMRDP)
of the project, the following are goals and objectives of the rehabilitation program:
a. Rehabilitate/re-vegetate all the disturbed areas within the MPSA areas affected by mining
operations by reshaping/re-contouring affected areas prior to re-vegetation;
b. Minimize the long-term visual impacts caused by mining through application of innovative
measures creating landforms and vegetation compatible with the surrounding landscape;
c. Manage and control off-site contamination, including water pollution, siltation and erosion
by defining drainage systems, fortifying environmental control structures and enhancing
slope stabilization;
d. Remove all unnecessary mine facilities and equipment used in operations and rehabilitate
the areas prior to abandonment; and
e. Conduct post rehabilitation monitoring and implement improvement and enhancement
programs
7.1 Decommissioning Plan
Decommissioning is the transitional stage period between cessation of operations and actual
closure that begins near, or at the cessation of production and ends with the removal of all
unwanted infrastructures.
7.1.1 List of Equipment that Require Decommissioning
Most of the equipment used for the Project are mobile and provided by a contractor/s.
Decommissioning of the equipment will be the responsibility of the contractor/s subject to QVPI’s
safety rules and policies.
7.1.2 Decommissioning Strategy, Timing and Techniques
QVPI will implement the following decommissioning strategy and timing.
Table 7-1: Decommissioning Strategy and Timing
Decommissioning Strategy Timeframe
Formation of the QVPI Closure Team. Start of IEC Campaign as part of social preparation.
Closure Planning. Two (2) years before closure
Inventory of all equipment and facilities by the QVPI Closure Team. Part of Closure Planning Within 2 years before Closure

QUARRY VENTURES PHILIPPINES, INC. Environmental Impact Assessment
February 2019 7-350
Decommissioning Strategy Timeframe
Assessment of the conditions of equipment and facilities by the QVPI Closure Team. Assessment of progressive rehabilitation.
Part of Closure Planning Within 2 years before Closure
Planning and review of decommissioning procedures vis-à-vis the standard operating procedures. Coordination with contractors.
Part of Closure Planning Within 1 year before Closure
Cross matching of company personnel and residents with the decommissioning tasks. Trainings/seminars will be provided as the need arises. Consultation with stakeholders. Strengthening of IEC Campaign as part of social preparation.
Part of Closure Planning Within 1 year before Closure
Decommissioning of equipment and facilities. Decommissioning and Rehabilitation Phase Within 6 months after closure
Post assessment by the QVPI Closure Team on the decommissioned equipment and facilities.
Decommissioning and Rehabilitation Phase within and after 1 year of closure
Rehabilitation of the decommissioned project component. Decommissioning and Rehabilitation Phase within and after 1 year of closure
The QVPI closure Team will be composed of the SHESD personnel. The Safety and health
personnel will be responsible for safety concerns, the CDO for community concerns and the
MEPEO for the environmental and rehabilitation concerns. The Heads of the Operations,
Administration and the Personnel Department will likewise be members of the Closure Team to
be headed by the Resident Manager.
7.2 Final Mine Rehabilitation Plan
7.2.1 Rehabilitation Strategy
The proposed final land uses for each project component will determine the rehabilitation of the
Project. The area disturbed area will be cleared and revegetated. Involvement of the host
community will be the prime strategy to ensure the success of rehabilitation.
The preparation of the area will be done using heavy equipment such as dump trucks, loaders,
bulldozers, etc. The final land configuration will incorporate road network to make as many areas
accessible as possible with provisions for drainage system.
The parameters considered in the rehabilitation plan to control erosion and sedimentation prior
to revegetation are the following:
Stabilization of the mine pit slope areas.
Spreading of top soil on the affected areas.
Introduction of self-sustaining vegetation.
Construction/maintenance of drainage system.

QUARRY VENTURES PHILIPPINES, INC. Environmental Impact Assessment
February 2019 7-351
Maintenance of nursery to meet the rehabilitation requirements.
7.2.2 Objectives and Methodology
The objective of rehabilitation is the attainment of safe, stable, revegetated mined-out areas. The
methodology will be revegetation in coordination with the host community. The final land
configuration will incorporate road network to make as many areas accessible as possible with
provisions for drainage system.
7.2.3 Materials, Operational, and Financial Resources
The material for backfilling will be sources from the stockpiled topsoil during operation. Seedlings
will be source from the company nursery and the community. The financial requirement will be
provided by the company thru the Final Mine Rehabilitation Fund.
Withdrawal from the FMRDF shall be based on a work and financial plan approved by the MRF
Committee1.
7.3 Social Plans
7.3.1 Retrenchment Packages
Retrenchment2 is allowed for closing or cessation of operation of the establishment or
undertaking. The requirements of the law for a valid retrenchment of workers are as follows:
Written notice to the employees and to the Department of Labor and Employment (DOLE) at
least one month prior to the intended date of retrenchment; and
Payment of separation pay equivalent to one month pay or at least ½ month pay for every
year of service, whichever is higher.
A retrenchment package will be given to company personnel. The remunerations will be
based, at the very least, on provisions of law and may be increased depending on the
financial considerations of the QVPI during the time of closure.
7.3.2 Labor Support Policies and Programs
1 Section 187-C of DAO No. 96-40 2 Article 283 of the Labor Code of the Philippines

QUARRY VENTURES PHILIPPINES, INC. Environmental Impact Assessment
February 2019 7-352
QVPI will soften the impact of closure to company personnel by providing a broad range of
placement services. This will assist the employees to make the transition to alternative jobs or in
becoming self-employed. These services can be any of the following:
Job Search. Provision of information to mine workers on labor markets and job-openings.
Transfer to other company projects.
Skills Training and Education Programs. Provision of job-related courses/trainings or
courses focused toward a future career which may vary from office skills to artisan multi-
skills training, computer technology, mechanical trades and similar vocations. Coordination
with TESDA will be conducted.
Enterprise Awareness. To sensitize and/or motivate those who consider self-employment
but have not yet seen such as a viable alternative; and
Counseling. To help workers cope both socially and financially after the loss of their job and
should be focused on money matters and property management.
7.4 Maintenance and Monitoring Plans
7.4.1 Maintenance and Monitoring Program and Procedures
During the implementation of the Rehabilitation Plan, the QVPI Closure Team will oversee the
implementation of the maintenance and monitoring plans. It will be guided by the closure criteria
and performance standards discussed in the previous paragraphs. The environmental, community
relations, safety and health personnel of QVPI will spearhead the maintenance and monitoring.
This will be in addition to the monitoring and/or audit conducted by the Mine Rehabilitation Fund
Committee (MRFC) through the Multi-partite Monitoring Team (MMT) and the Contingent
Liability Rehabilitation Fund Steering Committee and the Mines and Geosciences Bureau (MGB).
In compliance with regulation, QVPI will likewise submit a progress report containing details of
fully, partially, and on-going rehabilitation activities relative to the implementation of the plan.
The report will be submitted to the MRF Committee for review and evaluation within thirty (30)
days from the end of the term of the preceding work and financial plan. The results of the review
and evaluation shall be integrated in the succeeding year’s work and financial plan3.
The maintenance and monitoring plans will be prepared by the QVPI Closure Team in coordination
with the MMT. This will be formulated 2 years prior to closure. The intent is to have a realistic
plan based on actual scenario as possible.
3 Section 187-D (Progress Reporting) of DAO No. 96-40

QUARRY VENTURES PHILIPPINES, INC. Environmental Impact Assessment
February 2019 7-353
7.4.2 Long Term management and maintenance
At the end of the FMRDP implementation and based on the assessment of QVPI that the
objectives of project closure, as contained in the approved FMRDP have been achieved, QVPI will
prepare and submit a Final Rehabilitation Report with third party Environmental Audit (FRR with
EA) for pre-evaluation by the MRF Committee and final approval by the CLRF Steering Committee.
The MRF Committee and/or CLRF Steering Committee, after due review and evaluation of the FRR
with EA, may issue a Certificate of Final Relinquishment to QVPI signifying approval of the FRR
with EA and freeing QVPI from any further obligations insofar as the rehabilitated area/s are
concerned.
If residual care is still needed, QVPI will submit a Site Management Plan detailing how the
identified residual rehabilitation commitments are to be managed along with the corresponding
funding requirement.

QUARRY VENTURES PHILIPPINES, INC. Environmental Impact Assessment
February 2019 8-354
8 INSTITUTIONAL PLAN FOR EMP IMPLEMENTATION
A Mine Environmental Protection and Enhancement Office (MEPEO) shall be established by the
project proponent prior to project construction. The MEPEO shall report directly to the Mine
Resident Manager and shall take lead in implementing the environmental management programs
as committed in the Impacts Management Plan (IMP) and the Environmental Monitoring Plan
(EMoP) presented in this EIA. The Social Development Plan (SDP) and Information Education
Communication (IEC) Plan shall be competently implemented by the Community Relations Officer
(CRO).
As required under DENR Administrative Order 1996-40 and the Revised Procedural Manual for
DAO 2003-30, the MEPEO shall also have the following functions:
Planning and managing the implementation of the approved EPEP/AEPEP;
Monitoring and police compliance of Contractors on their implementation of provisions of
the EPEP and AEPEP;
Monitoring and evaluating the effectiveness of the mitigating and enhancement measures;
Planning, proposing and implementing modifications or additional measures deemed
necessary to effectively protect the environment;
Coordinating with relevant oversight agencies and other entities including the local
government units to ensure their effective participation in the implementation of the EPEP
and AEPEP;
Initiating, planning and implementing rehabilitation and abandonment programs;
Liaise with the Community Relations Officer (CRO) and the Mine Safety Personnel in creating
a holistic Safety and Health, Environmental and community relations program for the
Project;
Ensure compliance to ECC conditions and reporting requirements of the DENR-EMB;
Submission of Compliance Monitoring Report (CMR) in accordance with the specified format
in the implementing rules and regulations for Philippine Environmental Impact Statement
(PEIS) System; and
Monitor the actual project impacts vis-à-vis the predicted impacts and management
measures presented in the approved EIA and EIS Report.
Figure 8-1 presents the Table of Organization for the project.

QUARRY VENTURES PHILIPPINES, INC. Environmental Impact Assessment
February 2019 8-355
Figure 8-1: QVPI Table of Organization

QUARRY VENTURES PHILIPPINES, INC. Environmental Impact Assessment
February 2019 8-356
Annex 1: Accountability Statements
Annex 2: PEMAPS
Annex 3: Environmental Compliance Certificate
Annex 4: Copy of CMR and SMR Submitted
Annex 5: Mineral Production Sharing Agreement
Annex 6: Feasibility Study
Annex 7: Exploration Report
Annex 8: Terrestrial Sampling Photo Documentation
Annex 9: Ecological Indices Formula
Annex 10: Perception Survey Form
Annex 11: Perception Survey Photo Documentation
Annex 12: Complaint Resolution Correspondence
Annex 13: Certification on Latest Available CLUP