Environmental footprints of Mediterranean versus Western dietary patterns: Beyond the health...
8
RESEARCH Open Access Environmental footprints of Mediterranean versus Western dietary patterns: beyond the health benefits of the Mediterranean diet Sara Sáez-Almendros 1 , Biel Obrador 2 , Anna Bach-Faig 3 and Lluis Serra-Majem 4,5* Abstract Background: Dietary patterns can substantially vary the resource consumption and environmental impact of a given population. Dietary changes such as the increased consumption of vegetables and reduced consumption of animal products reduce the environmental footprint and thus the use of natural resources. The adherence of a given population to the Mediterranean Dietary Pattern (MDP) through the consumption of the food proportions and composition defined in the new Mediterranean Diet pyramid can thus not only influence human health but also the environment. The aim of the study was to analyze the sustainability of the MDP in the context of the Spanish population in terms of greenhouse gas emissions, agricultural land use, energy consumption and water consumption. Furthermore, we aimed to compare the current Spanish diet with the Mediterranean Diet and in comparison with the western dietary pattern, exemplified by the U.S.A. food pattern, in terms of their corresponding environmental footprints. Methods: The environmental footprints of the dietary patterns studied were calculated from the dietary make-up of each dietary pattern, and specific environmental footprints of each food group. The dietary compositions were obtained from different sources, including food balance sheets and household consumption surveys. The specific environmental footprints of food groups were obtained from different available life-cycle assessments. Results: The adherence of the Spanish population to the MDP has a marked impact on all the environmental footprints studied. Increasing adherence to the MDP pattern in Spain will reduce greenhouse gas emissions (72%), land use (58%) and energy consumption (52%), and to a lower extent water consumption (33%). On the other hand, the adherence to a western dietary pattern implies an increase in all these descriptors of between 12% and 72%. Conclusions: The MDP is presented as not only a cultural model but also as a healthy and environmentally-friendly model, adherence to which, in Spain would have, a significant contribution to increasing the sustainability of food production and consumption systems in addition to the well-known benefits on public health. Keywords: Mediterranean diet, Environmental footprints, Western pattern, Sustainable diets, Spain, Sustainability, Environment Background The environmental consequences of food systems are on public health agendas. Foods are produced, processed, distributed and consumed, these actions having conse- quences for both human health and the environment [1]. Furthermore, food production is also inevitably a driver of environmental pressures, particularly in relation to climate change, water use, toxic emissions and [2] greenhouse gas emissions (GHG), such as CO 2 , CH 4 and N 2 O, which are responsible for global warming. Agricul- ture is one of the main contributors to the emissions of two last gases mentioned whilst other parts of the food system contribute to carbon dioxide emissions due to the use of fossil fuels in processing, transportation, retailing, storage, and preparation. Food items differ substantially in their environmental footprints, which among many other descriptors, can be measured in terms of energy consump- tion, agriculture land use, water consumption or GHG * Correspondence: [email protected] 4 Department of Clinical Sciences, University of Las Palmas de Gran Canaria, Luis Pasteur s/n, Las Palmas de Gran Canaria 35016, Spain 5 Ciber Fisiopatología Obesidad y Nutrición (CIBEROBN, CB06/03), Instituto de Salud Carlos III, Madrid 28029, Spain Full list of author information is available at the end of the article © 2013 Sáez-Almendros et al.; licensee BioMed Central Ltd. This is an open access article distributed under the terms of the Creative Commons Attribution License (http://creativecommons.org/licenses/by/2.0), which permits unrestricted use, distribution, and reproduction in any medium, provided the original work is properly cited. Sáez-Almendros et al. Environmental Health 2013, 12:118 http://www.ehjournal.net/content/12/1/118
-
Upload
independent -
Category
Documents
-
view
1 -
download
0
Transcript of Environmental footprints of Mediterranean versus Western dietary patterns: Beyond the health...
Sáez-Almendros et al. Environmental Health 2013, 12:118http://www.ehjournal.net/content/12/1/118
RESEARCH Open Access
Environmental footprints of Mediterranean versusWestern dietary patterns: beyond the healthbenefits of the Mediterranean dietSara Sáez-Almendros1, Biel Obrador2, Anna Bach-Faig3 and Lluis Serra-Majem4,5*
Abstract
Background: Dietary patterns can substantially vary the resource consumption and environmental impact of a givenpopulation. Dietary changes such as the increased consumption of vegetables and reduced consumption of animalproducts reduce the environmental footprint and thus the use of natural resources. The adherence of a givenpopulation to the Mediterranean Dietary Pattern (MDP) through the consumption of the food proportions andcomposition defined in the new Mediterranean Diet pyramid can thus not only influence human health but also theenvironment. The aim of the study was to analyze the sustainability of the MDP in the context of the Spanish populationin terms of greenhouse gas emissions, agricultural land use, energy consumption and water consumption. Furthermore,we aimed to compare the current Spanish diet with the Mediterranean Diet and in comparison with the western dietarypattern, exemplified by the U.S.A. food pattern, in terms of their corresponding environmental footprints.
Methods: The environmental footprints of the dietary patterns studied were calculated from the dietary make-up ofeach dietary pattern, and specific environmental footprints of each food group. The dietary compositions were obtainedfrom different sources, including food balance sheets and household consumption surveys. The specific environmentalfootprints of food groups were obtained from different available life-cycle assessments.
Results: The adherence of the Spanish population to the MDP has a marked impact on all the environmental footprintsstudied. Increasing adherence to the MDP pattern in Spain will reduce greenhouse gas emissions (72%), land use (58%)and energy consumption (52%), and to a lower extent water consumption (33%). On the other hand, the adherence toa western dietary pattern implies an increase in all these descriptors of between 12% and 72%.
Conclusions: The MDP is presented as not only a cultural model but also as a healthy and environmentally-friendlymodel, adherence to which, in Spain would have, a significant contribution to increasing the sustainability of foodproduction and consumption systems in addition to the well-known benefits on public health.
Keywords: Mediterranean diet, Environmental footprints, Western pattern, Sustainable diets, Spain, Sustainability,Environment
BackgroundThe environmental consequences of food systems are onpublic health agendas. Foods are produced, processed,distributed and consumed, these actions having conse-quences for both human health and the environment[1]. Furthermore, food production is also inevitably adriver of environmental pressures, particularly in relation
* Correspondence: [email protected] of Clinical Sciences, University of Las Palmas de Gran Canaria,Luis Pasteur s/n, Las Palmas de Gran Canaria 35016, Spain5Ciber Fisiopatología Obesidad y Nutrición (CIBEROBN, CB06/03), Instituto deSalud Carlos III, Madrid 28029, SpainFull list of author information is available at the end of the article© 2013 Sáez-Almendros et al.; licensee BioMedCreative Commons Attribution License (http:/distribution, and reproduction in any medium
to climate change, water use, toxic emissions and [2]greenhouse gas emissions (GHG), such as CO2, CH4 andN2O, which are responsible for global warming. Agricul-ture is one of the main contributors to the emissions oftwo last gases mentioned whilst other parts of the foodsystem contribute to carbon dioxide emissions due to theuse of fossil fuels in processing, transportation, retailing,storage, and preparation. Food items differ substantially intheir environmental footprints, which among many otherdescriptors, can be measured in terms of energy consump-tion, agriculture land use, water consumption or GHG
Central Ltd. This is an open access article distributed under the terms of the/creativecommons.org/licenses/by/2.0), which permits unrestricted use,, provided the original work is properly cited.
Sáez-Almendros et al. Environmental Health 2013, 12:118 Page 2 of 8http://www.ehjournal.net/content/12/1/118
emissions [3]. Animal-based foods are by far the most landand energy intensive compared to foods of vegetableorigin [4]. Thus, dietary patterns can substantially varyin resource consumption and the subsequent impacton the environment, as well as on the health of a givenpopulation [3].Research has recently shown that certain dietary pat-
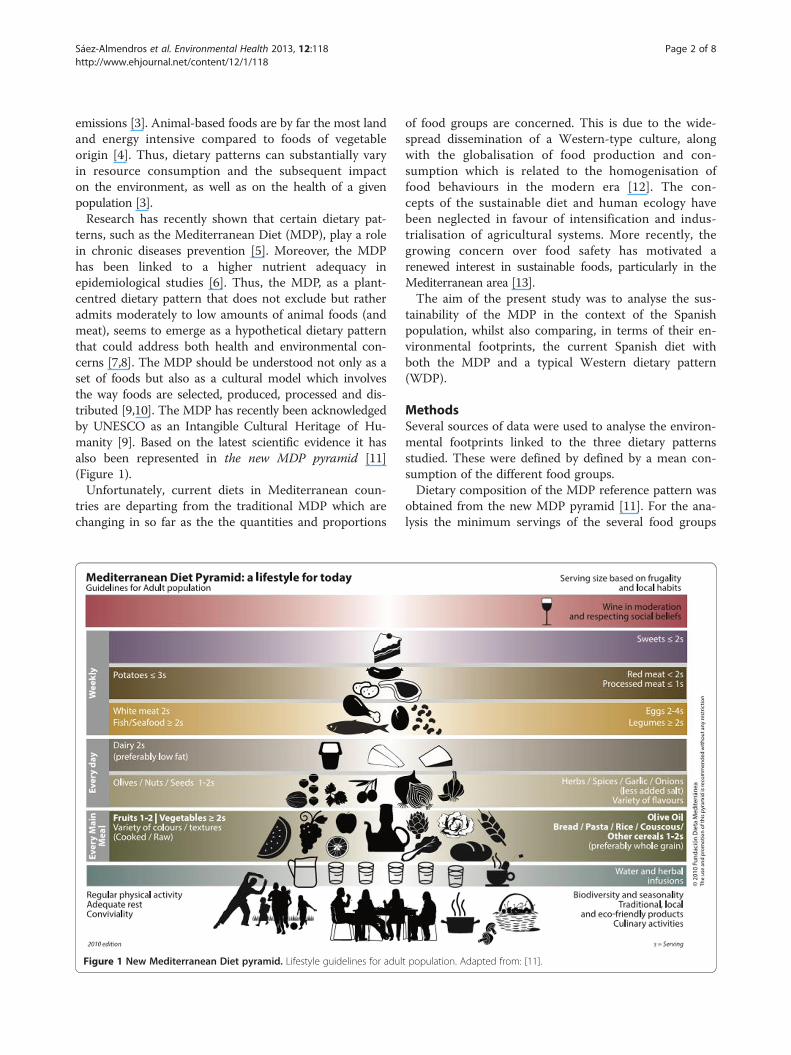
terns, such as the Mediterranean Diet (MDP), play a rolein chronic diseases prevention [5]. Moreover, the MDPhas been linked to a higher nutrient adequacy inepidemiological studies [6]. Thus, the MDP, as a plant-centred dietary pattern that does not exclude but ratheradmits moderately to low amounts of animal foods (andmeat), seems to emerge as a hypothetical dietary patternthat could address both health and environmental con-cerns [7,8]. The MDP should be understood not only as aset of foods but also as a cultural model which involvesthe way foods are selected, produced, processed and dis-tributed [9,10]. The MDP has recently been acknowledgedby UNESCO as an Intangible Cultural Heritage of Hu-manity [9]. Based on the latest scientific evidence it hasalso been represented in the new MDP pyramid [11](Figure 1).Unfortunately, current diets in Mediterranean coun-
tries are departing from the traditional MDP which arechanging in so far as the the quantities and proportions
Figure 1 New Mediterranean Diet pyramid. Lifestyle guidelines for adul
of food groups are concerned. This is due to the wide-spread dissemination of a Western-type culture, alongwith the globalisation of food production and con-sumption which is related to the homogenisation offood behaviours in the modern era [12]. The con-cepts of the sustainable diet and human ecology havebeen neglected in favour of intensification and indus-trialisation of agricultural systems. More recently, thegrowing concern over food safety has motivated arenewed interest in sustainable foods, particularly in theMediterranean area [13].The aim of the present study was to analyse the sus-
tainability of the MDP in the context of the Spanishpopulation, whilst also comparing, in terms of their en-vironmental footprints, the current Spanish diet withboth the MDP and a typical Western dietary pattern(WDP).
MethodsSeveral sources of data were used to analyse the environ-mental footprints linked to the three dietary patternsstudied. These were defined by defined by a mean con-sumption of the different food groups.Dietary composition of the MDP reference pattern was
obtained from the new MDP pyramid [11]. For the ana-lysis the minimum servings of the several food groups
t population. Adapted from: [11].
Sáez-Almendros et al. Environmental Health 2013, 12:118 Page 3 of 8http://www.ehjournal.net/content/12/1/118
recommended in the MDP pyramid (Figure 1) weretaken into account. We assumed that the recommendedservings from the MDP pyramid applied to the entirepopulation, despite these being addressed to adult popu-lation. This limitation, and the resulting uncertainty, alsoapply to the other dietary patterns considered, and re-spond to the lack of data on specific dietary compositionfor different age groups. Using only the adult populationwould change the absolute footprints, but would in anycase, only be a partial assessment of the true total foot-print, and would not in fact substantially change ourresults concerning the relative comparison of the envir-onmental footprints between dietary patterns.The current Spanish dietary pattern (SCP) was esti-
mated from the FAO food balance sheets for 2007 [14](SCPFB). The WDP was exemplified by the U.S.A. foodpattern, and data was also obtained from the FAO foodbalance sheets. This data was provided by FAOSTATdatabase [15]. These values reflect national per capitasupply at retail level for human consumption.At the same time, the SCP was estimated from the
Household Consumption Surveys of the Spanish Minis-try of Agriculture, Food and Environment [16] (SCPCS).The data set consisted of a representative sample of theSpanish population from 6000 households, 840 food ser-vice sector centres and 230 institutions in 2006, follow-ing a stratified random selection process which recordeddaily food purchases in the first case and monthly pur-chases in the other two cases [16]. This allowed the esti-mation of the annual apparent food consumption percapita (Kg/person per year). A comparison between thetwo independent estimates of SCP (from food balancesheets, SCPFB, and from consumption surveys, SCPCS)was used as a quality control for the estimates. The calo-ries from the different patterns were calculated throughfood composition tables and stated as comparable ran-ging around 2000 kcal.The methodological limitations of the consumption
surveys [17] and food balance sheets [18] should betaken into consideration when interpreting the results.Despite food purchases and food consumption beingfully equivalent, mostly due to food waste that mayoccur at household level, the amount of food purchasedreasonably corresponds to that consumed [19]. Further-more data on foods available for human consumptionobtained from the food balance sheets, generally over-estimate food consumption compared to individual diet-ary surveys [20].Footprints analysed include GHG emissions and use of
resources such as agricultural land use, energy consump-tion and water consumption. Specific footprints for eachfood group were obtained from several Life CycleAssessment (LCA) sources conducted in Spain andelsewhere (Additional file 1). The three phases analyzed in
the food system were the agricultural production, process-ing and packaging, transportation and retail. These threephases were considered key, where information was avail-able. Some specific footprint values for water consumptionand GHG emissions, were not available for some of thefood groups (cereals, fruits, vegetables, vegetable oils, nuts,etc.). This occurred mainly in the area of processing andtransportation. The uncertainties associated with the lackof data for specific footprint values and with the assump-tion of constant footprints in general imply that the envir-onmental footprint estimates discussed here should beconsidered as conservative.Regarding the limitations linked to environmental food
data; there were a limited number of food items includedin the analysis as data on the different processes waslacking for some food-items. It was assumed that eachfood category was represented by some representativefood items. Furthermore, post retailing (distribution fromstores to households, storing and cooking) and alterna-tive ways of production (eco-friendly) were not taken intoaccount, only conventional agriculture processes were in-cluded. Thus, neither the environmental impact of inten-sive resource-consuming processed foods, nor the energysavings related to a higher contribution by fresh, local,eco-friendly and seasonal products could be evaluated inthe study. Land use included both the land used for cropsand livestock production, implying an inherent bias inour estimates of this environmental pressure. In thecase of fish, data on land use were not available.Vegetable oils and animal fats had to be considered inone single category, which makes it difficult to obtaina clear idea of the relative contributions of “vegetal-source foods” and “animal-source foods” to differentenvironmental footprints.For comparison, the level of current real environmen-
tal pressure was estimated. The current footprint foreach environmental pressure was taken into consider-ation. Thus, current land use was defined as the agricul-tural area, including cultivated (arable and permanentcrops) and pasture areas. Data was obtained from theFAOSTAT database in 2008 [15]. Current energy con-sumption was estimated using data on the energy con-sumed by the agricultural, fishing and food-productionsectors for 2009 [21,22]. Current water consumptionwas defined as the total amount of water consumed bythe agricultural sector in 2009 and by food industries in2008 [23]. The current GHG emissions correspond tothe total gas emissions of agricultural and food indus-tries (in grams of CO2 equivalent).
ResultsThe MDP showed the lowest footprints in all the envir-onmental pressures taken into consideration, whereasthe WDP showed the highest (Table 1). The footprint
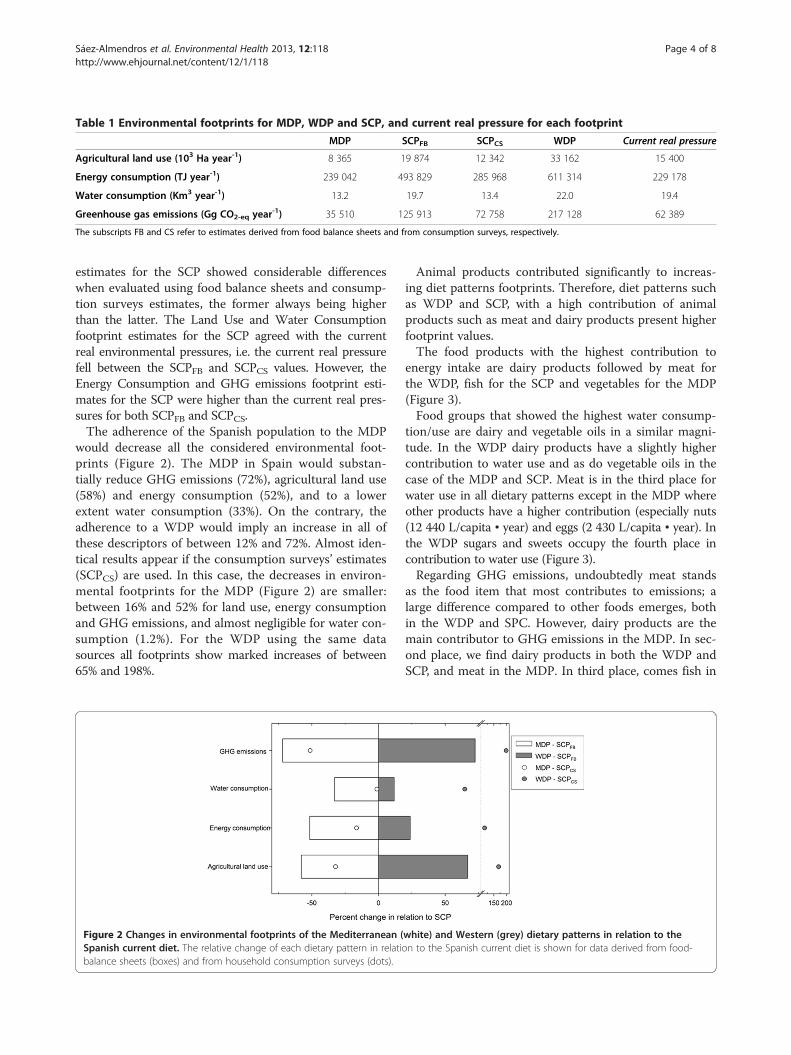
Table 1 Environmental footprints for MDP, WDP and SCP, and current real pressure for each footprint
MDP SCPFB SCPCS WDP Current real pressure
Agricultural land use (103 Ha year-1) 8 365 19 874 12 342 33 162 15 400
Energy consumption (TJ year-1) 239 042 493 829 285 968 611 314 229 178
Water consumption (Km3 year-1) 13.2 19.7 13.4 22.0 19.4
Greenhouse gas emissions (Gg CO2-eq year-1) 35 510 125 913 72 758 217 128 62 389
The subscripts FB and CS refer to estimates derived from food balance sheets and from consumption surveys, respectively.
Sáez-Almendros et al. Environmental Health 2013, 12:118 Page 4 of 8http://www.ehjournal.net/content/12/1/118
estimates for the SCP showed considerable differenceswhen evaluated using food balance sheets and consump-tion surveys estimates, the former always being higherthan the latter. The Land Use and Water Consumptionfootprint estimates for the SCP agreed with the currentreal environmental pressures, i.e. the current real pressurefell between the SCPFB and SCPCS values. However, theEnergy Consumption and GHG emissions footprint esti-mates for the SCP were higher than the current real pres-sures for both SCPFB and SCPCS.The adherence of the Spanish population to the MDP
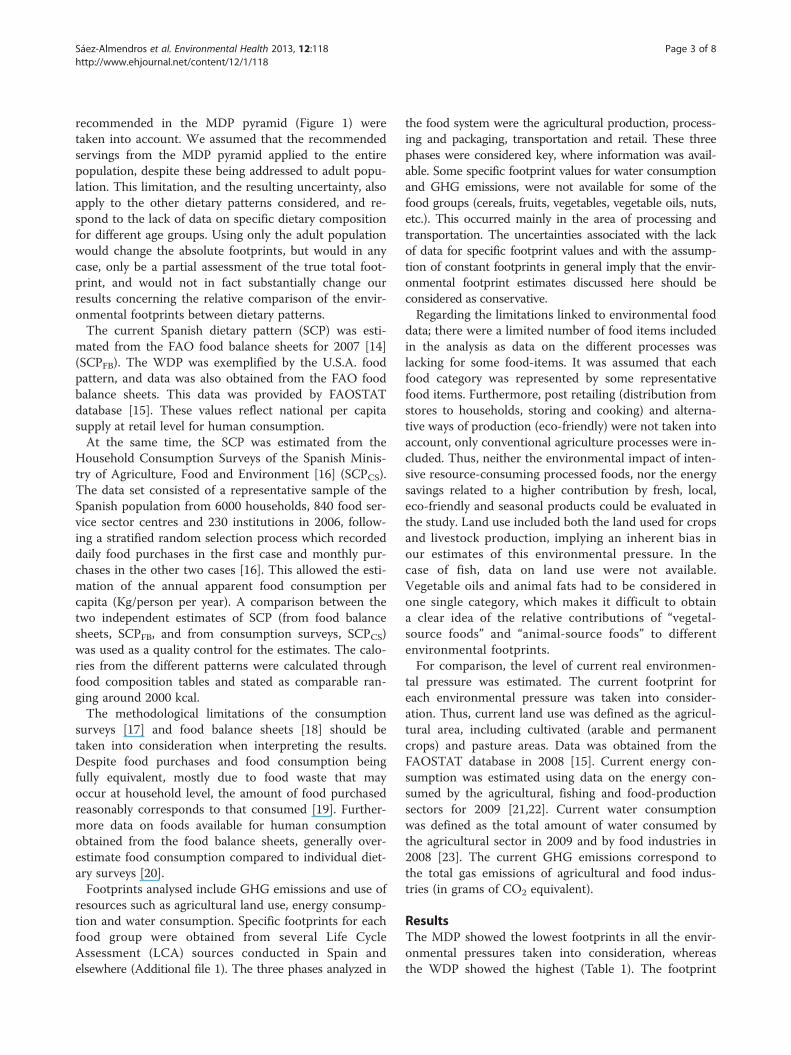
would decrease all the considered environmental foot-prints (Figure 2). The MDP in Spain would substan-tially reduce GHG emissions (72%), agricultural land use(58%) and energy consumption (52%), and to a lowerextent water consumption (33%). On the contrary, theadherence to a WDP would imply an increase in all ofthese descriptors of between 12% and 72%. Almost iden-tical results appear if the consumption surveys’ estimates(SCPCS) are used. In this case, the decreases in environ-mental footprints for the MDP (Figure 2) are smaller:between 16% and 52% for land use, energy consumptionand GHG emissions, and almost negligible for water con-sumption (1.2%). For the WDP using the same datasources all footprints show marked increases of between65% and 198%.
Figure 2 Changes in environmental footprints of the Mediterranean (Spanish current diet. The relative change of each dietary pattern in relatibalance sheets (boxes) and from household consumption surveys (dots).
Animal products contributed significantly to increas-ing diet patterns footprints. Therefore, diet patterns suchas WDP and SCP, with a high contribution of animalproducts such as meat and dairy products present higherfootprint values.The food products with the highest contribution to
energy intake are dairy products followed by meat forthe WDP, fish for the SCP and vegetables for the MDP(Figure 3).Food groups that showed the highest water consump-
tion/use are dairy and vegetable oils in a similar magni-tude. In the WDP dairy products have a slightly highercontribution to water use and as do vegetable oils in thecase of the MDP and SCP. Meat is in the third place forwater use in all dietary patterns except in the MDP whereother products have a higher contribution (especially nuts(12 440 L/capita • year) and eggs (2 430 L/capita • year). Inthe WDP sugars and sweets occupy the fourth place incontribution to water use (Figure 3).Regarding GHG emissions, undoubtedly meat stands
as the food item that most contributes to emissions; alarge difference compared to other foods emerges, bothin the WDP and SPC. However, dairy products are themain contributor to GHG emissions in the MDP. In sec-ond place, we find dairy products in both the WDP andSCP, and meat in the MDP. In third place, comes fish in
white) and Western (grey) dietary patterns in relation to theon to the Spanish current diet is shown for data derived from food-

Figure 3 Environmental footprints (energy consumption, water consumption, GHG emissions and agricultural land use) mean annualcontribution of each food group to the dietary pattern. *The fish group was not considered in water footprint and land use footprintbecause was not applicable.
Sáez-Almendros et al. Environmental Health 2013, 12:118 Page 5 of 8http://www.ehjournal.net/content/12/1/118
all the dietary patterns (Figure 3). A WDP would ac-count for double the GHG emissions compared with theSCP whilst WDP would produce 6 times greater emis-sions than the MDP.As in the case of GHG emissions, meat is the food
that most contributes to land use in both the WDP andthe SCP with high values of m2/capita and showing con-siderable differences in comparison with other foodgroups. Meanwhile dairy products in the MDP show thehighest contribution to land use. In the WDP and SCPmeat is followed by dairy products and for the MDP,dairy products are followed by meat and then, cerealsand vegetable oils (Figure 3).Regarding the environmental footprint mean annual
contribution of each food group to the dietary pattern;we observed that in the MDP, vegetables, fruit, and toa lesser extent cereals and vegetable oils have greaterweight, and had a comparatively higher contribution towater consumption and, to a lesser extent, energy con-sumption. Dairy products, as one of the main sources ofanimal protein in the MDP, were the food group whichpresented the highest footprint in all four analyzed foot-prints (Figure 3).Environmental footprints of food groups means were
found to be similar in the WDP and in the SCP in alower weight but with similar relative contributions.
Although, in both patterns, dairy, fish and vegetableoils were foods that contributed substantially in terms ofenergy consumption, in the WDP there was clearly ahigher contribution of meats and dairy food groups(Additional file 2). On the other hand, in the SCP the en-ergy contribution for vegetables was far more relevant. Inthese patterns, in the case of food related water con-sumption, vegetable oils followed by dairy and meatswere the foods that contributed most. However, in theWDP sweets had a greater weight. In terms of GHGemissions and land use in both dietary patterns, meat,followed by dairy were the most contributing food. Meatfigured in a much higher proportion.
DiscussionStudies such as the present on the assessment of foodrelated environmental impacts of mean food dietarypatterns, generally conclude that a shift towards lessanimal-based and more plant-based diets would haveboth a beneficial effect on climate and on the environmentoverall [3,4,24-29]. In the present study, it was found thatthe MDP implies lower demands on soil, compared toboth the SCP and to WDP, and also on water and energyresources (even though our estimates were conservative).In fact, it was observed that a shift towards MDP wouldresult in a reduction of the Spanish environmental
Sáez-Almendros et al. Environmental Health 2013, 12:118 Page 6 of 8http://www.ehjournal.net/content/12/1/118
footprint in any of the considered pressures from 33 to72%. On the contrary, a progressive shift towards WDPwould imply an increase in the footprints (12-72%).These results reinforce the sustainable character of theMDP in an increasingly globalised world [30,31].The comparison of the results on food environmental
footprints between studies is complex because the re-sults depend on a large variety of factors. A major limi-tation of this study was the use of data that has not beenrecently published, and the use of data from differentcountries (e.g. Northern Europe) belonging to differentagro-ecological zones. However, despite some aforemen-tioned limitations related to food intake and to environ-mental data sources used, the results in the present studyare in line with most of the available literature [30,31].We consider our footprint estimates for land use and
water consumption for the SCP to be realistic due to theagreement with the current real environmental pressures(Table 1). On the contrary, a slight overestimation of theenergy consumption and GHG emissions footprints isacknowledged for the SCP. A comparison of the envir-onmental footprints of the MDP and the WDP with thecurrent real environmental pressures (rather than withthe SCP) shows that the WDP would substantially increaseall the environmental footprints. The adherence of theSpanish population to the MDP would decrease all the en-vironmental pressures except energy consumption whichwould show an almost imperceptible increase.As far as the environmental contribution of the differ-
ent food groups is concerned, most of the literatureavailable, despite originating from different settings andtypes of analysis, converges overall in the global state-ments. Plant-based foods were the group that contrib-uted least to the selected environmental footprint, andas expected, in the MDP meat and dairy presented lowerfigures of water consumption and to a lesser extent en-ergy consumption compared to the other patterns. Plantfoods based on vegetables, cereals, and legumes are not-ably the food group with the lowest GHG emissionseven where processing and substantial transportation isinvolved [3]. In our study, legumes were included in thevegetable group as was indicated in other studies andsince separate LCA data was not available. In fact, le-gumes are stated as alternatives to animal protein foodsdue to their low environmental impact and long durabil-ity [3]. However, some vegetable origin foods contributesubstantially, together with dairy products, in the caseof the MDP and SCP, to either water consumption(vegetable oils in particular, and to some extent nuts) orland use (cereals and vegetable oils) in their production.In both the SCP and in the WDP, vegetal oils also contrib-uted to a great extent to water consumption and to energyconsumption footprints. Meanwhile animal-based foodswere found to cause the highest environmental impact in
all dietary patterns. As in other studies of the Spanish con-text, meat and dairy were the foods that most contributedto environmental footprints [32], although at a much lowerabsolute contribution than the WDP. As far as GHG emis-sions and land use were concerned, undoubtedly meat re-sulted as the food item that contributed most, showing alarge difference compared to other foods, both in theWDP and SCP. It was observed that a reduction in meatconsumption decreased GHG emissions [31], and land use,subsequently increasing the availability of land for otheruses [31]. Even though there is high production variability[3] which may be as much of 80% of global agricultureacross countries, land use is related to livestock productionand accounts for more than half of the GHG emissionsresulting from agriculture [14]. Meanwhile, dairy products,one of the main sources of animal protein in the MDP,contributed to a great extent in terms of energy consump-tion in the three dietary patterns. In the MDP, dairy prod-ucts was the food group which presented the highestfootprint in all 4 analyzed footprints since in the MDPmeat has a lower weight compared to the other patternsboth in frequency and amount (Additional file 3) [11].Regarding GHG emissions; fish also showed a remark-able environmental contribution in all the dietary patterns.According to our results, the MDP in Spain would sub-stantially reduce overall water consumption: despite a pos-sible increase in water consumption from vegetables andfruit groups. Water consumption of certain food groups asvegetable oils and fats or meat products would be lowerthan the WDP.The most relevant dietary distinctions in terms of
environmental cost were those that occurred betweenanimal-based versus plant-based diets, with an importantinfluence of the various ways foods are grown, processed,and transported. The largest environmental impact of foodproduction from the farm level to consumers is generallyassociated with primary production. In terms of energyconsumption, differences in greenhouse productionversus open-air cultivation of certain crops, and cannedor frozen-produce versus fresh-produce are substantial[25,33]. Besides the energy involved in agricultural produc-tion, the amount of energy used in household food storage,preparation and waste is not negligible [3].Food policy and dietary guidelines need to develop
and move on from the classical approach which only fo-cuses on nutrients and health, to one that takes intoconsideration environmental impact. Even consumersare tending to become more and more concerned aboutthe environment and, even more so, about their personalhealth, there is a strong resistance to changing certainfood choices (i.e. reducing meat consumption) whilstcultural culinary traditions are not easy to modify. Somestudies state that even radical changes in food consump-tion patterns would provoke quite small environmental

Sáez-Almendros et al. Environmental Health 2013, 12:118 Page 7 of 8http://www.ehjournal.net/content/12/1/118
benefits [27-29]. A significant reduction in environmen-tal footprints through a shift from the SCP towards aMDP type diet, would probably not only require sub-stantial changes in consumers’ food choices but morespecifically changes in agro-food-industry practices, pub-lic catering supply and agricultural and trade policies[7,29,34,35]. Spain is one of the major producers and ex-porters of typical Mediterranean products, thus it wouldmake sense to maintain a MDP agricultural productionmodel.
ConclusionA shift from the current Spanish pattern towards theMediterranean dietary pattern through the use of thenew Mediterranean Diet pyramid [11] would be benefi-cial from both a health and environmental perspective.The Mediterranean dietary pattern presented lower foot-prints than the current Spanish pattern, and to a muchlarger extent than the Western dietary pattern. TheMediterranean dietary pattern results in a lower envir-onmental impact due to the consumption of moreplant-derived products and less animal products. TheMediterranean dietary pattern is presented as not onlya cultural model but as a healthy and environmentallyfriendly model, adherence to which in Spain would makea significant contribution to greater sustainability of foodproduction and consumption, in addition to the well-knownbenefits on public health.
Additional files
Additional file 1: Environmental footprint sources of references(citation, geographic area and year) for the different productionand distribution phases.
Additional file 2: Relative intakes of each food group to the MDPand relative contributions to environmental footprints.
Additional file 3: Composition of the dietary patterns considered(Kg ind-1 y-1).
AbbreviationsMDP: Mediterranean diet; GHG: Greenhouse gases; CO2: Carbon dioxide;CH4: Methane; N2O: Nitrous oxide; UNESCO: United Nations EducationalScientific and Cultural Organization; WDP: Western dietary pattern;SCP: Spanish current dietary pattern; SCPFB: SCP estimated from food balancesheets; SCPCS: SCP estimated from the household consumption surveys: LifeCycle Assessment (LCA).
Competing interestsThe authors have no conflict of interest to declare.
Authors’ contributionsAll authors have made substantial contributions to conception and design,or acquisition of data, or analysis and interpretation of data; SSA and ABFhave been involved in drafting the manuscript; and all authors have beenrevising it critically for important intellectual content, given final approval ofthe version to be published. LSM acts as a guarantor of the content ofthis paper.
AcknowledgmentsProject in collaboration through Alberto Garrido with the PlataformaTecnológica de Agricultura Sostenible, Ministerio de Economía yCompetitividad, Spanish Government.
Author details1Department of Health Sciences, Universitat Oberta de Catalunya, RocBoronat, 117, Barcelona 08018, Spain. 2Department of Ecology, Faculty ofBiology, University of Barcelona, Diagonal 643, Barcelona 08028, Spain.3Mediterranean Diet Foundation, c/Johann Sebastian Bach 28, Barcelona08021, Spain. 4Department of Clinical Sciences, University of Las Palmas deGran Canaria, Luis Pasteur s/n, Las Palmas de Gran Canaria 35016, Spain.5Ciber Fisiopatología Obesidad y Nutrición (CIBEROBN, CB06/03), Instituto deSalud Carlos III, Madrid 28029, Spain.
Received: 28 June 2013 Accepted: 19 December 2013Published: 30 December 2013
References1. Gussow JD, Clancy KL: Dietary guidelines for sustainability. J Nutr Educ
1986, 18:1–5.2. United Nations Environment Programme (UNEP): Assessing the
Environmental Impacts of Consumption and Production: PriorityProducts and Materials. In A Report of the Working Group on theEnvironmental Impacts of Products and Materials to the International Panel forSustainable Resource Management. Edited by Hertwich E, van der Voet E,Suh S, Tukker A, Huijbregts M, Kazmierczyk P, Lenzen M, McNeely J,Moriguchi Y. Nairobi: UNEP; 2010.
3. Carlsson-Kanyama A, González AD: Potential contributions of foodconsumption patterns to climate change. Am J Clin Nutr 2009,89:1704S–1709S.
4. Baroni L, Cenci L, Tettamanti M, Berati M: Evaluating the environmentalimpact of various dietary patterns combined with different foodproduction systems. Eur J Clin Nutr 2007, 61:279–286.
5. Sofi F, Abbate R, Gensini GF, Casini A: Accruing evidence on benefits ofadherence to the Mediterranean diet on health: an updated systematicreview and meta-analysis. Am J Clin Nutr 2010, 92:1189–1196.
6. Serra-Majem L, Bes-Rastrollo M, Román B, Pfrimer K, Sánchez-Villegas A,Martínez-González MA: Dietary patterns and nutritional adequacy ina Mediterranean country. Br J Nutr 2009, 101:S21–S28.
7. Duchin F: Sustainable consumption of food: a framework for analyzingscenarios about changes in diets. J Ind Ecol 2005, 9:99–114.
8. De Boer J, Helms M, Aiking H: Protein consumption and sustainability:diet diversity in EU-15. Ecol Econ 2006, 59:267–274.
9. UNESCO: Representative list of the intangible cultural heritage ofhumanity. http://www.unesco.org/culture/ich/en/RL/00394 2010.
10. Serra-Majem L: Nutrición comunitaria y sostenibilidad: concepto yevidencias. Rev Esp Nutr Comunitaria 2010, 16:35–40.
11. Bach-Faig A, Berry EM, Lairon D, Reguant J, Trichopoulou A, Dernini S,Medina FX, Battino M, Belahsen R, Miranda G, Serra-Majem L, MediterraneanDiet Foundation Expert Group: Mediterranean diet pyramid today. Scienceand cultural updates. Public Health Nutr 2011, 14:2274–2284.
12. Da Silva R, Bach-Faig A, Raidó Quintana B, Buckland G, Vaz de Almeida MD,Serra-Majem L: Worldwide variation of adherence to the Mediterraneandiet, in 1961–1965 and 2000–2003. Public Health Nutr 2009, 12:1676–1684.
13. Medina FX: Food consumption and civil society: Mediterranean diet as asustainable resource for the Mediterranean area. Public Health Nutr 2011,14:2346–2349.
14. Food and Agriculture Organization of the United Nations: Food balancesheets 2007. http://faostat.fao.org/site/368/default.aspx#ancor.
15. Food and Agriculture Organization of the United Nations: FAOSTAT. http://faostat.fao.org/.
16. MAFE (Ministry of Agriculture, Food and Environment, Spain): Laalimentación en España 2006 (Food in Spain 2006). Madrid: MAFE; 2007.
17. Serra-Majem L: Food availability and consumption at national, householdand individual levels: implications for food-based dietary guidelinesdevelopment. Public Health Nutr 2001, 4:673–676.
18. Jacobs K, Sumner DA: The Food Balance Sheets of the Food and AgricultureOrganization: A review of Potential Ways to Broaden the Appropriate uses ofthe Data. Berkeley, CL: Department of Agricultural Economics, University ofCalifornia; 2002.
Sáez-Almendros et al. Environmental Health 2013, 12:118 Page 8 of 8http://www.ehjournal.net/content/12/1/118
19. Becker W: Comparability of household and individual food consumptiondata-evidence from Sweden. Public Health Nutr 2001, 4:1177–1182.
20. Serra-Majem L, MacLean D, Ribas L, Brulé D, Sekula W, Prattala R,Garcia-Closas R, Yngve A, Lalonde M, Petrasovits A: Comparative analysis ofnutrition data from national, household, and individual levels: results froma WHO-CINDI collaborative project in Canada, Finland, Poland, and Spain.J Epidemiol Community Health 2003, 57:74–80.
21. European Commission database Eurostat. http://epp.eurostat.ec.europa.eu/portal/page/portal/statistics/themes.
22. MITT (Ministry of Industry, Tourism and Trade): El libro de la energía enEspaña 2009 (The Energy Book in Spain 2009). Madrid: MITT; 2009.
23. Spanish national statistics institute database. http://www.ine.es/en/inebmenu/indice_en.htm.
24. Carlsson-Kanyama A, Pipping Ekström M, Shanahan H: Food and life cycleenergy inputs: consequences of diet and ways to increase efficiency.Ecol Econ 2003, 44:293–307.
25. Reijnders L, Soret S: Quantification of the environmental impact ofdifferent dietary protein choices. Am J Clin Nutr 2003, 78:664S–668S.
26. Macdiarmid J, Kyle J, Horgan G, Loe J, Fyfe C, Johnstone A, McNeill G: Livewell: abalance of healthy and sustainable food choices. Aberdeen: WWF Report, RowettInstitute of Nutrition and Health, University of Aberdeen; 2011.
27. Risku-Norja H, Kurppa S, Helenius J: Impact of Consumers’ Diet Choices onGreenhouse Gas Emissions. In Proceedings of the Conference “Future of theConsumer Society”: 28–29 May 2009; Tampere. Edited by Koskela M, Vinnari M.Tampere, Futures Research Centre; 2009:159–170.
28. Tukker A, Goldbohm RA, De Koning A, Verheijden M, Kleijn R, Wolf O,Pérez-Domínguez I, Rueda-Cantuche JM: Environmental impacts ofchanges to healthier diets in Europe. Ecol Econ 2011, 70:1776–1788.
29. Wallén A, Brandt N, Wennersten R: Does the Swedish consumer’s choiceof food influence greenhouse gas emissions? Environmental Science andPolicy 2004, 7:525–535.
30. Gussow JD: Mediterranean diets: are they environmentally responsible?Am J Clin Nutr 1995, 61:1383S–1389S.
31. Stehfest E, Bouwman L, van Vuuren DP, den Elze MGJ, Eickhout B, Kabat P:Climate benefits of changing diet. Clim Change 2009, 95:83–102.
32. Muñoz I, Milà L, Fernández-Alba AR: Life cycle assessment of the averageSpanish diet including human excretion. Int J Life Cycle Assess 2010,15:794–805.
33. Carlsson-Kanyama A, Faist M: Energy Use in the Food Sector: A Data Survey.Stockolm: Swedish Environmental Protection Agency; 2000.
34. De Boer J, Hoogland CT, Boersema JJ: Towards more sustainable foodchoices: value priorities and motivational orientations. Food Qual Prefer2007, 18:985–996.
35. Vieux F, Darmon N, Touazi D, Soler LG: Greenhouse gas emissions ofself-selected individual diets in France: changing the diet structureor consuming less? Ecol Econ 2012, 75:91–101.
doi:10.1186/1476-069X-12-118Cite this article as: Sáez-Almendros et al.: Environmental footprints ofMediterranean versus Western dietary patterns: beyond the healthbenefits of the Mediterranean diet. Environmental Health 2013 12:118.
Submit your next manuscript to BioMed Centraland take full advantage of:
• Convenient online submission
• Thorough peer review
• No space constraints or color figure charges
• Immediate publication on acceptance
• Inclusion in PubMed, CAS, Scopus and Google Scholar
• Research which is freely available for redistribution
Submit your manuscript at www.biomedcentral.com/submit