LECTURE NOTES For Environmental Health Students Occupational Health, Safety, and Hygiene
Upload
khangminh22Category
view
3download
0
Gordon McGranahan, Simon Lewin,Taryn Fransen, Caroline Hunt,Marianne Kjellén, Jules Pretty,Carolyn Stephens, Ivar Virgin
Environmental Change and Human Healthin Countries of Africa, the Caribbean and the Pacific
Stockholm Environment InstituteBox 2142
SE-103 14 StockholmSweden
Tel: +46 8 412 14 00Fax: +46 8 723 03 48
Home page: http://www.sei.se
Responsible Editor: Karin Hultcrantz (SEI)Project Coordinator: Marianne Kjellén (SEI)
Layout and cover: Helena Forslund (SEI)Editorial team: Caroline Hunt (LSHTM), Marianne Kjellén (SEI),
Simon Lewin (LSHTM), Gordon McGranahan (SEI)and Carolyn Stephens (LSHTM)
ISBN: 91 88714 69 1
© Copyright 1999 by the Stockholm Environment Institute. No part of this reportmay be reproduced in any form by photostat, microfilm, or any other means,
without written permission from the publisher.
Recommended Citation: McGranahan, G., Lewin, S., Fransen, T.,Hunt, C., Kjellén, M., Pretty, J., Stephens, C., Virgin, I. 1999.
Environmental Change and Human Health in Countries of Africa,the Caribbean and the Pacific. Stockholm Environment Institute,
Stockholm, 214 p.
Cover photo: Family Eating, Helena Forslund/SEITropical Strom, National Geographic/GreatShotsWoman in the Field, Charlotte Thege/PHOENIX
Foreword
The European Commission (Directorate-General for Development) and The SwedishInternational Development Co-operation Agency supported this report by the StockholmEnvironment Institute and the London School of Hygiene and Tropical Medicine. It adds aregional dimension to the global review of environment and health presented in the latestbiennial report of the World Resources Institute, World Resources 1998-99. The choice ofregion reflects the European Union’s longstanding commitment to assisting the African,Caribbean and Pacific (ACP) signatories of the Lomé Convention in their pursuit ofsustainable development.
This report provides ample evidence that protecting human health is one of the mostcompelling reasons for pursuing environmental improvements, especially in conditions ofpoverty. While ACP countries contribute relatively little to global resource depletion orwaste generation, their average burden of disease is very high and a disturbingly large shareof that burden is related to environmental conditions. Addressing these environmentalthreats to health means reducing poverty, and promoting sustainable development.
Healthy living environments and sustainable agriculture that ensures food security areimmediate priorities, and both can contribute to poverty reduction. Looking towards thefuture, it is also important to prevent development initiatives from damaging people’shealth. This requires enhanced integration of social and health aspects into the appraisal ofpublic and private investment projects and programmes. For this integration sound andefficient regulatory frameworks and sufficient capacity in the ACP countries are needed.Another challenge is to respond effectively to supranational health threats and to globalenvironmental risks, such as increasing regional water scarcity and international climatechange.
The report also demonstrates that there is much that can be done to achieve these aimsthrough the full integration of environmental aspects into health sector support programmes.New forms of inter-sectoral collaboration, and engagement with civil society, are needed.People in all walks of life need a better understanding of environmental conditions andhow they affect health. Policy-makers and donors need to consider the environmental andhealth consequences of their actions, and bring environment and health into the developmentmainstream. This calls for devising more strategic approaches to preventive environmentalhealth management.
It is hoped that this report will reach a large audience, in particular in the partnercountries in the ACP region, and will contribute to debate and, more importantly, to act insupport of better environmental stewardship and good health. In the context of one co-operation policy under the Lomé IV Convention and the successor agreement that is currentlyunder negotiation, the report will hopefully inform the preparation of future regional andcountry strategies.
Paol Nielson Maj-Inger KlingvallCommissioner for Development Minister for Development Co-operationand Humanitarian Aid Ministry for Foreign Affairs, SwedenEuropean Commission
Acknowledgements
This report has 8 authors and 18 identified contributors, as well as several hundredreferences. But even these numbers underestimate the extent to which this has been acollective effort.
The report builds on the work undertaken at the World Resources Institute (WRI) forWorld Resources 1998-99, under the editorship of Leslie Roberts. In addition to providinga sound base from which to start, the WRI team were kind enough to provide a data setenabling tables pertinent to the ACP countries to be appended to this report.
Extremely valuable and often very comprehensive reviews were received from thefollowing external reviewers: Elizabeth Ardayfio-Schandorf, Department of Geographyand Resource Development, University of Ghana; Martin Birley, Liverpool School of TropicalMedicine, United Kingdom; Juliette Bynoe-Sutherland, Ministry of Health, Barbados; MariaTeresa Cerqueira, PAHO/WHO, United States; Thomas Egwang, Med Biotech Laboratories,Kampala, Uganda; George Jambiya, Department of Geography, University of Dar es Salaam,Tanzania; Japhet K. Kiara, Ministry of Agriculture, Nairobi, Kenya; Jainend Kumar, Ministryof Agriculture, Fisheries and Forestry, Suva, Fiji; Gerald Leach, Stockholm EnvironmentInstitute, Sweden; Angela Mathee, South African Medical Research Council, Johannesburg,South Africa; David McCoy, London School of Hygiene and Tropical Medicine, UnitedKingdom; Don Robotham, City University of New York, United States; Jacob Songsore,Department of Geography and Resource Development, University of Ghana; André Soton,Centre Régional pour le Developpement et la Santé, Cotonou, Benin; Christian Bawa Yamba,The Nordic Africa Institute, Uppsala, Sweden.
Valuable comments and contributions were also received more informally from a numberof people, Ingrid Kökeritz, Stockholm Environment Institute; Shalini Bhargava, StockholmEnvironment Institute and David Gibbon, Department of Rural Development Studies,Swedish University of Agricultural Sciences.
Maps were produced by Simon Stevenson, London School of Hygiene and TropicalMedicine.
For language editing, we had excellent support from Jane Seymour for the review copyand Moyra S. Gough of WriteRight for the final version.
Helena Forslund made invaluable contributions, both in organising and creating thelayout of the final publication, under the supervision of Karin Hultcrantz.
Amos Tincani of the European Union had the original idea for this publication, andArtur Runge-Metzger helped guide the project through to completion. Margareta Tullbergat Sida has also provided support during the process.
The analysis and policy recommendations in this report represent the views of theauthors and do not necessarily reflect the views of the funders or affiliated organisations.As always, the authors bear responsibility for the remaining errors. If responsibility is to beapportioned, the SEI team bears more responsibility for Chapters 4-6, the LSHTM teamfor Chapters 2-3, and we all share at least some responsibility for Chapters 1 and 7.
List of Authors
Gordon McGranahan (Stockholm Environment Institute)Simon Lewin (London School of Hygiene and Tropical Medicine)Taryn Fransen (Stockholm Environment Institute)Caroline Hunt (London School of Hygiene and Tropical Medicine)Marianne Kjellén (Stockholm Environment Institute)Jules Pretty (Centre for Environment and Society, University of Essex / StockholmEnvironment Institute)Carolyn Stephens (London School of Hygiene and Tropical Medicine)Ivar Virgin (Stockholm Environment Institute)
List of Contributors
Dela Attipoe, Public Health Department (1995-1998), Accra Metropolitan Assembly, Ghana.(Box 5.6 & 7.2)
Martin Birley, Liverpool School of Tropical Medicine, United Kingdom.(Box 7.7)
Debbie Bradshaw, Centre for Epidemiological Research in Southern Africa, MedicalResearch Council of South Africa.
(Box 2.2)Thomas Egwang, Med Biotech Laboratories, Kampala, Uganda.
(Box 3.3 & 6.1)Anders Ellegård, Bioquest, Gothenburg, Sweden.
(Energy and Health)Cirre Fall, ENDA- Relais pour le Developpement Urbain Participe Dakar, Senegal.
(Box 7.5)Kevin Gray, Stockholm Environment Institute, Sweden.
(Box 1.1)A. D. Harries, Technical Adviser to the Malawi TB Programme, c/o British HighCommission, Lilongwe, Malawi.
(Box 7.3)George Jambiya, Department of Geography, University of Dar es Salaam, Tanzania.
(Box 7.4)Melissa Leach, Institute of Development Studies, University of Sussex, United Kingdom.
(Box 1.4)Nadine Nannan, Centre for Epidemiological Research in Southern Africa, Medical ResearchCouncil of South Africa.
(Box 2.2)Ogonda Onwuchekwa MD, MSc Environmental Epidemiology.
(Box 1.1 & 3.4)Don Robotham, City University of New York, United States.
(Box 1.2)David Satterhwaite, International Institute for Environment and Development, IIED, UK.
(Urban Services, Housing and Health)Jane Seymour, Editor / Researcher in Environmental Health, London, United Kingdom.
(Box 4.6)Ronald Subida, University of the Phillipines and London School of Hygiene and Tropical Medicine.
(Small Island States Health, literature review)Erica Toft, Erica Toft Konsult HB, Sweden.
(Box 4.5)Marc Vézina, International Water and Sanitation Reference Centre (IRC), The Nederlands.
(Box 5.5)
Table of Contents
Foreword..........................................................................................................iiiAcknowledgements...........................................................................................ivList of Authors and Contributors.......................................................................vList of Boxes...................................................................................................ixList of Figures..................................................................................................xList of Tables....................................................................................................xi
Executive Summary........................................................................................11. Background..................................................................................13
1.1 Introduction to the Report.....................................................................131.1.1 Purpose ............................................................................................... 1 41.1.2 Scope................................................................................................... 1 41.1.3 Intended Audience ............................................................................... 1 61.1.4 Structure ............................................................................................. 1 6
1.2 The ACP and the Economic Context.........................................................161.2.1 The ACP Grouping............................................................................... 1 61.2.2 Persistence of Poverty .......................................................................... 2 21.2.3 Globalisation and Economic Change .................................................... 2 3
1.3 The Diverse Forces Affecting Environmental and Health in the ACP.....311.3.1 Poverty Related Environmental Health Problems .................................. 3 21.3.2 ‘Modernisation’ and Global Environmental Threats to Health................3 31.3.3 Population Growth.................................................................................3 4
1.4 Conclusion.........................................................................35
2. Demographic and Health Trends.........................................................412.1 Introduction........................................................................................412.2 Demographic and Health Data: Availability and Reliability..................422.3 Demographic Trends.............................................................................43
2.3.1 Population Growth....................................................................462.3.2 The Demographic Effects of Migration and Displacement ...................... 4 9
2.4 Health Trends.......................................................................................502.4.1 The State of Health .............................................................................. 5 02.4.2 Estimating the Burden of Disease ......................................................... 5 92.4.3 Looking Ahead: Estimates for the Burden of Disease in 2020 ................ 6 2
2.5 Health, Wealth and Environment.................................................... 632.6 Conclusion............................................................................................ 66
3. Health in an Environmental Context.........................................................713.1 Health Conditions in an Environmental Context.................................723.2 Key Health Threats In An Environmental Context...............................76
3.2.1 Communicable and Nutritional Diseases .............................................. 7 63.2.2 Non-communicable Diseases ................................................................ 8 93.2.3 Injuries ................................................................................................ 8 9
3.3 Conclusions............................................................................................95
4. Agricultural Change, Rural Livelihoods and Health..............1014.1 Introduction......................................................................................1024.2 Overview of Trends and Future Challenges.........................................1024.3 The Links Between Agricultural Development and Food Security........107
4.3.1 Links Between Food Production and Food Security ............................ 107
4.3.2 Why Food Supply is Not the Same as Food Security ............................ 1 0 74.3.3 Changing Threats to Tenure ................................................................ 1 0 8
4.4 The Value of Wild Resources and Biodiversity for Food Security.........1104.4.1 Wild Foods and Food Security ..............................................................1104.4.2 The Value of Biodiversity for Livelihood Resilience ......................... .....112
4.5 The Health Costs of Past Approaches to Agricultural Development....1134.5.1 Modern Agricultural Development................................................1134.5.2 Environmental Impacts and Health Burdens of Modernist Systems . .....1154.5.3 Pesticides and Health .................................................................... .....1164.5.4 Health Effects of Increased Use of Fertiliser ................................... .....1184.5.5 Infectious Agents, Land Conversion and Increased Irrigation .......... .....120
4.6 The Problems and Opportunities of Biotechnology ...........................1204.6.1 What are Biotechnology and Genetic Engineering? ........................... . . .1234.6.2 Food and Farming Applications in the North ................................... . . .1234.6.3 The Relevance of Agricultural Biotechnology to Health in ACP countries...124
4.7 Conclusion.........................................................................................126
5. Urbanisation and Healthy Living Environments................................1315.1 Introduction.............................................................................................1325.2 The Urban Growth Phenomenon..............................................................134
5.2.1 The large cities.......................................................................................1355.2.2 Smaller cities and towns.........................................................................1365.2.3 Urbanisation – a blessing or a curse?.......................................................136
5.3 Urban Environmental Change and Health..........................................1375.4 Environmental Health in the Home and Neighbourhood...................141
5.4.1 Health Threatening Environmental Problems.........................................1435.4.2 Institutional Aspects of Environmental Health Problems inLow-Income Neighbourhoods............................................................149
5.5 Environmental Risks from Heavy Industry and Vehicular Transport..........1595.5.1 Industrial Pollution in ACP Countries........................................1595.5.2 Road Traffic Accidents............................................................................1605.5.3 Air Pollution from Non-Domestic Sources.....................................................160
5.6 The Urban Informal Economy, Livelihoods and the Environment..............1615.7 Conclusions......................................................................................166
6. Global Environmental Change..................................................................1716.1 Introduction..........................................................................................1716.2 Climate Change and Food Security.........................................................173
6.2.1 Direct Effects on Crops ............................................................... .......1736.2.2 Indirect Impacts of Climate Change on Crops ......................................174 6.2.3 Climate Change and Livestock ...................................................... . . . .175
6.3 Climate Change and Infectious Disease............................................1756.3.1 Malaria.........................................................................................1766.3.2 Schistosomiasis......................................................................................1 8 06.3.3 Dengue..................................................................................................1 8 0
6.4 Climate Change and Coastal Zones......................................................1816.5 Ozone Depletion and Human Health...................................................181
6.5.1 Skin Cancer............................................................................................1826.5.2 Eye Damage...........................................................................................1826.5.3 Immune System Suppression...................................................................1826.5.4 Indirect Impacts on Health....................................................................1 8 2
6.6 Conclusions.............................................................................................182
7. Environment and Health – the Shared Agenda............................................1877.1 The Shared Agenda..............................................................................1887.2 Key Principles for Successful Interventions...........................................1917.3 Environmental Care and Food Security.................................................193
7.3.1 Shifting to Sustainable Agriculture .........................................................1937.3.2 Providing Appropriate Support for the Pastoralist and Livestock Sector.....1937.3.3 Protecting Nature Whilst Ensuring Food Security....................................1957.3.4 Enhancing Participation by Rural Women...............................................1967.3.5 Improving Food Security in Urban Areas.................................................1967.3.6 Redirecting Biotechnology.......................................................................196
7.4 Achieving Healthy Living Environments...................................................1997.4.1 Building Local Capacities for Environmental Management.....................2007.4.2 Improving Water, Sanitation and other Environmental Service Provision.....2017.4.3 Improving Housing Conditions...........................................................207
7.5 Addressing Other Environmental and Health Burdens.......................2087.6 Conclusion............................................................................................209
Appendix I, List of ACP countries and HDI index Appendix II, Statistical Tables
List of Boxes
Box 1.1 The Lomé Conventions..................................................................................20Box 1.2 Globalisation: A Pivotal Process for Health and the Environment..................24Box 1.3 Health and Structural Adjustment in Zimbabwe.............................................29Box 1.4 Population Growth and Building Forests in Kissidougou, Republic of Guinea:
Implications for Environment, Food Security and Health................................35Box 2.1 The Limitations of Health and Demographic Data in the ACP Countries........42Box 2.2 Routinely Collected Demographic Data in South Africa - Are They Reliable?.....44Box 3.1 The Increasing Importance of Non-communicable Diseases -
Projections of the Disease Burden for Mauritius....................................75Box 3.2 Classifying Water-Related Infectious Diseases................................................77Box 3.3 The Health Risks of Development Projects: Infectious Agents and Irrigation......82Box 3.4 Occupational and Industrial Disease in the ACP Region.................................90Box 4.1 Contrasting Approaches to Agricultural Development and Food Needs.......105Box 4.2 Security of Tenure and Agricultural Productivity:
Evidence from Ghana, Kenya and Rwanda......................................109Box 4.3 Use of Wild Plants for Food and Medicine by Farming Communities in
ACP Countries...........................................................................................111Box 4.4 Diversity and Resilience in Farming Systems.........................................113Box 4.5 Pesticides and Workers’ Health.......................................................................118Box 4.6 Changing Forest Land Use and its Impact on Disease Vectors.............................121Box 5.1 A Stylised Account of Urban Environmental Change, Wealth and Health.........138Box 5.2 Compounding of Risk Factors......................................................................142Box 5.3 The Public and Domestic Domains in the Transmission of Disease.................144Box 5.4 Institutional Failures in Environmental Service Delivery.................................152Box 5.5 Water and Waste: the Need for Integrated Programmes at the Local Level -
A Case Study from Djenné, Mali...............................................................154Box 5.6 The Colonial Heritage: the Case of Public Health Legislation in Accra...........157Box 5.7 Urban Agriculture, Food Security and Environmental Health.........................163Box 6.1 The Development of Vaccines against Malaria, Schistosomiasis, and Filariasis....177Box 7.1 The Case for Combining Health and Environmental Agendas........................189Box 7.2 Co-ordination of Donor Projects in Accra, Ghana.........................................190Box 7.3 Donor Co-ordination in Tuberculosis Control in Malawi..............................192Box 7.4 Forest-Adjacent Communities in the Amani Nature Reserve, Tanzania:
Bearing the Costs and Missing the Benefits............................................197Box 7.5 Community-Based Approaches to Development - What are the Obstacles?......202Box 7.6 Using Scientific Evidence in Environmental Health Decision-Making:
The case of Water and Sanitation...............................................................204Box 7.7 Health Impact Assessment................................................................................210
List of Figures
Figure 1.1 a) ACP Countries in Africa and Small Island States off the African Coast....18Figure 1.1 b) ACP Countries in the Caribbean.................................................19Figure 1.1 c) ACP Countries in the Pacific....................................................19Figure 1.2 Population Density 1996 in ACP Africa...............................................34Figure 1.3 Gross Domestic Product per Capita in ACP Africa
Purchasing Power Parity, 1995.................................................34Figure 2.1 a) Total Fertility Rate 1975-1980.......................................................46Figure 2.1 b) Total Fertility Rate 1995-2000......................................................46Figure 2.2 a) Crude Birth Rate 1975-1980.......................................................47Figure 2.2 b) Crude Birth Rate 1995-2000.......................................................47Figure 2.3 a) Life Expectancy at Birth 1975-1980.............................................50Figure 2.3 b) Life Expectancy at Birth 1995-2000.............................................50Figure 2.4 Death Rates: Age- and Sex-standardised and Age Specific,
1955-2025 Estimates for SSA.........................................................52Figure 2.5 a) Infant Mortality Rate 1975-1980...................................................54Figure 2.5 b) Infant Mortality Rate 1995-2000...................................................54Figure 2.5 c) Infant Mortality Rate 2015-2020...................................................55Figure 2.6 Infant Mortality Rates for Selected ACP Countries, 1960-2020...........55Figure 2.7 Estimated Deaths by Sex and Cause, 0-4 year age group,
Sub-Saharan Africa, 1990 and Estimated Deaths, 2010................57Figure 2.8 Percentage Distribution of DALYs among Specific Causes..............61Figure 2.9 Infant Mortality Rates, Southern African Region, 1996..................64Figure 2.10 Infant Mortality Rates by Province, South Africa, 1990..................65Figure 2.11 Infant Mortality Rates by Residential Area, Cape Town, South Africa,
1992 and 1993.................................................................65Figure 3.1 Proportion of DALYs Associated with Environmental Exposures -
Sub-Saharan Africa......................................................................74Figure 3.2 Proportion of Population with Access to Safe Water.............................79Figure 3.3 Causes of Child Malnutrition...........................................................87Figure 3.4 Proportion of Children Suffering from Moderate and Severe Underweight....88Figure 4.1 Domesticated Land in ACP - Africa..................................................115Figure 5.1 Urban Environment Transition....................................................138Figure 5.2 Childhood Diarrhoea prevalence in Accra, by number of
High Risk Conditions............................................................142Figure 5.3 Water Supply and Sanitation Services - a Growing Gap...................150Figure 5.4 Application of Public Health-by-law on Enforcement of Sanitation Laws
in the Accra Metropolitan Area, 1996......................................158Figure 6.1 Carbon Dioxide Emissions per Capita 1995.................................172
List of Tables
Table 1.1 Changes in user-fee Policies in Zimbabwe, 1991-1995................................29Table 2.1 Stages of Demographic Transition..............................................................43Table 2.2 Estimated number of Births, Percentage of Births Registered, and Percentage
of Births Recorded with Health Authorities in 1994, South Africa...............44Table 2.3 The 10 leading causes of death in 1990......................................................53Table 2.4 Infant Mortality Rates in Pacific Island States............................................56Table 2.5 Changes in Child Mortality in Zimbabwe and Zambia, 1970-1990s...........58Table 3.1 Potential Relationships between Exposure Situations and Health Conditions....73Table 3.2 The Bradley-Feachem Classification of Water-Related Infectious Diseases..........77Table 4.1 Estimates of Chronic Undernutrition in the 93 Developing Countries
of the Study...........................................................................................103Table 4.2 Crop yields 1994-1996............................................................................104Table 5.1 Checklist for City-Related Environmental Problems by Context and by
Nature of the Hazard or Problem........................................................132Table 5.2 Selected Vectors and Related Diseases......................................................147Table 5.3 Principal Sources and Impacts of Selected Air Pollutants..........................162Table 5.4 Urban Agriculture in Selected ACP Cities.................................................163Table 6.1 Predicted Relationships between Climate Change and Crop Disease.........175Table 7.1 Median Reductions in Diarrhoeal Disease Morbidity from Improvements
in one or more Components of Water and Sanitation.............................205

Executive Summary
Executive Summary
Environmental Change and Human Health in Countries of Africa, the Caribbean and the Pacific 3
Background to this ReportInternationally, the links between environmental degradation and human health arereceiving greater attention. There is increasing recognition that environmental and health-related issues need to be integrated into the mainstream of the development agenda. Forthis to occur, decision-makers at every level, from heads of state to householders, need tobecome more aware of how and when their actions are likely to affect the environmentand health. Thus, whilst this report addresses issues of particular concern to theenvironment and health sectors, it is also of relevance to other sectors.
This report was financially supported by the European Community and the SwedishInternational Development Cooperation Agency (Sida) to provide a companion reportto the World Resource’s Institute’s World Resources Report, 1998-99, focusing on theACP group of states – the countries in Africa, the Caribbean and the Pacific that aresignatories to the Lomé Convention. The overall objective of the report is to informdebate on improving environment and health in the ACP region. More specifically, thereport is intended to assist ACP governments and Northern donors in developingassistance programmes that address the major environmental problems now threateningthe health of ACP residents, and avoid the health-threatening environmental damagethat can accompany inappropriate development initiatives.
Executive Summary
AudienceThis executive summary has been written forthose with an active interest in mainstreamingenvironmental and health issues, but withoutthe time to read the full report. This couldinclude senior officials in Health andEnvironment Ministries within the ACP, in thehealth and environment divisions ofinternational development organisations, andin large NGOs. The executive summary focuseson why environment and health issues areimportant, and indicates priorities for action.The justification for the claims made in theexecutive summary is provided in the mainbody of the report.
The full report is intended for a morediverse audience, including:
• Policy analysts and donors responsiblefor developing policy papers or programmesaddressing environmental and health issues (inthe ACP);
• Specialists and practitioners working onparticular aspects of environmental and healthissues, and wishing to understand the broadercontext or consequences of their work;
• Writers and others preparing morepopular material on these issues;
• Students interested in understandingenvironmental and health problems indeveloping countries.
Aims of the ReportThis report aims to first briefly describethe broad global, economic, political,social, institutional context in which ACPcountries currently find themselves(Chapter 1). It then describes the healthstatus and key health threats in ACPcountries in an environmental context(Chapters 2 and 3). Chapters 4 to 6 reviewenvironmental developments in the regionand they ways in which they are influencinghealth. Finally, environmental healthpriorities and measures which can be takento improve environmental health in ACPcountries are identified (Chapter 7).
Scope of the ReportThe focus of this report is on healthburdens in the ACP, and the environmentalproblems that contribute to them. Lessattention is paid to health burdens thatare not clearly linked to environmentalproblems, and environmental problemsthat do not contribute appreciably to illhealth. Health and the environment aredefined relatively narrowly, largely inphysical terms. The ‘environment’ is takento mean physical (not social)surroundings, and ‘environmentalproblems’ generally refer to deficienciesbrought about inadvertently by human
Environmental Change and Human Health in Countries of Africa, the Caribbean and the Pacific4
activity: pollution, resource depletion,ecosystem destruction and the like.‘Health’ is taken to be a state of well being,with an emphasis on freedom fromphysical health problems brought on byenvironmental inadequacies or problems.In terms of action, the report is primarilyconcerned with what can be done withinthe ACP countries themselves.
Environmental and Health Issues – aShared AgendaThis report argues that the environmentaland health sectors of ACP countries needto work closely to develop a shared agendafor environmental health for the followingreasons:
• Environmental and health problemsoverlap, especially in low-income ACPcountries. In comparisons with most otherparts of the world, it is apparent that:
- A larger share of the burden ofdisease arises from (physical)environmental threats, rather than,for example, from lifestyle choices; - A larger share of (physical)environmental burdens affects healthdirectly, rather than, for example,depleting the global resource base.
The link between environment and healthis, therefore, more immediate than inmany more affluent parts of the world, andenvironmental interventions hence havethe potential to dramatically reduce theburden of disease and increase quality oflife.
• The environmental and health sectorsare often weak players in a policy arenadominated by economic and politicalconsiderations. Many of the actions whichdegrade the environment and threatenhealth are taken by players outside of thenarrowly defined health and environmentalsectors.
• Conceived and implementedsectorally, environmental initiatives tend toover-emphasise regulative measures, whilsthealth initiatives tend to overemphasisecurative measures.
• Pursued independently, there is adanger that health and environmentalagendas will conflict:
- Local environmental healthproblems will be treated by means ofdisplacement, thus displacing ordelaying (rather than eliminating)environmental burdens; - Environmental capital will beprotected by denying the mostvulnerable groups access to theresources and environmental servicesthey need to protect their health.
• Pursued jointly, health andenvironmental agendas can be madecomplementary:
- Health prevention can move‘upstream’ and take advantage of themulti-sectoral approach toenvironmental improvement;- Environmental improvement canbecome grounded in issues of localconcern, and take advantage of thelocal presence of health professionals.
Report FindingsBackground to the ACP countriesThe ACP grouping is based on a series of aidand trade agreements (the Lomé Conventions)between the European Union and the 71signatories (as listed in Appendix 1).
The ACP region is extremely varied: itscountries include small island states wheretourism dominates the economy, andcontinental countries characterised by adependence on subsistence agriculture.Although many ACP countries are rich innatural resources, the transition from coloniesto independent countries left many nationswith a weak infrastructure and politicalinstability. More recently, economicglobalisation has undermined traditionalapproaches to poverty alleviation,environmental protection and healthimprovement. Debt, structural adjustmentand worsening terms of trade have also takena heavy toll on governance and infrastructure.At the same time, international aid to theregion has decreased.
The ACP countries include a large andgrowing share of the World’s poor. Humandevelopment indicators suggest that povertyand inequality in ACP-Africa are increasing.Conflicts and large-scale migration haveexacerbated the situation in numerouscountries. Persistent poverty remains the most
Executive Summary
Environmental Change and Human Health in Countries of Africa, the Caribbean and the Pacific 5
important barrier to environmental healthimprovement, and action taken in supportof environmental and health issues must,therefore, also support poverty alleviationand respond to the challenges of globalisation.Issues such as debt relief and improved termsof trade between the ACP and developedcountries could play an important part inpoverty alleviation.
Many of the environmental healthproblems of ACP countries can be groupedinto two categories, the first of whichremains dominant in most areas:
• A persistent poverty cluster: long-standing environmental health problems,such as unsanitary conditions, smoky fuels,and food insecurity, that conventionaldevelopment has failed to solve (or in somecases has made worse);
• A conventional developmentcluster: emerging environmental and healthproblems, ranging from hazardous industrialpollution to the health- threatening aspectsof global climate change, whichconventional development has helped tobring about.
Sustainable development entailsaddressing the problems associated withpersistent poverty, without addingappreciably to those resulting fromconventional development. Neither thehealth nor the environmental sector canmeet this twofold challenge alone. Unevendevelopment and rapid population growthwithin the ACP, coupled with new globalenvironmental threats originating largelyoutside of the ACP, are contributing to thechallenge. Building local capacity andimproving governance are critical to meetingthese challenges, and to ensuring thattargeted initiatives are effective in addressinglocal environmental and health priorities.
Demographic and health trendsThe twentieth century has witnessedsubstantial improvements in global healthand well being. These improvements havenot, however, been uniformly distributed.Most ACP countries still lag far behind bothother developing countries and developedcountries with regard to indicators of health
status. Environmental factors, often linkedto poverty, remain a major cause of deathand disease.
Demographic indicators, such as fertilityrates and infant mortality rates, are some ofthe highest in the world in ACP countries.Although the demographic transition isunder way (to varying degrees throughoutthe region), it is likely to take several decadesbefore the ACP-Africa demographic profilebegins to approximate that of otherdeveloping regions, such as Latin Americaor Asia.
Health conditions in the ACP countrieshave improved substantially over the past 50years, but are still amongst the worst in theworld. ACP-Africa contains approximately11% of the global population, but accountsfor 21% of the global burden of disease.
The burden of disease within the ACPregion is not equally distributed. There arelarge inequalities in health between andwithin countries, but in general, the poor, andpoor children in particular, bear adisproportionate burden of disease.
There are worrying indications that boththe economic hardships of the 1980s and1990s and the HIV/AIDS epidemic haveadversely affected health conditions in somecountries, particularly those in ACP-Africa.
Whilst the importance of non-communicable diseases and injuries isincreasing, communicable diseases, most ofwhich are environmentally related, still takethe largest toll of human health. In 1990, two-thirds of the disease burden in ACP-Africawas attributable to communicable, maternal,perinatal and nutritional conditions. By 2020,this figure should drop considerably, but theseconditions are still expected to account forsome 40% of the disease burden.
Injuries account for 15% of the burdenof disease in ACP-Africa, and this proportioncontinues to rise. Mental health problems areanother neglected, but important, area forintervention.
Key health threats in an environmentalcontextApproximately one-third of the total burdenof disease in ACP Africa is associated withenvironmental factors, manifested in the highprevalence of environmentally related deaths
Environmental Change and Human Health in Countries of Africa, the Caribbean and the Pacific6
and disabilities. The poorer countries of ACPCaribbean and Pacific are likely to experiencesimilar burdens. Healthier livingenvironments and improved food securitycould mitigate this burden.
Whilst demographic changes are focusingattention on adult health, the ‘unfinishedagenda’ of communicable diseases should notbe neglected. Many of the most importantcommunicable diseases in ACP countries -diarrhoeal disease, tuberculosis, malaria andacute respiratory infections - have strongenvironmental linkages. Improvements inenvironmental conditions are crucial tocontrolling these infections.
Water and sanitation related diseases arestill extremely important in many of thecountries included in this review. 10% ofthe disease burden in ACP Africa can beattributed to inadequate water, sanitationand hygiene, with children bearing most ofthis burden. Wealthier households and urbanhouseholds are more likely to have accessto water and sanitation services than poorerand rural households. The provision ofadequate water and sanitation thus remainsextremely important in improving healthand reducing disease in many ACP countries.Integrated approaches to service provision,which include hygiene promotion, are likelyto give the greatest health benefits and willalso maximise operational synergies byensuring that households have adequatewater for good hygiene practices.Improvements in water supply have alsobeen shown to bring substantial economicbenefits to households.
Approximately 32% of the burden ofdisease in ACP Africa can be attributed toprotein-energy malnutrition. Trendsindicate that the number of underweightchildren in ACP Africa may be rising. Keygroups for intervention include women andchildren, who often experience the worstliving conditions in both rural and urbansocieties. Improvements in food security forthe poorest households, combined withattention to the status of women, femaleeducation, and increasing the income ofpoor households, have all been shown tocontribute to reducing mal- and under-nutrition and reducing the burden ofdisease.
Acute respiratory infections were the mostcommon cause of death in developing regionsin the 1990s. Estimates suggest that over 50%of respiratory infections are associated withenvironmental exposures related to poorhousing conditions, overcrowding, poorhygiene and indoor and outdoor air pollution.
Tuberculosis remains a majorcontributor to the burden of disease in theACP countries and is related to poor livingenvironments, poverty and poor access toeffective treatment. This burden is expectedto rise by 2010, mainly due to rising HIVprevalence and demographic changes.
Injuries are growing as a contributor tothe burden of disease in the region, due toincreases in road traffic accidents, wars andviolence. The effects of armed conflicts inthe region on health and environment arevery substantial. Urban violence is alsogrowing as a public health threat, and inboth cases, the poor are at greatest risk.ACP-Africa has experienced by far thehighest levels of population movementresulting from wars, famines and otherenvironmental and political changes, whencompared with other regions. This has hadimportant demographic and health impacts,and deserves more attention.
In all ACP countries, the poor continueto bear the largest proportion of the diseaseburden. Diseases such as tuberculosis, acuterespiratory tract infections and diarrhoealdisease are closely linked to environmentalconditions most often encountered in poorareas, and not only are they compoundedby other aspects of poverty, but the unequaldistribution of resources helps to ensurethat these health inequalities aremaintained. Low quality and insufficientfood increases the risk of disease.
The poor are often unable to protectthemselves from the effects of natural andhuman-made disasters, which may furtherexacerbate poverty and disease. This is ofparticular concern in relation to the effectsof global warming.
Some of the key health threats reviewed arelinked to household-level behavioural patterns.Further research into the social and behaviouralaspects of health and disease is required in orderto develop programmes that encourage healthypractices at the household level.
Executive Summary
Environmental Change and Human Health in Countries of Africa, the Caribbean and the Pacific 7
Agricultural change, rural livelihoods andhealthFrom an ACP perspective, the environmentalaspects of agriculture are of special concernto health because they are closely related tofood security and malnutrition. Agricultureremains the predominant means of survivalin most ACP countries and the majority ofthe population is still employed or active inthe agricultural sector.
An increase in people’s access to food isimportant if ACP countries are to improve thehealth of their growing populations. Increasingthe food production levels is not, however, thesame as ensuring food security, as theseincreases may not benefit the most food-insecure groups. For weaker social groups,security and stability of land ownership areimportant in ensuring food security. Effortsto strengthen and assist low-cost sustainableagriculture will be important in improvingfood security and health in ACP countries, andwould include activities such as maintainingcrop genetic diversity, resolving land tenureproblems and implementing policies toempower rural women.
Mortality and illness due to pesticideexposure are more common in ACP countriesthan in industrialised ones, relative to thesmall amount of pesticides used. Older andmore toxic compounds (off-patent pesticides)still dominate the market in many countries,as they are far less costly than new ones.Policies and actions limiting the use of toxicpesticides, including the development ofIntegrated Pest Management (IPM), will beimportant in limiting pesticide poisonings andfacilitating sustainable agriculture.
Many ACP countries suffer from aninadequate replenishment of nutrientsremoved by agriculture and land degradation.This is most acute in ACP-Africa where, inmany countries, nutrient removal exceedsnutrient replenishment by a factor of threeto four. The region still accounts for less than1% of global fertiliser use, with very low ratesof fertiliser use per hectare, and in large partsof ACP-Africa, there is virtually no chemicalfertiliser usage at all. There is thus great scopefor increasing the productivity of African landby using more fertiliser, including biologicalnitrification, and because of the current lowfertiliser usage, a potential increase in the use
of fertiliser is not expected to pose asignificant health problem.
Land conversion and irrigation schemescan affect disease vectors and may increasedisease transmission, and an increasedawareness of the health-related effects of landuse changes is needed. Health impactassessment of irrigation schemes and forestconversion should be an important part ofproject development.
The erosion of crop genetic diversityrepresents a serious threat to food securityfor low-income farmers.
Genetic engineering is changing the paceof agricultural development, and has thetechnological potential to reducemalnutrition in ACP countries. There aremajor institutional barriers preventingbiotechnology from benefiting poor, small-scale farmers, however, who are also mostvulnerable to the risks of biotechnology.
Urbanisation and healthy living environmentsUrbanisation can be beneficial or harmfulto people’s health. Much depends upon howthe physical environmental changes thataccompany urbanisation are handled, butfor most ACP countries, the problems thatpose the greatest threat to health in theurban environment are those that low-income citizens face in and around theirhomes.
Rapid urban growth is likely to be afeature of most ACP countries for thecoming decades. Governments cannotprevent rapid urbanisation with policies andlegislation, but they can help ensure thaturbanisation benefits human health, in thatthe quality of urbanisation is more criticalto health than the rate of urbanisation.Unmanaged urban development creates veryunhealthy living environments, whilst goodlocal environmental management andservice provision, in both urban and ruralareas, can greatly reduce the burden ofdisease.
The most severe environmental healthproblems are closely interrelated and foundpredominantly in low-income homes andneighbourhoods. They include poor accessto water, inadequate sanitation,contaminated food, uncollected waste,smoky kitchens and a range of insect vectors
Environmental Change and Human Health in Countries of Africa, the Caribbean and the Pacific8
(the persistent poverty cluster). Importantenvironmental amenities, such as water andsanitation, are lagging behind populationgrowth in many urban areas.
Cooking with smoky fuels may becontributing significantly to respiratoryproblems, in particular for women andchildren. These problems are compoundedby other factors such as poverty, poorhousing, overcrowding, and air pollutionfrom other sources.
The relative lack of industrialdevelopment has meant a low averageexposure to chemical pollution in the generalpopulation. Where it does occur, however,exposure levels can be very high, posing athreat to industrial workers and nearby (oftenlow-income) residents (the conventionaldevelopment cluster).
The rapidly growing informal economyof smaller and less regulated enterprisescontributes appreciably to health byproviding livelihoods, but can, in somecircumstances, pose serious environmentalhealth threats.
Environmental deterioration and lack ofservices in low-income areas are anenvironmental and health priority. Neitherconventional public service delivery, norprivate service delivery, can meet thechallenge alone. Improvements that build onthe strengths of both private and publicsectors, and support the contribution of localresidents and their organisations, are morelikely to succeed. Strategies to addresscurrent deficiencies are also more likely tobe successful if they:
a. develop local capacities and givepriority to forging good relationshipsbetween residents and serviceproviders;
b. build on positive synergies, givingpriority to environmentalimprovements that alleviate poverty(which in turn increases the localcapacity to manage the environment);
c. draw upon and enhance bothscientific and local knowledge ofenvironmental and health issues;
d. improve housing security;e. respond to the diverse needs of
different groups.
Regulations and impact assessments canplay an important role in controllingpollution, especially in the formal economy.Conventional regulations are, however,difficult to apply efficiently in the informaleconomy, and can easily become self-defeating. All stakeholders need a betterunderstanding of environmental healthrisks in order to support more participatorysolutions.
Global Environmental ChangeUnlike the environmental problemsdescribed above, global environmentalchange is largely the result of activityoutside of the ACP countries. Only about2% of global carbon emissions originate inthe ACP of which three countriescontribute approximately 80% of theindustrial emissions, namely South Africa,Nigeria and Trindad and Tobago. As ACPcountries do not contribute appreciably tothe emissions of greenhouse gases or ozone-destroying chemicals, their main concernsshould be to ensure that internationalagreements are equitable as well as strict,and that vulnerability in the ACP isreduced. Developed countries, whichproduce the bulk of carbon emissions, needto take greater responsibility for theirenvironment and health impacts.
The projected effects of climate changeare worldwide, with uncertain regional andlocal implications. Major effects mayinclude an increase in temperatures and thefrequency of extreme weather events,coupled with a rise in sea level.
The health threats of climate changeinclude malnutrition arising fromagricultural disruption and the increasedincidence of infectious diseases spread byinsects and other vectors advantaged byclimate change, coupled with the direct lossof lives and livelihoods from rising sealevels and extreme weather events.
The ACP is likely to sufferdisproportionately from global climatechange due to geography (small islands andsemi-arid regions are especially vulnerable),the presence of already food-insecurepopulations and a lack of capacity foradaptation. They thus have a particularlysubstantial stake in limiting the global

Executive Summary
Environmental Change and Human Health in Countries of Africa, the Caribbean and the Pacific 9
emissions of greenhouse gases, which mayalso extend to ozone depleting substances.
The health risks of stratospheric ozonedepletion include skin cancer, which is lessof a risk for the dark-skinned majority ofACP residents, but also extend to eyediseases, immune system damage andecological and climatic effects that maypotentially undermine food security.
Environment and health – a shared agendaPoverty lies at the heart of theenvironmental challenge for most ACPcountries. Moreover, this povertyexacerbates the links betweenenvironmental degradation and ill health -the affluent can often afford to delay ordisplace environmental impacts, whilst thepoor, more typically, have to bear theconsequences in the form of ill health.
Two of the principal means by whichenvironmental burdens threaten health inthe ACP are the undermining of foodsecurity and the creation of unhealthyliving environments. These are particularlyimportant with regard to the large clusterof environmental health problemsassociated with poverty, including a largeshare of infectious diseases andmalnutrition.
This report clearly confirms that ‘a cleanenvironment supports good health, whilst adegraded environment increases thelikelihood of death and disease’. Betterhealth is one of the strongest reasons fortaking measures to improve the environmentin many ACP countries, in that the linkbetween the environment and health in thesecountries is far more immediate than in manymore affluent parts of the world, andenvironmental interventions have thepotential to dramatically reduce the burdenof disease and increase quality of life. It isalso important that a better environment andbetter health be pursued in tandem as ameans of achieving sustainable development.
Key actions on the shared agenda toimprove environmental health should,therefore, focus on the following:
• improving food security• achieving healthy living
environments.
Other areas for intervention include:
• reducing the environmental healthimpacts of development initiatives
• ensuring equitable control strategiesfor global environmental healthburdens.
Interventions, especially in relation tofood security and healthy livingenvironments, should be designed topromote the equitable participation ofwomen, enhance the livelihoods of thepoorest, and improve local capacitythrough education and institutionalsupport. Interventions also need to addressunderlying issues such as tenure, localsocial networks and issues relating todemand. Conventional supply-sideapproaches (such as attempts to increasefood production or the supply of water andother environmental services) that ignoreunderlying issues often fail to reach thosemost in need.
Improving food security: The key actionsshould include:
• The support and promotion ofsustainable agricultural practices, especiallyin areas where food security is currently atrisk. This would include minimising the useof external and non-renewable inputs thathave the potential to damage theenvironment or harm the health of farmersand consumers, and targeting the use ofthe remaining inputs with a view tominimising costs;
• Ensuring the full participation offarmers and other rural people in allprocesses of problem analysis, technologydevelopment, adaptation and extension, tocreate increased self-reliance and ensuregreater use of local knowledge andpractices;
• Integrating natural processes (such asnutrient cycling, nitrogen fixation, and pest-predator relationships) into agriculturalproduction processes, to promote profitableand efficient food production;
• Protecting nature’s goods andservices, and other public goods of thecountryside;.
Environmental Change and Human Health in Countries of Africa, the Caribbean and the Pacific10
• Redirecting biotechnology to reducerisks and better serve the needs of smallcultivators, subsistence food producers, andthe malnourished.
Achieving healthy living environments: Thekey actions should include:
• Increasing the capacity of localresidents to manage their own environments,recognising that this capacity depends uponadequate livelihoods, housing security,gender equity, knowledge of environmental-health links, the quality of local governanceand the availability of micro-finance;
• Improving the provision of water,sanitation and other environmental servicesto low-income households, urban and ruralalike.
To be avoided:
- skewed subsidies favouring thebetter-off;- poor relationships betweenresidents and service providers;- under-financed and over-constrained utilities;- an excessive reliance on importedcapital-intensive technologies;- poor maintenance of existinginfrastructure.
To be encouraged are approaches that are:
- based on a good understanding ofexisting formal and informal systemsof provision;- sensitive to local needs andpriorities;- making efficient use of the range oftechnologies available;
- involving residents in criticaldecisions;- informed by both scientific and localknowledge of environmental health links;- implementing housing programmesthat assist low-income households,especially in urban areas, to build, buyor extend their own homes. Many ofthe considerations that apply toenvironmental service provision alsoapply here.
Reducing the environmental health impactsof development initiatives: Health and socialimpact assessments need to be included inestablished procedures of impactinvestigation to safeguard health andenvironmental status. Over time, morestrategic approaches to preventiveenvironmental health management also needto be devised.
Ensuring equitable control strategies for globalenvironmental health burdens: An effectiveinternational platform is needed so that ACPcountries can represent and promote theirenvironmental and health concerns withregard to the impacts of global environmentalchange. Environmental problems such asclimate change, for example, are largelyattributed to northern activities, but may havea severe effect on ACP residents. The mainpreventative actions need to be takenelsewhere, but adaptive measures need to beexplored and developed. ACP countries havea collective interest in helping to ensure thataction is taken internationally to reduce therisks. Also they have an interest in ensuringthat the ‘polluter-pays’ principle is applied,and that their currently low contributions donot translate into inequitable rights to theglobal commons.

Chapter 1Background
Environmental Change and Human Health in Countries of Africa, the Caribbean and the Pacific 13
Background
Chapter 1 Background
Aims of the Chapter• To identify the goals and approach taken in this report.• To describe the economic setting within which the ACP’s environmental andhealth problems must be addressed.• To introduce some of the underlying forces influencing environmental changeand health in the ACP.
Main Points• This report is intended to inform discussions on environmental and healthissues in the ACP, and ways of addressing them.• The ACP countries include a large and growing share of the world’s poor.• Economic globalisation is undermining traditional approaches to povertyalleviation, environmental protection and health improvement within the ACP.• Persistent poverty remains the most important barrier to environmental healthimprovement in the ACP.• Uneven modernisation and rapid population growth within the ACP, alongwith new global environmental threats originating largely outside of the ACP, arecontributing to the challenge of managing environmental change to promote humanhealth.
Policy Implications• Environment and health need to be brought into the development mainstream.• Action taken in support of environment and health must also support povertyalleviation, and respond to the challenges of globalisation.• Building local capacity and improving governance are critical to meetingthese challenges, and ensuring that more targeted initiatives are effective in meetinglocal environment and health priorities.
1.1 Introduction to the ReportInternationally, the links betweenenvironmental degradation and human healthare receiving more, well deserved attention.Recent publications from the World HealthOrganization (World Health Organization,1997) and the World Resources Institute(World Resources Institute, 1998) haveprovided global summaries. This reportfocuses on the ACP group of states – thecountries in Africa, the Caribbean and thePacific that are signatories to the LoméConventions. ACP countries sufferdisproportionately from environmental healthproblems. Their burden of disease isespecially high, and a particularly large shareof that burden is associated withenvironmental factors. Many of theirenvironmental health problems can begrouped into two categories, the first of whichstill dominates in most ACP countries:
1. A persistent poverty cluster - long-standing environmental health problems,such as unsanitary conditions, smoky fuels,and food insecurity, that conventionaldevelopment has failed to solve (or in somecases has made worse).
2. A conventional development cluster– emerging environmental and healthproblems, ranging from hazardous industrialpollution to the health-threatening aspects ofglobal climate change, which conventionaldevelopment has helped to bring about.
Sustainable development entailsaddressing the persistent poverty cluster,without adding appreciably to theconventional development cluster. Neitherthe health nor the environment sector canmeet this twofold challenge alone. If healthand environmental improvements are
Chapter 1
Environmental Change and Human Health in Countries of Africa, the Caribbean and the Pacific14
pursued independently, the health agendais likely to overemphasise curativemeasures, while the environmental agendais likely to emphasise long-termsustainability at the expense of poorpeople’s needs today. The health and theenvironmental sectors have criticallyimportant roles to play in fosteringenvironmental health improvements, andcan be far more effective when working incollaboration. One of these roles is to helpensure that influential players outside of thehealth and environment sectors also takethese issues into account. Ultimately, it isthe combined efforts of all sectors of society,including civil society and local government,that will transform environmental and healthconditions, hopefully for the better.
1.1.1 PurposeThe overall objective of this report is tohelp provide the basis for a more informeddebate on improving the environment andhealth within the ACP. The executivesummary focuses on why environmentaland health issues are important, andsuggests priorities for action. The fullreport places more emphasis on the natureof the problems, how they are changing,and the challenges they pose. It is intendedto help bridge the gap between science andpolicy, by presenting research findings ina policy-relevant form. It also situates theenvironmental and health problems of theACP countries within the context ofcontemporary development trends,challenges and policies.
The report reflects the increasingrecognition that environment and healthissues need to be brought into the mainstreamof the development agenda in a moreintegrated fashion. Even in Europe and NorthAmerica, public concern has recently pushedhealth higher up on the environmentalagenda. Health is a comparatively moreserious environmental concern in developingcountries, where few can afford to displaceenvironmental burdens onto futuregenerations or distant populations. TheEuropean Community and Sida financiallysupported this report as a companion torecent global studies, focusing on issues ofparticular relevance to the ACP.
If environment and health issues are toenter the mainstream of development policy,decision makers at every level, from headsof state to householders, need to be moreaware of how and when their actions arelikely to affect the environment and health.Specialists in particular aspects of health andthe environment need to understand thebroader context of their work. People writingpolicy documents or preparing presentationsfor the media need reliable sources uponwhich to draw. Only a few are likely to reada report of this length and detail. There is agrowing demand for more relevantinformation on and analysis of environmentaland health issues, however, and this reportis a response to that demand.
More specifically, the report is intendedto assist ACP governments and Northerndonors in developing assistance programsthat improve environmental and healthconditions. Here, the goal is to identifyissues which are of particular concern froman ACP perspective, and indicate wheredevelopment assistance could play asupportive role. It is not to recommendparticular activities, or to contribute todebates about the future of the Loméagreements that define the ACP grouping(see section 1.2.1 below).
1.1.2 ScopeThe focus of this report is on health burdensin the ACP, and the environmental problemsthat contribute to them. Health burdens thatare not clearly linked to environmentalproblems, and environmental problems thatdo not contribute appreciably to ill-health,receive little attention. The terms ‘health’ and‘environment’ are used narrowly, to referprimarily to physical conditions. The‘environment’ is taken to mean physical (notsocial) surroundings, and ‘environmentalproblems’ generally refer to deficienciesbrought about inadvertently by human activity:pollution, resource depletion, ecosystemdestruction and the like. ‘Health’ is taken tomean physical and mental well being, and theemphasis is placed on biophysical healthproblems brought on by environmentalinadequacies. Biophysical health is, however,treated as means for people to achieve theiraspirations, rather than simply an end in itself,
Environmental Change and Human Health in Countries of Africa, the Caribbean and the Pacific 15
Background
and the report supports the goals implicit inWHO’s broader definitions of health.1
However defined, health andenvironmental problems cannot be isolatedfrom their social, economic and politicalcontext, particularly if the goal is to informaction. Issues of poverty, governance, anddevelopment policy are thus within the scopeof this report to the extent that they determinewhy environmental and health problemsemerge and persist, and how conditions canbe improved. Moreover, since the concepts ofthe environment and health are being definedrelatively narrowly, it is especially importantto consider how actions taken in support ofthe environment and health contribute to ordetract from other developmental goals.
Environmental health problems associatedwith poverty are given special attention. Thisis not only because they account for most ofthe environmental health burden in the ACP,but also because they help distinguish theenvironment and health challenge in the ACPfrom that in the North, whose problems tendto dominate the international policy debates.
In terms of action, the report is primarilyconcerned with what can be done within theACP countries themselves. Opportunities forimproving the environment and people’s healthin ACP countries through better internationaleconomic regimes, decreasing Northerncontribution to global environmentaldegradation, or policy shifts outside of the ACPare not considered. It must be recognised,however, that global processes are radicallychanging the environmental and healthchallenges being faced within the ACP.Development assistance is only one, relativelysmall aspect of the way in which Northernpolicies are affecting environmental and healthissues in the ACP.
Despite these limitations on the scope ofthis report, a wide range of problems areexamined, ranging, for example, fromsanitation problems in urban neighbourhoods
to the possible effects of global climatechanges on food security and malnutrition.The common feature is that virtually all ofthese problems involve environmentaldamage arising from human actions, andwhich put public health at risk. Moreattention is generally given to preventableenvironmental problems whose resolutionwould yield large health benefits in ACPcountries. Food security is, for example,given considerable attention becausemalnutrition is a major health burden in theregion, and one which environmentalimprovements could do much to resolve.Ambient air pollution, on the other hand, isgiven little attention because it is a lesserburden already discussed in some detail inthe global reports.
The region itself is extremely varied: itscountries include small island stateseconomically dominated by tourism, andcontinental countries with a large share ofthe population engaged in subsistenceagriculture. By emphasising issues ofimportance to health in the ACP as a whole,the report is inevitably more relevant toACP-Africa than to the ACP-Caribbean andPacific. Among the ACP-Caribbean andPacific, it is more relevant to the larger andpoorer islands of Papua New Guinea andHispaniola than to the smaller and moreaffluent islands such as Barbados and theBahamas.
There are a number of serious healthproblems in the ACP which would beconsidered to be environmentally-relatedunder a broader set of definitions, but whichare largely excluded from this report.Violence and HIV infection, for example,present critical challenges for many ACPcountries, but are only mentioned in thechapters on health (2 and 3). Mental illness,traffic accidents and smoking areincreasingly important health burdens, butagain are not deemed to be sufficiently
1 The well-known WHO definition of health as ‘a state of complete physical, mental and social well-being and not merely the absence of disease or infirmity’ (WHO, 1988) emphasises health as a positivequality and is extremely wide in scope (Curtis and Taket, 1996). Another WHO definition explicitlyrelates health to the physical and social environment, identifying it with ‘the extent to which anindividual or group is able to realise aspirations and satisfy needs, and to change or cope with theenvironment. Health is therefore seen as a resource for everyday life, not the objective of living; it is apositive concept encompassing social and personal resources as well as physical capacities’ (WHO/EURO, 1984).
Chapter 1
Environmental Change and Human Health in Countries of Africa, the Caribbean and the Pacific16
‘environmental’ to consider in the contextof environmental change (chapters 4-6).
1.1.3 Intended AudienceThe executive summary is primarily intendedfor policy makers with an interest inmainstreaming environmental and healthissues. This includes senior officials in Healthand Environment Ministries within the ACP,in the health and environment divisions ofinternational development organisations, andin large NGOs.
The full report, which may be readstraight through but which can also be usedas reference material, is intended for a morediverse audience, including:
• Policy analysts responsible fordeveloping official policy papers orprogrammes addressing environment andhealth issues.
• Specialists and practitioners workingon particular aspects of environment andhealth, who wish to understand the broadercontext or consequences of their work.
• Writers and others preparing morepopular material on these issues.
• Students interested in understandingenvironmental and health problems as seenin developing countries.
1.1.4 StructureThis report comprises seven chapters. Theremainder of this chapter examines some ofthe processes and forces which are influencingenvironmental and health issues in the ACP,and summarises some of the ways in whichenvironmental change and health are related.The following two chapters delineate thedemographic and health situation in the ACPregion. Chapter 2 assesses the overall healthand demographic situation, and reviews recenttrends, projected changes, and existing healthdifferentials among different groups of people.Chapter 3 reviews the key threats to humanhealth in ACP states, with the emphasis onenvironmental health threats. The subsequentthree chapters review environmentaldevelopments in the region, the way in whichthey are affecting health, and the kind of shifts
that would improve the health outlook. Theyfocus on agricultural change and food security(chapter 4), urbanisation and health threatsin the living environment (chapter 5), and thepotential threats posed by globalenvironmental changes (chapter 6). The finalchapter (7) draws together the conclusionsfrom the report and argues that a commonagenda on environment and health is needed,prioritising food security and healthy livingenvironments, and coordinating action toprevent growing environmental health threatsfrom other quarters.
The report has two appendices. Appendix1 gives a complete listing of the countriesthat constitute the ACP group of states.Appendix 2 includes tables extracted fromthe 1998-99 World Resources Report,focusing on ACP countries. When nototherwise referenced, figures in the mainreport refer to this Appendix.
1.2 The ACP and the EconomicContext
This section first describes the ACP grouping,and the convention that unites them. It thenexamines the economic context which helpsdefine the environment and health challengesmany of these countries face, looking in turnat the persistence of poverty and the relevanceof economic globalisation, including thestructural adjustment programmes that haveaccompanied globalisation.
1.2.1 The ACP GroupingThe ACP group of states comprises the 71signatories to the current Lomé Conventionin Africa (48 countries), the Caribbean (15)and the Pacific (8). Their locations areshown in Figure 1.1. The LoméConventions, summarised in Box 1.1, are aseries of aid and trade preference agreementsbetween the European Union and the ACPcountries, most of which were formerlyEuropean colonies. There have been a seriesof four conventions signed, and since thecurrent convention is due to expire in 2000,new arrangements are under consideration(European Commission, 1996). ACP-EUrelations, and the place of developmentassistance, have changed considerably sincethe first convention was signed in the mid1970s. Many of the ACP countries do,
Environmental Change and Human Health in Countries of Africa, the Caribbean and the Pacific 17
Background
nevertheless, still have close economic tieswith the European Union countries.
The ACP countries are estimated toaccount for slightly more than 1% of theGross World Product, despite containingmore than 10% of the population. At slightlyover $500, the GNP per capita in ACP-Africais less than half that of the ACP-Caribbeanand Pacific estimate of $1,200.2 RemoveSouth Africa, and the ACP-Africa average fallsbelow $300.3 Such measures of themonitored production of marketablecommodities, valued at internationalexchange rates, exaggerate internationaldisparities in consumption. Many residentsof low-income countries obtain anappreciable share of their goods outside ofthe market and, when they do purchase basicnecessities, prices in dollar equivalents arecomparatively low. Nevertheless, there is nodoubt that the ACP contains a large andgrowing share of the world’s poor.
Economic growth in recent decades hasbeen disappointing, particularly in Africa.Whereas the Gross World Product grew atabout 3% per annum between 1985 and 1995,the Gross ACP Product grew at less than 2% -lower than the population growth rate. Notall ACP economies have fared badly. Anumber of the ACP-Caribbean and Pacificeconomies have benefited from the globaleconomic upswing, and some ACP-Africaneconomies have grown far more rapidly thanthe average. Between 1995 and 1997, theeconomies of ACP-African countries pickedup, averaging about 4% annually, with GDPper capita increasing for the first time in manyyears (Fischer et al., 1998). However, this onlyjust begins to compensate for the longer termdecline, and the economic challenges are asdaunting as ever.
Over 80% of ACP’s export earnings stillcome from primary commodities, and morethan 40% of their exports go to the EU. TheEU also remains one of the principal sourcesof development assistance for the ACP, and in
1996-97 the EU member countries disbursedabout $8.7 billion in official developmentassistance to ACP-Africa, out of a total of $12.8billion from all OECD donor countries(OECD Development Assistance Committee,1999, Table 32 ).
Overall development assistance to the ACPhas been declining, however. Judging bystatistics published by the OECDDevelopment Assistance Committee, whichcover all of the major donors, netdisbursements to ACP-Africa (valued in$1996), including flows through multilateralorganisations, fell by over 20% between 1986-87 and 1996-97. Contributions of the EUmember states to ACP-Africa fell by about thesame percentage. Whilst figures on ACP-Caribbean and ACP-Pacific are not broken outin these summary statistics, it is safe to assumethat overall ACP development assistance hasfollowed similar trends. One of the fewexceptions is in the Official DevelopmentAssistance of the European Community, whichincludes the European Development Fund andcontributions from more than twenty differentbudgetlines of the annual budget of theEuropean Community. Gross disbursementsto ACP-Africa from these sources increasedby over 50% in real terms over this sameperiod, reaching approximately $2.5 billionin 1996-97 countries (OECD DevelopmentAssistance Committee, 1999, Table 34 andDAC deflators). Since overall contributionsof the EU member countries has beendeclining, this implies a sharp rise in therelative importance of European Community’sassistance activities.
Declining development assistance andlimited foreign direct investment haveexacerbated the external debt burdenssuffered by many ACP states. In the mid1990s, the ACP was receiving officialdevelopment assistance of roughly $18billion, and spending some $12 billionannually in servicing debts. The ACP
continued on page 21
2 These are averages weighted by population. Since in not only ACP-Africa but in ACP-Caribbean andACP-Pacific, some of the smaller countries have the highest incomes, arithmetic averages tend to besomewhat higher.3 Forty of the 62 countries classified as Low Income Countries by the World Bank (World Bank, 1998)are ACP countries, and all but two of these are in Sub-Saharan Africa. The remaining ACP countries,with the exception of the Bahamas, are classified as Middle Income.
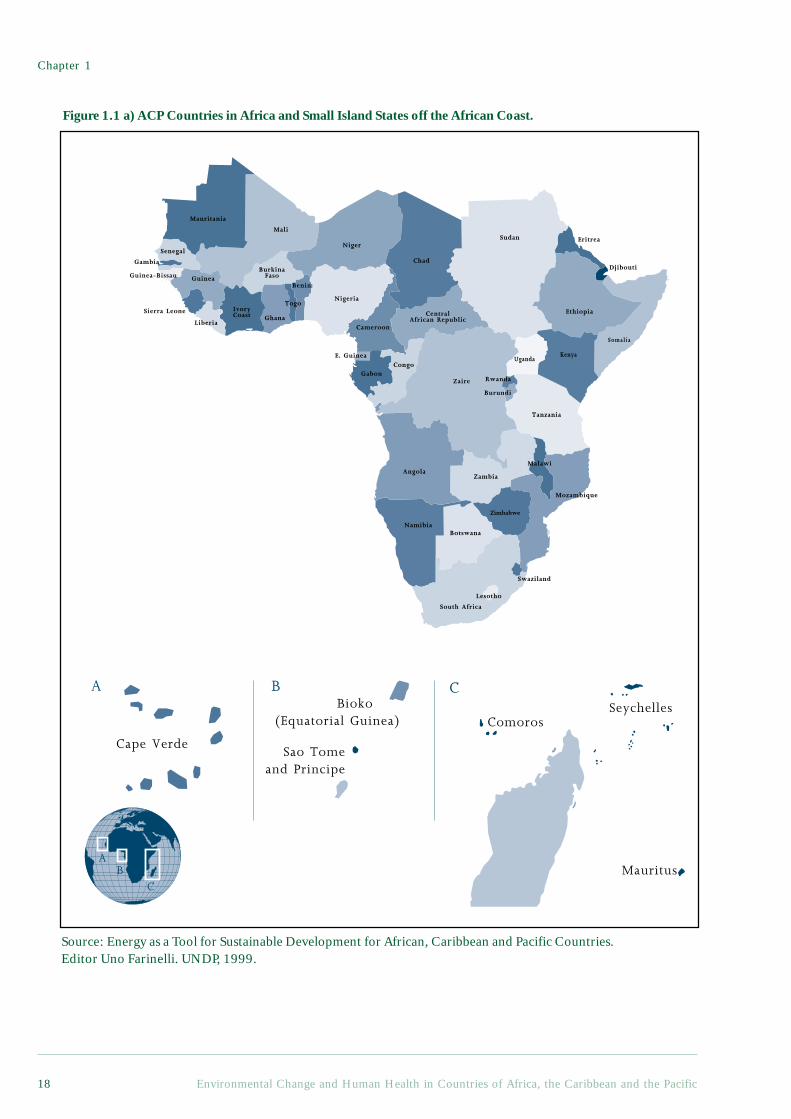
Chapter 1
Environmental Change and Human Health in Countries of Africa, the Caribbean and the Pacific18
Sudan
Ethiopia
KenyaUganda
Chad
Niger
Nigeria
Cameroon
GabonCongo
Zaire
CentralAfrican Republic
Mali
Mauritania
Senegal
Sierra Leone
Liberia
Guinea-Bissau
IvoryCoast Ghana
BurkinaFaso
Togo
Gambia
Benin
E. Guinea
AngolaZambia
Botswana
South Africa
Swaziland
Mozambique
Malawi
Rwanda
Burundi
Tanzania
Namibia
Lesotho
Guinea
Djibouti
Zimbabwe
Somalia
Eritrea
Figure 1.1 a) ACP Countries in Africa and Small Island States off the African Coast.
AB
C
A B C
Cape Verde
Bioko (Equatorial Guinea)
Sao Tomeand Principe
Mauritus
ComorosSeychelles
Madagascar
Source: Energy as a Tool for Sustainable Development for African, Caribbean and Pacific Countries.Editor Uno Farinelli. UNDP, 1999.
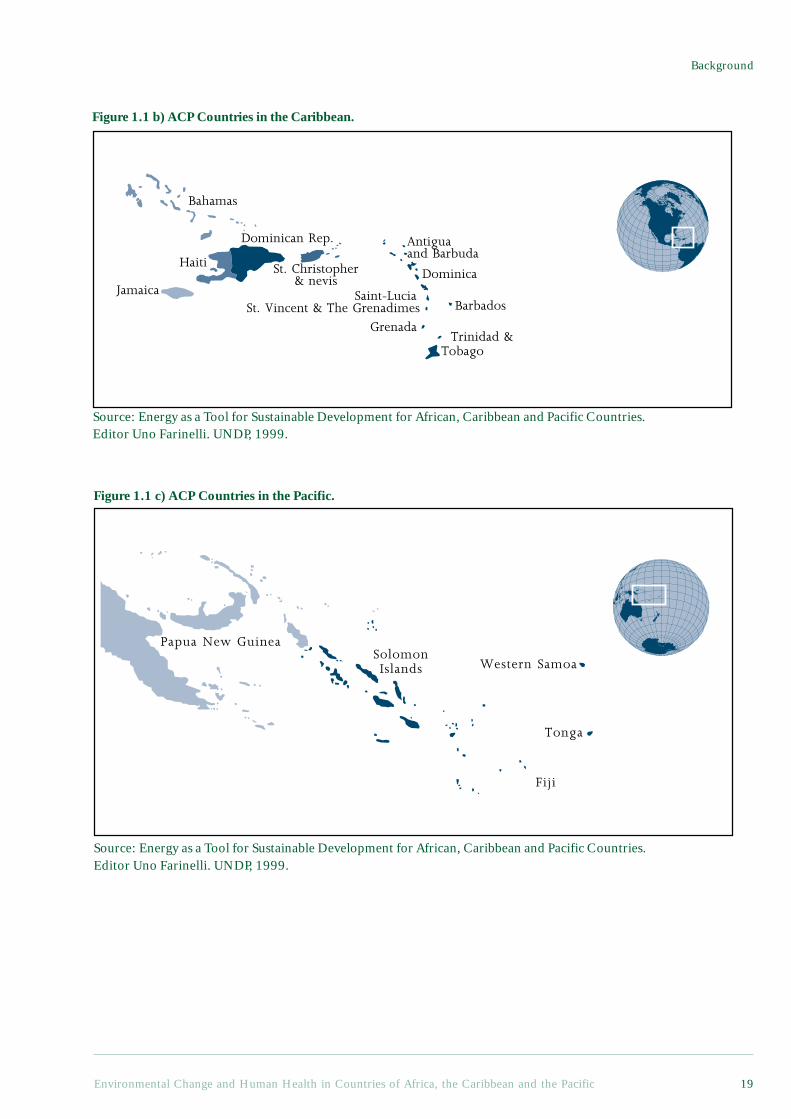
Environmental Change and Human Health in Countries of Africa, the Caribbean and the Pacific 19
Background
Haiti
Dominican Rep.
St. Christopher& nevis Dominica
Saint-LuciaSt. Vincent & The Grenadimes Barbados
Grenada Trinidad &Tobago
Antiguaand Barbuda
Jamaica
Bahamas
Figure 1.1 b) ACP Countries in the Caribbean.
Source: Energy as a Tool for Sustainable Development for African, Caribbean and Pacific Countries.Editor Uno Farinelli. UNDP, 1999.
Papua New Guinea
Fiji
Tonga
Western SamoaSolomonIslands
Figure 1.1 c) ACP Countries in the Pacific.
Source: Energy as a Tool for Sustainable Development for African, Caribbean and Pacific Countries.Editor Uno Farinelli. UNDP, 1999.
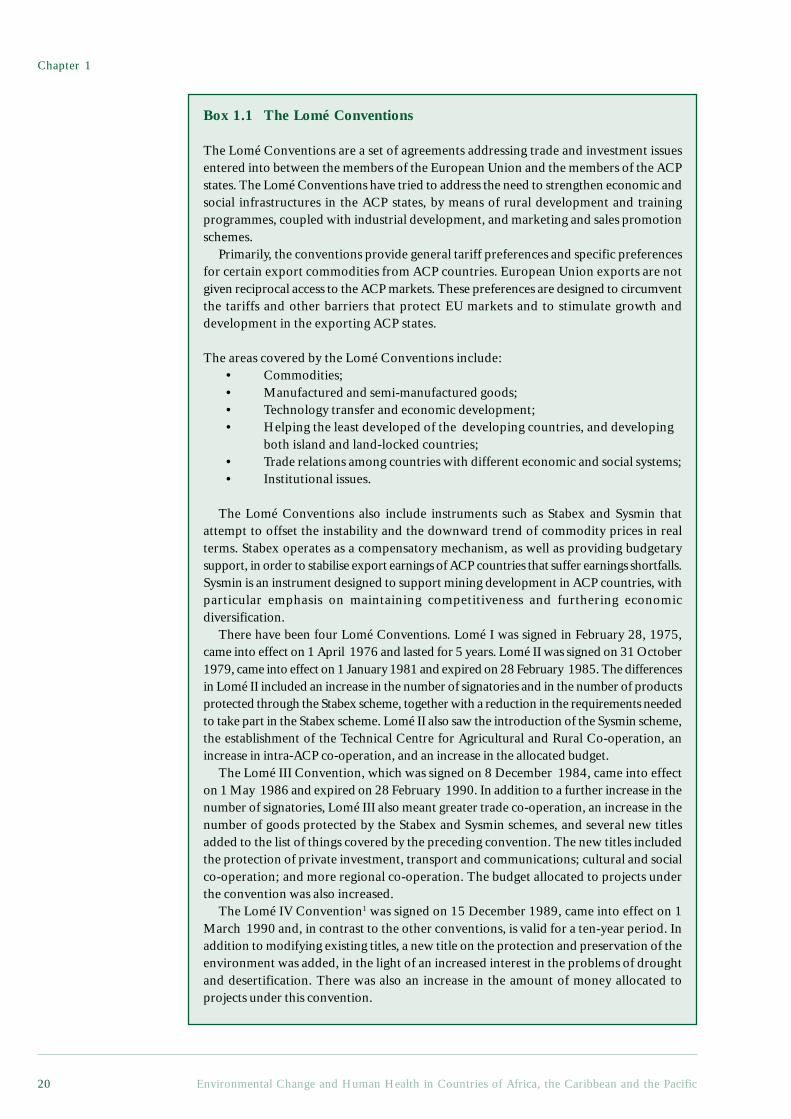
Chapter 1
Environmental Change and Human Health in Countries of Africa, the Caribbean and the Pacific20
Box 1.1 The Lomé Conventions
The Lomé Conventions are a set of agreements addressing trade and investment issuesentered into between the members of the European Union and the members of the ACPstates. The Lomé Conventions have tried to address the need to strengthen economic andsocial infrastructures in the ACP states, by means of rural development and trainingprogrammes, coupled with industrial development, and marketing and sales promotionschemes.
Primarily, the conventions provide general tariff preferences and specific preferencesfor certain export commodities from ACP countries. European Union exports are notgiven reciprocal access to the ACP markets. These preferences are designed to circumventthe tariffs and other barriers that protect EU markets and to stimulate growth anddevelopment in the exporting ACP states.
The areas covered by the Lomé Conventions include:• Commodities;• Manufactured and semi-manufactured goods;• Technology transfer and economic development;• Helping the least developed of the developing countries, and developing
both island and land-locked countries;• Trade relations among countries with different economic and social systems;• Institutional issues.
The Lomé Conventions also include instruments such as Stabex and Sysmin thatattempt to offset the instability and the downward trend of commodity prices in realterms. Stabex operates as a compensatory mechanism, as well as providing budgetarysupport, in order to stabilise export earnings of ACP countries that suffer earnings shortfalls.Sysmin is an instrument designed to support mining development in ACP countries, withparticular emphasis on maintaining competitiveness and furthering economicdiversification.
There have been four Lomé Conventions. Lomé I was signed in February 28, 1975,came into effect on 1 April 1976 and lasted for 5 years. Lomé II was signed on 31 October1979, came into effect on 1 January 1981 and expired on 28 February 1985. The differencesin Lomé II included an increase in the number of signatories and in the number of productsprotected through the Stabex scheme, together with a reduction in the requirements neededto take part in the Stabex scheme. Lomé II also saw the introduction of the Sysmin scheme,the establishment of the Technical Centre for Agricultural and Rural Co-operation, anincrease in intra-ACP co-operation, and an increase in the allocated budget.
The Lomé III Convention, which was signed on 8 December 1984, came into effecton 1 May 1986 and expired on 28 February 1990. In addition to a further increase in thenumber of signatories, Lomé III also meant greater trade co-operation, an increase in thenumber of goods protected by the Stabex and Sysmin schemes, and several new titlesadded to the list of things covered by the preceding convention. The new titles includedthe protection of private investment, transport and communications; cultural and socialco-operation; and more regional co-operation. The budget allocated to projects underthe convention was also increased.
The Lomé IV Convention1 was signed on 15 December 1989, came into effect on 1March 1990 and, in contrast to the other conventions, is valid for a ten-year period. Inaddition to modifying existing titles, a new title on the protection and preservation of theenvironment was added, in the light of an increased interest in the problems of droughtand desertification. There was also an increase in the amount of money allocated toprojects under this convention.
Environmental Change and Human Health in Countries of Africa, the Caribbean and the Pacific 21
Background
Under Lomé IV, cooperation under the ACP-EU regime is intended to support effortsdesigned to achieve comprehensive, self-reliant and self-sustained development. It is tobe based on development that achieves a “sustainable balance between its economicobjectives, the rational management of the environment and the enhancement of naturaland human resources.” The parties are to “attach special importance to environmentalprotection and the preservation and the restoration of natural equilibria in ACP states.”2
Lomé IV specifically mentions numerous environmental principles, including thepreventive principle, which calls on the parties to take a ”preventive approach aimedat avoiding harmful effects on the environment as a result of any programme oroperation.”3 EU member states are specifically prohibited from directly or indirectlyexporting hazardous or radioactive waste from the EU to the ACP states.4
In light of the expiry of the Lomé IV agreement in February 2000, negotiationsbegan on a successor agreement to Lomé IV in September 1998. The ACP and the EUhave agreed on the idea of building a strengthening partnership and a deeper politicaldialogue. This partnership would aim to bring about a further reduction in poverty,and to promote both sustainable development and the continued integration of ACPstates into the global economy. Political and public support for the Lomé Conventionswithin the EU appears to be dwindling, however, due to doubts about the effectivenessand efficiency of the convention, shifts in interests towards Eastern Europe and NorthAfrica, and the general downward pressure on aid budgets in the European Union.
Based on Contributions from Ogonda Onwuchekwa MD, MSc. EnvironmentalEpidemiology and Kevin Gray, Stockholm Environment Institute.
1 African, Caribbean and Pacific States-European Economic Community: Fourth Lomé Convention(Lomé IV) (15 December 1989, in force 1 September 1991) (1990) 29 I.L.M. 783, Art. 4.2 Art. 14. Under Article 33, the protection and the enhancement of environmental and naturalresources, the halting of the deterioration of land and forests, the restoration of ecological balances,the preservation of natural resources, and their rational exploitation, are basic objectives which theparties are to achieve in order to bring about an immediate improvement in living conditions and tosafeguard those of future generations (Art. 33).3 Art. 35.4 Art. 39(1). ACP states are specifically required to prohibit the direct or indirect import of hazardousand radioactive waste from the EU or from any other country.
countries as a whole have also seen adecrease in their share of international trade,despite the tariff preferences given to themby the European Union. Moreover, theoverall increase in foreign direct investmenthas not favoured ACP countries. Directforeign investment in the ACP was only onthe order of $3 billion a year in the mid 1990s(in contrast to $47 billion in Asia).
Whilst the latest Lomé conventionremains important for most ACP countries,it has, in many respects, been overtaken byother international developments (Stephenset al., 1999). Economic globalisation, andthe international agreements that have helpedpromote it, are redefining ACP-EU relations.
Conflict between the EU and the UnitedStates over the banana protocol is anindication of a more fundamental tensionbetween the EU’s relationship with the ACPand other global negotiations. Within thischanging landscape, it is difficult to foreseehow the Lomé arrangements will evolve.
One likelihood of particular relevance tothis report is that environmental issues willbecome an increasingly important aspect ofthe ACP’s development and internationalrelations. Historically, environmental issueshave not been prominent in the Loméconventions. In 1990, however, in the wakeof the Rio Conference environmental issueshave been given a higher priority in theLomé IV Convention.
continued from page 17
Chapter 1
Environmental Change and Human Health in Countries of Africa, the Caribbean and the Pacific22
Environmental screening and impactassessments are an integral part of co-operation. Trade in hazardous waste isprohibited by the Convention, the fightagainst desertification and other forms ofland degradation are emphasised, and aspecial Annex has been added related to thesustainable management of tropical forests(see Box 1.1). The local environmentalproblems that have a major influence on thehealth of ACP residents are generally notwell represented in internationalenvironmental agreements. They are,however, central in terms of the broaderdevelopment goals to which the Loméconventions aspire, and it is in conditionsof economic deprivation, in particular, thatthe health burdens of environmentalproblems come to the fore.
1.2.2 Persistence of PovertyGlobally, whilst the percentage of theworld’s population living in economicpoverty may be falling, the actual numberof poor people is reported to be rising, andthe gap between rich and poor to beexpanding (World Resources Institute,1998). The persistence of poverty, despiterapid global economic growth, quite rightlyraises questions about the quality of thisgrowth, and its relationship to broaderaspirations for human development. At thenational level, however, whilst povertypersists in the face of economic growth, itoften gets worse in times of economicstagnation and crisis. The economicdifficulties of many ACP countries thusmakes the challenge of alleviating povertyall the greater. Economic growth may notbe the best, and is certainly not the onlymeans of reducing poverty. But it is part ofalmost any optimistic vision for the poor inACP countries.
Of all the major regions of the world,economic poverty is both most pervasive anddeepest in ACP-Africa (Ravallion and Chen,1997). Research also indicates that theextent of economic poverty has been
increasing in Africa, Latin America andEastern and Central Europe, whilst it hasbeen declining in East Asia, South Asia, theMiddle East, and North Africa.
Such claims gloss over the difficultiesinherent in defining and measuring poverty,as well as the enormous variety of peoplewho can be classified as poor.4 Some of themost critical differences in environmentalconditions and health exist among peoplewho are poor, but live very differently. Evenwithin the same household, people can facevery different circumstances depending onthe season, the stage in the household’slifecycle, the individual’s age and positionin the household, and numerous otherfactors. One of the reasons that poor peopleare notoriously risk-averse is that they wantto avoid the often health-threatening changesthat can accompany a superficially minordecline in circumstances.
The urban and rural poor in ACPcountries often face many of the sameenvironmental problems, and theirlivelihoods are often intertwined. Urbancrowding can exacerbate local environmentalthreats, but access to environmental services,such as water and sanitation, are oftenparticularly lacking in poor rural areas. Thelivelihoods of rural dwellers tend to dependmore on food production, but the urban poorcan face even more severe problems accessingfood when their livelihoods are undermined.Moreover, many urban and rural settlementsspan the rural-urban divide, with residentsengaged in both traditionally urban and ruralactivities, or maintaining ties with familymembers resident elsewhere. Urban dwellersoften get a significant share of their fooddirectly from agriculture. Rural dwellersoften receive remittances, and a foothold inthe city, through their urban relatives. But inboth urban and rural contexts, poverty is athreat to health.
Most poor people in ACP countries arerural dwellers; often subsistence farmers,involved in buying and selling goods, but notproducing exclusively for the market. Urban
4 Most statistics rely on measures of private consumption, and these measures are typically very imperfect.More importantly, they ignore the non-marketed benefits from common property resources, state-provided goods, human capital and other assets. It is also sometimes argued that less tangible aspects ofpoverty, such as vulnerability and loss of dignity should be taken into account. (Baulch, 1996).
Environmental Change and Human Health in Countries of Africa, the Caribbean and the Pacific 23
Background
poverty is growing rapidly, however, and thereare indications that it is underestimated inofficial statistics (Satterthwaite, 1997). In thefollowing chapters on environmental andhealth trends, rural poverty is central to thediscussion of agricultural change, whilst urbanpoverty is central to the discussion ofurbanisation. There are, however, close linksbetween urban and rural poverty, and it shouldbe kept in mind that the rural-urbandistinction means something different in, forexample, small island states than in largeagrarian countries.
Overall, it is hard to overestimate theimportance of poverty for health. Poverty isprobably the best single predictor of illhealth (World Health Organization, 1996),in large part because it is associated withmalnutrition, environmental hazards thatthreaten health, and inadequate health care.Even in affluent countries, however, wherethe physical environmental hazardsassociated with poverty are largely absent,health is still closely linked to income (Kunstet al., 1998; Marmot and Smith, 1997;Montgomery et al., 1996). Indeed, the healthpatterns of affluent countries suggest thatsocial aspects of relative poverty cancontribute appreciably to ill health(Wilkinson, 1994). These social aspects mayalso be very important, though harder todiscern, in low-income countries wherepoverty is simultaneously associated with awide range of physical threats to health.Moreover, as discussed in more detailbelow, the physical hazards associated withpoverty are not simply a reflection ofeconomic scarcity. Many environmentalburdens and amenities are not distributedthrough the market, but even so, the poortend to be extremely disadvantaged.
1.2.3 Globalisation and Economic ChangeHuman activities around the world arebecoming ever more closely interconnected,environmentally, economically and evensocially. With regard to climate change, to takethe most obvious environmental example,greenhouse gas emissions from around theworld are combining, and threatening toincrease the average temperature globally,with numerous local repercussions (Jepma andMunasinghe, 1998). In the economic sphere,
an increasing share of production is tradedinternationally, international investment andfinancial flows are growing ever more rapidly,and nation states have less and less scope topursue independent economic policies.Socially, not only are people and ideas fromdifferent parts of the world being brought intocloser proximity, but there is an increasingconsciousness of the world as a whole(Yearley, 1996). The possible health impactsof global environmental change are examinedin Chapter 6. This section is concernedprimarily with economic globalisation, withsome asides on the social dimension.
Globalisation is not a neutral process.Contributions to greenhouse gas emissions areconcentrated in affluent countries, whereasthe burden borne is likely to be especiallyheavy in small island states, for example.Cultural influence is closely tied to commerce,both in the sense that the culture of the moreaffluent tends to dominate, and in the sensethat commercialisation is itself a culturalprocess. Economic globalisation has losers aswell as winners. Trans-national corporationsare clearly benefiting from economicglobalisation, and have been importantproponents of free trade and other policy shiftsin favour of globalisation. Most ACPcountries have been losers, and a number ofACP governments are understandably scepticalof the supposed economic benefits ofembracing globalisation. This scepticism wasbeen eloquently expressed by the UgandanFinance Minister, Basoga Nsadhu, duringdiscussions at the World Trade Organization(WTO) in 1996 (Coates, 1998).
‘We were told if we had democracywe would get funds. We haddemocracy and no funds came. Wewere told if we had structuraladjustment, foreign directinvestment would come. We hadStructural Adjustment Programmes,but no funds came. We were told ifwe had trade liberalisation andprivatisation, investment wouldcome, but none came. Now we aretold we will get funds if there is amultilateral investment agreement.You are trying to cheat Africa.’
continued on page 27
Chapter 1
Environmental Change and Human Health in Countries of Africa, the Caribbean and the Pacific24
Box 1.2 Globalisation: A Pivotal Process for Health and the Environment
Without a firm grasp of the globalisation processes unfolding in the world today, it isdifficult to develop effective policies for Health and the Environment in the ACP countries,or in the European Union for that matter. By profoundly shaping the economic and socialconditions under which we live, including health and environmental conditions,globalisation brings new issues to the fore which compel us as individuals, social strata,ethnicities and nations to shift the focus of our health, environmental and overall socialpolicies.
The Main Economic ProcessesOne needs to isolate some of the critical processes involved in globalisation, in orderto fully appreciate the impact it is already having and will surely continue to have evenmore powerfully in the future. Given the publicity accorded to the “banana war”between the European Union, the United States and the ACP countries, it is oftenassumed that the most important aspect of globalisation is the new imperatives ofworldwide free trade. Free trade in goods is a major feature of globalisation, but thefree movement of capital is a central issue.
The defining feature of economic globalisation is precisely this: the freedom ofmovement of capital across nearly all national frontiers, with three key financial centres,namely New York, London and Tokyo providing the axes of this international capitalmarket. Closely aligned to this international capital market are the international currencymarket and the freedom to buy and sell foreign currencies on the open market, withoutany exchange controls or other legal impediments maintained by states.
A major feature which has made this international capital and currency market areality is the global electronic and information revolution, leading to the widespreadinfluence of the Internet, the growth of private intranets and the enormous expansionin e-mail as a means of communication. What this means is that any change in theeconomic or political conditions in a particular country, whether Developed orDeveloping, is instantaneously communicated across the globe. Given this power totransfer huge sums of money and information electronically - and instantaneously -capital managers and currency speculators can act decisively by moving huge volumesof funds from what they consider to be at-risk countries to what they consider to besafe economies, long before national Ministries of Finance and Cabinets, not to mentionthe local citizenry, have the chance to act.
These central features of globalisation, which were initially confined to the majorcountries of the developed world, primarily the United Kingdom under Mrs. Thatcher,and the United States, have spread to most of the developing world. They are nowcommonplace in Latin America and the Caribbean, and in most parts of Africa andAsia. Although they may seem far away from people’s everyday lives and from healthand the environmental issues, they actually have a distinctly direct and powerfulaffect.
Any country which, in the eyes of these international money managers, develops anovervalued currency, or has too large a deficit in its national or foreign accounts, suchthat it seems unlikely that it will be able to service foreign loans, debts or foreigninvestments, or too high a rate of inflation which, of course, undermines the worth ofthese same foreign investments, or even too high a level of taxation, is in for a rudeawakening. They will be compelled to change course, to devalue, to cut their budgetdeficits, to raise interest rates, and essentially, either structurally adjust their economiesor face dire economic consequences. Previously, the International Monetary Fundprescribed these adjustments; nowdays, they are merely imposed by the internationalmoney markets. Capital simply flees, bringing about local economic crisis.
Environmental Change and Human Health in Countries of Africa, the Caribbean and the Pacific 25
Background
This new reality has been learnt by Mexico, Sweden, Malaysia, South Korea, Russia andBrazil, and many others, in a variety of ways, but always at the cost of economic stagnation,social hardship and dislocation. Even Germany and France, with their intractably highlevels of unemployment, have been subject to the imposition by global capital of essentiallythe same harsh disciplines.
The Impact on the Developed WorldOne major way in which these dramatic changes show themselves, especially in theeconomy of the United States, is in the shift in the composition of the labour force. Theservice sector (both producer and consumer services) continues to grow and nowcompletely overshadows the manufacturing sector as the major employer of labour. Thisdoes not mean manufacturing has become unimportant, but it does mean that it increasinglythe high-end manufacturing and manufacturing with a high technical content (usuallyinformatics or biotechnology) spheres which predominate.
Another very important way in which these changes show themselves is in the growthof new inequalities of both income and wealth in the Developed countries. This hugeservice sector is by no stretch of the imagination homogenous. I am not referring to thewell-known increased concentration of wealth and income in the uppermost 1% in thelast ten years, but to the growth of inequalities lower down on the social ladder. Thetransformation of the economy wrought by the deployment of information technology, inthe broadest sense, in an unregulated marketplace has widened the gap between differentstrata of middle and the working class. It has even opened up significant income andsocial benefit differences between employees within the same occupational group. Twopeople may thus both be waiters, but one is a waiter in a luxury restaurant on ParkAvenue in Manhattan, whilst the other works in a small establishment in the Bronx. Thedifferences in income, quality of life and the environment are likely to be huge.
One evident consequence of globalisation in the economies of the developed world isthis accelerated differentiation of incomes and benefits throughout a wide range ofoccupational groups. It seems to be fragmenting society, not just into classes and strata,but into substrata and sub-substrata, increasing social inequality at the detailed level andthereby sharply undermining social solidarity, and, one may add, the political consensussupporting society-wide health, environmental and general social policies.
The Impact on the Developing WorldWhat about the impact on the developing world? Clearly these economies are farmore vulnerable to international capital movements and to the competitive pressuresof the new networked, re-engineered super multinationals. In the new internationaldivision of labour, so-called low-end manufacturing (garments, electronic assembly)are increasingly outsourced to the developing world, where labour is cheap andrelatively unregulated. Their local markets are usually too small and poor, anddeveloping countries consequently have to pursue a policy of export-led developmentin order to compete, sending these low-priced light manufactured goods to the marketsof the developed world, thereby further displacing labour in those societies at thesame time they are also subsidising the developed world. Their cheap exports are akey reason for the low rates of inflation in the developed world and they make afundamental contribution to social stability by providing a wide range of everydaymanufactured staples for the working and middle class population of the developedworld at remarkably low prices. In return for this access to the markets of the developedworld, developing countries have to deregulate their own markets and open them tothe more technologically advanced exports of the developed countries.
In the Developing World, too, the impact of this process sharply increases inequalities.Those in favoured occupations in the new service sectors in the Developing countries
Chapter 1
Environmental Change and Human Health in Countries of Africa, the Caribbean and the Pacific26
(tourism and to some extent informatics) prosper, as do, to a lesser extent, those in theold enclave of raw materials sectors connected to mining. Those employed inmanufacturing in the export protection zones usually earn a subsistence wage, whilstthose who remain in sectors unable to compete in the global economy (for examplebananas) are simply marginalised. This new global marginalisation applies particularlyto the billions involved in the rural economy and comprises the major danger posed tothe Developing World by globalisation.
Entire regions of the world (sub-Saharan Africa in particular) have been experiencingthis awful reality of global marginalisation for a number of years now - they have fewmarketable raw materials, are unable to supply cheap manufactured goods, and offerno profitable investment opportunities. They are simply not players in the globalmarketplace. They are not, however, the only part of the Developing World facing asimilar threat: the Caribbean is also at very real risk. If the greatest threat to theDeveloping World in times gone by was posed by exploitation, the even more forbiddingthreat posed today is that of global marginalisation.
As rural societies become globally and nationally marginalised two things are likelyto follow. Firstly, a more drastic exploitation of the physical environment is likely,simply as a desperate act of survival, whilst inter-rural conflicts over declining ruralresources (packaged as ethnic or tribal) are also likely to erupt and to spiral downwardsinto chronic internecine violence and ethnic cleansing. Secondly, the scale of rural-urban migration and primary and secondary urbanisation is likely to grow also.
Unemployment and underemployment are, therefore, likely to increase and in acontext of growing social inequality, this inevitably means increased crime and violence,weakened social solidarity and instability. Health and environmental conditions inboth town and country are likely to deteriorate sharply because even in a best casescenario, raw materials exports and low-end manufacturing will certainly be unable toyield the revenues which governments need to finance improvements in health andenvironment systems. So, what can be done?
What can be done?There can be little doubt that the technical revolution which is at the root of theglobalisation process offers the prospect of eliminating poverty and, in fact, of drawingall of the groups in the world into a global community. Certain critical steps must,however, be taken for the majority of peoples in the Developing World (and in theDeveloped World also) to truly benefit in a sustainable manner.Firstly, urgent steps must be taken to prevent the threat of the global marginalisation ofthe Developing World, and of Africa in particular. Essentially, what this means is helpingdeveloping countries to become players and to earn higher incomes (as individuals, firmsand nations) in the global economy, in a sustainable manner. Increasing capacity in theDeveloping World, rather than welfare assistance to alleviate poverty, thus becomes thekey task.
This means radically improving education systems at every level, but higher educationin particular. It also means ensuring the ability to develop and maintain a moderninfrastructure in support of these activities. Research and especially development(technical imitation and innovation) capacities in the Developing World must bestrengthened.
Secondly, the capacity of the State in the Developing World must be enhanced,modernised and made transparent. Low institutional capacity is now universallyrecognised as a very serious obstacle to development. Every penny of public revenuesand developmental assistance must be used effectively, firstly as a requirement in itsown right and secondly in order to sustain political support at home and abroad forthese re-distributive activities. Broad social strata in both the Developed and Developed
Environmental Change and Human Health in Countries of Africa, the Caribbean and the Pacific 27
Background
Worlds need to understand, however, that inequalities will never be significantly reduced,solely by raising educational levels. Re-distribution of incomes and widespread publicprovision (one can debate the precise mechanisms) will be essential. Public supportcan and needs to be won for an understanding of this reality. This is the third point.
Fourthly, developing countries must be given longer periods of adjustment to theforces of the globally deregulated market. These economies will need subsidies andprotection for a considerable period while they build up their internal capacity. Further,the means of regulating the international capital and money markets need to be discussedand devised. Various ways of achieving this without undermining the market mechanismhave been proposed and these need to be pursued to the point of implementation,thereby ensuring that the fruits of the unprecedented growth in human capability whichspring from the revolution in information technology are used for the general benefitof society and are widely available to people throughout the world.
Fifthly, developed countries must provide the environmental space on the globalcommons for the developing countries to move into economic parity with the DevelopedWorld. International agreements restricting the abuse of the global environment arenecessary, and they must look towards a future where resources and sinks are equitablydistributed. Mechanisms are needed to ensure that environmental restrictions do notcement the economic status quo, or further heighten inequalities, but rather, provideopportunities for sustainable economic development.
Finally, coping with globalisation must not divert attention from fundamental humanrights and needs that cannot be met by economic development alone. The environmentaland health problems discussed in this report are a case in point.
Contributed by Don Robotham, City University of New York.
ReferencesCastells, Manuel 1997. The Information Age: Economy, Society and Culture Volume I: The Rise of the
Network Society. Oxford, Blackwell Publishers.Collier, Paul 1995. The Marginalization of Africa. International Labour Review. 134 (4-5): 541-557.Lash, Scott and Urry, John 1994. Economies of Signs and Space. London, Sage Publications.Robotham, Don 1997. Postcolonialities: the challenge of new modernities. In: Herzfeld, Michael (ed.)
Anthropology: Issues and Perspectives: 1. Transgressing Old Boundaries. International Social ScienceJournal. 153: 357-371.
As described in Box 1.2, globalisation,and its economic aspects in particular, ischanging the nature of the environmentaland health challenges faced by the ACPcountries. To date, few of the ACPeconomies, especially in ACP-Africa, havebenefited appreciably from the recentgrowth in the global economy, oftenportrayed as the positive side of economicglobalisation. But they have, nevertheless,been adversely affected by global economicphenomena such as the oil crisis of the1970s and the high interest rates of the
1980s (both of which contributed to the debtcrisis). Structural adjustment programmeshave been implemented in a large numberof ACP countries, at least in part to makethese countries more competitive within theglobal economy. Here too, unfortunately, theenvironmental and health costs have beenmore evident than the benefits.
Well over half of the countries of ACP-Africa have initiated a structural adjustmentprogramme, involving some combination ofcurrency devaluation, trade liberalisation,price reform, privatisation and supportiveinstitutional changes (Engberg-Pederson et al.,
continued from page 23
Chapter 1
Environmental Change and Human Health in Countries of Africa, the Caribbean and the Pacific28
1996), usually designed under the auspicesof the International Monetary Fund (IMF)and/or the World Bank. Virtually all ACPcountries have adopted at least some of theneo-liberal policies that underlie theseadjustment programmes.
Structural adjustment policies generallyadhere to the principles of orthodox marketeconomics, but were adopted as a responseto a number of events:
• In the 1960s and early 1970s, newlyindependent developing countries investedheavily in social, health and infrastructureprogrammes, often borrowing funds fromcommercial banks to finance theseprogrammes. Revenue from exports ofcommodities financed repayments on theseloans.
• Following the oil price rise of 1973-4,oil-importing developing countries werefaced with very large balance of tradedeficits. Oil revenues had created abundantfinancial liquidity internationally. Deficitcountries were, therefore, able to borrowfrom commercial banks at low interest ratesto finance these deficits. About $20 billiona year was transferred to developingcountries in the 1970s. Commodity pricesalso remained high and these countries were,therefore, able to invest and consume asbefore with little incentive to ‘adjust’ to thenew situation.
• This led to rising levels of debt, whichseemed sustainable as long as interest rateswere low, commodity prices high andcommercial banks willing to continuelending and ‘rolling over’ old debts.
• In 1979 there were further increasesin oil prices and increased borrowing wasnecessary. Recession in the developedcountries in the early 1980s led to decreasesin commodity prices -which continued formuch of the decade- and to increases ininterest rates. Commercial banks became lesswilling to lend to developing countries, asthe prospects for repayment seemed poor,and by the mid-1980s almost all commerciallending had ceased (Stewart, 1995).
• With decreasing commodity prices,terms of trade for many ACP countriesdeteriorated and debt service as a proportionof exports increased rapidly. Countries
developed large current account deficits and,as they were not able to secure finance fromcommercial sources, they approached theIMF and World Bank for loans. These loanswere conditional on the countries introducingcertain policy changes referred to as‘structural adjustments’. Consequently theIMF and the World Bank became majorpolicy makers in the majority of African andLatin American countries in the 1980s.
The problems described above wereparticularly acute for ACP-Africa, which hashigher debts than any other developingregion. Between 1990 and 1993, the regiontransferred $13.4 billion annually to externalcreditors – around four times as much as isspent on health services. As many countrieshave not been able to make their scheduledrepayments, arrears on loans haveaccumulated rapidly and, since 1988, abouttwo-thirds of increase in debt stock for ACP-Africa is due to the accumulation of intereston arrears. It is difficult to separate the effectsof structural adjustment from those of debt,as one of the purposes of adjustment is toensure that indebted countries are able togenerate funds to repay loans.
Structural adjustment includes a widerange of policy reforms designed to establisha basis for market-led economic growth.Adjustment usually starts with an IMFstabilisation programme which includes cuttinggovernment expenditure, mainly by reducingpublic sector wages, raising interest rates,controlling money supply, correcting over-valued currencies through devaluation,restricting imports and expanding exports.World Bank programmes, which usuallyfollow, include liberalising import regulationsto increase exposure to foreign competitionand removing domestic market ‘distortions’such as labour protection, food subsidies andstate control of agricultural and othermarketing. More recently, the Bank has alsobecome involved in social sector reform,including health financing and the redesign ofsocial safety nets.
Because of their pervasive and prolongednature, structural adjustment policies have hadmajor effects, not only on the macro-economy,but also on the social sector and the incomesof the poor (UNCTAD, 1998). Proponents
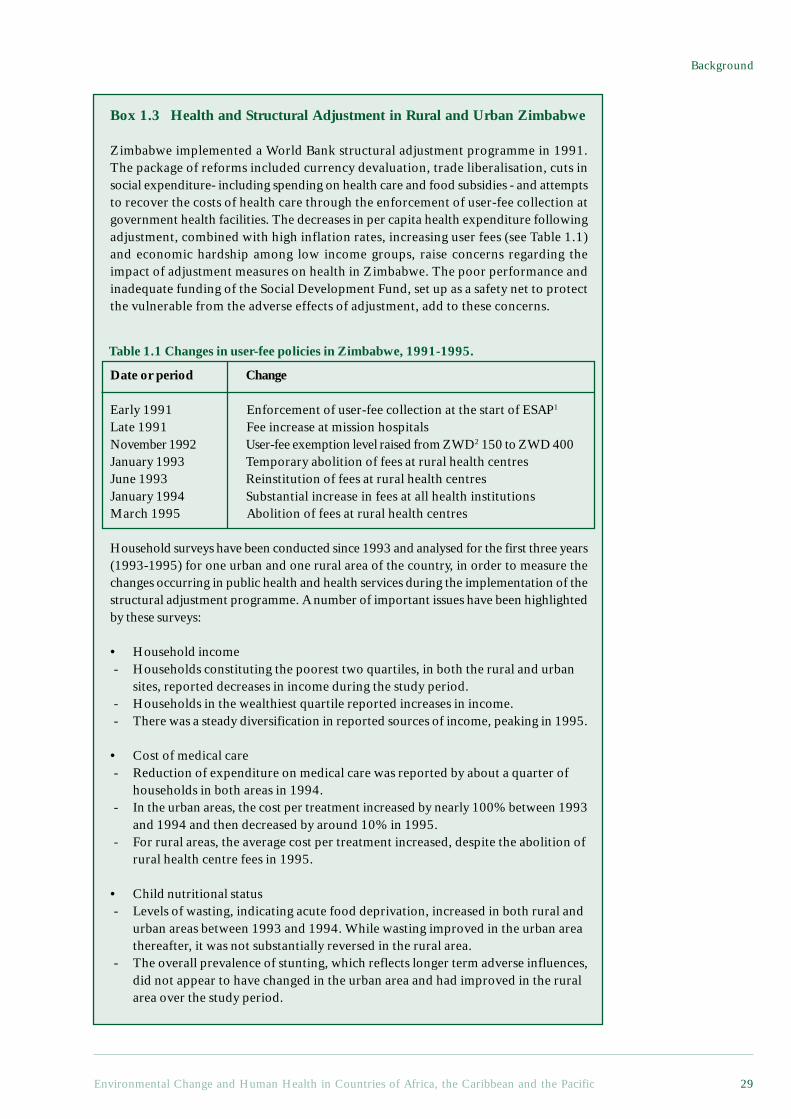
Environmental Change and Human Health in Countries of Africa, the Caribbean and the Pacific 29
Background
Box 1.3 Health and Structural Adjustment in Rural and Urban Zimbabwe
Zimbabwe implemented a World Bank structural adjustment programme in 1991.The package of reforms included currency devaluation, trade liberalisation, cuts insocial expenditure- including spending on health care and food subsidies - and attemptsto recover the costs of health care through the enforcement of user-fee collection atgovernment health facilities. The decreases in per capita health expenditure followingadjustment, combined with high inflation rates, increasing user fees (see Table 1.1)and economic hardship among low income groups, raise concerns regarding theimpact of adjustment measures on health in Zimbabwe. The poor performance andinadequate funding of the Social Development Fund, set up as a safety net to protectthe vulnerable from the adverse effects of adjustment, add to these concerns.
Date or period Change
Early 1991 Enforcement of user-fee collection at the start of ESAP1
Late 1991 Fee increase at mission hospitalsNovember 1992 User-fee exemption level raised from ZWD2 150 to ZWD 400January 1993 Temporary abolition of fees at rural health centresJune 1993 Reinstitution of fees at rural health centresJanuary 1994 Substantial increase in fees at all health institutionsMarch 1995 Abolition of fees at rural health centres
Household surveys have been conducted since 1993 and analysed for the first three years(1993-1995) for one urban and one rural area of the country, in order to measure thechanges occurring in public health and health services during the implementation of thestructural adjustment programme. A number of important issues have been highlightedby these surveys:
• Household income - Households constituting the poorest two quartiles, in both the rural and urban
sites, reported decreases in income during the study period. - Households in the wealthiest quartile reported increases in income. - There was a steady diversification in reported sources of income, peaking in 1995.
• Cost of medical care - Reduction of expenditure on medical care was reported by about a quarter of
households in both areas in 1994. - In the urban areas, the cost per treatment increased by nearly 100% between 1993
and 1994 and then decreased by around 10% in 1995. - For rural areas, the average cost per treatment increased, despite the abolition of
rural health centre fees in 1995.
• Child nutritional status - Levels of wasting, indicating acute food deprivation, increased in both rural and
urban areas between 1993 and 1994. While wasting improved in the urban areathereafter, it was not substantially reversed in the rural area.
- The overall prevalence of stunting, which reflects longer term adverse influences,did not appear to have changed in the urban area and had improved in the ruralarea over the study period.
Table 1.1 Changes in user-fee policies in Zimbabwe, 1991-1995.
Chapter 1
Environmental Change and Human Health in Countries of Africa, the Caribbean and the Pacific30
initially claimed that the poor would benefit,since economic growth would increase.Economic growth did not respond asanticipated, however in either quantity orquality. By the mid-1980s, evidence ofincreasing poverty in countries undergoingadjustment led the World Bank and otherinternational institutions to acknowledge theneed to take the social consequences ofadjustment into account. In response, attemptswere made to incorporate such concerns, mostnotably in Africa through the ‘SocialDimensions of Adjustment in Africa’ (SDA)programme. For the most part, however, thefunds devoted to such efforts have beenminimal. Between 1988 and 1993, when it waseffectively abandoned, for example, the SDAprogramme received some US$ 141 million,as against the US$ 4 billion committed foradjustment programmes (Engberg-Pederson etal., 1996, page 58).
Spending on health, welfare andeducation, as a proportion of governmentspending, fell in 10 out of the 13 countriesfor which data are available between 1981and 1990. Data on changes in access tohealth services are fragmentary, but accessis reported to have fallen in 50% ofcountries. Use of health services has beenadversely affected by a combination ofreduced resources (including drugs),
reduced incomes and rising user charges(Ekwempu et al., 1990). Decreases in serviceuse appear to have been most marked forpoor households (see Box 1.3 on StructuralAdjustment and Health in Zimbabwe).These decreases in access are not yetreflected in increases in indicators such asinfant or child mortality rates, but maternalmortality rates, which might act as a moreacute indicator of reduced access to care,have increased in certain countries. Studiesin Zimbabwe have shown that women’sattendance at antenatal clinics is particularlysensitive to increased fees (Watkins, 1995,citing Hongoro et al, 1994).
Some of the environmental impacts ofstructural adjustment have also been criticised,and structural adjustment has thus been faultedfor not addressing problems like deforestation,soil erosion, and industrial pollution (Reed,1996). Many of the more criticalenvironmental and health problems describedin the following chapters have, however, beenlargely ignored. This is unfortunate in lightof the evident links between poverty, theenvironment and health, all of which havebeen individually identified as areas neglectedin the pursuit of structural adjustment.
Structural adjustment has, to some degree,been the policy face of economic globalisation.In addition to bringing new economic
The study indicates that user-fees for health services may be adversely affecting health careutilisation. The belief that the poor, and particularly the rural poor, would benefit fromadjustment does not appear to be supported by the experience of Zimbabwe. These results,elaborated in the sources listed below, confirm the view that governments, NGOs andinternational agencies need to pay more attention to the potential adverse effects of macro-economic changes and, where these changes are unavoidable, to put in place more effectivemechanisms to mitigate their effects on the poor.
1 Economic and Structural Adjustment Programme.2 Zimbabwe dollars.
ReferencesBassett, M. T., Bijlmakers, L. and Sanders, D. M. 1997. Professionalism, patient satisfaction and
quality of health care: Experience during Zimbabwe’s structural adjustment programme. SocialScience and Medicine. 45(12):1845-1852.
Bijlmakers, L., Basset, M. T. and Sanders, D. M. 1996. Health and Structural Adjustment in Rural andUrban Zimbabwe. Research Report No. 101. Nordiska Afrikainstitutet (Uppsala, Sweden).
Bijlmakers, L., Basset, M. T. and Sanders, D. M. 1996. Socio-Economic Stress, Health and ChildNutritional Status at a Time of Economic Structural Adjustment: A Three-year Longitudinal Studyin Zimbabwe. Unpublished manuscript. Public Health Programme, University of the Western Cape.
Watkins, K. 1995. The Oxfam Poverty Report. Oxfam (Oxford).
Environmental Change and Human Health in Countries of Africa, the Caribbean and the Pacific 31
Background
challenges, both structural adjustmentprogrammes and global economic pressureshave tended to divert attention not only frompoverty issues, but from public problemswhich markets are ill-suited to solve.Environmental and health burdens often fallinto this category. It is difficult, for example,to set up a market for pollution, ensuring thatpolluters negotiate with those affected, andpay an agreed price for the damage they cause.Moreover, the overall health impact ofeconomic change depends critically on howit affects the most deprived sectors of society,rather than averages or aggregates.
Experience of structural adjustment andglobalisation indicate that both internationaland local measures are needed to ensure ACPcountries can respond to their environmentaland health challenges. Many of these measuresoverlap with those which are needed toalleviate poverty. Local capacity building andgood governance are particularly critical ifnegative environmental and health effects areto be avoided. They are needed in order toensure that the concerns of ACP residents arewell articulated in the international arena andin future adjustment programmes. They arealso needed in order to respond to the newlocal challenges that globalisation is bringing.Markets may not be an efficient means ofimproving the environment and public health,but nor is it appropriate to rely on publiclyfinanced environmental and health services.
1.3 The Diverse Forces AffectingEnvironmental and Health inthe ACP
This section sets out, in very general terms,to describe the role of persistent poverty,uneven modernisation, and the often very highpopulation growth rates in influencingenvironmental conditions, and hence healthin the ACP. These themes, and especially therole of poverty, re-appear throughout thereport, both in the chapters with a health focus(Chapter 2 and 3) and in those focusing onenvironmental trends (Chapter 4 - 6).
In discussing changing environments andhealth globally, the World Resources Report1998-99 considers such driving forces aspopulation growth, economic growth andpersistent inequalities, and then three mainenvironmental trends: the intensification of
agriculture, industrialisation and risingenergy use. A similar approach is taken inthis report, except that we have avoided theterm ‘driving’ forces, for reasons that shouldbecome apparent, and selected somewhatdifferent forces and trends.
The trends selected for this report areagricultural change, urbanisation and globalenvironmental change (Chapters 4 - 6).Urbanisation trends are given precedence overindustrialisation, since urbanisation has beenrapid in most ACP countries in recent years,whilst industrialisation has reportedly beenmore notable for its absence. Globalenvironmental change is separated out, sinceACP countries are responsible for only a smallshare of the risks that global environmentalchanges pose. Hence while effects of climatechange may seriously affect many ACPcountries, their contribution to the build-upof greenhouse gases is negligible.
It has long been the case that as humaninteraction with the environment haschanged, so have the health risks (Cohen,1989; Mascie-Taylor, 1993). Most of theinfamous infectious diseases, from measlesto the plague, emerged on a significant scaleonly after some combination of agriculture,higher population densities and trade gavethem the opportunity. Most non-communicable diseases, from coronary heartdisease to various cancers, became significantwith industrialisation, ‘affluent’ consumptionand ageing populations. New diseases,including some infectious diseases such asHIV/AIDS, continue to emerge even as othersdecline in importance.
The overall global burden of diseasehas lessened in recent centuries. But theimprovements have been uneven, and notwithout some major setbacks. For somesub-populations, often including groupsfar removed from the changes thatprovoked the new health risks, it is thesetbacks that have been more decisive.Smallpox decimated the Native Americanpopulations, and contributed to theirconquest (McNeill, 1989). The firstintroduction of measles into Fiji in 1875killed about a third of the population inthree months, with political consequencesthat still reverberate today (Mascie-Taylor,1993, page 12). By way of contrast,
Chapter 1
Environmental Change and Human Health in Countries of Africa, the Caribbean and the Pacific32
Europeans were the more obvious victimsof infectious diseases during the colonialencounter with Sub-Saharan Africa (a factthat helped delay and limit colonialencroachment). But even in ACP-Africa,the colonial encounter clearly created anumber of serious health problems(Feierman and Janzen, 1992).
The health profiles presented inChapters 2 and 3 indicate that a large shareof the ACP population continue to face anumber of very serious threats to theenvironment and to their health. Poverty,economic development (both within andbeyond the ACP) and population growthall influence the environmental problemsthat threaten health. As will be describedin Chapter 7, better environmentalmanagement has great potential forimproving health, particularly if it alsocontributes to poverty alleviation. Indeed,for most ACP countries, better health is amore compelling reason for pursuingenvironmental improvement than longer-term sustainability. The link between theenvironment and health is far moreimmediate than in many more affluentparts of the world, whilst contributions toglobal problems, such as greenhouse gasemissions, are far lower. In low-incomeregions, paying particular attention to theimpact on health is not simply a means ofjustifying an environmental agenda, it is ameans of helping to ensure thatenvironmental concerns are grounded inlocal priorities.
There are also geographical factors thatinfluence the disease burden, including someof the major infectious diseases of the region.The exceedingly high burden of malaria inACP-Africa, for example, has environmentalroots bound up with the ecology of Anophelesmosquitoes and disease transmission (Bradley,1991). While geographically linked, theprevalence of these diseases is also influencedby poverty, modernisation and populationdynamics. Not only does poverty make it moredifficult to adopt protective measures, forexample, but global modernisation andclimate change are likely to change thegeographical spread of many of these diseases,and population movements often exposesusceptible groups to new (for them) diseases.
1.3.1 Poverty Related EnvironmentalHealth Problems
As indicated in section 1.2.3, the ACPcountries contain a large and growing shareof the world’s poor. Poverty itself is a majorfactor in their morbidity and mortalityprofiles, leading to a greater disease burdenand a higher share of morbidity and mortalitydirectly attributable to environmentalproblems. Thus, while relatively obscurepollutants often capture the internationalheadlines, faecal pollution remains far moreimportant to human health globally, andespecially in less affluent countries. Muchthe same applies to the more indirect threatsto health arising from environmentalchange, and hence when agricultural systemsare disrupted, it is the poor who are mostlikely to lose their food security, and sufferfrom malnutrition.
Food insecurity and malnutrition arecommon in a wide range of low-incomesettings. They can persist even where foodproduction is technically more than sufficientto meet local needs. In rural areas in particular,the environmental dimensions of agriculturaldevelopment are central to food security.Attempts to increase agricultural productivity,some of which are environmentallydestructive, still tend to favour commercialfarming, although subsistence farming is oftenmore critical to food security. Land degradationand climatic change can easily underminesubsistence agriculture, and subsistencecultivators face many obstacles in their pursuitof sustainable agriculture. Moreover, andparticularly during difficult seasons, years orperiods of life, small cultivators often fall backon the ‘alms of nature’: foods and productsthat can be foraged from the surroundingcountryside. The rural poor, who are most atrisk from malnutrition, also tend to be mostdependent upon these common propertyresources (Dasgupta, 1993). Ecological change,agricultural expansion, or institutionalchanges, some of which may be implementedin the name of environmental protection, canundermine access to such resources.
Many of the other health threats in low-income settlements are related to localenvironmental conditions, but the same sortsof problems arise in a wide range ofgeographical sites, both rural and urban.
Environmental Change and Human Health in Countries of Africa, the Caribbean and the Pacific 33
Background
Until recently, the environmental healthburden of poverty was ascribedpredominantly to inadequate water andsanitation, acting in concert withmalnutrition, but it is increasinglyrecognised that a complex set ofinterconnected environmental and socio-economic conditions are usually involved.Thus, whilst diarrheal diseases tend to beblamed on the ingestion of contaminatedwater, the lack of water for washing is oftenmore important (Cairncross and Feachem,1993), and a wide range of environmentalconditions in and around the home areimplicated. Alternatively, whilst airpollution is often portrayed as an urbanindustrial hazard, the use of smoky cookingfuels is a far more significant hazard in mostACP countries, with women and smallchildren particularly at risk (Smith, 1994;World Health Organization, 1997).
1.3.2 ‘Modernisation’ and GlobalEnvironmental Threats to Health
The health threats from chemical pollutants,often associated with urbanisation,industrialisation, agricultural intensificationand other aspects of modernisation, are veryunevenly distributed across the ACPpopulations. With a few notable exceptions,such as South Africa, urbanisation andindustrialisation levels are far lower in ACPcountries than in most of the rest of theworld, as is the use of chemical fertilisersand pesticides. Workers in particularoccupations (see Box 4.5 on Pesticides andWorkers’ Health in Chapter 4), and residentsof particular locations, face exceedingly highrisks, but they are exceptions. Whether theyremain exceptions will depend upon the paceand nature of economic development, andthe speed with which countries are willingto adopt preventative measures.
In addition to the direct threats to healththat environmental correlates ofmodernisation can pose, people’s health isthreatened when their life support systemsand livelihoods are undermined. Thesethreats are increasingly global in scale(McMichael, 1993), and affluent countriesare typically the major contributors. Theeffects will be experienced locally,however. The fact that a relatively large
share of the population in ACP countriesis engaged in close-to-subsistenceagriculture affects their vulnerability toclimate change. As indicated above,malnutrition is a significant factor in illhealth, and when environmental changeundermines the subsistence strategies ofsmall cultivators, the health implicationscan be devastating. Land degradation andlocal climate change, such as drought, areobvious examples. Their impacts inSahelian Africa have been widelydocumented in the context of desertification(Raynaut, 1997).
Global climate change may also have amajor impact on the spread of infectiousdiseases. The geographical boundaries ofmany of the vector-borne diseases,including malaria, are likely to change. TheSmall Island States are particularlyvulnerable to changes in the sea level andextreme weather events.
Whilst these future threats to health needto be taken into account, it is the present daythreats that are especially severe in ACPcountries. Many of the future threats are,moreover, likely to exacerbate the poverty-related and geographically linkedenvironmental and health problems notedabove. Finding more resilient ways to addresscurrent environmental health problems isthus likely to be one of the best means ofsafeguarding against the dangers of globalthreats, including climate change.
And whilst ACP countries areparticularly vulnerable to globalenvironmental threats, the fact that theyare not major contributors and face otherenvironmental health problems changesthe policy context. In affluent settings,increasing material consumption levelsmay satisfy people’s desires, and still beboth environmentally unsustainable andunhealthy. Things are quite different inmore deprived settings, where increasingthe extent to which people’s materialdemands are met can bring about a directresult in the form of improved health. Withsound environmental management, thissame increase in affluence can be madeboth more sustainable and more healthy– but when trade-offs arise, they tend tobe more acute. The health balance is, for
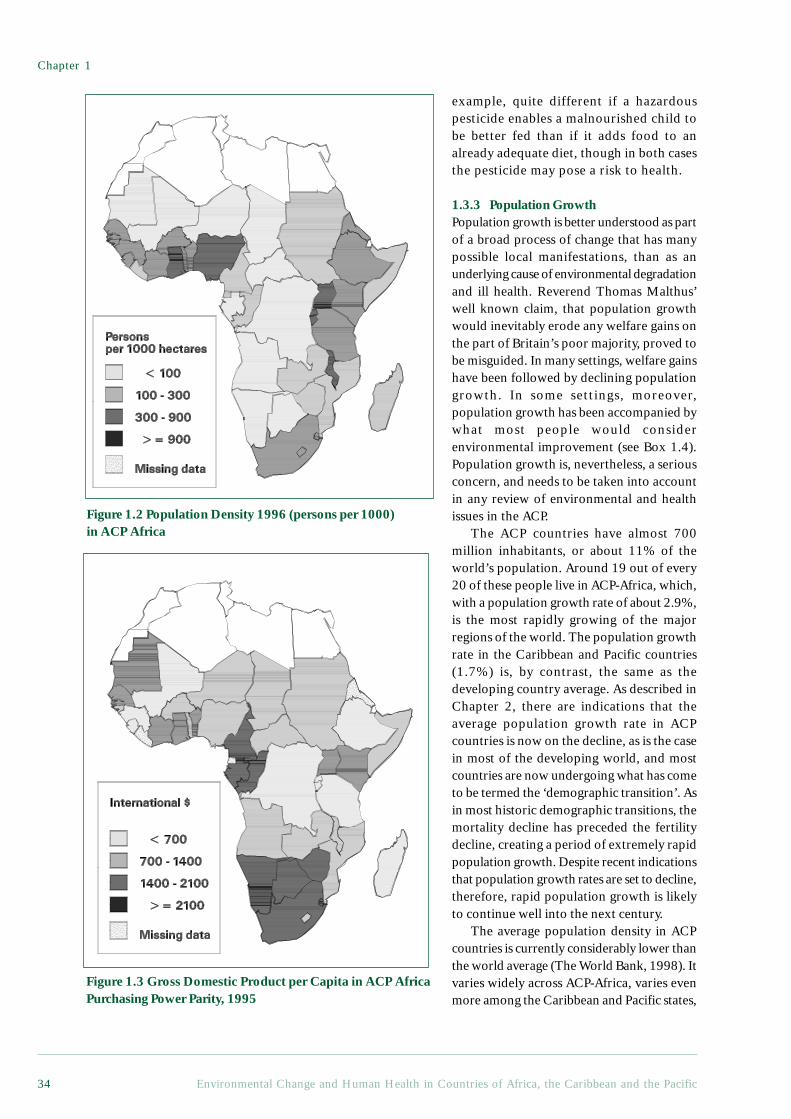
Chapter 1
Environmental Change and Human Health in Countries of Africa, the Caribbean and the Pacific34
example, quite different if a hazardouspesticide enables a malnourished child tobe better fed than if it adds food to analready adequate diet, though in both casesthe pesticide may pose a risk to health.
1.3.3 Population GrowthPopulation growth is better understood as partof a broad process of change that has manypossible local manifestations, than as anunderlying cause of environmental degradationand ill health. Reverend Thomas Malthus’well known claim, that population growthwould inevitably erode any welfare gains onthe part of Britain’s poor majority, proved tobe misguided. In many settings, welfare gainshave been followed by declining populationgrowth. In some settings, moreover,population growth has been accompanied bywhat most people would considerenvironmental improvement (see Box 1.4).Population growth is, nevertheless, a seriousconcern, and needs to be taken into accountin any review of environmental and healthissues in the ACP.
The ACP countries have almost 700million inhabitants, or about 11% of theworld’s population. Around 19 out of every20 of these people live in ACP-Africa, which,with a population growth rate of about 2.9%,is the most rapidly growing of the majorregions of the world. The population growthrate in the Caribbean and Pacific countries(1.7%) is, by contrast, the same as thedeveloping country average. As described inChapter 2, there are indications that theaverage population growth rate in ACPcountries is now on the decline, as is the casein most of the developing world, and mostcountries are now undergoing what has cometo be termed the ‘demographic transition’. Asin most historic demographic transitions, themortality decline has preceded the fertilitydecline, creating a period of extremely rapidpopulation growth. Despite recent indicationsthat population growth rates are set to decline,therefore, rapid population growth is likelyto continue well into the next century.
The average population density in ACPcountries is currently considerably lower thanthe world average (The World Bank, 1998). Itvaries widely across ACP-Africa, varies evenmore among the Caribbean and Pacific states,
Figure 1.2 Population Density 1996 (persons per 1000)in ACP Africa
Figure 1.3 Gross Domestic Product per Capita in ACP AfricaPurchasing Power Parity, 1995
Environmental Change and Human Health in Countries of Africa, the Caribbean and the Pacific 35
Background
and is generally a poor indicator ofenvironmental health problems ordegradation.5 Similarly, as illustrated in Figure1.2 and 1.3, while there is a relationshipbetween population density and GDP percapita it is not very tight.
The two most densely populated countriesin ACP-Africa are Mauritius, which has thehighest Human Development Index rankingin the region, and Rwanda, which has one ofthe lowest (see Appendix 1). Among theCaribbean states, the two most denselypopulated countries are Trinidad and Tobago,one of the highest ranking, and Haiti, thelowest. Similar contrasts apply to the leastdensely populated countries, which range fromBotswana to Mauritania. Quite clearly,population density alone implies very littleabout the environmental and health challengesfaced by a country.
One of the conclusions of this report isthat there are numerous ways of improvinghealth through better environmentalmanagement. This conclusion would not holdif, in a neo-Malthusian manner, lowermortality rates increased population growth,which in turn created environmental problemsand undermined the health gains. Severalaspects of the complex manner in whichpopulation growth influences environmentaland health issues are explored in other sectionsof this report. It is worth pointing out here,however, that health improvements, even whenresponsible for lowering mortality rates, do
not necessarily contribute to long-termpopulation growth. Indeed, lower infant andchild mortality is not only an end in itself,and a good indicator of improving well being,but is often a prerequisite for reducingpopulation growth.
1.4 ConclusionEnvironmental and health problems contributeto the many daunting challenges governmentsand civil societies in the ACP face. Indeed,from a policy perspective, environment andhealth issues cannot be divorced from theeconomic and social context. If economicglobalisation is allowed to affect the ACPadversely, for example, and poverty deepens,a number of the most critical environmentaland health problems will be exacerbated. Ifon the other hand, the measures taken toimprove the environment and health alsoalleviate poverty, the benefits will becompounded. Similarly, if new economic andsocial policies and programmes are alsodesigned to yield environmental and healthbenefits, they are more likely to contribute tohuman development. Local governance andcapacity building are, moreover, critical notonly for implementing the right environmentaland health policies, but for ensuring that theyare based on local priorities. The remainingchapters of this report focus on environmentaland health issues, but their relationships withpoverty, demographic change, and governanceare recurrent themes.
5 The population density with respect to arable land is somewhat more revealing, but it remains a poorindicator (Aryeetey Attoh, 1997).
Box 1.4 Population Growth and Building Forests in Kissidougou, Republicof Guinea: Implications for Environment, Food Security and Health
Population growth and accompanying agricultural expansion is frequently associatedwith deforestation and land degradation, accentuating malnutrition, conflict overscarce resources and attendant health problems. The image is of small-scale cultivatorscreating their own demise, and that for their own good, interventions are needed tolimit population growth and curtail agricultural expansion.
This is the image that policy-makers have held of Kissidougou prefecture in theWest African Republic of Guinea, with agricultural and forestry interventionsoperating accordingly. Research reveals a very different trajectory, however, calling
Chapter 1
Environmental Change and Human Health in Countries of Africa, the Caribbean and the Pacific36
into question the generalisations frequently made about links between population,environment and health. Here, in the northern margins of the West African forestbelt, settlement and agricultural expansion have been associated with the conversionof open savannas to woodland and even high forest vegetation. How has this happened,and how has this landscape enrichment impacted on health?
Villagers value a woodland belt around their compounds for a variety of reasons,ranging from protection from dry season fires, to shade for tree crops and privacy forpersonal and social activities. Woodland is established through fire and grazingmanagement, soil enrichment from gardening and disposal of household waste, andthe planting of socially or economically valuable trees. These woodland belts growover time into veritable islands of forest in a sea of savanna, and inasmuch aspopulation growth has multiplied the number of villages and hamlets in the prefecture,more people have meant more forest islands. Islands have sometimes coalesced tocover fully the intervening savannas. Many of the farming practices used in savannas– especially the mounding, rotation and organic matter manipulation techniques usedfor groundnuts, cassava and other crops – also serve to enrich soils and encourageconversion to forest. Through these processes, forest and forest thicket cover in theprefecture have increased by as much as 40% during the last fifty years.
Tracing the consequences of this landscape enrichment for nutrition and health iscertainly not straightforward, not least because over the same period so much elsehas changed in the broader economy and society. Nevertheless, villagers themselvestrace a number of important and positive associations. Soils, elders argue, are able tosupport higher yields of rice, peanuts and other food crops than they used to. Womendescribe how their workloads in respect of weeding rain-fed rice farms and in collectingfuelwood have diminished. Fuelwood can now be gathered conveniently alongsidefarming tasks, from the trunks and branches left when woody fallows are cleared.Time thus saved tends, however, to be reallocated to other work, making overallimprovements in workload hard to discern.
As vegetation has become more woody, so the oil palm (Elaeis guineensis) hasmultiplied in village territories, and is now available in northern localities where afew decades ago, palms could not be found. Palm fruit and kernel oils are valuablesources of fat and vitamins in the local diet, while income from the sale of palmproducts has become an important income generator for poorer families. Womenprocess kernel oil to sell during the seasonal hunger period at the height of the rains,when both food, and the income to buy it, are scarce, and alternatives lead toindebtedness. The same story can be told for the many fruit trees which form part ofvillage forests. Mangoes, avocados and oranges are traded from villages with reasonableroad access, and when not traded certainly improved village diets – especially forchildren who collect them independently. Indeed throughout the region, parentscomplain that when the mango season arrives they lose control over their children,since discipline through leverage over food can no longer be upheld.
Many of the trees in forest islands are also valuable for timber. Given the currentmarket conditions in Guinea, the sale of a large Afzelia africana or Milicia excelsatree would dig a family out of crisis, or deal with the large social expenditures – suchas funerals or medical costs – that can so easily precipitate them into it. Yet althoughresponsible for the establishment of such trees, villagers can neither fell them norbenefit from their income under existing legislation. Since the early colonial periodthe state forest department has claimed ownership of these trees, on the grounds thatthey are ‘natural’ and the villagers are incapable of looking after them. Were forestryincome to accrue to land managers who can enrich vegetation, they would probablyinvest more fully in valuable trees, bringing about a simultaneous improvement inthe environment, and in people’s income, food security and health. The fact that
Environmental Change and Human Health in Countries of Africa, the Caribbean and the Pacific 37
Background
farming can improve vegetation has similarly been ignored by policy-makers intenton ensuring that agriculture is concentrated in inland valley rice swamps. Not only isswamp farming itself associated with health hazards (e.g. Schistosomiasis, snakebite, and machete wounds), such policies have missed the opportunity to build onthe sort of local skills found in rain-fed farming areas that can improve yields andenrich vegetation at the same time. Finally, the conviction that Kissidougou’senvironment is degraded and degrading, coupled with international aid donors’preoccupation with environmental issues, has had severe opportunity costs: externalinterventions have been directed towards misplaced efforts at reafforestation at theexpense of far more pressing rural development concerns, including the need forimproved health care and food security in a country which ranks among the bottomfive in the world for its infant mortality levels.
Contributed by Melissa Leach, Institute of Development Studies, University of Sussex.
Based on Fairhead, J. and M. Leach, 1996, Misreading the African Landscape: society andecology in a forest-savanna mosaic. Cambridge: Cambridge University Press.
ReferencesAryeetey-Attoh, S. 1997. Population Geography of Sub-Saharan Africa. In: Aryeetey-Attoh S., (ed.).
Geography of Sub-Saharan Africa. Upper Saddle River, New Jersey, Prentice Hall. p 379.Baulch, B. 1996. The new poverty agenda: A disputed consensus. IDS Bulletin. 27(1):1-10.Bradley, D. J. 1991. Malaria. In: Feachem R.G., Jamison D.T., (eds.). Disease and Mortality in Sub-
Saharan Africa. Oxford, Oxford University Press for the World Bank. p 190-202.Cairncross, S. and Feachem, R. G. 1993. Environmental Health Engineering in the Tropics: An
Introductory Text. Chichester, John Wiley & Sons. 306 p.Coates, B. 1998. The Developmental Implications of the MAI: WDM critique of the Fitzgerald Report
to the UK Department of International Development. World Development Movement (London).Cohen, M. N. 1989. Health and the Rise of Civilization. New Haven, Conn., Yale University Press.
285 p.Curtis, S. and Taket, A. 1996. Health and Societies. London, Arnold.Dasgupta, P. 1993. An Inquiry into Well-Being and Destitution. Oxford, Oxford University Press.
662 p.Ekwempu, C. C., Maine, D., Olorukoba, M. B., Essien, E. S. and Kisseka, M. N. 1990. Structural
adjustment and health in Africa. The Lancet. 336:56-57.Engberg-Pederson, P., Gibbon, P., Raikes, P. and Usholt, L., (eds.) 1996. Limits of Adjustment in
Africa. Portsmouth, New Hampshire, Heinemann. 430 p.European Commission. 1996. Green Paper on Relations Between the European Union and the ACP
Countries on the Eve of the 21st Century. European Commission (Brussels).Feierman, S. and Janzen, J. M., (eds.) 1992. The Social Basis of Health and Healing in Africa. Berkeley,
University of California Press. 487 p.Fischer, S., Hernández-Catá, E. and Khan, M. S. 1998. Africa: Is This a Turning Point? Paper on Policy
Analysis and Assessment. International Monetary Fund (Washington). 24 p.Jepma, C. J. and Munasinghe, M. 1998. Climate Change Policy: Facts, Issues and Analysis. Cambridge,
Cambridge University Press. 331 p.Kunst, A. E., Groenhof, F., Mackenbach, J. P. and The EU Working Group on Socioeconomic
Inequalities in Health. 1998. Mortality by occupational class among men 30-64 years in 11European countries. Social Science and Medicine. 46(11):1459-1496.
Marmot, M. G. and Smith, G. D. 1997. Socio-economic differentials in health. Journal of HealthPsychology. 2(3):283-296.
Mascie-Taylor, C. G. N., (ed.) 1993. The Antropology of Disease. New York, Oxford University Press.169 p.
McMichael, A. J. 1993. Planetary Overload: Global Environmental Change and the Health of theHuman Species. Cambridge, Cambridge University Press. 352 p.
McNeill, W. H. 1989. Plagues and Peoples. New York, Doubleday. 340 p.Montgomery, L. E., Kiely, J. L. and Pappas, G. 1996. The effects of poverty, race, and family structure
on US children’s health: Data from the NHIS, 1978 through 1980 and 1989 through 1991.American Journal of Public Health. 86(10):1401-1405.
Ravallion, M. and Chen, S. 1997. What can new survey data tell us about recent changes in distributionand poverty. The World Bank Economic Review. 11(2):357-82.
Chapter 1
Environmental Change and Human Health in Countries of Africa, the Caribbean and the Pacific38
Raynaut, C., (ed.) 1997. Societies and Nature in the Sahel. London, Routledge.Reed, D. 1996. Structural Adjustment, the Environment, and Sustainable Development. London,
Earthscan. 386 p.Satterthwaite, D. 1997. Urban poverty: reconsidering its scale and nature. IDS Bulletin. 28(2):9-23.Smith, K. R. 1994. The health impact of cookstove smoke in Africa. In: Bass H.H., Franz J., Grawert
E., Hein W., Kappel R., Messner F., Pohlan J., Wohlmuth K., (eds.). African Development PerspectivesYearbook 1992/93: Energy and Sustainable Development. Münster, Lit Verlag. p 417-434.
Stephens, C., Leonardi, G., Lewin, S. and Chasco, M. 1999. The Multi-lateral Agreement on Investment:public health for the twenty first century? European Journal of Public Health. 9(1):3-5.
Stewart, F. 1995. Adjustment and Poverty: Options and Choices. London, Routledge.The World Bank. 1998. 1998 World Development Indicators. World Bank (Washington, DC). 390 p.UNCTAD. 1998. Trade and Development Report, 1998. Oxford University Press (Oxford).van Reisen, M. 1998. The European Community Programme. In: Randel J., German T., (eds.). The
Reality of Aid 1998/1999. London, Earthscan.Watkins, K. 1995. The Oxfam Poverty Report. Oxfam (Oxford).WHO. 1988. Basic Documentation, 37th Edition. World Health Organization (Geneva).WHO/EURO. 1984. Summary report of the working group on concepts and principles of health
promotion. World Health Organization Regional Office for Europe (Copenhagen).Wilkinson, R. G. 1994. The epidemiological transition: From material scarcity to social disadvantage?
Daedalus. 123(4):61-77.World Bank. 1998. World Development Report: Knowledge for Development. Oxford University Press
(New York). 251 p.World Health Organization. 1996. The World Health Report 1996: Fighting Disease, Fostering
Development. World Health Organization (Geneva). 137 p.World Health Organization. 1997. Health and Environment in Sustainable Development: Five years
after the Earth Summit. Geneva, World Health Organisation. 242 p.World Resources Institute. 1998. World Resources 1998-99: A Guide to the Global Environment.
Oxford University Press (New York). 369 p.Yearley, S. 1996. Sociology, Environmentalism, Globalisation. London, Sage Publications. 161 p.
Chapter 2Demographic and
Health Trends
Environmental Change and Human Health in Countries of Africa, the Caribbean and the Pacific 41
Demographic and Health Trends
Chapter 2 Demographic and Health Trends
Aims of the chapter• To provide an overview of the health and demographic situation in theACP countries, with particular emphasis on ACP-Africa.• To review changes in health and demographic patterns in the region duringthe past two decades.• To examine how these changes are different from the global pattern.• To discuss projections for mortality, morbidity and burden of disease trendsfor the next two decades.• To examine health differentials between and within ACP countries.
Main Points• Demographic indicators for ACP countries, such as fertility rates and infantmortality rates, are some of the highest in the world. Although the demographictransition is under way (to varying degrees throughout the region), it is likelyto take several decades before the ACP-Africa demographic profile begins toapproximate that of other developing regions such as Latin America or Asia.• Health conditions in the ACP countries have improved substantially duringthe past 50 years but are still amongst the worst in the world, particularly forchildren. There are worrying indications that the economic hardships of the1980s and 1990s and the HIV/AIDS epidemic have adversely affected healthconditions in some countries, particularly those in ACP-Africa. Further studiesare needed in this area.• ACP-Africa contains approximately 11% of the global population, butaccounts for 21% of the global burden of disease. Most of this burden isborne by children of less than five years of age.• The burden of disease within the ACP-Africa region is not equallydistributed. There are large inequalities in health between and within countries.In general, the poor bear a disproportionate burden of disease.• Whilst non-communicable diseases and injuries are increasing inimportance, communicable diseases, most of which are environmentallyrelated, still take the largest toll on human health. In 1990, two-thirds of thedisease burden in ACP-Africa was attributable to communicable, maternal,perinatal and nutritional conditions. By 2020, this should drop considerably,but would still account for some 40% of the disease burden.• Injuries account for 15% of the burden of disease in ACP-Africa, and thisproportion continues to rise. Mental health problems are another neglected,but important, area for intervention.
2.1 IntroductionThe twentieth century has witnessedsubstantial improvements in global health andwell being. These improvements have not,however, been uniformly distributed. MostACP countries still lag far behind both otherdeveloping countries and the establishedmarket economies of the West with regard toindicators of health status. Environmentalfactors, often linked to poverty, remain a majorcause of sickness and death.
This Chapter provides an overview of thedemographic and health situation in the ACPcountries, with particular emphasis on ACP-Africa. It examines changes in health anddemographic patterns in the region anddiscusses how these patterns are differentfrom global developments. It then presentsscenarios for changes in the burden of diseasein ACP-Africa over the next two decades. InChapter 3, we examine the relativeimportance of environmental factors in
Chapter 2
Environmental Change and Human Health in Countries of Africa, the Caribbean and the Pacific42
determining this disease burden and discusskey health threats within an environmentalcontext.
2.2 Demographic and Health Data:Availability and Reliability
Demographic and health data give insightinto the relationships between populationstructure, and the burden of death, diseaseand disability. They also allow us to beginto analyse the relative importance ofenvironmental factors in determining healthstatus, and to examine future trends inhealth status. As the WHO has stated,however, ‘...this exercise is fraught withuncertainty. Not only is the state of death,
sickness and disability reporting veryincomplete and often arbitrary, but rarelyis any effort made to report contributingfactors, be those environmental, nutritionalor otherwise’ (World Health Organization,1997, p 133). This is particularly true forsome areas of ACP-Africa and certainCaribbean and Pacific states, where healthand demographic reporting systems areweak and, in some cases, completely absent.(See Boxes 2.1 and 2.2 on data limitationsand reliability.)
In writing this report, as much care aspossible has been taken to point outdeficiencies in the available data and toindicate where assumptions are being made.
Box 2.1 The Limitations of Health and Demographic Data in the ACPCountries
The problem of data reliability faced in compiling this report is not new. A 1957 UNreport noted that ‘Africa south of the Sahara remains to a large extent an unknowncontinent, as far as statistical information is concerned; there have been few systematicurban studies, and great difficulties have often been encountered, especially in conductingcensuses and in obtaining accurate information from sufficiently representative cross-sections of the population.’ (United Nations, 1957, p. 148). While the situation hasimproved substantially since that report was written forty years ago, there are still anumber of problems with existing data which should be noted (Murray and Lopez,1996; Phillips and Verhasselt, 1994):• Because of the poor availability of reliable, quality data over a sufficiently long timeperiod and with comprehensive geographical spread, it can be difficult to detect changeand examine trends across the region.• Data from wealthier ACP countries tends to be more complete, reliable and availableand is therefore, out of necessity, given more emphasis in this review. Generalisation oftrends from these country data to other countries in the region should be done withcaution.• For many countries only crude rather than age-adjusted mortality data are reportedas population data by age group, needed to calculate age-adjusted rates is not available.As the age structures of populations across the region is very different, crude mortalityrates may not allow for useful cross-country comparisons.• There is very little reliable data on morbidity for much of the region. Most availabledata is cross-sectional (collected at one point in time) rather than longitudinal (sequentiallycollected over a period of time), focuses on particular groups such as women and childrenand is facility- rather than population-based. This makes any assessment of the extent of,and trends in, ill health at the population level difficult.• The data available on child health is better than that available for adults (Feachem etal., 1992), due to the focus on child health by national and international agencies overthe last two decades.• Country level or regional data conceal large variations at the local level, for examplebetween different socio-economic groups within a city.
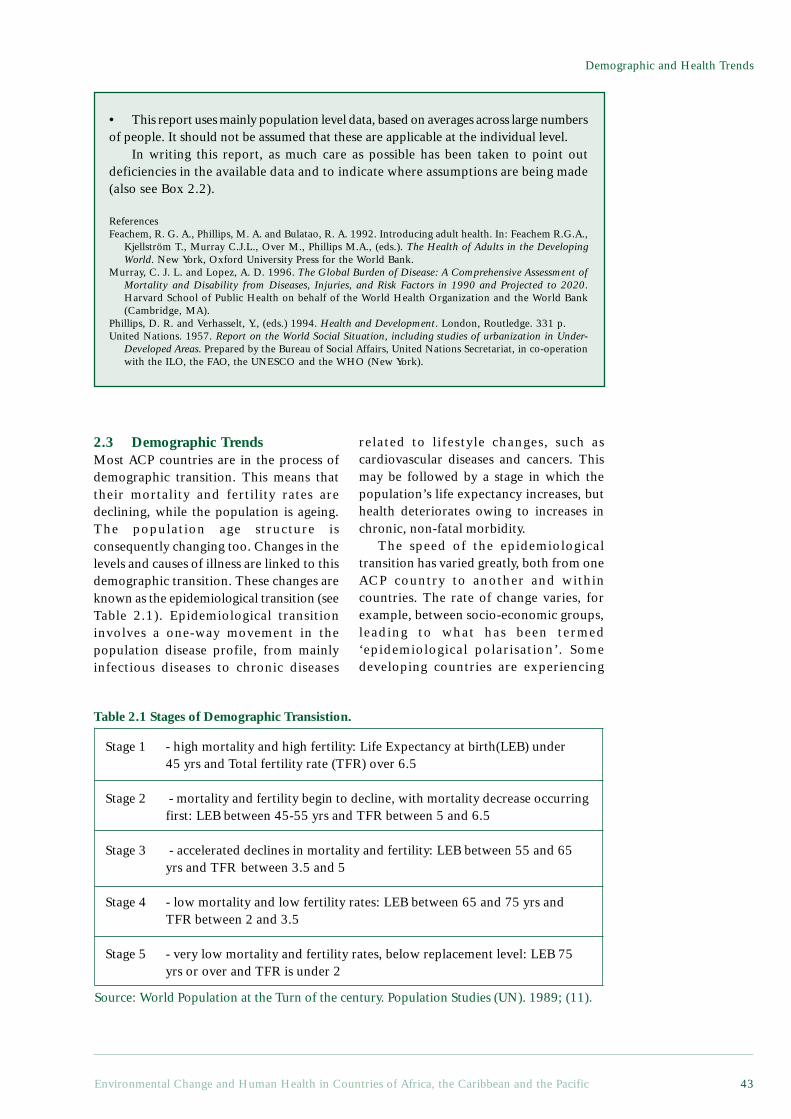
Environmental Change and Human Health in Countries of Africa, the Caribbean and the Pacific 43
Demographic and Health Trends
• This report uses mainly population level data, based on averages across large numbersof people. It should not be assumed that these are applicable at the individual level.
In writing this report, as much care as possible has been taken to point outdeficiencies in the available data and to indicate where assumptions are being made(also see Box 2.2).
ReferencesFeachem, R. G. A., Phillips, M. A. and Bulatao, R. A. 1992. Introducing adult health. In: Feachem R.G.A.,
Kjellström T., Murray C.J.L., Over M., Phillips M.A., (eds.). The Health of Adults in the DevelopingWorld. New York, Oxford University Press for the World Bank.
Murray, C. J. L. and Lopez, A. D. 1996. The Global Burden of Disease: A Comprehensive Assessment ofMortality and Disability from Diseases, Injuries, and Risk Factors in 1990 and Projected to 2020.Harvard School of Public Health on behalf of the World Health Organization and the World Bank(Cambridge, MA).
Phillips, D. R. and Verhasselt, Y., (eds.) 1994. Health and Development. London, Routledge. 331 p.United Nations. 1957. Report on the World Social Situation, including studies of urbanization in Under-
Developed Areas. Prepared by the Bureau of Social Affairs, United Nations Secretariat, in co-operationwith the ILO, the FAO, the UNESCO and the WHO (New York).
2.3 Demographic TrendsMost ACP countries are in the process ofdemographic transition. This means thattheir mortality and fertility rates aredeclining, while the population is ageing.The population age structure isconsequently changing too. Changes in thelevels and causes of illness are linked to thisdemographic transition. These changes areknown as the epidemiological transition (seeTable 2.1). Epidemiological transitioninvolves a one-way movement in thepopulation disease profile, from mainlyinfectious diseases to chronic diseases
related to lifestyle changes, such ascardiovascular diseases and cancers. Thismay be followed by a stage in which thepopulation’s life expectancy increases, buthealth deteriorates owing to increases inchronic, non-fatal morbidity.
The speed of the epidemiologicaltransition has varied greatly, both from oneACP country to another and withincountries. The rate of change varies, forexample, between socio-economic groups,leading to what has been termed‘epidemiological polarisation’. Somedeveloping countries are experiencing
Stage 1 - high mortality and high fertility: Life Expectancy at birth(LEB) under45 yrs and Total fertility rate (TFR) over 6.5
Stage 2 - mortality and fertility begin to decline, with mortality decrease occurringfirst: LEB between 45-55 yrs and TFR between 5 and 6.5
Stage 3 - accelerated declines in mortality and fertility: LEB between 55 and 65yrs and TFR between 3.5 and 5
Stage 4 - low mortality and low fertility rates: LEB between 65 and 75 yrs andTFR between 2 and 3.5
Stage 5 - very low mortality and fertility rates, below replacement level: LEB 75yrs or over and TFR is under 2
Table 2.1 Stages of Demographic Transistion.
Source: World Population at the Turn of the century. Population Studies (UN). 1989; (11).
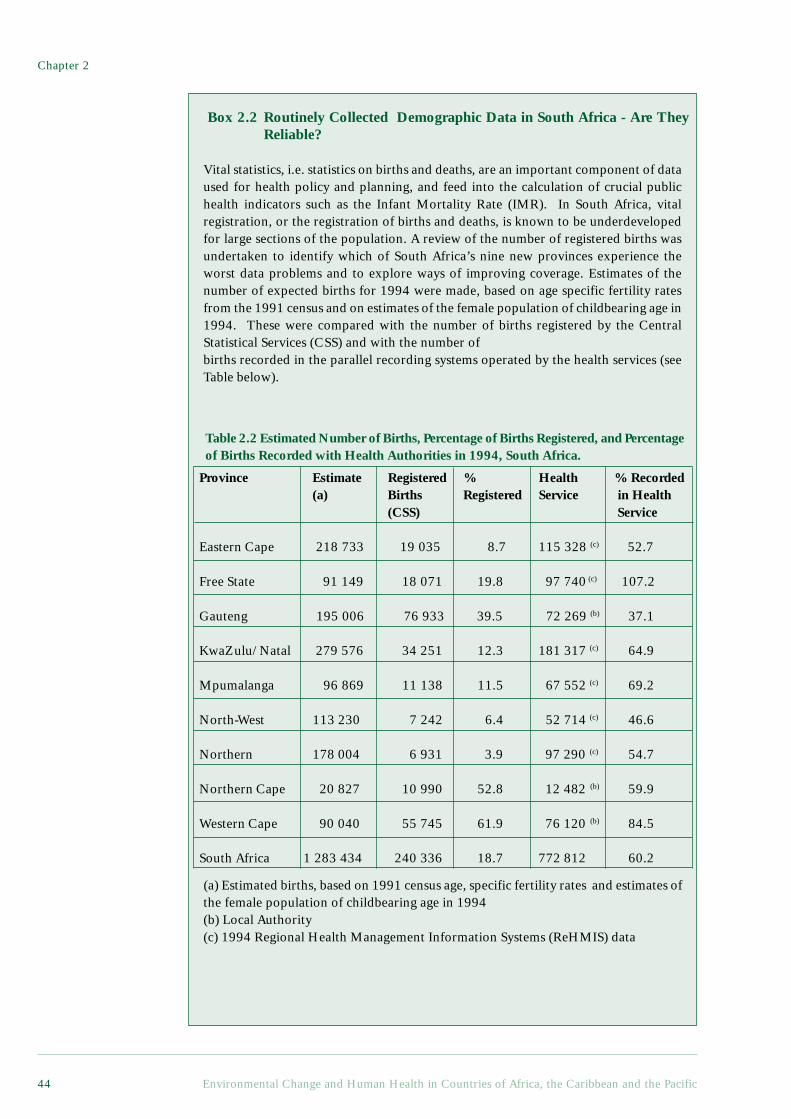
Chapter 2
Environmental Change and Human Health in Countries of Africa, the Caribbean and the Pacific44
Box 2.2 Routinely Collected Demographic Data in South Africa - Are TheyReliable?
Vital statistics, i.e. statistics on births and deaths, are an important component of dataused for health policy and planning, and feed into the calculation of crucial publichealth indicators such as the Infant Mortality Rate (IMR). In South Africa, vitalregistration, or the registration of births and deaths, is known to be underdevelopedfor large sections of the population. A review of the number of registered births wasundertaken to identify which of South Africa’s nine new provinces experience theworst data problems and to explore ways of improving coverage. Estimates of thenumber of expected births for 1994 were made, based on age specific fertility ratesfrom the 1991 census and on estimates of the female population of childbearing age in1994. These were compared with the number of births registered by the CentralStatistical Services (CSS) and with the number ofbirths recorded in the parallel recording systems operated by the health services (seeTable below).
(a) Estimated births, based on 1991 census age, specific fertility rates and estimates ofthe female population of childbearing age in 1994(b) Local Authority(c) 1994 Regional Health Management Information Systems (ReHMIS) data
Table 2.2 Estimated Number of Births, Percentage of Births Registered, and Percentageof Births Recorded with Health Authorities in 1994, South Africa.
Province Estimate Registered % Health % Recorded(a) Births Registered Service in Health
(CSS) Service
Eastern Cape 218 733 19 035 8.7 115 328 (c) 52.7
Free State 91 149 18 071 19.8 97 740 (c) 107.2
Gauteng 195 006 76 933 39.5 72 269 (b) 37.1
KwaZulu/ Natal 279 576 34 251 12.3 181 317 (c) 64.9
Mpumalanga 96 869 11 138 11.5 67 552 (c) 69.2
North-West 113 230 7 242 6.4 52 714 (c) 46.6
Northern 178 004 6 931 3.9 97 290 (c) 54.7
Northern Cape 20 827 10 990 52.8 12 482 (b) 59.9
Western Cape 90 040 55 745 61.9 76 120 (b) 84.5
South Africa 1 283 434 240 336 18.7 772 812 60.2
Environmental Change and Human Health in Countries of Africa, the Caribbean and the Pacific 45
Demographic and Health Trends
many ACP countries, income and landdistributions are extremely inequitable. Forcountries in ACP-Africa for which data areavailable, the richest 20% of thepopulation earn about 50% of thecountry’s income while the poorest 20%of the population earn, on average, lessthan 10% of the country’s income (WorldResources Institute, 1998).
This maldistribution exacerbates theimpacts of low average incomes andgenerally inadequate access to basic services,even where per capita GDP iscommensurate with middle incomecountries. South Africa, for example,although classified as an upper middleincome country, shows high levels ofinequality, with 65% of wealth held by 20%of the population, whilst the remainder havepoorer access to resources (World Bank,1997; World Resources Institute, 1998).
The table shows that the completeness of birth registration is very poor, with only19% of births registered by the CSS. It also demonstrates that provincial registrationsystems are not equally developed, resulting in substantial variance in coverage acrossthe provinces. Comparison with the number of births recorded by the health servicesindicates that there would be an improvement in recording of over 300% if the birthsrecorded through the health services were to be included in the registration system.Because vital registration data is incomplete, it is difficult to calculate indicators suchas the IMR accurately.
How can these problems with routinely collected vital registration data be resolved?Survey data may provide a mechanism for estimating mortality levels. The firstDemographic and Health Survey (DHS) has recently been conducted in South Africaand will provide reliable infant, childhood and adult mortality rates.
Until routinely available statistics are adequate, developing countries, many ofwhich have even poorer births and deaths data than South Africa, will have to rely onsurveys such as these. Concurrently, there is a need in the longer term to improve theaccuracy and coverage of the existing vital registration system. This issue has beenrecognised within South Africa, and provincial technical committees are currentlyinvestigating improved mechanisms for births and deaths registration (Bradshaw et al1998).
Contributed by Nadine Nannan and Debbie Bradshaw, Centre for EpidemiologicalResearch in Southern Africa, Medical Research Council of South Africa.
ReferencesBradshaw D, Kielkowsky D, Sitas F. 1998. New birth and death registration forms – a foundation for the
future, a challenge for health workers? S Afr Med J. 88(8):971-4.
‘delayed transition’ in which lifeexpectancy increases while infectiousdiseases remain significant (Phillips andVerhasselt, 1994). Epidemiologicaltransition is, in turn, linked to changes inthe types of risk present in theenvironment. Environmental changeswhich reduce the risk of infectious diseasesof poverty, such as diarrhoeal disease andacute respiratory tract infections, butincrease the risk of other diseases, such ascancers, contribute to the changes in thepopulation disease profile described above.
As indicated in Chapter 1, whilstpopulation growth in the ACP countries ishigher than that in other regions, it is notnecessarily increasing populations thatpose a problem to providing adequateenvironmental and health services.Unequal resource distribution, including ofincome and land, is more important. For
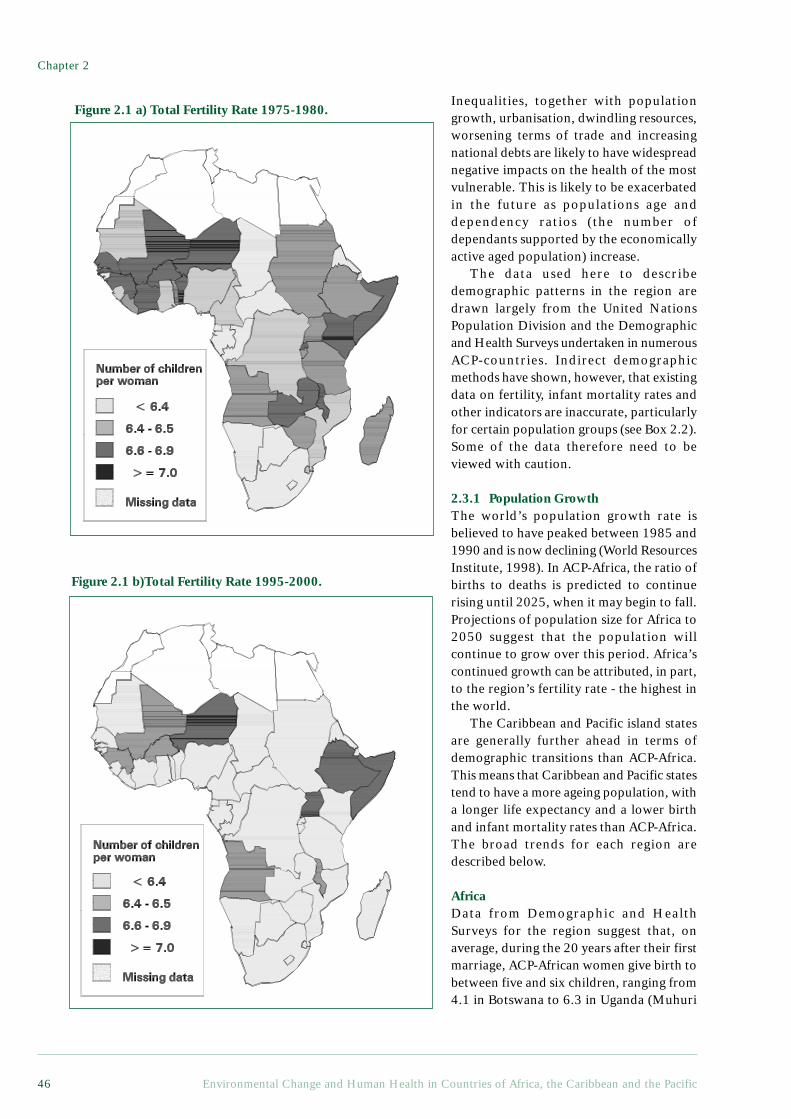
Chapter 2
Environmental Change and Human Health in Countries of Africa, the Caribbean and the Pacific46
Inequalities, together with populationgrowth, urbanisation, dwindling resources,worsening terms of trade and increasingnational debts are likely to have widespreadnegative impacts on the health of the mostvulnerable. This is likely to be exacerbatedin the future as populations age anddependency ratios (the number ofdependants supported by the economicallyactive aged population) increase.
The data used here to describedemographic patterns in the region aredrawn largely from the United NationsPopulation Division and the Demographicand Health Surveys undertaken in numerousACP-countries. Indirect demographicmethods have shown, however, that existingdata on fertility, infant mortality rates andother indicators are inaccurate, particularlyfor certain population groups (see Box 2.2).Some of the data therefore need to beviewed with caution.
2.3.1 Population GrowthThe world’s population growth rate isbelieved to have peaked between 1985 and1990 and is now declining (World ResourcesInstitute, 1998). In ACP-Africa, the ratio ofbirths to deaths is predicted to continuerising until 2025, when it may begin to fall.Projections of population size for Africa to2050 suggest that the population willcontinue to grow over this period. Africa’scontinued growth can be attributed, in part,to the region’s fertility rate - the highest inthe world.
The Caribbean and Pacific island statesare generally further ahead in terms ofdemographic transitions than ACP-Africa.This means that Caribbean and Pacific statestend to have a more ageing population, witha longer life expectancy and a lower birthand infant mortality rates than ACP-Africa.The broad trends for each region aredescribed below.
AfricaData from Demographic and HealthSurveys for the region suggest that, onaverage, during the 20 years after their firstmarriage, ACP-African women give birth tobetween five and six children, ranging from4.1 in Botswana to 6.3 in Uganda (Muhuri
Figure 2.1 a) Total Fertility Rate 1975-1980.
Figure 2.1 b)Total Fertility Rate 1995-2000.
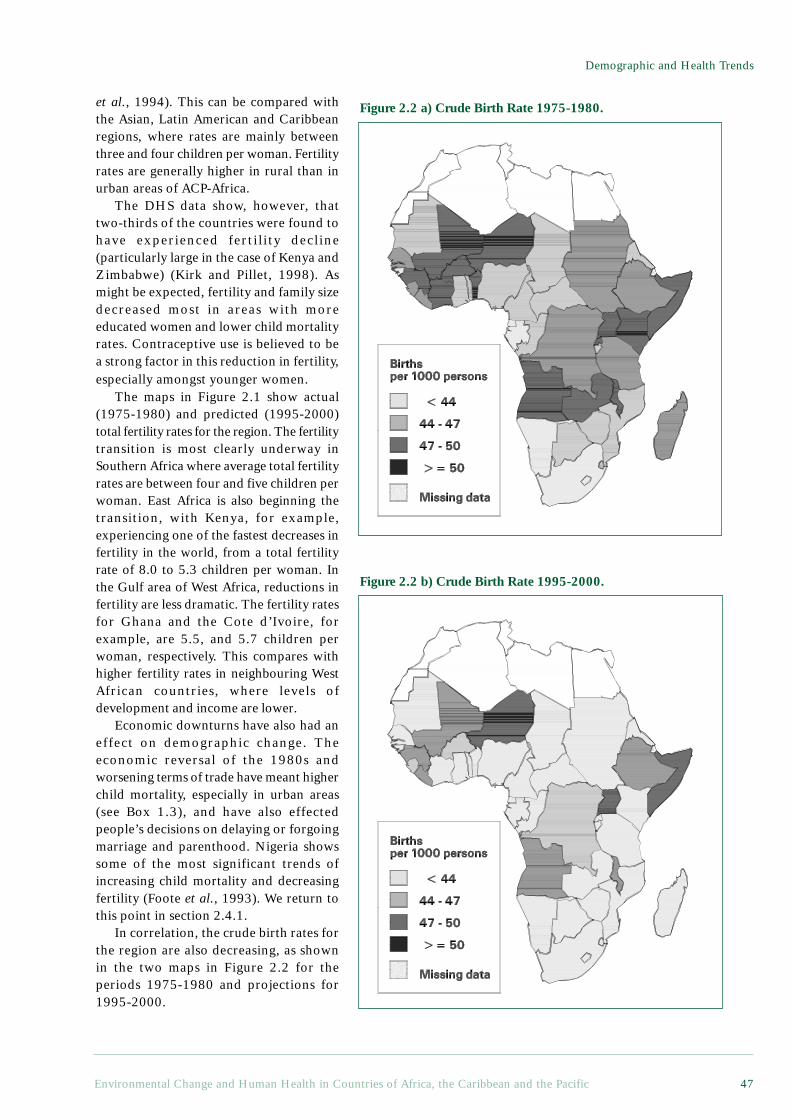
Environmental Change and Human Health in Countries of Africa, the Caribbean and the Pacific 47
Demographic and Health Trends
et al., 1994). This can be compared withthe Asian, Latin American and Caribbeanregions, where rates are mainly betweenthree and four children per woman. Fertilityrates are generally higher in rural than inurban areas of ACP-Africa.
The DHS data show, however, thattwo-thirds of the countries were found tohave experienced ferti l ity decline(particularly large in the case of Kenya andZimbabwe) (Kirk and Pillet, 1998). Asmight be expected, fertility and family sizedecreased most in areas with moreeducated women and lower child mortalityrates. Contraceptive use is believed to bea strong factor in this reduction in fertility,especially amongst younger women.
The maps in Figure 2.1 show actual(1975-1980) and predicted (1995-2000)total fertility rates for the region. The fertilitytransition is most clearly underway inSouthern Africa where average total fertilityrates are between four and five children perwoman. East Africa is also beginning thetransition, with Kenya, for example,experiencing one of the fastest decreases infertility in the world, from a total fertilityrate of 8.0 to 5.3 children per woman. Inthe Gulf area of West Africa, reductions infertility are less dramatic. The fertility ratesfor Ghana and the Cote d’Ivoire, forexample, are 5.5, and 5.7 children perwoman, respectively. This compares withhigher fertility rates in neighbouring WestAfrican countries, where levels ofdevelopment and income are lower.
Economic downturns have also had aneffect on demographic change. Theeconomic reversal of the 1980s andworsening terms of trade have meant higherchild mortality, especially in urban areas(see Box 1.3), and have also effectedpeople’s decisions on delaying or forgoingmarriage and parenthood. Nigeria showssome of the most significant trends ofincreasing child mortality and decreasingfertility (Foote et al., 1993). We return tothis point in section 2.4.1.
In correlation, the crude birth rates forthe region are also decreasing, as shownin the two maps in Figure 2.2 for theperiods 1975-1980 and projections for1995-2000.
Figure 2.2 a) Crude Birth Rate 1975-1980.
Figure 2.2 b) Crude Birth Rate 1995-2000.
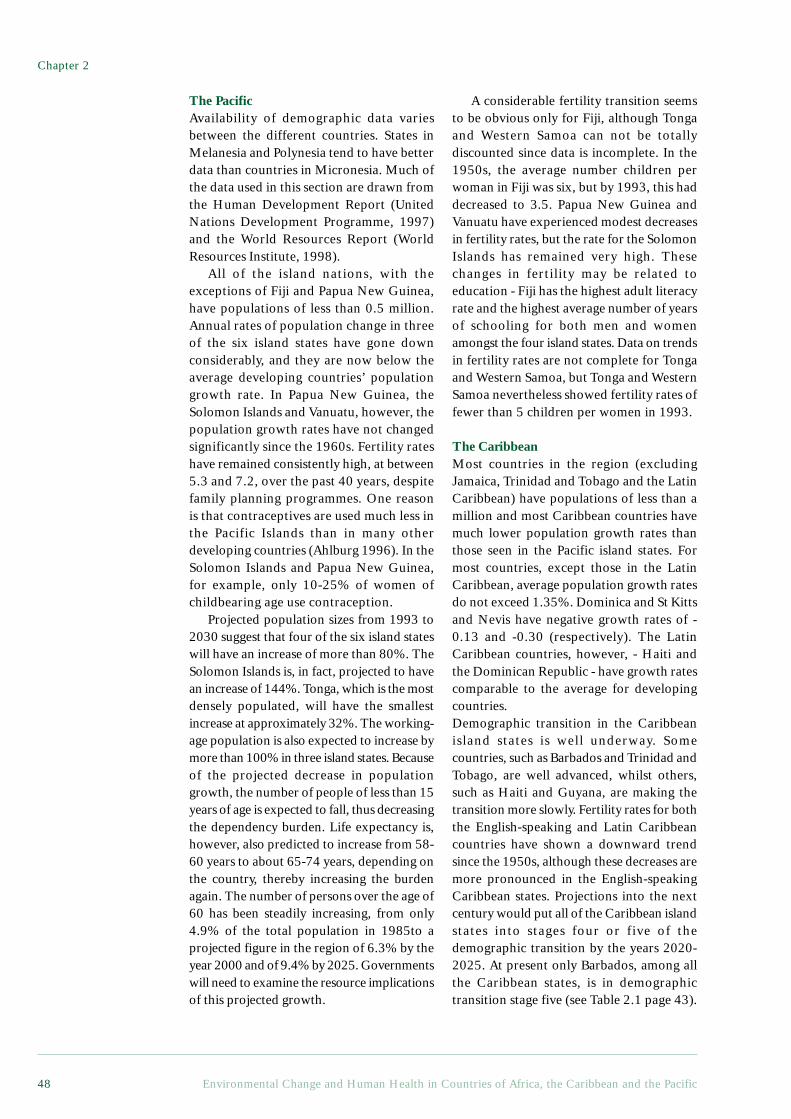
Chapter 2
Environmental Change and Human Health in Countries of Africa, the Caribbean and the Pacific48
The PacificAvailability of demographic data variesbetween the different countries. States inMelanesia and Polynesia tend to have betterdata than countries in Micronesia. Much ofthe data used in this section are drawn fromthe Human Development Report (UnitedNations Development Programme, 1997)and the World Resources Report (WorldResources Institute, 1998).
All of the island nations, with theexceptions of Fiji and Papua New Guinea,have populations of less than 0.5 million.Annual rates of population change in threeof the six island states have gone downconsiderably, and they are now below theaverage developing countries’ populationgrowth rate. In Papua New Guinea, theSolomon Islands and Vanuatu, however, thepopulation growth rates have not changedsignificantly since the 1960s. Fertility rateshave remained consistently high, at between5.3 and 7.2, over the past 40 years, despitefamily planning programmes. One reasonis that contraceptives are used much less inthe Pacific Islands than in many otherdeveloping countries (Ahlburg 1996). In theSolomon Islands and Papua New Guinea,for example, only 10-25% of women ofchildbearing age use contraception.
Projected population sizes from 1993 to2030 suggest that four of the six island stateswill have an increase of more than 80%. TheSolomon Islands is, in fact, projected to havean increase of 144%. Tonga, which is the mostdensely populated, will have the smallestincrease at approximately 32%. The working-age population is also expected to increase bymore than 100% in three island states. Becauseof the projected decrease in populationgrowth, the number of people of less than 15years of age is expected to fall, thus decreasingthe dependency burden. Life expectancy is,however, also predicted to increase from 58-60 years to about 65-74 years, depending onthe country, thereby increasing the burdenagain. The number of persons over the age of60 has been steadily increasing, from only4.9% of the total population in 1985to aprojected figure in the region of 6.3% by theyear 2000 and of 9.4% by 2025. Governmentswill need to examine the resource implicationsof this projected growth.
A considerable fertility transition seemsto be obvious only for Fiji, although Tongaand Western Samoa can not be totallydiscounted since data is incomplete. In the1950s, the average number children perwoman in Fiji was six, but by 1993, this haddecreased to 3.5. Papua New Guinea andVanuatu have experienced modest decreasesin fertility rates, but the rate for the SolomonIslands has remained very high. Thesechanges in fertility may be related toeducation - Fiji has the highest adult literacyrate and the highest average number of yearsof schooling for both men and womenamongst the four island states. Data on trendsin fertility rates are not complete for Tongaand Western Samoa, but Tonga and WesternSamoa nevertheless showed fertility rates offewer than 5 children per women in 1993.
The CaribbeanMost countries in the region (excludingJamaica, Trinidad and Tobago and the LatinCaribbean) have populations of less than amillion and most Caribbean countries havemuch lower population growth rates thanthose seen in the Pacific island states. Formost countries, except those in the LatinCaribbean, average population growth ratesdo not exceed 1.35%. Dominica and St Kittsand Nevis have negative growth rates of -0.13 and -0.30 (respectively). The LatinCaribbean countries, however, - Haiti andthe Dominican Republic - have growth ratescomparable to the average for developingcountries.Demographic transition in the Caribbeanisland states is well underway. Somecountries, such as Barbados and Trinidad andTobago, are well advanced, whilst others,such as Haiti and Guyana, are making thetransition more slowly. Fertility rates for boththe English-speaking and Latin Caribbeancountries have shown a downward trendsince the 1950s, although these decreases aremore pronounced in the English-speakingCaribbean states. Projections into the nextcentury would put all of the Caribbean islandstates into stages four or five of thedemographic transition by the years 2020-2025. At present only Barbados, among allthe Caribbean states, is in demographictransition stage five (see Table 2.1 page 43).
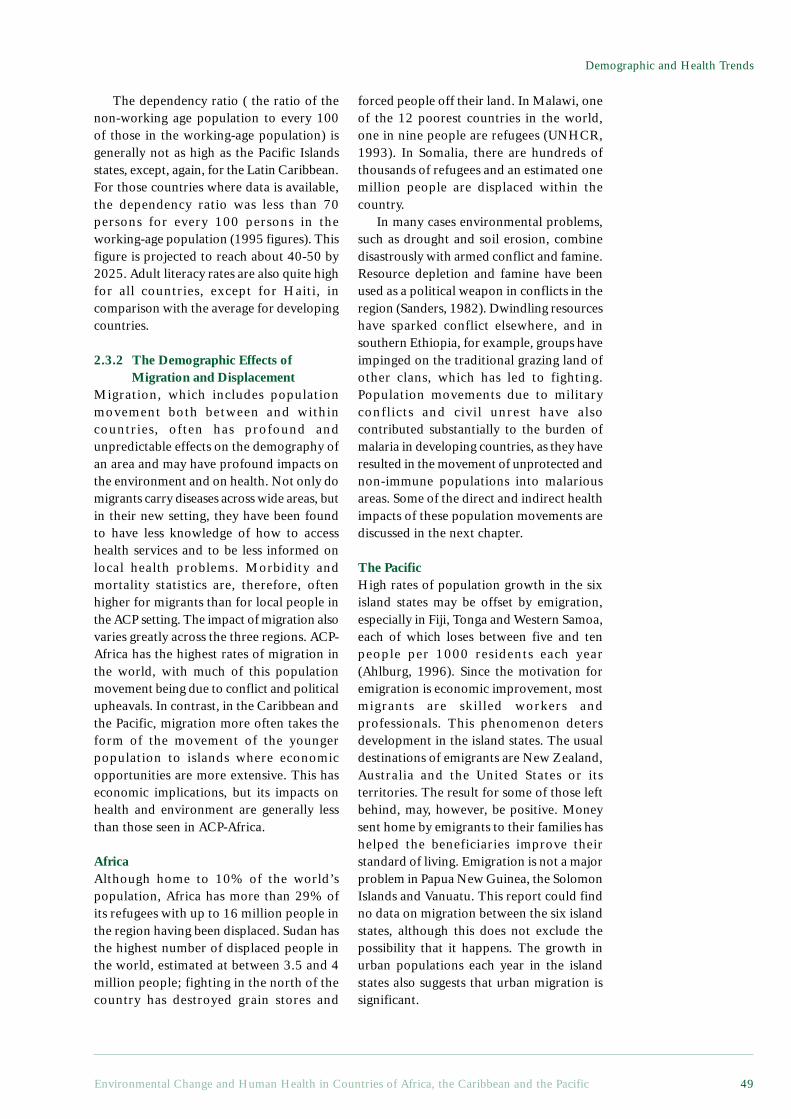
Environmental Change and Human Health in Countries of Africa, the Caribbean and the Pacific 49
Demographic and Health Trends
The dependency ratio ( the ratio of thenon-working age population to every 100of those in the working-age population) isgenerally not as high as the Pacific Islandsstates, except, again, for the Latin Caribbean.For those countries where data is available,the dependency ratio was less than 70persons for every 100 persons in theworking-age population (1995 figures). Thisfigure is projected to reach about 40-50 by2025. Adult literacy rates are also quite highfor all countries, except for Haiti, incomparison with the average for developingcountries.
2.3.2 The Demographic Effects ofMigration and Displacement
Migration, which includes populationmovement both between and withincountries, often has profound andunpredictable effects on the demography ofan area and may have profound impacts onthe environment and on health. Not only domigrants carry diseases across wide areas, butin their new setting, they have been foundto have less knowledge of how to accesshealth services and to be less informed onlocal health problems. Morbidity andmortality statistics are, therefore, oftenhigher for migrants than for local people inthe ACP setting. The impact of migration alsovaries greatly across the three regions. ACP-Africa has the highest rates of migration inthe world, with much of this populationmovement being due to conflict and politicalupheavals. In contrast, in the Caribbean andthe Pacific, migration more often takes theform of the movement of the youngerpopulation to islands where economicopportunities are more extensive. This haseconomic implications, but its impacts onhealth and environment are generally lessthan those seen in ACP-Africa.
AfricaAlthough home to 10% of the world’spopulation, Africa has more than 29% ofits refugees with up to 16 million people inthe region having been displaced. Sudan hasthe highest number of displaced people inthe world, estimated at between 3.5 and 4million people; fighting in the north of thecountry has destroyed grain stores and
forced people off their land. In Malawi, oneof the 12 poorest countries in the world,one in nine people are refugees (UNHCR,1993). In Somalia, there are hundreds ofthousands of refugees and an estimated onemillion people are displaced within thecountry.
In many cases environmental problems,such as drought and soil erosion, combinedisastrously with armed conflict and famine.Resource depletion and famine have beenused as a political weapon in conflicts in theregion (Sanders, 1982). Dwindling resourceshave sparked conflict elsewhere, and insouthern Ethiopia, for example, groups haveimpinged on the traditional grazing land ofother clans, which has led to fighting.Population movements due to militaryconflicts and civil unrest have alsocontributed substantially to the burden ofmalaria in developing countries, as they haveresulted in the movement of unprotected andnon-immune populations into malariousareas. Some of the direct and indirect healthimpacts of these population movements arediscussed in the next chapter.
The PacificHigh rates of population growth in the sixisland states may be offset by emigration,especially in Fiji, Tonga and Western Samoa,each of which loses between five and tenpeople per 1000 residents each year(Ahlburg, 1996). Since the motivation foremigration is economic improvement, mostmigrants are skilled workers andprofessionals. This phenomenon detersdevelopment in the island states. The usualdestinations of emigrants are New Zealand,Australia and the United States or itsterritories. The result for some of those leftbehind, may, however, be positive. Moneysent home by emigrants to their families hashelped the beneficiaries improve theirstandard of living. Emigration is not a majorproblem in Papua New Guinea, the SolomonIslands and Vanuatu. This report could findno data on migration between the six islandstates, although this does not exclude thepossibility that it happens. The growth inurban populations each year in the islandstates also suggests that urban migration issignificant.
Chapter 2
Environmental Change and Human Health in Countries of Africa, the Caribbean and the Pacific50
The CaribbeanEmigration is a common phenomenon inthe region. The PAHO Health ConditionsReport (PAHO, 1997) suggests thatcountries with larger populations, such asthe Dominican Republic, Haiti and Jamaica,are most affected by the socio-economicimpacts of emigration. In most countries,however, a negative migration balanceexists, i.e. a number of nationals born inthe country live abroad. The countrieswhich have a negative migration balance ofmore than 50% are: Dominica, St Kitts andNevis, and St Vincent and Grenadines.Antigua and Barbuda, Barbados, Guyana,Jamaica, and St Lucia have a negativemigration balance of between 30% and50%. The most common destination formigrants is the United States.
2.4 Health Trends
2.4.1 The State of HealthThe demographic transition has resulted inthe rapid ageing of developing countrypopulations and an increase in the numberof adults relative to the number of children.These changes, described in more detailabove, are expected to produce significantchanges in patterns of deaths and in theglobal burden of disease for countries inAfrica, the Caribbean and the Pacific. In thesections below, data on life expectancy andon deaths overall, and for specific agegroups, are examined for the ACPcountries.
Life ExpectancyLife expectancy at birth in one of the keymeasures that policy-makers use to assesshuman development. Based on lifeexpectancy, it would appear that healthconditions globally and in the ACP countrieshave improved substantially in the past 50years. The maps in Figure 2.3 show how lifeexpectancy varies across the region.
In ACP-Africa, life expectancy hasincreased from 36 to 52 years and thereappear to have been large reductions ininfant mortality rates — also see Figure 2.6for infant mortality rate trends for selectedACP countries and Figure 2.4 for death ratesfor ACP-Africa from 1955-2025 (World
Figure 2.3 a) Life Expectancy at Birth 1975-1980.
Figure 2.3 b) Life Expectancy at Birth 1995-2000.
Environmental Change and Human Health in Countries of Africa, the Caribbean and the Pacific 51
Demographic and Health Trends
Health Organization, 1998; WorldResources Institute, 1998). In the Caribbeanand Pacific Islands, life expectancy at birthfor males and females is comparable to thatin developed countries and considerablyhigher than in most developing countries.Only Haiti and Papua New Guinea, wherelife expectancy is lower, are exceptions tothis rule. The gains in life expectancy atbirth during the past 30 years have beenconsiderable- from about 50 years to on theorder of 65-70 years in most Caribbeanstates. As expected, female life expectancyis much higher than male life expectancy inboth the Caribbean and the Pacific.
While these trends in life expectancy areencouraging, there are now worrying signsthat these gains are being eroded. There aretwo primary reasons for this: the economicreversals experienced by many ACPcountries over the last decade and the spreadof the HIV/AIDS epidemic. For countriesin ACP-Africa which have experiencedeconomic reversals, there are someindications of an acute deterioration inhealth status, such as increasing rates ofwasting in children under five years of ageand increasing maternal mortality rates(Bijlmakers et al., 1996a; Bijlmakers et al.,1996b; Stewart, 1995; Watkins, 1995) (seechapter 1). Evidence of deterioration inindicators that measure longer-term healthimpacts, such as life expectancy, however,is more difficult to establish, as the effectsof economic reversals on health status mayonly become apparent several decades afterthe event. It is puzzling that these long termdeclines in mortality rates have been soresilient in the face of widespread erosionof socio-economic conditions in manydeveloping countries. Many theories havebeen advanced for understanding thesedeclines, and examined the importance ofincome, food and modern healthtechnology, socio-cultural changes and thebuild-up or depletion of a society’s healthstocks and assets (Murray and Chen, 1993).Whilst the relative importance of thesedifferent factors is not yet clear, it isimportant to note these trends and theirclose relationship to the demographic trendsdescribed above (Lee and Bastemeijer,1991).
The impacts of HIV/AIDS on lifeexpectancy are now becoming evident andconstitute a substantial threat todevelopment (UNAIDS, 1998). Extradeaths from AIDS among children andyoung adults, is expected to lead to a fallin life expectancy in countries where HIVprevalence is high. The data from ninecountries with an adult HIV prevalence of10% or more (Botswana, Kenya, Malawi,Mozambique, Namibia, Rwanda, SouthAfrica, Zambia and Zimbabwe), indicatethat HIV/AIDS will, on average, lead to adecrease in life expectancy of 17 years. By2010-2015 life expectancy will regress toan average of 47 years, in comparison withthe 64 years which would be expected inthe absence of HIV/AIDS (UNAIDS, 1998).There are also indications that HIV/AIDSwill contribute substantially to rising childmortality rates in many ACP-Africacountries, as discussed in Section 2.4.1.
DeathsThere are a number of different ways inwhich deaths can be classified. For thisreport, the classification of Murray andLopez (1996a) has been used, as it isrelatively simple, reflects the relationshipsbetween deaths and the epidemiologicaltransition, and is widely usedinternationally. Under this system, classifieddeaths are broken down into three broadcause groups:
Group I: Communicable, maternal,perinatal and nutritionalconditions;
Group II: Non-communicable diseases;Group III: Injuries.
It should be noted that this classificationreflects the bio-medical model of disease.In Chapter 3 we attempt to place thisclassification within an environmentalcontext by examining the importance ofenvironmental risk factors in determiningthe burden of disease across thesecategories.
In ACP-African countries, Group Icauses of death still account for 65% ofdeaths—the highest proportion of anyregion of the world. For the Caribbean,
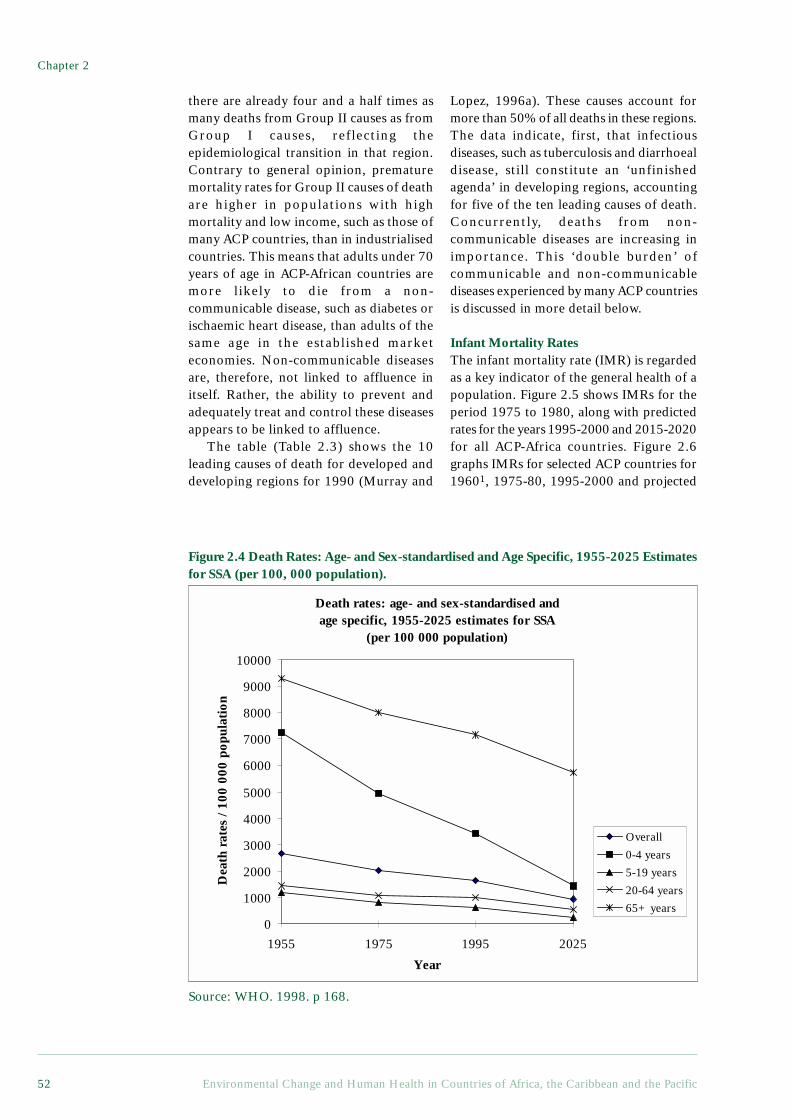
Chapter 2
Environmental Change and Human Health in Countries of Africa, the Caribbean and the Pacific52
Death rates: age- and sex-standardised and age specific, 1955-2025 estimates for SSA
(per 100 000 population)
0
1000
2000
3000
4000
5000
6000
7000
8000
9000
10000
1955 1975 1995 2025
Year
Dea
th r
ates
/ 10
0 00
0 po
pula
tion
Overall
0-4 years
5-19 years
20-64 years
65+ years
there are already four and a half times asmany deaths from Group II causes as fromGroup I causes, reflecting theepidemiological transition in that region.Contrary to general opinion, prematuremortality rates for Group II causes of deathare higher in populations with highmortality and low income, such as those ofmany ACP countries, than in industrialisedcountries. This means that adults under 70years of age in ACP-African countries aremore likely to die from a non-communicable disease, such as diabetes orischaemic heart disease, than adults of thesame age in the established marketeconomies. Non-communicable diseasesare, therefore, not linked to affluence initself. Rather, the ability to prevent andadequately treat and control these diseasesappears to be linked to affluence.
The table (Table 2.3) shows the 10leading causes of death for developed anddeveloping regions for 1990 (Murray and
Lopez, 1996a). These causes account formore than 50% of all deaths in these regions.The data indicate, first, that infectiousdiseases, such as tuberculosis and diarrhoealdisease, still constitute an ‘unfinishedagenda’ in developing regions, accountingfor five of the ten leading causes of death.Concurrently, deaths from non-communicable diseases are increasing inimportance. This ‘double burden’ ofcommunicable and non-communicablediseases experienced by many ACP countriesis discussed in more detail below.
Infant Mortality RatesThe infant mortality rate (IMR) is regardedas a key indicator of the general health of apopulation. Figure 2.5 shows IMRs for theperiod 1975 to 1980, along with predictedrates for the years 1995-2000 and 2015-2020for all ACP-Africa countries. Figure 2.6graphs IMRs for selected ACP countries for19601, 1975-80, 1995-2000 and projected
Figure 2.4 Death Rates: Age- and Sex-standardised and Age Specific, 1955-2025 Estimatesfor SSA (per 100, 000 population).
Source: WHO. 1998. p 168.
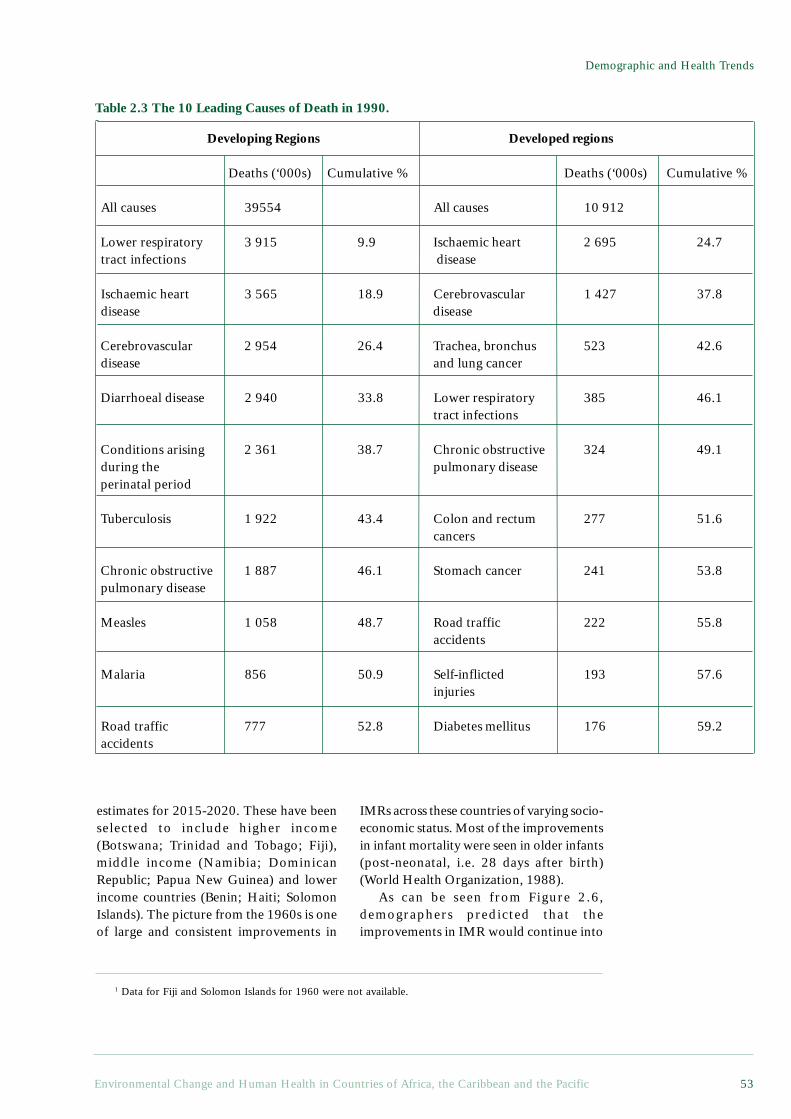
Environmental Change and Human Health in Countries of Africa, the Caribbean and the Pacific 53
Demographic and Health Trends
Developing Regions Developed regions
Deaths (‘000s) Cumulative % Deaths (‘000s) Cumulative %
All causes 39554 All causes 10 912
Lower respiratory 3 915 9.9 Ischaemic heart 2 695 24.7 tract infections disease
Ischaemic heart 3 565 18.9 Cerebrovascular 1 427 37.8 disease disease
Cerebrovascular 2 954 26.4 Trachea, bronchus 523 42.6 disease and lung cancer
Diarrhoeal disease 2 940 33.8 Lower respiratory 385 46.1tract infections
Conditions arising 2 361 38.7 Chronic obstructive 324 49.1 during the pulmonary disease perinatal period
Tuberculosis 1 922 43.4 Colon and rectum 277 51.6cancers
Chronic obstructive 1 887 46.1 Stomach cancer 241 53.8 pulmonary disease
Measles 1 058 48.7 Road traffic 222 55.8accidents
Malaria 856 50.9 Self-inflicted 193 57.6injuries
Road traffic 777 52.8 Diabetes mellitus 176 59.2 accidents
1 Data for Fiji and Solomon Islands for 1960 were not available.
estimates for 2015-2020. These have beenselected to include higher income(Botswana; Trinidad and Tobago; Fiji),middle income (Namibia; DominicanRepublic; Papua New Guinea) and lowerincome countries (Benin; Haiti; SolomonIslands). The picture from the 1960s is oneof large and consistent improvements in
IMRs across these countries of varying socio-economic status. Most of the improvementsin infant mortality were seen in older infants(post-neonatal, i.e. 28 days after birth)(World Health Organization, 1988).
As can be seen from Figure 2.6,demographers predicted that theimprovements in IMR would continue into
Table 2.3 The 10 Leading Causes of Death in 1990.
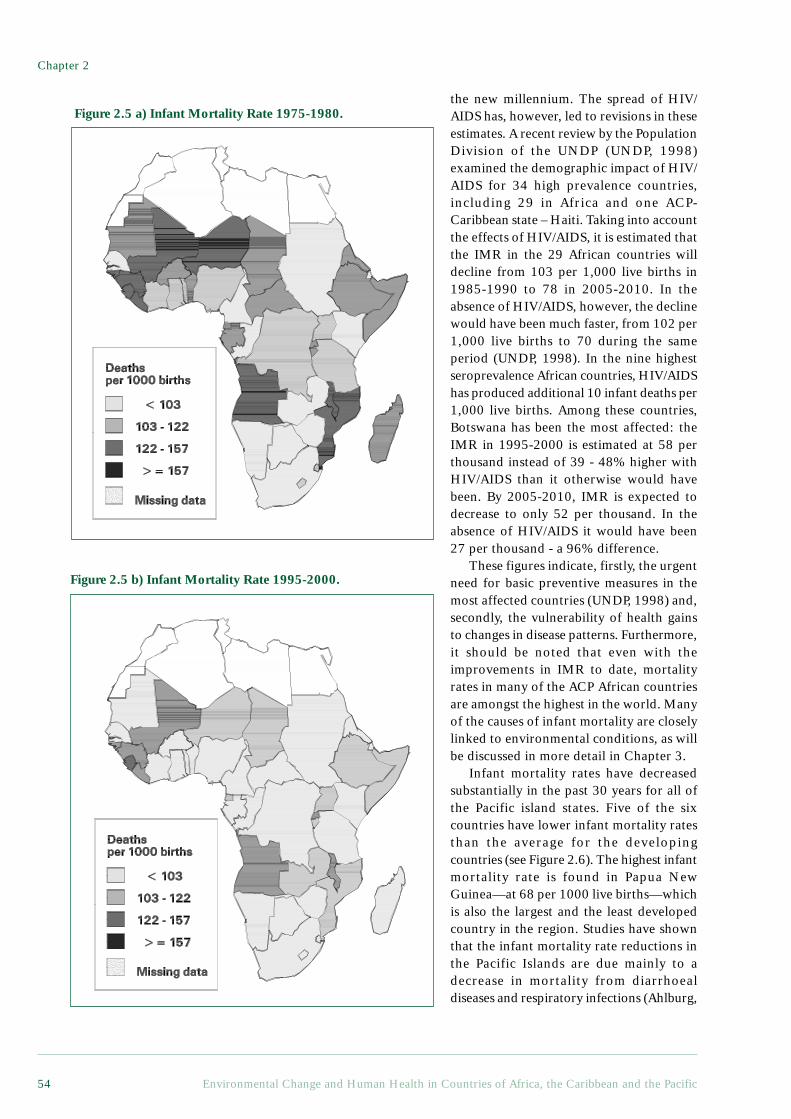
Chapter 2
Environmental Change and Human Health in Countries of Africa, the Caribbean and the Pacific54
the new millennium. The spread of HIV/AIDS has, however, led to revisions in theseestimates. A recent review by the PopulationDivision of the UNDP (UNDP, 1998)examined the demographic impact of HIV/AIDS for 34 high prevalence countries,including 29 in Africa and one ACP-Caribbean state – Haiti. Taking into accountthe effects of HIV/AIDS, it is estimated thatthe IMR in the 29 African countries willdecline from 103 per 1,000 live births in1985-1990 to 78 in 2005-2010. In theabsence of HIV/AIDS, however, the declinewould have been much faster, from 102 per1,000 live births to 70 during the sameperiod (UNDP, 1998). In the nine highestseroprevalence African countries, HIV/AIDShas produced additional 10 infant deaths per1,000 live births. Among these countries,Botswana has been the most affected: theIMR in 1995-2000 is estimated at 58 perthousand instead of 39 - 48% higher withHIV/AIDS than it otherwise would havebeen. By 2005-2010, IMR is expected todecrease to only 52 per thousand. In theabsence of HIV/AIDS it would have been27 per thousand - a 96% difference.
These figures indicate, firstly, the urgentneed for basic preventive measures in themost affected countries (UNDP, 1998) and,secondly, the vulnerability of health gainsto changes in disease patterns. Furthermore,it should be noted that even with theimprovements in IMR to date, mortalityrates in many of the ACP African countriesare amongst the highest in the world. Manyof the causes of infant mortality are closelylinked to environmental conditions, as willbe discussed in more detail in Chapter 3.
Infant mortality rates have decreasedsubstantially in the past 30 years for all ofthe Pacific island states. Five of the sixcountries have lower infant mortality ratesthan the average for the developingcountries (see Figure 2.6). The highest infantmortality rate is found in Papua NewGuinea—at 68 per 1000 live births—whichis also the largest and the least developedcountry in the region. Studies have shownthat the infant mortality rate reductions inthe Pacific Islands are due mainly to adecrease in mortality from diarrhoealdiseases and respiratory infections (Ahlburg,
Figure 2.5 b) Infant Mortality Rate 1995-2000.
Figure 2.5 a) Infant Mortality Rate 1975-1980.
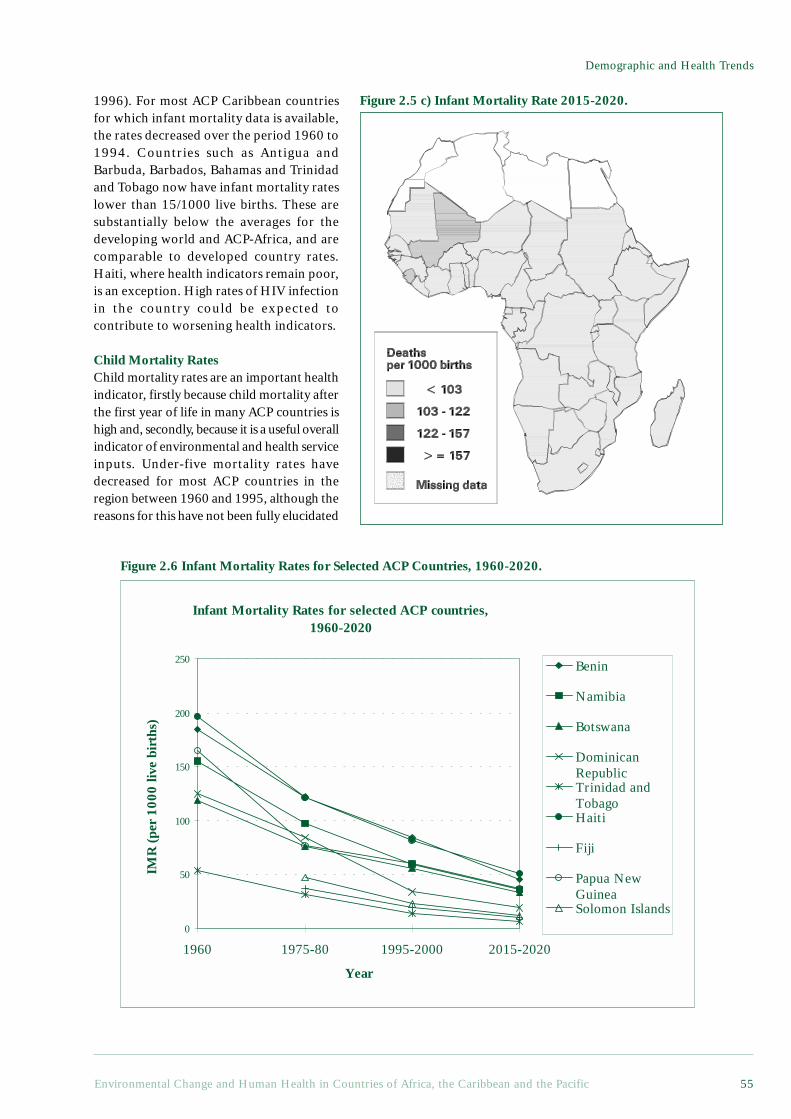
Environmental Change and Human Health in Countries of Africa, the Caribbean and the Pacific 55
Demographic and Health Trends
1996). For most ACP Caribbean countriesfor which infant mortality data is available,the rates decreased over the period 1960 to1994. Countries such as Antigua andBarbuda, Barbados, Bahamas and Trinidadand Tobago now have infant mortality rateslower than 15/1000 live births. These aresubstantially below the averages for thedeveloping world and ACP-Africa, and arecomparable to developed country rates.Haiti, where health indicators remain poor,is an exception. High rates of HIV infectionin the country could be expected tocontribute to worsening health indicators.
Child Mortality RatesChild mortality rates are an important healthindicator, firstly because child mortality afterthe first year of life in many ACP countries ishigh and, secondly, because it is a useful overallindicator of environmental and health serviceinputs. Under-five mortality rates havedecreased for most ACP countries in theregion between 1960 and 1995, although thereasons for this have not been fully elucidated
Figure 2.5 c) Infant Mortality Rate 2015-2020.
Figure 2.6 Infant Mortality Rates for Selected ACP Countries, 1960-2020.
Infant Mortality Rates for selected ACP countries, 1960-2020
0
50
100
150
200
250
1960 1975-80 1995-2000 2015-2020
Year
IMR
(pe
r 10
00 li
ve b
irth
s)
Benin
Namibia
Botswana
DominicanRepublicTrinidad andTobagoHaiti
Fiji
Papua NewGuineaSolomon Islands
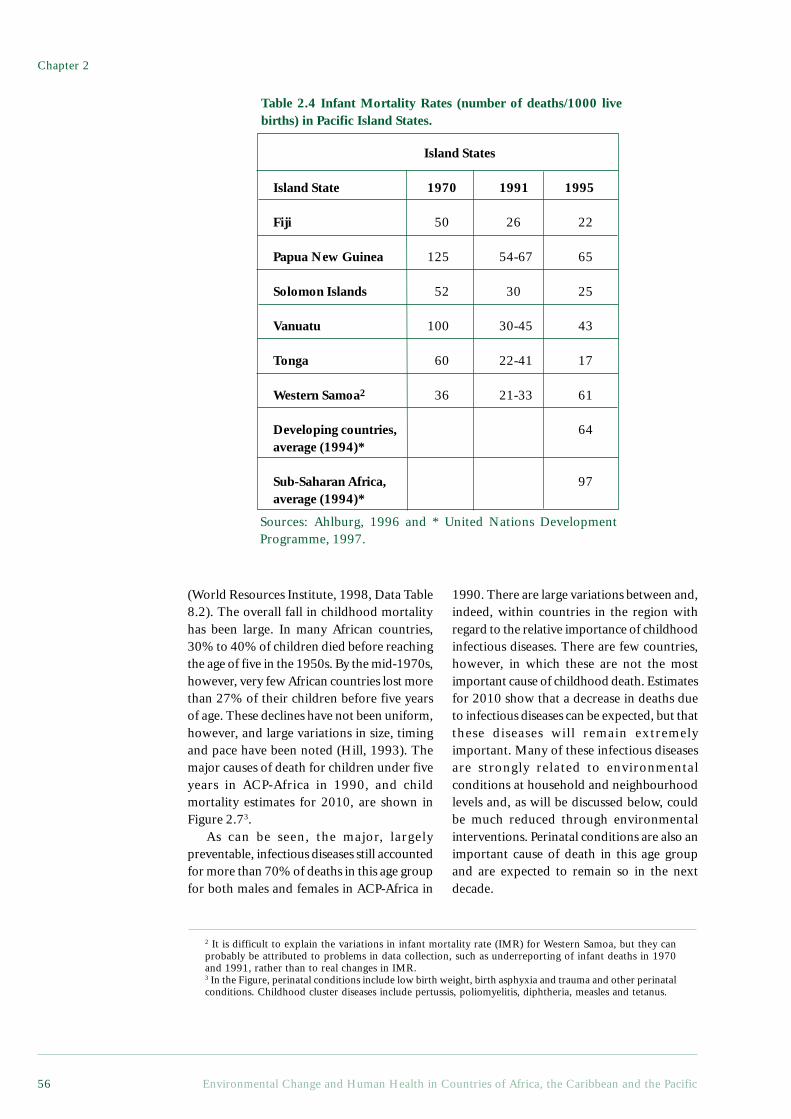
Chapter 2
Environmental Change and Human Health in Countries of Africa, the Caribbean and the Pacific56
1990. There are large variations between and,indeed, within countries in the region withregard to the relative importance of childhoodinfectious diseases. There are few countries,however, in which these are not the mostimportant cause of childhood death. Estimatesfor 2010 show that a decrease in deaths dueto infectious diseases can be expected, but thatthese diseases will remain extremelyimportant. Many of these infectious diseasesare strongly related to environmentalconditions at household and neighbourhoodlevels and, as will be discussed below, couldbe much reduced through environmentalinterventions. Perinatal conditions are also animportant cause of death in this age groupand are expected to remain so in the nextdecade.
(World Resources Institute, 1998, Data Table8.2). The overall fall in childhood mortalityhas been large. In many African countries,30% to 40% of children died before reachingthe age of five in the 1950s. By the mid-1970s,however, very few African countries lost morethan 27% of their children before five yearsof age. These declines have not been uniform,however, and large variations in size, timingand pace have been noted (Hill, 1993). Themajor causes of death for children under fiveyears in ACP-Africa in 1990, and childmortality estimates for 2010, are shown inFigure 2.73.
As can be seen, the major, largelypreventable, infectious diseases still accountedfor more than 70% of deaths in this age groupfor both males and females in ACP-Africa in
2 It is difficult to explain the variations in infant mortality rate (IMR) for Western Samoa, but they canprobably be attributed to problems in data collection, such as underreporting of infant deaths in 1970and 1991, rather than to real changes in IMR.3 In the Figure, perinatal conditions include low birth weight, birth asphyxia and trauma and other perinatalconditions. Childhood cluster diseases include pertussis, poliomyelitis, diphtheria, measles and tetanus.
Table 2.4 Infant Mortality Rates (number of deaths/1000 livebirths) in Pacific Island States.
Island States
Island State 1970 1991 1995
Fiji 50 26 22
Papua New Guinea 125 54-67 65
Solomon Islands 52 30 25
Vanuatu 100 30-45 43
Tonga 60 22-41 17
Western Samoa2 36 21-33 61
Developing countries, 64average (1994)*
Sub-Saharan Africa, 97average (1994)*
Sources: Ahlburg, 1996 and * United Nations DevelopmentProgramme, 1997.
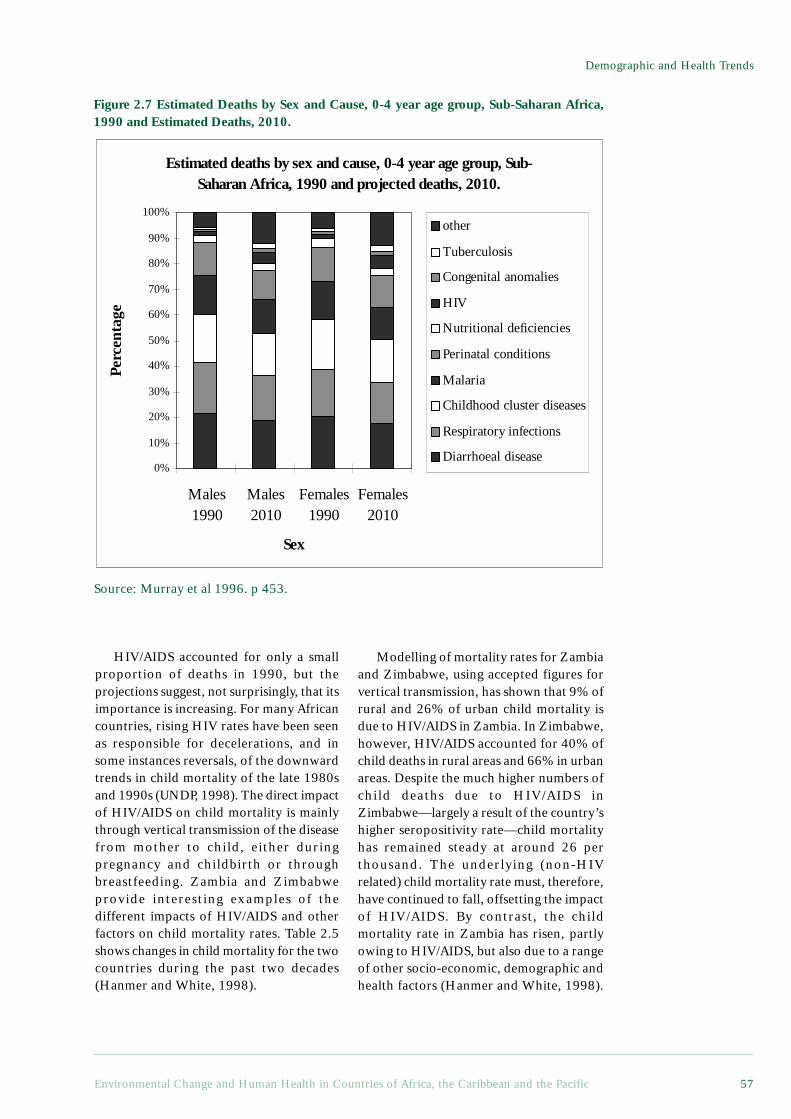
Environmental Change and Human Health in Countries of Africa, the Caribbean and the Pacific 57
Demographic and Health Trends
HIV/AIDS accounted for only a smallproportion of deaths in 1990, but theprojections suggest, not surprisingly, that itsimportance is increasing. For many Africancountries, rising HIV rates have been seenas responsible for decelerations, and insome instances reversals, of the downwardtrends in child mortality of the late 1980sand 1990s (UNDP, 1998). The direct impactof HIV/AIDS on child mortality is mainlythrough vertical transmission of the diseasefrom mother to child, either duringpregnancy and childbirth or throughbreastfeeding. Zambia and Zimbabweprovide interesting examples of thedifferent impacts of HIV/AIDS and otherfactors on child mortality rates. Table 2.5shows changes in child mortality for the twocountries during the past two decades(Hanmer and White, 1998).
Figure 2.7 Estimated Deaths by Sex and Cause, 0-4 year age group, Sub-Saharan Africa,1990 and Estimated Deaths, 2010.
Modelling of mortality rates for Zambiaand Zimbabwe, using accepted figures forvertical transmission, has shown that 9% ofrural and 26% of urban child mortality isdue to HIV/AIDS in Zambia. In Zimbabwe,however, HIV/AIDS accounted for 40% ofchild deaths in rural areas and 66% in urbanareas. Despite the much higher numbers ofchild deaths due to HIV/AIDS inZimbabwe—largely a result of the country’shigher seropositivity rate—child mortalityhas remained steady at around 26 perthousand. The underlying (non-HIVrelated) child mortality rate must, therefore,have continued to fall, offsetting the impactof HIV/AIDS. By contrast, the childmortality rate in Zambia has risen, partlyowing to HIV/AIDS, but also due to a rangeof other socio-economic, demographic andhealth factors (Hanmer and White, 1998).
Source: Murray et al 1996. p 453.
Estimated deaths by sex and cause, 0-4 year age group, Sub-Saharan Africa, 1990 and projected deaths, 2010.
0%
10%
20%
30%
40%
50%
60%
70%
80%
90%
100%
Males1990
Males2010
Females1990
Females2010
Sex
Perc
enta
ge
other
Tuberculosis
Congenital anomalies
HIV
Nutritional deficiencies
Perinatal conditions
Malaria
Childhood cluster diseases
Respiratory infections
Diarrhoeal disease
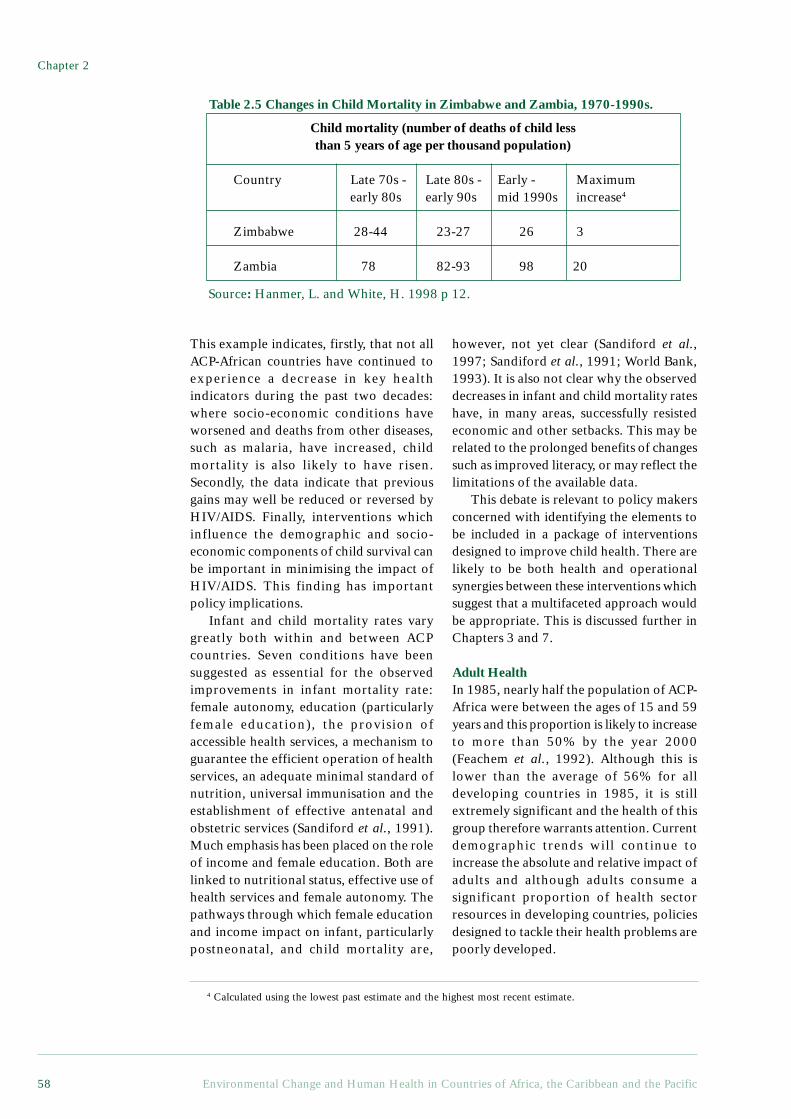
Chapter 2
Environmental Change and Human Health in Countries of Africa, the Caribbean and the Pacific58
This example indicates, firstly, that not allACP-African countries have continued toexperience a decrease in key healthindicators during the past two decades:where socio-economic conditions haveworsened and deaths from other diseases,such as malaria, have increased, childmortality is also likely to have risen.Secondly, the data indicate that previousgains may well be reduced or reversed byHIV/AIDS. Finally, interventions whichinfluence the demographic and socio-economic components of child survival canbe important in minimising the impact ofHIV/AIDS. This finding has importantpolicy implications.
Infant and child mortality rates varygreatly both within and between ACPcountries. Seven conditions have beensuggested as essential for the observedimprovements in infant mortality rate:female autonomy, education (particularlyfemale education), the provision ofaccessible health services, a mechanism toguarantee the efficient operation of healthservices, an adequate minimal standard ofnutrition, universal immunisation and theestablishment of effective antenatal andobstetric services (Sandiford et al., 1991).Much emphasis has been placed on the roleof income and female education. Both arelinked to nutritional status, effective use ofhealth services and female autonomy. Thepathways through which female educationand income impact on infant, particularlypostneonatal, and child mortality are,
however, not yet clear (Sandiford et al.,1997; Sandiford et al., 1991; World Bank,1993). It is also not clear why the observeddecreases in infant and child mortality rateshave, in many areas, successfully resistedeconomic and other setbacks. This may berelated to the prolonged benefits of changessuch as improved literacy, or may reflect thelimitations of the available data.
This debate is relevant to policy makersconcerned with identifying the elements tobe included in a package of interventionsdesigned to improve child health. There arelikely to be both health and operationalsynergies between these interventions whichsuggest that a multifaceted approach wouldbe appropriate. This is discussed further inChapters 3 and 7.
Adult HealthIn 1985, nearly half the population of ACP-Africa were between the ages of 15 and 59years and this proportion is likely to increaseto more than 50% by the year 2000(Feachem et al., 1992). Although this islower than the average of 56% for alldeveloping countries in 1985, it is stillextremely significant and the health of thisgroup therefore warrants attention. Currentdemographic trends will continue toincrease the absolute and relative impact ofadults and although adults consume asignificant proportion of health sectorresources in developing countries, policiesdesigned to tackle their health problems arepoorly developed.
Table 2.5 Changes in Child Mortality in Zimbabwe and Zambia, 1970-1990s.
Child mortality (number of deaths of child lessthan 5 years of age per thousand population)
Country Late 70s - Late 80s - Early - Maximum early 80s early 90s mid 1990s increase4
Zimbabwe 28-44 23-27 26 3
Zambia 78 82-93 98 20
4 Calculated using the lowest past estimate and the highest most recent estimate.
Source: Hanmer, L. and White, H. 1998 p 12.
Environmental Change and Human Health in Countries of Africa, the Caribbean and the Pacific 59
Demographic and Health Trends
Adult health has been neglected in manydeveloping countries for a number ofreasons (Timeaus, 1991). Firstly, theemphasis of primary healthcare servicessince the 1970s has been on child andmaternal health. The probability that aperson born in Africa will die between theages of 15 and 60 years is, however,equivalent to the risk of death in childhood.The illness or death of an adult can,furthermore, have major repercussions forthe household, particularly if the adult isthe major breadwinner. Secondly, the healthproblems of adults are more diverse thanthose of children, and are, therefore, lesseasily prevented. Thirdly, it is difficult toobtain population-based estimates relevantto the health problems of adults, whichlimits analysis and planning.
Rapid reductions in the death rates ofadults have been achieved in both richer andpoorer ACP-Africa countries since 1945,although there is tremendous variation byregion (Timeaus, 1991). As adult mortalitydeclines in developing countries, mortalityfrom communicable, non-communicableand reproductive diseases declines for malesand females. Injuries, however, remainconstant for females while declining formales (Murray et al., 1992). These declinesin non-communicable diseases are not wellunderstood. This pattern notwithstanding,the burden of adult ill health will increasein the future, due to the ageing of thepopulation (Phillips et al., 1992). There arealso considerable inequities in thedistribution of the burden of adult ill health.As is the case in the developing world,groups with lower socio-economic statushave both higher exposures to risks andhigher mortality for both non-communicable and communicable diseasesthan groups with higher socio-economicstatus (Cavelaars et al., 1997; Lynch andKaplan, 1997; Montgomery et al., 1996).
Adult ill health consumes a largeproportion of healthcare resources in manydeveloping countries. Households may spendas much on health-related care as the State.This may have a considerable impact on otheressential household expenditure and, hence,on the health of the family. The illness of deathof a child’s main caregiver has particularly
severe effects, and the mortality rates of infantswhose mothers die can, for example, be ashigh as 90% (Phillips et al., 1992). Asdescribed in Chapter 3, a substantialproportion of chronic diseases are associatedwith environmental exposures that have thepotential to be minimised or mitigated, and alarge proportion of adult deaths in developingcountries are, therefore, avoidable. We willreturn to this point in Chapters 3 and 7.
2.4.2 Estimating the Burden of DiseaseWhile mortality is a useful indicator ofhealth status, it does not adequately capturethe broader effects of ill health. Manyillnesses may not result in death, but mayproduce considerable morbidity andsubstantially reduce quality of life. Mostcases of childhood diarrhoeal disease, forexample, do not result in death. Childrenwho suffer repeated episodes of diarrhoeaare, however, more likely to experiencestunting and may be predisposed to otherinfectious diseases. Many other illnessesrelated to environmental conditions, suchas worm infestations and respiratoryinfections, also result in considerablemorbidity. In general, however, morbidityis studied far less and is seldom the focus ofhealth policy debates, despite its obviousimpact on quality of life and livelihoods.Quantifying the burden of disease and injury– including mortality and morbidity - at aglobal and regional level, using a commonset of methods and common units is onemethod of providing information to informinternational and regional health policydebates.
The global burden of disease study, co-ordinated by the WHO and the World Bank,has attempted to quantify the combinedburden of fatal (mortality) and non-fatal(morbidity) health outcomes in a singlemeasure, the Disability-Adjusted Life Year orDALY (Murray and Lopez, 1996a). This wasdone for 107 diseases and injuries by agegroup and by region. To calculate DALYs dueto each disease or injury in a given year andpopulation, the researchers added together:(a) the years of life lost through all deaths inthat year, and (b) the years of life expectedto be lived with a disability for all the casesbeginning in that year summed and weighted
Chapter 2
Environmental Change and Human Health in Countries of Africa, the Caribbean and the Pacific60
for the severity of the condition. One DALYis, therefore, one lost year of healthy life,and is a measure of the burden of the diseasein question in the population concerned.
The approach is complex and involvesa large number of estimations andassumptions, and it is beyond the scope ofthis report to discuss these in detail5. It is,however, important to bear in mind, firstly,that for many of the countries included inthis report, the burden of disease study canonly provide estimates of the diseaseburden. These may need to be refined orchanged when better data becomeavailable. Secondly, the uncertaintyinherent in the epidemiological data ondisease is far more significant, in terms ofits impact on the estimates derived, thanthe effects of changing any of the otherassumptions incorporated into thecalculations of the DALY (Murray andLopez, 1996a). For Sub-Saharan Africa inparticular, where the reliability of data formany diseases is poor and populationestimates uncertain, these results need tobe viewed with caution. Projections of thedisease burden from the baseline year of1990 into the future need to be viewed withcaution for the same reasons. Thirdly, themethodology used in calculating the DALYhas been challenged for being subjective,although a major strength of the approachis that the method is applied consistently(Paalman et al., 1998).
Although the methodology underlying theDALY approach used in the BOD assessmentsis the subject of much debate, the data arepresented here for three reasons. Firstly,because they are being used extensively by anumber of UN and bilateral agencies, andincreasingly at regional and national levels,in the development of health policies. Anumber of ACP countries, includingMauritius, South Africa and Tanzania, havealready initiated BOD studies. Secondly, thedata used for the global assessment has been
extensively reviewed and is among the bestdata available for the ACP regions. Finally,the data allow us to begin to assess theproportion of the disease burden attributableto environmental factors (see Chapter 3).
The three broad cause groups for thedisaggregation of deaths and disability havealready been described (see page 51). Thediagram below shows the distribution ofDALYs among these three cause groups,globally and for three regions: SSA, LatinAmerica and the Caribbean and ‘Other Asiaand Islands’6. Only the SSA region of theburden of disease study coincides with theACP region. Data on the island states of theCaribbean and Pacific is incorporatedwithin the Latin America and the Caribbeanand ‘Other Asia and Islands’ regions. Thesecombined data should not be seen asrepresentative of the small island states, asthe populations of the islands are small,relative to the rest of the region in whichthey are included, and are shown here forcomparative purposes only. More detaileddata on the disease burden for these regionsare shown in Appendix 2.7
The BOD study highlights the followingkey points with regard to the burden ofdisease for Sub-Saharan Africa in 1990(Murray and Lopez, 1996a):
• With only 11.3% of the globalpopulation, Sub-Saharan Africa aloneaccounts for 21.4% of the global burden.579 years of healthy life are lost in thisregion for every 1,000 of the population,compared with 124 years in the establishedmarket economies. More than 75% of thisburden was due to premature mortality, theremainder being due to disability.
• The age distribution of DALYsappears to differ markedly between regions.52% of the burden in SSA occurs in the agegroup 0-4 years, compared with only 6%in the established market economies. Afurther 31% of the burden in SSA occurs in
5 See (Murray et al 1996a) for an in-depth discussion of the development of the DALY.6 ‘Other Asia and Islands’ includes all Asian countries except India and China and all South PacificIslands, excluding New Zealand and Australia.7 Unfortunately, disaggregated burden of disease data for the Caribbean and Pacific islands were notavailable for this study.
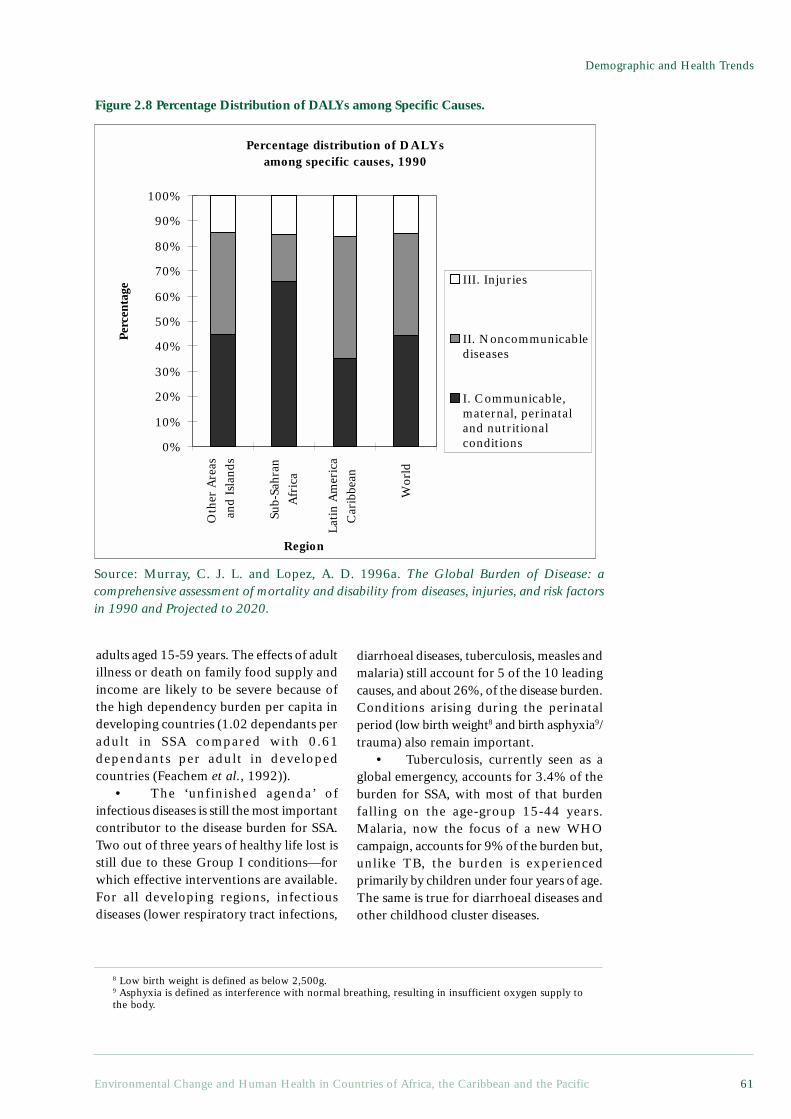
Environmental Change and Human Health in Countries of Africa, the Caribbean and the Pacific 61
Demographic and Health Trends
adults aged 15-59 years. The effects of adultillness or death on family food supply andincome are likely to be severe because ofthe high dependency burden per capita indeveloping countries (1.02 dependants peradult in SSA compared with 0.61dependants per adult in developedcountries (Feachem et al., 1992)).
• The ‘unfinished agenda’ ofinfectious diseases is still the most importantcontributor to the disease burden for SSA.Two out of three years of healthy life lost isstill due to these Group I conditions—forwhich effective interventions are available.For all developing regions, infectiousdiseases (lower respiratory tract infections,
diarrhoeal diseases, tuberculosis, measles andmalaria) still account for 5 of the 10 leadingcauses, and about 26%, of the disease burden.Conditions arising during the perinatalperiod (low birth weight8 and birth asphyxia9/trauma) also remain important.
• Tuberculosis, currently seen as aglobal emergency, accounts for 3.4% of theburden for SSA, with most of that burdenfalling on the age-group 15-44 years.Malaria, now the focus of a new WHOcampaign, accounts for 9% of the burden but,unlike TB, the burden is experiencedprimarily by children under four years of age.The same is true for diarrhoeal diseases andother childhood cluster diseases.
Figure 2.8 Percentage Distribution of DALYs among Specific Causes.
Source: Murray, C. J. L. and Lopez, A. D. 1996a. The Global Burden of Disease: acomprehensive assessment of mortality and disability from diseases, injuries, and risk factorsin 1990 and Projected to 2020.
8 Low birth weight is defined as below 2,500g.9 Asphyxia is defined as interference with normal breathing, resulting in insufficient oxygen supply tothe body.
Percentage distribution of DALYs among specific causes, 1990
Oth
er A
reas
and
Isl
ands
Wor
ld
Lati
n A
mer
ica
Car
ibbe
an
Sub-
Sahr
an
Afr
ica
0%
10%
20%
30%
40%
50%
60%
70%
80%
90%
100%
Region
Perc
enta
ge
III. Injuries
II. Noncommunicablediseases
I. Communicable,maternal, perinataland nutritionalconditions
Chapter 2
Environmental Change and Human Health in Countries of Africa, the Caribbean and the Pacific62
• Group II conditions account for18.8% of the disease burden in SSA. Themain contributors are cardiovasculardiseases, neuropsychiatric conditions,respiratory diseases and cancers. As discussedabove, this burden falls largely on adults. Theproportion of the burden attributable toGroup II conditions is far lower for SSA thanthe global average or that of otherdeveloping regions. This indicates that theepidemiological transition in SSA is still atan early stage.
• Group III conditions (injuries) arean important, and often neglected, groupacross all regions, accounting for about 15%of the burden in SSA. Intentional injuriesconstituted 6% of DALYs in SSA in 1990.The burden of injuries in SSA is likely toincrease in the next century up to 2020, dueto a combination of the steep projected risein road traffic accidents, war and violence,and the growth of the adult fraction of thepopulation. Road traffic accidents are thesecond most important cause of DALYsamong men aged 15-44 years.
• Another hidden burden is that ofmental illness. Depression accounts for 3.4%of the disease burden in developing countries,but over 12% of the burden for women aged15-44 years. When coupled withschizophrenia, bipolar disorder and obsessive-compulsive disorders, these diseases togetheraccount for approximately 19% of the diseaseburden within that age group.
2.4.3 Looking Ahead: Estimates for theBurden of Disease in 2020
Demographic and epidemiologicaltransitions are already well under way inmany of the countries included in this review(see maps), but most countries in SSA are atan earlier stage of the transition thancountries in many other developing regions(Murray and Lopez, 1996b). Projections
indicate that the demographic andepidemiological transitions in SSA are likelyto continue, but with differing speed, acrossthe region. These transitions, and relatedchanges in socio-economic status,environmental conditions and lifestyle, willimpact on the burden of disease in the region.These impacts have health and environmentplanning implications, and this section of thechapter examines estimates for the burdenof disease in 2020.
The global burden of disease studiesdeveloped scenarios for future burdens ofdisease and injury, using the data for 1990(described above) as a baseline (Murray andLopez, 1996b). These projections are basedon age-, sex- and cause-specific multivariatemodels, adjusted for changes over time inthree socio-economic determinants: incomeper capita10; human capital11 and smokingintensity12. Three scenarios, related to thesesocio-economic determinants, weredeveloped: baseline, optimistic andpessimistic, all of which scenarios makedifferent assumptions with regard toeconomic growth, mortality rates and birthrates across the regions. As with allprojections, the authors note that ‘Theresults of this exercise, however plausiblethey might appear and however correct (orincorrect) they might ultimately prove tobe, are nothing more than the numericalconsequences of the assumptions andmethod employed’ (Murray and Lopez,1996b, p 352). The findings shouldtherefore be viewed with caution.
According to the baseline scenario(pessimistic and optimistic scenarioprojections indicated in brackets), by 2020,males born in SSA, whose life expectancywas below 50 years in 1990, can probablyexpect to reach 57 (53-58) years of age.Females can probably expect to reach 64 (58-61) years, corresponding to an improvement
10 For the baseline scenario, GDP per capita is projected to increase in each region according to World Bankforecasts. For the optimistic scenario, a growth rate in per capita income 40% higher than the baseline wasused. For the pessimistic scenario, growth rates only slightly higher than the lowest trend in income percapita over the last 3 decades for a given region were assumed (Murray and Lopez, 1996b. Page 340).11 Based on estimates for 98 countries for each five year period from 1950-90 (Murray and Lopez,1996b. Page 341).12 Based on the assumption that the time course of the smoking epidemic observed in the United Kingdomwill be repeated in each region.
Environmental Change and Human Health in Countries of Africa, the Caribbean and the Pacific 63
Demographic and Health Trends
of 13 (7.8-14.5) years since 1990 (Murrayand Lopez, 1996a). Other estimates seem tosuggest that life expectancy will stagnate incountries with high HIV prevalence. A recentreview has shown that during the period1995-2000, life expectancy in the 29 Africancountries with the highest HIV prevalencewas estimated at around 47 years - 7 yearsless than it would have been in the absenceof HIV/AIDS. By 2000-2005, life expectancyin these 29 African countries is expected tostay constant, whereas in the absence of HIV/AIDS, it would have been 56 years.Considerable variation does, however, existbetween countries (UNDP, 1998). Largeshifts in the patterns of death and disabilityare expected to accompany thesedemographic changes.
In Sub-Saharan Africa, Group 1 causesof death are projected to fall from 5.3 millionin 1990 to 4 million in 2020. This is due toa relative contraction in the youngpopulation and to a continued decline incommunicable disease deaths, due toincreasing income and education andtechnical progress. These projections runcounter to the belief that infectious diseasesare making a ‘comeback’ worldwide. In1990, 65.9% of the disease burden in Sub-Saharan Africa was attributed tocommunicable, maternal, perinatal andnutritional conditions. By 2020, this isexpected to drop to about 39.8% (40.0-52.5)(Murray and Lopez, 1996a).
A 77% rise in the absolute number ofdeaths from non-communicable (Group II)diseases in 2020 is expected, in contrast tothe decline in Group I causes, whilst theburden of non-communicable diseases islikely to increase from 18.8% to 32% (25.6-33.6). Mental illness is likely to increase to15% of this burden, whilst tobacco willaccount for 9%—more than any other singlecause. This ‘double burden’ of bothcommunicable and non-communicablediseases is already being experienced in theACP countries (Lewin et al., 1998; Stephenset al., 1994). SSA can also expect a sharprise in the burden of injuries due to roadtraffic accidents and violence (Group 3).
Most of the projected changes in theburden of disease for Group II and IIIconditions for SSA can be attributed
primarily to changes in population growthand distribution, that is, demographicchange. Changes in the burden of Group Idiseases are due to a combination ofepidemiological (risk factor) change anddemographic change, the latter being moreimportant. The ways in which environmentaldriving forces influence and interact withthese changes, and the implications of thesechanges for policy making and serviceprovision, are discussed later in this report.
2.5 Health, Wealth and EnvironmentThe preceding sections of this chapter havedescribed the health and demographic trendsfor the ACP countries. Despite the overallimprovements in many health indices acrossthese countries, disaggregation of theavailable data suggest that these gains areoften not uniformly distributed acrossgeographic and socio-economic groups.Substantial differentials in health status andin demographic indices continue to existwithin and between countries, between theurban and rural setting; and by socio-economic status (see Figure 2.9, Infantmortality rates, Southern African Region,1996). In general, health status indices andburdens of disease are positively related toaccess to basic services, levels of education,income and other proxies of socio-economicstatus. In other words, health status improvesas socio-economic status improves – at boththe individual and country level (Bloom andMcIntyre, 1998; Murray and Lopez, 1996a;Stephens et al., 1994; World ResourcesInstitute, 1998). While these differentialshave been observed since statistics have beenavailable, there is evidence that they arewidening in many regions. Wideninginequalities in health and wellbeing by socio-economic status are of particular concern(Murray and Lopez, 1996a).
South Africa, as one of the world’s mostunequal societies, provides an interestingcase study of differentials in health andwellbeing. The country’s Gini coefficient—a measure of inequality calculated on thebasis of income per adult equivalent—is0.65, compared with 0.45 to 0.63 forcountries with similar per capita GDP(Fallon and daSilva, 1994; Whiteford andMcGrath, 1994), cited in (Bloom and
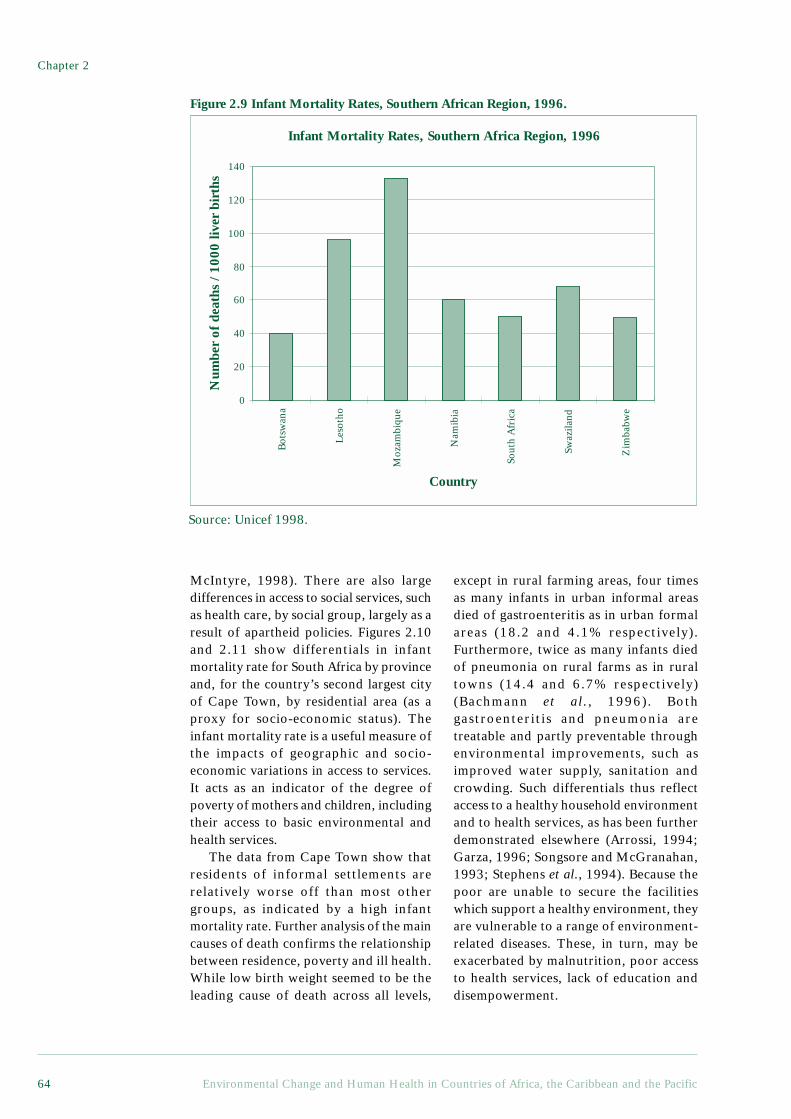
Chapter 2
Environmental Change and Human Health in Countries of Africa, the Caribbean and the Pacific64
McIntyre, 1998). There are also largedifferences in access to social services, suchas health care, by social group, largely as aresult of apartheid policies. Figures 2.10and 2.11 show differentials in infantmortality rate for South Africa by provinceand, for the country’s second largest cityof Cape Town, by residential area (as aproxy for socio-economic status). Theinfant mortality rate is a useful measure ofthe impacts of geographic and socio-economic variations in access to services.It acts as an indicator of the degree ofpoverty of mothers and children, includingtheir access to basic environmental andhealth services.
The data from Cape Town show thatresidents of informal settlements arerelatively worse off than most othergroups, as indicated by a high infantmortality rate. Further analysis of the maincauses of death confirms the relationshipbetween residence, poverty and ill health.While low birth weight seemed to be theleading cause of death across all levels,
except in rural farming areas, four timesas many infants in urban informal areasdied of gastroenteritis as in urban formalareas (18.2 and 4.1% respectively).Furthermore, twice as many infants diedof pneumonia on rural farms as in ruraltowns (14.4 and 6.7% respectively)(Bachmann et al. , 1996). Bothgastroenteritis and pneumonia aretreatable and partly preventable throughenvironmental improvements, such asimproved water supply, sanitation andcrowding. Such differentials thus reflectaccess to a healthy household environmentand to health services, as has been furtherdemonstrated elsewhere (Arrossi, 1994;Garza, 1996; Songsore and McGranahan,1993; Stephens et al., 1994). Because thepoor are unable to secure the facilitieswhich support a healthy environment, theyare vulnerable to a range of environment-related diseases. These, in turn, may beexacerbated by malnutrition, poor accessto health services, lack of education anddisempowerment.
Figure 2.9 Infant Mortality Rates, Southern African Region, 1996.
Infant Mortality Rates, Southern Africa Region, 1996
0
20
40
60
80
100
120
140
Bot
swan
a
Leso
tho
Moz
ambi
que
Nam
ibia
Sout
h A
fric
a
Swaz
iland
Zim
babw
e
Country
Num
ber
of d
eath
s / 1
000
liver
bir
ths
Source: Unicef 1998.
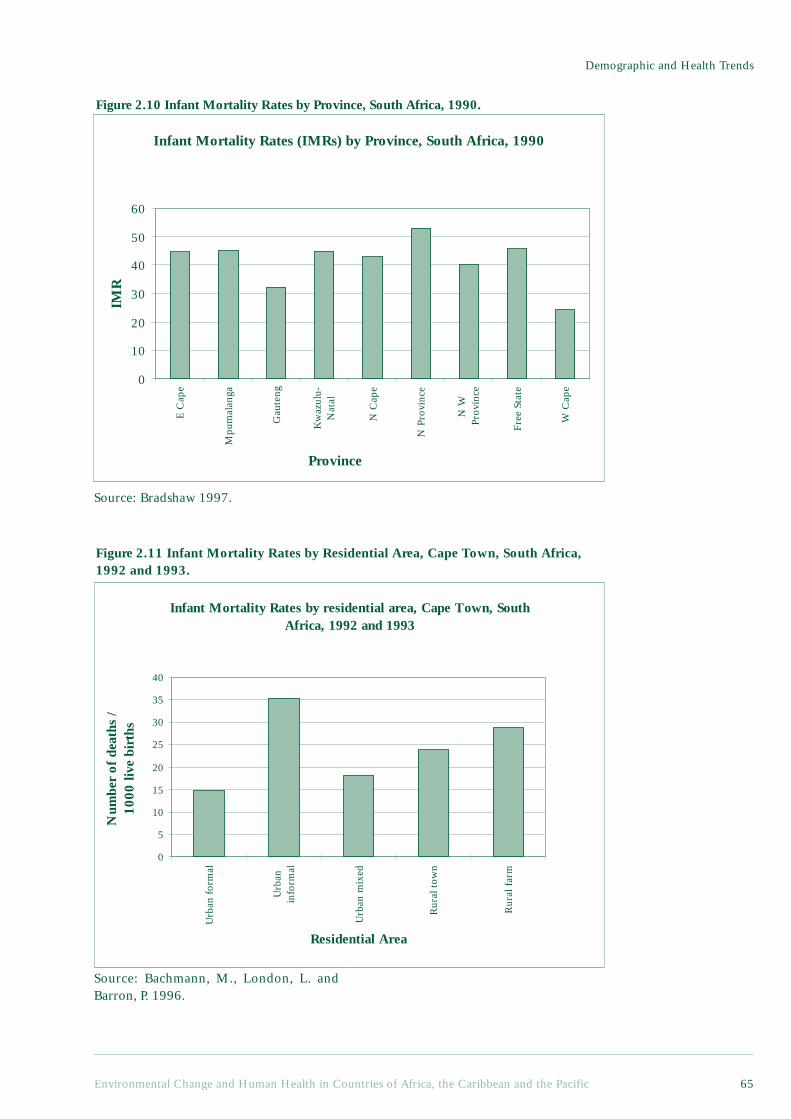
Environmental Change and Human Health in Countries of Africa, the Caribbean and the Pacific 65
Demographic and Health Trends
Figure 2.10 Infant Mortality Rates by Province, South Africa, 1990.
Figure 2.11 Infant Mortality Rates by Residential Area, Cape Town, South Africa,1992 and 1993.
Infant Mortality Rates (IMRs) by Province, South Africa, 1990
0
10
20
30
40
50
60
E C
ape
Mpu
mal
anga
Gau
teng
Kw
azul
u-N
atal
N C
ape
N P
rovi
nce
N W
Prov
ince
Free
Sta
te
W C
ape
Province
IMR
Infant Mortality Rates by residential area, Cape Town, South Africa, 1992 and 1993
0
5
10
15
20
25
30
35
40
Urb
an f
orm
al
Urb
anin
form
al
Urb
an m
ixed
Rur
al t
own
Rur
al f
arm
Residential Area
Num
ber
of d
eath
s /
1000
live
bir
ths
Source: Bradshaw 1997.
Source: Bachmann, M., London, L. andBarron, P. 1996.
Chapter 2
Environmental Change and Human Health in Countries of Africa, the Caribbean and the Pacific66
Disaggregated health and demographicdata are not available in many developingcountry settings (Bradley et al., 1991;Harpham et al., 1988). This makes theassessment of differentials in health andwellbeing across socio-economic andgeographical groups difficult. It is,nevertheless, important that policy makersaddress the problems of existing inequalities.The poor, whether in informal settlementsor rural areas, continue to experience thedrawbacks of unhealthy householdenvironments and food insecurity, even asconditions improve for wealthierhouseholds, and policy options for reducinginequalities and achieving greater equity inhealth need to be further developed, asdiscussed in the final chapter of this report.
2.6 ConclusionThis chapter has provided an overview ofdemographic and health trends in the ACPcountries, with particular emphasis on ACP-Africa. We have shown that whilst significantprogress has been made in improving health,as demonstrated by a range of indicators,health conditions within many ACP countriesare still poor. 39 of the 50 countries in theworld with the highest estimated under-five
mortality rates (U5MR) for 1996 are, forexample, within the ACP group (UNICEF,1998)13. Similarly, for infant mortality rates,the reduction experienced by the leastdeveloped countries between 1955 and 1995was only 75% of that experienced by otherdeveloping countries (World HealthOrganization, 1998). There are worryingindications that the gains in health statusover the last 50 years in many ACP countriesare being eroded by adverse economicconditions and HIV/AIDS. HIV/AIDS, inconjunction with the concurrent problemsof malnutrition and the high prevalence ofcommunicable diseases such as tuberculosis,is of particular concern.
Although non-communicable diseasesand injuries are increasing in importance,communicable diseases still take the largesttoll of human health in the ACP regions.By 2020, the burden of communicablediseases is predicted to fall, but will stillaccount for some 40% of the diseaseburden. In Chapter 3, we explore theimportance of environmental risk factorsin determining health and disease, andbegin to examine the extent to which theburden of disease could be reduced throughenvironmental interventions.
13 The ten countries with the highest estimated under five mortality rates in 1996 are, in descendingorder: Niger, Angola, Sierra Leone, Afghanistan, Liberia, Guinea-Bissau, Mali, Malawi, Mozambiqueand Somalia. It should be noted that most of the countries have been wracked by wars over the past fiveyears, with concomitant destruction of health, environmental and social services.
ReferencesAhlburg, D. A. 1996. Demographic and Social Change in the Island Nations of the Pacific. Asia-Pacific
Populations Research Reports No. 7. East-West Centre Programme on Population (Honolulu).Arrossi, S. 1994. Rapid Assessment Procedures in Urban Communities: The Experience of the Health and
Habitat Project in Barrio San Jorge, Argentina. RRA Notes No. 21. International Institute for Environmentand Development, London.
Bachmann, M., London, L. and Barron, P. 1996. Infant mortality rate inequalities in the Western CapeProvince of South Africa. International Journal of Epidemiology. 25(5):966-972.
Bijlmakers, L., Basset, M. T. and Sanders, D. M. 1996a. Health and Structural Adjustment in Rural andUrban Zimbabwe. Research Report No. 101. Nordiska Afrikainstitutet (Uppsala, Sweden).
Bijlmakers, L., Basset, M. T. and Sanders, D. M. 1996b. Socio-Economic Stress, Health and Child NutritionalStatus at a Time of Economic Structural Adjustment: A Three-year Longitudinal Study in Zimbabwe.Unpublished manuscript. Public Health Programme, University of the Western Cape.
Bloom, G. and McIntyre, D. 1998. Towards equity in kealth in an unequal society. Soc. Sci. Med.47(10):1529-38.
Bradley, D., Stephens, C., Harpham, T. and Cairncross, S. 1991. A Review of Environmental HealthImpacts in Developing Country Cities. Urban Management Program Discussion Paper No. 6. WorldBank/UNDP/UNCHS (Washington, DC). 58 p.
Cavelaars, A. E. J. M., Kunst, A. E. and Mackenbach, J. P. 1997. Socio-economic differences in risk factorsfor morbidity and mortality in the European Community: An international comparison. J of HealthPsychology. 2(3):353-72.
Fallon, P. and daSilva, L. 1994. South Africa: Economic Performance and Policies No. Discussion Paper 7.The World Bank, Southern Africa Department (Johannesburg).
Environmental Change and Human Health in Countries of Africa, the Caribbean and the Pacific 67
Demographic and Health Trends
Feachem, R. G. A., Phillips, M. A. and Bulatao, R. A. 1992. Introducing adult health. In: Feachem R.G.A.,Kjellström T., Murray C.J.L., Over M., Phillips M.A., (eds.). The Health of Adults in the DevelopingWorld. New York, Oxford University Press for the World Bank.
Foote, K. A., Hill, K. H. and Martin, L. G., (eds.) 1993. Demographic change in Sub-Saharan Africa.Washington, DC, National Academic Press.
Garza, G. 1996. Uncontrolled air pollution in Mexico City. Cities. 13(5):315-328.Hanmer, L. and White, H. 1998. The Impact of AIDS on Human Development: Trends in Under Five
Mortality Rates in Zambia and Zimbabwe. Paper presented at the Development Studies AssociationConference. Development and Project Planning Centre. University of Bradford.
Harpham, T., Lusty, T. and Vaughan, P., (eds.) 1988. In the Shadow of the City: Community Health and theUrban Poor. Oxford, Oxford University Press. 237 p.
Kirk, D. and Pillet, B. 1998. Fertility levels, trends, and differentials in Sub-Saharan Africa in the 1980sand 1990s. Studies in Family Planning. 29(1):1-22.
Lee, M. D. and Bastemeijer, T. F. 1991. Drinking Water Source Protection: A Review of EnvironmentalFactors Affecting Community Water Supplies. Occasional Paper No. 15. International Water and SanitationCentre (IRC) (The Hague). 66 p.
Lewin, S., Adams, J., Laubsher, R., Zwarenstein, M. and Bradshaw, D. 1998. Health and Environment:An Analysis of Intra-Urban Differentials in Cape Town. Unpublished data. Medical Research Councilof South Africa.
Lynch, J. W. and Kaplan, G. A. 1997. Understanding how inequality in the distribution of income effectshealth. J of Health Psychology. 2(3):297-314.
Montgomery, L. E., Kiely, J. L. and Pappas, G. 1996. The effects of poverty, race, and family structure onUS children’s health: Data from the NHIS, 1978 through 1980 and 1989 through 1991. AmericanJournal of Public Health. 86(10):1401-1405.
Muhuri, P., Blanc, A. and Rutstein, S. 1994. Demographic and Health Surveys Comparative Studies No.13: Socioeconomic Differentials in Fertility No. 13. Demographic and Health Surveys (DHS) (Calverton,Maryland, USA). 79 p.
Murray, C. J. D., Yang, G. and Qiao, X. 1992. Adult mortality: Levels, patterns and causes. In: FeachemR.G.A., Kjellström T., Murray C.J.L., Over M., Phillips M.A., (eds.). The Health of Adults in theDeveloping World. New York, Oxford University Press for the World Bank.
Murray, C. J. L. and Chen, L. S. 1993. In search of a contemporary theory for understanding mortalitychange. Social Science and Medicine. 36(2):143-155.
Murray, C. J. L. and Lopez, A. D. 1996a. The Global Burden of Disease: a comprehensive assessmentof mortality and disability from diseases, injuries, and risk factors in 1990 and Projected to 2020.Harvard School of Public Health on behalf of the World Health Organization and the World Bank(Cambridge, MA).
Murray, C. J. L. and Lopez, A. D. 1996b. Global Health Statistics: a compendium of incidence, prevalenceand mortality estimates for over 200 conditions. Global Burden of Disease and Injury Series. Volume II.Harvard School of Public Health on behalf of the World Health Organization and the World Bank(Cambridge, MA).
Paalman, M., Bekedam, H., Hawken, L. and Nyheim, D. 1998. A Critical review of priority setting in thehealth sector: The methodology of the 1993 World development report. Health policy and planning.13(1):13-31.
PAHO. 1997. Health Conditions in the Caribbean, 1997. Scientific Publication No. 561.Phillips, D. R. and Verhasselt, Y. 1994. Introduction: Health and development. In: Phillips D.R., Verhasselt
Y., (eds.). Health and Development. London, Routledge. p 3-32.Phillips, M. A., Feachem, R. G. A. and Koplan, J. P. 1992. The emerging agenda for adult health. In:
Feachem R.G.A., Kjellström T., Murray C.J.L., Over M., Phillips M.A., (eds.). The Health of Adults inthe Developing World. New York, Oxford University Press for the World Bank.
Sanders, D. 1982. Nutrition and the use of food as a weapon in Zimbabwe and Southern Africa. I J HealthServices. 12(2):201-213.
Sandiford, P., Cassel, J., Sanchez, G. and Coldham, C. 1997. Does intelligence account for the link betweenmaternal literacy and child survival? Social Science and Medicine. 45(8):1231-1239.
Sandiford, P., Morales, P., Gorter, A., Coyle, E. and Davey Smith, G. 1991. Why do child mortality ratesfall? An analysis of the Nicaraguan experience. AJPH. 81(1):30-37.
Songsore, J. and McGranahan, G. 1993. Environment, wealth and health: Towards an analysis of intra-urban differentials within the Greater Accra Metropolitan Area, Ghana. Environment and Urbanization.5(2):10-34.
Stephens, C., Timaeus, I., Akerman, M., Avle, S., Maia, P. B., Campanario, P., Doe, B., Lush, L., Tetteh, D.and Harpham, T. 1994. Environment and Health in Developing Countries: An Analysis of Intra-UrbanDifferentials Using Existing Data. London School of Hygiene & Tropical Medicine (London). 147 p.
Stewart, F. 1995. Adjustment and Poverty: Options and Choices. London, Routledge.Timeaus, I. 1991. Adult mortality: Levels, trends and data sources. In: Feachem R.G., Jamison D.T., (eds.).
Disease and Mortality in Sub-Saharan Africa. Oxford, Oxford University Press for the World Bank.UNAIDS. 1998. AIDS Epidemic Update. UNAIDS (Geneva).UNDP. 1998. Human Development Report 1998. Oxford University Press (Oxford).UNHCR. 1993. The State of the World’s Refugees, 1993: The Challenge of Protection. United Nations
High Commission for Refugees.UNICEF. 1998. The State of The World’s Children 1998. Oxford, Oxford University Press for UNICEF.United Nations Development Programme. 1997. Human Development Report 1997. Oxford University
Press (New York).
Chapter 2
Environmental Change and Human Health in Countries of Africa, the Caribbean and the Pacific68
Watkins, K. 1995. The Oxfam Poverty Report. Oxfam (Oxford).Whiteford, A. and McGrath, M., (eds.) 1994. Income Distribution, Inequality and Poverty in South Africa:
Preliminary Findings from the Project for Statistics on Living Standards and Development.World Bank. 1993. World Development Report 1993: Investing in Health. New York, Oxford University
Press. 329 p.World Bank. 1997. World Development Report 1997: The State in a Changing World. Oxford University
Press (New York). 265 p.World Health Organization. 1988. Urbanization and its Implications for Child Health: Potential for Action.
World Health Organization (Geneva). 80 p.World Health Organization. 1997. Health and Environment in Sustainable Development: Five years after
the Earth Summit. Geneva, World Health Organisation. 242 p.World Health Organization. 1998. The World Health Report 1998: Life in the 21st Century: A Vision for
All. World Health Organisation (Geneva).World Resources Institute. 1998. World Resources 1998-99: A Guide to the Global Environment. Oxford
University Press (New York). 369 p.
Chapter 3Health in an
Environmental Context
Environmental Change and Human Health in Countries of Africa, the Caribbean and the Pacific 71
Health in an Environmental Context
Chapter 3 Health in an Environmental Context
Aims of the Chapter• To explore the importance of environmental risk factors in determining healthand disease• To explore the extent to which the burden of disease could be reduced throughenvironmental interventions• To identify key health threats for the ACP countries within an environmentalcontext.
Main Points• About one-third of the total burden of disease in ACP Africa is associated withenvironmental factors, manifested in the high prevalence of environmentally relateddeaths and disabilities. Small children carry the weight of this burden. The poorercountries of ACP Caribbean and Pacific are likely to experience similar burdens.• Water and sanitation related diseases are still extremely important in manyof the countries included in this review. 10% of the disease burden in ACPAfrica can be attributed to inadequate water, sanitation and hygiene, with childrenbearing most of this burden. Wealthier households and urban households aremore likely to access water and sanitation services than poorer and ruralhouseholds.• Approximately 32% of the burden of disease in ACP Africa can be attributedto protein-energy malnutrition. Trends indicate that the number of underweightchildren in ACP Africa may be rising.• Tuberculosis remains a major contributor to the burden of disease in theACP countries. This burden is expected to rise by 2010, mainly due to risingHIV prevalence and demographic changes.• Injuries are growing as a contributor to the burden of disease in the region,due to increases in road traffic accidents, wars and violence. The effects ofarmed conflicts in the region on health and the environment are very substantial.Urban violence is also growing as a public health threat. In both cases, the poorare at greatest risk. Compared with other regions, ACP-Africa has experiencedthe highest levels of population movement due to wars, famines and otherenvironmental and political changes. This has had important demographic andhealth impacts.• In all ACP countries, the poor continue to bear the largest proportion of thedisease burden. Diseases such as tuberculosis, acute respiratory tract infectionsand diarrhoeal disease are closely linked to environmental conditions most oftenencountered in poor areas, and they are also compounded by other aspects ofpoverty. The unequal distribution of resources helps to ensure that these healthinequalities are maintained. Low quality and insufficient food increases the riskof disease.• The poor are often unable to protect themselves from the effects of naturaland human-made disasters, which may further exacerbate poverty and disease.This is of particular concern in relation to the effects of global warming, and isfurther discussed in Chapter 6.
Policy Implications• Because a substantial proportion of the burden of disease is associated withenvironmental factors, this burden could be mitigated by healthier livingenvironments and improved food security.
Chapter 3
Environmental Change and Human Health in Countries of Africa, the Caribbean and the Pacific72
• Key groups for intervention include women and children, who often experiencethe worst living conditions in both rural and urban societies. Improvements in foodsecurity for the poorest households, combined with attention to the status of women,to female education, and to increasing the income of poor household, have all beenshown to contribute to reducing mal- and under-nutrition and reducing the burden ofdisease.• While demographic changes are focusing attention on adult health, the ‘unfinishedagenda’ of communicable diseases should not be neglected. Many of the most importantcommunicable diseases in ACP countries - diarrhoeal disease, tuberculosis, malariaand acute respiratory infections - have strong environmental linkages. Improvementsin environmental conditions are crucial to controlling these infections.• The provision of adequate water and sanitation remains extremely important inimproving health and reducing disease in many ACP countries. Integrated approachesto service provision, which include hygiene promotion, are likely to give the greatesthealth benefit and will also maximise operational synergies by ensuring that householdshave adequate water for the disposal of excreta. Improvements in water supply havealso been shown to bring substantial economic benefits to households.• Injuries, including those attributable to road traffic accidents, violence and wars,are an area of growing concern. More attention should be given to the development ofintervention programmes.• Some of the key health threats reviewed are linked to household level behaviours.Further research into the social and behavioural aspects of health and disease is requiredin order to develop programmes to change behaviours at the household level.
3.1 Health Conditions in anEnvironmental Context
The review of demographic and health trends(Chapter 2) showed that communicablediseases are still important contributors toill health in the ACP countries. Many of thesecommunicable diseases are closely related toenvironmental exposures, and indeed, thisChapter shows that around one-third of thetotal burden of disease in ACP Africancountries is associated with environmentalfactors. The majority of this burden is carriedby children under the age of five years. Notall residents of ACP countries are equallyaffected- susceptibility, or the capacity to beaffected, is an important factor in determiningthe impacts of environmental risks.Susceptibility may vary by age, nutritionalstatus, immune status, genetic backgroundetc. (World Resources Institute, 1998)Nutritional status and immune status are, inturn, linked with poverty and access to healthcare. This section examines the relativeimportance of environmental risk factors in
determining the disease burden, based onrecent studies (Smith et al., 1998; WorldHealth Organization, 1997), and begins toexplore the poverty-environment-health nexus– a theme to which we will return later inthis report.
One of the major difficulties of this tasklies in defining what constitutes an‘environmental’ risk in a health context. Arecent review used the following approachin deciding what factors should be included(Smith et al., 1998):
• behavioural factors related topersonal and household hygiene;
• behavioural factors leading tocommunity and larger-scale pollution;
• a proportion of the direct and indirectrisks of malnutrition in order to account fordegraded soils, floods and other humanrelated impacts on the quantity, quality anddistribution of food;
• a component of environmentallyrelated injuries, based on the large variations
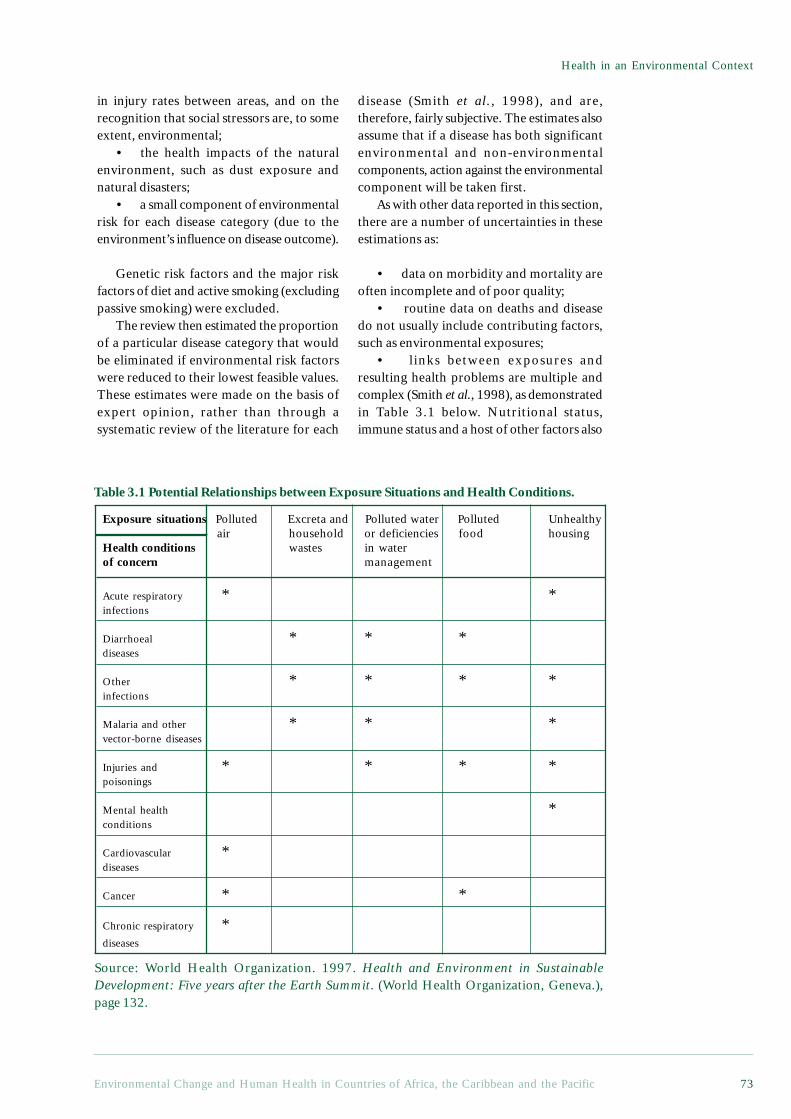
Environmental Change and Human Health in Countries of Africa, the Caribbean and the Pacific 73
Health in an Environmental Context
in injury rates between areas, and on therecognition that social stressors are, to someextent, environmental;
• the health impacts of the naturalenvironment, such as dust exposure andnatural disasters;
• a small component of environmentalrisk for each disease category (due to theenvironment’s influence on disease outcome).
Genetic risk factors and the major riskfactors of diet and active smoking (excludingpassive smoking) were excluded.
The review then estimated the proportionof a particular disease category that wouldbe eliminated if environmental risk factorswere reduced to their lowest feasible values.These estimates were made on the basis ofexpert opinion, rather than through asystematic review of the literature for each
disease (Smith et al., 1998), and are,therefore, fairly subjective. The estimates alsoassume that if a disease has both significantenvironmental and non-environmentalcomponents, action against the environmentalcomponent will be taken first.
As with other data reported in this section,there are a number of uncertainties in theseestimations as:
• data on morbidity and mortality areoften incomplete and of poor quality;
• routine data on deaths and diseasedo not usually include contributing factors,such as environmental exposures;
• links between exposures andresulting health problems are multiple andcomplex (Smith et al., 1998), as demonstratedin Table 3.1 below. Nutritional status,immune status and a host of other factors also
Exposure situations Polluted Excreta and Polluted water Polluted Unhealthy air household or deficiencies food housing
Health conditions wastes in waterof concern management
Acute respiratory * *infections
Diarrhoeal * * *diseases
Other * * * *infections
Malaria and other * * *vector-borne diseases
Injuries and * * * *poisonings
Mental health *conditions
Cardiovascular *diseases
Cancer * *
Chronic respiratory *diseases
Table 3.1 Potential Relationships between Exposure Situations and Health Conditions.
Source: World Health Organization. 1997. Health and Environment in SustainableDevelopment: Five years after the Earth Summit. (World Health Organization, Geneva.),page 132.
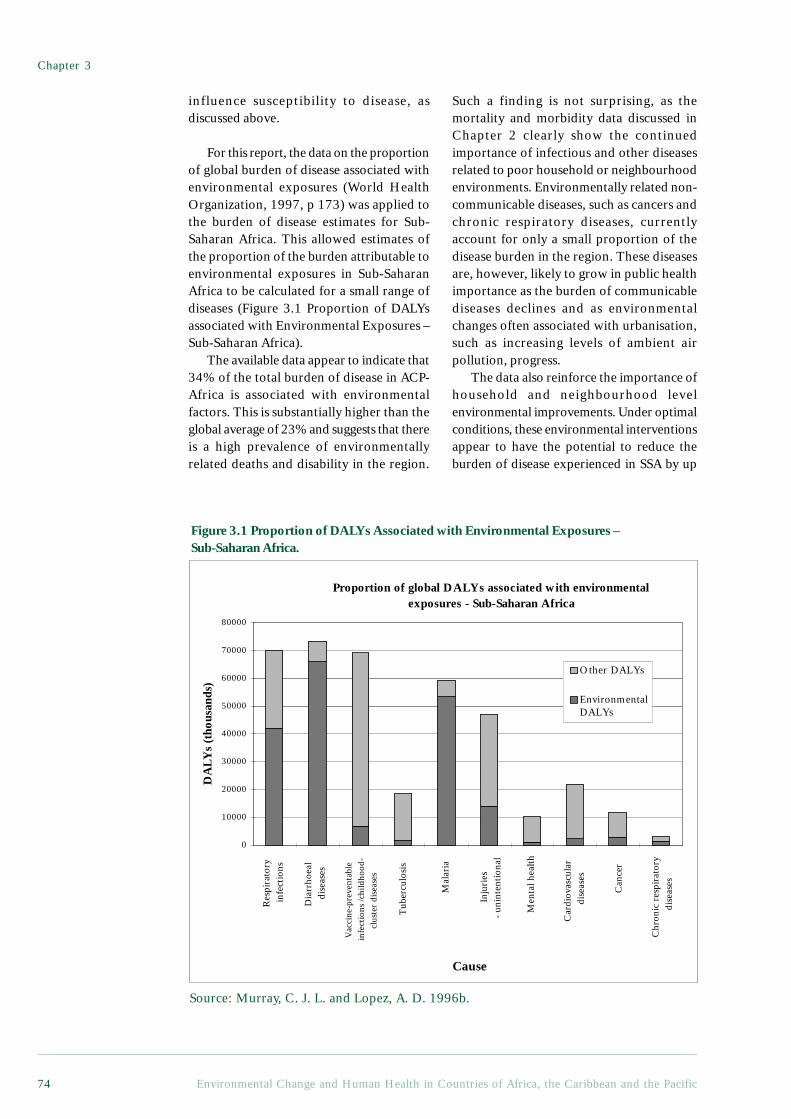
Chapter 3
Environmental Change and Human Health in Countries of Africa, the Caribbean and the Pacific74
Proportion of global DALYs associated with environmental exposures - Sub-Saharan Africa
Inju
ries
-
unin
tent
iona
l
Men
tal h
ealt
h
Car
diov
ascu
lar
dis
ease
s
Can
cer
Chr
onic
res
pira
tory
dis
ease
s
Mal
aria
Tub
ercu
losi
s
Vac
cine
-pre
vent
able
infe
ctio
ns /c
hild
hood
-cl
uste
r di
seas
es
Dia
rrho
eal
dise
ases
Res
pira
tory
in
fect
ions
0
10000
20000
30000
40000
50000
60000
70000
80000
Cause
DA
LYs
(tho
usan
ds)
Other DALYs
EnvironmentalDALYs
influence susceptibility to disease, asdiscussed above.
For this report, the data on the proportionof global burden of disease associated withenvironmental exposures (World HealthOrganization, 1997, p 173) was applied tothe burden of disease estimates for Sub-Saharan Africa. This allowed estimates ofthe proportion of the burden attributable toenvironmental exposures in Sub-SaharanAfrica to be calculated for a small range ofdiseases (Figure 3.1 Proportion of DALYsassociated with Environmental Exposures –Sub-Saharan Africa).
The available data appear to indicate that34% of the total burden of disease in ACP-Africa is associated with environmentalfactors. This is substantially higher than theglobal average of 23% and suggests that thereis a high prevalence of environmentallyrelated deaths and disability in the region.
Such a finding is not surprising, as themortality and morbidity data discussed inChapter 2 clearly show the continuedimportance of infectious and other diseasesrelated to poor household or neighbourhoodenvironments. Environmentally related non-communicable diseases, such as cancers andchronic respiratory diseases, currentlyaccount for only a small proportion of thedisease burden in the region. These diseasesare, however, likely to grow in public healthimportance as the burden of communicablediseases declines and as environmentalchanges often associated with urbanisation,such as increasing levels of ambient airpollution, progress.
The data also reinforce the importance ofhousehold and neighbourhood levelenvironmental improvements. Under optimalconditions, these environmental interventionsappear to have the potential to reduce theburden of disease experienced in SSA by up
Figure 3.1 Proportion of DALYs Associated with Environmental Exposures –Sub-Saharan Africa.
Source: Murray, C. J. L. and Lopez, A. D. 1996b.
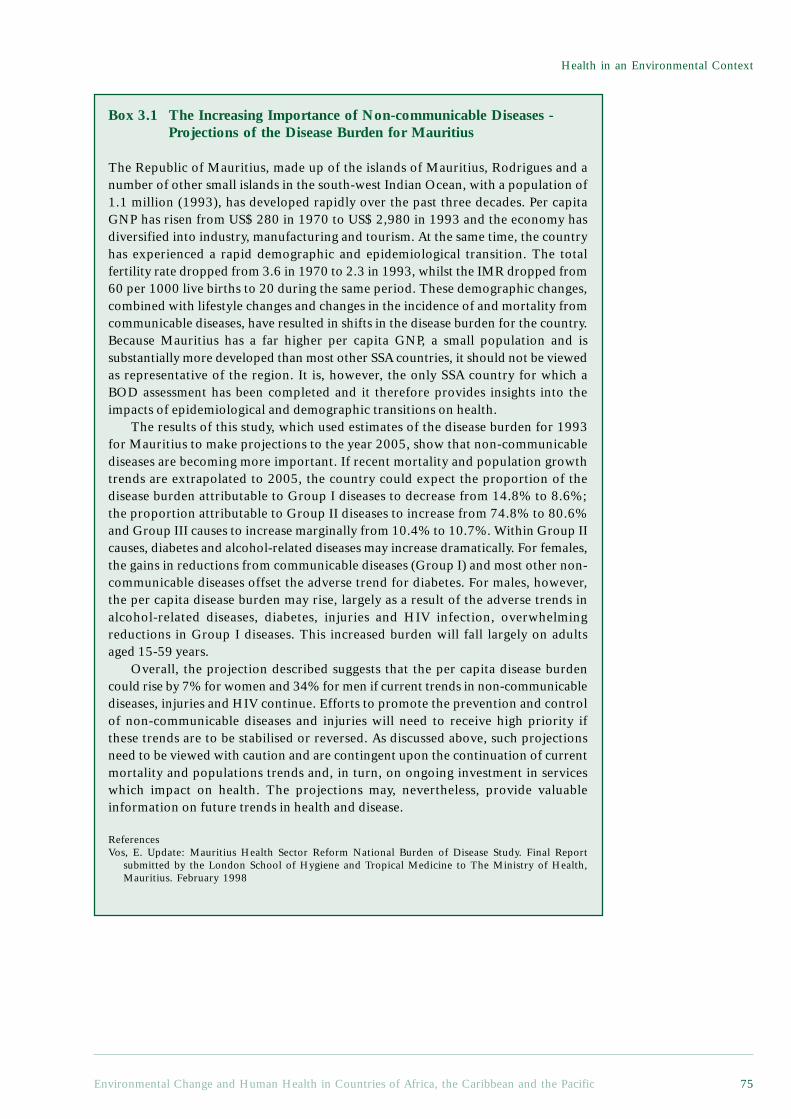
Environmental Change and Human Health in Countries of Africa, the Caribbean and the Pacific 75
Health in an Environmental Context
Box 3.1 The Increasing Importance of Non-communicable Diseases -Projections of the Disease Burden for Mauritius
The Republic of Mauritius, made up of the islands of Mauritius, Rodrigues and anumber of other small islands in the south-west Indian Ocean, with a population of1.1 million (1993), has developed rapidly over the past three decades. Per capitaGNP has risen from US$ 280 in 1970 to US$ 2,980 in 1993 and the economy hasdiversified into industry, manufacturing and tourism. At the same time, the countryhas experienced a rapid demographic and epidemiological transition. The totalfertility rate dropped from 3.6 in 1970 to 2.3 in 1993, whilst the IMR dropped from60 per 1000 live births to 20 during the same period. These demographic changes,combined with lifestyle changes and changes in the incidence of and mortality fromcommunicable diseases, have resulted in shifts in the disease burden for the country.Because Mauritius has a far higher per capita GNP, a small population and issubstantially more developed than most other SSA countries, it should not be viewedas representative of the region. It is, however, the only SSA country for which aBOD assessment has been completed and it therefore provides insights into theimpacts of epidemiological and demographic transitions on health.
The results of this study, which used estimates of the disease burden for 1993for Mauritius to make projections to the year 2005, show that non-communicablediseases are becoming more important. If recent mortality and population growthtrends are extrapolated to 2005, the country could expect the proportion of thedisease burden attributable to Group I diseases to decrease from 14.8% to 8.6%;the proportion attributable to Group II diseases to increase from 74.8% to 80.6%and Group III causes to increase marginally from 10.4% to 10.7%. Within Group IIcauses, diabetes and alcohol-related diseases may increase dramatically. For females,the gains in reductions from communicable diseases (Group I) and most other non-communicable diseases offset the adverse trend for diabetes. For males, however,the per capita disease burden may rise, largely as a result of the adverse trends inalcohol-related diseases, diabetes, injuries and HIV infection, overwhelmingreductions in Group I diseases. This increased burden will fall largely on adultsaged 15-59 years.
Overall, the projection described suggests that the per capita disease burdencould rise by 7% for women and 34% for men if current trends in non-communicablediseases, injuries and HIV continue. Efforts to promote the prevention and controlof non-communicable diseases and injuries will need to receive high priority ifthese trends are to be stabilised or reversed. As discussed above, such projectionsneed to be viewed with caution and are contingent upon the continuation of currentmortality and populations trends and, in turn, on ongoing investment in serviceswhich impact on health. The projections may, nevertheless, provide valuableinformation on future trends in health and disease.
ReferencesVos, E. Update: Mauritius Health Sector Reform National Burden of Disease Study. Final Report
submitted by the London School of Hygiene and Tropical Medicine to The Ministry of Health,Mauritius. February 1998
Chapter 3
Environmental Change and Human Health in Countries of Africa, the Caribbean and the Pacific76
to one-third. The synergistic effects of manyof these interventions, such as improved waterand sanitation facilities, across several diseasesmight mean that this is an underestimate ofthe overall benefits of environmentalimprovements. This is further discussed in thesection on key health threats below.
In that almost all environmentally relatedDALYs are accounted for by the age group 0-14 years, the health of children under 15 yearscould benefit greatly from environmentalimprovements and the improvedenvironmental regulation of pollutants, forexample. Diarrhoeal diseases, malaria andrespiratory infections are most closely linkedwith environmental factors and, respectively,constitute the top three environmentally relatedcauses of death and disability for the region.They account for more than 28% of allDALYs. Of the DALYs associated withenvironmental factors, about 80% occur inthe age group 0-4 years, indicating theparticular vulnerability of young children tothe multiple risks of inadequate environments.
While these figures can only be seen asbroad estimates, they do begin to highlightthe links between environmental factors anddisease burden. Disaggregated burden ofdisease figures for the Caribbean and thePacific small island states were, unfortunately,not available and so are not discussed here.It is, however, likely that the picture in theseislands, particularly those with low per capitaincomes and less developed infrastructure,is likely to be similar to that described above.
3.2 Key Health Threats In AnEnvironmental Context
Because of the importance of environmentallyrelated diseases in the ACP countries, it isuseful to examine in more detail thosemaking the largest contribution to the burdenof disease. In the section that follows, thekey health threats and their links toenvironmental conditions are discussed.
The key threats are classified using thescheme described in Chapter 2:communicable and nutritional diseases (GroupI conditions), non-communicable diseases(Group II) and injuries (Group III). Groupingcommunicable and nutritional diseases helpsto demonstrate the close relationship betweenmalnutrition and many infectious diseases.
Many of these diseases are also susceptible toimprovements in household living conditions.Within these three broad groups, the healthissues are presented in descending order oftheir contribution to the burden of diseaseattributable to environmental factors.
3.2.1 Communicable and NutritionalDiseases
Diarrhoeal DiseasesFaecal-oral diseases are the most importantcontributor to the environmental burden ofdisease in ACP-African countries and incertain Pacific and Caribbean countries.Murray and Lopez (1996) have attempted toassess the disease burden attributable to poorwater supply, sanitation and personal anddomestic hygiene practices, in order toindicate the proportion of the burden thatcould be prevented if the transmission of thesediseases were interrupted throughintervention. The authors suggest that 5.3%of all deaths worldwide are attributable topoor water supply, sanitation and hygiene andthat these risk factors account for 6.8% ofthe disease burden. This is equivalent to thedisease burden attributed to more well-publicised diseases such as malaria, measlesand tuberculosis. This burden is not equallydistributed across regions, however: in thedeveloped world, these risk factors accountfor a negligible proportion of the diseaseburden (0.1%) while in ACP-Africa theyaccount for approximately 10% of the burdenof disease and injury. These inequalitiesreflect the inequalities in access to water andsanitation between the developed and thedeveloping world.
Of the faecal-oral diseases, diarrhoealdiseases are the most important, particularlyin children under five years of age. Diarrhoeais a complex of symptoms and signs and,while a number of definitions have been usedin the literature, recent studies haveconsidered more than three stools in 24 hoursof observation as an indication of diarrhoeaafter the age of three months (Martines etal., 1993).
The aetiology of diarrhoeal diseases iscomplex, and varies according to age andgeographical setting. Rotavirus is asignificant cause amongst children under two
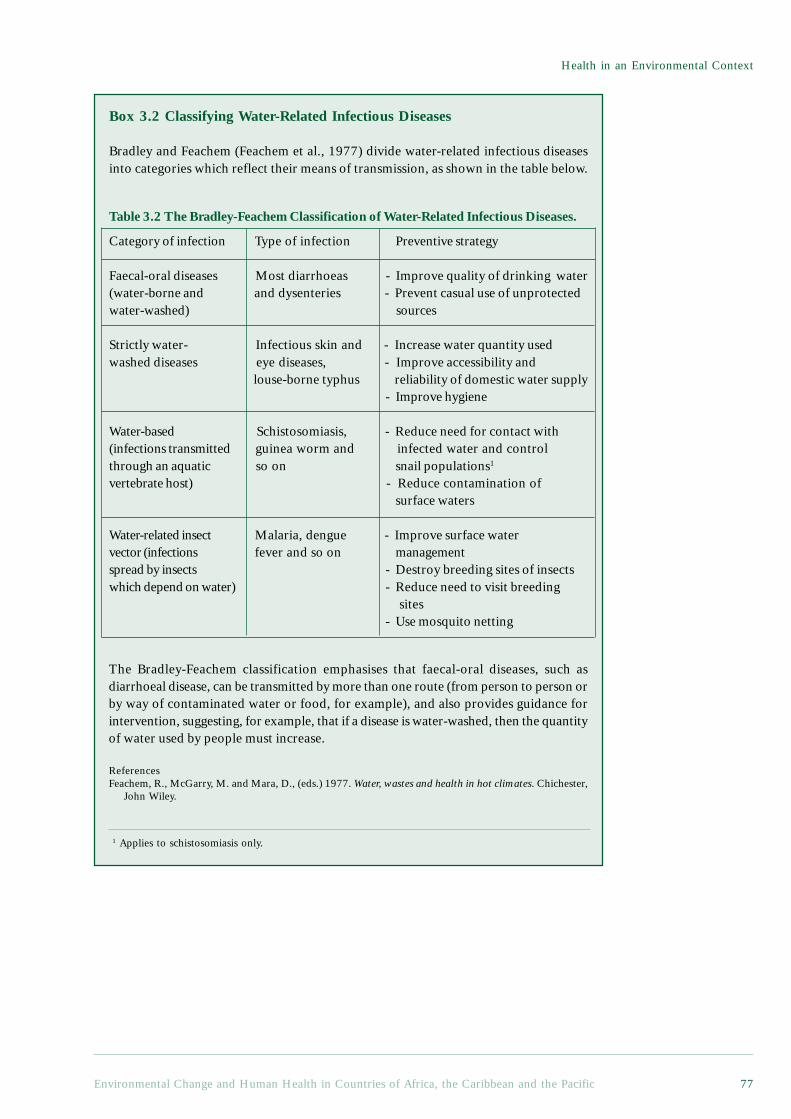
Environmental Change and Human Health in Countries of Africa, the Caribbean and the Pacific 77
Health in an Environmental Context
The Bradley-Feachem classification emphasises that faecal-oral diseases, such asdiarrhoeal disease, can be transmitted by more than one route (from person to person orby way of contaminated water or food, for example), and also provides guidance forintervention, suggesting, for example, that if a disease is water-washed, then the quantityof water used by people must increase.
ReferencesFeachem, R., McGarry, M. and Mara, D., (eds.) 1977. Water, wastes and health in hot climates. Chichester,
John Wiley.
1 Applies to schistosomiasis only.
Box 3.2 Classifying Water-Related Infectious Diseases
Bradley and Feachem (Feachem et al., 1977) divide water-related infectious diseasesinto categories which reflect their means of transmission, as shown in the table below.
Category of infection Type of infection Preventive strategy
Faecal-oral diseases Most diarrhoeas - Improve quality of drinking water(water-borne and and dysenteries - Prevent casual use of unprotectedwater-washed) sources
Strictly water- Infectious skin and - Increase water quantity usedwashed diseases eye diseases, - Improve accessibility and
louse-borne typhus reliability of domestic water supply - Improve hygiene
Water-based Schistosomiasis, - Reduce need for contact with(infections transmitted guinea worm and infected water and controlthrough an aquatic so on snail populations1
vertebrate host) - Reduce contamination ofsurface waters
Water-related insect Malaria, dengue - Improve surface watervector (infections fever and so on managementspread by insects - Destroy breeding sites of insectswhich depend on water) - Reduce need to visit breeding
sites - Use mosquito netting
Table 3.2 The Bradley-Feachem Classification of Water-Related Infectious Diseases.
Chapter 3
Environmental Change and Human Health in Countries of Africa, the Caribbean and the Pacific78
years of age in developing countries, butother viruses and bacteria, such asEscherichia coli, Salmonella, Shigella andVibrio cholerae, can also cause the disease.Diarrhoeal diseases are spread from thefaeces of an infected person to fluids (storedwater), fingers, flies or fields(neighbourhood contamination) and fromthere, either directly or via food, to a newhost (Kolsky, 1993). The risk of diarrhoeamorbidity and mortality is higher in poorerhouseholds, in conditions of poor personaland domestic hygiene, and amongst infantsof low birth weight, those who are notbreastfed and those who are malnourished(Chongsuvivatwong et al., 1994; Daniels etal., 1990; Martines et al., 1993).Improvements in water supply, excretadisposal and hygiene behaviour are stronglylinked to decreased diarrhoeal morbidity andmortality rates, as discussed below.
The burden of diarrhoeal diseases indeveloping countries remains extremely high.In ACP-African countries, approximately950,000 people died of diarrhoeal diseasesin 1990. Eighty-five per cent of these deathswere in the age group, 0-4 years (Murray andLopez, 1996a). On average, children underfive years of age in developing countries suffer3.5 episodes of diarrhoea per year, with therates in ACP-Africa even higher (Martines etal., 1993). Whilst there is evidence of areduction in diarrhoeal mortality during thepast 15 years, there is little evidence of areduction in incidence.
Interventions designed to improve watersupply, sanitation and hygiene behaviour, andthereby reduce the incidence of diarrhoealdiseases, are a public health priority. Accessto safe water and adequate sanitation is notonly a prerequisite for health, but is alsoincreasingly being seen as a social right.
Access to Water and SanitationData on changes in access to safe watersupplies over the past two decades for selectedACP countries are shown in the Figure 3.2(further data are available in the appendices).Whilst some countries improved coveragedramatically (Botswana), others achievedmore modest gains (Papua New Guinea;Benin), with some showing very little gain(Haiti). This does not necessarily mean that
services have not expanded, but rather thatexpansion of access to water has not kept pacewith population growth in these countries.
Despite what would seem to be obvioushealth, social and economic benefits, around50% of people in ACP-Africa do not haveaccess to safe water and adequate sanitation,with rural residents being twice as likely asurban dwellers to experience inadequate basicservices (UNICEF, 1998).
In the Caribbean, most countries, apartfrom Haiti, have high levels of access to safedrinking water and adequate sanitation. Levelsof access to these facilities have beenmaintained or increased since 1980.Unfortunately, access alone does not lead toa healthy environment. Contamination ofwater supplies and the indiscriminate disposalof waste and sewage are still serious publichealth problems, as indicated by thegastroenteritis rates seen across the region.This is especially true in Jamaica, St Vincentand the Grenadines, St Kitts and Nevis, andTrinidad and Tobago, where the incidencesof gastroenteritis remain high. Furthermore,due to high levels of extraction fromgroundwater sources in many of the islands,saline intrusion has started to occur, makingthe water unpalatable and non-potable. Asidefrom saline intrusion, dangers from othertoxins as a consequence of the improperdisposal of sewage, domestic and industrialwastes also pose potential threats to humanhealth in the region. The quality of surfacewater in the Caribbean has, for example, beenaffected by contamination with householdchemicals and pesticide runoffs.
Figures on access to water and sanitationfor the Pacific island states show that forseveral states, such as Papua New Guineaand the Solomon Islands, coverage is lowcompared with both the developing countriesaverage and the ACP-African average. Theincidence of waterborne and water relateddiseases in these areas are naturally high, ashas been concluded in a number of studies.Data on other forms of water pollution inthe region were not available.
There are also important differentials inwater and sanitation coverage in cities andtowns. In many ACP cities, subsidised publicwater and sanitation services are enjoyed bywealthier households, while poorer
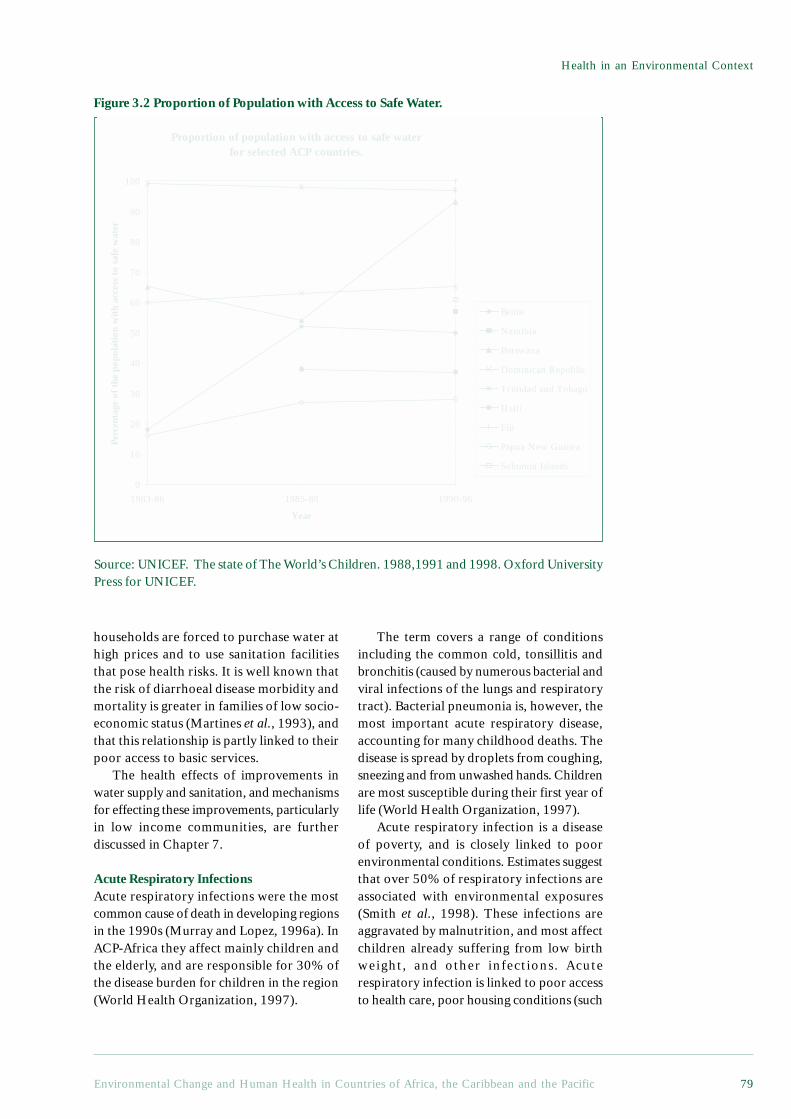
Environmental Change and Human Health in Countries of Africa, the Caribbean and the Pacific 79
Health in an Environmental Context
Proportion of population with access to safe water for selected ACP countries.
0
10
20
30
40
50
60
70
80
90
100
1983-86 1985-88 1990-96
Year
Perc
enta
ge o
f the
pop
ulat
ion
wit
h ac
cess
to
safe
wat
er
Benin
Namibia
Botswana
Dominican Republic
Trinidad and Tobago
Haiti
Fiji
Papua New Guinea
Solomon Islands
households are forced to purchase water athigh prices and to use sanitation facilitiesthat pose health risks. It is well known thatthe risk of diarrhoeal disease morbidity andmortality is greater in families of low socio-economic status (Martines et al., 1993), andthat this relationship is partly linked to theirpoor access to basic services.
The health effects of improvements inwater supply and sanitation, and mechanismsfor effecting these improvements, particularlyin low income communities, are furtherdiscussed in Chapter 7.
Acute Respiratory InfectionsAcute respiratory infections were the mostcommon cause of death in developing regionsin the 1990s (Murray and Lopez, 1996a). InACP-Africa they affect mainly children andthe elderly, and are responsible for 30% ofthe disease burden for children in the region(World Health Organization, 1997).
The term covers a range of conditionsincluding the common cold, tonsillitis andbronchitis (caused by numerous bacterial andviral infections of the lungs and respiratorytract). Bacterial pneumonia is, however, themost important acute respiratory disease,accounting for many childhood deaths. Thedisease is spread by droplets from coughing,sneezing and from unwashed hands. Childrenare most susceptible during their first year oflife (World Health Organization, 1997).
Acute respiratory infection is a diseaseof poverty, and is closely linked to poorenvironmental conditions. Estimates suggestthat over 50% of respiratory infections areassociated with environmental exposures(Smith et al., 1998). These infections areaggravated by malnutrition, and most affectchildren already suffering from low birthweight, and other infections. Acuterespiratory infection is linked to poor accessto health care, poor housing conditions (such
Figure 3.2 Proportion of Population with Access to Safe Water.
Source: UNICEF. The state of The World’s Children. 1988,1991 and 1998. Oxford UniversityPress for UNICEF.
Chapter 3
Environmental Change and Human Health in Countries of Africa, the Caribbean and the Pacific80
as inadequate inhalation and dampness),overcrowding and poor hygiene.Relationships between acute respiratoryinfection and both indoor and outdoor airpollution are also being investigated. A linkto the use of biomass fuels (such as wood,dung and coal) has been suggested.
Although most types of pneumoniacannot be prevented by vaccine, they can betreated by standard antibiotics. Efforts toreduce pneumonia mortality have centredaround improved case management(including simplifying case detection) andincreasing parental awareness of the needto seek medical attention (World HealthOrganization, 1998). This approach is beingundermined by the increasing resistance toantibiotics of bacteria that cause pneumonia.Broader strategies are being sought, such asintegrating prevention with measures toimprove nutrition, including breast feedingand increase birth weights. Smoke reduction,both from cigarettes and cooking stoves, mayalso be an important focus for prevention,although more research is needed in this area(Kibel and Wagstaff, 1995). This is furtherdiscussed in Chapter 5.
Malaria And Other Vector DiseasesThe environment plays a particularlyimportant role in determining thedistribution of vector-borne diseases, throughfactors such as water, temperature,humidity, vegetation density, patterns ofagriculture and housing construction (seeBox 3.3 and Table 5.2 Vector RelatedDiseases) (World Health Organization,1998). All vector borne diseases, includingmalaria, lymphatic filariasis andschistosomiasis (bilharzia), are most seriousin the poorest countries.
Ninety per cent of all malaria cases occurin tropical Africa (World Resources Institute,1998). It is estimated that there are 100million malaria cases every year in Africaand that 275 million people carry theparasite (Bradley et al., 1991). In most casesthis is Plasmodium falciparum, the moresevere type of malaria. The three mainmosquito vectors are resistant to one or moreinsecticides, and although urbanisation hasbeen traditionally held to reduce malaria,other evidence suggests that in urban and
peri-urban areas, transmission is oftenintense, but tends to be seasonal and forshorter periods than in rural areas.
Statistics increasingly suggest that thereis higher incidence of malaria in olderchildren and adults in the region, which isthought to be associated with urbanisationand personal protection from mosquito bitesby various means (both of which reduceimmunity), and which is seen to be worst innon-endemic areas where people reachadulthood without developing immunity.Malaria is also associated with populationmovements of non-immune people intoendemic areas. The movement of highlandpopulations in Uganda in the 1950s tocolonise lowland areas, for example, led to alarge epidemic.
Malaria is also an important cause of lowbirth rates in endemic areas as pregnantwomen are more susceptible to both malariaand anaemia. It is estimated that malariaaccounts for between 20% and 30% of infantdeaths in the region. Many of these childdeaths are in more remote areas with pooraccess to health care services.
The type of rapid informal urbanisationseen in ACP-Africa has increased the numberof breeding sites for the Culex mosquitoeswhich utilise pools of stagnant water. Culexare the vector for lymphatic filariasis, whichcauses the condition ‘elephantiasis’ and malegenital damage (World Health Organization,1998). In the urban context, breeding sitesfor Culex are often created when drains andother forms of sewerage disposal built toimprove sanitary conditions become blockeddue to inadequate maintenance or poordesign, creating stagnant pools. Pit latrinesare another important breeding site ifwaterlogged, as are cracked septic tanks(Curtis and Feachem, 1981). There is alsoevidence that Culex mosquitoes from onemassive breeding site, such as a sewagefarm, can infest a whole city (Curtis andFeachem, 1981). A study in India showedthat the prevalence of filariasis decreasedwith distance from the centre of the city,implying that the city is the major breedingsite for the mosquito vector and that the riskof disease increases with the growth of urbaninfrastructure (Overseas DevelopmentAdministration, 1985). Increasing urban
Environmental Change and Human Health in Countries of Africa, the Caribbean and the Pacific 81
Health in an Environmental Context
populations with inadequate or poorlyconstructed or maintained sanitation anddrainage can therefore produce an increasednumber of breeding sites for the Culexmosquito and lead to the increasedtransmission of filariasis within cities.
Some recent epidemics of vector bornediseases are being linked to climatic change(see Chapter 6), as well as to the opening upof non-endemic areas, changes in localenvironments (see Boxes 3.3 and Box 7.3Current status of development of vaccinesagainst malaria, schistosomiasis andfilariasis), insecticide resistance and anti-malarial drug resistance. The distributionand prevalence of a number of other vector-borne diseases, including dengue (mosquitovector)1, leishmaniasis (sandfly vector)2,African trypanosomiasis (tsetse fly)3,onchocerciasis (blackfly vector)4 andschistosomiasis (aquatic snail vector)5, arealso closely linked to environmentalconditions. Environmental improvements,coupled with adequate treatment andprophylaxis, hence have great potential toreduce the spread of these diseases.
TuberculosisTuberculosis ranks seventh in the list ofcontributors to the global disease burden,causing an estimated 385,000 deaths in ACP-Africa and two million deaths worldwide in1990 - probably more than any other singlepathogen (Murray et al., 1993; Murray andLopez, 1996a; Raviglione et al., 1995). Ithas been estimated for 1990 that about 1.7billion people were infected withtuberculosis, mainly in developing countries.Whilst all age groups are affected, incidenceand mortality is concentrated in adults aged15-59 years. Tuberculosis is caused by the
bacterium Mycobacterium tuberculosis,which usually infects the lungs. Infection isgenerally transmitted from people withpulmonary tuberculosis, particularly whencoughing or sneezing. It is important to notethat clinical disease may occur at any timefrom weeks to years after the initial infection,although most cases occur within two yearsof infection (Murray et al., 1993). Diseaseat a later date may be ‘activated’ byweakening of the host’s immune system,through malnutrition or HIV infection, forexample.
Both the incidence of tuberculosis andthe number of deaths attributable to thedisease are likely to rise in ACP-Africa andother low income ACP countries during thenext decade. Data shows that notificationrates for ACP-Africa increased by 19% forthe period 1989-91 when compared with1984-86 (Raviglione et al., 1995). Projectionsindicate that in ACP Africa, tuberculosisdeaths may increase by 2010 in absoluteterms and in relative terms from 4.7% toapproximately 7% of all deaths - and from3.3 to 5.8% of the disease burden (Murrayand Lopez, 1996a). Tuberculosis in theCaribbean, while generally less common thanthat in most countries in Latin America andACP-Africa, appears to be on the increase.The downward trend in the tuberculosis ratehas reversed during the latter half of thisdecade, and whilst the reasons for thereversal are not clear, it does coincide withthe deterioration of socio-economicconditions in a number of Caribbeancountries (PAHO, 1997).
There are a number of likely reasons forthis rise in incidence. Firstly, demographicshifts mean that the size of the most
1 Dengue is a viral disease causing fever, headache, tiredness, muscle pain, rashes and joint or bone pain.It is non-fatal, but those affected often experience a prolonged convalescence (Weatherall et al 1996).2 Leishmaniasis is caused by a parasite transmitted by sandflies, and is characterised by skin ulcers andnodules. These are not generally painful, but may disfigure or disable if scarring is severe or over a joint(Weatherall et al 1996).3 African trypanosomiasis, or sleeping sickness, is cause by a parasite transmitted by tsetse flies. Theseverity of the disease varies considerably, but initial fever, headache and malaise, later followed bymeningoencephalitis and death over months or years (Weatherall et al 1996).4 Onchocerciasis is transmitted by blackflies which breed in fast-flowing watercourses. It may causesevere eye lesions, including blindness, and skin disease (Weatherall et al 1996).5 Schistosomiasis is caused by a parasite transmitted by aquatic snails. It may cause both acute disease,including fever, rigors and vomiting, and chronic disease of the urinary system and liver (Weatherall etal 1996).
continued on page 84
Chapter 3
Environmental Change and Human Health in Countries of Africa, the Caribbean and the Pacific82
Box 3.3 The Health Risks of Development Projects: Infectious Agents andIrrigation
Irrigation programmes, the construction of dams or water impoundments, andagricultural practices such as rice cultivation and coffee growing, are often undertakenin order to provide economic benefits for local people, to provide safer water, and toprovide food. Whilst these goals are laudable, such interventions can adversely affectthe health of local people by expanding the water sources used by vectors whichtransmit communicable diseases. This is particularly true in many countries in Africa,South East Asia and South America, where increased prevalence, incidence, andintensity have been reported for schistosomiasis, malaria, and filarial parasites.
BilharziaIn Africa, the construction of water impoundments for irrigation and other projectshave not only intensified community levels of infection but also created new areas oftransmission. Slow moving water in irrigation canals and drainage ditches providesan ideal habitat for the snail which are the intermediate hosts to the organisms whichtransmit bilharzia (Schistosoma mansoni and S. haematobium).
There are a number of examples of this problem. In Senegal, as a result of theconstruction of a barrage to prevent sea water intrusion at Diama on the SenegalRiver, S. mansoni was introduced into the Lower and Middle Valleys of the SenegalRiver Basin and subsequently spread into the human population (Southgate, 1997). InMali, a study of 225 villages compared areas with irrigation programmes, villages inthe vicinity of small dams, settlements around a large artificial lake, communitiesalong the Niger River, and places in savannah areas without any irrigation programmes.The risk of schistosomiasis infection in irrigated areas was six times higher than insavannah villages (Brinkmann et al. 1988). Interestingly, even in the vicinity of naturalbodies of water, the prevalence of infection was three times less than near agriculturaldevelopment projects. There are a number of similar examples from ACP-Africancountries (Bizuneh, Ethiop Med J 33:259, 1995; Hilali et al, 1995; Amankwa et al.1994).
MalariaThe mosquito vectors of malaria, Anopheles gambiae and An. funestus, thrive in thequiet waters provided by dams built for drinking water, flood control, irrigation andwater storage, and in rice paddies (Githeko et al, 1993; Lindsay et al. 1995). Theepidemiological importance of rice fields varies from country to country (Lavantureet al. 1996). In West and Central Africa, where malaria is holoendemic, the rice fieldssupport the breeding of mosquito vectors. A comparison of a rice irrigation schemeand a sugar-cane belt in Kenya showed that the number of infective bites per personper year was 416 in the irrigated area - some 4.5 times more than in the cane belt(Githeko et al, 1993).
FilariasisThere are two major types of filarial diseases. Lymphatic filariasis is transmitted bymosquitoes and afflicts about 90 million people in Africa, South America, the Indiansubcontinent, south-east Asia, and China. The most dramatic manifestation of thedisease is elephantiasis of the limbs, usually the legs. Onchocerciasis, on the otherhand, is transmitted by simulium black flies and afflicts 18 million people in Africa,South and Central America, where it causes blindness in about 3 million people. Thelarvae of the black flies prefer fast running water and the term river blindness refers tothe fact that the majority of infected people live along river valleys. Filariasis
Environmental Change and Human Health in Countries of Africa, the Caribbean and the Pacific 83
Health in an Environmental Context
transmission is also affected by man-made development projects, although the list ofdocumented cases is not as long as for schistosomiasis and malaria.
Elephantiasis has been referred to as a disease of development. In north-eastern Ghana,high levels of lymphatic filariasis have been associated with two rice irrigation projects(Hunter, 1992), although this association is not always shown (Oemijati et al. 1978). Astudy in Liberia and Guinea showed that the black flies which transmit onchocerciasisbred in rivers and irrigation systems (Garms and Vajime, 1975).
ConclusionsIt is clear that development projects can have an adverse effect on the health of thevery people who are supposed to benefit from these projects. A multi-sectoral policyof prevention before development is strongly advocated (Hunter, 1992). Disease controlefforts involving the spraying of vector breeding sites have been frustrated by theemergence of drug resistance. At present, immunoprophylaxis as a control measure isnot yet practicable, although intense research efforts are ongoing in several laboratoriesto develop vaccines (see Box 6.1). Reasonable to moderate success has been achievedin developing vaccines against malaria and schistosomiasis, and several candidatevaccines are now at various stages of preclinical development (Bergquist and Colley,1998). Little progress has, in contrast, been made towards the development of vaccinesagainst filariasis. Prevention is, therefore, still the best strategy for managing theimpacts of vector borne diseases associated with development projects.
Contributed by Thomas Egwang, Med Biotech Laboratories, Kampala, Uganda.
ReferencesAmankwa, J.A., Bloch, P., Meyer-Lassen, J., Olsen, A., Christensen, N.O. 1994. Urinary and intestinal
schistosomiasis in the Tono Irrigation Scheme, Kassena/Nankana District, upper east region, Ghana.Trop Med Parasitol 45:319-323
Bergquist, N.R and Colley, D.G. 1998. Schistosomiasis vaccines: Research to development. ParasitologyToday 14: 99-104.
Bizuneh, A., Birrie, H., Debele, K. 1995. Colonization of irrigation canals by Bulinus abyssinicus andupsurge of urinary schistosomiasis in the middle Awash Valley of Ethiopia. Ethiop Med J 33:259-263
Brinkmann, U. K., Korte, R., and Schmidt-Ehry, B. 1988. The distribution and spread of schistosomiasisin relation to water resources development in Mali. Trop Med Parasitol 39:182-185.
Faye O, Fontenille D, Gaye O, Sy N, Molez JF, Konate L, Hebrard G, Herve JP, Trouillet J, Diallo S, et al.1995. Malaria and rice growing in the Senegal River delta. Ann Soc Belg Med Trop 75:179-189
Garms, R., Vajime, C.G. 1975. On the ecology and distribution of the species of the simulium damnosumcomplex in different bioclimatic zones of Liberia and Guinea. Tropenmed Parasitol 26:375-380
Githeko, A.K., Service, M.W., Mbogo, C.M., Atieli, F.K., Juma, F.O. 1993. Plasmodium falciparumsporozoite and entomological inoculation rates at the Ahero rice irrigation scheme and the Miwanisugar-belt in western Kenya. Ann Trop Med Parasitol 87:379-391
Hilali, A.H,, Madsen, H., Daffalla, A.A., Wassila, M., Christensen, N.O. 1995. Infection andtransmission pattern of Schistosoma mansoni in the Managil irrigation scheme, Sudan. Ann TropMed Parasitol 89:279-286
Hunter, J.M. 1992. Elephantiasis: a disease of development in north east Ghana. Soc Sci Med 35:627-45Laventure S, Mouchet J, Blanchy S, Marrama L, Rabarison P, Andrianaivolambo L, Rajaonarivelo E,
Rakotoarivony I, Roux J. 1996. Rice: source of life and death on the plateaux of Madagascar. Sante6:79-86
Lindsay, S.W., Armstrong Schellenberg, J.R., Zeiler, H.A., Daly, R.J., Salum, F.M., Wilkins, H.A. 1995.Exposure of Gambian children to Anopheles gambiae malaria vectors in an irrigated rice productionarea. Med Vet Entomol 9:50-58
Oemijati, S., Partono, F., Hudojo, Hadi, T.R., Clarke, M.D., Gunning, J.J., Cross, J.H. 1978. Brugiamalayi in Kresek, West Java, Indonesia: the effect of environmental changes of filarial endemicity.Trop Geogr Med 30:301-304
Southgate, V. R. 1997. Schistosomiasis in the Senegal River Basin: before and after the construction ofthe dams at Diama, Senegal and Manantali, Mali and future prospects. J Helminthol 71:125-132.
Chapter 3
Environmental Change and Human Health in Countries of Africa, the Caribbean and the Pacific84
6 See chapter 2 for discussion of health differentials.
susceptible population group (15-59 years)is growing. Secondly, rapid increases in HIVinfection rates will increase the proportionof the population susceptible to the disease -by the year 2000, an estimated 13.8% oftuberculosis cases may be associated withHIV (Dolin, 1994), cited in (Raviglione etal., 1995). Thirdly, increased numbers ofmalnourished people living in overcrowdedconditions caused by war, famine, naturaldisasters and economic marginalisation mayalso contribute to increased rates of disease.
A number of strategies have beenadopted in an attempt to control theepidemic. Short-course chemotherapy fortreatment and BCG immunisation to preventtuberculosis are two of the most cost-effective interventions available (Murray etal., 1993). The WHO has declaredtuberculosis a global emergency and ispromoting a policy of directly observedtherapy, short course (DOTS), as amechanism of achieving control of theepidemic. The emphasis on directobservation as a means of ensuringadherence to treatment is, however, notcurrently supported by evidence ofeffectiveness (Volmink and Garner, 1998;Zwarenstein et al., 1998 Forthcoming).Further research is needed in this area.There is good evidence to suggest thatpreventive treatment of HIV-infected adultsreduces the incidence of active tuberculosis(Wilkinson et al., 1998), and this should beimplemented where feasible.
The treatment of cases and contacts isonly one strategy for reducing the incidenceof tuberculosis. The relationship betweensocio-economic and environmentalconditions and tuberculosis incidence is wellknown, and data from developed countriesshow that the most dramatic drops in deathsfrom respiratory tuberculosis occurred beforethe widespread availability of chemotherapyand vaccination (McKeown, 1988; Metcalf,1991; World Resources Institute, 1998).During the first four decades of the 20thcentury, the annual risk of infection of
tuberculosis fell by 3% to 5% per year inEurope (Murray et al., 1993). This decreaseis largely attributed to improvements in socio-environmental conditions such as housing andnutrition, to improvements in general healthand, possibly, to the policy of isolatingtuberculosis patients in sanatoria.
Tuberculosis rates in both developing anddeveloped countries have been shown to varyinversely with socio-economic status(Coovadia and Benatar, 1991) andovercrowding (Elender et al., 1998) - a factwhich emphasises the link between poorliving conditions and disease transmission.The extent to which individualimprovements, such as those in housing,contributed to the reduction of tuberculosisrates is not clear, however, due to difficultiesin disaggregating these impacts (Porter andOgden, 1998). Overcrowding, poorventilation, poor sanitation and under-nutrition or malnutrition are all closelylinked to poverty and, as discussed earlier,there are synergies present in both theadverse effects of poverty on health and inthe benefits of interventions which broadlyaddress poverty. This point is crucial as,whilst anti-tuberculosis chemotherapy candecrease the annual risk of infection by 10to 12%, it does not contribute to decreasingother poverty-related diseases such aschildhood respiratory infections anddiarrhoeal disease. Others have commentedthat, ‘The consequences of a rigid biomedicalfocus is that the wider, more profound andlong-lasting interventions, such as improvedhousing, reduction of gender discriminationand ways of building the capacity ofcommunities to manage public healthproblems on their own terms, are notaddressed’ (Porter and Ogden, 1998, page109). Recent studies have estimated that upto 10% of the tuberculosis burden could beprevented through environmentalimprovements (World Health Organization,1997 and see Figure 2.11), but little attentionhas been paid by the health sector tostrategies that address socio-environmentaldeprivation and social inequalities6. This is
continued from page 81
Environmental Change and Human Health in Countries of Africa, the Caribbean and the Pacific 85
Health in an Environmental Context
not to suggest that people with tuberculosisshould not receive chemotherapy, but ratherthat equal attention needs to be paid toreducing poverty in areas where tuberculosisprevalence is high.
Acquired Immunodeficiency Syndrome AIDS/HIVTwo-thirds of all people with HIV live inACP-Africa (World Resources Institute,1998). In some areas, such as Botswana, upto 30% of the population have the virus (afigure that has doubled over the past fiveyears). The large population movements tothe cities of eastern and central Africa inthe 1970s and early 1980s are thought to bea large factor in the spread of the disease,and urban rates are still the highest in theregion. It was previously believed that theepidemic was levelling off, but currentestimates indicate that 7.4% of the adultpopulation in Africa, aged between 15 and49, are HIV positive.
It is estimated that 80% of those withthe virus in the region acquired it throughheterosexual transmission (Feachem andJamison, 1991). This is a very highproportion when compared withtransmission modes in other regions of theworld. It is believed that the high prevalenceof other infectious diseases, such as malaria,may facilitate the virus, through their impacton the immune system. The clearestassociation with another disease is withtuberculosis. It has been estimated that onehalf of all adults in ACP-Africa have latenttuberculosis, which could be activated byHIV infection.
The rates of vertical transmission frommother to child are thought to be between25% and 50%. A further 10 years will beneeded before the true extent of child HIVmorbidity and mortality are seen (becauseof the difficulties of diagnosis in childrenand increasing evidence that childreninfected before birth do not become ill untilthey are between seven and ten years of age).
The sex ratios of the disease vary byregion. In Zaire and Uganda, for example,the ratio of male to female AIDS cases isless than one, whereas in Cote d’Ivoire andSenegal, the ratios are between two and four.Urban/rural differences are generally high
throughout the region, with a much greaterprevalence of the virus in urban areas. InRwanda in 1990, the percentage of HIV-1seroprevalence was 30.3 for those in urbanenvironments and 1.7 for rural dwellers.Disproportionately high rates of infectionare expected in future, amongst women andlow income urban residents.
Whilst it is not clear why the rates ofHIV infection have risen rapidly in someareas but not in others, there are severalfactors which influence the shape of theepidemic. Migrancy – either for work or inresponse to conflict or environmentaldisasters such as drought – is an importantrisk factor in many ACP countries. Refugeesand those in conflict zones may have littlecontrol over exposure to HIV (UNAIDS,1998), and poverty and deprivation are,therefore, important in understanding thespread of HIV in the ACP countries. Studieselsewhere, for example, have shown thatwhere women do not have access tosanitation within the home, they may beforced to use communal facilities or opendefaecation. This, in turn, places them atrisk of rape and, therefore, for HIVinfection (Cairncross et al., 1998). Ingeneral, it is thought that people whosedaily existence is stressful and dangerousmay not care about the long-term risksposed by HIV. They may be more concernedwith food security and ways of ensuringaccess to basic subsistence facilities, suchas a supply of potable water.
Whilst the ‘environmental’ componentof HIV/AIDS is probably smaller than thatof many other diseases discussed in thisChapter, it is clearly a public health priorityfor the ACP countries. Its link to povertyand deprivation suggest that interventionsto improve living environments and foodsecurity, and to improve the status of womenmay impact positively on the spread of theepidemic.
Nutritional DiseasesThe term malnutrition is used to refer tothe consequences of the combination of aninadequate intake of both protein-basedenergy and micronutrients to ensure optimalgrowth and function (UNICEF, 1998, page14; World Health Organization, 1998, page
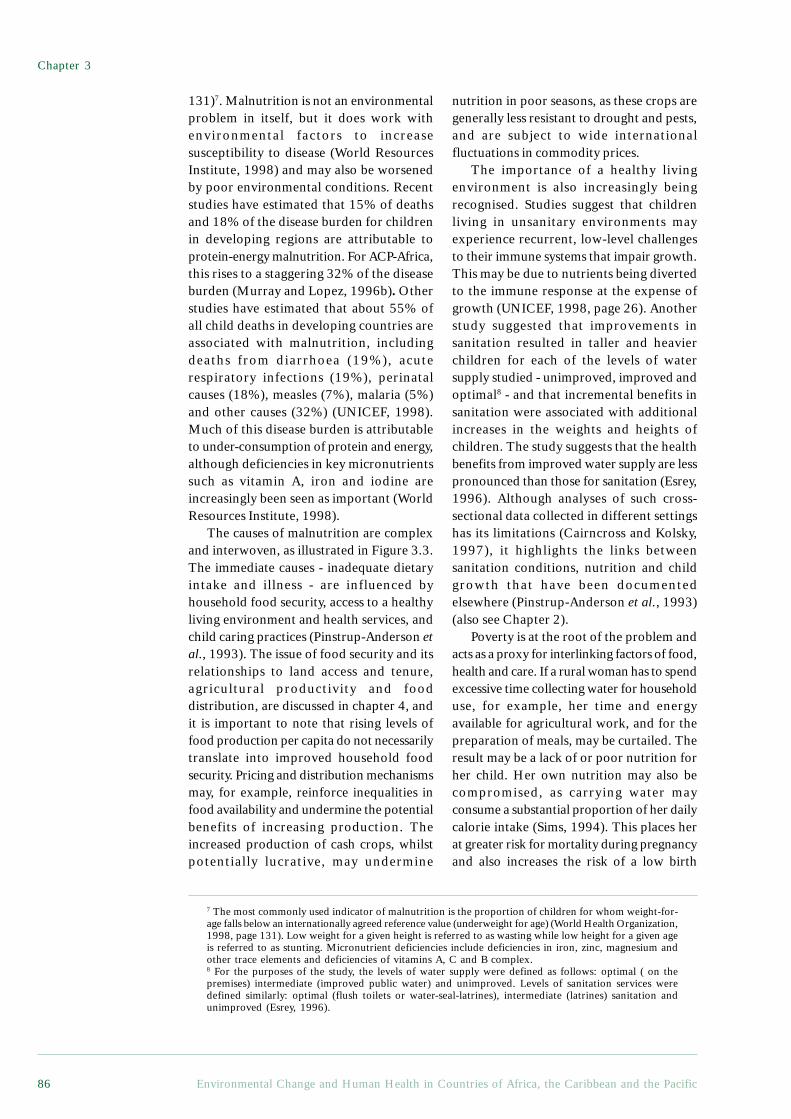
Chapter 3
Environmental Change and Human Health in Countries of Africa, the Caribbean and the Pacific86
131)7. Malnutrition is not an environmentalproblem in itself, but it does work withenvironmental factors to increasesusceptibility to disease (World ResourcesInstitute, 1998) and may also be worsenedby poor environmental conditions. Recentstudies have estimated that 15% of deathsand 18% of the disease burden for childrenin developing regions are attributable toprotein-energy malnutrition. For ACP-Africa,this rises to a staggering 32% of the diseaseburden (Murray and Lopez, 1996b). Otherstudies have estimated that about 55% ofall child deaths in developing countries areassociated with malnutrition, includingdeaths from diarrhoea (19%), acuterespiratory infections (19%), perinatalcauses (18%), measles (7%), malaria (5%)and other causes (32%) (UNICEF, 1998).Much of this disease burden is attributableto under-consumption of protein and energy,although deficiencies in key micronutrientssuch as vitamin A, iron and iodine areincreasingly been seen as important (WorldResources Institute, 1998).
The causes of malnutrition are complexand interwoven, as illustrated in Figure 3.3.The immediate causes - inadequate dietaryintake and illness - are influenced byhousehold food security, access to a healthyliving environment and health services, andchild caring practices (Pinstrup-Anderson etal., 1993). The issue of food security and itsrelationships to land access and tenure,agricultural productivity and fooddistribution, are discussed in chapter 4, andit is important to note that rising levels offood production per capita do not necessarilytranslate into improved household foodsecurity. Pricing and distribution mechanismsmay, for example, reinforce inequalities infood availability and undermine the potentialbenefits of increasing production. Theincreased production of cash crops, whilstpotentially lucrative, may undermine
nutrition in poor seasons, as these crops aregenerally less resistant to drought and pests,and are subject to wide internationalfluctuations in commodity prices.
The importance of a healthy livingenvironment is also increasingly beingrecognised. Studies suggest that childrenliving in unsanitary environments mayexperience recurrent, low-level challengesto their immune systems that impair growth.This may be due to nutrients being divertedto the immune response at the expense ofgrowth (UNICEF, 1998, page 26). Anotherstudy suggested that improvements insanitation resulted in taller and heavierchildren for each of the levels of watersupply studied - unimproved, improved andoptimal8 - and that incremental benefits insanitation were associated with additionalincreases in the weights and heights ofchildren. The study suggests that the healthbenefits from improved water supply are lesspronounced than those for sanitation (Esrey,1996). Although analyses of such cross-sectional data collected in different settingshas its limitations (Cairncross and Kolsky,1997), it highlights the links betweensanitation conditions, nutrition and childgrowth that have been documentedelsewhere (Pinstrup-Anderson et al., 1993)(also see Chapter 2).
Poverty is at the root of the problem andacts as a proxy for interlinking factors of food,health and care. If a rural woman has to spendexcessive time collecting water for householduse, for example, her time and energyavailable for agricultural work, and for thepreparation of meals, may be curtailed. Theresult may be a lack of or poor nutrition forher child. Her own nutrition may also becompromised, as carrying water mayconsume a substantial proportion of her dailycalorie intake (Sims, 1994). This places herat greater risk for mortality during pregnancyand also increases the risk of a low birth
7 The most commonly used indicator of malnutrition is the proportion of children for whom weight-for-age falls below an internationally agreed reference value (underweight for age) (World Health Organization,1998, page 131). Low weight for a given height is referred to as wasting while low height for a given ageis referred to as stunting. Micronutrient deficiencies include deficiencies in iron, zinc, magnesium andother trace elements and deficiencies of vitamins A, C and B complex.8 For the purposes of the study, the levels of water supply were defined as follows: optimal ( on thepremises) intermediate (improved public water) and unimproved. Levels of sanitation services weredefined similarly: optimal (flush toilets or water-seal-latrines), intermediate (latrines) sanitation andunimproved (Esrey, 1996).
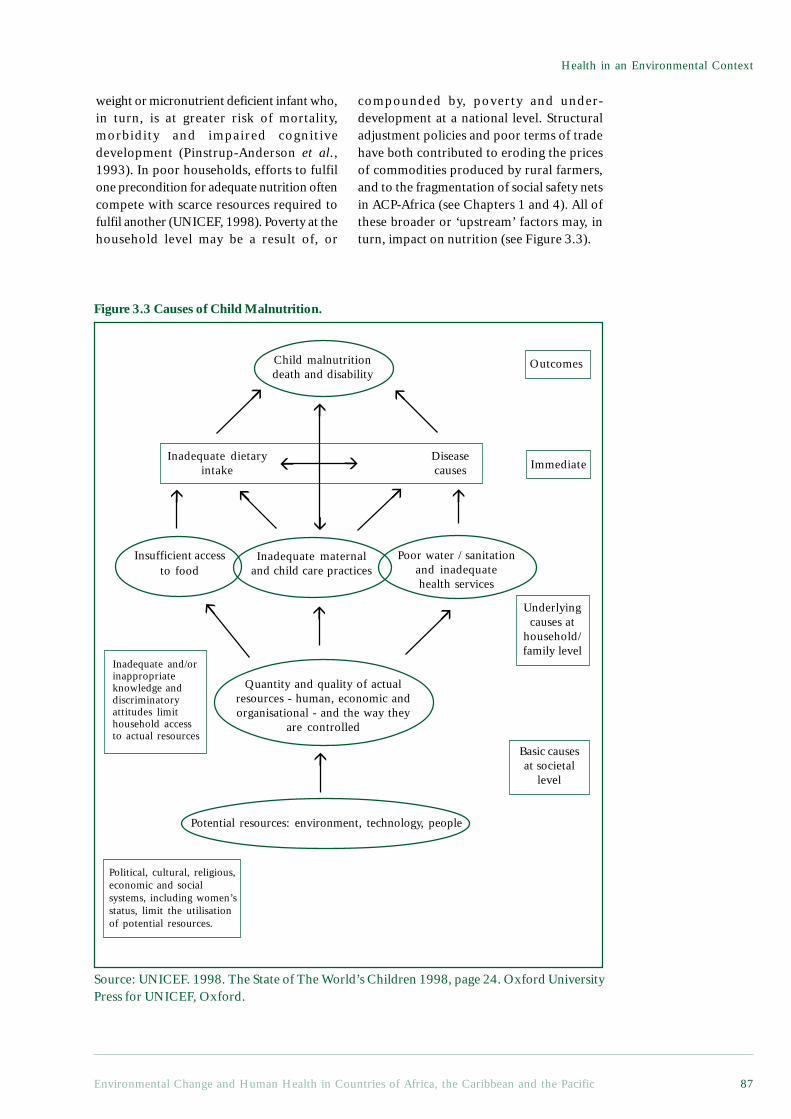
Environmental Change and Human Health in Countries of Africa, the Caribbean and the Pacific 87
Health in an Environmental Context
weight or micronutrient deficient infant who,in turn, is at greater risk of mortality,morbidity and impaired cognitivedevelopment (Pinstrup-Anderson et al.,1993). In poor households, efforts to fulfilone precondition for adequate nutrition oftencompete with scarce resources required tofulfil another (UNICEF, 1998). Poverty at thehousehold level may be a result of, or
compounded by, poverty and under-development at a national level. Structuraladjustment policies and poor terms of tradehave both contributed to eroding the pricesof commodities produced by rural farmers,and to the fragmentation of social safety netsin ACP-Africa (see Chapters 1 and 4). All ofthese broader or ‘upstream’ factors may, inturn, impact on nutrition (see Figure 3.3).
Figure 3.3 Causes of Child Malnutrition.
Political, cultural, religious,economic and socialsystems, including women’sstatus, limit the utilisationof potential resources.
Potential resources: environment, technology, people
Quantity and quality of actualresources - human, economic andorganisational - and the way they
are controlled
Insufficient accessto food
Inadequate maternaland child care practices
Poor water / sanitationand inadequatehealth services
Inadequate dietaryintake
Diseasecauses
Child malnutritiondeath and disability
Inadequate and/orinappropriateknowledge anddiscriminatoryattitudes limithousehold accessto actual resources
Outcomes
Immediate
Underlyingcauses at
household/family level
Basic causesat societal
level
Source: UNICEF. 1998. The State of The World’s Children 1998, page 24. Oxford UniversityPress for UNICEF, Oxford.
!
!
!
!
!
!
!!
!
!
!
!
!!
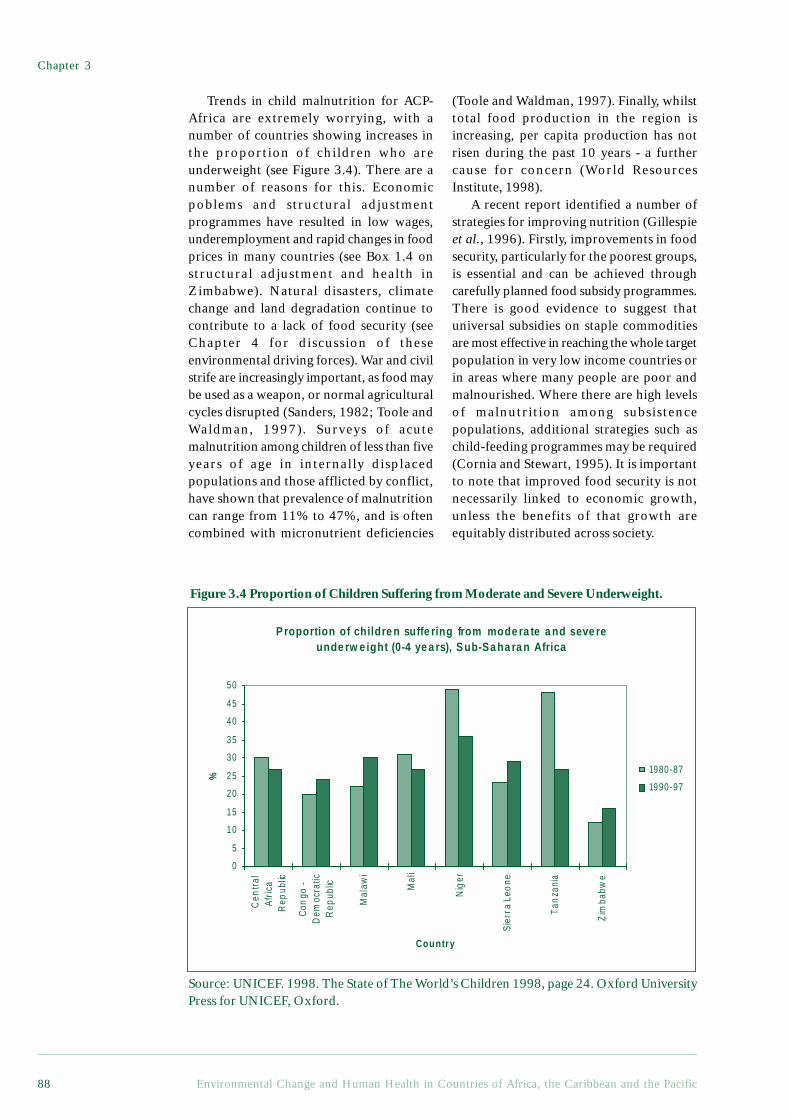
Chapter 3
Environmental Change and Human Health in Countries of Africa, the Caribbean and the Pacific88
Trends in child malnutrition for ACP-Africa are extremely worrying, with anumber of countries showing increases inthe proportion of children who areunderweight (see Figure 3.4). There are anumber of reasons for this. Economicpoblems and structural adjustmentprogrammes have resulted in low wages,underemployment and rapid changes in foodprices in many countries (see Box 1.4 onstructural adjustment and health inZimbabwe). Natural disasters, climatechange and land degradation continue tocontribute to a lack of food security (seeChapter 4 for discussion of theseenvironmental driving forces). War and civilstrife are increasingly important, as food maybe used as a weapon, or normal agriculturalcycles disrupted (Sanders, 1982; Toole andWaldman, 1997). Surveys of acutemalnutrition among children of less than fiveyears of age in internally displacedpopulations and those afflicted by conflict,have shown that prevalence of malnutritioncan range from 11% to 47%, and is oftencombined with micronutrient deficiencies
Figure 3.4 Proportion of Children Suffering from Moderate and Severe Underweight.
(Toole and Waldman, 1997). Finally, whilsttotal food production in the region isincreasing, per capita production has notrisen during the past 10 years - a furthercause for concern (World ResourcesInstitute, 1998).
A recent report identified a number ofstrategies for improving nutrition (Gillespieet al., 1996). Firstly, improvements in foodsecurity, particularly for the poorest groups,is essential and can be achieved throughcarefully planned food subsidy programmes.There is good evidence to suggest thatuniversal subsidies on staple commoditiesare most effective in reaching the whole targetpopulation in very low income countries orin areas where many people are poor andmalnourished. Where there are high levelsof malnutrition among subsistencepopulations, additional strategies such aschild-feeding programmes may be required(Cornia and Stewart, 1995). It is importantto note that improved food security is notnecessarily linked to economic growth,unless the benefits of that growth areequitably distributed across society.
P roportion of childre n suffe ring from mode ra te a nd seve re unde rw e ight (0-4 ye a rs), S ub-Sa ha ra n Africa
0
5
10
15
20
25
30
35
40
45
50
Cen
tral
Afr
ica
Rep
ublic
Con
go -
Dem
ocra
ticR
epub
lic
Mal
awi
Mal
i
Nig
er
Sie
rra
Leo
ne
Tan
zani
a
Zim
babw
e
Country
%
1980-87
1990-97
Source: UNICEF. 1998. The State of The World’s Children 1998, page 24. Oxford UniversityPress for UNICEF, Oxford.
Environmental Change and Human Health in Countries of Africa, the Caribbean and the Pacific 89
Health in an Environmental Context
Secondly, attention needs to be paid tothe status of women. There appears to be arelationship between nutritionalimprovement and efforts to reduce socialdiscrimination against women. This is notsurprising, in view of the synergies describedabove, but interventions are less easy toimplement. As discussed earlier, femaleeducation is a key component of this process.Thirdly, investments in the social sector,including health, education, sanitation,welfare and other services, can contribute toimproved nutrition through the promotion ofbreastfeeding, fortification of staple foods andimproving access to water and safe sanitation,for example. Breastfeeding is one of the mosteffective interventions to prevent diarrhoealdisease, which is strongly linked tomalnutrition.
Fourthly, more emphasis needs to beplaced on achieving healthy livingenvironments for the poor. This may impacton nutrition by reducing the incidence andseverity of infections, such as diarrhoealdisease, which are strongly related toenvironmental conditions. As discussed inmore detail in Chapter 7, ensuring healthyliving environments needs to be placed onthe agenda of agencies from municipal tointernational levels.
Finally, at a broader level, strategies toincrease household income among the poorhave been shown to contribute to higherprotein and energy consumption, increaseddemand for education and health services,and improvements in living conditions. Inthat malnutrition is often a result of multiple,interacting factors, the effect of a singleintervention may be limited, and integratedprogrammes, or those building on synergisticeffects, are likely to be more successful(Pinstrup-Anderson et al., 1993).
3.2.2 Non-communicable Diseases
Occupational and Industrial DiseasesIndustrial disease in the region is thought tobe extremely under-reported. Statistics are,for example, largely unavailable for theinformal sector that makes up a sizeableproportion of economic activity. Within theformal sector, mining, forestry, agriculture,construction and transportation are seen as
being responsible for the majority ofindustrial and occupational ill health (WorldHealth Organization, 1998). Box 3.4describes some of the health implications ofindustrialisation in the region.
3.2.3 InjuriesInjuries already account for 15% of the diseaseburden for ACP-Africa and projectionsindicate that this proportion will increase inthe next century (see above) due to steep risesin the burden of road accidents, war andviolence (Murray and Lopez, 1996a; Zwi etal., 1996). They may also partially reversethe substantial gains made by primary healthcare initiatives in developing countries overthe past two decades (Toole and Waldman,1997). Despite the magnitude of the problem,however, it has received inadequate attentionwith regard to control programmes andresearch (Zwi et al., 1996). Injuries areexamined here in several groupings: thoseattributable to wars, urban violence,domestic violence, road traffic accidents andnatural disasters.
WarArmed conflicts are estimated to have causedaround 750 000 deaths in Africa between1975 and 1989, mainly due to massmigrations and food shortages. Estimatessuggest that war-related injuries may beresponsible for 10% of the total injuryburden and approximately 1.5% of theglobal burden of disease in 1990, and thatthis burden may double to 3% by the year2020 (Murray and Lopez, 1996b). Childrenunder five years of age are at the highest risk,and may account for the largest proportionof mortality and morbidity. This is due toindirect effects such as diarrhoeal disease,malaria, acute respiratory infection andmeningitis - malnutrition contributes todeaths from all these causes. These effectsare related to the disruption or destructionof essential environmental and healthservices, leading to increased rates of disease(World Health Organization, 1997).
War trauma and landmines alsocontribute to the burden, with the effects ofthe latter being spread over many decadesand largely affecting civilian populations.
continued on page 92
Chapter 3
Environmental Change and Human Health in Countries of Africa, the Caribbean and the Pacific90
Box 3.4 Occupational and Industrial Disease in the ACP Region
Although industrialisation has brought many benefits to ACP countries, it has alsobrought problems. In addition to creating ambient pollution, industrialisation canharm the health of those working in or living in the immediate vicinity of industrialestablishments in three ways:
• direct physical injury from accidents• acute poisonings at the workplace or in the surrounding neighbourhoods• chronic poisonings (World Resources Institute, 1998)
Some ACP states are particularly vulnerable to the disbenefits of industrialisation inthat a number of them have experienced very high rates of industrial growth in recentyears - 15% for the Pacific countries between 1990 and 1995 compared with 2.6% forNorth America – whilst industrial and environmental regulations are simultaneouslyoften poorly developed and implemented.
The problem of industrial and occupational diseases in ACP countries is an areain which only a limited amount of work has been published, but the health costs ofindustrialisation can be divided into three main groups: direct costs, indirect costsand politico-economic costs (Packard, 1989).
Direct CostsThe direct costs of industrialisation include the short-term or long-term physical andmental effects, and can be seen in many settings. A recent study of workers in themedium to small-scale sawmill industry in Nigeria (Fatusi and Erhabor, 1996)demonstrated that their respiratory functions were worse than similar workers outsidethe sawmill. Studies of paint workers (Haruna, 1988) suggest that those workers whoare not protected from paint exposure are at higher risk of suffering from psychosomaticdisorders.
These problems are not restricted to factory and agricultural workers. In a studyof doctors and dentists in Nigeria (Olubuyide et al., 1997), the health care workerswere seen to have a higher rate of Hepatitis C antigen positivity than the controlgroup, with particularly high rates among surgeons. This was attributed to a lack ofresources for adequate protection through vaccination against the hepatitis B virusand provision of disposable gloves.
These costs may be due to a lack of awareness, to a lack of worker empowerment,or to a lack of resources for protective measures. In many cases, action is not necessarilydue to a lack of information on the toxicity of substances. The mining of asbestoscontinues in many African countries, for example, with no statutory levels for regulatingasbestos exposure, despite strong scientific evidence of an association between chronicexposure and cancers such as mesothelioma of the lungs (Packard, 1989). Attempts toprotect workers are often seen by the state and by industry as a threat: in Swaziland,which depends on migrant workers from Mozambique, trade union activities havebeen banned and workers who protested sacked, whilst in Nigeria, although workersare allowed to form trade unions, protesting workers are intimidated and sometimesarrested.
Indirect CostsThis is a relatively unexplored area and involves the seemingly ‘invisible’ effects onworkers, their families and the environment. Many of the workers who become illdue to the nature of their work (such as miners suffering from silicosis) leave theirjobs due to their ill health. Since they are very rarely paid adequate compensation or
Environmental Change and Human Health in Countries of Africa, the Caribbean and the Pacific 91
Health in an Environmental Context
pensions, the burden of their care falls on their families. Households therefore haveto cope, both with the burden of losing their breadwinner and with the costs ofmedical care.
In the agricultural sector, there are many examples of the unintended environmentalimpacts of large-scale farming, such as the introduction of previously unknown diseasevectors into newly irrigated areas (see Box 3.3). In the manufacturing industry, therehave been many cases of suspected environmental contamination, although there islittle documentation from the region. An outbreak of lead poisoning in Trinidad andTobago in 1991, resulting from the contamination of soil by the waste from leadrecycling, is a good example.
Politico-economic CostsThe problem of occupational/industrial diseases in ACP countries can sometimes bedue to a conscious decision by governments to promote industry. Improvements in theworking conditions are seen as expensive and as an additional production cost. Thishas also come about, in part, as a result of globalisation in which transnationalcorporations play countries and localities against each other, bidding down wages andother labour standards in a global ‘race to the bottom’ (Chomsky, 1998). Such processescan undermine environmental and industrial standards (Stephens et al., 1999). Asbestos,for example, although restricted or prohibited in many regions, is still being producedand used in countries such as Angola and Nigeria. This is mainly due to financialconsiderations, as it is considered cheaper, both in terms of labour and because of laxregulations governing the safety of workers and local populations.
Possible SolutionsThe solutions to occupational and industrial health problems lie with governmentsand investors alike. There is a need to take the full costs of industrial processes intoaccount and to consider all humans and other species that will be affected, bothdirectly and indirectly (see Box on Health Impact Assessment – Chapter 7). Adequatearrangements to protect humans and other species from suffering the possible adverseeffects of industrialisation need to be made for all stages of production.
Contributed by Ogonda Onwuchekwa MD, MSc. Environmental Epidemiology.
ReferencesChomsky, N. 1998. Domestic Constituencies. Z Magazine.Fatusi, A. and Erhabor, G. 1996. Occupational health status of sawmill worker in Nigeria. J. Roy. Soc.
Health. August, Vol. 116,(4).Haruna, A. Y. 1988. Comparative study of psychiatric morbidity among workers at a paint factory in
Nigeria. East African Medical Journal,. Vol. 75(January, No.1):4-10.Olubuyide, I. O. 1997. Prevalence and epidemiological characteristics of hepatitis B and C infections
among doctors and dentists in Nigeria. East African Medical Journal. June, Vol. 74,(No.6):357-361.Packard, R. M. 1989. Industrial production, health and disease in Sub-Saharan Africa. Soc. Sc. Med. Vol.
28(5):475-496.Stephens, C., Leonardi, G., Lewin, S. and Chasco, M. 1999. The Multi-lateral Agreement on Investment:
public health for the twenty first century? European Journal of Public Health. 9(1):3-5.World Resources Institute. 1998. World Resources 1998-99: A Guide to the Global Environment.
Oxford University Press (New York). 369 p.
Chapter 3
Environmental Change and Human Health in Countries of Africa, the Caribbean and the Pacific92
Estimates suggest that 30 million landmineshave been laid in Africa. Approximatelyone-third of landmine victims are non-combatants, and approximately 20% arechildren of less than 15 years of age (Jeffrey,1996). In several ACP-Africa countries, suchas Angola, Mozambique and southernSudan, the concentration of mines issufficiently high that, in addition to causingnumerous deaths and injuries annually, italso hinders development, farming,commerce, transport and recreation.Although data on these issues is scarce,studies from Afghanistan indicate that 20%of landmine victims were working in fieldsor collecting water when injured, thatanother 15% were travelling, and 8% wereplaying with a mine (Coupland, 1996).
Landmines may also seriously underminefood security in affected countries. Angolaand southern Sudan, in particular, havesuffered a massive loss of arable land, withwide social and economic ramifications(Andersson et al., 1995; Toole and Waldman,1997; World Health Organization, 1997).Normal points for collecting drinking waterare, in addition, frequently mined, andlandmines may also make it too dangerousto collect firewood in the forests (Coupland,1996). The environmental impacts of wars,through the disruption of infrastructure, and,in particular, the effects of landmines, are,therefore, well demonstrated (World HealthOrganization, 1997). The role played byenvironmental and resource factors infostering armed conflicts is only beginningto be researched, however, and remainslargely conjectural (Homer-Dixon 1993,1994).
Urban ViolenceWorldwide, urban violence is estimated tohave grown by between 3% and 5% perannum during the past two decades.Estimates for Africa suggest that, over a five-year period, more than two-thirds of theurban population are victims of some typeof crime, and one-third are victims of assault
and other crimes of personal contact9
(Gilbert, 1996; United Nations Centre forHuman Settlements (HABITAT), 1996).Research in Jamaica indicates that violenceand crime is a serious problem in the poorersections of the Kingston metropolitan area(KMA). These communities identified gangviolence as the most serious problem,followed by rape (domestic) and drug-relatedviolence. The impact of all types of violenceon children was also recognised (Moser etal., 1998). Much crime, particularly in low-income peri-urban areas, is, however,unreported and these figures therefore needto be viewed with caution.
It is important to note that ‘It is not thecity that generates violence: poverty, politicaland social exclusion, and economicdeprivation are all working against thesolidarity that would enable city inhabitantsto live together peacefully despite theirconflicts’ (United Nations Centre for HumanSettlements (HABITAT), 1996). Currentresearch supports the view that urbanviolence needs to be understood in the widersocietal context. It has been clearlydemonstrated, for example, that cities withhigh socio-economic inequalities have higherreported crime rates than cities that are moreegalitarian (Wilkinson, 1996), indicating theimportance of social cohesion in minimisingviolent crime. Furthermore, and contrary topopular belief, much of the burden ofviolence is borne by the poor who cannotafford to protect themselves from crime andits associated injuries, and who now see safetyas their first priority (Vanderschueren, 1998).In South Africa, for example, victimisationpatterns are closely related to different partsof the city, as a result of the apartheid policiesof separate development which haveundermined security in the former townshipareas and poorer settlements, whilst fosteringit in others. Recent surveys in bothJohannesburg and Durban indicated that themajority of victims of violent crime lived intownships, informal settlements and the innercity (Shaw and Louw, 1998). There are alsogender differentials in violent crime: murder
9 Includes mugging, aggravated theft, grievous bodily harm, sexual assault.
continued from page 89
Environmental Change and Human Health in Countries of Africa, the Caribbean and the Pacific 93
Health in an Environmental Context
rates are generally much higher for men thanfor women, with young men being atparticular risk.
The urban environment both influences andis influenced by violence - crime brings majorchanges to the spatial form of cities and is, inturn, influenced by those designs. Crime maydiscourage people from using the streets, publicspaces and public transport, and restrict themto their homes. Those who can afford to, maybarricade themselves within ‘fortified’ suburbsor housing developments and fortified offices,leading to further social segregation withincities and resulting in the abandonment ofneighbourhoods by traders and other services.For those who cannot afford to leave these areasor protect their assets (Shaw and Louw, 1998),the economic and social consequences may besevere (United Nations Centre for HumanSettlements (HABITAT), 1996). Moser andcolleagues have described how violence inKingston, Jamaica, has impacted negatively onassets such as labour, human capital, householdrelations and social capital10, thereby increasingthe vulnerability of the poor. The mobility ofthe poor has, for example, been reduced, asbus lines no longer enter many drug and gang-ridden areas. This has clear implications foraccess to and choice of jobs, and access to otherservices, such as schooling and health care.Human capital may be eroded when children’saccess to education facilities is limited byviolence, and social capital may be eroded ascommunity organisations are undermined.
In summary, urban violence may threatencommunity cohesion and the capacity ofsocieties to move towards better health andsustainable social development (World HealthOrganization, 1997). Environmentalinterventions also have an important role toplay in reducing urban violence.
Domestic ViolenceThe extent of domestic violence is verydifficult to estimate. Official statistics maybe obtained from police reports, hospital
data and crisis centres. This data shows thatdomestic violence is a significant cause ofinjury and death in the developing world,yet this is likely to give only a hint of a smallfraction of the real extent of domesticviolence.
It has been estimated that rape anddomestic violence are responsible forbetween 5% and 16% of the healthy yearslost to women of reproductive age (WorldHealth Organization, 1996). Research basedon more than 40 studies in 24 differentcountries has estimated that between 20%and 50% of all women have been assaultedby their intimate male partner (World HealthOrganization, 1997, page 154). The samesource estimated that between 50% and 60%of women abused by their partners are alsoraped by them.
The characteristics that emerge fromresearch are that the perpetrators of violenceagainst women are almost exclusively men,that women are most at risk from men theyknow, that women and girls are the mostfrequent victims of violence within the familyand between intimate partners, that physicalabuse in intimate relationships is almostalways accompanied by severe psychologicaland verbal abuse, and that the reaction ofmany professionals and social institutions hasbeen to either blame or ignore the victims(World Health Organization, 1998).
In one study in Papua New Guinea (Heiseet al., 1994), 18% of the married womensurveyed had received hospital treatment forthe injuries inflicted by their husbands.Between 1979 and 1982, 73% of the adultwomen murdered in the country were killedby their husbands.
In a study in Cape Town, 59% of teenagersreported having been beaten by their malepartners during an average of just over twoyears of sexual activity (Maforah et al., 1993).Another study in South Africa found that 28%of urban adolescents had been ‘forced to havesex against their will’ (Richter, 1996). Other
10 Social capital is defined as the networks, norms and trust that facilitate mutually beneficial cooperationin a community - both between households and community level social institutions which are horizontaland hierarchical in structure. Empirically it has been shown that the greater the collaboration ofhorizontally based social institutions at community level, the higher the ‘stocks’ of social capital(Putnam 1993 cited in Moser et al 1998).
Chapter 3
Environmental Change and Human Health in Countries of Africa, the Caribbean and the Pacific94
studies in ACP-Africa, cited in Heise et al1994, found that 46% of women in Ugandareported being physically abused, 42% ofwomen in Kenya reported that they wereregularly beaten, 60% of women surveyed inTanzania reported being physically abused and40% of women in a Zambian survey reportedhaving been beaten.
Whilst rape and domestic violence are notprimarily environmental issues, unsafeenvironments place women at greater risk(Cairncross et al., 1998). A safe environmentmay head women’s lists of environmentalconcerns in many areas and is therefore animportant issue that must be addressed bypolicy makers.
Road Traffic AccidentsAccording to the Global Burden of Diseasestatistics, road traffic accidents are the mostimportant cause of unintentional injury(Murray and Lopez, 1996a). ACP countrieshave only a fraction of the car ownership ofthe developed countries but at the same timecarry a disproportionately high rate of roadtraffic death and injuries, and an increase inroad traffic accidents is predicted in thefuture. Data for 1990 suggest that six Africancountries (Ethiopia, Ghana, Rwanda,Lesotho, Kenya and Cameroon) are the topsix nations for road traffic death rates per10,000 vehicles (Jacobs, 1997). Furtherresearch has suggested that between 1968and 1985, eight selected African countriesdisplayed the highest percentage increase inroad traffic accidents worldwide.
Historical data suggest that 20 years ago,traffic accidents in ACP countries werealready a growing problem. Data fromJamaica shows that as far back as the 1960s,road traffic death rates were increasing,whilst infectious, respiratory and intestinaldeath rates were all decreasing. Between1958 and 1974 the road traffic death rate inJamaica increased by more than 120%.
The situation is often compounded bythe lack of adequate medical and paramedicalfacilities available, which increases theproportion of fatalities from injuriesincurred. A disproportionately high numberof the deaths and injuries are suffered bypedestrians and children under 16 (and inmany cases involve public vehicles).
In Europe, during the 1950s and 1960s,car ownership increased and awareness ofroad safety was poor. From the 1960sonwards, however, safety was improved viathe introduction of speed limits, car safetyinspections, seat belts and improved car androad design, and accident rates improvedgreatly (World Health Organization, 1989).The lessons learnt from these settings needto be adapted for application in ACPcountries.
Natural DisastersIt is estimated that almost one third of theglobal burden of unintentional injuries areassociated with environmental factors(World Health Organization, 1998). Thelocation of many low income settlements,for example, leads to flooding and landslides,whilst poor housing materials and designsexacerbate domestic injuries and buildingcollapse. Poorly designed stoves can,furthermore, lead to burns, especiallyamongst children.
Most of the Small Island States are locatedin the tropics and many are low-lying, makingthem exceedingly vulnerable to climatechange (as further discussed in Chapter 6),rising sea levels and natural disasters.Concomitant with climate change aretemperature changes, higher rates of coastalland erosion and loss, fresh water shortageand changes in breeding areas of certainpathogens and vectors. Certain ecosystems,such as coral reefs, are sensitive totemperature changes, and their destructioncould, in conjunction with coastal landerosion, prove to be detrimental to foodsecurity and tourism - the main source ofincome in most of these countries. Freshwater shortage is another serious consequenceof climate change, since many of the islandstates depend primarily on rainwater as asource of water. With the lack of rainfall inthe tropics exhibited by the El Ninophenomenon, drought could occur morefrequently. This may reduce crop yieldsleading to malnutrition and health-relatedproblems.
Small Island States are also especiallysusceptible to natural disasters because ofthe impacts of loss of property and moreimportantly, loss of lives, on their small
Environmental Change and Human Health in Countries of Africa, the Caribbean and the Pacific 95
Health in an Environmental Context
populations. Hurricanes and storms arecommon occurrences in the tropics - in theCaribbean, in 1995 alone, there were 19hurricanes. Hurricanes, earthquakes andtsunamis also pose dangers in some Pacificisland states, as is exemplified by the recentevents in Papua New Guinea, where morethan 3,000 people died as a result of atsunami that swept the island following anundersea earthquake. All of the Small IslandStates’ populations are thus exceedinglyvulnerable to injuries, mortality and loss ofproperty as a result of environmentaldisasters.
3.3 ConclusionsWe have shown, in this chapter, thatapproximately one-third of the total burdenof disease in ACP-Africa and some of thepoorer countries of the Caribbean and Pacificis associated with environmental factors.Access to adequate water and sanitation isprobably the most important aspect of thehousehold and neighbourhood environmentsin relation to health, with ten percent of thedisease burden in ACP Africa attributableto poor water, sanitation and hygiene, andchildren bearing most of this burden.Improving access to basic facilities, inconjunction with appropriate hygienepromotion, can play an important part inreducing the burden of water and sanitationrelated diseases. We will return to this pointin Chapter 7.
Nutrition is another area of concern fortwo main reasons. Firstly, becausemalnutrition is a risk factor for manyenvironmentally related diseases, such asdiarrhoeal disease and acute respiratoryinfections. Secondly, because of the directeffects of protein-energy malnutrition on
health. The immediate causes ofmalnutrition are influenced by householdfood security, access to a healthy livingenvironment and health services, and childcaring practices, and all of these factors arelinked to poverty and deprivation.
Injuries are growing as a contributor tothe burden of disease in the region, due toincreases in road traffic accidents, wars andviolence. The effects of armed conflicts inthe region on health and environment arevery substantial, but urban violence is alsogrowing as a public health threat. In bothcases, the poor are at greatest risk.Compared with other regions, ACP-Africahas experienced the highest levels ofpopulation movement owing to wars,famines and other environmental andpolitical changes, and this has had animportant impact on demographic and healthmatters.
In all ACP countries, therefore, the poorcontinue to bear the largest proportion of thedisease burden. Whilst diseases such astuberculosis, acute respiratory tract infectionsand diarrhoeal disease are closely linked toenvironmental conditions, they are alsodiseases of poverty, and the unequaldistribution of resources helps to ensure thatthese health inequalities are maintained. Thefollowing Chapters explore the environmentalcontext of the health and demographic trendsoutlined above, specifically focusing onagricultural change, rural livelihoods andhealth, urbanisation and healthy livingenvironments, and global environmentchange. In the final Chapter we focus on waysto reduce the many environmental threats thatundermine health, by exploring interventionsdesigned to improve food security and createhealthy living environments.
ReferencesAndersson, N., Sousa, C. and Paredes, S. 1995. Social cost of land mines in four countries: Afghanistan,
Bosnia, Cambodia and Mozambique. BMJ.:718-21.Bradley, D., Stephens, C., Harpham, T. and Cairncross, S. 1991. A Review of Environmental Health
Impacts in Developing Country Cities. Urban Management Program Discussion Paper No. 6. WorldBank/UNDP/UNCHS (Washington, DC). 58 p.
Cairncross, S., Hunt, C., Dubey, M., Kolsky, P., Lewin, S., Mukherjee, R., Ramaswamy, V., Revi, A. andStephens, C. 1998. The Sustainable Use of Urban Environmental Health Indicators: Improving theunderstanding of the needs of the poor.
Cairncross, S. and Kolsky, P. J. 1997. Water, waste, and well-being: A multicountry study. Letter to the AmJ Epidemiol. 15;146(4):359-361.
Chongsuvivatwong, V., Mo-suwan, L., Chompikul, J., Vitsupakorn, K. and McNeill, D. 1994. Effects ofpiped water supply on the incidence of diarrheal diseases in children in Southern Thailand. SoutheastAsian J. Trop. Med. Public Health. 25(4):628-632.
Chapter 3
Environmental Change and Human Health in Countries of Africa, the Caribbean and the Pacific96
Churchill, A. 1987. Rural Water Supply and Sanitation: Time for a Change. Discussion Paper 18. WorldBank (Washington DC).
Coovadia, H. M. and Benatar, S. R. 1991. A Century of Tuberculosis: South African Perspectives. CapeTown, Oxford University Press.
Cornia, G. A. and Stewart, F. 1995. Food subsidies: Two errors of targeting. In: Stewart F., (ed.).Adjustment and Poverty: Options and Choices. London, Routledge.
Coupland, R. M. 1996. The effects of weapons: surgical challenge and medical dilemma. J R Coll SurgEdinb. 41:65-71.
Curtis, C. F. and Feachem, R. G. 1981. Sanitation and Culex pipiens mosquitoes: A brief review. AmericanJournal of Tropical Medicine and Hygiene. 84:17-25.
Daniels, D. L., Cousens, S. N., Makoae, L. N. and Feachem, R. G. 1990. A case-control study of theimpact of improved sanitation on diarrhoea morbidity in Lesotho. Bulletin of the World HealthOrganisation. 68(4):455-463.
Dolin, P. J. 1994. Ultraviolet radiation and cataract: A review of the epidemiological evidence. BritishJournal of Ophthalmology. 798:478-482.
Elender, F., Bentham, G. and Langford, I. 1998. Tubercolosis mortality in England and Wales during 1982-1992: Its association with poverty, ethnicity and AIDS. Social Science and Medicine. 46(6):673-681.
Esrey, S. A. 1996. Water, waste and well-being: A multicountry study. American Journal of Epidemiology.143(6):608-623.
Feachem, R. G. and Jamison, D. T., (eds.) 1991. Disease and Mortality in Sub-Saharan Africa. Oxford,Oxford University Press for the World Bank. 356 p.
Genthe, B., Strauss, N., Seger, J., Vundule, C., Maforah, F. and Kfir, R. 1997. The effect of type of watersupply on water quality in a developing community in South Africa. Wat Sci Tech. 35(11-12):35-40.
Gilbert, L. 1996. Urban violence and health: South Africa 1995. Social Science & Medicine. 43(5):873-886.Gillespie, S., Mason, J. and Martorell, R. 1996. How Nutrition Improves. 15. United Nations (New York).Heise, L. L., Raikes, A., Watts, C. and Zwi, A. 1994. Violence against women: A neglected public health
issue in less developed countries. Social Science and Medicine. 39(9):1165-1179.Homer-Dixon, T. F. 1993. Environmental change and violent conflict. Scientific American. February16-23.Homer-Dixon, T. F. 1994. Environmental scarcities and violent conflict: Evidence from cases. International
Security 19(1): 5-40.Jacobs, G. D. 1997. Road safety in the developing world. In: Fletcher T., McMichael A.J., (eds.). Health
at the Crossroads: Transport Policy and Urban Health. London School of Hygiene and TropicalMedicine, Sage.
Jeffrey, S. J. 1996. Antipersonnel mines who are the victims? J Accid Emerg Med. 13:343-346.Kibel, M. A. and Wagstaff, L. A. 1995. Child Health for All. A Manual for Southern Africa. Cape Town,
Oxford University Press.Kolsky, P. J. 1993. Diarrhoeal disease: current concepts and future challenges: Water, sanitation and
diarrhoea: The limits of understanding. Transactions of the Royal Society of Tropical Medicine andHygiene. 87(Supplement 3):43-46.
Maforah, N. F., Mathee, A., von Schirnding, Y. E. R., Arendse, R. and Cerff, P. J. 1993. EnvironmentalHealth in Informal Settlements: A Community Participatory Intervention. Medical Research Council(Tygerberg). 48 p.
Martines, J., Phillips, M. and Feachem, R. G. 1993. Diarrheal diseases. In: Jamison D.T., Mosley W.H.,Measham A.R., Bobadilla J.L., (eds.). Disease Control Priorities in Developing Countries. Oxford,Oxford University Press for the World Bank. p 91-116.
McKeown, T. 1988. The Origins of Human Disease. Oxford, Blackwell. 233 p.Metcalf, C. 1991. A history of tuberculosis. In: Coovadia H.M., Benatar S.R., (eds.). A Century of
Tuberculosis: South African Perspectives. Oxford, Oxford University Press.Moser, C., Holland, J. and Adam, S. 1998. Jamaica’s social investment fund: Building social capital to
curb urban violence. UNCHS Habitat Debate. 41(1):9-11.Murray, C., Styblo, K. and Rouillon, A. 1993. Tubercolosis. In: Jamison D.T., Mosley W.H., Measham
A.R., Bobadilla J.L., (eds.). Disease Control Priorities in Developing Countries. Oxford, OxfordUniversity Press for the World Bank.
Murray, C. J. L. and Lopez, A. D. 1996a. The Global Burden of Disease: a comprehensive assessmentof mortality and disability from diseases, injuries, and risk factors in 1990 and Projected to 2020.Harvard School of Public Health on behalf of the World Health Organization and the World Bank(Cambridge, MA).
Murray, C. J. L. and Lopez, A. D. 1996b. Global Health Statistics: a compendium of incidence, prevalenceand mortality estimates for over 200 conditions. Global Burden of Disease and Injury Series. VolumeII. Harvard School of Public Health on behalf of the World Health Organization and the World Bank(Cambridge, MA).
Overseas Development Administration (1985). Report of the ODA-VCRC Workshop on OperationalResearch in Filariasis Control. New Delhi, Overseas Development Administration.
PAHO. 1997. Health Conditions in the Caribbean, 1997. Scientific Publication No. 561.Pinstrup-Anderson, P., Burger, S., Habicht, J.-P. and Peterson, K. 1993. Protein-energy malnutrition. In:
Jamison D.T., Mosley W.H., Measham A.R., Bobadilla J.L., (eds.). Disease Control Priorities inDeveloping Countries. Oxford, Oxford University Press for the World Bank.
Porter, J. D. H. and Ogden, J. A. 1998. Social inequalities in the re-emergence of infectious disease. In:Strickland S.S., Shetty P.S., (eds.). Human Biology and Social Inequality. Cambridge, CambridgeUniversity Press. p 96-113.
Environmental Change and Human Health in Countries of Africa, the Caribbean and the Pacific 97
Health in an Environmental Context
Raviglione, M. C., Snider, D. E. and Kochi, A. 1995. Global Epidemiology of Tuberculosis: Morbidityand mortality of a worldwide epidemic. JAMA. 273(3):220-226.
Richter, L. 1996. A survey of reproductive health issues among urban Black youth in South Africa. Grantreport for Society of Family Health.
Sanders, D. 1982. Nutrition and the use of food as a weapon in Zimbabwe and Southern Africa. I J HealthServices. 12(2):201-213.
Shaw, M. and Louw, A. 1998. South Africa’s urban poor: Major victims of crime. UNCHS HabitatDebate. 4(1):11-12.
Sims, J. 1994. Women, Health and Environment. World Health Organisation (Geneva).Smith, K. R., Corvalan, C. and Kjellström, T. 1999. How much Global Ill-health is Attributable to
Environmental Factors? Epidemiology. 10(5):573-584.Toole, M. J. and Waldman, R. J. 1997. The public health aspects of complex emergencies and refugee
situations. Annu Rev Public Health. 18:283-312.UNAIDS. 1998. AIDS Epidemic Update. UNAIDS (Geneva).UNICEF. 1998. The State of The World’s Children 1998. Oxford, Oxford University Press for UNICEF.United Nations Centre for Human Settlements (HABITAT). 1996. An Urbanizing World: Global Report
on Human Settlements, 1996. Oxford, Oxford University Press for United Nations Centre for HumanSettlements (HABITAT). 559 p.
Vanderschueren, F. 1998. Towards safer cities. UNCHS Habitat Debate. 4(1):1-5.Weatherall D. J., Lendingham J. G. G., Warrell D. A., 1996. Oxford Textbook of Medicine. Oxford
University Press.Wilkinson, D., Squire, S. B. and Garner, P. 1998. Effect of preventive treatment for tuberculosis in adults
infected with HIV: Systematic review of randomised placebo controlled trials. British Medical Journal.317:625-629.
Wilkinson, R. G. 1996. Unhealthy Societies: The Afflictions of Inequality. London, Routledge.Volmink, J. and Garner, P. 1998. Promoting Adherence to Tuberculosis Treatment. In: The Cochrane
Library, Issue 2. Update Software: Updated quarterly. (Cochrane Review). (Oxford).World Health Organization. 1996. Violence Against Women. Fact Sheet No. N128. World Health
Organisation (Geneva).World Health Organization. 1997. Health and Environment in Sustainable Development: Five years after
the Earth Summit. Geneva, World Health Organisation. 242 p.World Health Organization. 1998. The World Health Report 1998: Life in the 21st Century: A Vision for
All. World Health Organisation (Geneva).World Resources Institute. 1998. World Resources 1998-99: A Guide to the Global Environment.
Oxford University Press (New York). 369 p.Zwarenstein, M., Schoeman, J., Lombard, C. J., Vundule, C. and Tatley, M. 1998 Forthcoming.
Surveillance or support: A randomised controlled trial of self supervised versus directly observedtreatment of tuberculosis. Lancet.
Zwi, A. B., Forjuoh, S., Murugusampillay, S., Odero, W. and Watts, C. 1996. Injuries in developing countries:policy response needed now. Transactions of the Royal Society of Tropical Medicine & Hygiene. 90:593-5.
Chapter 4Agricultural Change,
Rural Livelihoods and Health
Environmental Change and Human Health in Countries of Africa, the Caribbean and the Pacific 101
Agricultural Change, Rural Livelihoods and Health
Chapter 4 Agricultural Change, Rural Livelihoodsand Health
Aims of the Chapter• To identify the links between the socio-economic aspects of agriculturalproduction, food entitlements and the health situation in ACP countries.• To identify the links between agricultural development and food security.• To explore the health effects of agricultural intensification in ACP countries.• To explore the relevance of agricultural biotechnology to food security and health.
Main Points• For ACP countries to improve the health of their growing populations it willbecome increasingly important to ensure that people have secure and sufficientaccess to food.• Increasing food production does not guarantee food security.• Secure and stable land tenure can contribute to environmental protection andfood security, especially for weaker social groups. Indigenous land tenure systemshave an important, positive role to play.• The erosion of crop genetic diversity represents a threat to food security,especially for marginalised farmers.• Low-cost sustainable agricultural systems have largely been ignored byagricultural development assistance schemes, yet are very important for foodsecurity.• Mortality and illness due to pesticide exposure are common, relative to theamount of pesticides used, though they do not, as yet, constitute a major healthburden. The health risks of increased fertiliser use are less significant.• Land conversion and irrigation schemes can affect disease vectors and mayincrease disease transmission.• Genetic engineering is changing the pace and direction of agriculturaldevelopment, bringing benefits as well as risks, but its potential benefits for therural poor are unlikely to be realised, given current trends.
Policy Implications• Low-cost sustainable agriculture needs to be strengthened and assisted inorder to improve the food security and health of large population groups in ACPcountries. This will require giving support to small-scale farmers and rural womenin particular.• Policies and actions restricting the use of toxic pesticides, including thedevelopment of Integrated Pest Management (IPM) and Natural Pest Management,will be important in limiting the adverse impacts of agricultural modernisation.• Increased attention needs to be paid to the health-related effects of land usechanges. Health impact assessments of irrigation schemes and forest conversionshould become part of project development.• Research into the potential applications of biotechnology in small-scale farmingis needed if genetic engineering is to contribute effectively to food security. Moreindependent scientific and administrative capacity, and a new research anddevelopment paradigm, will be necessary to ensure that biotechnology contributesto, rather than detracts from, environmental and health-related improvements.
Chapter 4
Environmental Change and Human Health in Countries of Africa, the Caribbean and the Pacific102
1 Persons who, on average during the course of a year, are estimated to have food consumption levelsbelow those required to maintain body weight and support light activity. This threshold (ranging froman average of 1,760 Cals/person/day for Asia to 1,985 Cals/person/day for Latin America) is set equal to1.54 times the Basal Metabolic rate.
agrochemicals and infectious diseasesassociated with expansion of cultivated landand irrigation systems. Before reviewing theregional relevance of these arguments for ACPcountries, we would like to give an overviewof the agricultural prospects and problems inthe region, focusing on ACP-Africa. As willbe shown, the health situation in the regiondepends largely on the food entitlements ofthose most at risk. Understanding how theseentitlements can be better secured is,therefore, just as important as understandinghow more food can be produced. From ahealth perspective, this is how differentagricultural systems should be judged, andwe will, therefore, highlight the socio-economic aspect of agricultural productionand food entitlements which we believe areof crucial importance for health in the region.
4.2 Overview of Trends and FutureChallenges
Before discussing the relationship betweenhealth, food security and agriculturaldevelopment, it important to expand brieflyon the earlier discussion of trends innutritional diseases in Chapter 3. Whilst Eastand South Asia have increased their per capitacalorie supply, African ACP countries haveseen a stagnating or declining trend in percapita calorie supply over the past 25 years.In contrast to most other regions in the world,both the absolute number and the percentageof chronically undernourished people in ACPAfrican countries have also increased duringthe past 25 years (Table 4.1). In 1969/71, 35%of the total population of ACP-Africa sufferedfrom undernutrition1, corresponding to 94million people. In 1994/96, the situationdeteriorated and 39% of the population - or210 million people - suffered fromundernutrition (FAO, 1997). The average percapita calorie supply has also declined in ACPSmall Island States, due to a 15% decreasein Haiti. Countries such as Fiji, Jamaica,Papua New Guinea and Suriname have,however, seen an increase in per capita caloriesupply (See table 10.3 in Appendix 2).
4.1 IntroductionFrom an ACP perspective, the environmentalaspects of agriculture are of special relevanceto health, because they are closely related tofood security and malnutrition. As indicated inprevious chapters, malnutrition is one of themost serious threats to health, and is a largecontributor to ill health in ACP countries.
Lack of access to food is the major causeof malnutrition. Food security is often definedas access by all people to sufficient foodrequirements for a healthy and active life.Food insecurity is basically a problem ofpoverty, affecting those social groups with theweakest or most fragile food entitlements,both in terms of access to social networksand safety nets or to productive assets (capital,land agricultural inputs). Within suchhouseholds, children and households headedby women tend to be most vulnerable(Delgado, 1997; Denninger et al., 1996). Anyintervention that improves access to food andbetter nutrition will have a large direct andindirect impact on human health in ACPcountries (FAO, 1997).
Agriculture remains the predominantmeans of survival in most ACP countries andthe majority of the population is still employedor active in the agricultural sector.Agricultural productivity in ACP-Africa hasnot, however, generally kept pace withpopulation growth. Many of the ACPcountries have experienced a stagnating ordeclining trend in food supply per capita,whilst most countries in Asia show anincreasing food supply, relative to theirpopulation size. If ACP countries are toimprove the health of their growingpopulations, therefore, it will becomeincreasingly important to increase people’saccess to food through additional foodproduction, agricultural intensification, andempowerment of the most vulnerable groups.
In reviewing the global situation, WorldResources 1998-99 (World ResourcesInstitute, 1998) indicates that two of the mainhealth concerns in relation to agriculturalintensification are increased exposure to
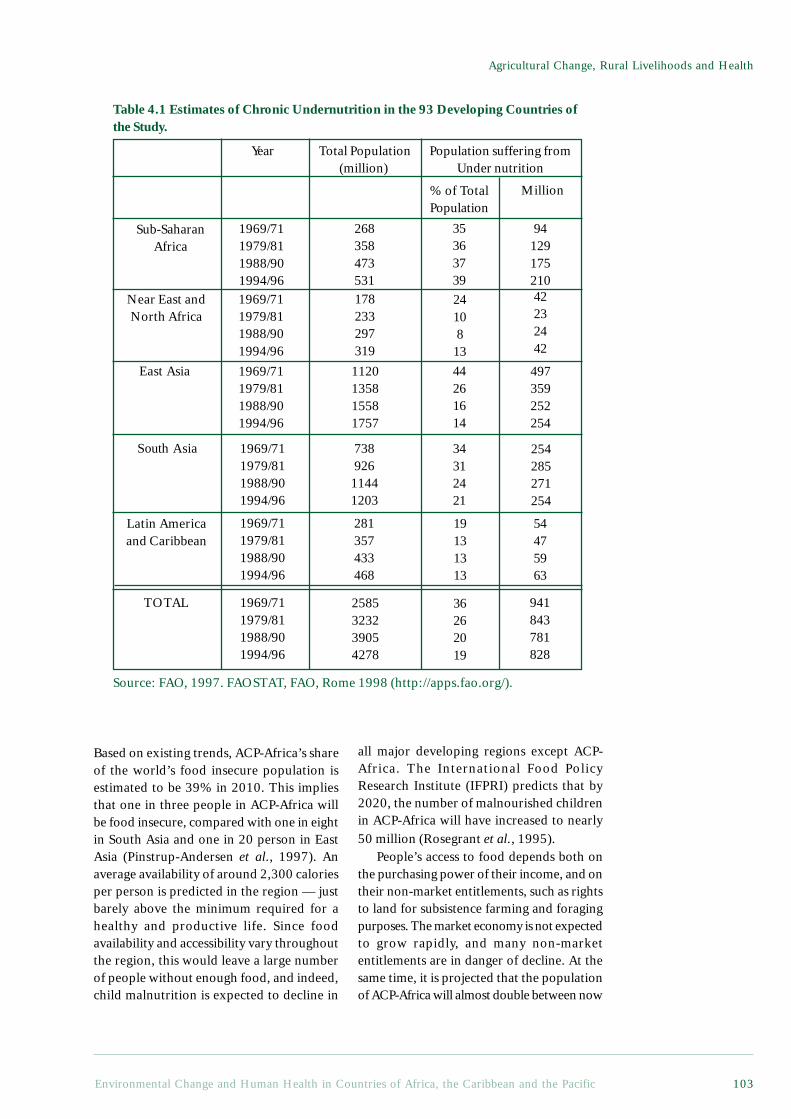
Environmental Change and Human Health in Countries of Africa, the Caribbean and the Pacific 103
Agricultural Change, Rural Livelihoods and Health
Table 4.1 Estimates of Chronic Undernutrition in the 93 Developing Countries ofthe Study.
Year Total Population(million)
Population suffering fromUnder nutrition
% of TotalPopulation
Million
Sub-SaharanAfrica
1969/711979/811988/901994/96
268358473531
35363739
94129175210
Near East andNorth Africa
1969/711979/811988/901994/96
178233297319
2410813
42232442
East Asia 1969/711979/811988/901994/96
1120135815581757
44261614
497359252254
South Asia
Latin Americaand Caribbean
1969/711979/811988/901994/96
73892611441203
34312421
254285271254
1969/711979/811988/901994/96
281357433468
19131313
54475963
TOTAL 1969/711979/811988/901994/96
2585323239054278
36262019
941843781828
Based on existing trends, ACP-Africa’s shareof the world’s food insecure population isestimated to be 39% in 2010. This impliesthat one in three people in ACP-Africa willbe food insecure, compared with one in eightin South Asia and one in 20 person in EastAsia (Pinstrup-Andersen et al., 1997). Anaverage availability of around 2,300 caloriesper person is predicted in the region — justbarely above the minimum required for ahealthy and productive life. Since foodavailability and accessibility vary throughoutthe region, this would leave a large numberof people without enough food, and indeed,child malnutrition is expected to decline in
all major developing regions except ACP-Africa. The International Food PolicyResearch Institute (IFPRI) predicts that by2020, the number of malnourished childrenin ACP-Africa will have increased to nearly50 million (Rosegrant et al., 1995).
People’s access to food depends both onthe purchasing power of their income, and ontheir non-market entitlements, such as rightsto land for subsistence farming and foragingpurposes. The market economy is not expectedto grow rapidly, and many non-marketentitlements are in danger of decline. At thesame time, it is projected that the populationof ACP-Africa will almost double between now
Source: FAO, 1997. FAOSTAT, FAO, Rome 1998 (http://apps.fao.org/).
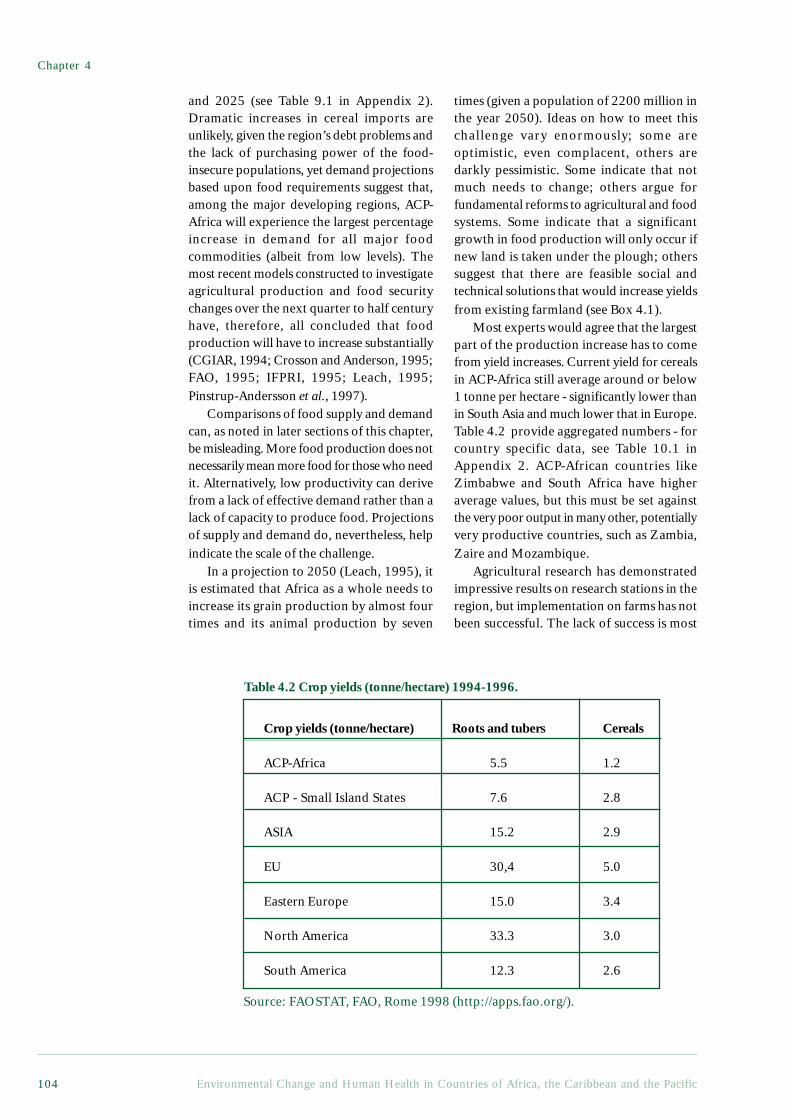
Chapter 4
Environmental Change and Human Health in Countries of Africa, the Caribbean and the Pacific104
and 2025 (see Table 9.1 in Appendix 2).Dramatic increases in cereal imports areunlikely, given the region’s debt problems andthe lack of purchasing power of the food-insecure populations, yet demand projectionsbased upon food requirements suggest that,among the major developing regions, ACP-Africa will experience the largest percentageincrease in demand for all major foodcommodities (albeit from low levels). Themost recent models constructed to investigateagricultural production and food securitychanges over the next quarter to half centuryhave, therefore, all concluded that foodproduction will have to increase substantially(CGIAR, 1994; Crosson and Anderson, 1995;FAO, 1995; IFPRI, 1995; Leach, 1995;Pinstrup-Andersson et al., 1997).
Comparisons of food supply and demandcan, as noted in later sections of this chapter,be misleading. More food production does notnecessarily mean more food for those who needit. Alternatively, low productivity can derivefrom a lack of effective demand rather than alack of capacity to produce food. Projectionsof supply and demand do, nevertheless, helpindicate the scale of the challenge.
In a projection to 2050 (Leach, 1995), itis estimated that Africa as a whole needs toincrease its grain production by almost fourtimes and its animal production by seven
times (given a population of 2200 million inthe year 2050). Ideas on how to meet thischallenge vary enormously; some areoptimistic, even complacent, others aredarkly pessimistic. Some indicate that notmuch needs to change; others argue forfundamental reforms to agricultural and foodsystems. Some indicate that a significantgrowth in food production will only occur ifnew land is taken under the plough; otherssuggest that there are feasible social andtechnical solutions that would increase yieldsfrom existing farmland (see Box 4.1).
Most experts would agree that the largestpart of the production increase has to comefrom yield increases. Current yield for cerealsin ACP-Africa still average around or below1 tonne per hectare - significantly lower thanin South Asia and much lower that in Europe.Table 4.2 provide aggregated numbers - forcountry specific data, see Table 10.1 inAppendix 2. ACP-African countries likeZimbabwe and South Africa have higheraverage values, but this must be set againstthe very poor output in many other, potentiallyvery productive countries, such as Zambia,Zaire and Mozambique.
Agricultural research has demonstratedimpressive results on research stations in theregion, but implementation on farms has notbeen successful. The lack of success is most
Table 4.2 Crop yields (tonne/hectare) 1994-1996.
Crop yields (tonne/hectare) Roots and tubers Cereals
ACP-Africa 5.5 1.2
ACP - Small Island States 7.6 2.8
ASIA 15.2 2.9
EU 30,4 5.0
Eastern Europe 15.0 3.4
North America 33.3 3.0
South America 12.3 2.6
Source: FAOSTAT, FAO, Rome 1998 (http://apps.fao.org/).
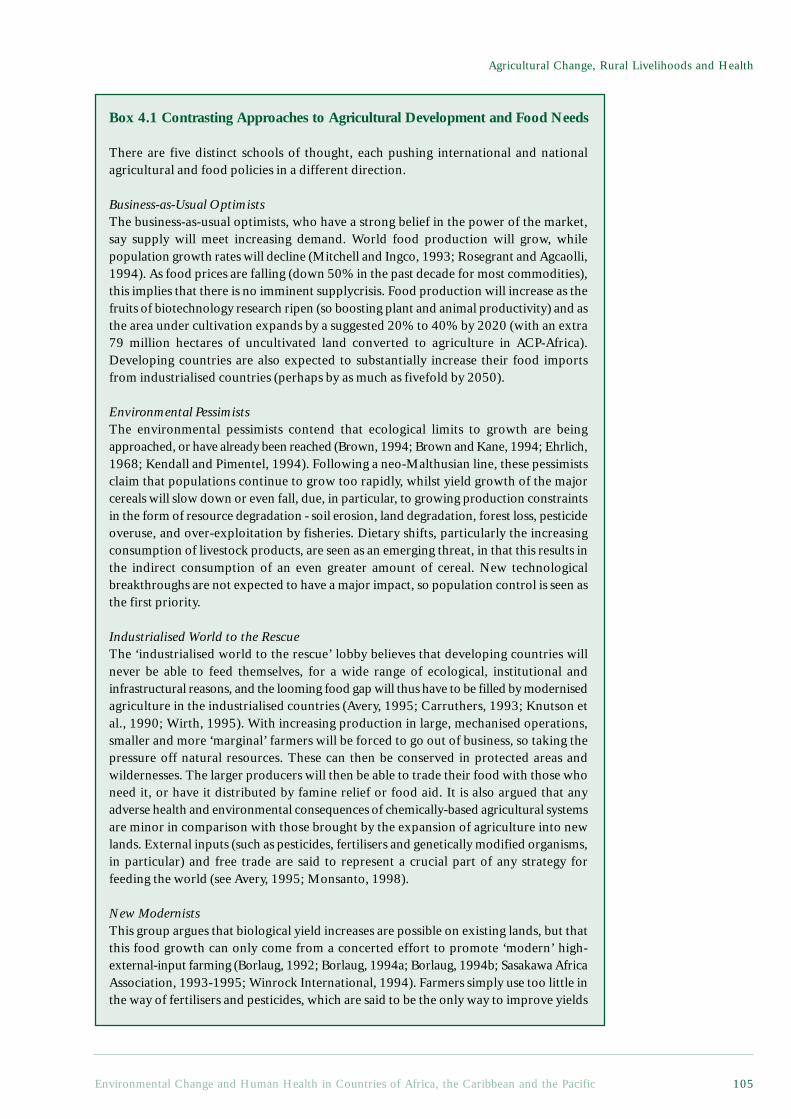
Environmental Change and Human Health in Countries of Africa, the Caribbean and the Pacific 105
Agricultural Change, Rural Livelihoods and Health
Box 4.1 Contrasting Approaches to Agricultural Development and Food Needs
There are five distinct schools of thought, each pushing international and nationalagricultural and food policies in a different direction.
Business-as-Usual OptimistsThe business-as-usual optimists, who have a strong belief in the power of the market,say supply will meet increasing demand. World food production will grow, whilepopulation growth rates will decline (Mitchell and Ingco, 1993; Rosegrant and Agcaolli,1994). As food prices are falling (down 50% in the past decade for most commodities),this implies that there is no imminent supplycrisis. Food production will increase as thefruits of biotechnology research ripen (so boosting plant and animal productivity) and asthe area under cultivation expands by a suggested 20% to 40% by 2020 (with an extra79 million hectares of uncultivated land converted to agriculture in ACP-Africa).Developing countries are also expected to substantially increase their food importsfrom industrialised countries (perhaps by as much as fivefold by 2050).
Environmental PessimistsThe environmental pessimists contend that ecological limits to growth are beingapproached, or have already been reached (Brown, 1994; Brown and Kane, 1994; Ehrlich,1968; Kendall and Pimentel, 1994). Following a neo-Malthusian line, these pessimistsclaim that populations continue to grow too rapidly, whilst yield growth of the majorcereals will slow down or even fall, due, in particular, to growing production constraintsin the form of resource degradation - soil erosion, land degradation, forest loss, pesticideoveruse, and over-exploitation by fisheries. Dietary shifts, particularly the increasingconsumption of livestock products, are seen as an emerging threat, in that this results inthe indirect consumption of an even greater amount of cereal. New technologicalbreakthroughs are not expected to have a major impact, so population control is seen asthe first priority.
Industrialised World to the RescueThe ‘industrialised world to the rescue’ lobby believes that developing countries willnever be able to feed themselves, for a wide range of ecological, institutional andinfrastructural reasons, and the looming food gap will thus have to be filled by modernisedagriculture in the industrialised countries (Avery, 1995; Carruthers, 1993; Knutson etal., 1990; Wirth, 1995). With increasing production in large, mechanised operations,smaller and more ‘marginal’ farmers will be forced to go out of business, so taking thepressure off natural resources. These can then be conserved in protected areas andwildernesses. The larger producers will then be able to trade their food with those whoneed it, or have it distributed by famine relief or food aid. It is also argued that anyadverse health and environmental consequences of chemically-based agricultural systemsare minor in comparison with those brought by the expansion of agriculture into newlands. External inputs (such as pesticides, fertilisers and genetically modified organisms,in particular) and free trade are said to represent a crucial part of any strategy forfeeding the world (see Avery, 1995; Monsanto, 1998).
New ModernistsThis group argues that biological yield increases are possible on existing lands, but thatthis food growth can only come from a concerted effort to promote ‘modern’ high-external-input farming (Borlaug, 1992; Borlaug, 1994a; Borlaug, 1994b; Sasakawa AfricaAssociation, 1993-1995; Winrock International, 1994). Farmers simply use too little inthe way of fertilisers and pesticides, which are said to be the only way to improve yields
Chapter 4
Environmental Change and Human Health in Countries of Africa, the Caribbean and the Pacific106
and so keep the pressure off natural habitats. This repeat of the Green Revolutionmodel is widely referred to as ‘science-based’ agriculture, the objective being to increasefarmers’ use of fertilisers and pesticides. It is also commonly argued that high-inputagriculture is more environmentally sustainable than low-input agriculture, as the latterrepresents the intensive use of local resources which may be degraded in the process.
Sustainable IntensificationAnother group is making the case for the benefits of ‘sustainable intensification’, on thegrounds that substantial growth is possible in currently unimproved or degraded areaswhilst simultaneously protecting or even regenerating natural resources (Hazell, 1995;Hewitt and Smith, 1995; McCalla, 1995; NAF, 1994; Pretty, 1998; Pretty, 1995a;Pretty, 1995b). They argue that regenerative and low-input (but not necessarily zero-input) agriculture can be highly productive, provided that farmers participate fully in allstages of technology development and extension. Evidence suggests that agricultural andpastoral land productivity is as much a function of human capacity and ingenuity as it isof biological and physical processes.
Based on Pretty, 1998.
ReferencesAvery, D. 1995. Saving the Planet with Pesticides and Plastic. The Hudson Institute (Indianapolis).Borlaug, N. 1992. Small-scale agriculture in Africa: The myths and realities. Feeding the Future (Newsletter
of the Sasakawa Africa Association). 4(2).Borlaug, N. 1994a. Agriculture Research for Sustainable Development: Testimony before US House of
Representatives Committee on Agriculture, March 1, 1994.Borlaug, N. 1994b. Letter: Chemical fertilizer ‘essential’. International Agricultural Development.(Nov-
Dec):23.Brown, L. R. 1994. The world food prospect: Entering a new era. . Assisting Sustainable Food Production:
Apathy or Action? Arlington, VA, Winrock International.Brown, L. R. and Kane, H. 1994. Full House: Reassessing the Earth’s Population Carrying Capacity. W.W.
Norton and Co. (New York).Carruthers, I. 1993. Going, going gone! Tropical agriculture as we knew it. Tropical Agriculture Association.
13(3):1-5.Ehrlich, P. 1968. The Population Bomb. New York, Ballantine.Hazell, P. B. R. 1995. Managing Agriculture Intensification. IFPRI 2020 Brief No. 11. IFPRI
(Washington, DC).Hewitt, T. I. and Smith, K. R. 1995. Intensive Agriculture and Environmental Quality: Examining the
Newest Agricultural Myth. Henry Wallace Institute for Alternative Agriculture (Greenbelt, MD).Kendall, H. W. and Pimentel, D. 1994. Constraints on the expansion of the global food supply. Ambio.
23:198-205.Knutson, R. D., Taylor, J. B., Penson, J. B. and Smith, E. G. 1990. Economic Impacts of Reduced
Chemical Use. A & M University (Texas).McCalla, A. 1995. Towards a strategic vision for the rural/agricultural/natural resource sector activities of
the World Bank. World Bank 15th Annual Agricultural Symposium, (Washington, DC), 5-6 January.Mitchell, D. O. and Ingco, M. D. 1993. The World Food Outlook. International Economics Department,
World Bank (Washington, DC).NAF. 1994. A Better Row to Hoe: The Economic, Environmental and Social Impact of Sustainable
Agriculture. Northwest Area Foundation (Minnesota).Pretty, J. 1998. Of Pandora, Progress and Pollution: A Review of Biotechnology and Genetic Engineering.
IIED (London).Pretty, J. N. 1995a. Participatory learning for sustainable agriculture. World Development. 23(8):1247-
1263.Pretty, J. N. 1995b. Regenerating Agriculture: Policies and Practice for Sustainability and Self-Reliance.
London, Earthscan Publications.Rosegrant, M. W. and Agcaolli, M. 1994. Global and Regional Food Demand, Supply and Trade Prospects
to 2010. IFPRI (Washington, DC).Sasakawa Africa Association. 1993-1995. Sasakawa Global 2000. Annual Reports. Sasakawa Africa
Association (Tokyo).Winrock International. 1994. Assisting Sustainable Food Production: Apathy or Action? Winrock
International (Arlington, VA).Wirth, T. E. 1995. US Policy, Food Security and Developing Countries. Undersecretary of State for
Global Affairs, presentation to Committee on Agricultural Sustainability for Developing Countries.(Washington, DC).
Environmental Change and Human Health in Countries of Africa, the Caribbean and the Pacific 107
Agricultural Change, Rural Livelihoods and Health
probably due to a mismatch betweentechnologies developed and the socio-economic context, preventing small-scale andsubsistence farmers from adopting researchresults. The big difference in productivitybetween farmers with the best practice andsubsistence farmers, does, nevertheless,indicate enormous potential for an increasein crop productivity in ACP-Africa.
4.3 The Links Between AgriculturalDevelopment and Food Security
4.3.1 Links Between Food Production andFood Security
What are the links between food productionpredictions and food security for ruralhouseholds? Many recent projections haveexamined aggregate data for cereals andconcluded that food insecurity is set to growmassively (Brown and Kane, 1994; FAO, 1995).
Whilst the global production of cerealshas been declining since 1985, however, thistrend could be caused by changes in cerealdemand rather than by emerging productionconstraints. The stabilisation of cerealproduction coincides with increasingproduction and consumption of high valuefoods such as fruit and vegetables, sugar andanimal products (Leach, 1995). Recent fallsin world cereal prices lend credence to thisview, suggesting that declining productionfigures are more likely to be a response toreduced demand than to supply problems.
This emphasis on cereals tends to neglectother crops of equal, if not greater, importancefor food security in ACP countries. Theseinclude root crops and tubers (such as yams,cassavas, sweet potatoes and arrowroot), whichare mostly grown and traded by women, as wellas various non-farmed tree products and otherwild foods (Scoones et al., 1992).
Furthermore, as argued by manyeconomists (see, for example, (Sen, 1994)),current levels of agricultural productivity andproduction say little about potential levels,because they are simply a response to presentlevels of demand and price/market conditions.Sen, (1982) also argues that ‘the most importantthematic deficiency of traditional developmenteconomics is its concentration on nationalproduct, aggregate income and total supply of
particular goods, rather than on “entitlements”of people and the “capabilities” theseentitlements generate’. There is clearly muchmore to food security and sustainablelivelihoods than food production alone.
4.3.2 Why Food Supply is Not the Sameas Food Security
Attempts to tackle hunger through increasingfood production alone will not solve the basicproblem of access to food. It is also importantto recognise social and political threats to rurallivelihoods in many ACP countries. Images offamine transmitted by Western media aredrawn repeatedly from a few countries ravagedby internal conflicts, such as Angola, Ethiopia,Somalia, Sudan and Mozambique. Instanceswhen food shortages are handled effectivelyby ACP governments, by contrast receivealmost no publicity (Drèze, 1995; Drèze andSen, 1989).
Drèze and Sen (1991) also remind us thatfood production is not the same as foodavailability (production minus exports plusimports), and that aggregate availability andthe ability to acquire food (food‘entitlements’) are very different things.Whilst food production undoubtedlyinfluences food entitlements, the connectionsare complex and there are also other mattersinvolved. There are all too many examplesof an ACP country maintaining per capitafood production while its people starved (deWaal, 1989; Watts, 1983). One example isthe so-called ‘Zimbabwe Miracle’. During theearly 1980s, activity was focused onsmallholders’ agriculture, and the productionof maize and cotton more than doubled. By1987, Zimbabwe was declared self-sufficientin food, with a surplus large enough to supplyfood deficit members of Southern AfricanDevelopment Community (SADC) (Scott,1995). This surplus was not, however, a trueindication of household food security and mayhave exacerbated food insecurity in the poorerareas. A large proportion of supplies weredelivered to the food marketing board, ratherthan being retained to meet local food needsThe aggregate figures had masked localdisparities in production and consumption.
Food entitlements for urban dwellers aremost often mediated through the market,
Chapter 4
Environmental Change and Human Health in Countries of Africa, the Caribbean and the Pacific108
whereas for rural dwellers in general, andsubsistence farmers in particular, theseentitlements tend to depend more on thelocal production. Malnutrition can thus bea threat to urban and rural dwellers atdifferent times and for different reasons.Urban-rural links are often created in thepursuit of food security, and hence urbandwellers will maintain rural contacts, or evenland, to provide food security in case theirpurchasing power is disrupted, whilst ruraldwellers will maintain urban contacts, in partto ensure against the loss of local foodentitlements.
4.3.3 Changing Threats to TenureACP-Africa is not, on the whole, characterisedby the sort of land access problemsconfronting the rural poor in Latin America,parts of Asia or, for that matter, some of theACP-Small Island States. The concentrationof land ownership tends to be rather low, asis the percentage of landless people amongthe rural population. The problem of accessto land in many parts of Africa involvesquestions of the form of tenure, and the lossof land rights in the transition from one formof tenure to another (Bruce, 1988; Cornia andStewart, 1995).
In general, the prevailing form of landownership in ACP-Africa has entailed varioustypes of communal ownership, usually by clanor lineage, combined with user rights (ofaccess) held by members of the clan orlineage. A common feature of many of Africa’stenure systems is that all eligible members oflocal lineage or kinship groups have beenassured access to at least some land. At thesame time, however, full ownership rightsover land traditionally reside with thecommunity, and individuals have a restrictedset of use, exclusion, and transfer rights overthe land they farm.
Historically, in the context of a high land-to-population ratio, these systems ensureadequate access to land for most people, butthe stability of these systems is being threatenedby two interrelated sets of pressures: risingpopulation and changing resource uses, andchanges in the form of tenure.
With regard to rising population andresource use, both arable and grazing landare becoming scarce in many areas. Losing
the ability to use communal grazing landmeans poor farmers are further marginalised,because they are left with small areas whichcannot maintain their few animals. Underthese circumstances, weaker social groupsare easily deprived of access to limitedresources, in particular because economicand political changes have created a situationin which local leaders may not fulfil theirtraditional redistributive obligations.
With regard to the changes in the form oftenure, there has been a clear shift from localcommunal or lineage-based property towardsa combination of private property and stateproperty (Lane and Moorehead, 1994). Thisshift towards private property, in which claimsto property are legitimated by the state, ratherthan by the community and/or communalgroup, holds further risks for the poor. Thisis especially true for women and pastoralists,who face the prospect of loss of all land rightsas a consequence of having few resources tofinance the costs of formal land registration.This change of tenure also affects the capacityof local groups to adapt to their particularenvironmental circumstances andtechnological options.
During the colonial era, many Africangovernments took the view that only Western-style tenure systems and property rights couldstimulate agricultural intensification andimprove economic efficiency, as indigenousland tenure systems were inherently insecureand inefficient, and so acted as a brake onproductivity. That thinking has been carriedforward into the post-independence period,with proponents claiming that when privateland ownership is clearly established, farmersare more likely to grow perennial crops, investin land management practices that benefit theagroecosystem in the long-term, and improvetheir overall productivity.
Evidence increasingly suggests, however,that the extension of state property regimeshas had a negative impact on both farmerincomes and natural resources. Maintainingpoor farmers’ access to these resources, andto their long-term productive value, willrequire some form of reassertion ofcommunity use and management rights (suchas building on local rather than centralisedsystems of property). Ongoing attempts toformulate and implement indigenous resource
Environmental Change and Human Health in Countries of Africa, the Caribbean and the Pacific 109
Agricultural Change, Rural Livelihoods and Health
management practices and rural codes must,furthermore, be supported (Cornia, 1994;Lane and Moorehead, 1994).
With a few exceptions, formal landrights have not been found to be asignificant factor in determining investmentsin land improvements, use of inputs, accessto credit, or the productivity of the land inACP-Africa. Rather, it is security of tenurethat matters most.
It is also becoming clear, as indicated inBox 4.2, that indigenous land tenure in ACP-Africa can result in productive systems(Migot-Adholla et al., 1991; Place andHazell, 1993; Place et al., 1990). Similarresults have been found in studies of landtenure systems in Cameroon, Nigeria andTogo and Ghana - even under conditions ofrapid population growth and increasingcommercialisation, the shift from common
Box 4.2 Security of Tenure and Agricultural Productivity: Evidence fromGhana, Kenya and Rwanda
While it is widely accepted that indigenous tenure systems can help provide foodsecurity, it is sometimes argued that this security is accompanied by a lack of flexibilityand lower productivity. Recent empirical studies have examined the productivity ofindigenous land tenure systems in eight regions of Ghana, Kenya and Rwanda,representing a variety of combinations of scarcity and commercialisation of agriculture.The research asked, ‘Are indigenous land rights systems a constraint on productivity?’Using household survey data and cross-sectional evidence, the investigators discoveredthat the rights which farmers hold over land vary widely and in many cases wereprivate. Land improvements were positively correlated with tenure security, but notwith formal land rights (private ownership); indeed, land improvements were theleast likely in the case of parcels with short-term use rights and most likely for thosewith long-term tenure security.
Land rights were highly transferable, including in those cases in which the landhad been acquired through non-market methods. With the exception of one of theeight areas surveyed, producers had complete rights to the land in between 45% and81% of the cases. Preferential transfer rights (including the preferential right to bequeaththe land) were found in 3% to 29% of the cases, whilst limited transfer rights prevailedin between 30% and 50% of the cases. With only two exceptions, the proportion ofland parcels that could not be sold at all varied between as little as 17% and 31%.Finally, it should be noted that whilst land markets have emerged in tandem with anincrease in land scarcity, the majority of transactions take place under the traditionalsystem and are not sanctioned by formal legislation.
The research indicates that between 70% and 80% of the land parcels had beenacquired through non-market methods (through inheritance, gifts, governmentallocation, clearing of forest lands), thus negating the hypothesis of spontaneousprivatisation of land rights due to growing land shortage. Even in the most land-scarce areas, only 20% to 30% of the parcels had been acquired through the market.Based on these findings, the researchers concluded that privatisation of land rightsis not a significant factor in determining investments in land improvements andagricultural intensification. Indigenous land tenure systems are thus not a constrainton productivity.
ReferenceHinchcliffe, F., Thompson, J. and Pretty, J. N. 1996. Sustainable Agriculture and Food Security in East
and Southern Africa. Report for the Committee on Food Security in East and Southern Africa. SwedishInternational Development Cooperation Agency (Sida) (Stockholm).
Chapter 4
Environmental Change and Human Health in Countries of Africa, the Caribbean and the Pacific110
property regimes to private regimes takesplace very slowly. Indeed, traditional systemsare often more flexible and adaptable to newconditions. The key point is that farmers aremore likely to improve lands in which theyhave a long-term interest. This interestderives from use and transfer rights thatfarmers have over land, whether these rightsare derived from private or common propertysystems. It is these ‘bundles of rights’ thatmust be protected if farmers are to beexpected to invest in sustainable agricultureand improve their production in the long-term (Ostrom, 1990).
4.4 The Value of Wild Resourcesand Biodiversity for FoodSecurity
4.4.1 Wild Foods and Food SecurityIt is widely recognised that hunter-gatherercommunities, such as the Kung San inBotswana or groups in Papua New Guinea,depend on wild resources for securelivelihoods. What is less widely recognised isthat farming households, regardless of whethertheir agricultural systems are predominantlypastoral, swidden or based on continuouscropping, also rely heavily on wild resources(see Box 4.3).
Many agricultural experts argue that thearea of farmed land will have to expandsubstantially if the growing world populationis to be fed. But if wild habitats are lost, theywill no longer be available to rural households,and those who will suffer most are the poorest,who tend to rely on wild habitats as sources offood, fuel, medicines and fodder. Recently, thecalls for expanding agricultural land have beentoned down, as it is being increasinglyrecognised that expansion on this scale willincur significant costs for rural households andnational economies alike.
Collecting, using, selling and managingwild resources, coupled with experimentsinvolving their cultivation and domestication,are an inextricable part of many agriculturalsystems, and contribute to overall foodsecurity. The term, wild foods is used here torefer both to plants and animals. Some aspectsof the value of wild resources in terms ofsustainable rural livelihoods follow:
• Wild foods are particularly importantfor the health of women and children. InTanzania, young unmarried and divorcedwomen engage in the collection and sale orwild leaves (Fleuret, 1979), whilst in WestAfrica, women are extensively involved inthe marketing of bush meat in both urbanand rural areas. Children rely on wild foodsin Sudan, Kenya and Zimbabwe, both assnack food and vital sources of protein(Scoones et al., 1992).
• The appearance of many wild foodsmay coincide with the hunger season whichprecedes crop harvests. At these times, farmersdepend on such wild foods to replace the absentnourishment from staples and to provide themwith the necessary energy to harvest their fields(Chambers et al., 1981).
• Wild foods provide insurance againstcrop failure, pest attack or drought becausethey can replace some of the lost crops(Saxena, 1986).
• Many wild foods have an advantageover cultivated crops in that their seeds cangerminate and grow under drought conditions(Saxena, 1979). During such times, localpeople not only rely more heavily upon theusual forest resources, but also on those wildfoods which require extensive processingbefore consumption.
• In many pastoral systems, a diet largelybased on livestock products is complementedby the collection and consumption of wildfoods, especially grains. The productivity ofwild grain harvesting can be high, relative toalternative cultivation options. The collectionof Panicum laetum (a wild millet), for example,yields 400-1100 kg/ha in the most productive,low-lying valleys of the Malian Gourma, whichis higher than typical yields for cultivated millet(Maiga et al., 1991).
• Wild resources are particularlyimportant for the rural poor, women andchildren, especially at times of stress, such asdrought, changing land availability orecological change. These groups generally haveless access to land, labour and capital, andthus need to draw more on the wild resourcesthat are freely available. In Zimbabwe, forexample, some poor households rely on wildfruit as an alternative to cultivated grain for aquarter of all dry season meals (Wilson, 1990).
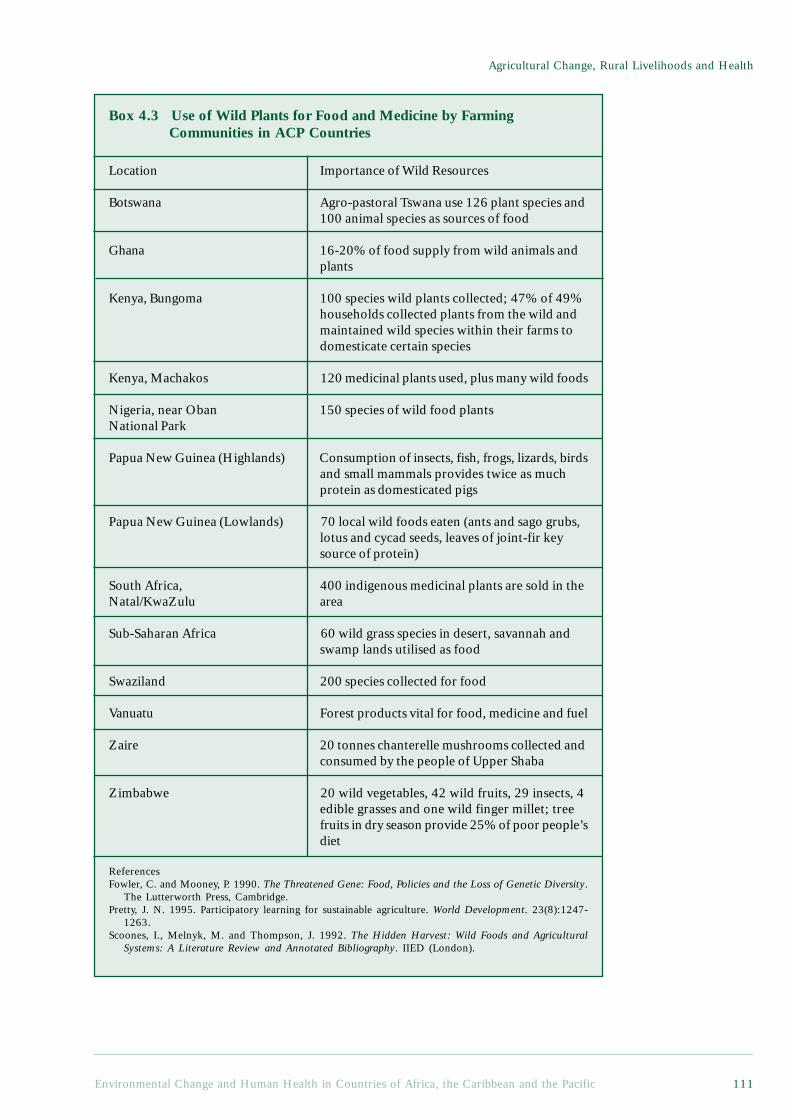
Environmental Change and Human Health in Countries of Africa, the Caribbean and the Pacific 111
Agricultural Change, Rural Livelihoods and Health
Box 4.3 Use of Wild Plants for Food and Medicine by FarmingCommunities in ACP Countries
Location Importance of Wild Resources
Botswana Agro-pastoral Tswana use 126 plant species and100 animal species as sources of food
Ghana 16-20% of food supply from wild animals andplants
Kenya, Bungoma 100 species wild plants collected; 47% of 49%households collected plants from the wild andmaintained wild species within their farms todomesticate certain species
Kenya, Machakos 120 medicinal plants used, plus many wild foods
Nigeria, near Oban 150 species of wild food plantsNational Park
Papua New Guinea (Highlands) Consumption of insects, fish, frogs, lizards, birdsand small mammals provides twice as muchprotein as domesticated pigs
Papua New Guinea (Lowlands) 70 local wild foods eaten (ants and sago grubs,lotus and cycad seeds, leaves of joint-fir keysource of protein)
South Africa, 400 indigenous medicinal plants are sold in theNatal/KwaZulu area
Sub-Saharan Africa 60 wild grass species in desert, savannah andswamp lands utilised as food
Swaziland 200 species collected for food
Vanuatu Forest products vital for food, medicine and fuel
Zaire 20 tonnes chanterelle mushrooms collected andconsumed by the people of Upper Shaba
Zimbabwe 20 wild vegetables, 42 wild fruits, 29 insects, 4edible grasses and one wild finger millet; treefruits in dry season provide 25% of poor people’sdiet
ReferencesFowler, C. and Mooney, P. 1990. The Threatened Gene: Food, Policies and the Loss of Genetic Diversity.
The Lutterworth Press, Cambridge.Pretty, J. N. 1995. Participatory learning for sustainable agriculture. World Development. 23(8):1247-
1263.Scoones, I., Melnyk, M. and Thompson, J. 1992. The Hidden Harvest: Wild Foods and Agricultural
Systems: A Literature Review and Annotated Bibliography. IIED (London).
Chapter 4
Environmental Change and Human Health in Countries of Africa, the Caribbean and the Pacific112
• Wild resources with a market valuerepresent ready sources of income for cash-poor households and may provide a significantproportion of total household income.
4.4.2 The Value of Biodiversity forLivelihood Resilience
Farmers of traditional and low-inputagricultural systems have long favoured cropdiversity, and even today, there are still ahuge variety of crop combinationscultivated, including cereals, legumes, rootcrops, vegetables and tree crops. In Africa,more than 80% of all cereals areintercropped, producing, in some cases,highly complex patterns, with up to 20species grown in close proximity.
In very variable conditions, farmersrarely standardise their practices. Theymaintain diversity, develop a variety ofstrategies and so spread risk. Mixtures ofcrops and varieties clearly provide farmerswith a range of outputs, and also representa logical approach to coping with variableenvironments. Mixed crops can also be lessvariable in time and space, and combinedyields are often greater, particularly ifdifferences in root and shoot geometry allowthe crops to use light, nutrients and watermore efficiently (Pretty, 1995).Intercropping can reduce weed problems,so influence labour requirements, returnsto labour can be increased, and erosion andrunoff may be reduced because of the greaterground cover given by the mixture.
It is only recently that fields restrictedto single species and varieties have becomecommon. The introduction of modernvarieties and breeds has almost alwaysdisplaced traditional varieties and breeds.The 20th century has seen the loss of some75% of the genetic diversity of agriculturalcrops. Only about 150 plant species are nowcultivated, of which just three supply almost60% of calories derived from plants (Fowlerand Mooney, 1990).
Such erosion of genetic diversity inagriculture represents a major threat to thefood security of the majority of the world’sproducers. Modern, uniform crop varietieswill only reach their potential if theenvironment is also uniform, which means
high quality land where the fertility andwater status have been evened out with theuse of fertilisers and irrigation. In areaswhere monocropping is prevalent, diseasesand pests can spread quickly and causedevastation. Whilst improved methods ofcontrolling animal and crop diseases are nowavailable, the costs of these services havebecome increasingly prohibitive for thefarmer, through the introduction ofstructural adjustment programmes (Cooperet al., 1992).
Crop genetic diversity provides securityfor the farmer against pests, disease andunexpected climatic conditions, and, in thehighly variable environments of ACP-Africa,can help small-scale farmers obtain higheryields than they could with monocropping.Higher yields are obtained from using amixture of crops and crop varieties, eachone specifically adapted to themicroenvironment in which it grows.Genetic diversity also provides farmingcommunities with a range of products withmultiple uses and values. Some varieties ofa particular crop may be good for immediateconsumption, for example, while others arebetter for long-term storage (Cooper et al.,1992).
Small grains, such as sorghum and millet,are more likely to meet these needs than maizehybrids, because they are more drought-tolerant, their seeds can be stored for muchlonger, and they can be relied upon togerminate after several seasons of storage.They also require fewer pesticides andfertilisers for cultivation (Mushita, 1992).
In some contexts, however, farmers havebecome dependent on a few largecorporations, which often dictate whichcrops should be grown where and when,simply by making available certain seeds atonly certain seasons (FAO, 1993). Somecountries have policies that make it illegalfor farmers to plant unimproved seeds, butmany improved seeds will only perform wellif accompanied by the use of inorganicfertilisers and pesticides, and abundantsupplies of water.
There is growing evidence to indicate thatdiversification reduces people’s susceptibilityto drought and other risks (Box 4.4).
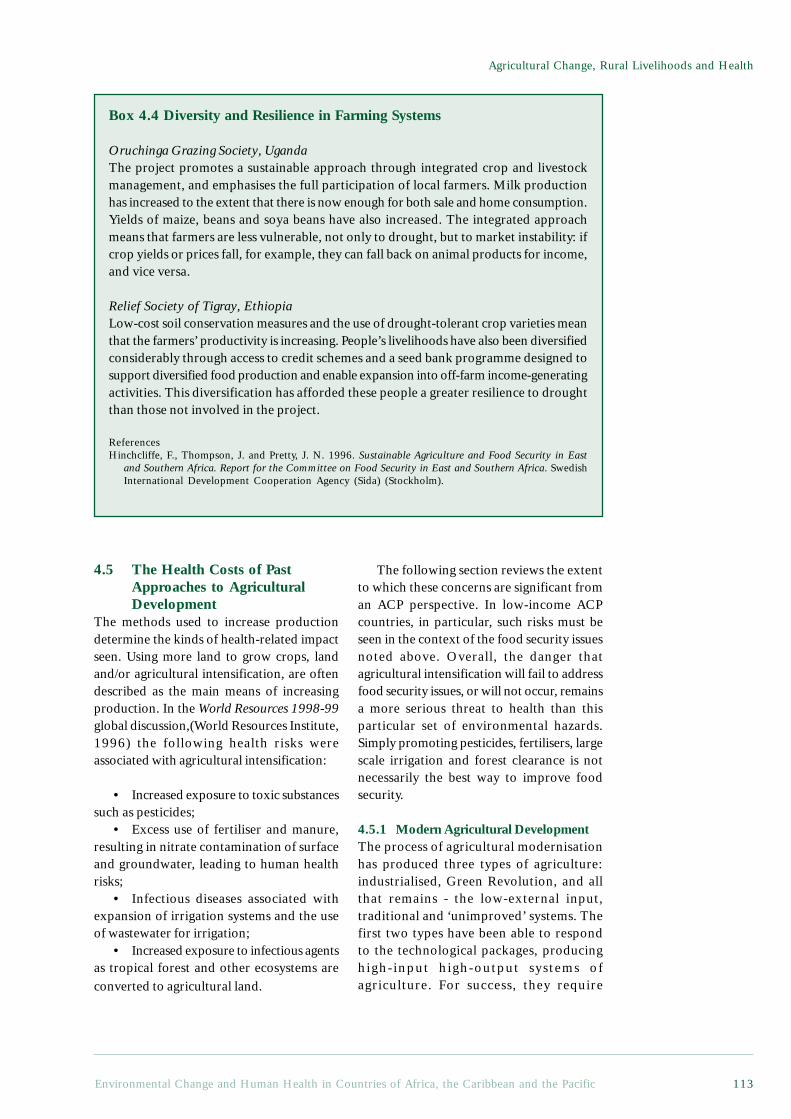
Environmental Change and Human Health in Countries of Africa, the Caribbean and the Pacific 113
Agricultural Change, Rural Livelihoods and Health
Box 4.4 Diversity and Resilience in Farming Systems
Oruchinga Grazing Society, UgandaThe project promotes a sustainable approach through integrated crop and livestockmanagement, and emphasises the full participation of local farmers. Milk productionhas increased to the extent that there is now enough for both sale and home consumption.Yields of maize, beans and soya beans have also increased. The integrated approachmeans that farmers are less vulnerable, not only to drought, but to market instability: ifcrop yields or prices fall, for example, they can fall back on animal products for income,and vice versa.
Relief Society of Tigray, EthiopiaLow-cost soil conservation measures and the use of drought-tolerant crop varieties meanthat the farmers’ productivity is increasing. People’s livelihoods have also been diversifiedconsiderably through access to credit schemes and a seed bank programme designed tosupport diversified food production and enable expansion into off-farm income-generatingactivities. This diversification has afforded these people a greater resilience to droughtthan those not involved in the project.
ReferencesHinchcliffe, F., Thompson, J. and Pretty, J. N. 1996. Sustainable Agriculture and Food Security in East
and Southern Africa. Report for the Committee on Food Security in East and Southern Africa. SwedishInternational Development Cooperation Agency (Sida) (Stockholm).
4.5 The Health Costs of PastApproaches to AgriculturalDevelopment
The methods used to increase productiondetermine the kinds of health-related impactseen. Using more land to grow crops, landand/or agricultural intensification, are oftendescribed as the main means of increasingproduction. In the World Resources 1998-99global discussion,(World Resources Institute,1996) the following health risks wereassociated with agricultural intensification:
• Increased exposure to toxic substancessuch as pesticides;
• Excess use of fertiliser and manure,resulting in nitrate contamination of surfaceand groundwater, leading to human healthrisks;
• Infectious diseases associated withexpansion of irrigation systems and the useof wastewater for irrigation;
• Increased exposure to infectious agentsas tropical forest and other ecosystems areconverted to agricultural land.
The following section reviews the extentto which these concerns are significant froman ACP perspective. In low-income ACPcountries, in particular, such risks must beseen in the context of the food security issuesnoted above. Overall, the danger thatagricultural intensification will fail to addressfood security issues, or will not occur, remainsa more serious threat to health than thisparticular set of environmental hazards.Simply promoting pesticides, fertilisers, largescale irrigation and forest clearance is notnecessarily the best way to improve foodsecurity.
4.5.1 Modern Agricultural DevelopmentThe process of agricultural modernisationhas produced three types of agriculture:industrialised, Green Revolution, and allthat remains - the low-external input,traditional and ‘unimproved’ systems. Thefirst two types have been able to respondto the technological packages, producinghigh-input high-output systems ofagriculture. For success, they require
Chapter 4
Environmental Change and Human Health in Countries of Africa, the Caribbean and the Pacific114
conditions that are either like those wherethe technologies were generated, or elseenvironments that can easily be changedand homogenised to suit the technologies.These tend to be endowed with most ofthe following attributes:
• Access to roads, urban markets,ports, coupled with ready access to inputs:machinery, marketing infrastructure,transport, agroprocessing facilities andcredit;
• Good soils;• Adequate supply of water, either
through stable rainfall or irrigation systems;• Access to modern crop varieties and
livestock breeds; and• Access to petroleum-based products
and machinery.
Most agricultural systems in industrialisedcountries count as high-external inputsystems. In developing countries, high-external input systems are found in the largeirrigated plains and deltas of South, SouthEast and East Asia, and parts of Latin Americaand North Africa, but also in some ACPcountries. They tend to be monocrop and/ormonoanimal enterprises, geared for sale ofproduce, and so include lowland irrigatedrice, wheat and cotton; plantations ofbananas, pineapples, oil palm, sugar cane,market gardening near to urban centres, andintensive livestock rearing and ranching.
These are the lands of the GreenRevolution, the success of which lay in itssimplicity. Agricultural scientists bred newvarieties of staple cereals that matured quickly,so permitting two or three crops to be growneach year; that were day-length insensitive, socould be grown by farmers at a wide range oflatitudes; and that produced more grain thanstraw. They were also much more responsiveto nitrogen than traditional varieties. Thesemodern varieties were distributed to farmers,together with high-cost inputs, such asinorganic fertilisers, pesticides, machinery,credit, and water regulation. These technicalinnovations were then implemented in themost favoured agroclimatic regions, and forthose classes of farmers with the best meansof realising them, the potential yield increases.Now, some 50% of the total wheat, rice and
maize acreage is planted with modern varieties,although the uptake varies considerably acrosscontinents. As a result, average cereal yieldshave roughly doubled in 30 years, and this hasled to an improvement of about 7% in the totalfood produced per capita over the same period.This average does, however, hide significantregional differences: in South East Asia, foodproduction per capita has increased by about30%, but in Africa it has fallen by 20%.
The third type of agriculture comprisesall the remaining agricultural and livelihoodsystems (Pretty, 1995), and represents alargely forgotten agriculture. These are thelow-external input systems, located mainlyin drylands, wetlands, uplands, savannas,swamps, near-deserts, mountains and hills,and forests. Farming systems in these areasare complex and diverse, and rurallivelihoods often depend on wild resources,as well as agricultural produce. They areremote from markets and infrastructure, theyare located on fragile or problem soils, andthey are less likely to be visited by agriculturalscientists and extension workers, or studiedin research institutions.
These forms of agriculture often have lowproductivity, with cereal yields typically only0.5 to 1 tonne per hectare. The poorestcountries tend to have higher proportions ofthese agricultural systems, and indeed, mostof the food production in Africa comes fromthese low-external input systems ofagriculture. By the mid-1990s, some 30% to35% of the world’s population, about 1.9-2.1 billion people, were directly supportedby this third and ‘forgotten’ agriculture(Pretty, 1995), yet these people are currentlyexcluded from development assistance andagricultural policies that focus on the highpotential lands. A 1988 US Office ofTechnology Assessment study of Africa said‘most agricultural development assistance ...has emphasised external resources’ (OTA,1988). But few farmers can afford to sustainthe use of external resources: their onlyimmediate alternative lies in low-externalinput systems, using technologies thatconserve resources.
Although there has recently been somerecognition of what can be achieved by amore sustainable form of agriculture, manyinstitutions still believe in the modernisation
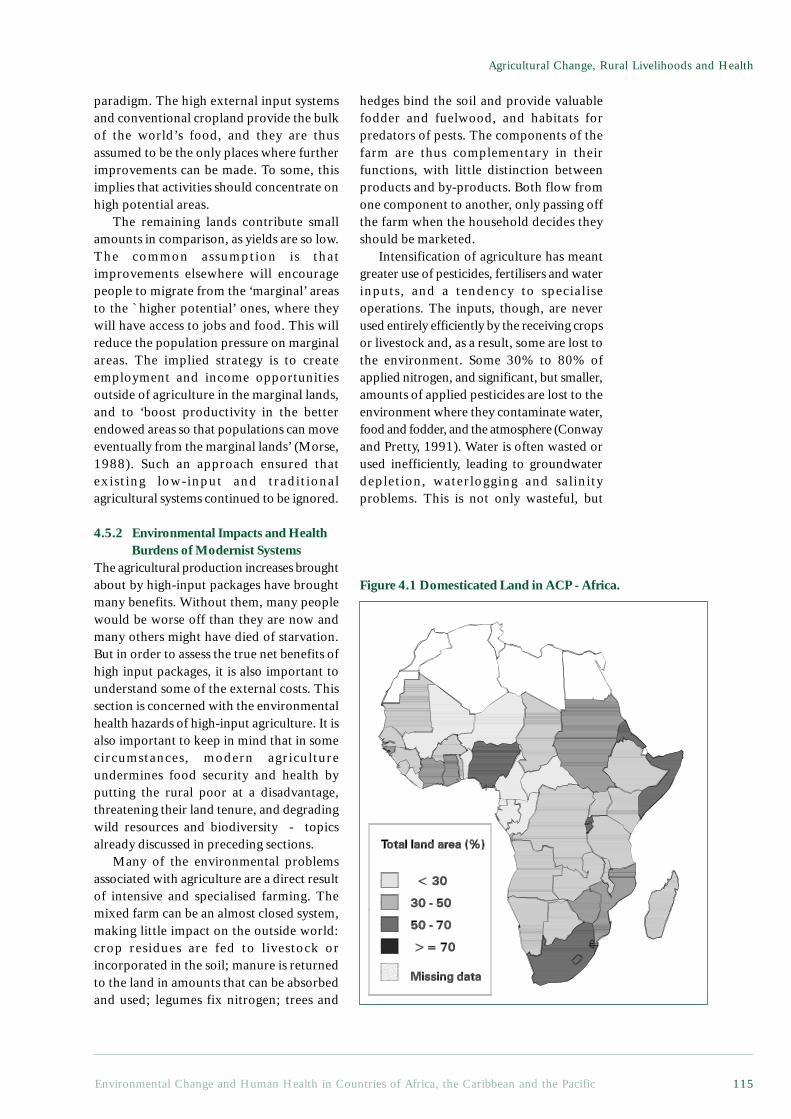
Environmental Change and Human Health in Countries of Africa, the Caribbean and the Pacific 115
Agricultural Change, Rural Livelihoods and Health
paradigm. The high external input systemsand conventional cropland provide the bulkof the world’s food, and they are thusassumed to be the only places where furtherimprovements can be made. To some, thisimplies that activities should concentrate onhigh potential areas.
The remaining lands contribute smallamounts in comparison, as yields are so low.The common assumption is thatimprovements elsewhere will encouragepeople to migrate from the ‘marginal’ areasto the `higher potential’ ones, where theywill have access to jobs and food. This willreduce the population pressure on marginalareas. The implied strategy is to createemployment and income opportunitiesoutside of agriculture in the marginal lands,and to ‘boost productivity in the betterendowed areas so that populations can moveeventually from the marginal lands’ (Morse,1988). Such an approach ensured thatexisting low-input and traditionalagricultural systems continued to be ignored.
4.5.2 Environmental Impacts and HealthBurdens of Modernist Systems
The agricultural production increases broughtabout by high-input packages have broughtmany benefits. Without them, many peoplewould be worse off than they are now andmany others might have died of starvation.But in order to assess the true net benefits ofhigh input packages, it is also important tounderstand some of the external costs. Thissection is concerned with the environmentalhealth hazards of high-input agriculture. It isalso important to keep in mind that in somecircumstances, modern agricultureundermines food security and health byputting the rural poor at a disadvantage,threatening their land tenure, and degradingwild resources and biodiversity - topicsalready discussed in preceding sections.
Many of the environmental problemsassociated with agriculture are a direct resultof intensive and specialised farming. Themixed farm can be an almost closed system,making little impact on the outside world:crop residues are fed to livestock orincorporated in the soil; manure is returnedto the land in amounts that can be absorbedand used; legumes fix nitrogen; trees and
hedges bind the soil and provide valuablefodder and fuelwood, and habitats forpredators of pests. The components of thefarm are thus complementary in theirfunctions, with little distinction betweenproducts and by-products. Both flow fromone component to another, only passing offthe farm when the household decides theyshould be marketed.
Intensification of agriculture has meantgreater use of pesticides, fertilisers and waterinputs, and a tendency to specialiseoperations. The inputs, though, are neverused entirely efficiently by the receiving cropsor livestock and, as a result, some are lost tothe environment. Some 30% to 80% ofapplied nitrogen, and significant, but smaller,amounts of applied pesticides are lost to theenvironment where they contaminate water,food and fodder, and the atmosphere (Conwayand Pretty, 1991). Water is often wasted orused inefficiently, leading to groundwaterdepletion, waterlogging and salinityproblems. This is not only wasteful, but
Figure 4.1 Domesticated Land in ACP - Africa.
Chapter 4
Environmental Change and Human Health in Countries of Africa, the Caribbean and the Pacific116
costly to those who want to use theseresources and expect them to beuncontaminated.
Many environmental and health-relatedimpacts have increased in recent years, whilstothers have persisted, all efforts to reducethem notwithstanding (Conway and Pretty,1991). Water systems have becomeincreasingly contaminated. Nitrates in watercan give rise to methaemoglobinaemia ininfants, pesticide-contaminated water canharm wildlife and pollute drinking water, andnitrates and phosphates from fertilisers,together with organic wastes from livestockmanures and silage, all contribute to algalgrowth in surface waters, deoxygenation, fishand coral deaths, and cause a generalnuisance. Eroded soil also disruptswatercourses, and runoff from eroded landcauses flooding and damage to housing,irrigation systems and natural resources.
Various pollutants also harm farms’ andlocal areas’ natural resources. Pesticidesdamage populations of the predators that helpkeep pest populations under control, as wellas other wildlife, whilst inducing resistancein target pests. Nitrates from fertilisers andammonia from livestock waste disruptnutrient-poor wild plant communities, whilstmetals from livestock wastes raise the metalcontent of soils, and pathogens in wastes canharm human and livestock health. Theatmosphere is contaminated by ammonia(which plays a role in acid rain production)nitrous oxide derived from fertilisers (whichplays a role in ozone layer depletion andglobal warming) and methane from livestockand paddy fields, (which also affects globalwarming).
The consumer is most likely to be directlyaffected by eating food contaminated bypesticide residues, nitrates and antibiotics. Inindustrialised countries, the levels of pesticidesin foods have been falling steadily since the1950s (Conway and Pretty, 1991), but thereare, nonetheless, occasional public scares overparticular products, and rare incidents ofsevere poisoning arising from the spraying ofillegal products. In ACP countries, however,daily intakes are often very high. These maybe in cereals or in fish, such as those from thelakes and rivers of Kenya, Nigeria and Tanzania(Atuma, 1985a; Atuma, 1985b).
The major hazard, however, lies in locallymarketed food. Leafy vegetables are oftensprayed twice a week and may come to marketwith a high degree of contamination,especially in the dry season. In Africa,vegetables have been found to containorganophosphates many times in excess ofhuman tolerance limits (Atuma, 1985b). Leafyvegetables have also found to be contaminatedwith faecal material, although this is notconfined to high intensity agriculture.
The costs of environmental damage aregrowing, and are dispersed throughout manyenvironments and sectors of nationaleconomies (Conway and Pretty, 1991). Recentanalyses, meanwhile, have been characterisedby the recognition that farmers themselvesare suffering declining incomes or health-related effects as a result of these modernapproaches to agriculture.
4.5.3 Pesticides and HealthIn the past 50 years, the use of pesticides inagriculture has increased dramatically, andthe value of the global market is now aboutUS $30 billion. Herbicides account fornearly half, insecticides a quarter, andfungicides less than a fifth. The largestindividual consumer is the USA, followedby countries of the Far East. On a globalscale, ACP-Africa is a relatively minorconsumer of pesticides - about 4% of thetotal world consumption. The consumptionis also quite variable, because of intermittentdemand (locust eradication campaigns), arecent decline in government pesticidesubsidies, and fluctuations in aid. Whilstapplication levels in many of the ACP-SmallIsland States are considerably higher, withonly about 3% of the ACP cropland, theirconsumption levels are also globallyinsignificant.
Pesticides are intended to be hazardous -their value lies in their ability to killunwanted organisms. But they are rarelyselective. Most act by interfering withfundamental biochemical and physiologicalprocesses that are common to a wide rangeof organisms - not only to pests and weeds,but to humans, too. Pesticides affect workersengaged in their manufacture, transport anddisposal, operators who apply them in thefield, the general public, and wildlife. In the
Environmental Change and Human Health in Countries of Africa, the Caribbean and the Pacific 117
Agricultural Change, Rural Livelihoods and Health
first case, the hazard is common to allindustries dealing with toxic chemicals. Ofgreater concern is the hazard to the fieldoperators because of the high variability infield conditions and frequent lack ofprotective clothing. Also at risk, however,are the general public and the widerenvironment, both of which are difficult toprotect directly.
At very high dosages, many pesticides arelethal both to laboratory animals and people,and can cause severe illness at sub-lethallevels, but the risks differ from pesticide topesticide. Some are known to be carcinogenic,others are suspected but unproven, some areacutely toxic but produce no long-term effects,whilst others are of long-term concern. Muchof the information on the health-related effectsof pesticides is, however, still highlycontroversial and there is no clear picture ofhow much harm they do to farmworkers andthose who eat the food produced.
In tropical countries, mortality and illnessdue to pesticide exposure are much morecommon, relative to the amount of pesticideused. Lack of legislation and widespreadmisunderstanding of the hazards involvedgreatly increase the dangers both toagricultural workers and to the generalpublic. Many pesticides known to be highlyhazardous and either banned or severelyrestricted in use in industrialised countries,such as DDT, parathion, mevinphos andendrin, are, moreover, still widely availablein developing countries. In some cases, theymay even end up being used for householdspraying - a use which was found to correlatewith respiratory problems among women inAccra (Benneh et al., 1993).
One of the best studies to quantify thesocial costs of pesticide use was conductedby the International Rice Research Institute(IRRI) in the Philippines. Researchersinvestigated the health of Filipino rice farmersexposed to pesticides, and found statisticallysignificant increased eye, skin, lung and
neurological disorders. Two-thirds of farmerssuffered from severe irritation of theconjunctivae; and about half had eczema, nailpitting, and various respiratory problems(Rola and Pingali, 1993).
According to the latest estimates by theWorld Health Organisation, at least threemillion, and perhaps as many as 25 million,agricultural workers are poisoned each year.Of these, some 20,000 die. The data paint ableak and worsening picture2:
The future pesticide consumption of theACP countries is difficult to predict, but it islikely to be influenced by a number of factors,such as profitability (which is determined bygovernment subsidies, the price of alternativemeans of plant protection, opportunity cost oflabour and so on), concern aboutenvironmental damage and direct damage tothe health of people handling pesticides, andplant pest resistance. Judging by trendselsewhere, as a country develops, the type andamounts of pesticides used are likely to changefrom a small number of compounds used on afew crops to a wide range and larger totalamount of insecticides, fungicides andherbicides on a large variety of crops. Africanpesticide consumption has been growing sincethe 1980s; between 1990 and 1995, sales rosefrom an estimated US$ 600 million to a US$1 billion, corresponding to an increase of 66%.Factors contributing to this growth include theincreasing focus of multinational agrochemicalcompanies on tropical markets (in the hopethat growth in this market will help to offset ageneral world market slump in the 1990s),the opening up of the South African pesticidemarket and, in particular, the rapid growth ofthe African horticultural industry, includingexport commodities such as vegetables, flowersand fruits (Waage et al., 1995)
Older and more toxic compounds (off-patent pesticides) still dominate the marketin many ACP countries as they are far lesscostly than new ones. Strict regulations,bans and severe restrictions in developed
2 For summaries, see: Pretty J N. 1995. Regenerating Agriculture: Policies and Practice for Sustainabilityand Self-Reliance. Earthscan Publications Ltd., London, 320 pp; Dinham B. 1993. The PesticidesHazard. The Pesticides Trust, London; Pesticides News 30 (1995), 10-11; Repetto R and Baliga S S.1996. Pesticides and the Immune System: The Public Health Risks. WRI, Washington DC. Singh G S.1996. Pesticides: a growing menace. Society for Participatory Research in Asia. New Delhi - reported inPesticides News No 35, p10; Pesticides News. 1997. Pesticide facts in Thailand. No 35, p8
Chapter 4
Environmental Change and Human Health in Countries of Africa, the Caribbean and the Pacific118
countries may be effective in graduallyreducing their availability, but new(patented), less toxic and moreenvironmentally friendly compounds maystill remain too expensive for manyapplications, so more toxic pesticidesremain in circulation.
In ACP-Africa, changes are visible in thepolitics of governments, international lendingagencies and donors (Matteson and Meltzer,1996). Many government policy reforms andinitiatives supported by lenders and donorshave the potential to affect pesticide use pattern,including the development of Integrated PestManagement (IPM) systems and their adoptionby farmers. These new policies may have bothdirect and indirect impacts, but much dependson whether policies are actually implemented.Pesticide and environmental legislation is,
furthermore, only valuable if it is followed upwith implementation and the means ofenforcing the regulations.
4.5.4. Health Effects of Increased Use ofFertiliser
In areas where soils are susceptible to nitrateleaching, over-fertilisation can result in highnitrate concentrations in surface and groundwater. In very young babies, high nitrateexposure can lead to methaemoglobinaemia(blue baby syndrome). Will over-fertilisationbe an issue in ACP-Africa in the foreseeablefuture? Perhaps locally, but not on a largescale. Even though the use of fertiliserincreased significantly between 1960 and1990, the region still accounts for less than1% of global fertiliser use. The average useof fertiliser in ACP-Africa is about 12
Box 4.5 Pesticides and Workers’ Health
Pesticides cause three million instances of severe poisoning and an estimated 20,000deaths every yearl. 99% of these fatalities occur in developing countries, even thoughthese countries use only 20% of the world’s pesticides (WHO/UNEP, 1990). Pesticideuse in ACP countries is largely restricted to large scale commercial farming, andagricultural workers in the horticultural and cash crop industries are often exposed tohigh pesticide levels (WHO/UNEP 1990). The use of toxic pesticides is probably one ofthe most important occupational hazards for these agricultural workers (Wesseling,McConnell et al, 1997), but the problems in this sector are many. The lack both oflegislation and of sufficient knowledge of the hazards involved, coupled with poorlabelling and the discomfort of wearing protective clothing in hot climates, all greatlyincrease the hazards. Many agricultural workers are, furthermore, unable read the labelscorrectly and extension systems in many countries are unable to ensure that productsare used safely.
Many of the pesticides used in the ACP countries are old, highly toxic and bannedor severely restricted in industrialised countries. These chemicals are cheaper becausethe proprietary rights of the original manufacturer have expired, but the use of thesechemicals is also explained by the lack of restrictive legislation and the difficulty inobtaining alternatives.
Organochlorine insecticides (such as DDT and dieldrin) are still in use in manyAfrican countries. These compounds belong to the first generation of insecticides to beused on a large scale in agriculture after World War II. The acute effect of these compoundsis a stimulation of the nervous system. Where poisoning occurs, the effects includedizziness, vomiting and convulsion. Organochlorine pesticides are, however, mainlyassociated with chronic effects, such as those on the central nervous, reproductive andimmune systems, and with a risk of cancer. Dieldrin has also been reported to beassociated with Parkinson’s disease (Fleming, Mann et al, 1994). Many of theorganochlorine compounds disrupt the hormone system. One of the best documentedof these compounds is DDT, which acts on the female sex hormone, oestrogen.
Environmental Change and Human Health in Countries of Africa, the Caribbean and the Pacific 119
Agricultural Change, Rural Livelihoods and Health
Organochlorine pesticides can stay in the soil for years and are easily absorbed bycertain root crops such as carrots (Hertzman and Akerblom, 1995). They are banned orhighly restricted in most industrialised countries, mainly because of their persistence inthe environment and their accumulation in fatty tissue, such as the brain and breast, andin breast milk, but are still in use in many ACP countries. Namibia, for example, usesup to 70,000 kilograms of DDT per annum to control malaria mosquitoes, along withdieldrin and alphametrin for tsetse fly control (Hines, 1995).
The pesticides associated with highest number of acute pesticide poisonings are thecholinesterase inhibitors, organophosphates and carbamates. Organophosphates andcarbamates degrade much faster and do not accumulate in fatty tissue, but have been heldresponsible for the majority of acute poisonings (Wesseling, 1997). These pesticides inhibitthe transmission of nerve impulses by inhibiting acetyl cholinesterase, a key enzyme in thenervous system. Early symptoms of poisoning include excessive sweating, headache,weakness, vomiting, abdominal cramps, diarrhoea, blurred vision and slurred speech(Dinham, 1997). Between 50% and 83% of pesticide fatalities in Zimbabwe 1980-84were caused by organophosphates (Wesseling, McConnell et al, 1997). Paraquat is awidely used herbicide in many ACP countries, and one of the most frequently used of allherbicides in Zambia (Phiri, 1995). Workers who spray paraquat regularly are often affectedin the skin, eyes, nose and fingernails (Dinham, 1993). There are several cases showingthat dermal absorption in dangerous concentrations is possible (Hayes and Laws, 1991),with the kidneys, liver and lungs as the most frequently affected organs. Paraquat is,furthermore, often brought into fields in soft drink bottles, which are used as pesticidecontainers, and there have, as a result, been several fatalities where a mouthful of Paraquatconcentrate was ingested by mistake (Wesseling, Hogstedt et al, 1997).
Contributed by Erica Toft, Erica Toft Konsult HB.
ReferencesDinham, B. 1997. Monocrotophos. Pesticide News(38): 20-21.Dinham, B. 1993. The Pesticides Hazard. Pesticides News 30: 10-11.Fleming, L., J. B. Mann, et al. 1994. Parkinson’s disease and brain levels of organochlorine pesticides. Ann
Neurol 36: 100-103.Hertzman, T. and M. Akerblom 1995. Executive summary of reports and recommendations. Agrochemical
Pesticides in the SADC Region, Use and Concerns. T. Hertzman and M. Akerblom. Maseru, Lesotho,SADC Environment and Land Management Sector (ELMS) Coordination Unit. Report No. 35: 3-48.
Mathuthu, A. S. 1995. Feasibility study of agrochemical pesticides in Zimbabwe. Agrochemical Pesticidesin the SADC Region, Use and Concerns. T. Hertzman and M. Akerblom. Maseru, Lesotho, SADCEnvironment and Land Management Sector (ELMS) Coordination Unit. Report No. 35: 135-199.
Phiri, J. S. 1995. Feasibility study of agrochemical pesticides in Zambia. Agrochemical Pesticides in theSADC Region, Use and Concerns. T. Hertzman and M. Akerblom. Maseru, Lesotho, SADC Environmentand Land Management Sector (ELMS) Coordination Unit. Report No. 35: 129-153.
Wesseling, C., R. McConnell, et al. 1997. Agricultural pesticide use in developing countries: healtheffects and research needs. Int J Health Serv 27(2): 273-308.
WHO/UNEP 1990. Public health impact of pesticides used in agriculture, WHO.
kilograms per hectare (see Table 10.2 inAppendix 2) compared with about 200 kgper hectare in the European Union.
In large parts of ACP-Africa there isvirtually no use of chemical fertiliser at all.Green manure is often used as fuel, and hencethere is considerable scope for increasing theproductivity of African land by using morefertiliser, including biological nitrification.ACP-Africa is projected to increase its use of
fertiliser - the demand is expected to rise from1.9 to 4.2 million tonnes NPK in the next 20years (Bumb and Baanante, 1996). Inorganicfertilisers are, however, too costly orunavailable for the large majority of small-scaleand subsistence farmers.
The main fertiliser-related problem is thatof the inadequate replenishment of nutrientsremoved by agriculture and land degradation.The situation is serious in many ACP countries,
Chapter 4
Environmental Change and Human Health in Countries of Africa, the Caribbean and the Pacific120
but most acute in Africa (both for majornutrients like nitrogen and phosphate, and formicronutrients like boron and manganese). Inmany countries in the region, nutrient removalexceeds nutrient replenishment by a factor ofthree to four. In the mid-1980s, all countriesin the region were thought to be suffering fromnutrient ‘mining’ to some degree (Bumb andBaanante, 1996), with the most seriousproblems occurring in semi-arid areas wherelivestock manure is in short supply and theuse of mineral fertilisers is out of reach (andseldom economic) for the farmers.Traditionally, long fallows, 10-15 years induration, were used to restore fertility, butincreased population pressure has led tocontinuous cultivation. In many instances, thisreduction in fallow periods has not beenaccompanied by alternative measures designedto restore fertility. As fertility declines and soilbecomes barren, farmers with few otherresources may be forced to clear more foreststo meet food demand (though see Box 4.6).
In the light of this situation, increasedfertiliser use in Africa may be a problemlocally, near large commercial farms or cities,but would probably not be a significanthealth problem for major parts of ACP-Africa.
4.5.5 Infectious Agents, Land Conversionand Increased Irrigation
The conversion of land, whether from foreststo agriculture, or rain-fed to irrigated land, candirectly influence the prevalence of a wide rangeof infectious diseases. In both cases, ecosystemsinvolving disease vectors are altered, andpeople move into new habitats. In the wrongcircumstances, serious health problemsemerge. Other changes in land use patternsand human settlement can also affect theecology of disease. Deforestation and moreextensive irrigation are of particular concern,however, since they are trends now unfoldingin many ACP countries.
The scope for increasing the irrigated landarea in Africa is quite restricted, since largeareas are already experiencing watershortages. Some increase in irrigatedcultivation may be possible, at reasonablecost, but by probably less than 15% of today’slevel (Leach, 1995). The health implicationsof such changes do, nevertheless, need to be
taken seriously in that they can increase theprevalence of a wide range of water-relateddiseases, as indicated in Box 3.3. Water iscentral to the life cycle of many knowndisease vectors, and it is no longer defensibleto introduce major changes to water systemswithout taking into account the potentialhealth effects.
The conversion of forest to agriculturalland is the main cause of tropicaldeforestation. Deforestation can have anumber of environmental consequences, andhealth concerns are often ignored. Asindicated in Box 4.6, deforestation does notsimply add or subtract from the burden ofdisease, but alters disease ecology in waysthat can be difficult to predict. As in thecase of water systems, health concernsshould inform policies which lead to changesto forest land use.
Most of the examples given in Boxes 4.6and 3.4 involve relatively common diseases,affecting primarily those living in the areassubject to ecological change. There is also therisk, in rare circumstances, of ecological anddemographic change creating opportunities forunfamiliar microbes to come into increasingcontact with people, and then spread to thegeneral population (Epstein, 1995; LeGuenno, 1995; Morse, 1995). Increasingcontact with forest animals, for example, alsoincreases human exposure to their viruses,creating more opportunities for viruses tojump species. More population movementsin and out of these areas could then,hypothetically, give these viruses theopportunity to spread. It is possible that HIV/AIDS and other ‘new’ viruses first emergedin this fashion. Our understanding of hownew diseases emerge, and the risks involvedin particular ecological shifts, is,unfortunately, insufficient to draw clear policyconclusions. It does, however, provide afurther indication that a precautionaryapproach is warranted.
4.6 The Problems andOpportunities of Biotechnology
Genetic engineering is changing the rate andcharacter of the development of bothagricultural and medical innovations, makingit difficult to judge the future on the basis of
Environmental Change and Human Health in Countries of Africa, the Caribbean and the Pacific 121
Agricultural Change, Rural Livelihoods and Health
Box 4.6 Changing Forest Land Use and its Impact on Disease Vectors
Forests may be cleared, degraded to less dense forest cover, or replanted with a new mixof trees, any of which changes can affect disease vectors and disease transmission. Publichealth is not always threatened, but it can be, and predicting the health implicationsrequires an understanding of the local vector and disease ecology.
The health outcome depends not only on the changes made to the forests, but onaccompanying population movements, and the quality and uses of the surrounding land.Hence, settlements encroaching on forest land may simply come into increasing contactwith pre-existing vectors, whilst the widespread conversion of forests to agricultural landmay totally eliminate forest species from the area, encouraging savanna species instead.Some of these savanna species may carry more (or less) virulent strains of the samedisease, or they may be vectors for different diseases.
In ACP-Africa, for example, the main malaria vectors are Anopheles gambiae and A.funestus, both of which can live in forest or savanna areas (Coluzzi, 1992). Members ofthe A. gambiae complex do, however, seem to prefer sites where humans have madechanges, and deforestation will thus tend to favour this species. Malaria prevalencies are,however, only likely to increase appreciably when deforestation increases the availabilityof freshwater sites where mosquitoes can breed, as in a conversion of forest land to ricepaddies.
Blackflies of the Simulium damnosum complex are the main vectors of humanonchocerciasis in Africa, although S. naevei also act as vectors in some areas. The latterlive in forests only, and deforestation has eliminated onchocerciasis in some areas.Deforestation can also affect S. damnosum if it changes the availability of water sites forthe blackfly breeding, or if the loss of forest affects the efficiency of transmission betweendifferent members of the chain of vectors (Walsh, 1993). In Uganda, where deforestationled to disappearance of S. neavei, they were replaced by S damnosum.
Human loiasis, caused by the filarial worm Loa loa, is confined to rainforests in Westand Equatorial Africa. Generally speaking, deforestation does appear to lead to a fall inprevalence, as breeding sites for the horsefly vector are drained. Developing rubberplantations can, however, lead to an increase in the vectors’ breeding success, and hencein the subsequent rate of transmission of the disease, as was the case in Saele, Nigeria,(Walsh, 1993).
The impact of deforestation on sleeping sickness depends on the type of the tsetse flyvector present. One study in Ethiopia suggests that development is viable in areas that arehome to Glossina morsitans only, since this particular species is easily disturbed bypeople and is likely to retreat in the face of deforestation (Hadis et al, 1995). Otherspecies of tsetse are, however, more adaptable and so more able to continue transmittingsleeping sickness, despite changes in forest cover.
The habits of people living and working in the area are also significant, e.g. whether,their daily round takes them into the forest, and at what times of day. For this and otherreasons, not all inhabitants of a given area are at equal risk. In south east Uganda, whereG. fuscipes fuscipes is the main vector of sleeping sickness, a study found that people withthe disease tended to have less economic power, come from families in which sleepingsickness had already appeared, and be more likely to collect firewood from the forest andto travel outside their own village - and were thus more likely to come into contact withthe vector (Okia et al, 1994).
Inhabitants new to an area, with a low immunity to endemic diseases, also faceespecially high risks. Work in the Philippines suggested that, in an area where the malariatransmission levels were generally low, being a young (under 30 years of age) male migrant
Chapter 4
Environmental Change and Human Health in Countries of Africa, the Caribbean and the Pacific122
into the area was a significant risk factor (Lansang et al, 1997). This finding has publichealth implications in ACP countries, particularly in relation to resettlement programmes,but also in more general terms.
Migrants can also bring a new disease vector into an area. Fears have been expressedthat Onchocerca volvulus strains from the savanna, which are more likely to cause blindnessin humans than other types of onchocerciasis, may be introduced into newly deforestedareas by people migrating into these areas from the savanna (Walsh, 1993).
Contributed by Jane Seymour, Environmental Health Researcher, London, United Kingdom.
ReferencesColuzzi, M. Malaria vector analysis and control. Parasitology Today 1992; 8: 113-18.Hadis, M, Endeshaw, T, Kebede, A, Asfaw, T, Tilahun, T. Decline of Glossina morsitans ugadensis in
Gambella, Ethiopia. East Africa Medical Journal 1995; 72: 6, 365-69.Lansang, MAD, Belizario, VY, Bustos, MDG, Saul, A, Aguirre, A. Malaria in an area of low transmission
in The Philippines. Acta Tropica 1997; 63: 4, 257-65.Okia, M, Mbulamberi, DB, de Muynck, A. Risk factors assessment for T.b. rhodesiense sleeping sickness
acquisition in S. E. Uganda: a case control study. Annales de la Societe Belge de Medicine Tropicale1994; 74: 2, 105-12.
Walsh, JF, Molyneux, DH, Birley, MH. Deforestation: effects on vector-borne disease. Parasitology1993; 106: S55-S75.
past trends. The emphasis here is onagricultural applications, in line with the restof this chapter, with particular reference tofood security. It is important to keep in mind,however, that medical applications may alsochange the context of environmental andhealth issues.
On the technical front, biotechnology hasconsiderable potential for addressing foodsecurity problems in ACP countries. Itspossible applications extend beyond the high-input commercial farms, whose links to foodsecurity are sometimes tenuous. A numberof the physical limitations of GreenRevolution technologies, which tied them tohigh-input packages and a limited number ofcrops, have been overcome and it is nowtechnically feasible to use genetic engineeringto support low-input agriculture, and to targetcrops and animals of special relevance tosmall-scale cultivators and their particularneeds. Provided that the potential side effectsand external costs can be contained, it is easyto imagine a far more equitable ‘RainbowRevolution’, helping to eliminate rural foodinsecurity in a wide range of settings.
As described in earlier sections, however,food insecurity is not primarily a technicalproblem, and institutionally, the new
developments in biotechnology give far lessreason for optimism. There is little financialpressure to serve the needs of people withoutfood security, and biotechnology is led bycommercial interests. The costs ofdeveloping applications is high, so whateverthe technical potential, in reality the vastmajority of biotechnology innovation isorientated towards large-scale commercialapplications. There are also strong vestedinterests in maintaining high-inputagriculture for genetically engineered foodcrops. Indeed, several of the companies thatdominate food and farming applications ofbiotechnology, are also major exporters ofchemical inputs. Moreover, the potentialrisks that accompany the use of geneticallyengineered species do not only, or evenprincipally, threaten the users. Currenttrends thus suggest that the technologicalpotential for serving low-input, small-scalefarmers will not be realised in theforeseeable future, but that these farmers willbear some of burdens of external costs andincreased competition.
The key question with regard to publichealth is whether the potential risks andinstitutional tendencies of newbiotechnologies represent challenges that
Environmental Change and Human Health in Countries of Africa, the Caribbean and the Pacific 123
Agricultural Change, Rural Livelihoods and Health
must be overcome, or reasons to resistbiotechnology-based approaches to foodsecurity. Biotechnology experts at present tendto be more optimistic than rural developmentspecialists and environmentalists, and thedebate is polarised and often confused.Institutions and policies lag far behindscientists’ and industry’s capacity to find newuses for the technologies. Ethical issues thatrequire considered and extensive publicconsideration are in danger of being lost amidthe technological push and pull.
4.6.1 What are Biotechnology and GeneticEngineering?
Biotechnology involves making molecularchanges to living or almost-living things,such as proteins, and as such, it has a longhistory. The Egyptians and Sumerians haddeveloped fermentation, bread-making,brewing and cheese-making by 2000 BC, andthe Greeks had developed graftingtechniques, enabling them to plant orchardsand groves to produce fruit on a larger scaleby 300 BC. The defining feature of modernbiotechnology, also known as geneticengineering, is that it involves transfer ofDNA from one organism to another, soallowing the recipient to express traits orcharacteristics normally associated with thedonor. It goes well beyond conventionalplant and animal breeding, involving suchtechniques as clonal propagation, embryotransfer, embryo rescue and mutantselection.
Modern biotechnology helps breeders tofacilitate the targeted improvement ofvarieties adapted to particular agroecologicalniches. As breeders and agriculturalscientists strive to increase the number andcomplexity of traits to be incorporated intonew crop varieties, DNA marker-assistedbreeding is becoming an increasinglyimportant tool. The use of the DNA markertechnology helps to identify genetic linkagesto qualitative and quantitative traits, whichsimplifies and facilitates conventionalbreeding efforts.
Genetic modification, or development oftransgenic organisms, is different fromconventional breeding, since it involves thedirect transfer of genetic material from oneorganism to another in order to change the
characteristics of the recipient animal orplant. This permits genes to be transferredhorizontally between organisms that do notnormally breed. As these transfers or mixesdo not occur in nature, the scope for geneticmodification (these modified organisms arecommonly called GMOs - genetically-modified organisms) is far greater than‘traditional’ breeding, which recombinesgenetic material from the same species orgenera, shifting only similar alleles.
Whilst biotechnology opens many newdoors, concerns have emerged over itspotential impact on the environment andhealth (Tiedje et al., 1989). Some of theconcerns relate to the effects of releasedGMOs on the structure and function ofecosystems - in particular, the creation ofnew weeds and the flow of ‘unwanted genes’into the gene pools of wild relatives from thetransformed crops. Others relate to the safetyof consuming genetically modified (GM)crops or their products. Another hotly debatedissue is the push, by biotechnology companies,for the extension of patent rights to livingmaterial, including genes. There is a growingconcern in developing countries that foreigncompanies will gain rights to indigenousknowledge and genetic resources, withouteven providing proper compensation. All ofthese concerns are heightened by the fact thatmost ACP countries lack both biosafetyinformation relevant to the region and thecapacity to enforce biosafety regulations.When building up capacity in biotechnologyin ACP countries, therefore, there is aconcomitant need for training in biosafetyrisk assessment and discussions of ethical andlegal implications (Virgin and Frederick,1995).
4.6.2 Food and Farming Applications in theNorth
Biotechnology is now the fastest growingindustry in both the health and the food andfarming sectors of the North. There are some1,500-2,000 biotechnology companies in theUSA, and a further 700 in Europe. The vastmajority of these companies are concernedwith medical applications and the productionof new drugs and pharmaceuticals. Arelatively small number only are developingtechnologies for the food and farming sector.
Chapter 4
Environmental Change and Human Health in Countries of Africa, the Caribbean and the Pacific124
Within this sector, however, biotechnologycompanies are playing an increasinglydominant role.
In the food and farming sector, there aresix international conglomerates thatcurrently dominate the market, namelyMonsanto, Novartis, AgrEvo, Dupont,Zeneca and Dow, who are said to havealready invested $8 billion collectively intechnology development - Monsanto alonespent $730 million on biotechnologyresearch in 1997. The growth in the farmingsector started later than the medical boomand remains slower than that in the medicalsector, but this situation is changing rapidly.In 1994, there were no GM crops growncommercially on farms anywhere in theworld. In 1998, approximately 28 millionhectares of GMO crops were cultivatedworld wide (more than 95 percent in USA,Argentina, Canada). In the USA, GMOswere sown on a quarter of all cotton-growingareas, and on 14% and 10% of soya andmaize areas, respectively. The USDepartment of Agriculture believes that some40% to 50% of all US crops will be GMOsby the year 2000 (James, 1998).
The first genetically engineered productseaten by humans were cheese and tomatoes.GMOs were first used to produce analternative enzyme to calf rennet for makingvegetarian cheese, namely chymosin, althoughlabelling has only recently revealed this toconsumers. Then in 1995, tomatoes with theirsoftening gene ‘switched-off ’ (allowing themto ripen on the vine without then rotting intransit) were introduced to the market in theform of tomato paste. They were quicklyfollowed by a wide range of GM crops beinggiven regulatory approval in the US, includingpotatoes, squash, oil seed rape, cotton andmaize. Slow softening apples, raspberries andmelon have also been produced.
The greatest growth area up to 1998 hasbeen in two very high profile crops, namelysoya beans developed by Monsanto to resisttreatment with the herbicide glyphosate, orRoundup, and maize engineered by Novartisto contain the Bacillus thuringiensis gene thatproduces a compound toxic to the corn borer.The maize also contains an antibiotic-resistantmarker, so that GM tissue can easily beidentified in the laboratory. This maize wasplanted on 200,000 hectares in 1996,increasing to two million hectares in 1997.Both Monsanto and Novartis claim that theseplants benefit farmers financially. They sayfewer chemical inputs are needed overall,although the sales of their own herbicideproducts did increase.
Studies3 from the USA and UK comparingGM with non-GM crops point to thefollowing improvements:
• GM soya in the US required 9-39%less herbicide4;
• GM cotton in Australia required 68%less insecticide;
• GM cotton in the US - 60% of thecrop went a whole season without needingany insecticides;
• GM rape in the UK - production costswere cut by two-thirds from £75-80 to £25per hectare;
• GM soya and canola yields were up5% to 9% in the US in 1996 owing to betterweed control and less injury to crops.
4.6.3 The Relevance of AgriculturalBiotechnology to Health in ACPCountries
A number of GM crops will be making theirway to ACP countries in the near future. Somewill come directly from international seedcompanies, and some via national andinternational crop breeding programmes.
3 Wilson M. 1997. Genetically-modified crops: are there significant risks or benefits? IEA EnvironmentUnit Occasional Discussion, 30 October 1997. Institute of Economic Affairs, London.Monsanto Crop Production. 1997. Weed control on the farm: management of GM herbicide tolerantcrops. High Wycombe. From trials run by the ARC as part of the EU-funded Familiarisation with andAcceptance of Crops incorporating Transgenic Technology (FACTT) project.4 It is not entirely clear what exactly these data mean, in that reporting agencies do not distinguishbetween the number of applications of a product, and the amount in kg of active ingredient used.
Environmental Change and Human Health in Countries of Africa, the Caribbean and the Pacific 125
Agricultural Change, Rural Livelihoods and Health
International seed companies are likely toincrease the number of field tests of transgenicplants in Africa, concentrating theirmarketing on countries that have already havea large market for elite crop varieties and afunctional biosafety regulatory structure.These crops will, however, be expensive, andbe more likely to compete with small-scalecultivators than be used by them.
At the same time, some ACP-Africancountries (such as South Africa, Kenya andZimbabwe) are building significant plantbiotechnology programmes within theirNational Agricultural Research Systems(NARS). These efforts focus on local cropsand local problems. In East Africa, KARI inKenya will soon test transgenic virus-resistantsweet potatoes developed in cooperation withMonsanto.
The research centres of the ConsultativeGroup on International AgriculturalResearch (CG-centres) are also workingintensively with the development oftransgenic crops for African crop breedingprogrammes. The International Institute ofTropical Agriculture (IITA) is working onthe production of transgenic yams, cowpeasand bananas that are resistant to disease andpests. Work on transgenic cassava is beingcarried out at the International Centre forTropical Agriculture (CIAT) in Colombia,where the research is concentrating ontransgenic cassava plants with increasedinsect resistance, modified starch quality anddecrease of cyanoglucoside content. TheFrench research organisation ORTSTROMand the International Laboratory for TropicalAgricultural Biotechnology (ILTAB) arecollaborating on the production ofgenetically engineered cassava plants that areresistant to the African Cassava MosaicVirus (ACMV). Finally, the Maize andWheat Improvement Center (CIMMYT) isalso working on the development oftransgenic pest-resistant maize varietiessuitable for Latin America and Africa.
In short, many transgenic crops (includingmaize, cowpeas, yams, cassava and bananas)will be ready to be incorporated into Africanbreeding programmes in the near future (threeto five years) and made available to asomewhat broader set of African farmers.Unfortunately, this does not imply that
biotechnology will lead to a generalimprovement in human health, since it is notclear how those groups currently facing foodinsecurity will be affected.
If biotechnology does not benefit small-scale and subsistence farmers, its relevance tofood security will be strictly limited. Whilstsome transgenic varieties will be availablethrough the NARS and the internationalresearch centres (IARCs), the majority of thevarieties will be marketed by largeagrobiotechnology corporations through theirlocal subsidiaries at a premium price. Eventhe NARS will have considerable difficultyreaching the majority of farmers. Farmerswithout good access to new technology orfinancial resources will benefit last, if at all.Increasing food supply from high-inputcommercial farms can lower food prices,giving more purchasing power to wagelabourers, but as long as a large proportion ofpeople without food security are themselvessmall farmers who depend on their ownagricultural sales and food production, anincrease in the food supply will not ensurefood security.
The overall health-related impact couldalso be negative if biotechnology hurts smallcultivators. Even if the potential hazards ofgenetic engineering are ignored, there are stilla number of ways in which biotechnologycould harm small cultivators: it could makeit more difficult for them to market theirproduce, by increasing supplies fromcompetitors or shifting demand towards morestandardised products, and it could divertpublic support from approaches more relevantto small-scale cultivators, such as thoseinvolving more traditional techniques andmeasures supporting local empowerment(Hobbelink, 1991; Rissler and Mellon,1996). Even if they were to be adopted bysmall farmers, biotechnology innovationscould reduce the diversity, flexibility andresilience of farming systems, and increasethe risk of the sort of extreme events that canlead to famine. There is even the potentialfor workers in large-scale commercial farmingto suffer if the demand for labour falls orproduction is shifted to other countries.Transgenic tropical crops such as sugar cane,coconut, vanilla and cocoa could be grownanywhere with appropriate genetic
Chapter 4
Environmental Change and Human Health in Countries of Africa, the Caribbean and the Pacific126
modification, and whole industries in tropicalcountries could, as a result, be furtherdestabilised or even disappear.
There are steps which could be taken toreduce the potentially negative impacts ofbiotechnology. More resources could bedevoted to the innovations relevant to foodsecurity, such as introducing hybrid vigourinto crop varieties without having to replenishseed stocks every year (Toenniessen, 1994).This would remove one of the inequitableaspects of conventional hybrids which needto be bought each year, favouring the moresuccessful commercial farmers. Numerouscomplementary measures could also be taken.In short, for biotechnology to be able toaddress some of the key challenges facing poorfarmers, suitable research paradigms will haveto be developed by the National AgriculturalResearch Centres in the ACP countries. Simplyembracing biotechnology on the grounds thatit can increase food production could be aserious mistake.
The overall impact of biotechnology onhealth in ACP countries is uncertain, not onlybecause its technical aspects remain poorlyunderstood, but also because it is unclear howACP governments and international actors willtake up the challenges biotechnology brings.Biotechnology will not solve the problems ofunsustainable agricultural practices and foodinsecurity. The question is whether it willbecome part of the solution, or another part
of the problem. It is far more likely to becomepart of the solution if it can be integrated intoa broad-based strategy for the environmentand health, keeping the interests of the poorto the fore, than if it is treated as atechnological fix for increasing foodproduction.
4.7 ConclusionIn making generalisations about agriculture andhealth, it is tempting to fall back on aggregatemeasures of food production and malnutrition.In this chapter we have tried to show why it isof critical importance to keep the social andenvironmental aspects of the agriculturalsystems in view, and not to reduce food securityto a question of food supply. As also indicatedin World Resources 1998-99 (World ResourcesInstitute, 1998), agricultural intensification canthreaten health by exposing people to harmfulchemicals or creating new habitats for diseasevectors, for example. More important for mostACP countries, those most at risk frommalnutrition may not have secure access tocommercially produced food, rely moreheavily on the ‘harvest’ of nature and a moregenetically diverse set of crops, and aregenerally more at risk from environmentaldisruptions. An approach to sustainableagriculture that takes health seriously mustenhance the livelihoods of the most vulnerablerural and urban dwellers. Elements of such astrategy are presented in Chapter 7.
ReferencesAtuma, S. S., and Okor D.I. 1985a. Pesticide usage in Nigeria. Ambio. 14:340-34.Atuma, S. S. 1985b. Residues of organochlorines in some Nigerian food material. Bull. Environ. Contam.
Toxicol. 35:735-8.Benneh, G., Songsore, J., Nabila, J. S., Amuzu, A. T., Tutu, K. A., Yangyuoru, Y. and McGranahan, G.
1993. Environmental Problems and the Urban Household in the Greater Accra Metropolitan Area(GAMA) -Ghana. Stockholm Environment Institute (Stockholm). 126 p.
Brown, L. R. and Kane, H. 1994. Full House: Reassessing the Earth’s Population Carrying Capacity.W.W. Norton and Co. (New York).
Bruce, J. 1988. A perspective on indigenous land tenure systems and land concentration. In: Downs R.E.,Reyna S., (eds.). Land and Society in Contemporary Africa. Hanover, NH, University Press of NewEngland. p 23-52.
Bumb, B. L. and Baanante, C. A. 1996. The Role of Fertilizer in Sustaining Food Security and Protectingthe Environment to 2020. Food, Agriculture, and the Environment Discussion Paper No. 17.International Food Policy Research Institute (Washington, DC). 54 p.
CGIAR. 1994. Sustainable Agriculture for a Food Secure World: A Vision for International AgriculturalResearch. Expert Panel of the CGIAR (Washington, DC and SAREC, Stockholm).
Chambers, R., Longhurst, R. and Pacey, A. 1981. Seasonal Dimensions to Rural Poverty. London,Frances Pinter.
Conway, R. G. and Pretty, R. J. 1991. Unwelcome Harvest. London, Earthscan Publications. 644 p.Cooper, D., Vellvé, R. and Hobbelink, H. 1992. Growing Diversity: Genetic Resources and Local Food
Security. London, IT.
Environmental Change and Human Health in Countries of Africa, the Caribbean and the Pacific 127
Agricultural Change, Rural Livelihoods and Health
Cornia, G. A. 1994. Neglected issues in the decline of Africa’s agriculture: Land tenure, land distributionand R & D constraints. In: Cornia G.A., Helleiner G.K., (eds.). From Adjustment to Development inAfrica: Conflict, Controversy, Convergence, Consensus? Houndsmills and London, Macmillan Press.
Cornia, G. A. and Stewart, F. 1995. Food subsidies: Two errors of targeting. In: Stewart F., (ed.).Adjustment and Poverty: Options and Choices. London, Routledge.
Crosson, P. and Anderson, J. 1995. Achieving a Sustainable Agricultural System in Sub-Saharan Africa:Building Block for Africa Paper No. 2, AFTES. World Bank (Washington, DC).
de Waal, A. 1989. Famine that Kills: Darfur, Sudan, 1985-85. Oxford, Oxford University Press.Delgado, C. L. 1997. The role of smallholder income generation from agriculture in Sub-Saharan Africa.
In: Haddad L., (ed.). Achieving Food Security in Southern Africa. Washington, DC, InternationalFood Policy Research Institute. p 145-173.
Denninger, M., Havnevik, K. and Brdarski, M. 1996. Food Security in East and Southern Africa. Commissionedby Sida. The Department for Natural Resources and the Environment. (Stockholm). 200 p.
Drèze, J. 1995. Famine prevention in Africa: Some experiences and lessons. In: Drèze J., A. S., Hussain A.,(eds.). The Political Economy of Hunger: Selected Essays. Oxford, Oxford University Press. p 554-604.
Drèze, J. and Sen, A. 1989. Hunger and Public Action. . WIDER Studies in Development Economics.Oxford, Oxford University Press.
Epstein, P. R. 1995. Commentary: Emerging diseases and ecosystem instability: New threats to publichealth. American Journal of Public Health. 85(2):168-172.
FAO. 1993. Strategies for Sustainable Agriculture and Rural Development (SARD): the Role of Agriculture,Forestry and Fisheries. Food and Agricultural Organization (Rome).
FAO. 1995. World Agriculture: Towards 2010. Rome, FAO.FAO. 1997. Human Nutrition in the Developing World. Rome, FAO. 449 p.Fleuret, A. 1979. The role of wild foliage plants in diet: A case study form Lusutho, Tanzania. Ecology of
Food and Nutrition. 8:87-93.Fowler, C. and Mooney, P. 1990. The Threatened Gene: Food, Policies and the Loss of Genetic Diversity.
Cambridge, The Lutterworth Press.Hobbelink, H. 1991. Biotechnology and the Future of World Agriculture. London, Zed Books.IFPRI. 1995. A 2020 Vision for Food, Agriculture and the Environment. International Food Policy
Research Institute (Washington, DC).James, C. 1998. Global Review of Commercialised Transgenic Crops: 1998. The International Service for
the Acquistion of Agri-biotech, ISAAA (Ithaca, NY).Lane, C. and Moorehead, R. 1994. Who should Own the Range? New Thinking on Pastoral Resource
Tenure in Drylands Africa. Pastoral Land Tenure Series No. 3. International Institute for Environmentand Development (London).
Le Guenno, B. 1995. Emerging viruses. Scientific American.:30-37.Leach, G. 1995. Global Land & Food in the 21st Century: Trends & Issues for Sustainability. POLESTAR
Series Report No. 5. Stockholm Environment Institute (Stockholm). 90 p.Maiga, A., De Leeuw, P., Diarra, L. and Hiernaux, P. 1991. The Harvesting of Wild Growing Grain Crops
in the Gourma Region of Mali. IIED Drylands Issue Paper No. 27. International Institute forEnvironment and Development (London).
Matteson, P. C. and Meltzer, M. 1996. Policy change in sub-Saharan Africa - impacts on the use andmanagement of pesticides. In: Dinham B., (ed.). Growing Food Security: Challenging the Linkbetween Pesticides and Access to Food. London, The Pesticides Trust/PAN. p 50-52.
Migot-Adholla, D., Hazell, P., Blarel, B. and Place, F. 1991. Indigenous land rights systems in Sub-SaharanAfrica: A constraint on productivity? The World Bank Economic Review. 5(1):155-175.
Morse, D. 1988. Policies for Sustainable Agriculture. International Fund for Agricultural Development(Rome).
Morse, S. S. 1995. Factors in the emergence of infectious diseases. Emerging Infectious Diseases. 1(1):7-15.Mushita, A. 1992. Zimbabwean farmers as the starting point. In: Cooper D., Vellvé R., Hobbelink H.,
(eds.). Growing Diversity: Genetic Resources and Local Food Security. London, IT.Ostrom, E. 1990. Governing the Commons: The Evolution of Institutions for Collective Action.
Cambridge, Cambridge University Press. 280 p.OTA. 1988. Enhancing Agriculture in Africa: A Role for US Development Assistance. US Office of
Technology Assessment (Washington DC).Pinstrup-Andersen, P., Pandya-Lorch, R. and Rosegrant, M. W. 1997. The World Food Situation:
Recent Developments, Emerging Issues, and Long-Term Prospects. 2020 Food Policy Report. Http://www.cgiar.org/ifpri/pubs/fpr/fpr24.pdf. The International Food Policy Research Institute(Washington, DC). 36 p.
Pinstrup-Andersson, P., Pandya-Lorch, R. and Rosegrant, M. W. 1997. The World Food Situation: RecentDevelopments, Emerging Issues and Long -Term Prospects No. Food Policy Report, 2020 Vision.International Food Policy Research Institute (IFPRI) (Washington D.C.).
Place, F. and Hazell, P. 1993. Productivity effects of indigenous land tenure systems in Sub-SaharanAfrica. American Journal of Agricultural Economics. 75(February):10-19.
Place, F., Hazell, P. and Lau, L. J. 1990. An Econometic Analysis of the Efficiency of Indigenous LandTenure System in Sub-Saharan Africa. Agriculture and Rural Development Department, World Bank(Washington, DC).
Pretty, J. N. 1995. Regenerating Agriculture: Policies and Practice for Sustainability and Self-Reliance.London, Earthscan Publications.
Chapter 4
Environmental Change and Human Health in Countries of Africa, the Caribbean and the Pacific128
Rissler, J. and Mellon, M. 1996. The Ecological Risks of Engineered Crops. Cambridge, Massachusetts,MIT Press.
Rola, A. and Pingali, P. 1993. Pesticides, Rice Productivity and Farmers: An Economic Assessment.International Rice Research Institute (IRRI), Manila and World Reosurces Institute (WRI),Washington.
Rosegrant, M. W., Agcaolli, M. and Perez, N. D. 1995. Global Food Projections to 2020: Implications forInvestment. IFPRI Food Agriculture and the Environment Discussion Paper No. 5. IFPRI (Washington,DC).
Saxena, S. 1986. Desert plants used as human food during scarcity and famines. In: Shankernarayan K.A.,Shanker V., (eds.). Desert Environment: Conservation and Management. Jodhpur, India, CAZRIPublications.
Saxena, S. K. 1979. Plant foods of Western Rajasthan. Man and Environment. III:35-43.Scoones, I., Melnyk, M. and Thompson, J. 1992. The Hidden Harvest: Wild Foods and Agricultural
Systems: A Literature Review and Annotated Bibliography. IIED (London).Scott, E. P. 1995. Home-based industries: An alternative strategy for household security in rural Zimbabwe.
J’nal Developing Areas. 29(2).Sen, A. 1982. Poverty and Famines: An Essay on Entitlement and Deprivation. Oxford, Clarendon Press.
257 p.Sen, A. 1994. Population and reasoned agency: Food fertility and economic development. In: Kiessing K.,
Landberg H., (eds.). Population, Economic Development and the Environment. Oxford, OxfordUniversity Press.
Tiedje, J. M., Colwell, R. K., Grossman, Y. L., Hodson, R. E., Lenski, R. E., Mack, R. N. and Regal, P. J.1989. The planned introduction of genetically engineered organisms: Ecological considerations andrecommendations. Ecology. 70:297-315.
Toenniessen, G., H. 1994. Feeding the World in the 21st Century: Plant Breeding, Biotechnolgy and thePotential of Apomixis. The Rockefeller Foundation (New York).
Waage, J. K., M’Boob, S. S. and Ketelaar, J. W. H., (eds.) 1995. IPM in Africa, Implementation Opportunitiesand Reseach Needs. Addis Ababa, Ethiopia, CTA, Technical Centre for Agricultural and RuralCooperation.
Watts, M. 1983. Silent Violence: Food, Famine, and Peasantry in Northern Nigeria. Los Angeles, Universityof California Press.
Wilson, K. B. 1990. Ecological Dynamics and Human Welfare: A Case Study of Population, Health andNutrition in Southern Zimbabwe. Department of Anthropology, University College, London (London).
Virgin, I. and Frederick, R. J. 1995. The Impact of International Harmonization on Adoption of BiosafetyRegulations. African Crop Science Journal. Vol 3(No 3):387-395.
World Resources Institute. 1998. World Resources 1998-99: A Guide to the Global Environment.Oxford University Press (New York). 369 p.
World Resources Institute, U. N. E. P., United Nations Development Programme, The World Bank. 1996.World Resources: A Guide to the Global Environment: The Urban Environment. Speciall Reprintfrom World Resources. World Resources Institute, United Nations Environment Programme, UnitedNations Development Programme, The World Bank (New York).
Chapter 5Urbanisation and Healthy
Living Environments
Environmental Change and Human Health in Countries of Africa, the Caribbean and the Pacific 131
Urbanisation and Healthy Living Environments
Chapter 5 Urbanisation and Healthy Living Environments
Aims of the Chapter • To identify the links between urbanisation, the quality of livingenvironments and the health situation in ACP countries. • To assess the most critical environmental health threats in the urban livingenvironment, and their socio-economic context. • To identify constraints on and opportunities for health-orientedenvironmental management in urban areas.
Main Points • Rapid urban growth will continue to be a feature of most ACP countriesfor the coming decades. Urbanisation can be beneficial to human health, butthis depends on good environmental management. The quality of urbanisationis more critical to health than the rate of urbanisation. • The most severe environmental health problems are closely interrelated andfound predominantly in low-income homes and neighbourhoods. They includepoor access to water, bad sanitation, contaminated food, uncollected waste, smokykitchens and a range of insect vectors (the persistent poverty cluster). • Important environmental amenities, such as water and sanitation, arelagging behind population growth in many urban areas. • Cooking with smoky fuels may be contributing significantly to respiratoryproblems, in particular for women and children. These problems arecompounded by other factors such as poverty, poor housing, overcrowding,and air pollution from other sources. • The relative lack of industrial development has meant a low averageexposure to chemical pollution in the general population. This factornotwithstanding, where it occurs, exposure levels can be very high, posinga threat to industrial workers and nearby (often low-income) residents (theconventional development cluster). • The rapidly growing informal economy of smaller and less regulatedenterprises contributes appreciably to health by providing livelihoods, butcan in some circumstances pose serious environmental health threats.
Policy Implications • Governments cannot prevent rapid urbanisation with policies andlegislation, but they can help ensure that urbanisation is a positive force.Unmanaged urban development creates very unhealthy living environments,whilst good local environmental management and service provision, in bothurban and rural areas, can greatly reduce the burden of disease. • The environmental deterioration and lack of services in low-income areasis an environmental and health priority. Conventional public service deliverycannot meet the challenge alone. Nor can private service delivery.Improvements that build on the strengths of both private and public sectors,and support the contribution of local residents and their organisations, aremore likely to succeed. Strategies to address current deficiencies are alsomore likely to be successful if they:
- develop local capacities and give priority to achieving good relationshipsbetween residents and service providers.- give priority to environmental improvements that people want, that havemultiple benefits, and that alleviate poverty (which in turn increases thelocal capacity to manage the environment).
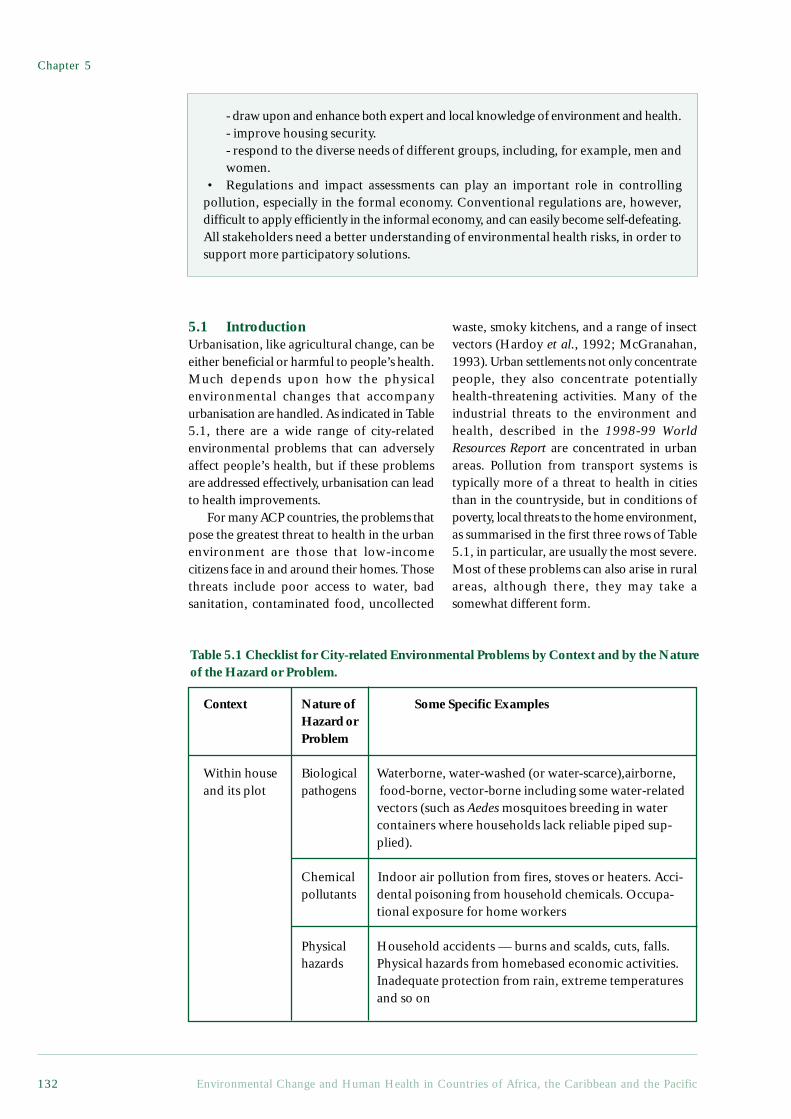
Chapter 5
Environmental Change and Human Health in Countries of Africa, the Caribbean and the Pacific132
- draw upon and enhance both expert and local knowledge of environment and health.- improve housing security.- respond to the diverse needs of different groups, including, for example, men andwomen.
• Regulations and impact assessments can play an important role in controllingpollution, especially in the formal economy. Conventional regulations are, however,difficult to apply efficiently in the informal economy, and can easily become self-defeating.All stakeholders need a better understanding of environmental health risks, in order tosupport more participatory solutions.
5.1 IntroductionUrbanisation, like agricultural change, can beeither beneficial or harmful to people’s health.Much depends upon how the physicalenvironmental changes that accompanyurbanisation are handled. As indicated in Table5.1, there are a wide range of city-relatedenvironmental problems that can adverselyaffect people’s health, but if these problemsare addressed effectively, urbanisation can leadto health improvements.
For many ACP countries, the problems thatpose the greatest threat to health in the urbanenvironment are those that low-incomecitizens face in and around their homes. Thosethreats include poor access to water, badsanitation, contaminated food, uncollected
waste, smoky kitchens, and a range of insectvectors (Hardoy et al., 1992; McGranahan,1993). Urban settlements not only concentratepeople, they also concentrate potentiallyhealth-threatening activities. Many of theindustrial threats to the environment andhealth, described in the 1998-99 WorldResources Report are concentrated in urbanareas. Pollution from transport systems istypically more of a threat to health in citiesthan in the countryside, but in conditions ofpoverty, local threats to the home environment,as summarised in the first three rows of Table5.1, in particular, are usually the most severe.Most of these problems can also arise in ruralareas, although there, they may take asomewhat different form.
Context Nature of Some Specific ExamplesHazard orProblem
Within house Biological Waterborne, water-washed (or water-scarce),airborne,and its plot pathogens food-borne, vector-borne including some water-related
vectors (such as Aedes mosquitoes breeding in watercontainers where households lack reliable piped sup-plied).
Chemical Indoor air pollution from fires, stoves or heaters. Acci-pollutants dental poisoning from household chemicals. Occupa-
tional exposure for home workers
Physical Household accidents — burns and scalds, cuts, falls.hazards Physical hazards from homebased economic activities.
Inadequate protection from rain, extreme temperaturesand so on
Table 5.1 Checklist for City-related Environmental Problems by Context and by the Natureof the Hazard or Problem.
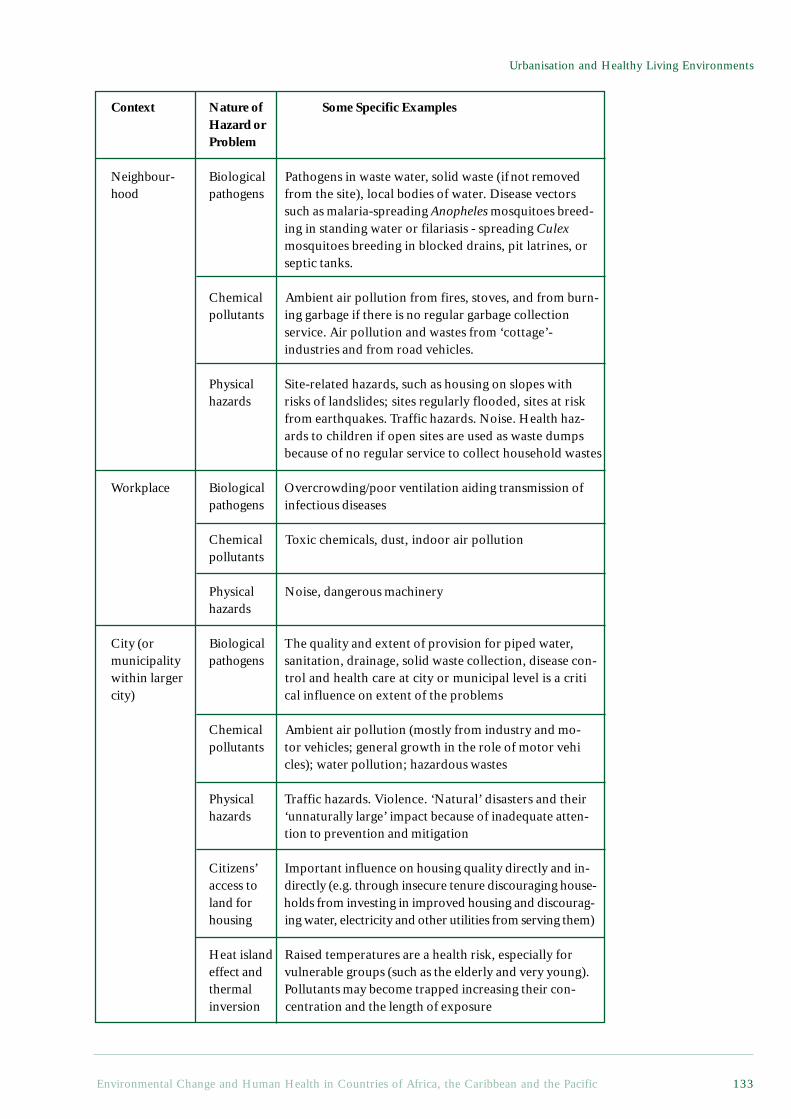
Environmental Change and Human Health in Countries of Africa, the Caribbean and the Pacific 133
Urbanisation and Healthy Living Environments
Context Nature of Some Specific ExamplesHazard orProblem
Neighbour- Biological Pathogens in waste water, solid waste (ifnot removedhood pathogens from the site), local bodies of water. Disease vectors
such as malaria-spreading Anopheles mosquitoes breed-ing in standing water or filariasis - spreading Culexmosquitoes breeding in blocked drains, pit latrines, orseptic tanks.
Chemical Ambient air pollution from fires, stoves, and from burn-pollutants ing garbage if there is no regular garbage collection
service. Air pollution and wastes from ‘cottage’-industries and from road vehicles.
Physical Site-related hazards, such as housing on slopes withhazards risks of landslides; sites regularly flooded, sites at risk
from earthquakes. Traffic hazards. Noise. Health haz-ards to children if open sites are used as waste dumpsbecause of no regular service to collect household wastes
Workplace Biological Overcrowding/poor ventilation aiding transmission ofpathogens infectious diseases
Chemical Toxic chemicals, dust, indoor air pollutionpollutants
Physical Noise, dangerous machineryhazards
City (or Biological The quality and extent of provision for piped water,municipality pathogens sanitation, drainage, solid waste collection, disease con-within larger trol and health care at city or municipal level is a criticity) cal influence on extent of the problems
Chemical Ambient air pollution (mostly from industry and mo-pollutants tor vehicles; general growth in the role of motor vehi
cles); water pollution; hazardous wastes
Physical Traffic hazards. Violence. ‘Natural’ disasters and theirhazards ‘unnaturally large’ impact because of inadequate atten-
tion to prevention and mitigation
Citizens’ Important influence on housing quality directly and in-access to directly (e.g. through insecure tenure discouraging house-land for holds from investing in improved housing and discourag-housing ing water, electricity and other utilities from serving them)
Heat island Raised temperatures are a health risk, especially foreffect and vulnerable groups (such as the elderly and very young).thermal Pollutants may become trapped increasing their con-inversion centration and the length of exposure
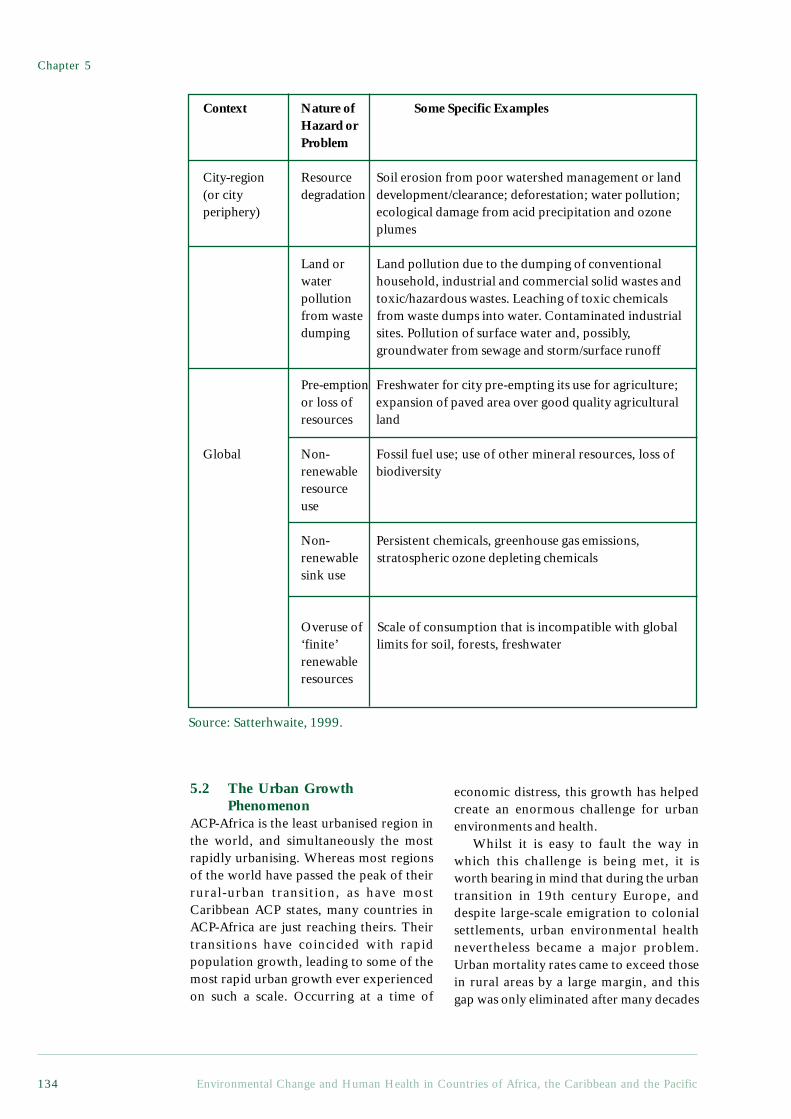
Chapter 5
Environmental Change and Human Health in Countries of Africa, the Caribbean and the Pacific134
5.2 The Urban GrowthPhenomenon
ACP-Africa is the least urbanised region inthe world, and simultaneously the mostrapidly urbanising. Whereas most regionsof the world have passed the peak of theirrural-urban transition, as have mostCaribbean ACP states, many countries inACP-Africa are just reaching theirs. Theirtransitions have coincided with rapidpopulation growth, leading to some of themost rapid urban growth ever experiencedon such a scale. Occurring at a time of
economic distress, this growth has helpedcreate an enormous challenge for urbanenvironments and health.
Whilst it is easy to fault the way inwhich this challenge is being met, it isworth bearing in mind that during the urbantransition in 19th century Europe, anddespite large-scale emigration to colonialsettlements, urban environmental healthnevertheless became a major problem.Urban mortality rates came to exceed thosein rural areas by a large margin, and thisgap was only eliminated after many decades
Context Nature of Some Specific ExamplesHazard orProblem
City-region Resource Soil erosion from poor watershed management or land(or city degradation development/clearance; deforestation; water pollution;periphery) ecological damage from acid precipitation and ozone
plumes
Land or Land pollution due to the dumping of conventionalwater household, industrial and commercial solid wastes andpollution toxic/hazardous wastes. Leaching of toxic chemicalsfrom waste from waste dumps into water. Contaminated industrialdumping sites. Pollution of surface water and, possibly,
groundwater from sewage and storm/surface runoff
Pre-emption Freshwater for city pre-empting its use for agriculture;or loss of expansion of paved area over good quality agriculturalresources land
Global Non- Fossil fuel use; use of other mineral resources, loss ofrenewable biodiversityresourceuse
Non- Persistent chemicals, greenhouse gas emissions,renewable stratospheric ozone depleting chemicalssink use
Overuse of Scale of consumption that is incompatible with global‘finite’ limits for soil, forests, freshwaterrenewableresources
Source: Satterhwaite, 1999.
Environmental Change and Human Health in Countries of Africa, the Caribbean and the Pacific 135
Urbanisation and Healthy Living Environments
of sanitary reform1 and economicdevelopment (Bairoch, 1988). In contrast,and despite the far more rapid urbangrowth, mortality rates in ACP-Africa aregenerally higher in rural than urban areas(Mosley et al., 1993). The rural-urbandisparity reflects the generally highereconomic development in urban areas,including access to education and healthservices.
Given the demographic dominance ofAfrican countries in the ACP, mostgeneralisations that apply to ACP-Africaalso apply to the ACP overall, despite thehigher urbanisation levels in several smallisland states, see Table 9.1 in Appendix 2.Between 1980 and 2000, according to UNPopulation Division estimates, the share ofthe ACP’s population living in urban areaswill have increased from 24% to 35%.Overall, urban growth rates are projectedto decline from 4.7% per annum between1980 and 1985, to 4.3% from 2000 to2005, and then to 3.3% from 2020 to2025. Such projections are inherentlyuncertain. Current estimates are alsounreliable.2 Projected urbanisation levelshave, for example, been revised downwardsin recent years (Satterthwaite, 1996). Thereare some indications that economicdifficulties have stemmed urban growth,but in the absence of even more profoundeconomic disruption or demographicshocks, rapid urbanisation is likely tocontinue.
Levels of urbanisation vary widelyamongst ACP countries. Estimatedurbanisation levels in ACP-Africa by the year2000 vary from 6% in Rwanda to 74% inBotswana, whilst in the Caribbean andPacific, they vary from 17% in Papua NewGuinea to 74% in Trinidad and Tobago.Urbanisation levels are generally higher inthe higher income countries, although
urbanisation often proceeds even wheneconomic growth falters, as has been the casein Zambia, for example.
Rural-urban migration still accounts fora large share of urban growth in most ACPcountries. Most rural-urban migration canprobably be explained by better economicopportunities in urban areas, althoughstructural adjustment may have reduced thisdifferential (Becker et al., 1994). Some ofthe worst urban health problems arise whenrural insurgency and famine are the drivingforces. Maputo, Luanda, Addis Ababa andMonrovia all received large numbers ofdisplaced people at times when urbanconditions were already precarious.Alternatively, urban violence, such asrecently experienced in Mogadishu andKigali, can drive people out of the cities(Simon, 1997). As described in Chapter 2,such migrants are at particular risk fromenvironmental health hazards.
5.2.1 The large citiesIt is common in ACP countries for there tobe what has been called a ‘primate city’ - adominant urban centre with a population atleast twice the size of the second largest city.This applies to both small countries likeBurundi, Gambia and Togo, and to largercountries such as Angola, Congo, Senegal,Mozambique and Sierra Leone (Aryeeyey-Attoh, 1997). Such cities often dominate thepolitical and economic landscape of thecountry, as well as providing the main linkto the global economy. They typicallycontain both a large share of the country’swealthy minority and a significant share ofthe poor.
Despite this tendency towards primatecities, only the metropolitan region ofPretoria-Witwatersrand-Vereeniging, centredon Johannesburg in South Africa, and witha population of more than eight million (the
1 The late 19th century sanitary movement was in many respects a precursor of the late 20th centuryenvironmental movement, but with an emphasis on local environments and health rather than on theglobal environment and sustainability (McGranahan et al., 1996).2 International statistics on urban population are based upon each country’s own definitions of whatconstitutes an urban settlement - and these definitions vary widely. Furthermore, the estimates are oftenbased upon outdated and unreliable information, and hence when referring to the urbanisation estimatesfor African countries published in 1993 (United Nations, 1993), Rakodi notes that ‘of the 53 countriesincluded, only two-thirds had had a census since 1980; figures for 19 were based on censuses carried outin the 1970s and 3 in the 1960s’ (Rakodi, 1997a; Rakodi, 1997b).
Chapter 5
Environmental Change and Human Health in Countries of Africa, the Caribbean and the Pacific136
UN definition of a Megacity), clearlyqualifies as a ‘World City’ within the globaleconomy (Rakodi, 1997b). Lagos is thesecond largest ACP city, and whilst there ismuch dispute over its population, even thelowest estimates put it at more than fivemillion.3 Kinshasa contained more than twomillion people in 1984, and is oftendescribed as having reached four million bythe mid-1990s, though here too, thepopulation figures are disputed. Their rolein the international arena is not, however,as large as these figures might imply.
South Africa also stands out by virtue ofhaving a large number of major cities. Asassessed in 1995, there were 38 cities withpopulations in excess of 750,000 in ACPcountries, of which eight were in South Africa.Of the remainder, 27 were in ACP-Africa andthree in ACP-Caribbean. Conversely, 24African ACP countries, 13 Caribbean, and alleight Pacific ACP countries have no cities atall with a population of over 750,000 (UnitedNations, 1998).
Large cities, particularly in poor countries,often combine the environmental problemsof poverty with those of uncontrolled urbanexpansion and industrialisation. As a result,their low-income residents often face bothinadequate local sanitation and deterioratingambient air and water quality. These citiesdo, on the other hand, also typically receivea disproportionate share of infrastructureinvestment, and their better-off residents oftenhave access to environmental services that areunavailable in smaller settlements.
5.2.2 Smaller cities and townsSmaller cities and towns are an important,and often neglected, part of the urban scene(Satterthwaite, 1996). There are, as describedbelow, good reasons to believe that some ofthe worst urban environmental healthproblems are experienced in these smallerurban centres, although it is the environmentaldistress of the primate cities that attracts themost attention. These small cities can,moreover, play a critical role in the local
economies. If information on the size anddevelopment of the larger cities is ofteninadequate and contradictory, information onthe smaller urban settlements is often lackingaltogether. A settlement of 5,000 people mayor may not be considered urban; dependingupon the definition a country employs.Similarly, peri-urban settlements beyond acity’s boundary may or may not be consideredurban, even if their income derives largelyfrom urban jobs.
5.2.3 Urbanisation – a blessing or a curse?Views on the costs and benefits of urbanisationhave shifted back and forth over recentdecades. In the 1950s and 1960s, rural-urbanmigration was typically portrayed in verypositive terms, on the grounds that it increasedagricultural productivity whilst simultaneouslyenabling the inherently more productive urbansector to expand. By the 1970s, the tables hadturned and urban bias was increasingly beingblamed for undermining rural potential,promoting over-urbanisation, and takingresources away from the predominantly ruralpoor (Lipton, 1989). In the 1990s, things haveshifted yet again, and the dangers of neglectingurban potential, and the rapidly growingpopulations of poor urban dwellers, have beenreceiving more attention from both researchers(Becker et al., 1994) and donors (SwedishInternational Development CooperationAgency (Sida), 1995).
Irrespective of whether urbanisation isviewed as harmful or beneficial, controllingpeople’s movements to and from urban centresis no solution. Even draconian measures, suchas those applied through apartheid in SouthAfrica, failed to control urbanisation directly.More indirect policies, with either an urbanor a rural bias, also tend to cause more harmthan good. Failing to give new urban residentsthe means to improve their localenvironment, for example, is an extremelydamaging means of making urban migrationless attractive. Alternatively, preventing smallcultivators from charging market prices fortheir produce is an extremely damaging means
3 Lagos is often cited in lists of the world’s 20 largest cities as having a population of between 7-11million, but the 1991 census suggested roughly five million. The state government considers this to bean under-enumeration, but the higher estimates are largely guesswork.
Environmental Change and Human Health in Countries of Africa, the Caribbean and the Pacific 137
Urbanisation and Healthy Living Environments
of keeping the urban cost of living down. Yetat times, both have been pursuedsimultaneously.
Overall, the quality of urbanisation is moreimportant than its rate, and is more easilyimproved by better policies and bettergovernance. This is certainly the case withregard to environmental and health concerns.As described in the following sections, thereis no inherent tendency for urbanisation andindustrialisation to create healthier or lesshealthy environments. Generally, they heralda change in the environmental and healthchallenges faced. There are, on the other hand,enormous differences in environmental andhealth conditions between differentsettlements, many of which relate toaffluence. Even between settlements andneighbourhoods of similar wealth, however,there can be large differences in theenvironmental hazards to which residents areexposed, and the burdens displaced onto thesurrounding environment.
5.3 Urban Environmental Changeand Health
The archetypal urban environmental problemsare smog, putrid rivers, garbage mountainsand other city-wide environmental burdens,and the cities which thus epitomiseenvironmental distress in many people’sminds are the newly industrialisingmegacities. As indicated above, such citiesare only found in a few ACP countries, butthe urban environmental problems which havehistorically caused the most ill health are thosewhich are prevalent in many low-incomeneighbourhoods, regardless of city-size, suchas poor sanitation, inadequate water supplies,food contamination, smoky kitchens andinsect vectors.
Box 5.1 summarises, in very simplifiedterms, the changing challenges that cities tendto face as they become wealthier.4
Environmental problems generally tend to bemore localised in poor urban centres and tothreaten health in a more direct way. Withincreasing wealth, however, many of these
problems are displaced. Water is transportedinto the city, serving the households’ needs,but placing a greater burden on the regionalwater system. Human faeces and domesticwaste are transported away, removing themfrom immediate human contact, but creatinga large-scale disposal problem.Industrialisation and urban growth can,moreover, exacerbate a range of citywide andeven global environmental problems, manyof which have health repercussions. But whereeconomic conditions are difficult, it is thelocal problems that are usually the greatestthreat to health. This applies to a large shareof the cities in ACP countries, and, inparticular, to their low-incomeneighbourhoods.
The environmental evolution of citiesdepends upon more than just wealth,however, and whilst economic conditions helpdetermine the environmental challenges a cityis likely to face, health outcomes also reflecthow well these challenges are met. Stylisedcurves such as those portrayed in Box 5.1hide the enormous variation that can existbetween cities of comparable wealth. Thephysical setting and economic functions of acity help determine its environmentalqualities, but most importantly, governmentpolicies and local initiatives can make a hugedifference.
In ACP countries, as elsewhere,environmental management strategies havechanged considerably in recent decades. Formost of this century, the orthodox response tolocal environmental health problems has beento provide environmental services, primarilythrough the public sector. This was theapproach that emerged from the sanitary reformof the 19th century, and from piped water tohousehold refuse collection, such services andtheir accompanying infrastructure became asymbol of development. During the decadesafter World War II, urban developmentassistance often focused on infrastructureprojects designed to improve urban servicedelivery. When the Water and SanitationDecade was initiated in the 1980s, providing
4 For a more comprehensive account of environmental transformations in cities as they get larger andwealthier, see Satterthwaite, 1997.
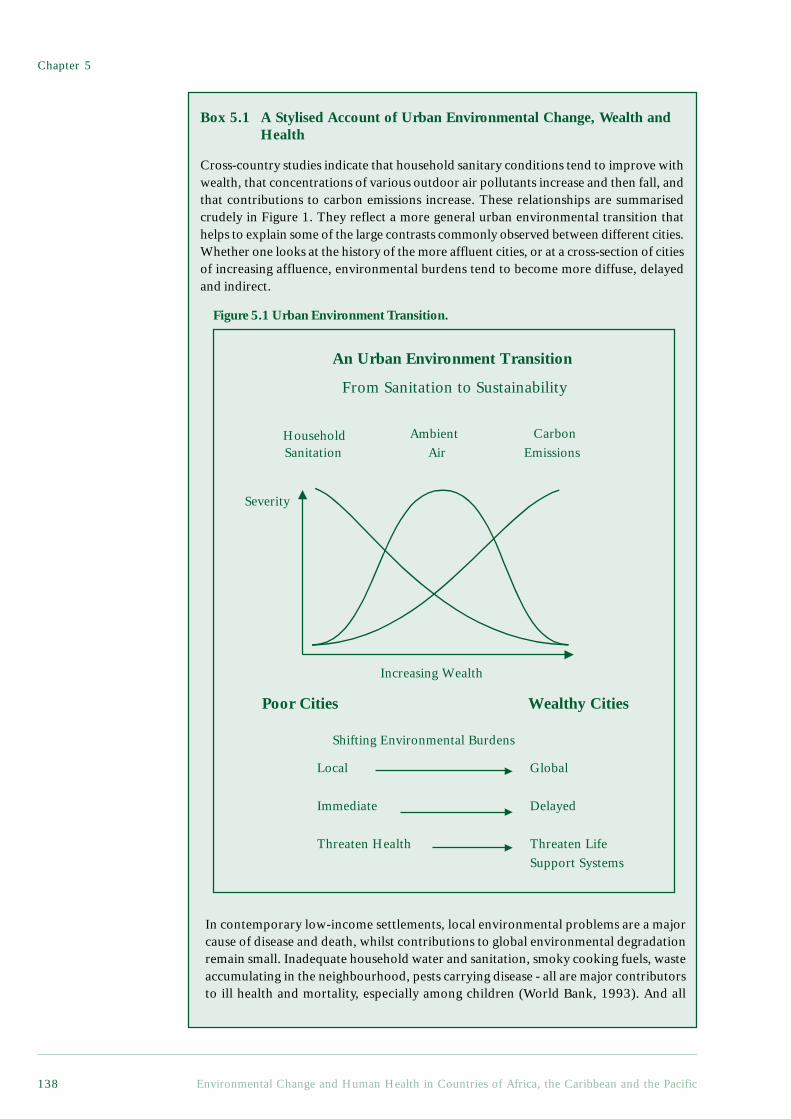
Chapter 5
Environmental Change and Human Health in Countries of Africa, the Caribbean and the Pacific138
CarbonEmissions
HouseholdSanitation
Increasing Wealth
Severity
Poor Cities Wealthy Cities
Local
Immediate
Threaten Health
Global
Delayed
Threaten LifeSupport Systems
Shifting Environmental Burdens
An Urban Environment Transition
From Sanitation to Sustainability
AmbientAir
Box 5.1 A Stylised Account of Urban Environmental Change, Wealth andHealth
Cross-country studies indicate that household sanitary conditions tend to improve withwealth, that concentrations of various outdoor air pollutants increase and then fall, andthat contributions to carbon emissions increase. These relationships are summarisedcrudely in Figure 1. They reflect a more general urban environmental transition thathelps to explain some of the large contrasts commonly observed between different cities.Whether one looks at the history of the more affluent cities, or at a cross-section of citiesof increasing affluence, environmental burdens tend to become more diffuse, delayedand indirect.
In contemporary low-income settlements, local environmental problems are a majorcause of disease and death, whilst contributions to global environmental degradationremain small. Inadequate household water and sanitation, smoky cooking fuels, wasteaccumulating in the neighbourhood, pests carrying disease - all are major contributorsto ill health and mortality, especially among children (World Bank, 1993). And all
Figure 5.1 Urban Environment Transition.
Environmental Change and Human Health in Countries of Africa, the Caribbean and the Pacific 139
Urbanisation and Healthy Living Environments
involve closely interrelated local environmental processes. Virtually everyone living,working and socialising in the neighbourhood is at risk, but especially women andchildren. Low-income settlements may also come to be the worst affected by globalenvironmental damage, but they have immediate concerns which are, and ought to be,the priority for local action.In contemporary affluent settlements, the most serious local environmental hazardshave been displaced or reduced, while existing lifestyles pose major, if often uncertain,delayed and diffuse threats to our life support systems. Waste, once a problem primarilyin and around people’s homes and workplaces, now interferes with a range of regionaland even global processes. High levels of materials and energy consumption and wastegeneration, selective pressures on distant ecosystems, new hazards arising fromtechnologies developed to meet the demands of the affluent; these are the stuff of theglobal sustainability challenge. And just as it is hard to live in a deprived neighbourhoodin a Southern city and avoid the local environmental hazards, so it is hard to live in anaffluent neighbourhood in the North and avoid contributing to global environmentalburdens.
Between these two extremes are a range of citywide and regional problems thattend to be most severe in large, industrialising middle income cities. Pollution ofambient air and waterways are typical examples (Shafik, 1995). In cross-country studies,this class of problems has received the most attention, generating the notion of theenvironmental Kuznets’ curve: an inverted U displaying the rise and then decline ofenvironmental burdens with increasing wealth (Grossman and Krueger, 1995; Seldenand Song, 1994; Selden and Song, 1995).
ReferencesGrossman, G. M. and Krueger, A. B. 1995. Economic growth and the environment. Quarterly Journal of
Economics. 110:353-378.Selden, T. M. and Song, D. 1994. Environmental quality and development: Is there a Kuznets curve for
air pollution emissions? Journal of Environmental Economics and Management. 27:147-162.Selden, T. M. and Song, D. 1995. Neoclassical growth, the J curve for abatement, and the inverted U curve
for pollution. Journal of Environmental Economics and Management. 29(2):162-168.Shafik, N. T. 1995. Economic development and environmental quality: An econometric analysis. Oxford
Economic Papers. 46:757-773.World Bank 1993. World Development Report 1993: Investing in Health. New York, Oxford University
Press. 329 p.
all households with adequate environmentalservices was still seen as primarily theresponsibility of public utilities, particularlyin urban areas. More recently, however, thedominant role of the public sector in providingenvironmental services, and the dominant roleof service delivery in improving localenvironments, have been called into question.
As former colonies, most ACP countriesinitially implemented restricted forms ofenvironmental service delivery, targeting thecolonial enclaves in particular. The earlypost-colonial period (the 1960s for manyACP countries) was characterised by
economic optimism, rapid rural-urbanmigration, and ambitious attempts to extendplanning and public service delivery.Economic setbacks, rapid urban populationgrowth and public sector failuresunfortunately undermined theseimprovement plans, which were probablyoverly ambitious in the first place. For themost part, and long before services reachedall urban residents, it became clear that thelocal environmental problems could notsimply be planned away, and during the1980s and 1990s, many ACP countriesexperienced what amounted to a public
Chapter 5
Environmental Change and Human Health in Countries of Africa, the Caribbean and the Pacific140
service crisis, as described in the GlobalReport on Human Settlements 1996:
‘The deterioration in the builtenvironment is sharply in evidencethroughout most of urban Africa. Asmore of the urban population wasforced into unplanned settlements on theoutskirts of large cities, or into morecrowded living space in an alreadydeteriorating housing stock in the moreestablished “high density” areas; as alower proportion of the population haddirect access to clean, piped water,regular garbage disposal and good healthservices, the quality of life for the vastmajority of the population deterioratedduring the 1980s and 1990s. This trendseems to have been accentuated by theeffects of structural adjustment in manycountries, according to which urbanworkers lost more than ruralsmallholders. Some demographers haveeven suggested that the decline inmortality rates that was clearly evidentduring the 1960s and 1970s may haveslowed down during the 1980s.’
United Nations Centre for HumanSettlements (HABITAT), 1996.
Whilst there are insufficient data todocument the overall state of the localenvironments in ACP cities, conditionsremain critical in most of the poorersettlements, and the goals of the Water andSanitation Decade (1980s) are still far fromrealised. The gap between the expansion ofservice provision and population may evenbe increasing, in particular in urban areas andit is this coupled with the need for appropriateinstitutional responses, communityinvolvement and good governance, that isdiscussed in section 5.4.2 below.
Economic difficulties have hadrepercussions for other urban pollutionproblems, such as ambient air and waterquality, and which also affect health. Therelatively low rate of industrialisation inmost ACP countries has presumably meantless growth in a wide range of pollutingactivities. Less private wealth has also meantless traffic pollution, less urban water
withdrawals, and less waste generation.Low-income residents are, on the other hand,particularly susceptible to ambientpollution, and pollution controls remainrudimentary in many urban areas. Whereeconomic growth is the dominant priorityand public sector resources are very scarce,there is a tendency to delay theimplementation of environmental controls,or to relax enforcement. Whilst someenvironmental controls may indeed inhibiteconomic growth to the point where theirnet health effect is negative, and standardsapplied in more affluent settings may,therefore, not be appropriate, a general lackof environmental regulation can create somevery serious environmental health problems,even where industrialisation rates are low.
The combination of rapid urbanisation,faltering economic growth and public sectorretrenchment has also fostered the growthof what is sometimes called the informaleconomy. Urban residents have done theirbest to respond to the lack of investment-led economic development, often throughsmall-scale informal activities, ranging frompetty trading and household industries tosmall transport concerns and urbanagriculture. Once considered marginalactivities awaiting displacement by moreformal economic enterprises, the informaleconomy has been expanding rapidly. (Seesection 5.6.) From an environmental andhealth perspective, the growth of theinformal economy has importantimplications. Poorly monitored, and largelyunregulated, the informal economynevertheless plays a critical role in providinglivelihoods, particularly for the moredeprived urban dwellers, but the informaleconomy also brings environmental hazards,and a more difficult regulatory challenge thanthe formal economy. Traditional regulatoryinstruments are particularly ill-suited to theinformal economy, and are more likely tocurtail production than to promote moreenvironmentally benign technologies. Thehealth of those who engage in informalactivities for their livelihoods is, moreover,easily compromised by economicdisruptions. Alternative means of improvingthe environmental performance of theinformal sector are still not well developed,
Environmental Change and Human Health in Countries of Africa, the Caribbean and the Pacific 141
Urbanisation and Healthy Living Environments
and this will become an even greaterchallenge if current urban trends continue.(See Box 5.5.)
Urbanisation is also associated with arange of health problems which, whilst notstrictly speaking threats from the physicalenvironment, nevertheless need to be takeninto account in assessing urban change andenvironmental planning. Hence, for example,violence, traffic accidents and mental illnesswere all identified in Chapter 2 as growinghealth problems, and all are intimatelyrelated to the quality of urbanisation. Thedifferent aspects of urbanisation mentionedin the preceding paragraphs are examinedin more detail below.
5.4 Environmental Health in theHome and Neighbourhood
As indicated in Chapters 2 and 3, two of themost serious health problems in the ACP arefaecal-oral and respiratory diseases, which areespecially prevalent in low-income settlements,urban and rural alike. The environmentalconditions that facilitate the spread of thesediseases tend to be associated with a numberof other environmental health problems aswell, and rapid urban growth, economicstagnation and public sector retrenchment arecombining, in many ACP countries, toundermine traditional approaches to localenvironmental improvement.
One of the functions of conventionalenvironmental services is to sever potentiallyhazardous environmental interconnections inand around the home. A conventional watersystem ensures that clean water is piped intohomes, and wastewater is piped out. Aconventional sanitation system ensures thatfaeces are immediately sealed off from airand from insects, and flushed away. Aconventional solid waste system ensures thatsolid waste is bagged, placed in closedcontainers, and then carted away. And aconventional energy system ensures that wirescarry electricity into every room, where itcan be cleanly converted into heat, light ormechanical drive. Utilities and municipalitiesare left to manage the potentially pollutingenergy conversions, and the disposal of largequantities of liquid and solid waste, but theresidential environmental health hazards aregreatly reduced.
In poor urban neighbourhoods, wherehouseholds are not provided with suchenvironmental services, it can be hard to evendistinguish between different problem areas.Bad sanitation may lead to contaminatedgroundwater and faeces finding their wayinto the solid waste, onto the open land, intothe drainage ditches, and generally intocontact with people. Flies may breed in thehuman and solid waste, and contaminate thefood. Solid waste may find its way into thedrains, causing accumulation of water inwhich mosquitoes breed. Microbial foodcontamination makes thorough cookingimportant, but cooking with smoky fuelsmay expose women and children tohazardous pollutants. The mosquito coilsand pesticides used to combat mosquitoesmay add to the air pollution and chemicalhazards. Crowding and poor housing canexacerbate most of these problems.
Health problems also interact. In veryunhealthy conditions, it can be misleadingto attribute a death to a single disease orother cause. Typically, mortality is precededby a series of health problems, oftencompounded by malnutrition. The diseasewhich finally leads to death, could often havebeen overcome by an individual without therecent history of other health problems. Illhealth can also have economic repercussions,further reducing people’s ability to avoid orwithstand environmental health hazards. Box5.2 illustrates some of the complexitiesinvolved in determining the risk factors andthe appropriate measures needed to reducethe incidence of childhood diarrhoea.
This multiplicity of interactions makes theenvironmental health problems of poorneighbourhoods very difficult to describe, letalone respond to in an effective manner. Atthe risk of suggesting that such entwinedproblems can actually be separated, thepresentation below groups the issues arounddifferent type of environmental media (just asthe presentations in previous chapters groupedby type of disease). Following the discussionof environmental conditions and hazards, thereare further sections on some of the underlyinginstitutional and organisational issues, coveringobstacles to conventional environmentalservice delivery and the importance of localinstitutions and the social context.
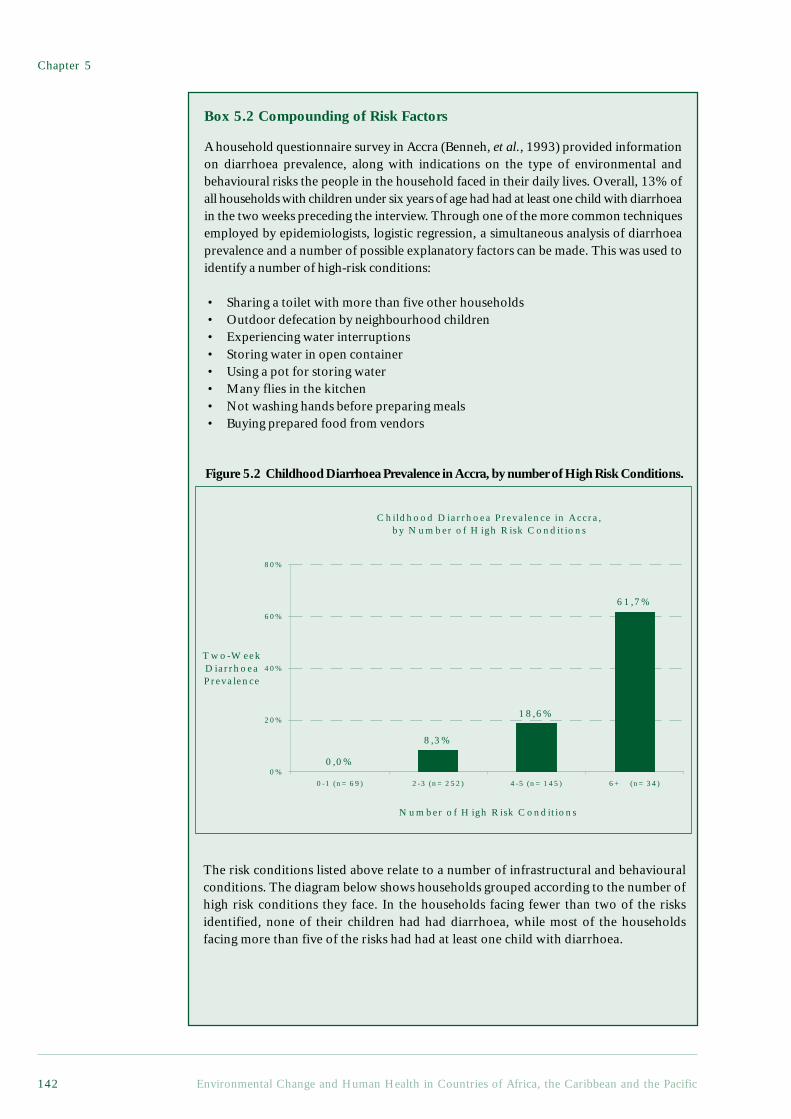
Chapter 5
Environmental Change and Human Health in Countries of Africa, the Caribbean and the Pacific142
Box 5.2 Compounding of Risk Factors
A household questionnaire survey in Accra (Benneh, et al., 1993) provided informationon diarrhoea prevalence, along with indications on the type of environmental andbehavioural risks the people in the household faced in their daily lives. Overall, 13% ofall households with children under six years of age had had at least one child with diarrhoeain the two weeks preceding the interview. Through one of the more common techniquesemployed by epidemiologists, logistic regression, a simultaneous analysis of diarrhoeaprevalence and a number of possible explanatory factors can be made. This was used toidentify a number of high-risk conditions:
• Sharing a toilet with more than five other households• Outdoor defecation by neighbourhood children• Experiencing water interruptions• Storing water in open container• Using a pot for storing water• Many flies in the kitchen• Not washing hands before preparing meals• Buying prepared food from vendors
Figure 5.2 Childhood Diarrhoea Prevalence in Accra, by number of High Risk Conditions.
The risk conditions listed above relate to a number of infrastructural and behaviouralconditions. The diagram below shows households grouped according to the number ofhigh risk conditions they face. In the households facing fewer than two of the risksidentified, none of their children had had diarrhoea, while most of the householdsfacing more than five of the risks had had at least one child with diarrhoea.
C h ildho od D iarrh oea P reva lence in A ccra , by N um b er o f H igh R isk C o nd itio n s
0 ,0 %
8 ,3 %
1 8 ,6%
6 1 ,7%
0 %
2 0%
4 0%
6 0%
8 0%
0 -1 (n = 6 9) 2 -3 (n = 2 52) 4 -5 (n = 1 45) 6 + (n= 34)
N u m ber o f H igh R isk C ond ition s
T w o -W eek D iarrh oea P reva lence
Environmental Change and Human Health in Countries of Africa, the Caribbean and the Pacific 143
Urbanisation and Healthy Living Environments
5.4.1 Health Threatening EnvironmentalProblems
Water and SanitationAs described in Chapter 3, various diarrhoealand other diseases are spread via faecal-oralroutes, and these routes are far more accessiblewhen water supplies and sanitary conditionsare inadequate. Water can carry many faecal-oral diseases, but is also critical for good hygiene.Washing, even with water that is not potable,can help curb faecal-oral diseases, as well as avariety of other health problems, ranging fromscabies to louse-borne typhus. Better sanitationcan lead to less contact with faecal material atdefecation sites, and less indirect exposure viawater, insects, food or human carriers.
Whilst many aspects of the transmissionof faecal-oral diseases are well known, evenwithin a given neighbourhood, it is usuallydifficult to identify the most importantroutes. The following conclusions, drawnfrom a recent epidemiological study of fiveAfrican countries (Bateman et al., 1993), doprobably apply, however, to most lowincome settlements in the ACP, and conformto the results presented in Chapter 3:
• the association between improvedsanitation and health is as strong or strongerthan the association between water suppliesand health;
• health benefits may not be seen withimproved water supplies in areas; where theoverall level of sanitation is low;
• water supplies should be as close aspossible to the point of use to maximise thehealth benefit;
• health benefits of improved watersupply and sanitation services can be seenonly if improved services are used - and usedproperly by the whole family - and areproperly maintained.
Where conventional services are lacking,urban water and sanitary facilities tend to becharacterised by diversity as well asinadequacy. Households without indoorpiping often have to obtain their water froma number of sources, such as overcrowded ordistant communal standpipes, expensiveprivate water vendors, heavily polluted wellsor open waterways. Households without flushtoilets may end up using one of a wide rangeof alternatives, including pit latrines, panlatrines, or latrines located over ponds,streams, drains or open sewers. Technicalimprovements are undoubtedly possible, andthere has been some success with relativelysimple but more hygienic latrines (Franceyset al., 1992; Mara, 1996). Overcrowding,combined with poor maintenance, however,can and often does defeat designimprovements. Public latrines are very difficultto manage, and when overused, can becomepublic health hazards. These inadequacies canalter the relative importance of the domesticand public domains of disease, as describedin Box 5.3.
Whilst water and sanitation problemsgive rise to particular problems in urbanareas, conditions are often even worse inrural areas, and the growing urban water andsanitation challenge should not be allowedto distract attention from the persistent ruralproblems.
This compounding of risk factors displays the importance of an holistic perspectivetowards improving health and living conditions in poor neighbourhoods. It may befutile to address only one isolated risk factor and expect an improvement in health.Some of the behavioural factors, however, such as failing to wash hands regularly, couldoften be substantially improved by, for example, a more reliable and convenient watersupply. Educational campaigns, which are relevant to the local context, can also beinstrumental in improving hygiene behaviour.
Reference:Benneh, G., Songsore, J., Nabila, J. S., Amuzu, A. T., Tutu, K. A., Yangyuoru, Y. and McGranahan, G.
1993. Environmental Problems and the Urban Household in the Greater Accra Metropolitan Area(GAMA) -Ghana. Stockholm Environment Institute (Stockholm).
Chapter 5
Environmental Change and Human Health in Countries of Africa, the Caribbean and the Pacific144
Box 5.3 The Public and Domestic Domains in the Transmission of Disease
One approach to classifying transmission routes for water-related infections, suchas diarrhoeal disease and worm infestations, is to distinguish between transmissionwithin the domestic domain, which includes the area normally occupied by andunder control of a household, and the public domain, which includes public placesof work, education, commerce and recreation as well as streets and fields.Transmission of infective agents in the public domain may be responsible for largeepidemics, and has, therefore, often been the focus of research and intervention.Transmission in the domestic domain is, however, also important in that it mayreduce the beneficial impact of water supplies and be the source of spread into thewider community. This classification is useful because different interventions maybe necessary to control transmission in the different domains. Intervention in onedomain only, such as the provision of latrines to control hookworm, may beinsufficient to control the disease, in that it has little impact on transmission in thepublic domain, e.g. through open defecation. Multi-faceted interventions may,therefore, often be necessary.
A study in north-eastern Brazil demonstrated the significance of the differentdomains very clearly, showing that the transmission of intestinal worms decreased ascommunity sanitation improved, but that the clustering of cases by householdsincreased. The researchers concluded that in communities which lack sanitation,most of the transmission is unaffected by the characteristics of the household since ittakes place in the contaminated public domain. As sanitation improves, thus decreasingcontamination in the public domain, transmission within the domestic domain becomesmore important. In other words, the specific characteristics of households maypredispose their members to infection. The study also showed that environmentalsanitation prevents transmission of diarrhoeal disease, mainly in children in excess ofone year of age, as they are more likely to play in the contaminated public domain.For infants, most transmission occurs in the domestic domain, and is, therefore, lessinfluenced by improvements in public domain sanitation. The relative importance ofthe two domains in the transmission of disease appears to vary from setting to settingand disease to disease. This may reflect both differences in hygiene behaviours andlevels of contamination of these domains across different settings and the naturalhistory of the diseases and their transmitting organisms.
There are political implications to the debate on the importance of the domesticand public domains in disease transmission. The public domain is a matter for publicconcern, and public regulation or interventions, such as drains and solid waste collection,can be used to reduce transmission that occurs there. The domestic domain, however,is private and transmission in that domain is largely the result of household behaviour,which is less amenable to public regulation. Health promotion interventions whichaim to change household behaviour, and interventions which facilitate those changes,such as the provision of an adequate water supply within the household, are importantin terms of controlling disease transmission in this domain. To achieve the greatestimpact on disease transmission, however, interventions tailored to both domains mustbe developed and implemented.
ReferencesMoraes, L. R. S. (1996). Health Impact of Drainage and Sewerage in Poor Urban Areas in Salvador,
Brazil. Unpublished PhD Thesis.University of London.Cairncross, S., U. Blumenthal, et al. (1995). “The public and domestic domains in the transmission of
disease.” Tropical Medicine and International Health 39: 173-176.
Environmental Change and Human Health in Countries of Africa, the Caribbean and the Pacific 145
Urbanisation and Healthy Living Environments
food seasonally, and food handling is largelyunder the control of the consumer. In urbanareas there is also a delay stemming fromthe need to transport, process and marketfood before it is obtained by the consumer.More importantly, in urban areas, it isdifficult for the consumer to monitor foodhandling which takes place before the foodis purchased. Finally, some urbanconsumption patterns can create foodcontamination problems. In a study ofMonrovia (Molbak et al., 1989), it was foundthat most urban (slum) households storedprepared food, and that 63% of the storedfood samples were contaminated withenterobacteria (83% for baby foods). Ruralhouseholds, on the other hand, were lessinclined to store cooked food, and only 39%of their food samples were contaminated.These problems tend to be exacerbatedwhen women, who carry out most of thedomestic labour with relation to cooking,face severe time constraints, as theycommonly also need to earn most or partsof the household’s income.
Air Pollution from Domestic SourcesThere are three major health risks which havebeen associated with the domestic use ofpolluting fuels (Chen et al., 1990). Firstly,pollution from domestic fuels may facilitatethe spread of acute respiratory infections byirritating the respiratory passages, and possiblyin other ways too. Secondly, exposure maycontribute to chronic obstructive lung disease,a significant health problem among adultwomen. Thirdly, long-term exposure is a riskfactor for cancer. Studies of personal exposureand indoor air pollution levels indicate that,whilst considerable variation does exist, manyusers of smoky fuels are exposed todisturbingly high levels of particulates andother pollutants (Smith, 1993).Epidemiological evidence is slowlyaccumulating, and seems likely to confirm thatdomestic fires can contribute significantly toall three of these health problems.5
Food ContaminationFood, like water, can transmit infectiousdiseases and harmful chemicals. Infectiousbacteria can multiply in food, and some ofthe bacteria and fungi that grow on foodproduce toxins. For viruses, protozoa andhelminths, food acts primarily as a carrier.As with water and sanitation, the majorhealth burden arising from foodcontamination is almost certainly itscontribution to the diarrhoea and dysenterythat figure so highly in the morbidity andmortality of children in the low-incomecountries. The extent to which foodcontamination is involved in the spread ofthese diseases is, however, poorlyunderstood. Most faecal-oral diseases canbe borne by food, but monitoring exposureto contaminated food is far more difficultthan for water, and there are no clearlyidentifiable food practices or facilitiesthrough which one could expect to capturea major part of the variation in food quality.Epidemiological studies give little indicationof the relative importance of foodcontamination, and one of the few attemptsto estimate indirectly the incidence ofdiarrhoea involving food contamination gavea strikingly wide range: 15% to 70% (Esreyand Feachem, 1989).
Food contamination can occur within thehome. Food handling and storage practicesare critical, and the dangers ofcontamination are greater, given inadequatewater and sanitation. Washing hands beforefood preparation and avoiding contactbetween food and flies are two obviousexamples of preventive measures in thehome. They are also practices that are easier,though less important, in homes with goodwater and sanitation facilities.
Food contamination is a problem in bothurban and rural areas, but can takesomewhat different forms. In rural areas,where subsistence agriculture is practised,the delay between food production andconsumption evolves from the need to store
5 Indoor air pollution can be particularly hazardous to health because it is released in close proximity topeople. The ‘rule of 1,000’ states that a pollutant released indoors is 1,000 times more likely to reachpeople’s lungs than a pollutant released outdoors (World Health Organization, 1997).
Chapter 5
Environmental Change and Human Health in Countries of Africa, the Caribbean and the Pacific146
As with water and sanitation, the extentto which ill health is actually caused byexposure to domestic smoke is difficult tocalculate. Cancer and chronic respiratoryproblems are likely to be the consequenceof long-term or past exposure, which is hardto assess. There are many other risk factorsfor respiratory infection and they tend tobe interrelated: crowding, poor ventilation,malnutrition, poor sanitation, lack ofimmunisation (Berman, 1991; Graham,1990). There are also other sources ofdomestic air pollution that may relate torespiratory illness, such as mosquito coils,waste burning and smoking. Generally, thewomen and children who are more exposedto air pollution from domestic fires are alsolikely to be more exposed to otherenvironmental hazards that also contributeto ill health.
Household fuel choice is often describedas an energy ladder, with fuels such as cropresidues and firewood at the bottom,followed by charcoal, kerosene, LPG and,finally, electricity (McGranahan and Kaijser,1993; Smith et al., 1994). Generally, thehigher up the ladder, the less polluting thefuel. Since smoke can be unpleasant as wellas unhealthy, and the less polluting fuels aremore convenient for most purposes, theyare usually favoured by wealthy householdswho can afford to switch. There is also arural-urban dimension to the ladder, withcrop residues and firewood being morereadily available in rural areas. Also,fuelwood smoke is more likely to havebeneficial side effects, such as controllinginsects in thatched roofs, in rural areas.
Whilst wood is less common in cities,it is often used in peri-urban areas, andmany ACP cities do have a fuelwood market.Charcoal has long been a characteristicurban household fuel in many ACPcountries, and urban households in anumber of countries also use coal. In termsof respirable particulates, which probablyrepresent the major health risk, charcoal isconsiderably less polluting than wood,
although carbon monoxide exposure maybe higher, as indicated in a study of Lusaka(Ellegård and Egnéus, 1992). Coal emissionsare closely related to the type of coal used,but research in South Africa indicates thatthey can be relatively high in terms both ofparticulates and carbon monoxide(Terblanche et al., 1993b). Studies of coaluse in China have produced some of the mostconvincing evidence of a link betweendomestic fuel use and cancer (Smith and Liu,1993), and indeed, coal occupies a somewhatambiguous place on the energy ladder,sometimes being viewed as a step up fromcharcoal, even though the associated healthrisks can be greater.
In many ACP countries, cooking withsmoky fuels is primarily an outdooractivity, even in urban areas, presumablywith the aim of lowering exposure levels.Poor households living in crowdedconditions can create specifically urbanproblems, however, in that a large numberof domestic users of smoky fuels can createa neighbourhood air pollution problem,and even contribute to citywide problems.Comparisons of particulate exposureamongst children in South Africa indicatethat the electrification, or otherwise of theneighbourhood, and perhaps even whethertheir school is in an electrifiedneighbourhood, can make a significantdifference (Terblanche et al., 1993a).6 Thisimplies that, as with water and sanitationproblems, it can be difficult for householdsin crowded areas to protect themselvesindividually from exposure to pollutionfrom domestic fires.
PestsMost pests are more common in rural areas,where there are also far greater variety ofhabitats and species. (See Box 3.3 InfectiousAgents and Irrigation, and Box 4.6 Changingforest land use and its impact on diseasevectors.) The opportunities for controllinginsect vectors are generally greater in urbanareas, but this fact notwithstanding, there are
6 It should be noted, however, that where the unit cost of electricity, or electric appliances, is high, mosthouseholds will continue to cook with smoky fuels, even if electricity is available in the neighbourhood.
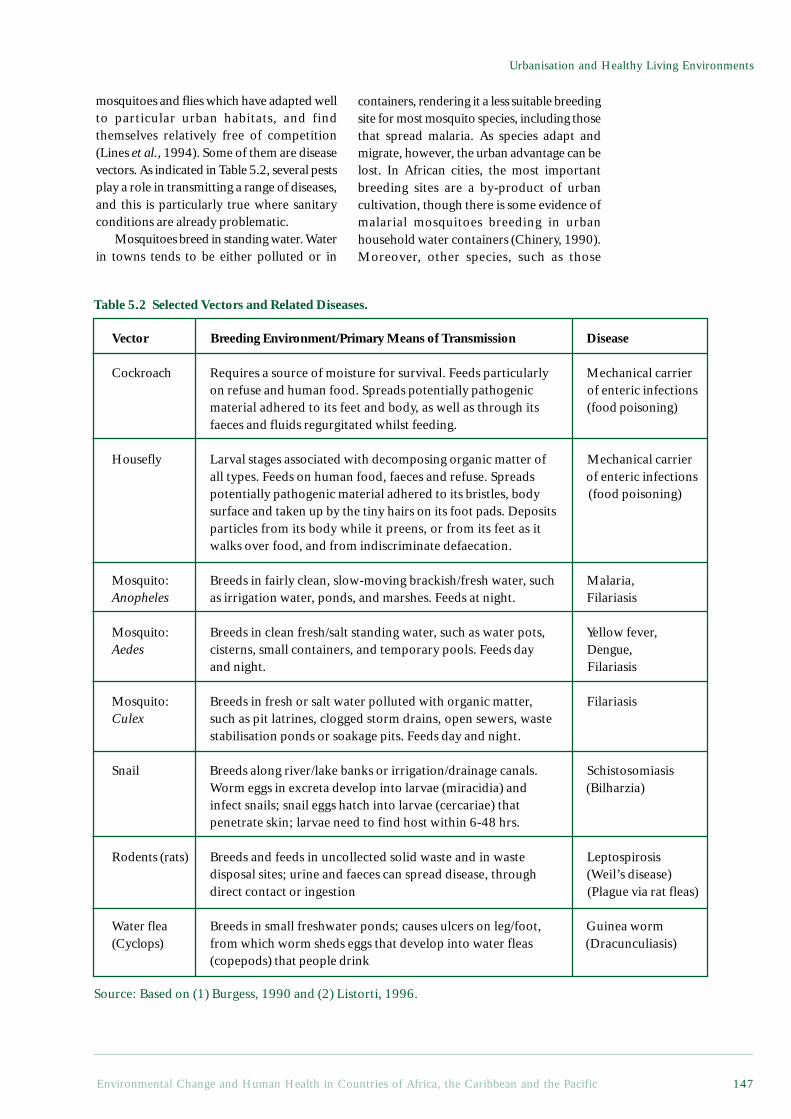
Environmental Change and Human Health in Countries of Africa, the Caribbean and the Pacific 147
Urbanisation and Healthy Living Environments
mosquitoes and flies which have adapted wellto particular urban habitats, and findthemselves relatively free of competition(Lines et al., 1994). Some of them are diseasevectors. As indicated in Table 5.2, several pestsplay a role in transmitting a range of diseases,and this is particularly true where sanitaryconditions are already problematic.
Mosquitoes breed in standing water. Waterin towns tends to be either polluted or in
containers, rendering it a less suitable breedingsite for most mosquito species, including thosethat spread malaria. As species adapt andmigrate, however, the urban advantage can belost. In African cities, the most importantbreeding sites are a by-product of urbancultivation, though there is some evidence ofmalarial mosquitoes breeding in urbanhousehold water containers (Chinery, 1990).Moreover, other species, such as those
Table 5.2 Selected Vectors and Related Diseases.
Vector Breeding Environment/Primary Means of Transmission Disease
Cockroach Requires a source of moisture for survival. Feeds particularly Mechanical carrieron refuse and human food. Spreads potentially pathogenic of enteric infectionsmaterial adhered to its feet and body, as well as through its (food poisoning)faeces and fluids regurgitated whilst feeding.
Housefly Larval stages associated with decomposing organic matter of Mechanical carrierall types. Feeds on human food, faeces and refuse. Spreads of enteric infectionspotentially pathogenic material adhered to its bristles, body (food poisoning)surface and taken up by the tiny hairs on its foot pads. Depositsparticles from its body while it preens, or from its feet as itwalks over food, and from indiscriminate defaecation.
Mosquito: Breeds in fairly clean, slow-moving brackish/fresh water, such Malaria,Anopheles as irrigation water, ponds, and marshes. Feeds at night. Filariasis
Mosquito: Breeds in clean fresh/salt standing water, such as water pots, Yellow fever,Aedes cisterns, small containers, and temporary pools. Feeds day Dengue,
and night. Filariasis
Mosquito: Breeds in fresh or salt water polluted with organic matter, FilariasisCulex such as pit latrines, clogged storm drains, open sewers, waste
stabilisation ponds or soakage pits. Feeds day and night.
Snail Breeds along river/lake banks or irrigation/drainage canals. SchistosomiasisWorm eggs in excreta develop into larvae (miracidia) and (Bilharzia)infect snails; snail eggs hatch into larvae (cercariae) thatpenetrate skin; larvae need to find host within 6-48 hrs.
Rodents (rats) Breeds and feeds in uncollected solid waste and in waste Leptospirosisdisposal sites; urine and faeces can spread disease, through (Weil’s disease)direct contact or ingestion (Plague via rat fleas)
Water flea Breeds in small freshwater ponds; causes ulcers on leg/foot, Guinea worm(Cyclops) from which worm sheds eggs that develop into water fleas (Dracunculiasis)
(copepods) that people drink
Source: Based on (1) Burgess, 1990 and (2) Listorti, 1996.
Chapter 5
Environmental Change and Human Health in Countries of Africa, the Caribbean and the Pacific148
7 Accumulation of decaying waste provides a breeding ground for flies and other insects. Aedes mosquitoes,the vectors of dengue fever, can breed in rainwater that collects in empty containers. Rats can feed onthe refuse, and this may increase the risk of rat-related diseases such as plague. And in tropical cities,when the rains come, the waste can block the drains leading to flooding and accumulation of waterwhere other mosquitoes can breed.
responsible for the spread of dengue fever(primarily an urban disease), are already welladapted to urban water containers.
Just as urban mosquito problems areintimately linked to water, urban fly problemsare linked to waste. Various families of flieshave adapted to the urban environment. Themost obvious health risk they pose is that theyprovide possible short cuts on faecal-oralroutes. The housefly, along with several otherspecies, is a filth feeder and breeder. Givenpoor sanitation, some flies are likely to be incontact with human faeces and will later landon human food, drink or skin. Open,uncollected piles of garbage increase the flypopulations by providing breeding sites, whilstopen food preparation areas, and especiallyfood stored in the open, provide opportunitiesfor flies to land on food. Where the risks arealready high, flies are particularly likely toincrease the prevalence of the diarrhoea anddysentery often associated with bad water andsanitation (Levine and Levine, 1991).
Some of the measures taken to controlinsects and other pests create their ownenvironmental health problems: mosquitocoils, and other substances burned to repelinsects, cause air pollution, whilst indoorspraying with aerosols and pump spraysexposes residents to potentially damagingpesticides. The health risks of such measurescan outweigh their sometimes minimal effecton the spread of vector borne disease.Mosquitoes and other disease vectors are,furthermore, developing resistance toinsecticides, including those applied in manygovernment programmes. All this points to theimportance of controlling breeding sites - aform of environmental management thatshould be far easier in urban rather than ruralareas.
Solid WasteSolid waste is a more intractable problemfor urban than rural dwellers, at least whereremoval services are lacking. Most domestic
solid waste is not a direct threat to health,but local accumulations can quickly becomeunpleasant, a nuisance and a threat - at leastindirectly - to health although it contains fewhazardous chemicals in comparison withindustrial waste. Faecal matter is, however,often mixed with domestic waste, especiallywhere disposable diapers are used or sanitaryfacilities are scarce, although if kept in closedcontainers and removed regularly, the healthrisks and unpleasantness to local residents areminimal. Even within and around the home,the more serious solid waste problems involveinadequate disposal, and accumulation ofwaste, which attracts pests, blocks the drainsor otherwise degrades the localenvironment.7 The two groups most directlyexposed to solid waste and its health hazardsare children and waste pickers.
Both the quantity and composition of wastevaries with wealth. Not surprisingly, wealthyhouseholds tend to produce more waste, andmuch of the additional waste comprises non-compostable materials such as paper, glass,metal and plastics (Cointreau, 1986). It is inlow-income areas, however, that problems ofremoving waste are most severe. Door-to-doorwaste collection is too expensive for manyhouseholds or municipalities to afford, andthe streets of many poor neighbourhoods are,in any case, too narrow for vehicles. Collectionpoints can easily become small garbage dumps,especially when collection is intermittent.Public budgets have been under great pressurein many ACP countries, and waste collectionis often among the services to suffer most(Stren and White, 1989). Indeed, solid wasteoften creates one of the most visibleenvironmental challenges in low-incomecommunities.
Other Household and NeighbourhoodEnvironmental ProblemsThere are a number of environmental problemsthat people encounter in and around theirhomes in addition to those described above.
Environmental Change and Human Health in Countries of Africa, the Caribbean and the Pacific 149
Urbanisation and Healthy Living Environments
Some, such as ambient air pollution from non-domestic sources, are better classified as city-wide problems, see section 5.5.3. Cookingand lighting may also pose a fire hazard –exacerbated by dense housing. Furthermore,many environmental problems arise becauselow-income residential areas are situated inunsuitable areas. The land in these areas isoften inexpensive for good reasons, somerelating to environmental conditions. Thelocation of many disadvantaged settlementsis, moreover, determined not through planningor market forces, but through a lack ofplanning or efficient markets. People settlewhere there are no well-articulated plans orownership patterns. Such land may be locatedon steep, unstable slopes or in flood proneareas, thereby creating various health risks.Polluting industries are, moreover, less likelyto encounter resistance from alreadydisadvantaged residents.
A number of very serious localenvironmental problems also arise frominadequate housing itself. One of the rolesof housing is to protect inhabitants fromnatural environmental hazards, such as rainand excessive heat or cold. At times,inadequate housing not only fails to fulfilthis role, but also creates newenvironmental problems through excessivecrowding, indoor damp, and concentrationsof pollutants. Such problems can be greatlyexacerbated when, as is common in manylow-income settlements, the home is also acommercial workplace. Women are oftenforced to combine childcare with economicactivities in the home, ranging fromcommercial cooking to cottage industries.The risks depend upon the nature of theactivity, and remain poorly documented. Itis likely, however, that there are manylocations where the juxtaposition of small-scale industry and housing create extremelyhazardous conditions.
The materials of which the house is builtmay also constitute a danger for its residents.Asbestos has, for example, been used indeveloping countries for several decades, oftenas roofing material for low-cost housing and
schools. Asbestos dust may be produced duringinadequately controlled repair or demolitionactivities. The impact on health in developingcountries is, however, poorly documented(World Health Organization, 1997). Resultsemerging from a recent study in Soweto, SouthAfrica, however, showed 43% of the studiedpopulation living in houses with asbestosroofs. The majority of these houses were over20 years old and most of them had no ceilings.Many of them were, furthermore, in a state ofdisrepair. A small proportion of the peoplehad undertaken repairs themselves, mostprobably without protective gear. The majoritywas unaware of any harm having been causedto their health.8
Policies to improve situations like theseneed to be carefully designed in order toactually improve housing conditions. Straight-forward prohibitions, without any provisionof alternatives for better (or cheaper) materialscan be counterproductive. Regulations incombination with alternatives and increasedawareness of the risks can help people makebetter-informed choices and undertakeprotective behaviour. The possibilities forimproving health through better housing isexplored in Chapter 7.
5.4.2 Institutional Aspects of EnvironmentalHealth Problems in Low-IncomeNeighbourhoods
A review of actual and anticipated progress inwater and sanitation provision indicates thateven the provision of ‘safe’ service levels isfalling behind. Official statistics collected from39 ACP governments indicate that, in the early1990s, eight ACP countries, namely Benin,Chad, Guinea, Guinea-Bissau, Lesotho, Mali,Niger, Zambia and Haiti, reported that halfor more of their urban dwellers did not have‘convenient’ access to safe water supplies.Similarly, 10 ACP countries reported that morethan half of their urban residents were without‘adequate’ sanitation, namely Angola, BurkinaFaso, Guinea-Bissau, Lesotho, Madagascar,Malawi, Mauritania, Sierra Leone, Somaliaand Haiti (See Table 7.4 in Appendix 2).Moreover, in all but five of the countries, at
8 Personal communication, Angela Mathee, South African Medical Research Council, May 1999.
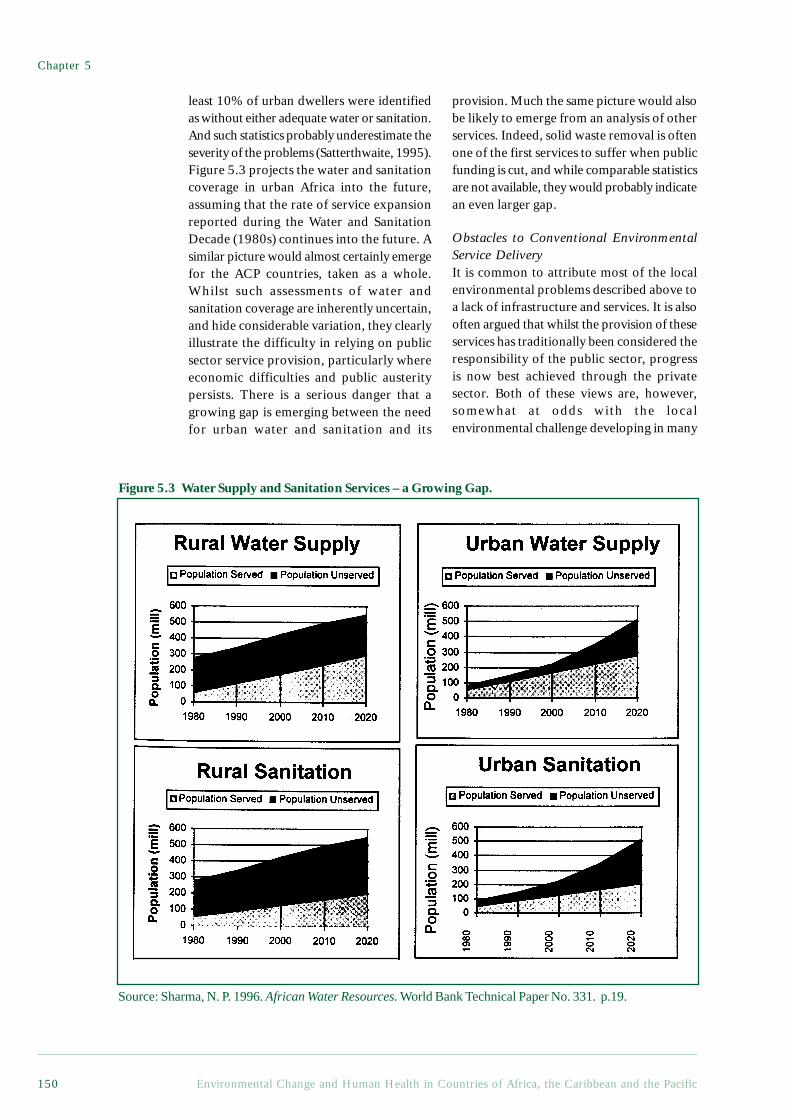
Chapter 5
Environmental Change and Human Health in Countries of Africa, the Caribbean and the Pacific150
least 10% of urban dwellers were identifiedas without either adequate water or sanitation.And such statistics probably underestimate theseverity of the problems (Satterthwaite, 1995).Figure 5.3 projects the water and sanitationcoverage in urban Africa into the future,assuming that the rate of service expansionreported during the Water and SanitationDecade (1980s) continues into the future. Asimilar picture would almost certainly emergefor the ACP countries, taken as a whole.Whilst such assessments of water andsanitation coverage are inherently uncertain,and hide considerable variation, they clearlyillustrate the difficulty in relying on publicsector service provision, particularly whereeconomic difficulties and public austeritypersists. There is a serious danger that agrowing gap is emerging between the needfor urban water and sanitation and its
provision. Much the same picture would alsobe likely to emerge from an analysis of otherservices. Indeed, solid waste removal is oftenone of the first services to suffer when publicfunding is cut, and while comparable statisticsare not available, they would probably indicatean even larger gap.
Obstacles to Conventional EnvironmentalService DeliveryIt is common to attribute most of the localenvironmental problems described above toa lack of infrastructure and services. It is alsooften argued that whilst the provision of theseservices has traditionally been considered theresponsibility of the public sector, progressis now best achieved through the privatesector. Both of these views are, however,somewhat at odds with the localenvironmental challenge developing in many
Figure 5.3 Water Supply and Sanitation Services – a Growing Gap.
Source: Sharma, N. P. 1996. African Water Resources. World Bank Technical Paper No. 331. p.19.
Environmental Change and Human Health in Countries of Africa, the Caribbean and the Pacific 151
Urbanisation and Healthy Living Environments
ACP cities. Whilst better service provision isundoubtedly needed, given the level ofcoverage that can realistically be achieved inthe foreseeable future, additional means ofimproving conditions in unservicedsettlements clearly need to be found.Moreover, whilst public services are in crisisin many countries, the private sector is notable to adequately fill the gap.
Some of the main service categories arelisted below, along with three examples foreach type, in descending order of capital cost.
• Piped water systems: providing safe(quality) drinking water and sufficient(quantity) water for washing.
- Household connections;- Yard taps;- Public standpipes.• Sanitation systems: ensuring human
faeces are removed from the livingenvironment.
- Flush toilets;- Ventilated improved pit latrines;- Bucket toilets.• Clean fuels: preventing smoky fuel
combustion in the home.9
- Electricity;- Kerosene;- Charcoal.• Garbage collection: preventing the
accumulation of waste in residential areas.- Daily door-to-door collection;- Weekly door-to-door collection;- Local collection points.
Typically, the more capital-intensiveoptions transfer most of the responsibility forthe service provision to the utility. Usersmerely have to turn a tap to get water in theirhome, turn a lever to flush faeces away, turna switch to get heat for cooking and spaceheating, and fill a container outside the doorto dispose of solid waste. Drains and cleaningservices ensure that water and waste do notaccumulate on public land.
The less capital-intensive services typicallyinvolve a far higher level of resident
involvement. Effective use also requires a fargreater understanding of the environmentalhealth risks involved. Even if water isuncontaminated at the source, it is difficultto maintain this quality if it is drawn from apublic source, transported home, and storedin containers designed for other purposes.Washing hygienically with a few litres ofwater requires far more care than with runningwater. Maintaining, and even using, a pit orbucket latrine hygienically is far moredifficult than with a flush toilet, especiallywhen water is not available at the site. Muchthe same applies to the other services.
Capital intensive service provision canbring new environmental challenges. Urbanpiped water systems increasingly place aburden on already strained water supplysystems: sewage is often released untreatedinto waterways, electricity generation oftenleads to a range of environmental problems,depending upon the resources andtechnologies employed, and in many cities,landfills are little more than open dumps.As discussed in Chapters 3 and 7, however,the health benefits of providing reliableservices can be substantial, and in any case,environmental constraints are rarely thereason for the lack of services. With respectto water, for example, provision is frequentlyinadequate in cities with extensive waterresources, and even where resources arescarce, providing low income householdswith sufficient water to meet their healthneeds is unlikely to make a large differenceto overall demand. The quantities of waterrequired to achieve health are small incomparison with typical water demands forother purposes (World Resources Institute,1998).
The past two decades have witnessednumerous attempts to privatise servicedelivery, in ACP countries as elsewhere.This is partly an aspect of a more generalshift towards market-based economicmanagement, and partly a response tospecific failures in public service provision.The failure of the public sector has often
9 Notwithstanding, ‘cleaner’ fuels provide no protection against accidents.
Chapter 5
Environmental Change and Human Health in Countries of Africa, the Caribbean and the Pacific152
been taken as a justification for shiftingresponsibility to the private sector. Inparticular, it is often claimed the failure ofpublic and other price-controlled utilities toexpand the water system has created asituation where people who would be willingto pay the full cost for a better service endup having to rely on distance sources orexpensive vendors (Serageldin, 1994).Evidence for this phenomenon, whichappears to be common in many ACPcountries as well as large parts of Asia andLatin America, comes principally from twosources:
1. The high prices that low-income urbandwellers often pay to obtain water frominformal vendors who have emerged to fillthe service gap, but do not have the capital orlegal basis to extend the piped system.
2. The results of ‘contingent valuation’surveys, which indicate both urban and ruraldwellers’ willingness to pay for better waterand sanitation services, even if they are on alow income.
As indicated in Box 5.4, however, theprivate sector is also prone to failure, and aprivate utility will also tend to under-provideenvironmental services in low income areas,unless it is well regulated. It is thus generallyaccepted, even by strong advocates ofprivatisation, that there is still an importantrole for the public sector in ensuring thatpublic health goals are pursued, thatmonopoly pricing does not result, and thatenvironmental burdens are not merelydisplaced.
The practice of privatisation has, in anycase, not conformed to any simple model ofprivate sector involvement. A recent reviewof the privatisation of services in East Africafound that numerous players have, in additionto private companies, been playing a growingpart in service provision (Semboja andTherkildsen, 1995). Non-governmentalorganisations (NGOs), community-basedorganisations (CBOs) and various levels ofgovernment have also helped to create someof the more successful attempts to meet localservice needs. There is, furthermore, acritical need for community involvement,
Box 5.4 Institutional Failures in Environmental Service Delivery
To some degree, the health hazards so prevalent in low-income settlements, in theACP as elsewhere, are simply the environmental face of unacceptable economic poverty.People who cannot afford adequate food, clothing and other basic necessities, cannotbe expected to afford a safe living environment. Environmental health is not an easilymarketed good, however. Services such as piped water, garbage collection, and sanitarysystems can, up to a point, be packaged and sold. Such services, however, only gopart of the way towards resolving local environmental inadequacies, and in somecases displace environmental burdens onto the broader environment. Equallyimportantly, the public sector, the private sector, and the local communities themselves,are all prone to their own particular failures if they are relied on to provideenvironmental services. A recognition of these weaknesses can help in the pursuit ofsound partnerships that build on the strengths of the different sectors. Whilst manyproblems are specific to a particular settlement, there are some common failures thatarise.
Public FailuresThe conventional public sector response to environmental health hazards in deprivedsettlements has been to try to provide affordable environmental services. Contradictorypolitical pressures and bureaucratic inefficiencies often prevent effective servicedelivery, however. A public utility will often be required to keep prices low, but notbe given sufficient funds to cover the costs of extending the services. A typical outcomeis subsidised (but often poorly maintained) services for wealthier residents, and a
Environmental Change and Human Health in Countries of Africa, the Caribbean and the Pacific 153
Urbanisation and Healthy Living Environments
utility so financially constrained that it cannot extend services to low income areas. Aperverse, but not uncommon, result is for poor households to end up paying higherprices for sub-standard services. Moreover, public utilities generally adopt standardoperating procedures appropriate to conventional service delivery, and find it difficultto adopt to lower cost, locally adapted solutions.
Private FailuresWhilst public failures have helped motivate attempts to shift responsibility forenvironmental service delivery to the private sector, the market, too, suffers seriousproblems as a mechanism for meeting local environmental needs. Environmentallysound sanitation, waste removal, pest control and even clean water provide publicbenefits to the neighbourhood, and even beyond, but it is not possible for a householdto protect itself effectively from local health hazards by purchasing environmentalservices unless other households do likewise. According to conventional marketeconomics, therefore, the private provision of environmental services will tend to beinadequate. These inadequacies are compounded when monopolies develop (due toincreasing returns to scale, for example), or the inadequacies are difficult to perceive(such as the imperceptibility of pathogen transmission).
Failures of Local Collective ActionLocal communities, especially in low-income areas, are increasingly called upon to takea lead in solving their own local environmental problems. Most low-incomeneighbourhoods are clearly not in the position to organise conventional environmentalservice delivery, but even in terms of their local extension and management, they have anumber of common failings. Local communities are rarely homogenous or particularlyharmonious, and conflicting interests often arise. Even if they can reach verbal agreementon what needs to be done, they rarely have the right to enforce this agreement shouldsome residents decide to opt out. Moreover, the boundaries of the environmental healthburdens rarely correspond to those of any well-defined community, and whilst localresidents may have a far better understanding of many aspects of their local environmentalproblems than outside experts, they are typically in a weak position in relation to externalsuppliers and some of the more technical environment and health issues.
particularly where services are not providedto individual households. Among the relevantservices, water and clean energy provisioncome closest to providing a private good,and even water in isolation provides publichealth benefits to the communities on thereceiving end. The benefits of goodsanitation, drainage and waste removalbenefit the community at large to an evenmore obvious extent.
There are several reasons why sanitationand drainage often lag behind waterdevelopments (Kolsky, 1992). Theboundaries of responsibilities of differentinstitutions and organisations are related to
the issues of public and private benefits -Box 5.5 provides an example of on instancewhere a successful doubling of waterconsumption levels created problems becausethe institution legally responsible for drainingaway the additional wastewaters was notinvolved. Over and above this type ofboundary problem, there is also the issue ofcapacity within the responsible institutions,and the fact that the capacity to act in acoordinated manner can also be problematicfor social institutions, such as the family.Local institutions, in relation to gender andhousing security, are described in thefollowing section.
Chapter 5
Environmental Change and Human Health in Countries of Africa, the Caribbean and the Pacific154
Box 5.5 Water and Waste: the Need for Integrated Programmes at the LocalLevel - A Case Study from Djenné, Mali
Djenné is a small Sahelian town in Mali, located on a tributary of the Niger River,upstream from Timbuktu. The two settlements have strong historical ties: in the past,camel caravans ensured a vibrant trade between them and both share the same Sahelianarchitecture – square adobe structures plastered with mud in colours from ochrebrown to light grey – that warranted the designation of Djenné as a UNESCO worldheritage site.
Though surrounded by water, Djenné’s 15,000 inhabitants recognised the needfor improved access to a potable water supply, especially in times of cholera. Theywere eager to take part in a programme initiated by National Water Directorate withthe help of a bilateral support agency. Ageing pipes, pumps and generators werereplaced and a larger water tower was designed to blend with the local architecturalstyle. Under the new system, management responsibilities are shared between volunteersof the Water User Association and professional managers based in the capital city ofBamako. The arrangement has yielded encouraging results. In the four years since theinitiation of the programme, for example, daily per capita water consumption in thetown has doubled to 12 litres. After operating costs, the total savings are enough toeventually replace ageing parts and renew equipment.
Problems have, however, also arisen. An improved water supply, coupled withhigher consumption, and in the absence of adequate and concomitant provision ofwastewater disposal, have lead to increased environmental pollution. Water is notdrained away from the public standpipes, and the surrounding areas consequentlybecome muddy and provide breeding grounds for flies and mosquitoes. The samestagnant pools of water are also undermining the foundations of the old adobe buildingsof the town that are a major tourist attraction and an important source of revenue.Clearly, improvements in water supply need to go hand-in-hand with improvementsin wastewater disposal, in order to minimise public health risks and protect the culturalheritage of Djenné. But what local processes exist to ensure this occurs?
Local government bodies, called communes, bear the legal responsibility for co-ordinating, contacting and controlling the actions of the water user association, localhealth association and tourist authorities. Communes could engage stakeholders in abroad-based planning exercise and follow through on a local environmental action plan,but to orchestrate such a concerted effort requires skills such as mediation, communication,planning and monitoring that most often do not exist at the local level. By building thiskind of capacity at local level, governments and external agencies could support andenable the local governance processes needed to ensure that essential environmentalinterventions do not have unexpected, and sometimes harmful, spin-offs.
Contributed by Marc Vézina, International Water and Sanitation Reference Centre (IRC)The Hague, The Netherlands.
Local institutions: their role in environmentalmanagementLocal institutions are far more critical toenvironmental management where servicesare lacking than is the case in areas wherethere is comprehensive coverage. As noted
above, the less capital-intensive technologiesdemand a far more sophisticatedunderstanding of environmental processes andhealth risks on the part of the users. Far morecooperation and informal regulation is alsorequired when, as is often the case, the
Environmental Change and Human Health in Countries of Africa, the Caribbean and the Pacific 155
Urbanisation and Healthy Living Environments
services (such as water taps, toilets, wastecollection) are provided collectively ratherthan to individual households. Moregenerally, in the absence of environmentalservices, the problem is not so much one oftechnology management as of managingwithout any well-defined technologies.
The relevant institutions extend fromcomparatively formal community-basedorganisations to informal arrangements. Thehousehold itself is a critical institution whichis often at the centre of much localenvironmental management. Land tenureinstitutions or, more generally, housingsecurity, can make a large difference to theincentives for local environmentalimprovement. Institutional relations alsodevelop between residents and thegovernmental or non-governmental playerswho provide the services that do exist. Theseand other local institutions can either helpor hinder people in pursuing theirenvironmental and health needs. Capacitybuilding within the different institutions isimportant, but it is also important to improvecollaboration and understanding betweeninstitutions at different levels.
If it is difficult to document the changingtrends of environmental service delivery, itis far harder to document the changinginstitutions in under-served areas. Theirevolution is, nevertheless, critical to localenvironmental and health conditions incities. When ‘top-down’ approaches to localenvironmental management were theprevailing orthodoxy, local institutionscould be ignored, even if, in practice, theyplayed an important role in determiningwhether the approaches succeeded. If localresidents are meant to become leadingpartners in improvement efforts, however,it is obviously critical to take these localinstitutions into account. Three particularlyimportant aspects of the local institutionalcontext are gender, housing security and therelationships with service providers.
GenderInternationally, there is a great deal ofdiscussion of how to empower women toenable them to meet their own needs and toachieve broader development goals. In theurban context, local environmental
management is central to any such endeavour.Women typically play a far more active rolein environmental management in and aroundthe home than men. They also tend to bemore exposed to environmental healthhazards. Men, on the other hand, tend todominate environmental serviceorganisations and, in many cases, the localorganisations that become involved inenvironmental management. Men may alsohave a disproportionate influence over thehousehold budget, including expenditure onclean fuels, sanitary facilities and otherprotective devices. Gender relations thusinfluence local environmental management,and changes that give women greaterinfluence should yield environmentalbenefits. Gender conflict can, on the otherhand, easily undermine attempts to improveenvironmental and health issues, andunsuccessful attempts to give women moreinfluence can be detrimental on all fronts.
Gender-related conflicts over localenvironmental management arise in andaround the home on a daily basis, and thehealth of the residents depends to a veryconsiderable degree on the way in which theyare resolved. A study of gender, localenvironmental management and health inAccra, where compound housing is common,found that environmental inadequacies in andaround the home posed a serious threat tohealth, primarily for children (both male andfemale), but that they primarily constituted alabour burden for adult women. It was almostexclusively women who managed thecompound housing environment, but changinggender relations were beginning to beperceived as a threat by men (Songsore andMcGranahan, 1998). Women were moreinclined to resent this labour burden whenthe men were not fulfilling their traditionaleconomic roles.
As mentioned above, women tend to bemore exposed to environmental healthhazards in and around the home. This ispartly a consequence of the fact that women,as well as children and the elderly, tend tospend many more hours in and around thehome area (Benneh et al., 1993). Women’shigher exposure is also a consequence oftheir disproportionately largerresponsibilities for cleaning, cooking and
Chapter 5
Environmental Change and Human Health in Countries of Africa, the Caribbean and the Pacific156
caring for the sick. For example, womenoften clean shared toilets, which potentiallyexposes them to pathogens contained infaeces. Cooking with smoky fuels alsoheightens the risk of respiratory infections,both for the women and for the smallchildren who are often together with theirmothers while cooking (Songsore andMcGranahan, 1998).
Despite the attention that has been devotedto gender issues in recent years (particularlyby development assistance agencies), a greatdeal remains to be learned about how to takegender into account when designing policies.Conventional service delivery often fails totake women’s views into account, and theseviews are particularly important when servicelevels are low. Perhaps more importantly,however, there is a need to empower womenwho manage the local environments,especially when adequate services are notgoing to be made available.
Housing SecurityIt is often observed that residents are moreinclined to invest in a better homeenvironment if they can be confident thatthey will benefit from their investments, andwill not be displaced, without compensation,after the improvements have been made.And just as residents in insecure housing oftenwant to avoid investing in environmentalinfrastructure and management, governmentsoften want to avoid providing environmentalservices to settlements considered illegal.Since much of the rapid urban growth inACP cities is taking place in an unplannedfashion on unsurveyed land, housinginsecurity is a common problem. It is oftencomplicated by the simultaneous applicationof different tenure rules in different spheresof society. Whilst freehold and leaseholdtenure are favoured by many governments,in practice, a wide range of tenure systemsoperate, often including traditional systemsdeveloped in rural settings, but nonethelessapplied in urban areas.
Housing security is important to theenvironmental management of theneighbourhood, as well as to moreindividualised improvements, and can be animportant issue, even where private tenure isregularised, in that a good neighbourhood
environment raises the value of the housing.Owner-occupiers typically have housingsecurity and benefit directly. Tenants, on theother hand, may have to pay the price in theform of higher rents, or may even faceeviction. Owner-occupiers thus have a moreimmediate incentive than tenants to join incollective efforts to improve local conditions.Other mechanisms are needed if tenants areto achieve housing security and a stake in theirneighbourhood. In most ACP cities, thecomplexity of the tenure arrangements is fargreater than the distinction between owner-occupiers and tenants implies, but the majorityof urban dwellers are probably tenants of onesort or other (World Bank, 1993).
Recent decades have seen a shift inattitudes towards informal settlements, andit is increasingly recognised that, in additionto creating a number of problems, they havean important role to play. Similarly, therehave been a number of attempts to introducenew tenure systems or adapt traditionalsystems to counteract some of theinadequacies of housing markets basedexclusively on private ownership rights(Payne, 1997). Botswana, for example,introduced ‘Certificates of Rights’ andZambia introduced ‘occupancy licences’, inorder to provide more security for people whodo not own the land they live on. Papua NewGuinea and Ghana, on the other hand, arecountries where traditional tenure systemshave continued to play an important role inurban housing. Rent controls have also beencommon, but although these can enhancehousing security, they simultaneously removeany incentives the owners might have had toimprove housing quality, and have thus tendedto be counterproductive.
From an environmental perspective, thegoal must be to give residents a stake in theircommunity and the assurance that if theycontribute to local environmentalimprovement, others will do likewise. Mostsuccessful attempts to improve housingsecurity have been carefully adapted to localcircumstances, and NGOs and localassociations can play an important supportiverole in this process. Given the rapid urbangrowth most ACP countries are experiencing,however, housing security will remain acritical issue for the foreseeable future.
Environmental Change and Human Health in Countries of Africa, the Caribbean and the Pacific 157
Urbanisation and Healthy Living Environments
Relationships with Service ProvidersHistorically, the traditional public sectorresponse to environmental problems hasentailed regulatory measures, at least whenthe environmental management functioncannot be transferred to a public entity suchas a utility. Sanitary inspectors, for example,were once a common means of attemptingto minimise public health hazards (see Box5.6). Such regulatory approaches tend,however, to reinforce conflict between thegovernment and the residents of deprivedareas. Conflict can also easily arise betweenservice providers and local residents whenthe quality of service is low. In a recent studyof Port Elizabeth, South Africa, for example,bucket latrines were found to be the sourceof numerous complaints on the part of
residents, who felt that the bucket collectorsdid not come on schedule and wereinsufficiently respectful when they did come(Thomas et al., 1999).
More local participation is often invokedas a means of improving relationshipsbetween residents and service providers, and,more generally, of promoting localenvironmental improvement. Donor-fundedprojects servicing low-income areas nowtypically require some form of localparticipation. As noted above, there is alsoconsiderably more involvement on the partof NGOs and CBOs in environmental serviceprovision, particularly in low-income areas.Securing good relationships between serviceproviders and local residents remains apriority, however.
Box 5.6 The Colonial Heritage: the Case of Public Health Legislation inAccra
Accra was made the capital of the then Gold Coast (now Ghana) by the colonial authoritiesin 1877. It is now estimated that Accra is home to 30% of the urban population of Ghanaand over 10% of the total population of Ghana (Min. of Local Government, 1992).
Most of the legislation and by-laws which guide environmental health in the capitaldate back to the colonial era. Many are outdated, ineffectual and have lost theirsignificance. Others have become impracticable, given the developmental trend that isseeing Accra develop the status of a metropolis.
Control of sanitation during the pre-independence era achieved successes within itsown limited remits, and also failed afterwards for a number of reasons:• It was based on an autocratic system, efficient at punishing offenders, but not interms of developing an understanding of the health risks among the public, or of securingpopular legitimacy.• A Sanitary Inspection Department was set up under the then Town Council as apolicing unit, with sweeping powers to find and prosecute sanitary offenders. Thisdepartment came to be seen by many as an oppressive wing of the local authority, ratherthan as an organ of change or development.• Laws and by-laws were specific to the residential environment only, e.g. The AccraTown Council Ordinance of 1943 (Gazette Notice No. 912). This led to the exclusion ofadequate inspection of the working environment - a problem that continues to this day.
With the attainment of independence, many aspects of sanitation policy were relaxedrather than redesigned:• The government and, for that matter, the local authorities failed to provide adequatesanitation infrastructure and deliver adequate sanitation services.• The Judicial Service’s handling of sanitation cases weakened to the extent that onlyaround 10% of sanitation offence cases brought for prosecution are disposed of after afrustrating long period of adjournments (Annual Reports of the Director of Public Health,Accra Metropolitan Authority. 1996 and 1997).
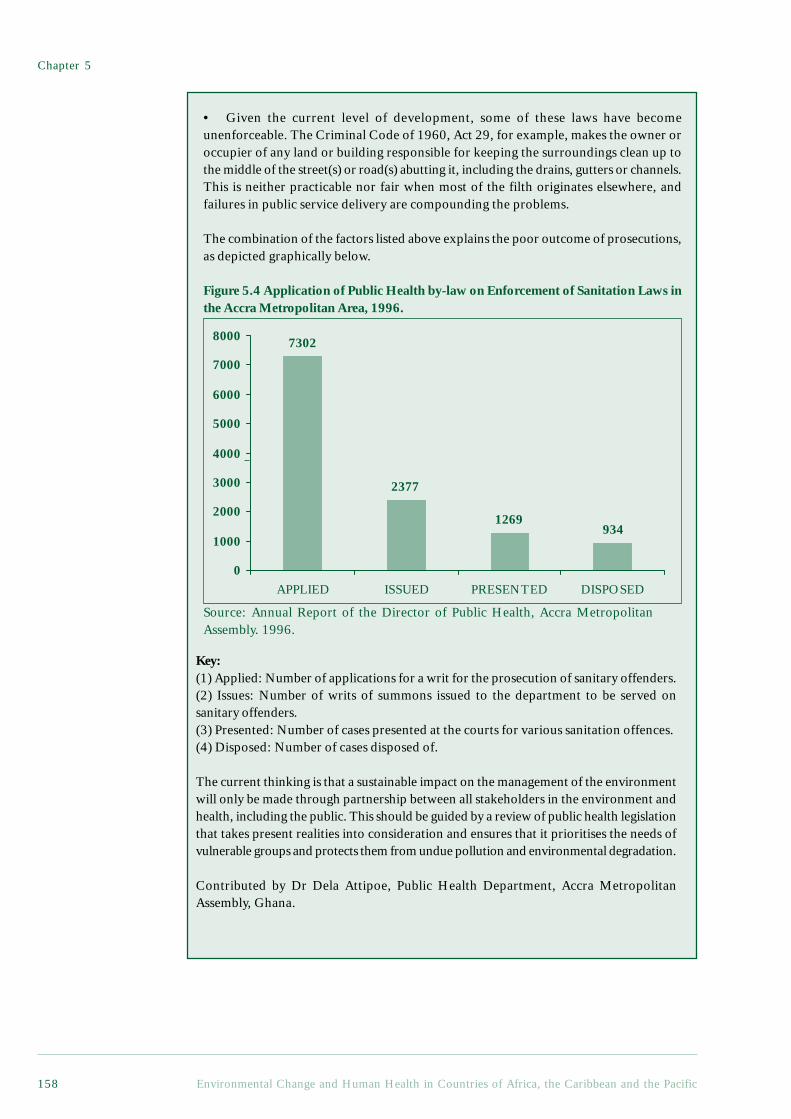
Chapter 5
Environmental Change and Human Health in Countries of Africa, the Caribbean and the Pacific158
• Given the current level of development, some of these laws have becomeunenforceable. The Criminal Code of 1960, Act 29, for example, makes the owner oroccupier of any land or building responsible for keeping the surroundings clean up tothe middle of the street(s) or road(s) abutting it, including the drains, gutters or channels.This is neither practicable nor fair when most of the filth originates elsewhere, andfailures in public service delivery are compounding the problems.
The combination of the factors listed above explains the poor outcome of prosecutions,as depicted graphically below.
Figure 5.4 Application of Public Health by-law on Enforcement of Sanitation Laws inthe Accra Metropolitan Area, 1996.
Key:(1) Applied: Number of applications for a writ for the prosecution of sanitary offenders.(2) Issues: Number of writs of summons issued to the department to be served onsanitary offenders.(3) Presented: Number of cases presented at the courts for various sanitation offences.(4) Disposed: Number of cases disposed of.
The current thinking is that a sustainable impact on the management of the environmentwill only be made through partnership between all stakeholders in the environment andhealth, including the public. This should be guided by a review of public health legislationthat takes present realities into consideration and ensures that it prioritises the needs ofvulnerable groups and protects them from undue pollution and environmental degradation.
Contributed by Dr Dela Attipoe, Public Health Department, Accra MetropolitanAssembly, Ghana.
1269934
2377
7302
0
1000
2000
3000
4000
5000
6000
7000
8000
APPLIED ISSUED PRESENTED DISPOSED
Source: Annual Report of the Director of Public Health, Accra MetropolitanAssembly. 1996.
Environmental Change and Human Health in Countries of Africa, the Caribbean and the Pacific 159
Urbanisation and Healthy Living Environments
5.5 Environmental Risks fromHeavy Industry and VehicularTransport
Industrialisation is one of the three maintrends examined in World Resources 1998-99. As indicated above, the dangers of rapidindustrialisation are less relevant in most ACPcountries than in many other parts of theglobe, and this is one reason whyindustrialisation has been included underurbanisation in this report, rather than thereverse. A second reason is that, given thelow level of industrial activity, the health risksfrom industrial pollution tend to be moreconcentrated in selected areas, typically incities or towns. The risk, for example, ofpersistent organic pollutants (POPs) and heavymetals being widely dispersed, creating low-level concentrations to which large sectors ofthe population become exposed, is lower herein comparative terms than elsewhere.
5.5.1 Industrial Pollution in ACP CountriesWhilst industrial pollution is not treated as amajor issue in this report, this should not betaken as implicit grounds for ignoringindustrial pollution where it does occur. Lowaverages hide hot spots where action is clearlywarranted. Moreover, some of theenvironmental health risks of industrialactivity arise not from exposure to pollutantsfrom multiple sources, but from concentratedexposures to pollutants from single sources.Such health risks (see Box 3.4), which includemost occupational hazards and manyhazardous wastes, deserve the same level ofstringency, regardless of the overall level ofindustrial activity. More generally, it is thehealth burden per unit of production (and thecosts of mitigation), not the aggregate healthburden, that should be decisive indetermining whether the health risks ofenvironmentally hazardous productionprocesses are acceptable.
In ACP countries, the average industrialcontribution to the Gross Domestic Productwas about $170 per capita in 1995, comparedto a world average of about $1,600 (see Table6.1 in Appendix 2). If Nigeria and South Africaare removed from the equation, the industrialcontribution falls to below $90 per capita. Incomparison, the industrial contribution in aheavily industrialised country such as South
Korea was over $4,000 per capita, and itreached a high of more than $15,000 inJapan—almost 100 times the ACP average.
The limited industrialisation that has takenplace in ACP countries has, nonetheless,brought many of the hazards described inWorld Resources 1998-99. Those affected areprimarily the comparatively small number ofindustrial workers, and those living in thevicinity of industrial establishments. For theseminorities, industrial pollution can be a majorhealth hazard. Effective regulation is oftenlacking, and public awareness is often low,partly because industrial pollution is not awidespread hazard. As a result, it is safe toassume that a larger share of the industrial healthrisks in ACP countries come from high levelsof exposure on the part of a few people, andthat a smaller share involves low levels ofexposure on the part of the general population.One might also expect a disproportionate shareof accidents relative to routine pollution,although of the 44 serious industrial accidentsworld-wide (1970-92) listed by the WHO(World Health Organization, 1997), only onewas in an ACP country (an ammonia tankexplosion in Dakar in 1992).
Major industrial polluters include mines,thermal power plants (especially coal-fired),fertiliser factories, textile mills, cementfactories, chemical manufacturing plants, pulp-and-paper plants, slaughterhouses andtanneries. These establishments tend to belocated near cities, or, in the case of mines andpulp-and-paper plants, in towns near theirresource base. They create water and airpollution problems, as well as various formsof solid waste, but most of the pollutants givingrise to concern are chemicals. A notableexception is the medical establishments, whosewaste can contain pathogens in sufficientquantities to spread infectious diseases.
In 1995, South Africa alone accounted foran estimated 40% of the industrial value addedin the ACP. Not surprisingly then, South Africais where a large share of the industrial pollutionproblems arise. South Africa has a long historyof industrialisation, but as one of the moreaffluent ACP countries, it also has relativelywell developed environmental regulations. Withits history of apartheid, however, concern forthe wellbeing of the majority of the populationhas been a low priority (McDonald, 1998).
Chapter 5
Environmental Change and Human Health in Countries of Africa, the Caribbean and the Pacific160
Whilst industrial pollution is less closelylinked to poverty than the problemsdescribed in the previous section, whenindustrial pollution does occur in low-income settings the consequences tend to bemore severe. The industrial pollutionaffecting townships such as Soweto are fairlywell documented. The dangers of poorlycontrolled industrial waste in low-incomesettings are also well illustrated by the townof Mafefe, South Africa (Booth et al., 1994).Mafefe is located alongside an asbestosmine, and a survey in 1987 found that onethird of the homes were built with materialscontaining asbestos, which can causescarring of the lung tissue leading to lungdisease (asbestosis) and various cancers.
Some industrial pollution problems aremore democratic in their impacts. SouthAfrica’s Mpumalanga Highveld has one ofthe highest concentrations of coal-burningindustries in the world, along with some ofworst industrial air pollution. Even thehealth of affluent residents is put at risk fromsuch pollution.
Not all industrial waste comes from localindustry, however. Trade in hazardous wastecan create health risks in receiving countries,and not all such trade is official (almost allofficial trade originates in the OECD and isbetween developed countries). In one of thebest known illegal attempts to exporthazardous waste, a German ship with 2,100tonnes of Italian hazardous waste sailed toNigeria in contravention of an EC directiveand had to return the waste to Europe(Cortinas de Nava, 1996). Following thisincident, the ACP countries proposed a newprovision in the Lomé convention, banningany export of hazardous wastes to any ACPcountry. The risks associated with illegal traderemain, however, and, as free trade expands,control is becoming more difficult.
There is also a danger that as environmentalcontrols tighten in affluent countries, countrieswith lax controls will attract pollutingindustries and technologies. The guidelines ofthe European Chemical Industry Council saythat the environmental and health safety aspectsof transferred technology should be ‘equivalentto that achieved in the home facilities of thetechnology supplier’ (Castleman, 1995). ACPcountries have a clear interest in following the
way in which such guidelines are developedand enforced, as well as in continuing todevelop their own standards.
5.5.2 Road Traffic AccidentsThe health risks of transportation systemsalso receive comparatively little attention inthis report – for similar reasons and withsimilar qualifications as withindustrialisation. The average level of vehicleownership in ACP countries is very low, andwhilst the numbers of vehicles are rapidlyincreasing in absolute terms, the transportsystem is currently not a major contributorto ill health. These problems can be expectedto change with time, particularly ifpreventative measures are not taken. Theinsufficient number of vehicles in relationto the demand for transport also leads tovehicle overuse, which increases the risk forbreakdowns and accidents, and also reducesengine efficiency. This is compounded bythe fact that many vehicles are very old, andthat the low quality of the roads furtheraggravate the problems of ageing vehicles.Poor traffic management and low levels ofcompliance with traffic rules also increasethe risk of accidents. Further concerns withregard to the disproportionately highincidence of motor vehicle accidents incomparison with the low number of vehicleswere noted in Chapter 3.
5.5.3 Air Pollution from Non-DomesticSources
Air pollution and accidents are the mainhealth burdens imposed by the transportsystem. Emissions of hazardous pollutants pervehicle are almost certainly higher than theglobal average, although not nearly highenough to offset the low numbers. Mostexposure to vehicular emissions occurs inurban areas, where ambient concentrationstend to be far higher than in rural areas. Themajor contributor to urban air pollution, inaddition to vehicles, is usually industrialactivity, although, as described in section 5.4,waste burning and household fuel use can alsobe important.
A list of air pollutants, with their principalsources, health and environmental effects, isprovided in Table 5.3. Whilst the healtheffects of air pollution have long been studied,
Environmental Change and Human Health in Countries of Africa, the Caribbean and the Pacific 161
Urbanisation and Healthy Living Environments
recent epidemiological findings have raisednew concerns, particularly in relation toparticulates of less than 10 µm in effectivediameter (PM10). These studies havedemonstrated relationships betweenparticulate levels and respiratory ailments incomparatively affluent cities, and atcomparatively low concentrations, and haveprovoked world-wide revisions in air qualitystandards and guidelines (Murray, 1998;Dockery and Pope III, 1994; Dockery et al.,1993; Pope III et al., 1995). Given theimportance of acute respiratory infections inmost ACP countries (see Chapter 3), theseresults suggest that even if it is not already amajor health problem, ambient air pollutionneeds to be taken seriously.
Air pollution monitoring is rare in mostACP countries, and the air pollution data thatare collected are not generally compiled ina form that allows international comparisons.The most severe problems are likely to beencountered in the few large industrial cities,especially those with adverse meteorologicaland topographical features. Perhaps evenmore than the large cities of South Africa,Lagos provides a telling example of thepotential risks of air pollution when coupledwith inadequately controlled urbandevelopment (Baumbach et al., 1995). Inaddition to the ambient air pollution in largecities, ‘hot spots,’ such as bus terminals andmarket places, can create locally elevatedconcentrations, posing a particularly severehazard to local workers. These ‘hot spots’do not depend so much on city size andoverall industrial development, and deserveparticular attention.
For some health hazards, most notablychildhood lead poisoning, air pollution addsto exposures that can also come fromnumerous other sources. Lead can lead to arange of health and developmental effects,including lower IQ levels among children. Inrecent studies of environment and health inBangkok and Cairo, exposure to lead wasidentified as a critical and avoidableenvironmental health problem (Abt Associatesand Sobotka & Co., 1990; Sessions et al., 1994).With a few exceptions, cities in ACP countriesare unlikely to have such severe problems, butthere are a number of reasons for concern.Among the reasons summarised in a recent
review of childhood lead poisoning in Africa(Nriagu et al., 1996), most of which arerelevant to several of the Small Island States,are:
• While gasoline consumption is low,the lead contents are among the highest inthe world (see Table 8.6 in Appendix 2);
• Numerous detailed studies haveindicated high levels of lead in particular groupsof children in high risk settings (such as livingnear mining centres or lead pollutingindustries, or working or schooling near traffic);
• Various socio-ecological factorspredispose low-income children in particularto lead exposure when it is present in theambient environment;
• Children can be more susceptible toenvironmental lead poisoning when they haveiron deficiency, and lead poisoning canaggravate communicable diseases.
5.6 The Urban Informal Economy,Livelihoods and theEnvironment
The economic survival of many urbandwellers in ACP countries, particularly duringperiods of stress, depends upon what hascome to be termed the informal economy.Informal economic enterprises include a verydiverse range of ‘small-scale, mostly familyoperated or individual activities that are notlegally registered and usually do not providetheir workers with social security or legalprotection’ (Rogerson, 1997). It has beenestimated that 63% of Sub-Saharan Africa’slabour force is already engaged in theinformal economy (Rogerson, 1997, citingILO-JASPA), and that in the 1990s it willaccount for 93% of all new jobs in urbanAfrica (Rogerson, 1997).
Being informal, these activities are verypoorly documented, and internationalestimates should be treated with scepticism.There are, however, a number of moredetailed studies demonstrating that, at leastin some cities, informal activities have beengrowing extremely rapidly, partly incompensation for the poor performance ofthe formal economy (Rakodi, 1997b). Forwomen in particular, going to work ininformal activities, where pay differentialsare high but access is easy, is a common
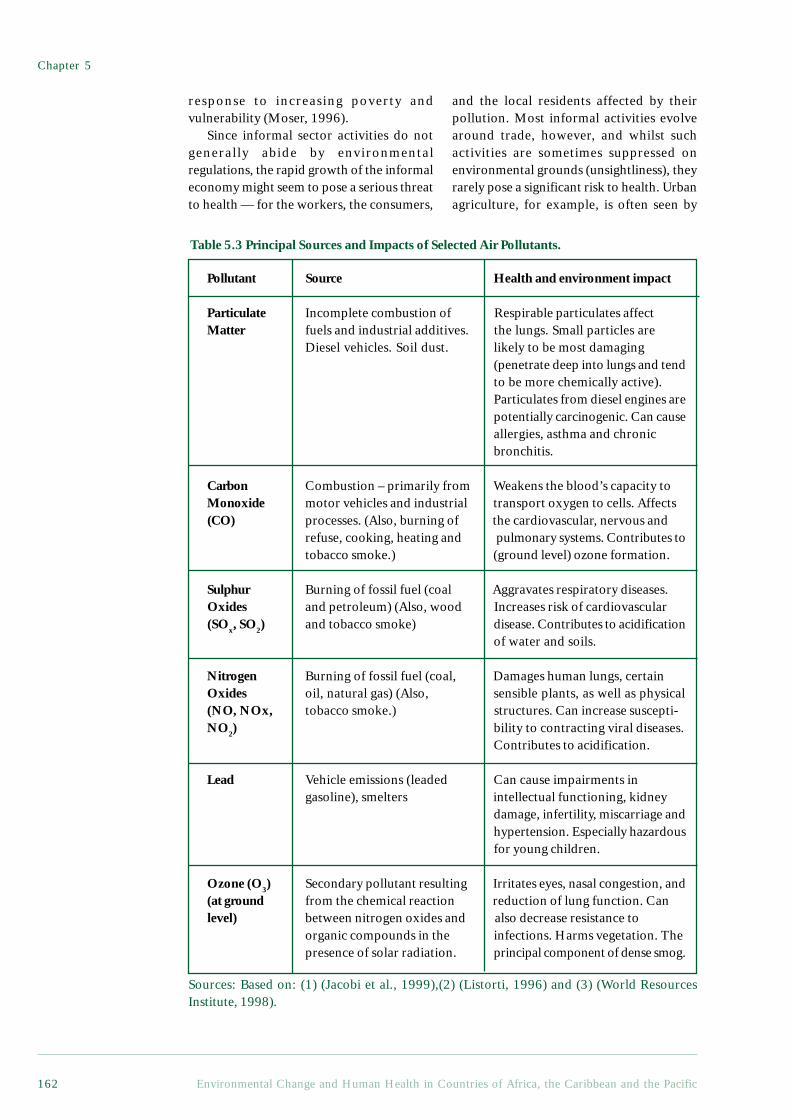
Chapter 5
Environmental Change and Human Health in Countries of Africa, the Caribbean and the Pacific162
Table 5.3 Principal Sources and Impacts of Selected Air Pollutants.
response to increasing poverty andvulnerability (Moser, 1996).
Since informal sector activities do notgenerally abide by environmentalregulations, the rapid growth of the informaleconomy might seem to pose a serious threatto health — for the workers, the consumers,
and the local residents affected by theirpollution. Most informal activities evolvearound trade, however, and whilst suchactivities are sometimes suppressed onenvironmental grounds (unsightliness), theyrarely pose a significant risk to health. Urbanagriculture, for example, is often seen by
Pollutant Source Health and environment impact
Particulate Incomplete combustion of Respirable particulates affectMatter fuels and industrial additives. the lungs. Small particles are
Diesel vehicles. Soil dust. likely to be most damaging(penetrate deep into lungs and tendto be more chemically active).Particulates from diesel engines arepotentially carcinogenic. Can causeallergies, asthma and chronicbronchitis.
Carbon Combustion – primarily from Weakens the blood’s capacity toMonoxide motor vehicles and industrial transport oxygen to cells. Affects(CO) processes. (Also, burning of the cardiovascular, nervous and
refuse, cooking, heating and pulmonary systems. Contributes totobacco smoke.) (ground level) ozone formation.
Sulphur Burning of fossil fuel (coal Aggravates respiratory diseases.Oxides and petroleum) (Also, wood Increases risk of cardiovascular(SOx, SO2) and tobacco smoke) disease. Contributes to acidification
of water and soils.
Nitrogen Burning of fossil fuel (coal, Damages human lungs, certainOxides oil, natural gas) (Also, sensible plants, as well as physical(NO, NOx, tobacco smoke.) structures. Can increase suscepti-NO2) bility to contracting viral diseases.
Contributes to acidification.
Lead Vehicle emissions (leaded Can cause impairments ingasoline), smelters intellectual functioning, kidney
damage, infertility, miscarriage andhypertension. Especially hazardousfor young children.
Ozone (O3) Secondary pollutant resulting Irritates eyes, nasal congestion, and(at ground from the chemical reaction reduction of lung function. Canlevel) between nitrogen oxides and also decrease resistance to
organic compounds in the infections. Harms vegetation. Thepresence of solar radiation. principal component of dense smog.
Sources: Based on: (1) (Jacobi et al., 1999),(2) (Listorti, 1996) and (3) (World ResourcesInstitute, 1998).
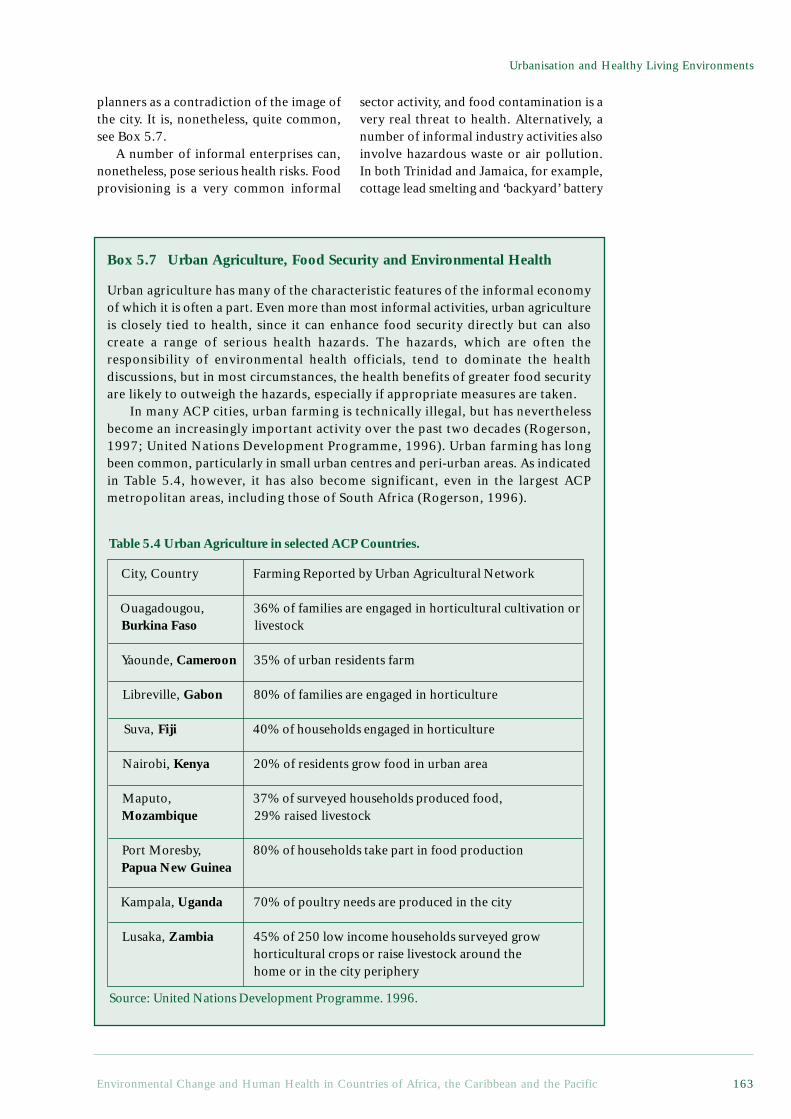
Environmental Change and Human Health in Countries of Africa, the Caribbean and the Pacific 163
Urbanisation and Healthy Living Environments
Box 5.7 Urban Agriculture, Food Security and Environmental Health
Urban agriculture has many of the characteristic features of the informal economyof which it is often a part. Even more than most informal activities, urban agricultureis closely tied to health, since it can enhance food security directly but can alsocreate a range of serious health hazards. The hazards, which are often theresponsibility of environmental health officials, tend to dominate the healthdiscussions, but in most circumstances, the health benefits of greater food securityare likely to outweigh the hazards, especially if appropriate measures are taken.
In many ACP cities, urban farming is technically illegal, but has neverthelessbecome an increasingly important activity over the past two decades (Rogerson,1997; United Nations Development Programme, 1996). Urban farming has longbeen common, particularly in small urban centres and peri-urban areas. As indicatedin Table 5.4, however, it has also become significant, even in the largest ACPmetropolitan areas, including those of South Africa (Rogerson, 1996).
Table 5.4 Urban Agriculture in selected ACP Countries.
planners as a contradiction of the image ofthe city. It is, nonetheless, quite common,see Box 5.7.
A number of informal enterprises can,nonetheless, pose serious health risks. Foodprovisioning is a very common informal
City, Country Farming Reported by Urban Agricultural Network
Ouagadougou, 36% of families are engaged in horticultural cultivation or Burkina Faso livestock
Yaounde, Cameroon 35% of urban residents farm
Libreville, Gabon 80% of families are engaged in horticulture
Suva, Fiji 40% of households engaged in horticulture
Nairobi, Kenya 20% of residents grow food in urban area
Maputo, 37% of surveyed households produced food, Mozambique 29% raised livestock
Port Moresby, 80% of households take part in food production Papua New Guinea
Kampala, Uganda 70% of poultry needs are produced in the city
Lusaka, Zambia 45% of 250 low income households surveyed grow horticultural crops or raise livestock around the home or in the city periphery
sector activity, and food contamination is avery real threat to health. Alternatively, anumber of informal industry activities alsoinvolve hazardous waste or air pollution.In both Trinidad and Jamaica, for example,cottage lead smelting and ‘backyard’ battery
Source: United Nations Development Programme. 1996.
Chapter 5
Environmental Change and Human Health in Countries of Africa, the Caribbean and the Pacific164
Most studies of urban agriculture note that the primary motive for urban farmingis obtaining food for household consumption, and that the cultivators are mostlywomen (Maxwell, 1995; United Nations Development Programme, 1996). This,combined with the observation that urban agriculture has expanded in response tothe crisis in the formal economy, suggests that it is has become an important elementof urban food security. Urban agriculture can add important micronutrients to theurban diet (Atkinson, 1992), but more importantly, it can often provide food whenincome falters. A study of urban farming in Kampala thus found that urban farmingwas often used by women ‘as a strategic reserve for times when there is no moneyfor buying food, either because of erratic household income or because, in conjugalhouseholds, the wife who is responsible for food is not allocated a sufficient amountof money by her husband’ (Maxwell, 1995). Moreover, recently abandoned orwidowed women fell back on urban farming when they had no other means ofacquiring food.
Access to land, as well as social norms and law enforcement, can radically alterthe opportunities for urban agriculture in different cities, however. Many urbanfarmers do not own the land they cultivate, and in some cases the very lack of tenuralclarity that prevents the efficient use of land by the formal sector provides importantopportunities for the socially excluded. It should not, on the other hand, be assumedthat all, or even most, urban cultivators in a city are poor. Indeed, there is evidencein some urban areas that the poorest groups are excluded from access to land, andthere are indications that the more affluent are increasingly dominating urbanagriculture. Such tendencies will tend to reduce the role of urban agriculture inproviding food security. From a health perspective, it is important to ensure thatlow-income residents have access to the urban ‘farmland’ if urban agriculture is tobe promoted in the name of food security.
The health risks of urban agriculture range from malaria to food contamination;the level of risk depends very much on how and where the agriculture is practised.Malarial mosquitoes generally favour rural settings, where there is open andunpolluted water for breeding. Urban farming, and especially irrigated agriculture,can introduce breeding sites into densely populated urban settings. Malarial andnuisance mosquitoes can be difficult to distinguish, however, and urban agricultureis sometimes unfairly blamed for promoting malaria. It is thus often wrongly believed,for example, that malaria mosquitoes breed in maize plants (Birley and Lock, 1998).A well-informed health perspective on urban agriculture can hence not only identifymeasures to prevent the urban agriculture from creating malaria risks, but in somecases, also correct misconceptions about these risks.
The possibilities for food contamination are heightened in urban agriculture becauseof potential exposure to urban pollutants, such as heavy metals and human waste. Leadparticles from air pollution can fall on crops this is a particular risk near roads used byvehicles powered by leaded fuel, but can be substantially reduced by washing (Birley andLock, 1998). Also, when the soil or water is contaminated by heavy metals, plant uptakecan lead to food contamination, although the importance of this exposure route is notwell documented. The risks associated with exposure to human waste are particularlypronounced when urban wastewater is used for irrigation, or, more generally, faecalmaterial is used as a fertiliser. Here too, there are many steps that can be taken to reducesuch risks, and although informal urban agriculture may be difficult to regulate, targetedmeasures designed to reduce some of the more serious risks are still possible. New moreecological approaches to urban sanitation are, moreover, being developed, many of whichcould directly benefit urban agriculture (Drangert et al., 1997; Esrey et al., 1998). Theirsuccess is far more likely to be assured if health and environmental sectors can combineto take an integrated approach.
Environmental Change and Human Health in Countries of Africa, the Caribbean and the Pacific 165
Urbanisation and Healthy Living Environments
ReferencesAtkinson, S. J. 1992. Food for the Cities: Urban Nutrition Policy in Developing Countries. PHP
Departmental Publication No. 5. London School of Hygiene & Tropical Medicine (London). 72 p.Birley, M. H. and Lock, K. 1998. Health and peri-urban natural resource production. Environment and
Urbanization. 10(1):89-106.Drangert, J.-O., Bew, J. and Winblad, U. 1997. Ecological Alternatives in Sanitation: Proceedings from
Sida Sanitation Workshop Balingsholm, Sweden 6-9 August 1997. Publications on Water ResourcesNo. 9. Swedish International Development Cooperation Agency (Sida) (Stockholm). 90 p.
Esrey, S. A., Gough, J., Rapaport, D., Sawyer, R., Simpson-Hébert, M., Vargas, J. and Winblad, U. 1998.Ecological Sanitation. Swedish International Development Cooperation Agency (Stockholm). 92 p.
Maxwell, D. G. 1995. Alternative Food Security Strategy: A Household Analysis of Urban Agriculture inKampala. World Development. 23(10):1669-1681.
Rogerson, C. M. 1996. Urban poverty and the informal economy in South Africa’s economic heartland.Environment and Urbanization. 8(1):167-181.
Rogerson, C. M. 1997. Globalization or informalization?: African urban economies in the 1990s. In:Rakodi C., (ed.). The Urban Challenge in Africa: Growth and Management of its Large Cities. Tokyo,United Nations University Press. p 337-370.
United Nations Development Programme. 1996. Urban Agriculture: Food, Jobs and Sustainable Cities.New York, United Nations Development Programme. 302 p.
recycling have been shown to pose aconsiderable risk to children’s health (Matteet al., 1991). Urban informal mining andthe processing of building materials, suchas sand and stone, is very important for theburgeoning building industry, and constitutesa major source of income for the pooresturban dwellers. As virtually no protectivegear is available, however, these people alsoinhale dust, and flying pieces of rocks canget into their eyes. Other injuries includethe smashing of hands and fingers (Jambiyaet al., 1997).
If informal activities were trulyundertaken with no concern for their healthconsequences, the impacts of these enterprisescould be devastating. The informal sector isnot unregulated, however: rather, it isinformally regulated. With food provision, forexample, there are two common institutionalresponses to preventing contamination, onemore relevant to formal enterprises and theother to informal enterprises. Firstly, certainpractices on the part of food handlers can beproscribed by the government, and additivesrestricted. Secondly, the economic lure offuture sales and the psychology of personalcontact can help ensure that a food vendorwill not sell food known to be contaminated,at least to regular customers. This inducementis multiplied when the vendor works in aneighbourhood where reputations, and hencesales, rise or fall with the quality of the foodsold. Similar links of patronage and
reputation can work back through the foodsystem, mitigating at least the worst excessesthat would arise in an anonymous, andunregulated, free market. The more seriousproblems arise when customers, localresidents and in some cases the operators areunaware of the health risks involved.
The informal sector can also, under theright circumstances, contribute to betterenvironmental management and, indirectly,better health. Where piped water is notprovided to people’s homes, informalenterprises can transport it at a comparativelylow cost. Waste disposal and recycling aretraditional informal activities which can haveenvironmental benefits. Romanos and Chifosargue that informal urban enterprises arealready making a significant contribution toenvironmental management, and could domore (Romanos and Chifos, 1996). Theirexamples are primarily taken from Asia,where such informal enterprises are moreactive in the water and waste sectors, but giventhe growth of the informal sector in manyACP countries, there are perhaps manyimportant lessons to be learnt from the Asianexperience.
Overall, the informal economy’scontribution to health by providing livelihoodsfor vulnerable populations undoubtedlyoutweighs the risks it poses to health throughhazardous practices. From a health perspective,it is critical to distinguish between the largelyaesthetic environmental impacts of most
Chapter 5
Environmental Change and Human Health in Countries of Africa, the Caribbean and the Pacific166
informal sector activities, and the healthhazards of a few. It is also important torecognise that those most at risk are likely tobe the informal sector workers themselves.Since these workers are often also localresidents, their awareness of the environmentalrisks can make a considerable difference.
5.7 ConclusionsUrbanisation in ACP countries has coincidedwith rapid population growth, creating someof the most rapid urban growth everexperienced on such a scale. Occurring at atime of economic distress, this growthconstitutes an enormous challenge for urbangovernance. Measures designed to restricturban growth are likely to becounterproductive, however, and the priorityshould be to improve the quality ofurbanisation, and to help ensure that citiescontribute to sustainable and healthydevelopment.
The major environmental health challengeis to improve conditions in low-income homesand neighbourhoods, where poor access towater, bad sanitation, contaminated food,uncollected waste, smoky kitchens and a rangeof insect vectors combine to form a complex ofhealth threatening conditions. Poverty is at theheart of this challenge, but better environmentalmanagement can be an important part of thesolution. Conventional public and capital-intensive approaches are increasingly seen asinadequate and unaffordable routes forimprovement, but leaving local environmentalmanagement to the private sector is even worse.It is necessary to combine the strengths ofgovernment, markets and community action,and to build on both scientific and localknowledge. Capacity building, education andawareness raising at all levels are crucial, as isthe need to take the views of local residentsmore seriously. This is further developed inChapter 7.
ReferencesAbt Associates and Sobotka & Co. 1990. Ranking Environmental Health Risks in Bangkok, Thailand.
USAID.Aryeeyey-Attoh, S. 1997. Urban Geography of Sub-Saharan Africa. In: Aryeeyey-Attoh S., (ed.). Geography
of Sub-Saharan Africa. Upper Saddle River, New Jersey, Simon & Schuster. p 182-222.Bairoch, P. 1988. Cities and Economic Development: From the Dawn of History to the Present. Braider,
C., translator. London, Mansell Publishing. 574 p.Bateman, O. M., Smith, S. and Roark, P. 1993. A Comparison of the Health Effects of Water Supply and
Sanitation in Urban and Rural Areas of Five African Countries. WASH Field Report No. 398. Waterand Sanitation for Health Project, WASH Operations Center (Arlington, VA).
Baumbach, G., Vogt, U., Hein, K. R. G., Oluwole, A. F., Ogunsola, O. J., Olaniyi, H. B. and Akeredolu,F. A. 1995. Air pollution in a large tropical city with a high traffic density - results of measurements inLagos, Nigeria. The Science of the Total Environment. 169(July 8):25-31.
Becker, C. M., Hamer, A. M. and Morrison, A. R. 1994. Beyond Urban Bias in Africa: Urbanization in anEra of Structural Adjustment. Portsmouth, NH, Heinemann. 294 p.
Benneh, G., Songsore, J., Nabila, J. S., Amuzu, A. T., Tutu, K. A., Yangyuoru, Y. and McGranahan, G.1993. Environmental Problems and the Urban Household in the Greater Accra Metropolitan Area(GAMA) -Ghana. Stockholm Environment Institute (Stockholm). 126 p.
Berman, S. 1991. Epidemiology of acute respiratory infections in children of developing countries.Reviews of Infectious Diseases. 13(Suppl. 6):455-462.
Booth, A., McCullum, J., Mpinga, J. and Mukute, M. 1994. State of the Environment in Southern Africa.SARDC - Southern African Research & Documentation Centre in collaboration with IUCN and theSouthern African Development Community (Harare). 332 p.
Burgess, N. R. H. 1990. Public Health Pests: A Guide to Identification, Biology and Control. London,Chapman and Hall. 162 p.
Castleman, B. I. 1995. The migration of industrial hazards. Journal of Occupational and EnvironmentalHealth. 1(2):85-96.
Chen, B. H., Hong, C. J., Pandey, M. R. and Smith, K. R. 1990. Indoor air pollution in developingcountries. World Health Statistics Quarterly. 43:127-138.
Chinery, W. A. 1990. Variation in frequency in breeding of anopheles gambiae s.l. and its relationship within-door adult mosquito density in various localities in Accra, Ghana. East African Medical Journal.67(5):328-335.
Cointreau, S. J. 1986. Environmental Management of Urban Solid Wastes in Developing Countries: AProject Guide. World Bank (Washington, DC). 214 p.
Cortinas de Nava, C. 1996. Worldwide overview of hazardous wastes. Toxicology and Industrial Health.12(2):127-138.
Environmental Change and Human Health in Countries of Africa, the Caribbean and the Pacific 167
Urbanisation and Healthy Living Environments
Dockery, D. W. and Pope III, C. A. 1994. Acute respiratory effects of particulate air pollution. Annu. Rev.Public Health. 15:107-132.
Dockery, D. W., Pope III, C. A., Xu, X., Spengler, J. D., Ware, J. H., Fay, M. E., Ferris, B. G. and Speizer,F. E. 1993. An association between air pollution and mortality in six U.S. cities. . New England Journalof Medicine. p 1753-1759.
Ellegård, A. and Egnéus, H. 1992. Health Effects of Charcoal and Woodfuel Use in Low-Income Householdsin Lusaka, Zambia. EE&D Report No. 14. Stockholm Environment Institute (Stockholm). 78 p.
Esrey, S. A. and Feachem, R. G. 1989. Interventions for the Control of Diarrhoeal Diseases among YoungChildren: Promotion of Food Hygiene. WHO/CDD No. 89.30. World Health Organization (Geneva).
Franceys, R., Pickford, J. and Reed, R. 1992. A Guide to the Development of On-Site Sanitation. Geneva,World Health Organization. 237 p.
Graham, N. M. H. 1990. The epidemiology of acute respiratory infections in children and adults: A globalperspective. Epidemiologic Reviews. 12:149-178.
Hardoy, J. E., Mitlin, D. and Satterthwaite, D. 1992. Environmental Problems in Third World Cities.London, Earthscan. 302 p.
Hettige, H., Huq, M., Pargal, S. and Wheeler, D. 1996. Determinants of pollution abatement in developingcountries: Evidence from South and Southeast Asia. World Development. 24(12):1891-1904.
Jacobi, P., Baena Segura, D. and Kjellén, M. 1999. Governmental responses to air pollution: summary ofa study of the implementation of rodízio in São Paulo. Environment and Urbanization. 11(1):79-88.
Jambiya, G., Kulindwa, K. and Sosovele, H. 1997. Poverty and the Environment: The Case of InformalSand-Mining, Quarrying and Lime-Making Activities in Dar es Salaam, Tanzania. Report No. 97.1.University of Dar es Salaam (Dar es Salaam).
Kolsky, P. J.; 1992 13-17 July, 1992. Paper 12: Water, Health and Cities - Concepts and Examples.Levine, O. S. and Levine, M. M. 1991. Houseflies (musca domestica) as mechanical vectors of shigellosis.
Reviews of Infectious Diseases. 13(July-August):688-696.Lines, J., Harpham, T., Leake, C. and Schofield, C. 1994. Trends, priorities and policy directions in the
control of vector-borne diseases in urban environments. Health Policy and Planning. 9(2):113-129.Lipton, M. 1989. Why Poor People Stay Poor: Urban Bias in World Development. Aldershot, U.K.,
Gower House. 467 p.Listorti, J. A. 1996. Bridging Environmental Health Gaps: Lessons for Sub-Saharan Africa Infrastructure
Projects: Volume I. AFTES Working Paper: Main Report No. 20. World Bank (Washington, DC). 64 p.Mara, D. 1996. Low-Cost Urban Sanitation. Chichester, John Wiley & Sons. 223 p.Matte, T. D., Figueroa, J. P., Ostrowski, S., Burr, G., Jackson-Hunt, L. and Baker, E. L. 1991. Lead
exposure from conventional and cottage lead smelting in Jamaica. Archives of EnvironmentalContamination and Toxicology. 21:65-71.
McDonald, D. 1998. Three steps forward, two steps back: Ideology and urban ecology in the New SouthAfrica. Review of African Political Economy (ROAPE). 75 (forthcoming).
McGranahan, G. 1993. Household environmental problems in low-income cities: An overview of problemsand prospects for improvement. Habitat International. 17(2):105-121.
McGranahan, G. and Kaijser, A. 1993. Household Energy: Problems, Policies and Prospects. EED ReportNo. 19. Stockholm Environment Institute (Stockholm).
McGranahan, G., Songsore, J. and Kjellén, M. 1996. Sustainability, poverty and urban environmentaltransitions. In: Pugh C., (ed.). Sustainability, the Environment and Urbanization. London, Earthscan.p 103-133.
Molbak, K., Hojlyng, N., Jepsen, S. and Gaarslev, K. 1989. Bacterial contamination of stored water andstored food: A potential source of diarrhoeal disease in West Africa. Epidemiology and Infection.102:309-316.
Moser, C. O. N. 1996. Confronting Crisis: A Comparative Study of Household Responses to Poverty andVulnerability in Four Poor Urban Communities. Environmentally Sustainable Development Studiesand Monographs Series No. 8. World Bank (Washington, DC). 100 p.
Mosley, W. H., Bobadilla, J. L. and Jamison, D. T. 1993. The health transition: Implications for healthpolicy in developing countries. In: Jamison D.T., Mosley W.H., Measham A.R., Bobadilla J.L., (eds.).Disease Control Priorities in Developing Countries. Oxford, Oxford University Press for the WorldBank. p 673-699.
Murray, F. 1998. Impacts on health. In: Kuylenstierna J., Hicks K., (eds.). Regional Air Pollution inDeveloping Countries: Background Document for Policy Dialogue Bangkok, March 1998. Stockholm,Stockholm Environment Institute. p 5-11.
Nriagu, J. O., Blankson, M. L. and Ocran, K. 1996. Childhood lead poisoning in Africa: A growing publichealth problem. The Science of the Total Environment. 181:93-100.
Payne, G. 1997. Urban Land Tenure and Property Rights in Developing Countries: A Review. IntermediateTechnology Publications/ODA (London). 73 p.
Pope III, C. A., Thun, M. J., Namboodiri, M. M., Dockery, D. W., Evans, J. S., Speizer, F. E. and Heath,C. W., Jr. 1995. Particulate air pollution as a predictor of mortality in a prospective study of U.S.adults. American Journal of Respiratory and Critical Care Medicine. 151:669-674.
Rakodi, C. 1997a. Global forces, urban change, and urban management in Africa. In: Rakodi C., (ed.).The Urban Challenge in Africa: Growth and Management of its Large Cities. Tokyo, United NationsUniversity Press. p 17-73.
Rakodi, C., (ed.) 1997b. The Urban Challenge in Africa: Growth and Management of its Large Cities.Tokyo, United Nations University Press. 628 p.
Chapter 5
Environmental Change and Human Health in Countries of Africa, the Caribbean and the Pacific168
Rogerson, C. M. 1997. Globalization or informalization?: African urban economies in the 1990s. In:Rakodi C., (ed.). The Urban Challenge in Africa: Growth and Management of its Large Cities. Tokyo,United Nations University Press. p 337-370.
Romanos, M. and Chifos, C. 1996. Contributions of the urban informal sector to environmentalmanagement. Regional Development Dialogue. 17(1):122-155.
Satterthwaite, D. 1995. The underestimation of urban poverty and of its health consequences. ThirdWorld Planning Review. 17(4):iii-xii.
Satterthwaite, D. 1996. The Scale and Nature of Urban Change in the South. International Institute forEnvironment and Development (London). 29 p.
Satterthwaite, D. 1997. Environmental transformations in cities as they get larger, wealthier and bettermanaged. The Geographical Journal. 163(2):216-224.
Satterhwaite, D. 1999. The Links between Poverty and the Environment in Urban Areas of Africa, Asiaand Latin America. UNDP (New York).
Semboja, J. and Therkildsen, O., (eds.) 1995. Service Provision under Stress in East Africa. Copenhagen,Centre for Development Research. 242 p.
Serageldin, I. 1994. Water Supply, Sanitation, and Environmental Sustainability: The Financing Challenge.World Bank (Washington, DC). 35 p.
Sessions, S., Gaffen, M., Moore, S., Efroymson, R., El-Gohary, F., Nasralla, M., El Gamal, A. andGawaad, A. A. 1994. Comparing Environmental Health Risks in Cairo, Egypt. Project in Developmentand the Environment (Washington, DC).
Sharma, N. P., Damhaug, T., Gilgan-Hunt, E., Grey, D., Okaru, V. and Rothberg, D. 1996. African WaterResources. World Bank Technical Paper No. 331. World Bank (Washington, DC). 115 p.
Simon, D. 1997. Urbanization, globalization and economic crisis in Africa. In: Rakodi C., (ed.). TheUrban Challenge in Africa: Growth and Management of its Large Cities. Tokyo, United NationsUniversity Press. p 74-108.
Smith, K. R. 1993. Fuel combustion, air pollution exposure, and health: The situation in developingcountries. Annual Review of Energy and the Environment.(18):529-566.
Smith, K. R., Apte, M. G., Yuqing, M., Wongsekiarttirat, W. and Kulkarni, A. 1994. Air pollution and theenergy ladder in Asian cities. Energy. 19(5):587-600.
Smith, K. R. and Liu, Y. 1993. Indoor air pollution in developing countries. In: Samet J., (ed.). Epidemiologyof Lung Cancer. New York, Marcel Dekker. p 151-184.
Songsore, J. and McGranahan, G. 1998. The political economy of household environmental management:Gender, environment and epidemiology in the Greater Accra Metropolitan Area. World Development.26(3):395-412.
Stren, R. E. and White, R. R., (eds.) 1989. African Cities in Crisis: Managing Rapid Urban Growth.Boulder, Colo., Westview Press. 335 p.
Swedish International Development Cooperation Agency (Sida). 1995. Towards an Urban World:Urbanization and Development Assistance. Swedish International Development Cooperation Agency(Sida) (Stockholm). 80 p.
Terblanche, A. P. S., Danford, I. R. and Nel, C. M. E. 1993a. Household energy use in South Africa, airpollution and human health. Journal of Energy in Southern Africa.(May):54-57.
Terblanche, A. P. S., Nel, C. M. E., Opperman, L. and Nyikos, H. 1993b. Exposure to air pollution fromtransitional household fuels in a South African population. Journal of Exposure Analysis andEnvironment Epidemiology. 3(Suppl. 1):15-22.
Thomas, E. P., Seager, J. R., Viljoen, E., Potgeiter, F., Rossouw, A., Tokota, B., McGranahan, G. andKjellén, M. 1999. Household Environment and Health in Port Elizabeth, South Africa. UrbanEnvironment Series No. 6. Stockholm Environment Institute (Stockholm). 126 p.
United Nations. 1993. World Urbanization Prospects: The 1992 Revision: Estimates and Projections ofUrban and Rural Populations and of Urban Agglomerations. Report No. ST/ESA/SER.A/136. UnitedNations (New York). 164 p.
United Nations. 1998. World Urbanization Prospects: The 1996 Revision: Estimates and Projections ofUrban and Rural Populations and of Urban Agglomerations. Report No. ST/ESA/SER.A/170. UnitedNations (New York). 191 p.
United Nations Centre for Human Settlements (HABITAT). 1996. An Urbanizing World: Global Reporton Human Settlements, 1996. Oxford, Oxford University Press for United Nations Centre for HumanSettlements (HABITAT). 559 p.
World Bank. 1993. Housing: Enabling Markets to Work. A World Bank Policy Paper. World Bank(Washington, DC). 159 p.
World Health Organization. 1997. Health and Environment in Sustainable Development: Five years afterthe Earth Summit. Geneva, World Health Organization. 242 p.
World Resources Institute. 1998. World Resources 1998-99: A Guide to the Global Environment.Oxford University Press (New York). 369 p.
Chapter 6Global Environmental
Change
Environmental Change and Human Health in Countries of Africa, the Caribbean and the Pacific 165
Global Environmental Change
Chapter 6 Global Environmental Change
Aims of the Chapter• To identify and describe the potential effects on health of global climatechange and ozone depletion, and their importance to ACP countries.
Main Points• The activities contributing to global climatic change and ozone depletionoriginate largely outside of the ACP country region – only about 2% of globalcarbon emissions originate within the ACP, for example.• The projected effects of climate change are world-wide, with uncertainregional and local implications. Major effects are likely to be increasedtemperatures and frequency of extreme weather events, along with a rise in sealevels.• The health threats of climate change include malnutrition arising fromagricultural disruption, infectious diseases spread by insects and other vectorsadvantaged by climate change, as well as the direct loss of lives and livelihoodsfrom rises in sea levels and extreme weather events.• The ACP is likely to suffer disproportionately from global climate change,due to its geography (small islands and semi-arid regions are particularlyexposed), the presence of already food-insecure populations, and a lack ofcapacity for adaptation.• The health risks of stratospheric ozone depletion include skin cancer, whichis less of a risk for the dark-skinned majority of ACP residents, but also extendto eye diseases, immune system damage and ecological and climatic effectsthat may potentially undermine food security.
Policy Implications• As ACP countries may suffer disproportionately from climatic change, theyhave a particularly high stake in limiting the global emissions of greenhousegases, which may also extend to ozone depleting substances.• As ACP countries do not contribute appreciably to the emissions ofgreenhouse gases or ozone-destroying chemicals, their main concerns shouldbe to ensure that international agreements are equitable as well as strict, andthat vulnerability in the ACP is reduced.
6.1 IntroductionThe preceding chapters discuss the effects onhuman health of environmental changes atlocal and regional levels. No overview ofenvironment and health issues would becomplete, however, without a discussion ofglobal environmental changes and the threatsthey pose to health. Unlike the environmentalproblems described in previous sections,global environmental changes are largely theresult of activity outside of the ACP countries.Human-induced climate change is, forexample, primarily a result of carbon dioxide(CO2) emissions, the vast majority of whichoriginate in non-ACP countries (Figure 6.1).
As this chapter illustrates, however, ACPcountries are vulnerable to the effects ofglobal environmental changes and to climatechanges in particular. Food security, theprevalence of infectious diseases, and UV-induced conditions may all be altered as aresult of climate changes.
While this chapter focuses on climatechange and, to a lesser extent, ozonedepletion, global environmental changescan also be taken to include the depletionof global resources and sinks, as well aspollutants that affect health far from theirsource (e.g. persistent organic pollutantsor POPs). These may also have health
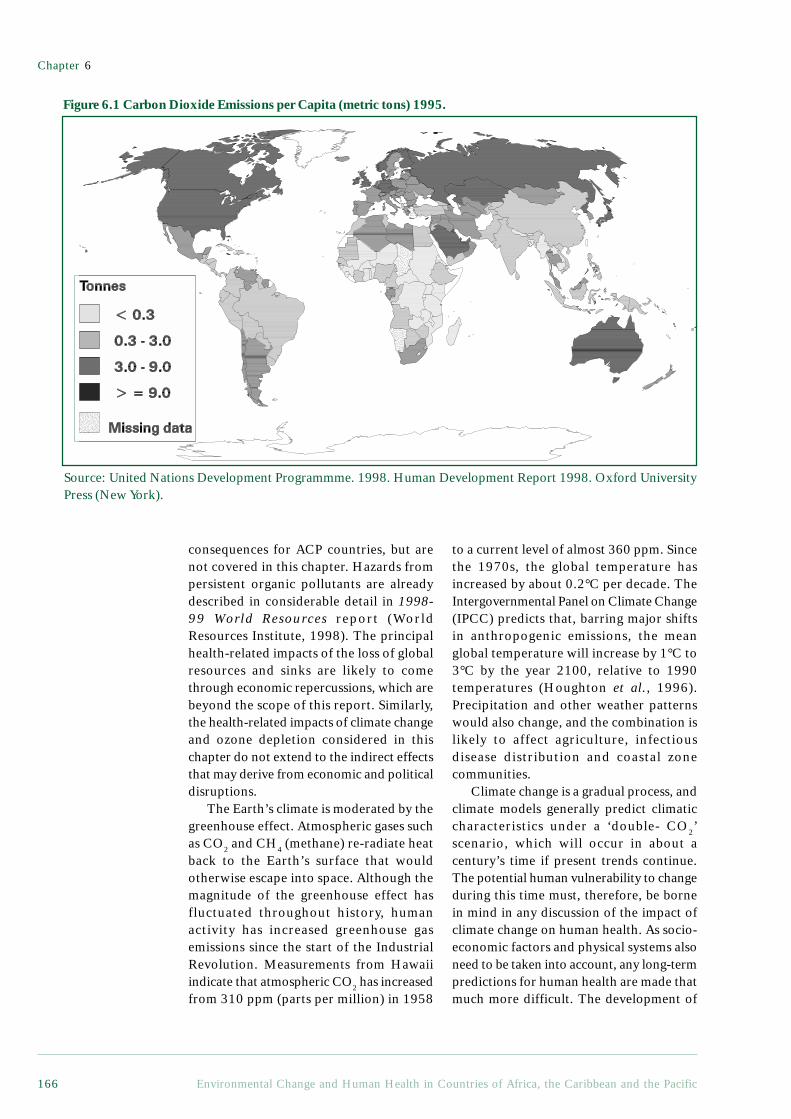
Chapter 6
Environmental Change and Human Health in Countries of Africa, the Caribbean and the Pacific166
consequences for ACP countries, but arenot covered in this chapter. Hazards frompersistent organic pollutants are alreadydescribed in considerable detail in 1998-99 World Resources report (WorldResources Institute, 1998). The principalhealth-related impacts of the loss of globalresources and sinks are likely to comethrough economic repercussions, which arebeyond the scope of this report. Similarly,the health-related impacts of climate changeand ozone depletion considered in thischapter do not extend to the indirect effectsthat may derive from economic and politicaldisruptions.
The Earth’s climate is moderated by thegreenhouse effect. Atmospheric gases suchas CO2 and CH4 (methane) re-radiate heatback to the Earth’s surface that wouldotherwise escape into space. Although themagnitude of the greenhouse effect hasfluctuated throughout history, humanactivity has increased greenhouse gasemissions since the start of the IndustrialRevolution. Measurements from Hawaiiindicate that atmospheric CO2 has increasedfrom 310 ppm (parts per million) in 1958
Figure 6.1 Carbon Dioxide Emissions per Capita (metric tons) 1995.
to a current level of almost 360 ppm. Sincethe 1970s, the global temperature hasincreased by about 0.2°C per decade. TheIntergovernmental Panel on Climate Change(IPCC) predicts that, barring major shiftsin anthropogenic emissions, the meanglobal temperature will increase by 1°C to3°C by the year 2100, relative to 1990temperatures (Houghton et al., 1996).Precipitation and other weather patternswould also change, and the combination islikely to affect agriculture, infectiousdisease distribution and coastal zonecommunities.
Climate change is a gradual process, andclimate models generally predict climaticcharacteristics under a ‘double- CO2’scenario, which will occur in about acentury’s time if present trends continue.The potential human vulnerability to changeduring this time must, therefore, be bornein mind in any discussion of the impact ofclimate change on human health. As socio-economic factors and physical systems alsoneed to be taken into account, any long-termpredictions for human health are made thatmuch more difficult. The development of
Source: United Nations Development Programmme. 1998. Human Development Report 1998. Oxford UniversityPress (New York).
Environmental Change and Human Health in Countries of Africa, the Caribbean and the Pacific 167
Global Environmental Change
an effective and affordable vaccine formalaria, for example, or of a successfulplanned retreat from coasts in preparationfor sea level rise, would drastically reducethe importance of these aspects of the globalchange threat. On the other hand, continuingpopulation growth and the mountinginternational debts of many ACP countrieslimit their ability to adapt to a changingclimate and ensure that in some ways, theirpopulations will be even more vulnerable acentury from now.
6.2 Climate Change and FoodSecurity
As explained in Chapter 4, food security iscritical to health, and is closely linked tothe evolution of agricultural systems. Twofactors make agriculture in ACP countriesparticularly vulnerable to climate change.Firstly, these countries are located in thegeographic regions likely to suffer the mostadverse effects of climate change, such asdrought, and to gain the least from potentialbenefits such as CO2 fertilisation (see section6.2.1 below). The overall impacts of climatechange on agriculture do, of course, dependon the complex interactions of physical,biological and socio-economic systems.Temperature, precipitation, CO2 fertilisationand the increasing frequency of extremeweather events will directly influence cropplants and livestock, and these same factorswill also affect agriculture indirectly byaltering the distribution of weeds, pests andcrop diseases.
Second, given their socio-economiccharacteristics, ACP countries are poorlyequipped to adapt their agricultural systemsto climate change. ACP countries dependappreciably on food produced by small-scalefarmers, who generally lack access toirrigation and other factors that buffer larger-scale agriculture against climate change.60% of the Sub-Saharan African population,for example, depends directly onagriculture; likewise, small island statesdepend heavily on local production, due tothe high cost of transporting food to remoteislands. Much of this food is produced ona subsistence scale. In contrast to thosecountries or regions whose food supply isimported from industrial farms, most people
in ACP countries are not well connected toan external food supply. This limits theirability to supplement their diets withimported food, should climate changereduce local food production. Those livingin conditions of poverty are generally mostvulnerable.
6.2.1 Direct Effects on CropsTemperature and precipitation are keydeterminants of cropland suitability and cropyield. Physiologically, most crop species havean optimum temperature range of about 5°C,from 15°C to 20°C or from 25°C to 30°C.Above these temperatures, sterility, loss ofpollen viability, or other reproductivedamages may result. In addition tofavourable temperatures, consistent moistureis critical during crop growth.
While mean temperature andprecipitation are major determinants of yield,the frequency and severity of extremeweather events are often equally important.A drought or storm, for example, may alterthe annual mean temperature andprecipitation only slightly, but couldcompletely destroy a season’s crops. Andwhilst changes in extreme events as a resultof climate change still comprise an area ofmajor uncertainty, several climate modelssuggest the possibility of increasing droughtsand heavy rainfall events (Kattenberg et al.,1996).
In many parts of Africa, the mainconstraints on agriculture are wateravailability and the length of the growingseason. Temperature extremes and solarradiation are also important factors in thehighlands (Watson et al., 1996). The meantemperature in Sub-Saharan Africa isexpected to increase over the next century,which would make the highlands in easternAfrica, Lesotho and parts of South Africasuitable for annual cropping (due todecreased risk of frost). In the lowlands,that same trend would accelerate cropgrowth, shorten the growing season and, ifgrowth accelerates while the grain isdeveloping, decrease yields. Highertemperatures also increase the atmosphericdemand for moisture (potentialevapotranspiration) - in semi-arid Africa,potential evapotranspiration could increase
Chapter 6
Environmental Change and Human Health in Countries of Africa, the Caribbean and the Pacific168
by up to 100 mm per degree of warming(Hulme, 1996). Precipitation patterns willalso be altered, with the effects varying byregion, so whilst monsoon rains may hithigher in the Sahel, alleviating drought butdamaging cropland with erosion andflooding, in tropical and mid-continentalregions, precipitation is expected todecrease (McMichael et al., 1996).
ACP countries in the Pacific mayexperience decreased yields as a result ofincreased cloudiness (decreasing solarradiation), rising temperatures (shrinkingthe duration of growth and increasingsterility), and more frequent and severedroughts, floods and seawater intrusion(Singh, 1994).
The increased atmospheric CO2
responsible for climate change may alter notonly temperature and precipitation, but thedistribution and abundance of plantcommunities as well, including crop species,by ‘fertilising’ them. Plants capture CO2
through openings called stomata, andphotosynthesise it to build carbohydrates.While the stomata are open, water vapourdiffuses out of the cells as CO2 diffuses in(transpiration). A higher- CO2 environmentcould reduce water loss by allowing plantsto reduce their stomatal openings whilemaintaining the necessary CO2 intake. In thearid environments of ACP-Africa, this couldbe especially important.
Some research has been done to predictthe combined effect of temperature,precipitation and CO2 on crops in Sub-Saharan Africa. Hulme et al (1996)describe their application of the CERES-Maize model to southern Africa to evaluatethe response of maize crops to differentclimate change scenarios. Their modelindicates high potential yields underincreased CO2 scenarios, mainly becausethey expect climate to change relativelylittle compared with the higher levels ofCO2. The authors acknowledge, however,that the CERES-Maize modelunderestimates water and nutrient stress,so it treats each season as an independentevent without accounting for water andnutrient depletion over time. In addition,the model estimates potential, not actualyields, and Sub-Saharan Africa is
characterised by a wide gap between thetwo. Other studies predict declines in maizeyields throughout Sub-Saharan Africa,ranging from –5% to –40% (Downing,1992; Muchena, 1994).
6.2.2 Indirect Impacts of Climate Changeon Crops
Temperature, precipitation and CO2
fertilisation have direct effects on cropplants, but their impact may not end there.Weeds, pests and crop diseases are alsolikely to be affected, via the samemechanisms that affect the cropsthemselves. These factors are seldomincluded in models, due to the indirectnature of their influence, but are worthconsidering.
Weeds cause crop production losses ofabout 25% in traditional productionsystems, so their distribution is importantto crop output (Parker and Fryer, 1975).Most weeds respond to very slight changesin temperature (Flint and Patterson, 1983;Flint et al., 1984; Patterson, 1993) and, likecrop plants, weeds will be affected by CO2
fertilisation. Whilst most crop plants (withthe important exception of maize) use C3
photosynthesis, however, 14 of the world’s18 worst weeds use the less-responsive C4
variety (Holm et al., 1977). CO2 fertilisationalone is, therefore, unlikely to favour weeds.In addition to affecting weeds directly,climate change may influence theeffectiveness of the mechanisms used to fightthem, and in C3 weeds, in particular,herbicides may be hampered by the high leafstarch concentrations typical of C3 plants inhigh- CO2 environments, or by their increasedgrowth of rhizomes and tubers (Watson etal., 1996). Weeds’ faster metabolic activityunder warmer conditions would, on theother hand, increase the uptake andeffectiveness of herbicides.
Several studies have attempted to predictinsect pests’ responses to climate change.Very little work has, unfortunately, beendone that pertains directly to ACP countries,although a few principles apply generally.Firstly, insect pests are relatively mobile, andare, therefore, capable of adapting quicklyto climate change by migrating (McMichaelet al., 1996). Secondly, pest outbreaks often
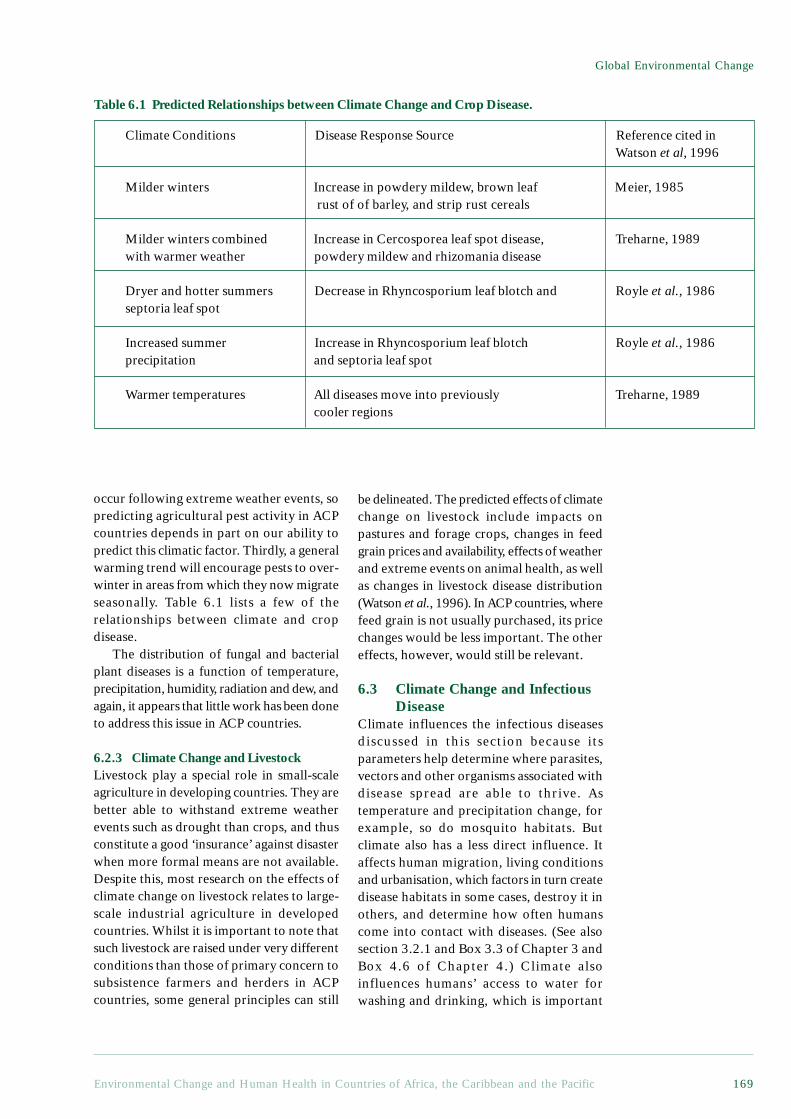
Environmental Change and Human Health in Countries of Africa, the Caribbean and the Pacific 169
Global Environmental Change
occur following extreme weather events, sopredicting agricultural pest activity in ACPcountries depends in part on our ability topredict this climatic factor. Thirdly, a generalwarming trend will encourage pests to over-winter in areas from which they now migrateseasonally. Table 6.1 lists a few of therelationships between climate and cropdisease.
The distribution of fungal and bacterialplant diseases is a function of temperature,precipitation, humidity, radiation and dew, andagain, it appears that little work has been doneto address this issue in ACP countries.
6.2.3 Climate Change and LivestockLivestock play a special role in small-scaleagriculture in developing countries. They arebetter able to withstand extreme weatherevents such as drought than crops, and thusconstitute a good ‘insurance’ against disasterwhen more formal means are not available.Despite this, most research on the effects ofclimate change on livestock relates to large-scale industrial agriculture in developedcountries. Whilst it is important to note thatsuch livestock are raised under very differentconditions than those of primary concern tosubsistence farmers and herders in ACPcountries, some general principles can still
be delineated. The predicted effects of climatechange on livestock include impacts onpastures and forage crops, changes in feedgrain prices and availability, effects of weatherand extreme events on animal health, as wellas changes in livestock disease distribution(Watson et al., 1996). In ACP countries, wherefeed grain is not usually purchased, its pricechanges would be less important. The othereffects, however, would still be relevant.
6.3 Climate Change and InfectiousDisease
Climate influences the infectious diseasesdiscussed in this section because itsparameters help determine where parasites,vectors and other organisms associated withdisease spread are able to thrive. Astemperature and precipitation change, forexample, so do mosquito habitats. Butclimate also has a less direct influence. Itaffects human migration, living conditionsand urbanisation, which factors in turn createdisease habitats in some cases, destroy it inothers, and determine how often humanscome into contact with diseases. (See alsosection 3.2.1 and Box 3.3 of Chapter 3 andBox 4.6 of Chapter 4.) Climate alsoinfluences humans’ access to water forwashing and drinking, which is important
Climate Conditions Disease Response Source Reference cited inWatson et al, 1996
Milder winters Increase in powdery mildew, brown leaf Meier, 1985 rust of of barley, and strip rust cereals
Milder winters combined Increase in Cercosporea leaf spot disease, Treharne, 1989with warmer weather powdery mildew and rhizomania disease
Dryer and hotter summers Decrease in Rhyncosporium leaf blotch and Royle et al., 1986septoria leaf spot
Increased summer Increase in Rhyncosporium leaf blotch Royle et al., 1986precipitation and septoria leaf spot
Warmer temperatures All diseases move into previously Treharne, 1989cooler regions
Table 6.1 Predicted Relationships between Climate Change and Crop Disease.
Chapter 6
Environmental Change and Human Health in Countries of Africa, the Caribbean and the Pacific170
months out of the year), indigenouspopulations build up immunity to it, andmost deaths in these zones occur in infantsand young children who are not yetimmune. Where climatic conditions allowmalaria and its vectors to build up for fewerthan eight months per year, malaria isseasonal. In these zones, epidemics arecommon and affect all age groups (Bradleyet al., 1991).
Most research into the effect of climatechange on malaria has focused on the role oftemperature. Researchers have suggested thatrecent malarial epidemics in Ethiopia andMadagascar may have been a result oftemperature effects of the El Niño-SouthernOscillation (ENSO) weather phenomenon(Bouma et al., 1996). In Rwanda, record hightemperatures in 1987 were associated withincreased malarial incidence, particularly athigh altitudes (Loevinsohn, 1994).Temperature affects malarial incidence in anumber of ways. The direct effect oftemperature on the malaria parasite occurswhile it resides within the Anopheles vector.All Plasmodium species spend several daysdeveloping inside the mosquito before themosquito becomes infective. This period iscalled the extrinsic cycle, and it is shortestaround 27-31°C (Martin and Lefebvre, 1995).Climate projections imply that more areas willmove up into this temperature range than willmove out of it (Bradley, 1993; Martin andLefebvre, 1995), and if the current climateprojections are thus realised, malariatransmission rates can be expected to increase.
The feeding behaviour of mosquitoes alsoresponds to temperature. Small changes intemperature can have a substantial effect onbiting frequency, increasing at highertemperatures before reaching a plateau around27°C (Lindsay and Birley, 1996). Egg-layingrates also increase and larval stages areshortened at higher temperatures (Bradley,1993). These influences all serve to increasethe reproduction rate of mosquitoes, and,indirectly, of malaria transmission. Bradley(1993) cautions, however, that hightemperatures could have counter-effects: thelife-expectancy of mosquitoes might fall athigher temperatures unless relative humidityincreases correspondingly. Lindsay and Birley(1996) also point out that the risk of mortality
for the control of faecal-oral diseases, asexplained in Chapter 3.
It should always be remembered thatdisease is a function of many different factors,including individual exposure andvulnerability, the community’s healthbehaviour, the home environment andphysical infrastructure, as well as institutionalcapacity to treat ill health. These are all inaddition to the climatic factors discussed inthis chapter, and some of them have a muchmore direct relationship with the healthoutcome. Many of these relationships aredealt with in the preceding chapters. Theeffects of climate change are also allprojections of our future, but many otherevents may change the significance of amodified climate or disease vectordistribution. Advances in vaccinations orother preventative measures could, forexample, tip the scale in favour of health inthe next century or even sooner. (The currentstatus of research and development of vaccinefor certain parasitic diseases is reviewed inBox 6.1.) Conversely, environmental trends,such as crowding and water scarcity, coulddo just the opposite.
6.3.1 MalariaMalaria is the world’s most important vector-transmitted disease. Around 270 millionpeople are infected at any given time, and atotal of two billion people are at risk. Between1 and 2 million people die from malaria eachyear, most of them in Africa. Four species ofparasites are responsible for causing malariain humans: Plasmodium falciparum, P. vivax,P. ovale and P. malariae. These parasites aretransmitted to humans through any of the 50to 60 species of Anopheles mosquito that serveas vectors for malaria. Infected individualstypically experience fever as their primarysymptom.
The distribution of the malarial parasiteand its anopheline vectors is limited inlatitude and altitude by climatic factors.Whilst malaria is most prevalent in Africa,it also afflicts almost every ACP country,as well as South-East Asia, Central andSouth America, and to a limited extent,parts of Europe. Malaria’s effects vary inseverity within these zones. In areas wheremalaria is perennial (transmitted 8-12
Environmental Change and Human Health in Countries of Africa, the Caribbean and the Pacific 171
Global Environmental Change
Box 6.1 The Development of Vaccines against Malaria, Schistosomiasis,and Filariasis
Disease control efforts involving the spraying of vector breeding sites are constrainedby the emergence of drug resistance and other undesirable side effects. Althoughintense research efforts are being undertaken in several laboratories to develop vaccines,this alternative control measure against parasitic diseases is not yet practicable. It is,however, reasonable to hope that vaccines against parasitic diseases be incorporatedinto immunisation programmes during the next decade. A great deal of effort is,however, needed before this dream becomes reality. Research is required to discoverefficacious vaccines, development is required to bring these vaccines into clinicaltrials, after which the production of the vaccines in sufficient quantities to providecoverage to the hundreds of millions of people at risk in tropical countries is alsorequired. The infusion of substantial funds is a sine qua non if parasitic disease vaccinesare to become incorporated into immunisation programmes.
This short review finds that moderate success has been achieved in developingvaccines against malaria and schistosomiasis, but that very little progress has been madetowards the development of vaccines against filarial diseases.
Schistosomiasis (bilharzia)Medical treatment remains the cornerstone of intervention in schistosomiasis. Rapidre-infection demands frequent treatments, but drug delivery requires an adequatetransport infrastructure to cover all parts of an endemic area on a regular basis, andthe prospect of drug resistance is never far away.
Vaccination hence remains an important complementary control strategy. Thefact that partial protective immunity does exist in infected people has been the motiveforce behind current research efforts to develop schistosomiasis vaccines. Sixschistosomiasis vaccine candidate molecules have undergone various stages of preclinicaldevelopment (Bergquist and Colley, 1998). These include target enzymes which areinvolved in key metabolic processes, muscle proteins and fatty acid binding proteins.Three of these candidate vaccines are patented and three are in the public domain.Four of these vaccines have been developed in the USA, one in France, and one,significantly, in Brazil. Protection in inbred mice has ranged from 30% to 70%. Ameeting held in Cairo in 1997 entitled Progress in Schistosomiasis Vaccinology,recognised that all of the candidate vaccines still require significant processdevelopment. Scaled-up production of antigen preparations, followed by clinical trialswas, however, endorsed for some of the candidates; for others, research aimed atDNA vaccination was recommended.
MalariaMalaria control programs are currently heavily dependent on chemotherapy treatmentof infected individuals, since the mosquito vectors have become resistant to insecticides.Anti-malarial drug resistance has, however, also become a serious problem in manycountries in Africa and Asia, as the parasites have become resistant to chloroquine,sulfadoxine/pyrimethamine, quinine, and other anti-malarials. It is, therefore,imperative that malaria vaccines be developed as a complementary tool of diseasecontrol. Reasonable progress has been made in this respect and a dozen vaccines orformulations are currently in various stages of preclinical development (Engers andGodal, 1998).
There are technical constraints on the production of malaria vaccines. Several100 litre-volumes of bacterial cultures are required to produce a few milligrams ofrecombinant1 proteins. The emergence of DNA vaccine technology2 might, however,
Chapter 6
Environmental Change and Human Health in Countries of Africa, the Caribbean and the Pacific172
provide the solution (Simmonds et al., 1997). DNA vaccines are relatively cheap andeasy to produce, and, most importantly, they do not require cold storage. This is animportant attribute for field use in tropical countries. DNA vaccinology in malariahas advanced fairly rapidly to the point where several malaria vaccines have alreadybeen incorporated into DNA constructs ready for clinical trials (Gramzinski et al.,1997; Hoffman et al., 1997; Leitner et al., 1997).
Peptide vaccine development, where parts of malaria proteins are artificiallyconstructed to produce an antigenic response,3 may be another way of circumventingthe technical problems of producing recombinant malaria vaccines and indeed, thefirst malaria vaccine to enter into clinical trials, the SPf66 vaccine, is a peptide-based vaccine (Patarroyo et al., 1988). One outstanding issue is the fact that themode of action of SPf66 remains unclear, but important strides in malaria vaccinologyand immunology can only be made when based on an understanding of immunologicalmechanisms. In conclusion, current scientific opinion on SPf66 is divided, with oneschool of thought advocating more research into SPf66 (Graves et al., 1998) andanother advocating abandoning field trials of the vaccine altogether (Gilbert andHill, 1997).
Filariasis.If several vaccine candidates are on the horizon for schistosomiasis and malaria, thereare few, if any at all, for filariasis. At present, the only filarial vaccine candidatemolecule characterised at the laboratory level is a potential transmission blockingvaccine (Wang et al., 1997). It will probably require another 5 to 10 years of intenseresearch efforts before filariasis vaccines reach the preclinical stage of development,and to compound this problem still further, there are very few funding agencies whichcurrently support work on filariasis vaccines.
Vaccine Production in ACP CountriesThe development of SPf66 vaccine in Colombia, in South America, demonstrates thatwith political will and adequate funding, Third World countries can produce vaccineslocally. The caveat is, however, that the production of vaccines requires investment inproduction facilities with good manufacturing practices and quality control. Whilstrecombinant vaccines could, in principle, be produced in ACP countries, the enormouscosts involved in setting up manufacturing facilities that meet regulatory requirementsconstitute a serious bottleneck. These financial and technical considerationsnotwithstanding, it would be appropriate for ACP countries to begin to manufacturetheir own vaccines locally, rather than to continue receiving them from majormultinationals through aid programmes. There is, therefore, an urgent need for capacitybuilding in this important domain.
1 Recombinant vaccine centres on the discovery that specific antibodies may be synthesised in responsenot only to the whole viral or microbe particle, but also to isolated components of the virus or microbe.Hence genetic coding for antigenic parts of a microbe or a virus could be ‘included’ into other organismswhich then reproduce and produce the desired antigen in large amounts.2 This involves the use of live vaccines which are recombinant harmless viruses carrying parts of a specificpathogen. One example of this might be a gene coding for the hepatitis B major antigen which istransferred to a harmless human virus. After injection of the virus into the bloodstream, the replication ofthe virus will not only create new virus particles, but will also create significant quantities of the majorhepatitis surface antigens. The sufficient number of antigens are thus created in the human body, ratherthan in the laboratory.3 The difference between recombinant and peptide vaccines is that the latter use chemically synthesisedparts of antigens, whereas recombinant vaccines use biologically synthesised parts.
Environmental Change and Human Health in Countries of Africa, the Caribbean and the Pacific 173
Global Environmental Change
Contributed by Thomas Egwang, Med Biotech Laboratories, Kampala, Uganda.
ReferencesBergquist, N. R. and Colley, D. G. 1998. Schistosomiasis vaccines: Research to development. Parasitology
Today. 14:99-104.Engers, H. D. and Godal, T. 1998. Malaria vaccine development: Current status. Parasitology Today.
14:56-64.Gilbert, S. C. and Hill, A. V. S. 1997. Protein particle vaccines against malaria. Parasitology Today.
13:302-306.Gramzinski, R. A., Maris, D. C., Doolan, D., Charoenvit, Y., Obaldia, N., Rossan, R., Sedegah, M.,
Wang, R., Hobart, P., Margalith, M. et al. 1997. Malaria DNA vaccines in Aotus monkeys. Vaccine.15:913-915.
Graves, P., Gelband, H. and Garner, P. 1998. The SPf66 malaria vaccine: what is the evidence for efficacy?Parasitology Today. 14:218-220.
Hoffman, S. L., Doolan, D. L., Sedegah, M., Wang, R., Scheller, L. F., Kumar, A., Weiss, W. R., Le, T. P.,Klinman, D. M., Hobart, P. et al. 1997. Toward clinical trials of DNA vaccines against malaria.Immunol Cell Biol. 75:376-381.
Leitner, W. W., Seguin, M. C., Ballou, W. R., Seitz, J. P., Schultz, A. M., Sheehy, M. J. and Lyon, J. A. 1997.Immune responses induced by intramuscular or gene gun injection of protective deoxyribonucleic acidvaccines that express the circumsporozoite protein from Plasmodium berghei malaria parasites. JImmunol. Dec 15;159(12):6112-6119.
Patarroyo, M. E., Amador, R., Clavijo, P., Moreno, A., Guzman, F., Romero, P., Tascon, R., Franco, A.,Murillo, L. A. and Ponton, G. 1988. A synthetic vaccine protects humans against challenge withasexual blood stages of Plasmodium falciparum malaria. Nature. 332:158-161.
Simmonds, R. S., Shearer, M. H. and Kennedy, R. C. 1997. DNA vaccines-from principle to practice.Parasitology Today. 13:328-331.
Wang, S. H., Zheng, H. J., Dissanayake, S., Cheng, W. F., Tao, Z. H., Lin, S. Z. and Piessens, W. F. 1997.Evaluation of recombinant chitinase and SXP1 antigens as antimicrofilarial vaccines. Am J Trop MedHyg. 56:474-481.
for mosquitoes should be highest when it isseeking a blood meal or laying eggs. Theprospects for changes in relative humidity in achanging climate are less well understood thanare those for temperature, so it is difficult tosay with certainty which effect will win out.
The uncertainty with regard to humidityapplies to precipitation as well, and there islittle agreement on regional precipitationamongst global climate models. This lack ofunity notwithstanding, increased rainfallgenerally increases both the probability of amosquito vector surviving through a given day,and the number of female mosquitoes perperson (both of which influence malariatransmission). Increased precipitation is thuscommonly presumed to increase malariaincidence. This is not, however, always thecase. It has been suggested that the failure ofthe south-west monsoons, which decreasedprecipitation during a recent ENSO year,increased malaria incidence in Sri Lanka bycreating standing pools of water where waterwould normally have been running. Thesepools provided excellent breeding sites for
Anopheles mosquitoes (Bouma et al., 1994).If climate change decreases precipitation inother currently humid tropical regions, it isplausible that the same effect could be seen.
Several models attempt to predict changesin malaria distribution as a result of climatechange (Jetten et al., 1996; Lindsay and Birley,1996; Martens et al., 1997; Martin andLefebvre, 1995). Whilst the models differ inapproach, they all point to general trends inthe pattern we can expect for malaria in responseto future climate change. Specifically, latitudesjust outside the current malarial zones are atrisk under global warming. These regions aretypically already home to the Anopheles vector,but the Plasmodium parasites are held at bayby low temperatures. The same is true for highaltitude zones within malarial bands -specifically, mountainous areas in eastern Africamay be at risk. Since these newly infiltratedzones would not be accustomed to coping withthe disease, malaria may initially pose a greaterthreat there than it does in its present locations.In many areas where malaria currently exists,control measures such as insecticide-
Chapter 6
Environmental Change and Human Health in Countries of Africa, the Caribbean and the Pacific174
impregnated bednets and chloroquine arewidespread. Whilst they are controversial, thesemeasures effectively reduce the short-termprevalence of malaria, although they take timeto put in place in newly infected regions.
In addition to latitudinal and altitudinalspread, seasonal malarial zones are likely toincrease in number at the expense of perennialzones (Martin and Lefebvre, 1995), thusincreasing the number of epidemics and theaverage age of malaria morbidity andmortality.
6.3.2 SchistosomiasisSchistosomiasis, also known as bilharzia, is awater-based disease caused by certain speciesof trematode worms (schistosomes).1 It isexpected to respond in a similar fashion asmalaria to changes in climate, as temperatureinfluences snail reproduction and growth,schistosome mortality, infectivity, and human-water contact (Martens et al., 1995).Schistosomiasis presently afflicts most of Sub-Saharan Africa and parts of the Caribbean. Apredictive model currently under developmentindicates that schistosomiasis is likely to spreadbeyond its current distribution limits as a resultof climate change. It will also decrease in someareas, however, as temperatures exceed theupper limit for the snail and the trematode.
6.3.3 DengueA severe influenza-like viral infection, denguecurrently infects 10-30 million people per year.It is common throughout the tropics, andspread by mosquitoes, mainly the Aedesaegypti. Like malaria, dengue and its vectorsare limited in range by climatic conditions.Dengue provides a good example of a primarilyurban disease, that is spread through differentspecies than malaria. As with most parasiticdiseases, however, its spread is influenced bymany factors other than climate. For dengue,the institutional capacity to provide watersupply and solid waste disposal in cities is
crucial, and disease distribution may, therefore,only partially be linked to climate change.
Climatic factors could, nonetheless,influence dengue transmission. Potentialexpansion of dengue transmission under +2°Cand +4°C scenarios has been analysed by Jettenand Focks (1997), and although their model isbased on temperature alone, excluding rainfalland other variables, they were able to validateit by comparing model projections to currentdengue distribution in five cities. Their resultsindicate that potential transmission intensitycould increase by a factor of one to fivethroughout all ACP regions and elsewhere inthe +2°C scenario, and by considerably morefor the +4°C scenario. In both cases, theincrease would be highest at the northern andsouthern limits of its current distribution.Intensity would only drop in very few locationsin northern Africa. In addition to the latitudinalexpansion demonstrated, this model alsoindicates altitudinal expansion, together witha general lengthening of the transmission seasonin most susceptible areas.2
The potential for increased transmissionintensity is dangerous, not only because of thelikely additional cases, but also as a result ofthe increasing hazard posed to individuals bymultiple dengue infections. Infection with onedengue serotype renders an individual immuneto that strain, but not to subsequent infectionsby other strains. Sequential infections bydifferent serotypes are increasingly likely toresult in more severe conditions, particularlyin adolescents.
Malaria, schistosomiasis and dengue arejust a few examples of the important diseaseswhose distributions are likely to respond toa changing climate, and whilst less researchhas been done into the relationship betweenclimate and other vector-borne diseases,onchocerciasis (river blindness), yellow fever,and, potentially, trypanosomiasis (sleepingsickness) are also amongst those that may beredistributed by climate change.
1 Infected persons excrete schistosome eggs. As the eggs find water, they develop into tiny swimmingorganisms that infect certain water snails. Some time after infection, the snail will shed a new form ofswimming schistosome, which will infect their next human host through the skin, most commonly whenbathing (Cairncross and Feachem, 1993). See also Box 3.3 Infectious Agents and Irrigation.2 It should be noted that actual dengue risk, apart from transmission intensity, also involves local conditionssuch as health services, local immunity and infrastructure. These factors were not included in this model.
Environmental Change and Human Health in Countries of Africa, the Caribbean and the Pacific 175
Global Environmental Change
6.4 Climate Change and CoastalZones
In a warmer world, the sea level will rise as aresult of the thermal expansion of ocean water,coupled with the melting of glaciers, ice capsand ice sheets. IPCC estimates that by the year2100, sea level will be 38-55 cm higher thanit is today (Houghton et al., 1996). Theconsequences of this rise depend not only onits global magnitude, however, but on the localphysical and ecological responses. The extentof flooding cannot, for example, be predictedsimply by estimating the land area, less than aset distance above sea level, since erosion, tidalflows and a variety of other factors areinvolved. It is impossible to say whether theintensity, frequency or locations of cycloneoccurrence would change in a warmer world(Kattenberg et al., 1996), but several climatemodels suggest that heavy rainfall events arelikely to increase in a warmer environment(McMichael et al., 1996).
Taken together or individually, a rise insea levels, coupled with extreme weatherevents, pose health risks to people living incoastal areas. These include Caribbean andPacific island residents, as well as deltal andcoastal populations of ACP-Africa. In fact, ina vulnerability index (equal to coastlinemultiplied by population density divided byland area) calculated for hundreds of countries,ACP countries weighed in on the high end(Gommes and du Guerny, 1998). Tuvalu,Seychelles, Kiribati and Barbados wereconsidered to be at particularly high risk.
More directly, the resulting flooding, stormsurges and inundation have the potential todrown and/or displace large numbers ofindividuals, leading to injury, over-crowdingand unsanitary conditions as people retreat fromthe coasts. There is also great potential fornatural disasters to damage health-related andother infrastructure (Finau et al., 1986). Inaddition to these direct impacts, agriculturalland, fisheries, freshwater supplies and diseasevectors could also be affected by a rise in sealevel, flooding and tropical storms.
In the short run, flooding as sea levels risecould decrease the quality and quantity offresh water. In the longer term, rising sealevels could lead to saltwater intruding intoaquifers. As already observed in Israel,northern China and the southern United
States, the geography and hydrology of coastalcities such as Dakar in Senegal, and of smallislands, render them susceptible, too - and itis quite difficult to restore aquifers that havebeen contaminated by saltwater in thismanner. In addition to reducing freshwaterquantity, intrusion could also reduce waterquality by raising the water table, flushingviral and bacterial contaminants from sewersystems out into waterways. Thiscontamination could harm coastal fisheriesand areas of mariculture, which provide animportant source of income and animalprotein in most coastal communities.
Any reduction in water supply could affecthealth in two ways. Firstly, reducing the watersupply makes it difficult to maintain basiclevels of hygiene, as washing is made moredifficult, and the spread of faecal-oral diseases,such as cholera, typhoid, hepatitis A anddiarrhoeal diseases may result. Additionally,as water supplies dwindle, people may turn topoorer quality freshwater sources, such ascontaminated rivers.
6.5 Ozone Depletion and HumanHealth
Stratospheric ozone (O3) is concentratedbetween 15 and 25 km altitude. Its mostimportant function to life on Earth is to absorbharmful ultraviolet (UV) radiation before itpenetrates the lower atmosphere.
Ozone depletion was first evident in the1970s. By the early 1990s stratospheric ozonewas being lost at a rate of 0.4% per yearbetween the latitudes of 30°N and 60°N. The1987 Montreal Protocol was designed to curbozone depletion by strictly limiting the use ofCFCs, (chloroflourocarbons), the long-lastingchlorine substances responsible for ozone loss.If its guidelines are followed, stratosphericozone damage should peak in the next decade,at a total loss (relative to the ozone of the1960s) of 12-13% in the north mid-latitudesduring the winter and spring, 6-7% at the samelatitude during the summer and fall, and 11%at the south mid-latitudes. This is expected toincrease UV radiation exposure by 15%, 8%and 13%, respectively (WMO et al., 1994).The intensity of UV radiation exposure is afunction of the angle of the radiation, that is,of the time of day, season and latitude, and isthought to increase exponentially, rather than
Chapter 6
Environmental Change and Human Health in Countries of Africa, the Caribbean and the Pacific176
linearly, as a function of ozone depletion(Booth and Madronich, 1994).
6.5.1 Skin CancerThe correlation between UVR exposure andskin cancer is perhaps the best understoodand most commonly acknowledged healtheffect of ozone depletion. Although themechanisms involved are complex, UVR hasbeen implicated as a cause of bothmelanomic and non-melanomic skincancers. Cancer, however, will probably beless of a concern in ACP countries thanelsewhere, at least in the foreseeable future.Skin cancer primarily afflicts fair-skinnedindividuals, while ACP countries aregenerally populated by people with darkerskin. Additionally, problems describedelsewhere in this section pose immediatethreats to people in ACP countries, whereascancer often has a latency period of 30-40years (McMichael et al., 1996).
6.5.2 Eye DamageUltraviolet radiation exposure has beenimplicated in a number of eye problems,most notably cataracts, which account forhalf of the world’s 25-35 million cases ofblindness (Harding, 1991; McMichael et al.,1996; Thylefors, 1995). In poor countries,their prevalence is probably much higherthan the 5-10% of the over-65 population ofWestern countries. The higher incidence isdue to micronutrient deficiencies anddiarrhoea. Melanin does not act as a defenceagainst UV-caused eye damage, and eyeexposure to certain UV radiation is thoughtto damage protein molecules, causingcataracts (Dahlback et al., 1989; Dolin,1994; Taylor et al., 1988; World HealthOrganization, 1994; World HealthOrganization, 1997).
6.5.3 Immune System SuppressionThe role of ultraviolet radiation in interferingwith immunity is poorly understood, butcould be of grave consequence to ACPcountries, which, often face a narrow marginbetween health and infectious disease. Severalresearchers have found some indication thatlow-level ultraviolet exposure causes bothlocal and systemic immunosuppression(Jeevan and Kripke, 1993; Kripke, 1990;
Morison, 1989; Noonan and DeFabo, 1992).Some evidence indicates that UV exposureinhibits antigen-presenting cells in the skin,impairing local immunity, and certain UVradiation exposure has been shown to dampensystemic immunity for days to weeks(McMichael et al., 1996). It is not yet clearwhether dark-skinned individuals respond tothe same level of exposure as light-skinnedindividuals (Oberhelman et al., 1994;Vermeer et al., 1991); nonetheless, any sucheffect has implications for infectious diseases,response to vaccination, and the progressionof cancers (Armstrong, 1994; Chapman et al.,1995).
6.5.4 Indirect Impacts on HealthUltra-violet radiation can also affectterrestrial and aquatic ecosystems, andinterfere with biogeochemical cycles relatingto climate change. Whilst these indirecthealth effects are poorly understood, theycould be of even greater significance thanthe direct effects (Lisorti, 1997).
6.6 ConclusionsThe health effects of climate change andozone depletion will only be felt after severalyears, partly because the effects of the drivingforces behind these global changes aredelayed, and partly because the healthimplications are often indirect and/or taketime to develop. If current projections arecorrect, when they occur, their causes willalready be history. To address these globalenvironment changes, one has to be able todeal with high levels of uncertainty.
Given their geography, ACP countriesmay be the more vulnerable with relation torising sea levels, extreme weather events andmore erratic rainfall. In addition, theeconomic resources of ACP countries putthem at a disadvantage in terms of mitigatingclimate change effects through improvedphysical infrastructure, for example. Finally,the actions required to reduce emissions ofharmful substances into the globalenvironment need to be taken by thewealthier countries in the ‘North’ and innewly industrialised countries. ACPcountries are not, therefore, in a goodposition to determine their own future withrelation to global environment change.
Environmental Change and Human Health in Countries of Africa, the Caribbean and the Pacific 177
Global Environmental Change
References:Armstrong, B. K. 1994. Stratospheric ozone and health. International Journal of Epidemiology.
23(5):873-885.Booth, C. R. and Madronich, S. 1994. Radiation amplification factors: Improved formulation accounts
for large increases in ultraviolet radiation associated with Antarctic ozone depletion. In: Weiler C.S.,Penhale P.A., (eds.). Ultraviolet Radiation in Antarctica: Measurements and Biological Effects.Washington, DC, American Geophysical Union. p 39-42.
Bouma, M. J., Dye, C. and van der Kaay, H. J. 1996. Falciparum malaria and climatic change in theNorthwest Frontier Province of Pakistan. American Journal of Tropical Medicine and Hygiene.55:131-137.
Bouma, M. J., Sondorp, H. E. and van der Kaay, H. J. 1994. Climate change and periodic epidemicmalaria. The Lancet. 343:1140.
Bradley, D., Stephens, C., Harpham, T. and Cairncross, S. 1991. A Review of Environmental HealthImpacts in Developing Country Cities. Urban Management Program Discussion Paper No. 6. WorldBank/UNDP/UNCHS (Washington, DC). 58 p.
Bradley, D. J. 1993. Human tropical diseases in a changing environment. In: Lake J., Bock G., AckrillK., (eds.). Environmental Change and Human Health. London, Ciba Foundation Symposium, CIBAFoundation. p 146-162.
Cairncross, S. and Feachem, R. G. 1993. Environmental Health Engineering in the Tropics: An IntroductoryText. Chichester, John Wiley & Sons. 306 p.
Chapman, R. S., Cooper, K. D., De Fabo, E. C., Frederick, J. E., Gelatt, K. N., Hammond, S. P., Hersey,P., Koren, H. S., Ley, R. D., Noonan, F. et al. 1995. Solar ultraviolet radiation and the risk of infectiousdisease: Summary of a workshop. Photochemistry and Photobiology. 61(3):223-247.
Dahlback, A., Henriksen, T., Larsen, S. H. H. and Stamnes, K. 1989. Biological UV-doses and the effectof an ozone layer depletion. Photochemistry and Photobiology. 49(5):621-625.
Dolin, P. J. 1994. Ultraviolet radiation and cataract: A review of the epidemiological evidence. BritishJournal of Ophthalmology. 798:478-482.
Downing, T. E. 1992. Climate Change and Vulnerable Places: Global Food Security and Country Studiesin Zimbabwe, Kenya, Senegal, and Chile. Research Report No. 1. Environmental Change Unit,University of Oxford (Oxford). 55 p.
Finau, S. A., Fungalei, S., ‘Isama’u, O., Finau, S. and Moa, P. 1986. Environmental and sanitary conditionsafter a cyclone in Tonga. Community Health Studies. 10(3):336-343.
Flint, E. P. and Patterson, D. T. 1983. Interference and temperature effects on growth in soybean (Glycinemax) and associated C3 and C4 weeds. Weed Science. 31:193-199.
Flint, E. P., Patterson, D. T., Mortensen, D. A., Riechers, G. H. and Beyers, J. L. 1984. Temperatureeffects on growth and leaf production in three weed species. Weed Science. 32:655-663.
Gommes, R. and du Guerny, J. 1998. Potential Impacts of Sea-Level Rise on Populations and Agriculture.Food and Agriculture Organization of the United Nations (Rome).
Harding, J. 1991. Cataract, Biochemistry, Epidemiology and Pharmacology. London, Chapman andHall.
Holm, L. G., Plucknett, D. L., Pancho, J. V. and Herberger, J. P. 1977. The World’s Worst Weeds:Distribution and Biology. Honolulu, HI, University of Hawaii Press.
Houghton, J. T., Meira Filho, L. G., Callander, B. A., Harris, N., Kattenberg, A. and Maskell, K., (eds.)1996. Climate Change 1995: The Science of Climate Change. Cambridge, University Press. 572 p.
Hulme, M., (ed.) 1996. Climate Change and Southern Africa: An Exploration of Some PotentialImpacts and Implications in the SADC Region. Norwich, Climate Research Unit, University of EastAnglia. 104 p.
Jeevan, A. and Kripke, M. L. 1993. Ozone depletion and the immune system. The Lancet. 342:1159-1160.Jetten, T. H., Martens, W. J. M. and Takken, W. 1996. Model simulations to estimate malaria risk under
climate change. Journal of Medical Entomology. 33:361-371.Kattenberg, A., Giorgi, F., Grassl, H., Meehl, G. A., Mitchell, J. F. B., Stouffer, R. J., Tokioka, T., Weaver,
A. J. and Wigley, T. M. L. 1996. Climate Models - Projections of Future Climate. In: Houghton J.T.,Meira Filho L.G., Callander B.A., Harris N., Kattenberg A., Maskell K., (eds.). Climate Change 1995:The Science of Climate Change. Cambridge, University Press. p 285-357.
Kripke, M. L. 1990. Effects of UV radiation on tumor immunity. Journal of the National CancerInstitute. 82:1392-1396.
Lindsay, S. W. and Birley, M. H. 1996. Climate change and malaria transmission. Annals of TropicalMedicine and Parasitology. 90(6):573-588.
Lisorti, J. A. 1997. Environmental Health Dimensions of Climate Change and Ozone Depletion. WorldBank (Washington, DC). 24 p.
Loevinsohn, M. E. 1994. Climatic warming and increased malaria incidence in Rwanda. The Lancet.343:714-718.
Martens, W. J. M., Jetten, T. H. and Focks, D. A. 1997. Sensitivity of malaria, schistosomiasis and dengueto global warming. Climatic Change. 35(2):145-156.
Martens, W. J. M., Niessen, L. W., Rotmans, J., Jetten, T. H. and McMichael, A. J. 1995. Potential impactof global climate change on malaria risk. Environmental Health Perspectives. 103(5):458-464.
Martin, P. H. and Lefebvre, M. G. 1995. Malaria and climate: Sensitivity of malaria potential transmissionto climate. Ambio. 24(4):200-207.
McMichael, A. J., Haines, A., Slooff, R. and Kovats, S., (eds.) 1996. Climate Change and Human Health.Geneva, World Health Organization. 297 p.
Meier, W. 1985. Pflanzenschutz im Feldbau: Tierische Schädlinge und Pflanzenkrankheiten. EidgenössicheForschungsanstalt fur Landwirtschaftlichen Pflanzenbau (Zurich-Reckenholz).
Chapter 6
Environmental Change and Human Health in Countries of Africa, the Caribbean and the Pacific178
Morison, W. L. 1989. Effects of ultraviolet radiation on the immune system in humans. Photochemistryand Photobiology. 50:515-524.
Muchena, P. 1994. Implications of climate change for maize yields in Zimbabwe. In: Rosenzweig C.,Iglesias A., (eds.). Implications of Climate Change for International Agriculture: Crop Modelling.Washington, DC, U.S. Environmental Protection Agency, Zimbabwe chapter. p 1-9.
Noonan, F. P. and DeFabo, E. C. 1992. Immunosuppression by ultraviolet-B radiation: Initiation byurocanic acid. Immunology Today. 13:250-254.
Oberhelman, L. J., Koren, H., LeVee, G. and Cooper, K. D. 1994. Dose response relationships ofimmunosuppression by UV radiation in dark- versus light-skinned human subjects. Clinical Research.42(2):A277.
Parker, C. and Fryer, J. D. 1975. Weed control problems causing major reductions in world food supplies.FAO Plant Projection Bulletin. 23:83-95.
Patterson, D. T. 1993. Implications of global climate change for impact of weeds, insects, and plantdiseases. International Crop Science. 1:273-280.
Royle, D. J., Shaw, M. W. and Cook, R. J. 1986. Patterns of development of Septoria nodorume and S.tritici in some winter wheat crops in western Europe, 1981-1983. Plant Pathology. 35:466-476.
Singh, U. 1994. Potential climate change impacts on the agricultural systems of the small island nations ofthe Pacific. Draft. IFDC-IRRI (Los Banos, Philippines). 28 p.
Taylor, H. R., West, S. K., Rosenthal, F. S., Munoz, B., Newland, H. S., Abbey, H. and Emmett, E. A.1988. Effect of ultraviolet radiation on cataract formation. New England Journal of Medicine.319(22):1429-1433.
Thylefors, B. 1995. Global data on blindness. Bulletin of the World Health Organization. 73:115-121.Treharne, K. 1989. The implications of the “greenhouse effect” for fertilizers and agrochemicals. In:
Bennett R.M., (ed.). The “Greenhouse Effect” and UK Agriculture. Reading, UK, Center for AgriculturalStrategy, University of Reading. p 67-78.
Watson, R. T., Zinyowera, M. C. and Moss, R. H., (eds.) 1996. Climate Change 1995: Impacts,Adaptations and Mitigation of Climate Change: Scientific-Technical Analysis. Cambridge, CambridgeUniversity Press. 879 p.
Vermeer, M., Schmieder, G. J., Yoshikawa, T., van den Berg, J.-W., Metzman, M. S., Taylor, J. R. andStreilein, J. W. 1991. Effects of ultraviolet B light on cutaneous immune responses of humans withdeeply pigmented skin. Journal of Investigative Dermatology. 97(4):729-734.
WMO, UNEP, NOAA and NASA. 1994. Scientific Assessment of Ozone Depletion: 1994. WMO ReportNo. 37. UNEP (Nairobi).
World Health Organization. 1994. The Effects of Solar UV Radiation on the Eye: Report of an InformalConsultation. World Health Organisation (Geneva).
World Health Organization. 1997. Health and Environment in Sustainable Development: Five years afterthe Earth Summit. Geneva, World Health Organisation. 242 p.
World Resources Institute. 1998. World Resources 1998-99: A Guide to the Global Environment.Oxford University Press (New York). 369 p.
Chapter 7Environment and Health - the
Shared Agenda
Environmental Change and Human Health in Countries of Africa, the Caribbean and the Pacific 187
Environment and Health – the Shared Agenda
Chapter 7 Environment and Health – the Shared Agenda
Aims of the Chapter• To present the case for a shared health and environmental agenda, addressingthe large burden of environmental health problems in ACP countries.• To identify and describe measures to improve environmental care and foodsecurity, and thereby reduce malnutrition.• To identify and describe measures to help achieve healthier living environments,thereby reducing the burden of (especially infectious) disease.• To identify priority actions for preventing environmental health burdens whichmight otherwise arise from conventional development initiatives and globalenvironmental change.
Main Points and Policy Conclusions• For most ACP countries, poverty lies at the heart of the environmentalchallenge, reinforcing the links between environmental degradation and ill health.The affluent can often afford to delay or displace environmental impacts, whilstthe poor more typically have to bear the consequences in the form of ill health.• In these conditions, it is especially critical that environmental and healthsectors develop a shared agenda, grounding environmental improvements inhealth concerns, and taking advantage of environmental means of improvinghealth.• Two of the principal ways in which environmental burdens threaten healthin the ACP are by undermining food security and creating unhealthy livingenvironments. These are particularly important for the large cluster ofenvironmental health problems associated with poverty, including a large shareof infectious diseases and malnutrition.• Conventional supply-side approaches (which focus on the quantities of foodproduced or the quantities of water and other environmental services supplied)often fail to address the underlying causes of food insecurity and unhealthy livingenvironments, and consequently fail to reach those most in need.• Key principles that can help guide attempts both to improve food security andto establish healthier living environments are listed below. These principles derivefrom the fact that the people now facing food insecurity and unhealthy livingenvironments are the most important resource for mobilising and implementingimprovements, but need greater capacity to do so effectively.
- Environmental improvements that enhance the livelihoods of the poorestwill also increase their capacity to achieve food security and create healthyliving environments.
- People with secure access to housing and land are more likely to invest inhealthy living environments and sustainable agriculture.
- Education and supportive public sector programmes can increase the capacityof local groups to pursue food security and healthy living environments.
- Women are central to food security and the management of the livingenvironment. Measures that favour men are likely to be inefficient as well asinequitable.
• Key actions that can be taken to improve environmental health prospects include.
- improving food security: support and promote a sustainable agriculture,building on successes that have been achieved in areas where externalinputs and incomes are currently low.
Chapter 7
Environmental Change and Human Health in Countries of Africa, the Caribbean and the Pacific188
- improving living environments: develop and support coherent multi-sectoralstrategies, including, but not limited to, improved service delivery systems.
- preventing health-threatening development initiatives: instituteenvironmental and health impact assessments in a systematic fashion.
- reducing the health burdens of global environmental change: create an effectiveinternational platform through which ACP countries can represent andpromote their environmental and health concerns.
7.1 The Shared AgendaAs seen in Chapter 3, the environmental healthburden in the ACP countries is especially largefor children. The dual impacts of foodinsecurity and unhealthy living environmentscombine to produce some of the worst levelsof child morbidity and mortality in the world.As seen in Chapter 2, the absolute number ofchildren in the region (and, therefore, thenumbers at risk) will continue to increase forseveral more decades. In addition, newenvironmental health challenges are alsoemerging.
A shared health and environmentalagenda is necessary to address this massivehealth burden. As mentioned at thebeginning of this report, if health-related andenvironmental assistance efforts areimplemented independently, the healthagenda is likely to over-emphasise curativemeasures, whilst the environmental agendais likely to over-emphasise long-termsustainability, at the expense of poor people’sneeds today. These divergent priorities relateto the way in which players in the differentsectors are credited for achievements,together with the way in which they canaccess funds for furthering the developmentsof their own organisations. It must berecognised that many important factorsaffecting both health and the environmentare outside of the control of environmentand health professionals, and that is preciselywhy activities need both to be put into thelarger context, and integrated into relateddevelopment initiatives.
The necessity to co-ordinate health andenvironmental concerns and activities has,therefore, been emphasised throughout thisreport. The advantages should be clear:health and environmental goals overlap, but
actions pursued independently may conflict.Box 7.1 points to some of the benefits ofthe ‘combined agenda’. Additionally, inmany settings, there are organisational gainsto be made from combining forces. Forexample, environment ministries (along withwomen’s, or gender ministries) have beenformed during recent years in manydeveloping countries. Still in their infancy,these ministries often lack the resources andpolitical power to achieve environmentalgoals. Health (and agriculture) ministriestend, in comparison, to have longer histories,and are comparatively well represented atregional or even district levels. Forgovernments to have environmental issuesdealt with by both health and agriculturalextension workers, would, therefore,probably mean a more efficient use ofexisting personnel, and could also improveco-ordination.
Better co-ordination can, in the long run,both reduce costs and increase healthbenefits, though this is not always apparentwhen a narrow sector perspective is taken,since the rewards and responsibilities areoften divided. These divisions occur in urbanas well as rural areas. In Port Elizabeth,South Africa, for example, numerousplayers, ranging from households to citydepartments, are involved in combatingpests. Households spend on average closeto 13 Rand per month on insecticides. Themunicipality’s Environmental Health Sub-Directorate has also been implementing avermin eradication programme, focusing oncockroaches, fleas, rodents and mosquitoes,using disinfection and removal operations(Thomas et al., 1999). But the combinedexpenditure of private households on insectcontrol amounts to far more than the
Environmental Change and Human Health in Countries of Africa, the Caribbean and the Pacific 189
Environment and Health – the Shared Agenda
Box 7.1 The Case for Combining Health and Environmental Agendas
• Environmental and health problems overlap, especially in low-income ACPcountries. Compared to most other parts of the world:
- a larger share of (physical) environmental burdens affect people’s health, ratherthan, for example, depleting the global resource base;
- a larger share of the burden of disease arises from (physical) environmentalthreats, rather than, for example, from lifestyle choices.
• Good health and environmental quality both require multidisciplinary researchand multi-sectoral action. Specifically:
- the actions which degrade the environment and threaten health are taken largelyby players outside of the health and environment sectors, narrowly defined;
- when conceived and implemented sectorally, environmental initiativesoveremphasise regulative measures, and health initiatives overemphasise curativemeasures.
• Pursued independently, there is a danger that health and environmental agendaswill work at cross-purposes:
- local environmental health problems will be treated by means of displacement,thereby displacing or delaying (rather than removing) environmental burdens;
- environmental capital will be protected by denying the most vulnerable groupsaccess to the resources and environmental services they need to protect theirhealth.
• Pursued together, health and environmental agendas can be made complementary:- health prevention can move ‘upstream’ and take advantage of the multi-sectoral
approach to environmental improvement;- environmental improvement can become grounded in issues of local concern,
and take advantage of the local presence of health professionals.
municipality spends, and indeed is roughlyequal to the municipality’s overall monthlyhealth budget. All of these players are,moreover, working in the areas where theyhave some degree of control, regardless ofwhether their actions are the most effective.A more ‘integrated pest management strategy’would extend to hygiene, food storage and,in particular, waste disposal, rather thanrelying on toxins for killing pests. Aprevention initiative, rather than control,would thus involve many more players,education and awareness raising, as well asthe sharing of funds and responsibility.
Whilst health, environment and otheragencies are often very well aware of theneed to collaborate, it may still be difficult
to realise in practice (Lewin, 1998). Thesharing of power, finance and informationis often problematic, as it requires mutualtrust and a commitment to goals that arebeyond those of each individualorganisation. Co-ordination of activities isa problem amongst donors and governmentaldepartments alike. Box 7.2 illustrates howexpensive infrastructure projects can easilyignore agencies not directly involved, suchas health departments. Donor co-ordinationis sometimes achieved when funds arescarce. In such circumstances, donors tendto team up around common pursuits. Butwhilst the increased emphasis given to‘catalytic’ or ‘seed’ funding may help co-ordination better water and sanitation
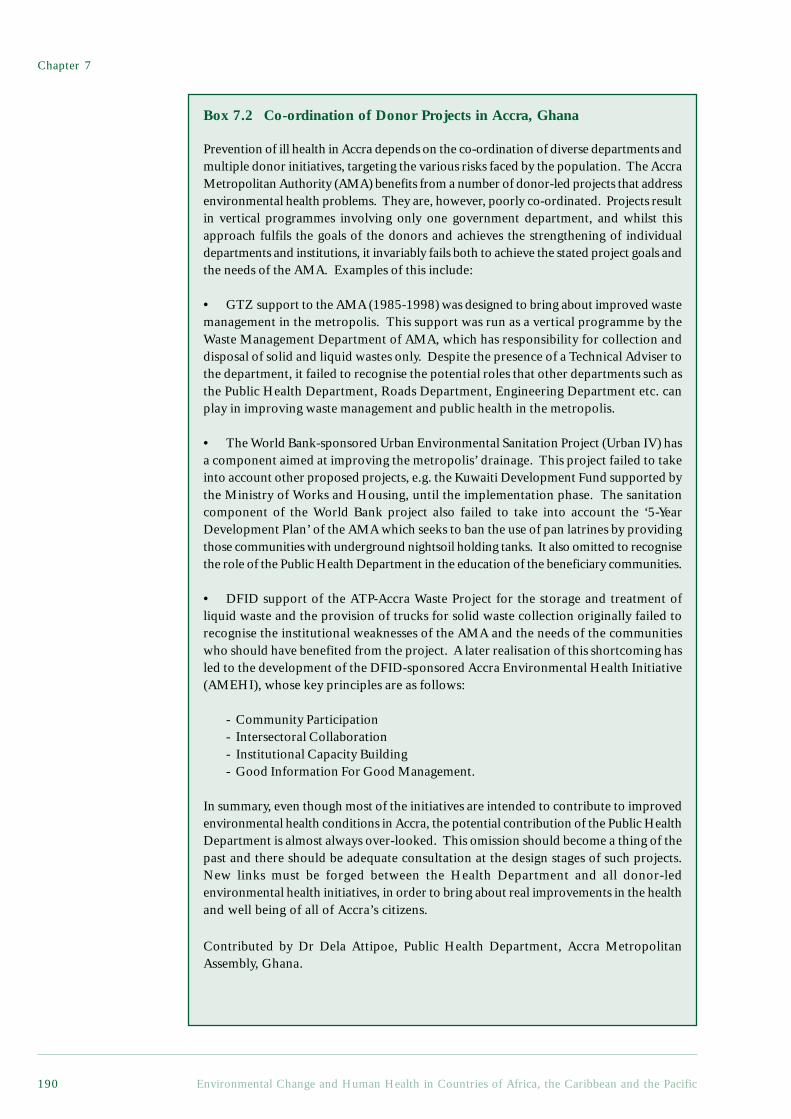
Chapter 7
Environmental Change and Human Health in Countries of Africa, the Caribbean and the Pacific190
Box 7.2 Co-ordination of Donor Projects in Accra, Ghana
Prevention of ill health in Accra depends on the co-ordination of diverse departments andmultiple donor initiatives, targeting the various risks faced by the population. The AccraMetropolitan Authority (AMA) benefits from a number of donor-led projects that addressenvironmental health problems. They are, however, poorly co-ordinated. Projects resultin vertical programmes involving only one government department, and whilst thisapproach fulfils the goals of the donors and achieves the strengthening of individualdepartments and institutions, it invariably fails both to achieve the stated project goals andthe needs of the AMA. Examples of this include:
• GTZ support to the AMA (1985-1998) was designed to bring about improved wastemanagement in the metropolis. This support was run as a vertical programme by theWaste Management Department of AMA, which has responsibility for collection anddisposal of solid and liquid wastes only. Despite the presence of a Technical Adviser tothe department, it failed to recognise the potential roles that other departments such asthe Public Health Department, Roads Department, Engineering Department etc. canplay in improving waste management and public health in the metropolis.
• The World Bank-sponsored Urban Environmental Sanitation Project (Urban IV) hasa component aimed at improving the metropolis’ drainage. This project failed to takeinto account other proposed projects, e.g. the Kuwaiti Development Fund supported bythe Ministry of Works and Housing, until the implementation phase. The sanitationcomponent of the World Bank project also failed to take into account the ‘5-YearDevelopment Plan’ of the AMA which seeks to ban the use of pan latrines by providingthose communities with underground nightsoil holding tanks. It also omitted to recognisethe role of the Public Health Department in the education of the beneficiary communities.
• DFID support of the ATP-Accra Waste Project for the storage and treatment ofliquid waste and the provision of trucks for solid waste collection originally failed torecognise the institutional weaknesses of the AMA and the needs of the communitieswho should have benefited from the project. A later realisation of this shortcoming hasled to the development of the DFID-sponsored Accra Environmental Health Initiative(AMEHI), whose key principles are as follows:
- Community Participation- Intersectoral Collaboration- Institutional Capacity Building- Good Information For Good Management.
In summary, even though most of the initiatives are intended to contribute to improvedenvironmental health conditions in Accra, the potential contribution of the Public HealthDepartment is almost always over-looked. This omission should become a thing of thepast and there should be adequate consultation at the design stages of such projects.New links must be forged between the Health Department and all donor-ledenvironmental health initiatives, in order to bring about real improvements in the healthand well being of all of Accra’s citizens.
Contributed by Dr Dela Attipoe, Public Health Department, Accra MetropolitanAssembly, Ghana.
Environmental Change and Human Health in Countries of Africa, the Caribbean and the Pacific 191
Environment and Health – the Shared Agenda
among donors, it still often falls short ofenabling co-ordination amongst the localplayers involved.
A more positive example of donor co-ordination is provided in Box 7.3. The donoractivities surrounding tuberculosis inMalawi have been successfully co-ordinatedto develop a responsive, harmonisedapproach to tuberculosis control. This typeof approach is often adopted in developmentinitiatives to help co-ordinate differentsectoral contributions. One of the importantconditions for its success is strong politicalsupport and a strategically well situated co-ordinating body.
Most of the remainder of this chapterfocuses on topics of particular relevance tothe shared environmental and health agenda.Food security and healthy livingenvironments are priority areas whichdeserve more attention and funding. Simplydoing more of the same in these areas isunlikely to be effective, however.Implementing a shared agenda will requirechanges in procedures, as well as changesin priorities. Detailing specific actions thatneed to be taken is difficult, since localconditions vary considerably, and adaptingto local specificities is one of the keys tosuccess. There are, however, commonprinciples that can help guide local action,some of which are summarised in thefollowing section.
7.2 Key Principles for SuccessfulInterventions
Environmental and health improvementprogrammes can both benefit from andcontribute to the pursuit of otherdevelopment goals. If progress can be madein reducing social conflict and inequalitywhile improving local governance andinternational relations, the task of achievingfood security and healthy livingenvironments will be far easier to realise.Simultaneously, more targeted actions,aimed at improving food security andachieving healthier environments, cancontribute to broader economic, politicaland environmental goals. If the moretargeted actions further these broader goals,the net effect on health will be enhanced.
Adequate livelihoods, local participation,education, equitable access to resources andgender equality are goals in and of themselves- they are seen by many as social rights. Theyalso provide the basis for principles that canhelp guide efforts to improve food security,achieve healthier living environments, and arange of other environmental and healthgoals.
Enhancing the livelihoods of the poorestPoverty and inequality account for a largeshare of the environmental health problemsin the ACP regions. Individuals andhouseholds with secure and sufficientlivelihoods are able to achieve much higherenvironmental health status than thosewithout (see Chapter 3). This hasimplications when choosing measures toimprove food security and achieve healthierliving environments. Two measures may havethe same costs, and produce the same directenvironmental health benefits. But if oneconstrains people’s livelihoods, whilst theother contributes to them and assists inreducing inequalities, the overall healthimpact of the latter will be greater, and insome cases far greater.
Increasing participationPeople want both food security and healthyliving environments, and will work hard toachieve them. External assistance may beneeded to help people achieve these goals,but to be successful, this assistance must havethe support of those it is intended to help.Local knowledge and local initiative can,moreover, contribute substantively to betterprogrammes and policies, and participationin one dimension of environmental healthimprovement can help enable moreparticipation in other dimensions.
Improving educationWhilst existing local knowledge is a valuableresource, education can provide significantbenefits to environmental health. Thepositive impact of female education uponhousehold health status is consistently foundby researchers and practitioners alike (WorldBank, 1993). More specifically, a betterknowledge of hygiene promotion is seen to
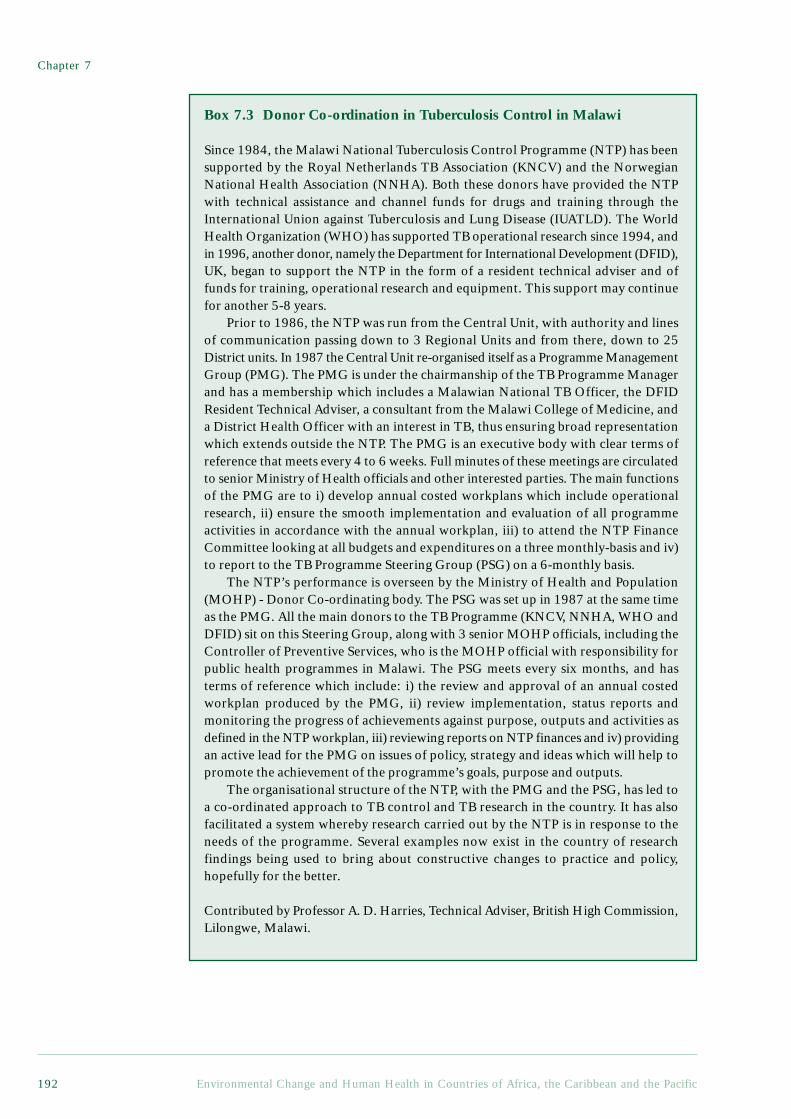
Chapter 7
Environmental Change and Human Health in Countries of Africa, the Caribbean and the Pacific192
Box 7.3 Donor Co-ordination in Tuberculosis Control in Malawi
Since 1984, the Malawi National Tuberculosis Control Programme (NTP) has beensupported by the Royal Netherlands TB Association (KNCV) and the NorwegianNational Health Association (NNHA). Both these donors have provided the NTPwith technical assistance and channel funds for drugs and training through theInternational Union against Tuberculosis and Lung Disease (IUATLD). The WorldHealth Organization (WHO) has supported TB operational research since 1994, andin 1996, another donor, namely the Department for International Development (DFID),UK, began to support the NTP in the form of a resident technical adviser and offunds for training, operational research and equipment. This support may continuefor another 5-8 years.
Prior to 1986, the NTP was run from the Central Unit, with authority and linesof communication passing down to 3 Regional Units and from there, down to 25District units. In 1987 the Central Unit re-organised itself as a Programme ManagementGroup (PMG). The PMG is under the chairmanship of the TB Programme Managerand has a membership which includes a Malawian National TB Officer, the DFIDResident Technical Adviser, a consultant from the Malawi College of Medicine, anda District Health Officer with an interest in TB, thus ensuring broad representationwhich extends outside the NTP. The PMG is an executive body with clear terms ofreference that meets every 4 to 6 weeks. Full minutes of these meetings are circulatedto senior Ministry of Health officials and other interested parties. The main functionsof the PMG are to i) develop annual costed workplans which include operationalresearch, ii) ensure the smooth implementation and evaluation of all programmeactivities in accordance with the annual workplan, iii) to attend the NTP FinanceCommittee looking at all budgets and expenditures on a three monthly-basis and iv)to report to the TB Programme Steering Group (PSG) on a 6-monthly basis.
The NTP’s performance is overseen by the Ministry of Health and Population(MOHP) - Donor Co-ordinating body. The PSG was set up in 1987 at the same timeas the PMG. All the main donors to the TB Programme (KNCV, NNHA, WHO andDFID) sit on this Steering Group, along with 3 senior MOHP officials, including theController of Preventive Services, who is the MOHP official with responsibility forpublic health programmes in Malawi. The PSG meets every six months, and hasterms of reference which include: i) the review and approval of an annual costedworkplan produced by the PMG, ii) review implementation, status reports andmonitoring the progress of achievements against purpose, outputs and activities asdefined in the NTP workplan, iii) reviewing reports on NTP finances and iv) providingan active lead for the PMG on issues of policy, strategy and ideas which will help topromote the achievement of the programme’s goals, purpose and outputs.
The organisational structure of the NTP, with the PMG and the PSG, has led toa co-ordinated approach to TB control and TB research in the country. It has alsofacilitated a system whereby research carried out by the NTP is in response to theneeds of the programme. Several examples now exist in the country of researchfindings being used to bring about constructive changes to practice and policy,hopefully for the better.
Contributed by Professor A. D. Harries, Technical Adviser, British High Commission,Lilongwe, Malawi.
Environmental Change and Human Health in Countries of Africa, the Caribbean and the Pacific 193
Environment and Health – the Shared Agenda
services. Agricultural education can play asimilar role for food security.
Gender equalityWomen are not only the primary providersof households’ health and environmental careand management, they also take the lead inmeeting nutritional and livelihood needs.Participation of women in the planning andimplementation of any environmental healthintervention is, therefore, a vital goal.Without it, environmental healthimprovements at household level are difficult,if not impossible, to achieve. Furthermore,initiatives which help improve women’sstatus in households tend to have positiveeffects on environmental care.
Giving local residents a stake inenvironmental improvementPeople who stand to benefit from investmentsin environmental improvement are more likelyto support them. Thus people with secureaccess to their housing are more likely to investin improvements to their living environments,whilst people with secure access to the futureproduce of the land are more likely to investin its sustainability.
These principles, and others, are returnedto later in the chapter in the discussions offood security and ways of achieving healthyliving environments. All have very practicalimplications for action, but the implicationsvary, depending upon local circumstances.
7.3 Environmental Care and FoodSecurity
This section examines methods of andapproaches to improving food security in theACP countries. It will discuss ways of shiftingto sustainable agriculture, providingappropriate support for the pastoralist andlivestock sector, protecting nature whilstsimultaneously ensuring food security,empowering rural women, improving foodsecurity in urban areas, and redirectingbiotechnology.
7.3.1 Shifting to Sustainable AgricultureThe basic health challenge for sustainableagriculture is to improve the food security ofvulnerable rural and urban dwellers bymaking better use of available resources.
Agricultural and rural development policiesover the past 50 years have emphasisedexternal inputs as the way to increase foodproduction. This has produced remarkablegrowth in food production, but a concomitantand even greater growth in the globalconsumption of pesticides, inorganicfertilisers, animal feeds, and machinery.Pesticides have replaced biological andmechanical methods of controlling pests,weeds and diseases, inorganic fertilisers havebeen substituted for livestock manures,composts, nitrogen-fixing crops and fertilesoils, information for management decisionscomes from input suppliers, researchers andextension workers, rather than from localsources, and fossil fuels have been substitutedfor locally-generated energy sources. Whatwere once valued local resources have oftennow become waste products.
Sustainability can be achieved by reducingand balancing the use of external inputs, byregenerating internal resources moreeffectively, or by combinations of bothapproaches. Used appropriately, technologiesand practices that conserve resources can behugely beneficial for both farmers and ruralenvironments. They make a positivecontribution to natural capital, eitherreturning it to pre-degraded levels orimproving it yet more. A more sustainableagriculture, that can also serve to reducemalnutrition, systematically pursues thefollowing goals:
• A thorough integration of naturalprocesses (such as nutrient cycling, nitrogenfixation, and pest-predator relationships) intoagricultural production processes, therebyensuring profitable and efficient foodproduction;
• A minimisation of the use of thoseexternal and non-renewable inputs with thepotential to damage the environment or harmthe health of farmers and consumers, and atargeted use of the remaining inputs, usedwith a view to minimising costs;
• The full participation of farmers andother rural people in all processes of problemanalysis, and technology development,adaptation and extension, leading to anincrease in self-reliance amongst farmers andrural communities;
Chapter 7
Environmental Change and Human Health in Countries of Africa, the Caribbean and the Pacific194
• A greater use of local knowledge andpractices, including innovative approachesnot yet fully understood by scientists or widelyadopted by farmers;
• The enhancement of nature’s goodsand services, and other public goods of thecountryside.
The best evidence of the widespreadredesign of farming systems in favour ofsustainability comes from areas wherefarming has been largely untouched bymodern packages of externally-suppliedtechnologies, where agricultural yields arelow and food insecurity high (Pretty, 1998;Pretty, 1995). In these lands, farmingcommunities adopting regenerativetechnologies have substantially improvedagricultural yields, often using few or noexternal inputs. Most of these successes arecommunity-based activities that haveinvolved the complete redesign of farmingand other economic activities at local level,with the full participation of farmers andlocal people in the process.
A recent survey of 74 rural initiatives inEast and Southern Africa found dramaticimprovements in food production, withimprovements in both natural and socialcapital (Hinchcliffe et al., 1996). Theseinitiatives share important commoncharacteristics. They made use of resource-conserving technologies in conjunction withgroup or collective approaches to agriculturalimprovement and natural resourcemanagement. They have put participatoryapproaches and farmer-centred activities atthe core of their agenda, which means theseactivities are occurring on local people’sown terms. They have supported the activeinvolvement of women as key producers andfacilitators of change. And they haveemphasised ‘adding value’ to agriculturalproducts through agro-processing, marketing,and other off-farm activities, thus creatingemployment and income-generatingopportunities, whilst retaining the surplusin the rural economy.
Despite the increasing number ofsuccessful sustainable agriculture initiativesin different parts of the world, including ACPcountries, it is clear that most of these arestill only ‘islands of success’. Finding ways
to spread or ‘scale up’ the processes whichhave brought about these transitions remainsa huge challenge.
A recent analysis of 95 agriculturalproject evaluations recorded on the OECDDevelopment Assistance Committeedatabase shows a disturbing rate of failure(Pretty and Thompson, 1996). The citedreasons for failure included an emphasis onexternal technologies only, no participationby local people, ineffective training ofprofessionals, and institutions working withno orientation towards the diversity of localconditions and needs of local people. Thisevidence from completed agriculturaldevelopment projects suggests four importantprinciples for sustainability:
• imposed technologies are notsustainable: if coercion or financial incentivesare used to encourage people to adoptsustainable agriculture technologies (such assoil conservation, alley cropping, integratedpest management), then they are not likely tobe sustainable;
• imposed institutions are notsustainable: if new institutional structures areimposed, such as co-operatives or other groupsat local level, or Project Management Unitsand other institutions at project level, thenthese were rarely sustained beyond theproject;
• expensive technologies are notsustainable: if expensive external inputs,including subsidised inputs, machinery or hightechnology hardware are introduced with nothought to how they will be paid for, they toowill not be sustained beyond the project;
• sustainability does not equalfossilisation or continuation of a thing orpractice forever: rather it implies an enhancedcapacity to adapt in the face of unexpectedchanges and emerging uncertainties.
A more sustainable agriculture can leadto both health and environmentalimprovements. It does, however, need co-ordinated action on the part of nationalgovernments, to encourage and nurture thetransition towards more sustainablealternatives. Without appropriate policysupport, it will remain at best, localised inextent, and at worst, wither away. Whilst
Environmental Change and Human Health in Countries of Africa, the Caribbean and the Pacific 195
Environment and Health – the Shared Agenda
investing further resources may beappropriate in some areas, there is much thatgovernments can do within existing resources(Pretty, 1995).
7.3.2 Providing Appropriate Supportfor the Pastoralist and LivestockSector
Over the past 30 years, the millions of dollarsthat have been spent on projects in pastoralareas in Africa have brought remarkably fewbenefits (Scoones, 1995). Many developmentagencies have now abandoned drylandpastoral areas, deeming them to be ‘no hope’zones, in favour of so-called ‘high potential’areas. National policies to ‘modernise’ thelivestock sector have, moreover, tended totry and force the creation of private ranchesand a move away from common propertysystems (Lane and Scoones, 1993). Thereare, however, several good reasons not toabandon traditional pastoral areas.
Firstly, the social and natural resourcecosts are very high. Many pastoral areas inAfrica are characterised by conflict or civilstrife, with great human cost borne by pastoralpeople. Nomadic pastoralists are nowconsidered to be amongst the most vulnerableof the world’s rural poor, and nationalgovernments and the international communitybear the monetary costs of this insecurity andfamine (ITDG, 1995; Scoones, 1995).
Secondly, livestock make a significantcontribution to national economies indryland Africa. In 1988, the total value oflivestock products was estimated to be 25%of the total agricultural output in Africa,equivalent to US$ 12 billion (USDA, 1990).If livestock benefits of manure and draughtpower are also included, this figure mayincrease to 35% of total agricultural GDP(Winrock International, 1992).
Thirdly, much of the land in ACP-Africais not suitable for arable production and sois best used as rangeland. For example, some87% of South Africa’s land falls into thiscategory. In these areas, communallymanaged livestock systems are the mostproductive form of land use and should thusbe supported in the interests of foodsecurity.
Pastoralists are often better off thansettled farmers during normal times. If their
flexible strategies are supported, they canmove their animals to follow the rains ortake them to established seasonal grazingareas. They do, however, need extra helpduring prolonged periods of environmentalstress. For these reasons, a sustainableapproach to agriculture and livestockdevelopment emphasises reducingvulnerability and strengthening localcontrol, which can be achieved by providingsupport to traditional pastoralist activitiesand enhancing productivity throughimprovements to traditional structures.
7.3.3 Protecting Nature Whilst EnsuringFood SecurityReinstating legal access and increasing theeconomic value of wild resources canpromote resource conservation by makingsustainable use a viable option. Experiencehas shown that for the economic returns fromcommon property resources to reach theirusers, effective institutions and incentives forthe management of common property areessential (Murphree, 1994). Approaches thatsupport and enhance local managementcapacity are vital.
In highly industrialised or post-industrialcountries, protecting nature is often associatedwith keeping people out. Since only a smallshare of the population lives off the land, andvirtually none depend upon harvesting naturalproducts, the sacrifice is comparatively small.It is clearly inappropriate, however, to simplytransfer such an approach to ACP countries,where the majority of the population live offthe land and many of the most vulnerabledepend on natural produce. Exclusionarypolicies are, in such conditions, less likelyto protect the natural resources, and indeed,as indicated in Box 1.4 (chapter 1),population expansion is not always bad forthe environment – in the right circumstancesit can be beneficial. Exclusionary policies are,moreover, far more likely to have negativehealth consequences.
The need to involve neighbouringcommunities in forest management has longbeen recognised (Westoby, 1989), thoughdeveloping practical strategies has proveddifficult. On the one hand, there aresometimes very real trade-offs involved, andfinding appropriate local solutions is often
Chapter 7
Environmental Change and Human Health in Countries of Africa, the Caribbean and the Pacific196
difficult. On the other hand, forest ministrieshave long principally seen their role asprotecting the forests from people, and thisgoal was often built into their institutionalstructure. The need to solicit the participationof local inhabitants is now recognised in mostefforts to protect or improve naturalecosystems. However, as indicated in Box 7.4,practice often remains far from ideal, andthe result can be an increase in healthburdens.
7.3.4 Enhancing Participation by RuralWomen
Women in ACP-Africa currently play a crucialrole in meeting the food and nutrition needsof their families in three main areas relatedto food security: food production, economicaccess to food and nutritional security.Women account for 70%-80% of householdfood production, and do some 95% of thework related to feeding and caring for thefamily (IFPRI, 1995). African women alsoperform about 90% of the work of processingfood crops and providing household waterand fuelwood, and 80% of the work of foodstorage and transport from farm to village.They achieve this, despite unequal access toland, inputs and information: they receive,on average, for example, only 4%-6% of allagricultural extension visits. They are alsogenerally excluded from an active role inresearch, such as seed development andselection.
Women also have valuable knowledge ofwild diversity. In some areas of ACP-Africa,women cultivate or collect an extremely widevariety of species of plants on land fragmentsbetween fields and in the areas surroundingcommunities. In times of famine or drought,this knowledge can be especially important.During the 1984-1985 famine in the Sudan,for example, female-headed households werefound to be better off nutritionally than thoseheaded by men, because women were moreknowledgeable in the collection and use ofwild plants that sustained their familiesthrough the crisis (de Waal, 1989).
An important means of gaining this access,other than through food production and thecollection of non-domesticated plants, isthrough income. Women are more likely tospend their income on household food than
men. Ensuring the nutritional security of thehousehold, through the combination of foodand other resources, is the almost exclusivedomain of women. If the constraintsconfronting women farmers were removedand women were granted access to theresources available to male farmers, theycould make a more significant contributionto combating food insecurity.
7.3.5 Improving Food Security in UrbanAreas
Increasing the supply of food from large-scalecommercial agriculture or imports andlowering food prices are more likely toimprove food security among urban than ruraldwellers, and this is one of a number of issuesaround which urban and rural interests cancome into conflict (Sah and Stiglitz, 1992).Interventions that depress urban food pricesare not, however, likely to prove an efficientmeans of improving urban food security.Moreover, some of the most vulnerable urbandwellers rely on rural links or urbanagriculture to ensure their food supply.
In many ACP cities, assisting low-incomehouseholds with urban agriculture could bean effective means of improving urban foodsecurity. As indicated in Chapter 5, there areindications that in some urban areas it isbecoming increasingly difficult for low-incomehouseholds to access agricultural land, andmeasures that both improve the food safety ofurban agriculture and improve access for low-income residents, especially women, couldthus make an appreciable difference.
More generally, of course, urban foodsecurity depends upon wages, employmentand informal sector opportunities, and theimportance of a health perspective is lessevident here. It is, nevertheless, important tokeep in mind that measures designed toimprove urban food security which underminethe economic opportunities of the morevulnerable urban residents are likely to becounterproductive.
7.3.6 Redirecting BiotechnologyOpinion is sharply divided on whetherbiotechnology and genetic engineering arecreating opportunities to be seized or a dangerto be avoided. These divisions extend to therole of biotechnology in addressing food
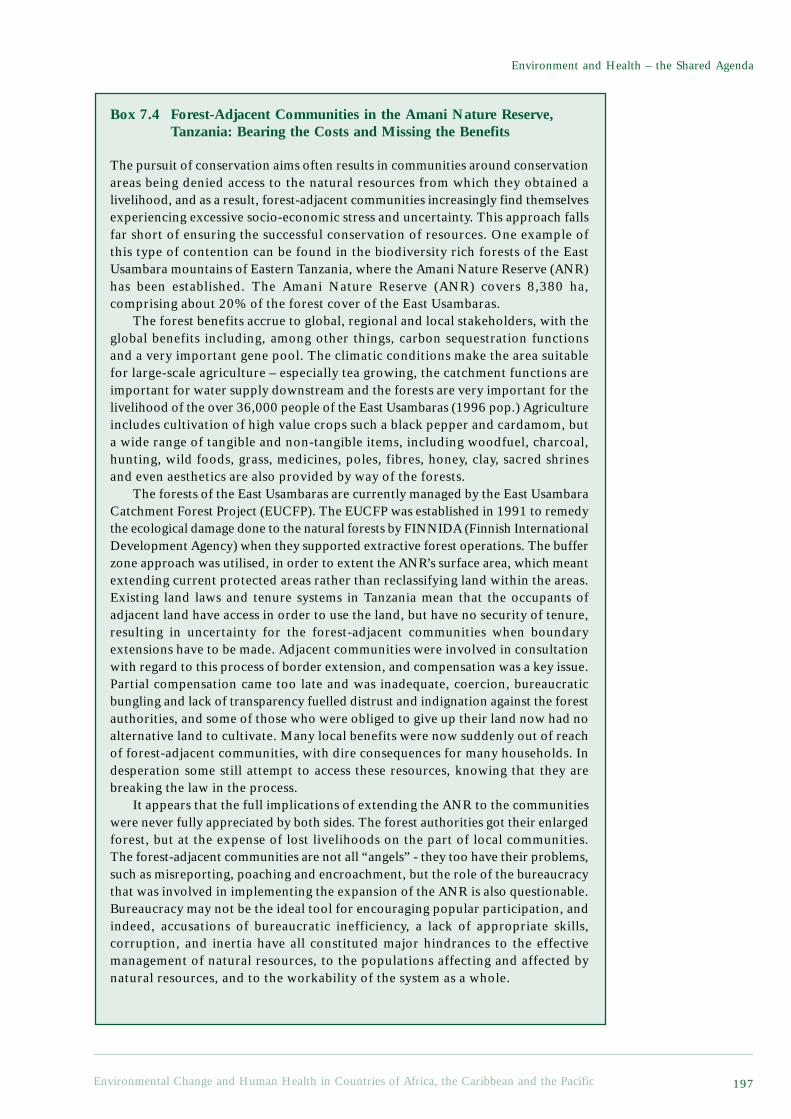
Environmental Change and Human Health in Countries of Africa, the Caribbean and the Pacific 197
Environment and Health – the Shared Agenda
Box 7.4 Forest-Adjacent Communities in the Amani Nature Reserve,Tanzania: Bearing the Costs and Missing the Benefits
The pursuit of conservation aims often results in communities around conservationareas being denied access to the natural resources from which they obtained alivelihood, and as a result, forest-adjacent communities increasingly find themselvesexperiencing excessive socio-economic stress and uncertainty. This approach fallsfar short of ensuring the successful conservation of resources. One example ofthis type of contention can be found in the biodiversity rich forests of the EastUsambara mountains of Eastern Tanzania, where the Amani Nature Reserve (ANR)has been established. The Amani Nature Reserve (ANR) covers 8,380 ha,comprising about 20% of the forest cover of the East Usambaras.
The forest benefits accrue to global, regional and local stakeholders, with theglobal benefits including, among other things, carbon sequestration functionsand a very important gene pool. The climatic conditions make the area suitablefor large-scale agriculture – especially tea growing, the catchment functions areimportant for water supply downstream and the forests are very important for thelivelihood of the over 36,000 people of the East Usambaras (1996 pop.) Agricultureincludes cultivation of high value crops such a black pepper and cardamom, buta wide range of tangible and non-tangible items, including woodfuel, charcoal,hunting, wild foods, grass, medicines, poles, fibres, honey, clay, sacred shrinesand even aesthetics are also provided by way of the forests.
The forests of the East Usambaras are currently managed by the East UsambaraCatchment Forest Project (EUCFP). The EUCFP was established in 1991 to remedythe ecological damage done to the natural forests by FINNIDA (Finnish InternationalDevelopment Agency) when they supported extractive forest operations. The bufferzone approach was utilised, in order to extent the ANR’s surface area, which meantextending current protected areas rather than reclassifying land within the areas.Existing land laws and tenure systems in Tanzania mean that the occupants ofadjacent land have access in order to use the land, but have no security of tenure,resulting in uncertainty for the forest-adjacent communities when boundaryextensions have to be made. Adjacent communities were involved in consultationwith regard to this process of border extension, and compensation was a key issue.Partial compensation came too late and was inadequate, coercion, bureaucraticbungling and lack of transparency fuelled distrust and indignation against the forestauthorities, and some of those who were obliged to give up their land now had noalternative land to cultivate. Many local benefits were now suddenly out of reachof forest-adjacent communities, with dire consequences for many households. Indesperation some still attempt to access these resources, knowing that they arebreaking the law in the process.
It appears that the full implications of extending the ANR to the communitieswere never fully appreciated by both sides. The forest authorities got their enlargedforest, but at the expense of lost livelihoods on the part of local communities.The forest-adjacent communities are not all “angels” - they too have their problems,such as misreporting, poaching and encroachment, but the role of the bureaucracythat was involved in implementing the expansion of the ANR is also questionable.Bureaucracy may not be the ideal tool for encouraging popular participation, andindeed, accusations of bureaucratic inefficiency, a lack of appropriate skills,corruption, and inertia have all constituted major hindrances to the effectivemanagement of natural resources, to the populations affecting and affected bynatural resources, and to the workability of the system as a whole.
Chapter 7
Environmental Change and Human Health in Countries of Africa, the Caribbean and the Pacific198
Some experts note that, internationally, there are few buffer zone initiativeswhich can truly claim to have succeeded in establishing stable and compatibleland use systems around a protected area in such a way that local people aregenuinely reconciled to the conservation function of the area. This failure isapparently often due to the fact that buffer zones have been imposed on people byexternal agencies oblivious to local needs and sensitivities.
In this example, field observations clearly show a healthy regeneration offlora and fauna in the new areas. Several forest-adjacent communities have notedpositive changes to the microclimate and increased availability of wild animalsand water supply. From the ecological point of view, something is being doneright. The question that now arises, however, is how can the communities adjacentto protected areas be brought into the joint management approach so that benefitsand costs are shared more equitably between the global and regional stakeholdersand the forest-adjacent communities?
One expert notes that the attitudes of local people towards protected areamanagers are strongly influenced not only by contacts with protected area employeesbut also by the services and benefits they personally receive. This suggests thatextension programs should be designed in a way that not only establish permanentlines of dialogue with ANR managers, but that also provide direct tangible benefitsfor local people. Whilst the former is in operation, there is little evidence of thelatter in some of the affected areas around the ANR.
The promotion of land-use practices that maintain low human density onadjacent lands is probably the most desirable long-term strategy. While this isdesirable, however, the main problem lies in how this can be done. Some peoplearound the ANR have been suggesting that they be relocated to other areas thathave more land, but most of these areas are in the lowlands, and the highlandcommunities are especially susceptible to prevailing lowland diseases. Their currentlevels of poverty would, moreover, necessitate a well-worked out program ofassisted re-settlement. Given Tanzania’s poor record of resettlement, such a moveis likely to be unpopular both with government and donor agencies. In the past,there have been a few successful initiatives that could be emulated, e.g. OperationUkara, where people were moved from the ultra-high density area of the island ofUkara to Sengerema District, but were such an exercise to be conducted again, itmust be done properly and not through coercion.
The core challenge for the ANR is to find ingenious ways of putting peopleback into conservation. It is important that participation should be viewed as ameans to an end. The interests of the global, regional and local stakeholders donot necessarily converge, but the goal should be ‘to promote local sustainablelivelihood’ whilst simultaneously - rather than, as opposed to - ‘preserving theintegrity of ecological values’. The project approach to participation concentrateson the mechanisms involved, but overlooks critical issues such as who isresponsible for, and has rights to, the land, its products and its services.
Contributed by George Jambiya, University of Dar es Salaam, Tanzania.
Environmental Change and Human Health in Countries of Africa, the Caribbean and the Pacific 199
Environment and Health – the Shared Agenda
security problems. Proponents ofbiotechnology tend to be pessimistic aboutthe alternative means of improving foodsecurity, and optimistic about all aspects ofbiotechnology, including its ability to solvethe world food problems. Opponents tend tobe optimistic about alternative means ofimproving food security, and pessimistic aboutboth the dangers biotechnology brings andthe likelihood that it will actually get morefood to those in need. The pro-lobby hopesthat protesters will go away, or will bepersuaded that biotechnology can benefit usall. The anti-lobby hopes policy-makers andthe public can be persuaded to preventgenetically modified organisms from enteringthe food chain.
This report is not the place to debate thetechnical potential of biotechnology, or topass judgement on the risks it will bring, orthe ethical questions it posses, though itshould be clear that whilst the potential isconsiderable, so are the risks. It is, however,important to note that biotechnology doesrepresent a challenge to ACP countries. Howthis challenge is met could have importantimplications for both environmental andhealth issues.
Opponents of biotechnology are surelycorrect in that there are alternative means ofimproving food security. Emerging empiricaldata on sustainable agriculture suggest thatcurrent and future populations can be fed withlow-cost (to both farmers and theenvironment) and regenerative technologies.Also, to the extent that biotechnology islimited to large-scale commercial farming, itcan at best address one side of the food securityproblem. Increasing food production is not,for the reasons outlined in Chapter 4, thesame as providing food security, especiallyfor the rural poor. Clearly, biotechnologyshould not be pursued as the solution to foodinsecurity.
Proponents may, however, be right to saythat biotechnology has the potential toovercome many of the barriers whichcurrently prevent modern technologies frombenefiting small cultivators. Whether thispotential can be realised, efficiently or safely,is open to debate. This debate needs to takeplace within ACP countries, and there needsto be the local capacity to ensure that
informed decisions can be taken. In mostindustrialised countries substantial effortshave been devoted to developing regulatorystructures, policies and procedures and tobiosafety mechanisms, in order to ensureenvironmentally safe applications ofbiotechnology (Doyle and Persley, 1996;Tzotzos, 1995). A major problem facing mostACP countries is the insufficient capacity forenforcement of biosafety regulations and lackof biosafety information relevant for theregion, and there is a hence a need for trainingand biosafety research to address shortage ofhuman resources and fill importantinformation gaps (Virgin and Frederick,1995).
7.4 Achieving Healthy LivingEnvironments
This section examines methods of andapproaches to achieving healthy livingenvironments, building upon Chapter 5. Itwill discuss how to enhance local capacitiesfor achieving healthy living environments,as well as more targeted attempts to improveenvironmental services and housingconditions.
Most people living in ACP countries areexposed to a high share of environmentalhealth hazards in and around their homes andwork places. It is through better livingconditions that environmental improvementscan have the greatest direct impact on health.This applies to rural as well as urban areas,and an overly sharp distinction between urbanand rural living be misleading. Indeed, someof the settings where the living environmentsare least healthy are peri-urban settlements thatcombine urban and rural lifestyles andlivelihoods.
Traditional tools of pollution abatementcan only go a small way towards achievingimproved living environments. A recent setof reports on Bridging Environmental HealthGaps concluded that ‘a focus on pollutioncontrol can give a false sense of achievementin environmental health improvement’, andargues cogently for paying more attention tothe role of infrastructure (Listorti, 1996).Much also depends upon the capacity of localresidents to meet their own environmentalhealth needs, and to represent their collectiveneeds to the government and in the political
Chapter 7
Environmental Change and Human Health in Countries of Africa, the Caribbean and the Pacific200
arena. Centrally mandated regulations,designed to ensure that living environmentsare ‘up to standard’ and to punish offenders,cannot be expected to come to terms withthe variety of conditions that prevail in lowincome settlements.
7.4.1 Building Local Capacities forEnvironmental Management
Building a stronger local capacity forenvironmental management is important inits own right, and can also improve thesuccess of external interventions and services.Most of the labour and investment forimproving living environments comes fromthe residents themselves, in that outsideexperts are rarely in good position to identifypriorities: the environmental health threatsin deprived settlements are closelyinterconnected, complex, and often specificto the particular settlement. Externallydesigned interventions are rarely accepteduncritically and relations between low-income residents and governmental agenciesare often strained. As described in sections7.4.2 and 7.4.3, environmental service andbetter housing programmes can help addressthese problems, but it is also important totake action to ensure that local residents havethe capacity and opportunity to improve theirown living environments, and influenceexternal interventions.
In the right conditions, people have a verystrong incentive to act to improve their localenvironments. Better health is not the onlymotivation, and indeed, many environmentalhealth experts have found that other reasonsare often far more important to the adoptionof better hygiene practices and technologies(Cairncross and Feachem, 1993). Cleanliness,convenience, privacy, propriety, status andreligious codes are often the factors whichmotivate people to improve their livingenvironment. Health often reinforces suchconcerns, however, and better health can be avery positive outcome.
Poverty alleviation is itself one of the mostimportant ways of building local capacities tomanage the environment. This report cannotdo justice to the strategies needed to improvelivelihoods in both urban and rural areas. Butin any attempt to improve environmentalhealth, it is necessary to take into account that
measures which also alleviate poverty will bedoubly beneficial to health, whilst those whichimpose a significant economic burden on thepoor are likely to be counterproductive. Inaddition, it is typically among the pooresthouseholds that improving living environmentsyields the largest health benefits.
Improving housing security is alsoimportant if residents are to have a sufficientincentive to improve their localenvironment. Expanding land registrationand formalising land tenure are tools, which,in the right context, can improve housingsecurity. Slum clearance and evictions, onthe other hand, undermine housing security,even beyond the bounds of the targeted areas.Although making environmentalimprovement a condition for land titling canbe an effective tool of environmentalmanagement, overly strict conditions canundermine housing security and becomecounterproductive. In some contexts, rentcontrol will enhance housing security, butin others it will give owners less reason toimprove or maintain the quality of theirliving environments. It is, therefore, vital thatthe local context is taken into account in thepursuit of housing security. If this is done,the benefits for people’s living environmentscan be substantial.
Giving women greater control over thelocal environment, either through bettertechnologies, more knowledge or, perhapsmost important, more influence overcollective initiatives (such as public services),can also increase local capacities. In mostsettlements, women are already central toenvironmental management in and aroundthe home. These management tasks are timeconsuming, onerous, and at times hazardous,particularly where services are lacking. Theyare also critical to achieving healthy livingenvironments. Measures that simply add newtasks, or create new constraints for women,are unlikely to be beneficial, even if they areenvironmentally motivated. Whilst women’sown priorities may not always be wellinformed or public-spirited, they willgenerally be preferable to centrally designedprescriptions.
Environmental education, focusing onlocal processes and health hazards, also hasa potentially important role to play. As
Environmental Change and Human Health in Countries of Africa, the Caribbean and the Pacific 201
Environment and Health – the Shared Agenda
described above, far more knowledge of theunderlying environmental processes isneeded to live healthily in a settlement whereservices are lacking. Formal schooling, aswell as more tailored educational initiativesand awareness programmes, rarely take localenvironmental management seriously.Considerable verbal support is given tohygiene education, but many practitionersstill feel that the level of professionalism iswoefully low (Quarry, 1994). There are alsoindications that a prescriptive approach tohygiene education often fails to provideresidents with the capacity to respond to theirspecific challenges. Given the localvariability in environmental conditions, itis clear that neither standard prescriptionsnor formal schooling, based on standardisedcurricula, can ensure that locally relevantinformation is made available. This gapcould potentially be filled by techniquesdrawn from Participatory Learning andAction (Pretty et al., 1995) and other locallyadaptive education.
Improving the quality of local governance,and its ability to respond to the environmentalconcerns of residents in a constructive fashion,is also critical. Many of the most criticalenvironmental health problems arise in thepublic domain, and a responsive localgovernment can work with residents to findsolutions. The importance of localgovernment, as well as non-governmentalorganisations, has become increasingly crucialwith the decline of central planning. In orderto fill its new responsibilities, however,greater capacity is needed. Increasing capacityin the areas of environmental health andcommunication with residents is particularlyimportant. Many improvements in livingenvironments are the joint outcome of publicand private initiatives, and better relations,especially with local residents, can lead togreater success.
Providing micro-finance for low-incomehouseholds can allow them to improve theirhousing and water and sanitation. This cantake the form of enabling them to affordconnection charges, of better provision
within their home (such as installing a well-designed latrine) or of allowing them to buyor build a better quality home. There aremany examples of successful community-based savings and loans schemes that havedone this with high levels of cost recovery.Utilities can play a similar role, for examplecollecting repayments for connection costsin the monthly bills. Sound financialmanagement is, moreover, critical to bothprivate and public initiatives, and isespecially important when subsidies areinvolved.
Many of the principles mentioned abovetend to be incorporated into community-based approaches. A community-basedapproach is, however, not a solution initself, but rather one way of trying to cometo grips with all these issues. Thatcollaboration with communities does notautomatically solve all problems is spelledout in Box 7.5. To work effectively withcommunities it is necessary to address allthese challenges.
7.4.2 Improving Water, Sanitation andother Environmental ServiceProvision1
Improving environmental service provisionremains one of the most important means ofbettering health in many ACP countries, evenif it is only a partial solution. Providing goodwater, sanitation and drainage can reduce awide range of ‘water-related’ infectiousdiseases (see Chapter 3). Cleaner energyservices can reduce respiratory infections andconditions, and waste removal can help avoida range of environmental hazards prevalent inmany low-income settlements (see chapter 5).From the evidence provided, it should be clearthat if everyone in the ACP group of stateshad ready access to even the most basicservices, the health benefits could beenormous.
There is still a great deal to be done, notonly in terms of investing in improvedinfrastructure, but in developing institutionalapproaches and technologies better adaptedto the needs of low-income settlements.
1 This and the following section draw heavily on materials prepared by David Satterthwaite in supportof an OECD-DAC initiative on Shaping the Urban Environment in the 21st Century.
Chapter 7
Environmental Change and Human Health in Countries of Africa, the Caribbean and the Pacific202
Box 7.5 Community-Based Approaches to Development - What are theObstacles?
Community approaches have been shown to be useful in resolving health and otherproblems arising from urban development. Certain obstacles can, however, reduce theeffectiveness of community interventions. Some of these obstacles are described below,and are based on the experience of a large NGO (Non-governmental organisation) inDakar, Senegal:
Constraints of collaboration with communities:• Lack of resources: in some communities, inadequate human and financial
resources, illiteracy and migration limit the capacity of community members toinvest in projects.
• The play of political interests at community level: it would be naive to believethat community leaders are concerned only with improving the living conditionsof the populations which they represent. These leaders have their own objectivesand strategies and their own stake in the social resources of they area. Thesemay be different from the objectives of the project and may prevent itsimplementation. In certain cases, government decentralisation creates a client-patron relationship between community leaders and local governments, whichmay also lead to a shift in the objectives of the project.
Institutional constraints - governments:• The quality of governance: the lack of definition regarding the roles of the
State and civil society may mean that governments do not recognise localinstitutions. Traditional institutions of social organisation are, therefore,weakened, whilst modern public institutions continue to evolve, often withdeleterious effects on the manner in which health problems are managed.
• Modes of interaction: the fact that governments do not recognise localinstitutions, a system of regulation which does not support communityorganisations, and the difficulties in establishing durable working relationshipswith government administrations are all important factors.
Institutional constraints - community organisations:• Turnover of personnel: it is difficult for NGOs, for example, which are themselves
unstable, to attract and retain qualified personnel.• Financial challenges: mobilising ongoing financing for communities, providing
regular budgetary support for their activities, and setting up transparent andefficient financial systems within the associations, institutions and organisationsof the community are all important challenges.
Constraints on participation:• Limited internal resources: Representatives of the African community are still,
in most cases, young people who are, themselves, still developing socially. Manyhave limited social support and financial resources.
• Indifference or external hostility:- the lack of financial backers, and the insistence that organisations undergorigid financial assessments, may hamper success in these initiatives.- the relevant governments and services sometimes react as though localorganisations are competitors in fields previously reserved for them. Theintegrated management of the city, which is currently a promising path forsustainable urban development, faces the inflexibility of the public authorities
Environmental Change and Human Health in Countries of Africa, the Caribbean and the Pacific 203
Environment and Health – the Shared Agenda
who are confined to traditional management styles, and do not attempt to solveproblems at a grass-roots level.
Constraints on ‘scaling-up’ of the initiatives:• High demands on resources: the extension of the pilot activities initiated at the
local level requires enormous human and financial resources, which NGOsoften lack.
• Government services, unaccustomed to collaboration with NGOs, do notrecognise their role in urban management and may, therefore, hinder progress.
• Local diversity: the diversity of local initiatives may hamper expansion.
Contributed by Cirre Fall, Enda – Relais pour le developpement Urbain Participe Dakar,Senegal.
Progress has, however, been slow, despitelong-standing recognition of the healthbenefits. The slow pace can be partially butnot fully explained by the lack of politicalwill and finance, and the failure of centrallyplanned solutions. Among the problems whichpersist are:
• skewed subsidies, favouring thebetter-off, and harming the mostdeprived;
• poor relations between serviceproviders and low-income residents;
• under-financed utilities;• too great a reliance on capital
intensive, often imported,technologies;
• poor maintenance of existinginfrastructure.
Improving environmental serviceprovision is a critical task, but not an easyone. It deserves the best that science andgovernance can provide. The appropriateapproach, given limited budgets, willinevitably vary considerably from place toplace and in line with technical,environmental, demand-related andinstitutional differences. Technical issues maybe related to the cost of supply, e.g. urbanversus rural location, distance from existingwater supplies, sewers, drains or electric grid,topography, soil structure, settlement layoutand opportunities for waste composting.
Environmental issues may be related to thevulnerability of local and regionalecosystems, such as excessive abstractionfrom aquifers, overloading of renewable ornon-renewable sinks, or deforestation dueto fuelwood use. Demand issues may berelated to the needs and priorities of localresidents, such as socio-economic status,health status, waste composition andcooking practices. Institutional issues maybe related to the organisational capacity toimprove service delivery, such as localgovernment structures, land tenure or thestrength of community based organisations,and the rules which guide the actions of theseplayers.
Different approaches are, of course, alsorequired for the different services. There are,for example, far more opportunities for costrecovery through user fees for water andelectricity, than for sanitation and wastecollection. Even for water and electricity,however, it is not possible to rely on marketmechanisms to ensure supply.
Prioritising various environmental serviceinterventions can be difficult to achieve onthe grounds of health improvement alone. Box7.6 presents a brief overview of the difficultiesinvolved.
There are a wide range of well-documented technological options for waterand sanitation (Cairncross and Feachem,1993; Mara, 1996), along with an evengreater number of locally developed
Chapter 7
Environmental Change and Human Health in Countries of Africa, the Caribbean and the Pacific204
Box 7.6 Using Scientific Evidence in Environmental Health Decision-Making: the case of Water and Sanitation
Many development and government agencies would like environmental health specialiststo provide clear scientific evidence to guide them in their choice of interventions. Anumber of studies have attempted to estimate the separate and joint health effects ofimprovements in water supply and sanitation in developing countries. Clear answers aredifficult to find, however, due to a variety of factors.
For example:- we still lack knowledge, of the way in which faecal-oral diseases are transmitted
and of the relative effectiveness of public health interventions in reducing thistransmission;- the health-related impacts of interventions such as an improved water supply or
sanitation depend on many additional factors, such as household hygiene practices(Cairncross and Kochar, 1994);- relationships between environmental and health issues are strongly confounded by
households’ socio-economic status. Latrine owners, for example, tend to be betteroff than non-owners, to be more likely to use improved water sources and largerquantities of water, and to be more likely to report good hygiene practices (Danielset al., 1990);- the interactions between the interventions (such as water supply and sanitation
measures) may vary from setting to setting, and are difficult to measure.
Bearing these factors in mind, analyses of existing and rigorous studies have producedthe following findings;
alternatives. There is a growing recognitionthat companies or agencies responsible forwater and sanitation need to be more awareof and responsive to users’ needs and localrealities.
Responsible organisations, for example,need a more detailed understanding ofexisting (formal and informal) systems andbusinesses that are already providing waterand sanitation to those they do not serve.They also require information on differentinhabitants’ own needs, priorities andwillingness to pay. Secondly, they need todevelop a range of responses to meet thediversity of needs, priorities and financialcapacities. For many of the lowest incomesettlements or within the weakest localauthorities, this will often include supportfor community provision and management.Community provision may take the form ofthe agency providing piped water and seweror drain connections to the site, and the
inhabitants organising the systems withintheir settlement. Community managementmay take the form of day to day responsibilityfor water points and shared sanitation andwashing facilities, for example, resting withcertain members of the community.
Responsible agencies also need to be moreactive in providing and maintaining bothsanitation and water supply. This is becauseimproved sanitation is needed to reducediarrhoeal and other water-related diseases.The safe disposal of households’ wastewaters(sullage) is also important because this containscertain disease-causing agents, and if notremoved, can provide a breeding ground fordisease-carrying insects or facilitate thedevelopment of soil-based parasitic worms,such as hookworm.
Responsible agencies could also draw ona considerable range of methods of safe, goodquality sanitation. When providing sewers,for example, costs can be cut by using smaller
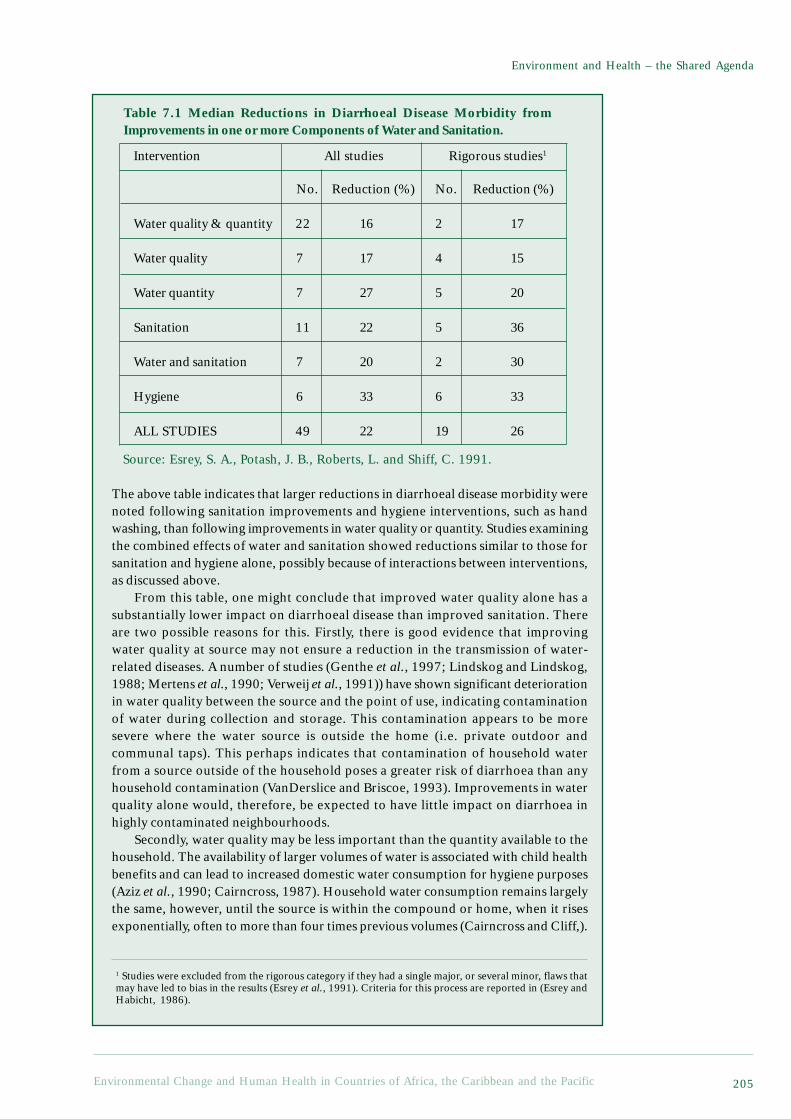
Environmental Change and Human Health in Countries of Africa, the Caribbean and the Pacific 205
Environment and Health – the Shared Agenda
1 Studies were excluded from the rigorous category if they had a single major, or several minor, flaws thatmay have led to bias in the results (Esrey et al., 1991). Criteria for this process are reported in (Esrey andHabicht, 1986).
Intervention All studies Rigorous studies1
No. Reduction (%) No. Reduction (%)
Water quality & quantity 22 16 2 17
Water quality 7 17 4 15
Water quantity 7 27 5 20
Sanitation 11 22 5 36
Water and sanitation 7 20 2 30
Hygiene 6 33 6 33
ALL STUDIES 49 22 19 26
Table 7.1 Median Reductions in Diarrhoeal Disease Morbidity fromImprovements in one or more Components of Water and Sanitation.
Source: Esrey, S. A., Potash, J. B., Roberts, L. and Shiff, C. 1991.
The above table indicates that larger reductions in diarrhoeal disease morbidity werenoted following sanitation improvements and hygiene interventions, such as handwashing, than following improvements in water quality or quantity. Studies examiningthe combined effects of water and sanitation showed reductions similar to those forsanitation and hygiene alone, possibly because of interactions between interventions,as discussed above.
From this table, one might conclude that improved water quality alone has asubstantially lower impact on diarrhoeal disease than improved sanitation. Thereare two possible reasons for this. Firstly, there is good evidence that improvingwater quality at source may not ensure a reduction in the transmission of water-related diseases. A number of studies (Genthe et al., 1997; Lindskog and Lindskog,1988; Mertens et al., 1990; Verweij et al., 1991)) have shown significant deteriorationin water quality between the source and the point of use, indicating contaminationof water during collection and storage. This contamination appears to be moresevere where the water source is outside the home (i.e. private outdoor andcommunal taps). This perhaps indicates that contamination of household waterfrom a source outside of the household poses a greater risk of diarrhoea than anyhousehold contamination (VanDerslice and Briscoe, 1993). Improvements in waterquality alone would, therefore, be expected to have little impact on diarrhoea inhighly contaminated neighbourhoods.
Secondly, water quality may be less important than the quantity available to thehousehold. The availability of larger volumes of water is associated with child healthbenefits and can lead to increased domestic water consumption for hygiene purposes(Aziz et al., 1990; Cairncross, 1987). Household water consumption remains largelythe same, however, until the source is within the compound or home, when it risesexponentially, often to more than four times previous volumes (Cairncross and Cliff,).
Chapter 7
Environmental Change and Human Health in Countries of Africa, the Caribbean and the Pacific206
This evidence suggests that water quality receives too much attention relative to therole of water in ‘washing away’ pathogens.
Finally, it should be remembered that environmental interventions are not withoutrisk and can, if badly designed or maintained, increase health risks. Drainageinterventions may, for example, in the absence of adequate maintenance, increase thenumber of sites for vector breeding, encouraging the transmission of diseases suchdengue, yellow fever and filariasis, or may increase exposure to contaminatedfloodwaters (Curtis and Feachem, 1981; World Health Organization, 1997). This riskcan be minimised if interventions are designed with careful attention to local conditions,including local risk perceptions (Stephens et al., 1994).
ReferencesAziz, K. M. A., Hoque, B. A., Huttly, S. R. A., Minnatullah, K. M., Hasan, Z., Patwary, M. K., Rahaman,
M. M. and Cairncross, S. 1990. Water Supply, Sanitation and Hygiene Education: Report of a HealthImpact Study in Mirzapur, Bangladesh. Water and Sanitation Report Series No. 1. UNDP-World BankWater and Sanitation Program, World Bank (Washington, DC).
Cairncross, S. 1987. The benefits of water supply. In: Pickford J., (ed.). Developing World Water II.London, Grosvenor Press.
Cairncross, S. and Cliff, J. L. 1987. Water use and health in Mueda, Mozambique. Trans Royal Soc TropMed Hyg. 81:51-54.
Cairncross, S. and Kochar, V., (eds.) 1994. Studying Hygiene Behaviour: Methods, Issues and Experiences.New Delhi, Sage Publications. 334 p.
Curtis, C. F. and Feachem, R. G. 1981. Sanitation and Culex pipiens mosquitoes: A brief review.American Journal of Tropical Medicine and Hygiene. 84:17-25.
Daniels, D. L., Cousens, S. N., Makoae, L. N. and Feachem, R. G. 1990. A case-control study of theimpact of improved sanitation on diarrhoea morbidity in Lesotho. Bulletin of the World HealthOrganisation. 68(4):455-463.
Esrey, S. A. and Habicht, J.-P. 1986. Epidemiologic evidence for health benefits from improved water andsanitation in developing countries. Epidemiologic Reviews. 8:117-128.
Esrey, S. A., Potash, J. B., Roberts, L. and Shiff, C. 1991. Effects of improved water supply and sanitationon ascariasis, diarrhoea, dracunliasis, hookworm infection, schistosomiasis, and trachoma. Bulletin ofthe World Health Organisation. 69(5):609-621.
Genthe, B., Strauss, N., Seger, J., Vundule, C., Maforah, F. and Kfir, R. 1997. The effect of type of watersupply on water quality in a developing community in South Africa. Wat Sci Tech. 35(11-12):35-40.
Lindskog, P. and Lindskog, U. 1988. Bacterial contamination of water in rural areas: An interventionstudy from Malawi. Journal of Tropical Medicine. 91:1-7.
Mertens, T. E., Fernando, M. A., Marshall, F. d., Kirkwood, B. R., Cairncross, S. and Radalowicz, A. 1990.Determinants of water quality, availability and use in Kurunegala, Sri Lanka. Trop. Med. Parasit. 41:89-97.
Stephens, C., Timaeus, I., Akerman, M., Avle, S., Maia, P. B., Campanario, P., Doe, B., Lush, L., Tetteh, D.and Harpham, T. 1994. Environment and Health in Developing Countries: An Analysis of Intra-UrbanDifferentials Using Existing Data. London School of Hygiene & Tropical Medicine (London). 147 p.
VanDerslice, J. and Briscoe, J. 1993. All coliforms are not created equal: A comparison of the effects ofwater source and in-house water contamination of infantile diarrheal disease. Water Resources Research.29(7):1983-1995.
Verweij, P. E., van Egmond, M., Bac, D. J., van der Schroeff, J. G. and Mouton, R. P. 1991. Hygiene, skininfections and type of water supply in Venda, South Africa. Trans Royal Soc Trop Med Hyg. 85:681-684.
World Health Organization. 1997. Health and Environment in Sustainable Development: Five years afterthe Earth Summit. Geneva, World Health Organisation. 242 p.
pipes and shallower trenches, shallowergradients and interceptor tanks. But wheresupport for improved sanitation is withinsettlements where sewers cannot beprovided, too little attention is often paid toensuring that there is an effective service forthe collection and disposal of excreta frombucket and pit latrines and septic tanks.Projects involving the construction of latrines
often fail to develop adequate programmesto ensure they can be regularly emptied.Households with latrines need an efficientand affordable service, in that the manualemptying of pit latrines is a very unpleasantand hazardous job.
‘On-site’ sanitation options that do notneed sewers tend to be lower cost. Theseinclude options such as ‘ventilated improved
Environmental Change and Human Health in Countries of Africa, the Caribbean and the Pacific 207
Environment and Health – the Shared Agenda
pit’ (VIP) latrines and pour-flush toilets,linked to double vaults or community septictanks. Local conditions, such as soilconditions, the ease with which pits can bedug, and groundwater levels will helpdetermine which is most appropriate in eachcircumstance. Provision for sanitation mustalso make provision for the safe disposal ofwastewater. In large and high-densityresidential areas, unit costs for sewer systemsmay, in fact, be comparable to ‘on-site’systems, and be much preferred by theinhabitants because these also removewastewater and do not need emptying.
These examples represent technologicalinnovations that may be beneficial in theprovision of water and sanitation. There areother types of innovation which can alsoimprove provision and cut costs. Institutionalinnovations, in settlements where it is tooexpensive or too difficult to providehousehold piped water connections, can, forexample, create a range of measures toimprove provision (many of which can alsorecover costs). Where people rely oncommunal water points and water vendors,for example, well-managed water kiosks(including those managed by communityorganisations) may improve service levels,reduce the distance that water has to becarried and reduce prices, whilstsimultaneously recovering costs. Waterconnections to each house or plot do,however, remain the ideal, because theseprovide health benefits that more distantsources do not. There are often ways in whichwater agencies can support such connections,rather than providing them themselves, e.g.for urban settlements where the inhabitantslack the income to afford connection charges,the water agency can provide connections towater mains and trunk sewers at thesettlement’s boundary with the inhabitantsorganising the systems within theirsettlements. For water agencies seeking toreach low-income households with affordablepiped supplies, selling the water or equipment‘wholesale’ to an organisation (such as a co-operative), with the community collectingpayments from households can reduce costs.Such innovations can make a large difference,but inevitably require close cooperation withthe residents themselves.
7.4.3 Improving Housing ConditionsIn the past, many housing programmes ‘forlow-income groups’ produced few units,usually with high unit costs and often inlocations that are too far from income-earningopportunities. There is, however, a newgeneration of shelter programmes that supportlow-income urban households with regard tothe building, purchase or extension of theirhomes, and to obtaining improvedinfrastructure and services (either bynegotiating provision from outside agenciesor by building it themselves). These can bringmultiple benefits, all of which contribute tobetter health.
Improved housing can bring about directimprovements in health. The infectiousdisease burden can be considerably reducedby improving housing quality and relievingovercrowding, and by improving theprovision for water, sanitation, drainage andgarbage management. Improved housing canalso reduce accidents such as burns, scaldsand fires that are related to the combinationof overcrowding, the use of open fires orkerosene stoves, and flammable buildings.Improved ventilation and the nature ofcooking facilities can greatly improverespiratory health. Health burdens arefurther reduced if the land on which housingstands is safe and not for instance, on floodplains or steep slopes.
Increasing home ownership is increasinglyseen as a positive step for low-income groups.Acquiring a legal home may bring substantialcost-savings. Better quality homes mean lessill health and reduced costs, as noted above.For many low-income groups, acquiring theirown shelter also means not having to pay rent.This can be a great saving as many tenant-households spend more than a third of theirincome on rent. Households who rent roomsor live in illegal settlements may also bepaying high prices for other services.
For low-income urban dwellers whoacquire their own shelter (usually within illegalor informal developments), their homes aretheir most valuable asset. If they can obtainsecure tenure of the land plot, they can improveand extend their homes, when resources areavailable. This combines improvements intheir living conditions with increases in theirasset base or increased incomes (e.g. through
Chapter 7
Environmental Change and Human Health in Countries of Africa, the Caribbean and the Pacific208
extending their house to allow a small businessto operate there, or building rooms which canbe rented out). Acquiring legal tenure alsomeans a better chance of obtaining loans (withthe house providing the collateral) andconnections to piped water, sewers andelectricity (since official utilities often refuseor are not allowed to serve ‘illegal’settlements).
Community-led housing programmes,whether they involve upgrading or newdevelopments, can bring many other benefits.These include increased demand for labourand services and also for building materials,fixtures, fittings or components made locally.They also include considerable time-saving,especially for women and girls (for instancetime saved when water no longer needs to becollected by hand and when garbage no longerneeds carrying to distant dumps or buried).Extended housing can, in addition, permitincome generation, e.g. by giving foodproducers increased space for food preparationand improved ventilation, ensuring garmentproducers have the space needed for privatefittings, storage and product design, andenabling traders and shop-owners to enlargewindows for trading. When housing andneighbourhood conditions improve, more localbusinesses tend to develop.
A further benefit of improved housingconditions may come in the form of bettercommunity organisation. Low-income groupswho work together to address their housingproblems often develop the capacity tonegotiate more resources, services, and legaltenure from government agencies. Many smallcommunity initiatives in squatter settlementsaimed at addressing some specific need (e.g.improved water or garbage collection) developinto more ambitious programmes. Manycommunities that organise to improve housingand basic services also develop the capacity towork together to address other developmentneeds.
As Chapter 3 has shown, child health anddevelopment is a crucial area of concern in theACP countries, with a very high environmentalhealth burden falling on children. Safe, secureand healthy housing brings tremendous benefitsfor children. When low-income groups acquiresuch housing, it brings dramatic falls in infantand child mortality and morbidity. But children’s
physical, mental and social development arealso much enhanced by safe and secure placesto live, study and play, and by homes that allowthem to avoid the constant movement andforced evictions that are so common for low-income families. The time-savings brought bygood quality housing also reduces work burdensfor children (especially girls) and may permitparents to spend more time with their children.
From the above paragraphs, it is obviousthat safe, secure and healthy housing cangreatly reduce the vulnerability of low-incomehouseholds. Serious illnesses and the costsof medicine or other treatment costs areamong the most common causes ofimpoverishment, and improved housing alsomeans much reduced health risks. Betterquality homes on sites with drainage reducerisks from floods and storms.
In terms of affordability, there are manyexamples of good - and inexpensive - projectssupporting improved housing for low-incomegroups. Indeed, when projects seek to keepdown costs and use loan-finance whenappropriate, full cost-recovery is oftenpossible, with funds recovered available tofurther extend the project.
7.5 Addressing Other Environmentaland Health Burdens
There are numerous other environmental andhealth issues that must be addressed, not just inthe ACP region, but internationally. Many ofthese fall into what we have labelled the‘conventional development cluster’ -environmental problems which environmentallyunmindful development tends to bring about.
Some, such as most of the vector bornediseases, are long-standing health threats whoseoverall incidence is declining. Many vector-borne diseases still represent a major burden,however, and their decline has been uneven.Certain developmental interventions, such asdams and other water-related interventions,can increase a number of water-relateddiseases, such as schistosomiasis and malaria.
A number of environmental health hazardstypically associated with urbanisation andindustrialisation, such as air and groundwaterpollution, are already becoming serious insome ACP countries. Every opportunity shouldbe taken to ensure that ACP countries benefitfrom recent improvements in environmental
Environmental Change and Human Health in Countries of Africa, the Caribbean and the Pacific 209
Environment and Health – the Shared Agenda
technology and management. Otherwise, notonly will there be a tendency to repeat someof the same environmental mistakes committedin more developed economies, butenvironmentally hazardous technologies willbe transferred to ACP countries to avoidincreasing restrictions in more affluentcountries. Generally speaking, chemicalpollutants in the ambient environment do notrepresent an appreciable health burden, exceptin selected locations. However, in theselocations, where, for example, industrialpollutants, agricultural chemicals, or miningwastes create acute hazards, action is needed.
More dispersed toxic environmentalhazards, such as lead exposure, also deserveattention, although more research is requiredboth to identify the scale of the problems andthe most appropriate interventions. Such threatstend to be less immediate, but are likely toincrease in importance over time. Developingthe means of addressing these problems couldhelp avoid future additional burdens.
Since many of these ‘other’ environmentalhealth burdens arise because of poorly chosenor designed development initiatives within theACP, environmental monitoring (to help detectemerging problems) and environmental andhealth impact assessment (to help ensure thathealth-threatening developments are avoided)are important tools for prevention. For suchtools to be effective, however, they need to beaccompanied by appropriate regulations andenforcement.2 More representativegovernments may also be better able to takeresidents’ needs into account. Given thepolitical will, enhanced project appraisalmethodologies (see Box 7.7) may greatlyenhance investments’ contributions to betterhealth.
Problems such as climate change,originating almost entirely from Northernactivities, could also have a major impacton health in the ACP, by further undermining
food security and increasing the burden ofvector borne diseases, especially in Africa.For the Caribbean and Pacific islands,climate change could exacerbate water-related health problems, and the threat ofextreme weather events. The mainpreventative actions need to be takenelsewhere, but adaptive measures need tobe explored and developed. It is thusimportant that ACP countries represent theirinterests effectively in internationalnegotiations on treaties to limit green housegas emissions, for example. ACP countrieshave a collective interest in helping to ensurethat action is taken internationally to reducethe risks, but they also have an interest inensuring that their currently lowcontributions do not translate into reducedrights to the global commons.3 Wherepossible, actions aimed at adapting to theeffects of climate change also need to beconsidered. It is in this latter context that ahealth and environment perspective isparticularly important. Local impacts ofglobal warming are likely to involve manyof the same environmental and health risksthat are already extant.
7.6 ConclusionWorking towards a shared health andenvironmental agenda is a powerful andproven means of improving conditions andprospects for people in ACP countries. Thisreport has identified two key areas ofparticular concern to the environmentalhealth status of the ACP countries, namelyfood security and healthy livingenvironments. These two areas, throughcomplex interactions of environmental,political, poverty and other factors, create aconsiderable burden on the most vulnerable.Children in the regions are particularly atrisk from malnutrition and the variousdiseases associated with inadequate services,
2 While enforcement of regulations is a typical problem in developing countries, this difficulty by nomeans forfeits the usefulness of regulations. Hettige et.al. (1996) show that informal regulation throughpressure from people living around industries has been very effective in South and South East Asia. Thisprocess is greatly helped by the existence of formal regulation, despite the lack of enforcement onbehalf of the authorities. Existing regulations will, in addition, serve as guidelines for industries that arein the process of investing in new equipment.3 ACP countries may have obligations arising from international agreements, or may engage in preventivemeasures through, for example, the Global Environment Facility or the Clean Development Mechanism(Goldemberg, 1998).
Chapter 7
Environmental Change and Human Health in Countries of Africa, the Caribbean and the Pacific210
housing and livelihoods. These two areashave also been selected as areas for potentialaction. Considerable research has beenundertaken in recent years into investigatingways of improving living conditions andfood security. This report has attempted todraw upon these experiences andrecommend areas of action.
In the case of food security, the adoptionof sustainable agricultural procedures canpromote both human health and the ‘health’of the environment. In the case of healthyliving environments, inter-sectoralapproaches to improving housing quality andenvironmental services can help to reduce asignificant health burden. In undertakingsuch actions, key processes, such as
promoting the participation of women,enhancing livelihoods and improvingeducation and governance, are fundamentalin achieving meaningful change.
In addition to these specificrecommendations for action, environmentalhealth assessment and safeguarding need totake a more prominent position within ACPcountries. On a global scale, processes suchas global environmental climate change, theorigins of which come from moreindustrialised countries, are alreadyimpacting upon the environment and healthof the ACP region. There is, therefore, a needfor an effective platform for ACP nations tovoice these inequities and lobby foraccountability and change.
Box 7.7 Health Impact Assessment
Less than 5% of government budgets are spent on developments in the health sector,albeit the development spending in the other sectors, representing 95% of the budget,has a major impact on health. This spending affects the physical, social and economicenvironment and creates many of the health benefits and disbenefits described inthe report. Shared actions are required at the design, implementation and operationalstages of projects, programmes and policies, to ensure that positive health impactsare maximised and negative ones minimised. One appropriate tool is prospectivehealth impact assessment (see Birley et al. 1997; Birley 1995 for details on conductinghealth impact assessments). Health impact assessment seeks to determine the changein health risk that may be reasonably attributed to an intervention, and to use thisinformation to prevent health-threatening developments.
Political CommitmentsThe Treaty of Maastricht obliges European member states to consider the healthimplications of their policies (Article 129, 1993). This obligation has not yet beenfully implemented, however, with regard either to internal or external policies.There is little or no recognition of the fact that lending and aid to third countriescan have major health-related impacts. The Organisation of African Unity issued apolicy statement on malaria control in 1997 recognising the need for all futuredevelopment activity in Africa to be subject to health and environmental impactassessments. At present, however, there is little or no evidence that this policy isbeing adopted by governments, donor agencies or UN organisations.
ProceduresHealth impact assessment can be seen as a component of Environmental ImpactAssessment (EIA), but although EIA procedures are established in many countries,they typically ignore health issues. One primary difference between EIAs andHIAs lies in the relative importance accorded to the human community.
Environmental Change and Human Health in Countries of Africa, the Caribbean and the Pacific 211
Environment and Health – the Shared Agenda
RegulationImpact assessments can be applied to a variety of development initiatives, whetherthey be projects, programmes or policies. The procedure requires a proponent tosubmit a plan to an authorising authority, in order to receive permission to proceed.The authority can require an impact statement to be included with the plans andpermission withheld until there are plans to ensure that all major impacts aremitigated. Consistent enforcement is a critical part of the process.
ScreeningThere is always a large stream of new development initiatives under preparationin every country. There is also, however, a lack of the time and other resourcesto carry out a detailed health impact assessment for them all. Screening providesa system of prioritisation, and a rapid health impact assessment will sometimesbe required to decide whether or not to devote resources to a detailed impactassessment.
CommissioningA steering committee can be established, comprising representatives from boththe proponent and other affected sectors - including the health and environmentsectors. This steering committee needs the skills required to engage in intersectoraldialogue, in that its task is to obtain a health impact assessment report for thedevelopment initiative, to accept or reject the report and to use the report duringany negotiations on any adjustments needed to safeguard health. The steeringcommittee will usually consist of civil servants who have been trained tocommission health impact assessments, but they do not necessarily have to betrained to undertake assessments themselves, as assessments are usually undertakenby trained consultants from universities or private companies.
Quality controlThe quality of the health impact assessment can be assured by setting appropriateterms of reference (TOR) for the assessor, choosing an assessor (or team ofassessors) with appropriate skills, and appraising the completed report. Prospectiveimpact assessment involves a great deal of uncertainty and a lack of data, andmany different forms of evidence must be used in addition to scientific evidence,including the opinions of affected communities. Numerous assumptions must bemade, and this is justified, provided that they are made explicitly. There is rarelyany opportunity for primary data collection.
BudgetingA typical impact assessment may require 0.1% of the budget for a new project orprogramme, and may involve 10 days of field travel by an experienced consultant.The report produced will be used in a negotiating forum, where the costs andbenefits of including health safeguards are discussed. A health risk managementbudget heading can then be added to the total budget. If this budget component isnot present, hidden costs associated with negative health-related impacts will betransferred to health sector, but the health sector’s small fixed budget means thatit will frequently be unable to absorb these costs. The national or local economywill consequently suffer various additional costs in the form of reducedproduction, pain and suffering, opportunity costs and lower educationalachievement. Methods of quantifying all of the costs, are, however, lacking.
Chapter 7
Environmental Change and Human Health in Countries of Africa, the Caribbean and the Pacific212
MethodsThe assessment should be as logical, rapid, simple and structured as possible. Ideally,two independent assessments of the same project, programme or policy should producethe same findings and recommendations. The assessment can rely on published andunpublished literature, key informant interview, focus group discussions and theparticipation of affected communities. The objective is to determine, in advance, whethera set of health risks will increase, decrease or stay the same, in order to identifymitigating actions in cases where risks will increase, and to provide the basis forrecommendations on implementation.
Scoping and boundingThe first step is to determine what to include and what not to include. Developmentinitiatives often have effects over wide geographical areas and over many years into thefuture. In geographical terms, it is necessary to consider downstream and downwindeffects, as well as human migration and circulation. Temporal stages should includeconstruction, operation, late operation and decommissioning or rehabilitation.
Identifying stakeholdersA critical step in the HIA process entails the identification of the various communitieswho have an interest in the project. This includes the proponents and contractors, butmost importantly of all, it includes all the affected communities. Some communitiesmay be beneficiaries and some may be disbeneficiaries, in that a large dam project, forexample, can displace tens or even hundreds of thousands of people from their ancestralhomelands. The community groups will differ in their vulnerability to the effects ofthe project, but particularly vulnerable groups may include women, children, the veryold, ethnic minorities and the very poor.
Identifying health hazards and analysing health determinantsA health hazard is defined as a potential cause of harm, a health risk, as a measure of thelikelihood of the harm affecting a particular stakeholder community at a particular timeand in a particular place, and a health impact, as a change in the health risk reasonablyattributable to a project, programme or policy. A list of health hazards can be constructedby means of brainstorming exercises and reference to the experience gained from similarprojects elsewhere.Health determinants constitute the factors that are known or postulated to be causallyrelated to states of health. In the analytic process, they lie between hazards and risks, andinclude pathogens and pollutants, foods and food processing, emotional support, behaviour,physiological and financial states, income, education, employment, access to medical careand housing. Health determinants can be listed and classified. The direction of changeassociated with a development initiative can, however, only be inferred.
Risk AssessmentAfter the evidence supporting possible changes in health determinants has been documented,the analysis proceeds as follows. A conclusion must be reached about the likely changein health risk associated with each health hazard for each stakeholder community duringeach project stage. This risk cannot generally be quantified, but it can be rated in termsof a likely increase, decrease or “no change”. Health risks flagged as likely to increasemay then require remedial action. This, in turn, requires a system of prioritisation.There is no single system of establishing priorities. Three possible approaches, however,follow:
Environmental Change and Human Health in Countries of Africa, the Caribbean and the Pacific 213
Environment and Health – the Shared Agenda
1. Precautionary principle2. Win-win solutions3. Risk perceptions
The precautionary principle is widely used in EIAs. It simply requires that actionshould be taken to avoid future regret. The win-win approach seeks actions that bothsafeguard health and improve the project performance. Treatment of wastewater foragriculture through lagoons may, for example, be a better option than activated sludgetreatment plants, from both a health-related and an agricultural perspective. The riskperceptions model places the decision in the hands of the affected community, whilstaccepting that their perception of risk may be very different to that which is based onscientific evidence.
RecommendationsThe final step in the HIA process is to make recommendations aimed both at safeguardinghealth and at mitigating residual impacts. The recommendations apply to the design,operation and maintenance of the intervention, and if they are to be useful, they shouldbe costed, specific, socially acceptable and introduced during budget negotiations.
Capacity BuildingOne of the current obstacles to implementation is the lack of trained capacity to advocate,require, manage or undertake HIAs, although courses have been run by regional officesof WHO and in the context of specific sectors (Birley et al. 1996). One importantobjective of the training is to enable specialists to communicate in an inter-sectoralforum where health-environment linkages can be explored and understood, so thatactions can be agreed and implemented. The capacity to enforce environmentalassessment regulations in a consistent manner is also critical.
Contribution from Martin Birely, Liverpool School of Tropical Medicine.
ReferencesSee www.liv.ac.uk/~mhb for an extended reference list, links to other sites, full texts and news of
forthcoming events.Birley, M., Bos, R., Engel, C., and Furu, P. (1996). “A multi-sectoral task-based course: Health opportunities
in water resources development.” Education for Health: Change in Training and Practice, 91, 71-83.Birley, M., Gomes, M., and Davy, A. (1997). “Health aspects of environmental assessment.” 18,
Environmental Division, The World Bank, Washington DC.Birley, M. H. (1995). The health impact assessment of development projects, HMSO, London, Liverpool.
Chapter 7
Environmental Change and Human Health in Countries of Africa, the Caribbean and the Pacific214
ReferencesCairncross, S. and Feachem, R. G. 1993. Environmental Health Engineering in the Tropics: An Introductory
Text. Chichester, John Wiley & Sons. 306 p.de Waal, A. 1989. Famine that Kills: Darfur, Sudan, 1985-85. Oxford, Oxford University Press.Doyle, J. J. and Persley, G. J. 1996. Enabling the Safe Use of Biotechnology: Principles and Practice.
Environmental Sustainable Development Studies and Monographs Series No. 10. World Bank(Washington, DC). 73 p.
Goldemberg, J., (ed.) 1998. Issues and Options: The Clean Development Mechanism. New York, UnitedNations Development Programme. 189 p.
Hettige, H., Huq, M., Pargal, S. and Wheeler, D. 1996. Determinants of pollution abatement in developingcountries: Evidence from South and Southeast Asia. World Development. 24(12):1891-1904.
Hinchcliffe, F., Thompson, J. and Pretty, J. N. 1996. Sustainable Agriculture and Food Security in Eastand Southern Africa. Report for the Committee on Food Security in East and Southern Africa. SwedishInternational Development Cooperation Agency (Sida) (Stockholm).
IFPRI. 1995. A 2020 Vision for Food, Agriculture and the Environment. International Food PolicyResearch Institute (Washington, DC).
ITDG. 1995. Farmers, Herders, Fisherfolk: Securing Food Supplies - Producing Change. Food SecurityProgress Report. ITDG (Rugby).
Lane, C. and Scoones, I. 1993. Barabaig natural resource management. In: Young M.D., Solbrig O.,(eds.). The World’s Savannas: Economic Driving Forces, Ecological Constraints and Policy Options forSustainable Use. Paris and New York, UNESCO and Parthenon.
Lewin, S. U., P. ; Strauss N. ; Killian, D. ; Hunt, C. 1998. Linking Health and Environment in Cape Town,South Africa: the View from Local Government. London School of Hygiene and Tropical Medicine,Health Systems Division & Medical Research Council of South Africa.
Listorti, J. A. 1996. Bridging Environmental Health Gaps: Recommendations for Sub-Saharan Africa andthe Rest of the Bank: Volume III. AFTES Working Paper No. 22. World Bank (Washington, DC). 14 p.
Mara, D. 1996. Low-Cost Urban Sanitation. Chichester, John Wiley & Sons. 223 p.Murphree, M. W. 1994. The evolution of Zimbabwe’s community-based wildlife use and management
programme. Tanzanian Community Conservation Workshop, 8-11 February, 1994.Pretty, J. 1998. The Living Land. London, Earthscan Publications.Pretty, J. N. 1995. Regenerating Agriculture: Policies and Practice for Sustainability and Self-Reliance.
London, Earthscan Publications.Pretty, J. N., Guijt, I., Scoones, I. and Thompson, J. 1995. A Trainer’s Guide for Participatory Learning
and Action. London, International Institute for Environment and Development. 267 p.Pretty, J. N. and Thompson, J. 1996. Sustainable Agriculture and the Overseas Development Administration.
DFID (formerly ODA) (London).Quarry, W. 1994. Hygiene education: Does it change behaviour? In: Cairncross S., Kochar V., (eds.).
Studying Hygiene Behaviour: Methods, Issues and Experiences. New Delhi, Sage Publications. p145-153.
Sah, R. K. and Stiglitz, J. E. 1992. Peasants versus City-Dwellers: Taxation and the Burden of EconomicDevelopment. Oxford, Clarendon Press. 223 p.
Scoones, I. 1995. Policies for pastoralists: New directions for pastoral development in Africa. In: BinnsT., (ed.). People and Environment in Africa.
Thomas, E. P., Seager, J. R., Viljoen, E., Potgeiter, F., Rossouw, A., Tokota, B., McGranahan, G. andKjellén, M. 1999. Household Environment and Health in Port Elizabeth, South Africa. UrbanEnvironment Series No. 6. Stockholm Environment Institute (Stockholm). 126 p.
Tzotzos, G. T. 1995. Biological risk assessment: An editorial overview of some key policy andimplementation issues. In: Tzotzos G.T., (ed.). Genetically Modified Organisms: A Guide to Biosafety.Wallingford, CAB International. p 1-7.
USDA. 1990. World Agriculture Trends and Indicators, 1970-89. Statistical Bulletin 815. US Departmentof Agriculture (Washington, DC).
Westoby, J. 1989. Introductin ot World Forestry. Oxford, Basil Blackwell. 228 p.Winrock International. 1992. Assessment of Animal Agriculture in Sub-Saharan Africa. Winrock
International (Arkansas).Virgin, I. and Frederick, R. J. 1995. The Impact of International Harmonization on Adoption of Biosafety
Regulations. African Crop Science Journal. Vol 3(No 3):387-395.World Bank. 1993. World Development Report 1993: Investing in Health. New York, Oxford University
Press. 329 p.

Appendix 1
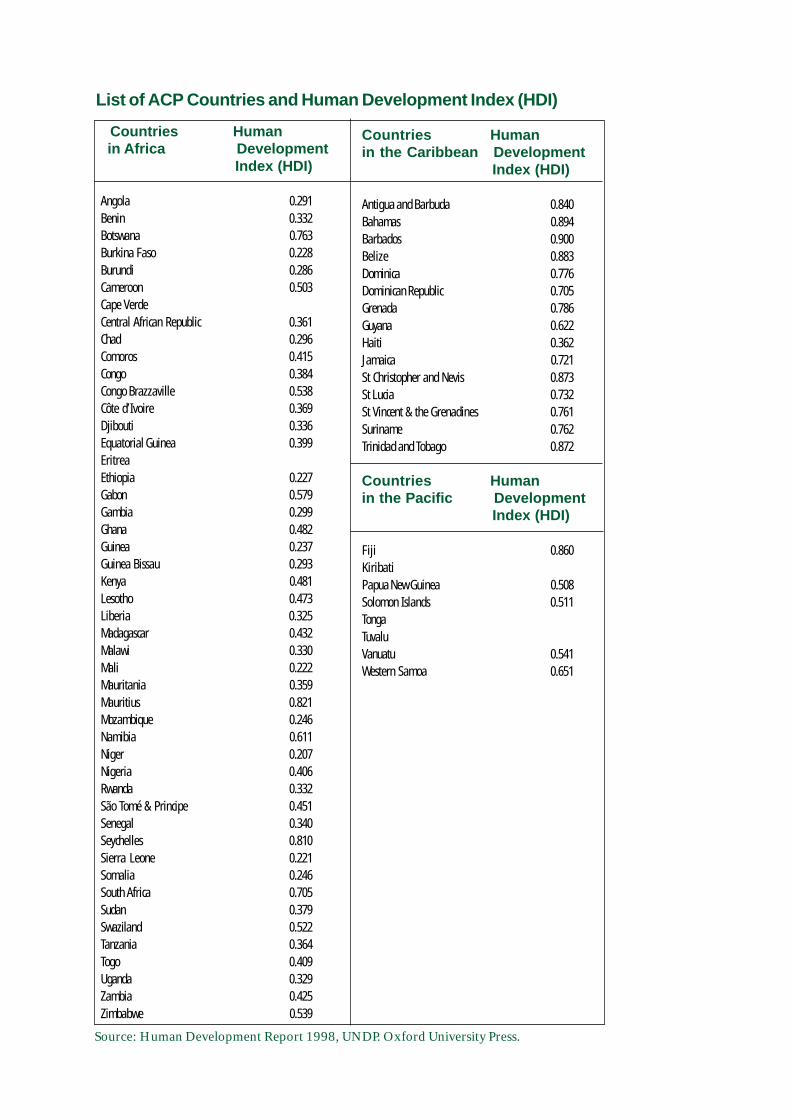
Countries Human in Africa Development
Index (HDI)
Angola 0.291Benin 0.332Botswana 0.763Burkina Faso 0.228Burundi 0.286Cameroon 0.503Cape VerdeCentral African Republic 0.361Chad 0.296Comoros 0.415Congo 0.384Congo Brazzaville 0.538Côte d’Ivoire 0.369Djibouti 0.336Equatorial Guinea 0.399EritreaEthiopia 0.227Gabon 0.579Gambia 0.299Ghana 0.482Guinea 0.237Guinea Bissau 0.293Kenya 0.481Lesotho 0.473Liberia 0.325Madagascar 0.432Malawi 0.330Mali 0.222Mauritania 0.359Mauritius 0.821Mozambique 0.246Namibia 0.611Niger 0.207Nigeria 0.406Rwanda 0.332São Tomé & Principe 0.451Senegal 0.340Seychelles 0.810Sierra Leone 0.221Somalia 0.246South Africa 0.705Sudan 0.379Swaziland 0.522Tanzania 0.364Togo 0.409Uganda 0.329Zambia 0.425Zimbabwe 0.539
Countries Humanin the Caribbean Development
Index (HDI)
Antigua and Barbuda 0.840Bahamas 0.894Barbados 0.900Belize 0.883Dominica 0.776Dominican Republic 0.705Grenada 0.786Guyana 0.622Haiti 0.362Jamaica 0.721St Christopher and Nevis 0.873St Lucia 0.732St Vincent & the Grenadines 0.761Suriname 0.762Trinidad and Tobago 0.872
Countries Humanin the Pacific Development
Index (HDI)
Fiji 0.860KiribatiPapua New Guinea 0.508Solomon Islands 0.511TongaTuvaluVanuatu 0.541Western Samoa 0.651
List of ACP Countries and Human Development Index (HDI)
Source: Human Development Report 1998, UNDP. Oxford University Press.
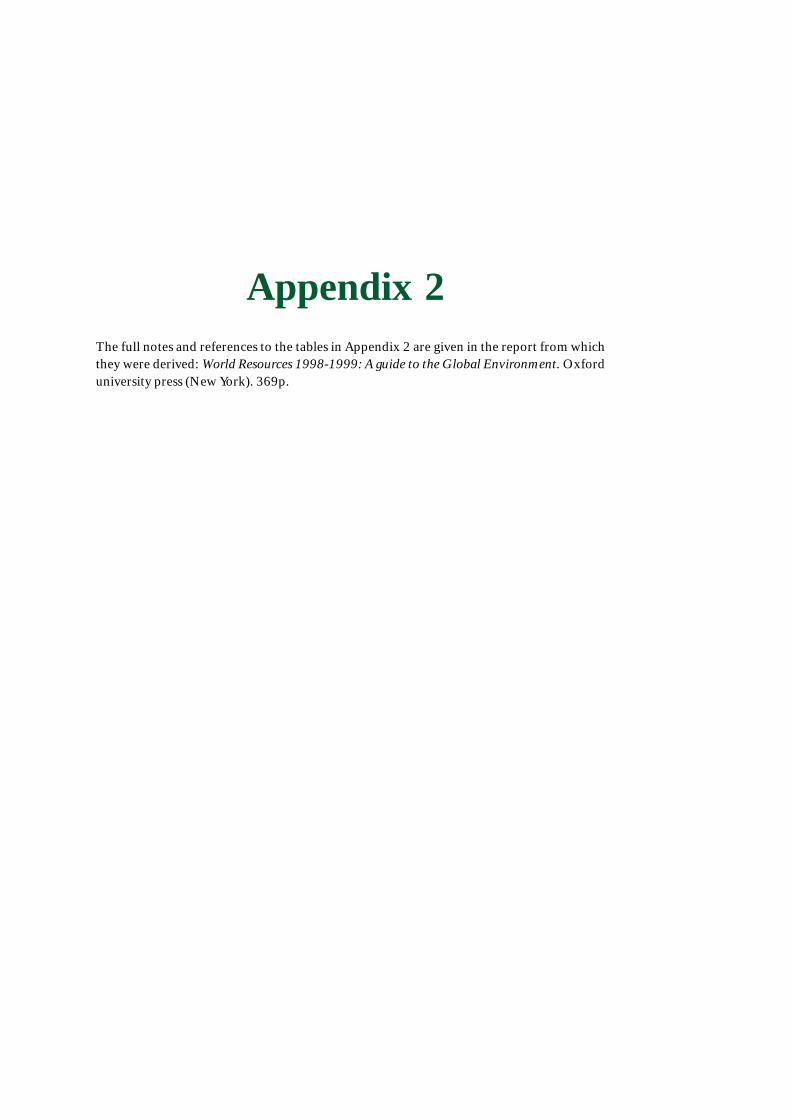
Appendix 2The full notes and references to the tables in Appendix 2 are given in the report from whichthey were derived: World Resources 1998-1999: A guide to the Global Environment. Oxforduniversity press (New York). 369p.
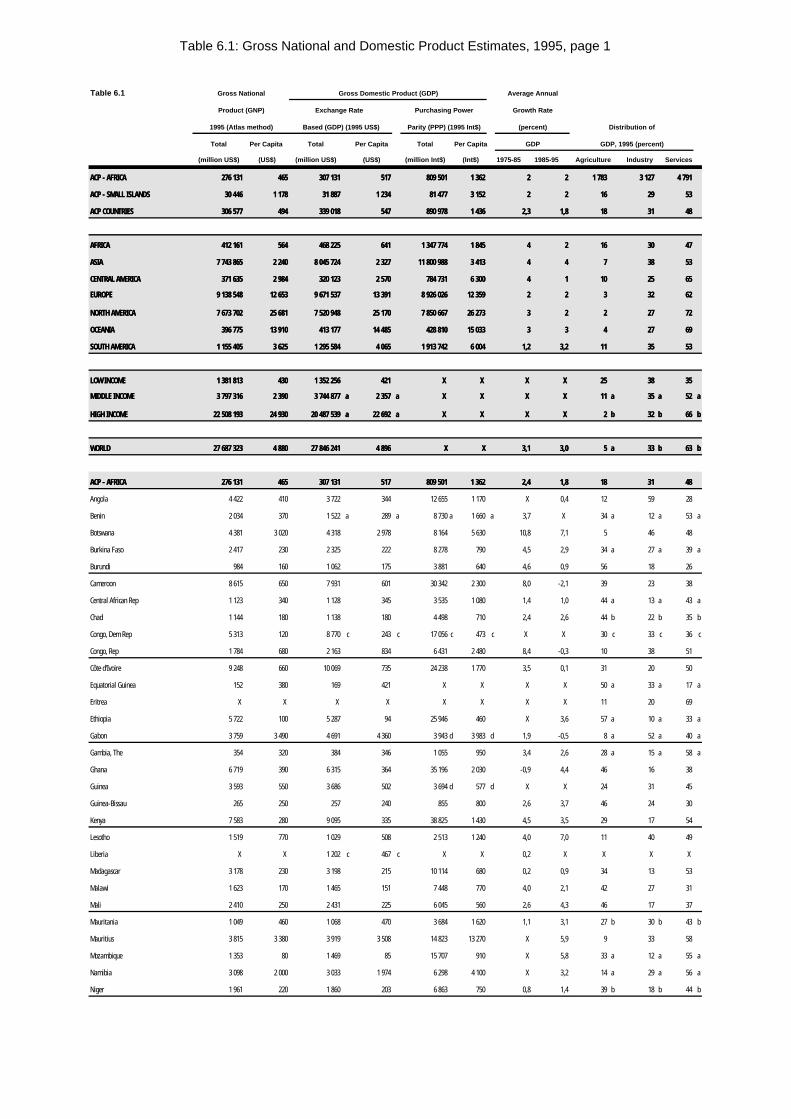
Table 6.1: Gross National and Domestic Product Estimates, 1995, page 1
Table 6.1 Gross National Gross Domestic Product (GDP) Average Annual
Product (GNP) Exchange Rate Purchasing Power Growth Rate
1995 (Atlas method) Based (GDP) (1995 US$) Parity (PPP) (1995 Int$) (percent) Distribution of
Total Per Capita Total Per Capita Total Per Capita GDP GDP, 1995 (percent)
(million US$) (US$) (million US$) (US$) (million Int$) (Int$) 1975-85 1985-95 Agriculture Industry Services
ACP - AFRICAACP - AFRICA 276 131276 131 465465 307 131307 131 517517 809 501809 501 1 3621 362 22 22 1 7831 783 3 1273 127 4 7914 791
ACP - SMALL ISLANDSACP - SMALL ISLANDS 30 44630 446 1 1781 178 31 88731 887 1 2341 234 81 47781 477 3 1523 152 22 22 1616 2929 5353
ACP COUNTRIESACP COUNTRIES 306 577306 577 494494 339 018339 018 547547 890 978890 978 1 4361 436 2,32,3 1,81,8 1818 3131 4848
AFRICAAFRICA 412 161412 161 564564 468 225468 225 641641 1 347 7741 347 774 1 8451 845 44 22 1616 3030 4747
ASIAASIA 7 743 8657 743 865 2 2402 240 8 045 7248 045 724 2 3272 327 11 800 98811 800 988 3 4133 413 44 44 77 3838 5353
CENTRAL AMERICACENTRAL AMERICA 371 635371 635 2 9842 984 320 123320 123 2 5702 570 784 731784 731 6 3006 300 44 11 1010 2525 6565
EUROPEEUROPE 9 138 5489 138 548 12 65312 653 9 671 5379 671 537 13 39113 391 8 926 0268 926 026 12 35912 359 22 22 33 3232 6262
NORTH AMERICANORTH AMERICA 7 673 7027 673 702 25 68125 681 7 520 9487 520 948 25 17025 170 7 850 6677 850 667 26 27326 273 33 22 22 2727 7272
OCEANIAOCEANIA 396 775396 775 13 91013 910 413 177413 177 14 48514 485 428 810428 810 15 03315 033 33 33 44 2727 6969
SOUTH AMERICASOUTH AMERICA 1 155 4051 155 405 3 6253 625 1 295 5841 295 584 4 0654 065 1 913 7421 913 742 6 0046 004 1,21,2 3,23,2 1111 3535 5353
LOW INCOMELOW INCOME 1 381 8131 381 813 430430 1 352 2561 352 256 421421 X X X X X X X X 2525 3838 3535
MIDDLE INCOMEMIDDLE INCOME 3 797 3163 797 316 2 3902 390 3 744 8773 744 877 aa 2 3572 357 aa X X X X X X X X 1111 aa 3535 aa 5252 aa
HIGH INCOMEHIGH INCOME 22 508 19322 508 193 24 93024 930 20 487 53920 487 539 aa 22 69222 692 aa X X X X X X X X 22 bb 3232 bb 6666 bb
WORLDWORLD 27 687 32327 687 323 4 8804 880 27 846 24127 846 241 4 8964 896 XX XX 3,13,1 3,03,0 55 aa 3333 bb 6363 bb
ACP - AFRICAACP - AFRICA 276 131276 131 465465 307 131307 131 517517 809 501809 501 1 3621 362 2,42,4 1,81,8 1818 3131 4848
Angola 4 422 410 3 722 344 12 655 1 170 X 0,4 12 59 28
Benin 2 034 370 1 522 a 289 a 8 730 a 1 660 a 3,7 X 34 a 12 a 53 a
Botswana 4 381 3 020 4 318 2 978 8 164 5 630 10,8 7,1 5 46 48
Burkina Faso 2 417 230 2 325 222 8 278 790 4,5 2,9 34 a 27 a 39 a
Burundi 984 160 1 062 175 3 881 640 4,6 0,9 56 18 26
Cameroon 8 615 650 7 931 601 30 342 2 300 8,0 -2,1 39 23 38
Central African Rep 1 123 340 1 128 345 3 535 1 080 1,4 1,0 44 a 13 a 43 a
Chad 1 144 180 1 138 180 4 498 710 2,4 2,6 44 b 22 b 35 b
Congo, Dem Rep 5 313 120 8 770 c 243 c 17 056 c 473 c X X 30 c 33 c 36 c
Congo, Rep 1 784 680 2 163 834 6 431 2 480 8,4 -0,3 10 38 51
Côte d'Ivoire 9 248 660 10 069 735 24 238 1 770 3,5 0,1 31 20 50
Equatorial Guinea 152 380 169 421 X X X X 50 a 33 a 17 a
Eritrea X X X X X X X X 11 20 69
Ethiopia 5 722 100 5 287 94 25 946 460 X 3,6 57 a 10 a 33 a
Gabon 3 759 3 490 4 691 4 360 3 943 d 3 983 d 1,9 -0,5 8 a 52 a 40 a
Gambia, The 354 320 384 346 1 055 950 3,4 2,6 28 a 15 a 58 a
Ghana 6 719 390 6 315 364 35 196 2 030 -0,9 4,4 46 16 38
Guinea 3 593 550 3 686 502 3 694 d 577 d X X 24 31 45
Guinea-Bissau 265 250 257 240 855 800 2,6 3,7 46 24 30
Kenya 7 583 280 9 095 335 38 825 1 430 4,5 3,5 29 17 54
Lesotho 1 519 770 1 029 508 2 513 1 240 4,0 7,0 11 40 49
Liberia X X 1 202 c 467 c X X 0,2 X X X X
Madagascar 3 178 230 3 198 215 10 114 680 0,2 0,9 34 13 53
Malawi 1 623 170 1 465 151 7 448 770 4,0 2,1 42 27 31
Mali 2 410 250 2 431 225 6 045 560 2,6 4,3 46 17 37
Mauritania 1 049 460 1 068 470 3 684 1 620 1,1 3,1 27 b 30 b 43 b
Mauritius 3 815 3 380 3 919 3 508 14 823 13 270 X 5,9 9 33 58
Mozambique 1 353 80 1 469 85 15 707 910 X 5,8 33 a 12 a 55 a
Namibia 3 098 2 000 3 033 1 974 6 298 4 100 X 3,2 14 a 29 a 56 a
Niger 1 961 220 1 860 203 6 863 750 0,8 1,4 39 b 18 b 44 b
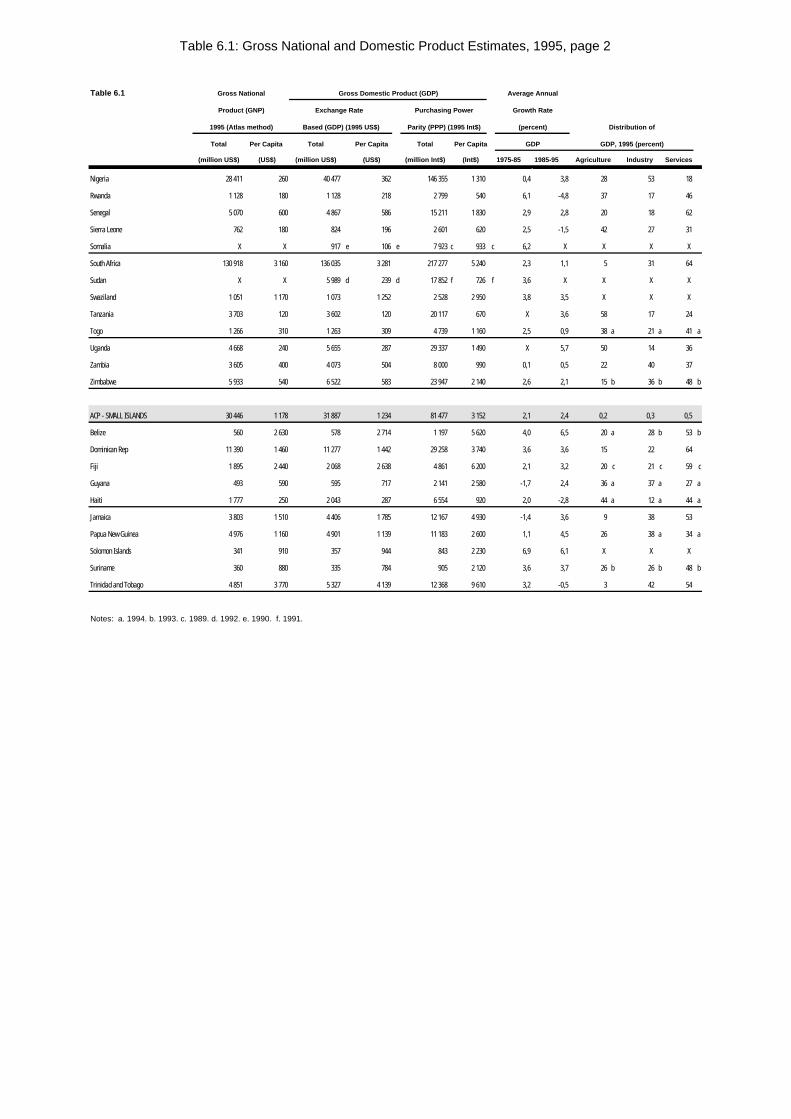
Table 6.1: Gross National and Domestic Product Estimates, 1995, page 2
Table 6.1 Gross National Gross Domestic Product (GDP) Average Annual
Product (GNP) Exchange Rate Purchasing Power Growth Rate
1995 (Atlas method) Based (GDP) (1995 US$) Parity (PPP) (1995 Int$) (percent) Distribution of
Total Per Capita Total Per Capita Total Per Capita GDP GDP, 1995 (percent)
(million US$) (US$) (million US$) (US$) (million Int$) (Int$) 1975-85 1985-95 Agriculture Industry Services
Nigeria 28 411 260 40 477 362 146 355 1 310 0,4 3,8 28 53 18
Rwanda 1 128 180 1 128 218 2 799 540 6,1 -4,8 37 17 46
Senegal 5 070 600 4 867 586 15 211 1 830 2,9 2,8 20 18 62
Sierra Leone 762 180 824 196 2 601 620 2,5 -1,5 42 27 31
Somalia X X 917 e 106 e 7 923 c 933 c 6,2 X X X X
South Africa 130 918 3 160 136 035 3 281 217 277 5 240 2,3 1,1 5 31 64
Sudan X X 5 989 d 239 d 17 852 f 726 f 3,6 X X X X
Swaziland 1 051 1 170 1 073 1 252 2 528 2 950 3,8 3,5 X X X
Tanzania 3 703 120 3 602 120 20 117 670 X 3,6 58 17 24
Togo 1 266 310 1 263 309 4 739 1 160 2,5 0,9 38 a 21 a 41 a
Uganda 4 668 240 5 655 287 29 337 1 490 X 5,7 50 14 36
Zambia 3 605 400 4 073 504 8 000 990 0,1 0,5 22 40 37
Zimbabwe 5 933 540 6 522 583 23 947 2 140 2,6 2,1 15 b 36 b 48 b
ACP - SMALL ISLANDS 30 446 1 178 31 887 1 234 81 477 3 152 2,1 2,4 0,2 0,3 0,5
Belize 560 2 630 578 2 714 1 197 5 620 4,0 6,5 20 a 28 b 53 b
Dominican Rep 11 390 1 460 11 277 1 442 29 258 3 740 3,6 3,6 15 22 64
Fiji 1 895 2 440 2 068 2 638 4 861 6 200 2,1 3,2 20 c 21 c 59 c
Guyana 493 590 595 717 2 141 2 580 -1,7 2,4 36 a 37 a 27 a
Haiti 1 777 250 2 043 287 6 554 920 2,0 -2,8 44 a 12 a 44 a
Jamaica 3 803 1 510 4 406 1 785 12 167 4 930 -1,4 3,6 9 38 53
Papua New Guinea 4 976 1 160 4 901 1 139 11 183 2 600 1,1 4,5 26 38 a 34 a
Solomon Islands 341 910 357 944 843 2 230 6,9 6,1 X X X
Suriname 360 880 335 784 905 2 120 3,6 3,7 26 b 26 b 48 b
Trinidad and Tobago 4 851 3 770 5 327 4 139 12 368 9 610 3,2 -0,5 3 42 54
Notes: a. 1994. b. 1993. c. 1989. d. 1992. e. 1990. f. 1991.
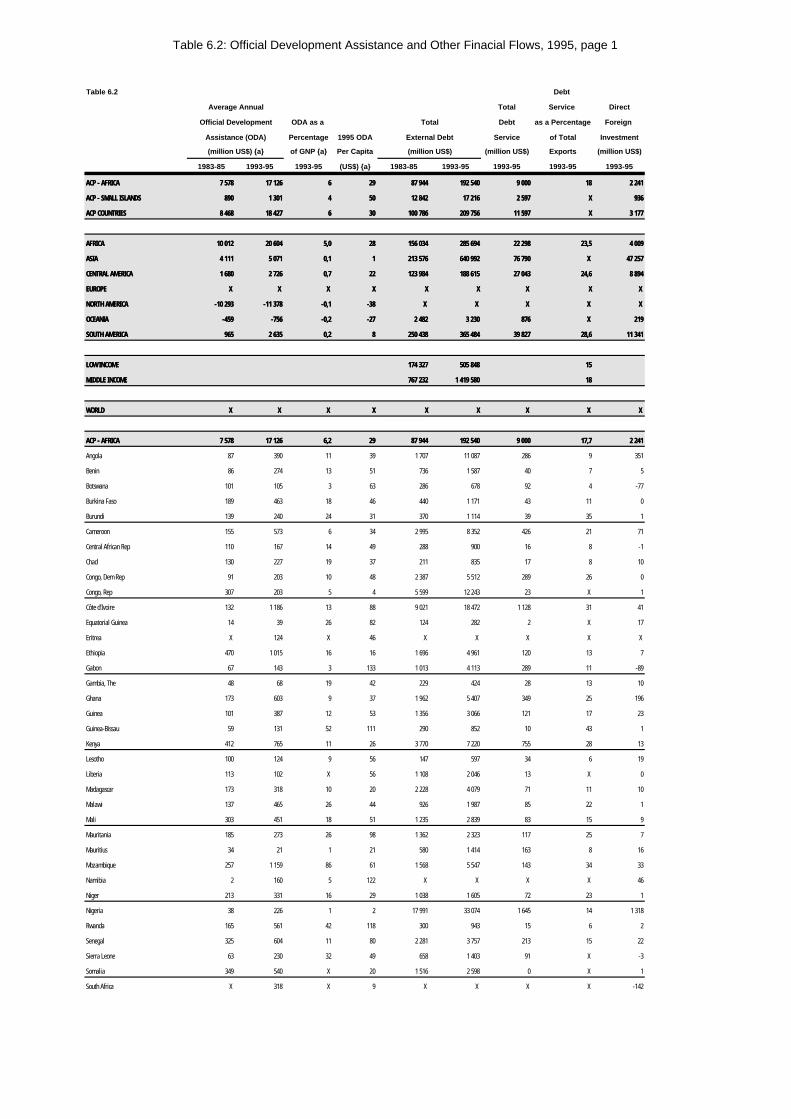
Table 6.2: Official Development Assistance and Other Finacial Flows, 1995, page 1
Table 6.2 Debt
Average Annual Total Service Direct
Official Development ODA as a Total Debt as a Percentage Foreign
Assistance (ODA) Percentage 1995 ODA External Debt Service of Total Investment
(million US$) {a} of GNP {a} Per Capita (million US$) (million US$) Exports (million US$)
1983-85 1993-95 1993-95 (US$) {a} 1983-85 1993-95 1993-95 1993-95 1993-95
ACP - AFRICAACP - AFRICA 7 5787 578 17 12617 126 66 2929 87 94487 944 192 540192 540 9 0009 000 1818 2 2412 241
ACP - SMALL ISLANDSACP - SMALL ISLANDS 890890 1 3011 301 44 5050 12 84212 842 17 21617 216 2 5972 597 XX 936936
ACP COUNTRIESACP COUNTRIES 8 4688 468 18 42718 427 66 3030 100 786100 786 209 756209 756 11 59711 597 XX 3 1773 177
AFRICAAFRICA 10 01210 012 20 60420 604 5,05,0 2828 156 034156 034 285 694285 694 22 29822 298 23,523,5 4 0094 009
ASIAASIA 4 1114 111 5 0715 071 0,10,1 11 213 576213 576 640 992640 992 76 79076 790 X X 47 25747 257
CENTRAL AMERICACENTRAL AMERICA 1 6801 680 2 7262 726 0,70,7 2222 123 984123 984 188 615188 615 27 04327 043 24,624,6 8 8948 894
EUROPEEUROPE X X X X X X XX XX XX X X XX X X
NORTH AMERICANORTH AMERICA -10 293-10 293 -11 378-11 378 -0,1-0,1 -38-38 X X X X X X X X X X
OCEANIAOCEANIA -459-459 -756-756 -0,2-0,2 -27-27 2 4822 482 3 2303 230 876876 X X 219219
SOUTH AMERICASOUTH AMERICA 965965 2 6352 635 0,20,2 88 250 438250 438 365 484365 484 39 82739 827 28,628,6 11 34111 341
LOW INCOMELOW INCOME 174 327174 327 505 848505 848 1515
MIDDLE INCOMEMIDDLE INCOME 767 232767 232 1 419 5801 419 580 1818
WORLDWORLD X X X X X X XX XX XX X X X X X X
ACP - AFRICAACP - AFRICA 7 5787 578 17 12617 126 6,26,2 2929 87 94487 944 192 540192 540 9 0009 000 17,717,7 2 2412 241
Angola 87 390 11 39 1 707 11 087 286 9 351
Benin 86 274 13 51 736 1 587 40 7 5
Botswana 101 105 3 63 286 678 92 4 -77
Burkina Faso 189 463 18 46 440 1 171 43 11 0
Burundi 139 240 24 31 370 1 114 39 35 1
Cameroon 155 573 6 34 2 995 8 352 426 21 71
Central African Rep 110 167 14 49 288 900 16 8 -1
Chad 130 227 19 37 211 835 17 8 10
Congo, Dem Rep 91 203 10 48 2 387 5 512 289 26 0
Congo, Rep 307 203 5 4 5 599 12 243 23 X 1
Côte d'Ivoire 132 1 186 13 88 9 021 18 472 1 128 31 41
Equatorial Guinea 14 39 26 82 124 282 2 X 17
Eritrea X 124 X 46 X X X X X
Ethiopia 470 1 015 16 16 1 696 4 961 120 13 7
Gabon 67 143 3 133 1 013 4 113 289 11 -89
Gambia, The 48 68 19 42 229 424 28 13 10
Ghana 173 603 9 37 1 962 5 407 349 25 196
Guinea 101 387 12 53 1 356 3 066 121 17 23
Guinea-Bissau 59 131 52 111 290 852 10 43 1
Kenya 412 765 11 26 3 770 7 220 755 28 13
Lesotho 100 124 9 56 147 597 34 6 19
Liberia 113 102 X 56 1 108 2 046 13 X 0
Madagascar 173 318 10 20 2 228 4 079 71 11 10
Malawi 137 465 26 44 926 1 987 85 22 1
Mali 303 451 18 51 1 235 2 839 83 15 9
Mauritania 185 273 26 98 1 362 2 323 117 25 7
Mauritius 34 21 1 21 580 1 414 163 8 16
Mozambique 257 1 159 86 61 1 568 5 547 143 34 33
Namibia 2 160 5 122 X X X X 46
Niger 213 331 16 29 1 038 1 605 72 23 1
Nigeria 38 226 1 2 17 991 33 074 1 645 14 1 318
Rwanda 165 561 42 118 300 943 15 6 2
Senegal 325 604 11 80 2 281 3 757 213 15 22
Sierra Leone 63 230 32 49 658 1 403 91 X -3
Somalia 349 540 X 20 1 516 2 598 0 X 1
South Africa X 318 X 9 X X X X -142
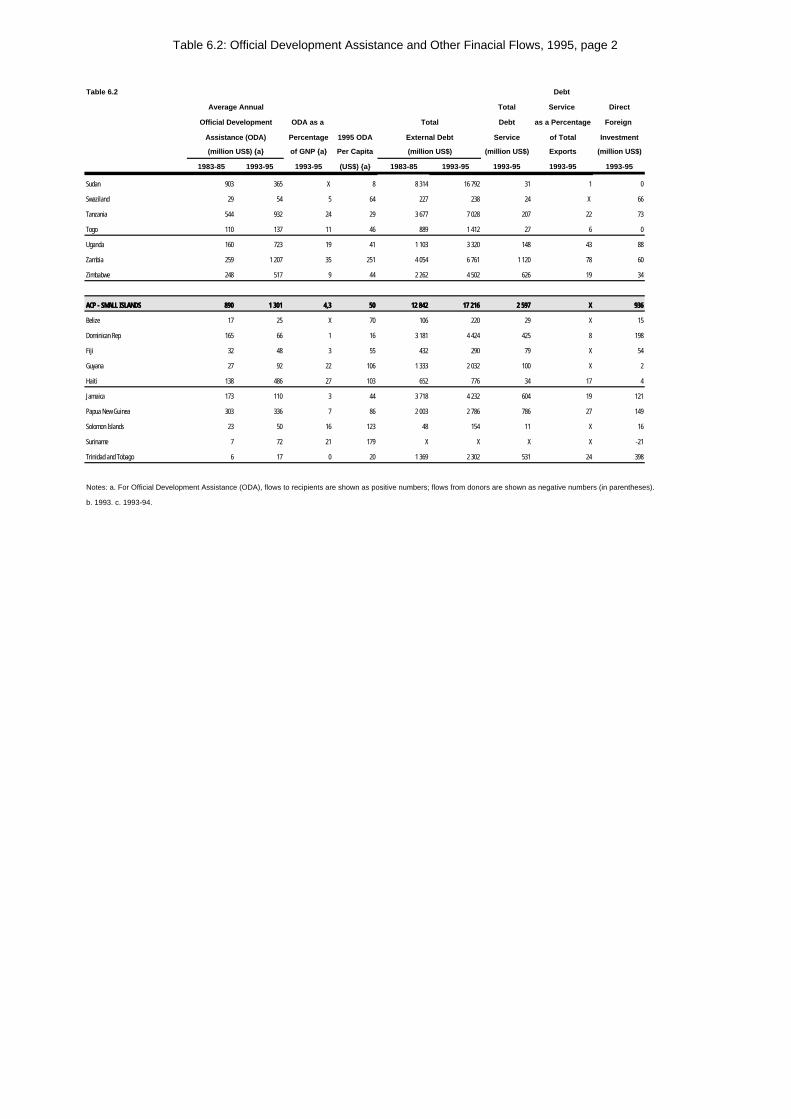
Table 6.2: Official Development Assistance and Other Finacial Flows, 1995, page 2
Table 6.2 Debt
Average Annual Total Service Direct
Official Development ODA as a Total Debt as a Percentage Foreign
Assistance (ODA) Percentage 1995 ODA External Debt Service of Total Investment
(million US$) {a} of GNP {a} Per Capita (million US$) (million US$) Exports (million US$)
1983-85 1993-95 1993-95 (US$) {a} 1983-85 1993-95 1993-95 1993-95 1993-95
Sudan 903 365 X 8 8 314 16 792 31 1 0
Swaziland 29 54 5 64 227 238 24 X 66
Tanzania 544 932 24 29 3 677 7 028 207 22 73
Togo 110 137 11 46 889 1 412 27 6 0
Uganda 160 723 19 41 1 103 3 320 148 43 88
Zambia 259 1 207 35 251 4 054 6 761 1 120 78 60
Zimbabwe 248 517 9 44 2 262 4 502 626 19 34
ACP - SMALL ISLANDSACP - SMALL ISLANDS 890890 1 3011 301 4,34,3 5050 12 84212 842 17 21617 216 2 5972 597 XX 936936
Belize 17 25 X 70 106 220 29 X 15
Dominican Rep 165 66 1 16 3 181 4 424 425 8 198
Fiji 32 48 3 55 432 290 79 X 54
Guyana 27 92 22 106 1 333 2 032 100 X 2
Haiti 138 486 27 103 652 776 34 17 4
Jamaica 173 110 3 44 3 718 4 232 604 19 121
Papua New Guinea 303 336 7 86 2 003 2 786 786 27 149
Solomon Islands 23 50 16 123 48 154 11 X 16
Suriname 7 72 21 179 X X X X -21
Trinidad and Tobago 6 17 0 20 1 369 2 302 531 24 398
Notes: a. For Official Development Assistance (ODA), flows to recipients are shown as positive numbers; flows from donors are shown as negative numbers (in parentheses).
b. 1993. c. 1993-94.
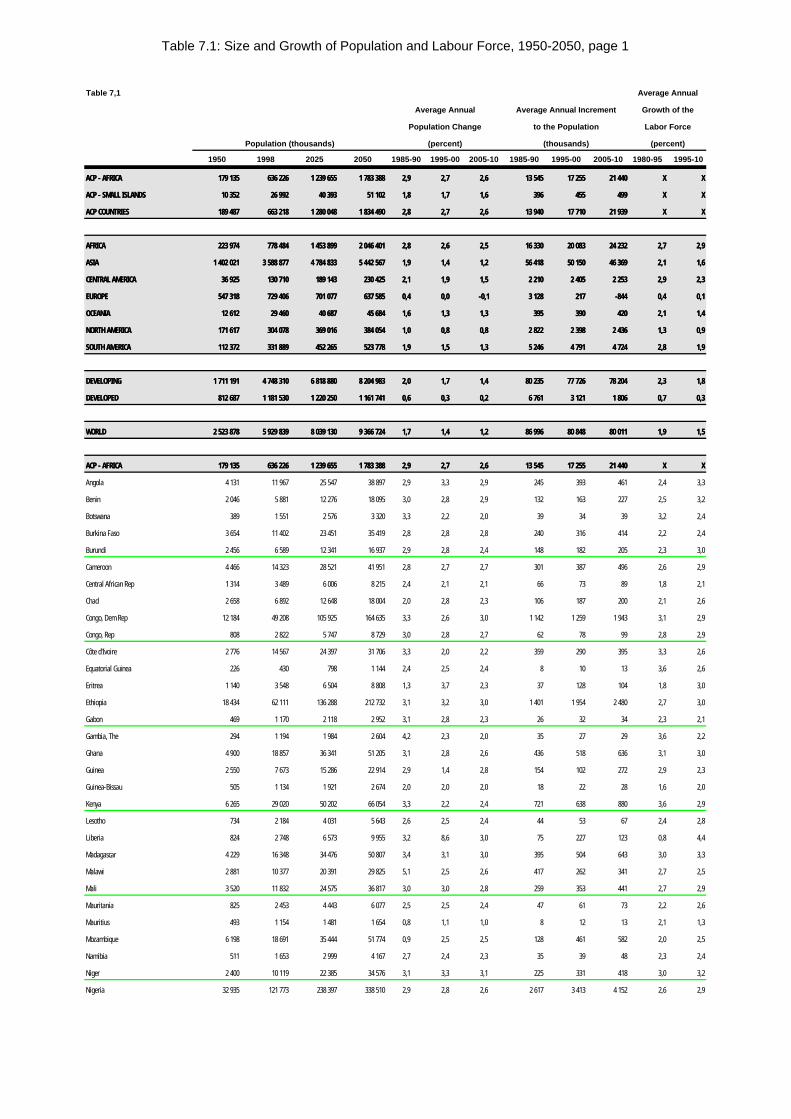
Table 7.1: Size and Growth of Population and Labour Force, 1950-2050, page 1
Table 7,1 Average Annual
Average Annual Average Annual Increment Growth of the
Population Change to the Population Labor Force
Population (thousands) (percent) (thousands) (percent)
1950 1998 2025 2050 1985-90 1995-00 2005-10 1985-90 1995-00 2005-10 1980-95 1995-10
ACP - AFRICAACP - AFRICA 179 135179 135 636 226636 226 1 239 6551 239 655 1 783 3881 783 388 2,92,9 2,72,7 2,62,6 13 54513 545 17 25517 255 21 44021 440 XX XX
ACP - SMALL ISLANDSACP - SMALL ISLANDS 10 35210 352 26 99226 992 40 39340 393 51 10251 102 1,81,8 1,71,7 1,61,6 396396 455455 499499 XX XX
ACP COUNTRIESACP COUNTRIES 189 487189 487 663 218663 218 1 280 0481 280 048 1 834 4901 834 490 2,82,8 2,72,7 2,62,6 13 94013 940 17 71017 710 21 93921 939 XX XX
AFRICAAFRICA 223 974223 974 778 484778 484 1 453 8991 453 899 2 046 4012 046 401 2,82,8 2,62,6 2,52,5 16 33016 330 20 08320 083 24 23224 232 2,72,7 2,92,9
ASIAASIA 1 402 0211 402 021 3 588 8773 588 877 4 784 8334 784 833 5 442 5675 442 567 1,91,9 1,41,4 1,21,2 56 41856 418 50 15050 150 46 36946 369 2,12,1 1,61,6
CENTRAL AMERICACENTRAL AMERICA 36 92536 925 130 710130 710 189 143189 143 230 425230 425 2,12,1 1,91,9 1,51,5 2 2102 210 2 4052 405 2 2532 253 2,92,9 2,32,3
EUROPEEUROPE 547 318547 318 729 406729 406 701 077701 077 637 585637 585 0,40,4 0,00,0 -0,1-0,1 3 1283 128 217217 -844-844 0,40,4 0,10,1
OCEANIAOCEANIA 12 61212 612 29 46029 460 40 68740 687 45 68445 684 1,61,6 1,31,3 1,31,3 395395 390390 420420 2,12,1 1,41,4
NORTH AMERICANORTH AMERICA 171 617171 617 304 078304 078 369 016369 016 384 054384 054 1,01,0 0,80,8 0,80,8 2 8222 822 2 3982 398 2 4362 436 1,31,3 0,90,9
SOUTH AMERICASOUTH AMERICA 112 372112 372 331 889331 889 452 265452 265 523 778523 778 1,91,9 1,51,5 1,31,3 5 2465 246 4 7914 791 4 7244 724 2,82,8 1,91,9
DEVELOPINGDEVELOPING 1 711 1911 711 191 4 748 3104 748 310 6 818 8806 818 880 8 204 9838 204 983 2,02,0 1,71,7 1,41,4 80 23580 235 77 72677 726 78 20478 204 2,32,3 1,81,8
DEVELOPEDDEVELOPED 812 687812 687 1 181 5301 181 530 1 220 2501 220 250 1 161 7411 161 741 0,60,6 0,30,3 0,20,2 6 7616 761 3 1213 121 1 8061 806 0,70,7 0,30,3
WORLDWORLD 2 523 8782 523 878 5 929 8395 929 839 8 039 1308 039 130 9 366 7249 366 724 1,71,7 1,41,4 1,21,2 86 99686 996 80 84880 848 80 01180 011 1,91,9 1,51,5
ACP - AFRICAACP - AFRICA 179 135179 135 636 226636 226 1 239 6551 239 655 1 783 3881 783 388 2,92,9 2,72,7 2,62,6 13 54513 545 17 25517 255 21 44021 440 XX XX
Angola 4 131 11 967 25 547 38 897 2,9 3,3 2,9 245 393 461 2,4 3,3
Benin 2 046 5 881 12 276 18 095 3,0 2,8 2,9 132 163 227 2,5 3,2
Botswana 389 1 551 2 576 3 320 3,3 2,2 2,0 39 34 39 3,2 2,4
Burkina Faso 3 654 11 402 23 451 35 419 2,8 2,8 2,8 240 316 414 2,2 2,4
Burundi 2 456 6 589 12 341 16 937 2,9 2,8 2,4 148 182 205 2,3 3,0
Cameroon 4 466 14 323 28 521 41 951 2,8 2,7 2,7 301 387 496 2,6 2,9
Central African Rep 1 314 3 489 6 006 8 215 2,4 2,1 2,1 66 73 89 1,8 2,1
Chad 2 658 6 892 12 648 18 004 2,0 2,8 2,3 106 187 200 2,1 2,6
Congo, Dem Rep 12 184 49 208 105 925 164 635 3,3 2,6 3,0 1 142 1 259 1 943 3,1 2,9
Congo, Rep 808 2 822 5 747 8 729 3,0 2,8 2,7 62 78 99 2,8 2,9
Côte d'Ivoire 2 776 14 567 24 397 31 706 3,3 2,0 2,2 359 290 395 3,3 2,6
Equatorial Guinea 226 430 798 1 144 2,4 2,5 2,4 8 10 13 3,6 2,6
Eritrea 1 140 3 548 6 504 8 808 1,3 3,7 2,3 37 128 104 1,8 3,0
Ethiopia 18 434 62 111 136 288 212 732 3,1 3,2 3,0 1 401 1 954 2 480 2,7 3,0
Gabon 469 1 170 2 118 2 952 3,1 2,8 2,3 26 32 34 2,3 2,1
Gambia, The 294 1 194 1 984 2 604 4,2 2,3 2,0 35 27 29 3,6 2,2
Ghana 4 900 18 857 36 341 51 205 3,1 2,8 2,6 436 518 636 3,1 3,0
Guinea 2 550 7 673 15 286 22 914 2,9 1,4 2,8 154 102 272 2,9 2,3
Guinea-Bissau 505 1 134 1 921 2 674 2,0 2,0 2,0 18 22 28 1,6 2,0
Kenya 6 265 29 020 50 202 66 054 3,3 2,2 2,4 721 638 880 3,6 2,9
Lesotho 734 2 184 4 031 5 643 2,6 2,5 2,4 44 53 67 2,4 2,8
Liberia 824 2 748 6 573 9 955 3,2 8,6 3,0 75 227 123 0,8 4,4
Madagascar 4 229 16 348 34 476 50 807 3,4 3,1 3,0 395 504 643 3,0 3,3
Malawi 2 881 10 377 20 391 29 825 5,1 2,5 2,6 417 262 341 2,7 2,5
Mali 3 520 11 832 24 575 36 817 3,0 3,0 2,8 259 353 441 2,7 2,9
Mauritania 825 2 453 4 443 6 077 2,5 2,5 2,4 47 61 73 2,2 2,6
Mauritius 493 1 154 1 481 1 654 0,8 1,1 1,0 8 12 13 2,1 1,3
Mozambique 6 198 18 691 35 444 51 774 0,9 2,5 2,5 128 461 582 2,0 2,5
Namibia 511 1 653 2 999 4 167 2,7 2,4 2,3 35 39 48 2,3 2,4
Niger 2 400 10 119 22 385 34 576 3,1 3,3 3,1 225 331 418 3,0 3,2
Nigeria 32 935 121 773 238 397 338 510 2,9 2,8 2,6 2 617 3 413 4 152 2,6 2,9
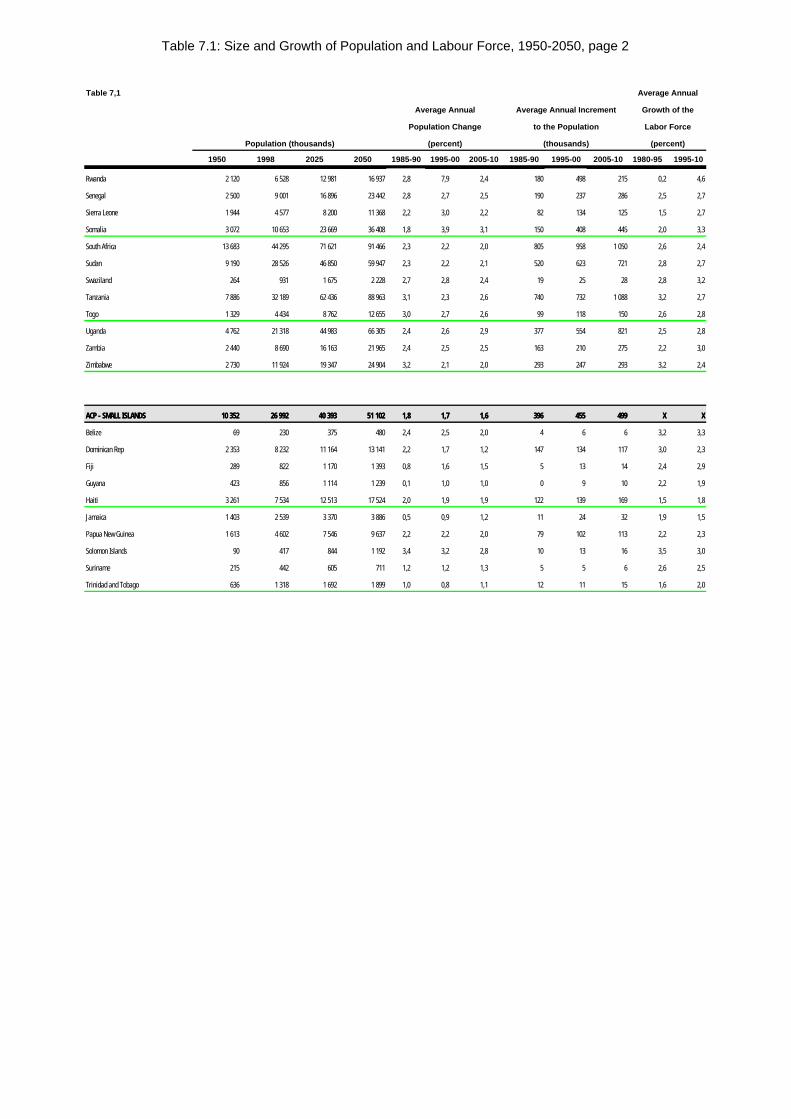
Table 7.1: Size and Growth of Population and Labour Force, 1950-2050, page 2
Table 7,1 Average Annual
Average Annual Average Annual Increment Growth of the
Population Change to the Population Labor Force
Population (thousands) (percent) (thousands) (percent)
1950 1998 2025 2050 1985-90 1995-00 2005-10 1985-90 1995-00 2005-10 1980-95 1995-10
Rwanda 2 120 6 528 12 981 16 937 2,8 7,9 2,4 180 498 215 0,2 4,6
Senegal 2 500 9 001 16 896 23 442 2,8 2,7 2,5 190 237 286 2,5 2,7
Sierra Leone 1 944 4 577 8 200 11 368 2,2 3,0 2,2 82 134 125 1,5 2,7
Somalia 3 072 10 653 23 669 36 408 1,8 3,9 3,1 150 408 445 2,0 3,3
South Africa 13 683 44 295 71 621 91 466 2,3 2,2 2,0 805 958 1 050 2,6 2,4
Sudan 9 190 28 526 46 850 59 947 2,3 2,2 2,1 520 623 721 2,8 2,7
Swaziland 264 931 1 675 2 228 2,7 2,8 2,4 19 25 28 2,8 3,2
Tanzania 7 886 32 189 62 436 88 963 3,1 2,3 2,6 740 732 1 088 3,2 2,7
Togo 1 329 4 434 8 762 12 655 3,0 2,7 2,6 99 118 150 2,6 2,8
Uganda 4 762 21 318 44 983 66 305 2,4 2,6 2,9 377 554 821 2,5 2,8
Zambia 2 440 8 690 16 163 21 965 2,4 2,5 2,5 163 210 275 2,2 3,0
Zimbabwe 2 730 11 924 19 347 24 904 3,2 2,1 2,0 293 247 293 3,2 2,4
ACP - SMALL ISLANDSACP - SMALL ISLANDS 10 35210 352 26 99226 992 40 39340 393 51 10251 102 1,81,8 1,71,7 1,61,6 396396 455455 499499 XX XX
Belize 69 230 375 480 2,4 2,5 2,0 4 6 6 3,2 3,3
Dominican Rep 2 353 8 232 11 164 13 141 2,2 1,7 1,2 147 134 117 3,0 2,3
Fiji 289 822 1 170 1 393 0,8 1,6 1,5 5 13 14 2,4 2,9
Guyana 423 856 1 114 1 239 0,1 1,0 1,0 0 9 10 2,2 1,9
Haiti 3 261 7 534 12 513 17 524 2,0 1,9 1,9 122 139 169 1,5 1,8
Jamaica 1 403 2 539 3 370 3 886 0,5 0,9 1,2 11 24 32 1,9 1,5
Papua New Guinea 1 613 4 602 7 546 9 637 2,2 2,2 2,0 79 102 113 2,2 2,3
Solomon Islands 90 417 844 1 192 3,4 3,2 2,8 10 13 16 3,5 3,0
Suriname 215 442 605 711 1,2 1,2 1,3 5 5 6 2,6 2,5
Trinidad and Tobago 636 1 318 1 692 1 899 1,0 0,8 1,1 12 11 15 1,6 2,0
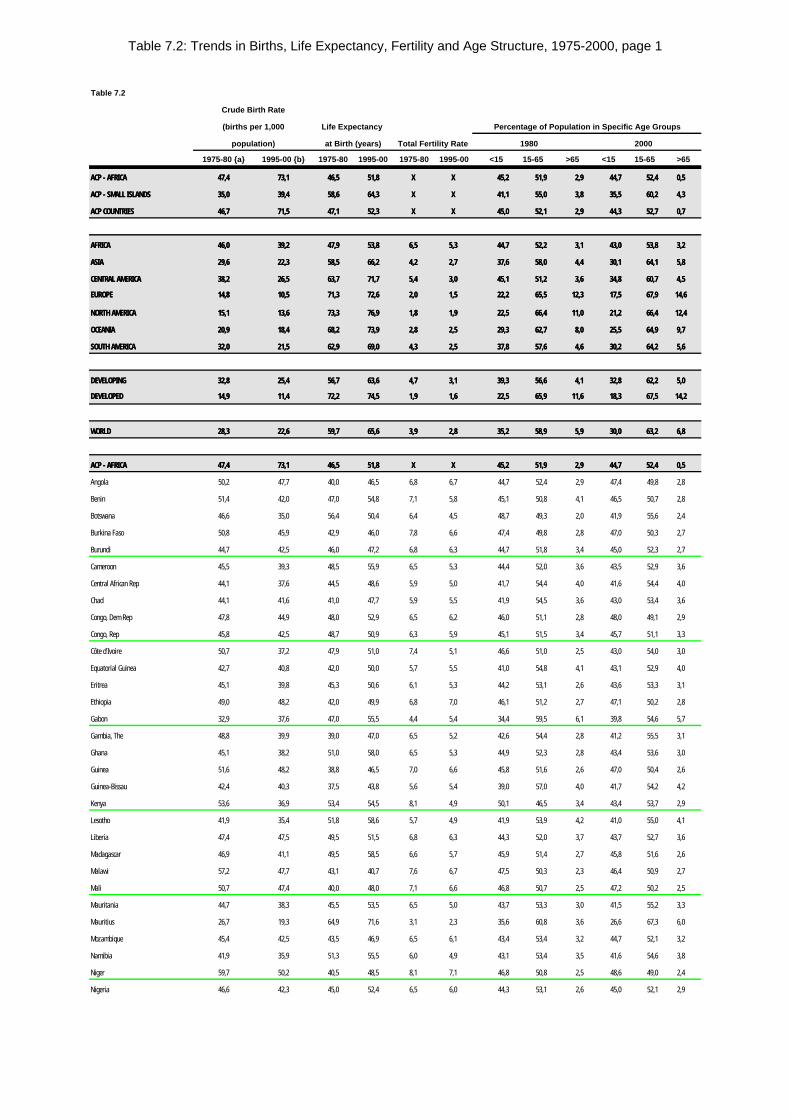
Table 7.2: Trends in Births, Life Expectancy, Fertility and Age Structure, 1975-2000, page 1
Table 7.2
Crude Birth Rate
(births per 1,000 Life Expectancy Percentage of Population in Specific Age Groups
population) at Birth (years) Total Fertility Rate 1980 2000
1975-80 {a} 1995-00 {b} 1975-80 1995-00 1975-80 1995-00 <15 15-65 >65 <15 15-65 >65
ACP - AFRICAACP - AFRICA 47,447,4 73,173,1 46,546,5 51,851,8 XX XX 45,245,2 51,951,9 2,92,9 44,744,7 52,452,4 0,50,5
ACP - SMALL ISLANDSACP - SMALL ISLANDS 35,035,0 39,439,4 58,658,6 64,364,3 XX XX 41,141,1 55,055,0 3,83,8 35,535,5 60,260,2 4,34,3
ACP COUNTRIESACP COUNTRIES 46,746,7 71,571,5 47,147,1 52,352,3 XX XX 45,045,0 52,152,1 2,92,9 44,344,3 52,752,7 0,70,7
AFRICAAFRICA 46,046,0 39,239,2 47,947,9 53,853,8 6,56,5 5,35,3 44,744,7 52,252,2 3,13,1 43,043,0 53,853,8 3,23,2
ASIAASIA 29,629,6 22,322,3 58,558,5 66,266,2 4,24,2 2,72,7 37,637,6 58,058,0 4,44,4 30,130,1 64,164,1 5,85,8
CENTRAL AMERICACENTRAL AMERICA 38,238,2 26,526,5 63,763,7 71,771,7 5,45,4 3,03,0 45,145,1 51,251,2 3,63,6 34,834,8 60,760,7 4,54,5
EUROPEEUROPE 14,814,8 10,510,5 71,371,3 72,672,6 2,02,0 1,51,5 22,222,2 65,565,5 12,312,3 17,517,5 67,967,9 14,614,6
NORTH AMERICANORTH AMERICA 15,115,1 13,613,6 73,373,3 76,976,9 1,81,8 1,91,9 22,522,5 66,466,4 11,011,0 21,221,2 66,466,4 12,412,4
OCEANIAOCEANIA 20,920,9 18,418,4 68,268,2 73,973,9 2,82,8 2,52,5 29,329,3 62,762,7 8,08,0 25,525,5 64,964,9 9,79,7
SOUTH AMERICASOUTH AMERICA 32,032,0 21,521,5 62,962,9 69,069,0 4,34,3 2,52,5 37,837,8 57,657,6 4,64,6 30,230,2 64,264,2 5,65,6
DEVELOPINGDEVELOPING 32,832,8 25,425,4 56,756,7 63,663,6 4,74,7 3,13,1 39,339,3 56,656,6 4,14,1 32,832,8 62,262,2 5,05,0
DEVELOPEDDEVELOPED 14,914,9 11,411,4 72,272,2 74,574,5 1,91,9 1,61,6 22,522,5 65,965,9 11,611,6 18,318,3 67,567,5 14,214,2
WORLDWORLD 28,328,3 22,622,6 59,759,7 65,665,6 3,93,9 2,82,8 35,235,2 58,958,9 5,95,9 30,030,0 63,263,2 6,86,8
ACP - AFRICAACP - AFRICA 47,447,4 73,173,1 46,546,5 51,851,8 XX XX 45,245,2 51,951,9 2,92,9 44,744,7 52,452,4 0,50,5
Angola 50,2 47,7 40,0 46,5 6,8 6,7 44,7 52,4 2,9 47,4 49,8 2,8
Benin 51,4 42,0 47,0 54,8 7,1 5,8 45,1 50,8 4,1 46,5 50,7 2,8
Botswana 46,6 35,0 56,4 50,4 6,4 4,5 48,7 49,3 2,0 41,9 55,6 2,4
Burkina Faso 50,8 45,9 42,9 46,0 7,8 6,6 47,4 49,8 2,8 47,0 50,3 2,7
Burundi 44,7 42,5 46,0 47,2 6,8 6,3 44,7 51,8 3,4 45,0 52,3 2,7
Cameroon 45,5 39,3 48,5 55,9 6,5 5,3 44,4 52,0 3,6 43,5 52,9 3,6
Central African Rep 44,1 37,6 44,5 48,6 5,9 5,0 41,7 54,4 4,0 41,6 54,4 4,0
Chad 44,1 41,6 41,0 47,7 5,9 5,5 41,9 54,5 3,6 43,0 53,4 3,6
Congo, Dem Rep 47,8 44,9 48,0 52,9 6,5 6,2 46,0 51,1 2,8 48,0 49,1 2,9
Congo, Rep 45,8 42,5 48,7 50,9 6,3 5,9 45,1 51,5 3,4 45,7 51,1 3,3
Côte d'Ivoire 50,7 37,2 47,9 51,0 7,4 5,1 46,6 51,0 2,5 43,0 54,0 3,0
Equatorial Guinea 42,7 40,8 42,0 50,0 5,7 5,5 41,0 54,8 4,1 43,1 52,9 4,0
Eritrea 45,1 39,8 45,3 50,6 6,1 5,3 44,2 53,1 2,6 43,6 53,3 3,1
Ethiopia 49,0 48,2 42,0 49,9 6,8 7,0 46,1 51,2 2,7 47,1 50,2 2,8
Gabon 32,9 37,6 47,0 55,5 4,4 5,4 34,4 59,5 6,1 39,8 54,6 5,7
Gambia, The 48,8 39,9 39,0 47,0 6,5 5,2 42,6 54,4 2,8 41,2 55,5 3,1
Ghana 45,1 38,2 51,0 58,0 6,5 5,3 44,9 52,3 2,8 43,4 53,6 3,0
Guinea 51,6 48,2 38,8 46,5 7,0 6,6 45,8 51,6 2,6 47,0 50,4 2,6
Guinea-Bissau 42,4 40,3 37,5 43,8 5,6 5,4 39,0 57,0 4,0 41,7 54,2 4,2
Kenya 53,6 36,9 53,4 54,5 8,1 4,9 50,1 46,5 3,4 43,4 53,7 2,9
Lesotho 41,9 35,4 51,8 58,6 5,7 4,9 41,9 53,9 4,2 41,0 55,0 4,1
Liberia 47,4 47,5 49,5 51,5 6,8 6,3 44,3 52,0 3,7 43,7 52,7 3,6
Madagascar 46,9 41,1 49,5 58,5 6,6 5,7 45,9 51,4 2,7 45,8 51,6 2,6
Malawi 57,2 47,7 43,1 40,7 7,6 6,7 47,5 50,3 2,3 46,4 50,9 2,7
Mali 50,7 47,4 40,0 48,0 7,1 6,6 46,8 50,7 2,5 47,2 50,2 2,5
Mauritania 44,7 38,3 45,5 53,5 6,5 5,0 43,7 53,3 3,0 41,5 55,2 3,3
Mauritius 26,7 19,3 64,9 71,6 3,1 2,3 35,6 60,8 3,6 26,6 67,3 6,0
Mozambique 45,4 42,5 43,5 46,9 6,5 6,1 43,4 53,4 3,2 44,7 52,1 3,2
Namibia 41,9 35,9 51,3 55,5 6,0 4,9 43,1 53,4 3,5 41,6 54,6 3,8
Niger 59,7 50,2 40,5 48,5 8,1 7,1 46,8 50,8 2,5 48,6 49,0 2,4
Nigeria 46,6 42,3 45,0 52,4 6,5 6,0 44,3 53,1 2,6 45,0 52,1 2,9
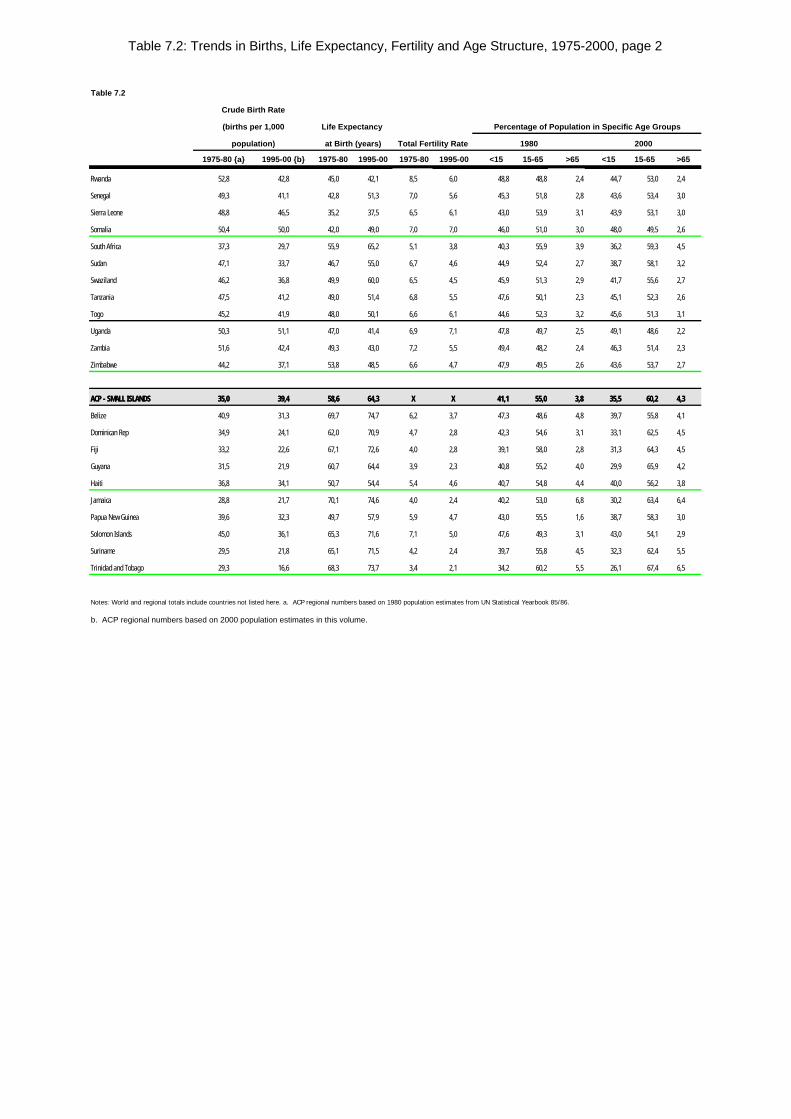
Table 7.2: Trends in Births, Life Expectancy, Fertility and Age Structure, 1975-2000, page 2
Table 7.2
Crude Birth Rate
(births per 1,000 Life Expectancy Percentage of Population in Specific Age Groups
population) at Birth (years) Total Fertility Rate 1980 2000
1975-80 {a} 1995-00 {b} 1975-80 1995-00 1975-80 1995-00 <15 15-65 >65 <15 15-65 >65
Rwanda 52,8 42,8 45,0 42,1 8,5 6,0 48,8 48,8 2,4 44,7 53,0 2,4
Senegal 49,3 41,1 42,8 51,3 7,0 5,6 45,3 51,8 2,8 43,6 53,4 3,0
Sierra Leone 48,8 46,5 35,2 37,5 6,5 6,1 43,0 53,9 3,1 43,9 53,1 3,0
Somalia 50,4 50,0 42,0 49,0 7,0 7,0 46,0 51,0 3,0 48,0 49,5 2,6
South Africa 37,3 29,7 55,9 65,2 5,1 3,8 40,3 55,9 3,9 36,2 59,3 4,5
Sudan 47,1 33,7 46,7 55,0 6,7 4,6 44,9 52,4 2,7 38,7 58,1 3,2
Swaziland 46,2 36,8 49,9 60,0 6,5 4,5 45,9 51,3 2,9 41,7 55,6 2,7
Tanzania 47,5 41,2 49,0 51,4 6,8 5,5 47,6 50,1 2,3 45,1 52,3 2,6
Togo 45,2 41,9 48,0 50,1 6,6 6,1 44,6 52,3 3,2 45,6 51,3 3,1
Uganda 50,3 51,1 47,0 41,4 6,9 7,1 47,8 49,7 2,5 49,1 48,6 2,2
Zambia 51,6 42,4 49,3 43,0 7,2 5,5 49,4 48,2 2,4 46,3 51,4 2,3
Zimbabwe 44,2 37,1 53,8 48,5 6,6 4,7 47,9 49,5 2,6 43,6 53,7 2,7
ACP - SMALL ISLANDSACP - SMALL ISLANDS 35,035,0 39,439,4 58,658,6 64,364,3 XX XX 41,141,1 55,055,0 3,83,8 35,535,5 60,260,2 4,34,3
Belize 40,9 31,3 69,7 74,7 6,2 3,7 47,3 48,6 4,8 39,7 55,8 4,1
Dominican Rep 34,9 24,1 62,0 70,9 4,7 2,8 42,3 54,6 3,1 33,1 62,5 4,5
Fiji 33,2 22,6 67,1 72,6 4,0 2,8 39,1 58,0 2,8 31,3 64,3 4,5
Guyana 31,5 21,9 60,7 64,4 3,9 2,3 40,8 55,2 4,0 29,9 65,9 4,2
Haiti 36,8 34,1 50,7 54,4 5,4 4,6 40,7 54,8 4,4 40,0 56,2 3,8
Jamaica 28,8 21,7 70,1 74,6 4,0 2,4 40,2 53,0 6,8 30,2 63,4 6,4
Papua New Guinea 39,6 32,3 49,7 57,9 5,9 4,7 43,0 55,5 1,6 38,7 58,3 3,0
Solomon Islands 45,0 36,1 65,3 71,6 7,1 5,0 47,6 49,3 3,1 43,0 54,1 2,9
Suriname 29,5 21,8 65,1 71,5 4,2 2,4 39,7 55,8 4,5 32,3 62,4 5,5
Trinidad and Tobago 29,3 16,6 68,3 73,7 3,4 2,1 34,2 60,2 5,5 26,1 67,4 6,5
Notes: World and regional totals include countries not listed here. a. ACP regional numbers based on 1980 population estimates from UN Statistical Yearbook 85/86.
b. ACP regional numbers based on 2000 population estimates in this volume.
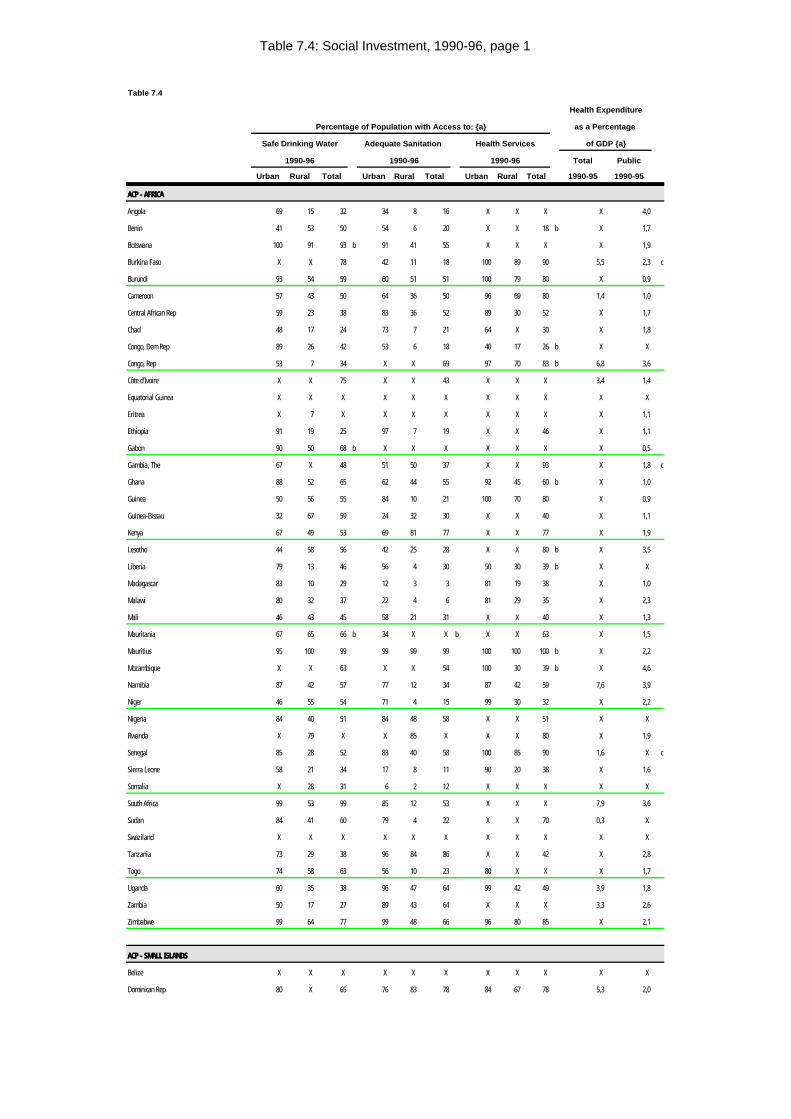
Table 7.4: Social Investment, 1990-96, page 1
Table 7.4
Health Expenditure
Percentage of Population with Access to: {a} as a Percentage
Safe Drinking Water Adequate Sanitation Health Services of GDP {a}
1990-96 1990-96 1990-96 Total Public
Urban Rural Total Urban Rural Total Urban Rural Total 1990-95 1990-95
ACP - AFRICAACP - AFRICA
Angola 69 15 32 34 8 16 X X X X 4,0
Benin 41 53 50 54 6 20 X X 18 b X 1,7
Botswana 100 91 93 b 91 41 55 X X X X 1,9
Burkina Faso X X 78 42 11 18 100 89 90 5,5 2,3 c
Burundi 93 54 59 60 51 51 100 79 80 X 0,9
Cameroon 57 43 50 64 36 50 96 69 80 1,4 1,0
Central African Rep 59 23 38 83 36 52 89 30 52 X 1,7
Chad 48 17 24 73 7 21 64 X 30 X 1,8
Congo, Dem Rep 89 26 42 53 6 18 40 17 26 b X X
Congo, Rep 53 7 34 X X 69 97 70 83 b 6,8 3,6
Côte d'Ivoire X X 75 X X 43 X X X 3,4 1,4
Equatorial Guinea X X X X X X X X X X X
Eritrea X 7 X X X X X X X X 1,1
Ethiopia 91 19 25 97 7 19 X X 46 X 1,1
Gabon 90 50 68 b X X X X X X X 0,5
Gambia, The 67 X 48 51 50 37 X X 93 X 1,8 c
Ghana 88 52 65 62 44 55 92 45 60 b X 1,0
Guinea 50 56 55 84 10 21 100 70 80 X 0,9
Guinea-Bissau 32 67 59 24 32 30 X X 40 X 1,1
Kenya 67 49 53 69 81 77 X X 77 X 1,9
Lesotho 44 58 56 42 25 28 X X 80 b X 3,5
Liberia 79 13 46 56 4 30 50 30 39 b X X
Madagascar 83 10 29 12 3 3 81 19 38 X 1,0
Malawi 80 32 37 22 4 6 81 29 35 X 2,3
Mali 46 43 45 58 21 31 X X 40 X 1,3
Mauritania 67 65 66 b 34 X X b X X 63 X 1,5
Mauritius 95 100 99 99 99 99 100 100 100 b X 2,2
Mozambique X X 63 X X 54 100 30 39 b X 4,6
Namibia 87 42 57 77 12 34 87 42 59 7,6 3,9
Niger 46 55 54 71 4 15 99 30 32 X 2,2
Nigeria 84 40 51 84 48 58 X X 51 X X
Rwanda X 79 X X 85 X X X 80 X 1,9
Senegal 85 28 52 83 40 58 100 85 90 1,6 X c
Sierra Leone 58 21 34 17 8 11 90 20 38 X 1,6
Somalia X 28 31 6 2 12 X X X X X
South Africa 99 53 99 85 12 53 X X X 7,9 3,6
Sudan 84 41 60 79 4 22 X X 70 0,3 X
Swaziland X X X X X X X X X X X
Tanzania 73 29 38 96 84 86 X X 42 X 2,8
Togo 74 58 63 56 10 23 80 X X X 1,7
Uganda 60 35 38 96 47 64 99 42 49 3,9 1,8
Zambia 50 17 27 89 43 64 X X X 3,3 2,6
Zimbabwe 99 64 77 99 48 66 96 80 85 X 2,1
ACP - SMALL ISLANDSACP - SMALL ISLANDS
Belize X X X X X X X X X X X
Dominican Rep 80 X 65 76 83 78 84 67 78 5,3 2,0
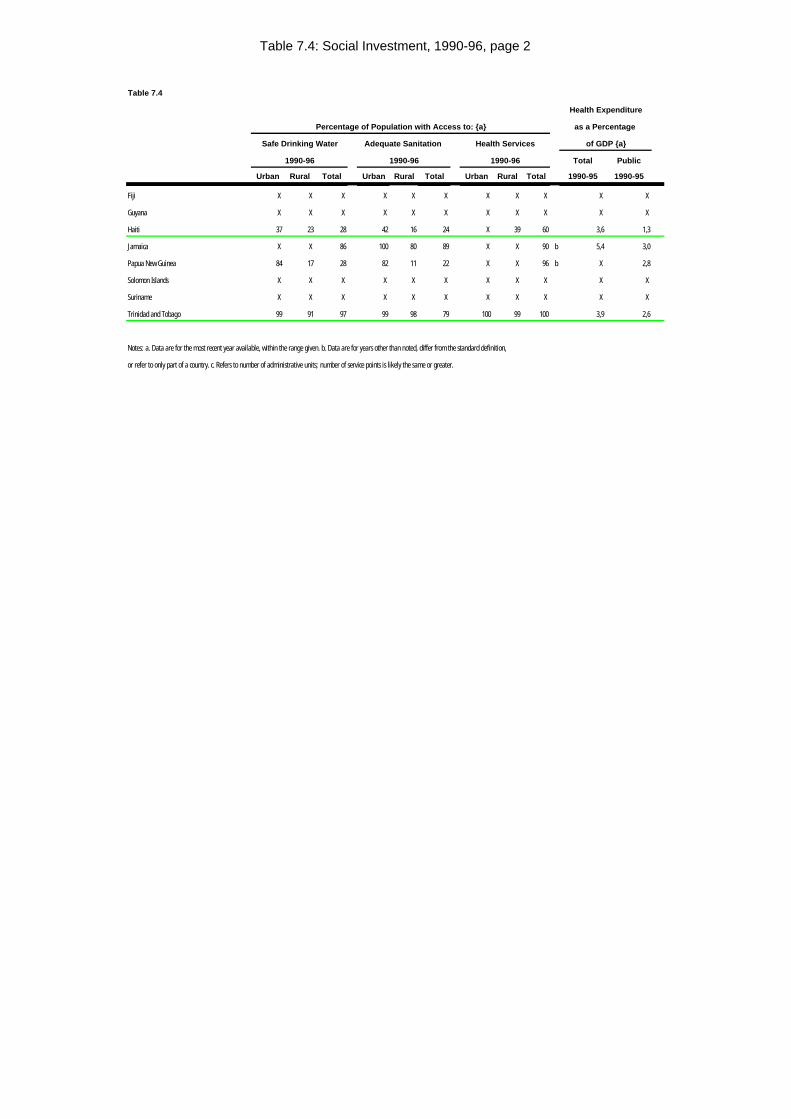
Table 7.4: Social Investment, 1990-96, page 2
Table 7.4
Health Expenditure
Percentage of Population with Access to: {a} as a Percentage
Safe Drinking Water Adequate Sanitation Health Services of GDP {a}
1990-96 1990-96 1990-96 Total Public
Urban Rural Total Urban Rural Total Urban Rural Total 1990-95 1990-95
Fiji X X X X X X X X X X X
Guyana X X X X X X X X X X X
Haiti 37 23 28 42 16 24 X 39 60 3,6 1,3
Jamaica X X 86 100 80 89 X X 90 b 5,4 3,0
Papua New Guinea 84 17 28 82 11 22 X X 96 b X 2,8
Solomon Islands X X X X X X X X X X X
Suriname X X X X X X X X X X X
Trinidad and Tobago 99 91 97 99 98 79 100 99 100 3,9 2,6
Notes: a. Data are for the most recent year available, within the range given. b. Data are for years other than noted, differ from the standard definition,
or refer to only part of a country. c. Refers to number of administrative units; number of service points is likely the same or greater.
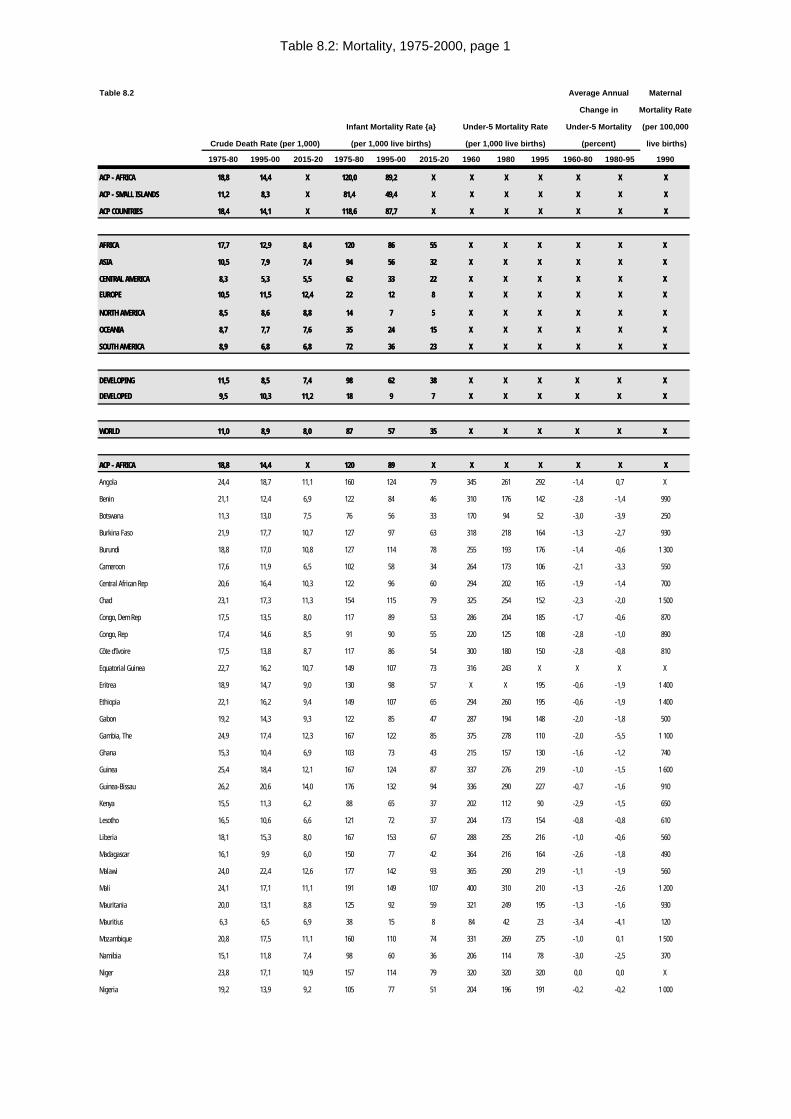
Table 8.2: Mortality, 1975-2000, page 1
Table 8.2 Average Annual Maternal
Change in Mortality Rate
Infant Mortality Rate {a} Under-5 Mortality Rate Under-5 Mortality (per 100,000
Crude Death Rate (per 1,000) (per 1,000 live births) (per 1,000 live births) (percent) live births)
1975-80 1995-00 2015-20 1975-80 1995-00 2015-20 1960 1980 1995 1960-80 1980-95 1990
ACP - AFRICAACP - AFRICA 18,818,8 14,414,4 XX 120,0120,0 89,289,2 XX XX XX XX XX XX XX
ACP - SMALL ISLANDSACP - SMALL ISLANDS 11,211,2 8,38,3 XX 81,481,4 49,449,4 XX XX XX XX XX XX XX
ACP COUNTRIESACP COUNTRIES 18,418,4 14,114,1 XX 118,6118,6 87,787,7 XX XX XX XX XX XX XX
AFRICAAFRICA 17,717,7 12,912,9 8,48,4 120120 8686 5555 X X X X X X XX XX X X
ASIAASIA 10,510,5 7,97,9 7,47,4 9494 5656 3232 X X X X X X XX XX X X
CENTRAL AMERICACENTRAL AMERICA 8,38,3 5,35,3 5,55,5 6262 3333 2222 X X X X X X XX XX X X
EUROPEEUROPE 10,510,5 11,511,5 12,412,4 2222 1212 88 X X X X X X XX XX X X
NORTH AMERICANORTH AMERICA 8,58,5 8,68,6 8,88,8 1414 77 55 X X X X X X XX XX X X
OCEANIAOCEANIA 8,78,7 7,77,7 7,67,6 3535 2424 1515 X X X X X X XX XX X X
SOUTH AMERICASOUTH AMERICA 8,98,9 6,86,8 6,86,8 7272 3636 2323 X X X X X X XX XX X X
DEVELOPINGDEVELOPING 11,511,5 8,58,5 7,47,4 9898 6262 3838 X X X X X X X X X X X X
DEVELOPEDDEVELOPED 9,59,5 10,310,3 11,211,2 1818 99 77 X X X X X X X X X X X X
WORLDWORLD 11,011,0 8,98,9 8,08,0 8787 5757 3535 X X X X X X X X X X X X
ACP - AFRICAACP - AFRICA 18,818,8 14,414,4 XX 120120 8989 XX XX XX XX XX XX XX
Angola 24,4 18,7 11,1 160 124 79 345 261 292 -1,4 0,7 X
Benin 21,1 12,4 6,9 122 84 46 310 176 142 -2,8 -1,4 990
Botswana 11,3 13,0 7,5 76 56 33 170 94 52 -3,0 -3,9 250
Burkina Faso 21,9 17,7 10,7 127 97 63 318 218 164 -1,3 -2,7 930
Burundi 18,8 17,0 10,8 127 114 78 255 193 176 -1,4 -0,6 1 300
Cameroon 17,6 11,9 6,5 102 58 34 264 173 106 -2,1 -3,3 550
Central African Rep 20,6 16,4 10,3 122 96 60 294 202 165 -1,9 -1,4 700
Chad 23,1 17,3 11,3 154 115 79 325 254 152 -2,3 -2,0 1 500
Congo, Dem Rep 17,5 13,5 8,0 117 89 53 286 204 185 -1,7 -0,6 870
Congo, Rep 17,4 14,6 8,5 91 90 55 220 125 108 -2,8 -1,0 890
Côte d'Ivoire 17,5 13,8 8,7 117 86 54 300 180 150 -2,8 -0,8 810
Equatorial Guinea 22,7 16,2 10,7 149 107 73 316 243 X X X X
Eritrea 18,9 14,7 9,0 130 98 57 X X 195 -0,6 -1,9 1 400
Ethiopia 22,1 16,2 9,4 149 107 65 294 260 195 -0,6 -1,9 1 400
Gabon 19,2 14,3 9,3 122 85 47 287 194 148 -2,0 -1,8 500
Gambia, The 24,9 17,4 12,3 167 122 85 375 278 110 -2,0 -5,5 1 100
Ghana 15,3 10,4 6,9 103 73 43 215 157 130 -1,6 -1,2 740
Guinea 25,4 18,4 12,1 167 124 87 337 276 219 -1,0 -1,5 1 600
Guinea-Bissau 26,2 20,6 14,0 176 132 94 336 290 227 -0,7 -1,6 910
Kenya 15,5 11,3 6,2 88 65 37 202 112 90 -2,9 -1,5 650
Lesotho 16,5 10,6 6,6 121 72 37 204 173 154 -0,8 -0,8 610
Liberia 18,1 15,3 8,0 167 153 67 288 235 216 -1,0 -0,6 560
Madagascar 16,1 9,9 6,0 150 77 42 364 216 164 -2,6 -1,8 490
Malawi 24,0 22,4 12,6 177 142 93 365 290 219 -1,1 -1,9 560
Mali 24,1 17,1 11,1 191 149 107 400 310 210 -1,3 -2,6 1 200
Mauritania 20,0 13,1 8,8 125 92 59 321 249 195 -1,3 -1,6 930
Mauritius 6,3 6,5 6,9 38 15 8 84 42 23 -3,4 -4,1 120
Mozambique 20,8 17,5 11,1 160 110 74 331 269 275 -1,0 0,1 1 500
Namibia 15,1 11,8 7,4 98 60 36 206 114 78 -3,0 -2,5 370
Niger 23,8 17,1 10,9 157 114 79 320 320 320 0,0 0,0 X
Nigeria 19,2 13,9 9,2 105 77 51 204 196 191 -0,2 -0,2 1 000
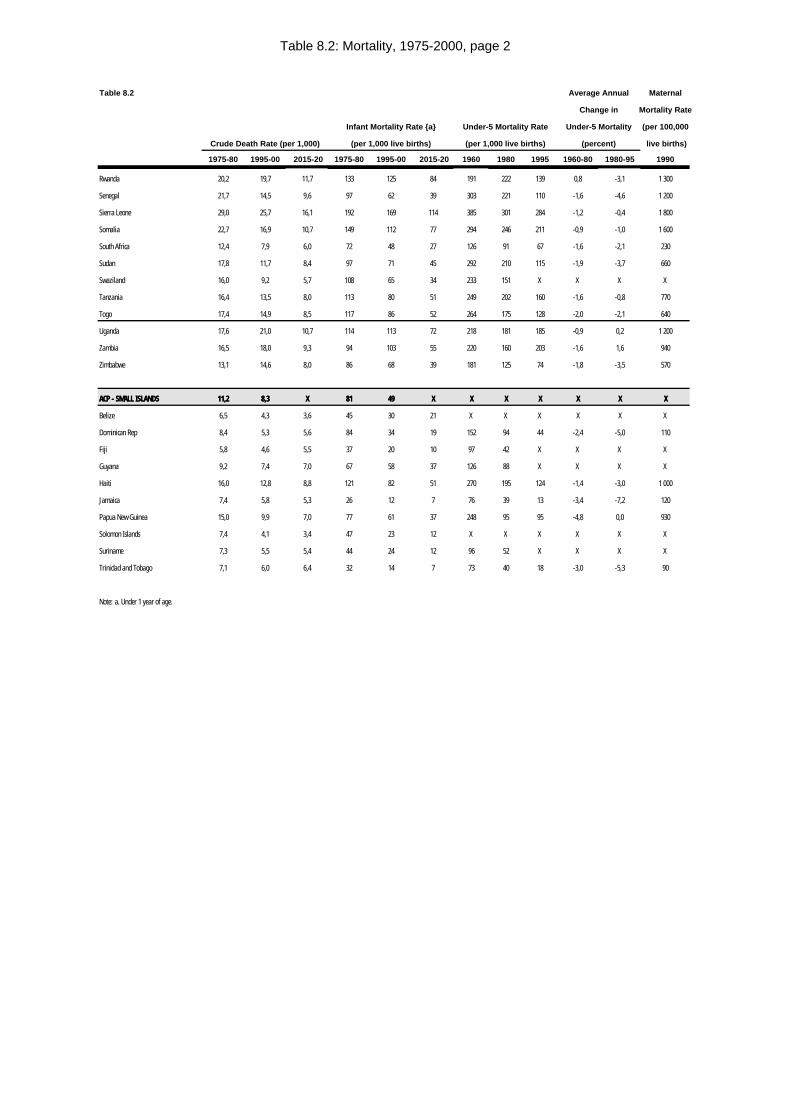
Table 8.2: Mortality, 1975-2000, page 2
Table 8.2 Average Annual Maternal
Change in Mortality Rate
Infant Mortality Rate {a} Under-5 Mortality Rate Under-5 Mortality (per 100,000
Crude Death Rate (per 1,000) (per 1,000 live births) (per 1,000 live births) (percent) live births)
1975-80 1995-00 2015-20 1975-80 1995-00 2015-20 1960 1980 1995 1960-80 1980-95 1990
Rwanda 20,2 19,7 11,7 133 125 84 191 222 139 0,8 -3,1 1 300
Senegal 21,7 14,5 9,6 97 62 39 303 221 110 -1,6 -4,6 1 200
Sierra Leone 29,0 25,7 16,1 192 169 114 385 301 284 -1,2 -0,4 1 800
Somalia 22,7 16,9 10,7 149 112 77 294 246 211 -0,9 -1,0 1 600
South Africa 12,4 7,9 6,0 72 48 27 126 91 67 -1,6 -2,1 230
Sudan 17,8 11,7 8,4 97 71 45 292 210 115 -1,9 -3,7 660
Swaziland 16,0 9,2 5,7 108 65 34 233 151 X X X X
Tanzania 16,4 13,5 8,0 113 80 51 249 202 160 -1,6 -0,8 770
Togo 17,4 14,9 8,5 117 86 52 264 175 128 -2,0 -2,1 640
Uganda 17,6 21,0 10,7 114 113 72 218 181 185 -0,9 0,2 1 200
Zambia 16,5 18,0 9,3 94 103 55 220 160 203 -1,6 1,6 940
Zimbabwe 13,1 14,6 8,0 86 68 39 181 125 74 -1,8 -3,5 570
ACP - SMALL ISLANDSACP - SMALL ISLANDS 11,211,2 8,38,3 XX 8181 4949 XX XX XX XX XX XX XX
Belize 6,5 4,3 3,6 45 30 21 X X X X X X
Dominican Rep 8,4 5,3 5,6 84 34 19 152 94 44 -2,4 -5,0 110
Fiji 5,8 4,6 5,5 37 20 10 97 42 X X X X
Guyana 9,2 7,4 7,0 67 58 37 126 88 X X X X
Haiti 16,0 12,8 8,8 121 82 51 270 195 124 -1,4 -3,0 1 000
Jamaica 7,4 5,8 5,3 26 12 7 76 39 13 -3,4 -7,2 120
Papua New Guinea 15,0 9,9 7,0 77 61 37 248 95 95 -4,8 0,0 930
Solomon Islands 7,4 4,1 3,4 47 23 12 X X X X X X
Suriname 7,3 5,5 5,4 44 24 12 96 52 X X X X
Trinidad and Tobago 7,1 6,0 6,4 32 14 7 73 40 18 -3,0 -5,3 90
Note: a. Under 1 year of age.
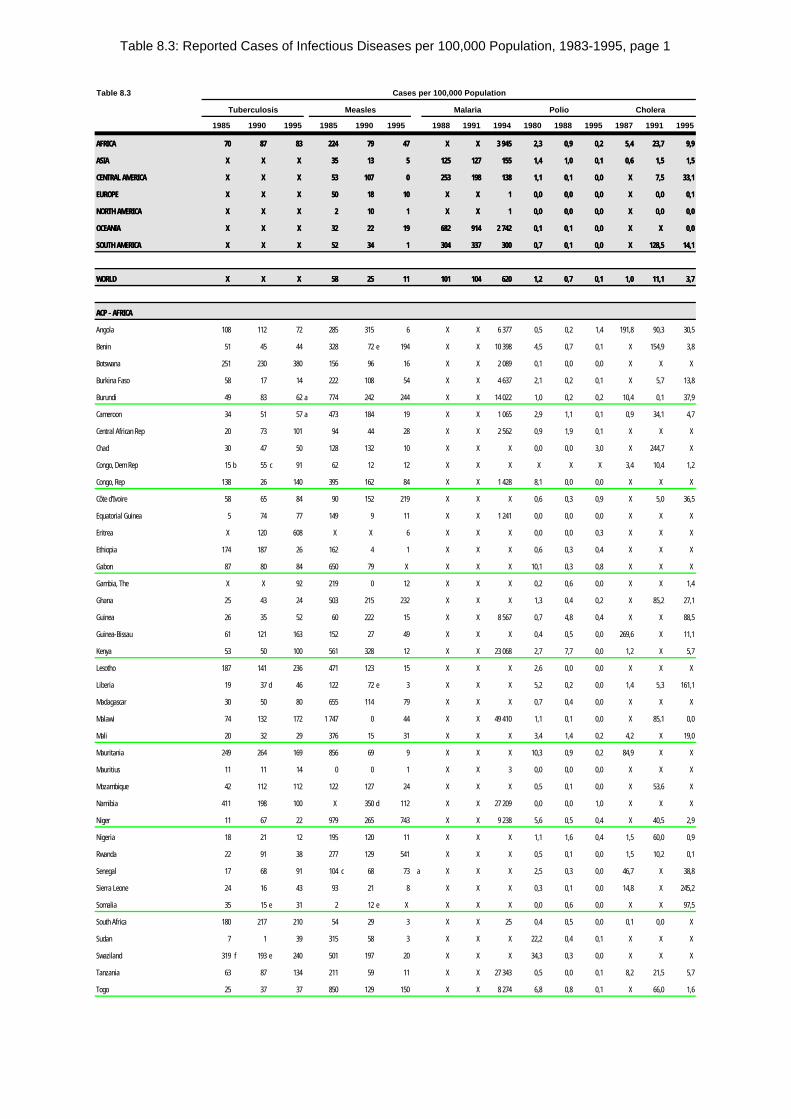
Table 8.3: Reported Cases of Infectious Diseases per 100,000 Population, 1983-1995, page 1
Table 8.3 Cases per 100,000 Population
Tuberculosis Measles Malaria Polio Cholera
1985 1990 1995 1985 1990 1995 1988 1991 1994 1980 1988 1995 1987 1991 1995
AFRICAAFRICA 7070 8787 8383 224224 7979 4747 X X X X 3 9453 945 2,32,3 0,90,9 0,20,2 5,45,4 23,723,7 9,99,9
ASIAASIA X X X X X X 3535 1313 55 125125 127127 155155 1,41,4 1,01,0 0,10,1 0,60,6 1,51,5 1,51,5
CENTRAL AMERICACENTRAL AMERICA X X X X X X 5353 107107 00 253253 198198 138138 1,11,1 0,10,1 0,00,0 X X 7,57,5 33,133,1
EUROPEEUROPE X X X X X X 5050 1818 1010 X X X X 11 0,00,0 0,00,0 0,00,0 X X 0,00,0 0,10,1
NORTH AMERICANORTH AMERICA X X X X X X 22 1010 11 X X X X 11 0,00,0 0,00,0 0,00,0 X X 0,00,0 0,00,0
OCEANIAOCEANIA X X X X X X 3232 2222 1919 682682 914914 2 7422 742 0,10,1 0,10,1 0,00,0 X X X X 0,00,0
SOUTH AMERICASOUTH AMERICA X X X X X X 5252 3434 11 304304 337337 300300 0,70,7 0,10,1 0,00,0 X X 128,5128,5 14,114,1
WORLDWORLD X X X X X X 5858 2525 1111 101101 104104 620620 1,21,2 0,70,7 0,10,1 1,01,0 11,111,1 3,73,7
ACP - AFRICAACP - AFRICA
Angola 108 112 72 285 315 6 X X 6 377 0,5 0,2 1,4 191,8 90,3 30,5
Benin 51 45 44 328 72 e 194 X X 10 398 4,5 0,7 0,1 X 154,9 3,8
Botswana 251 230 380 156 96 16 X X 2 089 0,1 0,0 0,0 X X X
Burkina Faso 58 17 14 222 108 54 X X 4 637 2,1 0,2 0,1 X 5,7 13,8
Burundi 49 83 62 a 774 242 244 X X 14 022 1,0 0,2 0,2 10,4 0,1 37,9
Cameroon 34 51 57 a 473 184 19 X X 1 065 2,9 1,1 0,1 0,9 34,1 4,7
Central African Rep 20 73 101 94 44 28 X X 2 562 0,9 1,9 0,1 X X X
Chad 30 47 50 128 132 10 X X X 0,0 0,0 3,0 X 244,7 X
Congo, Dem Rep 15 b 55 c 91 62 12 12 X X X X X X 3,4 10,4 1,2
Congo, Rep 138 26 140 395 162 84 X X 1 428 8,1 0,0 0,0 X X X
Côte d'Ivoire 58 65 84 90 152 219 X X X 0,6 0,3 0,9 X 5,0 36,5
Equatorial Guinea 5 74 77 149 9 11 X X 1 241 0,0 0,0 0,0 X X X
Eritrea X 120 608 X X 6 X X X 0,0 0,0 0,3 X X X
Ethiopia 174 187 26 162 4 1 X X X 0,6 0,3 0,4 X X X
Gabon 87 80 84 650 79 X X X X 10,1 0,3 0,8 X X X
Gambia, The X X 92 219 0 12 X X X 0,2 0,6 0,0 X X 1,4
Ghana 25 43 24 503 215 232 X X X 1,3 0,4 0,2 X 85,2 27,1
Guinea 26 35 52 60 222 15 X X 8 567 0,7 4,8 0,4 X X 88,5
Guinea-Bissau 61 121 163 152 27 49 X X X 0,4 0,5 0,0 269,6 X 11,1
Kenya 53 50 100 561 328 12 X X 23 068 2,7 7,7 0,0 1,2 X 5,7
Lesotho 187 141 236 471 123 15 X X X 2,6 0,0 0,0 X X X
Liberia 19 37 d 46 122 72 e 3 X X X 5,2 0,2 0,0 1,4 5,3 161,1
Madagascar 30 50 80 655 114 79 X X X 0,7 0,4 0,0 X X X
Malawi 74 132 172 1 747 0 44 X X 49 410 1,1 0,1 0,0 X 85,1 0,0
Mali 20 32 29 376 15 31 X X X 3,4 1,4 0,2 4,2 X 19,0
Mauritania 249 264 169 856 69 9 X X X 10,3 0,9 0,2 84,9 X X
Mauritius 11 11 14 0 0 1 X X 3 0,0 0,0 0,0 X X X
Mozambique 42 112 112 122 127 24 X X X 0,5 0,1 0,0 X 53,6 X
Namibia 411 198 100 X 350 d 112 X X 27 209 0,0 0,0 1,0 X X X
Niger 11 67 22 979 265 743 X X 9 238 5,6 0,5 0,4 X 40,5 2,9
Nigeria 18 21 12 195 120 11 X X X 1,1 1,6 0,4 1,5 60,0 0,9
Rwanda 22 91 38 277 129 541 X X X 0,5 0,1 0,0 1,5 10,2 0,1
Senegal 17 68 91 104 c 68 73 a X X X 2,5 0,3 0,0 46,7 X 38,8
Sierra Leone 24 16 43 93 21 8 X X X 0,3 0,1 0,0 14,8 X 245,2
Somalia 35 15 e 31 2 12 e X X X X 0,0 0,6 0,0 X X 97,5
South Africa 180 217 210 54 29 3 X X 25 0,4 0,5 0,0 0,1 0,0 X
Sudan 7 1 39 315 58 3 X X X 22,2 0,4 0,1 X X X
Swaziland 319 f 193 e 240 501 197 20 X X X 34,3 0,3 0,0 X X X
Tanzania 63 87 134 211 59 11 X X 27 343 0,5 0,0 0,1 8,2 21,5 5,7
Togo 25 37 37 850 129 150 X X 8 274 6,8 0,8 0,1 X 66,0 1,6
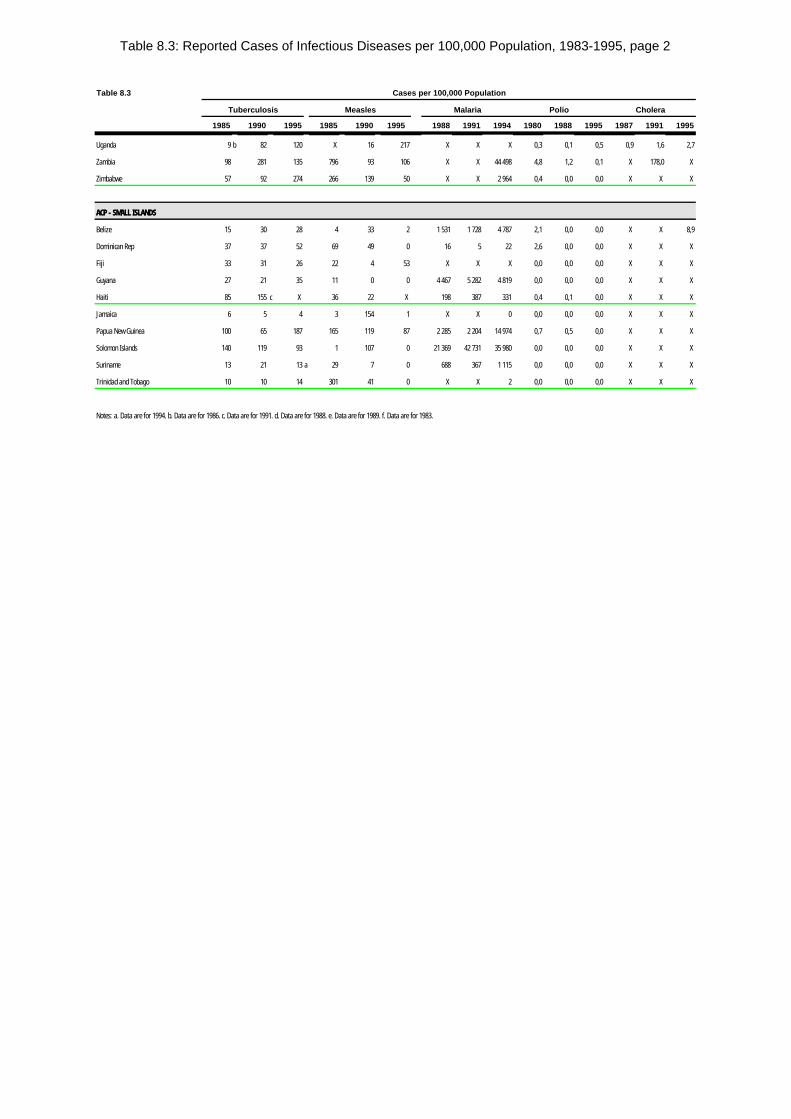
Table 8.3: Reported Cases of Infectious Diseases per 100,000 Population, 1983-1995, page 2
Table 8.3 Cases per 100,000 Population
Tuberculosis Measles Malaria Polio Cholera
1985 1990 1995 1985 1990 1995 1988 1991 1994 1980 1988 1995 1987 1991 1995
Uganda 9 b 82 120 X 16 217 X X X 0,3 0,1 0,5 0,9 1,6 2,7
Zambia 98 281 135 796 93 106 X X 44 498 4,8 1,2 0,1 X 178,0 X
Zimbabwe 57 92 274 266 139 50 X X 2 964 0,4 0,0 0,0 X X X
ACP - SMALL ISLANDSACP - SMALL ISLANDS
Belize 15 30 28 4 33 2 1 531 1 728 4 787 2,1 0,0 0,0 X X 8,9
Dominican Rep 37 37 52 69 49 0 16 5 22 2,6 0,0 0,0 X X X
Fiji 33 31 26 22 4 53 X X X 0,0 0,0 0,0 X X X
Guyana 27 21 35 11 0 0 4 467 5 282 4 819 0,0 0,0 0,0 X X X
Haiti 85 155 c X 36 22 X 198 387 331 0,4 0,1 0,0 X X X
Jamaica 6 5 4 3 154 1 X X 0 0,0 0,0 0,0 X X X
Papua New Guinea 100 65 187 165 119 87 2 285 2 204 14 974 0,7 0,5 0,0 X X X
Solomon Islands 140 119 93 1 107 0 21 369 42 731 35 980 0,0 0,0 0,0 X X X
Suriname 13 21 13 a 29 7 0 688 367 1 115 0,0 0,0 0,0 X X X
Trinidad and Tobago 10 10 14 301 41 0 X X 2 0,0 0,0 0,0 X X X
Notes: a. Data are for 1994. b. Data are for 1986. c. Data are for 1991. d. Data are for 1988. e. Data are for 1989. f. Data are for 1983.
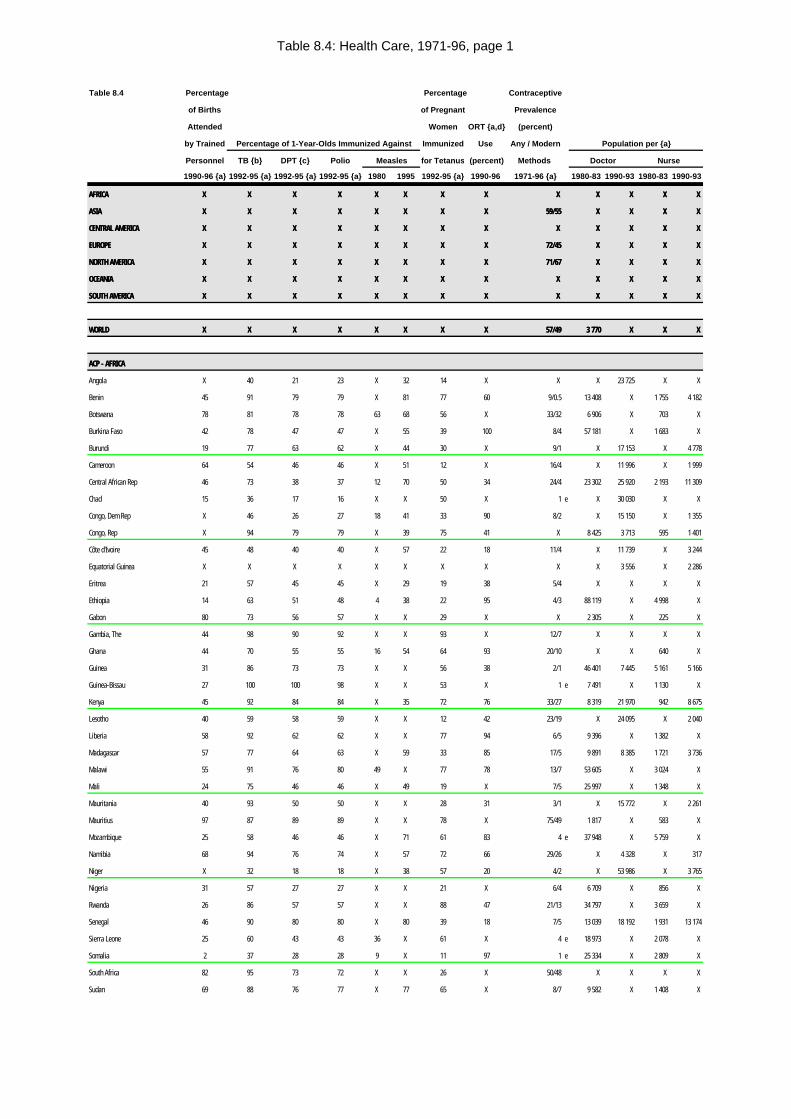
Table 8.4: Health Care, 1971-96, page 1
Table 8.4 Percentage Percentage Contraceptive
of Births of Pregnant Prevalence
Attended Women ORT {a,d} (percent)
by Trained Percentage of 1-Year-Olds Immunized Against Immunized Use Any / Modern Population per {a}
Personnel TB {b} DPT {c} Polio Measles for Tetanus (percent) Methods Doctor Nurse
1990-96 {a} 1992-95 {a} 1992-95 {a} 1992-95 {a} 1980 1995 1992-95 {a} 1990-96 1971-96 {a} 1980-83 1990-93 1980-83 1990-93
AFRICAAFRICA X X X X X X X X X X X X X X X X X X X X X X X X X X
ASIAASIA X X X X X X X X X X X X X X X X 59/5559/55 X X X X X X X X
CENTRAL AMERICACENTRAL AMERICA X X X X X X X X X X X X X X X X X X X X X X X X X X
EUROPEEUROPE X X X X X X X X X X X X X X X X 72/4572/45 X X X X X X X X
NORTH AMERICANORTH AMERICA X X X X X X X X X X X X X X X X 71/6771/67 X X X X X X X X
OCEANIAOCEANIA X X X X X X X X X X X X X X X X X X X X X X X X X X
SOUTH AMERICASOUTH AMERICA X X X X X X X X X X X X X X X X X X X X X X X X X X
WORLDWORLD X X X X X X X X X X X X X X X X 57/4957/49 3 7703 770 X X X X X X
ACP - AFRICAACP - AFRICA
Angola X 40 21 23 X 32 14 X X X 23 725 X X
Benin 45 91 79 79 X 81 77 60 9/0.5 13 408 X 1 755 4 182
Botswana 78 81 78 78 63 68 56 X 33/32 6 906 X 703 X
Burkina Faso 42 78 47 47 X 55 39 100 8/4 57 181 X 1 683 X
Burundi 19 77 63 62 X 44 30 X 9/1 X 17 153 X 4 778
Cameroon 64 54 46 46 X 51 12 X 16/4 X 11 996 X 1 999
Central African Rep 46 73 38 37 12 70 50 34 24/4 23 302 25 920 2 193 11 309
Chad 15 36 17 16 X X 50 X 1 e X 30 030 X X
Congo, Dem Rep X 46 26 27 18 41 33 90 8/2 X 15 150 X 1 355
Congo, Rep X 94 79 79 X 39 75 41 X 8 425 3 713 595 1 401
Côte d'Ivoire 45 48 40 40 X 57 22 18 11/4 X 11 739 X 3 244
Equatorial Guinea X X X X X X X X X X 3 556 X 2 286
Eritrea 21 57 45 45 X 29 19 38 5/4 X X X X
Ethiopia 14 63 51 48 4 38 22 95 4/3 88 119 X 4 998 X
Gabon 80 73 56 57 X X 29 X X 2 305 X 225 X
Gambia, The 44 98 90 92 X X 93 X 12/7 X X X X
Ghana 44 70 55 55 16 54 64 93 20/10 X X 640 X
Guinea 31 86 73 73 X X 56 38 2/1 46 401 7 445 5 161 5 166
Guinea-Bissau 27 100 100 98 X X 53 X 1 e 7 491 X 1 130 X
Kenya 45 92 84 84 X 35 72 76 33/27 8 319 21 970 942 8 675
Lesotho 40 59 58 59 X X 12 42 23/19 X 24 095 X 2 040
Liberia 58 92 62 62 X X 77 94 6/5 9 396 X 1 382 X
Madagascar 57 77 64 63 X 59 33 85 17/5 9 891 8 385 1 721 3 736
Malawi 55 91 76 80 49 X 77 78 13/7 53 605 X 3 024 X
Mali 24 75 46 46 X 49 19 X 7/5 25 997 X 1 348 X
Mauritania 40 93 50 50 X X 28 31 3/1 X 15 772 X 2 261
Mauritius 97 87 89 89 X X 78 X 75/49 1 817 X 583 X
Mozambique 25 58 46 46 X 71 61 83 4 e 37 948 X 5 759 X
Namibia 68 94 76 74 X 57 72 66 29/26 X 4 328 X 317
Niger X 32 18 18 X 38 57 20 4/2 X 53 986 X 3 765
Nigeria 31 57 27 27 X X 21 X 6/4 6 709 X 856 X
Rwanda 26 86 57 57 X X 88 47 21/13 34 797 X 3 659 X
Senegal 46 90 80 80 X 80 39 18 7/5 13 039 18 192 1 931 13 174
Sierra Leone 25 60 43 43 36 X 61 X 4 e 18 973 X 2 078 X
Somalia 2 37 28 28 9 X 11 97 1 e 25 334 X 2 809 X
South Africa 82 95 73 72 X X 26 X 50/48 X X X X
Sudan 69 88 76 77 X 77 65 X 8/7 9 582 X 1 408 X
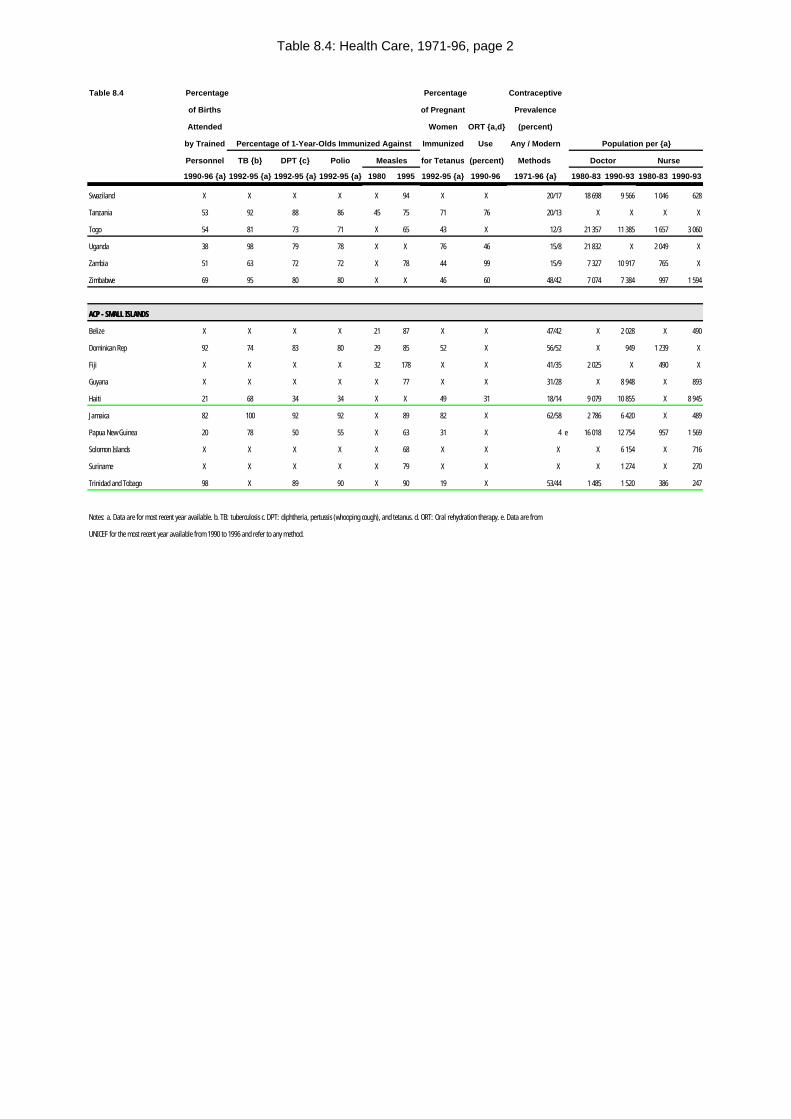
Table 8.4: Health Care, 1971-96, page 2
Table 8.4 Percentage Percentage Contraceptive
of Births of Pregnant Prevalence
Attended Women ORT {a,d} (percent)
by Trained Percentage of 1-Year-Olds Immunized Against Immunized Use Any / Modern Population per {a}
Personnel TB {b} DPT {c} Polio Measles for Tetanus (percent) Methods Doctor Nurse
1990-96 {a} 1992-95 {a} 1992-95 {a} 1992-95 {a} 1980 1995 1992-95 {a} 1990-96 1971-96 {a} 1980-83 1990-93 1980-83 1990-93
Swaziland X X X X X 94 X X 20/17 18 698 9 566 1 046 628
Tanzania 53 92 88 86 45 75 71 76 20/13 X X X X
Togo 54 81 73 71 X 65 43 X 12/3 21 357 11 385 1 657 3 060
Uganda 38 98 79 78 X X 76 46 15/8 21 832 X 2 049 X
Zambia 51 63 72 72 X 78 44 99 15/9 7 327 10 917 765 X
Zimbabwe 69 95 80 80 X X 46 60 48/42 7 074 7 384 997 1 594
ACP - SMALL ISLANDSACP - SMALL ISLANDS
Belize X X X X 21 87 X X 47/42 X 2 028 X 490
Dominican Rep 92 74 83 80 29 85 52 X 56/52 X 949 1 239 X
Fiji X X X X 32 178 X X 41/35 2 025 X 490 X
Guyana X X X X X 77 X X 31/28 X 8 948 X 893
Haiti 21 68 34 34 X X 49 31 18/14 9 079 10 855 X 8 945
Jamaica 82 100 92 92 X 89 82 X 62/58 2 786 6 420 X 489
Papua New Guinea 20 78 50 55 X 63 31 X 4 e 16 018 12 754 957 1 569
Solomon Islands X X X X X 68 X X X X 6 154 X 716
Suriname X X X X X 79 X X X X 1 274 X 270
Trinidad and Tobago 98 X 89 90 X 90 19 X 53/44 1 485 1 520 386 247
Notes: a. Data are for most recent year available. b. TB: tuberculosis c. DPT: diphtheria, pertussis (whooping cough), and tetanus. d. ORT: Oral rehydration therapy. e. Data are from
UNICEF for the most recent year available from 1990 to 1996 and refer to any method.
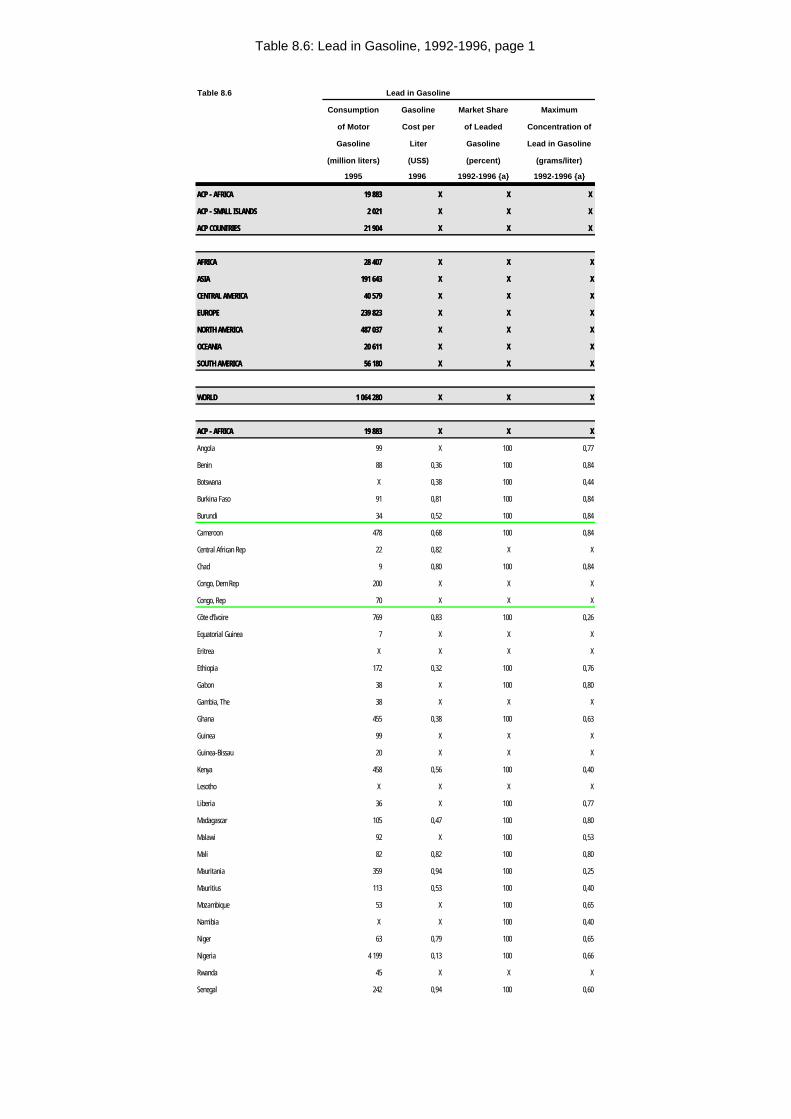
Table 8.6: Lead in Gasoline, 1992-1996, page 1
Table 8.6 Lead in Gasoline
Consumption Gasoline Market Share Maximum
of Motor Cost per of Leaded Concentration of
Gasoline Liter Gasoline Lead in Gasoline
(million liters) (US$) (percent) (grams/liter)
1995 1996 1992-1996 {a} 1992-1996 {a}
ACP - AFRICAACP - AFRICA 19 88319 883 XX X X X X
ACP - SMALL ISLANDSACP - SMALL ISLANDS 2 0212 021 XX X X X X
ACP COUNTRIESACP COUNTRIES 21 90421 904 XX X X X X
AFRICAAFRICA 28 40728 407 XX X X XX
ASIAASIA 191 643191 643 XX X X XX
CENTRAL AMERICACENTRAL AMERICA 40 57940 579 XX X X XX
EUROPEEUROPE 239 823239 823 XX X X XX
NORTH AMERICANORTH AMERICA 487 037487 037 XX X X XX
OCEANIAOCEANIA 20 61120 611 XX X X XX
SOUTH AMERICASOUTH AMERICA 56 18056 180 XX X X XX
WORLDWORLD 1 064 2801 064 280 XX X X XX
ACP - AFRICAACP - AFRICA 19 88319 883 XX X X XX
Angola 99 X 100 0,77
Benin 88 0,36 100 0,84
Botswana X 0,38 100 0,44
Burkina Faso 91 0,81 100 0,84
Burundi 34 0,52 100 0,84
Cameroon 478 0,68 100 0,84
Central African Rep 22 0,82 X X
Chad 9 0,80 100 0,84
Congo, Dem Rep 200 X X X
Congo, Rep 70 X X X
Côte d'Ivoire 769 0,83 100 0,26
Equatorial Guinea 7 X X X
Eritrea X X X X
Ethiopia 172 0,32 100 0,76
Gabon 38 X 100 0,80
Gambia, The 38 X X X
Ghana 455 0,38 100 0,63
Guinea 99 X X X
Guinea-Bissau 20 X X X
Kenya 458 0,56 100 0,40
Lesotho X X X X
Liberia 36 X 100 0,77
Madagascar 105 0,47 100 0,80
Malawi 92 X 100 0,53
Mali 82 0,82 100 0,80
Mauritania 359 0,94 100 0,25
Mauritius 113 0,53 100 0,40
Mozambique 53 X 100 0,65
Namibia X X 100 0,40
Niger 63 0,79 100 0,65
Nigeria 4 199 0,13 100 0,66
Rwanda 45 X X X
Senegal 242 0,94 100 0,60
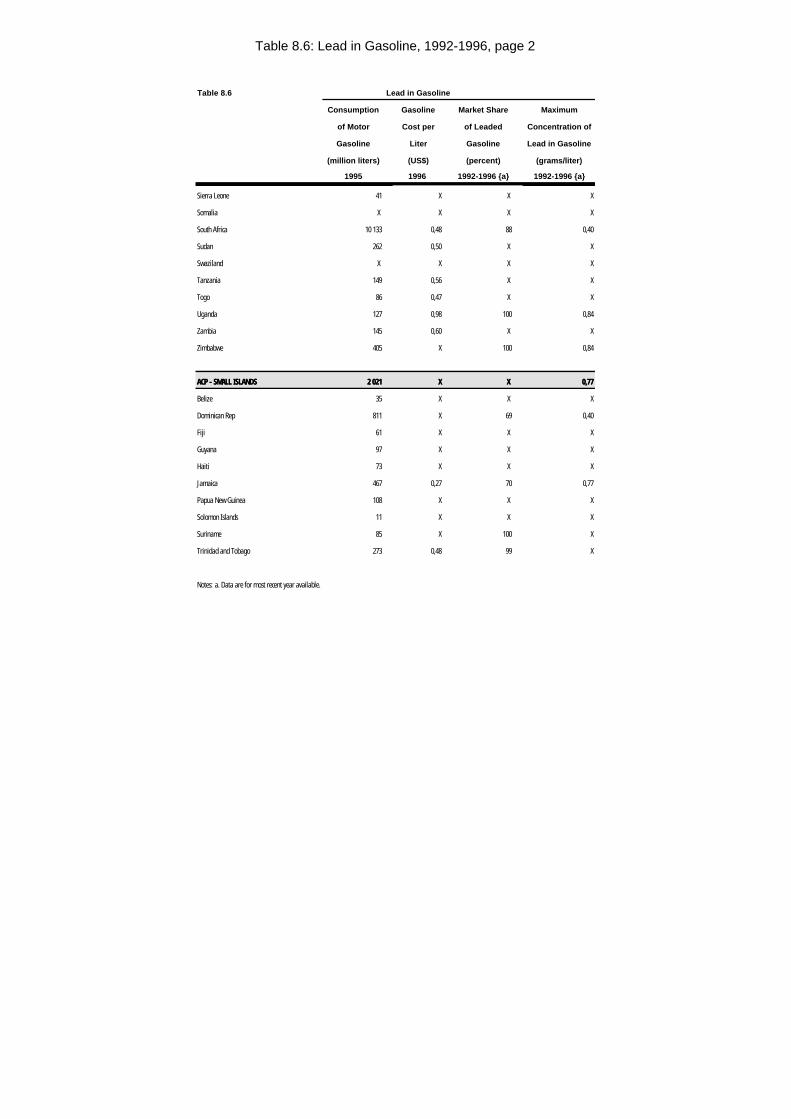
Table 8.6: Lead in Gasoline, 1992-1996, page 2
Table 8.6 Lead in Gasoline
Consumption Gasoline Market Share Maximum
of Motor Cost per of Leaded Concentration of
Gasoline Liter Gasoline Lead in Gasoline
(million liters) (US$) (percent) (grams/liter)
1995 1996 1992-1996 {a} 1992-1996 {a}
Sierra Leone 41 X X X
Somalia X X X X
South Africa 10 133 0,48 88 0,40
Sudan 262 0,50 X X
Swaziland X X X X
Tanzania 149 0,56 X X
Togo 86 0,47 X X
Uganda 127 0,98 100 0,84
Zambia 145 0,60 X X
Zimbabwe 405 X 100 0,84
ACP - SMALL ISLANDSACP - SMALL ISLANDS 2 0212 021 XX X X 0,770,77
Belize 35 X X X
Dominican Rep 811 X 69 0,40
Fiji 61 X X X
Guyana 97 X X X
Haiti 73 X X X
Jamaica 467 0,27 70 0,77
Papua New Guinea 108 X X X
Solomon Islands 11 X X X
Suriname 85 X 100 X
Trinidad and Tobago 273 0,48 99 X
Notes: a. Data are for most recent year available.
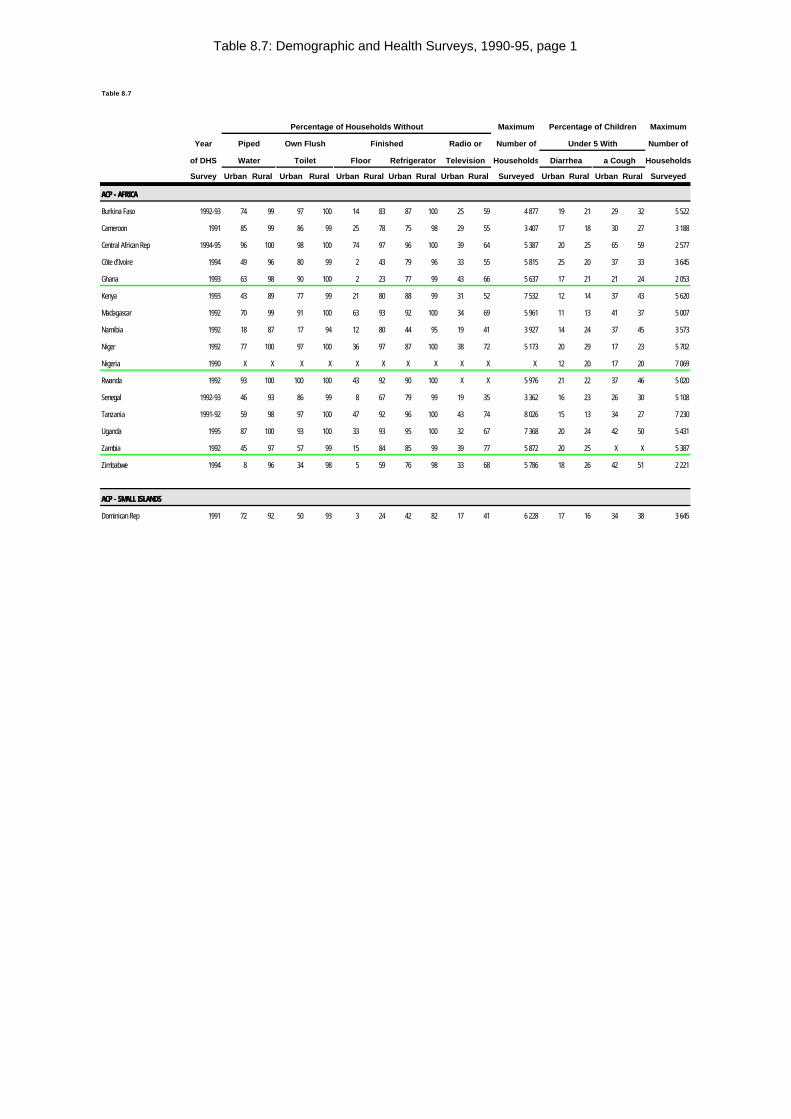
Table 8.7: Demographic and Health Surveys, 1990-95, page 1
Table 8.7
Percentage of Households Without Maximum Percentage of Children Maximum
Year Piped Own Flush Finished Radio or Number of Under 5 With Number of
of DHS Water Toilet Floor Refrigerator Television Households Diarrhea a Cough Households
Survey Urban Rural Urban Rural Urban Rural Urban Rural Urban Rural Surveyed Urban Rural Urban Rural Surveyed
ACP - AFRICAACP - AFRICA
Burkina Faso 1992-93 74 99 97 100 14 83 87 100 25 59 4 877 19 21 29 32 5 522
Cameroon 1991 85 99 86 99 25 78 75 98 29 55 3 407 17 18 30 27 3 188
Central African Rep 1994-95 96 100 98 100 74 97 96 100 39 64 5 387 20 25 65 59 2 577
Côte d'Ivoire 1994 49 96 80 99 2 43 79 96 33 55 5 815 25 20 37 33 3 645
Ghana 1993 63 98 90 100 2 23 77 99 43 66 5 637 17 21 21 24 2 053
Kenya 1993 43 89 77 99 21 80 88 99 31 52 7 532 12 14 37 43 5 620
Madagascar 1992 70 99 91 100 63 93 92 100 34 69 5 961 11 13 41 37 5 007
Namibia 1992 18 87 17 94 12 80 44 95 19 41 3 927 14 24 37 45 3 573
Niger 1992 77 100 97 100 36 97 87 100 38 72 5 173 20 29 17 23 5 702
Nigeria 1990 X X X X X X X X X X X 12 20 17 20 7 069
Rwanda 1992 93 100 100 100 43 92 90 100 X X 5 976 21 22 37 46 5 020
Senegal 1992-93 46 93 86 99 8 67 79 99 19 35 3 362 16 23 26 30 5 108
Tanzania 1991-92 59 98 97 100 47 92 96 100 43 74 8 026 15 13 34 27 7 230
Uganda 1995 87 100 93 100 33 93 95 100 32 67 7 368 20 24 42 50 5 431
Zambia 1992 45 97 57 99 15 84 85 99 39 77 5 872 20 25 X X 5 387
Zimbabwe 1994 8 96 34 98 5 59 76 98 33 68 5 786 18 26 42 51 2 221
ACP - SMALL ISLANDSACP - SMALL ISLANDS
Dominican Rep 1991 72 92 50 93 3 24 42 82 17 41 6 228 17 16 34 38 3 645
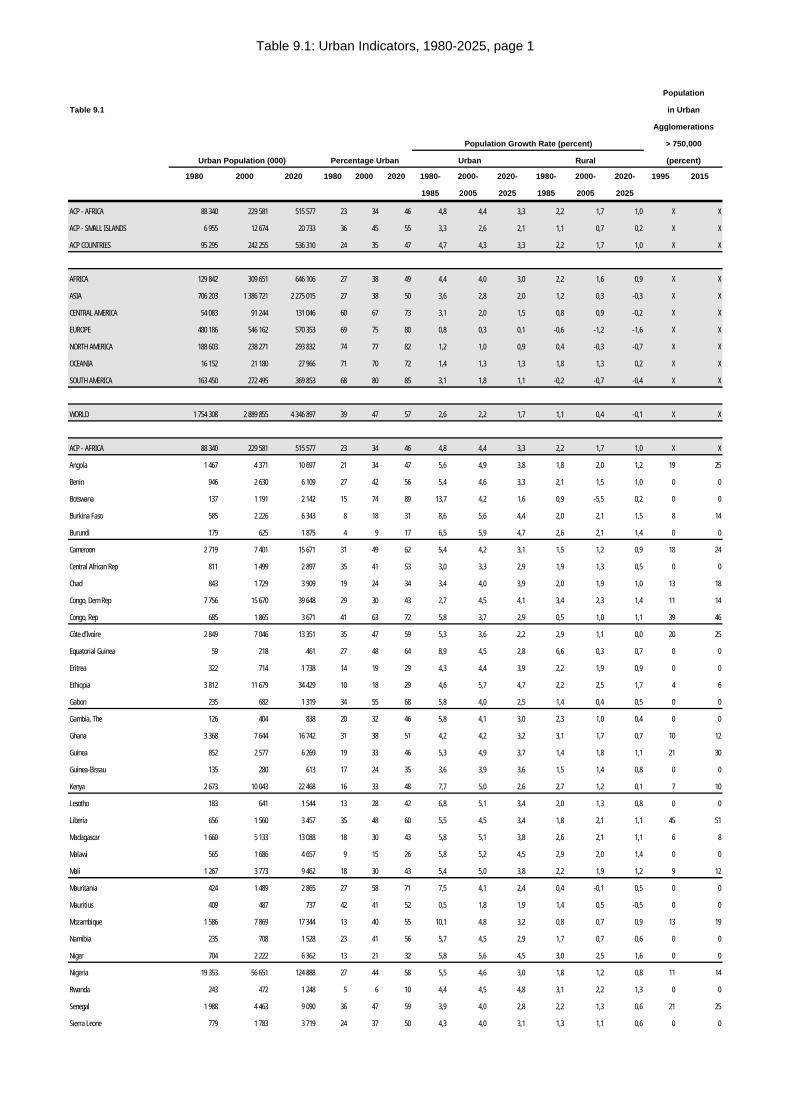
Table 9.1: Urban Indicators, 1980-2025, page 1
Population
Table 9.1 in Urban
Agglomerations
Population Growth Rate (percent) > 750,000
Urban Population (000) Percentage Urban Urban Rural (percent)
1980 2000 2020 1980 2000 2020 1980- 2000- 2020- 1980- 2000- 2020- 1995 2015
1985 2005 2025 1985 2005 2025
ACP - AFRICA 88 340 229 581 515 577 23 34 46 4,8 4,4 3,3 2,2 1,7 1,0 X X
ACP - SMALL ISLANDS 6 955 12 674 20 733 36 45 55 3,3 2,6 2,1 1,1 0,7 0,2 X X
ACP COUNTRIES 95 295 242 255 536 310 24 35 47 4,7 4,3 3,3 2,2 1,7 1,0 X X
AFRICA 129 842 309 651 646 106 27 38 49 4,4 4,0 3,0 2,2 1,6 0,9 X X
ASIA 706 203 1 386 721 2 275 015 27 38 50 3,6 2,8 2,0 1,2 0,3 -0,3 X X
CENTRAL AMERICA 54 083 91 244 131 046 60 67 73 3,1 2,0 1,5 0,8 0,9 -0,2 X X
EUROPE 480 186 546 162 570 353 69 75 80 0,8 0,3 0,1 -0,6 -1,2 -1,6 X X
NORTH AMERICA 188 603 238 271 293 832 74 77 82 1,2 1,0 0,9 0,4 -0,3 -0,7 X X
OCEANIA 16 152 21 180 27 966 71 70 72 1,4 1,3 1,3 1,8 1,3 0,2 X X
SOUTH AMERICA 163 450 272 495 369 853 68 80 85 3,1 1,8 1,1 -0,2 -0,7 -0,4 X X
WORLD 1 754 308 2 889 855 4 346 897 39 47 57 2,6 2,2 1,7 1,1 0,4 -0,1 X X
ACP - AFRICA 88 340 229 581 515 577 23 34 46 4,8 4,4 3,3 2,2 1,7 1,0 X X
Angola 1 467 4 371 10 697 21 34 47 5,6 4,9 3,8 1,8 2,0 1,2 19 25
Benin 946 2 630 6 109 27 42 56 5,4 4,6 3,3 2,1 1,5 1,0 0 0
Botswana 137 1 191 2 142 15 74 89 13,7 4,2 1,6 0,9 -5,5 0,2 0 0
Burkina Faso 585 2 226 6 343 8 18 31 8,6 5,6 4,4 2,0 2,1 1,5 8 14
Burundi 179 625 1 875 4 9 17 6,5 5,9 4,7 2,6 2,1 1,4 0 0
Cameroon 2 719 7 401 15 671 31 49 62 5,4 4,2 3,1 1,5 1,2 0,9 18 24
Central African Rep 811 1 499 2 897 35 41 53 3,0 3,3 2,9 1,9 1,3 0,5 0 0
Chad 843 1 729 3 909 19 24 34 3,4 4,0 3,9 2,0 1,9 1,0 13 18
Congo, Dem Rep 7 756 15 670 39 648 29 30 43 2,7 4,5 4,1 3,4 2,3 1,4 11 14
Congo, Rep 685 1 865 3 671 41 63 72 5,8 3,7 2,9 0,5 1,0 1,1 39 46
Côte d'Ivoire 2 849 7 046 13 351 35 47 59 5,3 3,6 2,2 2,9 1,1 0,0 20 25
Equatorial Guinea 59 218 461 27 48 64 8,9 4,5 2,8 6,6 0,3 0,7 0 0
Eritrea 322 714 1 738 14 19 29 4,3 4,4 3,9 2,2 1,9 0,9 0 0
Ethiopia 3 812 11 679 34 429 10 18 29 4,6 5,7 4,7 2,2 2,5 1,7 4 6
Gabon 235 682 1 319 34 55 68 5,8 4,0 2,5 1,4 0,4 0,5 0 0
Gambia, The 126 404 838 20 32 46 5,8 4,1 3,0 2,3 1,0 0,4 0 0
Ghana 3 368 7 644 16 742 31 38 51 4,2 4,2 3,2 3,1 1,7 0,7 10 12
Guinea 852 2 577 6 269 19 33 46 5,3 4,9 3,7 1,4 1,8 1,1 21 30
Guinea-Bissau 135 280 613 17 24 35 3,6 3,9 3,6 1,5 1,4 0,8 0 0
Kenya 2 673 10 043 22 468 16 33 48 7,7 5,0 2,6 2,7 1,2 0,1 7 10
Lesotho 183 641 1 544 13 28 42 6,8 5,1 3,4 2,0 1,3 0,8 0 0
Liberia 656 1 560 3 457 35 48 60 5,5 4,5 3,4 1,8 2,1 1,1 45 51
Madagascar 1 660 5 133 13 088 18 30 43 5,8 5,1 3,8 2,6 2,1 1,1 6 8
Malawi 565 1 686 4 657 9 15 26 5,8 5,2 4,5 2,9 2,0 1,4 0 0
Mali 1 267 3 773 9 462 18 30 43 5,4 5,0 3,8 2,2 1,9 1,2 9 12
Mauritania 424 1 489 2 865 27 58 71 7,5 4,1 2,4 0,4 -0,1 0,5 0 0
Mauritius 409 487 737 42 41 52 0,5 1,8 1,9 1,4 0,5 -0,5 0 0
Mozambique 1 586 7 869 17 344 13 40 55 10,1 4,8 3,2 0,8 0,7 0,9 13 19
Namibia 235 708 1 528 23 41 56 5,7 4,5 2,9 1,7 0,7 0,6 0 0
Niger 704 2 222 6 362 13 21 32 5,8 5,6 4,5 3,0 2,5 1,6 0 0
Nigeria 19 353 56 651 124 888 27 44 58 5,5 4,6 3,0 1,8 1,2 0,8 11 14
Rwanda 243 472 1 248 5 6 10 4,4 4,5 4,8 3,1 2,2 1,3 0 0
Senegal 1 988 4 463 9 090 36 47 59 3,9 4,0 2,8 2,2 1,3 0,6 21 25
Sierra Leone 779 1 783 3 719 24 37 50 4,3 4,0 3,1 1,3 1,1 0,6 0 0
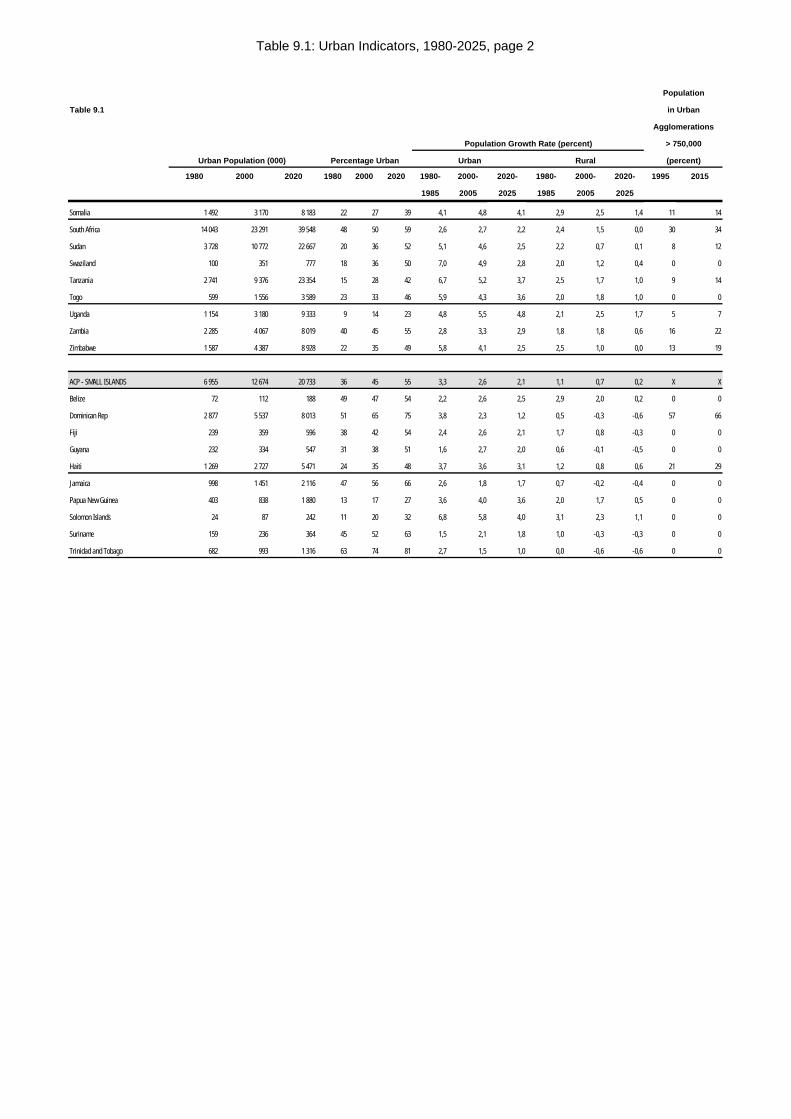
Table 9.1: Urban Indicators, 1980-2025, page 2
Population
Table 9.1 in Urban
Agglomerations
Population Growth Rate (percent) > 750,000
Urban Population (000) Percentage Urban Urban Rural (percent)
1980 2000 2020 1980 2000 2020 1980- 2000- 2020- 1980- 2000- 2020- 1995 2015
1985 2005 2025 1985 2005 2025
Somalia 1 492 3 170 8 183 22 27 39 4,1 4,8 4,1 2,9 2,5 1,4 11 14
South Africa 14 043 23 291 39 548 48 50 59 2,6 2,7 2,2 2,4 1,5 0,0 30 34
Sudan 3 728 10 772 22 667 20 36 52 5,1 4,6 2,5 2,2 0,7 0,1 8 12
Swaziland 100 351 777 18 36 50 7,0 4,9 2,8 2,0 1,2 0,4 0 0
Tanzania 2 741 9 376 23 354 15 28 42 6,7 5,2 3,7 2,5 1,7 1,0 9 14
Togo 599 1 556 3 589 23 33 46 5,9 4,3 3,6 2,0 1,8 1,0 0 0
Uganda 1 154 3 180 9 333 9 14 23 4,8 5,5 4,8 2,1 2,5 1,7 5 7
Zambia 2 285 4 067 8 019 40 45 55 2,8 3,3 2,9 1,8 1,8 0,6 16 22
Zimbabwe 1 587 4 387 8 928 22 35 49 5,8 4,1 2,5 2,5 1,0 0,0 13 19
ACP - SMALL ISLANDS 6 955 12 674 20 733 36 45 55 3,3 2,6 2,1 1,1 0,7 0,2 X X
Belize 72 112 188 49 47 54 2,2 2,6 2,5 2,9 2,0 0,2 0 0
Dominican Rep 2 877 5 537 8 013 51 65 75 3,8 2,3 1,2 0,5 -0,3 -0,6 57 66
Fiji 239 359 596 38 42 54 2,4 2,6 2,1 1,7 0,8 -0,3 0 0
Guyana 232 334 547 31 38 51 1,6 2,7 2,0 0,6 -0,1 -0,5 0 0
Haiti 1 269 2 727 5 471 24 35 48 3,7 3,6 3,1 1,2 0,8 0,6 21 29
Jamaica 998 1 451 2 116 47 56 66 2,6 1,8 1,7 0,7 -0,2 -0,4 0 0
Papua New Guinea 403 838 1 880 13 17 27 3,6 4,0 3,6 2,0 1,7 0,5 0 0
Solomon Islands 24 87 242 11 20 32 6,8 5,8 4,0 3,1 2,3 1,1 0 0
Suriname 159 236 364 45 52 63 1,5 2,1 1,8 1,0 -0,3 -0,3 0 0
Trinidad and Tobago 682 993 1 316 63 74 81 2,7 1,5 1,0 0,0 -0,6 -0,6 0 0
Table 10.1: Food and Agriculture Production, 1984-96, page 1
Table 10.1
Average Production
Index of Agricultural Production of Cereals of Roots and Tubers of Pulses
(1989-91 = 100) (1989-91 = 100) (000 metric % Change(000 metric % Change(000 metric% Change
Total Per Capita Total Per Capita tons) Since tons) Since tons) Since
84-86 94-96 84-86 94-96 84-86 94-96 84-86 94-96 94-96 84-86 94-96 84-86 94-96 84-86
ACP - AFRICAACP - AFRICA XX XX XX XX XX XX XX XX 86 14486 144 1818 122 383122 383 3535 6 5116 511 1717
ACP - SMALL ISLANDSACP - SMALL ISLANDS XX XX XX XX XX XX XX XX 1 7221 722 1919 2 8652 865 77 182182 -8-8
ACP COUNTRIESACP COUNTRIES XX XX XX XX XX XX XX XX 87 86687 866 1818 125 248125 248 3434 6 6936 693 1616
AFRICAAFRICA 8484 112112 9797 9898 9696 9898 8484 112112 113 585113 585 3030 135 876135 876 3838 7 2687 268 2727
ASIAASIA XX XX XX XX XX XX XX XX 948 317948 317 XX 260 294260 294 XX 27 38427 384 XX
CENTRAL AMERICACENTRAL AMERICA XX XX XX XX XX XX XX XX 31 35731 357 33 4 1544 154 88 2 0862 086 1818
EUROPEEUROPE XX XX XX XX XX XX XX XX 383 382383 382 XX 147 785147 785 XX 10 46110 461 XX
NORTH AMERICANORTH AMERICA 9494 9191 100100 8888 100100 8888 9494 9191 375 707375 707 00 25 64325 643 2020 3 5843 584 5757
OCEANIAOCEANIA 9797 111111 105105 104104 105105 107107 9797 115115 26 92826 928 00 3 1373 137 88 2 0502 050 4545
SOUTH AMERICASOUTH AMERICA 8888 115115 9797 106106 9696 108108 8888 118118 91 05691 056 1515 45 14845 148 88 3 9643 964 1717
DEVELOPINGDEVELOPING 8585 122122 9494 111111 9494 113113 8585 123123 1 137 9671 137 967 1919 436 491436 491 2121 40 44240 442 1515
DEVELOPEDDEVELOPED 9898 9696 101101 9494 101101 9494 9898 9797 832 364832 364 -7-7 185 545185 545 -20-20 16 35716 357 44
WORLDWORLD 9191 110110 9999 102102 9999 103103 9191 111111 1 970 3311 970 331 88 622 036622 036 99 56 79856 798 1212
ACP - AFRICAACP - AFRICA XX XX XX XX XX XX XX XX 86 14486 144 1818 122 383122 383 3535 6 5116 511 1717
Angola 98 125 113 106 112 108 97 126 372 13 2 641 41 169 76
Benin 79 140 92 122 94 108 81 125 687 26 2 595 40 72 37
Botswana 97 95 115 83 115 83 97 95 60 73 9 22 14 2
Burkina Faso 82 119 94 103 96 105 83 121 2 420 37 66 -109 65 10
Burundi 88 94 102 85 102 85 88 94 255 3 1 318 6 314 0
Cameroon 94 112 108 97 107 99 93 114 1 162 26 2 183 6 91 31
Central African Rep 87 108 98 97 96 99 85 110 107 -21 827 -2 25 54
Chad 77 121 85 106 88 109 80 124 966 41 535 -7 34 -16
Congo, Dem Rep 85 101 101 83 100 84 84 102 1 680 33 4 761 17 8 0
Congo, Rep 94 112 109 96 108 96 93 112 27 35 770 3 10 27
Côte d'Ivoire 83 114 98 98 100 105 85 123 1 768 39 1 953 19 463 20
Equatorial Guinea 96 95 109 84 107 82 94 93 X X 109 X 42 X
Eritrea X 113 X 103 X 103 X 114 211 X 2 127 X 1 057 X
Ethiopia 89 117 103 X 103 X 89 117 9 401 X 407 21 0 16
Gabon 88 105 102 92 102 92 88 106 27 40 6 0 4 -1
Gambia, The 99 85 122 70 122 69 99 83 100 -2 9 953 55 20 26
Ghana 87 144 102 125 102 123 87 142 1 740 45 781 19 60 21
Guinea 91 124 106 98 110 99 95 125 817 17 61 13 2 9
Guinea-Bissau 89 111 98 100 97 100 88 111 188 15 1 676 24 265 20
Kenya 80 103 94 89 94 88 80 102 3 278 19 62 55 5 -5
Lesotho 93 113 106 99 104 93 91 106 197 27 523 39 3 -5
Liberia X X X X X X X X 54 -443 129 19 12 9
Madagascar 94 104 111 88 110 89 93 105 2 673 13 569 7 271 14
Malawi 91 106 116 101 122 97 96 102 1 610 12 26 7 36 -27
Mali 78 116 91 99 94 97 81 114 2 319 41 5 -7 17 -29
Mauritania 84 100 96 88 96 88 84 100 218 56 20 -7 2 16
Mauritius 98 101 102 96 99 98 96 103 2 -209 989 26 212 -77
Mozambique 93 105 98 87 98 86 93 105 1 067 30 225 11 8 19
Namibia 83 107 95 94 94 94 82 107 88 12 263 7 435 54
Niger 79 121 92 102 92 102 79 121 2 300 31 55 829 69 1 663 63
Table 10.1: Food and Agriculture Production, 1984-96, page 2
Table 10.1
Average Production
Index of Agricultural Production of Cereals of Roots and Tubers of Pulses
(1989-91 = 100) (1989-91 = 100) (000 metric % Change(000 metric % Change(000 metric% Change
Total Per Capita Total Per Capita tons) Since tons) Since tons) Since
84-86 94-96 84-86 94-96 84-86 94-96 84-86 94-96 94-96 84-86 94-96 84-86 94-96 84-86
Nigeria 71 132 82 114 83 114 71 133 21 077 41 1 347 -31 126 -133
Rwanda 100 71 114 92 114 94 100 72 158 -96 75 21 36 -29
Senegal 83 112 95 98 95 98 83 111 1 017 7 294 56 41 21
Sierra Leone 92 94 102 89 103 88 93 93 415 -31 42 -4 13 -38
Somalia X X X X X X X X 361 -47 1 473 27 76 -33
South Africa 88 95 99 85 98 87 87 97 12 408 19 159 -51 111 -6
Sudan 104 126 116 113 113 116 101 129 4 565 32 8 -25 5 24
Swaziland 93 92 107 80 110 84 96 97 107 -55 7 003 -21 355 -12
Tanzania 90 99 106 84 106 84 91 98 4 160 15 846 2 29 -17
Togo 78 106 91 91 98 90 84 104 534 27 250 39 72 -3
Uganda 82 116 92 98 91 96 80 113 2 047 48 18 702 12 200 10
Zambia 81 96 91 86 91 86 81 97 1 208 5 588 37 24 70
Zimbabwe 93 97 109 85 109 80 93 91 2 292 -15 176 37 46 -7
ACP - SMALL ISLANDSACP - SMALL ISLANDS XX XX XX XX XX XX XX XX 1 7221 722 1919 2 8652 865 77 182182 -8-8
Belize 78 134 88 117 88 117 78 134 35 34 4 14 3 56
Dominican Rep 95 103 106 94 103 96 93 105 555 -8 258 13 84 -1
Fiji 95 107 98 99 99 99 95 107 20 -32 48 -40 1 56
Guyana 124 170 125 163 124 163 124 170 475 41 47 37 1 5
Haiti 110 91 121 83 122 84 110 92 391 -15 771 0 78 -18
Jamaica 92 115 94 110 94 110 92 115 4 -101 341 27 8 5
Papua New Guinea 98 108 109 96 110 96 99 107 3 29 1 267 6 2 22
Solomon Islands 121 106 144 90 144 90 121 106 X X 111 14 2 2
Suriname 112 93 119 88 119 88 112 93 221 -36 7 46 0 100
Trinidad and Tobago 93 105 98 101 98 102 93 106 18 59 12 22 2 -14
Table 10.3: Food Security, 1982-97, page 1
Table 10.3 Average Average Yield of
Average Daily Average Daily Yield of Cereals Roots and Tubers
Per Capita Per Capita Kilograms Percent Kilograms Percent
Calorie Supply Protein Supply Per Change Per Change
(kilocalories) (grams) Hectare Since Hectare Since
1982-84 1992-94 1982-84 1992-94 1994-96 1984-86 1994-96 1984-86
ACP - AFRICA 2 109 2 182 44 46 1 163 2,9 5 518 -6,5
ACP - SMALL ISLANDS 2 299 2 196 40 40 2 825 8,7 7 571 4,9
ACP COUNTRIES 2 118 2 183 44 46 1 207 3,5 5 573 -6,0
AFRICA X X X X 1 220 9,5 8 161 17
ASIA X X X X 2 895 X 15 195 X
CENTRAL AMERICA X X X X X X X X
EUROPE X X X X 2 884 X 15 134 X
NORTH AMERICA X X X X X X 22 863 38
OCEANIA X X X X 1 779 11,5 11 198 2
SOUTH AMERICA X X X X X 2 547 19,9 12 320 7
DEVELOPING 2 406 2 555 58 64 2 598 14,5 11 617 8
DEVELOPED 3 260 3 223 72 98 3 183 6,9 16 570 -5
WORLD 2 624 2 709 62 72 2 817 10,1 12 752 2
ACP - AFRICA 2 109 2 182 44 46 1 163 2,9 5 518 -6,5
Angola 1 986 1 756 50 39 405 -6,7 6 041 38
Benin 1 983 2 325 46 56 1 008 17,6 9 275 10
Botswana 2 215 2 268 70 69 300 43,6 6 000 10
Burkina Faso 1 698 2 471 50 72 808 17,6 5 219 -55
Burundi 1 904 1 802 61 57 1 298 10,7 6 471 -7
Cameroon 2 247 2 167 55 51 1 313 8,3 6 076 0
Central African Rep 2 154 1 959 36 41 790 -28,2 3 280 -23
Chad 1 441 1 840 41 53 639 14,0 4 163 -17
Congo, Dem Rep 2 080 2 032 34 32 793 -2,5 8 174 6
Congo, Rep 2 312 2 188 47 49 936 19,7 6 894 -3
Côte d'Ivoire 2 740 2 358 56 50 1 111 14,9 5 792 -1
Equatorial Guinea X X X X X X 2 632 -19
Eritrea X 1 608 b X X 699 X 2 812 X
Ethiopia 1 681 1 661 X X 1 354 24,4 3 679 2
Gabon 2 523 2 472 75 73 1 779 10,0 5 449 3
Gambia, The 2 226 2 295 49 47 1 106 -19,7 3 000 0
Ghana 1 862 2 360 40 50 1 399 35,3 10 995 50
Guinea 2 251 2 346 51 46 1 219 26,1 7 091 4
Guinea-Bissau 2 191 2 571 46 50 1 389 15,9 7 038 4
Kenya 2 042 1 914 55 50 1 822 11,2 8 031 9
Lesotho 2 267 2 164 67 60 1 560 56,2 14 804 -4
Liberia 2 496 1 728 X X 1 110 -13,3 7 356 15
Madagascar 2 419 2 056 57 48 2 010 12,5 6 707 9
Malawi 2 188 1 911 64 54 1 194 4,4 4 632 5
Mali 1 954 2 040 56 56 809 -6,5 5 007 17
Mauritania 2 317 2 578 78 78 750 18,2 2 000 5
Mauritius 2 669 2 942 61 78 4 339 -4,4 17 489 -35
Mozambique 1 809 1 685 32 31 647 18,3 4 099 0
Namibia 2 179 2 174 62 60 264 -43,5 8 438 -3
Niger 2 139 2 154 61 62 338 -8,4 7 450 -8
Nigeria 1 973 2 589 42 54 1 172 -13,5 10 573 22
Rwanda 2 238 1 861 X X 1 491 21,0 6 278 -22
Table 10.3: Food Security, 1982-97, page 2
Table 10.3 Average Average Yield of
Average Daily Average Daily Yield of Cereals Roots and Tubers
Per Capita Per Capita Kilograms Percent Kilograms Percent
Calorie Supply Protein Supply Per Change Per Change
(kilocalories) (grams) Hectare Since Hectare Since
1982-84 1992-94 1982-84 1992-94 1994-96 1984-86 1994-96 1984-86
Senegal 2 368 2 288 68 66 824 11,3 3 394 -28
Sierra Leone 1 974 1 888 42 43 1 192 -19,4 4 968 19
Somalia 1 969 1 533 X X 426 -81,1 10 000 -7
South Africa 2 867 2 776 75 72 1 918 23,7 21 062 34
Sudan 2 138 2 274 62 70 527 9,4 2 964 -1
Swaziland 2 529 2 653 64 63 1 735 -12,0 1 930 -29
Tanzania 2 286 2 054 56 49 1 310 3,6 7 713 -15
Togo 2 108 2 052 48 49 762 -10,3 5 716 -37
Uganda 2 246 2 160 50 52 1 552 20,7 5 727 -9
Zambia 2 114 1 954 55 51 1 538 -17,4 5 370 -2
Zimbabwe 2 162 1 999 55 49 1 163 -24,6 4 508 -12
ACP - SMALL ISLANDS 2 299 2 196 40 40 2 825 8,7 7 571 4,9
Belize 2 585 2 683 67 67 1 888 15,3 21 765 5
Dominican Rep 2 304 2 275 50 51 4 034 11,5 6 845 8
Fiji 2 571 3 023 64 73 2 533 11,4 5 502 -60
Guyana 2 512 2 410 54 64 3 807 16,1 10 523 32
Haiti 2 026 1 721 X X 929 -9,2 3 815 0
Jamaica 2 576 2 662 63 67 1 374 -27,6 15 291 20
Papua New Guinea 2 167 2 237 44 48 1 698 -30,0 7 073 -1
Solomon Islands 2 229 2 046 57 44 X X 17 251 6
Suriname 2 507 2 580 66 65 3 778 -5,9 11 827 51
Trinidad and Tobago 3 056 2 499 81 59 3 649 33,9 10 222 6
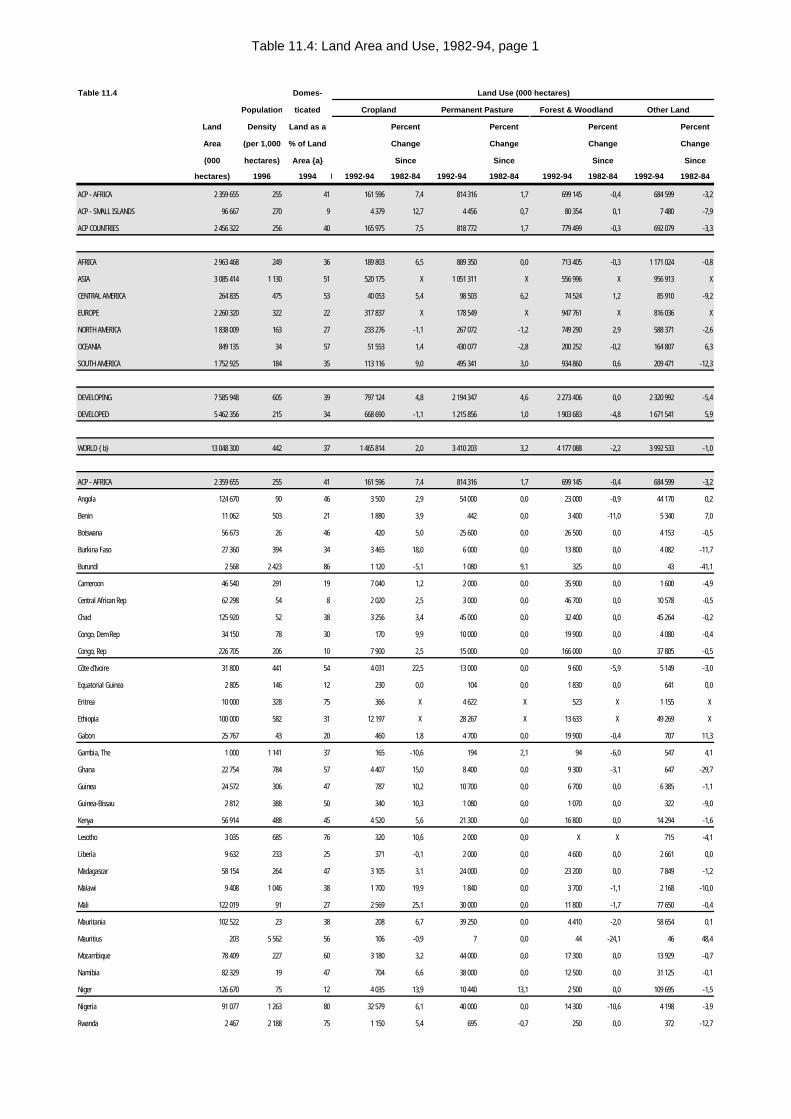
Table 11.4: Land Area and Use, 1982-94, page 1
Table 11.4 Domes- Land Use (000 hectares)
Population ticated Cropland Permanent Pasture Forest & Woodland Other Land
Land Density Land as a Percent Percent Percent Percent
Area (per 1,000 % of Land Change Change Change Change
(000 hectares) Area {a} Since Since Since Since
hectares) 1996 1994dom. 000 ha1992-94 1982-84 1992-94 1982-84 1992-94 1982-84 1992-94 1982-84
ACP - AFRICA 2 359 655 255 41 161 596 7,4 814 316 1,7 699 145 -0,4 684 599 -3,2
ACP - SMALL ISLANDS 96 667 270 9 4 379 12,7 4 456 0,7 80 354 0,1 7 480 -7,9
ACP COUNTRIES 2 456 322 256 40 165 975 7,5 818 772 1,7 779 499 -0,3 692 079 -3,3
AFRICA 2 963 468 249 36 189 803 6,5 889 350 0,0 713 405 -0,3 1 171 024 -0,8
ASIA 3 085 414 1 130 51 520 175 X 1 051 311 X 556 996 X 956 913 X
CENTRAL AMERICA 264 835 475 53 40 053 5,4 98 503 6,2 74 524 1,2 85 910 -9,2
EUROPE 2 260 320 322 22 317 837 X 178 549 X 947 761 X 816 036 X
NORTH AMERICA 1 838 009 163 27 233 276 -1,1 267 072 -1,2 749 290 2,9 588 371 -2,6
OCEANIA 849 135 34 57 51 553 1,4 430 077 -2,8 200 252 -0,2 164 807 6,3
SOUTH AMERICA 1 752 925 184 35 113 116 9,0 495 341 3,0 934 860 0,6 209 471 -12,3
DEVELOPING 7 585 948 605 39 797 124 4,8 2 194 347 4,6 2 273 406 0,0 2 320 992 -5,4
DEVELOPED 5 462 356 215 34 668 690 -1,1 1 215 856 1,0 1 903 683 -4,8 1 671 541 5,9
WORLD {b} 13 048 300 442 37 1 465 814 2,0 3 410 203 3,2 4 177 088 -2,2 3 992 533 -1,0
ACP - AFRICA 2 359 655 255 41 161 596 7,4 814 316 1,7 699 145 -0,4 684 599 -3,2
Angola 124 670 90 46 3 500 2,9 54 000 0,0 23 000 -0,9 44 170 0,2
Benin 11 062 503 21 1 880 3,9 442 0,0 3 400 -11,0 5 340 7,0
Botswana 56 673 26 46 420 5,0 25 600 0,0 26 500 0,0 4 153 -0,5
Burkina Faso 27 360 394 34 3 465 18,0 6 000 0,0 13 800 0,0 4 082 -11,7
Burundi 2 568 2 423 86 1 120 -5,1 1 080 9,1 325 0,0 43 -41,1
Cameroon 46 540 291 19 7 040 1,2 2 000 0,0 35 900 0,0 1 600 -4,9
Central African Rep 62 298 54 8 2 020 2,5 3 000 0,0 46 700 0,0 10 578 -0,5
Chad 125 920 52 38 3 256 3,4 45 000 0,0 32 400 0,0 45 264 -0,2
Congo, Dem Rep 34 150 78 30 170 9,9 10 000 0,0 19 900 0,0 4 080 -0,4
Congo, Rep 226 705 206 10 7 900 2,5 15 000 0,0 166 000 0,0 37 805 -0,5
Côte d'Ivoire 31 800 441 54 4 031 22,5 13 000 0,0 9 600 -5,9 5 149 -3,0
Equatorial Guinea 2 805 146 12 230 0,0 104 0,0 1 830 0,0 641 0,0
Eritrea 10 000 328 75 366 X 4 622 X 523 X 1 155 X
Ethiopia 100 000 582 31 12 197 X 28 267 X 13 633 X 49 269 X
Gabon 25 767 43 20 460 1,8 4 700 0,0 19 900 -0,4 707 11,3
Gambia, The 1 000 1 141 37 165 -10,6 194 2,1 94 -6,0 547 4,1
Ghana 22 754 784 57 4 407 15,0 8 400 0,0 9 300 -3,1 647 -29,7
Guinea 24 572 306 47 787 10,2 10 700 0,0 6 700 0,0 6 385 -1,1
Guinea-Bissau 2 812 388 50 340 10,3 1 080 0,0 1 070 0,0 322 -9,0
Kenya 56 914 488 45 4 520 5,6 21 300 0,0 16 800 0,0 14 294 -1,6
Lesotho 3 035 685 76 320 10,6 2 000 0,0 X X 715 -4,1
Liberia 9 632 233 25 371 -0,1 2 000 0,0 4 600 0,0 2 661 0,0
Madagascar 58 154 264 47 3 105 3,1 24 000 0,0 23 200 0,0 7 849 -1,2
Malawi 9 408 1 046 38 1 700 19,9 1 840 0,0 3 700 -1,1 2 168 -10,0
Mali 122 019 91 27 2 569 25,1 30 000 0,0 11 800 -1,7 77 650 -0,4
Mauritania 102 522 23 38 208 6,7 39 250 0,0 4 410 -2,0 58 654 0,1
Mauritius 203 5 562 56 106 -0,9 7 0,0 44 -24,1 46 48,4
Mozambique 78 409 227 60 3 180 3,2 44 000 0,0 17 300 0,0 13 929 -0,7
Namibia 82 329 19 47 704 6,6 38 000 0,0 12 500 0,0 31 125 -0,1
Niger 126 670 75 12 4 035 13,9 10 440 13,1 2 500 0,0 109 695 -1,5
Nigeria 91 077 1 263 80 32 579 6,1 40 000 0,0 14 300 -10,6 4 198 -3,9
Rwanda 2 467 2 188 75 1 150 5,4 695 -0,7 250 0,0 372 -12,7
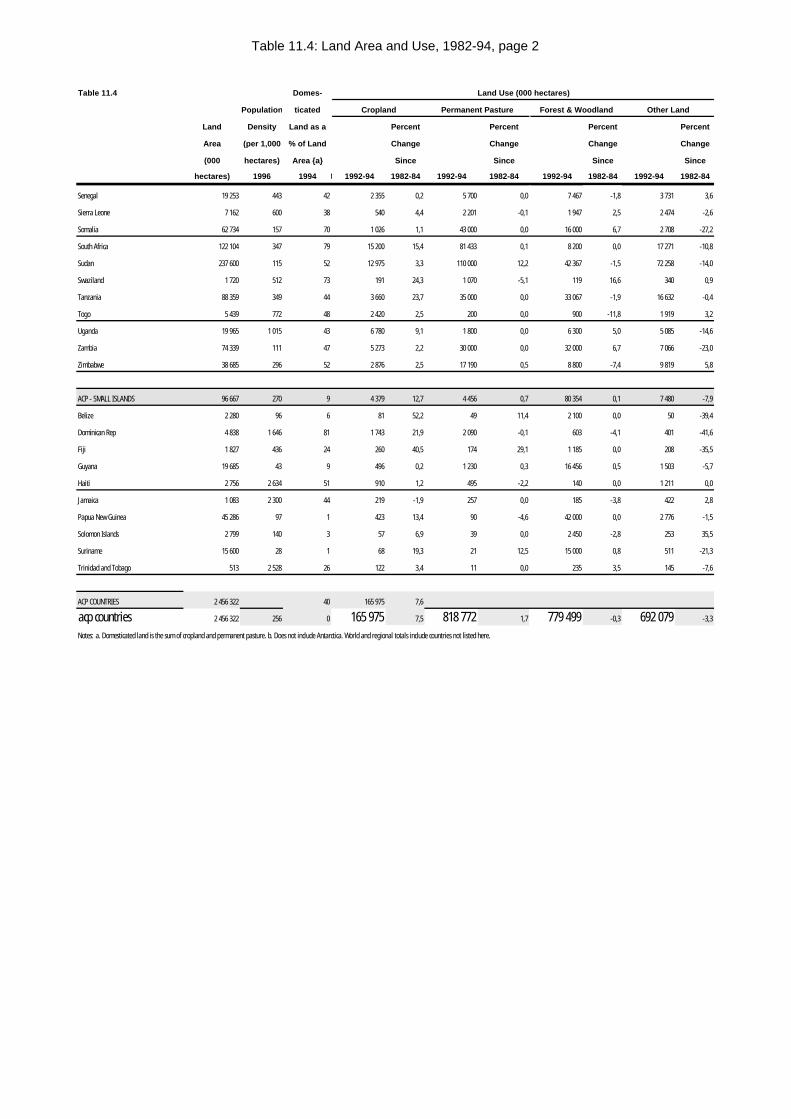
Table 11.4: Land Area and Use, 1982-94, page 2
Table 11.4 Domes- Land Use (000 hectares)
Population ticated Cropland Permanent Pasture Forest & Woodland Other Land
Land Density Land as a Percent Percent Percent Percent
Area (per 1,000 % of Land Change Change Change Change
(000 hectares) Area {a} Since Since Since Since
hectares) 1996 1994dom. 000 ha1992-94 1982-84 1992-94 1982-84 1992-94 1982-84 1992-94 1982-84
Senegal 19 253 443 42 2 355 0,2 5 700 0,0 7 467 -1,8 3 731 3,6
Sierra Leone 7 162 600 38 540 4,4 2 201 -0,1 1 947 2,5 2 474 -2,6
Somalia 62 734 157 70 1 026 1,1 43 000 0,0 16 000 6,7 2 708 -27,2
South Africa 122 104 347 79 15 200 15,4 81 433 0,1 8 200 0,0 17 271 -10,8
Sudan 237 600 115 52 12 975 3,3 110 000 12,2 42 367 -1,5 72 258 -14,0
Swaziland 1 720 512 73 191 24,3 1 070 -5,1 119 16,6 340 0,9
Tanzania 88 359 349 44 3 660 23,7 35 000 0,0 33 067 -1,9 16 632 -0,4
Togo 5 439 772 48 2 420 2,5 200 0,0 900 -11,8 1 919 3,2
Uganda 19 965 1 015 43 6 780 9,1 1 800 0,0 6 300 5,0 5 085 -14,6
Zambia 74 339 111 47 5 273 2,2 30 000 0,0 32 000 6,7 7 066 -23,0
Zimbabwe 38 685 296 52 2 876 2,5 17 190 0,5 8 800 -7,4 9 819 5,8
ACP - SMALL ISLANDS 96 667 270 9 4 379 12,7 4 456 0,7 80 354 0,1 7 480 -7,9
Belize 2 280 96 6 81 52,2 49 11,4 2 100 0,0 50 -39,4
Dominican Rep 4 838 1 646 81 1 743 21,9 2 090 -0,1 603 -4,1 401 -41,6
Fiji 1 827 436 24 260 40,5 174 29,1 1 185 0,0 208 -35,5
Guyana 19 685 43 9 496 0,2 1 230 0,3 16 456 0,5 1 503 -5,7
Haiti 2 756 2 634 51 910 1,2 495 -2,2 140 0,0 1 211 0,0
Jamaica 1 083 2 300 44 219 -1,9 257 0,0 185 -3,8 422 2,8
Papua New Guinea 45 286 97 1 423 13,4 90 -4,6 42 000 0,0 2 776 -1,5
Solomon Islands 2 799 140 3 57 6,9 39 0,0 2 450 -2,8 253 35,5
Suriname 15 600 28 1 68 19,3 21 12,5 15 000 0,8 511 -21,3
Trinidad and Tobago 513 2 528 26 122 3,4 11 0,0 235 3,5 145 -7,6
ACP COUNTRIES 2 456 322 40 165 975 7,6
acp countries 2 456 322 256 0 165 975 7,5 818 772 1,7 779 499 -0,3 692 079 -3,3
Notes: a. Domesticated land is the sum of cropland and permanent pasture. b. Does not include Antarctica. World and regional totals include countries not listed here.
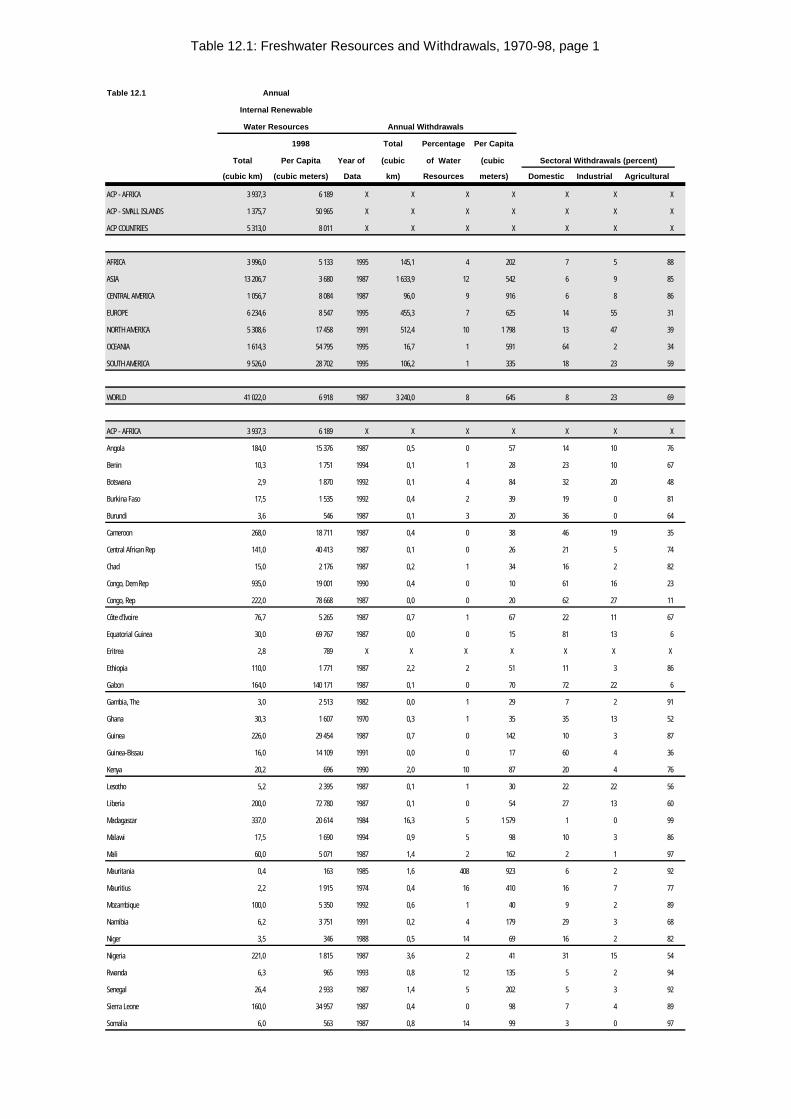
Table 12.1: Freshwater Resources and Withdrawals, 1970-98, page 1
Table 12.1 Annual
Internal Renewable
Water Resources Annual Withdrawals
1998 Total Percentage Per Capita
Total Per Capita Year of (cubic of Water (cubic Sectoral Withdrawals (percent)
(cubic km) (cubic meters) Data km) Resources meters) Domestic Industrial Agricultural
ACP - AFRICA 3 937,3 6 189 X X X X X X X
ACP - SMALL ISLANDS 1 375,7 50 965 X X X X X X X
ACP COUNTRIES 5 313,0 8 011 X X X X X X X
AFRICA 3 996,0 5 133 1995 145,1 4 202 7 5 88
ASIA 13 206,7 3 680 1987 1 633,9 12 542 6 9 85
CENTRAL AMERICA 1 056,7 8 084 1987 96,0 9 916 6 8 86
EUROPE 6 234,6 8 547 1995 455,3 7 625 14 55 31
NORTH AMERICA 5 308,6 17 458 1991 512,4 10 1 798 13 47 39
OCEANIA 1 614,3 54 795 1995 16,7 1 591 64 2 34
SOUTH AMERICA 9 526,0 28 702 1995 106,2 1 335 18 23 59
WORLD 41 022,0 6 918 1987 3 240,0 8 645 8 23 69
ACP - AFRICA 3 937,3 6 189 X X X X X X X
Angola 184,0 15 376 1987 0,5 0 57 14 10 76
Benin 10,3 1 751 1994 0,1 1 28 23 10 67
Botswana 2,9 1 870 1992 0,1 4 84 32 20 48
Burkina Faso 17,5 1 535 1992 0,4 2 39 19 0 81
Burundi 3,6 546 1987 0,1 3 20 36 0 64
Cameroon 268,0 18 711 1987 0,4 0 38 46 19 35
Central African Rep 141,0 40 413 1987 0,1 0 26 21 5 74
Chad 15,0 2 176 1987 0,2 1 34 16 2 82
Congo, Dem Rep 935,0 19 001 1990 0,4 0 10 61 16 23
Congo, Rep 222,0 78 668 1987 0,0 0 20 62 27 11
Côte d'Ivoire 76,7 5 265 1987 0,7 1 67 22 11 67
Equatorial Guinea 30,0 69 767 1987 0,0 0 15 81 13 6
Eritrea 2,8 789 X X X X X X X
Ethiopia 110,0 1 771 1987 2,2 2 51 11 3 86
Gabon 164,0 140 171 1987 0,1 0 70 72 22 6
Gambia, The 3,0 2 513 1982 0,0 1 29 7 2 91
Ghana 30,3 1 607 1970 0,3 1 35 35 13 52
Guinea 226,0 29 454 1987 0,7 0 142 10 3 87
Guinea-Bissau 16,0 14 109 1991 0,0 0 17 60 4 36
Kenya 20,2 696 1990 2,0 10 87 20 4 76
Lesotho 5,2 2 395 1987 0,1 1 30 22 22 56
Liberia 200,0 72 780 1987 0,1 0 54 27 13 60
Madagascar 337,0 20 614 1984 16,3 5 1 579 1 0 99
Malawi 17,5 1 690 1994 0,9 5 98 10 3 86
Mali 60,0 5 071 1987 1,4 2 162 2 1 97
Mauritania 0,4 163 1985 1,6 408 923 6 2 92
Mauritius 2,2 1 915 1974 0,4 16 410 16 7 77
Mozambique 100,0 5 350 1992 0,6 1 40 9 2 89
Namibia 6,2 3 751 1991 0,2 4 179 29 3 68
Niger 3,5 346 1988 0,5 14 69 16 2 82
Nigeria 221,0 1 815 1987 3,6 2 41 31 15 54
Rwanda 6,3 965 1993 0,8 12 135 5 2 94
Senegal 26,4 2 933 1987 1,4 5 202 5 3 92
Sierra Leone 160,0 34 957 1987 0,4 0 98 7 4 89
Somalia 6,0 563 1987 0,8 14 99 3 0 97
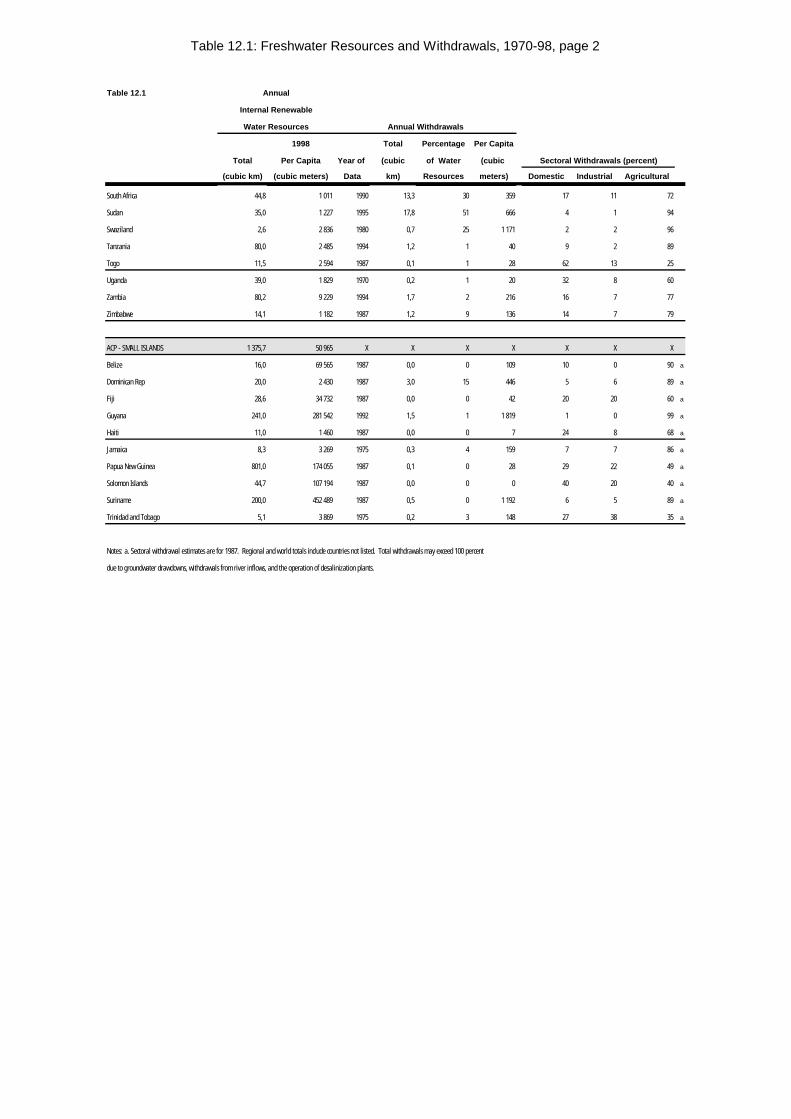
Table 12.1: Freshwater Resources and Withdrawals, 1970-98, page 2
Table 12.1 Annual
Internal Renewable
Water Resources Annual Withdrawals
1998 Total Percentage Per Capita
Total Per Capita Year of (cubic of Water (cubic Sectoral Withdrawals (percent)
(cubic km) (cubic meters) Data km) Resources meters) Domestic Industrial Agricultural
South Africa 44,8 1 011 1990 13,3 30 359 17 11 72
Sudan 35,0 1 227 1995 17,8 51 666 4 1 94
Swaziland 2,6 2 836 1980 0,7 25 1 171 2 2 96
Tanzania 80,0 2 485 1994 1,2 1 40 9 2 89
Togo 11,5 2 594 1987 0,1 1 28 62 13 25
Uganda 39,0 1 829 1970 0,2 1 20 32 8 60
Zambia 80,2 9 229 1994 1,7 2 216 16 7 77
Zimbabwe 14,1 1 182 1987 1,2 9 136 14 7 79
ACP - SMALL ISLANDS 1 375,7 50 965 X X X X X X X
Belize 16,0 69 565 1987 0,0 0 109 10 0 90 a
Dominican Rep 20,0 2 430 1987 3,0 15 446 5 6 89 a
Fiji 28,6 34 732 1987 0,0 0 42 20 20 60 a
Guyana 241,0 281 542 1992 1,5 1 1 819 1 0 99 a
Haiti 11,0 1 460 1987 0,0 0 7 24 8 68 a
Jamaica 8,3 3 269 1975 0,3 4 159 7 7 86 a
Papua New Guinea 801,0 174 055 1987 0,1 0 28 29 22 49 a
Solomon Islands 44,7 107 194 1987 0,0 0 0 40 20 40 a
Suriname 200,0 452 489 1987 0,5 0 1 192 6 5 89 a
Trinidad and Tobago 5,1 3 869 1975 0,2 3 148 27 38 35 a
Notes: a. Sectoral withdrawal estimates are for 1987. Regional and world totals include countries not listed. Total withdrawals may exceed 100 percent
due to groundwater drawdowns, withdrawals from river inflows, and the operation of desalinization plants.
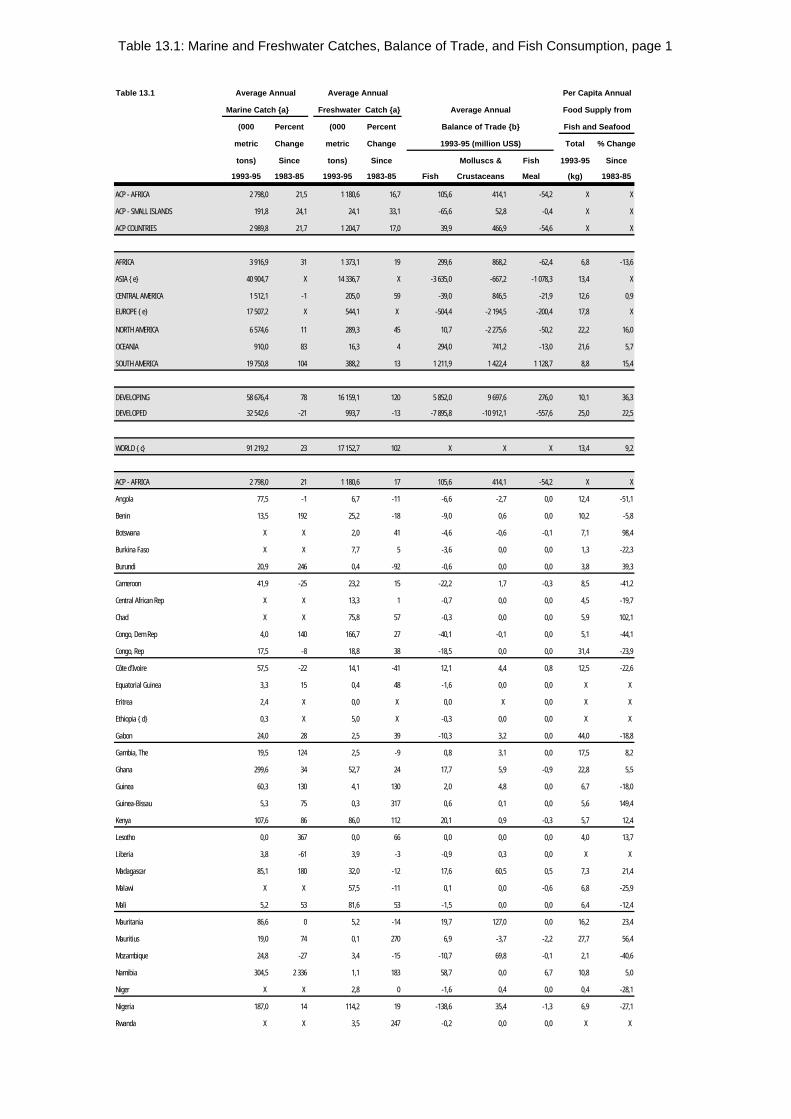
Table 13.1: Marine and Freshwater Catches, Balance of Trade, and Fish Consumption, page 1
Table 13.1 Average Annual Average Annual Per Capita Annual
Marine Catch {a} Freshwater Catch {a} Average Annual Food Supply from
(000 Percent (000 Percent Balance of Trade {b} Fish and Seafood
metric Change metric Change 1993-95 (million US$) Total % Change
tons) Since tons) Since Molluscs & Fish 1993-95 Since
1993-95 1983-85 1993-95 1983-85 Fish Crustaceans Meal (kg) 1983-85
ACP - AFRICA 2 798,0 21,5 1 180,6 16,7 105,6 414,1 -54,2 X X
ACP - SMALL ISLANDS 191,8 24,1 24,1 33,1 -65,6 52,8 -0,4 X X
ACP COUNTRIES 2 989,8 21,7 1 204,7 17,0 39,9 466,9 -54,6 X X
AFRICA 3 916,9 31 1 373,1 19 299,6 868,2 -62,4 6,8 -13,6
ASIA {e} 40 904,7 X 14 336,7 X -3 635,0 -667,2 -1 078,3 13,4 X
CENTRAL AMERICA 1 512,1 -1 205,0 59 -39,0 846,5 -21,9 12,6 0,9
EUROPE {e} 17 507,2 X 544,1 X -504,4 -2 194,5 -200,4 17,8 X
NORTH AMERICA 6 574,6 11 289,3 45 10,7 -2 275,6 -50,2 22,2 16,0
OCEANIA 910,0 83 16,3 4 294,0 741,2 -13,0 21,6 5,7
SOUTH AMERICA 19 750,8 104 388,2 13 1 211,9 1 422,4 1 128,7 8,8 15,4
DEVELOPING 58 676,4 78 16 159,1 120 5 852,0 9 697,6 276,0 10,1 36,3
DEVELOPED 32 542,6 -21 993,7 -13 -7 895,8 -10 912,1 -557,6 25,0 22,5
WORLD {c} 91 219,2 23 17 152,7 102 X X X 13,4 9,2
ACP - AFRICA 2 798,0 21 1 180,6 17 105,6 414,1 -54,2 X X
Angola 77,5 -1 6,7 -11 -6,6 -2,7 0,0 12,4 -51,1
Benin 13,5 192 25,2 -18 -9,0 0,6 0,0 10,2 -5,8
Botswana X X 2,0 41 -4,6 -0,6 -0,1 7,1 98,4
Burkina Faso X X 7,7 5 -3,6 0,0 0,0 1,3 -22,3
Burundi 20,9 246 0,4 -92 -0,6 0,0 0,0 3,8 39,3
Cameroon 41,9 -25 23,2 15 -22,2 1,7 -0,3 8,5 -41,2
Central African Rep X X 13,3 1 -0,7 0,0 0,0 4,5 -19,7
Chad X X 75,8 57 -0,3 0,0 0,0 5,9 102,1
Congo, Dem Rep 4,0 140 166,7 27 -40,1 -0,1 0,0 5,1 -44,1
Congo, Rep 17,5 -8 18,8 38 -18,5 0,0 0,0 31,4 -23,9
Côte d'Ivoire 57,5 -22 14,1 -41 12,1 4,4 0,8 12,5 -22,6
Equatorial Guinea 3,3 15 0,4 48 -1,6 0,0 0,0 X X
Eritrea 2,4 X 0,0 X 0,0 X 0,0 X X
Ethiopia {d} 0,3 X 5,0 X -0,3 0,0 0,0 X X
Gabon 24,0 28 2,5 39 -10,3 3,2 0,0 44,0 -18,8
Gambia, The 19,5 124 2,5 -9 0,8 3,1 0,0 17,5 8,2
Ghana 299,6 34 52,7 24 17,7 5,9 -0,9 22,8 5,5
Guinea 60,3 130 4,1 130 2,0 4,8 0,0 6,7 -18,0
Guinea-Bissau 5,3 75 0,3 317 0,6 0,1 0,0 5,6 149,4
Kenya 107,6 86 86,0 112 20,1 0,9 -0,3 5,7 12,4
Lesotho 0,0 367 0,0 66 0,0 0,0 0,0 4,0 13,7
Liberia 3,8 -61 3,9 -3 -0,9 0,3 0,0 X X
Madagascar 85,1 180 32,0 -12 17,6 60,5 0,5 7,3 21,4
Malawi X X 57,5 -11 0,1 0,0 -0,6 6,8 -25,9
Mali 5,2 53 81,6 53 -1,5 0,0 0,0 6,4 -12,4
Mauritania 86,6 0 5,2 -14 19,7 127,0 0,0 16,2 23,4
Mauritius 19,0 74 0,1 270 6,9 -3,7 -2,2 27,7 56,4
Mozambique 24,8 -27 3,4 -15 -10,7 69,8 -0,1 2,1 -40,6
Namibia 304,5 2 336 1,1 183 58,7 0,0 6,7 10,8 5,0
Niger X X 2,8 0 -1,6 0,4 0,0 0,4 -28,1
Nigeria 187,0 14 114,2 19 -138,6 35,4 -1,3 6,9 -27,1
Rwanda X X 3,5 247 -0,2 0,0 0,0 X X
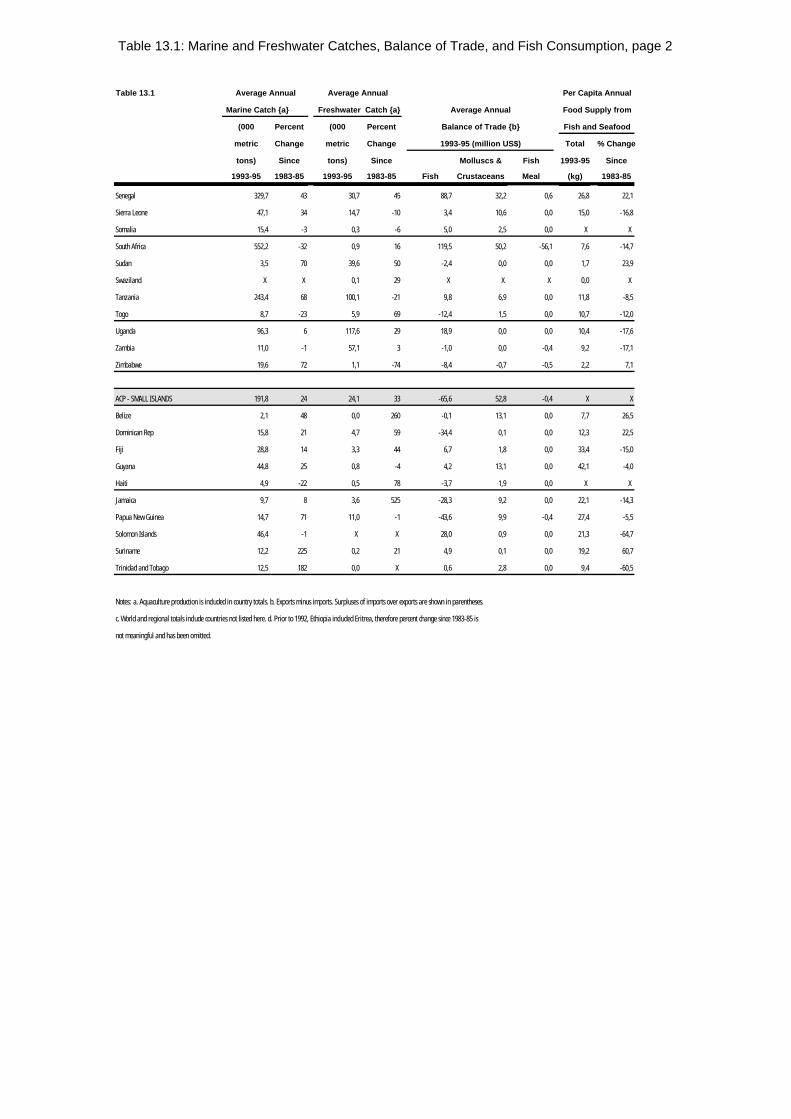
Table 13.1: Marine and Freshwater Catches, Balance of Trade, and Fish Consumption, page 2
Table 13.1 Average Annual Average Annual Per Capita Annual
Marine Catch {a} Freshwater Catch {a} Average Annual Food Supply from
(000 Percent (000 Percent Balance of Trade {b} Fish and Seafood
metric Change metric Change 1993-95 (million US$) Total % Change
tons) Since tons) Since Molluscs & Fish 1993-95 Since
1993-95 1983-85 1993-95 1983-85 Fish Crustaceans Meal (kg) 1983-85
Senegal 329,7 43 30,7 45 88,7 32,2 0,6 26,8 22,1
Sierra Leone 47,1 34 14,7 -10 3,4 10,6 0,0 15,0 -16,8
Somalia 15,4 -3 0,3 -6 5,0 2,5 0,0 X X
South Africa 552,2 -32 0,9 16 119,5 50,2 -56,1 7,6 -14,7
Sudan 3,5 70 39,6 50 -2,4 0,0 0,0 1,7 23,9
Swaziland X X 0,1 29 X X X 0,0 X
Tanzania 243,4 68 100,1 -21 9,8 6,9 0,0 11,8 -8,5
Togo 8,7 -23 5,9 69 -12,4 1,5 0,0 10,7 -12,0
Uganda 96,3 6 117,6 29 18,9 0,0 0,0 10,4 -17,6
Zambia 11,0 -1 57,1 3 -1,0 0,0 -0,4 9,2 -17,1
Zimbabwe 19,6 72 1,1 -74 -8,4 -0,7 -0,5 2,2 7,1
ACP - SMALL ISLANDS 191,8 24 24,1 33 -65,6 52,8 -0,4 X X
Belize 2,1 48 0,0 260 -0,1 13,1 0,0 7,7 26,5
Dominican Rep 15,8 21 4,7 59 -34,4 0,1 0,0 12,3 22,5
Fiji 28,8 14 3,3 44 6,7 1,8 0,0 33,4 -15,0
Guyana 44,8 25 0,8 -4 4,2 13,1 0,0 42,1 -4,0
Haiti 4,9 -22 0,5 78 -3,7 1,9 0,0 X X
Jamaica 9,7 8 3,6 525 -28,3 9,2 0,0 22,1 -14,3
Papua New Guinea 14,7 71 11,0 -1 -43,6 9,9 -0,4 27,4 -5,5
Solomon Islands 46,4 -1 X X 28,0 0,9 0,0 21,3 -64,7
Suriname 12,2 225 0,2 21 4,9 0,1 0,0 19,2 60,7
Trinidad and Tobago 12,5 182 0,0 X 0,6 2,8 0,0 9,4 -60,5
Notes: a. Aquaculture production is included in country totals. b. Exports minus imports. Surpluses of imports over exports are shown in parentheses.
c. World and regional totals include countries not listed here. d. Prior to 1992, Ethiopia included Eritrea, therefore percent change since 1983-85 is
not meaningful and has been omitted.
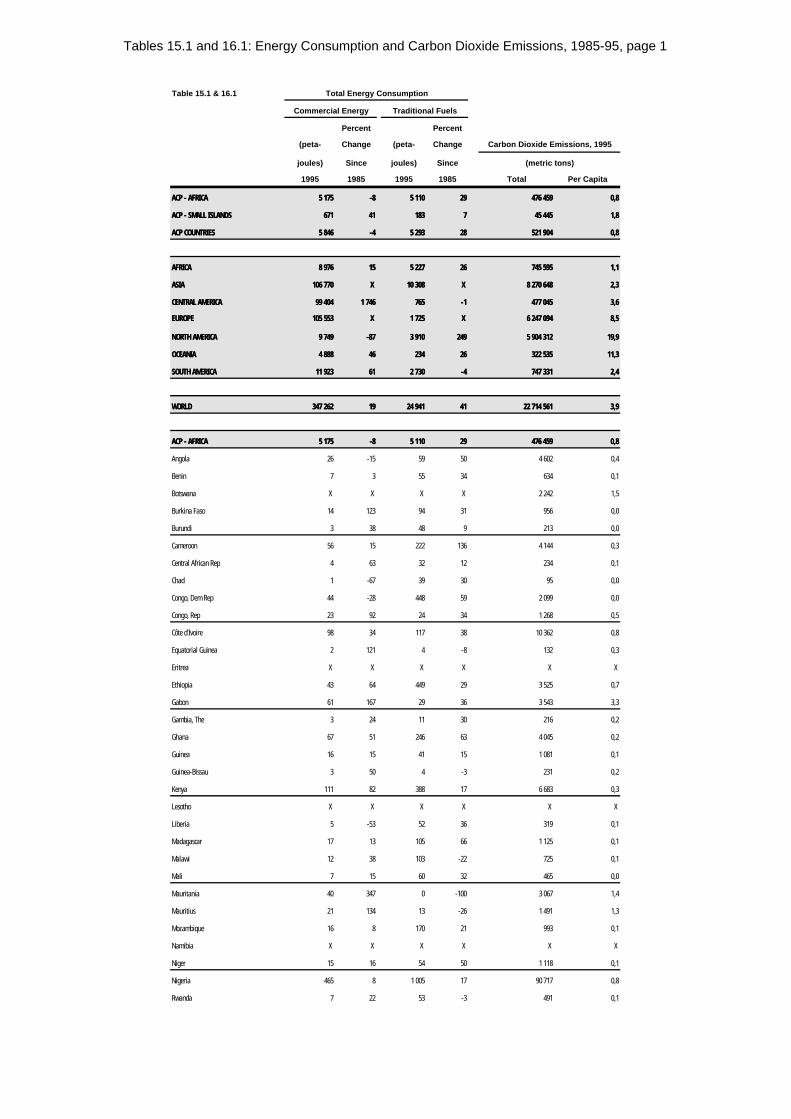
Tables 15.1 and 16.1: Energy Consumption and Carbon Dioxide Emissions, 1985-95, page 1
Table 15.1 & 16.1 Total Energy Consumption
Commercial Energy Traditional Fuels
Percent Percent
(peta- Change (peta- Change Carbon Dioxide Emissions, 1995
joules) Since joules) Since (metric tons)
1995 1985 1995 1985 Total Per Capita
ACP - AFRICAACP - AFRICA 5 1755 175 -8-8 5 1105 110 2929 476 459476 459 0,80,8
ACP - SMALL ISLANDSACP - SMALL ISLANDS 671671 4141 183183 77 45 44545 445 1,81,8
ACP COUNTRIESACP COUNTRIES 5 8465 846 -4-4 5 2935 293 2828 521 904521 904 0,80,8
AFRICAAFRICA 8 9768 976 1515 5 2275 227 2626 745 595745 595 1,11,1
ASIAASIA 106 770106 770 X X 10 30810 308 X X 8 270 6488 270 648 2,32,3
CENTRAL AMERICACENTRAL AMERICA 99 40499 404 1 7461 746 765765 -1-1 477 045477 045 3,63,6
EUROPEEUROPE 105 553105 553 X X 1 7251 725 X X 6 247 0946 247 094 8,58,5
NORTH AMERICANORTH AMERICA 9 7499 749 -87-87 3 9103 910 249249 5 904 3125 904 312 19,919,9
OCEANIAOCEANIA 4 8884 888 4646 234234 2626 322 535322 535 11,311,3
SOUTH AMERICASOUTH AMERICA 11 92311 923 6161 2 7302 730 -4-4 747 331747 331 2,42,4
WORLDWORLD 347 262347 262 1919 24 94124 941 4141 22 714 56122 714 561 3,93,9
ACP - AFRICAACP - AFRICA 5 1755 175 -8-8 5 1105 110 2929 476 459476 459 0,80,8
Angola 26 -15 59 50 4 602 0,4
Benin 7 3 55 34 634 0,1
Botswana X X X X 2 242 1,5
Burkina Faso 14 123 94 31 956 0,0
Burundi 3 38 48 9 213 0,0
Cameroon 56 15 222 136 4 144 0,3
Central African Rep 4 63 32 12 234 0,1
Chad 1 -67 39 30 95 0,0
Congo, Dem Rep 44 -28 448 59 2 099 0,0
Congo, Rep 23 92 24 34 1 268 0,5
Côte d'Ivoire 98 34 117 38 10 362 0,8
Equatorial Guinea 2 121 4 -8 132 0,3
Eritrea X X X X X X
Ethiopia 43 64 449 29 3 525 0,7
Gabon 61 167 29 36 3 543 3,3
Gambia, The 3 24 11 30 216 0,2
Ghana 67 51 246 63 4 045 0,2
Guinea 16 15 41 15 1 081 0,1
Guinea-Bissau 3 50 4 -3 231 0,2
Kenya 111 82 388 17 6 683 0,3
Lesotho X X X X X X
Liberia 5 -53 52 36 319 0,1
Madagascar 17 13 105 66 1 125 0,1
Malawi 12 38 103 -22 725 0,1
Mali 7 15 60 32 465 0,0
Mauritania 40 347 0 -100 3 067 1,4
Mauritius 21 134 13 -26 1 491 1,3
Mozambique 16 8 170 21 993 0,1
Namibia X X X X X X
Niger 15 16 54 50 1 118 0,1
Nigeria 465 8 1 005 17 90 717 0,8
Rwanda 7 22 53 -3 491 0,1
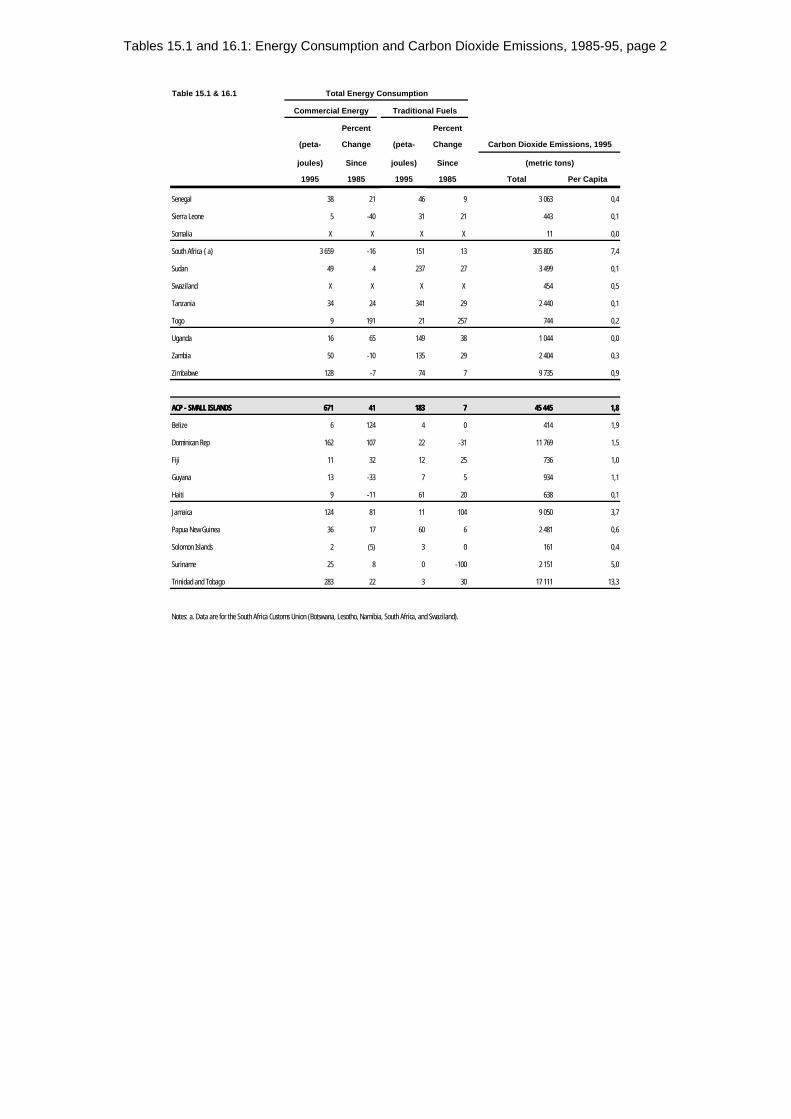
Tables 15.1 and 16.1: Energy Consumption and Carbon Dioxide Emissions, 1985-95, page 2
Table 15.1 & 16.1 Total Energy Consumption
Commercial Energy Traditional Fuels
Percent Percent
(peta- Change (peta- Change Carbon Dioxide Emissions, 1995
joules) Since joules) Since (metric tons)
1995 1985 1995 1985 Total Per Capita
Senegal 38 21 46 9 3 063 0,4
Sierra Leone 5 -40 31 21 443 0,1
Somalia X X X X 11 0,0
South Africa {a} 3 659 -16 151 13 305 805 7,4
Sudan 49 4 237 27 3 499 0,1
Swaziland X X X X 454 0,5
Tanzania 34 24 341 29 2 440 0,1
Togo 9 191 21 257 744 0,2
Uganda 16 65 149 38 1 044 0,0
Zambia 50 -10 135 29 2 404 0,3
Zimbabwe 128 -7 74 7 9 735 0,9
ACP - SMALL ISLANDSACP - SMALL ISLANDS 671671 4141 183183 77 45 44545 445 1,81,8
Belize 6 124 4 0 414 1,9
Dominican Rep 162 107 22 -31 11 769 1,5
Fiji 11 32 12 25 736 1,0
Guyana 13 -33 7 5 934 1,1
Haiti 9 -11 61 20 638 0,1
Jamaica 124 81 11 104 9 050 3,7
Papua New Guinea 36 17 60 6 2 481 0,6
Solomon Islands 2 (5) 3 0 161 0,4
Suriname 25 8 0 -100 2 151 5,0
Trinidad and Tobago 283 22 3 30 17 111 13,3
Notes: a. Data are for the South Africa Customs Union (Botswana, Lesotho, Namibia, South Africa, and Swaziland).
Copyright © 2022 FDOKUMEN