Entrepreneurship and Innovation in Australia
43
Entrepreneurship and Innovation in Australia: outlook, policies, and trends Dr Marcello Tonelli (School of Business) Venerdi – 13 Gennaio, 2012 www.qut.edu.au/business/ace
-
Upload
independent -
Category
Documents
-
view
3 -
download
0
Transcript of Entrepreneurship and Innovation in Australia
Entrepreneurship and Innovation in
Australia: outlook, policies, and trends
Dr Marcello Tonelli (School of Business)
Venerdi – 13 Gennaio, 2012
www.qut.edu.au/business/ace

2 / 43
Entrepreneurship Innovation
GEM Study
CAUSEE Study
Australia
www.qut.edu.au/business/ace
Economic Development

Starting a business
Being self-employed
Undertake an effort to transform innovations into economic goods
The catalyst to growth
Creating new opportunities
Any activity that adds value to a business, an organization, supply chain, value chain, .... anything where there is commerce... or not
Value, success: TBL
3 / 43
www.qut.edu.au/business/ace
Entrepreneurship is...

High growth entrepreneurship
Social entrepreneurship: organize, create and manage a venture with the emphasis towards social change.
Corporate entrepreneurship: the process whereby an individual or a group of individuals, in association with an existing organisation, create a new organisation or instigate renewal or innovation within that organisation (Sharma and Chrisman 1999)
Indigenous entrepreneurship
Women entrepreneurship
Immigrant entrepreneurship
Technopreneurship: university spinouts
Youth entrepreneurship
Necessity/survival entrepreneurship
Entrepreneurship education/training
Family business
4 / 43
www.qut.edu.au/business/ace
The Field of Entrepreneurship

Remote Environment
5 / 43
www.qut.edu.au/business/ace
Entrepreneurship Nexus
Close Environment
CREATOR(S) CREATING PROCESS NEW VALUE CREATION
Individuals
Teams
Organizations
Opportunity discovery and assessment
Exploitation decisions
Resource accumulation and gestation
New venture creation (and subsequent development)
Innovations

6 / 43
Entrepreneurship
Australia
www.qut.edu.au/business/ace
Innovation
CAUSEE Study
Economic Development
GEM Study

7 / 43
www.qut.edu.au/business/ace
Entrepreneurship & Innovation
Creative destruction: economic change revolves around innovation (Schumpeter 1942) The essence of entrepreneurship is innovation (Drucker, 1985) leading to ‘value’ creation (Khandwalla, 1987). Entrepreneurship is about new value creation in the form of innovation (Gartner 1985; Zahra et al. 1999).

8 / 43
www.qut.edu.au/business/ace
What Is Innovation?

Innovation is not invention in that innovation refers to the use of a new idea or method, whereas invention refers more directly to the creation of the idea or method itself. Innovation is the creation of better or more effective products, processes, services, or ideas [technologies] that are accepted by users [desirability], and proposed at the right time according to governments and society [viability].
9 / 43
www.qut.edu.au/business/ace
Innovation
What is viable in the marketplace
What is possible with technology
What is desirable to
users
Innovation

10 / 43
Entrepreneurship
Australia
www.qut.edu.au/business/ace
Innovation
CAUSEE Study
GEM Study
Economic Development

11 / 43
It is widely acknowledged that entrepreneurship is a key driver for economic development. New
businesses often introduce innovations into the market, create jobs and help to secure the
competitiveness of the national economy (Acs & Szerb, 2009).
Entrepreneurship & Economic Development
Entrepreneurship Economic
Development
Job Creation
Innovation
Productivity Growth
www.qut.edu.au/business/ace
Entrepreneurship (attitudes, activity and aspirations) is affected by national conditions.
Entrepreneurs with high aspirations materialize better in countries with a stable economic and
political climate and well-developed institutions (in fact they may migrate to other countries to
pursue their ideas).

12 / 43
Factor-Driven Economies Algeria*, Guatemala*, Jamaica*, Lebanon*, Morocco, Saudi Arabia*, Syria*, Kingdom of Tonga, Uganda, Venezuela*, West Bank and Gaza Strip, Yemen. Efficiency-Driven Economies Argentina, Bosnia and Herzegovina, Brazil, Chile*, China, Colombia, Croatia*, Dominican Republic, Ecuador, Hungary*, Iran, Jordan, Latvia*, Malaysia, Panama, Peru, Romania*, Russia*, Serbia, South Africa, Tunisia, Uruguay*. Innovation-Driven Economies Australia, Belgium, Denmark, Finland, France, Germany, Greece, Hong Kong, Iceland, Israel, Italy, Japan, Republic of Korea, Netherlands, Norway, Slovenia, Spain, Switzerland, United Kingdom, United Arab Emirates, United States.
*Country in transition to a more advanced stage
Importance of Different Types of National Conditions for
Economic Development
www.qut.edu.au/business/ace

13 / 43
As an economy matures and its wealth increases, one may expect the emphasis in industrial activity to gradually shift toward an expanding service sector that caters to the needs of an increasingly affluent population and supplies the services normally expected of a high-income society.
The industrial sector evolves and experiences improvements in variety and sophistication. Such a development would be typically associated with increasing research & development and knowledge intensity, as knowledge-generating institutions in the economy gain momentum.
This development opens the way for the advance of innovative, opportunity-seeking entrepreneurial activity that is not afraid to challenge established incumbents in the economy. Often, small and innovative entrepreneurial firms enjoy an innovation productivity advantage over large incumbents, enabling them to operate as „agents of creative destruction.‟
To the extent that the economic and financial institutions created during the scale-intensive phase of the economy are able to accommodate and support opportunity-seeking entrepreneurial activity, innovative entrepreneurial firms may emerge as significant drivers of economic growth and wealth creation.
In innovation-driven economies, the proportion of opportunity-driven versus necessity-driven entrepreneurship is expected to be higher than in factor- and efficiency-driven economies.
Entrepreneurship in Innovation-Driven Economies
www.qut.edu.au/business/ace

14 / 43
Given entrepreneurship's potential to support economic growth, it is the policy goal of many governments to develop a culture of entrepreneurial thinking. This can be done in a number of ways: by integrating entrepreneurship into education systems, legislating to encourage risk-taking, and national campaigns.
Government Strategies
www.qut.edu.au/business/ace

15 / 43
Entrepreneurship
Australia
www.qut.edu.au/business/ace
Innovation
GEM Study
Economic Development
CAUSEE Study

16 / 43
ACE is the Australian partner for the Global Entrepreneurship Monitor
(GEM) which measures entrepreneurial activity in more than 80 countries.
Each national team conducts a survey of at least 2,000 adult individuals (a
representative sample) annually using a proven methodology (see
http://www.gemconsortium.org). The main indicator of entrepreneurship is
the Total Early-Stage Entrepreneurial Activity rate (TEA) which measures
the propensity of a country to be entrepreneurial. (Reynolds 1998)
The GEM STUDY
(Global Entrepreneurship Monitor)
www.qut.edu.au/business/ace
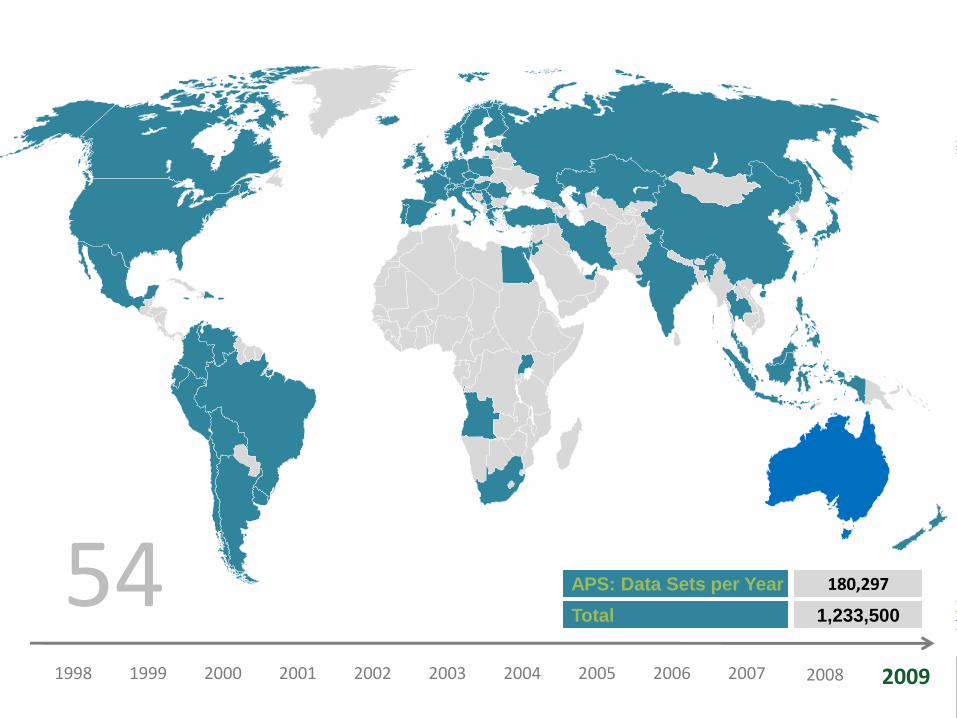
1998 1999 2000 2001 2002 2003 2004 2005 2006 2007 2009
54 APS: Data Sets per Year
Total
180,297
1,233,500
2008

But where does Australia rank
in entrepreneurship when
compared with other major
innovation-driven
economies?
18 / 43
www.qut.edu.au/business/ace
19 / 43
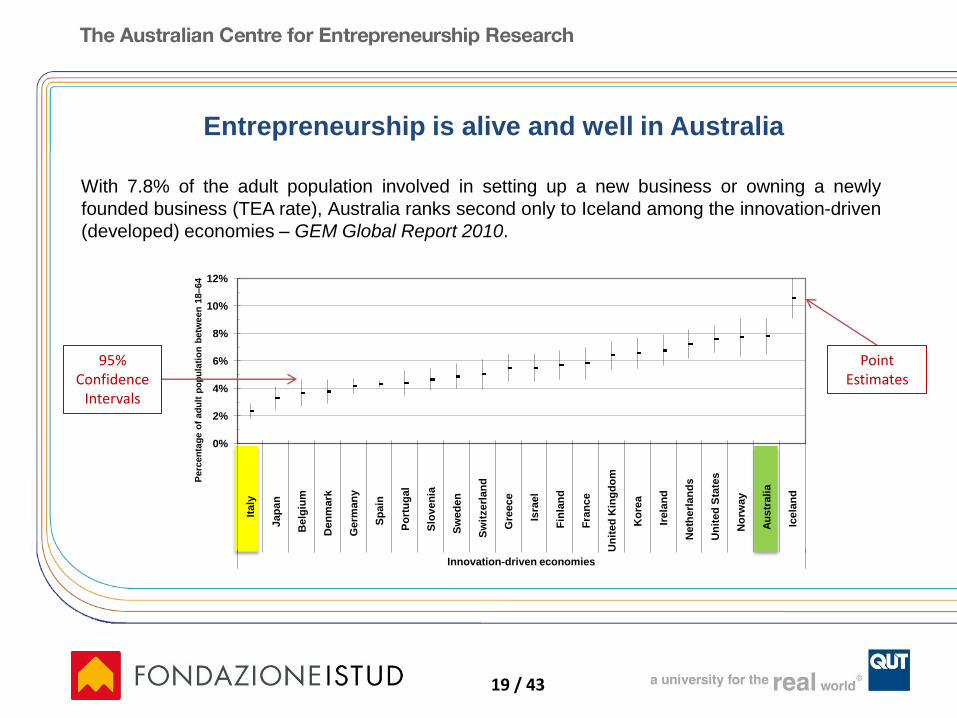
With 7.8% of the adult population involved in setting up a new business or owning a newly
founded business (TEA rate), Australia ranks second only to Iceland among the innovation-driven
(developed) economies – GEM Global Report 2010.
Entrepreneurship is alive and well in Australia
0%
2%
4%
6%
8%
10%
12%
Italy
Jap
an
Belg
ium
Den
mark
Germ
an
y
Sp
ain
Po
rtu
ga
l
Slo
ve
nia
Sw
ed
en
Sw
itzerl
an
d
Gre
ece
Isra
el
Fin
lan
d
Fra
nc
e
Un
ite
d K
ing
do
m
Ko
rea
Irela
nd
Neth
erl
an
ds
Un
ited
Sta
tes
No
rway
Au
str
ali
a
Icela
nd
Innovation-driven economies
Perc
en
tag
e o
f ad
ult
po
pu
lati
on
betw
een
18–64
95% Confidence
Intervals
Point Estimates
www.qut.edu.au/business/ace
20 / 43
The GEM data clearly show that Australia also compares well with other major economies in
terms of the “quality” of entrepreneurial activities being pursued. Indeed, not only the quantity of
entrepreneurs but also their aspiration and business goals are important drivers for economic
growth.
On average for each business started in Australia out of the necessity to earn a living due to a
lack of alternatives, there are three businesses where the founders want to take advantage of a
lucrative business opportunity in order to increase their personal income or enjoy greater
independence.
With respect to job growth expectations, a respectable 10% of the entrepreneurs aim to grow
their businesses larger than 20 employees in the next five years.
Both these indicators are higher than the average for innovation-driven economies.
Slightly below average is the international orientation of Australian entrepreneurs. Most likely due
to the large distances from international markets just 10% aim at a substantial share of
customers from international markets.
Quality of entrepreneurial activities
www.qut.edu.au/business/ace

21 / 43
So what are the drivers for this high quantity and quality of entrepreneurship in Australia? The
data point to a combination of both business opportunities and entrepreneurial skills.
Approximately 50% of the Australian population perceive opportunities to start-up and state that
they have the necessary skills to start a business.
Furthermore a large majority of the Australian population report high media attention for
entrepreneurship in Australia providing successful role models for prospective entrepreneurs.
As a result 8.7% of our respondents have the intention to start a business within the next three
years. These numbers are all well above average when compared to the other major economies.
Drivers of entrepreneurial activity
www.qut.edu.au/business/ace
22 / 43
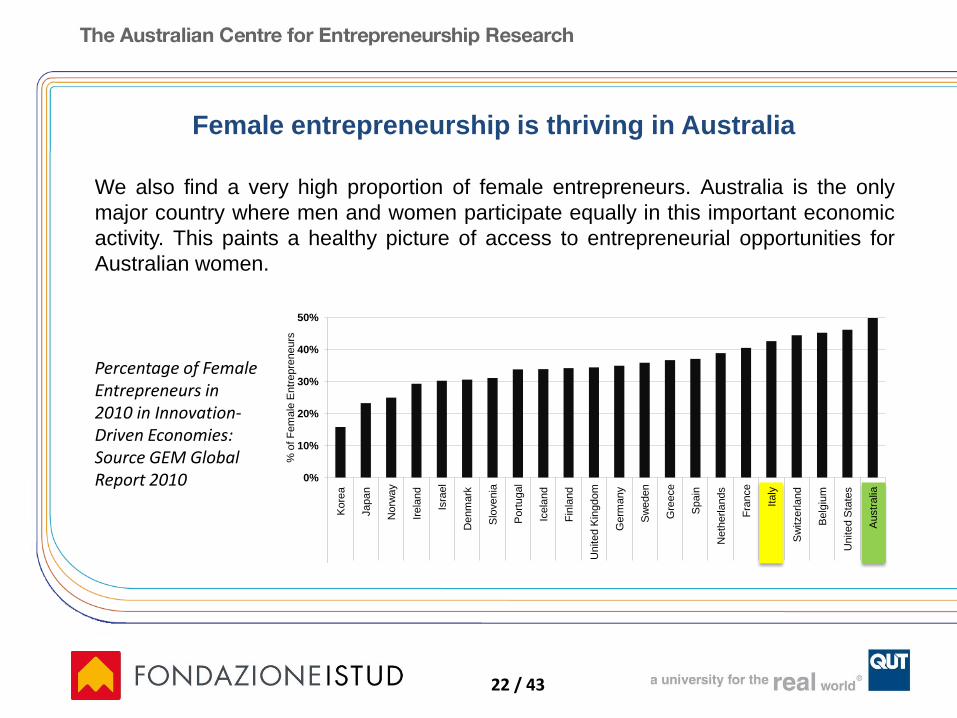
We also find a very high proportion of female entrepreneurs. Australia is the only
major country where men and women participate equally in this important economic
activity. This paints a healthy picture of access to entrepreneurial opportunities for
Australian women.
Female entrepreneurship is thriving in Australia
Percentage of Female Entrepreneurs in 2010 in Innovation-Driven Economies: Source GEM Global Report 2010 0%
10%
20%
30%
40%
50%
Kore
a
Japan
Norw
ay
Irela
nd
Isra
el
Denm
ark
Slo
venia
Port
ugal
Icela
nd
Fin
land
United K
ingdom
Germ
any
Sw
eden
Gre
ece
Spain
Neth
erla
nds
Fra
nce
Italy
Sw
itzerla
nd
Belg
ium
United S
tate
s
Au
str
alia
% o
f F
em
ale
Entr
epre
neurs
www.qut.edu.au/business/ace

23 / 43
Entrepreneurship
Australia
www.qut.edu.au/business/ace
Innovation
GEM Study
CAUSEE Study
Economic Development

The CAUSEE Study
(Comprehensive Australian Study of Entrepreneurial Emergence)
• Funded by
• Largest study ever of business start-up processes in Australia
• 4-year, concurrent study of on-going start-up development
• 3rd year data collection now completed
• Two different samples:
o Random sample of nascent firms, NF (625)
o Random sample of established young firms, YF (561)
24 / 43
www.qut.edu.au/business/ace

• Interview one of the founders every 12 months (40-60 min.)
• Interviewing conducted by external survey vendor
• Partly harmonised with international, counterpart studies
• Considerable unique contents – CAUSEE is cutting edge
• Launched practice-orientated reports on new business start-ups:
1. The role of family
2. Learning and adaptation
3. International perceptions and aspirations
4. ...
Research Approach
25 / 43
www.qut.edu.au/business/ace

How do you get hold of a large,
random sample of not-yet-
existing businesses???
30,105

From where was the data obtained?
27 / 43
www.qut.edu.au/business/ace

How do nascent and young
firms change the way
they view themselves?
28 / 43
www.qut.edu.au/business/ace

1. Growth Aspirations
23.2%
11.5%
76.4%
87.8%
0.0%
10.0%
20.0%
30.0%
40.0%
50.0%
60.0%
70.0%
80.0%
90.0%
100.0%
Wave 1 Wave2 Wave 3 Wave 1 Wave 2 Wave 3
Nascent Firms Young Firms
Maximum growth
Manageable size
Undecided
0.5% 0.7%
29 / 43
www.qut.edu.au/business/ace

2. Expectations of Geographic Market
70.8%
60.5% 63.1%
54.4% 54.8% 52.7%
42.6% 33.3% 37.9%
25.4% 24.4% 22.6%
0.0%
10.0%
20.0%
30.0%
40.0%
50.0%
60.0%
70.0%
80.0%
Wave 1 Wave 2 Wave 3
Aspirations for NFs to have national sales in 5 yrs
Aspirations for YFs to have national sales in 5 yrs
Aspirations for NFs to have international sales in 5 yrs
Aspirations for YFs to have international sales in 5 yrs
30 / 43
www.qut.edu.au/business/ace

3. Self-Assessed Novelty
0.62 0.51
0.33
1.35
1.19 1.10
0.43 0.41
1.34 1.27
1.05
0
0.5
1
1.5
2
2.5
3
Wave 1 Wave 2 Wave 3
Nascent Firms
0.29 0.26 0.22
0.89 0.71
0.65
0.23 0.17 0.16
0.92 0.97
0.89
Wave 1 Wave 2 Wave 3
Young Firms
Promotion/Selling
Product/service
Production/sourcing
Market/customers
31 / 43
www.qut.edu.au/business/ace

4. Perceived Strength of Competitive Advantages
44.9%
52.2% 51.8%
41.9% 40.4%
36.4%
Wave 1 Wave 2 Wave 3
Young Firms
Easy to copy
Diffcult to copy 44.9% 46.1% 42.1%
47.7% 47.4%
40.9%
30.0%
35.0%
40.0%
45.0%
50.0%
55.0%
60.0%
Wave 1 Wave 2 Wave 3
Nascent Firms
32 / 43
www.qut.edu.au/business/ace

5. Hi-Tech Perceptions
32.3% 31.3%
29.4%
26.5%
24.1% 23.0%
0.0%
5.0%
10.0%
15.0%
20.0%
25.0%
30.0%
35.0%
40.0%
45.0%
50.0%
Wave 1 Wave 2 Wave 3
Nascent Firms
Young Firms
33 / 43
www.qut.edu.au/business/ace

6. Survival Confidence Over Time
85.6%
81.6%
78.7%
82.9%
84.2%
82.4%
75.0%
77.0%
79.0%
81.0%
83.0%
85.0%
87.0%
89.0%
Wave 1 Wave 2 Wave3
Nascent Firms
Young Firms
34 / 43
www.qut.edu.au/business/ace

What concrete changes
do they undertake?
35 / 43
www.qut.edu.au/business/ace

I. The founder-owner team
92.7% 88.3% 74.5%
98.0% 92.9%
72.3%
7.3% 11.7% 25.5%
2.0% 7.1%
27.7%
0.0%
10.0%
20.0%
30.0%
40.0%
50.0%
60.0%
70.0%
80.0%
90.0%
100.0%
Solo Spouse team Other team Solo Spouse team Other team
Nascent Firms Young Firms
No Change Change
36 / 43
www.qut.edu.au/business/ace

39.4% 40.9%
35.9% 32.4%
30.6%
25.4%
13.8%
23.1%
0.0%
5.0%
10.0%
15.0%
20.0%
25.0%
30.0%
35.0%
40.0%
45.0%
Nascent Firms Young Firms
Product/Service Customer/Market Promotion/Selling Production/Sourcing
II. Changes of the business concept
37 / 43
www.qut.edu.au/business/ace

III. Changes in business concept – Why?
42.1% 42.6%
27.7% 30.8% 30.3% 29.4% 29.7%
21.4% 19.0%
21.7%
0.0%
5.0%
10.0%
15.0%
20.0%
25.0%
30.0%
35.0%
40.0%
45.0%
Nascent Firms Young Firms
Success with a customer refocussed the effort Customer requested changes
Internal interest in a new innovation led to changes Market research suggested it
Failure with a customer refocussed the effort
38 / 43
www.qut.edu.au/business/ace

IV. Business planning emphasis
3.37
2.47 2.82
1.95
3.77
2.98
2.58
0
0.5
1
1.5
2
2.5
3
3.5
4
4.5
5
WAVE 1 WAVE 2 WAVE 3 WAVE 1 WAVE 2 WAVE 3
Nascent Firms Young Firms
Action plan to follow step-by-step
Means of attracting external finance
Means of thinking things through to avoid mistakes
Facilitation of internal communication
39 / 43
www.qut.edu.au/business/ace

Summing up
By comparison to many other parts of the world, aspiring
entrepreneurs should look favorably to setting up new
businesses in Australia.
40 / 43
www.qut.edu.au/business/ace

41 / 43
Powering Ideas: An Innovation Agenda for the 21st Century (12 May 2009): pure research, networking, entrepreneurial innovation.
Current Policies
www.qut.edu.au/business/ace
Objectives Initiatives
25 per cent increase in businesses engaging in innovation over the next decade
Enterprise Connect, Clean Business Australia, Clean Energy Initiative ($4.5 billion)
Increase the number of businesses investing in R&D over time
R&D Tax Credit; lift the base tax incentive for R&D by larger firms
Innovative responses to climate change Clean Business Australia, the Green Car Innovation Fund, the Clean Energy Initiative, the Global Carbon Capture and Storage Institute, and the Climate Change Action Fund
Improve innovation skills and workplace capabilities Enterprise Connect and the Education Revolution
Get ideas to market Climate Ready, the Green Car Innovation Fund, the Commonwealth Commercialisation Institute
Work with the private sector to increase the supply of venture capital
Policies aimed at maintaining stability and liquidity in the Australian financial system; the Innovation Investment Follow-on Fund
Maintain a continuous dialogue with industry about how we can maximise business innovation
Enterprise Connect, Industry Innovation Councils, and industry-specific working groups (e.g. pharmaceuticals).

42 / 43
This said, the Australian government needs to continue supporting entrepreneurship (Ernst and Young – Nov 2011).
In particular:
• 64% of Australian entrepreneurs think the Government should help facilitate access to funding
• 70% of Australian entrepreneurs say there aren’t enough tax incentives for starting a new business
• 70% are not impressed by the current level of coordination between the various support providers, government associations and educational institutions
Where To From Here?
www.qut.edu.au/business/ace

Thanks for your attention!
www.qut.edu.au/business/ace
43 / 43