Ensuring fair access in IEEE 802.11p-based vehicle-to-infrastructure networks
17
RESEARCH Open Access Ensuring fair access in IEEE 802.11p-based vehicle-to-infrastructure networks Vettath Pathayapurayil Harigovindan * , Anchare V Babu and Lillykutty Jacob Abstract IEEE 802.11p is an approved amendment to the IEEE 802.11 standard to facilitate wireless access in vehicular environments (WAVE). In this article, we present an analytical model to evaluate the impact of vehicle mobility on the saturation throughput of IEEE 802.11p-based vehicle-to-infrastructure (V2I) networks. The throughput model is then used to investigate an unfairness problem that exists in such networks among vehicles with different mobility characteristics. Assuming a saturated network, if all the vehicles in the network use the same MAC parameters, IEEE 802.11p MAC protocol provides equal transmission opportunity for all of them, provided they have equal residence time in the coverage area of a road side unit (RSU). When vehicles have different mobility characteristics (e.g., extremely high and low speeds), they do not have similar chances of channel access. A vehicle moving with higher velocity has less chance to communicate with its RSU, as compared to a slow moving vehicle, due to its short residence time in the coverage area of RSU. Accordingly, the data transfer of a higher velocity vehicle gets degraded significantly, as compared to that of the vehicle with lower velocity, resulting in unfairness among them. In this article, our aim is to address this unfairness problem that exists among vehicles of different velocities in V2I networks. Analytical expressions are derived for optimal minimum CW (CW min ) required to ensure fairness, in the sense of equal chance of communicating with RSU, among competing vehicles of different mean velocities in the network. Analytical results are validated using extensive simulations. Keywords: IEEE 802.11p, fairness, residence time, saturation throughput, vehicle-to-infrastructure networks 1. Introduction Vehicular ad-hoc network (VANET) is an emerging wire- less network in which vehicles constitute the mobile nodes in the network. Such networks are aimed at providing sup- port for road safety, traffic management, and comfort applications by enabling vehicle-to-vehicle (V2V) or vehi- cle-to-infrastructure (V2I) communications [1,2]. The emerging technology for VANETs is the dedicated short range communications (DSRC), for which the Federal Communications Commission in the United States has allocated 75 MHz of spectrum between 5850 and 5925 MHz. The DSRC is based on IEEE 802.11 technology and is proceeding towards standardization under the standard IEEE 802.11p, whereas the entire communication stack is being standardized by the IEEE 1609 working group under the name wireless access in vehicular environments (WAVE). The overall WAVE architecture includes IEEE standards 1609.1 to 1609.4 (for resource management, security architecture, networking service, and multi-chan- nel operation, respectively) and IEEE 802.11p (MAC and PHY standard). IEEE 802.11p uses essentially the same PHY defined for 802.11a but operates in a 10 MHz wide channel instead of 20 MHz. The goal of 802.11p standard is to provide V2V and V2I communications over the dedi- cated 5.9 GHz licensed frequency band and supports data rates of 3-27 Mbps (3, 4.5, 6, 9, 12, 18, 24, and 27 Mbps) [3,4]. Future intelligent transportation systems (ITS) will necessitate wireless V2I communications. Besides the delivery of infotainment services, the role of typical V2I systems will include the provisioning of safety related, real-time, local, and situation-based services, such as speed limit information, safe distance warning, lane keep- ing support, intersection safety, traffic jam, and accident warning, etc. All these services aim to prevent accidents by providing timely information directly to the car and/ or to the driver. The main technical challenges for * Correspondence: [email protected] Department of Electronics and Communication Engineering, National Institute of Technology Calicut, Calicut, 673601, India Harigovindan et al. EURASIP Journal on Wireless Communications and Networking 2012, 2012:168 http:?/jwcn.eurasipjournals.com/content/2012/1/168 © 2012 Harigovindan et al; licensee Springer. This is an Open Access article distributed under the terms of the Creative Commons Attribution License (http://creativecommons.org/licenses/by/2.0), which permits unrestricted use, distribution, and reproduction in any medium, provided the original work is properly cited.
-
Upload
independent -
Category
Documents
-
view
1 -
download
0
Transcript of Ensuring fair access in IEEE 802.11p-based vehicle-to-infrastructure networks
RESEARCH Open Access
Ensuring fair access in IEEE 802.11p-basedvehicle-to-infrastructure networksVettath Pathayapurayil Harigovindan*, Anchare V Babu and Lillykutty Jacob
Abstract
IEEE 802.11p is an approved amendment to the IEEE 802.11 standard to facilitate wireless access in vehicularenvironments (WAVE). In this article, we present an analytical model to evaluate the impact of vehicle mobility onthe saturation throughput of IEEE 802.11p-based vehicle-to-infrastructure (V2I) networks. The throughput model isthen used to investigate an unfairness problem that exists in such networks among vehicles with different mobilitycharacteristics. Assuming a saturated network, if all the vehicles in the network use the same MAC parameters, IEEE802.11p MAC protocol provides equal transmission opportunity for all of them, provided they have equal residencetime in the coverage area of a road side unit (RSU). When vehicles have different mobility characteristics (e.g.,extremely high and low speeds), they do not have similar chances of channel access. A vehicle moving withhigher velocity has less chance to communicate with its RSU, as compared to a slow moving vehicle, due to itsshort residence time in the coverage area of RSU. Accordingly, the data transfer of a higher velocity vehicle getsdegraded significantly, as compared to that of the vehicle with lower velocity, resulting in unfairness among them.In this article, our aim is to address this unfairness problem that exists among vehicles of different velocities in V2Inetworks. Analytical expressions are derived for optimal minimum CW (CWmin) required to ensure fairness, in thesense of equal chance of communicating with RSU, among competing vehicles of different mean velocities in thenetwork. Analytical results are validated using extensive simulations.
Keywords: IEEE 802.11p, fairness, residence time, saturation throughput, vehicle-to-infrastructure networks
1. IntroductionVehicular ad-hoc network (VANET) is an emerging wire-less network in which vehicles constitute the mobile nodesin the network. Such networks are aimed at providing sup-port for road safety, traffic management, and comfortapplications by enabling vehicle-to-vehicle (V2V) or vehi-cle-to-infrastructure (V2I) communications [1,2]. Theemerging technology for VANETs is the dedicated shortrange communications (DSRC), for which the FederalCommunications Commission in the United States hasallocated 75 MHz of spectrum between 5850 and 5925MHz. The DSRC is based on IEEE 802.11 technology andis proceeding towards standardization under the standardIEEE 802.11p, whereas the entire communication stack isbeing standardized by the IEEE 1609 working group underthe name wireless access in vehicular environments(WAVE). The overall WAVE architecture includes IEEE
standards 1609.1 to 1609.4 (for resource management,security architecture, networking service, and multi-chan-nel operation, respectively) and IEEE 802.11p (MAC andPHY standard). IEEE 802.11p uses essentially the samePHY defined for 802.11a but operates in a 10 MHz widechannel instead of 20 MHz. The goal of 802.11p standardis to provide V2V and V2I communications over the dedi-cated 5.9 GHz licensed frequency band and supports datarates of 3-27 Mbps (3, 4.5, 6, 9, 12, 18, 24, and 27 Mbps)[3,4].Future intelligent transportation systems (ITS) will
necessitate wireless V2I communications. Besides thedelivery of infotainment services, the role of typical V2Isystems will include the provisioning of safety related,real-time, local, and situation-based services, such asspeed limit information, safe distance warning, lane keep-ing support, intersection safety, traffic jam, and accidentwarning, etc. All these services aim to prevent accidentsby providing timely information directly to the car and/or to the driver. The main technical challenges for
* Correspondence: [email protected] of Electronics and Communication Engineering, NationalInstitute of Technology Calicut, Calicut, 673601, India
Harigovindan et al. EURASIP Journal on Wireless Communications andNetworking 2012, 2012:168http:?/jwcn.eurasipjournals.com/content/2012/1/168
© 2012 Harigovindan et al; licensee Springer. This is an Open Access article distributed under the terms of the Creative CommonsAttribution License (http://creativecommons.org/licenses/by/2.0), which permits unrestricted use, distribution, and reproduction inany medium, provided the original work is properly cited.

communication in V2I and V2V networks are the veryhigh mobility of the nodes, highly dynamic topology,high variability in node density, and very short durationof communication [1-3]. The IEEE 802.11p uses theenhanced distributed channel access (EDCA) mediumaccess control (MAC) sublayer protocol based on distrib-uted coordination function (DCF) [4]. DCF, which isbased on Carrier Sense Multiple Access with CollisionAvoidance (CSMA/CA), was originally developed forWLANs [5]. Under DCF, all stations compete for accessby using CSMA/CA protocol; they sense the channelbefore transmitting, and if the medium is found idle for aminimum time equal to DIFS, the packet will be trans-mitted. Otherwise, the station enters backoff and ran-domly sets its backoff counter within the range of itsContention Window (CW). The random discrete backoff time is selected from the range [0, CW - 1]. To trans-mit packets after DIFS, node first decrements the backofftime counter and transmit only if the backoff counter is0. The countdown of backoff counter is frozen once thechannel becomes busy due to other node transmission,and resumes when the channel is idle for another DIFS.The size of CW depends on the history of transmissions.At the first transmission attempt, it is set to a predefinedvalue CWmin, the minimum CW. Upon each unsuccessfultransmissions, it is updated to 2sCWmin until it reaches amaximum value CWmax. Here s is called backoff stage.Each station maintains a retry counter that indicates thenumber of retransmission attempts of a data packet.More details of DCF can be found in [5]. The EDCAmechanism assigns four different priority classes forincoming packets at each node which are called AccessCategories (AC). Each AC has its own channel accessfunction when compared with 802.11 DCF in which allpackets exploit the same access function to acquire thechannel. Different access functions for different cate-gories mean assigning different delay times, differentminimum contention windows, and different number ofback-off stages for each type of service [6].The DCF protocol was originally developed for low
mobility networks such as WLANs and recent studieshave shown that it does not operate efficiently for ahigh mobility communication scenario such as vehicularnetworks. In static networks, the performance of theIEEE 802.11 DCF depends on network parameters suchas the number of communicating nodes, type of datatraffic, backoff procedure, packet size, data rates of dif-ferent nodes, etc. [7-11]. In vehicular communicationnetworks, the performance of DCF protocol is alsoaffected by other factors such as vehicle density andnode mobility [12-16]. Node mobility can be character-ized by node position, speed, and acceleration, directionof movement, potential communication duration, andpotential number of communication neighbors. All
these factors are highly dynamic in V2I networks, anddifficult to predict especially in an extreme mobilityenvironment.The problem of unfairness due to vehicles having dif-
ferent velocities has been reported in [17] for the V2Icommunication scenario, involving fixed RSU. The stan-dard IEEE 802.11p does not take into consideration, theresident time of nodes within the coverage of each RSU.Vehicles having different velocities have different residenttimes in the coverage area of an RSU. Assuming a satu-rated network, if all the vehicles in the network use thesame MAC parameters, DCF protocol provides equaltransmission opportunity for all of them. When vehicleshave different mobility characteristics (e.g., extremelyhigh and low speeds), they do not have similar chances ofcommunication with RSU due to the different residenttimes and, therefore, a fairness problem exists. A fastmoving vehicle has less chance to communicate with itsRSU and consequently less amount of data transferred ascompared to a slow moving vehicle. This problem occursfor each area covered by an RSU. Therefore, the amountof data transferred at each area (useful for next areas) isnot equal. The contiguous areas covered by differentRSUs and handoffs between them do not solve this pro-blem. Since emergency information are more vital for fas-ter vehicles, the above problem has more degrading effecton the efficiency of VANETs. In this article, our aim is toresolve this unfairness problem by adjusting the trans-mission probability of each vehicle according to its speed,through changing the minimum contention window size.In this way, the amount of successfully transmitted dataof all nodes are made equal regardless of their velocities,while in the coverage area of an RSU. Using Jain’s fair-ness index, we show how fairness in the sense of equalchance of communicating with RSU can be achieved by ajudicious choice of minimum CW for the competingvehicles of distinct velocities in the network. The impactof these choices on throughput are also presented. Theanalytical findings are verified with extensive simulationstudies.The major contributions of this article are as follows:• A modified analytical model for DCF is developed
for V2I networks for computing individual vehiclethroughput when vehicles are moving at very high velo-cities. The problem of unfairness that arises due to dif-ferent vehicle velocities is investigated using this model.Analytical expressions for optimal minimum CW para-meters to achieve the desired fairness objectives arederived.• Extensive analytical and simulation results are pro-
vided to support the claims.The rest of this article is organized as follows. Section
2 presents related study. In Section 3, we present ananalytical model to compute the saturation throughput
Harigovindan et al. EURASIP Journal on Wireless Communications andNetworking 2012, 2012:168http:?/jwcn.eurasipjournals.com/content/2012/1/168
Page 2 of 17
of a V2I network. In Section 4, we discuss how fairness indata transfer to RSU for individual node can be ensured.The analytical and simulation results are presented inSection 5. The article is concluded in Section 6.
2. Related workThe performance of DCF has been extensively studied inthe literature [6-11]. Furthermore, an extensive body ofresearch has been devoted to the performance evaluationof IEEE 802.11p standard [18-25]. A performance evalua-tion of IEEE 802.11p WAVE standard, considering colli-sion probability, throughput and delay, is presented in[18] using simulations and analytical means. Studiesshow that WAVE can prioritize messages; however, indense and high load scenarios the throughput decreasesand the delay increases significantly. Authors of [12,13]propose analytical model to evaluate performance andreliability of IEEE 802.11a-based V2V safety-relatedbroadcast services in DSRC system on highway. In [14],simulation results of IEEE 802.11p MAC protocol arepresented for the V2I scenario. The authors show thatthe specified MAC parameters for this protocol can leadto undesired throughput performance under dense anddynamic conditions. Authors of [15] propose a simplebut accurate analytical model to evaluate the throughputperformance of DCF in the high speed V2I communica-tions. They show that with node velocity increasing,throughput of DCF decreases monotonically due to mis-match between CW and mobility. Using a p-persistentCSMA based model, they analyze the performance whendifferent p parameter values are assigned to nodes withdifferent data rates (determined by the different distancesfrom the RSU). In [19], the same authors used a 3D Mar-kov chain to evaluate the throughput of DCF in thedrive-thru internet scenario. Their proposals for protocolenhancement are (i) CWmin should be adapted to thedata rates of the vehicles (according to their distancesfrom RSU) and also to the vehicle velocity; and (ii) themaximum backoff stage should be kept small (m = 1) tomitigate the impact of mobility. In [16], authors proposean analytic model to evaluate the DSRC-based inter-vehi-cle communication. The impacts of the channel accessparameters associated with different services includingarbitration inter-frame space (AIFS) and contention win-dow (CW) are investigated. In [20], Suthaputchakun andGanz study the use of IEEE 802.11e for priority basedsafety messaging for V2V in VANETs. Analytical modelfor DSRC network that uses the IEEE 802.11 DCF MACprotocol is developed in [21]. In [22,23], Tan et al. deriveanalytical models to characterize the average and the dis-tribution of the number of bytes downloaded by a vehicleby the end of its sojourn through an AP’s coverage range,in the presence of contention by other vehicles. Authors
of [24], propose a new vehicular channel access schemeto compromise the trade-off between system throughputand throughput fairness in V2I communication scenario.The problem of unfairness due to vehicles having dif-
ferent velocities has been explained for a V2I scenario in[17] and for a V2V scenario in [25]. Karamad and Ash-tiani [17] present an analysis, in which the network thatspans the coverage area of RSU is modeled as an M/G/∞queue. Customers in this queue are the batches of vehi-cles entering the network, with vehicles in a batch havingthe same speed. They divide the batches of vehiclesaccording to their speed into P classes. For class i, theservice time Ti in the M/G/∞ queuing model is the resi-dence time in the coverage area of RSU. Using thismodel, they obtain an expression for the saturationthroughput. They also approximate the number of pack-ets transmitted by a node during its residence time by apoisson random variable. Using these approximationsand results from Bianchi’s analysis [7], they derive anapproximation for the optimal CWmin for fair access. In[25], Alasmary and Zhuang propose two dynamic CWbased mechanisms to alleviate the performance degrada-tion caused by vehicle mobility in V2V networks. But thearticle does not describe the exact procedure for theselection of optimal CW value to achieve the objectives.In this article, we present a simple yet accurate analyticalmodel for DCF in high mobility scenario of V2I net-works, and use this model to analyze the problem ofunfairness that arises due to different vehicle velocities.We derive expressions for optimal minimum CW forvehicles with different mean velocities to achieve thedesired fairness objectives. Extensive studies of theimpact of parameters such as vehicle arrival rate, vehicledensity, mean vehicle speed, traffic jam density, andnumber of nodes, on the amount of data transmitted byeach vehicle during its sojourn time, are conducted.
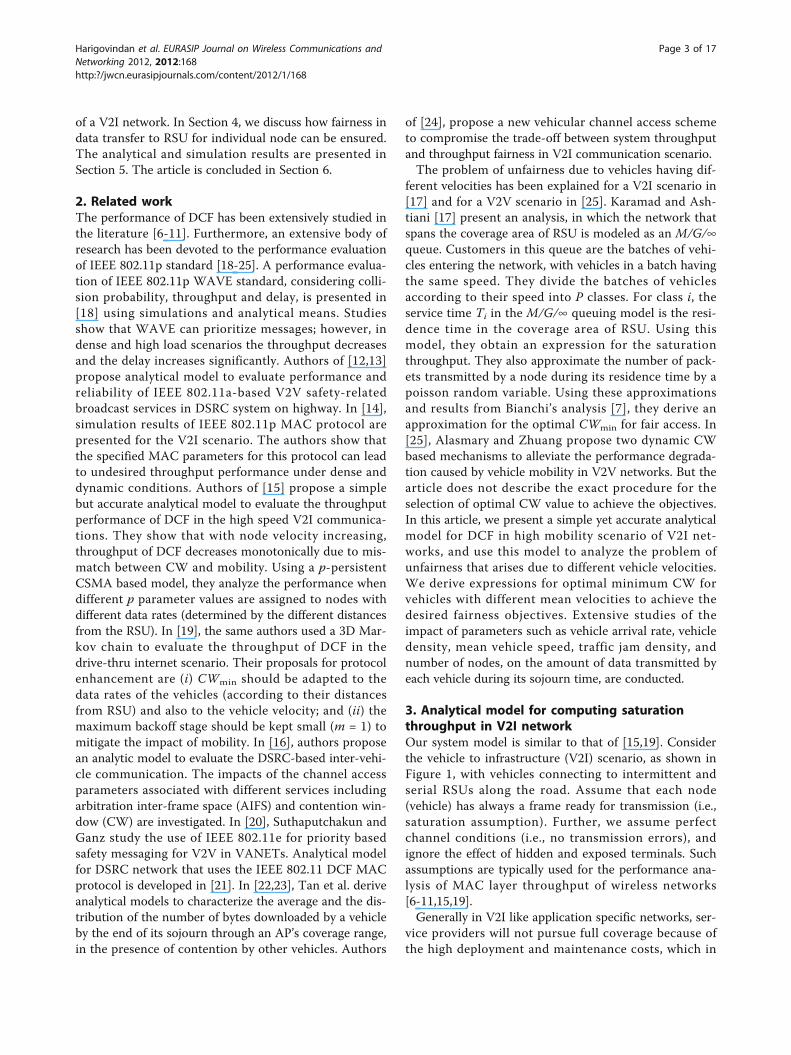
3. Analytical model for computing saturationthroughput in V2I networkOur system model is similar to that of [15,19]. Considerthe vehicle to infrastructure (V2I) scenario, as shown inFigure 1, with vehicles connecting to intermittent andserial RSUs along the road. Assume that each node(vehicle) has always a frame ready for transmission (i.e.,saturation assumption). Further, we assume perfectchannel conditions (i.e., no transmission errors), andignore the effect of hidden and exposed terminals. Suchassumptions are typically used for the performance ana-lysis of MAC layer throughput of wireless networks[6-11,15,19].Generally in V2I like application specific networks, ser-
vice providers will not pursue full coverage because ofthe high deployment and maintenance costs, which in
Harigovindan et al. EURASIP Journal on Wireless Communications andNetworking 2012, 2012:168http:?/jwcn.eurasipjournals.com/content/2012/1/168
Page 3 of 17
turn, makes non-coverage areas in the network. Even ifthey provide full coverage with contiguous areas coveredby different RSUs and hand offs between them, someemergency information (e.g., status of traffic load, prob-able crashes occurred in the next road, etc.) must becommunicated at each area. Since we are interested inthe amount of information at each area (useful for nextarea) communicated to different vehicles, we focus onone coverage area (zone 1) and outside region (zone 0)only. Unlike [15,19] in which the system model has mul-tiple zones within the coverage area of an RSU with dis-tinct transmission rates determined by the distances ofthe nodes from the RSU, our system model has only onezone within the coverage area of an RSU. We considerthe highway to be multi lane, with N lanes, where lane iis used by vehicles with mean speed μvi. Classifying thevehicles according to their mean speed, we have N classesof vehicles, a class i vehicle has a mean speed μvi. Let nibe the no of vehicles belonging to class i. The probabilitydensity function of Vi, the random variable representingclass i vehicle velocity, is assumed to be uniform [13,26]in the interval (vmin,i,vmax,i), with μvi representing themean and σvi representing the standard deviation.Accordingly vmax,i = μvi +
√3σvi
is the maximum speedand vmin,i = μvi − √
3σviis the minimum speed. The pdf
of Vi is given by
fVi (vi) =
{1
2√
31σvi
; μvi − √3σvi ≤ vi ≤ μvi +
√3σvi
0; otherwise(1)
The residence time of class i vehicle in the coveragearea of RSU is a random variable defined as
T1,i = d1Vi
; i ∈ [1, N] where d1 is the length of zone 1.
The mean sojourn time of class i vehicle in the coveragearea is calculated as follows:
E[T1,i] = d11
E[Vi]= d1
μvi +√
3σvi∫μvi−
√3σvi
1vi
1
2√
3σvi
dvi
=d1
2√
3σvi
ln(μvi +
√3σvi
μvi − √3σvi
)
(2)
With this model, the highway could be of multipleunidirectional lanes and the vehicles are allowed to havevariable speed, but move with constant mean velocity. Aclass i vehicle entering zone1 resides in the coveragearea of the RSU for a mean time duration E[T1,i] beforemoving out. The mobility of vehicles can then be repre-sented by the zone transitions using a Markov chainmodel as shown in Figure 2. To facilitate the use of dis-crete time Markov chain model for the throughput ana-lysis, the time that a class i node stays in each zone z is
INTERNET
RSURSU
Zone 1 Zone 0 Zone 1
6 Mbps 6 Mbps
6 Mbps
6 Mbps
Wireless ConnectionWired ConnectionRSU radio coverage Moving Direction of Vehicles
Figure 1 Vehicle to infrastructure scenario.
Harigovindan et al. EURASIP Journal on Wireless Communications andNetworking 2012, 2012:168http:?/jwcn.eurasipjournals.com/content/2012/1/168
Page 4 of 17
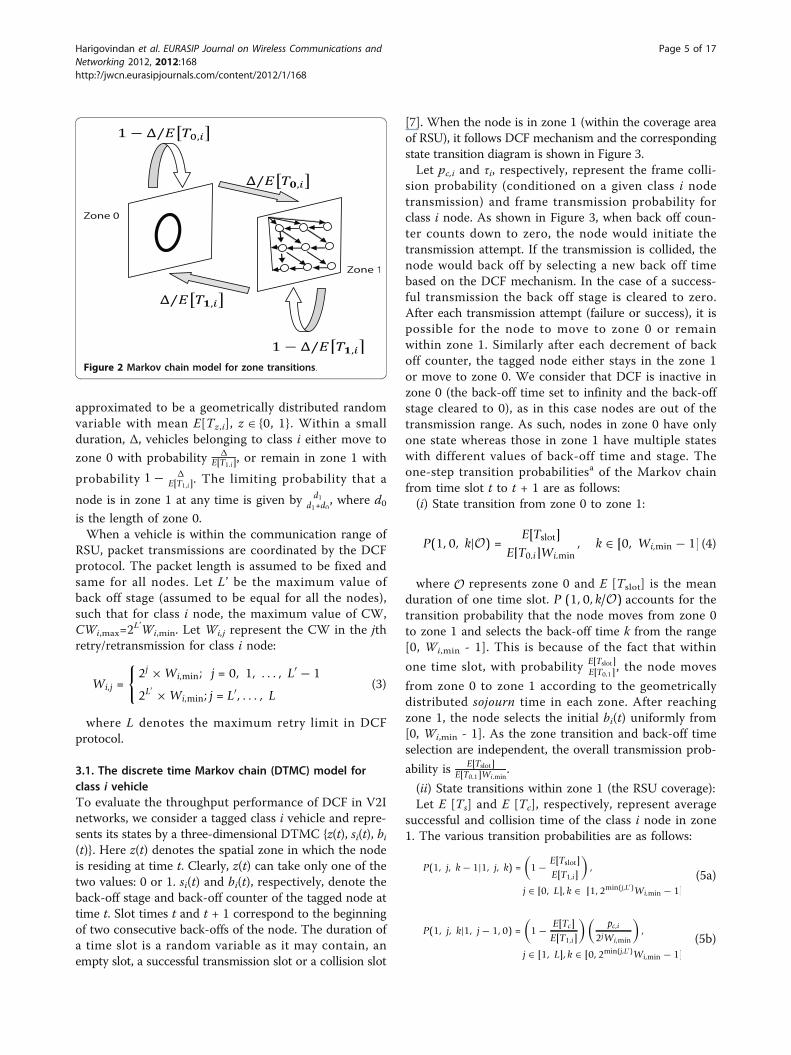
approximated to be a geometrically distributed randomvariable with mean E[Tz,i], z Î{0, 1}. Within a smallduration, Δ, vehicles belonging to class i either move to
zone 0 with probability �E[T1,i], or remain in zone 1 with
probability 1 − �E[T1,i]. The limiting probability that a
node is in zone 1 at any time is given by d1d1+d0
, where d0is the length of zone 0.When a vehicle is within the communication range of
RSU, packet transmissions are coordinated by the DCFprotocol. The packet length is assumed to be fixed andsame for all nodes. Let L’ be the maximum value ofback off stage (assumed to be equal for all the nodes),such that for class i node, the maximum value of CW,CWi,max=2
L’Wi,min. Let Wi,j represent the CW in the jthretry/retransmission for class i node:
Wi,j =
{2j × Wi,min; j = 0, 1, . . . , L′ − 1
2L′ × Wi,min; j = L′, . . . , L(3)
where L denotes the maximum retry limit in DCFprotocol.
3.1. The discrete time Markov chain (DTMC) model forclass i vehicleTo evaluate the throughput performance of DCF in V2Inetworks, we consider a tagged class i vehicle and repre-sents its states by a three-dimensional DTMC {z(t), si(t), bi(t)}. Here z(t) denotes the spatial zone in which the nodeis residing at time t. Clearly, z(t) can take only one of thetwo values: 0 or 1. si(t) and bi(t), respectively, denote theback-off stage and back-off counter of the tagged node attime t. Slot times t and t + 1 correspond to the beginningof two consecutive back-offs of the node. The duration ofa time slot is a random variable as it may contain, anempty slot, a successful transmission slot or a collision slot
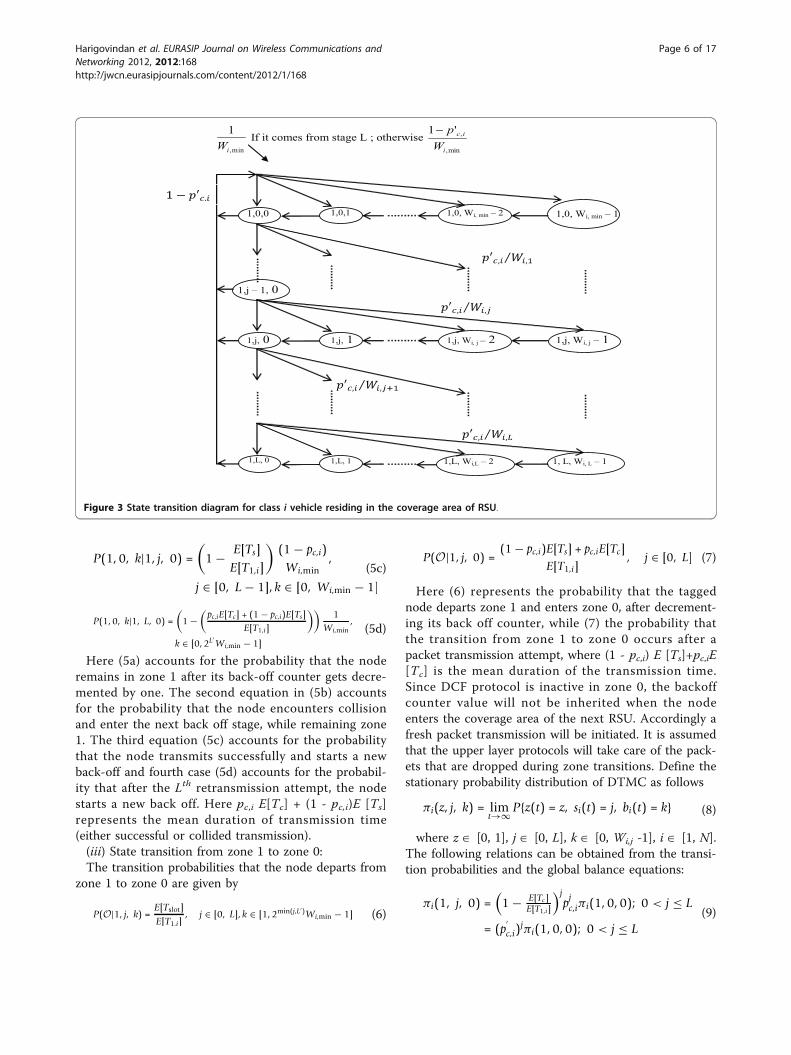
[7]. When the node is in zone 1 (within the coverage areaof RSU), it follows DCF mechanism and the correspondingstate transition diagram is shown in Figure 3.Let pc,i and τi, respectively, represent the frame colli-
sion probability (conditioned on a given class i nodetransmission) and frame transmission probability forclass i node. As shown in Figure 3, when back off coun-ter counts down to zero, the node would initiate thetransmission attempt. If the transmission is collided, thenode would back off by selecting a new back off timebased on the DCF mechanism. In the case of a success-ful transmission the back off stage is cleared to zero.After each transmission attempt (failure or success), it ispossible for the node to move to zone 0 or remainwithin zone 1. Similarly after each decrement of backoff counter, the tagged node either stays in the zone 1or move to zone 0. We consider that DCF is inactive inzone 0 (the back-off time set to infinity and the back-offstage cleared to 0), as in this case nodes are out of thetransmission range. As such, nodes in zone 0 have onlyone state whereas those in zone 1 have multiple stateswith different values of back-off time and stage. Theone-step transition probabilitiesa of the Markov chainfrom time slot t to t + 1 are as follows:(i) State transition from zone 0 to zone 1:
P(1, 0, k|O) =E[Tslot]
E[T0,i]Wi,min, k ∈ [0, Wi,min − 1] (4)
where O represents zone 0 and E [Tslot] is the meanduration of one time slot. P (1, 0, k/O) accounts for thetransition probability that the node moves from zone 0to zone 1 and selects the back-off time k from the range[0, Wi,min - 1]. This is because of the fact that within
one time slot, with probability E[Tslot ]E[T0,1] , the node moves
from zone 0 to zone 1 according to the geometricallydistributed sojourn time in each zone. After reachingzone 1, the node selects the initial bi(t) uniformly from[0, Wi,min - 1]. As the zone transition and back-off timeselection are independent, the overall transmission prob-
ability is E[Tslot ]E[T0,1]Wi,min
.
(ii) State transitions within zone 1 (the RSU coverage):Let E [Ts] and E [Tc], respectively, represent average
successful and collision time of the class i node in zone1. The various transition probabilities are as follows:
P(1, j, k − 1|1, j, k) =(
1 − E[Tslot]E[T1,i]
),
j ∈ [0, L], k ∈ [1, 2min(j,L′)Wi,min − 1]
(5a)
P(1, j, k|1, j − 1, 0) =(
1 − E[Tc]E[T1,i]
)(pc,i
2jWi,min
),
j ∈ [1, L], k ∈ [0, 2min(j,L′)Wi,min − 1]
(5b)
Zone 0
Zone 1
Figure 2 Markov chain model for zone transitions.
Harigovindan et al. EURASIP Journal on Wireless Communications andNetworking 2012, 2012:168http:?/jwcn.eurasipjournals.com/content/2012/1/168
Page 5 of 17
P(1, 0, k|1, j, 0) =(
1 − E[Ts]E[T1,i]
)(1 − pc,i)Wi,min
,
j ∈ [0, L − 1], k ∈ [0, Wi,min − 1]
(5c)
P(1, 0, k|1, L, 0) =(
1 −(
pc,iE[Tc] + (1 − pc,i)E[Ts]E[T1,i]
))1
Wi,min,
k ∈ [0, 2L′Wi,min − 1]
(5d)
Here (5a) accounts for the probability that the noderemains in zone 1 after its back-off counter gets decre-mented by one. The second equation in (5b) accountsfor the probability that the node encounters collisionand enter the next back off stage, while remaining zone1. The third equation (5c) accounts for the probabilitythat the node transmits successfully and starts a newback-off and fourth case (5d) accounts for the probabil-ity that after the Lth retransmission attempt, the nodestarts a new back off. Here pc,i E[Tc] + (1 - pc,i)E [Ts]represents the mean duration of transmission time(either successful or collided transmission).(iii) State transition from zone 1 to zone 0:The transition probabilities that the node departs from
zone 1 to zone 0 are given by
P(O|1, j, k) =E[Tslot]E[T1,i]
, j ∈ [0, L], k ∈ [1, 2min(j,L′)Wi,min − 1] (6)
P(O|1, j, 0) =(1 − pc,i)E[Ts] + pc,iE[Tc]
E[T1,i], j ∈ [0, L] (7)
Here (6) represents the probability that the taggednode departs zone 1 and enters zone 0, after decrement-ing its back off counter, while (7) the probability thatthe transition from zone 1 to zone 0 occurs after apacket transmission attempt, where (1 - pc,i) E [Ts]+pc,iE[Tc] is the mean duration of the transmission time.Since DCF protocol is inactive in zone 0, the backoffcounter value will not be inherited when the nodeenters the coverage area of the next RSU. Accordingly afresh packet transmission will be initiated. It is assumedthat the upper layer protocols will take care of the pack-ets that are dropped during zone transitions. Define thestationary probability distribution of DTMC as follows
πi(z, j, k) = limt→∞ P{z(t) = z, si(t) = j, bi(t) = k} (8)
where z Î [0, 1], j Î [0, L], k Î [0, Wi,j -1], i Î [1, N].The following relations can be obtained from the transi-tion probabilities and the global balance equations:
πi(1, j, 0) =(
1 − E[Tc]E[T1,i]
)jpj
c,iπi(1, 0, 0); 0 < j ≤ L
= (p′c,i)
jπi(1, 0, 0); 0 < j ≤ L(9)
min,
1
iW If it comes from stage L ; otherwise
min,
,'1
i
ic
W
p−
1,0,0 1,0,1 1,0, Wi, min – 2 1,0, Wi, min – 1
1,j, 0 1,j, 1 1,j, Wi, j – 2 1,j, Wi, j – 1
1,j – 1, 0
1,L, 0 1,L, 1 1,L, Wi,L – 2 1, L, Wi, L – 1
Figure 3 State transition diagram for class i vehicle residing in the coverage area of RSU.
Harigovindan et al. EURASIP Journal on Wireless Communications andNetworking 2012, 2012:168http:?/jwcn.eurasipjournals.com/content/2012/1/168
Page 6 of 17

πi(1, j, k) =(
Wi,j−kWi,j
)πi(1, j, 0); 0 ≤ j ≤ L, 1 ≤ k ≤ Wi,j − 1 (10)
L∑j=0
Wi,j−1∑k=0
πi(1, j, k) =d1
d1 + d0(11)
where p′c,i =
(1 − E[Tc]
E[T1,i]
)pc,i and (11) represents the
limiting probability that a node resides within zone 1.Combining (4) and (9)-(11), the following relation canbe obtained for steady state probability πi(1, 0, 0):
πi(1, 0, 0) =(
d1
d1 + d0
)2(1 − p
′c,i)(1 − 2p
′c,i)⎛
⎝(1 − 2p
′c,i
) (1 − (p
′c,i)
L+1)
+ Wi,min
(1 − (
2p′c,i
)L′+1) (
1 − p′c,i
)+Wi,min2L′
(p′c,i)
L′+1(1 − 2p
′c,i)(1 − (p
′c,i)
L−L′, )
⎞⎠ (12)
A frame transmission will occur when the back offcounter is equal to zero, regardless of the back off stage,while the vehicle is in zone 1. Here τi is the conditionalprobability that the class i vehicle transmits a frame in atime slot, given that the vehicle is in zone 1:
τi =
∑Lj=0 πi(1, j, 0)(
d1d1+d0
) =
∑Lj=0 (p
′c,i)
jπi(1, 0, 0)(
d1d1+d0
)
=
(1 − (p
′c,i)
L+1
(1 − p′c,i)
) ⎛⎝πi(1, 0, 0)(
d1d1+d0
)⎞⎠
(13)
Combining (12) and (13), we get the following expres-sion for τi :
τi =2(1 − (p
′c,i)
L+1)(1 − 2p
′c,i)(
(1 − 2p′c,i)(1 − (p
′c,i)
L+1) + Wi,min(1 − (2p
′c,i)
L′+1)(1 − p
′c,i)
+Wi,min2L′(p
′c,i)
L′+1(1 − 2p
′c,i)(1 − (p
′c,i)
L−L′)
)(14)
The conditional collision probability for the class inode, pc,i, can be expressed as,
pc,i = 1 − (1 − τi)ni−1N∏
j=1,j�=i
(1 − τj)nj (15)
Let ptr be the probability that at least one node trans-mits in a given slot time and is given by,
ptr = 1 −∏N
j=1(1 − τj)
nj (16)
The probability ps,i that a class i node transmits and itis successful is given by,
ps,i =niτi(1 − τi)
ni−1 ∏Nj=1,j�=i (1 − τj)
nj
ptr
(17)
The average successful payload information trans-mitted for class i nodes that are within the coveragearea of RSU is computed as follows
Zi =
(Average payload information for
class i transmitted in a slot time
)
Average length of a slot time× Mean residence time for class i
Zi =ptrps,iE [M]
(1 − ptr)σ + ptrpsE [Ts] + ptr(1 − ps)E [Tc]× E[T1,i]
(18)
where E [M] is the average payload length (assumed tobe equal for all nodes), ps is the probability that a trans-mission that occur in a time slot is successful, s is theduration of a empty time slot, E[T1,i] is the meansojourn time for class i within the coverage of RSU, E[Ts] and E [Tc], respectively, represent the mean dura-tion of successful and collision slots. Assuming basicaccess, these are computed as follows [7]:
E[Ts] = TH + TE[M] + SIFS + δ + TACK + DIFS + δ
E[Tc] = TH + TE[M] + DIFS + δ(19)
Here TH, TE[M] represent the transmission times ofheader and pay load, δ is the propagation delay, TACK isthe transmission time of the ACK packet and SIFS andDIFS are defined according to IEEE 802.11p standard.To compute the bits transferred for class i node using(18), τi and pc,i are first determined using (14) and (15).It may be noted that (14) and (15) form a set of non-linear equations which can be solved by using numericaltechniques [7]. The bits transferred can be determinedby using (16)-(18), if the no. of nodes corresponding toclass i, i Î (1, N) are given.In V2I networks, the no. of vehicles on the highway
depends on parameters such as vehicle arrival rate, vehi-cle density, and vehicle speed. The total arrival rate li ofclass i vehicles to the RSU can be determined as
λi = kiμvi (20)
where ki is the vehicle density (veh/meter) in lane ialong the highway segment and μvi is the mean vehiclespeed (m/sec). According to Greenshield’s model [23],the node density ki linearly changes with the mean velo-city μvi as
ki = kjam
(1 − μvi
vfree
)(21)
where kjam is the vehicle jam density at which trafficflow comes to a halt, vfree is the free moving velocity, i.e., the maximum speed with which vehicle can move,when the vehicle is driving alone on the road (usuallytaken as the speed limit of the road). The mean numberof class i nodes, Ni in the highway segment, is thendetermined using Little’s theorem as follows [15]:
Ni =λi(d1 + d0)
μvi
= kjam
(1 − μvi
vfree
)(d1 + d0)
(22)
Harigovindan et al. EURASIP Journal on Wireless Communications andNetworking 2012, 2012:168http:?/jwcn.eurasipjournals.com/content/2012/1/168
Page 7 of 17
The number of class i nodes within the coverage areaof RSU is given by
ni = Nid1
d1 + d0
= kjam
(1 − μvi
vfree
)d1
(23)
4. Ensuring fairness in V2I networksAs discussed earlier, the unfairness problem in V2I net-works is caused by distinct velocities of the vehicles. Afast moving vehicle has less chance to communicatewith its RSU, as compared to a slow moving vehicle,owing to their reduced residence time within RSU’s cov-erage. Accordingly, the bits transferred of fast movingvehicle is less as compared to that of vehicles withlower speed. In this section, using the model developedin previous section, analytical expression for the optimalminimum CW required to achieve bit-based fairness isobtained. We use the following Jain’s Fairness Index[27], in evaluating the fairness of channel access:
F =
(U∑
i=1yi
)2
UU∑
i=1y2
i
(24)
where U is the total number of nodes in the network,and yi’s are the individual node share. It may be notedthat F ≤ 1 and equality holds i f f yi = y ∀i.
4.1. Selection of minimum CW for fair service in V2InetworksOur objective is to ensure that all competing nodes inthe network achieve same amount of data transferred
regardless of their velocities. Let zi = Zinibe the bits trans-
ferred per node for class i and let∑N
i=1 ni = U be thetotal number of nodes in the network. To ensure fair-ness, our aim is to achieve the following
zj = z, j = 1, 2, 3, . . . , N (25)
In the following section, we derive expression for theminimum CW required, for vehicles belonging to differ-ent classes of mean velocities, to meet the desired fair-ness objective. Initially we consider a network with twovelocity classes. The analysis is then extended for a V2Inetwork with three velocity classes.4.1.1. Two classes of mean velocitiesIn the discussion that follows, the subscripts S and Fcorrespond to classes of slow and fast vehicles, respec-tively. Let nS denote the number of slow moving vehi-cles and nF denote the number of fast moving vehicles.Also, let μvS and μvF, respectively, denote the mean
velocities of the slow and fast moving vehicles and let E[T1,S] and E[T1,F], respectively, be mean values of theirresidence times. Further, let WS,min and WF,min be theminimum CW corresponding to two classes of veloci-ties. Let the conditional frame transmission probabilitiesof slow and fast nodes be τS and τF, respectively; and thecorresponding collision probabilities pc,S and pc,F. Using(14), τS and τF can be expressed in terms of these prob-abilities as:
τS =2(1 − (p
′c,S)
L+1)(1 − 2p
′c,S)(
(1 − 2p′c,S)(1 − (p
′c,S)
L+1) + WS,min(1 − (2p
′c,S)
L′+1)(1 − p
′c,S)
+WS,min2L′(p
′c,S)
L′+1(1 − 2p
′c,S)(1 − (p
′c,S)
L−L′)
)(26)
τF =2(1 − (p
′c,F)
L+1)(1 − 2p
′c,F)(
(1 − 2p′c,F)(1 − (p
′c,F)
L+1) + WF,min(1 − (2p
′c,F)
L′+1)(1 − p
′c,F)
+WF,min2L′(p′c,F)
L′+1(1 − 2p
′c,F)(1 − (p
′c,F)
L−L′)
)(27)
where p′c,S =
(1 − E[Tc]
E[T1,S]
)pc,S and
p′c,F =
(1 − E[Tc]
E[T1,F ]
)pc,F. Further, the collision probabilities
pc,S and pc,F are expressed as
pc,S = 1 − (1 − τS)nS−1(1 − τF)nF
pc,F = 1 − (1 − τF)nF−1(1 − τS)nS(28)
Recall that ptr is the probability that there is at leastone transmission in the given time slot, and let ptr,S andptr,F be the corresponding probabilities for slow and fastnodes, respectively:
ptr = 1 − (1 − τS)nS (1 − τF)nF
ptr,S = 1 − (1 − τS)nS
ptr,F = 1 − (1 − τF)nF
(29)
The success probabilities, as defined in (17), for twoclasses are:
ps,S =nSτS(1 − τS)nS−1(1 − τF)nF
ptr
ps,F =nFτF(1 − τF)nF−1(1 − τS)nS
ptr
(30)
The amount of bits transferred, as defined in (18), forslow and fast moving vehicles are given by,
ZS =ptrps,SE[M]
(1 − ptr)σ + ptrpsE[Ts] + ptr(1 − ps)E[Tc]× E[T1,S]
ZF =ptrps,FE[M]
(1 − ptr)σ + ptrpsE[Ts] + ptr(1 − ps)E[Tc]× E[T1,F]
(31)
Recall that the fairness index F becomes equal to unitywhen the bits transferred per node for slow and fastnodes are equal; i.e., zS = zF. From (28), we have(1 − pc,S)(1 − τS) = (1 − pc,F) (1 − τF) = (1 − τS)nS (1 − τF)nF.
Harigovindan et al. EURASIP Journal on Wireless Communications andNetworking 2012, 2012:168http:?/jwcn.eurasipjournals.com/content/2012/1/168
Page 8 of 17
Assume WS,min, WF,min >>1 and τS, τF <<1 so that pc,S ≅pc,F. Then using (26), (27) and assuming the retry limitto be infinite, the following approximation is valid:τSτF
= WF,minWS,min
. Utilizing (29), (30), and (31), we have the fol-
lowing approximation for ratio of bits transferred forslow and fast vehicles:
ZS
ZF
∼= nSτS(1 − τS)nS−1(1 − τF)nF E[T1,S]
nFτF(1 − τF)nF−1(1 − τS)nSE[T1,F]
∼=nS
τS1−τS
E[T1,S]
nFτF
1−τFE[T1,F]
∼= nSτSE[T1,S]nFτFE[T1,F]
(32)
The ratio of the bits transferred per node is given by
zS
zF=
ZS/nS
ZF/nF
∼= τSE[T1,S]τFE[T1,F]
∼= WF,minE[T1,S]WS,minE[T1,F]
(33)
Since F = 1 when zS = zF, the optimal minimum CWfor the fast vehicle to achieve desired fairness objectivecan be obtained as follows:
W∗F,min
∼=⌈
WS,minE[T1,F]E[T1,S]
⌉(34)
Similarly, the optimal minimum CW for the slowvehicle can be computed, given the minimum CW offast vehicle, as:
W∗S,min
∼=⌈
WF,minE[T1,S]E[T1,F]
⌉(35)
Under the default parameter settings (where all MACparameters are equal irrespective of node velocities), theratio of bits transferred per node for slow and fastnodes is obtained from (33) as zS / zF ≅ E[T1,S]/E[T1,F ].When optimal minimum CW is chosen according to(34) or (35), the ratio of bits transferred per node forslow and fast station becomes equal to unity, thusresulting in bit-based fairness.4.1.2. Three classes of mean velocitiesIn this section, we extend our analysis to a V2I networkin which there are three classes of mean velocities: slow(S), medium (M) and fast (F). Let nS, nM, nF, respec-tively, denote the number of vehicles corresponding tothe three categories. μvS, μvM, and μvF, respectively, betheir mean velocities; and E[T1,S], E[T1,M], and E[T1,F],respectively, be their mean residence time. Clearly, E[T1,
S] > E[T1,M] > E[T1,F]. Further, let τS, τM, and τF be theconditional frame transmission probabilities and let pc,S,pc ,M, and pc,F be the frame collision probabilities ofslow, medium and fast vehicles, respectively.To ensure fairness, the minimum CW of medium and
fast vehicles are decreased to improve their transmissionopportunity during their residence within the coveragearea of RSU. Keeping the minimum CW of slowest
vehicle constant at default value, the optimal minimumCW pair (W∗
M,min, W∗F,min) required to achieve F = 1 is
determined. Since the fairness index F becomes equal tounity when zS = zM = zF , where zi (i = S, M, F) repre-sent the bits transferred per node for slow, medium andfast nodes respectively. Expressions similar to (33) canbe obtained as
zS
zF
∼= WF,minE[T1,S]WS,minE[T1,F]
zS
zM
∼= WM,minE[T1,S]WS,minE[T1,M]
(36)
Hence approximate expressions for optimal minimumCW pair for medium and fast nodes can be obtained asfollows:
W∗M,min
∼=⌈
WS,minE[T1,M]E[T1,S]
⌉
W∗F,min
∼=⌈
WS,minE[T1,F]E[T1,S]
⌉ (37)
Note that W∗F,min required to achieve bit-based fairness
in a network with three classes of mean velocities issame as that of two classes case. Also, W∗
M,min requiredto achieve bit based fairness in network with threeclasses of mean velocities is same as that required in anetwork two velocity classes, where the mean velocitiesare μvM and μvS. Thus the optimal value of minimumCW required to achieve bit-based fairness in a networkwith two velocity classes, hold for network with threemean velocity classes as well. For a V2I network with Nnumber of mean velocity classes, the results of (37) canbe extended for all the higher velocity classes, providedwe consider the slowest vehicle to be the referencenode.
5. Analytical and simulation resultsIn this section, we present the analytical and simulationresults. The analytical results correspond to the mathe-matical model presented in the previous section and areobtained using MATLAB. To validate the analyticalresults, we simulate a V2I network using an event drivencustom simulation program, written in C++ program-ming language, that closely follows the IEEE 802.11pstandard: MAC layer based on EDCA and physical layerbased on IEEE 802.11a. A drive-thru internet scenario,shown in the Figure 1, is simulated in which RSU isdeployed along the road and vehicles passing through,compete for communication with RSUs. The whole roadlength is divided into two segments with one zone in thecoverage area of RSU and other zone representing theregion outside the coverage of RSU (we set d1 = 250 mand d0 = 50 m). When there are two classes of vehicles,
Harigovindan et al. EURASIP Journal on Wireless Communications andNetworking 2012, 2012:168http:?/jwcn.eurasipjournals.com/content/2012/1/168
Page 9 of 17

we simulate the road segment composed of two lanes.For the case of three classes, a three lane road segment issimulated. Vehicles arrive according to a poisson processwith rate l veh/sec. Lane i is used by vehicles belongingto class i of mean velocity vi. The probability distributionof vi is assumed to be uniform in the interval (vmin,i, vmax,
i) with μvi representing the mean speed and σvi, the stan-dard deviation. We consider two values for traffic jamdensity (kjam = 80 and 160 veh/km/lane) and the freeflow speed is selected as vfree = 160 km/hr [28]. The datatransmission rate is 6 Mbps. The system parameters usedfor simulation as well as for finding the numerical resultsare given in the in Table 1. All reported simulationresults are averages over multiple 100 s simulations.The number of vehicles corresponding to different
classes of mean velocities, within the coverage area ofRSU, are obtained using (23) with two values of kjam :80 and 160 veh/km/lane. Table 2 lists the number ofslow and fast vehicles in a network with two classes ofmean velocities for different choices of mean velocities.Similar results are shown in Table 3 for a network withthree classes of mean velocities. These results are laterused to study the throughput performance of V2Inetworks.
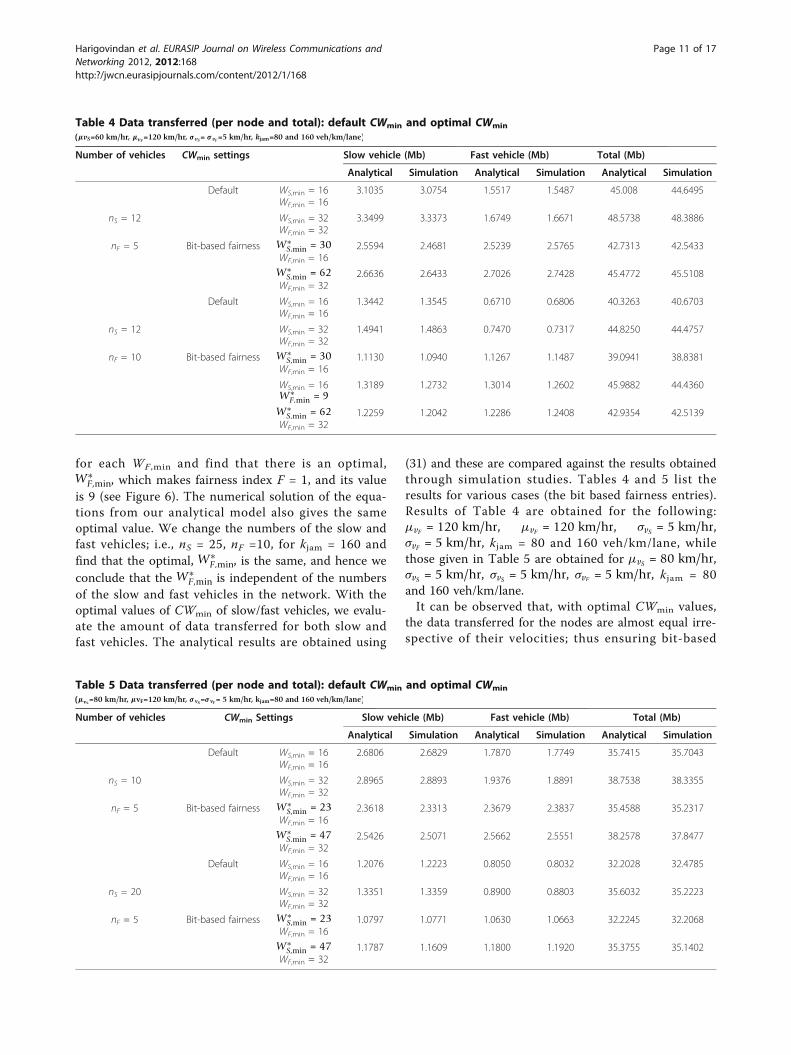
5.1. Network with two classes of mean velocitiesThe MAC parameters for slow and fast vehicles are keptthe same: L = 7, L’ = 5, WS,min = 16 or 32, WF,min = 16 or32. Further, we select μvS = 60 km/hr, μvF = 120 km/hr,σvF = 5 km/hr, σvF = 5 km/hr, kjam = 80 or 160 veh/km/lane and vfree = 160 km/hr. The number of vehicles corre-sponding to these specifications are listed in Table 2. Wefind the amount of data transferred (bits) for slow and fastvehicles by analysis using (31) as well as simulation. Herethe analytical results are obtained using (31). The resultsare shown in Tables 4 and 5. We find that the data trans-ferred for fast vehicles is very low compared to slow vehi-cles with default CWmin setting. Results are shown for twodifferent values of kjam and two different values of meanvelocities. The low data transfer for fast vehicle is causedby the DCF protocol which does not consider residence
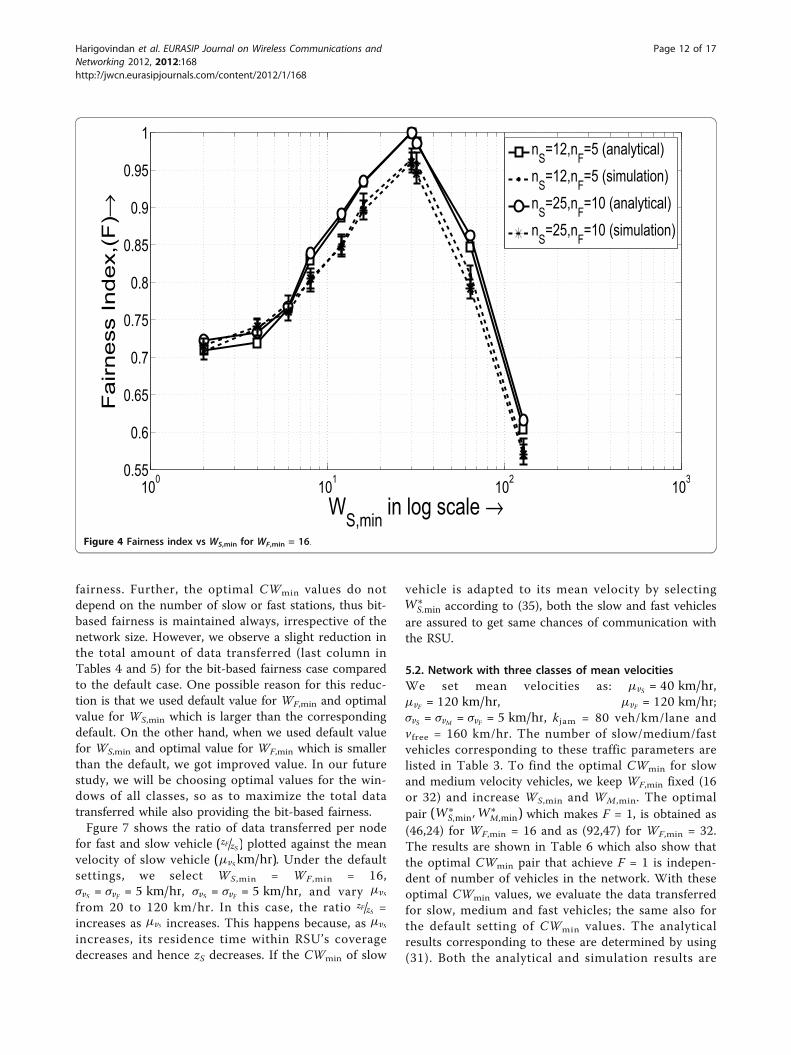
time of a vehicle for granting channel access. Further, weobserve that for default CWmin settings, the ratio of datatransferred per node for slow and fast vehicles is equal tothe ratio of their mean residence times. Our simulationresults for the default CWmin setting listed in Tables 4and 5 corroborate the analytical results given in (33).5.1.1. Evaluation of optimal CWmin for Slow and fastvehiclesContinuing with the case, where there are two class ofmean velocities, we try to achieve bit-based fairness bytuning CWmin of either slow or fast vehicles. Firstly, wekeep WF,min = 16, nS = 12, nF = 5 (corresponding toμvF = 120 km/hr, μvF = 120 km/hr, kjam = 80 veh/km/lane) and increase WS,min, minimum CW of the slowvehicle. We evaluate the fairness index defined arlier foreach WS,min and find that there is an optimal W∗
S,min
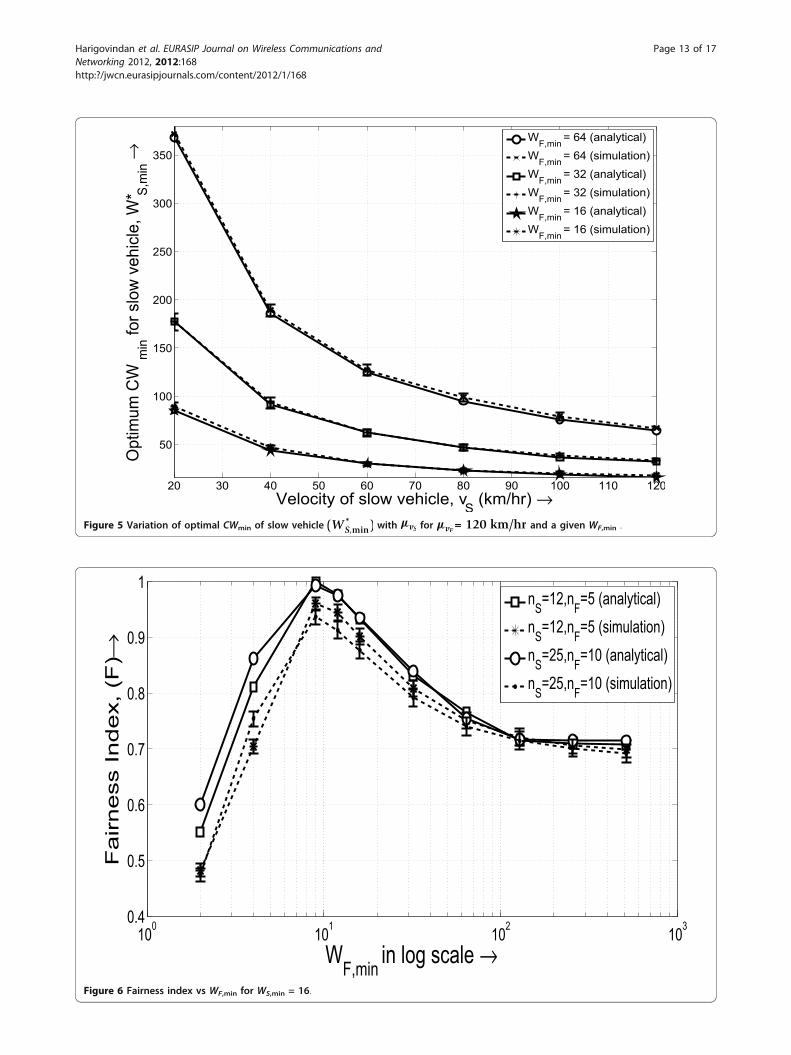
which makes Fairness index F = 1, and its value is 30(see Figure 4). The numerical solution of the equationsfrom our analytical model also gives the optimal valueto be equal to 30. We change the numbers of the slowand fast vehicles and keep nS = 25, nF = 10 (correspond-ing to μvS = 60 km/hr, μvF = 120 km/hr, kjam = 160veh/km/lane) and find that the WS,min is the same andis independent of the numbers of the slow and fast vehi-cles in the network. The fairness index is plotted againstthe WS ,min of the slow station in Figure 4. OptimalW∗
S,min for different cases are plotted in Figure 5. Wefind that the optimal values for the minimum CW, toensure fairness, strongly depend on the mean velocity ofthe vehicles. When CWmin of fast station is fixed, andvelocity of slow vehicle is increased, the optimum mini-mum CW of slow station reduces. Consequently, to getfair access to system resources, its CWmin has to bedecremented. It can also be seen from Figure 5 that, theoptimal CWmin of slow vehicle is roughly inversely pro-portional to their mean speed; i.e., WS,min ∝ 1/μvS.Next, we keep WS,min = 16; nS = 12, nF = 5, for kjam =
80 and vary WF,min , which is the CWmin of the fastvehicle. We evaluate the fairness index defined earlier
Table 1 System parameters
Parameter Value
Packet payload 8184 bits @ 6 Mb/s
MAC header 256 bits @ 6 Mb/s
PHY header 192 bits @ 3 Mb/s
ACK 112 bits + PHY header @ 3 Mb/s
Channel bit rate 6 Mb/s
Propagation delay 2 μs
Slot time 13 μs
SIFS 32 μs
DIFS 58 μs
Table 2 Network size: two classes of mean velocitiesμvS
, vF(km/hr) kjam = 80 veh/km/lane k
jam = 160 veh/km/lane
nS nF nS nF
60, 120 12 5 25 10
80, 120 10 5 20 10
Table 3 Network size: three classes of mean velocitiesμvS
, μvM, vF (km/hr) k
jam = 80 Veh/km/lane
kjam = 160 Veh/km/
lane
nS nM nF nS nM nF
40, 80, 120 15 10 5 30 20 10
30, 90, 150 16 8 1 32 17 2
Harigovindan et al. EURASIP Journal on Wireless Communications andNetworking 2012, 2012:168http:?/jwcn.eurasipjournals.com/content/2012/1/168
Page 10 of 17
for each WF ,min and find that there is an optimal,W∗
F,min, which makes fairness index F = 1, and its valueis 9 (see Figure 6). The numerical solution of the equa-tions from our analytical model also gives the sameoptimal value. We change the numbers of the slow andfast vehicles; i.e., nS = 25, nF =10, for kjam = 160 andfind that the optimal, W∗
F,min, is the same, and hence weconclude that the W∗
F,min is independent of the numbersof the slow and fast vehicles in the network. With theoptimal values of CWmin of slow/fast vehicles, we evalu-ate the amount of data transferred for both slow andfast vehicles. The analytical results are obtained using
(31) and these are compared against the results obtainedthrough simulation studies. Tables 4 and 5 list theresults for various cases (the bit based fairness entries).Results of Table 4 are obtained for the following:μvF = 120 km/hr, μvF = 120 km/hr, σvS = 5 km/hr,σvF = 5 km/hr, kjam = 80 and 160 veh/km/lane, whilethose given in Table 5 are obtained for μvS = 80 km/hr,σvS = 5 km/hr, σvS = 5 km/hr, σvF = 5 km/hr, kjam = 80and 160 veh/km/lane.It can be observed that, with optimal CWmin values,
the data transferred for the nodes are almost equal irre-spective of their velocities; thus ensuring bit-based
Table 4 Data transferred (per node and total): default CWmin and optimal CWmin(μvS=60 km/hr, μvF
=120 km/hr, σ vS= σ vF =5 km/hr, kjam=80 and 160 veh/km/lane)
Number of vehicles CWmin settings Slow vehicle (Mb) Fast vehicle (Mb) Total (Mb)
Analytical Simulation Analytical Simulation Analytical Simulation
Default WS,min = 16WF,min = 16
3.1035 3.0754 1.5517 1.5487 45.008 44.6495
nS = 12 WS,min = 32WF,min = 32
3.3499 3.3373 1.6749 1.6671 48.5738 48.3886
nF = 5 Bit-based fairness W∗S,min = 30
WF,min = 162.5594 2.4681 2.5239 2.5765 42.7313 42.5433
W∗S,min = 62
WF,min = 322.6636 2.6433 2.7026 2.7428 45.4772 45.5108
Default WS,min = 16WF,min = 16
1.3442 1.3545 0.6710 0.6806 40.3263 40.6703
nS = 12 WS,min = 32WF,min = 32
1.4941 1.4863 0.7470 0.7317 44.8250 44.4757
nF = 10 Bit-based fairness W∗S,min = 30
WF,min = 161.1130 1.0940 1.1267 1.1487 39.0941 38.8381
WS,min = 16W∗
F,min = 91.3189 1.2732 1.3014 1.2602 45.9882 44.4360
W∗S,min = 62
WF,min = 321.2259 1.2042 1.2286 1.2408 42.9354 42.5139
Table 5 Data transferred (per node and total): default CWmin and optimal CWmin(μvS
=80 km/hr, μvF=120 km/hr, σ vS=σ vF= 5 km/hr, kjam=80 and 160 veh/km/lane)
Number of vehicles CWmin Settings Slow vehicle (Mb) Fast vehicle (Mb) Total (Mb)
Analytical Simulation Analytical Simulation Analytical Simulation
Default WS,min = 16WF,min = 16
2.6806 2.6829 1.7870 1.7749 35.7415 35.7043
nS = 10 WS,min = 32WF,min = 32
2.8965 2.8893 1.9376 1.8891 38.7538 38.3355
nF = 5 Bit-based fairness W∗S,min = 23
WF,min = 162.3618 2.3313 2.3679 2.3837 35.4588 35.2317
W∗S,min = 47
WF,min = 322.5426 2.5071 2.5662 2.5551 38.2578 37.8477
Default WS,min = 16WF,min = 16
1.2076 1.2223 0.8050 0.8032 32.2028 32.4785
nS = 20 WS,min = 32WF,min = 32
1.3351 1.3359 0.8900 0.8803 35.6032 35.2223
nF = 5 Bit-based fairness W∗S,min = 23
WF,min = 161.0797 1.0771 1.0630 1.0663 32.2245 32.2068
W∗S,min = 47
WF,min = 321.1787 1.1609 1.1800 1.1920 35.3755 35.1402
Harigovindan et al. EURASIP Journal on Wireless Communications andNetworking 2012, 2012:168http:?/jwcn.eurasipjournals.com/content/2012/1/168
Page 11 of 17
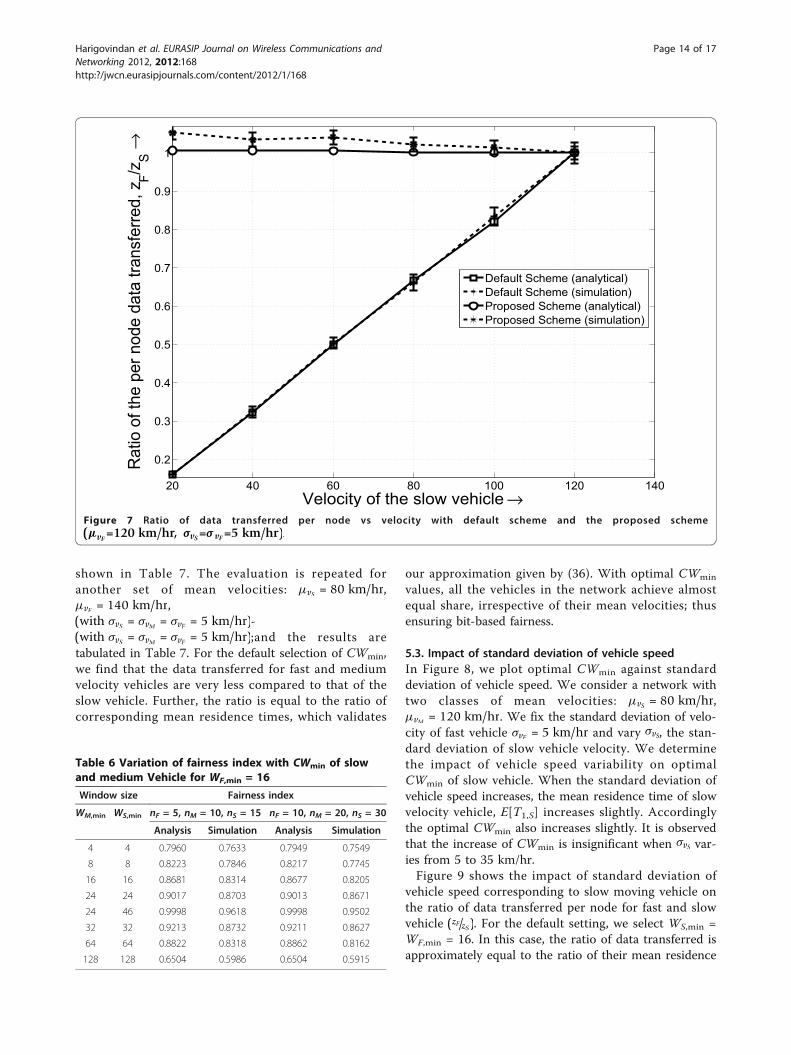
fairness. Further, the optimal CWmin values do notdepend on the number of slow or fast stations, thus bit-based fairness is maintained always, irrespective of thenetwork size. However, we observe a slight reduction inthe total amount of data transferred (last column inTables 4 and 5) for the bit-based fairness case comparedto the default case. One possible reason for this reduc-tion is that we used default value for WF,min and optimalvalue for WS,min which is larger than the correspondingdefault. On the other hand, when we used default valuefor WS,min and optimal value for WF,min which is smallerthan the default, we got improved value. In our futurestudy, we will be choosing optimal values for the win-dows of all classes, so as to maximize the total datatransferred while also providing the bit-based fairness.Fgure 7 shows the ratio of data transferred per node
for fast and slow vehicle (zF/zS) plotted against the meanvelocity of slow vehicle (μvS km/hr). Under the defaultsettings, we select WS ,min = WF,min = 16,σvS = σvF = 5 km/hr, σvS = σvF = 5 km/hr, and vary μvS
from 20 to 120 km/hr. In this case, the ratio zF/zS =increases as μvS increases. This happens because, as μvS
increases, its residence time within RSU’s coveragedecreases and hence zS decreases. If the CWmin of slow
vehicle is adapted to its mean velocity by selectingW∗
S,min according to (35), both the slow and fast vehiclesare assured to get same chances of communication withthe RSU.
5.2. Network with three classes of mean velocitiesWe set mean velocities as: μvS = 40 km/hr,μvF = 120 km/hr, μvF = 120 km/hr;σvS = σvM = σvF = 5 km/hr, kjam = 80 veh/km/lane andvfree = 160 km/hr. The number of slow/medium/fastvehicles corresponding to these traffic parameters arelisted in Table 3. To find the optimal CWmin for slowand medium velocity vehicles, we keep WF,min fixed (16or 32) and increase WS,min and WM,min. The optimalpair (W∗
S,min, W∗M,min) which makes F = 1, is obtained as
(46,24) for WF,min = 16 and as (92,47) for WF,min = 32.The results are shown in Table 6 which also show thatthe optimal CWmin pair that achieve F = 1 is indepen-dent of number of vehicles in the network. With theseoptimal CWmin values, we evaluate the data transferredfor slow, medium and fast vehicles; the same also forthe default setting of CWmin values. The analyticalresults corresponding to these are determined by using(31). Both the analytical and simulation results are
100 101 102 1030.55
0.6
0.65
0.7
0.75
0.8
0.85
0.9
0.95
1
WS,min in log scale →
Fa
irn
ess
In
de
x,(F
)→
nS=12,nF=5 (analytical)nS=12,nF=5 (simulation)nS=25,nF=10 (analytical)nS=25,nF=10 (simulation)
Figure 4 Fairness index vs WS,min for WF,min = 16.
Harigovindan et al. EURASIP Journal on Wireless Communications andNetworking 2012, 2012:168http:?/jwcn.eurasipjournals.com/content/2012/1/168
Page 12 of 17
20 30 40 50 60 70 80 90 100 110 120
50
100
150
200
250
300
350
Velocity of slow vehicle, vS (km/hr) →
Opt
imum
CW
min
for s
low
veh
icle
, W* S,
min
→WF,min = 64 (analytical)WF,min = 64 (simulation)WF,min = 32 (analytical)WF,min = 32 (simulation)WF,min = 16 (analytical)WF,min = 16 (simulation)
Figure 5 Variation of optimal CWmin of slow vehicle (W*S,min) with μvS for μvF
= 120 km/hr and a given WF,min .
100 101 102 1030.4
0.5
0.6
0.7
0.8
0.9
1
WF,min in log scale →
Fa
irn
ess I
nd
ex, (F
)→
nS=12,nF=5 (analytical)nS=12,nF=5 (simulation)nS=25,nF=10 (analytical)nS=25,nF=10 (simulation)
Figure 6 Fairness index vs WF,min for WS,min = 16.
Harigovindan et al. EURASIP Journal on Wireless Communications andNetworking 2012, 2012:168http:?/jwcn.eurasipjournals.com/content/2012/1/168
Page 13 of 17
shown in Table 7. The evaluation is repeated foranother set of mean velocities: μvS = 80 km/hr,μvF = 140 km/hr,(with σvS = σvM = σvF = 5 km/hr)-(with σvS = σvM = σvF = 5 km/hr);and the results aretabulated in Table 7. For the default selection of CWmin,we find that the data transferred for fast and mediumvelocity vehicles are very less compared to that of theslow vehicle. Further, the ratio is equal to the ratio ofcorresponding mean residence times, which validates
our approximation given by (36). With optimal CWmin
values, all the vehicles in the network achieve almostequal share, irrespective of their mean velocities; thusensuring bit-based fairness.
5.3. Impact of standard deviation of vehicle speedIn Figure 8, we plot optimal CWmin against standarddeviation of vehicle speed. We consider a network withtwo classes of mean velocities: μvS = 80 km/hr,μvM = 120 km/hr. We fix the standard deviation of velo-city of fast vehicle σvF = 5 km/hr and vary σvS, the stan-dard deviation of slow vehicle velocity. We determinethe impact of vehicle speed variability on optimalCWmin of slow vehicle. When the standard deviation ofvehicle speed increases, the mean residence time of slowvelocity vehicle, E[T1,S] increases slightly. Accordinglythe optimal CWmin also increases slightly. It is observedthat the increase of CWmin is insignificant when σvS var-ies from 5 to 35 km/hr.Figure 9 shows the impact of standard deviation of
vehicle speed corresponding to slow moving vehicle onthe ratio of data transferred per node for fast and slowvehicle (zF/zS). For the default setting, we select WS,min =WF,min = 16. In this case, the ratio of data transferred isapproximately equal to the ratio of their mean residence
20 40 60 80 100 120 140
0.2
0.3
0.4
0.5
0.6
0.7
0.8
0.9
1
Velocity of the slow vehicle →
Rat
io o
f the
per
nod
e da
ta tr
ansf
erre
d, z
F/zS
→
Default Scheme (analytical)Default Scheme (simulation)Proposed Scheme (analytical)Proposed Scheme (simulation)
Figure 7 Ratio of data transferred per node vs velocity with default scheme and the proposed scheme(μvF
=120 km/hr, σvS=σ vF =5 km/hr).
Table 6 Variation of fairness index with CWmin of slowand medium Vehicle for WF,min = 16
Window size Fairness index
WM,min WS,min nF = 5, nM = 10, nS = 15 nF = 10, nM = 20, nS = 30
Analysis Simulation Analysis Simulation
4 4 0.7960 0.7633 0.7949 0.7549
8 8 0.8223 0.7846 0.8217 0.7745
16 16 0.8681 0.8314 0.8677 0.8205
24 24 0.9017 0.8703 0.9013 0.8671
24 46 0.9998 0.9618 0.9998 0.9502
32 32 0.9213 0.8732 0.9211 0.8627
64 64 0.8822 0.8318 0.8862 0.8162
128 128 0.6504 0.5986 0.6504 0.5915
Harigovindan et al. EURASIP Journal on Wireless Communications andNetworking 2012, 2012:168http:?/jwcn.eurasipjournals.com/content/2012/1/168
Page 14 of 17
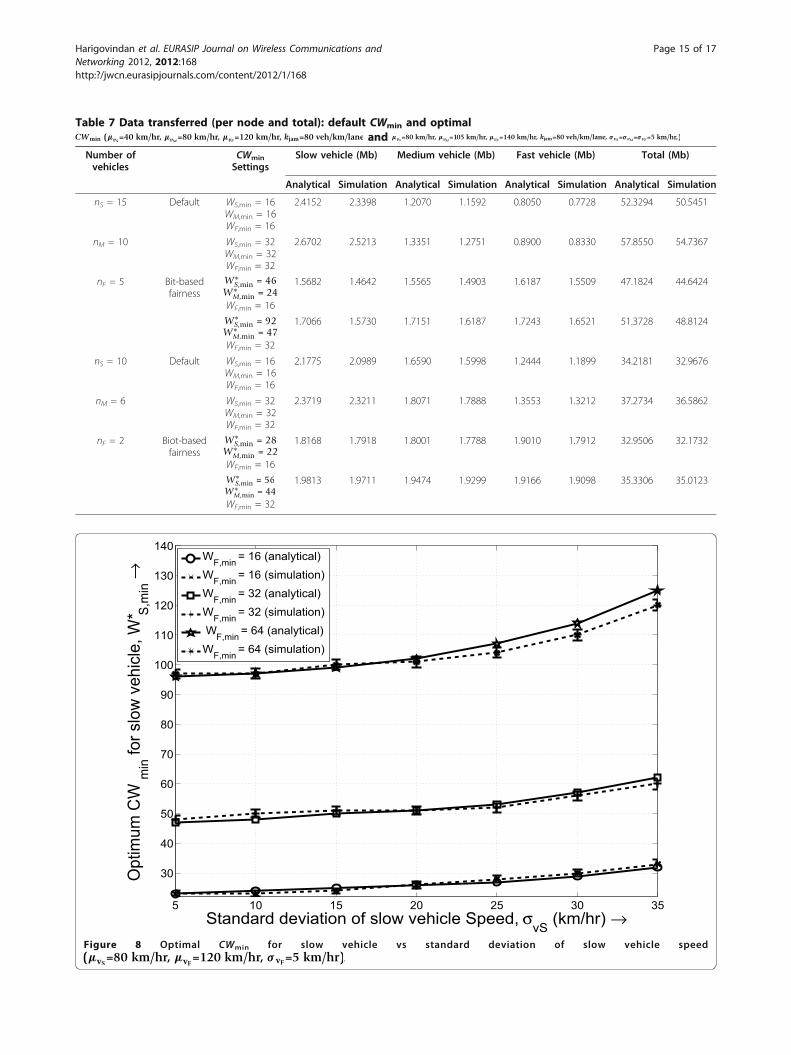
Table 7 Data transferred (per node and total): default CWmin and optimalCWmin (μvS
=40 km/hr, μvM=80 km/hr, μvF
=120 km/hr, kjam=80 veh/km/lane and μvS=80 km/hr, μvM
=105 km/hr, μvF=140 km/hr, kjam=80 veh/km/lane, σ vS=σ vM=σ vF =5 km/hr,)
Number ofvehicles
CWmin
SettingsSlow vehicle (Mb) Medium vehicle (Mb) Fast vehicle (Mb) Total (Mb)
Analytical Simulation Analytical Simulation Analytical Simulation Analytical Simulation
nS = 15 Default WS,min = 16WM,min = 16WF,min = 16
2.4152 2.3398 1.2070 1.1592 0.8050 0.7728 52.3294 50.5451
nM = 10 WS,min = 32WM,min = 32WF,min = 32
2.6702 2.5213 1.3351 1.2751 0.8900 0.8330 57.8550 54.7367
nF = 5 Bit-basedfairness
W∗S,min = 46
W∗M,min = 24
WF,min = 16
1.5682 1.4642 1.5565 1.4903 1.6187 1.5509 47.1824 44.6424
W∗S,min = 92
W∗M,min = 47
WF,min = 32
1.7066 1.5730 1.7151 1.6187 1.7243 1.6521 51.3728 48.8124
nS = 10 Default WS,min = 16WM,min = 16WF,min = 16
2.1775 2.0989 1.6590 1.5998 1.2444 1.1899 34.2181 32.9676
nM = 6 WS,min = 32WM,min = 32WF,min = 32
2.3719 2.3211 1.8071 1.7888 1.3553 1.3212 37.2734 36.5862
nF = 2 Biot-basedfairness
W∗S,min = 28
W∗M,min = 22
WF,min = 16
1.8168 1.7918 1.8001 1.7788 1.9010 1.7912 32.9506 32.1732
W∗S,min = 56
W∗M,min = 44
WF,min = 32
1.9813 1.9711 1.9474 1.9299 1.9166 1.9098 35.3306 35.0123
5 10 15 20 25 30 35
30
40
50
60
70
80
90
100
110
120
130
140
Standard deviation of slow vehicle Speed, σvS (km/hr) →
Opt
imum
CW
min
for s
low
veh
icle
, W* S,
min
→
WF,min = 16 (analytical)WF,min = 16 (simulation)WF,min = 32 (analytical)WF,min = 32 (simulation) WF,min = 64 (analytical)WF,min = 64 (simulation)
Figure 8 Optimal CWmin for slow vehicle vs standard deviation of slow vehicle speed(μvS
=80 km/hr, μvF=120 km/hr, σ vF=5 km/hr).
Harigovindan et al. EURASIP Journal on Wireless Communications andNetworking 2012, 2012:168http:?/jwcn.eurasipjournals.com/content/2012/1/168
Page 15 of 17
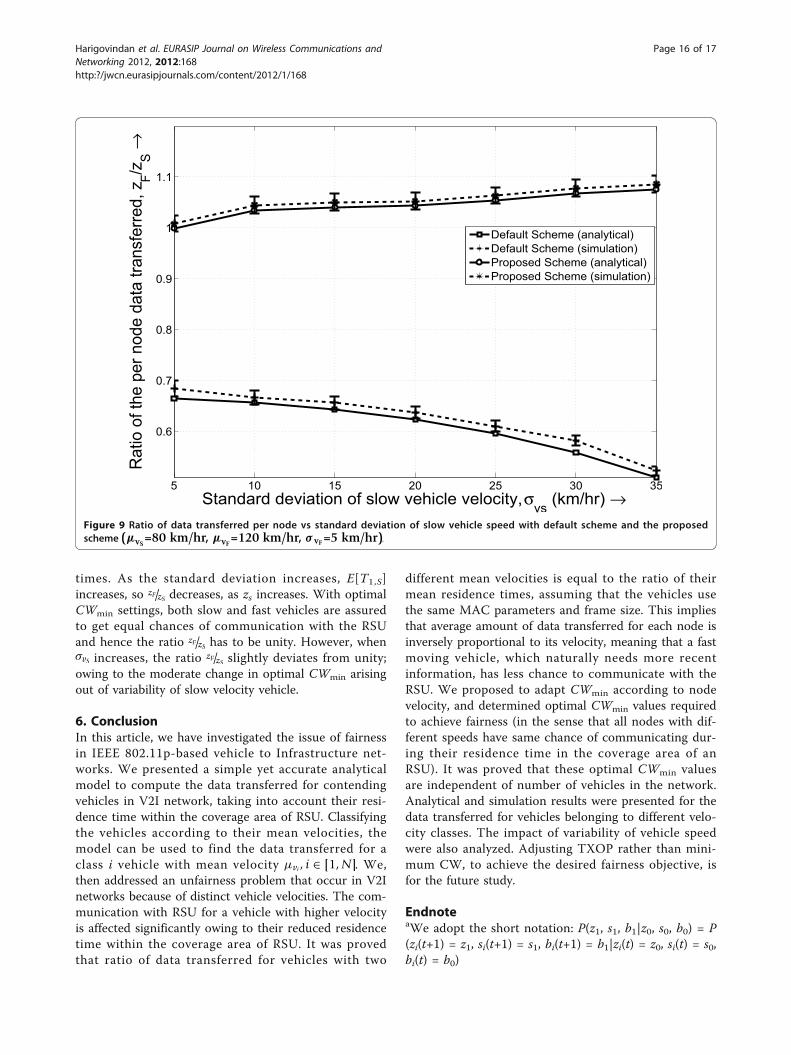
times. As the standard deviation increases, E[T1,S]increases, so zF/zS decreases, as zs increases. With optimalCWmin settings, both slow and fast vehicles are assuredto get equal chances of communication with the RSUand hence the ratio zF/zS has to be unity. However, whenσvS increases, the ratio zF/zS slightly deviates from unity;owing to the moderate change in optimal CWmin arisingout of variability of slow velocity vehicle.
6. ConclusionIn this article, we have investigated the issue of fairnessin IEEE 802.11p-based vehicle to Infrastructure net-works. We presented a simple yet accurate analyticalmodel to compute the data transferred for contendingvehicles in V2I network, taking into account their resi-dence time within the coverage area of RSU. Classifyingthe vehicles according to their mean velocities, themodel can be used to find the data transferred for aclass i vehicle with mean velocity μvi , i ∈ [1, N]. We,then addressed an unfairness problem that occur in V2Inetworks because of distinct vehicle velocities. The com-munication with RSU for a vehicle with higher velocityis affected significantly owing to their reduced residencetime within the coverage area of RSU. It was provedthat ratio of data transferred for vehicles with two
different mean velocities is equal to the ratio of theirmean residence times, assuming that the vehicles usethe same MAC parameters and frame size. This impliesthat average amount of data transferred for each node isinversely proportional to its velocity, meaning that a fastmoving vehicle, which naturally needs more recentinformation, has less chance to communicate with theRSU. We proposed to adapt CWmin according to nodevelocity, and determined optimal CWmin values requiredto achieve fairness (in the sense that all nodes with dif-ferent speeds have same chance of communicating dur-ing their residence time in the coverage area of anRSU). It was proved that these optimal CWmin valuesare independent of number of vehicles in the network.Analytical and simulation results were presented for thedata transferred for vehicles belonging to different velo-city classes. The impact of variability of vehicle speedwere also analyzed. Adjusting TXOP rather than mini-mum CW, to achieve the desired fairness objective, isfor the future study.
EndnoteaWe adopt the short notation: P(z1, s1, b1|z0, s0, b0) = P(zi(t+1) = z1, si(t+1) = s1, bi(t+1) = b1|zi(t) = z0, si(t) = s0,bi(t) = b0)
5 10 15 20 25 30 35
0.6
0.7
0.8
0.9
1
1.1
Standard deviation of slow vehicle velocity, σvs (km/hr) →
Rat
io o
f the
per
nod
e da
ta tr
ansf
erre
d, z
F/zS
→
Default Scheme (analytical)Default Scheme (simulation)Proposed Scheme (analytical)Proposed Scheme (simulation)
Figure 9 Ratio of data transferred per node vs standard deviation of slow vehicle speed with default scheme and the proposedscheme (μvS
=80 km/hr, μvF=120 km/hr, σ vF=5 km/hr).
Harigovindan et al. EURASIP Journal on Wireless Communications andNetworking 2012, 2012:168http:?/jwcn.eurasipjournals.com/content/2012/1/168
Page 16 of 17
Competing interestsThe authors declare that they have no competing interests.
Received: 12 September 2011 Accepted: 14 May 2012Published: 14 May 2012
References1. S Yousefi, MS Mousavi, M Fathy, Vehicular ad hoc networks (VANETs):
challenges and perspectives, in proc 6th IEEE Int Conf ITST, Chengdu, China,761–766 (2006)
2. H Hartenstein, KP Laberteaux, A tutorial survey on vehicular ad hocnetworks. IEEE Commun Mag. 46(6), 164–171 (2008)
3. R Uzcategui, G Acosta-Marum, Wave: a tutorial. IEEE Commun Mag. 47(5),126–133 (2009)
4. IEEE P802.11p/D5.0, draft amendment to standard for informationtechnology telecommunications and information exchange betweensystems LAN/MAN specific requirements Part 11: WLAN medium accesscontrol (MAC) and physical layer (PHY) specifications: wireless access invehicular environments (WAVE) (2008)
5. IEEE Standard for Information technology - Telecommunications andinformation exchange between systems - Local and metropolitan areanetworks - Specific requirements - Part 11: Wireless LAN MAC and PHYSpecifications (2007)
6. IEEE 802.11e/D4.0, Draft Supplement to Part 11: Wireless LAN MAC and PHYspecifications: MAC Enhancements for Quality of Service (QoS) (November2005)
7. G Bianchi, Performance analysis of the IEEE 802.11 distributed coordinationfunction. IEEE JSAC. 18(3), 535–547 (2000)
8. F Cali, M Conti, E Gregori, Dynamic tuning of the IEEE 802.11 protocol toachieve a theoretical throughput limit. IEEE/ACM Trans Network. 8(6),785–799 (2000). doi:10.1109/90.893874
9. DJ Deng, CH Ke, HH Chen, YM Huang, Contention window optimization forIEEE 802.11 DCF access control. IEEE Trans Wirel Commun. 7(12), 5129–5135(2008)
10. AV Babu, L Jacob, Fairness analysis of IEEE 802.11 multi-rate wireless LAN.IEEE Trans Veh Technol. 56, 3073–3088 (2007)
11. Y Xiao, Performance analysis of priority schemes for IEEE 802.11 and IEEE802.11e wireless LANs. IEEE Trans Wirel Commun. 4(4), 1506–1515 (2005)
12. X Chen, HH Refai, X Ma, On the enhancements to IEEE 802.11 MAC andtheir suitability for safety-critical applications in VANET. Wirel Commun MobComput. 10(9), 1530–8677 (2008)
13. X Ma, X Chen, HH Refai, Performance and reliability of DSRC vehicularsafety communication: a formal analysis. EURASIP J Wirel Commun Network.2009, 13 (2009). Article ID 969164
14. Y Wang, A Ahmed, B Krishnamachari, K Psounis, IEEE 802.11p performanceevaluation and protocol enhancement, in proc IEEE ICVES, Columbus Ohio,317–322 (2008)
15. TH Luan, X Ling, X (Sherman) Shen, MAC performance analysis for vehicle-to-infrastructure communication, in Proc Wireless Communications andNetworking Conference (WCNC), Sydney, (1–6 April 2010)
16. J He, Z Tang, T O’Farrell, TM Chen, Performance analysis of DSRC prioritymechanism for road safety applications in vehicular networks. WirelCommun Mob Comput. 11(7), 980–990 (2009)
17. E Karamad, F Ashtiani, A modified 802.11-based MAC scheme to assure FairAccess for vehicle-to-roadside communications. Comput Commun. 31(12),2898–2906 (2008). doi:10.1016/j.comcom.2008.01.030
18. S Eichler, Performance evaluation of the IEEE 802.11p WAVE communicationstandard, in Proc IEEE VTC-Fall, 2199–2203 (2007)
19. TH Luan, X Ling, X (Sherman) Shen, MAC in motion: impact of mobility onthe MAC of drive-thru internet. IEEE Trans Mob Comput. 29(2), 305–319(2012)
20. C Suthaputchakun, A Ganz, Secure priority based inter-vehiclecommunication MAC protocol for highway safety messaging, in 4thInternational Symposium on Wireless Communication Systems, Trondheim,518–523 (2007)
21. Md Imrul Hassan, HL Vu, T Sakurai, Performance analysis of the IEEE 802.11MAC protocol for DSRC with and without retransmissions, in IEEEInternational Symposium on a World of Wireless Mobile and MultimediabNetworks, Montreal, QC, Canada, 1–8 (June 2010)
22. WL Tan, WC Lau, O Yue, Modeling resource sharing for a road-side accesspoint supporting drive-thru internet, in Proc ACM VANET, New York, NY,USA, 33–42 (2009)
23. WL Tan, WC Lau, O Yue, TH Hui, Analytical models and performanceevaluation of drive-thru internet systems. IEEE JSAC. 29(1), 207–222 (2011)
24. S-T Sheu, Y-C Cheng, J-S Wu, A channel access scheme to compromisethroughput and fairness in IEEE 802.11p multi-rate/multi-channel wirelessvehicular networks, in IEEE 71st Vehicular Technology Conference, Taipei, (1–5May 20)
25. W Alasmary, W Zhuang, Mobility impact in IEEE 802.11p infrastructure lessvehicular networks. Ad Hoc Networks. 10(2), 222–230 (2010)
26. H Wu, RM Fujimoto, GF Riley, M Hunter, Spatial propagation of informationin vehicular networks. IEEE Trans Veh Technol. 58(1), 420–431 (2009)
27. R Jain, W Hawe, D Chiu, A quantitative measure of fairness anddiscrimination for resource allocation in shared computer systems. DECResearch Report TR-301 (September 1984)
28. RP Roess, ES Prassas, WR Mcshane, Traffic Engineering, 3rd edn. (PearsonPrentice Hall, Upper Saddle River, 2004)
doi:10.1186/1687-1499-2012-168Cite this article as: Harigovindan et al.: Ensuring fair access in IEEE802.11p-based vehicle-to-infrastructure networks. EURASIP Journal onWireless Communications and Networking 2012 2012:168.
Submit your manuscript to a journal and benefi t from:
7 Convenient online submission
7 Rigorous peer review
7 Immediate publication on acceptance
7 Open access: articles freely available online
7 High visibility within the fi eld
7 Retaining the copyright to your article
Submit your next manuscript at 7 springeropen.com
Harigovindan et al. EURASIP Journal on Wireless Communications andNetworking 2012, 2012:168http:?/jwcn.eurasipjournals.com/content/2012/1/168
Page 17 of 17


![[] IEEE 1120-2004 - IEEE Guide for the Planning, D(Book Fi org)](https://static.fdokumen.com/doc/165x107/63150fb6511772fe45103298/-ieee-1120-2004-ieee-guide-for-the-planning-dbook-fi-org.jpg)