Enhancing pilot ability to perform CDA with descriptive waypoints
25
Enhancing Pilot Ability to Perform CDA with Descriptive Waypoints 1 Systems Engineering Research Laboratory California State University Northridge (CSUN) 10/19/2011 0 0 0 0/ / /1 1 19 9 9 9/ / / /2 2 20 0 0 01 1 1 1 1 1 1 Authors: Michael LaMarr & Dr. Nhut Ho System Engineering Research Laboratory Dr. Walter Johnson & Vernol Battiste, NASA AMES Joe Biviano Lockheed Martin
Transcript of Enhancing pilot ability to perform CDA with descriptive waypoints

Enhancing Pilot Ability to Perform CDA with Descriptive Waypoints
1
Systems Engineering Research LaboratoryCalifornia State University Northridge (CSUN)
10/19/20110000///1119999////22200001111111
Authors: Michael LaMarr & Dr. Nhut Ho System Engineering Research LaboratoryDr. Walter Johnson & Vernol Battiste, NASA AMESJoe Biviano Lockheed Martin

� Previous Research� Objective� Method and Experimental Design� Results� Conclusion
2
Overview

Conventional Approach Vs. Continuous Descent Approach (CDA)
3
10,000 Feet
4,000 feet
ILS Glide Slope
Runway
Continuous Descent Approach
Conventional Approach
00
Current Problem with Conventional Approach� Cost of fuel = 27% operation cost to airlines� People complain about loud aircraft noise near
airports� Can’t expand runways� Limited air craft throughput at night
Implementation challenges for CDA:�Air Traffic Controllers (ATC) unable to maintain separation between decelerating aircraft�Pilots have difficulty maintaining a tight vertical flight profile
Proposed Solution Continuous Descent Approach� Idle engine at Higher altitude
� Less noise is produced � Less fuel is consumed ~220lbs� Fewer emissions produced
ai

Previous Research� Structure
� Reynolds et. al. (2005)ATC have difficulty predicting future trajectories of decelerating aircraftsStandardizing CDA deceleration profiles would allow ATC to use structured based abstractions and maintain aircraft separation
� Ho et. al. (2006)Pilots had highest speed accuracy with three gatesHaving too few or too many targets could increase workload
4
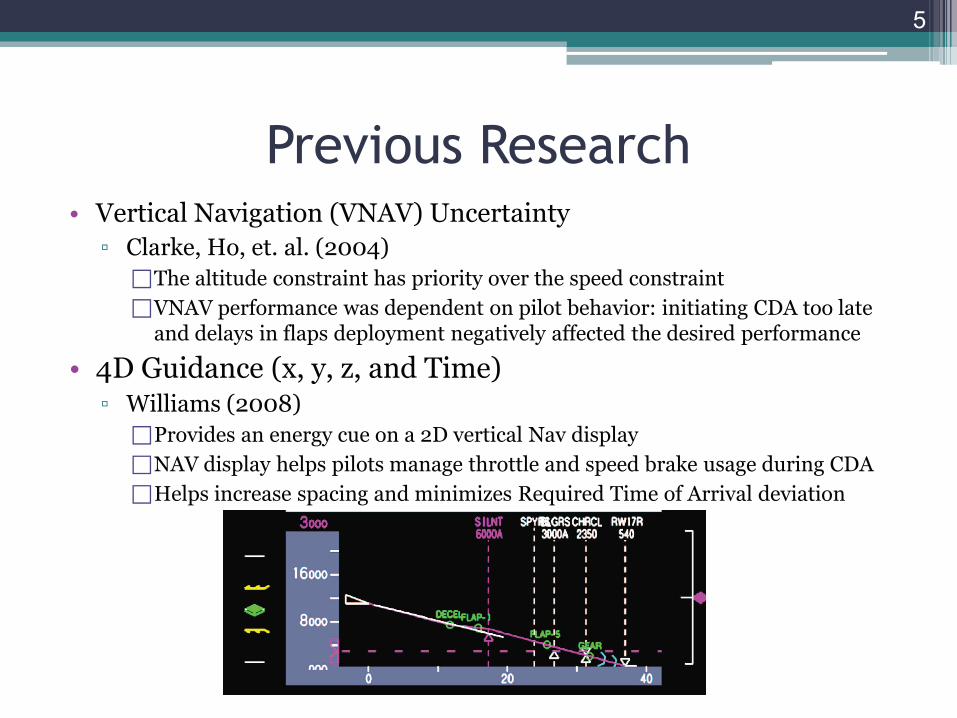
� Vertical Navigation (VNAV) Uncertainty� Clarke, Ho, et. al. (2004)
The altitude constraint has priority over the speed constraintVNAV performance was dependent on pilot behavior: initiating CDA too late and delays in flaps deployment negatively affected the desired performance
� 4D Guidance (x, y, z, and Time)� Williams (2008)
Provides an energy cue on a 2D vertical Nav displayNAV display helps pilots manage throttle and speed brake usage during CDAHelps increase spacing and minimizes Required Time of Arrival deviation
5
Previous Research

� To determine the feasibility of using gates for CDA initiated near top of descent, and number of gates and locations
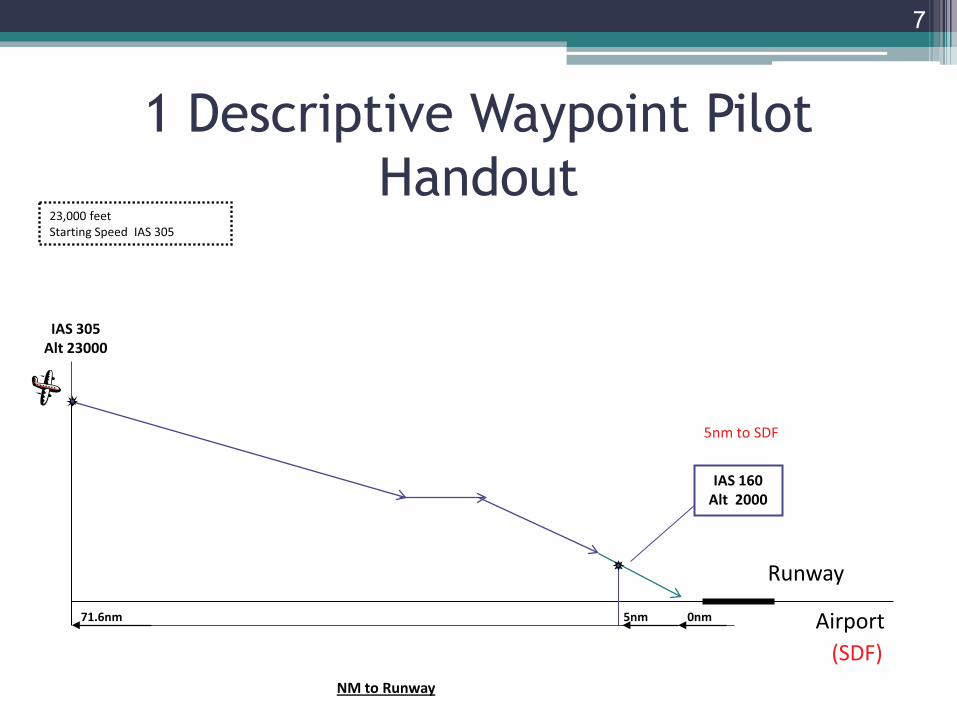
� Formalize gates as Descriptive Waypoints (DW): A Descriptive Waypoint is a target along the flight path that gives the pilot a target altitude and Indicated Airspeed (IAS)
6
Objective
7
23,000 feetStarting Speed IAS 305
Airport
IAS 160 Alt 2000
5nm71.6nm
NM to Runway
IAS 305 Alt 23000
(SDF)
0nm
5nm to SDF
Runway
1 Descriptive Waypoint Pilot Handout

8
23,000 feetStarting Speed IAS 305
Airport
IAS 160 Alt 2000
5nm38nm71.6nm
NM to Runway
IAS 305 Alt 13000
IAS 305 Alt 23000
Cheri
(SDF)
Alt<10
IAS 240 Alt 10000
0nm
5nm to SDF
21.1nm
Runway
3 Descriptive Waypoints Pilot Handout

9
23,000 feetStarting Speed IAS 305
Airport
IAS 160 Alt 2000
10nm 5nm22.1nm38nm56nm71.6nm
NM to Runway
IAS 160 Alt 5000
IAS 305 Alt 13000
IAS 305 Alt 18000
IAS 305 Alt 23000
Cheri
(SDF)
Alt<10
18nm to cheri
1Onm to SDF
IAS 240 Alt 10000
0nm
5nm to SDF
Runway
5 Descriptive Waypoints Pilot Handout

Method and Experimental Design� A 3 x3 within-subject factorial design was used
� Number of Descriptive Waypoints: One, Three, and Five� Tail Wind Speed Conditions: Slow, Normal, and High
� Dependent Variables � Deviation from Descriptive Waypoint altitude and Indicated Airspeed� Average power use of aircraft� Workload (Part-task), Pilot acceptance, & Pilot Feedback
10

Participants� Twelve IFR rated pilots with glass cockpit experience with 590 to
23,000 (Mean 7,660) hours flight time� Eleven males, one female� Age: 24 to 67, average = 38� Pilots range from flying 757, CRJ, beachcraft, private jets and a lear
jet� Two pilots had real world CDA experience, one in a simulator
11

Facilities� Study was run in Systems Engineering Research Laboratory (SERL),
California State University Northridge� Pilot was in a room with a one-way mirror� Flight chart was on desk for pilot to use
12

Mode ControlPanel (MCP)
Primary Flight Display (PFD)
13
Navigation Display
FlapsLanding GearSpeed Brakes
MACS
Flight Simulator Display

14
CSD
Vertical Situation Display

Results
15
0.00
2.00
4.00
6.00
8.00
10.00
12.00
14.00
1 DW 3 DW 5 DW
16
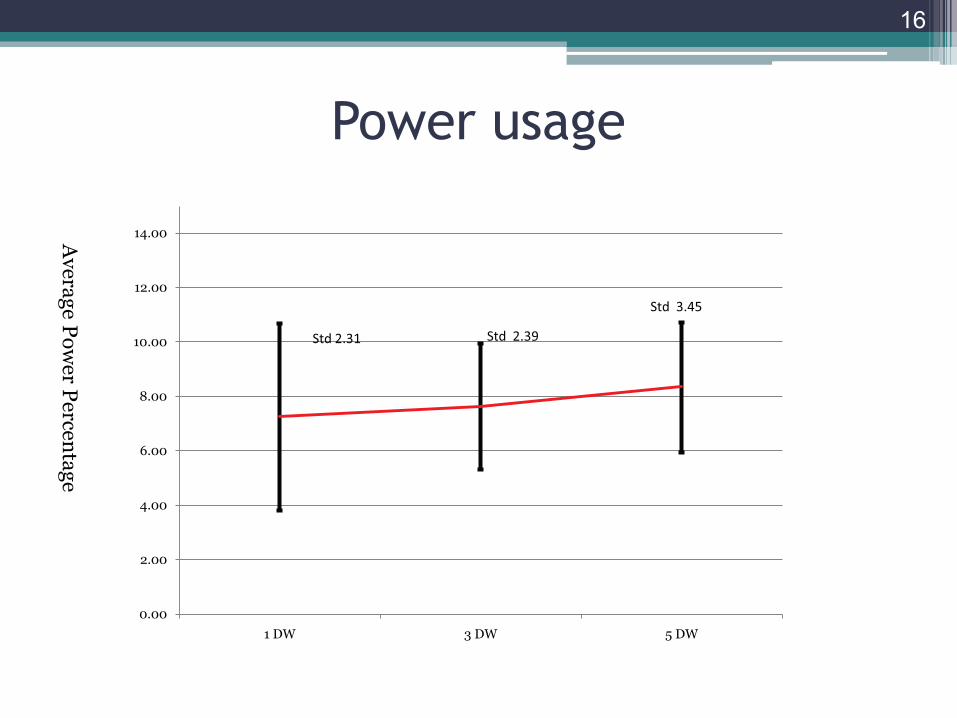
Power usage
Std 2.31 Std 2.39
Average Pow
er Percentage
Std 3.45

17
Average Altitude Deviation Main effect on DW
Altitude D
eviation in Feet
0
200
400
600
800
1000
1200
1400
1600
18nm to Cheri: DW Target 1
Cheri: DW Target 2
Alt<10: DW Target 3
10nm to SDF: DW Target 4
5nm to SDF: DW Target 5
1 DW Condition
3 DW Condition
5 DW Condition

0
1
2
3
4
5
1 DW 3 DW 5 DW
18
Std .67
Std .75
Std .72
Workload
AverageWorkload

Pilot Feedback� Pilots would feel comfortable (4.42 out of 6 on a scale) having the
DW put into a flight chart� Pilots would prefer 10-30nm spacing for DW� Pilots said they would fly more accurate if they had their standard
tools� Changes recommended from the pilots
� DW flight chart should implement distance to each DW and angle of descent� Implementation of DW into vertical NAV display
19

Pilot Feedback cont.� DWs helped them manage their vertical speed by giving them
checkpoints� DW 3 target at 10,000 feet altitude was seen as the most important
DW by the pilots � Pilots said they used speed brakes as little as possible� Responsibilities and tasks for Pilot Flying (PF) and Pilot Monitoring
(PM)� PF should fly vertical speed and IAS, and determine whether the targets at DWs
are met � PF should vocalize plan and callouts to PM� PM should monitor targets, air speed, IAS, and DWs, do all calculations for PF,
setting altitudes, MCP, work the gear and flaps, crosschecking altitude inputs, and talking to ATC
20
� The five DW condition gave structure for the pilots, and the aircraft consistently flew similar flight paths and were closer to their DW target altitudes
� The five DW condition used slightly more power (one percent) than the one and three DW conditions. � With automated assistance (green arc) pilots believed that they would intercept
DW without resorting to level flight
� The results of increasing performance in the three and five DW conditions support the use and implementation of DW into CDA procedures
21
Summary and Conclusion

References� Lowther, M. B., Clarke, J-P., & Ren, L., (2007). En Route Speed Change Optimization for Spacing Continuous
Descent Arrivals� Reynolds, H., Reynolds, T. & R. Hansman, J. (2005). Human Factors Implications of Continuous Descent
Approach Procedures for Noise Abatement in Air Traffic Control. 6th USA/Europe Air Traffic Management R&D Seminar, Baltimore, USA, June 27-30.
� Ho, N. T., Clarke, J-P., Riedel, R., & Omen, C. (2006). Development and Evaluation of a Pilot Cueing System for Near-Term Implementation of Aircraft Noise Abatement Approach Procedures. Journal of American Institute of Aeronautics and Astronautics.
� Clarke, J-P., B., Ho, N. T., Ren, L., Brown, J. A., Elmer, K. R., Tong, K-O & Wat, J. K. (2004). Continuous Descent Approach: Design and Flight Test for Louisville International Airport. Journal of Aircraft, 41(5), 1054-1066.
� Reynolds, H. (2006). Modeling the Air Traffic Controller’s Cognitive Projection Process. MIT International Center for Air Transportation Department of Aeronautics & Astronautics Massachusetts Institute of Technology Cambridge, MA, 2006
� Stell, L. (2010). Predictability of Top of Descent Location for operational Idle-thrust Descents. American Institute of Aeronautics and Astronautics.
� Kupfer, M., Callantine, T., Martin, L., Mercer, J. & Palmer, E., 2011, Controller Support Tools for Schedule-Based Terminal-Area Operations, Ninth USA/Europe Air Traffic Management Research and Development Seminar (ATM2011)
� Alam, S, Nguyen, M.H., Abbass, H.A., Lokan, C., Ellejmi, M., & Kirby, S., 2010, A Dynamic Continuous Descent Approach Methodology for Low Noise and Emission, 29th IEEE/AIAA Digital Avionics Systems Conference, October 3-7, 2010
� Ren, L. & Clark, J-P., 2007, Flight Demonstration of the Separation Analysis Methodology for Continuous Descent Arrival, Draft paper for 7th USA/Europe ATM 2007 R&D Seminar, Barcelona, Spain, 2-5 July 2007.
22

References� Clark, J-P., Bennett, D., Elmer, K., Firth, J., Hilb, R., Ho, N., Johnson, S., Lau, S., Ren, L., Senechal, D., Sizov, N.,
Slattery, R., Tong, K., Walton, J., Willgruber, A., Williams, D. (2006). Development, Design, and Flight Test Evaluation of a Continuous Descent Approach Procedure for Nighttime Operation at Louisville International Airport
� Koeslag, M. F., (1999) Advanced Continuous Descent Approaches –An algorithm design for the Flight Management System-.
� Moore, S. (2009). Benefits of Highly Predictable Flight Trajectories in Performing Routine Optimized Profile Descents: Current and Recommended Research. Environmental Working Group Operations Standing Committee 2009 Annual Workshop, NASA Ames.
� Williams, D. (2008). Flight Deck Merging and Spacing and Advanced FMS Operations. EWG Operations Standing Committee Meeting.
� Coppenbarger, R., Mead, R., Sweet, D., (2009). Field Evaluation of the Tailored Arrivals Concept for Datalink-Enabled Continuous Descent Approach. Journal of Aircraft, 46(4), July–August 2009
� Global Aviation Navigation, Inc., (2009). Retrieved May 2009, from http://www.globalair.com/d-TPP_pdf/00239IL17R.PDF
� Thomas, L. & Wickens, C. (2006). Individual Effects of Battlefield Display Frames of Reference on Navigation Tasks, Spatial Judgments, and Change Detection. Ergonomics, 49, 154-1173.
� Cowen, M., John, M., Oonk, H., & Smallman, H. (2001). The Use of 2D and 3D Displays for Shape-Understanding versus Relative-Position Tasks. Human Factors, 43(1), 79-98.
� Symmes, D., & Pella, J. (2005). Three-Dimensional Image. Microsoft® Encarta® 2006 [CD]. Redmond, WA: Microsoft Corporation, 2005.
� Prevot, T., (1998). A Display for Managing the Vertical Flight Path - an Appropriate Task with Inappropriate Feedback-. International Conference on Human-Computer Interaction in Aeronautics Montreal, Canada, 1998
23
References� Clark, J-P., Bennett, D., Elmer, K., Firth, J., Hilb, R., Ho, N., Johnson, S., Lau, S., Ren, L., Senechal, D., Sizov, N.,
Slattery, R., Tong, K., Walton, J., Willgruber, A., Williams, D. (2006). Development, Design, and Flight Test Evaluation of a Continuous Descent Approach Procedure for Nighttime Operation at Louisville International Airport
� Koeslag, M. F., (1999) Advanced Continuous Descent Approaches –An algorithm design for the Flight Management System-.
� Moore, S. (2009). Benefits of Highly Predictable Flight Trajectories in Performing Routine Optimized Profile Descents: Current and Recommended Research. Environmental Working Group Operations Standing Committee 2009 Annual Workshop, NASA Ames.
� Williams, D. (2008). Flight Deck Merging and Spacing and Advanced FMS Operations. EWG Operations Standing Committee Meeting.
� Coppenbarger, R., Mead, R., Sweet, D., (2009). Field Evaluation of the Tailored Arrivals Concept for Datalink-Enabled Continuous Descent Approach. Journal of Aircraft, 46(4), July–August 2009
� Global Aviation Navigation, Inc., (2009). Retrieved May 2009, from http://www.globalair.com/d-TPP_pdf/00239IL17R.PDF
� Thomas, L. & Wickens, C. (2006). Individual Effects of Battlefield Display Frames of Reference on Navigation Tasks, Spatial Judgments, and Change Detection. Ergonomics, 49, 154-1173.
� Cowen, M., John, M., Oonk, H., & Smallman, H. (2001). The Use of 2D and 3D Displays for Shape-Understanding versus Relative-Position Tasks. Human Factors, 43(1), 79-98.
� Symmes, D., & Pella, J. (2005). Three-Dimensional Image. Microsoft® Encarta® 2006 [CD]. Redmond, WA: Microsoft Corporation, 2005.
� Prevot, T., (1998). A Display for Managing the Vertical Flight Path - an Appropriate Task with Inappropriate Feedback-. International Conference on Human-Computer Interaction in Aeronautics Montreal, Canada, 1998
24

25
References� Johnson, W., Ho, N., Martin, P., Vu, K-P., Ligda, S., Battiste, V., Lachter, J., Dao, A. (2010), “Management Of
Continuous Descent Approaches During Interval Management Operations,” 29th Digital Avionics Systems Conference, Salt Lake City, Utah.
� Prevot, T., Callatine, T., Kopardekar, P., Smith, N., Palmer, E., Battiste, V., (2004). Trajectory-Oriented Operations with Limited Delegation: An Evolutionary Path to NAS Modernization. AIAA 4th Aviation Technology, Integration and Operations (ATIO) Forum, Chicago, IL, September 2004.