
Enhanced luminescence of CaMoO4:Eu by core@shell formation and its hyperthermia study after hybrid...
12
This journal is © The Royal Society of Chemistry 2014 Integr. Biol., 2014, 6, 53--64 | 53 Cite this: Integr. Biol., 2014, 6, 53 Enhanced luminescence of CaMoO 4 :Eu by core@shell formation and its hyperthermia study after hybrid formation with Fe 3 O 4 : cytotoxicity assessment on human liver cancer cells and mesenchymal stem cells† A. K. Parchur, a A. A. Ansari, b B. P. Singh, c T. N. Hasan, d N. A. Syed, d S. B. Rai a and R. S. Ningthoujam* e Highly water dispersible Eu 3+ doped CaMoO 4 nanoparticles (core) covered by CaMoO 4 (shell) have been prepared using the polyol method. Significant enhancement in luminescence intensity by core@shell formation is observed due to the decrease of non-radiative rate arising from surface/defect of particles. Effect of 266 nm laser excitation (Mo–O charge transfer band) on the asymmetric ratio (A 21 = intensity ratio of electric to mag- netic dipole transitions) has been studied and compared with a xenon lamp source. Luminescence intensity increases with the increase of power at 532 nm laser excitation. In order to explore materials, which can show dual functionalities such as luminescence as well as magnetic properties (magnetization of B14.2 emu g 1 ), water dispersible Fe 3 O 4 –CaMoO 4 :Eu hybrid magnetic nanoparticles (MN) have been prepared. This shows good heating ability up to B42 1C (hyperthermia) and luminescence in the red region (B612 nm), which is in a biological window (optical imaging). Biocompatibility of the synthesized Fe 3 O 4 –CaMoO 4 :Eu hybrid magnetic nanoparticles has been evaluated in vitro by assessing their cytotoxicity on human liver cancer cells (HepG2 cells) and hTERT cells using the MTT assay and fluorescent microscopy studies. Insight, innovation, integration Highly water dispersible Eu 3+ doped CaMoO 4 (core) covered by inactive CaMoO 4 (shell) nanoparticles have been successively prepared using the polyol method. Significant enhancement in luminescence intensity by core@shell formation was observed. Fe 3 O 4 –CaMoO 4 :Eu hybrid magnetic nanoparticles show both luminescence and magnetic behavior (saturation of magnetization B14.2 emu g 1 ). Furthermore, hybrid magnetic nanoparticles show good heating ability up to B42 1C (hyperthermia) and luminescence in the red region (B612 nm), which is in a biological window (optical imaging). Biocompatibility of the hybrid magnetic nanoparticles has been evaluated in vitro by assessing their cytotoxicity on human liver cancer cells (HepG2 cells) and hTERT cells. 1. Introduction In recent years, there has been enormous interest in the synthesis of rare-earth ion (Ln 3+ ) doped core and core@shell nanoparticles due to their wide applications. 1–18 These materials can be extensively used in optoelectronic and biological applica- tions. Moreover, core@shell and/or hybrid nanomaterials having both magnetic and luminescence properties are used in magnetic resonance imaging (MRI), in vitro and in vivo bio-labelling, drug delivery and hyperthermia applications. 19–21 In general, Fe 3 O 4 magnetic nanoparticles (MN) are used in hyperthermia applica- tions by coating the surface of nanoparticles using different surfactants, like, oleic acid (OA), dimercaptosuccinic acid (DMSA), chitosan (CS), O-carboxymethyl chitosan (OCMCS) and poly-ethylene glycol (PEG), etc. 20,22–24 However, it is difficult to prepare material, which can show luminescence as well as magnetic properties. Generally, luminescence intensity decreases with an increase of ferromagnetic species in the material. 1 For this, it is a Department of Physics, Banaras Hindu University, Varanasi-221005, India b King Abdullah Institute for Nanotechnology, King Saud University, Riyadh-11451, Saudi Arabia c Department of Physics, Indian Institute of Technology (BHU), Varanasi-221005, India d Research & Development, Bharathiar University, Coimbatore-641046, India e Chemistry Division, Bhabha Atomic Research Centre, Mumbai-400085, India. E-mail: [email protected], [email protected]; Fax: +91-22-25505151; Tel: +91-22-2559321 † Electronic supplementary information (ESI) available. See DOI: 10.1039/c3ib40148k Received 15th July 2013, Accepted 19th October 2013 DOI: 10.1039/c3ib40148k www.rsc.org/ibiology Integrative Biology PAPER
Transcript of Enhanced luminescence of CaMoO4:Eu by core@shell formation and its hyperthermia study after hybrid...
This journal is©The Royal Society of Chemistry 2014 Integr. Biol., 2014, 6, 53--64 | 53
Cite this: Integr. Biol., 2014,6, 53
Enhanced luminescence of CaMoO4:Eu bycore@shell formation and its hyperthermia studyafter hybrid formation with Fe3O4: cytotoxicityassessment on human liver cancer cells andmesenchymal stem cells†
A. K. Parchur,a A. A. Ansari,b B. P. Singh,c T. N. Hasan,d N. A. Syed,d S. B. Raia andR. S. Ningthoujam*e
Highly water dispersible Eu3+ doped CaMoO4 nanoparticles (core) covered by CaMoO4 (shell) have been
prepared using the polyol method. Significant enhancement in luminescence intensity by core@shell formation
is observed due to the decrease of non-radiative rate arising from surface/defect of particles. Effect of 266 nm
laser excitation (Mo–O charge transfer band) on the asymmetric ratio (A21 = intensity ratio of electric to mag-
netic dipole transitions) has been studied and compared with a xenon lamp source. Luminescence intensity
increases with the increase of power at 532 nm laser excitation. In order to explore materials, which can show
dual functionalities such as luminescence as well as magnetic properties (magnetization of B14.2 emu g�1),
water dispersible Fe3O4–CaMoO4:Eu hybrid magnetic nanoparticles (MN) have been prepared. This shows
good heating ability up to B42 1C (hyperthermia) and luminescence in the red region (B612 nm), which is in
a biological window (optical imaging). Biocompatibility of the synthesized Fe3O4–CaMoO4:Eu hybrid magnetic
nanoparticles has been evaluated in vitro by assessing their cytotoxicity on human liver cancer cells (HepG2
cells) and hTERT cells using the MTT assay and fluorescent microscopy studies.
Insight, innovation, integrationHighly water dispersible Eu3+ doped CaMoO4 (core) covered by inactive CaMoO4 (shell) nanoparticles have been successively prepared using the polyol method.Significant enhancement in luminescence intensity by core@shell formation was observed. Fe3O4–CaMoO4:Eu hybrid magnetic nanoparticles show bothluminescence and magnetic behavior (saturation of magnetization B14.2 emu g�1). Furthermore, hybrid magnetic nanoparticles show good heating ability upto B42 1C (hyperthermia) and luminescence in the red region (B612 nm), which is in a biological window (optical imaging). Biocompatibility of the hybridmagnetic nanoparticles has been evaluated in vitro by assessing their cytotoxicity on human liver cancer cells (HepG2 cells) and hTERT cells.
1. Introduction
In recent years, there has been enormous interest in thesynthesis of rare-earth ion (Ln3+) doped core and core@shell
nanoparticles due to their wide applications.1–18 These materialscan be extensively used in optoelectronic and biological applica-tions. Moreover, core@shell and/or hybrid nanomaterials havingboth magnetic and luminescence properties are used in magneticresonance imaging (MRI), in vitro and in vivo bio-labelling, drugdelivery and hyperthermia applications.19–21 In general, Fe3O4
magnetic nanoparticles (MN) are used in hyperthermia applica-tions by coating the surface of nanoparticles using differentsurfactants, like, oleic acid (OA), dimercaptosuccinic acid(DMSA), chitosan (CS), O-carboxymethyl chitosan (OCMCS) andpoly-ethylene glycol (PEG), etc.20,22–24 However, it is difficult toprepare material, which can show luminescence as well as magneticproperties. Generally, luminescence intensity decreases with anincrease of ferromagnetic species in the material.1 For this, it is
a Department of Physics, Banaras Hindu University, Varanasi-221005, Indiab King Abdullah Institute for Nanotechnology, King Saud University, Riyadh-11451,
Saudi Arabiac Department of Physics, Indian Institute of Technology (BHU), Varanasi-221005,
Indiad Research & Development, Bharathiar University, Coimbatore-641046, Indiae Chemistry Division, Bhabha Atomic Research Centre, Mumbai-400085, India.
E-mail: [email protected], [email protected]; Fax: +91-22-25505151;
Tel: +91-22-2559321
† Electronic supplementary information (ESI) available. See DOI: 10.1039/c3ib40148k
Received 15th July 2013,Accepted 19th October 2013
DOI: 10.1039/c3ib40148k
www.rsc.org/ibiology
Integrative Biology
PAPER
54 | Integr. Biol., 2014, 6, 53--64 This journal is©The Royal Society of Chemistry 2014
necessary to optimize the concentration of magnetic andluminescence materials to be used. Common techniques are(i) formation of the shell of Ln3+ doped inorganic host on asurface modified Fe3O4 nanoparticles (core@shell structures),(ii) mixing of proper amounts of Fe3O4 nanoparticles with inorganicphosphor nanomaterials (hybrid structures) and (iii) a MN-inertshell/organic ligand–phosphor system (e.g., liposome/vesicle inwhich MN is in the core (water dispersible) and phosphor is inthe lipid layer (oil dispersible). Recently, some nanocompositessuch as Fe3O4@Y2O3:Eu3+,25 Fe3O4@YVO4:Eu3+,26 Fe3O4@YPO4:Eu/Tb3+,27 etc. were prepared and their luminescence, magnetic andinduction heating properties were studied. The methods used forthe preparation of such nanoparticles needed a long time, andparticles were inhomogeneous in shape. Usually, Fe3O4 magneticnanoparticles were prepared by a co-precipitation method,and these were used for a hyperthermia application due to theirhigh biocompatibility.23 In particular, nanoparticles with surfacefunctionalization are more useful in biological applications.28–30
Gd based nanoparticles are used for cancer therapy throughhyperthermia as well as a contrast agent in MRI.31
In most cases, CaMoO4:Eu particles are not dispersible in apolar medium. This makes them less suitable for biological andpolymer based display applications. In order to make them dis-persible, there are a few ways: (i) particle size should be o50 nmand (ii) surface functionalization. Enhanced luminescence intensityfor dispersed particles is important, and thus it can be achievedby use of a functionalized ligand having a lower number of O–Hand C–H and core@shell formations. Luminescence intensity isalso dependent on the type of solvent where nanoparticles aredispersed, excitation wavelength and power density. These arenot discussed much in the literature. In this paper, significantenhancement in luminescence of Eu3+ doped CaMoO4 nano-particles (core) is achieved by forming inactive CaMoO4 (shell)on the surface of the core. The power density dependentluminescence using a 532 nm Nd:YAG laser is studied so that thedesired luminescence intensity can be obtained. Fe3O4@CaMoO4:Euhybrid nanoparticles are prepared for hyperthermia applica-tions. To the best of our knowledge, for the first time thesehybrid nanoparticles with excellent dispersibility, heating abilityup to B42 1C and luminescence properties have been prepared.Bio-compatibility of hybrid nanoparticles on cancerous andnormal cells was studied.
2. Experimental section2.1 Preparation
2.1.1 Preparation of CaMoO4:Eu@CaMoO4 nanoparticles.CaMoO4:Eu3+ (Eu3+ = 1, 3, 5 7, 10, 15, 20 and 30 at%) were prepared ata low-temperature B150 1C using urea hydrolysis in ethylene glycol(EG) as a medium as well as a capping agent. The detailed prepara-tion of CaMoO4:Eu3+ is described elsewhere.4 The as-preparedsamples were divided into three parts: the second and third partswere annealed at 500 and 900 1C for 4 h each to grow the crystallitesize and to remove the unwanted dangling bonds on the surface ofthe nanoparticles. The as-prepared sample was considered as a core.
In a typical process for the synthesis of core@shell nano-particles (CaMoO4 : Eu@CaMoO4 with stoichiometry of 1 : 1 moleratio), core nanoparticles obtained by the above are added to50 mL of EG and 2 g of urea followed by ultrasonication for30 min. To this, a stoichiometric amount of Ca2+ and MoO4
2�
ions dispersed in a minimum amount of distilled water are addedto the above solution under continuous stirring and is allowed toheat the solution at 120–150 1C for 2 h. The precipitate so obtainedwas centrifuged and excess of EG was removed by adding methanoland acetone. The particles obtained were allowed to dry at roomtemperature for B48 h.
2.1.2 Preparation of Fe3O4 magnetic nanoparticles. The super-paramagnetic Fe3O4 nanoparticles (Fe3O4-MN) were preparedusing the co-precipitation method discussed earlier.22 Fe3O4-MNnanoparticles were prepared by ferric chloride (FeCl3�6H2O) andferrous sulphate (FeSO4�7H2O) in a NH3 medium. In order toprepare dispersible particles in water, 4 g of PEG was dissolved in50 mL of distilled water and treated with the Fe3O4-MN. It was keptfor ultrasonication for 30 min to get homogeneous mixing.
2.1.3 Preparation of hybrid MN (Fe3O4–CaMoO4:Eu). Forthe preparation of the Fe3O4–CaMoO4:Eu hybrid MN (1 : 4 moleratio), 28.94 mg of Fe3O4 and 100 mg CaMoO4:Eu were dispersed in4 mL of distilled water containing 1 g of polyethylene glycol (PEG)and followed by ultrasonication for 30 min. The resulting hybridnanoparticles dispersed in PEG were used for hyperthermia experi-ments. The hybrid nanoparticles were collected after centrifugationand allowed to dry in an ambient atmosphere for 4 days. Thispowder was used to record luminescence of the sample.
2.1.4 Culture and maintenance of HepG2 and hTERT celllines. The HepG2 hepatoblastoma cells and hTERT humanmesenchymal cells were maintained between 10% and 90%confluency and propagated in 90% Eagle’s Minimal EssentialMedium (EMEM) (ATCC) and RPMI 1640, respectively. Mediawere supplemented with 10% fetal bovine serum (FBS) (ATCC)and 1% penicillin/streptomycin (10 000 I.U mL�1–10 000 mg mL�1)(ATCC). Cells were cultured as adherent monolayers(i.e., cultured at B70% to 80% confluence) and maintained at37 1C in a humidified atmosphere of 5% CO2. Cells wereharvested after brief trypsinization.
2.1.5 MTT assay. Cytotoxicity was determined by the yellow3-(4,5-dimethyl thiazol-2-yl)-2,5-diphenyltetrazolium bromide(MTT) assay.32 The MTT assay is based on the ability of viablecells to reduce soluble MTT into an insoluble, blue formazanproduct. In brief, around 105 cells per well were plated in96-well microtiter plates in a 100 mL of EMEM medium. After24 h the medium was changed, and cells were treated withFe3O4–CaMoO4:Eu hybrid magnetic nanoparticles at differentconcentrations (0, 5, 10, 20, 40, 80, 160, 320, 640 mg mL�1) for24 h. After this, the medium was aspirated off and 100 mL MTT(0.5 mg mL�1) was added and incubated for 4 h. The liquidfrom each well was aspirated and discarded. The formazancrystals formed during incubation with MTT was solubilisedby adding 100 mL of dimethyl sulfoxide (DMSO) to each well.The plates were placed on a shaker for 15 min for completesolubilization of crystals, and the optical density of each well wasdetermined. The quantity of formazan product as measured by
Paper Integrative Biology
This journal is©The Royal Society of Chemistry 2014 Integr. Biol., 2014, 6, 53--64 | 55
the amount of 545 nm absorbance is directly proportional tothe number of living cells in culture. The cell viability (%)related to control wells containing cell culture medium withoutFe3O4–CaMoO4:Eu hybrid magnetic nanoparticles as a vehiclewas calculated by:
Viability (%) = [A]test/[A]control � 100 (1)
where [A]test is the absorbance of the test sample and [A]control isthe absorbance of control sample. IC50 was also calculated.Triplicate experiments were carried out.
To examine the morphological changes in the nucleus andthe cytoplasm of cells after addition of Fe3O4–CaMoO4:Euhybrid magnetic nanoparticles into HepG2 cells and hTERT,fluorescent microscopy was performed. The HepG2 and hTERTcells, approximately 1 � 105, were cultured in 6 well plates in amedium made up of EMEM and treated with IC50 and thehighest concentration (640 mg mL�1) of Fe3O4–CaMoO4:Eu hybridmagnetic nanoparticles, respectively, for 24 h with technicaltriplicates. Untreated control and treated cells were observedunder an inverted microscope (Carl Zeiss, Deutschland). For eachexperiment, nuclei from 10 random fields of wells were examinedat 200 times magnification. DAPI, a fluorescent dye was used forexamining the treatment of HepG2 cells with Fe3O4–CaMoO4:Euhybrid magnetic nanoparticles.
40-6-Diamidino-2-phenylindole (DAPI) is known to formfluorescent complexes with natural double-stranded DNA, showingfluorescence specificity for adenine–thymine (AT), and adenine–uracil (AU) clusters. Because of this property, DAPI is a usefultool in various cytochemical investigations. When DAPI bindsto DNA, its fluorescence is strongly enhanced. Also, there is alsoevidence that DAPI binds to the minor groove, stabilized byhydrogen bonds between DAPI and acceptor groups of AT andAU base pairs. The membrane permeable fluorescent dye DAPI(2 mg mL�1) (Sigma Aldrich), which binds to the chromatin ofcells, was added to the fixed cells.
2.2 Characterization of magnetic and luminescencenanoparticles
X-ray diffraction (XRD) patterns of the powder samples wereexamined at room temperature using a PANalytical X’Pert X-raydiffractometer equipped with Ni filtered Cu Ka (l = 1.54056 Å)radiation as the X-ray source. Raman spectra was recorded on aJobin Yvon Horiba HR800, UV Raman microscope using a HeNelaser emitting at 632.8 nm. Excitation and emission spectra of all thesamples were recorded using an Edinburgh Instrument FLS920having 450 W xenon lamp. The emission spectra were also recordedusing 266 nm excitation from a Nd:YAG laser and 532 nm excitationfrom laser (Verdi V5). A Horiba Jobin Yvon iHR320 spectrometer wasused to detect the luminescence signal.
Induction heating of hybrid magnetic nanoparticles wasperformed in a 1.5 mL micro centrifuge tube, which was placedat the centre of a 6 cm diameter copper coil coated with Teflons
(Easy Heat 8310, Ambrell, UK). In a typical measurement, 5 mgof hybrid nanoparticles were dispersed in 1 mL of distilled water,which was inside a 1.5 mL microcentrifuge tube. AC magneticfield at different currents and fixed at 265 kHz was applied.
Heat generated within the sample was recorded using an opticaltemperature sensor. Temperature was measured with an accuracyof �0.01 1C. The resultant magnetic field at the centre of the6 cm copper coil was calculated using the following equation:
H ¼ 1:257ni
L(2)
where H is the magnetic field (measured in Oe), n, number of turnsin a coil, i, the applied current and L, the diameter of a turn in cm.H values are found to be 168, 251 and 335 Oe (equivalent to 13, 20and 27 kA m�1) for 200, 300 and 400 A applied currents, respectively.The room temperature magnetizations of these samples weredetermined using a Vibrating Sample Magnetometer (VSM).
3. Results and discussion3.1 XRD and TEM studies
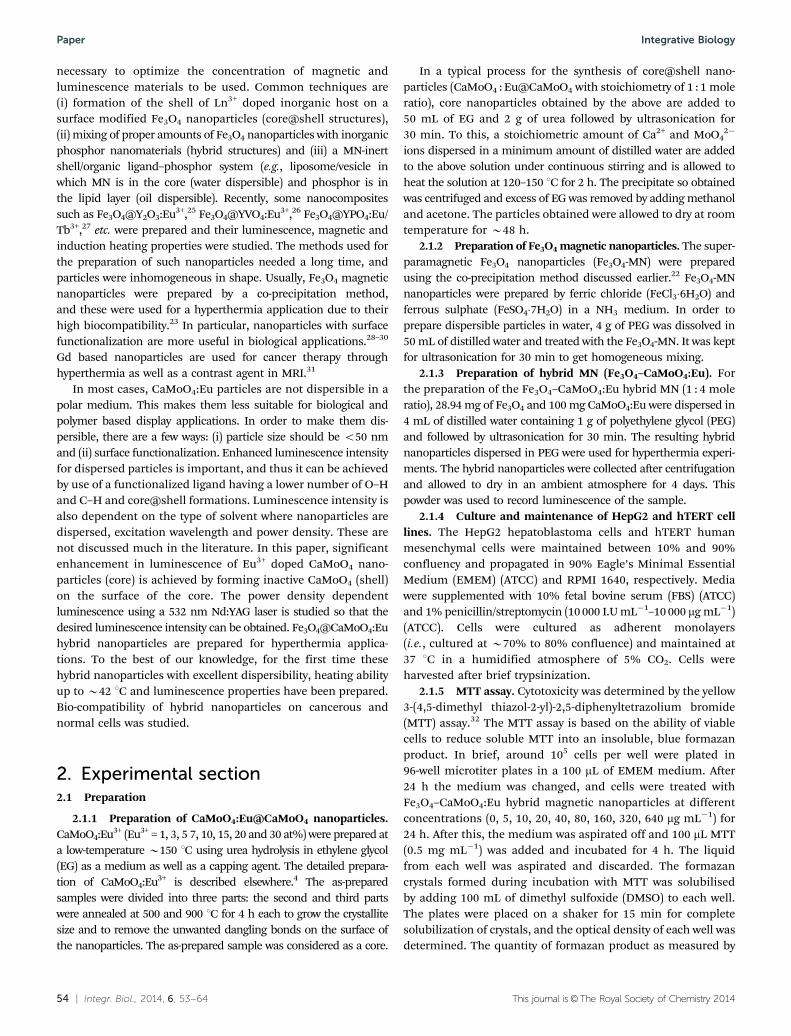
Crystal structures of as-prepared core (3 at% Eu3+ doped CaMoO4)and core@shell (shell: CaMoO4) nanoparticles have been examinedby an X-ray diffraction (XRD) method. Fig. 1 shows the XRDpatterns of core and core@shell samples. As-prepared samplesare well crystalline with tetragonal structure, and all peaks arematched with JCPDS card no. 29-0351. No extra impurityphases are detected. The standard diffraction pattern peaksare indexed to data with corresponding (hkl) planes between15–801. The average crystallite sizes calculated using Scherrerequation for as-prepared core and core@shell nanoparticles arefound to be 24 and 27 nm, respectively. The unit cell parametersare found to be a = 5.219 Å, c = 11.439 Å and V = 311.60 Å3 for coreand a = 5.219 Å, c = 11.439 Å and V = 311.62 Å3 for core@shellnanoparticles. These parameters are well matched with JCPDScard no. 29-0351 (a = 5.226 Å, c = 11.430 Å and V = 312.1 Å3).There is no significant change in lattice parameters and XRDpatterns when an active core (Eu3+ doped) is covered withinactive shell (Eu3+ un-doped), i.e., CaMoO4:[email protected] micro-strain that is acting on both core and core@shell
Fig. 1 (a) XRD patterns of the core (3 at% Eu3+ doped CaMoO4) andcore@shell (shell: CaMoO4) as-prepared nanoparticles. The (hkl) planes arerepresented in the figure itself. The Williamson–Hall plots for the core (b)and core@shell (c) samples. Solid green line represents the linear fit to theexperimental data. The micro-strain (ehkl) and effective crystallite sizes(Dhkl) are shown in the corresponding figures itself.
Integrative Biology Paper
56 | Integr. Biol., 2014, 6, 53--64 This journal is©The Royal Society of Chemistry 2014
nanoparticles was analysed by the Williamson–Hall method.3,33
The Williamson–Hall equation can be represented as shown below:
bhkl cos yl
¼ 1
Dhklþ ehklð Þsin y
l(3)
where bhkl is the full width at half maxima (FWHM) of XRD patterns,y is the diffraction angle, l is the wavelength of the X-rays, Dhkl is theeffective crystallite size and ehkl is the micro-strain. The instrumentalbroadening (einst) is removed by using the Si standard, discussed inour earlier report.4 Fig. 1(b and c) shows the plot between(bhklcos(y))/l and sin(y)/l for the as-prepared core and core@shellsamples. It is observed that the (bhklcos (y))/l value increases withsin(y)/l. The data points are fitted with a linear equation. The micro-strain (ehkl) and effective crystallite (Dhkl) sizes calculated are shownin the figure itself. The average effective crystallite sizes calculatedfrom the Williamson–Hall equation are 32 and 35 nm for core andcore–shell samples, respectively, which are slightly more than thoseof Scherrer equation. However, we do not find any significantdifference in ehkl (0.003) calculated for both core and core@shellwithin the span of the error bar. The effective crystallite size of thecore@shell sample is slightly higher than a core sample. Positiveslope values (ehkl) for both core and core@shell indicates tensilestrain acting on the particle. Patra et al. recently reported tensilestrain (positive slope) for SnO2 nanoparticles and compressive strain(negative slope) for nanorods.34 Sharma and co-workers recentlyreported a variation in strain (0.001–0.03) in Dy3+ doped CaMoO4. Itis found that strain almost increases with an increase in Dy3+
concentration, and it is relaxed by co-doping of K+ ions in CaMoO4.35
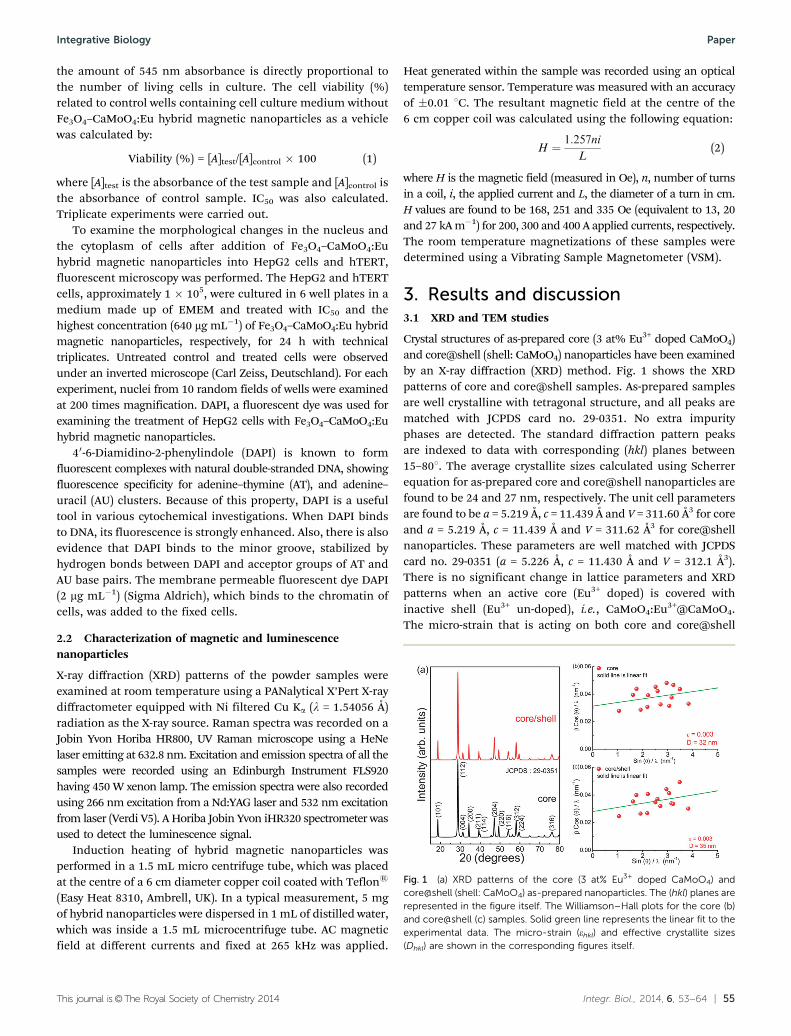
TEM images of CaMoO4:Eu3+@CaMoO4 and Fe3O4–CaMoO4:Eu areshown in Fig. 2. The particles are found to be spherical and sizes of30–40 nm are observed.
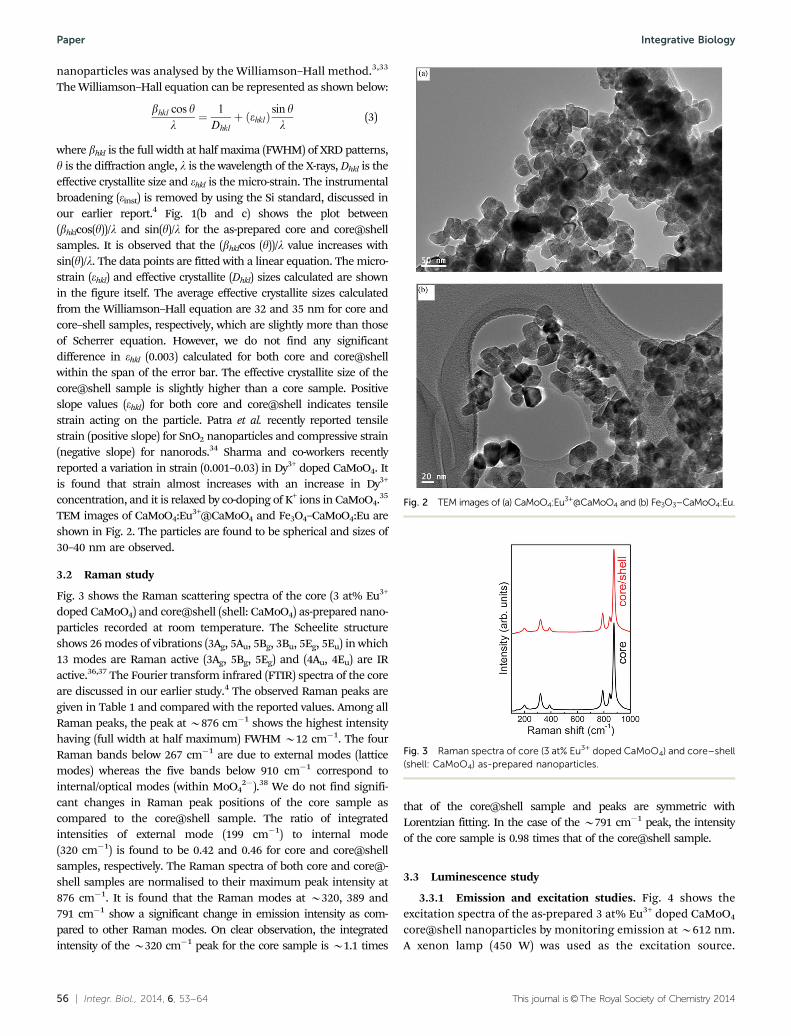
3.2 Raman study
Fig. 3 shows the Raman scattering spectra of the core (3 at% Eu3+
doped CaMoO4) and core@shell (shell: CaMoO4) as-prepared nano-particles recorded at room temperature. The Scheelite structureshows 26 modes of vibrations (3Ag, 5Au, 5Bg, 3Bu, 5Eg, 5Eu) in which13 modes are Raman active (3Ag, 5Bg, 5Eg) and (4Au, 4Eu) are IRactive.36,37 The Fourier transform infrared (FTIR) spectra of the coreare discussed in our earlier study.4 The observed Raman peaks aregiven in Table 1 and compared with the reported values. Among allRaman peaks, the peak at B876 cm�1 shows the highest intensityhaving (full width at half maximum) FWHM B12 cm�1. The fourRaman bands below 267 cm�1 are due to external modes (latticemodes) whereas the five bands below 910 cm�1 correspond tointernal/optical modes (within MoO4
2�).38 We do not find signifi-cant changes in Raman peak positions of the core sample ascompared to the core@shell sample. The ratio of integratedintensities of external mode (199 cm�1) to internal mode(320 cm�1) is found to be 0.42 and 0.46 for core and core@shellsamples, respectively. The Raman spectra of both core and core@-shell samples are normalised to their maximum peak intensity at876 cm�1. It is found that the Raman modes at B320, 389 and791 cm�1 show a significant change in emission intensity as com-pared to other Raman modes. On clear observation, the integratedintensity of the B320 cm�1 peak for the core sample is B1.1 times
that of the core@shell sample and peaks are symmetric withLorentzian fitting. In the case of the B791 cm�1 peak, the intensityof the core sample is 0.98 times that of the core@shell sample.
3.3 Luminescence study
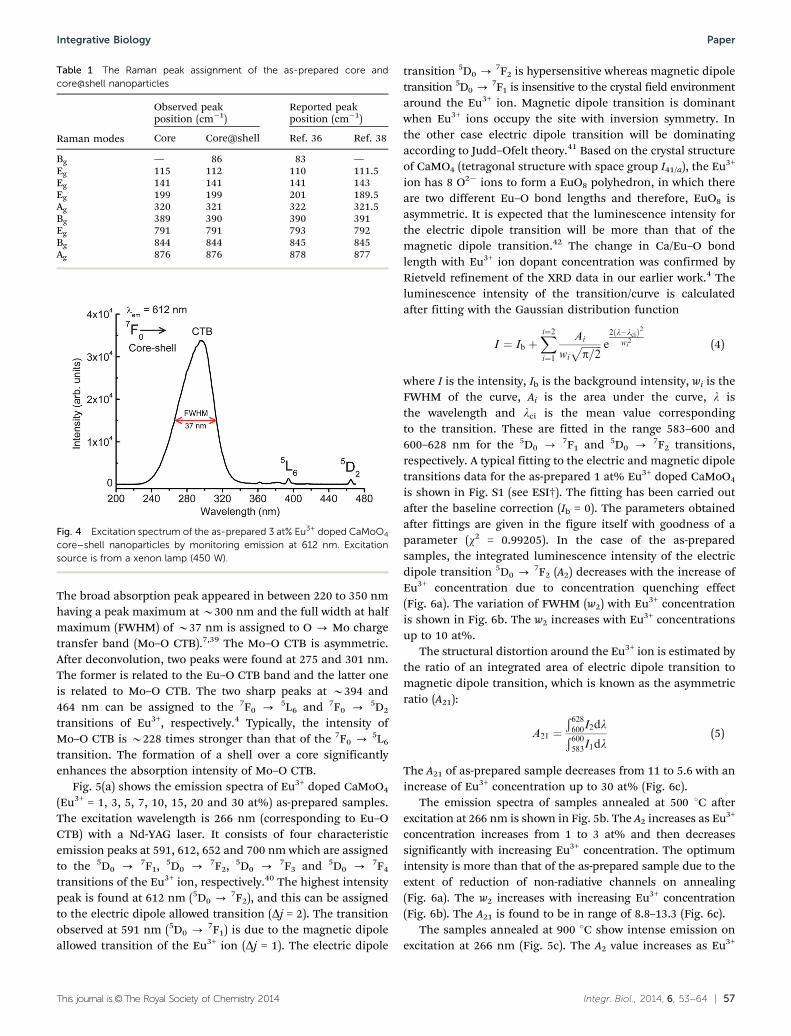
3.3.1 Emission and excitation studies. Fig. 4 shows theexcitation spectra of the as-prepared 3 at% Eu3+ doped CaMoO4
core@shell nanoparticles by monitoring emission at B612 nm.A xenon lamp (450 W) was used as the excitation source.
Fig. 2 TEM images of (a) CaMoO4:Eu3+@CaMoO4 and (b) Fe3O3–CaMoO4:Eu.
Fig. 3 Raman spectra of core (3 at% Eu3+ doped CaMoO4) and core–shell(shell: CaMoO4) as-prepared nanoparticles.
Paper Integrative Biology
This journal is©The Royal Society of Chemistry 2014 Integr. Biol., 2014, 6, 53--64 | 57
The broad absorption peak appeared in between 220 to 350 nmhaving a peak maximum at B300 nm and the full width at halfmaximum (FWHM) of B37 nm is assigned to O - Mo chargetransfer band (Mo–O CTB).7,39 The Mo–O CTB is asymmetric.After deconvolution, two peaks were found at 275 and 301 nm.The former is related to the Eu–O CTB band and the latter oneis related to Mo–O CTB. The two sharp peaks at B394 and464 nm can be assigned to the 7F0 - 5L6 and 7F0 - 5D2
transitions of Eu3+, respectively.4 Typically, the intensity ofMo–O CTB is B228 times stronger than that of the 7F0 - 5L6
transition. The formation of a shell over a core significantlyenhances the absorption intensity of Mo–O CTB.
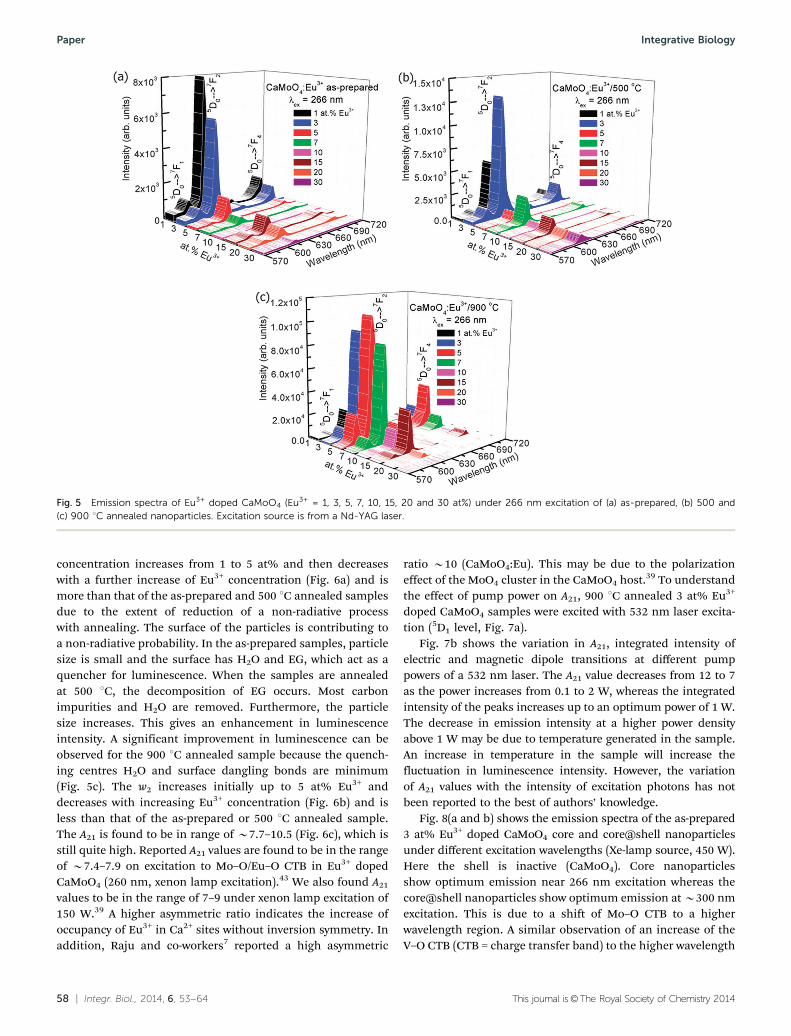
Fig. 5(a) shows the emission spectra of Eu3+ doped CaMoO4
(Eu3+ = 1, 3, 5, 7, 10, 15, 20 and 30 at%) as-prepared samples.The excitation wavelength is 266 nm (corresponding to Eu–OCTB) with a Nd-YAG laser. It consists of four characteristicemission peaks at 591, 612, 652 and 700 nm which are assignedto the 5D0 - 7F1, 5D0 - 7F2, 5D0 - 7F3 and 5D0 - 7F4
transitions of the Eu3+ ion, respectively.40 The highest intensitypeak is found at 612 nm (5D0 - 7F2), and this can be assignedto the electric dipole allowed transition (Dj = 2). The transitionobserved at 591 nm (5D0 - 7F1) is due to the magnetic dipoleallowed transition of the Eu3+ ion (Dj = 1). The electric dipole
transition 5D0 -7F2 is hypersensitive whereas magnetic dipole
transition 5D0 -7F1 is insensitive to the crystal field environment
around the Eu3+ ion. Magnetic dipole transition is dominantwhen Eu3+ ions occupy the site with inversion symmetry. Inthe other case electric dipole transition will be dominatingaccording to Judd–Ofelt theory.41 Based on the crystal structureof CaMO4 (tetragonal structure with space group I41/a), the Eu3+
ion has 8 O2� ions to form a EuO8 polyhedron, in which thereare two different Eu–O bond lengths and therefore, EuO8 isasymmetric. It is expected that the luminescence intensity forthe electric dipole transition will be more than that of themagnetic dipole transition.42 The change in Ca/Eu–O bondlength with Eu3+ ion dopant concentration was confirmed byRietveld refinement of the XRD data in our earlier work.4 Theluminescence intensity of the transition/curve is calculatedafter fitting with the Gaussian distribution function
I ¼ Ib þXi¼2
i¼1
Ai
wi
ffiffiffiffiffiffiffiffip=2
p e2 l�lcið Þ2
wi2 (4)
where I is the intensity, Ib is the background intensity, wi is theFWHM of the curve, Ai is the area under the curve, l isthe wavelength and lci is the mean value correspondingto the transition. These are fitted in the range 583–600 and600–628 nm for the 5D0 - 7F1 and 5D0 - 7F2 transitions,respectively. A typical fitting to the electric and magnetic dipoletransitions data for the as-prepared 1 at% Eu3+ doped CaMoO4
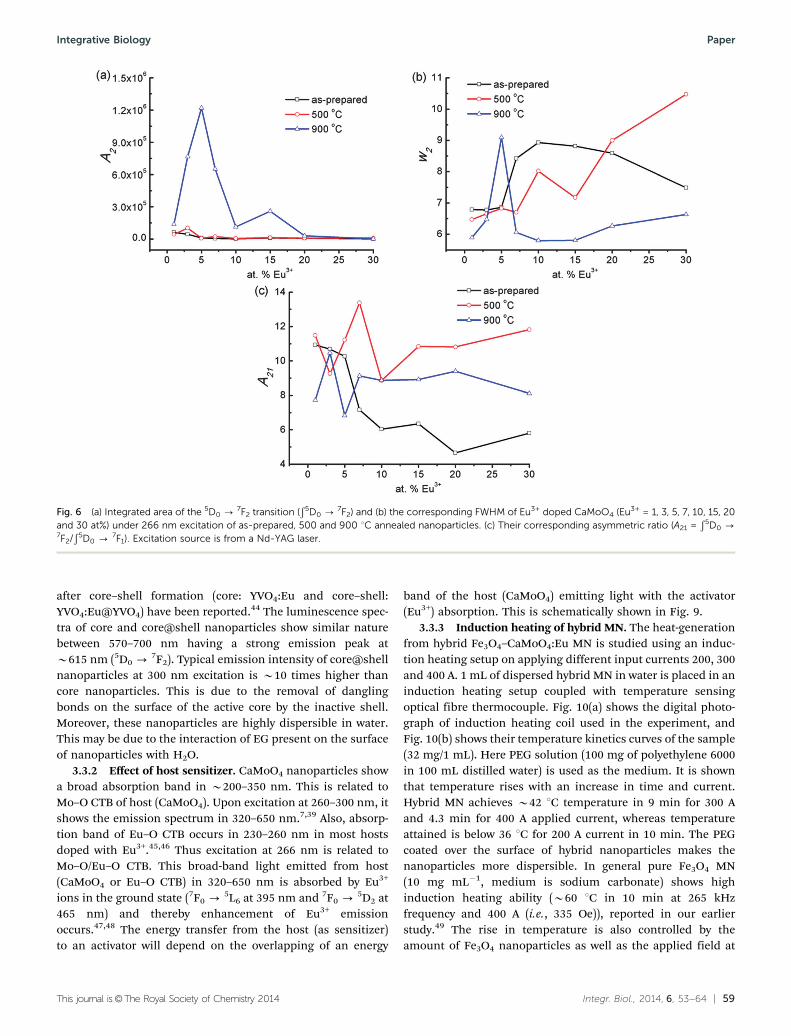
is shown in Fig. S1 (see ESI†). The fitting has been carried outafter the baseline correction (Ib = 0). The parameters obtainedafter fittings are given in the figure itself with goodness of aparameter (w2 = 0.99205). In the case of the as-preparedsamples, the integrated luminescence intensity of the electricdipole transition 5D0 - 7F2 (A2) decreases with the increase ofEu3+ concentration due to concentration quenching effect(Fig. 6a). The variation of FWHM (w2) with Eu3+ concentrationis shown in Fig. 6b. The w2 increases with Eu3+ concentrationsup to 10 at%.
The structural distortion around the Eu3+ ion is estimated bythe ratio of an integrated area of electric dipole transition tomagnetic dipole transition, which is known as the asymmetricratio (A21):
A21 ¼Ð 628600I2dlÐ 600583I1dl
(5)
The A21 of as-prepared sample decreases from 11 to 5.6 with anincrease of Eu3+ concentration up to 30 at% (Fig. 6c).
The emission spectra of samples annealed at 500 1C afterexcitation at 266 nm is shown in Fig. 5b. The A2 increases as Eu3+
concentration increases from 1 to 3 at% and then decreasessignificantly with increasing Eu3+ concentration. The optimumintensity is more than that of the as-prepared sample due to theextent of reduction of non-radiative channels on annealing(Fig. 6a). The w2 increases with increasing Eu3+ concentration(Fig. 6b). The A21 is found to be in range of 8.8–13.3 (Fig. 6c).
The samples annealed at 900 1C show intense emission onexcitation at 266 nm (Fig. 5c). The A2 value increases as Eu3+
Table 1 The Raman peak assignment of the as-prepared core andcore@shell nanoparticles
Raman modes
Observed peakposition (cm�1)
Reported peakposition (cm�1)
Core Core@shell Ref. 36 Ref. 38
Bg — 86 83 —Eg 115 112 110 111.5Eg 141 141 141 143Eg 199 199 201 189.5Ag 320 321 322 321.5Bg 389 390 390 391Eg 791 791 793 792Bg 844 844 845 845Ag 876 876 878 877
Fig. 4 Excitation spectrum of the as-prepared 3 at% Eu3+ doped CaMoO4
core–shell nanoparticles by monitoring emission at 612 nm. Excitationsource is from a xenon lamp (450 W).
Integrative Biology Paper
58 | Integr. Biol., 2014, 6, 53--64 This journal is©The Royal Society of Chemistry 2014
concentration increases from 1 to 5 at% and then decreaseswith a further increase of Eu3+ concentration (Fig. 6a) and ismore than that of the as-prepared and 500 1C annealed samplesdue to the extent of reduction of a non-radiative processwith annealing. The surface of the particles is contributing toa non-radiative probability. In the as-prepared samples, particlesize is small and the surface has H2O and EG, which act as aquencher for luminescence. When the samples are annealedat 500 1C, the decomposition of EG occurs. Most carbonimpurities and H2O are removed. Furthermore, the particlesize increases. This gives an enhancement in luminescenceintensity. A significant improvement in luminescence can beobserved for the 900 1C annealed sample because the quench-ing centres H2O and surface dangling bonds are minimum(Fig. 5c). The w2 increases initially up to 5 at% Eu3+ anddecreases with increasing Eu3+ concentration (Fig. 6b) and isless than that of the as-prepared or 500 1C annealed sample.The A21 is found to be in range of B7.7–10.5 (Fig. 6c), which isstill quite high. Reported A21 values are found to be in the rangeof B7.4–7.9 on excitation to Mo–O/Eu–O CTB in Eu3+ dopedCaMoO4 (260 nm, xenon lamp excitation).43 We also found A21
values to be in the range of 7–9 under xenon lamp excitation of150 W.39 A higher asymmetric ratio indicates the increase ofoccupancy of Eu3+ in Ca2+ sites without inversion symmetry. Inaddition, Raju and co-workers7 reported a high asymmetric
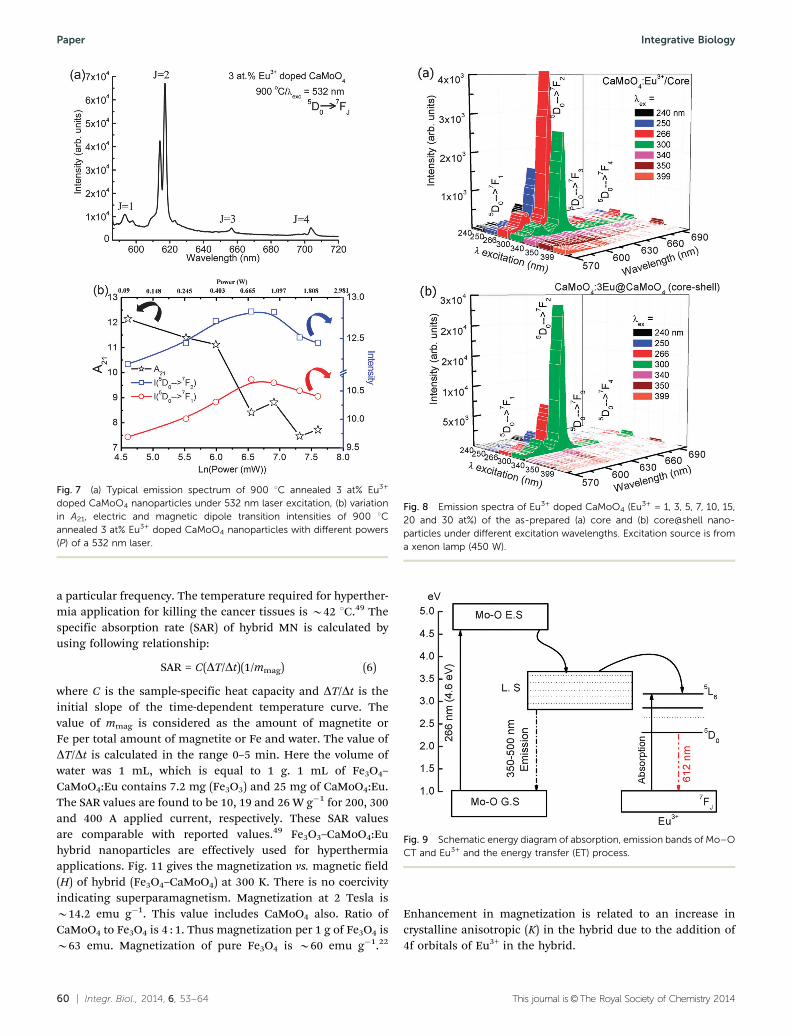
ratio B10 (CaMoO4:Eu). This may be due to the polarizationeffect of the MoO4 cluster in the CaMoO4 host.39 To understandthe effect of pump power on A21, 900 1C annealed 3 at% Eu3+
doped CaMoO4 samples were excited with 532 nm laser excita-tion (5D1 level, Fig. 7a).
Fig. 7b shows the variation in A21, integrated intensity ofelectric and magnetic dipole transitions at different pumppowers of a 532 nm laser. The A21 value decreases from 12 to 7as the power increases from 0.1 to 2 W, whereas the integratedintensity of the peaks increases up to an optimum power of 1 W.The decrease in emission intensity at a higher power densityabove 1 W may be due to temperature generated in the sample.An increase in temperature in the sample will increase thefluctuation in luminescence intensity. However, the variationof A21 values with the intensity of excitation photons has notbeen reported to the best of authors’ knowledge.
Fig. 8(a and b) shows the emission spectra of the as-prepared3 at% Eu3+ doped CaMoO4 core and core@shell nanoparticlesunder different excitation wavelengths (Xe-lamp source, 450 W).Here the shell is inactive (CaMoO4). Core nanoparticlesshow optimum emission near 266 nm excitation whereas thecore@shell nanoparticles show optimum emission at B300 nmexcitation. This is due to a shift of Mo–O CTB to a higherwavelength region. A similar observation of an increase of theV–O CTB (CTB = charge transfer band) to the higher wavelength
Fig. 5 Emission spectra of Eu3+ doped CaMoO4 (Eu3+ = 1, 3, 5, 7, 10, 15, 20 and 30 at%) under 266 nm excitation of (a) as-prepared, (b) 500 and(c) 900 1C annealed nanoparticles. Excitation source is from a Nd-YAG laser.
Paper Integrative Biology
This journal is©The Royal Society of Chemistry 2014 Integr. Biol., 2014, 6, 53--64 | 59
after core–shell formation (core: YVO4:Eu and core–shell:YVO4:Eu@YVO4) have been reported.44 The luminescence spec-tra of core and core@shell nanoparticles show similar naturebetween 570–700 nm having a strong emission peak atB615 nm (5D0 -
7F2). Typical emission intensity of core@shellnanoparticles at 300 nm excitation is B10 times higher thancore nanoparticles. This is due to the removal of danglingbonds on the surface of the active core by the inactive shell.Moreover, these nanoparticles are highly dispersible in water.This may be due to the interaction of EG present on the surfaceof nanoparticles with H2O.
3.3.2 Effect of host sensitizer. CaMoO4 nanoparticles showa broad absorption band in B200–350 nm. This is related toMo–O CTB of host (CaMoO4). Upon excitation at 260–300 nm, itshows the emission spectrum in 320–650 nm.7,39 Also, absorp-tion band of Eu–O CTB occurs in 230–260 nm in most hostsdoped with Eu3+.45,46 Thus excitation at 266 nm is related toMo–O/Eu–O CTB. This broad-band light emitted from host(CaMoO4 or Eu–O CTB) in 320–650 nm is absorbed by Eu3+
ions in the ground state (7F0 -5L6 at 395 nm and 7F0 -
5D2 at465 nm) and thereby enhancement of Eu3+ emissionoccurs.47,48 The energy transfer from the host (as sensitizer)to an activator will depend on the overlapping of an energy
band of the host (CaMoO4) emitting light with the activator(Eu3+) absorption. This is schematically shown in Fig. 9.
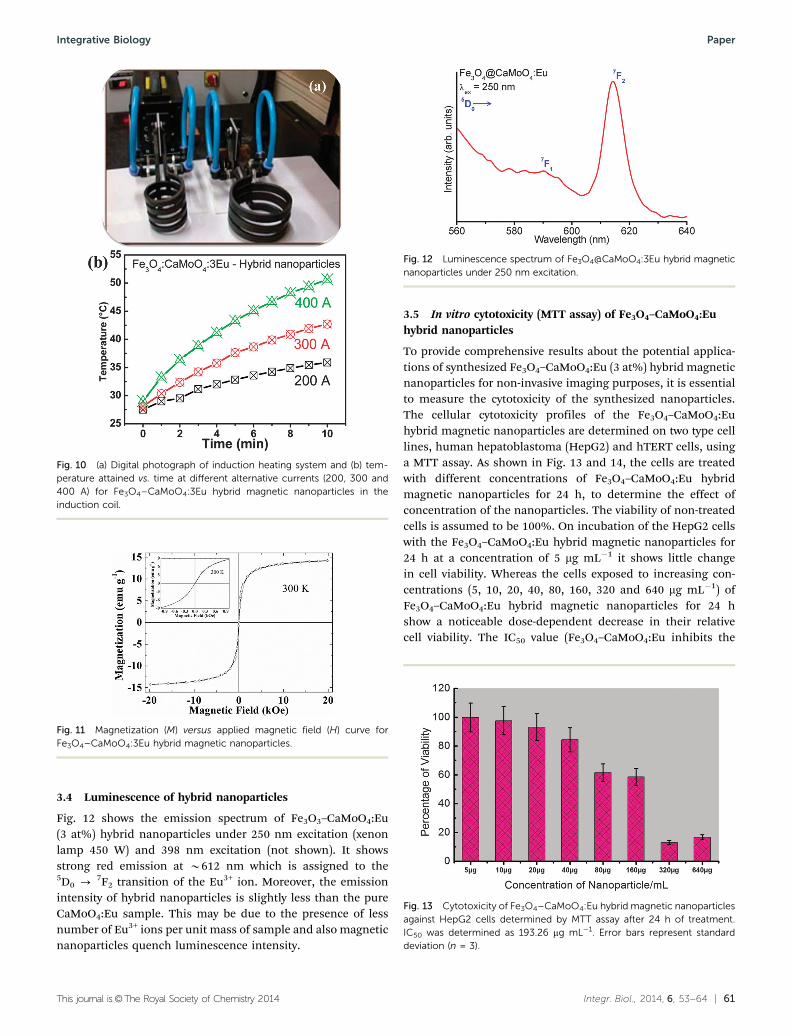
3.3.3 Induction heating of hybrid MN. The heat-generationfrom hybrid Fe3O4–CaMoO4:Eu MN is studied using an induc-tion heating setup on applying different input currents 200, 300and 400 A. 1 mL of dispersed hybrid MN in water is placed in aninduction heating setup coupled with temperature sensingoptical fibre thermocouple. Fig. 10(a) shows the digital photo-graph of induction heating coil used in the experiment, andFig. 10(b) shows their temperature kinetics curves of the sample(32 mg/1 mL). Here PEG solution (100 mg of polyethylene 6000in 100 mL distilled water) is used as the medium. It is shownthat temperature rises with an increase in time and current.Hybrid MN achieves B42 1C temperature in 9 min for 300 Aand 4.3 min for 400 A applied current, whereas temperatureattained is below 36 1C for 200 A current in 10 min. The PEGcoated over the surface of hybrid nanoparticles makes thenanoparticles more dispersible. In general pure Fe3O4 MN(10 mg mL�1, medium is sodium carbonate) shows highinduction heating ability (B60 1C in 10 min at 265 kHzfrequency and 400 A (i.e., 335 Oe)), reported in our earlierstudy.49 The rise in temperature is also controlled by theamount of Fe3O4 nanoparticles as well as the applied field at
Fig. 6 (a) Integrated area of the 5D0 - 7F2 transition (Ð 5D0 - 7F2) and (b) the corresponding FWHM of Eu3+ doped CaMoO4 (Eu3+ = 1, 3, 5, 7, 10, 15, 20
and 30 at%) under 266 nm excitation of as-prepared, 500 and 900 1C annealed nanoparticles. (c) Their corresponding asymmetric ratio (A21 =Ð 5D0 -
7F2/Ð 5D0 - 7F1). Excitation source is from a Nd-YAG laser.
Integrative Biology Paper
60 | Integr. Biol., 2014, 6, 53--64 This journal is©The Royal Society of Chemistry 2014
a particular frequency. The temperature required for hyperther-mia application for killing the cancer tissues is B42 1C.49 Thespecific absorption rate (SAR) of hybrid MN is calculated byusing following relationship:
SAR = C(DT/Dt)(1/mmag) (6)
where C is the sample-specific heat capacity and DT/Dt is theinitial slope of the time-dependent temperature curve. Thevalue of mmag is considered as the amount of magnetite orFe per total amount of magnetite or Fe and water. The value ofDT/Dt is calculated in the range 0–5 min. Here the volume ofwater was 1 mL, which is equal to 1 g. 1 mL of Fe3O4–CaMoO4:Eu contains 7.2 mg (Fe3O3) and 25 mg of CaMoO4:Eu.The SAR values are found to be 10, 19 and 26 W g�1 for 200, 300and 400 A applied current, respectively. These SAR valuesare comparable with reported values.49 Fe3O3–CaMoO4:Euhybrid nanoparticles are effectively used for hyperthermiaapplications. Fig. 11 gives the magnetization vs. magnetic field(H) of hybrid (Fe3O4–CaMoO4) at 300 K. There is no coercivityindicating superparamagnetism. Magnetization at 2 Tesla isB14.2 emu g�1. This value includes CaMoO4 also. Ratio ofCaMoO4 to Fe3O4 is 4 : 1. Thus magnetization per 1 g of Fe3O4 isB63 emu. Magnetization of pure Fe3O4 is B60 emu g�1.22
Enhancement in magnetization is related to an increase incrystalline anisotropic (K) in the hybrid due to the addition of4f orbitals of Eu3+ in the hybrid.
Fig. 7 (a) Typical emission spectrum of 900 1C annealed 3 at% Eu3+
doped CaMoO4 nanoparticles under 532 nm laser excitation, (b) variationin A21, electric and magnetic dipole transition intensities of 900 1Cannealed 3 at% Eu3+ doped CaMoO4 nanoparticles with different powers(P) of a 532 nm laser.
Fig. 8 Emission spectra of Eu3+ doped CaMoO4 (Eu3+ = 1, 3, 5, 7, 10, 15,20 and 30 at%) of the as-prepared (a) core and (b) core@shell nano-particles under different excitation wavelengths. Excitation source is froma xenon lamp (450 W).
Fig. 9 Schematic energy diagram of absorption, emission bands of Mo–OCT and Eu3+ and the energy transfer (ET) process.
Paper Integrative Biology
This journal is©The Royal Society of Chemistry 2014 Integr. Biol., 2014, 6, 53--64 | 61
3.4 Luminescence of hybrid nanoparticles
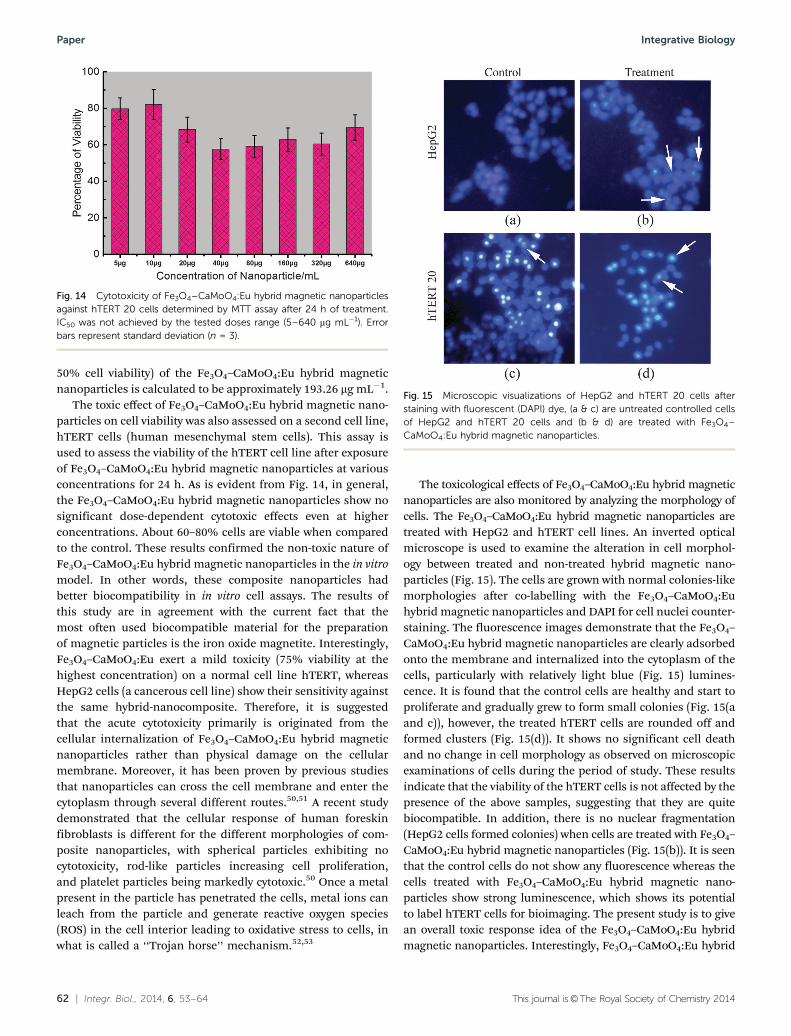
Fig. 12 shows the emission spectrum of Fe3O3–CaMoO4:Eu(3 at%) hybrid nanoparticles under 250 nm excitation (xenonlamp 450 W) and 398 nm excitation (not shown). It showsstrong red emission at B612 nm which is assigned to the5D0 - 7F2 transition of the Eu3+ ion. Moreover, the emissionintensity of hybrid nanoparticles is slightly less than the pureCaMoO4:Eu sample. This may be due to the presence of lessnumber of Eu3+ ions per unit mass of sample and also magneticnanoparticles quench luminescence intensity.
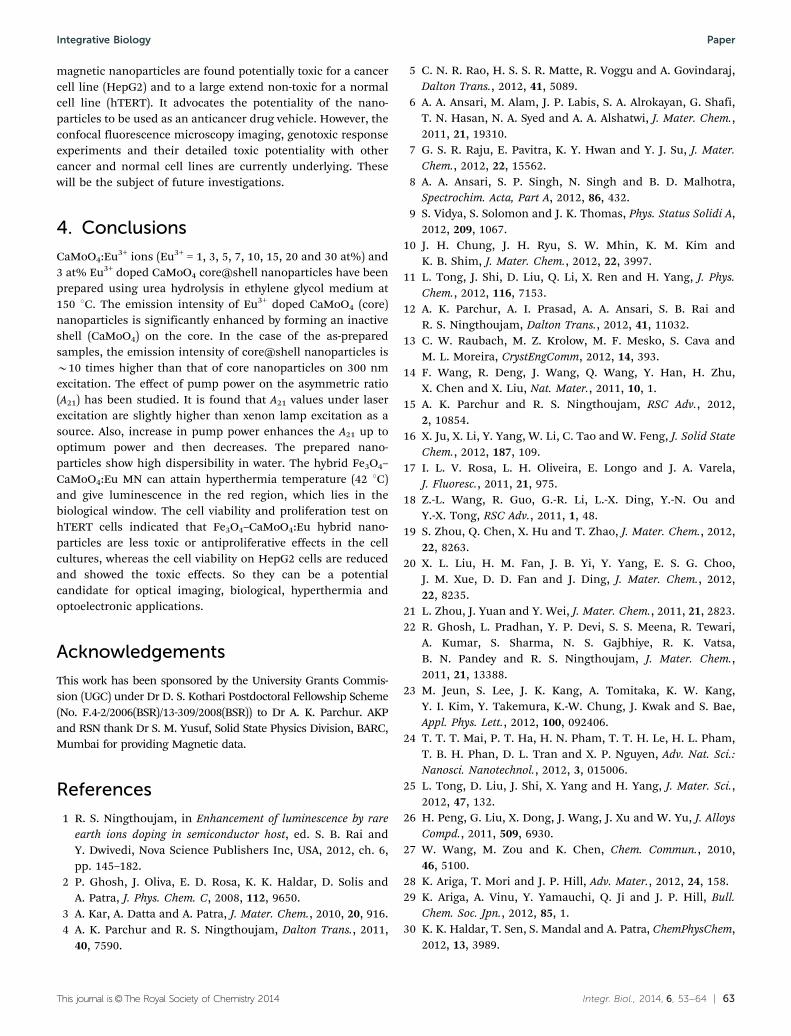
3.5 In vitro cytotoxicity (MTT assay) of Fe3O4–CaMoO4:Euhybrid nanoparticles
To provide comprehensive results about the potential applica-tions of synthesized Fe3O4–CaMoO4:Eu (3 at%) hybrid magneticnanoparticles for non-invasive imaging purposes, it is essentialto measure the cytotoxicity of the synthesized nanoparticles.The cellular cytotoxicity profiles of the Fe3O4–CaMoO4:Euhybrid magnetic nanoparticles are determined on two type celllines, human hepatoblastoma (HepG2) and hTERT cells, usinga MTT assay. As shown in Fig. 13 and 14, the cells are treatedwith different concentrations of Fe3O4–CaMoO4:Eu hybridmagnetic nanoparticles for 24 h, to determine the effect ofconcentration of the nanoparticles. The viability of non-treatedcells is assumed to be 100%. On incubation of the HepG2 cellswith the Fe3O4–CaMoO4:Eu hybrid magnetic nanoparticles for24 h at a concentration of 5 mg mL�1 it shows little changein cell viability. Whereas the cells exposed to increasing con-centrations (5, 10, 20, 40, 80, 160, 320 and 640 mg mL�1) ofFe3O4–CaMoO4:Eu hybrid magnetic nanoparticles for 24 hshow a noticeable dose-dependent decrease in their relativecell viability. The IC50 value (Fe3O4–CaMoO4:Eu inhibits the
Fig. 10 (a) Digital photograph of induction heating system and (b) tem-perature attained vs. time at different alternative currents (200, 300 and400 A) for Fe3O4–CaMoO4:3Eu hybrid magnetic nanoparticles in theinduction coil.
Fig. 11 Magnetization (M) versus applied magnetic field (H) curve forFe3O4–CaMoO4:3Eu hybrid magnetic nanoparticles.
Fig. 12 Luminescence spectrum of Fe3O4@CaMoO4:3Eu hybrid magneticnanoparticles under 250 nm excitation.
Fig. 13 Cytotoxicity of Fe3O4–CaMoO4:Eu hybrid magnetic nanoparticlesagainst HepG2 cells determined by MTT assay after 24 h of treatment.IC50 was determined as 193.26 mg mL�1. Error bars represent standarddeviation (n = 3).
Integrative Biology Paper
62 | Integr. Biol., 2014, 6, 53--64 This journal is©The Royal Society of Chemistry 2014
50% cell viability) of the Fe3O4–CaMoO4:Eu hybrid magneticnanoparticles is calculated to be approximately 193.26 mg mL�1.
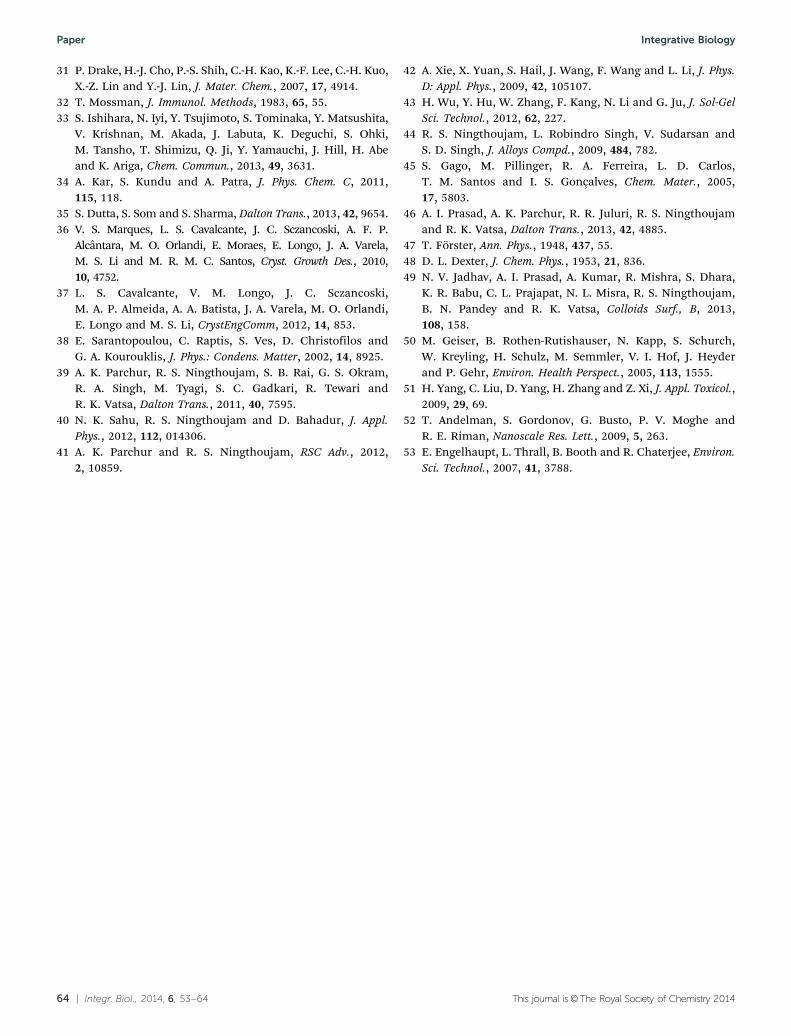
The toxic effect of Fe3O4–CaMoO4:Eu hybrid magnetic nano-particles on cell viability was also assessed on a second cell line,hTERT cells (human mesenchymal stem cells). This assay isused to assess the viability of the hTERT cell line after exposureof Fe3O4–CaMoO4:Eu hybrid magnetic nanoparticles at variousconcentrations for 24 h. As is evident from Fig. 14, in general,the Fe3O4–CaMoO4:Eu hybrid magnetic nanoparticles show nosignificant dose-dependent cytotoxic effects even at higherconcentrations. About 60–80% cells are viable when comparedto the control. These results confirmed the non-toxic nature ofFe3O4–CaMoO4:Eu hybrid magnetic nanoparticles in the in vitromodel. In other words, these composite nanoparticles hadbetter biocompatibility in in vitro cell assays. The results ofthis study are in agreement with the current fact that themost often used biocompatible material for the preparationof magnetic particles is the iron oxide magnetite. Interestingly,Fe3O4–CaMoO4:Eu exert a mild toxicity (75% viability at thehighest concentration) on a normal cell line hTERT, whereasHepG2 cells (a cancerous cell line) show their sensitivity againstthe same hybrid-nanocomposite. Therefore, it is suggestedthat the acute cytotoxicity primarily is originated from thecellular internalization of Fe3O4–CaMoO4:Eu hybrid magneticnanoparticles rather than physical damage on the cellularmembrane. Moreover, it has been proven by previous studiesthat nanoparticles can cross the cell membrane and enter thecytoplasm through several different routes.50,51 A recent studydemonstrated that the cellular response of human foreskinfibroblasts is different for the different morphologies of com-posite nanoparticles, with spherical particles exhibiting nocytotoxicity, rod-like particles increasing cell proliferation,and platelet particles being markedly cytotoxic.50 Once a metalpresent in the particle has penetrated the cells, metal ions canleach from the particle and generate reactive oxygen species(ROS) in the cell interior leading to oxidative stress to cells, inwhat is called a ‘‘Trojan horse’’ mechanism.52,53
The toxicological effects of Fe3O4–CaMoO4:Eu hybrid magneticnanoparticles are also monitored by analyzing the morphology ofcells. The Fe3O4–CaMoO4:Eu hybrid magnetic nanoparticles aretreated with HepG2 and hTERT cell lines. An inverted opticalmicroscope is used to examine the alteration in cell morphol-ogy between treated and non-treated hybrid magnetic nano-particles (Fig. 15). The cells are grown with normal colonies-likemorphologies after co-labelling with the Fe3O4–CaMoO4:Euhybrid magnetic nanoparticles and DAPI for cell nuclei counter-staining. The fluorescence images demonstrate that the Fe3O4–CaMoO4:Eu hybrid magnetic nanoparticles are clearly adsorbedonto the membrane and internalized into the cytoplasm of thecells, particularly with relatively light blue (Fig. 15) lumines-cence. It is found that the control cells are healthy and start toproliferate and gradually grew to form small colonies (Fig. 15(aand c)), however, the treated hTERT cells are rounded off andformed clusters (Fig. 15(d)). It shows no significant cell deathand no change in cell morphology as observed on microscopicexaminations of cells during the period of study. These resultsindicate that the viability of the hTERT cells is not affected by thepresence of the above samples, suggesting that they are quitebiocompatible. In addition, there is no nuclear fragmentation(HepG2 cells formed colonies) when cells are treated with Fe3O4–CaMoO4:Eu hybrid magnetic nanoparticles (Fig. 15(b)). It is seenthat the control cells do not show any fluorescence whereas thecells treated with Fe3O4–CaMoO4:Eu hybrid magnetic nano-particles show strong luminescence, which shows its potentialto label hTERT cells for bioimaging. The present study is to givean overall toxic response idea of the Fe3O4–CaMoO4:Eu hybridmagnetic nanoparticles. Interestingly, Fe3O4–CaMoO4:Eu hybrid
Fig. 14 Cytotoxicity of Fe3O4–CaMoO4:Eu hybrid magnetic nanoparticlesagainst hTERT 20 cells determined by MTT assay after 24 h of treatment.IC50 was not achieved by the tested doses range (5–640 mg mL�1). Errorbars represent standard deviation (n = 3).
Fig. 15 Microscopic visualizations of HepG2 and hTERT 20 cells afterstaining with fluorescent (DAPI) dye, (a & c) are untreated controlled cellsof HepG2 and hTERT 20 cells and (b & d) are treated with Fe3O4–CaMoO4:Eu hybrid magnetic nanoparticles.
Paper Integrative Biology
This journal is©The Royal Society of Chemistry 2014 Integr. Biol., 2014, 6, 53--64 | 63
magnetic nanoparticles are found potentially toxic for a cancercell line (HepG2) and to a large extend non-toxic for a normalcell line (hTERT). It advocates the potentiality of the nano-particles to be used as an anticancer drug vehicle. However, theconfocal fluorescence microscopy imaging, genotoxic responseexperiments and their detailed toxic potentiality with othercancer and normal cell lines are currently underlying. Thesewill be the subject of future investigations.
4. Conclusions
CaMoO4:Eu3+ ions (Eu3+ = 1, 3, 5, 7, 10, 15, 20 and 30 at%) and3 at% Eu3+ doped CaMoO4 core@shell nanoparticles have beenprepared using urea hydrolysis in ethylene glycol medium at150 1C. The emission intensity of Eu3+ doped CaMoO4 (core)nanoparticles is significantly enhanced by forming an inactiveshell (CaMoO4) on the core. In the case of the as-preparedsamples, the emission intensity of core@shell nanoparticles isB10 times higher than that of core nanoparticles on 300 nmexcitation. The effect of pump power on the asymmetric ratio(A21) has been studied. It is found that A21 values under laserexcitation are slightly higher than xenon lamp excitation as asource. Also, increase in pump power enhances the A21 up tooptimum power and then decreases. The prepared nano-particles show high dispersibility in water. The hybrid Fe3O4–CaMoO4:Eu MN can attain hyperthermia temperature (42 1C)and give luminescence in the red region, which lies in thebiological window. The cell viability and proliferation test onhTERT cells indicated that Fe3O4–CaMoO4:Eu hybrid nano-particles are less toxic or antiproliferative effects in the cellcultures, whereas the cell viability on HepG2 cells are reducedand showed the toxic effects. So they can be a potentialcandidate for optical imaging, biological, hyperthermia andoptoelectronic applications.
Acknowledgements
This work has been sponsored by the University Grants Commis-sion (UGC) under Dr D. S. Kothari Postdoctoral Fellowship Scheme(No. F.4-2/2006(BSR)/13-309/2008(BSR)) to Dr A. K. Parchur. AKPand RSN thank Dr S. M. Yusuf, Solid State Physics Division, BARC,Mumbai for providing Magnetic data.
References
1 R. S. Ningthoujam, in Enhancement of luminescence by rareearth ions doping in semiconductor host, ed. S. B. Rai andY. Dwivedi, Nova Science Publishers Inc, USA, 2012, ch. 6,pp. 145–182.
2 P. Ghosh, J. Oliva, E. D. Rosa, K. K. Haldar, D. Solis andA. Patra, J. Phys. Chem. C, 2008, 112, 9650.
3 A. Kar, A. Datta and A. Patra, J. Mater. Chem., 2010, 20, 916.4 A. K. Parchur and R. S. Ningthoujam, Dalton Trans., 2011,
40, 7590.
5 C. N. R. Rao, H. S. S. R. Matte, R. Voggu and A. Govindaraj,Dalton Trans., 2012, 41, 5089.
6 A. A. Ansari, M. Alam, J. P. Labis, S. A. Alrokayan, G. Shafi,T. N. Hasan, N. A. Syed and A. A. Alshatwi, J. Mater. Chem.,2011, 21, 19310.
7 G. S. R. Raju, E. Pavitra, K. Y. Hwan and Y. J. Su, J. Mater.Chem., 2012, 22, 15562.
8 A. A. Ansari, S. P. Singh, N. Singh and B. D. Malhotra,Spectrochim. Acta, Part A, 2012, 86, 432.
9 S. Vidya, S. Solomon and J. K. Thomas, Phys. Status Solidi A,2012, 209, 1067.
10 J. H. Chung, J. H. Ryu, S. W. Mhin, K. M. Kim andK. B. Shim, J. Mater. Chem., 2012, 22, 3997.
11 L. Tong, J. Shi, D. Liu, Q. Li, X. Ren and H. Yang, J. Phys.Chem., 2012, 116, 7153.
12 A. K. Parchur, A. I. Prasad, A. A. Ansari, S. B. Rai andR. S. Ningthoujam, Dalton Trans., 2012, 41, 11032.
13 C. W. Raubach, M. Z. Krolow, M. F. Mesko, S. Cava andM. L. Moreira, CrystEngComm, 2012, 14, 393.
14 F. Wang, R. Deng, J. Wang, Q. Wang, Y. Han, H. Zhu,X. Chen and X. Liu, Nat. Mater., 2011, 10, 1.
15 A. K. Parchur and R. S. Ningthoujam, RSC Adv., 2012,2, 10854.
16 X. Ju, X. Li, Y. Yang, W. Li, C. Tao and W. Feng, J. Solid StateChem., 2012, 187, 109.
17 I. L. V. Rosa, L. H. Oliveira, E. Longo and J. A. Varela,J. Fluoresc., 2011, 21, 975.
18 Z.-L. Wang, R. Guo, G.-R. Li, L.-X. Ding, Y.-N. Ou andY.-X. Tong, RSC Adv., 2011, 1, 48.
19 S. Zhou, Q. Chen, X. Hu and T. Zhao, J. Mater. Chem., 2012,22, 8263.
20 X. L. Liu, H. M. Fan, J. B. Yi, Y. Yang, E. S. G. Choo,J. M. Xue, D. D. Fan and J. Ding, J. Mater. Chem., 2012,22, 8235.
21 L. Zhou, J. Yuan and Y. Wei, J. Mater. Chem., 2011, 21, 2823.22 R. Ghosh, L. Pradhan, Y. P. Devi, S. S. Meena, R. Tewari,
A. Kumar, S. Sharma, N. S. Gajbhiye, R. K. Vatsa,B. N. Pandey and R. S. Ningthoujam, J. Mater. Chem.,2011, 21, 13388.
23 M. Jeun, S. Lee, J. K. Kang, A. Tomitaka, K. W. Kang,Y. I. Kim, Y. Takemura, K.-W. Chung, J. Kwak and S. Bae,Appl. Phys. Lett., 2012, 100, 092406.
24 T. T. T. Mai, P. T. Ha, H. N. Pham, T. T. H. Le, H. L. Pham,T. B. H. Phan, D. L. Tran and X. P. Nguyen, Adv. Nat. Sci.:Nanosci. Nanotechnol., 2012, 3, 015006.
25 L. Tong, D. Liu, J. Shi, X. Yang and H. Yang, J. Mater. Sci.,2012, 47, 132.
26 H. Peng, G. Liu, X. Dong, J. Wang, J. Xu and W. Yu, J. AlloysCompd., 2011, 509, 6930.
27 W. Wang, M. Zou and K. Chen, Chem. Commun., 2010,46, 5100.
28 K. Ariga, T. Mori and J. P. Hill, Adv. Mater., 2012, 24, 158.29 K. Ariga, A. Vinu, Y. Yamauchi, Q. Ji and J. P. Hill, Bull.
Chem. Soc. Jpn., 2012, 85, 1.30 K. K. Haldar, T. Sen, S. Mandal and A. Patra, ChemPhysChem,
2012, 13, 3989.
Integrative Biology Paper
64 | Integr. Biol., 2014, 6, 53--64 This journal is©The Royal Society of Chemistry 2014
31 P. Drake, H.-J. Cho, P.-S. Shih, C.-H. Kao, K.-F. Lee, C.-H. Kuo,X.-Z. Lin and Y.-J. Lin, J. Mater. Chem., 2007, 17, 4914.
32 T. Mossman, J. Immunol. Methods, 1983, 65, 55.33 S. Ishihara, N. Iyi, Y. Tsujimoto, S. Tominaka, Y. Matsushita,
V. Krishnan, M. Akada, J. Labuta, K. Deguchi, S. Ohki,M. Tansho, T. Shimizu, Q. Ji, Y. Yamauchi, J. Hill, H. Abeand K. Ariga, Chem. Commun., 2013, 49, 3631.
34 A. Kar, S. Kundu and A. Patra, J. Phys. Chem. C, 2011,115, 118.
35 S. Dutta, S. Som and S. Sharma, Dalton Trans., 2013, 42, 9654.36 V. S. Marques, L. S. Cavalcante, J. C. Sczancoski, A. F. P.
Alcantara, M. O. Orlandi, E. Moraes, E. Longo, J. A. Varela,M. S. Li and M. R. M. C. Santos, Cryst. Growth Des., 2010,10, 4752.
37 L. S. Cavalcante, V. M. Longo, J. C. Sczancoski,M. A. P. Almeida, A. A. Batista, J. A. Varela, M. O. Orlandi,E. Longo and M. S. Li, CrystEngComm, 2012, 14, 853.
38 E. Sarantopoulou, C. Raptis, S. Ves, D. Christofilos andG. A. Kourouklis, J. Phys.: Condens. Matter, 2002, 14, 8925.
39 A. K. Parchur, R. S. Ningthoujam, S. B. Rai, G. S. Okram,R. A. Singh, M. Tyagi, S. C. Gadkari, R. Tewari andR. K. Vatsa, Dalton Trans., 2011, 40, 7595.
40 N. K. Sahu, R. S. Ningthoujam and D. Bahadur, J. Appl.Phys., 2012, 112, 014306.
41 A. K. Parchur and R. S. Ningthoujam, RSC Adv., 2012,2, 10859.
42 A. Xie, X. Yuan, S. Hail, J. Wang, F. Wang and L. Li, J. Phys.D: Appl. Phys., 2009, 42, 105107.
43 H. Wu, Y. Hu, W. Zhang, F. Kang, N. Li and G. Ju, J. Sol-GelSci. Technol., 2012, 62, 227.
44 R. S. Ningthoujam, L. Robindro Singh, V. Sudarsan andS. D. Singh, J. Alloys Compd., 2009, 484, 782.
45 S. Gago, M. Pillinger, R. A. Ferreira, L. D. Carlos,T. M. Santos and I. S. Gonçalves, Chem. Mater., 2005,17, 5803.
46 A. I. Prasad, A. K. Parchur, R. R. Juluri, R. S. Ningthoujamand R. K. Vatsa, Dalton Trans., 2013, 42, 4885.
47 T. Forster, Ann. Phys., 1948, 437, 55.48 D. L. Dexter, J. Chem. Phys., 1953, 21, 836.49 N. V. Jadhav, A. I. Prasad, A. Kumar, R. Mishra, S. Dhara,
K. R. Babu, C. L. Prajapat, N. L. Misra, R. S. Ningthoujam,B. N. Pandey and R. K. Vatsa, Colloids Surf., B, 2013,108, 158.
50 M. Geiser, B. Rothen-Rutishauser, N. Kapp, S. Schurch,W. Kreyling, H. Schulz, M. Semmler, V. I. Hof, J. Heyderand P. Gehr, Environ. Health Perspect., 2005, 113, 1555.
51 H. Yang, C. Liu, D. Yang, H. Zhang and Z. Xi, J. Appl. Toxicol.,2009, 29, 69.
52 T. Andelman, S. Gordonov, G. Busto, P. V. Moghe andR. E. Riman, Nanoscale Res. Lett., 2009, 5, 263.
53 E. Engelhaupt, L. Thrall, B. Booth and R. Chaterjee, Environ.Sci. Technol., 2007, 41, 3788.
Paper Integrative Biology